UNITED STATES
SECURITIES AND EXCHANGE COMMISSION
Washington, D.C. 20549
FORM N-CSR
CERTIFIED SHAREHOLDER REPORT
OF
REGISTERED MANAGEMENT INVESTMENT COMPANIES
Investment Company Act file number: 811-07443
Name of Registrant: Vanguard Whitehall Funds
Address of Registrant:
P.O. Box 2600
Valley Forge, PA 19482
Name and address of agent for service:
Anne E. Robinson, Esquire
P.O. Box 876
Valley Forge, PA 19482
Registrant’s telephone number, including area code: (610) 669-1000
Date of fiscal year end: October 31
Date of reporting period: November 1, 2017 – October 31, 2018
Item 1: Reports to Shareholders
| Annual Report | October 31, 2018 |
| Vanguard Emerging Markets |
| Government Bond Index Fund |
Vanguard’s Principles for Investing Success
We want to give you the best chance of investment success. These principles, grounded in Vanguard’s research and experience, can put you on the right path.
Goals. Create clear, appropriate investment goals.
Balance. Develop a suitable asset allocation using broadly diversified funds. Cost. Minimize cost.
Discipline. Maintain perspective and long-term discipline.
A single theme unites these principles: Focus on the things you can control.
We believe there is no wiser course for any investor.
| Contents | |
| Your Fund’s Performance at a Glance. | 1 |
| CEO’s Perspective. | 3 |
| Fund Profile. | 5 |
| Performance Summary. | 7 |
| Financial Statements. | 10 |
| About Your Fund’s Expenses. | 51 |
| Glossary. | 53 |
Please note: The opinions expressed in this report are just that—informed opinions. They should not be considered promises or advice. Also, please keep in mind that the information and opinions cover the period through the date on the front of this report. Of course, the risks of investing in your fund are spelled out in the prospectus.
See the Glossary for definitions of investment terms used in this report.
Your Fund’s Performance at a Glance
• For the 12 months ended October 31, 2018, Vanguard Emerging Markets Government Bond Index Fund returned –4.05% for Investor Shares. It performed in line with its benchmark index (–3.70%) after taking operating costs into account and outpaced the –5.55% average return of its peers.
• Emerging-market bonds had a strong start to the fiscal year, underpinned by robust synchronized global growth and modest inflation. As the year progressed, however, the environment grew more challenging. U.S. interest rates headed higher, and the stronger dollar raised the cost of borrowing in dollars and precipitated capital outflows.
• Some countries with large short-term external funding needs, including Argentina and Turkey, were among the worst performers.
• Please note that shortly after the close of the period, Vanguard lowered the investment minimum for your fund’s Admiral Shares from $10,000 to $3,000.
| Total Returns: Fiscal Year Ended October 31, 2018 | ||||
| 30-Day SEC | Income | Capital | Total | |
| Yield | Returns | Returns | Returns | |
| Vanguard Emerging Markets Government Bond Index Fund | ||||
| Investor Shares | 5.12% | 3.95% | -8.00% | -4.05% |
| ETF Shares | 5.34 | |||
| Market Price | -3.82 | |||
| Net Asset Value | -3.84 | |||
| Admiral™ Shares | 5.34 | 4.15 | -7.95 | -3.80 |
| Institutional Shares | 5.32 | 4.16 | -7.98 | -3.82 |
| Bloomberg Barclays USD Emerging Markets | ||||
| Government RIC Capped Index | -3.70 | |||
| Emerging Markets Hard Currency Debt Funds | ||||
| Average | -5.55 |
Emerging Markets Hard Currency Debt Funds Average: Derived from data provided by Lipper, a Thomson Reuters Company.
Admiral Shares carry lower expenses and are available to investors who meet certain account-balance requirements. The Vanguard ETF® Shares shown are traded on the Nasdaq exchange and are available only through brokers. The table provides ETF returns based on both the Nasdaq market price and the net asset value for a share. U.S. Pat. Nos. 6,879,964; 7,337,138; 7,720,749; 7,925,573; 8,090,646; and 8,417,623.
For the ETF Shares, the market price is determined by the midpoint of the bid-offer spread as of the closing time of the New York Stock Exchange (generally 4 p.m., Eastern time). The net asset value is also determined as of the NYSE closing time. For more information about how the ETF Shares' market prices have compared with their net asset value, visit vanguard.com, select your ETF, and then select the Price and Performance tab. The ETF premium/discount analysis there shows the percentages of days on which the ETF Shares' market price was above or below the NAV.
1
| Total Returns: Inception Through October 31, 2018 | |
| Average | |
| Annual Return | |
| Emerging Markets Government Bond Index Fund Investor Shares (Returns since inception: | |
| 5/31/2013) | 3.03% |
| Bloomberg Barclays USD Emerging Markets Government RIC Capped Index | 3.30 |
| Emerging Markets Hard Currency Debt Funds Average | 1.53 |
| Emerging Markets Hard Currency Debt Funds Average: Derived from data provided by Lipper, a Thomson Reuters Company. | |
The figures shown represent past performance, which is not a guarantee of future results. (Current performance may be lower or higher than the performance data cited. For performance data current to the most recent month-end, visit our website at vanguard.com/performance.) Note, too, that both investment returns and principal value can fluctuate widely, so an investor’s shares, when sold, could be worth more or less than their original cost.
| Expense Ratios | |||||
| Your Fund Compared With Its Peer Group | |||||
| Investor | ETF | Admiral | Institutional | Peer Group | |
| Shares | Shares | Shares | Shares | Average | |
| Emerging Markets Government Bond Index | 0.49% | 0.32% | 0.32% | 0.29% | 1.13% |
The fund expense ratios shown are from the prospectus dated February 22, 2018, and represent estimated costs for the current fiscal year. For the fiscal year ended October 31, 2018, the expense ratios were 0.49% for Investor Shares, 0.30% for ETF Shares, 0.30% for Admiral Shares, and 0.29% for Institutional Shares. The peer-group expense ratio is derived from data provided by Lipper, a Thomson Reuters Company, and captures information through year-end 2017.
Peer group: Emerging Markets Hard Currency Debt Funds.
2
CEO’s Perspective

Tim Buckley
President and Chief Executive Officer
Dear Shareholder,
Over the years, I’ve found that prudent investors exhibit a common trait: discipline. No matter how the markets move or what new investing fad hits the headlines, those who stay focused on their goals and tune out the noise are set up for long-term success.
The prime gateway to investing is saving, and you don’t usually become a saver without a healthy dose of discipline. Savers make the decision to sock away part of their income, which means spending less and delaying gratification, no matter how difficult that may be.
Of course, disciplined investing extends beyond diligent saving. The financial markets, in the short term especially, are unpredictable; I have yet to meet the investor who can time them perfectly. It takes discipline to resist the urge to go all-in when markets are frothy or to retreat when things look bleak.
Staying put with your investments is one strategy for handling volatility. Another, rebalancing, requires even more discipline because it means steering your money away from strong performers and toward poorer performers.
Patience—a form of discipline—is also the friend of long-term investors. Higher returns are the potential reward for weathering the market’s turbulence and uncertainty.
3
We have been enjoying one of the longest bull markets in history, but it won’t continue forever. Prepare yourself now for how you will react when volatility comes back. Don’t panic. Don’t chase returns or look for answers outside the asset classes you trust. And be sure to rebalance periodically, even when there’s turmoil.
Whether you’re a master of self-control, get a boost from technology, or work with a professional advisor, know that discipline
is necessary to get the most out of your investment portfolio. And know that Vanguard is with you for the entire ride.
Thank you for your continued loyalty.
Sincerely,

Mortimer J. Buckley
President and Chief Executive Officer
November 16, 2018
| Market Barometer | |||
| Average Annual Total Returns | |||
| Periods Ended October 31, 2018 | |||
| One Year | Three Years | Five Years | |
| Stocks | |||
| Russell 1000 Index (Large-caps) | 6.98% | 11.31% | 11.05% |
| Russell 2000 Index (Small-caps) | 1.85 | 10.68 | 8.01 |
| Russell 3000 Index (Broad U.S. market) | 6.60 | 11.27 | 10.81 |
| FTSE All-World ex US Index (International) | -7.99 | 4.57 | 2.01 |
| Bonds | |||
| Bloomberg Barclays U.S. Aggregate Bond Index | |||
| (Broad taxable market) | -2.05% | 1.04% | 1.83% |
| Bloomberg Barclays Municipal Bond Index | |||
| (Broad tax-exempt market) | -0.51 | 1.90 | 3.25 |
| FTSE Three-Month U. S. Treasury Bill Index | 1.67 | 0.86 | 0.52 |
| CPI | |||
| Consumer Price Index | 2.52% | 2.07% | 1.60% |
4
Emerging Markets Government Bond Index Fund
Fund Profile
As of October 31, 2018
| Share-Class Characteristics | ||||
| Investor | Admiral | Institutional | ||
| Shares | ETF Shares | Shares | Shares | |
| Ticker Symbol | VGOVX | VWOB | VGAVX | VGIVX |
| Expense Ratio1 | 0.49% | 0.32% | 0.32% | 0.29% |
| 30-Day SEC Yield | 5.12% | 5.34% | 5.34% | 5.32% |
| Financial Attributes | ||
| Bloomberg | ||
| Barclays USD | ||
| Emerging Mkts | ||
| Government | ||
| Fund | RIC Capped Idx | |
| Number of Bonds | 1,037 | 1,116 |
| Yield to Maturity | ||
| (before expenses) | 6.0% | 6.0% |
| Average Coupon | 5.3% | 5.4% |
| Average Duration | 6.0 years | 6.1 years |
| Average Effective | ||
| Maturity | 10.0 years | 10.0 years |
| Short-Term | ||
| Reserves | 0.6% | — |
| Sector Diversification (% of portfolio) | |
| Foreign | 98.8% |
| Treasury/Agency | 0.1 |
| Other | 1.1 |
| Volatility Measures | |
| Bloomberg | |
| Barclays USD | |
| Emerging Mkts | |
| Government | |
| RIC Capped Idx | |
| R-Squared | 1.00 |
| Beta | 1.01 |
These measures show the degree and timing of the fund’s fluctuations compared with the index over 36 months.
| Distribution by Effective Maturity | |
| (% of portfolio) | |
| Under 1 Year | 1.5% |
| 1 - 3 Years | 19.7 |
| 3 - 5 Years | 19.2 |
| 5 - 10 Years | 33.7 |
| 10 - 20 Years | 8.2 |
| 20 - 30 Years | 16.2 |
| Over 30 Years | 1.5 |
| Distribution by Credit Quality (% of portfolio) | |
| U.S. Government | 0.1% |
| Aaa | 1.2 |
| Aa | 5.5 |
| A | 20.8 |
| Baa | 37.4 |
| Less Than Baa | 35.0 |
Credit-quality ratings are obtained from Barclays and are from Moody's, Fitch, and S&P. When ratings from all three agencies are used, the median rating is shown. When ratings from two of the agencies are used, the lower rating for each issue is shown. "Not Rated" is used to classify securities for which a rating is not available. For more information about these ratings, see the Glossary entry for Credit Quality.
1 The expense ratios shown are from the prospectus dated February 22, 2018, and represent estimated costs for the current fiscal year. For the fiscal year ended October 31, 2018, the expense ratios were 0.49% for Investor Shares, 0.30% for ETF Shares, 0.30% for Admiral Shares, and 0.29% for Institutional Shares.
5
Emerging Markets Government Bond Index Fund
| Market Diversification (% of portfolio exposure) | |
| Emerging Markets | |
| China | 17.0% |
| Mexico | 7.8 |
| Brazil | 6.0 |
| Indonesia | 5.4 |
| United Arab Emirates | 4.8 |
| Russia | 4.6 |
| Saudi Arabia | 4.2 |
| Turkey | 4.2 |
| Argentina | 3.9 |
| Qatar | 3.4 |
| Colombia | 2.3 |
| Philippines | 2.0 |
| South Africa | 1.7 |
| Lebanon | 1.6 |
| Chile | 1.5 |
| Oman | 1.4 |
| Kazakhstan | 1.4 |
| Egypt | 1.4 |
| India | 1.3 |
| Malaysia | 1.3 |
| Bahrain | 1.2 |
| Panama | 1.2 |
| Ecuador | 1.2 |
| Ukraine | 1.1 |
| Hungary | 1.1 |
| Peru | 1.1 |
| Dominican Republic | 1.0 |
| Uruguay | 1.0 |
| Other | 13.9 |
| Subtotal | 100.0% |
6
Emerging Markets Government Bond Index Fund
Performance Summary
All of the returns in this report represent past performance, which is not a guarantee of future results that may be achieved by the fund. (Current performance may be lower or higher than the performance data cited. For performance data current to the most recent month-end, visit our website at vanguard.com/performance.) Note, too, that both investment returns and principal value can fluctuate widely, so an investor’s shares, when sold, could be worth more or less than their original cost. The returns shown do not reflect taxes that a shareholder would pay on fund distributions or on the sale of fund shares.
Cumulative Performance: May 31, 2013, Through October 31, 2018
Initial Investment of $10,000
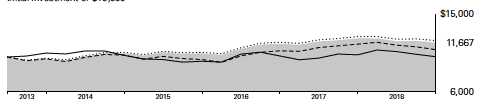
| Average Annual Total Returns | ||||
| Periods Ended October 31, 2018 | ||||
| Since | Final Value | |||
| One | Five | Inception | of a $10,000 | |
| Year | Years | (5/31/2013) | Investment | |
| Emerging Markets Government Bond Index | ||||
| Fund Investor Shares | -4.77% | 3.57% | 2.89% | $11,667 |
| Bloomberg Barclays USD Emerging Markets | ||||
| Government RIC Capped Index | -3.70 | 3.87 | 3.30 | 11,923 |
| Emerging Markets Hard Currency Debt Funds | ||||
| Average | -5.55 | 2.10 | 1.53 | 10,860 |
| Bloomberg Barclays Global Aggregate Index | ||||
| ex USD | -2.09 | -0.82 | 0.07 | 10,038 |
Emerging Markets Hard Currency Debt Funds Average: Derived from data provided by Lipper, a Thomson Reuters Company.
"Since Inception" performance is calculated from the Investor Shares’ inception date for both the fund and its comparative standards.
| Since | Final Value | |||
| One | Five | Inception | of a $10,000 | |
| Year | Years | (5/31/2013) | Investment | |
| Emerging Markets Government Bond Index Fund | ||||
| ETF Shares Net Asset Value | -3.84% | 3.74% | 3.18% | $11,848 |
| Emerging Markets Government Bond Index Fund | ||||
| ETF Shares Market Price | -3.82 | 3.69 | 3.27 | 11,903 |
| Bloomberg Barclays USD Emerging Markets | ||||
| Government RIC Capped Index | -3.70 | 3.87 | 3.30 | 11,923 |
| Bloomberg Barclays Global Aggregate Index ex USD | -2.09 | -0.82 | 0.07 | 10,038 |
| "Since Inception" performance is calculated from the ETF Shares’ inception date for both the fund and its comparative standards. | ||||
Vanguard fund returns are adjusted to reflect the 0.75% fee on purchases of fund shares. The fee does not apply to the ETF Shares. The
Fiscal-Year Total Returns table is not adjusted for fees.
See Financial Highlights for dividend and capital gains information.
7
| Emerging Markets Government Bond Index Fund | ||||
| Average Annual Total Returns | ||||
| Periods Ended October 31, 2018 | ||||
| Since | Final Value | |||
| One | Five | Inception | of a $10,000 | |
| Year | Years | (5/31/2013) | Investment | |
| Emerging Markets Government Bond Index Fund | ||||
| Admiral Shares | -4.52% | 3.60% | 3.06% | $11,772 |
| Bloomberg Barclays USD Emerging Markets | ||||
| Government RIC Capped Index | -3.70 | 3.87 | 3.30 | 11,923 |
| Bloomberg Barclays Global Aggregate Index ex USD | -2.09 | -0.82 | 0.07 | 10,038 |
"Since Inception" performance is calculated from the Admiral Shares’ inception date for both the fund and its comparative standards.
| Since | Final Value | ||
| Year One | (2/11/2015) Inception 1 | of a Investment $5,000,000 | |
| Emerging Markets Government Bond Index Fund | |||
| Institutional Shares | -4.54% | 3.81% | $5,746,585 |
| Bloomberg Barclays USD Emerging Markets | |||
| Government RIC Capped Index | -3.70 | 4.13 | 5,812,767 |
| Bloomberg Barclays Global Aggregate Index ex USD | -2.09 | 1.31 | 5,248,163 |
1 Institutional Shares were first issued on November 25, 2014, and were redeemed shortly thereafter. Institutional Shares were next issued on February 11, 2015. The total return shown is based on the period beginning February 11, 2015.
| Cumulative Returns of ETF Shares: May 31, 2013, Through October 31, 2018 | |||
| Since | |||
| One | Five | Inception | |
| Year | Years | (5/31/2013) | |
| Emerging Markets Government Bond Index Fund | |||
| ETF Shares Market Price | -3.82% | 19.86% | 19.03% |
| Emerging Markets Government Bond Index Fund | |||
| ETF Shares Net Asset Value | -3.84 | 20.15 | 18.48 |
| Bloomberg Barclays USD Emerging Markets | |||
| Government RIC Capped Index | -3.70 | 20.91 | 19.23 |
"Since Inception" performance is calculated from the ETF Shares’ inception date for both the fund and its comparative standard.
Vanguard fund returns are adjusted to reflect the 0.75% fee on purchases of fund shares. The fee does not apply to the ETF Shares. The Fiscal-Year Total Returns table is not adjusted for fees.
8
Emerging Markets Government Bond Index Fund
| Fiscal-Year Total Returns (%): May 31, 2013, Through October 31, 2018 | ||||
| Bloomberg | ||||
| Barclays USD | ||||
| Emerging Mkts | ||||
| Government | ||||
| Investor Shares | RIC Capped Idx | |||
| Fiscal Year | Income Returns | Capital Returns | Total Returns | Total Returns |
| 2013 | 1.51% | -2.89 | -1.38% | -1.39% |
| 2014 | 4.46 | 2.16 | 6.62 | 7.00 |
| 2015 | 4.36 | -4.52 | -0.16 | -0.08 |
| 2016 | 4.97 | 5.68 | 10.65 | 11.05 |
| 2017 | 4.66 | 0.80 | 5.46 | 5.74 |
| 2018 | 3.95 | -8.00 | -4.05 | -3.70 |
Average Annual Total Returns: Periods Ended September 30, 2018
This table presents returns through the latest calendar quarter—rather than through the end of the fiscal period.
Securities and Exchange Commission rules require that we provide this information.
| Since Inception | ||||||
| Inception Date | One Year | Five Years | Income | Capital | Total | |
| Investor Shares | 5/31/2013 | -2.17% | 4.42% | 4.40% | -1.01% | 3.39% |
| Fee-Adjusted Returns | -2.90 | 4.26 | 3.25 | |||
| ETF Shares | 5/31/2013 | |||||
| Market Price | -2.37 | 4.35 | 3.60 | |||
| Net Asset Value | -2.07 | 4.56 | 3.53 | |||
| Admiral Shares | 5/31/2013 | -2.08 | 4.57 | 4.57 | -1.03 | 3.54 |
| Fee-Adjusted Returns | -2.82 | 4.41 | 3.40 | |||
| Institutional Shares | 2/11/20151 | -2.09 | — | 4.79 | -0.23 | 4.56 |
| Fee-Adjusted Returns | -2.82 | — | 4.34 | |||
1 Institutional Shares were first issued on November 25, 2014, and were redeemed shortly thereafter. Institutional Shares were next issued on February 11, 2015. The total return shown is based on the period beginning February 11, 2015.
Vanguard fund returns are adjusted to reflect the 0.75% fee on purchases of fund shares. The fee does not apply to the ETF Shares. The Fiscal-Year Total Returns table is not adjusted for fees.
9
Emerging Markets Government Bond Index Fund
Financial Statements
Statement of Net Assets
As of October 31, 2018
The fund reports a complete list of its holdings in regulatory filings four times in each fiscal year, at the quarter-ends. For the second and fourth fiscal quarters, the lists appear in the fund’s semiannual and annual reports to shareholders. For the first and third fiscal quarters, the fund files the lists with the Securities and Exchange Commission on Form N-Q. Shareholders can look up the fund’s Forms N-Q on the SEC’s website at sec.gov.
| Face | Market | ||||
| Maturity | Amount | Value • | |||
| Coupon | Date | ($000) | ($000) | ||
| Angola (0.4%) | |||||
| Sovereign Bonds (0.4%) | |||||
| Republic of Angola | 9.500% | 11/12/25 | 1,600 | 1,763 | |
| 1 | Republic of Angola | 8.250% | 5/9/28 | 500 | 500 |
| Republic of Angola | 8.250% | 5/9/28 | 1,900 | 1,897 | |
| 1 | Republic of Angola | 9.375% | 5/8/48 | 1,600 | 1,608 |
| Total Angola (Cost $5,730) | 5,768 | ||||
| Argentina (3.8%) | |||||
| Sovereign Bonds (3.8%) | |||||
| Argentine Republic | 6.875% | 4/22/21 | 150 | 143 | |
| Argentine Republic | 6.875% | 4/22/21 | 4,075 | 3,901 | |
| Argentine Republic | 5.625% | 1/26/22 | 3,150 | 2,827 | |
| Argentine Republic | 4.625% | 1/11/23 | 1,800 | 1,521 | |
| Argentine Republic | 7.500% | 4/22/26 | 7,275 | 6,322 | |
| Argentine Republic | 6.875% | 1/26/27 | 4,950 | 4,104 | |
| Argentine Republic | 5.875% | 1/11/28 | 3,715 | 2,862 | |
| Argentine Republic | 6.625% | 7/6/28 | 1,300 | 1,028 | |
| Argentine Republic | 8.280% | 12/31/33 | 1,012 | 853 | |
| Argentine Republic | 8.280% | 12/31/33 | 3,434 | 2,923 | |
| Argentine Republic | 7.125% | 7/6/36 | 2,315 | 1,771 | |
| 2 | Argentine Republic | 2.500% | 12/31/38 | 6,844 | 3,790 |
| Argentine Republic | 7.625% | 4/22/46 | 1,700 | 1,335 | |
| Argentine Republic | 6.875% | 1/11/48 | 3,000 | 2,196 | |
| Argentine Republic | 7.125% | 6/28/17 | 1,600 | 1,186 | |
| 2 | City of Buenos Aires | 8.950% | 2/19/21 | 200 | 201 |
| 2 | City of Buenos Aires | 7.500% | 6/1/27 | 250 | 219 |
| 1,2 | City of Buenos Aires | 7.500% | 6/1/27 | 1,000 | 875 |
| 2 | Provincia de Buenos Aires | 10.875% | 1/26/21 | 940 | 947 |
| 1,2 | Provincia de Buenos Aires | 9.950% | 6/9/21 | 650 | 635 |
| 2 | Provincia de Buenos Aires | 9.950% | 6/9/21 | 955 | 934 |
| 2 | Provincia de Buenos Aires | 6.500% | 2/15/23 | 450 | 383 |
| 2 | Provincia de Buenos Aires | 9.125% | 3/16/24 | 1,000 | 894 |
| 2 | Provincia de Buenos Aires | 7.875% | 6/15/27 | 2,000 | 1,569 |
| Provincia de Cordoba | 7.125% | 6/10/21 | 300 | 277 | |
| 1 | Provincia de Cordoba | 7.125% | 8/1/27 | 550 | 424 |
| 2 | Provincia de Mendoza | 8.375% | 5/19/24 | 400 | 333 |
| 2 | Provincia del Chubut | 7.750% | 7/26/26 | 500 | 395 |
10
| Emerging Markets Government Bond Index Fund | |||||
| Face | Market | ||||
| Maturity | Amount | Value • | |||
| Coupon | Date | ($000) | ($000) | ||
| YPF SA | 8.500% | 3/23/21 | 1,200 | 1,210 | |
| 2 | YPF SA | 8.750% | 4/4/24 | 1,620 | 1,594 |
| YPF SA | 8.500% | 7/28/25 | 1,675 | 1,582 | |
| 1 | YPF SA | 7.000% | 12/15/47 | 1,025 | 774 |
| Total Argentina (Cost $57,114) | 50,008 | ||||
| Armenia (0.1%) | |||||
| Sovereign Bonds (0.1%) | |||||
| 1 | Republic of Armenia | 6.000% | 9/30/20 | 200 | 202 |
| Republic of Armenia | 6.000% | 9/30/20 | 200 | 202 | |
| Republic of Armenia | 7.150% | 3/26/25 | 500 | 522 | |
| Total Armenia (Cost $924) | 926 | ||||
| Azerbaijan (0.5%) | |||||
| Sovereign Bonds (0.5%) | |||||
| Republic of Azerbaijan | 4.750% | 3/18/24 | 800 | 787 | |
| 1 | Republic of Azerbaijan | 4.750% | 3/18/24 | 400 | 394 |
| 3 | Republic of Azerbaijan | 6.875% | 3/24/26 | 2,000 | 2,150 |
| 1,2 | Republic of Azerbaijan | 3.500% | 9/1/32 | 1,100 | 901 |
| State Oil Co. of the Azerbaijan Republic | 4.750% | 3/13/23 | 1,700 | 1,679 | |
| State Oil Co. of the Azerbaijan Republic | 6.950% | 3/18/30 | 700 | 743 | |
| Total Azerbaijan (Cost $6,691) | 6,654 | ||||
| Bahamas (0.1%) | |||||
| Sovereign Bond (0.1%) | |||||
| 1,2 | Commonwealth of the Bahamas | 6.000% | 11/21/28 | 850 | 860 |
| Total Bahamas (Cost $850) | 860 | ||||
| Bahrain (1.2%) | |||||
| Sovereign Bonds (1.2%) | |||||
| Bahrain Mumtalakat Holding Co. BSC | 4.000% | 11/25/21 | 250 | 236 | |
| Batelco International Finance No. 1 Ltd. | 4.250% | 5/1/20 | 400 | 391 | |
| CBB International Sukuk Co. 5 SPC | 5.624% | 2/12/24 | 1,000 | 980 | |
| CBB International Sukuk Co. 7 SPC | 6.875% | 10/5/25 | 550 | 570 | |
| 1 | Kingdom of Bahrain | 5.500% | 3/31/20 | 1,900 | 1,893 |
| Kingdom of Bahrain | 5.875% | 1/26/21 | 200 | 200 | |
| 1 | Kingdom of Bahrain | 6.125% | 7/5/22 | 1,200 | 1,208 |
| Kingdom of Bahrain | 6.125% | 8/1/23 | 1,425 | 1,438 | |
| 1 | Kingdom of Bahrain | 6.125% | 8/1/23 | 150 | 151 |
| 1 | Kingdom of Bahrain | 7.000% | 1/26/26 | 2,200 | 2,205 |
| Kingdom of Bahrain | 7.000% | 1/26/26 | 1,300 | 1,302 | |
| Kingdom of Bahrain | 7.000% | 10/12/28 | 2,200 | 2,144 | |
| 1 | Kingdom of Bahrain | 6.750% | 9/20/29 | 800 | 764 |
| 1 | Kingdom of Bahrain | 6.000% | 9/19/44 | 1,050 | 848 |
| Kingdom of Bahrain | 6.000% | 9/19/44 | 400 | 323 | |
| 1 | Oil and Gas Holding Co. BSCC | 7.500% | 10/25/27 | 1,200 | 1,170 |
| Total Bahrain (Cost $16,431) | 15,823 | ||||
| Belarus (0.1%) | |||||
| Sovereign Bonds (0.1%) | |||||
| Republic of Belarus | 6.875% | 2/28/23 | 800 | 823 | |
| Republic of Belarus | 7.625% | 6/29/27 | 1,050 | 1,109 | |
| Total Belarus (Cost $1,956) | 1,932 | ||||
11
| Emerging Markets Government Bond Index Fund | |||||
| Face | Market | ||||
| Maturity | Amount | Value • | |||
| Coupon | Date | ($000) | ($000) | ||
| Belize (0.0%) | |||||
| Sovereign Bond (0.0%) | |||||
| 2 | Belize | 4.938% | 2/20/34 | 450 | 250 |
| Total Belize (Cost $310) | 250 | ||||
| Bermuda (0.1%) | |||||
| Sovereign Bonds (0.1%) | |||||
| Bermuda | 4.854% | 2/6/24 | 400 | 410 | |
| 1 | Bermuda | 4.854% | 2/6/24 | 400 | 412 |
| 2 | Bermuda | 3.717% | 1/25/27 | 950 | 895 |
| Total Bermuda (Cost $1,769) | 1,717 | ||||
| Bolivia (0.1%) | |||||
| Sovereign Bonds (0.1%) | |||||
| Plurinational State of Bolivia | 4.875% | 10/29/22 | 400 | 392 | |
| Plurinational State of Bolivia | 5.950% | 8/22/23 | 600 | 606 | |
| 1,2 | Plurinational State of Bolivia | 4.500% | 3/20/28 | 1,000 | 921 |
| Total Bolivia (Cost $2,040) | 1,919 | ||||
| Brazil (5.7%) | |||||
| Sovereign Bonds (5.7%) | |||||
| Banco do Brasil SA | 6.000% | 1/22/20 | 695 | 712 | |
| Banco do Brasil SA | 5.375% | 1/15/21 | 375 | 380 | |
| Banco do Brasil SA | 5.875% | 1/26/22 | 1,875 | 1,904 | |
| Banco do Brasil SA | 3.875% | 10/10/22 | 1,726 | 1,641 | |
| Banco do Brasil SA | 5.875% | 1/19/23 | 850 | 860 | |
| 1 | Banco do Brasil SA | 4.875% | 4/19/23 | 800 | 784 |
| Banco do Brasil SA | 4.625% | 1/15/25 | 950 | 893 | |
| 2 | Banco do Brasil SA | 8.500% | 10/29/49 | 425 | 453 |
| Banco Nacional de Desenvolvimento | |||||
| Economico e Social | 5.500% | 7/12/20 | 600 | 617 | |
| 1 | Banco Nacional de Desenvolvimento | ||||
| Economico e Social | 5.500% | 7/12/20 | 200 | 206 | |
| Banco Nacional de Desenvolvimento | |||||
| Economico e Social | 5.750% | 9/26/23 | 1,000 | 1,034 | |
| Caixa Economica Federal | 3.500% | 11/7/22 | 350 | 335 | |
| Cemig Geracao e Transmissao SA | 9.250% | 12/5/24 | 1,000 | 1,068 | |
| Centrais Eletricas Brasileiras SA | 5.750% | 10/27/21 | 1,600 | 1,607 | |
| Federative Republic of Brazil | 4.875% | 1/22/21 | 3,117 | 3,168 | |
| Federative Republic of Brazil | 2.625% | 1/5/23 | 2,561 | 2,372 | |
| Federative Republic of Brazil | 8.875% | 4/15/24 | 982 | 1,182 | |
| Federative Republic of Brazil | 4.250% | 1/7/25 | 4,172 | 4,042 | |
| Federative Republic of Brazil | 8.750% | 2/4/25 | 500 | 607 | |
| Federative Republic of Brazil | 6.000% | 4/7/26 | 1,580 | 1,659 | |
| Federative Republic of Brazil | 10.125% | 5/15/27 | 466 | 616 | |
| 2 | Federative Republic of Brazil | 4.625% | 1/13/28 | 3,552 | 3,337 |
| Federative Republic of Brazil | 8.250% | 1/20/34 | 1,425 | 1,703 | |
| Federative Republic of Brazil | 7.125% | 1/20/37 | 2,195 | 2,404 | |
| Federative Republic of Brazil | 5.625% | 1/7/41 | 2,226 | 2,048 | |
| Federative Republic of Brazil | 5.000% | 1/27/45 | 3,586 | 2,994 | |
| Federative Republic of Brazil | 5.625% | 2/21/47 | 3,440 | 3,105 | |
| Petrobras Global Finance BV | 8.375% | 5/23/21 | 1,740 | 1,894 | |
| Petrobras Global Finance BV | 6.125% | 1/17/22 | 870 | 899 | |
| Petrobras Global Finance BV | 4.375% | 5/20/23 | 3,900 | 3,763 | |
12
| Emerging Markets Government Bond Index Fund | ||||
| Face | Market | |||
| Maturity | Amount | Value • | ||
| Coupon | Date | ($000) | ($000) | |
| Petrobras Global Finance BV | 6.250% | 3/17/24 | 1,325 | 1,337 |
| Petrobras Global Finance BV | 5.299% | 1/27/25 | 1,859 | 1,775 |
| Petrobras Global Finance BV | 8.750% | 5/23/26 | 3,048 | 3,410 |
| Petrobras Global Finance BV | 7.375% | 1/17/27 | 4,020 | 4,171 |
| Petrobras Global Finance BV | 5.999% | 1/27/28 | 6,958 | 6,575 |
| Petrobras Global Finance BV | 5.750% | 2/1/29 | 2,200 | 2,041 |
| Petrobras Global Finance BV | 6.875% | 1/20/40 | 1,653 | 1,570 |
| Petrobras Global Finance BV | 7.250% | 3/17/44 | 2,710 | 2,615 |
| Petrobras Global Finance BV | 6.850% | 6/5/15 | 2,575 | 2,292 |
| Petrobras International Finance Co. SA | 5.375% | 1/27/21 | 1,517 | 1,540 |
| Total Brazil (Cost $74,207) | 75,613 | |||
| Cameroon (0.0%) | ||||
| Sovereign Bond (0.0%) | ||||
| 2 Republic of Cameroon | 9.500% | 11/19/25 | 500 | 521 |
| Total Cameroon (Cost $494) | 521 | |||
| Chile (1.5%) | ||||
| Sovereign Bonds (1.5%) | ||||
| 1 Banco del Estado de Chile | 4.125% | 10/7/20 | 400 | 403 |
| 1 Banco del Estado de Chile | 2.668% | 1/8/21 | 400 | 389 |
| 1 Banco del Estado de Chile | 3.875% | 2/8/22 | 725 | 721 |
| 1 Corp. Nacional del Cobre de Chile | 3.875% | 11/3/21 | 400 | 402 |
| Corp. Nacional del Cobre de Chile | 3.000% | 7/17/22 | 350 | 338 |
| 1 Corp. Nacional del Cobre de Chile | 3.000% | 7/17/22 | 650 | 627 |
| Corp. Nacional del Cobre de Chile | 4.500% | 8/13/23 | 675 | 683 |
| 1 Corp. Nacional del Cobre de Chile | 4.500% | 8/13/23 | 150 | 152 |
| Corp. Nacional del Cobre de Chile | 4.500% | 9/16/25 | 1,100 | 1,094 |
| 1 Corp. Nacional del Cobre de Chile | 3.625% | 8/1/27 | 800 | 746 |
| Corp. Nacional del Cobre de Chile | 3.625% | 8/1/27 | 1,500 | 1,397 |
| 1 Corp. Nacional del Cobre de Chile | 5.625% | 9/21/35 | 300 | 317 |
| 1 Corp. Nacional del Cobre de Chile | 6.150% | 10/24/36 | 100 | 112 |
| 1 Corp. Nacional del Cobre de Chile | 4.250% | 7/17/42 | 400 | 355 |
| 1 Corp. Nacional del Cobre de Chile | 5.625% | 10/18/43 | 200 | 214 |
| Corp. Nacional del Cobre de Chile | 5.625% | 10/18/43 | 700 | 750 |
| 1 Corp. Nacional del Cobre de Chile | 4.875% | 11/4/44 | 400 | 388 |
| Corp. Nacional del Cobre de Chile | 4.875% | 11/4/44 | 900 | 874 |
| Corp. Nacional del Cobre de Chile | 4.500% | 8/1/47 | 1,450 | 1,338 |
| 1 Empresa de Transporte de Pasajeros | ||||
| Metro SA | 4.750% | 2/4/24 | 200 | 204 |
| 1 Empresa de Transporte de Pasajeros | ||||
| Metro SA | 5.000% | 1/25/47 | 400 | 397 |
| 1 Empresa Nacional del Petroleo | 4.750% | 12/6/21 | 536 | 541 |
| Empresa Nacional del Petroleo | 4.375% | 10/30/24 | 500 | 486 |
| 1 Empresa Nacional del Petroleo | 4.500% | 9/14/47 | 800 | 679 |
| Republic of Chile | 3.875% | 8/5/20 | 500 | 506 |
| Republic of Chile | 3.125% | 3/27/25 | 850 | 814 |
| Republic of Chile | 3.125% | 1/21/26 | 1,690 | 1,599 |
| 2 Republic of Chile | 3.240% | 2/6/28 | 2,350 | 2,204 |
| Republic of Chile | 3.860% | 6/21/47 | 1,150 | 1,039 |
| Total Chile (Cost $20,385) | 19,769 | |||
13
| Emerging Markets Government Bond Index Fund | ||||
| Face | Market | |||
| Maturity | Amount | Value • | ||
| Coupon | Date | ($000) | ($000) | |
| China (17.1%) | ||||
| Sovereign Bonds (17.1%) | ||||
| ABCL Glory Capital Ltd. | 2.500% | 6/21/21 | 1,500 | 1,450 |
| Agricultural Bank of China Ltd. | 2.750% | 5/21/20 | 250 | 247 |
| Agricultural Bank of China Ltd. | 2.750% | 10/20/20 | 450 | 442 |
| Amber Circle Funding Ltd. | 3.250% | 12/4/22 | 2,150 | 2,087 |
| 1 Avi Funding Co. Ltd. | 2.850% | 9/16/20 | 400 | 393 |
| Avi Funding Co. Ltd. | 2.850% | 9/16/20 | 300 | 295 |
| Avi Funding Co. Ltd. | 3.800% | 9/16/25 | 1,000 | 967 |
| 4 Bank of China Ltd. | 3.089% | 2/14/20 | 1,150 | 1,151 |
| 4 Bank of China Ltd. | 3.239% | 4/20/20 | 1,500 | 1,501 |
| 4 Bank of China Ltd. | 3.108% | 5/11/20 | 600 | 601 |
| Bank of China Ltd. | 2.875% | 6/30/20 | 2,800 | 2,763 |
| Bank of China Ltd. | 2.375% | 3/1/21 | 750 | 726 |
| Bank of China Ltd. | 2.250% | 7/12/21 | 700 | 669 |
| 4 Bank of China Ltd. | 3.300% | 7/11/22 | 1,500 | 1,502 |
| 1 Bank of China Ltd. | 5.000% | 11/13/24 | 1,000 | 1,019 |
| Bank of China Ltd. | 5.000% | 11/13/24 | 3,450 | 3,516 |
| Bank of China Ltd. | 3.875% | 6/30/25 | 775 | 755 |
| Beijing Gas Singapore Capital Corp. | 2.750% | 5/31/22 | 500 | 473 |
| Beijing State-Owned Assets Management | ||||
| Hong Kong Co. Ltd. | 4.125% | 5/26/25 | 1,000 | 957 |
| Bluestar Finance Holdings Ltd. | 4.375% | 6/11/20 | 200 | 200 |
| Bluestar Finance Holdings Ltd. | 3.500% | 9/30/21 | 300 | 291 |
| Bluestar Finance Holdings Ltd. | 4.375% | 12/29/49 | 700 | 700 |
| BOC Aviation Ltd. | 3.000% | 3/30/20 | 1,000 | 990 |
| BOC Aviation Ltd. | 2.375% | 9/15/21 | 450 | 429 |
| 1 BOC Aviation Ltd. | 2.375% | 9/15/21 | 900 | 858 |
| BOC Aviation Ltd. | 4.375% | 5/2/23 | 500 | 503 |
| BOC Aviation Ltd. | 3.875% | 4/27/26 | 800 | 760 |
| CCBL Cayman 1 Corp. Ltd. | 2.750% | 5/31/21 | 450 | 434 |
| CCBL Cayman Corp. Ltd. | 3.250% | 7/28/20 | 300 | 296 |
| 2 CCCI Treasure Ltd. | 3.500% | 12/29/49 | 1,100 | 1,082 |
| CGNPC International Ltd. | 4.000% | 5/19/25 | 500 | 486 |
| 2 Chalco Hong Kong Investment Co. Ltd. | 4.250% | 12/31/49 | 450 | 429 |
| Charming Light Investments Ltd. | 2.375% | 8/30/21 | 600 | 568 |
| Charming Light Investments Ltd. | 4.375% | 12/21/27 | 950 | 879 |
| China Cinda Finance 2014 Ltd. | 5.625% | 5/14/24 | 800 | 831 |
| China Cinda Finance 2015 I Ltd. | 3.125% | 4/23/20 | 2,200 | 2,168 |
| China Cinda Finance 2015 I Ltd. | 4.250% | 4/23/25 | 2,100 | 2,019 |
| China Cinda Finance 2017 I Ltd. | 3.650% | 3/9/22 | 300 | 294 |
| China Cinda Finance 2017 I Ltd. | 3.875% | 2/8/23 | 200 | 195 |
| China Cinda Finance 2017 I Ltd. | 4.400% | 3/9/27 | 2,400 | 2,279 |
| China Clean Energy Development Ltd. | 4.000% | 11/5/25 | 1,000 | 958 |
| 2 China Construction Bank Asia Corp. Ltd. | 4.250% | 8/20/24 | 700 | 700 |
| 4 China Construction Bank Corp. | 3.083% | 5/31/20 | 1,000 | 1,001 |
| 4 China Construction Bank Corp. | 3.121% | 12/4/20 | 675 | 676 |
| 4 China Construction Bank Corp. | 3.057% | 6/8/21 | 1,800 | 1,800 |
| 4 China Construction Bank Corp. | 3.157% | 6/8/23 | 200 | 200 |
| 2 China Construction Bank Corp. | 3.875% | 5/13/25 | 2,975 | 2,947 |
| China Development Bank | 2.500% | 10/9/20 | 2,500 | 2,448 |
| China Development Bank | 2.125% | 6/1/21 | 2,350 | 2,260 |
| China Development Bank | 2.625% | 1/24/22 | 3,350 | 3,238 |
| China Development Bank | 3.375% | 1/24/27 | 700 | 661 |
14
| Emerging Markets Government Bond Index Fund | ||||
| Face | Market | |||
| Maturity | Amount | Value • | ||
| Coupon | Date | ($000) | ($000) | |
| 4 China Development Bank Corp. | 2.873% | 3/6/20 | 200 | 200 |
| 4 China Development Bank Corp. | 3.023% | 3/6/22 | 1,300 | 1,299 |
| China Development Bank Corp. | 4.000% | 1/24/37 | 645 | 599 |
| China Great Wall International Holdings III Ltd. | 2.250% | 10/27/19 | 200 | 197 |
| China Great Wall International Holdings III Ltd. | 2.625% | 10/27/21 | 200 | 191 |
| China Great Wall International Holdings III Ltd. | 3.125% | 8/31/22 | 2,400 | 2,290 |
| China Great Wall International Holdings III Ltd. | 3.875% | 8/31/27 | 450 | 404 |
| 2 China Life Insurance Co. Ltd. | 4.000% | 7/3/75 | 1,000 | 970 |
| 2 China Minmetals Corp. | 3.750% | 12/31/49 | 750 | 689 |
| China Overseas Finance Cayman II Ltd. | 5.500% | 11/10/20 | 1,800 | 1,851 |
| China Overseas Finance Cayman III Ltd. | 5.375% | 10/29/23 | 1,300 | 1,349 |
| China Overseas Finance Cayman III Ltd. | 6.375% | 10/29/43 | 450 | 507 |
| China Overseas Finance Cayman V Ltd. | 3.950% | 11/15/22 | 1,750 | 1,722 |
| China Overseas Finance Cayman VI Ltd. | 5.950% | 5/8/24 | 200 | 212 |
| 1 China Resources Gas Group Ltd. | 4.500% | 4/5/22 | 400 | 404 |
| China Resources Land Ltd. | 6.000% | 2/27/24 | 400 | 428 |
| China Shenhua Overseas Capital Co. Ltd. | 3.125% | 1/20/20 | 850 | 841 |
| China Shenhua Overseas Capital Co. Ltd. | 3.875% | 1/20/25 | 600 | 581 |
| Chinalco Capital Holdings Ltd. | 4.000% | 8/25/21 | 1,300 | 1,253 |
| Chouzhou International Investment Ltd. | 4.000% | 12/5/20 | 500 | 480 |
| CITIC Ltd. | 6.375% | 4/10/20 | 1,000 | 1,032 |
| CITIC Ltd. | 6.625% | 4/15/21 | 400 | 422 |
| CITIC Ltd. | 2.800% | 12/14/21 | 300 | 288 |
| CITIC Ltd. | 3.125% | 2/28/22 | 200 | 193 |
| CITIC Ltd. | 6.800% | 1/17/23 | 1,700 | 1,852 |
| CITIC Ltd. | 3.700% | 6/14/26 | 500 | 463 |
| CITIC Ltd. | 3.875% | 2/28/27 | 750 | 695 |
| CITIC Ltd. | 4.000% | 1/11/28 | 625 | 579 |
| CITIC Securities Finance MTN Co. Ltd. | 3.500% | 10/30/19 | 1,705 | 1,696 |
| CNAC HK Finbridge Co. Ltd. | 4.125% | 3/14/21 | 2,000 | 1,991 |
| CNAC HK Finbridge Co. Ltd. | 3.500% | 7/19/22 | 2,600 | 2,507 |
| CNAC HK Finbridge Co. Ltd. | 4.625% | 3/14/23 | 1,500 | 1,495 |
| CNAC HK Finbridge Co. Ltd. | 4.125% | 7/19/27 | 2,150 | 1,988 |
| CNAC HK Finbridge Co. Ltd. | 5.125% | 3/14/28 | 350 | 345 |
| CNOOC Curtis Funding No 1 Pty Ltd. | 4.500% | 10/3/23 | 2,520 | 2,557 |
| 1 CNOOC Curtis Funding No 1 Pty Ltd. | 4.500% | 10/3/23 | 300 | 304 |
| 1 CNOOC Finance 2011 Ltd. | 4.250% | 1/26/21 | 1,888 | 1,909 |
| 1 CNOOC Finance 2011 Ltd. | 5.750% | 1/26/41 | 200 | 225 |
| 1 CNOOC Finance 2012 Ltd. | 3.875% | 5/2/22 | 1,400 | 1,396 |
| 1 CNOOC Finance 2012 Ltd. | 5.000% | 5/2/42 | 200 | 205 |
| CNOOC Finance 2013 Ltd. | 3.000% | 5/9/23 | 1,050 | 1,003 |
| CNOOC Finance 2013 Ltd. | 4.250% | 5/9/43 | 800 | 737 |
| CNOOC Finance 2015 Australia Pty Ltd. | 2.625% | 5/5/20 | 1,850 | 1,825 |
| CNOOC Finance 2015 USA LLC | 3.500% | 5/5/25 | 1,300 | 1,237 |
| CNOOC Finance 2015 USA LLC | 4.375% | 5/2/28 | 600 | 598 |
| CNOOC Nexen Finance 2014 ULC | 4.250% | 4/30/24 | 2,160 | 2,167 |
| CNOOC Nexen Finance 2014 ULC | 4.875% | 4/30/44 | 900 | 909 |
| CNPC General Capital Ltd. | 2.700% | 11/25/19 | 1,000 | 992 |
| 1 CNPC General Capital Ltd. | 3.950% | 4/19/22 | 700 | 700 |
| CNPC General Capital Ltd. | 3.400% | 4/16/23 | 250 | 243 |
| 1 CNPC HK Overseas Capital Ltd. | 4.500% | 4/28/21 | 1,225 | 1,248 |
| 1 CNPC HK Overseas Capital Ltd. | 5.950% | 4/28/41 | 400 | 460 |
| 2 CNRC Capitale Ltd. | 3.900% | 12/31/49 | 1,500 | 1,428 |
| COSCO Finance 2011 Ltd. | 4.000% | 12/3/22 | 1,050 | 1,040 |
15
| Emerging Markets Government Bond Index Fund | ||||
| Face | Market | |||
| Maturity | Amount | Value • | ||
| Coupon | Date | ($000) | ($000) | |
| 1 COSL Finance BVI Ltd. | 3.250% | 9/6/22 | 550 | 527 |
| COSL Singapore Capital Ltd. | 3.500% | 7/30/20 | 1,200 | 1,188 |
| COSL Singapore Capital Ltd. | 4.500% | 7/30/25 | 500 | 490 |
| 2 CRCC Yupeng Ltd. | 3.950% | 2/28/49 | 300 | 297 |
| CRCC Yuxiang Ltd. | 3.500% | 5/16/23 | 950 | 919 |
| 2 Dianjian Haixing Ltd. | 4.050% | 10/29/49 | 200 | 199 |
| 2 Dianjian Haiyu Ltd. | 3.500% | 12/31/49 | 1,050 | 975 |
| Export-Import Bank of China | 2.000% | 4/26/21 | 300 | 288 |
| Export-Import Bank of China | 2.625% | 3/14/22 | 2,400 | 2,316 |
| Export-Import Bank of China | 2.750% | 11/28/22 | 700 | 673 |
| Export-Import Bank of China | 3.625% | 7/31/24 | 500 | 489 |
| Export-Import Bank of China | 2.875% | 4/26/26 | 2,350 | 2,134 |
| Export-Import Bank of China | 3.375% | 3/14/27 | 500 | 465 |
| Export-Import Bank of China | 4.000% | 11/28/47 | 700 | 615 |
| Franshion Brilliant Ltd. | 5.750% | 12/31/49 | 500 | 458 |
| 1 Franshion Development Ltd. | 6.750% | 4/15/21 | 500 | 522 |
| Hongkong Xiangyu Investment Co. Ltd. | 4.500% | 1/30/23 | 500 | 449 |
| Huarong Finance 2017 Co. Ltd. | 3.375% | 1/24/20 | 300 | 296 |
| Huarong Finance 2017 Co. Ltd. | 3.750% | 4/27/22 | 700 | 678 |
| 4 Huarong Finance 2017 Co. Ltd. | 4.359% | 4/27/22 | 1,200 | 1,207 |
| Huarong Finance 2017 Co. Ltd. | 4.750% | 4/27/27 | 2,050 | 1,896 |
| Huarong Finance II Co. Ltd. | 2.875% | 11/19/18 | 1,600 | 1,599 |
| Huarong Finance II Co. Ltd. | 2.875% | 11/22/19 | 1,500 | 1,478 |
| Huarong Finance II Co. Ltd. | 4.500% | 1/16/20 | 1,760 | 1,761 |
| Huarong Finance II Co. Ltd. | 3.750% | 11/19/20 | 550 | 542 |
| Huarong Finance II Co. Ltd. | 3.250% | 6/3/21 | 1,250 | 1,207 |
| Huarong Finance II Co. Ltd. | 3.625% | 11/22/21 | 1,650 | 1,602 |
| Huarong Finance II Co. Ltd. | 5.500% | 1/16/25 | 1,800 | 1,792 |
| Huarong Finance II Co. Ltd. | 5.000% | 11/19/25 | 600 | 579 |
| Huarong Finance II Co. Ltd. | 4.625% | 6/3/26 | 1,250 | 1,165 |
| Huarong Finance II Co. Ltd. | 4.875% | 11/22/26 | 1,200 | 1,131 |
| 2 Huarong Finance II Co. Ltd. | 2.875% | 12/31/49 | 1,200 | 1,068 |
| ICBCIL Finance Co. Ltd. | 3.250% | 3/17/20 | 1,000 | 991 |
| ICBCIL Finance Co. Ltd. | 3.000% | 4/5/20 | 700 | 690 |
| ICBCIL Finance Co. Ltd. | 3.200% | 11/10/20 | 700 | 689 |
| 4 ICBCIL Finance Co. Ltd. | 3.264% | 5/15/21 | 1,000 | 997 |
| ICBCIL Finance Co. Ltd. | 2.750% | 5/19/21 | 1,450 | 1,398 |
| 1 ICBCIL Finance Co. Ltd. | 2.750% | 5/19/21 | 600 | 579 |
| ICBCIL Finance Co. Ltd. | 2.500% | 9/29/21 | 1,350 | 1,284 |
| Industrial & Commercial Bank of China Asia | ||||
| Ltd. | 5.125% | 11/30/20 | 950 | 971 |
| Industrial & Commercial Bank of China Ltd. | 3.231% | 11/13/19 | 1,300 | 1,293 |
| 4 Industrial & Commercial Bank of China Ltd. | 3.257% | 4/24/20 | 1,950 | 1,952 |
| Industrial & Commercial Bank of China Ltd. | 2.905% | 11/13/20 | 1,300 | 1,273 |
| Industrial & Commercial Bank of China Ltd. | 2.635% | 5/26/21 | 2,700 | 2,616 |
| Industrial & Commercial Bank of China Ltd. | 2.452% | 10/20/21 | 350 | 336 |
| 4 Industrial & Commercial Bank of China Ltd. | 3.437% | 4/24/22 | 1,400 | 1,405 |
| Industrial & Commercial Bank of China Ltd. | 2.957% | 11/8/22 | 500 | 481 |
| 4 Industrial & Commercial Bank of China Ltd. | 3.166% | 3/5/23 | 3,000 | 2,999 |
| Industrial & Commercial Bank of China Ltd. | 4.875% | 9/21/25 | 2,750 | 2,762 |
| Industrial & Commercial Bank of China Ltd. | 3.538% | 11/8/27 | 250 | 233 |
| Inventive Global Investments Ltd. | 2.375% | 12/7/19 | 1,200 | 1,184 |
| King Power Capital Ltd. | 5.625% | 11/3/24 | 500 | 522 |
| Kunlun Energy Co. Ltd. | 2.875% | 5/13/20 | 600 | 590 |
16
| Emerging Markets Government Bond Index Fund | ||||
| Face | Market | |||
| Maturity | Amount | Value • | ||
| Coupon | Date | ($000) | ($000) | |
| Kunlun Energy Co. Ltd. | 3.750% | 5/13/25 | 350 | 338 |
| MCC Holding Hong Kong Corp. Ltd. | 2.950% | 5/31/20 | 1,500 | 1,471 |
| Minmetals Bounteous Finance BVI Ltd. | 3.500% | 7/30/20 | 300 | 297 |
| Minmetals Bounteous Finance BVI Ltd. | 4.750% | 7/30/25 | 600 | 595 |
| Minmetals Bounteous Finance BVI Ltd. | 4.200% | 7/27/26 | 850 | 812 |
| Nexen Energy ULC | 7.875% | 3/15/32 | 475 | 627 |
| Nexen Energy ULC | 5.875% | 3/10/35 | 808 | 901 |
| Nexen Energy ULC | 6.400% | 5/15/37 | 1,285 | 1,527 |
| Nexen Energy ULC | 7.500% | 7/30/39 | 775 | 1,037 |
| People’s Republic of China | 2.125% | 11/2/22 | 1,000 | 956 |
| People’s Republic of China | 2.625% | 11/2/27 | 1,000 | 921 |
| Prosperous Ray Ltd. | 4.625% | 11/12/23 | 550 | 559 |
| Rongshi International Finance Ltd. | 2.875% | 5/4/22 | 500 | 481 |
| Rongshi International Finance Ltd. | 3.625% | 5/4/27 | 500 | 468 |
| Shanghai Electric Power Finance Ltd. | 3.625% | 8/11/20 | 1,100 | 1,086 |
| Sino-Ocean Land Treasure Finance I Ltd. | 4.625% | 7/30/19 | 25 | 25 |
| Sino-Ocean Land Treasure Finance I Ltd. | 6.000% | 7/30/24 | 350 | 340 |
| Sino-Ocean Land Treasure Finance II Ltd. | 4.450% | 2/4/20 | 1,100 | 1,093 |
| Sino-Ocean Land Treasure Finance II Ltd. | 5.950% | 2/4/27 | 250 | 235 |
| 2 Sino-Ocean Land Treasure III Ltd. | 4.900% | 12/31/49 | 600 | 487 |
| Sinochem Overseas Capital Co. Ltd. | 4.500% | 11/12/20 | 400 | 404 |
| 1 Sinochem Overseas Capital Co. Ltd. | 4.500% | 11/12/20 | 1,375 | 1,391 |
| 1 Sinochem Overseas Capital Co. Ltd. | 6.300% | 11/12/40 | 450 | 520 |
| Sinopec Capital 2013 Ltd. | 3.125% | 4/24/23 | 1,500 | 1,436 |
| 1 Sinopec Capital 2013 Ltd. | 3.125% | 4/24/23 | 200 | 192 |
| Sinopec Capital 2013 Ltd. | 4.250% | 4/24/43 | 400 | 367 |
| Sinopec Group Overseas Development 2012 | ||||
| Ltd. | 3.900% | 5/17/22 | 907 | 905 |
| 1 Sinopec Group Overseas Development 2012 | ||||
| Ltd. | 3.900% | 5/17/22 | 1,619 | 1,615 |
| 1 Sinopec Group Overseas Development 2012 | ||||
| Ltd. | 4.875% | 5/17/42 | 975 | 984 |
| Sinopec Group Overseas Development 2013 | ||||
| Ltd. | 4.375% | 10/17/23 | 2,025 | 2,046 |
| Sinopec Group Overseas Development 2013 | ||||
| Ltd. | 5.375% | 10/17/43 | 200 | 216 |
| Sinopec Group Overseas Development 2014 | ||||
| Ltd. | 4.375% | 4/10/24 | 2,000 | 2,017 |
| Sinopec Group Overseas Development 2015 | ||||
| Ltd. | 2.500% | 4/28/20 | 5,650 | 5,563 |
| Sinopec Group Overseas Development 2015 | ||||
| Ltd. | 3.250% | 4/28/25 | 1,900 | 1,775 |
| Sinopec Group Overseas Development 2015 | ||||
| Ltd. | 4.100% | 4/28/45 | 800 | 715 |
| Sinopec Group Overseas Development 2016 | ||||
| Ltd. | 2.750% | 5/3/21 | 400 | 390 |
| Sinopec Group Overseas Development 2016 | ||||
| Ltd. | 2.000% | 9/29/21 | 900 | 856 |
| Sinopec Group Overseas Development 2016 | ||||
| Ltd. | 3.500% | 5/3/26 | 1,000 | 938 |
| Sinopec Group Overseas Development 2017 | ||||
| Ltd. | 2.375% | 4/12/20 | 700 | 689 |
| 1 Sinopec Group Overseas Development 2017 | ||||
| Ltd. | 3.000% | 4/12/22 | 700 | 678 |
17
| Emerging Markets Government Bond Index Fund | |||||
| Face | Market | ||||
| Maturity | Amount | Value • | |||
| Coupon | Date | ($000) | ($000) | ||
| Sinopec Group Overseas Development 2017 | |||||
| Ltd. | 2.500% | 9/13/22 | 200 | 189 | |
| Sinopec Group Overseas Development 2017 | |||||
| Ltd. | 3.625% | 4/12/27 | 600 | 564 | |
| 1 | Sinopec Group Overseas Development 2017 | ||||
| Ltd. | 3.625% | 4/12/27 | 800 | 752 | |
| 1 | Sinopec Group Overseas Development 2017 | ||||
| Ltd. | 3.250% | 9/13/27 | 1,000 | 912 | |
| 1 | Sinopec Group Overseas Development 2017 | ||||
| Ltd. | 4.000% | 9/13/47 | 200 | 175 | |
| Skysea International Capital Management | 4.875% | 12/7/21 | 1,900 | 1,948 | |
| State Elite Global Ltd. | 3.125% | 1/20/20 | 1,000 | 992 | |
| State Grid Overseas Investment 2013 Ltd. | 3.125% | 5/22/23 | 1,410 | 1,364 | |
| 1 | State Grid Overseas Investment 2013 Ltd. | 4.375% | 5/22/43 | 200 | 193 |
| State Grid Overseas Investment 2014 Ltd. | 4.125% | 5/7/24 | 2,870 | 2,886 | |
| 1 | State Grid Overseas Investment 2014 Ltd. | 4.125% | 5/7/24 | 200 | 201 |
| 1 | State Grid Overseas Investment 2014 Ltd. | 4.850% | 5/7/44 | 350 | 361 |
| State Grid Overseas Investment 2014 Ltd. | 4.850% | 5/7/44 | 400 | 415 | |
| State Grid Overseas Investment 2016 Ltd. | 2.750% | 5/4/22 | 1,000 | 965 | |
| 1 | State Grid Overseas Investment 2016 Ltd. | 2.750% | 5/4/22 | 600 | 579 |
| State Grid Overseas Investment 2016 Ltd. | 3.750% | 5/2/23 | 1,200 | 1,192 | |
| State Grid Overseas Investment 2016 Ltd. | 2.875% | 5/18/26 | 700 | 636 | |
| State Grid Overseas Investment 2016 Ltd. | 3.500% | 5/4/27 | 1,000 | 938 | |
| 1 | State Grid Overseas Investment 2016 Ltd. | 3.500% | 5/4/27 | 1,200 | 1,127 |
| 1 | State Grid Overseas Investment 2016 Ltd. | 4.000% | 5/4/47 | 900 | 811 |
| Tewoo Group No 4 Ltd. | 3.150% | 12/1/20 | 500 | 488 | |
| Three Gorges Finance I Cayman Islands Ltd. | 2.300% | 6/2/21 | 400 | 386 | |
| Three Gorges Finance I Cayman Islands Ltd. | 3.700% | 6/10/25 | 900 | 869 | |
| Three Gorges Finance I Cayman Islands Ltd. | 3.150% | 6/2/26 | 2,300 | 2,119 | |
| Tsinghua Unic Ltd. | 4.750% | 1/31/21 | 850 | 797 | |
| Tsinghua Unic Ltd. | 5.375% | 1/31/23 | 700 | 634 | |
| Total China (Cost $231,564) | 224,986 | ||||
| Colombia (2.5%) | |||||
| Sovereign Bonds (2.5%) | |||||
| Ecopetrol SA | 5.875% | 9/18/23 | 2,585 | 2,695 | |
| Ecopetrol SA | 4.125% | 1/16/25 | 1,050 | 1,000 | |
| Ecopetrol SA | 5.375% | 6/26/26 | 1,970 | 1,980 | |
| Ecopetrol SA | 7.375% | 9/18/43 | 893 | 996 | |
| Ecopetrol SA | 5.875% | 5/28/45 | 1,830 | 1,734 | |
| Oleoducto Central SA | 4.000% | 5/7/21 | 400 | 395 | |
| Republic of Colombia | 11.750% | 2/25/20 | 340 | 376 | |
| Republic of Colombia | 4.375% | 7/12/21 | 1,609 | 1,634 | |
| 2 | Republic of Colombia | 2.625% | 3/15/23 | 1,410 | 1,326 |
| Republic of Colombia | 4.000% | 2/26/24 | 2,045 | 2,020 | |
| Republic of Colombia | 8.125% | 5/21/24 | 690 | 815 | |
| 2 | Republic of Colombia | 4.500% | 1/28/26 | 2,100 | 2,102 |
| 2 | Republic of Colombia | 3.875% | 4/25/27 | 3,150 | 2,993 |
| 2 | Republic of Colombia | 4.500% | 3/15/29 | 1,900 | 1,874 |
| Republic of Colombia | 7.375% | 9/18/37 | 1,090 | 1,323 | |
| Republic of Colombia | 6.125% | 1/18/41 | 1,682 | 1,818 | |
| 2 | Republic of Colombia | 5.625% | 2/26/44 | 1,984 | 2,039 |
| 2 | Republic of Colombia | 5.000% | 6/15/45 | 5,850 | 5,537 |
| Transportadora de Gas Internacional SA ESP | 5.700% | 3/20/22 | 600 | 609 | |
| Total Colombia (Cost $33,672) | 33,266 | ||||
18
| Emerging Markets Government Bond Index Fund | |||||
| Face | Market | ||||
| Maturity | Amount | Value • | |||
| Coupon | Date | ($000) | ($000) | ||
| Costa Rica (0.4%) | |||||
| Sovereign Bonds (0.4%) | |||||
| Banco Nacional de Costa Rica | 5.875% | 4/25/21 | 200 | 192 | |
| 1 | Banco Nacional de Costa Rica | 5.875% | 4/25/21 | 800 | 762 |
| Banco Nacional de Costa Rica | 6.250% | 11/1/23 | 400 | 378 | |
| Instituto Costarricense de Electricidad | 6.950% | 11/10/21 | 475 | 452 | |
| Instituto Costarricense de Electricidad | 6.375% | 5/15/43 | 200 | 143 | |
| Republic of Costa Rica | 4.250% | 1/26/23 | 1,132 | 990 | |
| Republic of Costa Rica | 4.375% | 4/30/25 | 200 | 166 | |
| Republic of Costa Rica | 5.625% | 4/30/43 | 600 | 438 | |
| Republic of Costa Rica | 7.000% | 4/4/44 | 2,230 | 1,848 | |
| Total Costa Rica (Cost $5,967) | 5,369 | ||||
| Cote d’Ivoire (0.3%) | |||||
| Sovereign Bonds (0.3%) | |||||
| 2 | Republic of Cote d’Ivoire | 6.375% | 3/3/28 | 1,300 | 1,205 |
| 1,2 | Republic of Cote d’Ivoire | 5.750% | 12/31/32 | 1,388 | 1,257 |
| 2 | Republic of Cote d’Ivoire | 5.750% | 12/31/32 | 1,317 | 1,193 |
| 2 | Republic of Cote d’Ivoire | 6.125% | 6/15/33 | 1,000 | 865 |
| Total Cote d’Ivoire (Cost $4,854) | 4,520 | ||||
| Croatia (0.7%) | |||||
| Sovereign Bonds (0.7%) | |||||
| Hrvatska Elektroprivreda | 5.875% | 10/23/22 | 500 | 520 | |
| Republic of Croatia | 6.750% | 11/5/19 | 1,222 | 1,259 | |
| Republic of Croatia | 6.625% | 7/14/20 | 1,794 | 1,872 | |
| Republic of Croatia | 6.375% | 3/24/21 | 2,200 | 2,308 | |
| Republic of Croatia | 5.500% | 4/4/23 | 1,400 | 1,469 | |
| Republic of Croatia | 6.000% | 1/26/24 | 1,435 | 1,545 | |
| Total Croatia (Cost $8,879) | 8,973 | ||||
| Dominican Republic (1.0%) | |||||
| Sovereign Bonds (1.0%) | |||||
| 2 | Dominican Republic | 7.500% | 5/6/21 | 2,102 | 2,173 |
| Dominican Republic | 6.600% | 1/28/24 | 1,075 | 1,121 | |
| 2 | Dominican Republic | 5.875% | 4/18/24 | 750 | 760 |
| Dominican Republic | 5.500% | 1/27/25 | 1,560 | 1,537 | |
| Dominican Republic | 6.875% | 1/29/26 | 1,145 | 1,199 | |
| Dominican Republic | 5.950% | 1/25/27 | 100 | 99 | |
| Dominican Republic | 6.000% | 7/19/28 | 169 | 167 | |
| 1 | Dominican Republic | 6.000% | 7/19/28 | 1,400 | 1,385 |
| Dominican Republic | 7.450% | 4/30/44 | 450 | 469 | |
| 1 | Dominican Republic | 6.850% | 1/27/45 | 1,170 | 1,150 |
| 2 | Dominican Republic | 6.850% | 1/27/45 | 1,819 | 1,778 |
| 1 | Dominican Republic | 6.500% | 2/15/48 | 1,650 | 1,548 |
| Total Dominican Republic (Cost $13,824) | 13,386 | ||||
| Ecuador (1.1%) | |||||
| Sovereign Bonds (1.1%) | |||||
| Republic of Ecuador | 10.500% | 3/24/20 | 1,500 | 1,534 | |
| Republic of Ecuador | 10.750% | 3/28/22 | 2,850 | 2,926 | |
| Republic of Ecuador | 8.750% | 6/2/23 | 1,300 | 1,231 | |
| Republic of Ecuador | 7.950% | 6/20/24 | 2,150 | 1,939 | |
| Republic of Ecuador | 9.650% | 12/13/26 | 1,550 | 1,443 | |
19
| Emerging Markets Government Bond Index Fund | |||||
| Face | Market | ||||
| Maturity | Amount | Value • | |||
| Coupon | Date | ($000) | ($000) | ||
| 1 | Republic of Ecuador | 9.625% | 6/2/27 | 370 | 345 |
| Republic of Ecuador | 9.625% | 6/2/27 | 800 | 745 | |
| 1 | Republic of Ecuador | 7.875% | 1/23/28 | 5,750 | 4,833 |
| Total Ecuador (Cost $16,318) | 14,996 | ||||
| Egypt (1.2%) | |||||
| Sovereign Bonds (1.2%) | |||||
| Arab Republic of Egypt | 5.750% | 4/29/20 | 1,012 | 1,018 | |
| Arab Republic of Egypt | 6.125% | 1/31/22 | 2,700 | 2,669 | |
| 1 | Arab Republic of Egypt | 5.577% | 2/21/23 | 1,200 | 1,151 |
| Arab Republic of Egypt | 5.875% | 6/11/25 | 3,375 | 3,149 | |
| Arab Republic of Egypt | 7.500% | 1/31/27 | 1,700 | 1,662 | |
| 1 | Arab Republic of Egypt | 6.588% | 2/21/28 | 3,000 | 2,752 |
| Arab Republic of Egypt | 6.875% | 4/30/40 | 1,050 | 880 | |
| Arab Republic of Egypt | 8.500% | 1/31/47 | 1,950 | 1,839 | |
| 1 | Arab Republic of Egypt | 7.903% | 2/21/48 | 1,200 | 1,073 |
| Total Egypt (Cost $17,238) | 16,193 | ||||
| El Salvador (0.4%) | |||||
| Sovereign Bonds (0.4%) | |||||
| Republic of El Salvador | 7.375% | 12/1/19 | 745 | 743 | |
| Republic of El Salvador | 7.750% | 1/24/23 | 785 | 791 | |
| Republic of El Salvador | 5.875% | 1/30/25 | 1,018 | 914 | |
| Republic of El Salvador | 6.375% | 1/18/27 | 669 | 599 | |
| 1 | Republic of El Salvador | 6.375% | 1/18/27 | 300 | 268 |
| Republic of El Salvador | 8.625% | 2/28/29 | 500 | 505 | |
| 1 | Republic of El Salvador | 8.625% | 2/28/29 | 150 | 151 |
| Republic of El Salvador | 8.250% | 4/10/32 | 604 | 591 | |
| Republic of El Salvador | 7.650% | 6/15/35 | 740 | 680 | |
| Republic of El Salvador | 7.625% | 2/1/41 | 568 | 514 | |
| Total El Salvador (Cost $5,895) | 5,756 | ||||
| Ethiopia (0.1%) | |||||
| Sovereign Bond (0.1%) | |||||
| Federal Democratic Republic of Ethiopia | 6.625% | 12/11/24 | 1,150 | 1,123 | |
| Total Ethiopia (Cost $1,120) | 1,123 | ||||
| Gabon (0.2%) | |||||
| Sovereign Bonds (0.2%) | |||||
| 1,2 | Gabonese Republic | 6.375% | 12/12/24 | 400 | 364 |
| 2 | Gabonese Republic | 6.375% | 12/12/24 | 1,586 | 1,447 |
| Gabonese Republic | 6.950% | 6/16/25 | 200 | 184 | |
| Total Gabon (Cost $2,163) | 1,995 | ||||
| Georgia (0.1%) | |||||
| Sovereign Bonds (0.1%) | |||||
| Georgian Railway JSC | 7.750% | 7/11/22 | 900 | 952 | |
| Republic of Georgia | 6.875% | 4/12/21 | 600 | 630 | |
| Total Georgia (Cost $1,589) | 1,582 | ||||
| Ghana (0.4%) | |||||
| Sovereign Bonds (0.4%) | |||||
| 1 | Republic of Ghana | 7.875% | 8/7/23 | 400 | 407 |
| 1,2 | Republic of Ghana | 8.125% | 1/18/26 | 300 | 301 |
20
| Emerging Markets Government Bond Index Fund | |||||
| Face | Market | ||||
| Maturity | Amount | Value • | |||
| Coupon | Date | ($000) | ($000) | ||
| 2 | Republic of Ghana | 8.125% | 1/18/26 | 1,670 | 1,677 |
| 2 | Republic of Ghana | 7.625% | 5/16/29 | 200 | 191 |
| 1,2 | Republic of Ghana | 7.625% | 5/16/29 | 850 | 810 |
| 2 | Republic of Ghana | 10.750% | 10/14/30 | 1,000 | 1,198 |
| 1,2 | Republic of Ghana | 8.627% | 6/16/49 | 800 | 750 |
| Total Ghana (Cost $5,245) | 5,334 | ||||
| Guatemala (0.2%) | |||||
| Sovereign Bonds (0.2%) | |||||
| Republic of Guatemala | 5.750% | 6/6/22 | 653 | 666 | |
| Republic of Guatemala | 4.500% | 5/3/26 | 1,500 | 1,375 | |
| Republic of Guatemala | 4.875% | 2/13/28 | 600 | 551 | |
| Total Guatemala (Cost $2,773) | 2,592 | ||||
| Honduras (0.1%) | |||||
| Sovereign Bonds (0.1%) | |||||
| Republic of Honduras | 8.750% | 12/16/20 | 200 | 215 | |
| 2 | Republic of Honduras | 7.500% | 3/15/24 | 400 | 420 |
| Republic of Honduras | 6.250% | 1/19/27 | 970 | 953 | |
| Total Honduras (Cost $1,582) | 1,588 | ||||
| Hungary (1.1%) | |||||
| Sovereign Bonds (1.1%) | |||||
| 1,5 | MFB Magyar Fejlesztesi Bank Zrt | 6.250% | 10/21/20 | 1,100 | 1,147 |
| MFB Magyar Fejlesztesi Bank Zrt | 6.250% | 10/21/20 | 200 | 209 | |
| Republic of Hungary | 6.250% | 1/29/20 | 2,065 | 2,132 | |
| Republic of Hungary | 6.375% | 3/29/21 | 3,897 | 4,126 | |
| Republic of Hungary | 5.375% | 2/21/23 | 1,812 | 1,903 | |
| Republic of Hungary | 5.750% | 11/22/23 | 1,470 | 1,575 | |
| Republic of Hungary | 5.375% | 3/25/24 | 1,325 | 1,404 | |
| Republic of Hungary | 7.625% | 3/29/41 | 1,450 | 1,967 | |
| Total Hungary (Cost $14,584) | 14,463 | ||||
| India (1.3%) | |||||
| Sovereign Bonds (1.3%) | |||||
| Bank of India | 3.125% | 5/6/20 | 400 | 393 | |
| Bank of India | 6.250% | 2/16/21 | 900 | 935 | |
| Bharat Petroleum Corp. Ltd. | 4.625% | 10/25/22 | 400 | 399 | |
| Bharat Petroleum Corp. Ltd. | 4.000% | 5/8/25 | 400 | 371 | |
| BPRL International Singapore Pte Ltd. | 4.375% | 1/18/27 | 550 | 507 | |
| Export-Import Bank of India | 2.750% | 4/1/20 | 600 | 591 | |
| Export-Import Bank of India | 2.750% | 8/12/20 | 200 | 196 | |
| Export-Import Bank of India | 3.125% | 7/20/21 | 1,100 | 1,074 | |
| Export-Import Bank of India | 4.000% | 1/14/23 | 600 | 592 | |
| Export-Import Bank of India | 3.375% | 8/5/26 | 2,200 | 1,994 | |
| 1 | Export-Import Bank of India | 3.875% | 2/1/28 | 1,400 | 1,284 |
| Indian Oil Corp. Ltd. | 5.625% | 8/2/21 | 500 | 516 | |
| Indian Oil Corp. Ltd. | 5.750% | 8/1/23 | 400 | 416 | |
| NTPC Ltd. | 5.625% | 7/14/21 | 400 | 414 | |
| NTPC Ltd. | 4.750% | 10/3/22 | 450 | 454 | |
| NTPC Ltd. | 4.375% | 11/26/24 | 400 | 389 | |
| NTPC Ltd. | 4.250% | 2/26/26 | 450 | 425 | |
| Oil India International Pte Ltd. | 4.000% | 4/21/27 | 800 | 715 | |
| Oil India Ltd. | 5.375% | 4/17/24 | 450 | 456 | |
21
| Emerging Markets Government Bond Index Fund | ||||
| Face | Market | |||
| Maturity | Amount | Value • | ||
| Coupon | Date | ($000) | ($000) | |
| ONGC Videsh Ltd. | 3.750% | 5/7/23 | 700 | 673 |
| ONGC Videsh Ltd. | 4.625% | 7/15/24 | 900 | 884 |
| Power Grid Corp. of India Ltd. | 3.875% | 1/17/23 | 600 | 585 |
| 4 State Bank of India | 3.358% | 4/6/20 | 1,150 | 1,153 |
| State Bank of India | 3.250% | 1/24/22 | 700 | 677 |
| 1 State Bank of India | 4.875% | 4/17/24 | 400 | 402 |
| State Bank of India | 4.875% | 4/17/24 | 200 | 201 |
| Total India (Cost $17,393) | 16,696 | |||
| Indonesia (5.4%) | ||||
| Sovereign Bonds (5.4%) | ||||
| Pelabuhan Indonesia II PT | 4.250% | 5/5/25 | 1,150 | 1,078 |
| 1 Pelabuhan Indonesia II PT | 4.250% | 5/5/25 | 300 | 281 |
| Pelabuhan Indonesia II PT | 5.375% | 5/5/45 | 500 | 440 |
| 1 Pelabuhan Indonesia III PT | 4.875% | 10/1/24 | 200 | 195 |
| Pertamina Persero PT | 5.250% | 5/23/21 | 450 | 462 |
| Pertamina Persero PT | 4.875% | 5/3/22 | 2,450 | 2,483 |
| Pertamina Persero PT | 4.300% | 5/20/23 | 1,100 | 1,073 |
| 1 Pertamina Persero PT | 4.300% | 5/20/23 | 430 | 419 |
| Pertamina Persero PT | 6.500% | 5/27/41 | 200 | 203 |
| Pertamina Persero PT | 6.000% | 5/3/42 | 1,450 | 1,374 |
| 1 Pertamina Persero PT | 6.000% | 5/3/42 | 750 | 711 |
| Pertamina Persero PT | 5.625% | 5/20/43 | 1,425 | 1,282 |
| 1 Pertamina Persero PT | 5.625% | 5/20/43 | 200 | 180 |
| Pertamina Persero PT | 6.450% | 5/30/44 | 1,600 | 1,582 |
| 1 Perusahaan Gas Negara Persero Tbk | 5.125% | 5/16/24 | 400 | 395 |
| Perusahaan Gas Negara Persero Tbk | 5.125% | 5/16/24 | 800 | 789 |
| Perusahaan Listrik Negara PT | 5.500% | 11/22/21 | 1,000 | 1,036 |
| 1 Perusahaan Listrik Negara PT | 4.125% | 5/15/27 | 1,450 | 1,310 |
| Perusahaan Listrik Negara PT | 5.450% | 5/21/28 | 200 | 198 |
| Perusahaan Listrik Negara PT | 5.250% | 10/24/42 | 500 | 441 |
| 1 Perusahaan Listrik Negara PT | 5.250% | 10/24/42 | 300 | 264 |
| 1 Perusahaan Listrik Negara PT | 6.150% | 5/21/48 | 1,600 | 1,554 |
| 1 Perusahaan Listrik Negara PT | 6.250% | 1/25/49 | 1,000 | 983 |
| Perusahaan Penerbit SBSN Indonesia III | 3.300% | 11/21/22 | 378 | 365 |
| 1 Perusahaan Penerbit SBSN Indonesia III | 3.750% | 3/1/23 | 800 | 778 |
| 1 Perusahaan Penerbit SBSN Indonesia III | 4.350% | 9/10/24 | 600 | 590 |
| Perusahaan Penerbit SBSN Indonesia III | 4.350% | 9/10/24 | 2,250 | 2,213 |
| 6 Perusahaan Penerbit SBSN Indonesia III | 4.325% | 5/28/25 | 1,200 | 1,166 |
| Perusahaan Penerbit SBSN Indonesia III | 4.550% | 3/29/26 | 1,250 | 1,213 |
| 6 Perusahaan Penerbit SBSN Indonesia III | 4.150% | 3/29/27 | 1,500 | 1,406 |
| 1 Perusahaan Penerbit SBSN Indonesia III | 4.400% | 3/1/28 | 1,000 | 948 |
| 1 Republic of Indonesia | 5.875% | 3/13/20 | 350 | 361 |
| Republic of Indonesia | 5.875% | 3/13/20 | 1,210 | 1,248 |
| Republic of Indonesia | 4.875% | 5/5/21 | 4,400 | 4,490 |
| Republic of Indonesia | 3.700% | 1/8/22 | 2,250 | 2,212 |
| Republic of Indonesia | 3.750% | 4/25/22 | 1,100 | 1,080 |
| Republic of Indonesia | 3.375% | 4/15/23 | 1,900 | 1,814 |
| Republic of Indonesia | 5.375% | 10/17/23 | 1,359 | 1,405 |
| Republic of Indonesia | 5.875% | 1/15/24 | 2,650 | 2,788 |
| Republic of Indonesia | 4.125% | 1/15/25 | 1,575 | 1,513 |
| 1 Republic of Indonesia | 4.125% | 1/15/25 | 200 | 192 |
| Republic of Indonesia | 4.750% | 1/8/26 | 2,400 | 2,374 |
| Republic of Indonesia | 4.350% | 1/8/27 | 1,100 | 1,057 |
22
| Emerging Markets Government Bond Index Fund | ||||
| Face | Market | |||
| Maturity | Amount | Value • | ||
| Coupon | Date | ($000) | ($000) | |
| Republic of Indonesia | 3.850% | 7/18/27 | 500 | 461 |
| 1 Republic of Indonesia | 3.850% | 7/18/27 | 1,000 | 924 |
| Republic of Indonesia | 3.500% | 1/11/28 | 200 | 180 |
| Republic of Indonesia | 4.100% | 4/24/28 | 1,300 | 1,222 |
| Republic of Indonesia | 8.500% | 10/12/35 | 1,840 | 2,412 |
| Republic of Indonesia | 6.625% | 2/17/37 | 2,637 | 2,955 |
| Republic of Indonesia | 7.750% | 1/17/38 | 2,188 | 2,728 |
| Republic of Indonesia | 5.250% | 1/17/42 | 1,750 | 1,681 |
| Republic of Indonesia | 4.625% | 4/15/43 | 2,175 | 1,931 |
| 1 Republic of Indonesia | 6.750% | 1/15/44 | 100 | 115 |
| Republic of Indonesia | 6.750% | 1/15/44 | 2,050 | 2,359 |
| Republic of Indonesia | 5.125% | 1/15/45 | 3,619 | 3,398 |
| Republic of Indonesia | 5.950% | 1/8/46 | 200 | 210 |
| Republic of Indonesia | 5.250% | 1/8/47 | 2,000 | 1,921 |
| Republic of Indonesia | 4.750% | 7/18/47 | 600 | 540 |
| Saka Energi Indonesia PT | 4.450% | 5/5/24 | 600 | 552 |
| Total Indonesia (Cost $74,652) | 71,535 | |||
| Iraq (0.3%) | ||||
| Sovereign Bonds (0.3%) | ||||
| 1 Republic of Iraq | 6.752% | 3/9/23 | 1,250 | 1,217 |
| Republic of Iraq | 6.752% | 3/9/23 | 950 | 926 |
| 2 Republic of Iraq | 5.800% | 1/15/28 | 1,445 | 1,329 |
| Total Iraq (Cost $3,496) | 3,472 | |||
| Jamaica (0.4%) | ||||
| Sovereign Bonds (0.4%) | ||||
| 2 Jamaica | 7.625% | 7/9/25 | 700 | 795 |
| Jamaica | 6.750% | 4/28/28 | 2,050 | 2,227 |
| 2 Jamaica | 8.000% | 3/15/39 | 1,148 | 1,336 |
| Jamaica | 7.875% | 7/28/45 | 950 | 1,099 |
| Total Jamaica (Cost $5,174) | 5,457 | |||
| Jordan (0.2%) | ||||
| Sovereign Bonds (0.2%) | ||||
| Hashemite Kingdom of Jordan | 6.125% | 1/29/26 | 850 | 815 |
| Hashemite Kingdom of Jordan | 5.750% | 1/31/27 | 1,200 | 1,103 |
| 1 Hashemite Kingdom of Jordan | 7.375% | 10/10/47 | 1,000 | 902 |
| Hashemite Kingdom of Jordan | 7.375% | 10/10/47 | 450 | 406 |
| Total Jordan (Cost $3,528) | 3,226 | |||
| Kazakhstan (1.4%) | ||||
| Sovereign Bonds (1.4%) | ||||
| Development Bank of Kazakhstan JSC | 4.125% | 12/10/22 | 1,700 | 1,666 |
| KazAgro National Management Holding JSC | 4.625% | 5/24/23 | 1,250 | 1,231 |
| Kazakhstan Temir Zholy Finance BV | 6.950% | 7/10/42 | 1,200 | 1,299 |
| 1 KazMunayGas National Co. JSC | 3.875% | 4/19/22 | 750 | 744 |
| KazMunayGas National Co. JSC | 4.750% | 4/24/25 | 400 | 399 |
| 1 KazMunayGas National Co. JSC | 4.750% | 4/24/25 | 1,000 | 999 |
| 1 KazMunayGas National Co. JSC | 4.750% | 4/19/27 | 400 | 389 |
| KazMunayGas National Co. JSC | 5.375% | 4/24/30 | 400 | 397 |
| 1 KazMunayGas National Co. JSC | 5.375% | 4/24/30 | 500 | 497 |
| 1 KazMunayGas National Co. JSC | 5.750% | 4/19/47 | 200 | 191 |
| KazMunayGas National Co. JSC | 5.750% | 4/19/47 | 2,300 | 2,195 |
23
| Emerging Markets Government Bond Index Fund | ||||
| Face | Market | |||
| Maturity | Amount | Value • | ||
| Coupon | Date | ($000) | ($000) | |
| 1 KazMunayGas National Co. JSC | 6.375% | 10/24/48 | 1,100 | 1,114 |
| Republic of Kazakhstan | 3.875% | 10/14/24 | 1,700 | 1,703 |
| Republic of Kazakhstan | 5.125% | 7/21/25 | 2,500 | 2,634 |
| Republic of Kazakhstan | 4.875% | 10/14/44 | 1,400 | 1,373 |
| Republic of Kazakhstan | 6.500% | 7/21/45 | 1,000 | 1,191 |
| Total Kazakhstan (Cost $17,589) | 18,022 | |||
| Kenya (0.3%) | ||||
| Sovereign Bonds (0.3%) | ||||
| 1 Republic of Kenya | 6.875% | 6/24/24 | 200 | 195 |
| Republic of Kenya | 6.875% | 6/24/24 | 1,925 | 1,872 |
| 1 Republic of Kenya | 7.250% | 2/28/28 | 800 | 753 |
| 1 Republic of Kenya | 8.250% | 2/28/48 | 1,000 | 912 |
| Total Kenya (Cost $3,946) | 3,732 | |||
| Kuwait (0.8%) | ||||
| Sovereign Bonds (0.8%) | ||||
| Equate Petrochemical BV | 3.000% | 3/3/22 | 900 | 862 |
| Equate Petrochemical BV | 4.250% | 11/3/26 | 1,350 | 1,308 |
| State of Kuwait | 2.750% | 3/20/22 | 3,325 | 3,230 |
| State of Kuwait | 3.500% | 3/20/27 | 4,600 | 4,467 |
| Total Kuwait (Cost $10,131) | 9,867 | |||
| Lebanon (1.6%) | ||||
| Sovereign Bonds (1.6%) | ||||
| Republic of Lebanon | 5.450% | 11/28/19 | 1,025 | 988 |
| Republic of Lebanon | 6.375% | 3/9/20 | 2,341 | 2,254 |
| Republic of Lebanon | 5.800% | 4/14/20 | 1,100 | 1,044 |
| Republic of Lebanon | 8.250% | 4/12/21 | 1,728 | 1,655 |
| Republic of Lebanon | 6.100% | 10/4/22 | 2,214 | 1,929 |
| Republic of Lebanon | 6.000% | 1/27/23 | 585 | 504 |
| Republic of Lebanon | 6.650% | 4/22/24 | 1,791 | 1,527 |
| Republic of Lebanon | 6.200% | 2/26/25 | 300 | 244 |
| Republic of Lebanon | 6.250% | 6/12/25 | 400 | 325 |
| Republic of Lebanon | 6.600% | 11/27/26 | 1,975 | 1,590 |
| Republic of Lebanon | 6.850% | 3/23/27 | 1,000 | 825 |
| Republic of Lebanon | 6.750% | 11/29/27 | 961 | 769 |
| Republic of Lebanon | 6.650% | 11/3/28 | 1,040 | 823 |
| Republic of Lebanon | 6.850% | 5/25/29 | 800 | 626 |
| Republic of Lebanon | 6.650% | 2/26/30 | 1,050 | 815 |
| Republic of Lebanon | 7.000% | 3/23/32 | 3,050 | 2,374 |
| Republic of Lebanon | 7.050% | 11/2/35 | 500 | 388 |
| Republic of Lebanon | 7.250% | 3/23/37 | 2,550 | 1,988 |
| Total Lebanon (Cost $23,591) | 20,668 | |||
| Malaysia (1.4%) | ||||
| Sovereign Bonds (1.4%) | ||||
| 1MDB Global Investments Ltd. | 4.400% | 3/9/23 | 2,700 | 2,478 |
| Axiata SPV2 Bhd. | 3.466% | 11/19/20 | 350 | 348 |
| Axiata SPV2 Bhd. | 4.357% | 3/24/26 | 1,350 | 1,324 |
| Cagamas Global plc | 2.745% | 12/10/19 | 500 | 496 |
| Danga Capital Bhd. | 3.035% | 3/1/21 | 800 | 779 |
| 2 Malayan Banking Bhd. | 3.905% | 10/29/26 | 700 | 689 |
| Malaysia Sovereign Sukuk Bhd. | 3.043% | 4/22/25 | 900 | 852 |
24
| Emerging Markets Government Bond Index Fund | ||||
| Face | Market | |||
| Maturity | Amount | Value • | ||
| Coupon | Date | ($000) | ($000) | |
| Malaysia Sovereign Sukuk Bhd. | 4.236% | 4/22/45 | 550 | 533 |
| Malaysia Sukuk Global Bhd. | 3.179% | 4/27/26 | 1,100 | 1,040 |
| Malaysia Sukuk Global Bhd. | 4.080% | 4/27/46 | 450 | 423 |
| Petroliam Nasional Bhd. | 7.625% | 10/15/26 | 485 | 595 |
| Petronas Capital Ltd. | 3.125% | 3/18/22 | 700 | 686 |
| 1 Petronas Capital Ltd. | 7.875% | 5/22/22 | 1,150 | 1,303 |
| Petronas Capital Ltd. | 3.500% | 3/18/25 | 1,600 | 1,545 |
| Petronas Capital Ltd. | 4.500% | 3/18/45 | 1,250 | 1,217 |
| Petronas Global Sukuk Ltd. | 2.707% | 3/18/20 | 2,150 | 2,130 |
| SSG Resources Ltd. | 4.250% | 10/4/22 | 700 | 695 |
| 1 Wakala Global Sukuk Bhd. | 4.646% | 7/6/21 | 750 | 773 |
| Total Malaysia (Cost $18,367) | 17,906 | |||
| Mexico (7.8%) | ||||
| Sovereign Bonds (7.8%) | ||||
| Banco Nacional de Comercio Exterior SNC | 4.375% | 10/14/25 | 900 | 865 |
| 2 Banco Nacional de Comercio Exterior SNC | 3.800% | 8/11/26 | 700 | 673 |
| Comision Federal de Electricidad | 4.875% | 5/26/21 | 1,450 | 1,450 |
| Comision Federal de Electricidad | 4.875% | 1/15/24 | 600 | 589 |
| 1 Comision Federal de Electricidad | 4.875% | 1/15/24 | 700 | 698 |
| 1 Comision Federal de Electricidad | 4.750% | 2/23/27 | 1,000 | 944 |
| Comision Federal de Electricidad | 5.750% | 2/14/42 | 700 | 649 |
| 1 Comision Federal de Electricidad | 6.125% | 6/16/45 | 200 | 195 |
| 1 Mexico City Airport Trust | 4.250% | 10/31/26 | 1,600 | 1,333 |
| Mexico City Airport Trust | 5.500% | 10/31/46 | 200 | 158 |
| 1 Mexico City Airport Trust | 5.500% | 7/31/47 | 1,000 | 799 |
| Mexico City Airport Trust | 5.500% | 7/31/47 | 3,300 | 2,599 |
| Petroleos Mexicanos | 6.000% | 3/5/20 | 1,019 | 1,041 |
| Petroleos Mexicanos | 5.500% | 1/21/21 | 4,139 | 4,181 |
| Petroleos Mexicanos | 6.375% | 2/4/21 | 2,670 | 2,733 |
| Petroleos Mexicanos | 4.875% | 1/24/22 | 2,620 | 2,580 |
| Petroleos Mexicanos | 3.500% | 1/30/23 | 2,495 | 2,303 |
| Petroleos Mexicanos | 4.625% | 9/21/23 | 1,343 | 1,283 |
| Petroleos Mexicanos | 4.875% | 1/18/24 | 1,469 | 1,406 |
| Petroleos Mexicanos | 4.250% | 1/15/25 | 1,460 | 1,317 |
| Petroleos Mexicanos | 4.500% | 1/23/26 | 1,700 | 1,513 |
| Petroleos Mexicanos | 6.875% | 8/4/26 | 3,630 | 3,620 |
| Petroleos Mexicanos | 6.500% | 3/13/27 | 6,080 | 5,891 |
| 1 Petroleos Mexicanos | 5.350% | 2/12/28 | 875 | 783 |
| 1 Petroleos Mexicanos | 6.500% | 1/23/29 | 2,000 | 1,921 |
| Petroleos Mexicanos | 6.625% | 6/15/35 | 3,697 | 3,376 |
| Petroleos Mexicanos | 6.500% | 6/2/41 | 3,920 | 3,361 |
| Petroleos Mexicanos | 5.500% | 6/27/44 | 1,211 | 936 |
| Petroleos Mexicanos | 6.375% | 1/23/45 | 1,360 | 1,133 |
| Petroleos Mexicanos | 5.625% | 1/23/46 | 3,047 | 2,367 |
| Petroleos Mexicanos | 6.750% | 9/21/47 | 7,759 | 6,672 |
| 1 Petroleos Mexicanos | 6.350% | 2/12/48 | 855 | 710 |
| 2 Poinsettia Finance Ltd. | 6.625% | 6/17/31 | 500 | 509 |
| United Mexican States | 3.500% | 1/21/21 | 200 | 199 |
| United Mexican States | 3.625% | 3/15/22 | 4,877 | 4,822 |
| United Mexican States | 4.000% | 10/2/23 | 2,676 | 2,643 |
| United Mexican States | 3.600% | 1/30/25 | 3,499 | 3,307 |
| United Mexican States | 4.125% | 1/21/26 | 3,712 | 3,580 |
| United Mexican States | 4.150% | 3/28/27 | 3,810 | 3,633 |
25
| Emerging Markets Government Bond Index Fund | |||||
| Face | Market | ||||
| Maturity | Amount | Value • | |||
| Coupon | Date | ($000) | ($000) | ||
| United Mexican States | 3.750% | 1/11/28 | 2,430 | 2,235 | |
| United Mexican States | 7.500% | 4/8/33 | 825 | 1,006 | |
| United Mexican States | 6.750% | 9/27/34 | 1,649 | 1,885 | |
| United Mexican States | 6.050% | 1/11/40 | 3,679 | 3,835 | |
| United Mexican States | 4.750% | 3/8/44 | 6,650 | 5,885 | |
| United Mexican States | 5.550% | 1/21/45 | 985 | 972 | |
| United Mexican States | 4.600% | 1/23/46 | 3,130 | 2,699 | |
| United Mexican States | 4.350% | 1/15/47 | 2,000 | 1,673 | |
| United Mexican States | 4.600% | 2/10/48 | 1,355 | 1,178 | |
| United Mexican States | 5.750% | 10/12/10 | 2,968 | 2,740 | |
| Total Mexico (Cost $111,557) | 102,880 | ||||
| Mongolia (0.3%) | |||||
| Sovereign Bonds (0.3%) | |||||
| Mongolia | 5.125% | 12/5/22 | 2,050 | 1,940 | |
| 1 | Mongolia | 5.625% | 5/1/23 | 1,000 | 951 |
| 1,7 | Trade & Development Bank of Mongolia LLC | 9.375% | 5/19/20 | 200 | 209 |
| 7 | Trade & Development Bank of Mongolia LLC | 9.375% | 5/19/20 | 400 | 419 |
| Total Mongolia (Cost $3,532) | 3,519 | ||||
| Morocco (0.4%) | |||||
| Sovereign Bonds (0.4%) | |||||
| Kingdom of Morocco | 4.250% | 12/11/22 | 1,850 | 1,839 | |
| Kingdom of Morocco | 5.500% | 12/11/42 | 725 | 736 | |
| OCP SA | 5.625% | 4/25/24 | 1,300 | 1,321 | |
| OCP SA | 4.500% | 10/22/25 | 950 | 898 | |
| 1 | OCP SA | 4.500% | 10/22/25 | 450 | 426 |
| OCP SA | 6.875% | 4/25/44 | 300 | 313 | |
| 1 | OCP SA | 6.875% | 4/25/44 | 200 | 209 |
| Total Morocco (Cost $5,827) | 5,742 | ||||
| Mozambique (0.0%) | |||||
| Sovereign Bond (0.0%) | |||||
| 8 | Republic of Mozambique | 10.500% | 1/18/23 | 644 | 538 |
| Total Mozambique (Cost $560) | 538 | ||||
| Namibia (0.1%) | |||||
| Sovereign Bonds (0.1%) | |||||
| Republic of Namibia | 5.500% | 11/3/21 | 500 | 500 | |
| Republic of Namibia | 5.250% | 10/29/25 | 700 | 630 | |
| Total Namibia (Cost $1,225) | 1,130 | ||||
| Nigeria (0.5%) | |||||
| Sovereign Bonds (0.5%) | |||||
| Federal Republic of Nigeria | 6.750% | 1/28/21 | 250 | 258 | |
| Federal Republic of Nigeria | 6.375% | 7/12/23 | 800 | 796 | |
| Federal Republic of Nigeria | 6.500% | 11/28/27 | 1,000 | 916 | |
| 1 | Federal Republic of Nigeria | 7.143% | 2/23/30 | 1,000 | 919 |
| 1 | Federal Republic of Nigeria | 7.875% | 2/16/32 | 1,500 | 1,442 |
| 1 | Federal Republic of Nigeria | 7.696% | 2/23/38 | 2,175 | 1,960 |
| Federal Republic of Nigeria | 7.625% | 11/28/47 | 1,000 | 882 | |
| Total Nigeria (Cost $7,823) | 7,173 | ||||
26
| Emerging Markets Government Bond Index Fund | |||||
| Face | Market | ||||
| Maturity | Amount | Value • | |||
| Coupon | Date | ($000) | ($000) | ||
| Oman (1.5%) | |||||
| Sovereign Bonds (1.5%) | |||||
| Lamar Funding Ltd. | 3.958% | 5/7/25 | 1,700 | 1,487 | |
| 1 | Oman Sovereign Sukuk SAOC | 5.932% | 10/31/25 | 1,200 | 1,197 |
| OmGrid Funding Ltd. | 5.196% | 5/16/27 | 500 | 453 | |
| Sultanate of Oman | 3.625% | 6/15/21 | 1,400 | 1,362 | |
| 1 | Sultanate of Oman | 3.625% | 6/15/21 | 1,300 | 1,264 |
| Sultanate of Oman | 3.875% | 3/8/22 | 800 | 772 | |
| 1 | Sultanate of Oman | 4.125% | 1/17/23 | 750 | 718 |
| Sultanate of Oman | 4.750% | 6/15/26 | 2,200 | 2,026 | |
| 1 | Sultanate of Oman | 4.750% | 6/15/26 | 1,800 | 1,657 |
| Sultanate of Oman | 5.375% | 3/8/27 | 2,200 | 2,072 | |
| 1 | Sultanate of Oman | 5.625% | 1/17/28 | 1,800 | 1,715 |
| Sultanate of Oman | 5.625% | 1/17/28 | 200 | 190 | |
| Sultanate of Oman | 6.500% | 3/8/47 | 2,115 | 1,891 | |
| Sultanate of Oman | 6.750% | 1/17/48 | 200 | 183 | |
| 1 | Sultanate of Oman | 6.750% | 1/17/48 | 2,500 | 2,276 |
| Total Oman (Cost $20,629) | 19,263 | ||||
| Pakistan (0.4%) | |||||
| Sovereign Bonds (0.4%) | |||||
| Islamic Republic of Pakistan | 6.750% | 12/3/19 | 600 | 601 | |
| 1 | Islamic Republic of Pakistan | 8.250% | 4/15/24 | 250 | 255 |
| Islamic Republic of Pakistan | 8.250% | 4/15/24 | 1,350 | 1,380 | |
| Islamic Republic of Pakistan | 8.250% | 9/30/25 | 450 | 459 | |
| 1 | Islamic Republic of Pakistan | 6.875% | 12/5/27 | 1,800 | 1,661 |
| Third Pakistan International Sukuk Co. Ltd. | 5.500% | 10/13/21 | 500 | 484 | |
| Third Pakistan International Sukuk Co. Ltd. | 5.625% | 12/5/22 | 200 | 191 | |
| Total Pakistan (Cost $5,238) | 5,031 | ||||
| Panama (1.2%) | |||||
| Sovereign Bonds (1.2%) | |||||
| 1,2 | Aeropuerto Internacional de Tocumen SA | 5.625% | 5/18/36 | 1,000 | 1,025 |
| Republic of Panama | 5.200% | 1/30/20 | 923 | 942 | |
| 2 | Republic of Panama | 4.000% | 9/22/24 | 400 | 398 |
| 2 | Republic of Panama | 3.750% | 3/16/25 | 1,800 | 1,756 |
| Republic of Panama | 7.125% | 1/29/26 | 1,325 | 1,538 | |
| Republic of Panama | 8.875% | 9/30/27 | 1,285 | 1,692 | |
| 2 | Republic of Panama | 3.875% | 3/17/28 | 1,250 | 1,198 |
| Republic of Panama | 9.375% | 4/1/29 | 1,000 | 1,386 | |
| 2 | Republic of Panama | 6.700% | 1/26/36 | 2,062 | 2,477 |
| 2 | Republic of Panama | 4.500% | 5/15/47 | 1,000 | 937 |
| 2 | Republic of Panama | 4.500% | 4/16/50 | 1,700 | 1,573 |
| 2 | Republic of Panama | 4.300% | 4/29/53 | 600 | 537 |
| Total Panama (Cost $15,884) | 15,459 | ||||
| Papua New Guinea (0.0%) | |||||
| Sovereign Bond (0.0%) | |||||
| 1 | Papua New Guinea Government International | ||||
| Bond | 8.375% | 10/4/28 | 500 | 497 | |
| Total Papua New Guinea (Cost $498) | 497 | ||||
27
| Emerging Markets Government Bond Index Fund | ||||
| Face | Market | |||
| Maturity | Amount | Value • | ||
| Coupon | Date | ($000) | ($000) | |
| Paraguay (0.3%) | ||||
| Sovereign Bonds (0.3%) | ||||
| Republic of Paraguay | 4.625% | 1/25/23 | 800 | 800 |
| Republic of Paraguay | 5.000% | 4/15/26 | 200 | 198 |
| Republic of Paraguay | 4.700% | 3/27/27 | 1,000 | 973 |
| Republic of Paraguay | 6.100% | 8/11/44 | 650 | 655 |
| 1 Republic of Paraguay | 5.600% | 3/13/48 | 800 | 762 |
| Total Paraguay (Cost $3,472) | 3,388 | |||
| Peru (1.1%) | ||||
| Sovereign Bonds (1.1%) | ||||
| Corp. Financiera de Desarrollo SA | 4.750% | 2/8/22 | 200 | 203 |
| Fondo MIVIVIENDA SA | 3.500% | 1/31/23 | 650 | 626 |
| Petroleos del Peru SA | 4.750% | 6/19/32 | 200 | 185 |
| 1 Petroleos del Peru SA | 5.625% | 6/19/47 | 1,850 | 1,739 |
| Republic of Peru | 7.350% | 7/21/25 | 1,950 | 2,348 |
| Republic of Peru | 4.125% | 8/25/27 | 2,047 | 2,061 |
| Republic of Peru | 8.750% | 11/21/33 | 2,122 | 3,031 |
| 2 Republic of Peru | 6.550% | 3/14/37 | 1,421 | 1,728 |
| Republic of Peru | 5.625% | 11/18/50 | 2,057 | 2,301 |
| Total Peru (Cost $14,575) | 14,222 | |||
| Philippines (1.9%) | ||||
| Sovereign Bonds (1.9%) | ||||
| 9 Power Sector Assets & Liabilities | ||||
| Management Corp. | 7.390% | 12/2/24 | 1,150 | 1,338 |
| Republic of the Philippines | 6.500% | 1/20/20 | 150 | 156 |
| Republic of the Philippines | 4.000% | 1/15/21 | 1,310 | 1,323 |
| Republic of the Philippines | 4.200% | 1/21/24 | 1,564 | 1,580 |
| Republic of the Philippines | 10.625% | 3/16/25 | 1,534 | 2,079 |
| Republic of the Philippines | 5.500% | 3/30/26 | 2,300 | 2,490 |
| Republic of the Philippines | 3.000% | 2/1/28 | 200 | 182 |
| Republic of the Philippines | 9.500% | 2/2/30 | 1,723 | 2,479 |
| Republic of the Philippines | 7.750% | 1/14/31 | 2,554 | 3,352 |
| Republic of the Philippines | 6.375% | 1/15/32 | 1,200 | 1,434 |
| Republic of the Philippines | 6.375% | 10/23/34 | 1,695 | 2,061 |
| Republic of the Philippines | 5.000% | 1/13/37 | 2,080 | 2,207 |
| Republic of the Philippines | 3.950% | 1/20/40 | 1,950 | 1,799 |
| Republic of the Philippines | 3.700% | 3/1/41 | 1,450 | 1,290 |
| Republic of the Philippines | 3.700% | 2/2/42 | 1,990 | 1,767 |
| Total Philippines (Cost $27,147) | 25,537 | |||
| Poland (0.8%) | ||||
| Sovereign Bonds (0.8%) | ||||
| Republic of Poland | 5.125% | 4/21/21 | 2,460 | 2,559 |
| Republic of Poland | 5.000% | 3/23/22 | 3,534 | 3,698 |
| Republic of Poland | 3.000% | 3/17/23 | 675 | 657 |
| Republic of Poland | 4.000% | 1/22/24 | 1,878 | 1,899 |
| Republic of Poland | 3.250% | 4/6/26 | 2,000 | 1,918 |
| Total Poland (Cost $10,936) | 10,731 | |||
28
| Emerging Markets Government Bond Index Fund | |||||
| Face | Market | ||||
| Maturity | Amount | Value • | |||
| Coupon | Date | ($000) | ($000) | ||
| Qatar (3.4%) | |||||
| Sovereign Bonds (3.4%) | |||||
| 1,2 | Nakilat Inc. | 6.067% | 12/31/33 | 700 | 768 |
| 1 | Ooredoo International Finance Ltd. | 4.750% | 2/16/21 | 500 | 510 |
| 1 | Ooredoo International Finance Ltd. | 3.250% | 2/21/23 | 1,050 | 1,004 |
| 1 | Ooredoo International Finance Ltd. | 5.000% | 10/19/25 | 900 | 920 |
| 1 | Ooredoo International Finance Ltd. | 3.750% | 6/22/26 | 250 | 235 |
| 1 | Ooredoo International Finance Ltd. | 3.875% | 1/31/28 | 1,750 | 1,645 |
| 1 | Qatari Diar Finance QSC | 5.000% | 7/21/20 | 2,480 | 2,533 |
| QNB Finance Ltd. | 2.875% | 4/29/20 | 3,300 | 3,250 | |
| 4 | QNB Finance Ltd. | 3.663% | 5/31/21 | 200 | 202 |
| 1,2 | Ras Laffan Liquefied Natural Gas Co. Ltd. III | 5.838% | 9/30/27 | 1,020 | 1,102 |
| 1,2 | Ras Laffan Liquefied Natural Gas Co. Ltd. III | 6.332% | 9/30/27 | 500 | 553 |
| State of Qatar | 5.250% | 1/20/20 | 1,000 | 1,022 | |
| 1 | State of Qatar | 5.250% | 1/20/20 | 2,007 | 2,050 |
| State of Qatar | 2.375% | 6/2/21 | 5,100 | 4,945 | |
| 1 | State of Qatar | 4.500% | 1/20/22 | 2,550 | 2,611 |
| State of Qatar | 3.241% | 1/18/23 | 475 | 467 | |
| 1 | State of Qatar | 3.875% | 4/23/23 | 1,000 | 1,002 |
| State of Qatar | 3.250% | 6/2/26 | 4,300 | 4,082 | |
| 1 | State of Qatar | 4.500% | 4/23/28 | 3,000 | 3,063 |
| State of Qatar | 9.750% | 6/15/30 | 325 | 481 | |
| 1 | State of Qatar | 9.750% | 6/15/30 | 750 | 1,109 |
| State of Qatar | 6.400% | 1/20/40 | 1,028 | 1,258 | |
| 1 | State of Qatar | 6.400% | 1/20/40 | 700 | 855 |
| State of Qatar | 5.750% | 1/20/42 | 650 | 744 | |
| 1 | State of Qatar | 5.750% | 1/20/42 | 316 | 362 |
| State of Qatar | 4.625% | 6/2/46 | 1,450 | 1,442 | |
| 1 | State of Qatar | 5.103% | 4/23/48 | 6,135 | 6,242 |
| Total Qatar (Cost $44,895) | 44,457 | ||||
| Romania (0.5%) | |||||
| Sovereign Bonds (0.5%) | |||||
| Republic of Romania | 6.750% | 2/7/22 | 2,682 | 2,888 | |
| Republic of Romania | 4.375% | 8/22/23 | 1,704 | 1,700 | |
| 1 | Republic of Romania | 4.875% | 1/22/24 | 100 | 102 |
| Republic of Romania | 4.875% | 1/22/24 | 470 | 479 | |
| 1 | Republic of Romania | 6.125% | 1/22/44 | 200 | 215 |
| Republic of Romania | 6.125% | 1/22/44 | 820 | 881 | |
| 1 | Republic of Romania | 5.125% | 6/15/48 | 500 | 463 |
| Republic of Romania | 5.125% | 6/15/48 | 500 | 462 | |
| Total Romania (Cost $7,507) | 7,190 | ||||
| Russia (4.7%) | |||||
| Sovereign Bonds (4.7%) | |||||
| Gazprom Neft OAO Via GPN Capital SA | 4.375% | 9/19/22 | 1,000 | 978 | |
| 1 | Gazprom Neft OAO Via GPN Capital SA | 6.000% | 11/27/23 | 200 | 206 |
| Gazprom Neft OAO Via GPN Capital SA | 6.000% | 11/27/23 | 1,550 | 1,597 | |
| Gazprom OAO Via Gaz Capital SA | 3.850% | 2/6/20 | 878 | 873 | |
| Gazprom OAO Via Gaz Capital SA | 5.999% | 1/23/21 | 1,700 | 1,739 | |
| Gazprom OAO Via Gaz Capital SA | 6.510% | 3/7/22 | 1,325 | 1,387 | |
| Gazprom OAO Via Gaz Capital SA | 4.950% | 7/19/22 | 550 | 551 | |
| Gazprom OAO Via Gaz Capital SA | 4.950% | 3/23/27 | 200 | 191 | |
| Gazprom OAO Via Gaz Capital SA | 4.950% | 2/6/28 | 650 | 619 | |
29
| Emerging Markets Government Bond Index Fund | |||||
| Face | Market | ||||
| Maturity | Amount | Value • | |||
| Coupon | Date | ($000) | ($000) | ||
| Gazprom OAO Via Gaz Capital SA | 8.625% | 4/28/34 | 875 | 1,068 | |
| Gazprom OAO Via Gaz Capital SA | 7.288% | 8/16/37 | 1,375 | 1,515 | |
| 1 | Gazprom OAO Via Gaz Capital SA | 7.288% | 8/16/37 | 100 | 110 |
| GTLK Europe DAC | 5.950% | 7/19/21 | 1,000 | 978 | |
| Rosneft Finance SA | 7.250% | 2/2/20 | 200 | 206 | |
| Rosneft Oil Co. Via Rosneft International | |||||
| Finance DAC | 4.199% | 3/6/22 | 1,927 | 1,872 | |
| Russian Federation | 5.000% | 4/29/20 | 2,800 | 2,844 | |
| Russian Federation | 4.500% | 4/4/22 | 3,800 | 3,832 | |
| 1 | Russian Federation | 4.875% | 9/16/23 | 450 | 460 |
| Russian Federation | 4.875% | 9/16/23 | 5,800 | 5,926 | |
| Russian Federation | 4.750% | 5/27/26 | 3,400 | 3,354 | |
| Russian Federation | 4.250% | 6/23/27 | 2,800 | 2,649 | |
| Russian Federation | 12.750% | 6/24/28 | 1,235 | 1,955 | |
| 2 | Russian Federation | 7.500% | 3/31/30 | 1,002 | 1,096 |
| Russian Federation | 5.625% | 4/4/42 | 4,400 | 4,463 | |
| Russian Federation | 5.875% | 9/16/43 | 600 | 630 | |
| 1 | Russian Federation | 5.250% | 6/23/47 | 4,600 | 4,254 |
| Russian Federation | 5.250% | 6/23/47 | 2,800 | 2,589 | |
| Russian Railways Via RZD Capital plc | 5.700% | 4/5/22 | 1,550 | 1,582 | |
| Sberbank of Russia Via SB Capital SA | 5.717% | 6/16/21 | 2,000 | 2,029 | |
| Sberbank of Russia Via SB Capital SA | 6.125% | 2/7/22 | 2,300 | 2,358 | |
| Sberbank of Russia Via SB Capital SA | 5.125% | 10/29/22 | 524 | 516 | |
| SCF Capital Designated Activity Co. | 5.375% | 6/16/23 | 400 | 384 | |
| Vnesheconombank Via VEB Finance plc | 6.902% | 7/9/20 | 1,350 | 1,363 | |
| Vnesheconombank Via VEB Finance plc | 6.025% | 7/5/22 | 1,225 | 1,193 | |
| Vnesheconombank Via VEB Finance plc | 5.942% | 11/21/23 | 1,125 | 1,077 | |
| Vnesheconombank Via VEB Finance plc | 6.800% | 11/22/25 | 1,275 | 1,255 | |
| VTB Bank OJSC Via VTB Capital SA | 6.551% | 10/13/20 | 550 | 567 | |
| VTB Bank OJSC Via VTB Capital SA | 6.950% | 10/17/22 | 1,925 | 1,889 | |
| Total Russia (Cost $62,760) | 62,155 | ||||
| Saudi Arabia (4.2%) | |||||
| Sovereign Bonds (4.2%) | |||||
| Kingdom of Saudi Arabia | 2.375% | 10/26/21 | 2,542 | 2,427 | |
| 1 | Kingdom of Saudi Arabia | 2.375% | 10/26/21 | 3,400 | 3,247 |
| 1 | Kingdom of Saudi Arabia | 2.875% | 3/4/23 | 2,400 | 2,280 |
| Kingdom of Saudi Arabia | 2.875% | 3/4/23 | 400 | 380 | |
| 1 | Kingdom of Saudi Arabia | 4.000% | 4/17/25 | 4,375 | 4,299 |
| 1 | Kingdom of Saudi Arabia | 3.250% | 10/26/26 | 5,440 | 5,033 |
| 1 | Kingdom of Saudi Arabia | 3.625% | 3/4/28 | 3,000 | 2,813 |
| Kingdom of Saudi Arabia | 3.625% | 3/4/28 | 2,400 | 2,251 | |
| 1 | Kingdom of Saudi Arabia | 4.500% | 4/17/30 | 2,400 | 2,366 |
| Kingdom of Saudi Arabia | 4.500% | 10/26/46 | 6,185 | 5,607 | |
| 1 | Kingdom of Saudi Arabia | 4.625% | 10/4/47 | 1,900 | 1,740 |
| Kingdom of Saudi Arabia | 4.625% | 10/4/47 | 3,550 | 3,258 | |
| Kingdom of Saudi Arabia | 5.000% | 4/17/49 | 200 | 192 | |
| 1 | Kingdom of Saudi Arabia | 5.000% | 4/17/49 | 3,100 | 2,979 |
| KSA Sukuk Ltd. | 2.894% | 4/20/22 | 1,500 | 1,447 | |
| 1 | KSA Sukuk Ltd. | 2.894% | 4/20/22 | 2,800 | 2,702 |
| 10 | KSA Sukuk Ltd. | 3.628% | 4/20/27 | 4,300 | 4,102 |
| 1 | KSA Sukuk Ltd. | 4.303% | 1/19/29 | 1,900 | 1,862 |
| Saudi Electricity Global Sukuk Co. | 4.211% | 4/3/22 | 625 | 627 | |
| Saudi Electricity Global Sukuk Co. 2 | 3.473% | 4/8/23 | 1,050 | 1,021 | |
30
| Emerging Markets Government Bond Index Fund | |||||
| Face | Market | ||||
| Maturity | Amount | Value • | |||
| Coupon | Date | ($000) | ($000) | ||
| Saudi Electricity Global Sukuk Co. 2 | 5.060% | 4/8/43 | 940 | 901 | |
| 1 | Saudi Electricity Global Sukuk Co. 3 | 4.000% | 4/8/24 | 650 | 636 |
| Saudi Electricity Global Sukuk Co. 3 | 4.000% | 4/8/24 | 1,950 | 1,910 | |
| 1 | Saudi Electricity Global Sukuk Co. 3 | 5.500% | 4/8/44 | 300 | 304 |
| Saudi Electricity Global Sukuk Co. 3 | 5.500% | 4/8/44 | 700 | 709 | |
| Total Saudi Arabia (Cost $57,589) | 55,093 | ||||
| Senegal (0.2%) | |||||
| Sovereign Bonds (0.2%) | |||||
| Republic of Senegal | 8.750% | 5/13/21 | 500 | 533 | |
| Republic of Senegal | 6.250% | 7/30/24 | 200 | 195 | |
| 2 | Republic of Senegal | 6.250% | 5/23/33 | 1,000 | 865 |
| 2 | Republic of Senegal | 6.750% | 3/13/48 | 200 | 165 |
| 1,2 | Republic of Senegal | 6.750% | 3/13/48 | 800 | 660 |
| Total Senegal (Cost $2,725) | 2,418 | ||||
| Serbia, Republic Of (0.3%) | |||||
| Sovereign Bonds (0.3%) | |||||
| Republic of Serbia | 4.875% | 2/25/20 | 1,425 | 1,436 | |
| Republic of Serbia | 7.250% | 9/28/21 | 2,150 | 2,319 | |
| Total Serbia, Republic Of (Cost $3,738) | 3,755 | ||||
| South Africa (1.6%) | |||||
| Sovereign Bonds (1.6%) | |||||
| Eskom Holdings SOC Ltd. | 5.750% | 1/26/21 | 2,200 | 2,106 | |
| Eskom Holdings SOC Ltd. | 6.750% | 8/6/23 | 930 | 869 | |
| 1 | Eskom Holdings SOC Ltd. | 7.125% | 2/11/25 | 200 | 187 |
| Eskom Holdings SOC Ltd. | 7.125% | 2/11/25 | 850 | 795 | |
| 1,11 Eskom Holdings SOC Ltd. | 6.350% | 8/10/28 | 900 | 868 | |
| 1 | Eskom Holdings SOC Ltd. | 8.450% | 8/10/28 | 400 | 386 |
| Republic of South Africa | 5.500% | 3/9/20 | 2,175 | 2,197 | |
| Republic of South Africa | 5.875% | 5/30/22 | 1,071 | 1,094 | |
| Republic of South Africa | 4.665% | 1/17/24 | 1,700 | 1,628 | |
| Republic of South Africa | 5.875% | 9/16/25 | 2,400 | 2,367 | |
| Republic of South Africa | 4.850% | 9/27/27 | 200 | 181 | |
| Republic of South Africa | 4.300% | 10/12/28 | 1,950 | 1,665 | |
| Republic of South Africa | 5.875% | 6/22/30 | 1,550 | 1,463 | |
| Republic of South Africa | 6.250% | 3/8/41 | 753 | 700 | |
| Republic of South Africa | 5.375% | 7/24/44 | 1,000 | 829 | |
| Republic of South Africa | 5.000% | 10/12/46 | 950 | 758 | |
| Republic of South Africa | 5.650% | 9/27/47 | 1,500 | 1,266 | |
| Republic of South Africa | 6.300% | 6/22/48 | 1,200 | 1,086 | |
| 1 | Transnet SOC Ltd. | 4.000% | 7/26/22 | 1,025 | 954 |
| ZAR Sovereign Capital Fund Propriety Ltd. | 3.903% | 6/24/20 | 200 | 198 | |
| Total South Africa (Cost $23,393) | 21,597 | ||||
| Sri Lanka (0.8%) | |||||
| Sovereign Bonds (0.8%) | |||||
| Democratic Socialist Republic of Sri Lanka | 6.250% | 10/4/20 | 1,532 | 1,476 | |
| Democratic Socialist Republic of Sri Lanka | 6.250% | 7/27/21 | 1,700 | 1,613 | |
| Democratic Socialist Republic of Sri Lanka | 5.750% | 4/18/23 | 200 | 180 | |
| 1 | Democratic Socialist Republic of Sri Lanka | 5.750% | 4/18/23 | 1,400 | 1,262 |
| Democratic Socialist Republic of Sri Lanka | 6.125% | 6/3/25 | 700 | 613 | |
| Democratic Socialist Republic of Sri Lanka | 6.850% | 11/3/25 | 700 | 636 | |
31
| Emerging Markets Government Bond Index Fund | ||||
| Face | Market | |||
| Maturity | Amount | Value • | ||
| Coupon | Date | ($000) | ($000) | |
| Democratic Socialist Republic of Sri Lanka | 6.825% | 7/18/26 | 1,600 | 1,439 |
| Democratic Socialist Republic of Sri Lanka | 6.200% | 5/11/27 | 2,000 | 1,711 |
| 1 Democratic Socialist Republic of Sri Lanka | 6.750% | 4/18/28 | 1,050 | 919 |
| Total Sri Lanka (Cost $10,869) | 9,849 | |||
| Supranational (0.3%) | ||||
| Sovereign Bonds (0.3%) | ||||
| 1 Africa Finance Corp. | 4.375% | 4/29/20 | 750 | 748 |
| 1 Africa Finance Corp. | 3.875% | 4/13/24 | 500 | 473 |
| African Export-Import Bank | 4.000% | 5/24/21 | 900 | 890 |
| African Export-Import Bank | 4.125% | 6/20/24 | 750 | 715 |
| 1 Arab Petroleum Investments Corp. | 4.125% | 9/18/23 | 600 | 600 |
| Total Supranational (Cost $3,525) | 3,426 | |||
| Suriname (0.0%) | ||||
| Sovereign Bond (0.0%) | ||||
| 2 Republic of Suriname | 9.250% | 10/26/26 | 300 | 294 |
| Total Suriname (Cost $308) | 294 | |||
| Tajikistan (0.0%) | ||||
| Sovereign Bond (0.0%) | ||||
| 2 Republic of Tajikistan | 7.125% | 9/14/27 | 500 | 446 |
| Total Tajikistan (Cost $451) | 446 | |||
| Thailand (0.1%) | ||||
| Sovereign Bonds (0.1%) | ||||
| 2 Krung Thai Bank PCL | 5.200% | 12/26/24 | 650 | 655 |
| PTT Public Co. Ltd. | 4.500% | 10/25/42 | 400 | 366 |
| Total Thailand (Cost $1,025) | 1,021 | |||
| Trinidad And Tobago (0.2%) | ||||
| Sovereign Bonds (0.2%) | ||||
| 1 Republic of Trinidad & Tobago | 4.375% | 1/16/24 | 400 | 384 |
| Republic of Trinidad & Tobago | 4.500% | 8/4/26 | 1,300 | 1,199 |
| 2 Trinidad Generation UnLtd | 5.250% | 11/4/27 | 600 | 566 |
| Total Trinidad And Tobago (Cost $2,291) | 2,149 | |||
| Tunisia (0.1%) | ||||
| Sovereign Bond (0.1%) | ||||
| Banque Centrale de Tunisie SA | 5.750% | 1/30/25 | 2,100 | 1,779 |
| Total Tunisia (Cost $2,005) | 1,779 | |||
| Turkey (4.3%) | ||||
| Sovereign Bonds (4.3%) | ||||
| Export Credit Bank of Turkey | 5.375% | 2/8/21 | 200 | 189 |
| 1 Export Credit Bank of Turkey | 5.375% | 2/8/21 | 500 | 474 |
| 1 Export Credit Bank of Turkey | 5.000% | 9/23/21 | 400 | 371 |
| 1 Export Credit Bank of Turkey | 4.250% | 9/18/22 | 500 | 435 |
| 1 Export Credit Bank of Turkey | 6.125% | 5/3/24 | 900 | 808 |
| Hazine Mustesarligi Varlik Kiralama AS | 4.251% | 6/8/21 | 1,250 | 1,178 |
| Hazine Mustesarligi Varlik Kiralama AS | 5.004% | 4/6/23 | 500 | 464 |
| 1 Hazine Mustesarligi Varlik Kiralama AS | 4.489% | 11/25/24 | 800 | 698 |
| Republic of Turkey | 7.500% | 11/7/19 | 1,416 | 1,434 |
| Republic of Turkey | 7.000% | 6/5/20 | 2,730 | 2,751 |
32
| Emerging Markets Government Bond Index Fund | |||||
| Face | Market | ||||
| Maturity | Amount | Value • | |||
| Coupon | Date | ($000) | ($000) | ||
| Republic of Turkey | 5.625% | 3/30/21 | 1,901 | 1,853 | |
| Republic of Turkey | 5.125% | 3/25/22 | 1,925 | 1,812 | |
| Republic of Turkey | 6.250% | 9/26/22 | 2,554 | 2,474 | |
| Republic of Turkey | 3.250% | 3/23/23 | 1,801 | 1,544 | |
| Republic of Turkey | 7.250% | 12/23/23 | 2,000 | 1,981 | |
| Republic of Turkey | 5.750% | 3/22/24 | 2,550 | 2,378 | |
| Republic of Turkey | 7.375% | 2/5/25 | 2,800 | 2,779 | |
| Republic of Turkey | 4.250% | 4/14/26 | 2,750 | 2,265 | |
| Republic of Turkey | 4.875% | 10/9/26 | 3,300 | 2,793 | |
| Republic of Turkey | 6.000% | 3/25/27 | 2,950 | 2,662 | |
| Republic of Turkey | 5.125% | 2/17/28 | 900 | 765 | |
| Republic of Turkey | 6.125% | 10/24/28 | 900 | 810 | |
| Republic of Turkey | 8.000% | 2/14/34 | 2,390 | 2,375 | |
| Republic of Turkey | 6.875% | 3/17/36 | 3,998 | 3,558 | |
| Republic of Turkey | 6.750% | 5/30/40 | 2,410 | 2,094 | |
| Republic of Turkey | 6.000% | 1/14/41 | 3,580 | 2,842 | |
| Republic of Turkey | 4.875% | 4/16/43 | 4,119 | 2,930 | |
| Republic of Turkey | 6.625% | 2/17/45 | 850 | 719 | |
| Republic of Turkey | 5.750% | 5/11/47 | 4,550 | 3,458 | |
| 1 | TC Ziraat Bankasi AS | 4.750% | 4/29/21 | 800 | 730 |
| TC Ziraat Bankasi AS | 5.125% | 5/3/22 | 900 | 797 | |
| Turkiye Halk Bankasi AS | 3.875% | 2/5/20 | 800 | 717 | |
| 1 | Turkiye Halk Bankasi AS | 3.875% | 2/5/20 | 400 | 359 |
| Turkiye Halk Bankasi AS | 4.750% | 2/11/21 | 700 | 594 | |
| Turkiye Halk Bankasi AS | 5.000% | 7/13/21 | 200 | 169 | |
| 1 | Turkiye Halk Bankasi AS | 5.000% | 7/13/21 | 500 | 424 |
| 1 | Turkiye Vakiflar Bankasi TAO | 5.625% | 5/30/22 | 500 | 440 |
| Turkiye Vakiflar Bankasi TAO | 6.000% | 11/1/22 | 200 | 163 | |
| 2 | Turkiye Vakiflar Bankasi TAO | 6.875% | 2/3/25 | 600 | 493 |
| 2 | Turkiye Vakiflar Bankasi TAO | 8.000% | 11/1/27 | 1,000 | 774 |
| Total Turkey (Cost $65,044) | 56,554 | ||||
| Ukraine (1.3%) | |||||
| Sovereign Bonds (1.3%) | |||||
| 2 | Oschadbank Via SSB #1 plc | 9.625% | 3/20/25 | 1,000 | 992 |
| 1 | Oschadbank Via SSB #1 plc | 9.625% | 3/20/25 | 200 | 198 |
| 1 | Ukraine | 7.750% | 9/1/20 | 378 | 376 |
| Ukraine | 7.750% | 9/1/20 | 600 | 597 | |
| 1 | Ukraine | 7.750% | 9/1/21 | 907 | 892 |
| Ukraine | 7.750% | 9/1/21 | 340 | 334 | |
| Ukraine | 7.750% | 9/1/22 | 1,750 | 1,697 | |
| Ukraine | 7.750% | 9/1/23 | 1,300 | 1,238 | |
| 1 | Ukraine | 8.994% | 2/1/24 | 700 | 700 |
| Ukraine | 7.750% | 9/1/24 | 1,750 | 1,644 | |
| Ukraine | 7.750% | 9/1/25 | 250 | 230 | |
| Ukraine | 7.750% | 9/1/26 | 2,050 | 1,853 | |
| Ukraine | 7.750% | 9/1/27 | 800 | 714 | |
| 1 | Ukraine | 9.750% | 11/1/28 | 1,200 | 1,200 |
| 1,2 | Ukraine | 7.375% | 9/25/32 | 2,900 | 2,418 |
| 2 | Ukraine Government International Bond | 7.375% | 9/25/32 | 250 | 208 |
| 1,2 | Ukraine Railways Via Shortline plc | 9.875% | 9/15/21 | 200 | 200 |
| 2 | Ukreximbank Via Biz Finance PLC | 9.625% | 4/27/22 | 350 | 353 |
| 1,2 | Ukreximbank Via Biz Finance plc | 9.750% | 1/22/25 | 200 | 198 |
| 2 | Ukreximbank Via Biz Finance plc | 9.750% | 1/22/25 | 700 | 696 |
| Total Ukraine (Cost $17,209) | 16,738 | ||||
33
| Emerging Markets Government Bond Index Fund | |||||
| Face | Market | ||||
| Maturity | Amount | Value • | |||
| Coupon | Date | ($000) | ($000) | ||
| United Arab Emirates (4.8%) | |||||
| Corporate Bonds (0.1%) | |||||
| First Gulf Bank PJSC | 2.625% | 2/24/20 | 900 | 888 | |
| 888 | |||||
| Sovereign Bonds (4.7%) | |||||
| 1 | Abu Dhabi Crude Oil Pipeline LLC | 3.650% | 11/2/29 | 800 | 740 |
| 1,2 | Abu Dhabi Crude Oil Pipeline LLC | 4.600% | 11/2/47 | 2,250 | 2,126 |
| Abu Dhabi National Energy Co. PJSC | 3.625% | 6/22/21 | 1,450 | 1,443 | |
| Abu Dhabi National Energy Co. PJSC | 5.875% | 12/13/21 | 780 | 825 | |
| 1 | Abu Dhabi National Energy Co. PJSC | 5.875% | 12/13/21 | 200 | 212 |
| Abu Dhabi National Energy Co. PJSC | 3.625% | 1/12/23 | 200 | 195 | |
| 1 | Abu Dhabi National Energy Co. PJSC | 3.625% | 1/12/23 | 2,500 | 2,438 |
| Abu Dhabi National Energy Co. PJSC | 3.875% | 5/6/24 | 850 | 828 | |
| 1 | Abu Dhabi National Energy Co. PJSC | 4.375% | 6/22/26 | 1,000 | 977 |
| 1 | Abu Dhabi National Energy Co. PJSC | 4.875% | 4/23/30 | 1,000 | 991 |
| 1 | Abu Dhabi National Energy Co. PJSC | 6.500% | 10/27/36 | 425 | 503 |
| ADCB Finance Cayman Ltd. | 2.625% | 3/10/20 | 2,000 | 1,966 | |
| ADCB Finance Cayman Ltd. | 4.500% | 3/6/23 | 425 | 425 | |
| 1 | DAE Funding LLC | 4.000% | 8/1/20 | 515 | 511 |
| 1 | DAE Funding LLC | 4.500% | 8/1/22 | 800 | 782 |
| 1 | DAE Funding LLC | 5.000% | 8/1/24 | 1,000 | 970 |
| 1 | Dolphin Energy Ltd. | 5.500% | 12/15/21 | 820 | 859 |
| DP World Crescent Ltd. | 3.908% | 5/31/23 | 1,000 | 983 | |
| 1 | DP World Crescent Ltd. | 4.848% | 9/26/28 | 1,000 | 977 |
| DP World Ltd. | 3.250% | 5/18/20 | 1,250 | 1,243 | |
| 1 | DP World Ltd. | 6.850% | 7/2/37 | 1,540 | 1,714 |
| 1 | DP World Ltd. | 5.625% | 9/25/48 | 1,000 | 943 |
| Dubai DOF Sukuk Ltd. | 6.450% | 5/2/22 | 200 | 215 | |
| 1 | Dubai Electricity & Water Authority | 7.375% | 10/21/20 | 1,975 | 2,111 |
| Emirate of Abu Dhabi | 2.125% | 5/3/21 | 2,065 | 1,997 | |
| 1 | Emirate of Abu Dhabi | 2.500% | 10/11/22 | 500 | 479 |
| Emirate of Abu Dhabi | 2.500% | 10/11/22 | 1,650 | 1,581 | |
| 1 | Emirate of Abu Dhabi | 3.125% | 5/3/26 | 1,400 | 1,323 |
| Emirate of Abu Dhabi | 3.125% | 5/3/26 | 2,107 | 1,991 | |
| 1 | Emirate of Abu Dhabi | 3.125% | 10/11/27 | 4,250 | 3,949 |
| Emirate of Abu Dhabi | 3.125% | 10/11/27 | 800 | 742 | |
| 1 | Emirate of Abu Dhabi | 4.125% | 10/11/47 | 3,500 | 3,236 |
| Emirate of Abu Dhabi | 4.125% | 10/11/47 | 700 | 647 | |
| Emirate of Dubai | 7.750% | 10/5/20 | 1,200 | 1,290 | |
| Emirate of Dubai | 3.875% | 1/30/23 | 1,100 | 1,088 | |
| Emirate of Dubai | 5.250% | 1/30/43 | 200 | 194 | |
| 1,2 | Emirates Airline | 4.500% | 2/6/25 | 842 | 828 |
| Emirates NBD PJSC | 3.250% | 11/19/19 | 935 | 931 | |
| Emirates Telecommunications Group Co. | |||||
| PJSC | 3.500% | 6/18/24 | 300 | 292 | |
| First Abu Dhabi Bank PJSC | 2.250% | 2/11/20 | 1,475 | 1,449 | |
| ICD Sukuk Co. Ltd. | 3.508% | 5/21/20 | 250 | 247 | |
| ICD Sukuk Co. Ltd. | 5.000% | 2/1/27 | 1,100 | 1,082 | |
| 1 | IPIC GMTN Ltd. | 5.000% | 11/15/20 | 1,400 | 1,438 |
| IPIC GMTN Ltd. | 5.000% | 11/15/20 | 250 | 257 | |
| 1 | IPIC GMTN Ltd. | 5.500% | 3/1/22 | 1,710 | 1,800 |
| 1 | IPIC GMTN Ltd. | 6.875% | 11/1/41 | 800 | 1,050 |
| 1 | MDC-GMTN BV | 5.500% | 4/20/21 | 450 | 471 |
| MDC-GMTN BV | 3.250% | 4/28/22 | 700 | 690 | |
34
| Emerging Markets Government Bond Index Fund | |||||
| Face | Market | ||||
| Maturity | Amount | Value • | |||
| Coupon | Date | ($000) | ($000) | ||
| 1 | MDC-GMTN BV | 3.250% | 4/28/22 | 200 | 197 |
| MDC-GMTN BV | 2.750% | 5/11/23 | 450 | 426 | |
| MDC-GMTN BV | 3.000% | 4/19/24 | 1,600 | 1,510 | |
| 2 | Medjool Ltd. | 3.875% | 3/19/23 | 171 | 167 |
| Noor Sukuk Co. Ltd. | 2.788% | 4/28/20 | 350 | 344 | |
| 1 | Oztel Holdings SPC Ltd. | 5.625% | 10/24/23 | 600 | 600 |
| 1 | Oztel Holdings SPC Ltd. | 6.625% | 4/24/28 | 900 | 884 |
| RAK Capital | 3.094% | 3/31/25 | 700 | 657 | |
| 2 | Ruwais Power Co. PJSC | 6.000% | 8/31/36 | 600 | 654 |
| Sharjah Sukuk 2 Ltd. | 3.839% | 1/27/21 | 700 | 699 | |
| Sharjah Sukuk Ltd. | 3.764% | 9/17/24 | 400 | 393 | |
| Sharjah Sukuk Program Ltd. | 4.226% | 3/14/28 | 700 | 686 | |
| Union National Bank PJSC | 4.000% | 3/13/23 | 900 | 889 | |
| 62,135 | |||||
| Total United Arab Emirates (Cost $64,995) | 63,023 | ||||
| United States (0.0%) | |||||
| U. S. Government and Agency Obligations (0.0%) | |||||
| United States Treasury Note/Bond | 2.875% | 10/31/20 | 530 | 530 | |
| Total United States (Cost $530) | 530 | ||||
| Uruguay (1.0%) | |||||
| Sovereign Bonds (1.0%) | |||||
| 2 | Oriental Republic of Uruguay | 8.000% | 11/18/22 | 348 | 391 |
| 2 | Oriental Republic of Uruguay | 4.500% | 8/14/24 | 1,689 | 1,712 |
| 2 | Oriental Republic of Uruguay | 4.375% | 10/27/27 | 2,305 | 2,279 |
| Oriental Republic of Uruguay | 7.875% | 1/15/33 | 546 | 713 | |
| 2 | Oriental Republic of Uruguay | 7.625% | 3/21/36 | 1,276 | 1,646 |
| 2 | Oriental Republic of Uruguay | 4.125% | 11/20/45 | 850 | 737 |
| 2 | Oriental Republic of Uruguay | 5.100% | 6/18/50 | 4,575 | 4,329 |
| 2 | Oriental Republic of Uruguay | 4.975% | 4/20/55 | 850 | 782 |
| Total Uruguay (Cost $12,787) | 12,589 | ||||
| Venezuela (0.7%) | |||||
| Sovereign Bonds (0.7%) | |||||
| 8 | Bolivarian Republic of Venezuela | 6.000% | 12/9/20 | 1,156 | 283 |
| 2,8 | Bolivarian Republic of Venezuela | 12.750% | 8/23/22 | 3,355 | 855 |
| 8 | Bolivarian Republic of Venezuela | 9.000% | 5/7/23 | 1,432 | 360 |
| 8 | Bolivarian Republic of Venezuela | 8.250% | 10/13/24 | 2,829 | 707 |
| 8 | Bolivarian Republic of Venezuela | 7.650% | 4/21/25 | 2,392 | 598 |
| 8 | Bolivarian Republic of Venezuela | 11.750% | 10/21/26 | 2,227 | 568 |
| 8 | Bolivarian Republic of Venezuela | 9.250% | 9/15/27 | 3,226 | 806 |
| 8 | Bolivarian Republic of Venezuela | 9.250% | 5/7/28 | 940 | 235 |
| 2,8 | Bolivarian Republic of Venezuela | 11.950% | 8/5/31 | 4,429 | 1,118 |
| 8 | Bolivarian Republic of Venezuela | 9.375% | 1/13/34 | 1,900 | 549 |
| 8 | Bolivarian Republic of Venezuela | 7.000% | 3/31/38 | 1,375 | 337 |
| 1 | CITGO Holding Inc. | 10.750% | 2/15/20 | 1,720 | 1,789 |
| 1 | CITGO Petroleum Corp. | 6.250% | 8/15/22 | 535 | 526 |
| CITGO Petroleum Corp. | 6.250% | 8/15/22 | 100 | 99 | |
| Total Venezuela (Cost $15,496) | 8,830 | ||||
35
| Emerging Markets Government Bond Index Fund | |||||
| Face | Market | ||||
| Maturity | Amount | Value • | |||
| Coupon | Date | ($000) | ($000) | ||
| Vietnam (0.2%) | |||||
| Sovereign Bonds (0.2%) | |||||
| Socialist Republic of Vietnam | 6.750% | 1/29/20 | 709 | 730 | |
| Socialist Republic of Vietnam | 4.800% | 11/19/24 | 1,275 | 1,285 | |
| Total Vietnam (Cost $2,033) | 2,015 | ||||
| Zambia (0.2%) | |||||
| Sovereign Bonds (0.2%) | |||||
| Republic of Zambia | 5.375% | 9/20/22 | 725 | 487 | |
| 1 | Republic of Zambia | 8.500% | 4/14/24 | 450 | 305 |
| Republic of Zambia | 8.500% | 4/14/24 | 1,000 | 683 | |
| 2 | Republic of Zambia | 8.970% | 7/30/27 | 1,100 | 745 |
| Total Zambia (Cost $3,142) | 2,220 | ||||
| Shares | |||||
| Temporary Cash Investments (0.6%) | |||||
| Money Market Fund (0.6%) | |||||
| 12 | Vanguard Market Liquidity Fund | ||||
| (Cost $8,279) | 2.308% | 82,794 | 8,279 | ||
| Total Temporary Cash Investments (Cost $8,279) | 8,279 | ||||
| Total Investments (99.4%) (Cost $1,375,534) | 1,309,980 | ||||
| Amount | |||||
| ($000) | |||||
| Other Assets and Liabilities (0.6%) | |||||
| Other Assets | |||||
| Investment in Vanguard | 66 | ||||
| Receivables for Investment Securities Sold | 6,442 | ||||
| Receivables for Accrued Income | 16,174 | ||||
| Receivables for Capital Shares Issued | 661 | ||||
| Variation Margin Receivable—Futures Contracts | 68 | ||||
| Other Assets13 | 109 | ||||
| Total Other Assets | 23,520 | ||||
| Liabilities | |||||
| Payables for Investment Securities Purchased | (13,671) | ||||
| Payables for Capital Shares Redeemed | (304) | ||||
| Payables for Distributions | (179) | ||||
| Payables to Vanguard | (353) | ||||
| Variation Margin Payable—Futures Contracts | (48) | ||||
| Other Liabilities | (564) | ||||
| Total Liabilities | (15,119) | ||||
| Net Assets (100%) | 1,318,381 | ||||
36
| Emerging Markets Government Bond Index Fund | |
| At October 31, 2018, net assets consisted of: | |
| Amount | |
| ($000) | |
| Paid-in Capital | 1,389,896 |
| Total Distributable Earnings (Loss) | (71,515) |
| Net Assets | 1,318,381 |
| Investor Shares—Net Assets | |
| Applicable to 1,074,730 outstanding $.001 par value shares of | |
| beneficial interest (unlimited authorization) | 10,008 |
| Net Asset Value Per Share—Investor Shares | $9.31 |
| ETF Shares—Net Assets | |
| Applicable to 13,915,368 outstanding $.001 par value shares of | |
| beneficial interest (unlimited authorization) | 1,033,493 |
| Net Asset Value Per Share—ETF Shares | $74.27 |
| Admiral Shares—Net Assets | |
| Applicable to 13,718,838 outstanding $.001 par value shares of | |
| beneficial interest (unlimited authorization) | 255,521 |
| Net Asset Value Per Share—Admiral Shares | $18.63 |
| Institutional Shares—Net Assets | |
| Applicable to 647,986 outstanding $.001 par value shares of | |
| beneficial interest (unlimited authorization) | 19,359 |
| Net Asset Value Per Share—Institutional Shares | $29.88 |
• See Note A in Notes to Financial Statements.
1 Security exempt from registration under Rule 144A of the Securities Act of 1933. Such securities may be sold in transactions
exempt from registration, normally to qualified institutional buyers. At October 31, 2018, the aggregate value of these securities
was $232,942,000, representing 17.7% of net assets.
2 The average or expected maturity is shorter than the final maturity shown because of the possibility of interim principal payments
and prepayments or the possibility of the issue being called.
3 Guaranteed by the Republic of Azerbaijan.
4 Adjustable-rate security based upon 3-month USD LIBOR plus spread.
5 Guaranteed by the Republic of Hungary.
6 Guaranteed by the Republic of Indonesia.
7 Guaranteed by the Government of Mongolia.
8 Non-income-producing security--security in default.
9 Guaranteed by the Republic of the Philippines.
10 Guaranteed by the Kingdom of Saudi Arabia.
11 Guaranteed by the Republic of South Africa.
12 Affiliated money market fund available only to Vanguard funds and certain trusts and accounts managed by Vanguard. Rate shown
is the 7-day yield.
13 Cash of $109,000 has been segregated as initial margin for open futures contracts.
37
| Emerging Markets Government Bond Index Fund | ||||
| Derivative Financial Instruments Outstanding as of Period End | ||||
| Futures Contracts | ||||
| ($000) | ||||
| Value and | ||||
| Number of | Unrealized | |||
| Long (Short) | Notional | Appreciation | ||
| Expiration | Contracts | Amount | (Depreciation) | |
| Long Futures Contracts | ||||
| Ultra 10-Year U. S. Treasury Note | December 2018 | 90 | 11,260 | (181) |
| 5-Year U. S. Treasury Note | December 2018 | 96 | 10,789 | (66) |
| (247) | ||||
| Short Futures Contracts | ||||
| 10-Year U. S. Treasury Note | December 2018 | (133) | (15,752) | 189 |
| 2-Year U. S. Treasury Note | December 2018 | (36) | (7,584) | 22 |
| Ultra Long U. S. Treasury Bond | December 2018 | (14) | (2,089) | 92 |
| 30-Year U.S. Treasury Bond | December 2018 | (1) | (138) | 6 |
| 309 | ||||
| 62 | ||||
See accompanying Notes, which are an integral part of the Financial Statements.
38
| Emerging Markets Government Bond Index Fund | |
| Statement of Operations | |
| Year Ended | |
| October 31, 2018 | |
| ($000) | |
| Investment Income | |
| Income | |
| Interest1 | 61,773 |
| Total Income | 61,773 |
| Expenses | |
| The Vanguard Group—Note B | |
| Investment Advisory Services | 40 |
| Management and Administrative—Investor Shares | 44 |
| Management and Administrative—ETF Shares | 2,796 |
| Management and Administrative—Admiral Shares | 751 |
| Management and Administrative—Institutional Shares | 54 |
| Marketing and Distribution—Investor Shares | 3 |
| Marketing and Distribution—ETF Shares | 54 |
| Marketing and Distribution—Admiral Shares | 21 |
| Marketing and Distribution—Institutional Shares | — |
| Custodian Fees | 76 |
| Auditing Fees | 49 |
| Shareholders’ Reports and Proxy—Investor Shares | 11 |
| Shareholders’ Reports and Proxy—ETF Shares | 36 |
| Shareholders’ Reports and Proxy—Admiral Shares | 5 |
| Shareholders’ Reports and Proxy—Institutional Shares | — |
| Trustees’ Fees and Expenses | 1 |
| Total Expenses | 3,941 |
| Net Investment Income | 57,832 |
| Realized Net Gain (Loss) | |
| Investment Securities Sold1,2 | (6,522) |
| Futures Contracts | (76) |
| Realized Net Gain (Loss) | (6,598) |
| Change in Unrealized Appreciation (Depreciation) | |
| Investment Securities1 | (103,517) |
| Futures Contracts | 62 |
| Change in Unrealized Appreciation (Depreciation) | (103,455) |
| Net Increase (Decrease) in Net Assets Resulting from Operations | (52,221) |
1 Interest income, realized net gain (loss), and change in unrealized appreciation (depreciation) from affiliated companies of the fund
were $81,000, $1,000, and ($1,000), respectively. Purchases and sales are for temporary cash investment purposes.
2 Includes $1,157,000 of net gain (loss) resulting from in-kind redemptions; such gain (loss) is not taxable to the fund.
See accompanying Notes, which are an integral part of the Financial Statements.
39
| Emerging Markets Government Bond Index Fund | ||
| Statement of Changes in Net Assets | ||
| Year Ended October 31, | ||
| 2018 | 2017 | |
| ($000) | ($000) | |
| Increase (Decrease) in Net Assets | ||
| Operations | ||
| Net Investment Income | 57,832 | 57,245 |
| Realized Net Gain (Loss) | (6,598) | 6,795 |
| Change in Unrealized Appreciation (Depreciation) | (103,455) | 4,599 |
| Net Increase (Decrease) in Net Assets Resulting from Operations | (52,221) | 68,639 |
| Distributions | ||
| Net Investment Income | ||
| Investor Shares | (489) | (597) |
| ETF Shares | (44,359) | (44,292) |
| Admiral Shares | (11,882) | (10,905) |
| Institutional Shares | (869) | (933) |
| Realized Capital Gain | ||
| Investor Shares | — | — |
| ETF Shares | — | — |
| Admiral Shares | — | — |
| Institutional Shares | — | — |
| Total Distributions | (57,599) | (56,727) |
| Capital Share Transactions | ||
| Investor Shares | (1,826) | 890 |
| ETF Shares | 115,604 | 118,819 |
| Admiral Shares | (9,200) | 94,634 |
| Institutional Shares | 879 | (1,051) |
| Net Increase (Decrease) from Capital Share Transactions | 105,457 | 213,292 |
| Total Increase (Decrease) | (4,363) | 225,204 |
| Net Assets | ||
| Beginning of Period | 1,322,744 | 1,097,540 |
| End of Period | 1,318,381 | 1,322,744 |
See accompanying Notes, which are an integral part of the Financial Statements.
40
| Emerging Markets Government Bond Index Fund | |||||
| Financial Highlights | |||||
| Investor Shares | |||||
| For a Share Outstanding | Year Ended October 31, | ||||
| Throughout Each Period | 2018 | 2017 | 2016 | 2015 | 2014 |
| Net Asset Value, Beginning of Period | $10.12 | $10.04 | $9.50 | $9.95 | $9.74 |
| Investment Operations | |||||
| Net Investment Income | . 4101 | .4501 | .454 | .427 | .417 |
| Net Realized and Unrealized Gain (Loss) | |||||
| on Investments 2 | (. 812) | . 082 | . 533 | (. 447) | . 213 |
| Total from Investment Operations | (. 402) | . 532 | . 987 | (. 020) | . 630 |
| Distributions | |||||
| Dividends from Net Investment Income | (. 408) | (. 452) | (. 447) | (. 430) | (. 420) |
| Distributions from Realized Capital Gains | — | — | — | — | — |
| Total Distributions | (. 408) | (. 452) | (. 447) | (. 430) | (. 420) |
| Net Asset Value, End of Period | $9.31 | $10.12 | $10.04 | $9.50 | $9.95 |
| Total Return3 | -4.05% | 5.46% | 10.65% | -0.16% | 6.62% |
| Ratios/Supplemental Data | |||||
| Net Assets, End of Period (Millions) | $10 | $13 | $12 | $9 | $7 |
| Ratio of Total Expenses to Average Net Assets | 0.49% | 0.49% | 0.49% | 0.49% | 0.49% |
| Ratio of Net Investment Income to | |||||
| Average Net Assets | 4.23% | 4.50% | 4.72% | 4.52% | 4.35% |
| Portfolio Turnover Rate 4 | 25% | 19% | 24% | 20% | 27% |
1 Calculated based on average shares outstanding.
2 Includes increases from purchase fees of $.01, $.01, $.01, $.01, and $.00.
3 Total returns do not include transaction or account service fees that may have applied in the periods shown. Fund prospectuses provide
information about any applicable transaction and account service fees.
4 Excludes the value of portfolio securities received or delivered as a result of in-kind purchases or redemptions of the fund’s capital
shares, including ETF Creation Units.
See accompanying Notes, which are an integral part of the Financial Statements.
41
| Emerging Markets Government Bond Index Fund | |||||
| Financial Highlights | |||||
| ETF Shares | |||||
| For a Share Outstanding | Year Ended October 31, | ||||
| Throughout Each Period | 2018 | 2017 | 2016 | 2015 | 2014 |
| Net Asset Value, Beginning of Period | $80.73 | $80.11 | $75.81 | $79.40 | $77.71 |
| Investment Operations | |||||
| Net Investment Income | 3.4111 | 3.7131 | 3.753 | 3.516 | 3.429 |
| Net Realized and Unrealized Gain (Loss) | |||||
| on Investments 2 | (6.445) | .589 | 4.228 | (3.556) | 1.700 |
| Total from Investment Operations | (3.034) | 4.302 | 7.981 | (.040) | 5.129 |
| Distributions | |||||
| Dividends from Net Investment Income | (3.426) | (3.682) | (3.681) | (3.550) | (3.439) |
| Distributions from Realized Capital Gains | — | — | — | — | — |
| Total Distributions | (3.426) | (3.682) | (3.681) | (3.550) | (3.439) |
| Net Asset Value, End of Period | $74.27 | $80.73 | $80.11 | $75.81 | $79.40 |
| Total Return | -3.84% | 5.56% | 10.84% | -0.01% | 6.79% |
| Ratios/Supplemental Data | |||||
| Net Assets, End of Period (Millions) | $1,033 | $1,002 | $874 | $501 | $222 |
| Ratio of Total Expenses to Average Net Assets | 0.30% | 0.32% | 0.32% | 0.34% | 0.34% |
| Ratio of Net Investment Income to | |||||
| Average Net Assets | 4.42% | 4.67% | 4.89% | 4.67% | 4.50% |
| Portfolio Turnover Rate 3 | 25% | 19% | 24% | 20% | 27% |
1 Calculated based on average shares outstanding.
2 Includes increases from purchase fees of $.04, $.07, $.04, $.06 and $.01.
3 Excludes the value of portfolio securities received or delivered as a result of in-kind purchases or redemptions of the fund’s capital
shares, including ETF Creation Units.
See accompanying Notes, which are an integral part of the Financial Statements.
42
| Emerging Markets Government Bond Index Fund | |||||
| Financial Highlights | |||||
| Admiral Shares | |||||
| For a Share Outstanding | Year Ended October 31, | ||||
| Throughout Each Period | 2018 | 2017 | 2016 | 2015 | 2014 |
| Net Asset Value, Beginning of Period | $20.24 | $20.09 | $19.00 | $19.90 | $19.48 |
| Investment Operations | |||||
| Net Investment Income | . 8581 | .9341 | .941 | .885 | .863 |
| Net Realized and Unrealized Gain (Loss) | |||||
| on Investments 2 | (1.613) | .150 | 1.076 | (.894) | .427 |
| Total from Investment Operations | (.755) | 1.084 | 2.017 | (.009) | 1.290 |
| Distributions | |||||
| Dividends from Net Investment Income | (. 855) | (. 934) | (. 927) | (. 891) | (. 870) |
| Distributions from Realized Capital Gains | — | — | — | — | — |
| Total Distributions | (. 855) | (. 934) | (. 927) | (. 891) | (. 870) |
| Net Asset Value, End of Period | $18.63 | $20.24 | $20.09 | $19.00 | $19.90 |
| Total Return3 | -3.80% | 5.57% | 10.89% | 0% | 6.78% |
| Ratios/Supplemental Data | |||||
| Net Assets, End of Period (Millions) | $256 | $288 | $191 | $131 | $118 |
| Ratio of Total Expenses to Average Net Assets | 0.30% | 0.32% | 0.32% | 0.33% | 0.34% |
| Ratio of Net Investment Income to | |||||
| Average Net Assets | 4.42% | 4.67% | 4.89% | 4.68% | 4.50% |
| Portfolio Turnover Rate 4 | 25% | 19% | 24% | 20% | 27% |
1 Calculated based on average shares outstanding.
2 Includes increases from purchase fees of $.01, $.02, $.01, $.02, and $.00.
3 Total returns do not include transaction or account service fees that may have applied in the periods shown. Fund prospectuses provide
information about any applicable transaction and account service fees.
4 Excludes the value of portfolio securities received or delivered as a result of in-kind purchases or redemptions of the fund’s capital
shares, including ETF Creation Units.
See accompanying Notes, which are an integral part of the Financial Statements.
43
| Emerging Markets Government Bond Index Fund | |||||
| Financial Highlights | |||||
| Institutional Shares | |||||
| Feb. 11, | Nov. 25, | ||||
| 20151, to | 20141 to | ||||
| For a Share Outstanding | Year Ended October 31, | Oct. 31, | Dec. 18, | ||
| Throughout Each Period | 2018 | 2017 | 2016 | 2015 | 2014 |
| Net Asset Value, Beginning of Period | $32.47 | $32.24 | $30.50 | $30.72 | $31.53 |
| Investment Operations | |||||
| Net Investment Income | 1.380 2 | 1.5082 | 1.521 | 1.019 | .108 |
| Net Realized and Unrealized Gain (Loss) | |||||
| on Investments 3 | (2.596) | .238 | 1.715 | (.159) | (1.240) |
| Total from Investment Operations | (1.216) | 1.746 | 3.236 | .860 | (1.132) |
| Distributions | |||||
| Dividends from Net Investment Income | (1.374) | (1.516) | (1.496) | (1.080) | (.108) |
| Distributions from Realized Capital Gains | — | — | — | — | — |
| Total Distributions | (1.374) | (1.516) | (1.496) | (1.080) | (.108) |
| Net Asset Value, End of Period | $29.88 | $32.47 | $32.24 | $30.50 | $30.29 |
| Total Return4 | -3.82% | 5.59% | 10.89% | 2.82% | -3.60% |
| Ratios/Supplemental Data | |||||
| Net Assets, End of Period (Millions) | $19 | $20 | $21 | $10 | $0 |
| Ratio of Total Expenses to Average Net Assets | 0.29% | 0.29% | 0.29% | 0.29% | 0.30% |
| Ratio of Net Investment Income to | |||||
| Average Net Assets | 4.43% | 4.70% | 4.92% | 4.75% | 4.72% |
| Portfolio Turnover Rate 5 | 25% | 19% | 24% | 20%6 | 20%6 |
1 The class commenced operations on November 25, 2014. On December 18, 2014, all outstanding shares were redeemed and the Net
Asset Value represents the per share amount at which such shares were redeemed. On February 11, 2015, the class recommenced
operations. The expense ratio and net income ratio for the periods shown have been annualized.
2 Calculated based on average shares outstanding.
3 Includes increases from purchase fees of $.02 for 2018, $.03 for 2017, $.02 for 2016, and $.04 in aggregate for periods prior to
November 1, 2015.
4 Total returns do not include transaction or account service fees that may have applied in the periods shown. Fund prospectuses provide
information about any applicable transaction and account service fees.
5 Excludes the value of portfolio securities received or delivered as a result of in-kind purchases or redemptions of the fund’s capital
shares, including ETF Creation Units.
6 Reflects the fund’s portfolio turnover for the fiscal year ended October 31, 2015.
See accompanying Notes, which are an integral part of the Financial Statements.
44
Emerging Markets Government Bond Index Fund
Notes to Financial Statements
Vanguard Emerging Markets Government Bond Index Fund is registered under the Investment Company Act of 1940 as an open-end investment company, or mutual fund. The fund invests in securities of foreign issuers, which may subject it to investment risks not normally associated with investing in securities of U.S. corporations. The fund offers four classes of shares: Investor Shares, ETF Shares, Admiral Shares, and Institutional Shares. Investor Shares are available to any investor who meets the fund’s minimum purchase requirements. ETF Shares are listed for trading on Nasdaq; they can be purchased and sold through a broker. Admiral Shares and Institutional Shares are designed for investors who meet certain administrative, service, and account-size criteria.
A. The following significant accounting policies conform to generally accepted accounting principles for U.S. investment companies. The fund consistently follows such policies in preparing its financial statements.
1. Security Valuation: Securities are valued as of the close of trading on the New York Stock Exchange (generally 4 p.m., Eastern time) on the valuation date. Bonds and temporary cash investments are valued using the latest bid prices or using valuations based on a matrix system (which considers such factors as security prices, yields, maturities, and ratings), both as furnished by independent pricing services. Investments in Vanguard Market Liquidity Fund are valued at that fund’s net asset value. Securities for which market quotations are not readily available, or whose values have been affected by events occurring before the fund’s pricing time but after the close of the securities’ primary markets, are valued at their fair values calculated according to procedures adopted by the board of trustees. These procedures include obtaining quotations from an independent pricing service, monitoring news to identify significant market- or security-specific events, and evaluating changes in the values of foreign market proxies (for example, ADRs, futures contracts, or exchange-traded funds), between the time the foreign markets close and the fund’s pricing time. When fair-value pricing is employed, the prices of securities used by a fund to calculate its net asset value may differ from quoted or published prices for the same securities.
2. Futures Contracts: The fund uses futures contracts to invest in fixed income asset classes with greater efficiency and lower cost than is possible through direct investment, to add value when these instruments are attractively priced, or to adjust sensitivity to changes in interest rates. The primary risks associated with the use of futures contracts are imperfect correlation between changes in market values of bonds held by the fund and the prices of futures contracts, and the possibility of an illiquid market. Counterparty risk involving futures is mitigated because a regulated clearinghouse is the counterparty instead of the clearing broker. To further mitigate counterparty risk, the fund trades futures contracts on an exchange, monitors the financial strength of its clearing brokers and clearinghouse, and has entered into clearing agreements with its clearing brokers. The clearinghouse imposes initial margin requirements to secure the fund’s performance and requires daily settlement of variation margin representing changes in the market value of each contract. Any assets pledged as initial margin for open contracts are noted in the Statement of Net Assets.
Futures contracts are valued at their quoted daily settlement prices. The notional amounts of the contracts are not recorded in the Statement of Net Assets. Fluctuations in the value of the contracts are recorded in the Statement of Net Assets as an asset (liability) and in the Statement of Operations as unrealized appreciation (depreciation) until the contracts are closed, when they are recorded as realized futures gains (losses).
45
Emerging Markets Government Bond Index Fund
During the year ended October 31, 2018, the fund’s average investments in long and short futures contracts each represented less than 1% of net assets, based on the average of the notional amounts at each quarter-end during the period.
3. Federal Income Taxes: The fund intends to continue to qualify as a regulated investment company and distribute all of its taxable income. Management has analyzed the fund’s tax positions taken for all open federal income tax years (October 31, 2015–2018), and has concluded that no provision for federal income tax is required in the fund’s financial statements.
4. Distributions: Distributions to shareholders are recorded on the ex-dividend date. Distributions are determined on a tax basis and may differ from net investment income and realized capital gains for financial reporting purposes.
5. Credit Facility: The fund and certain other funds managed by The Vanguard Group (“Vanguard”) participate in a $3.1 billion committed credit facility provided by a syndicate of lenders pursuant to a credit agreement that may be renewed annually; each fund is individually liable for its borrowings, if any, under the credit facility. Borrowings may be utilized for temporary and emergency purposes, and are subject to the fund’s regulatory and contractual borrowing restrictions. The participating funds are charged administrative fees and an annual commitment fee of 0.10% of the undrawn amount of the facility; these fees are allocated to the funds based on a method approved by the fund’s board of trustees and included in Management and Administrative expenses on the fund’s Statement of Operations. Any borrowings under this facility bear interest at a rate based upon the higher of the one-month London Interbank Offered Rate, federal funds effective rate, or overnight bank funding rate plus an agreed-upon spread.
The fund had no borrowings outstanding at October 31, 2018, or at any time during the period then ended.
6. Other: Interest income includes income distributions received from Vanguard Market Liquidity Fund and is accrued daily. Premiums and discounts on debt securities purchased are amortized and accreted, respectively, to interest income over the lives of the respective securities. Security transactions are accounted for on the date securities are bought or sold. Costs used to determine realized gains (losses) on the sale of investment securities are those of the specific securities sold. Fees assessed on capital share transactions are credited to paid-in capital.
Each class of shares has equal rights as to assets and earnings, except that each class separately bears certain class-specific expenses related to maintenance of shareholder accounts (included in Management and Administrative expenses), shareholder reporting, and the proxy. Marketing and distribution expenses are allocated to each class of shares based on a method approved by the board of trustees. Income, other non-class-specific expenses, and gains and losses on investments are allocated to each class of shares based on its relative net assets.
B. In accordance with the terms of a Funds’ Service Agreement (the “FSA”) between Vanguard and the fund, Vanguard furnishes to the fund investment advisory, corporate management, administrative, marketing, and distribution services at Vanguard’s cost of operations (as defined by the FSA). These costs of operations are allocated to the fund based on methods and guidelines approved by the board of trustees. Vanguard does not require reimbursement in the current period
46
Emerging Markets Government Bond Index Fund
for certain costs of operations (such as deferred compensation/benefits and risk/insurance costs); the fund’s liability for these costs of operations is included in Payables to Vanguard on the Statement of Net Assets. All other costs of operations payable to Vanguard are generally settled twice a month.
Upon the request of Vanguard, the fund may invest up to 0.40% of its net assets as capital in Vanguard. At October 31, 2018, the fund had contributed to Vanguard capital in the amount of $66,000, representing 0.01% of the fund’s net assets and 0.03% of Vanguard’s capitalization. The fund’s trustees and officers are also directors and employees, respectively, of Vanguard.
C. Various inputs may be used to determine the value of the fund’s investments. These inputs are summarized in three broad levels for financial statement purposes. The inputs or methodologies used to value securities are not necessarily an indication of the risk associated with investing in those securities.
Level 1—Quoted prices in active markets for identical securities.
Level 2—Other significant observable inputs (including quoted prices for similar securities, interest rates, prepayment speeds, credit risk, etc.).
Level 3—Significant unobservable inputs (including the fund’s own assumptions used to determine the fair value of investments). Any investments valued with significant unobservable inputs are noted on the Statement of Net Assets.
The following table summarizes the market value of the fund’s investments as of October 31, 2018, based on the inputs used to value them:
| Level 1 | Level 2 | Level 3 | |
| Investments | ($000) | ($000) | ($000) |
| Sovereign Bonds | — | 1,300,283 | — |
| Corporate Bonds | — | 888 | — |
| U.S. Government and Agency Obligations | — | 530 | — |
| Temporary Cash Investments | 8,279 | — | — |
| Futures Contracts—Assets1 | 68 | — | — |
| Futures Contracts—Liabilities1 | (48) | — | — |
| Total | 8,299 | 1,301,701 | — |
| 1 Represents variation margin on the last day of the reporting period. |
D. Permanent differences between book-basis and tax-basis components of net assets are reclassified among capital accounts in the financial statements to reflect their tax character. These reclassifications have no effect on net assets or net asset value per share. As of period end, the following permanent differences primarily attributable to the accounting for in-kind redemptions were reclassified to the following accounts:
| Amount | |
| ($000) | |
| Paid-in Capital | 1,095 |
| Total Distributable Earnings (Loss) | (1,095) |
47
Emerging Markets Government Bond Index Fund
Temporary differences between book-basis and tax-basis components of total distributable earnings (loss) arise when certain items of income, gain, or loss are recognized in different periods for financial statement and tax purposes; these differences will reverse at some time in the future. The differences are primarily related to the tax deferral of losses on wash sales, the realization of unrealized gains or losses on certain futures contracts, and payables for distributions. As of period end, the tax-basis components of total distributable earnings (loss) are detailed in the table as follows:
| Amount | |
| ($000) | |
| Undistributed Ordinary Income | 4,449 |
| Undistributed Long-Term Gains | — |
| Capital Loss Carryforwards (Non-expiring) | (10,065) |
| Net Unrealized Gains (Losses) | (65,554) |
As of October 31, 2018, gross unrealized appreciation and depreciation for investments and derivatives based on cost for U.S. federal income tax purposes were as follows:
| Amount | |
| ($000) | |
| Tax Cost | 1,375,534 |
| Gross Unrealized Appreciation | 8,801 |
| Gross Unrealized Depreciation | (74,355) |
| Net Unrealized Appreciation (Depreciation) | (65,554) |
E. During the year ended October 31, 2018, the fund purchased $390,215,000 of investment securities and sold $292,498,000 of investment securities, other than U.S. government securities and temporary cash investments. Purchases and sales of U.S. government securities were $54,241,000 and $53,695,000, respectively. Total purchases and sales include $122,639,000 and $23,559,000, respectively, in connection with in-kind purchases and redemptions of the fund’s capital shares.
48
Emerging Markets Government Bond Index Fund
| F. Capital share transactions for each class of shares were: | ||||
| Year Ended October 31, | ||||
| 2018 | 2017 | |||
| Amount | Shares | Amount | Shares | |
| ($000) | (000) | ($000) | (000) | |
| Investor Shares | ||||
| Issued1 | 5,198 | 528 | 8,929 | 892 |
| Issued in Lieu of Cash Distributions | 418 | 43 | 502 | 50 |
| Redeemed | (7,442) | (765) | (8,541) | (850) |
| Net Increase (Decrease)—Investor Shares | (1,826) | (194) | 890 | 92 |
| ETF Shares | ||||
| Issued1 | 139,633 | 1,801 | 206,684 | 2,608 |
| Issued in Lieu of Cash Distributions | — | — | — | — |
| Redeemed | (24,029) | (300) | (87,865) | (1,100) |
| Net Increase (Decrease)—ETF Shares | 115,604 | 1,501 | 118,819 | 1,508 |
| Admiral Shares | ||||
| Issued1 | 85,167 | 4,371 | 130,192 | 6,486 |
| Issued in Lieu of Cash Distributions | 9,869 | 510 | 9,143 | 457 |
| Redeemed | (104,236) | (5,368) | (44,701) | (2,245) |
| Net Increase (Decrease)—Admiral Shares | (9,200) | (487) | 94,634 | 4,698 |
| Institutional Shares | ||||
| Issued1 | — | — | — | — |
| Issued in Lieu of Cash Distributions | 879 | 28 | 949 | 29 |
| Redeemed | — | — | (2,000) | (64) |
| Net Increase (Decrease)—Institutional Shares | 879 | 28 | (1,051) | (35) |
1 Includes purchase fees for fiscal 2018 and 2017 of $686,000 and $1,024,000, respectively (fund totals).
G. Management has determined that no events or transactions occurred subsequent to October 31, 2018, that would require recognition or disclosure in these financial statements.
49
Report of Independent Registered Public Accounting Firm
To the Board of Trustees of Vanguard Whitehall Funds and Shareholders of Vanguard Emerging Markets Government Bond Index Fund
Opinion on the Financial Statements
We have audited the accompanying statement of net assets of Vanguard Emerging Markets Government Bond Index Fund (one of the funds constituting Vanguard Whitehall Funds, referred to hereafter as the “Fund”) as of October 31, 2018, the related statement of operations for the year ended October 31, 2018, the statement of changes in net assets for each of the two years in the period ended October 31, 2018, including the related notes, and the financial highlights for each of the periods indicated therein (collectively referred to as the “financial statements”). In our opinion, the financial statements present fairly, in all material respects, the financial position of the Fund as of October 31, 2018, the results of its operations for the year then ended, the changes in its net assets for each of the two years in the period ended October 31, 2018 and the financial highlights for each of the periods indicated therein in conformity with accounting principles generally accepted in the United States of America.
Basis for Opinion
These financial statements are the responsibility of the Fund’s management. Our responsibility is to express an opinion on the Fund’s financial statements based on our audits. We are a public accounting firm registered with the Public Company Accounting Oversight Board (United States) (“PCAOB”) and are required to be independent with respect to the Fund in accordance with the U.S. federal securities laws and the applicable rules and regulations of the Securities and Exchange Commission and the PCAOB.
We conducted our audits of these financial statements in accordance with the standards of the PCAOB. Those standards require that we plan and perform the audit to obtain reasonable assurance about whether the financial statements are free of material misstatement, whether due to error or fraud.
Our audits included performing procedures to assess the risks of material misstatement of the financial statements, whether due to error or fraud, and performing procedures that respond to those risks. Such procedures included examining, on a test basis, evidence regarding the amounts and disclosures in the financial statements. Our audits also included evaluating the accounting principles used and significant estimates made by management, as well as evaluating the overall presentation of the financial statements. Our procedures included confirmation of securities owned as of October 31, 2018 by correspondence with the custodians and brokers and by agreement to the underlying ownership records of the transfer agent; when replies were not received from brokers, we performed other auditing procedures. We believe that our audits provide a reasonable basis for our opinion.
/s/PricewaterhouseCoopers LLP
Philadelphia, Pennsylvania
December 13, 2018
We have served as the auditor of one or more investment companies in The Vanguard Group of Funds since 1975.
50
About Your Fund’s Expenses
As a shareholder of the fund, you incur ongoing costs, which include costs for portfolio management, administrative services, and shareholder reports (like this one), among others. Operating expenses, which are deducted from a fund’s gross income, directly reduce the investment return of the fund.
A fund’s expenses are expressed as a percentage of its average net assets. This figure is known as the expense ratio. The following examples are intended to help you understand the ongoing costs (in dollars) of investing in your fund and to compare these costs with those of other mutual funds. The examples are based on an investment of $1,000 made at the beginning of the period shown and held for the entire period.
The accompanying table illustrates your fund’s costs in two ways:
• Based on actual fund return. This section helps you to estimate the actual expenses that you paid over the period. The ”Ending Account Value“ shown is derived from the fund‘s actual return, and the third column shows the dollar amount that would have been paid by an investor who started with $1,000 in the fund. You may use the information here, together with the amount you invested, to estimate the expenses that you paid over the period.
To do so, simply divide your account value by $1,000 (for example, an $8,600 account value divided by $1,000 = 8.6), then multiply the result by the number given for your fund under the heading ”Expenses Paid During Period.“
• Based on hypothetical 5% yearly return. This section is intended to help you compare your fund‘s costs with those of other mutual funds. It assumes that the fund had a yearly return of 5% before expenses, but that the expense ratio is unchanged. In this case—because the return used is not the fund’s actual return—the results do not apply to your investment. The example is useful in making comparisons because the Securities and Exchange Commission requires all mutual funds to calculate expenses based on a 5% return. You can assess your fund’s costs by comparing this hypothetical example with the hypothetical examples that appear in shareholder reports of other funds.
Note that the expenses shown in the table are meant to highlight and help you compare ongoing costs only and do not reflect transaction costs incurred by the fund for buying and selling securities. Further, the expenses do not include any purchase, redemption, or account service fees described in the fund prospectus. If such fees were applied to your account, your costs would be higher. Your fund does not carry a “sales load.”
The calculations assume no shares were bought or sold during the period. Your actual costs may have been higher or lower, depending on the amount of your investment and the timing of any purchases or redemptions.
You can find more information about the fund’s expenses, including annual expense ratios, in the Financial Statements section of this report. For additional information on operating expenses and other shareholder costs, please refer to your fund’s current prospectus.
51
| Six Months Ended October 31, 2018 | |||
| Beginning | Ending | Expenses | |
| Account Value | Account Value | Paid During | |
| Emerging Markets Government Bond Index | 4/30/2018 | 10/31/2018 | Period |
| Based on Actual Fund Return | |||
| Investor Shares | $1,000.00 | $986.02 | $2.45 |
| ETF Shares | 1,000.00 | 987.18 | 1.40 |
| Admiral Shares | 1,000.00 | 987.66 | 1.40 |
| Institutional Shares | 1,000.00 | 987.12 | 1.45 |
| Based on Hypothetical 5% Yearly Return | |||
| Investor Shares | $1,000.00 | $1,022.74 | $2.50 |
| ETF Shares | 1,000.00 | 1,023.79 | 1.43 |
| Admiral Shares | 1,000.00 | 1,023.79 | 1.43 |
| Institutional Shares | 1,000.00 | 1,023.74 | 1.48 |
The calculations are based on expenses incurred in the most recent six-month period. The fund’s annualized six-month expense ratios for that period are 0.49% for Investor Shares, 0.28% for ETF Shares, 0.28% for Admiral Shares, and 0.29% for Institutional Shares. The dollar amounts shown as “Expenses Paid” are equal to the annualized expense ratio multiplied by the average account value over the period, multiplied by the number of days in the most recent six-month period, then divided by the number of days in the most recent 12-month period (184/365).
52
Glossary
30-Day SEC Yield. A fund’s 30-day SEC yield is derived using a formula specified by the U.S. Securities and Exchange Commission. Under the formula, data related to the fund’s security holdings in the previous 30 days are used to calculate the fund’s hypothetical net income for that period, which is then annualized and divided by the fund’s estimated average net assets over the calculation period. For the purposes of this calculation, a security’s income is based on its current market yield to maturity (for bonds), its actual income (for asset-backed securities), or its projected dividend yield (for stocks). Because the SEC yield represents hypothetical annualized income, it will differ—at times significantly—from the fund’s actual experience. As a result, the fund’s income distributions may be higher or lower than implied by the SEC yield.
Average Coupon. The average interest rate paid on the fixed income securities held by a fund. It is expressed as a percentage of face value.
Average Duration. An estimate of how much the value of the bonds held by a fund will fluctuate in response to a change in interest rates. To see how the value could change, multiply the average duration by the change in rates. If interest rates rise by 1 percentage point, the value of the bonds in a fund with an average duration of five years would decline by about 5%. If rates decrease by a percentage point, the value would rise by 5%.
Average Effective Maturity. The average length of time until fixed income securities held by a fund reach maturity and are repaid, taking into consideration the possibility that the issuer may call the bond before its maturity date. The figure reflects the proportion of fund assets represented by each security; it also reflects any futures contracts held. In general, the longer the average effective maturity, the more a fund’s share price will fluctuate in response to changes in market interest rates.
Beta. A measure of the magnitude of a fund’s past share-price fluctuations in relation to the ups and downs of a given market index. The index is assigned a beta of 1.00. Compared with a given index, a fund with a beta of 1.20 typically would have seen its share price rise or fall by 12% when the index rose or fell by 10%. For this report, beta is based on returns over the past 36 months for both the fund and the index. Note that a fund’s beta should be reviewed in conjunction with its R-squared (see definition). The lower the R-squared, the less correlation there is between the fund and the index, and the less reliable beta is as an indicator of volatility.
Credit Quality. Credit-quality ratings are measured on a scale that generally ranges from AAA (highest) to D (lowest). U.S. Treasury, U.S. Agency, and U.S. Agency mortgage-backed securities appear under “U.S. Government.” Credit-quality ratings are obtained from Barclays and are from Moody’s, Fitch, and S&P. When ratings from all three agencies are used, the median rating is shown. When ratings from two of the agencies are used, the lower rating for each issue is shown. “Not Rated” is used to classify securities for which a rating is not available.
Expense Ratio. A fund’s total annual operating expenses expressed as a percentage of the fund’s average net assets. The expense ratio includes management and administrative expenses, but does not include the transaction costs of buying and selling portfolio securities.
Inception Date. The date on which the assets of a fund (or one of its share classes) are first invested in accordance with the fund’s investment objective. For funds with a subscription period, the inception date is the day after that period ends. Investment performance is measured from the inception date.
53
R-Squared. A measure of how much of a fund’s past returns can be explained by the returns from the market in general, as measured by a given index. If a fund’s total returns were precisely synchronized with an index’s returns, its R-squared would be 1.00. If the fund’s returns bore no relationship to the index’s returns, its R-squared would be 0. For this report, R-squared is based on returns over the past 36 months for both the fund and the index.
Short-Term Reserves. The percentage of a fund invested in highly liquid, short-term securities that can be readily converted to cash.
Yield to Maturity. The rate of return an investor would receive if the fixed income securities held by a fund were held to their maturity dates.
54
BLOOMBERG is a trademark and service mark of Bloomberg Finance L.P. BARCLAYS is a trademark and service mark of Barclays Bank Plc, used under license. Bloomberg Finance L.P. and its affiliates, including Bloomberg Index Services Limited (BISL) (collectively, Bloomberg), or Bloomberg’s licensors, own all proprietary rights in the Bloomberg Barclays USD Emerging Markets Government RIC Capped Index (Index or Bloomberg Barclays Index).
Neither Barclays Bank Plc, Barclays Capital Inc., or any affiliate (collectively Barclays) or Bloomberg is the issuer or producer of the Emerging Markets Government Bond Index Fund and neither Bloomberg nor Barclays has any responsibilities, obligations or duties to investors in the Emerging Markets Government Bond Index Fund. The Index is licensed for use by The Vanguard Group, Inc. (Vanguard) as the sponsor of the Emerging Markets Government Bond Index Fund. Bloomberg and Barclays’ only relationship with Vanguard in respect of the Index is the licensing of the Index, which is determined, composed and calculated by BISL, or any successor thereto, without regard to the Issuer or the Emerging Markets Government Bond Index Fund or the owners of the Emerging Markets Government Bond Index Fund.
Additionally, Vanguard may for itself execute transaction(s) with Barclays in or relating to the Index in connection with the Emerging Markets Government Bond Index Fund. Investors acquire the Emerging Markets Government Bond Index Fund from Vanguard and investors neither acquire any interest in the Index nor enter into any relationship of any kind whatsoever with Bloomberg or Barclays upon making an investment in the Emerging Markets Government Bond Index Fund. The Emerging Markets Government Bond Index Fund is not sponsored, endorsed, sold or promoted by Bloomberg or Barclays. Neither Bloomberg nor Barclays makes any representation or warranty, express or implied regarding the advisability of investing in the Emerging Markets Government Bond Index Fund or the advisability of investing in securities generally or the ability of the Index to track corresponding or relative market performance. Neither Bloomberg nor Barclays has passed on the legality or suitability of the Emerging Markets Government Bond Index Fund with respect to any person or entity. Neither Bloomberg nor Barclays is responsible for and has not participated in the determination of the timing of, prices at, or quantities of the Emerging Markets Government Bond Index Fund to be issued. Neither Bloomberg nor Barclays has any obligation to take the needs of the Issuer or the owners of the Emerging Markets Government Bond Index Fund or any other third party into consideration in determining, composing or calculating the Index. Neither Bloomberg nor Barclays has any obligation or liability in connection with administration, marketing or trading of the Emerging Markets Government Bond Index Fund.
55
The licensing agreement between Bloomberg and Barclays is solely for the benefit of Bloomberg and Barclays and not for the benefit of the owners of the Emerging Markets Government Bond Index Fund, investors or other third parties. In addition, the licensing agreement between Vanguard and Bloomberg is solely for the benefit of Vanguard and Bloomberg and not for the benefit of the owners of the Emerging Markets Government Bond Index Fund, investors or other third parties.
NEITHER BLOOMBERG NOR BARCLAYS SHALL HAVE ANY LIABILITY TO THE ISSUER, INVESTORS OR TO OTHER THIRD PARTIES FOR THE QUALITY, ACCURACY AND/OR COMPLETENESS OF THE BLOOMBERG BARCLAYS INDEX OR ANY DATA INCLUDED THEREIN OR FOR INTERRUPTIONS IN THE DELIVERY OF THE BLOOMBERG BARCLAYS INDEX. NEITHER BLOOMBERG NOR BARCLAYS MAKES ANY WARRANTY, EXPRESS OR IMPLIED, AS TO RESULTS TO BE OBTAINED BY THE ISSUER, THE INVESTORS OR ANY OTHER PERSON OR ENTITY FROM THE USE OF THE BLOOMBERG BARCLAYS INDEX OR ANY DATA INCLUDED THEREIN. NEITHER BLOOMBERG NOR BARCLAYS MAKES ANY EXPRESS OR IMPLIED WARRANTIES, AND EACH HEREBY EXPRESSLY DISCLAIMS ALL WARRANTIES OF MERCHANTABILITY OR FITNESS FOR A PARTICULAR PURPOSE OR USE WITH RESPECT TO THE BLOOMBERG BARCLAYS INDEX OR ANY DATA INCLUDED THEREIN. BLOOMBERG RESERVES THE RIGHT TO CHANGE THE METHODS OF CALCULATION OR PUBLICATION, OR
TO CEASE THE CALCULATION OR PUBLICATION OF THE BLOOMBERG BARCLAYS INDEX, AND NEITHER BLOOMBERG NOR BARCLAYS SHALL BE LIABLE FOR ANY MISCALCULATION OF OR ANY INCORRECT, DELAYED OR INTERRUPTED PUBLICATION WITH RESPECT TO THE BLOOMBERG BARCLAYS INDEX. NEITHER BLOOMBERG NOR BARCLAYS SHALL BE LIABLE FOR ANY DAMAGES, INCLUDING, WITHOUT LIMITATION, ANY SPECIAL, INDIRECT OR CONSEQUENTIAL DAMAGES, OR ANY LOST PROFITS AND EVEN IF ADVISED OF THE POSSIBILITY OF SUCH, RESULTING FROM THE USE OF THE BLOOMBERG BARCLAYS INDEX OR ANY DATA INCLUDED THEREIN OR WITH RESPECT TO THE EMERGING MARKETS GOVERNMENT BOND INDEX FUND.
None of the information supplied by Bloomberg or Barclays and used in this publication may be reproduced in any manner without the prior written permission of both Bloomberg and Barclays Capital, the investment banking division of Barclays Bank Plc. Barclays Bank Plc is registered in England No. 1026167. Registered office 1 Churchill Place London E14 5HP.
© 2018 Bloomberg. Used with Permission.
Source: Bloomberg Index Services Limited. Copyright 2018, Bloomberg. All rights reserved.
56
This page intentionally left blank.
This page intentionally left blank.
The People Who Govern Your Fund
The trustees of your mutual fund are there to see that the fund is operated and managed in your best interests since, as a shareholder, you are a part owner of the fund. Your fund’s trustees also serve on the board of directors of The Vanguard Group, Inc., which is owned by the Vanguard funds and provides services to them on an at-cost basis.
A majority of Vanguard’s board members are independent, meaning that they have no affiliation with Vanguard or the funds they oversee, apart from the sizable personal investments they have made as private individuals. The independent board members have distinguished backgrounds in business, academia, and public service. Each of the trustees and executive officers oversees 211 Vanguard funds.
Information for each trustee and executive officer of the fund appears below. The mailing address of the trustees and officers is P.O. Box 876, Valley Forge, PA 19482. More information about the trustees is in the Statement of Additional Information, which can be obtained, without charge, by contacting Vanguard at 800-662-7447, or online at vanguard.com.
Interested Trustees1
F. William McNabb III
Born in 1957. Trustee since July 2009. Principal occupation(s) during the past five years and other experience: chairman of the board (January 2010–present) of Vanguard and of each of the investment companies served by Vanguard, trustee (2009–present) of each of the investment companies served by Vanguard, and director (2008–present) of Vanguard. Chief executive officer and president (2008–2017) of Vanguard and each of the investment companies served by Vanguard, managing director (1995–2008) of Vanguard, and director (1997–2018) of Vanguard Marketing Corporation. Director (2018–present) of UnitedHealth Group.
Mortimer J. Buckley
Born in 1969. Trustee since January 2018. Principal occupation(s) during the past five years and other experience: chief executive officer (January 2018–present) of Vanguard; chief executive officer, president, and trustee (January 2018–present) of each of the investment companies served by Vanguard; president and director (2017–present) of Vanguard; and president (February 2018–present) of Vanguard Marketing Corporation. Chief investment officer (2013–2017), managing director (2002–2017), head of the Retail Investor Group (2006–2012), and chief information officer (2001–2006) of Vanguard. Chairman of the board (2011–2017) of the Children’s Hospital of Philadelphia.
Independent Trustees
Emerson U. Fullwood
Born in 1948. Trustee since January 2008. Principal occupation(s) during the past five years and other experience: executive chief staff and marketing officer for North America and corporate vice president (retired 2008) of Xerox Corporation (document management products and services). Former president of the Worldwide Channels Group, Latin America, and Worldwide Customer Service and executive chief staff officer of Developing Markets of Xerox. Executive in residence and 2009–2010 Distinguished Minett Professor at the Rochester Institute of Technology. Lead director of SPX FLOW, Inc. (multi-industry manufacturing). Director of the University of Rochester Medical Center, the Monroe Community College Foundation, the United Way of Rochester, North Carolina A&T University, and Roberts Wesleyan College. Trustee of the University of Rochester.
Amy Gutmann
Born in 1949. Trustee since June 2006. Principal occupation(s) during the past five years and other experience: president (2004–present) of the University of Pennsylvania. Christopher H. Browne Distinguished Professor of Political Science, School of Arts and Sciences, and professor of communication, Annenberg School for Communication, with secondary faculty appointments in the Department of Philosophy, School of Arts and Sciences, and at the Graduate School of Education, University of Pennsylvania. Trustee of the National Constitution Center.
1 Mr. McNabb and Mr. Buckley are considered “interested persons,” as defined in the Investment Company Act of 1940, because they are officers of the Vanguard funds.
JoAnn Heffernan Heisen
Born in 1950. Trustee since July 1998. Principal occupation(s) during the past five years and other experience: corporate vice president of Johnson & Johnson (pharmaceuticals/medical devices/consumer products) and member of its executive committee (1997–2008). Chief global diversity officer (retired 2008), vice president and chief information officer (1997–2006), controller (1995–1997), treasurer (1991–1995), and assistant treasurer (1989–1991) of Johnson & Johnson. Director of Skytop Lodge Corporation (hotels) and the Robert Wood Johnson Foundation. Member of the advisory board of the Institute for Women’s Leadership at Rutgers University.
F. Joseph Loughrey
Born in 1949. Trustee since October 2009. Principal occupation(s) during the past five years and other experience: president and chief operating officer (retired 2009) and vice chairman of the board (2008–2009) of Cummins Inc. (industrial machinery). Chairman of the board of Hillenbrand, Inc. (specialized consumer services), Oxfam America, and the Lumina Foundation for Education. Director of the V Foundation for Cancer Research. Member of the advisory council for the College of Arts and Letters and chair of the advisory board to the Kellogg Institute for International Studies, both at the University of Notre Dame.
Mark Loughridge
Born in 1953. Trustee since March 2012. Principal occupation(s) during the past five years and other experience: senior vice president and chief financial officer (retired 2013) of IBM (information technology services). Fiduciary member of IBM’s Retirement Plan Committee (2004–2013), senior vice president and general manager (2002–2004) of IBM Global Financing, vice president and controller (1998–2002) of IBM, and a variety of other prior management roles at IBM. Member of the Council on Chicago Booth.
Scott C. Malpass
Born in 1962. Trustee since March 2012. Principal occupation(s) during the past five years and other experience: chief investment officer (1989–present) and vice president (1996–present) of the University of Notre Dame. Assistant professor of finance at the Mendoza College of Business, University of Notre Dame, and member of the Notre Dame 403(b) Investment Committee. Chairman of the board of TIFF Advisory Services, Inc. Member of the board of Catholic Investment Services, Inc. (investment advisors), the board of advisors for Spruceview Capital Partners, and the board of superintendence of the Institute for the Works of Religion.
Deanna Mulligan
Born in 1963. Trustee since January 2018. Principal occupation(s) during the past five years and other experience: president (2010–present) and chief executive officer (2011–present) of The Guardian Life Insurance Company of America. Chief operating officer (2010–2011) and executive vice president (2008–2010) of Individual Life and Disability of The Guardian Life Insurance Company of America. Member of the board of The Guardian Life Insurance Company of America, the American Council of Life Insurers, the Partnership for New York City (business leadership), and the Committee Encouraging Corporate Philanthropy. Trustee of the Economic Club of New York and the Bruce Museum (arts and science). Member of the Advisory Council for the Stanford Graduate School of Business.
André F. Perold
Born in 1952. Trustee since December 2004. Principal occupation(s) during the past five years and other experience: George Gund Professor of Finance and Banking, Emeritus at the Harvard Business School (retired 2011). Chief investment officer and co-managing partner of HighVista Strategies LLC (private investment firm). Overseer of the Museum of Fine Arts Boston.
Sarah Bloom Raskin
Born in 1961. Trustee since January 2018. Principal occupation(s) during the past five years and other experience: deputy secretary (2014–2017) of the United States Department of the Treasury. Governor (2010–2014) of the Federal Reserve Board. Commissioner (2007–2010) of financial regulation for the State of Maryland. Member of the board of directors (2012–2014) of Neighborhood Reinvestment Corporation. Director of i(x) Investments, LLC.
Peter F. Volanakis
Born in 1955. Trustee since July 2009. Principal occupation(s) during the past five years and other experience: president and chief operating officer (retired 2010) of Corning Incorporated (communications equipment) and director of Corning Incorporated (2000–2010) and Dow Corning (2001–2010). Director (2012) of SPX Corporation (multi-industry manufacturing). Overseer of the Amos Tuck School of Business Administration, Dartmouth College (2001–2013). Chairman of the board of trustees of Colby-Sawyer College. Member of the Board of Hypertherm Inc. (industrial cutting systems, software, and consumables).
Executive Officers
Glenn Booraem
Born in 1967. Principal occupation(s) during the past five years and other experience: principal of Vanguard. Investment stewardship officer (2017–present), treasurer (2015–2017), controller (2010–2015), and assistant controller (2001–2010) of each of the investment companies served by Vanguard.
Christine M. Buchanan
Born in 1970. Principal occupation(s) during the past five years and other experience: principal of Vanguard and global head of Fund Administration at Vanguard. Treasurer (2017–present) of each of the investment companies served by Vanguard. Partner (2005–2017) at KPMG LLP (audit, tax, and advisory services).
Brian Dvorak
Born in 1973. Principal occupation(s) during the past five years and other experience: principal of Vanguard. Chief compliance officer (2017–present) of Vanguard and each of the investment companies served by Vanguard. Assistant vice president (2017–present) of Vanguard Marketing Corporation. Vice president and director of Enterprise Risk Management (2011–2013) at Oppenheimer Funds, Inc.
Thomas J. Higgins
Born in 1957. Principal occupation(s) during the past five years and other experience: principal of Vanguard. Chief financial officer (2008–present) and treasurer (1998–2008) of each of the investment companies served by Vanguard.
Peter Mahoney
Born in 1974. Principal occupation(s) during the past five years and other experience: principal of Vanguard. Controller (2015–present) of each of the investment companies served by Vanguard. Head of International Fund Services (2008–2014) at Vanguard.
Anne E. Robinson
Born in 1970. Principal occupation(s) during the past five years and other experience: general counsel (2016–present) of Vanguard. Secretary (2016–present) of Vanguard and of each of the investment companies served by Vanguard. Managing director (2016–present) of Vanguard. Director and senior vice president (2016–2018) of Vanguard Marketing Corporation. Managing director and general counsel of Global Cards and Consumer Services (2014–2016) at Citigroup. Counsel (2003–2014) at American Express.
Michael Rollings
Born in 1963. Principal occupation(s) during the past five years and other experience: finance director (2017–present) and treasurer (2017) of each of the investment companies served by Vanguard. Managing director (2016–present) of Vanguard. Chief financial officer (2016–present) of Vanguard. Director (2016–present) of Vanguard Marketing Corporation. Executive vice president and chief financial officer (2006–2016) of MassMutual Financial Group.
| Vanguard Senior Management Team | |
| Joseph Brennan | Chris D. McIsaac |
| Mortimer J. Buckley | James M. Norris |
| Gregory Davis | Thomas M. Rampulla |
| John James | Karin A. Risi |
| Martha G. King | Anne E. Robinson |
| John T. Marcante | Michael Rollings |
| Chairman Emeritus and Senior Advisor | |
| John J. Brennan | |
| Chairman, 1996–2009 | |
| Chief Executive Officer and President, 1996–2008 | |
| Founder | |
| John C. Bogle | |
| Chairman and Chief Executive Officer, 1974–1996 | |
 | |
P.O. Box 2600 | |
Connect with Vanguard® > vanguard.com | |
| Fund Information > 800-662-7447 | |
| Direct Investor Account Services > 800-662-2739 | |
| Institutional Investor Services > 800-523-1036 | |
| Text Telephone for People | |
| Who Are Deaf or Hard of Hearing > 800-749-7273 | |
| This material may be used in conjunction | |
| with the offering of shares of any Vanguard | |
| fund only if preceded or accompanied by | |
| the fund’s current prospectus. | |
| All comparative mutual fund data are from Lipper, a | |
| Thomson Reuters Company, or Morningstar, Inc., unless | |
| otherwise noted. | |
| You can obtain a free copy of Vanguard’s proxy voting | |
| guidelines by visiting vanguard.com/proxyreporting or by | |
| calling Vanguard at 800-662-2739. The guidelines are | |
| also available from the SEC’s website, sec.gov. In | |
| addition, you may obtain a free report on how your fund | |
| voted the proxies for securities it owned during the 12 | |
| months ended June 30. To get the report, visit either | |
| vanguard.com/proxyreporting or sec.gov. | |
| You can review information about your fund on the | |
| SEC’s website, and you can receive copies of this | |
| information, for a fee, by sending a request via email | |
| addressed to publicinfo@sec.gov. | |
| © 2018 The Vanguard Group, Inc. | |
| All rights reserved. | |
| Vanguard Marketing Corporation, Distributor. | |
| Q11200 122018 | |
| Annual Report | | October 31, 2018 |
| Vanguard Global Minimum Volatility Fund | |
Vanguard’s Principles for Investing Success
We want to give you the best chance of investment success. These principles, grounded in Vanguard’s research and experience, can put you on the right path.
Goals. Create clear, appropriate investment goals.
Balance. Develop a suitable asset allocation using broadly diversified funds. Cost. Minimize cost.
Discipline. Maintain perspective and long-term discipline.
A single theme unites these principles: Focus on the things you can control.
We believe there is no wiser course for any investor.
| Contents | |
| Your Fund’s Performance at a Glance. | 1 |
| CEO’s Perspective. | 3 |
| Advisor’s Report. | 5 |
| Fund Profile. | 8 |
| Performance Summary. | 10 |
| Financial Statements. | 12 |
| Your Fund’s After-Tax Returns. | 36 |
| About Your Fund’s Expenses. | 37 |
| Glossary. | 39 |
Please note: The opinions expressed in this report are just that—informed opinions. They should not be considered promises or advice. Also, please keep in mind that the information and opinions cover the period through the date on the front of this report. Of course, the risks of investing in your fund are spelled out in the prospectus.
See the Glossary for definitions of investment terms used in this report.
Your Fund’s Performance at a Glance
• Vanguard Global Minimum Volatility Fund returned nearly 4% for the 12 months ended October 31, 2018, outpacing its benchmark, the FTSE Global All Cap Index (USD Hedged), by more than 2 percentage points.
• The fund’s objective is to create a portfolio that has broad equity exposure with less volatility than the global equity market. Over the fiscal year, the fund produced lower weekly volatility but also a higher risk-adjusted return than its benchmark. (We calculate weekly volatility and risk-adjusted return using standard deviation, as we discuss in the Advisor’s Report.)
• Our positions in financials, industrials, and information technology aided relative performance the most. Energy, communication services, and utilities were the biggest relative detractors.
• An underweight allocation to Europe helped lower volatility, as did our overweight positions in North America and the markets of the Pacific region.
| Total Returns: Fiscal Year Ended October 31, 2018 | |
| Total | |
| Returns | |
| Vanguard Global Minimum Volatility Fund | |
| Investor Shares | 3.89% |
| Admiral™ Shares | 3.93 |
| FTSE Global All Cap Index (USD Hedged) | 1.38 |
| Global Funds Average | -1.29 |
| Global Funds Average: Derived from data provided by Lipper, a Thomson Reuters Company. | |
| Admiral Shares carry lower expenses and are available to investors who meet certain account-balance requirements. | |
| Total Returns: Inception Through October 31, 2018 | |
| Average | |
| Annual Return | |
| Global Minimum Volatility Fund Investor Shares (Returns since inception: 12/12/2013) | 9.98% |
| FTSE Global All Cap Index (USD Hedged) | 8.72 |
| Global Funds Average | 5.42 |
| Global Funds Average: Derived from data provided by Lipper, a Thomson Reuters Company. | |
The figures shown represent past performance, which is not a guarantee of future results. (Current performance may be lower or higher than the performance data cited. For performance data current to the most recent month-end, visit our website at vanguard.com/performance.) Note, too, that both investment returns and principal value can fluctuate widely, so an investor’s shares, when sold, could be worth more or less than their original cost.
1
| Expense Ratios | |||
| Your Fund Compared With Its Peer Group | |||
| Investor | Admiral | Peer Group | |
| Shares | Shares | Average | |
| Global Minimum Volatility Fund | 0.25% | 0.17% | 1.18% |
The fund expense ratios shown are from the prospectus dated February 22, 2018, and represent estimated costs for the current fiscal year. For the fiscal year ended October 31, 2018, the fund’s expense ratios were 0.23% for Investor Shares and 0.15% for Admiral Shares. The peer-group expense ratio is derived from data provided by Lipper, a Thomson Reuters Company, and captures information through year-end 2017.
Peer group: Global Funds.
2
CEO’s Perspective

Tim Buckley
President and Chief Executive Officer
Dear Shareholder,
Over the years, I’ve found that prudent investors exhibit a common trait: discipline. No matter how the markets move or what new investing fad hits the headlines, those who stay focused on their goals and tune out the noise are set up for long-term success.
The prime gateway to investing is saving, and you don’t usually become a saver without a healthy dose of discipline. Savers make the decision to sock away part of their income, which means spending less and delaying gratification, no matter how difficult that may be.
Of course, disciplined investing extends beyond diligent saving. The financial markets, in the short term especially, are unpredictable; I have yet to meet the investor who can time them perfectly. It takes discipline to resist the urge to go all-in when markets are frothy or to retreat when things look bleak.
Staying put with your investments is one strategy for handling volatility. Another, rebalancing, requires even more discipline because it means steering your money away from strong performers and toward poorer performers.
Patience—a form of discipline—is also the friend of long-term investors. Higher returns are the potential reward for weathering the market’s turbulence and uncertainty.
3
We have been enjoying one of the longest bull markets in history, but it won’t continue forever. Prepare yourself now for how you will react when volatility comes back. Don’t panic. Don’t chase returns or look for answers outside the asset classes you trust. And be sure to rebalance periodically, even when there’s turmoil.
Whether you’re a master of self-control, get a boost from technology, or work with a professional advisor, know that discipline is necessary to get the most out of your investment portfolio. And know that Vanguard is with you for the entire ride.
Thank you for your continued loyalty.
Sincerely,

Mortimer J. Buckley
President and Chief Executive Officer
November 16, 2018
| Market Barometer | |||
| Average Annual Total Returns | |||
| Periods Ended October 31, 2018 | |||
| One Year | Three Years | Five Years | |
| Stocks | |||
| Russell 1000 Index (Large-caps) | 6.98% | 11.31% | 11.05% |
| Russell 2000 Index (Small-caps) | 1.85 | 10.68 | 8.01 |
| Russell 3000 Index (Broad U.S. market) | 6.60 | 11.27 | 10.81 |
| FTSE All-World ex US Index (International) | -7.99 | 4.57 | 2.01 |
| Bonds | |||
| Bloomberg Barclays U.S. Aggregate Bond Index | |||
| (Broad taxable market) | -2.05% | 1.04% | 1.83% |
| Bloomberg Barclays Municipal Bond Index | |||
| (Broad tax-exempt market) | -0.51 | 1.90 | 3.25 |
| FTSE Three-Month U. S. Treasury Bill Index | 1.67 | 0.86 | 0.52 |
| CPI | |||
| Consumer Price Index | 2.52% | 2.07% | 1.60% |
4
Advisor’s Report
For the 12 months ended October 31, 2018, Vanguard Global Minimum Volatility Fund returned 3.89% for Investor Shares and 3.93% for Admiral Shares, with an annualized weekly volatility of 9.92%. Its benchmark, the FTSE Global All Cap Index (USD Hedged), returned 1.38%, with an annualized weekly volatility of 12.57%. (To get the annualized weekly volatility, we calculate the standard deviation of weekly returns and multiply it by the square root of 52, the number of weeks in a year.)
Investment objective
Our objective is to create a portfolio that has broad equity exposure with less volatility than the global equity market. We achieved this over the performance period, as the fund’s weekly volatility averaged about 21% less than that of its benchmark.
It is important to mention, as we have in the past, that we do not target a specific volatility level. Rather, we seek to provide an equity fund that has lower absolute risk than the broad global market. Thus, when the broad global equity market is experiencing periods of low volatility, you should expect this fund’s volatility to be much closer to the volatility level of its benchmark.
We recognize that equity-like returns are also an important outcome of an investment in this fund, but achieving a total return higher than the benchmark’s is not our objective. Although our research leads us to expect that, on average, a minimum volatility fund may outperform the overall global market in sharp
downturns (while still experiencing losses), the fund should be expected to trail in strong bull markets. With that in mind, because the fund is expected to have a lower level of risk than the global equity market, you should not expect it to outperform the market over the long run.
We think an acceptable comparative performance measure for the fund over the long term is its risk-adjusted return. This can be calculated by dividing the portfolio’s total return for the period by the annualized standard deviation of weekly returns. We view 12 months to be a relatively short time, but for the annual period, the risk-adjusted return was about 0.44, compared with 0.13 for the benchmark. Over a longer period—since the fund’s inception on December 12, 2013—its risk-adjusted return was 1.12, compared with 0.84 for the benchmark.
Investment strategy
In building our portfolio, we use quantitative models that evaluate a variety of factors that drive a stock’s volatility. These fundamental drivers include risk factors such as growth, value, dividend yields, size, volatility, and liquidity. In addition, our portfolio construction process includes estimates of each stock’s correlation—or how its factors move in relation to one another. This approach allows us to make appropriate risk/ diversification trade-offs, while not relying solely on volatility estimates.
5
Our process also approaches currency exposure and its impact on a portfolio in a specific manner. We recognize that owning companies in foreign markets involves the risk of movements in foreign currency exchange rates relative to the U.S. dollar. Because of this, an optimization process that focuses solely on volatilities tied to an investor’s home currency will tend to overweight exposures to that currency. We aim to avoid such currency-specific exposures by focusing on equity volatilities and correlations measured in local currency terms. Then we use currency forward contracts to hedge the resulting exposure for U.S. investors. We believe this process can further reduce the volatility of the portfolio overall in the long run.
Finally, when constructing the portfolio, we apply constraints to reduce stock, sector, and country concentration risk. We find that these constraints, which allow for broader diversification and liquidity, reduce unnecessarily high risk exposures without significantly affecting our ability to reduce overall volatility. Drawing from the universe of about 7,900 stocks in the FTSE index, we construct a portfolio of about 600 stocks.
The investment environment
Global stock markets ended in negative territory for the 12 months, but U.S. stocks produced solid returns as increasing profits and a strong economy outweighed investor concerns about rising interest rates, higher inflation, and trade tensions. Large-capitalization stocks beat small-caps, and growth stocks outpaced value.
Emerging markets stocks were hurt by trade tensions and a rising dollar. Results in Europe and the Asia-Pacific region were also in negative territory, in part because of these areas’ greater economic dependence on emerging markets.
The overall U.S. fixed income market, as measured by the Bloomberg Barclays U.S. Aggregate Bond Index, returned –2.05%. Yields rose and prices mostly declined as investors remained concerned about the threat of inflation and the possibility that the Federal Reserve would more aggressively raise rates.
The Fed did raise rates in September—its eighth increase since the current tightening cycle began—and signaled more hikes to come. Attention is now focused on the pace of further rate increases, with many analysts expecting another one in December and three in 2019.
The fund’s successes and shortfalls
The benefits of our strategy become even clearer when you seek to remove some of the noise caused by short-term reversals in daily and weekly returns, which can increase volatility levels, and focus on monthly returns. For example, since inception, the fund has delivered about a 30% reduction in the annualized volatility of monthly returns relative to its benchmark.
Over the 12 months, our strategy of holding stocks that have lower correlations with one another provided diversification benefits. On average, we were overweighted in less volatile sectors, such as consumer staples,
6
communication services, and utilities, and underweighted in two of the benchmark’s more volatile sectors, energy and financials. Our underweight allocation to financials aided performance, as these stocks tended to lag the overall market.
As for regional allocations, our positions in Europe and the Pacific region contributed the most to relative performance and helped lower volatility. Our positions in emerging markets and the Middle East modestly increased volatility for the fund compared with its benchmark.
We expect our approach to portfolio construction to pay off in reduced volatility over the long run. With this in mind, we find that focusing on the long-term risk-adjusted returns of the portfolio relative to the benchmark realigns expectations with the fund’s objective. We thank you for your investment and look forward to serving our investors in the future.
Portfolio Manager: Antonio Picca
Vanguard Quantitative Equity Group
November 21, 2018
7
Global Minimum Volatility Fund
Fund Profile
As of October 31, 2018
| Share-Class Characteristics | ||
| Investor | Admiral | |
| Shares | Shares | |
| Ticker Symbol | VMVFX | VMNVX |
| Expense Ratio1 | 0.25% | 0.17% |
| Portfolio Characteristics | ||
| FTSE Global | ||
| All Cap Index | ||
| Fund | (USD Hedged) | |
| Number of Stocks | 612 | 7,869 |
| Median Market Cap | $9.6B | $42.7B |
| Price/Earnings Ratio | 17.5x | 15.3x |
| Price/Book Ratio | 2.1x | 2.1x |
| Return on Equity | 12.6% | 13.6% |
| Earnings Growth | ||
| Rate | 7.8% | 8.6% |
| Dividend Yield | 3.1% | 2.5% |
| Turnover Rate | 24% | — |
| Short-Term Reserves | -0.1% | — |
| Sector Diversification (% of equity exposure) | |
| Fund | |
| Communication Services | 10.3% |
| Consumer Discretionary | 10.4 |
| Consumer Staples | 12.2 |
| Energy | 1.7 |
| Financials | 16.7 |
| Health Care | 10.8 |
| Industrials | 7.7 |
| Information Technology | 11.5 |
| Materials | 3.5 |
| Real Estate | 7.9 |
| Utilities | 7.3 |
Sector categories are based on the Global Industry Classification Standard (“GICS”), except for the “Other” category (if applicable), which includes securities that have not been provided a GICS classification as of the effective reporting period.
| Volatility Measures | |
| FTSE Global | |
| All Cap Index | |
| (USD Hedged) | |
| R-Squared | 0.67 |
| Beta | 0.58 |
These measures show the degree and timing of the fund’s fluctuations compared with the index over 36 months.
| Ten Largest Holdings (% of total net assets) | ||
| Starwood Property Trust | ||
| Inc. | Mortgage REITs | 1.5% |
| Jack Henry & Associates Data Processing & | ||
| Inc. | Outsourced Services | 1.4 |
| Blackstone Mortgage | ||
| Trust Inc. | Mortgage REITs | 1.3 |
| Amdocs Ltd. | IT Consulting & | |
| Other Services | 1.3 | |
| Broadridge Financial | Data Processing & | |
| Solutions Inc. | Outsourced Services | 1.1 |
| China Mobile Ltd. | Wireless | |
| Telecommunication | ||
| Services | 1.0 | |
| HDFC Bank Ltd. | Diversified Banks | 1.0 |
| Church & Dwight Co. | ||
| Inc. | Household Products | 1.0 |
| Expeditors International | Air Freight & | |
| of Washington Inc. | Logistics | 0.9 |
| Quest Diagnostics Inc. | Health Care Services | 0.9 |
| Top Ten | 11.4% | |
The holdings listed exclude any temporary cash investments and equity index products.
Allocation by Region (% of portfolio)

1 The expense ratios shown are from the prospectus dated February 22, 2018, and represent estimated costs for the current fiscal year. For the fiscal year ended October 31, 2018, the expense ratios were 0.23% for Investor Shares and 0.15% for Admiral Shares.
8
Global Minimum Volatility Fund
| Market Diversification (% of equity exposure) | ||
| FTSE Global | ||
| All Cap | ||
| Index | ||
| (USD | ||
| Fund | Hedged) | |
| Europe | ||
| United Kingdom | 5.4% | 5.5% |
| Switzerland | 3.2 | 2.5 |
| France | 3.1 | 3.0 |
| Germany | 2.9 | 2.7 |
| Sweden | 1.1 | 1.0 |
| Other | 4.4 | 4.4 |
| Subtotal | 20.1% | 19.1% |
| Pacific | ||
| Japan | 8.1% | 8.1% |
| Australia | 2.9 | 2.2 |
| Hong Kong | 1.8 | 1.1 |
| South Korea | 1.8 | 1.5 |
| Other | 0.6 | 0.5 |
| Subtotal | 15.2% | 13.4% |
| Emerging Markets | ||
| India | 1.4% | 1.1% |
| China | 1.4 | 2.9 |
| Other | 2.5 | 5.2 |
| Subtotal | 5.3% | 9.2% |
| North America | ||
| United States | 55.3% | 55.1% |
| Canada | 3.9 | 3.0 |
| Subtotal | 59.2% | 58.1% |
| Middle East | 0.2% | 0.2% |
9
Global Minimum Volatility Fund
Performance Summary
All of the returns in this report represent past performance, which is not a guarantee of future results that may be achieved by the fund. (Current performance may be lower or higher than the performance data cited. For performance data current to the most recent month-end, visit our website at vanguard.com/performance.) Note, too, that both investment returns and principal value can fluctuate widely, so an investor’s shares, when sold, could be worth more or less than their original cost. The returns shown do not reflect taxes that a shareholder would pay on fund distributions or on the sale of fund shares.
Cumulative Performance: December 12, 2013, Through October 31, 2018
Initial Investment of $10,000
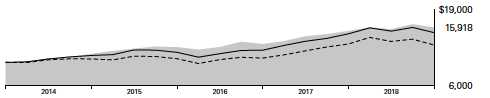
| Average Annual Total Returns | |||
| Periods Ended October 31, 2018 | |||
| Since | Final Value | ||
| One | Inception | of a $10,000 | |
| Year | (12/12/2013) | Investment | |
| Global Minimum Volatility Fund Investor | |||
| Shares | 3.89% | 9.98% | $15,918 |
| FTSE Global All Cap Index (USD | |||
| Hedged) | 1.38 | 8.72 | 15,043 |
| – Global Funds Average | -1.29 | 5.42 | 12,943 |
Global Funds Average: Derived from data provided by Lipper, a Thomson Reuters Company.
"Since Inception" performance is calculated from the Investor Shares’ inception date for both the fund and its comparative standards.
| Since | Final Value | ||
| One | Inception | of a $50,000 | |
| Year | (12/12/2013) | Investment | |
| Global Minimum Volatility Fund Admiral | |||
| Shares | 3.93% | 10.07% | $79,882 |
| FTSE Global All Cap Index (USD Hedged) | 1.38 | 8.72 | 75,216 |
| "Since Inception" performance is calculated from the Admiral Shares’ inception date for both the fund and its comparative standards. | |||
See Financial Highlights for dividend and capital gains information.
10
Global Minimum Volatility Fund
Fiscal-Year Total Returns (%): December 12, 2013, Through October 31, 2018
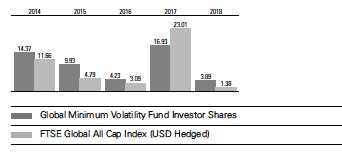
Average Annual Total Returns: Periods Ended September 30, 2018
This table presents returns through the latest calendar quarter—rather than through the end of the fiscal period.
Securities and Exchange Commission rules require that we provide this information.
| Inception | One | Since | |
| Date | Year | Inception | |
| Investor Shares | 12/12/2013 | 11.30% | 11.31% |
| Admiral Shares | 12/12/2013 | 11.42 | 11.40 |
11
Global Minimum Volatility Fund
Financial Statements
Statement of Net Assets
As of October 31, 2018
The fund reports a complete list of its holdings in regulatory filings four times in each fiscal year, at the quarter-ends. For the second and fourth fiscal quarters, the lists appear in the fund’s semiannual and annual reports to shareholders. For the first and third fiscal quarters, the fund files the lists with the Securities and Exchange Commission on Form N-Q. Shareholders can look up the fund’s Forms N-Q on the SEC’s website at sec.gov.
| Market | ||
| Value• | ||
| Shares | ($000) | |
| Common Stocks (99.2%)1 | ||
| Australia (2.9%) | ||
| AGL Energy Ltd. | 983,833 | 12,564 |
| Wesfarmers Ltd. | 367,202 | 12,161 |
| Woolworths Group Ltd. | 588,315 | 11,874 |
| Sonic Healthcare Ltd. | 548,436 | 8,778 |
| Cochlear Ltd. | 55,523 | 6,997 |
| Transurban Group | 787,070 | 6,331 |
| ASX Ltd. | 141,615 | 5,948 |
| Stockland | 2,204,185 | 5,638 |
| Caltex Australia Ltd. | 233,418 | 4,670 |
| Woodside Petroleum Ltd. | 115,122 | 2,834 |
| GPT Group | 514,397 | 1,881 |
| Amcor Ltd. | 176,247 | 1,663 |
| Coca-Cola Amatil Ltd. | 195,045 | 1,373 |
| JB Hi-Fi Ltd. | 75,108 | 1,224 |
| Crown Resorts Ltd. | 120,123 | 1,069 |
| BWP Trust | 383,701 | 941 |
| Goodman Group | 119,454 | 878 |
| Northern Star Resources | ||
| Ltd. | 126,398 | 790 |
| Computershare Ltd. | 43,610 | 612 |
| Charter Hall Retail REIT | 191,055 | 576 |
| 88,802 | ||
| Austria (0.1%) | ||
| voestalpine AG | 50,217 | 1,782 |
| OMV AG | 10,978 | 610 |
| Erste Group Bank AG | 11,360 | 462 |
| 2,854 | ||
| Belgium (0.4%) | ||
| Colruyt SA | 135,455 | 7,876 |
| Elia System Operator SA | 22,220 | 1,389 |
| Sofina SA | 5,842 | 1,117 |
| Cofinimmo SA | 5,895 | 705 |
| Ackermans & van Haaren | ||
| NV | 2,298 | 362 |
| 11,449 |
| Brazil (0.9%) | |||
| Telefonica Brasil SA ADR | 1,104,963 | 12,817 | |
| Ambev SA ADR | 1,870,822 | 8,101 | |
| Ultrapar Participacoes SA | |||
| ADR | 283,674 | 3,347 | |
| TIM Participacoes SA ADR | 117,950 | 1,825 | |
| Embraer SA ADR | 46,793 | 1,042 | |
| 27,132 | |||
| Canada (3.9%) | |||
| BCE Inc. | 537,987 | 20,821 | |
| Emera Inc. | 608,272 | 18,769 | |
| TELUS Corp. | 543,164 | 18,600 | |
| Dollarama Inc. | 607,876 | 16,812 | |
| Shaw Communications | |||
| Inc. Class B | 508,080 | 9,460 | |
| ^ | Canadian Tire Corp. Ltd. | ||
| Class A | 81,280 | 9,146 | |
| Intact Financial Corp. | 95,668 | 7,559 | |
| Bank of Montreal | 78,683 | 5,883 | |
| National Bank of Canada | 101,593 | 4,612 | |
| Pembina Pipeline Corp. | 108,535 | 3,511 | |
| Metro Inc. | 38,536 | 1,209 | |
| * | CGI Group Inc. Class A | 18,967 | 1,171 |
| Fortis Inc. | 34,129 | 1,128 | |
| 2 | Hydro One Ltd. | 53,573 | 779 |
| 119,460 | |||
| Chile (0.1%) | |||
| Enel Americas SA ADR | 157,624 | 1,242 | |
| Cia Cervecerias Unidas SA | |||
| ADR | 30,786 | 772 | |
| Enel Chile SA ADR | 152,793 | 657 | |
| Banco Santander Chile ADR 20,561 | 606 | ||
| 3,277 | |||
| China (1.4%) | |||
| China Mobile Ltd. ADR | 669,972 | 31,187 | |
| * | Ctrip.com International Ltd. | ||
| ADR | 238,838 | 7,949 | |
12
| Global Minimum Volatility Fund | ||
| Market | ||
| Value• | ||
| Shares | ($000) | |
| * New Oriental Education & | ||
| Technology Group Inc. ADR | 46,239 | 2,705 |
| ZTO Express Cayman Inc. | ||
| ADR | 99,752 | 1,618 |
| 43,459 | ||
| Denmark (0.5%) | ||
| Carlsberg A/S Class B | 66,717 | 7,360 |
| Coloplast A/S Class B | 51,189 | 4,777 |
| H Lundbeck A/S | 45,017 | 2,100 |
| Jyske Bank A/S | 19,159 | 782 |
| 15,019 | ||
| Finland (0.4%) | ||
| Elisa Oyj | 97,265 | 3,870 |
| Nokia Oyj | 408,899 | 2,310 |
| Sampo Oyj Class A | 47,215 | 2,171 |
| Fortum Oyj | 68,278 | 1,437 |
| Kesko Oyj Class B | 17,152 | 1,002 |
| Nokian Renkaat Oyj | 22,391 | 712 |
| 11,502 | ||
| France (3.0%) | ||
| Hermes International | 22,924 | 13,087 |
| Thales SA | 81,628 | 10,425 |
| Orange SA | 486,818 | 7,598 |
| Sanofi | 81,840 | 7,313 |
| Vivendi SA | 302,413 | 7,294 |
| Accor SA | 148,429 | 6,782 |
| Pernod Ricard SA | 40,624 | 6,195 |
| Dassault Systemes SE | 41,243 | 5,163 |
| Veolia Environnement SA | 249,840 | 4,979 |
| Sodexo SA | 40,591 | 4,143 |
| Eiffage SA | 33,530 | 3,275 |
| Alstom SA | 61,381 | 2,681 |
| Capgemini SE | 21,416 | 2,615 |
| Publicis Groupe SA | 42,340 | 2,451 |
| EssilorLuxottica SA | 15,111 | 2,064 |
| Lagardere SCA | 70,942 | 1,939 |
| Suez | 107,608 | 1,552 |
| SCOR SE | 28,753 | 1,329 |
| Covivio | 11,526 | 1,157 |
| Legrand SA | 14,345 | 937 |
| Ipsen SA | 4,557 | 632 |
| 93,611 | ||
| Germany (2.9%) | ||
| Deutsche Telekom AG | 961,479 | 15,770 |
| Deutsche Post AG | 356,181 | 11,246 |
| MTU Aero Engines AG | 32,501 | 6,901 |
| Henkel AG & Co. KGaA | ||
| Preference Shares | 59,430 | 6,493 |
| HUGO BOSS AG | 86,010 | 6,147 |
| Merck KGaA | 50,401 | 5,393 |
| Hannover Rueck SE | 26,902 | 3,618 |
| Fresenius SE & Co. KGaA | 56,165 | 3,570 |
| Beiersdorf AG | 30,239 | 3,127 |
| Aareal Bank AG | 80,125 | 2,981 |
| E.ON SE | 299,746 | 2,899 | |
| 2 | Scout24 AG | 66,268 | 2,746 |
| Fielmann AG | 43,608 | 2,705 | |
| Axel Springer SE | 38,553 | 2,560 | |
| Muenchener | |||
| Rueckversicherungs- | |||
| Gesellschaft AG in | |||
| Muenchen | 7,322 | 1,573 | |
| Fraport AG Frankfurt | |||
| Airport Services | |||
| Worldwide | 15,970 | 1,233 | |
| Brenntag AG | 23,192 | 1,211 | |
| RHOEN-KLINIKUM AG | 44,814 | 1,133 | |
| Fresenius Medical Care | |||
| AG & Co. KGaA | 14,355 | 1,127 | |
| *,2 | Delivery Hero SE | 27,859 | 1,122 |
| Freenet AG | 43,292 | 974 | |
| ProSiebenSat.1 Media SE | 42,098 | 972 | |
| Evonik Industries AG | 18,660 | 577 | |
| Rheinmetall AG | 6,494 | 562 | |
| Aurubis AG | 8,146 | 494 | |
| *,2 | Zalando SE | 11,772 | 455 |
| 87,589 | |||
| Hong Kong (1.8%) | |||
| CLP Holdings Ltd. | 2,168,350 | 24,297 | |
| Hang Seng Bank Ltd. | 424,500 | 9,954 | |
| Power Assets Holdings | |||
| Ltd. | 1,371,000 | 9,155 | |
| Yuexiu REIT | 5,326,000 | 3,235 | |
| Want Want China | |||
| Holdings Ltd. | 3,487,000 | 2,495 | |
| Chow Tai Fook Jewellery | |||
| Group Ltd. | 1,969,600 | 1,728 | |
| CK Infrastructure | |||
| Holdings Ltd. | 217,500 | 1,592 | |
| China Mengniu Dairy Co. | |||
| Ltd. | 482,000 | 1,426 | |
| MTR Corp. Ltd. | 104,500 | 507 | |
| Tingyi Cayman Islands | |||
| Holding Corp. | 302,000 | 448 | |
| 54,837 | |||
| India (1.4%) | |||
| HDFC Bank Ltd. ADR | 331,939 | 29,513 | |
| Infosys Ltd. ADR | 849,956 | 8,049 | |
| Dr Reddy’s Laboratories | |||
| Ltd. ADR | 160,635 | 5,467 | |
| 2 | Reliance Industries Ltd. | ||
| GDR | 26,708 | 762 | |
| 43,791 | |||
| Indonesia (0.2%) | |||
| Telekomunikasi Indonesia | |||
| Persero Tbk PT ADR | 286,923 | 7,231 | |
| Ireland (0.2%) | |||
| Kerry Group plc Class A | 34,890 | 3,574 | |
13
| Global Minimum Volatility Fund | |||
| Market | |||
| Value• | |||
| Shares | ($000) | ||
| * | ICON plc | 6,199 | 856 |
| Kingspan Group plc | 13,075 | 568 | |
| 4,998 | |||
| Israel (0.2%) | |||
| Bank Hapoalim BM | 679,226 | 4,595 | |
| Bank Leumi Le-Israel BM | 170,348 | 1,062 | |
| Paz Oil Co. Ltd. | 5,690 | 852 | |
| 6,509 | |||
| Italy (0.8%) | |||
| Assicurazioni Generali SPA | 405,209 | 6,539 | |
| Snam SPA | 946,154 | 3,912 | |
| Eni SPA | 180,000 | 3,197 | |
| UnipolSai Assicurazioni | |||
| SPA | 1,201,768 | 2,624 | |
| Davide Campari-Milano | |||
| SPA | 326,166 | 2,510 | |
| Terna Rete Elettrica | |||
| Nazionale SPA | 409,786 | 2,117 | |
| Mediobanca Banca di | |||
| Credito Finanziario SPA | 238,470 | 2,088 | |
| Atlantia SPA | 43,161 | 867 | |
| 23,854 | |||
| Japan (8.0%) | |||
| Canon Inc. | 511,900 | 14,581 | |
| Skylark Holdings Co. Ltd. | 915,100 | 14,247 | |
| NEC Corp. | 473,400 | 13,589 | |
| NTT DOCOMO Inc. | 526,800 | 13,064 | |
| Japan Tobacco Inc. | 472,000 | 12,128 | |
| Japan Post Holdings Co. | |||
| Ltd. | 963,600 | 11,427 | |
| ^ | Yamada Denki Co. Ltd. | 2,305,400 | 10,871 |
| ^ | Sawai Pharmaceutical Co. | ||
| Ltd. | 164,600 | 8,344 | |
| Daiichi Sankyo Co. Ltd. | 204,500 | 7,817 | |
| Mitsubishi Tanabe | |||
| Pharma Corp. | 526,300 | 7,774 | |
| Seven & i Holdings Co. | |||
| Ltd. | 172,300 | 7,461 | |
| Otsuka Holdings Co. Ltd. | 141,300 | 6,758 | |
| Kagome Co. Ltd. | 230,700 | 6,142 | |
| Lawson Inc. | 84,700 | 5,377 | |
| Toyo Suisan Kaisha Ltd. | 132,600 | 4,558 | |
| Chugoku Electric Power | |||
| Co. Inc. | 348,800 | 4,486 | |
| Taisho Pharmaceutical | |||
| Holdings Co. Ltd. | 37,700 | 4,020 | |
| Toho Co. Ltd. | 122,400 | 3,993 | |
| ABC-Mart Inc. | 66,800 | 3,905 | |
| Astellas Pharma Inc. | 239,100 | 3,694 | |
| Chugai Pharmaceutical | |||
| Co. Ltd. | 62,900 | 3,683 | |
| KDDI Corp. | 136,500 | 3,303 | |
| Ryohin Keikaku Co. Ltd. | 12,400 | 3,278 | |
| Sankyo Co. Ltd. | 81,700 | 3,119 | |
| Aozora Bank Ltd. | 90,000 | 3,106 | |
| Nitori Holdings Co. Ltd. | 22,600 | 2,951 | |
| Takashimaya Co. Ltd. | 174,500 | 2,746 | |
| Isetan Mitsukoshi Holdings | |||
| Ltd. | 221,000 | 2,583 | |
| Japan Airlines Co. Ltd. | 72,100 | 2,559 | |
| Nippon Telegraph & | |||
| Telephone Corp. | 59,700 | 2,462 | |
| Ajinomoto Co. Inc. | 148,100 | 2,393 | |
| Nissin Foods Holdings Co. | |||
| Ltd. | 37,100 | 2,392 | |
| Sumitomo Dainippon | |||
| Pharma Co. Ltd. | 113,800 | 2,378 | |
| K’s Holdings Corp. | 180,400 | 2,279 | |
| Dentsu Inc. | 45,100 | 2,092 | |
| Calbee Inc. | 62,800 | 2,083 | |
| Shionogi & Co. Ltd. | 32,400 | 2,072 | |
| Nippon Steel & Sumitomo | |||
| Metal Corp. | 94,000 | 1,734 | |
| Shimamura Co. Ltd. | 19,500 | 1,640 | |
| Rohto Pharmaceutical Co. | |||
| Ltd. | 51,000 | 1,615 | |
| MOS Food Services Inc. | 60,500 | 1,602 | |
| Nisshin Seifun Group Inc. | 77,500 | 1,542 | |
| Oriental Land Co. Ltd. | 16,200 | 1,524 | |
| Mitsubishi Materials Corp. | 51,700 | 1,431 | |
| Sega Sammy Holdings Inc. 107,300 | 1,378 | ||
| Fuji Media Holdings Inc. | 79,700 | 1,293 | |
| Secom Co. Ltd. | 14,800 | 1,212 | |
| Shimano Inc. | 7,600 | 1,038 | |
| Unicharm Corp. | 38,000 | 1,031 | |
| NH Foods Ltd. | 29,000 | 1,000 | |
| Ezaki Glico Co. Ltd. | 19,600 | 977 | |
| Benesse Holdings Inc. | 34,800 | 970 | |
| Hisamitsu Pharmaceutical | |||
| Co. Inc. | 17,100 | 964 | |
| Nippon Television Holdings | |||
| Inc. | 59,900 | 956 | |
| J Front Retailing Co. Ltd. | 72,900 | 955 | |
| Suzuken Co. Ltd. | 18,400 | 931 | |
| Kura Corp. | 15,800 | 916 | |
| Tsumura & Co. | 27,900 | 868 | |
| Sugi Holdings Co. Ltd. | 18,200 | 833 | |
| Marui Group Co. Ltd. | 37,200 | 801 | |
| MEIJI Holdings Co. Ltd. | 11,400 | 756 | |
| Kamigumi Co. Ltd. | 36,000 | 743 | |
| MediPal Holdings Corp. | 33,700 | 721 | |
| Studio Alice Co. Ltd. | 28,500 | 652 | |
| Kewpie Corp. | 28,100 | 646 | |
| Nichirei Corp. | 26,800 | 644 | |
| Hamamatsu Photonics KK | 19,000 | 635 | |
| Earth Corp. | 13,200 | 600 | |
| Bic Camera Inc. | 45,200 | 597 | |
| Yoshinoya Holdings Co. Ltd. | 31,400 | 516 | |
| ^ | UACJ Corp. | 20,900 | 456 |
| Sundrug Co. Ltd. | 12,100 | 440 | |
| 244,332 | |||
14
| Global Minimum Volatility Fund | ||
| Market | ||
| Value• | ||
| Shares | ($000) | |
| Mexico (0.4%) | ||
| Fomento Economico | ||
| Mexicano SAB de CV | ||
| ADR | 121,291 | 10,318 |
| Grupo Televisa SAB ADR | 92,350 | 1,328 |
| 11,646 | ||
| Netherlands (0.8%) | ||
| Koninklijke Ahold Delhaize | ||
| NV | 674,026 | 15,429 |
| Heineken NV | 45,502 | 4,094 |
| Akzo Nobel NV | 39,643 | 3,328 |
| Koninklijke KPN NV | 366,626 | 967 |
| Koninklijke Vopak NV | 8,000 | 362 |
| 24,180 | ||
| New Zealand (0.1%) | ||
| Spark New Zealand Ltd. | 1,236,367 | 3,193 |
| Norway (0.3%) | ||
| Orkla ASA | 1,103,743 | 9,525 |
| Poland (0.1%) | ||
| Powszechna Kasa | ||
| Oszczednosci Bank | ||
| Polski SA | 87,761 | 912 |
| Powszechny Zaklad | ||
| Ubezpieczen SA | 82,022 | 836 |
| Polski Koncern Naftowy | ||
| ORLEN SA | 33,682 | 810 |
| Bank Polska Kasa Opieki | ||
| SA | 24,731 | 674 |
| 3,232 | ||
| Singapore (0.5%) | ||
| Oversea-Chinese Banking | ||
| Corp. Ltd. | 814,348 | 6,326 |
| United Overseas Bank Ltd. | 306,300 | 5,416 |
| Singapore | ||
| Telecommunications | ||
| Ltd. | 1,339,900 | 3,061 |
| Singapore Airlines Ltd. | 140,540 | 963 |
| Singapore Technologies | ||
| Engineering Ltd. | 267,000 | 685 |
| Singapore Exchange Ltd. | 121,900 | 603 |
| 17,054 | ||
| South Africa (0.1%) | ||
| AngloGold Ashanti Ltd. | ||
| ADR | 325,726 | 3,065 |
| South Korea (1.8%) | ||
| KT Corp. | 510,114 | 12,834 |
| Korea Zinc Co. Ltd. | 34,802 | 11,607 |
| KT&G Corp. | 89,104 | 7,946 |
| SK Telecom Co. Ltd. | 26,464 | 6,218 |
| S-Oil Corp. | 35,502 | 3,874 |
| Maeil Dairies Co. Ltd. | 33,866 | 2,249 |
| GS Holdings Corp. | 51,116 | 2,182 |
| Samsung Fire & Marine | |||
| Insurance Co. Ltd. | 8,447 | 2,067 | |
| Kangwon Land Inc. | 64,885 | 1,643 | |
| Woori Bank | 101,757 | 1,410 | |
| Yuhan Corp. | 5,881 | 867 | |
| Macquarie Korea | |||
| Infrastructure Fund | 106,880 | 850 | |
| Hyundai Department | |||
| tore Co. Ltd. | 6,499 | 497 | |
| 54,244 | |||
| Spain (0.9%) | |||
| Enagas SA | 274,214 | 7,270 | |
| Merlin Properties Socimi | |||
| SA | 557,221 | 6,982 | |
| Red Electrica Corp. SA | 222,912 | 4,616 | |
| Endesa SA | 140,657 | 2,941 | |
| Bankinter SA | 213,493 | 1,749 | |
| Viscofan SA | 15,824 | 947 | |
| Ebro Foods SA | 40,418 | 793 | |
| Acerinox SA | 65,321 | 730 | |
| Telefonica SA | 84,013 | 689 | |
| Mediaset Espana | |||
| Comunicacion SA | 77,727 | 529 | |
| 27,246 | |||
| Sweden (1.0%) | |||
| Swedish Match AB | 418,420 | 21,314 | |
| Essity AB Class B | 174,354 | 3,979 | |
| Tele2 AB | 225,278 | 2,558 | |
| ^ | ICA Gruppen AB | 61,545 | 2,177 |
| Telia Co. AB | 450,547 | 2,028 | |
| 32,056 | |||
| Switzerland (3.2%) | |||
| Swisscom AG | 56,316 | 25,786 | |
| Sonova Holding AG | 95,983 | 15,653 | |
| Kuehne & Nagel | |||
| International AG | 108,640 | 15,099 | |
| Logitech International SA | 242,391 | 8,974 | |
| Baloise Holding AG | 60,686 | 8,674 | |
| Partners Group Holding AG | 7,766 | 5,529 | |
| Straumann Holding AG | 7,358 | 5,023 | |
| Flughafen Zurich AG | 14,896 | 2,944 | |
| Swiss Prime Site AG | 35,518 | 2,882 | |
| dormakaba Holding AG | 2,472 | 1,783 | |
| Allreal Holding AG | 9,242 | 1,418 | |
| Chocoladefabriken Lindt & | |||
| Spruengli AG | 178 | 1,227 | |
| Siegfried Holding AG | 2,483 | 996 | |
| 2 | Sunrise Communications | ||
| Group AG | 7,436 | 655 | |
| Swiss Life Holding AG | 1,704 | 643 | |
| 97,286 | |||
| Taiwan (0.7%) | |||
| Taiwan Semiconductor | |||
| Manufacturing Co. Ltd. | |||
| ADR | 290,485 | 11,067 | |
15
| Global Minimum Volatility Fund | |||
| Market | |||
| Value• | |||
| Shares | ($000) | ||
| Chunghwa Telecom Co. | |||
| Ltd. ADR | 212,819 | 7,466 | |
| United Microelectronics | |||
| Corp. ADR | 995,508 | 1,872 | |
| 20,405 | |||
| United Kingdom (5.3%) | |||
| GlaxoSmithKline plc | 1,172,613 | 22,711 | |
| Wm Morrison | |||
| Supermarkets plc | 3,751,538 | 11,886 | |
| Coca-Cola HBC AG | 364,790 | 10,775 | |
| Informa plc | 1,150,577 | 10,500 | |
| B&M European Value | |||
| Retail SA | 1,847,437 | 9,831 | |
| RSA Insurance Group plc 1,003,753 | 7,219 | ||
| Royal Dutch Shell plc | |||
| Class B | 220,000 | 7,175 | |
| Smith & Nephew plc | 436,406 | 7,094 | |
| Rightmove plc | 1,122,620 | 6,480 | |
| Tate & Lyle plc | 639,600 | 5,499 | |
| Compass Group plc | 273,047 | 5,371 | |
| Segro plc | 565,602 | 4,434 | |
| AstraZeneca plc | 57,793 | 4,421 | |
| Legal & General Group | |||
| plc | 1,234,390 | 3,961 | |
| Marks & Spencer Group | |||
| plc | 945,795 | 3,577 | |
| Pearson plc | 265,908 | 3,055 | |
| InterContinental Hotels | |||
| Group plc | 56,328 | 2,956 | |
| British Land Co. plc | 357,187 | 2,698 | |
| Whitbread plc | 42,714 | 2,402 | |
| Tesco plc | 858,633 | 2,338 | |
| SSE plc | 157,578 | 2,297 | |
| 2 | Merlin Entertainments plc | 532,359 | 2,199 |
| WH Smith plc | 82,727 | 2,056 | |
| UDG Healthcare plc | 205,596 | 1,658 | |
| Meggitt plc | 217,708 | 1,473 | |
| Inchcape plc | 208,142 | 1,438 | |
| Antofagasta plc | 136,063 | 1,362 | |
| BAE Systems plc | 189,630 | 1,272 | |
| Centrica plc | 625,777 | 1,175 | |
| DCC plc | 12,780 | 1,095 | |
| Next plc | 15,409 | 1,024 | |
| UK Commercial Property | |||
| REIT Ltd. | 899,207 | 1,008 | |
| Croda International plc | 15,997 | 985 | |
| ITV plc | 419,590 | 796 | |
| Direct Line Insurance | |||
| Group plc | 180,567 | 759 | |
| F&C Commercial Property | |||
| Trust Ltd. | 434,498 | 747 | |
| Derwent London plc | 19,681 | 736 | |
| St. James’s Place plc | 54,849 | 709 | |
| Associated British Foods | |||
| plc | 22,516 | 686 | |
| Kingfisher plc | 203,970 | 662 | |
| J Sainsbury plc | 165,110 | 656 | |
| Paddy Power Betfair plc | 7,479 | 641 | |
| Land Securities Group plc | 58,496 | 636 | |
| Schroders plc | 18,169 | 622 | |
| * | Indivior plc | 234,263 | 564 |
| Reckitt Benckiser Group plc | 6,727 | 544 | |
| TUI AG | 29,315 | 486 | |
| * | BTG plc | 62,378 | 439 |
| Saga plc | 229,498 | 349 | |
| 163,457 | |||
| United States (54.9%) | |||
| Communication Services (1.6%) | |||
| * | Madison Square Garden Co. | ||
| Class A | 49,190 | 13,607 | |
| Omnicom Group Inc. | 140,118 | 10,414 | |
| Cable One Inc. | 6,498 | 5,820 | |
| John Wiley & Sons Inc. | |||
| Class A | 105,106 | 5,701 | |
| * | Live Nation Entertainment | ||
| Inc. | 37,610 | 1,967 | |
| Tribune Media Co. Class A | 45,394 | 1,725 | |
| * | Zayo Group Holdings Inc. | 57,030 | 1,704 |
| New York Times Co. Class A | 60,550 | 1,599 | |
| Cinemark Holdings Inc. | 34,226 | 1,423 | |
| * | Liberty Media Corp-Liberty | ||
| Formula One | 34,303 | 1,135 | |
| * | Liberty Media Corp-Liberty | ||
| SiriusXM Class C | 25,431 | 1,050 | |
| * | Liberty Media Corp-Liberty | ||
| SiriusXM Class A | 19,623 | 809 | |
| News Corp. Class A | 57,416 | 757 | |
| * | Vonage Holdings Corp. | 51,969 | 689 |
| 48,400 | |||
| Consumer Discretionary (4.8%) | |||
| Service Corp. International | 544,011 | 22,560 | |
| Yum China Holdings Inc. | 403,479 | 14,558 | |
| TJX Cos. Inc. | 113,864 | 12,511 | |
| * | Grand Canyon Education | ||
| Inc. | 98,053 | 12,227 | |
| * | Bright Horizons Family | ||
| Solutions Inc. | 83,386 | 9,582 | |
| Ross Stores Inc. | 81,351 | 8,054 | |
| Pool Corp. | 40,381 | 5,886 | |
| * | Burlington Stores Inc. | 33,660 | 5,772 |
| Darden Restaurants Inc. | 53,265 | 5,675 | |
| Aramark | 134,505 | 4,831 | |
| Vail Resorts Inc. | 18,773 | 4,718 | |
| Dunkin’ Brands Group Inc. | 60,533 | 4,392 | |
| Churchill Downs Inc. | 16,038 | 4,003 | |
| Hyatt Hotels Corp. Class A | 56,778 | 3,929 | |
| * | Five Below Inc. | 32,337 | 3,681 |
| ^ | Cracker Barrel Old Country | ||
| Store Inc. | 18,083 | 2,869 | |
| Hasbro Inc. | 28,527 | 2,616 | |
16
| Global Minimum Volatility Fund | |||
| Market | |||
| Value• | |||
| Shares | ($000) | ||
| * | ServiceMaster Global | ||
| Holdings Inc. | 53,676 | 2,302 | |
| Graham Holdings Co. Class B | 3,895 | 2,263 | |
| Genuine Parts Co. | 22,435 | 2,197 | |
| Choice Hotels International | |||
| Inc. | 21,749 | 1,596 | |
| Yum! Brands Inc. | 17,076 | 1,544 | |
| * | Murphy USA Inc. | 15,687 | 1,265 |
| Columbia Sportswear Co. | 13,032 | 1,177 | |
| Texas Roadhouse Inc. | |||
| Class A | 17,927 | 1,084 | |
| Extended Stay America Inc. | 59,080 | 962 | |
| Aaron’s Inc. | 18,457 | 870 | |
| Callaway Golf Co. | 32,446 | 694 | |
| Wolverine World Wide Inc. | 19,535 | 687 | |
| Lithia Motors Inc. Class A | 7,560 | 674 | |
| Caleres Inc. | 17,496 | 598 | |
| * | Adtalem Global Education | ||
| Inc. | 9,000 | 456 | |
| 146,233 | |||
| Consumer Staples (4.2%) | |||
| Church & Dwight Co. Inc. | 496,058 | 29,451 | |
| Archer-Daniels-Midland Co. | 275,461 | 13,015 | |
| Colgate-Palmolive Co. | 200,380 | 11,933 | |
| Vector Group Ltd. | 869,258 | 11,752 | |
| 3 | Clorox Co. | 61,405 | 9,115 |
| Coca-Cola Co. | 164,700 | 7,886 | |
| Kimberly-Clark Corp. | 66,329 | 6,918 | |
| Costco Wholesale Corp. | 30,000 | 6,859 | |
| Procter & Gamble Co. | 73,366 | 6,506 | |
| Lancaster Colony Corp. | 37,365 | 6,404 | |
| Sysco Corp. | 66,363 | 4,734 | |
| Hershey Co. | 33,995 | 3,642 | |
| Hormel Foods Corp. | 72,386 | 3,159 | |
| Bunge Ltd. | 46,355 | 2,865 | |
| J&J Snack Foods Corp. | 8,387 | 1,310 | |
| Coca-Cola European | |||
| Partners plc | 27,089 | 1,232 | |
| PriceSmart Inc. | 13,028 | 914 | |
| Lamb Weston Holdings Inc. | 11,451 | 895 | |
| 128,590 | |||
| Energy (0.2%) | |||
| ONEOK Inc. | 71,694 | 4,703 | |
| Cabot Oil & Gas Corp. | 48,040 | 1,164 | |
| Ship Finance International | |||
| Ltd. | 77,542 | 969 | |
| 6,836 | |||
| Financials (11.4%) | |||
| Starwood Property Trust | |||
| Inc. | 2,117,399 | 45,990 | |
| Blackstone Mortgage | |||
| Trust Inc. Class A | 1,213,930 | 40,958 | |
| Apollo Commercial Real | |||
| Estate Finance Inc. | 1,276,038 | 23,875 | |
| AGNC Investment Corp. | 1,317,421 | 23,503 | |
| RenaissanceRe Holdings | |||
| Ltd. | 149,865 | 18,308 | |
| 4 | Brown & Brown Inc. | 539,994 | 15,217 |
| New Residential | |||
| Investment Corp. | 839,190 | 15,005 | |
| Arthur J Gallagher & Co. | 197,062 | 14,585 | |
| Washington Federal Inc. | 478,903 | 13,486 | |
| Two Harbors Investment | |||
| Corp. | 741,978 | 10,900 | |
| White Mountains Insurance | |||
| Group Ltd. | 11,576 | 10,264 | |
| Marsh & McLennan Cos. | |||
| Inc. | 115,997 | 9,831 | |
| Annaly Capital | |||
| Management Inc. | 973,089 | 9,604 | |
| Torchmark Corp. | 103,643 | 8,774 | |
| Bank of Hawaii Corp. | 89,616 | 7,029 | |
| Aon plc | 38,384 | 5,995 | |
| Capitol Federal Financial | |||
| Inc. | 455,900 | 5,658 | |
| ProAssurance Corp. | 115,023 | 5,052 | |
| MFA Financial Inc. | 671,474 | 4,653 | |
| Commerce Bancshares Inc. | 72,856 | 4,634 | |
| * | Arch Capital Group Ltd. | 153,715 | 4,361 |
| Chimera Investment Corp. | 224,401 | 4,174 | |
| WR Berkley Corp. | 50,652 | 3,844 | |
| TFS Financial Corp. | 219,700 | 3,232 | |
| American Financial Group | |||
| Inc. | 32,163 | 3,217 | |
| Old Republic International | |||
| Corp. | 139,839 | 3,083 | |
| Oritani Financial Corp. | 206,400 | 3,015 | |
| Willis Towers Watson plc | 16,123 | 2,308 | |
| * | Markel Corp. | 2,040 | 2,230 |
| Northwest Bancshares Inc. 128,863 | 2,080 | ||
| Invesco Mortgage Capital | |||
| Inc. | 114,359 | 1,725 | |
| Everest Re Group Ltd. | 7,759 | 1,690 | |
| Capstead Mortgage Corp. | 241,849 | 1,659 | |
| People’s United Financial | |||
| Inc. | 99,682 | 1,561 | |
| Loews Corp. | 32,594 | 1,518 | |
| First Hawaiian Inc. | 55,251 | 1,369 | |
| Fidelity National Financial | |||
| Inc. | 38,990 | 1,304 | |
| Alleghany Corp. | 1,988 | 1,194 | |
| Cullen/Frost Bankers Inc. | 12,049 | 1,180 | |
| Investors Bancorp Inc. | 102,965 | 1,151 | |
| Granite Point Mortgage | |||
| Trust Inc. | 54,907 | 1,022 | |
| Mercury General Corp. | 13,894 | 824 | |
| Primerica Inc. | 6,617 | 726 | |
| ARMOUR Residential REIT | |||
| Inc. | 32,000 | 697 | |
| FNB Corp. | 58,304 | 690 | |
17
| Global Minimum Volatility Fund | |||
| Market | |||
| Value• | |||
| Shares | ($000) | ||
| Hanover Insurance Group Inc. | 6,124 | 682 | |
| Redwood Trust Inc. | 36,230 | 595 | |
| Old National Bancorp | 32,114 | 573 | |
| Safety Insurance Group Inc. | 6,600 | 550 | |
| Cathay General Bancorp | 14,272 | 538 | |
| IBERIABANK Corp. | 7,000 | 521 | |
| Trustmark Corp. | 16,020 | 493 | |
| Home BancShares Inc. | 25,860 | 492 | |
| First Citizens BancShares | |||
| Inc. Class A | 1,000 | 427 | |
| First Financial Bankshares | |||
| Inc. | 5,000 | 295 | |
| PennyMac Mortgage | |||
| Investment Trust | 13,255 | 256 | |
| Independent Bank Corp. | 3,000 | 235 | |
| First Midwest Bancorp Inc. | 10,000 | 230 | |
| 349,062 | |||
| Health Care (5.4%) | |||
| 3 | Quest Diagnostics Inc. | 302,877 | 28,504 |
| Chemed Corp. | 86,984 | 26,472 | |
| *,3 | Premier Inc. Class A | 298,112 | 13,415 |
| * | Centene Corp. | 101,608 | 13,242 |
| Cigna Corp. | 58,801 | 12,572 | |
| Eli Lilly & Co. | 109,666 | 11,892 | |
| HCA Healthcare Inc. | 52,583 | 7,021 | |
| Universal Health Services | |||
| Inc. Class B | 53,444 | 6,497 | |
| * | Henry Schein Inc. | 67,355 | 5,590 |
| * | Laboratory Corp. of America | ||
| Holdings | 34,695 | 5,570 | |
| Humana Inc. | 17,288 | 5,539 | |
| Pfizer Inc. | 113,097 | 4,870 | |
| * | Molina Healthcare Inc. | 29,582 | 3,750 |
| Encompass Health Corp. | 55,042 | 3,704 | |
| STERIS plc | 29,223 | 3,194 | |
| * | DaVita Inc. | 45,209 | 3,044 |
| * | WellCare Health Plans Inc. | 9,794 | 2,703 |
| * | Varian Medical Systems Inc. | 20,456 | 2,442 |
| West Pharmaceutical | |||
| Services Inc. | 14,204 | 1,505 | |
| * | Tivity Health Inc. | 41,562 | 1,430 |
| * | LHC Group Inc. | 8,876 | 812 |
| * | Magellan Health Inc. | 12,294 | 800 |
| * | Amedisys Inc. | 5,554 | 611 |
| * | China Biologic Products | ||
| Holdings Inc. | 8,243 | 548 | |
| 165,727 | |||
| Industrials (5.1%) | |||
| Expeditors International of | |||
| Washington Inc. | 429,090 | 28,826 | |
| Waste Management Inc. | 276,960 | 24,780 | |
| Republic Services Inc. | |||
| Class A | 289,648 | 21,052 | |
| Harris Corp. | 108,243 | 16,097 | |
| BWX Technologies Inc. | 247,041 | 14,442 | |
| Rollins Inc. | 206,167 | 12,205 | |
| Carlisle Cos. Inc. | 61,603 | 5,950 | |
| * | AerCap Holdings NV | 103,556 | 5,186 |
| Hexcel Corp. | 74,622 | 4,367 | |
| Cintas Corp. | 22,330 | 4,061 | |
| * | Teledyne Technologies Inc. | 17,400 | 3,850 |
| General Dynamics Corp. | 20,100 | 3,469 | |
| National Presto Industries | |||
| Inc. | 17,011 | 2,121 | |
| Curtiss-Wright Corp. | 12,397 | 1,357 | |
| EMCOR Group Inc. | 18,738 | 1,330 | |
| * | AECOM | 37,956 | 1,106 |
| Macquarie Infrastructure | |||
| Corp. | 27,341 | 1,010 | |
| UniFirst Corp. | 5,821 | 869 | |
| HEICO Corp. | 10,113 | 848 | |
| Comfort Systems USA Inc. | 13,695 | 732 | |
| MSA Safety Inc. | 6,534 | 682 | |
| Valmont Industries Inc. | 5,378 | 669 | |
| Deluxe Corp. | 9,002 | 425 | |
| 155,434 | |||
| Information Technology (9.0%) | |||
| 3 | Jack Henry & Associates | ||
| Inc. | 281,537 | 42,183 | |
| Amdocs Ltd. | 630,040 | 39,863 | |
| Broadridge Financial | |||
| Solutions Inc. | 275,256 | 32,188 | |
| Fidelity National Information | |||
| Services Inc. | 272,519 | 28,369 | |
| 3 | Paychex Inc. | 353,707 | 23,164 |
| MAXIMUS Inc. | 173,647 | 11,282 | |
| Motorola Solutions Inc. | 78,062 | 9,567 | |
| * | Fiserv Inc. | 115,386 | 9,150 |
| Automatic Data Processing | |||
| Inc. | 60,455 | 8,710 | |
| Genpact Ltd. | 278,103 | 7,623 | |
| Amphenol Corp. Class A | 82,408 | 7,376 | |
| * | Synopsys Inc. | 67,688 | 6,060 |
| * | Tyler Technologies Inc. | 24,828 | 5,255 |
| Booz Allen Hamilton Holding | |||
| Corp. Class A | 102,212 | 5,064 | |
| Juniper Networks Inc. | 156,113 | 4,569 | |
| Dolby Laboratories Inc. | |||
| Class A | 59,626 | 4,103 | |
| * | F5 Networks Inc. | 22,708 | 3,980 |
| FLIR Systems Inc. | 74,832 | 3,466 | |
| * | Black Knight Inc. | 62,108 | 3,029 |
| InterDigital Inc. | 41,765 | 2,963 | |
| * | Bottomline Technologies | ||
| DE Inc. | 38,975 | 2,597 | |
| * | Check Point Software | ||
| Technologies Ltd. | 23,274 | 2,583 | |
| CDK Global Inc. | 43,763 | 2,505 | |
| Western Union Co. | 135,346 | 2,442 | |
| * | Euronet Worldwide Inc. | 14,108 | 1,569 |
18
| Global Minimum Volatility Fund | |||
| Market | |||
| Value• | |||
| Shares | ($000) | ||
| * | ExlService Holdings Inc. | 19,412 | 1,244 |
| * | ARRIS International plc | 40,521 | 1,008 |
| * | InterXion Holding NV | 15,315 | 902 |
| ^,* | ViaSat Inc. | 13,617 | 868 |
| * | CACI International Inc. | ||
| Class A | 4,783 | 854 | |
| * | CoreLogic Inc. | 17,606 | 715 |
| * | Viavi Solutions Inc. | 58,513 | 675 |
| * | EPAM Systems Inc. | 5,057 | 604 |
| 276,530 | |||
| Materials (2.5%) | |||
| AptarGroup Inc. | 269,622 | 27,491 | |
| Kaiser Aluminum Corp. | 151,369 | 14,436 | |
| Sonoco Products Co. | 199,070 | 10,865 | |
| Avery Dennison Corp. | 64,931 | 5,891 | |
| Royal Gold Inc. | 62,016 | 4,752 | |
| Compass Minerals | |||
| International Inc. | 75,877 | 3,681 | |
| Newmont Mining Corp. | 93,385 | 2,887 | |
| Reliance Steel & | |||
| Aluminum Co. | 27,134 | 2,141 | |
| Bemis Co. Inc. | 42,690 | 1,954 | |
| Silgan Holdings Inc. | 33,250 | 799 | |
| Sensient Technologies Corp. | 8,876 | 576 | |
| 75,473 | |||
| Real Estate (6.7%) | |||
| Equity Commonwealth | 863,590 | 25,718 | |
| Mid-America Apartment | |||
| Communities Inc. | 162,078 | 15,837 | |
| Highwoods Properties Inc. | 283,495 | 12,088 | |
| Rayonier Inc. | 379,328 | 11,456 | |
| PS Business Parks Inc. | 86,994 | 11,361 | |
| Equity LifeStyle Properties | |||
| Inc. | 107,882 | 10,215 | |
| 4 | Apple Hospitality REIT Inc. | 571,933 | 9,248 |
| Lamar Advertising Co. | |||
| Class A | 116,889 | 8,570 | |
| UDR Inc. | 175,503 | 6,878 | |
| WP Carey Inc. | 91,102 | 6,014 | |
| 4 | Hudson Pacific Properties | ||
| Inc. | 187,041 | 5,667 | |
| Camden Property Trust | 57,562 | 5,196 | |
| Sun Communities Inc. | 50,564 | 5,080 | |
| EastGroup Properties Inc. | 52,849 | 5,062 | |
| STAG Industrial Inc. | 187,110 | 4,951 | |
| American Homes 4 Rent | |||
| Class A | 204,147 | 4,301 | |
| First Industrial Realty | |||
| Trust Inc. | 139,199 | 4,273 | |
| Gaming and Leisure | |||
| Properties Inc. | 112,776 | 3,800 | |
| Douglas Emmett Inc. | 98,502 | 3,565 | |
| Life Storage Inc. | 33,170 | 3,123 | |
| Piedmont Office Realty | |||
| Trust Inc. Class A | 161,294 | 2,907 | |
| Empire State Realty Trust | |||
| Inc. | 175,348 | 2,781 | |
| National Health Investors | |||
| Inc. | 37,412 | 2,748 | |
| Healthcare Realty Trust Inc. | 97,524 | 2,717 | |
| Rexford Industrial Realty Inc. | 78,188 | 2,476 | |
| Terreno Realty Corp. | 58,765 | 2,200 | |
| Cousins Properties Inc. | 262,880 | 2,185 | |
| Liberty Property Trust | 49,083 | 2,055 | |
| AvalonBay Communities Inc. | 10,754 | 1,886 | |
| Healthcare Trust of America | |||
| Inc. Class A | 61,219 | 1,608 | |
| Medical Properties Trust Inc. 106,807 | 1,587 | ||
| ^ | National Retail Properties | ||
| Inc. | 33,465 | 1,565 | |
| Invitation Homes Inc. | 67,685 | 1,481 | |
| Duke Realty Corp. | 50,390 | 1,389 | |
| CubeSmart | 47,614 | 1,380 | |
| Weyerhaeuser Co. | 49,320 | 1,313 | |
| Kilroy Realty Corp. | 17,238 | 1,187 | |
| Outfront Media Inc. | 64,294 | 1,139 | |
| CorePoint Lodging Inc. | 58,159 | 952 | |
| Urstadt Biddle Properties | |||
| Inc. Class A | 40,998 | 816 | |
| Alexandria Real Estate | |||
| Equities Inc. | 5,878 | 719 | |
| Corporate Office Properties | |||
| Trust | 25,619 | 662 | |
| Ryman Hospitality | |||
| Properties Inc. | 8,425 | 654 | |
| Brandywine Realty Trust | 45,892 | 645 | |
| Hospitality Properties Trust | 24,687 | 633 | |
| VEREIT Inc. | 82,255 | 603 | |
| Universal Health Realty | |||
| Income Trust | 8,800 | 564 | |
| Paramount Group Inc. | 38,100 | 545 | |
| 203,800 | |||
| Utilities (4.0%) | |||
| IDACORP Inc. | 201,663 | 18,807 | |
| 3 | Ameren Corp. | 192,534 | 12,434 |
| Hawaiian Electric Industries | |||
| Inc. | 310,402 | 11,578 | |
| NorthWestern Corp. | 183,765 | 10,798 | |
| ALLETE Inc. | 132,946 | 9,838 | |
| Portland General Electric Co. 182,616 | 8,232 | ||
| OGE Energy Corp. | 176,784 | 6,391 | |
| MDU Resources Group Inc. | 253,723 | 6,333 | |
| Southern Co. | 133,667 | 6,019 | |
| DTE Energy Co. | 44,247 | 4,973 | |
| FirstEnergy Corp. | 119,247 | 4,446 | |
| CMS Energy Corp. | 77,812 | 3,853 | |
| WEC Energy Group Inc. | 51,120 | 3,497 | |
| Pinnacle West Capital Corp. | 37,117 | 3,053 | |
| NiSource Inc. | 117,675 | 2,984 | |
| El Paso Electric Co. | 50,531 | 2,883 | |
19
| Global Minimum Volatility Fund | ||
| Market | ||
| Value• | ||
| Shares | ($000) | |
| Eversource Energy | 36,445 | 2,306 |
| Alliant Energy Corp. | 47,673 | 2,049 |
| Evergy Inc. | 21,457 | 1,201 |
| Black Hills Corp. | 13,028 | 775 |
| 122,450 | ||
| 1,678,535 | ||
| Total Common Stocks | ||
| (Cost $2,868,313) | 3,034,830 | |
| Temporary Cash Investments (1.1%)1 | ||
| Money Market Fund (1.1%) | ||
| 5,6 Vanguard Market Liquidity | ||
| Fund, 2.308% | 316,720 | 31,672 |
| Face | ||
| Amount | ||
| ($000) | ||
| U. S. Government and Agency Obligations (0.0%) | ||
| 4 United States Treasury | ||
| Bill, 2.088%, 12/27/18 | 1,000 | 996 |
| Total Temporary Cash Investments | ||
| (Cost $32,668) | 32,668 | |
| Total Investments (100.3%) | ||
| (Cost $2,900,981) | 3,067,498 | |
| Amount | ||
| ($000) | ||
| Other Assets and Liabilities (-0.3%) | ||
| Other Assets | ||
| Investment in Vanguard | 161 | |
| Receivables for Accrued Income | 5,924 | |
| Receivables for Capital Shares Issued | 2,763 | |
| Variation Margin Receivable— | ||
| Futures Contracts | 105 | |
| Unrealized Appreciation— | ||
| Forwards Contracts | 11,982 | |
| Other Assets | 184 | |
| Total Other Assets | 21,119 | |
| Liabilities | ||
| Payables for Investment Securities | ||
| Purchased | (5,098) | |
| Collateral for Securities on Loan | (22,047) | |
| Payables for Capital Shares Redeemed | (1,444) | |
| Payables to Vanguard | (510) | |
| Variation Margin Payable— | ||
| Futures Contracts | (9) | |
| Unrealized Depreciation— | ||
| Forwards Contracts | (1,762) | |
| Total Liabilities | (30,870) | |
| Net Assets (100%) | 3,057,747 | |
| At October 31, 2018, net assets consisted of: | |
| Amount | |
| ($000) | |
| Paid-in Capital | 2,697,348 |
| Total Distributable Earnings (Loss) | 360,399 |
| Net Assets | 3,057,747 |
| Investor Shares—Net Assets | |
| Applicable to 37,412,087 outstanding | |
| $.001 par value shares of beneficial | |
| interest (unlimited authorization) | 515,362 |
| Net Asset Value Per Share— | |
| Investor Shares | $13.78 |
| Admiral Shares—Net Assets | |
| Applicable to 92,183,094 outstanding | |
| $.001 par value shares of beneficial | |
| interest (unlimited authorization) | 2,542,385 |
| Net Asset Value Per Share— | |
| Admiral Shares | $27.58 |
• See Note A in Notes to Financial Statements.
^ Includes partial security positions on loan to broker-dealers.
The total value of securities on loan is $20,965,000.
* Non-income-producing security.
1 The fund invests a portion of its cash reserves in equity
markets through the use of index futures contracts. After
giving effect to futures investments, the fund’s effective
common stock and temporary cash investment positions
represent 99.7% and 0.6%, respectively, of net assets.
2 Security exempt from registration under Rule 144A of the
Securities Act of 1933. Such securities may be sold in
transactions exempt from registration, normally to qualified
institutional buyers. At October 31, 2018, the aggregate value
of these securities was $8,718,000, representing 0.3% of
net assets.
3 Securities with a value of $3,359,000 have been segregated
as collateral for open forward currency contracts.
4 Securities with a value of $1,172,000 have been segregated as
initial margin for open futures contracts.
5 Affiliated money market fund available only to Vanguard funds
and certain trusts and accounts managed by Vanguard. Rate
shown is the 7-day yield.
6 Includes $22,047,000 of collateral received for securities
on loan.
ADR—American Depositary Receipt.
GDR—Global Depositary Receipt.
REIT—Real Estate Investment Trust.
| Global Minimum Volatility Fund | ||||||
| Derivative Financial Instruments Outstanding as of Period End | ||||||
| Futures Contracts | ||||||
| ($000) | ||||||
| Value and | ||||||
| Number of | Unrealized | |||||
| Long (Short) | Notional | Appreciation | ||||
| Expiration | Contracts | Amount | (Depreciation) | |||
| Long Futures Contracts | ||||||
| E-mini S&P 500 Index | December 2018 | 76 | 10,302 | 130 | ||
| FTSE 100 Index | December 2018 | 14 | 1,272 | (18) | ||
| Dow Jones EURO STOXX 50 Index | December 2018 | 34 | 1,230 | (57) | ||
| Topix Index | December 2018 | 5 | 727 | 5 | ||
| S&P ASX 200 Index | December 2018 | 6 | 616 | (35) | ||
| 25 | ||||||
| Forward Currency Contracts | ||||||
| Unrealized | ||||||
| Contract | Appreciation | |||||
| Settlement | Contract Amount (000) | (Depreciation) | ||||
| Counterparty | Date | Receive | Deliver | ($000) | ||
| Deutsche Bank AG | 11/15/18 | TWD | 494,646 | USD | 15,990 | 12 |
| Goldman Sachs International | 11/15/18 | JPY | 1,290,037 | USD | 11,491 | (45) |
| BNP Paribas | 11/15/18 | USD | 279,532 | EUR | 243,531 | 3,366 |
| Deutsche Bank AG | 11/15/18 | USD | 248,592 | JPY | 28,102,783 | (740) |
| Toronto-Dominion Bank | 11/15/18 | USD | 163,664 | GBP | 125,077 | 3,686 |
| Toronto-Dominion Bank | 11/15/18 | USD | 124,164 | CAD | 161,131 | 1,734 |
| Toronto-Dominion Bank | 11/15/18 | USD | 98,793 | CHF | 97,952 | 1,405 |
| Deutsche Bank AG | 11/15/18 | USD | 92,591 | AUD | 131,059 | (233) |
| Toronto-Dominion Bank | 11/15/18 | USD | 88,807 | HKD | 695,435 | 76 |
| Deutsche Bank AG | 11/15/18 | USD | 57,027 | KRW | 64,673,941 | 251 |
| Goldman Sachs International | 11/15/18 | USD | 43,632 | INR | 3,253,406 | (284) |
| BNP Paribas | 11/15/18 | USD | 35,755 | TWD | 1,108,589 | (109) |
| Deutsche Bank AG | 11/15/18 | USD | 31,726 | SEK | 288,804 | 128 |
| Toronto-Dominion Bank | 11/16/18 | USD | 24,453 | BRL | 91,801 | (175) |
| Goldman Sachs International | 11/15/18 | USD | 17,568 | SGD | 24,347 | (14) |
| Goldman Sachs International | 11/15/18 | USD | 14,741 | DKK | 95,734 | 189 |
| Goldman Sachs International | 11/15/18 | USD | 13,224 | MXN | 253,082 | 796 |
| Goldman Sachs International | 11/15/18 | USD | 9,350 | EUR | 8,256 | (13) |
| BNP Paribas | 11/15/18 | USD | 8,497 | NOK | 70,423 | 138 |
21
| Global Minimum Volatility Fund | ||||||
| Forward Currency Contracts (continued) | ||||||
| Unrealized | ||||||
| Contract | Appreciation | |||||
| Settlement | Contract Amount (000) | (Depreciation) | ||||
| Counterparty | Date | Receive | Deliver | ($000) | ||
| Deutsche Bank AG | 11/15/18 | USD | 6,604 | IDR | 101,881,401 | (85) |
| BNP Paribas | 11/15/18 | USD | 5,675 | ILS | 20,615 | 127 |
| Goldman Sachs International | 11/15/18 | USD | 3,448 | CLP | 2,348,307 | 72 |
| BNP Paribas | 11/15/18 | USD | 3,100 | NZD | 4,819 | (44) |
| Goldman Sachs International | 11/15/18 | USD | 1,716 | HKD | 13,434 | 2 |
| Goldman Sachs International | 11/15/18 | USD | 1,517 | ZAR | 22,667 | (17) |
| Goldman Sachs International | 11/15/18 | USD | 593 | JPY | 67,058 | (2) |
| Goldman Sachs International | 11/15/18 | USD | 52 | NZD | 81 | (1) |
| 10,220 | ||||||
AUD—Australian dollar.
BRL—Brazilian real.
CAD—Canadian dollar.
CHF—Swiss franc.
CLP—Chilean peso.
DKK—Danish krone.
EUR—Euro.
GBP—British pound.
HKD—Hong Kong dollar.
IDR—Indonesian rupiah.
ILS—Israeli shekel.
INR—Indian rupee.
JPY—Japanese yen.
KRW—Korean won.
MXN—Mexican peso.
NOK—Norwegian krone.
NZD—New Zealand dollar.
SEK—Swedish krona.
SGD—Singapore dollar.
TWD—Taiwanese dollar.
USD—U.S. dollar.
ZAR—South African rand.
At October 31, 2018, the counterparties had deposited in segregated accounts securities with a value of $9,693,000 in connection with open forward currency contracts. After October 31, 2018, the counterparties posted additional collateral of $1,603,000 in connection with open forward currency contracts as of October 31, 2018.
See accompanying Notes, which are an integral part of the Financial Statements.
22
| Global Minimum Volatility Fund | |
| Statement of Operations | |
| Year Ended | |
| October 31, 2018 | |
| ($000) | |
| Investment Income | |
| Income | |
| Dividends1 | 74,040 |
| Interest 2 | 360 |
| Securities Lending—Net | 638 |
| Total Income | 75,038 |
| Expenses | |
| The Vanguard Group—Note B | |
| Investment Advisory Services | 1,254 |
| Management and Administrative—Investor Shares | 783 |
| Management and Administrative—Admiral Shares | 1,698 |
| Marketing and Distribution—Investor Shares | 106 |
| Marketing and Distribution—Admiral Shares | 165 |
| Custodian Fees | 210 |
| Auditing Fees | 45 |
| Shareholders’ Reports and Proxy—Investor Shares | 16 |
| Shareholders’ Reports and Proxy—Admiral Shares | 26 |
| Trustees’ Fees and Expenses | 2 |
| Total Expenses | 4,305 |
| Net Investment Income | 70,733 |
| Realized Net Gain (Loss) | |
| Investment Securities Sold 2 | 93,642 |
| Futures Contracts | 603 |
| Forward Currency Contracts | 58,203 |
| Foreign Currencies | (2) |
| Realized Net Gain (Loss) | 152,446 |
| Change in Unrealized Appreciation (Depreciation) | |
| Investment Securities 2 | (146,981) |
| Futures Contracts | (164) |
| Forward Currency Contracts | 4,700 |
| Foreign Currencies | 6 |
| Change in Unrealized Appreciation (Depreciation) | (142,439) |
| Net Increase (Decrease) in Net Assets Resulting from Operations | 80,740 |
1 Dividends are net of foreign withholding taxes of $3,542,000.
2 Interest income, realized net gain (loss), and change in unrealized appreciation (depreciation) from an affiliated company of the fund
were $336,000, ($4,000), and $1,000, respectively. Purchases and sales are for temporary cash investment purposes.
See accompanying Notes, which are an integral part of the Financial Statements.
23
| Global Minimum Volatility Fund | ||
| Statement of Changes in Net Assets | ||
| Year Ended October 31, | ||
| 2018 | 2017 | |
| ($000) | ($000) | |
| Increase (Decrease) in Net Assets | ||
| Operations | ||
| Net Investment Income | 70,733 | 48,457 |
| Realized Net Gain (Loss) | 152,446 | 7,873 |
| Change in Unrealized Appreciation (Depreciation) | (142,439) | 229,772 |
| Net Increase (Decrease) in Net Assets Resulting from Operations | 80,740 | 286,102 |
| Distributions | ||
| Net Investment Income | ||
| Investor Shares | (12,387) | (11,274) |
| Admiral Shares | (40,756) | (32,305) |
| Realized Capital Gain | ||
| Investor Shares | — | — |
| Admiral Shares | — | — |
| Total Distributions | (53,143) | (43,579) |
| Capital Share Transactions | ||
| Investor Shares | (31,299) | 57,675 |
| Admiral Shares | 822,933 | 367,340 |
| Net Increase (Decrease) from Capital Share Transactions | 791,634 | 425,015 |
| Total Increase (Decrease) | 819,231 | 667,538 |
| Net Assets | ||
| Beginning of Period | 2,238,516 | 1,570,978 |
| End of Period | 3,057,747 | 2,238,516 |
See accompanying Notes, which are an integral part of the Financial Statements.
24
| Global Minimum Volatility Fund | |||||
| Financial Highlights | |||||
| Investor Shares | |||||
| Dec. 12, | |||||
| 20131 to | |||||
| For a Share Outstanding | Year Ended October 31, | Oct. 31, | |||
| Throughout Each Period | 2018 | 2017 | 2016 | 2015 | 2014 |
| Net Asset Value, Beginning of Period | $13.57 | $11.92 | $11.81 | $11.41 | $10.00 |
| Investment Operations | |||||
| Net Investment Income | . 374 2 | .3242 | .293 | .2882 | .262 |
| Net Realized and Unrealized Gain (Loss) | |||||
| on Investments | .148 | 1.650 | .181 | .795 | 1.172 |
| Total from Investment Operations | .522 | 1.974 | .474 | 1.083 | 1.434 |
| Distributions | |||||
| Dividends from Net Investment Income | (. 312) | (. 324) | (. 205) | (. 280) | (. 024) |
| Distributions from Realized Capital Gains | — | — | (.159) | (.403) | — |
| Total Distributions | (. 312) | (. 324) | (. 364) | (. 683) | (. 024) |
| Net Asset Value, End of Period | $13.78 | $13.57 | $11.92 | $11.81 | $11.41 |
| Total Return3 | 3.89% | 16.93% | 4.23% | 9.93% | 14.37% |
| Ratios/Supplemental Data | |||||
| Net Assets, End of Period (Millions) | $515 | $539 | $419 | $451 | $360 |
| Ratio of Total Expenses to Average Net Assets | 0.23% | 0.25% | 0.25% | 0.27% | 0.30%4 |
| Ratio of Net Investment Income to | |||||
| Average Net Assets | 2.66% | 2.54% | 2.63% | 2.52% | 3.18%4 |
| Portfolio Turnover Rate | 24% | 37% | 58% | 57% | 49% |
1 Inception.
2 Calculated based on average shares outstanding.
3 Total returns do not include account service fees that may have applied in the periods shown. Fund prospectuses provide information
about any applicable account service fees.
4 Annualized.
See accompanying Notes, which are an integral part of the Financial Statements.
25
| Global Minimum Volatility Fund | |||||
| Financial Highlights | |||||
| Admiral Shares | |||||
| Dec. 12, | |||||
| 20131 to | |||||
| For a Share Outstanding | Year Ended October 31, | Oct. 31, | |||
| Throughout Each Period | 2018 | 2017 | 2016 | 2015 | 2014 |
| Net Asset Value, Beginning of Period | $27.15 | $23.86 | $23.62 | $22.83 | $20.00 |
| Investment Operations | |||||
| Net Investment Income | .758 2 | .668 2 | .608 | .605 2 | .546 |
| Net Realized and Unrealized Gain (Loss) | |||||
| on Investments | .297 | 3.295 | .377 | 1.576 | 2.332 |
| Total from Investment Operations | 1.055 | 3.963 | .985 | 2.181 | 2.878 |
| Distributions | |||||
| Dividends from Net Investment Income | (. 625) | (. 673) | (. 427) | (. 585) | (. 048) |
| Distributions from Realized Capital Gains | — | — | (.318) | (.806) | — |
| Total Distributions | (. 625) | (. 673) | (.745) | (1.391) | (. 048) |
| Net Asset Value, End of Period | $27.58 | $27.15 | $23.86 | $23.62 | $22.83 |
| Total Return3 | 3.93% | 16.99% | 4.39% | 10.00% | 14.42% |
| Ratios/Supplemental Data | |||||
| Net Assets, End of Period (Millions) | $2,542 | $1,699 | $1,152 | $757 | $115 |
| Ratio of Total Expenses to Average Net Assets | 0.15% | 0.17% | 0.17% | 0.21% | 0.20%4 |
| Ratio of Net Investment Income to | |||||
| Average Net Assets | 2.74% | 2.62% | 2.71% | 2.58% | 3.28%4 |
| Portfolio Turnover Rate | 24% | 37% | 58% | 57% | 49% |
1 Inception.
2 Calculated based on average shares outstanding.
3 Total returns do not include account service fees that may have applied in the periods shown. Fund prospectuses provide information
about any applicable account service fees.
4 Annualized.
See accompanying Notes, which are an integral part of the Financial Statements.
26
Global Minimum Volatility Fund
Notes to Financial Statements
Vanguard Global Minimum Volatility Fund is registered under the Investment Company Act of 1940 as an open-end investment company, or mutual fund. The fund invests in securities of foreign issuers, which may subject it to investment risks not normally associated with investing in securities of U.S. corporations. To minimize the currency risk and volatility associated with investment in securities denominated in currencies other than the U.S. dollar, the fund attempts to hedge its currency exposure. The fund offers two classes of shares: Investor Shares and Admiral Shares. Investor Shares are available to any investor who meets the fund’s minimum purchase requirements. Admiral Shares are designed for investors who meet certain administrative, service, and account-size criteria.
A. The following significant accounting policies conform to generally accepted accounting principles for U.S. investment companies. The fund consistently follows such policies in preparing its financial statements.
1. Security Valuation: Securities are valued as of the close of trading on the New York Stock Exchange (generally 4 p.m., Eastern time) on the valuation date. Equity securities are valued at the latest quoted sales prices or official closing prices taken from the primary market in which each security trades; such securities not traded on the valuation date are valued at the mean of the latest quoted bid and asked prices. Securities for which market quotations are not readily available, or whose values have been affected by events occurring before the fund’s pricing time but after the close of the securities’ primary markets, are valued at their fair values calculated according to procedures adopted by the board of trustees. These procedures include obtaining quotations from an independent pricing service, monitoring news to identify significant market- or security-specific events, and evaluating changes in the values of foreign market proxies (for example, ADRs, futures contracts, or exchange-traded funds), between the time the foreign markets close and the fund’s pricing time. When fair-value pricing is employed, the prices of securities used by a fund to calculate its net asset value may differ from quoted or published prices for the same securities. Investments in Vanguard Market Liquidity Fund are valued at that fund’s net asset value. Temporary cash investments are valued using the latest bid prices or using valuations based on a matrix system (which considers such factors as security prices, yields, maturities, and ratings), both as furnished by independent pricing services.
2. Foreign Currency: Securities and other assets and liabilities denominated in foreign currencies are translated into U.S. dollars using exchange rates obtained from an independent third party as of the fund’s pricing time on the valuation date. Realized gains (losses) and unrealized appreciation (depreciation) on investment securities include the effects of changes in exchange rates since the securities were purchased, combined with the effects of changes in security prices. Fluctuations in the value of other assets and liabilities resulting from changes in exchange rates are recorded as unrealized foreign currency gains (losses) until the assets or liabilities are settled in cash, at which time they are recorded as realized foreign currency gains (losses).
3. Futures and Forward Currency Contracts: The fund uses index futures contracts to a limited extent, with the objective of maintaining full exposure to the stock market while maintaining liquidity. The fund may purchase or sell futures contracts to achieve a desired level of investment, whether to accommodate portfolio turnover or cash flows from capital share transactions. The primary risks associated with the use of futures contracts are imperfect correlation between changes in market values of stocks held by the fund and the prices of futures contracts, and the possibility of an illiquid market. Counterparty risk involving futures is mitigated because a regulated clearinghouse is the counterparty instead of the clearing broker. To further mitigate counterparty
27
Global Minimum Volatility Fund
risk, the fund trades futures contracts on an exchange, monitors the financial strength of its clearing brokers and clearinghouse, and has entered into clearing agreements with its clearing brokers. The clearinghouse imposes initial margin requirements to secure the fund’s performance and requires daily settlement of variation margin representing changes in the market value of each contract. Any assets pledged as initial margin for open contracts are noted in the Statement of Net Assets.
The fund enters into forward currency contracts to protect the value of securities and related receivables and payables against changes in future foreign exchange rates. The fund’s risks in using these contracts include movement in the values of the foreign currencies relative to the U.S. dollar and the ability of the counterparties to fulfill their obligations under the contracts. The fund mitigates its counterparty risk by entering into forward currency contracts only with a diverse group of prequalified counterparties, monitoring their financial strength, entering into master netting arrangements with its counterparties, and requiring its counterparties to transfer collateral as security for their performance. In the absence of a default, the collateral pledged or received by the fund cannot be repledged, resold, or rehypothecated. The master netting arrangements provide that, in the event of a counterparty’s default (including bankruptcy), the fund may terminate the forward currency contracts, determine the net amount owed by either party in accordance with its master netting arrangements, and sell or retain any collateral held up to the net amount owed to the fund under the master netting arrangements. The forward currency contracts contain provisions whereby a counterparty may terminate open contracts if the fund’s net assets decline below a certain level, triggering a payment by the fund if the fund is in a net liability position at the time of the termination. The payment amount would be reduced by any collateral the fund has pledged. Any assets pledged as collateral for open contracts are noted in the Statement of Net Assets. The value of collateral received or pledged is compared daily to the value of the forward currency contracts exposure with each counterparty, and any difference, if in excess of a specified minimum transfer amount, is adjusted and settled within two business days.
Futures contracts are valued at their quoted daily settlement prices. Forward currency contracts are valued at their quoted daily prices obtained from an independent third party, adjusted for currency risk based on the expiration date of each contract. The notional amounts of the contracts are not recorded in the Statement of Net Assets. Fluctuations in the value of the contracts are recorded in the Statement of Net Assets as an asset (liability) and in the Statement of Operations as unrealized appreciation (depreciation) until the contracts are closed, when they are recorded as realized gains (losses) on futures or forward currency contracts.
During the year ended October 31, 2018, the fund’s average investments in long and short futures contracts represented less than 1% and 0% of net assets, respectively, based on the average of the notional amounts at each quarter-end during the period. The fund’s average investment in forward currency contracts represented 47% of net assets, based on the average of the notional amounts at each quarter-end during the period.
4. Federal Income Taxes: The fund intends to continue to qualify as a regulated investment company and distribute all of its taxable income. Management has analyzed the fund’s tax positions taken for all open federal income tax years (October 31, 2015–2018), and has concluded that no provision for federal income tax is required in the fund’s financial statements.
5. Distributions: Distributions to shareholders are recorded on the ex-dividend date. Distributions are determined on a tax basis and may differ from net investment income and realized capital gains for financial reporting purposes.
28
Global Minimum Volatility Fund
6. Securities Lending: To earn additional income, the fund lends its securities to qualified institutional borrowers. Security loans are subject to termination by the fund at any time, and are required to be secured at all times by collateral in an amount at least equal to the market value of securities loaned. Daily market fluctuations could cause the value of loaned securities to be more or less than the value of the collateral received. When this occurs, the collateral is adjusted and settled before the opening of the market on the next business day. The fund further mitigates its counterparty risk by entering into securities lending transactions only with a diverse group of prequalified counterparties, monitoring their financial strength, and entering into master securities lending agreements with its counterparties. The master securities lending agreements provide that, in the event of a counterparty’s default (including bankruptcy), the fund may terminate any loans with that borrower, determine the net amount owed, and sell or retain the collateral up to the net amount owed to the fund; however, such actions may be subject to legal proceedings. While collateral mitigates counterparty risk, in the event of a default, the fund may experience delays and costs in recovering the securities loaned. The fund invests cash collateral received in Vanguard Market Liquidity Fund, and records a liability in the Statement of Net Assets for the return of the collateral, during the period the securities are on loan. Securities lending income represents fees charged to borrowers plus income earned on invested cash collateral, less expenses associated with the loan. During the term of the loan, the fund is entitled to all distributions made on or in respect of the loaned securities.
7. Credit Facility: The fund and certain other funds managed by The Vanguard Group (“Vanguard”) participate in a $3.1 billion committed credit facility provided by a syndicate of lenders pursuant to a credit agreement that may be renewed annually; each fund is individually liable for its borrowings, if any, under the credit facility. Borrowings may be utilized for temporary and emergency purposes, and are subject to the fund’s regulatory and contractual borrowing restrictions. The participating funds are charged administrative fees and an annual commitment fee of 0.10% of the undrawn amount of the facility; these fees are allocated to the funds based on a method approved by the fund’s board of trustees and included in Management and Administrative expenses on the fund’s Statement of Operations. Any borrowings under this facility bear interest at a rate based upon the higher of the one-month London Interbank Offered Rate, federal funds effective rate, or overnight bank funding rate plus an agreed-upon spread.
The fund had no borrowings outstanding at October 31, 2018, or at any time during the period then ended.
8. Other: Dividend income is recorded on the ex-dividend date. Interest income includes income distributions received from Vanguard Market Liquidity Fund and is accrued daily. Premiums and discounts on debt securities purchased are amortized and accreted, respectively, to interest income over the lives of the respective securities. Security transactions are accounted for on the date securities are bought or sold. Costs used to determine realized gains (losses) on the sale of investment securities are those of the specific securities sold.
Each class of shares has equal rights as to assets and earnings, except that each class separately bears certain class-specific expenses related to maintenance of shareholder accounts (included in Management and Administrative expenses), shareholder reporting, and the proxy. Marketing and distribution expenses are allocated to each class of shares based on a method approved by the board of trustees. Income, other non-class-specific expenses, and gains and losses on investments are allocated to each class of shares based on its relative net assets.
29
Global Minimum Volatility Fund
B. In accordance with the terms of a Funds’ Service Agreement (the “FSA”) between Vanguard and the fund, Vanguard furnishes to the fund investment advisory, corporate management, administrative, marketing, and distribution services at Vanguard’s cost of operations (as defined by the FSA). These costs of operations are allocated to the fund based on methods and guidelines approved by the board of trustees. Vanguard does not require reimbursement in the current period for certain costs of operations (such as deferred compensation/benefits and risk/insurance costs); the fund’s liability for these costs of operations is included in Payables to Vanguard on the Statement of Net Assets. All other costs of operations payable to Vanguard are generally settled twice a month.
Upon the request of Vanguard, the fund may invest up to 0.40% of its net assets as capital in Vanguard. At October 31, 2018, the fund had contributed to Vanguard capital in the amount of $161,000, representing 0.01% of the fund’s net assets and 0.06% of Vanguard’s capitalization. The fund’s trustees and officers are also directors and employees, respectively, of Vanguard.
C. Various inputs may be used to determine the value of the fund’s investments. These inputs are summarized in three broad levels for financial statement purposes. The inputs or methodologies used to value securities are not necessarily an indication of the risk associated with investing in those securities.
Level 1—Quoted prices in active markets for identical securities.
Level 2—Other significant observable inputs (including quoted prices for similar securities, interest rates, prepayment speeds, credit risk, etc.).
Level 3—Significant unobservable inputs (including the fund’s own assumptions used to determine the fair value of investments). Any investments valued with significant unobservable inputs are noted on the Statement of Net Assets.
The following table summarizes the market value of the fund’s investments as of October 31, 2018, based on the inputs used to value them:
| Level 1 | Level 2 | Level 3 | |
| Investments | ($000) | ($000) | ($000) |
| Common Stocks—International | 279,560 | 1,076,735 | — |
| Common Stocks—United States | 1,678,535 | — | — |
| Temporary Cash Investments | 31,672 | 996 | — |
| Futures Contracts—Assets1 | 105 | — | — |
| Futures Contracts—Liabilities1 | (9) | — | — |
| Forward Currency Contracts—Assets | — | 11,982 | — |
| Forward Currency Contracts—Liabilities | — | (1,762) | — |
| Total | 1,989,863 | 1,087,951 | — |
| 1 Represents variation margin on the last day of the reporting period. |
30
Global Minimum Volatility Fund
D. At October 31, 2018, the fair values of derivatives were reflected in the Statement of Net Assets as follows:
| Foreign | |||
| Equity | Exchange | ||
| Contracts | Contracts | Total | |
| Statement of Net Assets Caption | ($000) | ($000) | ($000) |
| Variation Margin Receivable—Futures Contracts | 105 | — | 105 |
| Unrealized Appreciation—Forward Currency Contracts | — | 11,982 | 11,982 |
| Total Assets | 105 | 11,982 | 12,087 |
| Variation Margin Payable—Futures Contracts | (9) | — | (9) |
| Unrealized Depreciation—Forward Currency Contracts | — | (1,762) | (1,762) |
| Total Liabilities | (9) | (1,762) | (1,771) |
Realized net gain (loss) and the change in unrealized appreciation (depreciation) on derivatives for the year ended October 31, 2018, were:
| Foreign | |||
| Equity | Exchange | ||
| Contracts | Contracts | Total | |
| Realized Net Gain (Loss) on Derivatives | ($000) | ($000) | ($000) |
| Futures Contracts | 603 | — | 603 |
| Forward Currency Contracts | — | 58,203 | 58,203 |
| Realized Net Gain (Loss) on Derivatives | 603 | 58,203 | 58,806 |
| Change in Unrealized Appreciation (Depreciation) on Derivatives | |||
| Futures Contracts | (164) | — | (164) |
| Forward Currency Contracts | — | 4,700 | 4,700 |
| Change in Unrealized Appreciation (Depreciation) on Derivatives | (164) | 4,700 | 4,536 |
E. Permanent differences between book-basis and tax-basis components of net assets are reclassified among capital accounts in the financial statements to reflect their tax character. These reclassifications have no effect on net assets or net asset value per share. As of period end, the following permanent differences primarily attributable to the accounting for foreign currency transactions, passive foreign investment companies, and distributions in connection with fund share redemptions were reclassified to the following accounts:
| Amount | |
| ($000) | |
| Paid-in Capital | 10,425 |
| Total Distributable Earnings (Loss) | (10,425) |
31
Global Minimum Volatility Fund
Temporary differences between book-basis and tax-basis components of total distributable earnings (loss) arise when certain items of income, gain, or loss are recognized in different periods for financial statement and tax purposes; these differences will reverse at some time in the future. The differences are primarily related to the tax deferral of losses on wash sales, the realization of unrealized gains or losses on certain futures contracts and forward currency contracts, and unrealized gains on passive foreign investment companies. As of period end, the tax-basis components of total distributable earnings (loss) are detailed in the table as follows:
| Amount | |
| ($000) | |
| Undistributed Ordinary Income | 99,275 |
| Undistributed Long-Term Gains | 97,243 |
| Capital Loss Carryforwards (Non-expiring)* | — |
| Net Unrealized Gains (Losses) | 164,166 |
* The fund used capital loss carryforwards of $7,155,000 to offset taxable capital gains realized during the year ended October 31, 2018, reducing the amount of capital gains that would otherwise be available to distribute to shareholders.
As of October 31, 2018, gross unrealized appreciation and depreciation for investments and derivatives based on cost for U.S. federal income tax purposes were as follows:
| Amount | |
| ($000) | |
| Tax Cost | 2,903,324 |
| Gross Unrealized Appreciation | 324,180 |
| Gross Unrealized Depreciation | (159,964) |
| Net Unrealized Appreciation (Depreciation) | 164,216 |
F. During the year ended October 31, 2018, the fund purchased $1,478,756,000 of investment securities and sold $614,859,000 of investment securities, other than temporary cash investments.
32
Global Minimum Volatility Fund
| G. Capital share transactions for each class of shares were: | ||||
| Year Ended October 31, | ||||
| 2018 | 2017 | |||
| Amount | Shares | Amount | Shares | |
| ($000) | (000) | ($000) | (000) | |
| Investor Shares | ||||
| Issued | 148,795 | 10,734 | 195,539 | 15,366 |
| Issued in Lieu of Cash Distributions | 11,552 | 854 | 10,598 | 886 |
| Redeemed | (191,646) | (13,898) | (148,462) | (11,703) |
| Net Increase (Decrease)—Investor Shares | (31,299) | (2,310) | 57,675 | 4,549 |
| Admiral Shares | ||||
| Issued | 1,279,510 | 46,244 | 705,355 | 27,658 |
| Issued in Lieu of Cash Distributions | 35,011 | 1,294 | 28,030 | 1,172 |
| Redeemed | (491,588) | (17,935) | (366,045) | (14,509) |
| Net Increase (Decrease)—Admiral Shares | 822,933 | 29,603 | 367,340 | 14,321 |
H. Management has determined that no events or transactions occurred subsequent to October 31, 2018, that would require recognition or disclosure in these financial statements.
33
Report of Independent Registered Public Accounting Firm
To the Board of Trustees of Vanguard Whitehall Funds and Shareholders of Vanguard Global Minimum Volatility Fund
Opinion on the Financial Statements
We have audited the accompanying statement of net assets of Vanguard Global Minimum Volatility Fund (one of the funds constituting Vanguard Whitehall Funds, referred to hereafter as the “Fund”) as of October 31, 2018, the related statement of operations for the year ended October 31, 2018, the statement of changes in net assets for each of the two years in the period ended October 31, 2018, including the related notes, and the financial highlights for each of the periods indicated therein (collectively referred to as the “financial statements”). In our opinion, the financial statements present fairly, in all material respects, the financial position of the Fund as of October 31, 2018, the results of its operations for the year then ended, the changes in its net assets for each of the two years in the period ended October 31, 2018 and the financial highlights for each of the periods indicated therein in conformity with accounting principles generally accepted in the United States of America.
Basis for Opinion
These financial statements are the responsibility of the Fund’s management. Our responsibility is to express an opinion on the Fund’s financial statements based on our audits. We are a public accounting firm registered with the Public Company Accounting Oversight Board (United States) (“PCAOB”) and are required to be independent with respect to the Fund in accordance with the U.S. federal securities laws and the applicable rules and regulations of the Securities and Exchange Commission and the PCAOB.
We conducted our audits of these financial statements in accordance with the standards of the PCAOB. Those standards require that we plan and perform the audit to obtain reasonable assurance about whether the financial statements are free of material misstatement, whether due to error or fraud.
Our audits included performing procedures to assess the risks of material misstatement of the financial statements, whether due to error or fraud, and performing procedures that respond to those risks. Such procedures included examining, on a test basis, evidence regarding the amounts and disclosures in the financial statements. Our audits also included evaluating the accounting principles used and significant estimates made by management, as well as evaluating the overall presentation of the financial statements. Our procedures included confirmation of securities owned as of October 31, 2018 by correspondence with the custodian and brokers and by agreement to the underlying ownership records of the transfer agent; when replies were not received from brokers, we performed other auditing procedures. We believe that our audits provide a reasonable basis for our opinion.
/s/PricewaterhouseCoopers LLP
Philadelphia, Pennsylvania
December 18, 2018
We have served as the auditor of one or more investment companies in The Vanguard Group of Funds since 1975.
34
Special 2018 tax information (unaudited) for Vanguard Global Minimum Volatility Fund
This information for the fiscal year ended October 31, 2018, is included pursuant to provisions of the Internal Revenue Code.
The fund distributed $38,885,000 of qualified dividend income to shareholders during the fiscal year.
For corporate shareholders, 20.7% of investment income (dividend income plus short-term gains, if any) qualifies for the dividends-received deduction.
35
Your Fund’s After-Tax Returns
This table presents returns for your fund both before and after taxes. The after-tax returns are shown in two ways: (1) assuming that an investor owned the fund during the entire period and paid taxes on the fund’s distributions, and (2) assuming that an investor paid taxes on the fund’s distributions and sold all shares at the end of each period.
Calculations are based on the highest individual federal income tax and capital gains tax rates in effect at the times of the distributions and the hypothetical sales. State and local taxes were not considered. After-tax returns reflect any qualified dividend income, using actual prior-year figures and estimates for 2018. (In the example, returns after the sale of fund shares may be higher than those assuming no sale. This occurs when the sale would have produced a capital loss. The calculation assumes that the investor received a tax deduction for the loss.)
The table shows returns for Investor Shares only; returns for other share classes will differ. Please note that your actual after-tax returns will depend on your tax situation and may differ from those shown. Also note that if you own the fund in a tax-deferred account, such as an individual retirement account or a 401(k) plan, this information does not apply to you. Such accounts are not subject to current taxes.
Finally, keep in mind that a fund’s performance—whether before or after taxes—does not guarantee future results.
Average Annual Total Returns: Global Minimum Volatility Fund Investor Shares
Periods Ended October 31, 2018
| Since | ||
| One | Inception | |
| Year | (12/12/2013) | |
| Returns Before Taxes | 3.89% | 9.98% |
| Returns After Taxes on Distributions | 3.21 | 9.00 |
| Returns After Taxes on Distributions and Sale of Fund Shares | 2.56 | 7.57 |
36
About Your Fund’s Expenses
As a shareholder of the fund, you incur ongoing costs, which include costs for portfolio management, administrative services, and shareholder reports (like this one), among others. Operating expenses, which are deducted from a fund’s gross income, directly reduce the investment return of the fund.
A fund’s expenses are expressed as a percentage of its average net assets. This figure is known as the expense ratio. The following examples are intended to help you understand the ongoing costs (in dollars) of investing in your fund and to compare these costs with those of other mutual funds. The examples are based on an investment of $1,000 made at the beginning of the period shown and held for the entire period.
The accompanying table illustrates your fund’s costs in two ways:
• Based on actual fund return. This section helps you to estimate the actual expenses that you paid over the period. The ”Ending Account Value“ shown is derived from the fund‘s actual return, and the third column shows the dollar amount that would have been paid by an investor who started with $1,000 in the fund. You may use the information here, together with the amount you invested, to estimate the expenses that you paid over the period.
To do so, simply divide your account value by $1,000 (for example, an $8,600 account value divided by $1,000 = 8.6), then multiply the result by the number given for your fund under the heading ”Expenses Paid During Period.“
• Based on hypothetical 5% yearly return. This section is intended to help you compare your fund‘s costs with those of other mutual funds. It assumes that the fund had a yearly return of 5% before expenses, but that the expense ratio is unchanged. In this case—because the return used is not the fund’s actual return—the results do not apply to your investment. The example is useful in making comparisons because the Securities and Exchange Commission requires all mutual funds to calculate expenses based on a 5% return. You can assess your fund’s costs by comparing this hypothetical example with the hypothetical examples that appear in shareholder reports of other funds.
Note that the expenses shown in the table are meant to highlight and help you compare ongoing costs only and do not reflect transaction costs incurred by the fund for buying and selling securities. Further, the expenses do not include any purchase, redemption, or account service fees described in the fund prospectus. If such fees were applied to your account, your costs would be higher. Your fund does not carry a “sales load.”
The calculations assume no shares were bought or sold during the period. Your actual costs may have been higher or lower, depending on the amount of your investment and the timing of any purchases or redemptions.
You can find more information about the fund’s expenses, including annual expense ratios, in the Financial Statements section of this report. For additional information on operating expenses and other shareholder costs, please refer to your fund’s current prospectus.
37
| Six Months Ended October 31, 2018 | |||
| Beginning | Ending | Expenses | |
| Account Value | Account Value | Paid During | |
| Global Minimum Volatility Fund | 4/30/2018 | 10/31/2018 | Period |
| Based on Actual Fund Return | |||
| Investor Shares | $1,000.00 | $1,018.48 | $1.07 |
| Admiral Shares | 1,000.00 | 1,018.09 | 0.66 |
| Based on Hypothetical 5% Yearly Return | |||
| Investor Shares | $1,000.00 | $1,024.15 | $1.07 |
| Admiral Shares | 1,000.00 | 1,024.55 | 0.66 |
The calculations are based on expenses incurred in the most recent six-month period. The fund’s annualized six-month expense ratios for that period are 0.21% for Investor Shares and 0.13% for Admiral Shares. The dollar amounts shown as “Expenses Paid” are equal to the annualized expense ratio multiplied by the average account value over the period, multiplied by the number of days in the most recent six-month period, then divided by the number of days in the most recent 12-month period (184/365).
38
Glossary
Beta. A measure of the magnitude of a fund’s past share-price fluctuations in relation to the ups and downs of a given market index. The index is assigned a beta of 1.00. Compared with a given index, a fund with a beta of 1.20 typically would have seen its share price rise or fall by 12% when the index rose or fell by 10%. For this report, beta is based on returns over the past 36 months for both the fund and the index. Note that a fund’s beta should be reviewed in conjunction with its R-squared (see definition). The lower the R-squared, the less correlation there is between the fund and the index, and the less reliable beta is as an indicator of volatility.
Dividend Yield. Dividend income earned by stocks, expressed as a percentage of the aggregate market value (or of net asset value, for a fund). The yield is determined by dividing the amount of the annual dividends by the aggregate value (or net asset value) at the end of the period. For a fund, the dividend yield is based solely on stock holdings and does not include any income produced by other investments.
Earnings Growth Rate. The average annual rate of growth in earnings over the past five years for the stocks now in a fund.
Equity Exposure. A measure that reflects a fund’s investments in stocks and stock futures. Any holdings in short-term reserves are excluded.
Expense Ratio. A fund’s total annual operating expenses expressed as a percentage of the fund’s average net assets. The expense ratio includes management and administrative expenses, but does not include the transaction costs of buying and selling portfolio securities.
Inception Date. The date on which the assets of a fund (or one of its share classes) are first invested in accordance with the fund’s investment objective. For funds with a subscription period, the inception date is the day after that period ends. Investment performance is measured from the inception date.
Median Market Cap. An indicator of the size of companies in which a fund invests; the midpoint of market capitalization (market price x shares outstanding) of a fund’s stocks, weighted by the proportion of the fund’s assets invested in each stock. Stocks representing half of the fund’s assets have market capitalizations above the median, and the rest are below it.
Price/Book Ratio. The share price of a stock divided by its net worth, or book value, per share. For a fund, the weighted average price/book ratio of the stocks it holds.
Price/Earnings Ratio. The ratio of a stock’s current price to its per-share earnings over the past year. For a fund, the weighted average P/E of the stocks it holds. P/E is an indicator of market expectations about corporate prospects; the higher the P/E, the greater the expectations for a company’s future growth.
R-Squared. A measure of how much of a fund’s past returns can be explained by the returns from the market in general, as measured by a given index. If a fund’s total returns were precisely synchronized with an index’s returns, its R-squared would be 1.00. If the fund’s returns bore no relationship to the index’s returns, its R-squared would be 0. For this report, R-squared is based on returns over the past 36 months for both the fund and the index.
39
Return on Equity. The annual average rate of return generated by a company during the past five years for each dollar of shareholder’s equity (net income divided by shareholder’s equity). For a fund, the weighted average return on equity for the companies whose stocks it holds.
Short-Term Reserves. The percentage of a fund invested in highly liquid, short-term securities that can be readily converted to cash.
Turnover Rate. An indication of the fund’s trading activity. Funds with high turnover rates incur higher transaction costs and may be more likely to distribute capital gains (which may be taxable to investors). The turnover rate excludes in-kind transactions, which have minimal impact on costs.
40
The Global Industry Classification Standard (“GICS”) was developed by and is the exclusive property and a service mark of MSCI Inc. (“MSCI”) and Standard and Poor’s, a division of McGraw-Hill Companies, Inc. (“S&P”), and is licensed for use by Vanguard. Neither MSCI, S&P nor any third party involved in making or compiling the GICS or any GICS classification makes any express or implied warranties or representations with respect to such standard or classification (or the results to be obtained by the use thereof), and all such parties hereby expressly disclaim all warranties of originality, accuracy, completeness, merchantability or fitness for a particular purpose with respect to any such standard or classification. Without limiting any of the foregoing, in no event shall MSCI, S&P, any of its affiliates or any third party involved in making or compiling the GICS or any GICS classification have any liability for any direct, indirect, special, punitive, consequential or any other damages (including lost profits) even if notified of the possibility of such damages.
41
This page intentionally left blank.
The People Who Govern Your Fund
The trustees of your mutual fund are there to see that the fund is operated and managed in your best interests since, as a shareholder, you are a part owner of the fund. Your fund’s trustees also serve on the board of directors of The Vanguard Group, Inc., which is owned by the Vanguard funds and provides services to them on an at-cost basis.
A majority of Vanguard’s board members are independent, meaning that they have no affiliation with Vanguard or the funds they oversee, apart from the sizable personal investments they have made as private individuals. The independent board members have distinguished backgrounds in business, academia, and public service. Each of the trustees and executive officers oversees 211 Vanguard funds.
Information for each trustee and executive officer of the fund appears below. The mailing address of the trustees and officers is P.O. Box 876, Valley Forge, PA 19482. More information about the trustees is in the Statement of Additional Information, which can be obtained, without charge, by contacting Vanguard at 800-662-7447, or online at vanguard.com.
Interested Trustees1
F. William McNabb III
Born in 1957. Trustee since July 2009. Principal occupation(s) during the past five years and other experience: chairman of the board (January 2010–present) of Vanguard and of each of the investment companies served by Vanguard, trustee (2009–present) of each of the investment companies served by Vanguard, and director (2008–present) of Vanguard. Chief executive officer and president (2008–2017) of Vanguard and each of the investment companies served by Vanguard, managing director (1995–2008) of Vanguard, and director (1997–2018) of Vanguard Marketing Corporation. Director (2018–present) of UnitedHealth Group.
Mortimer J. Buckley
Born in 1969. Trustee since January 2018. Principal occupation(s) during the past five years and other experience: chief executive officer (January 2018–present) of Vanguard; chief executive officer, president, and trustee (January 2018–present) of each of the investment companies served by Vanguard; president and director (2017–present) of Vanguard; and president (February 2018–present) of Vanguard Marketing Corporation. Chief investment officer (2013–2017), managing director (2002–2017), head of the Retail Investor Group (2006–2012), and chief information officer (2001–2006) of Vanguard. Chairman of the board (2011–2017) of the Children’s Hospital of Philadelphia.
Independent Trustees
Emerson U. Fullwood
Born in 1948. Trustee since January 2008. Principal occupation(s) during the past five years and other experience: executive chief staff and marketing officer for North America and corporate vice president (retired 2008) of Xerox Corporation (document management products and services). Former president of the Worldwide Channels Group, Latin America, and Worldwide Customer Service and executive chief staff officer of Developing Markets of Xerox. Executive in residence and 2009–2010 Distinguished Minett Professor at the Rochester Institute of Technology. Lead director of SPX FLOW, Inc. (multi-industry manufacturing). Director of the University of Rochester Medical Center, the Monroe Community College Foundation, the United Way of Rochester, North Carolina A&T University, and Roberts Wesleyan College. Trustee of the University of Rochester.
Amy Gutmann
Born in 1949. Trustee since June 2006. Principal occupation(s) during the past five years and other experience: president (2004–present) of the University of Pennsylvania. Christopher H. Browne Distinguished Professor of Political Science, School of Arts and Sciences, and professor of communication, Annenberg School for Communication, with secondary faculty appointments in the Department of Philosophy, School of Arts and Sciences, and at the Graduate School of Education, University of Pennsylvania. Trustee of the National Constitution Center.
1 Mr. McNabb and Mr. Buckley are considered “interested persons,” as defined in the Investment Company Act of 1940, because they are officers of the Vanguard funds.
JoAnn Heffernan Heisen
Born in 1950. Trustee since July 1998. Principal occupation(s) during the past five years and other experience: corporate vice president of Johnson & Johnson (pharmaceuticals/medical devices/consumer products) and member of its executive committee (1997–2008). Chief global diversity officer (retired 2008), vice president and chief information officer (1997–2006), controller (1995–1997), treasurer (1991–1995), and assistant treasurer (1989–1991) of Johnson & Johnson. Director of Skytop Lodge Corporation (hotels) and the Robert Wood Johnson Foundation. Member of the advisory board of the Institute for Women’s Leadership at Rutgers University.
F. Joseph Loughrey
Born in 1949. Trustee since October 2009. Principal occupation(s) during the past five years and other experience: president and chief operating officer (retired 2009) and vice chairman of the board (2008–2009) of Cummins Inc. (industrial machinery). Chairman of the board of Hillenbrand, Inc. (specialized consumer services), Oxfam America, and the Lumina Foundation for Education. Director of the V Foundation for Cancer Research. Member of the advisory council for the College of Arts and Letters and chair of the advisory board to the Kellogg Institute for International Studies, both at the University of Notre Dame.
Mark Loughridge
Born in 1953. Trustee since March 2012. Principal occupation(s) during the past five years and other experience: senior vice president and chief financial officer (retired 2013) of IBM (information technology services). Fiduciary member of IBM’s Retirement Plan Committee (2004–2013), senior vice president and general manager (2002–2004) of IBM Global Financing, vice president and controller (1998–2002) of IBM, and a variety of other prior management roles at IBM. Member of the Council on Chicago Booth.
Scott C. Malpass
Born in 1962. Trustee since March 2012. Principal occupation(s) during the past five years and other experience: chief investment officer (1989–present) and vice president (1996–present) of the University of Notre Dame. Assistant professor of finance at the Mendoza College of Business, University of Notre Dame, and member of the Notre Dame 403(b) Investment Committee. Chairman of the board of TIFF Advisory Services, Inc. Member of the board of Catholic Investment Services, Inc. (investment advisors), the board of advisors for Spruceview Capital Partners, and the board of superintendence of the Institute for the Works of Religion.
Deanna Mulligan
Born in 1963. Trustee since January 2018. Principal occupation(s) during the past five years and other experience: president (2010–present) and chief executive officer (2011–present) of The Guardian Life Insurance Company of America. Chief operating officer (2010–2011) and executive vice president (2008–2010) of Individual Life and Disability of The Guardian Life Insurance Company of America. Member of the board of The Guardian Life Insurance Company of America, the American Council of Life Insurers, the Partnership for New York City (business leadership), and the Committee Encouraging Corporate Philanthropy. Trustee of the Economic Club of New York and the Bruce Museum (arts and science). Member of the Advisory Council for the Stanford Graduate School of Business.
André F. Perold
Born in 1952. Trustee since December 2004. Principal occupation(s) during the past five years and other experience: George Gund Professor of Finance and Banking, Emeritus at the Harvard Business School (retired 2011). Chief investment officer and co-managing partner of HighVista Strategies LLC (private investment firm). Overseer of the Museum of Fine Arts Boston.
Sarah Bloom Raskin
Born in 1961. Trustee since January 2018. Principal occupation(s) during the past five years and other experience: deputy secretary (2014–2017) of the United States Department of the Treasury. Governor (2010–2014) of the Federal Reserve Board. Commissioner (2007–2010) of financial regulation for the State of Maryland. Member of the board of directors (2012–2014) of Neighborhood Reinvestment Corporation. Director of i(x) Investments, LLC.
Peter F. Volanakis
Born in 1955. Trustee since July 2009. Principal occupation(s) during the past five years and other experience: president and chief operating officer (retired 2010) of Corning Incorporated (communications equipment) and director of Corning Incorporated (2000–2010) and Dow Corning (2001–2010). Director (2012) of SPX Corporation (multi-industry manufacturing). Overseer of the Amos Tuck School of Business Administration, Dartmouth College (2001–2013). Chairman of the board of trustees of Colby-Sawyer College. Member of the Board of Hypertherm Inc. (industrial cutting systems, software, and consumables).
Executive Officers
Glenn Booraem
Born in 1967. Principal occupation(s) during the past five years and other experience: principal of Vanguard. Investment stewardship officer (2017–present), treasurer (2015–2017), controller (2010–2015), and assistant controller (2001–2010) of each of the investment companies served by Vanguard.
Christine M. Buchanan
Born in 1970. Principal occupation(s) during the past five years and other experience: principal of Vanguard and global head of Fund Administration at Vanguard. Treasurer (2017–present) of each of the investment companies served by Vanguard. Partner (2005–2017) at KPMG LLP (audit, tax, and advisory services).
Brian Dvorak
Born in 1973. Principal occupation(s) during the past five years and other experience: principal of Vanguard. Chief compliance officer (2017–present) of Vanguard and each of the investment companies served by Vanguard. Assistant vice president (2017–present) of Vanguard Marketing Corporation. Vice president and director of Enterprise Risk Management (2011–2013) at Oppenheimer Funds, Inc.
Thomas J. Higgins
Born in 1957. Principal occupation(s) during the past five years and other experience: principal of Vanguard. Chief financial officer (2008–present) and treasurer (1998–2008) of each of the investment companies served by Vanguard.
Peter Mahoney
Born in 1974. Principal occupation(s) during the past five years and other experience: principal of Vanguard. Controller (2015–present) of each of the investment companies served by Vanguard. Head of International Fund Services (2008–2014) at Vanguard.
Anne E. Robinson
Born in 1970. Principal occupation(s) during the past five years and other experience: general counsel (2016–present) of Vanguard. Secretary (2016–present) of Vanguard and of each of the investment companies served by Vanguard. Managing director (2016–present) of Vanguard. Director and senior vice president (2016–2018) of Vanguard Marketing Corporation. Managing director and general counsel of Global Cards and Consumer Services (2014–2016) at Citigroup. Counsel (2003–2014) at American Express.
Michael Rollings
Born in 1963. Principal occupation(s) during the past five years and other experience: finance director (2017–present) and treasurer (2017) of each of the investment companies served by Vanguard. Managing director (2016–present) of Vanguard. Chief financial officer (2016–present) of Vanguard. Director (2016–present) of Vanguard Marketing Corporation. Executive vice president and chief financial officer (2006–2016) of MassMutual Financial Group.
| Vanguard Senior Management Team | |
| Joseph Brennan | Chris D. McIsaac |
| Mortimer J. Buckley | James M. Norris |
| Gregory Davis | Thomas M. Rampulla |
| John James | Karin A. Risi |
| Martha G. King | Anne E. Robinson |
| John T. Marcante | Michael Rollings |
| Chairman Emeritus and Senior Advisor | |
| John J. Brennan | |
| Chairman, 1996–2009 | |
| Chief Executive Officer and President, 1996–2008 | |
| Founder | |
| John C. Bogle | |
| Chairman and Chief Executive Officer, 1974–1996 | |
 | |
P.O. Box 2600 | |
Connect with Vanguard® > vanguard.com | |
| Fund Information > 800-662-7447 | Source for Bloomberg Barclays indexes: Bloomberg |
| Direct Investor Account Services > 800-662-2739 | Index Services Limited. Copyright 2018, Bloomberg. All |
| Institutional Investor Services > 800-523-1036 | rights reserved. |
| Text Telephone for People | |
| Who Are Deaf or Hard of Hearing > 800-749-7273 | CFA® is a registered trademark owned by CFA Institute. |
| This material may be used in conjunction | |
| with the offering of shares of any Vanguard | |
| fund only if preceded or accompanied by | |
| the fund’s current prospectus. | |
| All comparative mutual fund data are from Lipper, a | |
| Thomson Reuters Company, or Morningstar, Inc., unless | |
| otherwise noted. | |
| You can obtain a free copy of Vanguard’s proxy voting | |
| guidelines by visiting vanguard.com/proxyreporting or by | |
| calling Vanguard at 800-662-2739. The guidelines are | |
| also available from the SEC’s website, sec.gov. In | |
| addition, you may obtain a free report on how your fund | |
| voted the proxies for securities it owned during the 12 | |
| months ended June 30. To get the report, visit either | |
| vanguard.com/proxyreporting or sec.gov. | |
| You can review information about your fund on the | |
| SEC’s website, and you can receive copies of this | |
| information, for a fee, by sending a request via email | |
| addressed to publicinfo@sec.gov. | |
| © 2018 The Vanguard Group, Inc. | |
| All rights reserved. | |
| Vanguard Marketing Corporation, Distributor. | |
| Q11940 122018 | |
| Annual Report | October 31, 2018 |
| Vanguard High Dividend Yield Index Fund |
Vanguard’s Principles for Investing Success
We want to give you the best chance of investment success. These principles, grounded in Vanguard’s research and experience, can put you on the right path.
Goals. Create clear, appropriate investment goals.
Balance. Develop a suitable asset allocation using broadly diversified funds. Cost. Minimize cost.
Discipline. Maintain perspective and long-term discipline.
A single theme unites these principles: Focus on the things you can control.
We believe there is no wiser course for any investor.
| Contents | |
| Your Fund’s Performance at a Glance. | 1 |
| CEO’s Perspective. | 3 |
| Fund Profile. | 5 |
| Performance Summary. | 7 |
| Financial Statements. | 9 |
| Your Fund’s After-Tax Returns. | 27 |
| About Your Fund’s Expenses. | 28 |
| Glossary. | 30 |
Please note: The opinions expressed in this report are just that—informed opinions. They should not be considered promises or advice. Also, please keep in mind that the information and opinions cover the period through the date on the front of this report. Of course, the risks of investing in your fund are spelled out in the prospectus.
See the Glossary for definitions of investment terms used in this report.
Your Fund’s Performance at a Glance
• For the 12 months ended October 31, 2018, Vanguard High Dividend Yield Index Fund returned 3.96% for Investor Shares. That performance was in line with the 4.12% return of its benchmark after taking into account the costs of running the fund, and it was more than the 3.07% average return of its peers.
• Stocks rallied through early 2018 on robust global economic momentum, but the environment grew more challenging—especially in late winter and just before the close of the period—amid concerns that included flagging growth outside the United States, inflation at home, and flare-ups in trade tensions.
• U.S. companies that are committed to paying larger-than-average dividends underperformed the broad U.S. stock market.
• The fund posted positive results in six of its ten market sectors. Consumer services and health care stood out, with double-digit returns. Basic materials lagged the most.
| Total Returns: Fiscal Year Ended October 31, 2018 | |
| Total | |
| Returns | |
| Vanguard High Dividend Yield Index Fund | |
| Investor Shares | 3.96% |
| ETF Shares | |
| Market Price | 4.00 |
| Net Asset Value | 4.05 |
| FTSE High Dividend Yield Index | 4.12 |
| Equity Income Funds Average | 3.07 |
Equity Income Funds Average: Derived from data provided by Lipper, a Thomson Reuters Company.
The Vanguard ETF® Shares shown are traded on the NYSE Arca exchange and are available only through brokers. The table provides ETF returns based on both the NYSE Arca market price and the net asset value for a share. U.S. Pat. Nos. 6,879,964; 7,337,138; 7,720,749; 7,925,573; 8,090,646; and 8,417,623.
For the ETF Shares, the market price is determined by the midpoint of the bid-offer spread as of the closing time of the New York Stock Exchange (generally 4 p.m., Eastern time). The net asset value is also determined as of the NYSE closing time. For more information about how the ETF Shares' market prices have compared with their net asset value, visit vanguard.com, select your ETF, and then select the Price and Performance tab. The ETF premium/discount analysis there shows the percentages of days on which the ETF Shares' market price was above or below the NAV.
1
| Total Returns: Ten Years Ended October 31, 2018 | |
| Average | |
| Annual Return | |
| High Dividend Yield Index Fund Investor Shares | 12.12% |
| FTSE High Dividend Yield Index | 12.32 |
| Equity Income Funds Average | 10.47 |
| Equity Income Funds Average: Derived from data provided by Lipper, a Thomson Reuters Company. |
The figures shown represent past performance, which is not a guarantee of future results. (Current performance may be lower or higher than the performance data cited. For performance data current to the most recent month-end, visit our website at vanguard.com/performance.) Note, too, that both investment returns and principal value can fluctuate widely, so an investor’s shares, when sold, could be worth more or less than their original cost.
| Expense Ratios | |||
| Your Fund Compared With Its Peer Group | |||
| Investor | ETF | Peer Group | |
| Shares | Shares | Average | |
| High Dividend Yield Index Fund | 0.15% | 0.08% | 1.15% |
The fund expense ratios shown are from the prospectus dated February 22, 2018, and represent estimated costs for the current fiscal year. For the fiscal year ended October 31, 2018, the fund’s expense ratios were 0.14% for Investor Shares and 0.06% for ETF Shares. The peer-group expense ratio is derived from data provided by Lipper, a Thomson Reuters Company, and captures information through year-end 2017.
Peer group: Equity Income Funds.
2
CEO’s Perspective

Tim Buckley
President and Chief Executive Officer
Dear Shareholder,
Over the years, I’ve found that prudent investors exhibit a common trait: discipline. No matter how the markets move or what new investing fad hits the headlines, those who stay focused on their goals and tune out the noise are set up for long-term success.
The prime gateway to investing is saving, and you don’t usually become a saver without a healthy dose of discipline. Savers make the decision to sock away part of their income, which means spending less and delaying gratification, no matter how difficult that may be.
Of course, disciplined investing extends beyond diligent saving. The financial markets, in the short term especially, are unpredictable; I have yet to meet the investor who can time them perfectly. It takes discipline to resist the urge to go all-in when markets are frothy or to retreat when things look bleak.
Staying put with your investments is one strategy for handling volatility. Another, rebalancing, requires even more discipline because it means steering your money away from strong performers and toward poorer performers.
Patience—a form of discipline—is also the friend of long-term investors. Higher returns are the potential reward for weathering the market’s turbulence and uncertainty.
3
We have been enjoying one of the longest bull markets in history, but it won’t continue forever. Prepare yourself now for how you will react when volatility comes back. Don’t panic. Don’t chase returns or look for answers outside the asset classes you trust. And be sure to rebalance periodically, even when there’s turmoil.
Whether you’re a master of self-control, get a boost from technology, or work with a professional advisor, know that discipline is necessary to get the most out of your investment portfolio. And know that Vanguard is with you for the entire ride.
Thank you for your continued loyalty.
Sincerely,

Mortimer J. Buckley
President and Chief Executive Officer
November 16, 2018
| Market Barometer | |||
| Average Annual Total Returns | |||
| Periods Ended October 31, 2018 | |||
| One Year | Three Years | Five Years | |
| Stocks | |||
| Russell 1000 Index (Large-caps) | 6.98% | 11.31% | 11.05% |
| Russell 2000 Index (Small-caps) | 1.85 | 10.68 | 8.01 |
| Russell 3000 Index (Broad U.S. market) | 6.60 | 11.27 | 10.81 |
| FTSE All-World ex US Index (International) | -7.99 | 4.57 | 2.01 |
| Bonds | |||
| Bloomberg Barclays U.S. Aggregate Bond Index | |||
| (Broad taxable market) | -2.05% | 1.04% | 1.83% |
| Bloomberg Barclays Municipal Bond Index | |||
| (Broad tax-exempt market) | -0.51 | 1.90 | 3.25 |
| FTSE Three-Month U. S. Treasury Bill Index | 1.67 | 0.86 | 0.52 |
| CPI | |||
| Consumer Price Index | 2.52% | 2.07% | 1.60% |
4
High Dividend Yield Index Fund
Fund Profile
As of October 31, 2018
| Share-Class Characteristics | ||
| Investor | ETF | |
| Shares | Shares | |
| Ticker Symbol | VHDYX | VYM |
| Expense Ratio1 | 0.15% | 0.08% |
| 30-Day SEC Yield | 3.25% | 3.35% |
| Portfolio Characteristics | |||
| FTSE High | DJ | ||
| Dividend | U.S. Total | ||
| Yield | Market | ||
| Fund | Index | FA Index | |
| Number of Stocks | 402 | 398 | 3,806 |
| Median Market | |||
| Cap | $104.9B | $104.9B | $71.6B |
| Price/Earnings | |||
| Ratio | 15.3x | 15.4x | 18.5x |
| Price/Book Ratio | 2.4x | 2.4x | 2.9x |
| Return on Equity | 15.4% | 15.2% | 15.0% |
| Earnings Growth | |||
| Rate | 3.3% | 3.5% | 8.2% |
| Dividend Yield | 3.2% | 3.2% | 1.8% |
| Foreign Holdings | 0.0% | 0.0% | 0.0% |
| Turnover Rate | 13% | — | — |
| Short-Term | |||
| Reserves | -0.2% | — | — |
| Volatility Measures | ||
| FTSE High | DJ | |
| Dividend | U.S. Total | |
| Yield | Market | |
| Index | FA Index | |
| R-Squared | 1.00 | 0.85 |
| Beta | 1.00 | 0.76 |
These measures show the degree and timing of the fund’s fluctuations compared with the indexes over 36 months.
| Sector Diversification (% of equity exposure) | |
| Fund | |
| Basic Materials | 3.7% |
| Consumer Goods | 13.4 |
| Consumer Services | 9.7 |
| Financials | 15.7 |
| Health Care | 13.8 |
| Industrials | 11.2 |
| Oil & Gas | 9.4 |
| Technology | 10.6 |
| Telecommunications | 4.9 |
| Utilities | 7.6 |
Sector categories are based on the Industry Classification Benchmark (“ICB”), except for the “Other” category (if applicable), which includes securities that have not been provided an ICB classification as of the effective reporting period.
| Ten Largest Holdings (% of total net assets) | ||
| Johnson & Johnson | Pharmaceuticals | 3.8% |
| JPMorgan Chase & Co. | Banks | 3.7 |
| Exxon Mobil Corp. | Integrated Oil & Gas | 3.4 |
| Pfizer Inc. | Pharmaceuticals | 2.5 |
| Verizon Communications Fixed Line | ||
| Inc. | Telecommunications | 2.4 |
| Wells Fargo & Co. | Banks | 2.3 |
| AT&T Inc. | Fixed Line | |
| Telecommunications | 2.3 | |
| Procter & Gamble Co. | Nondurable | |
| Household Products | 2.2 | |
| Intel Corp. | Semiconductors | 2.2 |
| Cisco Systems Inc. | Telecommunications | |
| Equipment | 2.2 | |
| Top Ten | 27.0% | |
The holdings listed exclude any temporary cash investments and equity index products.
1 The expense ratios shown are from the prospectus dated February 22, 2018, and represent estimated costs for the current fiscal year. For the fiscal year ended October 31, 2018, the expense ratios were 0.14% for Investor Shares and 0.06% for ETF Shares.
5
High Dividend Yield Index Fund
Investment Focus
6
High Dividend Yield Index Fund
Performance Summary
All of the returns in this report represent past performance, which is not a guarantee of future results that may be achieved by the fund. (Current performance may be lower or higher than the performance data cited. For performance data current to the most recent month-end, visit our website at vanguard.com/performance.) Note, too, that both investment returns and principal value can fluctuate widely, so an investor’s shares, when sold, could be worth more or less than their original cost. The returns shown do not reflect taxes that a shareholder would pay on fund distributions or on the sale of fund shares.
Cumulative Performance: October 31, 2008, Through October 31, 2018
Initial Investment of $10,000
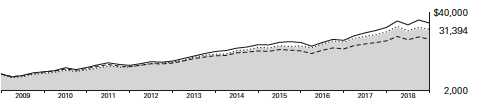
| Average Annual Total Returns | ||||
| Periods Ended October 31, 2018 | ||||
| Final Value | ||||
| One | Five | Ten | of a $10,000 | |
| Year | Years | Years | Investment | |
| High Dividend Yield Index Fund Investor | ||||
| Shares | 3.96% | 9.94% | 12.12% | $31,394 |
| FTSE High Dividend Yield Index | 4.12 | 10.10 | 12.32 | 31,947 |
| Equity Income Funds Average | 3.07 | 7.40 | 10.47 | 27,073 |
| Dow Jones U.S. Total Stock Market | ||||
| Float Adjusted Index | 6.56 | 10.76 | 13.36 | 35,036 |
Equity Income Funds Average: Derived from data provided by Lipper, a Thomson Reuters Company.
See Financial Highlights for dividend and capital gains information.
7
High Dividend Yield Index Fund
| Final Value | ||||
| One | Five | Ten | of a $10,000 | |
| Year | Years | Years | Investment | |
| High Dividend Yield Index Fund ETF Shares | ||||
| Net Asset Value | 4.05% | 10.02% | 12.22% | $31,685 |
| FTSE High Dividend Yield Index | 4.12 | 10.10 | 12.32 | 31,947 |
| Dow Jones U.S. Total Stock Market Float | ||||
| Adjusted Index | 6.56 | 10.76 | 13.36 | 35,036 |
| Cumulative Returns of ETF Shares: October 31, 2008, Through October 31, 2018 | |||
| One | Five | Ten | |
| Year | Years | Years | |
| High Dividend Yield Index Fund ETF Shares Market | |||
| Price | 4.00% | 60.99% | 215.86% |
| High Dividend Yield Index Fund ETF Shares Net | |||
| Asset Value | 4.05 | 61.18 | 216.85 |
| FTSE High Dividend Yield Index | 4.12 | 61.76 | 219.47 |
Fiscal-Year Total Returns (%): October 31, 2008, Through October 31, 2018
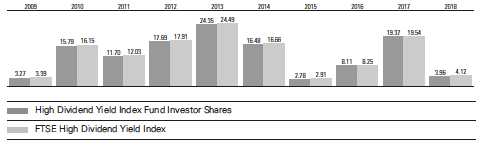
Average Annual Total Returns: Periods Ended September 30, 2018
This table presents returns through the latest calendar quarter—rather than through the end of the fiscal period.
Securities and Exchange Commission rules require that we provide this information.
| Inception | One | Five | Ten | |
| Date | Year | Years | Years | |
| Investor Shares | 11/16/2006 | 10.58% | 11.96% | 10.87% |
| ETF Shares | 11/10/2006 | |||
| Market Price | 10.70 | 12.04 | 10.94 | |
| Net Asset Value | 10.67 | 12.04 | 10.97 |
8
High Dividend Yield Index Fund
Financial Statements
Statement of Net Assets
As of October 31, 2018
The fund reports a complete list of its holdings in regulatory filings four times in each fiscal year, at the quarter-ends. For the second and fourth fiscal quarters, the lists appear in the fund’s semiannual and annual reports to shareholders. For the first and third fiscal quarters, the fund files the lists with the Securities and Exchange Commission on Form N-Q. Shareholders can look up the fund’s Forms N-Q on the SEC’s website at sec.gov.
| Market | |||
| Value• | |||
| Shares | ($000) | ||
| Common Stocks (99.7%)1 | |||
| Basic Materials (3.6%) | |||
| DowDuPont Inc. | 6,883,780 | 371,174 | |
| Linde plc | 1,690,315 | 279,697 | |
| Air Products & | |||
| Chemicals Inc. | 649,765 | 100,291 | |
| LyondellBasell Industries | |||
| NV Class A | 951,442 | 84,935 | |
| Nucor Corp. | 942,426 | 55,716 | |
| International Paper Co. | 1,211,116 | 54,936 | |
| CF Industries Holdings | |||
| Inc. | 690,407 | 33,160 | |
| RPM International Inc. | 388,743 | 23,779 | |
| Reliance Steel & | |||
| Aluminum Co. | 207,779 | 16,398 | |
| Olin Corp. | 493,078 | 9,960 | |
| Domtar Corp. | 184,282 | 8,534 | |
| Scotts Miracle-Gro Co. | 118,548 | 7,912 | |
| Commercial Metals Co. | 342,398 | 6,526 | |
| Compass Minerals | |||
| International Inc. | 100,304 | 4,866 | |
| Schweitzer-Mauduit | |||
| International Inc. | 89,688 | 2,863 | |
| PH Glatfelter Co. | 126,719 | 2,268 | |
| Schnitzer Steel | |||
| Industries Inc. | 76,702 | 2,063 | |
| Innophos Holdings Inc. | 57,021 | 1,671 | |
| ^ | Nexa Resources SA | 104,728 | 1,168 |
| §,* | Ferroglobe R&W Trust | 166,085 | — |
| 1,067,917 | |||
| Consumer Goods (13.4%) | |||
| Procter & Gamble Co. | 7,385,086 | 654,909 | |
| Coca-Cola Co. | 11,340,615 | 542,989 | |
| PepsiCo Inc. | 4,199,925 | 471,988 | |
| Philip Morris | |||
| International Inc. | 4,605,171 | 405,577 | |
| Altria Group Inc. | 5,613,278 | 365,088 | |
| Colgate-Palmolive Co. | 2,525,965 | 150,421 | |
| General Motors Co. | 3,890,128 | 142,340 |
| Ford Motor Co. | 11,658,996 | 111,343 |
| Kimberly-Clark Corp. | 1,032,347 | 107,674 |
| Kraft Heinz Co. | 1,785,925 | 98,172 |
| VF Corp. | 958,253 | 79,420 |
| Archer-Daniels-Midland | ||
| Co. | 1,654,177 | 78,160 |
| General Mills Inc. | 1,756,500 | 76,935 |
| Clorox Co. | 380,176 | 56,437 |
| Conagra Brands Inc. | 1,384,582 | 49,291 |
| Kellogg Co. | 735,294 | 48,147 |
| Hershey Co. | 415,530 | 44,524 |
| Genuine Parts Co. | 423,410 | 41,460 |
| Tapestry Inc. | 853,186 | 36,098 |
| JM Smucker Co. | 325,793 | 35,290 |
| Molson Coors Brewing | ||
| Co. Class B | 513,867 | 32,887 |
| Hasbro Inc. | 343,738 | 31,524 |
| Bunge Ltd. | 416,779 | 25,757 |
| Coca-Cola European | ||
| Partners plc | 546,529 | 24,862 |
| Garmin Ltd. | 337,170 | 22,307 |
| Whirlpool Corp. | 193,889 | 21,281 |
| Newell Brands Inc. | 1,337,886 | 21,246 |
| Campbell Soup Co. | 525,039 | 19,642 |
| Harley-Davidson Inc. | 497,349 | 19,009 |
| Hanesbrands Inc. | 1,101,263 | 18,898 |
| Polaris Industries Inc. | 173,616 | 15,448 |
| Leggett & Platt Inc. | 390,361 | 14,174 |
| Nu Skin Enterprises Inc. | ||
| Class A | 162,748 | 11,428 |
| Flowers Foods Inc. | 532,228 | 10,277 |
| Coty Inc. Class A | 673,673 | 7,107 |
| B&G Foods Inc. | 196,568 | 5,119 |
| Universal Corp. | 73,050 | 4,957 |
| HNI Corp. | 128,165 | 4,856 |
| Steelcase Inc. Class A | 247,656 | 4,111 |
| Vector Group Ltd. | 303,607 | 4,105 |
| MDC Holdings Inc. | 145,151 | 4,079 |
9
| High Dividend Yield Index Fund | ||
| Market | ||
| Value• | ||
| Shares | ($000) | |
| Nutrisystem Inc. | 88,746 | 3,156 |
| Sturm Ruger & Co. Inc. | 49,044 | 2,913 |
| Knoll Inc. | 141,991 | 2,819 |
| Dean Foods Co. | 299,329 | 2,392 |
| National Presto | ||
| Industries Inc. | 14,650 | 1,826 |
| Ethan Allen Interiors Inc. | 81,254 | 1,555 |
| Tupperware Brands Corp. | 396 | 14 |
| 3,934,012 | ||
| Consumer Services (9.6%) | ||
| Comcast Corp. Class A | 13,545,432 | 516,623 |
| Walmart Inc. | 4,229,903 | 424,175 |
| McDonald’s Corp. | 2,302,429 | 407,300 |
| CVS Health Corp. | 3,012,834 | 218,099 |
| Walgreens Boots | ||
| Alliance Inc. | 2,508,083 | 200,070 |
| Target Corp. | 1,589,644 | 132,942 |
| Delta Air Lines Inc. | 1,891,645 | 103,530 |
| Sysco Corp. | 1,411,503 | 100,682 |
| Carnival Corp. | 1,201,297 | 67,321 |
| Las Vegas Sands Corp. | 1,058,133 | 53,997 |
| Best Buy Co. Inc. | 716,235 | 50,251 |
| Omnicom Group Inc. | 658,960 | 48,974 |
| Darden Restaurants Inc. | 366,892 | 39,092 |
| Kohl’s Corp. | 494,798 | 37,471 |
| Viacom Inc. Class B | 1,046,139 | 33,456 |
| Macy’s Inc. | 905,889 | 31,063 |
| Interpublic Group of | ||
| Cos. Inc. | 1,137,189 | 26,337 |
| Nordstrom Inc. | 348,346 | 22,911 |
| KAR Auction Services | ||
| Inc. | 398,320 | 22,680 |
| Nielsen Holdings plc | 717,599 | 18,643 |
| Gap Inc. | 668,406 | 18,247 |
| H&R Block Inc. | 608,494 | 16,149 |
| Williams-Sonoma Inc. | 253,048 | 15,026 |
| Wyndham Hotels & | ||
| Resorts Inc. | 290,085 | 14,298 |
| Cinemark Holdings Inc. | 316,936 | 13,175 |
| L Brands Inc. | 379,353 | 12,299 |
| Six Flags Entertainment | ||
| Corp. | 211,578 | 11,396 |
| American Eagle | ||
| Outfitters Inc. | 475,675 | 10,969 |
| Wyndham Destinations | ||
| Inc. | 290,284 | 10,415 |
| Signet Jewelers Ltd. | 182,801 | 10,246 |
| Tribune Media Co. | ||
| Class A | 259,622 | 9,868 |
| Extended Stay America | ||
| Inc. | 561,538 | 9,142 |
| Cracker Barrel Old | ||
| Country Store Inc. | 56,455 | 8,958 |
| TEGNA Inc. | 634,703 | 7,324 |
| John Wiley & Sons Inc. | ||
| Class A | 130,371 | 7,071 |
| Bed Bath & Beyond Inc. | 467,548 | 6,424 |
| Sinclair Broadcast Group | ||
| Inc. Class A | 212,665 | 6,091 |
| Meredith Corp. | 115,969 | 5,979 |
| Big Lots Inc. | 136,731 | 5,677 |
| DSW Inc. Class A | 211,230 | 5,608 |
| Brinker International Inc. | 129,287 | 5,605 |
| International Game | ||
| Technology plc | 292,111 | 5,419 |
| Penske Automotive | ||
| Group Inc. | 116,605 | 5,175 |
| GameStop Corp. Class A | 341,130 | 4,980 |
| Office Depot Inc. | 1,782,042 | 4,562 |
| Sonic Corp. | 101,541 | 4,395 |
| Abercrombie & Fitch Co. | 219,178 | 4,318 |
| Dine Brands Global Inc. | 49,655 | 4,024 |
| Guess? Inc. | 182,238 | 3,871 |
| Tailored Brands Inc. | 165,531 | 3,478 |
| Chico’s FAS Inc. | 443,627 | 3,403 |
| Gannett Co. Inc. | 330,530 | 3,206 |
| New Media Investment | ||
| Group Inc. | 176,801 | 2,484 |
| Buckle Inc. | 110,233 | 2,249 |
| Copa Holdings SA Class A 30,109 | 2,181 | |
| National CineMedia Inc. | 230,798 | 2,066 |
| SpartanNash Co. | 107,301 | 1,915 |
| Weis Markets Inc. | 27,451 | 1,267 |
| Speedway Motorsports | ||
| Inc. | 32,995 | 512 |
| Barnes & Noble Inc. | 182 | 1 |
| 2,825,090 | ||
| Financials (15.7%) | ||
| JPMorgan Chase & Co. | 9,915,994 | 1,081,042 |
| Wells Fargo & Co. | 12,870,704 | 685,108 |
| US Bancorp | 4,557,980 | 238,246 |
| CME Group Inc. | 1,006,821 | 184,490 |
| PNC Financial Services | ||
| Group Inc. | 1,375,389 | 176,724 |
| Chubb Ltd. | 1,373,689 | 171,587 |
| BlackRock Inc. | 365,005 | 150,170 |
| Prudential Financial Inc. | 1,244,482 | 116,707 |
| BB&T Corp. | 2,308,087 | 113,466 |
| American International | ||
| Group Inc. | 2,636,497 | 108,861 |
| MetLife Inc. | 2,504,273 | 103,151 |
| Travelers Cos. Inc. | 799,979 | 100,101 |
| Aflac Inc. | 2,264,610 | 97,537 |
| SunTrust Banks Inc. | 1,375,823 | 86,209 |
| T. Rowe Price Group Inc. | 699,342 | 67,829 |
| KeyCorp | 3,129,135 | 56,825 |
| Regions Financial Corp. | 3,263,897 | 55,388 |
| Ameriprise Financial Inc. | 419,914 | 53,430 |
10
| High Dividend Yield Index Fund | ||
| Market | ||
| Value• | ||
| Shares | ($000) | |
| Fifth Third Bancorp | 1,978,386 | 53,397 |
| Citizens Financial Group | ||
| Inc. | 1,409,915 | 52,660 |
| Huntington Bancshares | ||
| Inc. | 3,243,346 | 46,477 |
| Arthur J Gallagher & Co. | 534,105 | 39,529 |
| Principal Financial Group | ||
| Inc. | 837,608 | 39,426 |
| Cincinnati Financial Corp. | 454,808 | 35,766 |
| Franklin Resources Inc. | 914,822 | 27,902 |
| Fidelity National Financial | ||
| Inc. | 781,808 | 26,151 |
| Invesco Ltd. | 1,201,024 | 26,074 |
| Western Union Co. | 1,323,983 | 23,885 |
| Unum Group | 613,500 | 22,245 |
| American Financial | ||
| Group Inc. | 212,565 | 21,263 |
| Old Republic International | ||
| Corp. | 838,281 | 18,484 |
| People’s United Financial | ||
| Inc. | 1,094,307 | 17,137 |
| Cullen/Frost Bankers Inc. | 169,155 | 16,564 |
| Popular Inc. | 298,211 | 15,510 |
| First Horizon National | ||
| Corp. | 958,460 | 15,470 |
| Eaton Vance Corp. | 342,313 | 15,421 |
| PacWest Bancorp | 363,362 | 14,760 |
| Janus Henderson Group | ||
| plc | 589,672 | 14,488 |
| First American Financial | ||
| Corp. | 321,623 | 14,258 |
| Lazard Ltd. Class A | 344,060 | 13,673 |
| Axis Capital Holdings Ltd. | 242,939 | 13,554 |
| New York Community | ||
| Bancorp Inc. | 1,409,265 | 13,501 |
| Umpqua Holdings Corp. | 648,554 | 12,452 |
| FNB Corp. | 954,297 | 11,289 |
| Glacier Bancorp Inc. | 249,860 | 10,594 |
| Hancock Whitney Corp. | 250,458 | 10,509 |
| BankUnited Inc. | 307,748 | 10,186 |
| Chemical Financial Corp. | 209,857 | 9,834 |
| United Bankshares Inc. | 293,918 | 9,749 |
| Bank of Hawaii Corp. | 123,341 | 9,675 |
| Valley National Bancorp | 949,443 | 9,475 |
| Navient Corp. | 774,917 | 8,974 |
| Community Bank System | ||
| Inc. | 147,718 | 8,625 |
| Cathay General Bancorp | 227,556 | 8,572 |
| RLI Corp. | 115,418 | 8,533 |
| BGC Partners Inc. Class A | 799,674 | 8,469 |
| Investors Bancorp Inc. | 726,796 | 8,126 |
| Fulton Financial Corp. | 507,075 | 8,118 |
| Columbia Banking | ||
| System Inc. | 215,136 | 7,979 |
| Old National Bancorp | 444,441 | 7,933 | |
| First Hawaiian Inc. | 313,706 | 7,774 | |
| First Financial Bancorp | 280,924 | 7,352 | |
| CVB Financial Corp. | 329,138 | 7,192 | |
| Legg Mason Inc. | 250,538 | 7,070 | |
| Federated Investors Inc. | |||
| Class B | 284,975 | 7,030 | |
| Kennedy-Wilson | |||
| Holdings Inc. | 369,890 | 7,020 | |
| ProAssurance Corp. | 156,216 | 6,861 | |
| Bank of NT Butterfield & | |||
| Son Ltd. | 160,606 | 6,471 | |
| WesBanco Inc. | 154,268 | 6,186 | |
| Trustmark Corp. | 198,253 | 6,106 | |
| Hope Bancorp Inc. | 366,346 | 5,305 | |
| Moelis & Co. Class A | 131,118 | 5,292 | |
| Horace Mann Educators | |||
| Corp. | 121,487 | 4,772 | |
| Mercury General Corp. | 80,097 | 4,751 | |
| Capitol Federal Financial | |||
| Inc. | 381,211 | 4,731 | |
| AmTrust Financial | |||
| Services Inc. | 328,027 | 4,704 | |
| Northwest Bancshares | |||
| Inc. | 282,709 | 4,563 | |
| NBT Bancorp Inc. | 124,463 | 4,542 | |
| Provident Financial | |||
| Services Inc. | 183,524 | 4,478 | |
| Westamerica | |||
| Bancorporation | 76,331 | 4,443 | |
| Waddell & Reed Financial | |||
| Inc. Class A | 228,858 | 4,364 | |
| HFF Inc. Class A | 111,101 | 4,083 | |
| S&T Bancorp Inc. | 100,639 | 4,037 | |
| * | Clearway Energy Inc. | 203,421 | 3,989 |
| First Commonwealth | |||
| Financial Corp. | 295,436 | 3,988 | |
| Artisan Partners Asset | |||
| Management Inc. | |||
| Class A | 140,171 | 3,842 | |
| Sandy Spring Bancorp Inc. | 102,869 | 3,657 | |
| Brookline Bancorp Inc. | 234,326 | 3,632 | |
| CNA Financial Corp. | 82,897 | 3,595 | |
| Safety Insurance Group Inc. | 42,869 | 3,570 | |
| Boston Private Financial | |||
| Holdings Inc. | 242,535 | 3,274 | |
| City Holding Co. | 43,925 | 3,241 | |
| BrightSphere Investment | |||
| Group plc | 237,947 | 2,713 | |
| American National | |||
| Insurance Co. | 21,704 | 2,675 | |
| Cohen & Steers Inc. | 65,246 | 2,505 | |
| Washington Trust | |||
| Bancorp Inc. | 43,873 | 2,253 |
11
| High Dividend Yield Index Fund | |||
| Market | |||
| Value• | |||
| Shares | ($000) | ||
| TFS Financial Corp. | 146,749 | 2,159 | |
| Community Trust | |||
| Bancorp Inc. | 45,819 | 2,085 | |
| TrustCo Bank Corp. NY | 274,668 | 2,057 | |
| FBL Financial Group Inc. | |||
| Class A | 29,117 | 2,008 | |
| * | Clearway Energy Inc. | ||
| Class A | 103,400 | 2,008 | |
| Flushing Financial Corp. | 80,841 | 1,834 | |
| Oritani Financial Corp. | 123,389 | 1,803 | |
| First Financial Corp. | 35,652 | 1,635 | |
| Dime Community | |||
| Bancshares Inc. | 95,324 | 1,537 | |
| Republic Bancorp Inc. | |||
| Class A | 28,929 | 1,298 | |
| Maiden Holdings Ltd. | 9,951 | 35 | |
| 4,604,078 | |||
| Health Care (13.7%) | |||
| Johnson & Johnson | 7,960,119 | 1,114,337 | |
| Pfizer Inc. | 17,202,163 | 740,725 | |
| Merck & Co. Inc. | 7,892,244 | 580,948 | |
| Amgen Inc. | 1,919,681 | 370,095 | |
| AbbVie Inc. | 4,492,955 | 349,777 | |
| Eli Lilly & Co. | 2,826,116 | 306,464 | |
| Gilead Sciences Inc. | 3,837,174 | 261,619 | |
| Bristol-Myers Squibb | |||
| Co. | 4,848,634 | 245,050 | |
| Cardinal Health Inc. | 920,396 | 46,572 | |
| Patterson Cos. Inc. | 256,647 | 5,795 | |
| Meridian Bioscience Inc. | 124,368 | 2,016 | |
| Owens & Minor Inc. | 73,320 | 579 | |
| 4,023,977 | |||
| Industrials (11.2%) | |||
| Boeing Co. | 1,606,130 | 569,951 | |
| 3M Co. | 1,689,675 | 321,477 | |
| General Electric Co. | 25,556,537 | 258,121 | |
| United Parcel Service | |||
| Inc. Class B | 2,047,210 | 218,110 | |
| Lockheed Martin Corp. | 735,407 | 216,099 | |
| Caterpillar Inc. | 1,721,012 | 208,793 | |
| Automatic Data | |||
| Processing Inc. | 1,305,650 | 188,118 | |
| Norfolk Southern Corp. | 836,764 | 140,434 | |
| Illinois Tool Works Inc. | 994,030 | 126,808 | |
| Emerson Electric Co. | 1,859,924 | 126,252 | |
| Waste Management Inc. | 1,277,667 | 114,313 | |
| Eaton Corp. plc | 1,294,958 | 92,810 | |
| Johnson Controls | |||
| International plc | 2,738,258 | 87,542 | |
| Paychex Inc. | 950,627 | 62,256 | |
| Cummins Inc. | 452,335 | 61,830 | |
| PACCAR Inc. | 1,016,954 | 58,180 | |
| Republic Services Inc. | |||
| Class A | 651,019 | 47,316 | |
| Fastenal Co. | 850,916 | 43,746 | |
| CH Robinson Worldwide | |||
| Inc. | 409,365 | 36,446 | |
| WestRock Co. | 752,521 | 32,336 | |
| Snap-on Inc. | 166,092 | 25,568 | |
| Packaging Corp. of | |||
| America | 276,761 | 25,409 | |
| Xerox Corp. | 660,573 | 18,410 | |
| Hubbell Inc. Class B | 161,697 | 16,445 | |
| National Instruments | |||
| Corp. | 327,390 | 16,032 | |
| Sonoco Products Co. | 290,382 | 15,849 | |
| MDU Resources Group | |||
| Inc. | 574,316 | 14,335 | |
| Watsco Inc. | 94,363 | 13,983 | |
| Bemis Co. Inc. | 268,329 | 12,281 | |
| MSC Industrial Direct Co. | |||
| Inc. Class A | 132,816 | 10,766 | |
| Ryder System Inc. | 155,756 | 8,615 | |
| Kennametal Inc. | 238,931 | 8,470 | |
| GATX Corp. | 110,908 | 8,310 | |
| Timken Co. | 202,160 | 7,995 | |
| ABM Industries Inc. | 195,074 | 5,998 | |
| Brady Corp. Class A | 138,544 | 5,582 | |
| Mobile Mini Inc. | 131,003 | 5,387 | |
| Otter Tail Corp. | 115,666 | 5,213 | |
| Covanta Holding Corp. | 346,480 | 5,090 | |
| Triton International Ltd. | 157,168 | 5,056 | |
| ManTech International | |||
| Corp. Class A | 78,205 | 4,480 | |
| Greenbrier Cos. Inc. | 93,405 | 4,432 | |
| McGrath RentCorp | 70,219 | 3,749 | |
| Greif Inc. Class A | 75,848 | 3,588 | |
| Aircastle Ltd. | 164,239 | 3,191 | |
| ^ | Ship Finance International | ||
| Ltd. | 243,779 | 3,047 | |
| GasLog Ltd. | 121,631 | 2,489 | |
| ^ | Seaspan Corp. Class A | 266,457 | 2,382 |
| H&E Equipment Services | |||
| Inc. | 97,204 | 2,342 | |
| AVX Corp. | 138,354 | 2,308 | |
| Briggs & Stratton Corp. | 123,192 | 1,790 | |
| Myers Industries Inc. | 103,573 | 1,643 | |
| American Railcar | |||
| Industries Inc. | 20,898 | 1,461 | |
| Macquarie Infrastructure | |||
| Corp. | 37,503 | 1,386 | |
| LSC Communications Inc. | 139,037 | 1,311 | |
| ^ | Teekay Corp. | 197,740 | 1,311 |
| 3,286,642 | |||
| Oil & Gas (9.4%) | |||
| Exxon Mobil Corp. | 12,561,212 | 1,000,877 | |
| Chevron Corp. | 5,647,566 | 630,551 | |
| Schlumberger Ltd. | 4,109,468 | 210,857 | |
12
| High Dividend Yield Index Fund | |||
| Market | |||
| Value• | |||
| Shares | ($000) | ||
| Occidental Petroleum | |||
| Corp. | 2,271,195 | 152,329 | |
| Marathon Petroleum | |||
| Corp. | 1,980,000 | 139,491 | |
| Phillips 66 | 1,245,971 | 128,111 | |
| Valero Energy Corp. | 1,275,761 | 116,209 | |
| Kinder Morgan Inc. | 5,622,553 | 95,696 | |
| Williams Cos. Inc. | 3,601,585 | 87,627 | |
| ONEOK Inc. | 1,213,983 | 79,637 | |
| Targa Resources Corp. | 657,951 | 33,996 | |
| OGE Energy Corp. | 590,529 | 21,348 | |
| Helmerich & Payne Inc. | 314,213 | 19,572 | |
| Murphy Oil Corp. | 485,648 | 15,473 | |
| PBF Energy Inc. Class A | 352,452 | 14,750 | |
| Nabors Industries Ltd. | 1,038,737 | 5,163 | |
| SemGroup Corp. Class A | 233,482 | 4,317 | |
| Archrock Inc. | 373,418 | 3,831 | |
| ^ | CVR Energy Inc. | 45,563 | 1,959 |
| 2,761,794 | |||
| Other (0.0%)2 | |||
| §,* | A Schulman Inc. CVR | 77,422 | 148 |
| Technology (10.6%) | |||
| Intel Corp. | 13,686,524 | 641,624 | |
| Cisco Systems Inc. | 13,958,271 | 638,591 | |
| International Business | |||
| Machines Corp. | 2,723,689 | 314,395 | |
| Broadcom Inc. | 1,278,186 | 285,662 | |
| QUALCOMM Inc. | 4,395,455 | 276,430 | |
| Texas Instruments Inc. | 2,904,149 | 269,592 | |
| HP Inc. | 4,776,894 | 115,314 | |
| Analog Devices Inc. | 1,093,986 | 91,578 | |
| Corning Inc. | 2,362,565 | 75,484 | |
| Hewlett Packard | |||
| Enterprise Co. | 4,484,257 | 68,385 | |
| Xilinx Inc. | 754,291 | 64,394 | |
| KLA-Tencor Corp. | 461,975 | 42,289 | |
| Maxim Integrated | |||
| Products Inc. | 824,035 | 41,218 | |
| CA Inc. | 929,113 | 41,216 | |
| Western Digital Corp. | 887,722 | 38,234 | |
| Seagate Technology plc | 844,559 | 33,977 | |
| Juniper Networks Inc. | 1,010,365 | 29,573 | |
| Cypress Semiconductor | |||
| Corp. | 1,062,603 | 13,750 | |
| Cogent Communications | |||
| Holdings Inc. | 123,234 | 6,406 | |
| Pitney Bowes Inc. | 620,505 | 4,108 | |
| TiVo Corp. | 356,595 | 3,923 | |
| NIC Inc. | 188,150 | 2,504 | |
| ADTRAN Inc. | 139,310 | 1,872 | |
| Xperi Corp. | 142,610 | 1,854 | |
| 3,102,373 | |||
| Telecommunications (4.9%) | ||
| Verizon | ||
| Communications Inc. | 12,264,929 | 700,205 |
| AT&T Inc. | 21,551,621 | 661,203 |
| CenturyLink Inc. | 2,832,316 | 58,459 |
| Telephone & Data | ||
| Systems Inc. | 288,711 | 8,901 |
| Consolidated | ||
| Communications | ||
| Holdings Inc. | 142,427 | 1,783 |
| Frontier Communications | ||
| Corp. | 4 | — |
| 1,430,551 | ||
| Utilities (7.6%) | ||
| NextEra Energy Inc. | 1,396,033 | 240,816 |
| Duke Energy Corp. | 2,113,675 | 174,653 |
| Dominion Energy Inc. | 1,930,969 | 137,910 |
| Southern Co. | 3,001,112 | 135,140 |
| Exelon Corp. | 2,858,907 | 125,249 |
| American Electric | ||
| Power Co. Inc. | 1,461,816 | 107,239 |
| Sempra Energy | 810,773 | 89,282 |
| Public Service Enterprise | ||
| Group Inc. | 1,494,530 | 79,853 |
| Xcel Energy Inc. | 1,506,875 | 73,852 |
| Consolidated Edison Inc. | 922,428 | 70,105 |
| Edison International | 941,275 | 65,315 |
| WEC Energy Group Inc. | 934,771 | 63,938 |
| PPL Corp. | 2,074,932 | 63,078 |
| DTE Energy Co. | 535,613 | 60,203 |
| Eversource Energy | 937,925 | 59,333 |
| FirstEnergy Corp. | 1,439,680 | 53,671 |
| Ameren Corp. | 720,136 | 46,506 |
| Entergy Corp. | 535,467 | 44,952 |
| Evergy Inc. | 802,084 | 44,909 |
| CMS Energy Corp. | 833,904 | 41,295 |
| CenterPoint Energy Inc. | 1,452,746 | 39,239 |
| Atmos Energy Corp. | 322,536 | 30,022 |
| Alliant Energy Corp. | 685,490 | 29,462 |
| AES Corp. | 1,957,096 | 28,534 |
| NiSource Inc. | 1,073,237 | 27,217 |
| Pinnacle West Capital | ||
| Corp. | 330,586 | 27,191 |
| UGI Corp. | 511,524 | 27,141 |
| Vectren Corp. | 246,272 | 17,616 |
| Aqua America Inc. | 527,172 | 17,149 |
| SCANA Corp. | 421,907 | 16,897 |
| IDACORP Inc. | 148,593 | 13,858 |
| National Fuel Gas Co. | 236,065 | 12,816 |
| ONE Gas Inc. | 153,443 | 12,108 |
| Hawaiian Electric | ||
| Industries Inc. | 321,607 | 11,996 |
13
| High Dividend Yield Index Fund | |||
| Market | |||
| Value• | |||
| Shares | ($000) | ||
| Portland General Electric | |||
| Co. | 263,259 | 11,868 | |
| New Jersey Resources | |||
| Corp. | 257,758 | 11,625 | |
| ALLETE Inc. | 151,600 | 11,218 | |
| Southwest Gas Holdings | |||
| Inc. | 144,457 | 11,162 | |
| Spire Inc. | 145,288 | 10,545 | |
| Avista Corp. | 192,898 | 9,919 | |
| Black Hills Corp. | 157,288 | 9,359 | |
| PNM Resources Inc. | 234,303 | 9,000 | |
| NorthWestern Corp. | 148,727 | 8,739 | |
| Avangrid Inc. | 166,356 | 7,820 | |
| South Jersey Industries | |||
| Inc. | 253,400 | 7,485 | |
| El Paso Electric Co. | 119,496 | 6,817 | |
| Northwest Natural | |||
| Holding Co. | 84,775 | 5,493 | |
| Pattern Energy Group Inc. | |||
| Class A | 266,544 | 4,777 | |
| Atlantica Yield plc | 175,110 | 3,434 | |
| 2,217,806 | |||
| Total Common Stocks | |||
| (Cost $25,799,491) | 29,254,388 | ||
| Temporary Cash Investments (0.1%)1 | |||
| Money Market Fund (0.1%) | |||
| 3,4 | Vanguard Market | ||
| Liquidity Fund, 2.308% | 279,805 | 27,981 | |
| Face | |||
| Amount | |||
| ($000) | |||
| U. S. Government and Agency Obligations (0.0%) | |||
| 5 | United States Treasury | ||
| Bill, 2.035%, 11/15/18 | 1,500 | 1,499 | |
| 5 | United States Treasury | ||
| Bill, 2.059%, 11/29/18 | 1,000 | 998 | |
| 5 | United States Treasury | ||
| Bill, 2.123%, 12/13/18 | 200 | 200 | |
| 5 | United States Treasury | ||
| Bill, 2.365%, 3/21/19 | 200 | 198 | |
| 2,895 | |||
| Total Temporary Cash Investments | |||
| (Cost $30,876) | 30,876 | ||
| Total Investments (99.8%) | |||
| (Cost $25,830,367) | 29,285,264 | ||
| Amount | |
| ($000) | |
| Other Assets and Liabilities (0.2%) | |
| Other Assets | |
| Investment in Vanguard | 1,541 |
| Receivables for Investment | |
| Securities Sold | 1,525 |
| Receivables for Accrued Income | 47,169 |
| Receivables for Capital Shares Issued | 6,419 |
| Variation Margin Receivable— | |
| Futures Contracts | 719 |
| Other Assets 5 | 531 |
| Total Other Assets | 57,904 |
| Liabilities | |
| Payables for Investment Securities | |
| Purchased | (36) |
| Collateral for Securities on Loan | (2,674) |
| Payables for Capital Shares Redeemed | (3,879) |
| Payables to Vanguard | (5,641) |
| Total Liabilities | (12,230) |
| Net Assets (100%) | 29,330,938 |
| At October 31, 2018, net assets consisted of: | |
| Amount | |
| ($000) | |
| Paid-in Capital | 26,303,805 |
| Total Distributable Earnings (Loss) | 3,027,133 |
| Net Assets | 29,330,938 |
| Investor Shares—Net Assets | |
| Applicable to 242,632,721 outstanding | |
| $.001 par value shares of beneficial | |
| interest (unlimited authorization) | 8,003,218 |
| Net Asset Value Per Share— | |
| Investor Shares | $32.98 |
14
| High Dividend Yield Index Fund | |
| Amount | |
| ($000) | |
| ETF Shares—Net Assets | |
| Applicable to 256,156,479 outstanding | |
| $.001 par value shares of beneficial | |
| interest (unlimited authorization) | 21,327,720 |
| Net Asset Value Per Share— | |
| ETF Shares | $83.26 |
• See Note A in Notes to Financial Statements.
^ Includes partial security positions on loan to broker-dealers.
The total value of securities on loan is $2,789,000.
§ Security value determined using significant unobservable inputs.
* Non-income-producing security.
1 The fund invests a portion of its cash reserves in equity
markets through the use of index futures contracts. After
giving effect to futures investments, the fund’s effective
common stock and temporary cash investment positions
represent 100.0% and -0.2%, respectively, of net assets.
2 “Other” represents securities that are not classified by the
fund’s benchmark index.
3 Affiliated money market fund available only to Vanguard funds
and certain trusts and accounts managed by Vanguard. Rate
shown is the 7-day yield.
4 Includes $2,674,000 of collateral received for securities on loan.
5 Securities with a value of $2,895,000 and cash of $478,000 have
been segregated as initial margin for open futures contracts.
CVR—Contingent Value Rights.
| Derivative Financial Instruments Outstanding as of Period End | ||||
| Futures Contracts | ||||
| ($000) | ||||
| Value and | ||||
| Number of | Unrealized | |||
| Long (Short) | Notional | Appreciation | ||
| Expiration | Contracts | Amount | (Depreciation) | |
| Long Futures Contracts | ||||
| E-mini S&P 500 Index | December 2018 | 557 | 75,504 | (4,942) |
See accompanying Notes, which are an integral part of the Financial Statements.
15
| High Dividend Yield Index Fund | |
| Statement of Operations | |
| Year Ended | |
| October 31, 2018 | |
| ($000) | |
| Investment Income | |
| Income | |
| Dividends | 919,242 |
| Interest1 | 821 |
| Securities Lending—Net | 655 |
| Total Income | 920,718 |
| Expenses | |
| The Vanguard Group—Note B | |
| Investment Advisory Services | 3,332 |
| Management and Administrative—Investor Shares | 8,813 |
| Management and Administrative—ETF Shares | 8,361 |
| Marketing and Distribution—Investor Shares | 1,398 |
| Marketing and Distribution—ETF Shares | 976 |
| Custodian Fees | 425 |
| Auditing Fees | 34 |
| Shareholders’ Reports and Proxy—Investor Shares | 99 |
| Shareholders’ Reports and Proxy—ETF Shares | 540 |
| Trustees’ Fees and Expenses | 19 |
| Total Expenses | 23,997 |
| Net Investment Income | 896,721 |
| Realized Net Gain (Loss) | |
| Investment Securities Sold1,2 | 2,076,282 |
| Futures Contracts | 276 |
| Realized Net Gain (Loss) | 2,076,558 |
| Change in Unrealized Appreciation (Depreciation) | |
| Investment Securities1 | (1,850,349) |
| Futures Contracts | (6,785) |
| Change in Unrealized Appreciation (Depreciation) | (1,857,134) |
| Net Increase (Decrease) in Net Assets Resulting from Operations | 1,116,145 |
1 Interest income, realized net gain (loss), and change in unrealized appreciation (depreciation) from an affiliated company of the fund
were $709,000, ($8,000), and $4,000, respectively.
2 Includes $2,313,174,000 of net gain (loss) resulting from in-kind redemptions; such gain (loss) is not taxable to the fund.
See accompanying Notes, which are an integral part of the Financial Statements.
16
| High Dividend Yield Index Fund | ||
| Statement of Changes in Net Assets | ||
| Year Ended October 31, | ||
| 2018 | 2017 | |
| ($000) | ($000) | |
| Increase (Decrease) in Net Assets | ||
| Operations | ||
| Net Investment Income | 896,721 | 763,919 |
| Realized Net Gain (Loss) | 2,076,558 | 853,945 |
| Change in Unrealized Appreciation (Depreciation) | (1,857,134) | 2,723,767 |
| Net Increase (Decrease) in Net Assets Resulting from Operations | 1,116,145 | 4,341,631 |
| Distributions | ||
| Net Investment Income | ||
| Investor Shares | (235,382) | (210,236) |
| ETF Shares | (640,458) | (567,866) |
| Realized Capital Gain | ||
| Investor Shares | — | — |
| ETF Shares | — | — |
| Total Distributions | (875,840) | (778,102) |
| Capital Share Transactions | ||
| Investor Shares | 350,836 | 718,901 |
| ETF Shares | 1,139,552 | 1,941,695 |
| Net Increase (Decrease) from Capital Share Transactions | 1,490,388 | 2,660,596 |
| Total Increase (Decrease) | 1,730,693 | 6,224,125 |
| Net Assets | ||
| Beginning of Period | 27,600,245 | 21,376,120 |
| End of Period | 29,330,938 | 27,600,245 |
See accompanying Notes, which are an integral part of the Financial Statements.
17
| High Dividend Yield Index Fund | |||||
| Financial Highlights | |||||
| Investor Shares | |||||
| For a Share Outstanding | Year Ended October 31, | ||||
| Throughout Each Period | 2018 | 2017 | 2016 | 2015 | 2014 |
| Net Asset Value, Beginning of Period | $32.67 | $28.20 | $26.89 | $26.98 | $23.83 |
| Investment Operations | |||||
| Net Investment Income | 1.0111 | .9271 | .854 | .815 | .727 |
| Net Realized and Unrealized Gain (Loss) | |||||
| on Investments | .284 | 4.472 | 1.286 | (.088) | 3.147 |
| Total from Investment Operations | 1.295 | 5.399 | 2.140 | .727 | 3.874 |
| Distributions | |||||
| Dividends from Net Investment Income | (. 985) | (. 929) | (. 830) | (. 817) | (.724) |
| Distributions from Realized Capital Gains | — | — | — | — | — |
| Total Distributions | (. 985) | (. 929) | (. 830) | (. 817) | (.724) |
| Net Asset Value, End of Period | $32.98 | $32.67 | $28.20 | $26.89 | $26.98 |
| Total Return2 | 3.96% | 19.37% | 8.11% | 2.78% | 16.48% |
| Ratios/Supplemental Data | |||||
| Net Assets, End of Period (Millions) | $8,003 | $7,590 | $5,879 | $4,368 | $4,066 |
| Ratio of Total Expenses to Average Net Assets | 0.14% | 0.15% | 0.15% | 0.16% | 0.18% |
| Ratio of Net Investment Income to | |||||
| Average Net Assets | 3.00% | 3.00% | 3.19% | 3.06% | 2.92% |
| Portfolio Turnover Rate 3 | 13% | 9% | 7% | 11% | 12% |
1 Calculated based on average shares outstanding.
2 Total returns do not include account service fees that may have applied in the periods shown. Fund prospectuses provide information
about any applicable account service fees.
3 Excludes the value of portfolio securities received or delivered as a result of in-kind purchases or redemptions of the fund’s capital
shares, including ETF Creation Units.
See accompanying Notes, which are an integral part of the Financial Statements.
18
| High Dividend Yield Index Fund | |||||
| Financial Highlights | |||||
| ETF Shares | |||||
| For a Share Outstanding | Year Ended October 31, | ||||
| Throughout Each Period | 2018 | 2017 | 2016 | 2015 | 2014 |
| Net Asset Value, Beginning of Period | $82.46 | $71.19 | $67.88 | $68.11 | $60.16 |
| Investment Operations | |||||
| Net Investment Income | 2.6231 | 2.3941 | 2.203 | 2.104 | 1.885 |
| Net Realized and Unrealized Gain (Loss) | |||||
| on Investments | .731 | 11.301 | 3.245 | (.222) | 7.943 |
| Total from Investment Operations | 3.354 | 13.695 | 5.448 | 1.882 | 9.828 |
| Distributions | |||||
| Dividends from Net Investment Income | (2.554) | (2.425) | (2.138) | (2.112) | (1.878) |
| Distributions from Realized Capital Gains | — | — | — | — | — |
| Total Distributions | (2.554) | (2.425) | (2.138) | (2.112) | (1.878) |
| Net Asset Value, End of Period | $83.26 | $82.46 | $71.19 | $67.88 | $68.11 |
| Total Return | 4.05% | 19.46% | 8.18% | 2.84% | 16.56% |
| Ratios/Supplemental Data | |||||
| Net Assets, End of Period (Millions) | $21,328 | $20,010 | $15,497 | $11,214 | $9,782 |
| Ratio of Total Expenses to Average Net Assets | 0.06% | 0.08% | 0.08% | 0.09% | 0.10% |
| Ratio of Net Investment Income to | |||||
| Average Net Assets | 3.08% | 3.07% | 3.26% | 3.13% | 3.00% |
| Portfolio Turnover Rate2 | 13% | 9% | 7% | 11% | 12% |
1 Calculated based on average shares outstanding.
2 Excludes the value of portfolio securities received or delivered as a result of in-kind purchases or redemptions of the fund’s capital
shares, including ETF Creation Units.
See accompanying Notes, which are an integral part of the Financial Statements.
19
High Dividend Yield Index Fund
Notes to Financial Statements
Vanguard High Dividend Yield Index Fund is registered under the Investment Company Act of 1940 as an open-end investment company, or mutual fund. The fund offers two classes of shares: Investor Shares and ETF Shares. Investor Shares are available to any investor who meets the fund’s minimum purchase requirements. ETF Shares are listed for trading on NYSE Arca; they can be purchased and sold through a broker.
A. The following significant accounting policies conform to generally accepted accounting principles for U.S. investment companies. The fund consistently follows such policies in preparing its financial statements.
1. Security Valuation: Securities are valued as of the close of trading on the New York Stock Exchange (generally 4 p.m., Eastern time) on the valuation date. Equity securities are valued at the latest quoted sales prices or official closing prices taken from the primary market in which each security trades; such securities not traded on the valuation date are valued at the mean of the latest quoted bid and asked prices. Securities for which market quotations are not readily available, or whose values have been materially affected by events occurring before the fund’s pricing time but after the close of the securities’ primary markets, are valued by methods deemed by the board of trustees to represent fair value. Investments in Vanguard Market Liquidity Fund are valued at that fund’s net asset value. Temporary cash investments are valued using the latest bid prices or using valuations based on a matrix system (which considers such factors as security prices, yields, maturities, and ratings), both as furnished by independent pricing services.
2. Futures Contracts: The fund uses index futures contracts to a limited extent, with the objectives of maintaining full exposure to the stock market, maintaining liquidity, and minimizing transaction costs. The fund may purchase futures contracts to immediately invest incoming cash in the market, or sell futures in response to cash outflows, thereby simulating a fully invested position in the underlying index while maintaining a cash balance for liquidity. The primary risks associated with the use of futures contracts are imperfect correlation between changes in market values of stocks held by the fund and the prices of futures contracts, and the possibility of an illiquid market. Counterparty risk involving futures is mitigated because a regulated clearinghouse is the counterparty instead of the clearing broker. To further mitigate counterparty risk, the fund trades futures contracts on an exchange, monitors the financial strength of its clearing brokers and clearinghouse, and has entered into clearing agreements with its clearing brokers. The clearinghouse imposes initial margin requirements to secure the fund’s performance and requires daily settlement of variation margin representing changes in the market value of each contract. Any assets pledged as initial margin for open contracts are noted in the Statement of Net Assets.
Futures contracts are valued at their quoted daily settlement prices. The notional amounts of the contracts are not recorded in the Statement of Net Assets. Fluctuations in the value of the contracts are recorded in the Statement of Net Assets as an asset (liability) and in the Statement of Operations as unrealized appreciation (depreciation) until the contracts are closed, when they are recorded as realized futures gains (losses).
During the year ended October 31, 2018, the fund’s average investments in long and short futures contracts represented less than 1% and 0% of net assets, respectively, based on the average of the notional amounts at each quarter-end during the period.
20
High Dividend Yield Index Fund
3. Federal Income Taxes: The fund intends to continue to qualify as a regulated investment company and distribute all of its taxable income. Management has analyzed the fund’s tax positions taken for all open federal income tax years (October 31, 2015–2018), and has concluded that no provision for federal income tax is required in the fund’s financial statements.
4. Distributions: Distributions to shareholders are recorded on the ex-dividend date. Distributions are determined on a tax basis and may differ from net investment income and realized capital gains for financial reporting purposes.
5. Securities Lending: To earn additional income, the fund lends its securities to qualified institutional borrowers. Security loans are subject to termination by the fund at any time, and are required to be secured at all times by collateral in an amount at least equal to the market value of securities loaned. Daily market fluctuations could cause the value of loaned securities to be more or less than the value of the collateral received. When this occurs, the collateral is adjusted and settled before the opening of the market on the next business day. The fund further mitigates its counterparty risk by entering into securities lending transactions only with a diverse group of prequalified counterpar-ties, monitoring their financial strength, and entering into master securities lending agreements with its counterparties. The master securities lending agreements provide that, in the event of a counterparty’s default (including bankruptcy), the fund may terminate any loans with that borrower, determine the net amount owed, and sell or retain the collateral up to the net amount owed to the fund; however, such actions may be subject to legal proceedings. While collateral mitigates counterparty risk, in the event of a default, the fund may experience delays and costs in recovering the securities loaned. The fund invests cash collateral received in Vanguard Market Liquidity Fund, and records a liability in the Statement of Net Assets for the return of the collateral, during the period the securities are on loan. Securities lending income represents fees charged to borrowers plus income earned on invested cash collateral, less expenses associated with the loan. During the term of the loan, the fund is entitled to all distributions made on or in respect of the loaned securities.
6. Credit Facility: The fund and certain other funds managed by The Vanguard Group (“Vanguard”) participate in a $3.1 billion committed credit facility provided by a syndicate of lenders pursuant to a credit agreement that may be renewed annually; each fund is individually liable for its borrowings, if any, under the credit facility. Borrowings may be utilized for temporary and emergency purposes, and are subject to the fund’s regulatory and contractual borrowing restrictions. The participating funds are charged administrative fees and an annual commitment fee of 0.10% of the undrawn amount of the facility; these fees are allocated to the funds based on a method approved by the fund’s board of trustees and included in Management and Administrative expenses on the fund’s Statement of Operations. Any borrowings under this facility bear interest at a rate based upon the higher of the one-month London Interbank Offered Rate, federal funds effective rate, or overnight bank funding rate plus an agreed-upon spread.
The fund had no borrowings outstanding at October 31, 2018, or at any time during the period then ended.
7. Other: Dividend income is recorded on the ex-dividend date. Interest income includes income distributions received from Vanguard Market Liquidity Fund and is accrued daily. Premiums and discounts on debt securities purchased are amortized and accreted, respectively, to interest income
21
High Dividend Yield Index Fund
over the lives of the respective securities. Security transactions are accounted for on the date securities are bought or sold. Costs used to determine realized gains (losses) on the sale of investment securities are those of the specific securities sold.
Each class of shares has equal rights as to assets and earnings, except that each class separately bears certain class-specific expenses related to maintenance of shareholder accounts (included in Management and Administrative expenses), shareholder reporting, and the proxy. Marketing and distribution expenses are allocated to each class of shares based on a method approved by the board of trustees. Income, other non-class-specific expenses, and gains and losses on investments are allocated to each class of shares based on its relative net assets.
B. In accordance with the terms of a Funds’ Service Agreement (the “FSA”) between Vanguard and the fund, Vanguard furnishes to the fund investment advisory, corporate management, administrative, marketing, and distribution services at Vanguard’s cost of operations (as defined by the FSA). These costs of operations are allocated to the fund based on methods and guidelines approved by the board of trustees. Vanguard does not require reimbursement in the current period for certain costs of operations (such as deferred compensation/benefits and risk/insurance costs); the fund’s liability for these costs of operations is included in Payables to Vanguard on the Statement of Net Assets. All other costs of operations payable to Vanguard are generally settled twice a month.
Upon the request of Vanguard, the fund may invest up to 0.40% of its net assets as capital in Vanguard. At October 31, 2018, the fund had contributed to Vanguard capital in the amount of $1,541,000, representing 0.01% of the fund’s net assets and 0.62% of Vanguard’s capitalization. The fund’s trustees and officers are also directors and employees, respectively, of Vanguard.
C. Various inputs may be used to determine the value of the fund’s investments. These inputs are summarized in three broad levels for financial statement purposes. The inputs or methodologies used to value securities are not necessarily an indication of the risk associated with investing in those securities.
Level 1—Quoted prices in active markets for identical securities.
Level 2—Other significant observable inputs (including quoted prices for similar securities, interest rates, prepayment speeds, credit risk, etc.).
Level 3—Significant unobservable inputs (including the fund’s own assumptions used to determine the fair value of investments). Any investments valued with significant unobservable inputs are noted on the Statement of Net Assets.
The following table summarizes the market value of the fund’s investments as of October 31, 2018, based on the inputs used to value them:
| Level 1 | Level 2 | Level 3 | |
| Investments | ($000) | ($000) | ($000) |
| Common Stocks | 29,254,240 | — | 148 |
| Temporary Cash Investments | 27,981 | 2,895 | — |
| Futures Contracts—Assets1 | 719 | — | — |
| Total | 29,282,940 | 2,895 | 148 |
| 1 Represents variation margin on the last day of the reporting period. |
22
High Dividend Yield Index Fund
D. Permanent differences between book-basis and tax-basis components of net assets are reclassified among capital accounts in the financial statements to reflect their tax character. These reclassifications have no effect on net assets or net asset value per share. As of period end, the following permanent differences primarily attributable to the accounting for in-kind redemptions, the expiration of capital loss carryforwards, and passive foreign investment companies were reclassified to the following accounts:
| Amount | |
| ($000) | |
| Paid-in Capital | 2,294,859 |
| Total Distributable Earnings (Loss) | (2,294,859) |
Temporary differences between book-basis and tax-basis components of total distributable earnings (loss) arise when certain items of income, gain, or loss are recognized in different periods for financial statement and tax purposes; these differences will reverse at some time in the future. The differences are primarily related to the tax deferral of losses on wash sales, the realization of unrealized gains or losses on certain futures contracts, and unrealized gains on passive foreign investment companies. As of period end, the tax-basis components of total distributable earnings (loss) are detailed in the table as follows:
| Amount | |
| ($000) | |
| Undistributed Ordinary Income | 76,039 |
| Undistributed Long-Term Gains | — |
| Capital Loss Carryforwards (Non-expiring) | (498,700) |
| Net Unrealized Gains (Losses) | 3,454,559 |
As of October 31, 2018, gross unrealized appreciation and depreciation for investments and derivatives based on cost for U.S. federal income tax purposes were as follows:
| Amount | |
| ($000) | |
| Tax Cost | 25,830,705 |
| Gross Unrealized Appreciation | 5,035,449 |
| Gross Unrealized Depreciation | (1,580,890) |
| Net Unrealized Appreciation (Depreciation) | 3,454,559 |
E. During the year ended October 31, 2018, the fund purchased $11,188,239,000 of investment securities and sold $9,678,196,000 of investment securities, other than temporary cash investments. Purchases and sales include $5,883,191,000 and $5,905,092,000, respectively, in connection with in-kind purchases and redemptions of the fund’s capital shares.
23
High Dividend Yield Index Fund
The fund purchased securities from and sold securities to other Vanguard funds or accounts managed by Vanguard or its affiliates, in accordance with procedures adopted by the board of trustees in compliance with Rule 17a-7 of the Investment Company Act of 1940. For the year ended October 31, 2018, such purchases and sales were $413,865,000 and $774,645,000, respectively; these amounts are included in the purchases and sales of investment securities noted above.
F. Capital share transactions for each class of shares were:
| Year Ended October 31, | ||||
| 2018 | 2017 | |||
| Amount | Shares | Amount | Shares | |
| ($000) | (000) | ($000) | (000) | |
| Investor Shares | ||||
| Issued | 1,640,168 | 48,448 | 2,032,133 | 66,558 |
| Issued in Lieu of Cash Distributions | 189,358 | 5,676 | 169,270 | 5,467 |
| Redeemed | (1,478,690) | (43,829) | (1,482,502) | (48,193) |
| Net Increase (Decrease)—Investor Shares | 350,836 | 10,295 | 718,901 | 23,832 |
| ETF Shares | ||||
| Issued | 7,116,592 | 83,559 | 4,601,220 | 59,187 |
| Issued in Lieu of Cash Distributions | — | — | — | — |
| Redeemed | (5,977,040) | (70,075) | (2,659,525) | (34,200) |
| Net Increase (Decrease)—ETF Shares | 1,139,552 | 13,484 | 1,941,695 | 24,987 |
G. Management has determined that no events or transactions occurred subsequent to October 31, 2018, that would require recognition or disclosure in these financial statements.
24
Report of Independent Registered Public Accounting Firm
To the Board of Trustees of Vanguard Whitehall Funds and Shareholders of Vanguard High Dividend Yield Index Fund
Opinion on the Financial Statements
We have audited the accompanying statement of net assets of Vanguard High Dividend Yield Index Fund (one of the funds constituting Vanguard Whitehall Funds, referred to hereafter as the “Fund”) as of October 31, 2018, the related statement of operations for the year ended October 31, 2018, the statement of changes in net assets for each of the two years in the period ended October 31, 2018, including the related notes, and the financial highlights for each of the five years in the period ended October 31, 2018 (collectively referred to as the “financial statements”). In our opinion, the financial statements present fairly, in all material respects, the financial position of the Fund as of October 31, 2018, the results of its operations for the year then ended, the changes in its net assets for each of the two years in the period ended October 31, 2018 and the financial highlights for each of the five years in the period ended October 31, 2018 in conformity with accounting principles generally accepted in the United States of America.
Basis for Opinion
These financial statements are the responsibility of the Fund’s management. Our responsibility is to express an opinion on the Fund’s financial statements based on our audits. We are a public accounting firm registered with the Public Company Accounting Oversight Board (United States) (“PCAOB”) and are required to be independent with respect to the Fund in accordance with the U.S. federal securities laws and the applicable rules and regulations of the Securities and Exchange Commission and the PCAOB.
We conducted our audits of these financial statements in accordance with the standards of the PCAOB. Those standards require that we plan and perform the audit to obtain reasonable assurance about whether the financial statements are free of material misstatement, whether due to error or fraud.
Our audits included performing procedures to assess the risks of material misstatement of the financial statements, whether due to error or fraud, and performing procedures that respond to those risks. Such procedures included examining, on a test basis, evidence regarding the amounts and disclosures in the financial statements. Our audits also included evaluating the accounting principles used and significant estimates made by management, as well as evaluating the overall presentation of the financial statements. Our procedures included confirmation of securities owned as of October 31, 2018 by correspondence with the custodian and brokers and by agreement to the underlying ownership records of the transfer agent; when replies were not received from brokers, we performed other auditing procedures. We believe that our audits provide a reasonable basis for our opinion.
/s/PricewaterhouseCoopers LLP
Philadelphia, Pennsylvania
December 13, 2018
We have served as the auditor of one or more investment companies in The Vanguard Group of Funds since 1975.
25
Special 2018 tax information (unaudited) for Vanguard High Dividend Yield Index Fund
This information for the fiscal year ended October 31, 2018, is included pursuant to provisions of the Internal Revenue Code.
The fund distributed $875,840,000 of qualified dividend income to shareholders during the fiscal year.
For corporate shareholders, 99.2% of investment income (dividend income plus short-term gains, if any) qualifies for the dividends-received deduction.
26
Your Fund’s After-Tax Returns
This table presents returns for your fund both before and after taxes. The after-tax returns are shown in two ways: (1) assuming that an investor owned the fund during the entire period and paid taxes on the fund’s distributions, and (2) assuming that an investor paid taxes on the fund’s distributions and sold all shares at the end of each period.
Calculations are based on the highest individual federal income tax and capital gains tax rates in effect at the times of the distributions and the hypothetical sales. State and local taxes were not considered. After-tax returns reflect any qualified dividend income, using actual prior-year figures and estimates for 2018. (In the example, returns after the sale of fund shares may be higher than those assuming no sale. This occurs when the sale would have produced a capital loss. The calculation assumes that the investor received a tax deduction for the loss.)
The table shows returns for Investor Shares only; returns for other share classes will differ. Please note that your actual after-tax returns will depend on your tax situation and may differ from those shown. Also note that if you own the fund in a tax-deferred account, such as an individual retirement account or a 401(k) plan, this information does not apply to you. Such accounts are not subject to current taxes.
Finally, keep in mind that a fund’s performance—whether before or after taxes—does not guarantee future results.
| Average Annual Total Returns: High Dividend Yield Index Fund Investor Shares | |||
| Periods Ended October 31, 2018 | |||
| One | Five | Ten | |
| Year | Years | Years | |
| Returns Before Taxes | 3.96% | 9.94% | 12.12% |
| Returns After Taxes on Distributions | 3.24 | 9.17 | 11.45 |
| Returns After Taxes on Distributions and Sale of Fund Shares | 2.86 | 7.77 | 10.01 |
27
About Your Fund’s Expenses
As a shareholder of the fund, you incur ongoing costs, which include costs for portfolio management, administrative services, and shareholder reports (like this one), among others. Operating expenses, which are deducted from a fund’s gross income, directly reduce the investment return of the fund.
A fund’s expenses are expressed as a percentage of its average net assets. This figure is known as the expense ratio. The following examples are intended to help you understand the ongoing costs (in dollars) of investing in your fund and to compare these costs with those of other mutual funds. The examples are based on an investment of $1,000 made at the beginning of the period shown and held for the entire period.
The accompanying table illustrates your fund’s costs in two ways:
• Based on actual fund return. This section helps you to estimate the actual expenses that you paid over the period. The ”Ending Account Value“ shown is derived from the fund‘s actual return, and the third column shows the dollar amount that would have been paid by an investor who started with $1,000 in the fund. You may use the information here, together with the amount you invested, to estimate the expenses that you paid over the period.
To do so, simply divide your account value by $1,000 (for example, an $8,600 account value divided by $1,000 = 8.6), then multiply the result by the number given for your fund under the heading ”Expenses Paid During Period.“
• Based on hypothetical 5% yearly return. This section is intended to help you compare your fund‘s costs with those of other mutual funds. It assumes that the fund had a yearly return of 5% before expenses, but that the expense ratio is unchanged. In this case—because the return used is not the fund’s actual return—the results do not apply to your investment. The example is useful in making comparisons because the Securities and Exchange Commission requires all mutual funds to calculate expenses based on a 5% return. You can assess your fund’s costs by comparing this hypothetical example with the hypothetical examples that appear in shareholder reports of other funds.
Note that the expenses shown in the table are meant to highlight and help you compare ongoing costs only and do not reflect transaction costs incurred by the fund for buying and selling securities. Further, the expenses do not include any purchase, redemption, or account service fees described in the fund prospectus. If such fees were applied to your account, your costs would be higher. Your fund does not carry a “sales load.”
The calculations assume no shares were bought or sold during the period. Your actual costs may have been higher or lower, depending on the amount of your investment and the timing of any purchases or redemptions.
You can find more information about the fund’s expenses, including annual expense ratios, in the Financial Statements section of this report. For additional information on operating expenses and other shareholder costs, please refer to your fund’s current prospectus.
28
| Six Months Ended October 31, 2018 | |||
| Beginning | Ending | Expenses | |
| Account Value | Account Value | Paid During | |
| High Dividend Yield Index Fund | 4/30/2018 | 10/31/2018 | Period |
| Based on Actual Fund Return | |||
| Investor Shares | $1,000.00 | $1,023.24 | $0.66 |
| ETF Shares | 1,000.00 | 1,023.78 | 0.20 |
| Based on Hypothetical 5% Yearly Return | |||
| Investor Shares | $1,000.00 | $1,024.55 | $0.66 |
| ETF Shares | 1,000.00 | 1,025.00 | 0.20 |
The calculations are based on expenses incurred in the most recent six-month period. The fund’s annualized six-month expense ratios for that period are 0.13% for Investor Shares and 0.04% for ETF Shares. The dollar amounts shown as “Expenses Paid” are equal to the annualized expense ratio multiplied by the average account value over the period, multiplied by the number of days in the most recent six-month period, then divided by the number of days in the most recent 12-month period (184/365).
29
Glossary
30-Day SEC Yield. A fund’s 30-day SEC yield is derived using a formula specified by the U.S. Securities and Exchange Commission. Under the formula, data related to the fund’s security holdings in the previous 30 days are used to calculate the fund’s hypothetical net income for that period, which is then annualized and divided by the fund’s estimated average net assets over the calculation period. For the purposes of this calculation, a security’s income is based on its current market yield to maturity (for bonds), its actual income (for asset-backed securities), or its projected dividend yield (for stocks). Because the SEC yield represents hypothetical annualized income, it will differ—at times significantly—from the fund’s actual experience. As a result, the fund’s income distributions may be higher or lower than implied by the SEC yield.
Beta. A measure of the magnitude of a fund’s past share-price fluctuations in relation to the ups and downs of a given market index. The index is assigned a beta of 1.00. Compared with a given index, a fund with a beta of 1.20 typically would have seen its share price rise or fall by 12% when the index rose or fell by 10%. For this report, beta is based on returns over the past 36 months for both the fund and the index. Note that a fund’s beta should be reviewed in conjunction with its R-squared (see definition). The lower the R-squared, the less correlation there is between the fund and the index, and the less reliable beta is as an indicator of volatility.
Dividend Yield. Dividend income earned by stocks, expressed as a percentage of the aggregate market value (or of net asset value, for a fund). The yield is determined by dividing the amount of the annual dividends by the aggregate value (or net asset value) at the end of the period. For a fund, the dividend yield is based solely on stock holdings and does not include any income produced by other investments.
Earnings Growth Rate. The average annual rate of growth in earnings over the past five years for the stocks now in a fund.
Equity Exposure. A measure that reflects a fund’s investments in stocks and stock futures. Any holdings in short-term reserves are excluded.
Expense Ratio. A fund’s total annual operating expenses expressed as a percentage of the fund’s average net assets. The expense ratio includes management and administrative expenses, but does not include the transaction costs of buying and selling portfolio securities.
Foreign Holdings. The percentage of a fund represented by securities or depositary receipts of companies based outside the United States.
Inception Date. The date on which the assets of a fund (or one of its share classes) are first invested in accordance with the fund’s investment objective. For funds with a subscription period, the inception date is the day after that period ends. Investment performance is measured from the inception date.
Median Market Cap. An indicator of the size of companies in which a fund invests; the midpoint of market capitalization (market price x shares outstanding) of a fund’s stocks, weighted by the proportion of the fund’s assets invested in each stock. Stocks representing half of the fund’s assets have market capitalizations above the median, and the rest are below it.
Price/Book Ratio. The share price of a stock divided by its net worth, or book value, per share.
For a fund, the weighted average price/book ratio of the stocks it holds.
30
Price/Earnings Ratio. The ratio of a stock’s current price to its per-share earnings over the past year. For a fund, the weighted average P/E of the stocks it holds. P/E is an indicator of market expectations about corporate prospects; the higher the P/E, the greater the expectations for a company’s future growth.
R-Squared. A measure of how much of a fund’s past returns can be explained by the returns from the market in general, as measured by a given index. If a fund’s total returns were precisely synchronized with an index’s returns, its R-squared would be 1.00. If the fund’s returns bore no relationship to the index’s returns, its R-squared would be 0. For this report, R-squared is based on returns over the past 36 months for both the fund and the index.
Return on Equity. The annual average rate of return generated by a company during the past five years for each dollar of shareholder’s equity (net income divided by shareholder’s equity). For a fund, the weighted average return on equity for the companies whose stocks it holds.
Short-Term Reserves. The percentage of a fund invested in highly liquid, short-term securities that can be readily converted to cash.
Turnover Rate. An indication of the fund’s trading activity. Funds with high turnover rates incur higher transaction costs and may be more likely to distribute capital gains (which may be taxable to investors). The turnover rate excludes in-kind transactions, which have minimal impact on costs.
31
This page intentionally left blank.
This page intentionally left blank.
This page intentionally left blank.
The People Who Govern Your Fund
The trustees of your mutual fund are there to see that the fund is operated and managed in your best interests since, as a shareholder, you are a part owner of the fund. Your fund’s trustees also serve on the board of directors of The Vanguard Group, Inc., which is owned by the Vanguard funds and provides services to them on an at-cost basis.
A majority of Vanguard’s board members are independent, meaning that they have no affiliation with Vanguard or the funds they oversee, apart from the sizable personal investments they have made as private individuals. The independent board members have distinguished backgrounds in business, academia, and public service. Each of the trustees and executive officers oversees 211 Vanguard funds.
Information for each trustee and executive officer of the fund appears below. The mailing address of the trustees and officers is P.O. Box 876, Valley Forge, PA 19482. More information about the trustees is in the Statement of Additional Information, which can be obtained, without charge, by contacting Vanguard at 800-662-7447, or online at vanguard.com.
Interested Trustees1
F. William McNabb III
Born in 1957. Trustee since July 2009. Principal occupation(s) during the past five years and other experience: chairman of the board (January 2010–present) of Vanguard and of each of the investment companies served by Vanguard, trustee (2009–present) of each of the investment companies served by Vanguard, and director (2008–present) of Vanguard. Chief executive officer and president (2008–2017) of Vanguard and each of the investment companies served by Vanguard, managing director (1995–2008) of Vanguard, and director (1997–2018) of Vanguard Marketing Corporation. Director (2018–present) of UnitedHealth Group.
Mortimer J. Buckley
Born in 1969. Trustee since January 2018. Principal occupation(s) during the past five years and other experience: chief executive officer (January 2018–present) of Vanguard; chief executive officer, president, and trustee (January 2018–present) of each of the investment companies served by Vanguard; president and director (2017–present) of Vanguard; and president (February 2018–present) of Vanguard Marketing Corporation. Chief investment officer (2013–2017), managing director (2002–2017), head of the Retail Investor Group (2006–2012), and chief information officer (2001–2006) of Vanguard. Chairman of the board (2011–2017) of the Children’s Hospital of Philadelphia.
Independent Trustees
Emerson U. Fullwood
Born in 1948. Trustee since January 2008. Principal occupation(s) during the past five years and other experience: executive chief staff and marketing officer for North America and corporate vice president (retired 2008) of Xerox Corporation (document management products and services). Former president of the Worldwide Channels Group, Latin America, and Worldwide Customer Service and executive chief staff officer of Developing Markets of Xerox. Executive in residence and 2009–2010 Distinguished Minett Professor at the Rochester Institute of Technology. Lead director of SPX FLOW, Inc. (multi-industry manufacturing). Director of the University of Rochester Medical Center, the Monroe Community College Foundation, the United Way of Rochester, North Carolina A&T University, and Roberts Wesleyan College. Trustee of the University of Rochester.
Amy Gutmann
Born in 1949. Trustee since June 2006. Principal occupation(s) during the past five years and other experience: president (2004–present) of the University of Pennsylvania. Christopher H. Browne Distinguished Professor of Political Science, School of Arts and Sciences, and professor of communication, Annenberg School for Communication, with secondary faculty appointments in the Department of Philosophy, School of Arts and Sciences, and at the Graduate School of Education, University of Pennsylvania. Trustee of the National Constitution Center.
1 Mr. McNabb and Mr. Buckley are considered “interested persons,” as defined in the Investment Company Act of 1940, because they are officers of the Vanguard funds.
JoAnn Heffernan Heisen
Born in 1950. Trustee since July 1998. Principal occupation(s) during the past five years and other experience: corporate vice president of Johnson & Johnson (pharmaceuticals/medical devices/consumer products) and member of its executive committee (1997–2008). Chief global diversity officer (retired 2008), vice president and chief information officer (1997–2006), controller (1995–1997), treasurer (1991–1995), and assistant treasurer (1989–1991) of Johnson & Johnson. Director of Skytop Lodge Corporation (hotels) and the Robert Wood Johnson Foundation. Member of the advisory board of the Institute for Women’s Leadership at Rutgers University.
F. Joseph Loughrey
Born in 1949. Trustee since October 2009. Principal occupation(s) during the past five years and other experience: president and chief operating officer (retired 2009) and vice chairman of the board (2008–2009) of Cummins Inc. (industrial machinery). Chairman of the board of Hillenbrand, Inc. (specialized consumer services), Oxfam America, and the Lumina Foundation for Education. Director of the V Foundation for Cancer Research. Member of the advisory council for the College of Arts and Letters and chair of the advisory board to the Kellogg Institute for International Studies, both at the University of Notre Dame.
Mark Loughridge
Born in 1953. Trustee since March 2012. Principal occupation(s) during the past five years and other experience: senior vice president and chief financial officer (retired 2013) of IBM (information technology services). Fiduciary member of IBM’s Retirement Plan Committee (2004–2013), senior vice president and general manager (2002–2004) of IBM Global Financing, vice president and controller (1998–2002) of IBM, and a variety of other prior management roles at IBM. Member of the Council on Chicago Booth.
Scott C. Malpass
Born in 1962. Trustee since March 2012. Principal occupation(s) during the past five years and other experience: chief investment officer (1989–present) and vice president (1996–present) of the University of Notre Dame. Assistant professor of finance at the Mendoza College of Business, University of Notre Dame, and member of the Notre Dame 403(b) Investment Committee. Chairman of the board of TIFF Advisory Services, Inc. Member of the board of Catholic Investment Services, Inc. (investment advisors), the board of advisors for Spruceview Capital Partners, and the board of superintendence of the Institute for the Works of Religion.
Deanna Mulligan
Born in 1963. Trustee since January 2018. Principal occupation(s) during the past five years and other experience: president (2010–present) and chief executive officer (2011–present) of The Guardian Life Insurance Company of America. Chief operating officer (2010–2011) and executive vice president (2008–2010) of Individual Life and Disability of The Guardian Life Insurance Company of America. Member of the board of The Guardian Life Insurance Company of America, the American Council of Life Insurers, the Partnership for New York City (business leadership), and the Committee Encouraging Corporate Philanthropy. Trustee of the Economic Club of New York and the Bruce Museum (arts and science). Member of the Advisory Council for the Stanford Graduate School of Business.
André F. Perold
Born in 1952. Trustee since December 2004. Principal occupation(s) during the past five years and other experience: George Gund Professor of Finance and Banking, Emeritus at the Harvard Business School (retired 2011). Chief investment officer and co-managing partner of HighVista Strategies LLC (private investment firm). Overseer of the Museum of Fine Arts Boston.
Sarah Bloom Raskin
Born in 1961. Trustee since January 2018. Principal occupation(s) during the past five years and other experience: deputy secretary (2014–2017) of the United States Department of the Treasury. Governor (2010–2014) of the Federal Reserve Board. Commissioner (2007–2010) of financial regulation for the State of Maryland. Member of the board of directors (2012–2014) of Neighborhood Reinvestment Corporation. Director of i(x) Investments, LLC.
Peter F. Volanakis
Born in 1955. Trustee since July 2009. Principal occupation(s) during the past five years and other experience: president and chief operating officer (retired 2010) of Corning Incorporated (communications equipment) and director of Corning Incorporated (2000–2010) and Dow Corning (2001–2010). Director (2012) of SPX Corporation (multi-industry manufacturing). Overseer of the Amos Tuck School of Business Administration, Dartmouth College (2001–2013). Chairman of the board of trustees of Colby-Sawyer College. Member of the Board of Hypertherm Inc. (industrial cutting systems, software, and consumables).
Executive Officers
Glenn Booraem
Born in 1967. Principal occupation(s) during the past five years and other experience: principal of Vanguard. Investment stewardship officer (2017–present), treasurer (2015–2017), controller (2010–2015), and assistant controller (2001–2010) of each of the investment companies served by Vanguard.
Christine M. Buchanan
Born in 1970. Principal occupation(s) during the past five years and other experience: principal of Vanguard and global head of Fund Administration at Vanguard. Treasurer (2017–present) of each of the investment companies served by Vanguard. Partner (2005–2017) at KPMG LLP (audit, tax, and advisory services).
Brian Dvorak
Born in 1973. Principal occupation(s) during the past five years and other experience: principal of Vanguard. Chief compliance officer (2017–present) of Vanguard and each of the investment companies served by Vanguard. Assistant vice president (2017–present) of Vanguard Marketing Corporation. Vice president and director of Enterprise Risk Management (2011–2013) at Oppenheimer Funds, Inc.
Thomas J. Higgins
Born in 1957. Principal occupation(s) during the past five years and other experience: principal of Vanguard. Chief financial officer (2008–present) and treasurer (1998–2008) of each of the investment companies served by Vanguard.
Peter Mahoney
Born in 1974. Principal occupation(s) during the past five years and other experience: principal of Vanguard. Controller (2015–present) of each of the investment companies served by Vanguard. Head of International Fund Services (2008–2014) at Vanguard.
Anne E. Robinson
Born in 1970. Principal occupation(s) during the past five years and other experience: general counsel (2016–present) of Vanguard. Secretary (2016–present) of Vanguard and of each of the investment companies served by Vanguard. Managing director (2016–present) of Vanguard. Director and senior vice president (2016–2018) of Vanguard Marketing Corporation. Managing director and general counsel of Global Cards and Consumer Services (2014–2016) at Citigroup. Counsel (2003–2014) at American Express.
Michael Rollings
Born in 1963. Principal occupation(s) during the past five years and other experience: finance director (2017–present) and treasurer (2017) of each of the investment companies served by Vanguard. Managing director (2016–present) of Vanguard. Chief financial officer (2016–present) of Vanguard. Director (2016–present) of Vanguard Marketing Corporation. Executive vice president and chief financial officer (2006–2016) of MassMutual Financial Group.
| Vanguard Senior Management Team | |
| Joseph Brennan | Chris D. McIsaac |
| Mortimer J. Buckley | James M. Norris |
| Gregory Davis | Thomas M. Rampulla |
| John James | Karin A. Risi |
| Martha G. King | Anne E. Robinson |
| John T. Marcante | Michael Rollings |
| Chairman Emeritus and Senior Advisor | |
| John J. Brennan | |
| Chairman, 1996–2009 | |
| Chief Executive Officer and President, 1996–2008 | |
| Founder | |
| John C. Bogle | |
| Chairman and Chief Executive Officer, 1974–1996 | |
 | |
P.O. Box 2600 | |
Connect with Vanguard® > vanguard.com | |
| Fund Information > 800-662-7447 | Source for Bloomberg Barclays indexes: Bloomberg |
| Direct Investor Account Services > 800-662-2739 | Index Services Limited. Copyright 2018, Bloomberg. All |
| Institutional Investor Services > 800-523-1036 | rights reserved. |
| Text Telephone for People | |
| Who Are Deaf or Hard of Hearing > 800-749-7273 | London Stock Exchange Group companies include FTSE |
| International Limited (”FTSE”), Frank Russell Company | |
| (”Russell”), MTS Next Limited (”MTS”), and FTSE TMX | |
| Global Debt Capital Markets Inc. (”FTSE TMX”). All | |
| This material may be used in conjunction | rights reserved. ”FTSE®”, ”Russell®”, ”MTS®”, ”FTSE |
| with the offering of shares of any Vanguard | TMX®” and ”FTSE Russell” and other service marks |
| fund only if preceded or accompanied by | and trademarks related to the FTSE or Russell indexes |
| the fund’s current prospectus. | are trademarks of the London Stock Exchange Group |
| companies and are used by FTSE, MTS, FTSE TMX and | |
| All comparative mutual fund data are from Lipper, a | Russell under licence. All information is provided for |
| Thomson Reuters Company, or Morningstar, Inc., unless | information purposes only. No responsibility or liability |
| otherwise noted. | can be accepted by the London Stock Exchange Group |
| You can obtain a free copy of Vanguard’s proxy voting | companies nor its licensors for any errors or for any |
| guidelines by visiting vanguard.com/proxyreporting or by | loss from use of this publication. Neither the London |
| calling Vanguard at 800-662-2739. The guidelines are | Stock Exchange Group companies nor any of its |
| also available from the SEC’s website, sec.gov. In | licensors make any claim, prediction, warranty or |
| addition, you may obtain a free report on how your fund | representation whatsoever, expressly or impliedly, |
| voted the proxies for securities it owned during the 12 | either as to the results to be obtained from the use of |
| months ended June 30. To get the report, visit either | the FTSE Indexes or the fitness or suitability of the |
| vanguard.com/proxyreporting or sec.gov. | Indexes for any particular purpose to which they might |
| be put. | |
| You can review information about your fund on the | |
| SEC’s website, and you can receive copies of this | |
| information, for a fee, by sending a request via email | |
| addressed to publicinfo@sec.gov. | |
| © 2018 The Vanguard Group, Inc. | |
| All rights reserved. | |
| Vanguard Marketing Corporation, Distributor. | |
| Q6230 122018 | |
| Annual Report | October 31, 2018 |
| Vanguard International Dividend Index Funds |
| Vanguard International Dividend Appreciation Index Fund |
| Vanguard International High Dividend Yield Index Fund |
Vanguard’s Principles for Investing Success
We want to give you the best chance of investment success. These principles, grounded in Vanguard’s research and experience, can put you on the right path.
Goals. Create clear, appropriate investment goals.
Balance. Develop a suitable asset allocation using broadly diversified funds. Cost. Minimize cost.
Discipline. Maintain perspective and long-term discipline.
A single theme unites these principles: Focus on the things you can control.
We believe there is no wiser course for any investor.
| Contents | |
| Your Fund’s Performance at a Glance. | 1 |
| CEO’s Perspective. | 3 |
| International Dividend Appreciation Index Fund. | 5 |
| International High Dividend Yield Index Fund. | 29 |
| Your Fund’s After-Tax Returns. | 64 |
| About Your Fund’s Expenses. | 65 |
| Glossary. | 67 |
Please note: The opinions expressed in this report are just that—informed opinions. They should not be considered promises or advice. Also, please keep in mind that the information and opinions cover the period through the date on the front of this report. Of course, the risks of investing in your fund are spelled out in the prospectus.
See the Glossary for definitions of investment terms used in this report.
Your Fund’s Performance at a Glance
• For the 12 months ended October 31, 2018, Vanguard International Dividend Appreciation Index Fund returned –7.13% for Investor Shares. Vanguard International High Dividend Yield Index Fund returned –7.09% for Investor Shares. Both funds’ returns were in line with those of their benchmark indexes after taking the cost of running the funds into account. The funds outpaced the average return of their peer groups.
• Of the major regional sectors, emerging markets held up the best for both funds, helped by double-digit returns from Russia. A number of European countries under-performed for both funds; they included Germany, the Netherlands, and Spain.
• Technology performed the best for the International Dividend Appreciation Index Fund; oil and gas returned the most for the International High Dividend Yield Index Fund.
• Please note that shortly after the close of the period, Vanguard lowered the investment minimum for your fund’s Admiral Shares from $10,000 to $3,000.
| Total Returns: Fiscal Year Ended October 31, 2018 | |
| Total Returns | |
| Vanguard International Dividend Appreciation Index Fund | |
| Investor Shares | -7.13% |
| ETF Shares | |
| Market Price | -7.57 |
| Net Asset Value | -7.04 |
| Admiral™ Shares | -7.03 |
| NASDAQ International Dividend Achievers Select Index | -6.76 |
| International Large-Cap Core Funds Average | -8.78 |
| International Large-Cap Core Funds Average: Derived from data provided by Lipper, a Thomson Reuters Company. |
1
| Total Returns | |
| Vanguard International High Dividend Yield Index Fund | |
| Investor Shares | -7.09% |
| ETF Shares | |
| Market Price | -7.53 |
| Net Asset Value | -7.03 |
| Admiral Shares | -7.00 |
| FTSE All-World ex US High Dividend Yield Index | -6.45 |
| International Equity Income Funds Average | -8.28 |
International Equity Income Funds Average: Derived from data provided by Lipper, a Thomson Reuters Company.
Admiral Shares carry lower expenses and are available to investors who meet certain account-balance requirements. The Vanguard ETF® Shares shown are traded on the Nasdaq exchange and are available only through brokers. The table provides ETF returns based on both the Nasdaq market price and the net asset value for a share. U.S. Pat. Nos. 6,879,964; 7,337,138; 7,720,749; 7,925,573; 8,090,646; and 8,417,623.
For the ETF Shares, the market price is determined by the midpoint of the bid-offer spread as of the closing time of the New York Stock Exchange (generally 4 p.m., Eastern time). The net asset value is also determined as of the NYSE closing time. For more information about how the ETF Shares' market prices have compared with their net asset value, visit vanguard.com, select your ETF, and then select the Price and Performance tab. The ETF premium/discount analysis there shows the percentages of days on which the ETF Shares' market price was above or below the NAV.
| Expense Ratios | ||||
| Your Fund Compared With Its Peer Group | ||||
| Investor | ETF | Admiral | Peer Group | |
| Shares | Shares | Shares | Average | |
| International Dividend Appreciation Index Fund | 0.35% | 0.25% | 0.25% | 1.12% |
| International High Dividend Yield Index Fund | 0.42 | 0.32 | 0.32 | 1.35 |
The fund expense ratios shown are from the prospectus dated February 22, 2018, and represent estimated costs for the current scal year. For the scal year ended October 31, 2018, the funds’ expense ratios were: for the International Dividend Appreciation Index Fund, 0.35% for Investor Shares, 0.25% for ETF Shares, and 0.25% for Admiral Shares; and for the International High Dividend Yield Index Fund, 0.42% for Investor Shares, 0.32% for ETF Shares, and 0.32% for Admiral Shares. The peer-group expense ratio is derived from data provided by Lipper, a Thomson Reuters Company, and captures information through year-end 2017.
Peer groups: For the International Dividend Appreciation Index Fund, International Large-Cap Core Funds; for the International High Dividend Yield Index Fund, International Equity Income Funds.
2
CEO’s Perspective

Tim Buckley
President and Chief Executive Officer
Dear Shareholder,
Over the years, I’ve found that prudent investors exhibit a common trait: discipline. No matter how the markets move or what new investing fad hits the headlines, those who stay focused on their goals and tune out the noise are set up for long-term success.
The prime gateway to investing is saving, and you don’t usually become a saver without a healthy dose of discipline. Savers make the decision to sock away part of their income, which means spending less and delaying gratification, no matter how difficult that may be.
Of course, disciplined investing extends beyond diligent saving. The financial markets, in the short term especially, are unpredictable; I have yet to meet the investor who can time them perfectly. It takes discipline to resist the urge to go all-in when markets are frothy or to retreat when things look bleak.
Staying put with your investments is one strategy for handling volatility. Another, rebalancing, requires even more discipline because it means steering your money away from strong performers and toward poorer performers.
Patience—a form of discipline—is also the friend of long-term investors. Higher returns are the potential reward for weathering the market’s turbulence and uncertainty.
3
We have been enjoying one of the longest bull markets in history, but it won’t continue forever. Prepare yourself now for how you will react when volatility comes back. Don’t panic. Don’t chase returns or look for answers outside the asset classes you trust. And be sure to rebalance periodically, even when there’s turmoil.
Whether you’re a master of self-control, get a boost from technology, or work with a professional advisor, know that discipline is necessary to get the most out of your investment portfolio. And know that Vanguard is with you for the entire ride.
Thank you for your continued loyalty.
Sincerely,

Mortimer J. Buckley
President and Chief Executive Officer
November 16, 2018
| Market Barometer | |||
| Average Annual Total Returns | |||
| Periods Ended October 31, 2018 | |||
| One Year | Three Years | Five Years | |
| Stocks | |||
| Russell 1000 Index (Large-caps) | 6.98% | 11.31% | 11.05% |
| Russell 2000 Index (Small-caps) | 1.85 | 10.68 | 8.01 |
| Russell 3000 Index (Broad U.S. market) | 6.60 | 11.27 | 10.81 |
| FTSE All-World ex US Index (International) | -7.99 | 4.57 | 2.01 |
| Bonds | |||
| Bloomberg Barclays U.S. Aggregate Bond Index | |||
| (Broad taxable market) | -2.05% | 1.04% | 1.83% |
| Bloomberg Barclays Municipal Bond Index | |||
| (Broad tax-exempt market) | -0.51 | 1.90 | 3.25 |
| FTSE Three-Month U. S. Treasury Bill Index | 1.67 | 0.86 | 0.52 |
| CPI | |||
| Consumer Price Index | 2.52% | 2.07% | 1.60% |
4
International Dividend Appreciation Index Fund
Fund Profile
As of October 31, 2018
| Share-Class Characteristics | |||
| Investor | ETF | Admiral | |
| Shares | Shares | Shares | |
| Ticker Symbol | VIAIX | VIGI | VIAAX |
| Expense Ratio1 | 0.35% | 0.25% | 0.25% |
| Portfolio Characteristics | ||
| NASDAQ | ||
| International | ||
| Dividend | ||
| Achievers | ||
| Fund | Select Index | |
| Number of Stocks | 312 | 309 |
| Median Market Cap | $41.4B | $41.4B |
| Price/Earnings Ratio | 18.3x | 18.4x |
| Price/Book Ratio | 2.8x | 2.8x |
| Return on Equity | 17.0% | 17.0% |
| Earnings Growth Rate | 10.3% | 10.3% |
| Dividend Yield | 2.0% | 2.0% |
| Turnover Rate | 36% | — |
| Short-Term Reserves | -0.1% | — |
| Sector Diversification (% of equity exposure) | |
| Fund | |
| Basic Materials | 4.3% |
| Consumer Goods | 24.6 |
| Consumer Services | 11.2 |
| Financials | 11.5 |
| Health Care | 11.7 |
| Industrials | 11.2 |
| Oil & Gas | 7.1 |
| Technology | 13.8 |
| Telecommunications | 3.3 |
| Utilities | 1.3 |
Sector categories are based on the Industry Classification Benchmark (“ICB”), except for the “Other” category (if applicable), which includes securities that have not been provided an ICB classification as of the effective reporting period.
| Ten Largest Holdings (% of total net assets) | ||
| Nestle SA | Food Products | 4.6% |
| SAP SE | Software | 3.4 |
| L'Oreal SA | Personal Products | 3.2 |
| Tencent Holdings Ltd. | Internet | 2.7 |
| Tata Consultancy | ||
| Services Ltd. | Computer Services | 2.5 |
| Unilever | Personal Products | 2.4 |
| Reliance Industries Ltd. | Exploration & | |
| Production | 2.3 | |
| Nippon Telegraph & | Fixed Line | |
| Telephone Corp. | Telecommunications | 2.2 |
| Diageo plc | Distillers & Vintners | 2.2 |
| Naspers Ltd. | Broadcasting & | |
| Entertainment | 2.0 | |
| Top Ten | 27.5% | |
The holdings listed exclude any temporary cash investments and equity index products.
Allocation by Region (% of portfolio)
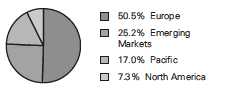

1 The expense ratios shown are from the prospectus dated February 22, 2018, and represent estimated costs for the current fiscal year. For the fiscal year ended October 31, 2018, the expense ratios were 0.35% for Investor Shares, 0.25% for ETF Shares, and 0.25% for Admiral Shares.
5
International Dividend Appreciation Index Fund
| Market Diversification (% of equity exposure) | ||
| NASDAQ | ||
| International | ||
| Dividend | ||
| Achievers | ||
| Fund | Select Index | |
| Europe | ||
| United Kingdom | 13.0% | 12.9% |
| France | 10.6 | 10.6 |
| Switzerland | 9.0 | 9.0 |
| Germany | 8.9 | 8.8 |
| Netherlands | 4.4 | 4.4 |
| Denmark | 1.2 | 1.2 |
| Sweden | 1.0 | 1.0 |
| Other | 2.4 | 2.4 |
| Subtotal | 50.5% | 50.3% |
| Pacific | ||
| Japan | 11.8% | 11.8% |
| Australia | 2.4 | 2.4 |
| Hong Kong | 2.1 | 2.1 |
| Other | 0.7 | 0.7 |
| Subtotal | 17.0% | 17.0% |
| Emerging Markets | ||
| India | 12.9% | 13.1% |
| China | 4.8 | 4.7 |
| South Africa | 3.3 | 3.3 |
| Russia | 1.2 | 1.2 |
| Mexico | 1.0 | 1.1 |
| Other | 2.0 | 2.0 |
| Subtotal | 25.2% | 25.4% |
| North America | ||
| Canada | 7.2% | 7.2% |
| Other | 0.1 | 0.1 |
| Subtotal | 7.3% | 7.3% |
6
International Dividend Appreciation Index Fund
Performance Summary
All of the returns in this report represent past performance, which is not a guarantee of future results that may be achieved by the fund. (Current performance may be lower or higher than the performance data cited. For performance data current to the most recent month-end, visit our website at vanguard.com/performance.) Note, too, that both investment returns and principal value can fluctuate widely, so an investor’s shares, when sold, could be worth more or less than their original cost. The returns shown do not reflect taxes that a shareholder would pay on fund distributions or on the sale of fund shares.
Cumulative Performance: February 25, 2016, Through October 31, 2018
Initial Investment of $10,000
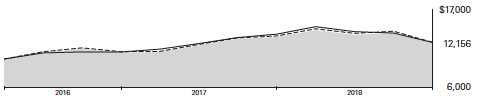
| Average Annual Total Returns | |||
| Periods Ended October 31, 2018 | |||
| Since | Final Value | ||
| One | Inception | of a $10,000 | |
| Year | (2/25/2016) | Investment | |
| International Dividend Appreciation | |||
| Index Fund Investor Shares | -7.59% | 7.56% | $12,156 |
| NASDAQ International Dividend | |||
| Achievers Select Index | -6.76 | 8.30 | 12,381 |
| International Large-Cap Core Funds | |||
| Average | -8.78 | 8.19 | 12,348 |
International Large-Cap Core Funds Average: Derived from data provided by Lipper, a Thomson Reuters Company.
"Since Inception" performance is calculated from the Investor Shares’ inception date for both the fund and its comparative standards.
| Since | Final Value | ||
| One | Inception | of a $10,000 | |
| Year | (2/25/2016) | Investment | |
| International Dividend Appreciation Index Fund | |||
| ETF Shares Net Asset Value | -7.04% | 7.86% | $12,249 |
| International Dividend Appreciation Index Fund | |||
| ETF Shares Market Price | -7.57 | 7.78 | 12,347 |
| NASDAQ International Dividend Achievers | |||
| Select Index | -6.76 | 8.30 | 12,381 |
"Since Inception" performance is calculated from the ETF Shares’ inception date for both the fund and its comparative standards. Vanguard fund returns are adjusted to reflect the 0.25% fee on purchases and redemptions. The fees do not apply to the ETF Shares. The Fiscal-Year Total Returns chart is not adjusted for fees.
See Financial Highlights for dividend and capital gains information.
7
International Dividend Appreciation Index Fund
| Average Annual Total Returns | |||
| Periods Ended October 31, 2018 | |||
| Since | Final Value | ||
| One | Inception | of a $10,000 | |
| Year | (3/2/2016) | Investment | |
| International Dividend Appreciation Index | |||
| Fund Admiral Shares | -7.49% | 6.57% | $11,846 |
| NASDAQ International Dividend Achievers | |||
| Select Index | -6.76 | 7.15 | 12,018 |
"Since Inception" performance is calculated from the Admiral Shares’ inception date for both the fund and its comparative standards.
| Cumulative Returns of ETF Shares: February 25, 2016, Through October 31, 2018 | ||
| Since | ||
| One | Inception | |
| Year | (2/25/2016) | |
| International Dividend Appreciation Index Fund ETF | ||
| Shares Market Price | -7.57% | 22.22% |
| International Dividend Appreciation Index Fund ETF | ||
| Shares Net Asset Value | -7.04 | 22.49 |
| NASDAQ International Dividend Achievers Select | ||
| Index | -6.76 | 23.81 |
"Since Inception" performance is calculated from the ETF Shares’ inception date for both the fund and its comparative standards.
Fiscal-Year Total Returns (%): February 25, 2016, Through October 31, 2018
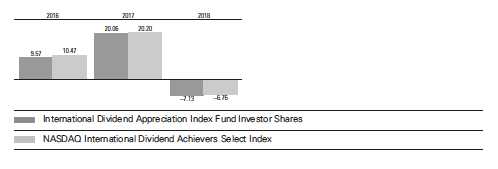
Vanguard fund returns are adjusted to reflect the 0.25% fee on purchases and redemptions. The fees do not apply to the ETF Shares. The Fiscal-Year Total Returns chart is not adjusted for fees.
8
International Dividend Appreciation Index Fund
Average Annual Total Returns: Periods Ended September 30, 2018
This table presents returns through the latest calendar quarter—rather than through the end of the fiscal period.
Securities and Exchange Commission rules require that we provide this information.
| Inception | One | Since | |
| Date | Year | Inception | |
| Investor Shares | 2/25/2016 | 2.73% | 11.92% |
| Fee-Adjusted Returns | 2.22 | 11.70 | |
| ETF Shares | 2/25/2016 | ||
| Market Price | 2.53 | 12.04 | |
| Net Asset Value | 2.84 | 12.03 | |
| Admiral Shares | 3/2/2016 | 2.82 | 10.87 |
| Fee-Adjusted Returns | 2.31 | 10.66 |
Vanguard fund returns are adjusted to reflect the 0.25% fee on purchases and redemptions. The fees do not apply to the ETF Shares. The Fiscal-Year Total Returns chart is not adjusted for fees.
9
International Dividend Appreciation Index Fund
Financial Statements
Statement of Net Assets
As of October 31, 2018
The fund reports a complete list of its holdings in regulatory filings four times in each fiscal year, at the quarter-ends. For the second and fourth fiscal quarters, the lists appear in the fund’s semiannual and annual reports to shareholders. For the first and third fiscal quarters, the fund files the lists with the Securities and Exchange Commission on Form N-Q. Shareholders can look up the fund’s Forms N-Q on the SEC’s website at sec.gov.
| Market | |||
| Value• | |||
| Shares | ($000) | ||
| Common Stocks (99.6%)1 | |||
| Australia (2.4%) | |||
| CSL Ltd. | 121,170 | 16,176 | |
| Aristocrat Leisure Ltd. | 170,412 | 3,211 | |
| Ramsay Health Care Ltd. | 53,861 | 2,150 | |
| REA Group Ltd. | 36,696 | 1,868 | |
| Domino’s Pizza | |||
| Enterprises Ltd. | 24,541 | 940 | |
| Qube Holdings Ltd. | 407,614 | 709 | |
| 25,054 | |||
| Belgium (0.8%) | |||
| UCB SA | 51,324 | 4,310 | |
| Sofina SA | 9,475 | 1,813 | |
| Ackermans & | |||
| van Haaren NV | 9,433 | 1,485 | |
| ^ | Melexis NV | 10,647 | 700 |
| 8,308 | |||
| Brazil (0.2%) | |||
| Ultrapar Participacoes SA | 146,400 | 1,741 | |
| Canada (7.2%) | |||
| Canadian National | |||
| Railway Co. | 199,395 | 17,046 | |
| Suncor Energy Inc. | 439,755 | 14,751 | |
| Canadian Natural | |||
| Resources Ltd. | 328,785 | 9,021 | |
| Imperial Oil Ltd. | 222,755 | 6,958 | |
| Saputo Inc. | 101,775 | 3,101 | |
| Franco-Nevada Corp. | 49,572 | 3,096 | |
| Intact Financial Corp. | 36,501 | 2,884 | |
| Metro Inc. | 68,487 | 2,149 | |
| CCL Industries Inc. | |||
| Class B | 45,295 | 1,905 | |
| ^ | Canadian Tire Corp. Ltd. | ||
| Class A | 16,430 | 1,849 | |
| SNC-Lavalin Group Inc. | 45,915 | 1,639 | |
| Methanex Corp. | 22,295 | 1,444 | |
| CAE Inc. | 71,778 | 1,266 | |
| Market | |||
| Value• | |||
| Shares | ($000) | ||
| Toromont Industries | |||
| Ltd. | 22,626 | 1,065 | |
| Ritchie Bros | |||
| Auctioneers Inc. | 30,683 | 1,032 | |
| Finning International | |||
| Inc. | 47,547 | 987 | |
| Empire Co. Ltd. | 49,244 | 896 | |
| Atco Ltd. | 27,880 | 813 | |
| Stella-Jones Inc. | 19,583 | 627 | |
| ^ | Canadian Western Bank | 25,628 | 596 |
| Cogeco | |||
| Communications Inc. | 10,801 | 530 | |
| Boyd Group Income | |||
| Fund | 4,867 | 445 | |
| Enghouse Systems Ltd. | 6,741 | 373 | |
| Richelieu Hardware Ltd. | 16,868 | 324 | |
| Equitable Group Inc. | 6,096 | 280 | |
| Cogeco Inc. | 3,974 | 187 | |
| 75,264 | |||
| China (4.8%) | |||
| Tencent Holdings Ltd. | 829,208 | 28,408 | |
| China Overseas Land | |||
| & Investment Ltd. | 2,939,000 | 9,240 | |
| China Gas Holdings | |||
| Ltd. | 1,331,400 | 4,226 | |
| Sunny Optical | |||
| Technology Group | |||
| Co. Ltd. | 296,100 | 2,585 | |
| China Resources Gas | |||
| Group Ltd. | 609,000 | 2,334 | |
| Sinopharm Group Co. | |||
| Ltd. | 318,800 | 1,544 | |
| China Everbright | |||
| International Ltd. | 1,724,592 | 1,380 | |
| China National Accord | |||
| Medicines Corp. Ltd. | |||
| Class B | 13,200 | 46 | |
| 49,763 | |||
10
International Dividend Appreciation Index Fund
| Market | ||
| Value• | ||
| Shares | ($000) | |
| Colombia (0.3%) | ||
| Grupo de Inversiones | ||
| Suramericana SA | 126,367 | 1,233 |
| Bancolombia SA ADR | 30,293 | 1,119 |
| Banco Davivienda SA | ||
| Preference Shares | 25,875 | 249 |
| Bancolombia SA | ||
| Preference Shares | 4,617 | 43 |
| 2,644 | ||
| Denmark (1.2%) | ||
| Coloplast A/S Class B | 53,076 | 4,953 |
| DSV A/S | 50,951 | 4,087 |
| Novozymes A/S | 67,035 | 3,311 |
| 12,351 | ||
| Egypt (0.0%) | ||
| Eastern Tobacco | 568,415 | 510 |
| Finland (0.2%) | ||
| Amer Sports Oyj | 30,978 | 1,152 |
| Huhtamaki Oyj | 29,327 | 822 |
| 1,974 | ||
| France (10.5%) | ||
| L’Oreal SA | 150,614 | 33,935 |
| Hermes International | 28,387 | 16,206 |
| Air Liquide SA | 115,389 | 13,949 |
| EssilorLuxottica SA | 95,672 | 13,067 |
| Dassault Systemes SE | 69,817 | 8,740 |
| Legrand SA | 70,639 | 4,613 |
| Sodexo SA | 40,209 | 4,104 |
| Sartorius Stedim Biotech | 24,638 | 3,053 |
| Eurofins Scientific SE | 4,702 | 2,370 |
| Arkema SA | 19,153 | 2,009 |
| SEB SA | 13,404 | 1,922 |
| Wendel SA | 12,405 | 1,607 |
| Eurazeo SE | 19,862 | 1,450 |
| Imerys SA | 21,241 | 1,309 |
| Rubis SCA | 25,356 | 1,308 |
| LISI | 13,650 | 398 |
| IPSOS | 13,654 | 364 |
| 110,404 | ||
| Germany (8.8%) | ||
| SAP SE | 330,057 | 35,341 |
| Bayer AG | 241,031 | 18,476 |
| Fresenius SE & Co. | ||
| KGaA | 148,629 | 9,446 |
| Fresenius Medical Care | ||
| AG & Co. KGaA | 82,298 | 6,462 |
| Henkel AG & Co. KGaA | ||
| Preference Shares | 47,628 | 5,204 |
| Merck KGaA | 34,400 | 3,681 |
| HeidelbergCement AG | 53,362 | 3,621 |
| Symrise AG | 35,035 | 2,935 |
| Fielmann AG | 23,544 | 1,460 |
| Sartorius AG | |||
| Preference Shares | 10,078 | 1,458 | |
| CTS Eventim AG & Co. | |||
| KGaA | 27,620 | 1,035 | |
| Bechtle AG | 11,246 | 999 | |
| Fuchs Petrolub SE | |||
| Preference Shares | 19,449 | 900 | |
| VTG AG | 7,375 | 441 | |
| AURELIUS Equity | |||
| Opportunities SE & | |||
| Co. KGaA | 9,371 | 436 | |
| Bertrandt AG | 2,393 | 198 | |
| Cewe Stiftung & Co. KGaA 1,881 | 147 | ||
| 92,240 | |||
| Hong Kong (2.1%) | |||
| Hong Kong & China | |||
| Gas Co. Ltd. | 4,114,256 | 7,859 | |
| MTR Corp. Ltd. | 1,613,000 | 7,826 | |
| Wheelock & Co. Ltd. | 545,000 | 2,913 | |
| Techtronic Industries | |||
| Co. Ltd. | 485,000 | 2,284 | |
| Minth Group Ltd. | 320,000 | 1,040 | |
| Johnson Electric | |||
| Holdings Ltd. | 226,000 | 507 | |
| 22,429 | |||
| India (12.9%) | |||
| Tata Consultancy | |||
| Services Ltd. | 1,004,140 | 26,324 | |
| Reliance Industries Ltd. | 1,663,366 | 23,880 | |
| HDFC Bank Ltd. ADR | 207,390 | 18,439 | |
| Hindustan Unilever Ltd. | 568,139 | 12,473 | |
| ITC Ltd. | 3,200,057 | 12,127 | |
| Infosys Ltd. ADR | 1,140,800 | 10,803 | |
| Housing Development | |||
| Finance Corp. Ltd. | 433,681 | 10,375 | |
| Larsen & Toubro Ltd. | 368,563 | 6,477 | |
| Asian Paints Ltd. | 251,209 | 4,181 | |
| IndusInd Bank Ltd. | 156,146 | 3,010 | |
| Pidilite Industries Ltd. | 134,416 | 1,743 | |
| Yes Bank Ltd. | 597,884 | 1,521 | |
| Page Industries Ltd. | 2,886 | 1,151 | |
| LIC Housing Finance Ltd. | 145,086 | 806 | |
| Info Edge India Ltd. | 30,814 | 658 | |
| Reliance Infrastructure Ltd. 81,239 | 394 | ||
| Kajaria Ceramics Ltd. | 56,939 | 304 | |
| Infosys Ltd. | 30,544 | 282 | |
| 134,948 | |||
| Ireland (0.8%) | |||
| Kerry Group plc Class A | 47,311 | 4,847 | |
| Kingspan Group plc | 47,534 | 2,065 | |
| ^ | Glanbia plc | 83,695 | 1,480 |
| Total Produce plc | 90,535 | 194 | |
| 8,586 | |||
11
International Dividend Appreciation Index Fund
| Market | ||
| Value• | ||
| Shares | ($000) | |
| Israel (0.0%) | ||
| Alony Hetz Properties & | ||
| Investments Ltd. | 41,614 | 396 |
| Italy (0.2%) | ||
| DiaSorin SPA | 15,603 | 1,480 |
| Reply SPA | 9,672 | 536 |
| 2,016 | ||
| Japan (11.7%) | ||
| Nippon Telegraph & | ||
| Telephone Corp. | 562,936 | 23,215 |
| Seven & i Holdings Co. | ||
| Ltd. | 237,900 | 10,301 |
| Bridgestone Corp. | 204,000 | 7,866 |
| Suzuki Motor Corp. | 132,000 | 6,582 |
| Asahi Group Holdings | ||
| Ltd. | 129,600 | 5,695 |
| Unicharm Corp. | 166,500 | 4,517 |
| Nitori Holdings Co. Ltd. | 30,688 | 4,007 |
| Sysmex Corp. | 56,200 | 3,942 |
| West Japan Railway Co. | 52,800 | 3,551 |
| Yakult Honsha Co. Ltd. | 46,800 | 3,314 |
| M3 Inc. | 174,600 | 2,830 |
| Daito Trust Construction | ||
| Co. Ltd. | 21,100 | 2,782 |
| Don Quijote Holdings | ||
| Co. Ltd. | 42,500 | 2,539 |
| Sekisui Chemical Co. | ||
| Ltd. | 137,200 | 2,158 |
| Hikari Tsushin Inc. | 12,300 | 2,148 |
| Shimadzu Corp. | 80,100 | 2,024 |
| Alfresa Holdings Corp. | 68,000 | 1,814 |
| Otsuka Corp. | 51,800 | 1,718 |
| Pola Orbis Holdings Inc. | 61,700 | 1,648 |
| Tokyo Century Corp. | 30,100 | 1,616 |
| Kobayashi | ||
| Pharmaceutical Co. Ltd. | 22,800 | 1,487 |
| MonotaRO Co. Ltd. | 67,200 | 1,482 |
| Tsuruha Holdings Inc. | 12,500 | 1,305 |
| Mitsubishi UFJ Lease & | ||
| Finance Co. Ltd. | 237,600 | 1,221 |
| Sundrug Co. Ltd. | 32,100 | 1,166 |
| Rinnai Corp. | 14,300 | 1,039 |
| Nihon M&A Center Inc. | 43,200 | 1,035 |
| Nomura Real Estate | ||
| Holdings Inc. | 51,300 | 964 |
| Relo Group Inc. | 40,700 | 959 |
| GMO Payment Gateway | ||
| Inc. | 19,600 | 950 |
| PALTAC Corp. | 17,400 | 886 |
| Hitachi Capital Corp. | 32,700 | 802 |
| Shimamura Co. Ltd. | 9,500 | 799 |
| Kurita Water Industries | ||
| Ltd. | 31,000 | 764 |
| Ci:z Holdings Co. Ltd. | 12,800 | 663 |
| Kaken Pharmaceutical | ||
| Co. Ltd. | 12,800 | 642 |
| NHK Spring Co. Ltd. | 70,100 | 600 |
| Koei Tecmo Holdings | ||
| Co. Ltd. | 35,240 | 558 |
| TS Tech Co. Ltd. | 19,200 | 553 |
| Yaoko Co. Ltd. | 9,900 | 541 |
| Kissei Pharmaceutical | ||
| Co. Ltd. | 18,800 | 540 |
| SHO-BOND Holdings | ||
| Co. Ltd. | 7,342 | 522 |
| Aeon Delight Co. Ltd. | 13,900 | 464 |
| Modec Inc. | 14,800 | 444 |
| Glory Ltd. | 18,700 | 435 |
| Fuyo General Lease | ||
| Co. Ltd. | 7,300 | 406 |
| Tosho Co. Ltd. | 9,900 | 385 |
| Miraca Holdings Inc. | 15,100 | 368 |
| Keihin Corp. | 18,300 | 360 |
| San-A Co. Ltd. | 8,000 | 337 |
| Senko Group Holdings | ||
| Co. Ltd. | 42,100 | 327 |
| Tokyo Ohka Kogyo Co. | ||
| Ltd. | 11,400 | 305 |
| Milbon Co. Ltd. | 8,300 | 298 |
| Starts Corp. Inc. | 14,000 | 291 |
| NEC Networks & | ||
| System Integration Corp. | 13,100 | 286 |
| Valor Holdings Co. Ltd. | 12,900 | 277 |
| Tokyo Seimitsu Co. Ltd. | 11,100 | 267 |
| Belc Co. Ltd. | 5,100 | 260 |
| Fukushima Industries | ||
| Corp. | 5,700 | 260 |
| Sato Holdings Corp. | 8,700 | 257 |
| Elecom Co. Ltd. | 10,800 | 256 |
| Kyokuto Kaihatsu Kogyo | ||
| Co. Ltd. | 17,700 | 253 |
| Ricoh Leasing Co. Ltd. | 7,100 | 233 |
| Sekisui Jushi Corp. | 12,600 | 229 |
| Nippon Parking | ||
| Development Co. Ltd. | 161,300 | 226 |
| Musashi Seimitsu | ||
| Industry Co. Ltd. | 14,000 | 204 |
| Nichicon Corp. | 22,600 | 188 |
| G-Tekt Corp. | 12,900 | 182 |
| Siix Corp. | 13,200 | 179 |
| Takara Leben Co. Ltd. | 61,400 | 177 |
| Hamakyorex Co. Ltd. | 4,500 | 145 |
| Hiday Hidaka Corp. | 7,120 | 139 |
| Yellow Hat Ltd. | 5,100 | 125 |
| Meiko Network Japan | ||
| Co. Ltd. | 10,300 | 90 |
12
International Dividend Appreciation Index Fund
| Market | ||
| Value• | ||
| Shares | ($000) | |
| F@N Communications | ||
| Inc. | 15,200 | 84 |
| Sanoh Industrial Co. | ||
| Ltd. | 10,900 | 62 |
| 122,544 | ||
| Mexico (1.1%) | ||
| America Movil SAB | ||
| de CV | 12,021,000 | 8,705 |
| Grupo Financiero | ||
| Inbursa SAB de CV | 1,790,255 | 2,321 |
| 11,026 | ||
| Morocco (0.2%) | ||
| Attijariwafa Bank | 52,462 | 2,285 |
| Netherlands (4.4%) | ||
| ^ Unilever NV | 460,855 | 24,764 |
| ASML Holding NV | 115,928 | 19,968 |
| Aalberts Industries NV | 29,235 | 1,072 |
| 45,804 | ||
| New Zealand (0.2%) | ||
| Ryman Healthcare Ltd. | 138,334 | 1,096 |
| Port of Tauranga Ltd. | 192,404 | 639 |
| Mainfreight Ltd. | 26,575 | 493 |
| 2,228 | ||
| Norway (0.1%) | ||
| Tomra Systems ASA | 41,226 | 1,021 |
| Philippines (0.9%) | ||
| SM Investments Corp. | 323,100 | 5,447 |
| Jollibee Foods Corp. | 304,019 | 1,570 |
| International Container | ||
| Terminal Services Inc. | 539,790 | 913 |
| Metro Pacific | ||
| Investments Corp. | 8,466,200 | 760 |
| Manila Water Co. Inc. | 533,900 | 250 |
| 8,940 | ||
| Russia (1.2%) | ||
| Novatek PJSC | 797,580 | 12,702 |
| South Africa (3.3%) | ||
| Naspers Ltd. | 117,960 | 20,690 |
| Sanlam Ltd. | 580,087 | 2,921 |
| Capitec Bank Holdings | ||
| Ltd. | 31,060 | 2,087 |
| Shoprite Holdings Ltd. | 159,468 | 1,947 |
| Discovery Ltd. | 174,274 | 1,870 |
| Remgro Ltd. | 142,803 | 1,841 |
| Mr Price Group Ltd. | 67,584 | 1,058 |
| PSG Group Ltd. | 62,466 | 932 |
| Barloworld Ltd. | 53,302 | 434 |
| Hosken Consolidated | |||
| Investments Ltd. | 23,357 | 201 | |
| * | Blue Label Telecoms | ||
| Ltd. | 250,487 | 88 | |
| 34,069 | |||
| South Korea (0.4%) | |||
| SK Holdings Co. Ltd. | 18,498 | 4,259 | |
| Hansae Co. Ltd. | 12,965 | 211 | |
| LEENO Industrial Inc. | 4,003 | 211 | |
| 4,681 | |||
| Spain (0.3%) | |||
| Grupo Catalana | |||
| Occidente SA | 32,288 | 1,334 | |
| Viscofan SA | 12,979 | 776 | |
| Vidrala SA | 6,724 | 559 | |
| Miquel y Costas & | |||
| Miquel SA | 6,751 | 222 | |
| * | Vidrala SA Rights | ||
| Exp. 11/12/18 | 6,556 | 26 | |
| 2,917 | |||
| Sweden (1.0%) | |||
| Investor AB Class B | 121,308 | 5,256 | |
| Trelleborg AB Class B | 64,349 | 1,161 | |
| * | AAK AB | 70,426 | 1,062 |
| ^ | Intrum AB | 34,933 | 891 |
| Hufvudstaden AB | |||
| Class A | 56,617 | 837 | |
| Loomis AB Class B | 20,742 | 641 | |
| Atrium Ljungberg AB | 34,662 | 587 | |
| * | Wihlborgs Fastigheter | ||
| AB | 43,734 | 493 | |
| 10,928 | |||
| Switzerland (9.0%) | |||
| Nestle SA | 575,847 | 48,615 | |
| ABB Ltd. | 582,131 | 11,713 | |
| Cie Financiere | |||
| Richemont SA | 140,138 | 10,243 | |
| Givaudan SA | 2,478 | 6,006 | |
| Partners Group | |||
| Holding AG | 7,106 | 5,059 | |
| Geberit AG | 9,883 | 3,870 | |
| EMS-Chemie Holding | |||
| AG | 6,254 | 3,446 | |
| Vifor Pharma AG | 17,944 | 2,593 | |
| Chocoladefabriken | |||
| Lindt & Spruengli AG | 278 | 1,917 | |
| Implenia AG | 4,951 | 275 | |
| 93,737 | |||
| Taiwan (0.2%) | |||
| E.Sun Financial | |||
| Holding Co. Ltd. | 2,779,707 | 1,846 | |
| Grape King Bio Ltd. | 32,000 | 202 | |
| 2,048 | |||
13
International Dividend Appreciation Index Fund
| Market | |||
| Value• | |||
| Shares | ($000) | ||
| Turkey (0.2%) | |||
| BIM Birlesik Magazalar | |||
| AS | 84,750 | 1,205 | |
| Enka Insaat ve Sanayi | |||
| AS | 1,330,529 | 1,112 | |
| 2,317 | |||
| United Kingdom (12.9%) | |||
| Diageo plc | 662,824 | 22,915 | |
| Shire plc | 244,424 | 14,751 | |
| Prudential plc | 695,960 | 13,936 | |
| Compass Group plc | 426,051 | 8,380 | |
| Associated British | |||
| Foods plc | 212,215 | 6,470 | |
| Experian plc | 246,841 | 5,677 | |
| RELX plc | 284,097 | 5,618 | |
| * | RELX plc | 267,647 | 5,296 |
| Ashtead Group plc | 133,204 | 3,288 | |
| Whitbread plc | 49,420 | 2,779 | |
| InterContinental Hotels | |||
| Group plc | 50,494 | 2,649 | |
| Bunzl plc | 88,671 | 2,616 | |
| Burberry Group plc | 112,413 | 2,601 | |
| Intertek Group plc | 42,705 | 2,559 | |
| Mondi plc | 98,175 | 2,312 | |
| Croda International plc | 35,389 | 2,180 | |
| Johnson Matthey plc | 51,737 | 1,962 | |
| St. James’s Place plc | 143,629 | 1,856 | |
| Micro Focus | |||
| International plc | 117,470 | 1,821 | |
| Hikma | |||
| Pharmaceuticals plc | 66,283 | 1,608 | |
| AVEVA Group plc | 43,276 | 1,448 | |
| JD Sports Fashion plc | 275,108 | 1,434 | |
| Meggitt plc | 211,595 | 1,432 | |
| Rightmove plc | 244,280 | 1,410 | |
| Jardine Lloyd | |||
| Thompson Group plc | 57,356 | 1,382 | |
| Renishaw plc | 19,823 | 1,065 | |
| RPC Group plc | 109,241 | 1,065 | |
| Travis Perkins plc | 68,905 | 973 | |
| IMI plc | 72,632 | 921 | |
| Abcam plc | 59,952 | 919 | |
| Spectris plc | 31,470 | 861 | |
| Dechra | |||
| Pharmaceuticals plc | 26,493 | 774 | |
| Victrex plc | 22,573 | 764 | |
| IWG plc | 249,907 | 733 | |
| WH Smith plc | 27,902 | 694 | |
| Grafton Group plc | 61,727 | 570 | |
| Genus plc | 19,059 | 538 | |
| Moneysupermarket.com | ||
| Group plc | 142,305 | 533 |
| Bodycote plc | 50,087 | 509 |
| Synthomer plc | 89,434 | 507 |
| QinetiQ Group plc | 140,034 | 496 |
| Diploma plc | 28,153 | 472 |
| Cranswick plc | 12,606 | 465 |
| Domino’s Pizza Group | ||
| plc | 120,480 | 436 |
| Rathbone Brothers plc | 12,911 | 380 |
| Senior plc | 106,438 | 371 |
| Paragon Banking | ||
| Group plc | 62,174 | 338 |
| Savills plc | 33,817 | 313 |
| EMIS Group plc | 26,482 | 306 |
| AG Barr plc | 30,413 | 297 |
| PZ Cussons plc | 103,679 | 289 |
| St. Modwen | ||
| Properties plc | 54,369 | 259 |
| Ted Baker plc | 11,005 | 258 |
| Hill & Smith Holdings | ||
| plc | 19,489 | 246 |
| Clarkson plc | 7,489 | 227 |
| Robert Walters plc | 30,038 | 224 |
| Treatt plc | 14,512 | 78 |
| Xaar plc | 14,628 | 27 |
| 135,288 | ||
| United States (0.1%) | ||
| Autoliv Inc. | 17,667 | 1,468 |
| Total Common Stocks | ||
| (Cost $1,086,469) | 1,042,631 | |
| Temporary Cash Investments (2.8%)1 | ||
| Money Market Fund (2.8%) | ||
| 2,3 Vanguard Market | ||
| Liquidity Fund, 2.308% | 293,799 | 29,380 |
| Face | ||
| Amount | ||
| ($000) | ||
| U. S. Government and Agency Obligations (0.0%) | ||
| 4 United States Treasury | ||
| Bill, 2.280%, 2/21/19 | 400 | 397 |
| Total Temporary Cash Investments | ||
| (Cost $29,777) | 29,777 | |
| Total Investments (102.4%) | ||
| (Cost $1,116,246) | 1,072,408 | |
14
International Dividend Appreciation Index Fund
| Amount | |
| ($000) | |
| Other Assets and Liabilities (-2.4%) | |
| Other Assets | |
| Investment in Vanguard | 57 |
| Receivables for Accrued Income | 2,710 |
| Receivables for Capital Shares Issued | 3,090 |
| Variation Margin Receivable— | |
| Futures Contracts | 18 |
| Unrealized Appreciation— | |
| Forward Currency Contracts | 87 |
| Other Assets | 902 |
| Total Other Assets | 6,864 |
| Liabilities | |
| Payables for Investment Securities | |
| Purchased | (6) |
| Collateral for Securities on Loan | (29,371) |
| Payables for Capital Shares Redeemed | (30) |
| Payables to Vanguard | (162) |
| Unrealized Depreciation— | |
| Forward Currency Contracts | (136) |
| Other Liabilities | (2,619) |
| Total Liabilities | (32,324) |
| Net Assets (100%) | 1,046,948 |
At October 31, 2018, net assets consisted of:
| Amount | |
| ($000) | |
| Paid-in Capital | 1,108,594 |
| Total Distributable Earnings (Loss) | (61,646) |
| Net Assets | 1,046,948 |
| Investor Shares—Net Assets | |
| Applicable to 484,166 outstanding | |
| $.001 par value shares of beneficial | |
| interest (unlimited authorization) | 11,365 |
| Net Asset Value Per Share— | |
| Investor Shares | $23.47 |
| Amount | |
| ($000) | |
| ETF Shares—Net Assets | |
| Applicable to 14,675,166 outstanding | |
| $.001 par value shares of beneficial | |
| interest (unlimited authorization) | 860,740 |
| Net Asset Value Per Share— | |
| ETF Shares | $58.65 |
| Admiral Shares—Net Assets | |
| Applicable to 6,130,310 outstanding | |
| $.001 par value shares of beneficial | |
| interest (unlimited authorization) | 174,843 |
| Net Asset Value Per Share— | |
| Admiral Shares | $28.52 |
• See Note A in Notes to Financial Statements.
^ Includes partial security positions on loan to broker-dealers. The total value of securities on loan is $27,800,000.
* Non-income-producing security.
1 The fund invests a portion of its cash reserves in equity markets through the use of index futures contracts. After giving effect to futures investments, the fund’s effective common stock and temporary cash investment positions represent 99.7% and 2.7%, respectively, of net assets.
2 Affiliated money market fund available only to Vanguard funds and certain trusts and accounts managed by Vanguard. Rate shown is the 7-day yield.
3 Includes $29,371,000 of collateral received for securities on loan.
4 Securities with a value of $352,000 have been segregated as initial margin for open futures contracts.
ADR—American Depositary Receipt.
15
| International Dividend Appreciation Index Fund | ||||||
| Derivative Financial Instruments Outstanding as of Period End | ||||||
| Futures Contracts | ||||||
| ($000) | ||||||
| Value and | ||||||
| Number of | Unrealized | |||||
| Long (Short) | Notional | Appreciation | ||||
| Expiration | Contracts | Amount | (Depreciation) | |||
| Long Futures Contracts | ||||||
| Dow Jones EURO STOXX 50 Index | December 2018 | 16 | 579 | (35) | ||
| MSCI Emerging Market Index | December 2018 | 9 | 431 | (16) | ||
| Topix Index | December 2018 | 1 | 145 | (12) | ||
| E-mini S&P 500 Index | December 2018 | 1 | 136 | (9) | ||
| (72) | ||||||
| Forward Currency Contracts | ||||||
| Unrealized | ||||||
| Contract | Appreciation | |||||
| Settlement | Contract Amount (000) | (Depreciation) | ||||
| Counterparty | Date | Receive | Deliver | ($000) | ||
| Goldman Sachs International | 12/28/18 | EUR | 1,771 | USD | 2,081 | (64) |
| BNP Paribas | 12/18/18 | JPY | 205,347 | USD | 1,849 | (21) |
| BNP Paribas | 12/28/18 | EUR | 1,265 | USD | 1,492 | (51) |
| BNP Paribas | 12/28/18 | USD | 2,866 | EUR | 2,448 | 78 |
| BNP Paribas | 12/18/18 | USD | 1,053 | JPY | 117,670 | 6 |
| Goldman Sachs International | 12/18/18 | USD | 634 | JPY | 70,900 | 3 |
| (49) | ||||||
| EUR—Euro. | ||||||
| JPY—Japanese yen. | ||||||
| USD—U.S. dollar. | ||||||
See accompanying Notes, which are an integral part of the Financial Statements.
16
| International Dividend Appreciation Index Fund | |
| Statement of Operations | |
| Year Ended | |
| October 31, 2018 | |
| ($000) | |
| Investment Income | |
| Income | |
| Dividends1 | 21,832 |
| Interest 2 | 107 |
| Securities Lending—Net | 162 |
| Total Income | 22,101 |
| Expenses | |
| The Vanguard Group—Note B | |
| Investment Advisory Services | 160 |
| Management and Administrative—Investor Shares | 35 |
| Management and Administrative—ETF Shares | 1,643 |
| Management and Administrative—Admiral Shares | 358 |
| Marketing and Distribution—Investor Shares | 3 |
| Marketing and Distribution—ETF Shares | 51 |
| Marketing and Distribution—Admiral Shares | 15 |
| Custodian Fees | 321 |
| Auditing Fees | 45 |
| Shareholders’ Reports and Proxy—Investor Shares | 1 |
| Shareholders’ Reports and Proxy—ETF Shares | 43 |
| Shareholders’ Reports and Proxy—Admiral Shares | 4 |
| Trustees’ Fees and Expenses | 1 |
| Total Expenses | 2,680 |
| Expenses Paid Indirectly | (16) |
| Net Expenses | 2,664 |
| Net Investment Income | 19,437 |
| Realized Net Gain (Loss) | |
| Investment Securities Sold 2,3 | 4,892 |
| Futures Contracts | (77) |
| Forward Currency Contracts | (210) |
| Foreign Currencies | 102 |
| Realized Net Gain (Loss) | 4,707 |
| Change in Unrealized Appreciation (Depreciation) | |
| Investment Securities 2,4 | (112,397) |
| Futures Contracts | (368) |
| Forward Currency Contracts | 130 |
| Foreign Currencies | (75) |
| Change in Unrealized Appreciation (Depreciation) | (112,710) |
| Net Increase (Decrease) in Net Assets Resulting from Operations | (88,566) |
1 Dividends are net of foreign withholding taxes of $2,476,000.
2 Interest income, realized net gain (loss), and change in unrealized appreciation (depreciation) from an affiliated company of the fund were $84,000, ($5,000), and $1,000, respectively. Purchases and sales are for temporary cash investment purposes.
3 Includes $19,897,000 of net gains resulting from in-kind redemptions; such gains are not taxable to the fund.
4 The change in unrealized appreciation (depreciation) is net of deferred foreign capital gains taxes of $1,345,000.
See accompanying Notes, which are an integral part of the Financial Statements.
17
| International Dividend Appreciation Index Fund | ||
| Statement of Changes in Net Assets | ||
| Year Ended October 31, | ||
| 2018 | 2017 | |
| ($000) | ($000) | |
| Increase (Decrease) in Net Assets | ||
| Operations | ||
| Net Investment Income | 19,437 | 8,955 |
| Realized Net Gain (Loss) | 4,707 | 3,449 |
| Change in Unrealized Appreciation (Depreciation) | (112,710) | 69,833 |
| Net Increase (Decrease) in Net Assets Resulting from Operations | (88,566) | 82,237 |
| Distributions | ||
| Net Investment Income | ||
| Investor Shares | (223) | (139) |
| ETF Shares | (15,685) | (6,195) |
| Admiral Shares | (3,362) | (1,916) |
| Realized Capital Gain | ||
| Investor Shares | — | — |
| ETF Shares | — | — |
| Admiral Shares | — | — |
| Total Distributions | (19,270) | (8,250) |
| Capital Share Transactions | ||
| Investor Shares | 1,981 | 4,699 |
| ETF Shares | 315,063 | 432,350 |
| Admiral Shares | 40,676 | 57,466 |
| Net Increase (Decrease) from Capital Share Transactions | 357,720 | 494,515 |
| Total Increase (Decrease) | 249,884 | 568,502 |
| Net Assets | ||
| Beginning of Period | 797,064 | 228,562 |
| End of Period | 1,046,948 | 797,064 |
See accompanying Notes, which are an integral part of the Financial Statements.
18
| International Dividend Appreciation Index Fund | |||
| Financial Highlights | |||
| Investor Shares | |||
| Feb. 25, | |||
| 20161 to | |||
| For a Share Outstanding | Year Ended October 31, | Oct. 31, | |
| Throughout Each Period | 2018 | 2017 | 2016 |
| Net Asset Value, Beginning of Period | $25.71 | $21.77 | $20.00 |
| Investment Operations | |||
| Net Investment Income2 | .461 | .460 | . 244 |
| Net Realized and Unrealized Gain (Loss) on Investments3 | (2.260) | 3.871 | 1.671 |
| Total from Investment Operations | (1.799) | 4.331 | 1.915 |
| Distributions | |||
| Dividends from Net Investment Income | (.441) | (.391) | (.145) |
| Distributions from Realized Capital Gains | — | — | — |
| Total Distributions | (.441) | (.391) | (.145) |
| Net Asset Value, End of Period | $23.47 | $25.71 | $21.77 |
| Total Return 4 | -7.13%5 | 20.06% 5 | 9.57% |
| Ratios/Supplemental Data | |||
| Net Assets, End of Period (Millions) | $11 | $11 | $4 |
| Ratio of Total Expenses to Average Net Assets | 0.35% | 0.35% | 0.35%6 |
| Ratio of Net Investment Income to Average Net Assets | 1.73% | 1.86% | 1.50%6 |
| Portfolio Turnover Rate7 | 36% | 9% | 8% |
1 Inception.
2 Calculated based on average shares outstanding.
3 Includes increases from purchase and redemption fees of $.01 for 2018 and $.01 for 2017.
4 Total returns do not include account service fees that may have applied in the periods shown. Fund prospectuses provide
information about any applicable account service fees.
5 Total return does not include transaction fees that may have applied in the period shown. Fund prospectuses provide information
about any applicable transaction fees.
6 Annualized.
7 Excludes the value of portfolio securities received or delivered as a result of in-kind purchases or redemptions of the fund’s capital
shares, including ETF Creation Units.
See accompanying Notes, which are an integral part of the Financial Statements.
19
| International Dividend Appreciation Index Fund | |||
| Financial Highlights | |||
| ETF Shares | |||
| Feb. 25, | |||
| 20161 to | |||
| For a Share Outstanding | Year Ended October 31, | Oct. 31, | |
| Throughout Each Period | 2018 | 2017 | 2016 |
| Net Asset Value, Beginning of Period | $64.25 | $54.43 | $50.00 |
| Investment Operations | |||
| Net Investment Income2 | 1.196 | 1.179 | .662 |
| Net Realized and Unrealized Gain (Loss) on Investments3 | (5.623) | 9.715 | 4.154 |
| Total from Investment Operations | (4.427) | 10.894 | 4.816 |
| Distributions | |||
| Dividends from Net Investment Income | (1.173) | (1.074) | (.386) |
| Distributions from Realized Capital Gains | — | — | — |
| Total Distributions | (1.173) | (1.074) | (. 386) |
| Net Asset Value, End of Period | $58.65 | $64.25 | $54.43 |
| Total Return | -7.04% | 20.19% | 9.64% |
| Ratios/Supplemental Data | |||
| Net Assets, End of Period (Millions) | $861 | $634 | $147 |
| Ratio of Total Expenses to Average Net Assets | 0.25% | 0.25% | 0.25%4 |
| Ratio of Net Investment Income to Average Net Assets | 1.83% | 1.96% | 1.60%4 |
| Portfolio Turnover Rate5 | 36% | 9% | 8% |
1 Inception.
2 Calculated based on average shares outstanding.
3 Includes increases from purchase and redemption fees of $.02 for 2018 and $.04 for 2017.
4 Annualized.
5 Excludes the value of portfolio securities received or delivered as a result of in-kind purchases or redemptions of the fund’s capital
shares, including ETF Creation Units.
See accompanying Notes, which are an integral part of the Financial Statements.
20
| International Dividend Appreciation Index Fund | |||
| Financial Highlights | |||
| Admiral Shares | |||
| March 2, | |||
| 20161 to | |||
| For a Share Outstanding | Year Ended October 31, | Oct. 31, | |
| Throughout Each Period | 2018 | 2017 | 2016 |
| Net Asset Value, Beginning of Period | $31.24 | $26.45 | $25.00 |
| Investment Operations | |||
| Net Investment Income2 | .576 | .573 | .285 |
| Net Realized and Unrealized Gain (Loss) on Investments3 | (2.727) | 4.720 | 1.352 |
| Total from Investment Operations | (2.151) | 5.293 | 1.637 |
| Distributions | |||
| Dividends from Net Investment Income | (.569) | (.503) | (.187) |
| Distributions from Realized Capital Gains | — | — | — |
| Total Distributions | (.569) | (.503) | (.187) |
| Net Asset Value, End of Period | $28.52 | $31.24 | $26.45 |
| Total Return 4 | -7.03%5 | 20.18%5 | 6.54% |
| Ratios/Supplemental Data | |||
| Net Assets, End of Period (Millions) | $175 | $152 | $77 |
| Ratio of Total Expenses to Average Net Assets | 0.25% | 0.25% | 0.25%6 |
| Ratio of Net Investment Income to Average Net Assets | 1.83% | 1.96% | 1.60%6 |
| Portfolio Turnover Rate7 | 36% | 9% | 8% |
1 Inception.
2 Calculated based on average shares outstanding.
3 Includes increases from purchase and redemption fees of $.01 for 2018 and $.02 for 2017.
4 Total returns do not include account service fees that may have applied in the periods shown. Fund prospectuses provide
information about any applicable account service fees.
5 Total return does not include transaction fees that may have applied in the period shown. Fund prospectuses provide information
about any applicable transaction fees.
6 Annualized.
7 Excludes the value of portfolio securities received or delivered as a result of in-kind purchases or redemptions of the fund’s capital
shares, including ETF Creation Units.
See accompanying Notes, which are an integral part of the Financial Statements.
21
International Dividend Appreciation Index Fund
Notes to Financial Statements
Vanguard International Dividend Appreciation Index Fund is registered under the Investment Company Act of 1940 as an open-end investment company, or mutual fund. The fund invests in securities of foreign issuers, which may subject it to investment risks not normally associated with investing in securities of U.S. corporations. The fund offers three classes of shares: Investor Shares, ETF Shares, and Admiral Shares. Investor Shares are available to any investor who meets the fund’s minimum purchase requirements. ETF Shares are listed for trading on Nasdaq; they can be purchased and sold through a broker. Admiral Shares are designed for investors who meet certain administrative, service, and account-size criteria.
A. The following significant accounting policies conform to generally accepted accounting principles for U.S. investment companies. The fund consistently follows such policies in preparing its financial statements.
1. Security Valuation: Securities are valued as of the close of trading on the New York Stock Exchange (generally 4 p.m., Eastern time) on the valuation date. Equity securities are valued at the latest quoted sales prices or official closing prices taken from the primary market in which each security trades; such securities not traded on the valuation date are valued at the mean of the latest quoted bid and asked prices. Securities for which market quotations are not readily available, or whose values have been affected by events occurring before the fund’s pricing time but after the close of the securities’ primary markets, are valued at their fair values calculated according to procedures adopted by the board of trustees. These procedures include obtaining quotations from an independent pricing service, monitoring news to identify significant market- or security-specific events, and evaluating changes in the values of foreign market proxies (for example, ADRs, futures contracts, or exchange-traded funds), between the time the foreign markets close and the fund’s pricing time. When fair-value pricing is employed, the prices of securities used by a fund to calculate its net asset value may differ from quoted or published prices for the same securities. Investments in Vanguard Market Liquidity Fund are valued at that fund’s net asset value. Temporary cash investments are valued using the latest bid prices or using valuations based on a matrix system (which considers such factors as security prices, yields, maturities, and ratings), both as furnished by independent pricing services.
2. Foreign Currency: Securities and other assets and liabilities denominated in foreign currencies are translated into U.S. dollars using exchange rates obtained from an independent third party as of the fund’s pricing time on the valuation date. Realized gains (losses) and unrealized appreciation (depreciation) on investment securities include the effects of changes in exchange rates since the securities were purchased, combined with the effects of changes in security prices. Fluctuations in the value of other assets and liabilities resulting from changes in exchange rates are recorded as unrealized foreign currency gains (losses) until the assets or liabilities are settled in cash, at which time they are recorded as realized foreign currency gains (losses).
3. Futures and Forward Currency Contracts: The fund uses index futures contracts to a limited extent, with the objectives of maintaining full exposure to the stock market, maintaining liquidity, and minimizing transaction costs. The fund may purchase futures contracts to immediately invest incoming cash in the market, or sell futures in response to cash outflows, thereby simulating a fully invested position in the underlying index while maintaining a cash balance for liquidity. The primary risks associated with the use of futures contracts are imperfect correlation between changes in market values of stocks held by the fund and the prices of futures contracts, and the possibility of an illiquid market. Counterparty risk involving futures is mitigated because a regulated clearing-house is the counterparty instead of the clearing broker. To further mitigate counterparty risk, the
22
International Dividend Appreciation Index Fund
fund trades futures contracts on an exchange, monitors the financial strength of its clearing brokers and clearinghouse, and has entered into clearing agreements with its clearing brokers. The clearing-house imposes initial margin requirements to secure the fund’s performance and requires daily settlement of variation margin representing changes in the market value of each contract. Any assets pledged as initial margin for open contracts are noted in the Statement of Net Assets.
The fund also enters into forward currency contracts to provide the appropriate currency exposure related to any open futures contracts. The fund’s risks in using these contracts include movement in the values of the foreign currencies relative to the U.S. dollar and the ability of the counterparties to fulfill their obligations under the contracts. The fund mitigates its counterparty risk by entering into forward currency contracts only with a diverse group of prequalified counterparties, monitoring their financial strength, entering into master netting arrangements with its counterparties, and requiring its counterparties to transfer collateral as security for their performance. In the absence of a default, the collateral pledged or received by the fund cannot be repledged, resold, or rehypothecated. The master netting arrangements provide that, in the event of a counterparty’s default (including bankruptcy), the fund may terminate the forward currency contracts, determine the net amount owed by either party in accordance with its master netting arrangements, and sell or retain any collateral held up to the net amount owed to the fund under the master netting arrangements.
The forward currency contracts contain provisions whereby a counterparty may terminate open contracts if the fund’s net assets decline below a certain level, triggering a payment by the fund if the fund is in a net liability position at the time of the termination. The payment amount would be reduced by any collateral the fund has pledged. Any assets pledged as collateral for open contracts are noted in the Statement of Net Assets. The value of collateral received or pledged is compared daily to the value of the forward currency contracts exposure with each counterparty, and any difference, if in excess of a specified minimum transfer amount, is adjusted and settled within two business days.
Futures contracts are valued at their quoted daily settlement prices. Forward currency contracts are valued at their quoted daily prices obtained from an independent third party, adjusted for currency risk based on the expiration date of each contract. The notional amounts of the contracts are not recorded in the Statement of Net Assets. Fluctuations in the value of the contracts are recorded in the Statement of Net Assets as an asset (liability) and in the Statement of Operations as unrealized appreciation (depreciation) until the contracts are closed, when they are recorded as realized gains (losses) on futures or forward currency contracts.
During the year ended October 31, 2018, the fund’s average investments in long and short futures contracts represented less than 1% and 0% of net assets, respectively, based on the average of the notional amounts at each quarter-end during the period. The fund’s average investment in forward currency contracts represented 2% of net assets, based on the average of the notional amounts at each quarter-end during the period.
4. Federal Income Taxes: The fund intends to continue to qualify as a regulated investment company and distribute all of its taxable income. Management has analyzed the fund’s tax positions taken for all open federal income tax years (October 31, 2016–2018), and has concluded that no provision for federal income tax is required in the fund’s financial statements.
5. Distributions: Distributions to shareholders are recorded on the ex-dividend date. Distributions are determined on a tax basis and may differ from net investment income and realized capital gains for financial reporting purposes.
23
International Dividend Appreciation Index Fund
6. Securities Lending: To earn additional income, the fund lends its securities to qualified institutional borrowers. Security loans are subject to termination by the fund at any time, and are required to be secured at all times by collateral in an amount at least equal to the market value of securities loaned. Daily market fluctuations could cause the value of loaned securities to be more or less than the value of the collateral received. When this occurs, the collateral is adjusted and settled before the opening of the market on the next business day. The fund further mitigates its counterparty risk by entering into securities lending transactions only with a diverse group of prequalified counterparties, monitoring their financial strength, and entering into master securities lending agreements with its counterparties. The master securities lending agreements provide that, in the event of a counterparty’s default (including bankruptcy), the fund may terminate any loans with that borrower, determine the net amount owed, and sell or retain the collateral up to the net amount owed to the fund; however, such actions may be subject to legal proceedings. While collateral mitigates counterparty risk, in the event of a default, the fund may experience delays and costs in recovering the securities loaned. The fund invests cash collateral received in Vanguard Market Liquidity Fund, and records a liability in the Statement of Net Assets for the return of the collateral, during the period the securities are on loan. Securities lending income represents fees charged to borrowers plus income earned on invested cash collateral, less expenses associated with the loan. During the term of the loan, the fund is entitled to all distributions made on or in respect of the loaned securities.
7. Credit Facility: The fund and certain other funds managed by The Vanguard Group (“Vanguard”) participate in a $3.1 billion committed credit facility provided by a syndicate of lenders pursuant to a credit agreement that may be renewed annually; each fund is individually liable for its borrowings, if any, under the credit facility. Borrowings may be utilized for temporary and emergency purposes, and are subject to the fund’s regulatory and contractual borrowing restrictions. The participating funds are charged administrative fees and an annual commitment fee of 0.10% of the undrawn amount of the facility; these fees are allocated to the funds based on a method approved by the fund’s board of trustees and included in Management and Administrative expenses on the fund’s Statement of Operations. Any borrowings under this facility bear interest at a rate based upon the higher of the one-month London Interbank Offered Rate, federal funds effective rate, or overnight bank funding rate plus an agreed-upon spread.
The fund had no borrowings outstanding at October 31, 2018, or at any time during the period then ended.
8. Other: Dividend income is recorded on the ex-dividend date. Interest income includes income distributions received from Vanguard Market Liquidity Fund and is accrued daily. Premiums and discounts on debt securities purchased are amortized and accreted, respectively, to interest income over the lives of the respective securities. Taxes on foreign dividends and capital gains have been provided for in accordance with the fund’s understanding of the applicable countries’ tax rules and rates. Foreign capital gains tax is accrued daily based upon net unrealized gains. Security transactions are accounted for on the date securities are bought or sold. Costs used to determine realized gains (losses) on the sale of investment securities are those of the specific securities sold. Fees assessed on capital share transactions are credited to paid-in capital.
24
International Dividend Appreciation Index Fund
Each class of shares has equal rights as to assets and earnings, except that each class separately bears certain class-specific expenses related to maintenance of shareholder accounts (included in Management and Administrative expenses), shareholder reporting, and the proxy. Marketing and distribution expenses are allocated to each class of shares based on a method approved by the board of trustees. Income, other non-class-specific expenses, and gains and losses on investments are allocated to each class of shares based on its relative net assets.
B. In accordance with the terms of a Funds’ Service Agreement (the “FSA”) between Vanguard and the fund, Vanguard furnishes to the fund investment advisory, corporate management, administrative, marketing, and distribution services at Vanguard’s cost of operations (as defined by the FSA). These costs of operations are allocated to the fund based on methods and guidelines approved by the board of trustees. Vanguard does not require reimbursement in the current period for certain costs of operations (such as deferred compensation/benefits and risk/insurance costs); the fund’s liability for these costs of operations is included in Payables to Vanguard on the Statement of Net Assets. All other costs of operations payable to Vanguard are generally settled twice a month.
Upon the request of Vanguard, the fund may invest up to 0.40% of its net assets as capital in Vanguard. At October 31, 2018, the fund had contributed to Vanguard capital in the amount of $57,000, representing 0.01% of the fund’s net assets and 0.02% of Vanguard’s capitalization. The fund’s trustees and officers are also directors and employees, respectively, of Vanguard.
C. The fund’s custodian bank has agreed to reduce its fees when the fund maintains cash on deposit in the non-interest-bearing custody account. For the year ended October 31, 2018, custodian fee offset arrangements reduced the fund’s expenses by $16,000 (an annual rate of 0.00% of average net assets).
D. Various inputs may be used to determine the value of the fund’s investments. These inputs are summarized in three broad levels for financial statement purposes. The inputs or methodologies used to value securities are not necessarily an indication of the risk associated with investing in those securities.
Level 1—Quoted prices in active markets for identical securities.
Level 2—Other significant observable inputs (including quoted prices for similar securities, interest rates, prepayment speeds, credit risk, etc.).
Level 3—Significant unobservable inputs (including the fund’s own assumptions used to determine the fair value of investments). Any investments valued with significant unobservable inputs are noted on the Statement of Net Assets.
25
International Dividend Appreciation Index Fund
The following table summarizes the market value of the fund’s investments as of October 31, 2018, based on the inputs used to value them:
| Level 1 | Level 2 | Level 3 | |
| Investments | ($000) | ($000) | ($000) |
| Common Stocks—North and South America | 90,675 | 1,468 | — |
| Common Stocks—Other | 29,242 | 921,246 | — |
| Temporary Cash Investments | 29,380 | 397 | — |
| Futures Contracts—Assets1 | 18 | — | — |
| Forward Currency Contracts—Assets | — | 87 | — |
| Forward Currency Contracts—Liabilities | — | (136) | — |
| Total | 149,315 | 923,062 | — |
| 1 Represents variation margin on the last day of the reporting period. |
E. At October 31, 2018, the fair values of derivatives were reflected in the Statement of Net Assets as follows:
| Foreign | |||
| Equity | Exchange | ||
| Contracts | Contracts | Total | |
| Statement of Net Assets Caption | ($000) | ($000) | ($000) |
| Variation Margin Receivable—Futures Contracts | 18 | — | 18 |
| Unrealized Appreciation—Forward Currency Contracts | — | 87 | 87 |
| Total Assets | 18 | 87 | 105 |
| Unrealized Depreciation—Forward Currency Contracts | — | (136) | (136) |
Realized net gain (loss) and the change in unrealized appreciation (depreciation) on derivatives for the year ended October 31, 2018, were:
| Foreign | |||
| Equity | Exchange | ||
| Contracts | Contracts | Total | |
| Realized Net Gain (Loss) on Derivatives | ($000) | ($000) | ($000) |
| Futures Contracts | (77) | — | (77) |
| Forward Currency Contracts | — | (210) | (210) |
| Realized Net Gain (Loss) on Derivatives | (77) | (210) | (287) |
| Change in Unrealized Appreciation (Depreciation) on Derivatives | |||
| Futures Contracts | (368) | — | (368) |
| Forward Currency Contracts | — | 130 | 130 |
| Change in Unrealized Appreciation (Depreciation) on Derivatives | (368) | 130 | (238) |
26
International Dividend Appreciation Index Fund
F. Permanent differences between book-basis and tax-basis components of net assets are reclassified among capital accounts in the financial statements to reflect their tax character. These reclassifications have no effect on net assets or net asset value per share. As of period end, the following permanent differences primarily attributable to the accounting for in-kind redemptions, foreign currency transactions, passive foreign investment companies, and tax expense on capital gains were reclassified to the following accounts:
| Amount | |
| ($000) | |
| Paid-in Capital | $19,897 |
| Total Distributable Earnings (Loss) | (19,897) |
Temporary differences between book-basis and tax-basis components of total distributable earnings (loss) arise when certain items of income, gain, or loss are recognized in different periods for financial statement and tax purposes; these differences will reverse at some time in the future. The differences are primarily related to the tax deferral of losses on wash sales, the realization of unrealized gains or losses on certain futures contracts, forward currency contracts, and unrealized gains on passive foreign investment companies. As of period end, the tax-basis components of total distributable earnings (loss) are detailed in the table as follows:
| Amount | |
| ($000) | |
| Undistributed Ordinary Income | 2,580 |
| Undistributed Long-Term Gains | — |
| Capital Loss Carryforwards (Non-expiring) | (18,445) |
| Net Unrealized Gains (Losses) | (45,754) |
As of October 31, 2018, gross unrealized appreciation and depreciation for investments and derivatives based on cost for U.S. federal income tax purposes were as follows:
| Amount | |
| ($000) | |
| Tax Cost | 1,118,073 |
| Gross Unrealized Appreciation | 63,512 |
| Gross Unrealized Depreciation | (109,190) |
| Net Unrealized Appreciation (Depreciation) | (45,678) |
27
International Dividend Appreciation Index Fund
G. During the year ended October 31, 2018, the fund purchased $771,552,000 of investment securities and sold $409,131,000 of investment securities, other than temporary cash investments. Purchases and sales include $270,977,000 and $35,414,000, respectively, in connection with in-kind purchases and redemptions of the fund’s capital shares.
| H. Capital share transactions for each class of shares were: | ||||
| Year Ended October 31, | ||||
| 2018 | 2017 | |||
| Amount | Shares | Amount | Shares | |
| ($000) | (000) | ($000) | (000) | |
| Investor Shares | ||||
| Issued1 | 9,433 | 358 | 9,682 | 418 |
| Issued in Lieu of Cash Distributions | 210 | 8 | 132 | 6 |
| Redeemed 2 | (7,662) | (294) | (5,115) | (217) |
| Net Increase (Decrease)—Investor Shares | 1,981 | 72 | 4,699 | 207 |
| ETF Shares | ||||
| Issued1 | 351,000 | 5,355 | 466,797 | 7,770 |
| Issued in Lieu of Cash Distributions | — | — | — | — |
| Redeemed 2 | (35,937) | (550) | (34,447) | (600) |
| Net Increase (Decrease)—ETF Shares | 315,063 | 4,805 | 432,350 | 7,170 |
| Admiral Shares | ||||
| Issued1 | 77,590 | 2,422 | 87,013 | 3,053 |
| Issued in Lieu of Cash Distributions | 2,791 | 90 | 1,580 | 54 |
| Redeemed 2 | (39,705) | (1,257) | (31,127) | (1,147) |
| Net Increase (Decrease)—Admiral Shares | 40,676 | 1,255 | 57,466 | 1,960 |
1 Includes purchase fees for fiscal 2018 and 2017 of $212,000 and $252,000, respectively (fund totals). 2 Net of redemption fees for fiscal 2018 and 2017 of $102,000 and $18,000, respectively (fund totals).
I. Management has determined that no events or transactions occurred subsequent to October 31, 2018, that would require recognition or disclosure in these financial statements.
28
International High Dividend Yield Index Fund
Fund Profile
As of October 31, 2018
| Share-Class Characteristics | |||
| Investor | ETF | Admiral | |
| Shares | Shares | Shares | |
| Ticker Symbol | VIHIX | VYMI | VIHAX |
| Expense Ratio1 | 0.42% | 0.32% | 0.32% |
| Portfolio Characteristics | ||
| FTSE | ||
| All-World | ||
| ex US High | ||
| Dividend Yield | ||
| Fund | Index | |
| Number of Stocks | 902 | 844 |
| Median Market Cap | $46.1B | $46.2B |
| Price/Earnings Ratio | 11.1x | 11.2x |
| Price/Book Ratio | 1.4x | 1.4x |
| Return on Equity | 12.0% | 12.0% |
| Earnings Growth Rate | 2.3% | 2.6% |
| Dividend Yield | 4.7% | 4.7% |
| Turnover Rate | 10% | — |
| Short-Term Reserves | -0.4% | — |
| Sector Diversification (% of equity exposure) | |
| Fund | |
| Basic Materials | 6.2% |
| Consumer Goods | 11.8 |
| Consumer Services | 3.9 |
| Financials | 36.3 |
| Health Care | 7.2 |
| Industrials | 8.3 |
| Oil & Gas | 11.7 |
| Technology | 3.7 |
| Telecommunications | 6.1 |
| Utilities | 4.8 |
Sector categories are based on the Industry Classification Benchmark (“ICB”), except for the “Other” category (if applicable), which includes securities that have not been provided an ICB classification as of the effective reporting period.
| Ten Largest Holdings (% of total net assets) | ||
| Royal Dutch Shell plc | Integrated Oil & Gas | 2.8% |
| Nestle SA | Food Products | 2.7 |
| Novartis AG | Pharmaceuticals | 2.0 |
| Taiwan Semiconductor | ||
| Manufacturing Co. Ltd. | Semiconductors | 1.9 |
| Roche Holding AG | Pharmaceuticals | 1.9 |
| HSBC Holdings plc | Banks | 1.7 |
| Toyota Motor Corp. | Automobiles | 1.6 |
| TOTAL SA | Integrated Oil & Gas | 1.6 |
| BP plc | Integrated Oil & Gas | 1.5 |
| Unilever | Personal Products | 1.5 |
| Top Ten | 19.2% | |
The holdings listed exclude any temporary cash investments and equity index products.
Allocation by Region (% of portfolio)
![]()
1 The expense ratios shown are from the prospectus dated February 22, 2018, and represent estimated costs for the current fiscal year. For the fiscal year ended October 31, 2018, the expense ratios were 0.42% for Investor Shares, 0.32% for ETF Shares, and 0.32% for Admiral Shares.
29
International High Dividend Yield Index Fund
| Market Diversi cation (% of equity exposure) | ||
| FTSE | ||
| All-World | ||
| ex US High | ||
| Dividend | ||
| Yield | ||
| Fund | Index | |
| Europe | ||
| United Kingdom | 17.0% | 17.1% |
| Switzerland | 9.7 | 9.7 |
| France | 6.4 | 6.4 |
| Germany | 6.0 | 6.0 |
| Spain | 3.2 | 3.2 |
| Netherlands | 2.3 | 2.3 |
| Italy | 2.0 | 2.0 |
| Sweden | 1.6 | 1.6 |
| Finland | 1.4 | 1.4 |
| Belgium | 1.1 | 1.1 |
| Other | 1.6 | 1.6 |
| Subtotal | 52.3 | 52.4 |
| Paci c | ||
| Japan | 7.9% | 7.9% |
| Australia | 7.5 | 7.5 |
| Hong Kong | 1.6 | 1.6 |
| Singapore | 1.3 | 1.3 |
| South Korea | 1.3 | 1.3 |
| Other | 0.2 | 0.2 |
| Subtotal | 19.8% | 19.8% |
| Emerging Markets | ||
| China | 5.4% | 5.4% |
| Taiwan | 5.1 | 5.2 |
| Brazil | 2.0 | 2.0 |
| Russia | 1.7 | 1.7 |
| South Africa | 1.4 | 1.4 |
| Thailand | 1.0 | 0.9 |
| Other | 4.2 | 4.0 |
| Subtotal | 20.8% | 20.6% |
| North America | ||
| Canada | 6.8% | 6.9% |
| Middle East | ||
| Other | 0.3% | 0.3% |
30
International High Dividend Yield Index Fund
Performance Summary
All of the returns in this report represent past performance, which is not a guarantee of future results that may be achieved by the fund. (Current performance may be lower or higher than the performance data cited. For performance data current to the most recent month-end, visit our website at vanguard.com/performance.) Note, too, that both investment returns and principal value can fluctuate widely, so an investor’s shares, when sold, could be worth more or less than their original cost. The returns shown do not reflect taxes that a shareholder would pay on fund distributions or on the sale of fund shares.
Cumulative Performance: February 25, 2016, Through October 31, 2018
Initial Investment of $10,000

| Average Annual Total Returns | |||
| Periods Ended October 31, 2018 | |||
| Since | Final Value | ||
| One | Inception | of a $10,000 | |
| Year | (2/25/2016) | Investment | |
| International High Dividend Yield Index | |||
| Fund Investor Shares | -7.54% | 9.55% | $12,768 |
| FTSE All-World ex US High Dividend | |||
| Yield Index | -6.45 | 10.62 | 13,106 |
| International Equity Income Funds | |||
| Average | -8.28 | 6.47 | 11,829 |
International Equity Income Funds Average: Derived from data provided by Lipper, a Thomson Reuters Company.
"Since Inception" performance is calculated from the Investor Shares’ inception date for both the fund and its comparative standards.
| Since | Final Value | ||
| One | Inception | of a $10,000 | |
| Year | (2/25/2016) | Investment | |
| International High Dividend Yield Index Fund | |||
| ETF Shares Net Asset Value | -7.03% | 9.85% | $12,861 |
| International High Dividend Yield Index Fund | |||
| ETF Shares Market Price | -7.53 | 9.74 | 11,829 |
| FTSE All-World ex US High Dividend Yield | |||
| Index | -6.45 | 10.62 | 13,106 |
"Since Inception" performance is calculated from the ETF Shares’ inception date for both the fund and its comparative standards.
Vanguard fund returns are adjusted to reflect the 0.25% fee on purchases and redemptions. The fees do not apply to the ETF Shares. The
Fiscal-Year Total Returns chart is not adjusted for fees.
See Financial Highlights for dividend and capital gains information.
31
International High Dividend Yield Index Fund
| Average Annual Total Returns | |||
| Periods Ended October 31, 2018 | |||
| Since | Final Value | ||
| One | Inception | of a $10,000 | |
| Year | (3/2/2016) | Investment | |
| International High Dividend Yield Index Fund | |||
| Admiral Shares | -7.46% | 8.39% | $12,394 |
| FTSE All-World ex US High Dividend Yield | |||
| Index | -6.45 | 9.28 | 12,667 |
"Since Inception" performance is calculated from the Admiral Shares’ inception date for both the fund and its comparative standards.
| Cumulative Returns of ETF Shares: February 25, 2016, Through October 31, 2018 | ||
| Since | ||
| One | Inception | |
| Year | (2/25/2016) | |
| International High Dividend Yield Index Fund ETF | ||
| Shares Market Price | -7.53% | 28.29% |
| International High Dividend Yield Index Fund ETF | ||
| Shares Net Asset Value | -7.03 | 28.61 |
| FTSE All-World ex US High Dividend Yield Index | -6.45 | 31.06 |
"Since Inception" performance is calculated from the ETF Shares’ inception date for both the fund and its comparative standards.
Fiscal-Year Total Returns (%): February 25, 2016, Through October 31, 2018
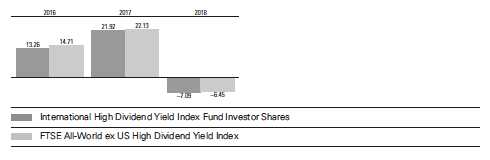
Vanguard fund returns are adjusted to reflect the 0.25% fee on purchases and redemptions. The fees do not apply to the ETF Shares. The Fiscal-Year Total Returns chart is not adjusted for fees.
32
International High Dividend Yield Index Fund
Average Annual Total Returns: Periods Ended September 30, 2018
This table presents returns through the latest calendar quarter—rather than through the end of the fiscal period.
Securities and Exchange Commission rules require that we provide this information.
| Inception | One | Since | |
| Date | Year | Inception | |
| Investor Shares | 2/25/2016 | -0.40% | 12.90% |
| Fee-Adjusted Returns | -0.89 | 12.69 | |
| ETF Shares | 2/25/2016 | ||
| Market Price | -0.77 | 12.96 | |
| Net Asset Value | -0.32 | 13.01 | |
| Admiral Shares | 3/2/2016 | -0.30 | 11.70 |
| Fee-Adjusted Returns | -0.79 | 11.49 |
Vanguard fund returns are adjusted to reflect the 0.25% fee on purchases and redemptions. The fees do not apply to the ETF Shares. The Fiscal-Year Total Returns chart is not adjusted for fees.
33
International High Dividend Yield Index Fund
Financial Statements
Statement of Net Assets
As of October 31, 2018
The fund reports a complete list of its holdings in regulatory filings four times in each fiscal year, at the quarter-ends. For the second and fourth fiscal quarters, the lists appear in the fund’s semiannual and annual reports to shareholders. For the first and third fiscal quarters, the fund files the lists with the Securities and Exchange Commission on Form N-Q. Shareholders can look up the fund’s Forms N-Q on the SEC’s website at sec.gov.
| Market | ||
| Value• | ||
| Shares | ($000) | |
| Common Stocks (99.4%)1 | ||
| Australia (7.5%) | ||
| Commonwealth Bank of | ||
| Australia | 200,682 | 9,868 |
| BHP Billiton Ltd. | 365,508 | 8,434 |
| Westpac Banking Corp. | 389,924 | 7,407 |
| Australia & New Zealand | ||
| Banking Group Ltd. | 330,300 | 6,080 |
| National Australia Bank | ||
| Ltd. | 310,013 | 5,552 |
| Wesfarmers Ltd. | 128,930 | 4,270 |
| Woolworths Group Ltd. | 148,782 | 3,003 |
| Macquarie Group Ltd. | 35,048 | 2,923 |
| Woodside Petroleum Ltd. | 106,050 | 2,611 |
| Rio Tinto Ltd. | 47,209 | 2,569 |
| Transurban Group | 297,642 | 2,394 |
| South32 Ltd. | 581,603 | 1,500 |
| Suncorp Group Ltd. | 146,487 | 1,457 |
| Brambles Ltd. | 183,579 | 1,383 |
| Insurance Australia | ||
| Group Ltd. | 262,420 | 1,269 |
| QBE Insurance Group | ||
| Ltd. | 155,212 | 1,247 |
| Amcor Ltd. | 130,001 | 1,227 |
| Telstra Corp. Ltd. | 469,408 | 1,027 |
| AGL Energy Ltd. | 74,572 | 952 |
| ASX Ltd. | 22,218 | 933 |
| APA Group | 133,848 | 911 |
| LendLease Group | 65,911 | 823 |
| Sonic Healthcare Ltd. | 47,258 | 756 |
| Tabcorp Holdings Ltd. | 217,603 | 714 |
| Aurizon Holdings Ltd. | 212,517 | 633 |
| Medibank Pvt Ltd. | 308,871 | 612 |
| Caltex Australia Ltd. | 30,077 | 602 |
| Sydney Airport | 130,759 | 598 |
| AMP Ltd. | 335,914 | 589 |
| Boral Ltd. | 135,532 | 540 |
| Incitec Pivot Ltd. | 189,722 | 526 | |
| Fortescue Metals | |||
| Group Ltd. | 182,922 | 521 | |
| Alumina Ltd. | 280,718 | 509 | |
| Challenger Ltd. | 67,490 | 492 | |
| Coca-Cola Amatil Ltd. | 61,226 | 431 | |
| Atlas Arteria Ltd. | 81,854 | 396 | |
| Bendigo & Adelaide | |||
| Bank Ltd. | 54,557 | 396 | |
| Crown Resorts Ltd. | 42,578 | 379 | |
| CIMIC Group Ltd. | 10,934 | 367 | |
| Orora Ltd. | 133,607 | 318 | |
| Healthscope Ltd. | 210,515 | 316 | |
| Downer EDI Ltd. | 63,931 | 315 | |
| Bank of Queensland | |||
| Ltd. | 45,692 | 313 | |
| Magellan Financial | |||
| Group Ltd. | 15,872 | 301 | |
| Qantas Airways Ltd. | 76,995 | 299 | |
| Whitehaven Coal Ltd. | 78,116 | 270 | |
| AusNet Services | 221,925 | 269 | |
| DuluxGroup Ltd. | 46,389 | 244 | |
| Adelaide Brighton Ltd. | 54,002 | 217 | |
| Metcash Ltd. | 105,620 | 206 | |
| IOOF Holdings Ltd. | 40,396 | 195 | |
| Sims Metal | |||
| Management Ltd. | 20,257 | 162 | |
| CSR Ltd. | 61,240 | 154 | |
| ^ | Harvey Norman | ||
| Holdings Ltd. | 64,780 | 147 | |
| Fairfax Media Ltd. | 288,531 | 131 | |
| Perpetual Ltd. | 5,110 | 126 | |
| Platinum Asset | |||
| Management Ltd. | 24,430 | 85 | |
| Orica Ltd. | 530 | 6 | |
| 80,975 |
34
International High Dividend Yield Index Fund
| Market | ||
| Value• | ||
| Shares | ($000) | |
| Austria (0.2%) | ||
| Erste Group Bank AG | 32,460 | 1,321 |
| ANDRITZ AG | 7,941 | 411 |
| Vienna Insurance Group | ||
| AG Wiener Versicherung | ||
| Gruppe | 4,048 | 108 |
| 1,840 | ||
| Belgium (1.1%) | ||
| Anheuser-Busch InBev | ||
| SA | 86,437 | 6,393 |
| KBC Group NV | 31,304 | 2,158 |
| Ageas | 21,190 | 1,060 |
| Solvay SA Class A | 8,095 | 922 |
| Groupe Bruxelles | ||
| Lambert SA | 8,435 | 785 |
| Proximus SADP | 15,516 | 395 |
| bpost SA | 10,960 | 166 |
| Telenet Group Holding | ||
| NV | 80 | 4 |
| 11,883 | ||
| Brazil (1.9%) | ||
| Itau Unibanco Holding | ||
| SA ADR | 266,513 | 3,510 |
| Banco Bradesco SA | ||
| ADR | 247,813 | 2,273 |
| Ambev SA ADR | 408,810 | 1,770 |
| Itausa - Investimentos | ||
| Itau SA Preference | ||
| Shares | 499,153 | 1,508 |
| Banco do Brasil SA | 119,190 | 1,369 |
| Banco Bradesco SA | ||
| Preference Shares | 123,929 | 1,142 |
| Itau Unibanco Holding | ||
| SA Preference Shares | 75,120 | 994 |
| Banco Bradesco SA | 111,627 | 907 |
| Ultrapar Participacoes | ||
| SA | 47,700 | 567 |
| Kroton Educacional SA | 169,110 | 519 |
| Telefonica Brasil SA | ||
| ADR | 44,297 | 514 |
| BB Seguridade | ||
| Participacoes SA | 72,000 | 512 |
| Banco Santander | ||
| Brasil SA | 43,300 | 491 |
| Cielo SA | 131,000 | 465 |
| Klabin SA | 82,200 | 412 |
| CCR SA | 128,363 | 378 |
| Ambev SA | 84,100 | 369 |
| Cia de Saneamento | ||
| Basico do Estado de | ||
| Sao Paulo | 43,400 | 326 |
| Cia Energetica de | ||
| Minas Gerais ADR | 91,056 | 264 |
| IRB Brasil Resseguros | 12,800 | 249 | |
| Petrobras Distribuidora | |||
| SA | 37,600 | 242 | |
| Bradespar SA | |||
| Preference Shares | 25,182 | 234 | |
| Cosan SA | 21,700 | 188 | |
| Transmissora Alianca | |||
| de Energia Eletrica SA | 28,000 | 168 | |
| Engie Brasil Energia SA | 15,000 | 160 | |
| Braskem SA Preference | |||
| Shares | 11,200 | 157 | |
| Braskem SA ADR | 5,140 | 143 | |
| Banco do Estado do Rio | |||
| Grande do Sul SA | |||
| Preference Shares | 26,100 | 139 | |
| Qualicorp Consultoria e | |||
| Corretora de Seguros | |||
| SA | 31,900 | 124 | |
| * | Centrais Eletricas | ||
| Brasileiras SA ADR | 17,247 | 121 | |
| Banco BTG Pactual SA | 22,629 | 120 | |
| EDP - Energias do Brasil | |||
| SA | 28,550 | 107 | |
| Cia de Transmissao de | |||
| Energia Eletrica Paulista | |||
| Preference Shares | 5,502 | 97 | |
| Sao Martinho SA | 17,800 | 93 | |
| * | Centrais Eletricas | ||
| Brasileiras SA | |||
| Preference Shares | 11,000 | 79 | |
| Smiles Fidelidade SA | 7,600 | 76 | |
| Cia Paranaense de | |||
| Energia Preference | |||
| Shares | 10,700 | 75 | |
| Telefonica Brasil SA | |||
| Preference Shares | 4,300 | 50 | |
| Cia Energetica de Minas | |||
| Gerais Preference | |||
| Shares | 4,557 | 14 | |
| Cia de Gas de Sao Paulo | |||
| COMGAS Preference | |||
| Shares Class A | 717 | 11 | |
| Cia Paranaense de | |||
| Energia ADR | 996 | 7 | |
| Cia Energetica de | |||
| Minas Gerais | 957 | 3 | |
| 20,947 | |||
| Canada (6.8%) | |||
| Royal Bank of Canada | 164,829 | 12,010 | |
| Toronto-Dominion Bank | 210,481 | 11,676 | |
| Bank of Nova Scotia | 140,390 | 7,534 | |
| Enbridge Inc. | 193,714 | 6,036 | |
| Bank of Montreal | 73,860 | 5,523 | |
35
International High Dividend Yield Index Fund
| Market | |||
| Value• | |||
| Shares | ($000) | ||
| Canadian Imperial Bank | |||
| of Commerce | 50,749 | 4,382 | |
| TransCanada Corp. | 103,845 | 3,916 | |
| Manulife Financial Corp. | 225,297 | 3,548 | |
| Sun Life Financial Inc. | 69,746 | 2,554 | |
| Rogers Communications | |||
| Inc. Class B | 40,481 | 2,085 | |
| Pembina Pipeline Corp. | 56,350 | 1,823 | |
| National Bank of Canada | 39,567 | 1,796 | |
| Fortis Inc. | 47,638 | 1,574 | |
| Thomson Reuters Corp. | 31,550 | 1,468 | |
| BCE Inc. | 33,357 | 1,291 | |
| Shaw Communications | |||
| Inc. Class B | 50,501 | 940 | |
| Power Corp. of Canada | 45,273 | 935 | |
| TELUS Corp. | 22,723 | 778 | |
| Great-West Lifeco Inc. | 31,357 | 720 | |
| Inter Pipeline Ltd. | 43,860 | 711 | |
| Power Financial Corp. | 28,020 | 603 | |
| 2 | Hydro One Ltd. | 37,105 | 540 |
| CI Financial Corp. | 27,994 | 414 | |
| Canadian Utilities Ltd. | |||
| Class A | 13,151 | 312 | |
| IGM Financial Inc. | 8,214 | 202 | |
| 73,371 | |||
| Chile (0.2%) | |||
| Sociedad Quimica y | |||
| Minera de Chile SA | |||
| Preference Shares | |||
| Class B | 11,219 | 484 | |
| Banco Santander Chile | |||
| ADR | 16,188 | 477 | |
| Enel Americas SA ADR | 58,917 | 464 | |
| Banco de Chile | 3,310,706 | 459 | |
| Enel Chile SA | 1,762,793 | 153 | |
| Aguas Andinas SA | |||
| Class A | 268,363 | 140 | |
| Colbun SA | 736,603 | 138 | |
| AES Gener SA | 403,703 | 113 | |
| Enel Chile SA ADR | 21,294 | 92 | |
| Enel Americas SA | 207,067 | 33 | |
| 2,553 | |||
| China (5.4%) | |||
| China Construction | |||
| Bank Corp. | 10,165,000 | 8,066 | |
| Industrial & Commercial | |||
| Bank of China Ltd. | 8,901,000 | 6,039 | |
| China Mobile Ltd. | 601,500 | 5,635 | |
| Bank of China Ltd. | 8,652,000 | 3,686 | |
| CNOOC Ltd. | 1,827,000 | 3,111 | |
| China Petroleum & | |||
| Chemical Corp. | 2,927,000 | 2,384 | |
| China Merchants Bank | |||
| Co. Ltd. | 433,500 | 1,674 | |
| Agricultural Bank of | |||
| China Ltd. | 3,478,000 | 1,531 | |
| China Overseas Land & | |||
| Investment Ltd. | 434,000 | 1,364 | |
| China Pacific Insurance | |||
| Group Co. Ltd. | 298,000 | 1,113 | |
| China Resources Land | |||
| Ltd. | 302,000 | 1,027 | |
| Country Garden | |||
| Holdings Co. Ltd. | 856,000 | 921 | |
| China Shenhua Energy | |||
| Co. Ltd. | 381,000 | 862 | |
| CITIC Ltd. | 552,000 | 829 | |
| China Evergrande Group | 337,000 | 808 | |
| China Telecom Corp. | |||
| Ltd. | 1,602,000 | 758 | |
| PICC Property & | |||
| Casualty Co. Ltd. | 773,000 | 751 | |
| Sunac China Holdings | |||
| Ltd. | 254,000 | 695 | |
| Bank of Communications | |||
| Co. Ltd. | 903,000 | 678 | |
| Hengan International | |||
| Group Co. Ltd. | 84,373 | 671 | |
| Guangdong Investment | |||
| Ltd. | 322,000 | 576 | |
| China CITIC Bank Corp. | |||
| Ltd. | 911,320 | 565 | |
| ANTA Sports Products | |||
| Ltd. | 135,000 | 557 | |
| Lenovo Group Ltd. | 836,000 | 533 | |
| China Minsheng Banking | |||
| Corp. Ltd. | 698,100 | 516 | |
| China Communications | |||
| Construction Co. Ltd. | 523,000 | 480 | |
| China Vanke Co. Ltd. | 146,108 | 451 | |
| Longfor Group Holdings | |||
| Ltd. | 163,000 | 396 | |
| China Resources Power | |||
| Holdings Co. Ltd. | 210,000 | 370 | |
| Guangzhou Automobile | |||
| Group Co. Ltd. | 354,000 | 359 | |
| 2 | Huatai Securities Co. Ltd. | 190,800 | 307 |
| 2 | CGN Power Co. Ltd. | 1,273,000 | 293 |
| China Cinda Asset | |||
| Management Co. Ltd. | 1,159,000 | 285 | |
| China Jinmao Holdings | |||
| Group Ltd. | 630,000 | 265 | |
| Huaneng Power | |||
| International Inc. | 474,000 | 264 | |
| Beijing Enterprises | |||
| Water Group Ltd. | 516,000 | 264 | |
| Shimao Property | |||
| Holdings Ltd. | 133,000 | 262 |
36
International High Dividend Yield Index Fund
| Market | |||
| Value• | |||
| Shares | ($000) | ||
| Zijin Mining Group Co. | |||
| Ltd. | 700,000 | 262 | |
| China Merchants Port | |||
| Holdings Co. Ltd. | 150,000 | 256 | |
| GF Securities Co. Ltd. | 191,000 | 247 | |
| Far East Horizon Ltd. | 247,000 | 240 | |
| Yangzijiang Shipbuilding | |||
| Holdings Ltd. | 256,500 | 230 | |
| China Communications | |||
| Services Corp. Ltd. | 282,000 | 229 | |
| Shenzhen International | |||
| Holdings Ltd. | 115,000 | 220 | |
| Yanzhou Coal Mining | |||
| Co. Ltd. | 228,000 | 217 | |
| China Resources Cement | |||
| Holdings Ltd. | 244,000 | 217 | |
| 2 | China Galaxy Securities | ||
| Co. Ltd. | 421,000 | 212 | |
| Weichai Power Co. Ltd. | 212,000 | 210 | |
| 2 | China Huarong Asset | ||
| Management Co. Ltd. | 1,154,000 | 210 | |
| Great Wall Motor Co. | |||
| Ltd. | 345,000 | 205 | |
| Kingboard Holdings Ltd. | 75,000 | 201 | |
| Agile Group Holdings Ltd. | 170,000 | 195 | |
| COSCO SHIPPING | |||
| Ports Ltd. | 188,000 | 192 | |
| China Everbright Bank | |||
| Co. Ltd. | 407,000 | 182 | |
| Chongqing Rural | |||
| Commercial Bank Co. | |||
| Ltd. | 322,000 | 178 | |
| 2 | Fuyao Glass Industry | ||
| Group Co. Ltd. | 60,000 | 177 | |
| Guangzhou R&F | |||
| Properties Co. Ltd. | 112,000 | 177 | |
| Sinopec Shanghai | |||
| Petrochemical Co. Ltd. | 398,000 | 175 | |
| Jiangsu Expressway | |||
| Co. Ltd. | 130,000 | 174 | |
| 2 | Dali Foods Group Co. | ||
| Ltd. | 243,000 | 174 | |
| China Everbright Ltd. | 96,000 | 170 | |
| Zhejiang Expressway | |||
| Co. Ltd. | 202,000 | 170 | |
| Nine Dragons Paper | |||
| Holdings Ltd. | 174,000 | 167 | |
| 2 | Sinopec Engineering | ||
| Group Co. Ltd. | 169,000 | 157 | |
| CIFI Holdings Group | |||
| Co. Ltd. | 364,000 | 153 | |
| China Reinsurance | |||
| Group Corp. | 755,000 | 145 |
| China State Construction | |||
| International Holdings | |||
| Ltd. | 198,000 | 142 | |
| Sino-Ocean Group | |||
| Holding Ltd. | 356,000 | 140 | |
| Lee & Man Paper | |||
| Manufacturing Ltd. | 155,000 | 133 | |
| 2 | China Merchants | ||
| Securities Co. Ltd. | 111,200 | 126 | |
| * | Country Garden | ||
| Services Holdings Co. | |||
| Ltd. | 95,402 | 124 | |
| China Power International | |||
| Development Ltd. | 611,370 | 121 | |
| Shenzhen Investment | |||
| Ltd. | 414,000 | 119 | |
| Logan Property | |||
| Holdings Co. Ltd. | 128,000 | 119 | |
| Sinotruk Hong Kong Ltd. | 81,000 | 117 | |
| Yuexiu Property Co. Ltd. | 660,000 | 105 | |
| Kingboard Laminates | |||
| Holdings Ltd. | 135,000 | 104 | |
| Shanghai Industrial | |||
| Holdings Ltd. | 49,000 | 103 | |
| 2 | BAIC Motor Corp. Ltd. | 179,000 | 101 |
| KWG Group Holdings | |||
| Ltd. | 128,500 | 99 | |
| Chongqing Changan | |||
| Automobile Co. Ltd. | |||
| Class B | 132,400 | 89 | |
| Metallurgical Corp. of | |||
| China Ltd. | 353,000 | 86 | |
| SOHO China Ltd. | 245,500 | 83 | |
| China Zhongwang | |||
| Holdings Ltd. | 180,400 | 80 | |
| 2 | Red Star Macalline | ||
| Group Corp. Ltd. | 74,757 | 66 | |
| COSCO SHIPPING | |||
| Energy Transportation | |||
| Co. Ltd. | 120,000 | 66 | |
| Yantai Changyu Pioneer | |||
| Wine Co. Ltd. Class B | 30,500 | 65 | |
| China Dongxiang Group | |||
| Co. Ltd. | 419,000 | 65 | |
| Sinotrans Ltd. | 185,000 | 65 | |
| China BlueChemical Ltd. | 176,000 | 60 | |
| Shenzhen Expressway | |||
| Co. Ltd. | 60,000 | 55 | |
| Yanlord Land Group Ltd. | 56,600 | 52 | |
| Huadian Power | |||
| International Corp. Ltd. | 134,000 | 51 | |
| Anhui Expressway Co. | |||
| Ltd. | 74,000 | 43 |
37
International High Dividend Yield Index Fund
| Market | |||
| Value• | |||
| Shares | ($000) | ||
| China Machinery | |||
| Engineering Corp. | 84,000 | 38 | |
| Shanghai Jinjiang | |||
| International Hotels | |||
| Development Co. Ltd. | |||
| Class B | 18,600 | 38 | |
| Sichuan Expressway | |||
| Co. Ltd. | 118,000 | 35 | |
| Huadian Fuxin Energy | |||
| Corp. Ltd. | 190,000 | 34 | |
| China South City | |||
| Holdings Ltd. | 220,000 | 32 | |
| Beijing Jingneng Clean | |||
| Energy Co. Ltd. | 122,000 | 23 | |
| Weifu High-Technology | |||
| Group Co. Ltd. Class B | 5,500 | 10 | |
| Beijing Enterprises | |||
| Holdings Ltd. | 1,000 | 5 | |
| 57,882 | |||
| Colombia (0.1%) | |||
| Ecopetrol SA ADR | 25,178 | 586 | |
| Bancolombia SA ADR | 13,055 | 482 | |
| Grupo Aval Acciones | |||
| y Valores Preference | |||
| Shares | 264,009 | 93 | |
| Ecopetrol SA | 19,170 | 22 | |
| Bancolombia SA | |||
| Preference Shares | 306 | 3 | |
| 1,186 | |||
| Czech Republic (0.1%) | |||
| CEZ AS | 17,909 | 426 | |
| Komercni banka as | 8,279 | 314 | |
| 2 | Moneta Money Bank AS | 61,234 | 203 |
| O2 Czech Republic AS | 5,665 | 60 | |
| Philip Morris CR AS | 74 | 46 | |
| 1,049 | |||
| Denmark (0.3%) | |||
| Danske Bank A/S | 77,093 | 1,476 | |
| Pandora A/S | 11,651 | 728 | |
| ISS A/S | 21,612 | 710 | |
| H Lundbeck A/S | 6,956 | 324 | |
| Tryg A/S | 12,671 | 305 | |
| 3,543 | |||
| Egypt (0.0%) | |||
| ElSewedy Electric Co. | 92,920 | 79 | |
| * | Egyptian Financial | ||
| Group-Hermes | |||
| Holding Co. | 97,887 | 77 | |
| Telecom Egypt Co. | 45,428 | 27 | |
| 183 | |||
| Finland (1.4%) | |||
| Nokia Oyj | 638,432 | 3,606 | |
| Sampo Oyj Class A | 55,585 | 2,556 | |
| Kone Oyj Class B | 44,325 | 2,157 | |
| UPM-Kymmene Oyj | 60,630 | 1,949 | |
| Fortum Oyj | 50,141 | 1,056 | |
| Stora Enso Oyj | 64,670 | 972 | |
| Elisa Oyj | 15,932 | 634 | |
| Nokian Renkaat Oyj | 15,327 | 488 | |
| Kesko Oyj Class B | 7,549 | 441 | |
| Orion Oyj Class B | 11,887 | 409 | |
| Metso Oyj | 11,983 | 378 | |
| 14,646 | |||
| France (6.4%) | |||
| TOTAL SA | 286,344 | 16,801 | |
| Sanofi | 123,566 | 11,042 | |
| BNP Paribas SA | 123,485 | 6,435 | |
| AXA SA | 219,705 | 5,499 | |
| Schneider Electric SE | 58,414 | 4,224 | |
| Orange SA | 218,091 | 3,404 | |
| Societe Generale SA | 82,283 | 3,016 | |
| Engie SA | 186,736 | 2,481 | |
| Cie Generale des | |||
| Etablissements | |||
| Michelin SCA | 20,210 | 2,069 | |
| Credit Agricole SA | 129,535 | 1,659 | |
| Renault SA | 20,823 | 1,555 | |
| Publicis Groupe SA | 24,080 | 1,394 | |
| Carrefour SA | 64,095 | 1,243 | |
| Veolia Environnement | |||
| SA | 57,733 | 1,151 | |
| Edenred | 27,124 | 1,029 | |
| SES SA Class A | 40,524 | 870 | |
| Bouygues SA | 23,127 | 843 | |
| SCOR SE | 17,915 | 828 | |
| Suez | 41,028 | 592 | |
| Natixis SA | 94,756 | 553 | |
| CNP Assurances | 18,914 | 422 | |
| Eutelsat | |||
| Communications SA | 19,373 | 392 | |
| 2 | Amundi SA | 6,549 | 389 |
| Lagardere SCA | 12,770 | 349 | |
| ^ | Casino Guichard | ||
| Perrachon SA | 6,803 | 300 | |
| Societe BIC SA | 2,658 | 254 | |
| 2 | ALD SA | 10,242 | 153 |
| 68,947 | |||
| Germany (5.9%) | |||
| Allianz SE | 48,776 | 10,161 | |
| Siemens AG | 87,428 | 10,050 | |
| BASF SE | 104,250 | 8,000 | |
| Deutsche Telekom AG | 367,120 | 6,022 | |
38
International High Dividend Yield Index Fund
| Market | |||
| Value• | |||
| Shares | ($000) | ||
| Daimler AG | 98,387 | 5,828 | |
| Muenchener | |||
| Rueckversicherungs- | |||
| Gesellschaft AG in | |||
| Muenchen | 17,013 | 3,654 | |
| Deutsche Post AG | 110,602 | 3,492 | |
| Bayerische Motoren | |||
| Werke AG | 36,290 | 3,125 | |
| Vonovia SE | 59,487 | 2,718 | |
| E.ON SE | 247,293 | 2,391 | |
| Porsche Automobil | |||
| Holding SE Preference | |||
| Shares | 17,715 | 1,127 | |
| Hannover Rueck SE | 6,725 | 904 | |
| LEG Immobilien AG | 7,257 | 793 | |
| Uniper SE | 22,238 | 642 | |
| Volkswagen AG | 3,771 | 621 | |
| ProSiebenSat.1 Media | |||
| SE | 26,131 | 603 | |
| Evonik Industries AG | 18,904 | 585 | |
| HUGO BOSS AG | 7,322 | 523 | |
| Bayerische Motoren | |||
| Werke AG Preference | |||
| Shares | 6,492 | 489 | |
| MAN SE | 3,571 | 372 | |
| 2 | Innogy ORD SE | 7,502 | 331 |
| *,§ | Innogy SE | 7,579 | 316 |
| Telefonica Deutschland | |||
| Holding AG | 81,217 | 316 | |
| METRO AG | 19,428 | 292 | |
| RTL Group SA | 4,507 | 289 | |
| 1&1 Drillisch AG | 5,558 | 248 | |
| Talanx AG | 4,238 | 152 | |
| CECONOMY AG | 22,835 | 117 | |
| Deutsche Lufthansa AG | 307 | 6 | |
| Axel Springer SE | 68 | 5 | |
| 64,172 | |||
| Greece (0.1%) | |||
| Hellenic | |||
| Telecommunications | |||
| Organization SA | 27,234 | 303 | |
| OPAP SA | 23,374 | 220 | |
| Motor Oil Hellas Corinth | |||
| Refineries SA | 6,869 | 163 | |
| Hellenic Petroleum SA | 7,538 | 60 | |
| 746 | |||
| Hong Kong (1.6%) | |||
| Sun Hung Kai | |||
| Properties Ltd. | 162,000 | 2,105 | |
| CLP Holdings Ltd. | 187,000 | 2,095 | |
| Hang Seng Bank Ltd. | 83,300 | 1,953 | |
| BOC Hong Kong | |||
| Holdings Ltd. | 411,000 | 1,539 | |
| Sands China Ltd. | 273,200 | 1,080 | |
| Power Assets | |||
| Holdings Ltd. | 151,373 | 1,011 | |
| New World | |||
| Development Co. Ltd. | 625,000 | 795 | |
| 2 | WH Group Ltd. | 967,639 | 680 |
| Swire Pacific Ltd. | |||
| Class A | 58,000 | 603 | |
| Sino Land Co. Ltd. | 334,000 | 525 | |
| CK Infrastructure | |||
| Holdings Ltd. | 71,000 | 520 | |
| Hang Lung Properties | |||
| Ltd. | 232,000 | 421 | |
| Wynn Macau Ltd. | 164,800 | 343 | |
| Hysan Development | |||
| Co. Ltd. | 68,000 | 319 | |
| NWS Holdings Ltd. | 160,000 | 318 | |
| PCCW Ltd. | 443,000 | 243 | |
| Kerry Properties Ltd. | 74,000 | 233 | |
| VTech Holdings Ltd. | 19,700 | 231 | |
| Xinyi Glass Holdings | |||
| Ltd. | 230,000 | 228 | |
| Yue Yuen Industrial | |||
| Holdings Ltd. | 80,500 | 221 | |
| Hopewell Holdings Ltd. | 71,000 | 219 | |
| 2 | BOC Aviation Ltd. | 24,200 | 173 |
| Li & Fung Ltd. | 648,000 | 129 | |
| Chow Tai Fook | |||
| Jewellery Group Ltd. | 135,000 | 118 | |
| Xinyi Solar Holdings Ltd. | 322,800 | 101 | |
| Haitong International | |||
| Securities Group Ltd. | 307,000 | 101 | |
| Lifestyle International | |||
| Holdings Ltd. | 55,000 | 95 | |
| Cafe de Coral Holdings | |||
| Ltd. | 38,000 | 82 | |
| Shun Tak Holdings Ltd. | 236,000 | 76 | |
| SA Sa International | |||
| Holdings Ltd. | 132,000 | 51 | |
| Hopewell Highway | |||
| Infrastructure Ltd. | 93,500 | 49 | |
| Guotai Junan | |||
| International Holdings | |||
| Ltd. | 264,000 | 48 | |
| Television Broadcasts | |||
| Ltd. | 22,000 | 46 | |
| CK Asset Holdings Ltd. | 4,000 | 26 | |
| Want Want China | |||
| Holdings Ltd. | 9,998 | 7 | |
| MTR Corp. Ltd. | 1,000 | 5 | |
| 16,789 |
39
International High Dividend Yield Index Fund
| Market | ||
| Value• | ||
| Shares | ($000) | |
| Hungary (0.1%) | ||
| MOL Hungarian Oil & | ||
| Gas plc | 48,409 | 508 |
| Magyar Telekom | ||
| Telecommunications plc | 49,466 | 67 |
| 575 | ||
| India (0.3%) | ||
| Oil & Natural Gas Corp. | ||
| Ltd. | 355,415 | 736 |
| Coal India Ltd. | 140,843 | 508 |
| Indian Oil Corp. Ltd. | 248,079 | 465 |
| Bharat Petroleum Corp. | ||
| Ltd. | 113,572 | 424 |
| Indiabulls Housing | ||
| Finance Ltd. | 36,738 | 414 |
| Bharti Infratel Ltd. | 98,476 | 358 |
| Hindustan Petroleum | ||
| Corp. Ltd. | 72,539 | 221 |
| NMDC Ltd. | 90,891 | 134 |
| REC Ltd. | 66,805 | 105 |
| Power Finance Corp. | ||
| Ltd. | 73,594 | 95 |
| Oil India Ltd. | 35,390 | 95 |
| NHPC Ltd. | 258,867 | 85 |
| 3,640 | ||
| Indonesia (0.2%) | ||
| Telekomunikasi | ||
| Indonesia Persero | ||
| Tbk PT | 5,387,200 | 1,365 |
| Adaro Energy Tbk PT | 1,596,900 | 173 |
| Bukit Asam Tbk PT | 409,500 | 115 |
| Tower Bersama | ||
| Infrastructure Tbk PT | 262,800 | 81 |
| Matahari Department | ||
| Store Tbk PT | 236,900 | 76 |
| Media Nusantara Citra | ||
| Tbk PT | 477,100 | 24 |
| Indocement Tunggal | ||
| Prakarsa Tbk PT | 2,600 | 3 |
| 1,837 | ||
| Israel (0.3%) | ||
| Bank Leumi Le-Israel | ||
| BM | 173,950 | 1,085 |
| Bank Hapoalim BM | 118,201 | 800 |
| Israel Chemicals Ltd. | 75,608 | 436 |
| Bezeq The Israeli | ||
| Telecommunication | ||
| Corp. Ltd. | 248,345 | 285 |
| Mizrahi Tefahot Bank | ||
| Ltd. | 15,026 | 253 |
| Delek Group Ltd. | 532 | 89 |
| Gazit-Globe Ltd. | 7,951 | 66 |
| * Shikun & Binui Ltd. | 22,868 | 43 |
| 3,057 |
| Italy (2.0%) | |||
| Eni SPA | 285,329 | 5,067 | |
| Enel SPA | 887,813 | 4,353 | |
| Intesa Sanpaolo SPA | |||
| (Registered) | 1,719,661 | 3,809 | |
| Assicurazioni Generali | |||
| SPA | 147,704 | 2,383 | |
| Atlantia SPA | 60,707 | 1,220 | |
| Snam SPA | 257,170 | 1,063 | |
| Terna Rete Elettrica | |||
| Nazionale SPA | 159,808 | 825 | |
| Mediobanca Banca di | |||
| Credito Finanziario SPA | 66,162 | 579 | |
| FinecoBank Banca | |||
| Fineco SPA | 44,405 | 464 | |
| 2 | Poste Italiane SPA | 53,341 | 383 |
| Unione di Banche | |||
| Italiane SPA | 118,808 | 363 | |
| Telecom Italia SPA | |||
| (Bearer) | 688,168 | 348 | |
| A2A SPA | 182,255 | 294 | |
| Italgas SPA | 54,652 | 282 | |
| UnipolSai Assicurazioni | |||
| SPA | 90,991 | 199 | |
| Banca Mediolanum SPA | 26,712 | 155 | |
| UniCredit SPA | 212 | 3 | |
| 21,790 | |||
| Japan (7.8%) | |||
| Toyota Motor Corp. | 288,100 | 16,877 | |
| Sumitomo Mitsui | |||
| Financial Group Inc. | 151,000 | 5,879 | |
| Mizuho Financial Group | |||
| Inc. | 2,904,200 | 4,988 | |
| KDDI Corp. | 202,400 | 4,898 | |
| Mitsubishi Corp. | 146,600 | 4,126 | |
| Tokio Marine Holdings | |||
| Inc. | 77,000 | 3,628 | |
| NTT DOCOMO Inc. | 143,700 | 3,564 | |
| Japan Tobacco Inc. | 135,700 | 3,487 | |
| Canon Inc. | 118,300 | 3,370 | |
| Mitsui & Co. Ltd. | 192,612 | 3,218 | |
| ITOCHU Corp. | 162,100 | 3,006 | |
| JXTG Holdings Inc. | 364,205 | 2,461 | |
| ORIX Corp. | 145,600 | 2,372 | |
| Nissan Motor Co. Ltd. | 216,300 | 1,968 | |
| Sumitomo Corp. | 127,638 | 1,936 | |
| Subaru Corp. | 69,100 | 1,864 | |
| Japan Post Holdings | |||
| Co. Ltd. | 146,552 | 1,738 | |
| MS&AD Insurance | |||
| Group Holdings Inc. | 57,400 | 1,724 | |
| Sumitomo Mitsui Trust | |||
| Holdings Inc. | 43,000 | 1,708 | |
| Marubeni Corp. | 177,800 | 1,442 | |
| Resona Holdings Inc. | 248,600 | 1,308 | |
40
International High Dividend Yield Index Fund
| Market | |||
| Value• | |||
| Shares | ($000) | ||
| Kansai Electric Power | |||
| Co. Inc. | 82,300 | 1,260 | |
| Daito Trust | |||
| Construction Co. Ltd. | 8,400 | 1,107 | |
| Daiwa Securities Group | |||
| Inc. | 177,800 | 1,020 | |
| Sekisui House Ltd. | 65,173 | 956 | |
| SBI Holdings Inc. | 24,900 | 650 | |
| Japan Post Bank Co. | |||
| Ltd. | 48,000 | 560 | |
| Sojitz Corp. | 141,100 | 474 | |
| Aozora Bank Ltd. | 13,700 | 473 | |
| Chugoku Electric | |||
| Power Co. Inc. | 33,573 | 432 | |
| Lawson Inc. | 5,700 | 362 | |
| DIC Corp. | 9,400 | 277 | |
| Sankyo Co. Ltd. | 5,400 | 206 | |
| Miraca Holdings Inc. | 6,600 | 161 | |
| Aoyama Trading Co. | |||
| Ltd. | 5,000 | 151 | |
| Heiwa Corp. | 5,700 | 130 | |
| Matsui Securities Co. | |||
| Ltd. | 12,000 | 122 | |
| Tokai Tokyo Financial | |||
| Holdings Inc. | 22,100 | 114 | |
| Hitachi Capital Corp. | 4,300 | 105 | |
| SKY Perfect JSAT | |||
| Holdings Inc. | 15,500 | 69 | |
| Ricoh Co. Ltd. | 1,000 | 10 | |
| Japan Airlines Co. Ltd. | 200 | 7 | |
| 84,208 | |||
| Malaysia (0.6%) | |||
| Tenaga Nasional Bhd. | 449,033 | 1,578 | |
| Malayan Banking Bhd. | 676,297 | 1,535 | |
| CIMB Group Holdings | |||
| Bhd. | 758,300 | 1,038 | |
| DiGi.Com Bhd. | 401,400 | 414 | |
| Maxis Bhd. | 314,000 | 393 | |
| Petronas Gas Bhd. | 83,900 | 367 | |
| MISC Bhd. | 156,500 | 228 | |
| Sime Darby Bhd. | 404,400 | 213 | |
| AMMB Holdings Bhd. | 208,400 | 189 | |
| YTL Corp. Bhd. | 509,068 | 129 | |
| Alliance Bank Malaysia | |||
| Bhd. | 134,800 | 128 | |
| British American | |||
| Tobacco Malaysia Bhd. | 16,300 | 121 | |
| Westports Holdings Bhd. | 134,900 | 110 | |
| Telekom Malaysia Bhd. | 129,800 | 74 | |
| YTL Power International | |||
| Bhd. | 317,848 | 72 | |
| 2 | Astro Malaysia Holdings | ||
| Bhd. | 162,500 | 52 | |
| 6,641 | |||
| Mexico (0.5%) | |||
| Grupo Financiero | |||
| Banorte SAB de CV | 322,900 | 1,777 | |
| Wal-Mart de Mexico | |||
| SAB de CV | 595,300 | 1,520 | |
| Grupo Mexico SAB de | |||
| CV Class B | 412,100 | 951 | |
| Grupo Aeroportuario | |||
| del Pacifico SAB de | |||
| CV Class B | 42,100 | 348 | |
| Banco Santander | |||
| Mexico SA Institucion | |||
| de Banca Multiple | |||
| Grupo Financiero | |||
| Santand Class B | 177,900 | 222 | |
| Promotora y Operadora | |||
| de Infraestructura SAB | |||
| de CV | 22,275 | 203 | |
| Industrias Penoles SAB | |||
| de CV | 13,990 | 197 | |
| Grupo Aeroportuario | |||
| del Centro Norte SAB | |||
| de CV Class B | 36,400 | 190 | |
| Kimberly-Clark de | |||
| Mexico SAB de CV | |||
| Class A | 90,200 | 130 | |
| * | Alpek SAB de CV | 51,000 | 67 |
| 2 | Nemak SAB de CV | 68,200 | 50 |
| Infraestructura | |||
| Energetica Nova SAB | |||
| de CV | 1,000 | 4 | |
| 5,659 | |||
| Netherlands (2.2%) | |||
| ^ | Unilever NV | 172,296 | 9,259 |
| ING Groep NV | 445,283 | 5,268 | |
| Koninklijke Ahold | |||
| Delhaize NV | 134,387 | 3,076 | |
| NN Group NV | 38,314 | 1,645 | |
| Aegon NV | 197,219 | 1,210 | |
| 2 | ABN AMRO Group NV | 46,934 | 1,151 |
| Koninklijke KPN NV | 381,118 | 1,006 | |
| ASR Nederland NV | 15,559 | 706 | |
| Randstad NV | 12,798 | 644 | |
| 2 | Signify NV | 12,962 | 319 |
| Boskalis Westminster | 150 | 4 | |
| 24,288 | |||
| New Zealand (0.2%) | |||
| Spark New Zealand Ltd. | 205,127 | 530 | |
| Auckland International | |||
| Airport Ltd. | 99,362 | 454 | |
| * | Fletcher Building Ltd. | 97,569 | 386 |
| Meridian Energy Ltd. | 150,765 | 309 | |
| Contact Energy Ltd. | 83,848 | 307 | |
41
International High Dividend Yield Index Fund
| Market | |||
| Value• | |||
| Shares | ($000) | ||
| SKYCITY Entertainment | |||
| Group Ltd. | 80,932 | 203 | |
| Mercury NZ Ltd. | 82,195 | 183 | |
| Air New Zealand Ltd. | 45,430 | 83 | |
| 2,455 | |||
| Norway (0.8%) | |||
| Equinor ASA | 111,250 | 2,878 | |
| DNB ASA | 120,629 | 2,179 | |
| Telenor ASA | 76,451 | 1,402 | |
| Marine Harvest ASA | 46,468 | 1,125 | |
| Orkla ASA | 86,270 | 745 | |
| ^ | Aker BP ASA | 12,657 | 415 |
| Gjensidige Forsikring | |||
| ASA | 19,410 | 300 | |
| 9,044 | |||
| Other (0.0%) 3 | |||
| * | Taishin Financial | ||
| Holding Co. Ltd. Rights | 22,356 | 2 | |
| Pakistan (0.0%) | |||
| Pakistan Petroleum Ltd. | 80,500 | 113 | |
| Oil & Gas Development | |||
| Co. Ltd. | 74,800 | 90 | |
| Habib Bank Ltd. | 71,175 | 78 | |
| Fauji Fertilizer Co. Ltd. | 55,500 | 41 | |
| 322 | |||
| Peru (0.2%) | |||
| Credicorp Ltd. | 7,584 | 1,712 | |
| Philippines (0.1%) | |||
| PLDT Inc. | 13,075 | 337 | |
| Manila Electric Co. | 32,110 | 221 | |
| Globe Telecom Inc. | 3,740 | 146 | |
| DMCI Holdings Inc. | 494,100 | 119 | |
| Aboitiz Power Corp. | 153,300 | 97 | |
| Semirara Mining & | |||
| Power Corp. Class A | 156,320 | 82 | |
| 1,002 | |||
| Poland (0.2%) | |||
| Polski Koncern Naftowy | |||
| ORLEN SA | 35,734 | 859 | |
| Powszechny Zaklad | |||
| Ubezpieczen SA | 65,586 | 668 | |
| Bank Polska Kasa | |||
| Opieki SA | 16,940 | 462 | |
| * | Polskie Gornictwo | ||
| Naftowe i | |||
| Gazownictwo SA | 203,308 | 332 | |
| 2,321 | |||
| Portugal (0.2%) | |||
| Galp Energia SGPS SA | 57,666 | 1,003 | |
| EDP - Energias de | |||
| Portugal SA | 253,906 | 892 | |
| 1,895 | |||
| Qatar (0.6%) | ||
| Qatar National Bank | ||
| QPSC | 50,532 | 2,705 |
| Industries Qatar QSC | 23,287 | 896 |
| Qatar Islamic Bank SAQ | 12,727 | 535 |
| Masraf Al Rayan QSC | 39,823 | 415 |
| Commercial Bank PQSC | 25,061 | 285 |
| Qatar Electricity & | ||
| Water Co. QSC | 5,449 | 281 |
| Barwa Real Estate Co. | 24,142 | 248 |
| Qatar Gas Transport | ||
| Co. Ltd. | 36,009 | 172 |
| Ooredoo QPSC | 8,860 | 168 |
| Qatar Navigation QSC | 5,673 | 111 |
| Doha Bank QPSC | 16,287 | 98 |
| Qatar International | ||
| Islamic Bank QSC | 3,076 | 52 |
| Al Meera Consumer | ||
| Goods Co. QSC | 514 | 21 |
| 5,987 | ||
| Russia (1.7%) | ||
| Lukoil PJSC ADR | 47,593 | 3,548 |
| Sberbank of Russia | ||
| PJSC | 1,111,840 | 3,196 |
| Gazprom PJSC ADR | 500,916 | 2,369 |
| Tatneft PJSC ADR | 28,579 | 2,006 |
| Rosneft Oil Co. PJSC | ||
| GDR | 139,935 | 980 |
| MMC Norilsk Nickel | ||
| PJSC ADR | 39,970 | 662 |
| AK Transneft OAO | ||
| Preference Shares | 189 | 491 |
| Surgutneftegas OAO | ||
| Preference Shares | 847,209 | 489 |
| Gazprom PJSC | 189,225 | 446 |
| LUKOIL PJSC | 5,705 | 428 |
| Mobile TeleSystems | ||
| PJSC ADR | 53,218 | 426 |
| Alrosa PJSC | 278,800 | 423 |
| Severstal PJSC GDR | 21,816 | 339 |
| Magnit PJSC GDR | 22,639 | 302 |
| MMC Norilsk Nickel | ||
| PJSC | 1,589 | 265 |
| Inter RAO UES PJSC | 4,307,000 | 261 |
| Novolipetsk Steel PJSC | 99,520 | 242 |
| Moscow Exchange | ||
| MICEX-RTS PJSC | 174,046 | 232 |
| Sberbank of Russia | ||
| PJSC ADR | 14,446 | 170 |
| Polyus PJSC GDR | 5,173 | 159 |
| Magnitogorsk Iron & | ||
| Steel Works PJSC | 206,300 | 150 |
| Magnit PJSC | 2,613 | 143 |
| PhosAgro PJSC GDR | 10,445 | 136 |
| RusHydro PJSC | 12,696,000 | 106 |
42
International High Dividend Yield Index Fund
| Market | ||
| Value• | ||
| Shares | ($000) | |
| Rostelecom PJSC | 82,370 | 88 |
| Aeroflot PJSC | 44,899 | 66 |
| Tatneft PJSC | 5,360 | 63 |
| Unipro PJSC | 1,488,000 | 61 |
| Tatneft PAO | ||
| Preference Shares | 6,510 | 52 |
| Federal Grid Co. | ||
| Unified Energy | ||
| System PJSC | 19,870,000 | 46 |
| Sistema PJSFC | 270,400 | 32 |
| ROSSETI PJSC | 2,214,653 | 23 |
| Severstal PJSC | 680 | 11 |
| LSR Group PJSC GDR | 1,332 | 2 |
| 18,413 | ||
| Singapore (1.3%) | ||
| DBS Group Holdings | ||
| Ltd. | 205,078 | 3,480 |
| Oversea-Chinese | ||
| Banking Corp. Ltd. | 375,500 | 2,917 |
| United Overseas Bank | ||
| Ltd. | 145,400 | 2,571 |
| Singapore | ||
| Telecommunications | ||
| Ltd. | 856,988 | 1,958 |
| Keppel Corp. Ltd. | 159,200 | 713 |
| Singapore Exchange | ||
| Ltd. | 98,573 | 488 |
| Singapore | ||
| Technologies | ||
| Engineering Ltd. | 170,200 | 437 |
| ComfortDelGro Corp. | ||
| Ltd. | 232,100 | 378 |
| Singapore Press | ||
| Holdings Ltd. | 179,400 | 344 |
| SATS Ltd. | 61,500 | 221 |
| Hutchison Port | ||
| Holdings Trust | 620,700 | 153 |
| Golden Agri-Resources | ||
| Ltd. | 800,100 | 147 |
| StarHub Ltd. | 51,700 | 70 |
| Frasers Property Ltd. | 59,700 | 68 |
| M1 Ltd. | 32,800 | 50 |
| SIA Engineering Co. | ||
| Ltd. | 7,500 | 15 |
| Singapore Airlines Ltd. | 800 | 5 |
| 14,015 | ||
| South Africa (1.4%) | ||
| Sasol Ltd. | 60,097 | 1,964 |
| Standard Bank Group | ||
| Ltd. | 145,780 | 1,615 |
| FirstRand Ltd. | 364,973 | 1,594 |
| MTN Group Ltd. | 203,618 | 1,182 |
| Sanlam Ltd. | 195,859 | 986 |
| Absa Group Ltd. | 78,517 | 793 |
| Nedbank Group Ltd. | 42,355 | 716 | |
| Vodacom Group Ltd. | 70,777 | 597 | |
| RMB Holdings Ltd. | 78,213 | 395 | |
| Woolworths Holdings | |||
| Ltd. | 111,869 | 386 | |
| NEPI Rockcastle plc | 39,788 | 344 | |
| Exxaro Resources Ltd. | 29,241 | 299 | |
| Life Healthcare Group | |||
| Holdings Ltd. | 170,734 | 284 | |
| Truworths | |||
| International Ltd. | 49,402 | 271 | |
| Foschini Group Ltd. | 24,497 | 268 | |
| AVI Ltd. | 39,409 | 267 | |
| Netcare Ltd. | 152,999 | 257 | |
| SPAR Group Ltd. | 19,627 | 234 | |
| Imperial Holdings Ltd. | 20,428 | 227 | |
| Investec Ltd. | 33,891 | 210 | |
| Rand Merchant | |||
| Investment Holdings | |||
| Ltd. | 68,857 | 160 | |
| * | MMI Holdings Ltd. | 126,499 | 153 |
| Sibanye Gold Ltd. | 198,790 | 138 | |
| Kumba Iron Ore Ltd. | 6,718 | 132 | |
| Telkom SA SOC Ltd. | 36,181 | 132 | |
| African Rainbow | |||
| Minerals Ltd. | 14,196 | 120 | |
| Santam Ltd. | 5,630 | 118 | |
| JSE Ltd. | 10,438 | 116 | |
| Liberty Holdings Ltd. | 15,038 | 110 | |
| Coronation Fund | |||
| Managers Ltd. | 31,840 | 106 | |
| Tsogo Sun Holdings | |||
| Ltd. | 69,630 | 96 | |
| Assore Ltd. | 3,910 | 82 | |
| MAS Real Estate Inc. | 48,064 | 69 | |
| Reunert Ltd. | 12,279 | 66 | |
| AECI Ltd. | 8,576 | 55 | |
| Tongaat Hulett Ltd. | 13,671 | 53 | |
| Bidvest Group Ltd. | 518 | 7 | |
| Mr Price Group Ltd. | 373 | 6 | |
| Oceana Group Ltd. | 956 | 6 | |
| Barloworld Ltd. | 374 | 3 | |
| 14,617 | |||
| South Korea (1.3%) | |||
| Samsung Electronics | |||
| Co. Ltd. Preference | |||
| Shares | 93,550 | 2,952 | |
| Shinhan Financial | |||
| Group Co. Ltd. | 51,902 | 1,933 | |
| SK Innovation Co. Ltd. | 6,917 | 1,298 | |
| Hana Financial Group Inc. | 33,933 | 1,143 | |
| KT&G Corp. | 12,607 | 1,124 | |
| Woori Bank | 56,455 | 782 | |
43
International High Dividend Yield Index Fund
| Market | |||
| Value• | |||
| Shares | ($000) | ||
| SK Telecom Co. Ltd. | |||
| ADR | 23,798 | 617 | |
| S-Oil Corp. | 4,545 | 496 | |
| Korea Electric Power | |||
| Corp. ADR | 37,518 | 449 | |
| Industrial Bank of | |||
| Korea | 30,330 | 396 | |
| Coway Co. Ltd. | 6,384 | 394 | |
| DB Insurance Co. Ltd. | 5,195 | 327 | |
| Kangwon Land Inc. | 12,529 | 317 | |
| LG Uplus Corp. | 22,000 | 313 | |
| Hyundai Marine & Fire | |||
| Insurance Co. Ltd. | 7,159 | 263 | |
| Korea Electric Power | |||
| Corp. | 10,962 | 262 | |
| Cheil Worldwide Inc. | 8,268 | 165 | |
| DGB Financial Group | |||
| Inc. | 18,602 | 154 | |
| NH Investment & | |||
| Securities Co. Ltd. | 13,685 | 147 | |
| Samsung Card Co. Ltd. | 3,790 | 112 | |
| Doosan Corp. | 738 | 78 | |
| * | Hyosung TNC Co. Ltd. | 305 | 47 |
| Hyosung Corp. | 973 | 44 | |
| Hite Jinro Co. Ltd. | 3,169 | 44 | |
| * | Hyosung Advanced | ||
| Materials Corp. | 316 | 29 | |
| BGF Co. Ltd. | 4,008 | 26 | |
| * | Hyosung Chemical Corp. | 225 | 26 |
| * | Hyosung Heavy | ||
| Industries Corp. | 657 | 24 | |
| 13,962 | |||
| Spain (3.2%) | |||
| Banco Santander SA | 1,833,056 | 8,722 | |
| Iberdrola SA | 683,141 | 4,834 | |
| Telefonica SA | 517,502 | 4,245 | |
| Banco Bilbao Vizcaya | |||
| Argentaria SA | 757,767 | 4,182 | |
| Repsol SA | 137,988 | 2,466 | |
| CaixaBank SA | 406,426 | 1,645 | |
| Ferrovial SA | 55,382 | 1,109 | |
| ACS Actividades de | |||
| Construccion y | |||
| Servicios SA | 27,784 | 1,040 | |
| Red Electrica Corp. SA | 48,675 | 1,008 | |
| ^ | Naturgy Energy Group | ||
| SA | 35,440 | 871 | |
| Banco de Sabadell SA | 649,448 | 855 | |
| Endesa SA | 36,730 | 768 | |
| Enagas SA | 25,344 | 672 | |
| Bankinter SA | 78,211 | 641 | |
| Bankia SA | 137,920 | 433 | |
| Mapfre SA | 112,789 | 337 | |
| Acerinox SA | 20,094 | 224 | |
| Acciona SA | 2,371 | 200 | |
| Mediaset Espana | |||
| Comunicacion SA | 20,585 | 140 | |
| Zardoya Otis SA | 18,336 | 125 | |
| 34,517 | |||
| Sweden (1.6%) | |||
| Nordea Bank AB | 362,144 | 3,147 | |
| Swedbank AB Class A | 113,964 | 2,564 | |
| Investor AB Class B | 51,737 | 2,242 | |
| Svenska Handelsbanken | |||
| AB Class A | 168,851 | 1,835 | |
| ^ | Hennes & Mauritz AB | ||
| Class B | 100,342 | 1,772 | |
| Skandinaviska Enskilda | |||
| Banken AB Class A | 162,235 | 1,679 | |
| Telia Co. AB | 308,903 | 1,391 | |
| SKF AB | 42,502 | 681 | |
| Skanska AB Class B | 40,548 | 637 | |
| Tele2 AB | 39,249 | 446 | |
| ^ | ICA Gruppen AB | 9,431 | 334 |
| Industrivarden AB | 964 | 20 | |
| Svenska Handelsbanken | |||
| AB Class B | 987 | 11 | |
| Kinnevik AB | 321 | 9 | |
| 16,768 | |||
| Switzerland (9.6%) | |||
| Nestle SA | 343,326 | 28,985 | |
| Novartis AG | 248,111 | 21,728 | |
| Roche Holding AG | 79,432 | 19,331 | |
| UBS Group AG | 400,691 | 5,600 | |
| Zurich Insurance Group | |||
| AG | 17,125 | 5,317 | |
| ABB Ltd. | 203,534 | 4,095 | |
| Credit Suisse Group | |||
| AG | 288,889 | 3,777 | |
| Swiss Re AG | 34,728 | 3,134 | |
| LafargeHolcim Ltd. | 54,262 | 2,513 | |
| Swiss Life Holding AG | 3,912 | 1,476 | |
| SGS SA | 591 | 1,404 | |
| Swisscom AG | 2,899 | 1,327 | |
| Adecco Group AG | 17,153 | 840 | |
| Kuehne & Nagel | |||
| International AG | 5,777 | 803 | |
| Baloise Holding AG | 5,400 | 772 | |
| Swiss Prime Site AG | 8,533 | 692 | |
| Roche Holding AG | |||
| (Bearer) | 2,755 | 671 | |
| Helvetia Holding AG | 795 | 487 | |
| PSP Swiss Property | |||
| AG | 4,521 | 436 | |
| Pargesa Holding SA | 4,161 | 305 | |
| Banque Cantonale | |||
| Vaudoise | 293 | 219 | |
| 103,912 | |||
44
International High Dividend Yield Index Fund
| Market | ||
| Value• | ||
| Shares | ($000) | |
| Taiwan (5.1%) | ||
| Taiwan Semiconductor | ||
| Manufacturing Co. | ||
| Ltd. | 2,736,200 | 20,542 |
| Hon Hai Precision | ||
| Industry Co. Ltd. | 1,360,000 | 3,462 |
| Formosa Plastics Corp. | 556,879 | 1,821 |
| Nan Ya Plastics Corp. | 644,000 | 1,604 |
| Cathay Financial | ||
| Holding Co. Ltd. | 906,908 | 1,440 |
| Formosa Chemicals & | ||
| Fibre Corp. | 392,000 | 1,423 |
| CTBC Financial | ||
| Holding Co. Ltd. | 2,121,120 | 1,420 |
| Uni-President | ||
| Enterprises Corp. | 551,000 | 1,336 |
| Fubon Financial | ||
| Holding Co. Ltd. | 820,000 | 1,287 |
| MediaTek Inc. | 167,000 | 1,234 |
| China Steel Corp. | 1,416,000 | 1,118 |
| Chunghwa Telecom | ||
| Co. Ltd. ADR | 31,323 | 1,099 |
| Delta Electronics Inc. | 244,400 | 1,029 |
| Mega Financial | ||
| Holding Co. Ltd. | 1,206,000 | 1,021 |
| Catcher Technology | ||
| Co. Ltd. | 83,000 | 839 |
| President Chain Store | ||
| Corp. | 67,000 | 758 |
| First Financial Holding | ||
| Co. Ltd. | 1,096,427 | 694 |
| Taiwan Mobile Co. Ltd. | 184,000 | 658 |
| Yuanta Financial | ||
| Holding Co. Ltd. | 1,260,000 | 613 |
| Formosa | ||
| Petrochemical Corp. | 153,000 | 604 |
| Taiwan Cooperative | ||
| Financial Holding Co. | ||
| Ltd. | 1,059,580 | 597 |
| Asustek Computer Inc. | 79,996 | 593 |
| Taiwan Cement Corp. | 514,600 | 578 |
| Hua Nan Financial | ||
| Holdings Co. Ltd. | 927,101 | 524 |
| Taishin Financial | ||
| Holding Co. Ltd. | 1,108,272 | 494 |
| Quanta Computer Inc. | 287,000 | 454 |
| Far Eastern New | ||
| Century Corp. | 448,000 | 451 |
| Far EasTone | ||
| Telecommunications | ||
| Co. Ltd. | 187,000 | 446 |
| United Microelectronics | ||
| Corp. ADR | 232,587 | 437 |
| Chunghwa Telecom | |||
| Co. Ltd. | 120,000 | 424 | |
| Pegatron Corp. | 226,000 | 413 | |
| SinoPac Financial | |||
| Holdings Co. Ltd. | 1,170,641 | 398 | |
| ^ | AU Optronics Corp. | ||
| ADR | 100,000 | 383 | |
| Pou Chen Corp. | 295,000 | 299 | |
| Cheng Shin Rubber | |||
| Industry Co. Ltd. | 204,994 | 289 | |
| Foxconn Technology | |||
| Co. Ltd. | 136,190 | 289 | |
| Novatek | |||
| Microelectronics Corp. | 63,000 | 279 | |
| Compal Electronics Inc. | 497,000 | 275 | |
| Asia Cement Corp. | 256,000 | 271 | |
| Lite-On Technology | |||
| Corp. | 235,194 | 270 | |
| Inventec Corp. | 330,994 | 268 | |
| Eclat Textile Co. Ltd. | 22,200 | 264 | |
| Feng TAY Enterprise | |||
| Co. Ltd. | 40,000 | 241 | |
| ASE Technology | |||
| Holding Co. Ltd. | 119,171 | 240 | |
| Realtek Semiconductor | |||
| Corp. | 51,000 | 205 | |
| Globalwafers Co. Ltd. | 24,000 | 191 | |
| Wistron Corp. | 310,656 | 190 | |
| Vanguard International | |||
| Semiconductor Corp. | 100,000 | 185 | |
| Synnex Technology | |||
| International Corp. | 170,000 | 183 | |
| Nanya Technology | |||
| Corp. | 93,000 | 155 | |
| Formosa Taffeta Co. | |||
| Ltd. | 130,000 | 142 | |
| Chicony Electronics | |||
| Co. Ltd. | 68,370 | 137 | |
| Teco Electric and | |||
| Machinery Co. Ltd. | 211,000 | 121 | |
| Feng Hsin Steel Co. | |||
| Ltd. | 57,000 | 108 | |
| Taiwan Secom Co. Ltd. | 36,000 | 102 | |
| Transcend | |||
| Information Inc. | 34,000 | 71 | |
| United | |||
| Microelectronics Corp. | 166,000 | 63 | |
| Taiwan Semiconductor | |||
| Manufacturing Co. | |||
| Ltd. ADR | 232 | 9 | |
| 55,041 |
45
International High Dividend Yield Index Fund
| Market | ||
| Value• | ||
| Shares | ($000) | |
| Thailand (0.9%) | ||
| PTT PCL | 1,627,100 | 2,502 |
| Siam Cement PCL | ||
| NVDR | 81,800 | 1,033 |
| Siam Commercial | ||
| Bank PCL (Local) | 243,900 | 1,012 |
| Advanced Info Service | ||
| PCL (Local) | 127,320 | 753 |
| PTT Exploration and | ||
| Production PCL (Local) | 159,400 | 668 |
| PTT Global Chemical | ||
| PCL | 234,099 | 547 |
| Krung Thai Bank PCL | 716,200 | 435 |
| Intouch Holdings PCL | 218,000 | 349 |
| Bangkok Bank PCL | ||
| (Foreign) | 53,800 | 344 |
| Charoen Pokphand | ||
| Foods PCL | 432,000 | 329 |
| Thai Oil PCL | 121,000 | 309 |
| Banpu PCL (Local) | 467,250 | 246 |
| IRPC PCL | 1,204,500 | 222 |
| Electricity Generating | ||
| PCL | 29,197 | 204 |
| Siam Cement PCL | ||
| (Foreign) | 14,150 | 179 |
| Thai Union Group PCL | 280,600 | 141 |
| Glow Energy PCL | 52,900 | 134 |
| Delta Electronics | ||
| Thailand PCL | 62,400 | 130 |
| Land & Houses Ord Shs | 410,100 | 128 |
| Ratchaburi Electricity | ||
| Generating Holding | ||
| PCL (Local) | 86,400 | 128 |
| Siam Commercial Bank | ||
| PCL | 30,700 | 127 |
| Land and House Public | ||
| NVDR | 265,200 | 83 |
| Siam City Cement PCL | ||
| (Local) | 9,600 | 70 |
| Banpu PCL | 47,250 | 25 |
| Intouch Holdings PCL - | ||
| NVDR | 10,800 | 17 |
| Siam Cement PCL | 600 | 7 |
| Siam City Cement PCL | ||
| (Foreign) | 532 | 4 |
| 10,126 | ||
| Turkey (0.2%) | ||
| Turkiye Garanti Bankasi | ||
| AS | 247,640 | 312 |
| Tupras Turkiye Petrol | ||
| Rafinerileri AS | 12,777 | 302 |
| Akbank T.A.S. | 245,003 | 290 |
| Turkcell Iletisim | ||
| Hizmetleri AS | 129,340 | 263 |
| Eregli Demir ve Celik | ||
| Fabrikalari TAS | 138,865 | 225 |
| Turkiye Is Bankasi AS | 167,372 | 120 |
| TAV Havalimanlari | ||
| Holding AS | 23,027 | 96 |
| Petkim Petrokimya | ||
| Holding AS | 79,456 | 72 |
| Turkiye Halk Bankasi | ||
| AS | 61,504 | 68 |
| Arcelik AS | 24,011 | 67 |
| Ford Otomotiv Sanayi | ||
| AS | 5,624 | 60 |
| Soda Sanayii AS | 45,670 | 55 |
| Turkiye Sise ve Cam | ||
| Fabrikalari AS | 65,366 | 55 |
| Tofas Turk Otomobil | ||
| Fabrikasi AS | 14,416 | 55 |
| Enka Insaat ve Sanayi | ||
| AS | 42,026 | 35 |
| 2,075 | ||
| United Arab Emirates (0.7%) | ||
| First Abu Dhabi Bank | ||
| PJSC | 1,240,935 | 4,672 |
| Emirates | ||
| Telecommunications | ||
| Group Co. PJSC | 199,236 | 945 |
| Emaar Properties PJSC | 551,276 | 765 |
| Abu Dhabi Commercial | ||
| Bank PJSC | 230,821 | 508 |
| Dubai Islamic Bank | ||
| PJSC | 184,772 | 265 |
| Aldar Properties PJSC | 464,841 | 219 |
| Emaar Malls PJSC | 276,536 | 138 |
| Dubai Investments | ||
| PJSC | 246,435 | 108 |
| DAMAC Properties | ||
| Dubai Co. PJSC | 166,712 | 92 |
| Air Arabia PJSC | 215,052 | 60 |
| Dubai Financial | ||
| Market PJSC | 229,335 | 54 |
| Al Waha Capital PJSC | 92,657 | 47 |
| 7,873 | ||
| United Kingdom (17.0%) | ||
| HSBC Holdings plc | 2,293,241 | 18,872 |
| Royal Dutch Shell plc | ||
| Class A | 587,909 | 18,730 |
| BP plc | 2,225,566 | 16,077 |
| Royal Dutch Shell plc | ||
| Class B | 364,843 | 11,899 |
| British American | ||
| Tobacco plc | 255,851 | 11,091 |
| AstraZeneca plc | 144,493 | 11,052 |
| GlaxoSmithKline plc | 555,438 | 10,758 |
| Unilever plc | 126,670 | 6,710 |
46
International High Dividend Yield Index Fund
| Market | ||
| Value• | ||
| Shares | ($000) | |
| Rio Tinto plc | 130,700 | 6,346 |
| Lloyds Banking | ||
| Group plc | 8,195,413 | 5,981 |
| Vodafone Group plc | 3,053,729 | 5,743 |
| Glencore plc | 1,328,354 | 5,406 |
| BHP Billiton plc | 236,023 | 4,708 |
| National Grid plc | 387,049 | 4,089 |
| Imperial Brands plc | 107,921 | 3,656 |
| BT Group plc | 953,141 | 2,919 |
| Aviva plc | 448,293 | 2,450 |
| BAE Systems plc | 362,540 | 2,431 |
| Anglo American plc | 111,839 | 2,387 |
| Legal & General Group | ||
| plc | 663,569 | 2,129 |
| SSE plc | 115,454 | 1,683 |
| WPP plc | 140,719 | 1,592 |
| Centrica plc | 649,793 | 1,220 |
| Standard Life Aberdeen | ||
| plc | 297,715 | 1,028 |
| Next plc | 15,432 | 1,025 |
| Persimmon plc | 34,692 | 1,015 |
| International | ||
| Consolidated Airlines | ||
| Group SA (London | ||
| Shares) | 114,911 | 886 |
| Randgold Resources | ||
| Ltd. | 10,781 | 848 |
| RSA Insurance Group | ||
| plc | 117,812 | 847 |
| Kingfisher plc | 250,465 | 813 |
| TUI AG | 48,736 | 809 |
| ITV plc | 421,295 | 800 |
| Taylor Wimpey plc | 380,487 | 783 |
| St. James’s Place plc | 60,013 | 776 |
| Micro Focus | ||
| International plc | 48,081 | 745 |
| J Sainsbury plc | 185,803 | 738 |
| Barratt Developments | ||
| plc | 111,420 | 731 |
| DS Smith plc | 144,334 | 724 |
| Marks & Spencer | ||
| Group plc | 186,823 | 707 |
| United Utilities Group | ||
| plc | 76,063 | 705 |
| John Wood Group plc | 75,622 | 689 |
| Direct Line Insurance | ||
| Group plc | 160,518 | 675 |
| Severn Trent plc | 27,447 | 652 |
| Berkeley Group | ||
| Holdings plc | 13,965 | 624 |
| Meggitt plc | 90,617 | 613 |
| Admiral Group plc | 22,337 | 574 |
| Bellway plc | 14,409 | 528 |
| G4S plc | 177,277 | 486 |
| Royal Mail plc | 105,205 | 483 |
| Babcock International | |||
| Group plc | 59,338 | 463 | |
| Tate & Lyle plc | 53,664 | 461 | |
| RPC Group plc | 47,310 | 461 | |
| Pennon Group plc | 48,236 | 460 | |
| Investec plc | 73,438 | 454 | |
| Travis Perkins plc | 29,958 | 423 | |
| Evraz plc | 56,342 | 390 | |
| IMI plc | 30,700 | 389 | |
| easyJet plc | 24,605 | 377 | |
| Inchcape plc | 46,912 | 324 | |
| Inmarsat plc | 51,797 | 301 | |
| William Hill plc | 101,736 | 273 | |
| Polymetal International | |||
| plc | 28,335 | 263 | |
| Dixons Carphone plc | 117,293 | 254 | |
| Ashmore Group plc | 46,413 | 209 | |
| British American | |||
| Tobacco plc ADR | 4,220 | 183 | |
| 2 | Quilter plc | 2,078 | 3 |
| 182,921 | |||
| United States (0.1%) | |||
| ASE Technology | |||
| Holding Co. Ltd. ADR | 152,180 | 583 | |
| Grupo Aval Acciones | |||
| y Valores SA ADR | 7,552 | 53 | |
| 636 | |||
| Total Common Stocks | |||
| (Cost $1,147,274) | 1,072,023 | ||
| Temporary Cash Investments (1.5%)1 | |||
| Money Market Fund (1.4%) | |||
| 4,5 | Vanguard Market | ||
| Liquidity Fund, | |||
| 2.308% | 153,483 | 15,348 | |
| Face | |||
| Amount | |||
| ($000) | |||
| U. S. Government and Agency Obligations (0.1%) | |||
| 6 | United States Treasury | ||
| Bill, 2.078%, 11/15/18 | 310 | 310 | |
| 6 | United States Treasury | ||
| Bill, 2.093%, 12/20/18 | 500 | 498 | |
| 808 | |||
| Total Temporary Cash Investments | |||
| (Cost $16,156) | 16,156 | ||
| Total Investments (100.9%) | |||
| (Cost $1,163,430) | 1,088,179 | ||
47
International High Dividend Yield Index Fund
| Amount | ||
| ($000) | ||
| Other Assets and Liabilities (-0.9%) | ||
| Other Assets | ||
| Investment in Vanguard | 60 | |
| Receivables for Investment Securities Sold | 54 | |
| Receivables for Accrued Income | 3,838 | |
| Receivables for Capital Shares Issued | 95 | |
| Variation Margin Receivable— | ||
| Futures Contracts | 79 | |
| Unrealized Appreciation— | ||
| Forward Currency Contracts | 177 | |
| Other Assets | 471 | |
| Total Other Assets | 4,774 | |
| Liabilities | ||
| Payables for Investment Securities | ||
| Purchased | (53) | |
| Collateral for Securities on Loan | (13,683) | |
| Payables for Capital Shares Redeemed | (110) | |
| Payables to Vanguard | (208) | |
| Unrealized Depreciation— | ||
| Forward Currency Contracts | (297) | |
| Other Liabilities | (25) | |
| Total Liabilities | (14,376) | |
| Net Assets (100%) | 1,078,577 | |
| At October 31, 2018, net assets consisted of: | |
| Amount | |
| ($000) | |
| Paid-in Capital | 1,155,441 |
| Total Distributable Earnings (Loss) | (76,864) |
| Net Assets | 1,078,577 |
| Investor Shares—Net Assets | |
| Applicable to 362,672 outstanding | |
| $.001 par value shares of beneficial | |
| interest (unlimited authorization) | 8,545 |
| Net Asset Value Per Share— | |
| Investor Shares | $23.56 |
| Amount | |
| ($000) | |
| ETF Shares—Net Assets | |
| Applicable to 15,110,515 outstanding | |
| $.001 par value shares of beneficial | |
| interest (unlimited authorization) | 889,314 |
| Net Asset Value Per Share— | |
| ETF Shares | $58.85 |
| Admiral Shares—Net Assets | |
| Applicable to 6,336,058 outstanding | |
| $.001 par value shares of beneficial | |
| interest (unlimited authorization) | 180,718 |
| Net Asset Value Per Share— | |
| Admiral Shares | $28.52 |
• See Note A in Notes to Financial Statements.
^ Includes partial security positions on loan to broker-dealers.
The total value of securities on loan is $12,882,000.
* Non-income-producing security.
§ Security value determined using significant unobservable
inputs.
1 The fund invests a portion of its cash reserves in equity
markets through the use of index futures contracts. After
giving effect to futures investments, the fund’s effective
common stock and temporary cash investment positions
represent 100.0% and 0.9%, respectively, of net assets.
2 Security exempt from registration under Rule 144A of the
Securities Act of 1933. Such securities may be sold in
transactions exempt from registration, normally to qualified
institutional buyers. At October 31, 2018, the aggregate value
of these securities was $6,250,000, representing 0.6% of net
assets.
3 “Other” represents securities that are not classified by the
fund’s benchmark index.
4 Affiliated money market fund available only to Vanguard funds
and certain trusts and accounts managed by Vanguard. Rate
shown is the 7-day yield.
5 Includes $13,683,000 of collateral received for securities
on loan.
6 Securities with a value of $658,000 have been segregated as
initial margin for open futures contracts.
ADR—American Depositary Receipt.
GDR—Global Depositary Receipt.
NVDR—Non-Voting Depository Receipt.
48
| International High Dividend Yield Index Fund | ||||||
| Derivative Financial Instruments Outstanding as of Period End | ||||||
| Futures Contracts | ||||||
| ($000) | ||||||
| Value and | ||||||
| Number of | Unrealized | |||||
| Long (Short) | Notional | Appreciation | ||||
| Expiration | Contracts | Amount | (Depreciation) | |||
| Long Futures Contracts | ||||||
| Dow Jones EURO STOXX 50 Index | December 2018 | 79 | 2,859 | (181) | ||
| E-mini S&P 500 Index | December 2018 | 14 | 1,898 | (123) | ||
| S&P ASX 200 Index | December 2018 | 16 | 1,644 | (113) | ||
| MSCI Emerging Market Index | December 2018 | 12 | 574 | (56) | ||
| (473) | ||||||
| Forward Currency Contracts | ||||||
| Unrealized | ||||||
| Contract | Appreciation | |||||
| Settlement | Contract Amount (000) | (Depreciation) | ||||
| Counterparty | Date | Receive | Deliver | ($000) | ||
| Goldman Sachs International | 12/28/18 | EUR | 3,208 | USD | 3,770 | (116) |
| Barclays Bank plc | 12/28/18 | EUR | 2,628 | USD | 3,114 | (120) |
| BNP Paribas | 12/27/18 | AUD | 2,499 | USD | 1,814 | (43) |
| Goldman Sachs International | 12/27/18 | AUD | 1,357 | USD | 980 | (18) |
| BNP Paribas | 12/28/18 | USD | 3,779 | EUR | 3,184 | 153 |
| BNP Paribas | 12/27/18 | USD | 1,010 | AUD | 1,392 | 24 |
| (120) | ||||||
| AUD—Australian dollar. | ||||||
| EUR—Euro. | ||||||
| USD—U.S. dollar. | ||||||
See accompanying Notes, which are an integral part of the Financial Statements.
49
| International High Dividend Yield Index Fund | |
| Statement of Operations | |
| Year Ended | |
| October 31, 2018 | |
| ($000) | |
| Investment Income | |
| Income | |
| Dividends1 | 46,556 |
| Interest 2 | 82 |
| Securities Lending—Net | 511 |
| Total Income | 47,149 |
| Expenses | |
| The Vanguard Group—Note B | |
| Investment Advisory Services | 162 |
| Management and Administrative—Investor Shares | 34 |
| Management and Administrative—ETF Shares | 2,263 |
| Management and Administrative—Admiral Shares | 512 |
| Marketing and Distribution—Investor Shares | 2 |
| Marketing and Distribution—ETF Shares | 51 |
| Marketing and Distribution—Admiral Shares | 15 |
| Custodian Fees | 356 |
| Auditing Fees | 45 |
| Shareholders’ Reports and Proxy—Investor Shares | 1 |
| Shareholders’ Reports and Proxy—ETF Shares | 40 |
| Shareholders’ Reports and Proxy—Admiral Shares | 3 |
| Trustees’ Fees and Expenses | 1 |
| Total Expenses | 3,485 |
| Expenses Paid Indirectly | (33) |
| Net Expenses | 3,452 |
| Net Investment Income | 43,697 |
| Realized Net Gain (Loss) | |
| Investment Securities Sold 2,3 | 6,053 |
| Futures Contracts | (59) |
| Forward Currency Contracts | (466) |
| Foreign Currencies | (260) |
| Realized Net Gain (Loss) | 5,268 |
| Change in Unrealized Appreciation (Depreciation) | |
| Investment Securities 2 | (142,537) |
| Futures Contracts | (612) |
| Forward Currency Contracts | 15 |
| Foreign Currencies | (73) |
| Change in Unrealized Appreciation (Depreciation) | (143,207) |
| Net Increase (Decrease) in Net Assets Resulting from Operations | (94,242) |
1 Dividends are net of foreign withholding taxes of $4,585,000.
2 Interest income, realized net gain (loss), and change in unrealized appreciation (depreciation) from an affiliated company of the fund
were $54,000, $8,000, and $1,000, respectively. Purchases and sales are for temporary cash investment purposes.
3 Includes $9,896,000 of net gains resulting from in-kind redemptions; such gains are not taxable to the fund.
See accompanying Notes, which are an integral part of the Financial Statements.
50
| International High Dividend Yield Index Fund | ||
| Statement of Changes in Net Assets | ||
| Year Ended October 31, | ||
| 2018 | 2017 | |
| ($000) | ($000) | |
| Increase (Decrease) in Net Assets | ||
| Operations | ||
| Net Investment Income | 43,697 | 16,777 |
| Realized Net Gain (Loss) | 5,268 | 3,108 |
| Change in Unrealized Appreciation (Depreciation) | (143,207) | 62,498 |
| Net Increase (Decrease) in Net Assets Resulting from Operations | (94,242) | 82,383 |
| Distributions | ||
| Net Investment Income | ||
| Investor Shares | (349) | (223) |
| ETF Shares | (33,497) | (11,765) |
| Admiral Shares | (7,177) | (3,905) |
| Realized Capital Gain | ||
| Investor Shares | — | — |
| ETF Shares | — | — |
| Admiral Shares | — | — |
| Total Distributions | (41,023) | (15,893) |
| Capital Share Transactions | ||
| Investor Shares | 834 | 4,675 |
| ETF Shares | 403,658 | 434,547 |
| Admiral Shares | 35,215 | 64,830 |
| Net Increase (Decrease) from Capital Share Transactions | 439,707 | 504,052 |
| Total Increase (Decrease) | 304,442 | 570,542 |
| Net Assets | ||
| Beginning of Period | 774,135 | 203,593 |
| End of Period | 1,078,577 | 774,135 |
See accompanying Notes, which are an integral part of the Financial Statements.
51
| International High Dividend Yield Index Fund | |||
| Financial Highlights | |||
| Investor Shares | |||
| Feb. 25, | |||
| 20161 to | |||
| For a Share Outstanding | Year Ended October 31, | Oct. 31, | |
| Throughout Each Period | 2018 | 2017 | 2016 |
| Net Asset Value, Beginning of Period | $26.29 | $22.24 | $20.00 |
| Investment Operations | |||
| Net Investment Income2 | 1.033 | .947 | .578 |
| Net Realized and Unrealized Gain (Loss) on Investments3 | (2.840) | 3.865 | 2.059 |
| Total from Investment Operations | (1.807) | 4.812 | 2.637 |
| Distributions | |||
| Dividends from Net Investment Income | (.923) | (.762) | (.397) |
| Distributions from Realized Capital Gains | — | — | — |
| Total Distributions | (.923) | (.762) | (.397) |
| Net Asset Value, End of Period | $23.56 | $26.29 | $22.24 |
| Total Return 4 | -7.09%5 | 21.92%5 | 13.26% |
| Ratios/Supplemental Data | |||
| Net Assets, End of Period (Millions) | $9 | $9 | $3 |
| Ratio of Total Expenses to Average Net Assets | 0.42% | 0.42% | 0.42%6,7 |
| Ratio of Net Investment Income to Average Net Assets | 3.96% | 3.63% | 3.55%6 |
| Portfolio Turnover Rate8 | 10% | 8% | 6% |
1 Inception.
2 Calculated based on average shares outstanding.
3 Includes increases from purchase and redemption fees of $.01 for 2018 and $.02 for 2017.
4 Total returns do not include account service fees that may have applied in the periods shown. Fund prospectuses provide
information about any applicable account service fees.
5 Total return does not include transaction fees that may have applied in the period shown. Fund prospectuses provide information
about any applicable transaction fees.
6 Annualized.
7 The ratio of total expenses to average net assets before an expense reimbursement of 0.31% was 0.73%. The expense
reimbursement was due to higher-than-anticipated custody costs associated with a higher volume of securities transactions, which
included transactions from a rebalance of the benchmark index shortly after the fund’s inception. The fund is not obligated to repay
this amount to Vanguard.
8 Excludes the value of portfolio securities received or delivered as a result of in-kind purchases or redemptions of the fund’s capital
shares, including ETF Creation Units.
See accompanying Notes, which are an integral part of the Financial Statements.
52
| International High Dividend Yield Index Fund | |||
| Financial Highlights | |||
| ETF Shares | |||
| Feb. 25, | |||
| 20161 to | |||
| For a Share Outstanding | Year Ended October 31, | Oct. 31, | |
| Throughout Each Period | 2018 | 2017 | 2016 |
| Net Asset Value, Beginning of Period | $65.69 | $55.61 | $50.00 |
| Investment Operations | |||
| Net Investment Income2 | 2.639 | 2.329 | 1.323 |
| Net Realized and Unrealized Gain (Loss) on Investments3 | (7.097) | 9.763 | 5.305 |
| Total from Investment Operations | (4.458) | 12.092 | 6.628 |
| Distributions | |||
| Dividends from Net Investment Income | (2.382) | (2.012) | (1.018) |
| Distributions from Realized Capital Gains | — | — | — |
| Total Distributions | (2.382) | (2.012) | (1.018) |
| Net Asset Value, End of Period | $58.85 | $65.69 | $55.61 |
| Total Return | -7.03% | 22.03% | 13.37% |
| Ratios/Supplemental Data | |||
| Net Assets, End of Period (Millions) | $889 | $598 | $117 |
| Ratio of Total Expenses to Average Net Assets | 0.32% | 0.32% | 0.32%4,5 |
| Ratio of Net Investment Income to Average Net Assets | 4.06% | 3.73% | 3.65%4 |
| Portfolio Turnover Rate6 | 10% | 8% | 6% |
1 Inception.
2 Calculated based on average shares outstanding.
3 Includes increases from purchase and redemption fees of $.02 for 2018 and $.04 for 2017.
4 Annualized.
5 The ratio of total expenses to average net assets before an expense reimbursement of 0.31% was 0.63%. The expense
reimbursement was due to higher-than-anticipated custody costs associated with a higher volume of securities transactions, which
included transactions from a rebalance of the benchmark index shortly after the fund’s inception. The fund is not obligated to repay
this amount to Vanguard.
6 Excludes the value of portfolio securities received or delivered as a result of in-kind purchases or redemptions of the fund’s capital
shares, including ETF Creation Units.
See accompanying Notes, which are an integral part of the Financial Statements.
53
| International High Dividend Yield Index Fund | |||
| Financial Highlights | |||
| Admiral Shares | |||
| March 2, | |||
| 20161 to | |||
| For a Share Outstanding | Year Ended October 31, | Oct. 31, | |
| Throughout Each Period | 2018 | 2017 | 2016 |
| Net Asset Value, Beginning of Period | $31.83 | $26.92 | $25.00 |
| Investment Operations | |||
| Net Investment Income2 | 1.264 | 1.114 | .597 |
| Net Realized and Unrealized Gain (Loss) on Investments3 | (3.423) | 4.743 | 1.817 |
| Total from Investment Operations | (2.159) | 5.857 | 2.414 |
| Distributions | |||
| Dividends from Net Investment Income | (1.151) | (.947) | (.494) |
| Distributions from Realized Capital Gains | — | — | — |
| Total Distributions | (1.151) | (.947) | (.494) |
| Net Asset Value, End of Period | $28.52 | $31.83 | $26.92 |
| Total Return 4 | -7.00%5 | 22.04%5 | 9.73% |
| Ratios/Supplemental Data | |||
| Net Assets, End of Period (Millions) | $181 | $168 | $84 |
| Ratio of Total Expenses to Average Net Assets | 0.32% | 0.32% | 0.32%6,7 |
| Ratio of Net Investment Income to Average Net Assets | 4.06% | 3.73% | 3.65%6 |
| Portfolio Turnover Rate8 | 10% | 8% | 6% |
1 Inception.
2 Calculated based on average shares outstanding.
3 Includes increases from purchase and redemption fees of $.01 for 2018 and $.02 for 2017.
4 Total returns do not include account service fees that may have applied in the periods shown. Fund prospectuses provide
information about any applicable account service fees.
5 Total return does not include transaction fees that may have applied in the period shown. Fund prospectuses provide information
about any applicable transaction fees.
6 Annualized.
7 The ratio of total expenses to average net assets before an expense reimbursement of 0.31% was 0.63%. The expense
reimbursement was due to higher-than-anticipated custody costs associated with a higher volume of securities transactions, which
included transactions from a rebalance of the benchmark index shortly after the fund’s inception. The fund is not obligated to repay
this amount to Vanguard.
8 Excludes the value of portfolio securities received or delivered as a result of in-kind purchases or redemptions of the fund’s capital
shares, including ETF Creation Units.
See accompanying Notes, which are an integral part of the Financial Statements.
54
International High Dividend Yield Index Fund
Notes to Financial Statements
Vanguard International High Dividend Yield Index Fund is registered under the Investment Company Act of 1940 as an open-end investment company, or mutual fund. The fund invests in securities of foreign issuers, which may subject it to investment risks not normally associated with investing in securities of U.S. corporations. The fund offers three classes of shares: Investor Shares, ETF Shares, and Admiral Shares. Investor Shares are available to any investor who meets the fund’s minimum purchase requirements. ETF Shares are listed for trading on Nasdaq; they can be purchased and sold through a broker. Admiral Shares are designed for investors who meet certain administrative, service, and account-size criteria.
A. The following significant accounting policies conform to generally accepted accounting principles for U.S. investment companies. The fund consistently follows such policies in preparing its financial statements.
1. Security Valuation: Securities are valued as of the close of trading on the New York Stock Exchange (generally 4 p.m., Eastern time) on the valuation date. Equity securities are valued at the latest quoted sales prices or official closing prices taken from the primary market in which each security trades; such securities not traded on the valuation date are valued at the mean of the latest quoted bid and asked prices. Securities for which market quotations are not readily available, or whose values have been affected by events occurring before the fund’s pricing time but after the close of the securities’ primary markets, are valued at their fair values calculated according to procedures adopted by the board of trustees. These procedures include obtaining quotations from an independent pricing service, monitoring news to identify significant market- or security-specific events, and evaluating changes in the values of foreign market proxies (for example, ADRs, futures contracts, or exchange-traded funds), between the time the foreign markets close and the fund’s pricing time. When fair-value pricing is employed, the prices of securities used by a fund to calculate its net asset value may differ from quoted or published prices for the same securities. Investments in Vanguard Market Liquidity Fund are valued at that fund’s net asset value. Temporary cash investments are valued using the latest bid prices or using valuations based on a matrix system (which considers such factors as security prices, yields, maturities, and ratings), both as furnished by independent pricing services.
2. Foreign Currency: Securities and other assets and liabilities denominated in foreign currencies are translated into U.S. dollars using exchange rates obtained from an independent third party as of the fund’s pricing time on the valuation date. Realized gains (losses) and unrealized appreciation (depreciation) on investment securities include the effects of changes in exchange rates since the securities were purchased, combined with the effects of changes in security prices. Fluctuations in the value of other assets and liabilities resulting from changes in exchange rates are recorded as unrealized foreign currency gains (losses) until the assets or liabilities are settled in cash, at which time they are recorded as realized foreign currency gains (losses).
3. Futures and Forward Currency Contracts: The fund uses index futures contracts to a limited extent, with the objectives of maintaining full exposure to the stock market, maintaining liquidity, and minimizing transaction costs. The fund may purchase futures contracts to immediately invest incoming cash in the market, or sell futures in response to cash outflows, thereby simulating a fully invested position in the underlying index while maintaining a cash balance for liquidity. The primary risks associated with the use of futures contracts are imperfect correlation between changes in market values of stocks held by the fund and the prices of futures contracts, and the possibility of an illiquid market. Counterparty risk involving futures is mitigated because a regulated clearing-house is the counterparty instead of the clearing broker. To further mitigate counterparty risk, the
55
International High Dividend Yield Index Fund
fund trades futures contracts on an exchange, monitors the financial strength of its clearing brokers and clearinghouse, and has entered into clearing agreements with its clearing brokers. The clearing-house imposes initial margin requirements to secure the fund’s performance and requires daily settlement of variation margin representing changes in the market value of each contract. Any assets pledged as initial margin for open contracts are noted in the Statement of Net Assets.
The fund also enters into forward currency contracts to provide the appropriate currency exposure related to any open futures contracts. The fund’s risks in using these contracts include movement in the values of the foreign currencies relative to the U.S. dollar and the ability of the counterparties to fulfill their obligations under the contracts. The fund mitigates its counterparty risk by entering into forward currency contracts only with a diverse group of prequalified counterparties, monitoring their financial strength, entering into master netting arrangements with its counterparties, and requiring its counterparties to transfer collateral as security for their performance. In the absence of a default, the collateral pledged or received by the fund cannot be repledged, resold, or rehypothecated. The master netting arrangements provide that, in the event of a counterparty’s default (including bankruptcy), the fund may terminate the forward currency contracts, determine the net amount owed by either party in accordance with its master netting arrangements, and sell or retain any collateral held up to the net amount owed to the fund under the master netting arrangements. The forward currency contracts contain provisions whereby a counterparty may terminate open contracts if the fund’s net assets decline below a certain level, triggering a payment by the fund if the fund is in a net liability position at the time of the termination. The payment amount would be reduced by any collateral the fund has pledged. Any assets pledged as collateral for open contracts are noted in the Statement of Net Assets. The value of collateral received or pledged is compared daily to the value of the forward currency contracts exposure with each counterparty, and any difference, if in excess of a specified minimum transfer amount, is adjusted and settled within two business days.
Futures contracts are valued at their quoted daily settlement prices. Forward currency contracts are valued at their quoted daily prices obtained from an independent third party, adjusted for currency risk based on the expiration date of each contract. The notional amounts of the contracts are not recorded in the Statement of Net Assets. Fluctuations in the value of the contracts are recorded in the Statement of Net Assets as an asset (liability) and in the Statement of Operations as unrealized appreciation (depreciation) until the contracts are closed, when they are recorded as realized gains (losses) on futures or forward currency contracts.
During the year ended October 31, 2018, the fund’s average investments in long and short futures contracts represented less than 1% and 0% of net assets, respectively, based on the average of the notional amounts at each quarter-end during the period. The fund’s average investment in forward currency contracts represented 3% of net assets, based on the average of the notional amounts at each quarter-end during the period.
4. Federal Income Taxes: The fund intends to continue to qualify as a regulated investment company and distribute all of its taxable income. Management has analyzed the fund’s tax positions taken for all open federal income tax years (October 31, 2016–2018), and has concluded that no provision for federal income tax is required in the fund’s financial statements.
5. Distributions: Distributions to shareholders are recorded on the ex-dividend date. Distributions are determined on a tax basis and may differ from net investment income and realized capital gains for financial reporting purposes.
56
International High Dividend Yield Index Fund
6. Securities Lending: To earn additional income, the fund lends its securities to qualified institutional borrowers. Security loans are subject to termination by the fund at any time, and are required to be secured at all times by collateral in an amount at least equal to the market value of securities loaned. Daily market fluctuations could cause the value of loaned securities to be more or less than the value of the collateral received. When this occurs, the collateral is adjusted and settled before the opening of the market on the next business day. The fund further mitigates its counterparty risk by entering into securities lending transactions only with a diverse group of prequalified counterparties, monitoring their financial strength, and entering into master securities lending agreements with its counterparties. The master securities lending agreements provide that, in the event of a counterparty’s default (including bankruptcy), the fund may terminate any loans with that borrower, determine the net amount owed, and sell or retain the collateral up to the net amount owed to the fund; however, such actions may be subject to legal proceedings. While collateral mitigates counterparty risk, in the event of a default, the fund may experience delays and costs in recovering the securities loaned. The fund invests cash collateral received in Vanguard Market Liquidity Fund, and records a liability in the Statement of Net Assets for the return of the collateral, during the period the securities are on loan. Securities lending income represents fees charged to borrowers plus income earned on invested cash collateral, less expenses associated with the loan. During the term of the loan, the fund is entitled to all distributions made on or in respect of the loaned securities.
7. Credit Facility: The fund and certain other funds managed by The Vanguard Group (“Vanguard”) participate in a $3.1 billion committed credit facility provided by a syndicate of lenders pursuant to a credit agreement that may be renewed annually; each fund is individually liable for its borrowings, if any, under the credit facility. Borrowings may be utilized for temporary and emergency purposes, and are subject to the fund’s regulatory and contractual borrowing restrictions. The participating funds are charged administrative fees and an annual commitment fee of 0.10% of the undrawn amount of the facility; these fees are allocated to the funds based on a method approved by the fund’s board of trustees and included in Management and Administrative expenses on the fund’s Statement of Operations. Any borrowings under this facility bear interest at a rate based upon the higher of the one-month London Interbank Offered Rate, federal funds effective rate, or overnight bank funding rate plus an agreed-upon spread.
The fund had no borrowings outstanding at October 31, 2018, or at any time during the period then ended.
8. Other: Dividend income is recorded on the ex-dividend date. Interest income includes income distributions received from Vanguard Market Liquidity Fund and is accrued daily. Premiums and discounts on debt securities purchased are amortized and accreted, respectively, to interest income over the lives of the respective securities. Security transactions are accounted for on the date securities are bought or sold. Costs used to determine realized gains (losses) on the sale of investment securities are those of the specific securities sold. Fees assessed on capital share transactions are credited to paid-in capital.
Each class of shares has equal rights as to assets and earnings, except that each class separately bears certain class-specific expenses related to maintenance of shareholder accounts (included in Management and Administrative expenses), shareholder reporting, and the proxy. Marketing and distribution expenses are allocated to each class of shares based on a method approved by the board of trustees. Income, other non-class-specific expenses, and gains and losses on investments are allocated to each class of shares based on its relative net assets.
57
International High Dividend Yield Index Fund
B. In accordance with the terms of a Funds’ Service Agreement (the “FSA”) between Vanguard and the fund, Vanguard furnishes to the fund investment advisory, corporate management, administrative, marketing, and distribution services at Vanguard’s cost of operations (as defined by the FSA). These costs of operations are allocated to the fund based on methods and guidelines approved by the board of trustees. Vanguard does not require reimbursement in the current period for certain costs of operations (such as deferred compensation/benefits and risk/insurance costs); the fund’s liability for these costs of operations is included in Payables to Vanguard on the Statement of Net Assets. All other costs of operations payable to Vanguard are generally settled twice a month.
Upon the request of Vanguard, the fund may invest up to 0.40% of its net assets as capital in Vanguard. At October 31, 2018, the fund had contributed to Vanguard capital in the amount of $60,000, representing 0.01% of the fund’s net assets and 0.02% of Vanguard’s capitalization. The fund’s trustees and officers are also directors and employees, respectively, of Vanguard.
C. The fund’s custodian bank has agreed to reduce its fees when the fund maintains cash on deposit in the non-interest-bearing custody account. For the year ended October 31, 2018, custodian fee offset arrangements reduced the fund’s expenses by $33,000 (an annual rate of 0.00% of average net assets).
D. Various inputs may be used to determine the value of the fund’s investments. These inputs are summarized in three broad levels for financial statement purposes. The inputs or methodologies used to value securities are not necessarily an indication of the risk associated with investing in those securities.
Level 1—Quoted prices in active markets for identical securities.
Level 2—Other significant observable inputs (including quoted prices for similar securities, interest rates, prepayment speeds, credit risk, etc.).
Level 3—Significant unobservable inputs (including the fund’s own assumptions used to determine the fair value of investments). Any investments valued with significant unobservable inputs are noted on the Statement of Net Assets.
The following table summarizes the market value of the fund’s investments as of October 31, 2018, based on the inputs used to value them:
| Level 1 | Level 2 | Level 3 | |
| Investments | ($000) | ($000) | ($000) |
| Common Stocks—North and South America | 106,064 | — | — |
| Common Stocks—Other | 3,603 | 962,040 | 316 |
| Temporary Cash Investments | 15,348 | 808 | — |
| Futures Contracts—Assets1 | 79 | — | — |
| Forward Currency Contracts—Assets | — | 177 | — |
| Forward Currency Contracts—Liabilities | — | (297) | — |
| Total | 125,094 | 962,728 | 316 |
| 1 Represents variation margin on the last day of the reporting period. |
58
International High Dividend Yield Index Fund
E. At October 31, 2018, the fair values of derivatives were reflected in the Statement of Net Assets as follows:
| Foreign | |||
| Equity | Exchange | ||
| Contracts | Contracts | Total | |
| Statement of Net Assets Caption | ($000) | ($000) | ($000) |
| Variation Margin Receivable—Futures Contracts | 79 | — | 79 |
| Unrealized Appreciation—Forward Currency Contracts | — | 177 | 177 |
| Total Assets | 79 | 177 | 256 |
| Unrealized Depreciation—Forward Currency Contracts | — | (297) | (297) |
Realized net gain (loss) and the change in unrealized appreciation (depreciation) on derivatives for the year ended October 31, 2018, were:
| Foreign | |||
| Equity | Exchange | ||
| Contracts | Contracts | Total | |
| Realized Net Gain (Loss) on Derivatives | ($000) | ($000) | ($000) |
| Futures Contracts | (59) | — | (59) |
| Forward Currency Contracts | — | (466) | (466) |
| Realized Net Gain (Loss) on Derivatives | (59) | (466) | (525) |
| Change in Unrealized Appreciation (Depreciation) on Derivatives | |||
| Futures Contracts | (612) | — | (612) |
| Forward Currency Contracts | — | 15 | 15 |
| Change in Unrealized Appreciation (Depreciation) on Derivatives | (612) | 15 | (597) |
F. Permanent differences between book-basis and tax-basis components of net assets are reclassified among capital accounts in the financial statements to reflect their tax character. These reclassifications have no effect on net assets or net asset value per share. As of period end, the following permanent differences primarily attributable to the accounting for in-kind redemptions, foreign currency transactions, passive foreign investment companies, and tax expense on capital gains were reclassified to the following accounts:
| Amount | |
| ($000) | |
| Paid-in Capital | 9,836 |
| Total Distributable Earnings (Loss) | (9,836) |
59
International High Dividend Yield Index Fund
Temporary differences between book-basis and tax-basis components of total distributable earnings (loss) arise when certain items of income, gain, or loss are recognized in different periods for financial statement and tax purposes; these differences will reverse at some time in the future. The differences are primarily related to the tax deferral of losses on wash sales, the realization of unrealized gains or losses on certain futures contracts, forward currency contracts, and unrealized gains on passive foreign investment companies. As of period end, the tax-basis components of total distributable earnings (loss) are detailed in the table as follows:
| Amount | |
| ($000) | |
| Undistributed Ordinary Income | 4,752 |
| Undistributed Long-Term Gains | — |
| Capital Loss Carryforwards (Non-expiring) | (5,468) |
| Net Unrealized Gains (Losses) | (76,122) |
As of October 31, 2018, gross unrealized appreciation and depreciation for investments and derivatives based on cost for U.S. federal income tax purposes were as follows:
| Amount | |
| ($000) | |
| Tax Cost | 1,164,122 |
| Gross Unrealized Appreciation | 52,928 |
| Gross Unrealized Depreciation | (128,984) |
| Net Unrealized Appreciation (Depreciation) | (76,056) |
G. During the year ended October 31, 2018, the fund purchased $594,307,000 of investment securities and sold $151,365,000 of investment securities, other than temporary cash investments. Purchases and sales include $370,138,000 and $50,274,000, respectively, in connection with in-kind purchases and redemptions of the fund’s capital shares.
60
International High Dividend Yield Index Fund
| H. Capital share transactions for each class of shares were: | ||||
| Year Ended October 31, | ||||
| 2018 | 2017 | |||
| Amount | Shares | Amount | Shares | |
| ($000) | (000) | ($000) | (000) | |
| Investor Shares | ||||
| Issued1 | 7,139 | 269 | 13,201 | 550 |
| Issued in Lieu of Cash Distributions | 323 | 13 | 208 | 8 |
| Redeemed 2 | (6,628) | (256) | (8,734) | (355) |
| Net Increase (Decrease)—Investor Shares | 834 | 26 | 4,675 | 203 |
| ETF Shares | ||||
| Issued1 | 461,728 | 6,912 | 452,772 | 7,299 |
| Issued in Lieu of Cash Distributions | — | — | — | — |
| Redeemed 2 | (58,070) | (900) | (18,225) | (300) |
| Net Increase (Decrease)—ETF Shares | 403,658 | 6,012 | 434,547 | 6,999 |
| Admiral Shares | ||||
| Issued1 | 79,430 | 2,484 | 95,890 | 3,234 |
| Issued in Lieu of Cash Distributions | 6,055 | 197 | 3,367 | 112 |
| Redeemed 2 | (50,270) | (1,611) | (34,427) | (1,195) |
| Net Increase (Decrease)—Admiral Shares | 35,215 | 1,070 | 64,830 | 2,151 |
1 Includes purchase fees for fiscal 2018 and 2017 of $212,00 and $265,000, respectively (fund totals).
2 Net of redemption fees for fiscal 2018 and 2017 of $124,000 and $24,000, respectively (fund totals).
I. Management has determined that no events or transactions occurred subsequent to October 31, 2018, that would require recognition or disclosure in these financial statements.
61
Report of Independent Registered Public Accounting Firm
To the Board of Trustees of Vanguard Whitehall Funds and Shareholders of Vanguard International Dividend Appreciation Index Fund and Vanguard International High Dividend Yield Index Fund
Opinions on the Financial Statements
We have audited the accompanying statements of net assets of Vanguard International Dividend Appreciation Index Fund and Vanguard International High Dividend Yield Index Fund (two of the funds constituting Vanguard Whitehall Funds, hereafter collectively referred to as the “Funds”) as of October 31, 2018, the related statements of operations for the year ended October 31, 2018, the statements of changes in net assets for each of the two years in the period ended October 31, 2018, including the related notes, and the financial highlights for each of the periods indicated therein (collectively referred to as the “financial statements”). In our opinion, the financial statements present fairly, in all material respects, the financial position of each of the Funds as of October 31, 2018, the results of each of their operations for the year then ended, the changes in each of their net assets for each of the two years in the period ended October 31, 2018 and each of the financial highlights for each of the periods indicated therein in conformity with accounting principles generally accepted in the United States of America.
Basis for Opinions
These financial statements are the responsibility of the Funds’ management. Our responsibility is to express an opinion on the Funds’ financial statements based on our audits. We are a public accounting firm registered with the Public Company Accounting Oversight Board (United States) (“PCAOB”) and are required to be independent with respect to the Funds in accordance with the U.S. federal securities laws and the applicable rules and regulations of the Securities and Exchange Commission and the PCAOB.
We conducted our audits of these financial statements in accordance with the standards of the PCAOB. Those standards require that we plan and perform the audit to obtain reasonable assurance about whether the financial statements are free of material misstatement, whether due to error or fraud.
Our audits included performing procedures to assess the risks of material misstatement of the financial statements, whether due to error or fraud, and performing procedures that respond to those risks. Such procedures included examining, on a test basis, evidence regarding the amounts and disclosures in the financial statements. Our audits also included evaluating the accounting principles used and significant estimates made by management, as well as evaluating the overall presentation of the financial statements. Our procedures included confirmation of securities owned as of October 31, 2018 by correspondence with the custodian and brokers and by agreement to the underlying ownership records of the transfer agent; when replies were not received from brokers, we performed other auditing procedures. We believe that our audits provide a reasonable basis for our opinions.
/s/PricewaterhouseCoopers LLP
Philadelphia, Pennsylvania
December 13, 2018
We have served as the auditor of one or more investment companies in The Vanguard Group of Funds since 1975.
62
Special 2018 tax information (unaudited) for Vanguard International Dividend Appreciation Index Fund
This information for the fiscal year ended October 31, 2018, is included pursuant to provisions of the Internal Revenue Code.
The fund distributed $15,982,000 of qualified dividend income to shareholders during the fiscal year.
The fund designates to shareholders foreign source income of $18,084,000 and foreign taxes paid of $1,932,000. Shareholders will receive more detailed information with their Form 1099-DIV in January 2019 to determine the calendar-year amounts to be included on their 2018 tax returns.
Special 2018 tax information (unaudited) for Vanguard International High Dividend Yield Index Fund
This information for the fiscal year ended October 31, 2018, is included pursuant to provisions of the Internal Revenue Code.
The fund distributed $27,523,000 of qualified dividend income to shareholders during the fiscal year.
The fund designates to shareholders foreign source income of $35,029,000 and foreign taxes paid of $3,188,000. Shareholders will receive more detailed information with their Form 1099-DIV in January 2019 to determine the calendar-year amounts to be included on their 2018 tax returns.
63
Your Fund’s After-Tax Returns
This table presents returns for your fund both before and after taxes. The after-tax returns are shown in two ways: (1) assuming that an investor owned the fund during the entire period and paid taxes on the fund’s distributions, and (2) assuming that an investor paid taxes on the fund’s distributions and sold all shares at the end of each period.
Calculations are based on the highest individual federal income tax and capital gains tax rates in effect at the times of the distributions and the hypothetical sales. State and local taxes were not considered. After-tax returns reflect any qualified dividend income, using actual prior-year figures and estimates for 2018. (In the example, returns after the sale of fund shares may be higher than those assuming no sale. This occurs when the sale would have produced a capital loss. The calculation assumes that the investor received a tax deduction for the loss.)
The table shows returns for Investor Shares only; returns for other share classes will differ. Please note that your actual after-tax returns will depend on your tax situation and may differ from those shown. Also note that if you own the fund in a tax-deferred account, such as an individual retirement account or a 401(k) plan, this information does not apply to you. Such accounts are not subject to current taxes.
Finally, keep in mind that a fund’s performance—whether before or after taxes—does not guarantee future results.
| Average Annual Total Returns: International Dividend Index Funds | ||
| Periods Ended October 31, 2018 | ||
| Since | ||
| One | Inception | |
| Year | (2/25/2016) | |
| International Dividend Appreciation Index Fund Investor Shares | ||
| Returns Before Taxes | -7.13% | 7.76% |
| Returns After Taxes on Distributions | -8.01 | 7.16 |
| Returns After Taxes on Distributions and Sale of | ||
| Fund Shares | -4.22 | 5.83 |
| Since | ||
| One | Inception | |
| Year | (2/25/2016) | |
| International High Dividend Yield Index Fund Investor Shares | ||
| Returns Before Taxes | -7.09% | 9.74% |
| Returns After Taxes on Distributions | -8.51 | 8.61 |
| Returns After Taxes on Distributions and Sale of | ||
| Fund Shares | -4.01 | 7.28 |
Vanguard fund returns are adjusted to reflect the 0.25% fee on purchases and redemptions.
64
About Your Fund’s Expenses
As a shareholder of the fund, you incur ongoing costs, which include costs for portfolio management, administrative services, and shareholder reports (like this one), among others. Operating expenses, which are deducted from a fund’s gross income, directly reduce the investment return of the fund.
A fund’s expenses are expressed as a percentage of its average net assets. This figure is known as the expense ratio. The following examples are intended to help you understand the ongoing costs (in dollars) of investing in your fund and to compare these costs with those of other mutual funds. The examples are based on an investment of $1,000 made at the beginning of the period shown and held for the entire period.
The accompanying table illustrates your fund’s costs in two ways:
• Based on actual fund return. This section helps you to estimate the actual expenses that you paid over the period. The ”Ending Account Value“ shown is derived from the fund‘s actual return, and the third column shows the dollar amount that would have been paid by an investor who started with $1,000 in the fund. You may use the information here, together with the amount you invested, to estimate the expenses that you paid over the period.
To do so, simply divide your account value by $1,000 (for example, an $8,600 account value divided by $1,000 = 8.6), then multiply the result by the number given for your fund under the heading ”Expenses Paid During Period.“
• Based on hypothetical 5% yearly return. This section is intended to help you compare your fund‘s costs with those of other mutual funds. It assumes that the fund had a yearly return of 5% before expenses, but that the expense ratio is unchanged. In this case—because the return used is not the fund’s actual return—the results do not apply to your investment. The example is useful in making comparisons because the Securities and Exchange Commission requires all mutual funds to calculate expenses based on a 5% return. You can assess your fund’s costs by comparing this hypothetical example with the hypothetical examples that appear in shareholder reports of other funds.
Note that the expenses shown in the table are meant to highlight and help you compare ongoing costs only and do not reflect transaction costs incurred by the fund for buying and selling securities. Further, the expenses do not include any purchase, redemption, or account service fees described in the fund prospectus. If such fees were applied to your account, your costs would be higher. Your fund does not carry a “sales load.”
The calculations assume no shares were bought or sold during the period. Your actual costs may have been higher or lower, depending on the amount of your investment and the timing of any purchases or redemptions.
You can find more information about the fund’s expenses, including annual expense ratios, in the Financial Statements section of this report. For additional information on operating expenses and other shareholder costs, please refer to your fund’s current prospectus.
65
| Six Months Ended October 31, 2018 | |||
| Beginning | Ending | Expenses | |
| Account Value | Account Value | Paid During | |
| 4/30/2018 | 10/31/2018 | Period | |
| Based on Actual Fund Return | |||
| International Dividend Appreciation Index Fund | |||
| Investor Shares | $1,000.00 | $907.75 | $1.68 |
| ETF Shares | 1,000.00 | 908.09 | 1.20 |
| Admiral Shares | 1,000.00 | 908.06 | 1.20 |
| International High Dividend Yield Index Fund | |||
| Investor Shares | $1,000.00 | $906.56 | $2.02 |
| ETF Shares | 1,000.00 | 902.54 | 1.53 |
| Admiral Shares | 1,000.00 | 906.87 | 1.54 |
| Based on Hypothetical 5% Yearly Return | |||
| International Dividend Appreciation Index Fund | |||
| Investor Shares | $1,000.00 | $1,023.44 | $1.79 |
| ETF Shares | 1,000.00 | 1,023.95 | 1.28 |
| Admiral Shares | 1,000.00 | 1,023.95 | 1.28 |
| International High Dividend Yield Index Fund | |||
| Investor Shares | $1,000.00 | $1,023.09 | $2.14 |
| ETF Shares | 1,000.00 | 1,023.59 | 1.63 |
| Admiral Shares | 1,000.00 | 1,023.59 | 1.63 |
The calculations are based on expenses incurred in the most recent six-month period. The funds’ annualized six-month expense ratios for that period are: for the International Dividend Appreciation Index Fund, 0.35% for Investor Shares, 0.25% for ETF Shares, and 0.25% for Admiral Shares; and for the International High Dividend Yield Index Fund, 0.42% for Investor Shares, 0.32% for ETF Shares, and 0.32% for Admiral Shares. The dollar amounts shown as “Expenses Paid” are equal to the annualized expense ratio multiplied by the average account value over the period, multiplied by the number of days in the six-month period, then divided by the number of days in the most recent 12-month period (184/365).
66
Glossary
Dividend Yield. Dividend income earned by stocks, expressed as a percentage of the aggregate market value (or of net asset value, for a fund). The yield is determined by dividing the amount of the annual dividends by the aggregate value (or net asset value) at the end of the period. For a fund, the dividend yield is based solely on stock holdings and does not include any income produced by other investments.
Earnings Growth Rate. The average annual rate of growth in earnings over the past five years for the stocks now in a fund.
Equity Exposure. A measure that reflects a fund’s investments in stocks and stock futures. Any holdings in short-term reserves are excluded.
Expense Ratio. A fund’s total annual operating expenses expressed as a percentage of the fund’s average net assets. The expense ratio includes management and administrative expenses, but does not include the transaction costs of buying and selling portfolio securities.
Fair-Value Pricing. Fair-value adjustments, which are required by the Securities and Exchange Commission, address pricing discrepancies that may arise because of time-zone differences among global stock markets. Foreign stocks may trade on exchanges that close many hours before a fund’s closing share price is calculated in the United States, generally at 4 p.m., Eastern time. In the hours between the foreign close and the U.S. close, the value of these foreign securities may change—because of company-specific announcements or market-wide developments, for example. Such price changes are not immediately reflected in international index values. Fair-value pricing takes such changes into account in calculating the fund’s daily net asset value, thus ensuring that the NAV doesn’t include “stale” prices. The result can be a temporary divergence between the return of the fund and that of its benchmark index—a difference that usually corrects itself when the foreign markets reopen.
Inception Date. The date on which the assets of a fund (or one of its share classes) are first invested in accordance with the fund’s investment objective. For funds with a subscription period, the inception date is the day after that period ends. Investment performance is measured from the inception date.
Median Market Cap. An indicator of the size of companies in which a fund invests; the midpoint of market capitalization (market price x shares outstanding) of a fund’s stocks, weighted by the proportion of the fund’s assets invested in each stock. Stocks representing half of the fund’s assets have market capitalizations above the median, and the rest are below it.
Price/Book Ratio. The share price of a stock divided by its net worth, or book value, per share. For a fund, the weighted average price/book ratio of the stocks it holds.
Price/Earnings Ratio. The ratio of a stock’s current price to its per-share earnings over the past year. For a fund, the weighted average P/E of the stocks it holds. P/E is an indicator of market expectations about corporate prospects; the higher the P/E, the greater the expectations for a company’s future growth.
Return on Equity. The annual average rate of return generated by a company during the past five years for each dollar of shareholder’s equity (net income divided by shareholder’s equity). For a fund, the weighted average return on equity for the companies whose stocks it holds.
67
Short-Term Reserves. The percentage of a fund invested in highly liquid, short-term securities that can be readily converted to cash.
Turnover Rate. An indication of the fund’s trading activity. Funds with high turnover rates incur higher transaction costs and may be more likely to distribute capital gains (which may be taxable to investors). The turnover rate excludes in-kind transactions, which have minimal impact on costs.
68
This page intentionally left blank.
This page intentionally left blank.
The People Who Govern Your Fund
The trustees of your mutual fund are there to see that the fund is operated and managed in your best interests since, as a shareholder, you are a part owner of the fund. Your fund’s trustees also serve on the board of directors of The Vanguard Group, Inc., which is owned by the Vanguard funds and provides services to them on an at-cost basis.
A majority of Vanguard’s board members are independent, meaning that they have no affiliation with Vanguard or the funds they oversee, apart from the sizable personal investments they have made as private individuals. The independent board members have distinguished backgrounds in business, academia, and public service. Each of the trustees and executive officers oversees 211 Vanguard funds.
Information for each trustee and executive officer of the fund appears below. The mailing address of the trustees and officers is P.O. Box 876, Valley Forge, PA 19482. More information about the trustees is in the Statement of Additional Information, which can be obtained, without charge, by contacting Vanguard at 800-662-7447, or online at vanguard.com.
Interested Trustees1
F. William McNabb III
Born in 1957. Trustee since July 2009. Principal occupation(s) during the past five years and other experience: chairman of the board (January 2010–present) of Vanguard and of each of the investment companies served by Vanguard, trustee (2009–present) of each of the investment companies served by Vanguard, and director (2008–present) of Vanguard. Chief executive officer and president (2008–2017) of Vanguard and each of the investment companies served by Vanguard, managing director (1995–2008) of Vanguard, and director (1997–2018) of Vanguard Marketing Corporation. Director (2018–present) of UnitedHealth Group.
Mortimer J. Buckley
Born in 1969. Trustee since January 2018. Principal occupation(s) during the past five years and other experience: chief executive officer (January 2018–present) of Vanguard; chief executive officer, president, and trustee (January 2018–present) of each of the investment companies served by Vanguard; president and director (2017–present) of Vanguard; and president (February 2018–present) of Vanguard Marketing Corporation. Chief investment officer (2013–2017), managing director (2002–2017), head of the Retail Investor Group (2006–2012), and chief information officer (2001–2006) of Vanguard. Chairman of the board (2011–2017) of the Children’s Hospital of Philadelphia.
Independent Trustees
Emerson U. Fullwood
Born in 1948. Trustee since January 2008. Principal occupation(s) during the past five years and other experience: executive chief staff and marketing officer for North America and corporate vice president (retired 2008) of Xerox Corporation (document management products and services). Former president of the Worldwide Channels Group, Latin America, and Worldwide Customer Service and executive chief staff officer of Developing Markets of Xerox. Executive in residence and 2009–2010 Distinguished Minett Professor at the Rochester Institute of Technology. Lead director of SPX FLOW, Inc. (multi-industry manufacturing). Director of the University of Rochester Medical Center, the Monroe Community College Foundation, the United Way of Rochester, North Carolina A&T University, and Roberts Wesleyan College. Trustee of the University of Rochester.
Amy Gutmann
Born in 1949. Trustee since June 2006. Principal occupation(s) during the past five years and other experience: president (2004–present) of the University of Pennsylvania. Christopher H. Browne Distinguished Professor of Political Science, School of Arts and Sciences, and professor of communication, Annenberg School for Communication, with secondary faculty appointments in the Department of Philosophy, School of Arts and Sciences, and at the Graduate School of Education, University of Pennsylvania. Trustee of the National Constitution Center.
1 Mr. McNabb and Mr. Buckley are considered “interested persons,” as defined in the Investment Company Act of 1940, because they are officers of the Vanguard funds.
JoAnn Heffernan Heisen
Born in 1950. Trustee since July 1998. Principal occupation(s) during the past five years and other experience: corporate vice president of Johnson & Johnson (pharmaceuticals/medical devices/consumer products) and member of its executive committee (1997–2008). Chief global diversity officer (retired 2008), vice president and chief information officer (1997–2006), controller (1995–1997), treasurer (1991–1995), and assistant treasurer (1989–1991) of Johnson & Johnson. Director of Skytop Lodge Corporation (hotels) and the Robert Wood Johnson Foundation. Member of the advisory board of the Institute for Women’s Leadership at Rutgers University.
F. Joseph Loughrey
Born in 1949. Trustee since October 2009. Principal occupation(s) during the past five years and other experience: president and chief operating officer (retired 2009) and vice chairman of the board (2008–2009) of Cummins Inc. (industrial machinery). Chairman of the board of Hillenbrand, Inc. (specialized consumer services), Oxfam America, and the Lumina Foundation for Education. Director of the V Foundation for Cancer Research. Member of the advisory council for the College of Arts and Letters and chair of the advisory board to the Kellogg Institute for International Studies, both at the University of Notre Dame.
Mark Loughridge
Born in 1953. Trustee since March 2012. Principal occupation(s) during the past five years and other experience: senior vice president and chief financial officer (retired 2013) of IBM (information technology services). Fiduciary member of IBM’s Retirement Plan Committee (2004–2013), senior vice president and general manager (2002–2004) of IBM Global Financing, vice president and controller (1998–2002) of IBM, and a variety of other prior management roles at IBM. Member of the Council on Chicago Booth.
Scott C. Malpass
Born in 1962. Trustee since March 2012. Principal occupation(s) during the past five years and other experience: chief investment officer (1989–present) and vice president (1996–present) of the University of Notre Dame. Assistant professor of finance at the Mendoza College of Business, University of Notre Dame, and member of the Notre Dame 403(b) Investment Committee. Chairman of the board of TIFF Advisory Services, Inc. Member of the board of Catholic Investment Services, Inc. (investment advisors), the board of advisors for Spruceview Capital Partners, and the board of superintendence of the Institute for the Works of Religion.
Deanna Mulligan
Born in 1963. Trustee since January 2018. Principal occupation(s) during the past five years and other experience: president (2010–present) and chief executive officer (2011–present) of The Guardian Life Insurance Company of America. Chief operating officer (2010–2011) and executive vice president (2008–2010) of Individual Life and Disability of The Guardian Life Insurance Company of America. Member of the board of The Guardian Life Insurance Company of America, the American Council of Life Insurers, the Partnership for New York City (business leadership), and the Committee Encouraging Corporate Philanthropy. Trustee of the Economic Club of New York and the Bruce Museum (arts and science). Member of the Advisory Council for the Stanford Graduate School of Business.
André F. Perold
Born in 1952. Trustee since December 2004. Principal occupation(s) during the past five years and other experience: George Gund Professor of Finance and Banking, Emeritus at the Harvard Business School (retired 2011). Chief investment officer and co-managing partner of HighVista Strategies LLC (private investment firm). Overseer of the Museum of Fine Arts Boston.
Sarah Bloom Raskin
Born in 1961. Trustee since January 2018. Principal occupation(s) during the past five years and other experience: deputy secretary (2014–2017) of the United States Department of the Treasury. Governor (2010–2014) of the Federal Reserve Board. Commissioner (2007–2010) of financial regulation for the State of Maryland. Member of the board of directors (2012–2014) of Neighborhood Reinvestment Corporation. Director of i(x) Investments, LLC.
Peter F. Volanakis
Born in 1955. Trustee since July 2009. Principal occupation(s) during the past five years and other experience: president and chief operating officer (retired 2010) of Corning Incorporated (communications equipment) and director of Corning Incorporated (2000–2010) and Dow Corning (2001–2010). Director (2012) of SPX Corporation (multi-industry manufacturing). Overseer of the Amos Tuck School of Business Administration, Dartmouth College (2001–2013). Chairman of the board of trustees of Colby-Sawyer College. Member of the Board of Hypertherm Inc. (industrial cutting systems, software, and consumables).
Executive Officers
Glenn Booraem
Born in 1967. Principal occupation(s) during the past five years and other experience: principal of Vanguard. Investment stewardship officer (2017–present), treasurer (2015–2017), controller (2010–2015), and assistant controller (2001–2010) of each of the investment companies served by Vanguard.
Christine M. Buchanan
Born in 1970. Principal occupation(s) during the past five years and other experience: principal of Vanguard and global head of Fund Administration at Vanguard. Treasurer (2017–present) of each of the investment companies served by Vanguard. Partner (2005–2017) at KPMG LLP (audit, tax, and advisory services).
Brian Dvorak
Born in 1973. Principal occupation(s) during the past five years and other experience: principal of Vanguard. Chief compliance officer (2017–present) of Vanguard and each of the investment companies served by Vanguard. Assistant vice president (2017–present) of Vanguard Marketing Corporation. Vice president and director of Enterprise Risk Management (2011–2013) at Oppenheimer Funds, Inc.
Thomas J. Higgins
Born in 1957. Principal occupation(s) during the past five years and other experience: principal of Vanguard. Chief financial officer (2008–present) and treasurer (1998–2008) of each of the investment companies served by Vanguard.
Peter Mahoney
Born in 1974. Principal occupation(s) during the past five years and other experience: principal of Vanguard. Controller (2015–present) of each of the investment companies served by Vanguard. Head of International Fund Services (2008–2014) at Vanguard.
Anne E. Robinson
Born in 1970. Principal occupation(s) during the past five years and other experience: general counsel (2016–present) of Vanguard. Secretary (2016–present) of Vanguard and of each of the investment companies served by Vanguard. Managing director (2016–present) of Vanguard. Director and senior vice president (2016–2018) of Vanguard Marketing Corporation. Managing director and general counsel of Global Cards and Consumer Services (2014–2016) at Citigroup. Counsel (2003–2014) at American Express.
Michael Rollings
Born in 1963. Principal occupation(s) during the past five years and other experience: finance director (2017–present) and treasurer (2017) of each of the investment companies served by Vanguard. Managing director (2016–present) of Vanguard. Chief financial officer (2016–present) of Vanguard. Director (2016–present) of Vanguard Marketing Corporation. Executive vice president and chief financial officer (2006–2016) of MassMutual Financial Group.
| Vanguard Senior Management Team | |
| Joseph Brennan | Chris D. McIsaac |
| Mortimer J. Buckley | James M. Norris |
| Gregory Davis | Thomas M. Rampulla |
| John James | Karin A. Risi |
| Martha G. King | Anne E. Robinson |
| John T. Marcante | Michael Rollings |
| Chairman Emeritus and Senior Advisor | |
| John J. Brennan | |
| Chairman, 1996–2009 | |
| Chief Executive Officer and President, 1996–2008 | |
| Founder | |
| John C. Bogle | |
| Chairman and Chief Executive Officer, 1974–1996 | |
 | |
P.O. Box 2600 | |
Connect with Vanguard® > vanguard.com | |
| Fund Information > 800-662-7447 | Source for Bloomberg Barclays indexes: Bloomberg |
| Direct Investor Account Services > 800-662-2739 | Index Services Limited. Copyright 2018, Bloomberg. All |
| Institutional Investor Services > 800-523-1036 | rights reserved. |
| Text Telephone for People | |
| Who Are Deaf or Hard of Hearing > 800-749-7273 | “Dividend Achievers” is a trademark of The NASDAQ |
| OMX Group, Inc. (collectively, with its affiliates | |
| “NASDAQ OMX”), and has been licensed for use by The | |
| Vanguard Group, Inc. Vanguard mutual funds are not | |
| This material may be used in conjunction | sponsored, endorsed, sold, or promoted by NASDAQ |
| with the offering of shares of any Vanguard | OMX and NASDAQ OMX makes no representation |
| fund only if preceded or accompanied by | regarding the advisability of investing in the funds. |
| the fund’s current prospectus. | NASDAQ OMX makes no warranties and bears no |
| liability with respect to the Vanguard mutual funds. | |
| All comparative mutual fund data are from Lipper, a | |
| Thomson Reuters Company, or Morningstar, Inc., unless | London Stock Exchange Group companies include FTSE |
| otherwise noted. | International Limited (”FTSE”), Frank Russell Company |
| (”Russell”), MTS Next Limited (”MTS”), and FTSE TMX | |
| You can obtain a free copy of Vanguard’s proxy voting | Global Debt Capital Markets Inc. (”FTSE TMX”). All |
| guidelines by visiting vanguard.com/proxyreporting or by | rights reserved. ”FTSE®”, ”Russell®”, ”MTS®”, ”FTSE |
| calling Vanguard at 800-662-2739. The guidelines are | TMX®” and ”FTSE Russell” and other service marks |
| also available from the SEC’s website, sec.gov. In | and trademarks related to the FTSE or Russell indexes |
| addition, you may obtain a free report on how your fund | are trademarks of the London Stock Exchange Group |
| voted the proxies for securities it owned during the 12 | companies and are used by FTSE, MTS, FTSE TMX and |
| months ended June 30. To get the report, visit either | Russell under licence. All information is provided for |
| vanguard.com/proxyreporting or sec.gov. | information purposes only. No responsibility or liability |
| You can review information about your fund on the | can be accepted by the London Stock Exchange Group |
| SEC’s website, and you can receive copies of this | companies nor its licensors for any errors or for any |
| information, for a fee, by sending a request via email | loss from use of this publication. Neither the London |
| addressed to publicinfo@sec.gov. | Stock Exchange Group companies nor any of its |
| licensors make any claim, prediction, warranty or | |
| representation whatsoever, expressly or impliedly, | |
| either as to the results to be obtained from the use of | |
| the FTSE Indexes or the fitness or suitability of the | |
| Indexes for any particular purpose to which they might | |
| be put. | |
| © 2018 The Vanguard Group, Inc. | |
| All rights reserved. | |
| Vanguard Marketing Corporation, Distributor. | |
| Q20150 122018 | |
| Annual Report | October 31, 2018 |
| Vanguard International Explorer™ Fund |
Vanguard’s Principles for Investing Success
We want to give you the best chance of investment success. These principles, grounded in Vanguard’s research and experience, can put you on the right path.
Goals. Create clear, appropriate investment goals.
Balance. Develop a suitable asset allocation using broadly diversified funds. Cost. Minimize cost.
Discipline. Maintain perspective and long-term discipline.
A single theme unites these principles: Focus on the things you can control.
We believe there is no wiser course for any investor.
| Contents | |
| Your Fund’s Performance at a Glance. | 1 |
| CEO’s Perspective. | 3 |
| Advisors’ Report. | 5 |
| Fund Profile. | 11 |
| Performance Summary. | 13 |
| Financial Statements. | 15 |
| Your Fund’s After-Tax Returns. | 35 |
| About Your Fund’s Expenses. | 36 |
| Trustees Approve Advisory Arrangements. | 38 |
| Glossary. | 40 |
Please note: The opinions expressed in this report are just that—informed opinions. They should not be considered promises or advice. Also, please keep in mind that the information and opinions cover the period through the date on the front of this report. Of course, the risks of investing in your fund are spelled out in the prospectus.
See the Glossary for definitions of investment terms used in this report.
Your Fund’s Performance at a Glance
• For the 12 months ended October 31, 2018, Vanguard International Explorer Fund returned –13.08%, trailing both its benchmark, the S&P EPAC SmallCap Index, and the average return of its peers.
• The fund’s advisors invest in smaller companies—mostly from the developed regions of Europe and the Pacific—that they believe have strong long-term growth prospects.
• European stocks, which represented more than half the fund’s assets on average, returned nearly –14%. The Pacific region returned about –12% and emerging markets about –28%. All three regions lagged their benchmark counterparts. Ten of the fund’s 11 industry sectors detracted from relative performance, with information technology, industrials, and consumer discretionary hurting most.
• For the ten years ended October 31, 2018, the fund’s average annual return slightly trailed that of its benchmark and its peers.
| Total Returns: Fiscal Year Ended October 31, 2018 | |
| Total | |
| Returns | |
| Vanguard International Explorer Fund | -13.08% |
| S&P EPAC SmallCap Index | -8.26 |
| International Small-Cap Funds Average | -9.98 |
| International Small-Cap Funds Average: Derived from data provided by Lipper, a Thomson Reuters Company. |
| Total Returns: Ten Years Ended October 31, 2018 | |
| Average | |
| Annual Return | |
| International Explorer Fund | 10.77% |
| S&P EPAC SmallCap Index | 10.85 |
| International Small-Cap Funds Average | 10.85 |
International Small-Cap Funds Average: Derived from data provided by Lipper, a Thomson Reuters Company.
The figures shown represent past performance, which is not a guarantee of future results. (Current performance may be lower or higher than the performance data cited. For performance data current to the most recent month-end, visit our website at vanguard.com/performance.) Note, too, that both investment returns and principal value can fluctuate widely, so an investor’s shares, when sold, could be worth more or less than their original cost.
1
| Expense Ratios | ||
| Your Fund Compared With Its Peer Group | ||
| Peer Group | ||
| Fund | Average | |
| International Explorer Fund | 0.38% | 1.52% |
The fund expense ratio shown is from the prospectus dated February 22, 2018, and represents estimated costs for the current fiscal year. For the fiscal year ended October 31, 2018, the fund’s expense ratio was 0.39%. The peer-group expense ratio is derived from data provided by Lipper, a Thomson Reuters Company, and captures information through year-end 2017.
Peer group: International Small-Cap Funds.
2
CEO’s Perspective

Tim Buckley
President and Chief Executive Officer
Dear Shareholder,
Over the years, I’ve found that prudent investors exhibit a common trait: discipline. No matter how the markets move or what new investing fad hits the headlines, those who stay focused on their goals and tune out the noise are set up for long-term success.
The prime gateway to investing is saving, and you don’t usually become a saver without a healthy dose of discipline. Savers make the decision to sock away part of their income, which means spending less and delaying gratification, no matter how difficult that may be.
Of course, disciplined investing extends beyond diligent saving. The financial markets, in the short term especially, are unpredictable; I have yet to meet the investor who can time them perfectly. It takes discipline to resist the urge to go all-in when markets are frothy or to retreat when things look bleak.
Staying put with your investments is one strategy for handling volatility. Another, rebalancing, requires even more discipline because it means steering your money away from strong performers and toward poorer performers.
Patience—a form of discipline—is also the friend of long-term investors. Higher returns are the potential reward for weathering the market’s turbulence and uncertainty.
3
We have been enjoying one of the longest bull markets in history, but it won’t continue forever. Prepare yourself now for how you will react when volatility comes back. Don’t panic. Don’t chase returns or look for answers outside the asset classes you trust. And be sure to rebalance periodically, even when there’s turmoil.
Whether you’re a master of self-control, get a boost from technology, or work with a professional advisor, know that discipline is necessary to get the most out of your investment portfolio. And know that Vanguard is with you for the entire ride.
Thank you for your continued loyalty.
Sincerely,

Mortimer J. Buckley
President and Chief Executive Officer
November 16, 2018
| Market Barometer | |||
| Average Annual Total Returns | |||
| Periods Ended October 31, 2018 | |||
| One Year | Three Years | Five Years | |
| Stocks | |||
| Russell 1000 Index (Large-caps) | 6.98% | 11.31% | 11.05% |
| Russell 2000 Index (Small-caps) | 1.85 | 10.68 | 8.01 |
| Russell 3000 Index (Broad U.S. market) | 6.60 | 11.27 | 10.81 |
| FTSE All-World ex US Index (International) | -7.99 | 4.57 | 2.01 |
| Bonds | |||
| Bloomberg Barclays U.S. Aggregate Bond Index | |||
| (Broad taxable market) | -2.05% | 1.04% | 1.83% |
| Bloomberg Barclays Municipal Bond Index | |||
| (Broad tax-exempt market) | -0.51 | 1.90 | 3.25 |
| FTSE Three-Month U. S. Treasury Bill Index | 1.67 | 0.86 | 0.52 |
| CPI | |||
| Consumer Price Index | 2.52% | 2.07% | 1.60% |
4
Advisors’ Report
For the fiscal year ended October 31, 2018, Vanguard International Explorer Fund returned –13.08%. Your fund is managed by three independent advisors, a strategy that enhances its diversification by providing exposure to distinct yet complementary investment approaches. It is not uncommon for different advisors to have different views about individual securities or the broader investment environment.
The advisors, the amount and percentage of fund assets each manages, and brief descriptions of their investment strategies are presented in the table on page 10. The advisors have also prepared a discussion of the investment environment that existed during the year and of how their portfolio positioning reflected that assessment. These comments were prepared on November 26, 2018.
Schroder Investment Management North America Inc.
Portfolio Manager: Matthew F. Dobbs, Head of Global Small Companies
The investment landscape over the 12 months ended October 31, 2018, could hardly contrast more with the one we reported on a year ago. International equity returns have been negative, the U.S. dollar has been strengthening against most other major currencies, and smaller international companies have underperformed their larger peers. Overall, the S&P EPAC SmallCap Index returned below –8% versus below –7% for the S&P EPAC LargeMidCap Index.
The bulk of the market declines came in October, though the pressures on investor confidence were increasingly evident through the summer. Those pressures included deteriorating U.S.-China relations, rising U.S. interest rates, and downward revisions in growth expectations in key developed economies (such as Japan and Europe) as well as a number of emerging markets. Small-caps underperformed most in Japan (markedly among specialty retailers and banks) and in the Pacific region outside Japan.
In Europe, a number of our financial and information technology holdings performed poorly. In financials, Cerved and Anima corrected in sympathy with rising investor nervousness about Italy, their home market. Among IT holdings, Altran fell after problems with integrating an acquisition, and U-blox reflected a more subdued demand outlook. On a more positive note, consumer companies that performed well included Amer Sports and Yoox Net-A-Porter, which were both subject to bid activity, and Basic-Fit, on solid operating performance.
Results in Japan lagged, with auto parts companies particularly out of favor amid slowing end markets and concern over supply-chain disruption and technological change. Health care and
5
industrials were also weak, more than offsetting strength among IT holdings including Kakaku.com, OBIC Business Consultants, and Digital Garage.
The prime challenge in the United Kingdom portion of the portfolio has been in the consumer cyclical segment. Continued uncertainty surrounding the Brexit negotiations, lackluster domestic demand, and a rise in interest rates all contributed to caution in the sector, with specialist retail stocks such as Superdry, Ted Baker, and Pets at Home among the most disappointing performers.
Turning to the outlook, purely financial forecasts and considerations are materially complicated by major and unpredictable political issues. The biggest one for international investors is poor relations between the U.S. and China, which go far beyond mere trade differences. Other imponderables include Brexit, whether Italy’s well-publicized issues will seriously destabilize the euro region, and (in our mind, of fundamental global import) whether China’s leadership holds the line on accepting lower trend growth as the price for long-term financial sustainability.
Some or all of these issues may be amenable to at least short-term outcomes that are better than the consensus would suggest. The global economic and financial fundamentals, however, are troubling and include an unbalanced-growth picture (the U.S. versus the rest), tightening liquidity, and the risk of more profound shocks in credit markets. We continue to focus on individual corporate fundamentals and companies where we feel the long-term growth potential is underappreciated by investors.
Wellington Management Company llp
Portfolio Manager:
Simon H. Thomas, Senior Managing Director and Equity Portfolio Manager
Global equities rose over the 12 months. At the beginning of the period, macroeconomic indicators continued to highlight a positive global economic cycle, with strong fundamentals across all regions. Throughout the period, however, markets became more volatile because of higher U.S. inflation, a rising U.S. dollar, and a moderation in quantitative easing. China’s stock market has declined and its currency has weakened against the dollar, and higher tariffs between the United States and China presented challenges to companies globally. The euro region’s economic growth remains good but is decelerating, with a divergence between service indexes and manufacturing indexes; the latter have been pressured by tariff uncertainty and rising protectionism.
Stock selection in information technology, financials, and materials detracted most from our portfolio’s relative performance. Weaker selection was partly offset by positive selection in health care and energy. Allocation among sectors, which
6
is largely a result of our bottom-up stock selection process, was also a relative detractor. The portfolio’s underweighting of real estate and overweighting of industrials hurt most, but those were partly offset by our overweighting of health care. Among regions, selection within Japan and Europe—specifically in Italy, Switzerland, France, and Germany—detracted most from relative performance.
Ams AG, Ferrotec Holdings, and Maisons du Monde were the biggest detractors for the period. Ams, an Austrian designer and maker of advanced sensor products, saw its share price decline amid growing concerns about weaker demand for the company’s 3D sensing device for high-end smartphones. The threat of high tariffs, and their potential negative impact on the technology hardware supply chain, is also hurting the company.
Ferrotec, a Japanese component supplier to the semiconductor industry, performed well in 2017 and was one of our largest holdings by the end of that year. More recently, we believe the market has been penalizing Ferrotec because of tariff concerns and peaking semiconductor demand at this point in the business cycle. The company, however, is taking market share, has diversified its business, and has exposure to favorable long-term trends related to the internet and connected devices. We have maintained our exposure to it and foresee a long secular growth trajectory.
Maisons du Monde, a French furniture and home furnishings company, traded down after multiple reductions in its sales-growth guidance. Under its new CEO, however, we think the company will benefit from recovering conditions in the French market as well as new opportunities.
Top relative contributors included Hikma Pharmaceuticals, BeiGene, and Asahi Intecc. Hikma, a U.K.-based multinational pharmaceutical company, reported core operating profits well ahead of expectations in the first six months of 2018, largely driven by cost savings. The company is also executing well under its new CEO and is seeing increasing demand for its injectable pain products as a result of a drug shortage in the United States.
BeiGene, a Chinese boutique biopharmaceutical research and development company, announced continued positive preliminary data from its Phase 1 clinical trial of Zanubrutinib, a drug that targets four types of tumors. It also announced approval by the China Food and Drug Administration of Revlimid and the commercial availability of Vidaza; both drugs target blood cancers. We sold our holding as BeiGene stock approached the upper end of our market-capitalization range.
Asahi Intecc, a Japan-based producer of ultrafine stainless steel wiring and mesh for the industrial and medical end markets, benefited from an expansion into the U.S. and Europe. The company has also been
7
able to opportunistically grow its already dominant market share in Japan, in part because of key competitors’ production missteps. Over the period, we trimmed the position on valuation discipline.
Relative to the benchmark, at the end of the period we were most overweight in the industrials, consumer discretionary, and health care sectors and most underweight in real estate, information technology, and consumer staples. By region, Japan was our largest overweighting versus the benchmark and we were most underweight in Europe. We continue to look for high-quality companies that have been neglected by the market and offer attractive investment opportunities.
TimesSquare Capital Management, LLC
Portfolio Manager: Magnus S. Larsson, Director and Head of International Equities
International markets have been volatile since the start of 2018, pressured by changing interest rates and mounting trade tensions. Overall, our holdings in Japan and in emerging markets detracted most from the portfolio’s relative performance.
Weakness in our portfolio in emerging markets resulted from challenges in India’s financial sector as an Indian infrastructure development and finance company— unconnected to any of our holdings—defaulted on interest payments. The default led debt investors to turn more risk-averse. With a large institutional investor trying to sell commercial paper at Dewan Housing, shares at that affordable-housing mortgage provider dropped on panic selling. Edelweiss, a diversified financial services company, declined as a result. Management teams for Dewan and Edelweiss both reaffirmed that they had sufficient funding levels for uninterrupted operations. Given the Indian government’s commitment to providing affordable housing, our long-term investment thesis remains intact.
Japan’s Horiba, a maker of measuring instruments, experienced a near-term slowdown in its key automotive and semiconductor businesses amid trade-war uncertainty. Japan Lifeline, which distributes third-party vascular medical devices as well as those designed internally, faced challenges from national health insurance price revisions and upfront promotion of new products. We remain positive on the company’s ability to capitalize on Japan’s changing demographics. Faring better was Japan’s largest variety discount store, Don Quijote, which benefited from continued strong execution and market-share gains.
In Europe, U.K. funeral-services provider Dignity detracted from performance. Its lower-price strategy for “simple” funerals implied cannibalization of its core, higher-margin “traditional” services. Another detractor was French consulting and
8
engineering services firm Altran, which identified forged purchase orders within its recently acquired firm Aricent. Although Altran did not expect a material impact on its financial outlook and saw the event as a one-off, the market responded harshly.
On the positive side, Italian online financial services firm FinecoBank benefited from steady growth in its clientele, a larger wallet share from existing clients, and operating leverage. Amplifon, an Italian global specialty retailer of hearing aids, gained market share and looked to develop a white-label brand that uses hearing-aid usage data to offer personalized experiences.
Given our strong valuation discipline, we took profit in some of our strongest contributors, namely in Italy, and opportunistically added to conviction ideas on undue weakness. We continue to use our bottom-up analysis in identifying businesses that have secure foundations to support their growth in most environments.
9
| Vanguard International Explorer Fund Investment Advisors | |||
| Fund Assets Managed | |||
| Investment Advisor | % | $ Million | Investment Strategy |
| Schroder Investment | 57 | 2,096 | The advisor employs a fundamental investment |
| Management North America | approach that considers macroeconomic factors | ||
| Inc. | while focusing primarily on company-specific factors, | ||
| including a company’s potential for long-term growth, | |||
| financial condition, quality of management, and | |||
| sensitivity to cyclical factors. The advisor also | |||
| considers the relative value of a company’s securities | |||
| compared with those of other companies and the | |||
| market as a whole. | |||
| Wellington Management | 25 | 923 | The advisor employs a traditional, bottom-up |
| Company LLP | approach that is opportunistic in nature, relying on | ||
| global and regional research resources to identify | |||
| both growth-oriented and neglected or | |||
| misunderstood companies. | |||
| TimesSquare Capital | 15 | 560 | The advisor employs a quality growth philosophy that |
| Management, LLC | is based on the premise that a skilled research | ||
| team—emphasizing management quality, superior | |||
| business models, and valuation—contributes to a | |||
| diversified portfolio that will generate superior | |||
| risk-adjusted returns over the long term. | |||
| Cash Investments | 3 | 70 | These short-term reserves are invested by Vanguard |
| in equity index products to simulate investment in | |||
| stocks. Each advisor also may maintain a modest | |||
| cash position. | |||
10
International Explorer Fund
Fund Profile
As of October 31, 2018
| Portfolio Characteristics | |||
| MSCI | |||
| S&P | AC | ||
| EPAC | World | ||
| SmallCap | Index | ||
| Fund | Index ex USA | ||
| Number of Stocks | 341 | 3,560 | 2,162 |
| Median Market Cap | $2.2B | $1.8B | $32.1B |
| Price/Earnings Ratio | 16.3x | 13.2x | 12.7x |
| Price/Book Ratio | 1.9x | 1.4x | 1.5x |
| Return on Equity | 12.3% | 9.9% | 12.6% |
| Earnings Growth | |||
| Rate | 15.9% | 12.0% | 8.7% |
| Dividend Yield | 2.3% | 2.6% | 3.2% |
| Turnover Rate | 40% | — | — |
| Ticker Symbol | VINEX | — | — |
| Expense Ratio1 | 0.38% | — | — |
| Short-Term Reserves | 3.5% | — | — |
| Sector Diversification (% of equity exposure) | |
| Fund | |
| Communication Services | 5.5% |
| Consumer Discretionary | 18.5 |
| Consumer Staples | 3.0 |
| Energy | 1.5 |
| Financials | 10.2 |
| Health Care | 7.8 |
| Industrials | 30.6 |
| Information Technology | 9.1 |
| Materials | 9.4 |
| Real Estate | 3.8 |
| Utilities | 0.6 |
Sector categories are based on the Global Industry Classification Standard (“GICS”), except for the “Other” category (if applicable), which includes securities that have not been provided a GICS classification as of the effective reporting period.
| Volatility Measures | ||
| MSCI | ||
| S&P | AC | |
| EPAC | World | |
| SmallCap | Index ex | |
| Index | USA | |
| R-Squared | 0.95 | 0.81 |
| Beta | 1.02 | 1.05 |
These measures show the degree and timing of the fund’s fluctuations compared with the indexes over 36 months.
| Ten Largest Holdings (% of total net assets) | ||
| Nippon Shinyaku Co. | ||
| Ltd. | Pharmaceuticals | 1.1% |
| Altran Technologies SA | IT Consulting & | |
| Other Services | 1.1 | |
| Dalata Hotel Group plc | Hotels, Resorts & | |
| Cruise Lines | 1.0 | |
| AMG Advanced | Diversified Metals & | |
| Metallurgical Group NV | Mining | 0.9 |
| NCSoft Corp. | Interactive Home | |
| Entertainment | 0.9 | |
| Anima Holding SPA | Asset Management | |
| & Custody Banks | 0.9 | |
| Befesa SA | Environmental & | |
| Facilities Services | 0.9 | |
| OCI NV | Fertilizers & | |
| Agricultural | ||
| Chemicals | 0.8 | |
| Ahlsell AB | Trading Companies & | |
| Distributors | 0.8 | |
| Elis SA | Diversified Support | |
| Services | 0.8 | |
| Top Ten | 9.2% | |
The holdings listed exclude any temporary cash investments and equity index products.
Allocation by Region (% of equity exposure)

1 The expense ratio shown is from the prospectus dated February 22, 2018, and represents estimated costs for the current fiscal year. For the fiscal year ended October 31, 2018, the expense ratio was 0.39%.
11
International Explorer Fund
| Market Diversification (% of equity exposure) | |||
| S&P | MSCI AC | ||
| EPAC | World | ||
| SmallCap | Index | ||
| Fund | Index | ex USA | |
| Europe | |||
| United Kingdom | 15.5% | 15.0% | 12.1% |
| Italy | 8.2 | 2.1 | 1.6 |
| France | 7.3 | 8.9 | 7.6 |
| Germany | 5.5 | 8.1 | 6.2 |
| Netherlands | 5.4 | 2.5 | 2.3 |
| Switzerland | 3.4 | 7.7 | 5.9 |
| Ireland | 2.5 | 0.3 | 0.4 |
| Sweden | 2.3 | 3.0 | 1.8 |
| Spain | 2.0 | 2.7 | 2.1 |
| Denmark | 1.4 | 1.1 | 1.1 |
| Austria | 1.2 | 0.2 | 0.2 |
| Other | 1.8 | 3.4 | 2.1 |
| Subtotal | 56.5% | 55.0% | 43.4% |
| Pacific | |||
| Japan | 27.2% | 26.7% | 16.9% |
| Australia | 5.0 | 6.7 | 4.7 |
| South Korea | 2.5 | 3.8 | 3.4 |
| Hong Kong | 1.7 | 1.7 | 2.3 |
| Other | 0.9 | 1.3 | 1.0 |
| Subtotal | 37.3% | 40.2% | 28.3% |
| Emerging Markets | |||
| China | 2.1% | 0.6% | 7.4% |
| India | 1.6 | 0.0 | 2.1 |
| Taiwan | 1.2 | 0.0 | 2.9 |
| Other | 1.0 | 0.0 | 8.5 |
| Subtotal | 5.9% | 0.6% | 20.9% |
| North America | |||
| Other | 0.3% | 0.3% | 6.7% |
| Middle East | 0.0% | 0.7% | 0.4% |
| Other | 0.0% | 3.2% | 0.3% |
"Other" represents securities that are not classified by the fund's benchmark index.
12
International Explorer Fund
Performance Summary
All of the returns in this report represent past performance, which is not a guarantee of future results that may be achieved by the fund. (Current performance may be lower or higher than the performance data cited. For performance data current to the most recent month-end, visit our website at vanguard.com/performance.) Note, too, that both investment returns and principal value can fluctuate widely, so an investor’s shares, when sold, could be worth more or less than their original cost. The returns shown do not reflect taxes that a shareholder would pay on fund distributions or on the sale of fund shares.
Cumulative Performance: October 31, 2008, Through October 31, 2018
Initial Investment of $10,000
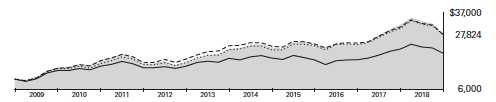
| Average Annual Total Returns | ||||
| Periods Ended October 31, 2018 | ||||
| One | Five | Ten | of a $10,000 | |
| Year | Years | Years | Investment | |
| International Explorer Fund | -13.08% | 4.55% | 10.77% | $27,824 |
| S&P EPAC SmallCap Index | -8.26 | 5.01 | 10.85 | 28,007 |
| International Small-Cap Funds Average | -9.98 | 3.56 | 10.85 | 28,010 |
| MSCI All Country World Index ex USA | -7.80 | 2.10 | 7.41 | 20,440 |
International Small-Cap Funds Average: Derived from data provided by Lipper, a Thomson Reuters Company.
See Financial Highlights for dividend and capital gains information.
13
International Explorer Fund
Fiscal-Year Total Returns (%): October 31, 2008, Through October 31, 2018

Average Annual Total Returns: Periods Ended September 30, 2018
This table presents returns through the latest calendar quarter—rather than through the end of the fiscal period.
Securities and Exchange Commission rules require that we provide this information.
| Inception | One | Five | Ten | |
| Date | Year | Years | Years | |
| International Explorer Fund | 11/4/1996 | 0.29% | 8.04% | 9.11% |
14
International Explorer Fund
Financial Statements
Statement of Net Assets
As of October 31, 2018
The fund reports a complete list of its holdings in regulatory filings four times in each fiscal year, at the quarter-ends. For the second and fourth fiscal quarters, the lists appear in the fund’s semiannual and annual reports to shareholders. For the first and third fiscal quarters, the fund files the lists with the Securities and Exchange Commission on Form N-Q. Shareholders can look up the fund’s Forms N-Q on the SEC’s website at sec.gov.
| Market | |||
| Value• | |||
| Shares | ($000) | ||
| Common Stocks (95.0%)1 | |||
| Australia (4.7%) | |||
| ^ | Bingo Industries Ltd. | 7,983,737 | 13,553 |
| Link Administration | |||
| Holdings Ltd. | 2,365,580 | 12,606 | |
| Iluka Resources Ltd. | 2,121,875 | 12,186 | |
| Steadfast Group Ltd. | 5,761,800 | 12,150 | |
| oOh!media Ltd. | 3,265,260 | 10,972 | |
| NRW Holdings Ltd. | 7,877,368 | 10,346 | |
| ALS Ltd. | 1,723,342 | 9,994 | |
| Computershare Ltd. | 687,563 | 9,655 | |
| SEEK Ltd. | 686,808 | 8,726 | |
| Incitec Pivot Ltd. | 2,870,473 | 7,954 | |
| IPH Ltd. | 2,005,600 | 7,700 | |
| Ansell Ltd. | 443,360 | 7,309 | |
| Challenger Ltd. | 982,800 | 7,158 | |
| ^ | Netwealth Group Ltd. | 1,378,245 | 6,868 |
| Monadelphous Group Ltd. | 586,491 | 6,002 | |
| Cleanaway Waste | |||
| Management Ltd. | 4,555,284 | 5,823 | |
| Mirvac Group | 3,590,948 | 5,524 | |
| Nufarm Ltd. | 1,320,880 | 5,341 | |
| Domain Holdings | |||
| Australia Ltd. | 2,458,208 | 4,325 | |
| Estia Health Ltd. | 2,109,977 | 3,058 | |
| SpeedCast International | |||
| Ltd. | 932,200 | 2,383 | |
| *,^ | Karoon Gas Australia Ltd. | 1,374,635 | 1,040 |
| 170,673 | |||
| Austria (1.2%) | |||
| Lenzing AG | 175,000 | 15,874 | |
| ANDRITZ AG | 153,036 | 7,929 | |
| Wienerberger AG | 281,844 | 6,483 | |
| Schoeller-Bleckmann | |||
| Oilfield Equipment AG | 61,058 | 5,451 | |
| ^ | Porr AG | 167,220 | 4,527 |
| Palfinger AG | 69,600 | 2,122 | |
| 42,386 | |||
| Belgium (0.7%) | |||
| Euronav NV | 1,222,089 | 11,380 | |
| Cie d’Entreprises CFE | 76,748 | 8,138 | |
| * | Galapagos NV | 52,470 | 5,390 |
| 24,908 | |||
| Brazil (0.2%) | |||
| Kroton Educacional SA | 1,359,900 | 4,173 | |
| Qualicorp Consultoria e | |||
| Corretora de Seguros SA | 638,100 | 2,469 | |
| 6,642 | |||
| China (2.0%) | |||
| Shenzhou International | |||
| Group Holdings Ltd. | 1,536,000 | 17,029 | |
| * | SINA Corp. | 187,609 | 11,877 |
| * | New Oriental Education & | ||
| Technology Group Inc. | |||
| ADR | 158,372 | 9,266 | |
| *,^ | iQIYI Inc. ADR | 454,814 | 8,933 |
| Nexteer Automotive | |||
| Group Ltd. | 4,160,000 | 5,866 | |
| *,^ | Baozun Inc. ADR | 118,828 | 4,730 |
| 2 | Crystal International | ||
| Group Ltd. | 7,970,000 | 4,363 | |
| Haitian International | |||
| Holdings Ltd. | 2,162,000 | 4,246 | |
| * | Vipshop Holdings Ltd. | ||
| ADR | 762,700 | 3,707 | |
| ^ | Tarena International Inc. | ||
| ADR | 302,745 | 2,619 | |
| 72,636 | |||
| Denmark (1.3%) | |||
| FLSmidth & Co. A/S | 400,000 | 20,988 | |
| Topdanmark A/S | 386,900 | 18,391 | |
| SimCorp A/S | 122,600 | 9,440 | |
| *,§ | OW Bunker A/S | 1,000,000 | — |
| 48,819 | |||
15
| International Explorer Fund | |||
| Market | |||
| Value• | |||
| Shares | ($000) | ||
| Finland (0.2%) | |||
| Metso Oyj | 171,282 | 5,408 | |
| * | Outotec Oyj | 705,689 | 2,729 |
| 8,137 | |||
| France (6.9%) | |||
| Altran Technologies SA | 3,923,268 | 38,886 | |
| Elis SA | 1,418,799 | 28,609 | |
| SPIE SA | 1,700,000 | 26,616 | |
| Nexity SA | 502,757 | 24,043 | |
| * | Ubisoft Entertainment SA | 200,311 | 17,969 |
| *,2 | SMCP SA | 750,000 | 17,736 |
| * | ID Logistics Group | 77,656 | 13,104 |
| 2 | Maisons du Monde SA | 464,638 | 11,648 |
| Kaufman & Broad SA | 250,000 | 10,253 | |
| Trigano SA | 100,000 | 10,153 | |
| * | SOITEC | 88,813 | 6,328 |
| * | Virbac SA | 38,634 | 6,199 |
| Orpea | 47,500 | 5,848 | |
| Albioma SA | 300,000 | 5,829 | |
| L’Occitane International | |||
| SA | 2,939,500 | 5,505 | |
| Imerys SA | 88,285 | 5,442 | |
| Rubis SCA | 84,426 | 4,356 | |
| Teleperformance | 25,000 | 4,117 | |
| * | Tikehau Capital SCA | 119,243 | 3,216 |
| * | Innate Pharma SA | 341,522 | 2,857 |
| * | Marie Brizard Wine & | ||
| Spirits SA | 514,107 | 2,444 | |
| LISI | 75,000 | 2,185 | |
| 253,343 | |||
| Germany (5.2%) | |||
| 2 | Befesa SA | 700,000 | 31,079 |
| Wacker Chemie AG | 225,000 | 20,098 | |
| Grand City Properties SA | 750,000 | 18,132 | |
| * | HelloFresh SE | 1,355,396 | 16,175 |
| SAF-Holland SA | 996,538 | 14,524 | |
| * | Stemmer Imaging AG | 294,500 | 12,981 |
| XING SE | 38,750 | 11,651 | |
| Duerr AG | 325,000 | 11,581 | |
| 2 | Aumann AG | 233,475 | 11,483 |
| ^ | RIB Software SE | 502,900 | 8,679 |
| STRATEC Biomedical AG | 107,258 | 7,041 | |
| * | Senvion SA | 1,225,000 | 6,985 |
| Stabilus SA | 80,900 | 5,422 | |
| CTS Eventim AG & Co. | |||
| KGaA | 110,800 | 4,154 | |
| Nemetschek SE | 29,100 | 3,825 | |
| GRENKE AG | 31,900 | 3,059 | |
| Zeal Network SE | 125,000 | 3,035 | |
| *,2 | windeln.de SE | 1,125,000 | 1,043 |
| 190,947 | |||
| Hong Kong (1.6%) | |||
| Techtronic Industries Co. | |||
| Ltd. | 4,199,500 | 19,774 | |
| ASM Pacific Technology | |||
| Ltd. | 1,064,800 | 9,235 | |
| Cathay Pacific Airways | |||
| Ltd. | 6,978,635 | 8,891 | |
| Value Partners Group | |||
| Ltd. | 10,332,000 | 7,706 | |
| ^ | Microport Scientific | ||
| Corp. | 5,415,000 | 6,465 | |
| Johnson Electric | |||
| Holdings Ltd. | 2,197,625 | 4,929 | |
| 57,000 | |||
| India (1.4%) | |||
| Container Corp. Of India | |||
| Ltd. | 1,541,754 | 13,225 | |
| Gujarat Pipavav Port Ltd. | 6,724,221 | 9,099 | |
| Zee Entertainment | |||
| Enterprises Ltd. | 1,446,958 | 8,832 | |
| Apollo Hospitals | |||
| Enterprise Ltd. | 482,865 | 7,460 | |
| Edelweiss Financial | |||
| Services Ltd. | 3,004,200 | 6,596 | |
| Indiabulls Housing | |||
| Finance Ltd. | 526,100 | 5,934 | |
| Multi Commodity | |||
| Exchange of India Ltd. | 205,558 | 1,955 | |
| 53,101 | |||
| Indonesia (0.0%) | |||
| Tower Bersama | |||
| Infrastructure Tbk PT | 2,782,300 | 856 | |
| Ireland (2.4%) | |||
| Dalata Hotel Group plc | 5,644,800 | 34,889 | |
| Smurfit Kappa Group plc | 750,000 | 24,383 | |
| Irish Continental Group | |||
| plc | 1,923,000 | 11,330 | |
| Irish Residential | |||
| Properties REIT plc | 6,500,000 | 10,477 | |
| Origin Enterprises plc | 1,075,000 | 6,914 | |
| 87,993 | |||
| Italy (7.7%) | |||
| 2 | Anima Holding SPA | 7,564,547 | 31,632 |
| Maire Tecnimont SPA | 6,000,000 | 26,228 | |
| Cerved Group SPA | 3,042,623 | 24,265 | |
| Interpump Group SPA | 785,935 | 22,674 | |
| Recordati SPA | 500,000 | 16,927 | |
| *,2 | Pirelli & C SPA | 2,250,000 | 16,535 |
| Salvatore Ferragamo | |||
| SPA | 633,586 | 14,987 | |
| Autogrill SPA | 1,473,792 | 14,490 | |
| DiaSorin SPA | 145,626 | 13,813 | |
| 2 | doBank SPA | 1,122,330 | 12,371 |
| 2, ^ Gima TT SPA | 1,191,877 | 11,596 | |
| Banca Generali SPA | 525,000 | 10,109 | |
| Amplifon SPA | 504,800 | 8,942 | |
16
| International Explorer Fund | |||
| Market | |||
| Value• | |||
| Shares | ($000) | ||
| FinecoBank Banca | |||
| Fineco SPA | 711,500 | 7,436 | |
| Buzzi Unicem SPA | 384,482 | 7,383 | |
| *,2, ^ OVS SPA | 4,164,512 | 7,354 | |
| Brunello Cucinelli SPA | 212,353 | 7,269 | |
| Datalogic SPA | 213,700 | 6,276 | |
| Credito Emiliano SPA | 1,000,000 | 5,964 | |
| Tamburi Investment | |||
| Partners SPA | 846,800 | 5,517 | |
| 2 | Banca Sistema SPA | 2,600,000 | 4,944 |
| Tod’s SPA | 54,967 | 3,361 | |
| *,2 | Piovan SPA | 235,471 | 2,347 |
| 282,420 | |||
| Japan (25.7%) | |||
| Nippon Shinyaku Co. Ltd. | 695,770 | 39,973 | |
| Disco Corp. | 148,400 | 23,590 | |
| Tokai Tokyo Financial | |||
| Holdings Inc. | 4,470,400 | 23,078 | |
| Glory Ltd. | 968,100 | 22,544 | |
| Zenkoku Hosho Co. Ltd. | 614,155 | 22,266 | |
| Kureha Corp. | 336,900 | 21,651 | |
| Hitachi Transport System | |||
| Ltd. | 841,400 | 21,606 | |
| Sumitomo Forestry Co. | |||
| Ltd. | 1,404,100 | 20,835 | |
| Tsuruha Holdings Inc. | 190,500 | 19,883 | |
| Digital Garage Inc. | 680,900 | 18,621 | |
| Ai Holdings Corp. | 940,000 | 17,931 | |
| Koito Manufacturing Co. | |||
| Ltd. | 372,200 | 17,719 | |
| Trusco Nakayama Corp. | 682,800 | 17,228 | |
| Aica Kogyo Co. Ltd. | 577,600 | 17,195 | |
| Nabtesco Corp. | 750,600 | 16,476 | |
| Daifuku Co. Ltd. | 382,900 | 16,444 | |
| Nippon Densetsu Kogyo | |||
| Co. Ltd. | 807,600 | 16,330 | |
| Shinmaywa Industries Ltd. | 1,299,700 | 16,001 | |
| Nitta Corp. | 435,200 | 15,795 | |
| ABC-Mart Inc. | 270,100 | 15,791 | |
| Horiba Ltd. | 333,800 | 15,622 | |
| Nifco Inc. | 681,200 | 15,524 | |
| IHI Corp. | 423,124 | 15,479 | |
| Sugi Holdings Co. Ltd. | 324,800 | 14,871 | |
| Musashi Seimitsu Industry | |||
| Co. Ltd. | 1,017,400 | 14,848 | |
| Izumi Co. Ltd. | 267,400 | 14,518 | |
| SCSK Corp. | 339,200 | 14,374 | |
| Kakaku.com Inc. | 793,000 | 14,363 | |
| Nishi-Nippon Financial | |||
| Holdings Inc. | 1,464,100 | 13,913 | |
| Toyo Tire & Rubber Co. | |||
| Ltd. | 764,900 | 12,760 | |
| Arcs Co. Ltd. | 525,100 | 12,689 | |
| DMG Mori Co. Ltd. | 863,400 | 12,457 | |
| Open House Co. Ltd. | 298,800 | 11,810 | ||
| Pola Orbis Holdings Inc. | 414,200 | 11,065 | ||
| en-japan Inc. | 277,100 | 11,053 | ||
| Persol Holdings Co. Ltd. | 563,900 | 10,698 | ||
| Kobe Steel Ltd. | 1,308,800 | 10,523 | ||
| OBIC Business | ||||
| Consultants Co. Ltd. | 131,300 | 10,494 | ||
| Sanwa Holdings Corp. | 843,990 | 9,904 | ||
| Miura Co. Ltd. | 381,100 | 9,307 | ||
| Asahi Intecc Co. Ltd. | 223,503 | 9,153 | ||
| Kyudenko Corp. | 248,730 | 9,050 | ||
| Lintec Corp. | 382,200 | 9,045 | ||
| TechnoPro Holdings Inc. | 167,500 | 8,726 | ||
| Kissei Pharmaceutical Co. | ||||
| Ltd. | 303,100 | 8,709 | ||
| JSP Corp. | 439,100 | 8,672 | ||
| Unipres Corp. | 480,000 | 8,586 | ||
| EPS Holdings Inc. | 417,900 | 8,160 | ||
| Jamco Corp. | 286,200 | 8,097 | ||
| Japan Lifeline Co. Ltd. | 550,000 | 8,018 | ||
| Dip Corp. | 367,600 | 7,978 | ||
| Benefit One Inc. | 303,200 | 7,816 | ||
| Ferrotec Holdings Corp. | 831,600 | 7,548 | ||
| TPR Co. Ltd. | 308,800 | 7,521 | ||
| Kyowa Exeo Corp. | 278,300 | 7,502 | ||
| Tokyo Steel Manufacturing | ||||
| Co. Ltd. | 917,700 | 7,236 | ||
| Nippon Yusen KK | 443,400 | 7,150 | ||
| Ichigo Inc. | 2,171,930 | 7,091 | ||
| Iriso Electronics Co. Ltd. | 165,300 | 6,981 | ||
| Daikyonishikawa Corp. | 711,000 | 6,792 | ||
| KH Neochem Co. Ltd. | 237,100 | 6,734 | ||
| ^ | Aruhi Corp. | 391,200 | 6,673 | |
| JGC Corp. | 330,900 | 6,405 | ||
| NEC Networks & System | ||||
| Integration Corp. | 285,400 | 6,221 | ||
| Nihon Parkerizing Co. Ltd. | 511,900 | 6,182 | ||
| Fukushima Industries Corp. | 130,700 | 5,953 | ||
| H2O Retailing Corp. | 381,700 | 5,931 | ||
| Daibiru Corp. | 571,100 | 5,757 | ||
| Obara Group Inc. | 144,600 | 5,685 | ||
| Itoham Yonekyu Holdings | ||||
| Inc. | 882,700 | 5,559 | ||
| Eagle Industry Co. Ltd. | 471,000 | 5,488 | ||
| Kumiai Chemical Industry | ||||
| Co. Ltd. | 830,500 | 5,170 | ||
| Yokogawa Bridge Holdings | ||||
| Corp. | 315,800 | 5,123 | ||
| Hitachi Metals Ltd. | 410,800 | 4,831 | ||
| San-In Godo Bank Ltd. | 624,800 | 4,741 | ||
| Kenedix Inc. | 903,900 | 4,705 | ||
| ^ | Harmonic Drive Systems | |||
| Inc. | 149,400 | 4,542 | ||
17
| International Explorer Fund | |||
| Market | |||
| Value• | |||
| Shares | ($000) | ||
| Kanto Denka Kogyo Co. | |||
| Ltd. | 459,000 | 4,168 | |
| ^ | Mirait Holdings Corp. | 255,700 | 4,129 |
| Nihon M&A Center Inc. | 156,200 | 3,743 | |
| Warabeya Nichiyo | |||
| Holdings Co. Ltd. | 225,000 | 3,658 | |
| *,^ | M&A Capital Partners Co. | ||
| Ltd. | 65,900 | 3,241 | |
| Tsutsumi Jewelry Co. Ltd. 137,700 | 2,705 | ||
| Tokyo Kiraboshi Financial | |||
| Group Inc. | 120,045 | 1,939 | |
| Tokyo Ohka Kogyo Co. Ltd. 70,980 | 1,901 | ||
| 938,244 | |||
| Malaysia (0.2%) | |||
| AirAsia Group Bhd. | 9,865,000 | 6,198 | |
| Mexico (0.3%) | |||
| Grupo Aeroportuario | |||
| del Pacifico SAB de | |||
| CV Class B | 1,021,243 | 8,449 | |
| Regional SAB de CV | 742,100 | 3,614 | |
| 12,063 | |||
| Netherlands (5.2%) | |||
| AMG Advanced | |||
| Metallurgical Group NV | 700,000 | 33,305 | |
| * | OCI NV | 1,021,995 | 29,038 |
| *,^ | Fugro NV | 2,125,000 | 27,302 |
| TKH Group NV | 437,500 | 22,099 | |
| SIF Holding NV | 975,000 | 16,325 | |
| *,2 | Basic-Fit NV | 550,000 | 15,836 |
| Van Lanschot Kempen NV | 600,000 | 14,696 | |
| 2 | NIBC Holding NV | 1,250,000 | 11,378 |
| IMCD NV | 166,880 | 11,317 | |
| Kendrion NV | 235,517 | 7,123 | |
| 188,419 | |||
| New Zealand (0.3%) | |||
| * | Fletcher Building Ltd. | 2,542,263 | 10,070 |
| Fisher & Paykel | |||
| Healthcare Corp. Ltd. | 267,800 | 2,382 | |
| 12,452 | |||
| Norway (0.8%) | |||
| Kongsberg Gruppen ASA | 963,831 | 15,826 | |
| *,2 | Elkem ASA | 2,640,235 | 7,842 |
| Borregaard ASA | 625,000 | 5,629 | |
| 29,297 | |||
| Other (0.7%) | |||
| ^,3 | Vanguard FTSE All World | ||
| ex-US Small-Cap ETF | 249,010 | 25,105 | |
| Singapore (0.4%) | |||
| Jardine Cycle & Carriage | |||
| Ltd. | 439,400 | 9,623 | |
| First Resources Ltd. | 5,709,600 | 6,511 | |
| 16,134 | |||
| South Africa (0.2%) | |||
| Reinet Investments SCA | 369,347 | 6,401 | |
| South Korea (2.4%) | |||
| NCSoft Corp. | 85,767 | 32,416 | |
| Medy-Tox Inc. | 26,248 | 10,753 | |
| 2, ^ Netmarble Corp. | 108,850 | 10,751 | |
| SK Holdings Co. Ltd. | 30,185 | 6,950 | |
| ^ | Mando Corp. | 220,700 | 5,938 |
| Nexen Tire Corp. | 782,668 | 5,614 | |
| Hankook Tire Co. Ltd. | 146,228 | 5,319 | |
| Samsung Securities Co. | |||
| Ltd. | 222,814 | 5,264 | |
| *,^ | Korea Aerospace | ||
| Industries Ltd. | 127,782 | 3,255 | |
| 86,260 | |||
| Spain (1.9%) | |||
| *,2 | Aedas Homes SAU | 500,000 | 12,943 |
| 2 | Prosegur Cash SA | 6,000,000 | 11,885 |
| Prosegur Cia de | |||
| Seguridad SA | 2,067,400 | 11,482 | |
| CIE Automotive SA | 362,357 | 9,590 | |
| Melia Hotels International | |||
| SA | 921,454 | 9,469 | |
| Viscofan SA | 146,200 | 8,745 | |
| Bolsas y Mercados | |||
| Espanoles SHMSF SA | 66,600 | 1,970 | |
| Global Dominion Access | |||
| SA | 316,774 | 1,692 | |
| 67,776 | |||
| Sweden (2.2%) | |||
| 2 | Ahlsell AB | 5,687,379 | 28,786 |
| Modern Times Group | |||
| MTG AB Class B | 442,300 | 16,327 | |
| Loomis AB Class B | 375,000 | 11,595 | |
| Concentric AB | 508,285 | 6,821 | |
| ^ | Hoist Finance AB | 766,600 | 6,148 |
| * | Cellavision AB | 150,171 | 4,195 |
| ^ | Alimak Group AB | 263,000 | 3,702 |
| Troax Group AB | 83,300 | 2,311 | |
| 79,885 | |||
| Switzerland (3.2%) | |||
| OC Oerlikon Corp. AG | 2,208,100 | 26,279 | |
| Ascom Holding AG | 951,900 | 15,181 | |
| ^ | Dufry AG | 120,742 | 13,605 |
| Logitech International SA | 362,500 | 13,421 | |
| Helvetia Holding AG | 20,000 | 12,251 | |
| u-blox Holding AG | 73,907 | 9,261 | |
| ^ | Comet Holding AG | 85,000 | 8,587 |
| VAT Group AG | 82,100 | 8,238 | |
| Daetwyler Holding AG | 44,000 | 6,680 | |
| ams AG | 86,899 | 3,385 | |
| 116,888 | |||
18
| International Explorer Fund | |||
| Market | |||
| Value• | |||
| Shares | ($000) | ||
| Taiwan (1.1%) | |||
| Chroma ATE Inc. | 4,625,700 | 16,295 | |
| Giant Manufacturing Co. | |||
| Ltd. | 1,785,000 | 6,832 | |
| CTCI Corp. | 4,336,000 | 6,123 | |
| Gourmet Master Co. Ltd. | 989,217 | 6,000 | |
| Nien Made Enterprise Co. | |||
| Ltd. | 722,000 | 4,478 | |
| 39,728 | |||
| United Arab Emirates (0.0%) | |||
| * | Lamprell plc | 1,214,295 | 978 |
| United Kingdom (14.7%) | |||
| B&M European Value | |||
| Retail SA | 3,936,728 | 20,948 | |
| Elementis plc | 6,634,352 | 17,334 | |
| Grainger plc | 4,992,605 | 17,248 | |
| SSP Group plc | 1,850,000 | 15,773 | |
| DCC plc | 174,000 | 14,914 | |
| Cineworld Group plc | 3,850,000 | 14,473 | |
| Bodycote plc | 1,370,000 | 13,913 | |
| Rentokil Initial plc | 3,316,296 | 13,373 | |
| Dunelm Group plc | 1,730,000 | 13,184 | |
| Hikma Pharmaceuticals | |||
| plc | 538,635 | 13,065 | |
| ^ | Restaurant Group plc | 4,253,304 | 13,064 |
| RPC Group plc | 1,302,000 | 12,691 | |
| Electrocomponents plc | 1,601,700 | 12,681 | |
| HomeServe plc | 1,000,000 | 12,139 | |
| Coats Group plc | 11,630,000 | 11,936 | |
| Melrose Industries plc | 5,365,900 | 11,551 | |
| Cranswick plc | 310,000 | 11,445 | |
| Dechra Pharmaceuticals | |||
| plc | 390,000 | 11,395 | |
| Auto Trader Group plc | 2,151,300 | 11,241 | |
| UDG Healthcare plc | 1,235,800 | 9,967 | |
| ^ | Rhi Magnesita NV | 203,581 | 9,868 |
| Ted Baker plc | 420,000 | 9,831 | |
| Genus plc | 339,937 | 9,604 | |
| Tyman plc | 2,712,497 | 9,594 | |
| Ultra Electronics Holdings | |||
| plc | 520,575 | 9,569 | |
| Abcam plc | 590,745 | 9,056 | |
| Investec plc | 1,420,000 | 8,779 | |
| Halma plc | 500,000 | 8,485 | |
| Redrow plc | 1,210,000 | 8,170 | |
| Telecom Plus plc | 520,000 | 8,114 | |
| Sanne Group plc | 1,130,177 | 8,085 | |
| IG Group Holdings plc | 1,040,000 | 8,029 | |
| Keller Group plc | 951,780 | 7,872 | |
| Superdry plc | 749,889 | 7,737 | |
| Lancashire Holdings Ltd. 1,009,399 | 7,610 | ||
| Hill & Smith Holdings plc | 547,452 | 6,922 | |
| QinetiQ Group plc | 1,895,000 | 6,712 | |
| Consort Medical plc | 464,523 | 6,611 | |
| Northgate plc | 1,369,916 | 6,598 | |
| Volution Group plc | 2,890,481 | 6,395 | |
| ^ | Kier Group plc | 558,412 | 6,250 |
| * | ASOS plc | 87,729 | 6,112 |
| Hays plc | 2,865,013 | 6,000 | |
| Pets at Home Group plc | 4,250,000 | 5,968 | |
| Segro plc | 750,000 | 5,880 | |
| * | Cairn Homes plc | 3,516,310 | 5,645 |
| Howden Joinery | |||
| Group plc | 910,000 | 5,449 | |
| Eco Animal Health | |||
| Group plc | 1,086,431 | 5,313 | |
| Polypipe Group plc | 1,114,800 | 5,277 | |
| Hunting plc | 601,372 | 5,160 | |
| Crest Nicholson | |||
| Holdings plc | 1,125,000 | 4,894 | |
| Diploma plc | 281,600 | 4,722 | |
| LondonMetric Property | |||
| plc | 2,050,000 | 4,721 | |
| Photo-Me International | |||
| plc | 3,150,000 | 4,454 | |
| 2 | ConvaTec Group plc | 2,047,039 | 4,231 |
| Jupiter Fund | |||
| Management plc | 933,400 | 4,017 | |
| Just Group plc | 3,000,000 | 3,400 | |
| James Fisher & Sons plc | 141,368 | 3,060 | |
| Vesuvius plc | 436,161 | 3,026 | |
| Rotork plc | 751,800 | 2,879 | |
| Clarkson plc | 70,800 | 2,150 | |
| Soco International plc | 355,881 | 382 | |
| 534,966 | |||
| United States (0.2%) | |||
| Samsonite International | |||
| SA | 2,435,400 | 7,024 | |
| Total Common Stocks | |||
| (Cost $3,448,028) | 3,467,679 | ||
| Temporary Cash Investments (8.5%)1 | |||
| Money Market Fund (7.4%) | |||
| 4,5 | Vanguard Market | ||
| Liquidity Fund, | |||
| 2.308% | 2,700,694 | 270,069 | |
19
| International Explorer Fund | |||
| Face | Market | ||
| Amount | Value • | ||
| ($000) | ($000) | ||
| Repurchase Agreement (1.0%) | |||
| Goldman Sachs & Co. | |||
| 2.180%, 11/1/18 (Dated | |||
| 10/31/18, Repurchase Value | |||
| $37,002,000 collateralized | |||
| by Federal Home Loan | |||
| Mortgage Corp. | |||
| 3.500%–4.000%, | |||
| 5/01/28–2/01/48, and | |||
| Federal National Mortgage | |||
| Assn. 3.530%, 10/01/29, | |||
| with a value of | |||
| $37,740,000) | 37,000 | 37,000 | |
| U. S. Government and Agency Obligations (0.1%) | |||
| 6 | United States Treasury Bill, | ||
| 2.034%, 11/15/18 | 3,400 | 3,397 | |
| 6 | United States Treasury Bill, | ||
| 2.302%, 2/28/19 | 200 | 199 | |
| 3,596 | |||
| Total Temporary Cash Investments | |||
| (Cost $310,656) | 310,665 | ||
| Total Investments (103.5%) | |||
| (Cost $3,758,684) | 3,778,344 | ||
| Other Assets and Liabilities (-3.5%) | |||
| Other Assets7 | 30,700 | ||
| Liabilities 4 | (159,650) | ||
| (128,950) | |||
| Net Assets (100%) | |||
| Applicable to 204,336,353 outstanding | |||
| $.001 par value shares of beneficial | |||
| interest (unlimited authorization) | 3,649,394 | ||
| Net Asset Value Per Share | $17.86 | ||
| Amount | |
| ($000) | |
| Statement of Assets and Liabilities | |
| Assets | |
| Investments in Securities, at Value | |
| Unaffiliated Issuers | 3,483,170 |
| Affiliated Issuers | 295,174 |
| Total Investments in Securities | 3,778,344 |
| Investment in Vanguard | 210 |
| Receivables for Investment | |
| Securities Sold | 7,254 |
| Receivables for Accrued Income | 10,773 |
| Receivables for Capital Shares Issued | 1,276 |
| Variation Margin Receivable— | |
| Futures Contracts | 1,064 |
| Unrealized Appreciation— | |
| Forward Currency Contracts | 521 |
| Other Assets7 | 9,602 |
| Total Assets | 3,809,044 |
| Liabilities | |
| Payables for Investment Securities | |
| Purchased | 12,098 |
| Collateral for Securities on Loan | 136,202 |
| Payables to Investment Advisor | 2,103 |
| Payables for Capital Shares Redeemed | 3,821 |
| Payables to Vanguard | 3,465 |
| Variation Margin Payable— | |
| Futures Contracts | 18 |
| Unrealized Depreciation— | |
| Forward Currency Contracts | 1,943 |
| Total Liabilities | 159,650 |
| Net Assets | 3,649,394 |
20
International Explorer Fund
| At October 31, 2018, net assets consisted of: | |
| Amount | |
| ($000) | |
| Paid-in Capital | 3,410,786 |
| Total Distributable Earnings (Loss) | 238,608 |
| Net Assets | 3,649,394 |
• See Note A in Notes to Financial Statements.
* Non-income-producing security.
^ Includes partial security positions on loan to broker-dealers. The total value of securities on loan is $125,439,000.
§ Security value determined using significant unobservable inputs.
1 The fund invests a portion of its cash reserves in equity markets through the use of index futures contracts. After giving effect to futures investments, the fund’s effective common stock and temporary cash investment positions represent 96.3% and 7.2%, respectively, of net assets.
2 Security exempt from registration under Rule 144A of the Securities Act of 1933. Such securities may be sold in transactions exempt from registration, normally to qualified institutional buyers. At October 31, 2018, the aggregate value of these securities was $267,783,000, representing 7.3% of net assets.
3 Considered an affiliated company of the fund as the issuer is another member of The Vanguard Group.
4 Includes $136,202,000 of collateral received for securities on loan.
5 Affiliated money market fund available only to Vanguard funds and certain trusts and accounts managed by Vanguard. Rate shown is the 7-day yield.
6 Securities with a value of $2,497,000 have been segregated as initial margin for open futures contracts.
7 Cash of $1,130,000 has been segregated as collateral for open forward currency contracts.
ADR—American Depositary Receipt.
REIT—Real Estate Investment Trust.
| Derivative Financial Instruments Outstanding as of Period End | ||||
| Futures Contracts | ||||
| ($000) | ||||
| Value and | ||||
| Number of | Unrealized | |||
| Long (Short) | Notional | Appreciation | ||
| Expiration | Contracts | Amount | (Depreciation) | |
| Long Futures Contracts | ||||
| Topix Index | December 2018 | 114 | 16,580 | (1,395) |
| Dow Jones EURO STOXX 50 Index | December 2018 | 390 | 14,109 | (717) |
| FTSE 100 Index | December 2018 | 127 | 11,543 | (317) |
| S&P ASX 200 Index | December 2018 | 64 | 6,569 | (429) |
| (2,858) | ||||
21
| International Explorer Fund | ||||||
| Forward Currency Contracts | ||||||
| Unrealized | ||||||
| Contract | Appreciation | |||||
| Settlement | Contract Amount (000) | (Depreciation) | ||||
| Counterparty | Date | Receive | Deliver | ($000) | ||
| Citibank, N.A. | 12/18/18 | JPY | 2,603,030 | USD | 23,333 | (164) |
| JPMorgan Chase Bank, N.A. | 12/28/18 | EUR | 18,576 | USD | 21,851 | (694) |
| UBS AG | 12/28/18 | GBP | 12,722 | USD | 16,821 | (508) |
| Barclays Bank plc | 12/18/18 | JPY | 1,688,555 | USD | 15,261 | (231) |
| JPMorgan Chase Bank, N.A. | 12/27/18 | AUD | 13,713 | USD | 9,910 | (193) |
| Morgan Stanley Capital Services LLC | 12/28/18 | EUR | 2,429 | USD | 2,838 | (72) |
| Goldman Sachs International | 12/18/18 | JPY | 308,975 | USD | 2,726 | 24 |
| Citibank, N.A. | 12/28/18 | GBP | 1,495 | USD | 1,962 | (45) |
| Goldman Sachs International | 12/27/18 | AUD | 1,548 | USD | 1,119 | (22) |
| JPMorgan Chase Bank, N.A. | 12/18/18 | USD | 17,049 | JPY | 1,893,840 | 192 |
| UBS AG | 12/28/18 | USD | 3,431 | EUR | 2,922 | 103 |
| UBS AG | 12/28/18 | USD | 2,504 | GBP | 1,924 | 37 |
| Goldman Sachs International | 12/28/18 | USD | 2,339 | GBP | 1,805 | 25 |
| JPMorgan Chase Bank, N.A. | 12/28/18 | USD | 2,333 | EUR | 2,018 | 34 |
| Citibank, N.A. | 12/18/18 | USD | 1,777 | JPY | 200,750 | (10) |
| Goldman Sachs International | 12/18/18 | USD | 1,776 | JPY | 199,364 | 1 |
| BNP Paribas | 12/18/18 | USD | 1,720 | JPY | 192,060 | 11 |
| Citibank, N.A. | 12/28/18 | USD | 1,698 | EUR | 1,483 | 8 |
| BNP Paribas | 12/28/18 | USD | 1,653 | EUR | 1,443 | 10 |
| BNP Paribas | 12/28/18 | USD | 1,578 | GBP | 1,193 | 48 |
| JPMorgan Chase Bank, N.A. | 12/18/18 | USD | 1,276 | JPY | 143,480 | (1) |
| BNP Paribas | 12/27/18 | USD | 860 | AUD | 1,215 | (1) |
| JPMorgan Chase Bank, N.A. | 12/27/18 | USD | 819 | AUD | 1,159 | (2) |
| Goldman Sachs International | 12/27/18 | USD | 787 | AUD | 1,084 | 19 |
| Citibank, N.A. | 12/27/18 | USD | 703 | AUD | 991 | 1 |
| Citibank, N.A. | 12/28/18 | USD | 1,698 | EUR | 1,483 | 8 |
| (1,422) | ||||||
| AUD—Australian dollar. | ||||||
| EUR—Euro. | ||||||
| GBP—British pound. | ||||||
| JPY—Japenese yen. | ||||||
| USD—U.S. dollar. | ||||||
See accompanying Notes, which are an integral part of the Financial Statements.
22
| International Explorer Fund | |
| Statement of Operations | |
| Year Ended | |
| October 31, 2018 | |
| ($000) | |
| Investment Income | |
| Income | |
| Dividends Received —Unaffiliated Issuers1 | 85,260 |
| Dividends—Affiliated Issuers | 777 |
| Interest Received—Unaffiliated Issuers | 592 |
| Interest—Affiliated Issuers | 2,851 |
| Securities Lending—Net | 3,392 |
| Total Income | 92,872 |
| Expenses | |
| Investment Advisory Fees—Note B | |
| Basic Fee | 9,450 |
| Performance Adjustment | (296) |
| The Vanguard Group—Note C | |
| Management and Administrative | 6,557 |
| Marketing and Distribution | 746 |
| Custodian Fees | 448 |
| Auditing Fees | 39 |
| Shareholders’ Reports and Proxy | 119 |
| Trustees’ Fees and Expenses | 7 |
| Total Expenses | 17,070 |
| Expenses Paid Indirectly | (80) |
| Net Expenses | 16,990 |
| Net Investment Income | 75,882 |
| Realized Net Gain (Loss) | |
| Investment Securities Sold—Unaffiliated Issuers | 254,485 |
| Investment Securities Sold—Affiliated Issuers | (18) |
| Futures Contracts | 1,013 |
| Forward Currency Contracts | (4,482) |
| Foreign Currencies | (2,318) |
| Realized Net Gain (Loss) | 248,680 |
| Change in Unrealized Appreciation (Depreciation) | |
| Investment Securities—Unaffiliated Issuers | (888,843) |
| Investment Securities—Affiliated Issuers | (3,917) |
| Futures Contracts | (6,253) |
| Forward Currency Contracts | 724 |
| Foreign Currencies | 400 |
| Change in Unrealized Appreciation (Depreciation) | (897,889) |
| Net Increase (Decrease) in Net Assets Resulting from Operations | (573,327) |
| 1 Dividends are net of foreign withholding taxes of $6,620,000. | |
| See accompanying Notes, which are an integral part of the Financial Statements. | |
23
| International Explorer Fund | ||
| Statement of Changes in Net Assets | ||
| Year Ended October 31, | ||
| 2018 | 2017 | |
| ($000) | ($000) | |
| Increase (Decrease) in Net Assets | ||
| Operations | ||
| Net Investment Income | 75,882 | 56,421 |
| Realized Net Gain (Loss) | 248,680 | 201,076 |
| Change in Unrealized Appreciation (Depreciation) | (897,889) | 648,383 |
| Net Increase (Decrease) in Net Assets Resulting from Operations | (573,327) | 905,880 |
| Distributions | ||
| Net Investment Income | (83,340) | (52,250) |
| Realized Capital Gain1 | (167,556) | — |
| Total Distributions | (250,896) | (52,250) |
| Capital Share Transactions | ||
| Issued | 1,249,140 | 810,710 |
| Issued in Lieu of Cash Distributions | 228,661 | 47,014 |
| Redeemed | (984,248) | (559,993) |
| Net Increase (Decrease) from Capital Share Transactions | 493,553 | 297,731 |
| Total Increase (Decrease) | (330,670) | 1,151,361 |
| Net Assets | ||
| Beginning of Period | 3,980,064 | 2,828,703 |
| End of Period | 3,649,394 | 3,980,064 |
1 Includes fiscal 2018 and 2017 short-term gain distributions totaling $38,075,000 and $0, respectively. Short-term gain distributions are treated as ordinary income dividends for tax purposes.
See accompanying Notes, which are an integral part of the Financial Statements.
24
| International Explorer Fund | |||||
| Financial Highlights | |||||
| For a Share Outstanding | Year Ended October 31, | ||||
| Throughout Each Period | 2018 | 2017 | 2016 | 2015 | 2014 |
| Net Asset Value, Beginning of Period | $21.87 | $16.82 | $17.76 | $18.26 | $18.50 |
| Investment Operations | |||||
| Net Investment Income | . 3691 | . 3331 | .318 | .287 | .335 |
| Net Realized and Unrealized Gain (Loss) | |||||
| on Investments | (3.032) | 5.035 | (.334) | .635 | .133 |
| Total from Investment Operations | (2.663) | 5.368 | (.016) | .922 | .468 |
| Distributions | |||||
| Dividends from Net Investment Income | (. 447) | (. 318) | (. 263) | (. 326) | (. 420) |
| Distributions from Realized Capital Gains | (.900) | — | (.661) | (1.096) | (.288) |
| Total Distributions | (1.347) | (.318) | (.924) | (1.422) | (.708) |
| Net Asset Value, End of Period | $17.86 | $21.87 | $16.82 | $17.76 | $18.26 |
| Total Return2 | -13.08% | 32.58% | -0.06% | 5.65% | 2.66% |
| Ratios/Supplemental Data | |||||
| Net Assets, End of Period (Millions) | $3,649 | $3,980 | $2,829 | $2,887 | $2,598 |
| Ratio of Total Expenses to Average Net Assets3 | 0.39% | 0.38% | 0.41% | 0.42% | 0.40% |
| Ratio of Net Investment Income to | |||||
| Average Net Assets | 1.75% | 1.68% | 1.83% | 1.53% | 1.69% |
| Portfolio Turnover Rate | 40% | 43% | 37% | 42% | 39% |
1 Calculated based on average shares outstanding.
2 Total returns do not include account service fees that may have applied in the periods shown. Fund prospectuses provide information about any applicable account service fees.
3 Includes performance-based investment advisory fee increases (decreases) of (0.01%), (0.01%), 0.00%, 0.00%, and 0.00%.
See accompanying Notes, which are an integral part of the Financial Statements.
25
International Explorer Fund
Notes to Financial Statements
Vanguard International Explorer Fund is registered under the Investment Company Act of 1940 as an open-end investment company, or mutual fund.
The fund invests in securities of foreign issuers, which may subject it to investment risks not normally associated with investing in securities of U.S. corporations. Further, at October 31, 2018, the fund had a concentration of its investments in securities issued in Japan, and the performance of such investments may be impacted by the country’s social, political, and economic conditions.
A. The following significant accounting policies conform to generally accepted accounting principles for U.S. investment companies. The fund consistently follows such policies in preparing its financial statements.
1. Security Valuation: Securities are valued as of the close of trading on the New York Stock Exchange (generally 4 p.m., Eastern time) on the valuation date. Equity securities are valued at the latest quoted sales prices or official closing prices taken from the primary market in which each security trades; such securities not traded on the valuation date are valued at the mean of the latest quoted bid and asked prices. Securities for which market quotations are not readily available, or whose values have been affected by events occurring before the fund’s pricing time but after the close of the securities’ primary markets, are valued at their fair values calculated according to procedures adopted by the board of trustees. These procedures include obtaining quotations from an independent pricing service, monitoring news to identify significant market- or security-specific events, and evaluating changes in the values of foreign market proxies (for example, ADRs, futures contracts, or exchange-traded funds), between the time the foreign markets close and the fund’s pricing time. When fair-value pricing is employed, the prices of securities used by a fund to calculate its net asset value may differ from quoted or published prices for the same securities. Investments in Vanguard Market Liquidity Fund are valued at that fund’s net asset value. Temporary cash investments are valued using the latest bid prices or using valuations based on a matrix system (which considers such factors as security prices, yields, maturities, and ratings), both as furnished by independent pricing services.
2. Foreign Currency: Securities and other assets and liabilities denominated in foreign currencies are translated into U.S. dollars using exchange rates obtained from an independent third party as of the fund’s pricing time on the valuation date. Realized gains (losses) and unrealized appreciation (depreciation) on investment securities include the effects of changes in exchange rates since the securities were purchased, combined with the effects of changes in security prices. Fluctuations in the value of other assets and liabilities resulting from changes in exchange rates are recorded as unrealized foreign currency gains (losses) until the assets or liabilities are settled in cash, at which time they are recorded as realized foreign currency gains (losses).
3. Futures and Forward Currency Contracts: The fund uses index futures contracts to a limited extent, with the objective of maintaining full exposure to the stock market while maintaining liquidity. The fund may purchase or sell futures contracts to achieve a desired level of investment, whether to accommodate portfolio turnover or cash flows from capital share transactions. The primary risks associated with the use of futures contracts are imperfect correlation between changes in market values of stocks held by the fund and the prices of futures contracts, and the possibility of an illiquid market. Counterparty risk involving futures is mitigated because a regulated clearinghouse is the counterparty instead of the clearing broker. To further mitigate counterparty risk, the fund trades futures contracts on an exchange, monitors the financial strength of its clearing brokers and clearinghouse, and has entered into clearing agreements with its clearing brokers. The
26
International Explorer Fund
clearinghouse imposes initial margin requirements to secure the fund’s performance and requires daily settlement of variation margin representing changes in the market value of each contract. Any assets pledged as initial margin for open contracts are noted in the Statement of Net Assets.
The fund enters into forward currency contracts to provide the appropriate currency exposure related to any open futures contracts or to protect the value of securities and related receivables and payables against changes in foreign exchange rates. The fund’s risks in using these contracts include movement in the values of the foreign currencies relative to the U.S. dollar and the ability of the counterparties to fulfill their obligations under the contracts. The fund mitigates its counterparty risk by entering into forward currency contracts only with a diverse group of prequalified counterparties, monitoring their financial strength, entering into master netting arrangements with its counterparties, and requiring its counterparties to transfer collateral as security for their performance. In the absence of a default, the collateral pledged or received by the fund cannot be repledged, resold, or rehypothecated. The master netting arrangements provide that, in the event of a counterparty’s default (including bankruptcy), the fund may terminate the forward currency contracts, determine the net amount owed by either party in accordance with its master netting arrangements, and sell or retain any collateral held up to the net amount owed to the fund under the master netting arrangements. The forward currency contracts contain provisions whereby a counterparty may terminate open contracts if the fund’s net assets decline below a certain level, triggering a payment by the fund if the fund is in a net liability position at the time of the termination. The payment amount would be reduced by any collateral the fund has pledged. Any assets pledged as collateral for open contracts are noted in the Statement of Net Assets. The value of collateral received or pledged is compared daily to the value of the forward currency contracts exposure with each counterparty, and any difference, if in excess of a specified minimum transfer amount, is adjusted and settled within two business days.
Futures contracts are valued at their quoted daily settlement prices. Forward currency contracts are valued at their quoted daily prices obtained from an independent third party, adjusted for currency risk based on the expiration date of each contract. The notional amounts of the contracts are not recorded in the Statement of Net Assets. Fluctuations in the value of the contracts are recorded in the Statement of Assets and Liabilities as an asset (liability) and in the Statement of Operations as unrealized appreciation (depreciation) until the contracts are closed, when they are recorded as realized gains (losses) on futures or forward currency contracts.
During the year ended October 31, 2018, the fund’s average investments in long and short futures contracts represented 2% and 0% of net assets, respectively, based on the average of the notional amounts at each quarter-end during the period. The fund’s average investment in forward currency contracts represented 6% of net assets, based on the average of the notional amounts at each quarter-end during the period.
4. Repurchase Agreements: The fund enters into repurchase agreements with institutional counterparties. Securities pledged as collateral to the fund under repurchase agreements are held by a custodian bank until the agreements mature, and in the absence of a default, such collateral cannot be repledged, resold, or rehypothecated. Each agreement requires that the market value of the collateral be sufficient to cover payments of interest and principal. The fund further mitigates its counterparty risk by entering into repurchase agreements only with a diverse group of prequalified counterparties, monitoring their financial strength, and entering into master repurchase agreements with its counterparties. The master repurchase agreements provide that, in the event of a
27
International Explorer Fund
counterparty’s default (including bankruptcy), the fund may terminate any repurchase agreements with that counterparty, determine the net amount owed, and sell or retain the collateral up to the net amount owed to the fund. Such action may be subject to legal proceedings, which may delay or limit the disposition of collateral.
5. Federal Income Taxes: The fund intends to continue to qualify as a regulated investment company and distribute all of its taxable income. Management has analyzed the fund’s tax positions taken for all open federal income tax years (October 31, 2015–2018), and has concluded that no provision for federal income tax is required in the fund’s financial statements.
6. Distributions: Distributions to shareholders are recorded on the ex-dividend date. Distributions are determined on a tax basis and may differ from net investment income and realized capital gains for financial reporting purposes.
7. Securities Lending: To earn additional income, the fund lends its securities to qualified institutional borrowers. Security loans are subject to termination by the fund at any time, and are required to be secured at all times by collateral in an amount at least equal to the market value of securities loaned. Daily market fluctuations could cause the value of loaned securities to be more or less than the value of the collateral received. When this occurs, the collateral is adjusted and settled before the opening of the market on the next business day. The fund further mitigates its counterparty risk by entering into securities lending transactions only with a diverse group of prequalified counterparties, monitoring their financial strength, and entering into master securities lending agreements with its counterparties. The master securities lending agreements provide that, in the event of a counterparty’s default (including bankruptcy), the fund may terminate any loans with that borrower, determine the net amount owed, and sell or retain the collateral up to the net amount owed to the fund; however, such actions may be subject to legal proceedings. While collateral mitigates counterparty risk, in the event of a default, the fund may experience delays and costs in recovering the securities loaned. The fund invests cash collateral received in Vanguard Market Liquidity Fund, and records a liability in the Statement of Assets and Liabilities for the return of the collateral, during the period the securities are on loan. Securities lending income represents fees charged to borrowers plus income earned on invested cash collateral, less expenses associated with the loan. During the term of the loan, the fund is entitled to all distributions made on or in respect of the loaned securities.
8. Credit Facility: The fund and certain other funds managed by The Vanguard Group (“Vanguard”) participate in a $3.1 billion committed credit facility provided by a syndicate of lenders pursuant to a credit agreement that may be renewed annually; each fund is individually liable for its borrowings, if any, under the credit facility. Borrowings may be utilized for temporary and emergency purposes, and are subject to the fund’s regulatory and contractual borrowing restrictions. The participating funds are charged administrative fees and an annual commitment fee of 0.10% of the undrawn amount of the facility; these fees are allocated to the funds based on a method approved by the fund’s board of trustees and included in Management and Administrative expenses on the fund’s Statement of Operations. Any borrowings under this facility bear interest at a rate based upon the higher of the one-month London Interbank Offered Rate, federal funds effective rate, or overnight bank funding rate plus an agreed-upon spread.
The fund had no borrowings outstanding at October 31, 2018, or at any time during the period then ended.
28
International Explorer Fund
9. Other: Dividend income is recorded on the ex-dividend date. Interest income includes income distributions received from Vanguard Market Liquidity Fund and is accrued daily. Premiums and discounts on debt securities purchased are amortized and accreted, respectively, to interest income over the lives of the respective securities. Security transactions are accounted for on the date securities are bought or sold. Costs used to determine realized gains (losses) on the sale of investment securities are those of the specific securities sold.
Taxes on foreign dividends and capital gains have been provided for in accordance with the fund’s understanding of the applicable countries’ tax rules and rates. Foreign capital gains tax is accrued daily based upon net unrealized gains. The fund has filed tax reclaims for previously withheld taxes on dividends earned in certain European Union countries. These filings are subject to various administrative and judicial proceedings within these countries. Such tax reclaims received during the year, if any, are included in dividend income. No other amounts for additional tax reclaims are reflected in the financial statements due to the uncertainty as to the ultimate resolution of proceedings, the likelihood of receipt of these reclaims, and the potential timing of payment.
B. The investment advisory firms Schroder Investment Management North America Inc., Wellington Management Company LLP, and TimesSquare Capital Management, LLC, each provide investment advisory services to a portion of the fund for a fee calculated at an annual percentage rate of average net assets managed by the advisor. The basic fee of Schroder Investment Management North America Inc. and Wellington Management Company LLP is subject to quarterly adjustments based on performance relative to the S&P EPAC SmallCap Index for the preceding three years. In accordance with the advisory contract entered into with TimesSquare Capital Management, LLC, beginning November 1, 2018, the investment advisory fee will be subject to quarterly adjustments based on performance relative to the S&P EPAC SmallCap Index since October 31, 2017.
Vanguard manages the cash reserves of the fund as described below.
For the year ended October 31, 2018, the aggregate investment advisory fee represented an effective annual basic rate of 0.22% of the fund’s average net assets, before a decrease of $296,000 (0.01%) based on performance.
C. In accordance with the terms of a Funds’ Service Agreement (the “FSA”) between Vanguard and the fund, Vanguard furnishes to the fund corporate management, administrative, marketing, distribution, and cash management services at Vanguard’s cost of operations (as defined by the FSA). These costs of operations are allocated to the fund based on methods and guidelines approved by the board of trustees. Vanguard does not require reimbursement in the current period for certain costs of operations (such as deferred compensation/benefits and risk/insurance costs); the fund’s liability for these costs of operations is included in Payables to Vanguard on the Statement of Assets and Liabilities. All other costs of operations payable to Vanguard are generally settled twice a month.
Upon the request of Vanguard, the fund may invest up to 0.40% of its net assets as capital in Vanguard. At October 31, 2018, the fund had contributed to Vanguard capital in the amount of $210,000, representing 0.01% of the fund’s net assets and 0.08% of Vanguard’s capitalization. The fund’s trustees and officers are also directors and employees, respectively, of Vanguard.
29
International Explorer Fund
D. The fund’s custodian bank has agreed to reduce its fees when the fund maintains cash on deposit in the non-interest-bearing custody account. For the year ended October 31, 2018, custodian fee offset arrangements reduced the fund’s expenses by $80,000 (an annual rate of 0.00% of average net assets).
E. Various inputs may be used to determine the value of the fund’s investments. These inputs are summarized in three broad levels for financial statement purposes. The inputs or methodologies used to value securities are not necessarily an indication of the risk associated with investing in those securities.
Level 1—Quoted prices in active markets for identical securities.
Level 2—Other significant observable inputs (including quoted prices for similar securities, interest rates, prepayment speeds, credit risk, etc.).
Level 3—Significant unobservable inputs (including the fund’s own assumptions used to determine the fair value of investments). Any investments valued with significant unobservable inputs are noted on the Statement of Net Assets.
The following table summarizes the market value of the fund’s investments as of October 31, 2018, based on the inputs used to value them:
| Level 1 | Level 2 | Level 3 | |
| Investments | ($000) | ($000) | ($000) |
| Common Stocks | 84,942 | 3,382,737 | — |
| Temporary Cash Investments | 270,069 | 40,596 | — |
| Futures Contracts—Assets1 | 1,064 | — | — |
| Futures Contracts—Liabilities1 | (18) | — | — |
| Forward Currency Contracts—Assets | — | 521 | — |
| Forward Currency Contracts—Liabilities | — | (1,943) | — |
| Total | 356,057 | 3,421,911 | — |
| 1 Represents variation margin on the last day of the reporting period. |
F. At October 31, 2018, the fair values of derivatives were reflected in the Statement of Assets and Liabilities as follows:
| Foreign | |||
| Equity | Exchange | ||
| Contracts | Contracts | Total | |
| Statement of Assets and Liabilities Caption | ($000) | ($000) | ($000) |
| Variation Margin Receivable—Futures Contracts | 1,064 | — | 1,064 |
| Unrealized Appreciation—Forward Currency Contracts | — | 521 | 521 |
| Total Assets | 1,064 | 521 | 1,585 |
| Variation Margin Payable—Futures Contracts | (18) | — | (18) |
| Unrealized Depreciation—Forward Currency Contracts | — | (1,943) | (1,943) |
| Total Liabilities | (18) | (1,943) | (1,961) |
30
International Explorer Fund
Realized net gain (loss) and the change in unrealized appreciation (depreciation) on derivatives for the year ended October 31, 2018, were:
| Foreign | |||
| Equity | Exchange | ||
| Contracts | Contracts | Total | |
| Realized Net Gain (Loss) on Derivatives | ($000) | ($000) | ($000) |
| Futures Contracts | 1,013 | — | 1,013 |
| Forward Currency Contracts | — | (4,482) | (4,482) |
| Realized Net Gain (Loss) on Derivatives | 1,013 | (4,482) | (3,469) |
| Change in Unrealized Appreciation (Depreciation) on Derivatives | |||
| Futures Contracts | (6,253) | — | (6,253) |
| Forward Currency Contracts | — | 724 | 724 |
| Change in Unrealized Appreciation (Depreciation) on Derivatives | (6,253) | 724 | (5,529) |
G. Permanent differences between book-basis and tax-basis components of net assets are reclassified among capital accounts in the financial statements to reflect their tax character. These reclassifications have no effect on net assets or net asset value per share. As of period end, the following permanent differences primarily attributable to the accounting for foreign currency transactions, passive foreign investment companies, distributions in connection with fund share redemptions, and tax expense on capital gains were reclassified to the following accounts:
| Amount | |
| ($000) | |
| Paid-in Capital | 40,340 |
| Total Distributable Earnings (Loss) | (40,340) |
Temporary differences between book-basis and tax-basis components of total distributable earnings (loss) arise when certain items of income, gain, or loss are recognized in different periods for financial statement and tax purposes; these differences will reverse at some time in the future. The differences are primarily related to the tax deferral of losses on wash sales and the realization of unrealized gains or losses on certain futures contracts and forward currency contracts and the unrealized gains on passive foreign investment companies. As of period end, the tax-basis components of total distributable earnings (loss) are detailed in the table as follows:
| Amount | |
| ($000) | |
| Undistributed Ordinary Income | 90,011 |
| Undistributed Long-Term Gains | 167,765 |
| Capital Loss Carryforwards (Non-expiring) | — |
| Net Unrealized Gains (Losses) | (16,032) |
31
International Explorer Fund
As of October 31, 2018, gross unrealized appreciation and depreciation for investments and derivatives based on cost for U.S. federal income tax purposes were as follows:
| Amount | |
| ($000) | |
| Tax Cost | 3,792,238 |
| Gross Unrealized Appreciation | 467,861 |
| Gross Unrealized Depreciation | (483,579) |
| Net Unrealized Appreciation (Depreciation) | (15,718) |
H. During the year ended October 31, 2018, the fund purchased $2,037,274,000 of investment securities and sold $1,645,624,000 of investment securities, other than temporary cash investments.
| I. Capital shares issued and redeemed were: | ||
| Year Ended October 31, | ||
| 2018 | 2017 | |
| Shares | Shares | |
| (000) | (000) | |
| Issued | 58,614 | 41,710 |
| Issued in Lieu of Cash Distributions | 10,930 | 2,904 |
| Redeemed | (47,185) | (30,798) |
| Net Increase (Decrease) in Shares Outstanding | 22,359 | 13,816 |
J. Transactions during the period in investments where the issuer is another member of The Vanguard Group were as follows:
| Current Period Transactions | ||||||||
| Oct. 31, | Proceeds | Realized | Oct. 31, | |||||
| 2017 | from | Net | Change in | Capital Gain | 2018 | |||
| Market | Purchases | Securities | Gain | Unrealized | Distributions | Market | ||
| Value | at Cost | Sold | (Loss) | App. (Dep.) | Income | Received | Value | |
| ($000) | ($000) | ($000) | ($000) | ($000) | ($000) | ($000) | ($000) | |
| Vanguard FTSE All | ||||||||
| World ex-US | ||||||||
| Small-Cap ETF | 29,042 | — | — | — | (3,937) | 777 | — | 25,105 |
| Vanguard Market | ||||||||
| Liquidity | 348,467 | NA1 | NA1 | (18) | 20 | 2,851 | — | 270,069 |
| Total | 377,509 | (18) | (3,917) | 3,628 | — | 295,174 | ||
| 1 Not applicable—purchases and sales are for temporary cash investment purposes. | ||||||||
K. Management has determined that no events or transactions occurred subsequent to October 31, 2018, that would require recognition or disclosure in these financial statements.
32
Report of Independent Registered Public Accounting Firm
To the Board of Trustees of Vanguard Whitehall Funds and Shareholders of Vanguard International Explorer Fund
Opinion on the Financial Statements
We have audited the accompanying statement of net assets and statement of assets and liabilities of Vanguard International Explorer Fund (one of the funds constituting Vanguard Whitehall Funds, referred to hereafter as the “Fund”) as of October 31, 2018, the related statement of operations for the year ended October 31, 2018, the statement of changes in net assets for each of the two years in the period ended October 31, 2018, including the related notes, and the financial highlights for each of the five years in the period ended October 31, 2018 (collectively referred to as the “financial statements”). In our opinion, the financial statements present fairly, in all material respects, the financial position of the Fund as of October 31, 2018, the results of its operations for the year then ended, the changes in its net assets for each of the two years in the period ended October 31, 2018 and the financial highlights for each of the five years in the period ended October 31, 2018 in conformity with accounting principles generally accepted in the United States of America.
Basis for Opinion
These financial statements are the responsibility of the Fund’s management. Our responsibility is to express an opinion on the Fund’s financial statements based on our audits. We are a public accounting firm registered with the Public Company Accounting Oversight Board (United States) (“PCAOB”) and are required to be independent with respect to the Fund in accordance with the U.S. federal securities laws and the applicable rules and regulations of the Securities and Exchange Commission and the PCAOB.
We conducted our audits of these financial statements in accordance with the standards of the PCAOB. Those standards require that we plan and perform the audit to obtain reasonable assurance about whether the financial statements are free of material misstatement, whether due to error or fraud.
Our audits included performing procedures to assess the risks of material misstatement of the financial statements, whether due to error or fraud, and performing procedures that respond to those risks. Such procedures included examining, on a test basis, evidence regarding the amounts and disclosures in the financial statements. Our audits also included evaluating the accounting principles used and significant estimates made by management, as well as evaluating the overall presentation of the financial statements. Our procedures included confirmation of securities owned as of October 31, 2018 by correspondence with the custodian and brokers and by agreement to the underlying ownership records of the transfer agent; when replies were not received from brokers, we performed other auditing procedures. We believe that our audits provide a reasonable basis for our opinion.
/s/PricewaterhouseCoopers LLP
Philadelphia, Pennsylvania
December 18, 2018
We have served as the auditor of one or more investment companies in The Vanguard Group of Funds since 1975.
33
Special 2018 tax information (unaudited) for Vanguard International Explorer Fund
This information for the fiscal year ended October 31, 2018, is included pursuant to provisions of the Internal Revenue Code.
The fund distributed $158,441,000 as capital gain dividends (20% rate gain distributions) to shareholders during the fiscal year.
For nonresident alien shareholders, 100% of short-term capital gain dividends distributed by the fund are qualified short-term capital gains.
The fund distributed $55,471,000 of qualified dividend income to shareholders during the fiscal year.
The fund designates to shareholders foreign source income of $86,186,000 and foreign taxes paid of $6,292,000. Shareholders will receive more detailed information with their Form 1099-DIV in January 2019 to determine the calendar-year amounts to be included on their 2018 tax returns.
34
Your Fund’s After-Tax Returns
This table presents returns for your fund both before and after taxes. The after-tax returns are shown in two ways: (1) assuming that an investor owned the fund during the entire period and paid taxes on the fund’s distributions, and (2) assuming that an investor paid taxes on the fund’s distributions and sold all shares at the end of each period.
Calculations are based on the highest individual federal income tax and capital gains tax rates in effect at the times of the distributions and the hypothetical sales. State and local taxes were not considered. After-tax returns reflect any qualified dividend income, using actual prior-year figures and estimates for 2018. (In the example, returns after the sale of fund shares may be higher than those assuming no sale. This occurs when the sale would have produced a capital loss. The calculation assumes that the investor received a tax deduction for the loss.)
Please note that your actual after-tax returns will depend on your tax situation and may differ from those shown. Also note that if you own the fund in a tax-deferred account, such as an individual retirement account or a 401(k) plan, this information does not apply to you. Such accounts are not subject to current taxes.
Finally, keep in mind that a fund’s performance—whether before or after taxes—does not guarantee future results.
| Average Annual Total Returns: International Explorer Fund | |||
| Periods Ended October 31, 2018 | |||
| One | Five | Ten | |
| Year | Years | Years | |
| Returns Before Taxes | -13.08% | 4.55% | 10.77% |
| Returns After Taxes on Distributions | -14.54 | 3.19 | 9.86 |
| Returns After Taxes on Distributions and Sale of Fund Shares | -6.79 | 3.36 | 8.85 |
35
About Your Fund’s Expenses
As a shareholder of the fund, you incur ongoing costs, which include costs for portfolio management, administrative services, and shareholder reports (like this one), among others. Operating expenses, which are deducted from a fund’s gross income, directly reduce the investment return of the fund.
A fund’s expenses are expressed as a percentage of its average net assets. This figure is known as the expense ratio. The following examples are intended to help you understand the ongoing costs (in dollars) of investing in your fund and to compare these costs with those of other mutual funds. The examples are based on an investment of $1,000 made at the beginning of the period shown and held for the entire period.
The accompanying table illustrates your fund’s costs in two ways:
• Based on actual fund return. This section helps you to estimate the actual expenses that you paid over the period. The ”Ending Account Value“ shown is derived from the fund‘s actual return, and the third column shows the dollar amount that would have been paid by an investor who started with $1,000 in the fund. You may use the information here, together with the amount you invested, to estimate the expenses that you paid over the period.
To do so, simply divide your account value by $1,000 (for example, an $8,600 account value divided by $1,000 = 8.6), then multiply the result by the number given for your fund under the heading ”Expenses Paid During Period.“
• Based on hypothetical 5% yearly return. This section is intended to help you compare your fund‘s costs with those of other mutual funds. It assumes that the fund had a yearly return of 5% before expenses, but that the expense ratio is unchanged. In this case—because the return used is not the fund’s actual return—the results do not apply to your investment. The example is useful in making comparisons because the Securities and Exchange Commission requires all mutual funds to calculate expenses based on a 5% return. You can assess your fund’s costs by comparing this hypothetical example with the hypothetical examples that appear in shareholder reports of other funds.
Note that the expenses shown in the table are meant to highlight and help you compare ongoing costs only and do not reflect transaction costs incurred by the fund for buying and selling securities. Further, the expenses do not include any purchase, redemption, or account service fees described in the fund prospectus. If such fees were applied to your account, your costs would be higher. Your fund does not carry a “sales load.”
The calculations assume no shares were bought or sold during the period. Your actual costs may have been higher or lower, depending on the amount of your investment and the timing of any purchases or redemptions.
You can find more information about the fund’s expenses, including annual expense ratios, in the Financial Statements section of this report. For additional information on operating expenses and other shareholder costs, please refer to your fund’s current prospectus.
36
| Six Months Ended October 31, 2018 | |||
| Beginning | Ending | Expenses | |
| Account Value | Account Value | Paid During | |
| International Explorer Fund | 4/30/2018 | 10/31/2018 | Period |
| Based on Actual Fund Return | $1,000.00 | $831.86 | $1.75 |
| Based on Hypothetical 5% Yearly Return | 1,000.00 | 1,023.29 | 1.94 |
The calculations are based on expenses incurred in the most recent six-month period. The fund’s annualized six-month expense ratio for that period is 0.38%. The dollar amounts shown as “Expenses Paid” are equal to the annualized expense ratio multiplied by the average account value over the period, multiplied by the number of days in the most recent six-month period, then divided by the number of days in the most recent 12-month period (184/365).
37
Trustees Approve Advisory Arrangements
The board of trustees of Vanguard International Explorer Fund has renewed the fund’s investment advisory arrangements with Schroder Investment Management North America Inc. (Schroder Inc.), TimesSquare Capital Management, LLC (TimesSquare), and Wellington Management Company LLP (Wellington Management), as well as a sub-advisory arrangement with Schroder Investment Management North America Limited (Schroder Ltd.). The board determined that renewing the fund’s advisory arrangements was in the best interests of the fund and its shareholders.
The board based its decision upon an evaluation of each advisor’s investment staff, portfolio management process, and performance. This evaluation included information provided to the board by Vanguard’s Portfolio Review Department, which is responsible for fund and advisor oversight and product management. The Portfolio Review Department met regularly with the advisors and made monthly presentations to the board during the fiscal year that directed the board’s focus to relevant information and topics.
The board, or an investment committee made up of board members, also received information through the year during advisor presentations. For each advisor presentation, the board was provided with letters and reports that included information about, among other things, the advisory firm and the advisor’s assessment of the investment environment, portfolio performance, and portfolio characteristics.
In addition, the board received monthly reports, which included a Market and Economic Report, a Fund Dashboard Monthly Summary, and a Fund Performance Report.
Prior to their meeting, the trustees were provided with a memo and materials that summarized the information they received over the course of the year. They also considered the factors discussed below, among others. However, no single factor determined whether the board approved the arrangements. Rather, it was the totality of the circumstances that drove the board’s decision.
Nature, extent, and quality of services
The board reviewed the quality of the fund’s investment management services over both the short and long term, and took into account the organizational depth and stability of each advisor. The board considered the following:
Schroder. Schroders plc, the parent company of Schroder Inc. and Schroder Ltd. (collectively, Schroder), founded in 1804, specializes in global equity and fixed income management. Schroder employs a bottom-up, fundamental research-driven process to select stocks, with a focus on identifying companies with sustainable competitive advantages, attractive earnings growth, and compelling valuations. Stock selection responsibilities are divided among five regional leaders who constitute Schroder’s International Small-Cap Committee, which is led by the portfolio manager. The regional team leverages Schroder’s extensive network of local analysts across the globe, as it believes that country factors are more important for smaller companies relative to larger companies. Schroder Inc. has advised the fund since its inception in 1996, and its affiliate Schroder Ltd. has advised the fund since 2003.
TimesSquare. TimesSquare, founded in 2000 as a small- and mid-cap growth specialist, is a strategic partner of Affiliated Managers Group, Inc. TimesSquare’s international small-cap equity team is led by the portfolio manager and is made up of four experienced members. All portfolio decisions are made collectively, allowing for accountability. Value chain analysis and interactions
38
with key stakeholders are at the core of the team’s research and idea-generation process, resulting in a portfolio comprising industry-leading companies with sustainable business models and quality management teams. TimesSquare has managed a portion of the fund since August 2017.
Wellington Management. Wellington Management, founded in 1928, is among the nation’s oldest and most respected institutional investment managers. Wellington Management’s international small-cap team uses a fundamental, research-driven investment process, employing a bottom-up approach that attempts to discover a company’s intrinsic value. In valuing a company, it believes that the same valuation metric should be applied on an industry-by-industry basis. Although the team’s valuation discipline is essential to the process, its philosophy is not biased toward growth or value, as it invests in both extended growth opportunities and neglected or misunderstood companies. Wellington Management has managed a portion of the fund since 2010.
The board concluded that each advisor’s experience, stability, depth, and performance, among other factors, warranted continuation of the advisory arrangements.
Investment performance
The board considered the short- and long-term performance of each advisor’s subportfolio, including any periods of outperformance or underperformance compared with a relevant benchmark index and peer group. The board concluded that the performance was such that the advisory arrangements should continue. Information about the fund’s most recent performance can be found in the Performance Summary section of this report.
Cost
The board concluded that the fund’s expense ratio was well below the average expense ratio charged by funds in its peer group and that the fund’s advisory fee rate was also well below its peer-group average. Information about the fund’s expense ratio appears in the About Your Fund’s Expenses section of this report as well as in the Financial Statements section, which also includes information about the fund’s advisory fee rate.
The board did not consider the profitability of Schroder, TimesSquare, or Wellington Management in determining whether to approve the advisory fees, because the firms are independent of Vanguard and the advisory fees are the result of arm’s-length negotiations.
The benefit of economies of scale
The board concluded that the fund’s shareholders benefit from economies of scale because of breakpoints in the advisory fee schedules for Schroder, TimesSquare, and Wellington Management. The breakpoints reduce the effective rate of the fees as the fund’s assets managed by each advisor increase.
The board will consider whether to renew the advisory arrangements again after a one-year period.
39
Glossary
Beta. A measure of the magnitude of a fund’s past share-price fluctuations in relation to the ups and downs of a given market index. The index is assigned a beta of 1.00. Compared with a given index, a fund with a beta of 1.20 typically would have seen its share price rise or fall by 12% when the index rose or fell by 10%. For this report, beta is based on returns over the past 36 months for both the fund and the index. Note that a fund’s beta should be reviewed in conjunction with its R-squared (see definition). The lower the R-squared, the less correlation there is between the fund and the index, and the less reliable beta is as an indicator of volatility.
Dividend Yield. Dividend income earned by stocks, expressed as a percentage of the aggregate market value (or of net asset value, for a fund). The yield is determined by dividing the amount of the annual dividends by the aggregate value (or net asset value) at the end of the period. For a fund, the dividend yield is based solely on stock holdings and does not include any income produced by other investments.
Earnings Growth Rate. The average annual rate of growth in earnings over the past five years for the stocks now in a fund.
Equity Exposure. A measure that reflects a fund’s investments in stocks and stock futures. Any holdings in short-term reserves are excluded.
Expense Ratio. A fund’s total annual operating expenses expressed as a percentage of the fund’s average net assets. The expense ratio includes management and administrative expenses, but does not include the transaction costs of buying and selling portfolio securities.
Inception Date. The date on which the assets of a fund (or one of its share classes) are first invested in accordance with the fund’s investment objective. For funds with a subscription period, the inception date is the day after that period ends. Investment performance is measured from the inception date.
Median Market Cap. An indicator of the size of companies in which a fund invests; the midpoint of market capitalization (market price x shares outstanding) of a fund’s stocks, weighted by the proportion of the fund’s assets invested in each stock. Stocks representing half of the fund’s assets have market capitalizations above the median, and the rest are below it.
Price/Book Ratio. The share price of a stock divided by its net worth, or book value, per share. For a fund, the weighted average price/book ratio of the stocks it holds.
Price/Earnings Ratio. The ratio of a stock’s current price to its per-share earnings over the past year. For a fund, the weighted average P/E of the stocks it holds. P/E is an indicator of market expectations about corporate prospects; the higher the P/E, the greater the expectations for a company’s future growth.
R-Squared. A measure of how much of a fund’s past returns can be explained by the returns from the market in general, as measured by a given index. If a fund’s total returns were precisely synchronized with an index’s returns, its R-squared would be 1.00. If the fund’s returns bore no relationship to the index’s returns, its R-squared would be 0. For this report, R-squared is based on returns over the past 36 months for both the fund and the index.
40
Return on Equity. The annual average rate of return generated by a company during the past five years for each dollar of shareholder’s equity (net income divided by shareholder’s equity). For a fund, the weighted average return on equity for the companies whose stocks it holds.
Short-Term Reserves. The percentage of a fund invested in highly liquid, short-term securities that can be readily converted to cash.
Turnover Rate. An indication of the fund’s trading activity. Funds with high turnover rates incur higher transaction costs and may be more likely to distribute capital gains (which may be taxable to investors). The turnover rate excludes in-kind transactions, which have minimal impact on costs.
41
The Global Industry Classification Standard (“GICS”) was developed by and is the exclusive property and a service mark of MSCI Inc. (“MSCI”) and Standard and Poor’s, a division of McGraw-Hill Companies, Inc. (“S&P”), and is licensed for use by Vanguard. Neither MSCI, S&P nor any third party involved in making or compiling the GICS or any GICS classification makes any express or implied warranties or representations with respect to such standard or classification (or the results to be obtained by the use thereof), and all such parties hereby expressly disclaim all warranties of originality, accuracy, completeness, merchantability or fitness for a particular purpose with respect to any such standard or classification. Without limiting any of the foregoing, in no event shall MSCI, S&P, any of its affiliates or any third party involved in making or compiling the GICS or any GICS classification have any liability for any direct, indirect, special, punitive, consequential or any other damages (including lost profits) even if notified of the possibility of such damages.
42
The People Who Govern Your Fund
The trustees of your mutual fund are there to see that the fund is operated and managed in your best interests since, as a shareholder, you are a part owner of the fund. Your fund’s trustees also serve on the board of directors of The Vanguard Group, Inc., which is owned by the Vanguard funds and provides services to them on an at-cost basis.
A majority of Vanguard’s board members are independent, meaning that they have no affiliation with Vanguard or the funds they oversee, apart from the sizable personal investments they have made as private individuals. The independent board members have distinguished backgrounds in business, academia, and public service. Each of the trustees and executive officers oversees 211 Vanguard funds.
Information for each trustee and executive officer of the fund appears below. The mailing address of the trustees and officers is P.O. Box 876, Valley Forge, PA 19482. More information about the trustees is in the Statement of Additional Information, which can be obtained, without charge, by contacting Vanguard at 800-662-7447, or online at vanguard.com.
Interested Trustees1
F. William McNabb III
Born in 1957. Trustee since July 2009. Principal occupation(s) during the past five years and other experience: chairman of the board (January 2010–present) of Vanguard and of each of the investment companies served by Vanguard, trustee (2009–present) of each of the investment companies served by Vanguard, and director (2008–present) of Vanguard. Chief executive officer and president (2008–2017) of Vanguard and each of the investment companies served by Vanguard, managing director (1995–2008) of Vanguard, and director (1997–2018) of Vanguard Marketing Corporation. Director (2018–present) of UnitedHealth Group.
Mortimer J. Buckley
Born in 1969. Trustee since January 2018. Principal occupation(s) during the past five years and other experience: chief executive officer (January 2018–present) of Vanguard; chief executive officer, president, and trustee (January 2018–present) of each of the investment companies served by Vanguard; president and director (2017–present) of Vanguard; and president (February 2018–present) of Vanguard Marketing Corporation. Chief investment officer (2013–2017), managing director (2002–2017), head of the Retail Investor Group (2006–2012), and chief information officer (2001–2006) of Vanguard. Chairman of the board (2011–2017) of the Children’s Hospital of Philadelphia.
Independent Trustees
Emerson U. Fullwood
Born in 1948. Trustee since January 2008. Principal occupation(s) during the past five years and other experience: executive chief staff and marketing officer for North America and corporate vice president (retired 2008) of Xerox Corporation (document management products and services). Former president of the Worldwide Channels Group, Latin America, and Worldwide Customer Service and executive chief staff officer of Developing Markets of Xerox. Executive in residence and 2009–2010 Distinguished Minett Professor at the Rochester Institute of Technology. Lead director of SPX FLOW, Inc. (multi-industry manufacturing). Director of the University of Rochester Medical Center, the Monroe Community College Foundation, the United Way of Rochester, North Carolina A&T University, and Roberts Wesleyan College. Trustee of the University of Rochester.
Amy Gutmann
Born in 1949. Trustee since June 2006. Principal occupation(s) during the past five years and other experience: president (2004–present) of the University of Pennsylvania. Christopher H. Browne Distinguished Professor of Political Science, School of Arts and Sciences, and professor of communication, Annenberg School for Communication, with secondary faculty appointments in the Department of Philosophy, School of Arts and Sciences, and at the Graduate School of Education, University of Pennsylvania. Trustee of the National Constitution Center.
1 Mr. McNabb and Mr. Buckley are considered “interested persons,” as defined in the Investment Company Act of 1940, because they are officers of the Vanguard funds.
JoAnn Heffernan Heisen
Born in 1950. Trustee since July 1998. Principal occupation(s) during the past five years and other experience: corporate vice president of Johnson & Johnson (pharmaceuticals/medical devices/consumer products) and member of its executive committee (1997–2008). Chief global diversity officer (retired 2008), vice president and chief information officer (1997–2006), controller (1995–1997), treasurer (1991–1995), and assistant treasurer (1989–1991) of Johnson & Johnson. Director of Skytop Lodge Corporation (hotels) and the Robert Wood Johnson Foundation. Member of the advisory board of the Institute for Women’s Leadership at Rutgers University.
F. Joseph Loughrey
Born in 1949. Trustee since October 2009. Principal occupation(s) during the past five years and other experience: president and chief operating officer (retired 2009) and vice chairman of the board (2008–2009) of Cummins Inc. (industrial machinery). Chairman of the board of Hillenbrand, Inc. (specialized consumer services), Oxfam America, and the Lumina Foundation for Education. Director of the V Foundation for Cancer Research. Member of the advisory council for the College of Arts and Letters and chair of the advisory board to the Kellogg Institute for International Studies, both at the University of Notre Dame.
Mark Loughridge
Born in 1953. Trustee since March 2012. Principal occupation(s) during the past five years and other experience: senior vice president and chief financial officer (retired 2013) of IBM (information technology services). Fiduciary member of IBM’s Retirement Plan Committee (2004–2013), senior vice president and general manager (2002–2004) of IBM Global Financing, vice president and controller (1998–2002) of IBM, and a variety of other prior management roles at IBM. Member of the Council on Chicago Booth.
Scott C. Malpass
Born in 1962. Trustee since March 2012. Principal occupation(s) during the past five years and other experience: chief investment officer (1989–present) and vice president (1996–present) of the University of Notre Dame. Assistant professor of finance at the Mendoza College of Business, University of Notre Dame, and member of the Notre Dame 403(b) Investment Committee. Chairman of the board of TIFF Advisory Services, Inc. Member of the board of Catholic Investment Services, Inc. (investment advisors), the board of advisors for Spruceview Capital Partners, and the board of superintendence of the Institute for the Works of Religion.
Deanna Mulligan
Born in 1963. Trustee since January 2018. Principal occupation(s) during the past five years and other experience: president (2010–present) and chief executive officer (2011–present) of The Guardian Life Insurance Company of America. Chief operating officer (2010–2011) and executive vice president (2008–2010) of Individual Life and Disability of The Guardian Life Insurance Company of America. Member of the board of The Guardian Life Insurance Company of America, the American Council of Life Insurers, the Partnership for New York City (business leadership), and the Committee Encouraging Corporate Philanthropy. Trustee of the Economic Club of New York and the Bruce Museum (arts and science). Member of the Advisory Council for the Stanford Graduate School of Business.
André F. Perold
Born in 1952. Trustee since December 2004. Principal occupation(s) during the past five years and other experience: George Gund Professor of Finance and Banking, Emeritus at the Harvard Business School (retired 2011). Chief investment officer and co-managing partner of HighVista Strategies LLC (private investment firm). Overseer of the Museum of Fine Arts Boston.
Sarah Bloom Raskin
Born in 1961. Trustee since January 2018. Principal occupation(s) during the past five years and other experience: deputy secretary (2014–2017) of the United States Department of the Treasury. Governor (2010–2014) of the Federal Reserve Board. Commissioner (2007–2010) of financial regulation for the State of Maryland. Member of the board of directors (2012–2014) of Neighborhood Reinvestment Corporation. Director of i(x) Investments, LLC.
Peter F. Volanakis
Born in 1955. Trustee since July 2009. Principal occupation(s) during the past five years and other experience: president and chief operating officer (retired 2010) of Corning Incorporated (communications equipment) and director of Corning Incorporated (2000–2010) and Dow Corning (2001–2010). Director (2012) of SPX Corporation (multi-industry manufacturing). Overseer of the Amos Tuck School of Business Administration, Dartmouth College (2001–2013). Chairman of the board of trustees of Colby-Sawyer College. Member of the Board of Hypertherm Inc. (industrial cutting systems, software, and consumables).
Executive Officers
Glenn Booraem
Born in 1967. Principal occupation(s) during the past five years and other experience: principal of Vanguard. Investment stewardship officer (2017–present), treasurer (2015–2017), controller (2010–2015), and assistant controller (2001–2010) of each of the investment companies served by Vanguard.
Christine M. Buchanan
Born in 1970. Principal occupation(s) during the past five years and other experience: principal of Vanguard and global head of Fund Administration at Vanguard. Treasurer (2017–present) of each of the investment companies served by Vanguard. Partner (2005–2017) at KPMG LLP (audit, tax, and advisory services).
Brian Dvorak
Born in 1973. Principal occupation(s) during the past five years and other experience: principal of Vanguard. Chief compliance officer (2017–present) of Vanguard and each of the investment companies served by Vanguard. Assistant vice president (2017–present) of Vanguard Marketing Corporation. Vice president and director of Enterprise Risk Management (2011–2013) at Oppenheimer Funds, Inc.
Thomas J. Higgins
Born in 1957. Principal occupation(s) during the past five years and other experience: principal of Vanguard. Chief financial officer (2008–present) and treasurer (1998–2008) of each of the investment companies served by Vanguard.
Peter Mahoney
Born in 1974. Principal occupation(s) during the past five years and other experience: principal of Vanguard. Controller (2015–present) of each of the investment companies served by Vanguard. Head of International Fund Services (2008–2014) at Vanguard.
Anne E. Robinson
Born in 1970. Principal occupation(s) during the past five years and other experience: general counsel (2016–present) of Vanguard. Secretary (2016–present) of Vanguard and of each of the investment companies served by Vanguard. Managing director (2016–present) of Vanguard. Director and senior vice president (2016–2018) of Vanguard Marketing Corporation. Managing director and general counsel of Global Cards and Consumer Services (2014–2016) at Citigroup. Counsel (2003–2014) at American Express.
Michael Rollings
Born in 1963. Principal occupation(s) during the past five years and other experience: finance director (2017–present) and treasurer (2017) of each of the investment companies served by Vanguard. Managing director (2016–present) of Vanguard. Chief financial officer (2016–present) of Vanguard. Director (2016–present) of Vanguard Marketing Corporation. Executive vice president and chief financial officer (2006–2016) of MassMutual Financial Group.
| Vanguard Senior Management Team | |
| Joseph Brennan | Chris D. McIsaac |
| Mortimer J. Buckley | James M. Norris |
| Gregory Davis | Thomas M. Rampulla |
| John James | Karin A. Risi |
| Martha G. King | Anne E. Robinson |
| John T. Marcante | Michael Rollings |
| Chairman Emeritus and Senior Advisor | |
| John J. Brennan | |
| Chairman, 1996–2009 | |
| Chief Executive Officer and President, 1996–2008 | |
| Founder | |
| John C. Bogle | |
| Chairman and Chief Executive Officer, 1974–1996 | |
 | |
P.O. Box 2600 | |
Connect with Vanguard® > vanguard.com | |
| Fund Information > 800-662-7447 | Source for Bloomberg Barclays indexes: Bloomberg |
| Direct Investor Account Services > 800-662-2739 | Index Services Limited. Copyright 2018, Bloomberg. All |
| Institutional Investor Services > 800-523-1036 | rights reserved. |
| Text Telephone for People | |
| Who Are Deaf or Hard of Hearing > 800-749-7273 | |
| This material may be used in conjunction | |
| with the offering of shares of any Vanguard | |
| fund only if preceded or accompanied by | |
| the fund’s current prospectus. | |
| All comparative mutual fund data are from Lipper, a | |
| Thomson Reuters Company, or Morningstar, Inc., unless | |
| otherwise noted. | |
| You can obtain a free copy of Vanguard’s proxy voting | |
| guidelines by visiting vanguard.com/proxyreporting or by | |
| calling Vanguard at 800-662-2739. The guidelines are | |
| also available from the SEC’s website, sec.gov. In | |
| addition, you may obtain a free report on how your fund | |
| voted the proxies for securities it owned during the 12 | |
| months ended June 30. To get the report, visit either | |
| vanguard.com/proxyreporting or sec.gov. | |
| You can review information about your fund on the | |
| SEC’s website, and you can receive copies of this | |
| information, for a fee, by sending a request via email | |
| addressed to publicinfo@sec.gov. | |
| © 2018 The Vanguard Group, Inc. | |
| All rights reserved. | |
| Vanguard Marketing Corporation, Distributor. | |
| Q1260 122018 | |
| Annual Report | October 31, 2018 |
| Vanguard Mid-Cap Growth Fund |
Vanguard’s Principles for Investing Success
We want to give you the best chance of investment success. These principles, grounded in Vanguard’s research and experience, can put you on the right path.
Goals. Create clear, appropriate investment goals.
Balance. Develop a suitable asset allocation using broadly diversified funds. Cost. Minimize cost.
Discipline. Maintain perspective and long-term discipline.
A single theme unites these principles: Focus on the things you can control.
We believe there is no wiser course for any investor.
| Contents | |
| Your Fund’s Performance at a Glance. | 1 |
| CEO’s Perspective. | 3 |
| Advisors’ Report. | 5 |
| Fund Profile. | 9 |
| Performance Summary. | 10 |
| Financial Statements. | 12 |
| Your Fund’s After-Tax Returns. | 26 |
| About Your Fund’s Expenses. | 27 |
| Glossary. | 29 |
Please note: The opinions expressed in this report are just that—informed opinions. They should not be considered promises or advice. Also, please keep in mind that the information and opinions cover the period through the date on the front of this report. Of course, the risks of investing in your fund are spelled out in the prospectus.
See the Glossary for definitions of investment terms used in this report.
Your Fund’s Performance at a Glance
• For the 12 months ended October 31, 2018, Vanguard Mid-Cap Growth Fund returned 9.61%. It finished well ahead of its benchmark, the Russell Midcap Growth Index, and the average return of its mid-capitalization growth fund peers.
• The broad U.S. stock market returned well over 6% as corporate earnings remained strong and the economy continued to grow. Growth stocks outperformed their value counterparts, and large-cap stocks surpassed mid- and small-caps.
• The advisors’ stock selection in health care contributed the most to the fund’s relative performance. Industrial and financial stocks were also sources of strength.
In contrast, the information technology, consumer staples, and consumer discretionary sectors detracted from relative performance.
• Please note that after the close of the period, Vanguard announced that Frontier Capital Management Co., LLC, and Wellington Management Company llp would join RS Investments as advisors to the fund. William Blair Investment Management, LLC, will no longer serve as an advisor.
| Total Returns: Fiscal Year Ended October 31, 2018 | |
| Total | |
| Returns | |
| Vanguard Mid-Cap Growth Fund | 9.61% |
| Russell Midcap Growth Index | 6.14 |
| Mid-Cap Growth Funds Average | 6.16 |
| Mid-Cap Growth Funds Average: Derived from data provided by Lipper, a Thomson Reuters Company. | |
| Total Returns: Ten Years Ended October 31, 2018 | |
| Average | |
| Annual Return | |
| Mid-Cap Growth Fund | 13.82% |
| Russell Midcap Growth Index | 15.10 |
| Mid-Cap Growth Funds Average | 13.03 |
| Mid-Cap Growth Funds Average: Derived from data provided by Lipper, a Thomson Reuters Company. | |
The figures shown represent past performance, which is not a guarantee of future results. (Current performance may be lower or higher than the performance data cited. For performance data current to the most recent month-end, visit our website at vanguard.com/performance.) Note, too, that both investment returns and principal value can fluctuate widely, so an investor’s shares, when sold, could be worth more or less than their original cost.
1
| Expense Ratios | ||
| Your Fund Compared With Its Peer Group | ||
| Peer Group | ||
| Fund | Average | |
| Mid-Cap Growth Fund | 0.36% | 1.21% |
The fund expense ratio shown is from the prospectus dated February 22, 2018, and represents estimated costs for the current fiscal year. For the fiscal year ended October 31, 2018, the fund’s expense ratio was 0.36%. The peer-group expense ratio is derived from data provided by Lipper, a Thomson Reuters Company, and captures information through year-end 2017.
Peer group: Mid-Cap Growth Funds.
2
CEO’s Perspective

Tim Buckley
President and Chief Executive Officer
Dear Shareholder,
Over the years, I’ve found that prudent investors exhibit a common trait: discipline. No matter how the markets move or what new investing fad hits the headlines, those who stay focused on their goals and tune out the noise are set up for long-term success.
The prime gateway to investing is saving, and you don’t usually become a saver without a healthy dose of discipline. Savers make the decision to sock away part of their income, which means spending less and delaying gratification, no matter how difficult that may be.
Of course, disciplined investing extends beyond diligent saving. The financial markets, in the short term especially, are unpredictable; I have yet to meet the investor who can time them perfectly. It takes discipline to resist the urge to go all-in when markets are frothy or to retreat when things look bleak.
Staying put with your investments is one strategy for handling volatility. Another, rebalancing, requires even more discipline because it means steering your money away from strong performers and toward poorer performers.
Patience—a form of discipline—is also the friend of long-term investors. Higher returns are the potential reward for weathering the market’s turbulence and uncertainty.
3
We have been enjoying one of the longest bull markets in history, but it won’t continue forever. Prepare yourself now for how you will react when volatility comes back. Don’t panic. Don’t chase returns or look for answers outside the asset classes you trust. And be sure to rebalance periodically, even when there’s turmoil.
Whether you’re a master of self-control, get a boost from technology, or work with a professional advisor, know that discipline is necessary to get the most out of your investment portfolio. And know that Vanguard is with you for the entire ride.
Thank you for your continued loyalty.
Sincerely,

Mortimer J. Buckley
President and Chief Executive Officer
November 16, 2018
| Market Barometer | |||
| Average Annual Total Returns | |||
| Periods Ended October 31, 2018 | |||
| One Year | Three Years | Five Years | |
| Stocks | |||
| Russell 1000 Index (Large-caps) | 6.98% | 11.31% | 11.05% |
| Russell 2000 Index (Small-caps) | 1.85 | 10.68 | 8.01 |
| Russell 3000 Index (Broad U.S. market) | 6.60 | 11.27 | 10.81 |
| FTSE All-World ex US Index (International) | -7.99 | 4.57 | 2.01 |
| Bonds | |||
| Bloomberg Barclays U.S. Aggregate Bond Index | |||
| (Broad taxable market) | -2.05% | 1.04% | 1.83% |
| Bloomberg Barclays Municipal Bond Index | |||
| (Broad tax-exempt market) | -0.51 | 1.90 | 3.25 |
| FTSE Three-Month U. S. Treasury Bill Index | 1.67 | 0.86 | 0.52 |
| CPI | |||
| Consumer Price Index | 2.52% | 2.07% | 1.60% |
4
Advisors’ Report
For the fiscal year ended October 31, 2018, Vanguard Mid-Cap Growth Fund returned 9.61%, surpassing both the performance of its benchmark, the Russell Midcap Growth Index, and the average return of its mid-cap growth fund peers. During the period, your fund was managed by two independent advisors, a strategy that enhances its diversification by providing exposure to distinct yet complementary investment approaches. It is not uncommon for different advisors to have different views about individual securities or the broader investment environment.
Please note that after the close of the period, Vanguard announced that Frontier Capital Management Co., LLC, and Wellington Management Company llp would join RS Investments as advisors to the fund. William Blair Investment Management, LLC, will no longer serve as an advisor.
Also, please be aware that the RS Investments discussion refers to industry sectors as defined by Russell classifications, rather than by the Global Industry Classification Standard used elsewhere in this report. The following comments were prepared on November 20, 2018.
| Vanguard Mid-Cap Growth Fund Investment Advisors | |||
| Fund Assets Managed | |||
| Investment Advisor | % | $ Million | Investment Strategy |
| William Blair Investment | 49 | 2,056 | Uses a fundamental investment approach in |
| Management, LLC | pursuit of superior long-term investment results | ||
| from growth-oriented companies with | |||
| leadership positions and strong market | |||
| presence. | |||
| RS Investments | 48 | 1,997 | RS Investments, a Victory Capital investment |
| franchise, employs both fundamental analysis | |||
| and quantitative screening in seeking to identify | |||
| companies that the investment team believes | |||
| will produce sustainable earnings growth over a | |||
| multiyear horizon. Investment candidates | |||
| typically exhibit some or all of the following key | |||
| criteria: strong organic revenue growth, | |||
| expanding margins and profitability, innovative | |||
| products or services, defensible competitive | |||
| advantages, growing market share, and | |||
| experienced management teams. | |||
| Cash Investments | 3 | 108 | These short-term reserves are invested by |
| Vanguard in equity index products to simulate | |||
| investment in stocks. Each advisor may also | |||
| maintain a modest cash position. | |||
5
William Blair Investment Management, LLC
Portfolio Managers: Dan Crowe, CFA, Partner
Robert C. Lanphier, Partner
David Ricci, CFA, Partner
Strong corporate earnings and a favorable economic backdrop supported the Russell Midcap Growth Index for the 12 months ended October 31, 2018. Although the index landed in positive territory, equities experienced higher volatility and declining returns during the period—between February and April and then more prominently in October—as investors grew increasingly concerned about rising interest rates, inflationary pressures, and heightened trade tensions.
Our performance was driven by a combination of strong stock selection and our investment style. Emphasis on more sustainable growers, and the portfolio’s resulting higher valuation exposure, provided a tailwind during the period. We seek to invest in companies with significant competitive barriers, value-added products and services, and flexible pricing. This proved to be beneficial as investors digested the potential for inflation-related cost pressures on businesses.
Stock selection was positive in many sectors, most notably health care, industrials, and financials. The top contributors were Copart, in industrials, and Ross Stores, in consumer discretionary. Copart, an online auction platform for salvage vehicles, benefited from higher volumes and favorable pricing. As increasing auto part complexity and rising labor costs have driven up the cost to repair cars, insurers have been increasingly likely to forego repairs and scrap newer cars. Ross Stores, an off-price apparel and home accessories retailer, outperformed on solid fundamentals and execution, reporting strong traffic and ticket growth. The company has benefited from struggling department stores; by offering ample high-quality products at attractive prices, it has enhanced the consumer’s “treasure hunt” experience while improving profitability. Other standout performers included ABIOMED (health care), Domino’s Pizza (consumer discretionary), and Verisk Analytics (industrials).
Top detractors included Newell Brands, Mohawk Industries, and Six Flags Entertainment in consumer discretionary, and Vulcan Materials and Axalta Coating Systems in materials. Newell Brands, a diversified consumer and commercial products company, was hurt by store closures and inventory de-stocking amid a challenging retail environment; its 2016 acquisition of Jarden also proved to be more complex than anticipated. We liquidated our position in the company. Mohawk Industries, a leader and low-cost producer in the otherwise fragmented flooring industry, underperformed on
6
margin pressure stemming from inflation and the company’s capacity expansion in luxury vinyl tile. Higher-than-expected inflation and reduced confidence in Mohawk’s ability to continue to pass through price increases were considerations in our sale of the stock.
Although the U.S. economy remains healthy, a number of risks could slow or derail growth. Among these are trade tensions with China, as an abrupt rise in the price of goods in either country could dent consumer confidence and curtail growth. Additionally, many U.S. businesses rely on China, either as a source of revenue or as the location of parts of their supply chain. In the United States, rising input costs and higher interest rates are prominent risks that could dampen both economic growth and stock valuations.
While we remain optimistic about the U.S. economy, we believe it is important to be aware of these risks and how they could affect corporate performance. Given that we are now over nine years into an economic recovery, it is important to find businesses with durable growth drivers whose stocks present attractive risk/ reward opportunities. We believe building a portfolio of companies with these characteristics will allow us to outperform in a variety of economic scenarios.
RS Investments
Portfolio Managers: D. Scott Tracy, CFA, Chief Investment Officer
Stephen J. Bishop
Melissa Chadwick-Dunn
Christopher W. Clark, CFA
U.S. equity markets generally rose during the 12 months ended October 31, 2018, although performance across market segments was mixed. Growth-oriented mid-cap stocks, as measured by the Russell Midcap Growth Index, returned about 6%, while value-oriented mid-cap stocks, as measured by the Russell Midcap Value Index, had almost flat returns. Underlying fundamentals were strong, as earnings across styles and market capitalizations exceeded expectations. Earnings were driven by strong economic growth, the largest corporate tax cuts in decades, and solid business execution. U.S. stocks across styles and market caps now appear materially cheaper than they were a year ago.
Your fund’s fiscal 2018 comprised four very different periods. The Russell Midcap Growth Index returned almost 10% for the three months ended January 31, 2018. February brought a rise in volatility amid increased expectations for interest rate hikes under new Federal Reserve
7
Chairman Jerome Powell. Other factors included uncertainty surrounding trade policy following the threat of tariffs and the potential for a trade war with China. These concerns helped push down the index, which shed more than –4% for the three months ended April 30. The index then rebounded, returning more than 6% for the three months ended July 30, as investors focused anew on underlying U.S. economic strength and high earnings growth. The final three months of the fiscal year saw investor enthusiasm wane again; the index returned about –5% for that period, perhaps in part because of concerns about tariffs and U.S.-Chinese trade relations.
Sector returns for our portion of the portfolio were mixed. Stock selection in consumer discretionary, technology, producer durables, and consumer staples weighed on performance. Stock selection in health care, materials and processing, financial services, and energy was positive.
In consumer discretionary, Norwegian Cruise Line detracted most. Norwegian Cruise Line is a global cruise line operator. We purchased the stock given the shift in consumer preference to experiences over tangible goods, which has resulted in strong travel expenditures supported further by a growing population of retirees. The company is supported by a secular cost story—it will continue to shift
bookings away from travel agents to online, eliminating commissions of roughly 15% that it pays on 70% of cruise tickets. This move will allow it to deleverage and return capital to shareholders. Unfortunately, the stock underperformed over the period, as investors were concerned about supply growth in the cruise market. We believe such fears are unfounded, given the expense and time needed to build new ships, but we did not feel the time was right to fight the market because there was also uncertainty about the effects of currency fluctuations and fuel costs that had already bitten into earnings. As we do see weakness in the overall leisure market, we decided to revisit this asset-intensive, leveraged business later.
Health care was our top-performing sector; Illumina, the leader in genetic analytics, drove its results. We own the company because of its undisputed leadership in the next-generation sequencing market, and because it is poised to expand to address an ever-changing landscape of customer needs and diagnostics. One driver here is that sequencing has made its way into clinical applications. The stock performed exceptionally well as margins have expanded despite significant investment in research and development. We maintain our conviction in the company.
8
Mid-Cap Growth Fund
Fund Profile
As of October 31, 2018
| Portfolio Characteristics | |||
| DJ | |||
| U.S. | |||
| Russell | Total | ||
| Midcap | Market | ||
| Growth | FA | ||
| Fund | Index | Index | |
| Number of Stocks | 113 | 416 | 3,806 |
| Median Market Cap | $12.2B | $13.6B | $71.6B |
| Price/Earnings Ratio | 26.2x | 22.8x | 18.5x |
| Price/Book Ratio | 4.9x | 5.6x | 2.9x |
| Return on Equity | 15.6% | 19.5% | 15.0% |
| Earnings Growth | |||
| Rate | 14.4% | 14.1% | 8.2% |
| Dividend Yield | 0.7% | 0.9% | 1.8% |
| Foreign Holdings | 1.9% | 0.0% | 0.0% |
| Turnover Rate | 75% | — | — |
| Ticker Symbol | VMGRX | — | — |
| Expense Ratio1 | 0.36% | — | — |
| 30-Day SEC Yield | 0.38% | — | — |
| Short-Term Reserves | 1.5% | — | — |
Sector Diversification (% of equity exposure)
| Fund | |
| Communication Services | 5.2% |
| Consumer Discretionary | 15.7 |
| Consumer Staples | 2.4 |
| Energy | 1.7 |
| Financials | 6.6 |
| Health Care | 16.6 |
| Industrials | 16.2 |
| Information Technology | 29.7 |
| Materials | 5.1 |
| Real Estate | 0.7 |
| Utilities | 0.1 |
Sector categories are based on the Global Industry Classification Standard (“GICS”), except for the “Other” category (if applicable), which includes securities that have not been provided a GICS classification as of the effective reporting period.
| Volatility Measures | ||
| Russell | DJ | |
| Midcap | U.S. Total | |
| Growth | Market | |
| Index | FA Index | |
| R-Squared | 0.94 | 0.87 |
| Beta | 0.98 | 1.13 |
| These measures show the degree and timing of the fund’s fluctuations compared with the indexes over 36 months. | ||
Ten Largest Holdings (% of total net assets)
| Worldpay Inc. | Data Processing & | |
| Outsourced Services | 2.2% | |
| Ulta Beauty Inc. | Specialty Stores | 2.0 |
| WEX Inc. | Data Processing & | |
| Outsourced Services | 1.9 | |
| Vail Resorts Inc. | Leisure Facilities | 1.8 |
| Global Payments Inc. | Data Processing & | |
| Outsourced Services | 1.7 | |
| Ross Stores Inc. | Apparel Retail | 1.7 |
| Ultimate Software | ||
| Group Inc. | Application Software | 1.7 |
| Ball Corp. | Metal & Glass | |
| Containers | 1.6 | |
| GoDaddy Inc. | Internet Services & | |
| Infrastructure | 1.6 | |
| DexCom Inc. | Health Care | |
| Equipment | 1.6 | |
| Top Ten | 17.8% |
The holdings listed exclude any temporary cash investments and equity index products.
1 The expense ratio shown is from the prospectus dated February 22, 2018, and represents estimated costs for the current fiscal year. For the fiscal year ended October 31, 2018, the expense ratio was 0.36%.
9
Mid-Cap Growth Fund
Performance Summary
All of the returns in this report represent past performance, which is not a guarantee of future results that may be achieved by the fund. (Current performance may be lower or higher than the performance data cited. For performance data current to the most recent month-end, visit our website at vanguard.com/performance.) Note, too, that both investment returns and principal value can fluctuate widely, so an investor’s shares, when sold, could be worth more or less than their original cost. The returns shown do not reflect taxes that a shareholder would pay on fund distributions or on the sale of fund shares.
Cumulative Performance: October 31, 2008, Through October 31, 2018
Initial Investment of $10,000
| Average Annual Total Returns | ||||
| Periods Ended October 31, 2018 | ||||
| Final Value | ||||
| One | Five | Ten | of a $10,000 | |
| Year | Years | Years | Investment | |
| Mid-Cap Growth Fund | 9.61% | 8.99% | 13.82% | $36,481 |
| Russell Midcap Growth Index | 6.14 | 10.10 | 15.10 | 40,801 |
| Mid-Cap Growth Funds Average | 6.16 | 8.45 | 13.03 | 34,036 |
| Dow Jones U.S. Total Stock Market | ||||
| Float Adjusted Index | 6.56 | 10.76 | 13.36 | 35,036 |
Mid-Cap Growth Funds Average: Derived from data provided by Lipper, a Thomson Reuters Company.
See Financial Highlights for dividend and capital gains information.
10
Mid-Cap Growth Fund
Fiscal-Year Total Returns (%): October 31, 2008, Through October 31, 2018
Average Annual Total Returns: Periods Ended September 30, 2018
This table presents returns through the latest calendar quarter—rather than through the end of the fiscal period.
Securities and Exchange Commission rules require that we provide this information.
| Inception | One | Five | Ten | |
| Date | Year | Years | Years | |
| Mid-Cap Growth Fund | 12/31/1997 | 24.95% | 11.70% | 12.56% |
11
Mid-Cap Growth Fund
Financial Statements
Statement of Net Assets
As of October 31, 2018
The fund reports a complete list of its holdings in regulatory filings four times in each fiscal year, at the quarter-ends. For the second and fourth fiscal quarters, the lists appear in the fund’s semiannual and annual reports to shareholders. For the first and third fiscal quarters, the fund files the lists with the Securities and Exchange Commission on Form N-Q. Shareholders can look up the fund’s Forms N-Q on the SEC’s website at sec.gov.
| Market | |||
| Value• | |||
| Shares | ($000) | ||
| Common Stocks (96.1%)1 | |||
| Communication Services (4.9%) | |||
| * | Take-Two Interactive | ||
| Software Inc. | 489,130 | 63,034 | |
| * | Live Nation Entertainment | ||
| Inc. | 984,900 | 51,510 | |
| * | IAC/InterActiveCorp | 240,150 | 47,211 |
| Activision Blizzard Inc. | 331,922 | 22,919 | |
| * | Yelp Inc. Class A | 474,210 | 20,306 |
| 204,980 | |||
| Consumer Discretionary (15.2%) | |||
| * | Ulta Beauty Inc. | 309,152 | 84,868 |
| Vail Resorts Inc. | 304,032 | 76,409 | |
| Ross Stores Inc. | 700,900 | 69,389 | |
| Six Flags Entertainment | |||
| Corp. | 1,033,632 | 55,671 | |
| Hilton Worldwide | |||
| Holdings Inc. | 543,230 | 38,662 | |
| * | Chipotle Mexican Grill Inc. | ||
| Class A | 77,500 | 35,676 | |
| * | O’Reilly Automotive Inc. | 109,290 | 35,055 |
| Tiffany & Co. | 312,690 | 34,802 | |
| * | Burlington Stores Inc. | 183,367 | 31,446 |
| Ferrari NV | 225,580 | 26,418 | |
| Domino’s Pizza Inc. | 95,200 | 25,589 | |
| Aptiv plc | 325,800 | 25,021 | |
| * | Under Armour Inc. | 1,067,590 | 21,170 |
| Brunswick Corp. | 401,923 | 20,896 | |
| Hasbro Inc. | 214,580 | 19,679 | |
| * | CarMax Inc. | 287,100 | 19,497 |
| * | Wayfair Inc. | 116,600 | 12,860 |
| 633,108 | |||
| Consumer Staples (2.3%) | |||
| Keurig Dr Pepper Inc. | 1,878,590 | 48,843 | |
| Conagra Brands Inc. | 1,032,719 | 36,765 | |
| * | Post Holdings Inc. | 86,770 | 7,672 |
| 93,280 | |||
| Energy (1.5%) | ||||
| * | Parsley Energy Inc. | |||
| Class A | 1,181,900 | 27,680 | ||
| Diamondback Energy Inc. | 187,201 | 21,034 | ||
| * | Concho Resources Inc. | 109,217 | 15,191 | |
| 63,905 | ||||
| Financials (6.2%) | ||||
| Cboe Global Markets Inc. | 521,900 | 58,896 | ||
| Progressive Corp. | 822,260 | 57,312 | ||
| Arthur J Gallagher & Co. | 601,200 | 44,495 | ||
| Kemper Corp. | 444,410 | 33,415 | ||
| East West Bancorp Inc. | 499,900 | 26,215 | ||
| * | Western Alliance Bancorp | 399,506 | 19,272 | |
| * | SVB Financial Group | 71,280 | 16,910 | |
| 256,515 | ||||
| Health Care (16.0%) | ||||
| * | DexCom Inc. | 498,380 | 66,170 | |
| Encompass Health Corp. | 705,500 | 47,480 | ||
| * | WellCare Health Plans Inc. | 157,680 | 43,518 | |
| * | Centene Corp. | 332,487 | 43,330 | |
| * | Mettler-Toledo International | |||
| Inc. | 73,700 | 40,301 | ||
| Cooper Cos. Inc. | 152,349 | 39,353 | ||
| * | Align Technology Inc. | 176,434 | 39,027 | |
| Teleflex Inc. | 154,200 | 37,122 | ||
| Agilent Technologies Inc. | 549,100 | 35,576 | ||
| * | Illumina Inc. | 101,730 | 31,653 | |
| * | Veeva Systems Inc. | |||
| Class A | 341,412 | 31,188 | ||
| * | Intuitive Surgical Inc. | 49,907 | 26,011 | |
| * | Edwards Lifesciences Corp. 160,792 | 23,733 | ||
| West Pharmaceutical | ||||
| Services Inc. | 218,579 | 23,152 | ||
| * | Exact Sciences Corp. | 321,970 | 22,876 | |
| * | IDEXX Laboratories Inc. | 102,900 | 21,827 | |
| * | Sage Therapeutics Inc. | 163,580 | 21,050 | |
| * | Neurocrine Biosciences Inc. 186,010 | 19,931 | ||
| * | ABIOMED Inc. | 56,100 | 19,141 | |
12
| Mid-Cap Growth Fund | |||
| Market | |||
| Value• | |||
| Shares | ($000) | ||
| * | BeiGene Ltd. ADR | 138,910 | 17,494 |
| * | Bluebird Bio Inc. | 147,930 | 16,968 |
| 666,901 | |||
| Industrials (15.6%) | |||
| BWX Technologies Inc. | 1,009,104 | 58,992 | |
| * | CoStar Group Inc. | 140,647 | 50,833 |
| Equifax Inc. | 475,565 | 48,241 | |
| * | Verisk Analytics Inc. | ||
| Class A | 391,000 | 46,857 | |
| Fortive Corp. | 619,300 | 45,983 | |
| * | Copart Inc. | 918,700 | 44,934 |
| * | Middleby Corp. | 356,700 | 40,057 |
| TransUnion | 535,047 | 35,179 | |
| KAR Auction Services Inc. | 599,920 | 34,160 | |
| Hexcel Corp. | 550,180 | 32,197 | |
| * | Teledyne Technologies Inc. | 144,950 | 32,075 |
| Parker-Hannifin Corp. | 187,520 | 28,434 | |
| * | Clean Harbors Inc. | 413,630 | 28,143 |
| Waste Connections Inc. | 345,400 | 26,402 | |
| Roper Technologies Inc. | 86,400 | 24,443 | |
| Rockwell Automation Inc. | 143,580 | 23,652 | |
| Xylem Inc. | 348,500 | 22,855 | |
| HEICO Corp. Class A | 255,600 | 17,038 | |
| * | XPO Logistics Inc. | 95,650 | 8,549 |
| 649,024 | |||
| Information Technology (28.7%) | |||
| * | Worldpay Inc. Class A | 976,899 | 89,718 |
| * | WEX Inc. | 437,980 | 77,067 |
| Global Payments Inc. | 637,157 | 72,782 | |
| * | Ultimate Software Group | ||
| Inc. | 260,190 | 69,374 | |
| * | GoDaddy Inc. Class A | 908,649 | 66,486 |
| * | Euronet Worldwide Inc. | 591,561 | 65,770 |
| Booz Allen Hamilton | |||
| Holding Corp. Class A | 1,204,433 | 59,668 | |
| * | ServiceNow Inc. | 297,860 | 53,925 |
| * | Black Knight Inc. | 1,004,358 | 48,983 |
| * | Arista Networks Inc. | 194,900 | 44,895 |
| Total System Services Inc. | 418,030 | 38,103 | |
| * | Wix.com Ltd. | 378,170 | 36,815 |
| Sabre Corp. | 1,470,730 | 36,254 | |
| * | Dropbox Inc. Class A | 1,534,982 | 36,026 |
| Marvell Technology Group | |||
| Ltd. | 2,184,530 | 35,848 | |
| * | Red Hat Inc. | 158,600 | 27,222 |
| * | Tyler Technologies Inc. | 128,200 | 27,135 |
| * | Twilio Inc. Class A | 352,470 | 26,513 |
| * | Pure Storage Inc. Class A | 1,272,000 | 25,669 |
| ^ | Microchip Technology Inc. | 389,000 | 25,588 |
| * | Guidewire Software Inc. | 284,400 | 25,303 |
| * | Proofpoint Inc. | 276,080 | 25,110 |
| * | Zendesk Inc. | 434,270 | 23,872 |
| Dolby Laboratories Inc. | |||
| Class A | 333,600 | 22,955 | |
| * | Trimble Inc. | 526,660 | 19,687 |
| Lam Research Corp. | 135,178 | 19,159 | |
| j2 Global Inc. | 258,600 | 18,836 | |
| CDK Global Inc. | 319,200 | 18,271 | |
| Maxim Integrated | |||
| Products Inc. | 343,250 | 17,169 | |
| * | Nutanix Inc. | 360,350 | 14,958 |
| Xilinx Inc. | 169,970 | 14,510 | |
| * | Square Inc. | 134,950 | 9,912 |
| 1,193,583 | |||
| Materials (4.9%) | |||
| Ball Corp. | 1,509,600 | 67,630 | |
| Celanese Corp. Class A | 545,830 | 52,913 | |
| Vulcan Materials Co. | 387,200 | 39,161 | |
| * | Allegheny Technologies | ||
| Inc. | 1,126,150 | 29,156 | |
| * | Axalta Coating Systems | ||
| Ltd. | 639,800 | 15,790 | |
| 204,650 | |||
| Other (0.3%) | |||
| 2 | Vanguard Mid-Cap Growth | ||
| ETF | 100,223 | 12,898 | |
| Real Estate (0.5%) | |||
| * | SBA Communications | ||
| Corp. Class A | 123,500 | 20,028 | |
| Total Common Stocks | |||
| (Cost $3,298,875) | 3,998,872 | ||
| Temporary Cash Investments (4.0%)1 | |||
| Money Market Fund (3.8%) | |||
| 3,4 | Vanguard Market Liquidity | ||
| Fund, 2.308% | 1,587,471 | 158,747 | |
| Face | |||
| Amount | |||
| ($000) | |||
| U. S. Government and Agency Obligations (0.2%) | |||
| 5 | United States Treasury | ||
| Bill, 2.034%–2.078%, | |||
| 11/15/18 | 3,000 | 2,998 | |
| 5 | United States Treasury | ||
| Bill, 2.302%, 2/28/19 | 3,000 | 2,977 | |
| 5,975 | |||
| Total Temporary Cash Investments | |||
| (Cost $164,682) | 164,722 | ||
| Total Investments (100.1%) | |||
| (Cost $3,463,557) | 4,163,594 | ||
| 13 |
| Mid-Cap Growth Fund | |
| Amount | |
| ($000) | |
| Other Assets and Liabilities (-0.1%) | |
| Other Assets | 77,297 |
| Liabilities 4 | (80,083) |
| (2,786) | |
| Net Assets (100%) | |
| Applicable to 148,166,145 outstanding | |
| $.001 par value shares of beneficial | |
| interest (unlimited authorization) | 4,160,808 |
| Net Asset Value Per Share | $28.08 |
| Amount | |
| ($000) | |
| Statement of Assets and Liabilities | |
| Assets | |
| Investments in Securities, at Value | |
| Unaffiliated Issuers | 3,991,949 |
| Affiliated Issuers | 171,645 |
| Total Investments in Securities | 4,163,594 |
| Investment in Vanguard | 234 |
| Receivables for Investment Securities | |
| Sold | 71,861 |
| Receivables for Accrued Income | 1,239 |
| Receivables for Capital Shares Issued | 3,315 |
| Variation Margin Receivable— | |
| Futures Contracts | 648 |
| Total Assets | 4,240,891 |
| Liabilities | |
| Payables for Investment Securities | |
| Purchased | 63,854 |
| Collateral for Securities on Loan | 6,964 |
| Payables to Investment Advisor | 1,931 |
| Payables for Capital Shares Redeemed | 3,356 |
| Payables to Vanguard | 3,978 |
| Total Liabilities | 80,083 |
| Net Assets | 4,160,808 |
| At October 31, 2018, net assets consisted of: | |
| Amount | |
| ($000) | |
| Paid-in Capital | 2,987,653 |
| Total Distributable Earnings (Loss) | 1,173,155 |
| Net Assets | 4,160,808 |
• See Note A in Notes to Financial Statements.
* Non-income-producing security.
^ Includes partial security positions on loan to broker-dealers.
The total value of securities on loan is $6,931,000.
1 The fund invests a portion of its cash reserves in equity
markets through the use of index futures contracts. After
giving effect to futures investments, the fund’s effective
common stock and temporary cash investment positions
represent 98.4% and 1.7%, respectively, of net assets.
2 Considered an affiliated company of the fund as the issuer is
another member of The Vanguard Group.
3 Affiliated money market fund available only to Vanguard funds
and certain trusts and accounts managed by Vanguard. Rate
shown is the 7-day yield.
4 Includes $6,964,000 of collateral received for securities
on loan.
5 Securities with a value of $4,626,000 have been segregated
as initial margin for open futures contracts.
ADR—American Depositary Receipt.
14
| Mid-Cap Growth Fund | ||||
| Derivative Financial Instruments Outstanding as of Period End | ||||
| Futures Contracts | ||||
| ($000) | ||||
| Value and | ||||
| Number of | Unrealized | |||
| Long (Short) | Notional | Appreciation | ||
| Expiration | Contracts | Amount | (Depreciation) | |
| Long Futures Contracts | ||||
| E-mini S&P 500 Index | December 2018 | 414 | 56,120 | (4,210) |
| E-mini S&P Mid-Cap 400 Index | December 2018 | 211 | 38,503 | (4,725) |
| (8,935) | ||||
See accompanying Notes, which are an integral part of the Financial Statements.
15
| Mid-Cap Growth Fund | |
| Statement of Operations | |
| Year Ended | |
| October 31, 2018 | |
| ($000) | |
| Investment Income | |
| Income | |
| Dividends—Unaffiliated Issuers | 29,786 |
| Dividends—Affiliated Issuers | 94 |
| Interest—Unaffiliated Issuers | 117 |
| Interest—Affiliated Issuers | 3,031 |
| Securities Lending—Net | 257 |
| Total Income | 33,285 |
| Expenses | |
| Investment Advisory Fees—Note B | |
| Basic Fee | 8,715 |
| Performance Adjustment | (1,759) |
| The Vanguard Group—Note C | |
| Management and Administrative | 7,970 |
| Marketing and Distribution | 690 |
| Custodian Fees | 45 |
| Auditing Fees | 36 |
| Shareholders’ Reports and Proxy | 80 |
| Trustees’ Fees and Expenses | 7 |
| Total Expenses | 15,784 |
| Expenses Paid Indirectly | (152) |
| Net Expenses | 15,632 |
| Net Investment Income | 17,653 |
| Realized Net Gain (Loss) | |
| Investment Securities Sold—Unaffiliated Issuers | 546,066 |
| Investment Securities Sold—Affiliated Issuers | (46) |
| Futures Contracts | 10,071 |
| Realized Net Gain (Loss) | 556,091 |
| Change in Unrealized Appreciation (Depreciation) | |
| Investment Securities— Unaffiliated Issuers | (164,921) |
| Investment Securities—Affiliated Issuers | 440 |
| Futures Contracts | (11,380) |
| Change in Unrealized Appreciation (Depreciation) | (175,861) |
| Net Increase (Decrease) in Net Assets Resulting from Operations | 397,883 |
See accompanying Notes, which are an integral part of the Financial Statements.
16
| Mid-Cap Growth Fund | ||
| Statement of Changes in Net Assets | ||
| Year Ended October 31, | ||
| 2018 | 2017 | |
| ($000) | ($000) | |
| Increase (Decrease) in Net Assets | ||
| Operations | ||
| Net Investment Income | 17,653 | 15,976 |
| Realized Net Gain (Loss) | 556,091 | 334,086 |
| Change in Unrealized Appreciation (Depreciation) | (175,861) | 492,259 |
| Net Increase (Decrease) in Net Assets Resulting from Operations | 397,883 | 842,321 |
| Distributions | ||
| Net Investment Income | (14,941) | (27,123) |
| Realized Capital Gain | (130,422) | — |
| Total Distributions | (145,363) | (27,123) |
| Capital Share Transactions | ||
| Issued | 898,740 | 471,816 |
| Issued in Lieu of Cash Distributions | 140,921 | 26,277 |
| Redeemed | (1,371,055) | (1,053,660) |
| Net Increase (Decrease) from Capital Share Transactions | (331,394) | (555,567) |
| Total Increase (Decrease) | (78,874) | 259,631 |
| Net Assets | ||
| Beginning of Period | 4,239,682 | 3,980,051 |
| End of Period | 4,160,808 | 4,239,682 |
See accompanying Notes, which are an integral part of the Financial Statements.
17
| Mid-Cap Growth Fund | |||||
| Financial Highlights | |||||
| For a Share Outstanding | Year Ended October 31, | ||||
| Throughout Each Period | 2018 | 2017 | 2016 | 2015 | 2014 |
| Net Asset Value, Beginning of Period | $26.51 | $21.75 | $24.88 | $26.40 | $25.72 |
| Investment Operations | |||||
| Net Investment Income | .1141 | .0931 | .1472 | .064 3 | .045 |
| Net Realized and Unrealized Gain (Loss) | |||||
| on Investments | 2.379 | 4.817 | (1.437) | 1.625 | 3.134 |
| Total from Investment Operations | 2.493 | 4.910 | (1.290) | 1.689 | 3.179 |
| Distributions | |||||
| Dividends from Net Investment Income | (. 095) | (.150) | (. 070) | (. 038) | (. 007) |
| Distributions from Realized Capital Gains | (.828) | — | (1.770) | (3.171) | (2.492) |
| Total Distributions | (.923) | (.150) | (1.840) | (3.209) | (2.499) |
| Net Asset Value, End of Period | $28.08 | $26.51 | $21.75 | $24.88 | $26.40 |
| Total Return4 | 9.61% | 22.69% | -5.49% | 6.68% | 13.42% |
| Ratios/Supplemental Data | |||||
| Net Assets, End of Period (Millions) | $4,161 | $4,240 | $3,980 | $4,317 | $3,319 |
| Ratio of Total Expenses to Average Net Assets5 | 0.36% | 0.36% | 0.36% | 0.43% | 0.46% |
| Ratio of Net Investment Income to | |||||
| Average Net Assets | 0.40% | 0.39% | 0.64%2 | 0.25%3 | 0.16% |
| Portfolio Turnover Rate | 75% | 118% | 91% | 93% | 82% |
1 Calculated based on average shares outstanding.
2 Net investment income per share and the ratio of net investment income to average net assets include $.018 and 0.08%, respectively,
resulting from a special dividend from TransDigm Group in October 2016.
3 Net investment income per share and the ratio of net investment income to average net assets include $.006 and 0.03%, respectively,
resulting from a special dividend from Lazard Ltd. in February 2015.
4 Total returns do not include account service fees that may have applied in the periods shown. Fund prospectuses provide information
about any applicable account service fees.
5 Includes performance-based investment advisory fee increases (decreases) of (0.04%), (0.05%), (0.04%), (0.01%), and (0.02%).
See accompanying Notes, which are an integral part of the Financial Statements.
18
Mid-Cap Growth Fund
Notes to Financial Statements
Vanguard Mid-Cap Growth Fund is registered under the Investment Company Act of 1940 as an open-end investment company, or mutual fund.
A. The following significant accounting policies conform to generally accepted accounting principles for U.S. investment companies. The fund consistently follows such policies in preparing its financial statements.
1. Security Valuation: Securities are valued as of the close of trading on the New York Stock Exchange (generally 4 p.m., Eastern time) on the valuation date. Equity securities are valued at the latest quoted sales prices or official closing prices taken from the primary market in which each security trades; such securities not traded on the valuation date are valued at the mean of the latest quoted bid and asked prices. Securities for which market quotations are not readily available, or whose values have been materially affected by events occurring before the fund’s pricing time but after the close of the securities’ primary markets, are valued by methods deemed by the board of trustees to represent fair value. Investments in Vanguard Market Liquidity Fund are valued at that fund’s net asset value. Temporary cash investments are valued using the latest bid prices or using valuations based on a matrix system (which considers such factors as security prices, yields, maturities, and ratings), both as furnished by independent pricing services.
2. Futures Contracts: The fund uses index futures contracts to a limited extent, with the objective of maintaining full exposure to the stock market while maintaining liquidity. The fund may purchase or sell futures contracts to achieve a desired level of investment, whether to accommodate portfolio turnover or cash flows from capital share transactions. The primary risks associated with the use of futures contracts are imperfect correlation between changes in market values of stocks held by the fund and the prices of futures contracts, and the possibility of an illiquid market. Counterparty risk involving futures is mitigated because a regulated clearinghouse is the counterparty instead of the clearing broker. To further mitigate counterparty risk, the fund trades futures contracts on an exchange, monitors the financial strength of its clearing brokers and clearinghouse, and has entered into clearing agreements with its clearing brokers. The clearinghouse imposes initial margin requirements to secure the fund’s performance and requires daily settlement of variation margin representing changes in the market value of each contract. Any assets pledged as initial margin for open contracts are noted in the Statement of Net Assets.
Futures contracts are valued at their quoted daily settlement prices. The notional amounts of the contracts are not recorded in the Statement of Net Assets. Fluctuations in the value of the contracts are recorded in the Statement of Assets and Liabilities as an asset (liability) and in the Statement of Operations as unrealized appreciation (depreciation) until the contracts are closed, when they are recorded as realized futures gains (losses).
During the year ended October 31, 2018, the fund’s average investments in long and short futures contracts represented 2% and 0% of net assets, respectively, based on the average of the notional amounts at each quarter-end during the period.
3. Federal Income Taxes: The fund intends to continue to qualify as a regulated investment company and distribute all of its taxable income. Management has analyzed the fund’s tax positions taken for all open federal income tax years (October 31, 2015–2018), and has concluded that no provision for federal income tax is required in the fund’s financial statements.
19
Mid-Cap Growth Fund
4. Distributions: Distributions to shareholders are recorded on the ex-dividend date. Distributions are determined on a tax basis and may differ from net investment income and realized capital gains for financial reporting purposes.
5. Securities Lending: To earn additional income, the fund lends its securities to qualified institutional borrowers. Security loans are subject to termination by the fund at any time, and are required to be secured at all times by collateral in an amount at least equal to the market value of securities loaned. Daily market fluctuations could cause the value of loaned securities to be more or less than the value of the collateral received. When this occurs, the collateral is adjusted and settled before the opening of the market on the next business day. The fund further mitigates its counterparty risk by entering into securities lending transactions only with a diverse group of prequalified counterparties, monitoring their financial strength, and entering into master securities lending agreements with its counterparties. The master securities lending agreements provide that, in the event of a counterparty’s default (including bankruptcy), the fund may terminate any loans with that borrower, determine the net amount owed, and sell or retain the collateral up to the net amount owed to the fund; however, such actions may be subject to legal proceedings. While collateral mitigates counterparty risk, in the event of a default, the fund may experience delays and costs in recovering the securities loaned. The fund invests cash collateral received in Vanguard Market Liquidity Fund, and records a liability in the Statement of Assets and Liabilities for the return of the collateral, during the period the securities are on loan. Securities lending income represents fees charged to borrowers plus income earned on invested cash collateral, less expenses associated with the loan. During the term of the loan, the fund is entitled to all distributions made on or in respect of the loaned securities.
6. Credit Facility: The fund and certain other funds managed by The Vanguard Group (“Vanguard”) participate in a $3.1 billion committed credit facility provided by a syndicate of lenders pursuant to a credit agreement that may be renewed annually; each fund is individually liable for its borrowings, if any, under the credit facility. Borrowings may be utilized for temporary and emergency purposes, and are subject to the fund’s regulatory and contractual borrowing restrictions. The participating funds are charged administrative fees and an annual commitment fee of 0.10% of the undrawn amount of the facility; these fees are allocated to the funds based on a method approved by the fund’s board of trustees and included in Management and Administrative expenses on the fund’s Statement of Operations. Any borrowings under this facility bear interest at a rate based upon the higher of the one-month London Interbank Offered Rate, federal funds effective rate, or overnight bank funding rate plus an agreed-upon spread.
The fund had no borrowings outstanding at October 31, 2018, or at any time during the period then ended.
7. Other: Dividend income is recorded on the ex-dividend date. Interest income includes income distributions received from Vanguard Market Liquidity Fund and is accrued daily. Premiums and discounts on debt securities purchased are amortized and accreted, respectively, to interest income over the lives of the respective securities. Security transactions are accounted for on the date securities are bought or sold. Costs used to determine realized gains (losses) on the sale of investment securities are those of the specific securities sold.
20
Mid-Cap Growth Fund
B. The investment advisory firms William Blair Investment Management, LLC, and Victory Capital Management Inc., through its RS Investments franchise, each provide investment advisory services to a portion of the fund for a fee calculated at an annual percentage rate of average net assets managed by the advisor. The basic fee of William Blair Investment Management, LLC, is subject to quarterly adjustments based on performance relative to the Russell Midcap Growth Index for the preceding five years. The basic fee of Victory Capital Management Inc., is subject to quarterly adjustments based on performance relative to the Russell Midcap Growth Index since January 31, 2017.
Vanguard manages the cash reserves of the fund as described below.
For the year ended October 31, 2018, the aggregate investment advisory fee represented an effective annual basic rate of 0.20% of the fund’s average net assets, before a decrease of $1,759,000 (0.04%) based on performance.
C. In accordance with the terms of a Funds’ Service Agreement (the “FSA”) between Vanguard and the fund, Vanguard furnishes to the fund corporate management, administrative, marketing, distribution, and cash management services at Vanguard’s cost of operations (as defined by the FSA). These costs of operations are allocated to the fund based on methods and guidelines approved by the board of trustees. Vanguard does not require reimbursement in the current period for certain costs of operations (such as deferred compensation/benefits and risk/insurance costs); the fund’s liability for these costs of operations is included in Payables to Vanguard on the Statement of Assets and Liabilities. All other costs of operations payable to Vanguard are generally settled twice a month.
Upon the request of Vanguard, the fund may invest up to 0.40% of its net assets as capital in Vanguard. At October 31, 2018, the fund had contributed to Vanguard capital in the amount of $234,000, representing 0.01% of the fund’s net assets and 0.09% of Vanguard’s capitalization. The fund’s trustees and officers are also directors and employees, respectively, of Vanguard.
D. The fund has asked its investment advisors to direct certain security trades, subject to obtaining the best price and execution, to brokers who have agreed to rebate to the fund part of the commissions generated. Such rebates are used solely to reduce the fund’s management and administrative expenses. The fund’s custodian bank has also agreed to reduce its fees when the fund maintains cash on deposit in the non-interest bearing custody account. For the year ended October 31, 2018, these arrangements reduced the fund’s management and administrative expenses by $148,000 and custodian fees by $4,000. The total expense reduction represented an effective annual rate of 0.00% of the fund’s average net assets.
E. Various inputs may be used to determine the value of the fund’s investments. These inputs are summarized in three broad levels for financial statement purposes. The inputs or methodologies used to value securities are not necessarily an indication of the risk associated with investing in those securities.
Level 1—Quoted prices in active markets for identical securities.
Level 2—Other significant observable inputs (including quoted prices for similar securities, interest rates, prepayment speeds, credit risk, etc.).
Level 3—Significant unobservable inputs (including the fund’s own assumptions used to determine the fair value of investments). Any investments valued with significant unobservable inputs are noted on the Statement of Net Assets.
21
Mid-Cap Growth Fund
The following table summarizes the market value of the fund’s investments as of October 31, 2018, based on the inputs used to value them:
| Level 1 | Level 2 | Level 3 | |
| Investments | ($000) | ($000) | ($000) |
| Common Stocks | 3,998,872 | — | — |
| Temporary Cash Investments | 158,747 | 5,975 | — |
| Futures Contracts—Assets1 | 648 | — | — |
| Total | 4,158,267 | 5,975 | — |
| 1 Represents variation margin on the last day of the reporting period. |
F. Permanent differences between book-basis and tax-basis components of net assets are reclassified among capital accounts in the financial statements to reflect their tax character. These reclassifications have no effect on net assets or net asset value per share. As of period end, the following permanent differences primarily attributable to the accounting for distributions in connection with fund share redemptions were reclassified to the following accounts:
| Amount | |
| ($000) | |
| Paid-in Capital | 80,332 |
| Total Distributable Earnings (Loss) | (80,332) |
Temporary differences between book-basis and tax-basis components of total distributable earnings (loss) arise when certain items of income, gain, or loss are recognized in different periods for financial statement and tax purposes; these differences will reverse at some time in the future. The differences are primarily related to the tax deferral of losses on wash sales and the realization of unrealized gains or losses on certain futures contracts. As of period end, the tax-basis components of total distributable earnings (loss) are detailed in the table as follows:
| Amount | |
| ($000) | |
| Undistributed Ordinary Income | 62,435 |
| Undistributed Long-Term Gains | 414,238 |
| Capital Loss Carryforwards (Non-expiring) | — |
| Net Unrealized Gains (Losses) | 700,037 |
As of October 31, 2018, gross unrealized appreciation and depreciation for investments and derivatives based on cost for U.S. federal income tax purposes were as follows:
| Amount | |
| ($000) | |
| Tax Cost | 3,463,557 |
| Gross Unrealized Appreciation | 831,833 |
| Gross Unrealized Depreciation | (131,796) |
| Net Unrealized Appreciation (Depreciation) | 700,037 |
22
Mid-Cap Growth Fund
G. During the year ended October 31, 2018, the fund purchased $3,158,033,000 of investment securities and sold $3,621,300,000 of investment securities, other than temporary cash investments.
| H. Capital shares issued and redeemed were: | ||
| Year Ended October 31, | ||
| 2018 | 2017 | |
| Shares | Shares | |
| (000) | (000) | |
| Issued | 31,360 | 19,783 |
| Issued in Lieu of Cash Distributions | 5,324 | 1,160 |
| Redeemed | (48,445) | (43,995) |
| Net Increase (Decrease) in Shares Outstanding | (11,761) | (23,052) |
I. Transactions during the period in investments where the issuer is another member of The Vanguard Group were as follows:
| Current Period Transactions | ||||||||
| Oct. 31, | Proceeds | Realized | Oct. 31, | |||||
| 2017 | from | Net | Change in | Capital Gain | 2018 | |||
| Market | Purchases | Securities | Gain | Unrealized | Distributions | Market | ||
| Value | at Cost | Sold | (Loss) | App. (Dep.) | Income | Received | Value | |
| ($000) | ($000) | ($000) | ($000) | ($000) | ($000) | ($000) | ($000) | |
| Vanguard Market | ||||||||
| Liquidity Fund | 213,537 | NA1 | NA1 | (46) | 16 | 3,031 | — | 158,747 |
| Vanguard Mid-Cap | ||||||||
| Growth ETF | 12,474 | — | — | — | 424 | 94 | — | 12,898 |
| Total | 226,011 | (46) | 440 | 3,125 | — | 171,645 | ||
| 1 Not applicable—purchases and sales are for temporary cash investment purposes. | ||||||||
J. On November, 30, 2018, the Board of Trustees approved changes to the advisors of the fund. Frontier Capital Management Co., LLC, and Wellington Management Company llp will join RS Investments as advisors to the fund. William Blair Investment Management, LLC, will no longer serve as an advisor.
Management has determined that no other events or transactions occurred subsequent to October 31, 2018, that would require recognition or disclosure in these financial statements.
23
Report of Independent Registered Public Accounting Firm
To the Board of Trustees of Vanguard Whitehall Funds and Shareholders of Vanguard Mid-Cap Growth Fund
Opinion on the Financial Statements
We have audited the accompanying statement of net assets and statement of assets and liabilities of Vanguard Mid-Cap Growth Fund (one of the funds constituting Vanguard Whitehall Funds, referred to hereafter as the “Fund”) as of October 31, 2018, the related statement of operations for the year ended October 31, 2018, the statement of changes in net assets for each of the two years in the period ended October 31, 2018, including the related notes, and the financial highlights for each of the five years in the period ended October 31, 2018 (collectively referred to as the “financial statements”). In our opinion, the financial statements present fairly, in all material respects, the financial position of the Fund as of October 31, 2018, the results of its operations for the year then ended, the changes in its net assets for each of the two years in the period ended October 31, 2018 and the financial highlights for each of the five years in the period ended October 31, 2018 in conformity with accounting principles generally accepted in the United States of America.
Basis for Opinion
These financial statements are the responsibility of the Fund’s management. Our responsibility is to express an opinion on the Fund’s financial statements based on our audits. We are a public accounting firm registered with the Public Company Accounting Oversight Board (United States) (“PCAOB”) and are required to be independent with respect to the Fund in accordance with the U.S. federal securities laws and the applicable rules and regulations of the Securities and Exchange Commission and the PCAOB.
We conducted our audits of these financial statements in accordance with the standards of the PCAOB. Those standards require that we plan and perform the audit to obtain reasonable assurance about whether the financial statements are free of material misstatement, whether due to error or fraud.
Our audits included performing procedures to assess the risks of material misstatement of the financial statements, whether due to error or fraud, and performing procedures that respond to those risks. Such procedures included examining, on a test basis, evidence regarding the amounts and disclosures in the financial statements. Our audits also included evaluating the accounting principles used and significant estimates made by management, as well as evaluating the overall presentation of the financial statements. Our procedures included confirmation of securities owned as of October 31, 2018 by correspondence with the custodians and brokers and by agreement to the underlying ownership records of the transfer agent; when replies were not received from brokers, we performed other auditing procedures. We believe that our audits provide a reasonable basis for our opinion.
/s/PricewaterhouseCoopers LLP
Philadelphia, Pennsylvania
December 13, 2018
We have served as the auditor of one or more investment companies in The Vanguard Group of Funds since 1975.
24
Special 2018 tax information (unaudited) for Vanguard Mid-Cap Growth Fund
This information for the fiscal year ended October 31, 2018, is included pursuant to provisions of the Internal Revenue Code.
The fund distributed $203,428,000 as capital gain dividends (20% rate gain distributions) to shareholders during the fiscal year.
The fund distributed $14,941,000 of qualified dividend income to shareholders during the fiscal year.
For corporate shareholders, 37.8% of investment income (dividend income plus short-term gains, if any) qualifies for the dividends-received deduction.
25
Your Fund’s After-Tax Returns
This table presents returns for your fund both before and after taxes. The after-tax returns are shown in two ways: (1) assuming that an investor owned the fund during the entire period and paid taxes on the fund’s distributions, and (2) assuming that an investor paid taxes on the fund’s distributions and sold all shares at the end of each period.
Calculations are based on the highest individual federal income tax and capital gains tax rates in effect at the times of the distributions and the hypothetical sales. State and local taxes were not considered. After-tax returns reflect any qualified dividend income, using actual prior-year figures and estimates for 2018. (In the example, returns after the sale of fund shares may be higher than those assuming no sale. This occurs when the sale would have produced a capital loss. The calculation assumes that the investor received a tax deduction for the loss.)
Please note that your actual after-tax returns will depend on your tax situation and may differ from those shown. Also note that if you own the fund in a tax-deferred account, such as an individual retirement account or a 401(k) plan, this information does not apply to you. Such accounts are not subject to current taxes.
Finally, keep in mind that a fund’s performance—whether before or after taxes—does not guarantee future results.
| Average Annual Total Returns: Mid-Cap Growth Fund | |||
| Periods Ended October 31, 2018 | |||
| One | Five | Ten | |
| Year | Years | Years | |
| Returns Before Taxes | 9.61% | 8.99% | 13.82% |
| Returns After Taxes on Distributions | 8.73 | 7.09 | 12.65 |
| Returns After Taxes on Distributions and Sale of Fund Shares | 6.25 | 6.58 | 11.33 |
26
About Your Fund’s Expenses
As a shareholder of the fund, you incur ongoing costs, which include costs for portfolio management, administrative services, and shareholder reports (like this one), among others. Operating expenses, which are deducted from a fund’s gross income, directly reduce the investment return of the fund.
A fund’s expenses are expressed as a percentage of its average net assets. This figure is known as the expense ratio. The following examples are intended to help you understand the ongoing costs (in dollars) of investing in your fund and to compare these costs with those of other mutual funds. The examples are based on an investment of $1,000 made at the beginning of the period shown and held for the entire period.
The accompanying table illustrates your fund’s costs in two ways:
• Based on actual fund return. This section helps you to estimate the actual expenses that you paid over the period. The ”Ending Account Value“ shown is derived from the fund‘s actual return, and the third column shows the dollar amount that would have been paid by an investor who started with $1,000 in the fund. You may use the information here, together with the amount you invested, to estimate the expenses that you paid over the period.
To do so, simply divide your account value by $1,000 (for example, an $8,600 account value divided by $1,000 = 8.6), then multiply the result by the number given for your fund under the heading ”Expenses Paid During Period.“
• Based on hypothetical 5% yearly return. This section is intended to help you compare your fund‘s costs with those of other mutual funds. It assumes that the fund had a yearly return of 5% before expenses, but that the expense ratio is unchanged. In this case—because the return used is not the fund’s actual return—the results do not apply to your investment. The example is useful in making comparisons because the Securities and Exchange Commission requires all mutual funds to calculate expenses based on a 5% return. You can assess your fund’s costs by comparing this hypothetical example with the hypothetical examples that appear in shareholder reports of other funds.
Note that the expenses shown in the table are meant to highlight and help you compare ongoing costs only and do not reflect transaction costs incurred by the fund for buying and selling securities. Further, the expenses do not include any purchase, redemption, or account service fees described in the fund prospectus. If such fees were applied to your account, your costs would be higher. Your fund does not carry a “sales load.”
The calculations assume no shares were bought or sold during the period. Your actual costs may have been higher or lower, depending on the amount of your investment and the timing of any purchases or redemptions.
You can find more information about the fund’s expenses, including annual expense ratios, in the Financial Statements section of this report. For additional information on operating expenses and other shareholder costs, please refer to your fund’s current prospectus.
27
| Six Months Ended October 31, 2018 | |||
| Beginning | Ending | Expenses | |
| Account Value | Account Value | Paid During | |
| Mid-Cap Growth Fund | 4/30/2018 | 10/31/2018 | Period |
| Based on Actual Fund Return | $1,000.00 | $1,018.87 | $1.78 |
| Based on Hypothetical 5% Yearly Return | 1,000.00 | 1,023.44 | 1.79 |
The calculations are based on expenses incurred in the most recent six-month period. The fund’s annualized six-month expense ratio for that period is 0.35%. The dollar amounts shown as “Expenses Paid” are equal to the annualized expense ratio multiplied by the average account value over the period, multiplied by the number of days in the most recent six-month period, then divided by the number of days in the most recent 12-month period (184/365).
28
Glossary
30-Day SEC Yield. A fund’s 30-day SEC yield is derived using a formula specified by the U.S. Securities and Exchange Commission. Under the formula, data related to the fund’s security holdings in the previous 30 days are used to calculate the fund’s hypothetical net income for that period, which is then annualized and divided by the fund’s estimated average net assets over the calculation period. For the purposes of this calculation, a security’s income is based on its current market yield to maturity (for bonds), its actual income (for asset-backed securities), or its projected dividend yield (for stocks). Because the SEC yield represents hypothetical annualized income, it will differ—at times significantly—from the fund’s actual experience. As a result, the fund’s income distributions may be higher or lower than implied by the SEC yield.
Beta. A measure of the magnitude of a fund’s past share-price fluctuations in relation to the ups and downs of a given market index. The index is assigned a beta of 1.00. Compared with a given index, a fund with a beta of 1.20 typically would have seen its share price rise or fall by 12% when the index rose or fell by 10%. For this report, beta is based on returns over the past 36 months for both the fund and the index. Note that a fund’s beta should be reviewed in conjunction with its R-squared (see definition). The lower the R-squared, the less correlation there is between the fund and the index, and the less reliable beta is as an indicator of volatility.
Dividend Yield. Dividend income earned by stocks, expressed as a percentage of the aggregate market value (or of net asset value, for a fund). The yield is determined by dividing the amount of the annual dividends by the aggregate value (or net asset value) at the end of the period. For a fund, the dividend yield is based solely on stock holdings and does not include any income produced by other investments.
Earnings Growth Rate. The average annual rate of growth in earnings over the past five years for the stocks now in a fund.
Equity Exposure. A measure that reflects a fund’s investments in stocks and stock futures. Any holdings in short-term reserves are excluded.
Expense Ratio. A fund’s total annual operating expenses expressed as a percentage of the fund’s average net assets. The expense ratio includes management and administrative expenses, but does not include the transaction costs of buying and selling portfolio securities.
Foreign Holdings. The percentage of a fund represented by securities or depositary receipts of companies based outside the United States.
Inception Date. The date on which the assets of a fund (or one of its share classes) are first invested in accordance with the fund’s investment objective. For funds with a subscription period, the inception date is the day after that period ends. Investment performance is measured from the inception date.
Median Market Cap. An indicator of the size of companies in which a fund invests; the midpoint of market capitalization (market price x shares outstanding) of a fund’s stocks, weighted by the proportion of the fund’s assets invested in each stock. Stocks representing half of the fund’s assets have market capitalizations above the median, and the rest are below it.
Price/Book Ratio. The share price of a stock divided by its net worth, or book value, per share.
For a fund, the weighted average price/book ratio of the stocks it holds.
29
Price/Earnings Ratio. The ratio of a stock’s current price to its per-share earnings over the past year. For a fund, the weighted average P/E of the stocks it holds. P/E is an indicator of market expectations about corporate prospects; the higher the P/E, the greater the expectations for a company’s future growth.
R-Squared. A measure of how much of a fund’s past returns can be explained by the returns from the market in general, as measured by a given index. If a fund’s total returns were precisely synchronized with an index’s returns, its R-squared would be 1.00. If the fund’s returns bore no relationship to the index’s returns, its R-squared would be 0. For this report, R-squared is based on returns over the past 36 months for both the fund and the index.
Return on Equity. The annual average rate of return generated by a company during the past five years for each dollar of shareholder’s equity (net income divided by shareholder’s equity). For a fund, the weighted average return on equity for the companies whose stocks it holds.
Short-Term Reserves. The percentage of a fund invested in highly liquid, short-term securities that can be readily converted to cash.
Turnover Rate. An indication of the fund’s trading activity. Funds with high turnover rates incur higher transaction costs and may be more likely to distribute capital gains (which may be taxable to investors). The turnover rate excludes in-kind transactions, which have minimal impact on costs.
30
The Global Industry Classification Standard (“GICS”) was developed by and is the exclusive property and a service mark of MSCI Inc. (“MSCI”) and Standard and Poor’s, a division of McGraw-Hill Companies, Inc. (“S&P”), and is licensed for use by Vanguard. Neither MSCI, S&P nor any third party involved in making or compiling the GICS or any GICS classification makes any express or implied warranties or representations with respect to such standard or classification (or the results to be obtained by the use thereof), and all such parties hereby expressly disclaim all warranties of originality, accuracy, completeness, merchantability or fitness for a particular purpose with respect to any such standard or classification. Without limiting any of the foregoing, in no event shall MSCI, S&P, any of its affiliates or any third party involved in making or compiling the GICS or any GICS classification have any liability for any direct, indirect, special, punitive, consequential or any other damages (including lost profits) even if notified of the possibility of such damages.
31
This page intentionally left blank.
This page intentionally left blank.
This page intentionally left blank.
The People Who Govern Your Fund
The trustees of your mutual fund are there to see that the fund is operated and managed in your best interests since, as a shareholder, you are a part owner of the fund. Your fund’s trustees also serve on the board of directors of The Vanguard Group, Inc., which is owned by the Vanguard funds and provides services to them on an at-cost basis.
A majority of Vanguard’s board members are independent, meaning that they have no affiliation with Vanguard or the funds they oversee, apart from the sizable personal investments they have made as private individuals. The independent board members have distinguished backgrounds in business, academia, and public service. Each of the trustees and executive officers oversees 211 Vanguard funds.
Information for each trustee and executive officer of the fund appears below. The mailing address of the trustees and officers is P.O. Box 876, Valley Forge, PA 19482. More information about the trustees is in the Statement of Additional Information, which can be obtained, without charge, by contacting Vanguard at 800-662-7447, or online at vanguard.com.
Interested Trustees1
F. William McNabb III
Born in 1957. Trustee since July 2009. Principal occupation(s) during the past five years and other experience: chairman of the board (January 2010–present) of Vanguard and of each of the investment companies served by Vanguard, trustee (2009–present) of each of the investment companies served by Vanguard, and director (2008–present) of Vanguard. Chief executive officer and president (2008–2017) of Vanguard and each of the investment companies served by Vanguard, managing director (1995–2008) of Vanguard, and director (1997–2018) of Vanguard Marketing Corporation. Director (2018–present) of UnitedHealth Group.
Mortimer J. Buckley
Born in 1969. Trustee since January 2018. Principal occupation(s) during the past five years and other experience: chief executive officer (January 2018–present) of Vanguard; chief executive officer, president, and trustee (January 2018–present) of each of the investment companies served by Vanguard; president and director (2017–present) of Vanguard; and president (February 2018–present) of Vanguard Marketing Corporation. Chief investment officer (2013–2017), managing director (2002–2017), head of the Retail Investor Group (2006–2012), and chief information officer (2001–2006) of Vanguard. Chairman of the board (2011–2017) of the Children’s Hospital of Philadelphia.
Independent Trustees
Emerson U. Fullwood
Born in 1948. Trustee since January 2008. Principal occupation(s) during the past five years and other experience: executive chief staff and marketing officer for North America and corporate vice president (retired 2008) of Xerox Corporation (document management products and services). Former president of the Worldwide Channels Group, Latin America, and Worldwide Customer Service and executive chief staff officer of Developing Markets of Xerox. Executive in residence and 2009–2010 Distinguished Minett Professor at the Rochester Institute of Technology. Lead director of SPX FLOW, Inc. (multi-industry manufacturing). Director of the University of Rochester Medical Center, the Monroe Community College Foundation, the United Way of Rochester, North Carolina A&T University, and Roberts Wesleyan College. Trustee of the University of Rochester.
Amy Gutmann
Born in 1949. Trustee since June 2006. Principal occupation(s) during the past five years and other experience: president (2004–present) of the University of Pennsylvania. Christopher H. Browne Distinguished Professor of Political Science, School of Arts and Sciences, and professor of communication, Annenberg School for Communication, with secondary faculty appointments in the Department of Philosophy, School of Arts and Sciences, and at the Graduate School of Education, University of Pennsylvania. Trustee of the National Constitution Center.
1 Mr. McNabb and Mr. Buckley are considered “interested persons,” as defined in the Investment Company Act of 1940, because they are officers of the Vanguard funds.
JoAnn Heffernan Heisen
Born in 1950. Trustee since July 1998. Principal occupation(s) during the past five years and other experience: corporate vice president of Johnson & Johnson (pharmaceuticals/medical devices/consumer products) and member of its executive committee (1997–2008). Chief global diversity officer (retired 2008), vice president and chief information officer (1997–2006), controller (1995–1997), treasurer (1991–1995), and assistant treasurer (1989–1991) of Johnson & Johnson. Director of Skytop Lodge Corporation (hotels) and the Robert Wood Johnson Foundation. Member of the advisory board of the Institute for Women’s Leadership at Rutgers University.
F. Joseph Loughrey
Born in 1949. Trustee since October 2009. Principal occupation(s) during the past five years and other experience: president and chief operating officer (retired 2009) and vice chairman of the board (2008–2009) of Cummins Inc. (industrial machinery). Chairman of the board of Hillenbrand, Inc. (specialized consumer services), Oxfam America, and the Lumina Foundation for Education. Director of the V Foundation for Cancer Research. Member of the advisory council for the College of Arts and Letters and chair of the advisory board to the Kellogg Institute for International Studies, both at the University of Notre Dame.
Mark Loughridge
Born in 1953. Trustee since March 2012. Principal occupation(s) during the past five years and other experience: senior vice president and chief financial officer (retired 2013) of IBM (information technology services). Fiduciary member of IBM’s Retirement Plan Committee (2004–2013), senior vice president and general manager (2002–2004) of IBM Global Financing, vice president and controller (1998–2002) of IBM, and a variety of other prior management roles at IBM. Member of the Council on Chicago Booth.
Scott C. Malpass
Born in 1962. Trustee since March 2012. Principal occupation(s) during the past five years and other experience: chief investment officer (1989–present) and vice president (1996–present) of the University of Notre Dame. Assistant professor of finance at the Mendoza College of Business, University of Notre Dame, and member of the Notre Dame 403(b) Investment Committee. Chairman of the board of TIFF Advisory Services, Inc. Member of the board of Catholic Investment Services, Inc. (investment advisors), the board of advisors for Spruceview Capital Partners, and the board of superintendence of the Institute for the Works of Religion.
Deanna Mulligan
Born in 1963. Trustee since January 2018. Principal occupation(s) during the past five years and other experience: president (2010–present) and chief executive officer (2011–present) of The Guardian Life Insurance Company of America. Chief operating officer (2010–2011) and executive vice president (2008–2010) of Individual Life and Disability of The Guardian Life Insurance Company of America. Member of the board of The Guardian Life Insurance Company of America, the American Council of Life Insurers, the Partnership for New York City (business leadership), and the Committee Encouraging Corporate Philanthropy. Trustee of the Economic Club of New York and the Bruce Museum (arts and science). Member of the Advisory Council for the Stanford Graduate School of Business.
André F. Perold
Born in 1952. Trustee since December 2004. Principal occupation(s) during the past five years and other experience: George Gund Professor of Finance and Banking, Emeritus at the Harvard Business School (retired 2011). Chief investment officer and co-managing partner of HighVista Strategies LLC (private investment firm). Overseer of the Museum of Fine Arts Boston.
Sarah Bloom Raskin
Born in 1961. Trustee since January 2018. Principal occupation(s) during the past five years and other experience: deputy secretary (2014–2017) of the United States Department of the Treasury. Governor (2010–2014) of the Federal Reserve Board. Commissioner (2007–2010) of financial regulation for the State of Maryland. Member of the board of directors (2012–2014) of Neighborhood Reinvestment Corporation. Director of i(x) Investments, LLC.
Peter F. Volanakis
Born in 1955. Trustee since July 2009. Principal occupation(s) during the past five years and other experience: president and chief operating officer (retired 2010) of Corning Incorporated (communications equipment) and director of Corning Incorporated (2000–2010) and Dow Corning (2001–2010). Director (2012) of SPX Corporation (multi-industry manufacturing). Overseer of the Amos Tuck School of Business Administration, Dartmouth College (2001–2013). Chairman of the board of trustees of Colby-Sawyer College. Member of the Board of Hypertherm Inc. (industrial cutting systems, software, and consumables).
Executive Officers
Glenn Booraem
Born in 1967. Principal occupation(s) during the past five years and other experience: principal of Vanguard. Investment stewardship officer (2017–present), treasurer (2015–2017), controller (2010–2015), and assistant controller (2001–2010) of each of the investment companies served by Vanguard.
Christine M. Buchanan
Born in 1970. Principal occupation(s) during the past five years and other experience: principal of Vanguard and global head of Fund Administration at Vanguard. Treasurer (2017–present) of each of the investment companies served by Vanguard. Partner (2005–2017) at KPMG LLP (audit, tax, and advisory services).
Brian Dvorak
Born in 1973. Principal occupation(s) during the past five years and other experience: principal of Vanguard. Chief compliance officer (2017–present) of Vanguard and each of the investment companies served by Vanguard. Assistant vice president (2017–present) of Vanguard Marketing Corporation. Vice president and director of Enterprise Risk Management (2011–2013) at Oppenheimer Funds, Inc.
Thomas J. Higgins
Born in 1957. Principal occupation(s) during the past five years and other experience: principal of Vanguard. Chief financial officer (2008–present) and treasurer (1998–2008) of each of the investment companies served by Vanguard.
Peter Mahoney
Born in 1974. Principal occupation(s) during the past five years and other experience: principal of Vanguard. Controller (2015–present) of each of the investment companies served by Vanguard. Head of International Fund Services (2008–2014) at Vanguard.
Anne E. Robinson
Born in 1970. Principal occupation(s) during the past five years and other experience: general counsel (2016–present) of Vanguard. Secretary (2016–present) of Vanguard and of each of the investment companies served by Vanguard. Managing director (2016–present) of Vanguard. Director and senior vice president (2016–2018) of Vanguard Marketing Corporation. Managing director and general counsel of Global Cards and Consumer Services (2014–2016) at Citigroup. Counsel (2003–2014) at American Express.
Michael Rollings
Born in 1963. Principal occupation(s) during the past five years and other experience: finance director (2017–present) and treasurer (2017) of each of the investment companies served by Vanguard. Managing director (2016–present) of Vanguard. Chief financial officer (2016–present) of Vanguard. Director (2016–present) of Vanguard Marketing Corporation. Executive vice president and chief financial officer (2006–2016) of MassMutual Financial Group.
| Vanguard Senior Management Team | |
| Joseph Brennan | Chris D. McIsaac |
| Mortimer J. Buckley | James M. Norris |
| Gregory Davis | Thomas M. Rampulla |
| John James | Karin A. Risi |
| Martha G. King | Anne E. Robinson |
| John T. Marcante | Michael Rollings |
| Chairman Emeritus and Senior Advisor | |
| John J. Brennan | |
| Chairman, 1996–2009 | |
| Chief Executive Officer and President, 1996–2008 | |
| Founder | |
| John C. Bogle | |
| Chairman and Chief Executive Officer, 1974–1996 | |
 | |
P.O. Box 2600 | |
Connect with Vanguard® > vanguard.com | |
| Fund Information > 800-662-7447 | Source for Bloomberg Barclays indexes: Bloomberg |
| Direct Investor Account Services > 800-662-2739 | Index Services Limited. Copyright 2018, Bloomberg. All |
| Institutional Investor Services > 800-523-1036 | rights reserved. |
| Text Telephone for People | |
| Who Are Deaf or Hard of Hearing > 800-749-7273 | CFA® is a registered trademark owned by CFA Institute. |
| This material may be used in conjunction | |
| with the offering of shares of any Vanguard | |
| fund only if preceded or accompanied by | |
| the fund’s current prospectus. | |
| All comparative mutual fund data are from Lipper, a | |
| Thomson Reuters Company, or Morningstar, Inc., unless | |
| otherwise noted. | |
| You can obtain a free copy of Vanguard’s proxy voting | |
| guidelines by visiting vanguard.com/proxyreporting or by | |
| calling Vanguard at 800-662-2739. The guidelines are | |
| also available from the SEC’s website, sec.gov. In | |
| addition, you may obtain a free report on how your fund | |
| voted the proxies for securities it owned during the 12 | |
| months ended June 30. To get the report, visit either | |
| vanguard.com/proxyreporting or sec.gov. | |
| You can review information about your fund on the | |
| SEC’s website, and you can receive copies of this | |
| information, for a fee, by sending a request via email | |
| addressed to publicinfo@sec.gov. | |
| © 2018 The Vanguard Group, Inc. | |
| All rights reserved. | |
| Vanguard Marketing Corporation, Distributor. | |
| Q3010 122018 | |
| Annual Report | October 31, 2018 |
| Vanguard Selected Value Fund |
Vanguard’s Principles for Investing Success
We want to give you the best chance of investment success. These principles, grounded in Vanguard’s research and experience, can put you on the right path.
Goals. Create clear, appropriate investment goals.
Balance. Develop a suitable asset allocation using broadly diversified funds. Cost. Minimize cost.
Discipline. Maintain perspective and long-term discipline.
A single theme unites these principles: Focus on the things you can control.
We believe there is no wiser course for any investor.
| Contents | |
| Your Fund’s Performance at a Glance. | 1 |
| CEO’s Perspective. | 3 |
| Advisors’ Report. | 5 |
| Fund Profile. | 11 |
| Performance Summary. | 12 |
| Financial Statements. | 14 |
| Your Fund’s After-Tax Returns. | 29 |
| About Your Fund’s Expenses. | 30 |
| Glossary. | 32 |
Please note: The opinions expressed in this report are just that—informed opinions. They should not be considered promises or advice. Also, please keep in mind that the information and opinions cover the period through the date on the front of this report. Of course, the risks of investing in your fund are spelled out in the prospectus.
See the Glossary for definitions of investment terms used in this report.
Your Fund’s Performance at a Glance
• Vanguard Selected Value Fund returned –9.15% for the 12 months ended October 31, 2018. The fund lagged far behind its benchmark, the Russell Midcap Value Index, and the average return of its mid-capitalization value fund peers.
• The broad stock market returned more than 6% for the 12 months as corporate earnings remained strong and the U.S. economy continued to grow. Growth stocks outperformed their value counterparts, and large-cap stocks surpassed mid- and small-caps.
• In ten of the 11 industry sectors, the advisors’ stock selections underperformed those in the benchmark. Industrials, information technology, materials, and health care were the greatest detractors from relative performance.
• Over the past decade, the fund’s average annual return trailed that of its benchmark but exceeded that of its peers.
| Total Returns: Fiscal Year Ended October 31, 2018 | |
| Total | |
| Returns | |
| Vanguard Selected Value Fund | -9.15% |
| Russell Midcap Value Index | 0.16 |
| Mid-Cap Value Funds Average | -1.92 |
| Mid-Cap Value Funds Average: Derived from data provided by Lipper, a Thomson Reuters Company. | |
| Total Returns: Ten Years Ended October 31, 2018 | |
| Average | |
| Annual Return | |
| Selected Value Fund | 12.69% |
| Russell Midcap Value Index | 13.35 |
| Mid-Cap Value Funds Average | 12.05 |
| Mid-Cap Value Funds Average: Derived from data provided by Lipper, a Thomson Reuters Company. | |
The figures shown represent past performance, which is not a guarantee of future results. (Current performance may be lower or higher than the performance data cited. For performance data current to the most recent month-end, visit our website at vanguard.com/performance.) Note, too, that both investment returns and principal value can fluctuate widely, so an investor’s shares, when sold, could be worth more or less than their original cost.
1
| Expense Ratios | ||
| Your Fund Compared With Its Peer Group | ||
| Peer Group | ||
| Fund | Average | |
| Selected Value Fund | 0.39% | 1.15% |
The fund expense ratio shown is from the prospectus dated February 22, 2018, and represents estimated costs for the current fiscal year. For the fiscal year ended October 31, 2018, the fund’s expense ratio was 0.36%. The peer-group expense ratio is derived from data provided by Lipper, a Thomson Reuters Company, and captures information through year-end 2017.
Peer group: Mid-Cap Value Funds.
2
CEO’s Perspective

Tim Buckley
President and Chief Executive Officer
Dear Shareholder,
Over the years, I’ve found that prudent investors exhibit a common trait: discipline. No matter how the markets move or what new investing fad hits the headlines, those who stay focused on their goals and tune out the noise are set up for long-term success.
The prime gateway to investing is saving, and you don’t usually become a saver without a healthy dose of discipline. Savers make the decision to sock away part of their income, which means spending less and delaying gratification, no matter how difficult that may be.
Of course, disciplined investing extends beyond diligent saving. The financial markets, in the short term especially, are unpredictable; I have yet to meet the investor who can time them perfectly. It takes discipline to resist the urge to go all-in when markets are frothy or to retreat when things look bleak.
Staying put with your investments is one strategy for handling volatility. Another, rebalancing, requires even more discipline because it means steering your money away from strong performers and toward poorer performers.
Patience—a form of discipline—is also the friend of long-term investors. Higher returns are the potential reward for weathering the market’s turbulence and uncertainty.
3
We have been enjoying one of the longest bull markets in history, but it won’t continue forever. Prepare yourself now for how you will react when volatility comes back. Don’t panic. Don’t chase returns or look for answers outside the asset classes you trust. And be sure to rebalance periodically, even when there’s turmoil.
Whether you’re a master of self-control, get a boost from technology, or work with a professional advisor, know that discipline is necessary to get the most out of your investment portfolio. And know that Vanguard is with you for the entire ride.
Thank you for your continued loyalty.
Sincerely,

Mortimer J. Buckley
President and Chief Executive Officer
November 16, 2018
| Market Barometer | |||
| Average Annual Total Returns | |||
| Periods Ended October 31, 2018 | |||
| One Year | Three Years | Five Years | |
| Stocks | |||
| Russell 1000 Index (Large-caps) | 6.98% | 11.31% | 11.05% |
| Russell 2000 Index (Small-caps) | 1.85 | 10.68 | 8.01 |
| Russell 3000 Index (Broad U.S. market) | 6.60 | 11.27 | 10.81 |
| FTSE All-World ex US Index (International) | -7.99 | 4.57 | 2.01 |
| Bonds | |||
| Bloomberg Barclays U.S. Aggregate Bond Index | |||
| (Broad taxable market) | -2.05% | 1.04% | 1.83% |
| Bloomberg Barclays Municipal Bond Index | |||
| (Broad tax-exempt market) | -0.51 | 1.90 | 3.25 |
| FTSE Three-Month U. S. Treasury Bill Index | 1.67 | 0.86 | 0.52 |
| CPI | |||
| Consumer Price Index | 2.52% | 2.07% | 1.60% |
4
Advisors’ Report
For the 12 months ended October 31, 2018, Vanguard Selected Value Fund returned –9.15%. Your fund is managed by three independent advisors. This provides exposure to distinct yet complementary investment approaches, enhancing the fund’s diversification. It is not uncommon for different advisors to have different views about individual securities or the broader investment environment.
The advisors, the percentage and amount of fund assets each manages, and a brief description of their investment strategies are presented in the table below. The advisors have also prepared a discussion of the investment environment that existed during the fiscal year and of how portfolio positioning reflects this assessment. These comments were prepared on November 19, 2018.
| Vanguard Selected Value Fund Investment Advisors | |||
| Fund Assets Managed | |||
| Investment Advisor | % | $ Million | Investment Strategy |
| Barrow, Hanley, Mewhinney & | 57 | 5,041 | Conducts fundamental research on individual |
| Strauss, LLC | stocks exhibiting traditional value | ||
| characteristics: price/earnings and price/book | |||
| ratios below the market average and dividend | |||
| yields above the market average. | |||
| Pzena Investment Management, | 24 | 2,141 | Uses a fundamental, bottom-up, |
| LLC | deep-value-oriented investment strategy. Seeks | ||
| to buy good businesses at low prices, focusing | |||
| exclusively on companies that are | |||
| underperforming their historically demonstrated | |||
| earnings power. | |||
| Donald Smith & Co., Inc. | 17 | 1,530 | Conducts fundamental research on the lowest |
| price-to-tangible book value companies. | |||
| Research focuses on underlying quality of book | |||
| value and assets, and on long-term earnings | |||
| potential. | |||
| Cash Investments | 2 | 99 | These short-term reserves are invested by |
| Vanguard in equity index products to simulate | |||
| investment in stocks. Each advisor may also | |||
| maintain a cash position. | |||
5
Barrow, Hanley, Mewhinney & Strauss, LLC
Portfolio Managers:
James P. Barrow, Founding Director
Mark Giambrone, Managing Director
Our strategy has witnessed a significant period of underperformance this fiscal year. Although this is not the first time we have gone through short-term under-peformance, we feel it’s important to discuss the primary factors creating what should prove to be temporary challenges.
First, the highest-priced stocks within the Russell Midcap Value Index handily outperformed the less expensive ones. Second, stock selection was a detractor for us as several holdings underperformed in 2018.
Growth dominated value in the mid-capitalization area of the market. The Russell Midcap Growth Index outperformed the Russell Midcap Value Index by nearly 6 percentage points, driven in large part by expensively valued technology stocks. Because the Russell index construction methodology does not include price/earnings ratio (P/E) in its growth/value output, many tech stocks have made their way into the Russell Midcap Value Index. Twitter, Autodesk, NetApp, and Zillow, for example, reside in the Russell value category despite having little to no earnings.
Another challenge was the good second-quarter performance of real estate, a sector in which our portfolio has been and is still underweight because of valuation concerns.
Looking at the Russell Midcap Value Index by P/E, the most expensive stocks—which include many tech and real estate investment trust (REIT) stocks—outperformed from January through September, while the cheapest stocks have been punished. For that period, the second-most-expensive quintile outperformed the cheapest one by 22 percentage points. As we are valuation-centric investors, this environment hurt our performance. Our mid-cap portfolio trades at 13 times next-12-months earnings, which in aggregate put it into the second-cheapest quintile of stocks (11.6 through 15.1 times next-12-months earnings).
With the stock market setting new records and the economy nearing its longest expansionary period in history, investor optimism is high. Money continues to flow into passive benchmarks and exchange-traded funds (ETFs), with a large weighting to what has already worked: tech and internet-related stocks. Instead of the performance gap narrowing for many of these growth stocks relative to their value counterparts, the gap in performance (and valuations) has widened to extreme levels. It is often clear only in hindsight what will challenge these stocks’ dominance, but it will most likely include increased regulatory scrutiny. Until growth loses favor, we are patiently
6
and methodically executing our value process, knowing that a cycle of value-stock outperformance will follow.
Growth investing often benefits from slow economic growth and low interest rates—prominent features of the investment landscape during the bull market of the past nine-plus years. Conversely, value stocks typically benefit from stronger growth and rising interest rates. However, even in the face of a sustained rise in rates over the past two years, growth has continued in an accelerated manner to outperform value.
We remain focused on owning a concentrated portfolio of good companies that are trading at valuations below the mid-cap market for reasons that we see as temporary or overblown, and we remain optimistic that a fundamental premium combined with a valuation advantage positions the portfolio well for the future. Should growth stocks falter and value stocks outperform, our value-centric portfolio should once again outperform its benchmark.
We appreciate your patience as we wait for a performance rebound. Over the period from March 31, 1999, through September 30, 2018, when our strategy underperformed by 3 percentage points during a quarter, it subsequently experienced a performance advantage of 2.21 percentage points over the next one-year period, 3.68 percentage points over the next three-year period, and 5.56 percentage points over the next five-year period.
Pzena Investment Management, LLC
Portfolio Managers:
Richard Pzena, Managing Principal and Co-Chief Investment Officer
John Flynn, Principal
Ben Silver, CFA, CPA, Principal
U.S. equities rose over the fund’s fiscal year despite bouts of volatility due to trade tensions, rising interest rates, and fears of a recession. Value stocks widely lagged growth across the market-cap spectrum. Our holdings in industrials and health care detracted from relative performance, though that was partly offset by pockets of strength in consumer discretionary and financials.
Door-and-window maker JELD-WEN and Flex, a leading outsourced electronics assembler, were the main detractors. JELD-WEN was hurt by rising costs, recent weakness in organic growth, and an adverse legal decision in an action brought by a customer. During the period, the company replaced its CEO over disappointing earnings in recent quarters. Our investment case remains based on an attractive market structure and JELD-WEN’s ability to generate high returns on capital over the long term.
Flex recently announced it would terminate its shoe-assembly relationship with Nike, a development that the markets did not receive well. The retirement of Flex’s long-tenured CEO combined with a material reduction in fiscal 2019 guidance
7
also weighed on the stock. Although the developments clearly hurt the company, the steep decline in Flex’s share price appears excessive in our view.
Oil-and-gas explorer and producer Murphy Oil was the largest contributor to performance amid a broad rally in energy. The company has demonstrated good management initiatives in dealing with earnings disappointments while maintaining balance sheet strength, preserving its ability to make positive acquisitions. Murphy recently announced a joint venture with Petrobras for deep-water operations in the Gulf of Mexico.
Interpublic Group of Companies and Omnicom Group also added to returns. Both advertising agencies posted better-than-expected organic growth despite investors’ concerns over potential disruption by technology and new market participants.
The opportunity set has broadened, allowing us to add several new positions in varied industries, notably KKR in alternative investments, MEDNAX in physician services, and Carlisle Companies, an industrial conglomerate. We sold our holdings in Hilton Worldwide, and Validus Holdings as those stocks approached fair value. We also exited Lamar Advertising after missed sales targets and lowered earnings guidance led us to believe that its previously positive organic growth had turned negative.
Financials remains our largest sector exposure; we still see strong earnings growth in the sector and its valuations are attractive. Our exposure to consumer staples, utilities, and real estate is limited, and we remain on the sidelines in materials and communication services based on their higher valuations.
Market leadership by growth stocks has contributed to the widest value dispersions in over 50 years. Although the broad market appears fully valued, we believe that wide spreads offer value investors an assortment of attractive possibilities. We remain encouraged by the breadth and depth of the opportunities available today and are optimistic that their value will ultimately be unlocked.
Donald Smith & Co., Inc.
Portfolio Managers: Donald G. Smith, President and Co-Chief Investment Officer
Richard L. Greenberg, CFA, Co-Chief Investment Officer
Our portion of the fund continues to meet our criteria of owning a concentrated portfolio of low price-to-tangible-book value stocks with attractive long-term earnings potential. Our holdings are valued at a substantial discount to the market: They stand at 97% of tangible book value versus 980% for the S&P 500 Index and at 6.5 times our estimate of normalized earnings versus 16.1 times normalized earnings for the S&P 500.
8
Most industries declined over the period, led by precious metals, airline and aircraft leasing, technology, financials, and home-builders. Some of the decline was offset by energy company results.
After a strong 2017, Air France (–37.2%) was one of the largest detractors for the period as union strikes hurt results. A newly appointed CEO recently reached agreement with 75% of the workforce, boosting the stock. JetBlue (–12.6%) and AerCap (–4.9%) also declined over the 12 months.
Micron (–14.9%) began falling after its stock reached a high in May amid concerns over falling memory prices and a peak in earnings. Despite the recent price decline, the stock has several positives, including cash that exceeds debt and a recently announced stock repurchase plan of about $10 billion.
Precious metals holdings also lost ground (Leagold returned –54.1%, IAMGOLD –37.7%, Kinross –34.4%, Gold Fields –28.9%, and Yamana –12.4%) as gold prices dropped. The slide of gold-mining stocks was much more pronounced than the decline in the commodity itself.
Homebuilders also detracted (Taylor Morrison returned –31.5% and Toll Brothers –26.1%) after outperforming substantially in 2017. Higher interest rates and rising housing prices hurt home affordability, weakening sales. We believe that the stocks’ valuations, which are now below book value and at six times earnings, reflect the slowdown.
Most of our financial holdings declined (Unum Group returned –28.7%, CNA Financial –14.6%, MFA Financial –6.7%, Everest Re –6.2%, and Aspen 0.0%); the exceptions were Axis Capital (+5.5%) and XL Group (+44.3%). AXA Group announced plans to acquire XL Group, lifting the stock and property and casualty insurance more broadly. Unum and CNA were hurt by market worries about the long-term-care business.
Most energy stocks in our portfolio rose (WPX Energy was up 42.2% and Noble 20.7%) as oil prices climbed significantly despite an October decline. Nabors (–8.4%) has lagged this year because of lackluster international earnings.
We added to our holdings in Air France, Axis, CNA, Gold Fields, JetBlue, Taylor Morrison, and Unum. We trimmed our exposure to AerCap, IAMGOLD, Kinross, Micron, Noble, Toll Brothers, WPX Energy, and Yamana Gold. We eliminated Brio Gold, News Corp., Sanmina, and XL Group.
Two new companies were added to the portfolio. Leagold operates the Los Filos gold mine in Mexico. Earlier in the year, by purchasing Brio Gold, Leagold acquired the Santa Luz project, which had not achieved commercial production because of technical and engineering missteps.
9
Leagold trades at an attractive valuation of 73% of tangible book value and has the technical expertise and balance-sheet flexibility to successfully develop that project. Depreciation of the Brazilian real should also benefit its cost structure.
Jefferies is a global investment and merchant bank that trades at 81% of tangible book value. When Leucadia combined with Jefferies in 2012, it created an eclectic group of assets, including a large stake in a beef company
and the Jefferies investment banking business. The current management team has been reducing noncore holdings and applying the proceeds to a substantial stock buyback at a discount to both tangible book value and our estimated net asset value.
The largest industry weightings are airlines and aircraft leasing (31.4%), insurance (24.4%), metals (15.1%), and technology (14.5%).
10
Selected Value Fund
Fund Profile
As of October 31, 2018
| Portfolio Characteristics | |||
| DJ | |||
| U.S. | |||
| Russell | Total | ||
| Midcap | Market | ||
| Value | FA | ||
| Fund | Index | Index | |
| Number of Stocks | 118 | 591 | 3,806 |
| Median Market Cap | $8.6B | $12.9B | $71.6B |
| Price/Earnings Ratio | 13.7x | 14.5x | 18.5x |
| Price/Book Ratio | 1.5x | 1.8x | 2.9x |
| Return on Equity | 11.4% | 9.7% | 15.0% |
| Earnings Growth | |||
| Rate | 8.7% | 6.6% | 8.2% |
| Dividend Yield | 2.2% | 2.3% | 1.8% |
| Foreign Holdings | 11.8% | 0.0% | 0.0% |
| Turnover Rate | 31% | — | — |
| Ticker Symbol | VASVX | — | — |
| Expense Ratio1 | 0.39% | — | — |
| 30-Day SEC Yield | 2.02% | — | — |
| Short-Term Reserves | 2.2% | — | — |
| Sector Diversification (% of equity exposure) | |
| Fund | |
| Communication Services | 3.3% |
| Consumer Discretionary | 11.7 |
| Consumer Staples | 2.2 |
| Energy | 8.3 |
| Financials | 26.1 |
| Health Care | 5.6 |
| Industrials | 18.7 |
| Information Technology | 9.4 |
| Materials | 4.2 |
| Real Estate | 5.6 |
| Utilities | 4.9 |
Sector categories are based on the Global Industry Classification Standard (“GICS”), except for the “Other” category (if applicable), which includes securities that have not been provided a GICS classification as of the effective reporting period.
| Volatility Measures | ||
| Russell | DJ | |
| Midcap | U.S. Total | |
| Value | Market | |
| Index | FA Index | |
| R-Squared | 0.86 | 0.78 |
| Beta | 1.06 | 1.07 |
These measures show the degree and timing of the fund’s fluctuations compared with the indexes over 36 months.
| Ten Largest Holdings (% of total net assets) | ||
| AerCap Holdings NV | Trading Companies & | |
| Distributors | 2.5% | |
| Willis Towers Watson | ||
| plc | Insurance Brokers | 2.4 |
| Axis Capital Holdings | Property & Casualty | |
| Ltd. | Insurance | 2.4 |
| Micron Technology Inc. | Semiconductors | 2.3 |
| KeyCorp | Regional Banks | 2.2 |
| Cigna Corp. | Managed Health | |
| Care | 2.0 | |
| MGM Growth Properties | ||
| LLC | Hotel & Resort REITs | 1.8 |
| Xcel Energy Inc. | Electric Utilities | 1.8 |
| Dollar General Corp. | General Merchandise | |
| Stores | 1.8 | |
| Coca-Cola European | ||
| Partners plc | Soft Drinks | 1.8 |
| Top Ten | 21.0% | |
The holdings listed exclude any temporary cash investments and equity index products.
Investment Focus
1 The expense ratio shown is from the prospectus dated February 22, 2018, and represents estimated costs for the current fiscal year. For the fiscal year ended October 31, 2018, the expense ratio was 0.36%.
11
Selected Value Fund
Performance Summary
All of the returns in this report represent past performance, which is not a guarantee of future results that may be achieved by the fund. (Current performance may be lower or higher than the performance data cited. For performance data current to the most recent month-end, visit our website at vanguard.com/performance.) Note, too, that both investment returns and principal value can fluctuate widely, so an investor’s shares, when sold, could be worth more or less than their original cost. The returns shown do not reflect taxes that a shareholder would pay on fund distributions or on the sale of fund shares.
Cumulative Performance: October 31, 2008, Through October 31, 2018
Initial Investment of $10,000
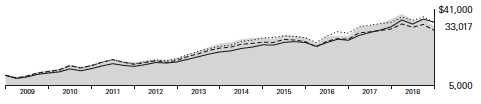
| Average Annual Total Returns | ||||
| Periods Ended October 31, 2018 | ||||
| Final Value | ||||
| One | Five | Ten | of a $10,000 | |
| Year | Years | Years | Investment | |
| Selected Value Fund | -9.15% | 5.75% | 12.69% | $33,017 |
| Russell Midcap Value Index | 0.16 | 8.11 | 13.35 | 35,010 |
| Mid-Cap Value Funds Average | -1.92 | 6.44 | 12.05 | 31,189 |
| Dow Jones U.S. Total Stock Market | ||||
| Float Adjusted Index | 6.56 | 10.76 | 13.36 | 35,036 |
Mid-Cap Value Funds Average: Derived from data provided by Lipper, a Thomson Reuters Company.
See Financial Highlights for dividend and capital gains information.
12
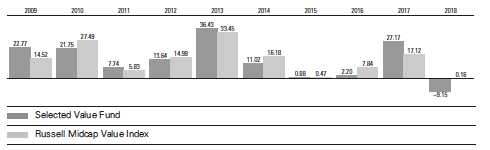
Average Annual Total Returns: Periods Ended September 30, 2018
This table presents returns through the latest calendar quarter—rather than through the end of the fiscal period.
Securities and Exchange Commission rules require that we provide this information.
| Inception | One | Five | Ten | |
| Date | Year | Years | Years | |
| Selected Value Fund | 2/15/1996 | 0.83% | 8.41% | 11.40% |
13
Selected Value Fund
Financial Statements
Statement of Net Assets
As of October 31, 2018
The fund reports a complete list of its holdings in regulatory filings four times in each fiscal year, at the quarter-ends. For the second and fourth fiscal quarters, the lists appear in the fund’s semiannual and annual reports to shareholders. For the first and third fiscal quarters, the fund files the lists with the Securities and Exchange Commission on Form N-Q. Shareholders can look up the fund’s Forms N-Q on the SEC’s website at sec.gov.
| Market | |||
| Value• | |||
| Shares | ($000) | ||
| Common Stocks (96.2%)1 | |||
| Communication Services (3.1%) | |||
| Meredith Corp. | 2,197,203 | 113,288 | |
| Omnicom Group Inc. | 991,174 | 73,664 | |
| Interpublic Group of | |||
| Cos. Inc. | 2,446,990 | 56,672 | |
| News Corp. Class A | 2,158,265 | 28,468 | |
| 272,092 | |||
| Consumer Discretionary (11.3%) | |||
| Dollar General Corp. | 1,436,369 | 159,983 | |
| Advance Auto Parts Inc. | 990,106 | 158,179 | |
| Royal Caribbean Cruises | |||
| Ltd. | 1,434,199 | 150,204 | |
| * | Norwegian Cruise Line | ||
| Holdings Ltd. | 2,888,876 | 127,313 | |
| Hanesbrands Inc. | 4,765,444 | 81,775 | |
| Whirlpool Corp. | 722,104 | 79,258 | |
| * | Taylor Morrison Home | ||
| Corp. Class A | 3,989,443 | 65,985 | |
| Lennar Corp. Class A | 1,063,094 | 45,692 | |
| Adient plc | 1,473,929 | 44,837 | |
| Lear Corp. | 243,622 | 32,377 | |
| Newell Brands Inc. | 1,799,427 | 28,575 | |
| Foot Locker Inc. | 233,050 | 10,986 | |
| Gildan Activewear Inc. | |||
| Class A | 294,986 | 8,823 | |
| Toll Brothers Inc. | 98,920 | 3,330 | |
| 997,317 | |||
| Consumer Staples (2.1%) | |||
| Coca-Cola European | |||
| Partners plc | 3,482,376 | 158,413 | |
| Kellogg Co. | 337,425 | 22,095 | |
| 180,508 | |||
| Energy (8.0%) | |||
| Devon Energy Corp. | 4,196,744 | 135,975 | |
| ^ | Vermilion Energy Inc. | 5,054,911 | 134,258 |
| Golar LNG Ltd. | 4,964,236 | 132,942 | |
| * | Parsley Energy Inc. | ||
| Class A | 3,232,592 | 75,707 | |
| TechnipFMC plc | 1,648,322 | 43,351 | |
| Murphy Oil Corp. | 1,247,432 | 39,743 | |
| National Oilwell Varco | |||
| Inc. | 1,055,581 | 38,845 | |
| Cenovus Energy Inc. | 3,219,653 | 27,238 | |
| *,^ | Chesapeake Energy | ||
| Corp. | 7,553,423 | 26,513 | |
| * | Rowan Cos. plc Class A | 996,725 | 15,858 |
| * | Noble Corp. plc | 2,506,000 | 12,580 |
| * | Superior Energy | ||
| Services Inc. | 1,120,132 | 8,771 | |
| Nabors Industries Ltd. | 1,741,181 | 8,654 | |
| * | WPX Energy Inc. | 400,879 | 6,430 |
| 706,865 | |||
| Financials (25.2%) | |||
| Willis Towers Watson | |||
| plc | 1,496,966 | 214,306 | |
| Axis Capital Holdings | |||
| Ltd. | 3,803,122 | 212,176 | |
| KeyCorp | 10,531,925 | 191,260 | |
| Unum Group | 4,048,194 | 146,788 | |
| FNB Corp. | 11,034,229 | 130,535 | |
| Jefferies Financial | |||
| Group Inc. | 4,923,522 | 105,708 | |
| New York Community | |||
| Bancorp Inc. | 10,507,952 | 100,666 | |
| CNA Financial Corp. | 2,066,402 | 89,620 | |
| Everest Re Group Ltd. | 401,462 | 87,463 | |
| Fifth Third Bancorp | 3,211,464 | 86,677 | |
| Navient Corp. | 7,082,122 | 82,011 | |
| Fidelity National | |||
| Financial Inc. | 2,312,597 | 77,356 | |
| Regions Financial Corp. | 4,105,725 | 69,674 | |
| Element Fleet | |||
| Management Corp. | 11,576,000 | 68,149 | |
| KKR & Co. Inc. Class A | 2,750,798 | 65,056 | |
14
Selected Value Fund
| Market | |||
| Value• | |||
| Shares | ($000) | ||
| Voya Financial Inc. | 1,418,125 | 62,057 | |
| Discover Financial | |||
| Services | 727,226 | 50,666 | |
| Valley National Bancorp | 4,931,900 | 49,220 | |
| Aspen Insurance | |||
| Holdings Ltd. | 1,162,711 | 48,694 | |
| * | SLM Corp. | 3,679,623 | 37,311 |
| AXA Equitable Holdings | |||
| Inc. | 1,669,563 | 33,876 | |
| Invesco Ltd. | 1,501,950 | 32,607 | |
| Webster Financial Corp. | 528,766 | 31,113 | |
| Allstate Corp. | 251,853 | 24,107 | |
| Torchmark Corp. | 279,434 | 23,657 | |
| Hanover Insurance Group | |||
| Inc. | 198,464 | 22,105 | |
| Hartford Financial | |||
| Services Group Inc. | 424,208 | 19,268 | |
| Legg Mason Inc. | 639,775 | 18,055 | |
| Franklin Resources Inc. | 587,849 | 17,929 | |
| MFA Financial Inc. | 2,274,657 | 15,763 | |
| Comerica Inc. | 121,055 | 9,873 | |
| 2,223,746 | |||
| Health Care (5.3%) | |||
| Cigna Corp. | 825,927 | 176,592 | |
| Cardinal Health Inc. | 3,129,174 | 158,336 | |
| * | Mylan NV | 2,077,324 | 64,916 |
| * | MEDNAX Inc. | 1,150,225 | 47,493 |
| McKesson Corp. | 122,713 | 15,310 | |
| 462,647 | |||
| Industrials (18.1%) | |||
| * | AerCap Holdings NV | 4,343,188 | 217,507 |
| Spirit AeroSystems | |||
| Holdings Inc. Class A | 1,814,760 | 152,458 | |
| * | Air France-KLM ADR | 15,446,816 | 151,533 |
| Stanley Black & Decker | |||
| Inc. | 1,222,572 | 142,454 | |
| Johnson Controls | |||
| International plc | 3,812,542 | 121,887 | |
| * | JetBlue Airways Corp. | 6,704,707 | 112,170 |
| Ryder System Inc. | 1,911,292 | 105,713 | |
| Owens Corning | 2,121,013 | 100,260 | |
| Nielsen Holdings plc | 3,114,782 | 80,922 | |
| Wabtec Corp. | 943,882 | 77,417 | |
| Carlisle Cos. Inc. | 510,391 | 49,299 | |
| Actuant Corp. Class A | 1,717,514 | 40,963 | |
| Terex Corp. | 1,176,904 | 39,297 | |
| * | JELD-WEN Holding Inc. | 2,356,110 | 38,310 |
| KBR Inc. | 1,837,216 | 36,340 | |
| Dover Corp. | 400,127 | 33,146 | |
| Snap-on Inc. | 214,256 | 32,983 | |
| * | Avis Budget Group Inc. | 1,159,232 | 32,598 |
| * | AECOM | 1,101,235 | 32,090 |
| 1,597,347 | |||
| Information Technology (8.9%) | |||
| * | Micron Technology Inc. | 5,302,400 | 200,007 |
| ^ | Microchip Technology | ||
| Inc. | 2,045,185 | 134,532 | |
| Total System Services | |||
| Inc. | 1,186,435 | 108,144 | |
| Versum Materials Inc. | 2,413,420 | 76,168 | |
| Avnet Inc. | 1,478,844 | 59,257 | |
| * | Anixter International Inc. | 794,655 | 52,201 |
| Hewlett Packard | |||
| Enterprise Co. | 3,220,553 | 49,113 | |
| Genpact Ltd. | 1,016,327 | 27,857 | |
| * | Celestica Inc. | 2,081,919 | 21,610 |
| * | Arrow Electronics Inc. | 304,204 | 20,598 |
| Jabil Inc. | 711,890 | 17,605 | |
| * | Flex Ltd. | 1,991,393 | 15,652 |
| 782,744 | |||
| Materials (4.0%) | |||
| * | Axalta Coating | ||
| Systems Ltd. | 5,026,479 | 124,054 | |
| * | Kinross Gold Corp. | 37,516,000 | 97,166 |
| Gold Fields Ltd. ADR | 19,946,600 | 53,058 | |
| * | IAMGOLD Corp. | 13,311,507 | 45,525 |
| Yamana Gold Inc. | 12,223,219 | 27,747 | |
| * | Leagold Mining Corp. | 6,787,563 | 7,528 |
| 355,078 | |||
| Other (0.0%) | |||
| * | Leagold Mining Corp | ||
| Warrants Exp. | |||
| 5/29/2020 | 2,944,713 | — | |
| Real Estate (5.5%) | |||
| 2 | MGM Growth Properties | ||
| LLC Class A | 5,661,046 | 160,151 | |
| Liberty Property Trust | 2,971,818 | 124,430 | |
| GEO Group Inc. | 3,757,991 | 83,089 | |
| HCP Inc. | 2,759,205 | 76,016 | |
| ^ | Realogy Holdings Corp. | 1,286,639 | 24,536 |
| Hospitality Properties | |||
| Trust | 583,800 | 14,957 | |
| 483,179 | |||
| Utilities (4.7%) | |||
| Xcel Energy Inc. | 3,267,346 | 160,133 | |
| Pinnacle West Capital | |||
| Corp. | 1,883,415 | 154,911 | |
| Edison International | 1,181,254 | 81,967 | |
| Avangrid Inc. | 445,533 | 20,944 | |
| 417,955 | |||
| Total Common Stocks | |||
| (Cost $7,478,268) | 8,479,478 | ||
15
Selected Value Fund
| Market | |||
| Value• | |||
| Shares | ($000) | ||
| Temporary Cash Investments (5.2%)1 | |||
| Money Market Fund (5.1%) | |||
| 3,4 | Vanguard Market | ||
| Liquidity Fund, | |||
| 2.308% | 4,482,238 | 448,224 | |
| Face | |||
| Amount | |||
| ($000) | |||
| U. S. Government and Agency Obligations (0.1%) | |||
| 5 | United States Treasury | ||
| Bill, 2.078%, 11/15/18 | 5,000 | 4,996 | |
| 5 | United States Treasury | ||
| Bill, 2.133%, 1/3/19 | 68 | 68 | |
| 5 | United States Treasury | ||
| Bill, 2.194%, 1/24/19 | 2,000 | 1,989 | |
| 5 | United States Treasury | ||
| Bill, 2.280%, 2/7/19 | 300 | 298 | |
| 5 | United States Treasury | ||
| Bill, 2.313%, 2/28/19 | 3,000 | 2,977 | |
| 10,328 | |||
| Total Temporary Cash Investments | |||
| (Cost $458,537) | 458,552 | ||
| Total Investments (101.4%) | |||
| (Cost $7,936,805) | 8,938,030 | ||
| Other Assets and Liabilities (-1.4%) | |||
| Other Assets | 89,162 | ||
| Liabilities 4 | (216,185) | ||
| (127,023) | |||
| Net Assets (100%) | |||
| Applicable to 321,760,506 outstanding | |||
| $.001 par value shares of beneficial | |||
| interest (unlimited authorization) | 8,811,007 | ||
| Net Asset Value Per Share | $27.38 | ||
| Amount | |
| ($000) | |
| Statement of Assets and Liabilities | |
| Assets | |
| Investments in Securities, at Value | |
| Unaffiliated Issuers | 8,329,655 |
| Affiliated Issuers | 608,375 |
| Total Investments in Securities | 8,938,030 |
| Investment in Vanguard | 494 |
| Receivables for Investment Securities | |
| Sold | 19,073 |
| Receivables for Accrued Income | 7,115 |
| Receivables for Capital Shares Issued | 1,927 |
| Variation Margin Receivable—Futures | |
| Contracts | 1,083 |
| Other Assets 4 | 59,470 |
| Total Assets | 9,027,192 |
| Liabilities | |
| Payables for Investment Securities | |
| Purchased | 29,275 |
| Collateral for Securities on Loan | 165,820 |
| Payables to Investment Advisor | 3,841 |
| Payables for Capital Shares Redeemed | 8,852 |
| Payables to Vanguard | 8,397 |
| Total Liabilities | 216,185 |
| Net Assets | 8,811,007 |
16
Selected Value Fund
| At October 31, 2018, net assets consisted of: | |
| Amount | |
| ($000) | |
| Paid-in Capital | 7,033,101 |
| Total Distributable Earnings (Loss) | 1,777,906 |
| Net Assets | 8,811,007 |
• See Note A in Notes to Financial Statements.
* Non-income-producing security.
^ Includes partial security positions on loan to broker-dealers.
The total value of securities on loan is $162,134,000.
1 The fund invests a portion of its cash reserves in equity
markets through the use of index futures contracts. After
giving effect to futures investments, the fund’s effective
common stock and temporary cash investment positions
represent 97.4% and 4.0%, respectively, of net assets.
2 Considered an affiliated company of the fund as the fund
owns more than 5% of the outstanding voting securities of
such a company.
3 Affiliated money market fund available only to Vanguard
funds and certain trusts and accounts managed by Vanguard.
Rate shown is the 7-day yield.
4 Includes $165,820,000 of collateral received for securities
on loan, of which $106,420,000 is held in Vanguard Market
Liquidity Fund and $59,400,000 is held in cash.
5 Securities with a value of $5,434,000 have been segregated
as initial margin for open futures contracts.
ADR—American Depositary Receipt.
| Derivative Financial Instruments Outstanding as of Period End | ||||
| Futures Contracts | ||||
| ($000) | ||||
| Value and | ||||
| Number of | Unrealized | |||
| Long (Short) | Notional | Appreciation | ||
| Expiration | Contracts | Amount | (Depreciation) | |
| Long Futures Contracts | ||||
| E-mini S&P 500 Index | December 2018 | 766 | 103,835 | (5,512) |
17
| Selected Value Fund | |
| Statement of Operations | |
| Year Ended | |
| October 31, 2018 | |
| ($000) | |
| Investment Income | |
| Income | |
| Dividends—Unaffiliated Issuers1 | 187,639 |
| Dividends—Affiliated Issuers | 6,170 |
| Interest—Unaffiliated Issuers | 169 |
| Interest—Affiliated Issuers | 8,816 |
| Securities Lending—Net | 1,005 |
| Total Income | 203,799 |
| Expenses | |
| Investment Advisory Fees—Note B | |
| Basic Fee | 22,497 |
| Performance Adjustment | (1,582) |
| The Vanguard Group—Note C | |
| Management and Administrative | 14,654 |
| Marketing and Distribution | 1,638 |
| Custodian Fees | 80 |
| Auditing Fees | 35 |
| Shareholders’ Reports and Proxy | 223 |
| Trustees’ Fees and Expenses | 15 |
| Total Expenses | 37,560 |
| Expenses Paid Indirectly | (227) |
| Net Expenses | 37,333 |
| Net Investment Income | 166,466 |
| Realized Net Gain (Loss) | |
| Investment Securities Sold—Unaffiliated Issuers | 749,879 |
| Investment Securities Sold—Affiliated Issuers | 1,557 |
| Futures Contracts | 11,767 |
| Foreign Currencies | (5) |
| Realized Net Gain (Loss) | 763,198 |
| Change in Unrealized Appreciation (Depreciation) | |
| Investment Securities—Unaffiliated Issuers | (1,886,850) |
| Investment Securities—Affiliated Issuers | 72,149 |
| Futures Contracts | (7,597) |
| Change in Unrealized Appreciation (Depreciation) | (1,822,298) |
| Net Increase (Decrease) in Net Assets Resulting from Operations | (892,634) |
| 1 Dividends are net of foreign withholding taxes of $2,057,000. | |
| See accompanying Notes, which are an integral part of the Financial Statements. | |
18
| Selected Value Fund | ||
| Statement of Changes in Net Assets | ||
| Year Ended October 31, | ||
| 2018 | 2017 | |
| ($000) | ($000) | |
| Increase (Decrease) in Net Assets | ||
| Operations | ||
| Net Investment Income | 166,466 | 147,219 |
| Realized Net Gain (Loss) | 763,198 | 910,522 |
| Change in Unrealized Appreciation (Depreciation) | (1,822,298) | 1,284,821 |
| Net Increase (Decrease) in Net Assets Resulting from Operations | (892,634) | 2,342,562 |
| Distributions | ||
| Net Investment Income | (135,374) | (160,953) |
| Realized Capital Gain1 | (859,146) | (259,949) |
| Total Distributions | (994,520) | (420,902) |
| Capital Share Transactions | ||
| Issued | 1,443,090 | 1,344,907 |
| Issued in Lieu of Cash Distributions | 917,398 | 390,140 |
| Redeemed | (2,236,747) | (1,883,953) |
| Net Increase (Decrease) from Capital Share Transactions | 123,741 | (148,906) |
| Total Increase (Decrease) | (1,763,413) | 1,772,754 |
| Net Assets | ||
| Beginning of Period | 10,574,420 | 8,801,666 |
| End of Period | 8,811,007 | 10,574,420 |
1 Includes fiscal 2018 and 2017 short-term gain distributions totaling $74,529,000 and $0, respectively. Short-term gain distributions are treated as ordinary income dividends for tax purposes.
See accompanying Notes, which are an integral part of the Financial Statements.
19
| Selected Value Fund | |||||
| Financial Highlights | |||||
| For a Share Outstanding | Year Ended October 31, | ||||
| Throughout Each Period | 2018 | 2017 | 2016 | 2015 | 2014 |
| Net Asset Value, Beginning of Period | $33.15 | $27.24 | $28.15 | $29.49 | $28.07 |
| Investment Operations | |||||
| Net Investment Income | . 4931 | .4491 | . 5271 | .478 | .415 |
| Net Realized and Unrealized Gain (Loss) | |||||
| on Investments | (3.153) | 6.760 | .030 | (.245) | 2.555 |
| Total from Investment Operations | (2.660) | 7.209 | .557 | .233 | 2.970 |
| Distributions | |||||
| Dividends from Net Investment Income | (.423) | (.501) | (.443) | (.404) | (.330) |
| Distributions from Realized Capital Gains | (2.687) | (.798) | (1.024) | (1.169) | (1.220) |
| Total Distributions | (3.110) | (1.299) | (1.467) | (1.573) | (1.550) |
| Net Asset Value, End of Period | $27.38 | $33.15 | $27.24 | $28.15 | $29.49 |
| Total Return2 | -9.15% | 27.17% | 2.20% | 0.88% | 11.02% |
| Ratios/Supplemental Data | |||||
| Net Assets, End of Period (Millions) | $8,811 | $10,574 | $8,802 | $9,663 | $10,153 |
| Ratio of Total Expenses to Average Net Assets3 | 0.36% | 0.39% | 0.35% | 0.39% | 0.41% |
| Ratio of Net Investment Income to | |||||
| Average Net Assets | 1.61% | 1.47% | 2.00% | 1.62% | 1.53% |
| Portfolio Turnover Rate | 31% | 22% | 27% | 24% | 18% |
1 Calculated based on average shares outstanding.
2 Total returns do not include account service fees that may have applied in the periods shown. Fund prospectuses provide information
about any applicable account service fees.
3 Includes performance-based investment advisory fee increases (decreases) of (0.02%), 0.00%, (0.04%), (0.02%), and 0.01%.
See accompanying Notes, which are an integral part of the Financial Statements.
20
Selected Value Fund
Notes to Financial Statements
Vanguard Selected Value Fund is registered under the Investment Company Act of 1940 as an open-end investment company, or mutual fund.
A. The following significant accounting policies conform to generally accepted accounting principles for U.S. investment companies. The fund consistently follows such policies in preparing its financial statements.
1. Security Valuation: Securities are valued as of the close of trading on the New York Stock Exchange (generally 4 p.m., Eastern time) on the valuation date. Equity securities are valued at the latest quoted sales prices or official closing prices taken from the primary market in which each security trades; such securities not traded on the valuation date are valued at the mean of the latest quoted bid and asked prices. Securities for which market quotations are not readily available, or whose values have been affected by events occurring before the fund’s pricing time but after the close of the securities’ primary markets, are valued at their fair values calculated according to procedures adopted by the board of trustees. These procedures include obtaining quotations from an independent pricing service, monitoring news to identify significant market- or security-specific events, and evaluating changes in the values of foreign market proxies (for example, ADRs, futures contracts, or exchange-traded funds), between the time the foreign markets close and the fund’s pricing time. When fair-value pricing is employed, the prices of securities used by a fund to calculate its net asset value may differ from quoted or published prices for the same securities. Investments in Vanguard Market Liquidity Fund are valued at that fund’s net asset value. Temporary cash investments are valued using the latest bid prices or using valuations based on a matrix system (which considers such factors as security prices, yields, maturities, and ratings), both as furnished by independent pricing services.
2. Foreign Currency: Securities and other assets and liabilities denominated in foreign currencies are translated into U.S. dollars using exchange rates obtained from an independent third party as of the fund’s pricing time on the valuation date. Realized gains (losses) and unrealized appreciation (depreciation) on investment securities include the effects of changes in exchange rates since the securities were purchased, combined with the effects of changes in security prices. Fluctuations in the value of other assets and liabilities resulting from changes in exchange rates are recorded as unrealized foreign currency gains (losses) until the assets or liabilities are settled in cash, at which time they are recorded as realized foreign currency gains (losses).
3. Futures Contracts: The fund uses index futures contracts to a limited extent, with the objective of maintaining full exposure to the stock market while maintaining liquidity. The fund may purchase or sell futures contracts to achieve a desired level of investment, whether to accommodate portfolio turnover or cash flows from capital share transactions. The primary risks associated with the use of futures contracts are imperfect correlation between changes in market values of stocks held by the fund and the prices of futures contracts, and the possibility of an illiquid market. Counterparty risk involving futures is mitigated because a regulated clearinghouse is the counterparty instead of the clearing broker. To further mitigate counterparty risk, the fund trades futures contracts on an exchange, monitors the financial strength of its clearing brokers and clearinghouse, and has entered into clearing agreements with its clearing brokers. The clearinghouse imposes initial margin requirements to secure the fund’s performance and requires daily settlement of variation margin representing changes in the market value of each contract. Any assets pledged as initial margin for open contracts are noted in the Statement of Net Assets.
21
Selected Value Fund
Futures contracts are valued at their quoted daily settlement prices. The notional amounts of the contracts are not recorded in the Statement of Net Assets. Fluctuations in the value of the contracts are recorded in the Statement of Assets and Liabilities as an asset (liability) and in the Statement of Operations as unrealized appreciation (depreciation) until the contracts are closed, when they are recorded as realized futures gains (losses).
During the year ended October 31, 2018, the fund’s average investments in long and short futures contracts represented 2% and 0% of net assets, respectively, based on the average of the notional amounts at each quarter-end during the period.
4. Federal Income Taxes: The fund intends to continue to qualify as a regulated investment company and distribute all of its taxable income. Management has analyzed the fund’s tax positions taken for all open federal income tax years (October 31, 2015–2018), and has concluded that no provision for federal income tax is required in the fund’s financial statements.
5. Distributions: Distributions to shareholders are recorded on the ex-dividend date. Distributions are determined on a tax basis and may differ from net investment income and realized capital gains for financial reporting purposes.
6. Securities Lending: To earn additional income, the fund lends its securities to qualified institutional borrowers. Security loans are subject to termination by the fund at any time, and are required to be secured at all times by collateral in an amount at least equal to the market value of securities loaned. Daily market fluctuations could cause the value of loaned securities to be more or less than the value of the collateral received. When this occurs, the collateral is adjusted and settled before the opening of the market on the next business day. The fund further mitigates its counterparty risk by entering into securities lending transactions only with a diverse group of prequalified counterparties, monitoring their financial strength, and entering into master securities lending agreements with its counterparties. The master securities lending agreements provide that, in the event of a counterparty’s default (including bankruptcy), the fund may terminate any loans with that borrower, determine the net amount owed, and sell or retain the collateral up to the net amount owed to the fund; however, such actions may be subject to legal proceedings. While collateral mitigates counterparty risk, in the event of a default, the fund may experience delays and costs in recovering the securities loaned. The fund invests cash collateral received in Vanguard Market Liquidity Fund, and records a liability in the Statement of Assets and Liabilities for the return of the collateral, during the period the securities are on loan. Securities lending income represents fees charged to borrowers plus income earned on invested cash collateral, less expenses associated with the loan. During the term of the loan, the fund is entitled to all distributions made on or in respect of the loaned securities.
7. Credit Facility: The fund and certain other funds managed by The Vanguard Group (“Vanguard”) participate in a $3.1 billion committed credit facility provided by a syndicate of lenders pursuant to a credit agreement that may be renewed annually; each fund is individually liable for its borrowings, if any, under the credit facility. Borrowings may be utilized for temporary and emergency purposes, and are subject to the fund’s regulatory and contractual borrowing restrictions. The participating funds are charged administrative fees and an annual commitment fee of 0.10% of the undrawn amount of the facility; these fees are allocated to the funds based on a method approved by the
22
Selected Value Fund
fund’s board of trustees and included in Management and Administrative expenses on the fund’s Statement of Operations. Any borrowings under this facility bear interest at a rate based upon the higher of the one-month London Interbank Offered Rate, federal funds effective rate, or overnight bank funding rate plus an agreed-upon spread.
The fund had no borrowings outstanding at October 31, 2018, or at any time during the period then ended.
8. Other: Dividend income is recorded on the ex-dividend date. Interest income includes income distributions received from Vanguard Market Liquidity Fund and is accrued daily. Premiums and discounts on debt securities purchased are amortized and accreted, respectively, to interest income over the lives of the respective securities. Security transactions are accounted for on the date securities are bought or sold. Costs used to determine realized gains (losses) on the sale of investment securities are those of the specific securities sold.
B. The investment advisory firms Barrow, Hanley, Mewhinney & Strauss, LLC, Pzena Investment Management, LLC, and Donald Smith & Co., Inc., each provide investment advisory services to a portion of the fund for a fee calculated at an annual percentage rate of average net assets managed by the advisor. The basic fees of Barrow, Hanley, Mewhinney & Strauss, LLC, and Pzena Investment Management, LLC, are subject to quarterly adjustments based on performance relative to the Russell Midcap Value Index for the preceding three years. The basic fee of Donald Smith & Co., Inc., is subject to quarterly adjustments based on performance relative to the MSCI Investable Market 2500 Index for the preceding five years.
Vanguard manages the cash reserves of the fund as described below.
For the year ended October 31, 2018, the aggregate investment advisory fee represented an effective annual basic rate of 0.22% of the fund’s average net assets, before a net decrease of $1,582,000 (0.02%) based on performance.
C. In accordance with the terms of a Funds’ Service Agreement (the “FSA”) between Vanguard and the fund, Vanguard furnishes to the fund corporate management, administrative, marketing, distribution, and cash management services at Vanguard’s cost of operations (as defined by the FSA). These costs of operations are allocated to the fund based on methods and guidelines approved by the board of trustees. Vanguard does not require reimbursement in the current period for certain costs of operations (such as deferred compensation/benefits and risk/insurance costs); the fund’s liability for these costs of operations is included in Payables to Vanguard on the Statement of Assets and Liabilities. All other costs of operations payable to Vanguard are generally settled twice a month.
Upon the request of Vanguard, the fund may invest up to 0.40% of its net assets as capital in Vanguard. At October 31, 2018, the fund had contributed to Vanguard capital in the amount of $494,000, representing 0.01% of the fund’s net assets and 0.20% of Vanguard’s capitalization. The fund’s trustees and officers are also directors and employees, respectively, of Vanguard.
23
Selected Value Fund
D. The fund has asked its investment advisors to direct certain security trades, subject to obtaining the best price and execution, to brokers who have agreed to rebate to the fund part of the commissions generated. Such rebates are used solely to reduce the fund’s management and administrative expenses. The fund’s custodian bank has also agreed to reduce its fees when the fund maintains cash on deposit in the non-interest-bearing custody account. For the year ended October 31, 2018, these arrangements reduced the fund’s management and administrative expenses by $213,000 and custodian fees by $14,000. The total expense reduction represented an effective annual rate of 0.00% of the fund’s average net assets.
E. Various inputs may be used to determine the value of the fund’s investments. These inputs are summarized in three broad levels for financial statement purposes. The inputs or methodologies used to value securities are not necessarily an indication of the risk associated with investing in those securities.
Level 1—Quoted prices in active markets for identical securities.
Level 2—Other significant observable inputs (including quoted prices for similar securities, interest rates, prepayment speeds, credit risk, etc.).
Level 3—Significant unobservable inputs (including the fund’s own assumptions used to determine the fair value of investments). Any investments valued with significant unobservable inputs are noted on the Statement of Net Assets.
The following table summarizes the market value of the fund’s investments as of October 31, 2018, based on the inputs used to value them:
| Level 1 | Level 2 | Level 3 | |
| Investments | ($000) | ($000) | ($000) |
| Common Stocks | 8,479,478 | — | — |
| Temporary Cash Investments | 448,224 | 10,328 | — |
| Futures Contracts—Assets1 | 1,083 | — | — |
| Total | 8,928,785 | 10,328 | — |
| 1 Represents variation margin on the last day of the reporting period. |
F. Permanent differences between book-basis and tax-basis components of net assets are reclassified among capital accounts in the financial statements to reflect their tax character. These reclassifications have no effect on net assets or net asset value per share. As of period end, the following permanent differences primarily attributable to the accounting for foreign currency transactions, and distributions in connection with fund share redemptions were reclassified to the following accounts:
| Amount | |
| ($000) | |
| Paid-in Capital | 101,774 |
| Total Distributable Earnings (Loss) | (101,774) |
24
Selected Value Fund
Temporary differences between book-basis and tax-basis components of total distributable earnings (loss) arise when certain items of income, gain, or loss are recognized in different periods for financial statement and tax purposes; these differences will reverse at some time in the future. The differences are primarily related to the tax deferral of losses on wash sales and the realization of unrealized gains or losses on certain futures contracts. As of period end, the tax-basis components of total distributable earnings (loss) are detailed in the table as follows:
| Amount | |
| ($000) | |
| Undistributed Ordinary Income | 117,191 |
| Undistributed Long-Term Gains | 668,267 |
| Capital Loss Carryforwards | — |
| Net Unrealized Gains (Losses) | 1,000,190 |
As of October 31, 2018, gross unrealized appreciation and depreciation for investments and derivatives based on cost for U.S. federal income tax purposes were as follows:
| Amount | |
| ($000) | |
| Tax Cost | 7,937,840 |
| Gross Unrealized Appreciation | 1,986,070 |
| Gross Unrealized Depreciation | (985,880) |
| Net Unrealized Appreciation (Depreciation) | 1,000,190 |
G. During the year ended October 31, 2018, the fund purchased $3,062,747,000 of investment securities and sold $3,410,026,000 of investment securities, other than temporary cash investments
| H. Capital shares issued and redeemed were: | ||
| Year Ended October 31, | ||
| 2018 | 2017 | |
| Shares | Shares | |
| (000) | (000) | |
| Issued | 46,684 | 44,024 |
| Issued in Lieu of Cash Distributions | 29,479 | 13,370 |
| Redeemed | (73,418) | (61,444) |
| Net Increase (Decrease) in Shares Outstanding | 2,745 | (4,050) |
25
Selected Value Fund
I. Certain of the fund’s investments are in companies that are considered to be affiliated companies of the fund because the fund owns more than 5% of the outstanding voting securities of the company or the issuer is another member of The Vanguard Group. Transactions during the period in securities of these companies were as follows:
| Current Period Transactions | ||||||||
| Oct. 31, | Proceeds Realized | Oct. 31, | ||||||
| 2017 | from | Net | Change in | Capital Gain | 2018 | |||
| Market | Purchases | Securities | Gain | Unrealized | Distributions | Market | ||
| Value | at Cost | Sold | (Loss) | App. (Dep.) | Income | Received | Value | |
| ($000) | ($000) | ($000) | ($000) | ($000) | ($000) | ($000) | ($000) | |
| Brio Gold Inc. | 10,157 | — | — | — | (10,157) | — | — | — |
| Golar LNG Ltd. | 112,896 | — | 11,466 | (5,268) | 36,780 | 1,406 | — | NA1 |
| MGM Growth | ||||||||
| Properties LLC | ||||||||
| Class A | — | 168,953 | 13,554 | 347 | 4,405 | 4,764 | — | 160,151 |
| SeaWorld | ||||||||
| Entertainment Inc. | NA2 | — | 98,923 | 6,552 | 41,085 | — | — | — |
| Vanguard Market | ||||||||
| Liquidity Fund | 755,485 | NA 3 | NA 3 | (74) | 36 | 8,816 | — | 448,224 |
| Total | 878,538 | 1,557 | 72,149 | 14,986 | — | 608,375 | ||
1 Not applicable—at October 31, 2018, the issuer was not an affiliated company of the fund. 2 Not applicable—at October 31, 2017, the issuer was not an affiliated company of the fund. 3 Not applicable—purchases and sales are for temporary cash investment purposes.
J. Management has determined that no events or transactions occurred subsequent to October 31, 2018, that would require recognition or disclosure in these financial statements.
26
Report of Independent Registered Public Accounting Firm
To the Board of Trustees of Vanguard Whitehall Funds and Shareholders of Vanguard Selected Value Fund
Opinion on the Financial Statements
We have audited the accompanying statement of net assets and statement of assets and liabilities of Vanguard Selected Value Fund (one of the funds constituting Vanguard Whitehall Funds, referred to hereafter as the “Fund”) as of October 31, 2018, the related statement of operations for the year ended October 31, 2018, the statement of changes in net assets for each of the two years in the period ended October 31, 2018, including the related notes, and the financial highlights for each of the five years in the period ended October 31, 2018 (collectively referred to as the “financial statements”). In our opinion, the financial statements present fairly, in all material respects, the financial position of the Fund as of October 31, 2018, the results of its operations for the year then ended, the changes in its net assets for each of the two years in the period ended October 31, 2018 and the financial highlights for each of the five years in the period ended October 31, 2018 in conformity with accounting principles generally accepted in the United States of America.
Basis for Opinion
These financial statements are the responsibility of the Fund’s management. Our responsibility is to express an opinion on the Fund’s financial statements based on our audits. We are a public accounting firm registered with the Public Company Accounting Oversight Board (United States) (“PCAOB”) and are required to be independent with respect to the Fund in accordance with the U.S. federal securities laws and the applicable rules and regulations of the Securities and Exchange Commission and the PCAOB.
We conducted our audits of these financial statements in accordance with the standards of the PCAOB. Those standards require that we plan and perform the audit to obtain reasonable assurance about whether the financial statements are free of material misstatement, whether due to error or fraud.
Our audits included performing procedures to assess the risks of material misstatement of the financial statements, whether due to error or fraud, and performing procedures that respond to those risks. Such procedures included examining, on a test basis, evidence regarding the amounts and disclosures in the financial statements. Our audits also included evaluating the accounting principles used and significant estimates made by management, as well as evaluating the overall presentation of the financial statements. Our procedures included confirmation of securities owned as of October 31, 2018 by correspondence with the custodians and brokers and by agreement to the underlying ownership records of the transfer agent; when replies were not received from brokers, we performed other auditing procedures. We believe that our audits provide a reasonable basis for our opinion.
/s/PricewaterhouseCoopers LLP
Philadelphia, Pennsylvania
December 13, 2018
We have served as the auditor of one or more investment companies in The Vanguard Group of Funds since 1975.
27
Special 2018 tax information (unaudited) for Vanguard Selected Value Fund
This information for the fiscal year ended October 31, 2018, is included pursuant to provisions of the Internal Revenue Code.
The fund distributed $869,975,000 as capital gain dividends (20% rate gain distributions) to shareholders during the fiscal year.
For nonresident alien shareholders, 100% of short-term capital gain dividends distributed by the fund are qualified short-term capital gains.
The fund distributed $354,112,000 of qualified dividend income to shareholders during the fiscal year.
For corporate shareholders, 75.9% of investment income (dividend income plus short-term gains, if any) qualifies for the dividends-received deduction.
28
Your Fund’s After-Tax Returns
This table presents returns for your fund both before and after taxes. The after-tax returns are shown in two ways: (1) assuming that an investor owned the fund during the entire period and paid taxes on the fund’s distributions, and (2) assuming that an investor paid taxes on the fund’s distributions and sold all shares at the end of each period.
Calculations are based on the highest individual federal income tax and capital gains tax rates in effect at the times of the distributions and the hypothetical sales. State and local taxes were not considered. After-tax returns reflect any qualified dividend income, using actual prior-year figures and estimates for 2018. (In the example, returns after the sale of fund shares may be higher than those assuming no sale. This occurs when the sale would have produced a capital loss. The calculation assumes that the investor received a tax deduction for the loss.)
Please note that your actual after-tax returns will depend on your tax situation and may differ from those shown. Also note that if you own the fund in a tax-deferred account, such as an individual retirement account or a 401(k) plan, this information does not apply to you. Such accounts are not subject to current taxes.
Finally, keep in mind that a fund’s performance—whether before or after taxes—does not guarantee future results.
| Average Annual Total Returns: Selected Value Fund | |||
| Periods Ended October 31, 2018 | |||
| One | Five | Ten | |
| Year | Years | Years | |
| Returns Before Taxes | -9.15% | 5.75% | 12.69% |
| Returns After Taxes on Distributions | -11.21 | 4.23 | 11.69 |
| Returns After Taxes on Distributions and Sale of Fund Shares | -3.76 | 4.41 | 10.54 |
29
About Your Fund’s Expenses
As a shareholder of the fund, you incur ongoing costs, which include costs for portfolio management, administrative services, and shareholder reports (like this one), among others. Operating expenses, which are deducted from a fund’s gross income, directly reduce the investment return of the fund.
A fund’s expenses are expressed as a percentage of its average net assets. This figure is known as the expense ratio. The following examples are intended to help you understand the ongoing costs (in dollars) of investing in your fund and to compare these costs with those of other mutual funds. The examples are based on an investment of $1,000 made at the beginning of the period shown and held for the entire period.
The accompanying table illustrates your fund’s costs in two ways:
• Based on actual fund return. This section helps you to estimate the actual expenses that you paid over the period. The ”Ending Account Value“ shown is derived from the fund‘s actual return, and the third column shows the dollar amount that would have been paid by an investor who started with $1,000 in the fund. You may use the information here, together with the amount you invested, to estimate the expenses that you paid over the period.
To do so, simply divide your account value by $1,000 (for example, an $8,600 account value divided by $1,000 = 8.6), then multiply the result by the number given for your fund under the heading ”Expenses Paid During Period.“
• Based on hypothetical 5% yearly return. This section is intended to help you compare your fund‘s costs with those of other mutual funds. It assumes that the fund had a yearly return of 5% before expenses, but that the expense ratio is unchanged. In this case—because the return used is not the fund’s actual return—the results do not apply to your investment. The example is useful in making comparisons because the Securities and Exchange Commission requires all mutual funds to calculate expenses based on a 5% return. You can assess your fund’s costs by comparing this hypothetical example with the hypothetical examples that appear in shareholder reports of other funds.
Note that the expenses shown in the table are meant to highlight and help you compare ongoing costs only and do not reflect transaction costs incurred by the fund for buying and selling securities. Further, the expenses do not include any purchase, redemption, or account service fees described in the fund prospectus. If such fees were applied to your account, your costs would be higher. Your fund does not carry a “sales load.”
The calculations assume no shares were bought or sold during the period. Your actual costs may have been higher or lower, depending on the amount of your investment and the timing of any purchases or redemptions.
You can find more information about the fund’s expenses, including annual expense ratios, in the Financial Statements section of this report. For additional information on operating expenses and other shareholder costs, please refer to your fund’s current prospectus.
30
| Six Months Ended October 31, 2018 | |||
| Beginning | Ending | Expenses | |
| Account Value | Account Value | Paid During | |
| Selected Value Fund | 4/30/2018 | 10/31/2018 | Period |
| Based on Actual Fund Return | $1,000.00 | $923.44 | $1.84 |
| Based on Hypothetical 5% Yearly Return | 1,000.00 | 1,023.39 | 1.94 |
The calculations are based on expenses incurred in the most recent six-month period. The fund’s annualized six-month expense ratio for that period is 0.38%. The dollar amounts shown as “Expenses Paid” are equal to the annualized expense ratio multiplied by the average account value over the period, multiplied by the number of days in the most recent six-month period, then divided by the number of days in the most recent 12-month period (184/365).
31
Glossary
30-Day SEC Yield. A fund’s 30-day SEC yield is derived using a formula specified by the U.S. Securities and Exchange Commission. Under the formula, data related to the fund’s security holdings in the previous 30 days are used to calculate the fund’s hypothetical net income for that period, which is then annualized and divided by the fund’s estimated average net assets over the calculation period. For the purposes of this calculation, a security’s income is based on its current market yield to maturity (for bonds), its actual income (for asset-backed securities), or its projected dividend yield (for stocks). Because the SEC yield represents hypothetical annualized income, it will differ—at times significantly—from the fund’s actual experience. As a result, the fund’s income distributions may be higher or lower than implied by the SEC yield.
Beta. A measure of the magnitude of a fund’s past share-price fluctuations in relation to the ups and downs of a given market index. The index is assigned a beta of 1.00. Compared with a given index, a fund with a beta of 1.20 typically would have seen its share price rise or fall by 12% when the index rose or fell by 10%. For this report, beta is based on returns over the past 36 months for both the fund and the index. Note that a fund’s beta should be reviewed in conjunction with its R-squared (see definition). The lower the R-squared, the less correlation there is between the fund and the index, and the less reliable beta is as an indicator of volatility.
Dividend Yield. Dividend income earned by stocks, expressed as a percentage of the aggregate market value (or of net asset value, for a fund). The yield is determined by dividing the amount of the annual dividends by the aggregate value (or net asset value) at the end of the period. For a fund, the dividend yield is based solely on stock holdings and does not include any income produced by other investments.
Earnings Growth Rate. The average annual rate of growth in earnings over the past five years for the stocks now in a fund.
Equity Exposure. A measure that reflects a fund’s investments in stocks and stock futures. Any holdings in short-term reserves are excluded.
Expense Ratio. A fund’s total annual operating expenses expressed as a percentage of the fund’s average net assets. The expense ratio includes management and administrative expenses, but does not include the transaction costs of buying and selling portfolio securities.
Foreign Holdings. The percentage of a fund represented by securities or depositary receipts of companies based outside the United States.
Inception Date. The date on which the assets of a fund (or one of its share classes) are first invested in accordance with the fund’s investment objective. For funds with a subscription period, the inception date is the day after that period ends. Investment performance is measured from the inception date.
Median Market Cap. An indicator of the size of companies in which a fund invests; the midpoint of market capitalization (market price x shares outstanding) of a fund’s stocks, weighted by the proportion of the fund’s assets invested in each stock. Stocks representing half of the fund’s assets have market capitalizations above the median, and the rest are below it.
Price/Book Ratio. The share price of a stock divided by its net worth, or book value, per share.
For a fund, the weighted average price/book ratio of the stocks it holds.
32
Price/Earnings Ratio. The ratio of a stock’s current price to its per-share earnings over the past year. For a fund, the weighted average P/E of the stocks it holds. P/E is an indicator of market expectations about corporate prospects; the higher the P/E, the greater the expectations for a company’s future growth.
R-Squared. A measure of how much of a fund’s past returns can be explained by the returns from the market in general, as measured by a given index. If a fund’s total returns were precisely synchronized with an index’s returns, its R-squared would be 1.00. If the fund’s returns bore no relationship to the index’s returns, its R-squared would be 0. For this report, R-squared is based on returns over the past 36 months for both the fund and the index.
Return on Equity. The annual average rate of return generated by a company during the past five years for each dollar of shareholder’s equity (net income divided by shareholder’s equity). For a fund, the weighted average return on equity for the companies whose stocks it holds.
Short-Term Reserves. The percentage of a fund invested in highly liquid, short-term securities that can be readily converted to cash.
Turnover Rate. An indication of the fund’s trading activity. Funds with high turnover rates incur higher transaction costs and may be more likely to distribute capital gains (which may be taxable to investors). The turnover rate excludes in-kind transactions, which have minimal impact on costs.
33
The Global Industry Classification Standard (“GICS”) was developed by and is the exclusive property and a service mark of MSCI Inc. (“MSCI”) and Standard and Poor’s, a division of McGraw-Hill Companies, Inc. (“S&P”), and is licensed for use by Vanguard. Neither MSCI, S&P nor any third party involved in making or compiling the GICS or any GICS classification makes any express or implied warranties or representations with respect to such standard or classification (or the results to be obtained by the use thereof), and all such parties hereby expressly disclaim all warranties of originality, accuracy, completeness, merchantability or fitness for a particular purpose with respect to any such standard or classification. Without limiting any of the foregoing, in no event shall MSCI, S&P, any of its affiliates or any third party involved in making or compiling the GICS or any GICS classification have any liability for any direct, indirect, special, punitive, consequential or any other damages (including lost profits) even if notified of the possibility of such damages.
34
The People Who Govern Your Fund
The trustees of your mutual fund are there to see that the fund is operated and managed in your best interests since, as a shareholder, you are a part owner of the fund. Your fund’s trustees also serve on the board of directors of The Vanguard Group, Inc., which is owned by the Vanguard funds and provides services to them on an at-cost basis.
A majority of Vanguard’s board members are independent, meaning that they have no affiliation with Vanguard or the funds they oversee, apart from the sizable personal investments they have made as private individuals. The independent board members have distinguished backgrounds in business, academia, and public service. Each of the trustees and executive officers oversees 211 Vanguard funds.
Information for each trustee and executive officer of the fund appears below. The mailing address of the trustees and officers is P.O. Box 876, Valley Forge, PA 19482. More information about the trustees is in the Statement of Additional Information, which can be obtained, without charge, by contacting Vanguard at 800-662-7447, or online at vanguard.com.
Interested Trustees1
F. William McNabb III
Born in 1957. Trustee since July 2009. Principal occupation(s) during the past five years and other experience: chairman of the board (January 2010–present) of Vanguard and of each of the investment companies served by Vanguard, trustee (2009–present) of each of the investment companies served by Vanguard, and director (2008–present) of Vanguard. Chief executive officer and president (2008–2017) of Vanguard and each of the investment companies served by Vanguard, managing director (1995–2008) of Vanguard, and director (1997–2018) of Vanguard Marketing Corporation. Director (2018–present) of UnitedHealth Group.
Mortimer J. Buckley
Born in 1969. Trustee since January 2018. Principal occupation(s) during the past five years and other experience: chief executive officer (January 2018–present) of Vanguard; chief executive officer, president, and trustee (January 2018–present) of each of the investment companies served by Vanguard; president and director (2017–present) of Vanguard; and president (February 2018–present) of Vanguard Marketing Corporation. Chief investment officer (2013–2017), managing director (2002–2017), head of the Retail Investor Group (2006–2012), and chief information officer (2001–2006) of Vanguard. Chairman of the board (2011–2017) of the Children’s Hospital of Philadelphia.
Independent Trustees
Emerson U. Fullwood
Born in 1948. Trustee since January 2008. Principal occupation(s) during the past five years and other experience: executive chief staff and marketing officer for North America and corporate vice president (retired 2008) of Xerox Corporation (document management products and services). Former president of the Worldwide Channels Group, Latin America, and Worldwide Customer Service and executive chief staff officer of Developing Markets of Xerox. Executive in residence and 2009–2010 Distinguished Minett Professor at the Rochester Institute of Technology. Lead director of SPX FLOW, Inc. (multi-industry manufacturing). Director of the University of Rochester Medical Center, the Monroe Community College Foundation, the United Way of Rochester, North Carolina A&T University, and Roberts Wesleyan College. Trustee of the University of Rochester.
Amy Gutmann
Born in 1949. Trustee since June 2006. Principal occupation(s) during the past five years and other experience: president (2004–present) of the University of Pennsylvania. Christopher H. Browne Distinguished Professor of Political Science, School of Arts and Sciences, and professor of communication, Annenberg School for Communication, with secondary faculty appointments in the Department of Philosophy, School of Arts and Sciences, and at the Graduate School of Education, University of Pennsylvania. Trustee of the National Constitution Center.
1 Mr. McNabb and Mr. Buckley are considered “interested persons,” as defined in the Investment Company Act of 1940, because they are officers of the Vanguard funds.
JoAnn Heffernan Heisen
Born in 1950. Trustee since July 1998. Principal occupation(s) during the past five years and other experience: corporate vice president of Johnson & Johnson (pharmaceuticals/medical devices/consumer products) and member of its executive committee (1997–2008). Chief global diversity officer (retired 2008), vice president and chief information officer (1997–2006), controller (1995–1997), treasurer (1991–1995), and assistant treasurer (1989–1991) of Johnson & Johnson. Director of Skytop Lodge Corporation (hotels) and the Robert Wood Johnson Foundation. Member of the advisory board of the Institute for Women’s Leadership at Rutgers University.
F. Joseph Loughrey
Born in 1949. Trustee since October 2009. Principal occupation(s) during the past five years and other experience: president and chief operating officer (retired 2009) and vice chairman of the board (2008–2009) of Cummins Inc. (industrial machinery). Chairman of the board of Hillenbrand, Inc. (specialized consumer services), Oxfam America, and the Lumina Foundation for Education. Director of the V Foundation for Cancer Research. Member of the advisory council for the College of Arts and Letters and chair of the advisory board to the Kellogg Institute for International Studies, both at the University of Notre Dame.
Mark Loughridge
Born in 1953. Trustee since March 2012. Principal occupation(s) during the past five years and other experience: senior vice president and chief financial officer (retired 2013) of IBM (information technology services). Fiduciary member of IBM’s Retirement Plan Committee (2004–2013), senior vice president and general manager (2002–2004) of IBM Global Financing, vice president and controller (1998–2002) of IBM, and a variety of other prior management roles at IBM. Member of the Council on Chicago Booth.
Scott C. Malpass
Born in 1962. Trustee since March 2012. Principal occupation(s) during the past five years and other experience: chief investment officer (1989–present) and vice president (1996–present) of the University of Notre Dame. Assistant professor of finance at the Mendoza College of Business, University of Notre Dame, and member of the Notre Dame 403(b) Investment Committee. Chairman of the board of TIFF Advisory Services, Inc. Member of the board of Catholic Investment Services, Inc. (investment advisors), the board of advisors for Spruceview Capital Partners, and the board of superintendence of the Institute for the Works of Religion.
Deanna Mulligan
Born in 1963. Trustee since January 2018. Principal occupation(s) during the past five years and other experience: president (2010–present) and chief executive officer (2011–present) of The Guardian Life Insurance Company of America. Chief operating officer (2010–2011) and executive vice president (2008–2010) of Individual Life and Disability of The Guardian Life Insurance Company of America. Member of the board of The Guardian Life Insurance Company of America, the American Council of Life Insurers, the Partnership for New York City (business leadership), and the Committee Encouraging Corporate Philanthropy. Trustee of the Economic Club of New York and the Bruce Museum (arts and science). Member of the Advisory Council for the Stanford Graduate School of Business.
André F. Perold
Born in 1952. Trustee since December 2004. Principal occupation(s) during the past five years and other experience: George Gund Professor of Finance and Banking, Emeritus at the Harvard Business School (retired 2011). Chief investment officer and co-managing partner of HighVista Strategies LLC (private investment firm). Overseer of the Museum of Fine Arts Boston.
Sarah Bloom Raskin
Born in 1961. Trustee since January 2018. Principal occupation(s) during the past five years and other experience: deputy secretary (2014–2017) of the United States Department of the Treasury. Governor (2010–2014) of the Federal Reserve Board. Commissioner (2007–2010) of financial regulation for the State of Maryland. Member of the board of directors (2012–2014) of Neighborhood Reinvestment Corporation. Director of i(x) Investments, LLC.
Peter F. Volanakis
Born in 1955. Trustee since July 2009. Principal occupation(s) during the past five years and other experience: president and chief operating officer (retired 2010) of Corning Incorporated (communications equipment) and director of Corning Incorporated (2000–2010) and Dow Corning (2001–2010). Director (2012) of SPX Corporation (multi-industry manufacturing). Overseer of the Amos Tuck School of Business Administration, Dartmouth College (2001–2013). Chairman of the board of trustees of Colby-Sawyer College. Member of the Board of Hypertherm Inc. (industrial cutting systems, software, and consumables).
Executive Officers
Glenn Booraem
Born in 1967. Principal occupation(s) during the past five years and other experience: principal of Vanguard. Investment stewardship officer (2017–present), treasurer (2015–2017), controller (2010–2015), and assistant controller (2001–2010) of each of the investment companies served by Vanguard.
Christine M. Buchanan
Born in 1970. Principal occupation(s) during the past five years and other experience: principal of Vanguard and global head of Fund Administration at Vanguard. Treasurer (2017–present) of each of the investment companies served by Vanguard. Partner (2005–2017) at KPMG LLP (audit, tax, and advisory services).
Brian Dvorak
Born in 1973. Principal occupation(s) during the past five years and other experience: principal of Vanguard. Chief compliance officer (2017–present) of Vanguard and each of the investment companies served by Vanguard. Assistant vice president (2017–present) of Vanguard Marketing Corporation. Vice president and director of Enterprise Risk Management (2011–2013) at Oppenheimer Funds, Inc.
Thomas J. Higgins
Born in 1957. Principal occupation(s) during the past five years and other experience: principal of Vanguard. Chief financial officer (2008–present) and treasurer (1998–2008) of each of the investment companies served by Vanguard.
Peter Mahoney
Born in 1974. Principal occupation(s) during the past five years and other experience: principal of Vanguard. Controller (2015–present) of each of the investment companies served by Vanguard. Head of International Fund Services (2008–2014) at Vanguard.
Anne E. Robinson
Born in 1970. Principal occupation(s) during the past five years and other experience: general counsel (2016–present) of Vanguard. Secretary (2016–present) of Vanguard and of each of the investment companies served by Vanguard. Managing director (2016–present) of Vanguard. Director and senior vice president (2016–2018) of Vanguard Marketing Corporation. Managing director and general counsel of Global Cards and Consumer Services (2014–2016) at Citigroup. Counsel (2003–2014) at American Express.
Michael Rollings
Born in 1963. Principal occupation(s) during the past five years and other experience: finance director (2017–present) and treasurer (2017) of each of the investment companies served by Vanguard. Managing director (2016–present) of Vanguard. Chief financial officer (2016–present) of Vanguard. Director (2016–present) of Vanguard Marketing Corporation. Executive vice president and chief financial officer (2006–2016) of MassMutual Financial Group.
| Vanguard Senior Management Team | |
| Joseph Brennan | Chris D. McIsaac |
| Mortimer J. Buckley | James M. Norris |
| Gregory Davis | Thomas M. Rampulla |
| John James | Karin A. Risi |
| Martha G. King | Anne E. Robinson |
| John T. Marcante | Michael Rollings |
| Chairman Emeritus and Senior Advisor | |
| John J. Brennan | |
| Chairman, 1996–2009 | |
| Chief Executive Officer and President, 1996–2008 | |
| Founder | |
| John C. Bogle | |
| Chairman and Chief Executive Officer, 1974–1996 | |
 | |
P.O. Box 2600 | |
Connect with Vanguard® > vanguard.com | |
| Fund Information > 800-662-7447 | Source for Bloomberg Barclays indexes: Bloomberg |
| Direct Investor Account Services > 800-662-2739 | Index Services Limited. Copyright 2018, Bloomberg. All |
| Institutional Investor Services > 800-523-1036 | rights reserved. |
| Text Telephone for People | |
| Who Are Deaf or Hard of Hearing > 800-749-7273 | CFA® is a registered trademark owned by CFA Institute. |
| This material may be used in conjunction | |
| with the offering of shares of any Vanguard | |
| fund only if preceded or accompanied by | |
| the fund’s current prospectus. | |
| All comparative mutual fund data are from Lipper, a | |
| Thomson Reuters Company, or Morningstar, Inc., unless | |
| otherwise noted. | |
| You can obtain a free copy of Vanguard’s proxy voting | |
| guidelines by visiting vanguard.com/proxyreporting or by | |
| calling Vanguard at 800-662-2739. The guidelines are | |
| also available from the SEC’s website, sec.gov. In | |
| addition, you may obtain a free report on how your fund | |
| voted the proxies for securities it owned during the 12 | |
| months ended June 30. To get the report, visit either | |
| vanguard.com/proxyreporting or sec.gov. | |
| You can review information about your fund on the | |
| SEC’s website, and you can receive copies of this | |
| information, for a fee, by sending a request via email | |
| addressed to publicinfo@sec.gov. | |
| © 2018 The Vanguard Group, Inc. | |
| All rights reserved. | |
| Vanguard Marketing Corporation, Distributor. | |
| Q9340 122018 | |
Item 2: Code of Ethics. The Registrant has adopted a code of ethics that applies to the Registrant’s principal
executive officer, principal financial officer, principal accounting officer or controller or persons performing similar
functions. The Code of Ethics was amended during the reporting period covered by this report to make certain
technical, non-material changes.
Item 3: Audit Committee Financial Expert. All members of the Audit Committee have been determined by the
Registrant’s Board of Trustees to be Audit Committee Financial Experts and to be independent: JoAnn Heffernan
Heisen, F. Joseph Loughrey, Mark Loughridge, Sarah Bloom Raskin, and Peter F. Volanakis.
Item 4: Principal Accountant Fees and Services.
(a) Audit Fees.
Audit Fees of the Registrant.
Fiscal Year Ended October 31, 2018: $328,000
Fiscal Year Ended October 31, 2017: $341,000
Aggregate Audit Fees of Registered Investment Companies in the Vanguard Group.
Fiscal Year Ended October 31, 2018: $9,734,277
Fiscal Year Ended October 31, 2017: $8,424,459
Includes fees billed in connection with audits of the Registrant, other registered investment companies in the
Vanguard complex, The Vanguard Group, Inc. and Vanguard Marketing Corporation.
(b) Audit-Related Fees.
Fiscal Year Ended October 31, 2018: $5,581,336
Fiscal Year Ended October 31, 2017: $3,194,093
Includes fees billed in connection with assurance and related services provided to the Registrant, other
registered investment companies in the Vanguard complex, The Vanguard Group, Inc., and Vanguard
Marketing Corporation.
(c) Tax Fees.
Fiscal Year Ended October 31, 2018: $347,985
Fiscal Year Ended October 31, 2017: $274,313
Includes fees billed in connection with tax compliance, planning, and advice services provided to the
Registrant, other registered investment companies in the Vanguard complex, The Vanguard Group, Inc., and
Vanguard Marketing Corporation.
(d) All Other Fees.
Fiscal Year Ended October 31, 2018: $0
Fiscal Year Ended October 31, 2017: $0
Includes fees billed for services related to tax reported information provided to the Registrant, other registered
investment companies in the Vanguard complex, The Vanguard Group, Inc., and Vanguard Marketing
Corporation.
(e) (1) Pre-Approval Policies. The policy of the Registrant’s Audit Committee is to consider and, if
appropriate, approve before the principal accountant is engaged for such services, all specific audit and non-
audit services provided to: the Registrant, other registered investment companies in the Vanguard complex,
The Vanguard Group, Inc., and entities controlled by The Vanguard Group, Inc. that provide ongoing services
to the Registrant. In making a determination, the Audit Committee considers whether the services are
consistent with maintaining the principal accountant’s independence.
In the event of a contingency situation in which the principal accountant is needed to provide services in
between scheduled Audit Committee meetings, the Chairman of the Audit Committee would be called on to
consider and, if appropriate, pre-approve audit or permitted non-audit services in an amount sufficient to
complete services through the next Audit Committee meeting, and to determine if such services would be
consistent with maintaining the accountant’s independence. At the next scheduled Audit Committee meeting,
services and fees would be presented to the Audit Committee for formal consideration, and, if appropriate,
approval by the entire Audit Committee. The Audit Committee would again consider whether such services and
fees are consistent with maintaining the principal accountant’s independence.
The Registrant’s Audit Committee is informed at least annually of all audit and non-audit services provided
by the principal accountant to the Vanguard complex, whether such services are provided to: the Registrant,
other registered investment companies in the Vanguard complex, The Vanguard Group, Inc., or other entities
controlled by The Vanguard Group, Inc. that provide ongoing services to the Registrant.
(2) No percentage of the principal accountant’s fees or services were approved pursuant to the waiver
provision of paragraph (c)(7)(i)(C) of Rule 2-01 of Regulation S-X.
(f) For the most recent fiscal year, over 50% of the hours worked under the principal accountant’s
engagement were not performed by persons other than full-time, permanent employees of the principal
accountant.
(g) Aggregate Non-Audit Fees.
Fiscal Year Ended October 31, 2018: $347,985
Fiscal Year Ended October 31, 2017: $274,313
Includes fees billed for non-audit services provided to the Registrant, other registered investment companies in
the Vanguard complex, The Vanguard Group, Inc., and Vanguard Marketing Corporation.
(h) For the most recent fiscal year, the Audit Committee has determined that the provision of all non-audit
services was consistent with maintaining the principal accountant’s independence.
Item 5: Audit Committee of Listed Registrants.
The Registrant is a listed issuer as defined in rule 10A-3 under the Securities Exchange Act of 1934 (“Exchange Act”).
The Registrant has a separately-designated standing audit committee established in accordance with Section
3(a)(58)(A) of the Exchange Act. The Registrant’s audit committee members are: JoAnn Heffernan Heisen, F. Joseph
Loughrey, Mark Loughridge, Sarah Bloom Raskin, and Peter F. Volanakis.
Item 6: Investments.
Not Applicable.
Item 7: Disclosure of Proxy Voting Policies and Procedures for Closed-End Management Investment Companies.
Not Applicable.
Item 8: Portfolio Managers of Closed-End Management Investment Companies.
Not Applicable.
Item 9: Purchase of Equity Securities by Closed-End Management Investment Company and Affiliated Purchasers.
Not Applicable.
Item 10: Submission of Matters to a Vote of Security Holders.
Not Applicable.
Item 11: Controls and Procedures.
(a) Disclosure Controls and Procedures. The Principal Executive and Financial Officers concluded
that the Registrant’s Disclosure Controls and Procedures are effective based on their evaluation of the
Disclosure Controls and Procedures as of a date within 90 days of the filing date of this report.
(b) Internal Control Over Financial Reporting. There were no significant changes in Registrant’s
Internal Control Over Financial Reporting or in other factors that could significantly affect this control
subsequent to the date of the evaluation, including any corrective actions with regard to significant deficiencies
and material weaknesses.
Item 12: Disclosure of Securities Lending Activities for Closed-End Management
Investment Companies.
Not Applicable.
Item 13: Exhibits.
(a) Code of Ethics.
(b) Certifications.
Pursuant to the requirements of the Securities Exchange Act of 1934 and the Investment Company Act of
1940, the registrant has duly caused this report to be signed on its behalf by the undersigned, thereunto duly
authorized.
| VANGUARD WHITEHALL FUNDS | |
| By: | /s/ MORTIMER J. BUCKLEY* |
| MORTIMER J. BUCKLEY | |
| CHIEF EXECUTIVE OFFICER | |
| Date: December 18, 2018 | |
Pursuant to the requirements of the Securities Exchange Act of 1934 and the Investment Company Act of
1940, this report has been signed below by the following persons on behalf of the registrant and in the
capacities and on the dates indicated.
| VANGUARD WHITEHALL FUNDS | |
| By: | /s/ MORTIMER J. BUCKLEY* |
| MORTIMER J. BUCKLEY | |
| CHIEF EXECUTIVE OFFICER | |
| Date: December 18, 2018 | |
| VANGUARD WHITEHALL FUNDS | |
| By: | /s/ THOMAS J. HIGGINS* |
| THOMAS J. HIGGINS | |
| CHIEF FINANCIAL OFFICER | |
| Date: December 18, 2018 | |
* By: /s/ Anne E. Robinson
Anne E. Robinson, pursuant to a Power of Attorney filed on January 18, 2018 see file Number 33-32216,
Incorporated by Reference.