UNITED STATES
SECURITIES AND EXCHANGE COMMISSION
Washington, D.C. 20549
FORM N-CSR
CERTIFIED SHAREHOLDER REPORT
OF
REGISTERED MANAGEMENT INVESTMENT COMPANIES
Investment Company Act file number: 811-07443
Name of Registrant: | | Vanguard Whitehall Funds |
Address of Registrant: | | P.O. Box 2600 |
| | Valley Forge, PA 19482 |
| | |
Name and address of agent for service: | | Anne E. Robinson, Esquire |
| | P.O. Box 876 |
| | Valley Forge, PA 19482 |
Registrant’s telephone number, including area code: (610) 669-1000
Date of fiscal year end: October 31
Date of reporting period: November 1, 2018—October 31, 2019
Item 1: Reports to Shareholders

Annual Report | October 31, 2019 Vanguard Selected Value Fund |
See the inside front cover for important information about access to your fund’s annual and semiannual shareholder reports. |
Important information about access to shareholder reports
Beginning on January 1, 2021, as permitted by regulations adopted by the Securities and Exchange Commission, paper copies of your fund’s annual and semiannual shareholder reports will no longer be sent to you by mail, unless you specifically request them. Instead, you will be notified by mail each time a report is posted on the website and will be provided with a link to access the report.
If you have already elected to receive shareholder reports electronically, you will not be affected by this change and do not need to take any action. You may elect to receive shareholder reports and other communications from the fund electronically by contacting your financial intermediary (such as a broker-dealer or bank) or, if you invest directly with the fund, by calling Vanguard at one of the phone numbers on the back cover of this report or by logging on to vanguard.com.
You may elect to receive paper copies of all future shareholder reports free of charge. If you invest through a financial intermediary, you can contact the intermediary to request that you continue to receive paper copies. If you invest directly with the fund, you can call Vanguard at one of the phone numbers on the back cover of this report or log on to vanguard.com. Your election to receive paper copies will apply to all the funds you hold through an intermediary or directly with Vanguard.
Contents | |
| |
A Note From Our Chairman | 1 |
Your Fund’s Performance at a Glance | 2 |
Advisors’ Report | 3 |
About Your Fund’s Expenses | 8 |
Performance Summary | 10 |
Financial Statements | 12 |
Please note: The opinions expressed in this report are just that—informed opinions. They should not be considered promises or advice. Also, please keep in mind that the information and opinions cover the period through the date on the front of this report. Of course, the risks of investing in your fund are spelled out in the prospectus.
A Note From Our Chairman

Tim Buckley
Chairman and Chief Executive Officer
Dear Shareholder,
Recent volatility in financial markets— affecting stocks, bonds, and commodities— has been a good reminder of the wise old adage, “Never keep all your eggs in one basket.” Maintaining balance and diversification in your investment portfolio can help to both limit risk and set you up for long-term success.
It’s understandable why some investors might become complacent after a long market run-up like the one that lifted stock prices, especially U.S. stock prices, in the years following the global financial crisis. But failing to rebalance regularly can leave a portfolio with a much different mix of assets than intended and, often, more risk than intended.
Balance across and diversification within asset classes are powerful tools for managing risk and achieving your investment goals. A portfolio’s allocation will determine a large portion of its long-term return and also the majority of its volatility risk. A well-diversified portfolio is less vulnerable to significant swings in the performance of any one segment of the asset classes in which it invests.
Balance and diversification will never eliminate the risk of loss, nor will they guarantee positive returns in a declining market. But they should reduce the chance that you’ll suffer disproportionate losses in one particular high-flying asset class or sector when it comes back to earth. And exposure to all key market components should give you at least some participation in the sectors that are performing best at any given time.
Vanguard is committed to helping you achieve balance and diversification in your portfolios to help meet your investment goals. We thank you for your continued loyalty.
Sincerely,

Mortimer J. Buckley
Chairman and Chief Executive Officer
November 18, 2019
1
Your Fund’s Performance at a Glance
· Vanguard Selected Value Fund returned 12.51% for the 12 months ended October 31, 2019. It outperformed its benchmark, the Russell Midcap Value Index, which returned 10.08%.
· The broad U.S. stock market, as measured by the Russell 3000 Index, climbed more than 13% for the year. Although stocks endured stretches of volatility, their performance was boosted by the Federal Reserve’s accommodative stance and corporate earnings that largely exceeded investor expectations.
· Growth stocks outperformed their value counterparts, while large- and mid-capitalization stocks surpassed small-caps.
· Returns were positive in eight of the fund’s 11 sectors. The advisors’ holdings in materials, information technology, and consumer discretionary contributed most to relative performance. Real estate, health care, and utilities were the biggest detractors.
· Over the past decade, the fund’s average annualized return trailed that of its expense-free benchmark.
Market Barometer
| | Average Annual Total Returns | |
| | Periods Ended October 31, 2019 | |
| | One Year | | Three Years | | Five Years | |
Stocks | | | | | | | |
Russell 1000 Index (Large-caps) | | 14.15% | | 14.73% | | 10.55% | |
Russell 2000 Index (Small-caps) | | 4.90 | | 10.96 | | 7.37 | |
Russell 3000 Index (Broad U.S. market) | | 13.49 | | 14.47 | | 10.31 | |
FTSE All-World ex US Index (International) | | 11.52 | | 8.21 | | 4.16 | |
| | | | | | | |
Bonds | | | | | | | |
Bloomberg Barclays U.S. Aggregate Bond Index (Broad taxable market) | | 11.51% | | 3.29% | | 3.24% | |
Bloomberg Barclays Municipal Bond Index (Broad tax-exempt market) | | 9.42 | | 3.62 | | 3.55 | |
FTSE Three-Month U.S. Treasury Bill Index | | 2.35 | | 1.57 | | 0.98 | |
| | | | | | | |
CPI | | | | | | | |
Consumer Price Index | | 1.76% | | 2.11% | | 1.62% | |
2
Advisors’ Report
For the 12 months ended October 31, 2019, Vanguard Selected Value Fund returned 12.51%, outperforming its benchmark, the Russell Midcap Value Index, which returned 10.08%. Your fund is managed by three independent advisors, a strategy that enhances the fund’s diversification by providing exposure to distinct yet complementary investment approaches. It’s not uncommon for different advisors to have different views about individual securities or the broader investment environment.
We note with sorrow the passing of Donald G. Smith, the founder, president, and co-chief investment officer of Donald Smith & Co., Inc., on October 30, 2019. Mr. Smith had been a co-portfolio manager of the portion of the fund managed by the firm since 2005, and his contributions will be missed. Jon Hartsel, CFA, co-chief investment officer and director of research for Donald Smith & Co., has been named co-portfolio manager. Mr. Hartsel will serve alongside Richard L. Greenberg, CFA, chief executive officer and co-chief investment officer of Donald Smith & Co., who has been a co-portfolio manager of the fund since 2005.
The table on page 7 lists the advisors, the amount and percentage of fund assets each manages, and brief descriptions of their investment strategies. The advisors have provided the following assessment of the investment environment during the past 12 months and the notable successes and shortfalls in their portfolios. These comments were prepared on November 19, 2019.
Barrow, Hanley, Mewhinney & Strauss, LLC
Portfolio Managers:
James P. Barrow,
Founding Director
Mark Giambrone,
Managing Director
Our portfolio strategy this fiscal year resulted in solid performance driven by favorable stock selection. Our underweight position in real estate and utilities, sectors that we believe are broadly expensive, was a minor detractor relative to the last several years.
Two of our holdings were acquired, which we believe is a testament to our strategy of buying fundamentally undervalued businesses. Longtime holding Total System Services was acquired by Global Payments, which propelled the stock to a 48% gain. Recent addition Liberty Property Trust was up 46% as strong fundamental performance was augmented by a deal, announced just before the end of the fiscal year, that the company would be acquired by Prologis.
Dollar General, the portfolio’s largest position during the 12 months, was up 45%; its growth in same-store sales and new store openings increased earnings at a double-digit pace. Our technology investments also delivered strong returns, as Microchip Technology and new holding Marvell Technology Group recovered from a sharp sell-off in late 2018.
3
Similarly, we benefited from adding to our industrial investments after that fourth-quarter sell-off by building new positions in Jacobs Engineering Group, BWX Technologies, and J.B. Hunt Transport Services, which have since recovered. Financial holdings Fidelity National Financial, Element Fleet Management, and New York Community Bancorp began the period trading at ten times or less our estimate of normalized earnings but outperformed significantly as operational execution and lower interest rates lifted sentiment.
Energy-related investments detracted most. We believe that holdings in Hess, Kosmos Energy, and Parsley Energy have world-class reserves and strong production growth potential not yet recognized by the market.
Looking forward, we are confident that an extended cycle for value stocks is overdue. Though the growth cycle over the past ten-plus years has been longer than most, it has recently decelerated as investors reassess historically extreme valuation divergences and unprofitable business models.
Pzena Investment Management, LLC
Portfolio Managers:
Richard Pzena, Managing Principal and Co-Chief Investment Officer
John Flynn, Principal
Ben Silver, CFA, CPA, Principal
In a market that favored growth and low volatility over value stocks, our value discipline disappointed.
Energy and health care holdings detracted most from portfolio performance, while positions in the financial, information technology, and industrial sectors added to results.
Mylan was the largest individual detractor amid lackluster results and a hoped-for improvement in generic drug pricing that didn’t materialize. The company recently announced a merger with Pfizer’s Upjohn, which increases Mylan’s distribution reach into Asia while providing significant cash flow from Upjohn’s off-patent drug portfolio. MEDNAX, a physician-outsourcing firm, detracted as its neonatal business remained under pressure amid lower birth rates and its anesthesia practice was pressured from payer mix (the percentage of revenue coming from private and government insurance and self-paying individuals). We exited the position as incremental research revealed increased challenges to cost reduction, widening the range of outcomes.
4
In energy, National Oilwell Varco and new position Halliburton detracted, as weak oil prices and temporary oversupply masked the fact that oil-and-gas capital spending must pick up dramatically to offset a looming shortfall in energy supply over the next several years.
Top contributors included engineering and construction company KBR and industrial conglomerate Carlisle Companies. KBR continues to generate strong organic growth in its government services segment and anticipates more revenue growth in its hydrocarbon business. Carlisle reported strong results as earnings beat consensus on higher revenue growth, better margins, and a lower tax rate.
We initiated several other new positions in addition to Halliburton, including PVH, Mohawk Industries, Baker Hughes, and Wabtec. Notable positions we sold to help fund these purchases included MEDNAX, Dover Corp., News Corp., and Franklin Resources.
Although it’s frustrating to see the continued dispersion between growth and value stocks, we point to the lessons of history. The scale of the opportunity we see in value today is second only to that of the late-1990s bubble period. The market continues to reward low-volatility stocks, which are perceived as safe, but many of these companies aren’t delivering earnings growth; in some cases, earnings-per-share growth is negative. Many of our holdings are delivering real earnings growth and returning significant amounts of capital to shareholders through dividends and buybacks, yet the market ignores them. The portfolio remains positioned in economically sensitive companies where we are finding a wide range of good businesses at compelling valuations.
Donald Smith & Co., Inc.
Portfolio Managers:
Richard L. Greenberg, CFA,
Chief Executive Officer
and Co-Chief Investment Officer
Jon Hartsel, CFA
Co-Chief Investment Officer
and Director of Research
After dipping in the fourth quarter of 2018, the market recovered strongly this year. Despite significant appreciation, our holdings are valued at a substantial discount to the market, at 106% of tangible book value and 6.6 times our estimate of normalized earnings, compared with the Standard & Poor’s 500 Index at over 1,170% of tangible book value and 17.9 times normalized earnings.
The top contributing industries were gold miners, homebuilders, and aircraft leasing/ airline holdings, but those were offset by energy and financial stocks.
5
Gold miners rose strongly (Gold Fields, +134.4%; Kinross Gold, +87.1%; Leagold Mining, +78.1%; and IAMGOLD, +9.5%) as worries over the U.S.-China trade dispute and the health of the economy sent the price of gold soaring since last year. Gold surpassed $1,500 per ounce in August, which benefited the industry.
Homebuilders Taylor Morrison (+51.5%) and Toll Brothers (+19.6%) were large contributors. Although builders under-performed through most of 2018, the industry started 2019 with a strong rally, buoyed by lower mortgage rates and optimism about the spring selling season. Many builders reported double-digit increases in third-quarter 2019 orders, and the market appears robust.
Many of the top portfolio holdings performed well. Air France (+22.8%) reported solid earnings and announced approval from its pilots’ union to expand the low-budget carrier Transavia. Aircraft lessor AerCap (+15.6%) also reported good earnings over the summer and booked higher-than-expected premiums on plane sales, which further boosted the stock. Micron Technology (+26.1%) was also a strong contributor.
Financial and insurance holdings were mixed. Unum Group (–21.5%) and Jefferies Group (–4.7%) hurt performance, but that was offset by CNA Financial (+11.5%) and MFA Financial (+22.4%). Energy holdings also detracted.
We added to our holdings in Celestica, Gold Fields, IAMGOLD, JetBlue, Jefferies Group, Taylor Morrison, and Unum Group. We trimmed our exposure in AerCap, Kinross Gold, MFA Financial, Micron Technology, Noble, and Everest Re Group. Aspen Insurance (which was taken over), Yamana Gold, Axis Capital, and Nabors Industries are no longer held in the portfolio. There were no new holdings for the fiscal year.
The largest industry weightings were airlines (24.4%), metals (22.2%), insurance (15.8%), and aircraft leasing (13.9%).
6
Vanguard Selected Value Fund Investment Advisors
| | Fund Assets Managed | | |
Investment Advisor | | % | | $ Million | | Investment Strategy |
Barrow, Hanley, Mewhinney & Strauss, LLC | | 51 | | 4,043 | | Conducts fundamental research on individual stocks exhibiting traditional value characteristics: price/earnings and price/book ratios below the market average and dividend yields above the market average. |
Pzena Investment Management, LLC | | 28 | | 2,182 | | Uses a fundamental, bottom-up, deep-value-oriented investment strategy. Seeks to buy good businesses at low prices, focusing exclusively on companies that are underperforming their historically demonstrated earnings power. |
Donald Smith & Co., Inc. | | 20 | | 1,543 | | Conducts fundamental research on the lowest price-to-tangible book value companies. Research focuses on underlying quality of book value and assets, and on long-term earnings potential. |
Cash Investments | | 1 | | 124 | | These short-term reserves are invested by Vanguard in equity index products to simulate investment in stocks. Each advisor may also maintain a cash position. |
7
About Your Fund’s Expenses
As a shareholder of the fund, you incur ongoing costs, which include costs for portfolio management, administrative services, and shareholder reports (like this one), among others. Operating expenses, which are deducted from a fund’s gross income, directly reduce the investment return of the fund.
A fund’s expenses are expressed as a percentage of its average net assets. This figure is known as the expense ratio. The following examples are intended to help you understand the ongoing costs (in dollars) of investing in your fund and to compare these costs with those of other mutual funds. The examples are based on an investment of $1,000 made at the beginning of the period shown and held for the entire period.
The accompanying table illustrates your fund’s costs in two ways:
· Based on actual fund return. This section helps you to estimate the actual expenses that you paid over the period. The “Ending Account Value” shown is derived from the fund’s actual return, and the third column shows the dollar amount that would have been paid by an investor who started with $1,000 in the fund. You may use the information here, together with the amount you invested, to estimate the expenses that you paid over the period.
To do so, simply divide your account value by $1,000 (for example, an $8,600 account value divided by $1,000 = 8.6), then multiply the result by the number given for your fund under the heading “Expenses Paid During Period.”
· Based on hypothetical 5% yearly return. This section is intended to help you compare your fund’s costs with those of other mutual funds. It assumes that the fund had a yearly return of 5% before expenses, but that the expense ratio is unchanged. In this case—because the return used is not the fund’s actual return—the results do not apply to your investment. The example is useful in making comparisons because the Securities and Exchange Commission requires all mutual funds to calculate expenses based on a 5% return. You can assess your fund’s costs by comparing this hypothetical example with the hypothetical examples that appear in shareholder reports of other funds.
Note that the expenses shown in the table are meant to highlight and help you compare ongoing costs only and do not reflect transaction costs incurred by the fund for buying and selling securities. Further, the expenses do not include any purchase, redemption, or account service fees described in the fund prospectus. If such fees were applied to your account, your costs would be higher. Your fund does not carry a “sales load.”
The calculations assume no shares were bought or sold during the period. Your actual costs may have been higher or lower, depending on the amount of your investment and the timing of any purchases or redemptions.
You can find more information about the fund’s expenses, including annual expense ratios, in the Financial Statements section of this report. For additional information on operating expenses and other shareholder costs, please refer to your fund’s current prospectus.
8
Six Months Ended October 31, 2019
| | Beginning | | Ending | | Expenses |
| | Account Value | | Account Value | | Paid During |
Selected Value Fund | | 4/30/2019 | | 10/31/2019 | | Period |
Based on Actual Fund Return | | $1,000.00 | | $1,036.83 | | $1.75 |
Based on Hypothetical 5% Yearly Return | | 1,000.00 | | 1,023.49 | | 1.73 |
The calculations are based on expenses incurred in the most recent six-month period. The fund’s annualized six-month expense ratio for that period is 0.34%. The dollar amounts shown as “Expenses Paid” are equal to the annualized expense ratio multiplied by the average account value over the period, multiplied by the number of days in the most recent six-month period, then divided by the number of days in the most recent 12-month period (184/365).
9
Selected Value Fund
Performance Summary
All of the returns in this report represent past performance, which is not a guarantee of future results that may be achieved by the fund. (Current performance may be lower or higher than the performance data cited. For performance data current to the most recent month-end, visit our website at vanguard.com/performance.) Note, too, that both investment returns and principal value can fluctuate widely, so an investor’s shares, when sold, could be worth more or less than their original cost. The returns shown do not reflect taxes that a shareholder would pay on fund distributions or on the sale of fund shares.
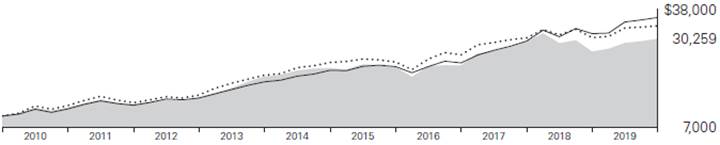
Cumulative Performance: October 31, 2009, Through October 31, 2019
Initial Investment of $10,000
| | Average Annual Total Returns | |
| | Periods Ended October 31, 2019 | |
| | | | | Final Value |
| | One | Five | Ten | of a $10,000 |
| | Year | Years | Years | Investment |

| Selected Value Fund | 12.51% | 6.03% | 11.71% | $30,259 |

| Russell Midcap Value Index | 10.08 | 6.95 | 12.90 | 33,652 |

| Dow Jones U.S. Total Stock Market Float Adjusted Index | 13.39 | 10.26 | 13.62 | 35,859 |
See Financial Highlights for dividend and capital gains information.
10
Selected Value Fund
Sector Diversification
As of October 31, 2019
Communication Services | | 1.1 | % |
Consumer Discretionary | | 17.4 | |
Consumer Staples | | 1.4 | |
Energy | | 5.6 | |
Financials | | 23.6 | |
Health Care | | 1.7 | |
Industrials | | 22.8 | |
Information Technology | | 8.3 | |
Materials | | 7.4 | |
Other | | 0.0 | |
Real Estate | | 5.7 | |
Utilities | | 5.0 | |
The table reflects the fund’s equity exposure, based on its investments in stocks and stock index futures. Any holdings in short-term reserves are excluded. Sector categories are based on the Global Industry Classification Standard (“GICS”), except for the “Other” category (if applicable), which includes securities that have not been provided a GICS classification as of the effective reporting period.
The Global Industry Classification Standard (“GICS”) was developed by and is the exclusive property and a service mark of MSCI Inc. (“MSCI”) and Standard and Poor’s, a division of McGraw-Hill Companies, Inc. (“S&P”), and is licensed for use by Vanguard. Neither MSCI, S&P nor any third party involved in making or compiling the GICS or any GICS classification makes any express or implied warranties or representations with respect to such standard or classification (or the results to be obtained by the use thereof), and all such parties hereby expressly disclaim all warranties of originality, accuracy, completeness, merchantability or fitness for a particular purpose with respect to any such standard or classification. Without limiting any of the foregoing, in no event shall MSCI, S&P, any of its affiliates or any third party involved in making or compiling the GICS or any GICS classification have any liability for any direct, indirect, special, punitive, consequential or any other damages (including lost profits) even if notified of the possibility of such damages.
11
Selected Value Fund
Financial Statements
Statement of Net Assets
As of October 31, 2019
The fund files its complete schedule of portfolio holdings with the Securities and Exchange Commission (SEC) for the first and third quarters of each fiscal year as an exhibit to its reports on Form N-PORT. The fund’s Form N-PORT reports are available on the SEC’s website at www.sec.gov.
| | | | | Market | |
| | | | | Value· | |
| | | Shares | | ($000) | |
Common Stocks (95.8%)1 | | | | | |
Communication Services (0.9%) | | | | | |
| Interpublic Group of Cos. Inc. | | 2,165,722 | | 47,104 | |
| Omnicom Group Inc. | | 285,382 | | 22,029 | |
| | | | | 69,133 | |
Consumer Discretionary (16.8%) | | | | | |
| Dollar General Corp. | | 848,677 | | 136,077 | |
| Aramark | | 2,751,684 | | 120,414 | |
| Wyndham Hotels & Resorts Inc. | | 2,159,554 | | 116,551 | |
| Lennar Corp. Class A | | 1,887,677 | | 112,506 | |
| Advance Auto Parts Inc. | | 681,427 | | 110,718 | |
*,2 | SeaWorld Entertainment Inc. | | 4,180,740 | | 110,455 | |
* | Taylor Morrison Home Corp. Class A | | 4,114,443 | | 103,067 | |
| Royal Caribbean Cruises Ltd. | | 909,096 | | 98,937 | |
| MGM Resorts International | | 3,341,362 | | 95,229 | |
* | Norwegian Cruise Line Holdings Ltd. | | 1,766,396 | | 89,662 | |
| Lear Corp. | | 527,126 | | 62,080 | |
| Newell Brands Inc. | | 2,571,382 | | 48,779 | |
* | Mohawk Industries Inc. | | 320,091 | | 45,895 | |
| PVH Corp. | | 398,801 | | 34,759 | |
| Gildan Activewear Inc. Class A | | 981,646 | | 25,061 | |
| Foot Locker Inc. | | 233,050 | | 10,140 | |
| Toll Brothers Inc. | | 98,920 | | 3,934 | |
| | | | | 1,324,264 | |
Consumer Staples (1.2%) | | | | | |
| Coca-Cola European Partners plc | | 1,074,654 | | 57,505 | |
| Kellogg Co. | | 337,425 | | 21,437 | |
| Spectrum Brands Holdings Inc. | | 368,061 | | 18,480 | |
| | | | | 97,422 | |
Energy (5.4%) | | | | | |
| Hess Corp. | | 1,620,619 | | 106,556 | |
| National Oilwell Varco Inc. | | 3,079,331 | | 69,655 | |
| Kosmos Energy Ltd. | | 11,038,752 | | 68,440 | |
| Halliburton Co. | | 2,416,832 | | 46,524 | |
| Parsley Energy Inc. Class A | | 2,441,953 | | 38,607 | |
| Baker Hughes Co. Class A | | 1,348,277 | | 28,853 | |
| Cenovus Energy Inc. | | 3,219,653 | | 27,335 | |
| TechnipFMC plc | | 1,277,750 | | 25,210 | |
| Murphy Oil Corp. | | 352,996 | | 7,282 | |
* | WPX Energy Inc. | | 400,879 | | 4,001 | |
*,^ | Valaris plc Class A | | 685,248 | | 2,816 | |
* | Noble Corp. plc | | 2,006,000 | | 2,467 | |
| | | | | 427,746 | |
Financials (22.8%) | | | | | |
| Axis Capital Holdings Ltd. | | 2,965,837 | | 176,260 | |
| Willis Towers Watson plc | | 712,306 | | 133,130 | |
| Unum Group | | 4,346,094 | | 119,691 | |
| Fidelity National Financial Inc. | | 2,415,213 | | 110,713 | |
| New York Community Bancorp Inc. | | 8,065,082 | | 93,958 | |
| CNA Financial Corp. | | 2,066,402 | | 92,658 | |
| Jefferies Financial Group Inc. | | 4,906,607 | | 91,606 | |
| FNB Corp. | | 6,994,255 | | 84,351 | |
| Northern Trust Corp. | | 820,725 | | 81,810 | |
| KKR & Co. Inc. Class A | | 2,750,798 | | 79,306 | |
| Regions Financial Corp. | | 4,105,725 | | 66,102 | |
| Voya Financial Inc. | | 1,218,871 | | 65,770 | |
| Element Fleet Management Corp. | | 7,337,400 | | 62,394 | |
| Fifth Third Bancorp | | 1,945,926 | | 56,588 | |
| Everest Re Group Ltd. | | 212,796 | | 54,708 | |
| KeyCorp | | 3,042,425 | | 54,672 | |
| Navient Corp. | | 3,625,053 | | 49,917 | |
| Valley National Bancorp | | 4,010,311 | | 46,439 | |
12
Selected Value Fund
| | | | | Market | |
| | | | | Value· | |
| | | Shares | | ($000) | |
| AXA Equitable Holdings Inc. | | 1,927,461 | | 41,633 | |
| CNO Financial Group Inc. | | 1,986,667 | | 31,091 | |
| Invesco Ltd. | | 1,501,950 | | 25,263 | |
| Hartford Financial Services Group Inc. | | 424,208 | | 24,214 | |
| Legg Mason Inc. | | 639,775 | | 23,838 | |
| Webster Financial Corp. | | 528,766 | | 23,319 | |
| Globe Life Inc. | | 235,908 | | 22,961 | |
| Allstate Corp. | | 211,186 | | 22,474 | |
| Hanover Insurance Group Inc. | | 167,883 | | 22,112 | |
| SLM Corp. | | 2,510,295 | | 21,187 | |
| MFA Financial Inc. | | 1,416,357 | | 10,750 | |
| Comerica Inc. | | 121,055 | | 7,919 | |
| | | | | 1,796,834 | |
Health Care (1.4%) | | | | | |
| Cardinal Health Inc. | | 1,089,555 | | 53,879 | |
* | Mylan NV | | 1,810,193 | | 34,665 | |
| McKesson Corp. | | 193,631 | | 25,753 | |
| | | | | 114,297 | |
Industrials (22.1%) | | | | | |
* | AerCap Holdings NV | | 3,700,000 | | 214,156 | |
* | Air France-KLM ADR | | 15,446,816 | | 182,427 | |
* | JetBlue Airways Corp. | | 8,354,707 | | 161,246 | |
| Stanley Black & Decker Inc. | | 924,678 | | 139,932 | |
| JB Hunt Transport Services Inc. | | 943,094 | | 110,870 | |
| Wabtec Corp. | | 1,535,739 | | 106,534 | |
| Spirit AeroSystems Holdings Inc. Class A | | 1,245,409 | | 101,899 | |
| Johnson Controls International plc | | 2,203,386 | | 95,473 | |
| Jacobs Engineering Group Inc. | | 1,012,594 | | 94,759 | |
| BWX Technologies Inc. | | 1,256,639 | | 73,011 | |
| Owens Corning | | 1,083,768 | | 66,413 | |
* | AECOM | | 1,442,899 | | 57,730 | |
| Ryder System Inc. | | 1,058,956 | | 51,497 | |
* | JELD-WEN Holding Inc. | | 2,926,689 | | 50,017 | |
| Nielsen Holdings plc | | 2,408,983 | | 48,565 | |
| Carlisle Cos. Inc. | | 285,125 | | 43,416 | |
| Actuant Corp. Class A | | 1,717,514 | | 42,543 | |
* | Avis Budget Group Inc. | | 1,403,938 | | 41,711 | |
| Snap-on Inc. | | 199,989 | | 32,532 | |
| Terex Corp. | | 1,076,438 | | 29,656 | |
| | | | | 1,744,387 | |
Information Technology (7.8%) | | | | | |
| Microchip Technology Inc. | | 1,044,751 | | 98,510 | |
* | Micron Technology Inc. | | 2,047,300 | | 97,349 | |
| Marvell Technology Group Ltd. | | 3,773,225 | | 92,029 | |
| Avnet Inc. | | 1,478,844 | | 58,503 | |
| Hewlett Packard Enterprise Co. | | 3,220,553 | | 52,849 | |
* | Anixter International Inc. | | 624,710 | | 51,695 | |
| KBR Inc. | | 1,620,427 | | 45,631 | |
* | Arrow Electronics Inc. | | 304,204 | | 24,117 | |
* | Flex Ltd. | | 1,991,393 | | 23,399 | |
| Genpact Ltd. | | 498,692 | | 19,534 | |
* | Celestica Inc. | | 2,485,719 | | 17,947 | |
| Juniper Networks Inc. | | 706,087 | | 17,525 | |
| Jabil Inc. | | 349,822 | | 12,880 | |
| | | | | 611,968 | |
Materials (7.1%) | | | | | |
| Gold Fields Ltd. ADR | | 24,378,000 | | 150,656 | |
* | Element Solutions Inc. | | 11,509,900 | | 124,997 | |
*,2 | IAMGOLD Corp. | | 31,339,433 | | 117,209 | |
* | Axalta Coating | | | | | |
| Systems Ltd. | | 3,257,639 | | 96,068 | |
* | Kinross Gold Corp. | | 12,815,632 | | 62,156 | |
* | Leagold Mining Corp. | | 6,787,563 | | 13,399 | |
| | | | | 564,485 | |
Other (0.0%) | | | | | |
* | Leagold Mining Corp | | | | | |
| Warrants Exp. | | | | | |
| 5/29/2020 | | 2,944,713 | | — | |
Real Estate (5.5%) | | | | | |
| HCP Inc. | | 3,622,821 | | 136,290 | |
| Liberty Property Trust | | 2,069,420 | | 122,241 | |
| MGM Growth Properties LLC Class A | | 3,588,359 | | 111,993 | |
| GEO Group Inc. | | 2,494,282 | | 37,963 | |
| Service Properties Trust | | 583,800 | | 14,770 | |
^ | Realogy Holdings Corp. | | 1,286,639 | | 10,139 | |
| | | | | 433,396 | |
Utilities (4.8%) | | | | | |
| Xcel Energy Inc. | | 1,952,988 | | 124,034 | |
| Edison International | | 1,943,258 | | 122,231 | |
| Pinnacle West Capital Corp. | | 914,393 | | 86,063 | |
| Avangrid Inc. | | 957,737 | | 47,935 | |
| | | | | 380,263 | |
Total Common Stocks | | | | | |
(Cost $6,270,326) | | | | 7,564,195 | |
13
Selected Value Fund
| | | | | Market | |
| | | | | Value· | |
| | | Shares | | ($000) | |
Temporary Cash Investments (4.1%)1 | | | | | |
Money Market Fund (4.0%) | | | | | |
3,4 | Vanguard Market Liquidity Fund, 1.984% | | 3,171,048 | | 317,137 | |
| | | | | | |
| | | Face | | | |
| | | Amount | | | |
| | | ($000) | | | |
U.S. Government and Agency Obligations (0.1%) | | | | | |
5 | United States Treasury Bill, 2.135%, 11/14/19 | | 2,500 | | 2,499 | |
5 | United States Treasury Bill, 2.048%, 11/21/19 | | 1,000 | | 999 | |
5 | United States Treasury Bill, 1.817%, 1/30/20 | | 1,750 | | 1,743 | |
| | | | | 5,241 | |
Total Temporary Cash Investments | | | | | |
(Cost $322,367) | | | | 322,378 | |
Total Investments (99.9%) | | | | | |
(Cost $6,592,693) | | | | 7,886,573 | |
Other Assets and Liabilities (0.1%) | | | | | |
Other Assets5 | | | | 28,630 | |
Liabilities4 | | | | (22,852 | ) |
| | | | 5,778 | |
Net Assets (100%) | | | | | |
Applicable to 286,013,340 outstanding $.001 par value shares of beneficial interest (unlimited authorization) | | 7,892,351 | |
Net Asset Value Per Share | | | | $27.59 | |
| | | | Amount | |
| | | | ($000 | ) |
Statement of Assets and Liabilities | | | | | |
Assets | | | | | |
Investments in Securities, at Value | | | | | |
Unaffiliated Issuers | | | | 7,341,772 | |
Affiliated Issuers | | | | 544,801 | |
Total Investments in Securities | | | | 7,886,573 | |
Investment in Vanguard | | | | 370 | |
Receivables for Investment Securities Sold | | | | 21,174 | |
Receivables for Accrued Income | | | | 4,121 | |
Receivables for Capital Shares Issued | | | | 2,621 | |
Other Assets5 | | | | 344 | |
Total Assets | | | | 7,915,203 | |
Liabilities | | | | | |
Payables for Investment Securities Purchased | | | | 4,614 | |
Collateral for Securities on Loan | | | | 2,518 | |
Payable to Investment Advisor | | | | 3,532 | |
Payables for Capital Shares Redeemed | | | | 5,617 | |
Payables to Vanguard | | | | 6,039 | |
Variation Margin Payable—Futures Contracts | | | | 516 | |
Other Liabilities | | | | 16 | |
Total Liabilities | | | | 22,852 | |
Net Assets | | | | 7,892,351 | |
14
Selected Value Fund
At October 31, 2019, net assets consisted of:
| | | | Amount | |
| | | | ($000 | ) |
Paid-in Capital | | | | 6,065,062 | |
Total Distributable Earnings (Loss) | | | | 1,827,289 | |
Net Assets | | | | 7,892,351 | |
· See Note A in Notes to Financial Statements.
* Non-income-producing security.
^ Includes partial security positions on loan to broker-dealers. The total value of securities on loan is $2,167,000.
1 The fund invests a portion of its cash reserves in equity markets through the use of index futures contracts. After giving effect to futures investments, the fund’s effective common stock and temporary cash investment positions represent 97.4% and 2.5%, respectively, of net assets.
2 Considered an affiliated company of the fund as the fund owns more than 5% of the outstanding voting securities of such company.
3 Affiliated money market fund available only to Vanguard funds and certain trusts and accounts managed by Vanguard. Rate shown is the 7-day yield.
4 Collateral of $2,518,000 was received for securities on loan.
5 Securities with a value of $5,241,000 and cash of $344,000 have been segregated as initial margin for open futures contracts.
ADR—American Depositary Receipt.
Derivative Financial Instruments Outstanding as of Period End |
|
Futures Contracts |
| | | | ($000) |
| | | | Value and |
| | Number of | | Unrealized |
| | Long (Short) | Notional | Appreciation |
| Expiration | Contracts | Amount | (Depreciation) |
Long Futures Contracts | | | | |
E-mini S&P 500 Index | December 2019 | 819 | 124,316 | 3,217 |
See accompanying Notes, which are an integral part of the Financial Statements.
15
Selected Value Fund
Statement of Operations
| | Year Ended | |
| | October 31, 2019 | |
| | ($000 | ) |
Investment Income | | | |
Income | | | |
Dividends—Unaffiliated Issuers1 | | 163,473 | |
Dividends—Affiliated Issuers | | 6,756 | |
Interest—Unaffiliated Issuers | | 184 | |
Interest—Affiliated Issuers | | 8,166 | |
Securities Lending—Net | | 690 | |
Total Income | | 179,269 | |
Expenses | | | |
Investment Advisory Fees—Note B | | | |
Basic Fee | | 18,250 | |
Performance Adjustment | | (4,730 | ) |
The Vanguard Group—Note C | | | |
Management and Administrative | | 11,821 | |
Marketing and Distribution | | 912 | |
Custodian Fees | | 47 | |
Auditing Fees | | 34 | |
Shareholders’ Reports | | 134 | |
Trustees’ Fees and Expenses | | 9 | |
Total Expenses | | 26,477 | |
Expenses Paid Indirectly | | (304 | ) |
Net Expenses | | 26,173 | |
Net Investment Income | | 153,096 | |
Realized Net Gain (Loss) | | | |
Investment Securities Sold—Unaffiliated Issuers | | 460,232 | |
Investment Securities Sold—Affiliated Issuers | | 3,732 | |
Futures Contracts | | 13,486 | |
Foreign Currencies | | 19 | |
Realized Net Gain (Loss) | | 477,469 | |
Change in Unrealized Appreciation (Depreciation) | | | |
Investment Securities—Unaffiliated Issuers | | 282,608 | |
Investment Securities—Affiliated Issuers | | 10,047 | |
Futures Contracts | | 8,729 | |
Change in Unrealized Appreciation (Depreciation) | | 301,384 | |
Net Increase (Decrease) in Net Assets Resulting from Operations | | 931,949 | |
1 Dividends are net of foreign withholding taxes of $1,620,000.
See accompanying Notes, which are an integral part of the Financial Statements.
16
Selected Value Fund
Statement of Changes in Net Assets
| | Year Ended October 31, | |
| | 2019 | | 2018 | |
| | ($000 | ) | ($000 | ) |
Increase (Decrease) in Net Assets | | | | | |
Operations | | | | | |
Net Investment Income | | 153,096 | | 166,466 | |
Realized Net Gain (Loss) | | 477,469 | | 763,198 | |
Change in Unrealized Appreciation (Depreciation) | | 301,384 | | (1,822,298 | ) |
Net Increase (Decrease) in Net Assets Resulting from Operations | | 931,949 | | (892,634 | ) |
Distributions | | | | | |
Net Investment Income | | (155,280 | ) | (135,374 | ) |
Realized Capital Gain1 | | (665,160 | ) | (859,146 | ) |
Total Distributions | | (820,440 | ) | (994,520 | ) |
Capital Share Transactions | | | | | |
Issued | | 750,115 | | 1,443,090 | |
Issued in Lieu of Cash Distributions | | 757,580 | | 917,398 | |
Redeemed | | (2,537,860 | ) | (2,236,747 | ) |
Net Increase (Decrease) from Capital Share Transactions | | (1,030,165 | ) | 123,741 | |
Total Increase (Decrease) | | (918,656 | ) | (1,763,413 | ) |
Net Assets | | | | | |
Beginning of Period | | 8,811,007 | | 10,574,420 | |
End of Period | | 7,892,351 | | 8,811,007 | |
1 Includes fiscal 2019 and 2018 short-term gain distributions totaling $0 and $74,529,000, respectively. Short-term gain distributions are treated as ordinary income dividends for tax purposes.
See accompanying Notes, which are an integral part of the Financial Statements.
17
Selected Value Fund
Financial Highlights
For a Share Outstanding | | | | Year Ended October 31, | |
Throughout Each Period | | 2019 | | 2018 | | 2017 | | 2016 | | 2015 | |
Net Asset Value, Beginning of Period | | $27.38 | | $33.15 | | $27.24 | | $28.15 | | $29.49 | |
Investment Operations | | | | | | | | | | | |
Net Investment Income | | .493 | 1 | .493 | 1 | .449 | 1 | .527 | 1 | .478 | |
Net Realized and Unrealized Gain (Loss) on Investments | | 2.392 | | (3.153 | ) | 6.760 | | .030 | | (.245 | ) |
Total from Investment Operations | | 2.885 | | (2.660 | ) | 7.209 | | .557 | | .233 | |
Distributions | | | | | | | | | | | |
Dividends from Net Investment Income | | (.506 | ) | (.423 | ) | (.501 | ) | (.443 | ) | (.404 | ) |
Distributions from Realized Capital Gains | | (2.169 | ) | (2.687 | ) | (.798 | ) | (1.024 | ) | (1.169 | ) |
Total Distributions | | (2.675 | ) | (3.110 | ) | (1.299 | ) | (1.467 | ) | (1.573 | ) |
Net Asset Value, End of Period | | $27.59 | | $27.38 | | $33.15 | | $27.24 | | $28.15 | |
| | | | | | | | | | | |
Total Return2 | | 12.51% | | -9.15% | | 27.17% | | 2.20% | | 0.88% | |
| | | | | | | | | | | |
Ratios/Supplemental Data | | | | | | | | | | | |
Net Assets, End of Period (Millions) | | $7,892 | | $8,811 | | $10,574 | | $8,802 | | $9,663 | |
Ratio of Total Expenses to Average Net Assets3 | | 0.33% | | 0.36% | | 0.39% | | 0.35% | | 0.39% | |
Ratio of Net Investment Income to Average Net Assets | | 1.89% | | 1.61% | | 1.47% | | 2.00% | | 1.62% | |
Portfolio Turnover Rate | | 31% | | 31% | | 22% | | 27% | | 24% | |
1 Calculated based on average shares outstanding.
2 Total returns do not include account service fees that may have applied in the periods shown. Fund prospectuses provide information about any applicable account service fees.
3 Includes performance-based investment advisory fee increases (decreases) of (0.06%), (0.02%), 0.00%, (0.04%), and (0.02%).
See accompanying Notes, which are an integral part of the Financial Statements.
18
Selected Value Fund
Notes to Financial Statements
Vanguard Selected Value Fund is registered under the Investment Company Act of 1940 as an open-end investment company, or mutual fund.
A. The following significant accounting policies conform to generally accepted accounting principles for U.S. investment companies. The fund consistently follows such policies in preparing its financial statements.
1. Security Valuation: Securities are valued as of the close of trading on the New York Stock Exchange (generally 4 p.m., Eastern time) on the valuation date. Equity securities are valued at the latest quoted sales prices or official closing prices taken from the primary market in which each security trades; such securities not traded on the valuation date are valued at the mean of the latest quoted bid and asked prices. Securities for which market quotations are not readily available, or whose values have been affected by events occurring before the fund’s pricing time but after the close of the securities’ primary markets, are valued at their fair values calculated according to procedures adopted by the board of trustees. These procedures include obtaining quotations from an independent pricing service, monitoring news to identify significant market- or security-specific events, and evaluating changes in the values of foreign market proxies (for example, ADRs, futures contracts, or exchange-traded funds), between the time the foreign markets close and the fund’s pricing time. When fair-value pricing is employed, the prices of securities used by a fund to calculate its net asset value may differ from quoted or published prices for the same securities. Investments in Vanguard Market Liquidity Fund are valued at that fund’s net asset value. Temporary cash investments are valued using the latest bid prices or using valuations based on a matrix system (which considers such factors as security prices, yields, maturities, and ratings), both as furnished by independent pricing services.
2. Foreign Currency: Securities and other assets and liabilities denominated in foreign currencies are translated into U.S. dollars using exchange rates obtained from an independent third party as of the fund’s pricing time on the valuation date. Realized gains (losses) and unrealized appreciation (depreciation) on investment securities include the effects of changes in exchange rates since the securities were purchased, combined with the effects of changes in security prices. Fluctuations in the value of other assets and liabilities resulting from changes in exchange rates are recorded as unrealized foreign currency gains (losses) until the assets or liabilities are settled in cash, at which time they are recorded as realized foreign currency gains (losses).
3. Futures Contracts: The fund uses index futures contracts to a limited extent, with the objective of maintaining full exposure to the stock market while maintaining liquidity. The fund may purchase or sell futures contracts to achieve a desired level of investment, whether to accommodate portfolio turnover or cash flows from capital share transactions. The primary risks associated with the use of futures contracts are imperfect correlation between changes in market values of stocks held by the fund and the prices of futures contracts, and the possibility of an illiquid market. Counterparty risk involving futures is mitigated because a regulated clearinghouse is the counterparty instead of the clearing broker. To further mitigate counterparty risk, the fund trades futures contracts on an exchange, monitors the financial strength of its clearing brokers and clearinghouse, and has entered into clearing agreements with its clearing brokers. The clearinghouse imposes initial margin requirements to secure the fund’s performance and requires daily settlement of variation margin representing changes in the market value of each contract. Any assets pledged as initial margin for open contracts are noted in the Statement of Net Assets.
19
Selected Value Fund
Futures contracts are valued at their quoted daily settlement prices. The notional amounts of the contracts are not recorded in the Statement of Net Assets. Fluctuations in the value of the contracts are recorded in the Statement of Assets and Liabilities as an asset (liability) and in the Statement of Operations as unrealized appreciation (depreciation) until the contracts are closed, when they are recorded as realized futures gains (losses).
During the year ended October 31, 2019, the fund’s average investments in long and short futures contracts represented 1% and 0% of net assets, respectively, based on the average of the notional amounts at each quarter-end during the period.
4. Federal Income Taxes: The fund intends to continue to qualify as a regulated investment company and distribute all of its taxable income. Management has analyzed the fund’s tax positions taken for all open federal income tax years (October 31, 2016–2019), and has concluded that no provision for federal income tax is required in the fund’s financial statements.
5. Distributions: Distributions to shareholders are recorded on the ex-dividend date. Distributions are determined on a tax basis and may differ from net investment income and realized capital gains for financial reporting purposes.
6. Securities Lending: To earn additional income, the fund lends its securities to qualified institutional borrowers. Security loans are subject to termination by the fund at any time, and are required to be secured at all times by collateral in an amount at least equal to the market value of securities loaned. Daily market fluctuations could cause the value of loaned securities to be more or less than the value of the collateral received. When this occurs, the collateral is adjusted and settled before the opening of the market on the next business day. The fund further mitigates its counterparty risk by entering into securities lending transactions only with a diverse group of prequalified counterparties, monitoring their financial strength, and entering into master securities lending agreements with its counterparties. The master securities lending agreements provide that, in the event of a counterparty’s default (including bankruptcy), the fund may terminate any loans with that borrower, determine the net amount owed, and sell or retain the collateral up to the net amount owed to the fund; however, such actions may be subject to legal proceedings. While collateral mitigates counterparty risk, in the event of a default, the fund may experience delays and costs in recovering the securities loaned. The fund invests cash collateral received in Vanguard Market Liquidity Fund, and records a liability in the Statement of Assets and Liabilities for the return of the collateral, during the period the securities are on loan. Securities lending income represents fees charged to borrowers plus income earned on invested cash collateral, less expenses associated with the loan. During the term of the loan, the fund is entitled to all distributions made on or in respect of the loaned securities.
7. Credit Facility: The fund and certain other funds managed by The Vanguard Group (“Vanguard”) participate in a $4.3 billion committed credit facility provided by a syndicate of lenders pursuant to a credit agreement that may be renewed annually; each fund is individually liable for its borrowings, if any, under the credit facility. Borrowings may be utilized for temporary and emergency purposes, and are subject to the fund’s regulatory and contractual borrowing restrictions. The participating funds are charged administrative fees and an annual commitment fee of 0.10% of the undrawn amount of the facility; these fees are allocated to the funds based on a method approved by the fund’s board of trustees and included in Management and Administrative expenses on the fund’s Statement of Operations. Any borrowings under this facility bear interest at a rate based upon the higher of the one-month London Interbank Offered Rate, federal funds effective rate, or overnight bank funding rate plus an agreed-upon spread.
20
Selected Value Fund
The fund had no borrowings outstanding at October 31, 2019, or at any time during the period then ended.
8. Other: Dividend income is recorded on the ex-dividend date. Interest income includes income distributions received from Vanguard Market Liquidity Fund and is accrued daily. Premiums and discounts on debt securities purchased are amortized and accreted, respectively, to interest income over the lives of the respective securities. Security transactions are accounted for on the date securities are bought or sold. Costs used to determine realized gains (losses) on the sale of investment securities are those of the specific securities sold.
B. The investment advisory firms Barrow, Hanley, Mewhinney & Strauss, LLC, Pzena Investment Management, LLC, and Donald Smith & Co., Inc., each provide investment advisory services to a portion of the fund for a fee calculated at an annual percentage rate of average net assets managed by the advisor. The basic fees of Barrow, Hanley, Mewhinney & Strauss, LLC, and Pzena Investment Management, LLC, are subject to quarterly adjustments based on performance relative to the Russell Midcap Value Index for the preceding three years. The basic fee of Donald Smith & Co., Inc., is subject to quarterly adjustments based on performance relative to the MSCI Investable Market 2500 Index for the preceding five years.
Vanguard manages the cash reserves of the fund as described below.
For the year ended October 31, 2019, the aggregate investment advisory fee represented an effective annual basic rate of 0.23% of the fund’s average net assets, before a net decrease of $4,730,000 (0.06%) based on performance.
C. In accordance with the terms of a Funds’ Service Agreement (the “FSA”) between Vanguard and the fund, Vanguard furnishes to the fund corporate management, administrative, marketing, distribution, and cash management services at Vanguard’s cost of operations (as defined by the FSA). These costs of operations are allocated to the fund based on methods and guidelines approved by the board of trustees. Vanguard does not require reimbursement in the current period for certain costs of operations (such as deferred compensation/benefits and risk/insurance costs); the fund’s liability for these costs of operations is included in Payables to Vanguard on the Statement of Assets and Liabilities. All other costs of operations payable to Vanguard are generally settled twice a month.
Upon the request of Vanguard, the fund may invest up to 0.40% of its net assets as capital in Vanguard. At October 31, 2019, the fund had contributed to Vanguard capital in the amount of $370,000, representing less than 0.01% of the fund’s net assets and 0.15% of Vanguard’s capital received pursuant to the FSA. The fund’s trustees and officers are also directors and employees, respectively, of Vanguard.
D. The fund has asked its investment advisors to direct certain security trades, subject to obtaining the best price and execution, to brokers who have agreed to rebate to the fund part of the commissions generated. Such rebates are used solely to reduce the fund’s management and administrative expenses. The fund’s custodian bank has also agreed to reduce its fees when the fund maintains cash on deposit in the non-interest-bearing custody account. For the year ended October 31, 2019, these arrangements reduced the fund’s management and administrative expenses by $302,000 and custodian fees by $2,000. The total expense reduction represented an effective annual rate of 0.00% of the fund’s average net assets.
21
Selected Value Fund
E. Various inputs may be used to determine the value of the fund’s investments. These inputs are summarized in three broad levels for financial statement purposes. The inputs or methodologies used to value securities are not necessarily an indication of the risk associated with investing in those securities.
Level 1—Quoted prices in active markets for identical securities.
Level 2—Other significant observable inputs (including quoted prices for similar securities, interest rates, prepayment speeds, credit risk, etc.).
Level 3—Significant unobservable inputs (including the fund’s own assumptions used to determine the fair value of investments). Any investments valued with significant unobservable inputs are noted on the Statement of Net Assets.
The following table summarizes the market value of the fund’s investments and derivatives as of October 31, 2019, based on the inputs used to value them:
Investments | | Level 1
($000 | ) | Level 2
($000 | ) | Level 3
($000 | ) |
Common Stocks | | 7,564,195 | | — | | — | |
Temporary Cash Investments | | 317,137 | | 5,241 | | — | |
Futures Contracts—Liabilities1 | | (516 | ) | — | | — | |
Total | | 7,880,816 | | 5,241 | | — | |
1 Represents variation margin on the last day of the reporting period.
F. Permanent differences between book-basis and tax-basis components of net assets are reclassified among capital accounts in the financial statements to reflect their tax character. These reclassifications have no effect on net assets or net asset value per share. As of period end, permanent differences primarily attributable to the accounting for foreign currency transactions and distributions in connection with fund share redemptions were reclassified between the following accounts:
| | Amount ($000 | ) |
Paid-in Capital | | 62,126 | |
Total Distributable Earnings (Loss) | | (62,126 | ) |
22
Selected Value Fund
Temporary differences between book-basis and tax-basis components of total distributable earnings (loss) arise when certain items of income, gain, or loss are recognized in different periods for financial statement and tax purposes; these differences will reverse at some time in the future. The differences are primarily related to the tax deferral of losses on wash sales and the realization of unrealized gains or losses on certain futures contracts. As of period end, the tax-basis components of total distributable earnings (loss) are detailed in the table as follows:
| | Amount | |
| | $(000 | ) |
Undistributed Ordinary Income | | 100,008 | |
Undistributed Long-Term Gains | | 438,837 | |
Capital Loss Carryforwards (Non-expiring) | | — | |
Net Unrealized Gains (Losses) | | 1,293,797 | |
As of October 31, 2019, gross unrealized appreciation and depreciation for investments and derivatives based on cost for U.S. federal income tax purposes were as follows:
| | Amount | |
| | $(000 | ) |
Tax Cost | | 6,592,776 | |
Gross Unrealized Appreciation | | 1,918,523 | |
Gross Unrealized Depreciation | | (624,726 | ) |
Net Unrealized Appreciation (Depreciation) | | 1,293,797 | |
G. During the year ended October 31, 2019, the fund purchased $2,412,446,000 of investment securities and sold $4,078,392,000 of investment securities, other than temporary cash investments.
H. Capital shares issued and redeemed were:
| | Year Ended October 31, | |
| | 2019 | | 2018 | |
| | Shares | | Shares | |
| | (000 | ) | (000 | ) |
Issued | | 29,246 | | 46,684 | |
Issued in Lieu of Cash Distributions | | 33,010 | | 29,479 | |
Redeemed | | (98,003 | ) | (73,418 | ) |
Net Increase (Decrease) in Shares Outstanding | | (35,747 | ) | 2,745 | |
23
Selected Value Fund
I. Certain of the fund’s investments are in companies that are considered to be affiliated companies of the fund because the fund owns more than 5% of the outstanding voting securities of the company or the issuer is another member of The Vanguard Group. Transactions during the period in securities of these companies were as follows:
| | | | Current Period Transactions | | | |
| | Oct. 31, | | | | Proceeds | | Realized | | | | | | | | Oct. 31, | |
| | 2018 | | | | from | | Net | | Change in | | | | Capital Gain | | 2019 | |
| | Market | | Purchases | | Securities | | Gain | | Unrealized | | | | Distributions | | Market | |
| | Value | | at Cost | | Sold1 | | (Loss | ) | App. (Dep. | ) | Income | | Received | | Value | |
| | ($000 | ) | ($000 | ) | ($000 | ) | ($000 | ) | ($000 | ) | ($000 | ) | ($000 | ) | ($000 | ) |
IAMGOLD Corp. | | NA2 | | 54,484 | | — | | — | | 17,200 | | — | | — | | 117,209 | |
MGM Growth | | | | | | | | | | | | | | | | | |
Properties LLC | | | | | | | | | | | | | | | | | |
Class A | | 160,151 | | — | | 61,606 | | 3,673 | | 11,004 | | 6,756 | | — | | NA3 | |
SeaWorld | | | | | | | | | | | | | | | | | |
Entertainment Inc. | | — | | 128,605 | | — | | — | | (18,150 | ) | — | | — | | 110,455 | |
Vanguard Market | | | | | | | | | | | | | | | | | |
Liquidity Fund | | 448,224 | | NA4 | | NA4 | | 59 | | (7 | ) | 8,166 | | — | | 317,137 | |
Total | | 608,375 | | | | | | 3,732 | | 10,047 | | 14,922 | | — | | 544,801 | |
1 Does not include adjustments to related return of capital.
2 Not applicable—at October 31, 2018, the issuer was not an affiliated company of the fund.
3 Not applicable—at October 31, 2019, the security was still held, but issuer was no longer an affiliated company of the fund.
4 Not applicable—purchases and sales are for temporary cash investment purposes.
J. In November 2019, the board of trustees approved changes to the investment advisors of the fund. Cooke & Bieler will join Pzena Investment Management, LLC, and Donald Smith & Co., Inc., as investment advisors to the fund. Barrow, Hanley, Mewhinney & Stauss, LLC, will no longer serve as an investment advisor.
Management has determined that no other events or transactions occurred subsequent to October 31, 2019, that would require recognition or disclosure in these financial statements.
24
Report of Independent Registered Public Accounting Firm
To the Board of Trustees of Vanguard Whitehall Funds and Shareholders of Vanguard Selected Value Fund
Opinion on the Financial Statements
We have audited the accompanying statement of net assets and statement of assets and liabilities of Vanguard Selected Value Fund (one of the funds constituting Vanguard Whitehall Funds, referred to hereafter as the “Fund”) as of October 31, 2019, the related statement of operations for the year ended October 31, 2019, the statement of changes in net assets for each of the two years in the period ended October 31, 2019, including the related notes, and the financial highlights for each of the five years in the period ended October 31, 2019 (collectively referred to as the “financial statements”). In our opinion, the financial statements present fairly, in all material respects, the financial position of the Fund as of October 31, 2019, the results of its operations for the year then ended, the changes in its net assets for each of the two years in the period ended October 31, 2019 and the financial highlights for each of the five years in the period ended October 31, 2019 in conformity with accounting principles generally accepted in the United States of America.
Basis for Opinion
These financial statements are the responsibility of the Fund’s management. Our responsibility is to express an opinion on the Fund’s financial statements based on our audits. We are a public accounting firm registered with the Public Company Accounting Oversight Board (United States) (“PCAOB”) and are required to be independent with respect to the Fund in accordance with the U.S. federal securities laws and the applicable rules and regulations of the Securities and Exchange Commission and the PCAOB.
We conducted our audits of these financial statements in accordance with the standards of the PCAOB. Those standards require that we plan and perform the audit to obtain reasonable assurance about whether the financial statements are free of material misstatement, whether due to error or fraud.
Our audits included performing procedures to assess the risks of material misstatement of the financial statements, whether due to error or fraud, and performing procedures that respond to those risks. Such procedures included examining, on a test basis, evidence regarding the amounts and disclosures in the financial statements. Our audits also included evaluating the accounting principles used and significant estimates made by management, as well as evaluating the overall presentation of the financial statements. Our procedures included confirmation of securities owned as of October 31, 2019 by correspondence with the custodian and brokers and by agreement to the underlying ownership records of the transfer agent; when replies were not received from brokers, we performed other auditing procedures. We believe that our audits provide a reasonable basis for our opinion.
/s/PricewaterhouseCoopers LLP
Philadelphia, Pennsylvania
December 13, 2019
We have served as the auditor of one or more investment companies in The Vanguard Group of Funds since 1975.
25
Special 2019 tax information (unaudited) for Vanguard Selected Value Fund
This information for the fiscal year ended October 31, 2019, is included pursuant to provisions of the Internal Revenue Code.
The fund distributed $712,586,000 as capital gain dividends (20% rate gain distributions) to shareholders during the fiscal year.
The fund distributed $155,280,000 of qualified dividend income to shareholders during the fiscal year.
For corporate shareholders, 75.2% of investment income (dividend income plus short-term gains, if any) qualifies for the dividends-received deduction.
26
The People Who Govern Your Fund
The trustees of your mutual fund are there to see that the fund is operated and managed in your best interests since, as a shareholder, you are a part owner of the fund. Your fund’s trustees also serve on the board of directors of The Vanguard Group, Inc., which is owned by the Vanguard funds and provides services to them.
A majority of Vanguard’s board members are independent, meaning that they have no affiliation with Vanguard or the funds they oversee, apart from the sizable personal investments they have made as private individuals. The independent board members have distinguished backgrounds in business, academia, and public service. Each of the trustees and executive officers oversees 213 Vanguard funds.
Information for each trustee and executive officer of the fund appears below. That information, as well as the Vanguard fund count, is as of the date on the cover of this fund report. The mailing address of the trustees and officers is P.O. Box 876, Valley Forge, PA 19482. More information about the trustees is in the Statement of Additional Information, which can be obtained, without charge, by contacting Vanguard at 800-662-7447, or online at vanguard.com.
Interested Trustee1
Mortimer J. Buckley
Born in 1969. Trustee since January 2018. Principal occupation(s) during the past five years and other experience: chairman of the board (January 2019– present) of Vanguard and of each of the investment companies served by Vanguard; chief executive officer (January 2018–present) of Vanguard; chief executive officer, president, and trustee (January 2018–present) of each of the investment companies served by Vanguard; president and director (2017–present) of Vanguard; and president (February 2018–present) of Vanguard Marketing Corporation. Chief investment officer (2013–2017), managing director (2002–2017), head of the Retail Investor Group (2006–2012), and chief information officer (2001–2006) of Vanguard. Chairman of the board (2011–2017) and trustee (2009–2017) of the Children’s Hospital of Philadelphia; trustee (2018–present) of The Shipley School.
Independent Trustees
Emerson U. Fullwood
Born in 1948. Trustee since January 2008. Principal occupation(s) during the past five years and other experience: executive chief staff and marketing officer for North America and corporate vice president (retired 2008) of Xerox Corporation (document management products and services). Former president of the Worldwide Channels Group, Latin America, and Worldwide Customer Service and executive chief staff officer of Developing Markets of Xerox. Executive in residence and 2009–2010 Distinguished Minett Professor at the Rochester Institute of Technology. Director of SPX FLOW, Inc. (multi-industry manufacturing). Director of the University of Rochester Medical Center, the Monroe Community College Foundation, the United Way of Rochester, North Carolina A&T University, and Roberts Wesleyan College. Trustee of the University of Rochester.
Amy Gutmann
Born in 1949. Trustee since June 2006. Principal occupation(s) during the past five years and other experience: president (2004–present) of the University of Pennsylvania. Christopher H. Browne Distinguished Professor of Political Science, School of Arts and Sciences, and professor of communication, Annenberg School for Communication, with secondary faculty appointments in the Department of Philosophy, School of Arts and Sciences, and at the Graduate School of Education, University of Pennsylvania. Trustee of the National Constitution Center.
F. Joseph Loughrey
Born in 1949. Trustee since October 2009. Principal occupation(s) during the past five years and other experience: president and chief operating officer (retired 2009) and vice chairman of the board (2008–2009) of Cummins Inc. (industrial machinery). Chairman of the board of Hillenbrand, Inc. (specialized consumer services), and the Lumina Foundation.
1 Mr. Buckley is considered an “interested person,” as defined in the Investment Company Act of 1940, because he is an officer of the Vanguard funds.
Director of the V Foundation and Oxfam America. Member of the advisory council for the College of Arts and Letters and chair of the advisory board to the Kellogg Institute for International Studies, both at the University of Notre Dame.
Mark Loughridge
Born in 1953. Trustee since March 2012. Principal occupation(s) during the past five years and other experience: senior vice president and chief financial officer (retired 2013) of IBM (information technology services). Fiduciary member of IBM’s Retirement Plan Committee (2004–2013), senior vice president and general manager (2002–2004) of IBM Global Financing, vice president and controller (1998–2002) of IBM, and a variety of other prior management roles at IBM. Member of the Council on Chicago Booth.
Scott C. Malpass
Born in 1962. Trustee since March 2012. Principal occupation(s) during the past five years and other experience: chief investment officer (1989–present) and vice president (1996–present) of the University of Notre Dame. Assistant professor of finance at the Mendoza College of Business, University of Notre Dame, and member of the Notre Dame 403(b) Investment Committee. Chairman of the board of TIFF Advisory Services, Inc. Member of the board of Catholic Investment Services, Inc. (investment advisors) and the board of superintendence of the Institute for the Works of Religion.
Deanna Mulligan
Born in 1963. Trustee since January 2018. Principal occupation(s) during the past five years and other experience: president (2010–present) and chief executive officer (2011–present) of The Guardian Life Insurance Company of America. Chief operating officer (2010–2011) and executive vice president (2008–2010) of Individual Life and Disability of The Guardian Life Insurance Company of America. Member of the board of The Guardian Life Insurance Company of America, the American Council of Life Insurers, the Partnership for New York City (business leadership), and the Committee Encouraging Corporate Philanthropy. Trustee of the Economic Club of New York and the Bruce Museum (arts and science). Member of the Advisory Council for the Stanford Graduate School of Business.
André F. Perold
Born in 1952. Trustee since December 2004. Principal occupation(s) during the past five years and other experience: George Gund Professor of Finance and Banking, Emeritus at the Harvard Business School (retired 2011). Chief investment officer and co-managing partner of HighVista Strategies (private investment firm). Board of advisors and investment committee member of the Museum of Fine Arts Boston. Board member (2018–present) of RIT Capital Partners (investment firm); investment committee member of Partners Health Care System.
Sarah Bloom Raskin
Born in 1961. Trustee since January 2018. Principal occupation(s) during the past five years and other experience: deputy secretary (2014–2017) of the United States Department of the Treasury. Governor (2010–2014) of the Federal Reserve Board. Commissioner (2007–2010) of financial regulation for the State of Maryland. Member of the board of directors (2012–2014) of Neighborhood Reinvestment Corporation. Director (2017–present) of i(x) Investments; director (2017–present) of Reserve Trust. Rubinstein Fellow (2017–present) of Duke University; trustee (2017–present) of Amherst College.
Peter F. Volanakis
Born in 1955. Trustee since July 2009. Principal occupation(s) during the past five years and other experience: president and chief operating officer (retired 2010) of Corning Incorporated (communications equipment) and director of Corning Incorporated (2000–2010) and Dow Corning (2001–2010). Director (2012) of SPX Corporation (multi-industry manufacturing). Overseer of the Amos Tuck School of Business Administration, Dartmouth College (2001–2013). Chairman of the board of trustees of Colby-Sawyer College. Member of the board of Hypertherm Inc. (industrial cutting systems, software, and consumables).
Executive Officers
John Bendl
Born in 1970. Principal occupation(s) during the past five years and other experience: principal of Vanguard. Chief financial officer (October 2019–present) of each of the investment companies served by Vanguard. Chief accounting officer, treasurer, and controller of Vanguard (2017–present). Partner (2003–2016) at KPMG (audit, tax, and advisory services).
Glenn Booraem
Born in 1967. Principal occupation(s) during the past five years and other experience: principal of Vanguard. Investment stewardship officer (2017–present), treasurer (2015–2017), controller (2010–2015), and assistant controller (2001–2010) of each of the investment companies served by Vanguard.
Christine M. Buchanan
Born in 1970. Principal occupation(s) during the past five years and other experience: principal of Vanguard. Treasurer (2017–present) of each of the investment companies served by Vanguard. Partner (2005–2017) at KPMG (audit, tax, and advisory services).
David Cermak
Born in 1960. Principal occupation(s) during the past five years and other experience: principal of Vanguard. Finance director (October 2019–present) of each of the investment companies served by Vanguard. Managing director and head (2017–present) of Vanguard Investments Singapore. Managing director and head (2017–2019) of Vanguard Investments Hong Kong. Representative director and head (2014–2017) of Vanguard Investments Japan.
Thomas J. Higgins
Born in 1957. Principal occupation(s) during the past five years and other experience: principal of Vanguard. Finance director (October 2019–present), chief financial officer (2008–2019), and treasurer (1998–2008) of each of the investment companies served by Vanguard.
Peter Mahoney
Born in 1974. Principal occupation(s) during the past five years and other experience: principal of Vanguard. Controller (2015–present) of each of the investment companies served by Vanguard. Head of International Fund Services (2008–2014) at Vanguard.
Anne E. Robinson
Born in 1970. Principal occupation(s) during the past five years and other experience: general counsel (2016–present) of Vanguard. Secretary (2016–present) of Vanguard and of each of the investment companies served by Vanguard. Managing director (2016–present) of Vanguard. Managing director and general counsel of Global Cards and Consumer Services (2014–2016) at Citigroup. Counsel (2003–2014) at American Express.
Michael Rollings
Born in 1963. Principal occupation(s) during the past five years and other experience: finance director (2017–present) and treasurer (2017) of each of the investment companies served by Vanguard. Managing director (2016–present) of Vanguard. Chief financial officer (2016–present) of Vanguard. Director (2016–present) of Vanguard Marketing Corporation. Executive vice president and chief financial officer (2006–2016) of MassMutual Financial Group.
John E. Schadl
Born in 1972. Principal occupation(s) during the past five years and other experience: principal of Vanguard. Chief compliance officer (2019–present) of Vanguard and of each of the investment companies served by Vanguard. Assistant vice president (May 2019–present) of Vanguard Marketing Corporation.
Vanguard Senior Management Team
Joseph Brennan | | Chris D. McIsaac |
Mortimer J. Buckley | | James M. Norris |
Gregory Davis | | Thomas M. Rampulla |
John James | | Karin A. Risi |
Martha G. King | | Anne E. Robinson |
John T. Marcante | | Michael Rollings |
| 
|
| |
| |
| P.O. Box 2600 |
| Valley Forge, PA 19482-2600 |
Connect with Vanguard® > vanguard.com
Fund Information > 800-662-7447
Direct Investor Account Services > 800-662-2739
Institutional Investor Services > 800-523-1036
Text Telephone for People
Who Are Deaf or Hard of Hearing > 800-749-7273
This material may be used in conjunction with the offering of shares of any Vanguard fund only if preceded or accompanied by the fund’s current prospectus.
All comparative mutual fund data are from Morningstar, Inc., unless otherwise noted.
You can obtain a free copy of Vanguard’s proxy voting guidelines by visiting vanguard.com/proxyreporting or by calling Vanguard at 800-662-2739. The guidelines are also available from the SEC’s website, www.sec.gov. In addition, you may obtain a free report on how your fund voted the proxies for securities it owned during the 12 months ended June 30. To get the report, visit either vanguard.com/proxyreporting or www.sec.gov.
You can review information about your fund on the SEC’s website, and you can receive copies of this information, for a fee, by sending a request via email addressed to publicinfo@sec.gov.
Source for Bloomberg Barclays indexes: Bloomberg Index Services Limited. Copyright 2019, Bloomberg. All rights reserved.
CFA® is a registered trademark owned by CFA Institute.
| © 2019 The Vanguard Group, Inc. |
| All rights reserved. |
| Vanguard Marketing Corporation, Distributor. |
| |
| Q9340 122019 |

Annual Report | October 31, 2019 Vanguard Mid-Cap Growth Fund |
See the inside front cover for important information about access to your fund’s annual and semiannual shareholder reports. |
Important information about access to shareholder reports
Beginning on January 1, 2021, as permitted by regulations adopted by the Securities and Exchange Commission, paper copies of your fund’s annual and semiannual shareholder reports will no longer be sent to you by mail, unless you specifically request them. Instead, you will be notified by mail each time a report is posted on the website and will be provided with a link to access the report.
If you have already elected to receive shareholder reports electronically, you will not be affected by this change and do not need to take any action. You may elect to receive shareholder reports and other communications from the fund electronically by contacting your financial intermediary (such as a broker-dealer or bank) or, if you invest directly with the fund, by calling Vanguard at one of the phone numbers on the back cover of this report or by logging on to vanguard.com.
You may elect to receive paper copies of all future shareholder reports free of charge. If you invest through a financial intermediary, you can contact the intermediary to request that you continue to receive paper copies. If you invest directly with the fund, you can call Vanguard at one of the phone numbers on the back cover of this report or log on to vanguard.com. Your election to receive paper copies will apply to all the funds you hold through an intermediary or directly with Vanguard.
Contents | | |
| | |
A Note From Our Chairman | | 1 |
Your Fund’s Performance at a Glance | | 2 |
Advisors’ Report | | 3 |
About Your Fund’s Expenses | | 10 |
Performance Summary | | 12 |
Financial Statements | | 14 |
Please note: The opinions expressed in this report are just that—informed opinions. They should not be considered promises or advice. Also, please keep in mind that the information and opinions cover the period through the date on the front of this report. Of course, the risks of investing in your fund are spelled out in the prospectus.
A Note From Our Chairman

Tim Buckley
Chairman and Chief Executive Officer
Dear Shareholder,
Recent volatility in financial markets— affecting stocks, bonds, and commodities— has been a good reminder of the wise old adage, “Never keep all your eggs in one basket.” Maintaining balance and diversification in your investment portfolio can help to both limit risk and set you up for long-term success.
It’s understandable why some investors might become complacent after a long market run-up like the one that lifted stock prices, especially U.S. stock prices, in the years following the global financial crisis. But failing to rebalance regularly can leave a portfolio with a much different mix of assets than intended and, often, more risk than intended.
Balance across and diversification within asset classes are powerful tools for managing risk and achieving your investment goals. A portfolio’s allocation will determine a large portion of its long-term return and also the majority of its volatility risk. A well-diversified portfolio is less vulnerable to significant swings in the performance of any one segment of the asset classes in which it invests.
Balance and diversification will never eliminate the risk of loss, nor will they guarantee positive returns in a declining market. But they should reduce the chance that you’ll suffer disproportionate losses in one particular high-flying asset class or sector when it comes back to earth. And exposure to all key market components should give you at least some participation in the sectors that are performing best at any given time.
Vanguard is committed to helping you achieve balance and diversification in your portfolios to help meet your investment goals. We thank you for your continued loyalty.
Sincerely,

Mortimer J. Buckley
Chairman and Chief Executive Officer
November 18, 2019
1
Your Fund’s Performance at a Glance
· Vanguard Mid-Cap Growth Fund returned 13.56% for the 12 months ended October 31, 2019. It underperformed its benchmark, the Russell Midcap Growth Index, which returned 18.93%.
· The broad U.S. stock market, as measured by the Russell 3000 Index, climbed more than 13% for the 12 months. While stocks endured stretches of volatility, their performance was boosted by the Federal Reserve’s accommodative stance and by corporate earnings that largely exceeded investor expectations.
· Growth stocks outperformed their value counterparts, while large- and mid-capitalization stocks surpassed small-caps.
· Returns were positive for eight of the fund’s ten sectors. Weak selections in industrials, consumer discretionary, and financials detracted most from relative performance.
· Over the decade ended October 31, 2019, the fund’s average annualized return trailed that of its expense-free benchmark by about 1 percentage point.
Market Barometer
| | Average Annual Total Returns |
| | Periods Ended October 31, 2019 |
| | One Year | | Three Years | | Five Years |
Stocks | | | | | | |
Russell 1000 Index (Large-caps) | | 14.15% | | 14.73% | | 10.55% |
Russell 2000 Index (Small-caps) | | 4.90 | | 10.96 | | 7.37 |
Russell 3000 Index (Broad U.S. market) | | 13.49 | | 14.47 | | 10.31 |
FTSE All-World ex US Index (International) | | 11.52 | | 8.21 | | 4.16 |
| | | | | | |
Bonds | | | | | | |
Bloomberg Barclays U.S. Aggregate Bond Index (Broad taxable market) | | 11.51% | | 3.29% | | 3.24% |
Bloomberg Barclays Municipal Bond Index (Broad tax-exempt market) | | 9.42 | | 3.62 | | 3.55 |
FTSE Three-Month U.S. Treasury Bill Index | | 2.35 | | 1.57 | | 0.98 |
| | | | | | |
CPI | | | | | | |
Consumer Price Index | | 1.76% | | 2.11% | | 1.62% |
2
Advisors’ Report
For the 12 months ended October 31, 2019, Vanguard Mid-Cap Growth Fund returned 13.56%. It underperformed its benchmark, the Russell Midcap Growth Index, which returned 18.93%.
Your fund is managed by three independent advisors, a strategy that enhances its diversification by providing exposure to distinct yet complementary investment approaches. It’s not uncommon for different advisors to have different views about individual securities or the broader investment environment.
The table on page 9 lists the advisors, the amount and percentage of fund assets each manages, and brief descriptions of their investment strategies.
The advisors have provided the following assessment of the investment environment during the past 12 months and the notable successes and shortfalls in their portfolios. These comments were prepared on November 20, 2019.
RS Investments
Portfolio Managers:
D. Scott Tracy, CFA,
Chief Investment Officer
Stephen J. Bishop
Melissa Chadwick-Dunn
Christopher W. Clark, CFA
Paul Leung, CFA
The portfolio’s positive absolute return was driven by the performance of mid-capitalization growth companies in the information technology, consumer staples, and industrial sectors, while the largest detractors in terms of absolute performance were holdings in materials and energy.
Among our holdings, the IT sector provided the largest positive contribution to relative performance. The largest detractors were in health care, consumer discretionary, industrials, and materials.
RingCentral, which provides software-as-a-service solutions for business communications and collaboration,
3
primarily in the U.S., was the largest contributor. Its products include RingCentral Office, a multitenant, multilocation, and enterprise-grade communications and collaboration product that enables employees to communicate by voice, text, team messaging and collaboration, and HD video and web conferencing through smartphones, tablets, PCs, and desk phones for businesses. The outlook for RingCentral remains strong, driven by its continued march upmarket to the much larger enterprise market and by its attractive valuation relative to its anticipated growth rate.
Another large contributor in IT was Okta, which provides enterprise-grade identity management services in two segments, subscription and professional services. We purchased the stock given the view that as the network perimeter becomes increasingly blurred and as compliance and regulatory requirements continue to increase, enterprises will spend more on identity management to protect apps, data, and users. Okta is quickly becoming the default identity layer in the cloud. Despite some noise in late summer over valuation concerns, the company performed well over the 12 months because of strong fundamentals, including reported growth measures that were ahead of already high expectations.
A more challenging area was the performance of biotechnology holdings in the health care sector. The largest detractor was Bluebird Bio, a clinical-stage biopharmarmaceutical company focused on developing transformative gene therapies for severe genetic diseases and cancer. The stock underperformed in part because of investor uncertainty about the durability of the company’s previously reported trial results, the company’s inability to share results of trials it has launched in partnership with Celgene, and a company-induced messaging misstep during a sell-side trip. We believe that enterprise value is now at a level materially too low given the multiple catalysts for the company, including the launch of three products.
In consumer discretionary, Vail Resorts, which operates U.S. mountain resorts and urban ski areas, disappointed. Despite a strong bounce-back in 2019, the stock’s 12-month performance lagged because of a subpar fourth quarter of 2018. We continue to like the stock because of the industry’s structural attractiveness and high barriers to entry. The company has best-in-class assets and the ability to segment its clients with dynamic pricing, which we believe will continue to drive growth and the company’s ability to monetize properties.
4
Another holding that drove consumer discretionary’s underperformance was Under Armour, which develops, markets, and distributes branded performance apparel, footwear, and accessories. We owned Under Armour because of the opportunity for growth in footwear (a $5 billion opportunity) and international expansion, as well as our view that with improved execution, margins would return from a low of 3% to their historical peak of 11% to 12%. Second-quarter earnings missed expectations, driven by weakness in North America, but the company showed signs of improved inventories, which we believed could drive the stock higher if met with better product innovations. After the fiscal year ended, we decided to move on from the holding after a Wall Street Journal feature that highlighted an accounting probe and the lack of a near-term catalyst that we felt could offer a countervailing narrative.
In the materials sector, one of the largest drivers of underperformance was Allegheny Technologies, which manufactures and sells specialty materials and components worldwide. The company operates through two segments, High Performance Materials and Components (HPMC) and Flat Rolled Products. We owned the stock primarily for HPMC, as the aerospace business was growing with 20% margins. We viewed Allegheny as likely to thrive in the second half of 2019 and in 2020, and we felt that could drive better optics, but we decided to move on because of trade concerns.
Our focus remains on companies that we believe can grow earnings through innovation and by taking market share— characteristics of mid-cap growth stocks that have the high growth of small-cap companies and the more proven business models of large-caps. We view the recent outsized market fluctuations as noise, preferring to focus on how our investments perform relative to the fundamental anchor points that track the progress of our long-term growth stories.
For the most recent period, we believe that investors have unfairly punished high-growth stocks. Our process can take advantage of this by adding to some of our favorite investments, by initiating new ones at attractive prices when markets sell off, and by upgrading outsized winners when markets rally faster than underlying fundamentals. We believe that this environment works to our strengths as stock pickers as we work to uncover companies with high-quality growth stories that now appear to have a valuation discount relative to their long-term average.
5
Frontier Capital Management Co., LLC
Portfolio Managers:
Stephen M. Knightly, CFA, President
Christopher J. Scarpa, Vice President
Ravi Dabas, Vice President
Performance
Note: On December 17, 2018, Vanguard transitioned Frontier’s allocation from Vanguard Morgan™ Growth Fund to Vanguard Mid-Cap Growth Fund. The commentary below is for the period from December 17, 2018, through October 31, 2019.
The period witnessed heightened volatility as the market ended 2018 with a major decline. It rebounded strongly to start 2019 as the Federal Reserve signaled a change in monetary policy. Gyrations in the market have persisted, however, driven by trade tensions and mixed economic data.
Frontier’s portion of the Mid-Cap Growth Fund modestly underperformed as a result of unfavorable sector positioning. Stock selection was neutral. Our overweight position in health care accounted for the majority of the negative sector allocation. Uncertainty over the 2020 presidential election and policies being voiced by several leading candidates combined to make health care the second-worst-performing sector.
The largest contributors to relative performance were in materials, health care, and financials. In materials, an emphasis on companies with steady demand trends, leading market positions, and new growth catalysts performed well. In health care, a focus on drug development companies paid dividends given a favorable acquisition environment. Finally, in financials, a concentration on payment processors benefiting from the favorable secular trend toward electronic payments was rewarded.
In terms of relative stock selection, technology and consumer discretionary stocks detracted most. Technology holdings, hurt by sales-force reorganizations at several software firms, hindered results. In consumer discretionary, company-specific setbacks dampened performance.
By positioning, we are overweight in health care, believing it offers attractive long-term growth characteristics at reasonable prices. We are also overweight in financials, with an emphasis on payment processors benefiting from electronic commerce. We are underweight in technology—specifically software, because of heightened valuations—and in consumer staples, where we see limited growth.
6
Outlook
We expect the pattern of increased volatility to persist as investors weigh the positive effects of easing monetary policy with headwinds from a slowing economy. Ongoing trade tensions coupled with the upcoming presidential election are likely to add to uncertainty. In this environment, we remain focused on owning companies that have multiple levers to grow their earnings without overly relying on a strong economy. While positive about the outlook, we are watching both trade tensions and consumer confidence closely. The team is taking a selective approach to managing exposure, especially in the frothy technology sector. At the same time, we are finding attractive opportunities in health care, materials and financials. We believe that elevated market volatility will present opportunities to buy good companies at reasonable valuations.
Wellington Management Company LLP
Portfolio Manager:
Timothy N. Manning,
Senior Managing Director
and Equity Portfolio Manager
Note: On December 17, 2018, Vanguard added Wellington as an advisor on Vanguard Mid-Cap Growth Fund. The commentary below is for the period from December 17, 2018, through October 31, 2019.
Over the period, large-capitalization stocks (as measured by the Standard & Poor’s 500 Index) outperformed small-caps (as measured by the Russell 2000 Index) and mid-caps (as measured by the S&P MidCap 400 Index). By style factor, growth outperformed value. Among other notable style factors, beta, momentum, and volatility all underperformed. In aggregate, style factors modestly boosted performance, mainly as a result of the portfolio’s underweight exposures to beta and momentum relative to the index.
In this environment, the portfolio performed strongly, driven almost entirely by positive stock selection. By sector, our holdings in information technology and, to lesser extents, industrials and consumer discretionary drove results. Notable contributors included Global Payments, a provider of payment technology services; Seattle Genetics, a biotechnology company that specializes in delivering cancer-killing agents directly to tumor cells; and IHS Markit, a global information provider whose proprietary data is essential to many industries.
Detractors included Centene, a Medicaid-focused managed care organization; Gartner, an IT research and advisory services company; and Bluebird Bio, a biotech company that specializes in therapies based on gene editing.
7
In terms of positioning, the portfolio remains significantly overweight in consumer discretionary, a position funded by underweight allocations to sectors such as consumer staples, materials, financials and industrials. We added several new holdings over the period, largely in IT and health care. We also eliminated several holdings, a few of which were also in IT and health care but had graduated beyond our mid-cap opportunity set through their strong performance.
Our outlook for the U.S. economy is for continued growth, albeit at a more moderate pace, as global economies slow. Uncertainty has led companies to slow their decision-making and reduce capital expenditures, though employment in the U.S. remains strong. Sources of volatility in coming quarters may include political headlines, the buildup to the 2020 elections, Brexit, geopolitical hotspots, and tariffs. Despite that, we believe our holdings are well-positioned to sustain growth in an increasingly protectionist world.
8
Vanguard Mid-Cap Growth Fund Investment Advisors
| | Fund Assets Managed | | |
Investment Advisor | | % | | $ Million | | Investment Strategy |
RS Investments | | 46 | | 2,072 | | RS Investments, a Victory Capital investment franchise, employs both fundamental analysis and quantitative screening in seeking to identify companies that the investment team believes will produce sustainable earnings growth over a multiyear horizon. Investment candidates typically exhibit some or all of the following key criteria: strong organic revenue growth, expanding margins and profitability, innovative products or services, defensible competitive advantages, growing market share, and experienced management teams. |
Frontier Capital Management Co., LLC | | 45 | | 2,069 | | Frontier Capital employs a fundamental, bottom-up, and research-intensive investment approach to select mid-cap growth stocks. Frontier Capital seeks companies with above-average mid-cap growth prospects and competitive advantages that will allow them to earn superior rates of return on capital over a business cycle. The approach attempts to balance growth prospects with reasonable valuation and is long-term in nature; investment time frames are typically three to five years. |
Wellington Management Company LLP | | 7 | | 314 | | Wellington Management uses traditional methods of stock selection—fundamental research and analysis—to identify companies that it believes have above-average growth prospects. Wellington Management believes there is a short-term bias in equity markets that rewards near-term cyclical growth and creates opportunity for long-term growth. The team focuses on sustainable earnings power and develops bottom-up valuations based on return on invested capital forecasts, price-to-sales, and quantitative risk factors. Wellington Management seeks to control risk by emphasizing larger positions in established growth stocks and holding smaller positions in emerging names. |
Cash Investments | | 2 | | 81 | | These short-term reserves are invested by Vanguard in equity index products to simulate investment in stocks. Each advisor may also maintain a modest cash position. |
9
About Your Fund’s Expenses
As a shareholder of the fund, you incur ongoing costs, which include costs for portfolio management, administrative services, and shareholder reports (like this one), among others. Operating expenses, which are deducted from a fund’s gross income, directly reduce the investment return of the fund.
A fund’s expenses are expressed as a percentage of its average net assets. This figure is known as the expense ratio. The following examples are intended to help you understand the ongoing costs (in dollars) of investing in your fund and to compare these costs with those of other mutual funds. The examples are based on an investment of $1,000 made at the beginning of the period shown and held for the entire period.
The accompanying table illustrates your fund’s costs in two ways:
· Based on actual fund return. This section helps you to estimate the actual expenses that you paid over the period. The “Ending Account Value” shown is derived from the fund’s actual return, and the third column shows the dollar amount that would have been paid by an investor who started with $1,000 in the fund. You may use the information here, together with the amount you invested, to estimate the expenses that you paid over the period.
To do so, simply divide your account value by $1,000 (for example, an $8,600 account value divided by $1,000 = 8.6), then multiply the result by the number given for your fund under the heading “Expenses Paid During Period.”
· Based on hypothetical 5% yearly return. This section is intended to help you compare your fund’s costs with those of other mutual funds. It assumes that the fund had a yearly return of 5% before expenses, but that the expense ratio is unchanged. In this case—because the return used is not the fund’s actual return—the results do not apply to your investment. The example is useful in making comparisons because the Securities and Exchange Commission requires all mutual funds to calculate expenses based on a 5% return. You can assess your fund’s costs by comparing this hypothetical example with the hypothetical examples that appear in shareholder reports of other funds.
Note that the expenses shown in the table are meant to highlight and help you compare ongoing costs only and do not reflect transaction costs incurred by the fund for buying and selling securities. Further, the expenses do not include any purchase, redemption, or account service fees described in the fund prospectus. If such fees were applied to your account, your costs would be higher. Your fund does not carry a “sales load.”
The calculations assume no shares were bought or sold during the period. Your actual costs may have been higher or lower, depending on the amount of your investment and the timing of any purchases or redemptions.
You can find more information about the fund’s expenses, including annual expense ratios, in the Financial Statements section of this report. For additional information on operating expenses and other shareholder costs, please refer to your fund’s current prospectus.
10
Six Months Ended October 31, 2019
| | Beginning | | Ending | | Expenses |
| | Account Value | | Account Value | | Paid During |
Mid-Cap Growth Fund | | 4/30/2019 | | 10/31/2019 | | Period |
Based on Actual Fund Return | | $1,000.00 | | $989.02 | | $1.80 |
Based on Hypothetical 5% Yearly Return | | 1,000.00 | | 1,023.39 | | 1.84 |
The calculations are based on expenses incurred in the most recent six-month period. The fund’s annualized six-month expense ratio for that period is 0.36%. The dollar amounts shown as “Expenses Paid” are equal to the annualized expense ratio multiplied by the average account value over the period, multiplied by the number of days in the most recent six-month period, then divided by the number of days in the most recent 12-month period (184/365).
11
Mid-Cap Growth Fund
Performance Summary
All of the returns in this report represent past performance, which is not a guarantee of future results that may be achieved by the fund. (Current performance may be lower or higher than the performance data cited. For performance data current to the most recent month-end, visit our website at vanguard.com/performance.) Note, too, that both investment returns and principal value can fluctuate widely, so an investor’s shares, when sold, could be worth more or less than their original cost. The returns shown do not reflect taxes that a shareholder would pay on fund distributions or on the sale of fund shares.
Cumulative Performance: October 31, 2009, Through October 31, 2019
Initial Investment of $10,000
| | | | Average Annual Total Returns | | |
| | | | Periods Ended October 31, 2019 | | |
| | | | | | | | | | Final Value |
| | | | One | | Five | | Ten | | of a $10,000 |
| | | | Year | | Years | | Years | | Investment |

| | Mid-Cap Growth Fund | | 13.56% | | 9.02% | | 13.41% | | $35,199 |

| | Russell Midcap Growth Index | | 18.93 | | 10.92 | | 14.76 | | 39,619 |

| | Dow Jones U.S. Total Stock Market Float Adjusted Index | | 13.39 | | 10.26 | | 13.62 | | 35,859 |
See Financial Highlights for dividend and capital gains information.
12
Mid-Cap Growth Fund
Sector Diversification
As of October 31, 2019
Communication Services | | 5.4% |
Consumer Discretionary | | 15.1 |
Consumer Staples | | 2.2 |
Energy | | 1.1 |
Financials | | 6.5 |
Health Care | | 14.3 |
Industrials | | 17.9 |
Information Technology | | 31.7 |
Materials | | 3.7 |
Real Estate | | 2.1 |
The table reflects the fund’s equity exposure, based on its investments in stocks and stock index futures. Any holdings in short-term reserves are excluded. Sector categories are based on the Global Industry Classification Standard (“GICS”), except for the “Other” category (if applicable), which includes securities that have not been provided a GICS classification as of the effective reporting period.
The Global Industry Classification Standard (“GICS”) was developed by and is the exclusive property and a service mark of MSCI Inc. (“MSCI”) and Standard and Poor’s, a division of McGraw-Hill Companies, Inc. (“S&P”), and is licensed for use by Vanguard. Neither MSCI, S&P nor any third party involved in making or compiling the GICS or any GICS classification makes any express or implied warranties or representations with respect to such standard or classification (or the results to be obtained by the use thereof), and all such parties hereby expressly disclaim all warranties of originality, accuracy, completeness, merchantability or fitness for a particular purpose with respect to any such standard or classification. Without limiting any of the foregoing, in no event shall MSCI, S&P, any of its affiliates or any third party involved in making or compiling the GICS or any GICS classification have any liability for any direct, indirect, special, punitive, consequential or any other damages (including lost profits) even if notified of the possibility of such damages.
13
Mid-Cap Growth Fund
Financial Statements
Statement of Net Assets
As of October 31, 2019
The fund files its complete schedule of portfolio holdings with the Securities and Exchange Commission (SEC) for the first and third quarters of each fiscal year as an exhibit to its reports on Form N-PORT. The fund’s Form N-PORT reports are available on the SEC’s website at www.sec.gov.
| | | | | Market |
| | | | | Value· |
| | | Shares | | ($000) |
Common Stocks (95.6%)1 | | | | |
Communication Services (5.0%) | | | | |
* | Live Nation Entertainment Inc. | | 1,036,867 | | 73,099 |
* | Twitter Inc. | | 2,057,998 | | 61,678 |
* | IAC/InterActiveCorp | | 169,022 | | 38,411 |
* | Take-Two Interactive Software Inc. | | 302,659 | | 36,425 |
* | Electronic Arts Inc. | | 203,569 | | 19,624 |
| | | | | 229,237 |
Consumer Discretionary (14.5%) | | | | |
| Dollar General Corp. | | 657,869 | | 105,483 |
* | O’Reilly Automotive Inc. | | 167,483 | | 72,941 |
* | Burlington Stores Inc. | | 309,015 | | 59,383 |
| Vail Resorts Inc. | | 170,521 | | 39,624 |
| Hilton Worldwide Holdings Inc. | | 362,280 | | 35,127 |
| Hasbro Inc. | | 339,780 | | 33,064 |
* | Grand Canyon Education Inc. | | 327,960 | | 30,159 |
* | Under Armour Inc. Class C | | 1,557,550 | | 28,815 |
| Ross Stores Inc. | | 260,635 | | 28,584 |
* | Bright Horizons Family Solutions Inc. | | 192,148 | | 28,538 |
| Tractor Supply Co. | | 251,620 | | 23,909 |
*,^ | Eldorado Resorts Inc. | | 512,709 | | 22,954 |
| Domino’s Pizza Inc. | | 84,029 | | 22,824 |
| Yum! Brands Inc. | | 186,713 | | 18,991 |
* | Under Armour Inc. Class A | | 819,487 | | 16,922 |
| Aramark | | 366,956 | | 16,058 |
| Expedia Group Inc. | | 112,289 | | 15,345 |
| BorgWarner Inc. | | 345,785 | | 14,412 |
* | Floor & Decor Holdings Inc. Class A | | 268,730 | | 12,316 |
| Advance Auto Parts Inc. | | 69,839 | | 11,348 |
* | Capri Holdings Ltd. | | 345,298 | | 10,728 |
*,^ | Carvana Co. Class A | | 130,555 | | 10,585 |
| | | | | 658,110 |
Consumer Staples (2.0%) | | | | |
* | Post Holdings Inc. | | 348,910 | | 35,903 |
| Church & Dwight Co. Inc. | | 461,560 | | 32,281 |
| Tyson Foods Inc. Class A | | 255,500 | | 21,153 |
| | | | | 89,337 |
Energy (1.0%) | | | | |
| Diamondback Energy Inc. | | 190,261 | | 16,317 |
| Noble Energy Inc. | | 812,024 | | 15,640 |
| Concho Resources Inc. | | 187,016 | | 12,627 |
| | | | | 44,584 |
Financials (6.1%) | | | | |
| Aon plc | | 346,191 | | 66,870 |
| KKR & Co. Inc. Class A | | 1,363,667 | | 39,315 |
| Moody’s Corp. | | 164,395 | | 36,281 |
| LPL Financial Holdings Inc. | | 401,287 | | 32,440 |
| Nasdaq Inc. | | 298,606 | | 29,792 |
* | LendingTree Inc. | | 66,000 | | 23,750 |
| MSCI Inc. Class A | | 89,700 | | 21,040 |
| Webster Financial Corp. | | 313,966 | | 13,846 |
* | Texas Capital Bancshares Inc. | | 180,026 | | 9,732 |
| First Republic Bank | | 56,141 | | 5,971 |
| | | | | 279,037 |
Health Care (13.7%) | | | | |
* | Exact Sciences Corp. | | 690,661 | | 60,088 |
| Cooper Cos. Inc. | | 205,439 | | 59,783 |
* | Seattle Genetics Inc. | | 354,472 | | 38,070 |
* | IQVIA Holdings Inc. | | 262,540 | | 37,916 |
| Teleflex Inc. | | 105,019 | | 36,485 |
* | Insulet Corp. | | 210,279 | | 30,558 |
* | GW Pharmaceuticals plc ADR | | 225,220 | | 30,139 |
* | Bluebird Bio Inc. | | 363,740 | | 29,463 |
* | DexCom Inc. | | 187,780 | | 28,963 |
* | WellCare Health Plans Inc. | | 95,990 | | 28,471 |
14
Mid-Cap Growth Fund
| | | | | Market |
| | | | | Value· |
| | | Shares | | ($000) |
* | Sage Therapeutics Inc. | | 180,150 | | 24,437 |
| STERIS plc | | 167,740 | | 23,747 |
* | Intuitive Surgical Inc. | | 41,617 | | 23,012 |
* | Incyte Corp. | | 235,452 | | 19,759 |
| ResMed Inc. | | 126,734 | | 18,746 |
* | Edwards Lifesciences Corp. | | 68,668 | | 16,369 |
* | IDEXX Laboratories Inc. | | 53,649 | | 15,290 |
* | 10X Genomics Inc. Class A | | 241,210 | | 13,990 |
* | Alcon Inc. | | 233,102 | | 13,816 |
* | Exelixis Inc. | | 863,682 | | 13,344 |
* | BioMarin Pharmaceutical Inc. | | 180,101 | | 13,185 |
* | Align Technology Inc. | | 48,069 | | 12,127 |
* | Penumbra Inc. | | 58,286 | | 9,091 |
* | Illumina Inc. | | 26,022 | | 7,690 |
* | Centene Corp. | | 116,552 | | 6,187 |
* | Mettler-Toledo International Inc. | | 7,962 | | 5,613 |
* | ABIOMED Inc. | | 24,883 | | 5,165 |
| | | | | 621,504 |
Industrials (17.3%) | | | | |
* | IHS Markit Ltd. | | 1,253,334 | | 87,758 |
| L3Harris Technologies Inc. | | 371,997 | | 76,747 |
| Waste Connections Inc. | | 551,240 | | 50,934 |
| Cintas Corp. | | 176,095 | | 47,311 |
| Ingersoll-Rand plc | | 363,700 | | 46,150 |
| Hexcel Corp. | | 586,853 | | 43,791 |
| Roper Technologies Inc. | | 119,792 | | 40,365 |
| BWX Technologies Inc. | | 639,959 | | 37,182 |
| HEICO Corp. Class A | | 385,260 | | 36,704 |
| TransUnion | | 388,026 | | 32,059 |
| IDEX Corp. | | 191,200 | | 29,737 |
| AMETEK Inc. | | 312,670 | | 28,656 |
| Jacobs Engineering Group Inc. | | 294,514 | | 27,561 |
| Knight-Swift Transportation Holdings Inc. | | 653,893 | | 23,841 |
| Woodward Inc. | | 215,030 | | 22,935 |
| Rockwell Automation Inc. | | 131,300 | | 22,582 |
* | Teledyne Technologies Inc. | | 64,050 | | 21,111 |
| Verisk Analytics Inc. Class A | | 143,980 | | 20,834 |
* | Clean Harbors Inc. | | 249,030 | | 20,535 |
* | JetBlue Airways Corp. | | 1,022,919 | | 19,742 |
* | Stericycle Inc. | | 302,426 | | 17,420 |
* | Kirby Corp. | | 182,728 | | 14,465 |
| Quanta Services Inc. | | 341,713 | | 14,369 |
| | | | | 782,789 |
Information Technology (30.4%) | | | | |
| Global Payments Inc. | | 709,749 | | 120,075 |
| Lam Research Corp. | | 319,561 | | 86,614 |
* | Euronet Worldwide Inc. | | 527,931 | | 73,947 |
| Microchip Technology Inc. | | 733,150 | | 69,129 |
* | RingCentral Inc. Class A | | 405,660 | | 65,522 |
| KLA Corp. | | 376,124 | | 63,580 |
| Marvell Technology Group Ltd. | | 2,299,726 | | 56,090 |
* | Black Knight Inc. | | 851,438 | | 54,662 |
| Amphenol Corp. Class A | | 527,811 | | 52,955 |
| Monolithic Power Systems Inc. | | 300,901 | | 45,111 |
* | DocuSign Inc. Class A | | 674,030 | | 44,614 |
* | WEX Inc. | | 232,352 | | 43,956 |
* | Fair Isaac Corp. | | 141,790 | | 43,110 |
| KBR Inc. | | 1,464,842 | | 41,250 |
* | Twilio Inc. Class A | | 427,160 | | 41,247 |
* | Proofpoint Inc. | | 319,370 | | 36,846 |
* | Dropbox Inc. Class A | | 1,821,542 | | 36,103 |
| SS&C Technologies Holdings Inc. | | 686,025 | | 35,680 |
* | Advanced Micro Devices Inc. | | 1,001,157 | | 33,969 |
| Leidos Holdings Inc. | | 369,212 | | 31,837 |
* | Wix.com Ltd. | | 251,500 | | 30,701 |
| Genpact Ltd. | | 732,218 | | 28,681 |
* | GoDaddy Inc. Class A | | 406,819 | | 26,455 |
| Fidelity National Information Services Inc. | | 193,563 | | 25,504 |
* | FleetCor Technologies Inc. | | 79,960 | | 23,526 |
* | Guidewire Software Inc. | | 188,654 | | 21,269 |
* | ServiceNow Inc. | | 80,730 | | 19,961 |
* | Gartner Inc. | | 125,880 | | 19,396 |
* | Okta Inc. | | 163,540 | | 17,837 |
| Booz Allen Hamilton Holding Corp. Class A | | 228,158 | | 16,056 |
* | Trimble Inc. | | 364,080 | | 14,505 |
* | Splunk Inc. | | 108,449 | | 13,010 |
* | Square Inc. | | 170,510 | | 10,474 |
* | Autodesk Inc. | | 69,290 | | 10,211 |
* | Keysight Technologies Inc. | | 88,410 | | 8,922 |
* | Tyler Technologies Inc. | | 31,511 | | 8,461 |
| CDW Corp. | | 44,336 | | 5,671 |
* | Ceridian HCM Holding Inc. | | 75,585 | | 3,647 |
| | | | | 1,380,584 |
Materials (3.6%) | | | | |
| Ball Corp. | | 712,817 | | 49,876 |
| Sherwin-Williams Co. | | 80,523 | | 46,085 |
| FMC Corp. | | 408,332 | | 37,362 |
| Vulcan Materials Co. | | 213,707 | | 30,532 |
| | | | | 163,855 |
15
Mid-Cap Growth Fund
| | | | | Market |
| | | | | Value· |
| | | Shares | | ($000) |
Real Estate (2.0%) | | | | |
| SBA Communications Corp. Class A | | 213,945 | | 51,486 |
| CyrusOne Inc. | | 328,880 | | 23,442 |
| Brixmor Property Group Inc. | | 681,643 | | 15,010 |
| | | | | 89,938 |
Total Common Stocks
(Cost $3,609,631) | | | | 4,338,975 |
Temporary Cash Investments (5.0%)1 | | | | |
Money Market Fund (4.9%) | | | | |
2,3 | Vanguard Market Liquidity Fund, 1.984% | | 2,194,671 | | 219,489 |
| | | | | |
| | | Face
Amount
($000 |
)
| |
U.S. Government and Agency Obligations (0.1%) | | | | |
4 | United States Treasury Bill, 1.954%, 11/7/19 | | 3,500 | | 3,499 |
4 | United States Treasury Bill, 1.997%–2.082%, 12/26/19 | | 2,600 | | 2,594 |
| | | | | 6,093 |
Total Temporary Cash Investments
(Cost $225,538) | | | | 225,582 |
Total Investments (100.6%)
(Cost $3,835,169) | | | | 4,564,557 |
| | | | | |
| | | | | Amount |
| | | | | ($000) |
Other Assets and Liabilities (-0.6%) | | | | |
Other Assets | | | | 22,059 |
Liabilities3 | | | | (50,428) |
| | | | | (28,369) |
Net Assets (100%) | | | | |
Applicable to 162,384,190 outstanding $.001 par value shares of beneficial interest (unlimited authorization) | | | | 4,536,188 |
Net Asset Value Per Share | | | | $27.93 |
| | Amount |
| | ($000) |
Statement of Assets and Liabilities | | |
Assets | | |
Investments in Securities, at Value | | |
Unaffiliated Issuers | | 4,345,068 |
Affiliated Issuers | | 219,489 |
Total Investments in Securities | | 4,564,557 |
Investment in Vanguard | | 214 |
Receivables for Investment Securities Sold | | 17,211 |
Receivables for Accrued Income | | 852 |
Receivables for Capital Shares Issued | | 3,782 |
Total Assets | | 4,586,616 |
Liabilities | | |
Payables for Investment Securities Purchased | | 16,603 |
Collateral for Securities on Loan | | 25,732 |
Payables to Investment Advisor | | 1,804 |
Payables for Capital Shares Redeemed | | 3,007 |
Payables to Vanguard | | 2,964 |
Variation Margin Payable—Future Contracts | | 318 |
Total Liabilities | | 50,428 |
Net Assets | | 4,536,188 |
At October 31, 2019, net assets consisted of:
| | Amount |
| | ($000) |
Paid-in Capital | | 3,369,285 |
Total Distributable Earnings (Loss) | | 1,166,903 |
Net Assets | | 4,536,188 |
· See Note A in Notes to Financial Statements.
* Non-income-producing security.
^ Includes partial security positions on loan to broker-dealers. The total value of securities on loan is $24,946,000.
1 The fund invests a portion of its cash reserves in equity markets through the use of index futures contracts. After giving effect to futures investments, the fund’s effective common stock and temporary cash investment positions represent 97.4% and 3.2%, respectively, of net assets.
2 Affiliated money market fund available only to Vanguard funds and certain trusts and accounts managed by Vanguard. Rate shown is the 7-day yield.
3 Collateral of $25,732,000 was received for securities on loan.
4 Securities with a value of $3,594,000 have been segregated as initial margin for open futures contracts.
ADR—American Depositary Receipt.
16
Mid-Cap Growth Fund
Derivative Financial Instruments Outstanding as of Period End |
| | | | | | ($000) |
| | | | | | | | Value and |
| | | | Number of | | | | Unrealized |
| | | | Long (Short | ) | Notional | | Appreciation |
| | Expiration | | Contracts | | Amount | | (Depreciation) |
Long Futures Contracts | | | | | | | | |
E-mini S&P 500 Index | | December 2019 | | 530 | | 80,449 | | 769 |
See accompanying Notes, which are an integral part of the Financial Statements.
17
Mid-Cap Growth Fund
Statement of Operations
| | Year Ended |
| | October 31, 2019 |
| | ($000) |
Investment Income | | |
Income | | |
Dividends—Unaffiliated Issuers | | 23,378 |
Dividends—Affiliated Issuers | | — |
Interest—Unaffiliated Issuers | | 159 |
Interest—Affiliated Issuers | | 4,327 |
Securities Lending—Net | | 147 |
Total Income | | 28,011 |
Expenses | | |
Investment Advisory Fees—Note B | | |
Basic Fee | | 8,187 |
Performance Adjustment | | (980) |
The Vanguard Group—Note C | | |
Management and Administrative | | 8,145 |
Marketing and Distribution | | 480 |
Custodian Fees | | 116 |
Auditing Fees | | 35 |
Shareholders’ Reports | | 88 |
Trustees’ Fees and Expenses | | 5 |
Total Expenses | | 16,076 |
Expenses Paid Indirectly | | (162) |
Net Expenses | | 15,914 |
Net Investment Income | | 12,097 |
Realized Net Gain (Loss) | | |
Investment Securities Sold—Unaffiliated Issuers | | 475,814 |
Investment Securities Sold—Affiliated Issuers | | 3,411 |
Futures Contracts | | 16,514 |
Realized Net Gain (Loss) | | 495,739 |
Change in Unrealized Appreciation (Depreciation) | | |
Investment Securities—Unaffiliated Issuers | | 33,500 |
Investment Securities—Affiliated Issuers | | (4,149) |
Futures Contracts | | 9,704 |
Change in Unrealized Appreciation (Depreciation) | | 39,055 |
Net Increase (Decrease) in Net Assets Resulting from Operations | | 546,891 |
See accompanying Notes, which are an integral part of the Financial Statements.
18
Mid-Cap Growth Fund
Statement of Changes in Net Assets
| | Year Ended October 31, |
| | 2019 | | 2018 |
| | ($000) | | ($000) |
Increase (Decrease) in Net Assets | | | | |
Operations | | | | |
Net Investment Income | | 12,097 | | 17,653 |
Realized Net Gain (Loss) | | 495,739 | | 556,091 |
Change in Unrealized Appreciation (Depreciation) | | 39,055 | | (175,861) |
Net Increase (Decrease) in Net Assets Resulting from Operations | | 546,891 | | 397,883 |
Distributions | | | | |
Net Investment Income | | (14,634) | | (14,941) |
Realized Capital Gain1 | | (465,496) | | (130,422) |
Total Distributions | | (480,130) | | (145,363) |
Capital Share Transactions | | | | |
Issued | | 877,078 | | 898,740 |
Issued in Lieu of Cash Distributions | | 461,067 | | 140,921 |
Redeemed | | (1,029,526) | | (1,371,055) |
Net Increase (Decrease) from Capital Share Transactions | | 308,619 | | (331,394) |
Total Increase (Decrease) | | 375,380 | | (78,874) |
Net Assets | | | | |
Beginning of Period | | 4,160,808 | | 4,239,682 |
End of Period | | 4,536,188 | | 4,160,808 |
1 Includes fiscal 2019 and 2018 short-term gain distributions totaling $51,435,000 and $0, respectively. Short-term gain distributions are treated as ordinary income dividends for tax purposes.
See accompanying Notes, which are an integral part of the Financial Statements.
19
Mid-Cap Growth Fund
Financial Highlights
For a Share Outstanding | | Year Ended October 31, | |
Throughout Each Period | | 2019 | | 2018 | | 2017 | | 2016 | | 2015 | |
Net Asset Value, Beginning of Period | | $28.08 | | $26.51 | | $21.75 | | $24.88 | | $26.40 | |
Investment Operations | | | | | | | | | | | |
Net Investment Income | | .074 | 1 | .114 | 1 | .093 | 1 | .147 | 2 | .064 | 3 |
Net Realized and Unrealized Gain (Loss) on Investments | | 3.027 | | 2.379 | | 4.817 | | (1.437 | ) | 1.625 | |
Total from Investment Operations | | 3.101 | | 2.493 | | 4.910 | | (1.290 | ) | 1.689 | |
Distributions | | | | | | | | | | | |
Dividends from Net Investment Income | | (.099 | ) | (.095 | ) | (.150 | ) | (.070 | ) | (.038 | ) |
Distributions from Realized Capital Gains | | (3.152 | ) | (.828 | ) | — | | (1.770 | ) | (3.171 | ) |
Total Distributions | | (3.251 | ) | (.923 | ) | (.150 | ) | (1.840 | ) | (3.209 | ) |
Net Asset Value, End of Period | | $27.93 | | $28.08 | | $26.51 | | $21.75 | | $24.88 | |
| | | | | | | | | | | |
Total Return4 | | 13.56% | | 9.61% | | 22.69% | | -5.49% | | 6.68% | |
| | | | | | | | | | | |
Ratios/Supplemental Data | | | | | | | | | | | |
Net Assets, End of Period (Millions) | | $4,536 | | $4,161 | | $4,240 | | $3,980 | | $4,317 | |
Ratio of Total Expenses to Average Net Assets5 | | 0.36% | | 0.36% | | 0.36% | | 0.36% | | 0.43% | |
Ratio of Net Investment Income to Average Net Assets | | 0.27% | | 0.40% | | 0.39% | | 0.64%2 | | 0.25%3 | |
Portfolio Turnover Rate | | 111% | | 75% | | 118% | | 91% | | 93% | |
1 Calculated based on average shares outstanding.
2 Net investment income per share and the ratio of net investment income to average net assets include $.018 and 0.08%, respectively, resulting from a special dividend from TransDigm Group in October 2016.
3 Net investment income per share and the ratio of net investment income to average net assets include $.006 and 0.03%, respectively, resulting from a special dividend from Lazard Ltd. in February 2015.
4 Total returns do not include account service fees that may have applied in the periods shown. Fund prospectuses provide information about any applicable account service fees.
5 Includes performance-based investment advisory fee increases (decreases) of (0.02%), (0.04%), (0.05%), (0.04%), and (0.01%).
See accompanying Notes, which are an integral part of the Financial Statements.
20
Mid-Cap Growth Fund
Notes to Financial Statements
Vanguard Mid-Cap Growth Fund is registered under the Investment Company Act of 1940 as an open-end investment company, or mutual fund.
A. The following significant accounting policies conform to generally accepted accounting principles for U.S. investment companies. The fund consistently follows such policies in preparing its financial statements.
1. Security Valuation: Securities are valued as of the close of trading on the New York Stock Exchange (generally 4 p.m., Eastern time) on the valuation date. Equity securities are valued at the latest quoted sales prices or official closing prices taken from the primary market in which each security trades; such securities not traded on the valuation date are valued at the mean of the latest quoted bid and asked prices. Securities for which market quotations are not readily available, or whose values have been materially affected by events occurring before the fund’s pricing time but after the close of the securities’ primary markets, are valued by methods deemed by the board of trustees to represent fair value. Investments in Vanguard Market Liquidity Fund are valued at that fund’s net asset value. Temporary cash investments are valued using the latest bid prices or using valuations based on a matrix system (which considers such factors as security prices, yields, maturities, and ratings), both as furnished by independent pricing services.
2. Futures Contracts: The fund uses index futures contracts to a limited extent, with the objective of maintaining full exposure to the stock market while maintaining liquidity. The fund may purchase or sell futures contracts to achieve a desired level of investment, whether to accommodate portfolio turnover or cash flows from capital share transactions. The primary risks associated with the use of futures contracts are imperfect correlation between changes in market values of stocks held by the fund and the prices of futures contracts, and the possibility of an illiquid market. Counterparty risk involving futures is mitigated because a regulated clearinghouse is the counterparty instead of the clearing broker. To further mitigate counterparty risk, the fund trades futures contracts on an exchange, monitors the financial strength of its clearing brokers and clearinghouse, and has entered into clearing agreements with its clearing brokers. The clearinghouse imposes initial margin requirements to secure the fund’s performance and requires daily settlement of variation margin representing changes in the market value of each contract. Any assets pledged as initial margin for open contracts are noted in the Statement of Net Assets.
Futures contracts are valued at their quoted daily settlement prices. The notional amounts of the contracts are not recorded in the Statement of Net Assets. Fluctuations in the value of the contracts are recorded in the Statement of Assets and Liabilities as an asset (liability) and in the Statement of Operations as unrealized appreciation (depreciation) until the contracts are closed, when they are recorded as realized futures gains (losses).
During the year ended October 31, 2019, the fund’s average investments in long and short futures contracts represented 2% and 0% of net assets, respectively, based on the average of the notional amounts at each quarter-end during the period.
3. Federal Income Taxes: The fund intends to continue to qualify as a regulated investment company and distribute all of its taxable income. Management has analyzed the fund’s tax positions taken for all open federal income tax years (October 31, 2016–2019), and has concluded that no provision for federal income tax is required in the fund’s financial statements.
21
Mid-Cap Growth Fund
4. Distributions: Distributions to shareholders are recorded on the ex-dividend date. Distributions are determined on a tax basis and may differ from net investment income and realized capital gains for financial reporting purposes.
5. Securities Lending: To earn additional income, the fund lends its securities to qualified institutional borrowers. Security loans are subject to termination by the fund at any time, and are required to be secured at all times by collateral in an amount at least equal to the market value of securities loaned. Daily market fluctuations could cause the value of loaned securities to be more or less than the value of the collateral received. When this occurs, the collateral is adjusted and settled before the opening of the market on the next business day. The fund further mitigates its counterparty risk by entering into securities lending transactions only with a diverse group of prequalified counterparties, monitoring their financial strength, and entering into master securities lending agreements with its counterparties. The master securities lending agreements provide that, in the event of a counterparty’s default (including bankruptcy), the fund may terminate any loans with that borrower, determine the net amount owed, and sell or retain the collateral up to the net amount owed to the fund; however, such actions may be subject to legal proceedings. While collateral mitigates counterparty risk, in the event of a default, the fund may experience delays and costs in recovering the securities loaned. The fund invests cash collateral received in Vanguard Market Liquidity Fund, and records a liability in the Statement of Assets and Liabilities for the return of the collateral, during the period the securities are on loan. Securities lending income represents fees charged to borrowers plus income earned on invested cash collateral, less expenses associated with the loan. During the term of the loan, the fund is entitled to all distributions made on or in respect of the loaned securities.
6. Credit Facility: The fund and certain other funds managed by The Vanguard Group (“Vanguard”) participate in a $4.3 billion committed credit facility provided by a syndicate of lenders pursuant to a credit agreement that may be renewed annually; each fund is individually liable for its borrowings, if any, under the credit facility. Borrowings may be utilized for temporary and emergency purposes, and are subject to the fund’s regulatory and contractual borrowing restrictions. The participating funds are charged administrative fees and an annual commitment fee of 0.10% of the undrawn amount of the facility; these fees are allocated to the funds based on a method approved by the fund’s board of trustees and included in Management and Administrative expenses on the fund’s Statement of Operations. Any borrowings under this facility bear interest at a rate based upon the higher of the one-month London Interbank Offered Rate, federal funds effective rate, or overnight bank funding rate plus an agreed-upon spread.
The fund had no borrowings outstanding at October 31, 2019, or at any time during the period then ended.
7. Other: Dividend income is recorded on the ex-dividend date. Interest income includes income distributions received from Vanguard Market Liquidity Fund and is accrued daily. Premiums and discounts on debt securities purchased are amortized and accreted, respectively, to interest income over the lives of the respective securities. Security transactions are accounted for on the date securities are bought or sold. Costs used to determine realized gains (losses) on the sale of investment securities are those of the specific securities sold.
22
Mid-Cap Growth Fund
B. The investment advisory firms Victory Capital Management Inc., through its RS Investments franchise, and, beginning December 2018, Frontier Capital Management Co., LLC, and Wellington Management Company LLP each provide investment advisory services to a portion of the fund for a fee calculated at an annual percentage rate of average net assets managed by the advisor. The basic fee of Victory Capital Management Inc. is subject to quarterly adjustments based on performance relative to the Russell Midcap Growth Index since January 31, 2017. In accordance with the advisory contracts entered into with Frontier Capital Management Co., LLC, and Wellington Management Company LLP, beginning February 1, 2020, the investment advisory fees will be subject to quarterly adjustments based on performance relative to the Russell Midcap Growth Index since January 31, 2019. Until December 2018, a portion of the fund was managed by William Blair Investment Management, LLC. The basic fee paid to William Blair Investment Management, LLC, was subject to quarterly adjustments based on performance relative to the Russell Midcap Growth Index for the preceding five years.
Vanguard manages the cash reserves of the fund as described below.
For the year ended October 31, 2019, the aggregate investment advisory fee represented an effective annual basic rate of 0.18% of the fund’s average net assets, before a decrease of $980,000 (0.02%) based on performance.
C. In accordance with the terms of a Funds’ Service Agreement (the “FSA”) between Vanguard and the fund, Vanguard furnishes to the fund corporate management, administrative, marketing, distribution, and cash management services at Vanguard’s cost of operations (as defined by the FSA). These costs of operations are allocated to the fund based on methods and guidelines approved by the board of trustees. Vanguard does not require reimbursement in the current period for certain costs of operations (such as deferred compensation/benefits and risk/insurance costs); the fund’s liability for these costs of operations is included in Payables to Vanguard on the Statement of Assets and Liabilities. All other costs of operations payable to Vanguard are generally settled twice a month.
Upon the request of Vanguard, the fund may invest up to 0.40% of its net assets as capital in Vanguard. At October 31, 2019, the fund had contributed to Vanguard capital in the amount of $214,000, representing less than 0.01% of the fund’s net assets and 0.09% of Vanguard’s capital received pursuant to the FSA. The fund’s trustees and officers are also directors and employees, respectively, of Vanguard.
D. The fund has asked its investment advisors to direct certain security trades, subject to obtaining the best price and execution, to brokers who have agreed to rebate to the fund part of the commissions generated. Such rebates are used solely to reduce the fund’s management and administrative expenses. For the year ended October 31, 2019, these arrangements reduced the fund’s expenses by $162,000 (an annual rate of 0.00% of average net assets).
E. Various inputs may be used to determine the value of the fund’s investments. These inputs are summarized in three broad levels for financial statement purposes. The inputs or methodologies used to value securities are not necessarily an indication of the risk associated with investing in those securities.
23
Mid-Cap Growth Fund
Level 1—Quoted prices in active markets for identical securities.
Level 2—Other significant observable inputs (including quoted prices for similar securities, interest rates, prepayment speeds, credit risk, etc.).
Level 3—Significant unobservable inputs (including the fund’s own assumptions used to determine the fair value of investments). Any investments valued with significant unobservable inputs are noted on the Statement of Net Assets.
The following table summarizes the market value of the fund’s investments and derivatives as of October 31, 2019, based on the inputs used to value them:
| | Level 1 | | Level 2 | | Level 3 |
Investments | | ($000 | ) | ($000 | ) | ($000) |
Common Stocks | | 4,338,975 | | — | | — |
Temporary Cash Investments | | 219,489 | | 6,093 | | — |
Futures Contracts—Liabilities1 | | (318 | ) | — | | — |
Total | | 4,558,146 | | 6,093 | | — |
1 Represents variation margin on the last day of the reporting period.
F. Permanent differences between book-basis and tax-basis components of net assets are reclassified among capital accounts in the financial statements to reflect their tax character. These reclassifications have no effect on net assets or net asset value per share. As of period end, permanent differences primarily attributable to the accounting for distributions in connection with fund share redemptions were reclassified between the following accounts:
| | Amount | |
| | ($000 | ) |
Paid-in Capital | | 73,013 | |
Total Distributable Earnings (Loss) | | (73,013 | ) |
Temporary differences between book-basis and tax-basis components of total distributable earnings (loss) arise when certain items of income, gain, or loss are recognized in different periods for financial statement and tax purposes; these differences will reverse at some time in the future. The differences are primarily related to the tax deferral of losses on wash sales and the realization of unrealized gains or losses on certain futures contracts. As of period end, the tax-basis components of total distributable earnings (loss) are detailed in the table as follows:
| | Amount | |
| | ($000 | ) |
Undistributed Ordinary Income | | 6,681 | |
Undistributed Long-Term Gains | | 433,977 | |
Capital Loss Carryforwards (Non-expiring) | | — | |
Net Unrealized Gains (Losses) | | 728,704 | |
24
Mid-Cap Growth Fund
As of October 31, 2019, gross unrealized appreciation and depreciation for investments and derivatives based on cost for U.S. federal income tax purposes were as follows:
| | Amount | |
| | ($000 | ) |
Tax Cost | | 3,835,853 | |
Gross Unrealized Appreciation | | 857,673 | |
Gross Unrealized Depreciation | | (128,969 | ) |
Net Unrealized Appreciation (Depreciation) | | 728,704 | |
G. During the year ended October 31, 2019, the fund purchased $4,707,084,000 of investment securities and sold $4,873,002,000 of investment securities, other than temporary cash investments.
The fund purchased securities from and sold securities to other Vanguard funds or accounts managed by Vanguard or its affiliates, in accordance with procedures adopted by the board of trustees in compliance with Rule 17a-7 of the Investment Company Act of 1940. For the year ended October 31, 2019, such purchases and sales were $1,393,770,000 and $271,072,000, respectively; these amounts are included in the purchases and sales of investment securities noted above.
H. Capital shares issued and redeemed were:
| | Year Ended October 31, | |
| | 2019 | | 2018 | |
| | Shares | | Shares | |
| | (000 | ) | (000 | ) |
Issued | | 32,573 | | 31,360 | |
Issued in Lieu of Cash Distributions | | 20,099 | | 5,324 | |
Redeemed | | (38,454 | ) | (48,445 | ) |
Net Increase (Decrease) in Shares Outstanding | | 14,218 | | (11,761 | ) |
25
Mid-Cap Growth Fund
I. Transactions during the period in investments where the issuer is another member of The Vanguard Group were as follows:
| | | | Current Period Transactions | | |
| | Oct. 31, | | | | Proceeds | | Realized | | | | | | | | Oct. 31, |
| | 2018 | | | | from | | Net | | Change in | | | | Capital Gain | | 2019 |
| | Market | | Purchases | | Securities | | Gain | | Unrealized | | | | Distributions | | Market |
| | Value | | at Cost | | Sold | | (Loss | ) | App. (Dep. | ) | Income | | Received | | Value |
| | ($000 | ) | ($000 | ) | ($000 | ) | ($000 | ) | ($000 | ) | ($000 | ) | ($000 | ) | ($000) |
Vanguard Market Liquidity Fund | | 158,747 | | NA1 | | NA1 | | (1 | ) | 3 | | 4,327 | | — | | 219,489 |
Vanguard Mid-Cap Growth ETF | | 12,898 | | — | | 12,158 | | 3,412 | | (4,152 | ) | — | | — | | — |
Total | | 171,645 | | | | | | 3,411 | | (4,149 | ) | 4,327 | | — | | 219,489 |
1 Not applicable—purchases and sales are for temporary cash investment purposes.
J. Management has determined that no events or transactions occurred subsequent to October 31, 2019, that would require recognition or disclosure in these financial statements.
26
Report of Independent Registered
Public Accounting Firm
To the Board of Trustees of Vanguard Whitehall Funds and Shareholders of Vanguard Mid-Cap Growth Fund
Opinion on the Financial Statements
We have audited the accompanying statement of net assets and statement of assets and liabilities of Vanguard Mid-Cap Growth Fund (one of the funds constituting Vanguard Whitehall Funds, referred to hereafter as the “Fund”) as of October 31, 2019, the related statement of operations for the year ended October 31, 2019, the statement of changes in net assets for each of the two years in the period ended October 31, 2019, including the related notes, and the financial highlights for each of the five years in the period ended October 31, 2019 (collectively referred to as the “financial statements”). In our opinion, the financial statements present fairly, in all material respects, the financial position of the Fund as of October 31, 2019, the results of its operations for the year then ended, the changes in its net assets for each of the two years in the period ended October 31, 2019 and the financial highlights for each of the five years in the period ended October 31, 2019 in conformity with accounting principles generally accepted in the United States of America.
Basis for Opinion
These financial statements are the responsibility of the Fund’s management. Our responsibility is to express an opinion on the Fund’s financial statements based on our audits. We are a public accounting firm registered with the Public Company Accounting Oversight Board (United States) (“PCAOB”) and are required to be independent with respect to the Fund in accordance with the U.S. federal securities laws and the applicable rules and regulations of the Securities and Exchange Commission and the PCAOB.
We conducted our audits of these financial statements in accordance with the standards of the PCAOB. Those standards require that we plan and perform the audit to obtain reasonable assurance about whether the financial statements are free of material misstatement, whether due to error or fraud.
Our audits included performing procedures to assess the risks of material misstatement of the financial statements, whether due to error or fraud, and performing procedures that respond to those risks. Such procedures included examining, on a test basis, evidence regarding the amounts and disclosures in the financial statements. Our audits also included evaluating the accounting principles used and significant estimates made by management, as well as evaluating the overall presentation of the financial statements. Our procedures included confirmation of securities owned as of October 31, 2019 by correspondence with the custodian and brokers and by agreement to the underlying ownership records of the transfer agent; when replies were not received from brokers, we performed other auditing procedures. We believe that our audits provide a reasonable basis for our opinion.
/s/PricewaterhouseCoopers LLP
Philadelphia, Pennsylvania
December 13, 2019
We have served as the auditor of one or more investment companies in The Vanguard Group of Funds since 1975.
27
Special 2019 tax information (unaudited) for Vanguard Mid-Cap Growth Fund
This information for the fiscal year ended October 31, 2019, is included pursuant to provisions of the Internal Revenue Code.
The fund distributed $485,975,000 as capital gain dividends (20% rate gain distributions) to shareholders during the fiscal year.
For nonresident alien shareholders, 100% of short-term capital gain dividends distributed by the fund are qualified short-term capital gains.
The fund distributed $25,351,000 of qualified dividend income to shareholders during the fiscal year.
For corporate shareholders, 100% of investment income (dividend income plus short-term gains, if any) qualifies for the dividends-received deduction.
28
This page intentionally left blank.
This page intentionally left blank.
The People Who Govern Your Fund
The trustees of your mutual fund are there to see that the fund is operated and managed in your best interests since, as a shareholder, you are a part owner of the fund. Your fund’s trustees also serve on the board of directors of The Vanguard Group, Inc., which is owned by the Vanguard funds and provides services to them.
A majority of Vanguard’s board members are independent, meaning that they have no affiliation with Vanguard or the funds they oversee, apart from the sizable personal investments they have made as private individuals. The independent board members have distinguished backgrounds in business, academia, and public service. Each of the trustees and executive officers oversees 213 Vanguard funds.
Information for each trustee and executive officer of the fund appears below. That information, as well as the Vanguard fund count, is as of the date on the cover of this fund report. The mailing address of the trustees and officers is P.O. Box 876, Valley Forge, PA 19482. More information about the trustees is in the Statement of Additional Information, which can be obtained, without charge, by contacting Vanguard at 800-662-7447, or online at vanguard.com.
Interested Trustee1
Mortimer J. Buckley
Born in 1969. Trustee since January 2018. Principal occupation(s) during the past five years and other experience: chairman of the board (January 2019–present) of Vanguard and of each of the investment companies served by Vanguard; chief executive officer (January 2018–present) of Vanguard; chief executive officer, president, and trustee (January 2018–present) of each of the investment companies served by Vanguard; president and director (2017–present) of Vanguard; and president (February 2018–present) of Vanguard Marketing Corporation. Chief investment officer (2013–2017), managing director (2002–2017), head of the Retail Investor Group (2006–2012), and chief information officer (2001–2006) of Vanguard. Chairman of the board (2011–2017) and trustee (2009–2017) of the Children’s Hospital of Philadelphia; trustee (2018–present) of The Shipley School.
Independent Trustees
Emerson U. Fullwood
Born in 1948. Trustee since January 2008. Principal occupation(s) during the past five years and other experience: executive chief staff and marketing officer for North America and corporate vice president (retired 2008) of Xerox Corporation (document management products and services). Former president of the Worldwide Channels Group, Latin America, and Worldwide Customer Service and executive chief staff officer of Developing Markets of Xerox. Executive in residence and 2009–2010 Distinguished Minett Professor at the Rochester Institute of Technology. Director of SPX FLOW, Inc. (multi-industry manufac-turing). Director of the University of Rochester Medical Center, the Monroe Community College Foundation, the United Way of Rochester, North Carolina A&T University, and Roberts Wesleyan College. Trustee of the University of Rochester.
Amy Gutmann
Born in 1949. Trustee since June 2006. Principal occupation(s) during the past five years and other experience: president (2004–present) of the University of Pennsylvania. Christopher H. Browne Distinguished Professor of Political Science, School of Arts and Sciences, and professor of communication, Annenberg School for Communication, with secondary faculty appointments in the Department of Philosophy, School of Arts and Sciences, and at the Graduate School of Education, University of Pennsylvania. Trustee of the National Constitution Center.
F. Joseph Loughrey
Born in 1949. Trustee since October 2009. Principal occupation(s) during the past five years and other experience: president and chief operating officer (retired 2009) and vice chairman of the board (2008–2009) of Cummins Inc. (industrial machinery). Chairman of the board of Hillenbrand, Inc. (specialized consumer services), and the Lumina Foundation.
1 Mr. Buckley is considered an “interested person,” as defined in the Investment Company Act of 1940, because he is an officer of the Vanguard funds.
Director of the V Foundation and Oxfam America. Member of the advisory council for the College of Arts and Letters and chair of the advisory board to the Kellogg Institute for International Studies, both at the University of Notre Dame.
Mark Loughridge
Born in 1953. Trustee since March 2012. Principal occupation(s) during the past five years and other experience: senior vice president and chief financial officer (retired 2013) of IBM (information technology services). Fiduciary member of IBM’s Retirement Plan Committee (2004–2013), senior vice president and general manager (2002–2004) of IBM Global Financing, vice president and controller (1998–2002) of IBM, and a variety of other prior management roles at IBM. Member of the Council on Chicago Booth.
Scott C. Malpass
Born in 1962. Trustee since March 2012. Principal occupation(s) during the past five years and other experience: chief investment officer (1989–present) and vice president (1996–present) of the University of Notre Dame. Assistant professor of finance at the Mendoza College of Business, University of Notre Dame, and member of the Notre Dame 403(b) Investment Committee. Chairman of the board of TIFF Advisory Services, Inc. Member of the board of Catholic Investment Services, Inc. (investment advisors) and the board of superintendence of the Institute for the Works of Religion.
Deanna Mulligan
Born in 1963. Trustee since January 2018. Principal occupation(s) during the past five years and other experience: president (2010–present) and chief executive officer (2011–present) of The Guardian Life Insurance Company of America. Chief operating officer (2010–2011) and executive vice president (2008–2010) of Individual Life and Disability of The Guardian Life Insurance Company of America. Member of the board of The Guardian Life Insurance Company of America, the American Council of Life Insurers, the Partnership for New York City (business leadership), and the Committee Encouraging Corporate Philanthropy. Trustee of the Economic Club of New York and the Bruce Museum (arts and science). Member of the Advisory Council for the Stanford Graduate School of Business.
André F. Perold
Born in 1952. Trustee since December 2004. Principal occupation(s) during the past five years and other experience: George Gund Professor of Finance and Banking, Emeritus at the Harvard Business School (retired 2011). Chief investment officer and co-managing partner of HighVista Strategies (private investment firm). Board of advisors and investment committee member of the Museum of Fine Arts Boston. Board member (2018–present) of RIT Capital Partners (investment firm); investment committee member of Partners Health Care System.
Sarah Bloom Raskin
Born in 1961. Trustee since January 2018. Principal occupation(s) during the past five years and other experience: deputy secretary (2014–2017) of the United States Department of the Treasury. Governor (2010–2014) of the Federal Reserve Board. Commissioner (2007–2010) of financial regulation for the State of Maryland. Member of the board of directors (2012–2014) of Neighborhood Reinvestment Corporation. Director (2017–present) of i(x) Investments; director (2017–present) of Reserve Trust. Rubinstein Fellow (2017–present) of Duke University; trustee (2017–present) of Amherst College.
Peter F. Volanakis
Born in 1955. Trustee since July 2009. Principal occupation(s) during the past five years and other experience: president and chief operating officer (retired 2010) of Corning Incorporated (communications equipment) and director of Corning Incorporated (2000–2010) and Dow Corning (2001–2010). Director (2012) of SPX Corporation (multi-industry manufacturing). Overseer of the Amos Tuck School of Business Administration, Dartmouth College (2001–2013). Chairman of the board of trustees of Colby-Sawyer College. Member of the board of Hypertherm Inc. (industrial cutting systems, software, and consumables).
Executive Officers
John Bendl
Born in 1970. Principal occupation(s) during the past five years and other experience: principal of Vanguard. Chief financial officer (October 2019–present) of each of the investment companies served by Vanguard. Chief accounting officer, treasurer, and controller of Vanguard (2017–present). Partner (2003–2016) at KPMG (audit, tax, and advisory services).
Glenn Booraem
Born in 1967. Principal occupation(s) during the past five years and other experience: principal of Vanguard. Investment stewardship officer (2017–present), treasurer (2015–2017), controller (2010–2015), and assistant controller (2001–2010) of each of the investment companies served by Vanguard.
Christine M. Buchanan
Born in 1970. Principal occupation(s) during the past five years and other experience: principal of Vanguard. Treasurer (2017–present) of each of the investment companies served by Vanguard. Partner (2005–2017) at KPMG (audit, tax, and advisory services).
David Cermak
Born in 1960. Principal occupation(s) during the past five years and other experience: principal of Vanguard. Finance director (October 2019–present) of each of the investment companies served by Vanguard. Managing director and head (2017–present) of Vanguard Investments Singapore. Managing director and head (2017–2019) of Vanguard Investments Hong Kong. Representative director and head (2014–2017) of Vanguard Investments Japan.
Thomas J. Higgins
Born in 1957. Principal occupation(s) during the past five years and other experience: principal of Vanguard. Finance director (October 2019–present), chief financial officer (2008–2019), and treasurer (1998–2008) of each of the investment companies served by Vanguard.
Peter Mahoney
Born in 1974. Principal occupation(s) during the past five years and other experience: principal of Vanguard. Controller (2015–present) of each of the investment companies served by Vanguard. Head of International Fund Services (2008–2014) at Vanguard.
Anne E. Robinson
Born in 1970. Principal occupation(s) during the past five years and other experience: general counsel (2016–present) of Vanguard. Secretary (2016–present) of Vanguard and of each of the investment companies served by Vanguard. Managing director (2016–present) of Vanguard. Managing director and general counsel of Global Cards and Consumer Services (2014–2016) at Citigroup. Counsel (2003–2014) at American Express.
Michael Rollings
Born in 1963. Principal occupation(s) during the past five years and other experience: finance director (2017–present) and treasurer (2017) of each of the investment companies served by Vanguard. Managing director (2016–present) of Vanguard. Chief financial officer (2016–present) of Vanguard. Director (2016–present) of Vanguard Marketing Corporation. Executive vice president and chief financial officer (2006–2016) of MassMutual Financial Group.
John E. Schadl
Born in 1972. Principal occupation(s) during the past five years and other experience: principal of Vanguard. Chief compliance officer (2019–present) of Vanguard and of each of the investment companies served by Vanguard. Assistant vice president (May 2019–present) of Vanguard Marketing Corporation.
Vanguard Senior Management Team
Joseph Brennan | | Chris D. McIsaac |
Mortimer J. Buckley | | James M. Norris |
Gregory Davis | | Thomas M. Rampulla |
John James | | Karin A. Risi |
Martha G. King | | Anne E. Robinson |
John T. Marcante | | Michael Rollings |
| 
|
| |
| |
| P.O. Box 2600 |
| Valley Forge, PA 19482-2600 |
Connect with Vanguard® > vanguard.com
Fund Information > 800-662-7447
Direct Investor Account Services > 800-662-2739
Institutional Investor Services > 800-523-1036
Text Telephone for People
Who Are Deaf or Hard of Hearing > 800-749-7273
This material may be used in conjunction with the offering of shares of any Vanguard fund only if preceded or accompanied by the fund’s current prospectus.
All comparative mutual fund data are from Morningstar, Inc., unless otherwise noted.
You can obtain a free copy of Vanguard’s proxy voting guidelines by visiting vanguard.com/proxyreporting or by calling Vanguard at 800-662-2739. The guidelines are also available from the SEC’s website, www.sec.gov. In addition, you may obtain a free report on how your fund voted the proxies for securities it owned during the 12 months ended June 30. To get the report, visit either vanguard.com/proxyreporting or www.sec.gov.
You can review information about your fund on the SEC’s website, and you can receive copies of this information, for a fee, by sending a request via email addressed to publicinfo@sec.gov.
Source for Bloomberg Barclays indexes: Bloomberg Index Services Limited. Copyright 2019, Bloomberg. All rights reserved.
CFA® is a registered trademark owned by CFA Institute.
| © 2019 The Vanguard Group, Inc. |
| All rights reserved. |
| Vanguard Marketing Corporation, Distributor. |
| |
| Q3010 122019 |

Annual Report | October 31, 2019 Vanguard International Explorer™ Fund |
See the inside front cover for important information about access to your fund’s annual and semiannual shareholder reports. |
Important information about access to shareholder reports
Beginning on January 1, 2021, as permitted by regulations adopted by the Securities and Exchange Commission, paper copies of your fund’s annual and semiannual shareholder reports will no longer be sent to you by mail, unless you specifically request them. Instead, you will be notified by mail each time a report is posted on the website and will be provided with a link to access the report.
If you have already elected to receive shareholder reports electronically, you will not be affected by this change and do not need to take any action. You may elect to receive shareholder reports and other communications from the fund electronically by contacting your financial intermediary (such as a broker-dealer or bank) or, if you invest directly with the fund, by calling Vanguard at one of the phone numbers on the back cover of this report or by logging on to vanguard.com.
You may elect to receive paper copies of all future shareholder reports free of charge. If you invest through a financial intermediary, you can contact the intermediary to request that you continue to receive paper copies. If you invest directly with the fund, you can call Vanguard at one of the phone numbers on the back cover of this report or log on to vanguard.com. Your election to receive paper copies will apply to all the funds you hold through an intermediary or directly with Vanguard.
Contents | |
| |
A Note From Our Chairman | 1 |
Your Fund’s Performance at a Glance | 2 |
Advisors’ Report | 3 |
About Your Fund’s Expenses | 9 |
Performance Summary | 11 |
Financial Statements | 13 |
Trustees Approve Advisory Arrangements | 33 |
Please note: The opinions expressed in this report are just that—informed opinions. They should not be considered promises or advice. Also, please keep in mind that the information and opinions cover the period through the date on the front of this report. Of course, the risks of investing in your fund are spelled out in the prospectus.
A Note From Our Chairman

Tim Buckley
Chairman and Chief Executive Officer
Dear Shareholder,
Recent volatility in financial markets—affecting stocks, bonds, and commodities—has been a good reminder of the wise old adage, “Never keep all your eggs in one basket.” Maintaining balance and diversification in your investment portfolio can help to both limit risk and set you up for long-term success.
It’s understandable why some investors might become complacent after a long market run-up like the one that lifted stock prices, especially U.S. stock prices, in the years following the global financial crisis. But failing to rebalance regularly can leave a portfolio with a much different mix of assets than intended and, often, more risk than intended.
Balance across and diversification within asset classes are powerful tools for managing risk and achieving your investment goals. A portfolio’s allocation will determine a large portion of its long-term return and also the majority of its volatility risk. A well-diversified portfolio is less vulnerable to significant swings in the performance of any one segment of the asset classes in which it invests.
Balance and diversification will never eliminate the risk of loss, nor will they guarantee positive returns in a declining market. But they should reduce the chance that you’ll suffer disproportionate losses in one particular high-flying asset class or sector when it comes back to earth. And exposure to all key market components should give you at least some participation in the sectors that are performing best at any given time.
Vanguard is committed to helping you achieve balance and diversification in your portfolios to help meet your investment goals. We thank you for your continued loyalty.
Sincerely,

Mortimer J. Buckley
Chairman and Chief Executive Officer
November 18, 2019
1
Your Fund’s Performance at a Glance
· For the 12 months ended October 31, 2019, Vanguard International Explorer Fund returned 4.85%. It trailed its benchmark, the S&P EPAC SmallCap Index, which returned 7.69%.
· The fund’s advisors invest in smaller companies that they believe have strong long-term growth prospects.
· Stocks from the Pacific region and emerging markets boosted relative performance. European stocks, which represented more than half of the fund’s assets on average, were the biggest laggards.
· Only three of the fund’s 11 industry sectors helped relative performance; health care contributed the most. Real estate, consumer discretionary, and materials were the largest detractors.
· For the ten years ended October 31, 2019, the fund’s average annual return was 7.03%, below the 7.79% return of its benchmark.
Market Barometer | | | | | | | |
| | Average Annual Total Returns | |
| | Periods Ended October 31, 2019 | |
| | One Year | | Three Years | | Five Years | |
Stocks | | | | | | | |
Russell 1000 Index (Large-caps) | | 14.15% | | 14.73% | | 10.55% | |
Russell 2000 Index (Small-caps) | | 4.90 | | 10.96 | | 7.37 | |
Russell 3000 Index (Broad U.S. market) | | 13.49 | | 14.47 | | 10.31 | |
FTSE All-World ex US Index (International) | | 11.52 | | 8.21 | | 4.16 | |
| | | | | | | |
Bonds | | | | | | | |
Bloomberg Barclays U.S. Aggregate Bond Index | | | | | | | |
(Broad taxable market) | | 11.51% | | 3.29% | | 3.24% | |
Bloomberg Barclays Municipal Bond Index | | | | | | | |
(Broad tax-exempt market) | | 9.42 | | 3.62 | | 3.55 | |
FTSE Three-Month U.S. Treasury Bill Index | | 2.35 | | 1.57 | | 0.98 | |
| | | | | | | |
CPI | | | | | | | |
Consumer Price Index | | 1.76% | | 2.11% | | 1.62% | |
2
Advisors’ Report
For the fiscal year ended October 31, 2019, Vanguard International Explorer Fund returned 4.85%. Your fund is managed by three independent advisors, a strategy that enhances its diversification by providing exposure to distinct yet complementary investment approaches. It is not uncommon for different advisors to have different views about individual securities or the broader investment environment.
The advisors, the amount and percentage of fund assets each manages, and brief descriptions of their investment strategies are presented in the table below. The advisors have also prepared a discussion of the investment environment that existed during the year and of how their portfolio positioning reflected that assessment. These comments were prepared on November 21, 2019.
Schroder Investment Management North America Inc.
Portfolio Manager:
Matthew F. Dobbs,
Head of Global Small Companies
International small-capitalization equities largely erased last year’s losses, gaining 7.7% for the fiscal year as measured by the S&P EPAC SmallCap Index. However, they once again fell short of their larger-cap peers, as the S&P EPAC Large-MidCap Index rose 10.8%.
Overall returns masked volatility as markets weakened in the closing months of 2018, followed by a rally in the first quarter of 2019. Since then, they have largely marked time amid generally anemic economic growth and negative earnings revisions.
Small-cap underperformance was particularly marked in Asia ex-Japan markets. Smaller-company stocks fell in a number of sectors (including communication services, financials, and consumer staples), while larger-cap peers rose more than 10%. Small-caps also lagged in continental Europe. More internationally diversified larger companies in sectors such as consumer discretionary, industrials, and materials fared better than smaller companies more exposed to domestic economic trends.
In our portion of the portfolio, continental European markets disappointed most. Our sector allocation was somewhat weighted toward more cyclical growth, which was not helpful in the current economy.
However, stock selection was the biggest headwind, most notably in industrials (Maire Tecnimont, Befesa, Senvion, and Aumann) but also in information technology (Stemmer Imaging), communication services (Ubisoft), and materials (AMG Advanced Metallurgical). Our positioning in real estate also detracted. The portfolio had minimal exposure to REITs, which were in demand as interest rates declined worldwide, particularly in Europe.
3
Stock selection was also negative in the United Kingdom. The consumer discretionary sector supplied some of the strongest performers (such as Dunelm and Pets at Home) but also significant disappointments (including Ted Baker and Superdry).
A partial offset was provided by stock selection in Asia ex-Japan markets, both developed and emerging. Notable contributors included Techtronic Industries, New Oriental, ASM Pacific Technology, NCSoft, and Giant Manufacturing. In Japan, a minimal exposure to REITs was more than offset by strong selection in industrials, health care, and information technology.
We continue to focus on companies offering superior return and growth characteristics. We remain underweighted in classically defensive (and, in our view, expensive) sectors such as health care, utilities, consumer staples, and REITs.
Wellington Management Company LLP
Portfolio Manager:
Simon H. Thomas, Senior Managing Director and Equity Portfolio Manager
Toward the end of 2018, global equities tumbled. Concerns about slowing global growth weighed heavily on the markets, China’s economy grew at the weakest pace in a decade, and economic growth in the euro zone moderated.
In the third quarter of 2019, the European Central Bank unveiled a sweeping, long-term economic stimulus package to bolster the euro-zone economy against slowing growth and trade frictions. It included an open-ended asset purchase program and more favorable bank lending conditions.
U.S. President Donald Trump canceled a tariff increase scheduled for October, and the U.S. and China made substantial progress toward a “phase one” trade agreement. The risk of a no-deal Brexit declined significantly after a draft deal was agreed upon by the U.K. and the European Union. On the monetary front, most global central banks reiterated their dovish policy stances.
Stock selection in consumer discretionary, industrials, and communication services detracted most from our portion of the portfolio’s relative performance. This was partly offset by positive selection in health care, materials, and financials.
Allocation among sectors—a result of our bottom-up stock selection process—also hurt, driven primarily by significantly underweighted exposures to real estate and information technology. Among regions, selection in Europe—specifically in the U.K., Italy, Switzerland, and France—lagged the most.
4
Among the top relative detractors were Maisons du Monde, IHI, and oOh!media. Maisons du Monde is a French-based home decor and furniture company. It reported lower-than-expected EBITDA and margins, driven partly by currency headwinds, heightened promotional activity to reduce inventory, and increased marketing costs. We believe the market is overreacting to short-term noise and that, at the end of the year, the company is still well-positioned to meet or exceed full-year guidance.
IHI is a Japanese industrial machinery company. Its stock sold off on weaker-than-expected results and reduced guidance compounded by a series of downward earnings revisions. We believe this weakness is short-sighted and mostly temporary.
oOh!media is an Australia-based outdoor advertising company. Its stock sold off following an abrupt broad-based slowdown in the Australian advertising industry. We believe this ignores some of the expected idiosyncratic drivers of future performance: digitalization of assets, better return on investment (ROI) for clients, and an increasing share of the Australian market.
Top relative contributors included Nippon Shinyaku, Ultra Electronics, and Rentokil Initial. Nippon Shinyaku is a Japan-based manufacturer and retailer of pharmaceuticals and foodstuffs. It benefited from stronger-than-expected sales and the news that the U.S. Food and Drug Administration had delayed approval of competitor Sarepta Therapeutics’ drug candidate Golodirsen.
Ultra Electronics is a U.K.-based defense contractor. Organic revenue growth was higher than expected, pointing to potential early success in its new CEO’s “Focus, Fix, Grow” strategic initiative. Its order book was strong, with increased visibility in U.S. revenues of about 50% to 2023.
Rentokil Initial is an international support services business with market-leading positions in pest control and hygiene services. It has had a great run over the past year, with steady organic growth, consistent and improving margins, and strong capital allocation.
Relative to the benchmark, at the end of the period our portfolio was most overweighted in industrials, health care, and consumer discretionary and most underweighted in real estate, information technology, and communication services. By region, Japan was our largest overweight and Asia Pacific ex-Japan our biggest underweight. We continue to look for high-quality companies that have been neglected by the market and offer attractive investment opportunities.
5
TimesSquare Capital Management, LLC
Portfolio Manager:
Magnus S. Larsson,
Director and Head of International Equities
Markets reversed course at the start of 2019 as hopes of easing tensions resulted in market gains. However, clouds reappeared on the horizon with renewed global trade tensions and a slowdown in the rate of global economic expansion. In response, a number of central banks embarked on monetary easing.
In our portion of the fund, contributions were strongest from holdings in Japan, driven by stock selection. Europe and the emerging markets slightly detracted. In Japan, some of last year’s largest detractors posted the strongest gains. After a challenging 2018, Horiba, a manufacturer of instruments for the semiconductor and automotive end markets, outperformed after management’s announcement of a new midterm plan as fundamentals for the semiconductor sector bottomed.
Charging ahead by 35% was Open House, a developer of new detached homes that retail for two-thirds the price of a condominium. As it expanded market share in cities with growing populations of younger couples, the company upwardly revised its full-year forecasts.
Partially offsetting these winners was shopping center operator Izumi. The company released disappointing fiscal-year results, downwardly revised its medium-term guidance, and cut new store openings.
In Asia ex-Japan, shares in IPH, Australia’s largest intellectual property management services provider, benefited when it announced plans to acquire its peer, Xenith IP Group, to create a market leader. In contrast, outsourced fund administration services provider Link Administration declined when the company lowered its fiscal-year earnings guidance after client losses and account consolidation.
In Europe, Spain-based Prosegur Compañia de Seguridad (PSG) provides security services in Europe and Latin America. Argentina contributes about 19% of its revenues. Its shares sold off after the primary presidential elections in Argentina, which the incumbent lost, and the weakening of the Argentine peso.
Hurt by the weaker automotive market was German-based SAF-Holland, a leading commercial vehicle supplier of systems and components. Shares retreated when the company pared 2020 forecasts in the face of deteriorating economic conditions.
U.K.-based Auto Trader is an online marketplace for passenger vehicles. Its shares ascended as it sustained strong growth through package upsell and price increases.
6
French-based Altran Technologies is the global leader in engineering consulting. In the first quarter of 2019, it reported strong results based on revenue growth and margin expansion, integration of its Aricent acquisition, and profit turnaround in Germany. In June 2019, French information technology consulting firm Capgemini announced its plan to buy Altran, leading shares to rally further.
Weakness in the emerging markets came from India’s financial sector. Edelweiss, a diversified financial services company, lost ground because of tight liquidity in the commercial paper funding market.
Adhering to our strong valuation discipline, we took profit from some of our strongest contributors and added to conviction ideas with undue weakness. We continue to employ our bottom-up analysis to identify businesses with secure foundations to support their growth in most environments.
7
Vanguard International Explorer Fund Investment Advisors
| | Fund Assets Managed | | |
Investment Advisor | | % | | $ Million | | Investment Strategy |
Schroder Investment Management North America Inc. | | 48 | | 1,553 | | The advisor employs a fundamental investment approach that considers macroeconomic factors while focusing primarily on company-specific factors, including a company’s potential for long-term growth, financial condition, quality of management, and sensitivity to cyclical factors. The advisor also considers the relative value of a company’s securities compared with those of other companies and the market as a whole. |
Wellington Management Company LLP | | 29 | | 907 | | The advisor employs a traditional, bottom-up approach that is opportunistic in nature, relying on global and regional research resources to identify both growth-oriented and neglected or misunderstood companies. |
TimesSquare Capital Management, LLC | | 21 | | 653 | | The advisor employs a quality growth philosophy that is based on the premise that a skilled research team—emphasizing management quality, superior business models, and valuation—contributes to a diversified portfolio that will generate superior risk-adjusted returns over the long term. |
Cash Investments | | 2 | | 50 | | These short-term reserves are invested by Vanguard in equity index products to simulate investment in stocks. Each advisor also may maintain a modest cash position. |
8
About Your Fund’s Expenses
As a shareholder of the fund, you incur ongoing costs, which include costs for portfolio management, administrative services, and shareholder reports (like this one), among others. Operating expenses, which are deducted from a fund’s gross income, directly reduce the investment return of the fund.
A fund’s expenses are expressed as a percentage of its average net assets. This figure is known as the expense ratio. The following examples are intended to help you understand the ongoing costs (in dollars) of investing in your fund and to compare these costs with those of other mutual funds. The examples are based on an investment of $1,000 made at the beginning of the period shown and held for the entire period.
The accompanying table illustrates your fund’s costs in two ways:
· Based on actual fund return. This section helps you to estimate the actual expenses that you paid over the period. The “Ending Account Value” shown is derived from the fund’s actual return, and the third column shows the dollar amount that would have been paid by an investor who started with $1,000 in the fund. You may use the information here, together with the amount you invested, to estimate the expenses that you paid over the period.
To do so, simply divide your account value by $1,000 (for example, an $8,600 account value divided by $1,000 = 8.6), then multiply the result by the number given for your fund under the heading “Expenses Paid During Period.”
· Based on hypothetical 5% yearly return. This section is intended to help you compare your fund’s costs with those of other mutual funds. It assumes that the fund had a yearly return of 5% before expenses, but that the expense ratio is unchanged. In this case—because the return used is not the fund’s actual return—the results do not apply to your investment. The example is useful in making comparisons because the Securities and Exchange Commission requires all mutual funds to calculate expenses based on a 5% return. You can assess your fund’s costs by comparing this hypothetical example with the hypothetical examples that appear in shareholder reports of other funds.
Note that the expenses shown in the table are meant to highlight and help you compare ongoing costs only and do not reflect transaction costs incurred by the fund for buying and selling securities. Further, the expenses do not include any purchase, redemption, or account service fees described in the fund prospectus. If such fees were applied to your account, your costs would be higher. Your fund does not carry a “sales load.”
The calculations assume no shares were bought or sold during the period. Your actual costs may have been higher or lower, depending on the amount of your investment and the timing of any purchases or redemptions.
You can find more information about the fund’s expenses, including annual expense ratios, in the Financial Statements section of this report. For additional information on operating expenses and other shareholder costs, please refer to your fund’s current prospectus.
9
Six Months Ended October 31, 2019 | | | |
International Explorer Fund | Beginning
Account Value
4/30/2019 | Ending
Account Value
10/31/2019 | Expenses
Paid During
Period |
Based on Actual Fund Return | $1,000.00 | $993.08 | $1.96 |
Based on Hypothetical 5% Yearly Return | 1,000.00 | 1,023.24 | 1.99 |
The calculations are based on expenses incurred in the most recent six-month period. The fund’s annualized six-month expense ratio for that period is 0.39%. The dollar amounts shown as “Expenses Paid” are equal to the annualized expense ratio multiplied by the average account value over the period, multiplied by the number of days in the most recent six-month period, then divided by the number of days in the most recent 12-month period (184/365).
10
International Explorer Fund
Performance Summary
All of the returns in this report represent past performance, which is not a guarantee of future results that may be achieved by the fund. (Current performance may be lower or higher than the performance data cited. For performance data current to the most recent month-end, visit our website at vanguard.com/performance.) Note, too, that both investment returns and principal value can fluctuate widely, so an investor’s shares, when sold, could be worth more or less than their original cost. The returns shown do not reflect taxes that a shareholder would pay on fund distributions or on the sale of fund shares.
Cumulative Performance: October 31, 2009, Through October 31, 2019
Initial Investment of $10,000
| | | | Average Annual Total Returns | | |
| | | | Periods Ended October 31, 2019 | | |
| | | | | | | | | | Final Value |
| | | | One | | Five | | Ten | | of a $10,000 |
| | | | Year | | Years | | Years | | Investment |

| | International Explorer Fund | | 4.85% | | 4.99% | | 7.03% | | $19,728 |

| | S&P EPAC SmallCap Index | | 7.69 | | 6.72 | | 7.79 | | 21,177 |

| | MSCI All Country World Index ex USA | | 11.84 | | 4.31 | | 5.42 | | 16,960 |
See Financial Highlights for dividend and capital gains information.
11
International Explorer Fund
Sector Diversification
As of October 31, 2019
Communication Services | | 3.5 | % |
Consumer Discretionary | | 18.0 | |
Consumer Staples | | 4.1 | |
Energy | | 0.9 | |
Financials | | 9.3 | |
Health Care | | 9.3 | |
Industrials | | 29.4 | |
Information Technology | | 11.9 | |
Materials | | 7.4 | |
Real Estate | | 4.3 | |
Utilities | | 1.9 | |
The table reflects the fund’s equity exposure, based on its investments in stocks and stock index futures. Any holdings in short-term reserves are excluded. Sector categories are based on the Global Industry Classification Standard (“GICS”), except for the “Other” category (if applicable), which includes securities that have not been provided a GICS classification as of the effective reporting period.
The Global Industry Classification Standard (“GICS”) was developed by and is the exclusive property and a service mark of MSCI Inc. (“MSCI”) and Standard and Poor’s, a division of McGraw-Hill Companies, Inc. (“S&P”), and is licensed for use by Vanguard. Neither MSCI, S&P nor any third party involved in making or compiling the GICS or any GICS classification makes any express or implied warranties or representations with respect to such standard or classification (or the results to be obtained by the use thereof), and all such parties hereby expressly disclaim all warranties of originality, accuracy, completeness, merchantability or fitness for a particular purpose with respect to any such standard or classification. Without limiting any of the foregoing, in no event shall MSCI, S&P, any of its affiliates or any third party involved in making or compiling the GICS or any GICS classification have any liability for any direct, indirect, special, punitive, consequential or any other damages (including lost profits) even if notified of the possibility of such damages.
12
International Explorer Fund
Financial Statements
Statement of Net Assets
As of October 31, 2019
The fund files its complete schedule of portfolio holdings with the Securities and Exchange Commission (SEC) for the first and third quarters of each fiscal year as an exhibit to its reports on Form N-PORT. The fund’s Form N-PORT reports are available on the SEC’s website at www.sec.gov.
| | | | | | Market | |
| | | | | | Value· | |
| | | | Shares | | ($000 | ) |
Common Stocks (96.2%)1 | | | | | |
Australia (4.1%) | | | | | |
| | Iluka Resources Ltd. | | 2,340,990 | | 15,153 | |
| | Steadfast Group Ltd. | | 5,260,200 | | 13,027 | |
| | Link Administration Holdings Ltd. | | 3,018,099 | | 11,638 | |
| | Challenger Ltd. | | 1,937,400 | | 10,626 | |
| | James Hardie Industries plc | | 583,838 | | 10,027 | |
| | IPH Ltd. | | 1,801,500 | | 10,021 | |
^ | | Bingo Industries Ltd. | | 6,000,716 | | 9,925 | |
| | oOh!media Ltd. | | 4,084,466 | | 7,763 | |
| | Monadelphous Group Ltd. | | 683,643 | | 7,236 | |
| | Incitec Pivot Ltd. | | 2,922,883 | | 6,955 | |
| | NRW Holdings Ltd. | | 4,308,734 | | 6,700 | |
^,* | | Nufarm Ltd. | | 1,424,898 | | 5,815 | |
| | Bravura Solutions Ltd. | | 1,850,922 | | 5,207 | |
| | Domain Holdings Australia Ltd. | | 2,134,985 | | 4,658 | |
| | Ansell Ltd. | | 200,767 | | 3,818 | |
| | Costa Group Holdings Ltd. | | 1,243,546 | | 2,446 | |
| | | | | | 131,015 | |
Austria (1.4%) | | | | | |
| | Lenzing AG | | 112,500 | | 11,850 | |
| | Wienerberger AG | | 401,639 | | 10,879 | |
| | ANDRITZ AG | | 185,424 | | 8,338 | |
^ | | Porr AG | | 216,375 | | 5,124 | |
| | Schoeller-Bleckmann Oilfield Equipment AG | | 63,088 | | 3,606 | |
* | | S&T AG | | 141,473 | | 3,051 | |
| | Palfinger AG | | 59,200 | | 1,691 | |
| | | | | | 44,539 | |
Belgium (1.2%) | | | | | |
| | Barco NV | | 48,100 | | 10,476 | |
* | | Galapagos NV | | 48,862 | | 8,996 | |
| | Cie d’Entreprises CFE | | 92,991 | | 8,964 | |
| | Euronav NV | | 653,426 | | 7,369 | |
| | Shurgard Self Storage SA | | 84,439 | | 2,850 | |
| | | | | | 38,655 | |
Brazil (0.4%) | | | | | |
| | Cogna Educacao | | 2,291,300 | | 5,525 | |
| | Odontoprev SA | | 1,494,500 | | 5,511 | |
| | | | | | 11,036 | |
China (2.9%) | | | | | |
| | Shenzhou International Group Holdings Ltd. | | 807,600 | | 11,160 | |
| | Li Ning Co. Ltd. | | 2,588,000 | | 8,775 | |
2 | | A-Living Services Co. Ltd. | | 2,701,450 | | 8,175 | |
* | | New Oriental Education & Technology Group Inc. ADR | | 60,538 | | 7,389 | |
| | BEST Inc. ADR | | 1,179,300 | | 6,722 | |
*,2 | | Tongcheng-Elong Holdings Ltd. | | 4,010,800 | | 6,530 | |
| | Haitian International Holdings Ltd. | | 2,760,000 | | 6,513 | |
| | HUYA Inc. ADR | | 287,900 | | 6,403 | |
| | Huazhu Group Ltd. ADR | | 161,009 | | 6,096 | |
| | Shandong Weigao Group Medical Polymer Co. Ltd. | | 5,272,000 | | 6,053 | |
| | Nexteer Automotive Group Ltd. | | 5,660,000 | | 5,275 | |
^,* | | Baozun Inc. ADR | | 116,975 | | 5,091 | |
* | | 51job Inc. ADR | | 50,364 | | 3,967 | |
*,2 | | Topsports International Holdings Ltd. | | 2,076,000 | | 2,504 | |
| | | | | | 90,653 | |
Denmark (1.2%) | | | | | |
| | Topdanmark A/S | | 401,183 | | 17,968 | |
| | Royal Unibrew A/S | | 197,358 | | 16,191 | |
| | SimCorp A/S | | 45,300 | | 4,054 | |
*,§ | | OW Bunker A/S | | 1,000,000 | | — | |
| | | | | | 38,213 | |
13
International Explorer Fund
| | | | | | Market | |
| | | | | | Value· | |
| | | | Shares | | ($000 | ) |
Finland (0.3%) | | | | | |
| | Metso Oyj | | 144,825 | | 5,483 | |
* | | Outotec Oyj | | 737,607 | | 4,754 | |
| | | | | | 10,237 | |
France (10.1%) | | | | | |
| | Rubis SCA | | 717,875 | | 41,628 | |
| | Altran Technologies SA | | 2,352,640 | | 37,405 | |
| | Nexity SA | | 617,102 | | 31,940 | |
| | Elis SA | | 1,340,102 | | 25,621 | |
| | Teleperformance | | 99,751 | | 22,632 | |
| | Trigano SA | | 250,000 | | 22,547 | |
| | SPIE SA | | 826,026 | | 17,434 | |
* | | Ubisoft Entertainment SA | | 252,049 | | 14,896 | |
| | Orpea | | 123,500 | | 14,875 | |
* | | ID Logistics Group | | 66,038 | | 12,625 | |
| | Kaufman & Broad SA | | 327,221 | | 12,483 | |
*,2 | | SMCP SA | | 848,055 | | 11,939 | |
* | | SOITEC | | 101,874 | | 11,237 | |
* | | Virbac SA | | 37,915 | | 9,246 | |
2 | | Maisons du Monde SA | | 613,685 | | 8,493 | |
| | Gaztransport Et Technigaz SA | | 92,100 | | 8,403 | |
| | Imerys SA | | 193,288 | | 7,467 | |
^ | | Tikehau Capital SCA | | 222,747 | | 5,718 | |
^,* | | Innate Pharma SA | | 341,522 | | 2,064 | |
| | LISI | | 53,100 | | 1,867 | |
| | | | | | 320,520 | |
Germany (4.6%) | | | | | |
| | Stabilus SA | | 394,207 | | 22,132 | |
* | | HelloFresh SE | | 1,143,728 | | 19,946 | |
| | Grand City Properties SA | | 805,000 | | 18,846 | |
^ | | S&T AG | | 665,853 | | 14,200 | |
| | New Work SE | | 33,576 | | 10,577 | |
| | CTS Eventim AG & Co. KGaA | | 163,300 | | 9,890 | |
| | Wacker Chemie AG | | 125,683 | | 9,846 | |
^ | | STRATEC SE | | 130,052 | | 9,825 | |
2 | | Befesa SA | | 225,000 | | 8,348 | |
| | Stemmer Imaging AG | | 291,170 | | 7,952 | |
| | SAF-Holland SA | | 683,338 | | 4,825 | |
| | Nemetschek SE | | 94,000 | | 4,796 | |
| | MorphoSys AG | | 28,700 | | 3,133 | |
^,* | | Jumia Technologies AG ADR | | 134,391 | | 867 | |
| | | | | | 145,183 | |
Hong Kong (1.4%) | | | | | |
| | Techtronic Industries Co. Ltd. | | 1,964,500 | | 15,353 | |
| | ASM Pacific Technology Ltd. | | 1,079,400 | | 15,071 | |
^ | | Value Partners Group Ltd. | | 12,173,000 | | 6,408 | |
| | Johnson Electric Holdings Ltd. | | 2,646,625 | | 4,833 | |
2 | | Crystal International Group Ltd. | | 9,975,500 | | 3,850 | |
| | | | | | 45,515 | |
India (0.9%) | | | | | |
| | Apollo Hospitals Enterprise Ltd. | | 481,499 | | 10,075 | |
| | Gujarat Pipavav Port Ltd. | | 6,724,221 | | 8,187 | |
| | Container Corp. Of India Ltd. | | 980,838 | | 8,127 | |
| | Zee Entertainment Enterprises Ltd. | | 818,671 | | 3,004 | |
| | | | | | 29,393 | |
Ireland (2.9%) | | | | | |
| | Dalata Hotel Group plc | | 5,608,000 | | 33,153 | |
| | Smurfit Kappa Group plc | | 411,543 | | 13,745 | |
| | Irish Continental Group plc | | 1,855,500 | | 8,873 | |
| | Flutter Entertainment plc | | 82,610 | | 8,520 | |
| | Irish Residential Properties REIT plc | | 3,800,000 | | 7,442 | |
| | Kingspan Group plc | | 141,545 | | 7,333 | |
| | Glanbia plc | | 629,963 | | 7,026 | |
| | Origin Enterprises plc | | 1,175,000 | | 6,148 | |
| | | | | | 92,240 | |
Italy (7.6%) | | | | | |
| | Cerved Group SPA | | 3,269,945 | | 31,825 | |
| | Recordati SPA | | 506,193 | | 21,273 | |
| | Banca Generali SPA | | 603,573 | | 19,705 | |
| | Autogrill SPA | | 1,807,899 | | 17,875 | |
| | FinecoBank Banca Fineco SPA | | 1,569,500 | | 17,694 | |
| | Interpump Group SPA | | 639,909 | | 17,542 | |
| | Salvatore Ferragamo SPA | | 773,108 | | 14,460 | |
| | DiaSorin SPA | | 107,735 | | 12,147 | |
2 | | doValue SPA | | 1,000,000 | | 11,827 | |
| | Amplifon SPA | | 439,400 | | 11,050 | |
2 | | Anima Holding SPA | | 2,496,678 | | 10,838 | |
| | PRADA SPA | | 2,972,900 | | 10,220 | |
| | Maire Tecnimont SPA | | 2,513,562 | | 6,586 | |
| | Brunello Cucinelli SPA | | 202,689 | | 6,353 | |
| | Buzzi Unicem SPA | | 258,499 | | 6,237 | |
| | IMA Industria Macchine Automatiche SPA | | 85,439 | | 5,818 | |
^,*,2 | | OVS SPA | | 2,231,966 | | 4,454 | |
^ | | Tod’s SPA | | 83,838 | | 3,973 | |
| | Tamburi Investment Partners SPA | | 461,734 | | 3,303 | |
14
International Explorer Fund
| | | | | | Market | |
| | | | | | Value· | |
| | | | Shares | | ($000 | ) |
2 | | Gima TT SPA | | 300,000 | | 2,323 | |
2 | | Piovan SPA | | 325,000 | | 2,001 | |
| | Datalogic SPA | | 67,800 | | 1,050 | |
| | | | | | 238,554 | |
Japan (27.8%) | | | | | |
| | Nippon Shinyaku Co. Ltd. | | 372,370 | | 33,594 | |
| | Zenkoku Hosho Co. Ltd. | | 785,455 | | 32,792 | |
| | Nabtesco Corp. | | 884,200 | | 28,148 | |
| | Disco Corp. | | 110,600 | | 24,137 | |
| | Pigeon Corp. | | 434,800 | | 21,226 | |
| | ABC-Mart Inc. | | 258,900 | | 17,752 | |
| | Kureha Corp. | | 269,800 | | 17,244 | |
| | Sumitomo Forestry Co. Ltd. | | 1,184,200 | | 17,188 | |
| | SCSK Corp. | | 328,500 | | 16,722 | |
| | Daifuku Co. Ltd. | | 311,300 | | 16,518 | |
| | Glory Ltd. | | 528,000 | | 15,546 | |
| | Nippon Densetsu Kogyo Co. Ltd. | | 717,000 | | 15,521 | |
| | SBI Holdings Inc. | | 695,700 | | 15,130 | |
| | Koito Manufacturing Co. Ltd. | | 288,100 | | 15,071 | |
| | Ai Holdings Corp. | | 831,200 | | 15,064 | |
| | Digital Garage Inc. | | 456,000 | | 14,927 | |
| | en-japan Inc. | | 347,700 | | 14,717 | |
| | GMO internet Inc. | | 869,600 | | 14,613 | |
| | Sugi Holdings Co. Ltd. | | 261,300 | | 14,504 | |
| | Toyo Tire Corp. | | 1,039,500 | | 14,499 | |
| | Trusco Nakayama Corp. | | 567,800 | | 13,729 | |
| | Aica Kogyo Co. Ltd. | | 423,000 | | 13,433 | |
| | Tsuruha Holdings Inc. | | 114,400 | | 12,869 | |
| | Musashi Seimitsu Industry Co. Ltd. | | 874,500 | | 12,148 | |
| | JGC Holdings Corp. | | 831,300 | | 12,023 | |
^ | | Aruhi Corp. | | 517,400 | | 11,632 | |
| | Nifco Inc. | | 428,700 | | 11,316 | |
| | IHI Corp. | | 430,724 | | 10,614 | |
| | Open House Co. Ltd. | | 408,400 | | 10,436 | |
| | Horiba Ltd. | | 154,000 | | 10,392 | |
| | Asahi Intecc Co. Ltd. | | 365,306 | | 10,052 | |
| | Kyoritsu Maintenance Co. Ltd. | | 226,800 | | 10,033 | |
| | Asics Corp. | | 580,700 | | 9,970 | |
| | Kyudenko Corp. | | 303,630 | | 9,922 | |
| | Hazama Ando Corp. | | 1,228,200 | | 9,516 | |
| | Yokogawa Bridge Holdings Corp. | | 517,800 | | 9,479 | |
| | Sushiro Global Holdings Ltd. | | 132,400 | | 9,103 | |
| | KH Neochem Co. Ltd. | | 366,700 | | 8,930 | |
| | Iriso Electronics Co. Ltd. | | 180,200 | | 8,910 | |
| | Kyowa Exeo Corp. | | 337,300 | | 8,582 | |
| | Shinmaywa Industries Ltd. | | 675,600 | | 8,323 | |
| | NEC Networks & System Integration Corp. | | 262,700 | | 8,292 | |
| | TechnoPro Holdings Inc. | | 126,700 | | 7,793 | |
| | Ichigo Inc. | | 1,954,030 | | 7,783 | |
| | THK Co. Ltd. | | 268,900 | | 7,732 | |
| | Nihon M&A Center Inc. | | 252,300 | | 7,671 | |
| | JSP Corp. | | 400,500 | | 7,423 | |
* | | M&A Capital Partners Co. Ltd. | | 109,000 | | 7,266 | |
^ | | ZOZO Inc. | | 311,900 | | 7,265 | |
| | Arcs Co. Ltd. | | 358,600 | | 7,196 | |
| | Japan Lifeline Co. Ltd. | | 463,300 | | 7,142 | |
| | Sanwa Holdings Corp. | | 605,190 | | 7,078 | |
| | OBIC Business Consultants Co. Ltd. | | 176,500 | | 7,071 | |
| | Nippon Gas Co. Ltd. | | 247,300 | | 7,000 | |
| | Kobe Bussan Co. Ltd. | | 234,800 | | 6,948 | |
| | Mirait Holdings Corp. | | 431,500 | | 6,929 | |
^ | | Harmonic Drive Systems Inc. | | 147,700 | | 6,850 | |
| | Nitta Corp. | | 233,500 | | 6,810 | |
| | Japan Airport Terminal Co. Ltd. | | 137,800 | | 6,807 | |
| | Kissei Pharmaceutical Co. Ltd. | | 263,000 | | 6,775 | |
| | Katitas Co. Ltd. | | 155,100 | | 6,693 | |
| | Tokyo Ohka Kogyo Co. Ltd. | | 164,080 | | 6,498 | |
| | Miura Co. Ltd. | | 199,300 | | 6,005 | |
| | Ferrotec Holdings Corp. | | 594,600 | | 5,897 | |
| | EPS Holdings Inc. | | 481,100 | | 5,866 | |
| | Daibiru Corp. | | 525,700 | | 5,837 | |
| | Benefit One Inc. | | 284,300 | | 5,755 | |
| | DMG Mori Co. Ltd. | | 326,800 | | 5,291 | |
^ | | Hitachi Transport System Ltd. | | 183,000 | | 5,209 | |
| | Kenedix Inc. | | 944,800 | | 5,143 | |
| | Nippon Yusen KK | | 278,100 | | 4,996 | |
| | Obara Group Inc. | | 133,100 | | 4,962 | |
| | Nihon Parkerizing Co. Ltd. | | 417,800 | | 4,899 | |
| | H2O Retailing Corp. | | 411,700 | | 4,669 | |
| | Jamco Corp. | | 329,600 | | 4,481 | |
| | Ship Healthcare Holdings Inc. | | 103,200 | | 4,399 | |
| | TPR Co. Ltd. | | 241,200 | | 4,318 | |
| | Kumiai Chemical Industry Co. Ltd. | | 457,200 | | 4,228 | |
| | Warabeya Nichiyo Holdings Co. Ltd. | | 235,200 | | 4,141 | |
| | Kanto Denka Kogyo Co. Ltd. | | 459,000 | | 4,058 | |
| | Bank of Kyoto Ltd. | | 100,800 | | 3,990 | |
| | Pola Orbis Holdings Inc. | | 169,900 | | 3,834 | |
15
International Explorer Fund
| | | | | | Market | |
| | | | | | Value· | |
| | | | Shares | | ($000 | ) |
| | San-In Godo Bank Ltd. | | 653,100 | | 3,831 | |
| | Fukushima Industries Corp. | | 120,300 | | 3,774 | |
| | Modec Inc. | | 133,000 | | 3,648 | |
^ | | UT Group Co. Ltd. | | 144,300 | | 3,584 | |
| | Mani Inc. | | 132,000 | | 3,485 | |
| | Ibiden Co. Ltd. | | 134,800 | | 3,113 | |
| | Persol Holdings Co. Ltd. | | 130,700 | | 2,510 | |
| | Kakaku.com Inc. | | 81,500 | | 1,892 | |
| | Tokyo Kiraboshi Financial Group Inc. | | 130,745 | | 1,841 | |
| | Lintec Corp. | | 76,600 | | 1,609 | |
| | Izumi Co. Ltd. | | 35,800 | | 1,347 | |
| | Tsutsumi Jewelry Co. Ltd. | | 68,200 | | 1,239 | |
| | Daikyonishikawa Corp. | | 105,300 | | 809 | |
| | Shinko Electric Industries Co. Ltd. | | 55,900 | | 546 | |
| | | | | | 878,553 | |
Mexico (0.7%) | | | | | |
| | Grupo Aeroportuario del Pacifico SAB de CV Class B | | 1,021,243 | | 10,707 | |
| | Regional SAB de CV | | 1,189,500 | | 6,318 | |
| | Megacable Holdings S AB de CV | | 1,181,400 | | 4,854 | |
| | | | | | 21,879 | |
Netherlands (3.2%) | | | | | |
| | TKH Group NV | | 356,851 | | 18,293 | |
2 | | NIBC Holding NV | | 1,750,000 | | 14,268 | |
| | Van Lanschot Kempen NV | | 511,424 | | 11,792 | |
| | SIF Holding NV | | 790,000 | | 11,389 | |
*,2 | | Basic-Fit NV | | 325,265 | | 9,948 | |
^ | | AMG Advanced Metallurgical Group NV | | 404,208 | | 9,945 | |
| | IMCD NV | | 107,740 | | 8,413 | |
* | | OCI NV | | 325,000 | | 7,307 | |
*,2 | | Marel HF | | 1,423,672 | | 6,618 | |
| | BE Semiconductor Industries NV | | 98,945 | | 3,668 | |
| | | | | | 101,641 | |
New Zealand (0.2%) | | | | | |
| | Fletcher Building Ltd. | | 2,339,446 | | 6,874 | |
| | | | | | | |
Norway (1.4%) | | | | | |
| | Kongsberg Gruppen ASA | | 1,572,678 | | 23,234 | |
| | Borregaard ASA | | 868,467 | | 8,367 | |
2 | | Elkem ASA | | 2,930,363 | | 6,965 | |
| | Tomra Systems ASA | | 250,000 | | 6,738 | |
| | | | | | 45,304 | |
Other (0.7%) | | | | | |
3 | | Vanguard FTSE All World ex-US Small-Cap ETF | | 212,436 | | 22,452 | |
| | | | | | | |
Singapore (0.1%) | | | | | |
| | Venture Corp. Ltd. | | 303,000 | | 3,515 | |
| | | | | | | |
South Africa (0.2%) | | | | | |
| | Reinet Investments SCA | | 265,904 | | 4,763 | |
| | | | | | | |
South Korea (1.0%) | | | | | |
| | Nexen Tire Corp. | | 906,523 | | 7,285 | |
| | Medy-Tox Inc. | | 15,527 | | 4,394 | |
| | Korea Aerospace Industries Ltd. | | 133,561 | | 4,360 | |
| | Hankook Tire & Technology Co. Ltd. | | 157,743 | | 4,206 | |
^ | | Douzone Bizon Co. Ltd. | | 60,541 | | 3,820 | |
| | Hanon Systems | | 326,781 | | 3,252 | |
| | Hansol Chemical Co. Ltd. | | 38,000 | | 3,055 | |
| | | | | | 30,372 | |
Spain (1.8%) | | | | | |
| | Prosegur Cia de Seguridad SA | | 3,007,455 | | 11,671 | |
*,2 | | Aedas Homes SAU | | 500,000 | | 11,552 | |
| | Melia Hotels International SA | | 1,116,471 | | 9,104 | |
| | CIE Automotive SA | | 333,957 | | 8,318 | |
2 | | Prosegur Cash SA | | 5,000,000 | | 7,819 | |
| | Viscofan SA | | 125,700 | | 6,817 | |
2 | | Global Dominion Access SA | | 357,274 | | 1,500 | |
| | | | | | 56,781 | |
Sweden (3.3%) | | | | | |
| | Loomis AB Class B | | 556,823 | | 21,560 | |
| | Nordic Entertainment Group AB Class B | | 657,600 | | 18,692 | |
^ | | Intrum AB | | 576,600 | | 15,545 | |
| | Arjo AB | | 2,791,495 | | 11,513 | |
2 | | Bravida Holding AB | | 882,251 | | 8,130 | |
| | Nibe Industrier AB Class B | | 543,821 | | 7,446 | |
| | Husqvarna AB | | 832,108 | | 6,375 | |
| | Modern Times Group MTG AB Class B | | 489,000 | | 4,535 | |
| | Karnov Group AB | | 706,800 | | 3,573 | |
2 | | Alimak Group AB | | 213,060 | | 2,809 | |
| | Cellavision AB | | 83,648 | | 2,387 | |
| | Troax Group AB | | 155,900 | | 1,738 | |
| | | | | | 104,303 | |
16
International Explorer Fund
| | | | | | Market | |
| | | | | | Value· | |
| | | | Shares | | ($000 | ) |
Switzerland (2.0%) | | | | | |
| | OC Oerlikon Corp. AG | | 2,236,519 | | 22,951 | |
| | Dufry AG | | 146,295 | | 12,724 | |
2 | | VAT Group AG | | 62,800 | | 9,234 | |
| | Logitech International SA | | 204,436 | | 8,392 | |
| | Comet Holding AG | | 71,427 | | 7,146 | |
| | Ascom Holding AG | | 254,000 | | 2,519 | |
| | | | | | 62,966 | |
Taiwan (1.5%) | | | | | |
| | Chroma ATE Inc. | | 4,449,000 | | 22,121 | |
| | Ennoconn Corp. | | 1,221,763 | | 9,135 | |
| | CTCI Corp. | | 4,336,000 | | 5,830 | |
| | Nien Made Enterprise Co. Ltd. | | 635,000 | | 5,760 | |
| | Gourmet Master Co. Ltd. | | 898,217 | | 4,084 | |
| | | | | | 46,930 | |
United Arab Emirates (0.0%) | | | | | |
* | | Lamprell plc | | 1,150,000 | | 658 | |
| | | | | | | |
United Kingdom (13.1%) | | | | | |
| | Melrose Industries plc | | 6,263,500 | | 17,310 | |
| | B&M European Value Retail SA | | 3,273,019 | | 15,702 | |
| | Electrocomponents plc | | 1,746,600 | | 15,411 | |
| | Restaurant Group plc | | 7,885,560 | | 13,886 | |
| | Genus plc | | 368,952 | | 13,862 | |
| | SSP Group plc | | 1,600,000 | | 13,194 | |
| | Hikma Pharmaceuticals plc | | 477,108 | | 12,425 | |
| | Hill & Smith Holdings plc | | 663,316 | | 11,250 | |
| | Renishaw plc | | 222,300 | | 10,928 | |
| | Bodycote plc | | 1,150,000 | | 10,663 | |
| | UDG Healthcare plc | | 1,037,000 | | 10,395 | |
| | Dunelm Group plc | | 1,000,000 | | 10,240 | |
| | Elementis plc | | 5,239,541 | | 10,083 | |
| | Halma plc | | 400,000 | | 9,706 | |
| | Cranswick plc | | 235,000 | | 9,447 | |
| | Dechra Pharmaceuticals plc | | 270,000 | | 9,210 | |
2 | | Auto Trader Group plc | | 1,259,700 | | 9,179 | |
| | Tyman plc | | 3,286,568 | | 9,035 | |
| | Abcam plc | | 592,315 | | 8,944 | |
| | Grainger plc | | 2,650,000 | | 8,812 | |
| | Volution Group plc | | 3,357,598 | | 8,681 | |
| | IG Group Holdings plc | | 1,020,000 | | 8,392 | |
| | HomeServe plc | | 540,000 | | 8,111 | |
2 | | ConvaTec Group plc | | 3,146,872 | | 8,040 | |
| | Howden Joinery Group plc | | 1,063,800 | | 7,962 | |
| | QinetiQ Group plc | | 1,900,000 | | 7,746 | |
| | Pets at Home Group plc | | 2,900,000 | | 7,724 | |
| | Telecom Plus plc | | 485,000 | | 7,566 | |
| | Cairn Homes plc | | 5,726,250 | | 7,424 | |
| | Consort Medical plc | | 736,413 | | 6,960 | |
| | Keywords Studios plc | | 482,000 | | 6,946 | |
| | Segro plc | | 620,000 | | 6,782 | |
| | Rentokil Initial plc | | 1,125,929 | | 6,626 | |
| | Polypipe Group plc | | 1,078,700 | | 6,326 | |
| | Next plc | | 70,500 | | 6,013 | |
| | Cineworld Group plc | | 2,040,000 | | 5,879 | |
| | Rhi Magnesita NV | | 126,924 | | 5,720 | |
| | Keller Group plc | | 846,780 | | 5,689 | |
| | LondonMetric Property plc | | 1,850,000 | | 5,554 | |
| | Jupiter Fund Management plc | | 1,241,700 | | 5,513 | |
| | Redrow plc | | 700,000 | | 5,457 | |
| | Investec plc | | 875,000 | | 4,961 | |
| | Ultra Electronics Holdings plc | | 172,993 | | 4,370 | |
| | Northgate plc | | 900,000 | | 4,017 | |
| | James Fisher & Sons plc | | 141,368 | | 3,555 | |
| | Photo-Me International plc | | 2,815,075 | | 3,346 | |
| | Clarkson plc | | 83,900 | | 3,073 | |
| | Hunting plc | | 601,372 | | 3,073 | |
| | Fevertree Drinks plc | | 107,336 | | 2,586 | |
| | Superdry plc | | 480,000 | | 2,549 | |
| | Vesuvius plc | | 436,161 | | 2,257 | |
| | Ted Baker plc | | 390,000 | | 2,054 | |
| | Glanbia plc | | 132,020 | | 1,475 | |
| | Eco Animal Health Group plc | | 230,000 | | 1,063 | |
| | Coats Group plc | | 1,000,000 | | 923 | |
| | | | | | 414,095 | |
United States (0.2%) | | | | | |
2 | | Samsonite International SA | | 3,021,300 | | 6,152 | |
Total Common Stocks
(Cost $2,791,927) | | | | 3,042,991 | |
Temporary Cash Investments (6.8%)1 | | | | | |
Money Market Fund (5.5%) | | | | | |
4,5 | | Vanguard Market Liquidity Fund, 1.984% | | 1,730,748 | | 173,092 | |
17
International Explorer Fund
| | | | Face | | Market | |
| | | | Amount | | Value· | |
| | | | ($000) | | ($000 | ) |
Repurchase Agreement (1.2%) | | | | | |
| | Goldman Sachs & Co. 1.700%, 11/1/19 (Dated 10/31/19, Repurchase Value $37,502,000 collateralized by Federal National Mortgage Assn. 4.000%, 11/01/48–8/01/49, with a value of $38,250,000) | | 37,500 | | 37,500 | |
| | | | | | | |
U.S. Government and Agency Obligations (0.1%) | | | | | |
| | United States Treasury Bill, 1.669%, 1/9/20 | | 300 | | 299 | |
6 | | United States Treasury Bill, 1.817%, 1/30/20 | | 2,750 | | 2,740 | |
| | | | | | 3,039 | |
Total Temporary Cash Investments
(Cost $213,614) | | | | 213,631 | |
Total Investments (103.0%)
(Cost $3,005,541) | | | | 3,256,622 | |
Other Assets and Liabilities (-3.0%) | | | | | |
Other Assets4 | | | | 45,275 | |
Liabilities4 | | | | (139,395 | ) |
| | | | (94,120 | ) |
Net Assets (100%) | | | | | |
Applicable to 183,695,142 outstanding $.001 par value shares of beneficial interest (unlimited authorization) | | | | 3,162,502 | |
Net Asset Value Per Share | | | | $17.22 | |
| | | | Amount | |
| | | | ($000 | ) |
Statement of Assets and Liabilities | | | | | |
Assets | | | | | |
Investments in Securities, at Value | | | | | |
Unaffiliated Issuers | | | | 3,061,078 | |
Affiliated Issuers | | | | 195,544 | |
Total Investments in Securitie | | | | 3,256,622 | |
Investment in Vanguard | | | | 144 | |
Receivables for Investment Securities Sold | | | | 14,740 | |
Receivables for Accrued Income | | | | 8,856 | |
Receivables for Capital Shares Issued | | | | 439 | |
Variation Margin Receivable—Futures Contracts | | | | 114 | |
Unrealized Appreciation—Forward Currency Contracts | | | | 1,406 | |
Other Assets4 | | | | 19,576 | |
Total Assets | | | | 3,301,897 | |
Liabilities | | | | | |
Payables for Investment Securities Purchased | | | | 26,939 | |
Collateral for Securities on Loan | | | | 102,768 | |
Payables to Investment Advisor | | | | 1,605 | |
Payables for Capital Shares Redeemed | | | | 4,746 | |
Payables to Vanguard | | | | 2,476 | |
Variation Margin Payable—Futures Contracts | | | | 191 | |
Unrealized Depreciation—Forward Currency Contracts | | | | 670 | |
Total Liabilities | | | | 139,395 | |
Net Assets | | | | 3,162,502 | |
18
International Explorer Fund
At October 31, 2019, net assets consisted of:
| | | | Amount | |
| | | | ($000 | ) |
Paid-in Capital | | | | 3,053,754 | |
Total Distributable Earnings (Loss) | | | | 108,748 | |
Net Assets | | | | 3,162,502 | |
· See Note A in Notes to Financial Statements.
^ Includes partial security positions on loan to broker-dealers. The total value of securities on loan is $97,452,000.
* Non-income-producing security.
§ Security value determined using significant unobservable inputs.
1 The fund invests a portion of its cash reserves in equity markets through the use of index futures contracts. After giving effect to futures investments, the fund’s effective common stock and temporary cash investment positions represent 97.2% and 5.8%, respectively, of net assets.
2 Security exempt from registration under Rule 144A of the Securities Act of 1933. Such securities may be sold in transactions exempt from registration, normally to qualified institutional buyers. At October 31, 2019, the aggregate value of these securities was $183,496,000, representing 5.8% of net assets.
3 Considered an affiliated company of the fund as the issuer is another member of The Vanguard Group.
4 Collateral of $102,768,000 was received for securities on loan, of which $102,755,000 is held in Vanguard Market Liquidity Fund and $13,000 is held in cash.
5 Affiliated money market fund available only to Vanguard funds and certain trusts and accounts managed by Vanguard. Rate shown is the 7-day yield.
6 Securities with a value of $1,992,000 have been segregated as initial margin for open futures contracts.
ADR—American Depositary Receipt.
REIT—Real Estate Investment Trust.
Derivative Financial Instruments Outstanding as of Period End |
Futures Contracts |
| | | | | | | | ($000 | ) |
| | | | | | | | Value and | |
| | | | Number of | | | | Unrealized | |
| | | | Long (Short | ) | Notional | | Appreciation | |
| | Expiration | | Contracts | | Amount | | (Depreciation | ) |
Long Futures Contracts | | | | | | | | | |
Topix Index | | December 2019 | | 70 | | 10,815 | | 539 | |
Dow Jones EURO STOXX 50 Index | | December 2019 | | 208 | | 8,372 | | 299 | |
FTSE 100 Index | | December 2019 | | 66 | | 6,195 | | 63 | |
S&P ASX 200 Index | | December 2019 | | 54 | | 6,179 | | 88 | |
| | | | | | | | 989 | |
19
International Explorer Fund
Forward Currency Contracts | | | | | | | | | | | |
| | Contract | | | | | | Unrealized | | Unrealized | |
| | Settlement | | Contract Amount (000) | | Appreciation | | (Depreciation | ) |
Counterparty | | Date | | Receive | | Deliver | | ($000 | ) | ($000 | ) |
Royal Bank of Canada | | 12/16/19 | | JPY | 1,788,845 | | USD | 16,661 | | — | | (42 | ) |
Bank of America, N.A. | | 12/16/19 | | JPY | 1,510,618 | | USD | 14,058 | | — | | (25 | ) |
Bank of America, N.A. | | 12/24/19 | | GBP | 9,527 | | USD | 11,877 | | 488 | | — | |
Bank of America, N.A. | | 12/24/19 | | EUR | 9,636 | | USD | 10,682 | | 108 | | — | |
Royal Bank of Canada | | 12/24/19 | | GBP | 7,984 | | USD | 9,893 | | 469 | | — | |
Royal Bank of Canada | | 12/24/19 | | EUR | 8,768 | | USD | 9,688 | | 130 | | — | |
Royal Bank of Canada | | 12/23/19 | | AUD | 10,585 | | USD | 7,159 | | 149 | | — | |
Toronto-Dominion Bank | | 12/24/19 | | AUD | 7,366 | | USD | 5,063 | | 22 | | — | |
Bank of America, N.A. | | 12/24/19 | | AUD | 4,182 | | USD | 2,876 | | 11 | | — | |
State Street Bank & Trust Co. | | 12/16/19 | | USD | 6,618 | | JPY | 716,540 | | — | | (38 | ) |
Bank of America, N.A. | | 12/24/19 | | USD | 5,919 | | GBP | 4,606 | | — | | (60 | ) |
Goldman Sachs International | | 12/23/19 | | USD | 5,007 | | AUD | 7,341 | | — | | (61 | ) |
Goldman Sachs International | | 12/16/19 | | USD | 4,312 | | JPY | 463,130 | | 10 | | — | |
Royal Bank of Canada | | 12/24/19 | | USD | 4,308 | | EUR | 3,909 | | — | | (69 | ) |
Morgan Stanley Capital Services LLC | | 12/24/19 | | USD | 3,197 | | EUR | 2,874 | | — | | (21 | ) |
Royal Bank of Canada | | 12/24/19 | | USD | 3,158 | | GBP | 2,562 | | — | | (167 | ) |
BNP Paribas | | 12/16/19 | | USD | 2,912 | | JPY | 316,160 | | — | | (25 | ) |
Royal Bank of Canada | | 12/16/19 | | USD | 2,807 | | JPY | 301,020 | | 11 | | — | |
UBS AG | | 12/24/19 | | USD | 2,087 | | EUR | 1,868 | | — | | (4 | ) |
BNP Paribas | | 12/24/19 | | USD | 1,880 | | GBP | 1,455 | | — | | (9 | ) |
Standard Chartered Bank | | 12/24/19 | | USD | 1,846 | | GBP | 1,429 | | — | | (8 | ) |
Standard Chartered Bank | | 12/16/19 | | USD | 1,822 | | JPY | 197,460 | | — | | (12 | ) |
BNP Paribas | | 12/24/19 | | USD | 1,696 | | EUR | 1,517 | | — | | (3 | ) |
BNP Paribas | | 12/23/19 | | USD | 1,611 | | AUD | 2,334 | | — | | (1 | ) |
Morgan Stanley Capital Services LLC | | 12/23/19 | | USD | 1,479 | | AUD | 2,183 | | — | | (28 | ) |
State Street Bank & Trust Co. | | 12/24/19 | | USD | 1,444 | | GBP | 1,171 | | — | | (76 | ) |
Toronto-Dominion Bank | | 12/16/19 | | USD | 1,009 | | JPY | 107,800 | | 8 | | — | |
HSBC Bank USA, N.A. | | 12/24/19 | | USD | 932 | | GBP | 724 | | — | | (8 | ) |
Bank of America, N.A. | | 12/24/19 | | USD | 842 | | EUR | 756 | | — | | (4 | ) |
Bank of America, N.A. | | 12/23/19 | | USD | 570 | | AUD | 834 | | — | | (6 | ) |
Royal Bank of Canada | | 12/23/19 | | USD | 110 | | AUD | 164 | | — | | (3 | ) |
| | | | | | | | 1,406 | | (670 | ) |
AUD—Australian dollar.
EUR—euro.
GBP—British pound.
JPY—Japanese yen.
USD—U.S. dollar.
See accompanying Notes, which are an integral part of the Financial Statements.
20
International Explorer Fund
Statement of Operations
| Year Ended |
| October 31, 2019 |
| ($000) |
Investment Income | |
Income | |
Dividends—Unaffiliated Issuers1 | 80,564 |
Dividends—Affiliated Issuers | 693 |
Interest—Unaffiliated Issuers | 587 |
Interest—Affiliated Issuers | 2,193 |
Securities Lending—Net | 4,035 |
Total Income | 88,072 |
Expenses | |
Investment Advisory Fees—Note B | |
Basic Fee | 7,846 |
Performance Adjustment | (1,138) |
The Vanguard Group—Note C | |
Management and Administrative | 5,219 |
Marketing and Distribution | 457 |
Custodian Fees | 249 |
Auditing Fees | 38 |
Shareholders’ Reports | 49 |
Trustees’ Fees and Expenses | 4 |
Total Expenses | 12,724 |
Expenses Paid Indirectly | (72) |
Net Expenses | 12,652 |
Net Investment Income | 75,420 |
Realized Net Gain (Loss) | |
Investment Securities Sold—Unaffiliated Issuers | (181,708) |
Investment Securities Sold—Affiliated Issuers | (1) |
Futures Contracts | 2,165 |
Forward Currency Contracts | (1,273) |
Foreign Currencies | (229) |
Realized Net Gain (Loss) | (181,046) |
Change in Unrealized Appreciation (Depreciation) | |
Investment Securities—Unaffiliated Issuers | 230,892 |
Investment Securities—Affiliated Issuers | 529 |
Futures Contracts | 3,847 |
Forward Currency Contracts | 2,158 |
Foreign Currencies | 539 |
Change in Unrealized Appreciation (Depreciation) | 237,965 |
Net Increase (Decrease) in Net Assets Resulting from Operations | 132,339 |
1 Dividends are net of foreign withholding taxes of $7,234,000.
See accompanying Notes, which are an integral part of the Financial Statements.
21
International Explorer Fund
Statement of Changes in Net Assets
| Year Ended October 31, |
| 2019 | 2018 |
| ($000) | ($000) |
Increase (Decrease) in Net Assets | | |
Operations | | |
Net Investment Income | 75,420 | 75,882 |
Realized Net Gain (Loss) | (181,046) | 248,680 |
Change in Unrealized Appreciation (Depreciation) | 237,965 | (897,889) |
Net Increase (Decrease) in Net Assets Resulting from Operations | 132,339 | (573,327) |
Distributions | | |
Net Investment Income | (57,408) | (83,340) |
Realized Capital Gain1 | (204,757) | (167,556) |
Total Distributions | (262,165) | (250,896) |
Capital Share Transactions | | |
Issued | 549,998 | 1,249,140 |
Issued in Lieu of Cash Distributions | 237,472 | 228,661 |
Redeemed | (1,144,536) | (984,248) |
Net Increase (Decrease) from Capital Share Transactions | (357,066) | 493,553 |
Total Increase (Decrease) | (486,892) | (330,670) |
Net Assets | | |
Beginning of Period | 3,649,394 | 3,980,064 |
End of Period | 3,162,502 | 3,649,394 |
1 Includes fiscal 2019 and 2018 short-term gain distributions totaling $40,208,000 and $38,075,000, respectively. Short-term gain distributions are treated as ordinary income dividends for tax purposes.
See accompanying Notes, which are an integral part of the Financial Statements.
22
International Explorer Fund
Financial Highlights
For a Share Outstanding | | | | Year Ended October 31, | |
Throughout Each Period | | 2019 | | 2018 | | 2017 | | 2016 | | 2015 | |
Net Asset Value, Beginning of Period | | $17.86 | | $21.87 | | $16.82 | | $17.76 | | $18.26 | |
Investment Operations | | | | | | | | | | | |
Net Investment Income | | .379 | 1 | .369 | 1 | .333 | 1 | .318 | | .287 | |
Net Realized and Unrealized Gain (Loss) on Investments | | .300 | | (3.032 | ) | 5.035 | | (.334 | ) | .635 | |
Total from Investment Operations | | .679 | | (2.663 | ) | 5.368 | | (.016 | ) | .922 | |
Distributions | | | | | | | | | | | |
Dividends from Net Investment Income | | (.289 | ) | (.447 | ) | (.318 | ) | (.263 | ) | (.326 | ) |
Distributions from Realized Capital Gains | | (1.030 | ) | (.900 | ) | — | | (.661 | ) | (1.096 | ) |
Total Distributions | | (1.319 | ) | (1.347 | ) | (.318 | ) | (.924 | ) | (1.422 | ) |
Net Asset Value, End of Period | | $17.22 | | $17.86 | | $21.87 | | $16.82 | | $17.76 | |
| | | | | | | | | | | |
Total Return2 | | 4.85% | | -13.08% | | 32.58% | | -0.06% | | 5.65% | |
| | | | | | | | | | | |
Ratios/Supplemental Data | | | | | | | | | | | |
Net Assets, End of Period (Millions) | | $3,163 | | $3,649 | | $3,980 | | $2,829 | | $2,887 | |
Ratio of Total Expenses to Average Net Assets3 | | 0.39% | | 0.39% | | 0.38% | | 0.41% | | 0.42% | |
Ratio of Net Investment Income to Average Net Assets | | 2.28% | | 1.75% | | 1.68% | | 1.83% | | 1.53% | |
Portfolio Turnover Rate | | 35% | | 40% | | 43% | | 37% | | 42% | |
1 Calculated based on average shares outstanding.
2 Total returns do not include account service fees that may have applied in the periods shown. Fund prospectuses provide information about any applicable account service fees.
3 Includes performance-based investment advisory fee increases (decreases) of (0.03%), (0.01%), (0.01%), 0.00%, and 0.00%.
See accompanying Notes, which are an integral part of the Financial Statements.
23
International Explorer Fund
Notes to Financial Statements
Vanguard International Explorer Fund is registered under the Investment Company Act of 1940 as an open-end investment company, or mutual fund.
The fund invests in securities of foreign issuers, which may subject it to investment risks not normally associated with investing in securities of U.S. corporations. Further, at October 31, 2019, the fund had a concentration of its investments in securities issued in Japan, and the performance of such investments may be impacted by the country’s social, political, and economic conditions.
A. The following significant accounting policies conform to generally accepted accounting principles for U.S. investment companies. The fund consistently follows such policies in preparing its financial statements.
1. Security Valuation: Securities are valued as of the close of trading on the New York Stock Exchange (generally 4 p.m., Eastern time) on the valuation date. Equity securities are valued at the latest quoted sales prices or official closing prices taken from the primary market in which each security trades; such securities not traded on the valuation date are valued at the mean of the latest quoted bid and asked prices. Securities for which market quotations are not readily available, or whose values have been affected by events occurring before the fund’s pricing time but after the close of the securities’ primary markets, are valued at their fair values calculated according to procedures adopted by the board of trustees. These procedures include obtaining quotations from an independent pricing service, monitoring news to identify significant market- or security-specific events, and evaluating changes in the values of foreign market proxies (for example, ADRs, futures contracts, or exchange-traded funds), between the time the foreign markets close and the fund’s pricing time. When fair-value pricing is employed, the prices of securities used by a fund to calculate its net asset value may differ from quoted or published prices for the same securities. Investments in Vanguard Market Liquidity Fund are valued at that fund’s net asset value. Temporary cash investments are valued using the latest bid prices or using valuations based on a matrix system (which considers such factors as security prices, yields, maturities, and ratings), both as furnished by independent pricing services.
2. Foreign Currency: Securities and other assets and liabilities denominated in foreign currencies are translated into U.S. dollars using exchange rates obtained from an independent third party as of the fund’s pricing time on the valuation date. Realized gains (losses) and unrealized appreciation (depreciation) on investment securities include the effects of changes in exchange rates since the securities were purchased, combined with the effects of changes in security prices. Fluctuations in the value of other assets and liabilities resulting from changes in exchange rates are recorded as unrealized foreign currency gains (losses) until the assets or liabilities are settled in cash, at which time they are recorded as realized foreign currency gains (losses).
3. Futures and Forward Currency Contracts: The fund uses index futures contracts to a limited extent, with the objective of maintaining full exposure to the stock market while maintaining liquidity. The fund may purchase or sell futures contracts to achieve a desired level of investment, whether to accommodate portfolio turnover or cash flows from capital share transactions. The primary risks associated with the use of futures contracts are imperfect correlation between changes in market values of stocks held by the fund and the prices of futures contracts, and the possibility of an illiquid market. Counterparty risk involving futures is mitigated because a regulated clearinghouse is the counterparty instead of the clearing broker. To further mitigate counterparty risk, the fund trades futures contracts on an exchange, monitors the financial strength of its clearing brokers and clearinghouse, and has entered into clearing agreements with its clearing brokers. The
24
International Explorer Fund
clearinghouse imposes initial margin requirements to secure the fund’s performance and requires daily settlement of variation margin representing changes in the market value of each contract. Any assets pledged as initial margin for open contracts are noted in the Statement of Net Assets.
The fund enters into forward currency contracts to provide the appropriate currency exposure related to any open futures contracts or to protect the value of securities and related receivables and payables against changes in foreign exchange rates. The fund’s risks in using these contracts include movement in the values of the foreign currencies relative to the U.S. dollar and the ability of the counterparties to fulfill their obligations under the contracts. The fund mitigates its counter-party risk by entering into forward currency contracts only with a diverse group of prequalified counterparties, monitoring their financial strength, entering into master netting arrangements with its counterparties, and requiring its counterparties to transfer collateral as security for their performance. In the absence of a default, the collateral pledged or received by the fund cannot be repledged, resold, or rehypothecated. The master netting arrangements provide that, in the event of a counterparty’s default (including bankruptcy), the fund may terminate the forward currency contracts, determine the net amount owed by either party in accordance with its master netting arrangements, and sell or retain any collateral held up to the net amount owed to the fund under the master netting arrangements. The forward currency contracts contain provisions whereby a counterparty may terminate open contracts if the fund’s net assets decline below a certain level, triggering a payment by the fund if the fund is in a net liability position at the time of the termination. The payment amount would be reduced by any collateral the fund has pledged. Any assets pledged as collateral for open contracts are noted in the Statement of Net Assets. The value of collateral received or pledged is compared daily to the value of the forward currency contracts exposure with each counterparty, and any difference, if in excess of a specified minimum transfer amount, is adjusted and settled within two business days.
Futures contracts are valued at their quoted daily settlement prices. Forward currency contracts are valued at their quoted daily prices obtained from an independent third party, adjusted for currency risk based on the expiration date of each contract. The notional amounts of the contracts are not recorded in the Statement of Net Assets. Fluctuations in the value of the contracts are recorded in the Statement of Assets and Liabilities as an asset (liability) and in the Statement of Operations as unrealized appreciation (depreciation) until the contracts are closed, when they are recorded as realized gains (losses) on futures or forward currency contracts.
During the year ended October 31, 2019, the fund’s average investments in long and short futures contracts represented 1% and 0% of net assets, respectively, based on the average of the notional amounts at each quarter-end during the period. The fund’s average investment in forward currency contracts represented 6% of net assets, based on the average of the notional amounts at each quarter-end during the period.
4. Repurchase Agreements: The fund enters into repurchase agreements with institutional counterparties. Securities pledged as collateral to the fund under repurchase agreements are held by a custodian bank until the agreements mature, and in the absence of a default, such collateral cannot be repledged, resold, or rehypothecated. Each agreement requires that the market value of the collateral be sufficient to cover payments of interest and principal. The fund further mitigates its counterparty risk by entering into repurchase agreements only with a diverse group of prequalified counterparties, monitoring their financial strength, and entering into master repurchase agreements with its counterparties. The master repurchase agreements provide that, in the event of a counterparty’s default (including bankruptcy), the fund may terminate any repurchase agreements
25
International Explorer Fund
with that counterparty, determine the net amount owed, and sell or retain the collateral up to the net amount owed to the fund. Such action may be subject to legal proceedings, which may delay or limit the disposition of collateral.
5. Federal Income Taxes: The fund intends to continue to qualify as a regulated investment company and distribute all of its taxable income. Management has analyzed the fund’s tax positions taken for all open federal income tax years (October 31, 2016–2019), and has concluded that no provision for federal income tax is required in the fund’s financial statements.
6. Distributions: Distributions to shareholders are recorded on the ex-dividend date. Distributions are determined on a tax basis and may differ from net investment income and realized capital gains for financial reporting purposes.
7. Securities Lending: To earn additional income, the fund lends its securities to qualified institutional borrowers. Security loans are subject to termination by the fund at any time, and are required to be secured at all times by collateral in an amount at least equal to the market value of securities loaned. Daily market fluctuations could cause the value of loaned securities to be more or less than the value of the collateral received. When this occurs, the collateral is adjusted and settled before the opening of the market on the next business day. The fund further mitigates its counterparty risk by entering into securities lending transactions only with a diverse group of prequalified counterparties, monitoring their financial strength, and entering into master securities lending agreements with its counterparties. The master securities lending agreements provide that, in the event of a counterparty’s default (including bankruptcy), the fund may terminate any loans with that borrower, determine the net amount owed, and sell or retain the collateral up to the net amount owed to the fund; however, such actions may be subject to legal proceedings. While collateral mitigates counterparty risk, in the event of a default, the fund may experience delays and costs in recovering the securities loaned. The fund invests cash collateral received in Vanguard Market Liquidity Fund, and records a liability in the Statement of Assets and Liabilities for the return of the collateral, during the period the securities are on loan. Securities lending income represents fees charged to borrowers plus income earned on invested cash collateral, less expenses associated with the loan. During the term of the loan, the fund is entitled to all distributions made on or in respect of the loaned securities.
8. Credit Facility: The fund and certain other funds managed by The Vanguard Group (“Vanguard”) participate in a $4.3 billion committed credit facility provided by a syndicate of lenders pursuant to a credit agreement that may be renewed annually; each fund is individually liable for its borrowings, if any, under the credit facility. Borrowings may be utilized for temporary and emergency purposes, and are subject to the fund’s regulatory and contractual borrowing restrictions. The participating funds are charged administrative fees and an annual commitment fee of 0.10% of the undrawn amount of the facility; these fees are allocated to the funds based on a method approved by the fund’s board of trustees and included in Management and Administrative expenses on the fund’s Statement of Operations. Any borrowings under this facility bear interest at a rate based upon the higher of the one-month London Interbank Offered Rate, federal funds effective rate, or overnight bank funding rate plus an agreed-upon spread.
The fund had no borrowings outstanding at October 31, 2019, or at any time during the period then ended.
26
International Explorer Fund
9. Other: Dividend income is recorded on the ex-dividend date. Interest income includes income distributions received from Vanguard Market Liquidity Fund and is accrued daily. Premiums and discounts on debt securities purchased are amortized and accreted, respectively, to interest income over the lives of the respective securities. Security transactions are accounted for on the date securities are bought or sold. Costs used to determine realized gains (losses) on the sale of investment securities are those of the specific securities sold.
Withholding taxes on foreign dividends and capital gains have been provided for in accordance with the fund’s understanding of the applicable countries’ tax rules and rates. The fund has filed tax reclaims for previously withheld taxes on dividends earned in certain European Union countries. These filings are subject to various administrative and judicial proceedings within these countries. Such tax reclaims received during the year, if any, are included in dividend income. No other amounts for additional tax reclaims are reflected in the financial statements due to the uncertainty as to the ultimate resolution of proceedings, the likelihood of receipt of these reclaims, and the potential timing of payment.
B. The investment advisory firms Schroder Investment Management North America Inc., Wellington Management Company LLP, and TimesSquare Capital Management, LLC, each provide investment advisory services to a portion of the fund for a fee calculated at an annual percentage rate of average net assets managed by the advisor. The basic fee of Schroder Investment Management North America Inc. and Wellington Management Company LLP is subject to quarterly adjustments based on performance relative to the S&P EPAC SmallCap Index for the preceding three years. The basic fee of TimesSquare Capital Management, LLC, is subject to quarterly adjustments based on performance relative to the S&P EPAC SmallCap Index since October 31, 2017.
Vanguard manages the cash reserves of the fund as described below.
For the year ended October 31, 2019, the aggregate investment advisory fee represented an effective annual basic rate of 0.24% of the fund’s average net assets, before a decrease of $1,138,000 (0.03%) based on performance.
C. In accordance with the terms of a Funds’ Service Agreement (the “FSA”) between Vanguard and the fund, Vanguard furnishes to the fund corporate management, administrative, marketing, distribution, and cash management services at Vanguard’s cost of operations (as defined by the FSA). These costs of operations are allocated to the fund based on methods and guidelines approved by the board of trustees. Vanguard does not require reimbursement in the current period for certain costs of operations (such as deferred compensation/benefits and risk/insurance costs); the fund’s liability for these costs of operations is included in Payables to Vanguard on the Statement of Assets and Liabilities. All other costs of operations payable to Vanguard are generally settled twice a month.
Upon the request of Vanguard, the fund may invest up to 0.40% of its net assets as capital in Vanguard. At October 31, 2019, the fund had contributed to Vanguard capital in the amount of $144,000, representing less than 0.01% of the fund’s net assets and 0.06% of Vanguard’s capital received pursuant to the FSA. The fund’s trustees and officers are also directors and employees, respectively, of Vanguard.
27
International Explorer Fund
D. The fund’s custodian bank has agreed to reduce its fees when the fund maintains cash on deposit in the non-interest-bearing custody account. For the year ended October 31, 2019, custodian fee offset arrangements reduced the fund’s expenses by $72,000 (an annual rate of 0.00% of average net assets).
E. Various inputs may be used to determine the value of the fund’s investments. These inputs are summarized in three broad levels for financial statement purposes. The inputs or methodologies used to value securities are not necessarily an indication of the risk associated with investing in those securities.
Level 1—Quoted prices in active markets for identical securities.
Level 2—Other significant observable inputs (including quoted prices for similar securities, interest rates, prepayment speeds, credit risk, etc.).
Level 3—Significant unobservable inputs (including the fund’s own assumptions used to determine the fair value of investments). Any investments valued with significant unobservable inputs are noted on the Statement of Net Assets.
The following table summarizes the market value of the fund’s investments and derivatives as of October 31, 2019, based on the inputs used to value them:
| Level 1 | Level 2 | Level 3 |
Investments | ($000) | ($000) | ($000) |
Common Stocks | 91,902 | 2,951,089 | — |
Temporary Cash Investments | 173,092 | 40,539 | — |
Futures Contracts—Assets1 | 114 | — | — |
Futures Contracts—Liabilities1 | (191) | — | — |
Forward Currency Contracts—Assets | — | 1,406 | — |
Forward Currency Contracts—Liabilities | — | (670) | — |
Total | 264,917 | 2,992,364 | — |
1 Represents variation margin on the last day of the reporting period.
F. At October 31, 2019, the fair values of derivatives were reflected in the Statement of Assets and Liabilities as follows:
| | Foreign | |
| Equity | Exchange | |
| Contracts | Contracts | Total |
Statement of Assets and Liabilities Caption | ($000) | ($000) | ($000) |
Variation Margin Receivable—Futures Contracts | 114 | — | 114 |
Unrealized Appreciation—Forward Currency Contracts | — | 1,406 | 1,406 |
Total Assets | 114 | 1,406 | 1,520 |
| | | |
Variation Margin Payable—Futures Contracts | (191) | — | (191) |
Unrealized Depreciation—Forward Currency Contracts | — | (670) | (670) |
Total Liabilities | (191) | (670) | (861) |
28
International Explorer Fund
Realized net gain (loss) and the change in unrealized appreciation (depreciation) on derivatives for the year ended October 31, 2019, were:
| | Foreign | |
| Equity | Exchange | |
| Contracts | Contracts | Total |
Realized Net Gain (Loss) on Derivatives | ($000) | ($000) | ($000) |
Futures Contracts | 2,165 | — | 2,165 |
Forward Currency Contracts | — | (1,273) | (1,273) |
Realized Net Gain (Loss) on Derivatives | 2,165 | (1,273) | 892 |
| | | |
Change in Unrealized Appreciation (Depreciation) on Derivatives | | | |
Futures Contracts | 3,847 | — | 3,847 |
Forward Currency Contracts | — | 2,158 | 2,158 |
Change in Unrealized Appreciation (Depreciation) on Derivatives | 3,847 | 2,158 | 6,005 |
G. Permanent differences between book-basis and tax-basis components of net assets are reclassified among capital accounts in the financial statements to reflect their tax character. These reclassifications have no effect on net assets or net asset value per share. As of period end, permanent differences primarily attributable to the accounting for foreign currency transactions, passive foreign investment companies and distributions in connection with fund share redemptions were reclassified between the following accounts:
| Amount |
| ($000) |
Paid-in Capital | 34 |
Total Distributable Earnings (Loss) | (34) |
Temporary differences between book-basis and tax-basis components of total distributable earnings (loss) arise when certain items of income, gain, or loss are recognized in different periods for financial statement and tax purposes; these differences will reverse at some time in the future. The differences are primarily related to the tax deferral of losses on wash sales, the realization of unrealized gains or losses on certain futures contracts and forward currency contracts, and unrealized gains on passive foreign investment companies. As of period end, the tax-basis components of total distributable earnings (loss) are detailed in the table as follows:
| Amount |
| ($000) |
Undistributed Ordinary Income | 74,531 |
Undistributed Long-Term Gains | — |
Capital Loss Carryforwards (Non-expiring) | (199,981) |
Net Unrealized Gains (Losses) | 236,365 |
29
International Explorer Fund
As of October 31, 2019, gross unrealized appreciation and depreciation for investments and derivatives based on cost for U.S. federal income tax purposes were as follows:
| Amount |
| ($000) |
Tax Cost | 3,021,109 |
Gross Unrealized Appreciation | 553,839 |
Gross Unrealized Depreciation | (317,699) |
Net Unrealized Appreciation (Depreciation) | 236,140 |
H. During the year ended October 31, 2019, the fund purchased $1,096,886,000 of investment securities and sold $1,571,544,000 of investment securities, other than temporary cash investments.
I. Capital shares issued and redeemed were:
| Year Ended October 31, |
| 2019 | 2018 |
| Shares | Shares |
| (000) | (000) |
Issued | 33,619 | 58,614 |
Issued in Lieu of Cash Distributions | 15,758 | 10,930 |
Redeemed | (70,018) | (47,185) |
Net Increase (Decrease) in Shares Outstanding | (20,641) | 22,359 |
J. Transactions during the period in investments where the issuer is another member of The Vanguard Group were as follows:
| | Current Period Transactions | |
| Oct. 31, | | Proceeds | Realized | | | | Oct. 31, |
| 2018 | | from | Net | Change in | | Capital Gain | 2019 |
| Market | Purchases | Securities | Gain | Unrealized | | Distributions | Market |
| Value | at Cost | Sold | (Loss) | App. (Dep.) | Income | Received | Value |
| ($000) | ($000) | ($000) | ($000) | ($000) | ($000) | ($000) | ($000) |
Vanguard FTSE All World ex-US Small-Cap ETF | 25,105 | 2,955 | 6,116 | (16) | 524 | 693 | — | 22,452 |
Vanguard Market Liquidity Fund | 270,069 | NA1 | NA1 | 15 | 5 | 2,193 | — | 173,092 |
Total | 295,174 | | | (1) | 529 | 2,886 | — | 195,544 |
1 Not applicable—purchases and sales are for temporary cash investment purposes.
K. Management has determined that no events or transactions occurred subsequent to October 31, 2019, that would require recognition or disclosure in these financial statements.
30
Report of Independent Registered Public Accounting Firm
To the Board of Trustees of Vanguard Whitehall Funds and Shareholders of Vanguard International Explorer Fund
Opinion on the Financial Statements
We have audited the accompanying statement of net assets and statement of assets and liabilities of Vanguard International Explorer Fund (one of the funds constituting Vanguard Whitehall Funds, referred to hereafter as the “Fund”) as of October 31, 2019, the related statement of operations for the year ended October 31, 2019, the statement of changes in net assets for each of the two years in the period ended October 31, 2019, including the related notes, and the financial highlights for each of the five years in the period ended October 31, 2019 (collectively referred to as the “financial statements”). In our opinion, the financial statements present fairly, in all material respects, the financial position of the Fund as of October 31, 2019, the results of its operations for the year then ended, the changes in its net assets for each of the two years in the period ended October 31, 2019 and the financial highlights for each of the five years in the period ended October 31, 2019 in conformity with accounting principles generally accepted in the United States of America.
Basis for Opinion
These financial statements are the responsibility of the Fund’s management. Our responsibility is to express an opinion on the Fund’s financial statements based on our audits. We are a public accounting firm registered with the Public Company Accounting Oversight Board (United States) (“PCAOB”) and are required to be independent with respect to the Fund in accordance with the U.S. federal securities laws and the applicable rules and regulations of the Securities and Exchange Commission and the PCAOB.
We conducted our audits of these financial statements in accordance with the standards of the PCAOB. Those standards require that we plan and perform the audit to obtain reasonable assurance about whether the financial statements are free of material misstatement, whether due to error or fraud.
Our audits included performing procedures to assess the risks of material misstatement of the financial statements, whether due to error or fraud, and performing procedures that respond to those risks. Such procedures included examining, on a test basis, evidence regarding the amounts and disclosures in the financial statements. Our audits also included evaluating the accounting principles used and significant estimates made by management, as well as evaluating the overall presentation of the financial statements. Our procedures included confirmation of securities owned as of October 31, 2019 by correspondence with the custodian and brokers and by agreement to the underlying ownership records of the transfer agent; when replies were not received from brokers, we performed other auditing procedures. We believe that our audits provide a reasonable basis for our opinion.
/s/PricewaterhouseCoopers LLP
Philadelphia, Pennsylvania
December 18, 2019
We have served as the auditor of one or more investment companies in The Vanguard Group of Funds since 1975.
31
Special 2019 tax information (unaudited) for Vanguard International Explorer Fund
This information for the fiscal year ended October 31, 2019, is included pursuant to provisions of the Internal Revenue Code.
The fund distributed $164,550,000 as capital gain dividends (20% rate gain distributions) to shareholders during the fiscal year.
For nonresident alien shareholders, 100% of short-term capital gain dividends distributed by the fund are qualified short-term capital gains.
The fund distributed $57,408,000 of qualified dividend income to shareholders during the fiscal year.
The fund designates to shareholders foreign source income of $87,471,000 and foreign taxes paid of $6,588,000. Shareholders will receive more detailed information with their Form 1099-DIV in January 2020 to determine the calendar-year amounts to be included on their 2019 tax returns.
32
Trustees Approve Advisory Arrangements
The board of trustees of Vanguard International Explorer Fund has renewed the fund’s investment advisory arrangements with Schroder Investment Management North America Inc. (Schroder Inc.), TimesSquare Capital Management, LLC (TimesSquare), and Wellington Management Company LLP (Wellington Management), as well as the sub-advisory arrangement with Schroder Investment Management North America Limited (Schroder Ltd.). The board determined that renewing the fund’s advisory arrangements was in the best interests of the fund and its shareholders.
The board based its decision upon an evaluation of each advisor’s investment staff, portfolio management process, and performance. This evaluation included information provided to the board by Vanguard’s Portfolio Review Department, which is responsible for fund and advisor oversight and product management. The Portfolio Review Department met regularly with the advisors and made monthly presentations to the board during the fiscal year that directed the board’s focus to relevant information and topics.
The board, or an investment committee made up of board members, also received information throughout the year during advisor presentations. For each advisor presentation, the board was provided with letters and reports that included information about, among other things, the advisory firm and the advisor’s assessment of the investment environment, portfolio performance, and portfolio characteristics.
In addition, the board received monthly reports, which included a Market and Economic Report, a Fund Dashboard Monthly Summary, and a Fund Performance Report.
Prior to their meeting, the trustees were provided with a memo and materials that summarized the information they received over the course of the year. They also considered the factors discussed below, among others. However, no single factor determined whether the board approved the arrangements. Rather, it was the totality of the circumstances that drove the board’s decision.
Nature, extent, and quality of services
The board reviewed the quality of the fund’s investment management services over both the short and long term, and took into account the organizational depth and stability of each advisor. The board considered the following:
Schroder. Schroders plc, the parent company of Schroder Inc. and Schroder Ltd. (collectively, Schroder), founded in 1804, specializes in global equity and fixed income management. Schroder employs a bottom-up, fundamental research-driven process to select stocks, with a focus on identifying companies with sustainable competitive advantages, attractive earnings growth, and compelling valuations. Stock selection responsibilities are divided among five regional leaders who comprise Schroder’s International Small-Cap Committee, which is led by the portfolio manager. The regional team leverages Schroder’s extensive network of local analysts across the globe, as it believes that country factors are more important for smaller companies relative to larger companies. Schroder Inc. has advised the fund since its inception in 1996, and its affiliate Schroder Ltd. has advised the fund since 2003.
TimesSquare. TimesSquare, founded in 2000 as a small- and mid-cap growth specialist, is a strategic partner of Affiliated Managers Group, Inc. TimesSquare’s small-cap equity team is led by the portfolio manager and is made up of six experienced members. All portfolio decisions are made collectively, allowing for accountability. Value chain analysis and interactions with key
33
stakeholders are at the core of the team’s research and idea-generation process, resulting in a portfolio comprised of industry-leading companies with sustainable business models and quality management teams. TimesSquare has managed a portion of the fund since 2017.
Wellington Management. Wellington Management, founded in 1928, is among the nation’s oldest and most respected institutional investment managers. Wellington Management’s international small-cap team uses a fundamental, research-driven investment process, employing a bottom-up approach that attempts to discover a company’s intrinsic value. In valuing a company, it believes that the same valuation metric should be applied on an industry-by-industry basis. Although the team’s valuation discipline is essential to the process, its philosophy is not biased toward growth or value as it invests in both extended growth opportunities and neglected or misunderstood companies. Wellington Management has managed a portion of the fund since 2010.
The board concluded that each advisor’s experience, stability, depth, and performance, among other factors, warranted continuation of the advisory arrangements.
Investment performance
The board considered the short- and long-term performance of each advisor’s subportfolio, including any periods of outperformance or underperformance compared with a relevant benchmark index and peer group. The board concluded that the performance was such that the advisory arrangements should continue.
Cost
The board concluded that the fund’s expense ratio was well below the average expense ratio charged by funds in its peer group and that the fund’s advisory fee rate was also well below the peer-group average.
The board did not consider the profitability of Schroder, TimesSquare, or Wellington Management in determining whether to approve the advisory fees, because the firms are independent of Vanguard and the advisory fees are the result of arm’s-length negotiations.
The benefit of economies of scale
The board concluded that the fund’s shareholders benefit from economies of scale because of breakpoints in the advisory fee schedules for Schroder, TimesSquare, and Wellington Management. The breakpoints reduce the effective rate of the fees as the fund’s assets managed by each advisor increase.
The board will consider whether to renew the advisory arrangements again after a one-year period.
34
The People Who Govern Your Fund
The trustees of your mutual fund are there to see that the fund is operated and managed in your best interests since, as a shareholder, you are a part owner of the fund. Your fund’s trustees also serve on the board of directors of The Vanguard Group, Inc., which is owned by the Vanguard funds and provides services to them.
A majority of Vanguard’s board members are independent, meaning that they have no affiliation with Vanguard or the funds they oversee, apart from the sizable personal investments they have made as private individuals. The independent board members have distinguished backgrounds in business, academia, and public service. Each of the trustees and executive officers oversees 213 Vanguard funds.
Information for each trustee and executive officer of the fund appears below. That information, as well as the Vanguard fund count, is as of the date on the cover of this fund report. The mailing address of the trustees and officers is P.O. Box 876, Valley Forge, PA 19482. More information about the trustees is in the Statement of Additional Information, which can be obtained, without charge, by contacting Vanguard at 800-662-7447, or online at vanguard.com.
Interested Trustee1
Mortimer J. Buckley
Born in 1969. Trustee since January 2018. Principal occupation(s) during the past five years and other experience: chairman of the board (January 2019–present) of Vanguard and of each of the investment companies served by Vanguard; chief executive officer (January 2018–present) of Vanguard; chief executive officer, president, and trustee (January 2018–present) of each of the investment companies served by Vanguard; president and director (2017–present) of Vanguard; and president (February 2018–present) of Vanguard Marketing Corporation. Chief investment officer (2013–2017), managing director (2002–2017), head of the Retail Investor Group (2006–2012), and chief information officer (2001–2006) of Vanguard. Chairman of the board (2011–2017) and trustee (2009–2017) of the Children’s Hospital of Philadelphia; trustee (2018–present) of The Shipley School.
Independent Trustees
Emerson U. Fullwood
Born in 1948. Trustee since January 2008. Principal occupation(s) during the past five years and other experience: executive chief staff and marketing officer for North America and corporate vice president (retired 2008) of Xerox Corporation (document management products and services). Former president of the Worldwide Channels Group, Latin America, and Worldwide Customer Service and executive chief staff officer of Developing Markets of Xerox. Executive in residence and 2009–2010 Distinguished Minett Professor at the Rochester Institute of Technology. Director of SPX FLOW, Inc. (multi-industry manufacturing). Director of the University of Rochester Medical Center, the Monroe Community College Foundation, the United Way of Rochester, North Carolina A&T University, and Roberts Wesleyan College. Trustee of the University of Rochester.
Amy Gutmann
Born in 1949. Trustee since June 2006. Principal occupation(s) during the past five years and other experience: president (2004–present) of the University of Pennsylvania. Christopher H. Browne Distinguished Professor of Political Science, School of Arts and Sciences, and professor of communication, Annenberg School for Communication, with secondary faculty appointments in the Department of Philosophy, School of Arts and Sciences, and at the Graduate School of Education, University of Pennsylvania. Trustee of the National Constitution Center.
F. Joseph Loughrey
Born in 1949. Trustee since October 2009. Principal occupation(s) during the past five years and other experience: president and chief operating officer (retired 2009) and vice chairman of the board (2008–2009) of Cummins Inc. (industrial machinery). Chairman of the board of Hillenbrand, Inc. (specialized consumer services), and the Lumina Foundation.
1 Mr. Buckley is considered an “interested person,” as defined in the Investment Company Act of 1940, because he is an officer of the Vanguard funds.
35
Director of the V Foundation and Oxfam America. Member of the advisory council for the College of Arts and Letters and chair of the advisory board to the Kellogg Institute for International Studies, both at the University of Notre Dame.
Mark Loughridge
Born in 1953. Trustee since March 2012. Principal occupation(s) during the past five years and other experience: senior vice president and chief financial officer (retired 2013) of IBM (information technology services). Fiduciary member of IBM’s Retirement Plan Committee (2004–2013), senior vice president and general manager (2002–2004) of IBM Global Financing, vice president and controller (1998–2002) of IBM, and a variety of other prior management roles at IBM. Member of the Council on Chicago Booth.
Scott C. Malpass
Born in 1962. Trustee since March 2012. Principal occupation(s) during the past five years and other experience: chief investment officer (1989–present) and vice president (1996–present) of the University of Notre Dame. Assistant professor of finance at the Mendoza College of Business, University of Notre Dame, and member of the Notre Dame 403(b) Investment Committee. Chairman of the board of TIFF Advisory Services, Inc. Member of the board of Catholic Investment Services, Inc. (investment advisors) and the board of superintendence of the Institute for the Works of Religion.
Deanna Mulligan
Born in 1963. Trustee since January 2018. Principal occupation(s) during the past five years and other experience: president (2010–present) and chief executive officer (2011–present) of The Guardian Life Insurance Company of America. Chief operating officer (2010–2011) and executive vice president (2008–2010) of Individual Life and Disability of The Guardian Life Insurance Company of America. Member of the board of The Guardian Life Insurance Company of America, the American Council of Life Insurers, the Partnership for New York City (business leadership), and the Committee Encouraging Corporate Philanthropy. Trustee of the Economic Club of New York and the Bruce Museum (arts and science). Member of the Advisory Council for the Stanford Graduate School of Business.
André F. Perold
Born in 1952. Trustee since December 2004. Principal occupation(s) during the past five years and other experience: George Gund Professor of Finance and Banking, Emeritus at the Harvard Business School (retired 2011). Chief investment officer and co-managing partner of HighVista Strategies (private investment firm). Board of advisors and investment committee member of the Museum of Fine Arts Boston. Board member (2018–present) of RIT Capital Partners (investment firm); investment committee member of Partners Health Care System.
Sarah Bloom Raskin
Born in 1961. Trustee since January 2018. Principal occupation(s) during the past five years and other experience: deputy secretary (2014–2017) of the United States Department of the Treasury. Governor (2010–2014) of the Federal Reserve Board. Commissioner (2007–2010) of financial regulation for the State of Maryland. Member of the board of directors (2012–2014) of Neighborhood Reinvestment Corporation. Director (2017–present) of i(x) Investments; director (2017–present) of Reserve Trust. Rubinstein Fellow (2017–present) of Duke University; trustee (2017–present) of Amherst College.
Peter F. Volanakis
Born in 1955. Trustee since July 2009. Principal occupation(s) during the past five years and other experience: president and chief operating officer (retired 2010) of Corning Incorporated (communications equipment) and director of Corning Incorporated (2000–2010) and Dow Corning (2001–2010). Director (2012) of SPX Corporation (multi-industry manufacturing). Overseer of the Amos Tuck School of Business Administration, Dartmouth College (2001–2013). Chairman of the board of trustees of Colby-Sawyer College. Member of the board of Hypertherm Inc. (industrial cutting systems, software, and consumables).
36
Executive Officers
John Bendl
Born in 1970. Principal occupation(s) during the past five years and other experience: principal of Vanguard. Chief financial officer (October 2019–present) of each of the investment companies served by Vanguard. Chief accounting officer, treasurer, and controller of Vanguard (2017–present). Partner (2003–2016) at KPMG (audit, tax, and advisory services).
Glenn Booraem
Born in 1967. Principal occupation(s) during the past five years and other experience: principal of Vanguard. Investment stewardship officer (2017–present), treasurer (2015–2017), controller (2010–2015), and assistant controller (2001–2010) of each of the investment companies served by Vanguard.
Christine M. Buchanan
Born in 1970. Principal occupation(s) during the past five years and other experience: principal of Vanguard. Treasurer (2017–present) of each of the investment companies served by Vanguard. Partner (2005–2017) at KPMG (audit, tax, and advisory services).
David Cermak
Born in 1960. Principal occupation(s) during the past five years and other experience: principal of Vanguard. Finance director (October 2019–present) of each of the investment companies served by Vanguard. Managing director and head (2017–present) of Vanguard Investments Singapore. Managing director and head (2017–2019) of Vanguard Investments Hong Kong. Representative director and head (2014–2017) of Vanguard Investments Japan.
Thomas J. Higgins
Born in 1957. Principal occupation(s) during the past five years and other experience: principal of Vanguard. Finance director (October 2019–present), chief financial officer (2008–2019), and treasurer (1998–2008) of each of the investment companies served by Vanguard.
Peter Mahoney
Born in 1974. Principal occupation(s) during the past five years and other experience: principal of Vanguard. Controller (2015–present) of each of the investment companies served by Vanguard. Head of International Fund Services (2008–2014) at Vanguard.
Anne E. Robinson
Born in 1970. Principal occupation(s) during the past five years and other experience: general counsel (2016–present) of Vanguard. Secretary (2016–present) of Vanguard and of each of the investment companies served by Vanguard. Managing director (2016–present) of Vanguard. Managing director and general counsel of Global Cards and Consumer Services (2014–2016) at Citigroup. Counsel (2003–2014) at American Express.
Michael Rollings
Born in 1963. Principal occupation(s) during the past five years and other experience: finance director (2017–present) and treasurer (2017) of each of the investment companies served by Vanguard. Managing director (2016–present) of Vanguard. Chief financial officer (2016–present) of Vanguard. Director (2016–present) of Vanguard Marketing Corporation. Executive vice president and chief financial officer (2006–2016) of MassMutual Financial Group.
John E. Schadl
Born in 1972. Principal occupation(s) during the past five years and other experience: principal of Vanguard. Chief compliance officer (2019–present) of Vanguard and of each of the investment companies served by Vanguard. Assistant vice president (May 2019–present) of Vanguard Marketing Corporation.
Vanguard Senior Management Team
Joseph Brennan | Chris D. McIsaac |
Mortimer J. Buckley | James M. Norris |
Gregory Davis | Thomas M. Rampulla |
John James | Karin A. Risi |
Martha G. King | Anne E. Robinson |
John T. Marcante | Michael Rollings |
37
| 
|
| |
| P.O. Box 2600 |
| Valley Forge, PA 19482-2600 |
Connect with Vanguard® > vanguard.com
Fund Information > 800-662-7447
Direct Investor Account Services > 800-662-2739
Institutional Investor Services > 800-523-1036
Text Telephone for People
Who Are Deaf or Hard of Hearing > 800-749-7273
This material may be used in conjunction with the offering of shares of any Vanguard fund only if preceded or accompanied by the fund’s current prospectus.
All comparative mutual fund data are from Morningstar, Inc., unless otherwise noted.
You can obtain a free copy of Vanguard’s proxy voting guidelines by visiting vanguard.com/proxyreporting or by calling Vanguard at 800-662-2739. The guidelines are also available from the SEC’s website, www.sec.gov. In addition, you may obtain a free report on how your fund voted the proxies for securities it owned during the 12 months ended June 30. To get the report, visit either vanguard.com/proxyreporting or www.sec.gov.
You can review information about your fund on the SEC’s website, and you can receive copies of this information, for a fee, by sending a request via email addressed to publicinfo@sec.gov.
Source for Bloomberg Barclays indexes: Bloomberg Index Services Limited. Copyright 2019, Bloomberg. All rights reserved.
| © 2019 The Vanguard Group, Inc. |
| All rights reserved. |
| Vanguard Marketing Corporation, Distributor. |
| |
| Q1260 122019 |

Annual Report | October 31, 2019 Vanguard High Dividend Yield Index Fund |
See the inside front cover for important information about access to your fund’s annual and semiannual shareholder reports. |
Important information about access to shareholder reports
Beginning on January 1, 2021, as permitted by regulations adopted by the Securities and Exchange Commission, paper copies of your fund’s annual and semiannual shareholder reports will no longer be sent to you by mail, unless you specifically request them. Instead, you will be notified by mail each time a report is posted on the website and will be provided with a link to access the report.
If you have already elected to receive shareholder reports electronically, you will not be affected by this change and do not need to take any action. You may elect to receive shareholder reports and other communications from the fund electronically by contacting your financial intermediary (such as a broker-dealer or bank) or, if you invest directly with the fund, by calling Vanguard at one of the phone numbers on the back cover of this report or by logging on to vanguard.com.
You may elect to receive paper copies of all future shareholder reports free of charge. If you invest through a financial intermediary, you can contact the intermediary to request that you continue to receive paper copies. If you invest directly with the fund, you can call Vanguard at one of the phone numbers on the back cover of this report or log on to vanguard.com. Your election to receive paper copies will apply to all the funds you hold through an intermediary or directly with Vanguard.
Contents | |
| |
A Note From Our Chairman | 1 |
Your Fund’s Performance at a Glance | 2 |
About Your Fund’s Expenses | 3 |
Performance Summary | 5 |
Financial Statements | 8 |
Please note: The opinions expressed in this report are just that—informed opinions. They should not be considered promises or advice. Also, please keep in mind that the information and opinions cover the period through the date on the front of this report. Of course, the risks of investing in your fund are spelled out in the prospectus.
A Note From Our Chairman

Tim Buckley
Chairman and Chief Executive Officer
Dear Shareholder,
Recent volatility in financial markets— affecting stocks, bonds, and commodities— has been a good reminder of the wise old adage, “Never keep all your eggs in one basket.” Maintaining balance and diversification in your investment portfolio can help to both limit risk and set you up for long-term success.
It’s understandable why some investors might become complacent after a long market run-up like the one that lifted stock prices, especially U.S. stock prices, in the years following the global financial crisis. But failing to rebalance regularly can leave a portfolio with a much different mix of assets than intended and, often, more risk than intended.
Balance across and diversification within asset classes are powerful tools for managing risk and achieving your investment goals. A portfolio’s allocation will determine a large portion of its long-term return and also the majority of its volatility risk. A well-diversified portfolio is less vulnerable to significant swings in the performance of any one segment of the asset classes in which it invests.
Balance and diversification will never eliminate the risk of loss, nor will they guarantee positive returns in a declining market. But they should reduce the chance that you’ll suffer disproportionate losses in one particular high-flying asset class or sector when it comes back to earth. And exposure to all key market components should give you at least some participation in the sectors that are performing best at any given time.
Vanguard is committed to helping you achieve balance and diversification in your portfolios to help meet your investment goals. We thank you for your continued loyalty.
Sincerely,

Mortimer J. Buckley
Chairman and Chief Executive Officer
November 18, 2019
1
Your Fund’s Performance at a Glance
· For the 12 months ended October 31, 2019, Vanguard High Dividend Yield Index Fund returned 11.31% for ETF Shares. It performed in line with its benchmark, the FTSE High Dividend Yield Index.
· The fund emphasizes large-capitalization stocks that are forecasted to have above-average dividend yields.
· The broad U.S. stock market, as measured by the Russell 3000 Index, climbed more than 13% for the year. While stocks endured stretches of volatility at the end of 2018 and during the spring of 2019, their performance was boosted by the Federal Reserve’s accommodative stance and corporate earnings that largely exceeded investor expectations.
· U.S. companies that are committed to paying larger-than-average dividends underperformed the broad U.S. stock market.
· The fund recorded positive results in nine of its ten market sectors. Technology, financials, and utilities stocks contributed the most to returns. Oil and gas stocks delivered the only negative performance.
· For the ten years ended October 31, 2019, the fund’s average annual return of 13.06% for ETF Shares was in line with that of its benchmark.
Market Barometer | | | | | | | |
| | Average Annual Total Returns | |
| | Periods Ended October 31, 2019 | |
| | One Year | | Three Years | | Five Years | |
Stocks | | | | | | | |
Russell 1000 Index (Large-caps) | | 14.15% | | 14.73% | | 10.55% | |
Russell 2000 Index (Small-caps) | | 4.90 | | 10.96 | | 7.37 | |
Russell 3000 Index (Broad U.S. market) | | 13.49 | | 14.47 | | 10.31 | |
FTSE All-World ex US Index (International) | | 11.52 | | 8.21 | | 4.16 | |
| | | | | | | |
Bonds | | | | | | | |
Bloomberg Barclays U.S. Aggregate Bond Index (Broad taxable market) | | 11.51% | | 3.29% | | 3.24% | |
Bloomberg Barclays Municipal Bond Index (Broad tax-exempt market) | | 9.42 | | 3.62 | | 3.55 | |
FTSE Three-Month U.S. Treasury Bill Index | | 2.35 | | 1.57 | | 0.98 | |
| | | | | | | |
CPI | | | | | | | |
Consumer Price Index | | 1.76% | | 2.11% | | 1.62% | |
2
About Your Fund’s Expenses
As a shareholder of the fund, you incur ongoing costs, which include costs for portfolio management, administrative services, and shareholder reports (like this one), among others. Operating expenses, which are deducted from a fund’s gross income, directly reduce the investment return of the fund.
A fund’s expenses are expressed as a percentage of its average net assets. This figure is known as the expense ratio. The following examples are intended to help you understand the ongoing costs (in dollars) of investing in your fund and to compare these costs with those of other mutual funds. The examples are based on an investment of $1,000 made at the beginning of the period shown and held for the entire period.
The accompanying table illustrates your fund’s costs in two ways:
· Based on actual fund return. This section helps you to estimate the actual expenses that you paid over the period. The “Ending Account Value” shown is derived from the fund’s actual return, and the third column shows the dollar amount that would have been paid by an investor who started with $1,000 in the fund. You may use the information here, together with the amount you invested, to estimate the expenses that you paid over the period.
To do so, simply divide your account value by $1,000 (for example, an $8,600 account value divided by $1,000 = 8.6), then multiply the result by the number given for your fund under the heading “Expenses Paid During Period.”
· Based on hypothetical 5% yearly return. This section is intended to help you compare your fund’s costs with those of other mutual funds. It assumes that the fund had a yearly return of 5% before expenses, but that the expense ratio is unchanged. In this case—because the return used is not the fund’s actual return—the results do not apply to your investment. The example is useful in making comparisons because the Securities and Exchange Commission requires all mutual funds to calculate expenses based on a 5% return. You can assess your fund’s costs by comparing this hypothetical example with the hypothetical examples that appear in shareholder reports of other funds.
Note that the expenses shown in the table are meant to highlight and help you compare ongoing costs only and do not reflect transaction costs incurred by the fund for buying and selling securities. Further, the expenses do not include any purchase, redemption, or account service fees described in the fund prospectus. If such fees were applied to your account, your costs would be higher. Your fund does not carry a “sales load.”
The calculations assume no shares were bought or sold during the period. Your actual costs may have been higher or lower, depending on the amount of your investment and the timing of any purchases or redemptions.
You can find more information about the fund’s expenses, including annual expense ratios, in the Financial Statements section of this report. For additional information on operating expenses and other shareholder costs, please refer to your fund’s current prospectus.
3
Six Months Ended October 31, 2019 | | | |
High Dividend Yield Index Fund | Beginning
Account Value
4/30/2019 | Ending
Account Value
10/31/2019 | Expenses
Paid During
Period |
Based on Actual Fund Return | | | |
Investor Shares | $1,000.00 | $1,032.63 | $0.72 |
ETF Shares | 1,000.00 | 1,033.08 | 0.31 |
Admiral™ Shares | 1,000.00 | 1,032.82 | 0.41 |
Based on Hypothetical 5% Yearly Return | | | |
Investor Shares | $1,000.00 | $1,024.50 | $0.71 |
ETF Shares | 1,000.00 | 1,024.90 | 0.31 |
Admiral Shares | 1,000.00 | 1,024.80 | 0.41 |
The calculations are based on expenses incurred in the most recent six-month period. The fund’s annualized six-month expense ratios for that period are 0.14% for Investor Shares, 0.06% for ETF Shares, and 0.08% for Admiral Shares. The dollar amounts shown as “Expenses Paid” are equal to the annualized expense ratio multiplied by the average account value over the period, multiplied by the number of days in the most recent six-month period, then divided by the number of days in the most recent 12-month period (184/365).
4
High Dividend Yield Index Fund
Performance Summary
All of the returns in this report represent past performance, which is not a guarantee of future results that may be achieved by the fund. (Current performance may be lower or higher than the performance data cited. For performance data current to the most recent month-end, visit our website at vanguard.com/performance.) Note, too, that both investment returns and principal value can fluctuate widely, so an investor’s shares, when sold, could be worth more or less than their original cost. The returns shown do not reflect taxes that a shareholder would pay on fund distributions or on the sale of fund shares.
Cumulative Performance: October 31, 2009, Through October 31, 2019
Initial Investment of $10,000
| | | | Average Annual Total Returns | | |
| | | | Periods Ended October 31, 2019 | | |
| | | | | | | | | | Final Value |
| | | | One | | Five | | Ten | | of a $10,000 |
| | | | Year | | Years | | Years | | Investment |

| | High Dividend Yield Index Fund Investor Shares | | 11.20% | | 8.93% | | 12.95% | | $33,805 |

| | FTSE High Dividend Yield Index | | 11.32 | | 9.07 | | 13.15 | | 34,398 |

| | Dow Jones U.S. Total Stock Market Float Adjusted Index | | 13.39 | | 10.26 | | 13.62 | | 35,859 |
| | | | | | | | | | Final Value |
| | | | One | | Five | | Ten | | of a $10,000 |
| | | | Year | | Years | | Years | | Investment |
High Dividend Yield Index Fund ETF Shares Net Asset Value | | 11.31% | | 9.01% | | 13.06% | | $34,115 |
High Dividend Yield Index Fund ETF Shares Market Price | | 11.39 | | 9.02 | | 13.07 | | 34,143 |
FTSE High Dividend Yield Index | | 11.32 | | 9.07 | | 13.15 | | 34,398 |
Dow Jones U.S. Total Stock Market Float Adjusted Index | | 13.39 | | 10.26 | | 13.62 | | 35,859 |
See Financial Highlights for dividend and capital gains information.
5
High Dividend Yield Index Fund
| | Total Returns | | |
| | Period Ended October 31, 2019 | | |
| | Since | | Final Value |
| | Inception | | of a $10,000 |
| | (2/7/2019) | | Investment |
High Dividend Yield Index Fund Admiral Shares | | 10.64% | | $11,064 |
FTSE High Dividend Yield Index | | 10.68 | | 11,068 |
Dow Jones U.S. Total Stock Market Float Adjusted Index | | 12.61 | | 11,261 |
“Since Inception” performance is calculated from the Admiral Shares’ inception date for both the fund and its comparative standards.
Cumulative Returns of ETF Shares: October 31, 2009, Through October 31, 2019
| | One | | Five | | Ten | |
| | Year | | Years | | Years | |
High Dividend Yield Index Fund ETF Shares Market Price | | 11.39% | | 53.98% | | 241.43 | % |
High Dividend Yield Index Fund ETF Shares Net Asset Value | | 11.31 | | 53.92 | | 241.15 | |
FTSE High Dividend Yield Index | | 11.32 | | 54.36 | | 243.98 | |
For the ETF Shares, the market price is determined by the midpoint of the bid-offer spread as of the closing time of the New York Stock Exchange (generally 4 p.m., Eastern time). The net asset value is also determined as of the NYSE closing time. For more information about how the ETF Shares’ market prices have compared with their net asset value, visit vanguard.com, select your ETF, and then select the Price and Performance tab. The ETF premium/discount analysis there shows the percentages of days on which the ETF Shares’ market price was above or below the NAV.
6
High Dividend Yield Index Fund
Sector Diversification
As of October 31, 2019
Basic Materials | | 3.5 | % |
Consumer Goods | | 14.1 | |
Consumer Services | | 9.3 | |
Financials | | 18.9 | |
Health Care | | 12.8 | |
Industrials | | 8.3 | |
Oil & Gas | | 8.4 | |
Technology | | 10.4 | |
Other | | 0.0 | |
Telecommunications | | 5.3 | |
Utilities | | 9.0 | |
Sector categories are based on the Industry Classification Benchmark (“ICB”), except for the “Other” category (if applicable), which includes securities that have not been provided an ICB classification as of the effective reporting period.
The Industry Classification Benchmark (“ICB”) is owned by FTSE. FTSE does not accept any liability to any person for any loss or damage arising out of any error or omission in the ICB.
7
High Dividend Yield Index Fund
Financial Statements
Statement of Net Assets
As of October 31, 2019
The fund files its complete schedule of portfolio holdings with the Securities and Exchange Commission (SEC) for the first and third quarters of each fiscal year as an exhibit to its reports on Form N-PORT. The fund’s Form N-PORT reports are available on the SEC’s website at www.sec.gov.
| | | | | Market | |
| | | | | Value· | |
| | | Shares | | ($000 | ) |
Common Stocks (99.8%)1 | | | | | |
Basic Materials (3.5%) | | | | | |
| Linde plc | | 1,865,256 | | 369,974 | |
| DuPont de Nemours Inc. | | 2,577,438 | | 169,879 | |
| Air Products & Chemicals Inc. | | 758,687 | | 161,798 | |
| Dow Inc. | | 2,569,176 | | 129,718 | |
| LyondellBasell Industries NV Class A | | 914,464 | | 82,027 | |
| International Paper Co. | | 1,350,988 | | 59,011 | |
| Nucor Corp. | | 1,049,163 | | 56,497 | |
| Eastman Chemical Co. | | 466,658 | | 35,485 | |
| CF Industries Holdings Inc. | | 751,329 | | 34,073 | |
| RPM International Inc. | | 441,207 | | 31,957 | |
| Reliance Steel & Aluminum Co. | | 222,379 | | 25,805 | |
| Huntsman Corp. | | 752,862 | | 16,661 | |
| Scotts Miracle-Gro Co. | | 135,163 | | 13,569 | |
| Olin Corp. | | 565,011 | | 10,362 | |
| Southern Copper Corp. | | 283,168 | | 10,075 | |
| Cabot Corp. | | 194,776 | | 8,490 | |
| Commercial Metals Co. | | 404,563 | | 7,820 | |
| Domtar Corp. | | 212,020 | | 7,715 | |
| Compass Minerals International Inc. | | 114,720 | | 6,479 | |
| Trinseo SA | | 137,384 | | 5,839 | |
| Schweitzer-Mauduit International Inc. | | 103,882 | | 4,206 | |
| Orion Engineered Carbons SA | | 199,976 | | 3,312 | |
| Innophos Holdings Inc. | | 66,573 | | 2,172 | |
| Schnitzer Steel Industries Inc. | | 86,089 | | 1,837 | |
^ | Nexa Resources SA | | 118,532 | | 1,267 | |
| | | | | 1,256,028 | |
Consumer Goods (14.1%) | | | | | |
| Procter & Gamble Co. | | 8,498,697 | | 1,058,173 | |
| Coca-Cola Co. | | 13,184,928 | | 717,656 | |
| PepsiCo Inc. | | 4,817,083 | | 660,759 | |
| Philip Morris International Inc. | | 5,342,959 | | 435,130 | |
| Altria Group Inc. | | 6,431,947 | | 288,087 | |
| Colgate-Palmolive Co. | | 2,886,667 | | 198,025 | |
| General Motors Co. | | 4,266,218 | | 158,533 | |
| Kimberly-Clark Corp. | | 1,173,279 | | 155,905 | |
| Ford Motor Co. | | 13,449,984 | | 115,535 | |
| General Mills Inc. | | 2,060,465 | | 104,795 | |
| VF Corp. | | 1,057,332 | | 87,008 | |
| Archer-Daniels-Midland Co. | | 1,911,486 | | 80,359 | |
| Hershey Co. | | 495,144 | | 72,722 | |
| Kraft Heinz Co. | | 2,150,293 | | 69,519 | |
| Corteva Inc. | | 2,575,838 | | 67,951 | |
| Clorox Co. | | 433,413 | | 64,011 | |
| Kellogg Co. | | 847,311 | | 53,830 | |
| Genuine Parts Co. | | 484,664 | | 49,717 | |
| Garmin Ltd. | | 499,317 | | 46,811 | |
| Conagra Brands Inc. | | 1,649,163 | | 44,610 | |
| JM Smucker Co. | | 379,866 | | 40,144 | |
| Hasbro Inc. | | 399,053 | | 38,832 | |
| Coca-Cola European Partners plc | | 608,578 | | 32,565 | |
| Whirlpool Corp. | | 213,733 | | 32,513 | |
| Molson Coors Brewing Co. Class B | | 594,202 | | 31,326 | |
| Campbell Soup Co. | | 570,735 | | 26,431 | |
| Tapestry Inc. | | 994,248 | | 25,711 | |
| Bunge Ltd. | | 469,819 | | 25,370 | |
| Newell Brands Inc. | | 1,295,585 | | 24,577 | |
| Autoliv Inc. | | 298,144 | | 23,207 | |
| Leggett & Platt Inc. | | 447,442 | | 22,954 | |
| Harley-Davidson Inc. | | 533,815 | | 20,771 | |
| Polaris Inc. | | 196,786 | | 19,413 | |
| Hanesbrands Inc. | | 1,227,127 | | 18,665 | |
| Flowers Foods Inc. | | 665,068 | | 14,445 | |
| Goodyear Tire & Rubber Co. | | 787,517 | | 12,498 | |
| Coty Inc. Class A | | 989,862 | | 11,571 | |
| Nu Skin Enterprises Inc. Class A | | 197,504 | | 8,805 | |
| LCI Industries | | 81,980 | | 7,962 | |
| Spectrum Brands Holdings Inc. | | 143,197 | | 7,190 | |
8
High Dividend Yield Index Fund
| | | | | Market | |
| | | | | Value· | |
| | | Shares | | ($000 | ) |
| MDC Holdings Inc. | | 167,868 | | 6,498 | |
| Kontoor Brands Inc. | | 148,418 | | 5,640 | |
| HNI Corp. | | 144,657 | | 5,497 | |
| Steelcase Inc. Class A | | 291,914 | | 5,100 | |
| Vector Group Ltd. | | 372,327 | | 4,542 | |
| Universal Corp. | | 82,390 | | 4,515 | |
| Knoll Inc. | | 164,655 | | 4,403 | |
^ | B&G Foods Inc. | | 216,000 | | 3,359 | |
| Tenneco Inc. Class A | | 167,536 | | 2,109 | |
| Tupperware Brands Corp. | | 164,375 | | 1,583 | |
| Ethan Allen Interiors Inc. | | 79,894 | | 1,575 | |
| National Presto Industries Inc. | | 17,438 | | 1,501 | |
| | | | | 5,020,408 | |
Consumer Services (9.3%) | | | | | |
| Comcast Corp. Class A | | 15,483,048 | | 693,950 | |
| Walmart Inc. | | 4,829,730 | | 566,334 | |
| McDonald’s Corp. | | 2,639,522 | | 519,194 | |
| CVS Health Corp. | | 4,462,273 | | 296,250 | |
| Target Corp. | | 1,713,418 | | 183,182 | |
| Walgreens Boots Alliance Inc. | | 2,615,922 | | 143,300 | |
| Sysco Corp. | | 1,639,562 | | 130,952 | |
| Las Vegas Sands Corp. | | 1,171,557 | | 72,449 | |
| Carnival Corp. | | 1,368,857 | | 58,710 | |
| Omnicom Group Inc. | | 744,020 | | 57,431 | |
| Best Buy Co. Inc. | | 789,226 | | 56,690 | |
| Darden Restaurants Inc. | | 423,540 | | 47,551 | |
| Delta Air Lines Inc. | | 701,063 | | 38,615 | |
| Vail Resorts Inc. | | 137,161 | | 31,872 | |
| Interpublic Group of Cos. Inc. | | 1,315,962 | | 28,622 | |
| Kohl’s Corp. | | 555,356 | | 28,468 | |
| Viacom Inc. Class B | | 1,208,125 | | 26,047 | |
| Nielsen Holdings plc | | 1,213,591 | | 24,466 | |
| Williams-Sonoma Inc. | | 266,717 | | 17,814 | |
| Wyndham Hotels & Resorts Inc. | | 328,233 | | 17,715 | |
| H&R Block Inc. | | 695,899 | | 17,391 | |
* | IAA Inc. | | 452,816 | | 17,275 | |
| Macy’s Inc. | | 1,055,006 | | 15,994 | |
| Wyndham Destinations Inc. | | 311,796 | | 14,470 | |
| Cinemark Holdings Inc. | | 365,060 | | 13,361 | |
| L Brands Inc. | | 778,852 | | 13,272 | |
| Nordstrom Inc. | | 369,415 | | 13,262 | |
| Gap Inc. | | 740,928 | | 12,048 | |
| Six Flags Entertainment Corp. | | 271,446 | | 11,452 | |
| KAR Auction Services Inc. | | 454,716 | | 11,304 | |
| TEGNA Inc. | | 740,576 | | 11,131 | |
| Cracker Barrel Old Country Store Inc. | | 65,307 | | 10,155 | |
| Extended Stay America Inc. | | 635,148 | | 9,025 | |
| American Eagle Outfitters Inc. | | 577,441 | | 8,881 | |
| Sinclair Broadcast Group Inc. Class A | | 208,835 | | 8,320 | |
| John Wiley & Sons Inc. Class A | | 150,014 | | 6,911 | |
| Cheesecake Factory Inc. | | 140,884 | | 5,888 | |
| Penske Automotive Group Inc. | | 117,437 | | 5,722 | |
| Brinker International Inc. | | 125,303 | | 5,570 | |
^ | Bed Bath & Beyond Inc. | | 405,693 | | 5,558 | |
| Meredith Corp. | | 133,847 | | 5,046 | |
| International Game Technology plc | | 331,759 | | 4,392 | |
| Dine Brands Global Inc. | | 56,307 | | 4,119 | |
| Gannett Co. Inc. | | 355,168 | | 3,854 | |
| Office Depot Inc. | | 1,834,067 | | 3,778 | |
| Abercrombie & Fitch Co. | | 224,610 | | 3,636 | |
| Designer Brands Inc. Class A | | 218,032 | | 3,598 | |
| Big Lots Inc. | | 135,091 | | 2,927 | |
| Guess? Inc. | | 170,949 | | 2,863 | |
| Signet Jewelers Ltd. | | 175,081 | | 2,808 | |
| Copa Holdings SA Class A | | 26,785 | | 2,725 | |
| Buckle Inc. | | 96,089 | | 2,010 | |
| New Media Investment Group Inc. | | 204,885 | | 1,805 | |
| Weis Markets Inc. | | 32,827 | | 1,264 | |
| | | | | 3,301,427 | |
Financials (18.9%) | | | | | |
| JPMorgan Chase & Co. | | 10,936,328 | | 1,366,166 | |
| Wells Fargo & Co. | | 13,664,797 | | 705,513 | |
| Citigroup Inc. | | 7,602,638 | | 546,325 | |
| US Bancorp | | 4,917,881 | | 280,418 | |
| CME Group Inc. | | 1,217,014 | | 250,401 | |
| Chubb Ltd. | | 1,565,075 | | 238,549 | |
| PNC Financial Services Group Inc. | | 1,527,935 | | 224,148 | |
| Morgan Stanley | | 4,083,322 | | 188,037 | |
| BlackRock Inc. | | 406,893 | | 187,862 | |
| American International Group Inc. | | 2,996,231 | | 158,680 | |
| Progressive Corp. | | 2,000,887 | | 139,462 | |
| BB&T Corp. | | 2,624,579 | | 139,234 | |
| Aflac Inc. | | 2,533,698 | | 134,691 | |
| Prudential Financial Inc. | | 1,408,528 | | 128,373 | |
| MetLife Inc. | | 2,714,148 | | 126,995 | |
| Travelers Cos. Inc. | | 899,255 | | 117,856 | |
| SunTrust Banks Inc. | | 1,521,984 | | 104,012 | |
| T. Rowe Price Group Inc. | | 790,258 | | 91,512 | |
| State Street Corp. | | 1,279,522 | | 84,538 | |
| Synchrony Financial | | 2,302,179 | | 81,428 | |
| Fifth Third Bancorp | | 2,540,327 | | 73,873 | |
| Ameriprise Financial Inc. | | 449,393 | | 67,809 | |
| KeyCorp | | 3,485,960 | | 62,643 | |
9
High Dividend Yield Index Fund
| | | | | Market | |
| | | | | Value· | |
| | | Shares | | ($000 | ) |
| Cincinnati Financial Corp. | | 522,810 | | 59,187 | |
| Arthur J Gallagher & Co. | | 631,721 | | 57,626 | |
| Regions Financial Corp. | | 3,442,261 | | 55,420 | |
| Citizens Financial Group Inc. | | 1,540,860 | | 54,177 | |
| Huntington Bancshares Inc. | | 3,595,561 | | 50,805 | |
| Principal Financial Group Inc. | | 949,938 | | 50,708 | |
| Fidelity National Financial Inc. | | 907,508 | | 41,600 | |
| Western Union Co. | | 1,459,970 | | 36,587 | |
| Comerica Inc. | | 514,702 | | 33,672 | |
| Franklin Resources Inc. | | 961,014 | | 26,476 | |
| First American Financial Corp. | | 373,226 | | 23,058 | |
| Invesco Ltd. | | 1,346,293 | | 22,645 | |
| People’s United Financial Inc. | | 1,354,015 | | 21,894 | |
| AXA Equitable Holdings Inc. | | 1,003,261 | | 21,670 | |
| Old Republic International Corp. | | 962,312 | | 21,498 | |
| TCF Financial Corp. | | 521,292 | | 20,638 | |
| Unum Group | | 708,910 | | 19,523 | |
| New York Community Bancorp Inc. | | 1,551,344 | | 18,073 | |
| Popular Inc. | | 325,184 | | 17,709 | |
| Eaton Vance Corp. | | 380,925 | | 17,370 | |
| Cullen/Frost Bankers Inc. | | 192,711 | | 17,359 | |
| Synovus Financial Corp. | | 502,802 | | 17,030 | |
| First Horizon National Corp. | | 1,065,918 | | 17,023 | |
| Axis Capital Holdings Ltd. | | 281,806 | | 16,748 | |
| PacWest Bancorp | | 403,017 | | 14,908 | |
| FNB Corp. | | 1,108,385 | | 13,367 | |
| RLI Corp. | | 136,196 | | 13,255 | |
| Lazard Ltd. Class A | | 353,540 | | 13,198 | |
| United Bankshares Inc. | | 332,366 | | 13,142 | |
| Valley National Bancorp | | 1,104,900 | | 12,795 | |
| Janus Henderson Group plc | | 549,777 | | 12,716 | |
| Glacier Bancorp Inc. | | 295,289 | | 12,497 | |
| First Hawaiian Inc. | | 456,054 | | 12,464 | |
| Bank of Hawaii Corp. | | 138,433 | | 12,087 | |
| Hancock Whitney Corp. | | 306,004 | | 11,934 | |
| Umpqua Holdings Corp. | | 753,989 | | 11,928 | |
| Community Bank System Inc. | | 172,986 | | 11,725 | |
| Associated Banc-Corp | | 548,960 | | 11,040 | |
| BankUnited Inc. | | 320,990 | | 11,010 | |
| Legg Mason Inc. | | 292,718 | | 10,907 | |
| Federated Investors Inc. Class B | | 329,336 | | 10,519 | |
| Old National Bancorp | | 580,227 | | 10,441 | |
| Columbia Banking System Inc. | | 251,303 | | 9,876 | |
| Kennedy-Wilson Holdings Inc. | | 414,757 | | 9,543 | |
| Navient Corp. | | 692,566 | | 9,537 | |
| Investors Bancorp Inc. | | 788,896 | | 9,506 | |
| CVB Financial Corp. | | 456,140 | | 9,479 | |
| Fulton Financial Corp. | | 554,796 | | 9,465 | |
| Cathay General Bancorp | | 262,682 | | 9,344 | |
| Santander Consumer USA Holdings Inc. | | 357,930 | | 8,977 | |
| OneMain Holdings Inc. | | 224,368 | | 8,975 | |
| First Financial Bancorp | | 333,758 | | 7,823 | |
| Trustmark Corp. | | 220,685 | | 7,574 | |
| ProAssurance Corp. | | 182,901 | | 7,173 | |
| WesBanco Inc. | | 181,026 | | 6,805 | |
| Pacific Premier Bancorp Inc. | | 200,682 | | 6,774 | |
| Great Western Bancorp Inc. | | 192,612 | | 6,716 | |
| Capitol Federal Financial Inc. | | 447,598 | | 6,387 | |
| Horace Mann Educators Corp. | | 139,479 | | 6,076 | |
| Bank of NT Butterfield & Son Ltd. | | 183,706 | | 6,053 | |
| Westamerica Bancorporation | | 88,245 | | 5,826 | |
| Hope Bancorp Inc. | | 405,434 | | 5,785 | |
| NBT Bancorp Inc. | | 143,955 | | 5,722 | |
| Moelis & Co. Class A | | 159,243 | | 5,682 | |
| Northwest Bancshares Inc. | | 336,622 | | 5,679 | |
| Provident Financial Services Inc. | | 208,468 | | 5,201 | |
| BGC Partners Inc. Class A | | 996,697 | | 5,183 | |
| Cohen & Steers Inc. | | 76,486 | | 5,005 | |
| Safety Insurance Group Inc. | | 49,733 | | 4,834 | |
| Berkshire Hills Bancorp Inc. | | 155,514 | | 4,826 | |
| City Holding Co. | | 59,089 | | 4,688 | |
| Clearway Energy Inc. | | 257,773 | | 4,673 | |
| First Commonwealth Financial Corp. | | 328,584 | | 4,630 | |
| Artisan Partners Asset Management Inc. Class A | | 167,925 | | 4,593 | |
| Mercury General Corp. | | 91,825 | | 4,413 | |
| CNA Financial Corp. | | 95,025 | | 4,261 | |
| S&T Bancorp Inc. | | 113,055 | | 4,257 | |
| Brookline Bancorp Inc. | | 264,022 | | 4,145 | |
| Sandy Spring Bancorp Inc. | | 118,869 | | 4,101 | |
| Waddell & Reed Financial Inc. Class A | | 241,348 | | 3,997 | |
| TFS Financial Corp. | | 183,571 | | 3,536 | |
| Boston Private Financial Holdings Inc. | | 279,155 | | 3,140 | |
10
High Dividend Yield Index Fund
| | | | Market | |
| | | | Value· | |
| | Shares | | ($000 | ) |
| American National Insurance Co. | | 25,480 | | 3,057 | |
| TrustCo Bank Corp. NY | | 318,645 | | 2,753 | |
| Stock Yards Bancorp Inc. | | 67,620 | | 2,701 | |
| Washington Trust Bancorp Inc. | | 50,637 | | 2,587 | |
| Oritani Financial Corp. | | 131,610 | | 2,456 | |
| Brightsphere Investment Group Inc. | | 235,195 | | 2,310 | |
| Community Trust Bancorp Inc. | | 51,183 | | 2,242 | |
| Dime Community Bancshares Inc. | | 107,740 | | 2,078 | |
| Flushing Financial Corp. | | 90,142 | | 1,951 | |
| Clearway Energy Inc. Class A | | 108,534 | | 1,863 | |
| FBL Financial Group Inc. Class A | | 31,993 | | 1,836 | |
| Republic Bancorp Inc. Class A | | 32,305 | | 1,437 | |
| | | | | 6,734,485 | |
Health Care (12.7%) | | | | | |
| Johnson & Johnson | | 9,135,756 | | 1,206,285 | |
| Merck & Co. Inc. | | 8,859,878 | | 767,797 | |
| Pfizer Inc. | | 19,142,355 | | 734,492 | |
| Amgen Inc. | | 2,061,084 | | 439,526 | |
| AbbVie Inc. | | 5,083,924 | | 404,426 | |
| Eli Lilly & Co. | | 2,956,454 | | 336,888 | |
| Bristol-Myers Squibb Co. | | 5,623,105 | | 322,598 | |
| Gilead Sciences Inc. | | 4,384,783 | | 279,355 | |
| Cardinal Health Inc. | | 1,025,275 | | 50,700 | |
| Patterson Cos. Inc. | | 280,517 | | 4,805 | |
| | | | | 4,546,872 | |
Industrials (8.2%) | | | | | |
| Lockheed Martin Corp. | | 850,448 | | 320,347 | |
| 3M Co. | | 1,922,458 | | 317,186 | |
| United Parcel Service Inc. Class B | | 2,398,493 | | 276,234 | |
| Caterpillar Inc. | | 1,874,510 | | 258,308 | |
| Automatic Data Processing Inc. | | 1,495,051 | | 242,542 | |
| Illinois Tool Works Inc. | | 1,114,475 | | 187,878 | |
| Waste Management Inc. | | 1,461,113 | | 163,952 | |
| Emerson Electric Co. | | 2,125,788 | | 149,124 | |
| Eaton Corp. plc | | 1,448,471 | | 126,176 | |
| Johnson Controls International plc | | 2,733,472 | | 118,441 | |
| Paychex Inc. | | 1,100,566 | | 92,051 | |
| Cummins Inc. | | 527,554 | | 90,993 | |
| PACCAR Inc. | | 1,169,679 | | 88,966 | |
| Fastenal Co. | | 1,968,207 | | 70,737 | |
| Packaging Corp. of America | | 322,421 | | 35,292 | |
| CH Robinson Worldwide Inc. | | 463,217 | | 35,038 | |
| Westrock Co. | | 868,649 | | 32,461 | |
| Snap-on Inc. | | 187,248 | | 30,460 | |
| Toro Co. | | 361,607 | | 27,891 | |
| Hubbell Inc. Class B | | 185,114 | | 26,231 | |
| Xerox Holdings Corp. | | 625,783 | | 21,233 | |
| Sonoco Products Co. | | 339,347 | | 19,580 | |
| Watsco Inc. | | 110,679 | | 19,513 | |
| MDU Resources Group Inc. | | 670,891 | | 19,382 | |
| National Instruments Corp. | | 443,813 | | 18,369 | |
| nVent Electric plc | | 517,079 | | 11,924 | |
| Timken Co. | | 230,334 | | 11,286 | |
| MSC Industrial Direct Co. Inc. Class A | | 148,977 | | 10,907 | |
| Macquarie Infrastructure Corp. | | 252,025 | | 10,872 | |
| GATX Corp. | | 121,412 | | 9,658 | |
| Kennametal Inc. | | 281,201 | | 8,703 | |
| Ryder System Inc. | | 178,554 | | 8,683 | |
| ABM Industries Inc. | | 228,006 | | 8,313 | |
| Otter Tail Corp. | | 132,687 | | 7,521 | |
| Triton International Ltd. | | 185,710 | | 6,816 | |
| McGrath RentCorp | | 81,759 | | 6,239 | |
| Covanta Holding Corp. | | 395,697 | | 5,714 | |
| Mobile Mini Inc. | | 151,069 | | 5,683 | |
| Aircastle Ltd. | | 174,411 | | 4,747 | |
| Actuant Corp. Class A | | 187,219 | | 4,637 | |
| Seaspan Corp. Class A | | 375,361 | | 4,069 | |
| Ship Finance International Ltd. | | 272,836 | | 3,948 | |
| H&E Equipment Services Inc. | | 107,420 | | 3,646 | |
| Greif Inc. Class A | | 87,062 | | 3,410 | |
| Greenbrier Cos. Inc. | | 107,821 | | 3,158 | |
| AVX Corp. | | 158,534 | | 2,429 | |
| Myers Industries Inc. | | 120,133 | | 2,034 | |
| GasLog Ltd. | | 136,723 | | 1,875 | |
| | | | | 2,934,657 | |
Oil & Gas (8.4%) | | | | | |
| Exxon Mobil Corp. | | 14,561,689 | | 983,933 | |
| Chevron Corp. | | 6,556,456 | | 761,467 | |
| Phillips 66 | | 1,541,491 | | 180,077 | |
| Schlumberger Ltd. | | 4,763,736 | | 155,726 | |
| Marathon Petroleum Corp. | | 2,256,819 | | 144,323 | |
| Valero Energy Corp. | | 1,431,827 | | 138,859 | |
| Kinder Morgan Inc. | | 6,721,945 | | 134,304 | |
| Occidental Petroleum Corp. | | 3,078,236 | | 124,668 | |
| ONEOK Inc. | | 1,413,618 | | 98,713 | |
| Williams Cos. Inc. | | 4,158,303 | | 92,772 | |
| Targa Resources Corp. | | 780,855 | | 30,360 | |
11
High Dividend Yield Index Fund
| | | | Market | |
| | | | Value· | |
| | Shares | | ($000 | ) |
| OGE Energy Corp. | | 682,017 | | 29,368 | |
| Apache Corp. | | 1,282,413 | | 27,777 | |
| Helmerich & Payne Inc. | | 363,281 | | 13,623 | |
| PBF Energy Inc. Class A | | 409,990 | | 13,234 | |
| Murphy Oil Corp. | | 526,209 | | 10,856 | |
| Delek US Holdings Inc. | | 266,242 | | 10,636 | |
| Equitrans Midstream Corp. | | 700,546 | | 9,752 | |
^,* | Cosan Ltd. | | 398,794 | | 6,708 | |
| Core Laboratories NV | | 150,901 | | 6,646 | |
| CVR Energy Inc. | | 99,151 | | 4,702 | |
| Golar LNG Ltd. | | 320,037 | | 4,407 | |
| Archrock Inc. | | 444,968 | | 4,289 | |
| SemGroup Corp. Class A | | 265,578 | | 4,276 | |
| Nabors Industries Ltd. | | 1,202,062 | | 2,224 | |
^ | RPC Inc. | | 200,030 | | 828 | |
| | | | | 2,994,528 | |
Other (0.0%)2 | | | | | |
*,§ | A Schulman Inc. CVR | | 77,428 | | 34 | |
| | | | | | |
Technology (10.4%) | | | | | |
| Intel Corp. | | 15,253,129 | | 862,259 | |
| Cisco Systems Inc. | | 14,728,009 | | 699,728 | |
| International Business Machines Corp. | | 3,048,771 | | 407,712 | |
| Broadcom Inc. | | 1,327,639 | | 388,799 | |
| Texas Instruments Inc. | | 3,220,276 | | 379,960 | |
| QUALCOMM Inc. | | 4,179,689 | | 336,214 | |
| KLA Corp. | | 546,408 | | 92,365 | |
| HP Inc. | | 5,193,546 | | 90,212 | |
| Corning Inc. | | 2,652,547 | | 78,595 | |
| Hewlett Packard Enterprise Co. | | 4,608,144 | | 75,620 | |
| Maxim Integrated Products Inc. | | 952,908 | | 55,897 | |
| Seagate Technology plc | | 918,938 | | 53,326 | |
| Western Digital Corp. | | 1,006,662 | | 51,994 | |
| NetApp Inc. | | 816,786 | | 45,642 | |
| Cypress Semiconductor Corp. | | 1,257,444 | | 29,261 | |
| Juniper Networks Inc. | | 1,165,827 | | 28,936 | |
| Cogent Communications Holdings Inc. | | 144,026 | | 8,446 | |
| Xperi Corp. | | 165,464 | | 3,360 | |
| TiVo Corp. | | 407,495 | | 3,317 | |
| Pitney Bowes Inc. | | 568,189 | | 2,500 | |
| ADTRAN Inc. | | 162,190 | | 1,429 | |
| | | | | 3,695,572 | |
Telecommunications (5.3%) | | | | | |
| AT&T Inc. | | 25,113,986 | | 966,637 | |
| Verizon Communications Inc. | | 14,235,961 | | 860,849 | |
| CenturyLink Inc. | | 3,756,838 | | 48,613 | |
| | | | | 1,876,099 | |
Utilities (9.0%) | | | | | |
| NextEra Energy Inc. | | 1,645,186 | | 392,114 | |
| Duke Energy Corp. | | 2,502,029 | | 235,841 | |
| Dominion Energy Inc. | | 2,754,087 | | 227,350 | |
| Southern Co. | | 3,574,279 | | 223,964 | |
| American Electric Power Co. Inc. | | 1,697,156 | | 160,195 | |
| Exelon Corp. | | 3,333,556 | | 151,643 | |
| Sempra Energy | | 942,750 | | 136,237 | |
| Xcel Energy Inc. | | 1,763,271 | | 111,985 | |
| Public Service Enterprise Group Inc. | | 1,730,787 | | 109,576 | |
| Consolidated Edison Inc. | | 1,144,492 | | 105,545 | |
| WEC Energy Group Inc. | | 1,084,180 | | 102,347 | |
| Eversource Energy | | 1,110,358 | | 92,981 | |
| FirstEnergy Corp. | | 1,824,949 | | 88,182 | |
| PPL Corp. | | 2,484,291 | | 83,199 | |
| Entergy Corp. | | 681,352 | | 82,771 | |
| DTE Energy Co. | | 628,180 | | 79,980 | |
| Edison International | | 1,200,337 | | 75,501 | |
| Ameren Corp. | | 840,334 | | 65,294 | |
| CMS Energy Corp. | | 971,408 | | 62,092 | |
| Evergy Inc. | | 809,537 | | 51,737 | |
| CenterPoint Energy Inc. | | 1,727,720 | | 50,225 | |
| Atmos Energy Corp. | | 410,972 | | 46,226 | |
| Alliant Energy Corp. | | 816,006 | | 43,526 | |
| AES Corp. | | 2,284,946 | | 38,958 | |
| Pinnacle West Capital Corp. | | 387,198 | | 36,443 | |
| NiSource Inc. | | 1,283,204 | | 35,981 | |
| UGI Corp. | | 710,397 | | 33,865 | |
| Aqua America Inc. | | 744,005 | | 33,726 | |
| IDACORP Inc. | | 171,361 | | 18,442 | |
| Portland General Electric Co. | | 304,531 | | 17,322 | |
| Hawaiian Electric Industries Inc. | | 380,416 | | 17,176 | |
| ONE Gas Inc. | | 177,611 | | 16,489 | |
| Black Hills Corp. | | 207,004 | | 16,318 | |
| Southwest Gas Holdings Inc. | | 184,258 | | 16,086 | |
| ALLETE Inc. | | 176,068 | | 15,152 | |
| Spire Inc. | | 169,512 | | 14,249 | |
| PNM Resources Inc. | | 270,199 | | 14,091 | |
| New Jersey Resources Corp. | | 302,640 | | 13,195 | |
| National Fuel Gas Co. | | 279,723 | | 12,674 | |
| NorthWestern Corp. | | 172,495 | | 12,509 | |
| Avista Corp. | | 223,830 | | 10,751 | |
| South Jersey Industries Inc. | | 316,636 | | 10,183 | |
| Avangrid Inc. | | 193,312 | | 9,675 | |
| El Paso Electric Co. | | 139,021 | | 9,274 | |
12
High Dividend Yield Index Fund
| | | | Market | |
| | | | Value· | |
| | Shares | | ($000 | ) |
| Pattern Energy Group Inc. Class A | | 302,816 | | 8,488 | |
| Northwest Natural Holding Co. | | 103,433 | | 7,174 | |
| Atlantica Yield plc | | 198,369 | | 4,763 | |
| TerraForm Power Inc. Class A | | 247,105 | | 4,196 | |
| | | | | 3,205,691 | |
Total Common Stocks
(Cost $30,639,061) | | | | 35,565,801 | |
Temporary Cash Investments (0.0%)1 | | | | | |
Money Market Fund (0.0%) | | | | | |
3,4 | Vanguard Market Liquidity Fund, 1.984% | | 106,742 | | 10,675 | |
| | | | | | |
| | | Face | | | |
| | | Amount | | | |
| | | ($000) | | | |
U.S. Government and Agency Obligations (0.0%) | | | | | |
5 | United States Treasury Bill, 2.211%, 11/7/19 | | 3,000 | | 2,999 | |
5 | United States Treasury Bill, 1.997%, 12/26/19 | | 1,400 | | 1,397 | |
| | | | | 4,396 | |
Total Temporary Cash Investments
(Cost $15,070) | | | | 15,071 | |
Total Investments (99.8%)
(Cost $30,654,131) | | | | 35,580,872 | |
| | Amount | |
| | ($000 | ) |
Other Assets and Liabilities (0.2%) | | | |
Other Assets | | | |
Investment in Vanguard | | 1,636 | |
Receivables for Investment Securities Sold | | 72,553 | |
Receivables for Accrued Income | | 61,938 | |
Receivables for Capital Shares Issued | | 34,740 | |
Other Assets | | 3,730 | |
Total Other Assets | | 174,597 | |
Liabilities | | | |
Payables for Investment Securities Purchased | | (105,194 | ) |
Collateral for Securities on Loan | | (5,305 | ) |
Payables for Capital Shares Redeemed | | (4,200 | ) |
Payables to Vanguard | | (4,545 | ) |
Variation Margin Payable—Future Contracts | | (269 | ) |
Total Liabilities | | (119,513 | ) |
Net Assets (100%) | | 35,635,956 | |
At October 31, 2019, net assets consisted of:
| | Amount | |
| | ($000 | ) |
Paid-in Capital | | 31,594,056 | |
Total Distributable Earnings (Loss) | | 4,041,900 | |
Net Assets | | 35,635,956 | |
| | | |
Investor Shares—Net Assets | | | |
Applicable to 158,975 outstanding $.001 par value shares of beneficial interest (unlimited authorization) | | 5,644 | |
Net Asset Value Per Share—Investor Shares | | $35.50 | |
| | | |
ETF Shares—Net Assets | | | |
Applicable to 299,273,138 outstanding $.001 par value shares of beneficial interest (unlimited authorization) | | 26,816,016 | |
Net Asset Value Per Share—ETF Shares | | $89.60 | |
| | | |
Admiral Shares—Net Assets | | | |
Applicable to 326,230,045 outstanding $.001 par value shares of beneficial interest (unlimited authorization) | | 8,814,296 | |
Net Asset Value Per Share—Admiral Shares | | $27.02 | |
· See Note A in Notes to Financial Statements.
^ Includes partial security positions on loan to broker-dealers. The total value of securities on loan is $4,863,000.
* Non-income-producing security.
§ Security value determined using significant unobservable inputs.
1 The fund invests a portion of its cash reserves in equity markets through the use of index futures contracts. After giving effect to futures investments, the fund’s effective common stock and temporary cash investment positions represent 100.0% and -0.2%, respectively, of net assets.
2 “Other” represents securities that are not classified by the fund’s benchmark index.
3 Affiliated money market fund available only to Vanguard funds and certain trusts and accounts managed by Vanguard. Rate shown is the 7-day yield.
4 Collateral of $5,305,000 was received for securities on loan.
5 Securities with a value of $3,046,000 have been segregated as initial margin for open futures contracts.
CVR—Contingent Value Rights.
13
High Dividend Yield Index Fund
Derivative Financial Instruments Outstanding as of Period End |
Futures Contracts |
| | | | | | | | ($000 | ) |
| | | | | | | | Value and | |
| | | | Number of | | | | Unrealized | |
| | | | Long (Short | ) | Notional | | Appreciation | |
| | Expiration | | Contracts | | Amount | | (Depreciation | ) |
Long Futures Contracts | | | | | | | | | |
E-mini S&P 500 Index | | December 2019 | | 449 | | 68,154 | | 922 | |
See accompanying Notes, which are an integral part of the Financial Statements.
14
High Dividend Yield Index Fund
Statement of Operations
| | Year Ended | |
| | October 31, 2019 | |
| | ($000 | ) |
Investment Income | | | |
Income | | | |
Dividends | | 1,098,701 | |
Interest1 | | 610 | |
Securities Lending—Net | | 1,229 | |
Total Income | | 1,100,540 | |
Expenses | | | |
The Vanguard Group—Note B | | | |
Investment Advisory Services | | 3,293 | |
Management and Administrative—Investor Shares | | 5,023 | |
Management and Administrative—ETF Shares | | 9,775 | |
Management and Administrative—Admiral Shares | | 2,627 | |
Marketing and Distribution—Investor Shares | | 519 | |
Marketing and Distribution—ETF Shares | | 1,076 | |
Marketing and Distribution—Admiral Shares | | 109 | |
Custodian Fees | | 414 | |
Auditing Fees | | 33 | |
Shareholders’ Reports—Investor Shares | | 89 | |
Shareholders’ Reports—ETF Shares | | 542 | |
Shareholders’ Reports—Admiral Shares | | 11 | |
Trustees’ Fees and Expenses | | 15 | |
Total Expenses | | 23,526 | |
Net Investment Income | | 1,077,014 | |
Realized Net Gain (Loss) | | | |
Investment Securities Sold1,2 | | 898,618 | |
Futures Contracts | | 5,287 | |
Realized Net Gain (Loss) | | 903,905 | |
Change in Unrealized Appreciation (Depreciation) | | | |
Investment Securities1 | | 1,471,844 | |
Futures Contracts | | 5,864 | |
Change in Unrealized Appreciation (Depreciation) | | 1,477,708 | |
Net Increase (Decrease) in Net Assets Resulting from Operations | | 3,458,627 | |
1 Interest income, realized net gain (loss), and change in unrealized appreciation (depreciation) from an affiliated company of the fund were $499,000, $37,000, and $1,000, respectively. Purchases and sales are for temporary cash investment purposes.
2 Includes $1,387,069,000 of net gain (loss) resulting from in-kind redemptions, such gain (loss) is not taxable to the fund.
See accompanying Notes, which are an integral part of the Financial Statements.
15
High Dividend Yield Index Fund
Statement of Changes in Net Assets
| | Year Ended October 31, | |
| | 2019 | | 2018 | |
| | ($000 | ) | ($000 | ) |
Increase (Decrease) in Net Assets | | | | | |
Operations | | | | | |
Net Investment Income | | 1,077,014 | | 896,721 | |
Realized Net Gain (Loss) | | 903,905 | | 2,076,558 | |
Change in Unrealized Appreciation (Depreciation) | | 1,477,708 | | (1,857,134 | ) |
Net Increase (Decrease) in Net Assets Resulting from Operations | | 3,458,627 | | 1,116,145 | |
Distributions | | | | | |
Net Investment Income | | | | | |
Investor Shares | | (136,910 | ) | (235,382 | ) |
ETF Shares | | (785,436 | ) | (640,458 | ) |
Admiral Shares | | (131,730 | ) | — | |
Realized Capital Gain | | | | | |
Investor Shares | | — | | — | |
ETF Shares | | — | | — | |
Admiral Shares | | — | | — | |
Total Distributions | | (1,054,076 | ) | (875,840 | ) |
Capital Share Transactions | | | | | |
Investor Shares | | (8,358,258 | ) | 350,836 | |
ETF Shares | | 3,714,888 | | 1,139,552 | |
Admiral Shares | | 8,543,837 | | — | |
Net Increase (Decrease) from Capital Share Transactions | | 3,900,467 | | 1,490,388 | |
Total Increase (Decrease) | | 6,305,018 | | 1,730,693 | |
Net Assets | | | | | |
Beginning of Period | | 29,330,938 | | 27,600,245 | |
End of Period | | 35,635,956 | | 29,330,938 | |
See accompanying Notes, which are an integral part of the Financial Statements.
16
High Dividend Yield Index Fund
Financial Highlights
Investor Shares
For a Share Outstanding | | Year Ended October 31, | |
Throughout Each Period | | 2019 | | 2018 | | 2017 | | 2016 | | 2015 | |
Net Asset Value, Beginning of Period | | $32.98 | | $32.67 | | $28.20 | | $26.89 | | $26.98 | |
Investment Operations | | | | | | | | | | | |
Net Investment Income | | 1.141 | 1 | 1.011 | 1 | .927 | 1 | .854 | | .815 | |
Net Realized and Unrealized Gain (Loss) on Investments | | 2.461 | | .284 | | 4.472 | | 1.286 | | (.088 | ) |
Total from Investment Operations | | 3.602 | | 1.295 | | 5.399 | | 2.140 | | .727 | |
Distributions | | | | | | | | | | | |
Dividends from Net Investment Income | | (1.082 | ) | (.985 | ) | (.929 | ) | (.830 | ) | (.817 | ) |
Distributions from Realized Capital Gains | | — | | — | | — | | — | | — | |
Total Distributions | | (1.082 | ) | (.985 | ) | (.929 | ) | (.830 | ) | (.817 | ) |
Net Asset Value, End of Period | | $35.50 | | $32.98 | | $32.67 | | $28.20 | | $26.89 | |
| | | | | | | | | | | |
Total Return2 | | 11.20% | | 3.96% | | 19.37% | | 8.11% | | 2.78% | |
| | | | | | | | | | | |
Ratios/Supplemental Data | | | | | | | | | | | |
Net Assets, End of Period (Millions) | | $6 | | $8,003 | | $7,590 | | $5,879 | | $4,368 | |
Ratio of Total Expenses to Average Net Assets | | 0.14% | | 0.14% | | 0.15% | | 0.15% | | 0.16% | |
Ratio of Net Investment Income to Average Net Assets | | 3.43% | | 3.00% | | 3.00% | | 3.19% | | 3.06% | |
Portfolio Turnover Rate3 | | 7% | | 13% | | 9% | | 7% | | 11% | |
1 Calculated based on average shares outstanding.
2 Total returns do not include account service fees that may have applied in the periods shown. Fund prospectuses provide information about any applicable account service fees.
3 Excludes the value of portfolio securities received or delivered as a result of in-kind purchases or redemptions of the fund’s capital shares, including ETF Creation Units.
See accompanying Notes, which are an integral part of the Financial Statements.
17
High Dividend Yield Index Fund
Financial Highlights
ETF Shares
For a Share Outstanding | | Year Ended October 31, | |
Throughout Each Period | | 2019 | | 2018 | | 2017 | | 2016 | | 2015 | |
Net Asset Value, Beginning of Period | | $83.26 | | $82.46 | | $71.19 | | $67.88 | | $68.11 | |
Investment Operations | | | | | | | | | | | |
Net Investment Income | | 2.8911 | | 2.6231 | | 2.3941 | | 2.203 | | 2.104 | |
Net Realized and Unrealized Gain (Loss) on Investments | | 6.251 | | .731 | | 11.301 | | 3.245 | | (.222 | ) |
Total from Investment Operations | | 9.142 | | 3.354 | | 13.695 | | 5.448 | | 1.882 | |
Distributions | | | | | | | | | | | |
Dividends from Net Investment Income | | (2.802 | ) | (2.554 | ) | (2.425 | ) | (2.138 | ) | (2.112 | ) |
Distributions from Realized Capital Gains | | — | | — | | — | | ��� | | — | |
Total Distributions | | (2.802 | ) | (2.554 | ) | (2.425 | ) | (2.138 | ) | (2.112 | ) |
Net Asset Value, End of Period | | $89.60 | | $83.26 | | $82.46 | | $71.19 | | $67.88 | |
| | | | | | | | | | | |
Total Return | | 11.31% | | 4.05% | | 19.46% | | 8.18% | | 2.84% | |
| | | | | | | | | | | |
Ratios/Supplemental Data | | | | | | | | | | | |
Net Assets, End of Period (Millions) | | $26,816 | | $21,328 | | $20,010 | | $15,497 | | $11,214 | |
Ratio of Total Expenses to Average Net Assets | | 0.06% | | 0.06% | | 0.08% | | 0.08% | | 0.09% | |
Ratio of Net Investment Income to Average Net Assets | | 3.38% | | 3.08% | | 3.07% | | 3.26% | | 3.13% | |
Portfolio Turnover Rate2 | | 7% | | 13% | | 9% | | 7% | | 11% | |
1 Calculated based on average shares outstanding.
2 Excludes the value of portfolio securities received or delivered as a result of in-kind purchases or redemptions of the fund’s capital shares, including ETF Creation Units.
See accompanying Notes, which are an integral part of the Financial Statements.
18
High Dividend Yield Index Fund
Financial Highlights
Admiral Shares
| | February 7, 20191 to |
For a Share Outstanding Throughout the Period | | October 31, 2019 |
Net Asset Value, Beginning of Period | | $25.00 |
Investment Operations | | |
Net Investment Income2 | | .624 |
Net Realized and Unrealized Gain (Loss) on Investments | | 2.010 |
Total from Investment Operations | | 2.634 |
Distributions | | |
Dividends from Net Investment Income | | (.614) |
Distributions from Realized Capital Gains | | — |
Total Distributions | | (.614) |
Net Asset Value, End of Period | | $27.02 |
| | |
Total Return3 | | 10.64% |
| | |
Ratios/Supplemental Data | | |
Net Assets, End of Period (Millions) | | $8,814 |
Ratio of Total Expenses to Average Net Assets | | 0.08%4 |
Ratio of Net Investment Income to Average Net Assets | | 3.24%4 |
Portfolio Turnover Rate5 | | 7%6 |
1 Inception.
2 Calculated based on average shares outstanding.
3 Total returns do not include account service fees that may have applied in the periods shown. Fund prospectuses provide information about any applicable account service fees.
4 Annualized.
5 Excludes the value of portfolio securities received or delivered as a result of in-kind purchases or redemptions of the fund’s capital shares, including ETF Creation Units.
6 Reflects the fund’s portfolio turnover for the fiscal year ended October 31, 2019.
See accompanying Notes, which are an integral part of the Financial Statements.
19
High Dividend Yield Index Fund
Notes to Financial Statements
Vanguard High Dividend Yield Index Fund is registered under the Investment Company Act of 1940 as an open-end investment company, or mutual fund. The fund offers three classes of shares: Investor Shares, ETF Shares, and Admiral Shares. Each of the share classes has different eligibility and minimum purchase requirements, and is designed for different types of investors. ETF Shares are listed for trading on NYSE Arca; they can be purchased and sold through a broker. Admiral shares were issued on February 7, 2019.
A. The following significant accounting policies conform to generally accepted accounting principles for U.S. investment companies. The fund consistently follows such policies in preparing its financial statements.
1. Security Valuation: Securities are valued as of the close of trading on the New York Stock Exchange (generally 4 p.m., Eastern time) on the valuation date. Equity securities are valued at the latest quoted sales prices or official closing prices taken from the primary market in which each security trades; such securities not traded on the valuation date are valued at the mean of the latest quoted bid and asked prices. Securities for which market quotations are not readily available, or whose values have been materially affected by events occurring before the fund’s pricing time but after the close of the securities’ primary markets, are valued by methods deemed by the board of trustees to represent fair value. Investments in Vanguard Market Liquidity Fund are valued at that fund’s net asset value. Temporary cash investments are valued using the latest bid prices or using valuations based on a matrix system (which considers such factors as security prices, yields, maturities, and ratings), both as furnished by independent pricing services.
2. Futures Contracts: The fund uses index futures contracts to a limited extent, with the objectives of maintaining full exposure to the stock market, maintaining liquidity, and minimizing transaction costs. The fund may purchase futures contracts to immediately invest incoming cash in the market, or sell futures in response to cash outflows, thereby simulating a fully invested position in the underlying index while maintaining a cash balance for liquidity. The primary risks associated with the use of futures contracts are imperfect correlation between changes in market values of stocks held by the fund and the prices of futures contracts, and the possibility of an illiquid market. Counterparty risk involving futures is mitigated because a regulated clearinghouse is the counterparty instead of the clearing broker. To further mitigate counterparty risk, the fund trades futures contracts on an exchange, monitors the financial strength of its clearing brokers and clearinghouse, and has entered into clearing agreements with its clearing brokers. The clearinghouse imposes initial margin requirements to secure the fund’s performance and requires daily settlement of variation margin representing changes in the market value of each contract. Any assets pledged as initial margin for open contracts are noted in the Statement of Net Assets.
Futures contracts are valued at their quoted daily settlement prices. The notional amounts of the contracts are not recorded in the Statement of Net Assets. Fluctuations in the value of the contracts are recorded in the Statement of Net Assets as an asset (liability) and in the Statement of Operations as unrealized appreciation (depreciation) until the contracts are closed, when they are recorded as realized futures gains (losses).
During the year ended October 31, 2019, the fund’s average investments in long and short futures contracts represented less than 1% and 0% of net assets, respectively, based on the average of the notional amounts at each quarter-end during the period.
20
High Dividend Yield Index Fund
3. Federal Income Taxes: The fund intends to continue to qualify as a regulated investment company and distribute all of its taxable income. Management has analyzed the fund’s tax positions taken for all open federal income tax years (October 31, 2016–2019), and has concluded that no provision for federal income tax is required in the fund’s financial statements.
4. Distributions: Distributions to shareholders are recorded on the ex-dividend date. Distributions are determined on a tax basis and may differ from net investment income and realized capital gains for financial reporting purposes.
5. Securities Lending: To earn additional income, the fund lends its securities to qualified institutional borrowers. Security loans are subject to termination by the fund at any time, and are required to be secured at all times by collateral in an amount at least equal to the market value of securities loaned. Daily market fluctuations could cause the value of loaned securities to be more or less than the value of the collateral received. When this occurs, the collateral is adjusted and settled before the opening of the market on the next business day. The fund further mitigates its counterparty risk by entering into securities lending transactions only with a diverse group of prequalified counterparties, monitoring their financial strength, and entering into master securities lending agreements with its counterparties. The master securities lending agreements provide that, in the event of a counterparty’s default (including bankruptcy), the fund may terminate any loans with that borrower, determine the net amount owed, and sell or retain the collateral up to the net amount owed to the fund; however, such actions may be subject to legal proceedings. While collateral mitigates counterparty risk, in the event of a default, the fund may experience delays and costs in recovering the securities loaned. The fund invests cash collateral received in Vanguard Market Liquidity Fund, and records a liability in the Statement of Net Assets for the return of the collateral, during the period the securities are on loan. Securities lending income represents fees charged to borrowers plus income earned on invested cash collateral, less expenses associated with the loan. During the term of the loan, the fund is entitled to all distributions made on or in respect of the loaned securities.
6. Credit Facility: The fund and certain other funds managed by The Vanguard Group (“Vanguard”) participate in a $4.3 billion committed credit facility provided by a syndicate of lenders pursuant to a credit agreement that may be renewed annually; each fund is individually liable for its borrowings, if any, under the credit facility. Borrowings may be utilized for temporary and emergency purposes, and are subject to the fund’s regulatory and contractual borrowing restrictions. The participating funds are charged administrative fees and an annual commitment fee of 0.10% of the undrawn amount of the facility; these fees are allocated to the funds based on a method approved by the fund’s board of trustees and included in Management and Administrative expenses on the fund’s Statement of Operations. Any borrowings under this facility bear interest at a rate based upon the higher of the one-month London Interbank Offered Rate, federal funds effective rate, or overnight bank funding rate plus an agreed-upon spread.
The fund had no borrowings outstanding at October 31, 2019, or at any time during the period then ended.
7. Other: Dividend income is recorded on the ex-dividend date. Interest income includes income distributions received from Vanguard Market Liquidity Fund and is accrued daily. Premiums and discounts on debt securities purchased are amortized and accreted, respectively, to interest income over the lives of the respective securities. Security transactions are accounted for on the date securities are bought or sold. Costs used to determine realized gains (losses) on the sale of investment securities are those of the specific securities sold.
21
High Dividend Yield Index Fund
Each class of shares has equal rights as to assets and earnings, except that each class separately bears certain class-specific expenses related to maintenance of shareholder accounts (included in Management and Administrative expenses) and shareholder reporting. Marketing and distribution expenses are allocated to each class of shares based on a method approved by the board of trustees. Income, other non-class-specific expenses, and gains and losses on investments are allocated to each class of shares based on its relative net assets.
B. In accordance with the terms of a Funds’ Service Agreement (the “FSA”) between Vanguard and the fund, Vanguard furnishes to the fund investment advisory, corporate management, administrative, marketing, and distribution services at Vanguard’s cost of operations (as defined by the FSA). These costs of operations are allocated to the fund based on methods and guidelines approved by the board of trustees. Vanguard does not require reimbursement in the current period for certain costs of operations (such as deferred compensation/benefits and risk/insurance costs); the fund’s liability for these costs of operations is included in Payables to Vanguard on the Statement of Net Assets. All other costs of operations payable to Vanguard are generally settled twice a month.
Upon the request of Vanguard, the fund may invest up to 0.40% of its net assets as capital in Vanguard. At October 31, 2019, the fund had contributed to Vanguard capital in the amount of $1,636,000, representing less than 0.01%of the fund’s net assets and 0.65% of Vanguard’s capital received pursuant to the FSA. The fund’s trustees and officers are also directors and employees, respectively, of Vanguard.
C. Various inputs may be used to determine the value of the fund’s investments. These inputs are summarized in three broad levels for financial statement purposes. The inputs or methodologies used to value securities are not necessarily an indication of the risk associated with investing in those securities.
Level 1—Quoted prices in active markets for identical securities.
Level 2—Other significant observable inputs (including quoted prices for similar securities, interest rates, prepayment speeds, credit risk, etc.).
Level 3—Significant unobservable inputs (including the fund’s own assumptions used to determine the fair value of investments). Any investments valued with significant unobservable inputs are noted on the Statement of Net Assets.
The following table summarizes the market value of the fund’s investments and derivatives as of October 31, 2019, based on the inputs used to value them:
Investments | | Level 1
($000 | ) | Level 2
($000 | ) | Level 3
($000 | ) |
Common Stocks | | 35,565,767 | | — | | 34 | |
Temporary Cash Investments | | 10,675 | | 4,396 | | — | |
Futures Contracts—Liabilities1 | | (269 | ) | — | | — | |
Total | | 35,576,173 | | 4,396 | | 34 | |
1 Represents variation margin on the last day of the reporting period.
22
High Dividend Yield Index Fund
D. Permanent differences between book-basis and tax-basis components of net assets are reclassified among capital accounts in the financial statements to reflect their tax character. These reclassifications have no effect on net assets or net asset value per share. As of period end, permanent differences primarily attributable to the accounting for in-kind redemptions and passive foreign investment companies were reclassified between the following accounts:
| | Amount ($000 | ) |
Paid-in Capital | | 1,389,784 | |
Total Distributable Earnings (Loss) | | (1,389,784 | ) |
Temporary differences between book-basis and tax-basis components of total distributable earnings (loss) arise when certain items of income, gain, or loss are recognized in different periods for financial statement and tax purposes; these differences will reverse at some time in the future. The differences are primarily related to the tax deferral of losses on wash sales, the realization of unrealized gains or losses on certain futures contracts, and unrealized gains on passive foreign investment companies. As of period end, the tax-basis components of total distributable earnings (loss) are detailed in the table as follows:
| | Amount
($000 | ) |
Undistributed Ordinary Income | | 98,770 | |
Undistributed Long-Term Gains | | — | |
Capital Loss Carryforwards (Non-expiring) | | (978,815 | ) |
Net Unrealized Gains (Losses) | | 4,925,239 | |
As of October 31, 2019, gross unrealized appreciation and depreciation for investments and derivatives based on cost for U.S. federal income tax purposes were as follows:
| | Amount | |
| | ($000 | ) |
Tax Cost | | 30,655,633 | |
Gross Unrealized Appreciation | | 6,488,941 | |
Gross Unrealized Depreciation | | (1,563,702 | ) |
Net Unrealized Appreciation (Depreciation) | | 4,925,239 | |
E. During the year ended October 31, 2019, the fund purchased $9,967,850,000 of investment securities and sold $6,024,468,000 of investment securities, other than temporary cash investments. Purchases and sales include $6,311,784,000 and $3,786,158,000, respectively, in connection with in-kind purchases and redemptions of the fund’s capital shares.
23
High Dividend Yield Index Fund
F. Capital share transactions for each class of shares were:
| | Year Ended October 31, | |
| | 2019 | | 2018 | |
| | Amount | | Shares | | Amount | | Shares | |
| | ($000 | ) | (000 | ) | ($000 | ) | (000 | ) |
Investor Shares | | | | | | | | | |
Issued | | 1,187,273 | | 35,128 | | 1,640,168 | | 48,448 | |
Issued in Lieu of Cash Distributions | | 112,567 | | 3,539 | | 189,358 | | 5,676 | |
Redeemed1 | | (9,658,098 | ) | (281,141 | ) | (1,478,690 | ) | (43,829 | ) |
Net Increase (Decrease)—Investor Shares | | (8,358,258 | ) | (242,474 | ) | 350,836 | | 10,295 | |
ETF Shares | | | | | | | | | |
Issued | | 7,516,552 | | 88,367 | | 7,116,592 | | 83,559 | |
Issued in Lieu of Cash Distributions | | — | | — | | — | | — | |
Redeemed | | (3,801,664 | ) | (45,250 | ) | (5,977,040 | ) | (70,075 | ) |
Net Increase (Decrease)—ETF Shares | | 3,714,888 | | 43,117 | | 1,139,552 | | 13,484 | |
Admiral Shares2 | | | | | | | | | |
Issued1 | | 9,304,199 | | 355,228 | | — | | — | |
Issued in Lieu of Cash Distributions | | 100,934 | | 3,824 | | — | | — | |
Redeemed | | (861,296 | ) | (32,822 | ) | — | | — | |
Net Increase (Decrease)—Admiral Shares | | 8,543,837 | | 326,230 | | — | | — | |
1 In November 2018, the fund announced changes to the availability and minimum investment criteria of the Investor and Admiral share classes. As a result, all of the outstanding Investor Shares automatically converted to Admiral Shares beginning in April 2019, with the exception of those held by Vanguard funds and certain other institutional investors. Investor Shares—Redeemed and Admiral Shares—Issued include 244,521,000 and 321,285,000 shares, respectively, in the amount of $8,204,425,000 from the conversion during the year ended October 31, 2019.
2 Inception was February 7, 2019, for Admiral Shares.
G. Effective at the close of business on November 7, 2019, the remaining Investor Shares were converted to Admiral Shares.
Management has determined that no other events or transactions occurred subsequent to October 31, 2019, that would require recognition or disclosure in these financial statements.
24
Report of Independent Registered
Public Accounting Firm
To the Board of Trustees of Vanguard Whitehall Funds and Shareholders of Vanguard High Dividend Yield Index Fund
Opinion on the Financial Statements
We have audited the accompanying statement of net assets of Vanguard High Dividend Yield Index Fund (one of the funds constituting Vanguard Whitehall Funds, referred to hereafter as the “Fund”) as of October 31, 2019, the related statement of operations for the year ended October 31, 2019, the statement of changes in net assets for each of the two years in the period ended October 31, 2019, including the related notes, and the financial highlights for each of the periods indicated therein (collectively referred to as the “financial statements”). In our opinion, the financial statements present fairly, in all material respects, the financial position of the Fund as of October 31, 2019, the results of its operations for the year then ended, the changes in its net assets for each of the two years in the period ended October 31, 2019 and the financial highlights for each of the periods indicated therein in conformity with accounting principles generally accepted in the United States of America.
Basis for Opinion
These financial statements are the responsibility of the Fund’s management. Our responsibility is to express an opinion on the Fund’s financial statements based on our audits. We are a public accounting firm registered with the Public Company Accounting Oversight Board (United States) (“PCAOB”) and are required to be independent with respect to the Fund in accordance with the U.S. federal securities laws and the applicable rules and regulations of the Securities and Exchange Commission and the PCAOB.
We conducted our audits of these financial statements in accordance with the standards of the PCAOB. Those standards require that we plan and perform the audit to obtain reasonable assurance about whether the financial statements are free of material misstatement, whether due to error or fraud.
Our audits included performing procedures to assess the risks of material misstatement of the financial statements, whether due to error or fraud, and performing procedures that respond to those risks. Such procedures included examining, on a test basis, evidence regarding the amounts and disclosures in the financial statements. Our audits also included evaluating the accounting principles used and significant estimates made by management, as well as evaluating the overall presentation of the financial statements. Our procedures included confirmation of securities owned as of October 31, 2019 by correspondence with the custodian and brokers and by agreement to the underlying ownership records of the transfer agent; when replies were not received from brokers, we performed other auditing procedures. We believe that our audits provide a reasonable basis for our opinion.
/s/PricewaterhouseCoopers LLP
Philadelphia, Pennsylvania
December 13, 2019
We have served as the auditor of one or more investment companies in The Vanguard Group of Funds since 1975.
25
Special 2019 tax information (unaudited) for Vanguard High Dividend Yield Index Fund
This information for the fiscal year ended October 31, 2019, is included pursuant to provisions of the Internal Revenue Code.
The fund distributed $1,054,076,000 of qualified dividend income to shareholders during the fiscal year.
For corporate shareholders, 97.6% of investment income (dividend income plus short-term gains, if any) qualifies for the dividends-received deduction.
26
London Stock Exchange Group companies include FTSE International Limited (“FTSE”), Frank Russell Company (“Russell”), MTS Next Limited (“MTS”), and FTSE TMX Global Debt Capital Markets Inc. (“FTSE TMX”). All rights reserved. “FTSE®”, “Russell®”, “MTS®”, “FTSE TMX®” and “FTSE Russell” and other service marks and trademarks related to the FTSE or Russell indexes are trademarks of the London Stock Exchange Group companies and are used by FTSE, MTS, FTSE TMX and Russell under license. All information is provided for information purposes only. Every effort is made to ensure that all information given in this publication is accurate, but no responsibility or liability can be accepted by the London Stock Exchange Group companies nor its licensors for any errors or for any loss from use of this publication. Neither the London Stock Exchange Group companies nor any of their licensors make any claim, prediction, warranty or representation whatsoever, expressly or impliedly, either as to the results to be obtained from the use of the Indices or the fitness or suitability of the Indices for any particular purpose to which they might be put. The London Stock Exchange Group companies do not provide investment advice and nothing in this document should be taken as constituting financial or investment advice. The London Stock Exchange Group companies make no representation regarding the advisability of investing in any asset. A decision to invest in any such asset should not be made in reliance on any information herein. Indexes cannot be invested in directly. Inclusion of an asset in an index is not a recommendation to buy, sell or hold that asset. The general information contained in this publication should not be acted upon without obtaining specific legal, tax, and investment advice from a licensed professional. No part of this information may be reproduced, stored in a retrieval system or transmitted in any form or by any means, electronic, mechanical, photocopying, recording or otherwise, without prior written permission of the London Stock Exchange Group companies. Distribution of the London Stock Exchange Group companies’ index values and the use of their indexes to create financial products require a license with FTSE, FTSE TMX, MTS and/or Russell and/or its licensors.
27
This page intentionally left blank.
This page intentionally left blank.
This page intentionally left blank.
This page intentionally left blank.
This page intentionally left blank.
This page intentionally left blank.
This page intentionally left blank.
The People Who Govern Your Fund
The trustees of your mutual fund are there to see that the fund is operated and managed in your best interests since, as a shareholder, you are a part owner of the fund. Your fund’s trustees also serve on the board of directors of The Vanguard Group, Inc., which is owned by the Vanguard funds and provides services to them.
A majority of Vanguard’s board members are independent, meaning that they have no affiliation with Vanguard or the funds they oversee, apart from the sizable personal investments they have made as private individuals. The independent board members have distinguished backgrounds in business, academia, and public service. Each of the trustees and executive officers oversees 213 Vanguard funds.
Information for each trustee and executive officer of the fund appears below. That information, as well as the Vanguard fund count, is as of the date on the cover of this fund report. The mailing address of the trustees and officers is P.O. Box 876, Valley Forge, PA 19482. More information about the trustees is in the Statement of Additional Information, which can be obtained, without charge, by contacting Vanguard at 800-662-7447, or online at vanguard.com.
Interested Trustee1
Mortimer J. Buckley
Born in 1969. Trustee since January 2018. Principal occupation(s) during the past five years and other experience: chairman of the board (January 2019–present) of Vanguard and of each of the investment companies served by Vanguard; chief executive officer (January 2018–present) of Vanguard; chief executive officer, president, and trustee (January 2018–present) of each of the investment companies served by Vanguard; president and director (2017–present) of Vanguard; and president (February 2018–present) of Vanguard Marketing Corporation. Chief investment officer (2013–2017), managing director (2002–2017), head of the Retail Investor Group (2006–2012), and chief information officer (2001–2006) of Vanguard. Chairman of the board (2011–2017) and trustee (2009–2017) of the Children’s Hospital of Philadelphia; trustee (2018–present) of The Shipley School.
Independent Trustees
Emerson U. Fullwood
Born in 1948. Trustee since January 2008. Principal occupation(s) during the past five years and other experience: executive chief staff and marketing officer for North America and corporate vice president (retired 2008) of Xerox Corporation (document management products and services). Former president of the Worldwide Channels Group, Latin America, and Worldwide Customer Service and executive chief staff officer of Developing Markets of Xerox. Executive in residence and 2009–2010 Distinguished Minett Professor at the Rochester Institute of Technology. Director of SPX FLOW, Inc. (multi-industry manufacturing). Director of the University of Rochester Medical Center, the Monroe Community College Foundation, the United Way of Rochester, North Carolina A&T University, and Roberts Wesleyan College. Trustee of the University of Rochester.
Amy Gutmann
Born in 1949. Trustee since June 2006. Principal occupation(s) during the past five years and other experience: president (2004–present) of the University of Pennsylvania. Christopher H. Browne Distinguished Professor of Political Science, School of Arts and Sciences, and professor of communication, Annenberg School for Communication, with secondary faculty appointments in the Department of Philosophy, School of Arts and Sciences, and at the Graduate School of Education, University of Pennsylvania. Trustee of the National Constitution Center.
F. Joseph Loughrey
Born in 1949. Trustee since October 2009. Principal occupation(s) during the past five years and other experience: president and chief operating officer (retired 2009) and vice chairman of the board (2008–2009) of Cummins Inc. (industrial machinery). Chairman of the board of Hillenbrand, Inc. (specialized consumer services), and the Lumina Foundation.
1 Mr. Buckley is considered an “interested person,” as defined in the Investment Company Act of 1940, because he is an officer of the Vanguard funds.
Director of the V Foundation and Oxfam America. Member of the advisory council for the College of Arts and Letters and chair of the advisory board to the Kellogg Institute for International Studies, both at the University of Notre Dame.
Mark Loughridge
Born in 1953. Trustee since March 2012. Principal occupation(s) during the past five years and other experience: senior vice president and chief financial officer (retired 2013) of IBM (information technology services). Fiduciary member of IBM’s Retirement Plan Committee (2004–2013), senior vice president and general manager (2002–2004) of IBM Global Financing, vice president and controller (1998–2002) of IBM, and a variety of other prior management roles at IBM. Member of the Council on Chicago Booth.
Scott C. Malpass
Born in 1962. Trustee since March 2012. Principal occupation(s) during the past five years and other experience: chief investment officer (1989–present) and vice president (1996–present) of the University of Notre Dame. Assistant professor of finance at the Mendoza College of Business, University of Notre Dame, and member of the Notre Dame 403(b) Investment Committee. Chairman of the board of TIFF Advisory Services, Inc. Member of the board of Catholic Investment Services, Inc. (investment advisors) and the board of superintendence of the Institute for the Works of Religion.
Deanna Mulligan
Born in 1963. Trustee since January 2018. Principal occupation(s) during the past five years and other experience: president (2010–present) and chief executive officer (2011–present) of The Guardian Life Insurance Company of America. Chief operating officer (2010–2011) and executive vice president (2008–2010) of Individual Life and Disability of The Guardian Life Insurance Company of America. Member of the board of The Guardian Life Insurance Company of America, the American Council of Life Insurers, the Partnership for New York City (business leadership), and the Committee Encouraging Corporate Philanthropy. Trustee of the Economic Club of New York and the Bruce Museum (arts and science). Member of the Advisory Council for the Stanford Graduate School of Business.
André F. Perold
Born in 1952. Trustee since December 2004. Principal occupation(s) during the past five years and other experience: George Gund Professor of Finance and Banking, Emeritus at the Harvard Business School (retired 2011). Chief investment officer and co-managing partner of HighVista Strategies (private investment firm). Board of advisors and investment committee member of the Museum of Fine Arts Boston. Board member (2018–present) of RIT Capital Partners (investment firm); investment committee member of Partners Health Care System.
Sarah Bloom Raskin
Born in 1961. Trustee since January 2018. Principal occupation(s) during the past five years and other experience: deputy secretary (2014–2017) of the United States Department of the Treasury. Governor (2010–2014) of the Federal Reserve Board. Commissioner (2007–2010) of financial regulation for the State of Maryland. Member of the board of directors (2012–2014) of Neighborhood Reinvestment Corporation. Director (2017–present) of i(x) Investments; director (2017–present) of Reserve Trust. Rubinstein Fellow (2017–present) of Duke University; trustee (2017–present) of Amherst College.
Peter F. Volanakis
Born in 1955. Trustee since July 2009. Principal occupation(s) during the past five years and other experience: president and chief operating officer (retired 2010) of Corning Incorporated (communications equipment) and director of Corning Incorporated (2000–2010) and Dow Corning (2001–2010). Director (2012) of SPX Corporation (multi-industry manufacturing). Overseer of the Amos Tuck School of Business Administration, Dartmouth College (2001–2013). Chairman of the board of trustees of Colby-Sawyer College. Member of the board of Hypertherm Inc. (industrial cutting systems, software, and consumables).
Executive Officers
John Bendl
Born in 1970. Principal occupation(s) during the past five years and other experience: principal of Vanguard. Chief financial officer (October 2019–present) of each of the investment companies served by Vanguard. Chief accounting officer, treasurer, and controller of Vanguard (2017–present). Partner (2003–2016) at KPMG (audit, tax, and advisory services).
Glenn Booraem
Born in 1967. Principal occupation(s) during the past five years and other experience: principal of Vanguard. Investment stewardship officer (2017–present), treasurer (2015–2017), controller (2010–2015), and assistant controller (2001–2010) of each of the investment companies served by Vanguard.
Christine M. Buchanan
Born in 1970. Principal occupation(s) during the past five years and other experience: principal of Vanguard. Treasurer (2017–present) of each of the investment companies served by Vanguard. Partner (2005–2017) at KPMG (audit, tax, and advisory services).
David Cermak
Born in 1960. Principal occupation(s) during the past five years and other experience: principal of Vanguard. Finance director (October 2019–present) of each of the investment companies served by Vanguard. Managing director and head (2017–present) of Vanguard Investments Singapore. Managing director and head (2017–2019) of Vanguard Investments Hong Kong. Representative director and head (2014–2017) of Vanguard Investments Japan.
Thomas J. Higgins
Born in 1957. Principal occupation(s) during the past five years and other experience: principal of Vanguard. Finance director (October 2019–present), chief financial officer (2008–2019), and treasurer (1998–2008) of each of the investment companies served by Vanguard.
Peter Mahoney
Born in 1974. Principal occupation(s) during the past five years and other experience: principal of Vanguard. Controller (2015–present) of each of the investment companies served by Vanguard. Head of International Fund Services (2008–2014) at Vanguard.
Anne E. Robinson
Born in 1970. Principal occupation(s) during the past five years and other experience: general counsel (2016–present) of Vanguard. Secretary (2016–present) of Vanguard and of each of the investment companies served by Vanguard. Managing director (2016–present) of Vanguard. Managing director and general counsel of Global Cards and Consumer Services (2014–2016) at Citigroup. Counsel (2003–2014) at American Express.
Michael Rollings
Born in 1963. Principal occupation(s) during the past five years and other experience: finance director (2017–present) and treasurer (2017) of each of the investment companies served by Vanguard. Managing director (2016–present) of Vanguard. Chief financial officer (2016–present) of Vanguard. Director (2016–present) of Vanguard Marketing Corporation. Executive vice president and chief financial officer (2006–2016) of MassMutual Financial Group.
John E. Schadl
Born in 1972. Principal occupation(s) during the past five years and other experience: principal of Vanguard. Chief compliance officer (2019–present) of Vanguard and of each of the investment companies served by Vanguard. Assistant vice president (May 2019–present) of Vanguard Marketing Corporation.
Vanguard Senior Management Team
Joseph Brennan | Chris D. McIsaac |
Mortimer J. Buckley | James M. Norris |
Gregory Davis | Thomas M. Rampulla |
John James | Karin A. Risi |
Martha G. King | Anne E. Robinson |
John T. Marcante | Michael Rollings |
| 
P.O. Box 2600 Valley Forge, PA 19482-2600 |
Connect with Vanguard® > vanguard.com
Fund Information > 800-662-7447
Direct Investor Account Services > 800-662-2739
Institutional Investor Services > 800-523-1036
Text Telephone for People
Who Are Deaf or Hard of Hearing > 800-749-7273
This material may be used in conjunction with the offering of shares of any Vanguard fund only if preceded or accompanied by the fund’s current prospectus.
All comparative mutual fund data are from Morningstar, Inc., unless otherwise noted.
You can obtain a free copy of Vanguard’s proxy voting guidelines by visiting vanguard.com/proxyreporting or by calling Vanguard at 800-662-2739. The guidelines are also available from the SEC’s website, www.sec.gov. In addition, you may obtain a free report on how your fund voted the proxies for securities it owned during the 12 months ended June 30. To get the report, visit either vanguard.com/proxyreporting or www.sec.gov.
You can review information about your fund on the SEC’s website, and you can receive copies of this information, for a fee, by sending a request via email addressed to publicinfo@sec.gov.
Source for Bloomberg Barclays indexes: Bloomberg Index Services Limited. Copyright 2019, Bloomberg. All rights reserved.
| © 2019 The Vanguard Group, Inc. All rights reserved. U.S. Patent Nos. 6,879,964; 7,337,138; 7,720,749; 7,925,573; 8,090,646; 8,417,623; and 8,626,636. Vanguard Marketing Corporation, Distributor. Q6230 122019 |

Annual Report | October 31, 2019 Vanguard Emerging Markets Government Bond Index Fund |
See the inside front cover for important information about access to your fund’s annual and semiannual shareholder reports. |
Important information about access to shareholder reports
Beginning on January 1, 2021, as permitted by regulations adopted by the Securities and Exchange Commission, paper copies of your fund’s annual and semiannual shareholder reports will no longer be sent to you by mail, unless you specifically request them. Instead, you will be notified by mail each time a report is posted on the website and will be provided with a link to access the report.
If you have already elected to receive shareholder reports electronically, you will not be affected by this change and do not need to take any action. You may elect to receive shareholder reports and other communications from the fund electronically by contacting your financial intermediary (such as a broker-dealer or bank) or, if you invest directly with the fund, by calling Vanguard at one of the phone numbers on the back cover of this report or by logging on to vanguard.com.
You may elect to receive paper copies of all future shareholder reports free of charge. If you invest through a financial intermediary, you can contact the intermediary to request that you continue to receive paper copies. If you invest directly with the fund, you can call Vanguard at one of the phone numbers on the back cover of this report or log on to vanguard.com. Your election to receive paper copies will apply to all the funds you hold through an intermediary or directly with Vanguard.
Contents | |
| |
A Note From Our Chairman | 1 |
Your Fund’s Performance at a Glance | 2 |
About Your Fund’s Expenses | 3 |
Performance Summary | 5 |
Financial Statements | 8 |
Please note: The opinions expressed in this report are just that—informed opinions. They should not be considered promises or advice. Also, please keep in mind that the information and opinions cover the period through the date on the front of this report. Of course, the risks of investing in your fund are spelled out in the prospectus.
A Note From Our Chairman

Tim Buckley
Chairman and Chief Executive Officer
Dear Shareholder,
Recent volatility in financial markets—affecting stocks, bonds, and commodities—has been a good reminder of the wise old adage, “Never keep all your eggs in one basket.” Maintaining balance and diversification in your investment portfolio can help to both limit risk and set you up for long-term success.
It’s understandable why some investors might become complacent after a long market run-up like the one that lifted stock prices, especially U.S. stock prices, in the years following the global financial crisis. But failing to rebalance regularly can leave a portfolio with a much different mix of assets than intended and, often, more risk than intended.
Balance across and diversification within asset classes are powerful tools for managing risk and achieving your investment goals. A portfolio’s allocation will determine a large portion of its long-term return and also the majority of its volatility risk. A well-diversified portfolio is less vulnerable to significant swings in the performance of any one segment of the asset classes in which it invests.
Balance and diversification will never eliminate the risk of loss, nor will they guarantee positive returns in a declining market. But they should reduce the chance that you’ll suffer disproportionate losses in one particular high-flying asset class or sector when it comes back to earth. And exposure to all key market components should give you at least some participation in the sectors that are performing best at any given time.
Vanguard is committed to helping you achieve balance and diversification in your portfolios to help meet your investment goals. We thank you for your continued loyalty.
Sincerely,

Mortimer J. Buckley
Chairman and Chief Executive Officer
November 18, 2019
1
Your Fund’s Performance at a Glance
· Global markets rallied during the 12 months ended October 31, 2019, and emerging markets led the way. Investors were initially concerned about global growth, the impact of tighter monetary policies, and growing trade tensions. But worries ebbed as central banks turned more accommodative, growth concerns eased, and investors again reached for yield. Global bond yields ended the period lower, pushing bond prices higher.
· For the full fiscal year, Vanguard Emerging Markets Government Bond Index Fund returned 13.47% for ETF Shares. This result almost precisely matched that of the fund’s benchmark index, a theoretical construct that, unlike your fund, incurs no operating or transaction costs.
· Three of the largest emerging-market government bond issuers—Mexico, Indonesia, and Brazil, which together accounted for 23% of the index as of October 31—each returned more than 20% in U.S. dollar terms. Returns were negative for just four of the more than 70 countries in the index.
· By credit quality, returns were highest (+18%) for Baa-rated issues, the last rung on the investment-grade ladder of bonds. They accounted for the largest slice of the index, roughly 37%.
· By maturity, returns were highest among 20-year-plus issues.
Market Barometer
| | Average Annual Total Returns | |
| | Periods Ended October 31, 2019 | |
| | One Year | | Three Years | | Five Years | |
Stocks | | | | | | | |
Russell 1000 Index (Large-caps) | | 14.15% | | 14.73% | | 10.55% | |
Russell 2000 Index (Small-caps) | | 4.90 | | 10.96 | | 7.37 | |
Russell 3000 Index (Broad U.S. market) | | 13.49 | | 14.47 | | 10.31 | |
FTSE All-World ex US Index (International) | | 11.52 | | 8.21 | | 4.16 | |
| | | | | | | |
Bonds | | | | | | | |
Bloomberg Barclays U.S. Aggregate Bond Index (Broad taxable market) | | 11.51% | | 3.29% | | 3.24% | |
Bloomberg Barclays Municipal Bond Index (Broad tax-exempt market) | | 9.42 | | 3.62 | | 3.55 | |
FTSE Three-Month U.S. Treasury Bill Index | | 2.35 | | 1.57 | | 0.98 | |
| | | | | | | |
CPI | | | | | | | |
Consumer Price Index | | 1.76% | | 2.11% | | 1.62% | |
Fund returns are adjusted to reflect the 0.75% fee on purchases of fund shares. The fee does not apply to the ETF Shares.
2
About Your Fund’s Expenses
As a shareholder of the fund, you incur ongoing costs, which include costs for portfolio management, administrative services, and shareholder reports (like this one), among others. Operating expenses, which are deducted from a fund’s gross income, directly reduce the investment return of the fund.
A fund’s expenses are expressed as a percentage of its average net assets. This figure is known as the expense ratio. The following examples are intended to help you understand the ongoing costs (in dollars) of investing in your fund and to compare these costs with those of other mutual funds. The examples are based on an investment of $1,000 made at the beginning of the period shown and held for the entire period.
The accompanying table illustrates your fund’s costs in two ways:
· Based on actual fund return. This section helps you to estimate the actual expenses that you paid over the period. The “Ending Account Value” shown is derived from the fund’s actual return, and the third column shows the dollar amount that would have been paid by an investor who started with $1,000 in the fund. You may use the information here, together with the amount you invested, to estimate the expenses that you paid over the period.
To do so, simply divide your account value by $1,000 (for example, an $8,600 account value divided by $1,000 = 8.6), then multiply the result by the number given for your fund under the heading “Expenses Paid During Period.”
· Based on hypothetical 5% yearly return. This section is intended to help you compare your fund’s costs with those of other mutual funds. It assumes that the fund had a yearly return of 5% before expenses, but that the expense ratio is unchanged. In this case—because the return used is not the fund’s actual return—the results do not apply to your investment. The example is useful in making comparisons because the Securities and Exchange Commission requires all mutual funds to calculate expenses based on a 5% return. You can assess your fund’s costs by comparing this hypothetical example with the hypothetical examples that appear in shareholder reports of other funds.
Note that the expenses shown in the table are meant to highlight and help you compare ongoing costs only and do not reflect transaction costs incurred by the fund for buying and selling securities. Further, the expenses do not include any purchase, redemption, or account service fees described in the fund prospectus. If such fees were applied to your account, your costs would be higher. Your fund does not carry a “sales load.”
The calculations assume no shares were bought or sold during the period. Your actual costs may have been higher or lower, depending on the amount of your investment and the timing of any purchases or redemptions.
You can find more information about the fund’s expenses, including annual expense ratios, in the Financial Statements section of this report. For additional information on operating expenses and other shareholder costs, please refer to your fund’s current prospectus.
3
Six Months Ended October 31, 2019 | | | |
| Beginning | Ending | Expenses |
| Account Value | Account Value | Paid During |
Emerging Markets Government Bond Index | 4/30/2019 | 10/31/2019 | Period |
Based on Actual Fund Return | | | |
ETF Shares | $1,000.00 | $1,058.43 | $1.14 |
Admiral™ Shares | 1,000.00 | 1,058.33 | 1.14 |
Institutional Shares | 1,000.00 | 1,058.39 | 1.04 |
Based on Hypothetical 5% Yearly Return | | | |
ETF Shares | $1,000.00 | $1,024.10 | $1.12 |
Admiral Shares | 1,000.00 | 1,024.10 | 1.12 |
Institutional Shares | 1,000.00 | 1,024.20 | 1.02 |
The calculations are based on expenses incurred in the most recent six-month period. The fund’s annualized six-month expense ratios for that period are 0.22% for ETF Shares, 0.22% for Admiral Shares, and 0.20% for Institutional Shares. The dollar amounts shown as “Expenses Paid” are equal to the annualized expense ratio multiplied by the average account value over the period, multiplied by the number of days in the most recent six-month period, then divided by the number of days in the most recent 12-month period (184/365).
4
Emerging Markets Government Bond Index Fund
Performance Summary
All of the returns in this report represent past performance, which is not a guarantee of future results that may be achieved by the fund. (Current performance may be lower or higher than the performance data cited. For performance data current to the most recent month-end, visit our website at vanguard.com/performance.) Note, too, that both investment returns and principal value can fluctuate widely, so an investor’s shares, when sold, could be worth more or less than their original cost. The returns shown do not reflect taxes that a shareholder would pay on fund distributions or on the sale of fund shares.
Cumulative Performance: May 31, 2013, Through October 31, 2019
Initial Investment of $10,000

| | Average Annual Total Returns | |
| | Periods Ended October 31, 2019 | |
| | | | Since | Final Value |
| | One | Five | Inception | of a $10,000 |
| | Year | Years | (5/31/2013) | Investment |

| Emerging Markets Government Bond Index Fund ETF Shares Net Asset Value | 13.47% | 5.01% | 4.72% | $13,444 |
| Emerging Markets Government Bond Index Fund ETF Shares Market Price | 13.61 | 4.98 | 4.81 | 13,523 |

| Bloomberg Barclays USD Emerging Markets Government RIC Capped Index | 13.45 | 5.09 | 4.82 | 13,527 |

| Bloomberg Barclays Global Aggregate Index ex USD | 7.84 | 1.20 | 1.24 | 10,825 |
“Since Inception” performance is calculated from the ETF Shares’ inception date for both the fund and its comparative standards.
See Financial Highlights for dividend and capital gains information.
5
Emerging Markets Government Bond Index Fund
| | Average Annual Total Returns | |
| | Periods Ended October 31, 2019 | |
| | | | Since | Final Value |
| | One | Five | Inception | of a $10,000 |
| | Year | Years | (5/31/2013) | Investment |
Emerging Markets Government Bond Index Fund Admiral Shares | 12.61% | 4.87% | 4.61% | $13,356 |
Bloomberg Barclays USD Emerging Markets Government RIC Capped Index | 13.45 | 5.09 | 4.82 | 13,527 |
Bloomberg Barclays Global Aggregate Index ex USD | 7.84 | 1.20 | 1.24 | 10,825 |
“Since Inception” performance is calculated from the Admiral Shares’ inception date for both the fund and its comparative standards.
| | Since | Final Value |
| One | Inception | of a $5,000,000 |
| Year | (2/11/2015)1 | Investment |
Emerging Markets Government Bond Index Fund Institutional Shares | 12.61% | 5.79% | $6,520,084 |
Bloomberg Barclays USD Emerging Markets Government RIC Capped Index | 13.45 | 6.04 | 6,594,534 |
Bloomberg Barclays Global Aggregate Index ex USD | 7.84 | 2.66 | 5,659,735 |
“Since Inception” performance is calculated from the Institutional Shares’ inception date for both the fund and its comparative standards.
¹Institutional Shares were first issued on November 25, 2014, and were redeemed shortly thereafter. Institutional Shares were next issued on February 11, 2015. The total returns shown are based on the period beginning February 11, 2015.
Cumulative Returns of ETF Shares: May 31, 2013, Through October 31, 2019
| | | Since |
| One | Five | Inception |
| Year | Years | (5/31/2013) |
Emerging Markets Government Bond Index Fund ETF Shares Market Price | 13.61% | 27.53% | 35.23% |
Emerging Markets Government Bond Index Fund ETF Shares Net Asset Value | 13.47 | 27.66 | 34.44 |
Bloomberg Barclays USD Emerging Markets Government RIC Capped Index | 13.45 | 28.19 | 35.27 |
“Since Inception” performance is calculated from the ETF Shares’ inception date for both the fund and its comparative standards.
For the ETF Shares, the market price is determined by the midpoint of the bid-offer spread as of the closing time of the New York Stock Exchange (generally 4 p.m., Eastern time). The net asset value is also determined as of the NYSE closing time. For more information about how the ETF Shares’ market prices have compared with their net asset value, visit vanguard.com, select your ETF, and then select the Price and Performance tab. The ETF premium/discount analysis there shows the percentages of days on which the ETF Shares’ market price was above or below the NAV.
Vanguard fund returns are adjusted to reflect the 0.75% fee on purchases of fund shares. The fee does not apply to the ETF Shares.
6
Emerging Markets Government Bond Index Fund
Sector Diversification
As of October 31, 2019
Foreign | 99.8 | % |
Treasury/Agency | 0.2 | |
7
Emerging Markets Government Bond Index Fund
Financial Statements
Statement of Net Assets
As of October 31, 2019
The fund files its complete schedule of portfolio holdings with the Securities and Exchange Commission (SEC) for the first and third quarters of each fiscal year as an exhibit to its reports on Form N-PORT. The fund’s Form N-PORT reports are available on the SEC’s website at www.sec.gov.
| | Coupon | Maturity
Date | | Face
Amount
($000 | ) | Market
Value·
($000 | ) |
Angola (0.5%) | | | | | | | |
Sovereign Bonds (0.5%) | | | | | | | |
| Republic of Angola | 9.500% | 11/12/25 | | 2,950 | | 3,327 | |
| Republic of Angola | 8.250% | 5/9/28 | | 3,550 | | 3,709 | |
1 | Republic of Angola | 9.375% | 5/8/48 | | 1,600 | | 1,692 | |
| Republic of Angola | 9.375% | 5/8/48 | | 1,300 | | 1,375 | |
Total Angola (Cost $9,806) | | | | | | 10,103 | |
Argentina (2.0%) | | | | | | | |
Sovereign Bonds (2.0%) | | | | | | | |
| Argentine Republic | 6.875% | 4/22/21 | | 7,917 | | 3,563 | |
| Argentine Republic | 5.625% | 1/26/22 | | 6,300 | | 2,670 | |
| Argentine Republic | 4.625% | 1/11/23 | | 2,786 | | 1,114 | |
| Argentine Republic | 7.500% | 4/22/26 | | 11,475 | | 4,848 | |
| Argentine Republic | 6.875% | 1/26/27 | | 6,630 | | 2,619 | |
| Argentine Republic | 5.875% | 1/11/28 | | 7,813 | | 2,969 | |
| Argentine Republic | 6.625% | 7/6/28 | | 1,456 | | 564 | |
| Argentine Republic | 8.280% | 12/31/33 | | 7,745 | | 3,911 | |
2 | Argentine Republic | 8.280% | 12/31/33 | | 2,379 | | 1,184 | |
| Argentine Republic | 7.125% | 7/6/36 | | 2,765 | | 1,071 | |
2 | Argentine Republic | 3.750% | 12/31/38 | | 10,244 | | 4,098 | |
| Argentine Republic | 7.625% | 4/22/46 | | 4,725 | | 1,890 | |
| Argentine Republic | 6.875% | 1/11/48 | | 6,200 | | 2,395 | |
| Argentine Republic | 7.125% | 6/28/17 | | 4,175 | | 1,659 | |
2 | Provincia de Buenos Aires | 9.125% | 3/16/24 | | 800 | | 280 | |
2 | Provincia de Buenos Aires | 7.875% | 6/15/27 | | 2,200 | | 750 | |
2 | YPF SA | 8.750% | 4/4/24 | | 520 | | 433 | |
| YPF SA | 8.500% | 7/28/25 | | 2,162 | | 1,712 | |
Total Argentina (Cost $73,464) | | | | | | 37,730 | |
Armenia (0.1%) | | | | | | | |
Sovereign Bonds (0.1%) | | | | | | | |
| Republic of Armenia | 7.150% | 3/26/25 | | 700 | | 816 | |
1 | Republic of Armenia | 3.950% | 9/26/29 | | 900 | | 876 | |
Total Armenia (Cost $1,615) | | | | | | 1,692 | |
Azerbaijan (0.5%) | | | | | | | |
Sovereign Bonds (0.5%) | | | | | | | |
1 | Republic of Azerbaijan | 4.750% | 3/18/24 | | 400 | | 424 | |
1,2 | Republic of Azerbaijan | 3.500% | 9/1/32 | | 1,100 | | 1,068 | |
8
Emerging Markets Government Bond Index Fund
| | Coupon | Maturity
Date | | Face
Amount
($000 | ) | Market
Value·
($000 | ) |
2 | Republic of Azerbaijan | 3.500% | 9/1/32 | | 850 | | 825 | |
| Republic of Azerbaijan | 4.750% | 3/18/24 | | 1,800 | | 1,907 | |
3 | Southern Gas Corridor CJSC | 6.875% | 3/24/26 | | 3,600 | | 4,199 | |
Total Azerbaijan (Cost $7,907) | | | | | | 8,423 | |
Bahamas (0.1%) | | | | | | | |
Sovereign Bond (0.1%) | | | | | | | |
1,2 | Commonwealth of the Bahamas | 6.000% | 11/21/28 | | 850 | | 927 | |
Total Bahamas (Cost $850) | | | | | | 927 | |
Bahrain (1.6%) | | | | | | | |
Sovereign Bonds (1.6%) | | | | | | | |
| CBB International Sukuk Co. 5 SPC | 5.624% | 2/12/24 | | 2,050 | | 2,193 | |
| CBB International Sukuk Co. 6 SPC | 5.250% | 3/20/25 | | 1,400 | | 1,485 | |
| CBB International Sukuk Co. 7 SPC | 6.875% | 10/5/25 | | 1,500 | | 1,725 | |
1 | CBB International Sukuk Programme Co. SPC | 4.500% | 3/30/27 | | 800 | | 825 | |
| Kingdom of Bahrain | 5.875% | 1/26/21 | | 900 | | 927 | |
1 | Kingdom of Bahrain | 6.125% | 7/5/22 | | 2,600 | | 2,769 | |
1 | Kingdom of Bahrain | 6.125% | 8/1/23 | | 150 | | 164 | |
| Kingdom of Bahrain | 6.125% | 8/1/23 | | 2,475 | | 2,698 | |
1 | Kingdom of Bahrain | 7.000% | 1/26/26 | | 2,200 | | 2,514 | |
| Kingdom of Bahrain | 7.000% | 1/26/26 | | 1,550 | | 1,774 | |
| Kingdom of Bahrain | 7.000% | 10/12/28 | | 2,200 | | 2,539 | |
1 | Kingdom of Bahrain | 6.750% | 9/20/29 | | 800 | | 911 | |
| Kingdom of Bahrain | 6.750% | 9/20/29 | | 2,000 | | 2,280 | |
1 | Kingdom of Bahrain | 5.625% | 9/30/31 | | 2,300 | | 2,415 | |
1 | Kingdom of Bahrain | 6.000% | 9/19/44 | | 1,050 | | 1,057 | |
| Kingdom of Bahrain | 6.000% | 9/19/44 | | 2,000 | | 2,013 | |
| Kingdom of Bahrain | 7.500% | 9/20/47 | | 600 | | 703 | |
Total Bahrain (Cost $27,120) | | | | | | 28,992 | |
Belarus (0.2%) | | | | | | | |
Sovereign Bonds (0.2%) | | | | | | | |
| Republic of Belarus | 6.875% | 2/28/23 | | 1,075 | | 1,156 | |
| Republic of Belarus | 6.200% | 2/28/30 | | 1,200 | | 1,283 | |
| Republic of Belarus | 7.625% | 6/29/27 | | 1,250 | | 1,440 | |
Total Belarus (Cost $3,663) | | | | | | 3,879 | |
Belize (0.0%) | | | | | | | |
Sovereign Bond (0.0%) | | | | | | | |
2 | Belize | 4.938% | 2/20/34 | | 550 | | 330 | |
Total Belize (Cost $380) | | | | | | 330 | |
Bermuda (0.1%) | | | | | | | |
Sovereign Bonds (0.1%) | | | | | | | |
2 | Bermuda | 3.717% | 1/25/27 | | 1,550 | | 1,625 | |
1,2 | Bermuda | 4.750% | 2/15/29 | | 800 | | 914 | |
Total Bermuda (Cost $2,338) | | | | | | 2,539 | |
Bolivia (0.1%) | | | | | | | |
Sovereign Bonds (0.1%) | | | | | | | |
| Plurinational State of Bolivia | 4.875% | 10/29/22 | | 400 | | 412 | |
| Plurinational State of Bolivia | 5.950% | 8/22/23 | | 800 | | 856 | |
1,2 | Plurinational State of Bolivia | 4.500% | 3/20/28 | | 1,600 | | 1,490 | |
Total Bolivia (Cost $2,805) | | | | | | 2,758 | |
9
Emerging Markets Government Bond Index Fund
| | Coupon | Maturity
Date | | Face
Amount
($000 | ) | Market
Value·
($000 | ) |
Brazil (6.5%) | | | | | | | |
Sovereign Bonds (6.5%) | | | | | | | |
| Banco do Brasil SA | 5.375% | 1/15/21 | | 375 | | 386 | |
| Banco do Brasil SA | 5.875% | 1/26/22 | | 2,075 | | 2,192 | |
| Banco do Brasil SA | 3.875% | 10/10/22 | | 3,126 | | 3,192 | |
| Cemig Geracao e Transmissao SA | 9.250% | 12/5/24 | | 2,500 | | 2,895 | |
| Centrais Eletricas Brasileiras SA | 5.750% | 10/27/21 | | 3,050 | | 3,199 | |
| Federative Republic of Brazil | 4.875% | 1/22/21 | | 5,017 | | 5,180 | |
| Federative Republic of Brazil | 2.625% | 1/5/23 | | 4,561 | | 4,561 | |
| Federative Republic of Brazil | 8.875% | 4/15/24 | | 1,425 | | 1,808 | |
| Federative Republic of Brazil | 4.250% | 1/7/25 | | 7,103 | | 7,503 | |
| Federative Republic of Brazil | 8.750% | 2/4/25 | | 517 | | 666 | |
| Federative Republic of Brazil | 6.000% | 4/7/26 | | 3,630 | | 4,206 | |
| Federative Republic of Brazil | 10.125% | 5/15/27 | | 1,456 | | 2,080 | |
2 | Federative Republic of Brazil | 4.625% | 1/13/28 | | 6,552 | | 7,000 | |
2 | Federative Republic of Brazil | 4.500% | 5/30/29 | | 3,250 | | 3,417 | |
| Federative Republic of Brazil | 8.250% | 1/20/34 | | 2,639 | | 3,652 | |
| Federative Republic of Brazil | 7.125% | 1/20/37 | | 3,586 | | 4,595 | |
| Federative Republic of Brazil | 5.625% | 1/7/41 | | 4,726 | | 5,293 | |
| Federative Republic of Brazil | 5.000% | 1/27/45 | | 5,686 | | 5,892 | |
| Federative Republic of Brazil | 5.625% | 2/21/47 | | 5,440 | | 6,106 | |
| Petrobras Global Finance BV | 6.250% | 3/17/24 | | 2,825 | | 3,157 | |
| Petrobras Global Finance BV | 5.299% | 1/27/25 | | 3,606 | | 3,914 | |
| Petrobras Global Finance BV | 8.750% | 5/23/26 | | 4,048 | | 5,166 | |
| Petrobras Global Finance BV | 7.375% | 1/17/27 | | 4,405 | | 5,286 | |
| Petrobras Global Finance BV | 5.999% | 1/27/28 | | 7,538 | | 8,495 | |
| Petrobras Global Finance BV | 5.750% | 2/1/29 | | 5,075 | | 5,648 | |
1 | Petrobras Global Finance BV | 5.093% | 1/15/30 | | 2,187 | | 2,316 | |
| Petrobras Global Finance BV | 7.250% | 3/17/44 | | 2,485 | | 3,019 | |
| Petrobras Global Finance BV | 6.900% | 3/19/49 | | 4,400 | | 5,104 | |
| Petrobras Global Finance BV | 6.850% | 6/5/15 | | 4,375 | | 5,026 | |
Total Brazil (Cost $108,472) | | | | | | 120,954 | |
Cameroon (0.1%) | | | | | | | |
Sovereign Bond (0.1%) | | | | | | | |
2 | Republic of Cameroon | 9.500% | 11/19/25 | | 1,350 | | 1,487 | |
Total Cameroon (Cost $1,408) | | | | | | 1,487 | |
Chile (0.7%) | | | | | | | |
Sovereign Bonds (0.7%) | | | | | | | |
1 | Corp. Nacional del Cobre de Chile | 4.500% | 8/13/23 | | 150 | | 161 | |
1 | Corp. Nacional del Cobre de Chile | 3.625% | 8/1/27 | | 800 | | 841 | |
| Corp. Nacional del Cobre de Chile | 3.625% | 8/1/27 | | 1,700 | | 1,785 | |
| Republic of Chile | 3.125% | 1/21/26 | | 1,290 | | 1,355 | |
2 | Republic of Chile | 3.240% | 2/6/28 | | 3,750 | | 3,984 | |
| Republic of Chile | 3.860% | 6/21/47 | | 1,750 | | 2,019 | |
2 | Republic of Chile | 3.500% | 1/25/50 | | 3,100 | | 3,378 | |
Total Chile (Cost $12,599) | | | | | | 13,523 | |
10
Emerging Markets Government Bond Index Fund
| | Coupon | Maturity
Date | | Face
Amount
($000 | ) | Market
Value·
($000 | ) |
China (3.9%) | | | | | | | |
Sovereign Bonds (3.9%) | | | | | | | |
| Avi Funding Co. Ltd. | 3.800% | 9/16/25 | | 600 | | 636 | |
1 | Bank of China Ltd. | 5.000% | 11/13/24 | | 1,000 | | 1,091 | |
| Bank of China Ltd. | 5.000% | 11/13/24 | | 4,250 | | 4,637 | |
| China Cinda Finance 2015 I Ltd. | 4.250% | 4/23/25 | | 2,900 | | 3,087 | |
2 | China Construction Bank Corp. | 4.250% | 2/27/29 | | 3,000 | | 3,155 | |
| CNAC HK Finbridge Co. Ltd. | 3.500% | 7/19/22 | | 2,898 | | 2,949 | |
| CNAC HK Finbridge Co. Ltd. | 4.125% | 7/19/27 | | 1,580 | | 1,664 | |
| CNAC HK Finbridge Co. Ltd. | 5.125% | 3/14/28 | | 1,900 | | 2,129 | |
1 | CNOOC Curtis Funding No 1 Pty Ltd. | 4.500% | 10/3/23 | | 300 | | 321 | |
| CNOOC Curtis Funding No 1 Pty Ltd. | 4.500% | 10/3/23 | | 3,914 | | 4,203 | |
1 | CNOOC Finance 2011 Ltd. | 4.250% | 1/26/21 | | 2,288 | | 2,337 | |
1 | CNOOC Finance 2012 Ltd. | 3.875% | 5/2/22 | | 1,600 | | 1,653 | |
| CNOOC Finance 2013 Ltd. | 3.000% | 5/9/23 | | 2,250 | | 2,285 | |
| CNOOC Finance 2015 USA LLC | 3.500% | 5/5/25 | | 1,300 | | 1,361 | |
| CNOOC Finance 2015 USA LLC | 4.375% | 5/2/28 | | 1,000 | | 1,112 | |
| CNOOC Nexen Finance 2014 ULC | 4.250% | 4/30/24 | | 2,560 | | 2,731 | |
| Export-Import Bank of China | 3.625% | 7/31/24 | | 1,927 | | 2,039 | |
2 | Huarong Finance 2017 Co. Ltd. | 4.500% | 12/31/49 | | 350 | | 356 | |
| Huarong Finance II Co. Ltd. | 3.625% | 11/22/21 | | 1,250 | | 1,268 | |
2 | Huarong Finance II Co. Ltd. | 2.875% | 12/31/49 | | 1,200 | | 1,183 | |
| Industrial & Commercial Bank of China Ltd. | 4.875% | 9/21/25 | | 3,350 | | 3,693 | |
| People’s Republic of China | 2.125% | 11/2/22 | | 2,473 | | 2,486 | |
| People’s Republic of China | 3.250% | 10/19/23 | | 2,700 | | 2,831 | |
| People’s Republic of China | 2.625% | 11/2/27 | | 1,751 | | 1,807 | |
| People’s Republic of China | 3.500% | 10/19/28 | | 900 | | 997 | |
| People’s Republic of China | 4.000% | 10/19/48 | | 1,100 | | 1,324 | |
1 | Sinochem Overseas Capital Co. Ltd. | 4.500% | 11/12/20 | | 1,575 | | 1,607 | |
| Sinochem Overseas Capital Co. Ltd. | 4.500% | 11/12/20 | | 800 | | 817 | |
1 | Sinopec Group Overseas Development 2012 Ltd. | 3.900% | 5/17/22 | | 1,369 | | 1,418 | |
| Sinopec Group Overseas Development 2012 Ltd. | 3.900% | 5/17/22 | | 1,107 | | 1,148 | |
| Sinopec Group Overseas Development 2013 Ltd. | 4.375% | 10/17/23 | | 3,493 | | 3,742 | |
| Sinopec Group Overseas Development 2014 Ltd. | 4.375% | 4/10/24 | | 300 | | 324 | |
| Sinopec Group Overseas Development 2015 Ltd. | 3.250% | 4/28/25 | | 3,250 | | 3,351 | |
| State Grid Overseas Investment 2014 Ltd. | 4.125% | 5/7/24 | | 2,870 | | 3,080 | |
1 | State Grid Overseas Investment 2014 Ltd. | 4.125% | 5/7/24 | | 200 | | 215 | |
1 | State Grid Overseas Investment 2016 Ltd. | 3.500% | 5/4/27 | | 1,200 | | 1,267 | |
| State Grid Overseas Investment 2016 Ltd. | 3.500% | 5/4/27 | | 2,600 | | 2,748 | |
Total China (Cost $69,960) | | | | | | 73,052 | |
Colombia (3.4%) | | | | | | | |
Sovereign Bonds (3.4%) | | | | | | | |
| Ecopetrol SA | 5.875% | 9/18/23 | | 2,685 | | 2,980 | |
| Ecopetrol SA | 4.125% | 1/16/25 | | 1,050 | | 1,103 | |
| Ecopetrol SA | 5.375% | 6/26/26 | | 2,140 | | 2,397 | |
| Ecopetrol SA | 7.375% | 9/18/43 | | 1,238 | | 1,643 | |
| Ecopetrol SA | 5.875% | 5/28/45 | | 2,130 | | 2,452 | |
| Republic of Colombia | 4.375% | 7/12/21 | | 3,409 | | 3,520 | |
2 | Republic of Colombia | 2.625% | 3/15/23 | | 1,960 | | 1,970 | |
11
Emerging Markets Government Bond Index Fund
| | Coupon | Maturity
Date | | Face
Amount
($000 | ) | Market
Value·
($000 | ) |
| Republic of Colombia | 4.000% | 2/26/24 | | 4,045 | | 4,273 | |
| Republic of Colombia | 8.125% | 5/21/24 | | 1,680 | | 2,071 | |
2 | Republic of Colombia | 4.500% | 1/28/26 | | 2,275 | | 2,483 | |
2 | Republic of Colombia | 3.875% | 4/25/27 | | 4,275 | | 4,535 | |
2 | Republic of Colombia | 4.500% | 3/15/29 | | 4,300 | | 4,773 | |
| Republic of Colombia | 7.375% | 9/18/37 | | 2,493 | | 3,543 | |
| Republic of Colombia | 6.125% | 1/18/41 | | 4,082 | | 5,277 | |
2 | Republic of Colombia | 5.625% | 2/26/44 | | 4,684 | | 5,796 | |
2 | Republic of Colombia | 5.000% | 6/15/45 | | 8,550 | | 9,897 | |
| Republic of Colombia | 5.200% | 5/15/49 | | 3,100 | | 3,712 | |
Total Colombia (Cost $56,755) | | | | | | 62,425 | |
Costa Rica (0.4%) | | | | | | | |
Sovereign Bonds (0.4%) | | | | | | | |
| Republic of Costa Rica | 4.250% | 1/26/23 | | 1,982 | | 1,938 | |
| Republic of Costa Rica | 4.375% | 4/30/25 | | 500 | | 479 | |
| Republic of Costa Rica | 5.625% | 4/30/43 | | 1,200 | | 1,043 | |
| Republic of Costa Rica | 7.000% | 4/4/44 | | 2,330 | | 2,298 | |
| Republic of Costa Rica | 7.158% | 3/12/45 | | 1,351 | | 1,345 | |
Total Costa Rica (Cost $6,912) | | | | | | 7,103 | |
Cote d’Ivoire (0.4%) | | | | | | | |
Sovereign Bonds (0.4%) | | | | | | | |
2 | Republic of Cote d’Ivoire | 6.375% | 3/3/28 | | 1,900 | | 1,963 | |
2 | Republic of Cote d’Ivoire | 5.750% | 12/31/32 | | 1,605 | | 1,588 | |
1,2 | Republic of Cote d’Ivoire | 5.750% | 12/31/32 | | 1,320 | | 1,306 | |
2 | Republic of Cote d’Ivoire | 6.125% | 6/15/33 | | 2,800 | | 2,749 | |
Total Cote d’Ivoire (Cost $7,337) | | | | | | 7,606 | |
Croatia (0.6%) | | | | | | | |
Sovereign Bonds (0.6%) | | | | | | | |
| Republic of Croatia | 6.375% | 3/24/21 | | 2,600 | | 2,737 | |
| Republic of Croatia | 5.500% | 4/4/23 | | 3,500 | | 3,866 | |
| Republic of Croatia | 6.000% | 1/26/24 | | 3,235 | | 3,723 | |
Total Croatia (Cost $9,896) | | | | | | 10,326 | |
Dominican Republic (1.5%) | | | | | | | |
Sovereign Bonds (1.5%) | | | | | | | |
2 | Dominican Republic | 7.500% | 5/6/21 | | 1,735 | | 1,811 | |
| Dominican Republic | 6.600% | 1/28/24 | | 1,075 | | 1,192 | |
2 | Dominican Republic | 5.875% | 4/18/24 | | 1,950 | | 2,085 | |
| Dominican Republic | 5.500% | 1/27/25 | | 2,860 | | 3,058 | |
| Dominican Republic | 6.875% | 1/29/26 | | 1,795 | | 2,050 | |
| Dominican Republic | 5.950% | 1/25/27 | | 3,200 | | 3,510 | |
1 | Dominican Republic | 6.000% | 7/19/28 | | 1,400 | | 1,533 | |
| Dominican Republic | 6.000% | 7/19/28 | | 1,519 | | 1,685 | |
| Dominican Republic | 7.450% | 4/30/44 | | 1,900 | | 2,278 | |
1 | Dominican Republic | 6.850% | 1/27/45 | | 870 | | 970 | |
2 | Dominican Republic | 6.850% | 1/27/45 | | 3,219 | | 3,626 | |
1 | Dominican Republic | 6.500% | 2/15/48 | | 1,000 | | 1,077 | |
| Dominican Republic | 6.400% | 6/5/49 | | 550 | | 595 | |
1 | Dominican Republic | 6.400% | 6/5/49 | | 3,100 | | 3,317 | |
Total Dominican Republic (Cost $27,288) | | | | | | 28,787 | |
12
Emerging Markets Government Bond Index Fund
| | Coupon | Maturity
Date | | Face
Amount
($000 | ) | Market
Value·
($000 | ) |
Ecuador (1.9%) | | | | | | | |
Sovereign Bonds (1.9%) | | | | | | | |
| Republic of Ecuador | 10.750% | 3/28/22 | | 6,300 | | 6,740 | |
| Republic of Ecuador | 8.750% | 6/2/23 | | 2,300 | | 2,339 | |
| Republic of Ecuador | 7.950% | 6/20/24 | | 5,450 | | 5,277 | |
1 | Republic of Ecuador | 7.875% | 3/27/25 | | 500 | | 470 | |
| Republic of Ecuador | 9.650% | 12/13/26 | | 3,150 | | 3,112 | |
1 | Republic of Ecuador | 9.625% | 6/2/27 | | 370 | | 361 | |
| Republic of Ecuador | 9.625% | 6/2/27 | | 3,200 | | 3,123 | |
| Republic of Ecuador | 8.875% | 10/23/27 | | 2,950 | | 2,764 | |
1 | Republic of Ecuador | 7.875% | 1/23/28 | | 4,950 | | 4,440 | |
1 | Republic of Ecuador | 10.750% | 1/31/29 | | 3,600 | | 3,657 | |
1 | Republic of Ecuador | 9.500% | 3/27/30 | | 2,400 | | 2,316 | |
Total Ecuador (Cost $36,041) | | | | | | 34,599 | |
Egypt (1.7%) | | | | | | | |
Sovereign Bonds (1.7%) | | | | | | | |
| Arab Republic of Egypt | 6.125% | 1/31/22 | | 4,653 | | 4,809 | |
1 | Arab Republic of Egypt | 5.577% | 2/21/23 | | 1,200 | | 1,232 | |
| Arab Republic of Egypt | 5.577% | 2/21/23 | | 950 | | 974 | |
| Arab Republic of Egypt | 6.200% | 3/1/24 | | 1,250 | | 1,322 | |
| Arab Republic of Egypt | 5.875% | 6/11/25 | | 2,475 | | 2,566 | |
| Arab Republic of Egypt | 7.500% | 1/31/27 | | 3,500 | | 3,801 | |
1 | Arab Republic of Egypt | 6.588% | 2/21/28 | | 800 | | 813 | |
| Arab Republic of Egypt | 6.588% | 2/21/28 | | 1,725 | | 1,758 | |
1 | Arab Republic of Egypt | 7.600% | 3/1/29 | | 2,000 | | 2,115 | |
| Arab Republic of Egypt | 7.600% | 3/1/29 | | 1,150 | | 1,218 | |
| Arab Republic of Egypt | 6.875% | 4/30/40 | | 800 | | 778 | |
| Arab Republic of Egypt | 8.500% | 1/31/47 | | 4,450 | | 4,682 | |
1 | Arab Republic of Egypt | 7.903% | 2/21/48 | | 200 | | 200 | |
| Arab Republic of Egypt | 7.903% | 2/21/48 | | 2,600 | | 2,607 | |
| Arab Republic of Egypt | 8.700% | 3/1/49 | | 2,750 | | 2,950 | |
Total Egypt (Cost $30,739) | | | | | | 31,825 | |
El Salvador (0.6%) | | | | | | | |
Sovereign Bonds (0.6%) | | | | | | | |
| Republic of El Salvador | 7.750% | 1/24/23 | | 985 | | 1,079 | |
| Republic of El Salvador | 5.875% | 1/30/25 | | 1,218 | | 1,266 | |
1 | Republic of El Salvador | 6.375% | 1/18/27 | | 300 | | 313 | |
| Republic of El Salvador | 6.375% | 1/18/27 | | 1,402 | | 1,473 | |
1 | Republic of El Salvador | 8.625% | 2/28/29 | | 150 | | 177 | |
| Republic of El Salvador | 8.625% | 2/28/29 | | 1,100 | | 1,304 | |
| Republic of El Salvador | 8.250% | 4/10/32 | | 882 | | 1,021 | |
| Republic of El Salvador | 7.650% | 6/15/35 | | 1,990 | | 2,163 | |
| Republic of El Salvador | 7.625% | 2/1/41 | | 1,218 | | 1,328 | |
1,2 | Republic of El Salvador | 7.125% | 1/20/50 | | 1,800 | | 1,818 | |
Total El Salvador (Cost $11,048) | | | | | | 11,942 | |
Ethiopia (0.1%) | | | | | | | |
Sovereign Bond (0.1%) | | | | | | | |
| Federal Democratic Republic of Ethiopia | 6.625% | 12/11/24 | | 1,750 | | 1,836 | |
Total Ethiopia (Cost $1,740) | | | | | | 1,836 | |
13
Emerging Markets Government Bond Index Fund
| | Coupon | Maturity
Date | | Face
Amount
($000 | ) | Market
Value·
($000 | ) |
Gabon (0.2%) | | | | | | | |
Sovereign Bonds (0.2%) | | | | | | | |
2 | Gabonese Republic | 6.375% | 12/12/24 | | 2,586 | | 2,575 | |
1,2 | Gabonese Republic | 6.375% | 12/12/24 | | 400 | | 398 | |
| Gabonese Republic | 6.950% | 6/16/25 | | 1,050 | | 1,060 | |
Total Gabon (Cost $3,983) | | | | | | 4,033 | |
Georgia (0.0%) | | | | | | | |
Sovereign Bond (0.0%) | | | | | | | |
| Republic of Georgia | 6.875% | 4/12/21 | | 800 | | 847 | |
Total Georgia (Cost $828) | | | | | | 847 | |
Ghana (0.8%) | | | | | | | |
Sovereign Bonds (0.8%) | | | | | | | |
1 | Republic of Ghana | 7.875% | 8/7/23 | | 400 | | 435 | |
1,2 | Republic of Ghana | 8.125% | 1/18/26 | | 300 | | 318 | |
2 | Republic of Ghana | 8.125% | 1/18/26 | | 2,970 | | 3,149 | |
2 | Republic of Ghana | 7.875% | 3/26/27 | | 500 | | 520 | |
2 | Republic of Ghana | 7.625% | 5/16/29 | | 2,800 | | 2,833 | |
2 | Republic of Ghana | 10.750% | 10/14/30 | | 1,000 | | 1,263 | |
2 | Republic of Ghana | 8.125% | 3/26/32 | | 3,000 | | 3,036 | |
1,2 | Republic of Ghana | 8.627% | 6/16/49 | | 800 | | 798 | |
2 | Republic of Ghana | 8.950% | 3/26/51 | | 2,200 | | 2,226 | |
Total Ghana (Cost $14,220) | | | | | | 14,578 | |
Guatemala (0.4%) | | | | | | | |
Sovereign Bonds (0.4%) | | | | | | | |
| Republic of Guatemala | 5.750% | 6/6/22 | | 1,453 | | 1,554 | |
| Republic of Guatemala | 4.500% | 5/3/26 | | 1,700 | | 1,782 | |
| Republic of Guatemala | 4.375% | 6/5/27 | | 1,000 | | 1,032 | |
| Republic of Guatemala | 4.875% | 2/13/28 | | 600 | | 639 | |
1,2 | Republic of Guatemala | 4.900% | 6/1/30 | | 800 | | 846 | |
2 | Republic of Guatemala | 6.125% | 6/1/50 | | 1,400 | | 1,643 | |
Total Guatemala (Cost $7,017) | | | | | | 7,496 | |
Honduras (0.2%) | | | | | | | |
Sovereign Bonds (0.2%) | | | | | | | |
| Republic of Honduras | 8.750% | 12/16/20 | | 200 | | 213 | |
2 | Republic of Honduras | 7.500% | 3/15/24 | | 1,200 | | 1,324 | |
| Republic of Honduras | 6.250% | 1/19/27 | | 1,170 | | 1,254 | |
Total Honduras (Cost $2,673) | | | | | | 2,791 | |
Hungary (1.1%) | | | | | | | |
Sovereign Bonds (1.1%) | | | | | | | |
| Republic of Hungary | 6.375% | 3/29/21 | | 4,377 | | 4,634 | |
| Republic of Hungary | 5.375% | 2/21/23 | | 3,482 | | 3,809 | |
| Republic of Hungary | 5.750% | 11/22/23 | | 3,754 | | 4,247 | |
| Republic of Hungary | 5.375% | 3/25/24 | | 3,975 | | 4,470 | |
| Republic of Hungary | 7.625% | 3/29/41 | | 2,100 | | 3,453 | |
Total Hungary (Cost $19,600) | | | | | | 20,613 | |
14
Emerging Markets Government Bond Index Fund
| | Coupon | Maturity
Date | | Face
Amount
($000 | ) | Market
Value·
($000 | ) |
Indonesia (6.7%) | | | | | | | |
Sovereign Bonds (6.7%) | | | | | | | |
| Pertamina Persero PT | 4.875% | 5/3/22 | | 750 | | 792 | |
1 | Pertamina Persero PT | 4.300% | 5/20/23 | | 430 | | 454 | |
| Pertamina Persero PT | 4.300% | 5/20/23 | | 1,500 | | 1,582 | |
| Pertamina Persero PT | 6.500% | 5/27/41 | | 200 | | 254 | |
1 | Pertamina Persero PT | 5.625% | 5/20/43 | | 200 | | 230 | |
| Pertamina Persero PT | 6.450% | 5/30/44 | | 1,800 | | 2,299 | |
| Pertamina Persero PT | 6.500% | 11/7/48 | | 400 | | 522 | |
1 | Perusahaan Listrik Negara PT | 4.125% | 5/15/27 | | 1,450 | | 1,517 | |
| Perusahaan Listrik Negara PT | 4.125% | 5/15/27 | | 750 | | 785 | |
| Perusahaan Listrik Negara PT | 5.450% | 5/21/28 | | 200 | | 229 | |
1 | Perusahaan Listrik Negara PT | 5.250% | 10/24/42 | | 300 | | 333 | |
4 | Perusahaan Penerbit SBSN Indonesia III | 3.400% | 3/29/21 | | 1,200 | | 1,216 | |
| Perusahaan Penerbit SBSN Indonesia III | 3.400% | 3/29/22 | | 1,700 | | 1,736 | |
| Perusahaan Penerbit SBSN Indonesia III | 3.300% | 11/21/22 | | 378 | | 387 | |
1 | Perusahaan Penerbit SBSN Indonesia III | 3.750% | 3/1/23 | | 800 | | 830 | |
4 | Perusahaan Penerbit SBSN Indonesia III | 3.750% | 3/1/23 | | 2,000 | | 2,075 | |
4 | Perusahaan Penerbit SBSN Indonesia III | 3.900% | 8/20/24 | | 650 | | 686 | |
1 | Perusahaan Penerbit SBSN Indonesia III | 4.350% | 9/10/24 | | 600 | | 645 | |
| Perusahaan Penerbit SBSN Indonesia III | 4.350% | 9/10/24 | | 2,900 | | 3,117 | |
| Perusahaan Penerbit SBSN Indonesia III | 4.325% | 5/28/25 | | 3,469 | | 3,716 | |
| Perusahaan Penerbit SBSN Indonesia III | 4.550% | 3/29/26 | | 2,985 | | 3,254 | |
| Perusahaan Penerbit SBSN Indonesia III | 4.150% | 3/29/27 | | 4,450 | | 4,761 | |
1 | Perusahaan Penerbit SBSN Indonesia III | 4.400% | 3/1/28 | | 1,500 | | 1,635 | |
4 | Perusahaan Penerbit SBSN Indonesia III | 4.400% | 3/1/28 | | 2,182 | | 2,378 | |
1,4 | Perusahaan Penerbit SBSN Indonesia III | 4.450% | 2/20/29 | | 1,000 | | 1,100 | |
4 | Perusahaan Penerbit SBSN Indonesia III | 4.450% | 2/20/29 | | 600 | | 660 | |
| Republic of Indonesia | 4.875% | 5/5/21 | | 4,800 | | 4,976 | |
| Republic of Indonesia | 3.700% | 1/8/22 | | 2,250 | | 2,311 | |
| Republic of Indonesia | 3.750% | 4/25/22 | | 3,150 | | 3,247 | |
| Republic of Indonesia | 3.375% | 4/15/23 | | 4,400 | | 4,517 | |
| Republic of Indonesia | 5.375% | 10/17/23 | | 2,559 | | 2,828 | |
| Republic of Indonesia | 5.875% | 1/15/24 | | 2,850 | | 3,213 | |
| Republic of Indonesia | 4.450% | 2/11/24 | | 900 | | 967 | |
1 | Republic of Indonesia | 4.125% | 1/15/25 | | 200 | | 213 | |
| Republic of Indonesia | 4.125% | 1/15/25 | | 3,280 | | 3,497 | |
| Republic of Indonesia | 4.750% | 1/8/26 | | 4,550 | | 5,035 | |
| Republic of Indonesia | 4.350% | 1/8/27 | | 2,300 | | 2,511 | |
1 | Republic of Indonesia | 3.850% | 7/18/27 | | 1,000 | | 1,061 | |
| Republic of Indonesia | 3.850% | 7/18/27 | | 1,450 | | 1,539 | |
| Republic of Indonesia | 3.500% | 1/11/28 | | 2,586 | | 2,685 | |
| Republic of Indonesia | 4.100% | 4/24/28 | | 1,858 | | 2,002 | |
| Republic of Indonesia | 4.750% | 2/11/29 | | 2,000 | | 2,277 | |
| Republic of Indonesia | 3.400% | 9/18/29 | | 1,300 | | 1,350 | |
| Republic of Indonesia | 8.500% | 10/12/35 | | 2,440 | | 3,826 | |
| Republic of Indonesia | 6.625% | 2/17/37 | | 2,487 | | 3,353 | |
| Republic of Indonesia | 7.750% | 1/17/38 | | 3,288 | | 4,916 | |
| Republic of Indonesia | 5.250% | 1/17/42 | | 4,050 | | 4,849 | |
| Republic of Indonesia | 4.625% | 4/15/43 | | 2,725 | | 3,038 | |
1 | Republic of Indonesia | 6.750% | 1/15/44 | | 100 | | 143 | |
| Republic of Indonesia | 6.750% | 1/15/44 | | 3,150 | | 4,526 | |
| Republic of Indonesia | 5.125% | 1/15/45 | | 5,069 | | 6,076 | |
| Republic of Indonesia | 5.950% | 1/8/46 | | 600 | | 798 | |
15
Emerging Markets Government Bond Index Fund
| | Coupon | Maturity
Date | | Face
Amount
($000 | ) | Market
Value·
($000 | ) |
| Republic of Indonesia | 5.250% | 1/8/47 | | 2,850 | | 3,493 | |
| Republic of Indonesia | 4.750% | 7/18/47 | | 1,850 | | 2,117 | |
| Republic of Indonesia | 4.350% | 1/11/48 | | 3,050 | | 3,336 | |
| Republic of Indonesia | 5.350% | 2/11/49 | | 2,300 | | 2,924 | |
| Republic of Indonesia | 3.700% | 10/30/49 | | 750 | | 750 | |
Total Indonesia (Cost $116,293) | | | | | | 125,567 | |
Iraq (0.3%) | | | | | | | |
Sovereign Bonds (0.3%) | | | | | | | |
1 | Republic of Iraq | 6.752% | 3/9/23 | | 850 | | 858 | |
| Republic of Iraq | 6.752% | 3/9/23 | | 1,350 | | 1,361 | |
2 | Republic of Iraq | 5.800% | 1/15/28 | | 4,445 | | 4,264 | |
Total Iraq (Cost $6,408) | | | | | | 6,483 | |
Jamaica (0.6%) | | | | | | | |
Sovereign Bonds (0.6%) | | | | | | | |
| Jamaica | 6.750% | 4/28/28 | | 3,050 | | 3,607 | |
2 | Jamaica | 8.000% | 3/15/39 | | 1,948 | | 2,571 | |
| Jamaica | 7.875% | 7/28/45 | | 3,250 | | 4,274 | |
Total Jamaica (Cost $9,418) | | | | | | 10,452 | |
Jordan (0.3%) | | | | | | | |
Sovereign Bonds (0.3%) | | | | | | | |
| Hashemite Kingdom of Jordan | 6.125% | 1/29/26 | | 2,200 | | 2,322 | |
| Hashemite Kingdom of Jordan | 5.750% | 1/31/27 | | 1,614 | | 1,669 | |
| Hashemite Kingdom of Jordan | 7.375% | 10/10/47 | | 1,650 | | 1,742 | |
Total Jordan (Cost $5,369) | | | | | | 5,733 | |
Kazakhstan (1.0%) | | | | | | | |
Sovereign Bonds (1.0%) | | | | | | | |
| KazMunayGas National Co. JSC | 5.750% | 4/19/47 | | 1,800 | | 2,101 | |
| KazMunayGas National Co. JSC | 6.375% | 10/24/48 | | 200 | | 252 | |
1 | KazMunayGas National Co. JSC | 6.375% | 10/24/48 | | 900 | | 1,131 | |
| Republic of Kazakhstan | 3.875% | 10/14/24 | | 2,350 | | 2,500 | |
| Republic of Kazakhstan | 5.125% | 7/21/25 | | 5,450 | | 6,183 | |
| Republic of Kazakhstan | 4.875% | 10/14/44 | | 1,800 | | 2,186 | |
| Republic of Kazakhstan | 6.500% | 7/21/45 | | 2,430 | | 3,532 | |
Total Kazakhstan (Cost $15,948) | | | | | | 17,885 | |
Kenya (0.6%) | | | | | | | |
Sovereign Bonds (0.6%) | | | | | | | |
1 | Republic of Kenya | 6.875% | 6/24/24 | | 200 | | 212 | |
| Republic of Kenya | 6.875% | 6/24/24 | | 3,275 | | 3,480 | |
2 | Republic of Kenya | 7.000% | 5/22/27 | | 1,825 | | 1,913 | |
| Republic of Kenya | 7.250% | 2/28/28 | | 1,800 | | 1,901 | |
2 | Republic of Kenya | 8.000% | 5/22/32 | | 2,500 | | 2,668 | |
| Republic of Kenya | 8.250% | 2/28/48 | | 1,625 | | 1,707 | |
Total Kenya (Cost $11,208) | | | | | | 11,881 | |
Kuwait (0.8%) | | | | | | | |
Sovereign Bonds (0.8%) | | | | | | | |
| State of Kuwait | 2.750% | 3/20/22 | | 6,175 | | 6,263 | |
| State of Kuwait | 3.500% | 3/20/27 | | 7,940 | | 8,555 | |
Total Kuwait (Cost $14,281) | | | | | | 14,818 | |
16
Emerging Markets Government Bond Index Fund
| | Coupon | Maturity
Date | | Face
Amount
($000 | ) | Market
Value·
($000 | ) |
Lebanon (1.0%) | | | | | | | |
Sovereign Bonds (1.0%) | | | | | | | |
| Republic of Lebanon | 8.250% | 4/12/21 | | 3,828 | | 2,672 | |
| Republic of Lebanon | 6.100% | 10/4/22 | | 5,039 | | 3,001 | |
| Republic of Lebanon | 6.000% | 1/27/23 | | 1,035 | | 614 | |
| Republic of Lebanon | 6.650% | 4/22/24 | | 1,991 | | 1,142 | |
| Republic of Lebanon | 6.200% | 2/26/25 | | 2,100 | | 1,187 | |
| Republic of Lebanon | 6.250% | 6/12/25 | | 400 | | 225 | |
| Republic of Lebanon | 6.600% | 11/27/26 | | 3,105 | | 1,719 | |
| Republic of Lebanon | 6.850% | 3/23/27 | | 2,900 | | 1,610 | |
| Republic of Lebanon | 6.750% | 11/29/27 | | 2,461 | | 1,361 | |
| Republic of Lebanon | 6.650% | 11/3/28 | | 1,440 | | 798 | |
| Republic of Lebanon | 6.850% | 5/25/29 | | 500 | | 276 | |
| Republic of Lebanon | 6.650% | 2/26/30 | | 3,050 | | 1,690 | |
| Republic of Lebanon | 7.000% | 3/23/32 | | 2,050 | | 1,138 | |
| Republic of Lebanon | 7.050% | 11/2/35 | | 500 | | 279 | |
| Republic of Lebanon | 7.250% | 3/23/37 | | 2,100 | | 1,166 | |
Total Lebanon (Cost $29,074) | | | | | | 18,878 | |
Malaysia (1.0%) | | | | | | | |
Sovereign Bonds (1.0%) | | | | | | | |
| 1MDB Global Investments Ltd. | 4.400% | 3/9/23 | | 4,700 | | 4,545 | |
| Malaysia Sovereign Sukuk Bhd. | 3.043% | 4/22/25 | | 2,750 | | 2,856 | |
| Malaysia Sovereign Sukuk Bhd. | 4.236% | 4/22/45 | | 975 | | 1,201 | |
| Malaysia Sukuk Global Bhd. | 3.179% | 4/27/26 | | 1,750 | | 1,830 | |
| Malaysia Sukuk Global Bhd. | 4.080% | 4/27/46 | | 700 | | 847 | |
| Petronas Capital Ltd. | 3.500% | 3/18/25 | | 2,800 | | 2,957 | |
| Petronas Capital Ltd. | 4.500% | 3/18/45 | | 2,650 | | 3,253 | |
1 | Wakala Global Sukuk Bhd. | 4.646% | 7/6/21 | | 750 | | 780 | |
Total Malaysia (Cost $17,097) | | | | | | 18,269 | |
Mexico (9.5%) | | | | | | | |
Sovereign Bonds (9.5%) | | | | | | | |
1 | Mexico City Airport Trust | 5.500% | 7/31/47 | | 590 | | 593 | |
| Mexico City Airport Trust | 5.500% | 7/31/47 | | 3,154 | | 3,174 | |
| Petroleos Mexicanos | 6.875% | 8/4/26 | | 5,830 | | 6,394 | |
1 | Petroleos Mexicanos | 6.490% | 1/23/27 | | 3,366 | | 3,592 | |
| Petroleos Mexicanos | 6.500% | 3/13/27 | | 9,770 | | 10,350 | |
| Petroleos Mexicanos | 5.350% | 2/12/28 | | 4,750 | | 4,676 | |
| Petroleos Mexicanos | 6.500% | 1/23/29 | | 3,525 | | 3,674 | |
1 | Petroleos Mexicanos | 6.840% | 1/23/30 | | 8,159 | | 8,696 | |
| Petroleos Mexicanos | 6.625% | 6/15/35 | | 4,901 | | 4,992 | |
| Petroleos Mexicanos | 6.500% | 6/2/41 | | 2,160 | | 2,135 | |
| Petroleos Mexicanos | 6.375% | 1/23/45 | | 3,385 | | 3,299 | |
| Petroleos Mexicanos | 5.625% | 1/23/46 | | 3,792 | | 3,402 | |
| Petroleos Mexicanos | 6.750% | 9/21/47 | | 10,529 | | 10,485 | |
| Petroleos Mexicanos | 6.350% | 2/12/48 | | 5,755 | | 5,475 | |
1 | Petroleos Mexicanos | 7.690% | 1/23/50 | | 14,265 | | 15,555 | |
| United Mexican States | 3.625% | 3/15/22 | | 4,073 | | 4,202 | |
| United Mexican States | 8.000% | 9/24/22 | | 400 | | 464 | |
| United Mexican States | 4.000% | 10/2/23 | | 5,226 | | 5,538 | |
| United Mexican States | 3.600% | 1/30/25 | | 4,399 | | 4,617 | |
| United Mexican States | 4.125% | 1/21/26 | | 4,462 | | 4,778 | |
| United Mexican States | 4.150% | 3/28/27 | | 6,160 | | 6,593 | |
| United Mexican States | 3.750% | 1/11/28 | | 5,230 | | 5,447 | |
17
Emerging Markets Government Bond Index Fund
| | Coupon | Maturity
Date | | Face
Amount
($000 | ) | Market
Value·
($000 | ) |
| United Mexican States | 4.500% | 4/22/29 | | 7,300 | | 8,038 | |
| United Mexican States | 7.500% | 4/8/33 | | 1,010 | | 1,413 | |
| United Mexican States | 6.750% | 9/27/34 | | 2,776 | | 3,758 | |
| United Mexican States | 6.050% | 1/11/40 | | 4,955 | | 6,304 | |
| United Mexican States | 4.750% | 3/8/44 | | 8,570 | | 9,348 | |
| United Mexican States | 5.550% | 1/21/45 | | 3,314 | | 4,033 | |
| United Mexican States | 4.600% | 1/23/46 | | 6,981 | | 7,453 | |
| United Mexican States | 4.350% | 1/15/47 | | 3,626 | | 3,757 | |
| United Mexican States | 4.600% | 2/10/48 | | 5,743 | | 6,188 | |
2 | United Mexican States | 4.500% | 1/31/50 | | 2,500 | | 2,692 | |
| United Mexican States | 5.750% | 10/12/10 | | 4,612 | | 5,355 | |
Total Mexico (Cost $165,823) | | | | | | 176,470 | |
Mongolia (0.3%) | | | | | | | |
Sovereign Bonds (0.3%) | | | | | | | |
| Mongolia | 10.875% | 4/6/21 | | 1,300 | | 1,424 | |
| Mongolia | 5.125% | 12/5/22 | | 2,850 | | 2,888 | |
1 | Mongolia | 5.625% | 5/1/23 | | 200 | | 204 | |
| Mongolia | 8.750% | 3/9/24 | | 1,200 | | 1,357 | |
Total Mongolia (Cost $5,708) | | | | | | 5,873 | |
Morocco (0.3%) | | | | | | | |
Sovereign Bonds (0.3%) | | | | | | | |
| Kingdom of Morocco | 4.250% | 12/11/22 | | 3,200 | | 3,359 | |
| Kingdom of Morocco | 5.500% | 12/11/42 | | 925 | | 1,116 | |
| OCP SA | 6.875% | 4/25/44 | | 300 | | 374 | |
Total Morocco (Cost $4,511) | | | | | | 4,849 | |
Mozambique (0.0%) | | | | | | | |
Sovereign Bond (0.0%) | | | | | | | |
1,2 | Republic of Mozambique | 5.000% | 9/15/31 | | 797 | | 701 | |
Total Mozambique (Cost $701) | | | | | | 701 | |
Namibia (0.1%) | | | | | | | |
Sovereign Bonds (0.1%) | | | | | | | |
| Republic of Namibia | 5.500% | 11/3/21 | | 1,000 | | 1,034 | |
| Republic of Namibia | 5.250% | 10/29/25 | | 1,150 | | 1,172 | |
Total Namibia (Cost $2,174) | | | | | | 2,206 | |
Nigeria (1.1%) | | | | | | | |
Sovereign Bonds (1.1%) | | | | | | | |
| Federal Republic of Nigeria | 6.750% | 1/28/21 | | 750 | | 777 | |
| Federal Republic of Nigeria | 6.375% | 7/12/23 | | 1,200 | | 1,263 | |
1 | Federal Republic of Nigeria | 7.625% | 11/21/25 | | 800 | | 871 | |
| Federal Republic of Nigeria | 7.625% | 11/21/25 | | 1,150 | | 1,254 | |
| Federal Republic of Nigeria | 6.500% | 11/28/27 | | 2,700 | | 2,713 | |
1 | Federal Republic of Nigeria | 7.143% | 2/23/30 | | 1,000 | | 1,002 | |
1 | Federal Republic of Nigeria | 8.747% | 1/21/31 | | 1,600 | | 1,764 | |
| Federal Republic of Nigeria | 7.875% | 2/16/32 | | 2,100 | | 2,172 | |
1 | Federal Republic of Nigeria | 7.875% | 2/16/32 | | 1,500 | | 1,547 | |
1 | Federal Republic of Nigeria | 7.696% | 2/23/38 | | 2,175 | | 2,172 | |
18
Emerging Markets Government Bond Index Fund
| | Coupon | Maturity
Date | | Face
Amount
($000 | ) | Market
Value·
($000 | ) |
| Federal Republic of Nigeria | 7.625% | 11/28/47 | | 2,600 | | 2,541 | |
| Federal Republic of Nigeria | 9.248% | 1/21/49 | | 1,500 | | 1,665 | |
Total Nigeria (Cost $19,317) | | | | | | 19,741 | |
Oman (2.1%) | | | | | | | |
Sovereign Bonds (2.1%) | | | | | | | |
| Oman Sovereign Sukuk SAOC | 4.397% | 6/1/24 | | 3,600 | | 3,624 | |
1 | Oman Sovereign Sukuk SAOC | 5.932% | 10/31/25 | | 1,700 | | 1,818 | |
| Oman Sovereign Sukuk SAOC | 5.932% | 10/31/25 | | 1,500 | | 1,611 | |
| Sultanate of Oman | 3.625% | 6/15/21 | | 2,200 | | 2,203 | |
1 | Sultanate of Oman | 3.625% | 6/15/21 | | 1,300 | | 1,300 | |
| Sultanate of Oman | 3.875% | 3/8/22 | | 1,450 | | 1,453 | |
1 | Sultanate of Oman | 4.125% | 1/17/23 | | 1,250 | | 1,255 | |
| Sultanate of Oman | 4.125% | 1/17/23 | | 1,000 | | 1,005 | |
1 | Sultanate of Oman | 4.875% | 2/1/25 | | 1,200 | | 1,206 | |
| Sultanate of Oman | 4.750% | 6/15/26 | | 5,400 | | 5,266 | |
| Sultanate of Oman | 5.375% | 3/8/27 | | 3,425 | | 3,394 | |
1 | Sultanate of Oman | 5.625% | 1/17/28 | | 1,800 | | 1,779 | |
| Sultanate of Oman | 5.625% | 1/17/28 | | 2,250 | | 2,227 | |
1 | Sultanate of Oman | 6.000% | 8/1/29 | | 3,700 | | 3,694 | |
| Sultanate of Oman | 6.500% | 3/8/47 | | 3,215 | | 2,983 | |
1 | Sultanate of Oman | 6.750% | 1/17/48 | | 2,500 | | 2,344 | |
| Sultanate of Oman | 6.750% | 1/17/48 | | 2,800 | | 2,631 | |
Total Oman (Cost $39,516) | | | | | | 39,793 | |
Pakistan (0.5%) | | | | | | | |
Sovereign Bonds (0.5%) | | | | | | | |
1 | Islamic Republic of Pakistan | 8.250% | 4/15/24 | | 250 | | 272 | |
| Islamic Republic of Pakistan | 8.250% | 4/15/24 | | 1,750 | | 1,906 | |
| Islamic Republic of Pakistan | 8.250% | 9/30/25 | | 1,100 | | 1,203 | |
1 | Islamic Republic of Pakistan | 6.875% | 12/5/27 | | 1,350 | | 1,350 | |
| Islamic Republic of Pakistan | 6.875% | 12/5/27 | | 1,250 | | 1,253 | |
| Third Pakistan International Sukuk Co. Ltd. | 5.500% | 10/13/21 | | 1,700 | | 1,709 | |
| Third Pakistan International Sukuk Co. Ltd. | 5.625% | 12/5/22 | | 1,400 | | 1,405 | |
Total Pakistan (Cost $8,933) | | | | | | 9,098 | |
Panama (1.7%) | | | | | | | |
Sovereign Bonds (1.7%) | | | | | | | |
2 | Republic of Panama | 4.000% | 9/22/24 | | 2,300 | | 2,461 | |
2 | Republic of Panama | 3.750% | 3/16/25 | | 2,359 | | 2,492 | |
| Republic of Panama | 7.125% | 1/29/26 | | 1,825 | | 2,286 | |
| Republic of Panama | 8.875% | 9/30/27 | | 1,935 | | 2,769 | |
2 | Republic of Panama | 3.875% | 3/17/28 | | 2,233 | | 2,420 | |
| Republic of Panama | 9.375% | 4/1/29 | | 1,550 | | 2,366 | |
2 | Republic of Panama | 3.160% | 1/23/30 | | 2,100 | | 2,158 | |
2 | Republic of Panama | 6.700% | 1/26/36 | | 3,645 | | 5,126 | |
2 | Republic of Panama | 4.500% | 5/15/47 | | 2,200 | | 2,579 | |
2 | Republic of Panama | 4.500% | 4/16/50 | | 3,100 | | 3,631 | |
2 | Republic of Panama | 4.300% | 4/29/53 | | 1,350 | | 1,556 | |
2 | Republic of Panama | 3.870% | 7/23/60 | | 1,300 | | 1,376 | |
Total Panama (Cost $28,653) | | | | | | 31,220 | |
19
Emerging Markets Government Bond Index Fund
| | Coupon | Maturity
Date | | Face
Amount
($000 | ) | Market
Value·
($000 | ) |
Papua New Guinea (0.0%) | | | | | | | |
Sovereign Bonds (0.0%) | | | | | | | |
1 | Papua New Guinea Government International Bond | 8.375% | 10/4/28 | | 500 | | 530 | |
| Papua New Guinea Government International Bond | 8.375% | 10/4/28 | | 300 | | 321 | |
Total Papua New Guinea (Cost $811) | | | | | | 851 | |
Paraguay (0.5%) | | | | | | | |
Sovereign Bonds (0.5%) | | | | | | | |
| Republic of Paraguay | 4.625% | 1/25/23 | | 1,672 | | 1,765 | |
| Republic of Paraguay | 5.000% | 4/15/26 | | 1,180 | | 1,303 | |
| Republic of Paraguay | 4.700% | 3/27/27 | | 700 | | 767 | |
| Republic of Paraguay | 6.100% | 8/11/44 | | 2,000 | | 2,426 | |
| Republic of Paraguay | 5.600% | 3/13/48 | | 1,000 | | 1,159 | |
1,2 | Republic of Paraguay | 5.400% | 3/30/50 | | 900 | | 1,026 | |
Total Paraguay (Cost $7,863) | | | | | | 8,446 | |
Peru (1.3%) | | | | | | | |
Sovereign Bonds (1.3%) | | | | | | | |
| Republic of Peru | 7.350% | 7/21/25 | | 3,159 | | 3,995 | |
| Republic of Peru | 4.125% | 8/25/27 | | 2,447 | | 2,731 | |
| Republic of Peru | 2.844% | 6/20/30 | | 1,400 | | 1,446 | |
| Republic of Peru | 8.750% | 11/21/33 | | 2,786 | | 4,580 | |
2 | Republic of Peru | 6.550% | 3/14/37 | | 2,821 | | 4,106 | |
| Republic of Peru | 5.625% | 11/18/50 | | 4,557 | | 6,624 | |
Total Peru (Cost $21,113) | | | | | | 23,482 | |
Philippines (2.8%) | | | | | | | |
Sovereign Bonds (2.8%) | | | | | | | |
| Republic of the Philippines | 4.000% | 1/15/21 | | 2,585 | | 2,640 | |
| Republic of the Philippines | 4.200% | 1/21/24 | | 2,514 | | 2,717 | |
2 | Republic of the Philippines | 7.500% | 9/25/24 | | 1,150 | | 1,384 | |
| Republic of the Philippines | 10.625% | 3/16/25 | | 2,484 | | 3,562 | |
| Republic of the Philippines | 5.500% | 3/30/26 | | 2,500 | | 2,997 | |
| Republic of the Philippines | 3.000% | 2/1/28 | | 3,600 | | 3,796 | |
| Republic of the Philippines | 3.750% | 1/14/29 | | 3,350 | | 3,721 | |
| Republic of the Philippines | 9.500% | 2/2/30 | | 2,973 | | 4,787 | |
| Republic of the Philippines | 7.750% | 1/14/31 | | 3,004 | | 4,450 | |
| Republic of the Philippines | 6.375% | 1/15/32 | | 1,850 | | 2,518 | |
| Republic of the Philippines | 6.375% | 10/23/34 | | 3,495 | | 4,950 | |
| Republic of the Philippines | 5.000% | 1/13/37 | | 2,480 | | 3,174 | |
| Republic of the Philippines | 3.950% | 1/20/40 | | 3,650 | | 4,177 | |
| Republic of the Philippines | 3.700% | 3/1/41 | | 3,450 | | 3,881 | |
| Republic of the Philippines | 3.700% | 2/2/42 | | 3,390 | | 3,806 | |
Total Philippines (Cost $48,881) | | | | | | 52,560 | |
Poland (1.1%) | | | | | | | |
Sovereign Bonds (1.1%) | | | | | | | |
| Republic of Poland | 5.125% | 4/21/21 | | 2,700 | | 2,818 | |
| Republic of Poland | 5.000% | 3/23/22 | | 5,409 | | 5,786 | |
| Republic of Poland | 3.000% | 3/17/23 | | 3,853 | | 3,974 | |
| Republic of Poland | 4.000% | 1/22/24 | | 3,478 | | 3,761 | |
| Republic of Poland | 3.250% | 4/6/26 | | 3,060 | | 3,261 | |
Total Poland (Cost $19,048) | | | | | | 19,600 | |
20
Emerging Markets Government Bond Index Fund
| | Coupon | Maturity
Date | | Face
Amount
($000 | ) | Market
Value·
($000 | ) |
Qatar (4.6%) | | | | | | | |
Sovereign Bonds (4.6%) | | | | | | | |
5 | QNB Finance Ltd., 3M USD LIBOR + 1.350% | 3.474% | 5/31/21 | | 2,300 | | 2,313 | |
| SoQ Sukuk A QSC | 3.241% | 1/18/23 | | 935 | | 969 | |
| State of Qatar | 2.375% | 6/2/21 | | 7,250 | | 7,272 | |
1 | State of Qatar | 4.500% | 1/20/22 | | 2,750 | | 2,888 | |
1 | State of Qatar | 3.875% | 4/23/23 | | 1,200 | | 1,267 | |
| State of Qatar | 3.875% | 4/23/23 | | 7,475 | | 7,893 | |
| State of Qatar | 3.375% | 3/14/24 | | 3,800 | | 3,974 | |
| State of Qatar | 3.250% | 6/2/26 | | 6,400 | | 6,720 | |
1 | State of Qatar | 4.500% | 4/23/28 | | 5,100 | | 5,832 | |
| State of Qatar | 4.000% | 3/14/29 | | 6,550 | | 7,275 | |
1 | State of Qatar | 9.750% | 6/15/30 | | 1,050 | | 1,723 | |
| State of Qatar | 9.750% | 6/15/30 | | 825 | | 1,358 | |
1 | State of Qatar | 6.400% | 1/20/40 | | 700 | | 1,018 | |
| State of Qatar | 6.400% | 1/20/40 | | 678 | | 991 | |
1 | State of Qatar | 5.750% | 1/20/42 | | 516 | | 709 | |
| State of Qatar | 5.750% | 1/20/42 | | 1,650 | | 2,280 | |
| State of Qatar | 4.625% | 6/2/46 | | 3,350 | | 4,079 | |
| State of Qatar | 5.103% | 4/23/48 | | 11,400 | | 14,542 | |
1 | State of Qatar | 4.817% | 3/14/49 | | 900 | | 1,104 | |
| State of Qatar | 4.817% | 3/14/49 | | 9,905 | | 12,158 | |
Total Qatar (Cost $79,245) | | | | | | 86,365 | |
Romania (0.7%) | | | | | | | |
Sovereign Bonds (0.7%) | | | | | | | |
| Republic of Romania | 6.750% | 2/7/22 | | 3,582 | | 3,935 | |
| Republic of Romania | 4.375% | 8/22/23 | | 2,424 | | 2,592 | |
1 | Republic of Romania | 4.875% | 1/22/24 | | 100 | | 110 | |
| Republic of Romania | 4.875% | 1/22/24 | | 1,930 | | 2,118 | |
1 | Republic of Romania | 6.125% | 1/22/44 | | 200 | | 259 | |
| Republic of Romania | 6.125% | 1/22/44 | | 1,470 | | 1,905 | |
1 | Republic of Romania | 5.125% | 6/15/48 | | 500 | | 574 | |
| Republic of Romania | 5.125% | 6/15/48 | | 1,700 | | 1,963 | |
Total Romania (Cost $12,657) | | | | | | 13,456 | |
Russia (4.8%) | | | | | | | |
Sovereign Bonds (4.8%) | | | | | | | |
| Gazprom Neft OAO Via GPN Capital SA | 4.375% | 9/19/22 | | 3,200 | | 3,321 | |
1 | Gazprom Neft OAO Via GPN Capital SA | 6.000% | 11/27/23 | | 200 | | 222 | |
| Gazprom Neft OAO Via GPN Capital SA | 6.000% | 11/27/23 | | 1,550 | | 1,721 | |
| Rosneft Oil Co. Via Rosneft International Finance DAC | 4.199% | 3/6/22 | | 3,327 | | 3,416 | |
| Russian Federation | 4.500% | 4/4/22 | | 4,400 | | 4,633 | |
1 | Russian Federation | 4.875% | 9/16/23 | | 450 | | 493 | |
| Russian Federation | 4.875% | 9/16/23 | | 6,000 | | 6,570 | |
| Russian Federation | 4.750% | 5/27/26 | | 5,000 | | 5,503 | |
| Russian Federation | 4.250% | 6/23/27 | | 5,400 | | 5,794 | |
| Russian Federation | 12.750% | 6/24/28 | | 4,785 | | 8,157 | |
| Russian Federation | 4.375% | 3/21/29 | | 5,000 | | 5,419 | |
2 | Russian Federation | 7.500% | 3/31/30 | | 3,656 | | 4,176 | |
| Russian Federation | 5.100% | 3/28/35 | | 7,000 | | 8,086 | |
| Russian Federation | 5.625% | 4/4/42 | | 5,600 | | 6,928 | |
| Russian Federation | 5.875% | 9/16/43 | | 2,600 | | 3,322 | |
1 | Russian Federation | 5.250% | 6/23/47 | | 4,800 | | 5,747 | |
21
Emerging Markets Government Bond Index Fund
| | Coupon | Maturity
Date | | Face
Amount
($000 | ) | Market
Value·
($000 | ) |
| Russian Federation | 5.250% | 6/23/47 | | 7,600 | | 9,100 | |
| Sberbank of Russia Via SB Capital SA | 5.717% | 6/16/21 | | 1,025 | | 1,075 | |
| Sberbank of Russia Via SB Capital SA | 6.125% | 2/7/22 | | 1,900 | | 2,043 | |
| Sberbank of Russia Via SB Capital SA | 5.125% | 10/29/22 | | 3,024 | | 3,182 | |
Total Russia (Cost $81,478) | | | | | | 88,908 | |
Saudi Arabia (7.7%) | | | | | | | |
Sovereign Bonds (7.7%) | | | | | | | |
1 | Kingdom of Saudi Arabia | 2.375% | 10/26/21 | | 3,500 | | 3,504 | |
| Kingdom of Saudi Arabia | 2.375% | 10/26/21 | | 6,192 | | 6,207 | |
1 | Kingdom of Saudi Arabia | 2.875% | 3/4/23 | | 2,400 | | 2,448 | |
| Kingdom of Saudi Arabia | 2.875% | 3/4/23 | | 2,610 | | 2,666 | |
1 | Kingdom of Saudi Arabia | 4.000% | 4/17/25 | | 4,375 | | 4,698 | |
| Kingdom of Saudi Arabia | 4.000% | 4/17/25 | | 3,400 | | 3,656 | |
| Kingdom of Saudi Arabia | 3.250% | 10/26/26 | | 4,300 | | 4,450 | |
1 | Kingdom of Saudi Arabia | 3.250% | 10/26/26 | | 5,795 | | 5,983 | |
1 | Kingdom of Saudi Arabia | 3.625% | 3/4/28 | | 3,000 | | 3,154 | |
| Kingdom of Saudi Arabia | 3.625% | 3/4/28 | | 5,100 | | 5,372 | |
1 | Kingdom of Saudi Arabia | 4.375% | 4/16/29 | | 5,650 | | 6,314 | |
| Kingdom of Saudi Arabia | 4.375% | 4/16/29 | | 1,400 | | 1,568 | |
1 | Kingdom of Saudi Arabia | 4.500% | 4/17/30 | | 2,950 | | 3,341 | |
| Kingdom of Saudi Arabia | 4.500% | 4/17/30 | | 2,400 | | 2,721 | |
| Kingdom of Saudi Arabia | 4.500% | 10/26/46 | | 11,085 | | 12,206 | |
1 | Kingdom of Saudi Arabia | 4.625% | 10/4/47 | | 2,100 | | 2,352 | |
| Kingdom of Saudi Arabia | 4.625% | 10/4/47 | | 6,930 | | 7,780 | |
1 | Kingdom of Saudi Arabia | 5.000% | 4/17/49 | | 2,500 | | 2,962 | |
| Kingdom of Saudi Arabia | 5.000% | 4/17/49 | | 4,300 | | 5,107 | |
1 | Kingdom of Saudi Arabia | 5.250% | 1/16/50 | | 3,700 | | 4,560 | |
| Kingdom of Saudi Arabia | 5.250% | 1/16/50 | | 2,350 | | 2,902 | |
1 | KSA Sukuk Ltd. | 2.894% | 4/20/22 | | 3,300 | | 3,351 | |
| KSA Sukuk Ltd. | 2.894% | 4/20/22 | | 5,450 | | 5,536 | |
6 | KSA Sukuk Ltd. | 3.628% | 4/20/27 | | 7,900 | | 8,297 | |
1 | KSA Sukuk Ltd. | 4.303% | 1/19/29 | | 1,900 | | 2,106 | |
| KSA Sukuk Ltd. | 4.303% | 1/19/29 | | 1,200 | | 1,331 | |
1 | KSA Sukuk Ltd. | 2.969% | 10/29/29 | | 5,175 | | 5,165 | |
1 | Saudi Arabian Oil Co. | 2.875% | 4/16/24 | | 3,200 | | 3,249 | |
| Saudi Arabian Oil Co. | 2.875% | 4/16/24 | | 600 | | 608 | |
1 | Saudi Arabian Oil Co. | 3.500% | 4/16/29 | | 5,400 | | 5,580 | |
1 | Saudi Arabian Oil Co. | 4.250% | 4/16/39 | | 5,300 | | 5,702 | |
1 | Saudi Arabian Oil Co. | 4.375% | 4/16/49 | | 4,800 | | 5,175 | |
1 | Saudi Electricity Global Sukuk Co. 3 | 4.000% | 4/8/24 | | 650 | | 671 | |
| Saudi Electricity Global Sukuk Co. 3 | 4.000% | 4/8/24 | | 2,150 | | 2,265 | |
| Saudi Electricity Global Sukuk Co. 4 | 4.222% | 1/27/24 | | 400 | | 423 | |
Total Saudi Arabia (Cost $134,384) | | | | | | 143,410 | |
Senegal (0.3%) | | | | | | | |
Sovereign Bonds (0.3%) | | | | | | | |
| Republic of Senegal | 6.250% | 7/30/24 | | 800 | | 874 | |
2 | Republic of Senegal | 6.250% | 5/23/33 | | 1,900 | | 1,944 | |
1,2 | Republic of Senegal | 6.750% | 3/13/48 | | 800 | | 786 | |
2 | Republic of Senegal | 6.750% | 3/13/48 | | 1,200 | | 1,180 | |
Total Senegal (Cost $4,610) | | | | | | 4,784 | |
22
Emerging Markets Government Bond Index Fund
| | Coupon | Maturity
Date | | Face
Amount
($000 | ) | Market
Value·
($000 | ) |
Serbia (0.2%) | | | | | | | |
Sovereign Bond (0.2%) | | | | | | | |
| Republic of Serbia | 7.250% | 9/28/21 | | 2,963 | | 3,234 | |
Total Serbia (Cost $3,127) | | | | | | 3,234 | |
South Africa (2.1%) | | | | | | | |
Sovereign Bonds (2.1%) | | | | | | | |
| Eskom Holdings SOC Ltd. | 5.750% | 1/26/21 | | 2,950 | | 2,971 | |
| Republic of South Africa | 5.875% | 5/30/22 | | 1,471 | | 1,583 | |
| Republic of South Africa | 4.665% | 1/17/24 | | 2,700 | | 2,815 | |
| Republic of South Africa | 5.875% | 9/16/25 | | 3,950 | | 4,305 | |
| Republic of South Africa | 4.875% | 4/14/26 | | 2,350 | | 2,418 | |
| Republic of South Africa | 4.850% | 9/27/27 | | 1,800 | | 1,826 | |
| Republic of South Africa | 4.300% | 10/12/28 | | 3,550 | | 3,426 | |
| Republic of South Africa | 4.850% | 9/30/29 | | 3,400 | | 3,366 | |
| Republic of South Africa | 5.875% | 6/22/30 | | 2,550 | | 2,708 | |
| Republic of South Africa | 6.250% | 3/8/41 | | 1,451 | | 1,561 | |
| Republic of South Africa | 5.375% | 7/24/44 | | 1,800 | | 1,726 | |
| Republic of South Africa | 5.000% | 10/12/46 | | 1,400 | | 1,281 | |
| Republic of South Africa | 5.650% | 9/27/47 | | 2,900 | | 2,924 | |
| Republic of South Africa | 6.300% | 6/22/48 | | 1,250 | | 1,323 | |
| Republic of South Africa | 5.750% | 9/30/49 | | 5,100 | | 4,934 | |
Total South Africa (Cost $38,773) | | | | | | 39,167 | |
Sri Lanka (1.4%) | | | | | | | |
Sovereign Bonds (1.4%) | | | | | | | |
| Democratic Socialist Republic of Sri Lanka | 6.250% | 7/27/21 | | 1,900 | | 1,938 | |
| Democratic Socialist Republic of Sri Lanka | 5.750% | 1/18/22 | | 950 | | 960 | |
| Democratic Socialist Republic of Sri Lanka | 5.875% | 7/25/22 | | 1,500 | | 1,516 | |
1 | Democratic Socialist Republic of Sri Lanka | 5.750% | 4/18/23 | | 1,400 | | 1,403 | |
| Democratic Socialist Republic of Sri Lanka | 5.750% | 4/18/23 | | 850 | | 854 | |
| Democratic Socialist Republic of Sri Lanka | 6.850% | 3/14/24 | | 2,000 | | 2,065 | |
| Democratic Socialist Republic of Sri Lanka | 6.350% | 6/28/24 | | 500 | | 507 | |
| Democratic Socialist Republic of Sri Lanka | 6.125% | 6/3/25 | | 1,400 | | 1,381 | |
| Democratic Socialist Republic of Sri Lanka | 6.850% | 11/3/25 | | 2,650 | | 2,690 | |
| Democratic Socialist Republic of Sri Lanka | 6.825% | 7/18/26 | | 1,800 | | 1,812 | |
| Democratic Socialist Republic of Sri Lanka | 6.200% | 5/11/27 | | 2,650 | | 2,548 | |
| Democratic Socialist Republic of Sri Lanka | 6.750% | 4/18/28 | | 2,250 | | 2,199 | |
| Democratic Socialist Republic of Sri Lanka | 7.850% | 3/14/29 | | 2,550 | | 2,629 | |
| Democratic Socialist Republic of Sri Lanka | 7.550% | 3/28/30 | | 2,650 | | 2,666 | |
Total Sri Lanka (Cost $24,997) | | | | | | 25,168 | |
Suriname (0.0%) | | | | | | | |
Sovereign Bond (0.0%) | | | | | | | |
2 | Republic of Suriname | 9.250% | 10/26/26 | | 900 | | 769 | |
Total Suriname (Cost $891) | | | | | | 769 | |
Tajikistan (0.0%) | | | | | | | |
Sovereign Bond (0.0%) | | | | | | | |
2 | Republic of Tajikistan | 7.125% | 9/14/27 | | 775 | | 659 | |
Total Tajikistan (Cost $716) | | | | | | 659 | |
23
Emerging Markets Government Bond Index Fund
| | Coupon | Maturity
Date | | Face
Amount
($000 | ) | Market
Value·
($000 | ) |
Trinidad And Tobago (0.2%) | | | | | | | |
Sovereign Bonds (0.2%) | | | | | | | |
1 | Republic of Trinidad & Tobago | 4.375% | 1/16/24 | | 400 | | 416 | |
| Republic of Trinidad & Tobago | 4.500% | 8/4/26 | | 2,300 | | 2,393 | |
Total Trinidad And Tobago (Cost $2,682) | | | | | | 2,809 | |
Tunisia (0.1%) | | | | | | | |
Sovereign Bond (0.1%) | | | | | | | |
| Banque Centrale de Tunisie SA | 5.750% | 1/30/25 | | 1,450 | | 1,328 | |
Total Tunisia (Cost $1,348) | | | | | | 1,328 | |
Turkey (5.5%) | | | | | | | |
Sovereign Bonds (5.5%) | | | | | | | |
| Hazine Mustesarligi Varlik Kiralama AS | 4.251% | 6/8/21 | | 2,550 | | 2,546 | |
| Hazine Mustesarligi Varlik Kiralama AS | 5.800% | 2/21/22 | | 3,200 | | 3,261 | |
| Hazine Mustesarligi Varlik Kiralama AS | 5.004% | 4/6/23 | | 1,975 | | 1,962 | |
1 | Hazine Mustesarligi Varlik Kiralama AS | 4.489% | 11/25/24 | | 800 | | 770 | |
7 | Hazine Mustesarligi Varlik Kiralama AS | 4.489% | 11/25/24 | | 1,000 | | 963 | |
| Republic of Turkey | 5.625% | 3/30/21 | | 3,201 | | 3,269 | |
| Republic of Turkey | 5.125% | 3/25/22 | | 1,625 | | 1,641 | |
| Republic of Turkey | 6.250% | 9/26/22 | | 4,511 | | 4,663 | |
| Republic of Turkey | 3.250% | 3/23/23 | | 3,076 | | 2,915 | |
| Republic of Turkey | 7.250% | 12/23/23 | | 3,400 | | 3,621 | |
| Republic of Turkey | 5.750% | 3/22/24 | | 4,513 | | 4,547 | |
| Republic of Turkey | 6.350% | 8/10/24 | | 3,900 | | 4,017 | |
| Republic of Turkey | 7.375% | 2/5/25 | | 5,700 | | 6,113 | |
| Republic of Turkey | 4.250% | 4/14/26 | | 3,150 | | 2,870 | |
| Republic of Turkey | 4.875% | 10/9/26 | | 5,100 | | 4,775 | |
| Republic of Turkey | 6.000% | 3/25/27 | | 6,012 | | 5,944 | |
| Republic of Turkey | 5.125% | 2/17/28 | | 3,400 | | 3,170 | |
| Republic of Turkey | 6.125% | 10/24/28 | | 3,600 | | 3,542 | |
| Republic of Turkey | 7.625% | 4/26/29 | | 5,650 | | 6,053 | |
| Republic of Turkey | 11.875% | 1/15/30 | | 2,409 | | 3,321 | |
| Republic of Turkey | 8.000% | 2/14/34 | | 3,090 | | 3,399 | |
| Republic of Turkey | 6.875% | 3/17/36 | | 4,948 | | 4,892 | |
| Republic of Turkey | 7.250% | 3/5/38 | | 1,150 | | 1,182 | |
| Republic of Turkey | 6.750% | 5/30/40 | | 3,460 | | 3,356 | |
| Republic of Turkey | 6.000% | 1/14/41 | | 5,057 | | 4,538 | |
| Republic of Turkey | 4.875% | 4/16/43 | | 5,519 | | 4,408 | |
| Republic of Turkey | 6.625% | 2/17/45 | | 5,550 | | 5,251 | |
| Republic of Turkey | 5.750% | 5/11/47 | | 6,750 | | 5,788 | |
Total Turkey (Cost $102,399) | | | | | | 102,777 | |
Ukraine (1.6%) | | | | | | | |
Sovereign Bonds (1.6%) | | | | | | | |
1 | Ukraine | 7.750% | 9/1/21 | | 907 | | 949 | |
| Ukraine | 7.750% | 9/1/21 | | 2,190 | | 2,293 | |
| Ukraine | 7.750% | 9/1/22 | | 2,750 | | 2,931 | |
| Ukraine | 7.750% | 9/1/23 | | 1,300 | | 1,392 | |
1 | Ukraine | 8.994% | 2/1/24 | | 700 | | 779 | |
| Ukraine | 8.994% | 2/1/24 | | 1,450 | | 1,614 | |
| Ukraine | 7.750% | 9/1/24 | | 2,310 | | 2,481 | |
| Ukraine | 7.750% | 9/1/25 | | 2,450 | | 2,634 | |
| Ukraine | 7.750% | 9/1/26 | | 2,750 | | 2,957 | |
| Ukraine | 7.750% | 9/1/27 | | 2,200 | | 2,370 | |
24
Emerging Markets Government Bond Index Fund
| | Coupon | Maturity
Date | | Face
Amount
($000 | ) | Market
Value·
($000 | ) |
1 | Ukraine | 9.750% | 11/1/28 | | 1,200 | | 1,430 | |
| Ukraine | 9.750% | 11/1/28 | | 1,750 | | 2,082 | |
1,2 | Ukraine | 7.375% | 9/25/32 | | 2,700 | | 2,825 | |
2 | Ukraine | 7.375% | 9/25/32 | | 2,450 | | 2,566 | |
Total Ukraine (Cost $26,512) | | | | | | 29,303 | |
United Arab Emirates (3.9%) | | | | | | | |
Sovereign Bonds (3.9%) | | | | | | | |
1,2 | Abu Dhabi Crude Oil Pipeline LLC | 4.600% | 11/2/47 | | 2,750 | | 3,171 | |
2 | Abu Dhabi Crude Oil Pipeline LLC | 4.600% | 11/2/47 | | 1,325 | | 1,531 | |
1 | DP World plc | 6.850% | 7/2/37 | | 2,940 | | 3,869 | |
| Dubai DOF Sukuk Ltd. | 6.450% | 5/2/22 | | 1,000 | | 1,090 | |
| Emirate of Abu Dhabi | 2.125% | 5/3/21 | | 4,265 | | 4,270 | |
1 | Emirate of Abu Dhabi | 2.500% | 10/11/22 | | 700 | | 707 | |
| Emirate of Abu Dhabi | 2.500% | 10/11/22 | | 4,600 | | 4,650 | |
1 | Emirate of Abu Dhabi | 2.125% | 9/30/24 | | 5,100 | | 5,073 | |
1 | Emirate of Abu Dhabi | 3.125% | 5/3/26 | | 450 | | 469 | |
| Emirate of Abu Dhabi | 3.125% | 5/3/26 | | 3,707 | | 3,864 | |
1 | Emirate of Abu Dhabi | 3.125% | 10/11/27 | | 4,250 | | 4,427 | |
| Emirate of Abu Dhabi | 3.125% | 10/11/27 | | 4,450 | | 4,649 | |
1 | Emirate of Abu Dhabi | 2.500% | 9/30/29 | | 5,100 | | 5,064 | |
1 | Emirate of Abu Dhabi | 4.125% | 10/11/47 | | 2,000 | | 2,290 | |
| Emirate of Abu Dhabi | 4.125% | 10/11/47 | | 3,150 | | 3,632 | |
1 | Emirate of Abu Dhabi | 3.125% | 9/30/49 | | 7,100 | | 6,808 | |
| Emirate of Dubai | 3.875% | 1/30/23 | | 1,100 | | 1,141 | |
| Emirate of Dubai | 5.250% | 1/30/43 | | 1,000 | | 1,145 | |
1 | MDC - GMTN BV | 5.000% | 11/15/20 | | 1,750 | | 1,796 | |
1 | MDC - GMTN BV | 5.500% | 3/1/22 | | 2,510 | | 2,687 | |
| MDGH - GMTN BV | 5.000% | 11/15/20 | | 500 | | 514 | |
1 | MDGH - GMTN BV | 3.700% | 11/7/49 | | 2,650 | | 2,731 | |
| RAK Capital | 3.094% | 3/31/25 | | 1,850 | | 1,867 | |
| Sharjah Sukuk 2 Ltd. | 3.839% | 1/27/21 | | 700 | | 710 | |
| Sharjah Sukuk Ltd. | 3.764% | 9/17/24 | | 600 | | 630 | |
| Sharjah Sukuk Program Ltd. | 3.854% | 4/3/26 | | 1,600 | | 1,683 | |
| Sharjah Sukuk Program Ltd. | 4.226% | 3/14/28 | | 2,500 | | 2,708 | |
Total United Arab Emirates (Cost $70,650) | | | | | | 73,176 | |
United States (0.1%) | | | | | | | |
U.S. Government and Agency Obligations (0.1%) | | | | | | | |
| United States Treasury Note/Bond | 1.500% | 10/31/21 | | 2,654 | | 2,653 | |
| United States Treasury Note/Bond | 2.875% | 5/15/49 | | 30 | | 34 | |
Total United States (Cost $2,681) | | | | | | 2,687 | |
Uruguay (1.5%) | | | | | | | |
Sovereign Bonds (1.5%) | | | | | | | |
2 | Oriental Republic of Uruguay | 4.500% | 8/14/24 | | 2,189 | | 2,357 | |
2 | Oriental Republic of Uruguay | 4.375% | 10/27/27 | | 2,705 | | 2,976 | |
2 | Oriental Republic of Uruguay | 4.375% | 1/23/31 | | 2,763 | | 3,063 | |
| Oriental Republic of Uruguay | 7.875% | 1/15/33 | | 1,296 | | 1,929 | |
2 | Oriental Republic of Uruguay | 7.625% | 3/21/36 | | 1,765 | | 2,610 | |
2 | Oriental Republic of Uruguay | 4.125% | 11/20/45 | | 1,305 | | 1,395 | |
2 | Oriental Republic of Uruguay | 5.100% | 6/18/50 | | 7,000 | | 8,376 | |
2 | Oriental Republic of Uruguay | 4.975% | 4/20/55 | | 4,650 | | 5,441 | |
Total Uruguay (Cost $25,048) | | | | | | 28,147 | |
25
Emerging Markets Government Bond Index Fund
| | Coupon | Maturity
Date | | Face
Amount
($000 | ) | Market
Value·
($000 | ) |
Uzbekistan (0.1%) | | | | | | | |
Sovereign Bonds (0.1%) | | | | | | | |
| Republic of Uzbekistan | 4.750% | 2/20/24 | | 800 | | 841 | |
| Republic of Uzbekistan | 5.375% | 2/20/29 | | 975 | | 1,069 | |
Total Uzbekistan (Cost $1,792) | | | | | | 1,910 | |
Venezuela (0.1%) | | | | | | | |
Sovereign Bonds (0.1%) | | | | | | | |
8 | Bolivarian Republic of Venezuela | 6.000% | 12/9/20 | | 2,356 | | 241 | |
2,8 | Bolivarian Republic of Venezuela | 12.750% | 8/23/22 | | 3,355 | | 344 | |
8 | Bolivarian Republic of Venezuela | 9.000% | 5/7/23 | | 1,532 | | 157 | |
8 | Bolivarian Republic of Venezuela | 8.250% | 10/13/24 | | 2,829 | | 290 | |
8 | Bolivarian Republic of Venezuela | 7.650% | 4/21/25 | | 2,392 | | 245 | |
8 | Bolivarian Republic of Venezuela | 11.750% | 10/21/26 | | 2,227 | | 228 | |
8 | Bolivarian Republic of Venezuela | 9.250% | 9/15/27 | | 3,226 | | 339 | |
8 | Bolivarian Republic of Venezuela | 9.250% | 5/7/28 | | 940 | | 96 | |
2,8 | Bolivarian Republic of Venezuela | 11.950% | 8/5/31 | | 4,429 | | 454 | |
8 | Bolivarian Republic of Venezuela | 9.375% | 1/13/34 | | 1,900 | | 200 | |
8 | Bolivarian Republic of Venezuela | 7.000% | 3/31/38 | | 1,375 | | 141 | |
Total Venezuela (Cost $13,422) | | | | | | 2,735 | |
Vietnam (0.1%) | | | | | | | |
Sovereign Bond (0.1%) | | | | | | | |
| Socialist Republic of Vietnam | 4.800% | 11/19/24 | | 1,600 | | 1,749 | |
Total Vietnam (Cost $1,631) | | | | | | 1,749 | |
Zambia (0.2%) | | | | | | | |
Sovereign Bonds (0.2%) | | | | | | | |
| Republic of Zambia | 5.375% | 9/20/22 | | 1,350 | | 934 | |
| Republic of Zambia | 8.500% | 4/14/24 | | 1,800 | | 1,268 | |
| Republic of Zambia | 8.970% | 7/30/27 | | 2,125 | | 1,498 | |
Total Zambia (Cost $4,481) | | | | | | 3,700 | |
| | | | | | | | |
| | | | | Shares | | | |
Temporary Cash Investments (0.4%) | | | | | | | |
Money Market Fund (0.4%) | | | | | | | |
9 | Vanguard Market Liquidity Fund | 1.984% | | | 74,021 | | 7,403 | |
Total Temporary Cash Investments (Cost $7,403) | | | | | | 7,403 | |
Total Investments (98.9%) (Cost $1,797,539) | | | | | | 1,841,696 | |
26
Emerging Markets Government Bond Index Fund
| | Amount | |
| | ($000 | ) |
Other Assets and Liabilities (1.1%) | | | |
Other Assets | | | |
Investment in Vanguard | | 84 | |
Receivables for Investment Securities Sold | | 11,352 | |
Receivables for Accrued Income | | 21,267 | |
Receivables for Capital Shares Issued | | 610 | |
Variation Margin Receivable—Futures Contracts | | 151 | |
Other Assets10 | | 191 | |
Total Other Assets | | 33,655 | |
Liabilities | | | |
Payables for Investment Securities Purchased | | (12,745 | ) |
Payables for Capital Shares Redeemed | | (543 | ) |
Payables for Distributions | | (197 | ) |
Payables to Vanguard | | (336 | ) |
Variation Margin Payable—Futures Contracts | | (132 | ) |
Total Liabilities | | (13,953 | ) |
Net Assets (100%) | | 1,861,398 | |
27
Emerging Markets Government Bond Index Fund
At October 31, 2019, net assets consisted of:
| | Amount | |
| | ($000 | ) |
Paid-in Capital | | 1,814,940 | |
Total Distributable Earnings (Loss) | | 46,458 | |
Net Assets | | 1,861,398 | |
| | | |
ETF Shares—Net Assets | | | |
Applicable to 19,134,821 outstanding $.001 par value shares of beneficial interest (unlimited authorization) | | 1,538,097 | |
Net Asset Value Per Share—ETF Shares | | $80.38 | |
| | | |
Admiral Shares—Net Assets | | | |
Applicable to 13,530,667 outstanding $.001 par value shares of beneficial interest (unlimited authorization) | | 272,761 | |
Net Asset Value Per Share—Admiral Shares | | $20.16 | |
| | | |
Institutional Shares—Net Assets | | | |
Applicable to 1,563,059 outstanding $.001 par value shares of beneficial interest (unlimited authorization) | | 50,540 | |
Net Asset Value Per Share—Institutional Shares | | $32.33 | |
· See Note A in Notes to Financial Statements.
1 Security exempt from registration under Rule 144A of the Securities Act of 1933. Such securities may be sold in transactions exempt from registration, normally to qualified institutional buyers. At October 31, 2019, the aggregate value of these securities was $265,307,000, representing 14.3% of net assets.
2 The average or expected maturity is shorter than the final maturity shown because of the possibility of interim principal payments and prepayments or the possibility of the issue being called.
3 Guaranteed by the Republic of Azerbaijan.
4 Guaranteed by the Republic of Indonesia.
5 Adjustable-rate security; rate shown is effective rate at period end. Certain adjustable-rate securities are not based on a published reference rate and spread but are determined by the issuer or agent based on current market conditions.
6 Guaranteed by the Kingdom of Saudi Arabia.
7 Guaranteed by the Republic of Turkey.
8 Non-income-producing security—security in default.
9 Affiliated money market fund available only to Vanguard funds and certain trusts and accounts managed by Vanguard. Rate shown is the 7-day yield.
10 Cash of $85,000 has been segregated as initial margin for open futures contracts.
LIBOR—London Interbank Offered Rate.
28
Emerging Markets Government Bond Index Fund
Derivative Financial Instruments Outstanding as of Period End
| | | | | | | | ($000 | ) |
| | | | | | | | Value and | |
| | | | Number of | | | | Unrealized | |
| | | | Long (Short | ) | Notional | | Appreciation | |
| | Expiration | | Contracts | | Amount | | (Depreciation | ) |
Long Futures Contracts | | | | | | | | | |
30-Year U.S. Treasury Bond | | December 2019 | | 23 | | 3,712 | | (14 | ) |
Ultra 10-Year U.S. Treasury Note | | December 2019 | | 19 | | 2,700 | | (1 | ) |
5-Year U.S. Treasury Note | | December 2019 | | 10 | | 1,192 | | — | |
| | | | | | | | (15 | ) |
| | | | | | | | | |
Short Futures Contracts | | | | | | | | | |
Ultra Long U.S. Treasury Bond | | December 2019 | | (7 | ) | (1,328 | ) | (1 | ) |
10-Year U.S. Treasury Note | | December 2019 | | (40 | ) | (5,212 | ) | 71 | |
| | | | | | | | 70 | |
| | | | | | | | 55 | |
See accompanying Notes, which are an integral part of the Financial Statements.
29
Emerging Markets Government Bond Index Fund
Statement of Operations
| | Year Ended | |
| | October 31, 2019 | |
| | ($000 | ) |
Investment Income | | | |
Income | | | |
Interest1 | | 78,641 | |
Total Income | | 78,641 | |
Expenses | | | |
The Vanguard Group—Note B | | | |
Investment Advisory Services | | 55 | |
Management and Administrative—Investor Shares | | 13 | |
Management and Administrative—ETF Shares | | 2,897 | |
Management and Administrative—Admiral Shares | | 607 | |
Management and Administrative—Institutional Shares | | 69 | |
Marketing and Distribution—Investor Shares | | 1 | |
Marketing and Distribution—ETF Shares | | 59 | |
Marketing and Distribution—Admiral Shares | | 17 | |
Marketing and Distribution—Institutional Shares | | 1 | |
Custodian Fees | | 46 | |
Auditing Fees | | 47 | |
Shareholders’ Reports—Investor Shares | | 11 | |
Shareholders’ Reports—ETF Shares | | 42 | |
Shareholders’ Reports—Admiral Shares | | 5 | |
Shareholders’ Reports—Institutional Shares | | — | |
Trustees’ Fees and Expenses | | 1 | |
Total Expenses | | 3,871 | |
Net Investment Income | | 74,770 | |
Realized Net Gain (Loss) | | | |
Investment Securities Sold1,2 | | 6,417 | |
Futures Contracts | | (49 | ) |
Realized Net Gain (Loss) | | 6,368 | |
Change in Unrealized Appreciation (Depreciation) | | | |
Investment Securities1 | | 109,711 | |
Futures Contracts | | (7 | ) |
Change in Unrealized Appreciation (Depreciation) | | 109,704 | |
Net Increase (Decrease) in Net Assets Resulting from Operations | | 190,842 | |
1 Interest income, realized net gain (loss), and change in unrealized appreciation (depreciation) from an affiliated company of the fund were $246,000, $2,000, and $1,000, respectively. Purchases and sales are for temporary cash investment purposes.
2 Includes ($54,000) of net gain (loss) resulting from in-kind redemptions; such gain (loss) is not taxable to the fund.
See accompanying Notes, which are an integral part of the Financial Statements.
30
Emerging Markets Government Bond Index Fund
Statement of Changes in Net Assets
| | Year Ended October 31, | |
| | 2019 | | 2018 | |
| | ($000 | ) | ($000 | ) |
Increase (Decrease) in Net Assets | | | | | |
Operations | | | | | |
Net Investment Income | | 74,770 | | 57,832 | |
Realized Net Gain (Loss) | | 6,368 | | (6,598 | ) |
Change in Unrealized Appreciation (Depreciation) | | 109,704 | | (103,455 | ) |
Net Increase (Decrease) in Net Assets Resulting from Operations | | 190,842 | | (52,221 | ) |
Distributions | | | | | |
Net Investment Income | | | | | |
Investor Shares | | (224 | ) | (489 | ) |
ETF Shares | | (58,791 | ) | (44,359 | ) |
Admiral Shares | | (12,340 | ) | (11,882 | ) |
Institutional Shares | | (1,568 | ) | (869 | ) |
Realized Capital Gain | | | | | |
Investor Shares | | — | | — | |
ETF Shares | | — | | — | |
Admiral Shares | | — | | — | |
Institutional Shares | | — | | — | |
Total Distributions | | (72,923 | ) | (57,599 | ) |
Capital Share Transactions | | | | | |
Investor Shares | | (10,529 | ) | (1,826 | ) |
ETF Shares | | 409,733 | | 115,604 | |
Admiral Shares | | (3,148 | ) | (9,200 | ) |
Institutional Shares | | 29,042 | | 879 | |
Net Increase (Decrease) from Capital Share Transactions | | 425,098 | | 105,457 | |
Total Increase (Decrease) | | 543,017 | | (4,363 | ) |
Net Assets | | | | | |
Beginning of Period | | 1,318,381 | | 1,322,744 | |
End of Period | | 1,861,398 | | 1,318,381 | |
See accompanying Notes, which are an integral part of the Financial Statements.
31
Emerging Markets Government Bond Index Fund
Financial Highlights
Investor Shares
| | Nov. 1, | | | | | | | | |
| | 2018, to | | | | | | | | |
For a Share Outstanding | | Oct. 101, | | Year Ended October 31, |
Throughout Each Period | | 2019 | | 2018 | | 2017 | | 2016 | | 2015 |
Net Asset Value, Beginning of Period | | $9.31 | | $10.12 | | $10.04 | | $9.50 | | $9.95 |
Investment Operations | | | | | | | | | | |
Net Investment Income | | .4162 | | .4102 | | .4502 | | .454 | | .427 |
Net Realized and Unrealized Gain (Loss) on Investments3 | | 0.777 | | (.812) | | .082 | | .533 | | (.447) |
Total from Investment Operations | | 1.193 | | (.402) | | .532 | | .987 | | (.020) |
Distributions | | | | | | | | | | |
Dividends from Net Investment Income | | (.403) | | (.408) | | (.452) | | (.447) | | (.430) |
Distributions from Realized Capital Gains | | — | | — | | — | | — | | — |
Total Distributions | | (.403) | | (.408) | | (.452) | | (.447) | | (.430) |
Net Asset Value, End of Period | | $10.101 | | $9.31 | | $10.12 | | $10.04 | | $9.50 |
| | | | | | | | | | |
Total Return4 | | 13.05% | | -4.05% | | 5.46% | | 10.65% | | -0.16% |
| | | | | | | | | | |
Ratios/Supplemental Data | | | | | | | | | | |
Net Assets, End of Period (Millions) | | — | | $10 | | $13 | | $12 | | $9 |
Ratio of Total Expenses to Average Net Assets | | 0.49%5 | | 0.49% | | 0.49% | | 0.49% | | 0.49% |
Ratio of Net Investment Income to Average Net Assets | | 4.60%5 | | 4.23% | | 4.50% | | 4.72% | | 4.52% |
Portfolio Turnover Rate6 | | 48%7 | | 25% | | 19% | | 24% | | 20% |
1 Net asset value as of October 10, 2019, on which date the remaining Investor Shares were converted to Admiral Shares.
2 Calculated based on average shares outstanding.
3 Includes increases from purchase fees of $.00, $.01, $.01, $,01, and $.01.
4 Total returns do not include transaction or account service fees that may have applied in the periods shown. Fund prospectuses provide information about any applicable transaction and account service fees.
5 Annualized.
6 Excludes the value of portfolio securities received or delivered as a result of in-kind purchases or redemptions of the fund’s capital shares, including ETF Creation Units.
7 Reflects the fund’s portfolio turnover for the fiscal year ended October 31, 2019.
See accompanying Notes, which are an integral part of the Financial Statements.
32
Emerging Markets Government Bond Index Fund
Financial Highlights
ETF Shares
For a Share Outstanding | | Year Ended October 31, |
Throughout Each Period | | 2019 | | 2018 | | 2017 | | 2016 | | 2015 |
Net Asset Value, Beginning of Period | | $74.27 | | $80.73 | | $80.11 | | $75.81 | | $79.40 |
Investment Operations | | | | | | | | | | |
Net Investment Income | | 3.7381 | | 3.4111 | | 3.7131 | | 3.753 | | 3.516 |
Net Realized and Unrealized Gain (Loss) on Investments2 | | 6.044 | | (6.445) | | .589 | | 4.228 | | (3.556) |
Total from Investment Operations | | 9.782 | | (3.034) | | 4.302 | | 7.981 | | (.040) |
Distributions | | | | | | | | | | |
Dividends from Net Investment Income | | (3.672) | | (3.426) | | (3.682) | | (3.681) | | (3.550) |
Distributions from Realized Capital Gains | | — | | — | | — | | — | | — |
Total Distributions | | (3.672) | | (3.426) | | (3.682) | | (3.681) | | (3.550) |
Net Asset Value, End of Period | | $80.38 | | $74.27 | | $80.73 | | $80.11 | | $75.81 |
| | | | | | | | | | |
Total Return | | 13.47% | | -3.84% | | 5.56% | | 10.84% | | -0.01% |
| | | | | | | | | | |
Ratios/Supplemental Data | | | | | | | | | | |
Net Assets, End of Period (Millions) | | $1,538 | | $1,033 | | $1,002 | | $874 | | $501 |
Ratio of Total Expenses to Average Net Assets | | 0.25% | | 0.30% | | 0.32% | | 0.32% | | 0.34% |
Ratio of Net Investment Income to Average Net Assets | | 4.79% | | 4.42% | | 4.67% | | 4.89% | | 4.67% |
Portfolio Turnover Rate3 | | 48% | | 25% | | 19% | | 24% | | 20% |
1 Calculated based on average shares outstanding.
2 Includes increases from purchase fees of $.00, $.04, $.07, $.04, and $.06.
3 Excludes the value of portfolio securities received or delivered as a result of in-kind purchases or redemptions of the fund’s capital shares, including ETF Creation Units.
See accompanying Notes, which are an integral part of the Financial Statements.
33
Emerging Markets Government Bond Index Fund
Financial Highlights
Admiral Shares
For a Share Outstanding | | Year Ended October 31, |
Throughout Each Period | | 2019 | | 2018 | | 2017 | | 2016 | | 2015 |
Net Asset Value, Beginning of Period | | $18.63 | | $20.24 | | $20.09 | | $19.00 | | $19.90 |
Investment Operations | | | | | | | | | | |
Net Investment Income | | .9391 | | .8581 | | .9341 | | .941 | | .885 |
Net Realized and Unrealized Gain (Loss) on Investments2 | | 1.521 | | (1.613) | | .150 | | 1.076 | | (.894) |
Total from Investment Operations | | 2.460 | | (.755) | | 1.084 | | 2.017 | | (.009) |
Distributions | | | | | | | | | | |
Dividends from Net Investment Income | | (.930) | | (.855) | | (.934) | | (.927) | | (.891) |
Distributions from Realized Capital Gains | | — | | — | | — | | — | | — |
Total Distributions | | (.930) | | (.855) | | (.934) | | (.927) | | (.891) |
Net Asset Value, End of Period | | $20.16 | | $18.63 | | $20.24 | | $20.09 | | $19.00 |
| | | | | | | | | | |
Total Return3 | | 13.46% | | -3.80% | | 5.57% | | 10.89% | | 0% |
| | | | | | | | | | |
Ratios/Supplemental Data | | | | | | | | | | |
Net Assets, End of Period (Millions) | | $273 | | $256 | | $288 | | $191 | | $131 |
Ratio of Total Expenses to Average Net Assets | | 0.25% | | 0.30% | | 0.32% | | 0.32% | | 0.33% |
Ratio of Net Investment Income to Average Net Assets | | 4.79% | | 4.42% | | 4.67% | | 4.89% | | 4.68% |
Portfolio Turnover Rate4 | | 48% | | 25% | | 19% | | 24% | | 20% |
1 Calculated based on average shares outstanding.
2 Includes increases from purchase fees of $.00, $.01, $.02, $.01, and $.02.
3 Total returns do not include transaction or account service fees that may have applied in the periods shown. Fund prospectuses provide information about any applicable transaction and account service fees.
4 Excludes the value of portfolio securities received or delivered as a result of in-kind purchases or redemptions of the fund’s capital shares, including ETF Creation Units.
See accompanying Notes, which are an integral part of the Financial Statements.
34
Emerging Markets Government Bond Index Fund
Financial Highlights
Institutional Shares
| | | | | | | | | | Feb. 11, | | Nov. 25, |
| | | | | | | | | | 20151 to | | 20141 to |
For a Share Outstanding | | Year Ended October 31, | | | Oct. 31, | | Dec. 18, |
Throughout Each Period | | 2019 | | 2018 | | 2017 | | 2016 | | 2015 | | 2014 |
Net Asset Value, Beginning of Period | | $29.88 | | $32.47 | | $32.24 | | $30.50 | | $30.72 | | $31.53 |
Investment Operations | | | | | | | | | | | | |
Net Investment Income | | 1.5222 | | 1.3802 | | 1.5082 | | 1.521 | | 1.019 | | .108 |
Net Realized and Unrealized Gain (Loss) on Investments3 | | 2.425 | | (2.596) | | .238 | | 1.715 | | (.159) | | (1.240) |
Total from Investment Operations | | 3.947 | | (1.216) | | 1.746 | | 3.236 | | .860 | | (1.132) |
Distributions | | | | | | | | | | | | |
Dividends from Net Investment Income | | (1.497) | | (1.374) | | (1.516) | | (1.496) | | (1.080) | | (.108) |
Distributions from Realized Capital Gains | | — | | — | | — | | — | | — | | — |
Total Distributions | | (1.497) | | (1.374) | | (1.516) | | (1.496) | | (1.080) | | (.108) |
Net Asset Value, End of Period | | $32.33 | | $29.88 | | $32.47 | | $32.24 | | $30.50 | | $30.29 |
| | | | | | | | | | | | |
Total Return4 | | 13.46% | | -3.82% | | 5.59% | | 10.89% | | 2.82% | | -3.60% |
| | | | | | | | | | | | |
Ratios/Supplemental Data | | | | | | | | | | | | |
Net Assets, End of Period (Millions) | | $51 | | $19 | | $20 | | $21 | | $10 | | $0 |
Ratio of Total Expenses to Average Net Assets | | 0.23% | | 0.29% | | 0.29% | | 0.29% | | 0.29% | | 0.30% |
Ratio of Net Investment Income to Average Net Assets | | 4.81% | | 4.43% | | 4.70% | | 4.92% | | 4.75% | | 4.72% |
Portfolio Turnover Rate5 | | 48% | | 25% | | 19% | | 24% | | 20%6 | | 20%6 |
| | | | | | | | | | | | | |
1 The class commenced operations on November 25, 2014. On December 18, 2014, all outstanding shares were redeemed and the Net Asset Value represents the per share amount at which such shares were redeemed. On February 11, 2015, the class recommenced operations. The expense ratio and net income ratio for the periods shown have been annualized.
2 Calculated based on average shares outstanding.
3 Includes increases from purchase fees of $.00 for 2019, $.02 for 2018, $.03 for 2017, $.02 for 2016, and $.04 in aggregate for periods prior to November 1, 2015.
4 Total returns do not include transaction or account service fees that may have applied in the periods shown. Fund prospectuses provide information about any applicable transaction and account service fees.
5 Excludes the value of portfolio securities received or delivered as a result of in-kind purchases or redemptions of the fund’s capital shares, including ETF Creation Units.
6 Reflects the fund’s portfolio turnover for the fiscal year ended October 31, 2015.
See accompanying Notes, which are an integral part of the Financial Statements.
35
Emerging Markets Government Bond Index Fund
Notes to Financial Statements
Vanguard Emerging Markets Government Bond Index Fund is registered under the Investment Company Act of 1940 as an open-end investment company, or mutual fund. The fund invests in securities of foreign issuers, which may subject it to investment risks not normally associated with investing in securities of U.S. corporations. The fund offers three classes of shares: ETF Shares, Admiral Shares, and Institutional Shares. Each of the share classes has different eligibility and minimum purchase requirements, and is designed for different types of investors. ETF Shares are listed for trading on Nasdaq; they can be purchased and sold through a broker. Prior to October 10, 2019, the fund offered Investor Shares. Effective at the close of business on October 10, 2019, the remaining Investor Shares were converted to Admiral Shares.
A. The following significant accounting policies conform to generally accepted accounting principles for U.S. investment companies. The fund consistently follows such policies in preparing its financial statements.
1. Security Valuation: Securities are valued as of the close of trading on the New York Stock Exchange (generally 4 p.m., Eastern time) on the valuation date. Bonds and temporary cash investments are valued using the latest bid prices or using valuations based on a matrix system (which considers such factors as security prices, yields, maturities, and ratings), both as furnished by independent pricing services. Investments in Vanguard Market Liquidity Fund are valued at that fund’s net asset value. Securities for which market quotations are not readily available, or whose values have been affected by events occurring before the fund’s pricing time but after the close of the securities’ primary markets, are valued at their fair values calculated according to procedures adopted by the board of trustees. These procedures include obtaining quotations from an independent pricing service, monitoring news to identify significant market- or security-specific events, and evaluating changes in the values of foreign market proxies (for example, ADRs, futures contracts, or exchange-traded funds), between the time the foreign markets close and the fund’s pricing time. When fair-value pricing is employed, the prices of securities used by a fund to calculate its net asset value may differ from quoted or published prices for the same securities.
2. Futures Contracts: The fund uses futures contracts to invest in fixed income asset classes with greater efficiency and lower cost than is possible through direct investment, to add value when these instruments are attractively priced, or to adjust sensitivity to changes in interest rates. The primary risks associated with the use of futures contracts are imperfect correlation between changes in market values of bonds held by the fund and the prices of futures contracts, and the possibility of an illiquid market. Counterparty risk involving futures is mitigated because a regulated clearinghouse is the counterparty instead of the clearing broker. To further mitigate counterparty risk, the fund trades futures contracts on an exchange, monitors the financial strength of its clearing brokers and clearinghouse, and has entered into clearing agreements with its clearing brokers. The clearinghouse imposes initial margin requirements to secure the fund’s performance and requires daily settlement of variation margin representing changes in the market value of each contract. Any assets pledged as initial margin for open contracts are noted in the Statement of Net Assets.
Futures contracts are valued at their quoted daily settlement prices. The notional amounts of the contracts are not recorded in the Statement of Net Assets. Fluctuations in the value of the contracts are recorded in the Statement of Net Assets as an asset (liability) and in the Statement of Operations as unrealized appreciation (depreciation) until the contracts are closed, when they are recorded as realized futures gains (losses).
36
Emerging Markets Government Bond Index Fund
During the year ended October 31, 2019, the fund’s average investments in long and short futures contracts each represented 1% of net assets, based on the average of the notional amounts at each quarter-end during the period.
3. Federal Income Taxes: The fund intends to continue to qualify as a regulated investment company and distribute all of its taxable income. Management has analyzed the fund’s tax positions taken for all open federal income tax years (October 31, 2016–2019), and has concluded that no provision for federal income tax is required in the fund’s financial statements.
4. Distributions: Distributions to shareholders are recorded on the ex-dividend date. Distributions are determined on a tax basis and may differ from net investment income and realized capital gains for financial reporting purposes.
5. Credit Facility: The fund and certain other funds managed by The Vanguard Group (“Vanguard”) participate in a $4.3 billion committed credit facility provided by a syndicate of lenders pursuant to a credit agreement that may be renewed annually; each fund is individually liable for its borrowings, if any, under the credit facility. Borrowings may be utilized for temporary and emergency purposes, and are subject to the fund’s regulatory and contractual borrowing restrictions. The participating funds are charged administrative fees and an annual commitment fee of 0.10% of the undrawn amount of the facility; these fees are allocated to the funds based on a method approved by the fund’s board of trustees and included in Management and Administrative expenses on the fund’s Statement of Operations. Any borrowings under this facility bear interest at a rate based upon the higher of the one-month London Interbank Offered Rate, federal funds effective rate, or overnight bank funding rate plus an agreed-upon spread.
The fund had no borrowings outstanding at October 31, 2019, or at any time during the period then ended.
6. Other: Interest income includes income distributions received from Vanguard Market Liquidity Fund and is accrued daily. Premiums and discounts on debt securities purchased are amortized and accreted, respectively, to interest income over the lives of the respective securities. Security transactions are accounted for on the date securities are bought or sold. Costs used to determine realized gains (losses) on the sale of investment securities are those of the specific securities sold. Fees assessed on capital share transactions are credited to paid-in capital.
Each class of shares has equal rights as to assets and earnings, except that each class separately bears certain class-specific expenses related to maintenance of shareholder accounts (included in Management and Administrative expenses) and shareholder reporting. Marketing and distribution expenses are allocated to each class of shares based on a method approved by the board of trustees. Income, other non-class-specific expenses, and gains and losses on investments are allocated to each class of shares based on its relative net assets.
B. In accordance with the terms of a Funds’ Service Agreement (the “FSA”) between Vanguard and the fund, Vanguard furnishes to the fund investment advisory, corporate management, administrative, marketing, and distribution services at Vanguard’s cost of operations (as defined by the FSA). These costs of operations are allocated to the fund based on methods and guidelines approved by the board of trustees. Vanguard does not require reimbursement in the current period for certain costs of operations (such as deferred compensation/benefits and risk/insurance costs); the fund’s liability for these costs of operations is included in Payables to Vanguard on the Statement of Net Assets. All other costs of operations payable to Vanguard are generally settled twice a month.
37
Emerging Markets Government Bond Index Fund
Upon the request of Vanguard, the fund may invest up to 0.40% of its net assets as capital in Vanguard. At October 31, 2019, the fund had contributed to Vanguard capital in the amount of $84,000, representing less than 0.01% of the fund’s net assets and 0.03% of Vanguard’s capital received pursuant to the FSA. The fund’s trustees and officers are also directors and employees, respectively, of Vanguard.
C. Various inputs may be used to determine the value of the fund’s investments. These inputs are summarized in three broad levels for financial statement purposes. The inputs or methodologies used to value securities are not necessarily an indication of the risk associated with investing in those securities.
Level 1—Quoted prices in active markets for identical securities.
Level 2—Other significant observable inputs (including quoted prices for similar securities, interest rates, prepayment speeds, credit risk, etc.).
Level 3—Significant unobservable inputs (including the fund’s own assumptions used to determine the fair value of investments). Any investments valued with significant unobservable inputs are noted on the Statement of Net Assets.
The following table summarizes the market value of the fund’s investments and derivatives as of October 31, 2019, based on the inputs used to value them:
| | Level 1 | | Level 2 | | Level 3 | |
Investments | | ($000 | ) | ($000 | ) | ($000 | ) |
Sovereign Bonds | | — | | 1,831,606 | | — | |
U.S. Government and Agency Obligations | | — | | 2,687 | | — | |
Temporary Cash Investments | | 7,403 | | — | | — | |
Futures Contracts—Assets1 | | 151 | | — | | — | |
Futures Contracts—Liabilities1 | | (132 | ) | — | | — | |
Total | | 7,422 | | 1,834,293 | | — | |
1 Represents variation margin on the last day of the reporting period.
D. Permanent differences between book-basis and tax-basis components of net assets are reclassified among capital accounts in the financial statements to reflect their tax character. These reclassifications have no effect on net assets or net asset value per share. As of period end, permanent differences primarily attributable to the accounting for in-kind redemptions were reclassified between the following accounts:
| | Amount | |
| | ($000 | ) |
Paid-in Capital | | (54 | ) |
Total Distributable Earnings (Loss) | | 54 | |
38
Emerging Markets Government Bond Index Fund
Temporary differences between book-basis and tax-basis components of total distributable earnings (loss) arise when certain items of income, gain, or loss are recognized in different periods for financial statement and tax purposes; these differences will reverse at some time in the future. The differences are primarily related to the tax deferral of losses on wash sales and straddles, the realization of unrealized gains or losses on certain futures contracts, and payables for distributions. As of period end, the tax-basis components of total distributable earnings (loss) are detailed in the table as follows:
| | Amount | |
| | ($000 | ) |
Undistributed Ordinary Income | | 6,263 | |
Undistributed Long-Term Gains | | — | |
Capital Loss Carryforwards (Non-expiring)* | | (3,445 | ) |
Net Unrealized Gains (Losses) | | 43,953 | |
*The fund used capital loss carryforwards of $6,620,000 to offset taxable capital gains realized during the year ended October 31, 2019.
As of October 31, 2019, gross unrealized appreciation and depreciation for investments and derivatives based on cost for U.S. federal income tax purposes were as follows:
| | Amount | |
| | ($000 | ) |
Tax Cost | | 1,797,743 | |
Gross Unrealized Appreciation | | 108,900 | |
Gross Unrealized Depreciation | | (64,947 | ) |
Net Unrealized Appreciation (Depreciation) | | 43,953 | |
E. During the year ended October 31, 2019, the fund purchased $1,093,482,000 of investment securities and sold $685,211,000 of investment securities, other than U.S. government securities and temporary cash investments. Purchases and sales of U.S. government securities were $60,295,000 and $55,579,000, respectively. Total purchases and sales include $399,613,000 and $7,428,000, respectively, in connection with in-kind purchases and redemptions of the fund’s capital shares.
39
Emerging Markets Government Bond Index Fund
F. Capital share transactions for each class of shares were:
| | Year Ended October 31, | |
| | 2019 | | 2018 | |
| | Amount | | Shares | | Amount | | Shares | |
| | ($000 | ) | (000 | ) | ($000 | ) | (000 | ) |
Investor Shares | | | | | | | | | |
Issued1 | | 1,019 | | 106 | | 5,198 | | 528 | |
Issued in Lieu of Cash Distributions | | 207 | | 22 | | 418 | | 43 | |
Redeemed2 | | (11,755 | ) | (1,203 | ) | (7,442 | ) | (765 | ) |
Net Increase (Decrease)—Investor Shares | | (10,529 | ) | (1,075 | ) | (1,826 | ) | (194 | ) |
ETF Shares | | | | | | | | | |
Issued1 | | 417,149 | | 5,319 | | 139,633 | | 1,801 | |
Issued in Lieu of Cash Distributions | | — | | — | | — | | — | |
Redeemed | | (7,416 | ) | (100 | ) | (24,029 | ) | (300 | ) |
Net Increase (Decrease)—ETF Shares | | 409,733 | | 5,219 | | 115,604 | | 1,501 | |
Admiral Shares | | | | | | | | | |
Issued1,2 | | 63,817 | | 3,263 | | 85,167 | | 4,371 | |
Issued in Lieu of Cash Distributions | | 10,121 | | 516 | | 9,869 | | 510 | |
Redeemed | | (77,086 | ) | (3,967 | ) | (104,236 | ) | (5,368 | ) |
Net Increase (Decrease)—Admiral Shares | | (3,148 | ) | (188 | ) | (9,200 | ) | (487 | ) |
Institutional Shares | | | | | | | | | |
Issued1 | | 28,354 | | 892 | | — | | — | |
Issued in Lieu of Cash Distributions | | 1,568 | | 50 | | 879 | | 28 | |
Redeemed | | (880 | ) | (27 | ) | — | | — | |
Net Increase (Decrease)—Institutional Shares | | 29,042 | | 915 | | 879 | | 28 | |
1 Includes purchase fees for fiscal 2019 and 2018 of $532,000 and $686,000, respectively (fund totals).
2 In November 2018, the fund announced changes to the availability and minimum investment criteria of the Investor and Admiral share classes. As a result, all of the outstanding Investor Shares automatically converted to Admiral Shares beginning in April 2019. Investor Shares—Redeemed and Admiral Shares—Issued include 981,000 and 490,000 shares, respectively, in the amount of $9,638,000 from the conversion during the year ended October 31, 2019.
G. Management has determined that no events or transactions occurred subsequent to October 31, 2019, that would require recognition or disclosure in these financial statements.
40
Report of Independent Registered Public Accounting Firm
To the Board of Trustees of Vanguard Whitehall Funds and Shareholders of Vanguard Emerging Markets Government Bond Index Fund
Opinion on the Financial Statements
We have audited the accompanying statement of net assets of Vanguard Emerging Markets Government Bond Index Fund (one of the funds constituting Vanguard Whitehall Funds, referred to hereafter as the “Fund”) as of October 31, 2019, the related statement of operations for the year ended October 31, 2019, the statement of changes in net assets for each of the two years in the period ended October 31, 2019, including the related notes, and the financial highlights for each of the periods indicated therein (collectively referred to as the “financial statements”). In our opinion, the financial statements present fairly, in all material respects, the financial position of the Fund as of October 31, 2019, the results of its operations for the year then ended, the changes in its net assets for each of the two years in the period ended October 31, 2019 and the financial highlights for each of the periods indicated therein in conformity with accounting principles generally accepted in the United States of America.
Basis for Opinion
These financial statements are the responsibility of the Fund’s management. Our responsibility is to express an opinion on the Fund’s financial statements based on our audits. We are a public accounting firm registered with the Public Company Accounting Oversight Board (United States) (“PCAOB”) and are required to be independent with respect to the Fund in accordance with the U.S. federal securities laws and the applicable rules and regulations of the Securities and Exchange Commission and the PCAOB.
We conducted our audits of these financial statements in accordance with the standards of the PCAOB. Those standards require that we plan and perform the audit to obtain reasonable assurance about whether the financial statements are free of material misstatement, whether due to error or fraud.
Our audits included performing procedures to assess the risks of material misstatement of the financial statements, whether due to error or fraud, and performing procedures that respond to those risks. Such procedures included examining, on a test basis, evidence regarding the amounts and disclosures in the financial statements. Our audits also included evaluating the accounting principles used and significant estimates made by management, as well as evaluating the overall presentation of the financial statements. Our procedures included confirmation of securities owned as of October 31, 2019 by correspondence with the custodian, transfer agent and brokers; when replies were not received from brokers, we performed other auditing procedures. We believe that our audits provide a reasonable basis for our opinion.
/s/PricewaterhouseCoopers LLP
Philadelphia, Pennsylvania
December 13, 2019
We have served as the auditor of one or more investment companies in The Vanguard Group of Funds since 1975.
41
BLOOMBERG is a trademark and service mark of Bloomberg Finance L.P. BARCLAYS is a trademark and service mark of Barclays Bank Plc, used under license. Bloomberg Finance L.P. and its affiliates, including Bloomberg Index Services Limited (BISL) (collectively, Bloomberg), or Bloomberg’s licensors, own all proprietary rights in the Bloomberg Barclays USD Emerging Markets Government RIC Capped Index (Index or Bloomberg Barclays Index).
Neither Barclays Bank Plc, Barclays Capital Inc., or any affiliate (collectively Barclays) or Bloomberg is the issuer or producer of the Emerging Markets Government Bond Index Fund and neither Bloomberg nor Barclays has any responsibilities, obligations or duties to investors in the Emerging Markets Government Bond Index Fund. The Index is licensed for use by The Vanguard Group, Inc. (Vanguard) as the sponsor of the Emerging Markets Government Bond Index Fund. Bloomberg and Barclays’ only relationship with Vanguard in respect of the Index is the licensing of the Index, which is determined, composed and calculated by BISL, or any successor thereto, without regard to the Issuer or the Emerging Markets Government Bond Index Fund or the owners of the Emerging Markets Government Bond Index Fund.
Additionally, Vanguard may for itself execute transaction(s) with Barclays in or relating to the Index in connection with the Emerging Markets Government Bond Index Fund. Investors acquire the Emerging Markets Government Bond Index Fund from Vanguard and investors neither acquire any interest in the Index nor enter into any relationship of any kind whatsoever with Bloomberg or Barclays upon making an investment in the Emerging Markets Government Bond Index Fund. The Emerging Markets Government Bond Index Fund is not sponsored, endorsed, sold or promoted by Bloomberg or Barclays. Neither Bloomberg nor Barclays makes any representation or warranty, express or implied regarding the advisability of investing in the Emerging Markets Government Bond Index Fund or the advisability of investing in securities generally or the ability of the Index to track corresponding or relative market performance. Neither Bloomberg nor Barclays has passed on the legality or suitability of the Emerging Markets Government Bond Index Fund with respect to any person or entity. Neither Bloomberg nor Barclays is responsible for and has not participated in the determination of the timing of, prices at, or quantities of the Emerging Markets Government Bond Index Fund to be issued. Neither Bloomberg nor Barclays has any obligation to take the needs of the Issuer or the owners of the Emerging Markets Government Bond Index Fund or any other third party into consideration in determining, composing or calculating the Index. Neither Bloomberg nor Barclays has any obligation or liability in connection with administration, marketing or trading of the Emerging Markets Government Bond Index Fund.
42
The licensing agreement between Bloomberg and Barclays is solely for the benefit of Bloomberg and Barclays and not for the benefit of the owners of the Emerging Markets Government Bond Index Fund, investors or other third parties. In addition, the licensing agreement between Vanguard and Bloomberg is solely for the benefit of Vanguard and Bloomberg and not for the benefit of the owners of the Emerging Markets Government Bond Index Fund, investors or other third parties.
NEITHER BLOOMBERG NOR BARCLAYS SHALL HAVE ANY LIABILITY TO THE ISSUER, INVESTORS OR TO OTHER THIRD PARTIES FOR THE QUALITY, ACCURACY AND/OR COMPLETENESS OF THE BLOOMBERG BARCLAYS INDEX OR ANY DATA INCLUDED THEREIN OR FOR INTERRUPTIONS IN THE DELIVERY OF THE BLOOMBERG BARCLAYS INDEX. NEITHER BLOOMBERG NOR BARCLAYS MAKES ANY WARRANTY, EXPRESS OR IMPLIED, AS TO RESULTS TO BE OBTAINED BY THE ISSUER, THE INVESTORS OR ANY OTHER PERSON OR ENTITY FROM THE USE OF THE BLOOMBERG BARCLAYS INDEX OR ANY DATA INCLUDED THEREIN. NEITHER BLOOMBERG NOR BARCLAYS MAKES ANY EXPRESS OR IMPLIED WARRANTIES, AND EACH HEREBY EXPRESSLY DISCLAIMS ALL WARRANTIES OF MERCHANTABILITY OR FITNESS FOR A PARTICULAR PURPOSE OR USE WITH RESPECT TO THE BLOOMBERG BARCLAYS INDEX OR ANY DATA INCLUDED THEREIN. BLOOMBERG RESERVES THE RIGHT TO CHANGE THE METHODS OF CALCULATION OR PUBLICATION, OR TO CEASE THE CALCULATION OR PUBLICATION OF THE BLOOMBERG BARCLAYS INDEX, AND NEITHER BLOOMBERG NOR BARCLAYS SHALL BE LIABLE FOR ANY MISCALCULATION OF OR ANY INCORRECT, DELAYED OR INTERRUPTED PUBLICATION WITH RESPECT TO THE BLOOMBERG BARCLAYS INDEX. NEITHER BLOOMBERG NOR BARCLAYS SHALL BE LIABLE FOR ANY DAMAGES, INCLUDING, WITHOUT LIMITATION, ANY SPECIAL, INDIRECT OR CONSEQUENTIAL DAMAGES, OR ANY LOST PROFITS AND EVEN IF ADVISED OF THE POSSIBILITY OF SUCH, RESULTING FROM THE USE OF THE BLOOMBERG BARCLAYS INDEX OR ANY DATA INCLUDED THEREIN OR WITH RESPECT TO THE EMERGING MARKETS GOVERNMENT BOND INDEX FUND.
None of the information supplied by Bloomberg or Barclays and used in this publication may be reproduced in any manner without the prior written permission of both Bloomberg and Barclays Capital, the investment banking division of Barclays Bank Plc. Barclays Bank Plc is registered in England No. 1026167. Registered office 1 Churchill Place London E14 5HP.
© 2019 Bloomberg. Used with Permission.
Source: Bloomberg Index Services Limited. Copyright 2019, Bloomberg. All rights reserved.
43
This page intentionally left blank.
This page intentionally left blank.
This page intentionally left blank.
The People Who Govern Your Fund
The trustees of your mutual fund are there to see that the fund is operated and managed in your best interests since, as a shareholder, you are a part owner of the fund. Your fund’s trustees also serve on the board of directors of The Vanguard Group, Inc., which is owned by the Vanguard funds and provides services to them.
A majority of Vanguard’s board members are independent, meaning that they have no affiliation with Vanguard or the funds they oversee, apart from the sizable personal investments they have made as private individuals. The independent board members have distinguished backgrounds in business, academia, and public service. Each of the trustees and executive officers oversees 213 Vanguard funds.
Information for each trustee and executive officer of the fund appears below. That information, as well as the Vanguard fund count, is as of the date on the cover of this fund report. The mailing address of the trustees and officers is P.O. Box 876, Valley Forge, PA 19482. More information about the trustees is in the Statement of Additional Information, which can be obtained, without charge, by contacting Vanguard at 800-662-7447, or online at vanguard.com.
Interested Trustee1
Mortimer J. Buckley
Born in 1969. Trustee since January 2018. Principal occupation(s) during the past five years and other experience: chairman of the board (January 2019–present) of Vanguard and of each of the investment companies served by Vanguard; chief executive officer (January 2018–present) of Vanguard; chief executive officer, president, and trustee (January 2018–present) of each of the investment companies served by Vanguard; president and director (2017–present) of Vanguard; and president (February 2018–present) of Vanguard Marketing Corporation. Chief investment officer (2013–2017), managing director (2002–2017), head of the Retail Investor Group (2006–2012), and chief information officer (2001–2006) of Vanguard. Chairman of the board (2011–2017) and trustee (2009–2017) of the Children’s Hospital of Philadelphia; trustee (2018–present) of The Shipley School.
Independent Trustees
Emerson U. Fullwood
Born in 1948. Trustee since January 2008. Principal occupation(s) during the past five years and other experience: executive chief staff and marketing officer for North America and corporate vice president (retired 2008) of Xerox Corporation (document management products and services). Former president of the Worldwide Channels Group, Latin America, and Worldwide Customer Service and executive chief staff officer of Developing Markets of Xerox. Executive in residence and 2009–2010 Distinguished Minett Professor at the Rochester Institute of Technology. Director of SPX FLOW, Inc. (multi-industry manufacturing). Director of the University of Rochester Medical Center, the Monroe Community College Foundation, the United Way of Rochester, North Carolina A&T University, and Roberts Wesleyan College. Trustee of the University of Rochester.
Amy Gutmann
Born in 1949. Trustee since June 2006. Principal occupation(s) during the past five years and other experience: president (2004–present) of the University of Pennsylvania. Christopher H. Browne Distinguished Professor of Political Science, School of Arts and Sciences, and professor of communication, Annenberg School for Communication, with secondary faculty appointments in the Department of Philosophy, School of Arts and Sciences, and at the Graduate School of Education, University of Pennsylvania. Trustee of the National Constitution Center.
F. Joseph Loughrey
Born in 1949. Trustee since October 2009. Principal occupation(s) during the past five years and other experience: president and chief operating officer (retired 2009) and vice chairman of the board (2008–2009) of Cummins Inc. (industrial machinery). Chairman of the board of Hillenbrand, Inc. (specialized consumer services), and the Lumina Foundation.
1 Mr. Buckley is considered an “interested person,” as defined in the Investment Company Act of 1940, because he is an officer of the Vanguard funds.
Director of the V Foundation and Oxfam America. Member of the advisory council for the College of Arts and Letters and chair of the advisory board to the Kellogg Institute for International Studies, both at the University of Notre Dame.
Mark Loughridge
Born in 1953. Trustee since March 2012. Principal occupation(s) during the past five years and other experience: senior vice president and chief financial officer (retired 2013) of IBM (information technology services). Fiduciary member of IBM’s Retirement Plan Committee (2004–2013), senior vice president and general manager (2002–2004) of IBM Global Financing, vice president and controller (1998–2002) of IBM, and a variety of other prior management roles at IBM. Member of the Council on Chicago Booth.
Scott C. Malpass
Born in 1962. Trustee since March 2012. Principal occupation(s) during the past five years and other experience: chief investment officer (1989–present) and vice president (1996–present) of the University of Notre Dame. Assistant professor of finance at the Mendoza College of Business, University of Notre Dame, and member of the Notre Dame 403(b) Investment Committee. Chairman of the board of TIFF Advisory Services, Inc. Member of the board of Catholic Investment Services, Inc. (investment advisors) and the board of superintendence of the Institute for the Works of Religion.
Deanna Mulligan
Born in 1963. Trustee since January 2018. Principal occupation(s) during the past five years and other experience: president (2010–present) and chief executive officer (2011–present) of The Guardian Life Insurance Company of America. Chief operating officer (2010–2011) and executive vice president (2008–2010) of Individual Life and Disability of The Guardian Life Insurance Company of America. Member of the board of The Guardian Life Insurance Company of America, the American Council of Life Insurers, the Partnership for New York City (business leadership), and the Committee Encouraging Corporate Philanthropy. Trustee of the Economic Club of New York and the Bruce Museum (arts and science). Member of the Advisory Council for the Stanford Graduate School of Business.
André F. Perold
Born in 1952. Trustee since December 2004. Principal occupation(s) during the past five years and other experience: George Gund Professor of Finance and Banking, Emeritus at the Harvard Business School (retired 2011). Chief investment officer and co-managing partner of HighVista Strategies (private investment firm). Board of advisors and investment committee member of the Museum of Fine Arts Boston. Board member (2018–present) of RIT Capital Partners (investment firm); investment committee member of Partners Health Care System.
Sarah Bloom Raskin
Born in 1961. Trustee since January 2018. Principal occupation(s) during the past five years and other experience: deputy secretary (2014–2017) of the United States Department of the Treasury. Governor (2010–2014) of the Federal Reserve Board. Commissioner (2007–2010) of financial regulation for the State of Maryland. Member of the board of directors (2012–2014) of Neighborhood Reinvestment Corporation. Director (2017–present) of i(x) Investments; director (2017–present) of Reserve Trust. Rubinstein Fellow (2017–present) of Duke University; trustee (2017–present) of Amherst College.
Peter F. Volanakis
Born in 1955. Trustee since July 2009. Principal occupation(s) during the past five years and other experience: president and chief operating officer (retired 2010) of Corning Incorporated (communications equipment) and director of Corning Incorporated (2000–2010) and Dow Corning (2001–2010). Director (2012) of SPX Corporation (multi-industry manufacturing). Overseer of the Amos Tuck School of Business Administration, Dartmouth College (2001–2013). Chairman of the board of trustees of Colby-Sawyer College. Member of the board of Hypertherm Inc. (industrial cutting systems, software, and consumables).
Executive Officers
John Bendl
Born in 1970. Principal occupation(s) during the past five years and other experience: principal of Vanguard. Chief financial officer (October 2019–present) of each of the investment companies served by Vanguard. Chief accounting officer, treasurer, and controller of Vanguard (2017–present). Partner (2003–2016) at KPMG (audit, tax, and advisory services).
Glenn Booraem
Born in 1967. Principal occupation(s) during the past five years and other experience: principal of Vanguard. Investment stewardship officer (2017–present), treasurer (2015–2017), controller (2010–2015), and assistant controller (2001–2010) of each of the investment companies served by Vanguard.
Christine M. Buchanan
Born in 1970. Principal occupation(s) during the past five years and other experience: principal of Vanguard. Treasurer (2017–present) of each of the investment companies served by Vanguard. Partner (2005–2017) at KPMG (audit, tax, and advisory services).
David Cermak
Born in 1960. Principal occupation(s) during the past five years and other experience: principal of Vanguard. Finance director (October 2019–present) of each of the investment companies served by Vanguard. Managing director and head (2017–present) of Vanguard Investments Singapore. Managing director and head (2017–2019) of Vanguard Investments Hong Kong. Representative director and head (2014–2017) of Vanguard Investments Japan.
Thomas J. Higgins
Born in 1957. Principal occupation(s) during the past five years and other experience: principal of Vanguard. Finance director (October 2019–present), chief financial officer (2008–2019), and treasurer (1998–2008) of each of the investment companies served by Vanguard.
Peter Mahoney
Born in 1974. Principal occupation(s) during the past five years and other experience: principal of Vanguard. Controller (2015–present) of each of the investment companies served by Vanguard. Head of International Fund Services (2008–2014) at Vanguard.
Anne E. Robinson
Born in 1970. Principal occupation(s) during the past five years and other experience: general counsel (2016–present) of Vanguard. Secretary (2016–present) of Vanguard and of each of the investment companies served by Vanguard. Managing director (2016–present) of Vanguard. Managing director and general counsel of Global Cards and Consumer Services (2014–2016) at Citigroup. Counsel (2003–2014) at American Express.
Michael Rollings
Born in 1963. Principal occupation(s) during the past five years and other experience: finance director (2017–present) and treasurer (2017) of each of the investment companies served by Vanguard. Managing director (2016–present) of Vanguard. Chief financial officer (2016–present) of Vanguard. Director (2016–present) of Vanguard Marketing Corporation. Executive vice president and chief financial officer (2006–2016) of MassMutual Financial Group.
John E. Schadl
Born in 1972. Principal occupation(s) during the past five years and other experience: principal of Vanguard. Chief compliance officer (2019–present) of Vanguard and of each of the investment companies served by Vanguard. Assistant vice president (May 2019–present) of Vanguard Marketing Corporation.
Vanguard Senior Management Team | |
| |
Joseph Brennan | Chris D. McIsaac |
Mortimer J. Buckley | James M. Norris |
Gregory Davis | Thomas M. Rampulla |
John James | Karin A. Risi |
Martha G. King | Anne E. Robinson |
John T. Marcante | Michael Rollings |
| 
P.O. Box 2600 Valley Forge, PA 19482-2600 |
Connect with Vanguard® > vanguard.com
Fund Information > 800-662-7447
Direct Investor Account Services > 800-662-2739
Institutional Investor Services > 800-523-1036
Text Telephone for People
Who Are Deaf or Hard of Hearing > 800-749-7273
This material may be used in conjunction with the offering of shares of any Vanguard fund only if preceded or accompanied by the fund’s current prospectus.
All comparative mutual fund data are from Morningstar, Inc., unless otherwise noted.
You can obtain a free copy of Vanguard’s proxy voting guidelines by visiting vanguard.com/proxyreporting or by calling Vanguard at 800-662-2739. The guidelines are also available from the SEC’s website, www.sec.gov. In addition, you may obtain a free report on how your fund voted the proxies for securities it owned during the 12 months ended June 30. To get the report, visit either vanguard.com/proxyreporting or www.sec.gov.
You can review information about your fund on the SEC’s website, and you can receive copies of this information, for a fee, by sending a request via email addressed to publicinfo@sec.gov.
| © 2019 The Vanguard Group, Inc. All rights reserved. U.S. Patent Nos. 6,879,964; 7,337,138; 7,720,749; 7,925,573; 8,090,646; 8,417,623; and 8,626,636. Vanguard Marketing Corporation, Distributor. Q11200 122019 |

Annual Report | October 31, 2019 Vanguard Global Minimum Volatility Fund |
See the inside front cover for important information about access to your fund’s annual and semiannual shareholder reports. |
Important information about access to shareholder reports
Beginning on January 1, 2021, as permitted by regulations adopted by the Securities and Exchange Commission, paper copies of your fund’s annual and semiannual shareholder reports will no longer be sent to you by mail, unless you specifically request them. Instead, you will be notified by mail each time a report is posted on the website and will be provided with a link to access the report.
If you have already elected to receive shareholder reports electronically, you will not be affected by this change and do not need to take any action. You may elect to receive shareholder reports and other communications from the fund electronically by contacting your financial intermediary (such as a broker-dealer or bank) or, if you invest directly with the fund, by calling Vanguard at one of the phone numbers on the back cover of this report or by logging on to vanguard.com.
You may elect to receive paper copies of all future shareholder reports free of charge. If you invest through a financial intermediary, you can contact the intermediary to request that you continue to receive paper copies. If you invest directly with the fund, you can call Vanguard at one of the phone numbers on the back cover of this report or log on to vanguard.com. Your election to receive paper copies will apply to all the funds you hold through an intermediary or directly with Vanguard.
Contents | |
A Note From Our Chairman | 1 |
Your Fund’s Performance at a Glance | 2 |
Advisor’s Report | 3 |
About Your Fund’s Expenses | 6 |
Performance Summary | 8 |
Financial Statements | 10 |
Please note: The opinions expressed in this report are just that—informed opinions. They should not be considered promises or advice. Also, please keep in mind that the information and opinions cover the period through the date on the front of this report. Of course, the risks of investing in your fund are spelled out in the prospectus.
A Note From Our Chairman

Tim Buckley
Chairman and Chief Executive Officer
Dear Shareholder,
Recent volatility in financial markets— affecting stocks, bonds, and commodities— has been a good reminder of the wise old adage, “Never keep all your eggs in one basket.” Maintaining balance and diversification in your investment portfolio can help to both limit risk and set you up for long-term success.
It’s understandable why some investors might become complacent after a long market run-up like the one that lifted stock prices, especially U.S. stock prices, in the years following the global financial crisis. But failing to rebalance regularly can leave a portfolio with a much different mix of assets than intended and, often, more risk than intended.
Balance across and diversification within asset classes are powerful tools for managing risk and achieving your investment goals. A portfolio’s allocation will determine a large portion of its long-term return and also the majority of its volatility risk. A well-diversified portfolio is less vulnerable to significant swings in the performance of any one segment of the asset classes in which it invests.
Balance and diversification will never eliminate the risk of loss, nor will they guarantee positive returns in a declining market. But they should reduce the chance that you’ll suffer disproportionate losses in one particular high-flying asset class or sector when it comes back to earth. And exposure to all key market components should give you at least some participation in the sectors that are performing best at any given time.
Vanguard is committed to helping you achieve balance and diversification in your portfolios to help meet your investment goals. We thank you for your continued loyalty.
Sincerely,

Mortimer J. Buckley
Chairman and Chief Executive Officer
November 18, 2019
1
Your Fund’s Performance at a Glance
· Vanguard Global Minimum Volatility Fund returned 14.54% for Admiral Shares for the 12 months ended October 31, 2019, outpacing its benchmark, the FTSE Global All Cap Index (USD Hedged), which returned 13.21%.
· The fund achieved low volatility over the period, as its weekly volatility averaged about 32% less than that of its benchmark. The fund regularly uses derivatives to hedge portfolio risks. The fund’s holdings of forward currency contracts and equity index futures contracts boosted performance.
· The fund benefited from overweighting lower-volatility sectors such as utilities and real estate, which outperformed because of lower interest rates. Stock selection in financials and an underweight allocation to the more volatile energy sector helped performance most. Information technology was the largest detractor.
· Our positions in North America, which account for more than 50% of the fund’s holdings, helped returns on a relative basis while lowering volatility. The fund’s positions in Europe and the Pacific region also helped reduce volatility.
Market Barometer
| | Average Annual Total Returns | |
| | Periods Ended October 31, 2019 | |
| | One Year | | Three Years | | Five Years | |
Stocks | | | | | | | |
Russell 1000 Index (Large-caps) | | 14.15% | | 14.73% | | 10.55% | |
Russell 2000 Index (Small-caps) | | 4.90 | | 10.96 | | 7.37 | |
Russell 3000 Index (Broad U.S. market) | | 13.49 | | 14.47 | | 10.31 | |
FTSE All-World ex US Index (International) | | 11.52 | | 8.21 | | 4.16 | |
| | | | | | | |
Bonds | | | | | | | |
Bloomberg Barclays U.S. Aggregate Bond Index (Broad taxable market) | | 11.51% | | 3.29% | | 3.24% | |
Bloomberg Barclays Municipal Bond Index (Broad tax-exempt market) | | 9.42 | | 3.62 | | 3.55 | |
FTSE Three-Month U.S. Treasury Bill Index | | 2.35 | | 1.57 | | 0.98 | |
| | | | | | | |
CPI | | | | | | | |
Consumer Price Index | | 1.76% | | 2.11% | | 1.62% | |
2
Advisor’s Report
For the 12 months ended October 31, 2019, Vanguard Global Minimum Volatility Fund returned 14.41% for Investor Shares and 14.54% for Admiral Shares, with an annualized weekly volatility of 9.01%. Its benchmark, the FTSE Global All Cap Index (USD Hedged), returned 13.21%, with an annualized weekly volatility of 13.24%. (To get the annualized weekly volatility, we calculate the standard deviation of weekly returns and multiply it by the square root of 52, the number of weeks in a year.)
Investment objective
Our objective is to create a portfolio that has broad equity exposure with less volatility than the global equity market. We achieved this over the performance period, as the fund’s weekly volatility averaged about 32% less than that of its benchmark.
It is important to mention, as we have in the past, that we do not target a specific volatility level. Rather, we seek to provide an equity fund that has lower absolute risk than the broad global market. Thus, when the broad global equity market is experiencing periods of low volatility, you should expect this fund’s volatility to be much closer to the volatility level of its benchmark.
We recognize that equity-like returns are also an important outcome of an investment in this fund, but achieving a total return higher than the benchmark’s is not our objective. Although our research leads us to expect that, on average, a minimum volatility fund may outperform the overall global market in sharp downturns (while still experiencing losses), the fund should be expected to trail in strong bull markets. With that in mind, because the fund is expected to have a lower level of risk than the global equity market, you should not expect it to outperform the market over the long run.
We think an acceptable comparative performance measure for the fund over the long term is its risk-adjusted return. This can be calculated by dividing the portfolio’s total return for the period by the annualized standard deviation of weekly returns. We view 12 months to be a relatively short time, but for the annual period, the risk-adjusted return was about 1.64, compared with 1.14 for the benchmark. Over a longer period— since the fund’s inception on December 12, 2013—its risk-adjusted return was 1.21, compared with 0.89 for the benchmark.
Investment strategy
In building our portfolio, we use quantitative models that evaluate a variety of factors that drive a stock’s volatility. These fundamental drivers include risk factors such as growth, value, dividend yields, size, volatility, and liquidity. In addition, our portfolio construction process includes estimates of each stock’s correlation—or how its factors move in relation to one another. This approach allows us to make appropriate risk/diversification trade-offs, while not relying solely on volatility estimates.
3
Our process also approaches currency exposure and its impact on a portfolio in a specific manner. We recognize that owning companies in foreign markets involves the risk of movements in foreign currency exchange rates relative to the U.S. dollar. Because of this, an optimization process that focuses solely on volatilities tied to an investor’s home currency will tend to overweight exposures to that currency. We aim to avoid such currency-specific exposures by focusing on equity volatilities and correlations measured in local currency terms. Then we use currency forward contracts to hedge the resulting exposure for U.S. investors. We believe this process can further reduce the volatility of the portfolio overall in the long run.
Finally, when constructing the portfolio, we apply constraints to reduce stock, sector, and country concentration risk. We find that these constraints, which allow for broader diversification and liquidity, reduce unnecessarily high risk exposures without significantly affecting our ability to reduce overall volatility. Drawing from the universe of about 7,700 stocks in the benchmark, we construct a portfolio of about 400–500 stocks.
The investment environment
Stocks posted strong returns for the 12 months ended October 31, 2019, despite the U.S.-China trade dispute, tensions with Iran, uncertainty over the U.K. leaving the European Union, and recession jitters spurred by an inversion of the yield curve.
U.S. stocks returned 14.33% for the period, as measured by the Standard & Poor’s 500 Index. Large-capitalization stocks beat small-caps, and growth stocks outpaced value.
U.S. stocks again performed better than their non-U.S. counterparts. The FTSE Global All Cap ex US Index, which tracks non-U.S. stocks of all sizes in both developed and emerging markets, returned 11.18% for the period. Outside the United States, emerging markets stocks outpaced those in developed markets.
Fixed income markets advanced as central banks took more accommodative stances amid a deteriorating global economic outlook. Facing dimmer growth prospects and below-target inflation, a number of major central banks pursued more accommodative monetary policy.
The U.S. Federal Reserve, after raising short-term interest rates four times in 2018, cut them this year in August, September, and the end of October. The range for the federal funds rate ended the period at 1.5%–1.75% as U.S. GDP growth and labor market gains slowed, though they remained in positive territory. The European Central Bank announced in September that it would push its deposit rate further below zero and start a new round of open-ended asset purchases in November.
4
Given the outlook for weaker growth, tame inflation, and ongoing central bank support, global bond yields fell and prices rose. The overall U.S. market for taxable, investment-grade bonds, as measured by the Bloomberg Barclays U.S. Aggregate Bond Index, returned 11.51%. The Bloomberg Barclays Global Aggregate Bond Index returned 9.54%.
The fund’s successes and shortfalls
The benefits of our strategy become even clearer when you seek to remove some of the noise caused by short-term reversals in daily and weekly returns, which can increase volatility levels, and focus on monthly returns. For example, since inception, the fund has delivered about a 35% reduction in the annualized volatility of monthly returns relative to its benchmark.
Over the 12 months, our strategy of holding stocks that have lower correlations with one another provided diversification benefits. On average, we were over-weighted in less volatile sectors such as utilities and real estate, both of which benefited from lower interest rates. Our underweighting of the volatile energy sector and our stock selection in financials aided performance most.
As for regional allocations, our positions in North America, which account for more than 50% of the fund’s holdings, helped relative returns while lowering volatility. The fund’s positions in Europe and the Pacific region also helped reduce volatility. Our positions in emerging markets increased volatility and detracted from performance.
Despite uncertainty over Brexit, we continue to overweight the U.K. because most of this market’s volatility is currency-related, and that can be minimized through our currency-hedging strategies.
We expect our approach to portfolio construction to pay off in reduced volatility over the long run. With this in mind, we find that focusing on the long-term risk-adjusted returns of the portfolio relative to the benchmark realigns expectations with the fund’s objective. We thank you for your investment and look forward to serving our investors in the future.
Portfolio Manager:
Antonio Picca
Vanguard Quantitative Equity Group
November 25, 2019
5
About Your Fund’s Expenses
As a shareholder of the fund, you incur ongoing costs, which include costs for portfolio management, administrative services, and shareholder reports (like this one), among others. Operating expenses, which are deducted from a fund’s gross income, directly reduce the investment return of the fund.
A fund’s expenses are expressed as a percentage of its average net assets. This figure is known as the expense ratio. The following examples are intended to help you understand the ongoing costs (in dollars) of investing in your fund and to compare these costs with those of other mutual funds. The examples are based on an investment of $1,000 made at the beginning of the period shown and held for the entire period.
The accompanying table illustrates your fund’s costs in two ways:
· Based on actual fund return. This section helps you to estimate the actual expenses that you paid over the period. The “Ending Account Value” shown is derived from the fund’s actual return, and the third column shows the dollar amount that would have been paid by an investor who started with $1,000 in the fund. You may use the information here, together with the amount you invested, to estimate the expenses that you paid over the period.
To do so, simply divide your account value by $1,000 (for example, an $8,600 account value divided by $1,000 = 8.6), then multiply the result by the number given for your fund under the heading “Expenses Paid During Period.”
· Based on hypothetical 5% yearly return. This section is intended to help you compare your fund’s costs with those of other mutual funds. It assumes that the fund had a yearly return of 5% before expenses, but that the expense ratio is unchanged. In this case—because the return used is not the fund’s actual return—the results do not apply to your investment. The example is useful in making comparisons because the Securities and Exchange Commission requires all mutual funds to calculate expenses based on a 5% return. You can assess your fund’s costs by comparing this hypothetical example with the hypothetical examples that appear in shareholder reports of other funds.
Note that the expenses shown in the table are meant to highlight and help you compare ongoing costs only and do not reflect transaction costs incurred by the fund for buying and selling securities. Further, the expenses do not include any purchase, redemption, or account service fees described in the fund prospectus. If such fees were applied to your account, your costs would be higher. Your fund does not carry a “sales load.”
The calculations assume no shares were bought or sold during the period. Your actual costs may have been higher or lower, depending on the amount of your investment and the timing of any purchases or redemptions.
You can find more information about the fund’s expenses, including annual expense ratios, in the Financial Statements section of this report. For additional information on operating expenses and other shareholder costs, please refer to your fund’s current prospectus.
6
Six Months Ended October 31, 2019 | | | |
Global Minimum Volatility Fund | Beginning
Account Value
4/30/2019 | Ending
Account Value
10/31/2019 | Expenses
Paid During
Period |
Based on Actual Fund Return | | | |
Investor Shares | $1,000.00 | $1,055.99 | $0.98 |
Admiral™ Shares | 1,000.00 | 1,056.69 | 0.67 |
Based on Hypothetical 5% Yearly Return | | | |
Investor Shares | $1,000.00 | $1,024.25 | $0.97 |
Admiral Shares | 1,000.00 | 1,024.55 | 0.66 |
The calculations are based on expenses incurred in the most recent six-month period. The fund’s annualized six-month expense ratios for that period are 0.19% for Investor Shares and 0.13% for Admiral Shares. The dollar amounts shown as “Expenses Paid” are equal to the annualized expense ratio multiplied by the average account value over the period, multiplied by the number of days in the most recent six-month period, then divided by the number of days in the most recent 12-month period (184/365).
7
Global Minimum Volatility Fund
Performance Summary
All of the returns in this report represent past performance, which is not a guarantee of future results that may be achieved by the fund. (Current performance may be lower or higher than the performance data cited. For performance data current to the most recent month-end, visit our website at vanguard.com/performance.) Note, too, that both investment returns and principal value can fluctuate widely, so an investor’s shares, when sold, could be worth more or less than their original cost. The returns shown do not reflect taxes that a shareholder would pay on fund distributions or on the sale of fund shares.
Cumulative Performance: December 12, 2013, Through October 31, 2019
Initial Investment of $10,000
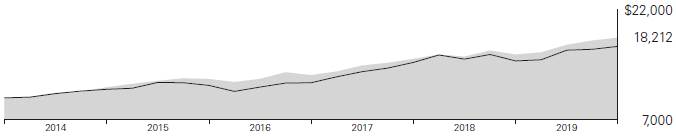
| | | | Average Annual Total Returns | | |
| | | | Periods Ended October 31, 2019 | | |
| | | | | | | | Since | | Final Value |
| | | | One | | Five | | Inception | | of a $10,000 |
| | | | Year | | Years | | (12/12/2013) | | Investment |

| | Global Minimum Volatility Fund Investor Shares | | 14.41% | | 9.75% | | 10.72% | | $18,212 |

| | FTSE Global All Cap Index (USD Hedged) | | 13.21 | | 8.81 | | 9.47 | | 17,030 |
“Since Inception” performance is calculated from the Investor Shares’ inception date for both the fund and its comparative standard(s).
| | | | | | | | Since | | Final Value |
| | | | One | | Five | | Inception | | of a $50,000 |
| | | | Year | | Years | | (12/12/2013) | | Investment |
Global Minimum Volatility Fund Admiral Shares | | 14.54% | | 9.85% | | 10.81% | | $91,499 |
FTSE Global All Cap Index (USD Hedged) | | 13.21 | | 8.81 | | 9.47 | | 85,150 |
“Since Inception” performance is calculated from the Admiral Shares’ inception date for both the fund and its comparative standard(s).
See Financial Highlights for dividend and capital gains information.
8
Global Minimum Volatility Fund
Sector Diversification
As of October 31, 2019
Communication Services | | 8.9 | % |
Consumer Discretionary | | 12.7 | |
Consumer Staples | | 12.0 | |
Energy | | 0.7 | |
Financials | | 20.5 | |
Health Care | | 6.5 | |
Industrials | | 7.0 | |
Information Technology | | 11.7 | |
Materials | | 3.9 | |
Real Estate | | 8.5 | |
Utilities | | 7.6 | |
The table reflects the fund’s equity exposure, based on its investments in stocks and stock index futures. Any holdings in short-term reserves are excluded. Sector categories are based on the Global Industry Classification Standard (“GICS”), except for the “Other” category (if applicable), which includes securities that have not been provided a GICS classification as of the effective reporting period.
The Global Industry Classification Standard (“GICS”) was developed by and is the exclusive property and a service mark of MSCI Inc. (“MSCI”) and Standard and Poor’s, a division of McGraw-Hill Companies, Inc. (“S&P”), and is licensed for use by Vanguard. Neither MSCI, S&P nor any third party involved in making or compiling the GICS or any GICS classification makes any express or implied warranties or representations with respect to such standard or classification (or the results to be obtained by the use thereof), and all such parties hereby expressly disclaim all warranties of originality, accuracy, completeness, merchantability or fitness for a particular purpose with respect to any such standard or classification. Without limiting any of the foregoing, in no event shall MSCI, S&P, any of its affiliates or any third party involved in making or compiling the GICS or any GICS classification have any liability for any direct, indirect, special, punitive, consequential or any other damages (including lost profits) even if notified of the possibility of such damages.
9
Global Minimum Volatility Fund
Financial Statements
Statement of Net Assets
As of October 31, 2019
The fund files its complete schedule of portfolio holdings with the Securities and Exchange Commission (SEC) for the first and third quarters of each fiscal year as an exhibit to its reports on Form N-PORT. The fund’s Form N-PORT reports are available on the SEC’s website at www.sec.gov.
| | | | | Market | |
| | | | | Value· | |
| | | Shares | | ($000 | ) |
Common Stocks (99.2%)1 | | | | | |
Australia (4.3%) | | | | | |
| Wesfarmers Ltd. | | 1,542,014 | | 42,367 | |
| Woolworths Group Ltd. | | 1,239,262 | | 31,956 | |
| Transurban Group | | 2,998,142 | | 30,707 | |
| Sonic Healthcare Ltd. | | 976,443 | | 19,231 | |
| AGL Energy Ltd. | | 803,390 | | 10,967 | |
| Tabcorp Holdings Ltd. | | 1,985,708 | | 6,580 | |
| Ramsay Health Care Ltd. | | 111,672 | | 5,276 | |
| Caltex Australia Ltd. | | 206,074 | | 3,874 | |
| ASX Ltd. | | 62,353 | | 3,539 | |
| Coles Group Ltd. | | 319,424 | | 3,306 | |
| Sydney Airport | | 532,017 | | 3,222 | |
| Stockland | | 927,109 | | 3,130 | |
^ | JB Hi-Fi Ltd. | | 97,888 | | 2,502 | |
| Crown Resorts Ltd. | | 276,216 | | 2,373 | |
| Aurizon Holdings Ltd. | | 547,529 | | 2,227 | |
| Coca-Cola Amatil Ltd. | | 236,282 | | 1,658 | |
| Insurance Australia Group Ltd. | | 287,752 | | 1,577 | |
| BWP Trust | | 383,701 | | 1,097 | |
| Independence Group NL | | 227,394 | | 996 | |
* | Xero Ltd. | | 18,331 | | 869 | |
| Origin Energy Ltd. | | 144,275 | | 782 | |
| Newcrest Mining Ltd. | | 35,461 | | 774 | |
| | | | | 179,010 | |
Belgium (0.7%) | | | | | |
| Ageas | | 222,129 | | 12,810 | |
| Colruyt SA | | 162,878 | | 9,060 | |
| UCB SA | | 45,498 | | 3,667 | |
| Elia System Operator SA/NV | | 20,328 | | 1,753 | |
| Cofinimmo SA | | 8,075 | | 1,195 | |
| Sofina SA | | 4,201 | | 930 | |
| | | | | 29,415 | |
Brazil (1.7%) | | | | | |
| Telefonica Brasil SA ADR | | 2,189,645 | | 28,838 | |
* | Vale SA Class B ADR | | 1,042,885 | | 12,243 | |
^ | Gerdau SA ADR | | 3,012,024 | | 9,910 | |
| Ambev SA ADR | | 2,059,006 | | 8,874 | |
| Embraer SA ADR | | 216,325 | | 3,758 | |
| Cia Brasileira de Distribuicao ADR | | 166,551 | | 3,434 | |
| TIM Participacoes SA ADR | | 177,578 | | 2,513 | |
^ | Ultrapar Participacoes SA ADR | | 173,881 | | 812 | |
| | | | | 70,382 | |
Canada (5.9%) | | | | | |
| BCE Inc. | | 1,105,104 | | 52,423 | |
| TELUS Corp. | | 878,949 | | 31,265 | |
^ | Emera Inc. | | 702,284 | | 29,076 | |
| National Bank of Canada | | 474,888 | | 24,525 | |
| Shaw Communications Inc. Class B | | 897,517 | | 18,317 | |
^ | Canadian Tire Corp. Ltd. Class A | | 144,142 | | 15,539 | |
| Intact Financial Corp. | | 118,307 | | 12,207 | |
| Dollarama Inc. | | 355,254 | | 11,951 | |
| Fortis Inc. | | 215,352 | | 8,947 | |
| Pembina Pipeline Corp. | | 167,720 | | 5,905 | |
| Metro Inc. | | 129,604 | | 5,481 | |
* | CGI Inc. | | 66,388 | | 5,160 | |
| RioCan REIT | | 241,405 | | 4,844 | |
| Royal Bank of Canada | | 59,220 | | 4,777 | |
| George Weston Ltd. | | 59,615 | | 4,773 | |
| Loblaw Cos. Ltd. | | 53,097 | | 2,832 | |
| TC Energy Corp. | | 41,023 | | 2,068 | |
2 | Hydro One Ltd. | | 44,707 | | 831 | |
| Inter Pipeline Ltd. | | 48,726 | | 818 | |
| | | | | 241,739 | |
Chile (0.2%) | | | | | |
| Enel Americas SA ADR | | 576,217 | | 5,509 | |
| Banco Santander Chile ADR | | 63,482 | | 1,538 | |
| Cia Cervecerias Unidas SA ADR | | 45,370 | | 900 | |
| | | | | 7,947 | |
China (1.0%) | | | | | |
| China Mobile Ltd. ADR | | 580,782 | | 23,452 | |
| ZTO Express Cayman Inc. ADR | | 524,591 | | 11,541 | |
10
Global Minimum Volatility Fund
| | | | | Market | |
| | | | | Value· | |
| | | Shares | | ($000 | ) |
*,^ | China Biologic Products Holdings Inc. | | 54,014 | | 6,160 | |
| | | | | 41,153 | |
Denmark (0.6%) | | | | | |
| Carlsberg A/S Class B | | 109,147 | | 15,371 | |
| Coloplast A/S Class B | | 38,734 | | 4,663 | |
| Tryg A/S | | 101,509 | | 2,837 | |
| | | | | 22,871 | |
Finland (0.2%) | | | | | |
| Elisa Oyj | | 67,333 | | 3,678 | |
| Sampo Oyj Class A | | 47,215 | | 1,935 | |
| Kesko Oyj Class B | | 26,004 | | 1,733 | |
| | | | | 7,346 | |
France (0.4%) | | | | | |
| Orange SA | | 469,112 | | 7,550 | |
| Hermes International | | 8,471 | | 6,102 | |
| Veolia Environnement SA | | 77,194 | | 2,032 | |
| Sodexo SA | | 17,959 | | 1,977 | |
| Lagardere SCA | | 37,869 | | 846 | |
| | | | | 18,507 | |
Germany (1.8%) | | | | | |
| Deutsche Telekom AG | | 2,224,301 | | 39,138 | |
| Muenchener Rueckversicherungs-Gesellschaft AG in Muenchen | | 34,327 | | 9,538 | |
| Hannover Rueck SE | | 52,945 | | 9,382 | |
| Merck KGaA | | 50,401 | | 6,011 | |
| Fielmann AG | | 43,608 | | 3,363 | |
| MTU Aero Engines AG | | 7,100 | | 1,899 | |
| Beiersdorf AG | | 15,426 | | 1,825 | |
| Fraport AG Frankfurt Airport Services Worldwide | | 19,445 | | 1,625 | |
| E.ON SE | | 82,802 | | 835 | |
| RHOEN-KLINIKUM AG | | 22,764 | | 469 | |
| | | | | 74,085 | |
| | | | | | |
Hong Kong (2.1%) | | | | | |
| CLP Holdings Ltd. | | 2,168,350 | | 22,519 | |
| Power Assets Holdings Ltd. | | 2,673,500 | | 19,078 | |
| Hang Seng Bank Ltd. | | 687,400 | | 14,343 | |
| CK Hutchison Holdings Ltd. | | 1,148,000 | | 10,600 | |
| China Mengniu Dairy Co. Ltd. | | 1,168,000 | | 4,657 | |
| CK Infrastructure Holdings Ltd. | | 444,000 | | 3,195 | |
| Want Want China Holdings Ltd. | | 3,487,000 | | 2,938 | |
| MTR Corp. Ltd. | | 506,500 | | 2,904 | |
| BOC Hong Kong Holdings Ltd. | | 828,500 | | 2,846 | |
| Chow Tai Fook Jewellery Group Ltd. | | 1,131,200 | | 1,017 | |
| Jardine Matheson Holdings Ltd. | | 15,300 | | 872 | |
| | | | | 84,969 | |
India (2.2%) | | | | | |
| Infosys Ltd. ADR | | 5,521,558 | | 52,952 | |
| HDFC Bank Ltd. ADR | | 400,442 | | 24,463 | |
| Dr Reddy’s Laboratories Ltd. ADR | | 203,918 | | 7,983 | |
| ICICI Bank Ltd. ADR | | 259,496 | | 3,381 | |
| | | | | 88,779 | |
Indonesia (0.2%) | | | | | |
| Telekomunikasi Indonesia Persero Tbk PT ADR | | 286,923 | | 8,286 | |
| | | | | | |
Ireland (0.3%) | | | | | |
| Kerry Group plc Class A | | 110,749 | | 13,386 | |
| | | | | | |
Israel (0.3%) | | | | | |
| Bank Hapoalim BM | | 1,045,629 | | 8,369 | |
| Bank Leumi Le-Israel BM | | 527,723 | | 3,844 | |
| Paz Oil Co. Ltd. | | 5,690 | | 873 | |
| | | | | 13,086 | |
Italy (1.5%) | | | | | |
| Assicurazioni Generali SPA | | 2,330,042 | | 47,248 | |
| Snam SPA | | 1,019,531 | | 5,234 | |
| UnipolSai Assicurazioni SPA | | 1,201,768 | | 3,354 | |
| Eni SPA | | 180,000 | | 2,731 | |
| Davide Campari-Milano SPA | | 268,066 | | 2,459 | |
| Hera SPA | | 543,844 | | 2,330 | |
| | | | | 63,356 | |
Japan (7.3%) | | | | | |
| Japan Tobacco Inc. | | 2,319,400 | | 52,425 | |
| Canon Inc. | | 938,900 | | 25,763 | |
| Yamada Denki Co. Ltd. | | 4,384,600 | | 21,193 | |
| Softbank Corp. | | 1,258,500 | | 17,263 | |
| Skylark Holdings Co. Ltd. | | 912,600 | | 16,564 | |
^ | Sawai Pharmaceutical Co. Ltd. | | 164,600 | | 9,288 | |
| Sekisui House Ltd. | | 412,100 | | 8,887 | |
| Toyo Suisan Kaisha Ltd. | | 177,700 | | 7,482 | |
| ABC-Mart Inc. | | 108,400 | | 7,432 | |
| Shionogi & Co. Ltd. | | 106,900 | | 6,416 | |
| Kagome Co. Ltd. | | 230,700 | | 5,815 | |
| Mitsubishi Tanabe Pharma Corp. | | 473,200 | | 5,663 | |
| NEC Corp. | | 134,800 | | 5,342 | |
11
Global Minimum Volatility Fund
| | | | | Market | |
| | | | | Value· | |
| | | Shares | | ($000 | ) |
| Chugoku Electric Power Co. Inc. | | 346,800 | | 4,620 | |
| Mitsubishi Materials Corp. | | 155,900 | | 4,483 | |
| J Front Retailing Co. Ltd. | | 337,000 | | 4,285 | |
| Ajinomoto Co. Inc. | | 222,300 | | 4,226 | |
| Nitori Holdings Co. Ltd. | | 27,200 | | 4,140 | |
| Fujitsu Ltd. | | 46,600 | | 4,130 | |
| Pan Pacific International Holdings Corp. | | 260,700 | | 4,104 | |
| Japan Airlines Co. Ltd. | | 131,600 | | 4,101 | |
| ANA Holdings Inc. | | 115,300 | | 3,959 | |
| West Japan Railway Co. | | 44,100 | | 3,832 | |
| Kyocera Corp. | | 53,800 | | 3,530 | |
| Toshiba Corp. | | 93,600 | | 3,201 | |
| Chugai Pharmaceutical Co. Ltd. | | 37,600 | | 3,164 | |
| Hitachi High-Technologies Corp. | | 48,300 | | 3,005 | |
| Asahi Group Holdings Ltd. | | 58,700 | | 2,940 | |
| Seiko Epson Corp. | | 205,400 | | 2,905 | |
| Marui Group Co. Ltd. | | 127,500 | | 2,834 | |
| FUJIFILM Holdings Corp. | | 64,400 | | 2,827 | |
| Ezaki Glico Co. Ltd. | | 55,400 | | 2,571 | |
| Calbee Inc. | | 76,500 | | 2,557 | |
| Yoshinoya Holdings Co. Ltd. | | 108,600 | | 2,525 | |
| Nissin Foods Holdings Co. Ltd. | | 33,200 | | 2,508 | |
| Sankyo Co. Ltd. | | 68,300 | | 2,390 | |
| Nippon Steel Corp. | | 154,200 | | 2,251 | |
| Nippon Shinyaku Co. Ltd. | | 21,900 | | 1,976 | |
| NH Foods Ltd. | | 41,000 | | 1,723 | |
| Ryohin Keikaku Co. Ltd. | | 77,100 | | 1,716 | |
| Nisshin Seifun Group Inc. | | 86,100 | | 1,707 | |
| Isetan Mitsukoshi Holdings Ltd. | | 200,800 | | 1,601 | |
| MOS Food Services Inc. | | 60,500 | | 1,530 | |
| MediPal Holdings Corp. | | 60,600 | | 1,385 | |
| Murata Manufacturing Co. Ltd. | | 24,400 | | 1,329 | |
| Suzuken Co. Ltd. | | 24,500 | | 1,308 | |
| MS&AD Insurance Group Holdings Inc. | | 37,900 | | 1,224 | |
| Kamigumi Co. Ltd. | | 52,000 | | 1,176 | |
| Ibiden Co. Ltd. | | 50,200 | | 1,159 | |
| Astellas Pharma Inc. | | 65,200 | | 1,119 | |
| Takashimaya Co. Ltd. | | 95,300 | | 1,106 | |
| Kewpie Corp. | | 46,300 | | 1,051 | |
| Tokyu Corp. | | 51,600 | | 976 | |
| TIS Inc. | | 15,800 | | 958 | |
| Obic Co. Ltd. | | 7,600 | | 952 | |
| Taisho Pharmaceutical Holdings Co. Ltd. | | 12,600 | | 897 | |
| Kintetsu Group Holdings Co. Ltd. | | 15,600 | | 850 | |
| Japan Post Holdings Co. Ltd. | | 88,900 | | 816 | |
| Ricoh Co. Ltd. | | 91,400 | | 814 | |
| Kyowa Kirin Co. Ltd. | | 43,500 | | 800 | |
| Toho Co. Ltd. | | 18,500 | | 747 | |
| | | | | 299,541 | |
Mexico (0.6%) | | | | | |
| Fomento Economico Mexicano SAB de CV ADR | | 263,592 | | 23,465 | |
| | | | | | |
Netherlands (0.1%) | | | | | |
| Koninklijke Ahold Delhaize NV | | 145,603 | | 3,629 | |
| | | | | | |
New Zealand (0.1%) | | | | | |
| Spark New Zealand Ltd. | | 1,853,510 | | 5,317 | |
| | | | | | |
Norway (0.5%) | | | | | |
| Orkla ASA | | 1,589,771 | | 15,281 | |
| Telenor ASA | | 282,663 | | 5,290 | |
| | | | | 20,571 | |
Poland (0.2%) | | | | | |
| Bank Polska Kasa Opieki SA | | 173,106 | | 4,889 | |
| Powszechny Zaklad Ubezpieczen SA | | 322,890 | | 3,125 | |
* | KGHM Polska Miedz SA | | 50,781 | | 1,113 | |
| | | | | 9,127 | |
Singapore (0.8%) | | | | | |
| Singapore Telecommunications Ltd. | | 3,775,400 | | 9,142 | |
| Oversea-Chinese Banking Corp. Ltd. | | 1,090,048 | | 8,763 | |
| Ascendas REIT | | 1,982,100 | | 4,616 | |
| United Overseas Bank Ltd. | | 210,900 | | 4,152 | |
| Singapore Airlines Ltd. | | 380,940 | | 2,633 | |
| Singapore Technologies Engineering Ltd. | | 613,500 | | 1,797 | |
| Wilmar International Ltd. | | 480,400 | | 1,321 | |
| DBS Group Holdings Ltd. | | 51,700 | | 986 | |
| | | | | 33,410 | |
South Africa (0.2%) | | | | | |
| AngloGold Ashanti Ltd. ADR | | 242,748 | | 5,360 | |
* | Harmony Gold Mining Co. Ltd. ADR | | 259,662 | | 904 | |
| | | | | 6,264 | |
12
Global Minimum Volatility Fund
| | | | | Market | |
| | | | | Value· | |
| | | Shares | | ($000 | ) |
South Korea (2.7%) | | | | | |
| KT&G Corp. | | 249,870 | | 21,449 | |
| Samsung Electronics Co. Ltd. | | 487,444 | | 21,067 | |
| Korea Zinc Co. Ltd. | | 47,481 | | 17,693 | |
| KT Corp. | | 510,114 | | 11,620 | |
| SK Telecom Co. Ltd. | | 33,310 | | 6,809 | |
| POSCO | | 33,301 | | 6,042 | |
| Samsung Life Insurance Co. Ltd. | | 64,590 | | 3,922 | |
| Kangwon Land Inc. | | 116,922 | | 3,148 | |
| Maeil Dairies Co. Ltd. | | 33,866 | | 2,569 | |
| Yuhan Corp. | | 11,398 | | 2,197 | |
| Shinhan Financial Group Co. Ltd. | | 60,030 | | 2,187 | |
| GS Holdings Corp. | | 51,116 | | 2,178 | |
| SK Holdings Co. Ltd. | | 9,589 | | 2,127 | |
| Korea Aerospace Industries Ltd. | | 43,257 | | 1,412 | |
| Samsung SDS Co. Ltd. | | 7,874 | | 1,360 | |
| Hyundai Steel Co. | | 44,481 | | 1,212 | |
| Macquarie Korea Infrastructure Fund | | 106,880 | | 1,089 | |
| Lotte Shopping Co. Ltd. | | 9,517 | | 1,017 | |
| Samsung C&T Corp. | | 10,189 | | 873 | |
| Samsung Fire & Marine Insurance Co. Ltd. | | 4,258 | | 792 | |
| Woori Financial Group Inc. | | 78,497 | | 791 | |
| | | | | 111,554 | |
Spain (1.5%) | | | | | |
2 | Aena SME SA | | 123,770 | | 22,720 | |
* | Ferrovial SA | | 503,682 | | 14,860 | |
^ | Industria de Diseno Textil SA | | 299,481 | | 9,332 | |
| Merlin Properties Socimi SA | | 591,496 | | 8,708 | |
| Endesa SA | | 140,657 | | 3,831 | |
| Viscofan SA | | 23,272 | | 1,262 | |
| Red Electrica Corp. SA | | 57,686 | | 1,159 | |
| Ebro Foods SA | | 40,418 | | 887 | |
| Enagas SA | | 35,683 | | 883 | |
| | | | | 63,642 | |
Sweden (0.3%) | | | | | |
| Swedish Match AB | | 212,015 | | 9,960 | |
| ICA Gruppen AB | | 77,486 | | 3,429 | |
| | | | | 13,389 | |
Switzerland (2.2%) | | | | | |
| Swisscom AG | | 78,675 | | 40,242 | |
| Baloise Holding AG | | 85,388 | | 15,793 | |
| Kuehne & Nagel International AG | | 48,203 | | 7,788 | |
| Chocoladefabriken Lindt & Spruengli AG | | 784 | | 5,827 | |
| Swiss Re AG | | 49,138 | | 5,154 | |
| Flughafen Zurich AG | | 24,531 | | 4,420 | |
| Geberit AG | | 6,417 | | 3,260 | |
| Sonova Holding AG | | 8,715 | | 2,000 | |
| Allreal Holding AG | | 9,242 | | 1,801 | |
| Logitech International SA | | 43,815 | | 1,799 | |
| Swiss Prime Site AG | | 16,696 | | 1,721 | |
| dormakaba Holding AG | | 1,251 | | 801 | |
| | | | | 90,606 | |
Taiwan (0.3%) | | | | | |
| Chunghwa Telecom Co. Ltd. ADR | | 135,685 | | 4,963 | |
| Taiwan Semiconductor Manufacturing Co. Ltd. ADR | | 64,179 | | 3,314 | |
| United Microelectronics Corp. ADR | | 995,508 | | 2,250 | |
| | | | | 10,527 | |
United Kingdom (8.9%) | | | | | |
| GlaxoSmithKline plc | | 2,325,701 | | 53,270 | |
| Compass Group plc | | 1,270,347 | | 33,822 | |
| Diageo plc | | 520,578 | | 21,308 | |
| Next plc | | 190,582 | | 16,254 | |
| Whitbread plc | | 290,373 | | 15,284 | |
| Wm Morrison Supermarkets plc | | 5,753,834 | | 14,864 | |
| Smith & Nephew plc | | 681,044 | | 14,620 | |
| Coca-Cola HBC AG | | 425,241 | | 12,948 | |
| Informa plc | | 1,264,847 | | 12,713 | |
| Segro plc | | 1,028,956 | | 11,256 | |
| BAE Systems plc | | 1,463,704 | | 10,934 | |
| National Grid plc | | 895,980 | | 10,476 | |
| Tate & Lyle plc | | 1,152,374 | | 10,051 | |
| Halma plc | | 413,936 | | 10,044 | |
| B&M European Value Retail SA | | 2,078,091 | | 9,969 | |
| InterContinental Hotels Group plc | | 159,709 | | 9,665 | |
| Rightmove plc | | 1,233,010 | | 9,571 | |
| RSA Insurance Group plc | | 1,268,108 | | 8,579 | |
| Royal Dutch Shell plc Class B | | 263,565 | | 7,591 | |
| Admiral Group plc | | 243,447 | | 6,371 | |
| Marks & Spencer Group plc | | 2,421,359 | | 5,704 | |
| Smiths Group plc | | 266,122 | | 5,563 | |
| Associated British Foods plc | | 176,845 | | 5,105 | |
| Land Securities Group plc | | 415,631 | | 5,063 | |
| DCC plc | | 42,098 | | 3,948 | |
| Direct Line Insurance Group plc | | 1,074,562 | | 3,789 | |
| British Land Co. plc | | 465,562 | | 3,743 | |
13
Global Minimum Volatility Fund
| | | | | Market | |
| | | | | Value· | |
| | | Shares | | ($000 | ) |
| Meggitt plc | | 451,751 | | 3,655 | |
| WH Smith plc | | 112,075 | | 3,176 | |
| GVC Holdings plc | | 250,805 | | 2,893 | |
| AstraZeneca plc | | 26,944 | | 2,628 | |
| SSE plc | | 157,578 | | 2,622 | |
| Tesco plc | | 839,167 | | 2,562 | |
| Aviva plc | | 426,704 | | 2,300 | |
| Derwent London plc | | 46,306 | | 2,131 | |
| Inchcape plc | | 254,502 | | 2,128 | |
| UDG Healthcare plc | | 205,596 | | 2,061 | |
| Sage Group plc | | 219,625 | | 2,047 | |
| JD Sports Fashion plc | | 112,404 | | 1,118 | |
| UK Commercial Property REIT Ltd. | | 899,207 | | 1,022 | |
| Pearson plc | | 109,102 | | 964 | |
| Bunzl plc | | 36,572 | | 951 | |
| Kingfisher plc | | 352,661 | | 946 | |
| J Sainsbury plc | | 341,484 | | 900 | |
| HSBC Holdings plc | | 112,702 | | 851 | |
| Legal & General Group plc | | 228,405 | | 781 | |
| Imperial Brands plc | | 33,563 | | 736 | |
| | | | | 368,977 | |
United States (50.1%) | | | | | |
Communication Services (0.6%) | | | | | |
* | Liberty Broadband Corp. | | 122,075 | | 14,413 | |
| Cable One Inc. | | 4,509 | | 5,976 | |
| John Wiley & Sons Inc. Class A | | 33,994 | | 1,566 | |
* | Liberty Media Corp-Liberty SiriusXM Class C | | 27,307 | | 1,234 | |
* | Madison Square Garden Co. Class A | | 3,059 | | 817 | |
| | | | | 24,006 | |
Consumer Discretionary (5.6%) | | | | | |
3 | Dollar General Corp. | | 313,988 | | 50,345 | |
3 | Yum! Brands Inc. | | 444,765 | | 45,237 | |
* | Bright Horizons Family Solutions Inc. | | 164,406 | | 24,418 | |
| Service Corp. International | | 426,784 | | 19,410 | |
| Yum China Holdings Inc. | | 381,635 | | 16,219 | |
| TJX Cos. Inc. | | 227,728 | | 13,128 | |
* | Murphy USA Inc. | | 74,816 | | 8,823 | |
| Graham Holdings Co. Class B | | 11,897 | | 7,491 | |
* | Dollar Tree Inc. | | 64,796 | | 7,153 | |
| Dunkin’ Brands Group Inc. | | 89,443 | | 7,032 | |
| Choice Hotels International Inc. | | 65,264 | | 5,775 | |
| Pool Corp. | | 26,439 | | 5,483 | |
* | Grand Canyon Education Inc. | | 50,681 | | 4,661 | |
* | ServiceMaster Global Holdings Inc. | | 89,846 | | 3,628 | |
| Ross Stores Inc. | | 26,600 | | 2,917 | |
| Aaron’s Inc. | | 37,248 | | 2,791 | |
| Genuine Parts Co. | | 26,668 | | 2,736 | |
| Bloomin’ Brands Inc. | | 92,257 | | 1,828 | |
| Hyatt Hotels Corp. Class A | | 11,409 | | 853 | |
| | | | | 229,928 | |
Consumer Staples (3.2%) | | | | | |
3 | Mondelez International Inc. Class A | | 427,485 | | 22,422 | |
3 | Church & Dwight Co. Inc. | | 253,764 | | 17,748 | |
| PepsiCo Inc. | | 106,423 | | 14,598 | |
| Sysco Corp. | | 170,324 | | 13,604 | |
| Colgate-Palmolive Co. | | 176,445 | | 12,104 | |
| Flowers Foods Inc. | | 381,799 | | 8,293 | |
| Hershey Co. | | 49,744 | | 7,306 | |
| Vector Group Ltd. | | 471,423 | | 5,751 | |
| Costco Wholesale Corp. | | 19,327 | | 5,742 | |
| Brown-Forman Corp. Class B | | 72,501 | | 4,750 | |
| Lancaster Colony Corp. | | 32,159 | | 4,476 | |
| Philip Morris International Inc. | | 49,775 | | 4,054 | |
| Coca-Cola European Partners plc | | 73,403 | | 3,928 | |
| J&J Snack Foods Corp. | | 19,547 | | 3,729 | |
| Archer-Daniels-Midland Co. | | 45,930 | | 1,931 | |
* | Nomad Foods Ltd. | | 82,317 | | 1,606 | |
| WD-40 Co. | | 4,825 | | 904 | |
| | | | | 132,946 | |
Energy (0.1%) | | | | | |
* | Cosan Ltd. | | 99,620 | | 1,676 | |
| Ship Finance International Ltd. | | 77,542 | | 1,122 | |
| | | | | 2,798 | |
Financials (13.8%) | | | | | |
| Starwood Property Trust Inc. | | 2,532,178 | | 62,292 | |
| Blackstone Mortgage Trust Inc. Class A | | 1,638,384 | | 59,473 | |
| AGNC Investment Corp. | | 3,281,250 | | 55,945 | |
| Apollo Commercial Real Estate Finance Inc. | | 1,836,031 | | 33,599 | |
| Annaly Capital Management Inc. | | 3,305,277 | | 29,681 | |
| Chimera Investment Corp. | | 1,347,030 | | 27,291 | |
| RenaissanceRe Holdings Ltd. | | 144,465 | | 27,041 | |
| Two Harbors Investment Corp. | | 1,852,606 | | 25,696 | |
14
Global Minimum Volatility Fund
| | | | | Market | |
| | | | | Value· | |
| | | Shares | | ($000 | ) |
4 | Brown & Brown Inc. | | 658,622 | | 24,817 | |
| White Mountains Insurance Group Ltd. | | 20,321 | | 21,764 | |
| Washington Federal Inc. | | 586,823 | | 21,395 | |
| MFA Financial Inc. | | 2,783,386 | | 21,126 | |
| WR Berkley Corp. | | 245,502 | | 17,161 | |
| Arthur J Gallagher & Co. | | 176,880 | | 16,135 | |
| Hanover Insurance Group Inc. | | 97,728 | | 12,872 | |
| New Residential Investment Corp. | | 605,918 | | 9,598 | |
| Globe Life Inc. | | 90,862 | | 8,844 | |
* | Arch Capital Group Ltd. | | 195,274 | | 8,155 | |
| Bank of Hawaii Corp. | | 80,035 | | 6,988 | |
| Invesco Mortgage Capital Inc. | | 430,540 | | 6,777 | |
| Capitol Federal Financial Inc. | | 455,900 | | 6,506 | |
| Cincinnati Financial Corp. | | 52,238 | | 5,914 | |
| Axis Capital Holdings Ltd. | | 95,930 | | 5,701 | |
| Redwood Trust Inc. | | 343,825 | | 5,618 | |
| New York Community Bancorp Inc. | | 478,383 | | 5,573 | |
| Marsh & McLennan Cos. Inc. | | 42,972 | | 4,453 | |
| American Financial Group Inc. | | 41,163 | | 4,283 | |
| TFS Financial Corp. | | 219,700 | | 4,231 | |
| ProAssurance Corp. | | 95,916 | | 3,762 | |
| Fidelity National Financial Inc. | | 79,734 | | 3,655 | |
| Willis Towers Watson plc | | 16,827 | | 3,145 | |
| Northwest Bancshares Inc. | | 180,081 | | 3,038 | |
| PennyMac Mortgage Investment Trust | | 122,635 | | 2,807 | |
| Old Republic International Corp. | | 95,728 | | 2,138 | |
| Commerce Bancshares Inc. | | 33,016 | | 2,125 | |
* | Markel Corp. | | 1,424 | | 1,667 | |
* | Alleghany Corp. | | 1,988 | | 1,547 | |
| First American Financial Corp. | | 20,888 | | 1,290 | |
| Capstead Mortgage Corp. | | 164,302 | | 1,270 | |
| ARMOUR Residential REIT Inc. | | 64,620 | | 1,081 | |
| Granite Point Mortgage Trust Inc. | | 54,907 | | 1,021 | |
| Investors Bancorp Inc. | | 83,565 | | 1,007 | |
| | | | | 568,482 | |
Health Care (2.5%) | | | | | |
| Chemed Corp. | | 112,058 | | 44,141 | |
3 | Quest Diagnostics Inc. | | 320,187 | | 32,419 | |
*,3 | Premier Inc. Class A | | 232,665 | | 7,580 | |
| Universal Health Services Inc. Class B | | 53,444 | | 7,346 | |
| Zoetis Inc. | | 46,264 | | 5,918 | |
* | Laboratory Corp. of America Holdings | | 10,420 | | 1,717 | |
* | Henry Schein Inc. | | 26,304 | | 1,646 | |
| Encompass Health Corp. | | 19,631 | | 1,257 | |
| | | | | 102,024 | |
Industrials (2.6%) | | | | | |
3 | Republic Services Inc. Class A | | 333,744 | | 29,206 | |
| Carlisle Cos. Inc. | | 118,794 | | 18,089 | |
| Expeditors International of Washington Inc. | | 200,312 | | 14,611 | |
| Waste Management Inc. | | 125,265 | | 14,056 | |
| BWX Technologies Inc. | | 126,874 | | 7,371 | |
* | Teledyne Technologies Inc. | | 17,400 | | 5,735 | |
* | AECOM | | 109,217 | | 4,370 | |
| Hexcel Corp. | | 53,144 | | 3,966 | |
| EMCOR Group Inc. | | 36,466 | | 3,198 | |
| Rollins Inc. | | 61,218 | | 2,333 | |
| National Presto Industries Inc. | | 17,011 | | 1,464 | |
| Macquarie Infrastructure Corp. | | 29,318 | | 1,265 | |
| Valmont Industries Inc. | | 7,060 | | 969 | |
| Curtiss-Wright Corp. | | 6,472 | | 875 | |
| AMERCO | | 2,036 | | 825 | |
| UniFirst Corp. | | 3,921 | | 787 | |
| | | | | 109,120 | |
Information Technology (7.9%) | | | | | |
| Amdocs Ltd. | | 828,008 | | 53,986 | |
3 | Jack Henry & Associates Inc. | | 294,409 | | 41,677 | |
3 | Paychex Inc. | | 460,574 | | 38,522 | |
| Citrix Systems Inc. | | 310,078 | | 33,755 | |
| Genpact Ltd. | | 676,028 | | 26,480 | |
* | Black Knight Inc. | | 365,842 | | 23,487 | |
3 | Broadridge Financial Solutions Inc. | | 166,049 | | 20,793 | |
3 | Motorola Solutions Inc. | | 122,932 | | 20,446 | |
| MAXIMUS Inc. | | 255,462 | | 19,604 | |
| Western Union Co. | | 572,497 | | 14,347 | |
| Seagate Technology plc | | 106,924 | | 6,205 | |
| Booz Allen Hamilton Holding Corp. Class A | | 81,883 | | 5,762 | |
15
Global Minimum Volatility Fund
| | | | | Market | |
| | | | | Value· | |
| | | Shares | | ($000 | ) |
| Dolby Laboratories Inc. Class A | | 74,802 | | 4,812 | |
* | Check Point Software Technologies Ltd. | | 23,831 | | 2,679 | |
| j2 Global Inc. | | 27,938 | | 2,653 | |
* | ExlService Holdings Inc. | | 24,622 | | 1,714 | |
| Sabre Corp. | | 62,498 | | 1,467 | |
* | CoreLogic Inc. | | 36,165 | | 1,464 | |
| Automatic Data Processing Inc. | | 7,395 | | 1,200 | |
* | ViaSat Inc. | | 15,466 | | 1,065 | |
| InterDigital Inc. | | 17,574 | | 942 | |
* | Viavi Solutions Inc. | | 58,513 | | 934 | |
| FLIR Systems Inc. | | 13,671 | | 705 | |
| | | | | 324,699 | |
Materials (2.3%) | | | | | |
| AptarGroup Inc. | | 297,883 | | 35,195 | |
| Kaiser Aluminum Corp. | | 166,865 | | 17,868 | |
| Royal Gold Inc. | | 128,669 | | 14,853 | |
| Reliance Steel & Aluminum Co. | | 119,285 | | 13,842 | |
| Sonoco Products Co. | | 192,980 | | 11,135 | |
| Silgan Holdings Inc. | | 100,451 | | 3,091 | |
| Compass Minerals International Inc. | | 14,414 | | 814 | |
| | | | | 96,798 | |
Real Estate (7.2%) | | | | | |
| Equity Commonwealth | | 1,061,488 | | 34,159 | |
| Mid-America Apartment Communities Inc. | | 162,078 | | 22,527 | |
| Camden Property Trust | | 162,842 | | 18,624 | |
| Equity LifeStyle Properties Inc. | | 230,680 | | 16,134 | |
| Sun Communities Inc. | | 87,944 | | 14,304 | |
| Gaming and Leisure Properties Inc. | | 328,534 | | 13,260 | |
| Highwoods Properties Inc. | | 278,204 | | 13,020 | |
| PS Business Parks Inc. | | 70,969 | | 12,813 | |
3 | UDR Inc. | | 236,106 | | 11,864 | |
4 | Apple Hospitality REIT Inc. | | 698,594 | | 11,513 | |
| Rayonier Inc. | | 379,328 | | 10,234 | |
| EastGroup Properties Inc. | | 71,082 | | 9,521 | |
| Terreno Realty Corp. | | 155,832 | | 8,790 | |
| WP Carey Inc. | | 91,102 | | 8,387 | |
| American Homes 4 Rent Class A | | 298,727 | | 7,907 | |
| First Industrial Realty Trust Inc. | | 166,495 | | 7,011 | |
| Rexford Industrial Realty Inc. | | 140,018 | | 6,733 | |
4 | Hudson Pacific Properties Inc. | | 187,041 | | 6,719 | |
| Lamar Advertising Co. Class A | | 83,448 | | 6,677 | |
| Life Storage Inc. | | 60,021 | | 6,538 | |
| STAG Industrial Inc. | | 187,110 | | 5,808 | |
| Extra Space Storage Inc. | | 49,015 | | 5,503 | |
| CubeSmart | | 158,737 | | 5,032 | |
| National Health Investors Inc. | | 49,749 | | 4,268 | |
| Douglas Emmett Inc. | | 98,502 | | 4,267 | |
| Piedmont Office Realty Trust Inc. Class A | | 161,294 | | 3,619 | |
| Healthcare Realty Trust Inc. | | 97,524 | | 3,391 | |
| Retail Properties of America Inc. | | 235,338 | | 3,238 | |
| AvalonBay Communities Inc. | | 11,968 | | 2,605 | |
| Invitation Homes Inc. | | 67,685 | | 2,084 | |
| Duke Realty Corp. | | 50,390 | | 1,771 | |
| Weingarten Realty Investors | | 46,422 | | 1,473 | |
| Kilroy Realty Corp. | | 17,238 | | 1,447 | |
| American Assets Trust Inc. | | 28,116 | | 1,377 | |
| American Campus Communities Inc. | | 26,821 | | 1,341 | |
| Empire State Realty Trust Inc. | | 84,877 | | 1,228 | |
| Urstadt Biddle Properties Inc. Class A | | 40,998 | | 997 | |
| Agree Realty Corp. | | 11,041 | | 870 | |
| Federal Realty Investment Trust | | 5,825 | | 792 | |
| Urban Edge Properties | | 35,984 | | 760 | |
| | | | | 298,606 | |
Utilities (4.3%) | | | | | |
| IDACORP Inc. | | 201,663 | | 21,703 | |
| Hawaiian Electric Industries Inc. | | 479,477 | | 21,648 | |
| DTE Energy Co. | | 131,545 | | 16,748 | |
| NorthWestern Corp. | | 229,912 | | 16,673 | |
3 | Ameren Corp. | | 192,534 | | 14,960 | |
| ALLETE Inc. | | 132,702 | | 11,420 | |
| Sempra Energy | | 65,314 | | 9,439 | |
3 | Consolidated Edison Inc. | | 99,603 | | 9,185 | |
| MDU Resources Group Inc. | | 314,187 | | 9,077 | |
| Portland General Electric Co. | | 159,385 | | 9,066 | |
| Public Service Enterprise Group Inc. | | 125,095 | | 7,920 | |
| Avista Corp. | | 140,070 | | 6,728 | |
| CMS Energy Corp. | | 77,812 | | 4,974 | |
16
Global Minimum Volatility Fund
| | | | | Market | |
| | | | | Value· | |
| | | Shares | | ($000 | ) |
| OGE Energy Corp. | | 113,294 | | 4,878 | |
| WEC Energy Group Inc. | | 51,120 | | 4,826 | |
| Eversource Energy | | 36,445 | | 3,052 | |
| Alliant Energy Corp. | | 47,673 | | 2,543 | |
| Black Hills Corp. | | 29,141 | | 2,297 | |
| | | | | 177,137 | |
| | | | | 2,066,544 | |
Total Common Stocks
(Cost $3,631,533) | | | | 4,090,880 | |
Temporary Cash Investment (3.2%)1 | | | | | |
Money Market Fund (3.2%) | | | | | |
5,6 | Vanguard Market Liquidity Fund, 1.984%
(Cost $132,904) | | 1,328,944 | | 132,908 | |
Total Investments (102.4%)
(Cost $3,764,437) | | | | 4,223,788 | |
| | | | Amount | |
| | | | ($000 | ) |
Other Assets and Liabilities (-2.4%) | | | | | |
Other Assets | | | | | |
Investment in Vanguard | | | | 189 | |
Receivables for Investment Securities Sold | | | | 287 | |
Receivables for Accrued Income | | | | 8,220 | |
Receivables for Capital Shares Issued | | | | 7,925 | |
Variation Margin Receivable—Futures Contracts | | | | 10 | |
Unrealized Appreciation—Forward Currency Contracts | | | | 3,531 | |
Other Assets | | | | 1,451 | |
Total Other Assets | | | | 21,613 | |
Liabilities | | | | | |
Payables for Investment Securities Purchased | | | | (3,118 | ) |
Collateral for Securities on Loan | | | | (71,664 | ) |
Payables for Capital Shares Redeemed | | | | (822 | ) |
Payables to Vanguard | | | | (513 | ) |
Variation Margin Payable—Futures Contracts | | | | (77 | ) |
Unrealized Depreciation—Forward Currency Contracts | | | | (41,469 | ) |
Other Liabilities | | | | (1,744 | ) |
Total Liabilities | | | | (119,407 | ) |
Net Assets (100%) | | | | 4,125,994 | |
At October 31, 2019, net assets consisted of:
| | | | Amount | |
| | | | ($000 | ) |
Paid-in Capital | | | | 3,502,261 | |
Total Distributable Earnings (Loss) | | | | 623,733 | |
Net Assets | | | | 4,125,994 | |
| | | | | |
Investor Shares—Net Assets | | | |
Applicable to 43,721,992 outstanding $.001 par value shares of beneficial interest (unlimited authorization) | | 643,279 | |
Net Asset Value Per Share—Investor Shares | | | | $14.71 | |
| | | | | |
Admiral Shares—Net Assets | | | |
Applicable to 118,253,681 outstanding $.001 par value shares of beneficial interest (unlimited authorization) | | 3,482,715 | |
Net Asset Value Per Share—Admiral Shares | | | | $29.45 | |
· | See Note A in Notes to Financial Statements. |
* | Non-income-producing security. |
^ | Includes partial security positions on loan to broker-dealers. |
| The total value of securities on loan is $65,933,000. |
1 | The fund invests a portion of its cash reserves in equity markets through the use of index futures contracts. After giving effect to futures investments, the fund’s effective common stock and temporary cash investment positions represent 99.8% and 2.6%, respectively, of net assets. |
2 | Security exempt from registration under Rule 144A of the Securities Act of 1933. Such securities may be sold in transactions exempt from registration, normally to qualified institutional buyers. At October 31, 2019, the aggregate value of these securities was $23,551,000, representing 0.6% of net assets. |
3 | Securities with a value of $71,458,000 have been segregated as collateral for open forward currency contracts. |
4 | Securities with a value of $1,782,000 have been segregated as initial margin for open futures contracts. |
5 | Affiliated money market fund available only to Vanguard funds and certain trusts and accounts managed by Vanguard. Rate shown is the 7-day yield. |
6 | Collateral of $71,664,000 was received for securities on loan. |
| ADR—American Depositary Receipt. |
| REIT—Real Estate Investment Trust. |
17
Global Minimum Volatility Fund
Derivative Financial Instruments Outstanding as of Period End |
|
Futures Contracts |
| | | | ($000) |
| | | | Value and |
| | Number of | | Unrealized |
| | Long (Short) | Notional | Appreciation |
| Expiration | Contracts | Amount | (Depreciation) |
Long Futures Contracts | | | | |
E-mini S&P 500 Index | December 2019 | 126 | 19,126 | 75 |
Dow Jones EURO STOXX 50 Index | December 2019 | 73 | 2,938 | 80 |
Topix Index | December 2019 | 9 | 1,391 | 115 |
FTSE 100 Index | December 2019 | 12 | 1,126 | (9) |
S&P ASX 200 Index | December 2019 | 6 | 686 | (2) |
| | | | 259 |
Forward Currency Contracts | | | | | |
| Contract | | | | | Unrealized | Unrealized |
| Settlement | | Contract Amount (000) | Appreciation | (Depreciation) |
Counterparty | Date | | Receive | | Deliver | ($000) | ($000) |
Deutsche Bank AG | 11/15/19 | GBP | 11,892 | USD | 15,006 | 405 | — |
Goldman Sachs International | 11/15/19 | GBP | 10,983 | USD | 14,198 | 36 | — |
Barclays Bank plc | 11/15/19 | CAD | 13,622 | USD | 10,431 | — | (89) |
Barclays Bank plc | 11/15/19 | USD | 357,757 | GBP | 292,770 | — | (21,660) |
Toronto-Dominion Bank | 11/15/19 | USD | 263,757 | EUR | 240,003 | — | (4,181) |
Deutsche Bank AG | 11/15/19 | USD | 246,437 | JPY | 26,296,764 | 2,716 | — |
Royal Bank of Canada | 11/15/19 | USD | 245,330 | CAD | 326,933 | — | (2,899) |
Toronto-Dominion Bank | 11/15/19 | USD | 172,281 | AUD | 255,567 | — | (3,966) |
BNP Paribas | 11/15/19 | USD | 105,576 | KRW | 126,456,278 | — | (3,147) |
BNP Paribas | 11/15/19 | USD | 105,116 | HKD | 824,331 | — | (74) |
Toronto-Dominion Bank | 11/15/19 | USD | 81,823 | CHF | 80,896 | — | (270) |
Toronto-Dominion Bank | 11/15/19 | USD | 81,596 | INR | 5,834,692 | — | (550) |
Goldman Sachs International | 11/18/19 | USD | 69,239 | BRL | 283,479 | — | (1,364) |
Toronto-Dominion Bank | 11/15/19 | USD | 41,056 | JPY | 4,451,744 | — | (203) |
Deutsche Bank AG | 11/15/19 | USD | 31,044 | SGD | 42,874 | — | (475) |
Toronto-Dominion Bank | 11/15/19 | USD | 23,817 | DKK | 161,865 | — | (373) |
Royal Bank of Canada | 11/15/19 | USD | 23,672 | MXN | 466,110 | — | (501) |
Toronto-Dominion Bank | 11/15/19 | USD | 19,269 | NOK | 176,572 | 67 | — |
Goldman Sachs International | 11/15/19 | USD | 15,330 | GBP | 12,139 | — | (402) |
Deutsche Bank AG | 11/15/19 | USD | 13,034 | ZAR | 199,971 | — | (173) |
Deutsche Bank AG | 11/15/19 | USD | 12,680 | SEK | 125,551 | — | (333) |
Barclays Bank plc | 11/18/19 | USD | 12,489 | ILS | 43,722 | 73 | — |
Goldman Sachs International | 11/15/19 | USD | 11,342 | JPY | 1,230,684 | — | (64) |
Deutsche Bank AG | 11/15/19 | USD | 10,975 | TWD | 337,553 | — | (121) |
BNP Paribas | 11/15/19 | USD | 8,373 | PLN | 32,995 | — | (263) |
Toronto-Dominion Bank | 11/15/19 | USD | 8,314 | IDR | 118,411,770 | — | (109) |
| | | | | | | | |
18
Global Minimum Volatility Fund
Forward Currency Contracts (continued) | | | | | |
| Contract | | | | | Unrealized | Unrealized |
| Settlement | | Contract Amount (000) | Appreciation | (Depreciation) |
Counterparty | Date | | Receive | | Deliver | ($000) | ($000) |
Goldman Sachs International | 11/15/19 | USD | 6,981 | NZD | 11,052 | — | (107) |
BNP Paribas | 11/15/19 | USD | 6,929 | INR | 495,618 | — | (49) |
Toronto-Dominion Bank | 11/15/19 | USD | 6,808 | CLP | 4,910,935 | 183 | — |
Barclays Bank plc | 11/15/19 | USD | 4,306 | CHF | 4,259 | — | (16) |
Goldman Sachs International | 11/15/19 | USD | 1,935 | JPY | 206,478 | 21 | — |
Goldman Sachs International | 11/15/19 | USD | 1,892 | AUD | 2,806 | — | (43) |
BNP Paribas | 11/15/19 | USD | 1,711 | NOK | 15,670 | 7 | — |
Goldman Sachs International | 11/15/19 | USD | 1,012 | CAD | 1,348 | — | (11) |
Goldman Sachs International | 11/15/19 | USD | 842 | CLP | 608,275 | 22 | — |
BNP Paribas | 11/18/19 | USD | 610 | BRL | 2,499 | — | (12) |
Toronto-Dominion Bank | 11/15/19 | USD | 269 | MXN | 5,311 | — | (6) |
Goldman Sachs International | 11/15/19 | USD | 266 | KRW | 319,062 | — | (8) |
Goldman Sachs International | 11/18/19 | USD | 154 | ILS | 537 | 1 | — |
| | | | | | 3,531 | (41,469) |
| | | | | | | | |
AUD—Australian dollar.
BRL—Brazilian real.
CAD—Canadian dollar.
CHF—Swiss franc.
CLP—Chilean peso.
DKK—Danish krone.
EUR—euro.
GBP—British pound.
HKD—Hong Kong dollar.
IDR—Indonesian rupiah.
ILS—Israeli shekel.
INR—Indian rupee.
JPY—Japanese yen.
KRW—Korean won.
MXN—Mexican peso.
NOK—Norwegian krone.
NZD—New Zealand dollar.
PLN—Polish zloty.
SEK—Swedish krona.
SGD—Singapore dollar.
TWD—Taiwanese dollar.
USD—U.S. dollar.
ZAR—South African rand.
At October 31, 2019, the counterparties had deposited in segregated accounts cash of $3,625,000 in connection with open forward currency contracts.
See accompanying Notes, which are an integral part of the Financial Statements.
19
Global Minimum Volatility Fund
Statement of Operations
| | Year Ended | |
| | October 31, 2019 | |
| | ($000 | ) |
Investment Income | | | |
Income | | | |
Dividends1 | | 117,408 | |
Interest2 | | 542 | |
Securities Lending—Net | | 694 | |
Total Income | | 118,644 | |
Expenses | | | |
The Vanguard Group—Note B | | | |
Investment Advisory Services | | 1,665 | |
Management and Administrative—Investor Shares | | 794 | |
Management and Administrative—Admiral Shares | | 2,393 | |
Marketing and Distribution—Investor Shares | | 74 | |
Marketing and Distribution—Admiral Shares | | 195 | |
Custodian Fees | | 160 | |
Auditing Fees | | 44 | |
Shareholders’ Reports—Investor Shares | | 17 | |
Shareholders’ Reports—Admiral Shares | | 29 | |
Trustees’ Fees and Expenses | | 2 | |
Total Expenses | | 5,373 | |
Net Investment Income | | 113,271 | |
Realized Net Gain (Loss) | | | |
Investment Securities Sold2 | | 57,613 | |
Futures Contracts | | 1,434 | |
Forward Currency Contracts | | 70,567 | |
Foreign Currencies | | 650 | |
Realized Net Gain (Loss) | | 130,264 | |
Change in Unrealized Appreciation (Depreciation) | | | |
Investment Securities2 | | 292,834 | |
Futures Contracts | | 234 | |
Forward Currency Contracts | | (48,158 | ) |
Foreign Currencies | | 86 | |
Change in Unrealized Appreciation (Depreciation) | | 244,996 | |
Net Increase (Decrease) in Net Assets Resulting from Operations | | 488,531 | |
1 Dividends are net of foreign withholding taxes of $5,463,000.
2 Interest income, realized net gain (loss), and change in unrealized appreciation (depreciation) from an affiliated company of the fund were $536,000, ($7,000), and $2,000, respectively. Purchases and sales are for temporary cash investment purposes.
See accompanying Notes, which are an integral part of the Financial Statements.
20
Global Minimum Volatility Fund
Statement of Changes in Net Assets
| | Year Ended October 31, | |
| | 2019 | | 2018 | |
| | ($000 | ) | ($000 | ) |
Increase (Decrease) in Net Assets | | | | | |
Operations | | | | | |
Net Investment Income | | 113,271 | | 70,733 | |
Realized Net Gain (Loss) | | 130,264 | | 152,446 | |
Change in Unrealized Appreciation (Depreciation) | | 244,996 | | (142,439 | ) |
Net Increase (Decrease) in Net Assets Resulting from Operations | | 488,531 | | 80,740 | |
Distributions | | | | | |
Net Investment Income | | | | | |
Investor Shares | | (11,167) | | (12,387 | ) |
Admiral Shares | | (61,918) | | (40,756 | ) |
Realized Capital Gain1 | | | | | |
Investor Shares | | (22,331) | | — | |
Admiral Shares | | (119,380) | | — | |
Total Distributions | | (214,796) | | (53,143 | ) |
Capital Share Transactions | | | | | |
Investor Shares | | 84,477 | | (31,299 | ) |
Admiral Shares | | 710,035 | | 822,933 | |
Net Increase (Decrease) from Capital Share Transactions | | 794,512 | | 791,634 | |
Total Increase (Decrease) | | 1,068,247 | | 819,231 | |
Net Assets | | | | | |
Beginning of Period | | 3,057,747 | | 2,238,516 | |
End of Period | | 4,125,994 | | 3,057,747 | |
1 Includes fiscal 2019 and 2018 short-term gain distributions totaling $44,448,000 and $0, respectively. Short-term gain distributions are treated as ordinary income dividends for tax purposes.
See accompanying Notes, which are an integral part of the Financial Statements.
21
Global Minimum Volatility Fund
Financial Highlights
Investor Shares
For a Share Outstanding | | | | Year Ended October 31, | |
Throughout Each Period | | 2019 | | 2018 | | 2017 | | 2016 | | 2015 | |
Net Asset Value, Beginning of Period | | $13.78 | | $13.57 | | $11.92 | | $11.81 | | $11.41 | |
Investment Operations | | | | | | | | | | | |
Net Investment Income | | .428 | 1 | .374 | 1 | .324 | 1 | .293 | | .288 | 1 |
Net Realized and Unrealized Gain (Loss) on Investments | | 1.403 | | .148 | | 1.650 | | .181 | | .795 | |
Total from Investment Operations | | 1.831 | | .522 | | 1.974 | | .474 | | 1.083 | |
Distributions | | | | | | | | | | | |
Dividends from Net Investment Income | | (.300 | ) | (.312 | ) | (.324 | ) | (.205 | ) | (.280 | ) |
Distributions from Realized Capital Gains | | (.601 | ) | — | | — | | (.159 | ) | (.403 | ) |
Total Distributions | | (.901 | ) | (.312 | ) | (.324 | ) | (.364 | ) | (.683 | ) |
Net Asset Value, End of Period | | $14.71 | | $13.78 | | $13.57 | | $11.92 | | $11.81 | |
| | | | | | | | | | | |
Total Return2 | | 14.41% | | 3.89% | | 16.93% | | 4.23% | | 9.93% | |
| | | | | | | | | | | |
Ratios/Supplemental Data | | | | | | | | | | | |
Net Assets, End of Period (Millions) | | $643 | | $515 | | $539 | | $419 | | $451 | |
Ratio of Total Expenses to Average Net Assets | | 0.21% | | 0.23% | | 0.25% | | 0.25% | | 0.27% | |
Ratio of Net Investment Income to Average Net Assets | | 3.09% | | 2.66% | | 2.54% | | 2.63% | | 2.52% | |
Portfolio Turnover Rate | | 46% | | 24% | | 37% | | 58% | | 57% | |
1 Calculated based on average shares outstanding.
2 Total returns do not include account service fees that may have applied in the periods shown. Fund prospectuses provide information about any applicable account service fees.
See accompanying Notes, which are an integral part of the Financial Statements.
22
Global Minimum Volatility Fund
Financial Highlights
Admiral Shares
For a Share Outstanding | | | | Year Ended October 31, | |
Throughout Each Period | | 2019 | | 2018 | | 2017 | | 2016 | | 2015 | |
Net Asset Value, Beginning of Period | | $27.58 | | $27.15 | | $23.86 | | $23.62 | | $22.83 | |
Investment Operations | | | | | | | | | | | |
Net Investment Income | | .878 | 1 | .758 | 1 | .668 | 1 | .608 | | .605 | 1 |
Net Realized and Unrealized Gain (Loss) on Investments | | 2.819 | | .297 | | 3.295 | | .377 | | 1.576 | |
Total from Investment Operations | | 3.697 | | 1.055 | | 3.963 | | .985 | | 2.181 | |
Distributions | | | | | | | | | | | |
Dividends from Net Investment Income | | (.624 | ) | (.625 | ) | (.673 | ) | (.427 | ) | (.585 | ) |
Distributions from Realized Capital Gains | | (1.203 | ) | — | | — | | (.318 | ) | (.806 | ) |
Total Distributions | | (1.827 | ) | (.625 | ) | (.673 | ) | (.745 | ) | (1.391 | ) |
Net Asset Value, End of Period | | $29.45 | | $27.58 | | $27.15 | | $23.86 | | $23.62 | |
| | | | | | | | | | | |
Total Return2 | | 14.54% | | 3.93% | | 16.99% | | 4.39% | | 10.00% | |
| | | | | | | | | | | |
Ratios/Supplemental Data | | | | | | | | | | | |
Net Assets, End of Period (Millions) | | $3,483 | | $2,542 | | $1,699 | | $1,152 | | $757 | |
Ratio of Total Expenses to Average Net Assets | | 0.14% | | 0.15% | | 0.17% | | 0.17% | | 0.21% | |
Ratio of Net Investment Income to Average Net Assets | | 3.16% | | 2.74% | | 2.62% | | 2.71% | | 2.58% | |
Portfolio Turnover Rate | | 46% | | 24% | | 37% | | 58% | | 57% | |
1 Calculated based on average shares outstanding.
2 Total returns do not include account service fees that may have applied in the periods shown. Fund prospectuses provide information about any applicable account service fees.
See accompanying Notes, which are an integral part of the Financial Statements.
23
Global Minimum Volatility Fund
Notes to Financial Statements
Vanguard Global Minimum Volatility Fund is registered under the Investment Company Act of 1940 as an open-end investment company, or mutual fund. The fund invests in securities of foreign issuers, which may subject it to investment risks not normally associated with investing in securities of U.S. corporations. To minimize the currency risk and volatility associated with investment in securities denominated in currencies other than the U.S. dollar, the fund attempts to hedge its currency exposure. The fund offers two classes of shares: Investor Shares and Admiral Shares. Each of the share classes has different eligibility and minimum purchase requirements, and is designed for different types of investors.
A. The following significant accounting policies conform to generally accepted accounting principles for U.S. investment companies. The fund consistently follows such policies in preparing its financial statements.
1. Security Valuation: Securities are valued as of the close of trading on the New York Stock Exchange (generally 4 p.m., Eastern time) on the valuation date. Equity securities are valued at the latest quoted sales prices or official closing prices taken from the primary market in which each security trades; such securities not traded on the valuation date are valued at the mean of the latest quoted bid and asked prices. Securities for which market quotations are not readily available, or whose values have been affected by events occurring before the fund’s pricing time but after the close of the securities’ primary markets, are valued at their fair values calculated according to procedures adopted by the board of trustees. These procedures include obtaining quotations from an independent pricing service, monitoring news to identify significant market-or security-specific events, and evaluating changes in the values of foreign market proxies (for example, ADRs, futures contracts, or exchange-traded funds), between the time the foreign markets close and the fund’s pricing time. When fair-value pricing is employed, the prices of securities used by a fund to calculate its net asset value may differ from quoted or published prices for the same securities. Investments in Vanguard Market Liquidity Fund are valued at that fund’s net asset value. Temporary cash investments are valued using the latest bid prices or using valuations based on a matrix system (which considers such factors as security prices, yields, maturities, and ratings), both as furnished by independent pricing services.
2. Foreign Currency: Securities and other assets and liabilities denominated in foreign currencies are translated into U.S. dollars using exchange rates obtained from an independent third party as of the fund’s pricing time on the valuation date. Realized gains (losses) and unrealized appreciation (depreciation) on investment securities include the effects of changes in exchange rates since the securities were purchased, combined with the effects of changes in security prices. Fluctuations in the value of other assets and liabilities resulting from changes in exchange rates are recorded as unrealized foreign currency gains (losses) until the assets or liabilities are settled in cash, at which time they are recorded as realized foreign currency gains (losses).
3. Futures and Forward Currency Contracts: The fund uses index futures contracts to a limited extent, with the objective of maintaining full exposure to the stock market while maintaining liquidity. The fund may purchase or sell futures contracts to achieve a desired level of investment, whether to accommodate portfolio turnover or cash flows from capital share transactions. The primary risks associated with the use of futures contracts are imperfect correlation between
24
Global Minimum Volatility Fund
changes in market values of stocks held by the fund and the prices of futures contracts, and the possibility of an illiquid market. Counterparty risk involving futures is mitigated because a regulated clearinghouse is the counterparty instead of the clearing broker. To further mitigate counterparty risk, the fund trades futures contracts on an exchange, monitors the financial strength of its clearing brokers and clearinghouse, and has entered into clearing agreements with its clearing brokers. The clearinghouse imposes initial margin requirements to secure the fund’s performance and requires daily settlement of variation margin representing changes in the market value of each contract. Any assets pledged as initial margin for open contracts are noted in the Statement of Net Assets.
The fund enters into forward currency contracts to protect the value of securities and related receivables and payables against changes in future foreign exchange rates. The fund’s risks in using these contracts include movement in the values of the foreign currencies relative to the U.S. dollar and the ability of the counterparties to fulfill their obligations under the contracts. The fund mitigates its counterparty risk by entering into forward currency contracts only with a diverse group of prequalified counterparties, monitoring their financial strength, entering into master netting arrangements with its counterparties, and requiring its counterparties to transfer collateral as security for their performance. In the absence of a default, the collateral pledged or received by the fund cannot be repledged, resold, or rehypothecated. The master netting arrangements provide that, in the event of a counterparty’s default (including bankruptcy), the fund may terminate the forward currency contracts, determine the net amount owed by either party in accordance with its master netting arrangements, and sell or retain any collateral held up to the net amount owed to the fund under the master netting arrangements. The forward currency contracts contain provisions whereby a counterparty may terminate open contracts if the fund’s net assets decline below a certain level, triggering a payment by the fund if the fund is in a net liability position at the time of the termination. The payment amount would be reduced by any collateral the fund has pledged. Any assets pledged as collateral for open contracts are noted in the Statement of Net Assets. The value of collateral received or pledged is compared daily to the value of the forward currency contracts exposure with each counterparty, and any difference, if in excess of a specified minimum transfer amount, is adjusted and settled within two business days.
Futures contracts are valued at their quoted daily settlement prices. Forward currency contracts are valued at their quoted daily prices obtained from an independent third party, adjusted for currency risk based on the expiration date of each contract. The notional amounts of the contracts are not recorded in the Statement of Net Assets. Fluctuations in the value of the contracts are recorded in the Statement of Net Assets as an asset (liability) and in the Statement of Operations as unrealized appreciation (depreciation) until the contracts are closed, when they are recorded as realized gains (losses) on futures or forward currency contracts.
During the year ended October 31, 2019, the fund’s average investments in long and short futures contracts represented less than 1% and 0% of net assets, respectively, based on the average of the notional amounts at each quarter-end during the period. The fund’s average investment in forward currency contracts represented 48% of net assets, based on the average of the notional amounts at each quarter-end during the period.
25
Global Minimum Volatility Fund
The following table summarizes the fund’s derivative assets and liabilities by counterparty for derivatives subject to arrangements that provide for offsetting assets and liabilities. Exchange-traded derivatives are listed separately.
| Assets | Liabilities | | Amounts Not Offset in the | Net |
| Reflected in | Reflected in | Net Amount | Statement of Net Assets | Exposure3 |
| Statement of | Statement of | Receivable | Collateral | Collateral | (Not Less |
| Net Assets1 | Net Assets1 | (Payable) | Pledged2 | Received2 | Than $0) |
| ($000) | ($000) | ($000) | ($000) | ($000) | ($000) |
Derivatives Subject to Offsetting Arrangements, by Counterparty | | | | | | |
Barclays Bank PLC | 73 | (21,765) | (21,692) | 39,319 | — | — |
BNP Paribas | 7 | (3,545) | (3,538) | 6,132 | — | — |
Deutsche Bank AG | 3,121 | (1,102) | 2,019 | — | 3,625 | — |
Goldman Sachs International | 80 | (1,999) | (1,919) | 4,168 | — | — |
Royal Bank of Canada | — | (3,400) | (3,400) | 7,041 | — | — |
The Toronto-Dominion Bank | 250 | (9,658) | (9,408) | 14,798 | — | — |
Exchange-Traded Futures Contracts | 10 | (77) | (67) | 1,782 | — | — |
Total | 3,541 | (41,546) | (38,005) | 73,240 | 3,625 | — |
1 Absent an event of default or early termination, derivative assets and liabilities are presented gross and not offset in the Statement of Net Assets.
2 Securities or other assets pledged as collateral are noted in the Statement of Net Assets. Securities or other assets received as collateral are held in a segregated account and not included in the fund’s security holdings in the Statement of Net Assets.
3 Net Exposure represents the net amount receivable from the counterparty in the event of default. Counterparties are not required to exchange collateral if amount is below a specified minimum transfer amount.
4. Federal Income Taxes: The fund intends to continue to qualify as a regulated investment company and distribute all of its taxable income. Management has analyzed the fund’s tax positions taken for all open federal income tax years (October 31, 2016–2019), and has concluded that no provision for federal income tax is required in the fund’s financial statements.
5. Distributions: Distributions to shareholders are recorded on the ex-dividend date. Distributions are determined on a tax basis and may differ from net investment income and realized capital gains for financial reporting purposes.
6. Securities Lending: To earn additional income, the fund lends its securities to qualified institutional borrowers. Security loans are subject to termination by the fund at any time, and are required to be secured at all times by collateral in an amount at least equal to the market value of securities loaned. Daily market fluctuations could cause the value of loaned securities to be more or less than the value of the collateral received. When this occurs, the collateral is adjusted and settled before the opening of the market on the next business day. The fund further mitigates its counterparty risk by entering into securities lending transactions only with a diverse group of prequalified counterparties, monitoring their financial strength, and entering into master securities lending agreements with its counterparties. The master securities lending agreements provide that, in the event of a counterparty’s default (including bankruptcy), the fund may terminate any
26
Global Minimum Volatility Fund
loans with that borrower, determine the net amount owed, and sell or retain the collateral up to the net amount owed to the fund; however, such actions may be subject to legal proceedings. While collateral mitigates counterparty risk, in the event of a default, the fund may experience delays and costs in recovering the securities loaned. The fund invests cash collateral received in Vanguard Market Liquidity Fund, and records a liability in the Statement of Net Assets for the return of the collateral, during the period the securities are on loan. Securities lending income represents fees charged to borrowers plus income earned on invested cash collateral, less expenses associated with the loan. During the term of the loan, the fund is entitled to all distributions made on or in respect of the loaned securities.
7. Credit Facility: The fund and certain other funds managed by The Vanguard Group (“Vanguard”) participate in a $4.3 billion committed credit facility provided by a syndicate of lenders pursuant to a credit agreement that may be renewed annually; each fund is individually liable for its borrowings, if any, under the credit facility. Borrowings may be utilized for temporary and emergency purposes, and are subject to the fund’s regulatory and contractual borrowing restrictions. The participating funds are charged administrative fees and an annual commitment fee of 0.10% of the undrawn amount of the facility; these fees are allocated to the funds based on a method approved by the fund’s board of trustees and included in Management and Administrative expenses on the fund’s Statement of Operations. Any borrowings under this facility bear interest at a rate based upon the higher of the one-month London Interbank Offered Rate, federal funds effective rate, or overnight bank funding rate plus an agreed-upon spread.
The fund had no borrowings outstanding at October 31, 2019, or at any time during the period then ended.
8. Other: Dividend income is recorded on the ex-dividend date. Interest income includes income distributions received from Vanguard Market Liquidity Fund and is accrued daily. Premiums and discounts on debt securities purchased are amortized and accreted, respectively, to interest income over the lives of the respective securities. Security transactions are accounted for on the date securities are bought or sold. Costs used to determine realized gains (losses) on the sale of investment securities are those of the specific securities sold.
Each class of shares has equal rights as to assets and earnings, except that each class separately bears certain class-specific expenses related to maintenance of shareholder accounts (included in Management and Administrative expenses) and shareholder reporting. Marketing and distribution expenses are allocated to each class of shares based on a method approved by the board of trustees. Income, other non-class-specific expenses, and gains and losses on investments are allocated to each class of shares based on its relative net assets.
B. In accordance with the terms of a Funds’ Service Agreement (the “FSA”) between Vanguard and the fund, Vanguard furnishes to the fund investment advisory, corporate management, administrative, marketing, and distribution services at Vanguard’s cost of operations (as defined by the FSA). These costs of operations are allocated to the fund based on methods and guidelines approved by the board of trustees. Vanguard does not require reimbursement in the current period for certain costs of operations (such as deferred compensation/benefits and risk/insurance costs); the fund’s liability for these costs of operations is included in Payables to Vanguard on the Statement of Net Assets. All other costs of operations payable to Vanguard are generally settled twice a month.
27
Global Minimum Volatility Fund
Upon the request of Vanguard, the fund may invest up to 0.40% of its net assets as capital in Vanguard. At October 31, 2019, the fund had contributed to Vanguard capital in the amount of $189,000, representing less than 0.01% of the fund’s net assets and 0.08% of Vanguard’s capital received pursuant to the FSA. The fund’s trustees and officers are also directors and employees, respectively, of Vanguard.
C. Various inputs may be used to determine the value of the fund’s investments. These inputs are summarized in three broad levels for financial statement purposes. The inputs or methodologies used to value securities are not necessarily an indication of the risk associated with investing in those securities.
Level 1—Quoted prices in active markets for identical securities.
Level 2—Other significant observable inputs (including quoted prices for similar securities, interest rates, prepayment speeds, credit risk, etc.).
Level 3—Significant unobservable inputs (including the fund’s own assumptions used to determine the fair value of investments). Any investments valued with significant unobservable inputs are noted on the Statement of Net Assets.
The following table summarizes the market value of the fund’s investments and derivatives as of October 31, 2019, based on the inputs used to value them:
Investments | | Level 1
($000 | ) | Level 2
($000 | ) | Level 3
($000 | ) |
Common Stocks—International | | 498,542 | | 1,525,794 | | — | |
Common Stocks—United States | | 2,066,544 | | — | | — | |
Temporary Cash Investments | | 132,908 | | — | | — | |
Futures Contracts—Assets1 | | 10 | | — | | — | |
Futures Contracts—Liabilities1 | | (77 | ) | — | | — | |
Forward Currency Contracts—Assets | | — | | 3,531 | | — | |
Forward Currency Contracts—Liabilities | | — | | (41,469 | ) | — | |
Total | | 2,697,927 | | 1,487,856 | | — | |
1 Represents variation margin on the last day of the reporting period.
28
Global Minimum Volatility Fund
D. At October 31, 2019, the fair values of derivatives were reflected in the Statement of Net Assets as follows:
| | Foreign | |
| Equity | Exchange | |
| Contracts | Contracts | Total |
Statement of Net Assets Caption | ($000) | ($000) | ($000) |
Variation Margin Receivable—Futures Contracts | 10 | — | 10 |
Unrealized Appreciation—Forward Currency Contracts | — | 3,531 | 3,531 |
Total Assets | 10 | 3,531 | 3,541 |
| | | |
Variation Margin Payable—Futures Contracts | (77) | — | (77) |
Unrealized Depreciation—Forward Currency Contracts | — | (41,469) | (41,469) |
Total Liabilities | (77) | (41,469) | (41,546) |
Realized net gain (loss) and the change in unrealized appreciation (depreciation) on derivatives for the year ended October 31, 2019, were:
| | Foreign | |
| Equity | Exchange | |
| Contracts | Contracts | Total |
Realized Net Gain (Loss) on Derivatives | ($000) | ($000) | ($000) |
Futures Contracts | 1,434 | — | 1,434 |
Forward Currency Contracts | — | 70,567 | 70,567 |
Realized Net Gain (Loss) on Derivatives | 1,434 | 70,567 | 72,001 |
| | | |
Change in Unrealized Appreciation (Depreciation) on Derivatives | | | |
Futures Contracts | 234 | — | 234 |
Forward Currency Contracts | — | (48,158) | (48,158) |
Change in Unrealized Appreciation (Depreciation) on Derivatives | 234 | (48,158 | (47,924) |
E. Permanent differences between book-basis and tax-basis components of net assets are reclassified among capital accounts in the financial statements to reflect their tax character. These reclassifications have no effect on net assets or net asset value per share. As of period end, permanent differences primarily attributable to the accounting for foreign currency transactions, passive foreign investment companies, and distributions in connection with fund share redemptions were reclassified between the following accounts:
| Amount ($000) |
Paid-in Capital | 10,401 |
Total Distributable Earnings (Loss) | (10,401) |
Temporary differences between book-basis and tax-basis components of total distributable earnings (loss) arise when certain items of income, gain, or loss are recognized in different periods for financial statement and tax purposes; these differences will reverse at some time in the future.
29
Global Minimum Volatility Fund
The differences are primarily related to the tax deferral of losses on wash sales; the realization of unrealized gains or losses on certain futures contracts and forward currency contracts; and unrealized gains on passive foreign investment companies. As of period end, the tax-basis components of total distributable earnings (loss) are detailed in the table as follows:
| Amount ($000) |
Undistributed Ordinary Income | 91,107 |
Undistributed Long-Term Gains | 75,955 |
Capital Loss Carryforwards (Non-Expiring) | — |
Net Unrealized Gains (Losses) | 456,868 |
As of October 31, 2019, gross unrealized appreciation and depreciation for investments and derivatives based on cost for U.S. federal income tax purposes were as follows:
| Amount ($000) |
Tax Cost | 3,765,918 |
Gross Unrealized Appreciation | 561,593 |
Gross Unrealized Depreciation | (104,761) |
Net Unrealized Appreciation (Depreciation) | 456,832 |
F. During the year ended October 31, 2019, the fund purchased $2,346,828,000 of investment securities and sold $1,636,458,000 of investment securities, other than temporary cash investments.
G. Capital share transactions for each class of shares were:
| Year Ended October 31, |
| | 2019 | | | 2018 |
| Amount | Shares | | Amount | Shares |
| ($000) | (000) | | ($000) | (000) |
Investor Shares | | | | | |
Issued | 205,945 | 14,903 | | 148,795 | 10,734 |
Issued in Lieu of Cash Distributions | 31,225 | 2,486 | | 11,552 | 854 |
Redeemed | (152,693) | (11,079) | | (191,646) | (13,898) |
Net Increase (Decrease)—Investor Shares | 84,477 | 6,310 | | (31,299) | (2,310) |
Admiral Shares | | | | | |
Issued | 1,109,795 | 40,175 | | 1,279,510 | 46,244 |
Issued in Lieu of Cash Distributions | 163,610 | 6,511 | | 35,011 | 1,294 |
Redeemed | (563,370) | (20,615) | | (491,588) | (17,935) |
Net Increase (Decrease)—Admiral Shares | 710,035 | 26,071 | | 822,933 | 29,603 |
H. Management has determined that no events or transactions occurred subsequent to October 31, 2019, that would require recognition or disclosure in these financial statements.
30
Report of Independent Registered Public Accounting Firm
To the Board of Trustees of Vanguard Whitehall Funds and Shareholders of Vanguard Global Minimum Volatility Fund
Opinion on the Financial Statements
We have audited the accompanying statement of net assets of Vanguard Global Minimum Volatility Fund (one of the funds constituting Vanguard Whitehall Funds, referred to hereafter as the “Fund”) as of October 31, 2019, the related statement of operations for the year ended October 31, 2019, the statement of changes in net assets for each of the two years in the period ended October 31, 2019, including the related notes, and the financial highlights for each of the five years in the period ended October 31, 2019 (collectively referred to as the “financial statements”). In our opinion, the financial statements present fairly, in all material respects, the financial position of the Fund as of October 31, 2019, the results of its operations for the year then ended, the changes in its net assets for each of the two years in the period ended October 31, 2019 and the financial highlights for each of the five years in the period ended October 31, 2019 in conformity with accounting principles generally accepted in the United States of America.
Basis for Opinion
These financial statements are the responsibility of the Fund’s management. Our responsibility is to express an opinion on the Fund’s financial statements based on our audits. We are a public accounting firm registered with the Public Company Accounting Oversight Board (United States) (“PCAOB”) and are required to be independent with respect to the Fund in accordance with the U.S. federal securities laws and the applicable rules and regulations of the Securities and Exchange Commission and the PCAOB.
We conducted our audits of these financial statements in accordance with the standards of the PCAOB. Those standards require that we plan and perform the audit to obtain reasonable assurance about whether the financial statements are free of material misstatement, whether due to error or fraud.
Our audits included performing procedures to assess the risks of material misstatement of the financial statements, whether due to error or fraud, and performing procedures that respond to those risks. Such procedures included examining, on a test basis, evidence regarding the amounts and disclosures in the financial statements. Our audits also included evaluating the accounting principles used and significant estimates made by management, as well as evaluating the overall presentation of the financial statements. Our procedures included confirmation of securities owned as of October 31, 2019 by correspondence with the custodian and brokers and by agreement to the underlying ownership records of the transfer agent; when replies were not received from brokers, we performed other auditing procedures. We believe that our audits provide a reasonable basis for our opinion.
/s/PricewaterhouseCoopers LLP
Philadelphia, Pennsylvania
December 18, 2019
We have served as the auditor of one or more investment companies in The Vanguard Group of Funds since 1975.
31
Special 2019 tax information (unaudited) for Vanguard Global Minimum Volatility Fund
This information for the fiscal year ended October 31, 2019, is included pursuant to provisions of the Internal Revenue Code.
The fund distributed $47,649,000 of qualified dividend income to shareholders during the fiscal year.
For corporate shareholders, 18.5% of investment income (dividend income plus short-term gains, if any) qualifies for the dividends-received deduction.
32
This page intentionally left blank.
This page intentionally left blank.
The People Who Govern Your Fund
The trustees of your mutual fund are there to see that the fund is operated and managed in your best interests since, as a shareholder, you are a part owner of the fund. Your fund’s trustees also serve on the board of directors of The Vanguard Group, Inc., which is owned by the Vanguard funds and provides services to them.
A majority of Vanguard’s board members are independent, meaning that they have no affiliation with Vanguard or the funds they oversee, apart from the sizable personal investments they have made as private individuals. The independent board members have distinguished backgrounds in business, academia, and public service. Each of the trustees and executive officers oversees 213 Vanguard funds.
Information for each trustee and executive officer of the fund appears below. That information, as well as the Vanguard fund count, is as of the date on the cover of this fund report. The mailing address of the trustees and officers is P.O. Box 876, Valley Forge, PA 19482. More information about the trustees is in the Statement of Additional Information, which can be obtained, without charge, by contacting Vanguard at 800-662-7447, or online at vanguard.com.
Interested Trustee1
Mortimer J. Buckley
Born in 1969. Trustee since January 2018. Principal occupation(s) during the past five years and other experience: chairman of the board (January 2019–present) of Vanguard and of each of the investment companies served by Vanguard; chief executive officer (January 2018–present) of Vanguard; chief executive officer, president, and trustee (January 2018–present) of each of the investment companies served by Vanguard; president and director (2017–present) of Vanguard; and president (February 2018–present) of Vanguard Marketing Corporation. Chief investment officer (2013–2017), managing director (2002–2017), head of the Retail Investor Group (2006–2012), and chief information officer (2001–2006) of Vanguard. Chairman of the board (2011–2017) and trustee (2009–2017) of the Children’s Hospital of Philadelphia; trustee (2018–present) of The Shipley School.
Independent Trustees
Emerson U. Fullwood
Born in 1948. Trustee since January 2008. Principal occupation(s) during the past five years and other experience: executive chief staff and marketing officer for North America and corporate vice president (retired 2008) of Xerox Corporation (document management products and services). Former president of the Worldwide Channels Group, Latin America, and Worldwide Customer Service and executive chief staff officer of Developing Markets of Xerox. Executive in residence and 2009–2010 Distinguished Minett Professor at the Rochester Institute of Technology. Director of SPX FLOW, Inc. (multi-industry manufacturing). Director of the University of Rochester Medical Center, the Monroe Community College Foundation, the United Way of Rochester, North Carolina A&T University, and Roberts Wesleyan College. Trustee of the University of Rochester.
Amy Gutmann
Born in 1949. Trustee since June 2006. Principal occupation(s) during the past five years and other experience: president (2004–present) of the University of Pennsylvania. Christopher H. Browne Distinguished Professor of Political Science, School of Arts and Sciences, and professor of communication, Annenberg School for Communication, with secondary faculty appointments in the Department of Philosophy, School of Arts and Sciences, and at the Graduate School of Education, University of Pennsylvania. Trustee of the National Constitution Center.
F. Joseph Loughrey
Born in 1949. Trustee since October 2009. Principal occupation(s) during the past five years and other experience: president and chief operating officer (retired 2009) and vice chairman of the board (2008–2009) of Cummins Inc. (industrial machinery). Chairman of the board of Hillenbrand, Inc. (specialized consumer services), and the Lumina Foundation.
1 Mr. Buckley is considered an “interested person,” as defined in the Investment Company Act of 1940, because he is an officer of the Vanguard funds.
Director of the V Foundation and Oxfam America. Member of the advisory council for the College of Arts and Letters and chair of the advisory board to the Kellogg Institute for International Studies, both at the University of Notre Dame.
Mark Loughridge
Born in 1953. Trustee since March 2012. Principal occupation(s) during the past five years and other experience: senior vice president and chief financial officer (retired 2013) of IBM (information technology services). Fiduciary member of IBM’s Retirement Plan Committee (2004–2013), senior vice president and general manager (2002–2004) of IBM Global Financing, vice president and controller (1998–2002) of IBM, and a variety of other prior management roles at IBM. Member of the Council on Chicago Booth.
Scott C. Malpass
Born in 1962. Trustee since March 2012. Principal occupation(s) during the past five years and other experience: chief investment officer (1989–present) and vice president (1996–present) of the University of Notre Dame. Assistant professor of finance at the Mendoza College of Business, University of Notre Dame, and member of the Notre Dame 403(b) Investment Committee. Chairman of the board of TIFF Advisory Services, Inc. Member of the board of Catholic Investment Services, Inc. (investment advisors) and the board of superintendence of the Institute for the Works of Religion.
Deanna Mulligan
Born in 1963. Trustee since January 2018. Principal occupation(s) during the past five years and other experience: president (2010–present) and chief executive officer (2011–present) of The Guardian Life Insurance Company of America. Chief operating officer (2010–2011) and executive vice president (2008–2010) of Individual Life and Disability of The Guardian Life Insurance Company of America. Member of the board of The Guardian Life Insurance Company of America, the American Council of Life Insurers, the Partnership for New York City (business leadership), and the Committee Encouraging Corporate Philanthropy. Trustee of the Economic Club of New York and the Bruce Museum (arts and science). Member of the Advisory Council for the Stanford Graduate School of Business.
André F. Perold
Born in 1952. Trustee since December 2004. Principal occupation(s) during the past five years and other experience: George Gund Professor of Finance and Banking, Emeritus at the Harvard Business School (retired 2011). Chief investment officer and co-managing partner of HighVista Strategies (private investment firm). Board of advisors and investment committee member of the Museum of Fine Arts Boston. Board member (2018–present) of RIT Capital Partners (investment firm); investment committee member of Partners Health Care System.
Sarah Bloom Raskin
Born in 1961. Trustee since January 2018. Principal occupation(s) during the past five years and other experience: deputy secretary (2014–2017) of the United States Department of the Treasury. Governor (2010–2014) of the Federal Reserve Board. Commissioner (2007–2010) of financial regulation for the State of Maryland. Member of the board of directors (2012–2014) of Neighborhood Reinvestment Corporation. Director (2017–present) of i(x) Investments; director (2017–present) of Reserve Trust. Rubinstein Fellow (2017–present) of Duke University; trustee (2017–present) of Amherst College.
Peter F. Volanakis
Born in 1955. Trustee since July 2009. Principal occupation(s) during the past five years and other experience: president and chief operating officer (retired 2010) of Corning Incorporated (communications equipment) and director of Corning Incorporated (2000–2010) and Dow Corning (2001–2010). Director (2012) of SPX Corporation (multi-industry manufacturing). Overseer of the Amos Tuck School of Business Administration, Dartmouth College (2001–2013). Chairman of the board of trustees of Colby-Sawyer College. Member of the board of Hypertherm Inc. (industrial cutting systems, software, and consumables).
Executive Officers
John Bendl
Born in 1970. Principal occupation(s) during the past five years and other experience: principal of Vanguard. Chief financial officer (October 2019–present) of each of the investment companies served by Vanguard. Chief accounting officer, treasurer, and controller of Vanguard (2017–present). Partner (2003–2016) at KPMG (audit, tax, and advisory services).
Glenn Booraem
Born in 1967. Principal occupation(s) during the past five years and other experience: principal of Vanguard. Investment stewardship officer (2017–present), treasurer (2015–2017), controller (2010–2015), and assistant controller (2001–2010) of each of the investment companies served by Vanguard.
Christine M. Buchanan
Born in 1970. Principal occupation(s) during the past five years and other experience: principal of Vanguard. Treasurer (2017–present) of each of the investment companies served by Vanguard. Partner (2005–2017) at KPMG (audit, tax, and advisory services).
David Cermak
Born in 1960. Principal occupation(s) during the past five years and other experience: principal of Vanguard. Finance director (October 2019–present) of each of the investment companies served by Vanguard. Managing director and head (2017–present) of Vanguard Investments Singapore. Managing director and head (2017–2019) of Vanguard Investments Hong Kong. Representative director and head (2014–2017) of Vanguard Investments Japan.
Thomas J. Higgins
Born in 1957. Principal occupation(s) during the past five years and other experience: principal of Vanguard. Finance director (October 2019–present), chief financial officer (2008–2019), and treasurer (1998–2008) of each of the investment companies served by Vanguard.
Peter Mahoney
Born in 1974. Principal occupation(s) during the past five years and other experience: principal of Vanguard. Controller (2015–present) of each of the investment companies served by Vanguard. Head of International Fund Services (2008–2014) at Vanguard.
Anne E. Robinson
Born in 1970. Principal occupation(s) during the past five years and other experience: general counsel (2016–present) of Vanguard. Secretary (2016–present) of Vanguard and of each of the investment companies served by Vanguard. Managing director (2016–present) of Vanguard. Managing director and general counsel of Global Cards and Consumer Services (2014–2016) at Citigroup. Counsel (2003–2014) at American Express.
Michael Rollings
Born in 1963. Principal occupation(s) during the past five years and other experience: finance director (2017–present) and treasurer (2017) of each of the investment companies served by Vanguard. Managing director (2016–present) of Vanguard. Chief financial officer (2016–present) of Vanguard. Director (2016–present) of Vanguard Marketing Corporation. Executive vice president and chief financial officer (2006–2016) of MassMutual Financial Group.
John E. Schadl
Born in 1972. Principal occupation(s) during the past five years and other experience: principal of Vanguard. Chief compliance officer (2019–present) of Vanguard and of each of the investment companies served by Vanguard. Assistant vice president (May 2019–present) of Vanguard Marketing Corporation.
Vanguard Senior Management Team |
| |
Joseph Brennan | Chris D. McIsaac |
Mortimer J. Buckley | James M. Norris |
Gregory Davis | Thomas M. Rampulla |
John James | Karin A. Risi |
Martha G. King | Anne E. Robinson |
John T. Marcante | Michael Rollings |
| 
|
| |
| P.O. Box 2600 |
| Valley Forge, PA 19482-2600 |
Connect with Vanguard® > vanguard.com
Fund Information > 800-662-7447
Direct Investor Account Services > 800-662-2739
Institutional Investor Services > 800-523-1036
Text Telephone for People
Who Are Deaf or Hard of Hearing > 800-749-7273
This material may be used in conjunction with the offering of shares of any Vanguard fund only if preceded or accompanied by the fund’s current prospectus.
All comparative mutual fund data are from Morningstar, Inc., unless otherwise noted.
You can obtain a free copy of Vanguard’s proxy voting guidelines by visiting vanguard.com/proxyreporting or by calling Vanguard at 800-662-2739. The guidelines are also available from the SEC’s website, www.sec.gov. In addition, you may obtain a free report on how your fund voted the proxies for securities it owned during the 12 months ended June 30. To get the report, visit either vanguard.com/proxyreporting or www.sec.gov.
You can review information about your fund on the SEC’s website, and you can receive copies of this information, for a fee, by sending a request via email addressed to publicinfo@sec.gov.
Source for Bloomberg Barclays indexes: Bloomberg Index Services Limited. Copyright 2019, Bloomberg. All rights reserved.
| © 2019 The Vanguard Group, Inc. |
| All rights reserved. |
| Vanguard Marketing Corporation, Distributor. |
| |
| Q11940 122019 |

Annual Report | October 31, 2019 Vanguard International Dividend Index Funds |
Vanguard International Dividend Appreciation Index Fund Vanguard International High Dividend Yield Index Fund See the inside front cover for important information about access to your fund’s annual and semiannual shareholder reports. |
Important information about access to shareholder reports
Beginning on January 1, 2021, as permitted by regulations adopted by the Securities and Exchange Commission, paper copies of your fund’s annual and semiannual shareholder reports will no longer be sent to you by mail, unless you specifically request them. Instead, you will be notified by mail each time a report is posted on the website and will be provided with a link to access the report.
If you have already elected to receive shareholder reports electronically, you will not be affected by this change and do not need to take any action. You may elect to receive shareholder reports and other communications from the fund electronically by contacting your financial intermediary (such as a broker-dealer or bank) or, if you invest directly with the fund, by calling Vanguard at one of the phone numbers on the back cover of this report or by logging on to vanguard.com.
You may elect to receive paper copies of all future shareholder reports free of charge. If you invest through a financial intermediary, you can contact the intermediary to request that you continue to receive paper copies. If you invest directly with the fund, you can call Vanguard at one of the phone numbers on the back cover of this report or log on to vanguard.com. Your election to receive paper copies will apply to all the funds you hold through an intermediary or directly with Vanguard.
Contents | |
| |
A Note From Our Chairman | 1 |
Your Fund’s Performance at a Glance | 2 |
About Your Fund’s Expenses | 3 |
International Dividend Appreciation Index Fund | 5 |
International High Dividend Yield Index Fund | 28 |
Please note: The opinions expressed in this report are just that—informed opinions. They should not be considered promises or advice. Also, please keep in mind that the information and opinions cover the period through the date on the front of this report. Of course, the risks of investing in your fund are spelled out in the prospectus.
A Note From Our Chairman

Tim Buckley
Chairman and Chief Executive Officer
Dear Shareholder,
Recent volatility in financial markets—affecting stocks, bonds, and commodities—has been a good reminder of the wise old adage, “Never keep all your eggs in one basket.” Maintaining balance and diversification in your investment portfolio can help to both limit risk and set you up for long-term success.
It’s understandable why some investors might become complacent after a long market run-up like the one that lifted stock prices, especially U.S. stock prices, in the years following the global financial crisis. But failing to rebalance regularly can leave a portfolio with a much different mix of assets than intended and, often, more risk than intended.
Balance across and diversification within asset classes are powerful tools for managing risk and achieving your investment goals. A portfolio’s allocation will determine a large portion of its long-term return and also the majority of its volatility risk. A well-diversified portfolio is less vulnerable to significant swings in the performance of any one segment of the asset classes in which it invests.
Balance and diversification will never eliminate the risk of loss, nor will they guarantee positive returns in a declining market. But they should reduce the chance that you’ll suffer disproportionate losses in one particular high-flying asset class or sector when it comes back to earth. And exposure to all key market components should give you at least some participation in the sectors that are performing best at any given time.
Vanguard is committed to helping you achieve balance and diversification in your portfolios to help meet your investment goals. We thank you for your continued loyalty.
Sincerely,

Mortimer J. Buckley
Chairman and Chief Executive Officer
November 18, 2019
1
Your Fund’s Performance at a Glance
· For the 12 months ended October 31, 2019, Admiral Shares of Vanguard International Dividend Appreciation Index Fund returned 18.38%. Admiral Shares of Vanguard International High Dividend Yield Index Fund returned 8.30%.
· The performance difference between the funds reflected investors’ longstanding preference for faster-growing companies over slower-growing ones that pay higher dividends.
· Investors contended with economic uncertainty and volatility amid signs of decelerating global growth, ongoing trade disputes, heightened international tensions, and continued uncertainty about how the United Kingdom would exit the European Union.
· Emerging markets had the highest return among the major regional sectors for the International Dividend Appreciation Index Fund, and North America had the highest return for the International High Dividend Yield Index Fund. Europe, which had the largest allocation in both funds, contributed most to the funds’ returns.
· For the International Dividend Appreciation Index Fund, consumer goods contributed most to the fund’s return; for the International High Dividend Yield Index Fund, the top-contributing sector was financials. Technology had the highest sector return in both funds.
Market Barometer
| | Average Annual Total Returns | |
| | Periods Ended October 31, 2019 | |
| | One Year | | Three Years | | Five Years | |
Stocks | | | | | | | |
Russell 1000 Index (Large-caps) | | 14.15% | | 14.73% | | 10.55% | |
Russell 2000 Index (Small-caps) | | 4.90 | | 10.96 | | 7.37 | |
Russell 3000 Index (Broad U.S. market) | | 13.49 | | 14.47 | | 10.31 | |
FTSE All-World ex US Index (International) | | 11.52 | | 8.21 | | 4.16 | |
| | | | | | | |
Bonds | | | | | | | |
Bloomberg Barclays U.S. Aggregate Bond Index (Broad taxable market) | | 11.51% | | 3.29% | | 3.24% | |
Bloomberg Barclays Municipal Bond Index (Broad tax-exempt market) | | 9.42 | | 3.62 | | 3.55 | |
FTSE Three-Month U.S. Treasury Bill Index | | 2.35 | | 1.57 | | 0.98 | |
| | | | | | | |
CPI | | | | | | | |
Consumer Price Index | | 1.76% | | 2.11% | | 1.62% | |
Fund returns are adjusted to reflect the 0.25% fee on purchases and redemptions. The fees do not apply to the ETF Shares.
2
About Your Fund’s Expenses
As a shareholder of the fund, you incur ongoing costs, which include costs for portfolio management, administrative services, and shareholder reports (like this one), among others. Operating expenses, which are deducted from a fund’s gross income, directly reduce the investment return of the fund.
A fund’s expenses are expressed as a percentage of its average net assets. This figure is known as the expense ratio. The following examples are intended to help you understand the ongoing costs (in dollars) of investing in your fund and to compare these costs with those of other mutual funds. The examples are based on an investment of $1,000 made at the beginning of the period shown and held for the entire period.
The accompanying table illustrates your fund’s costs in two ways:
· Based on actual fund return. This section helps you to estimate the actual expenses that you paid over the period. The “Ending Account Value” shown is derived from the fund’s actual return, and the third column shows the dollar amount that would have been paid by an investor who started with $1,000 in the fund. You may use the information here, together with the amount you invested, to estimate the expenses that you paid over the period.
To do so, simply divide your account value by $1,000 (for example, an $8,600 account value divided by $1,000 = 8.6), then multiply the result by the number given for your fund under the heading “Expenses Paid During Period.”
· Based on hypothetical 5% yearly return. This section is intended to help you compare your fund’s costs with those of other mutual funds. It assumes that the fund had a yearly return of 5% before expenses, but that the expense ratio is unchanged. In this case—because the return used is not the fund’s actual return—the results do not apply to your investment. The example is useful in making comparisons because the Securities and Exchange Commission requires all mutual funds to calculate expenses based on a 5% return. You can assess your fund’s costs by comparing this hypothetical example with the hypothetical examples that appear in shareholder reports of other funds.
Note that the expenses shown in the table are meant to highlight and help you compare ongoing costs only and do not reflect transaction costs incurred by the fund for buying and selling securities. Further, the expenses do not include any purchase, redemption, or account service fees described in the fund prospectus. If such fees were applied to your account, your costs would be higher. Your fund does not carry a “sales load.”
The calculations assume no shares were bought or sold during the period. Your actual costs may have been higher or lower, depending on the amount of your investment and the timing of any purchases or redemptions.
You can find more information about the fund’s expenses, including annual expense ratios, in the Financial Statements section of this report. For additional information on operating expenses and other shareholder costs, please refer to your fund’s current prospectus.
3
Six Months Ended October 31, 2019 | | | |
| Beginning | Ending | Expenses |
| Account Value | Account Value | Paid During |
| 4/30/2019 | 10/31/2019 | Period |
Based on Actual Fund Return | | | |
International Dividend Appreciation Index Fund | | | |
ETF Shares | $1,000.00 | $1,042.70 | $0.82 |
Admiral™ Shares | 1,000.00 | 1,042.65 | 0.88 |
International High Dividend Yield Index Fund | | | |
ETF Shares | $1,000.00 | $1,009.29 | $1.22 |
Admiral Shares | 1,000.00 | 1,009.08 | 1.16 |
Based on Hypothetical 5% Yearly Return | | | |
International Dividend Appreciation Index Fund | | | |
ETF Shares | $1,000.00 | $1,024.40 | $0.82 |
Admiral Shares | 1,000.00 | 1,024.35 | 0.87 |
International High Dividend Yield Index Fund | | | |
ETF Shares | $1,000.00 | $1,024.00 | $1.22 |
Admiral Shares | 1,000.00 | 1,024.05 | 1.17 |
The calculations are based on expenses incurred in the most recent six-month period. The funds’ annualized six-month expense ratios for that period are: for the International Dividend Appreciation Index Fund, 0.16% for ETF Shares and 0.17% for Admiral Shares; and for the International High Dividend Yield Index Fund, 0.24% for ETF Shares and 0.23% for Admiral Shares. The dollar amounts shown as “Expenses Paid” are equal to the annualized expense ratio multiplied by the average account value over the period, multiplied by the number of days in the six-month period, then divided by the number of days in the most recent 12-month period (184/365).
4
International Dividend Appreciation Index Fund
Performance Summary
All of the returns in this report represent past performance, which is not a guarantee of future results that may be achieved by the fund. (Current performance may be lower or higher than the performance data cited. For performance data current to the most recent month-end, visit our website at vanguard.com/performance.) Note, too, that both investment returns and principal value can fluctuate widely, so an investor’s shares, when sold, could be worth more or less than their original cost. The returns shown do not reflect taxes that a shareholder would pay on fund distributions or on the sale of fund shares.
Cumulative Performance: February 25, 2016, Through October 31, 2019
Initial Investment of $10,000

| | Average Annual Total Returns | |
| | Periods Ended October 31, 2019 | |
| | | Since | Final Value |
| | One | Inception | of a $10,000 |
| | Year | (2/25/2016) | Investment |

| International Dividend Appreciation Index Fund ETF Shares Net Asset Value | 18.96% | 10.77% | $14,572 |
| International Dividend Appreciation Index Fund ETF Shares Market Price | 19.43 | 10.83 | 14,597 |

| NASDAQ International Dividend Achievers Select Index | 19.30 | 11.18 | 14,770 |
“Since Inception” performance is calculated from the ETF Shares’ inception date for both the fund and its comparative standard(s).
| | | Since | Final Value |
| | One | Inception | of a $10,000 |
| | Year | (3/2/2016) | Investment |
International Dividend Appreciation Index Fund Admiral Shares | 18.38% | 9.82% | $14,093 |
NASDAQ International Dividend Achievers Select Index | 19.30 | 10.33 | 14,338 |
“Since Inception” performance is calculated from the Admiral Shares’ inception date for both the fund and its comparative standard(s).
Vanguard fund returns are adjusted to reflect the 0.25% fee on purchases and redemptions. The fees do not apply to the ETF Shares.
See Financial Highlights for dividend and capital gains information.
5
International Dividend Appreciation Index Fund
Cumulative Returns of ETF Shares: February 25, 2016, Through October 31, 2019
| | Since |
| One | Inception |
| Year | (2/25/2016) |
International Dividend Appreciation Index Fund ETF Shares Market Price | 19.43% | 45.97% |
International Dividend Appreciation Index Fund ETF Shares Net Asset Value | 18.96 | 45.72 |
NASDAQ International Dividend Achievers Select Index | 19.30 | 47.70 |
“Since Inception” performance is calculated from the ETF Shares’ inception date for both the fund and its comparative standard(s).
For the ETF Shares, the market price is determined by the midpoint of the bid-offer spread as of the closing time of the New York Stock Exchange (generally 4 p.m., Eastern time). The net asset value is also determined as of the NYSE closing time. For more information about how the ETF Shares’ market prices have compared with their net asset value, visit vanguard.com, select your ETF, and then select the Price and Performance tab. The ETF premium/discount analysis there shows the percentages of days on which the ETF Shares’ market price was above or below the NAV.
Vanguard fund returns are adjusted to reflect the 0.25% fee on purchases of fund shares. The fee does not apply to the ETF Shares.
6
International Dividend Appreciation Index Fund
Sector Diversification
As of October 31, 2019
Basic Materials | 3.4 | % |
Consumer Goods | 21.5 | |
Consumer Services | 9.1 | |
Financials | 15.7 | |
Health Care | 12.5 | |
Industrials | 11.9 | |
Oil & Gas | 3.3 | |
Other | 0.2 | |
Technology | 17.4 | |
Telecommunications | 3.2 | |
Utilities | 1.8 | |
The table reflects the fund’s equity exposure, based on its investments in stocks and stock index futures. Any holdings in short-term reserves are excluded. Sector categories are based on the Industry Classification Benchmark (“ICB”), except for the “Other” category (if applicable), which includes securities that have not been provided an ICB classification as of the effective reporting period.
The Industry Classification Benchmark (“ICB”) is owned by FTSE. FTSE does not accept any liability to any person for any loss or damage arising out of any error or omission in the ICB.
7
International Dividend Appreciation Index Fund
Financial Statements
Statement of Net Assets
As of October 31, 2019
The fund files its complete schedule of portfolio holdings with the Securities and Exchange Commission (SEC) for the first and third quarters of each fiscal year as an exhibit to its reports on Form N-PORT. The fund’s Form N-PORT reports are available on the SEC’s website at www.sec.gov.
| | | | | Market | |
| | | | | Value· | |
| | | Shares | | ($000 | ) |
Common Stocks (99.7%)1 | | | | | |
Australia (2.2%) | | | | | |
| CSL Ltd. | | 104,319 | | 18,397 | |
| Aristocrat Leisure Ltd. | | 150,180 | | 3,275 | |
| Brambles Ltd. | | 364,584 | | 3,014 | |
| Ramsay Health Care Ltd. | | 49,420 | | 2,335 | |
| REA Group Ltd. | | 29,724 | | 2,231 | |
| SEEK Ltd. | | 78,540 | | 1,229 | |
| Qube Holdings Ltd. | | 392,491 | | 880 | |
| Washington H Soul Pattinson & Co. Ltd. | | 54,397 | | 813 | |
| Domino’s Pizza Enterprises Ltd. | | 20,288 | | 714 | |
| Technology One Ltd. | | 67,417 | | 343 | |
| Corporate Travel Management Ltd. | | 23,156 | | 281 | |
| | | | | 33,512 | |
Belgium (0.5%) | | | | | |
| UCB SA | | 45,613 | | 3,677 | |
| Sofina SA | | 7,887 | | 1,745 | |
| Ackermans & van Haaren NV | | 7,151 | | 1,096 | |
| Barco NV | | 2,754 | | 600 | |
| | | | | 7,118 | |
Canada (7.8%) | | | | | |
| Toronto-Dominion Bank | | 419,340 | | 23,945 | |
| Canadian National Railway Co. (Toronto Shares) | | 168,123 | | 15,037 | |
| Brookfield Asset Management Inc. Class A | | 227,378 | | 12,573 | |
| Suncor Energy Inc. | | 362,689 | | 10,783 | |
| Alimentation Couche-Tard Inc. Class B | | 207,960 | | 6,237 | |
| Loblaw Cos. Ltd. | | 83,632 | | 4,460 | |
| Imperial Oil Ltd. | | 177,896 | | 4,430 | |
| Franco-Nevada Corp. | | 44,432 | | 4,311 | |
| Magna International Inc. | | 73,683 | | 3,962 | |
| Fortis Inc. | | 95,238 | | 3,957 | |
| Intact Financial Corp. | | 32,849 | | 3,389 | |
| George Weston Ltd. | | 33,679 | | 2,696 | |
| Saputo Inc. | | 89,621 | | 2,599 | |
| Dollarama Inc. | | 71,470 | | 2,404 | |
| Metro Inc. | | 55,624 | | 2,352 | |
| CCL Industries Inc. Class B | | 40,496 | | 1,667 | |
| CAE Inc. | | 66,123 | | 1,658 | |
^ | Canadian Tire Corp. Ltd. Class A | | 13,793 | | 1,487 | |
| Gildan Activewear Inc. | | 46,560 | | 1,190 | |
| Empire Co. Ltd. | | 42,584 | | 1,131 | |
| Ritchie Bros Auctioneers Inc. | | 26,304 | | 1,082 | |
| Toromont Industries Ltd. | | 20,256 | | 1,046 | |
| Atco Ltd. | | 22,093 | | 777 | |
| Boyd Group Income Fund | | 5,474 | | 763 | |
| SNC-Lavalin Group Inc. | | 39,968 | | 723 | |
| Methanex Corp. | | 18,731 | | 710 | |
| Finning International Inc. | | 39,855 | | 679 | |
| Cogeco Communications Inc. | | 7,212 | | 623 | |
| Canadian Western Bank | | 22,295 | | 565 | |
| TFI International Inc. | | 17,598 | | 561 | |
| Stella-Jones Inc. | | 17,277 | | 479 | |
| Enghouse Systems Ltd. | | 13,270 | | 387 | |
| Equitable Group Inc. | | 3,497 | | 301 | |
| Richelieu Hardware Ltd. | | 11,578 | | 238 | |
| Cogeco Inc. | | 2,958 | | 229 | |
| | | | | 119,431 | |
China (5.4%) | | | | | |
| Tencent Holdings Ltd. | | 1,316,024 | | 53,382 | |
| China Overseas Land & Investment Ltd. | | 2,509,119 | | 7,918 | |
| China Merchants Bank Co. Ltd. | | 1,049,500 | | 5,005 | |
| China Gas Holdings Ltd. | | 1,165,800 | | 4,966 | |
| Sunny Optical Technology Group Co. Ltd. | | 253,554 | | 4,076 | |
| China Resources Gas Group Ltd. | | 541,000 | | 3,262 | |
8
International Dividend Appreciation Index Fund
| | | | | Market | |
| | | | | Value· | |
| | | Shares | | ($000 | ) |
| Guangdong Investment Ltd. | | 1,504,000 | | 3,255 | |
| Sinopharm Group Co. Ltd. | | 278,800 | | 998 | |
| | | | | 82,862 | |
Colombia (0.3%) | | | | | |
| Bancolombia SA ADR | | 29,489 | | 1,530 | |
| Grupo de Inversiones Suramericana SA | | 96,353 | | 975 | |
| Grupo Argos SA | | 138,925 | | 752 | |
| Cementos Argos SA | | 244,767 | | 553 | |
| Bancolombia SA Preference Shares | | 8,068 | | 105 | |
| | | | | 3,915 | |
Denmark (1.0%) | | | | | |
| Coloplast A/S Class B | | 45,819 | | 5,516 | |
| DSV Panalpina A/S | | 55,372 | | 5,382 | |
| Novozymes A/S | | 55,166 | | 2,600 | |
| GN Store Nord A/S | | 32,694 | | 1,438 | |
| Schouw & Co. A/S | | 5,500 | | 395 | |
| | | | | 15,331 | |
Finland (0.2%) | | | | | |
| Wartsila OYJ Abp | | 134,920 | | 1,426 | |
| Huhtamaki Oyj | | 24,298 | | 1,125 | |
| | | | | 2,551 | |
France (13.1%) | | | | | |
| LVMH Moet Hennessy Louis Vuitton SE | | 116,183 | | 49,617 | |
| Airbus SE | | 178,457 | | 25,601 | |
| Hermes International | | 24,197 | | 17,431 | |
| EssilorLuxottica SA | | 99,697 | | 15,223 | |
* | L’Oreal SA Loyalty Shares 2021 | | 46,336 | | 13,533 | |
| Air Liquide SA Loyalty Shares 2021 | | 88,849 | | 11,814 | |
* | L’Oreal SA Loyalty Shares 2020 | | 35,992 | | 10,512 | |
| Dassault Systemes SE | | 60,092 | | 9,127 | |
| L’Oreal SA | | 23,342 | | 6,817 | |
| L’Oreal SA Loyalty Shares | | 23,101 | | 6,747 | |
| Legrand SA | | 59,301 | | 4,633 | |
| Sodexo SA | | 35,040 | | 3,856 | |
| Sartorius Stedim Biotech | | 21,342 | | 3,197 | |
| Teleperformance | | 13,244 | | 3,005 | |
| Air Liquide SA | | 20,032 | | 2,664 | |
^ | Eurofins Scientific SE | | 4,098 | | 2,078 | |
| Getlink SE | | 123,270 | | 2,065 | |
| Arkema SA | | 18,165 | | 1,859 | |
| Orpea | | 14,691 | | 1,769 | |
| Ingenico Group SA | | 15,235 | | 1,629 | |
| Wendel SA | | 10,002 | | 1,418 | |
| Eurazeo SE | | 19,501 | | 1,361 | |
| Rubis SCA | | 23,117 | | 1,341 | |
| Cie Plastic Omnium SA | | 33,312 | | 910 | |
| SEB SA | | 4,136 | | 628 | |
| SEB Loyalty Shares | | 3,419 | | 520 | |
| SEB SA (XPAR) | | 2,405 | | 365 | |
| SEB SA Loyalty Shares | | 2,114 | | 321 | |
| | | | | 200,041 | |
Germany (5.0%) | | | | | |
| SAP SE | | 282,732 | | 37,463 | |
| Fresenius SE & Co. KGaA | | 126,952 | | 6,685 | |
| Fresenius Medical Care AG & Co. KGaA | | 70,168 | | 5,065 | |
| Henkel AG & Co. KGaA Preference Shares | | 41,924 | | 4,355 | |
| Merck KGaA | | 29,457 | | 3,513 | |
| HeidelbergCement AG | | 47,159 | | 3,496 | |
| Symrise AG Class A | | 31,340 | | 3,012 | |
| Rational AG | | 2,519 | | 1,917 | |
| Brenntag AG | | 34,007 | | 1,704 | |
| Sartorius AG Preference Shares | | 8,758 | | 1,702 | |
| Fielmann AG | | 20,192 | | 1,557 | |
| CTS Eventim AG & Co. KGaA | | 23,267 | | 1,409 | |
| Bechtle AG | | 10,223 | | 1,107 | |
^ | GRENKE AG | | 10,402 | | 984 | |
| Fuchs Petrolub SE Preference Shares | | 14,545 | | 620 | |
| Gerresheimer AG | | 6,658 | | 537 | |
| Duerr AG | | 15,575 | | 459 | |
| Krones AG | | 6,622 | | 433 | |
| Cewe Stiftung & Co. KGaA | | 1,495 | | 144 | |
| Bertrandt AG | | 66 | | 3 | |
| | | | | 76,165 | |
Hong Kong (4.3%) | | | | | |
| AIA Group Ltd. | | 2,776,760 | | 27,652 | |
| MTR Corp. Ltd. | | 1,428,120 | | 8,188 | |
| CK Hutchison Holdings Ltd. | | 879,078 | | 8,117 | |
| Hong Kong & China Gas Co. Ltd. | | 3,979,581 | | 7,724 | |
| CLP Holdings Ltd. | | 578,000 | | 6,003 | |
| Techtronic Industries Co. Ltd. | | 418,984 | | 3,274 | |
| Wheelock & Co. Ltd. | | 460,746 | | 2,849 | |
| Minth Group Ltd. | | 257,000 | | 909 | |
| Hysan Development Co. Ltd. | | 223,000 | | 879 | |
| | | | | 65,595 | |
9
International Dividend Appreciation Index Fund
| | | | | Market | |
| | | | | Value· | |
| | | Shares | | ($000 | ) |
Hungary (0.2%) | | | | | |
| OTP Bank Nyrt | | 63,238 | | 2,916 | |
| | | | | | |
India (11.2%) | | | | | |
| Reliance Industries Ltd. | | 1,459,575 | | 30,084 | |
| Tata Consultancy Services Ltd. | | 863,939 | | 27,657 | |
| HDFC Bank Ltd. ADR | | 362,206 | | 22,127 | |
| Hindustan Unilever Ltd. | | 498,207 | | 15,270 | |
| Housing Development Finance Corp. Ltd. | | 396,248 | | 11,892 | |
| ITC Ltd. | | 2,821,015 | | 10,238 | |
| Kotak Mahindra Bank Ltd. | | 439,634 | | 9,751 | |
| Infosys Ltd. ADR | | 959,201 | | 9,199 | |
| Bajaj Finance Ltd. | | 132,822 | | 7,532 | |
| Larsen & Toubro Ltd. | | 322,950 | | 6,701 | |
| Asian Paints Ltd. | | 220,567 | | 5,622 | |
| IndusInd Bank Ltd. | | 159,111 | | 2,943 | |
| Godrej Consumer Products Ltd. | | 236,182 | | 2,465 | |
| Pidilite Industries Ltd. | | 116,497 | | 2,300 | |
| Berger Paints India Ltd. | | 219,615 | | 1,629 | |
| Container Corp. Of India Ltd. | | 139,044 | | 1,152 | |
| Page Industries Ltd. | | 2,604 | | 944 | |
| LIC Housing Finance Ltd. | | 118,555 | | 689 | |
| Sundaram Finance Ltd. | | 24,724 | | 561 | |
| Yes Bank Ltd. | | 563,178 | | 558 | |
| Infosys Ltd. | | 49,153 | | 473 | |
| Persistent Systems Ltd. | | 18,942 | | 166 | |
* | Reliance Infrastructure Ltd. | | 53,014 | | 26 | |
| | | | | 169,979 | |
Indonesia (0.6%) | | | | | |
| Bank Rakyat Indonesia Persero Tbk PT | | 28,061,900 | | 8,408 | |
| | | | | | |
Ireland (0.5%) | | | | | |
| Kerry Group plc Class A | | 40,299 | | 4,871 | |
| Kingspan Group plc | | 41,557 | | 2,153 | |
| Glanbia plc | | 77,973 | | 869 | |
| Total Produce plc | | 82,398 | | 134 | |
| | | | | 8,027 | |
Italy (0.1%) | | | | | |
| DiaSorin SPA | | 13,197 | | 1,488 | |
| Reply SPA | | 8,058 | | 525 | |
| | | | | 2,013 | |
Japan (10.7%) | | | | | |
| Nippon Telegraph & Telephone Corp. | | 447,922 | | 22,236 | |
| KDDI Corp. | | 581,371 | | 16,087 | |
| Tokio Marine Holdings Inc. | | 164,600 | | 8,899 | |
| Seven & i Holdings Co. Ltd. | | 207,100 | | 7,824 | |
| Bridgestone Corp. | | 178,966 | | 7,436 | |
| Terumo Corp. | | 174,076 | | 5,681 | |
| Asahi Group Holdings Ltd. | | 112,043 | | 5,611 | |
| Suzuki Motor Corp. | | 113,400 | | 5,354 | |
| Nitori Holdings Co. Ltd. | | 28,001 | | 4,262 | |
| West Japan Railway Co. | | 46,005 | | 3,997 | |
| M3 Inc. | | 151,500 | | 3,630 | |
| Sysmex Corp. | | 47,530 | | 3,101 | |
| Obic Co. Ltd. | | 23,300 | | 2,917 | |
| Hikari Tsushin Inc. | | 10,600 | | 2,323 | |
| Yakult Honsha Co. Ltd. | | 39,200 | | 2,247 | |
| Pan Pacific International Holdings Corp. | | 141,864 | | 2,233 | |
| Sekisui Chemical Co. Ltd. | | 122,100 | | 2,129 | |
| Koito Manufacturing Co. Ltd. | | 37,100 | | 1,941 | |
| Otsuka Corp. | | 47,400 | | 1,911 | |
| Shimadzu Corp. | | 70,477 | | 1,882 | |
| MonotaRO Co. Ltd. | | 56,599 | | 1,710 | |
| TOTO Ltd. | | 39,500 | | 1,613 | |
| MISUMI Group Inc. | | 62,500 | | 1,571 | |
| Kansai Paint Co. Ltd. | | 60,700 | | 1,462 | |
| Itochu Techno-Solutions Corp. | | 53,503 | | 1,441 | |
| Welcia Holdings Co. Ltd. | | 24,100 | | 1,385 | |
| Mitsubishi UFJ Lease & Finance Co. Ltd. | | 218,102 | | 1,339 | |
| USS Co. Ltd. | | 69,100 | | 1,338 | |
| Hakuhodo DY Holdings Inc. | | 86,900 | | 1,297 | |
| Alfresa Holdings Corp. | | 56,700 | | 1,266 | |
| Pola Orbis Holdings Inc. | | 55,400 | | 1,250 | |
| GMO Payment Gateway Inc. | | 16,900 | | 1,245 | |
| Nomura Real Estate Holdings Inc. | | 51,380 | | 1,218 | |
| Tokyo Century Corp. | | 26,200 | | 1,210 | |
| Lawson Inc. | | 21,800 | | 1,203 | |
| Nihon M&A Center Inc. | | 37,900 | | 1,152 | |
| SCSK Corp. | | 22,100 | | 1,125 | |
| Rinnai Corp. | | 14,084 | | 1,035 | |
| Persol Holdings Co. Ltd. | | 53,500 | | 1,028 | |
| Stanley Electric Co. Ltd. | | 36,200 | | 1,002 | |
| PALTAC Corp. | | 19,754 | | 953 | |
| Sundrug Co. Ltd. | | 28,124 | | 931 | |
| Relo Group Inc. | | 35,700 | | 874 | |
| Goldwin Inc. | | 11,000 | | 842 | |
| Kurita Water Industries Ltd. | | 28,400 | | 818 | |
| AEON Financial Service Co. Ltd. | | 48,400 | | 738 | |
| Seven Bank Ltd. | | 251,600 | | 729 | |
10
International Dividend Appreciation Index Fund
| | | | | Market | |
| | | | | Value· | |
| | | Shares | | ($000 | ) |
| J Front Retailing Co. Ltd. | | 57,100 | | 726 | |
| Benefit One Inc. | | 35,200 | | 713 | |
| Kewpie Corp. | | 31,300 | | 710 | |
| Koei Tecmo Holdings Co. Ltd. | | 30,540 | | 705 | |
| OBIC Business Consultants Co. Ltd. | | 17,100 | | 685 | |
| Hitachi Capital Corp. | | 29,600 | | 663 | |
| NOF Corp. | | 17,900 | | 605 | |
| TS Tech Co. Ltd. | | 18,500 | | 592 | |
| Izumi Co. Ltd. | | 15,100 | | 568 | |
| Sanwa Holdings Corp. | | 48,500 | | 567 | |
| NHK Spring Co. Ltd. | | 59,500 | | 486 | |
| SHO-BOND Holdings Co. Ltd. | | 11,884 | | 461 | |
| NEC Networks & System Integration Corp. | | 14,500 | | 458 | |
| San-A Co. Ltd. | | 9,426 | | 446 | |
| en-japan Inc. | | 10,500 | | 444 | |
| Aica Kogyo Co. Ltd. | | 13,600 | | 432 | |
| Fuyo General Lease Co. Ltd. | | 6,400 | | 417 | |
| Glory Ltd. | | 13,900 | | 409 | |
| Starts Corp. Inc. | | 15,542 | | 401 | |
| Yaoko Co. Ltd. | | 8,400 | | 392 | |
| Noevir Holdings Co. Ltd. | | 7,200 | | 389 | |
| Senko Group Holdings Co. Ltd. | | 47,560 | | 383 | |
| Ai Holdings Corp. | | 21,070 | | 382 | |
| Aeon Delight Co. Ltd. | | 10,900 | | 380 | |
| Milbon Co. Ltd. | | 6,700 | | 367 | |
| Keihin Corp. | | 15,000 | | 357 | |
| Elecom Co. Ltd. | | 8,700 | | 338 | |
| Tokyo Seimitsu Co. Ltd. | | 10,372 | | 333 | |
| Modec Inc. | | 12,000 | | 329 | |
| Kissei Pharmaceutical Co. Ltd. | | 10,500 | | 270 | |
| Funai Soken Holdings Inc. | | 10,700 | | 258 | |
| Valor Holdings Co. Ltd. | | 14,612 | | 249 | |
| Koshidaka Holdings Co. Ltd. | | 16,900 | | 245 | |
| Hogy Medical Co. Ltd. | | 6,600 | | 220 | |
| Sato Holdings Corp. | | 7,400 | | 218 | |
| Prestige International Inc. | | 25,800 | | 214 | |
| Ricoh Leasing Co. Ltd. | | 6,100 | | 206 | |
| Mitsubishi Pencil Co. Ltd. | | 13,000 | | 205 | |
| Belc Co. Ltd. | | 4,200 | | 202 | |
| Sekisui Jushi Corp. | | 9,800 | | 201 | |
| Nippon Signal Company Ltd. | | 17,400 | | 200 | |
| Musashi Seimitsu Industry Co. Ltd. | | 14,200 | | 197 | |
| Kanematsu Electronics Ltd. | | 5,800 | | 181 | |
| Yellow Hat Ltd. | | 10,000 | | 163 | |
| Tosho Co. Ltd. | | 7,900 | | 161 | |
| Piolax Inc. | | 8,200 | | 160 | |
| JAC Recruitment Co. Ltd. | | 8,400 | | 158 | |
| Siix Corp. | | 10,200 | | 155 | |
| G-Tekt Corp. | | 8,800 | | 152 | |
| Hiday Hidaka Corp. | | 7,562 | | 148 | |
| Yondoshi Holdings Inc. | | 6,000 | | 146 | |
| Fukushima Industries Corp. | | 4,600 | | 144 | |
| JCU Corp. | | 5,600 | | 137 | |
| Fujicco Co. Ltd. | | 7,200 | | 131 | |
| Link And Motivation Inc. | | 23,800 | | 128 | |
| Hamakyorex Co. Ltd. | | 3,700 | | 126 | |
| Tosei Corp. | | 9,800 | | 124 | |
| Nippon Parking Development Co. Ltd. | | 80,200 | | 122 | |
| Kyokuto Kaihatsu Kogyo Co. Ltd. | | 8,700 | | 117 | |
| WDB Holdings Co. Ltd. | | 4,100 | | 104 | |
| Monogatari Corp. | | 1,200 | | 104 | |
| Sinko Industries Ltd. | | 5,600 | | 95 | |
| World Holdings Co. Ltd. | | 3,400 | | 57 | |
| | | | | 163,312 | |
Malaysia (0.0%) | | | | | |
| Bursa Malaysia Bhd. | | 163,100 | | 236 | |
| | | | | | |
Mexico (1.1%) | | | | | |
| America Movil SAB de CV | | 10,350,556 | | 8,200 | |
| Grupo Elektra SAB de CV | | 54,585 | | 3,967 | |
| Grupo Financiero Inbursa SAB de CV | | 1,514,155 | | 1,881 | |
| Grupo Carso SAB de CV | | 523,204 | | 1,752 | |
| Grupo Aeroportuario del Sureste SAB de CV Class B | | 61,953 | | 1,016 | |
| | | | | 16,816 | |
Morocco (0.1%) | | | | | |
| Attijariwafa Bank | | 47,836 | | 2,337 | |
| | | | | | |
Netherlands (3.3%) | | | | | |
| ASML Holding NV | | 97,738 | | 25,619 | |
| Unilever NV | | 394,316 | | 23,307 | |
| Aalberts NV | | 25,090 | | 1,011 | |
| | | | | 49,937 | |
New Zealand (0.1%) | | | | | |
| Ryman Healthcare Ltd. | | 120,703 | | 998 | |
| Mainfreight Ltd. | | 20,848 | | 537 | |
| | | | | 1,535 | |
Norway (0.1%) | | | | | |
| Tomra Systems ASA | | 35,069 | | 945 | |
11
International Dividend Appreciation Index Fund
| | | | | Market | |
| | | | | Value· | |
| | | Shares | | ($000 | ) |
Philippines (0.8%) | | | | | |
| SM Investments Corp. | | 276,490 | | 5,605 | |
| Ayala Land Inc. | | 3,377,670 | | 3,228 | |
| Jollibee Foods Corp. | | 252,868 | | 1,155 | |
| International Container Terminal Services Inc. | | 449,580 | | 1,051 | |
| Metro Pacific Investments Corp. | | 6,866,500 | | 649 | |
| | | | | 11,688 | |
South Africa (1.8%) | | | | | |
| Naspers Ltd. | | 100,633 | | 14,241 | |
| Sanlam Ltd. | | 495,195 | | 2,606 | |
| Capitec Bank Holdings Ltd. | | 27,722 | | 2,520 | |
| Remgro Ltd. | | 133,024 | | 1,525 | |
| Discovery Ltd. | | 151,591 | | 1,207 | |
| Bidvest Group Ltd. | | 71,854 | | 981 | |
| PSG Group Ltd. | | 62,273 | | 974 | |
| Clicks Group Ltd. | | 57,453 | | 934 | |
| Mr Price Group Ltd. | | 56,175 | | 594 | |
| SPAR Group Ltd. | | 38,228 | | 514 | |
| Santam Ltd. | | 27,038 | | 505 | |
| Mondi plc (XJSE) | | 23,843 | | 493 | |
| Barloworld Ltd. | | 56,839 | | 453 | |
| Netcare Ltd. | | 300,130 | | 340 | |
| Hosken Consolidated Investments Ltd. | | 18,181 | | 108 | |
| | | | | 27,995 | |
South Korea (3.9%) | | | | | |
| Samsung Electronics Co. Ltd. | | 1,373,314 | | 59,354 | |
| LEENO Industrial Inc. | | 3,504 | | 160 | |
| | | | | 59,514 | |
Spain (2.1%) | | | | | |
^ | Industria de Diseno Textil SA | | 716,713 | | 22,334 | |
| Amadeus IT Group SA | | 100,748 | | 7,453 | |
| Grupo Catalana Occidente SA | | 27,640 | | 968 | |
| Viscofan SA | | 11,692 | | 634 | |
| Vidrala SA | | 7,142 | | 621 | |
* | Vidrala SA Rights Exp. 11/11/2019 | | 7,142 | | 31 | |
| Miquel y Costas & Miquel SA | | 7,483 | | 126 | |
| | | | | 32,167 | |
Sweden (1.7%) | | | | | |
| Assa Abloy AB Class B | | 240,443 | | 5,710 | |
^ | Investor AB Class B | | 100,991 | | 5,181 | |
| Hexagon AB Class B | | 81,426 | | 4,169 | |
| Svenska Cellulosa AB SCA Class B | | 165,797 | | 1,692 | |
| L E Lundbergforetagen AB Class B | | 34,114 | | 1,286 | |
| Castellum AB | | 61,399 | | 1,255 | |
| Trelleborg AB Class B | | 73,676 | | 1,191 | |
| AAK AB | | 57,604 | | 1,022 | |
| Hufvudstaden AB Class A | | 48,515 | | 812 | |
| Hexpol AB | | 69,832 | | 623 | |
| Loomis AB Class B | | 15,536 | | 601 | |
| Atrium Ljungberg AB | | 29,031 | | 578 | |
| Wihlborgs Fastigheter AB | | 31,897 | | 483 | |
| AF POYRY AB | | 21,429 | | 456 | |
| Biotage AB | | 19,244 | | 199 | |
| | | | | 25,258 | |
Switzerland (12.9%) | | | | | |
| Nestle SA | | 621,917 | | 66,534 | |
| Novartis AG | | 586,557 | | 51,251 | |
| Roche Holding AG | | 161,556 | | 48,621 | |
| Cie Financiere Richemont SA | | 119,255 | | 9,371 | |
| Givaudan SA | | 2,179 | | 6,402 | |
| Partners Group Holding AG | | 6,069 | | 4,743 | |
| Geberit AG | | 8,375 | | 4,255 | |
| EMS-Chemie Holding AG | | 5,222 | | 3,272 | |
| Chocoladefabriken Lindt & Spruengli AG | | 262 | | 1,947 | |
| Interroll Holding AG | | 238 | | 492 | |
| Orior AG | | 2,030 | | 178 | |
| | | | | 197,066 | |
Taiwan (0.2%) | | | | | |
| E.Sun Financial Holding Co. Ltd. | | 2,646,788 | | 2,391 | |
| Grape King Bio Ltd. | | 29,000 | | 180 | |
| | | | | 2,571 | |
Thailand (0.1%) | | | | | |
| Central Pattana PCL (Foreign) | | 1,077,100 | | 2,283 | |
| Central Pattana PCL | | 18,000 | | 38 | |
| | | | | 2,321 | |
Turkey (0.1%) | | | | | |
| BIM Birlesik Magazalar AS | | 142,594 | | 1,180 | |
| | | | | | |
United Kingdom (8.2%) | | | | | |
| Diageo plc | | 555,606 | | 22,742 | |
| RELX plc | | 450,758 | | 10,852 | |
| Prudential plc | | 599,122 | | 10,465 | |
| Compass Group plc | | 361,738 | | 9,631 | |
| Experian plc | | 210,024 | | 6,620 | |
| Associated British Foods plc | | 181,182 | | 5,230 | |
| Ferguson plc | | 52,993 | | 4,525 | |
| Ashtead Group plc | | 112,282 | | 3,419 | |
12
International Dividend Appreciation Index Fund
| | | | | Market | |
| | | | | Value· | |
| | | Shares | | ($000 | ) |
| InterContinental Hotels Group plc | | 42,185 | | 2,553 | |
| Intertek Group plc | | 36,751 | | 2,548 | |
| Burberry Group plc | | 95,469 | | 2,532 | |
| JD Sports Fashion plc | | 228,746 | | 2,275 | |
| Halma plc | | 84,000 | | 2,038 | |
| Bunzl plc | | 76,028 | | 1,978 | |
| Croda International plc | | 31,589 | | 1,971 | |
^ | Flutter Entertainment plc | | 17,798 | | 1,836 | |
| Smiths Group plc | | 87,450 | | 1,828 | |
| Johnson Matthey plc | | 45,509 | | 1,808 | |
| Mondi plc (XLON) | | 86,314 | | 1,790 | |
| Rightmove plc | | 217,913 | | 1,692 | |
| Whitbread plc | | 32,091 | | 1,689 | |
| Spirax-Sarco Engineering plc | | 16,391 | | 1,682 | |
| Meggitt plc | | 191,576 | | 1,550 | |
| Hikma Pharmaceuticals plc | | 57,504 | | 1,498 | |
| Intermediate Capital Group plc | | 65,467 | | 1,260 | |
| Hiscox Ltd. | | 64,288 | | 1,241 | |
| IWG plc | | 215,052 | | 1,071 | |
| Beazley plc | | 118,871 | | 903 | |
| Spectris plc | | 28,297 | | 877 | |
| Renishaw plc | | 17,460 | | 858 | |
| Dechra Pharmaceuticals plc | | 25,088 | | 856 | |
| WH Smith plc | | 26,447 | | 749 | |
| Abcam plc | | 49,227 | | 743 | |
| Rotork plc | | 182,223 | | 712 | |
| Grafton Group plc | | 61,443 | | 622 | |
| National Express Group plc | | 106,784 | | 618 | |
| Genus plc | | 16,384 | | 616 | |
| Victrex plc | | 20,897 | | 594 | |
| Moneysupermarket.com Group plc | | 132,150 | | 588 | |
| Dart Group plc | | 34,294 | | 562 | |
| Diploma plc | | 23,810 | | 493 | |
| QinetiQ Group plc | | 117,745 | | 480 | |
| RWS Holdings plc | | 59,069 | | 459 | |
| Bodycote plc | | 46,668 | | 433 | |
| Cranswick plc | | 10,754 | | 432 | |
| Synthomer plc | | 111,183 | | 401 | |
| Ultra Electronics Holdings plc | | 14,993 | | 379 | |
| Savills plc | | 30,324 | | 360 | |
| James Fisher & Sons plc | | 13,608 | | 342 | |
| GB Group plc | | 40,935 | | 321 | |
| Rathbone Brothers plc | | 11,576 | | 312 | |
| Greencore Group plc | | 93,156 | | 280 | |
| Hill & Smith Holdings plc | | 15,938 | | 270 | |
| Telecom Plus plc | | 16,794 | | 262 | |
| St. Modwen Properties plc | | 44,852 | | 262 | |
| Clarkson plc | | 6,367 | | 233 | |
| 4imprint Group plc | | 6,041 | | 232 | |
| Hilton Food Group plc | | 16,915 | | 223 | |
| Senior plc | | 84,590 | | 202 | |
| CVS Group plc | | 14,809 | | 185 | |
| EMIS Group plc | | 12,782 | | 178 | |
| AG Barr plc | | 24,616 | | 177 | |
| Vitec Group plc | | 9,136 | | 149 | |
| Avon Rubber plc | | 6,361 | | 146 | |
| Robert Walters plc | | 17,010 | | 117 | |
| Speedy Hire plc | | 105,961 | | 74 | |
| Brooks Macdonald Group plc | | 2,816 | | 71 | |
| | | | | 125,095 | |
United States (0.1%) | | | | | |
| Autoliv Inc. | | 14,334 | | 1,119 | |
Total Common Stocks | | | | | |
(Cost $1,345,664) | | | | 1,518,956 | |
Temporary Cash Investments (2.5%)1 | | | | | |
Money Market Fund (2.5%) | | | | | |
2,3 | Vanguard Market Liquidity Fund, 1.984% | | 373,623 | | 37,366 | |
| | | Face | | | |
| | | Amount | | | |
| | | ($000 | ) | | | |
U.S. Government and Agency Obligations (0.0%) | | | | | |
4 | United States Treasury Bill, 2.048%, 11/21/19 | | 300 | | 300 | |
| Total Temporary Cash Investments | | | | | |
| (Cost $37,665) | | | | 37,666 | |
| Total Investments (102.2%) | | | | | |
| (Cost $1,383,329) | | | | 1,556,622 | |
| | | | | | | |
13
International Dividend Appreciation Index Fund
| | | | Amount | |
| | | | ($000 | ) |
Other Assets and Liabilities (-2.2%) | | | | | |
Other Assets | | | | | |
Investment in Vanguard | | | | 67 | |
Receivables for Accrued Income | | | | 4,487 | |
Receivables for Capital Shares Issued | | | | 135 | |
Variation Margin Receivable—Futures Contracts | | | | 2 | |
Unrealized Appreciation—Forward Currency Contracts | | | | 35 | |
Other Assets4 | | | | 3,417 | |
Total Other Assets | | | | 8,143 | |
Liabilities | | | | | |
Payables for Investment Securities Purchased | | | | (4,976 | ) |
Collateral for Securities on Loan | | | | (31,373 | ) |
Payables for Capital Shares Redeemed | | | | (18 | ) |
Payables to Vanguard | | | | (151 | ) |
Variation Margin Payable—Futures Contracts | | | | (17 | ) |
Unrealized Depreciation—Forward Currency Contracts | | | | (19 | ) |
Other Liabilities | | | | (4,819 | ) |
Total Liabilities | | | | (41,373 | ) |
Net Assets (100%) | | | | 1,523,392 | |
At October 31, 2019, net assets consisted of:
| | | | Amount | |
| | | | ($000 | ) |
Paid-in Capital | | | | 1,384,487 | |
Total Distributable Earnings (Loss) | | | | 138,905 | |
Net Assets | | | | 1,523,392 | |
ETF Shares—Net Assets | | | | | |
Applicable to 18,989,053 outstanding $.001 par value shares of beneficial interest (unlimited authorization) | | | | 1,304,960 | |
Net Asset Value Per Share—ETF Shares | | | | $68.72 | |
| | | | Amount | |
| | | | ($000 | ) |
Admiral Shares—Net Assets | | | | | |
Applicable to 6,536,356 outstanding $.001 par value shares of beneficial interest (unlimited authorization) | | | | 218,432 | |
Net Asset Value Per Share—Admiral Shares | | | | $33.42 | |
· See Note A in Notes to Financial Statements.
^ Includes partial security positions on loan to broker-dealers.
The total value of securities on loan is $28,970,000.
* Non-income-producing security.
1 The fund invests a portion of its cash reserves in equity markets through the use of index futures contracts. After giving effect to futures investments, the fund’s effective common stock and temporary cash investment positions represent 100.0% and 2.2%, respectively, of net assets.
2 Affiliated money market fund available only to Vanguard funds and certain trusts and accounts managed by Vanguard. Rate shown is the 7-day yield.
3 Collateral of $31,373,000 was received for securities on loan.
4 Securities with a value of $300,000 and cash of $335,000 have been segregated as initial margin for open futures contracts.
ADR—American Depositary Receipt.
14
International Dividend Appreciation Index Fund
Derivative Financial Instruments Outstanding as of Period End |
Futures Contracts
| | | | ($000) |
| Expiration | Number of Long (Short) Contracts | Notional
Amount | Value and Unrealized Appreciation (Depreciation) |
Long Futures Contracts | | | | |
Dow Jones EURO STOXX 50 Index | December 2019 | 49 | 1,972 | 63 |
MSCI Emerging Market Index | December 2019 | 37 | 1,927 | 54 |
Topix Index | December 2019 | 4 | 618 | 45 |
E-mini S&P 500 Index | December 2019 | 1 | 152 | — |
| | | | 162 |
Forward Currency Contracts |
Counterparty | Contract Settlement Date | Contract Amount (000) | Unrealized Appreciation ($000) | Unrealized (Depreciation) ($000) |
| Receive | | Deliver |
Bank of America, N.A. | 12/24/19 | EUR | 2,084 | USD | 2,311 | 23 | — |
Bank of America, N.A. | 12/16/19 | JPY | 108,851 | USD | 1,012 | — | (1) |
BNP Paribas | 12/24/19 | USD | 1,487 | EUR | 1,344 | — | (18) |
Goldman Sachs International | 12/30/19 | USD | 1,243 | JPY | 133,000 | 6 | — |
BNP Paribas | 12/16/19 | USD | 749 | JPY | 80,000 | 6 | — |
| | | | | | | 35 | (19) |
| | | | | | | | |
EUR—Euro.
JPY—Japanese yen.
USD—U.S. dollar.
See accompanying Notes, which are an integral part of the Financial Statements.
15
International Dividend Appreciation Index Fund
Statement of Operations
| Year Ended |
| October 31, 2019 |
| ($000) |
Investment Income | |
Income | |
Dividends1 | 30,886 |
Interest2 | 125 |
Securities Lending—Net | 119 |
Total Income | 31,130 |
Expenses | |
The Vanguard Group—Note B | |
Investment Advisory Services | 187 |
Management and Administrative—Investor Shares | 22 |
Management and Administrative—ETF Shares | 1,738 |
Management and Administrative—Admiral Shares | 323 |
Marketing and Distribution—Investor Shares | 1 |
Marketing and Distribution—ETF Shares | 60 |
Marketing and Distribution—Admiral Shares | 12 |
Custodian Fees | 88 |
Auditing Fees | 43 |
Shareholders’ Reports—Investor Shares | 2 |
Shareholders’ Reports—ETF Shares | 45 |
Shareholders’ Reports—Admiral Shares | 4 |
Trustees’ Fees and Expenses | 1 |
Total Expenses | 2,526 |
Expenses Paid Indirectly | (27) |
Net Expenses | 2,499 |
Net Investment Income | 28,631 |
Realized Net Gain (Loss) | |
Investment Securities Sold2 | (24,379) |
Futures Contracts | 868 |
Forward Currency Contracts | (130) |
Foreign Currencies | (256) |
Realized Net Gain (Loss) | (23,897) |
Change in Unrealized Appreciation (Depreciation) | |
Investment Securities2,3 | 214,452 |
Futures Contracts | 234 |
Forward Currency Contracts | 65 |
Foreign Currencies | 96 |
Change in Unrealized Appreciation (Depreciation) | 214,847 |
Net Increase (Decrease) in Net Assets Resulting from Operations | 219,581 |
1 Dividends are net of foreign withholding taxes of $2,382,000.
2 Interest income, realized net gain (loss), and change in unrealized appreciation (depreciation) from an affiliated company of the fund were $110,000, ($3,000), and $1,000, respectively. Purchases and sales are for temporary cash investment purposes.
3 The change in unrealized appreciation (depreciation) is net of deferred foreign capital gains taxes of $4,025,000. See accompanying Notes, which are an integral part of the Financial Statements.
16
International Dividend Appreciation Index Fund
Statement of Changes in Net Assets
| Year Ended October 31, |
| 2019 | | 2018 |
| ($000) | | ($000) |
Increase (Decrease) in Net Assets | | | |
Operations | | | |
Net Investment Income | 28,631 | | 19,437 |
Realized Net Gain (Loss) | (23,897) | | 4,707 |
Change in Unrealized Appreciation (Depreciation) | 214,847 | | (112,710) |
Net Increase (Decrease) in Net Assets Resulting from Operations | 219,581 | | (88,566) |
Distributions | | | |
Net Investment Income | | | |
Investor Shares | (90) | | (223) |
ETF Shares | (16,043) | | (15,685) |
Admiral Shares | (2,897) | | (3,362) |
Realized Capital Gain | | | |
Investor Shares | — | | — |
ETF Shares | — | | — |
Admiral Shares | — | | — |
Total Distributions | (19,030) | | (19,270) |
Capital Share Transactions | | | |
Investor Shares | (12,733) | | 1,981 |
ETF Shares | 275,183 | | 315,063 |
Admiral Shares | 13,443 | | 40,676 |
Net Increase (Decrease) from Capital Share Transactions | 275,893 | | 357,720 |
Total Increase (Decrease) | 476,444 | | 249,884 |
Net Assets | | | |
Beginning of Period | 1,046,948 | | 797,064 |
End of Period | 1,523,392 | | 1,046,948 |
See accompanying Notes, which are an integral part of the Financial Statements.
17
International Dividend Appreciation Index Fund
Financial Highlights
Investor Shares
| | Nov. 1, | | | | | | Feb. 25, | |
| | 2018 to | | Year Ended | | 20162 to | |
| | July 26, | | October 31, | | | Oct. 31, | |
For a Share Outstanding Throughout Each Period | | 20191 | | 2018 | | 2017 | | 2016 | |
Net Asset Value, Beginning of Period | | $23.47 | | $25.71 | | $21.77 | | $20.00 | |
Investment Operations | | .273 | 4 | .461 | | .460 | | .244 | |
Net Investment Income3 | | 3.630 | | (2.260 | ) | 3.871 | | 1.671 | |
Net Realized and Unrealized Gain (Loss) on Investments5 | | 3.903 | | (1.799 | ) | 4.331 | | 1.915 | |
Total from Investment Operations | | | | | | | | | |
Distributions | | | | | | | | | |
Dividends from Net Investment Income | | (.283 | ) | (.441 | ) | (.391 | ) | (.145 | ) |
Distributions from Realized Capital Gains | | — | | — | | — | | — | |
Total Distributions | | (.283 | ) | (.441 | ) | (.391 | ) | (.145 | ) |
Net Asset Value, End of Period | | $27.091 | | $23.47 | | $25.71 | | $21.77 | |
Total Return6 | | 16.74%7 | | -7.13%7 | | 20.06%7 | | 9.57% | |
Ratios/Supplemental Data | | | | | | | | | |
Net Assets, End of Period (Millions) | | — | | $11 | | $11 | | $4 | |
Ratio of Total Expenses to Average Net Assets | | 0.35%8 | | 0.35% | | 0.35% | | 0.35%8 | |
Ratio of Net Investment Income to Average Net Assets | | 1.48%4,8 | | 1.73% | | 1.86% | | 1.50%8 | |
Portfolio Turnover Rate9 | | 42%10 | | 36% | | 9% | | 8% | |
| | | | | | | | | | |
1 Net asset value as of July 26, 2019, on which date the remaining Investor Shares were converted to Admiral Shares.
2 Inception.
3 Calculated based on average shares outstanding.
4 Net investment income per share and the ratio of net investment income to average net assets include $.155 and 0.65%, respectively, resulting from a special dividend from Naspers Ltd. in September 2019.
5 Includes increases from purchase and redemption fees of $.01 for 2019, $.01 for 2018, and $.01 for 2017.
6 Total returns do not include account service fees that may have applied in the periods shown. Fund prospectuses provide information about any applicable account service fees.
7 Total returns do not include transaction fees that may have applied in the period shown. Fund prospectuses provide information about any applicable transaction fees.
8 Annualized.
9 Excludes the value of portfolio securities received or delivered as a result of in-kind purchases or redemptions of the fund’s capital shares, including ETF Creation Units.
10 Reflect the fund’s portfolio turnover for the fiscal year ended October 31, 2019.
See accompanying Notes, which are an integral part of the Financial Statements.
18
International Dividend Appreciation Index Fund
Financial Highlights
ETF Shares
| | | | | | | | Feb. 25, | |
| | | | | | 20161 to | |
For a Share Outstanding | | | | Year Ended October 31, | | | Oct. 31, | |
Throughout Each Period | | 2019 | | 2018 | | 2017 | | 2016 | |
Net Asset Value, Beginning of Period | | $58.65 | | $64.25 | | $54.43 | | $50.00 | |
Investment Operations | | | | | | | | | |
Net Investment Income2 | | 1.452 | 3 | 1.196 | | 1.179 | | .662 | |
Net Realized and Unrealized Gain (Loss) on Investments4 | | 9.578 | | (5.623 | ) | 9.715 | | 4.154 | |
Total from Investment Operations | | 11.030 | | (4.427 | ) | 10.894 | | 4.816 | |
Distributions | | | | | | | | | |
Dividends from Net Investment Income | | (.960 | ) | (1.173 | ) | (1.074 | ) | (.386 | ) |
Distributions from Realized Capital Gains | | — | | — | | — | | — | |
Total Distributions | | (.960 | ) | (1.173 | ) | (1.074 | ) | (.386 | ) |
Net Asset Value, End of Period | | $68.72 | | $58.65 | | $64.25 | | $54.43 | |
Total Return | | 18.96% | | -7.04% | | 20.19% | | 9.64% | |
Ratios/Supplemental Data | | | | | | | | | |
Net Assets, End of Period (Millions) | | $1,305 | | $861 | | $634 | | $147 | |
Ratio of Total Expenses to Average Net Assets | | 0.20% | | 0.25% | | 0.25% | | 0.25%5 | |
Ratio of Net Investment Income to Average Net Assets | | 2.24%3 | | 1.83% | | 1.96% | | 1.60%5 | |
Portfolio Turnover Rate6 | | 42% | | 36% | | 9% | | 8% | |
| | | | | | | | | | |
1 Inception.
2 Calculated based on average shares outstanding.
3 Net investment income per share and the ratio of net investment income to average net assets include $.388 and 0.65%, respectively, resulting from a special dividend from Naspers Ltd. in September 2019.
4 Includes increases from purchase and redemption fees of $.02 for 2019, $.02 for 2018, and $.04 for 2017.
5 Annualized.
6 Excludes the value of portfolio securities received or delivered as a result of in-kind purchases or redemptions of the fund’s capital shares, including ETF Creation Units.
See accompanying Notes, which are an integral part of the Financial Statements.
19
International Dividend Appreciation Index Fund
Financial Highlights
Admiral Shares
| | | | | | | | March 2, | |
| | | | | | 20161 to | |
For a Share Outstanding | | | | Year Ended October 31, | | | Oct. 31, | |
Throughout Each Period | | 2019 | | 2018 | | 2017 | | 2016 | |
Net Asset Value, Beginning of Period | | $28.52 | | $31.24 | | $26.45 | | $25.00 | |
Investment Operations | | | | | | | | | |
Net Investment Income2 | | .6863 | | .576 | | .573 | | .285 | |
Net Realized and Unrealized Gain (Loss) on Investments4 | | 4.679 | | (2.727 | ) | 4.720 | | 1.352 | |
Total from Investment Operations | | 5.365 | | (2.151 | ) | 5.293 | | 1.637 | |
Distributions | | | | | | | | | |
Dividends from Net Investment Income | | (.465 | ) | (.569 | ) | (.503 | ) | (.187 | ) |
Distributions from Realized Capital Gains | | — | | — | | — | | — | |
Total Distributions | | (.465 | ) | (.569 | ) | (.503 | ) | (.187 | ) |
Net Asset Value, End of Period | | $33.42 | | $28.52 | | $31.24 | | $26.45 | |
Total Return5 | | 18.96%6 | | -7.03%6 | | 20.18%6 | | 6.54% | |
Ratios/Supplemental Data | | | | | | | | | |
Net Assets, End of Period (Millions) | | $218 | | $175 | | $152 | | $77 | |
Ratio of Total Expenses to Average Net Assets | | 0.20% | | 0.25% | | 0.25% | | 0.25%7 | |
Ratio of Net Investment Income to Average Net Assets | | 2.24%3 | | 1.83% | | 1.96% | | 1.60%7 | |
Portfolio Turnover Rate8 | | 42% | | 36% | | 9% | | 8% | |
| | | | | | | | | | |
1 Inception.
2 Calculated based on average shares outstanding.
3 Net investment income per share and the ratio of net investment income to average net assets include $.188 and 0.65%, respectively, resulting from a special dividend from Naspers Ltd. in September 2019.
4 Includes increases from purchase and redemption fees of $.01 for 2019, $.01 for 2018, and $.02 for 2017.
5 Total returns do not include account service fees that may have applied in the periods shown. Fund prospectuses provide information about any applicable account service fees.
6 Total returns do not include transaction fees that may have applied in the period shown. Fund prospectuses provide information about any applicable transaction fees.
7 Annualized.
8 Excludes the value of portfolio securities received or delivered as a result of in-kind purchases or redemptions of the fund’s capital shares, including ETF Creation Units.
See accompanying Notes, which are an integral part of the Financial Statements.
20
International Dividend Appreciation Index Fund
Notes to Financial Statements
Vanguard International Dividend Appreciation Index Fund is registered under the Investment Company Act of 1940 as an open-end investment company, or mutual fund. The fund invests in securities of foreign issuers, which may subject it to investment risks not normally associated with investing in securities of U.S. corporations. The fund offers two classes of shares: ETF Shares and Admiral Shares. Each of the share classes has different eligibility and minimum purchase requirements, and is designed for different types of investors. ETF Shares are listed for trading on Nasdaq; they can be purchased and sold through a broker. Prior to July 26, 2019, the fund offered Investor Shares. Effective at the close of business on July 26, 2019, the remaining Investor Shares were converted to Admiral Shares.
A. The following significant accounting policies conform to generally accepted accounting principles for U.S. investment companies. The fund consistently follows such policies in preparing its financial statements.
1. Security Valuation: Securities are valued as of the close of trading on the New York Stock Exchange (generally 4 p.m., Eastern time) on the valuation date. Equity securities are valued at the latest quoted sales prices or official closing prices taken from the primary market in which each security trades; such securities not traded on the valuation date are valued at the mean of the latest quoted bid and asked prices. Securities for which market quotations are not readily available, or whose values have been affected by events occurring before the fund’s pricing time but after the close of the securities’ primary markets, are valued at their fair values calculated according to procedures adopted by the board of trustees. These procedures include obtaining quotations from an independent pricing service, monitoring news to identify significant market- or security-specific events, and evaluating changes in the values of foreign market proxies (for example, ADRs, futures contracts, or exchange-traded funds), between the time the foreign markets close and the fund’s pricing time. When fair-value pricing is employed, the prices of securities used by a fund to calculate its net asset value may differ from quoted or published prices for the same securities. Investments in Vanguard Market Liquidity Fund are valued at that fund’s net asset value. Temporary cash investments are valued using the latest bid prices or using valuations based on a matrix system (which considers such factors as security prices, yields, maturities, and ratings), both as furnished by independent pricing services.
2. Foreign Currency: Securities and other assets and liabilities denominated in foreign currencies are translated into U.S. dollars using exchange rates obtained from an independent third party as of the fund’s pricing time on the valuation date. Realized gains (losses) and unrealized appreciation (depreciation) on investment securities include the effects of changes in exchange rates since the securities were purchased, combined with the effects of changes in security prices. Fluctuations in the value of other assets and liabilities resulting from changes in exchange rates are recorded as unrealized foreign currency gains (losses) until the assets or liabilities are settled in cash, at which time they are recorded as realized foreign currency gains (losses).
3. Futures and Forward Currency Contracts: The fund uses index futures contracts to a limited extent, with the objectives of maintaining full exposure to the stock market, maintaining liquidity, and minimizing transaction costs. The fund may purchase futures contracts to immediately invest incoming cash in the market, or sell futures in response to cash outflows, thereby simulating a fully invested position in the underlying index while maintaining a cash balance for liquidity. The primary risks associated with the use of futures contracts are imperfect correlation between changes in market values of stocks held by the fund and the prices of futures contracts, and the possibility
21
International Dividend Appreciation Index Fund
of an illiquid market. Counterparty risk involving futures is mitigated because a regulated clearing-house is the counterparty instead of the clearing broker. To further mitigate counterparty risk, the fund trades futures contracts on an exchange, monitors the financial strength of its clearing brokers and clearinghouse, and has entered into clearing agreements with its clearing brokers. The clearinghouse imposes initial margin requirements to secure the fund’s performance and requires daily settlement of variation margin representing changes in the market value of each contract. Any assets pledged as initial margin for open contracts are noted in the Statement of Net Assets.
The fund also enters into forward currency contracts to provide the appropriate currency exposure related to any open futures contracts. The fund’s risks in using these contracts include movement in the values of the foreign currencies relative to the U.S. dollar and the ability of the counterparties to fulfill their obligations under the contracts. The fund mitigates its counterparty risk by entering into forward currency contracts only with a diverse group of prequalified counterparties, monitoring their financial strength, entering into master netting arrangements with its counterparties, and requiring its counterparties to transfer collateral as security for their performance. In the absence of a default, the collateral pledged or received by the fund cannot be repledged, resold, or rehypothecated. The master netting arrangements provide that, in the event of a counterparty’s default (including bankruptcy), the fund may terminate the forward currency contracts, determine the net amount owed by either party in accordance with its master netting arrangements, and sell or retain any collateral held up to the net amount owed to the fund under the master netting arrangements. The forward currency contracts contain provisions whereby a counterparty may terminate open contracts if the fund’s net assets decline below a certain level, triggering a payment by the fund if the fund is in a net liability position at the time of the termination. The payment amount would be reduced by any collateral the fund has pledged. Any assets pledged as collateral for open contracts are noted in the Statement of Net Assets. The value of collateral received or pledged is compared daily to the value of the forward currency contracts exposure with each counterparty, and any difference, if in excess of a specified minimum transfer amount, is adjusted and settled within two business days.
Futures contracts are valued at their quoted daily settlement prices. Forward currency contracts are valued at their quoted daily prices obtained from an independent third party, adjusted for currency risk based on the expiration date of each contract. The notional amounts of the contracts are not recorded in the Statement of Net Assets. Fluctuations in the value of the contracts are recorded in the Statement of Net Assets as an asset (liability) and in the Statement of Operations as unrealized appreciation (depreciation) until the contracts are closed, when they are recorded as realized gains (losses) on futures or forward currency contracts.
During the year ended October 31, 2019, the fund’s average investments in long and short futures contracts represented less than 1% and 0% of net assets, respectively, based on the average of the notional amounts at each quarter-end during the period. The fund’s average investment in forward currency contracts represented less than 1% of net assets, based on the average of the notional amounts at each quarter-end during the period.
4. Federal Income Taxes: The fund intends to continue to qualify as a regulated investment company and distribute all of its taxable income. Management has analyzed the fund’s tax positions taken for all open federal income tax years (October 31, 2016–2019), and has concluded that no provision for federal income tax is required in the fund’s financial statements.
22
International Dividend Appreciation Index Fund
5. Distributions: Distributions to shareholders are recorded on the ex-dividend date. Distributions are determined on a tax basis and may differ from net investment income and realized capital gains for financial reporting purposes.
6. Securities Lending: To earn additional income, the fund lends its securities to qualified institutional borrowers. Security loans are subject to termination by the fund at any time, and are required to be secured at all times by collateral in an amount at least equal to the market value of securities loaned. Daily market fluctuations could cause the value of loaned securities to be more or less than the value of the collateral received. When this occurs, the collateral is adjusted and settled before the opening of the market on the next business day. The fund further mitigates its counterparty risk by entering into securities lending transactions only with a diverse group of prequalified counterparties, monitoring their financial strength, and entering into master securities lending agreements with its counterparties. The master securities lending agreements provide that, in the event of a counterparty’s default (including bankruptcy), the fund may terminate any loans with that borrower, determine the net amount owed, and sell or retain the collateral up to the net amount owed to the fund; however, such actions may be subject to legal proceedings. While collateral mitigates counterparty risk, in the event of a default, the fund may experience delays and costs in recovering the securities loaned. The fund invests cash collateral received in Vanguard Market Liquidity Fund, and records a liability in the Statement of Net Assets for the return of the collateral, during the period the securities are on loan. Securities lending income represents fees charged to borrowers plus income earned on invested cash collateral, less expenses associated with the loan. During the term of the loan, the fund is entitled to all distributions made on or in respect of the loaned securities.
7. Credit Facility: The fund and certain other funds managed by The Vanguard Group (“Vanguard”) participate in a $4.3 billion committed credit facility provided by a syndicate of lenders pursuant to a credit agreement that may be renewed annually; each fund is individually liable for its borrowings, if any, under the credit facility. Borrowings may be utilized for temporary and emergency purposes, and are subject to the fund’s regulatory and contractual borrowing restrictions. The participating funds are charged administrative fees and an annual commitment fee of 0.10% of the undrawn amount of the facility; these fees are allocated to the funds based on a method approved by the fund’s board of trustees and included in Management and Administrative expenses on the fund’s Statement of Operations. Any borrowings under this facility bear interest at a rate based upon the higher of the one-month London Interbank Offered Rate, federal funds effective rate, or overnight bank funding rate plus an agreed-upon spread.
The fund had no borrowings outstanding at October 31, 2019, or at any time during the period then ended.
8. Other: Dividend income is recorded on the ex-dividend date. Interest income includes income distributions received from Vanguard Market Liquidity Fund and is accrued daily. Premiums and discounts on debt securities purchased are amortized and accreted, respectively, to interest income over the lives of the respective securities. Taxes on foreign dividends and capital gains have been provided for in accordance with the fund’s understanding of the applicable countries’ tax rules and rates. Foreign capital gains tax is accrued daily based upon net unrealized gains. Security transactions are accounted for on the date securities are bought or sold. Costs used to determine realized gains (losses) on the sale of investment securities are those of the specific securities sold. Fees assessed on capital share transactions are credited to paid-in capital.
23
International Dividend Appreciation Index Fund
Each class of shares has equal rights as to assets and earnings, except that each class separately bears certain class-specific expenses related to maintenance of shareholder accounts (included in Management and Administrative expenses) and shareholder reporting. Marketing and distribution expenses are allocated to each class of shares based on a method approved by the board of trustees. Income, other non-class-specific expenses, and gains and losses on investments are allocated to each class of shares based on its relative net assets.
B. In accordance with the terms of a Funds’ Service Agreement (the “FSA”) between Vanguard and the fund, Vanguard furnishes to the fund investment advisory, corporate management, administrative, marketing, and distribution services at Vanguard’s cost of operations (as defined by the FSA). These costs of operations are allocated to the fund based on methods and guidelines approved by the board of trustees. Vanguard does not require reimbursement in the current period for certain costs of operations (such as deferred compensation/benefits and risk/insurance costs); the fund’s liability for these costs of operations is included in Payables to Vanguard on the Statement of Net Assets. All other costs of operations payable to Vanguard are generally settled twice a month.
Upon the request of Vanguard, the fund may invest up to 0.40% of its net assets as capital in Vanguard. At October 31, 2019, the fund had contributed to Vanguard capital in the amount of $67,000, representing less than 0.01% of the fund’s net assets and 0.03% of Vanguard’s capital received pursuant to the FSA. The fund’s trustees and officers are also directors and employees, respectively, of Vanguard.
C. The fund’s custodian bank has agreed to reduce its fees when the fund maintains cash on deposit in the non-interest-bearing custody account. For the year ended October 31, 2019, custodian fee offset arrangements reduced the fund’s expenses by $27,000 (an annual rate of 0.00% of average net assets).
D. Various inputs may be used to determine the value of the fund’s investments. These inputs are summarized in three broad levels for financial statement purposes. The inputs or methodologies used to value securities are not necessarily an indication of the risk associated with investing in those securities.
Level 1—Quoted prices in active markets for identical securities.
Level 2—Other significant observable inputs (including quoted prices for similar securities, interest rates, prepayment speeds, credit risk, etc.).
Level 3—Significant unobservable inputs (including the fund’s own assumptions used to determine the fair value of investments). Any investments valued with significant unobservable inputs are noted on the Statement of Net Assets.
24
International Dividend Appreciation Index Fund
The following table summarizes the market value of the fund’s investments and derivatives as of October 31, 2019, based on the inputs used to value them:
| Level 1 | Level 2 | Level 3 |
Investments | ($000) | ($000) | ($000) |
Common Stocks—North and South America | 140,162 | 1,119 | — |
Common Stocks—Other | 31,326 | 1,346,349 | — |
Temporary Cash Investments | 37,366 | 300 | — |
Futures Contracts—Assets1 | 2 | — | — |
Futures Contracts—Liabilities1 | (17) | — | — |
Forward Currency Contracts—Assets | — | 35 | — |
Forward Currency Contracts—Liabilities | — | (19) | — |
Total | 208,839 | 1,347,784 | — |
1 Represents variation margin on the last day of the reporting period.
E. At October 31, 2019, the fair values of derivatives were reflected in the Statement of Net Assets as follows:
| | Foreign | |
| Equity | Exchange | |
| Contracts | Contracts | Total |
Statement of Net Assets Caption | ($000) | ($000) | ($000) |
Variation Margin Receivable—Futures Contracts | 2 | — | 2 |
Unrealized Appreciation—Forward Currency Contracts | — | 35 | 35 |
Total Assets | 2 | 35 | 37 |
| | | |
Variation Margin Payable—Futures Contracts | (17) | — | (17) |
Unrealized Depreciation—Forward Currency Contracts | — | (19) | (19) |
Total Liabilities | (17) | (19) | (36) |
Realized net gain (loss) and the change in unrealized appreciation (depreciation) on derivatives for the year ended October 31, 2019, were:
| | Foreign | |
| Equity | Exchange | |
| Contracts | Contracts | Total |
Realized Net Gain (Loss) on Derivatives | ($000) | ($000) | ($000) |
Futures Contracts | 868 | — | 868 |
Forward Currency Contracts | — | (130) | (130) |
Realized Net Gain (Loss) on Derivatives | 868 | (130) | 738 |
| | | |
Change in Unrealized Appreciation (Depreciation) on Derivatives | | | |
Futures Contracts | 234 | — | 234 |
Forward Currency Contracts | — | 65 | 65 |
Change in Unrealized Appreciation (Depreciation) on Derivatives | 234 | 65 | 299 |
25
International Dividend Appreciation Index Fund
F. Permanent differences between book-basis and tax-basis components of net assets are reclassified among capital accounts in the financial statements to reflect their tax character. These reclassifications have no effect on net assets or net asset value per share. As of period end, permanent differences primarily attributable to the accounting for foreign currency transactions, passive foreign investment companies, and tax expense on capital gains were reclassified between the individual components of total distributable earnings (loss).
| Amount |
| ($000) |
Paid-in Capital | — |
Total Distributable Earnings (Loss) | — |
Temporary differences between book-basis and tax-basis components of total distributable earnings (loss) arise when certain items of income, gain, or loss are recognized in different periods for financial statement and tax purposes; these differences will reverse at some time in the future. The differences are primarily related to the tax deferral of losses on wash sales, the realization of unrealized gains or losses on certain futures contracts, forward currency contracts, and unrealized gains on passive foreign investment companies. As of period end, the tax-basis components of total distributable earnings (loss) are detailed in the table as follows:
| Amount |
| ($000) |
Undistributed Ordinary Income | 12,421 |
Undistributed Long-Term Gains | — |
Capital Loss Carryforwards (Non-expiring) | (41,245) |
Net Unrealized Gains (Losses) | 167,748 |
As of October 31, 2019, gross unrealized appreciation and depreciation for investments and derivatives based on cost for U.S. federal income tax purposes were as follows:
| Amount |
| ($000) |
Tax Cost | 1,384,914 |
Gross Unrealized Appreciation | 222,608 |
Gross Unrealized Depreciation | (50,856) |
Net Unrealized Appreciation (Depreciation) | 171,752 |
G. During the year ended October 31, 2019, the fund purchased $812,147,000 of investment securities and sold $529,414,000 of investment securities, other than temporary cash investments. Purchases and sales include $219,924,000 and $0, respectively, in connection with in-kind purchases and redemptions of the fund’s capital shares.
26
International Dividend Appreciation Index Fund
H. Capital share transactions for each class of shares were:
| | | Year Ended October 31, |
| 2019 | | 2018 |
| Amount | Shares | Amount | Shares |
| ($000) | (000) | ($000) | (000) |
Investor Shares | | | | |
Issued1 | 1,629 | 66 | 9,433 | 358 |
Issued in Lieu of Cash Distributions | 85 | 3 | 210 | 8 |
Redeemed2,3 | (14,447) | (553) | (7,662) | (294) |
Net Increase (Decrease)—Investor Shares | (12,733) | (484) | 1,981 | 72 |
ETF Shares | | | | |
Issued1 | 275,183 | 4,314 | 351,000 | 5,355 |
Issued in Lieu of Cash Distributions | — | — | — | — |
Redeemed2 | — | — | (35,937) | (550) |
Net Increase (Decrease)—ETF Shares | 275,183 | 4,314 | 315,063 | 4,805 |
Admiral Shares | | | | |
Issued1,3 | 55,427 | 1,777 | 77,590 | 2,422 |
Issued in Lieu of Cash Distributions | 2,382 | 78 | 2,791 | 90 |
Redeemed2 | (44,366) | (1,449) | (39,705) | (1,257) |
Net Increase (Decrease)—Admiral Shares | 13,443 | 406 | 40,676 | 1,255 |
| | | | | |
1 Includes purchase fees for fiscal 2019 and 2018 of $197,000 and $212,000, respectively (fund totals).
2 Net of redemption fees for fiscal 2019 and 2018 of $105,000 and $102,000, respectively (fund totals).
3 In November 2018, the fund announced changes to the availability and minimum investment criteria of the Investor and Admiral share classes. As a result, all of the outstanding Investor Shares automatically converted to Admiral Shares beginning in April 2019. Investor Shares—Redeemed and Admiral Shares—Issued include 487,000 and 400,000 shares, respectively, in the amount of $12,787,000 from the conversion during the year ended October 31, 2019.
I. Management has determined that no events or transactions occurred subsequent to October 31, 2019, that would require recognition or disclosure in these financial statements.
27
International High Dividend Yield Index Fund
Performance Summary
All of the returns in this report represent past performance, which is not a guarantee of future results that may be achieved by the fund. (Current performance may be lower or higher than the performance data cited. For performance data current to the most recent month-end, visit our website at vanguard.com/performance.) Note, too, that both investment returns and principal value can fluctuate widely, so an investor’s shares, when sold, could be worth more or less than their original cost. The returns shown do not reflect taxes that a shareholder would pay on fund distributions or on the sale of fund shares.
Cumulative Performance: February 25, 2016, Through October 31, 2019
Initial Investment of $10,000
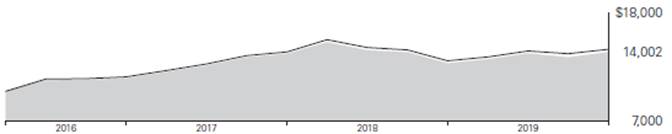
| | | | Average Annual Total Returns | | |
| | | | Periods Ended October 31, 2019 | | |
| | | | | | Since | | Final Value |
| | | | One | | Inception | | of a $10,000 |
| | | | Year | | (2/25/2016) | | Investment |

| | International High Dividend Yield Index Fund ETF Shares Net Asset Value | | 8.87% | | 9.58% | | $14,002 |
| | International High Dividend Yield Index Fund ETF Shares Market Price | | 9.33 | | 9.63 | | 14,025 |

| | FTSE All-World ex US High Dividend Yield Index | | 8.96 | | 10.17 | | 14,280 |
“Since Inception” performance is calculated from the ETF Shares’ inception date for both the fund and its comparative standard(s).
| | | | Since | | Final Value |
| | One | | Inception | | of a $10,000 |
| | Year | | (3/2/2016) | | Investment |
International High Dividend Yield Index Fund Admiral Shares | | 8.30% | | 8.52% | | $13,491 |
FTSE All-World ex US High Dividend Yield Index | | 8.96 | | 9.19 | | 13,802 |
“Since Inception” performance is calculated from the Admiral Shares’ inception date for both the fund and its comparative standard(s).
Vanguard fund returns are adjusted to reflect the 0.25% fee on purchases and redemptions. The fees do not apply to the ETF Shares. See Financial Highlights for dividend and capital gains information.
28
International High Dividend Yield Index Fund
Cumulative Returns of ETF Shares: February 25, 2016, Through October 31, 2019
| | | | | | | | Since |
| | | | One | | | | Inception |
| | | | Year | | | | (2/25/2016) |
International High Dividend Yield Index Fund ETF Shares Market Price | | | | 9.33% | | | | 40.25% |
International High Dividend Yield Index Fund ETF Shares Net Asset Value | | | | 8.87 | | | | 40.02 |
FTSE All-World ex US High Dividend Yield Index | | | | 8.96 | | | | 42.80 |
“Since Inception” performance is calculated from the ETF Shares’ inception date for both the fund and its comparative standard(s).
For the ETF Shares, the market price is determined by the midpoint of the bid-offer spread as of the closing time of the New York Stock Exchange (generally 4 p.m., Eastern time). The net asset value is also determined as of the NYSE closing time. For more information about how the ETF Shares’ market prices have compared with their net asset value, visit vanguard.com, select your ETF, and then select the Price and Performance tab. The ETF premium/discount analysis there shows the percentages of days on which the ETF Shares’ market price was above or below the NAV.
Vanguard fund returns are adjusted to reflect the 0.25% fee on purchases and redemptions. The fees do not apply to the ETF Shares.
29
International High Dividend Yield Index Fund
Sector Diversification
As of October 31, 2019
Basic Materials | 7.0% |
Consumer Goods | 9.4 |
Consumer Services | 3.7 |
Financials | 38.1 |
Health Care | 5.1 |
Industrials | 9.9 |
Oil & Gas | 10.8 |
Technology | 4.3 |
Telecommunications | 6.2 |
Utilities | 5.5 |
The table reflects the fund’s equity exposure, based on its investments in stocks and stock index futures. Any holdings in short-term reserves are excluded. Sector categories are based on the Industry Classification Benchmark (“ICB”), except for the “Other” category (if applicable), which includes securities that have not been provided an ICB classification as of the effective reporting period.
The Industry Classification Benchmark (“ICB”) is owned by FTSE. FTSE does not accept any liability to any person for any loss or damage arising out of any error or omission in the ICB.
30
International High Dividend Yield Index Fund
Financial Statements
Statement of Net Assets
As of October 31, 2019
The fund files its complete schedule of portfolio holdings with the Securities and Exchange Commission (SEC) for the first and third quarters of each fiscal year as an exhibit to its reports on Form N-PORT. The fund’s Form N-PORT reports are available on the SEC’s website at www.sec.gov.
| | | | Market |
| | | | Value• |
| | Shares | | ($000) |
Common Stocks (99.4%)1 | | | |
Australia (7.5%) | | | |
| Commonwealth Bank of Australia | 261,762 | | 14,193 |
| BHP Group Ltd. | 435,395 | | 10,673 |
| Westpac Banking Corp. | 515,909 | | 10,017 |
| National Australia Bank Ltd. | 426,091 | | 8,364 |
| Australia & New Zealand Banking Group Ltd. | 418,764 | | 7,696 |
| Woolworths Group Ltd. | 185,990 | | 4,796 |
| Wesfarmers Ltd. | 167,238 | | 4,595 |
| Macquarie Group Ltd. | 45,483 | | 4,200 |
| Transurban Group | 400,111 | | 4,098 |
| Rio Tinto Ltd. | 54,852 | | 3,430 |
| Woodside Petroleum Ltd. | 137,984 | | 3,058 |
| Amcor plc | 239,612 | | 2,294 |
| Insurance Australia Group Ltd. | 341,880 | | 1,873 |
| Suncorp Group Ltd. | 186,948 | | 1,736 |
| QBE Insurance Group Ltd. | 196,487 | | 1,709 |
| ASX Ltd. | 28,696 | | 1,629 |
| Telstra Corp. Ltd. | 614,662 | | 1,480 |
| Fortescue Metals Group Ltd. | 235,678 | | 1,442 |
| Origin Energy Ltd. | 260,377 | | 1,412 |
| APA Group | 174,530 | | 1,402 |
| Sonic Healthcare Ltd. | 70,791 | | 1,394 |
| AGL Energy Ltd. | 96,769 | | 1,321 |
| South32 Ltd. | 745,344 | | 1,304 |
| Aurizon Holdings Ltd. | 283,067 | | 1,152 |
| Lendlease Group | 83,672 | | 1,081 |
| Sydney Airport | 164,383 | | 996 |
| Medibank Pvt Ltd. | 410,201 | | 956 |
| Tabcorp Holdings Ltd. | 282,633 | | 936 |
| Caltex Australia Ltd. | 37,021 | | 696 |
| Magellan Financial Group Ltd. | 19,724 | | 654 |
| AMP Ltd. | 497,535 | | 629 |
| Boral Ltd. | 173,701 | | 603 |
| Alumina Ltd. | 372,312 | | 581 |
| Incitec Pivot Ltd. | 241,143 | | 574 |
| Atlas Arteria Ltd. | 102,488 | | 567 |
| Coca-Cola Amatil Ltd. | 77,035 | | 541 |
| Bendigo & Adelaide Bank Ltd. | 72,932 | | 535 |
| Downer EDI Ltd. | 88,918 | | 495 |
| Challenger Ltd. | 84,005 | | 461 |
| Crown Resorts Ltd. | 52,307 | | 449 |
| Star Entertainment Grp Ltd. | 121,590 | | 394 |
| Qantas Airways Ltd. | 88,940 | | 393 |
| Orora Ltd. | 176,765 | | 377 |
| Bank of Queensland Ltd. | 58,732 | | 367 |
| AusNet Services | 264,503 | | 338 |
| CIMIC Group Ltd. | 14,525 | | 331 |
| Metcash Ltd. | 133,182 | | 259 |
| IOOF Holdings Ltd. | 50,765 | | 258 |
| Flight Centre Travel Group Ltd. | 8,268 | | 243 |
^ | Harvey Norman Holdings Ltd. | 85,756 | | 242 |
| Whitehaven Coal Ltd. | 96,721 | | 220 |
| CSR Ltd. | 74,144 | | 212 |
| Sims Metal Management Ltd. | 24,809 | | 160 |
| Perpetual Ltd. | 6,182 | | 153 |
| Adelaide Brighton Ltd. | 65,209 | | 138 |
| Platinum Asset Management Ltd. | 42,866 | | 122 |
| Coles Group Ltd. | 413 | | 4 |
| | | | 110,233 |
Austria (0.3%) | | | |
| Erste Group Bank AG | 42,316 | | 1,497 |
| OMV AG | 20,996 | | 1,227 |
| Raiffeisen Bank International AG | 19,387 | | 478 |
| ANDRITZ AG | 10,367 | | 466 |
| voestalpine AG | 17,233 | | 432 |
| Vienna Insurance Group AG Wiener Versicherung Gruppe | 5,751 | | 156 |
| | | | 4,256 |
31
International High Dividend Yield Index Fund
| | | | Market |
| | | | Value• |
| | Shares | | ($000) |
Belgium (0.5%) | | | |
| KBC Group NV | 40,479 | | 2,846 |
| Ageas | 27,258 | | 1,572 |
| Solvay SA Class A | 10,290 | | 1,119 |
| Groupe Bruxelles Lambert SA | 10,833 | | 1,088 |
| Proximus SADP | 20,804 | | 640 |
| bpost SA | 81 | | 1 |
| | | | 7,266 |
Brazil (2.5%) | | | |
| Vale SA | 507,060 | | 5,968 |
| Itau Unibanco Holding SA ADR | 519,425 | | 4,690 |
| Banco Bradesco SA ADR | 396,341 | | 3,472 |
| Itausa - Investimentos Itau SA Preference Shares | 647,959 | | 2,215 |
| Ambev SA ADR | 503,634 | | 2,171 |
| Banco Bradesco SA Preference Shares | 200,874 | | 1,762 |
| Banco do Brasil SA | 123,594 | | 1,484 |
| Itau Unibanco Holding SA Preference Shares | 163,580 | | 1,478 |
| Banco Bradesco SA | 146,072 | | 1,196 |
| IRB Brasil Resseguros S/A | 123,141 | | 1,160 |
| BB Seguridade Participacoes SA | 101,200 | | 857 |
| Telefonica Brasil SA ADR | 58,839 | | 775 |
| Petrobras Distribuidora SA | 100,990 | | 712 |
| Banco Santander Brasil SA | 59,791 | | 702 |
| CCR SA | 166,477 | | 682 |
| Banco BTG Pactual SA | 36,379 | | 589 |
| Ambev SA | 132,400 | | 574 |
| Cogna Educacao | 217,832 | | 525 |
| Hypera SA | 59,480 | | 509 |
| Klabin SA | 109,400 | | 432 |
| Cia Energetica de Minas Gerais ADR | 114,973 | | 386 |
| YDUQS Part | 36,700 | | 359 |
| Cosan SA | 24,000 | | 346 |
| TIM Participacoes SA | 120,000 | | 342 |
| Cielo SA | 163,600 | | 308 |
| Engie Brasil Energia SA | 25,450 | | 287 |
| Bradespar SA Preference Shares | 33,082 | | 264 |
| Transmissora Alianca de Energia Eletrica SA | 34,900 | | 251 |
| EDP - Energias do Brasil SA | 43,950 | | 208 |
| Porto Seguro SA | 14,400 | | 206 |
| Fleury SA | 31,000 | | 197 |
| Cia Paranaense de Energia Preference Shares | 13,700 | | 190 |
| Cia de Transmissao de Energia Eletrica Paulista Preference Shares | 28,208 | | 166 |
| Banco do Estado do Rio Grande do Sul SA Preference Shares | 29,600 | | 165 |
* | Via Varejo SA | 54,700 | | 101 |
| Cia Energetica de Minas Gerais Preference Shares | 26,457 | | 90 |
| Telefonica Brasil SA Preference Shares | 4,300 | | 57 |
| Cia Paranaense de Energia ADR | 996 | | 14 |
| Cia Energetica de Minas Gerais | 957 | | 4 |
| | | | 35,894 |
Canada (6.9%) | | | |
| Royal Bank of Canada | 213,379 | | 17,212 |
| Toronto-Dominion Bank | 272,572 | | 15,565 |
| Enbridge Inc. | 292,418 | | 10,650 |
| Bank of Nova Scotia | 182,173 | | 10,448 |
^ | Bank of Montreal | 94,342 | | 6,984 |
| TC Energy Corp. | 135,339 | | 6,822 |
| Canadian Imperial Bank of Commerce | 65,586 | | 5,592 |
| Manulife Financial Corp. | 290,903 | | 5,418 |
| Sun Life Financial Inc. | 87,756 | | 3,937 |
| Fortis Inc. | 63,990 | | 2,658 |
| Pembina Pipeline Corp. | 75,251 | | 2,649 |
| National Bank of Canada | 49,663 | | 2,565 |
| BCE Inc. | 44,107 | | 2,092 |
| Shaw Communications Inc. Class B | 66,733 | | 1,362 |
| Power Corp. of Canada | 51,898 | | 1,201 |
| TELUS Corp. | 29,463 | | 1,048 |
| Inter Pipeline Ltd. | 60,885 | | 1,022 |
| Great-West Lifeco Inc. | 38,569 | | 938 |
2 | Hydro One Ltd. | 47,038 | | 875 |
| Power Financial Corp. | 33,943 | | 794 |
| Canadian Utilities Ltd. Class A | 17,864 | | 521 |
| IGM Financial Inc. | 12,270 | | 346 |
| | | | 100,699 |
Chile (0.2%) | | | |
| Enel Americas SA ADR | 89,988 | | 860 |
| Banco Santander Chile ADR | 23,781 | | 576 |
| Sociedad Quimica y Minera de Chile SA Preference Shares Class B | 13,304 | | 355 |
32
International High Dividend Yield Index Fund
| | | | Market |
| | | | Value• |
| | Shares | | ($000) |
| Enel Chile SA | 2,891,030 | | 238 |
| Enel Americas SA | 926,943 | | 174 |
| Colbun SA | 989,856 | | 171 |
| Engie Energia Chile SA | 67,873 | | 101 |
| Enel Chile SA ADR | 21,294 | | 88 |
| AES Gener SA | 403,703 | | 87 |
| Embotelladora Andina SA Preference Shares | 28,688 | | 83 |
| Sociedad Quimica y Minera de Chile SA ADR | 400 | | 11 |
| Banco de Chile | 11,240 | | 1 |
| | | | 2,745 |
China (5.3%) | | | |
| China Construction Bank Corp. | 13,816,000 | | 11,070 |
| Industrial & Commercial Bank of China Ltd. | 11,556,000 | | 8,279 |
| China Mobile Ltd. | 782,919 | | 6,363 |
| Bank of China Ltd. | 11,277,000 | | 4,599 |
| CNOOC Ltd. | 2,355,000 | | 3,505 |
| China Merchants Bank Co. Ltd. | 560,928 | | 2,675 |
| China Petroleum & Chemical Corp. | 3,764,000 | | 2,141 |
| Agricultural Bank of China Ltd. | 4,569,000 | | 1,880 |
| China Overseas Land & Investment Ltd. | 568,000 | | 1,792 |
| China Resources Land Ltd. | 398,000 | | 1,693 |
| Country Garden Holdings Co. Ltd. | 1,098,000 | | 1,524 |
| Sunac China Holdings Ltd. | 333,354 | | 1,512 |
| PetroChina Co. Ltd. | 3,094,000 | | 1,509 |
| China Pacific Insurance Group Co. Ltd. | 384,400 | | 1,395 |
| Anhui Conch Cement Co. Ltd. | 177,328 | | 1,060 |
| China Shenhua Energy Co. Ltd. | 509,000 | | 1,034 |
2 | Longfor Group Holdings Ltd. | 243,500 | | 1,011 |
| CITIC Ltd. | 742,000 | | 976 |
| Guangdong Investment Ltd. | 432,000 | | 935 |
2 | Postal Savings Bank of China Co. Ltd. | 1,404,000 | | 900 |
| China Vanke Co. Ltd. | 234,205 | | 854 |
| China CITIC Bank Corp. Ltd. | 1,412,320 | | 819 |
* | China Evergrande Group | 324,000 | | 789 |
| Bank of Communications Co. Ltd. | 1,099,000 | | 751 |
| Hengan International Group Co. Ltd. | 105,343 | | 736 |
| China Minsheng Banking Corp. Ltd. | 978,100 | | 684 |
| Shimao Property Holdings Ltd. | 175,500 | | 588 |
| China Jinmao Holdings Group Ltd. | 884,000 | | 588 |
| China Communications Construction Co. Ltd. | 665,000 | | 506 |
| China National Building Material Co. Ltd. | 586,000 | | 494 |
| Guangzhou Automobile Group Co. Ltd. | 472,000 | | 471 |
| Weichai Power Co. Ltd. | 294,000 | | 463 |
2 | CGN Power Co. Ltd. | 1,722,000 | | 447 |
| Beijing Enterprises Water Group Ltd. | 826,000 | | 431 |
| Dongfeng Motor Group Co. Ltd. | 422,000 | | 423 |
| Kunlun Energy Co. Ltd. | 440,000 | | 410 |
| Great Wall Motor Co. Ltd. | 454,500 | | 368 |
| China Resources Cement Holdings Ltd. | 324,000 | | 355 |
| China Resources Power Holdings Co. Ltd. | 274,000 | | 344 |
| CIFI Holdings Group Co. Ltd. | 496,000 | | 331 |
| Zijin Mining Group Co. Ltd. | 840,000 | | 291 |
| Yanzhou Coal Mining Co. Ltd. | 284,000 | | 288 |
| China Merchants Port Holdings Co. Ltd. | 184,000 | | 288 |
| Huaneng Power International Inc. | 602,000 | | 286 |
| Far East Horizon Ltd. | 299,000 | | 283 |
| Kingboard Holdings Ltd. | 105,000 | | 280 |
| Agile Group Holdings Ltd. | 200,000 | | 270 |
| China Cinda Asset Management Co. Ltd. | 1,293,000 | | 268 |
| Shenzhen International Holdings Ltd. | 131,500 | | 267 |
| Future Land Development Holdings Ltd. | 242,000 | | 255 |
| China Medical System Holdings Ltd. | 183,000 | | 248 |
| China State Construction International Holdings Ltd. | 260,000 | | 239 |
2 | China Huarong Asset Management Co. Ltd. | 1,608,000 | | 237 |
33
International High Dividend Yield Index Fund
| | | | Market |
| | | | Value• |
| | Shares | | ($000) |
| Jiangsu Expressway Co. Ltd. | 174,000 | | 231 |
| Guangzhou R&F Properties Co. Ltd. | 147,200 | | 228 |
| Logan Property Holdings Co. Ltd. | 144,000 | | 219 |
2 | Fuyao Glass Industry Group Co. Ltd. | 72,000 | | 203 |
| China Everbright Bank Co. Ltd. | 442,000 | | 203 |
| COSCO SHIPPING Ports Ltd. | 258,000 | | 203 |
| Nine Dragons Paper Holdings Ltd. | 232,000 | | 201 |
2 | Dali Foods Group Co. Ltd. | 291,000 | | 199 |
2 | BAIC Motor Corp. Ltd. | 320,500 | | 199 |
| Yuexiu Property Co. Ltd. | 886,000 | | 195 |
| Bosideng International Holdings Ltd. | 374,000 | | 193 |
| Shenzhen Investment Ltd. | 482,000 | | 190 |
| KWG Group Holdings Ltd. | 178,000 | | 179 |
| China Everbright Ltd. | 120,000 | | 178 |
| Chongqing Rural Commercial Bank Co. Ltd. | 333,000 | | 178 |
| China Molybdenum Co. Ltd. | 558,000 | | 176 |
| Shanghai Lujiazui Finance & Trade Zone Development Co. Ltd. Class B | 154,162 | | 170 |
| Zhejiang Expressway Co. Ltd. | 204,000 | | 167 |
| China Reinsurance Group Corp. | 950,000 | | 155 |
| Sino-Ocean Group Holding Ltd. | 414,500 | | 152 |
| Sinotruk Hong Kong Ltd. | 94,500 | | 143 |
| Sinopec Shanghai Petrochemical Co. Ltd. | 496,000 | | 137 |
| Zoomlion Heavy Industry Science and Technology Co. Ltd. | 186,600 | | 137 |
| Kingboard Laminates Holdings Ltd. | 146,500 | | 134 |
| Shenzhen Expressway Co. Ltd. | 100,000 | | 134 |
| China Power International Development Ltd. | 618,370 | | 129 |
| Shanghai Industrial Holdings Ltd. | 65,000 | | 121 |
2 | Sinopec Engineering Group Co. Ltd. | 209,000 | | 119 |
| Lee & Man Paper Manufacturing Ltd. | 211,000 | | 117 |
| Greentown China Holdings Ltd. | 108,500 | | 100 |
| Poly Property Group Co. Ltd. | 271,000 | | 98 |
| Maanshan Iron & Steel Co. Ltd. | 244,000 | | 92 |
| Huadian Power International Corp. Ltd. | 230,000 | | 86 |
| Metallurgical Corp. of China Ltd. | 406,000 | | 86 |
| Sinotrans Ltd. | 289,000 | | 85 |
| Hopson Development Holdings Ltd. | 88,000 | | 85 |
| Yanlord Land Group Ltd. | 92,900 | | 82 |
| China Zhongwang Holdings Ltd. | 198,400 | | 82 |
| Huaxin Cement Co. Ltd. Class B | 44,700 | | 81 |
| Datang International Power Generation Co. Ltd. | 400,000 | | 79 |
| Huadian Fuxin Energy Corp. Ltd. | 350,000 | | 68 |
| Angang Steel Co. Ltd. | 197,000 | | 66 |
| Guangshen Railway Co. Ltd. | 200,000 | | 64 |
2 | Red Star Macalline Group Corp. Ltd. | 74,757 | | 60 |
| China BlueChemical Ltd. | 240,000 | | 58 |
| China International Marine Containers Group Co. Ltd. | 63,960 | | 56 |
| Chongqing Changan Automobile Co. Ltd. Class B | 119,300 | | 49 |
| China Machinery Engineering Corp. | 117,000 | | 46 |
| Shanghai Jinjiang International Hotels Co. Ltd. Class B | 25,000 | | 46 |
| Anhui Expressway Co. Ltd. | 74,000 | | 44 |
| Beijing Jingneng Clean Energy Co. Ltd. | 232,000 | | 41 |
| China South City Holdings Ltd. | 352,000 | | 41 |
| Weifu High-Technology Group Co. Ltd. Class B | 23,200 | | 37 |
| Sichuan Expressway Co. Ltd. | 118,000 | | 34 |
| Shandong Chenming Paper Holdings Ltd. | 61,500 | | 26 |
| PICC Property & Casualty Co. Ltd. | 1,000 | | 1 |
34
International High Dividend Yield Index Fund
| | | | Market |
| | | | Value• |
| | Shares | | ($000) |
2 | China Galaxy Securities Co. Ltd. | 2,000 | | 1 |
| GF Securities Co. Ltd. | 600 | | 1 |
2 | China Merchants Securities Co. Ltd. | 400 | | — |
| | | | 76,890 |
Colombia (0.1%) | | | |
| Ecopetrol SA ADR | 33,481 | | 611 |
| Interconexion Electrica SA ESP | 61,157 | | 353 |
| Grupo Aval Acciones y Valores Preference Shares | 420,560 | | 172 |
| Ecopetrol SA | 54,855 | | 49 |
| Bancolombia SA Preference Shares | 306 | | 4 |
| | | | 1,189 |
Czech Republic (0.1%) | | | |
| CEZ AS | 23,578 | | 538 |
| Komercni banka AS | 11,250 | | 380 |
2 | Moneta Money Bank AS | 72,545 | | 241 |
| O2 Czech Republic AS | 6,600 | | 62 |
| | | | 1,221 |
Denmark (0.2%) | | | |
| Danske Bank A/S | 98,487 | | 1,407 |
| ISS A/S | 27,412 | | 718 |
| Pandora A/S | 13,255 | | 652 |
| Tryg A/S | 17,915 | | 501 |
| H Lundbeck A/S | 14 | | 1 |
| | | | 3,279 |
Egypt (0.0%) | | | |
| Egypt Kuwait Holding Co. SAE | 109,871 | | 153 |
| Eastern Co. SAE | 140,781 | | 141 |
| ElSewedy Electric Co. | 104,978 | | 87 |
| Telecom Egypt Co. | 45,428 | | 32 |
| | | | 413 |
Finland (1.5%) | | | |
| Kone Oyj Class B | 57,679 | | 3,673 |
| Nordea Bank Abp | 476,265 | | 3,486 |
| Nokia Oyj | 828,673 | | 3,042 |
| Sampo Oyj Class A | 72,342 | | 2,965 |
| UPM-Kymmene Oyj | 78,771 | | 2,565 |
| Fortum Oyj | 63,601 | | 1,554 |
| Elisa Oyj | 21,070 | | 1,151 |
| Stora Enso Oyj | 85,110 | | 1,106 |
| Orion Oyj Class B | 15,264 | | 677 |
| Kesko Oyj Class B | 10,009 | | 667 |
| Metso Oyj | 15,910 | | 602 |
| Nokian Renkaat Oyj | 20,189 | | 577 |
| | | | 22,065 |
France (6.4%) | | | |
| TOTAL SA | 356,354 | | 18,840 |
| Sanofi | 160,219 | | 14,770 |
| BNP Paribas SA | 159,843 | | 8,353 |
| AXA SA | 283,687 | | 7,510 |
| Schneider Electric SE | 77,371 | | 7,191 |
| Orange SA | 282,388 | | 4,545 |
| Societe Generale SA | 113,772 | | 3,236 |
| Cie Generale des Etablissements Michelin SCA | 26,065 | | 3,174 |
| Cie de Saint-Gobain | 71,944 | | 2,930 |
| Credit Agricole SA | 169,312 | | 2,209 |
| Peugeot SA | 80,325 | | 2,034 |
| Veolia Environnement SA | 74,076 | | 1,950 |
| Engie SA | 112,327 | | 1,881 |
| Renault SA | 27,063 | | 1,382 |
| Publicis Groupe SA | 31,777 | | 1,368 |
| Valeo SA | 35,131 | | 1,308 |
| Bouygues SA | 30,772 | | 1,305 |
| Engie Loyalty Shares 2021 | 65,712 | | 1,100 |
| SES SA Class A | 52,187 | | 1,012 |
| SCOR SE | 23,286 | | 982 |
| Suez | 54,593 | | 852 |
| Engie Loyalty Shares 2020 | 47,482 | | 795 |
2 | Amundi SA | 8,441 | | 603 |
| Natixis SA | 124,712 | | 573 |
| Rexel SA | 45,080 | | 559 |
| Eutelsat Communications SA | 27,603 | | 524 |
| CNP Assurances | 23,644 | | 469 |
^ | Casino Guichard Perrachon SA | 8,101 | | 437 |
| Lagardere SCA | 17,343 | | 388 |
| Engie | 18,396 | | 317 |
| Societe BIC SA | 3,707 | | 257 |
| Imerys SA | 5,400 | | 209 |
2 | ALD SA | 12,047 | | 171 |
| | | | 93,234 |
Germany (7.6%) | | | |
| Allianz SE | 62,386 | | 15,236 |
| Siemens AG | 111,880 | | 12,911 |
| Bayer AG | 137,974 | | 10,704 |
| BASF SE | 135,236 | | 10,281 |
| Deutsche Telekom AG | 476,706 | | 8,388 |
| Daimler AG | 126,928 | | 7,403 |
| Muenchener Rueckversicherungs-Gesellschaft AG in Muenchen | 21,272 | | 5,910 |
| Volkswagen AG Preference Shares | 27,000 | | 5,133 |
| Deutsche Post AG | 144,036 | | 5,103 |
| Vonovia SE | 80,108 | | 4,266 |
35
International High Dividend Yield Index Fund
| | | | Market |
| | | | Value• |
| | Shares | | ($000) |
| Bayerische Motoren Werke AG | 44,932 | | 3,441 |
| E.ON SE | 319,962 | | 3,227 |
| RWE AG | 84,599 | | 2,578 |
| Porsche Automobil Holding SE Preference Shares | 22,746 | | 1,675 |
| HeidelbergCement AG | 22,040 | | 1,634 |
| Hannover Rueck SE | 8,873 | | 1,572 |
2 | Covestro AG | 25,317 | | 1,216 |
| Aroundtown SA | 130,966 | | 1,107 |
| LEG Immobilien AG | 9,380 | | 1,077 |
| Commerzbank AG | 154,390 | | 924 |
| Volkswagen AG | 4,787 | | 905 |
| Uniper SE | 29,004 | | 904 |
| GEA Group AG | 24,584 | | 751 |
| Bayerische Motoren Werke AG Preference Shares | 11,657 | | 717 |
| Evonik Industries AG | 24,808 | | 654 |
| Deutsche Lufthansa AG | 35,714 | | 619 |
| ProSiebenSat.1 Media SE | 30,498 | | 450 |
| Axel Springer SE | 6,117 | | 428 |
| METRO AG | 25,070 | | 409 |
| HUGO BOSS AG | 9,253 | | 390 |
| HOCHTIEF AG | 2,909 | | 363 |
| Telefonica Deutschland Holding AG | 97,139 | | 308 |
| RTL Group SA | 5,567 | | 283 |
| Talanx AG | 5,590 | | 258 |
| 1&1 Drillisch AG | 6,802 | | 182 |
| Axel Springer SE (XETR) | 766 | | 55 |
* | CECONOMY AG | 123 | | 1 |
| | | | 111,463 |
Greece (0.1%) | | | |
| Hellenic Telecommunications Organization SA | 36,698 | | 556 |
| OPAP SA | 31,050 | | 338 |
| Motor Oil Hellas Corinth Refineries SA | 7,952 | | 197 |
| Mytilineos SA | 15,077 | | 165 |
| Hellenic Petroleum SA | 8,167 | | 78 |
| | | | 1,334 |
Hong Kong (2.0%) | | | |
| CK Hutchison Holdings Ltd. | 393,500 | | 3,633 |
| Sun Hung Kai Properties Ltd. | 211,000 | | 3,197 |
| CLP Holdings Ltd. | 242,000 | | 2,513 |
| Hang Seng Bank Ltd. | 107,300 | | 2,239 |
| BOC Hong Kong Holdings Ltd. | 532,500 | | 1,829 |
| Sands China Ltd. | 355,200 | | 1,750 |
| Power Assets Holdings Ltd. | 203,099 | | 1,449 |
2 | WH Group Ltd. | 1,242,139 | | 1,311 |
| New World Development Co. Ltd. | 849,000 | | 1,214 |
| Wharf Real Estate Investment Co. Ltd. | 182,000 | | 1,070 |
| Henderson Land Development Co. Ltd. | 193,587 | | 967 |
| Lenovo Group Ltd. | 1,112,000 | | 775 |
| Swire Pacific Ltd. Class A | 76,788 | | 732 |
| Sino Land Co. Ltd. | 472,000 | | 706 |
| Hang Lung Properties Ltd. | 305,576 | | 672 |
| CK Infrastructure Holdings Ltd. | 92,472 | | 666 |
| Wynn Macau Ltd. | 217,600 | | 472 |
| NagaCorp Ltd. | 218,000 | | 396 |
| Hysan Development Co. Ltd. | 97,000 | | 382 |
| PCCW Ltd. | 584,000 | | 347 |
| Xinyi Glass Holdings Ltd. | 292,000 | | 328 |
| NWS Holdings Ltd. | 203,000 | | 302 |
| Yue Yuen Industrial Holdings Ltd. | 103,000 | | 290 |
| Xinyi Solar Holdings Ltd. | 496,800 | | 281 |
2 | BOC Aviation Ltd. | 29,500 | | 277 |
| Kerry Properties Ltd. | 85,000 | | 275 |
| VTech Holdings Ltd. | 22,900 | | 201 |
| Chow Tai Fook Jewellery Group Ltd. | 152,000 | | 137 |
| Cafe de Coral Holdings Ltd. | 48,000 | | 131 |
| First Pacific Co. Ltd. | 332,000 | | 127 |
| Shun Tak Holdings Ltd. | 260,000 | | 107 |
| Shougang Fushan Resources Group Ltd. | 504,000 | | 104 |
| Haitong International Securities Group Ltd. | 344,000 | | 100 |
| Shui On Land Ltd. | 494,500 | | 100 |
| Li & Fung Ltd. | 836,000 | | 91 |
| Dah Sing Financial Holdings Ltd. | 20,400 | | 76 |
| Guotai Junan International Holdings Ltd. | 439,000 | | 74 |
| Lifestyle International Holdings Ltd. | 66,000 | | 69 |
| Television Broadcasts Ltd. | 38,200 | | 63 |
| SA Sa International Holdings Ltd. | 132,000 | | 32 |
| | | | 29,485 |
36
International High Dividend Yield Index Fund
| | | | Market |
| | | | Value• |
| | Shares | | ($000) |
Hungary (0.1%) | | | |
| MOL Hungarian Oil & Gas Plc | 63,363 | | 627 |
| Magyar Telekom Telecommunications plc | 55,066 | | 82 |
| | | | 709 |
India (0.5%) | | | |
| Bharat Petroleum Corp. Ltd. | 147,720 | | 1,094 |
| Oil & Natural Gas Corp. Ltd. | 446,118 | | 890 |
| Indian Oil Corp. Ltd. | 311,080 | | 643 |
| Coal India Ltd. | 212,550 | | 621 |
| NTPC Ltd. | 349,184 | | 602 |
| Hero MotoCorp Ltd. | 14,427 | | 549 |
| Vedanta Ltd. | 248,751 | | 519 |
| Hindustan Petroleum Corp. Ltd. | 89,237 | | 408 |
| Bharti Infratel Ltd. | 126,810 | | 339 |
| REC Ltd. | 97,862 | | 193 |
| NMDC Ltd. | 104,759 | | 166 |
| Castrol India Ltd. | 71,908 | | 154 |
| Indiabulls Housing Finance Ltd. | 49,299 | | 143 |
| Oracle Financial Services Software Ltd. | 3,211 | | 142 |
* | Power Finance Corp. Ltd. | 90,764 | | 140 |
| NHPC Ltd. | 341,647 | | 113 |
| Hindustan Zinc Ltd. | 33,073 | | 99 |
| Oil India Ltd. | 36,768 | | 89 |
| Mangalore Refinery & Petrochemicals Ltd. | 34,738 | | 27 |
| | | | 6,931 |
Indonesia (0.2%) | | | |
| Telekomunikasi Indonesia Persero Tbk PT | 6,874,500 | | 2,006 |
| United Tractors Tbk PT | 227,904 | | 352 |
| Perusahaan Gas Negara Tbk PT | 1,540,800 | | 231 |
| Adaro Energy Tbk PT | 1,805,000 | | 168 |
| Tower Bersama Infrastructure Tbk PT | 282,500 | | 127 |
| Bukit Asam Tbk PT | 569,800 | | 91 |
| Matahari Department Store Tbk PT | 340,100 | | 88 |
| Media Nusantara Citra Tbk PT | 699,000 | | 66 |
| Surya Citra Media Tbk PT | 729,900 | | 64 |
| | | | 3,193 |
Ireland (0.1%) | | | |
| Bank of Ireland Group plc | 136,977 | | 660 |
| AIB Group plc | 115,114 | | 369 |
| | | | 1,029 |
Israel (0.3%) | | | |
| Bank Leumi Le-Israel BM | 220,040 | | 1,603 |
| Bank Hapoalim BM | 161,050 | | 1,289 |
| Mizrahi Tefahot Bank Ltd. | 19,414 | | 482 |
| Bezeq The Israeli Telecommunication Corp. Ltd. | 290,280 | | 192 |
| Gazit-Globe Ltd. | 12,441 | | 125 |
| Delek Group Ltd. | 715 | | 89 |
| Shikun & Binui Ltd. | 556 | | 2 |
| | | | 3,782 |
Italy (2.6%) | | | |
| Enel SPA | 1,147,682 | | 8,895 |
| Eni SPA | 368,475 | | 5,590 |
| Intesa Sanpaolo SPA (Registered) | 2,211,636 | | 5,542 |
| UniCredit SPA | 330,104 | | 4,188 |
| Assicurazioni Generali SPA | 189,676 | | 3,846 |
| Atlantia SPA | 78,627 | | 1,943 |
| Snam SPA | 337,180 | | 1,731 |
| Terna Rete Elettrica Nazionale SPA | 209,203 | | 1,383 |
| Mediobanca Banca di Credito Finanziario SPA | 107,982 | | 1,284 |
| FinecoBank Banca Fineco SPA | 90,034 | | 1,015 |
2 | Poste Italiane SPA | 67,756 | | 823 |
| Telecom Italia SPA (Bearer) | 895,079 | | 518 |
| A2A SPA | 230,492 | | 463 |
| Unione di Banche Italiane SPA | 140,495 | | 428 |
| Italgas SPA | 57,595 | | 371 |
| Banca Mediolanum SPA | 41,760 | | 358 |
| UnipolSai Assicurazioni SPA | 85,298 | | 238 |
| | | | 38,616 |
Japan (10.4%) | | | |
| Toyota Motor Corp. | 368,413 | | 25,561 |
| Mitsubishi UFJ Financial Group Inc. | 1,843,000 | | 9,555 |
| Takeda Pharmaceutical Co. Ltd. | 225,000 | | 8,130 |
| KDDI Corp. | 256,300 | | 7,092 |
| Honda Motor Co. Ltd. | 257,000 | | 6,953 |
| Sumitomo Mitsui Financial Group Inc. | 191,754 | | 6,808 |
| Mizuho Financial Group Inc. | 3,750,700 | | 5,823 |
| Tokio Marine Holdings Inc. | 97,234 | | 5,257 |
| NTT DOCOMO Inc. | 172,400 | | 4,726 |
| Mitsubishi Corp. | 185,000 | | 4,705 |
37
International High Dividend Yield Index Fund
| | | | Market |
| | | | Value• |
| | Shares | | ($000) |
| Nippon Telegraph & Telephone Corp. | 92,300 | | 4,582 |
| Mitsui & Co. Ltd. | 249,812 | | 4,290 |
| ITOCHU Corp. | 200,284 | | 4,188 |
| Canon Inc. | 149,100 | | 4,091 |
| Japan Tobacco Inc. | 174,800 | | 3,951 |
| Komatsu Ltd. | 135,100 | | 3,163 |
| ORIX Corp. | 189,400 | | 2,976 |
| Sumitomo Corp. | 165,338 | | 2,685 |
| Subaru Corp. | 90,509 | | 2,594 |
| MS&AD Insurance Group Holdings Inc. | 72,500 | | 2,341 |
| JXTG Holdings Inc. | 456,605 | | 2,134 |
| Sumitomo Mitsui Trust Holdings Inc. | 53,900 | | 1,964 |
| Sekisui House Ltd. | 85,502 | | 1,844 |
| Nissan Motor Co. Ltd. | 286,200 | | 1,806 |
| Japan Post Holdings Co. Ltd. | 195,874 | | 1,798 |
| Nippon Steel Corp. | 121,100 | | 1,768 |
| Marubeni Corp. | 232,000 | | 1,633 |
| Mitsubishi Chemical Holdings Corp. | 188,800 | | 1,439 |
| Resona Holdings Inc. | 323,100 | | 1,405 |
| Daito Trust Construction Co. Ltd. | 9,500 | | 1,259 |
| Idemitsu Kosan Co. Ltd. | 35,453 | | 1,042 |
| Daiwa Securities Group Inc. | 229,714 | | 1,033 |
| Sumitomo Chemical Co. Ltd. | 225,700 | | 1,032 |
| JFE Holdings Inc. | 76,400 | | 956 |
| Yamaha Motor Co. Ltd. | 41,400 | | 810 |
^ | SBI Holdings Inc. | 33,600 | | 731 |
| LIXIL Group Corp. | 39,000 | | 725 |
| NSK Ltd. | 66,100 | | 615 |
| Mitsui Chemicals Inc. | 25,500 | | 606 |
| Sojitz Corp. | 189,200 | | 596 |
| Japan Post Bank Co. Ltd. | 59,848 | | 595 |
| Seiko Epson Corp. | 41,000 | | 580 |
| SUMCO Corp. | 34,900 | | 580 |
| Chugoku Electric Power Co. Inc. | 43,435 | | 579 |
| Amada Holdings Co. Ltd. | 47,700 | | 543 |
| Haseko Corp. | 41,986 | | 542 |
| Aozora Bank Ltd. | 17,600 | | 452 |
| Lawson Inc. | 7,000 | | 386 |
| Mitsubishi Gas Chemical Co. Inc. | 26,400 | | 372 |
| Denka Co. Ltd. | 12,700 | | 367 |
| Sumitomo Rubber Industries Ltd. | 26,200 | | 347 |
| DIC Corp. | 11,800 | | 338 |
| Seven Bank Ltd. | 96,500 | | 280 |
| Sankyo Co. Ltd. | 7,500 | | 262 |
| NTN Corp. | 60,200 | | 187 |
| Miraca Holdings Inc. | 7,600 | | 179 |
| Heiwa Corp. | 7,400 | | 152 |
| Hitachi Capital Corp. | 6,300 | | 141 |
| Matsui Securities Co. Ltd. | 14,400 | | 119 |
| SKY Perfect JSAT Holdings Inc. | 17,000 | | 70 |
| | | | 151,738 |
Kuwait (0.3%) | | | |
| National Bank of Kuwait SAKP | 899,526 | | 2,789 |
| Ahli United Bank BSC | 680,731 | | 602 |
| Mobile Telecommunications Co. KSC | 309,624 | | 577 |
| Gulf Bank KSCP | 246,648 | | 214 |
| Humansoft Holding Co. KSC | 13,726 | | 140 |
| Boubyan Petrochemicals Co. KSCP | 55,032 | | 134 |
| | | | 4,456 |
Malaysia (0.6%) | | | |
| Tenaga Nasional Bhd. | 576,933 | | 1,911 |
| Malayan Banking Bhd. | 889,497 | | 1,829 |
| CIMB Group Holdings Bhd. | 1,018,600 | | 1,278 |
| DiGi.Com Bhd. | 543,100 | | 610 |
| Maxis Bhd. | 408,000 | | 525 |
| Petronas Gas Bhd. | 115,432 | | 460 |
| MISC Bhd. | 207,300 | | 413 |
| Gamuda Bhd. | 320,200 | | 286 |
| Sime Darby Bhd. | 514,200 | | 279 |
| AMMB Holdings Bhd. | 280,600 | | 268 |
| Westports Holdings Bhd. | 149,700 | | 153 |
| YTL Corp. Bhd. | 642,368 | | 134 |
| Alliance Bank Malaysia Bhd. | 157,100 | | 108 |
| British American Tobacco Malaysia Bhd. | 20,000 | | 90 |
2 | Astro Malaysia Holdings Bhd. | 218,600 | | 71 |
| Telekom Malaysia Bhd. | 5,800 | | 5 |
| | | | 8,420 |
Mexico (0.5%) | | | |
| Wal-Mart de Mexico SAB de CV | 764,735 | | 2,295 |
| Grupo Financiero Banorte SAB de CV | 416,146 | | 2,271 |
| Grupo Mexico SAB de CV Class B | 532,300 | | 1,402 |
| Grupo Aeroportuario del Pacifico SAB de CV Class B | 53,654 | | 563 |
38
International High Dividend Yield Index Fund
| | | | Market |
| | | | Value• |
| | Shares | | ($000) |
| Grupo Aeroportuario del Centro Norte SAB de CV Class B | 46,700 | | 324 |
| Promotora y Operadora de Infraestructura SAB de CV | 31,290 | | 289 |
| Kimberly-Clark de Mexico SAB de CV Class A | 122,800 | | 248 |
| Industrias Penoles SAB de CV | 18,365 | | 220 |
| Banco Santander Mexico SA Institucion de Banca Multiple Grupo Financiero Santand | 80,300 | | 108 |
| Alpek SAB de CV | 51,000 | | 55 |
2 | Nemak SAB de CV | 84,600 | | 38 |
| | | | 7,813 |
Netherlands (2.1%) | | | |
| Unilever NV | 214,469 | | 12,677 |
| ING Groep NV | 576,459 | | 6,528 |
| Koninklijke Ahold Delhaize NV | 163,235 | | 4,068 |
| NN Group NV | 49,179 | | 1,876 |
| Koninklijke KPN NV | 487,771 | | 1,514 |
2 | ABN AMRO Bank NV | 61,137 | | 1,140 |
| Aegon NV | 260,009 | | 1,128 |
| Randstad NV | 16,309 | | 905 |
| ASR Nederland NV | 20,706 | | 759 |
2 | Signify NV | 17,375 | | 509 |
| | | | 31,104 |
New Zealand (0.2%) | | | |
| Spark New Zealand Ltd. | 272,548 | | 782 |
| Meridian Energy Ltd. | 182,969 | | 539 |
| Contact Energy Ltd. | 107,135 | | 507 |
| Fletcher Building Ltd. | 128,291 | | 377 |
| Mercury NZ Ltd. | 98,178 | | 312 |
| SKYCITY Entertainment Group Ltd. | 94,556 | | 237 |
| Air New Zealand Ltd. | 72,124 | | 130 |
| | | | 2,884 |
Norway (0.8%) | | | |
| DNB ASA | 154,083 | | 2,806 |
| Equinor ASA | 145,151 | | 2,695 |
| Telenor ASA | 95,501 | | 1,787 |
| Mowi ASA | 62,957 | | 1,537 |
| Orkla ASA | 112,992 | | 1,086 |
| Norsk Hydro ASA | 198,322 | | 701 |
| Gjensidige Forsikring ASA | 24,541 | | 459 |
^ | Aker BP ASA | 16,125 | | 447 |
| Salmar ASA | 7,630 | | 356 |
| Leroy Seafood Group ASA | 36,981 | | 248 |
| | | | 12,122 |
Pakistan (0.0%) | | | |
| Habib Bank Ltd. | 96,375 | | 79 |
| Oil & Gas Development Co. Ltd. | 90,700 | | 75 |
| Pakistan Petroleum Ltd. | 96,480 | | 71 |
| Fauji Fertilizer Co. Ltd. | 93,500 | | 57 |
| | | | 282 |
Philippines (0.1%) | | | |
| PLDT Inc. | 17,220 | | 370 |
| Manila Electric Co. | 37,220 | | 248 |
| Aboitiz Power Corp. | 220,800 | | 174 |
| Globe Telecom Inc. | 4,140 | | 149 |
| DMCI Holdings Inc. | 579,800 | | 94 |
| Semirara Mining & Power Corp. Class A | 156,320 | | 72 |
| | | | 1,107 |
Poland (0.2%) | | | |
| Powszechna Kasa Oszczednosci Bank Polski SA | 125,939 | | 1,257 |
| Powszechny Zaklad Ubezpieczen SA | 82,971 | | 803 |
| Bank Polska Kasa Opieki SA | 23,266 | | 657 |
| Polskie Gornictwo Naftowe i Gazownictwo SA | 245,745 | | 303 |
| | | | 3,020 |
Portugal (0.2%) | | | |
| EDP - Energias de | | | |
| Portugal SA | 334,433 | | 1,378 |
| Galp Energia SGPS SA | 76,049 | | 1,216 |
| | | | 2,594 |
Qatar (0.5%) | | | |
| Qatar National Bank QPSC | 657,344 | | 3,465 |
| Industries Qatar QSC | 298,562 | | 861 |
| Qatar Islamic Bank SAQ | 172,994 | | 723 |
| Masraf Al Rayan QSC | 551,174 | | 568 |
| Commercial Bank PSQC | 291,767 | | 344 |
| Qatar Electricity & Water Co. QSC | 73,389 | | 318 |
| Qatar International Islamic Bank QSC | 109,729 | | 286 |
| Qatar Gas Transport Co. Ltd. | 383,592 | | 260 |
| Barwa Real Estate Co. | 271,095 | | 255 |
| Ooredoo QPSC | 121,155 | | 243 |
| Qatar Insurance Co. SAQ | 236,815 | | 200 |
| Doha Bank QPSC | 216,422 | | 151 |
| Gulf International Services QSC | 64,963 | | 30 |
| | | | 7,704 |
39
International High Dividend Yield Index Fund
| | | | Market |
| | | | Value• |
| | Shares | | ($000) |
Russia (2.0%) | | | |
| Sberbank of Russia PJSC | 1,452,940 | | 5,325 |
| Lukoil PJSC ADR | 57,658 | | 5,313 |
| Gazprom PJSC ADR | 660,342 | | 5,294 |
| Tatneft PJSC ADR | 36,260 | | 2,543 |
| MMC Norilsk Nickel PJSC ADR | 39,350 | | 1,092 |
| MMC Norilsk Nickel PJSC | 3,855 | | 1,076 |
| Rosneft Oil Co. PJSC GDR | 161,685 | | 1,075 |
| Gazprom PJSC | 242,165 | | 982 |
| LUKOIL PJSC | 9,724 | | 898 |
| Surgutneftegas OAO Preference Shares | 1,124,277 | | 661 |
| AK Transneft OAO Preference Shares | 223 | | 579 |
| Mobile TeleSystems PJSC ADR | 64,488 | | 577 |
| Alrosa PJSC | 349,300 | | 406 |
| Severstal PJSC GDR | 25,695 | | 351 |
| Inter RAO UES PJSC | 5,057,000 | | 341 |
| Magnit PJSC GDR | 26,858 | | 306 |
| Moscow Exchange MICEX-RTS PJSC | 201,426 | | 299 |
| Novolipetsk Steel PJSC | 144,980 | | 283 |
| Magnit PJSC | 5,134 | | 259 |
| Polyus PJSC GDR | 4,076 | | 240 |
| Polyus PJSC | 1,910 | | 223 |
| Sberbank of Russia PJSC ADR | 14,446 | | 212 |
| Tatneft PJSC | 13,843 | | 162 |
| Rostelecom PJSC | 120,210 | | 147 |
| Magnitogorsk Iron & Steel Works PJSC | 246,000 | | 140 |
| PhosAgro PJSC GDR | 10,445 | | 132 |
| RusHydro PJSC | 16,098,000 | | 128 |
| Aeroflot PJSC | 73,719 | | 123 |
| Tatneft PAO Preference Shares | 10,870 | | 112 |
| Federal Grid Co. Unified Energy System PJSC | 36,460,000 | | 105 |
| Sistema PJSFC | 394,300 | | 90 |
| PhosAgro PJSC | 1,668 | | 63 |
| Unipro PJSC | 1,488,000 | | 61 |
| Mobile TeleSystems PJSC | 9,210 | | 41 |
| Rosneft Oil Co. PJSC | 5,910 | | 39 |
| Severstal PJSC | 2,705 | | 37 |
| | | | 29,715 |
Saudi Arabia (0.9%) | | | |
| Saudi Basic Industries Corp. | 99,801 | | 2,334 |
| Al Rajhi Bank | 135,136 | | 2,177 |
| National Commercial Bank | 150,274 | | 1,744 |
| Saudi Telecom Co. | 66,635 | | 1,703 |
| Riyad Bank | 148,033 | | 876 |
| Samba Financial Group | 109,499 | | 809 |
| Saudi Electricity Co. | 87,903 | | 487 |
| Saudi Arabian Fertilizer Co. | 22,254 | | 464 |
| Alinma Bank | 82,431 | | 461 |
| Yanbu National Petrochemical Co. | 25,649 | | 340 |
| Jarir Marketing Co. | 6,497 | | 274 |
* | Dar Al Arkan Real Estate Development Co. | 56,294 | | 181 |
| Bank Al-Jazira | 42,960 | | 149 |
| Sahara International Petrochemical Co. | 33,643 | | 148 |
| Advanced Petrochemical Co. | 11,849 | | 147 |
| Saudi Cement Co. | 7,997 | | 146 |
| Saudi Industrial Investment Group | 23,510 | | 132 |
| Saudi Airlines Catering Co. | 3,975 | | 92 |
| Seera Group Holding | 15,604 | | 76 |
| Qassim Cement Co. | 5,185 | | 75 |
| Yanbu Cement Co. | 8,210 | | 70 |
| | | | 12,885 |
Singapore (1.5%) | | | |
| DBS Group Holdings Ltd. | 265,478 | | 5,060 |
| Oversea-Chinese Banking Corp. Ltd. | 497,400 | | 3,999 |
| United Overseas Bank Ltd. | 189,545 | | 3,732 |
| Singapore Telecommunications Ltd. | 1,095,288 | | 2,652 |
| Keppel Corp. Ltd. | 210,612 | | 1,061 |
| CapitaLand Ltd. | 368,500 | | 974 |
| Singapore Exchange Ltd. | 122,732 | | 806 |
| Singapore Technologies Engineering Ltd. | 226,100 | | 662 |
| Singapore Airlines Ltd. | 78,600 | | 543 |
| ComfortDelGro Corp. Ltd. | 305,600 | | 516 |
| Venture Corp. Ltd. | 39,500 | | 458 |
| Singapore Press Holdings Ltd. | 241,000 | | 392 |
| SATS Ltd. | 91,800 | | 341 |
| Singapore Post Ltd. | 209,900 | | 148 |
| Golden Agri-Resources Ltd. | 908,500 | | 136 |
| Hutchison Port Holdings Trust | 722,000 | | 112 |
| StarHub Ltd. | 76,200 | | 73 |
| Frasers Property Ltd. | 49,800 | | 67 |
| SIA Engineering Co. Ltd. | 33,000 | | 65 |
| | | | 21,797 |
40
International High Dividend Yield Index Fund
| | | | Market |
| | | | Value• |
| | Shares | | ($000) |
South Africa (1.3%) | | | |
| Standard Bank Group Ltd. | 189,863 | | 2,180 |
| FirstRand Ltd. | 472,138 | | 2,041 |
| MTN Group Ltd. | 266,560 | | 1,650 |
| Sasol Ltd. | 82,537 | | 1,496 |
| Sanlam Ltd. | 260,367 | | 1,370 |
| Absa Group Ltd. | 107,499 | | 1,103 |
| Old Mutual Ltd. | 697,558 | | 907 |
| Nedbank Group Ltd. | 59,502 | | 903 |
| Vodacom Group Ltd. | 88,924 | | 777 |
| RMB Holdings Ltd. | 114,403 | | 602 |
| Woolworths Holdings Ltd. | 144,085 | | 548 |
| NEPI Rockcastle plc | 52,093 | | 454 |
| Foschini Group Ltd. | 34,973 | | 403 |
| Mr Price Group Ltd. | 37,335 | | 395 |
| SPAR Group Ltd. | 27,376 | | 368 |
| Tiger Brands Ltd. | 25,345 | | 360 |
| Life Healthcare Group Holdings Ltd. | 202,205 | | 319 |
| Exxaro Resources Ltd. | 37,492 | | 307 |
| AVI Ltd. | 46,537 | | 267 |
| Investec Ltd. | 42,853 | | 243 |
| Barloworld Ltd. | 30,150 | | 240 |
| Netcare Ltd. | 211,441 | | 239 |
| Truworths International Ltd. | 60,818 | | 216 |
| Rand Merchant Investment Holdings Ltd. | 107,130 | | 212 |
| Sappi Ltd. | 81,176 | | 208 |
| Telkom SA SOC Ltd. | 41,737 | | 191 |
| Momentum Metropolitan Holdings | 140,893 | | 188 |
| Kumba Iron Ore Ltd. | 7,363 | | 179 |
| African Rainbow Minerals Ltd. | 14,786 | | 148 |
| Pioneer Foods Group Ltd. | 19,633 | | 140 |
| Liberty Holdings Ltd. | 17,037 | | 131 |
| Santam Ltd. | 5,878 | | 110 |
| Reunert Ltd. | 22,643 | | 107 |
| Coronation Fund Managers Ltd. | 36,685 | | 103 |
| JSE Ltd. | 11,823 | | 102 |
| Distell Group Holdings Ltd. | 11,475 | | 102 |
| MAS Real Estate Inc. | 64,758 | | 81 |
| Assore Ltd. | 4,752 | | 80 |
| Tsogo Sun Gaming Ltd. | 69,678 | | 57 |
| Tsogo Sun Hotels Ltd. | 69,630 | | 17 |
| Sibanye Gold Ltd. | 20 | | — |
| | | | 19,544 |
South Korea (1.2%) | | | |
| Samsung Electronics Co. Ltd. Preference Shares | 121,581 | | 4,280 |
| Shinhan Financial Group Co. Ltd. | 66,688 | | 2,430 |
| KB Financial Group Inc. | 57,194 | | 2,059 |
| KT&G Corp. | 16,360 | | 1,404 |
| Hana Financial Group Inc. | 43,727 | | 1,266 |
| SK Innovation Co. Ltd. | 8,425 | | 1,153 |
| Woori Financial Group Inc. | 82,401 | | 831 |
| SK Telecom Co. Ltd. ADR | 30,998 | | 715 |
| Woongjin Coway Co. Ltd. | 8,239 | | 650 |
| S-Oil Corp. | 5,993 | | 512 |
| Industrial Bank of Korea | 40,166 | | 407 |
| DB Insurance Co. Ltd. | 6,913 | | 300 |
| BNK Financial Group Inc. | 43,330 | | 259 |
| Cheil Worldwide Inc. | 10,127 | | 215 |
| Hyundai Marine & Fire Insurance Co. Ltd. | 8,910 | | 193 |
| NH Investment & Securities Co. Ltd. | 18,134 | | 188 |
| DGB Financial Group Inc. | 23,076 | | 139 |
| Samsung Card Co. Ltd. | 4,245 | | 122 |
| Hite Jinro Co. Ltd. | 4,296 | | 105 |
| KEPCO Plant Service & Engineering Co. Ltd. | 2,979 | | 83 |
| Ssangyong Cement Industrial Co. Ltd. | 14,555 | | 73 |
| HDC Holdings Co. Ltd. | 5,288 | | 54 |
| Doosan Co. Ltd. | 792 | | 53 |
* | Doosan Solus Co. Ltd. | 1,232 | | 19 |
* | Doosan Fuel Cell Co. Ltd. | 2,235 | | 15 |
| Hyosung TNC Co. Ltd. | 12 | | 2 |
| | | | 17,527 |
Spain (3.2%) | | | |
| Banco Santander SA (XMAD) | 2,347,173 | | 9,425 |
| Iberdrola SA | 870,932 | | 8,952 |
| Banco Bilbao Vizcaya Argentaria SA | 979,202 | | 5,157 |
| Telefonica SA | 670,242 | | 5,147 |
| Repsol SA | 196,942 | | 3,246 |
| Ferrovial SA | 70,248 | | 2,073 |
2 | Aena SME SA | 10,411 | | 1,911 |
| CaixaBank SA | 531,655 | | 1,525 |
| ACS Actividades de Construccion y Servicios SA | 35,804 | | 1,453 |
| Red Electrica Corp. SA | 64,009 | | 1,286 |
| Endesa SA | 46,753 | | 1,273 |
| Naturgy Energy Group SA | 44,940 | | 1,224 |
| Banco de Sabadell SA | 832,662 | | 915 |
| Enagas SA | 33,728 | | 835 |
| Bankinter SA | 102,601 | | 711 |
| Mapfre SA | 148,857 | | 415 |
| Bankia SA | 181,383 | | 346 |
| Acciona SA | 3,025 | | 315 |
41
International High Dividend Yield Index Fund
| | | | Market |
| | | | Value• |
| | Shares | | ($000) |
| Banco Santander SA (XMEX) | 77,341 | | 306 |
| Zardoya Otis SA | 25,297 | | 192 |
| Mediaset Espana Comunicacion SA | 462 | | 3 |
| | | | 46,710 |
Sweden (1.6%) | | | |
^ | Investor AB Class B | 66,634 | | 3,419 |
| Volvo AB Class B | 220,759 | | 3,308 |
^ | Hennes & Mauritz AB Class B | 129,325 | | 2,711 |
| Svenska Handelsbanken AB Class A | 211,114 | | 2,119 |
| Swedbank AB Class A | 147,790 | | 2,071 |
| Skandinaviska Enskilda Banken AB Class A | 212,468 | | 2,038 |
| Telia Co. AB | 388,478 | | 1,709 |
| Skanska AB Class B | 52,883 | | 1,127 |
| Tele2 AB | 78,616 | | 1,125 |
| Boliden AB | 40,477 | | 1,091 |
| SKF AB | 56,761 | | 1,028 |
^ | Kinnevik AB | 35,535 | | 972 |
| Castellum AB | 39,911 | | 816 |
| Svenska Handelsbanken AB Class B | 9,217 | | 93 |
| ICA Gruppen AB | 32 | | 1 |
| | | | 23,628 |
Switzerland (3.1%) | | | |
| Zurich Insurance Group AG | 21,515 | | 8,427 |
| UBS Group AG | 505,706 | | 5,985 |
| ABB Ltd. | 263,584 | | 5,535 |
| Swiss Re AG | 41,011 | | 4,302 |
| LafargeHolcim Ltd. | 74,498 | | 3,845 |
| Swiss Life Holding AG | 4,899 | | 2,454 |
| SGS SA | 757 | | 1,974 |
| Swisscom AG | 3,740 | | 1,913 |
| Julius Baer Group Ltd. | 32,082 | | 1,421 |
| Adecco Group AG | 22,668 | | 1,348 |
| Baloise Holding AG | 6,884 | | 1,273 |
| Kuehne & Nagel International AG | 7,435 | | 1,201 |
| Roche Holding AG (Bearer) | 3,890 | | 1,160 |
| Swiss Prime Site AG | 11,203 | | 1,155 |
| PSP Swiss Property AG | 5,840 | | 773 |
| Helvetia Holding AG | 4,848 | | 681 |
| Flughafen Zurich AG | 2,849 | | 513 |
| Pargesa Holding SA | 5,768 | | 456 |
| Dufry AG | 4,050 | | 352 |
| Banque Cantonale Vaudoise | 415 | | 325 |
| Sulzer AG | 2,468 | | 250 |
| | | | 45,343 |
Taiwan (5. 6%) | | | |
| Taiwan Semiconductor Manufacturing Co. Ltd. | 3,548,118 | | 34,771 |
| Hon Hai Precision Industry Co. Ltd. | 1,762,000 | | 4,654 |
| MediaTek Inc. | 217,826 | | 2,909 |
| Formosa Plastics Corp. | 717,879 | | 2,304 |
| Nan Ya Plastics Corp. | 829,000 | | 1,959 |
| CTBC Financial Holding Co. Ltd. | 2,676,120 | | 1,860 |
| Uni-President Enterprises Corp. | 709,000 | | 1,751 |
| Fubon Financial Holding Co. Ltd. | 1,082,000 | | 1,583 |
| Mega Financial Holding Co. Ltd. | 1,606,000 | | 1,576 |
^ | Chunghwa Telecom Co. Ltd. ADR | 42,075 | | 1,539 |
| Cathay Financial Holding Co. Ltd. | 1,159,908 | | 1,535 |
| Formosa Chemicals & Fibre Corp. | 503,000 | | 1,462 |
| China Steel Corp. | 1,830,000 | | 1,409 |
| Delta Electronics Inc. | 317,802 | | 1,395 |
| First Financial Holding Co. Ltd. | 1,450,751 | | 1,064 |
| Yuanta Financial Holding Co. Ltd. | 1,660,000 | | 1,037 |
| Hua Nan Financial Holdings Co. Ltd. | 1,338,708 | | 962 |
| Taiwan Cement Corp. | 711,478 | | 945 |
| Catcher Technology Co. Ltd. | 108,672 | | 921 |
| Taiwan Mobile Co. Ltd. | 233,000 | | 869 |
| Chailease Holding Co. Ltd. | 179,860 | | 810 |
| Quanta Computer Inc. | 391,000 | | 750 |
| Asustek Computer Inc. | 104,268 | | 707 |
| Taishin Financial Holding Co. Ltd. | 1,478,310 | | 686 |
| ASE Technology Holding Co. Ltd. | 256,171 | | 665 |
| Chunghwa Telecom Co. Ltd. | 175,000 | | 644 |
| United Microelectronics Corp. ADR | 282,031 | | 637 |
| Formosa Petrochemical Corp. | 199,000 | | 634 |
| SinoPac Financial Holdings Co. Ltd. | 1,541,641 | | 633 |
| Yageo Corp. | 57,000 | | 585 |
| Pegatron Corp. | 294,000 | | 571 |
| Far Eastern New Century Corp. | 575,000 | | 559 |
42
International High Dividend Yield Index Fund
| | | | Market |
| | | | Value• |
| | Shares | | ($000) |
| Far EasTone Telecommunications Co. Ltd. | 233,000 | | 559 |
| Novatek Microelectronics Corp. | 83,000 | | 532 |
| Pou Chen Corp. | 390,000 | | 521 |
| Lite-On Technology Corp. | 314,194 | | 518 |
| Realtek Semiconductor Corp. | 69,000 | | 512 |
| Asia Cement Corp. | 342,000 | | 483 |
| Cheng Shin Rubber Industry Co. Ltd. | 266,994 | | 420 |
| Eclat Textile Co. Ltd. | 29,200 | | 391 |
| Wistron Corp. | 404,656 | | 371 |
| Globalwafers Co. Ltd. | 31,000 | | 370 |
| Feng TAY Enterprise Co. Ltd. | 53,400 | | 361 |
| Compal Electronics Inc. | 581,000 | | 347 |
| Foxconn Technology Co. Ltd. | 156,190 | | 334 |
| Inventec Corp. | 439,994 | | 319 |
| Vanguard International Semiconductor Corp. | 127,000 | | 271 |
| Nanya Technology Corp. | 117,000 | | 268 |
| Chicony Electronics Co. Ltd. | 84,370 | | 262 |
| Synnex Technology International Corp. | 190,000 | | 227 |
| Teco Electric and Machinery Co. Ltd. | 251,000 | | 223 |
| Taiwan Fertilizer Co. Ltd. | 103,000 | | 164 |
| Formosa Taffeta Co. Ltd. | 144,000 | | 164 |
| United Microelectronics Corp. | 312,000 | | 144 |
| Taiwan Secom Co. Ltd. | 39,000 | | 112 |
| Transcend Information Inc. | 39,000 | | 85 |
| Oriental Union Chemical Corp. | 98,000 | | 71 |
| Taiwan Semiconductor Manufacturing Co. Ltd. ADR | 100 | | 5 |
| | | | 82,420 |
Thailand (0.9%) | | | |
| PTT PCL (Foreign) | 2,198,500 | | 3,294 |
| Advanced Info Service PCL (Foreign) | 165,604 | | 1,256 |
| Siam Commercial Bank PCL (Foreign) | 325,900 | | 1,208 |
| Siam Cement PCL NVDR | 79,400 | | 966 |
| PTT Exploration & Production PCL (Foreign) | 200,030 | | 798 |
| Intouch Holdings PCL (Foreign) | 282,206 | | 617 |
| Siam Cement PCL (Foreign) | 44,550 | | 542 |
| PTT Global Chemical PCL (Foreign) | 308,899 | | 522 |
| Krung Thai Bank PCL (Foreign) | 899,300 | | 494 |
| Digital Telecommunications Infrastructure Fund (Foreign) | 772,997 | | 456 |
| Bangkok Bank PCL (Foreign) | 70,400 | | 407 |
| Thai Oil PCL (Foreign) | 133,600 | | 303 |
| Ratchaburi Electricity Generating Holding PCL (Foreign) | 108,600 | | 265 |
| Banpu PCL | 628,800 | | 242 |
| Land & Houses PCL (Foreign) | 604,300 | | 194 |
| IRPC PCL (Foreign) | 1,602,800 | | 180 |
| Thai Union Group PCL | 342,300 | | 165 |
| Siam Commercial Bank PCL | 30,700 | | 114 |
| Land & Houses PCL | 345,100 | | 111 |
| Delta Electronics Thailand PCL | 73,600 | | 107 |
| Siam City Cement PCL (Foreign) | 12,232 | | 88 |
| Intouch Holdings PCL NVDR | 32,600 | | 71 |
| Thai Union Frozen Products PCL (Foreign) | 75,500 | | 36 |
| Electricity Generating PCL (Foreign) | 697 | | 8 |
| Charoen Pokphand Foods PCL (Foreign) | 4,200 | | 3 |
| | | | 12,447 |
Turkey (0.2%) | | | |
| Turkiye Garanti Bankasi AS | 311,096 | | 500 |
| Akbank T.A.S. | 394,746 | | 477 |
| Tupras Turkiye Petrol Rafinerileri AS | 18,576 | | 404 |
| Turkcell Iletisim Hizmetleri AS | 157,109 | | 345 |
| Eregli Demir ve Celik Fabrikalari TAS | 199,609 | | 228 |
* | Turkiye Is Bankasi AS | 208,186 | | 211 |
| TAV Havalimanlari Holding AS | 24,689 | | 113 |
| Ford Otomotiv Sanayi AS | 8,913 | | 101 |
| Petkim Petrokimya Holding AS | 152,845 | | 92 |
43
International High Dividend Yield Index Fund
| | | | Market |
| | | | Value• |
| | Shares | | ($000) |
| Enka Insaat ve Sanayi AS | 87,765 | | 89 |
| Turk Telekomunikasyon AS | 74,684 | | 76 |
| Tekfen Holding AS | 25,555 | | 76 |
| Tofas Turk Otomobil Fabrikasi AS | 17,337 | | 68 |
| Turkiye Sise ve Cam Fabrikalari AS | 85,947 | | 65 |
| Iskenderun Demir ve Celik AS | 20,117 | | 21 |
* | Turkiye Halk Bankasi AS | 1,321 | | 1 |
| | | | 2,867 |
United Arab Emirates (0.4%) | | | |
| First Abu Dhabi Bank PJSC | 648,001 | | 2,682 |
| Emirates Telecommunications Group Co. PJSC | 259,009 | | 1,168 |
| Abu Dhabi Commercial Bank PJSC | 394,225 | | 836 |
| Aldar Properties PJSC | 568,383 | | 363 |
| Dubai Islamic Bank PJSC | 242,951 | | 350 |
| Abu Dhabi Islamic Bank PJSC | 137,345 | | 200 |
| Emaar Malls PJSC | 299,613 | | 159 |
| Air Arabia PJSC | 325,568 | | 121 |
| Dana Gas PJSC | 437,823 | | 109 |
| Dubai Investments PJSC | 296,770 | | 104 |
* | DAMAC Properties Dubai Co. PJSC | 241,142 | | 57 |
| Al Waha Capital PJSC | 703 | | — |
| | | | 6,149 |
United Kingdom (16.6%) | | | |
| HSBC Holdings plc | 2,992,595 | | 22,609 |
| Royal Dutch Shell plc Class A | 679,258 | | 19,690 |
| AstraZeneca plc | 194,021 | | 18,920 |
| BP plc | 2,942,743 | | 18,661 |
| GlaxoSmithKline plc | 724,520 | | 16,595 |
| Royal Dutch Shell plc Class B | 508,425 | | 14,643 |
| British American Tobacco plc | 333,226 | | 11,655 |
| Unilever plc | 161,030 | | 9,642 |
| Rio Tinto plc | 162,451 | | 8,458 |
| Vodafone Group plc | 3,966,514 | | 8,095 |
| Lloyds Banking Group plc | 10,440,997 | | 7,680 |
| BHP Group plc | 307,222 | | 6,516 |
| National Grid plc | 513,299 | | 6,002 |
| Barclays plc | 2,538,959 | | 5,507 |
| Glencore plc | 1,626,703 | | 4,910 |
| Anglo American plc | 184,853 | | 4,758 |
| Standard Chartered plc | 389,545 | | 3,535 |
| BAE Systems plc | 472,267 | | 3,528 |
| BT Group plc | 1,287,732 | | 3,417 |
| Aviva plc | 575,910 | | 3,104 |
| Imperial Brands plc | 140,754 | | 3,088 |
| Legal & General Group plc | 874,158 | | 2,988 |
| SSE plc | 151,078 | | 2,513 |
| WPP plc | 180,501 | | 2,253 |
| Royal Bank of Scotland Group plc | 671,634 | | 1,857 |
| Persimmon plc | 46,922 | | 1,384 |
| Standard Life Aberdeen plc | 351,394 | | 1,382 |
| Barratt Developments plc | 149,353 | | 1,221 |
| Smurfit Kappa Group plc | 35,370 | | 1,177 |
| United Utilities Group plc | 100,768 | | 1,138 |
| St. James’s Place plc | 77,675 | | 1,048 |
| Taylor Wimpey plc | 482,750 | | 1,035 |
| RSA Insurance Group plc | 152,502 | | 1,032 |
| Severn Trent plc | 35,093 | | 1,026 |
| Berkeley Group Holdings plc | 17,409 | | 992 |
| GVC Holdings plc | 85,815 | | 990 |
| ITV plc | 555,156 | | 963 |
| Carnival plc | 23,264 | | 931 |
| Meggitt plc | 114,934 | | 930 |
| DS Smith plc | 189,037 | | 876 |
| Wm Morrison Supermarkets plc | 328,737 | | 849 |
| Kingfisher plc | 314,908 | | 845 |
| TUI AG | 64,498 | | 844 |
| Centrica plc | 861,676 | | 811 |
| Admiral Group plc | 30,591 | | 801 |
| Polymetal International plc | 46,519 | | 765 |
| Bellway plc | 18,263 | | 747 |
| Pennon Group plc | 62,622 | | 728 |
| Direct Line Insurance Group plc | 204,707 | | 722 |
| Phoenix Group Holdings plc | 78,130 | | 714 |
| Micro Focus International plc | 49,886 | | 685 |
| Marks & Spencer Group plc | 289,560 | | 682 |
| Schroders plc | 16,527 | | 663 |
| International Consolidated Airlines Group SA (London Shares) | 96,101 | | 662 |
| J Sainsbury plc | 242,998 | | 640 |
| G4S plc | 229,634 | | 616 |
| Tate & Lyle plc | 69,569 | | 607 |
| Investec plc | 98,741 | | 560 |
| IMI plc | 40,374 | | 525 |
| Inchcape plc | 60,920 | | 509 |
44
International High Dividend Yield Index Fund
| | | | Market |
| | | | Value• |
| | Shares | | ($000) |
| easyJet plc | 28,510 | | 457 |
| Cineworld Group plc | 150,367 | | 433 |
| John Wood Group plc | 98,416 | | 432 |
| Evraz plc | 80,984 | | 386 |
| Ashmore Group plc | 56,487 | | 341 |
| Virgin Money UK plc | 182,622 | | 325 |
| Babcock International Group plc | 37,505 | | 269 |
| British American Tobacco plc ADR | 4,220 | | 148 |
| Dixons Carphone plc | 732 | | 1 |
| Travis Perkins plc | 38 | | 1 |
| Inmarsat plc | 21 | | — |
| | | | 243,517 |
United States (0.0%) | | | |
| ASE Technology Holding Co. Ltd. ADR | 124,585 | | 635 |
| Grupo Aval Acciones y Valores SA ADR | 7,552 | | 62 |
| | | | 697 |
Total Common Stocks | | | |
(Cost $1,480,921) | | | 1,454,416 |
Temporary Cash Investments (1.2%)1 | | | |
Money Market Fund (1.1%) | | | |
3,4 | Vanguard Market Liquidity Fund, 1.984% | 161,001 | | 16,102 |
| | | | |
| | Face | | |
| | Amount | | |
| | ($000 | ) | |
| U.S. Government and Agency Obligations (0.1%) | | | |
5 | United States Treasury Bill, 2.157%, 11/7/19 | 750 | | 750 |
5 | United States Treasury Bill, 2.048%, 11/21/19 | 100 | | 100 |
| | | | 850 |
Total Temporary Cash Investments | | | |
(Cost $16,951) | | | 16,952 |
Total Investments (100.6%) | | | |
(Cost $1,497,872) | | | 1,471,368 |
| | Amount | |
| | ($000 | ) |
Other Assets and Liabilities (-0.6%) | | | |
Other Assets | | | |
Investment in Vanguard | | 65 | |
Receivables for Investment Securities Sold | | 4,674 | |
Receivables for Accrued Income | | 5,820 | |
Receivables for Capital Shares Issued | | 105 | |
Unrealized Appreciation—Forward Currency Contracts | | 10 | |
Other Assets | | 2,116 | |
Total Other Assets | | 12,790 | |
Liabilities | | | |
Payables for Investment Securities Purchased | | (982 | ) |
Collateral for Securities on Loan | | (16,095 | ) |
Payables for Capital Shares Redeemed | | (53 | ) |
Payables to Vanguard | | (199 | ) |
Variation Margin Payable—Futures Contracts | | (3 | ) |
Other Liabilities | | (3,896 | ) |
Total Liabilities | | (21,228 | ) |
Net Assets (100%) | | 1,462,930 | |
At October 31, 2019, net assets consisted of:
| | Amount | |
| | ($000 | ) |
Paid-in Capital | | 1,487,144 | |
Total Distributable Earnings (Loss) | | (24,214 | ) |
Net Assets | | 1,462,930 | |
| | | |
ETF Shares—Net Assets | | | |
Applicable to 20,636,068 outstanding $.001 par value shares of beneficial interest (unlimited authorization) | | 1,264,332 | |
Net Asset Value Per Share—ETF Shares | | $61.27 | |
45
International High Dividend Yield Index Fund
| | Amount | |
| | ($000 | ) |
Admiral Shares—Net Assets | | | |
Applicable to 6,689,662 outstanding $.001 par value shares of beneficial interest (unlimited authorization) | | 198,598 | |
Net Asset Value Per Share—Admiral Shares | | $29.69 | |
· See Note A in Notes to Financial Statements.
^ Includes partial security positions on loan to broker-dealers. The total value of securities on loan is $14,872,000.
* Non-income-producing security.
1 The fund invests a portion of its cash reserves in equity markets through the use of index futures contracts. After giving effect to futures investments, the fund’s effective common stock and temporary cash investment positions represent 100.0% and 0.6%, respectively, of net assets.
2 Security exempt from registration under Rule 144A of the Securities Act of 1933. Such securities may be sold in transactions exempt from registration, normally to qualified institutional buyers. At October 31, 2019, the aggregate value of these securities was $12,562,000, representing 0.9% of net assets.
3 Affiliated money market fund available only to Vanguard funds and certain trusts and accounts managed by Vanguard. Rate shown is the 7-day yield.
4 Collateral of $16,095,000 was received for securities on loan.
5 Securities with a value of $250,000 have been segregated as initial margin for open futures contracts.
ADR—American Depositary Receipt.
GDR—Global Depositary Receipt.
NVDR—Non-Voting Depository Receipt.
Derivative Financial Instruments Outstanding as of Period End | | | | |
| | | | |
Futures Contracts | | | | |
| | | | |
| | | | ($000) |
| | | | Value and |
| | Number of | | Unrealized |
| | Long (Short) | Notional | Appreciation |
| Expiration | Contracts | Amount | (Depreciation) |
Long Futures Contracts | | | | |
E-mini S&P 500 Index | December 2019 | 55 | 8,348 | 109 |
| | | | | | | | |
Forward Currency Contracts | | | | |
| | | | |
| Contract | | | | Unrealized | Unrealized |
| Settlement | | Contract Amount (000) | Appreciation | (Depreciation) |
Counterparty | Date | | Receive | | Deliver | ($000) | ($000) |
Goldman Sachs International | 12/30/19 | | USD | 2,291 | | JPY | 245,218 | 10 | — |
| | | | | | | | | | | | | |
JPY—Japanese yen.
USD—U.S. dollar.
See accompanying Notes, which are an integral part of the Financial Statements.
46
International High Dividend Yield Index Fund
Statement of Operations
| Year Ended |
| October 31, 2019 |
| ($000) |
Investment Income | |
Income | |
Dividends1 | 59,818 |
Interest2 | 131 |
Securities Lending—Net | 399 |
Total Income | 60,348 |
Expenses | |
The Vanguard Group—Note B | |
Investment Advisory Services | 184 |
Management and Administrative—Investor Shares | 18 |
Management and Administrative—ETF Shares | 2,418 |
Management and Administrative—Admiral Shares | 436 |
Marketing and Distribution—Investor Shares | 1 |
Marketing and Distribution—ETF Shares | 59 |
Marketing and Distribution—Admiral Shares | 12 |
Custodian Fees | 133 |
Auditing Fees | 43 |
Shareholders’ Reports—Investor Shares | — |
Shareholders’ Reports—ETF Shares | 32 |
Shareholders’ Reports—Admiral Shares | 2 |
Trustees’ Fees and Expenses | 1 |
Total Expenses | 3,339 |
Expenses Paid Indirectly | (21) |
Net Expenses | 3,318 |
Net Investment Income | 57,030 |
Realized Net Gain (Loss) | |
Investment Securities Sold2 | 1,683 |
Futures Contracts | (162) |
Forward Currency Contracts | (176) |
Foreign Currencies | (85) |
Realized Net Gain (Loss) | 1,260 |
Change in Unrealized Appreciation (Depreciation) | |
Investment Securities2 | 48,747 |
Futures Contracts | 582 |
Forward Currency Contracts | 130 |
Foreign Currencies | 111 |
Change in Unrealized Appreciation (Depreciation) | 49,570 |
Net Increase (Decrease) in Net Assets Resulting from Operations | 107,860 |
1 Dividends are net of foreign withholding taxes of $5,774,000.
2 Interest income, realized net gain (loss), and change in unrealized appreciation (depreciation) from an affiliated company of the fund were $109,000, $1,000, and ($1,000), respectively. Purchases and sales are for temporary cash investment purposes.
See accompanying Notes, which are an integral part of the Financial Statements.
47
International High Dividend Yield Index Fund
Statement of Changes in Net Assets
| | Year Ended October 31, | |
| | 2019 | | 2018 | |
| | ($000 | ) | ($000 | ) |
Increase (Decrease) in Net Assets | | | | | |
Operations | | | | | |
Net Investment Income | | 57,030 | | 43,697 | |
Realized Net Gain (Loss) | | 1,260 | | 5,268 | |
Change in Unrealized Appreciation (Depreciation) | | 49,570 | | (143,207 | ) |
Net Increase (Decrease) in Net Assets Resulting from Operations | | 107,860 | | (94,242 | ) |
Distributions | | | | | |
Net Investment Income | | | | | |
Investor Shares | | (149 | ) | (349 | ) |
ETF Shares | | (46,829 | ) | (33,497 | ) |
Admiral Shares | | (8,233 | ) | (7,177 | ) |
Realized Capital Gain | | | | | |
Investor Shares | | — | | — | |
ETF Shares | | — | | — | |
Admiral Shares | | — | | — | |
Total Distributions | | (55,211 | ) | (41,023 | ) |
Capital Share Transactions | | | | | |
Investor Shares | | (8,751 | ) | 834 | |
ETF Shares | | 329,989 | | 403,658 | |
Admiral Shares | | 10,466 | | 35,215 | |
Net Increase (Decrease) from Capital Share Transactions | | 331,704 | | 439,707 | |
Total Increase (Decrease) | | 384,353 | | 304,442 | |
Net Assets | | | | | |
Beginning of Period | | 1,078,577 | | 774,135 | |
End of Period | | 1,462,930 | | 1,078,577 | |
See accompanying Notes, which are an integral part of the Financial Statements.
48
International High Dividend Yield Index Fund
Financial Highlights
Investor Shares
| Nov. 1, | | | Feb. 25, | |
| 2018 to | | Year Ended | 20162 to | |
| July 26, | | | October 31, | | Oct. 31, | |
For a Share Outstanding Throughout Each Period | 20191 | 2018 | 2017 | 2016 | |
Net Asset Value, Beginning of Period | $23.56 | $26.29 | $22.24 | $20.00 | |
Investment Operations | | | | | |
Net Investment Income3 | .775 | 1.033 | .947 | .578 | |
Net Realized and Unrealized Gain (Loss) on Investments4 | .757 | (2.840) | 3.865 | 2.059 | |
Total from Investment Operations | 1.532 | (1.807) | 4.812 | 2.637 | |
Distributions | | | | | |
Dividends from Net Investment Income | (.762) | (.923) | (.762) | (.397) | |
Distributions from Realized Capital Gains | — | — | — | — | |
Total Distributions | (.762) | (.923) | (.762) | (.397) | |
Net Asset Value, End of Period | $24.331 | $23.56 | $26.29 | $22.24 | |
| | | | | |
Total Return5 | 6.66%6 | -7.09%6 | 21.92%6 | 13.26% | |
| | | | | |
Ratios/Supplemental Data | | | | | |
Net Assets, End of Period (Millions) | $— | $9 | $9 | $3 | |
Ratio of Total Expenses to Average Net Assets | 0.42%7 | 0.42% | 0.42% | 0.42%7,8 | |
Ratio of Net Investment Income to Average Net Assets | 4.41%7 | 3.96% | 3.63% | 3.55%7 | |
Portfolio Turnover Rate9 | 15%10 | 10% | 8% | 6% | |
| | | | | | | |
1 Net asset value as of July 26, 2019, on which date the remaining Investor Shares were converted to Admiral Shares.
2 Inception.
3 Calculated based on average shares outstanding.
4 Includes increases from purchase and redemption fees of $.01 for 2019, $.01 for 2018, and $.02 for 2017.
5 Total returns do not include account service fees that may have applied in the periods shown. Fund prospectuses provide information about any applicable account service fees.
6 Total returns do not include transaction fees that may have applied in the periods shown. Fund prospectuses provide information about any applicable transaction fees.
7 Annualized.
8 The ratio of total expenses to average net assets before an expense reimbursement of 0.31% was 0.73%. The expense reimbursement was due to higher-than-anticipated custody costs associated with a higher volume of securities transactions, which included transactions from a rebalance of the benchmark index shortly after the fund’s inception. The fund is not obligated to repay this amount to Vanguard.
9 Excludes the value of portfolio securities received or delivered as a result of in-kind purchases or redemptions of the fund’s capital shares, including ETF Creation Units.
10 Reflects the fund’s portfolio turnover for the fiscal year ended October 31, 2019.
See accompanying Notes, which are an integral part of the Financial Statements.
49
International High Dividend Yield Index Fund
Financial Highlights
ETF Shares
| | | | Feb. 25, | |
| | | | 20161 to | |
For a Share Outstanding | | Year Ended October 31, | | Oct. 31, | |
Throughout Each Period | 2019 | 2018 | 2017 | 2016 | |
Net Asset Value, Beginning of Period | $58.85 | $65.69 | $55.61 | $50.00 | |
Investment Operations | | | | | |
Net Investment Income2 | 2.746 | 2.639 | 2.329 | 1.323 | |
Net Realized and Unrealized Gain (Loss) on Investments3 | 2.302 | (7.097) | 9.763 | 5.305 | |
Total from Investment Operations | 5.048 | (4.458) | 12.092 | 6.628 | |
Distributions | | | | | |
Dividends from Net Investment Income | (2.628) | (2.382) | (2.012) | (1.018) | |
Distributions from Realized Capital Gains | — | — | — | — | |
Total Distributions | (2.628) | (2.382) | (2.012) | (1.018) | |
Net Asset Value, End of Period | $61.27 | $58.85 | $65.69 | $55.61 | |
| | | | | |
Total Return | 8.87% | -7.03% | 22.03% | 13.37% | |
| | | | | |
Ratios/Supplemental Data | | | | | |
Net Assets, End of Period (Millions) | $1,264 | $889 | $598 | $117 | |
Ratio of Total Expenses to Average Net Assets | 0.27% | 0.32% | 0.32% | 0.32%4,5 | |
Ratio of Net Investment Income to Average Net Assets | 4.59% | 4.06% | 3.73% | 3.65%4 | |
Portfolio Turnover Rate6 | 15% | 10% | 8% | 6% | |
| | | | | | |
1 Inception.
2 Calculated based on average shares outstanding.
3 Includes increases from purchase and redemption fees of $.01 for 2019, $.02 for 2018, and $.04 for 2017.
4 Annualized.
5 The ratio of total expenses to average net assets before an expense reimbursement of 0.31% was 0.63%. The expense reimbursement was due to higher-than-anticipated custody costs associated with a higher volume of securities transactions, which included transactions from a rebalance of the benchmark index shortly after the fund’s inception. The fund is not obligated to repay this amount to Vanguard.
6 Excludes the value of portfolio securities received or delivered as a result of in-kind purchases or redemptions of the fund’s capital shares, including ETF Creation Units.
See accompanying Notes, which are an integral part of the Financial Statements.
50
International High Dividend Yield Index Fund
Financial Highlights
Admiral Shares
| | | | March 2, | |
| | | | 20161 to | |
For a Share Outstanding | | Year Ended October 31, | | Oct. 31, | |
Throughout Each Period | 2019 | 2018 | 2017 | 2016 | |
Net Asset Value, Beginning of Period | $28.52 | $31.83 | $26.92 | $25.00 | |
Investment Operations | | | | | |
Net Investment Income2 | 1.322 | 1.264 | 1.114 | .597 | |
Net Realized and Unrealized Gain (Loss) on Investments3 | 1.120 | (3.423) | 4.743 | 1.817 | |
Total from Investment Operations | 2.442 | (2.159) | 5.857 | 2.414 | |
Distributions | | | | | |
Dividends from Net Investment Income | (1.272) | (1.151) | (.947) | (.494) | |
Distributions from Realized Capital Gains | — | — | — | — | |
Total Distributions | (1.272) | (1.151) | (.947) | (.494) | |
Net Asset Value, End of Period | $29.69 | $28.52 | $31.83 | $26.92 | |
| | | | | |
Total Return4 | 8.83%5 | -7.00%5 | 22.04%5 | 9.73% | |
| | | | | |
Ratios/Supplemental Data | | | | | |
Net Assets, End of Period (Millions) | $199 | $181 | $168 | $84 | |
Ratio of Total Expenses to Average Net Assets | 0.27% | 0.32% | 0.32% | 0.32%6,7 | |
Ratio of Net Investment Income to Average Net Assets | 4.57% | 4.06% | 3.73% | 3.65%6 | |
Portfolio Turnover Rate8 | 15% | 10% | 8% | 6% | |
| | | | | | |
1 Inception.
2 Calculated based on average shares outstanding.
3 Includes increases from purchase and redemption fees of $.01 for 2019, $.01 for 2018, and $.02 for 2017.
4 Total returns do not include account service fees that may have applied in the periods shown. Fund prospectuses provide information about any applicable account service fees.
5 Total returns do not include transaction fees that may have applied in the periods shown. Fund prospectuses provide information about any applicable transaction fees.
6 Annualized.
7 The ratio of total expenses to average net assets before an expense reimbursement of 0.31% was 0.63%. The expense reimbursement was due to higher-than-anticipated custody costs associated with a higher volume of securities transactions, which included transactions from a rebalance of the benchmark index shortly after the fund’s inception. The fund is not obligated to repay this amount to Vanguard.
8 Excludes the value of portfolio securities received or delivered as a result of in-kind purchases or redemptions of the fund’s capital shares, including ETF Creation Units.
See accompanying Notes, which are an integral part of the Financial Statements.
51
International High Dividend Yield Index Fund
Notes to Financial Statements
Vanguard International High Dividend Yield Index Fund is registered under the Investment Company Act of 1940 as an open-end investment company, or mutual fund. The fund invests in securities of foreign issuers, which may subject it to investment risks not normally associated with investing in securities of U.S. corporations. The fund offers two classes of shares: ETF Shares and Admiral Shares. Each of the share classes has different eligibility and minimum purchase requirements, and is designed for different types of investors. Prior to July 26, 2019, the fund offered Investor Shares. ETF Shares are listed for trading on Nasdaq; they can be purchased and sold through a broker. Effective at the close of business on July 26, 2019, the remaining Investor Shares were converted to Admiral Shares.
A. The following significant accounting policies conform to generally accepted accounting principles for U.S. investment companies. The fund consistently follows such policies in preparing its financial statements.
1. Security Valuation: Securities are valued as of the close of trading on the New York Stock Exchange (generally 4 p.m., Eastern time) on the valuation date. Equity securities are valued at the latest quoted sales prices or official closing prices taken from the primary market in which each security trades; such securities not traded on the valuation date are valued at the mean of the latest quoted bid and asked prices. Securities for which market quotations are not readily available, or whose values have been affected by events occurring before the fund’s pricing time but after the close of the securities’ primary markets, are valued at their fair values calculated according to procedures adopted by the board of trustees. These procedures include obtaining quotations from an independent pricing service, monitoring news to identify significant market- or security-specific events, and evaluating changes in the values of foreign market proxies (for example, ADRs, futures contracts, or exchange-traded funds), between the time the foreign markets close and the fund’s pricing time. When fair-value pricing is employed, the prices of securities used by a fund to calculate its net asset value may differ from quoted or published prices for the same securities. Investments in Vanguard Market Liquidity Fund are valued at that fund’s net asset value. Temporary cash investments are valued using the latest bid prices or using valuations based on a matrix system (which considers such factors as security prices, yields, maturities, and ratings), both as furnished by independent pricing services.
2. Foreign Currency: Securities and other assets and liabilities denominated in foreign currencies are translated into U.S. dollars using exchange rates obtained from an independent third party as of the fund’s pricing time on the valuation date. Realized gains (losses) and unrealized appreciation (depreciation) on investment securities include the effects of changes in exchange rates since the securities were purchased, combined with the effects of changes in security prices. Fluctuations in the value of other assets and liabilities resulting from changes in exchange rates are recorded as unrealized foreign currency gains (losses) until the assets or liabilities are settled in cash, at which time they are recorded as realized foreign currency gains (losses).
3. Futures and Forward Currency Contracts: The fund uses index futures contracts to a limited extent, with the objectives of maintaining full exposure to the stock market, maintaining liquidity, and minimizing transaction costs. The fund may purchase futures contracts to immediately invest incoming cash in the market, or sell futures in response to cash outflows, thereby simulating a fully invested position in the underlying index while maintaining a cash balance for liquidity. The primary risks associated with the use of futures contracts are imperfect correlation between changes in market values of stocks held by the fund and the prices of futures contracts, and the possibility of an illiquid market. Counterparty risk involving futures is mitigated because a regulated clearinghouse
52
International High Dividend Yield Index Fund
is the counterparty instead of the clearing broker. To further mitigate counterparty risk, the fund trades futures contracts on an exchange, monitors the financial strength of its clearing brokers and clearinghouse, and has entered into clearing agreements with its clearing brokers. The clearinghouse imposes initial margin requirements to secure the fund’s performance and requires daily settlement of variation margin representing changes in the market value of each contract. Any assets pledged as initial margin for open contracts are noted in the Statement of Net Assets.
The fund also enters into forward currency contracts to provide the appropriate currency exposure related to any open futures contracts. The fund’s risks in using these contracts include movement in the values of the foreign currencies relative to the U.S. dollar and the ability of the counterparties to fulfill their obligations under the contracts. The fund mitigates its counterparty risk by entering into forward currency contracts only with a diverse group of prequalified counterparties, monitoring their financial strength, entering into master netting arrangements with its counterparties, and requiring its counterparties to transfer collateral as security for their performance. In the absence of a default, the collateral pledged or received by the fund cannot be repledged, resold, or rehypothecated. The master netting arrangements provide that, in the event of a counterparty’s default (including bankruptcy), the fund may terminate the forward currency contracts, determine the net amount owed by either party in accordance with its master netting arrangements, and sell or retain any collateral held up to the net amount owed to the fund under the master netting arrangements. The forward currency contracts contain provisions whereby a counterparty may terminate open contracts if the fund’s net assets decline below a certain level, triggering a payment by the fund if the fund is in a net liability position at the time of the termination. The payment amount would be reduced by any collateral the fund has pledged. Any assets pledged as collateral for open contracts are noted in the Statement of Net Assets. The value of collateral received or pledged is compared daily to the value of the forward currency contracts exposure with each counterparty, and any difference, if in excess of a specified minimum transfer amount, is adjusted and settled within two business days.
Futures contracts are valued at their quoted daily settlement prices. Forward currency contracts are valued at their quoted daily prices obtained from an independent third party, adjusted for currency risk based on the expiration date of each contract. The notional amounts of the contracts are not recorded in the Statement of Net Assets. Fluctuations in the value of the contracts are recorded in the Statement of Net Assets as an asset (liability) and in the Statement of Operations as unrealized appreciation (depreciation) until the contracts are closed, when they are recorded as realized gains (losses) on futures or forward currency contracts.
During the year ended October 31, 2019, the fund’s average investments in long and short futures contracts represented less than 1% and 0% of net assets, respectively, based on the average of the notional amounts at each quarter-end during the period. The fund’s average investment in forward currency contracts represented less than 1% of net assets, based on the average of the notional amounts at each quarter-end during the period.
4. Federal Income Taxes: The fund intends to continue to qualify as a regulated investment company and distribute all of its taxable income. Management has analyzed the fund’s tax positions taken for all open federal income tax years (October 31, 2016–2019), and has concluded that no provision for federal income tax is required in the fund’s financial statements.
5. Distributions: Distributions to shareholders are recorded on the ex-dividend date. Distributions are determined on a tax basis and may differ from net investment income and realized capital gains for financial reporting purposes.
53
International High Dividend Yield Index Fund
6. Securities Lending: To earn additional income, the fund lends its securities to qualified institutional borrowers. Security loans are subject to termination by the fund at any time, and are required to be secured at all times by collateral in an amount at least equal to the market value of securities loaned. Daily market fluctuations could cause the value of loaned securities to be more or less than the value of the collateral received. When this occurs, the collateral is adjusted and settled before the opening of the market on the next business day. The fund further mitigates its counterparty risk by entering into securities lending transactions only with a diverse group of prequalified counterparties, monitoring their financial strength, and entering into master securities lending agreements with its counterparties. The master securities lending agreements provide that, in the event of a counterparty’s default (including bankruptcy), the fund may terminate any loans with that borrower, determine the net amount owed, and sell or retain the collateral up to the net amount owed to the fund; however, such actions may be subject to legal proceedings. While collateral mitigates counterparty risk, in the event of a default, the fund may experience delays and costs in recovering the securities loaned. The fund invests cash collateral received in Vanguard Market Liquidity Fund, and records a liability in the Statement of Net Assets for the return of the collateral, during the period the securities are on loan. Securities lending income represents fees charged to borrowers plus income earned on invested cash collateral, less expenses associated with the loan. During the term of the loan, the fund is entitled to all distributions made on or in respect of the loaned securities.
7. Credit Facility: The fund and certain other funds managed by The Vanguard Group (“Vanguard”) participate in a $4.3 billion committed credit facility provided by a syndicate of lenders pursuant to a credit agreement that may be renewed annually; each fund is individually liable for its borrowings, if any, under the credit facility. Borrowings may be utilized for temporary and emergency purposes, and are subject to the fund’s regulatory and contractual borrowing restrictions. The participating funds are charged administrative fees and an annual commitment fee of 0.10% of the undrawn amount of the facility; these fees are allocated to the funds based on a method approved by the fund’s board of trustees and included in Management and Administrative expenses on the fund’s Statement of Operations. Any borrowings under this facility bear interest at a rate based upon the higher of the one-month London Interbank Offered Rate, federal funds effective rate, or overnight bank funding rate plus an agreed-upon spread.
The fund had no borrowings outstanding at October 31, 2019, or at any time during the period then ended.
8. Other: Dividend income is recorded on the ex-dividend date. Interest income includes income distributions received from Vanguard Market Liquidity Fund and is accrued daily. Premiums and discounts on debt securities purchased are amortized and accreted, respectively, to interest income over the lives of the respective securities. Security transactions are accounted for on the date securities are bought or sold. Costs used to determine realized gains (losses) on the sale of investment securities are those of the specific securities sold. Fees assessed on capital share transactions are credited to paid-in capital.
Each class of shares has equal rights as to assets and earnings, except that each class separately bears certain class-specific expenses related to maintenance of shareholder accounts (included in Management and Administrative expenses) and shareholder reporting. Marketing and distribution expenses are allocated to each class of shares based on a method approved by the board of trustees. Income, other non-class-specific expenses, and gains and losses on investments are allocated to each class of shares based on its relative net assets.
54
International High Dividend Yield Index Fund
B. In accordance with the terms of a Funds’ Service Agreement (the “FSA”) between Vanguard and the fund, Vanguard furnishes to the fund investment advisory, corporate management, administrative, marketing, and distribution services at Vanguard’s cost of operations (as defined by the FSA). These costs of operations are allocated to the fund based on methods and guidelines approved by the board of trustees. Vanguard does not require reimbursement in the current period for certain costs of operations (such as deferred compensation/benefits and risk/insurance costs); the fund’s liability for these costs of operations is included in Payables to Vanguard on the Statement of Net Assets. All other costs of operations payable to Vanguard are generally settled twice a month.
Upon the request of Vanguard, the fund may invest up to 0.40% of its net assets as capital in Vanguard. At October 31, 2019, the fund had contributed to Vanguard capital in the amount of $65,000, representing less than 0.01% of the fund’s net assets and 0.03% of Vanguard’s capital received pursuant to the FSA. The fund’s trustees and officers are also directors and employees, respectively, of Vanguard.
C. The fund’s custodian bank has agreed to reduce its fees when the fund maintains cash on deposit in the non-interest-bearing custody account. For the year ended October 31, 2019, custodian fee offset arrangements reduced the fund’s expenses by $21,000 (an annual rate of 0.00% of average net assets).
D. Various inputs may be used to determine the value of the fund’s investments. These inputs are summarized in three broad levels for financial statement purposes. The inputs or methodologies used to value securities are not necessarily an indication of the risk associated with investing in those securities.
Level 1—Quoted prices in active markets for identical securities.
Level 2—Other significant observable inputs (including quoted prices for similar securities, interest rates, prepayment speeds, credit risk, etc.).
Level 3—Significant unobservable inputs (including the fund’s own assumptions used to determine the fair value of investments). Any investments valued with significant unobservable inputs are noted on the Statement of Net Assets.
The following table summarizes the market value of the fund’s investments and derivatives as of October 31, 2019, based on the inputs used to value them:
| Level 1 | Level 2 | Level 3 |
Investments | ($000) | ($000) | ($000) |
Common Stocks—North and South America | 147,827 | 1,210 | — |
Common Stocks—Other | 4,139 | 1,301,240 | — |
Temporary Cash Investments | 16,102 | 850 | — |
Futures Contracts—Liabilities1 | (3) | — | — |
Forward Currency Contracts—Assets | — | 10 | — |
Total | 168,065 | 1,303,310 | — |
1 Represents variation margin on the last day of the reporting period.
55
International High Dividend Yield Index Fund
E. At October 31, 2019, the fair values of derivatives were reflected in the Statement of Net Assets as follows:
| | | | Foreign | | | |
| | Equity | | Exchange | | | |
| | Contracts | | Contracts | | Total | |
Statement of Net Assets Caption | | ($000 | ) | ($000 | ) | ($000 | ) |
Unrealized Appreciation—Forward Currency Contracts | | — | | 10 | | 10 | |
Total Assets | | — | | 10 | | 10 | |
| | | | | | | |
Variation Margin Payable—Futures Contracts | | (3 | ) | — | | (3 | ) |
Total Liabilities | | (3 | ) | — | | (3 | ) |
Realized net gain (loss) and the change in unrealized appreciation (depreciation) on derivatives for the year ended October 31, 2019, were:
| | | | Foreign | | | |
| | Equity | | Exchange | | | |
| | Contracts | | Contracts | | Total | |
Realized Net Gain (Loss) on Derivatives | | ($000 | ) | ($000 | ) | ($000 | ) |
Futures Contracts | | (162 | ) | — | | (162 | ) |
Forward Currency Contracts | | — | | (176 | ) | (176 | ) |
Realized Net Gain (Loss) on Derivatives | | (162 | ) | (176 | ) | (338 | ) |
| | | | | | | |
Change in Unrealized Appreciation (Depreciation) on Derivatives | | | | | | | |
Futures Contracts | | 582 | | — | | 582 | |
Forward Currency Contracts | | — | | 130 | | 130 | |
Change in Unrealized Appreciation (Depreciation) on Derivatives | | 582 | | 130 | | 712 | |
F. Permanent differences between book-basis and tax-basis components of net assets are reclassified among capital accounts in the financial statements to reflect their tax character. These reclassifications have no effect on net assets or net asset value per share. As of period end, permanent differences primarily attributable to the accounting for in-kind redemptions, foreign currency transactions, and passive foreign investment companies were reclassified between the following accounts:
| | Amount | |
| | ($000 | ) |
Paid-in Capital | | (1 | ) |
Total Distributable Earnings (Loss) | | 1 | |
56
International High Dividend Yield Index Fund
Temporary differences between book-basis and tax-basis components of total distributable earnings (loss) arise when certain items of income, gain, or loss are recognized in different periods for financial statement and tax purposes; these differences will reverse at some time in the future. The differences are primarily related to the tax deferral of losses on wash sales, the realization of unrealized gains or losses on certain futures contracts, forward currency contracts, and unrealized gains on passive foreign investment companies. As of period end, the tax-basis components of total distributable earnings (loss) are detailed in the table as follows:
| | Amount | |
| | ($000 | ) |
Undistributed Ordinary Income | | 7,526 | |
Undistributed Long-Term Gains | | — | |
Capital Loss Carryforwards (Non-expiring)* | | (3,605 | ) |
Net Unrealized Gains (Losses) | | (28,116 | ) |
* The fund used capital loss carryforwards of $1,863,000 to offset taxable capital gains realized during the year ended October 31, 2019.
As of October 31, 2019, gross unrealized appreciation and depreciation for investments and derivatives based on cost for U.S. federal income tax purposes were as follows:
| | Amount | |
| | ($000 | ) |
Tax Cost | | 1,499,529 | |
Gross Unrealized Appreciation | | 115,068 | |
Gross Unrealized Depreciation | | (143,229 | ) |
Net Unrealized Appreciation (Depreciation) | | (28,161 | ) |
G. During the year ended October 31, 2019, the fund purchased $511,064,000 of investment securities and sold $179,098,000 of investment securities, other than temporary cash investments. Purchases and sales include $275,166,000 and $0, respectively, in connection with in-kind purchases and redemptions of the fund’s capital shares.
57
International High Dividend Yield Index Fund
H. Capital share transactions for each class of shares were:
| | | | | | Year Ended October 31, | |
| | 2019 | | | | 2018 | |
| | Amount | | Shares | | Amount | | Shares | |
| | ($000 | ) | (000 | ) | ($000 | ) | (000 | ) |
Investor Shares | | | | | | | | | |
Issued1 | | 452 | | 19 | | 7,139 | | 269 | |
Issued in Lieu of Cash Distributions | | 140 | | 6 | | 323 | | 13 | |
Redeemed2,3 | | (9,343 | ) | (388 | ) | (6,628 | ) | (256 | ) |
Net Increase (Decrease)—Investor Shares | | (8,751 | ) | (363 | ) | 834 | | 26 | |
ETF Shares | | | | | | | | | |
Issued1 | | 329,989 | | 5,526 | | 461,728 | | 6,912 | |
Issued in Lieu of Cash Distributions | | — | | — | | — | | — | |
Redeemed2 | | — | | — | | (58,070 | ) | (900 | ) |
Net Increase (Decrease)—ETF Shares | | 329,989 | | 5,526 | | 403,658 | | 6,012 | |
Admiral Shares | | | | | | | | | |
Issued1,3 | | 50,620 | | 1,746 | | 79,430 | | 2,484 | |
Issued in Lieu of Cash Distributions | | 6,920 | | 243 | | 6,055 | | 197 | |
Redeemed2 | | (47,074 | ) | (1,635 | ) | (50,270 | ) | (1,611 | ) |
Net Increase (Decrease)—Admiral Shares | | 10,466 | | 354 | | 35,215 | | 1,070 | |
1 Includes purchase fees for fiscal 2019 and 2018 of $193,000 and $212,000, respectively (fund totals).
2 Net of redemption fees for fiscal 2019 and 2018 of $102,000 and $124,000, respectively (fund totals).
3 In November 2018, the fund announced changes to the availability and minimum investment criteria of the Investor and Admiral share classes. As a result, all of the outstanding Investor Shares automatically converted to Admiral Shares beginning in April 2019. Investor Shares—Redeemed and Admiral Shares—Issued include 316,000 and 261,000 shares, respectively, in the amount of $7,630,000 from the conversion during the year ended October 31, 2019.
I. Management has determined that no events or transactions occurred subsequent to October 31, 2019, that would require recognition or disclosure in these financial statements.
58
Report of Independent Registered Public Accounting Firm
To the Board of Trustees of Vanguard Whitehall Funds and Shareholders of Vanguard International Dividend Appreciation Index Fund and Vanguard International High Dividend Yield Index Fund
Opinions on the Financial Statements
We have audited the accompanying statements of net assets of Vanguard International Dividend Appreciation Index Fund and Vanguard International High Dividend Yield Index Fund (two of the funds constituting Vanguard Whitehall Funds, hereafter collectively referred to as the “Funds”) as of October 31, 2019, the related statements of operations for the year ended October 31, 2019, the statements of changes in net assets for each of the two years in the period ended October 31, 2019, including the related notes, and the financial highlights for each of the periods indicated therein (collectively referred to as the “financial statements”). In our opinion, the financial statements present fairly, in all material respects, the financial position of each of the Funds as of October 31, 2019, the results of each of their operations for the year then ended, the changes in each of their net assets for each of the two years in the period ended October 31, 2019 and each of the financial highlights for each of the periods indicated therein in conformity with accounting principles generally accepted in the United States of America.
Basis for Opinions
These financial statements are the responsibility of the Funds’ management. Our responsibility is to express an opinion on the Funds’ financial statements based on our audits. We are a public accounting firm registered with the Public Company Accounting Oversight Board (United States) (“PCAOB”) and are required to be independent with respect to the Funds in accordance with the U.S. federal securities laws and the applicable rules and regulations of the Securities and Exchange Commission and the PCAOB.
We conducted our audits of these financial statements in accordance with the standards of the PCAOB. Those standards require that we plan and perform the audit to obtain reasonable assurance about whether the financial statements are free of material misstatement, whether due to error or fraud.
Our audits included performing procedures to assess the risks of material misstatement of the financial statements, whether due to error or fraud, and performing procedures that respond to those risks. Such procedures included examining, on a test basis, evidence regarding the amounts and disclosures in the financial statements. Our audits also included evaluating the accounting principles used and significant estimates made by management, as well as evaluating the overall presentation of the financial statements. Our procedures included confirmation of securities owned as of October 31, 2019 by correspondence with the custodian and brokers and by agreement to the underlying ownership records of the transfer agent; when replies were not received from brokers, we performed other auditing procedures. We believe that our audits provide a reasonable basis for our opinions.
/s/PricewaterhouseCoopers LLP
Philadelphia, Pennsylvania
December 13, 2019
We have served as the auditor of one or more investment companies in The Vanguard Group of Funds since 1975.
59
Special 2019 tax information (unaudited) for Vanguard International Dividend Appreciation Index Fund
This information for the fiscal year ended October 31, 2019, is included pursuant to provisions of the Internal Revenue Code.
The fund distributed $17,121,000 of qualified dividend income to shareholders during the fiscal year.
The fund designates to shareholders foreign source income of $32,865,000 and foreign taxes paid of $2,692,000. Shareholders will receive more detailed information with their Form 1099-DIV in January 2020 to determine the calendar-year amounts to be included on their 2019 tax returns.
Special 2019 tax information (unaudited) for Vanguard International High Dividend Yield Index Fund
This information for the fiscal year ended October 31, 2019, is included pursuant to provisions of the Internal Revenue Code.
The fund distributed $39,108,000 of qualified dividend income to shareholders during the fiscal year.
The fund designates to shareholders foreign source income of $65,538,000 and foreign taxes paid of $4,272,000. Shareholders will receive more detailed information with their Form 1099-DIV in January 2020 to determine the calendar-year amounts to be included on their 2019 tax returns.
60
London Stock Exchange Group companies include FTSE International Limited (“FTSE”), Frank Russell Company (“Russell”), MTS Next Limited (“MTS”), and FTSE TMX Global Debt Capital Markets Inc. (“FTSE TMX”). All rights reserved. “FTSE®”, “Russell®”, “ MTS®”, “ FTSE TMX®” and “FTSE Russell” and other service marks and trademarks related to the FTSE or Russell indexes are trademarks of the London Stock Exchange Group companies and are used by FTSE, MTS, FTSE TMX and Russell under license. All information is provided for information purposes only. Every effort is made to ensure that all information given in this publication is accurate, but no responsibility or liability can be accepted by the London Stock Exchange Group companies nor its licensors for any errors or for any loss from use of this publication. Neither the London Stock Exchange Group companies nor any of their licensors make any claim, prediction, warranty or representation whatsoever, expressly or impliedly, either as to the results to be obtained from the use of the Indices or the fitness or suitability of the Indices for any particular purpose to which they might be put. The London Stock Exchange Group companies do not provide investment advice and nothing in this document should be taken as constituting financial or investment advice. The London Stock Exchange Group companies make no representation regarding the advisability of investing in any asset. A decision to invest in any such asset should not be made in reliance on any information herein. Indexes cannot be invested in directly. Inclusion of an asset in an index is not a recommendation to buy, sell or hold that asset. The general information contained in this publication should not be acted upon without obtaining specific legal, tax, and investment advice from a licensed professional. No part of this information may be reproduced, stored in a retrieval system or transmitted in any form or by any means, electronic, mechanical, photocopying, recording or otherwise, without prior written permission of the London Stock Exchange Group companies. Distribution of the London Stock Exchange Group companies’ index values and the use of their indexes to create financial products require a license with FTSE, FTSE TMX, MTS and/or Russell and/or its licensors.
61
This page intentionally left blank.
The People Who Govern Your Fund
The trustees of your mutual fund are there to see that the fund is operated and managed in your best interests since, as a shareholder, you are a part owner of the fund. Your fund’s trustees also serve on the board of directors of The Vanguard Group, Inc., which is owned by the Vanguard funds and provides services to them.
A majority of Vanguard’s board members are independent, meaning that they have no affiliation with Vanguard or the funds they oversee, apart from the sizable personal investments they have made as private individuals. The independent board members have distinguished backgrounds in business, academia, and public service. Each of the trustees and executive officers oversees 213 Vanguard funds.
Information for each trustee and executive officer of the fund appears below. That information, as well as the Vanguard fund count, is as of the date on the cover of this fund report. The mailing address of the trustees and officers is P.O. Box 876, Valley Forge, PA 19482. More information about the trustees is in the Statement of Additional Information, which can be obtained, without charge, by contacting Vanguard at 800-662-7447, or online at vanguard.com.
Interested Trustee1
Mortimer J. Buckley
Born in 1969. Trustee since January 2018. Principal occupation(s) during the past five years and other experience: chairman of the board (January 2019– present) of Vanguard and of each of the investment companies served by Vanguard; chief executive officer (January 2018–present) of Vanguard; chief executive officer, president, and trustee (January 2018–present) of each of the investment companies served by Vanguard; president and director (2017–present) of Vanguard; and president (February 2018–present) of Vanguard Marketing Corporation. Chief investment officer (2013–2017), managing director (2002–2017), head of the Retail Investor Group (2006–2012), and chief information officer (2001–2006) of Vanguard. Chairman of the board (2011–2017) and trustee (2009–2017) of the Children’s Hospital of Philadelphia; trustee (2018–present) of The Shipley School.
Independent Trustees
Emerson U. Fullwood
Born in 1948. Trustee since January 2008. Principal occupation(s) during the past five years and other experience: executive chief staff and marketing officer for North America and corporate vice president (retired 2008) of Xerox Corporation (document management products and services). Former president of the Worldwide Channels Group, Latin America, and Worldwide Customer Service and executive chief staff officer of Developing Markets of Xerox. Executive in residence and 2009–2010 Distinguished Minett Professor at the Rochester Institute of Technology. Director of SPX FLOW, Inc. (multi-industry manufacturing). Director of the University of Rochester Medical Center, the Monroe Community College Foundation, the United Way of Rochester, North Carolina A&T University, and Roberts Wesleyan College. Trustee of the University of Rochester.
Amy Gutmann
Born in 1949. Trustee since June 2006. Principal occupation(s) during the past five years and other experience: president (2004–present) of the University of Pennsylvania. Christopher H. Browne Distinguished Professor of Political Science, School of Arts and Sciences, and professor of communication, Annenberg School for Communication, with secondary faculty appointments in the Department of Philosophy, School of Arts and Sciences, and at the Graduate School of Education, University of Pennsylvania. Trustee of the National Constitution Center.
F. Joseph Loughrey
Born in 1949. Trustee since October 2009. Principal occupation(s) during the past five years and other experience: president and chief operating officer (retired 2009) and vice chairman of the board (2008–2009) of Cummins Inc. (industrial machinery). Chairman of the board of Hillenbrand, Inc. (specialized consumer services), and the Lumina Foundation.
1 Mr. Buckley is considered an “interested person,” as defined in the Investment Company Act of 1940, because he is an officer of the Vanguard funds.
Director of the V Foundation and Oxfam America. Member of the advisory council for the College of Arts and Letters and chair of the advisory board to the Kellogg Institute for International Studies, both at the University of Notre Dame.
Mark Loughridge
Born in 1953. Trustee since March 2012. Principal occupation(s) during the past five years and other experience: senior vice president and chief financial officer (retired 2013) of IBM (information technology services). Fiduciary member of IBM’s Retirement Plan Committee (2004–2013), senior vice president and general manager (2002–2004) of IBM Global Financing, vice president and controller (1998–2002) of IBM, and a variety of other prior management roles at IBM. Member of the Council on Chicago Booth.
Scott C. Malpass
Born in 1962. Trustee since March 2012. Principal occupation(s) during the past five years and other experience: chief investment officer (1989–present) and vice president (1996–present) of the University of Notre Dame. Assistant professor of finance at the Mendoza College of Business, University of Notre Dame, and member of the Notre Dame 403(b) Investment Committee. Chairman of the board of TIFF Advisory Services, Inc. Member of the board of Catholic Investment Services, Inc. (investment advisors) and the board of superintendence of the Institute for the Works of Religion.
Deanna Mulligan
Born in 1963. Trustee since January 2018. Principal occupation(s) during the past five years and other experience: president (2010–present) and chief executive officer (2011–present) of The Guardian Life Insurance Company of America. Chief operating officer (2010–2011) and executive vice president (2008–2010) of Individual Life and Disability of The Guardian Life Insurance Company of America. Member of the board of The Guardian Life Insurance Company of America, the American Council of Life Insurers, the Partnership for New York City (business leadership), and the Committee Encouraging Corporate Philanthropy. Trustee of the Economic Club of New York and the Bruce Museum (arts and science). Member of the Advisory Council for the Stanford Graduate School of Business.
André F. Perold
Born in 1952. Trustee since December 2004. Principal occupation(s) during the past five years and other experience: George Gund Professor of Finance and Banking, Emeritus at the Harvard Business School (retired 2011). Chief investment officer and co-managing partner of HighVista Strategies (private investment firm). Board of advisors and investment committee member of the Museum of Fine Arts Boston. Board member (2018–present) of RIT Capital Partners (investment firm); investment committee member of Partners Health Care System.
Sarah Bloom Raskin
Born in 1961. Trustee since January 2018. Principal occupation(s) during the past five years and other experience: deputy secretary (2014–2017) of the United States Department of the Treasury. Governor (2010–2014) of the Federal Reserve Board. Commissioner (2007–2010) of financial regulation for the State of Maryland. Member of the board of directors (2012–2014) of Neighborhood Reinvestment Corporation. Director (2017–present) of i(x) Investments; director (2017–present) of Reserve Trust. Rubinstein Fellow (2017–present) of Duke University; trustee (2017–present) of Amherst College.
Peter F. Volanakis
Born in 1955. Trustee since July 2009. Principal occupation(s) during the past five years and other experience: president and chief operating officer (retired 2010) of Corning Incorporated (communications equipment) and director of Corning Incorporated (2000–2010) and Dow Corning (2001–2010). Director (2012) of SPX Corporation (multi-industry manufacturing). Overseer of the Amos Tuck School of Business Administration, Dartmouth College (2001–2013). Chairman of the board of trustees of Colby-Sawyer College. Member of the board of Hypertherm Inc. (industrial cutting systems, software, and consumables).
Executive Officers
John Bendl
Born in 1970. Principal occupation(s) during the past five years and other experience: principal of Vanguard. Chief financial officer (October 2019–present) of each of the investment companies served by Vanguard. Chief accounting officer, treasurer, and controller of Vanguard (2017–present). Partner (2003–2016) at KPMG (audit, tax, and advisory services).
Glenn Booraem
Born in 1967. Principal occupation(s) during the past five years and other experience: principal of Vanguard. Investment stewardship officer (2017–present), treasurer (2015–2017), controller (2010–2015), and assistant controller (2001–2010) of each of the investment companies served by Vanguard.
Christine M. Buchanan
Born in 1970. Principal occupation(s) during the past five years and other experience: principal of Vanguard. Treasurer (2017–present) of each of the investment companies served by Vanguard. Partner (2005–2017) at KPMG (audit, tax, and advisory services).
David Cermak
Born in 1960. Principal occupation(s) during the past five years and other experience: principal of Vanguard. Finance director (October 2019–present) of each of the investment companies served by Vanguard. Managing director and head (2017–present) of Vanguard Investments Singapore. Managing director and head (2017–2019) of Vanguard Investments Hong Kong. Representative director and head (2014–2017) of Vanguard Investments Japan.
Thomas J. Higgins
Born in 1957. Principal occupation(s) during the past five years and other experience: principal of Vanguard. Finance director (October 2019–present), chief financial officer (2008–2019), and treasurer (1998–2008) of each of the investment companies served by Vanguard.
Peter Mahoney
Born in 1974. Principal occupation(s) during the past five years and other experience: principal of Vanguard. Controller (2015–present) of each of the investment companies served by Vanguard. Head of International Fund Services (2008–2014) at Vanguard.
Anne E. Robinson
Born in 1970. Principal occupation(s) during the past five years and other experience: general counsel (2016–present) of Vanguard. Secretary (2016–present) of Vanguard and of each of the investment companies served by Vanguard. Managing director (2016–present) of Vanguard. Managing director and general counsel of Global Cards and Consumer Services (2014–2016) at Citigroup. Counsel (2003–2014) at American Express.
Michael Rollings
Born in 1963. Principal occupation(s) during the past five years and other experience: finance director (2017–present) and treasurer (2017) of each of the investment companies served by Vanguard. Managing director (2016–present) of Vanguard. Chief financial officer (2016–present) of Vanguard. Director (2016–present) of Vanguard Marketing Corporation. Executive vice president and chief financial officer (2006–2016) of MassMutual Financial Group.
John E. Schadl
Born in 1972. Principal occupation(s) during the past five years and other experience: principal of Vanguard. Chief compliance officer (2019–present) of Vanguard and of each of the investment companies served by Vanguard. Assistant vice president (May 2019–present) of Vanguard Marketing Corporation.
Vanguard Senior Management Team |
| |
Joseph Brennan | Chris D. McIsaac |
Mortimer J. Buckley | James M. Norris |
Gregory Davis | Thomas M. Rampulla |
John James | Karin A. Risi |
Martha G. King | Anne E. Robinson |
John T. Marcante | Michael Rollings |
| 
P.O. Box 2600 Valley Forge, PA 19482-2600 |
Connect with Vanguard® > vanguard.com
Fund Information > 800-662-7447
Direct Investor Account Services > 800-662-2739
Institutional Investor Services > 800-523-1036
Text Telephone for People
Who Are Deaf or Hard of Hearing > 800-749-7273
This material may be used in conjunction with the offering of shares of any Vanguard fund only if preceded or accompanied by the fund’s current prospectus.
All comparative mutual fund data are from Morningstar, Inc., unless otherwise noted.
You can obtain a free copy of Vanguard’s proxy voting guidelines by visiting vanguard.com/proxyreporting or by calling Vanguard at 800-662-2739. The guidelines are also available from the SEC’s website, www.sec.gov. In addition, you may obtain a free report on how your fund voted the proxies for securities it owned during the 12 months ended June 30. To get the report, visit either vanguard.com/proxyreporting or www.sec.gov.
You can review information about your fund on the SEC’s website, and you can receive copies of this information, for a fee, by sending a request via email addressed to publicinfo@sec.gov.
Source for Bloomberg Barclays indexes: Bloomberg Index Services Limited. Copyright 2019, Bloomberg. All rights reserved.
“Dividend Achievers” is a trademark of The NASDAQ OMX Group, Inc. (collectively, with its affiliates “NASDAQ OMX”), and has been licensed for use by The Vanguard Group, Inc. Vanguard mutual funds are not sponsored, endorsed, sold, or promoted by NASDAQ OMX and NASDAQ OMX makes no representation regarding the advisability of investing in the funds. NASDAQ OMX MAKES NO WARRANTIES AND BEARS NO LIABILITY WITH RESPECT TO THE VANGUARD MUTUAL FUNDS.
| © 2019 The Vanguard Group, Inc. All rights reserved. U.S. Patent Nos. 6,879,964; 7,337,138; 7,720,749; 7,925,573; 8,090,646; 8,417,623; and 8,626,636. Vanguard Marketing Corporation, Distributor. Q20150 122019 |
Item 2: Code of Ethics. The Registrant has adopted a code of ethics that applies to the Registrant’s principal executive officer, principal financial officer, principal accounting officer or controller or persons performing similar functions. The Code of Ethics was amended during the reporting period covered by this report to make certain technical, non-material changes.
Item 3: Audit Committee Financial Expert. All members of the Audit Committee have been determined by the Registrant’s Board of Trustees to be Audit Committee Financial Experts and to be independent: F. Joseph Loughrey, Mark Loughridge, Sarah Bloom Raskin, and Peter F. Volanakis.
Item 4: Principal Accountant Fees and Services.
(a) Audit Fees.
Audit Fees of the Registrant.
Fiscal Year Ended October 31, 2019: $317,000
Fiscal Year Ended October 31, 2018: $328,000
Aggregate Audit Fees of Registered Investment Companies in the Vanguard Group.
Fiscal Year Ended October 31, 2019: $9,568,215
Fiscal Year Ended October 31, 2018: $9,734,277
Includes fees billed in connection with audits of the Registrant, other registered investment companies in the Vanguard complex, The Vanguard Group, Inc., and Vanguard Marketing Corporation.
(b) Audit-Related Fees.
Fiscal Year Ended October 31, 2019: $3,012,031
Fiscal Year Ended October 31, 2018: $5,581,336
Includes fees billed in connection with assurance and related services provided to the Registrant, other registered investment companies in the Vanguard complex, The Vanguard Group, Inc., and Vanguard Marketing Corporation.
(c) Tax Fees.
Fiscal Year Ended October 31, 2019: $357,238
Fiscal Year Ended October 31, 2018: $347,985
Includes fees billed in connection with tax compliance, planning, and advice services provided to the Registrant, other registered investment companies in the Vanguard complex, The Vanguard Group, Inc., and Vanguard Marketing Corporation.
(d) All Other Fees.
Fiscal Year Ended October 31, 2019: $0
Fiscal Year Ended October 31, 2018: $0
Includes fees billed for services related to tax reported information provided to the Registrant, other registered investment companies in the Vanguard complex, The Vanguard Group, Inc., and Vanguard Marketing Corporation.
(e) (1) Pre-Approval Policies. The policy of the Registrant’s Audit Committee is to consider, and, if appropriate, approve before the principal accountant is engaged for such services, all specific audit and non-audit services provided to: the Registrant, other registered investment companies in the Vanguard complex, The Vanguard Group, Inc., and entities controlled by The Vanguard Group, Inc. that provide ongoing services to the Registrant. In making a determination, the Audit Committee considers whether the services are consistent with maintaining the principal accountant’s independence.
In the event of a contingency situation in which the principal accountant is needed to provide services in between scheduled Audit Committee meetings, the Chairman of the Audit Committee would be called on to consider and, if appropriate, pre-approve audit or permitted non-audit services in an amount sufficient to complete services through the next Audit Committee meeting, and to determine if such services would be consistent with maintaining the accountant’s independence. At the next scheduled Audit Committee meeting, services and fees would be presented to the Audit Committee for formal consideration, and, if appropriate, approval by the entire Audit Committee. The Audit Committee would again consider whether such services and fees are consistent with maintaining the principal accountant’s independence.
The Registrant’s Audit Committee is informed at least annually of all audit and non-audit services provided by the principal accountant to the Vanguard complex, whether such services are provided to: the Registrant, other registered investment companies in the Vanguard complex, The Vanguard Group, Inc., or other entities controlled by The Vanguard Group, Inc. that provide ongoing services to the Registrant.
(2) No percentage of the principal accountant’s fees or services were approved pursuant to the waiver provision of paragraph (c)(7)(i)(C) of Rule 2-01 of Regulation S-X.
(f) For the most recent fiscal year, over 50% of the hours worked under the principal accountant’s engagement were not performed by persons other than full-time, permanent employees of the principal accountant.
(g) Aggregate Non-Audit Fees.
Fiscal Year Ended October 31, 2019: $357,238
Fiscal Year Ended October 31, 2018: $347,985
Includes fees billed for non-audit services provided to the Registrant, other registered investment companies in the Vanguard complex, The Vanguard Group, Inc., and Vanguard Marketing Corporation.
(h) For the most recent fiscal year, the Audit Committee has determined that the provision of all non-audit services was consistent with maintaining the principal accountant’s independence.
Item 5: Audit Committee of Listed Registrants.
The Registrant is a listed issuer as defined in rule 10A-3 under the Securities Exchange Act of 1934 (“Exchange Act”). The Registrant has a separately-designated standing audit committee established in accordance with Section 3(a)(58)(A) of the Exchange Act. The Registrant’s audit committee members are: F. Joseph Loughrey, Mark Loughridge, Sarah Bloom Raskin, and Peter F. Volanakis.
Item 6: Investments.
Not applicable.
Item 7: Disclosure of Proxy Voting Policies and Procedures for Closed-End Management Investment Companies.
Not applicable.
Item 8: Portfolio Managers of Closed-End Management Investment Companies.
Not applicable.
Item 9: Purchase of Equity Securities by Closed-End Management Investment Company and Affiliated Purchasers.
Not applicable.
Item 10: Submission of Matters to a Vote of Security Holders.
Not applicable.
Item 11: Controls and Procedures.
(a) Disclosure Controls and Procedures. The Principal Executive and Financial Officers concluded that the Registrant’s Disclosure Controls and Procedures are effective based on their evaluation of the Disclosure Controls and Procedures as of a date within 90 days of the filing date of this report.
(b) Internal Control Over Financial Reporting. There were no significant changes in Registrant’s Internal Control Over Financial Reporting or in other factors that could significantly affect this control subsequent to the date of the evaluation, including any corrective actions with regard to significant deficiencies and material weaknesses.
Item 12: Disclosure of Securities Lending Activities for Closed-End Management
Investment Companies.
Not applicable.
Item 13: Exhibits.
(a) Code of Ethics.
(b) Certifications.
Pursuant to the requirements of the Securities Exchange Act of 1934 and the Investment Company Act of 1940, the registrant has duly caused this report to be signed on its behalf by the undersigned, thereunto duly authorized.
| VANGUARD WHITEHALL FUNDS |
| |
BY: | /s/ MORTIMER J. BUCKLEY* | |
| | |
| MORTIMER J. BUCKLEY | |
| CHIEF EXECUTIVE OFFICER | |
Date: December 18, 2019
Pursuant to the requirements of the Securities Exchange Act of 1934 and the Investment Company Act of 1940, this report has been signed below by the following persons on behalf of the registrant and in the capacities and on the dates indicated.
| VANGUARD WHITEHALL FUNDS |
| |
BY: | /s/ MORTIMER J. BUCKLEY* | |
| | |
| MORTIMER J. BUCKLEY | |
| CHIEF EXECUTIVE OFFICER | |
|
Date: December 18, 2019 |
|
| VANGUARD WHITEHALL FUNDS |
| |
BY: | /s/ JOHN BENDL* | |
| | |
| JOHN BENDL | |
| CHIEF FINANCIAL OFFICER | |
| |
Date: December 18, 2019 | |
* By: /s/ Anne E. Robinson
Anne E. Robinson, pursuant to a Power of Attorney filed on January 18, 2018 (see file Number 33-32216) and a Power of Attorney filed on October 30, 2019 (see file Number 811-02554), Incorporated by Reference.