UNITED STATES
SECURITIES AND EXCHANGE COMMISSION
Washington, D.C. 20549
FORM N-CSR
CERTIFIED SHAREHOLDER REPORT
OF
REGISTERED MANAGEMENT INVESTMENT COMPANIES
Investment Company Act file number: 811-07443
| Name of Registrant: | Vanguard Whitehall Funds |
| Address of Registrant: | P.O. Box 2600 |
| | Valley Forge, PA 19482 |
| Name and address of agent for service: | Anne E. Robinson, Esquire |
| | P.O. Box 876 |
| | Valley Forge, PA 19482 |
Registrant’s telephone number, including area code: (610) 669-1000
Date of fiscal year end: October 31
Date of reporting period: November 1, 2021—October 31, 2022
Item 1: Reports to Shareholders
Annual Report | October 31, 2022
Vanguard Selected Value Fund
Contents
Your Fund’s Performance at a Glance
| 1 |
Advisors' Report
| 2 |
About Your Fund’s Expenses
| 6 |
Performance Summary
| 8 |
Financial Statements
| 10 |
Please note: The opinions expressed in this report are just that—informed opinions. They should not be considered promises or advice. Also, please keep in mind that the information and opinions cover the period through the date on the front of this report. Of course, the risks of investing in your fund are spelled out in the prospectus.
Your Fund’s Performance at a Glance
| • | The 12 months ended October 31, 2022, were a volatile, challenging period for financial markets. Vanguard Selected Value Fund returned –7.29%, ahead of the –10.18% return of its benchmark, the Russell Midcap Value Index. |
| • | The global economic backdrop deteriorated as inflation reached multidecade highs, notably in energy and food prices after Russia invaded Ukraine in February. Price increases then broadened to other goods and services, adding to concerns that inflation would remain stubbornly high. Many central banks tightened aggressively to try to rein in inflation, which increased fears of a recession. |
| • | The broad U.S. stock market, as measured by the Russell 3000 Index, returned –16.52%. Value stocks outperformed growth, and large-capitalization stocks lost less ground than mid- and small-caps. |
| • | Returns were positive in four industry sectors. Strong selection in financial stocks, the fund’s largest sector, drove outperformance relative to the benchmark. Consumer discretionary and consumer staples detracted most. |
| • | For the decade ended October 31, 2022, the fund’s average annual return of 10.07% fell just short of the 10.42% return of its expense-free benchmark. |
Market Barometer
| | Average Annual Total Returns
Periods Ended October 31, 2022 |
| | One Year | Three Years | Five Years |
| Stocks | | | |
| Russell 1000 Index (Large-caps) | -16.38% | 9.99% | 10.19% |
| Russell 2000 Index (Small-caps) | -18.54 | 7.05 | 5.56 |
| Russell 3000 Index (Broad U.S. market) | -16.52 | 9.79 | 9.87 |
| FTSE All-World ex US Index (International) | -24.20 | -1.16 | -0.18 |
| Bonds | | | |
Bloomberg U.S. Aggregate Float Adjusted Index
(Broad taxable market) | -15.69% | -3.73% | -0.50% |
Bloomberg Municipal Bond Index
(Broad tax-exempt market) | -11.98 | -2.18 | 0.37 |
| FTSE Three-Month U.S. Treasury Bill Index | 0.88 | 0.59 | 1.15 |
| CPI | | | |
| Consumer Price Index | 7.75% | 5.01% | 3.85% |
For the 12 months ended October 31, 2022, Vanguard Selected Value Fund returned –7.29%. It declined less than its benchmark, the Russell Midcap Value Index, which returned –10.18%.
Your fund is managed by three independent advisors, a strategy that enhances its diversification by providing exposure to distinct yet complementary investment approaches. It’s not uncommon for different advisors to have different views about individual securities or the broader investment environment.
The accompanying table lists the advisors, the amount and percentage of fund assets each manages, and brief descriptions of their investment strategies.
The advisors have provided the following assessment of the investment environment during the past 12 months and the notable successes and shortfalls in their portfolios. These comments were prepared on November 15, 2022.
Pzena Investment Management, LLC
Portfolio Managers:
Richard Pzena, Managing Principal
and Co-Chief Investment Officer
John J. Flynn, Principal
Benjamin S. Silver, CFA, CPA, Principal
Mid-capitalization value stocks had a strong finish to 2021, helped by improving sentiment surrounding the COVID-19
Omicron variant. The global macroeconomic environment quickly soured in early 2022, however, as Russia's invasion of Ukraine exacerbated inflationary pressures. The consequential rise in input costs had a more pronounced effect on smaller domestic companies, which underperformed their large-cap peers. That said, the portfolio’s performance was well ahead of the benchmark’s, with energy being the top absolute contributing sector.
Two of the portfolio’s top individual performers—U.S. oil servicers NOV and Halliburton—were particularly strong as the attractiveness of energy independence reasserted itself in the minds of U.S. consumers and the government. Crude prices had been rising for months on a general supply-demand imbalance, then spiked on the developments in Eastern Europe. Shares of Halliburton also were higher on the company’s earnings report, which revealed a dividend increase, higher margins, and lower-than-expected capital spending. Shares of pharma distributor Cardinal were up after activist investor Elliott Management disclosed a sizable stake in the company, seeking to turn around the underperforming business. This was followed by a shake-up of the board and the formation of a business review committee.
Consumer discretionary, consumer staples, and materials were the largest sector detractors. Door and window manufacturer JELD-WEN fell after the CEO resigned, while housing sentiment
declined as interest rates rose. Labor shortages and associated cost inflation pressured the profitability of Fresenius Medical Care’s dialysis centers, prompting management to issue a major cut to fiscal 2022 guidance. Apparel company PVH, which owns the Tommy Hilfiger and Calvin Klein brands, was weak. The company displayed impressive earnings resiliency, but the market worried about its sizable exposure to the European consumer as the euro depreciated and inflation surged.
Although macro concerns have weighed on the market and the portfolio more recently, we believe that the companies we own are well-positioned for the long term, with solid competitive positions and strong balance sheets. Valuation remains our discipline, and the presence of economic uncertainty is generally a time of great opportunity for the long-term, disciplined, valuation-focused investor—particularly as domestic value stocks remain at historically cheap levels.
Cooke & Bieler, LP
Portfolio Managers:
Mehul Trivedi, CFA, Partner and Research Analyst
William Weber, CFA, Partner and Research Analyst
The investing environment for the 12 months was shaped by persistent inflation, rising interest rates, geopolitical uncertainty, and growing economic pessimism. The volatile environment left
investors without many safe havens. Equities and bonds both suffered as the Federal Reserve raised rates five times during the period and 10-year Treasury yields spiked.
The tilt of the portfolio has changed as we trimmed or eliminated some of the more defensive positions that held up well relative to the benchmark, while adding to positions that we believe have been unfairly punished for their perceived vulnerability to a recession. As stock valuations contracted across the board, the team often found opportunities within the portfolio itself, driving turnover lower than in the prior year.
Successes and shortfalls
The portfolio’s largest successes came from financial holdings, particularly insurance companies, which had been among the largest detractors in the prior year. These holdings benefited from their stable business models and positive exposure to rising interest rates. Although we have trimmed many of these holdings, the portfolio remains overweighted relative to the benchmark. Stock selection within communication services also helped the portfolio, as did an underweight to real estate.
As investors considered the potential of a recession, consumer-related holdings were hit particularly hard. Helen of Troy, an initial beneficiary of the pandemic, struggled as slower orders and retailer inventory destocking seemed poised to weigh on revenue and margins. Stanley Black & Decker and Hanesbrands
management teams saw similar trends, and Stanley lowered expectations. Health care stocks also weighed on results, and an underweight to energy remained a headwind.
Outlook
The widespread persistence of inflationary pressures has forced the Fed to aggressively tighten monetary policy, increasing both interest rates and the odds of a recession. This reality has greatly soured investor sentiment for equities, particularly those of companies deemed to be economically sensitive. Across capitalization ranges, the consumer discretionary, industrial, and information technology sectors have experienced significant declines. This has presented a meaningful challenge to relative performance in light of the portfolio’s significant exposure to the consumer discretionary and industrial sectors. Though entering a recession overweighted to cyclical sectors is not ideal, we are increasingly convinced that portfolio holdings in these sectors will be an important source of returns going forward.
Donald Smith & Co., Inc.
Portfolio Managers:
Richard L. Greenberg, CFA,
Chief Executive Officer
and Co-Chief Investment Officer
Jon Hartsel, CFA,
Co-Chief Investment Officer
and Director of Research
Markets struggled this year as recession concerns and the Federal Reserve’s increasingly aggressive monetary policy stance weighed on stocks. After a steep decline during the summer months, value stocks and our portfolio made a significant recovery to close the 12 months.
Two announced corporate actions in the period helped performance. Atlas Air, a global air freight company, rallied on news that it would be taken private by a group of investors. Euronav announced plans to merge with Frontline to create the world’s largest oil tanker company. We took the opportunity to fully exit Euronav.
Several insurance holdings were among the top contributors to the portfolio as interest rates rose. Unum, a life and disability insurance company with a run-off long-term care business, outperformed as wage inflation benefited its core disability business. Life insurer Genworth Financial rose as the company completed an IPO for a 20% stake in Enact, a private mortgage insurer, and began a share buyback that represented the first return of capital to shareholders in over a decade.
Some of the commodity-related holdings also were strong. The Mosaic Company was aided by the unprecedented rise in fertilizer prices after Russia’s invasion of Ukraine. Aluminum producer Alcoa Group also benefited from very strong supply and demand fundamentals for the metal. We sold most of the Mosaic position and exited Alcoa because of concerns about valuation and the sustainability of profitability above normalized levels.
Gold miners were the primary detractors as they continued to struggle with the backdrop of rising real interest rates, a strong U.S. dollar, and inflationary cost pressures. IAMGOLD revised upward its estimate of the remaining cost for developing a large mine in Canada. Homebuilders Taylor Morrison Home and M/I Homes also sold off as mortgage-rate increases led to concerns about home affordability. Other detractors included airline and aircraft leasing holdings.
Primary risks for the portfolio include a potential recession that would impact economically sensitive industries such as airlines and commodity producers. A steep decline in home prices, accompanied by an increase in
foreclosures, would affect homebuilders and private mortgage insurers.
Throughout the 12 months, we sold many of the outperformers to rotate into new names. Some new industries we have invested in include private mortgage insurance, steel, and energy. The largest industry weightings in the portfolio are insurance, building and real estate, aircraft leasing and airlines, financials, and shipping. Currently, the portfolio trades at 79% of tangible book value and 5.9x our estimate of “normalized” earnings, versus the Standard & Poor’s 500 Index at 1173% of tangible book value and 15.5x normalized earnings.
| |
| | Fund Assets Managed | |
| Investment Advisor | % | $ Million | Investment Strategy |
| Pzena Investment Management, LLC | 40 | 2,302 | Uses a fundamental, bottom-up, deep-value-oriented investment strategy. Seeks to buy good businesses at low prices, focusing exclusively on companies that are underperforming their historically demonstrated earnings power. |
| Cooke & Bieler, L.P. | 38 | 2,207 | Conducts fundamental research in seeking high-quality businesses that have a record of generating attractive and sustainable returns on capital, durable competitive advantages, and skilled and shareholder-friendly management teams. |
| Donald Smith & Co., Inc. | 21 | 1,196 | Conducts fundamental research on the lowest price-to-tangible book value companies. Research focuses on underlying quality of book value and assets, and on long-term earnings potential. |
| Cash Investments | 1 | 82 | These short-term reserves are invested by Vanguard in equity index products to simulate investment in stocks. Each advisor may also maintain a modest cash position. |
About Your Fund’s Expenses
As a shareholder of the fund, you incur ongoing costs, which include costs for portfolio management, administrative services, and shareholder reports (like this one), among others. Operating expenses, which are deducted from a fund’s gross income, directly reduce the investment return of the fund.
A fund’s expenses are expressed as a percentage of its average net assets. This figure is known as the expense ratio. The following examples are intended to help you understand the ongoing costs (in dollars) of investing in your fund and to compare these costs with those of other mutual funds. The examples are based on an investment of $1,000 made at the beginning of the period shown and held for the entire period.
The accompanying table illustrates your fund’s costs in two ways:
| • | Based on actual fund return. This section helps you to estimate the actual expenses that you paid over the period. The ”Ending Account Value“ shown is derived from the fund‘s actual return, and the third column shows the dollar amount that would have been paid by an investor who started with $1,000 in the fund. You may use the information here, together with the amount you invested, to estimate the expenses that you paid over the period. |
To do so, simply divide your account value by $1,000 (for example, an $8,600 account value divided by $1,000 = 8.6), then multiply the result by the number given for your fund under the heading ”Expenses Paid During Period.“
| • | Based on hypothetical 5% yearly return. This section is intended to help you compare your fund‘s costs with those of other mutual funds. It assumes that the fund had a yearly return of 5% before expenses, but that the expense ratio is unchanged. In this case—because the return used is not the fund’s actual return—the results do not apply to your investment. The example is useful in making comparisons because the Securities and Exchange Commission requires all mutual funds to calculate expenses based on a 5% return. You can assess your fund’s costs by comparing this hypothetical example with the hypothetical examples that appear in shareholder reports of other funds. |
Note that the expenses shown in the table are meant to highlight and help you compare ongoing costs only and do not reflect transaction costs incurred by the fund for buying and selling securities. Further, the expenses do not include any purchase, redemption, or account service fees described in the fund prospectus. If such fees were applied to your account, your costs would be higher. Your fund does not carry a “sales load.”
The calculations assume no shares were bought or sold during the period. Your actual costs may have been higher or lower, depending on the amount of your investment and the timing of any purchases or redemptions.
You can find more information about the fund’s expenses, including annual expense ratios, in the Financial Statements section of this report. For additional information on operating expenses and other shareholder costs, please refer to your fund’s current prospectus.
| Six Months Ended October 31, 2022 | | | |
| Selected Value Fund | Beginning
Account Value
4/30/2022 | Ending
Account Value
10/31/2022 | Expenses
Paid During
Period |
| Based on Actual Fund Return | $1,000.00 | $956.40 | $1.87 |
| Based on Hypothetical 5% Yearly Return | 1,000.00 | 1,023.29 | 1.94 |
The calculations are based on expenses incurred in the most recent six-month period. The fund’s annualized six-month expense ratio for that period is 0.38%. The dollar amounts shown as “Expenses Paid” are equal to the annualized expense ratio multiplied by the average account value over the period, multiplied by the number of days in the most recent six-month period, then divided by the number of days in the most recent 12-month period (184/365).
All of the returns in this report represent past performance, which is not a guarantee of future results that may be achieved by the fund. (Current performance may be lower or higher than the performance data cited. For performance data current to the most recent month-end, visit our website at vanguard.com/performance.) Note, too, that both investment returns and principal value can fluctuate widely, so an investor’s shares, when sold, could be worth more or less than their original cost. The returns shown do not reflect taxes that a shareholder would pay on fund distributions or on the sale of fund shares.
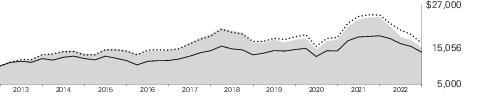
Cumulative Performance: October 31, 2012, Through October 31, 2022
Initial Investment of $10,000
| | | Average Annual Total Returns
Periods Ended October 31, 2022 | |
| | | One
Year | Five
Years | Ten
Years | Final Value
of a $10,000
Investment |
 | Selected Value Fund | -7.29% | 5.62% | 10.07% | $26,107 |
 | Russell Midcap Value Index | -10.18 | 6.49 | 10.42 | 26,943 |
 | Dow Jones U.S. Total Stock Market Float Adjusted Index | -16.94 | 9.72 | 12.36 | 32,058 |
See Financial Highlights for dividend and capital gains information.
| Communication Services | 1.7% |
| Consumer Discretionary | 14.9 |
| Consumer Staples | 1.2 |
| Energy | 4.8 |
| Financials | 27.8 |
| Health Care | 7.9 |
| Industrials | 19.3 |
| Information Technology | 10.0 |
| Materials | 6.0 |
| Real Estate | 2.4 |
| Utilities | 4.0 |
The table reflects the fund’s investments, except for short-term investments and derivatives. Sector categories are based on the Global Industry Classification Standard (“GICS”), except for the “Other” category (if applicable), which includes securities that have not been provided a GICS classification as of the effective reporting period.
Global Industry Classification Standard (“GICS”) was developed by and is the exclusive property and a service mark of MSCI Inc. (“MSCI”) and Standard and Poor’s, a division of McGraw-Hill Companies, Inc. (“S&P”), and is licensed for use by Vanguard. Neither MSCI, S&P nor any third party involved in making or compiling the GICS or any GICS classification makes any express or implied warranties or representations with respect to such standard or classification (or the results to be obtained by the use thereof), and all such parties hereby expressly disclaim all warranties of originality, accuracy, completeness, merchantability or fitness for a particular purpose with respect to any such standard or classification. Without limiting any of the foregoing, in no event shall MSCI, S&P, any of its affiliates or any third party involved in making or compiling the GICS or any GICS classification have any liability for any direct, indirect, special, punitive, consequential or any other damages (including lost profits) even if notified of the possibility of such damages.
The fund files its complete schedule of portfolio holdings with the Securities and Exchange Commission (SEC) for the first and third quarters of each fiscal year as an exhibit to its reports on Form N-PORT. The fund’s Form N-PORT reports are available on the SEC’s website at www.sec.gov.
| | | Shares | Market
Value•
($000) |
| Common Stocks (94.9%) |
| Communication Services (1.6%) |
| | Omnicom Group Inc. | 789,400 | 57,429 |
| | Activision Blizzard Inc. | 512,200 | 37,288 |
| | | | 94,717 |
| Consumer Discretionary (14.2%) |
| | Gildan Activewear Inc. | 3,456,308 | 109,046 |
| * | Taylor Morrison Home Corp. Class A | 3,571,543 | 94,074 |
| | Lear Corp. | 545,377 | 75,649 |
| | Gentex Corp. | 2,217,574 | 58,743 |
| | Newell Brands Inc. | 4,134,510 | 57,098 |
| | Gap Inc. | 4,927,103 | 55,528 |
| * | Skechers USA Inc. Class A | 1,495,952 | 51,506 |
| * | Helen of Troy Ltd. | 469,550 | 44,429 |
| * | CarMax Inc. | 701,040 | 44,172 |
| * | M/I Homes Inc. | 893,000 | 37,051 |
| * | Mohawk Industries Inc. | 368,505 | 34,916 |
| | Hasbro Inc. | 529,746 | 34,566 |
| | Whirlpool Corp. | 238,100 | 32,915 |
| | American Eagle Outfitters Inc. | 2,764,660 | 31,407 |
| | PVH Corp. | 586,275 | 30,088 |
| | Hanesbrands Inc. | 3,982,200 | 27,159 |
| | | | 818,347 |
| Consumer Staples (1.1%) |
| | Ingredion Inc. | 271,800 | 24,223 |
| | General Mills Inc. | 243,130 | 19,834 |
| | Spectrum Brands Holdings Inc. | 422,849 | 19,510 |
| | | | 63,567 |
| Energy (4.5%) |
| | NOV Inc. | 3,022,292 | 67,699 |
| | Civitas Resources Inc. | 894,142 | 62,510 |
| | Williams Cos. Inc. | 1,616,200 | 52,898 |
| | Halliburton Co. | 1,340,100 | 48,806 |
| * | TechnipFMC plc | 2,854,756 | 30,232 |
| | | | 262,145 |
| Financials (26.4%) |
| | Unum Group | 2,587,048 | 117,944 |
| | Globe Life Inc. | 748,402 | 86,455 |
| | Jefferies Financial Group Inc. | 2,426,641 | 83,501 |
| | Fidelity National Financial Inc. | 2,090,375 | 82,319 |
| | Equitable Holdings Inc. | 2,539,734 | 77,767 |
| | | Shares | Market
Value•
($000) |
| | Voya Financial Inc. | 991,837 | 67,802 |
| | CNO Financial Group Inc. | 2,627,895 | 57,971 |
| | State Street Corp. | 751,470 | 55,609 |
| | Progressive Corp. | 432,477 | 55,530 |
| | KeyCorp. | 2,888,324 | 51,614 |
| | Essent Group Ltd. | 1,248,450 | 49,414 |
| | Fifth Third Bancorp | 1,352,424 | 48,268 |
| | American International Group Inc. | 839,128 | 47,830 |
| | Regions Financial Corp. | 2,149,320 | 47,178 |
| | Axis Capital Holdings Ltd. | 834,770 | 45,637 |
| | Radian Group Inc. | 2,170,000 | 45,288 |
| * | Arch Capital Group Ltd. | 770,029 | 44,277 |
| | RenaissanceRe Holdings Ltd. | 280,530 | 43,392 |
| | Reinsurance Group of America Inc. | 285,446 | 42,009 |
| | CNA Financial Corp. | 970,889 | 40,486 |
| | FirstCash Holdings Inc. | 403,669 | 39,741 |
| | Webster Financial Corp. | 703,913 | 38,194 |
| | Allstate Corp. | 301,815 | 38,104 |
| * | Genworth Financial Inc. Class A | 7,557,900 | 35,295 |
| | Loews Corp. | 521,400 | 29,730 |
| | Synchrony Financial | 775,850 | 27,589 |
| | Cboe Global Markets Inc. | 214,000 | 26,643 |
| | Invesco Ltd. | 1,529,420 | 23,431 |
| | MGIC Investment Corp. | 1,612,799 | 22,015 |
| | Everest Re Group Ltd. | 51,771 | 16,705 |
| * | M&T Bank Corp. | 70,980 | 11,951 |
| 1 | Enact Holdings Inc. | 463,439 | 11,883 |
| | Commerce Bancshares Inc. | 107,458 | 7,612 |
| | Navient Corp. | 479,339 | 7,257 |
| | | | 1,526,441 |
| Health Care (7.5%) |
| | Cardinal Health Inc. | 883,028 | 67,022 |
| * | Integra LifeSciences Holdings Corp. | 965,775 | 48,530 |
| | Perrigo Co. plc | 1,191,391 | 47,989 |
| 1 | Fresenius Medical Care AG & Co. KGaA ADR | 3,162,591 | 43,865 |
| | Baxter International Inc. | 782,820 | 42,546 |
| | DENTSPLY SIRONA Inc. | 1,354,800 | 41,755 |
| * | Syneos Health Inc. | 634,849 | 31,984 |
| | Laboratory Corp. of America Holdings | 142,400 | 31,593 |
| * | Henry Schein Inc. | 429,802 | 29,424 |
| * | Enovis Corp. | 546,409 | 27,020 |
| | | Shares | Market
Value•
($000) |
| | McKesson Corp. | 60,148 | 23,420 |
| | | | 435,148 |
| Industrials (18.3%) |
| * | AerCap Holdings NV | 3,677,179 | 196,398 |
| | Terex Corp. | 1,868,137 | 75,734 |
| * | IAA Inc. | 1,590,692 | 60,335 |
| | BWX Technologies Inc. | 833,545 | 47,495 |
| | Westinghouse Air Brake Technologies Corp. | 505,211 | 47,126 |
| | Woodward Inc. | 461,755 | 42,343 |
| | AMETEK Inc. | 323,710 | 41,972 |
| | Esab Corp. | 1,101,330 | 41,080 |
| | Stanley Black & Decker Inc. | 505,350 | 39,665 |
| | Acuity Brands Inc. | 213,154 | 39,129 |
| | Enerpac Tool Group Corp. Class A | 1,539,856 | 39,128 |
| * | JetBlue Airways Corp. | 4,790,529 | 38,516 |
| | MSC Industrial Direct Co. Inc. Class A | 457,552 | 37,968 |
| * | MasTec Inc. | 487,571 | 37,582 |
| | Triton International Ltd. | 601,700 | 36,517 |
| | Armstrong World Industries Inc. | 472,630 | 35,717 |
| * | Atlas Air Worldwide Holdings Inc. | 325,459 | 32,917 |
| | PACCAR Inc. | 292,400 | 28,313 |
| * | JELD-WEN Holding Inc. | 2,664,409 | 28,269 |
| * | Gates Industrial Corp. plc | 2,455,530 | 27,379 |
| * | Fortune Brands Home & Security Inc. | 403,620 | 24,346 |
| | Textainer Group Holdings Ltd. | 746,360 | 22,331 |
| | MDU Resources Group Inc. | 781,863 | 22,267 |
| | Snap-on Inc. | 56,185 | 12,476 |
| *,1 | Air France KLM ADR | 4,102,756 | 5,621 |
| | | | 1,060,624 |
| Information Technology (9.5%) |
| * | Arrow Electronics Inc. | 957,548 | 96,961 |
| | Avnet Inc. | 1,564,918 | 62,894 |
| | TE Connectivity Ltd. | 463,970 | 56,711 |
| | Cognizant Technology Solutions Corp. Class A | 839,956 | 52,287 |
| | MKS Instruments Inc. | 570,220 | 46,844 |
| | Amdocs Ltd. | 528,363 | 45,603 |
| | SS&C Technologies Holdings Inc. | 790,883 | 40,667 |
| | Open Text Corp. | 1,204,100 | 34,859 |
| * | Celestica Inc. | 3,126,093 | 34,262 |
| | Micron Technology Inc. | 524,649 | 28,383 |
| | Genpact Ltd. | 505,149 | 24,500 |
| | Juniper Networks Inc. | 392,407 | 12,008 |
| | Hewlett Packard Enterprise Co. | 840,287 | 11,991 |
| | | | 547,970 |
| | | Shares | Market
Value•
($000) |
| Materials (5.7%) |
| | Olin Corp. | 1,151,133 | 60,953 |
| | Dow Inc. | 1,247,196 | 58,294 |
| * | Axalta Coating Systems Ltd. | 1,982,429 | 46,230 |
| | US Steel Corp. | 2,268,700 | 46,191 |
| | Kinross Gold Corp. | 8,320,709 | 30,204 |
| * | IAMGOLD Corp. | 19,855,730 | 28,989 |
| * | Eldorado Gold Corp. | 3,834,000 | 21,432 |
| | Centerra Gold Inc. | 3,735,276 | 17,444 |
| | Mosaic Co. | 239,370 | 12,866 |
| * | Equinox Gold Corp. | 2,671,383 | 8,804 |
| | | | 331,407 |
| Real Estate (2.3%) |
| * | CBRE Group Inc. Class A | 699,524 | 49,624 |
| * | Howard Hughes Corp. | 474,941 | 29,138 |
| | DiamondRock Hospitality Co. | 2,318,654 | 21,656 |
| | Vornado Realty Trust | 716,742 | 16,908 |
| | Park Hotels & Resorts Inc. | 1,024,815 | 13,405 |
| | | | 130,731 |
| Utilities (3.8%) |
| | NRG Energy Inc. | 1,577,110 | 70,024 |
| | Edison International | 1,047,544 | 62,894 |
| | Constellation Energy Corp. | 440,000 | 41,598 |
| | Atmos Energy Corp. | 303,473 | 32,335 |
| | Entergy Corp. | 110,564 | 11,846 |
| | | | 218,697 |
Total Common Stocks
(Cost $5,102,287) | 5,489,794 |
| Temporary Cash Investments (4.7%) |
| Money Market Fund (4.7%) |
| 2,3 | Vanguard Market Liquidity Fund, 3.117% (Cost $273,795) | 2,738,867 | 273,832 |
| Total Investments (99.6%) (Cost $5,376,082) | 5,763,626 |
| Other Assets and Liabilities—Net (0.4%) | 23,314 |
| Net Assets (100%) | 5,786,940 |
| Cost is in $000. |
| • | See Note A in Notes to Financial Statements. |
| * | Non-income-producing security. |
| 1 | Includes partial security positions on loan to broker-dealers. The total value of securities on loan is $10,489,000. |
| 2 | Affiliated money market fund available only to Vanguard funds and certain trusts and accounts managed by Vanguard. Rate shown is the 7-day yield. |
| 3 | Collateral of $10,682,000 was received for securities on loan. |
| | ADR—American Depositary Receipt. |
Derivative Financial Instruments Outstanding as of Period End
| Futures Contracts |
| | | | ($000) |
| | Expiration | Number of
Long (Short)
Contracts | Notional
Amount | Value and
Unrealized
Appreciation
(Depreciation) |
| Long Futures Contracts | | | | |
| E-mini S&P 500 Index | December 2022 | 444 | 86,203 | (588) |
See accompanying Notes, which are an integral part of the Financial Statements.
Statement of Assets and Liabilities
|
| ($000s, except shares and per-share amounts) | Amount |
| Assets | |
| Investments in Securities, at Value1 | |
| Unaffiliated Issuers (Cost $5,102,287) | 5,489,794 |
| Affiliated Issuers (Cost $273,795) | 273,832 |
| Total Investments in Securities | 5,763,626 |
| Investment in Vanguard | 207 |
| Cash Collateral Pledged—Futures Contracts | 4,554 |
| Foreign Currency, at Value (Cost $26) | 24 |
| Receivables for Investment Securities Sold | 57,825 |
| Receivables for Accrued Income | 3,210 |
| Receivables for Capital Shares Issued | 1,338 |
| Total Assets | 5,830,784 |
| Liabilities | |
| Due to Custodian | 594 |
| Payables for Investment Securities Purchased | 21,756 |
| Collateral for Securities on Loan | 10,682 |
| Payables to Investment Advisor | 3,302 |
| Payables for Capital Shares Redeemed | 6,478 |
| Payables to Vanguard | 389 |
| Variation Margin Payable—Futures Contracts | 643 |
| Total Liabilities | 43,844 |
| Net Assets | 5,786,940 |
| 1 Includes $10,489 of securities on loan. | |
| At October 31, 2022, net assets consisted of: | |
| | |
| Paid-in Capital | 4,748,666 |
| Total Distributable Earnings (Loss) | 1,038,274 |
| Net Assets | 5,786,940 |
| |
| Net Assets | |
Applicable to 209,547,639 outstanding $.001 par value shares of
beneficial interest (unlimited authorization) | 5,786,940 |
| Net Asset Value Per Share | $27.62 |
See accompanying Notes, which are an integral part of the Financial Statements.
|
| | Year Ended
October 31, 2022 |
| | ($000) |
| Investment Income | |
| Income | |
| Dividends1 | 111,603 |
| Interest2 | 2,296 |
| Securities Lending—Net | 109 |
| Total Income | 114,008 |
| Expenses | |
| Investment Advisory Fees—Note B | |
| Basic Fee | 13,756 |
| Performance Adjustment | 73 |
| The Vanguard Group—Note C | |
| Management and Administrative | 9,442 |
| Marketing and Distribution | 429 |
| Custodian Fees | 23 |
| Auditing Fees | 30 |
| Shareholders’ Reports | 127 |
| Trustees’ Fees and Expenses | 2 |
| Other Expenses | 16 |
| Total Expenses | 23,898 |
| Expenses Paid Indirectly | (149) |
| Net Expenses | 23,749 |
| Net Investment Income | 90,259 |
| Realized Net Gain (Loss) | |
| Investment Securities Sold2 | 664,269 |
| Futures Contracts | (22,049) |
| Foreign Currencies | (40) |
| Realized Net Gain (Loss) | 642,180 |
| Change in Unrealized Appreciation (Depreciation) | |
| Investment Securities2 | (1,207,907) |
| Futures Contracts | (4,874) |
| Foreign Currencies | (2) |
| Change in Unrealized Appreciation (Depreciation) | (1,212,783) |
| Net Increase (Decrease) in Net Assets Resulting from Operations | (480,344) |
| 1 | Dividends are net of foreign withholding taxes of $749,000. |
| 2 | Interest income, realized net gain (loss), capital gain distributions received, and change in unrealized appreciation (depreciation) from an affiliated company of the fund were $2,253,000, ($86,000), $6,000, and $18,000, respectively. Purchases and sales are for temporary cash investment purposes. |
See accompanying Notes, which are an integral part of the Financial Statements.
Statement of Changes in Net Assets
|
| | Year Ended October 31, |
| | 2022
($000) | 2021
($000) |
| | | |
| Increase (Decrease) in Net Assets | | |
| Operations | | |
| Net Investment Income | 90,259 | 83,448 |
| Realized Net Gain (Loss) | 642,180 | 438,021 |
| Change in Unrealized Appreciation (Depreciation) | (1,212,783) | 2,084,933 |
| Net Increase (Decrease) in Net Assets Resulting from Operations | (480,344) | 2,606,402 |
| Distributions | | |
| Total Distributions | (497,527) | (550,483) |
| Capital Share Transactions | | |
| Issued | 573,444 | 1,117,513 |
| Issued in Lieu of Cash Distributions | 454,963 | 506,643 |
| Redeemed | (1,063,876) | (1,889,032) |
| Net Increase (Decrease) from Capital Share Transactions | (35,469) | (264,876) |
| Total Increase (Decrease) | (1,013,340) | 1,791,043 |
| Net Assets | | |
| Beginning of Period | 6,800,280 | 5,009,237 |
| End of Period | 5,786,940 | 6,800,280 |
See accompanying Notes, which are an integral part of the Financial Statements.
For a Share Outstanding
Throughout Each Period | Year Ended October 31, |
| 2022 | 2021 | 2020 | 2019 | 2018 |
| Net Asset Value, Beginning of Period | $32.26 | $22.78 | $27.59 | $27.38 | $33.15 |
| Investment Operations | | | | | |
| Net Investment Income1 | .417 | .389 | .368 | .493 | .493 |
| Net Realized and Unrealized Gain (Loss) on Investments | (2.674) | 11.737 | (3.163) | 2.392 | (3.153) |
| Total from Investment Operations | (2.257) | 12.126 | (2.795) | 2.885 | (2.660) |
| Distributions | | | | | |
| Dividends from Net Investment Income | (.393) | (.360) | (.450) | (.506) | (.423) |
| Distributions from Realized Capital Gains | (1.990) | (2.286) | (1.565) | (2.169) | (2.687) |
| Total Distributions | (2.383) | (2.646) | (2.015) | (2.675) | (3.110) |
| Net Asset Value, End of Period | $27.62 | $32.26 | $22.78 | $27.59 | $27.38 |
| Total Return2 | -7.29% | 56.30% | -11.25% | 12.51% | -9.15% |
| Ratios/Supplemental Data | | | | | |
| Net Assets, End of Period (Millions) | $5,787 | $6,800 | $5,009 | $7,892 | $8,811 |
| Ratio of Total Expenses to Average Net Assets3 | 0.38%4 | 0.32% | 0.31% | 0.33% | 0.36% |
| Ratio of Net Investment Income to Average Net Assets | 1.43% | 1.30% | 1.58% | 1.89% | 1.61% |
| Portfolio Turnover Rate | 26% | 30% | 85% | 31% | 31% |
| 1 | Calculated based on average shares outstanding. |
| 2 | Total returns do not include account service fees that may have applied in the periods shown. Fund prospectuses provide information about any applicable account service fees. |
| 3 | Includes performance-based investment advisory fee increases (decreases) of 0.00%, (0.05%), (0.06%), (0.06%), and (0.02%). |
| 4 | The ratio of expenses to average net assets for the period net of reduction from broker commission abatement arrangements was 0.38%. |
See accompanying Notes, which are an integral part of the Financial Statements.
Notes to Financial Statements
Vanguard Selected Value Fund is registered under the Investment Company Act of 1940 as an open-end investment company, or mutual fund. Significant market disruptions, such as those caused by pandemics (e.g., COVID-19 pandemic), natural or environmental disasters, war (e.g., Russia’s invasion of Ukraine), acts of terrorism, or other events, can adversely affect local and global markets and normal market operations. Any such disruptions could have an adverse impact on the value of the fund’s investments and fund performance.
| A. | The following significant accounting policies conform to generally accepted accounting principles for U.S. investment companies. The fund consistently follows such policies in preparing its financial statements. |
1. Security Valuation: Securities are valued as of the close of trading on the New York Stock Exchange (generally 4 p.m., Eastern time) on the valuation date. Equity securities are valued at the latest quoted sales prices or official closing prices taken from the primary market in which each security trades; such securities not traded on the valuation date are valued at the mean of the latest quoted bid and asked prices. Securities for which market quotations are not readily available, or whose values have been affected by events occurring before the fund’s pricing time but after the close of the securities’ primary markets, are valued by methods deemed by the valuation designee to represent fair value and subject to oversight by the board of trustees. These procedures include obtaining quotations from an independent pricing service, monitoring news to identify significant market- or security-specific events, and evaluating changes in the values of foreign market proxies (for example, ADRs, futures contracts, or exchange-traded funds), between the time the foreign markets close and the fund’s pricing time. When fair-value pricing is employed, the prices of securities used by a fund to calculate its net asset value may differ from quoted or published prices for the same securities. Investments in Vanguard Market Liquidity Fund are valued at that fund's net asset value. Temporary cash investments are valued using the latest bid prices or using valuations based on a matrix system (which considers such factors as security prices, yields, maturities, and ratings), both as furnished by independent pricing services.
2. Foreign Currency: Securities and other assets and liabilities denominated in foreign currencies are translated into U.S. dollars using exchange rates obtained from an independent third party as of the fund’s pricing time on the valuation date. Realized gains (losses) and unrealized appreciation (depreciation) on investment securities include the effects of changes in exchange rates since the securities were purchased, combined with the effects of changes in security prices. Fluctuations in the value of other assets and liabilities resulting from changes in exchange rates are recorded as unrealized foreign currency gains (losses) until the assets or liabilities are settled in cash, at which time they are recorded as realized foreign currency gains (losses).
3. Futures Contracts: The fund uses index futures contracts to a limited extent, with the objective of maintaining full exposure to the stock market while maintaining liquidity. The fund may purchase or sell futures contracts to achieve a desired level of investment, whether to accommodate portfolio turnover or cash flows from capital share transactions. The primary risks associated with the use of futures contracts are imperfect correlation between changes in market values of stocks held by the fund and the prices of futures contracts, and the possibility of an illiquid market. Counterparty risk involving futures is mitigated because a regulated clearinghouse is the counterparty instead of the clearing broker. To further mitigate counterparty risk, the fund trades futures contracts on an exchange, monitors the financial strength of its clearing brokers and clearinghouse, and has entered into clearing agreements with its clearing brokers. The
clearinghouse imposes initial margin requirements to secure the fund’s performance and requires daily settlement of variation margin representing changes in the market value of each contract. Any securities pledged as initial margin for open contracts are noted in the Schedule of Investments.
Futures contracts are valued at their quoted daily settlement prices. The notional amounts of the contracts are not recorded in the Statement of Assets and Liabilities. Fluctuations in the value of the contracts are recorded in the Statement of Assets and Liabilities as an asset (liability) and in the Statement of Operations as unrealized appreciation (depreciation) until the contracts are closed, when they are recorded as realized gains (losses) on futures contracts.
During the year ended October 31, 2022, the fund’s average investments in long and short futures contracts represented 2% and 0% of net assets, respectively, based on the average of the notional amounts at each quarter-end during the period.
4. Federal Income Taxes: The fund intends to continue to qualify as a regulated investment company and distribute virtually all of its taxable income. The fund’s tax returns are open to examination by the relevant tax authorities until expiration of the applicable statute of limitations, which is generally three years after the filing of the tax return. Management has analyzed the fund’s tax positions taken for all open federal and state income tax years, and has concluded that no provision for income tax is required in the fund’s financial statements.
5. Distributions: Distributions to shareholders are recorded on the ex-dividend date. Distributions are determined on a tax basis at the fiscal year-end and may differ from net investment income and realized capital gains for financial reporting purposes.
6. Securities Lending: To earn additional income, the fund lends its securities to qualified institutional borrowers. Security loans are subject to termination by the fund at any time, and are required to be secured at all times by collateral in an amount at least equal to the market value of securities loaned. Daily market fluctuations could cause the value of loaned securities to be more or less than the value of the collateral received. When this occurs, the collateral is adjusted and settled before the opening of the market on the next business day. The fund further mitigates its counterparty risk by entering into securities lending transactions only with a diverse group of prequalified counterparties, monitoring their financial strength, and entering into master securities lending agreements with its counterparties. The master securities lending agreements provide that, in the event of a counterparty’s default (including bankruptcy), the fund may terminate any loans with that borrower, determine the net amount owed, and sell or retain the collateral up to the net amount owed to the fund; however, such actions may be subject to legal proceedings. While collateral mitigates counterparty risk, in the event of a default, the fund may experience delays and costs in recovering the securities loaned. The fund invests cash collateral received in Vanguard Market Liquidity Fund, and records a liability in the Statement of Assets and Liabilities for the return of the collateral, during the period the securities are on loan. Collateral investments in Vanguard Market Liquidity Fund are subject to market appreciation or depreciation. Securities lending income represents fees charged to borrowers plus income earned on invested cash collateral, less expenses associated with the loan. During the term of the loan, the fund is entitled to all distributions made on or in respect of the loaned securities.
7. Credit Facilities and Interfund Lending Program: The fund and certain other funds managed by The Vanguard Group ("Vanguard") participate in a $4.4 billion committed credit facility provided by a syndicate of lenders pursuant to a credit agreement and an uncommitted credit facility provided by Vanguard. Both facilities may be renewed annually. Each fund is individually liable for its
borrowings, if any, under the credit facilities. Borrowings may be utilized for temporary or emergency purposes and are subject to the fund’s regulatory and contractual borrowing restrictions. With respect to the committed credit facility, the participating funds are charged administrative fees and an annual commitment fee of 0.10% of the undrawn committed amount of the facility, which are allocated to the funds based on a method approved by the fund’s board of trustees and included in Management and Administrative expenses on the fund’s Statement of Operations. Any borrowings under either facility bear interest at an agreed-upon spread plus the higher of the federal funds effective rate, the overnight bank funding rate, or the Daily Simple Secured Overnight Financing Rate inclusive of an additional agreed-upon spread. However, borrowings under the uncommitted credit facility may bear interest based upon an alternate rate agreed to by the fund and Vanguard.
In accordance with an exemptive order (the “Order”) from the SEC, the fund may participate in a joint lending and borrowing program that allows registered open-end Vanguard funds to borrow money from and lend money to each other for temporary or emergency purposes (the “Interfund Lending Program”), subject to compliance with the terms and conditions of the Order, and to the extent permitted by the fund’s investment objective and investment policies. Interfund loans and borrowings normally extend overnight but can have a maximum duration of seven days. Loans may be called on one business day’s notice. The interest rate to be charged is governed by the conditions of the Order and internal procedures adopted by the board of trustees. The board of trustees is responsible for overseeing the Interfund Lending Program.
For the year ended October 31, 2022, the fund did not utilize the credit facilities or the Interfund Lending Program.
8. Other: Dividend income is recorded on the ex-dividend date. Non-cash dividends included in income, if any, are recorded at the fair value of the securities received. Interest income includes income distributions received from Vanguard Market Liquidity Fund and is accrued daily. Premiums and discounts on debt securities are amortized and accreted, respectively, to interest income over the lives of the respective securities, except for premiums on certain callable debt securities that are amortized to the earliest call date. Security transactions are accounted for on the date securities are bought or sold. Costs used to determine realized gains (losses) on the sale of investment securities are those of the specific securities sold.
| B. | The investment advisory firms Cooke & Bieler, LP, Pzena Investment Management, LLC, and Donald Smith & Co., Inc., each provide investment advisory services to a portion of the fund for a fee calculated at an annual percentage rate of average net assets managed by the advisor. The basic fee of Cooke & Bieler, LP, is subject to quarterly adjustments based on performance relative to the Russell Midcap Value Index since January 31, 2020. The basic fee of Pzena Investment Management, LLC, is subject to quarterly adjustments based on performance relative to the Russell Midcap Value Index for the preceding three years. The basic fee of Donald Smith & Co., Inc., is subject to quarterly adjustments based on performance relative to the MSCI Investable Market 2500 Index for the preceding five years. |
Vanguard manages the cash reserves of the fund as described below.
For the year ended October 31, 2022, the aggregate investment advisory fee paid to all advisors represented an effective annual basic rate of 0.22% of the fund’s average net assets, before a net increase of $73,000 (less than 0.01%) based on performance.
| C. | In accordance with the terms of a Funds' Service Agreement (the “FSA”) between Vanguard and the fund, Vanguard furnishes to the fund corporate management, administrative, marketing, distribution and cash management services at Vanguard’s cost of operations (as defined by the FSA). These costs of operations are allocated to the fund based on methods and guidelines approved by the board of trustees and are generally settled twice a month. |
Upon the request of Vanguard, the fund may invest up to 0.40% of its net assets as capital in Vanguard. At October 31, 2022, the fund had contributed to Vanguard capital in the amount of $207,000, representing less than 0.01% of the fund’s net assets and 0.08% of Vanguard’s capital received pursuant to the FSA. The fund’s trustees and officers are also directors and employees, respectively, of Vanguard.
| D. | The fund has asked its investment advisors to direct certain security trades, subject to obtaining the best price and execution, to brokers who have agreed to rebate to the fund part of the commissions generated. Such rebates are used solely to reduce the fund’s management and administrative expenses. For the year ended October 31, 2022, these arrangements reduced the fund’s expenses by $149,000 (an annual rate of less than 0.01% of average net assets). |
| E. | Various inputs may be used to determine the value of the fund’s investments and derivatives. These inputs are summarized in three broad levels for financial statement purposes. The inputs or methodologies used to value securities are not necessarily an indication of the risk associated with investing in those securities. |
Level 1—Quoted prices in active markets for identical securities.
Level 2—Other significant observable inputs (including quoted prices for similar securities, interest rates, prepayment speeds, credit risk, etc.).
Level 3—Significant unobservable inputs (including the fund’s own assumptions used to determine the fair value of investments). Any investments and derivatives valued with significant unobservable inputs are noted on the Schedule of Investments.
At October 31, 2022, 100% of the market value of the fund’s investments and derivatives was determined based on Level 1 inputs.
| F. | Permanent differences between book-basis and tax-basis components of net assets are reclassified among capital accounts in the financial statements to reflect their tax character. These reclassifications have no effect on net assets or net asset value per share. As of period end, permanent differences primarily attributable to the accounting for applicable foreign currency transactions and distributions in connection with fund share redemptions were reclassified between the following accounts: |
| | Amount
($000) |
| Paid-in Capital | 49,431 |
| Total Distributable Earnings (Loss) | (49,431) |
Temporary differences between book-basis and tax-basis components of total distributable earnings (loss) arise when certain items of income, gain, or loss are recognized in different periods for financial statement and tax purposes; these differences will reverse at some time in the future. The differences are primarily related to the deferral of losses from wash sales and the recognition
of unrealized gains or losses from certain derivative contracts. As of period end, the tax-basis components of total distributable earnings (loss) are detailed in the table as follows:
| | Amount
($000) |
| Undistributed Ordinary Income | 81,178 |
| Undistributed Long-Term Gains | 573,995 |
| Capital Loss Carryforwards | — |
| Qualified Late-Year Losses | — |
| Net Unrealized Gains (Losses) | 383,101 |
The tax character of distributions paid was as follows:
| | Year Ended October 31, |
| | 2022
Amount
($000) | 2021
Amount
($000) |
| Ordinary Income* | 168,799 | 74,966 |
| Long-Term Capital Gains | 328,728 | 475,517 |
| Total | 497,527 | 550,483 |
| * | Includes short-term capital gains, if any. |
As of October 31, 2022, gross unrealized appreciation and depreciation for investments and derivatives based on cost for U.S. federal income tax purposes were as follows:
| | Amount
($000) |
| Tax Cost | 5,380,523 |
| Gross Unrealized Appreciation | 1,159,533 |
| Gross Unrealized Depreciation | (776,432) |
| Net Unrealized Appreciation (Depreciation) | 383,101 |
| G. | During the year ended October 31, 2022, the fund purchased $1,554,206,000 of investment securities and sold $2,015,032,000 of investment securities, other than temporary cash investments. |
| H. | Capital shares issued and redeemed were: |
| | Year Ended October 31, |
| | 2022
Shares
(000) | 2021
Shares
(000) |
| | | |
| Issued | 19,356 | 37,120 |
| Issued in Lieu of Cash Distributions | 15,825 | 19,853 |
| Redeemed | (36,410) | (66,137) |
| Net Increase (Decrease) in Shares Outstanding | (1,229) | (9,164) |
| I. | Management has determined that no events or transactions occurred subsequent to October 31, 2022, that would require recognition or disclosure in these financial statements. |
Report of Independent Registered Public Accounting Firm
To the Board of Trustees of Vanguard Whitehall Funds and Shareholders of Vanguard Selected Value Fund
Opinion on the Financial Statements
We have audited the accompanying statement of assets and liabilities, including the schedule of investments, of Vanguard Selected Value Fund (one of the funds constituting Vanguard Whitehall Funds, referred to hereafter as the "Fund") as of October 31, 2022, the related statement of operations for the year ended October 31, 2022, the statement of changes in net assets for each of the two years in the period ended October 31, 2022, including the related notes, and the financial highlights for each of the five years in the period ended October 31, 2022 (collectively referred to as the "financial statements"). In our opinion, the financial statements present fairly, in all material respects, the financial position of the Fund as of October 31, 2022, the results of its operations for the year then ended, the changes in its net assets for each of the two years in the period ended October 31, 2022 and the financial highlights for each of the five years in the period ended October 31, 2022 in conformity with accounting principles generally accepted in the United States of America.
Basis for Opinion
These financial statements are the responsibility of the Fund’s management. Our responsibility is to express an opinion on the Fund’s financial statements based on our audits. We are a public accounting firm registered with the Public Company Accounting Oversight Board (United States) (PCAOB) and are required to be independent with respect to the Fund in accordance with the U.S. federal securities laws and the applicable rules and regulations of the Securities and Exchange Commission and the PCAOB.
We conducted our audits of these financial statements in accordance with the standards of the PCAOB. Those standards require that we plan and perform the audit to obtain reasonable assurance about whether the financial statements are free of material misstatement, whether due to error or fraud.
Our audits included performing procedures to assess the risks of material misstatement of the financial statements, whether due to error or fraud, and performing procedures that respond to those risks. Such procedures included examining, on a test basis, evidence regarding the amounts and disclosures in the financial statements. Our audits also included evaluating the accounting principles used and significant estimates made by management, as well as evaluating the overall presentation of the financial statements. Our procedures included confirmation of securities owned as of October 31, 2022 by correspondence with the custodian, transfer agent and brokers; when replies were not received from brokers, we performed other auditing procedures. We believe that our audits provide a reasonable basis for our opinion.
/s/PricewaterhouseCoopers LLP
Philadelphia, Pennsylvania
December 16, 2022
We have served as the auditor of one or more investment companies in The Vanguard Group of Funds since 1975.
Tax information (unaudited)
For corporate shareholders, 85.7%, or if subsequently determined to be different, the maximum percentage allowable by law, of ordinary income (dividend income plus short-term gains, if any) for the fiscal year qualified for the dividends-received deduction.
The fund hereby designates $100,399,000, or if subsequently determined to be different, the maximum amount allowable by law, as qualified dividend income for individual shareholders for the fiscal year.
The fund hereby designates $629,000, or if subsequently determined to be different, the maximum amount allowable by law, of interest earned from obligations of the U.S. government which is generally exempt from state income tax.
For nonresident alien shareholders, 100% of short-term capital gain dividends distributed by the fund for the fiscal year are qualified short-term capital gains.
The fund distributed $370,652,000 as capital gain dividends (20% rate gain distributions) to shareholders during the fiscal year.
This page intentionally left blank.
The People Who Govern Your Fund
The trustees of your mutual fund are there to see that the fund is operated and managed in your best interests since, as a shareholder, you are a part owner of the fund. Your fund’s trustees also serve on the board of directors of The Vanguard Group, Inc., which is owned by the Vanguard funds and provides services to them.
A majority of Vanguard’s board members are independent, meaning that they have no affiliation with Vanguard or the funds they oversee, apart from the sizable personal investments they have made as private individuals. The independent board members have distinguished backgrounds in business, academia, and public service. Each of the trustees and executive officers oversees 206 Vanguard funds.
Information for each trustee and executive officer of the fund appears below. That information, as well as the Vanguard fund count, is as of the date on the cover of this fund report. The mailing address of the trustees and officers is P.O. Box 876, Valley Forge, PA 19482. More information about the trustees is in the Statement of Additional Information, which can be obtained, without charge, by contacting Vanguard at 800-662-7447, or online at vanguard.com.
Interested Trustee1
Mortimer J. Buckley
Born in 1969. Trustee since January 2018. Principal occupation(s) during the past five years and other experience: chairman of the board (2019–present) of Vanguard and of each of the investment companies served by Vanguard; chief executive officer (2018–present) of Vanguard; chief executive officer, president, and trustee (2018–present) of each of the investment companies served by Vanguard; president and director (2017–present) of Vanguard; and president (2018–present) of Vanguard Marketing Corporation. Chief investment officer (2013–2017), managing director (2002–2017), head of the Retail Investor Group (2006–2012), and chief information officer (2001–2006) of Vanguard. Member of the board of governors of the Investment Company Institute and the board of governors of FINRA. Trustee and vice chair of The Shipley School.
Independent Trustees
Tara Bunch
Born in 1962. Trustee since November 2021. Principal occupation(s) during the past five years and other experience: head of global operations at Airbnb (2020–present). Vice president of AppleCare (2012–2020). Member of the board of directors of Out & Equal (2002–2006), the advisory board of the University of California, Berkeley School of Engineering (2020–present), and the advisory board
of Santa Clara University’s Leavey School of Business (2018–present).
Emerson U. Fullwood
Born in 1948. Trustee since January 2008. Principal occupation(s) during the past five years and other experience: executive chief staff and marketing officer for North America and corporate vice president (retired 2008) of Xerox Corporation (document management products and services). Former president of the Worldwide Channels Group, Latin America, and Worldwide Customer Service and executive chief staff officer of Developing Markets of Xerox. Executive in residence and 2009–2010 Distinguished Minett Professor at the Rochester Institute of Technology. Member of the board of directors of the University of Rochester Medical Center, the Monroe Community College Foundation, the United Way of Rochester, North Carolina A&T University, Roberts Wesleyan College, and the Rochester Philharmonic Orchestra. Trustee of the University of Rochester.
F. Joseph Loughrey
Born in 1949. Trustee since October 2009. Principal occupation(s) during the past five years and other experience: president and chief operating officer (retired 2009) and vice chairman of the board (2008–2009) of Cummins Inc. (industrial machinery). Chairman of the board of Hillenbrand, Inc. (specialized consumer services). Director of the V Foundation. Member of the advisory council for the College of
1 Mr. Buckley is considered an “interested person,” as defined in the Investment Company Act of 1940, because he is an officer of the Vanguard funds.
Arts and Letters at the University of Notre Dame. Chairman of the board of Saint Anselm College.
Mark Loughridge
Born in 1953. Trustee since March 2012. Principal occupation(s) during the past five years and other experience: senior vice president and chief financial officer (retired 2013) of IBM (information technology services). Fiduciary member of IBM’s Retirement Plan Committee (2004–2013), senior vice president and general manager (2002–2004) of IBM Global Financing, vice president and controller (1998–2002) of IBM, and a variety of other prior management roles at IBM. Member of the Council on Chicago Booth.
Scott C. Malpass
Born in 1962. Trustee since March 2012. Principal occupation(s) during the past five years and other experience: adjunct professor of finance at the University of Notre Dame (2020–present). Chief investment officer (retired 2020) and vice president (retired 2020) of the University of Notre Dame. Assistant professor (retired June 2020) of finance at the Mendoza College of Business, University of Notre Dame, and member of the Notre Dame 403(b) Investment Committee. Member of the board of Catholic Investment Services, Inc. (investment advisors), the board of superintendence of the Institute for the Works of Religion, and the board of directors of Paxos Trust Company (finance).
Deanna Mulligan
Born in 1963. Trustee since January 2018. Principal occupation(s) during the past five years and other experience: chief executive officer of Purposeful (advisory firm for CEOs and C-level executives; 2021–present). Board chair (2020), chief executive officer (2011–2020), and president (2010–2019) of The Guardian Life Insurance Company of America. Chief operating officer (2010–2011) and executive vice president (2008–2010) of Individual Life and Disability of the Guardian Life Insurance Company of America. Member of the board of the Economic Club of New York. Trustee of the Partnership for New York City (business leadership), Chief Executives for Corporate Purpose, and the NewYork-Presbyterian Hospital.
André F. Perold
Born in 1952. Trustee since December 2004. Principal occupation(s) during the past five years and other experience: George Gund Professor of Finance and Banking, Emeritus at the Harvard Business School (retired 2011). Chief investment officer and co-managing partner of HighVista Strategies (private investment firm). Member of the board (2018–present) of RIT Capital Partners (investment
firm). Member of the investment committee of Partners Health Care System.
Sarah Bloom Raskin
Born in 1961. Trustee since January 2018. Principal occupation(s) during the past five years and other experience: deputy secretary (2014–2017) of the United States Department of the Treasury. Governor (2010–2014) of the Federal Reserve Board. Commissioner (2007–2010) of financial regulation for the State of Maryland. Colin W. Brown Distinguished Professor of the Practice of Law (2021–present), professor (2020–present), Distinguished Fellow of the Global Financial Markets Center (2020–present), and Rubenstein Fellow (2017–2020) at Duke University. Trustee (2017–present) of Amherst College and member of Amherst College Investment Committee (2019–present). Member of the Regenerative Crisis Response Committee (2020–present).
David A. Thomas
Born in 1956. Trustee since July 2021. Principal occupation(s) during the past five years and other experience: president of Morehouse College (2018–present). Professor of business administration, emeritus at Harvard University (2017–2018). Dean (2011–2016) and professor of management (2016–2017) at the Georgetown University McDonough School of Business. Director of DTE Energy Company (2013–present). Trustee of Common Fund (2019–present).
Peter F. Volanakis
Born in 1955. Trustee since July 2009. Principal occupation(s) during the past five years and other experience: president and chief operating officer (retired 2010) of Corning Incorporated (communications equipment) and director of Corning Incorporated (2000–2010) and Dow Corning (2001–2010). Director (2012) of SPX Corporation (multi-industry manufacturing). Overseer of the Amos Tuck School of Business Administration, Dartmouth College (2001–2013). Member of the BMW Group Mobility Council.
Executive Officers
Christine M. Buchanan
Born in 1970. Principal occupation(s) during the past five years and other experience: principal of Vanguard. Chief financial officer (2021–present) and treasurer (2017–present) of each of the investment companies served by Vanguard. Partner (2005–2017) at KPMG (audit, tax, and advisory services).
John Galloway
Born in 1973. Principal occupation(s) during the past five years and other experience: principal of Vanguard. Investment stewardship officer (September 2020–present) of each of the investment companies served by Vanguard. Head of Investor Advocacy (February 2020–present) and head of Marketing Strategy and Planning (2017–2020) at Vanguard. Special assistant to the President of the United States (2015).
Ashley Grim
Born in 1984. Principal occupation(s) during the past five years and other experience: treasurer (February 2022–present) of each of the investment companies served by Vanguard. Fund transfer agent controller (2019–2022) and director of Audit Services (2017–2019) at Vanguard. Senior manager (2015–2017) at PriceWaterhouseCoopers (audit and assurance, consulting, and tax services).
Peter Mahoney
Born in 1974. Principal occupation(s) during the past five years and other experience: principal of Vanguard. Controller (2015–present) of each of the investment companies served by Vanguard. Head of International Fund Services (2008–2014) at Vanguard.
Anne E. Robinson
Born in 1970. Principal occupation(s) during the past five years and other experience: general counsel (2016–present) of Vanguard. Secretary (2016–present) of Vanguard and of each of the investment companies served by Vanguard. Managing director (2016–present) of Vanguard. Managing director and general counsel of Global Cards and Consumer Services (2014–2016) at Citigroup. Counsel (2003–2014) at American Express. Nonexecutive director of the board of National Grid (energy).
Michael Rollings
Born in 1963. Principal occupation(s) during the past five years and other experience: finance director (2017–present) and treasurer (2017) of each of the investment companies served by Vanguard. Managing director (2016–present) of Vanguard. Chief financial officer (2016–present) of Vanguard. Director (2016–present) of Vanguard Marketing Corporation. Executive vice president and chief financial officer (2006–2016) of MassMutual Financial Group.
John E. Schadl
Born in 1972. Principal occupation(s) during the past five years and other experience: principal of Vanguard. Chief compliance officer (2019–present) of Vanguard and of each of the investment companies served by Vanguard. Assistant vice president (2019–present) of Vanguard Marketing Corporation.
Vanguard Senior Management Team
| Matthew Benchener | Thomas M. Rampulla |
| Joseph Brennan | Karin A. Risi |
| Mortimer J. Buckley | Anne E. Robinson |
| Gregory Davis | Michael Rollings |
| John James | Nitin Tandon |
| Chris D. Mclsaac | Lauren Valente |
Connect with Vanguard®>vanguard.com
Fund Information > 800-662-7447
Direct Investor Account Services > 800-662-2739
Institutional Investor Services > 800-523-1036
Text Telephone for People Who Are Deaf or Hard of Hearing > 800-749-7273
This material may be used in conjunction with the offering of shares of any Vanguard fund only if preceded or accompanied by the fund’s current prospectus.
All comparative mutual fund data are from Morningstar, Inc., unless otherwise noted.
You can obtain a free copy of Vanguard’s proxy voting guidelines by visiting vanguard.com/proxyreporting or by calling Vanguard at 800-662-2739. The guidelines are also available from the SEC’s website, www.sec.gov. In addition, you may obtain a free report on how your fund voted the proxies for securities it owned during the 12 months ended June 30. To get the report, visit either vanguard.com/proxyreporting or www.sec.gov.
You can review information about your fund on the SEC’s website, and you can receive copies of this information, for a fee, by sending a request via email addressed to publicinfo@sec.gov.
Source for Bloomberg indexes: Bloomberg Index Services Limited. Copyright 2022, Bloomberg. All rights reserved.
CFA® is a registered trademark owned by CFA Institute.
© 2022 The Vanguard Group, Inc.
All rights reserved.
Vanguard Marketing Corporation, Distributor.
Q9340 122022
Annual Report | October 31, 2022
Vanguard Mid-Cap Growth Fund
Contents
Your Fund’s Performance at a Glance
| 1 |
Advisors’ Report
| 2 |
About Your Fund’s Expenses
| 7 |
Performance Summary
| 9 |
Financial Statements
| 11 |
Please note: The opinions expressed in this report are just that—informed opinions. They should not be considered promises or advice. Also, please keep in mind that the information and opinions cover the period through the date on the front of this report. Of course, the risks of investing in your fund are spelled out in the prospectus.
Your Fund’s Performance at a Glance
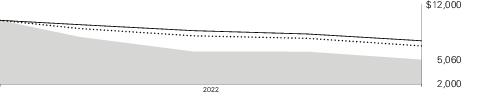
| • | The 12 months ended October 31, 2022, were a volatile, challenging period for financial markets. Vanguard Mid-Cap Growth Fund returned –32.22%, short of the –28.94% return of its benchmark, the Russell Midcap Growth Index. |
| • | The economic backdrop deteriorated as inflation soared to multidecade highs, fueled in part by higher energy and food prices in the wake of Russia's invasion of Ukraine. Then price increases broadened to other categories of goods and services, adding to concerns that inflation would remain stubbornly high. That prompted aggressive tightening by the Federal Reserve to bring inflation back in check and increased fears of a recession. |
| • | The broad U.S. stock market, as measured by the Russell 3000 Index, returned –16.52%. Value stocks outperformed growth, and large-capitalization stocks lost less ground than mid- and small-caps. |
| • | Negative selection in information technology and health care, the fund’s two largest sectors, weighed most on performance relative to the benchmark. An underweight allocation to the high-performing energy sector also hurt. Consumer discretionary was a net contributor despite double-digit declines. |
| • | For the decade ended October 31, the fund’s average annual return was 9.65%, trailing the 11.95% return of its benchmark. |
Market Barometer
| | Average Annual Total Returns
Periods Ended October 31, 2022 |
| | One Year | Three Years | Five Years |
| Stocks | | | |
| Russell 1000 Index (Large-caps) | -16.38% | 9.99% | 10.19% |
| Russell 2000 Index (Small-caps) | -18.54 | 7.05 | 5.56 |
| Russell 3000 Index (Broad U.S. market) | -16.52 | 9.79 | 9.87 |
| FTSE All-World ex US Index (International) | -24.20 | -1.16 | -0.18 |
| Bonds | | | |
Bloomberg U.S. Aggregate Float Adjusted Index
(Broad taxable market) | -15.69% | -3.73% | -0.50% |
Bloomberg Municipal Bond Index
(Broad tax-exempt market) | -11.98 | -2.18 | 0.37 |
| FTSE Three-Month U.S. Treasury Bill Index | 0.88 | 0.59 | 1.15 |
| CPI | | | |
| Consumer Price Index | 7.75% | 5.01% | 3.85% |
For the 12 months ended October 31, 2022, Vanguard Mid-Cap Growth Fund returned –32.22%. It trailed its benchmark, the Russell Midcap Growth Index, which returned –28.94%.
Your fund is managed by three independent advisors, a strategy that enhances its diversification by providing exposure to distinct yet complementary investment approaches. It’s not uncommon for different advisors to have different views about individual securities or the broader investment environment.
The accompanying table lists the advisors, the amount and percentage of fund assets each manages, and brief descriptions of their investment strategies.
The advisors have provided the following assessment of the investment environment during the past 12 months and the notable successes and shortfalls in their portfolios. These comments were prepared on November 16, 2022.
Frontier Capital Management Co., LLC
Portfolio Managers:
Christopher J. Scarpa, Vice President
Ravi Dabas, Vice President
Equities fell sharply as the U.S. economy transitioned from a robust recovery to a steep slowdown, accelerated by rising interest rates and a screeching inventory adjustment.
We increased our energy weighting after Russia invaded Ukraine, and we
purchased companies with recurring-revenue business models in the industrial and information technology sectors after the significant market correction. Conversely, we reduced exposure to apparel and home-goods companies and lowered our interest rate risk by selling stocks whose earnings power was too distant.
Adverse sector allocation more than offset solid stock selection in our portion of the fund. Our underweight positions in energy and consumer staples, the top-performing sectors, accounted for most of the allocation challenges as investors reached for inflation hedge on the one hand and safety on the other.
Stock selection was the strongest in information technology, followed by consumer discretionary and health care. Network security provider Palo Alto Networks (+1%) benefited from a strong product cycle as it gained market share in an escalating cybersecurity environment. Engineering services provider KBR (+18%) outperformed as investors sought comfort in its recurring government-related work, while its clean-energy business gained from higher commodity prices. In consumer discretionary, toymaker Mattel (–13%) reported better-than-expected results, powered by increased distribution, inventory replenishment, and new product launches. Discount retailer Dollar General (+16%) exceeded sales expectations on improved affordability despite inflationary pressures. Signify Health (+82%) rose sharply as CVS Health agreed to buy the
value-based care provider for a 78% premium.
Together, these contributions overcame the headwinds from economically sensitive stocks such as SVB Financial Group, Caesars Entertainment, and Block, which underperformed in the rising rate environment.
Outlook
We feel that the benchmark’s decline over the 12 months partly reflects the fears of a looming recession because of higher interest rates. Inflation is likely to moderate, as price declines are visible in categories ranging from rents and home values to commodities and autos. Also, the ongoing market correction places U.S. equities on firmer footing by driving out excess speculation and setting the stage for the next expansion. We remain confident in the portfolio’s performance and in our ability to find companies with multiple ways to win and with unrecognized earnings potential that is not reflected in their stock prices.
Wellington Management Company LLP
Portfolio Manager:
Timothy N. Manning,
Senior Managing Director
and Equity Portfolio Manager
Over the 12 months, large-capitalization stocks outperformed their mid- and small-cap counterparts, as measured by their respective Russell indexes. Among mid-caps, value led growth by more than 18 percentage points.
In this environment, our portion of the fund underperformed the Russell Midcap Growth Index. Most notably, stock selection in the health care, consumer staples, and financial sectors detracted from relative performance; this was partly offset by positive selection in communication services and consumer discretionary. Sector allocation decisions were also a material headwind to relative performance, because of underweight positioning in energy and overweight positioning in communication services. At the individual stock level, the biggest relative detractors included Align Technology, a medical device company focused on dentistry and orthodontics; Synaptics, a diversified provider of semiconductors; and Match Group, a global leader in online dating apps.
Top relative contributors included Wingstop, a high-quality restaurant franchise; Gartner, an information technology research and advisory services company; and BWX Technologies, a nuclear components and fuel provider for the commercial nuclear power industry.
Relative to the benchmark, the portfolio now has the largest overweightings to communication services, health care, and financials, and it is most underweight in industrials and energy. Over the period, we added several new holdings, including Align Technology and Agilent Technologies, a provider of analytical instrumentation and consumable products used for research and quality assurance in the life sciences, diagnostics, and applied chemical markets. We also eliminated
several holdings, including KLA, a supplier of process controls and chip-inspection equipment for the semiconductor industry.
We seek to own the stocks of companies with strong secular growth characteristics and high and sustainable return on invested capital that are inexpensive on long-term earnings power. Although the portfolio trailed its benchmark for the period, we are excited by the opportunity set we are seeing today, believing that the volatile market environment has created more potential opportunities for active management to generate excess return. We expect that an increasingly challenging near-term macroeconomic backdrop, given the Federal Reserve’s resolve to tame inflation at the cost of lower growth, will eventually yield to a healthy and balanced macro backdrop. Within our opportunity set, we continue to focus on strong secular growers with high returns on invested capital trading at reasonable prices.
RS Investments
Portfolio Managers:
D. Scott Tracy, CFA,
Chief Investment Officer
Stephen J. Bishop
Melissa Chadwick-Dunn
Christopher W. Clark, CFA
Paul Leung, CFA
The portfolio’s negative absolute return was driven by the performance of mid-cap
growth companies in the information technology, consumer discretionary, health care, and industrial sectors. In terms of absolute performance, the only contribution came from holdings in the energy sector.
The largest driver of positive relative performance was consumer discretionary, driven in part by the performance of O’Reilly Automotive, a retailer and supplier of automotive aftermarket parts, tools, supplies, equipment, and accessories. We initially purchased the stock because of the large, fragmented, addressable market; an aging inventory of cars on the road that provides a tailwind for replacement-parts demand; and consistency that has driven growth for almost 30 years. The stock performed exceptionally well for the 12 months, beating expectations across the board and raising guidance despite a challenging macroeconomic environment. O’Reilly appears to be benefiting from inflation as car owners in this environment would prefer to maintain their older vehicles rather than buy a new or used one. The company’s strong execution, resistance toward a potential recession, and buybacks make the story attractive for the foreseeable future.
The fund’s largest area of underperformance was information technology, driven in part by RingCentral, a provider of software-as-a-service solutions for businesses to support modern communications. We initially purchased the stock in early 2014, given the thesis that RingCentral operates in a
huge—approximately $50 billion—global market (with about $15 billion in the United States alone) that was only 10% penetrated by cloud offerings. Although RingCentral exceeded reduced expectations for the better part of the year, the stock was severely challenged in part because the company further reduced guidance to be conservative given the macro environment and large customers’ cautiousness.
Given the global impact of the COVID-19 pandemic and Russia’s invasion of Ukraine on corporate fundamentals—fiscal and monetary response, global logistics, inflation, consumer behavior, and societal norms—we believe that investors should expect all companies to feel some direct and indirect effects over the next few quarters and years. As a result, global equity markets are likely to experience higher volatility (to both the upside and downside) and divergence as new companies emerge while others struggle
to retain leadership. We feel this will create an abundance of opportunities across sectors, industries, and markets as the economy and markets transition and recover.
The current opportunity set appears especially pronounced for secular growth companies, rather than those that are more cyclical in nature. This is because of the continued strength in underlying fundamentals and relative underperformance by secular growth companies since early November 2020, when market leadership abruptly shifted from companies with better long-term sustainable growth opportunities to areas that had been more challenged by COVID-19 or that could benefit from inflationary pressures. As a result, we believe we can now allocate to companies with clear paths of outsized growth with much improved relative valuations compared with fall 2020.
Vanguard Mid-Cap Growth Fund Investment Advisors
| |
| | Fund Assets Managed | |
| Investment Advisor | % | $ Million | Investment Strategy |
| Frontier Capital Management Co., LLC | 41 | 1,211 | Frontier Capital employs a fundamental, bottom-up, research-intensive investment approach to select mid-cap growth stocks. It seeks companies with above-average mid-cap growth prospects and competitive advantages that will allow them to earn superior rates of return on capital over a business cycle. The approach attempts to balance growth prospects with reasonable valuation and is long-term in nature; investment time frames are typically three to five years. |
| Wellington Management Company LLP | 38 | 1,129 | Wellington Management uses traditional methods of stock selection—fundamental research and analysis—to identify companies that it believes have above-average growth prospects. It believes that a short-term bias in equity markets rewards near-term cyclical growth and creates opportunity for long-term growth. The team focuses on sustainable earnings power and develops bottom-up valuations based on return on investment capital forecasts, price-to-sales, and quantitative risk factors. It seeks to control risk by emphasizing larger positions in established growth stocks and smaller positions in emerging names. |
| RS Investments | 19 | 552 | RS Investments, a Victory Capital investment franchise, employs both fundamental analysis and quantitative screening in seeking to identify companies that the investment team believes will produce sustainable earnings growth over a multiyear horizon. Investment candidates typically exhibit some or all of the following criteria: strong organic revenue growth, expanding margins and profitability, innovative products or services, defensible competitive advantages, growing market share, and experienced management teams. |
| Cash Investments | 2 | 64 | These short-term reserves are invested by Vanguard in equity index products to simulate investment in stocks. Each advisor may also maintain a modest cash position. |
About Your Fund’s Expenses
As a shareholder of the fund, you incur ongoing costs, which include costs for portfolio management, administrative services, and shareholder reports (like this one), among others. Operating expenses, which are deducted from a fund’s gross income, directly reduce the investment return of the fund.
A fund’s expenses are expressed as a percentage of its average net assets. This figure is known as the expense ratio. The following examples are intended to help you understand the ongoing costs (in dollars) of investing in your fund and to compare these costs with those of other mutual funds. The examples are based on an investment of $1,000 made at the beginning of the period shown and held for the entire period.
The accompanying table illustrates your fund’s costs in two ways:
| • | Based on actual fund return. This section helps you to estimate the actual expenses that you paid over the period. The ”Ending Account Value“ shown is derived from the fund‘s actual return, and the third column shows the dollar amount that would have been paid by an investor who started with $1,000 in the fund. You may use the information here, together with the amount you invested, to estimate the expenses that you paid over the period. |
To do so, simply divide your account value by $1,000 (for example, an $8,600 account value divided by $1,000 = 8.6), then multiply the result by the number given for your fund under the heading ”Expenses Paid During Period.“
| • | Based on hypothetical 5% yearly return. This section is intended to help you compare your fund‘s costs with those of other mutual funds. It assumes that the fund had a yearly return of 5% before expenses, but that the expense ratio is unchanged. In this case—because the return used is not the fund’s actual return—the results do not apply to your investment. The example is useful in making comparisons because the Securities and Exchange Commission requires all mutual funds to calculate expenses based on a 5% return. You can assess your fund’s costs by comparing this hypothetical example with the hypothetical examples that appear in shareholder reports of other funds. |
Note that the expenses shown in the table are meant to highlight and help you compare ongoing costs only and do not reflect transaction costs incurred by the fund for buying and selling securities. Further, the expenses do not include any purchase, redemption, or account service fees described in the fund prospectus. If such fees were applied to your account, your costs would be higher. Your fund does not carry a “sales load.”
The calculations assume no shares were bought or sold during the period. Your actual costs may have been higher or lower, depending on the amount of your investment and the timing of any purchases or redemptions.
You can find more information about the fund’s expenses, including annual expense ratios, in the Financial Statements section of this report. For additional information on operating expenses and other shareholder costs, please refer to your fund’s current prospectus.
| Six Months Ended October 31, 2022 | | | |
| Mid-Cap Growth Fund | Beginning
Account Value
4/30/2022 | Ending
Account Value
10/31/2022 | Expenses
Paid During
Period |
| Based on Actual Fund Return | $1,000.00 | $923.70 | $1.65 |
| Based on Hypothetical 5% Yearly Return | 1,000.00 | 1,023.49 | 1.73 |
The calculations are based on expenses incurred in the most recent six-month period. The fund’s annualized six-month expense ratio for that period is 0.34%. The dollar amounts shown as “Expenses Paid” are equal to the annualized expense ratio multiplied by the average account value over the period, multiplied by the number of days in the most recent six-month period, then divided by the number of days in the most recent 12-month period (184/365).
All of the returns in this report represent past performance, which is not a guarantee of future results that may be achieved by the fund. (Current performance may be lower or higher than the performance data cited. For performance data current to the most recent month-end, visit our website at vanguard.com/performance.) Note, too, that both investment returns and principal value can fluctuate widely, so an investor’s shares, when sold, could be worth more or less than their original cost. The returns shown do not reflect taxes that a shareholder would pay on fund distributions or on the sale of fund shares.
Cumulative Performance: October 31, 2012, Through October 31, 2022
Initial Investment of $10,000
| | | Average Annual Total Returns
Periods Ended October 31, 2022 | |
| | | One
Year | Five
Years | Ten
Years | Final Value
of a $10,000
Investment |
 | Mid-Cap Growth Fund | -32.22% | 6.57% | 9.65% | $25,134 |
 | Russell Midcap Growth Index | -28.94 | 8.66 | 11.95 | 30,927 |
 | Dow Jones U.S. Total Stock Market Float Adjusted Index | -16.94 | 9.72 | 12.36 | 32,058 |
See Financial Highlights for dividend and capital gains information.
| Communication Services | 5.6% |
| Consumer Discretionary | 15.3 |
| Consumer Staples | 1.9 |
| Energy | 3.9 |
| Financials | 9.0 |
| Health Care | 20.8 |
| Industrials | 12.4 |
| Information Technology | 29.6 |
| Materials | 1.1 |
| Real Estate | 0.4 |
The table reflects the fund’s investments, except for short-term investments and derivatives. Sector categories are based on the Global Industry Classification Standard (“GICS”), except for the “Other” category (if applicable), which includes securities that have not been provided a GICS classification as of the effective reporting period.
Global Industry Classification Standard (“GICS”) was developed by and is the exclusive property and a service mark of MSCI Inc. (“MSCI”) and Standard and Poor’s, a division of McGraw-Hill Companies, Inc. (“S&P”), and is licensed for use by Vanguard. Neither MSCI, S&P nor any third party involved in making or compiling the GICS or any GICS classification makes any express or implied warranties or representations with respect to such standard or classification (or the results to be obtained by the use thereof), and all such parties hereby expressly disclaim all warranties of originality, accuracy, completeness, merchantability or fitness for a particular purpose with respect to any such standard or classification. Without limiting any of the foregoing, in no event shall MSCI, S&P, any of its affiliates or any third party involved in making or compiling the GICS or any GICS classification have any liability for any direct, indirect, special, punitive, consequential or any other damages (including lost profits) even if notified of the possibility of such damages.
The fund files its complete schedule of portfolio holdings with the Securities and Exchange Commission (SEC) for the first and third quarters of each fiscal year as an exhibit to its reports on Form N-PORT. The fund’s Form N-PORT reports are available on the SEC’s website at www.sec.gov.
| | | Shares | Market
Value•
($000) |
| Common Stocks (95.3%) |
| Communication Services (5.3%) |
| * | ZoomInfo Technologies Inc. Class A | 1,214,284 | 54,072 |
| | Electronic Arts Inc. | 389,513 | 49,063 |
| * | Live Nation Entertainment Inc. | 269,291 | 21,438 |
| * | Match Group Inc. | 396,833 | 17,143 |
| * | Take-Two Interactive Software Inc. | 55,474 | 6,573 |
| * | Pinterest Inc. Class A | 254,170 | 6,253 |
| * | Roku Inc. | 41,403 | 2,299 |
| | | | 156,841 |
| Consumer Discretionary (14.6%) |
| | Hilton Worldwide Holdings Inc. | 351,085 | 47,488 |
| * | Mattel Inc. | 2,441,284 | 46,287 |
| | Wingstop Inc. | 253,784 | 40,197 |
| * | Lululemon Athletica Inc. | 109,585 | 36,058 |
| * | O'Reilly Automotive Inc. | 29,616 | 24,794 |
| * | Etsy Inc. | 251,743 | 23,641 |
| * | Chipotle Mexican Grill Inc. Class A | 15,669 | 23,477 |
| * | Caesars Entertainment Inc. | 533,775 | 23,342 |
| | Dollar General Corp. | 81,756 | 20,852 |
| * | Planet Fitness Inc. Class A | 298,441 | 19,542 |
| | Advance Auto Parts Inc. | 74,984 | 14,241 |
| * | Ulta Beauty Inc. | 29,380 | 12,321 |
| | Ross Stores Inc. | 123,644 | 11,832 |
| | Darden Restaurants Inc. | 74,558 | 10,672 |
| * | Bright Horizons Family Solutions Inc. | 158,163 | 10,331 |
| *,1 | Leslie's Inc. | 723,538 | 10,159 |
| | Churchill Downs Inc. | 43,120 | 8,965 |
| * | Dollar Tree Inc. | 54,890 | 8,700 |
| | Tractor Supply Co. | 39,460 | 8,672 |
| * | Burlington Stores Inc. | 56,387 | 8,061 |
| * | Five Below Inc. | 47,840 | 7,001 |
| *,1 | Chewy Inc. Class A | 163,471 | 6,331 |
| * | Floor & Decor Holdings Inc. Class A | 71,157 | 5,221 |
| | Lithia Motors Inc. Class A | 14,601 | 2,893 |
| | | | 431,078 |
| Consumer Staples (1.8%) |
| * | Freshpet Inc. | 595,963 | 35,132 |
| | Hershey Co. | 40,100 | 9,574 |
| | | Shares | Market
Value•
($000) |
| | Constellation Brands Inc. Class A | 36,890 | 9,115 |
| | | | 53,821 |
| Energy (3.8%) |
| | Coterra Energy Inc. | 1,516,069 | 47,195 |
| | Cheniere Energy Inc. | 167,450 | 29,540 |
| | SM Energy Co. | 275,126 | 12,375 |
| | Diamondback Energy Inc. | 61,171 | 9,611 |
| | Matador Resources Co. | 101,080 | 6,717 |
| | Range Resources Corp. | 163,430 | 4,654 |
| | | | 110,092 |
| Financials (8.6%) |
| | Ares Management Corp. Class A | 645,365 | 48,938 |
| | Hamilton Lane Inc. Class A | 710,149 | 42,481 |
| | Aon plc Class A (XNYS) | 145,456 | 40,944 |
| | LPL Financial Holdings Inc. | 119,757 | 30,616 |
| | MSCI Inc. Class A | 56,182 | 26,342 |
| | KKR & Co. Inc. | 509,826 | 24,793 |
| * | SVB Financial Group | 57,690 | 13,324 |
| | Apollo Global Management Inc. | 185,124 | 10,248 |
| | Moody's Corp. | 27,384 | 7,253 |
| | FactSet Research Systems Inc. | 15,920 | 6,774 |
| | Kinsale Capital Group Inc. | 9,200 | 2,900 |
| | | | 254,613 |
| Health Care (19.8%) |
| | Agilent Technologies Inc. | 794,733 | 109,951 |
| * | ICON plc | 282,658 | 55,921 |
| * | Seagen Inc. | 292,450 | 37,188 |
| * | DexCom Inc. | 293,875 | 35,494 |
| * | Omnicell Inc. | 432,708 | 33,457 |
| * | Veeva Systems Inc. Class A | 155,031 | 26,036 |
| | Humana Inc. | 44,249 | 24,695 |
| * | Align Technology Inc. | 120,704 | 23,453 |
| * | Signify Health Inc. Class A | 770,650 | 22,526 |
| * | Insulet Corp. | 86,391 | 22,359 |
| * | Sarepta Therapeutics Inc. | 156,683 | 17,865 |
| * | Molina Healthcare Inc. | 49,289 | 17,688 |
| | ResMed Inc. | 68,580 | 15,341 |
| * | Hologic Inc. | 185,488 | 12,576 |
| | Teleflex Inc. | 57,629 | 12,365 |
| | AmerisourceBergen Corp. Class A | 76,652 | 12,051 |
| * | IDEXX Laboratories Inc. | 31,783 | 11,432 |
| * | Jazz Pharmaceuticals plc | 76,857 | 11,051 |
| | Alcon Inc. | 172,477 | 10,466 |
| | | Shares | Market
Value•
($000) |
| * | Amedisys Inc. | 103,135 | 10,065 |
| * | Horizon Therapeutics plc | 133,350 | 8,310 |
| * | Repligen Corp. | 42,090 | 7,681 |
| * | BioMarin Pharmaceutical Inc. | 78,751 | 6,822 |
| * | Inspire Medical Systems Inc. | 32,462 | 6,329 |
| * | Incyte Corp. | 84,640 | 6,292 |
| * | Moderna Inc. | 38,710 | 5,819 |
| * | Illumina Inc. | 23,813 | 5,449 |
| * | Tenet Healthcare Corp. | 104,690 | 4,644 |
| * | Novocure Ltd. | 65,729 | 4,644 |
| * | Edwards Lifesciences Corp. | 59,190 | 4,287 |
| * | Exact Sciences Corp. | 99,456 | 3,459 |
| | | | 585,716 |
| Industrials (11.8%) |
| | BWX Technologies Inc. | 883,382 | 50,335 |
| | Hexcel Corp. | 729,854 | 40,653 |
| | TransUnion | 665,447 | 39,441 |
| | Cintas Corp. | 68,717 | 29,380 |
| | KBR Inc. | 431,957 | 21,498 |
| | Waste Connections Inc. (XTSE) | 152,630 | 20,133 |
| | Quanta Services Inc. | 131,328 | 18,654 |
| * | Chart Industries Inc. | 75,686 | 16,869 |
| * | Builders FirstSource Inc. | 217,680 | 13,422 |
| * | MasTec Inc. | 156,455 | 12,060 |
| | Knight-Swift Transportation Holdings Inc. | 214,855 | 10,319 |
| * | Evoqua Water Technologies Corp. | 236,060 | 9,249 |
| | Ritchie Bros Auctioneers Inc. | 138,490 | 9,048 |
| | HEICO Corp. Class A | 68,840 | 8,763 |
| * | Clean Harbors Inc. | 64,540 | 7,904 |
| | Equifax Inc. | 40,284 | 6,830 |
| * | Axon Enterprise Inc. | 39,003 | 5,673 |
| * | XPO Logistics Inc. | 105,460 | 5,456 |
| | Verisk Analytics Inc. Class A | 29,720 | 5,434 |
| * | Lyft Inc. Class A | 306,849 | 4,492 |
| | Advanced Drainage Systems Inc. | 37,019 | 4,290 |
| * | WillScot Mobile Mini Holdings Corp. | 82,190 | 3,495 |
| * | CoStar Group Inc. | 40,570 | 3,356 |
| | Regal Rexnord Corp. | 20,760 | 2,627 |
| | | | 349,381 |
| Information Technology (28.2%) |
| * | Gartner Inc. | 313,891 | 94,770 |
| * | Palo Alto Networks Inc. | 402,296 | 69,030 |
| | CDW Corp. | 337,785 | 58,373 |
| * | Ceridian HCM Holding Inc. | 811,781 | 53,732 |
| * | Paycom Software Inc. | 109,635 | 37,934 |
| * | Shift4 Payments Inc. Class A | 774,810 | 35,618 |
| * | EPAM Systems Inc. | 78,618 | 27,516 |
| * | Varonis Systems Inc. Class B | 922,244 | 24,688 |
| * | MongoDB Inc. Class A | 128,430 | 23,507 |
| * | Fair Isaac Corp. | 47,332 | 22,664 |
| * | Synopsys Inc. | 75,712 | 22,150 |
| * | Arista Networks Inc. | 178,852 | 21,616 |
| * | ON Semiconductor Corp. | 350,514 | 21,532 |
| * | Enphase Energy Inc. | 61,110 | 18,761 |
| | Genpact Ltd. | 382,691 | 18,561 |
| | | Shares | Market
Value•
($000) |
| | Microchip Technology Inc. | 299,890 | 18,515 |
| * | Synaptics Inc. | 201,657 | 17,867 |
| * | Wolfspeed Inc. | 226,882 | 17,867 |
| | Global Payments Inc. | 149,852 | 17,122 |
| | KLA Corp. | 49,994 | 15,821 |
| | Monolithic Power Systems Inc. | 36,775 | 12,483 |
| * | Lattice Semiconductor Corp. | 239,491 | 11,618 |
| | Marvell Technology Inc. | 291,356 | 11,561 |
| * | Bill.com Holdings Inc. | 83,927 | 11,192 |
| | Jack Henry & Associates Inc. | 55,870 | 11,121 |
| * | Trade Desk Inc. Class A | 203,553 | 10,837 |
| * | Block Inc. (XNYS) | 170,204 | 10,224 |
| * | Dropbox Inc. Class A | 443,954 | 9,656 |
| * | Keysight Technologies Inc. | 55,007 | 9,579 |
| * | Dlocal Ltd. Class A | 418,993 | 9,344 |
| * | HubSpot Inc. | 30,579 | 9,068 |
| * | Atlassian Corp. | 44,368 | 8,995 |
| | Amphenol Corp. Class A | 117,744 | 8,929 |
| * | Dynatrace Inc. | 208,620 | 7,352 |
| * | Autodesk Inc. | 33,697 | 7,221 |
| | Entegris Inc. | 89,417 | 7,094 |
| * | Okta Inc. | 117,947 | 6,619 |
| * | Datadog Inc. Class A | 74,890 | 6,029 |
| | Lam Research Corp. | 13,080 | 5,295 |
| * | Zscaler Inc. | 27,170 | 4,187 |
| * | Sitime Corp. | 42,048 | 3,776 |
| * | Splunk Inc. | 42,230 | 3,510 |
| * | Workday Inc. Class A | 21,993 | 3,427 |
| * | Coherent Corp. | 96,478 | 3,243 |
| * | Toast Inc. Class A | 120,780 | 2,668 |
| * | Five9 Inc. | 19,980 | 1,204 |
| | | | 833,876 |
| Materials (1.0%) |
| | Graphic Packaging Holding Co. | 540,840 | 12,418 |
| | Sherwin-Williams Co. | 48,346 | 10,879 |
| | CF Industries Holdings Inc. | 59,740 | 6,348 |
| | | | 29,645 |
| Real Estate (0.4%) |
| | Extra Space Storage Inc. | 32,770 | 5,815 |
| | SBA Communications Corp. Class A | 21,150 | 5,708 |
| | | | 11,523 |
Total Common Stocks
(Cost $2,790,973) | 2,816,586 |
| | | Shares | Market
Value•
($000) |
| Temporary Cash Investments (4.9%) |
| Money Market Fund (4.9%) |
| 2,3 | Vanguard Market Liquidity Fund, 3.117% (Cost $145,416) | 1,454,572 | 145,428 |
| Total Investments (100.2%) (Cost $2,936,389) | 2,962,014 |
| Other Assets and Liabilities—Net (-0.2%) | (6,062) |
| Net Assets (100%) | 2,955,952 |
| Cost is in $000. |
| • | See Note A in Notes to Financial Statements. |
| * | Non-income-producing security. |
| 1 | Includes partial security positions on loan to broker-dealers. The total value of securities on loan is $5,204,000. |
| 2 | Affiliated money market fund available only to Vanguard funds and certain trusts and accounts managed by Vanguard. Rate shown is the 7-day yield. |
| 3 | Collateral of $5,522,000 was received for securities on loan. |
Derivative Financial Instruments Outstanding as of Period End
| Futures Contracts |
| | | | ($000) |
| | Expiration | Number of
Long (Short)
Contracts | Notional
Amount | Value and
Unrealized
Appreciation
(Depreciation) |
| Long Futures Contracts | | | | |
| E-mini S&P 500 Index | December 2022 | 329 | 63,875 | (165) |
See accompanying Notes, which are an integral part of the Financial Statements.
Statement of Assets and Liabilities
|
| ($000s, except shares and per-share amounts) | Amount |
| Assets | |
| Investments in Securities, at Value1 | |
| Unaffiliated Issuers (Cost $2,790,973) | 2,816,586 |
| Affiliated Issuers (Cost $145,416) | 145,428 |
| Total Investments in Securities | 2,962,014 |
| Investment in Vanguard | 111 |
| Cash | 1 |
| Cash Collateral Pledged—Futures Contracts | 3,418 |
| Receivables for Investment Securities Sold | 18,260 |
| Receivables for Accrued Income | 501 |
| Receivables for Capital Shares Issued | 875 |
| Total Assets | 2,985,180 |
| Liabilities | |
| Payables for Investment Securities Purchased | 20,006 |
| Collateral for Securities on Loan | 5,522 |
| Payables to Investment Advisor | 1,012 |
| Payables for Capital Shares Redeemed | 1,946 |
| Payables to Vanguard | 250 |
| Variation Margin Payable—Futures Contracts | 483 |
| Other Liabilities | 9 |
| Total Liabilities | 29,228 |
| Net Assets | 2,955,952 |
| 1 Includes $5,204 of securities on loan. | |
| At October 31, 2022, net assets consisted of: | |
| | |
| Paid-in Capital | 3,215,171 |
| Total Distributable Earnings (Loss) | (259,219) |
| Net Assets | 2,955,952 |
| |
| Net Assets | |
Applicable to 153,597,985 outstanding $.001 par value shares of
beneficial interest (unlimited authorization) | 2,955,952 |
| Net Asset Value Per Share | $19.24 |
See accompanying Notes, which are an integral part of the Financial Statements.
|
| | Year Ended
October 31, 2022 |
| | ($000) |
| Investment Income | |
| Income | |
| Dividends1 | 16,614 |
| Interest2 | 1,265 |
| Securities Lending—Net | 13 |
| Total Income | 17,892 |
| Expenses | |
| Investment Advisory Fees—Note B | |
| Basic Fee | 7,443 |
| Performance Adjustment | (1,892) |
| The Vanguard Group—Note C | |
| Management and Administrative | 6,972 |
| Marketing and Distribution | 281 |
| Custodian Fees | 43 |
| Auditing Fees | 32 |
| Shareholders’ Reports | 88 |
| Trustees’ Fees and Expenses | 1 |
| Other Expenses | 16 |
| Total Expenses | 12,984 |
| Expenses Paid Indirectly | (140) |
| Net Expenses | 12,844 |
| Net Investment Income | 5,048 |
| Realized Net Gain (Loss) | |
| Investment Securities Sold2 | (229,996) |
| Futures Contracts | (3,511) |
| Foreign Currencies | 1 |
| Realized Net Gain (Loss) | (233,506) |
| Change in Unrealized Appreciation (Depreciation) | |
| Investment Securities2 | (1,354,060) |
| Futures Contracts | (7,834) |
| Change in Unrealized Appreciation (Depreciation) | (1,361,894) |
| Net Increase (Decrease) in Net Assets Resulting from Operations | (1,590,352) |
| | |
| 1 | Dividends are net of foreign withholding taxes of $27,000. |
| 2 | Interest income, realized net gain (loss), capital gain distributions received, and change in unrealized appreciation (depreciation) from an affiliated company of the fund were $1,239,000, ($17,000), $2,000, and ($13,000), respectively. Purchases and sales are for temporary cash investment purposes. |
See accompanying Notes, which are an integral part of the Financial Statements.
Statement of Changes in Net Assets
|
| | Year Ended October 31, |
| | 2022
($000) | 2021
($000) |
| | | |
| Increase (Decrease) in Net Assets | | |
| Operations | | |
| Net Investment Income | 5,048 | (1,915) |
| Realized Net Gain (Loss) | (233,506) | 1,291,603 |
| Change in Unrealized Appreciation (Depreciation) | (1,361,894) | 283,921 |
| Net Increase (Decrease) in Net Assets Resulting from Operations | (1,590,352) | 1,573,609 |
| Distributions | | |
| Total Distributions | (1,251,685) | (305,267) |
| Capital Share Transactions | | |
| Issued | 449,924 | 663,839 |
| Issued in Lieu of Cash Distributions | 1,179,383 | 290,788 |
| Redeemed | (1,121,695) | (1,346,909) |
| Net Increase (Decrease) from Capital Share Transactions | 507,612 | (392,282) |
| Total Increase (Decrease) | (2,334,425) | 876,060 |
| Net Assets | | |
| Beginning of Period | 5,290,377 | 4,414,317 |
| End of Period | 2,955,952 | 5,290,377 |
See accompanying Notes, which are an integral part of the Financial Statements.
For a Share Outstanding
Throughout Each Period | Year Ended October 31, |
| 2022 | 2021 | 2020 | 2019 | 2018 |
| Net Asset Value, Beginning of Period | $38.72 | $29.89 | $27.93 | $28.08 | $26.51 |
| Investment Operations | | | | | |
| Net Investment Income (Loss)1 | .031 | (.013) | .068 | .074 | .114 |
| Net Realized and Unrealized Gain (Loss) on Investments | (10.190) | 10.957 | 4.680 | 3.027 | 2.379 |
| Total from Investment Operations | (10.159) | 10.944 | 4.748 | 3.101 | 2.493 |
| Distributions | | | | | |
| Dividends from Net Investment Income | (.005) | (.051) | (.067) | (.099) | (.095) |
| Distributions from Realized Capital Gains | (9.316) | (2.063) | (2.721) | (3.152) | (.828) |
| Total Distributions | (9.321) | (2.114) | (2.788) | (3.251) | (.923) |
| Net Asset Value, End of Period | $19.24 | $38.72 | $29.89 | $27.93 | $28.08 |
| Total Return2 | -32.22% | 37.68% | 18.33% | 13.56% | 9.61% |
| Ratios/Supplemental Data | | | | | |
| Net Assets, End of Period (Millions) | $2,956 | $5,290 | $4,414 | $4,536 | $4,161 |
| Ratio of Total Expenses to Average Net Assets3 | 0.35%4 | 0.33% | 0.34% | 0.36% | 0.36% |
| Ratio of Net Investment Income (Loss) to Average Net Assets | 0.14% | (0.04)% | 0.25% | 0.27% | 0.40% |
| Portfolio Turnover Rate | 71% | 98% | 74% | 111% | 75% |
| 1 | Calculated based on average shares outstanding. |
| 2 | Total returns do not include account service fees that may have applied in the periods shown. Fund prospectuses provide information about any applicable account service fees. |
| 3 | Includes performance-based investment advisory fee increases (decreases) of (0.05%), (0.06%), (0.05%), (0.02%), and (0.04%). |
| 4 | The ratio of expenses to average net assets for the period net of reduction from broker commission abatement arrangements was 0.35%. |
See accompanying Notes, which are an integral part of the Financial Statements.
Notes to Financial Statements
Vanguard Mid-Cap Growth Fund is registered under the Investment Company Act of 1940 as an open-end investment company, or mutual fund. Significant market disruptions, such as those caused by pandemics (e.g., COVID-19 pandemic), natural or environmental disasters, war (e.g., Russia’s invasion of Ukraine), acts of terrorism, or other events, can adversely affect local and global markets and normal market operations. Any such disruptions could have an adverse impact on the value of the fund’s investments and fund performance.
| A. | The following significant accounting policies conform to generally accepted accounting principles for U.S. investment companies. The fund consistently follows such policies in preparing its financial statements. |
1. Security Valuation: Securities are valued as of the close of trading on the New York Stock Exchange (generally 4 p.m., Eastern time) on the valuation date. Equity securities are valued at the latest quoted sales prices or official closing prices taken from the primary market in which each security trades; such securities not traded on the valuation date are valued at the mean of the latest quoted bid and asked prices. Securities for which market quotations are not readily available, or whose values have been affected by events occurring before the fund’s pricing time but after the close of the securities’ primary markets, are valued by methods deemed by the valuation designee to represent fair value and subject to oversight by the board of trustees. Investments in Vanguard Market Liquidity Fund are valued at that fund's net asset value.
2. Foreign Currency: Securities and other assets and liabilities denominated in foreign currencies are translated into U.S. dollars using exchange rates obtained from an independent third party as of the fund’s pricing time on the valuation date. Realized gains (losses) and unrealized appreciation (depreciation) on investment securities include the effects of changes in exchange rates since the securities were purchased, combined with the effects of changes in security prices. Fluctuations in the value of other assets and liabilities resulting from changes in exchange rates are recorded as unrealized foreign currency gains (losses) until the assets or liabilities are settled in cash, at which time they are recorded as realized foreign currency gains (losses).
3. Futures Contracts: The fund uses index futures contracts to a limited extent, with the objective of maintaining full exposure to the stock market while maintaining liquidity. The fund may purchase or sell futures contracts to achieve a desired level of investment, whether to accommodate portfolio turnover or cash flows from capital share transactions. The primary risks associated with the use of futures contracts are imperfect correlation between changes in market values of stocks held by the fund and the prices of futures contracts, and the possibility of an illiquid market. Counterparty risk involving futures is mitigated because a regulated clearinghouse is the counterparty instead of the clearing broker. To further mitigate counterparty risk, the fund trades futures contracts on an exchange, monitors the financial strength of its clearing brokers and clearinghouse, and has entered into clearing agreements with its clearing brokers. The clearinghouse imposes initial margin requirements to secure the fund’s performance and requires daily settlement of variation margin representing changes in the market value of each contract. Any securities pledged as initial margin for open contracts are noted in the Schedule of Investments.
Futures contracts are valued at their quoted daily settlement prices. The notional amounts of the contracts are not recorded in the Statement of Assets and Liabilities. Fluctuations in the value of the contracts are recorded in the Statement of Assets and Liabilities as an asset (liability) and in the Statement of Operations as unrealized appreciation (depreciation) until the contracts are closed, when they are recorded as realized gains (losses) on futures contracts.
During the year ended October 31, 2022, the fund’s average investments in long and short futures contracts represented 2% and 0% of net assets, respectively, based on the average of the notional amounts at each quarter-end during the period.
4. Federal Income Taxes: The fund intends to continue to qualify as a regulated investment company and distribute virtually all of its taxable income. The fund’s tax returns are open to examination by the relevant tax authorities until expiration of the applicable statute of limitations, which is generally three years after the filing of the tax return. Management has analyzed the fund’s tax positions taken for all open federal and state income tax years, and has concluded that no provision for income tax is required in the fund’s financial statements.
5. Distributions: Distributions to shareholders are recorded on the ex-dividend date. Distributions are determined on a tax basis at the fiscal year-end and may differ from net investment income and realized capital gains for financial reporting purposes.
6. Securities Lending: To earn additional income, the fund lends its securities to qualified institutional borrowers. Security loans are subject to termination by the fund at any time, and are required to be secured at all times by collateral in an amount at least equal to the market value of securities loaned. Daily market fluctuations could cause the value of loaned securities to be more or less than the value of the collateral received. When this occurs, the collateral is adjusted and settled before the opening of the market on the next business day. The fund further mitigates its counterparty risk by entering into securities lending transactions only with a diverse group of prequalified counterparties, monitoring their financial strength, and entering into master securities lending agreements with its counterparties. The master securities lending agreements provide that, in the event of a counterparty’s default (including bankruptcy), the fund may terminate any loans with that borrower, determine the net amount owed, and sell or retain the collateral up to the net amount owed to the fund; however, such actions may be subject to legal proceedings. While collateral mitigates counterparty risk, in the event of a default, the fund may experience delays and costs in recovering the securities loaned. The fund invests cash collateral received in Vanguard Market Liquidity Fund, and records a liability in the Statement of Assets and Liabilities for the return of the collateral, during the period the securities are on loan. Collateral investments in Vanguard Market Liquidity Fund are subject to market appreciation or depreciation. Securities lending income represents fees charged to borrowers plus income earned on invested cash collateral, less expenses associated with the loan. During the term of the loan, the fund is entitled to all distributions made on or in respect of the loaned securities.
7. Credit Facilities and Interfund Lending Program: The fund and certain other funds managed by The Vanguard Group ("Vanguard") participate in a $4.4 billion committed credit facility provided by a syndicate of lenders pursuant to a credit agreement and an uncommitted credit facility provided by Vanguard. Both facilities may be renewed annually. Each fund is individually liable for its borrowings, if any, under the credit facilities. Borrowings may be utilized for temporary or emergency purposes and are subject to the fund’s regulatory and contractual borrowing restrictions. With respect to the committed credit facility, the participating funds are charged administrative fees and an annual commitment fee of 0.10% of the undrawn committed amount of the facility, which are allocated to the funds based on a method approved by the fund’s board of trustees and included in Management and Administrative expenses on the fund’s Statement of Operations. Any borrowings under either facility bear interest at an agreed-upon spread plus the higher of the federal funds effective rate, the overnight bank funding rate, or the Daily Simple
Secured Overnight Financing Rate inclusive of an additional agreed-upon spread. However, borrowings under the uncommitted credit facility may bear interest based upon an alternate rate agreed to by the fund and Vanguard.
In accordance with an exemptive order (the “Order”) from the SEC, the fund may participate in a joint lending and borrowing program that allows registered open-end Vanguard funds to borrow money from and lend money to each other for temporary or emergency purposes (the “Interfund Lending Program”), subject to compliance with the terms and conditions of the Order, and to the extent permitted by the fund’s investment objective and investment policies. Interfund loans and borrowings normally extend overnight but can have a maximum duration of seven days. Loans may be called on one business day’s notice. The interest rate to be charged is governed by the conditions of the Order and internal procedures adopted by the board of trustees. The board of trustees is responsible for overseeing the Interfund Lending Program.
For the year ended October 31, 2022, the fund did not utilize the credit facilities or the Interfund Lending Program.
8. Other: Dividend income is recorded on the ex-dividend date. Non-cash dividends included in income, if any, are recorded at the fair value of the securities received. Interest income includes income distributions received from Vanguard Market Liquidity Fund and is accrued daily. Security transactions are accounted for on the date securities are bought or sold. Costs used to determine realized gains (losses) on the sale of investment securities are those of the specific securities sold.
| B. | The investment advisory firms Victory Capital Management Inc., through its RS Investments franchise, Frontier Capital Management Co., LLC, and Wellington Management Company llp, each provide investment advisory services to a portion of the fund for a fee calculated at an annual percentage rate of average net assets managed by the advisor. The basic fees of Victory Capital Management Inc., Frontier Capital Management Co., LLC, and Wellington Management Company llp, are subject to quarterly adjustments based on performance relative to the Russell Midcap Growth Index for the preceding 3 years. |
Vanguard manages the cash reserves of the fund as described below.
For the year ended October 31, 2022, the aggregate investment advisory fee paid to all advisors represented an effective annual basic rate of 0.20% of the fund’s average net assets, before a net decrease of $1,892,000 (0.05%) based on performance.
| C. | In accordance with the terms of a Funds' Service Agreement (the “FSA”) between Vanguard and the fund, Vanguard furnishes to the fund corporate management, administrative, marketing, distribution and cash management services at Vanguard’s cost of operations (as defined by the FSA). These costs of operations are allocated to the fund based on methods and guidelines approved by the board of trustees and are generally settled twice a month. |
Upon the request of Vanguard, the fund may invest up to 0.40% of its net assets as capital in Vanguard. At October 31, 2022, the fund had contributed to Vanguard capital in the amount of $111,000, representing less than 0.01% of the fund’s net assets and 0.04% of Vanguard’s capital received pursuant to the FSA. The fund’s trustees and officers are also directors and employees, respectively, of Vanguard.
| D. | The fund has asked its investment advisors to direct certain security trades, subject to obtaining the best price and execution, to brokers who have agreed to rebate to the fund part of |
the commissions generated. Such rebates are used solely to reduce the fund’s management and administrative expenses. For the year ended October 31, 2022, these arrangements reduced the fund’s expenses by $140,000 (an annual rate of less than 0.01% of average net assets).
| E. | Various inputs may be used to determine the value of the fund’s investments and derivatives. These inputs are summarized in three broad levels for financial statement purposes. The inputs or methodologies used to value securities are not necessarily an indication of the risk associated with investing in those securities. |
Level 1—Quoted prices in active markets for identical securities.
Level 2—Other significant observable inputs (including quoted prices for similar securities, interest rates, prepayment speeds, credit risk, etc.).
Level 3—Significant unobservable inputs (including the fund’s own assumptions used to determine the fair value of investments). Any investments and derivatives valued with significant unobservable inputs are noted on the Schedule of Investments.
At October 31, 2022, 100% of the market value of the fund’s investments and derivatives was determined based on Level 1 inputs.
| F. | Permanent differences between book-basis and tax-basis components of net assets, if any, are reclassified among capital accounts in the financial statements to reflect their tax character. These reclassifications have no effect on net assets or net asset value per share. As of period end, permanent differences primarily attributable to the accounting for applicable foreign currency transactions were reclassified between the individual components of total distributable earnings (loss). |
Temporary differences between book-basis and tax-basis components of total distributable earnings (loss) arise when certain items of income, gain, or loss are recognized in different periods for financial statement and tax purposes; these differences will reverse at some time in the future. The differences are primarily related to the deferral of losses from wash sales; and the recognition of unrealized gains or losses from certain derivative contracts. As of period end, the tax-basis components of total distributable earnings (loss) are detailed in the table as follows:
| | Amount
($000) |
| Undistributed Ordinary Income | 4,152 |
| Undistributed Long-Term Gains | — |
| Capital Loss Carryforwards | (227,754) |
| Qualified Late-Year Losses | — |
| Net Unrealized Gains (Losses) | (35,617) |
The tax character of distributions paid was as follows:
| | Year Ended October 31, |
| | 2022
Amount
($000) | 2021
Amount
($000) |
| Ordinary Income* | 319,558 | 7,351 |
| Long-Term Capital Gains | 932,127 | 297,916 |
| Total | 1,251,685 | 305,267 |
| * | Includes short-term capital gains, if any. |
As of October 31, 2022, gross unrealized appreciation and depreciation for investments and derivatives based on cost for U.S. federal income tax purposes were as follows:
| | Amount
($000) |
| Tax Cost | 2,997,631 |
| Gross Unrealized Appreciation | 444,778 |
| Gross Unrealized Depreciation | (480,395) |
| Net Unrealized Appreciation (Depreciation) | (35,617) |
| G. | During the year ended October 31, 2022, the fund purchased $2,550,326,000 of investment securities and sold $3,191,547,000 of investment securities, other than temporary cash investments. |
The fund purchased securities from and sold securities to other Vanguard funds or accounts managed by Vanguard or its affiliates, in accordance with procedures adopted by the board of trustees in compliance with Rule 17a-7 of the Investment Company Act of 1940. For the year ended October 31, 2022, such purchases were $373,000 and sales were $0; these amounts, other than temporary cash investments, are included in the purchases and sales of investment securities noted above.
| H. | Capital shares issued and redeemed were: |
| | Year Ended October 31, |
| | 2022
Shares
(000) | 2021
Shares
(000) |
| | | |
| Issued | 18,174 | 19,010 |
| Issued in Lieu of Cash Distributions | 46,070 | 8,647 |
| Redeemed | (47,262) | (38,747) |
| Net Increase (Decrease) in Shares Outstanding | 16,982 | (11,090) |
| I. | In December 2022, the Board of Trustees approved the termination of the fund’s investment advisory agreement with RS Investments and the reallocation of the portion of the fund's assets RS Investments managed (approximately 20%) to Frontier Capital Management Co., LLC, an existing manager on the fund; these changes will take effect in December 2022 as well. Following the transition, Frontier will manage approximately 60% and Wellington Management Company LLP will continue to manage approximately 40% of the fund. |
Report of Independent Registered Public Accounting Firm
To the Board of Trustees of Vanguard Whitehall Funds and Shareholders of Vanguard Mid-Cap Growth Fund
Opinion on the Financial Statements
We have audited the accompanying statement of assets and liabilities, including the schedule of investments, of Vanguard Mid-Cap Growth Fund (one of the funds constituting Vanguard Whitehall Funds, referred to hereafter as the "Fund") as of October 31, 2022, the related statement of operations for the year ended October 31, 2022, the statement of changes in net assets for each of the two years in the period ended October 31, 2022, including the related notes, and the financial highlights for each of the five years in the period ended October 31, 2022 (collectively referred to as the "financial statements"). In our opinion, the financial statements present fairly, in all material respects, the financial position of the Fund as of October 31, 2022, the results of its operations for the year then ended, the changes in its net assets for each of the two years in the period ended October 31, 2022 and the financial highlights for each of the five years in the period ended October 31, 2022 in conformity with accounting principles generally accepted in the United States of America.
Basis for Opinion
These financial statements are the responsibility of the Fund’s management. Our responsibility is to express an opinion on the Fund’s financial statements based on our audits. We are a public accounting firm registered with the Public Company Accounting Oversight Board (United States) (PCAOB) and are required to be independent with respect to the Fund in accordance with the U.S. federal securities laws and the applicable rules and regulations of the Securities and Exchange Commission and the PCAOB.
We conducted our audits of these financial statements in accordance with the standards of the PCAOB. Those standards require that we plan and perform the audit to obtain reasonable assurance about whether the financial statements are free of material misstatement, whether due to error or fraud.
Our audits included performing procedures to assess the risks of material misstatement of the financial statements, whether due to error or fraud, and performing procedures that respond to those risks. Such procedures included examining, on a test basis, evidence regarding the amounts and disclosures in the financial statements. Our audits also included evaluating the accounting principles used and significant estimates made by management, as well as evaluating the overall presentation of the financial statements. Our procedures included confirmation of securities owned as of October 31, 2022 by correspondence with the custodian, transfer agent and brokers; when replies were not received from brokers, we performed other auditing procedures. We believe that our audits provide a reasonable basis for our opinion.
/s/PricewaterhouseCoopers LLP
Philadelphia, Pennsylvania
December 16, 2022
We have served as the auditor of one or more investment companies in The Vanguard Group of Funds since 1975.
Tax information (unaudited)
For corporate shareholders, 100%, or if subsequently determined to be different, the maximum percentage allowable by law, of ordinary income (dividend income plus short-term gains, if any) for the fiscal year qualified for the dividends-received deduction.
The fund hereby designates $12,817,000, or if subsequently determined to be different, the maximum amount allowable by law, as qualified dividend income for individual shareholders for the fiscal year.
The fund hereby designates $124,000, or if subsequently determined to be different, the maximum amount allowable by law, of interest earned from obligations of the U.S. government which is generally exempt from state income tax.
For nonresident alien shareholders, 100% of short-term capital gain dividends distributed by the fund for the fiscal year are qualified short-term capital gains.
The fund distributed $932,127,000 as capital gain dividends (20% rate gain distributions) to shareholders during the fiscal year.
This page intentionally left blank.
The People Who Govern Your Fund
The trustees of your mutual fund are there to see that the fund is operated and managed in your best interests since, as a shareholder, you are a part owner of the fund. Your fund’s trustees also serve on the board of directors of The Vanguard Group, Inc., which is owned by the Vanguard funds and provides services to them.
A majority of Vanguard’s board members are independent, meaning that they have no affiliation with Vanguard or the funds they oversee, apart from the sizable personal investments they have made as private individuals. The independent board members have distinguished backgrounds in business, academia, and public service. Each of the trustees and executive officers oversees 206 Vanguard funds.
Information for each trustee and executive officer of the fund appears below. That information, as well as the Vanguard fund count, is as of the date on the cover of this fund report. The mailing address of the trustees and officers is P.O. Box 876, Valley Forge, PA 19482. More information about the trustees is in the Statement of Additional Information, which can be obtained, without charge, by contacting Vanguard at 800-662-7447, or online at vanguard.com.
Interested Trustee1
Mortimer J. Buckley
Born in 1969. Trustee since January 2018. Principal occupation(s) during the past five years and other experience: chairman of the board (2019–present) of Vanguard and of each of the investment companies served by Vanguard; chief executive officer (2018–present) of Vanguard; chief executive officer, president, and trustee (2018–present) of each of the investment companies served by Vanguard; president and director (2017–present) of Vanguard; and president (2018–present) of Vanguard Marketing Corporation. Chief investment officer (2013–2017), managing director (2002–2017), head of the Retail Investor Group (2006–2012), and chief information officer (2001–2006) of Vanguard. Member of the board of governors of the Investment Company Institute and the board of governors of FINRA. Trustee and vice chair of The Shipley School.
Independent Trustees
Tara Bunch
Born in 1962. Trustee since November 2021. Principal occupation(s) during the past five years and other experience: head of global operations at Airbnb (2020–present). Vice president of AppleCare (2012–2020). Member of the board of directors of Out & Equal (2002–2006), the advisory board of the University of California, Berkeley School of Engineering (2020–present), and the advisory board
of Santa Clara University’s Leavey School of Business (2018–present).
Emerson U. Fullwood
Born in 1948. Trustee since January 2008. Principal occupation(s) during the past five years and other experience: executive chief staff and marketing officer for North America and corporate vice president (retired 2008) of Xerox Corporation (document management products and services). Former president of the Worldwide Channels Group, Latin America, and Worldwide Customer Service and executive chief staff officer of Developing Markets of Xerox. Executive in residence and 2009–2010 Distinguished Minett Professor at the Rochester Institute of Technology. Member of the board of directors of the University of Rochester Medical Center, the Monroe Community College Foundation, the United Way of Rochester, North Carolina A&T University, Roberts Wesleyan College, and the Rochester Philharmonic Orchestra. Trustee of the University of Rochester.
F. Joseph Loughrey
Born in 1949. Trustee since October 2009. Principal occupation(s) during the past five years and other experience: president and chief operating officer (retired 2009) and vice chairman of the board (2008–2009) of Cummins Inc. (industrial machinery). Chairman of the board of Hillenbrand, Inc. (specialized consumer services). Director of the V Foundation. Member of the advisory council for the College of
1 Mr. Buckley is considered an “interested person,” as defined in the Investment Company Act of 1940, because he is an officer of the Vanguard funds.
Arts and Letters at the University of Notre Dame. Chairman of the board of Saint Anselm College.
Mark Loughridge
Born in 1953. Trustee since March 2012. Principal occupation(s) during the past five years and other experience: senior vice president and chief financial officer (retired 2013) of IBM (information technology services). Fiduciary member of IBM’s Retirement Plan Committee (2004–2013), senior vice president and general manager (2002–2004) of IBM Global Financing, vice president and controller (1998–2002) of IBM, and a variety of other prior management roles at IBM. Member of the Council on Chicago Booth.
Scott C. Malpass
Born in 1962. Trustee since March 2012. Principal occupation(s) during the past five years and other experience: adjunct professor of finance at the University of Notre Dame (2020–present). Chief investment officer (retired 2020) and vice president (retired 2020) of the University of Notre Dame. Assistant professor (retired June 2020) of finance at the Mendoza College of Business, University of Notre Dame, and member of the Notre Dame 403(b) Investment Committee. Member of the board of Catholic Investment Services, Inc. (investment advisors), the board of superintendence of the Institute for the Works of Religion, and the board of directors of Paxos Trust Company (finance).
Deanna Mulligan
Born in 1963. Trustee since January 2018. Principal occupation(s) during the past five years and other experience: chief executive officer of Purposeful (advisory firm for CEOs and C-level executives; 2021–present). Board chair (2020), chief executive officer (2011–2020), and president (2010–2019) of The Guardian Life Insurance Company of America. Chief operating officer (2010–2011) and executive vice president (2008–2010) of Individual Life and Disability of the Guardian Life Insurance Company of America. Member of the board of the Economic Club of New York. Trustee of the Partnership for New York City (business leadership), Chief Executives for Corporate Purpose, and the NewYork-Presbyterian Hospital.
André F. Perold
Born in 1952. Trustee since December 2004. Principal occupation(s) during the past five years and other experience: George Gund Professor of Finance and Banking, Emeritus at the Harvard Business School (retired 2011). Chief investment officer and co-managing partner of HighVista Strategies (private investment firm). Member of the board (2018–present) of RIT Capital Partners (investment
firm). Member of the investment committee of Partners Health Care System.
Sarah Bloom Raskin
Born in 1961. Trustee since January 2018. Principal occupation(s) during the past five years and other experience: deputy secretary (2014–2017) of the United States Department of the Treasury. Governor (2010–2014) of the Federal Reserve Board. Commissioner (2007–2010) of financial regulation for the State of Maryland. Colin W. Brown Distinguished Professor of the Practice of Law (2021–present), professor (2020–present), Distinguished Fellow of the Global Financial Markets Center (2020–present), and Rubenstein Fellow (2017–2020) at Duke University. Trustee (2017–present) of Amherst College and member of Amherst College Investment Committee (2019–present). Member of the Regenerative Crisis Response Committee (2020–present).
David A. Thomas
Born in 1956. Trustee since July 2021. Principal occupation(s) during the past five years and other experience: president of Morehouse College (2018–present). Professor of business administration, emeritus at Harvard University (2017–2018). Dean (2011–2016) and professor of management (2016–2017) at the Georgetown University McDonough School of Business. Director of DTE Energy Company (2013–present). Trustee of Common Fund (2019–present).
Peter F. Volanakis
Born in 1955. Trustee since July 2009. Principal occupation(s) during the past five years and other experience: president and chief operating officer (retired 2010) of Corning Incorporated (communications equipment) and director of Corning Incorporated (2000–2010) and Dow Corning (2001–2010). Director (2012) of SPX Corporation (multi-industry manufacturing). Overseer of the Amos Tuck School of Business Administration, Dartmouth College (2001–2013). Member of the BMW Group Mobility Council.
Executive Officers
Christine M. Buchanan
Born in 1970. Principal occupation(s) during the past five years and other experience: principal of Vanguard. Chief financial officer (2021–present) and treasurer (2017–present) of each of the investment companies served by Vanguard. Partner (2005–2017) at KPMG (audit, tax, and advisory services).
John Galloway
Born in 1973. Principal occupation(s) during the past five years and other experience: principal of Vanguard. Investment stewardship officer (September 2020–present) of each of the investment companies served by Vanguard. Head of Investor Advocacy (February 2020–present) and head of Marketing Strategy and Planning (2017–2020) at Vanguard. Special assistant to the President of the United States (2015).
Ashley Grim
Born in 1984. Principal occupation(s) during the past five years and other experience: treasurer (February 2022–present) of each of the investment companies served by Vanguard. Fund transfer agent controller (2019–2022) and director of Audit Services (2017–2019) at Vanguard. Senior manager (2015–2017) at PriceWaterhouseCoopers (audit and assurance, consulting, and tax services).
Peter Mahoney
Born in 1974. Principal occupation(s) during the past five years and other experience: principal of Vanguard. Controller (2015–present) of each of the investment companies served by Vanguard. Head of International Fund Services (2008–2014) at Vanguard.
Anne E. Robinson
Born in 1970. Principal occupation(s) during the past five years and other experience: general counsel (2016–present) of Vanguard. Secretary (2016–present) of Vanguard and of each of the investment companies served by Vanguard. Managing director (2016–present) of Vanguard. Managing director and general counsel of Global Cards and Consumer Services (2014–2016) at Citigroup. Counsel (2003–2014) at American Express. Nonexecutive director of the board of National Grid (energy).
Michael Rollings
Born in 1963. Principal occupation(s) during the past five years and other experience: finance director (2017–present) and treasurer (2017) of each of the investment companies served by Vanguard. Managing director (2016–present) of Vanguard. Chief financial officer (2016–present) of Vanguard. Director (2016–present) of Vanguard Marketing Corporation. Executive vice president and chief financial officer (2006–2016) of MassMutual Financial Group.
John E. Schadl
Born in 1972. Principal occupation(s) during the past five years and other experience: principal of Vanguard. Chief compliance officer (2019–present) of Vanguard and of each of the investment companies served by Vanguard. Assistant vice president (2019–present) of Vanguard Marketing Corporation.
Vanguard Senior Management Team
| Matthew Benchener | Thomas M. Rampulla |
| Joseph Brennan | Karin A. Risi |
| Mortimer J. Buckley | Anne E. Robinson |
| Gregory Davis | Michael Rollings |
| John James | Nitin Tandon |
| Chris D. Mclsaac | Lauren Valente |
Connect with Vanguard®>vanguard.com
Fund Information > 800-662-7447
Direct Investor Account Services > 800-662-2739
Institutional Investor Services > 800-523-1036
Text Telephone for People Who Are Deaf or Hard of Hearing > 800-749-7273
This material may be used in conjunction with the offering of shares of any Vanguard fund only if preceded or accompanied by the fund’s current prospectus.
All comparative mutual fund data are from Morningstar, Inc., unless otherwise noted.
You can obtain a free copy of Vanguard’s proxy voting guidelines by visiting vanguard.com/proxyreporting or by calling Vanguard at 800-662-2739. The guidelines are also available from the SEC’s website, www.sec.gov. In addition, you may obtain a free report on how your fund voted the proxies for securities it owned during the 12 months ended June 30. To get the report, visit either vanguard.com/proxyreporting or www.sec.gov.
You can review information about your fund on the SEC’s website, and you can receive copies of this information, for a fee, by sending a request via email addressed to publicinfo@sec.gov.
Source for Bloomberg indexes: Bloomberg Index Services Limited. Copyright 2022, Bloomberg. All rights reserved.
CFA® is a registered trademark owned by CFA Institute.
© 2022 The Vanguard Group, Inc.
All rights reserved.
Vanguard Marketing Corporation, Distributor.
Q3010 122022
Annual Report | October 31, 2022
Vanguard International Explorer™ Fund
Contents
Please note: The opinions expressed in this report are just that—informed opinions. They should not be considered promises or advice. Also, please keep in mind that the information and opinions cover the period through the date on the front of this report. Of course, the risks of investing in your fund are spelled out in the prospectus.
Your Fund’s Performance at a Glance
| • | For the 12 months ended October 31, 2022, Vanguard International Explorer Fund returned –35.83%. Its benchmark, the Spliced International Explorer Index, returned –32.39%. |
| • | The year was a volatile, challenging period for financial markets. The economic backdrop deteriorated as inflation soared to multidecade highs, fueled in part by higher energy and food prices in the wake of Russia’s invasion of Ukraine. Then price increases broadened to other categories of goods and services, adding to concerns that inflation would remain stubbornly high. That prompted aggressive tightening by many central banks to bring inflation back in check and increased fears of a recession. |
| • | The fund’s three advisors invest in smaller companies––mostly from developed European and Pacific markets––that they believe have strong long-term growth prospects. |
| • | For the 12 months, each region posted negative absolute returns for both the fund and the benchmark. On a relative basis, emerging markets helped fund performance. The Pacific region and Europe were the largest regional detractors relative to the benchmark. |
| • | 3 of the fund’s 11 industry sectors—consumer discretionary, materials, and utilities—helped relative performance. The largest relative detractors were information technology and industrials. |
Market Barometer
| | Average Annual Total Returns
Periods Ended October 31, 2022 |
| | One Year | Three Years | Five Years |
| Stocks | | | |
| Russell 1000 Index (Large-caps) | -16.38% | 9.99% | 10.19% |
| Russell 2000 Index (Small-caps) | -18.54 | 7.05 | 5.56 |
| Russell 3000 Index (Broad U.S. market) | -16.52 | 9.79 | 9.87 |
| FTSE All-World ex US Index (International) | -24.20 | -1.16 | -0.18 |
| Bonds | | | |
Bloomberg U.S. Aggregate Float Adjusted Index
(Broad taxable market) | -15.69% | -3.73% | -0.50% |
Bloomberg Municipal Bond Index
(Broad tax-exempt market) | -11.98 | -2.18 | 0.37 |
| FTSE Three-Month U.S. Treasury Bill Index | 0.88 | 0.59 | 1.15 |
| CPI | | | |
| Consumer Price Index | 7.75% | 5.01% | 3.85% |
For the fiscal year ended October 31, 2022, Vanguard International Explorer Fund returned −35.83%. Your fund is managed by three independent advisors, a strategy that enhances its diversification by providing exposure to distinct yet complementary investment approaches. It is not uncommon for different advisors to have different views about individual securities or the broader investment environment.
The advisors and the amount and percentage of fund assets each manages are presented in the table below. The advisors have also prepared a discussion of the investment environment that existed during the year and of how their portfolio positioning reflected that assessment. These comments were prepared on November 15, 2022.
Schroder Investment Management
North America Inc.
Portfolio Managers:
Luke Biermann,
Lead Portfolio Manager
Alexander Deane,
Co-Portfolio Manager
International equities fell sharply over the last 12 months. Russia’s invasion of Ukraine in February set commodity prices soaring, contributing to a surge in inflation and risk aversion. Central banks around the world have been forced to raise interest rates aggressively, putting further pressure on equities. Elsewhere, Chinese equities were negatively affected
by renewed COVID-19 outbreaks, leading to new lockdowns as China perseveres with a zero-COVID policy. Small-capitalization stocks fell more than large-caps; the MSCI EAFE Small Cap Index returned −30.3% compared with −23.0% for the MSCI EAFE Index.
Stock selection drove the fund’s underperformance over the 12 months, a period marked by an environment in which quality and growth factors underperformed their value counterparts. This was a headwind for our quality-growth bias. Stock-selection impact was weakest in continental Europe and, to lesser extents, in Japan and Pacific ex Japan. Selection did, though, add value in the United Kingdom. Regional allocation was positive thanks to our emerging markets exposure and a modest cash holding.
Negative selection in continental Europe made the most significant impact, while our health care holdings (Arjo, Dermapharm) were weak. Stock selection in consumer staples (HelloFresh, Royal Unibrew) and industrials (Fluidra, Montana Aerospace) also notably detracted, as did both selection in information technology (Cint, Comet) and an overweighting of that sector. Selection in consumer discretionary (D’Ieteren) was strong.
Stock selection in Japan was a lesser detractor. Picks in industrials (Daifuku, Trusco Nakayama), consumer discretionary (Oisix Ra Daichi, Koito Manufacturing), and consumer staples (Tsuruha) dampened results. These shortfalls were partly offset by better
selection in materials (Kureha, Aica Kogyo) and real estate (Daibiru).
Selection in Pacific ex Japan also detracted more modestly. Selection in Hong Kong/China (Techtronic Industries, Li-Ning) and Australia (Xero, James Hardie) provided the main areas of weakness. Our emerging markets exposure helped results thanks to our holdings in India (Apollo Hospitals, Oberoi Realty).
The fund’s performance in the United Kingdom outperformed that of the benchmark. Selection in industrials (QinetiQ) and utilities (Telecom Plus) and our underweighting of communication services added value, with only a modest offset from selection in financials (Bridgepoint, Petershill Partners).
We continue to focus the portfolio on high-quality companies that offer above-average and relatively visible earnings growth. Information technology remains our largest sector overweight given the secular opportunity we see from digital transformation together with the rich vein of small-caps well-positioned to service it. Conversely, we remain underweight in financials and real estate.
Wellington Management Company llp
Portfolio Manager:
Mary L. Pryshlak, CFA,
Senior Managing Director and
Head of Investment Research
For the 12 months ended October 31, 2022, international small-cap equities returned −32.1% as measured by the custom index, which reflects the S&P Developed EPAC Small Cap Index through October 9, 2022, and the MSCI EAFE Small Cap Index from October 10, 2022, through the end of the period. Global equities, meanwhile, fell −19.96% as measured by the MSCI All Country World Index. Ten of 11 sectors in the MSCI EAFE Small Cap Index posted negative returns, with health care, information technology, and communication services declining most.
Inflation remained elevated through the first 10 months of 2022 and led many central banks to continue down paths of tighter monetary policies. Soaring energy prices due to the war in Ukraine have certainly contributed, particularly in Europe, though there are many other factors to consider. Notably, supply-chain bottlenecks, rising input costs, tight labor markets, and geopolitical dynamics broadly have all made an inflationary impact this year.
Our portion of the International Explorer Fund outperformed the custom index over the period. Strong stock selection in the health care, industrials, and materials sectors contributed most to our relative performance. This was partly offset by weaker selection in information technology, consumer discretionary, and real estate. Among regions, selection in emerging markets and the United Kingdom contributed most to relative
performance, while selection in Japan and North America detracted.
Among the top relative contributors were overweight positions in London-based insurance company Beazley and engineered polymer solutions company Trelleborg. Top relative detractors included out-of-benchmark positions in Lightspeed Commerce, an e-commerce software-as-a-service (SaaS) provider, and electric vehicle manufacturer Arrival.
Our global industry analysts will continue to focus on identifying companies with the potential to emerge from this period of market volatility stronger than their peers. We believe that the team’s deep fundamental research, experience managing in a variety of market environments, and long-term orientation will be critical in navigating today’s market environment and maintain conviction that we will be able to generate alpha for Vanguard shareholders over the long term.
Baillie Gifford Overseas Ltd.
Portfolio Managers:
Brian Lum, CFA,
Chair of the International Smaller Companies Portfolio Construction Group
Steven Vaughan, CFA
Portfolio Manager
Companies can be significant for different reasons. Some are driven by a vision to shape and transform industries. Some have unique skill sets to exploit emerging
opportunities. Some operate at a superior level through distinctive culture or thoughtful stewardship. Our approach aims to invest in exceptional international smaller companies that derive their advantage from multiple sources.
It’s impossible to miss the further deterioration in economic headlines over the year. Despite robust operational progress from many constituents, the portfolio has not been immune from this environment. A decade of “cheap money” has possibly artificially adjusted the competitive positioning within marketplaces. We believe that the quality of the portfolio, which contains well-run companies offering distinctive products, leaves it well-placed relative to peers to manage challenging operational conditions.
Companies that are more directly exposed to economic policies have been challenged this year. Hypoport, a provider of end-to-end mortgage support for German customers, was among the leading detractors for the period. Hypoport operates Europace, Germany’s leading online business-to-business mortgage marketplace, and its subsidiary, Dr. Klein, which is the country’s second-largest mortgage broker. Its share price fell as the market worried about the effects on the German housing market of rising interest rates and lower consumer confidence. In the current economic climate, fewer people are willing to buy properties, hence a decline in mortgage demand. This hasn’t
dented our enthusiasm for this business, which has enjoyed double-digit organic growth without resorting to external funding in the past 19 years.
Conversely, CreditAccess Grameen, a microfinance provider in rural India that lends mostly to women, enjoyed share price growth during the period. Although CreditAccess Grameen’s customer count remains largely the same, it has seen a strong pickup in loan growth and robust operating performance, which is expected to continue in the coming months. More generally, the company has demonstrated superior operational metrics, credit quality, loan distribution, and repayment structures compared with peers.
Our work on portfolio resiliency offered reassurance about the quality of the vast majority of our holdings. Over timescales that allow these companies’ offerings to gain traction, we are excited to watch them deliver on their potential. The portfolio construction group, meanwhile, continues to explore the smaller-company universe. Ongoing research—including productive investment trips to South Korea, Israel, Switzerland, and Canada—is generating interesting new ideas. We see plenty to be optimistic about.
Vanguard International Explorer Fund Investment Advisors
| | Fund Assets Managed | |
| Investment Advisor | % | $ Million | Investment Strategy |
| Schroder Investment Management North America Inc. | 38 | 549 | The advisor employs a fundamental investment approach that considers macroeconomic factors while focusing primarily on company-specific factors, including a company’s potential for long-term growth, financial condition, quality of management, and sensitivity to cyclical factors. The advisor also considers the relative value of a company’s securities compared with those of other companies and the market as a whole. |
| Wellington Management Company llp | 40 | 585 | The advisor allocates the assets in its portion of the fund to a team of global analysts who seek to add value through in-depth fundamental research and understanding of their industries. By covering the same companies over a period of many years, these investment professionals gain comprehensive insight to guide decisions for their subportfolios. |
| Baillie Gifford Overseas Ltd. | 19 | 277 | The advisor employs rigorous, fundamental, bottom-up analysis. It believes that a few companies will drive most of the market’s return over the long run and considers sustainable earnings growth and free cash flow growth to be the most important determinants of a company’s prospects. |
| Cash Investments | 3 | 36 | These short-term reserves are invested by Vanguard in equity index products to simulate investment in stocks. Each advisor also may maintain a modest cash position. |
About Your Fund’s Expenses
As a shareholder of the fund, you incur ongoing costs, which include costs for portfolio management, administrative services, and shareholder reports (like this one), among others. Operating expenses, which are deducted from a fund’s gross income, directly reduce the investment return of the fund.
A fund‘s expenses are expressed as a percentage of its average net assets. This figure is known as the expense ratio. The following examples are intended to help you understand the ongoing costs (in dollars) of investing in your fund and to compare these costs with those of other mutual funds. The examples are based on an investment of $1,000 made at the beginning of the period shown and held for the entire period.
The accompanying table illustrates your fund’s costs in two ways:
| • | Based on actual fund return. This section helps you to estimate the actual expenses that you paid over the period. The ”Ending Account Value“ shown is derived from the fund’s actual return, and the third column shows the dollar amount that would have been paid by an investor who started with $1,000 in the fund. You may use the information here, together with the amount you invested, to estimate the expenses that you paid over the period. |
To do so, simply divide your account value by $1,000 (for example, an $8,600 account value divided by $1,000 = 8.6), then multiply the result by the number given for your fund under the heading ”Expenses Paid During Period.“
| • | Based on hypothetical 5% yearly return. This section is intended to help you compare your fund‘s costs with those of other mutual funds. It assumes that the fund had a yearly return of 5% before expenses, but that the expense ratio is unchanged. In this case—because the return used is not the fund’s actual return—the results do not apply to your investment. The example is useful in making comparisons because the Securities and Exchange Commission requires all mutual funds to calculate expenses based on a 5% return. You can assess your fund’s costs by comparing this hypothetical example with the hypothetical examples that appear in shareholder reports of other funds. |
Note that the expenses shown in the table are meant to highlight and help you compare ongoing costs only and do not reflect transaction costs incurred by the fund for buying and selling securities. Further, the expenses do not include any purchase, redemption, or account service fees described in the fund prospectus. If such fees were applied to your account, your costs would be higher. Your fund does not carry a “sales load.”
The calculations assume no shares were bought or sold during the period. Your actual costs may have been higher or lower, depending on the amount of your investment and the timing of any purchases or redemptions.
You can find more information about the fund’s expenses, including annual expense ratios, in the Financial Statements section of this report. For additional information on operating expenses and other shareholder costs, please refer to your fund’s current prospectus.
| Six Months Ended October 31, 2022 | | | |
| International Explorer Fund | Beginning
Account Value
4/30/2022 | Ending
Account Value
10/31/2022 | Expenses
Paid During
Period |
| Based on Actual Fund Return | $1,000.00 | $835.50 | $1.99 |
| Based on Hypothetical 5% Yearly Return | 1,000.00 | 1,023.04 | 2.19 |
The calculations are based on expenses incurred in the most recent six-month period. The fund's annualized six-month expense ratio for that period is 0.43%. The dollar amounts shown as ”Expenses Paid” are equal to the annualized expense ratio multiplied by the average account value over the period, multiplied by the number of days in the most recent six-month period, then divided by the number of days in the most recent 12-month period (184/365).
International Explorer Fund
All of the returns in this report represent past performance, which is not a guarantee of future results that may be achieved by the fund. (Current performance may be lower or higher than the performance data cited. For performance data current to the most recent month-end, visit our website at vanguard.com/performance.) Note, too, that both investment returns and principal value can fluctuate widely, so an investor’s shares, when sold, could be worth more or less than their original cost. The returns shown do not reflect taxes that a shareholder would pay on fund distributions or on the sale of fund shares.
Cumulative Performance: October 31, 2012, Through October 31, 2022
Initial Investment of $10,000
| | | Average Annual Total Returns
Periods Ended October 31, 2022 | |
| | | One
Year | Five
Years | Ten
Years | Final Value
of a $10,000
Investment |
 | International Explorer Fund | -35.83% | -4.39% | 4.18% | $15,056 |
 | Spliced International Explorer Index | -32.39 | -2.26 | 4.99 | 16,281 |
 | MSCI All Country World Index ex USA | -24.73 | -0.60 | 3.27 | 13,796 |
Spliced International Explorer Index: S&P EPAC SmallCap Index through September 30, 2022; MSCI EAFE Small Cap Index thereafter.
See Financial Highlights for dividend and capital gains information.
International Explorer Fund
| |
| Japan | 28.7% |
| United Kingdom | 16.5 |
| Sweden | 5.6 |
| Australia | 5.0 |
| Germany | 4.7 |
| Taiwan | 4.3 |
| Italy | 4.2 |
| Switzerland | 3.9 |
| Belgium | 3.5 |
| Canada | 2.8 |
| France | 2.5 |
| Netherlands | 2.0 |
| Hong Kong | 1.9 |
| Brazil | 1.8 |
| India | 1.8 |
| Ireland | 1.3 |
| Singapore | 1.1 |
| South Korea | 1.1 |
| Israel | 1.1 |
| Denmark | 1.1 |
| Other | 5.1 |
The table reflects the fund’s investments, except for short-term investments and derivatives.
International Explorer Fund
The fund files its complete schedule of portfolio holdings with the Securities and Exchange Commission (SEC) for the first and third quarters of each fiscal year as an exhibit to its reports on Form N-PORT. The fund’s Form N-PORT reports are available on the SEC’s website at www.sec.gov.
| | | | | | Shares | Market
Value•
($000) |
| Common Stocks (96.3%) |
| Australia (4.8%) |
| | James Hardie Industries plc | 306,699 | 6,696 |
| * | Xero Ltd. | 83,879 | 4,165 |
| | Vicinity Ltd. | 3,126,431 | 3,898 |
| | Iluka Resources Ltd. | 700,039 | 3,879 |
| | Netwealth Group Ltd. | 447,742 | 3,477 |
| | Charter Hall Group | 382,235 | 3,173 |
| | Whitehaven Coal Ltd. | 511,503 | 2,971 |
| * | Pilbara Minerals Ltd. | 899,289 | 2,923 |
| | IGO Ltd. | 271,071 | 2,651 |
| | Orora Ltd. | 1,339,414 | 2,599 |
| * | Omni Bridgeway Ltd. | 891,719 | 2,567 |
| | Deterra Royalties Ltd. | 975,228 | 2,559 |
| *,1 | Tyro Payments Ltd. | 2,595,293 | 2,534 |
| | Mineral Resources Ltd. | 49,760 | 2,333 |
| | Credit Corp. Group Ltd. | 174,063 | 2,069 |
| | Ansell Ltd. | 111,045 | 2,005 |
| | Liberty Financial Group Ltd. | 791,237 | 1,821 |
| *,1 | Temple & Webster Group Ltd. | 476,812 | 1,697 |
| | Nufarm Ltd. | 454,353 | 1,619 |
| | Metcash Ltd. | 571,060 | 1,499 |
| | Elders Ltd. | 168,536 | 1,405 |
| * | Bellevue Gold Ltd. | 2,687,730 | 1,269 |
| | Lovisa Holdings Ltd. | 77,206 | 1,202 |
| | Seven Group Holdings Ltd. | 99,021 | 1,161 |
| | OZ Minerals Ltd. | 74,766 | 1,158 |
| | Reliance Worldwide Corp. Ltd. | 528,787 | 1,086 |
| | Bapcor Ltd. | 234,962 | 994 |
| | Nick Scali Ltd. | 127,420 | 821 |
| *,1 | Vulcan Energy Resources Ltd. | 159,894 | 777 |
| *,1 | Flight Centre Travel Group Ltd. | 58,792 | 626 |
| * | Cleanspace Holdings Ltd. | 1,717,529 | 582 |
| | CSR Ltd. | 165,237 | 489 |
| | | | | | Shares | Market
Value•
($000) |
| | GrainCorp Ltd. Class A | 85,472 | 459 |
| * | SiteMinder Ltd. | 227,960 | 452 |
| | Atlas Arteria Ltd. | 56,130 | 236 |
| | | | | | | 69,852 |
| Austria (0.9%) |
| *,2 | BAWAG Group AG | 116,356 | 5,617 |
| | ANDRITZ AG | 84,680 | 3,935 |
| | Addiko Bank AG | 202,137 | 2,137 |
| | Wienerberger AG | 41,680 | 953 |
| | AT&S Austria Technologie & Systemtechnik AG | 8,743 | 270 |
| | | | | | | 12,912 |
| Belgium (3.4%) |
| | D'ieteren Group | 62,567 | 10,413 |
| | Azelis Group NV | 356,334 | 8,155 |
| | Barco NV | 371,683 | 8,025 |
| | Lotus Bakeries NV | 967 | 5,378 |
| | Warehouses De Pauw CVA | 183,216 | 4,702 |
| | Recticel SA | 274,689 | 3,796 |
| | Aedifica SA | 44,961 | 3,429 |
| | Melexis NV | 36,949 | 2,541 |
| | KBC Ancora | 61,848 | 2,199 |
| *,1,2 | Biocartis Group NV | 196,013 | 236 |
| | | | | | | 48,874 |
| Brazil (1.8%) |
| * | TOTVS SA | 1,102,100 | 7,075 |
| * | TIM SA | 2,143,600 | 5,478 |
| | Rumo SA | 1,219,800 | 5,228 |
| *,2 | Locaweb Servicos de Internet SA | 2,190,800 | 4,636 |
| * | Cia de Saneamento Basico do Estado de Sao Paulo | 269,200 | 3,132 |
| * | Magazine Luiza SA | 256 | — |
| | | | | | | 25,549 |
| Canada (2.7%) |
| * | Kinaxis Inc. | 87,633 | 9,353 |
| * | Nuvei Corp. | 119,983 | 3,608 |
International Explorer Fund
| | | | | | Shares | Market
Value•
($000) |
| | Colliers International Group Inc. | 32,293 | 3,031 |
| * | Docebo Inc. | 100,112 | 2,911 |
| * | Lightspeed Commerce Inc. | 144,623 | 2,771 |
| * | MEG Energy Corp. | 168,197 | 2,515 |
| | Parex Resources Inc. | 157,262 | 2,399 |
| | Endeavour Mining plc | 134,205 | 2,387 |
| | Boardwalk REIT | 61,515 | 2,189 |
| *,1 | Lightspeed Commerce Inc. (XTSE) | 108,851 | 2,086 |
| *,1 | EcoSynthetix Inc. | 644,246 | 2,028 |
| | Stelco Holdings Inc. | 64,095 | 1,614 |
| *,1 | Boat Rocker Media Inc. | 741,886 | 1,514 |
| | | | | | | 38,406 |
| China (0.6%) |
| * | Tongcheng Travel Holdings Ltd. | 1,667,200 | 2,603 |
| | Beijing Enterprises Holdings Ltd. | 915,000 | 2,321 |
| | China Datang Corp. Renewable Power Co. Ltd. Class H | 5,981,000 | 1,615 |
| | Minth Group Ltd. | 430,145 | 848 |
| * | Kingdee International Software Group Co. Ltd. | 312,300 | 512 |
| | Pou Sheng International Holdings Ltd. | 9,530,464 | 480 |
| 2 | IMAX China Holding Inc. | 775,400 | 446 |
| * | Niu Technologies ADR | 64,247 | 168 |
| | | | | | | 8,993 |
| Denmark (1.0%) |
| | Royal Unibrew A/S | 109,305 | 6,244 |
| * | ALK-Abello A/S Class B | 250,429 | 4,141 |
| * | Ascendis Pharma A/S ADR | 20,228 | 2,326 |
| * | Zealand Pharma A/S | 82,866 | 2,134 |
| *,3 | OW Bunker A/S | 1,000,000 | — |
| | | | | | | 14,845 |
| Finland (0.3%) |
| | Kemira OYJ | 182,867 | 2,414 |
| * | Nanoform Finland plc | 420,063 | 1,100 |
| | Wartsila OYJ Abp | 145,050 | 989 |
| | | | | | | 4,503 |
| France (2.5%) |
| | Nexans SA | 66,987 | 6,255 |
| | Trigano SA | 57,333 | 5,868 |
| * | JCDecaux SE | 362,657 | 4,579 |
| | Kaufman & Broad SA | 181,241 | 4,404 |
| * | ESI Group | 32,330 | 2,326 |
| | Rubis SCA | 101,858 | 2,313 |
| 2 | ALD SA | 197,436 | 2,107 |
| | Rothschild & Co. | 58,365 | 2,070 |
| | | | | | Shares | Market
Value•
($000) |
| | L'Occitane International SA | 493,750 | 1,212 |
| | Gaztransport Et Technigaz SA | 10,309 | 1,199 |
| * | Vallourec SA Class A | 101,929 | 1,085 |
| | Vicat SA | 33,260 | 762 |
| | Imerys SA | 17,537 | 718 |
| * | Cellectis SA ADR | 146,217 | 363 |
| *,1 | Cellectis SA | 60,983 | 154 |
| | | | | | | 35,415 |
| Germany (4.5%) |
| | Gerresheimer AG | 116,262 | 6,660 |
| | New Work SE | 52,663 | 6,598 |
| | Hensoldt AG | 244,609 | 5,747 |
| | Dermapharm Holding SE | 149,618 | 5,689 |
| 2 | Befesa SA | 161,485 | 5,609 |
| | Stabilus SE | 80,643 | 4,424 |
| * | Hypoport SE | 43,887 | 4,287 |
| | Jenoptik AG | 192,751 | 4,226 |
| * | HelloFresh SE | 190,616 | 3,810 |
| * | CTS Eventim AG & Co. KGaA | 76,552 | 3,654 |
| | Stemmer Imaging AG | 96,893 | 2,676 |
| | AIXTRON SE | 98,539 | 2,421 |
| * | Tonies SE | 406,400 | 2,039 |
| *,2 | Auto1 Group SE | 238,458 | 1,604 |
| * | Evotec SE | 76,428 | 1,458 |
| | Bertrandt AG | 39,920 | 1,189 |
| 1,2 | Aumann AG | 84,638 | 1,023 |
| * | Immatics NV | 81,466 | 921 |
| * | Cherry AG | 149,681 | 774 |
| * | Jumia Technologies AG ADR | 63,864 | 317 |
| * | Veganz Group AG | 15,898 | 271 |
| | | | | | | 65,397 |
| Hong Kong (1.8%) |
| | Kerry Properties Ltd. | 2,681,500 | 4,242 |
| * | Melco Resorts & Entertainment Ltd. ADR | 687,682 | 3,762 |
| | Hang Lung Properties Ltd. | 2,758,000 | 3,469 |
| | Dah Sing Financial Holdings Ltd. | 1,659,600 | 3,284 |
| | Techtronic Industries Co. Ltd. | 346,500 | 3,281 |
| | Johnson Electric Holdings Ltd. | 2,212,625 | 2,279 |
| * | Mandarin Oriental International Ltd. | 1,354,400 | 2,231 |
| 2 | Crystal International Group Ltd. | 6,289,500 | 1,604 |
| | Vitasoy International Holdings Ltd. | 590,000 | 1,007 |
| * | Hypebeast Ltd. | 12,315,700 | 762 |
International Explorer Fund
| | | | | | Shares | Market
Value•
($000) |
| | Chow Sang Sang Holdings International Ltd. | 404,000 | 373 |
| | Luk Fook Holdings International Ltd. | 81,000 | 176 |
| | | | | | | 26,470 |
| Hungary (0.1%) |
| *,2 | Wizz Air Holdings plc | 22,620 | 444 |
| | MOL Hungarian Oil & Gas plc | 51,646 | 310 |
| | | | | | | 754 |
| India (1.7%) |
| | Apollo Hospitals Enterprise Ltd. | 170,829 | 9,328 |
| | Oberoi Realty Ltd. | 590,288 | 6,607 |
| | Gujarat Pipavav Port Ltd. | 3,634,089 | 3,769 |
| * | CreditAccess Grameen Ltd. | 300,194 | 3,541 |
| | Alembic Pharmaceuticals Ltd. | 199,431 | 1,326 |
| * | Zomato Ltd. | 689,599 | 526 |
| | | | | | | 25,097 |
| Ireland (1.2%) |
| | Bank of Ireland Group plc | 1,013,074 | 7,295 |
| | AIB Group plc | 1,784,719 | 5,163 |
| | Smurfit Kappa Group plc | 105,765 | 3,501 |
| * | Dalata Hotel Group plc | 642,332 | 2,061 |
| | | | | | | 18,020 |
| Israel (1.0%) |
| | Maytronics Ltd. | 510,604 | 5,506 |
| | Melisron Ltd. | 66,622 | 4,943 |
| * | Nayax Ltd. | 105,443 | 2,622 |
| * | Wix.com Ltd. | 21,919 | 1,843 |
| | | | | | | 14,914 |
| Italy (4.0%) |
| | Brunello Cucinelli SpA | 239,142 | 13,862 |
| | Reply SpA | 104,204 | 11,335 |
| | PRADA SpA | 968,200 | 4,411 |
| | Recordati Industria Chimica e Farmaceutica SpA | 110,413 | 4,148 |
| 2 | BFF Bank SpA | 573,845 | 4,048 |
| | Moncler SpA | 90,111 | 3,888 |
| | Stevanato Group SpA | 224,377 | 3,779 |
| 2 | Technogym SpA | 547,154 | 3,762 |
| | Italgas SpA | 654,734 | 3,373 |
| 2 | OVS SpA | 1,556,147 | 2,905 |
| | Salvatore Ferragamo SpA | 109,723 | 1,613 |
| | Buzzi Unicem SpA | 62,131 | 1,031 |
| | | | | | | 58,155 |
| Japan (27.6%) |
| | Food & Life Cos. Ltd. | 944,100 | 15,881 |
| | | | | | Shares | Market
Value•
($000) |
| | Aica Kogyo Co. Ltd. | 404,600 | 8,696 |
| | FP Corp. | 348,900 | 8,301 |
| | Nifco Inc. | 355,200 | 8,249 |
| | Nippon Shinyaku Co. Ltd. | 147,800 | 8,183 |
| | KOMEDA Holdings Co. Ltd. | 479,000 | 8,000 |
| | Kissei Pharmaceutical Co. Ltd. | 443,100 | 7,827 |
| | Miura Co. Ltd. | 379,800 | 7,735 |
| | SBI Holdings Inc. | 426,600 | 7,706 |
| | Calbee Inc. | 382,000 | 7,673 |
| | Musashi Seimitsu Industry Co. Ltd. | 652,700 | 7,533 |
| | Trusco Nakayama Corp. | 558,400 | 7,480 |
| | Sumitomo Forestry Co. Ltd. | 456,300 | 7,138 |
| | Kureha Corp. | 109,600 | 7,037 |
| | Ai Holdings Corp. | 465,000 | 6,883 |
| | GMO Internet Group Inc. | 383,300 | 6,608 |
| * | Raksul Inc. | 328,700 | 6,465 |
| | Katitas Co. Ltd. | 287,900 | 6,443 |
| | Japan Material Co. Ltd. | 445,700 | 5,868 |
| | Nippon Densetsu Kogyo Co. Ltd. | 513,700 | 5,747 |
| | Harmonic Drive Systems Inc. | 167,500 | 5,591 |
| | Daifuku Co. Ltd. | 121,300 | 5,552 |
| | Megachips Corp. | 309,900 | 5,305 |
| | Fukushima Galilei Co. Ltd. | 190,100 | 5,228 |
| | NEC Networks & System Integration Corp. | 481,800 | 5,163 |
| | Kyoritsu Maintenance Co. Ltd. | 124,200 | 5,117 |
| | Hakuhodo DY Holdings Inc. | 599,400 | 5,050 |
| | Heiwa Real Estate Co. Ltd. | 166,900 | 4,628 |
| | Tsugami Corp. | 605,200 | 4,532 |
| | Glory Ltd. | 278,800 | 4,299 |
| | eGuarantee Inc. | 265,700 | 4,291 |
| | Koito Manufacturing Co. Ltd. | 298,800 | 4,242 |
| *,1 | Oisix ra daichi Inc. | 370,000 | 4,174 |
| | Obara Group Inc. | 178,700 | 4,144 |
| | OBIC Business Consultants Co. Ltd. | 141,700 | 4,073 |
| | Tokyo Tatemono Co. Ltd. | 283,400 | 3,897 |
| 1 | Nittoku Co. Ltd. | 228,400 | 3,888 |
| | Kyushu Electric Power Co. Inc. | 774,000 | 3,832 |
| | Fukuoka Financial Group Inc. | 223,600 | 3,805 |
| | Tokyo Century Corp. | 111,300 | 3,796 |
International Explorer Fund
| | | | | | Shares | Market
Value•
($000) |
| | Iriso Electronics Co. Ltd. | 129,300 | 3,746 |
| | DMG Mori Co. Ltd. | 307,100 | 3,554 |
| | Frontier Real Estate Investment Corp. | 997 | 3,520 |
| | Seino Holdings Co. Ltd. | 456,500 | 3,508 |
| | Digital Garage Inc. | 141,000 | 3,376 |
| * | Sansan Inc. | 339,844 | 3,370 |
| | JMDC Inc. | 94,600 | 3,350 |
| | Asahi Intecc Co. Ltd. | 192,606 | 3,281 |
| | Bank of Kyoto Ltd. | 88,700 | 3,196 |
| | Fukuyama Transporting Co. Ltd. | 143,100 | 3,122 |
| | Nikon Corp. | 320,985 | 3,104 |
| *,1 | Bengo4.com Inc. | 143,400 | 3,056 |
| | Comforia Residential REIT Inc. | 1,403 | 2,978 |
| | Outsourcing Inc. | 375,800 | 2,928 |
| *,1 | Universal Entertainment Corp. | 216,900 | 2,927 |
| | Kamakura Shinsho Ltd. | 539,900 | 2,906 |
| | Ulvac Inc. | 73,300 | 2,890 |
| * | Japan Airport Terminal Co. Ltd. | 64,200 | 2,748 |
| *,1 | GA Technologies Co. Ltd. | 282,500 | 2,720 |
| | Optex Group Co. Ltd. | 190,300 | 2,620 |
| *,1 | WealthNavi Inc. | 276,300 | 2,572 |
| | Mani Inc. | 166,100 | 2,420 |
| | dip Corp. | 86,400 | 2,419 |
| | COLOPL Inc. | 512,900 | 2,416 |
| | Asics Corp. | 149,300 | 2,288 |
| | Yamaha Motor Co. Ltd. | 110,760 | 2,286 |
| | Ibiden Co. Ltd. | 66,700 | 2,248 |
| | Shima Seiki Manufacturing Ltd. | 161,100 | 2,248 |
| *,1 | Istyle Inc. | 674,100 | 2,219 |
| | KH Neochem Co. Ltd. | 128,500 | 2,193 |
| | Infomart Corp. | 628,500 | 2,033 |
| | Tokyo Ohka Kogyo Co. Ltd. | 46,600 | 2,009 |
| | JSR Corp. | 102,861 | 1,954 |
| 1 | Kitanotatsujin Corp. | 983,400 | 1,906 |
| | Ichiyoshi Securities Co. Ltd. | 464,834 | 1,883 |
| | Amada Co. Ltd. | 255,700 | 1,798 |
| 1 | Snow Peak Inc. | 136,000 | 1,789 |
| *,1 | JTOWER Inc. | 43,000 | 1,744 |
| | Sojitz Corp. | 114,980 | 1,695 |
| * | Locondo Inc. | 195,500 | 1,635 |
| | IHI Corp. | 65,400 | 1,459 |
| | Nabtesco Corp. | 68,500 | 1,455 |
| | Kawasaki Heavy Industries Ltd. | 80,700 | 1,372 |
| | Ebara Corp. | 42,200 | 1,371 |
| * | Park24 Co. Ltd. | 102,100 | 1,361 |
| | Sumitomo Heavy Industries Ltd. | 64,100 | 1,215 |
| | | | | | Shares | Market
Value•
($000) |
| | Air Water Inc. | 107,200 | 1,197 |
| | Tsuruha Holdings Inc. | 20,000 | 1,162 |
| | THK Co. Ltd. | 66,300 | 1,156 |
| | NET One Systems Co. Ltd. | 55,130 | 1,132 |
| | JGC Holdings Corp. | 93,100 | 1,120 |
| | Anicom Holdings Inc. | 279,200 | 1,116 |
| | NOF Corp. | 32,300 | 1,111 |
| | Fuji Corp. | 80,200 | 1,059 |
| | Inaba Denki Sangyo Co. Ltd. | 56,200 | 1,049 |
| | COMSYS Holdings Corp. | 62,600 | 1,026 |
| | JINS Holdings Inc. | 33,900 | 1,019 |
| | EXEO Group Inc. | 69,300 | 1,015 |
| | Nihon M&A Center Holdings Inc. | 89,700 | 1,012 |
| | Kansai Paint Co. Ltd. | 77,200 | 1,007 |
| | Square Enix Holdings Co. Ltd. | 21,997 | 982 |
| | Showa Denko KK | 66,800 | 975 |
| | Inter Action Corp. | 101,000 | 966 |
| | Ushio Inc. | 91,500 | 950 |
| | Yamato Holdings Co. Ltd. | 62,300 | 923 |
| | TechnoPro Holdings Inc. | 36,200 | 868 |
| | SHO-BOND Holdings Co. Ltd. | 19,000 | 822 |
| | BayCurrent Consulting Inc. | 29,070 | 816 |
| | Mitsubishi Gas Chemical Co. Inc. | 61,600 | 783 |
| | Kyudenko Corp. | 36,000 | 764 |
| | Shin-Etsu Polymer Co. Ltd. | 91,100 | 759 |
| | Marui Group Co. Ltd. | 46,200 | 756 |
| | Kadokawa Corp. | 42,035 | 753 |
| | Disco Corp. | 3,100 | 741 |
| | Max Co. Ltd. | 49,500 | 705 |
| | Simplex Holdings Inc. | 43,750 | 697 |
| | Hino Motors Ltd. | 161,000 | 669 |
| | NSK Ltd. | 125,000 | 661 |
| * | Demae-Can Co. Ltd. | 201,200 | 654 |
| | Comture Corp. | 39,239 | 638 |
| | Seria Co. Ltd. | 37,200 | 608 |
| | MIRAIT ONE Corp. | 63,200 | 607 |
| | Denka Co. Ltd. | 25,800 | 598 |
| | Teijin Ltd. | 65,000 | 590 |
| | Kumagai Gumi Co. Ltd. | 34,700 | 587 |
| | Nippon Shokubai Co. Ltd. | 16,300 | 585 |
| | Lintec Corp. | 36,300 | 545 |
| | Yamazen Corp. | 86,400 | 537 |
| | MEC Co. Ltd. | 33,600 | 537 |
| | Rorze Corp. | 10,500 | 528 |
| | Yokogawa Bridge Holdings Corp. | 39,600 | 526 |
International Explorer Fund
| | | | | | Shares | Market
Value•
($000) |
| | Japan Steel Works Ltd. | 24,800 | 512 |
| * | Uzabase Inc. | 104,300 | 499 |
| | Sekisui Jushi Corp. | 43,500 | 498 |
| 1 | GMO Financial Gate Inc. | 5,025 | 469 |
| | Giken Ltd. | 19,700 | 424 |
| | Toyo Construction Co. Ltd. | 67,000 | 405 |
| | Shibaura Machine Co. Ltd. | 19,600 | 380 |
| | Ichikoh Industries Ltd. | 34,300 | 98 |
| | | | | | | 399,544 |
| Mexico (0.4%) |
| | Corp. Inmobiliaria Vesta SAB de CV | 1,595,800 | 3,468 |
| | Grupo Aeroportuario del Pacifico SAB de CV Class B | 153,558 | 2,379 |
| | | | | | | 5,847 |
| Netherlands (1.9%) |
| | BE Semiconductor Industries NV | 161,816 | 8,247 |
| | TKH Group NV | 189,462 | 6,700 |
| | ASM International NV | 23,357 | 5,167 |
| *,2 | Alfen Beheer BV | 31,439 | 3,335 |
| | Allfunds Group plc | 305,805 | 1,923 |
| | Corbion NV | 34,414 | 916 |
| 2 | CTP NV | 82,976 | 861 |
| | | | | | | 27,149 |
| New Zealand (0.2%) |
| * | Volpara Health Technologies Ltd. | 2,748,429 | 1,184 |
| | Fletcher Building Ltd. | 389,173 | 1,162 |
| | | | | | | 2,346 |
| Norway (0.4%) |
| | Borregaard ASA | 284,031 | 3,819 |
| | Aker ASA Class A | 21,736 | 1,534 |
| | Subsea 7 SA | 70,991 | 708 |
| | | | | | | 6,061 |
| Other (0.6%) |
| 1 | iShares MSCI EAFE Small-Cap ETF | 164,542 | 8,382 |
| Philippines (0.3%) |
| | Wilcon Depot Inc. | 8,101,000 | 4,117 |
| Poland (0.1%) |
| 1 | Grupa Pracuj SA | 175,848 | 1,670 |
| Singapore (1.1%) |
| | Venture Corp. Ltd. | 443,700 | 4,993 |
| * | SATS Ltd. | 1,998,700 | 3,858 |
| | CapitaLand Ascott Trust | 4,804,500 | 3,239 |
| | Suntec REIT | 2,812,900 | 2,565 |
| | ComfortDelGro Corp. Ltd. | 931,700 | 837 |
| | | | | | | 15,492 |
| | | | | | Shares | Market
Value•
($000) |
| South Africa (0.4%) |
| 1 | Thungela Resources Ltd. | 253,090 | 3,863 |
| * | Discovery Ltd. | 193,720 | 1,267 |
| | | | | | | 5,130 |
| South Korea (1.0%) |
| | Koh Young Technology Inc. | 540,695 | 4,523 |
| | Douzone Bizon Co. Ltd. | 162,887 | 3,481 |
| | PI Advanced Materials Co. Ltd. | 109,379 | 2,271 |
| | Park Systems Corp. | 19,921 | 1,530 |
| | Hanon Systems | 169,206 | 925 |
| * | Cafe24 Corp. | 108,131 | 765 |
| | SNT Motiv Co. Ltd. | 24,501 | 758 |
| | NCSoft Corp. | 2,694 | 736 |
| | | | | | | 14,989 |
| Spain (0.7%) |
| | Bankinter SA | 590,185 | 3,570 |
| | Fluidra SA | 231,305 | 3,142 |
| | Almirall SA | 318,346 | 2,966 |
| * | Arima Real Estate SOCIMI SA | 81,451 | 608 |
| | | | | | | 10,286 |
| Sweden (5.4%) |
| | Avanza Bank Holding AB | 649,603 | 12,958 |
| | Trelleborg AB Class B | 392,437 | 8,641 |
| | AddTech AB Class B | 595,491 | 7,195 |
| | Hemnet Group AB | 522,368 | 6,490 |
| * | Cint Group AB | 1,129,018 | 5,946 |
| | HMS Networks AB | 147,675 | 3,799 |
| | Billerud AB | 287,834 | 3,716 |
| | INVISIO AB | 228,642 | 3,393 |
| | Paradox Interactive AB | 185,744 | 3,208 |
| | Hufvudstaden AB Class A | 237,625 | 2,832 |
| | Catena AB | 72,372 | 2,458 |
| | Arjo AB Class B | 601,988 | 2,401 |
| | Sweco AB Class B | 291,112 | 2,187 |
| | SSAB AB Class A | 436,676 | 2,100 |
| | Cellavision AB | 108,819 | 2,041 |
| * | Surgical Science Sweden AB | 131,025 | 1,889 |
| 2 | Thule Group AB | 94,501 | 1,862 |
| * | Xvivo Perfusion AB | 81,959 | 1,179 |
| * | VNV Global AB | 512,570 | 1,100 |
| *,1 | Embracer Group AB Class B | 221,056 | 1,063 |
| * | Bactiguard Holding AB Class B | 93,579 | 951 |
| *,1 | Storytel AB | 125,017 | 442 |
| | Nyfosa AB | 68,261 | 408 |
| | | | | | | 78,259 |
| Switzerland (3.8%) |
| *,2 | Sensirion Holding AG | 83,931 | 7,636 |
International Explorer Fund
| | | | | | Shares | Market
Value•
($000) |
| | Julius Baer Group Ltd. | 155,137 | 7,443 |
| | Tecan Group AG (Registered) | 17,260 | 6,332 |
| * | SIG Group AG | 300,051 | 5,768 |
| | Bossard Holding AG (Registered) Class A | 22,128 | 4,393 |
| * | Siegfried Holding AG (Registered) | 7,013 | 4,175 |
| *,2 | PolyPeptide Group AG | 134,085 | 3,899 |
| | Comet Holding AG (Registered) | 23,746 | 3,780 |
| *,2 | Montana Aerospace AG | 317,260 | 3,638 |
| * | u-blox Holding AG | 24,655 | 2,524 |
| * | Dufry AG (Registered) | 76,058 | 2,509 |
| | Cembra Money Bank AG | 24,223 | 1,757 |
| | Emmi AG (Registered) | 1,198 | 956 |
| | | | | | | 54,810 |
| Taiwan (4.1%) |
| | Airtac International Group | 568,593 | 13,011 |
| | Chroma ATE Inc. | 1,807,694 | 9,869 |
| | Global Unichip Corp. | 501,000 | 7,536 |
| | Voltronic Power Technology Corp. | 142,252 | 5,768 |
| | ASPEED Technology Inc. | 88,200 | 4,572 |
| | Giant Manufacturing Co. Ltd. | 662,000 | 4,213 |
| | Nien Made Enterprise Co. Ltd. | 475,000 | 3,662 |
| | Advantech Co. Ltd. | 344,000 | 3,117 |
| | Sinbon Electronics Co. Ltd. | 358,000 | 2,780 |
| | Vanguard International Semiconductor Corp. | 1,267,000 | 2,601 |
| | TCI Co. Ltd. | 303,000 | 1,009 |
| | Realtek Semiconductor Corp. | 94,248 | 743 |
| | Nanya Technology Corp. | 304,000 | 513 |
| | Parade Technologies Ltd. | 3,000 | 57 |
| | | | | | | 59,451 |
| United Kingdom (15.9%) |
| | Beazley plc | 1,715,117 | 12,301 |
| | Spectris plc | 324,283 | 11,239 |
| | IMI plc | 636,601 | 8,968 |
| | Safestore Holdings plc | 812,926 | 8,422 |
| | Rotork plc | 2,743,829 | 8,042 |
| *,2 | Network International Holdings plc | 2,038,798 | 7,635 |
| | RS Group plc | 667,567 | 7,346 |
| | Games Workshop Group plc | 89,460 | 6,567 |
| | Cranswick plc | 172,575 | 5,892 |
| * | Abcam plc | 332,759 | 5,151 |
| *,2 | Trainline plc | 1,233,494 | 4,694 |
| | | | | | Shares | Market
Value•
($000) |
| *,1 | Victoria plc | 804,284 | 4,655 |
| | Softcat plc | 342,846 | 4,405 |
| | Pennon Group plc | 456,921 | 4,391 |
| | Alpha FX Group plc | 191,995 | 4,180 |
| 2 | ConvaTec Group plc | 1,670,256 | 4,179 |
| | Keywords Studios plc | 150,955 | 4,174 |
| | QinetiQ Group plc | 980,000 | 4,039 |
| | Smart Metering Systems plc | 477,701 | 4,008 |
| | Telecom Plus plc | 160,000 | 3,890 |
| | Dunelm Group plc | 380,000 | 3,772 |
| | Weir Group plc | 215,000 | 3,746 |
| | Pets at Home Group plc | 1,090,000 | 3,604 |
| | LondonMetric Property plc | 1,630,559 | 3,497 |
| | IG Group Holdings plc | 360,000 | 3,284 |
| | Halma plc | 135,000 | 3,274 |
| * | Verona Pharma plc ADR | 250,919 | 3,212 |
| * | National Express Group plc | 1,624,995 | 3,150 |
| | Burford Capital Ltd. | 389,030 | 3,145 |
| | Dechra Pharmaceuticals plc | 101,000 | 3,036 |
| 2 | Auto Trader Group plc | 500,000 | 2,993 |
| | NCC Group plc | 1,280,000 | 2,927 |
| | Berkeley Group Holdings plc | 73,550 | 2,926 |
| * | FD Technologies plc | 187,787 | 2,888 |
| * | SSP Group plc | 1,162,185 | 2,702 |
| * | Team17 Group plc | 560,741 | 2,651 |
| | Diploma plc | 90,000 | 2,560 |
| | Bodycote plc | 450,000 | 2,559 |
| | Redrow plc | 530,000 | 2,550 |
| * | Immunocore Holdings plc ADR | 43,562 | 2,489 |
| | Vistry Group plc | 330,000 | 2,283 |
| * | WH Smith plc | 163,832 | 2,215 |
| | Harbour Energy plc | 495,264 | 2,149 |
| | Energean plc | 127,754 | 2,100 |
| | Derwent London plc | 82,915 | 2,052 |
| | B&M European Value Retail SA | 544,444 | 2,012 |
| | Renishaw plc | 50,000 | 2,006 |
| | Greggs plc | 83,818 | 1,943 |
| | Serica Energy plc | 525,688 | 1,816 |
| * | Wise plc Class A | 235,000 | 1,790 |
| | Smiths Group plc | 96,513 | 1,729 |
| * | Hyve Group plc | 2,741,451 | 1,682 |
| 2 | Sabre Insurance Group plc | 1,575,767 | 1,624 |
| | dotdigital group plc | 1,794,282 | 1,559 |
| | UNITE Group plc | 150,518 | 1,538 |
| * | Molten Ventures plc | 407,163 | 1,493 |
| 2 | Petershill Partners plc | 650,000 | 1,475 |
| | Segro plc | 160,000 | 1,440 |
| | Keller Group plc | 194,578 | 1,400 |
International Explorer Fund
| | | | | | Shares | Market
Value•
($000) |
| | Intermediate Capital Group plc | 112,657 | 1,372 |
| 2 | Bridgepoint Group plc | 550,000 | 1,257 |
| * | Restaurant Group plc | 3,400,911 | 1,240 |
| *,2 | DP Eurasia NV | 2,357,397 | 1,048 |
| * | Angle plc | 1,598,871 | 1,028 |
| | Impax Asset Management Group plc | 125,777 | 965 |
| *,1 | Naked Wines plc | 699,191 | 874 |
| * | Hotel Chocolat Group plc | 497,672 | 838 |
| | Synthomer plc | 470,619 | 609 |
| | Marshalls plc | 87,426 | 253 |
| * | easyJet plc | 60,795 | 242 |
| *,1 | Arrival SA | 228,747 | 177 |
| | | | | | | 229,352 |
| United States (0.1%) |
| * | Merus NV | 87,382 | 1,791 |
Total Common Stocks
(Cost $1,563,015) | 1,392,832 |
| Temporary Cash Investments (5.8%) |
| Money Market Fund (5.3%) |
| 4,5 | Vanguard Market Liquidity Fund, 3.117% | 771,601 | 77,144 |
| | | | | | Face
Amount
($000) | Market
Value•
($000) |
| Repurchase Agreements (0.5%) |
| | Goldman Sachs & Co.
2.980%, 11/1/2022 (Dated 10/31/22, Repurchase Value $6,901,000, collateralized by Fannie Mae 2.500%–6.000%, 10/1/31–12/1/51, and Freddie Mac 2.500%–5.500%, 7/1/43–4/1/52, with a value of $7,038,000) | 6,900 | 6,900 |
Total Temporary Cash Investments
(Cost $84,028) | 84,044 |
Total Investments (102.1%)
(Cost $1,647,043) | | 1,476,876 |
| Other Assets and Liabilities—Net (-2.1%) | | (30,002) |
| Net Assets (100%) | | 1,446,874 |
| • | See Note A in Notes to Financial Statements. |
| * | Non-income-producing security. |
| 1 | Includes partial security positions on loan to broker-dealers. The total value of securities on loan is $30,278,000. |
| 2 | Security exempt from registration under Rule 144A of the Securities Act of 1933. Such securities may be sold in transactions exempt from registration, normally to qualified institutional buyers. At October 31, 2022, the aggregate value was $80,177,000, representing 5.5% of net assets. |
| 3 | Security value determined using significant unobservable inputs. |
| 4 | Affiliated money market fund available only to Vanguard funds and certain trusts and accounts managed by Vanguard. Rate shown is the 7-day yield. |
| 5 | Collateral of $33,985,000 was received for securities on loan. |
| | ADR—American Depositary Receipt. |
| | REIT—Real Estate Investment Trust. |
International Explorer Fund
Derivative Financial Instruments Outstanding as of Period End
| Futures Contracts |
| | | | ($000) |
| | Expiration | Number of
Long (Short)
Contracts | Notional
Amount | Value and
Unrealized
Appreciation
(Depreciation) |
| Long Futures Contracts |
| MSCI EAFE Index | December 2022 | 224 | 19,666 | 1,115 |
| MSCI Emerging Market Index | December 2022 | 210 | 8,963 | (144) |
| | | | | 971 |
See accompanying Notes, which are an integral part of the Financial Statements.
International Explorer Fund
Statement of Assets and Liabilities
|
| ($000s, except shares and per-share amounts) | Amount |
| Assets | |
| Investments in Securities, at Value1 | |
| Unaffiliated Issuers (Cost $1,569,915) | 1,399,732 |
| Affiliated Issuers (Cost $77,128) | 77,144 |
| Total Investments in Securities | 1,476,876 |
| Investment in Vanguard | 62 |
| Cash | 5,264 |
| Foreign Currency, at Value (Cost $941) | 942 |
| Cash Collateral Pledged—Futures Contracts | 1,730 |
| Receivables for Investment Securities Sold | 12,703 |
| Receivables for Accrued Income | 8,563 |
| Receivables for Capital Shares Issued | 303 |
| Total Assets | 1,506,443 |
| Liabilities | |
| Payables for Investment Securities Purchased | 18,666 |
| Collateral for Securities on Loan | 33,985 |
| Payables for Capital Shares Redeemed | 5,358 |
| Payables to Investment Advisor | 940 |
| Payables to Vanguard | 375 |
| Variation Margin Payable—Futures Contracts | 245 |
| Total Liabilities | 59,569 |
| Net Assets | 1,446,874 |
| 1 Includes $30,278 of securities on loan. | |
At October 31, 2022, net assets consisted of: |
|
| | |
| Paid-in Capital | 1,741,756 |
| Total Distributable Earnings (Loss) | (294,882) |
| Net Assets | 1,446,874 |
| | |
| Net Assets | |
Applicable to 104,343,224 outstanding $.001 par value shares of
beneficial interest (unlimited authorization) | 1,446,874 |
| Net Asset Value Per Share | $13.87 |
See accompanying Notes, which are an integral part of the Financial Statements.
International Explorer Fund
|
| | Year Ended
October 31, 2022 |
| | ($000) |
| Investment Income | |
| Income | |
| Dividends1 | 46,520 |
| Interest2 | 770 |
| Securities Lending—Net | 939 |
| Total Income | 48,229 |
| Expenses | |
| Investment Advisory Fees—Note B | |
| Basic Fee | 5,646 |
| Performance Adjustment | (1,133) |
| The Vanguard Group—Note C | |
| Management and Administrative | 3,184 |
| Marketing and Distribution | 147 |
| Custodian Fees | 208 |
| Auditing Fees | 35 |
| Shareholders’ Reports | 97 |
| Trustees’ Fees and Expenses | 1 |
| Other Expenses | 288 |
| Total Expenses | 8,473 |
| Expenses Paid Indirectly | (2) |
| Net Expenses | 8,471 |
| Net Investment Income | 39,758 |
| Realized Net Gain (Loss) | |
| Investment Securities Sold2 | (120,780) |
| Futures Contracts | (18,360) |
| Foreign Currencies | (1,493) |
| Realized Net Gain (Loss) | (140,633) |
| Change in Unrealized Appreciation (Depreciation) | |
| Investment Securities2 | (836,907) |
| Futures Contracts | 1,470 |
| Foreign Currencies | (388) |
| Change in Unrealized Appreciation (Depreciation) | (835,825) |
| Net Increase (Decrease) in Net Assets Resulting from Operations | (936,700) |
| 1 | Dividends include foreign tax reclaims of $4,302,000 and are net of foreign withholding taxes of $5,343,000. |
| 2 | Interest income, realized net gain (loss), capital gain distributions received, and change in unrealized appreciation (depreciation) from an affiliated company of the fund were $682,000, ($29,000), $2,000, and $10,000, respectively. Purchases and sales are for temporary cash investment purposes. |
See accompanying Notes, which are an integral part of the Financial Statements.
International Explorer Fund
Statement of Changes in Net Assets
|
| | Year Ended October 31, |
| | 2022
($000) | 2021
($000) |
| Increase (Decrease) in Net Assets | | |
| Operations | | |
| Net Investment Income | 39,758 | 36,253 |
| Realized Net Gain (Loss) | (140,633) | 359,948 |
| Change in Unrealized Appreciation (Depreciation) | (835,825) | 411,374 |
| Net Increase (Decrease) in Net Assets Resulting from Operations | (936,700) | 807,575 |
| Distributions | | |
| Total Distributions | (121,682) | (29,013) |
| Capital Share Transactions | | |
| Issued | 212,144 | 270,839 |
| Issued in Lieu of Cash Distributions | 102,893 | 25,535 |
| Redeemed | (624,760) | (588,908) |
| Net Increase (Decrease) from Capital Share Transactions | (309,723) | (292,534) |
| Total Increase (Decrease) | (1,368,105) | 486,028 |
| Net Assets | | |
| Beginning of Period | 2,814,979 | 2,328,951 |
| End of Period | 1,446,874 | 2,814,979 |
See accompanying Notes, which are an integral part of the Financial Statements.
International Explorer Fund
For a Share Outstanding
Throughout Each Period | Year Ended October 31, |
| 2022 | 2021 | 2020 | 2019 | 2018 |
| Net Asset Value, Beginning of Period | $22.70 | $16.90 | $17.22 | $17.86 | $21.87 |
| Investment Operations | | | | | |
| Net Investment Income1 | .337 | .280 | .211 | .379 | .369 |
| Net Realized and Unrealized Gain (Loss) on Investments | (8.145) | 5.736 | (.081) | .300 | (3.032) |
| Total from Investment Operations | (7.808) | 6.016 | .130 | .679 | (2.663) |
| Distributions | | | | | |
| Dividends from Net Investment Income | (.487) | (.216) | (.450) | (.289) | (.447) |
| Distributions from Realized Capital Gains | (.535) | — | — | (1.030) | (.900) |
| Total Distributions | (1.022) | (.216) | (.450) | (1.319) | (1.347) |
| Net Asset Value, End of Period | $13.87 | $22.70 | $16.90 | $17.22 | $17.86 |
| Total Return2 | -35.83% | 35.79% | 0.62% | 4.85% | -13.08% |
| Ratios/Supplemental Data | | | | | |
| Net Assets, End of Period (Millions) | $1,447 | $2,815 | $2,329 | $3,163 | $3,649 |
| Ratio of Total Expenses to Average Net Assets3 | 0.41%4 | 0.40% | 0.39% | 0.39% | 0.39% |
| Ratio of Net Investment Income to Average Net Assets | 1.94% | 1.30% | 1.29% | 2.28% | 1.75% |
| Portfolio Turnover Rate | 60% | 51% | 71% | 35% | 40% |
| 1 | Calculated based on average shares outstanding. |
| 2 | Total returns do not include account service fees that may have applied in the periods shown. Fund prospectuses provide information about any applicable account service fees. |
| 3 | Includes performance-based investment advisory fee increases (decreases) of (0.06%), (0.05%), (0.04%), (0.03%), and (0.01%). |
| 4 | The ratio of expenses to average net assets for the period net of reduction from broker commission abatement arrangements was 0.41%. |
See accompanying Notes, which are an integral part of the Financial Statements.
International Explorer Fund
Notes to Financial Statements
Vanguard International Explorer Fund is registered under the Investment Company Act of 1940 as an open-end investment company, or mutual fund. The fund invests in securities of foreign issuers, which may subject it to investment risks not normally associated with investing in securities of U.S. corporations. Significant market disruptions, such as those caused by pandemics (e.g., COVID-19 pandemic), natural or environmental disasters, war (e.g., Russia's invasion of Ukraine), acts of terrorism, or other events, can adversely affect local and global markets and normal market operations. Any such disruptions could have an adverse impact on the value of the fund's investments and fund performance.
A. The following significant accounting policies conform to generally accepted accounting principles for U.S. investment companies. The fund consistently follows such policies in preparing its financial statements.
1. Security Valuation: Securities are valued as of the close of trading on the New York Stock Exchange (generally 4 p.m., Eastern time) on the valuation date. Equity securities are valued at the latest quoted sales prices or official closing prices taken from the primary market in which each security trades; such securities not traded on the valuation date are valued at the mean of the latest quoted bid and asked prices. Securities for which market quotations are not readily available, or whose values have been affected by events occurring before the fund’s pricing time but after the close of the securities’ primary markets, are valued by methods deemed by the valuation designee to represent fair value and subject to oversight by the board of trustees. These procedures include obtaining quotations from an independent pricing service, monitoring news to identify significant market- or security-specific events, and evaluating changes in the values of foreign market proxies (for example, ADRs, futures contracts, or exchange-traded funds), between the time the foreign markets close and the fund’s pricing time. When fair-value pricing is employed, the prices of securities used by a fund to calculate its net asset value may differ from quoted or published prices for the same securities. Investments in Vanguard Market Liquidity Fund are valued at that fund's net asset value.
2. Foreign Currency: Securities and other assets and liabilities denominated in foreign currencies are translated into U.S. dollars using exchange rates obtained from an independent third party as of the fund’s pricing time on the valuation date. Realized gains (losses) and unrealized appreciation (depreciation) on investment securities include the effects of changes in exchange rates since the securities were purchased, combined with the effects of changes in security prices. Fluctuations in the value of other assets and liabilities resulting from changes in exchange rates are recorded as unrealized foreign currency gains (losses) until the assets or liabilities are settled in cash, at which time they are recorded as realized foreign currency gains (losses).
3. Repurchase Agreements: The fund enters into repurchase agreements with institutional counterparties. Securities pledged as collateral to the fund under repurchase agreements are held by a custodian bank until the agreements mature, and in the absence of a default, such collateral cannot be repledged, resold, or rehypothecated. Each agreement requires that the market value of the collateral be sufficient to cover payments of interest and principal. The fund further mitigates its counterparty risk by entering into repurchase agreements only with a diverse group of prequalified counterparties, monitoring their financial strength, and entering into master repurchase agreements with its counterparties. The master repurchase agreements provide that, in the event of a counterparty's default (including bankruptcy), the fund may terminate any repurchase agreements with that counterparty, determine the net amount owed, and sell or retain the collateral up to the net amount owed to the fund. Such action may be subject to legal proceedings, which may delay or limit the disposition of collateral.
International Explorer Fund
4. Futures Contracts: The fund uses index futures contracts to a limited extent, with the objective of maintaining full exposure to the stock market while maintaining liquidity. The fund may purchase or sell futures contracts to achieve a desired level of investment, whether to accommodate portfolio turnover or cash flows from capital share transactions. The primary risks associated with the use of futures contracts are imperfect correlation between changes in market values of stocks held by the fund and the prices of futures contracts, and the possibility of an illiquid market. Counterparty risk involving futures is mitigated because a regulated clearinghouse is the counterparty instead of the clearing broker. To further mitigate counterparty risk, the fund trades futures contracts on an exchange, monitors the financial strength of its clearing brokers and clearinghouse, and has entered into clearing agreements with its clearing brokers. The clearinghouse imposes initial margin requirements to secure the fund’s performance and requires daily settlement of variation margin representing changes in the market value of each contract. Any securities pledged as initial margin for open contracts are noted in the Schedule of Investments.
Futures contracts are valued at their quoted daily settlement prices. The notional amounts of the contracts are not recorded in the Statement of Assets and Liabilities. Fluctuations in the value of the contracts are recorded in the Statement of Assets and Liabilities as an asset (liability) and in the Statement of Operations as unrealized appreciation (depreciation) until the contracts are closed, when they are recorded as realized gains (losses) on futures contracts.
During the year ended October 31, 2022, the fund’s average investments in long and short futures contracts represented 2% and 0% of net assets, respectively, based on the average of the notional amounts at each quarter-end during the period.
5. Federal Income Taxes: The fund intends to continue to qualify as a regulated investment company and distribute virtually all of its taxable income. The fund’s tax returns are open to examination by the relevant tax authorities until expiration of the applicable statute of limitations, which is generally three years after the filing of the tax return. Management has analyzed the fund’s tax positions taken for all open federal and state income tax years, and has concluded that no provision for income tax is required in the fund’s financial statements.
6. Distributions: Distributions to shareholders are recorded on the ex-dividend date. Distributions are determined on a tax basis at the fiscal year-end and may differ from net investment income and realized capital gains for financial reporting purposes.
7. Securities Lending: To earn additional income, the fund lends its securities to qualified institutional borrowers. Security loans are subject to termination by the fund at any time, and are required to be secured at all times by collateral in an amount at least equal to the market value of securities loaned. Daily market fluctuations could cause the value of loaned securities to be more or less than the value of the collateral received. When this occurs, the collateral is adjusted and settled before the opening of the market on the next business day. The fund further mitigates its counterparty risk by entering into securities lending transactions only with a diverse group of prequalified counterparties, monitoring their financial strength, and entering into master securities lending agreements with its counterparties. The master securities lending agreements provide that, in the event of a counterparty’s default (including bankruptcy), the fund may terminate any loans with that borrower, determine the net amount owed, and sell or retain the collateral up to the net amount owed to the fund; however, such actions may be subject to legal proceedings. While collateral mitigates counterparty risk, in the event of a default, the fund may experience delays and costs in recovering the securities loaned. The fund invests cash collateral received in Vanguard Market Liquidity Fund, and records a liability in the Statement of Assets and Liabilities
International Explorer Fund
for the return of the collateral, during the period the securities are on loan. Collateral investments in Vanguard Market Liquidity Fund are subject to market appreciation or depreciation. Securities lending income represents fees charged to borrowers plus income earned on invested cash collateral, less expenses associated with the loan. During the term of the loan, the fund is entitled to all distributions made on or in respect of the loaned securities.
8. Credit Facilities and Interfund Lending Program: The fund and certain other funds managed by The Vanguard Group ("Vanguard") participate in a $4.4 billion committed credit facility provided by a syndicate of lenders pursuant to a credit agreement and an uncommitted credit facility provided by Vanguard. Both facilities may be renewed annually. Each fund is individually liable for its borrowings, if any, under the credit facilities. Borrowings may be utilized for temporary or emergency purposes and are subject to the fund’s regulatory and contractual borrowing restrictions. With respect to the committed credit facility, the participating funds are charged administrative fees and an annual commitment fee of 0.10% of the undrawn committed amount of the facility, which are allocated to the funds based on a method approved by the fund’s board of trustees and included in Management and Administrative expenses on the fund’s Statement of Operations. Any borrowings under either facility bear interest at an agreed-upon spread plus the higher of the federal funds effective rate, the overnight bank funding rate, or the Daily Simple Secured Overnight Financing Rate inclusive of an additional agreed-upon spread. However, borrowings under the uncommitted credit facility may bear interest based upon an alternate rate agreed to by the fund and Vanguard.
In accordance with an exemptive order (the “Order”) from the SEC, the fund may participate in a joint lending and borrowing program that allows registered open-end Vanguard funds to borrow money from and lend money to each other for temporary or emergency purposes (the “Interfund Lending Program”), subject to compliance with the terms and conditions of the Order, and to the extent permitted by the fund’s investment objective and investment policies. Interfund loans and borrowings normally extend overnight but can have a maximum duration of seven days. Loans may be called on one business day’s notice. The interest rate to be charged is governed by the conditions of the Order and internal procedures adopted by the board of trustees. The board of trustees is responsible for overseeing the Interfund Lending Program.
For the year ended October 31, 2022, the fund did not utilize the credit facilities or the Interfund Lending Program.
9. Other: Dividend income is recorded on the ex-dividend date. Non-cash dividends included in income, if any, are recorded at the fair value of the securities received. Interest income includes income distributions received from Vanguard Market Liquidity Fund and is accrued daily. Security transactions are accounted for on the date securities are bought or sold. Costs used to determine realized gains (losses) on the sale of investment securities are those of the specific securities sold.
Taxes on foreign dividends and capital gains have been provided for in accordance with the fund’s understanding of the applicable countries’ tax rules and rates. Deferred foreign capital gains tax, if any, is accrued daily based upon net unrealized gains. The fund has filed tax reclaims for previously withheld taxes on dividends earned in certain European Union countries. These filings are subject to various administrative and judicial proceedings within these countries. Amounts related to these reclaims are recorded when there are no significant uncertainties as to the ultimate resolution of proceedings, the likelihood of receipt of these reclaims, and the potential timing of payment. Such tax reclaims and related professional fees, if any, are included in dividend income and other expenses, respectively.
International Explorer Fund
B. The investment advisory firms Wellington Management Company llp, Schroder Investment Management North America Inc., and Baillie Gifford Overseas Ltd. each provide investment advisory services to a portion of the fund for a fee calculated at an annual percentage rate of average net assets managed by the advisor. The basic fees of Wellington Management Company llp and Schroder Investment Management North America Inc. are subject to quarterly adjustments based on performance relative to the benchmark for the preceding three years; prior to October 1, 2022, the benchmark was S&P EPAC SmallCap Index and thereafter the new benchmark is MSCI EAFE Small Cap Index. The benchmark change will be fully phased in by October 2025. The basic fee of Baillie Gifford Overseas Ltd. is subject to quarterly adjustments based on performance relative to the MSCI All Country World Index ex US Small-Cap Index since October 31, 2020. Until September 2022, a portion of the fund was managed by TimesSquare Capital Management, LLC. The basic fee paid to TimesSquare Capital Management, LLC, was subject to quarterly adjustments based on performance relative to the S&P EPAC SmallCap Index for the preceding three years.
Vanguard manages the cash reserves of the fund as described below.
For the year ended October 31, 2022, the aggregate investment advisory fee represented an effective annual basic rate of 0.27% of the fund’s average net assets, before a decrease of $1,133,000 (0.06%) based on performance.
C. In accordance with the terms of a Funds’ Service Agreement (the “FSA”) between Vanguard and the fund, Vanguard furnishes to the fund corporate management, administrative, marketing, distribution, and cash management services at Vanguard’s cost of operations (as defined by the FSA). These costs of operations are allocated to the fund based on methods and guidelines approved by the board of trustees and are generally settled twice a month.
Upon the request of Vanguard, the fund may invest up to 0.40% of its net assets as capital in Vanguard. At October 31, 2022, the fund had contributed to Vanguard capital in the amount of $62,000, representing less than 0.01% of the fund’s net assets and 0.02% of Vanguard’s capital received pursuant to the FSA. The fund’s trustees and officers are also directors and employees, respectively, of Vanguard.
D. The fund has asked its investment advisor to direct certain security trades, subject to obtaining the best price and execution, to brokers who have agreed to rebate to the fund part of the commissions generated. Such rebates are used solely to reduce the fund’s management and administrative expenses. For the year ended October 31, 2022, these arrangements reduced the fund’s expenses by $2,000 (an annual rate of less than 0.01% of average net assets).
E. Various inputs may be used to determine the value of the fund’s investments and derivatives. These inputs are summarized in three broad levels for financial statement purposes. The inputs or methodologies used to value securities are not necessarily an indication of the risk associated with investing in those securities.
Level 1—Quoted prices in active markets for identical securities.
Level 2—Other significant observable inputs (including quoted prices for similar securities, interest rates, prepayment speeds, credit risk, etc.).
Level 3—Significant unobservable inputs (including the fund’s own assumptions used to determine the fair value of investments). Any investments and derivatives valued with significant unobservable inputs are noted on the Schedule of Investments.
International Explorer Fund
The following table summarizes the market value of the fund's investments and derivatives as of October 31, 2022, based on the inputs used to value them:
| | Level 1
($000) | Level 2
($000) | Level 3
($000) | Total
($000) |
| Investments | | | | |
| Assets | | | | |
| Common Stocks | 99,332 | 1,293,500 | — | 1,392,832 |
| Temporary Cash Investments | 77,144 | 6,900 | — | 84,044 |
| Total | 176,476 | 1,300,400 | — | 1,476,876 |
| | | | |
| Derivative Financial Instruments | | | | |
| Assets | | | | |
| Futures Contracts1 | 1,115 | — | — | 1,115 |
| Liabilities | | | | |
| Futures Contracts1 | 144 | — | — | 144 |
| 1 | Includes cumulative appreciation (depreciation) on futures contracts and centrally cleared swaps, if any, as reported in the Schedule of Investments. Only current day’s variation margin is reported within the Statement of Assets and Liabilities. |
F. Permanent differences between book-basis and tax-basis components of net assets are reclassified among capital accounts in the financial statements to reflect their tax character. These reclassifications have no effect on net assets or net asset value per share. As of period end, permanent differences primarily attributable to the accounting for applicable foreign currency transactions and passive foreign investment companies were reclassified between the individual components of total distributable earnings (loss).
Temporary differences between book-basis and tax-basis components of total distributable earnings (loss) arise when certain items of income, gain, or loss are recognized in different periods for financial statement and tax purposes; these differences will reverse at some time in the future. The differences are primarily related to the deferral of losses from wash sales; the recognition of unrealized gains or losses from certain derivative contracts; and the recognition of unrealized gains from passive foreign investment companies. As of period end, the tax-basis components of total distributable earnings (loss) are detailed in the table as follows:
| | Amount
($000) |
| Undistributed Ordinary Income | 24,429 |
| Undistributed Long-Term Gains | — |
| Capital Loss Carryforwards | (122,835) |
| Qualified Late-Year Losses | — |
| Net Unrealized Gains (Losses) | (198,857) |
International Explorer Fund
The tax character of distributions paid was as follows:
| | Year Ended October 31, |
| | 2022
Amount
($000) | 2021
Amount
($000) |
| Ordinary Income* | 88,637 | 29,013 |
| Long-Term Capital Gains | 33,045 | — |
| Total | 121,682 | 29,013 |
| * | Includes short-term capital gains, if any. |
As of October 31, 2022, gross unrealized appreciation and depreciation for investments and derivatives based on cost for U.S. federal income tax purposes were as follows:
| | Amount
($000) |
| Tax Cost | 1,675,725 |
| Gross Unrealized Appreciation | 147,753 |
| Gross Unrealized Depreciation | (346,602) |
| Net Unrealized Appreciation (Depreciation) | (198,849) |
G. During the year ended October 31, 2022, the fund purchased $1,175,417,000 of investment securities and sold $1,523,149,000 of investment securities, other than temporary cash investments.
The fund purchased securities from and sold securities to other funds or accounts managed by its investment advisors or their affiliates, in accordance with procedures adopted by the board of trustees in compliance with Rule 17a-7 of the Investment Company Act of 1940. For the year ended October 31, 2022, such purchases were $7,656,000 and sales were $160,000, resulting in net realized gain of $25,000; these amounts, other than temporary cash investments, are included in the purchases and sales of investment securities noted above.
H. Capital shares issued and redeemed were:
| | Year Ended October 31, | |
| | 2022
Shares
(000) | | 2021
Shares
(000) | |
| | | |
| Issued | 12,320 | | 12,684 | |
| Issued in Lieu of Cash Distributions | 5,056 | | 1,290 | |
| Redeemed | (37,018) | | (27,817) | |
| Net Increase (Decrease) in Shares Outstanding | (19,642) | | (13,843) | |
I. Management has determined that no events or transactions occurred subsequent to October 31, 2022, that would require recognition or disclosure in these financial statements.
Report of Independent Registered
Public Accounting Firm
To the Board of Trustees of Vanguard Whitehall Funds and Shareholders of Vanguard International Explorer Fund
Opinion on the Financial Statements
We have audited the accompanying statement of assets and liabilities, including the schedule of investments, of Vanguard International Explorer Fund (one of the funds constituting Vanguard Whitehall Funds, referred to hereafter as the "Fund") as of October 31, 2022, the related statement of operations for the year ended October 31, 2022, the statement of changes in net assets for each of the two years in the period ended October 31, 2022, including the related notes, and the financial highlights for each of the five years in the period ended October 31, 2022 (collectively referred to as the "financial statements"). In our opinion, the financial statements present fairly, in all material respects, the financial position of the Fund as of October 31, 2022, the results of its operations for the year then ended, the changes in its net assets for each of the two years in the period ended October 31, 2022 and the financial highlights for each of the five years in the period ended October 31, 2022 in conformity with accounting principles generally accepted in the United States of America.
Basis for Opinion
These financial statements are the responsibility of the Fund’s management. Our responsibility is to express an opinion on the Fund’s financial statements based on our audits. We are a public accounting firm registered with the Public Company Accounting Oversight Board (United States) (PCAOB) and are required to be independent with respect to the Fund in accordance with the U.S. federal securities laws and the applicable rules and regulations of the Securities and Exchange Commission and the PCAOB.
We conducted our audits of these financial statements in accordance with the standards of the PCAOB. Those standards require that we plan and perform the audit to obtain reasonable assurance about whether the financial statements are free of material misstatement, whether due to error or fraud.
Our audits included performing procedures to assess the risks of material misstatement of the financial statements, whether due to error or fraud, and performing procedures that respond to those risks. Such procedures included examining, on a test basis, evidence regarding the amounts and disclosures in the financial statements. Our audits also included evaluating the accounting principles used and significant estimates made by management, as well as evaluating the overall presentation of the financial statements. Our procedures included confirmation of securities owned as of October 31, 2022 by correspondence with the custodian, transfer agent and brokers; when replies were not received from brokers, we performed other auditing procedures. We believe that our audits provide a reasonable basis for our opinion.
/s/PricewaterhouseCoopers LLP
Philadelphia, Pennsylvania
December 16, 2022
We have served as the auditor of one or more investment companies in The Vanguard Group of Funds since 1975.
Tax information (unaudited)
The fund hereby designates $34,805,000, or if subsequently determined to be different, the maximum amount allowable by law, as qualified dividend income for individual shareholders for the fiscal year.
The fund hereby designates $190,000, or if subsequently determined to be different, the maximum amount allowable by law, of interest earned from obligations of the U.S. government which is generally exempt from state income tax.
For nonresident alien shareholders, 100% of short-term capital gain dividends distributed by the fund for the fiscal year are qualified short-term capital gains.
The fund distributed $33,045,000 as capital gain dividends (20% rate gain distributions) to shareholders during the fiscal year.
The fund designates to shareholders foreign source income of $47,072,000 and foreign taxes paid of $3,222,000, or if subsequently determined to be different, the maximum amounts allowable by law. Shareholders will receive more detailed information with their Form 1099-DIV to determine the calendar-year amounts to be included on their tax returns.
Trustees Approve Advisory Arrangements
At its May 2022 meeting, the board of trustees of Vanguard International Explorer Fund renewed the fund’s investment advisory arrangements with Baillie Gifford Overseas Limited (Baillie Gifford); Schroder Investment Management North America Inc. (Schroder Inc.), as well as the sub-advisory arrangement with Schroder Investment Management North America Limited (Schroder Ltd.); TimesSquare Capital Management, LLC (TimesSquare); and Wellington Management Company llp (Wellington Management). The board determined that renewing each of the fund’s advisory arrangements was in the best interests of the fund and its shareholders.
At its September 2022 meeting, the board approved restructuring the fund’s investment team by removing TimesSquare as an investment advisor to the fund, effective October 10, 2022. At the September meeting, the board also approved amendments to the existing investment advisory agreements with Schroder Inc. and Wellington Management, as well as to the sub-advisory arrangement with Schroder Ltd. (the Amended Agreements). Effective in the fourth quarter of 2022, the compensation benchmark for Schroder Inc. and Wellington Management, the S&P EPAC SmallCap Index, was replaced with the MSCI EAFE Small Cap Index. In connection with its review of the Amended Agreements, the board noted that it most recently approved the renewals of the investment advisory agreements with Schroder Inc. and Wellington Management at the May meeting and that, aside from the changes to the compensation benchmarks, the terms of the agreements remained the same. The board concluded that the new index accurately reflects the investment strategy of the fund. The board determined that the termination of TimesSquare and the approval of the Amended Agreements were in the best interests of the fund and its shareholders.
The board based its decisions upon an evaluation of each advisor’s investment staff, portfolio management process, and performance. This evaluation included information provided to the board by Vanguard’s Portfolio Review Department, which is responsible for fund and advisor oversight and product management. The Portfolio Review Department met regularly with the advisors and made monthly presentations to the board during the fiscal year that directed the board’s focus to relevant information and topics.
The board, or an investment committee made up of board members, also received information throughout the year during advisor presentations. For each advisor presentation, the board was provided with letters and reports that included information about, among other things, the advisory firm and the advisor’s assessment of the investment environment, portfolio performance, and portfolio characteristics.
In addition, the board received periodic reports throughout the year, which included information about the fund’s performance relative to its peers and benchmark, as applicable, and updates, as needed, on the Portfolio Review Department’s ongoing assessment of the advisors.
Prior to the May meeting, the trustees were provided with a memo and materials that summarized the information they received over the course of the year. Prior to the September meeting, the board received information concerning the proposed termination of TimesSquare, the new compensation benchmark, and the proposed Amended Agreements. They also considered the factors discussed below, among others. However, no single factor determined whether the board approved the arrangements. Rather, it was the totality of the circumstances that drove the board’s decisions.
Nature, extent, and quality of services
The board reviewed the quality of the fund’s investment management services provided by Baillie Gifford, Schroder Inc., Schroder Ltd., TimesSquare, and Wellington Management over both the short and long term, and took into account the organizational depth and stability of each advisor. The board considered the following:
Baillie Gifford. Baillie Gifford—a unit of Baillie Gifford & Co., founded in 1908—is among the largest independently owned investment management firms in the United Kingdom. Baillie Gifford invests with a long-term perspective and has a strong preference for high-quality growth companies with sustainable competitive advantages. The investment process is driven by rigorous, fundamental, bottom-up analysis undertaken by the dedicated International Smaller Companies team. The investment team seeks significant upside in each stock it invests in and considers sustainable earnings growth and free cash flow growth to be the most important determinants of a company’s prospects. Baillie Gifford has managed a portion of the fund since 2020.
Schroder. Schroders plc, the parent company of Schroder Inc. and Schroder Ltd. (collectively, Schroder), founded in 1804, specializes in global equity and fixed income management. Schroder employs a bottom-up, fundamental research-driven process to select stocks, with a focus on identifying companies with sustainable competitive advantages, attractive earnings growth, and compelling valuations. Stock selection responsibilities are divided among five regional leaders who make up Schroder’s International Small-Cap Committee, which is led by the portfolio manager. The regional team leverages Schroder’s extensive network of local analysts across the globe, as it believes that country factors are more important for smaller companies relative to larger companies. Schroder Inc. has advised the fund since its inception in 1996, and its affiliate Schroder Ltd. has managed a portion of the fund since 2003.
TimesSquare. TimesSquare, founded in 2000 as a small- and mid-cap growth specialist, is a strategic partner of Affiliated Managers Group, Inc. TimesSquare’s small-cap equity team is led by the portfolio manager and is made up of five experienced members. All portfolio decisions are made collectively, allowing for accountability. Value chain analysis and interactions with key stakeholders are at the core of the team’s research and idea-generation process, resulting in a portfolio consisting of industry-leading companies with sustainable business models and quality management teams. TimesSquare has managed a portion of the fund since 2017.
Wellington Management. Wellington Management, founded in 1928, is among the nation’s oldest and most respected institutional investment managers. Wellington Management’s international small-cap research equity team employs a bottom-up approach that seeks to add value through in-depth fundamental research and understanding of its industries. It believes that the experience of covering the same companies over a period of many years provides its Global Industry Analysts with in-depth knowledge of their coverage, which in turn leads to better and more timely decisions and increases their potential to produce superior results. Wellington Management has managed a portion of the fund since 2010.
At the May meeting, the board concluded that each advisor’s experience, stability, depth, and performance, among other factors, warranted continuation and approval of the advisory
arrangements. At the September meeting, the board reviewed these factors in connection with a proposal to terminate TimesSquare and concluded it was appropriate to approve the Amended Agreements.
Investment performance
The board considered the short-term, long-term, and since-inception performance, as applicable, of Baillie Gifford’s, Schroder’s, TimesSquare’s, and Wellington Management’s subportfolios, including any periods of outperformance or underperformance compared with a relevant benchmark index and peer group. At the May meeting, the board concluded that the performance was such that the advisory arrangements should continue. At the September meeting, the board determined that the Amended Agreements should be approved.
Cost
The board concluded that the fund’s expense ratio was below the average expense ratio charged by funds in its peer group and that Baillie Gifford’s, Schroder’s, TimesSquare’s, or Wellington Management’s advisory fee rates were also below the peer-group average. The board noted the restructuring of the fund’s advisory arrangements would not cause the fund’s expense ratio to increase.
The board did not consider the profitability of Baillie Gifford, Schroder, TimesSquare, or Wellington Management in determining whether to approve the advisory fees, because the firms are independent of Vanguard and the advisory fees are the result of arm’s-length negotiations.
The benefit of economies of scale
The board concluded that the fund’s shareholders benefit from economies of scale because of breakpoints in the advisory fee schedules for Baillie Gifford, Schroder, TimesSquare, and Wellington Management. The breakpoints reduce the effective rate of the fees as the fund’s assets managed by each advisor increase.
The board will consider whether to renew the advisory arrangement with Baillie Gifford, Schroder, and Wellington Management again after a one-year period.
This page intentionally left blank.
The People Who Govern Your Fund
The trustees of your mutual fund are there to see that the fund is operated and managed in your best interests since, as a shareholder, you are a part owner of the fund. Your fund’s trustees also serve on the board of directors of The Vanguard Group, Inc., which is owned by the Vanguard funds and provides services to them.
A majority of Vanguard’s board members are independent, meaning that they have no affiliation with Vanguard or the funds they oversee, apart from the sizable personal investments they have made as private individuals. The independent board members have distinguished backgrounds in business, academia, and public service. Each of the trustees and executive officers oversees 206 Vanguard funds.
Information for each trustee and executive officer of the fund appears below. That information, as well as the Vanguard fund count, is as of the date on the cover of this fund report. The mailing address of the trustees and officers is P.O. Box 876, Valley Forge, PA 19482. More information about the trustees is in the Statement of Additional Information, which can be obtained, without charge, by contacting Vanguard at 800-662-7447, or online at vanguard.com.
Interested Trustee1
Mortimer J. Buckley
Born in 1969. Trustee since January 2018. Principal occupation(s) during the past five years and other experience: chairman of the board (2019–present) of Vanguard and of each of the investment companies served by Vanguard; chief executive officer (2018–present) of Vanguard; chief executive officer, president, and trustee (2018–present) of each of the investment companies served by Vanguard; president and director (2017–present) of Vanguard; and president (2018–present) of Vanguard Marketing Corporation. Chief investment officer (2013–2017), managing director (2002–2017), head of the Retail Investor Group (2006–2012), and chief information officer (2001–2006) of Vanguard. Member of the board of governors of the Investment Company Institute and the board of governors of FINRA. Trustee and vice chair of The Shipley School.
Independent Trustees
Tara Bunch
Born in 1962. Trustee since November 2021. Principal occupation(s) during the past five years and other experience: head of global operations at Airbnb (2020–present). Vice president of AppleCare (2012–2020). Member of the board of directors of Out & Equal (2002–2006), the advisory board of the University of California, Berkeley School of Engineering (2020–present), and the advisory board of Santa Clara University’s Leavey School of Business (2018–present).
Emerson U. Fullwood
Born in 1948. Trustee since January 2008. Principal occupation(s) during the past five years and other experience: executive chief staff and marketing officer for North America and corporate vice president (retired 2008) of Xerox Corporation (document management products and services). Former president of the Worldwide Channels Group, Latin America, and Worldwide Customer Service and executive chief staff officer of Developing Markets of Xerox. Executive in residence and 2009–2010 Distinguished Minett Professor at the Rochester Institute of Technology. Member of the board of directors of the University of Rochester Medical Center, the Monroe Community College Foundation, the United Way of Rochester, North Carolina A&T University, Roberts Wesleyan College, and the Rochester Philharmonic Orchestra. Trustee of the University of Rochester.
1 Mr. Buckley is considered an “interested person,” as defined in the Investment Company Act of 1940, because he is an officer of the Vanguard funds.
F. Joseph Loughrey
Born in 1949. Trustee since October 2009. Principal occupation(s) during the past five years and other experience: president and chief operating officer (retired 2009) and vice chairman of the board (2008–2009) of Cummins Inc. (industrial machinery). Chairman of the board of Hillenbrand, Inc. (specialized consumer services). Director of the V Foundation. Member of the advisory council for the College of Arts and Letters at the University of Notre Dame. Chairman of the board of Saint Anselm College.
Mark Loughridge
Born in 1953. Trustee since March 2012. Principal occupation(s) during the past five years and other experience: senior vice president and chief financial officer (retired 2013) of IBM (information technology services). Fiduciary member of IBM’s Retirement Plan Committee (2004–2013), senior vice president and general manager (2002–2004) of IBM Global Financing, vice president and controller (1998–2002) of IBM, and a variety of other prior management roles at IBM. Member of the Council on Chicago Booth.
Scott C. Malpass
Born in 1962. Trustee since March 2012. Principal occupation(s) during the past five years and other experience: adjunct professor of finance at the University of Notre Dame (2020–present). Chief investment officer (retired 2020) and vice president (retired 2020) of the University of Notre Dame. Assistant professor (retired June 2020) of finance at the Mendoza College of Business, University of Notre Dame, and member of the Notre Dame 403(b) Investment Committee. Member of the board of Catholic Investment Services, Inc. (investment advisors), the board of superintendence of the Institute for the Works of Religion, and the board of directors of Paxos Trust Company (finance).
Deanna Mulligan
Born in 1963. Trustee since January 2018. Principal occupation(s) during the past five years and other experience: chief executive officer of Purposeful (advisory firm for CEOs and C-level executives; 2021–present). Board chair (2020), chief executive officer (2011–2020), and president (2010–2019) of The Guardian Life Insurance Company of America. Chief operating officer (2010–2011) and executive vice president (2008–2010) of Individual Life and Disability of the Guardian Life Insurance Company of America. Member of the board of the Economic Club of New York. Trustee of the Partnership for New York City (business leadership), Chief Executives for Corporate Purpose, and the NewYork-Presbyterian Hospital.
André F. Perold
Born in 1952. Trustee since December 2004. Principal occupation(s) during the past five years and other experience: George Gund Professor of Finance and Banking, Emeritus at the Harvard Business School (retired 2011). Chief investment officer and co-managing partner of HighVista Strategies (private investment firm). Member of the board (2018–present) of RIT Capital Partners (investment firm). Member of the investment committee of Partners Health Care System.
Sarah Bloom Raskin
Born in 1961. Trustee since January 2018. Principal occupation(s) during the past five years and other experience: deputy secretary (2014–2017) of the United States Department of the Treasury. Governor (2010–2014) of the Federal Reserve Board. Commissioner (2007–2010) of financial regulation for the State of Maryland. Colin W. Brown Distinguished Professor of the Practice of Law (2021–present), professor (2020–present), Distinguished Fellow of the Global Financial Markets Center (2020–present), and Rubenstein Fellow (2017–2020) at Duke University. Trustee (2017–present) of Amherst College and member of Amherst College Investment Committee (2019–present). Member of the Regenerative Crisis Response Committee (2020–present).
David A. Thomas
Born in 1956. Trustee since July 2021. Principal occupation(s) during the past five years and other experience: president of Morehouse College (2018–present). Professor of business administration, emeritus at Harvard University (2017–2018). Dean (2011–2016) and professor of management (2016–2017) at the Georgetown University McDonough School of Business. Director of DTE Energy Company (2013–present). Trustee of Common Fund (2019–present).
Peter F. Volanakis
Born in 1955. Trustee since July 2009. Principal occupation(s) during the past five years and other experience: president and chief operating officer (retired 2010) of Corning Incorporated (communications equipment) and director of Corning Incorporated (2000–2010) and Dow Corning (2001–2010). Director (2012) of SPX Corporation (multi-industry manufacturing). Overseer of the Amos Tuck School of Business Administration, Dartmouth College (2001–2013). Member of the BMW Group Mobility Council.
Executive Officers
Christine M. Buchanan
Born in 1970. Principal occupation(s) during the past five years and other experience: principal of Vanguard. Chief financial officer (2021–present) and treasurer (2017–present) of each of the investment companies served by Vanguard. Partner (2005–2017) at KPMG (audit, tax, and advisory services).
John Galloway
Born in 1973. Principal occupation(s) during the past five years and other experience: principal of Vanguard. Investment stewardship officer (September 2020–present) of each of the investment companies served by Vanguard. Head of Investor Advocacy (February 2020–present) and head of Marketing Strategy and Planning (2017–2020) at Vanguard. Special assistant to the President of the United States (2015).
Ashley Grim
Born in 1984. Principal occupation(s) during the past five years and other experience: treasurer (February 2022–present) of each of the investment companies served by Vanguard. Fund transfer agent controller (2019–2022) and director of Audit Services (2017–2019) at Vanguard. Senior manager (2015–2017) at PriceWaterhouseCoopers (audit and assurance, consulting, and tax services).
Peter Mahoney
Born in 1974. Principal occupation(s) during the past five years and other experience: principal of Vanguard. Controller (2015–present) of each of the investment companies served by Vanguard. Head of International Fund Services (2008–2014) at Vanguard.
Anne E. Robinson
Born in 1970. Principal occupation(s) during the past five years and other experience: general counsel (2016–present) of Vanguard. Secretary (2016–present) of Vanguard and of each of the investment companies served by Vanguard. Managing director (2016–present) of Vanguard. Managing director and general counsel of Global Cards and Consumer Services (2014–2016) at Citigroup. Counsel (2003–2014) at American Express. Nonexecutive director of the board of National Grid (energy).
Michael Rollings
Born in 1963. Principal occupation(s) during the past five years and other experience: finance director (2017–present) and treasurer (2017) of each of the investment companies served by Vanguard. Managing director (2016–present) of Vanguard. Chief financial officer (2016–present) of Vanguard. Director (2016–present) of Vanguard Marketing Corporation. Executive vice president and chief financial officer (2006–2016) of MassMutual Financial Group.
John E. Schadl
Born in 1972. Principal occupation(s) during the past five years and other experience: principal of Vanguard. Chief compliance officer (2019–present) of Vanguard and of each of the investment companies served by Vanguard. Assistant vice president (2019–present) of Vanguard Marketing Corporation.
Vanguard Senior Management Team
| Matthew Benchener | Thomas M. Rampulla |
| Joseph Brennan | Karin A. Risi |
| Mortimer J. Buckley | Anne E. Robinson |
| Gregory Davis | Michael Rollings |
| John James | Nitin Tandon |
| Chris D. McIsaac | Lauren Valente |
Connect with Vanguard®>vanguard.com
Fund Information > 800-662-7447
Direct Investor Account Services > 800-662-2739
Institutional Investor Services > 800-523-1036
Text Telephone for People
Who Are Deaf or Hard of Hearing > 800-749-7273
This material may be used in conjunction with the offering of shares of any Vanguard fund only if preceded or accompanied by the fund’s current prospectus.
All comparative mutual fund data are from Morningstar, Inc., unless otherwise noted.
You can obtain a free copy of Vanguard’s proxy voting guidelines by visiting vanguard.com/proxyreporting or by calling Vanguard at 800-662-2739. The guidelines are also available from the SEC’s website, www.sec.gov. In addition, you may obtain a free report on how your fund voted the proxies for securities it owned during the 12 months ended June 30. To get the report, visit either vanguard.com/proxyreporting or www.sec.gov.
You can review information about your fund on the SEC’s website, and you can receive copies of this information, for a fee, by sending a request via email addressed to publicinfo@sec.gov.
Source for Bloomberg indexes: Bloomberg Index Services Limited. Copyright 2022, Bloomberg. All rights reserved.
CFA® is a registered trademark owned by CFA Institute.
© 2022 The Vanguard Group, Inc.
All rights reserved.
Vanguard Marketing Corporation, Distributor.
Q1260 122022
Annual Report | October 31, 2022
Vanguard High Dividend Yield Index Fund
Contents
Please note: The opinions expressed in this report are just that—informed opinions. They should not be considered promises or advice. Also, please keep in mind that the information and opinions cover the period through the date on the front of this report. Of course, the risks of investing in your fund are spelled out in the prospectus.
Your Fund’s Performance at a Glance
| • | For the 12 months ended October 31, 2022, Vanguard High Dividend Yield Index Fund returned 1.19% for Admiral Shares and 1.18% for ETF shares. (ETF returns are based on net asset value.) The fund’s benchmark, the FTSE High Dividend Yield Index, returned 1.28%. |
| • | The year was a volatile, challenging period for financial markets. The economic backdrop deteriorated as inflation soared to multidecade highs, fueled in part by higher energy and food prices in the wake of Russia’s invasion of Ukraine. Then price increases broadened to other categories of goods and services, adding to concerns that inflation would remain stubbornly high. That prompted aggressive tightening by many central banks to bring inflation back in check and increased fears of a recession. |
| • | Energy and health care stocks contributed most to the fund’s performance. Financials and telecommunications detracted most. |
| • | For the past decade, the fund’s ETF Shares posted an average annual return of 11.29%, slightly behind the 11.36% benchmark average. |
Market Barometer
| | Average Annual Total Returns
Periods Ended October 31, 2022 |
| | One Year | Three Years | Five Years |
| Stocks | | | |
| Russell 1000 Index (Large-caps) | -16.38% | 9.99% | 10.19% |
| Russell 2000 Index (Small-caps) | -18.54 | 7.05 | 5.56 |
| Russell 3000 Index (Broad U.S. market) | -16.52 | 9.79 | 9.87 |
| FTSE All-World ex US Index (International) | -24.20 | -1.16 | -0.18 |
| Bonds | | | |
Bloomberg U.S. Aggregate Float Adjusted Index
(Broad taxable market) | -15.69% | -3.73% | -0.50% |
Bloomberg Municipal Bond Index
(Broad tax-exempt market) | -11.98 | -2.18 | 0.37 |
| FTSE Three-Month U.S. Treasury Bill Index | 0.88 | 0.59 | 1.15 |
| CPI | | | |
| Consumer Price Index | 7.75% | 5.01% | 3.85% |
About Your Fund’s Expenses
As a shareholder of the fund, you incur ongoing costs, which include costs for portfolio management, administrative services, and shareholder reports (like this one), among others. Operating expenses, which are deducted from a fund’s gross income, directly reduce the investment return of the fund.
A fund‘s expenses are expressed as a percentage of its average net assets. This figure is known as the expense ratio. The following examples are intended to help you understand the ongoing costs (in dollars) of investing in your fund and to compare these costs with those of other mutual funds. The examples are based on an investment of $1,000 made at the beginning of the period shown and held for the entire period.
The accompanying table illustrates your fund’s costs in two ways:
| • | Based on actual fund return. This section helps you to estimate the actual expenses that you paid over the period. The ”Ending Account Value“ shown is derived from the fund’s actual return, and the third column shows the dollar amount that would have been paid by an investor who started with $1,000 in the fund. You may use the information here, together with the amount you invested, to estimate the expenses that you paid over the period. |
To do so, simply divide your account value by $1,000 (for example, an $8,600 account value divided by $1,000 = 8.6), then multiply the result by the number given for your fund under the heading ”Expenses Paid During Period.“
| • | Based on hypothetical 5% yearly return. This section is intended to help you compare your fund‘s costs with those of other mutual funds. It assumes that the fund had a yearly return of 5% before expenses, but that the expense ratio is unchanged. In this case—because the return used is not the fund’s actual return—the results do not apply to your investment. The example is useful in making comparisons because the Securities and Exchange Commission requires all mutual funds to calculate expenses based on a 5% return. You can assess your fund’s costs by comparing this hypothetical example with the hypothetical examples that appear in shareholder reports of other funds. |
Note that the expenses shown in the table are meant to highlight and help you compare ongoing costs only and do not reflect transaction costs incurred by the fund for buying and selling securities. Further, the expenses do not include any purchase, redemption, or account service fees described in the fund prospectus. If such fees were applied to your account, your costs would be higher. Your fund does not carry a “sales load.”
The calculations assume no shares were bought or sold during the period. Your actual costs may have been higher or lower, depending on the amount of your investment and the timing of any purchases or redemptions.
You can find more information about the fund’s expenses, including annual expense ratios, in the Financial Statements section of this report. For additional information on operating expenses and other shareholder costs, please refer to your fund’s current prospectus.
| Six Months Ended October 31, 2022 | | | |
| | Beginning
Account Value
4/30/2022 | Ending
Account Value
10/31/2022 | Expenses
Paid During
Period |
| Based on Actual Fund Return | | | |
| High Dividend Yield Index Fund | | | |
| ETF Shares | $1,000.00 | $1,005.40 | $0.30 |
| Admiral™ Shares | 1,000.00 | 1,005.40 | 0.40 |
| Based on Hypothetical 5% Yearly Return | | | |
| High Dividend Yield Index Fund | | | |
| ETF Shares | $1,000.00 | $1,024.90 | $0.31 |
| Admiral Shares | 1,000.00 | 1,024.80 | 0.41 |
The calculations are based on expenses incurred in the most recent six-month period. The fund's annualized six-month expense ratios for that period are 0.06% for ETF Shares and 0.08% for Admiral Shares. The dollar amounts shown as “Expenses Paid” are equal to the annualized expense ratio multiplied by the average account value over the period, multiplied by the number of days in the most recent six-month period, then divided by the number of days in the most recent 12-month period (184/365).
High Dividend Yield Index Fund
All of the returns in this report represent past performance, which is not a guarantee of future results that may be achieved by the fund. (Current performance may be lower or higher than the performance data cited. For performance data current to the most recent month-end, visit our website at vanguard.com/performance.) Note, too, that both investment returns and principal value can fluctuate widely, so an investor’s shares, when sold, could be worth more or less than their original cost. The returns shown do not reflect taxes that a shareholder would pay on fund distributions or on the sale of fund shares.
Cumulative Performance: October 31, 2012, Through October 31, 2022
Initial Investment of $10,000
| | | Average Annual Total Returns
Periods Ended October 31, 2022 | |
| | | One
Year | Five
Years | Ten
Years | Final Value
of a $10,000
Investment |
 | High Dividend Yield Index Fund ETF Shares Net Asset Value | 1.18% | 8.63% | 11.29% | $29,154 |
| | High Dividend Yield Index Fund
ETF Shares Market Price | 1.23 | 8.63 | 11.29 | 29,152 |
 | FTSE High Dividend Yield Index | 1.28 | 8.68 | 11.36 | 29,321 |
 | Dow Jones U.S. Total Stock Market Float Adjusted Index | -16.94 | 9.72 | 12.36 | 32,058 |
| | | | |
| | | One
Year | Since
Inception
(2/7/2019) | Final Value
of a $10,000
Investment |
| High Dividend Yield Index Fund Admiral Shares | 1.19% | 10.36% | $14,442 |
| FTSE High Dividend Yield Index | 1.28 | 10.43 | 14,475 |
| Dow Jones U.S. Total Stock Market Float Adjusted Index | -16.94 | 11.13 | 14,820 |
“Since Inception” performance is calculated from the Admiral Shares’ inception date for both the fund and its comparative standard(s).
See Financial Highlights for dividend and capital gains information.
High Dividend Yield Index Fund
| Cumulative Returns of ETF Shares: October 31, 2012, Through October 31, 2022 |
| | One
Year | Five
Years | Ten
Years |
| High Dividend Yield Index Fund ETF Shares Market Price | 1.23% | 51.25% | 191.52% |
| High Dividend Yield Index Fund ETF Shares Net Asset Value | 1.18 | 51.24 | 191.54 |
| FTSE High Dividend Yield Index | 1.28 | 51.59 | 193.21 |
For the ETF Shares, the market price is determined by the midpoint of the bid-offer spread as of the closing time of the New York Stock Exchange (generally 4 p.m., Eastern time). The net asset value is also determined as of the NYSE closing time. For more information about how the ETF Shares’ market prices have compared with their net asset value, visit vanguard.com, select your ETF, click on Price, and then scroll down to the Premium/Discount chart. The ETF premium/discount chart there shows the percentage and days on which the ETF Shares’ market price was above or below the NAV.
High Dividend Yield Index Fund
| Basic Materials | 3.6% |
| Consumer Discretionary | 8.6 |
| Consumer Staples | 12.7 |
| Energy | 11.2 |
| Financials | 20.2 |
| Health Care | 15.2 |
| Industrials | 10.4 |
| Real Estate | 0.0 |
| Technology | 5.9 |
| Telecommunications | 4.6 |
| Utilities | 7.6 |
The table reflects the fund’s investments, except for short-term investments and derivatives. Sector categories are based on the Industry Classification Benchmark (“ICB”), except for the “Other” category (if applicable), which includes securities that have not been provided an ICB classification as of the effective reporting period.
The fund may invest in derivatives (such as futures and swap contracts) for various reasons, including, but not limited to, attempting to remain fully invested and tracking its target index as closely as possible.
The Industry Classification Benchmark (“ICB”) is owned by FTSE. FTSE does not accept any liability to any person for any loss or damage arising out of any error or omission in the ICB.
High Dividend Yield Index Fund
The fund files its complete schedule of portfolio holdings with the Securities and Exchange Commission (SEC) for the first and third quarters of each fiscal year as an exhibit to its reports on Form N-PORT. The fund’s Form N-PORT reports are available on the SEC’s website at www.sec.gov.
| | | | | | Shares | Market
Value•
($000) |
| Common Stocks (99.8%) |
| Basic Materials (3.6%) |
| | Linde plc | 2,191,364 | 651,602 |
| | Air Products and Chemicals Inc. | 966,245 | 241,948 |
| | Nucor Corp. | 1,140,523 | 149,842 |
| | Newmont Corp. | 3,462,558 | 146,535 |
| | Dow Inc. | 3,133,046 | 146,439 |
| | Fastenal Co. | 2,510,119 | 121,314 |
| | International Flavors & Fragrances Inc. | 1,109,127 | 108,262 |
| | CF Industries Holdings Inc. | 865,760 | 91,996 |
| | LyondellBasell Industries NV Class A | 1,117,926 | 85,465 |
| | Steel Dynamics Inc. | 753,482 | 70,865 |
| | International Paper Co. | 1,572,991 | 52,868 |
| | Reliance Steel & Aluminum Co. | 260,876 | 52,561 |
| | Celanese Corp. Class A | 470,967 | 45,269 |
| | Eastman Chemical Co. | 531,612 | 40,833 |
| | Olin Corp. | 581,185 | 30,774 |
| | Commercial Metals Co. | 523,198 | 23,806 |
| | Huntsman Corp. | 829,741 | 22,204 |
| | Timken Co. | 271,117 | 19,328 |
| | Chemours Co. | 670,632 | 19,200 |
| | Cabot Corp. | 239,887 | 17,627 |
| | Southern Copper Corp. | 370,745 | 17,414 |
| | Avient Corp. | 392,264 | 13,529 |
| | Sensient Technologies Corp. | 180,856 | 12,924 |
| | Scotts Miracle-Gro Co. | 174,850 | 8,027 |
| | Carpenter Technology Corp. | 205,903 | 7,701 |
| | Worthington Industries Inc. | 135,444 | 6,442 |
| | Tronox Holdings plc | 504,413 | 6,053 |
| | Mativ Holdings Inc. | 234,401 | 5,565 |
| | Kaiser Aluminum Corp. | 68,241 | 5,513 |
| | | | | | | 2,221,906 |
| Consumer Discretionary (8.6%) |
| | Home Depot Inc. | 4,506,660 | 1,334,557 |
| | | | | | Shares | Market
Value•
($000) |
| | Walmart Inc. | 6,286,274 | 894,725 |
| | McDonald's Corp. | 3,222,793 | 878,727 |
| | Starbucks Corp. | 5,003,528 | 433,256 |
| | Target Corp. | 2,022,651 | 332,220 |
| | Ford Motor Co. | 17,172,883 | 229,601 |
| | Genuine Parts Co. | 604,098 | 107,445 |
| | Darden Restaurants Inc. | 539,887 | 77,279 |
| | Omnicom Group Inc. | 885,609 | 64,428 |
| | Best Buy Co. Inc. | 875,055 | 59,863 |
| | Garmin Ltd. | 670,932 | 59,069 |
| | Interpublic Group of Cos. Inc. | 1,710,819 | 50,965 |
| | Advance Auto Parts Inc. | 265,852 | 50,491 |
| | VF Corp. | 1,522,245 | 43,003 |
| | Hasbro Inc. | 572,093 | 37,329 |
| | Williams-Sonoma Inc. | 297,213 | 36,804 |
| | Paramount Global Class B | 1,913,712 | 35,059 |
| | Tapestry Inc. | 1,096,066 | 34,723 |
| | Whirlpool Corp. | 232,173 | 32,096 |
| | Autoliv Inc. | 380,007 | 30,534 |
| | H&R Block Inc. | 694,033 | 28,560 |
| | Polaris Inc. | 246,052 | 24,999 |
| | Macy's Inc. | 1,172,728 | 24,451 |
| | Newell Brands Inc. | 1,644,140 | 22,706 |
| | TEGNA Inc. | 965,449 | 20,159 |
| | Leggett & Platt Inc. | 579,555 | 19,560 |
| 1 | Sirius XM Holdings Inc. | 3,052,287 | 18,436 |
| | Ralph Lauren Corp. Class A | 184,047 | 17,059 |
| | Kohl's Corp. | 556,584 | 16,670 |
| | Wendy's Co. | 739,182 | 15,360 |
| | Travel + Leisure Co. | 356,696 | 13,547 |
| | Penske Automotive Group Inc. | 116,866 | 13,045 |
| | LCI Industries | 107,510 | 11,408 |
| | Foot Locker Inc. | 353,057 | 11,192 |
| | Cracker Barrel Old Country Store Inc. | 97,975 | 11,191 |
| | Hanesbrands Inc. | 1,515,137 | 10,333 |
| | Gap Inc. | 860,194 | 9,694 |
| | Dana Inc. | 557,024 | 8,890 |
High Dividend Yield Index Fund
| | | | | | Shares | Market
Value•
($000) |
| | Kontoor Brands Inc. | 240,439 | 8,584 |
| | International Game Technology plc | 423,424 | 8,490 |
| | Jack in the Box Inc. | 91,384 | 8,063 |
| | John Wiley & Sons Inc. Class A | 185,571 | 7,829 |
| | American Eagle Outfitters Inc. | 667,117 | 7,578 |
| | MDC Holdings Inc. | 247,599 | 7,542 |
| | Strategic Education Inc. | 98,124 | 6,771 |
| | Oxford Industries Inc. | 65,488 | 6,662 |
| | Wolverine World Wide Inc. | 335,440 | 5,746 |
| | HNI Corp. | 178,490 | 5,174 |
| | Rent-A-Center Inc. | 229,469 | 4,784 |
| | La-Z-Boy Inc. | 186,368 | 4,616 |
| | Dine Brands Global Inc. | 63,788 | 4,599 |
| | Sinclair Broadcast Group Inc. Class A | 174,279 | 3,104 |
| | Steelcase Inc. Class A | 374,921 | 2,913 |
| | Guess? Inc. | 147,356 | 2,502 |
| | Big Lots Inc. | 122,120 | 2,304 |
| | | | | | | 5,216,695 |
| Consumer Staples (12.7%) |
| | Procter & Gamble Co. | 10,430,388 | 1,404,660 |
| | PepsiCo Inc. | 6,028,231 | 1,094,606 |
| | Coca-Cola Co. | 17,026,700 | 1,019,048 |
| | Philip Morris International Inc. | 6,760,498 | 620,952 |
| | CVS Health Corp. | 5,719,508 | 541,637 |
| | Mondelez International Inc. Class A | 6,029,563 | 370,698 |
| | Altria Group Inc. | 7,906,975 | 365,856 |
| | Colgate-Palmolive Co. | 3,607,206 | 266,356 |
| | Archer-Daniels-Midland Co. | 2,439,678 | 236,600 |
| | General Mills Inc. | 2,594,941 | 211,695 |
| | Sysco Corp. | 2,220,205 | 192,181 |
| | Kimberly-Clark Corp. | 1,466,606 | 182,534 |
| | Hershey Co. | 636,326 | 151,936 |
| | Kroger Co. | 2,858,650 | 135,186 |
| | Kraft Heinz Co. | 3,049,868 | 117,328 |
| | Walgreens Boots Alliance Inc. | 3,120,961 | 113,915 |
| | Tyson Foods Inc. Class A | 1,244,717 | 85,076 |
| | Kellogg Co. | 1,098,364 | 84,376 |
| | Conagra Brands Inc. | 2,048,508 | 75,180 |
| | J M Smucker Co. | 448,766 | 67,611 |
| | Clorox Co. | 433,235 | 63,270 |
| | Bunge Ltd. | 609,842 | 60,191 |
| | Hormel Foods Corp. | 1,247,483 | 57,946 |
| | Campbell Soup Co. | 843,652 | 44,638 |
| | Coca-Cola Europacific Partners plc | 878,587 | 41,337 |
| | | | | | Shares | Market
Value•
($000) |
| | Molson Coors Beverage Co. Class B | 761,808 | 38,418 |
| | Ingredion Inc. | 284,874 | 25,388 |
| | Flowers Foods Inc. | 815,013 | 23,399 |
| | Energizer Holdings Inc. | 289,586 | 8,366 |
| | Nu Skin Enterprises Inc. Class A | 215,859 | 8,244 |
| | Spectrum Brands Holdings Inc. | 172,950 | 7,980 |
| | Reynolds Consumer Products Inc. | 238,956 | 7,298 |
| | Weis Markets Inc. | 71,191 | 6,668 |
| | Vector Group Ltd. | 622,127 | 6,607 |
| | Medifast Inc. | 47,094 | 5,510 |
| | Universal Corp. | 104,920 | 5,310 |
| 1 | B&G Foods Inc. | 304,809 | 4,993 |
| | Calavo Growers Inc. | 74,688 | 2,583 |
| | | | | | | 7,755,577 |
| Energy (11.2%) |
| | Exxon Mobil Corp. | 18,189,558 | 2,015,585 |
| | Chevron Corp. | 8,571,626 | 1,550,607 |
| | ConocoPhillips | 5,567,968 | 702,065 |
| | EOG Resources Inc. | 2,548,588 | 347,933 |
| | Schlumberger Ltd. | 6,155,402 | 320,266 |
| | Marathon Petroleum Corp. | 2,169,062 | 246,449 |
| | Devon Energy Corp. | 2,864,439 | 221,564 |
| | Phillips 66 | 2,095,584 | 218,548 |
| | Valero Energy Corp. | 1,712,574 | 215,014 |
| | Williams Cos. Inc. | 5,310,037 | 173,798 |
| | Kinder Morgan Inc. | 8,668,378 | 157,071 |
| | Diamondback Energy Inc. | 753,327 | 118,355 |
| | ONEOK Inc. | 1,934,850 | 114,775 |
| | Baker Hughes Co. Class A | 4,143,045 | 114,597 |
| | Coterra Energy Inc. | 3,416,852 | 106,367 |
| | Chesapeake Energy Corp. | 527,247 | 53,922 |
| | Murphy Oil Corp. | 637,505 | 30,925 |
| | DT Midstream Inc. | 421,464 | 25,161 |
| | Helmerich & Payne Inc. | 444,604 | 22,012 |
| | Antero Midstream Corp. | 1,461,491 | 15,565 |
| | Equitrans Midstream Corp. | 1,776,097 | 14,955 |
| | Archrock Inc. | 587,461 | 4,412 |
| | | | | | | 6,789,946 |
| Financials (20.1%) |
| | JPMorgan Chase & Co. | 12,720,895 | 1,601,306 |
| | Bank of America Corp. | 30,633,862 | 1,104,044 |
| | Wells Fargo & Co. | 16,543,485 | 760,835 |
| | Goldman Sachs Group Inc. | 1,451,316 | 499,993 |
| | Morgan Stanley | 5,457,486 | 448,442 |
| | BlackRock Inc. | 653,894 | 422,357 |
| | Chubb Ltd. | 1,813,366 | 389,674 |
| | Citigroup Inc. | 8,435,248 | 386,840 |
High Dividend Yield Index Fund
| | | | | | Shares | Market
Value•
($000) |
| | Progressive Corp. | 2,543,865 | 326,632 |
| | PNC Financial Services Group Inc. | 1,798,407 | 291,036 |
| | Blackstone Inc. | 3,049,795 | 277,958 |
| | CME Group Inc. | 1,562,789 | 270,831 |
| | Truist Financial Corp. | 5,790,893 | 259,374 |
| | US Bancorp | 5,846,183 | 248,170 |
| | MetLife Inc. | 2,935,187 | 214,885 |
| | Travelers Cos. Inc. | 1,032,900 | 190,529 |
| | American International Group Inc. | 3,339,127 | 190,330 |
| | Aflac Inc. | 2,729,272 | 177,703 |
| | Prudential Financial Inc. | 1,636,899 | 172,185 |
| | Arthur J Gallagher & Co. | 906,465 | 169,581 |
| | Allstate Corp. | 1,173,515 | 148,156 |
| | Ameriprise Financial Inc. | 471,369 | 145,710 |
| | Bank of New York Mellon Corp. | 3,202,120 | 134,841 |
| | M&T Bank Corp. | 762,120 | 128,318 |
| | Discover Financial Services | 1,190,368 | 124,346 |
| | State Street Corp. | 1,597,012 | 118,179 |
| | Apollo Global Management Inc. | 1,998,828 | 110,655 |
| | Fifth Third Bancorp | 2,999,074 | 107,037 |
| | T. Rowe Price Group Inc. | 974,011 | 103,401 |
| | Hartford Financial Services Group Inc. | 1,402,491 | 101,554 |
| | Huntington Bancshares Inc. | 6,324,282 | 96,003 |
| | Principal Financial Group Inc. | 1,072,961 | 94,560 |
| | Regions Financial Corp. | 4,083,221 | 89,627 |
| | Citizens Financial Group Inc. | 2,122,776 | 86,822 |
| | Northern Trust Corp. | 894,649 | 75,464 |
| | KeyCorp | 4,149,006 | 74,143 |
| | Cincinnati Financial Corp. | 680,627 | 70,322 |
| | First Horizon Corp. | 2,304,240 | 56,477 |
| | Everest Re Group Ltd. | 169,280 | 54,620 |
| | Ares Management Corp. Class A | 660,010 | 50,049 |
| | Equitable Holdings Inc. | 1,627,793 | 49,843 |
| | Fidelity National Financial Inc. | 1,147,667 | 45,195 |
| | East West Bancorp Inc. | 614,800 | 44,001 |
| | Credicorp Ltd. | 296,544 | 43,402 |
| | Reinsurance Group of America Inc. | 290,900 | 42,812 |
| | American Financial Group Inc. | 292,606 | 42,460 |
| | Webster Financial Corp. | 759,665 | 41,219 |
| | Comerica Inc. | 567,978 | 40,042 |
| | Lincoln National Corp. | 737,975 | 39,755 |
| | Unum Group | 871,863 | 39,748 |
| | Cullen/Frost Bankers Inc. | 253,681 | 39,333 |
| | Ally Financial Inc. | 1,340,673 | 36,949 |
| | | | | | Shares | Market
Value•
($000) |
| | Zions Bancorp NA | 647,320 | 33,622 |
| | Assurant Inc. | 231,481 | 31,449 |
| | Jefferies Financial Group Inc. | 884,431 | 30,433 |
| | SouthState Corp. | 324,251 | 29,322 |
| | Franklin Resources Inc. | 1,241,127 | 29,104 |
| | Old Republic International Corp. | 1,230,116 | 28,551 |
| | Glacier Bancorp Inc. | 480,747 | 27,537 |
| | Prosperity Bancshares Inc. | 380,850 | 27,257 |
| | Carlyle Group Inc. | 900,214 | 25,458 |
| | Synovus Financial Corp. | 625,199 | 24,914 |
| | Invesco Ltd. | 1,622,524 | 24,857 |
| | Old National Bancorp | 1,268,261 | 24,807 |
| | United Bankshares Inc. | 564,512 | 23,907 |
| | Popular Inc. | 319,896 | 22,623 |
| | Hanover Insurance Group Inc. | 154,002 | 22,560 |
| | Valley National Bancorp | 1,862,029 | 22,102 |
| | First American Financial Corp. | 438,400 | 22,095 |
| | RLI Corp. | 168,802 | 21,956 |
| | FNB Corp. | 1,513,075 | 21,864 |
| | Cadence Bank | 783,759 | 21,671 |
| | Home BancShares Inc. | 821,586 | 20,942 |
| | Bank OZK | 485,680 | 20,875 |
| | Hancock Whitney Corp. | 372,318 | 20,801 |
| | OneMain Holdings Inc. | 504,562 | 19,456 |
| | Houlihan Lokey Inc. Class A | 216,453 | 19,334 |
| | Umpqua Holdings Corp. | 938,708 | 18,662 |
| | New York Community Bancorp Inc. | 2,002,809 | 18,646 |
| | Axis Capital Holdings Ltd. | 338,391 | 18,500 |
| | SLM Corp. | 1,086,938 | 18,032 |
| | MGIC Investment Corp. | 1,312,873 | 17,921 |
| | United Community Banks Inc. | 459,465 | 17,689 |
| | Independent Bank Corp. (Massachusetts) | 197,864 | 17,216 |
| | Evercore Inc. Class A | 158,380 | 16,646 |
| | CVB Financial Corp. | 577,078 | 16,574 |
| | FirstCash Holdings Inc. | 166,774 | 16,419 |
| | Associated Banc-Corp | 644,840 | 15,702 |
| | Assured Guaranty Ltd. | 257,743 | 15,256 |
| | Pacific Premier Bancorp Inc. | 404,971 | 14,745 |
| | Lazard Ltd. Class A | 388,329 | 14,644 |
| | Radian Group Inc. | 700,174 | 14,613 |
| | Community Bank System Inc. | 230,516 | 14,391 |
| | First Hawaiian Inc. | 554,799 | 14,192 |
| | Cathay General Bancorp | 310,423 | 14,155 |
| | BOK Financial Corp. | 127,882 | 14,091 |
| | Janus Henderson Group plc | 590,915 | 13,455 |
High Dividend Yield Index Fund
| | | | | | Shares | Market
Value•
($000) |
| | Kemper Corp. | 275,912 | 13,153 |
| | Bank of Hawaii Corp. | 171,612 | 13,034 |
| | Fulton Financial Corp. | 699,239 | 12,747 |
| | Jackson Financial Inc. Class A | 330,464 | 12,677 |
| | First Bancorp | 800,783 | 12,644 |
| | Simmons First National Corp. Class A | 529,657 | 12,643 |
| | PacWest Bancorp | 504,481 | 12,541 |
| | BankUnited Inc. | 335,648 | 12,067 |
| | Walker & Dunlop Inc. | 132,547 | 11,924 |
| | Moelis & Co. Class A | 275,386 | 11,693 |
| | Columbia Banking System Inc. | 339,527 | 11,364 |
| | Atlantic Union Bankshares Corp. | 323,539 | 11,175 |
| | First Merchants Corp. | 247,409 | 11,109 |
| | Banner Corp. | 147,533 | 11,028 |
| | Washington Federal Inc. | 279,299 | 10,809 |
| | CNO Financial Group Inc. | 489,228 | 10,792 |
| | First Financial Bancorp | 401,894 | 10,477 |
| | WesBanco Inc. | 252,388 | 10,207 |
| | Independent Bank Group Inc. | 154,509 | 9,748 |
| | Stock Yards Bancorp Inc. | 124,107 | 9,704 |
| | Trustmark Corp. | 264,165 | 9,661 |
| | Towne Bank | 291,391 | 9,598 |
| | Renasant Corp. | 235,821 | 9,520 |
| | Virtu Financial Inc. Class A | 423,726 | 9,483 |
| | Heartland Financial USA Inc. | 177,768 | 8,768 |
| | NBT Bancorp Inc. | 181,022 | 8,579 |
| | BancFirst Corp. | 85,073 | 8,152 |
| | Northwest Bancshares Inc. | 525,541 | 7,915 |
| | Bank of NT Butterfield & Son Ltd. | 214,967 | 7,425 |
| | Artisan Partners Asset Management Inc. Class A | 259,669 | 7,403 |
| | Navient Corp. | 481,969 | 7,297 |
| | Provident Financial Services Inc. | 316,464 | 7,095 |
| | Westamerica Bancorp | 112,834 | 7,078 |
| | Horace Mann Educators Corp. | 177,843 | 7,018 |
| | Hope Bancorp Inc. | 499,612 | 6,780 |
| | Sandy Spring Bancorp Inc. | 188,742 | 6,689 |
| | Cohen & Steers Inc. | 110,216 | 6,631 |
| | City Holding Co. | 63,698 | 6,424 |
| | S&T Bancorp Inc. | 169,067 | 6,392 |
| | Eagle Bancorp Inc. | 136,676 | 6,189 |
| | First Commonwealth Financial Corp. | 402,550 | 5,773 |
| | | | | | Shares | Market
Value•
($000) |
| | Berkshire Hills Bancorp Inc. | 189,703 | 5,549 |
| | Employers Holdings Inc. | 117,511 | 5,125 |
| | Virtus Investment Partners Inc. | 29,821 | 5,114 |
| | CNA Financial Corp. | 118,234 | 4,930 |
| | Capitol Federal Financial Inc. | 563,793 | 4,612 |
| | Brookline Bancorp Inc. | 326,035 | 4,483 |
| | 1st Source Corp. | 70,170 | 4,081 |
| | Washington Trust Bancorp Inc. | 73,830 | 3,581 |
| | Argo Group International Holdings Ltd. | 137,262 | 3,414 |
| | Mercury General Corp. | 115,314 | 3,344 |
| | Community Trust Bancorp Inc. | 68,399 | 3,235 |
| | WisdomTree Investments Inc. | 586,980 | 3,187 |
| | TFS Financial Corp. | 218,248 | 3,066 |
| | Kearny Financial Corp. | 263,023 | 2,667 |
| | Republic Bancorp Inc. Class A | 37,721 | 1,748 |
| | Federated Hermes Inc. Class B | 516 | 18 |
| | | | | | | 12,266,354 |
| Health Care (15.2%) |
| | Johnson & Johnson | 11,483,558 | 1,997,795 |
| | Eli Lilly & Co. | 3,674,466 | 1,330,487 |
| | Pfizer Inc. | 24,647,428 | 1,147,338 |
| | AbbVie Inc. | 7,707,027 | 1,128,309 |
| | Merck & Co. Inc. | 11,032,080 | 1,116,446 |
| | Bristol-Myers Squibb Co. | 9,290,522 | 719,737 |
| | Amgen Inc. | 2,329,592 | 629,805 |
| | Medtronic plc | 5,832,363 | 509,399 |
| | Gilead Sciences Inc. | 5,471,046 | 429,258 |
| | Cardinal Health Inc. | 1,186,342 | 90,043 |
| | Viatris Inc. | 5,275,439 | 53,440 |
| | Organon & Co. | 1,105,997 | 28,955 |
| | Perrigo Co. plc | 585,025 | 23,565 |
| | Premier Inc. Class A | 513,568 | 17,913 |
| | Patterson Cos. Inc. | 377,659 | 9,808 |
| | Healthcare Services Group Inc. | 319,709 | 4,463 |
| | | | | | | 9,236,761 |
| Industrials (10.3%) |
| | Raytheon Technologies Corp. | 6,487,829 | 615,176 |
| | Honeywell International Inc. | 2,941,034 | 600,030 |
| | United Parcel Service Inc. Class B | 3,207,146 | 538,063 |
| | Lockheed Martin Corp. | 1,036,270 | 504,332 |
| | Caterpillar Inc. | 2,304,568 | 498,847 |
| | Automatic Data Processing Inc. | 1,819,737 | 439,830 |
High Dividend Yield Index Fund
| | | | | | Shares | Market
Value•
($000) |
| | 3M Co. | 2,483,208 | 312,363 |
| | Illinois Tool Works Inc. | 1,349,665 | 288,194 |
| | General Dynamics Corp. | 1,059,770 | 264,730 |
| | Eaton Corp. plc | 1,746,676 | 262,124 |
| | Emerson Electric Co. | 2,572,108 | 222,745 |
| | L3Harris Technologies Inc. | 838,356 | 206,630 |
| | Johnson Controls International plc | 3,033,637 | 175,466 |
| | Paychex Inc. | 1,404,684 | 166,188 |
| | Cummins Inc. | 614,399 | 150,227 |
| | PACCAR Inc. | 1,487,115 | 143,997 |
| | DuPont de Nemours Inc. | 2,212,412 | 126,550 |
| | Synchrony Financial | 2,089,105 | 74,289 |
| | Hubbell Inc. Class B | 232,883 | 55,305 |
| | RPM International Inc. | 554,978 | 52,484 |
| | CH Robinson Worldwide Inc. | 531,970 | 51,984 |
| | Snap-on Inc. | 228,717 | 50,787 |
| | Packaging Corp. of America | 402,118 | 48,339 |
| | Huntington Ingalls Industries Inc. | 171,332 | 44,044 |
| | Watsco Inc. | 143,310 | 38,831 |
| | Westrock Co. | 1,102,029 | 37,535 |
| | Sonoco Products Co. | 423,212 | 26,273 |
| | nVent Electric plc | 717,091 | 26,174 |
| | MDU Resources Group Inc. | 878,425 | 25,017 |
| | Western Union Co. | 1,675,082 | 22,630 |
| | Crane Holdings Co. | 204,374 | 20,507 |
| | ManpowerGroup Inc. | 223,670 | 17,522 |
| | Ryder System Inc. | 214,817 | 17,295 |
| | MSC Industrial Direct Co. Inc. Class A | 200,776 | 16,660 |
| | Flowserve Corp. | 565,611 | 16,222 |
| | Triton International Ltd. | 265,381 | 16,106 |
| | GATX Corp. | 153,406 | 16,063 |
| | ABM Industries Inc. | 290,003 | 12,908 |
| | Otter Tail Corp. | 177,730 | 11,983 |
| | Scorpio Tankers Inc. | 210,794 | 10,105 |
| | McGrath RentCorp | 104,889 | 9,865 |
| | Kennametal Inc. | 350,599 | 9,364 |
| 1 | ZIM Integrated Shipping Services Ltd. | 357,056 | 8,387 |
| 1 | ADT Inc. | 908,496 | 7,686 |
| | Greif Inc. Class A | 111,371 | 7,374 |
| | Granite Construction Inc. | 190,616 | 6,429 |
| | H&E Equipment Services Inc. | 137,465 | 5,191 |
| | SFL Corp. Ltd. | 497,951 | 5,079 |
| | Greenbrier Cos. Inc. | 138,061 | 4,875 |
| | Apogee Enterprises Inc. | 95,679 | 4,390 |
| 1 | Atlas Corp. | 257,252 | 3,805 |
| | Trinseo plc | 150,872 | 2,839 |
| | | | | | | 6,299,839 |
| | | | | | Shares | Market
Value•
($000) |
| Real Estate (0.0%) |
| | Kennedy-Wilson Holdings Inc. | 510,497 | 8,479 |
| Technology (5.9%) |
| | Broadcom Inc. | 1,722,631 | 809,843 |
| | Texas Instruments Inc. | 4,022,253 | 646,094 |
| | QUALCOMM Inc. | 4,888,694 | 575,204 |
| | International Business Machines Corp. | 3,926,696 | 543,023 |
| | Intel Corp. | 17,856,782 | 507,668 |
| | HP Inc. | 4,511,964 | 124,620 |
| | Corning Inc. | 3,295,086 | 106,003 |
| | Hewlett Packard Enterprise Co. | 5,651,778 | 80,651 |
| | NetApp Inc. | 956,312 | 66,244 |
| | NortonLifeLock Inc. | 2,486,805 | 56,028 |
| | Seagate Technology Holdings plc | 803,421 | 39,898 |
| | National Instruments Corp. | 568,535 | 21,707 |
| | Avnet Inc. | 408,909 | 16,434 |
| | Xerox Holdings Corp. | 494,566 | 7,236 |
| | | | | | | 3,600,653 |
| Telecommunications (4.6%) |
| | Cisco Systems Inc. | 18,134,193 | 823,836 |
| | Verizon Communications Inc. | 18,335,775 | 685,208 |
| | Comcast Corp. Class A | 19,104,993 | 606,392 |
| | AT&T Inc. | 31,238,818 | 569,484 |
| | Juniper Networks Inc. | 1,390,270 | 42,542 |
| | Lumen Technologies Inc. | 4,472,526 | 32,918 |
| | Cogent Communications Holdings Inc. | 186,193 | 9,777 |
| | Telephone & Data Systems Inc. | 435,054 | 7,396 |
| | | | | | | 2,777,553 |
| Utilities (7.6%) |
| | NextEra Energy Inc. | 8,564,096 | 663,717 |
| | Duke Energy Corp. | 3,360,462 | 313,128 |
| | Southern Co. | 4,631,366 | 303,262 |
| | Waste Management Inc. | 1,808,027 | 286,337 |
| | Dominion Energy Inc. | 3,624,798 | 253,627 |
| | Sempra Energy | 1,376,015 | 207,696 |
| | American Electric Power Co. Inc. | 2,241,276 | 197,053 |
| | Exelon Corp. | 4,332,535 | 167,193 |
| | Xcel Energy Inc. | 2,377,711 | 154,813 |
| | Consolidated Edison Inc. | 1,546,093 | 135,994 |
| | WEC Energy Group Inc. | 1,375,766 | 125,649 |
| | Public Service Enterprise Group Inc. | 2,174,817 | 121,942 |
| | Eversource Energy | 1,506,399 | 114,908 |
| | Edison International | 1,641,276 | 98,542 |
| | Entergy Corp. | 883,060 | 94,611 |
| | FirstEnergy Corp. | 2,496,713 | 94,151 |
High Dividend Yield Index Fund
| | | | | | Shares | Market
Value•
($000) |
| | DTE Energy Co. | 838,934 | 94,053 |
| | Ameren Corp. | 1,118,578 | 91,186 |
| | PPL Corp. | 3,204,751 | 84,894 |
| | CenterPoint Energy Inc. | 2,740,909 | 78,417 |
| | AES Corp. | 2,903,715 | 75,961 |
| | CMS Energy Corp. | 1,258,614 | 71,804 |
| | Atmos Energy Corp. | 600,604 | 63,994 |
| | Evergy Inc. | 966,884 | 59,106 |
| | Alliant Energy Corp. | 1,090,539 | 56,893 |
| | NRG Energy Inc. | 1,027,028 | 45,600 |
| | NiSource Inc. | 1,767,168 | 45,399 |
| | Essential Utilities Inc. | 1,006,742 | 44,518 |
| | Vistra Corp. | 1,788,095 | 41,073 |
| | Pinnacle West Capital Corp. | 491,177 | 33,012 |
| | UGI Corp. | 911,163 | 32,191 |
| | OGE Energy Corp. | 868,176 | 31,801 |
| | National Fuel Gas Co. | 381,626 | 25,756 |
| | IDACORP Inc. | 218,992 | 22,928 |
| | Southwest Gas Holdings Inc. | 290,074 | 21,196 |
| | Black Hills Corp. | 292,655 | 19,131 |
| | New Jersey Resources Corp. | 416,959 | 18,613 |
| | South Jersey Industries Inc. | 531,289 | 18,420 |
| | ONE Gas Inc. | 232,931 | 18,048 |
| | Hawaiian Electric Industries Inc. | 473,185 | 18,000 |
| | Portland General Electric Co. | 386,689 | 17,378 |
| | PNM Resources Inc. | 369,465 | 17,169 |
| | Spire Inc. | 220,426 | 15,388 |
| | ALLETE Inc. | 247,643 | 13,935 |
| | NorthWestern Corp. | 243,551 | 12,867 |
| | Avista Corp. | 313,454 | 12,861 |
| | | | | | Shares | Market
Value•
($000) |
| | Avangrid Inc. | 307,990 | 12,529 |
| | Clearway Energy Inc. Class C | 353,033 | 12,264 |
| | MGE Energy Inc. | 157,369 | 10,715 |
| | SJW Group | 117,008 | 8,270 |
| | Atlantica Sustainable Infrastructure plc | 273,330 | 7,574 |
| | Northwest Natural Holding Co. | 150,128 | 7,220 |
| | Clearway Energy Inc. Class A | 152,542 | 4,932 |
| | | | | | | 4,597,719 |
Total Common Stocks
(Cost $50,450,670) | 60,771,482 |
| Temporary Cash Investments (0.1%) |
| Money Market Fund (0.1%) |
| 2,3 | Vanguard Market Liquidity Fund, 3.117%
(Cost $76,794) | 768,163 | 76,801 |
Total Investments (99.9%)
(Cost $50,527,464) | | 60,848,283 |
| Other Assets and Liabilities—Net (0.1%) | | 39,631 |
| Net Assets (100%) | | 60,887,914 |
| • | See Note A in Notes to Financial Statements. |
| 1 | Includes partial security positions on loan to broker-dealers. The total value of securities on loan is $40,215,000. |
| 2 | Affiliated money market fund available only to Vanguard funds and certain trusts and accounts managed by Vanguard. Rate shown is the 7-day yield. |
| 3 | Collateral of $44,188,000 was received for securities on loan. |
High Dividend Yield Index Fund
Derivative Financial Instruments Outstanding as of Period End
| Futures Contracts |
| | | | ($000) |
| | Expiration | Number of
Long (Short)
Contracts | Notional
Amount | Value and
Unrealized
Appreciation
(Depreciation) |
| Long Futures Contracts |
| E-mini S&P 500 Index | December 2022 | 481 | 93,386 | 1,707 |
| Over-the-Counter Total Return Swaps |
| Reference Entity | Termination
Date | Counterparty | Notional
Amount
($000) | Floating
Interest
Rate
Received
(Paid)1
(%) | Value and
Unrealized
Appreciation
($000) | Value and
Unrealized
(Depreciation)
($000) |
| Clorox Co. | 8/31/23 | BANA | 13,224 | (3.074) | 1,908 | — |
| Paramount Global Class B | 8/31/23 | BANA | 11,348 | (3.074) | — | (313) |
| | | | | | 1,908 | (313) |
| 1 | Based on USD Overnight Bank Funding Rate as of the most recent payment date. Floating interest payment received/paid monthly. |
| | BANA—Bank of America, N.A. |
At October 31, 2022, the counterparties had deposited in segregated accounts securities with a value of $2,317,000 in connection with open over-the-counter swap contracts.
See accompanying Notes, which are an integral part of the Financial Statements.
High Dividend Yield Index Fund
Statement of Assets and Liabilities
|
| ($000s, except shares and per-share amounts) | Amount |
| Assets | |
| Investments in Securities, at Value1 | |
| Unaffiliated Issuers (Cost $50,450,670) | 60,771,482 |
| Affiliated Issuers (Cost $76,794) | 76,801 |
| Total Investments in Securities | 60,848,283 |
| Investment in Vanguard | 2,155 |
| Cash Collateral Pledged—Futures Contracts | 4,810 |
| Receivables for Investment Securities Sold | 1,708 |
| Receivables for Accrued Income | 86,773 |
| Receivables for Capital Shares Issued | 10,542 |
| Unrealized Appreciation—Over-the-Counter Swap Contracts | 1,908 |
| Total Assets | 60,956,179 |
| Liabilities | |
| Due to Custodian | 1,641 |
| Payables for Investment Securities Purchased | 11,989 |
| Collateral for Securities on Loan | 44,188 |
| Payables for Capital Shares Redeemed | 7,822 |
| Payables to Vanguard | 1,633 |
| Variation Margin Payable—Futures Contracts | 679 |
| Unrealized Depreciation—Over-the-Counter Swap Contracts | 313 |
| Total Liabilities | 68,265 |
| Net Assets | 60,887,914 |
| 1 Includes $40,215 of securities on loan. | |
At October 31, 2022, net assets consisted of: |
|
| | |
| Paid-in Capital | 53,353,885 |
| Total Distributable Earnings (Loss) | 7,534,029 |
| Net Assets | 60,887,914 |
| |
| ETF Shares—Net Assets | |
Applicable to 457,502,229 outstanding $.001 par value shares of
beneficial interest (unlimited authorization) | 48,688,871 |
| Net Asset Value Per Share—ETF Shares | $106.42 |
| |
| Admiral Shares—Net Assets | |
Applicable to 380,143,108 outstanding $.001 par value shares of
beneficial interest (unlimited authorization) | 12,199,043 |
| Net Asset Value Per Share—Admiral Shares | $32.09 |
See accompanying Notes, which are an integral part of the Financial Statements.
14
High Dividend Yield Index Fund
|
| | Year Ended
October 31, 2022 |
| | ($000) |
| Investment Income | |
| Income | |
| Dividends 1 | 1,718,598 |
| Interest 2 | 395 |
| Securities Lending—Net | 1,597 |
| Total Income | 1,720,590 |
| Expenses | |
| The Vanguard Group—Note B | |
| Investment Advisory Services | 1,499 |
| Management and Administrative—ETF Shares | 22,404 |
| Management and Administrative—Admiral Shares | 8,448 |
| Marketing and Distribution—ETF Shares | 1,661 |
| Marketing and Distribution—Admiral Shares | 508 |
| Custodian Fees | 442 |
| Auditing Fees | 30 |
| Shareholders’ Reports—ETF Shares | 832 |
| Shareholders’ Reports—Admiral Shares | 138 |
| Trustees’ Fees and Expenses | 21 |
| Other Expenses | 37 |
| Total Expenses | 36,020 |
| Expenses Paid Indirectly | (13) |
| Net Expenses | 36,007 |
| Net Investment Income | 1,684,583 |
| Realized Net Gain (Loss) | |
| Investment Securities Sold2,3 | 671,793 |
| Futures Contracts | (19,177) |
| Swap Contracts | (13,055) |
| Realized Net Gain (Loss) | 639,561 |
| Change in Unrealized Appreciation (Depreciation) | |
| Investment Securities2 | (1,655,662) |
| Futures Contracts | (1,999) |
| Swap Contracts | (2,023) |
| Change in Unrealized Appreciation (Depreciation) | (1,659,684) |
| Net Increase (Decrease) in Net Assets Resulting from Operations | 664,460 |
| 1 | Dividends are net of foreign withholding taxes of $835,000. |
| 2 | Interest income, realized net gain (loss), capital gain distributions received, and change in unrealized appreciation (depreciation) from an affiliated company of the fund were $395,000, ($41,000), $1,000, and $7,000, respectively. Purchases and sales are for temporary cash investment purposes. |
| 3 | Includes $1,174,269,000 of net gain (loss) resulting from in-kind redemptions. |
See accompanying Notes, which are an integral part of the Financial Statements.
High Dividend Yield Index Fund
Statement of Changes in Net Assets
|
| | Year Ended October 31, |
| | 2022
($000) | 2021
($000) |
| Increase (Decrease) in Net Assets | | |
| Operations | | |
| Net Investment Income | 1,684,583 | 1,357,112 |
| Realized Net Gain (Loss) | 639,561 | 1,205,834 |
| Change in Unrealized Appreciation (Depreciation) | (1,659,684) | 11,496,343 |
| Net Increase (Decrease) in Net Assets Resulting from Operations | 664,460 | 14,059,289 |
| Distributions | | |
| ETF Shares | (1,318,564) | (1,045,675) |
| Admiral Shares | (352,553) | (295,106) |
| Total Distributions | (1,671,117) | (1,340,781) |
| Capital Share Transactions | | |
| ETF Shares | 9,692,470 | 3,606,248 |
| Admiral Shares | 1,017,487 | 916,264 |
| Net Increase (Decrease) from Capital Share Transactions | 10,709,957 | 4,522,512 |
| Total Increase (Decrease) | 9,703,300 | 17,241,020 |
| Net Assets | | |
| Beginning of Period | 51,184,614 | 33,943,594 |
| End of Period | 60,887,914 | 51,184,614 |
See accompanying Notes, which are an integral part of the Financial Statements.
High Dividend Yield Index Fund
| ETF Shares | | | | | |
For a Share Outstanding
Throughout Each Period | Year Ended October 31, |
| 2022 | 2021 | 2020 | 2019 | 2018 |
| Net Asset Value, Beginning of Period | $108.42 | $79.49 | $89.60 | $83.26 | $82.46 |
| Investment Operations | | | | | |
| Net Investment Income1 | 3.232 | 3.010 | 2.950 | 2.891 | 2.623 |
| Net Realized and Unrealized Gain (Loss) on Investments | (2.016) | 28.887 | (10.184) | 6.251 | .731 |
| Total from Investment Operations | 1.216 | 31.897 | (7.234) | 9.142 | 3.354 |
| Distributions | | | | | |
| Dividends from Net Investment Income | (3.216) | (2.967) | (2.876) | (2.802) | (2.554) |
| Distributions from Realized Capital Gains | — | — | — | — | — |
| Total Distributions | (3.216) | (2.967) | (2.876) | (2.802) | (2.554) |
| Net Asset Value, End of Period | $106.42 | $108.42 | $79.49 | $89.60 | $83.26 |
| Total Return | 1.18% | 40.55% | -8.17% | 11.31% | 4.05% |
| Ratios/Supplemental Data | | | | | |
| Net Assets, End of Period (Millions) | $48,689 | $39,766 | $26,279 | $26,816 | $21,328 |
| Ratio of Total Expenses to Average Net Assets | 0.06% 2 | 0.06% | 0.06% | 0.06% | 0.06% |
| Ratio of Net Investment Income to Average Net Assets | 3.01% | 2.99% | 3.53% | 3.38% | 3.08% |
| Portfolio Turnover Rate3 | 9% | 8% | 11% | 7% | 13% |
| 1 | Calculated based on average shares outstanding. |
| 2 | The ratio of expenses to average net assets for the period net of reduction from custody fee offset arrangements was 0.06%. |
| 3 | Excludes the value of portfolio securities received or delivered as a result of in-kind purchases or redemptions of the fund’s capital shares, including ETF Creation Units. |
See accompanying Notes, which are an integral part of the Financial Statements.
High Dividend Yield Index Fund
| Admiral Shares | | | | |
For a Share Outstanding
Throughout Each Period | Year Ended October 31, | February 7,
20191 to
October 31,
2019 |
| 2022 | 2021 | 2020 |
| Net Asset Value, Beginning of Period | $32.69 | $23.97 | $27.02 | $25.00 |
| Investment Operations | | | | |
| Net Investment Income2 | .970 | .902 | .887 | .624 |
| Net Realized and Unrealized Gain (Loss) on Investments | (.607) | 8.707 | (3.075) | 2.010 |
| Total from Investment Operations | .363 | 9.609 | (2.188) | 2.634 |
| Distributions | | | | |
| Dividends from Net Investment Income | (.963) | (.889) | (.862) | (.614) |
| Distributions from Realized Capital Gains | — | — | — | — |
| Total Distributions | (.963) | (.889) | (.862) | (.614) |
| Net Asset Value, End of Period | $32.09 | $32.69 | $23.97 | $27.02 |
| Total Return3 | 1.19% | 40.50% | -8.19% | 10.64% |
| Ratios/Supplemental Data | | | | |
| Net Assets, End of Period (Millions) | $12,199 | $11,418 | $7,665 | $8,814 |
| Ratio of Total Expenses to Average Net Assets | 0.08% 4 | 0.08% | 0.08% | 0.08% 5 |
| Ratio of Net Investment Income to Average Net Assets | 2.99% | 2.97% | 3.52% | 3.24% 5 |
| Portfolio Turnover Rate6 | 9% | 8% | 11% | 7% 7 |
| 1 | Inception. |
| 2 | Calculated based on average shares outstanding. |
| 3 | Total returns do not include account service fees that may have applied in the periods shown. Fund prospectuses provide information about any applicable account service fees. |
| 4 | The ratio of expenses to average net assets for the period net of reduction from custody fee offset arrangements was 0.08%. |
| 5 | Annualized. |
| 6 | Excludes the value of portfolio securities received or delivered as a result of in-kind purchases or redemptions of the fund’s capital shares, including ETF Creation Units. |
| 7 | Reflects the fund’s portfolio turnover for the fiscal year ended October 31, 2019. |
See accompanying Notes, which are an integral part of the Financial Statements.
High Dividend Yield Index Fund
Notes to Financial Statements
Vanguard High Dividend Yield Index Fund is registered under the Investment Company Act of 1940 as an open-end investment company, or mutual fund. The fund offers two classes of shares: ETF Shares and Admiral Shares. Each of the share classes has different eligibility and minimum purchase requirements, and is designed for different types of investors. ETF Shares are listed for trading on NYSE Arca; they can be purchased and sold through a broker.
Significant market disruptions, such as those caused by pandemics (e.g., COVID-19 pandemic), natural or environmental disasters, war (e.g., Russia's invasion of Ukraine), acts of terrorism, or other events, can adversely affect local and global markets and normal market operations. Any such disruptions could have an adverse impact on the value of the fund's investments and fund performance.
A. The following significant accounting policies conform to generally accepted accounting principles for U.S. investment companies. The fund consistently follows such policies in preparing its financial statements.
1. Security Valuation: Securities are valued as of the close of trading on the New York Stock Exchange (generally 4 p.m., Eastern time) on the valuation date. Equity securities are valued at the latest quoted sales prices or official closing prices taken from the primary market in which each security trades; such securities not traded on the valuation date are valued at the mean of the latest quoted bid and asked prices. Securities for which market quotations are not readily available, or whose values have been affected by events occurring before the fund's pricing time but after the close of the securities’ primary markets, are valued by methods deemed by the valuation designee to represent fair value and subject to oversight by the board of trustees. Investments in Vanguard Market Liquidity Fund are valued at that fund's net asset value.
2. Futures Contracts: The fund uses index futures contracts to a limited extent, with the objectives of maintaining full exposure to the stock market, maintaining liquidity, and minimizing transaction costs. The fund may purchase futures contracts to immediately invest incoming cash in the market, or sell futures in response to cash outflows, thereby simulating a fully invested position in the underlying index while maintaining a cash balance for liquidity. The primary risks associated with the use of futures contracts are imperfect correlation between changes in market values of stocks held by the fund and the prices of futures contracts, and the possibility of an illiquid market. Counterparty risk involving futures is mitigated because a regulated clearinghouse is the counterparty instead of the clearing broker. To further mitigate counterparty risk, the fund trades futures contracts on an exchange, monitors the financial strength of its clearing brokers and clearinghouse, and has entered into clearing agreements with its clearing brokers. The clearinghouse imposes initial margin requirements to secure the fund’s performance and requires daily settlement of variation margin representing changes in the market value of each contract. Any securities pledged as initial margin for open contracts are noted in the Schedule of Investments.
Futures contracts are valued at their quoted daily settlement prices. The notional amounts of the contracts are not recorded in the Statement of Assets and Liabilities. Fluctuations in the value of the contracts are recorded in the Statement of Assets and Liabilities as an asset (liability) and in the Statement of Operations as unrealized appreciation (depreciation) until the contracts are closed, when they are recorded as realized gains (losses) on futures contracts.
During the year ended October 31, 2022, the fund’s average investments in long and short futures contracts represented less than 1% and 0% of net assets, respectively, based on the average of the notional amounts at each quarter-end during the period.
High Dividend Yield Index Fund
3. Swap Contracts: The fund has entered into equity swap contracts to earn the total return on selected reference stocks in the fund’s target index. Under the terms of the swaps, the fund receives the total return on the referenced stock (i.e., receiving the increase or paying the decrease in value of the selected reference stock and receiving the equivalent of any dividends in respect of the selected referenced stock) over a specified period of time, applied to a notional amount that represents the value of a designated number of shares of the selected reference stock at the beginning of the equity swap contract. The fund also pays a floating rate that is based on short-term interest rates, applied to the notional amount. At the same time, the fund generally invests an amount approximating the notional amount of the swap in high-quality temporary cash investments.
A risk associated with all types of swaps is the possibility that a counterparty may default on its obligation to pay net amounts due to the fund. The fund’s maximum amount subject to counterparty risk is the unrealized appreciation on the swap contract. The fund mitigates its counterparty risk by entering into swaps only with a diverse group of prequalified counterparties, monitoring their financial strength, entering into master netting arrangements with its counterparties, and requiring its counterparties to transfer collateral as security for their performance. In the absence of a default, the collateral pledged or received by the fund cannot be repledged, resold, or rehypothecated. In the event of a counterparty’s default (including bankruptcy), the fund may terminate any swap contracts with that counterparty, determine the net amount owed by either party in accordance with its master netting arrangements, and sell or retain any collateral held up to the net amount owed to the fund under the master netting arrangements. The swap contracts contain provisions whereby a counterparty may terminate open contracts if the fund's net assets decline below a certain level, triggering a payment by the fund if the fund is in a net liability position at the time of the termination. The payment amount would be reduced by any collateral the fund has pledged. Any securities pledged as collateral for open contracts are noted in the Schedule of Investments. The value of collateral received or pledged is compared daily to the value of the swap contracts exposure with each counterparty, and any difference, if in excess of a specified minimum transfer amount, is adjusted and settled within two business days.
The notional amounts of swap contracts are not recorded in the Statement of Assets and Liabilities. Swaps are valued daily based on market quotations received from independent pricing services or recognized dealers and the change in value is recorded in the Statement of Assets and Liabilities as an asset (liability) and in the Statement of Operations as unrealized appreciation (depreciation) until periodic payments are made or the termination of the swap, at which time realized gain (loss) is recorded.
During the year ended October 31, 2022, the fund’s average amounts of investments in total return swaps represented less than 1% of net assets, based on the average of notional amounts at each quarter-end during the period.
4. Federal Income Taxes: The fund intends to continue to qualify as a regulated investment company and distribute virtually all of its taxable income. The fund’s tax returns are open to examination by the relevant tax authorities until expiration of the applicable statute of limitations, which is generally three years after the filing of the tax return. Management has analyzed the fund’s tax positions taken for all open federal and state income tax years, and has concluded that no provision for income tax is required in the fund’s financial statements.
High Dividend Yield Index Fund
5. Distributions: Distributions to shareholders are recorded on the ex-dividend date. Distributions are determined on a tax basis at the fiscal year-end and may differ from net investment income and realized capital gains for financial reporting purposes.
6. Securities Lending: To earn additional income, the fund lends its securities to qualified institutional borrowers. Security loans are subject to termination by the fund at any time, and are required to be secured at all times by collateral in an amount at least equal to the market value of securities loaned. Daily market fluctuations could cause the value of loaned securities to be more or less than the value of the collateral received. When this occurs, the collateral is adjusted and settled before the opening of the market on the next business day. The fund further mitigates its counterparty risk by entering into securities lending transactions only with a diverse group of prequalified counterparties, monitoring their financial strength, and entering into master securities lending agreements with its counterparties. The master securities lending agreements provide that, in the event of a counterparty’s default (including bankruptcy), the fund may terminate any loans with that borrower, determine the net amount owed, and sell or retain the collateral up to the net amount owed to the fund; however, such actions may be subject to legal proceedings. While collateral mitigates counterparty risk, in the event of a default, the fund may experience delays and costs in recovering the securities loaned. The fund invests cash collateral received in Vanguard Market Liquidity Fund, and records a liability in the Statement of Assets and Liabilities for the return of the collateral, during the period the securities are on loan. Collateral investments in Vanguard Market Liquidity Fund are subject to market appreciation or depreciation. Securities lending income represents fees charged to borrowers plus income earned on invested cash collateral, less expenses associated with the loan. During the term of the loan, the fund is entitled to all distributions made on or in respect of the loaned securities.
7. Credit Facilities and Interfund Lending Program: The fund and certain other funds managed by The Vanguard Group ("Vanguard") participate in a $4.4 billion committed credit facility provided by a syndicate of lenders pursuant to a credit agreement and an uncommitted credit facility provided by Vanguard. Both facilities may be renewed annually. Each fund is individually liable for its borrowings, if any, under the credit facilities. Borrowings may be utilized for temporary or emergency purposes and are subject to the fund’s regulatory and contractual borrowing restrictions. With respect to the committed credit facility, the participating funds are charged administrative fees and an annual commitment fee of 0.10% of the undrawn committed amount of the facility, which are allocated to the funds based on a method approved by the fund’s board of trustees and included in Management and Administrative expenses on the fund’s Statement of Operations. Any borrowings under either facility bear interest at an agreed-upon spread plus the higher of the federal funds effective rate, the overnight bank funding rate, or the Daily Simple Secured Overnight Financing Rate inclusive of an additional agreed-upon spread. However, borrowings under the uncommitted credit facility may bear interest based upon an alternate rate agreed to by the fund and Vanguard.
In accordance with an exemptive order (the “Order”) from the SEC, the fund may participate in a joint lending and borrowing program that allows registered open-end Vanguard funds to borrow money from and lend money to each other for temporary or emergency purposes (the “Interfund Lending Program”), subject to compliance with the terms and conditions of the Order, and to the extent permitted by the fund’s investment objective and investment policies. Interfund loans and borrowings normally extend overnight but can have a maximum duration of seven days. Loans may be called on one business day’s notice. The interest rate to be charged is governed by the conditions of the Order and internal procedures adopted by the board of trustees. The board of trustees is responsible for overseeing the Interfund Lending Program.
High Dividend Yield Index Fund
For the year ended October 31, 2022, the fund did not utilize the credit facilities or the Interfund Lending Program.
8. Other: Dividend income is recorded on the ex-dividend date. Non-cash dividends included in income, if any, are recorded at the fair value of the securities received. Interest income includes income distributions received from Vanguard Market Liquidity Fund and is accrued daily. Security transactions are accounted for on the date securities are bought or sold. Costs used to determine realized gains (losses) on the sale of investment securities are those of the specific securities sold.
Each class of shares has equal rights as to assets and earnings, except that each class separately bears certain class-specific expenses related to maintenance of shareholder accounts (included in Management and Administrative expenses) and shareholder reporting. Marketing and distribution expenses are allocated to each class of shares based on a method approved by the board of trustees. Income, other non-class-specific expenses, and gains and losses on investments are allocated to each class of shares based on its relative net assets.
B. In accordance with the terms of a Funds’ Service Agreement (the “FSA”) between Vanguard and the fund, Vanguard furnishes to the fund investment advisory, corporate management, administrative, marketing, and distribution services at Vanguard’s cost of operations (as defined by the FSA). These costs of operations are allocated to the fund based on methods and guidelines approved by the board of trustees and are generally settled twice a month.
Upon the request of Vanguard, the fund may invest up to 0.40% of its net assets as capital in Vanguard. At October 31, 2022, the fund had contributed to Vanguard capital in the amount of $2,155,000, representing less than 0.01% of the fund’s net assets and 0.86% of Vanguard’s capital received pursuant to the FSA. The fund’s trustees and officers are also directors and employees, respectively, of Vanguard.
C. The fund’s custodian bank has agreed to reduce its fees when the fund maintains cash on deposit in the non-interest-bearing custody account. For the year ended October 31, 2022, custodian fee offset arrangements reduced the fund’s expenses by $13,000 (an annual rate of less than 0.01% of average net assets).
D. Various inputs may be used to determine the value of the fund’s investments and derivatives. These inputs are summarized in three broad levels for financial statement purposes. The inputs or methodologies used to value securities are not necessarily an indication of the risk associated with investing in those securities.
Level 1—Quoted prices in active markets for identical securities.
Level 2—Other significant observable inputs (including quoted prices for similar securities, interest rates, prepayment speeds, credit risk, etc.).
Level 3—Significant unobservable inputs (including the fund’s own assumptions used to determine the fair value of investments). Any investments and derivatives valued with significant unobservable inputs are noted on the Schedule of Investments.
High Dividend Yield Index Fund
The following table summarizes the market value of the fund's investments and derivatives as of October 31, 2022, based on the inputs used to value them:
| | Level 1
($000) | Level 2
($000) | Level 3
($000) | Total
($000) |
| Investments | | | | |
| Assets | | | | |
| Common Stocks | 60,771,482 | — | — | 60,771,482 |
| Temporary Cash Investments | 76,801 | — | — | 76,801 |
| Total | 60,848,283 | — | — | 60,848,283 |
| | | | |
| Derivative Financial Instruments | | | | |
| Assets | | | | |
| Futures Contracts1 | 1,707 | — | — | 1,707 |
| Swap Contracts | — | 1,908 | — | 1,908 |
| Total | 1,707 | 1,908 | — | 3,615 |
| Liabilities | | | | |
| Swap Contracts | — | 313 | — | 313 |
| 1 | Includes cumulative appreciation (depreciation) on futures contracts and centrally cleared swaps, if any, as reported in the Schedule of Investments. Only current day’s variation margin is reported within the Statement of Assets and Liabilities. |
E. Permanent differences between book-basis and tax-basis components of net assets are reclassified among capital accounts in the financial statements to reflect their tax character. These reclassifications have no effect on net assets or net asset value per share. As of period end, permanent differences primarily attributable to the accounting for applicable in-kind redemptions, corporate actions, and swap agreements were reclassified between the following accounts:
| | Amount
($000) |
| Paid-in Capital | 1,174,008 |
| Total Distributable Earnings (Loss) | (1,174,008) |
Temporary differences between book-basis and tax-basis components of total distributable earnings (loss) arise when certain items of income, gain, or loss are recognized in different periods for financial statement and tax purposes; these differences will reverse at some time in the future. The differences are primarily related to the deferral of losses from wash sales; the recognition of unrealized gains or losses from certain derivative contracts; and the classification of securities for tax purposes. As of period end, the tax-basis components of total distributable earnings (loss) are detailed in the table as follows:
| | Amount
($000) |
| Undistributed Ordinary Income | 175,807 |
| Undistributed Long-Term Gains | — |
| Capital Loss Carryforwards | (2,837,648) |
| Qualified Late-Year Losses | — |
| Net Unrealized Gains (Losses) | 10,195,870 |
High Dividend Yield Index Fund
The tax character of distributions paid was as follows:
| | Year Ended October 31, |
| | 2022
Amount
($000) | 2021
Amount
($000) |
| Ordinary Income* | 1,671,117 | 1,340,781 |
| Long-Term Capital Gains | — | — |
| Total | 1,671,117 | 1,340,781 |
| * | Includes short-term capital gains, if any. |
As of October 31, 2022, gross unrealized appreciation and depreciation for investments and derivatives based on cost for U.S. federal income tax purposes were as follows:
| | Amount
($000) |
| Tax Cost | 50,652,413 |
| Gross Unrealized Appreciation | 13,209,458 |
| Gross Unrealized Depreciation | (3,013,588) |
| Net Unrealized Appreciation (Depreciation) | 10,195,870 |
F. During the year ended October 31, 2022, the fund purchased $18,456,543,000 of investment securities and sold $7,668,261,000 of investment securities, other than temporary cash investments. Purchases and sales include $11,691,627,000 and $2,895,244,000, respectively, in connection with in-kind purchases and redemptions of the fund’s capital shares.
The fund purchased securities from and sold securities to other Vanguard funds or accounts managed by Vanguard or its affiliates, in accordance with procedures adopted by the board of trustees in compliance with Rule 17a-7 of the Investment Company Act of 1940. For the year ended October 31, 2022, such purchases were $693,189,000 and sales were $687,302,000, resulting in net realized loss of $104,120,000; these amounts, other than temporary cash investments, are included in the purchases and sales of investment securities noted above.
G. Capital share transactions for each class of shares were:
| | Year Ended October 31, |
| | 2022 | | 2021 |
| | Amount
($000) | Shares
(000) | | Amount
($000) | Shares
(000) |
| ETF Shares | | | | | |
| Issued | 12,609,654 | 117,634 | | 7,291,624 | 73,333 |
| Issued in Lieu of Cash Distributions | — | — | | — | — |
| Redeemed | (2,917,184) | (26,900) | | (3,685,376) | (37,150) |
| Net Increase (Decrease)—ETF Shares | 9,692,470 | 90,734 | | 3,606,248 | 36,183 |
High Dividend Yield Index Fund
| | Year Ended October 31, |
| | 2022 | | 2021 |
| | Amount
($000) | Shares
(000) | | Amount
($000) | Shares
(000) |
| Admiral Shares | | | | | |
| Issued | 2,387,226 | 73,103 | | 2,290,496 | 75,589 |
| Issued in Lieu of Cash Distributions | 273,445 | 8,660 | | 229,798 | 7,717 |
| Redeemed | (1,643,184) | (50,873) | | (1,604,030) | (53,826) |
| Net Increase (Decrease)—Admiral Shares | 1,017,487 | 30,890 | | 916,264 | 29,480 |
H. Management has determined that no events or transactions occurred subsequent to October 31, 2022, that would require recognition or disclosure in these financial statements.
Report of Independent Registered
Public Accounting Firm
To the Board of Trustees of Vanguard Whitehall Funds and Shareholders of Vanguard High Dividend Yield Index Fund
Opinion on the Financial Statements
We have audited the accompanying statement of assets and liabilities, including the schedule of investments, of Vanguard High Dividend Yield Index Fund (one of the funds constituting Vanguard Whitehall Funds, referred to hereafter as the "Fund") as of October 31, 2022, the related statement of operations for the year ended October 31, 2022, the statement of changes in net assets for each of the two years in the period ended October 31, 2022, including the related notes, and the financial highlights for each of the periods indicated therein (collectively referred to as the "financial statements"). In our opinion, the financial statements present fairly, in all material respects, the financial position of the Fund as of October 31, 2022, the results of its operations for the year then ended, the changes in its net assets for each of the two years in the period ended October 31, 2022 and the financial highlights for each of the periods indicated therein in conformity with accounting principles generally accepted in the United States of America.
Basis for Opinion
These financial statements are the responsibility of the Fund’s management. Our responsibility is to express an opinion on the Fund’s financial statements based on our audits. We are a public accounting firm registered with the Public Company Accounting Oversight Board (United States) (PCAOB) and are required to be independent with respect to the Fund in accordance with the U.S. federal securities laws and the applicable rules and regulations of the Securities and Exchange Commission and the PCAOB.
We conducted our audits of these financial statements in accordance with the standards of the PCAOB. Those standards require that we plan and perform the audit to obtain reasonable assurance about whether the financial statements are free of material misstatement, whether due to error or fraud.
Our audits included performing procedures to assess the risks of material misstatement of the financial statements, whether due to error or fraud, and performing procedures that respond to those risks. Such procedures included examining, on a test basis, evidence regarding the amounts and disclosures in the financial statements. Our audits also included evaluating the accounting principles used and significant estimates made by management, as well as evaluating the overall presentation of the financial statements. Our procedures included confirmation of securities owned as of October 31, 2022 by correspondence with the custodian, transfer agent and brokers; when replies were not received from brokers, we performed other auditing procedures. We believe that our audits provide a reasonable basis for our opinion.
/s/PricewaterhouseCoopers LLP
Philadelphia, Pennsylvania
December 16, 2022
We have served as the auditor of one or more investment companies in The Vanguard Group of Funds since 1975.
Tax information (unaudited)
For corporate shareholders, 98.7%, or if subsequently determined to be different, the maximum percentage allowable by law, of ordinary income (dividend income plus short-term gains, if any) for the fiscal year qualified for the dividends-received deduction.
The fund hereby designates $1,671,117,000, or if subsequently determined to be different, the maximum amount allowable by law, as qualified dividend income for individual shareholders for the fiscal year.
The fund hereby designates $137,000, or if subsequently determined to be different, the maximum amount allowable by law, of interest earned from obligations of the U.S. government which is generally exempt from state income tax.
London Stock Exchange Group companies include FTSE International Limited (“FTSE”), Frank Russell Company (“Russell”), MTS Next Limited (“MTS”), and FTSE TMX Global Debt Capital Markets Inc. (“FTSE TMX”). All rights reserved. “FTSE®”, “Russell®”, “MTS®”, “FTSE TMX®” and “FTSE Russell” and other service marks and trademarks related to the FTSE or Russell indexes are trademarks of the London Stock Exchange Group companies and are used by FTSE, MTS, FTSE TMX and Russell under license. All information is provided for information purposes only. Every effort is made to ensure that all information given in this publication is accurate, but no responsibility or liability can be accepted by the London Stock Exchange Group companies nor its licensors for any errors or for any loss from use of this publication. Neither the London Stock Exchange Group companies nor any of their licensors make any claim, prediction, warranty or representation whatsoever, expressly or impliedly, either as to the results to be obtained from the use of the Indices or the fitness or suitability of the Indices for any particular purpose to which they might be put. The London Stock Exchange Group companies do not provide investment advice and nothing in this document should be taken as constituting financial or investment advice. The London Stock Exchange Group companies make no representation regarding the advisability of investing in any asset. A decision to invest in any such asset should not be made in reliance on any information herein. Indexes cannot be invested in directly. Inclusion of an asset in an index is not a recommendation to buy, sell or hold that asset. The general information contained in this publication should not be acted upon without obtaining specific legal, tax, and investment advice from a licensed professional. No part of this information may be reproduced, stored in a retrieval system or transmitted in any form or by any means, electronic, mechanical, photocopying, recording or otherwise, without prior written permission of the London Stock Exchange Group companies. Distribution of the London Stock Exchange Group companies’ index values and the use of their indexes to create financial products require a license with FTSE, FTSE TMX, MTS and/or Russell and/or its licensors.
This page intentionally left blank.
The People Who Govern Your Fund
The trustees of your mutual fund are there to see that the fund is operated and managed in your best interests since, as a shareholder, you are a part owner of the fund. Your fund’s trustees also serve on the board of directors of The Vanguard Group, Inc., which is owned by the Vanguard funds and provides services to them.
A majority of Vanguard’s board members are independent, meaning that they have no affiliation with Vanguard or the funds they oversee, apart from the sizable personal investments they have made as private individuals. The independent board members have distinguished backgrounds in business, academia, and public service. Each of the trustees and executive officers oversees 206 Vanguard funds.
Information for each trustee and executive officer of the fund appears below. That information, as well as the Vanguard fund count, is as of the date on the cover of this fund report. The mailing address of the trustees and officers is P.O. Box 876, Valley Forge, PA 19482. More information about the trustees is in the Statement of Additional Information, which can be obtained, without charge, by contacting Vanguard at 800-662-7447, or online at vanguard.com.
Interested Trustee1
Mortimer J. Buckley
Born in 1969. Trustee since January 2018. Principal occupation(s) during the past five years and other experience: chairman of the board (2019–present) of Vanguard and of each of the investment companies served by Vanguard; chief executive officer (2018–present) of Vanguard; chief executive officer, president, and trustee (2018–present) of each of the investment companies served by Vanguard; president and director (2017–present) of Vanguard; and president (2018–present) of Vanguard Marketing Corporation. Chief investment officer (2013–2017), managing director (2002–2017), head of the Retail Investor Group (2006–2012), and chief information officer (2001–2006) of Vanguard. Member of the board of governors of the Investment Company Institute and the board of governors of FINRA. Trustee and vice chair of The Shipley School.
Independent Trustees
Tara Bunch
Born in 1962. Trustee since November 2021. Principal occupation(s) during the past five years and other experience: head of global operations at Airbnb (2020–present). Vice president of AppleCare (2012–2020). Member of the board of directors of Out & Equal (2002–2006), the advisory board of the University of California, Berkeley School of Engineering (2020–present), and the advisory board of Santa Clara University’s Leavey School of Business (2018–present).
Emerson U. Fullwood
Born in 1948. Trustee since January 2008. Principal occupation(s) during the past five years and other experience: executive chief staff and marketing officer for North America and corporate vice president (retired 2008) of Xerox Corporation (document management products and services). Former president of the Worldwide Channels Group, Latin America, and Worldwide Customer Service and executive chief staff officer of Developing Markets of Xerox. Executive in residence and 2009–2010 Distinguished Minett Professor at the Rochester Institute of Technology. Member of the board of directors of the University of Rochester Medical Center, the Monroe Community College Foundation, the United Way of Rochester, North Carolina A&T University, Roberts Wesleyan College, and the Rochester Philharmonic Orchestra. Trustee of the University of Rochester.
1 Mr. Buckley is considered an “interested person,” as defined in the Investment Company Act of 1940, because he is an officer of the Vanguard funds.
F. Joseph Loughrey
Born in 1949. Trustee since October 2009. Principal occupation(s) during the past five years and other experience: president and chief operating officer (retired 2009) and vice chairman of the board (2008–2009) of Cummins Inc. (industrial machinery). Chairman of the board of Hillenbrand, Inc. (specialized consumer services). Director of the V Foundation. Member of the advisory council for the College of Arts and Letters at the University of Notre Dame. Chairman of the board of Saint Anselm College.
Mark Loughridge
Born in 1953. Trustee since March 2012. Principal occupation(s) during the past five years and other experience: senior vice president and chief financial officer (retired 2013) of IBM (information technology services). Fiduciary member of IBM’s Retirement Plan Committee (2004–2013), senior vice president and general manager (2002–2004) of IBM Global Financing, vice president and controller (1998–2002) of IBM, and a variety of other prior management roles at IBM. Member of the Council on Chicago Booth.
Scott C. Malpass
Born in 1962. Trustee since March 2012. Principal occupation(s) during the past five years and other experience: adjunct professor of finance at the University of Notre Dame (2020–present). Chief investment officer (retired 2020) and vice president (retired 2020) of the University of Notre Dame. Assistant professor (retired June 2020) of finance at the Mendoza College of Business, University of Notre Dame, and member of the Notre Dame 403(b) Investment Committee. Member of the board of Catholic Investment Services, Inc. (investment advisors), the board of superintendence of the Institute for the Works of Religion, and the board of directors of Paxos Trust Company (finance).
Deanna Mulligan
Born in 1963. Trustee since January 2018. Principal occupation(s) during the past five years and other experience: chief executive officer of Purposeful (advisory firm for CEOs and C-level executives; 2021–present). Board chair (2020), chief executive officer (2011–2020), and president (2010–2019) of The Guardian Life Insurance Company of America. Chief operating officer (2010–2011) and executive vice president (2008–2010) of Individual Life and Disability of the Guardian Life Insurance Company of America. Member of the board of the Economic Club of New York. Trustee of the Partnership for New York City (business leadership), Chief Executives for Corporate Purpose, and the NewYork-Presbyterian Hospital.
André F. Perold
Born in 1952. Trustee since December 2004. Principal occupation(s) during the past five years and other experience: George Gund Professor of Finance and Banking, Emeritus at the Harvard Business School (retired 2011). Chief investment officer and co-managing partner of HighVista Strategies (private investment firm). Member of the board (2018–present) of RIT Capital Partners (investment firm). Member of the investment committee of Partners Health Care System.
Sarah Bloom Raskin
Born in 1961. Trustee since January 2018. Principal occupation(s) during the past five years and other experience: deputy secretary (2014–2017) of the United States Department of the Treasury. Governor (2010–2014) of the Federal Reserve Board. Commissioner (2007–2010) of financial regulation for the State of Maryland. Colin W. Brown Distinguished Professor of the Practice of Law (2021–present), professor (2020–present), Distinguished Fellow of the Global Financial Markets Center (2020–present), and Rubenstein Fellow (2017–2020) at Duke University. Trustee (2017–present) of Amherst College and member of Amherst College Investment Committee (2019–present). Member of the Regenerative Crisis Response Committee (2020–present).
David A. Thomas
Born in 1956. Trustee since July 2021. Principal occupation(s) during the past five years and other experience: president of Morehouse College (2018–present). Professor of business administration, emeritus at Harvard University (2017–2018). Dean (2011–2016) and professor of management (2016–2017) at the Georgetown University McDonough School of Business. Director of DTE Energy Company (2013–present). Trustee of Common Fund (2019–present).
Peter F. Volanakis
Born in 1955. Trustee since July 2009. Principal occupation(s) during the past five years and other experience: president and chief operating officer (retired 2010) of Corning Incorporated (communications equipment) and director of Corning Incorporated (2000–2010) and Dow Corning (2001–2010). Director (2012) of SPX Corporation (multi-industry manufacturing). Overseer of the Amos Tuck School of Business Administration, Dartmouth College (2001–2013). Member of the BMW Group Mobility Council.
Executive Officers
Christine M. Buchanan
Born in 1970. Principal occupation(s) during the past five years and other experience: principal of Vanguard. Chief financial officer (2021–present) and treasurer (2017–present) of each of the investment companies served by Vanguard. Partner (2005–2017) at KPMG (audit, tax, and advisory services).
John Galloway
Born in 1973. Principal occupation(s) during the past five years and other experience: principal of Vanguard. Investment stewardship officer (September 2020–present) of each of the investment companies served by Vanguard. Head of Investor Advocacy (February 2020–present) and head of Marketing Strategy and Planning (2017–2020) at Vanguard. Special assistant to the President of the United States (2015).
Ashley Grim
Born in 1984. Principal occupation(s) during the past five years and other experience: treasurer (February 2022–present) of each of the investment companies served by Vanguard. Fund transfer agent controller (2019–2022) and director of Audit Services (2017–2019) at Vanguard. Senior manager (2015–2017) at PriceWaterhouseCoopers (audit and assurance, consulting, and tax services).
Peter Mahoney
Born in 1974. Principal occupation(s) during the past five years and other experience: principal of Vanguard. Controller (2015–present) of each of the investment companies served by Vanguard. Head of International Fund Services (2008–2014) at Vanguard.
Anne E. Robinson
Born in 1970. Principal occupation(s) during the past five years and other experience: general counsel (2016–present) of Vanguard. Secretary (2016–present) of Vanguard and of each of the investment companies served by Vanguard. Managing director (2016–present) of Vanguard. Managing director and general counsel of Global Cards and Consumer Services (2014–2016) at Citigroup. Counsel (2003–2014) at American Express. Nonexecutive director of the board of National Grid (energy).
Michael Rollings
Born in 1963. Principal occupation(s) during the past five years and other experience: finance director (2017–present) and treasurer (2017) of each of the investment companies served by Vanguard. Managing director (2016–present) of Vanguard. Chief financial officer (2016–present) of Vanguard. Director (2016–present) of Vanguard Marketing Corporation. Executive vice president and chief financial officer (2006–2016) of MassMutual Financial Group.
John E. Schadl
Born in 1972. Principal occupation(s) during the past five years and other experience: principal of Vanguard. Chief compliance officer (2019–present) of Vanguard and of each of the investment companies served by Vanguard. Assistant vice president (2019–present) of Vanguard Marketing Corporation.
Vanguard Senior Management Team
| Matthew Benchener | Thomas M. Rampulla |
| Joseph Brennan | Karin A. Risi |
| Mortimer J. Buckley | Anne E. Robinson |
| Gregory Davis | Michael Rollings |
| John James | Nitin Tandon |
| Chris D. McIsaac | Lauren Valente |
Connect with Vanguard®>vanguard.com
Fund Information > 800-662-7447
Direct Investor Account Services > 800-662-2739
Institutional Investor Services > 800-523-1036
Text Telephone for People
Who Are Deaf or Hard of Hearing > 800-749-7273
This material may be used in conjunction with the offering of shares of any Vanguard fund only if preceded or accompanied by the fund’s current prospectus.
All comparative mutual fund data are from Morningstar, Inc., unless otherwise noted.
You can obtain a free copy of Vanguard’s proxy voting guidelines by visiting vanguard.com/proxyreporting or by calling Vanguard at 800-662-2739. The guidelines are also available from the SEC’s website, www.sec.gov. In addition, you may obtain a free report on how your fund voted the proxies for securities it owned during the 12 months ended June 30. To get the report, visit either vanguard.com/proxyreporting or www.sec.gov.
You can review information about your fund on the SEC’s website, and you can receive copies of this information, for a fee, by sending a request via email addressed to publicinfo@sec.gov.
Source for Bloomberg indexes: Bloomberg Index Services Limited. Copyright 2022, Bloomberg. All rights reserved.
© 2022 The Vanguard Group, Inc.
All rights reserved.
U.S. Patent No. 6,879,964.
Vanguard Marketing Corporation, Distributor.
Q6230 122022
Annual Report | October 31, 2022
Vanguard Emerging Markets Government Bond Index Fund
Contents
Your Fund’s Performance at a Glance
| 1 |
About Your Fund’s Expenses
| 2 |
Performance Summary
| 4 |
Financial Statements
| 7 |
Please note: The opinions expressed in this report are just that—informed opinions. They should not be considered promises or advice. Also, please keep in mind that the information and opinions cover the period through the date on the front of this report. Of course, the risks of investing in your fund are spelled out in the prospectus.
Your Fund’s Performance at a Glance
| • | The 12 months ended October 31, 2022, were a volatile, challenging period for financial markets. Vanguard Emerging Markets Government Bond Index Fund returned –23.25% for Admiral Shares, –23.24% for Institutional Shares, and –22.68% for ETF Shares (based on net asset value). The fund's benchmark index returned –23.08%. |
| • | The economic backdrop deteriorated as inflation soared to multidecade highs, fueled in part by higher energy and food prices in the wake of Russia’s invasion of Ukraine. Then price increases broadened to other categories of goods and services, adding to concerns that inflation would remain stubbornly high. That prompted aggressive tightening by many central banks to bring inflation back in check, which weighed on bond prices and increased fears of recession. |
| • | Amid these conditions, U.S. dollar-denominated emerging-market debt posted negative returns across almost all countries, sectors, and credit ratings. The worst declines were in bonds from Eastern Europe, but they constituted only about 3% of the portfolio’s weighting. |
| • | At period-end, the fund’s 30-day SEC yield net of expenses—a proxy for its income-generating potential over 12 months—ranged from 7.61% for ETF Shares to 7.68% for Institutional Shares. |
Market Barometer
| | Average Annual Total Returns
Periods Ended October 31, 2022 |
| | One Year | Three Years | Five Years |
| Stocks | | | |
| Russell 1000 Index (Large-caps) | -16.38% | 9.99% | 10.19% |
| Russell 2000 Index (Small-caps) | -18.54 | 7.05 | 5.56 |
| Russell 3000 Index (Broad U.S. market) | -16.52 | 9.79 | 9.87 |
| FTSE All-World ex US Index (International) | -24.20 | -1.16 | -0.18 |
| Bonds | | | |
Bloomberg U.S. Aggregate Float Adjusted Index
(Broad taxable market) | -15.69% | -3.73% | -0.50% |
Bloomberg Municipal Bond Index
(Broad tax-exempt market) | -11.98 | -2.18 | 0.37 |
| FTSE Three-Month U.S. Treasury Bill Index | 0.88 | 0.59 | 1.15 |
| CPI | | | |
| Consumer Price Index | 7.75% | 5.01% | 3.85% |
Fund returns are adjusted to reflect the 0.75% fee on purchases of fund shares. The fee does not apply to the ETF Shares.
About Your Fund’s Expenses
As a shareholder of the fund, you incur ongoing costs, which include costs for portfolio management, administrative services, and shareholder reports (like this one), among others. Operating expenses, which are deducted from a fund’s gross income, directly reduce the investment return of the fund.
A fund’s expenses are expressed as a percentage of its average net assets. This figure is known as the expense ratio. The following examples are intended to help you understand the ongoing costs (in dollars) of investing in your fund and to compare these costs with those of other mutual funds. The examples are based on an investment of $1,000 made at the beginning of the period shown and held for the entire period.
The accompanying table illustrates your fund’s costs in two ways:
| • | Based on actual fund return. This section helps you to estimate the actual expenses that you paid over the period. The ”Ending Account Value“ shown is derived from the fund‘s actual return, and the third column shows the dollar amount that would have been paid by an investor who started with $1,000 in the fund. You may use the information here, together with the amount you invested, to estimate the expenses that you paid over the period. |
To do so, simply divide your account value by $1,000 (for example, an $8,600 account value divided by $1,000 = 8.6), then multiply the result by the number given for your fund under the heading ”Expenses Paid During Period.“
| • | Based on hypothetical 5% yearly return. This section is intended to help you compare your fund‘s costs with those of other mutual funds. It assumes that the fund had a yearly return of 5% before expenses, but that the expense ratio is unchanged. In this case—because the return used is not the fund’s actual return—the results do not apply to your investment. The example is useful in making comparisons because the Securities and Exchange Commission requires all mutual funds to calculate expenses based on a 5% return. You can assess your fund’s costs by comparing this hypothetical example with the hypothetical examples that appear in shareholder reports of other funds. |
Note that the expenses shown in the table are meant to highlight and help you compare ongoing costs only and do not reflect transaction costs incurred by the fund for buying and selling securities. Further, the expenses do not include any purchase, redemption, or account service fees described in the fund prospectus. If such fees were applied to your account, your costs would be higher. Your fund does not carry a “sales load.”
The calculations assume no shares were bought or sold during the period. Your actual costs may have been higher or lower, depending on the amount of your investment and the timing of any purchases or redemptions.
You can find more information about the fund’s expenses, including annual expense ratios, in the Financial Statements section of this report. For additional information on operating expenses and other shareholder costs, please refer to your fund’s current prospectus.
| Six Months Ended October 31, 2022 | | | |
| | Beginning
Account Value
4/30/2022 | Ending
Account Value
10/31/2022 | Expenses
Paid During
Period |
| Based on Actual Fund Return | | | |
| Emerging Markets Government Bond Index Fund | | | |
| ETF Shares | $1,000.00 | $903.40 | $0.96 |
| Admiral™ Shares | 1,000.00 | 903.60 | 0.96 |
| Institutional Shares | 1,000.00 | 903.80 | 0.86 |
| Based on Hypothetical 5% Yearly Return | | | |
| Emerging Markets Government Bond Index Fund | | | |
| ETF Shares | $1,000.00 | $1,024.20 | $1.02 |
| Admiral Shares | 1,000.00 | 1,024.20 | 1.02 |
| Institutional Shares | 1,000.00 | 1,024.30 | 0.92 |
The calculations are based on expenses incurred in the most recent six-month period. The fund’s annualized six-month expense ratios for that period are 0.20% for ETF Shares, 0.20% for Admiral Shares, and 0.18% for Institutional Shares. The dollar amounts shown as “Expenses Paid” are equal to the annualized expense ratio multiplied by the average account value over the period, multiplied by the number of days in the most recent six-month period, then divided by the number of days in the most recent 12-month period (184/365).
Emerging Markets Government Bond Index Fund
All of the returns in this report represent past performance, which is not a guarantee of future results that may be achieved by the fund. (Current performance may be lower or higher than the performance data cited. For performance data current to the most recent month-end, visit our website at vanguard.com/performance.) Note, too, that both investment returns and principal value can fluctuate widely, so an investor’s shares, when sold, could be worth more or less than their original cost. The returns shown do not reflect taxes that a shareholder would pay on fund distributions or on the sale of fund shares.
Cumulative Performance: May 31, 2013, Through October 31, 2022
Initial Investment of $10,000
| | | Average Annual Total Returns
Periods Ended October 31, 2022 | |
| | | One
Year | Five
Years | Since
Inception
(5/31/2013) | Final Value
of a $10,000
Investment |
 | Emerging Markets Government Bond Index Fund ETF Shares Net Asset Value | -22.68% | -2.25% | 1.01% | $10,994 |
| | Emerging Markets Government Bond Index Fund ETF Shares Market Price | -23.19 | -2.43 | 0.96 | 10,946 |
 | Bloomberg USD Emerging Markets Government RIC Capped Index | -23.08 | -2.31 | 1.03 | 11,017 |
 | Bloomberg Global Aggregate Index ex USD | -24.59 | -3.91 | -1.84 | 8,398 |
“Since Inception” performance is calculated from the ETF Shares’ inception date for both the fund and its comparative standard(s).
| | | | |
| | | One
Year | Five
Years | Since
Inception
(5/31/2013) | Final Value
of a $10,000
Investment |
| Emerging Markets Government Bond Index Fund Admiral Shares | -23.25% | -2.39% | 0.94% | $10,924 |
| Bloomberg USD Emerging Markets Government RIC Capped Index | -23.08 | -2.31 | 1.03 | 11,017 |
| Bloomberg Global Aggregate Index ex USD | -24.59 | -3.91 | -1.84 | 8,398 |
“Since Inception” performance is calculated from the Admiral Shares’ inception date for both the fund and its comparative standard(s).
Vanguard fund returns are adjusted to reflect the 0.75% fee on purchases and redemptions. The fee does not apply to the ETF Shares.
See Financial Highlights for dividend and capital gains information.
Emerging Markets Government Bond Index Fund
| | | Average Annual Total Returns
Periods Ended October 31, 2022 | |
| | | One
Year | Five
Years | Since
Inception
(2/11/2015) 1 | Final Value
of a $5,000,000
Investment |
| Emerging Markets Government Bond Index Fund Institutional Shares | -23.24% | -2.38% | 0.85% | $5,337,269 |
| Bloomberg USD Emerging Markets Government RIC Capped Index | -23.08 | -2.31 | 0.93 | 5,370,737 |
| Bloomberg Global Aggregate Index ex USD | -24.59 | -3.91 | -1.79 | 4,349,707 |
| “Since Inception” performance is calculated from the Institutional Shares’ inception date for both the fund and its comparative standard(s). |
| 1Institutional Shares were first issued on November 25, 2014, and were redeemed shortly thereafter. Institutional Shares were next issued on February 11, 2015. The total returns shown are based on the period beginning February 11, 2015. |
Cumulative Returns of ETF Shares: May 31, 2013, Through October 31, 2022
| | One
Year | Five
Years | Since
Inception
(5/31/2013) |
| Emerging Markets Government Bond Index Fund ETF Shares Market Price | -23.19% | -11.56% | 9.46% |
| Emerging Markets Government Bond Index Fund ETF Shares Net Asset Value | -22.68 | -10.77 | 9.94 |
| Bloomberg USD Emerging Markets Government RIC Capped Index | -23.08 | -11.02 | 10.17 |
"Since Inception" performance is calculated from the ETF Shares’ inception date for both the fund and its comparative standard(s).
For the ETF Shares, the market price is determined by the midpoint of the bid-offer spread as of the closing time of the New York Stock Exchange (generally 4 p.m., Eastern time). The net asset value is also determined as of the NYSE closing time. For more information about how the ETF Shares' market prices have compared with their net asset value, visit vanguard.com, select your ETF, and click on Price, and then scroll down to the Premium/Discount Chart. The ETF premium/discount analysis there shows the percentages of days on which the ETF Shares' market price was above or below the NAV.
Vanguard fund returns are adjusted to reflect the 0.75% fee on purchases of fund shares. The fee does not apply to the ETF Shares.
Emerging Markets Government Bond Index Fund
| Mexico | 9.8% |
| Saudi Arabia | 9.6 |
| Indonesia | 7.5 |
| Turkey | 7.1 |
| United Arab Emirates | 6.6 |
| Qatar | 5.4 |
| China | 5.0 |
| Brazil | 3.8 |
| Philippines | 3.4 |
| Colombia | 3.1 |
| Oman | 2.7 |
| Peru | 2.4 |
| Dominican Republic | 2.4 |
| Chile | 2.3 |
| Panama | 2.3 |
| Egypt | 2.2 |
| South Africa | 2.1 |
| Bahrain | 2.0 |
| Argentina | 1.8 |
| Uruguay | 1.5 |
| Malaysia | 1.3 |
| Nigeria | 1.1 |
| Hungary | 1.1 |
| Romania | 1.0 |
| Other | 12.5 |
The table reflects the fund’s investments, except for short-term investments and derivatives.
The fund may invest in derivatives (such as futures and swap contracts) for various reasons, including, but not limited to, attempting to remain fully invested and tracking its target index as closely as possible.
Emerging Markets Government Bond Index Fund
The fund files its complete schedule of portfolio holdings with the Securities and Exchange Commission (SEC) for the first and third quarters of each fiscal year as an exhibit to its reports on Form N-PORT. The fund’s Form N-PORT reports are available on the SEC’s website at www.sec.gov.
| | | Coupon | Maturity
Date | Face
Amount
($000) | Market
Value•
($000) |
| U.S. Government and Agency Obligations (0.2%) | | |
| | United States Treasury Note/Bond (Cost $4,305) | 4.375% | 10/31/24 | 4,310 | 4,301 |
| Corporate Bonds (14.1%) | | |
| Azerbaijan (0.2%) | | |
| 1 | Southern Gas Corridor CJSC | 6.875% | 3/24/26 | 6,200 | 6,084 |
| Brazil (0.2%) | | |
| | Petrobras Global Finance BV | 6.875% | 1/20/40 | 1 | 1 |
| | Petrobras Global Finance BV | 6.850% | 6/5/15 | 5,450 | 4,254 |
| | | | | | 4,255 |
| Chile (0.2%) | | |
| | Corp. Nacional del Cobre de Chile | 3.700% | 1/30/50 | 8,300 | 5,374 |
| China (3.3%) | | |
| | Bank of China Ltd. | 5.000% | 11/13/24 | 9,400 | 9,289 |
| | China Cinda Finance 2015 I Ltd. | 4.250% | 4/23/25 | 5,400 | 5,031 |
| | China Construction Bank Corp. | 4.250% | 2/27/29 | 5,750 | 5,650 |
| | China Construction Bank Corp. | 2.450% | 6/24/30 | 6,350 | 5,868 |
| | China Construction Bank Corp. | 2.850% | 1/21/32 | 6,200 | 5,621 |
| | CNAC HK Finbridge Co. Ltd. | 5.125% | 3/14/28 | 5,555 | 4,868 |
| | CNOOC Finance 2014 ULC | 4.250% | 4/30/24 | 7,006 | 6,913 |
| | CNOOC Finance 2015 USA LLC | 3.500% | 5/5/25 | 6,200 | 5,946 |
| | Industrial & Commercial Bank of China Ltd. | 4.875% | 9/21/25 | 6,240 | 6,120 |
| | Industrial & Commercial Bank of China Ltd. | 3.200% | 12/31/99 | 19,325 | 17,269 |
| | Sinopec Group Overseas Development 2015 Ltd. | 3.250% | 4/28/25 | 4,850 | 4,636 |
| | Sinopec Group Overseas Development 2018 Ltd. | 2.700% | 5/13/30 | 4,750 | 3,995 |
| | State Grid Overseas Investment 2014 Ltd. | 4.125% | 5/7/24 | 5,020 | 4,959 |
| | State Grid Overseas Investment BVI Ltd. | 3.500% | 5/4/27 | 7,394 | 6,968 |
| | | | | | 93,133 |
| Colombia (0.5%) | | |
| | Ecopetrol SA | 5.375% | 6/26/26 | 4,675 | 4,247 |
| | Ecopetrol SA | 6.875% | 4/29/30 | 6,325 | 5,194 |
| | Ecopetrol SA | 5.875% | 5/28/45 | 6,267 | 3,827 |
| | | | | | 13,268 |
| Indonesia (0.4%) | | |
| 2 | Freeport Indonesia PT | 5.315% | 4/14/32 | 4,500 | 3,781 |
| | Freeport Indonesia PT | 5.315% | 4/14/32 | 200 | 168 |
| | Pertamina Persero PT | 6.450% | 5/30/44 | 4,400 | 3,967 |
| | Pertamina Persero PT | 6.500% | 11/7/48 | 200 | 179 |
Emerging Markets Government Bond Index Fund
| | | Coupon | Maturity
Date | Face
Amount
($000) | Market
Value•
($000) |
| | Perusahaan Perseroan Persero PT Perusahaan Listrik Negara | 4.125% | 5/15/27 | 4,557 | 4,180 |
| | | | | | 12,275 |
| Kazakhstan (0.1%) | | |
| | KazMunayGas National Co. JSC | 6.375% | 10/24/48 | 4,700 | 3,343 |
| Malaysia (0.9%) | | |
| | Petronas Capital Ltd. | 3.500% | 3/18/25 | 5,050 | 4,875 |
| | Petronas Capital Ltd. | 3.500% | 4/21/30 | 7,050 | 6,273 |
| | Petronas Capital Ltd. | 4.500% | 3/18/45 | 4,700 | 3,911 |
| | Petronas Capital Ltd. | 4.550% | 4/21/50 | 8,600 | 7,051 |
| 2 | Petronas Capital Ltd. | 3.404% | 4/28/61 | 4,000 | 2,497 |
| | Petronas Capital Ltd. | 3.404% | 4/28/61 | 1,400 | 870 |
| | | | | | 25,477 |
| Mexico (4.1%) | | |
| | Mexico City Airport Trust | 5.500% | 7/31/47 | 6,579 | 4,211 |
| | Petroleos Mexicanos | 6.875% | 8/4/26 | 7,650 | 7,079 |
| | Petroleos Mexicanos | 6.490% | 1/23/27 | 4,906 | 4,294 |
| | Petroleos Mexicanos | 6.500% | 3/13/27 | 12,625 | 11,060 |
| | Petroleos Mexicanos | 5.350% | 2/12/28 | 6,070 | 4,847 |
| | Petroleos Mexicanos | 8.750% | 6/2/29 | 6,300 | 5,637 |
| | Petroleos Mexicanos | 6.840% | 1/23/30 | 7,600 | 6,019 |
| | Petroleos Mexicanos | 5.950% | 1/28/31 | 11,925 | 8,597 |
| | Petroleos Mexicanos | 6.625% | 6/15/35 | 8,700 | 6,015 |
| | Petroleos Mexicanos | 6.500% | 6/2/41 | 5,000 | 3,088 |
| | Petroleos Mexicanos | 6.750% | 9/21/47 | 17,200 | 10,359 |
| | Petroleos Mexicanos | 6.350% | 2/12/48 | 5,100 | 2,931 |
| | Petroleos Mexicanos | 7.690% | 1/23/50 | 25,034 | 16,227 |
| | Petroleos Mexicanos | 6.950% | 1/28/60 | 12,015 | 7,200 |
| 3 | Petroleos Mexicanos | 6.700% | 2/16/32 | 21,199 | 15,962 |
| | | | | | 113,526 |
| Peru (0.1%) | | |
| | Petroleos del Peru SA | 5.625% | 6/19/47 | 6,300 | 3,969 |
| Qatar (1.0%) | | |
| | Qatar Energy | 1.375% | 9/12/26 | 1,175 | 1,033 |
| 2 | Qatar Energy | 2.250% | 7/12/31 | 5,400 | 4,332 |
| | Qatar Energy | 3.300% | 7/12/51 | 12,625 | 8,551 |
| 2 | Qatar Petroleum | 1.375% | 9/12/26 | 3,700 | 3,253 |
| | Qatar Petroleum | 2.250% | 7/12/31 | 5,500 | 4,392 |
| | Qatar Petroleum | 3.125% | 7/12/41 | 10,984 | 7,760 |
| | | | | | 29,321 |
| Saudi Arabia (2.2%) | | |
| 2 | SA Global Sukuk Ltd. | 1.602% | 6/17/26 | 3,900 | 3,415 |
| | SA Global Sukuk Ltd. | 1.602% | 6/17/26 | 2,338 | 2,049 |
| | SA Global Sukuk Ltd. | 2.694% | 6/17/31 | 9,450 | 7,717 |
| | Saudi Arabian Oil Co. | 2.875% | 4/16/24 | 6,175 | 5,955 |
| | Saudi Arabian Oil Co. | 3.500% | 4/16/29 | 9,316 | 8,282 |
| 2 | Saudi Arabian Oil Co. | 2.250% | 11/24/30 | 1,475 | 1,166 |
| | Saudi Arabian Oil Co. | 2.250% | 11/24/30 | 5,100 | 4,025 |
| 2 | Saudi Arabian Oil Co. | 4.250% | 4/16/39 | 1,500 | 1,229 |
| | Saudi Arabian Oil Co. | 4.250% | 4/16/39 | 7,500 | 6,150 |
| | Saudi Arabian Oil Co. | 4.375% | 4/16/49 | 9,455 | 7,372 |
| | Saudi Arabian Oil Co. | 3.250% | 11/24/50 | 7,208 | 4,519 |
| | Saudi Arabian Oil Co. | 3.500% | 11/24/70 | 7,150 | 4,370 |
Emerging Markets Government Bond Index Fund
| | | Coupon | Maturity
Date | Face
Amount
($000) | Market
Value•
($000) |
| | Saudi Electricity Global Sukuk Co. 3 | 4.000% | 4/8/24 | 4,700 | 4,610 |
| | | | | | 60,859 |
| United Arab Emirates (0.9%) | | |
| 3 | Abu Dhabi Crude Oil Pipeline LLC | 4.600% | 11/2/47 | 6,875 | 5,917 |
| 2 | DP World Ltd. | 6.850% | 7/2/37 | 5,070 | 4,866 |
| | DP World Ltd. | 5.625% | 9/25/48 | 475 | 394 |
| | DP World Salaam | 6.000% | 12/31/99 | 4,650 | 4,515 |
| 2 | MDGH GMTN RSC Ltd. | 3.700% | 11/7/49 | 300 | 221 |
| | MDGH GMTN RSC Ltd. | 3.700% | 11/7/49 | 3,803 | 2,801 |
| | MDGH GMTN RSC Ltd. | 3.950% | 5/21/50 | 6,750 | 5,215 |
| | | | | | 23,929 |
| Total Corporate Bonds (Cost $502,657) | | 394,813 |
| Sovereign Bonds (83.9%) | | |
| Angola (0.8%) | | |
| | Republic of Angola | 9.500% | 11/12/25 | 500 | 489 |
| | Republic of Angola | 8.250% | 5/9/28 | 8,150 | 6,893 |
| | Republic of Angola | 8.000% | 11/26/29 | 5,623 | 4,575 |
| 2 | Republic of Angola | 8.750% | 4/14/32 | 5,000 | 4,039 |
| | Republic of Angola | 8.750% | 4/14/32 | 400 | 324 |
| | Republic of Angola | 9.375% | 5/8/48 | 5,400 | 4,109 |
| | Republic of Angola | 9.125% | 11/26/49 | 4,000 | 3,029 |
| | | | | | 23,458 |
| Argentina (1.8%) | | |
| 4 | Provincia de Buenos Aires, 6.375% coupon rate effective 9/1/23 | 5.250% | 9/1/37 | 19,450 | 5,857 |
| | Republic of Argentina | 1.000% | 7/9/29 | 8,276 | 1,699 |
| 4 | Republic of Argentina, 0.750% coupon rate effective 7/9/23 | 0.500% | 7/9/30 | 50,477 | 10,650 |
| 4 | Republic of Argentina, 3.625% coupon rate effective 7/9/23 | 1.500% | 7/9/35 | 64,304 | 12,780 |
| 4 | Republic of Argentina, 3.625% coupon rate effective 7/9/23 | 1.500% | 7/9/46 | 6,574 | 1,338 |
| 4 | Republic of Argentina, 4.250% coupon rate effective 7/9/23 | 3.875% | 1/9/38 | 35,791 | 9,259 |
| 4 | Republic of Argentina, 4.875% coupon rate effective 7/9/29 | 3.500% | 7/9/41 | 32,889 | 7,834 |
| | | | | | 49,417 |
| Armenia (0.2%) | | |
| | Republic of Armenia | 7.150% | 3/26/25 | 1,700 | 1,670 |
| | Republic of Armenia | 3.950% | 9/26/29 | 1,650 | 1,198 |
| 2 | Republic of Armenia | 3.600% | 2/2/31 | 950 | 650 |
| | Republic of Armenia | 3.600% | 2/2/31 | 1,050 | 720 |
| | | | | | 4,238 |
| Azerbaijan (0.2%) | | |
| | Republic of Azerbaijan | 4.750% | 3/18/24 | 3,950 | 3,872 |
| 3 | Republic of Azerbaijan | 3.500% | 9/1/32 | 3,350 | 2,697 |
| | | | | | 6,569 |
| Bahamas (0.1%) | | |
| 2,3 | Commonwealth of Bahamas | 6.000% | 11/21/28 | 850 | 542 |
| 3 | Commonwealth of Bahamas | 6.000% | 11/21/28 | 700 | 445 |
| 2,3 | Commonwealth of Bahamas | 8.950% | 10/15/32 | 1,750 | 1,133 |
Emerging Markets Government Bond Index Fund
| | | Coupon | Maturity
Date | Face
Amount
($000) | Market
Value•
($000) |
| 3 | Commonwealth of Bahamas | 8.950% | 10/15/32 | 1,400 | 907 |
| | | | | | 3,027 |
| Bahrain (2.0%) | | |
| | CBB International Sukuk Co. 5 Spc | 5.624% | 2/12/24 | 3,400 | 3,398 |
| | CBB International Sukuk Co. 6 Spc | 5.250% | 3/20/25 | 2,400 | 2,370 |
| | CBB International Sukuk Co. 6 Spc | 6.875% | 10/5/25 | 3,750 | 3,851 |
| | CBB International Sukuk Programme Co. WLL | 6.250% | 11/14/24 | 3,458 | 3,482 |
| | CBB International Sukuk Programme Co. WLL | 4.500% | 3/30/27 | 2,856 | 2,710 |
| | CBB International Sukuk Programme Co. WLL | 3.950% | 9/16/27 | 2,600 | 2,412 |
| | CBB International Sukuk Programme Co. WLL | 3.875% | 5/18/29 | 2,950 | 2,560 |
| | Kingdom of Bahrain | 7.000% | 1/26/26 | 4,425 | 4,429 |
| | Kingdom of Bahrain | 4.250% | 1/25/28 | 1,600 | 1,407 |
| | Kingdom of Bahrain | 7.000% | 10/12/28 | 5,100 | 4,911 |
| | Kingdom of Bahrain | 6.750% | 9/20/29 | 4,100 | 3,856 |
| | Kingdom of Bahrain | 7.375% | 5/14/30 | 3,650 | 3,486 |
| | Kingdom of Bahrain | 5.625% | 9/30/31 | 2,970 | 2,503 |
| | Kingdom of Bahrain | 5.450% | 9/16/32 | 3,900 | 3,156 |
| | Kingdom of Bahrain | 5.250% | 1/25/33 | 2,200 | 1,725 |
| 2 | Kingdom of Bahrain | 5.625% | 5/18/34 | 1,800 | 1,418 |
| | Kingdom of Bahrain | 5.625% | 5/18/34 | 1,100 | 864 |
| | Kingdom of Bahrain | 6.000% | 9/19/44 | 4,000 | 2,821 |
| | Kingdom of Bahrain | 7.500% | 9/20/47 | 2,800 | 2,248 |
| | Kingdom of Bahrain | 6.250% | 1/25/51 | 1,900 | 1,337 |
| | | | | | 54,944 |
| Belarus (0.1%) | | |
| | Republic of Belarus | 5.875% | 2/24/26 | 1,650 | 342 |
| | Republic of Belarus | 7.625% | 6/29/27 | 1,600 | 320 |
| | Republic of Belarus | 6.200% | 2/28/30 | 1,800 | 368 |
| | Republic of Belarus | 6.378% | 2/24/31 | 2,500 | 499 |
| | | | | | 1,529 |
| Bermuda (0.3%) | | |
| | Government of Bermuda | 3.717% | 1/25/27 | 1,750 | 1,639 |
| 2 | Government of Bermuda | 4.750% | 2/15/29 | 600 | 573 |
| | Government of Bermuda | 2.375% | 8/20/30 | 1,600 | 1,265 |
| 2 | Government of Bermuda | 5.000% | 7/15/32 | 2,600 | 2,400 |
| 2 | Government of Bermuda | 3.375% | 8/20/50 | 1,000 | 634 |
| | Government of Bermuda | 3.375% | 8/20/50 | 1,200 | 766 |
| | | | | | 7,277 |
| Bolivia (0.2%) | | |
| 2,3 | Bolivian Government | 4.500% | 3/20/28 | 700 | 551 |
| 3 | Bolivian Government | 4.500% | 3/20/28 | 3,506 | 2,741 |
| 2 | Bolivian Government | 7.500% | 3/2/30 | 1,400 | 1,232 |
| | Bolivian Government | 7.500% | 3/2/30 | 200 | 178 |
| | | | | | 4,702 |
| Brazil (3.5%) | | |
| | Federative Republic of Brazil | 8.875% | 4/15/24 | 3,226 | 3,416 |
| | Federative Republic of Brazil | 4.250% | 1/7/25 | 13,353 | 13,008 |
| | Federative Republic of Brazil | 8.750% | 2/4/25 | 2,125 | 2,271 |
| | Federative Republic of Brazil | 2.875% | 6/6/25 | 8,250 | 7,742 |
| | Federative Republic of Brazil | 6.000% | 4/7/26 | 3,600 | 3,688 |
| | Federative Republic of Brazil | 10.125% | 5/15/27 | 2,200 | 2,560 |
| | Federative Republic of Brazil | 4.625% | 1/13/28 | 10,500 | 9,870 |
| | Federative Republic of Brazil | 4.500% | 5/30/29 | 6,300 | 5,663 |
| | Federative Republic of Brazil | 3.875% | 6/12/30 | 11,100 | 9,378 |
Emerging Markets Government Bond Index Fund
| | | Coupon | Maturity
Date | Face
Amount
($000) | Market
Value•
($000) |
| | Federative Republic of Brazil | 3.750% | 9/12/31 | 4,700 | 3,871 |
| | Federative Republic of Brazil | 8.250% | 1/20/34 | 4,200 | 4,552 |
| | Federative Republic of Brazil | 7.125% | 1/20/37 | 5,050 | 5,053 |
| | Federative Republic of Brazil | 5.625% | 1/7/41 | 6,500 | 5,238 |
| | Federative Republic of Brazil | 5.000% | 1/27/45 | 10,986 | 7,952 |
| | Federative Republic of Brazil | 5.625% | 2/21/47 | 5,233 | 3,986 |
| | Federative Republic of Brazil | 4.750% | 1/14/50 | 16,160 | 10,849 |
| | | | | | 99,097 |
| Chile (2.0%) | | |
| | Republic of Chile | 3.125% | 1/21/26 | 2,200 | 2,053 |
| | Republic of Chile | 2.750% | 1/31/27 | 5,000 | 4,507 |
| | Republic of Chile | 3.240% | 2/6/28 | 6,540 | 5,898 |
| | Republic of Chile | 2.450% | 1/31/31 | 5,607 | 4,497 |
| | Republic of Chile | 2.550% | 7/27/33 | 6,709 | 5,015 |
| | Republic of Chile | 3.500% | 1/31/34 | 8,350 | 6,759 |
| | Republic of Chile | 3.100% | 5/7/41 | 8,550 | 5,659 |
| | Republic of Chile | 4.340% | 3/7/42 | 6,350 | 4,915 |
| | Republic of Chile | 3.860% | 6/21/47 | 3,925 | 2,812 |
| | Republic of Chile | 3.500% | 1/25/50 | 7,200 | 4,754 |
| | Republic of Chile | 4.000% | 1/31/52 | 3,050 | 2,162 |
| | Republic of Chile | 3.500% | 4/15/53 | 4,350 | 2,783 |
| | Republic of Chile | 3.100% | 1/22/61 | 6,250 | 3,512 |
| | Republic of Chile | 3.250% | 9/21/71 | 3,350 | 1,853 |
| | | | | | 57,179 |
| China (1.6%) | | |
| | China Government Bond | 0.400% | 10/21/23 | 3,500 | 3,365 |
| | China Government Bond | 1.950% | 12/3/24 | 6,000 | 5,691 |
| | China Government Bond | 0.550% | 10/21/25 | 7,200 | 6,406 |
| | China Government Bond | 2.625% | 11/2/27 | 3,824 | 3,526 |
| | China Government Bond | 3.500% | 10/19/28 | 2,300 | 2,190 |
| | China Government Bond | 2.125% | 12/3/29 | 8,200 | 7,176 |
| | China Government Bond | 1.200% | 10/21/30 | 4,750 | 3,799 |
| | China Government Bond | 1.750% | 10/26/31 | 1,800 | 1,474 |
| | China Government Bond | 2.750% | 12/3/39 | 1,925 | 1,462 |
| | China Government Bond | 4.000% | 10/19/48 | 1,800 | 1,574 |
| 2 | China Government Bond | 2.250% | 10/21/50 | 300 | 181 |
| | China Government Bond | 2.250% | 10/21/50 | 1,200 | 728 |
| 2 | China Government Bond | 2.500% | 10/26/51 | 2,525 | 1,611 |
| | China Government Bond | 2.500% | 10/26/51 | 600 | 382 |
| | Export-Import Bank of China | 3.625% | 7/31/24 | 4,972 | 4,871 |
| | | | | | 44,436 |
| Colombia (2.6%) | | |
| | Republic of Colombia | 4.000% | 2/26/24 | 4,745 | 4,553 |
| | Republic of Colombia | 8.125% | 5/21/24 | 3,205 | 3,222 |
| | Republic of Colombia | 4.500% | 1/28/26 | 5,117 | 4,605 |
| | Republic of Colombia | 3.875% | 4/25/27 | 6,150 | 5,147 |
| | Republic of Colombia | 4.500% | 3/15/29 | 6,300 | 5,094 |
| | Republic of Colombia | 3.000% | 1/30/30 | 4,675 | 3,313 |
| | Republic of Colombia | 3.125% | 4/15/31 | 8,080 | 5,553 |
| | Republic of Colombia | 3.250% | 4/22/32 | 6,300 | 4,211 |
| | Republic of Colombia | 7.375% | 9/18/37 | 5,662 | 4,782 |
| | Republic of Colombia | 6.125% | 1/18/41 | 7,845 | 5,613 |
| | Republic of Colombia | 4.125% | 2/22/42 | 3,150 | 1,777 |
| | Republic of Colombia | 5.625% | 2/26/44 | 7,675 | 4,984 |
Emerging Markets Government Bond Index Fund
| | | Coupon | Maturity
Date | Face
Amount
($000) | Market
Value•
($000) |
| | Republic of Colombia | 5.000% | 6/15/45 | 14,100 | 8,527 |
| | Republic of Colombia | 5.200% | 5/15/49 | 8,470 | 5,159 |
| | Republic of Colombia | 4.125% | 5/15/51 | 5,750 | 3,070 |
| | Republic of Colombia | 3.875% | 2/15/61 | 3,350 | 1,707 |
| | | | | | 71,317 |
| Costa Rica (0.4%) | | |
| | Republic of Costa Rica | 4.375% | 4/30/25 | 1,600 | 1,546 |
| | Republic of Costa Rica | 6.125% | 2/19/31 | 3,825 | 3,560 |
| | Republic of Costa Rica | 5.625% | 4/30/43 | 1,500 | 1,095 |
| | Republic of Costa Rica | 7.000% | 4/4/44 | 3,130 | 2,649 |
| | Republic of Costa Rica | 7.158% | 3/12/45 | 4,201 | 3,636 |
| | | | | | 12,486 |
| Croatia (0.2%) | | |
| | Republic of Croatia | 6.000% | 1/26/24 | 5,425 | 5,470 |
| Dominican Republic (2.3%) | | |
| | Dominican Republic | 5.500% | 1/27/25 | 4,300 | 4,217 |
| | Dominican Republic | 6.875% | 1/29/26 | 4,995 | 4,910 |
| | Dominican Republic | 5.950% | 1/25/27 | 5,350 | 4,998 |
| | Dominican Republic | 6.000% | 7/19/28 | 4,069 | 3,715 |
| 2 | Dominican Republic | 5.500% | 2/22/29 | 4,950 | 4,346 |
| | Dominican Republic | 5.500% | 2/22/29 | 900 | 786 |
| | Dominican Republic | 4.500% | 1/30/30 | 5,606 | 4,487 |
| 2 | Dominican Republic | 4.875% | 9/23/32 | 950 | 735 |
| | Dominican Republic | 4.875% | 9/23/32 | 10,250 | 7,884 |
| 2 | Dominican Republic | ��6.000% | 2/22/33 | 2,275 | 1,907 |
| | Dominican Republic | 6.000% | 2/22/33 | 3,250 | 2,720 |
| | Dominican Republic | 5.300% | 1/21/41 | 4,350 | 2,989 |
| | Dominican Republic | 7.450% | 4/30/44 | 4,650 | 3,882 |
| | Dominican Republic | 6.850% | 1/27/45 | 6,294 | 4,873 |
| | Dominican Republic | 6.500% | 2/15/48 | 3,250 | 2,378 |
| | Dominican Republic | 6.400% | 6/5/49 | 4,700 | 3,396 |
| | Dominican Republic | 5.875% | 1/30/60 | 9,777 | 6,447 |
| | | | | | 64,670 |
| Ecuador (0.7%) | | |
| 3 | Republic of Ecuador | 0.000% | 7/31/30 | 3,205 | 1,009 |
| 4 | Republic of Ecuador, 2.500% coupon rate effective 7/31/23 | 1.500% | 7/31/40 | 10,633 | 3,521 |
| 4 | Republic of Ecuador, 3.500% coupon rate effective 7/31/23 | 2.500% | 7/31/35 | 26,431 | 9,623 |
| 4 | Republic of Ecuador, 6.000% coupon rate effective 7/31/23 | 5.500% | 7/31/30 | 11,620 | 6,170 |
| | | | | | 20,323 |
| Egypt (2.1%) | | |
| | Arab Republic of Egypt | 4.550% | 11/20/23 | 1,478 | 1,433 |
| | Arab Republic of Egypt | 6.200% | 3/1/24 | 2,600 | 2,492 |
| | Arab Republic of Egypt | 5.750% | 5/29/24 | 3,970 | 3,754 |
| | Arab Republic of Egypt | 5.875% | 6/11/25 | 4,675 | 4,022 |
| | Arab Republic of Egypt | 5.250% | 10/6/25 | 2,350 | 1,952 |
| 2 | Arab Republic of Egypt | 3.875% | 2/16/26 | 500 | 376 |
| | Arab Republic of Egypt | 3.875% | 2/16/26 | 1,650 | 1,245 |
| | Arab Republic of Egypt | 7.500% | 1/31/27 | 6,200 | 4,982 |
| 2 | Arab Republic of Egypt | 5.800% | 9/30/27 | 400 | 291 |
| | Arab Republic of Egypt | 5.800% | 9/30/27 | 2,850 | 2,084 |
| | Arab Republic of Egypt | 6.588% | 2/21/28 | 4,600 | 3,291 |
Emerging Markets Government Bond Index Fund
| | | Coupon | Maturity
Date | Face
Amount
($000) | Market
Value•
($000) |
| | Arab Republic of Egypt | 7.600% | 3/1/29 | 5,200 | 3,720 |
| | Arab Republic of Egypt | 5.875% | 2/16/31 | 4,750 | 2,910 |
| | Arab Republic of Egypt | 7.053% | 1/15/32 | 4,900 | 3,091 |
| | Arab Republic of Egypt | 7.625% | 5/29/32 | 3,744 | 2,367 |
| 2 | Arab Republic of Egypt | 7.300% | 9/30/33 | 2,700 | 1,678 |
| | Arab Republic of Egypt | 7.300% | 9/30/33 | 900 | 564 |
| | Arab Republic of Egypt | 6.875% | 4/30/40 | 1,200 | 689 |
| | Arab Republic of Egypt | 8.500% | 1/31/47 | 8,280 | 4,832 |
| | Arab Republic of Egypt | 7.903% | 2/21/48 | 4,700 | 2,634 |
| | Arab Republic of Egypt | 8.700% | 3/1/49 | 4,950 | 2,935 |
| | Arab Republic of Egypt | 8.875% | 5/29/50 | 6,140 | 3,695 |
| 2 | Arab Republic of Egypt | 8.750% | 9/30/51 | 1,300 | 769 |
| | Arab Republic of Egypt | 8.750% | 9/30/51 | 725 | 435 |
| | Arab Republic of Egypt | 8.150% | 11/20/59 | 1,750 | 1,005 |
| 2 | Arab Republic of Egypt | 7.500% | 2/16/61 | 3,100 | 1,713 |
| | Arab Republic of Egypt | 7.500% | 2/16/61 | 1,400 | 771 |
| | | | | | 59,730 |
| El Salvador (0.2%) | | |
| | Republic of El Salvador | 6.375% | 1/18/27 | 2,662 | 1,054 |
| | Republic of El Salvador | 8.625% | 2/28/29 | 1,985 | 794 |
| | Republic of El Salvador | 8.250% | 4/10/32 | 1,532 | 609 |
| | Republic of El Salvador | 7.650% | 6/15/35 | 3,000 | 1,082 |
| | Republic of El Salvador | 7.625% | 2/1/41 | 1,918 | 667 |
| 2 | Republic of El Salvador | 7.125% | 1/20/50 | 150 | 51 |
| | Republic of El Salvador | 7.125% | 1/20/50 | 3,350 | 1,131 |
| 2 | Republic of El Salvador | 9.500% | 7/15/52 | 600 | 226 |
| | Republic of El Salvador | 9.500% | 7/15/52 | 2,450 | 933 |
| | | | | | 6,547 |
| Ethiopia (0.1%) | | |
| | Federal Republic of Ethiopia | 6.625% | 12/11/24 | 3,150 | 1,624 |
| Gabon (0.2%) | | |
| | Republic of Gabon | 6.950% | 6/16/25 | 2,200 | 1,993 |
| 3 | Republic of Gabon | 6.625% | 2/6/31 | 2,600 | 1,826 |
| 2,3 | Republic of Gabon | 6.625% | 2/6/31 | 700 | 491 |
| 2 | Republic of Gabon | 7.000% | 11/24/31 | 2,125 | 1,486 |
| | Republic of Gabon | 7.000% | 11/24/31 | 400 | 281 |
| | | | | | 6,077 |
| Georgia (0.0%) | | |
| 2 | Republic of Georgia | 2.750% | 4/22/26 | 750 | 638 |
| | Republic of Georgia | 2.750% | 4/22/26 | 800 | 681 |
| | | | | | 1,319 |
| Ghana (0.5%) | | |
| 3 | Republic of Ghana | 8.125% | 1/18/26 | 4,295 | 1,564 |
| 3 | Republic of Ghana | 6.375% | 2/11/27 | 5,206 | 1,600 |
| 3 | Republic of Ghana | 7.875% | 3/26/27 | 1,130 | 355 |
| 3 | Republic of Ghana | 7.750% | 4/7/29 | 1,200 | 351 |
| 3 | Republic of Ghana | 7.625% | 5/16/29 | 4,900 | 1,396 |
| 3 | Republic of Ghana | 10.750% | 10/14/30 | 3,100 | 2,036 |
| 3 | Republic of Ghana | 8.125% | 3/26/32 | 3,900 | 1,140 |
| | Republic of Ghana | 8.625% | 4/7/34 | 3,150 | 918 |
| 3 | Republic of Ghana | 7.875% | 2/11/35 | 2,942 | 842 |
| 2 | Republic of Ghana | 8.875% | 5/7/42 | 200 | 54 |
| | Republic of Ghana | 8.875% | 5/7/42 | 1,200 | 331 |
Emerging Markets Government Bond Index Fund
| | | Coupon | Maturity
Date | Face
Amount
($000) | Market
Value•
($000) |
| 3 | Republic of Ghana | 8.627% | 6/16/49 | 3,250 | 905 |
| 3 | Republic of Ghana | 8.950% | 3/26/51 | 2,925 | 850 |
| 2,3 | Republic of Ghana | 8.750% | 3/11/61 | 200 | 56 |
| 3 | Republic of Ghana | 8.750% | 3/11/61 | 2,850 | 813 |
| | | | | | 13,211 |
| Guatemala (0.6%) | | |
| | Republic of Guatemala | 4.500% | 5/3/26 | 2,250 | 2,133 |
| | Republic of Guatemala | 4.375% | 6/5/27 | 1,400 | 1,293 |
| | Republic of Guatemala | 4.875% | 2/13/28 | 2,200 | 2,028 |
| 2 | Republic of Guatemala | 5.250% | 8/10/29 | 1,700 | 1,568 |
| 3 | Republic of Guatemala | 4.900% | 6/1/30 | 1,600 | 1,457 |
| | Republic of Guatemala | 5.375% | 4/24/32 | 1,600 | 1,479 |
| 2 | Republic of Guatemala | 3.700% | 10/7/33 | 900 | 688 |
| | Republic of Guatemala | 3.700% | 10/7/33 | 600 | 457 |
| 2 | Republic of Guatemala | 4.650% | 10/7/41 | 900 | 666 |
| | Republic of Guatemala | 4.650% | 10/7/41 | 600 | 441 |
| 3 | Republic of Guatemala | 6.125% | 6/1/50 | 4,400 | 3,779 |
| | | | | | 15,989 |
| Honduras (0.1%) | | |
| | Republic of Honduras | 6.250% | 1/19/27 | 2,220 | 1,760 |
| 2 | Republic of Honduras | 5.625% | 6/24/30 | 650 | 444 |
| | Republic of Honduras | 5.625% | 6/24/30 | 1,150 | 789 |
| | | | | | 2,993 |
| Hungary (1.1%) | | |
| | Republic of Hungary | 5.750% | 11/22/23 | 3,040 | 3,034 |
| | Republic of Hungary | 5.375% | 3/25/24 | 5,743 | 5,688 |
| 2 | Republic of Hungary | 5.250% | 6/16/29 | 5,300 | 4,885 |
| | Republic of Hungary | 5.250% | 6/16/29 | 200 | 184 |
| 2 | Republic of Hungary | 2.125% | 9/22/31 | 5,200 | 3,726 |
| | Republic of Hungary | 2.125% | 9/22/31 | 1,750 | 1,261 |
| 2 | Republic of Hungary | 5.500% | 6/16/34 | 4,025 | 3,480 |
| | Republic of Hungary | 7.625% | 3/29/41 | 3,870 | 3,858 |
| 2 | Republic of Hungary | 3.125% | 9/21/51 | 4,600 | 2,524 |
| | Republic of Hungary | 3.125% | 9/21/51 | 1,600 | 881 |
| | | | | | 29,521 |
| Indonesia (7.0%) | | |
| | Perusahaan Penerbit SBSN Indonesia III | 3.900% | 8/20/24 | 2,250 | 2,215 |
| | Perusahaan Penerbit SBSN Indonesia III | 4.350% | 9/10/24 | 4,800 | 4,754 |
| | Perusahaan Penerbit SBSN Indonesia III | 4.325% | 5/28/25 | 6,369 | 6,260 |
| | Perusahaan Penerbit SBSN Indonesia III | 2.300% | 6/23/25 | 2,000 | 1,860 |
| | Perusahaan Penerbit SBSN Indonesia III | 4.550% | 3/29/26 | 5,320 | 5,203 |
| 2 | Perusahaan Penerbit SBSN Indonesia III | 1.500% | 6/9/26 | 2,950 | 2,594 |
| | Perusahaan Penerbit SBSN Indonesia III | 1.500% | 6/9/26 | 1,275 | 1,121 |
| | Perusahaan Penerbit SBSN Indonesia III | 4.150% | 3/29/27 | 7,377 | 7,018 |
| 2 | Perusahaan Penerbit SBSN Indonesia III | 4.400% | 6/6/27 | 4,275 | 4,083 |
| | Perusahaan Penerbit SBSN Indonesia III | 4.400% | 6/6/27 | 600 | 573 |
| | Perusahaan Penerbit SBSN Indonesia III | 4.400% | 3/1/28 | 5,190 | 4,923 |
| | Perusahaan Penerbit SBSN Indonesia III | 4.450% | 2/20/29 | 3,485 | 3,301 |
| | Perusahaan Penerbit SBSN Indonesia III | 2.800% | 6/23/30 | 3,550 | 2,985 |
| 2 | Perusahaan Penerbit SBSN Indonesia III | 2.550% | 6/9/31 | 1,300 | 1,044 |
| | Perusahaan Penerbit SBSN Indonesia III | 2.550% | 6/9/31 | 1,800 | 1,446 |
| 2 | Perusahaan Penerbit SBSN Indonesia III | 4.700% | 6/6/32 | 4,400 | 4,130 |
| | Perusahaan Penerbit SBSN Indonesia III | 3.800% | 6/23/50 | 2,300 | 1,625 |
| 2 | Perusahaan Penerbit SBSN Indonesia III | 3.550% | 6/9/51 | 1,600 | 1,082 |
Emerging Markets Government Bond Index Fund
| | | Coupon | Maturity
Date | Face
Amount
($000) | Market
Value•
($000) |
| | Perusahaan Penerbit SBSN Indonesia III | 3.550% | 6/9/51 | 1,000 | 676 |
| | Republic of Indonesia | 5.875% | 1/15/24 | 5,350 | 5,407 |
| | Republic of Indonesia | 4.125% | 1/15/25 | 6,300 | 6,162 |
| | Republic of Indonesia | 4.750% | 1/8/26 | 6,600 | 6,476 |
| | Republic of Indonesia | 4.350% | 1/8/27 | 4,500 | 4,321 |
| | Republic of Indonesia | 3.850% | 7/18/27 | 3,270 | 3,058 |
| | Republic of Indonesia | 4.150% | 9/20/27 | 1,700 | 1,609 |
| | Republic of Indonesia | 3.500% | 1/11/28 | 3,886 | 3,550 |
| | Republic of Indonesia | 4.100% | 4/24/28 | 3,200 | 3,013 |
| | Republic of Indonesia | 4.750% | 2/11/29 | 3,758 | 3,611 |
| | Republic of Indonesia | 3.400% | 9/18/29 | 2,450 | 2,145 |
| | Republic of Indonesia | 2.850% | 2/14/30 | 4,200 | 3,572 |
| | Republic of Indonesia | 3.850% | 10/15/30 | 5,050 | 4,523 |
| | Republic of Indonesia | 1.850% | 3/12/31 | 3,650 | 2,782 |
| | Republic of Indonesia | 2.150% | 7/28/31 | 3,925 | 3,061 |
| | Republic of Indonesia | 3.550% | 3/31/32 | 3,600 | 3,087 |
| | Republic of Indonesia | 4.650% | 9/20/32 | 4,000 | 3,693 |
| | Republic of Indonesia | 8.500% | 10/12/35 | 4,900 | 5,765 |
| | Republic of Indonesia | 6.625% | 2/17/37 | 4,487 | 4,642 |
| | Republic of Indonesia | 7.750% | 1/17/38 | 6,150 | 6,832 |
| | Republic of Indonesia | 5.250% | 1/17/42 | 7,025 | 6,375 |
| | Republic of Indonesia | 4.625% | 4/15/43 | 4,560 | 3,834 |
| | Republic of Indonesia | 6.750% | 1/15/44 | 6,205 | 6,416 |
| | Republic of Indonesia | 5.125% | 1/15/45 | 6,201 | 5,449 |
| | Republic of Indonesia | 5.950% | 1/8/46 | 3,866 | 3,743 |
| | Republic of Indonesia | 5.250% | 1/8/47 | 4,650 | 4,162 |
| | Republic of Indonesia | 4.750% | 7/18/47 | 3,000 | 2,502 |
| | Republic of Indonesia | 4.350% | 1/11/48 | 5,850 | 4,560 |
| | Republic of Indonesia | 5.350% | 2/11/49 | 3,173 | 2,803 |
| | Republic of Indonesia | 3.700% | 10/30/49 | 3,100 | 2,172 |
| | Republic of Indonesia | 3.500% | 2/14/50 | 2,500 | 1,691 |
| | Republic of Indonesia | 4.200% | 10/15/50 | 5,250 | 3,952 |
| | Republic of Indonesia | 3.050% | 3/12/51 | 6,300 | 4,020 |
| | Republic of Indonesia | 4.300% | 3/31/52 | 2,600 | 1,979 |
| | Republic of Indonesia | 5.450% | 9/20/52 | 1,500 | 1,351 |
| | Republic of Indonesia | 3.200% | 9/23/61 | 1,900 | 1,168 |
| | Republic of Indonesia | 4.450% | 4/15/70 | 3,200 | 2,397 |
| | Republic of Indonesia | 3.350% | 3/12/71 | 2,425 | 1,458 |
| | | | | | 194,234 |
| Iraq (0.2%) | | |
| 3 | Republic of Iraq | 5.800% | 1/15/28 | 5,806 | 4,952 |
| Ivory Coast (0.2%) | | |
| 3 | Ivory Coast | 6.375% | 3/3/28 | 2,350 | 2,141 |
| 3 | Ivory Coast | 6.125% | 6/15/33 | 4,100 | 3,210 |
| | | | | | 5,351 |
| Jamaica (0.5%) | | |
| 3 | Jamaica | 6.750% | 4/28/28 | 4,600 | 4,837 |
| 3 | Jamaica | 8.000% | 3/15/39 | 3,850 | 4,270 |
| | Jamaica | 7.875% | 7/28/45 | 5,800 | 6,209 |
| | | | | | 15,316 |
| Jordan (0.5%) | | |
| | Kingdom of Jordan | 4.950% | 7/7/25 | 1,600 | 1,497 |
| | Kingdom of Jordan | 6.125% | 1/29/26 | 3,500 | 3,355 |
| | Kingdom of Jordan | 5.750% | 1/31/27 | 3,200 | 2,948 |
Emerging Markets Government Bond Index Fund
| | | Coupon | Maturity
Date | Face
Amount
($000) | Market
Value•
($000) |
| 2 | Kingdom of Jordan | 7.750% | 1/15/28 | 1,625 | 1,580 |
| | Kingdom of Jordan | 7.750% | 1/15/28 | 200 | 194 |
| 2 | Kingdom of Jordan | 5.850% | 7/7/30 | 300 | 249 |
| | Kingdom of Jordan | 5.850% | 7/7/30 | 3,411 | 2,830 |
| | Kingdom of Jordan | 7.375% | 10/10/47 | 3,250 | 2,441 |
| | | | | | 15,094 |
| Kazakhstan (0.7%) | | |
| | Republic of Kazakhstan | 3.875% | 10/14/24 | 4,470 | 4,433 |
| | Republic of Kazakhstan | 5.125% | 7/21/25 | 7,850 | 8,027 |
| | Republic of Kazakhstan | 4.875% | 10/14/44 | 2,950 | 2,248 |
| | Republic of Kazakhstan | 4.875% | 10/14/44 | 200 | 152 |
| | Republic of Kazakhstan | 6.500% | 7/21/45 | 4,630 | 4,104 |
| | | | | | 18,964 |
| Kenya (0.6%) | | |
| | Republic of Kenya | 6.875% | 6/24/24 | 6,025 | 5,277 |
| | Republic of Kenya | 7.000% | 5/22/27 | 2,875 | 2,295 |
| | Republic of Kenya | 7.250% | 2/28/28 | 3,300 | 2,508 |
| | Republic of Kenya | 8.000% | 5/22/32 | 4,000 | 2,814 |
| 2 | Republic of Kenya | 6.300% | 1/23/34 | 1,800 | 1,146 |
| | Republic of Kenya | 6.300% | 1/23/34 | 1,350 | 863 |
| | Republic of Kenya | 8.250% | 2/28/48 | 3,025 | 1,944 |
| | | | | | 16,847 |
| Kuwait (0.5%) | | |
| | Kuwait | 3.500% | 3/20/27 | 13,825 | 13,195 |
| Lebanon (0.1%) | | |
| 5 | Lebanon Republic | 6.650% | 4/22/24 | 1,860 | 116 |
| 5 | Lebanon Republic | 6.200% | 2/26/25 | 3,498 | 215 |
| 5 | Lebanon Republic | 6.600% | 11/27/26 | 6,295 | 385 |
| 5 | Lebanon Republic | 6.850% | 3/23/27 | 5,380 | 332 |
| 5 | Lebanon Republic | 6.750% | 11/29/27 | 4,009 | 250 |
| 5 | Lebanon Republic | 6.650% | 11/3/28 | 3,000 | 184 |
| 5 | Lebanon Republic | 6.850% | 5/25/29 | 3,300 | 198 |
| 5 | Lebanon Republic | 6.650% | 2/26/30 | 4,520 | 279 |
| 5 | Lebanon Republic | 7.000% | 3/23/32 | 3,895 | 242 |
| 5 | Lebanon Republic | 7.250% | 3/23/37 | 2,905 | 184 |
| | | | | | 2,385 |
| Malaysia (0.4%) | | |
| | Malaysia Sovereign Sukuk Bhd. | 3.043% | 4/22/25 | 2,850 | 2,740 |
| 2 | Malaysia Sovereign Sukuk Bhd. | 2.070% | 4/28/31 | 1,250 | 1,030 |
| | Malaysia Sovereign Sukuk Bhd. | 4.236% | 4/22/45 | 2,025 | 1,791 |
| 2 | Malaysia Sovereign Sukuk Bhd. | 3.075% | 4/28/51 | 700 | 488 |
| | Malaysia Sukuk Global Bhd. | 3.179% | 4/27/26 | 3,000 | 2,872 |
| | Malaysia Sukuk Global Bhd. | 4.080% | 4/27/46 | 1,800 | 1,547 |
| | Malaysia Wakala Sukuk Bhd. | 2.070% | 4/28/31 | 925 | 762 |
| | Malaysia Wakala Sukuk Bhd. | 3.075% | 4/28/51 | 500 | 350 |
| | | | | | 11,580 |
| Maldives (0.0%) | | |
| 2 | Maldives Sukuk Issuance Ltd. | 9.875% | 4/8/26 | 1,365 | 1,031 |
| | Maldives Sukuk Issuance Ltd. | 9.875% | 4/8/26 | 200 | 151 |
| | | | | | 1,182 |
| Mexico (5.6%) | | |
| | United Mexican States | 3.900% | 4/27/25 | 2,450 | 2,404 |
| | United Mexican States | 4.125% | 1/21/26 | 6,162 | 5,944 |
Emerging Markets Government Bond Index Fund
| | | Coupon | Maturity
Date | Face
Amount
($000) | Market
Value•
($000) |
| | United Mexican States | 4.150% | 3/28/27 | 7,270 | 6,947 |
| | United Mexican States | 3.750% | 1/11/28 | 5,875 | 5,388 |
| | United Mexican States | 4.500% | 4/22/29 | 9,636 | 8,971 |
| | United Mexican States | 3.250% | 4/16/30 | 7,125 | 6,006 |
| | United Mexican States | 2.659% | 5/24/31 | 10,707 | 8,320 |
| | United Mexican States | 8.300% | 8/15/31 | 3,650 | 4,095 |
| | United Mexican States | 4.750% | 4/27/32 | 7,290 | 6,614 |
| | United Mexican States | 7.500% | 4/8/33 | 2,500 | 2,709 |
| | United Mexican States | 4.875% | 5/19/33 | 7,075 | 6,251 |
| | United Mexican States | 3.500% | 2/12/34 | 9,047 | 6,940 |
| | United Mexican States | 6.750% | 9/27/34 | 5,479 | 5,509 |
| | United Mexican States | 6.050% | 1/11/40 | 8,599 | 7,951 |
| | United Mexican States | 4.280% | 8/14/41 | 10,720 | 7,805 |
| | United Mexican States | 4.750% | 3/8/44 | 11,556 | 8,800 |
| | United Mexican States | 5.550% | 1/21/45 | 8,559 | 7,278 |
| | United Mexican States | 4.600% | 1/23/46 | 7,350 | 5,383 |
| | United Mexican States | 4.350% | 1/15/47 | 4,576 | 3,210 |
| | United Mexican States | 4.600% | 2/10/48 | 6,298 | 4,554 |
| | United Mexican States | 4.500% | 1/31/50 | 6,999 | 4,990 |
| | United Mexican States | 5.000% | 4/27/51 | 7,675 | 5,843 |
| | United Mexican States | 4.400% | 2/12/52 | 12,775 | 8,764 |
| | United Mexican States | 3.771% | 5/24/61 | 9,850 | 5,760 |
| | United Mexican States | 3.750% | 4/19/71 | 5,850 | 3,358 |
| | United Mexican States | 5.750% | 10/12/10 | 8,330 | 6,360 |
| | | | | | 156,154 |
| Mongolia (0.2%) | | |
| | Mongolia | 8.750% | 3/9/24 | 1,900 | 1,785 |
| 2 | Mongolia | 5.125% | 4/7/26 | 848 | 650 |
| | Mongolia | 5.125% | 4/7/26 | 1,000 | 773 |
| 2 | Mongolia | 3.500% | 7/7/27 | 900 | 613 |
| | Mongolia | 3.500% | 7/7/27 | 600 | 412 |
| 2 | Mongolia | 4.450% | 7/7/31 | 1,100 | 723 |
| | Mongolia | 4.450% | 7/7/31 | 400 | 263 |
| | | | | | 5,219 |
| Morocco (0.3%) | | |
| | Kingdom of Morocco | 2.375% | 12/15/27 | 2,400 | 1,978 |
| | Kingdom of Morocco | 3.000% | 12/15/32 | 3,100 | 2,246 |
| | Kingdom of Morocco | 5.500% | 12/11/42 | 2,465 | 1,859 |
| 2 | Kingdom of Morocco | 4.000% | 12/15/50 | 1,850 | 1,096 |
| | Kingdom of Morocco | 4.000% | 12/15/50 | 1,825 | 1,079 |
| | | | | | 8,258 |
| Mozambique (0.1%) | | |
| 4 | Republic of Mozambique, 9.000% coupon rate effective 9/15/23 | 5.000% | 9/15/31 | 2,800 | 1,904 |
| Namibia (0.1%) | | |
| | Republic of Namibia | 5.250% | 10/29/25 | 2,300 | 2,064 |
| Nigeria (1.1%) | | |
| | Republic of Nigeria | 7.625% | 11/21/25 | 3,500 | 3,014 |
| | Republic of Nigeria | 6.500% | 11/28/27 | 4,800 | 3,407 |
| 2 | Republic of Nigeria | 6.125% | 9/28/28 | 3,000 | 1,974 |
| | Republic of Nigeria | 6.125% | 9/28/28 | 800 | 527 |
| 2 | Republic of Nigeria | 8.375% | 3/24/29 | 2,750 | 1,982 |
| | Republic of Nigeria | 8.375% | 3/24/29 | 1,452 | 1,052 |
Emerging Markets Government Bond Index Fund
| | | Coupon | Maturity
Date | Face
Amount
($000) | Market
Value•
($000) |
| | Republic of Nigeria | 7.143% | 2/23/30 | 4,200 | 2,749 |
| | Republic of Nigeria | 8.747% | 1/21/31 | 3,150 | 2,221 |
| | Republic of Nigeria | 7.875% | 2/16/32 | 4,550 | 2,939 |
| 2 | Republic of Nigeria | 7.375% | 9/28/33 | 2,400 | 1,447 |
| | Republic of Nigeria | 7.375% | 9/28/33 | 2,300 | 1,392 |
| | Republic of Nigeria | 7.696% | 2/23/38 | 3,767 | 2,213 |
| | Republic of Nigeria | 7.625% | 11/28/47 | 4,600 | 2,613 |
| | Republic of Nigeria | 9.248% | 1/21/49 | 2,300 | 1,479 |
| 2 | Republic of Nigeria | 8.250% | 9/28/51 | 2,950 | 1,701 |
| | Republic of Nigeria | 8.250% | 9/28/51 | 1,000 | 580 |
| | | | | | 31,290 |
| Oman (2.7%) | | |
| | Oman Sovereign Sukuk Co. | 4.397% | 6/1/24 | 6,375 | 6,248 |
| | Oman Sovereign Sukuk Co. | 5.932% | 10/31/25 | 4,656 | 4,708 |
| 2 | Oman Sovereign Sukuk Co. | 4.875% | 6/15/30 | 4,100 | 3,908 |
| | Oman Sovereign Sukuk Co. | 4.875% | 6/15/30 | 1,351 | 1,291 |
| | Sultanate of Oman | 4.875% | 2/1/25 | 3,644 | 3,545 |
| | Sultanate of Oman | 4.750% | 6/15/26 | 7,500 | 7,108 |
| | Sultanate of Oman | 5.375% | 3/8/27 | 5,900 | 5,638 |
| | Sultanate of Oman | 6.750% | 10/28/27 | 4,340 | 4,360 |
| | Sultanate of Oman | 5.625% | 1/17/28 | 7,650 | 7,310 |
| | Sultanate of Oman | 6.000% | 8/1/29 | 6,972 | 6,633 |
| | Sultanate of Oman | 6.250% | 1/25/31 | 5,300 | 5,073 |
| | Sultanate of Oman | 7.375% | 10/28/32 | 3,137 | 3,211 |
| | Sultanate of Oman | 6.500% | 3/8/47 | 6,115 | 5,047 |
| | Sultanate of Oman | 6.750% | 1/17/48 | 8,750 | 7,326 |
| 2 | Sultanate of Oman | 7.000% | 1/25/51 | 1,150 | 983 |
| | Sultanate of Oman | 7.000% | 1/25/51 | 2,100 | 1,795 |
| | | | | | 74,184 |
| Pakistan (0.3%) | | |
| | Islamic Republic of Pakistan | 8.250% | 4/15/24 | 3,000 | 1,280 |
| | Islamic Republic of Pakistan | 8.250% | 9/30/25 | 1,650 | 594 |
| | Islamic Republic of Pakistan | 6.000% | 4/8/26 | 4,050 | 1,328 |
| | Islamic Republic of Pakistan | 6.875% | 12/5/27 | 4,900 | 1,560 |
| | Islamic Republic of Pakistan | 7.375% | 4/8/31 | 4,400 | 1,375 |
| | Islamic Republic of Pakistan | 8.875% | 4/8/51 | 2,770 | 843 |
| | Pakistan Global Sukuk Programme Co. Ltd. | 7.950% | 1/31/29 | 3,000 | 1,591 |
| | | | | | 8,571 |
| Panama (2.2%) | | |
| | Republic of Panama | 4.000% | 9/22/24 | 2,800 | 2,717 |
| | Republic of Panama | 3.750% | 3/16/25 | 3,859 | 3,697 |
| | Republic of Panama | 7.125% | 1/29/26 | 2,925 | 3,064 |
| | Republic of Panama | 8.875% | 9/30/27 | 3,150 | 3,582 |
| | Republic of Panama | 3.875% | 3/17/28 | 1,433 | 1,303 |
| | Republic of Panama | 9.375% | 4/1/29 | 3,050 | 3,525 |
| | Republic of Panama | 3.160% | 1/23/30 | 6,600 | 5,385 |
| | Republic of Panama | 2.252% | 9/29/32 | 7,900 | 5,504 |
| | Republic of Panama | 3.298% | 1/19/33 | 3,050 | 2,341 |
| 3 | Republic of Panama | 6.700% | 1/26/36 | 6,000 | 5,870 |
| 3 | Republic of Panama | 4.500% | 5/15/47 | 3,700 | 2,577 |
| 3 | Republic of Panama | 4.500% | 4/16/50 | 7,900 | 5,397 |
| 3 | Republic of Panama | 4.300% | 4/29/53 | 5,650 | 3,691 |
| | Republic of Panama | 4.500% | 4/1/56 | 7,875 | 5,185 |
| 3 | Republic of Panama | 3.870% | 7/23/60 | 8,950 | 5,177 |
Emerging Markets Government Bond Index Fund
| | | Coupon | Maturity
Date | Face
Amount
($000) | Market
Value•
($000) |
| | Republic of Panama | 4.500% | 1/19/63 | 5,100 | 3,247 |
| | | | | | 62,262 |
| Papua New Guinea (0.0%) | | |
| | Papua New Guinea | 8.375% | 10/4/28 | 1,600 | 1,264 |
| Paraguay (0.6%) | | |
| | Republic of Paraguay | 5.000% | 4/15/26 | 1,700 | 1,662 |
| | Republic of Paraguay | 4.700% | 3/27/27 | 1,600 | 1,530 |
| 3 | Republic of Paraguay | 4.950% | 4/28/31 | 3,000 | 2,747 |
| 2 | Republic of Paraguay | 2.739% | 1/29/33 | 608 | 452 |
| | Republic of Paraguay | 2.739% | 1/29/33 | 1,400 | 1,020 |
| 2 | Republic of Paraguay | 3.849% | 6/28/33 | 400 | 325 |
| | Republic of Paraguay | 3.849% | 6/28/33 | 1,100 | 894 |
| | Republic of Paraguay | 6.100% | 8/11/44 | 3,400 | 2,935 |
| | Republic of Paraguay | 5.600% | 3/13/48 | 1,650 | 1,280 |
| 3 | Republic of Paraguay | 5.400% | 3/30/50 | 3,550 | 2,720 |
| | | | | | 15,565 |
| Peru (2.2%) | | |
| | Republic of Peru | 7.350% | 7/21/25 | 4,709 | 4,902 |
| | Republic of Peru | 2.392% | 1/23/26 | 3,100 | 2,801 |
| | Republic of Peru | 4.125% | 8/25/27 | 3,447 | 3,245 |
| | Republic of Peru | 2.783% | 1/23/31 | 13,200 | 10,438 |
| | Republic of Peru | 1.862% | 12/1/32 | 4,300 | 2,985 |
| | Republic of Peru | 8.750% | 11/21/33 | 6,500 | 7,711 |
| | Republic of Peru | 3.000% | 1/15/34 | 7,850 | 5,870 |
| 3 | Republic of Peru | 6.550% | 3/14/37 | 3,646 | 3,651 |
| | Republic of Peru | 3.300% | 3/11/41 | 4,125 | 2,790 |
| | Republic of Peru | 5.625% | 11/18/50 | 7,558 | 6,941 |
| | Republic of Peru | 3.550% | 3/10/51 | 5,475 | 3,602 |
| | Republic of Peru | 2.780% | 12/1/60 | 6,325 | 3,362 |
| | Republic of Peru | 3.600% | 1/15/72 | 3,000 | 1,773 |
| | Republic of Peru | 3.230% | 7/28/21 | 3,027 | 1,609 |
| | | | | | 61,680 |
| Philippines (3.4%) | | |
| | Republic of Philippines | 4.200% | 1/21/24 | 4,314 | 4,240 |
| | Republic of Philippines | 10.625% | 3/16/25 | 4,300 | 4,805 |
| | Republic of Philippines | 5.500% | 3/30/26 | 3,500 | 3,528 |
| | Republic of Philippines | 3.229% | 3/29/27 | 1,900 | 1,752 |
| | Republic of Philippines | 5.170% | 10/13/27 | 1,100 | 1,096 |
| | Republic of Philippines | 3.000% | 2/1/28 | 6,450 | 5,827 |
| | Republic of Philippines | 3.750% | 1/14/29 | 5,150 | 4,744 |
| | Republic of Philippines | 9.500% | 2/2/30 | 6,035 | 7,259 |
| | Republic of Philippines | 2.457% | 5/5/30 | 3,525 | 2,909 |
| | Republic of Philippines | 7.750% | 1/14/31 | 5,300 | 5,986 |
| | Republic of Philippines | 1.648% | 6/10/31 | 4,075 | 3,049 |
| | Republic of Philippines | 1.950% | 1/6/32 | 2,500 | 1,898 |
| | Republic of Philippines | 6.375% | 1/15/32 | 3,300 | 3,415 |
| | Republic of Philippines | 3.556% | 9/29/32 | 2,400 | 2,060 |
| | Republic of Philippines | 5.609% | 4/13/33 | 2,400 | 2,396 |
| | Republic of Philippines | 6.375% | 10/23/34 | 5,935 | 6,122 |
| | Republic of Philippines | 5.000% | 1/13/37 | 4,205 | 3,840 |
| | Republic of Philippines | 3.950% | 1/20/40 | 6,200 | 4,766 |
| | Republic of Philippines | 3.700% | 3/1/41 | 6,000 | 4,476 |
| | Republic of Philippines | 3.700% | 2/2/42 | 6,270 | 4,681 |
| | Republic of Philippines | 2.950% | 5/5/45 | 4,100 | 2,656 |
Emerging Markets Government Bond Index Fund
| | | Coupon | Maturity
Date | Face
Amount
($000) | Market
Value•
($000) |
| | Republic of Philippines | 2.650% | 12/10/45 | 4,700 | 2,858 |
| | Republic of Philippines | 3.200% | 7/6/46 | 7,275 | 4,770 |
| | Republic of Philippines | 4.200% | 3/29/47 | 3,150 | 2,460 |
| | Republic of Philippines | 5.950% | 10/13/47 | 2,300 | 2,249 |
| | | | | | 93,842 |
| Poland (0.4%) | | |
| 6 | Republic of Poland | 4.000% | 1/22/24 | 6,100 | 6,011 |
| | Republic of Poland | 3.250% | 4/6/26 | 5,575 | 5,235 |
| | | | | | 11,246 |
| Qatar (4.2%) | | |
| | State of Qatar | 3.375% | 3/14/24 | 6,189 | 6,074 |
| | State of Qatar | 3.400% | 4/16/25 | 6,392 | 6,173 |
| | State of Qatar | 3.250% | 6/2/26 | 10,750 | 10,161 |
| | State of Qatar | 4.500% | 4/23/28 | 9,450 | 9,201 |
| | State of Qatar | 4.000% | 3/14/29 | 12,725 | 12,063 |
| | State of Qatar | 3.750% | 4/16/30 | 9,715 | 9,042 |
| 2 | State of Qatar | 9.750% | 6/15/30 | 4,193 | 5,411 |
| 2 | State of Qatar | 6.400% | 1/20/40 | 2,670 | 2,914 |
| 2 | State of Qatar | 5.750% | 1/20/42 | 3,600 | 3,680 |
| | State of Qatar | 4.625% | 6/2/46 | 6,375 | 5,621 |
| | State of Qatar | 5.103% | 4/23/48 | 18,600 | 17,233 |
| | State of Qatar | 4.817% | 3/14/49 | 18,725 | 16,608 |
| | State of Qatar | 4.400% | 4/16/50 | 15,900 | 13,398 |
| | | | | | 117,579 |
| Romania (0.9%) | | |
| | Romania | 4.875% | 1/22/24 | 2,870 | 2,848 |
| 2 | Romania | 3.000% | 2/27/27 | 3,450 | 2,960 |
| | Romania | 3.000% | 2/27/27 | 326 | 280 |
| 2 | Romania | 5.250% | 11/25/27 | 3,340 | 3,062 |
| | Romania | 5.250% | 11/25/27 | 200 | 184 |
| 2 | Romania | 3.000% | 2/14/31 | 1,000 | 740 |
| | Romania | 3.000% | 2/14/31 | 3,276 | 2,422 |
| 2 | Romania | 3.625% | 3/27/32 | 3,350 | 2,469 |
| 2 | Romania | 6.000% | 5/25/34 | 1,550 | 1,312 |
| | Romania | 6.000% | 5/25/34 | 850 | 720 |
| | Romania | 6.125% | 1/22/44 | 3,700 | 2,962 |
| | Romania | 5.125% | 6/15/48 | 4,128 | 2,882 |
| 2 | Romania | 4.000% | 2/14/51 | 1,576 | 923 |
| | Romania | 4.000% | 2/14/51 | 4,294 | 2,522 |
| | | | | | 26,286 |
| Rwanda (0.1%) | | |
| 2 | Republic of Rwanda | 5.500% | 8/9/31 | 1,700 | 1,267 |
| | Republic of Rwanda | 5.500% | 8/9/31 | 200 | 149 |
| | | | | | 1,416 |
| Saudi Arabia (7.2%) | | |
| | Kingdom of Saudi Arabia | 4.000% | 4/17/25 | 13,050 | 12,738 |
| | Kingdom of Saudi Arabia | 2.900% | 10/22/25 | 7,900 | 7,450 |
| | Kingdom of Saudi Arabia | 3.250% | 10/26/26 | 16,750 | 15,743 |
| | Kingdom of Saudi Arabia | 2.500% | 2/3/27 | 4,000 | 3,622 |
| | Kingdom of Saudi Arabia | 3.625% | 3/4/28 | 15,832 | 14,742 |
| | Kingdom of Saudi Arabia | 4.375% | 4/16/29 | 12,500 | 11,949 |
| | Kingdom of Saudi Arabia | 4.500% | 4/17/30 | 9,450 | 9,020 |
| | Kingdom of Saudi Arabia | 3.250% | 10/22/30 | 4,719 | 4,123 |
| | Kingdom of Saudi Arabia | 2.750% | 2/3/32 | 3,300 | 2,726 |
Emerging Markets Government Bond Index Fund
| | | Coupon | Maturity
Date | Face
Amount
($000) | Market
Value•
($000) |
| | Kingdom of Saudi Arabia | 5.500% | 10/25/32 | 7,300 | 7,402 |
| | Kingdom of Saudi Arabia | 2.250% | 2/2/33 | 8,800 | 6,754 |
| | Kingdom of Saudi Arabia | 4.500% | 10/26/46 | 20,225 | 16,135 |
| | Kingdom of Saudi Arabia | 4.625% | 10/4/47 | 13,893 | 11,168 |
| | Kingdom of Saudi Arabia | 5.000% | 4/17/49 | 11,700 | 9,978 |
| | Kingdom of Saudi Arabia | 5.250% | 1/16/50 | 10,542 | 9,346 |
| | Kingdom of Saudi Arabia | 3.250% | 11/17/51 | 3,625 | 2,337 |
| | Kingdom of Saudi Arabia | 3.750% | 1/21/55 | 9,073 | 6,341 |
| | Kingdom of Saudi Arabia | 4.500% | 4/22/60 | 9,400 | 7,385 |
| | Kingdom of Saudi Arabia | 3.450% | 2/2/61 | 7,150 | 4,592 |
| | KSA Sukuk Ltd. | 3.628% | 4/20/27 | 13,675 | 12,917 |
| | KSA Sukuk Ltd. | 5.268% | 10/25/28 | 7,400 | 7,448 |
| | KSA Sukuk Ltd. | 4.303% | 1/19/29 | 6,500 | 6,229 |
| | KSA Sukuk Ltd. | 2.969% | 10/29/29 | 7,745 | 6,775 |
| | KSA Sukuk Ltd. | 2.250% | 5/17/31 | 6,225 | 5,034 |
| | | | | | 201,954 |
| Senegal (0.2%) | | |
| 3 | Republic of Senegal | 6.250% | 5/23/33 | 3,300 | 2,478 |
| 3 | Republic of Senegal | 6.750% | 3/13/48 | 3,200 | 2,033 |
| | | | | | 4,511 |
| Serbia (0.1%) | | |
| | Republic of Serbia | 2.125% | 12/1/30 | 3,250 | 2,253 |
| South Africa (2.0%) | | |
| | Republic of South Africa | 4.665% | 1/17/24 | 4,700 | 4,625 |
| | Republic of South Africa | 5.875% | 9/16/25 | 6,100 | 6,047 |
| | Republic of South Africa | 4.875% | 4/14/26 | 3,850 | 3,623 |
| | Republic of South Africa | 4.850% | 9/27/27 | 3,000 | 2,723 |
| | Republic of South Africa | 4.300% | 10/12/28 | 3,600 | 3,076 |
| | Republic of South Africa | 4.850% | 9/30/29 | 9,860 | 8,371 |
| | Republic of South Africa | 5.875% | 6/22/30 | 4,300 | 3,821 |
| | Republic of South Africa | 5.875% | 4/20/32 | 4,300 | 3,683 |
| | Republic of South Africa | 6.250% | 3/8/41 | 2,400 | 1,828 |
| | Republic of South Africa | 5.375% | 7/24/44 | 3,150 | 2,106 |
| | Republic of South Africa | 5.000% | 10/12/46 | 3,150 | 1,986 |
| | Republic of South Africa | 5.650% | 9/27/47 | 4,875 | 3,257 |
| | Republic of South Africa | 6.300% | 6/22/48 | 200 | 145 |
| | Republic of South Africa | 5.750% | 9/30/49 | 11,050 | 7,354 |
| | Republic of South Africa | 7.300% | 4/20/52 | 4,950 | 3,878 |
| | | | | | 56,523 |
| Sri Lanka (0.3%) | | |
| 5 | Republic of Sri Lanka | 6.850% | 3/14/24 | 3,150 | 733 |
| 5 | Republic of Sri Lanka | 6.350% | 6/28/24 | 1,600 | 372 |
| 5 | Republic of Sri Lanka | 6.125% | 6/3/25 | 1,950 | 468 |
| 5 | Republic of Sri Lanka | 6.850% | 11/3/25 | 4,600 | 1,077 |
| 5 | Republic of Sri Lanka | 6.825% | 7/18/26 | 3,250 | 735 |
| 5 | Republic of Sri Lanka | 6.200% | 5/11/27 | 4,800 | 1,103 |
| 5 | Republic of Sri Lanka | 6.750% | 4/18/28 | 4,050 | 929 |
| 5 | Republic of Sri Lanka | 7.850% | 3/14/29 | 4,275 | 946 |
| 5 | Republic of Sri Lanka | 7.550% | 3/28/30 | 4,775 | 1,092 |
| | | | | | 7,455 |
| Suriname (0.0%) | | |
| 5 | Republic of Suriname | 9.250% | 10/26/26 | 1,700 | 1,371 |
Emerging Markets Government Bond Index Fund
| | | Coupon | Maturity
Date | Face
Amount
($000) | Market
Value•
($000) |
| Tajikistan (0.0%) | | |
| 3 | Republic of Tajikistan | 7.125% | 9/14/27 | 1,375 | 880 |
| Trinidad & Tobago (0.2%) | | |
| | Republic of Trinidad & Tobago | 4.375% | 1/16/24 | 1,300 | 1,282 |
| 2 | Republic of Trinidad & Tobago | 4.375% | 1/16/24 | 200 | 196 |
| | Republic of Trinidad & Tobago | 4.500% | 8/4/26 | 3,200 | 3,094 |
| 2 | Republic of Trinidad & Tobago | 4.500% | 6/26/30 | 650 | 592 |
| | Republic of Trinidad & Tobago | 4.500% | 6/26/30 | 1,000 | 910 |
| | | | | | 6,074 |
| Tunisia (0.1%) | | |
| | Tunisian Republic | 5.750% | 1/30/25 | 3,125 | 1,950 |
| Turkey (7.0%) | | |
| | Hazine Mustesarligi Varlik Kiralama A/S | 4.489% | 11/25/24 | 2,878 | 2,665 |
| | Hazine Mustesarligi Varlik Kiralama A/S | 9.758% | 11/13/25 | 14,100 | 14,257 |
| | Hazine Mustesarligi Varlik Kiralama A/S | 5.125% | 6/22/26 | 350 | 311 |
| 2 | Hazine Mustesarligi Varlik Kiralama A/S | 7.250% | 2/24/27 | 8,600 | 7,969 |
| | Hazine Mustesarligi Varlik Kiralama A/S | 7.250% | 2/24/27 | 900 | 836 |
| | Republic of Turkey | 7.250% | 12/23/23 | 6,250 | 6,306 |
| | Republic of Turkey | 5.750% | 3/22/24 | 7,700 | 7,578 |
| | Republic of Turkey | 6.350% | 8/10/24 | 7,200 | 7,040 |
| | Republic of Turkey | 5.600% | 11/14/24 | 8,100 | 7,740 |
| | Republic of Turkey | 7.375% | 2/5/25 | 10,250 | 10,069 |
| | Republic of Turkey | 4.250% | 3/13/25 | 6,300 | 5,707 |
| | Republic of Turkey | 6.375% | 10/14/25 | 7,958 | 7,385 |
| | Republic of Turkey | 4.750% | 1/26/26 | 7,200 | 6,305 |
| | Republic of Turkey | 4.250% | 4/14/26 | 200 | 171 |
| | Republic of Turkey | 4.875% | 10/9/26 | 11,774 | 10,029 |
| | Republic of Turkey | 6.000% | 3/25/27 | 13,367 | 11,644 |
| | Republic of Turkey | 8.600% | 9/24/27 | 3,750 | 3,612 |
| | Republic of Turkey | 5.125% | 2/17/28 | 6,050 | 4,884 |
| | Republic of Turkey | 6.125% | 10/24/28 | 8,808 | 7,336 |
| | Republic of Turkey | 7.625% | 4/26/29 | 9,300 | 8,201 |
| | Republic of Turkey | 11.875% | 1/15/30 | 4,680 | 5,151 |
| | Republic of Turkey | 5.250% | 3/13/30 | 6,248 | 4,665 |
| | Republic of Turkey | 5.950% | 1/15/31 | 7,050 | 5,409 |
| | Republic of Turkey | 5.875% | 6/26/31 | 5,550 | 4,180 |
| | Republic of Turkey | 6.500% | 9/20/33 | 4,700 | 3,543 |
| | Republic of Turkey | 8.000% | 2/14/34 | 4,621 | 4,064 |
| | Republic of Turkey | 6.875% | 3/17/36 | 8,750 | 6,573 |
| | Republic of Turkey | 7.250% | 3/5/38 | 3,175 | 2,502 |
| | Republic of Turkey | 6.750% | 5/30/40 | 6,400 | 4,594 |
| | Republic of Turkey | 6.000% | 1/14/41 | 9,265 | 5,972 |
| | Republic of Turkey | 4.875% | 4/16/43 | 9,200 | 5,396 |
| | Republic of Turkey | 6.625% | 2/17/45 | 9,550 | 6,493 |
| | Republic of Turkey | 5.750% | 5/11/47 | 11,275 | 6,954 |
| | | | | | 195,541 |
| Ukraine (0.3%) | | |
| 5 | Ukraine | 7.750% | 9/1/25 | 7,700 | 1,562 |
| 5 | Ukraine | 8.994% | 2/1/26 | 2,350 | 398 |
| 5 | Ukraine | 7.750% | 9/1/26 | 4,200 | 715 |
| 5 | Ukraine | 7.750% | 9/1/27 | 4,130 | 696 |
| 5 | Ukraine | 7.750% | 9/1/28 | 4,275 | 759 |
| 5 | Ukraine | 7.750% | 9/1/29 | 4,200 | 741 |
| 5 | Ukraine | 9.750% | 11/1/30 | 5,075 | 936 |
Emerging Markets Government Bond Index Fund
| | | Coupon | Maturity
Date | Face
Amount
($000) | Market
Value•
($000) |
| 2,5 | Ukraine | 6.876% | 5/21/31 | 650 | 99 |
| 5 | Ukraine | 6.876% | 5/21/31 | 4,590 | 680 |
| 3,5 | Ukraine | 7.375% | 9/25/34 | 9,450 | 1,484 |
| 2,5 | Ukraine | 7.253% | 3/15/35 | 1,800 | 287 |
| 5 | Ukraine | 7.253% | 3/15/35 | 6,300 | 991 |
| | | | | | 9,348 |
| United Arab Emirates (5.6%) | | |
| | Dubai DOF Sukuk Ltd. | 5.000% | 4/30/29 | 5,030 | 5,069 |
| 7 | Dubai DOF Sukuk Ltd. | 2.763% | 9/9/30 | 4,500 | 3,871 |
| | Emirate of Abu Dhabi | 2.125% | 9/30/24 | 9,050 | 8,633 |
| | Emirate of Abu Dhabi | 2.500% | 4/16/25 | 9,700 | 9,240 |
| | Emirate of Abu Dhabi | 3.125% | 5/3/26 | 8,322 | 7,890 |
| | Emirate of Abu Dhabi | 3.125% | 10/11/27 | 13,950 | 13,001 |
| | Emirate of Abu Dhabi | 1.625% | 6/2/28 | 5,046 | 4,283 |
| | Emirate of Abu Dhabi | 2.500% | 9/30/29 | 9,500 | 8,248 |
| | Emirate of Abu Dhabi | 3.125% | 4/16/30 | 9,575 | 8,598 |
| | Emirate of Abu Dhabi | 1.700% | 3/2/31 | 4,850 | 3,821 |
| | Emirate of Abu Dhabi | 1.875% | 9/15/31 | 5,700 | 4,501 |
| 2 | Emirate of Abu Dhabi | 2.000% | 10/19/31 | 2,700 | 2,146 |
| | Emirate of Abu Dhabi | 2.000% | 10/19/31 | 475 | 377 |
| | Emirate of Abu Dhabi | 4.050% | 7/7/32 | 5,600 | 5,205 |
| 2 | Emirate of Abu Dhabi | 2.875% | 10/19/41 | 1,850 | 1,306 |
| | Emirate of Abu Dhabi | 2.875% | 10/19/41 | 1,100 | 776 |
| | Emirate of Abu Dhabi | 4.125% | 10/11/47 | 9,350 | 7,554 |
| | Emirate of Abu Dhabi | 3.125% | 9/30/49 | 12,600 | 8,490 |
| | Emirate of Abu Dhabi | 3.875% | 4/16/50 | 12,450 | 9,574 |
| | Emirate of Abu Dhabi | 3.000% | 9/15/51 | 4,050 | 2,622 |
| 8 | Emirate of Abu Dhabi | 4.951% | 7/7/52 | 3,850 | 3,503 |
| | Emirate of Abu Dhabi | 3.250% | 10/19/61 | 6,300 | 4,153 |
| | Emirate of Abu Dhabi | 2.700% | 9/2/70 | 4,800 | 2,706 |
| | Emirate of Dubai | 5.250% | 1/30/43 | 3,500 | 2,941 |
| | Emirate of Dubai | 3.900% | 9/9/50 | 3,842 | 2,521 |
| | Finance Department Government of Sharjah | 3.625% | 3/10/33 | 2,400 | 1,803 |
| | Finance Department Government of Sharjah | 4.000% | 7/28/50 | 3,148 | 1,825 |
| | Finance Department Government of Sharjah | 4.375% | 3/10/51 | 1,600 | 950 |
| | RAK Capital | 3.094% | 3/31/25 | 3,133 | 2,990 |
| | Sharjah Sukuk Ltd. | 3.764% | 9/17/24 | 1,910 | 1,828 |
| | Sharjah Sukuk Program Ltd. | 3.854% | 4/3/26 | 3,470 | 3,150 |
| | Sharjah Sukuk Program Ltd. | 2.942% | 6/10/27 | 3,190 | 2,732 |
| | Sharjah Sukuk Program Ltd. | 4.226% | 3/14/28 | 4,100 | 3,620 |
| | Sharjah Sukuk Program Ltd. | 3.234% | 10/23/29 | 3,039 | 2,483 |
| | Sharjah Sukuk Program Ltd. | 3.886% | 4/4/30 | 2,300 | 1,936 |
| | Sharjah Sukuk Program Ltd. | 3.200% | 7/13/31 | 2,250 | 1,767 |
| | | | | | 156,113 |
| Uruguay (1.5%) | | |
| 3 | Oriental Republic of Uruguay | 4.375% | 10/27/27 | 4,566 | 4,521 |
| 3 | Oriental Republic of Uruguay | 4.375% | 1/23/31 | 7,774 | 7,422 |
| 3 | Oriental Republic of Uruguay | 7.875% | 1/15/33 | 2,600 | 3,073 |
| | Oriental Republic of Uruguay | 5.750% | 10/28/34 | 2,653 | 2,704 |
| 3 | Oriental Republic of Uruguay | 7.625% | 3/21/36 | 3,165 | 3,746 |
| 3 | Oriental Republic of Uruguay | 4.125% | 11/20/45 | 2,120 | 1,794 |
| 3 | Oriental Republic of Uruguay | 5.100% | 6/18/50 | 12,517 | 11,274 |
| 3 | Oriental Republic of Uruguay | 4.975% | 4/20/55 | 8,209 | 7,163 |
| | | | | | 41,697 |
Emerging Markets Government Bond Index Fund
| | | Coupon | Maturity
Date | Face
Amount
($000) | Market
Value•
($000) |
| Uzbekistan (0.2%) | | |
| | Republic of Uzbekistan | 4.750% | 2/20/24 | 1,645 | 1,570 |
| | Republic of Uzbekistan | 5.375% | 2/20/29 | 1,675 | 1,411 |
| | Republic of Uzbekistan | 3.700% | 11/25/30 | 2,300 | 1,663 |
| 2 | Republic of Uzbekistan | 3.900% | 10/19/31 | 950 | 674 |
| | Republic of Uzbekistan | 3.900% | 10/19/31 | 400 | 286 |
| | | | | | 5,604 |
| Vietnam (0.1%) | | |
| | Socialist Republic of Vietnam | 4.800% | 11/19/24 | 3,100 | 2,989 |
| Zambia (0.1%) | | |
| 5 | Republic of Zambia | 8.500% | 4/14/24 | 3,130 | 1,264 |
| 5 | Republic of Zambia | 8.970% | 7/30/27 | 4,025 | 1,612 |
| | | | | | 2,876 |
| Total Sovereign Bonds (Cost $3,083,643) | | 2,342,173 |
| | | | | Shares | |
| Temporary Cash Investments (0.6%) | | |
| Money Market Fund (0.6%) | | |
| 9 | Vanguard Market Liquidity Fund (Cost $18,333) | 3.117% | | 183,377 | 18,334 |
| Total Investments (98.8%) (Cost $3,608,938) | | 2,759,621 |
| Other Assets and Liabilities—Net (1.2%) | | 32,241 |
| Net Assets (100.0%) | | 2,791,862 |
| Cost is in $000. | | |
| • | See Note A in Notes to Financial Statements. |
| 1 | Guaranteed by the Republic of Azerbaijan. |
| 2 | Security exempt from registration under Rule 144A of the Securities Act of 1933. Such securities may be sold in transactions exempt from registration, normally to qualified institutional buyers. At October 31, 2022, the aggregate value was $144,840,000, representing 5.2% of net assets. |
| 3 | The average or expected maturity is shorter than the final maturity shown because of the possibility of interim principal payments and prepayments or the possibility of the issue being called. |
| 4 | Step bond. |
| 5 | Non-income-producing security—security in default. |
| 6 | Securities with a value of $169,000 have been segregated as initial margin for open futures contracts. |
| 7 | Guaranteed by the Kingdom of United Arab Emirates. |
| 8 | Includes securities purchased on a when-issued or delayed-delivery basis for which the fund has not taken delivery as of October 31, 2022. |
| 9 | Affiliated money market fund available only to Vanguard funds and certain trusts and accounts managed by Vanguard. Rate shown is the 7-day yield. |
| | GMTN—Global Medium Term Note. |
Emerging Markets Government Bond Index Fund
Derivative Financial Instruments Outstanding as of Period End
| Futures Contracts |
| | | | ($000) |
| | Expiration | Number of
Long (Short)
Contracts | Notional
Amount | Value and
Unrealized
Appreciation
(Depreciation) |
| Long Futures Contracts | | | | |
| 5-Year U.S. Treasury Note | December 2022 | 29 | 3,091 | (3) |
| Ultra 10-Year U.S. Treasury Note | December 2022 | 11 | 1,276 | (4) |
| | | | | (7) |
| Short Futures Contracts | | | | |
| Ultra Long U.S. Treasury Bond | December 2022 | (16) | (2,043) | 163 |
| | | | | 156 |
See accompanying Notes, which are an integral part of the Financial Statements.
Emerging Markets Government Bond Index Fund
Statement of Assets and Liabilities
|
| ($000s, except shares and per-share amounts) | Amount |
| Assets | |
| Investments in Securities, at Value | |
| Unaffiliated Issuers (Cost $3,590,605) | 2,741,287 |
| Affiliated Issuers (Cost $18,333) | 18,334 |
| Total Investments in Securities | 2,759,621 |
| Investment in Vanguard | 112 |
| Receivables for Investment Securities Sold | 31,090 |
| Receivables for Accrued Income | 38,147 |
| Receivables for Capital Shares Issued | 184 |
| Variation Margin Receivable—Futures Contracts | 27 |
| Total Assets | 2,829,181 |
| Liabilities | |
| Due to Custodian | 129 |
| Payables for Investment Securities Purchased | 36,673 |
| Payables for Capital Shares Redeemed | 130 |
| Payables for Distributions | 147 |
| Payables to Vanguard | 240 |
| Total Liabilities | 37,319 |
| Net Assets | 2,791,862 |
| At October 31, 2022, net assets consisted of: | |
| | |
| Paid-in Capital | 3,851,192 |
| Total Distributable Earnings (Loss) | (1,059,330) |
| Net Assets | 2,791,862 |
| |
| ETF Shares—Net Assets | |
Applicable to 44,870,036 outstanding $.001 par value shares of
beneficial interest (unlimited authorization) | 2,582,451 |
| Net Asset Value Per Share—ETF Shares | $57.55 |
| |
| Admiral Shares—Net Assets | |
Applicable to 10,802,759 outstanding $.001 par value shares of
beneficial interest (unlimited authorization) | 155,788 |
| Net Asset Value Per Share—Admiral Shares | $14.42 |
| |
| Institutional Shares—Net Assets | |
Applicable to 2,318,215 outstanding $.001 par value shares of
beneficial interest (unlimited authorization) | 53,623 |
| Net Asset Value Per Share—Institutional Shares | $23.13 |
See accompanying Notes, which are an integral part of the Financial Statements.
Emerging Markets Government Bond Index Fund
|
| | Year Ended
October 31, 2022 |
| | ($000) |
| Investment Income | |
| Income | |
| Interest1 | 153,771 |
| Total Income | 153,771 |
| Expenses | |
| The Vanguard Group—Note B | |
| Investment Advisory Services | 57 |
| Management and Administrative—ETF Shares | 5,320 |
| Management and Administrative—Admiral Shares | 353 |
| Management and Administrative—Institutional Shares | 68 |
| Marketing and Distribution—ETF Shares | 157 |
| Marketing and Distribution—Admiral Shares | 9 |
| Marketing and Distribution—Institutional Shares | 2 |
| Custodian Fees | 55 |
| Auditing Fees | 44 |
| Shareholders’ Reports—ETF Shares | 133 |
| Shareholders’ Reports—Admiral Shares | 10 |
| Shareholders’ Reports—Institutional Shares | — |
| Trustees’ Fees and Expenses | 1 |
| Other Expenses | 36 |
| Total Expenses | 6,245 |
| Expenses Paid Indirectly | (1) |
| Net Expenses | 6,244 |
| Net Investment Income | 147,527 |
| Realized Net Gain (Loss) | |
| Investment Securities Sold1,2 | (163,124) |
| Futures Contracts | (149) |
| Realized Net Gain (Loss) | (163,273) |
| Change in Unrealized Appreciation (Depreciation) | |
| Investment Securities1 | (799,089) |
| Futures Contracts | 175 |
| Change in Unrealized Appreciation (Depreciation) | (798,914) |
| Net Increase (Decrease) in Net Assets Resulting from Operations | (814,660) |
| 1 | Interest income, realized net gain (loss), capital gain distributions received, and change in unrealized appreciation (depreciation) from an affiliated company of the fund were $116,000, $2,000, less than $1,000, and $1,000, respectively. Purchases and sales are for temporary cash investment purposes. |
| 2 | Includes ($18,872,000) of net gain (loss) resulting from in-kind redemptions. |
See accompanying Notes, which are an integral part of the Financial Statements.
Emerging Markets Government Bond Index Fund
Statement of Changes in Net Assets
|
| | Year Ended October 31, |
| | 2022
($000) | 2021
($000) |
| | | |
| Increase (Decrease) in Net Assets | | |
| Operations | | |
| Net Investment Income | 147,527 | 122,751 |
| Realized Net Gain (Loss) | (163,273) | 27,409 |
| Change in Unrealized Appreciation (Depreciation) | (798,914) | (70,850) |
| Net Increase (Decrease) in Net Assets Resulting from Operations | (814,660) | 79,310 |
| Distributions | | |
| ETF Shares | (135,745) | (106,958) |
| Admiral Shares | (9,185) | (9,798) |
| Institutional Shares | (2,162) | (1,721) |
| Total Distributions | (147,092) | (118,477) |
| Capital Share Transactions | | |
| ETF Shares | 446,745 | 1,209,882 |
| Admiral Shares | (26,860) | (1,061) |
| Institutional Shares | 22,957 | 2,461 |
| Net Increase (Decrease) from Capital Share Transactions | 442,842 | 1,211,282 |
| Total Increase (Decrease) | (518,910) | 1,172,115 |
| Net Assets | | |
| Beginning of Period | 3,310,772 | 2,138,657 |
| End of Period | 2,791,862 | 3,310,772 |
See accompanying Notes, which are an integral part of the Financial Statements.
Emerging Markets Government Bond Index Fund
| ETF Shares | | | | | |
For a Share Outstanding
Throughout Each Period | Year Ended October 31, |
| 2022 | 2021 | 2020 | 2019 | 2018 |
| Net Asset Value, Beginning of Period | $78.02 | $78.01 | $80.38 | $74.27 | $80.73 |
| Investment Operations | | | | | |
| Net Investment Income1 | 3.170 | 3.190 | 3.551 | 3.738 | 3.411 |
| Net Realized and Unrealized Gain (Loss) on Investments2 | (20.455) | (.036) | (2.322) | 6.044 | (6.445) |
| Total from Investment Operations | (17.285) | 3.154 | 1.229 | 9.782 | (3.034) |
| Distributions | | | | | |
| Dividends from Net Investment Income | (3.185) | (3.144) | (3.599) | (3.672) | (3.426) |
| Distributions from Realized Capital Gains | — | — | — | — | — |
| Total Distributions | (3.185) | (3.144) | (3.599) | (3.672) | (3.426) |
| Net Asset Value, End of Period | $57.55 | $78.02 | $78.01 | $80.38 | $74.27 |
| Total Return | -22.68% | 4.06% | 1.65% | 13.47% | -3.84% |
| Ratios/Supplemental Data | | | | | |
| Net Assets, End of Period (Millions) | $2,582 | $3,024 | $1,853 | $1,538 | $1,033 |
| Ratio of Total Expenses to Average Net Assets | 0.20%3 | 0.20% | 0.25% | 0.25% | 0.30% |
| Ratio of Net Investment Income to Average Net Assets | 4.73% | 4.02% | 4.55% | 4.79% | 4.42% |
| Portfolio Turnover Rate4 | 17% | 16% | 21% | 48% | 25% |
| 1 | Calculated based on average shares outstanding. |
| 2 | Includes increases from purchase fees of $0.02, $.00, $.00, $.00, and $.04. |
| 3 | The ratio of expenses to average net assets for the period net of reduction from custody fee offset arrangements was 0.20%. |
| 4 | Excludes the value of portfolio securities received or delivered as a result of in-kind purchases or redemptions of the fund’s capital shares, including ETF Creation Units. |
See accompanying Notes, which are an integral part of the Financial Statements.
Emerging Markets Government Bond Index Fund
| Admiral Shares | | | | | |
For a Share Outstanding
Throughout Each Period | Year Ended October 31, |
| 2022 | 2021 | 2020 | 2019 | 2018 |
| Net Asset Value, Beginning of Period | $19.58 | $19.58 | $20.16 | $18.63 | $20.24 |
| Investment Operations | | | | | |
| Net Investment Income1 | .798 | .806 | .897 | .939 | .858 |
| Net Realized and Unrealized Gain (Loss) on Investments2 | (5.149) | (.015) | (.586) | 1.521 | (1.613) |
| Total from Investment Operations | (4.351) | .791 | .311 | 2.460 | (.755) |
| Distributions | | | | | |
| Dividends from Net Investment Income | (.809) | (.791) | (.891) | (.930) | (.855) |
| Distributions from Realized Capital Gains | — | — | — | — | — |
| Total Distributions | (.809) | (.791) | (.891) | (.930) | (.855) |
| Net Asset Value, End of Period | $14.42 | $19.58 | $19.58 | $20.16 | $18.63 |
| Total Return3 | -22.67% | 4.04% | 1.66% | 13.46% | -3.80% |
| Ratios/Supplemental Data | | | | | |
| Net Assets, End of Period (Millions) | $156 | $242 | $243 | $273 | $256 |
| Ratio of Total Expenses to Average Net Assets | 0.20%4 | 0.20% | 0.25% | 0.25% | 0.30% |
| Ratio of Net Investment Income to Average Net Assets | 4.69% | 4.03% | 4.57% | 4.79% | 4.42% |
| Portfolio Turnover Rate5 | 17% | 16% | 21% | 48% | 25% |
| 1 | Calculated based on average shares outstanding. |
| 2 | Includes increases from purchase fees of $.00, $.00, $.00, $.00, and $.01. |
| 3 | Total returns do not include transaction or account service fees that may have applied in the periods shown. Fund prospectuses provide information about any applicable transaction and account service fees. |
| 4 | The ratio of expenses to average net assets for the period net of reduction from custody fee offset arrangements was 0.20%. |
| 5 | Excludes the value of portfolio securities received or delivered as a result of in-kind purchases or redemptions of the fund’s capital shares, including ETF Creation Units. |
See accompanying Notes, which are an integral part of the Financial Statements.
Emerging Markets Government Bond Index Fund
| Institutional Shares | | | | | |
For a Share Outstanding
Throughout Each Period | Year Ended October 31, |
| 2022 | 2021 | 2020 | 2019 | 2018 |
| Net Asset Value, Beginning of Period | $31.41 | $31.40 | $32.33 | $29.88 | $32.47 |
| Investment Operations | | | | | |
| Net Investment Income1 | 1.286 | 1.298 | 1.443 | 1.522 | 1.380 |
| Net Realized and Unrealized Gain (Loss) on Investments2 | (8.261) | (.014) | (.938) | 2.425 | (2.596) |
| Total from Investment Operations | (6.975) | 1.284 | .505 | 3.947 | (1.216) |
| Distributions | | | | | |
| Dividends from Net Investment Income | (1.305) | (1.274) | (1.435) | (1.497) | (1.374) |
| Distributions from Realized Capital Gains | — | — | — | — | — |
| Total Distributions | (1.305) | (1.274) | (1.435) | (1.497) | (1.374) |
| Net Asset Value, End of Period | $23.13 | $31.41 | $31.40 | $32.33 | $29.88 |
| Total Return3 | -22.66% | 4.10% | 1.68% | 13.46% | -3.82% |
| Ratios/Supplemental Data | | | | | |
| Net Assets, End of Period (Millions) | $54 | $45 | $42 | $51 | $19 |
| Ratio of Total Expenses to Average Net Assets | 0.18%4 | 0.18% | 0.23% | 0.23% | 0.29% |
| Ratio of Net Investment Income to Average Net Assets | 4.79% | 4.05% | 4.59% | 4.81% | 4.43% |
| Portfolio Turnover Rate5 | 17% | 16% | 21% | 48% | 25% |
| 1 | Calculated based on average shares outstanding. |
| 2 | Includes increases from purchase fees of $.00, $.00, $.00, $.00, and $0.02. |
| 3 | Total returns do not include transaction or account service fees that may have applied in the periods shown. Fund prospectuses provide information about any applicable transaction and account service fees. |
| 4 | The ratio of expenses to average net assets for the period net of reduction from custody fee offset arrangements was 0.18%. |
| 5 | Excludes the value of portfolio securities received or delivered as a result of in-kind purchases or redemptions of the fund’s capital shares, including ETF Creation Units. |
See accompanying Notes, which are an integral part of the Financial Statements.
Emerging Markets Government Bond Index Fund
Notes to Financial Statements
Vanguard Emerging Markets Government Bond Index Fund is registered under the Investment Company Act of 1940 as an open-end investment company, or mutual fund. The fund offers three classes of shares: ETF Shares, Admiral Shares, and Institutional Shares. Each of the share classes has different eligibility and minimum purchase requirements, and is designed for different types of investors. ETF Shares are listed for trading on Nasdaq; they can be purchased and sold through a broker.
The fund invests in securities of foreign issuers, which may subject it to investment risks not normally associated with investing in securities of U.S. corporations. Significant market disruptions, such as those caused by pandemics (e.g., COVID-19 pandemic), natural or environmental disasters, war (e.g., Russia’s invasion of Ukraine), acts of terrorism, or other events, can adversely affect local and global markets and normal market operations. Any such disruptions could have an adverse impact on the value of the fund’s investments and fund performance.
| A. | The following significant accounting policies conform to generally accepted accounting principles for U.S. investment companies. The fund consistently follows such policies in preparing its financial statements. |
1. Security Valuation: Securities are valued as of the close of trading on the New York Stock Exchange (generally 4 p.m., Eastern time) on the valuation date. Bonds and temporary cash investments are valued using the latest bid prices or using valuations based on a matrix system (which considers such factors as security prices, yields, maturities, and ratings), both as furnished by independent pricing services.Investments in Vanguard Market Liquidity Fund are valued at that fund's net asset value. Securities for which market quotations are not readily available, or whose values have been affected by events occurring before the fund’s pricing time but after the close of the securities’ primary markets, are valued by methods deemed by the valuation designee to represent fair value and subject to oversight by the board of trustees.
2. Futures Contracts: The fund uses futures contracts to invest in fixed income asset classes with greater efficiency and lower cost than is possible through direct investment, to add value when these instruments are attractively priced, or to adjust sensitivity to changes in interest rates. The primary risks associated with the use of futures contracts are imperfect correlation between changes in market values of bonds held by the fund and the prices of futures contracts, and the possibility of an illiquid market. Counterparty risk involving futures is mitigated because a regulated clearinghouse is the counterparty instead of the clearing broker. To further mitigate counterparty risk, the fund trades futures contracts on an exchange, monitors the financial strength of its clearing brokers and clearinghouse, and has entered into clearing agreements with its clearing brokers. The clearinghouse imposes initial margin requirements to secure the fund’s performance and requires daily settlement of variation margin representing changes in the market value of each contract. Any securities pledged as initial margin for open contracts are noted in the Schedule of Investments.
Futures contracts are valued at their quoted daily settlement prices. The notional amounts of the contracts are not recorded in the Statement of Assets and Liabilities. Fluctuations in the value of the contracts are recorded in the Statement of Assets and Liabilities as an asset (liability) and in the Statement of Operations as unrealized appreciation (depreciation) until the contracts are closed, when they are recorded as realized gains (losses) on futures contracts.
Emerging Markets Government Bond Index Fund
During the year ended October 31, 2022, the fund’s average investments in long and short futures contracts represented less than 1% of net assets, based on the average of the notional amounts at each quarter-end during the period.
3. Federal Income Taxes: The fund intends to continue to qualify as a regulated investment company and distribute virtually all of its taxable income. The fund’s tax returns are open to examination by the relevant tax authorities until expiration of the applicable statute of limitations, which is generally three years after the filing of the tax return. Management has analyzed the fund’s tax positions taken for all open federal and state income tax years, and has concluded that no provision for income tax is required in the fund’s financial statements.
4. Distributions: Distributions to shareholders are recorded on the ex-dividend date. Distributions are determined on a tax basis at the fiscal year-end and may differ from net investment income and realized capital gains for financial reporting purposes.
5. Credit Facilities and Interfund Lending Program: The fund and certain other funds managed by The Vanguard Group ("Vanguard") participate in a $4.4 billion committed credit facility provided by a syndicate of lenders pursuant to a credit agreement and an uncommitted credit facility provided by Vanguard. Both facilities may be renewed annually. Each fund is individually liable for its borrowings, if any, under the credit facilities. Borrowings may be utilized for temporary or emergency purposes and are subject to the fund’s regulatory and contractual borrowing restrictions. With respect to the committed credit facility, the participating funds are charged administrative fees and an annual commitment fee of 0.10% of the undrawn committed amount of the facility, which are allocated to the funds based on a method approved by the fund’s board of trustees and included in Management and Administrative expenses on the fund’s Statement of Operations. Any borrowings under either facility bear interest at an agreed-upon spread plus the higher of the federal funds effective rate, the overnight bank funding rate, or the Daily Simple Secured Overnight Financing Rate inclusive of an additional agreed-upon spread. However, borrowings under the uncommitted credit facility may bear interest based upon an alternate rate agreed to by the fund and Vanguard.
In accordance with an exemptive order (the “Order”) from the SEC, the fund may participate in a joint lending and borrowing program that allows registered open-end Vanguard funds to borrow money from and lend money to each other for temporary or emergency purposes (the “Interfund Lending Program”), subject to compliance with the terms and conditions of the Order, and to the extent permitted by the fund’s investment objective and investment policies. Interfund loans and borrowings normally extend overnight but can have a maximum duration of seven days. Loans may be called on one business day’s notice. The interest rate to be charged is governed by the conditions of the Order and internal procedures adopted by the board of trustees. The board of trustees is responsible for overseeing the Interfund Lending Program.
For the year ended October 31, 2022, the fund did not utilize the credit facilities or the Interfund Lending Program.
6. Other: Interest income includes income distributions received from Vanguard Market Liquidity Fund and is accrued daily. Premiums and discounts on debt securities are amortized and accreted, respectively, to interest income over the lives of the respective securities, except for premiums on certain callable debt securities that are amortized to the earliest call date. Security transactions are
Emerging Markets Government Bond Index Fund
accounted for on the date securities are bought or sold. Costs used to determine realized gains (losses) on the sale of investment securities are those of the specific securities sold. Fees assessed on capital share transactions are credited to paid-in capital.
Each class of shares has equal rights as to assets and earnings, except that each class separately bears certain class-specific expenses related to maintenance of shareholder accounts (included in Management and Administrative expenses) and shareholder reporting. Marketing and distribution expenses are allocated to each class of shares based on a method approved by the board of trustees. Income, other non-class-specific expenses, and gains and losses on investments are allocated to each class of shares based on its relative net assets.
| B. | In accordance with the terms of a Funds' Service Agreement (the “FSA”) between Vanguard and the fund, Vanguard furnishes to the fund investment advisory, corporate management, administrative, marketing, and distribution services at Vanguard’s cost of operations (as defined by the FSA). These costs of operations are allocated to the fund based on methods and guidelines approved by the board of trustees and are generally settled twice a month. |
Upon the request of Vanguard, the fund may invest up to 0.40% of its net assets as capital in Vanguard. At October 31, 2022, the fund had contributed to Vanguard capital in the amount of $112,000, representing less than 0.01% of the fund’s net assets and 0.04% of Vanguard’s capital received pursuant to the FSA. The fund’s trustees and officers are also directors and employees, respectively, of Vanguard.
| C. | The fund’s custodian bank has agreed to reduce its fees when the fund maintains cash on deposit in the non-interest-bearing custody account. For the year ended October 31, 2022, custodian fee offset arrangements reduced the fund’s expenses by $1,000 (an annual rate of less than 0.01% of average net assets). |
| D. | Various inputs may be used to determine the value of the fund’s investments and derivatives. These inputs are summarized in three broad levels for financial statement purposes. The inputs or methodologies used to value securities are not necessarily an indication of the risk associated with investing in those securities. |
Level 1—Quoted prices in active markets for identical securities.
Level 2—Other significant observable inputs (including quoted prices for similar securities, interest rates, prepayment speeds, credit risk, etc.).
Level 3—Significant unobservable inputs (including the fund’s own assumptions used to determine the fair value of investments). Any investments and derivatives valued with significant unobservable inputs are noted on the Schedule of Investments.
Emerging Markets Government Bond Index Fund
The following table summarizes the market value of the fund’s investments and derivatives as of October 31, 2022, based on the inputs used to value them:
| | Level 1
($000) | Level 2
($000) | Level 3
($000) | Total
($000) |
| Investments | | | | |
| Assets | | | | |
| U.S. Government and Agency Obligations | — | 4,301 | — | 4,301 |
| Corporate Bonds | — | 394,813 | — | 394,813 |
| Sovereign Bonds | — | 2,342,173 | — | 2,342,173 |
| Temporary Cash Investments | 18,334 | — | — | 18,334 |
| Total | 18,334 | 2,741,287 | — | 2,759,621 |
| Derivative Financial Instruments | | | | |
| Assets | | | | |
| Futures Contracts1 | 163 | — | — | 163 |
| Liabilities | | | | |
| Futures Contracts1 | 7 | — | — | 7 |
| 1 | Includes cumulative appreciation (depreciation) on futures contracts and centrally cleared swaps, if any, as reported in the Schedule of Investments. Only current day’s variation margin is reported within the Statement of Assets and Liabilities. |
| E. | Permanent differences between book-basis and tax-basis components of net assets are reclassified among capital accounts in the financial statements to reflect their tax character. These reclassifications have no effect on net assets or net asset value per share. As of period end, permanent differences primarily attributable to the accounting for applicable in-kind redemptions and corporate actions were reclassified between the following accounts: |
| | Amount
($000) |
| Paid-in Capital | (18,871) |
| Total Distributable Earnings (Loss) | 18,871 |
Temporary differences between book-basis and tax-basis components of total distributable earnings (loss) arise when certain items of income, gain, or loss are recognized in different periods for financial statement and tax purposes; these differences will reverse at some time in the future. The differences are primarily related to the deferral of losses from wash sales; the recognition of unrealized gains or losses from certain derivative contracts; the inclusion of payables for distributions; corporate actions; and the treatment of amortization adjustments from certain fixed
Emerging Markets Government Bond Index Fund
income securities. As of period end, the tax-basis components of total distributable earnings (loss) are detailed in the table as follows:
| | Amount
($000) |
| Undistributed Ordinary Income | 13,138 |
| Undistributed Long-Term Gains | — |
| Capital Loss Carryforwards | (258,847) |
| Qualified Late-Year Losses | — |
| Net Unrealized Gains (Losses) | (813,474) |
The tax character of distributions paid was as follows:
| | Year Ended October 31, |
| | 2022
Amount
($000) | 2021
Amount
($000) |
| Ordinary Income* | 147,092 | 118,477 |
| Long-Term Capital Gains | — | — |
| Total | 147,092 | 118,477 |
| * | Includes short-term capital gains, if any. |
As of October 31, 2022, gross unrealized appreciation and depreciation for investments and derivatives based on cost for U.S. federal income tax purposes were as follows:
| | Amount
($000) |
| Tax Cost | 3,573,096 |
| Gross Unrealized Appreciation | 2,558 |
| Gross Unrealized Depreciation | (816,032) |
| Net Unrealized Appreciation (Depreciation) | (813,474) |
| F. | During the year ended October 31, 2022, the fund purchased $1,133,188,000 of investment securities and sold $697,720,000 of investment securities, other than U.S. government securities and temporary cash investments. Purchases and sales of U.S. government securities were $96,383,000 and $91,791,000, respectively. Purchases and sales include $709,356,000 and $271,686,000, respectively, in connection with in-kind purchases and redemptions of the fund's capital shares. |
The fund purchased securities from and sold securities to other Vanguard funds or accounts managed by Vanguard or its affiliates, in accordance with procedures adopted by the board of trustees in compliance with Rule 17a-7 of the Investment Company Act of 1940. For the year ended October 31, 2022, such purchases were $913,000 and sales were $2,092,000, resulting in net realized loss of $91,000; these amounts, other than temporary cash investments, are included in the purchases and sales of investment securities noted above.
Emerging Markets Government Bond Index Fund
| G. | Capital share transactions for each class of shares were: |
| | Year Ended October 31, | |
| | 2022 | | 2021 |
| | Amount
($000) | Shares
(000) | | Amount
($000) | Shares
(000) |
| ETF Shares | | | | | |
| Issued1 | 722,837 | 10,308 | | 1,758,897 | 22,006 |
| Issued in Lieu of Cash Distributions | — | — | | — | — |
| Redeemed | (276,092) | (4,200) | | (549,015) | (7,000) |
| Net Increase (Decrease)—ETF Shares | 446,745 | 6,108 | | 1,209,882 | 15,006 |
| Admiral Shares | | | | | |
| Issued1 | 30,869 | 1,842 | | 37,672 | 1,880 |
| Issued in Lieu of Cash Distributions | 7,464 | 449 | | 8,085 | 406 |
| Redeemed | (65,193) | (3,837) | | (46,818) | (2,342) |
| Net Increase (Decrease)—Admiral Shares | (26,860) | (1,546) | | (1,061) | (56) |
| Institutional Shares | | | | | |
| Issued1 | 39,706 | 1,508 | | 5,306 | 165 |
| Issued in Lieu of Cash Distributions | 2,162 | 83 | | 1,721 | 54 |
| Redeemed | (18,911) | (700) | | (4,566) | (144) |
| Net Increase (Decrease)—Institutional Shares | 22,957 | 891 | | 2,461 | 75 |
| 1 | Includes purchase fees for fiscal 2022 and 2021 of $1,041,000 and $335,000, respectively (fund totals). |
| H. | Management has determined that no events or transactions occurred subsequent to October 31, 2022, that would require recognition or disclosure in these financial statements. |
Report of Independent Registered Public Accounting Firm
To the Board of Trustees of Vanguard Whitehall Funds and Shareholders of Vanguard Emerging Markets Government Bond Index Fund
Opinion on the Financial Statements
We have audited the accompanying statement of assets and liabilities, including the schedule of investments, of Vanguard Emerging Markets Government Bond Index Fund (one of the funds constituting Vanguard Whitehall Funds, referred to hereafter as the "Fund") as of October 31, 2022, the related statement of operations for the year ended October 31, 2022, the statement of changes in net assets for each of the two years in the period ended October 31, 2022, including the related notes, and the financial highlights for each of the five years in the period ended October 31, 2022 (collectively referred to as the "financial statements"). In our opinion, the financial statements present fairly, in all material respects, the financial position of the Fund as of October 31, 2022, the results of its operations for the year then ended, the changes in its net assets for each of the two years in the period ended October 31, 2022 and the financial highlights for each of the five years in the period ended October 31, 2022 in conformity with accounting principles generally accepted in the United States of America.
Basis for Opinion
These financial statements are the responsibility of the Fund’s management. Our responsibility is to express an opinion on the Fund’s financial statements based on our audits. We are a public accounting firm registered with the Public Company Accounting Oversight Board (United States) (PCAOB) and are required to be independent with respect to the Fund in accordance with the U.S. federal securities laws and the applicable rules and regulations of the Securities and Exchange Commission and the PCAOB.
We conducted our audits of these financial statements in accordance with the standards of the PCAOB. Those standards require that we plan and perform the audit to obtain reasonable assurance about whether the financial statements are free of material misstatement, whether due to error or fraud.
Our audits included performing procedures to assess the risks of material misstatement of the financial statements, whether due to error or fraud, and performing procedures that respond to those risks. Such procedures included examining, on a test basis, evidence regarding the amounts and disclosures in the financial statements. Our audits also included evaluating the accounting principles used and significant estimates made by management, as well as evaluating the overall presentation of the financial statements. Our procedures included confirmation of securities owned as of October 31, 2022 by correspondence with the custodian, transfer agent and brokers; when replies were not received from brokers, we performed other auditing procedures. We believe that our audits provide a reasonable basis for our opinion.
/s/PricewaterhouseCoopers LLP
Philadelphia, Pennsylvania
December 15, 2022
We have served as the auditor of one or more investment companies in The Vanguard Group of Funds since 1975.
Tax information (unaudited)
The fund hereby designates $129,000, or if subsequently determined to be different, the maximum amount allowable by law, of interest earned from obligations of the U.S. government which is generally exempt from state income tax.
The fund hereby designates 100%, or if subsequently determined to be different, the maximum percentage allowable by law, of ordinary income dividends eligible to be treated as interest income for purposes of Section 163(j) and the regulations thereunder for the fiscal year.
"Bloomberg®" and Bloomberg USD Emerging Markets Government RIC Capped Index are service marks of Bloomberg Finance L.P. and its affiliates, including Bloomberg Index Services Limited (BISL), the administrator of the index (collectively, Bloomberg), and have been licensed for use for certain purposes by The Vanguard Group, Inc. (Vanguard).
The Emerging Markets Government Bond Index Fund is not sponsored, endorsed, sold or promoted by Bloomberg. Bloomberg does not make any representation or warranty, express or implied, to the owners of or counterparties to the Emerging Markets Government Bond Index Fund or any member of the public regarding the advisability of investing in securities generally or in the Emerging Markets Government Bond Index Fund particularly. The only relationship of Bloomberg to Vanguard is the licensing of certain trademarks, trade names and service marks and of the Bloomberg USD Emerging Markets Government RIC Capped Index, which is determined, composed and calculated by BISL without regard to Vanguard or the Emerging Markets Government Bond Index Fund. Bloomberg has no obligation to take the needs of Vanguard or the owners of the Emerging Markets Government Bond Index Fund into consideration in determining, composing or calculating the Bloomberg USD Emerging Markets Government RIC Capped Index. Bloomberg is not responsible for and has not participated in the determination of the timing of, prices at, or quantities of the Emerging Markets Government Bond Index Fund to be issued. Bloomberg shall not have any obligation or liability, including, without limitation, to Emerging Markets Government Bond Index Fund customers, in connection with the administration, marketing or trading of the Emerging Markets Government Bond Index Fund.
BLOOMBERG DOES NOT GUARANTEE THE ACCURACY AND/OR THE COMPLETENESS OF THE BLOOMBERG USD EMERGING MARKETS GOVERNMENT RIC CAPPED INDEX OR ANY DATA RELATED THERETO AND SHALL HAVE NO LIABILITY FOR ANY ERRORS, OMISSIONS OR INTERRUPTIONS THEREIN. BLOOMBERG DOES NOT MAKE ANY WARRANTY, EXPRESS OR IMPLIED, AS TO RESULTS TO BE OBTAINED BY VANGUARD, OWNERS OF THE EMERGING MARKETS GOVERNMENT BOND INDEX FUND OR ANY OTHER PERSON OR ENTITY FROM THE USE OF THE BLOOMBERG USD EMERGING MARKETS GOVERNMENT RIC CAPPED INDEX OR ANY DATA RELATED THERETO. BLOOMBERG DOES NOT MAKE ANY EXPRESS OR IMPLIED WARRANTIES AND EXPRESSLY DISCLAIMS ALL WARRANTIES OF MERCHANTABILITY OR FITNESS FOR A PARTICULAR PURPOSE OR USE WITH RESPECT TO THE BLOOMBERG USD EMERGING MARKETS GOVERNMENT RIC CAPPED INDEX OR ANY DATA RELATED THERETO. WITHOUT LIMITING ANY OF THE FOREGOING, TO THE MAXIMUM EXTENT ALLOWED BY LAW, BLOOMBERG, ITS LICENSORS, AND ITS AND THEIR RESPECTIVE EMPLOYEES, CONTRACTORS,AGENTS, SUPPLIERS, AND VENDORS SHALL HAVE NO LIABILITY OR RESPONSIBILITY WHATSOEVER FOR ANY INJURY OR DAMAGES—WHETHER DIRECT, INDIRECT, CONSEQUENTIAL, INCIDENTAL, PUNITIVE OR OTHERWISE—ARISING IN CONNECTION WITH THE EMERGING MARKETS GOVERNMENT BOND INDEX FUND OR BLOOMBERG USD EMERGING MARKETS GOVERNMENT RIC CAPPED INDEX OR ANY DATA OR VALUES RELATING THERETO—WHETHER ARISING FROM THEIR NEGLIGENCE OR OTHERWISE, EVEN IF NOTIFIED OF THE POSSIBILITY THEREOF.
© 2022 Bloomberg.
Used with Permission. Source: Bloomberg Index Services Limited. Copyright 2022, Bloomberg. All rights reserved.
This page intentionally left blank.
The People Who Govern Your Fund
The trustees of your mutual fund are there to see that the fund is operated and managed in your best interests since, as a shareholder, you are a part owner of the fund. Your fund’s trustees also serve on the board of directors of The Vanguard Group, Inc., which is owned by the Vanguard funds and provides services to them.
A majority of Vanguard’s board members are independent, meaning that they have no affiliation with Vanguard or the funds they oversee, apart from the sizable personal investments they have made as private individuals. The independent board members have distinguished backgrounds in business, academia, and public service. Each of the trustees and executive officers oversees 206 Vanguard funds.
Information for each trustee and executive officer of the fund appears below. That information, as well as the Vanguard fund count, is as of the date on the cover of this fund report. The mailing address of the trustees and officers is P.O. Box 876, Valley Forge, PA 19482. More information about the trustees is in the Statement of Additional Information, which can be obtained, without charge, by contacting Vanguard at 800-662-7447, or online at vanguard.com.
Interested Trustee1
Mortimer J. Buckley
Born in 1969. Trustee since January 2018. Principal occupation(s) during the past five years and other experience: chairman of the board (2019–present) of Vanguard and of each of the investment companies served by Vanguard; chief executive officer (2018–present) of Vanguard; chief executive officer, president, and trustee (2018–present) of each of the investment companies served by Vanguard; president and director (2017–present) of Vanguard; and president (2018–present) of Vanguard Marketing Corporation. Chief investment officer (2013–2017), managing director (2002–2017), head of the Retail Investor Group (2006–2012), and chief information officer (2001–2006) of Vanguard. Member of the board of governors of the Investment Company Institute and the board of governors of FINRA. Trustee and vice chair of The Shipley School.
Independent Trustees
Tara Bunch
Born in 1962. Trustee since November 2021. Principal occupation(s) during the past five years and other experience: head of global operations at Airbnb (2020–present). Vice president of AppleCare (2012–2020). Member of the board of directors of Out & Equal (2002–2006), the advisory board of the University of California, Berkeley School of Engineering (2020–present), and the advisory board
of Santa Clara University’s Leavey School of Business (2018–present).
Emerson U. Fullwood
Born in 1948. Trustee since January 2008. Principal occupation(s) during the past five years and other experience: executive chief staff and marketing officer for North America and corporate vice president (retired 2008) of Xerox Corporation (document management products and services). Former president of the Worldwide Channels Group, Latin America, and Worldwide Customer Service and executive chief staff officer of Developing Markets of Xerox. Executive in residence and 2009–2010 Distinguished Minett Professor at the Rochester Institute of Technology. Member of the board of directors of the University of Rochester Medical Center, the Monroe Community College Foundation, the United Way of Rochester, North Carolina A&T University, Roberts Wesleyan College, and the Rochester Philharmonic Orchestra. Trustee of the University of Rochester.
F. Joseph Loughrey
Born in 1949. Trustee since October 2009. Principal occupation(s) during the past five years and other experience: president and chief operating officer (retired 2009) and vice chairman of the board (2008–2009) of Cummins Inc. (industrial machinery). Chairman of the board of Hillenbrand, Inc. (specialized consumer services). Director of the V Foundation. Member of the advisory council for the College of
1 Mr. Buckley is considered an “interested person,” as defined in the Investment Company Act of 1940, because he is an officer of the Vanguard funds.
Arts and Letters at the University of Notre Dame. Chairman of the board of Saint Anselm College.
Mark Loughridge
Born in 1953. Trustee since March 2012. Principal occupation(s) during the past five years and other experience: senior vice president and chief financial officer (retired 2013) of IBM (information technology services). Fiduciary member of IBM’s Retirement Plan Committee (2004–2013), senior vice president and general manager (2002–2004) of IBM Global Financing, vice president and controller (1998–2002) of IBM, and a variety of other prior management roles at IBM. Member of the Council on Chicago Booth.
Scott C. Malpass
Born in 1962. Trustee since March 2012. Principal occupation(s) during the past five years and other experience: adjunct professor of finance at the University of Notre Dame (2020–present). Chief investment officer (retired 2020) and vice president (retired 2020) of the University of Notre Dame. Assistant professor (retired June 2020) of finance at the Mendoza College of Business, University of Notre Dame, and member of the Notre Dame 403(b) Investment Committee. Member of the board of Catholic Investment Services, Inc. (investment advisors), the board of superintendence of the Institute for the Works of Religion, and the board of directors of Paxos Trust Company (finance).
Deanna Mulligan
Born in 1963. Trustee since January 2018. Principal occupation(s) during the past five years and other experience: chief executive officer of Purposeful (advisory firm for CEOs and C-level executives; 2021–present). Board chair (2020), chief executive officer (2011–2020), and president (2010–2019) of The Guardian Life Insurance Company of America. Chief operating officer (2010–2011) and executive vice president (2008–2010) of Individual Life and Disability of the Guardian Life Insurance Company of America. Member of the board of the Economic Club of New York. Trustee of the Partnership for New York City (business leadership), Chief Executives for Corporate Purpose, and the NewYork-Presbyterian Hospital.
André F. Perold
Born in 1952. Trustee since December 2004. Principal occupation(s) during the past five years and other experience: George Gund Professor of Finance and Banking, Emeritus at the Harvard Business School (retired 2011). Chief investment officer and co-managing partner of HighVista Strategies (private investment firm). Member of the board (2018–present) of RIT Capital Partners (investment
firm). Member of the investment committee of Partners Health Care System.
Sarah Bloom Raskin
Born in 1961. Trustee since January 2018. Principal occupation(s) during the past five years and other experience: deputy secretary (2014–2017) of the United States Department of the Treasury. Governor (2010–2014) of the Federal Reserve Board. Commissioner (2007–2010) of financial regulation for the State of Maryland. Colin W. Brown Distinguished Professor of the Practice of Law (2021–present), professor (2020–present), Distinguished Fellow of the Global Financial Markets Center (2020–present), and Rubenstein Fellow (2017–2020) at Duke University. Trustee (2017–present) of Amherst College and member of Amherst College Investment Committee (2019–present). Member of the Regenerative Crisis Response Committee (2020–present).
David A. Thomas
Born in 1956. Trustee since July 2021. Principal occupation(s) during the past five years and other experience: president of Morehouse College (2018–present). Professor of business administration, emeritus at Harvard University (2017–2018). Dean (2011–2016) and professor of management (2016–2017) at the Georgetown University McDonough School of Business. Director of DTE Energy Company (2013–present). Trustee of Common Fund (2019–present).
Peter F. Volanakis
Born in 1955. Trustee since July 2009. Principal occupation(s) during the past five years and other experience: president and chief operating officer (retired 2010) of Corning Incorporated (communications equipment) and director of Corning Incorporated (2000–2010) and Dow Corning (2001–2010). Director (2012) of SPX Corporation (multi-industry manufacturing). Overseer of the Amos Tuck School of Business Administration, Dartmouth College (2001–2013). Member of the BMW Group Mobility Council.
Executive Officers
Christine M. Buchanan
Born in 1970. Principal occupation(s) during the past five years and other experience: principal of Vanguard. Chief financial officer (2021–present) and treasurer (2017–present) of each of the investment companies served by Vanguard. Partner (2005–2017) at KPMG (audit, tax, and advisory services).
John Galloway
Born in 1973. Principal occupation(s) during the past five years and other experience: principal of Vanguard. Investment stewardship officer (September 2020–present) of each of the investment companies served by Vanguard. Head of Investor Advocacy (February 2020–present) and head of Marketing Strategy and Planning (2017–2020) at Vanguard. Special assistant to the President of the United States (2015).
Ashley Grim
Born in 1984. Principal occupation(s) during the past five years and other experience: treasurer (February 2022–present) of each of the investment companies served by Vanguard. Fund transfer agent controller (2019–2022) and director of Audit Services (2017–2019) at Vanguard. Senior manager (2015–2017) at PriceWaterhouseCoopers (audit and assurance, consulting, and tax services).
Peter Mahoney
Born in 1974. Principal occupation(s) during the past five years and other experience: principal of Vanguard. Controller (2015–present) of each of the investment companies served by Vanguard. Head of International Fund Services (2008–2014) at Vanguard.
Anne E. Robinson
Born in 1970. Principal occupation(s) during the past five years and other experience: general counsel (2016–present) of Vanguard. Secretary (2016–present) of Vanguard and of each of the investment companies served by Vanguard. Managing director (2016–present) of Vanguard. Managing director and general counsel of Global Cards and Consumer Services (2014–2016) at Citigroup. Counsel (2003–2014) at American Express. Nonexecutive director of the board of National Grid (energy).
Michael Rollings
Born in 1963. Principal occupation(s) during the past five years and other experience: finance director (2017–present) and treasurer (2017) of each of the investment companies served by Vanguard. Managing director (2016–present) of Vanguard. Chief financial officer (2016–present) of Vanguard. Director (2016–present) of Vanguard Marketing Corporation. Executive vice president and chief financial officer (2006–2016) of MassMutual Financial Group.
John E. Schadl
Born in 1972. Principal occupation(s) during the past five years and other experience: principal of Vanguard. Chief compliance officer (2019–present) of Vanguard and of each of the investment companies served by Vanguard. Assistant vice president (2019–present) of Vanguard Marketing Corporation.
Vanguard Senior Management Team
| Matthew Benchener | Thomas M. Rampulla |
| Joseph Brennan | Karin A. Risi |
| Mortimer J. Buckley | Anne E. Robinson |
| Gregory Davis | Michael Rollings |
| John James | Nitin Tandon |
| Chris D. Mclsaac | Lauren Valente |
Connect with Vanguard®>vanguard.com
Fund Information > 800-662-7447
Direct Investor Account Services > 800-662-2739
Institutional Investor Services > 800-523-1036
Text Telephone for People Who Are Deaf or Hard of Hearing > 800-749-7273
This material may be used in conjunction with the offering of shares of any Vanguard fund only if preceded or accompanied by the fund’s current prospectus.
All comparative mutual fund data are from Morningstar, Inc., unless otherwise noted.
You can obtain a free copy of Vanguard’s proxy voting guidelines by visiting vanguard.com/proxyreporting or by calling Vanguard at 800-662-2739. The guidelines are also available from the SEC’s website, www.sec.gov. In addition, you may obtain a free report on how your fund voted the proxies for securities it owned during the 12 months ended June 30. To get the report, visit either vanguard.com/proxyreporting or www.sec.gov.
You can review information about your fund on the SEC’s website, and you can receive copies of this information, for a fee, by sending a request via email addressed to publicinfo@sec.gov.
© 2022 The Vanguard Group, Inc.
All rights reserved.
U.S. Patent Nos. 6,879,964.
Vanguard Marketing Corporation, Distributor.
Q11200 122022
Annual Report | October 31, 2022
Vanguard Global Minimum Volatility Fund
Contents
Your Fund’s Performance at a Glance
| 1 |
Advisor's Report
| 2 |
About Your Fund’s Expenses
| 5 |
Performance Summary
| 7 |
Financial Statements
| 9 |
Please note: The opinions expressed in this report are just that—informed opinions. They should not be considered promises or advice. Also, please keep in mind that the information and opinions cover the period through the date on the front of this report. Of course, the risks of investing in your fund are spelled out in the prospectus.
Your Fund’s Performance at a Glance
| • | The 12 months ended October 31, 2022, was a volatile, challenging period for financial markets. Vanguard Global Minimum Volatility Fund returned –4.28% for Investor Shares and –4.24% for Admiral Shares, outperforming the –14.57% return of its benchmark. |
| • | The economic backdrop deteriorated as inflation soared to multidecade highs, fueled in part by higher energy and food prices in the wake of Russia’s invasion of Ukraine. Then price increases broadened to other categories of goods and services, adding to concerns that inflation would remain stubbornly high. That prompted aggressive tightening by many central banks to bring inflation back in check and increased fears of a recession. |
| • | The fund outperformed the benchmark in 10 of the 11 industry sectors; stock selection was strong, primarily within health care, consumer discretionary, and communication services. An underweight to energy stocks detracted from relative performance. By region, positions in North America, which accounts for more than 60% of fund holdings, contributed most. |
| • | The fund’s average volatility for the 12 months was 26.5% less than that of its benchmark. |
| • | The fund regularly uses derivatives to hedge portfolio risks. Its holdings in forward foreign currencies and futures helped its performance. |
Market Barometer
| | Average Annual Total Returns
Periods Ended October 31, 2022 |
| | One Year | Three Years | Five Years |
| Stocks | | | |
| Russell 1000 Index (Large-caps) | -16.38% | 9.99% | 10.19% |
| Russell 2000 Index (Small-caps) | -18.54 | 7.05 | 5.56 |
| Russell 3000 Index (Broad U.S. market) | -16.52 | 9.79 | 9.87 |
| FTSE All-World ex US Index (International) | -24.20 | -1.16 | -0.18 |
| Bonds | | | |
Bloomberg U.S. Aggregate Float Adjusted Index
(Broad taxable market) | -15.69% | -3.73% | -0.50% |
Bloomberg Municipal Bond Index
(Broad tax-exempt market) | -11.98 | -2.18 | 0.37 |
| FTSE Three-Month U.S. Treasury Bill Index | 0.88 | 0.59 | 1.15 |
| CPI | | | |
| Consumer Price Index | 7.75% | 5.01% | 3.85% |
For the 12 months ended October 31, 2022, Vanguard Global Minimum Volatility Fund returned –4.28% for Investor Shares and –4.24% for Admiral Shares, with an annualized weekly volatility of 13.00%. Its benchmark, the FTSE Global All Cap Index (USD Hedged), returned –14.57%, with annualized weekly volatility of 17.68%. (To determine annualized weekly volatility, we calculate the standard deviation of weekly returns and multiply it by the square root of 52, the number of weeks in a year.)
Investment objective
Our objective is to create a portfolio that has broad equity exposure with less volatility than that of the global equity market. We achieved this over the performance period, with the fund’s weekly volatility averaging 26.5% less than that of its benchmark.
It is important to mention, as we have in the past, that we do not target a specific volatility level. Rather, we seek to provide an equity fund that has lower absolute risk than that of the broad global market. Thus, when the broad global equity market is experiencing periods of low volatility, you should expect this fund’s volatility to be much closer to that of its benchmark.
We recognize that equity-like returns are also an important outcome of an investment in this fund, but achieving a total return higher than the benchmark’s is not our objective. Although our research leads us to expect that, on average, a minimum volatility fund may hold up better than the overall global market in sharp downturns (while still experiencing
losses), the fund should be expected to trail in strong bull markets. With that in mind, because the fund is expected to have a lower level of risk than the global equity market, you should not expect it to outperform the market over the long run.
We think a reasonable comparative performance measure for the fund over the long term is its risk-adjusted return. This can be calculated by dividing the portfolio’s total return for the period by the annualized standard deviation of monthly returns. Since inception, the risk-adjusted annual return for the fund was 7.1%, compared with the 6.3% risk-adjusted return of the benchmark.
Investment strategy
In building our portfolio, we use quantitative models that evaluate a variety of factors that drive a stock’s volatility. These fundamental drivers include risk factors such as growth, value, dividend yield, size, volatility, and liquidity. In addition, our process includes estimates of each stock’s correlation—or how its factors move in relation to one another. This approach allows us to make appropriate risk/diversification trade-offs without relying solely on volatility estimates.
We also consider the effect of currency exposure. We recognize that owning companies in foreign markets involves the risk of movements in exchange rates relative to the U.S. dollar. Because of this, an optimization process that focuses solely on volatilities tied to an investor’s
home currency will tend to overweight exposures to that currency.
We aim to avoid currency-specific exposures by focusing on equity volatilities and correlations measured in local currency terms. We use currency forward contracts to hedge the resulting exposure for U.S. investors. We believe that this process can further reduce the overall volatility of the portfolio in the long run.
Finally, we apply constraints to reduce stock, sector, and country concentration risk. We find that these constraints, which allow for broader diversification and liquidity, reduce unnecessarily high risk exposures without significantly affecting our ability to lower overall volatility.
The benefits of our strategy become even clearer when you remove some of the noise caused by short-term reversals in daily and weekly returns, which can increase volatility levels, and focus on monthly returns. Since inception, the fund has delivered a 22.5% volatility discount relative to its benchmark.
The investment environment
For financial markets, the 12 months were a tough, volatile period. The U.S. Federal Reserve raised interest rates six times during the year (the most recent increase was announced on November 2, right after the end of the fund’s fiscal year) and committed to further hikes until they are deemed “sufficiently restrictive” to quell inflation. Speculative growth and mega-tech stocks deflated as one of
history’s longest bull runs limped across its finish line.
Within this environment, there were few safe havens for investors. Both international and domestic markets ended the period in negative territory, as did emerging markets. Ten of the benchmark’s 11 sectors also lost ground. The exception was energy, where prices surged amid high demand and tight supply for oil.
The fund’s successes and shortfalls
Our portfolio is designed to deliver equity-like returns with lower market volatility. The fund delivered on this objective, significantly outpacing the benchmark on a relative basis while offering a significant discount to volatility.
At the sector level, the fund outperformed the benchmark in 10 of the 11 industry classifications. In general, stock selection was strong, primarily within health care, consumer discretionary, and communication services. Overweight positions in health care companies Amgen, Gilead Sciences, and Vertex Pharmaceuticals contributed notably. An underweight allocation to energy stocks, which performed well overall, detracted from relative performance.
As for regional allocations, our positions in North America, which account for more than 60% of the fund’s holdings, contributed most to relative performance. Positions in the Pacific and Europe also helped results. In early 2022, in response to heightened geopolitical tensions, we disposed of and discontinued purchase of
all Russian stocks and select Chinese stocks.
We remain convinced in the fund’s ability to deliver a strong risk/return profile over the long term. Despite the challenging environment that we have seen since the pandemic began, the fund has delivered a significant volatility discount to the market.
We expect our approach to portfolio construction to pay off in reduced volatility over the long run, and we will continue to focus patiently on its long-term risk-adjusted returns.
John Ameriks, Ph.D., Principal, Global Head
of the Quantitative Equity Group,
and Portfolio Manager
Vanguard Quantitative Equity Group
November 15, 2022
About Your Fund’s Expenses
As a shareholder of the fund, you incur ongoing costs, which include costs for portfolio management, administrative services, and shareholder reports (like this one), among others. Operating expenses, which are deducted from a fund’s gross income, directly reduce the investment return of the fund.
A fund’s expenses are expressed as a percentage of its average net assets. This figure is known as the expense ratio. The following examples are intended to help you understand the ongoing costs (in dollars) of investing in your fund and to compare these costs with those of other mutual funds. The examples are based on an investment of $1,000 made at the beginning of the period shown and held for the entire period.
The accompanying table illustrates your fund’s costs in two ways:
| • | Based on actual fund return. This section helps you to estimate the actual expenses that you paid over the period. The ”Ending Account Value“ shown is derived from the fund‘s actual return, and the third column shows the dollar amount that would have been paid by an investor who started with $1,000 in the fund. You may use the information here, together with the amount you invested, to estimate the expenses that you paid over the period. |
To do so, simply divide your account value by $1,000 (for example, an $8,600 account value divided by $1,000 = 8.6), then multiply the result by the number given for your fund under the heading ”Expenses Paid During Period.“
| • | Based on hypothetical 5% yearly return. This section is intended to help you compare your fund‘s costs with those of other mutual funds. It assumes that the fund had a yearly return of 5% before expenses, but that the expense ratio is unchanged. In this case—because the return used is not the fund’s actual return—the results do not apply to your investment. The example is useful in making comparisons because the Securities and Exchange Commission requires all mutual funds to calculate expenses based on a 5% return. You can assess your fund’s costs by comparing this hypothetical example with the hypothetical examples that appear in shareholder reports of other funds. |
Note that the expenses shown in the table are meant to highlight and help you compare ongoing costs only and do not reflect transaction costs incurred by the fund for buying and selling securities. Further, the expenses do not include any purchase, redemption, or account service fees described in the fund prospectus. If such fees were applied to your account, your costs would be higher. Your fund does not carry a “sales load.”
The calculations assume no shares were bought or sold during the period. Your actual costs may have been higher or lower, depending on the amount of your investment and the timing of any purchases or redemptions.
You can find more information about the fund’s expenses, including annual expense ratios, in the Financial Statements section of this report. For additional information on operating expenses and other shareholder costs, please refer to your fund’s current prospectus.
| Six Months Ended October 31, 2022 | | | |
| | Beginning
Account Value
4/30/2022 | Ending
Account Value
10/31/2022 | Expenses
Paid During
Period |
| Based on Actual Fund Return | | | |
| Global Minimum Volatility Fund | | | |
| Investor Shares | $1,000.00 | $973.70 | $1.04 |
| Admiral™ Shares | 1,000.00 | 974.10 | 0.70 |
| Based on Hypothetical 5% Yearly Return | | | |
| Global Minimum Volatility Fund | | | |
| Investor Shares | $1,000.00 | $1,024.15 | $1.07 |
| Admiral Shares | 1,000.00 | 1,024.50 | 0.71 |
The calculations are based on expenses incurred in the most recent six-month period. The fund’s annualized six-month expense ratios for that period are 0.21% for Investor Shares and 0.14% for Admiral Shares. The dollar amounts shown as “Expenses Paid” are equal to the annualized expense ratio multiplied by the average account value over the period, multiplied by the number of days in the most recent six-month period, then divided by the number of days in the most recent 12-month period (184/365).
Global Minimum Volatility Fund
All of the returns in this report represent past performance, which is not a guarantee of future results that may be achieved by the fund. (Current performance may be lower or higher than the performance data cited. For performance data current to the most recent month-end, visit our website at vanguard.com/performance.) Note, too, that both investment returns and principal value can fluctuate widely, so an investor’s shares, when sold, could be worth more or less than their original cost. The returns shown do not reflect taxes that a shareholder would pay on fund distributions or on the sale of fund shares.
Cumulative Performance: December 12, 2013, Through October 31, 2022
Initial Investment of $10,000
| | | Average Annual Total Returns
Periods Ended October 31, 2022 | |
| | | One
Year | Five
Years | Since
Inception
(12/12/2013) | Final Value
of a $10,000
Investment |
 | Global Minimum Volatility Fund Investor Shares | -4.28% | 4.13% | 7.33% | $18,755 |
 | FTSE Global All Cap Index (USD Hedged) | -14.57 | 7.25 | 8.74 | 21,052 |
“Since Inception” performance is calculated from the Investor Shares’ inception date for both the fund and its comparative standard(s).
| | | | |
| | | One
Year | Five
Years | Since
Inception
(12/12/2013) | Final Value
of a $50,000
Investment |
| Global Minimum Volatility Fund Admiral Shares | -4.24% | 4.19% | 7.41% | $94,377 |
| FTSE Global All Cap Index (USD Hedged) | -14.57 | 7.25 | 8.74 | 105,260 |
“Since Inception” performance is calculated from the Admiral Shares’ inception date for both the fund and its comparative standard(s).
See Financial Highlights for dividend and capital gains information.
Global Minimum Volatility Fund
| United States | 57.7% |
| Japan | 9.6 |
| Canada | 6.3 |
| Australia | 4.2 |
| India | 3.8 |
| Switzerland | 3.3 |
| United Kingdom | 2.7 |
| China | 2.6 |
| South Korea | 2.6 |
| Hong Kong | 1.4 |
| Taiwan | 1.2 |
| France | 1.0 |
| Other | 3.6 |
The table reflects the fund’s investments, except for short-term investments and derivatives.
Global Minimum Volatility Fund
The fund files its complete schedule of portfolio holdings with the Securities and Exchange Commission (SEC) for the first and third quarters of each fiscal year as an exhibit to its reports on Form N-PORT. The fund’s Form N-PORT reports are available on the SEC’s website at www.sec.gov.
| | | Shares | Market
Value•
($000) |
| Common Stocks (98.3%) |
| Australia (4.1%) |
| | Wesfarmers Ltd. | 938,238 | 27,227 |
| | Westpac Banking Corp. | 637,076 | 9,837 |
| | Coles Group Ltd. | 929,129 | 9,715 |
| | Transurban Group (XASX) | 1,075,044 | ��� 9,120 |
| | Medibank Pvt Ltd. | 2,530,369 | 4,556 |
| | National Australia Bank Ltd. | 218,095 | 4,530 |
| * | Telstra Group Ltd. | 1,633,339 | 4,096 |
| | Commonwealth Bank of Australia | 52,780 | 3,539 |
| | Australia & New Zealand Banking Group Ltd. | 165,175 | 2,706 |
| | Sonic Healthcare Ltd. | 117,067 | 2,451 |
| | Atlas Arteria Ltd. | 436,237 | 1,836 |
| | Insurance Australia Group Ltd. | 351,338 | 1,103 |
| | Aurizon Holdings Ltd. | 355,338 | 823 |
| | APA Group | 111,946 | 754 |
| | Ramsay Health Care Ltd. | 15,567 | 584 |
| | ASX Ltd. | 12,788 | 554 |
| | Washington H Soul Pattinson & Co. Ltd. | 30,785 | 551 |
| | Steadfast Group Ltd. | 161,235 | 522 |
| | BWP Trust | 199,306 | 521 |
| | CSL Ltd. | 2,185 | 391 |
| | | | 85,416 |
| Belgium (0.1%) |
| | Etablissements Franz Colruyt NV | 92,274 | 2,224 |
| Brazil (0.5%) |
| 1 | Banco Bradesco SA ADR | 2,693,302 | 10,208 |
| Canada (6.1%) |
| 1 | Royal Bank of Canada | 335,491 | 31,041 |
| 1 | Enbridge Inc. | 554,802 | 21,616 |
| 1 | Emera Inc. | 440,654 | 16,331 |
| | BCE Inc. | 256,098 | 11,551 |
| | Intact Financial Corp. | 64,876 | 9,858 |
| 2 | Hydro One Ltd. | 365,187 | 9,157 |
| | Fortis Inc. (XTSE) | 233,756 | 9,120 |
| | Metro Inc. | 121,139 | 6,346 |
| | Dollarama Inc. | 83,125 | 4,939 |
| | Capital Power Corp. | 60,188 | 2,014 |
| 1 | Canadian Utilities Ltd. Class A | 60,201 | 1,602 |
| | | Shares | Market
Value•
($000) |
| | CCL Industries Inc. Class B | 24,867 | 1,168 |
| | Quebecor Inc. Class B | 57,175 | 1,078 |
| | Atco Ltd. Class I | 19,934 | 619 |
| | Brookfield Infrastructure Corp. Class A | 13,272 | 573 |
| | TMX Group Ltd. | 4,250 | 409 |
| | | | 127,422 |
| China (2.6%) |
| *,1,2 | Koolearn Technology Holding Ltd. | 1,728,000 | 8,420 |
| | China Shenhua Energy Co. Ltd. Class H | 2,273,500 | 5,972 |
| | China Resources Land Ltd. | 1,704,000 | 5,331 |
| | China Overseas Land & Investment Ltd. | 2,538,500 | 4,851 |
| | Anhui Conch Cement Co. Ltd. Class H | 1,448,414 | 3,728 |
| | Yum China Holdings Inc. | 73,000 | 2,955 |
| | China Mengniu Dairy Co. Ltd. | 867,000 | 2,775 |
| | Tsingtao Brewery Co. Ltd. Class H | 396,000 | 2,772 |
| | Zhongsheng Group Holdings Ltd. | 645,500 | 2,450 |
| | ENN Energy Holdings Ltd. | 184,500 | 1,834 |
| | Tencent Holdings Ltd. | 59,400 | 1,561 |
| | ZTO Express Cayman Inc. | 83,800 | 1,426 |
| | China Pacific Insurance Group Co. Ltd. Class H | 863,600 | 1,392 |
| | Haier Smart Home Co. Ltd. Class H | 446,200 | 1,117 |
| 2 | Nongfu Spring Co. Ltd. Class H | 187,800 | 943 |
| | New China Life Insurance Co. Ltd. Class H | 585,900 | 931 |
| | Ping An Insurance Group Co. of China Ltd. Class H | 224,000 | 897 |
| | Tingyi Cayman Islands Holding Corp. | 572,000 | 894 |
| | Shanghai Fudan Microelectronics Group Co. Ltd. Class H | 186,000 | 805 |
| | Flat Glass Group Co. Ltd. Class H | 224,000 | 525 |
| *,2 | Ping An Healthcare and Technology Co. Ltd. | 262,400 | 485 |
Global Minimum Volatility Fund
| | | Shares | Market
Value•
($000) |
| | China Merchants Bank Co. Ltd. Class H | 142,000 | 465 |
| | China Conch Venture Holdings Ltd. | 305,000 | 450 |
| | China Resources Gas Group Ltd. | 140,800 | 361 |
| | | | 53,340 |
| Finland (0.4%) |
| | Nokia OYJ | 1,154,340 | 5,130 |
| | Sampo OYJ Class A | 61,463 | 2,811 |
| | Orion OYJ Class B | 11,593 | 533 |
| | Elisa OYJ | 10,830 | 523 |
| | | | 8,997 |
| France (1.0%) |
| | Orange SA | 967,506 | 9,218 |
| | Vivendi SE | 915,610 | 7,494 |
| | Bouygues SA | 40,229 | 1,148 |
| | Edenred | 21,618 | 1,108 |
| | Bollore SE | 109,320 | 547 |
| 1 | Eutelsat Communications SA | 48,894 | 491 |
| | | | 20,006 |
| Germany (0.0%) |
| | Fielmann AG | 23,134 | 737 |
| Hong Kong (1.3%) |
| | CLP Holdings Ltd. | 1,676,605 | 11,253 |
| | Power Assets Holdings Ltd. | 1,529,270 | 7,312 |
| | Link REIT | 419,100 | 2,477 |
| | Sun Hung Kai Properties Ltd. | 223,000 | 2,397 |
| | Want Want China Holdings Ltd. | 2,180,000 | 1,432 |
| | Chow Tai Fook Jewellery Group Ltd. | 828,200 | 1,418 |
| | Hang Seng Bank Ltd. | 55,800 | 786 |
| | MTR Corp. Ltd. | 123,500 | 543 |
| 2 | ESR Cayman Ltd. | 173,200 | 295 |
| | | | 27,913 |
| India (3.7%) |
| | ICICI Bank Ltd. ADR | 1,557,015 | 34,317 |
| 3 | Infosys Ltd. ADR | 1,501,995 | 28,132 |
| | Dr Reddy's Laboratories Ltd. ADR | 201,322 | 10,934 |
| 2 | Reliance Industries Ltd. GDR | 43,800 | 2,676 |
| | Wipro Ltd. ADR | 251,308 | 1,181 |
| | | | 77,240 |
| Indonesia (0.2%) |
| | Telkom Indonesia Persero Tbk PT ADR | 160,059 | 4,453 |
| Israel (0.1%) |
| | Bank Leumi Le-Israel BM | 77,775 | 742 |
| | Bank Hapoalim BM | 48,124 | 464 |
| | | | 1,206 |
| Italy (0.1%) |
| | UnipolSai Assicurazioni SpA | 589,372 | 1,329 |
| Japan (9.5%) |
| | Softbank Corp. | 2,886,600 | 28,475 |
| | Mizuho Financial Group Inc. | 1,782,000 | 19,273 |
| | Canon Inc. | 893,400 | 18,938 |
| | | Shares | Market
Value•
($000) |
| | Sumitomo Mitsui Financial Group Inc. | 540,900 | 15,189 |
| | Yamada Denki Co. Ltd. | 3,239,000 | 10,438 |
| | Japan Post Holdings Co. Ltd. | 1,533,100 | 10,309 |
| | Japan Post Bank Co. Ltd. | 1,477,900 | 9,847 |
| | FUJIFILM Holdings Corp. | 215,100 | 9,841 |
| | East Japan Railway Co. | 128,900 | 6,868 |
| | Takeda Pharmaceutical Co. Ltd. | 162,700 | 4,297 |
| | Skylark Holdings Co. Ltd. | 387,700 | 4,136 |
| | Secom Co. Ltd. | 67,800 | 3,863 |
| | Sawai Group Holdings Co. Ltd. | 124,100 | 3,582 |
| | ENEOS Holdings Inc. | 1,082,800 | 3,572 |
| | Kagome Co. Ltd. | 174,100 | 3,480 |
| | Japan Tobacco Inc. | 196,700 | 3,294 |
| | Toho Co. Ltd. (XTKS) | 87,600 | 3,115 |
| | SG Holdings Co. Ltd. | 227,500 | 3,015 |
| | Trend Micro Inc. | 55,800 | 2,814 |
| | Kyocera Corp. | 55,800 | 2,702 |
| | Toyo Suisan Kaisha Ltd. | 69,700 | 2,615 |
| | West Japan Railway Co. | 59,100 | 2,343 |
| | Tobu Railway Co. Ltd. | 96,100 | 2,223 |
| | Tokyo Gas Co. Ltd. | 104,200 | 1,862 |
| | ABC-Mart Inc. | 39,100 | 1,743 |
| | Kintetsu Group Holdings Co. Ltd. | 42,500 | 1,436 |
| | Odakyu Electric Railway Co. Ltd. | 92,600 | 1,101 |
| | MOS Food Services Inc. | 49,900 | 1,059 |
| | Yamato Holdings Co. Ltd. | 62,100 | 920 |
| | Hankyu Hanshin Holdings Inc. | 29,700 | 882 |
| * | Shizuoka Financial Group Inc. | 138,400 | 874 |
| | Central Japan Railway Co. | 7,300 | 845 |
| | Kyushu Railway Co. | 36,100 | 755 |
| | Hirose Electric Co. Ltd. | 5,800 | 752 |
| | Obayashi Corp. | 109,400 | 702 |
| | Tokyu Corp. | 59,100 | 681 |
| | Keio Corp. | 19,300 | 677 |
| | KYORIN Holdings Inc. | 54,700 | 677 |
| | Seven Bank Ltd. | 324,600 | 586 |
| | Aozora Bank Ltd. | 33,900 | 583 |
| | Zensho Holdings Co. Ltd. | 22,800 | 569 |
| | Brother Industries Ltd. | 32,300 | 550 |
| | Lion Corp. | 50,700 | 512 |
| | Chugoku Electric Power Co. Inc. | 108,100 | 507 |
| | Nagoya Railroad Co. Ltd. | 33,000 | 506 |
| | Ezaki Glico Co. Ltd. | 21,600 | 486 |
| | Osaka Gas Co. Ltd. | 31,600 | 468 |
| | Oracle Corp. Japan | 8,700 | 463 |
| | Medipal Holdings Corp. | 30,200 | 374 |
| | Chubu Electric Power Co. Inc. | 45,700 | 372 |
| | Haseko Corp. | 36,100 | 372 |
| | Kewpie Corp. | 23,200 | 366 |
| | Toho Gas Co. Ltd. | 19,100 | 356 |
| | Nishimatsu Construction Co. Ltd. | 14,000 | 341 |
| | | | 196,606 |
| Mexico (0.6%) |
| | America Movil SAB de CV Class L ADR | 479,041 | 9,011 |
Global Minimum Volatility Fund
| | | Shares | Market
Value•
($000) |
| | Fomento Economico Mexicano SAB de CV ADR | 35,509 | 2,543 |
| | Grupo Aeroportuario del Sureste SAB de CV ADR | 2,328 | 543 |
| | | | 12,097 |
| Netherlands (0.1%) |
| | Koninklijke KPN NV | 524,531 | 1,467 |
| | Koninklijke Vopak NV | 20,960 | 428 |
| | | | 1,895 |
| New Zealand (0.1%) |
| | Fisher & Paykel Healthcare Corp. Ltd. | 134,335 | 1,526 |
| | Infratil Ltd. | 81,484 | 414 |
| | | | 1,940 |
| Norway (0.4%) |
| | Orkla ASA | 1,232,183 | 8,311 |
| | DNB Bank ASA | 23,684 | 419 |
| | | | 8,730 |
| Singapore (0.7%) |
| | Oversea-Chinese Banking Corp. Ltd. | 1,062,061 | 9,117 |
| | Singapore Exchange Ltd. | 794,026 | 4,722 |
| | Singapore Technologies Engineering Ltd. | 250,700 | 584 |
| | United Overseas Bank Ltd. | 21,233 | 417 |
| | | | 14,840 |
| South Korea (2.6%) |
| | KT&G Corp. | 263,069 | 17,668 |
| | Samsung Electronics Co. Ltd. | 295,936 | 12,317 |
| | Samsung Electronics Co. Ltd. Preference Shares | 271,644 | 10,152 |
| | Korea Zinc Co. Ltd. | 17,595 | 7,890 |
| | Shinhan Financial Group Co. Ltd. | 71,183 | 1,809 |
| | Maeil Dairies Co. Ltd. | 28,395 | 938 |
| | Samsung Life Insurance Co. Ltd. | 9,408 | 445 |
| | LG Uplus Corp. | 55,319 | 444 |
| | Samsung SDS Co. Ltd. | 4,865 | 426 |
| | Samsung Fire & Marine Insurance Co. Ltd. | 2,909 | 408 |
| | Shinsegae Inc. | 2,636 | 392 |
| | SSANGYONG C&E Co. Ltd. | 95,535 | 381 |
| | | | 53,270 |
| Spain (0.2%) |
| | Enagas SA | 173,007 | 2,809 |
| | Endesa SA | 107,310 | 1,793 |
| | | | 4,602 |
| Sweden (0.1%) |
| 1 | Telia Co. AB | 611,372 | 1,620 |
| Switzerland (3.2%) |
| | Swisscom AG (Registered) | 61,055 | 30,148 |
| | Novartis AG (Registered) | 238,415 | 19,286 |
| | Roche Holding AG (Bearer) | 12,980 | 5,268 |
| | Schindler Holding AG Ptg. Ctf. | 17,960 | 2,929 |
| 2 | Galenica AG | 31,063 | 2,232 |
| | | Shares | Market
Value•
($000) |
| | Swiss Prime Site AG (Registered) | 22,430 | 1,810 |
| | Banque Cantonale Vaudoise (Registered) | 17,241 | 1,534 |
| | EMS-Chemie Holding AG (Registered) | 2,068 | 1,300 |
| | Allreal Holding AG (Registered) | 8,295 | 1,188 |
| | Baloise Holding AG (Registered) | 4,631 | 633 |
| | PSP Swiss Property AG (Registered) | 4,329 | 463 |
| | | | 66,791 |
| Taiwan (1.2%) |
| | Taiwan Semiconductor Manufacturing Co. Ltd. ADR | 289,217 | 17,801 |
| | Chunghwa Telecom Co. Ltd. ADR | 151,576 | 5,216 |
| | ASE Technology Holding Co. Ltd. ADR | 231,794 | 1,180 |
| | | | 24,197 |
| United Kingdom (2.7%) |
| | Halma plc | 322,336 | 7,816 |
| | BAE Systems plc | 810,222 | 7,579 |
| | National Grid plc | 605,608 | 6,598 |
| | Reckitt Benckiser Group plc | 85,541 | 5,677 |
| | Sage Group plc | 578,874 | 4,825 |
| | GSK plc | 273,646 | 4,483 |
| | Admiral Group plc | 159,235 | 3,682 |
| | British American Tobacco plc | 88,740 | 3,505 |
| | Tate & Lyle plc | 320,448 | 2,575 |
| | Rightmove plc | 406,390 | 2,288 |
| | Pearson plc | 156,450 | 1,729 |
| | Imperial Brands plc | 54,052 | 1,317 |
| | B&M European Value Retail SA | 303,271 | 1,121 |
| | United Utilities Group plc | 75,092 | 809 |
| | Phoenix Group Holdings plc | 92,424 | 575 |
| | Severn Trent plc | 15,538 | 446 |
| | | | 55,025 |
| United States (56.7%) |
| 3 | Gilead Sciences Inc. | 502,305 | 39,411 |
| | Merck & Co. Inc. | 362,288 | 36,664 |
| | Amgen Inc. | 134,397 | 36,334 |
| | Amdocs Ltd. | 406,455 | 35,081 |
| 3 | Bristol-Myers Squibb Co. | 448,414 | 34,739 |
| | Lockheed Martin Corp. | 70,806 | 34,460 |
| | Johnson & Johnson | 196,620 | 34,206 |
| | International Business Machines Corp. | 245,361 | 33,931 |
| | McDonald's Corp. | 118,132 | 32,210 |
| | Republic Services Inc. Class A | 238,716 | 31,658 |
| | AbbVie Inc. | 213,298 | 31,227 |
| | Colgate-Palmolive Co. | 406,861 | 30,043 |
| | Waste Management Inc. | 189,410 | 29,997 |
| 3 | Cisco Systems Inc. | 643,376 | 29,229 |
| 4 | Equity Commonwealth | 1,091,502 | 28,554 |
| | AptarGroup Inc. | 274,408 | 27,208 |
| | Church & Dwight Co. Inc. | 364,183 | 26,997 |
| 3 | Hormel Foods Corp. | 563,484 | 26,174 |
| | Chemed Corp. | 48,609 | 22,694 |
Global Minimum Volatility Fund
| | | Shares | Market
Value•
($000) |
| | Service Corp. International | 335,967 | 20,363 |
| 1 | Sirius XM Holdings Inc. | 3,131,870 | 18,916 |
| | Dollar General Corp. | 73,050 | 18,631 |
| | CH Robinson Worldwide Inc. | 188,385 | 18,409 |
| | White Mountains Insurance Group Ltd. | 12,722 | 18,016 |
| | General Mills Inc. | 212,225 | 17,313 |
| | Jack Henry & Associates Inc. | 85,636 | 17,047 |
| | Quest Diagnostics Inc. | 114,137 | 16,396 |
| | AT&T Inc. | 893,814 | 16,294 |
| | AmerisourceBergen Corp. Class A | 102,922 | 16,181 |
| 3 | Flowers Foods Inc. | 558,563 | 16,036 |
| | Progressive Corp. | 124,650 | 16,005 |
| | Becton Dickinson and Co. | 67,788 | 15,996 |
| | Kimberly-Clark Corp. | 126,975 | 15,803 |
| | Hawaiian Electric Industries Inc. | 409,097 | 15,562 |
| | Broadridge Financial Solutions Inc. | 96,068 | 14,416 |
| | Sonoco Products Co. | 216,362 | 13,432 |
| | Silgan Holdings Inc. | 268,919 | 12,736 |
| | Washington Federal Inc. | 324,336 | 12,552 |
| | Northrop Grumman Corp. | 22,437 | 12,318 |
| | IDACORP Inc. | 111,641 | 11,689 |
| | NortonLifeLock Inc. (XNGS) | 515,541 | 11,615 |
| | Duke Energy Corp. | 117,285 | 10,929 |
| | Commerce Bancshares Inc. | 154,059 | 10,914 |
| * | Check Point Software Technologies Ltd. | 75,655 | 9,777 |
| | Premier Inc. Class A | 278,965 | 9,730 |
| | Oracle Corp. | 124,461 | 9,717 |
| | Dolby Laboratories Inc. Class A | 145,329 | 9,714 |
| | Williams Cos. Inc. | 282,462 | 9,245 |
| | Consolidated Edison Inc. | 100,078 | 8,803 |
| * | Tyler Technologies Inc. | 23,609 | 7,633 |
| | Kellogg Co. | 97,054 | 7,456 |
| | PepsiCo Inc. | 36,269 | 6,586 |
| | Maximus Inc. | 100,681 | 6,209 |
| | NewMarket Corp. | 18,783 | 5,716 |
| | American States Water Co. | 61,089 | 5,526 |
| | MDU Resources Group Inc. | 173,280 | 4,935 |
| | Huntington Ingalls Industries Inc. | 18,057 | 4,642 |
| * | FTI Consulting Inc. | 29,675 | 4,618 |
| | Hershey Co. | 17,687 | 4,223 |
| | WP Carey Inc. REIT | 53,681 | 4,096 |
| | Atmos Energy Corp. | 37,873 | 4,035 |
| | Landstar System Inc. | 23,102 | 3,609 |
| | Prosperity Bancshares Inc. | 49,601 | 3,550 |
| | Royal Gold Inc. | 35,819 | 3,401 |
| | Motorola Solutions Inc. | 13,218 | 3,301 |
| | Dominion Energy Inc. | 46,848 | 3,278 |
| | Graco Inc. | 47,050 | 3,274 |
| | California Water Service Group | 52,508 | 3,259 |
| | Capitol Federal Financial Inc. | 358,205 | 2,930 |
| * | Henry Schein Inc. | 41,523 | 2,843 |
| | | Shares | Market
Value•
($000) |
| | Assurant Inc. | 18,753 | 2,548 |
| | Ameren Corp. | 29,752 | 2,425 |
| * | Grand Canyon Education Inc. | 23,219 | 2,336 |
| | United Bankshares Inc. | 53,614 | 2,271 |
| | Lancaster Colony Corp. | 12,571 | 2,266 |
| * | Vertex Pharmaceuticals Inc. | 6,611 | 2,063 |
| | Royalty Pharma plc Class A | 48,043 | 2,033 |
| | TFS Financial Corp. | 143,421 | 2,015 |
| | Werner Enterprises Inc. | 47,021 | 1,843 |
| | Southwest Gas Holdings Inc. | 24,288 | 1,775 |
| | Rollins Inc. | 41,274 | 1,737 |
| | CVB Financial Corp. | 56,656 | 1,627 |
| | Independent Bank Corp. (XNGS) | 18,415 | 1,602 |
| | Verizon Communications Inc. | 40,525 | 1,514 |
| | Evergy Inc. | 24,699 | 1,510 |
| | First Interstate BancSystem Inc. Class A | 32,887 | 1,500 |
| | Balchem Corp. | 10,641 | 1,488 |
| | Lincoln Electric Holdings Inc. | 9,904 | 1,406 |
| | Old National Bancorp | 68,036 | 1,331 |
| | Genuine Parts Co. | 7,117 | 1,266 |
| | First Financial Bankshares Inc. | 32,855 | 1,265 |
| | Avista Corp. | 30,729 | 1,261 |
| * | Insight Enterprises Inc. | 12,109 | 1,144 |
| | Eastern Bankshares Inc. | 57,802 | 1,108 |
| | Procter & Gamble Co. | 7,708 | 1,038 |
| | New Jersey Resources Corp. | 22,104 | 987 |
| * | Enstar Group Ltd. | 4,732 | 949 |
| | Northwest Bancshares Inc. | 61,950 | 933 |
| | ONE Gas Inc. | 11,488 | 890 |
| * | NetScout Systems Inc. | 23,315 | 837 |
| | NorthWestern Corp. | 15,583 | 823 |
| * | Prestige Consumer Healthcare Inc. | 14,289 | 778 |
| | Provident Financial Services Inc. | 32,557 | 730 |
| | Madison Square Garden Sports Corp. | 4,200 | 658 |
| | CSG Systems International Inc. | 8,832 | 571 |
| | Spire Inc. | 8,085 | 564 |
| | Community Bank System Inc. | 8,977 | 560 |
| | Bank of Hawaii Corp. | 7,042 | 535 |
| | Hanover Insurance Group Inc. | 3,586 | 525 |
| | Independent Bank Group Inc. | 8,085 | 510 |
| | Laureate Education Inc. Class A | 38,579 | 488 |
| | Hope Bancorp Inc. | 32,859 | 446 |
| | Roper Technologies Inc. | 1,066 | 442 |
| | Reynolds Consumer Products Inc. | 14,421 | 440 |
| | Chesapeake Utilities Corp. | 3,374 | 420 |
| * | PRA Group Inc. | 12,523 | 419 |
Global Minimum Volatility Fund
| | | Shares | Market
Value•
($000) |
| | Mercury General Corp. | 12,962 | 376 |
| | ServisFirst Bancshares Inc. | 4,859 | 366 |
| | | | 1,177,111 |
Total Common Stocks
(Cost $1,898,937) | 2,039,215 |
| Temporary Cash Investments (5.7%) |
| Money Market Fund (5.7%) |
| 5,6 | Vanguard Market Liquidity Fund, 3.117% (Cost $118,834) | 1,188,626 | 118,839 |
| Total Investments (104.0%) (Cost $2,017,771) | 2,158,054 |
| Other Assets and Liabilities—Net (-4.0%) | (82,355) |
| Net Assets (100%) | 2,075,699 |
| Cost is in $000. |
| • | See Note A in Notes to Financial Statements. |
| * | Non-income-producing security. |
| 1 | Includes partial security positions on loan to broker-dealers. The total value of securities on loan is $100,392,000. |
| 2 | Security exempt from registration under Rule 144A of the Securities Act of 1933. Such securities may be sold in transactions exempt from registration, normally to qualified institutional buyers. At October 31, 2022, the aggregate value was $24,208,000, representing 1.2% of net assets. |
| 3 | Securities with a value of $3,673,000 have been segregated as collateral for open forward currency contracts. |
| 4 | Securities with a value of $1,022,000 have been segregated as initial margin for open futures contracts. |
| 5 | Affiliated money market fund available only to Vanguard funds and certain trusts and accounts managed by Vanguard. Rate shown is the 7-day yield. |
| 6 | Collateral of $109,416,000 was received for securities on loan. |
| | ADR—American Depositary Receipt. |
| | GDR—Global Depositary Receipt. |
| | Ptg. Ctf.—Participating Certificates. |
| | REIT—Real Estate Investment Trust. |
Derivative Financial Instruments Outstanding as of Period End
| Futures Contracts |
| | | | ($000) |
| | Expiration | Number of
Long (Short)
Contracts | Notional
Amount | Value and
Unrealized
Appreciation
(Depreciation) |
| Long Futures Contracts | | | | |
| E-mini S&P 500 Index | December 2022 | 110 | 21,356 | 541 |
| Euro Stoxx 50 Index | December 2022 | 6 | 215 | 1 |
| FTSE 100 Index | December 2022 | 12 | 978 | (44) |
| S&P ASX 200 Index | December 2022 | 6 | 658 | (15) |
| Topix Index | December 2022 | 9 | 1,166 | 11 |
| | | | | 494 |
Global Minimum Volatility Fund
| Forward Currency Contracts |
| | Contract
Settlement
Date | Contract Amount (000) | Unrealized
Appreciation
($000) | Unrealized
Depreciation
($000) |
| Counterparty | Receive | Deliver |
| Deutsche Bank AG | 11/18/22 | CAD | 8,195 | USD | 5,963 | 53 | — |
| BNP Paribas | 11/18/22 | GBP | 11,682 | USD | 13,101 | 303 | — |
| BNP Paribas | 11/18/22 | HKD | 41,215 | USD | 5,254 | — | (1) |
| Barclays Bank plc | 11/18/22 | HKD | 21,356 | USD | 2,723 | — | (1) |
| BNP Paribas | 11/18/22 | JPY | 846,481 | USD | 5,766 | — | (62) |
| Deutsche Bank AG | 11/18/22 | USD | 77,999 | AUD | 120,956 | 590 | — |
| BNP Paribas | 11/18/22 | USD | 5,562 | AUD | 8,622 | 44 | — |
| Deutsche Bank AG | 11/18/22 | USD | 9,700 | BRL | 51,114 | — | (154) |
| State Street Bank & Trust Co. | 11/18/22 | USD | 115,946 | CAD | 158,750 | — | (590) |
| BNP Paribas | 11/18/22 | USD | 17,884 | CAD | 24,467 | — | (76) |
| Citibank, N.A. | 11/18/22 | USD | 62,014 | CHF | 60,843 | 1,136 | — |
| State Street Bank & Trust Co. | 11/18/22 | USD | 5,066 | CHF | 5,024 | 39 | — |
| Bank of Montreal | 11/18/22 | USD | — | CNH | 2 | — | — |
| State Street Bank & Trust Co. | 11/18/22 | USD | 1,278 | DKK | 9,589 | 4 | — |
| State Street Bank & Trust Co. | 11/18/22 | USD | 37,171 | EUR | 37,489 | 75 | — |
| Toronto-Dominion Bank | 11/18/22 | USD | 59,565 | GBP | 52,676 | — | (872) |
| BNP Paribas | 11/18/22 | USD | 4,826 | GBP | 4,279 | — | (84) |
| Barclays Bank plc | 11/18/22 | USD | 97,146 | HKD | 761,890 | 51 | — |
| BNP Paribas | 11/18/22 | USD | 4,211 | IDR | 64,142,370 | 100 | — |
| BNP Paribas | 11/18/22 | USD | 2,883 | ILS | 10,126 | 14 | — |
| State Street Bank & Trust Co. | 11/18/22 | USD | 58,858 | INR | 4,825,717 | 652 | — |
| Goldman Sachs International | 11/18/22 | USD | 8,886 | INR | 736,987 | — | (3) |
| Barclays Bank plc | 11/18/22 | USD | 5,512 | INR | 457,637 | — | (8) |
| Royal Bank of Canada | 11/18/22 | USD | 4,335 | INR | 355,972 | 42 | — |
| State Street Bank & Trust Co. | 11/18/22 | USD | 212,930 | JPY | 30,689,513 | 6,127 | — |
| Bank of Montreal | 11/18/22 | USD | 3,436 | JPY | 495,102 | 100 | — |
| State Street Bank & Trust Co. | 11/18/22 | USD | 47,768 | KRW | 67,908,888 | 93 | — |
| Goldman Sachs International | 11/18/22 | USD | 2,310 | KRW | 3,284,843 | 4 | — |
| Deutsche Bank AG | 11/18/22 | USD | 9,384 | MXN | 189,874 | — | (166) |
| Toronto-Dominion Bank | 11/18/22 | USD | 9,743 | NOK | 103,269 | — | (196) |
| State Street Bank & Trust Co. | 11/18/22 | USD | 2,722 | NZD | 4,773 | — | (54) |
| Bank of Montreal | 11/18/22 | USD | 51 | SEK | 554 | — | — |
| Royal Bank of Canada | 11/18/22 | USD | 14,011 | SGD | 19,974 | — | (101) |
Global Minimum Volatility Fund
| Forward Currency Contracts (continued) |
| | Contract
Settlement
Date | Contract Amount (000) | Unrealized
Appreciation
($000) | Unrealized
Depreciation
($000) |
| Counterparty | Receive | Deliver |
| Deutsche Bank AG | 11/18/22 | USD | 26,660 | TWD | 840,476 | 543 | — |
| BNP Paribas | 11/18/22 | USD | 2,162 | TWD | 68,237 | 41 | — |
| | | | | | | 10,011 | (2,368) |
| AUD—Australian dollar. |
| BRL—Brazilian real. |
| CAD—Canadian dollar. |
| CHF—Swiss franc. |
| CNH—Chinese yuan (offshore). |
| DKK—Danish krone. |
| EUR—euro. |
| GBP—British pound. |
| HKD—Hong Kong dollar. |
| IDR—Indonesian rupiah. |
| ILS—Israeli shekel. |
| INR—Indian rupee. |
| JPY—Japanese yen. |
| KRW—Korean won. |
| MXN—Mexican peso. |
| NOK—Norwegian krone. |
| NZD—New Zealand dollar. |
| SEK—Swedish krona. |
| SGD—Singapore dollar. |
| TWD—Taiwanese dollar. |
| USD—U.S. dollar. |
At October 31, 2022, the counterparties had deposited in segregated accounts securities with a value of $4,675,000 and cash of $1,814,000 in connection with open forward currency contracts.
See accompanying Notes, which are an integral part of the Financial Statements.
Global Minimum Volatility Fund
Statement of Assets and Liabilities
|
| ($000s, except shares and per-share amounts) | Amount |
| Assets | |
| Investments in Securities, at Value1 | |
| Unaffiliated Issuers (Cost $1,898,937) | 2,039,215 |
| Affiliated Issuers (Cost $118,834) | 118,839 |
| Total Investments in Securities | 2,158,054 |
| Investment in Vanguard | 78 |
| Foreign Currency, at Value (Cost $1,656) | 1,654 |
| Receivables for Investment Securities Sold | 12,070 |
| Receivables for Accrued Income | 6,942 |
| Receivables for Capital Shares Issued | 475 |
| Unrealized Appreciation—Forward Currency Contracts | 10,011 |
| Total Assets | 2,189,284 |
| Liabilities | |
| Due to Custodian | 397 |
| Payables for Investment Securities Purchased | 13 |
| Collateral for Securities on Loan | 109,416 |
| Payables for Capital Shares Redeemed | 1,222 |
| Payables to Vanguard | 142 |
| Variation Margin Payable—Futures Contracts | 27 |
| Unrealized Depreciation—Forward Currency Contracts | 2,368 |
| Total Liabilities | 113,585 |
| Net Assets | 2,075,699 |
| 1 Includes $100,392 of securities on loan. | |
| At October 31, 2022, net assets consisted of: | |
| | |
| Paid-in Capital | 1,847,891 |
| Total Distributable Earnings (Loss) | 227,808 |
| Net Assets | 2,075,699 |
| |
| Investor Shares—Net Assets | |
Applicable to 18,951,077 outstanding $.001 par value shares of
beneficial interest (unlimited authorization) | 259,965 |
| Net Asset Value Per Share—Investor Shares | $13.72 |
| |
| Admiral Shares—Net Assets | |
Applicable to 66,159,257 outstanding $.001 par value shares of
beneficial interest (unlimited authorization) | 1,815,734 |
| Net Asset Value Per Share—Admiral Shares | $27.44 |
See accompanying Notes, which are an integral part of the Financial Statements.
Global Minimum Volatility Fund
|
| | Year Ended
October 31, 2022 |
| | ($000) |
| Investment Income | |
| Income | |
| Dividends1 | 62,688 |
| Interest2 | 81 |
| Securities Lending—Net | 672 |
| Total Income | 63,441 |
| Expenses | |
| The Vanguard Group—Note B | |
| Investment Advisory Services | 546 |
| Management and Administrative—Investor Shares | 452 |
| Management and Administrative—Admiral Shares | 2,188 |
| Marketing and Distribution—Investor Shares | 21 |
| Marketing and Distribution—Admiral Shares | 104 |
| Custodian Fees | 112 |
| Auditing Fees | 38 |
| Shareholders’ Reports—Investor Shares | 19 |
| Shareholders’ Reports—Admiral Shares | 32 |
| Trustees’ Fees and Expenses | 1 |
| Other Expenses | 27 |
| Total Expenses | 3,540 |
| Expenses Paid Indirectly | (1) |
| Net Expenses | 3,539 |
| Net Investment Income | 59,902 |
| Realized Net Gain (Loss) | |
| Investment Securities Sold2,3 | 16,986 |
| Futures Contracts | (3,330) |
| Forward Currency Contracts | 148,465 |
| Foreign Currencies | (482) |
| Realized Net Gain (Loss) | 161,639 |
| Change in Unrealized Appreciation (Depreciation) | |
| Investment Securities2 | (344,982) |
| Futures Contracts | 476 |
| Forward Currency Contracts | 10,147 |
| Foreign Currencies | (324) |
| Change in Unrealized Appreciation (Depreciation) | (334,683) |
| Net Increase (Decrease) in Net Assets Resulting from Operations | (113,142) |
| 1 | Dividends are net of foreign withholding taxes of $3,383,000. |
| 2 | Interest income, realized net gain (loss), capital gain distributions received, and change in unrealized appreciation (depreciation) from an affiliated company of the fund were $81,000, ($4,000), less than $1,000, and $5,000, respectively. Purchases and sales are for temporary cash investment purposes. |
| 3 | Includes $31,951,000 of net gain (loss) resulting from in-kind redemptions. |
See accompanying Notes, which are an integral part of the Financial Statements.
Global Minimum Volatility Fund
Statement of Changes in Net Assets
|
| | Year Ended October 31, |
| | 2022
($000) | 2021
($000) |
| | | |
| Increase (Decrease) in Net Assets | | |
| Operations | | |
| Net Investment Income | 59,902 | 54,760 |
| Realized Net Gain (Loss) | 161,639 | 242,664 |
| Change in Unrealized Appreciation (Depreciation) | (334,683) | 239,710 |
| Net Increase (Decrease) in Net Assets Resulting from Operations | (113,142) | 537,134 |
| Distributions | | |
| Investor Shares | (10,057) | (6,959) |
| Admiral Shares | (83,618) | (62,342) |
| Total Distributions | (93,675) | (69,301) |
| Capital Share Transactions | | |
| Investor Shares | (18,912) | (87,211) |
| Admiral Shares | (448,415) | (793,086) |
| Net Increase (Decrease) from Capital Share Transactions | (467,327) | (880,297) |
| Total Increase (Decrease) | (674,144) | (412,464) |
| Net Assets | | |
| Beginning of Period | 2,749,843 | 3,162,307 |
| End of Period | 2,075,699 | 2,749,843 |
See accompanying Notes, which are an integral part of the Financial Statements.
Global Minimum Volatility Fund
| Investor Shares | | | | | |
For a Share Outstanding
Throughout Each Period | Year Ended October 31, |
| 2022 | 2021 | 2020 | 2019 | 2018 |
| Net Asset Value, Beginning of Period | $14.83 | $12.77 | $14.71 | $13.78 | $13.57 |
| Investment Operations | | | | | |
| Net Investment Income1 | .347 | .252 | .293 | .428 | .374 |
| Net Realized and Unrealized Gain (Loss) on Investments | (.952) | 2.085 | (1.571) | 1.403 | .148 |
| Total from Investment Operations | (.605) | 2.337 | (1.278) | 1.831 | .522 |
| Distributions | | | | | |
| Dividends from Net Investment Income | (.505) | (.277) | (.397) | (.300) | (.312) |
| Distributions from Realized Capital Gains | — | — | (.265) | (.601) | — |
| Total Distributions | (.505) | (.277) | (.662) | (.901) | (.312) |
| Net Asset Value, End of Period | $13.72 | $14.83 | $12.77 | $14.71 | $13.78 |
| Total Return2 | -4.28% | 18.51% | -9.22% | 14.41% | 3.89% |
| Ratios/Supplemental Data | | | | | |
| Net Assets, End of Period (Millions) | $260 | $301 | $338 | $643 | $515 |
| Ratio of Total Expenses to Average Net Assets | 0.21%3 | 0.21% | 0.21% | 0.21% | 0.23% |
| Ratio of Net Investment Income to Average Net Assets | 2.46% | 1.77% | 2.16% | 3.09% | 2.66% |
| Portfolio Turnover Rate | 51%4 | 24% | 58% | 46% | 24% |
| 1 | Calculated based on average shares outstanding. |
| 2 | Total returns do not include account service fees that may have applied in the periods shown. Fund prospectuses provide information about any applicable account service fees. |
| 3 | The ratio of expenses to average net assets for the period net of reduction from custody fee offset arrangements was 0.21%. |
| 4 | Excludes the value of portfolio securities received or delivered as a result of in-kind purchases or redemptions of the fund’s capital shares. |
See accompanying Notes, which are an integral part of the Financial Statements.
Global Minimum Volatility Fund
| Admiral Shares | | | | | |
For a Share Outstanding
Throughout Each Period | Year Ended October 31, |
| 2022 | 2021 | 2020 | 2019 | 2018 |
| Net Asset Value, Beginning of Period | $29.67 | $25.56 | $29.45 | $27.58 | $27.15 |
| Investment Operations | | | | | |
| Net Investment Income1 | .712 | .520 | .608 | .878 | .758 |
| Net Realized and Unrealized Gain (Loss) on Investments | (1.910) | 4.177 | (3.155) | 2.819 | .297 |
| Total from Investment Operations | (1.198) | 4.697 | (2.547) | 3.697 | 1.055 |
| Distributions | | | | | |
| Dividends from Net Investment Income | (1.032) | (.587) | (.812) | (.624) | (.625) |
| Distributions from Realized Capital Gains | — | — | (.531) | (1.203) | — |
| Total Distributions | (1.032) | (.587) | (1.343) | (1.827) | (.625) |
| Net Asset Value, End of Period | $27.44 | $29.67 | $25.56 | $29.45 | $27.58 |
| Total Return2 | -4.24% | 18.60% | -9.18% | 14.54% | 3.93% |
| Ratios/Supplemental Data | | | | | |
| Net Assets, End of Period (Millions) | $1,816 | $2,449 | $2,824 | $3,483 | $2,542 |
| Ratio of Total Expenses to Average Net Assets | 0.14%3 | 0.14% | 0.14% | 0.14% | 0.15% |
| Ratio of Net Investment Income to Average Net Assets | 2.52% | 1.83% | 2.26% | 3.16% | 2.74% |
| Portfolio Turnover Rate | 51%4 | 24% | 58% | 46% | 24% |
| 1 | Calculated based on average shares outstanding. |
| 2 | Total returns do not include account service fees that may have applied in the periods shown. Fund prospectuses provide information about any applicable account service fees. |
| 3 | The ratio of expenses to average net assets for the period net of reduction from custody fee offset arrangements was 0.14%. |
| 4 | Excludes the value of portfolio securities received or delivered as a result of in-kind purchases or redemptions of the fund’s capital shares. |
See accompanying Notes, which are an integral part of the Financial Statements.
Global Minimum Volatility Fund
Notes to Financial Statements
Vanguard Global Minimum Volatility Fund is registered under the Investment Company Act of 1940 as an open-end investment company, or mutual fund. The fund offers two classes of shares: Investor Shares and Admiral Shares. Each of the share classes has different eligibility and minimum purchase requirements, and is designed for different types of investors.
The fund invests in securities of foreign issuers, which may subject it to investment risks not normally associated with investing in securities of U.S. corporations. To minimize the currency risk and volatility associated with investment in securities denominated in currencies other than the U.S. dollar, the fund attempts to hedge its currency exposure. Significant market disruptions, such as those caused by pandemics (e.g., COVID-19 pandemic), natural or environmental disasters, war (e.g., Russia’s invasion of Ukraine), acts of terrorism, or other events, can adversely affect local and global markets and normal market operations. Any such disruptions could have an adverse impact on the value of the fund’s investments and fund performance.
| A. | The following significant accounting policies conform to generally accepted accounting principles for U.S. investment companies. The fund consistently follows such policies in preparing its financial statements. |
1. Security Valuation: Securities are valued as of the close of trading on the New York Stock Exchange (generally 4 p.m., Eastern time) on the valuation date. Equity securities are valued at the latest quoted sales prices or official closing prices taken from the primary market in which each security trades; such securities not traded on the valuation date are valued at the mean of the latest quoted bid and asked prices. Securities for which market quotations are not readily available, or whose values have been affected by events occurring before the fund’s pricing time but after the close of the securities’ primary markets, are valued by methods deemed by the valuation designee to represent fair value and subject to oversight by the board of trustees. These procedures include obtaining quotations from an independent pricing service, monitoring news to identify significant market- or security-specific events, and evaluating changes in the values of foreign market proxies (for example, ADRs, futures contracts, or exchange-traded funds), between the time the foreign markets close and the fund’s pricing time. When fair-value pricing is employed, the prices of securities used by a fund to calculate its net asset value may differ from quoted or published prices for the same securities. Investments in Vanguard Market Liquidity Fund are valued at that fund's net asset value.
2. Foreign Currency: Securities and other assets and liabilities denominated in foreign currencies are translated into U.S. dollars using exchange rates obtained from an independent third party as of the fund’s pricing time on the valuation date. Realized gains (losses) and unrealized appreciation (depreciation) on investment securities include the effects of changes in exchange rates since the securities were purchased, combined with the effects of changes in security prices. Fluctuations in the value of other assets and liabilities resulting from changes in exchange rates are recorded as unrealized foreign currency gains (losses) until the assets or liabilities are settled in cash, at which time they are recorded as realized foreign currency gains (losses).
3. Futures Contracts: The fund uses index futures contracts to a limited extent, with the objective of maintaining full exposure to the stock market while maintaining liquidity. The fund may purchase or sell futures contracts to achieve a desired level of investment, whether to accommodate portfolio turnover or cash flows from capital share transactions. The primary risks associated with the use of futures contracts are imperfect correlation between changes in market values of stocks held by the fund and the prices of futures contracts, and the possibility of an illiquid market. Counterparty risk involving futures is mitigated because a regulated clearinghouse is the
Global Minimum Volatility Fund
counterparty instead of the clearing broker. To further mitigate counterparty risk, the fund trades futures contracts on an exchange, monitors the financial strength of its clearing brokers and clearinghouse, and has entered into clearing agreements with its clearing brokers. The clearinghouse imposes initial margin requirements to secure the fund’s performance and requires daily settlement of variation margin representing changes in the market value of each contract. Any securities pledged as initial margin for open contracts are noted in the Schedule of Investments.
Futures contracts are valued at their quoted daily settlement prices. The notional amounts of the contracts are not recorded in the Statement of Assets and Liabilities. Fluctuations in the value of the contracts are recorded in the Statement of Assets and Liabilities as an asset (liability) and in the Statement of Operations as unrealized appreciation (depreciation) until the contracts are closed, when they are recorded as realized gains (losses) on futures contracts.
During the year ended October 31, 2022, the fund’s average investments in long and short futures contracts represented 1% and 0% of net assets, respectively, based on the average of the notional amounts at each quarter-end during the period.
4. Forward Currency Contracts: The fund enters into forward currency contracts to protect the value of securities and related receivables and payables against changes in future foreign exchange rates. The fund’s risks in using these contracts include movement in the values of the foreign currencies relative to the U.S. dollar and the ability of the counterparties to fulfill their obligations under the contracts. The fund mitigates its counterparty risk by entering into forward currency contracts only with a diverse group of prequalified counterparties, monitoring their financial strength, entering into master netting arrangements with its counterparties, and requiring its counterparties to transfer collateral as security for their performance. In the absence of a default, the collateral pledged or received by the fund cannot be repledged, resold, or rehypothecated. The master netting arrangements provide that, in the event of a counterparty’s default (including bankruptcy), the fund may terminate the forward currency contracts, determine the net amount owed by either party in accordance with its master netting arrangements, and sell or retain any collateral held up to the net amount owed to the fund under the master netting arrangements. The forward currency contracts contain provisions whereby a counterparty may terminate open contracts if the fund’s net assets decline below a certain level, triggering a payment by the fund if the fund is in a net liability position at the time of the termination. The payment amount would be reduced by any collateral the fund has pledged. Any securities pledged as collateral for open contracts are noted in the Schedule of Investments. The value of collateral received or pledged is compared daily to the value of the forward currency contracts exposure with each counterparty, and any difference, if in excess of a specified minimum transfer amount, is adjusted and settled within two business days.
Forward currency contracts are valued at their quoted daily prices obtained from an independent third party, adjusted for currency risk based on the expiration date of each contract. The notional amounts of the contracts are not recorded in the Statement of Assets and Liabilities. Fluctuations in the value of the contracts are recorded in the Statement of Assets and Liabilities as an asset (liability) and in the Statement of Operations as unrealized appreciation (depreciation) until the contracts are closed, when they are recorded as realized gains (losses) on forward currency contracts.
During the year ended October 31, 2022, the fund’s average investment in forward currency contracts represented 46% of net assets, based on the average of the notional amounts at each quarter-end during the period.
Global Minimum Volatility Fund
5. Federal Income Taxes: The fund intends to continue to qualify as a regulated investment company and distribute virtually all of its taxable income. The fund’s tax returns are open to examination by the relevant tax authorities until expiration of the applicable statute of limitations, which is generally three years after the filing of the tax return. Management has analyzed the fund’s tax positions taken for all open federal and state income tax years, and has concluded that no provision for income tax is required in the fund’s financial statements.
6. Distributions: Distributions to shareholders are recorded on the ex-dividend date. Distributions are determined on a tax basis at the fiscal year-end and may differ from net investment income and realized capital gains for financial reporting purposes.
7. Securities Lending: To earn additional income, the fund lends its securities to qualified institutional borrowers. Security loans are subject to termination by the fund at any time, and are required to be secured at all times by collateral in an amount at least equal to the market value of securities loaned. Daily market fluctuations could cause the value of loaned securities to be more or less than the value of the collateral received. When this occurs, the collateral is adjusted and settled before the opening of the market on the next business day. The fund further mitigates its counterparty risk by entering into securities lending transactions only with a diverse group of prequalified counterparties, monitoring their financial strength, and entering into master securities lending agreements with its counterparties. The master securities lending agreements provide that, in the event of a counterparty’s default (including bankruptcy), the fund may terminate any loans with that borrower, determine the net amount owed, and sell or retain the collateral up to the net amount owed to the fund; however, such actions may be subject to legal proceedings. While collateral mitigates counterparty risk, in the event of a default, the fund may experience delays and costs in recovering the securities loaned. The fund invests cash collateral received in Vanguard Market Liquidity Fund, and records a liability in the Statement of Assets and Liabilities for the return of the collateral, during the period the securities are on loan. Collateral investments in Vanguard Market Liquidity Fund are subject to market appreciation or depreciation. Securities lending income represents fees charged to borrowers plus income earned on invested cash collateral, less expenses associated with the loan. During the term of the loan, the fund is entitled to all distributions made on or in respect of the loaned securities.
8. Credit Facilities and Interfund Lending Program: The fund and certain other funds managed by The Vanguard Group ("Vanguard") participate in a $4.4 billion committed credit facility provided by a syndicate of lenders pursuant to a credit agreement and an uncommitted credit facility provided by Vanguard. Both facilities may be renewed annually. Each fund is individually liable for its borrowings, if any, under the credit facilities. Borrowings may be utilized for temporary or emergency purposes and are subject to the fund’s regulatory and contractual borrowing restrictions. With respect to the committed credit facility, the participating funds are charged administrative fees and an annual commitment fee of 0.10% of the undrawn committed amount of the facility, which are allocated to the funds based on a method approved by the fund’s board of trustees and included in Management and Administrative expenses on the fund’s Statement of Operations. Any borrowings under either facility bear interest at an agreed-upon spread plus the higher of the federal funds effective rate, the overnight bank funding rate, or the Daily Simple Secured Overnight Financing Rate inclusive of an additional agreed-upon spread. However, borrowings under the uncommitted credit facility may bear interest based upon an alternate rate agreed to by the fund and Vanguard.
In accordance with an exemptive order (the “Order”) from the SEC, the fund may participate in a joint lending and borrowing program that allows registered open-end Vanguard funds to borrow
Global Minimum Volatility Fund
money from and lend money to each other for temporary or emergency purposes (the “Interfund Lending Program”), subject to compliance with the terms and conditions of the Order, and to the extent permitted by the fund’s investment objective and investment policies. Interfund loans and borrowings normally extend overnight but can have a maximum duration of seven days. Loans may be called on one business day’s notice. The interest rate to be charged is governed by the conditions of the Order and internal procedures adopted by the board of trustees. The board of trustees is responsible for overseeing the Interfund Lending Program.
For the year ended October 31, 2022, the fund did not utilize the credit facilities or the Interfund Lending Program.
9. Other: Dividend income is recorded on the ex-dividend date. Non-cash dividends included in income, if any, are recorded at the fair value of the securities received. Interest income includes income distributions received from Vanguard Market Liquidity Fund and is accrued daily. Security transactions are accounted for on the date securities are bought or sold. Costs used to determine realized gains (losses) on the sale of investment securities are those of the specific securities sold.
Taxes on foreign dividends and capital gains have been provided for in accordance with the fund's understanding of the applicable countries' tax rules and rates. Deferred foreign capital gains tax, if any, is accrued daily based upon net unrealized gains. The fund has filed tax reclaims for previously withheld taxes on dividends earned in certain European Union countries. These filings are subject to various administrative and judicial proceedings within these countries. Amounts related to these reclaims are recorded when there are no significant uncertainties as to the ultimate resolution of proceedings, the likelihood of receipt of these reclaims, and the potential timing of payment. Such tax reclaims and related professional fees, if any, are included in dividend income and other expenses, respectively.
Each class of shares has equal rights as to assets and earnings, except that each class separately bears certain class-specific expenses related to maintenance of shareholder accounts (included in Management and Administrative expenses) and shareholder reporting. Marketing and distribution expenses are allocated to each class of shares based on a method approved by the board of trustees. Income, other non-class-specific expenses, and gains and losses on investments are allocated to each class of shares based on its relative net assets.
| B. | In accordance with the terms of a Funds' Service Agreement (the “FSA”) between Vanguard and the fund, Vanguard furnishes to the fund investment advisory, corporate management, administrative, marketing, and distribution services at Vanguard’s cost of operations (as defined by the FSA). These costs of operations are allocated to the fund based on methods and guidelines approved by the board of trustees and are generally settled twice a month. |
Upon the request of Vanguard, the fund may invest up to 0.40% of its net assets as capital in Vanguard. At October 31, 2022, the fund had contributed to Vanguard capital in the amount of $78,000, representing less than 0.01% of the fund’s net assets and 0.03% of Vanguard’s capital received pursuant to the FSA. The fund’s trustees and officers are also directors and employees, respectively, of Vanguard.
| C. | The fund’s custodian bank has agreed to reduce its fees when the fund maintains cash on deposit in the non-interest-bearing custody account. For the year ended October 31, 2022, custodian fee offset arrangements reduced the fund’s expenses by $1,000 (an annual rate of less than 0.01% of average net assets). |
Global Minimum Volatility Fund
| D. | Various inputs may be used to determine the value of the fund’s investments and derivatives. These inputs are summarized in three broad levels for financial statement purposes. The inputs or methodologies used to value securities are not necessarily an indication of the risk associated with investing in those securities. |
Level 1—Quoted prices in active markets for identical securities.
Level 2—Other significant observable inputs (including quoted prices for similar securities, interest rates, prepayment speeds, credit risk, etc.).
Level 3—Significant unobservable inputs (including the fund’s own assumptions used to determine the fair value of investments). Any investments and derivatives valued with significant unobservable inputs are noted on the Schedule of Investments.
The following table summarizes the market value of the fund’s investments and derivatives as of October 31, 2022, based on the inputs used to value them:
| | Level 1
($000) | Level 2
($000) | Level 3
($000) | Total
($000) |
| Investments | | | | |
| Assets | | | | |
| Common Stocks—North and South America | 1,326,838 | — | — | 1,326,838 |
| Common Stocks—Other | 103,214 | 609,163 | — | 712,377 |
| Temporary Cash Investments | 118,839 | — | — | 118,839 |
| Total | 1,548,891 | 609,163 | — | 2,158,054 |
| Derivative Financial Instruments | | | | |
| Assets | | | | |
| Futures Contracts1 | 553 | — | — | 553 |
| Forward Currency Contracts | — | 10,011 | — | 10,011 |
| Total | 553 | 10,011 | — | 10,564 |
| Liabilities | | | | |
| Futures Contracts1 | 59 | — | — | 59 |
| Forward Currency Contracts | — | 2,368 | — | 2,368 |
| Total | 59 | 2,368 | — | 2,427 |
| 1 | Includes cumulative appreciation (depreciation) on futures contracts and centrally cleared swaps, if any, as reported in the Schedule of Investments. Only current day’s variation margin is reported within the Statement of Assets and Liabilities. |
Global Minimum Volatility Fund
E.At October 31, 2022, the fair values of derivatives were reflected in the Statement of Assets and Liabilities as follows:
| Statement of Assets and Liabilities | Equity
Contracts
($000) | Foreign
Exchange
Contracts
($000) | Total
($000) |
| Unrealized Appreciation—Futures Contracts1 | 553 | — | 553 |
| Unrealized Appreciation—Forward Currency Contracts | — | 10,011 | 10,011 |
| Total Assets | 553 | 10,011 | 10,564 |
| | | | |
| Unrealized Depreciation—Futures Contracts1 | 59 | — | 59 |
| Unrealized Depreciation—Forward Currency Contracts | — | 2,368 | 2,368 |
| Total Liabilities | 59 | 2,368 | 2,427 |
| 1 | Includes cumulative appreciation (depreciation) on futures contracts and centrally cleared swaps, if any, as reported in the Schedule of Investments. Only current day’s variation margin is reported within the Statement of Assets and Liabilities. |
Realized net gain (loss) and the change in unrealized appreciation (depreciation) on derivatives for the year ended October 31, 2022, were:
| Realized Net Gain (Loss) on Derivatives | Equity
Contracts
($000) | Foreign
Exchange
Contracts
($000) | Total
($000) |
| Futures Contracts | (3,330) | — | (3,330) |
| Forward Currency Contracts | — | 148,465 | 148,465 |
| Realized Net Gain (Loss) on Derivatives | (3,330) | 148,465 | 145,135 |
| Change in Unrealized Appreciation (Depreciation) on Derivatives |
| Futures Contracts | 476 | — | 476 |
| Forward Currency Contracts | — | 10,147 | 10,147 |
| Change in Unrealized Appreciation (Depreciation) on Derivatives | 476 | 10,147 | 10,623 |
| F. | Permanent differences between book-basis and tax-basis components of net assets are reclassified among capital accounts in the financial statements to reflect their tax character. These reclassifications have no effect on net assets or net asset value per share. As of period end, permanent differences primarily attributable to the accounting for applicable in-kind redemptions, foreign currency transactions, passive foreign investment companies, and distributions in connection with fund share redemptions were reclassified between the following accounts: |
| | Amount
($000) |
| Paid-in Capital | 48,584 |
| Total Distributable Earnings (Loss) | (48,584) |
Temporary differences between book-basis and tax-basis components of total distributable earnings (loss) arise when certain items of income, gain, or loss are recognized in different periods for financial statement and tax purposes; these differences will reverse at some time in the future. The differences are primarily related to the deferral of losses from wash sales; the recognition of
Global Minimum Volatility Fund
unrealized gains or losses from certain derivative contracts; and the recognition of unrealized gains from passive foreign investment companies. As of period end, the tax-basis components of total distributable earnings (loss) are detailed in the table as follows:
| | Amount
($000) |
| Undistributed Ordinary Income | 41,610 |
| Undistributed Long-Term Gains | 48,646 |
| Capital Loss Carryforwards | — |
| Qualified Late-Year Losses | — |
| Net Unrealized Gains (Losses) | 137,552 |
The tax character of distributions paid was as follows:
| | Year Ended October 31, |
| | 2022
Amount
($000) | 2021
Amount
($000) |
| Ordinary Income* | 93,675 | 69,301 |
| Long-Term Capital Gains | — | — |
| Total | 93,675 | 69,301 |
| * | Includes short-term capital gains, if any. |
As of October 31, 2022, gross unrealized appreciation and depreciation for investments and derivatives based on cost for U.S. federal income tax purposes were as follows:
| | Amount
($000) |
| Tax Cost | 2,020,854 |
| Gross Unrealized Appreciation | 266,907 |
| Gross Unrealized Depreciation | (129,076) |
| Net Unrealized Appreciation (Depreciation) | 137,831 |
| G. | During the year ended October 31, 2022, the fund purchased $1,212,413,000 of investment securities and sold $1,574,229,000 of investment securities, other than temporary cash investments. Purchases and sales include $0 and $219,562,000, respectively, in connection with in-kind purchases and redemptions of the fund's capital shares. |
The fund purchased securities from and sold securities to other Vanguard funds or accounts managed by Vanguard or its affiliates, in accordance with procedures adopted by the board of trustees in compliance with Rule 17a-7 of the Investment Company Act of 1940. For the year ended October 31, 2022, such purchases were $48,175,000 and sales were $113,000, resulting in net realized gain of $37,000; these amounts, other than temporary cash investments, are included in the purchases and sales of investment securities noted above.
Global Minimum Volatility Fund
| H. | Capital share transactions for each class of shares were: |
| | Year Ended October 31, | |
| | 2022 | | 2021 |
| | Amount
($000) | Shares
(000) | | Amount
($000) | Shares
(000) |
| Investor Shares | | | | | |
| Issued | 38,697 | 2,740 | | 49,143 | 3,454 |
| Issued in Lieu of Cash Distributions | 9,216 | 633 | | 6,352 | 470 |
| Redeemed | (66,825) | (4,728) | | (142,706) | (10,122) |
| Net Increase (Decrease)—Investor Shares | (18,912) | (1,355) | | (87,211) | (6,198) |
| Admiral Shares | | | | | |
| Issued | 190,619 | 6,722 | | 439,983 | 15,585 |
| Issued in Lieu of Cash Distributions | 73,352 | 2,518 | | 55,463 | 2,050 |
| Redeemed | (712,386) | (25,628) | | (1,288,532) | (45,588) |
| Net Increase (Decrease)—Admiral Shares | (448,415) | (16,388) | | (793,086) | (27,953) |
| I. | Management has determined that no events or transactions occurred subsequent to October 31, 2022, that would require recognition or disclosure in these financial statements. |
Report of Independent Registered Public Accounting Firm
To the Board of Trustees of Vanguard Whitehall Funds and Shareholders of Vanguard Global Minimum Volatility Fund
Opinion on the Financial Statements
We have audited the accompanying statement of assets and liabilities, including the schedule of investments, of Vanguard Global Minimum Volatility Fund (one of the funds constituting Vanguard Whitehall Funds, referred to hereafter as the "Fund") as of October 31, 2022, the related statement of operations for the year ended October 31, 2022, the statement of changes in net assets for each of the two years in the period ended October 31, 2022, including the related notes, and the financial highlights for each of the five years in the period ended October 31, 2022 (collectively referred to as the "financial statements"). In our opinion, the financial statements present fairly, in all material respects, the financial position of the Fund as of October 31, 2022, the results of its operations for the year then ended, the changes in its net assets for each of the two years in the period ended October 31, 2022 and the financial highlights for each of the five years in the period ended October 31, 2022 in conformity with accounting principles generally accepted in the United States of America.
Basis for Opinion
These financial statements are the responsibility of the Fund’s management. Our responsibility is to express an opinion on the Fund’s financial statements based on our audits. We are a public accounting firm registered with the Public Company Accounting Oversight Board (United States) (PCAOB) and are required to be independent with respect to the Fund in accordance with the U.S. federal securities laws and the applicable rules and regulations of the Securities and Exchange Commission and the PCAOB.
We conducted our audits of these financial statements in accordance with the standards of the PCAOB. Those standards require that we plan and perform the audit to obtain reasonable assurance about whether the financial statements are free of material misstatement, whether due to error or fraud.
Our audits included performing procedures to assess the risks of material misstatement of the financial statements, whether due to error or fraud, and performing procedures that respond to those risks. Such procedures included examining, on a test basis, evidence regarding the amounts and disclosures in the financial statements. Our audits also included evaluating the accounting principles used and significant estimates made by management, as well as evaluating the overall presentation of the financial statements. Our procedures included confirmation of securities owned as of October 31, 2022 by correspondence with the custodian, transfer agent and brokers; when replies were not received from brokers, we performed other auditing procedures. We believe that our audits provide a reasonable basis for our opinion.
/s/PricewaterhouseCoopers LLP
Philadelphia, Pennsylvania
December 16, 2022
We have served as the auditor of one or more investment companies in The Vanguard Group of Funds since 1975.
Tax information (unaudited)
For corporate shareholders, 43.3%, or if subsequently determined to be different, the maximum percentage allowable by law, of ordinary income (dividend income plus short-term gains, if any) for the fiscal year qualified for the dividends-received deduction.
The fund hereby designates $66,425,000, or if subsequently determined to be different, the maximum amount allowable by law, as qualified dividend income for individual shareholders for the fiscal year.
The fund hereby designates $26,000, or if subsequently determined to be different, the maximum amount allowable by law, of interest earned from obligations of the U.S. government which is generally exempt from state income tax.
The fund distributed $10,816,000 as capital gain dividends (20% rate gain distributions) to shareholders during the fiscal year.
The fund hereby designates $8,337,000, or if subsequently determined to be different, the maximum amount allowable by law, of qualified business income for individual shareholders for the fiscal year.
This page intentionally left blank.
The People Who Govern Your Fund
The trustees of your mutual fund are there to see that the fund is operated and managed in your best interests since, as a shareholder, you are a part owner of the fund. Your fund’s trustees also serve on the board of directors of The Vanguard Group, Inc., which is owned by the Vanguard funds and provides services to them.
A majority of Vanguard’s board members are independent, meaning that they have no affiliation with Vanguard or the funds they oversee, apart from the sizable personal investments they have made as private individuals. The independent board members have distinguished backgrounds in business, academia, and public service. Each of the trustees and executive officers oversees 206 Vanguard funds.
Information for each trustee and executive officer of the fund appears below. That information, as well as the Vanguard fund count, is as of the date on the cover of this fund report. The mailing address of the trustees and officers is P.O. Box 876, Valley Forge, PA 19482. More information about the trustees is in the Statement of Additional Information, which can be obtained, without charge, by contacting Vanguard at 800-662-7447, or online at vanguard.com.
Interested Trustee1
Mortimer J. Buckley
Born in 1969. Trustee since January 2018. Principal occupation(s) during the past five years and other experience: chairman of the board (2019–present) of Vanguard and of each of the investment companies served by Vanguard; chief executive officer (2018–present) of Vanguard; chief executive officer, president, and trustee (2018–present) of each of the investment companies served by Vanguard; president and director (2017–present) of Vanguard; and president (2018–present) of Vanguard Marketing Corporation. Chief investment officer (2013–2017), managing director (2002–2017), head of the Retail Investor Group (2006–2012), and chief information officer (2001–2006) of Vanguard. Member of the board of governors of the Investment Company Institute and the board of governors of FINRA. Trustee and vice chair of The Shipley School.
Independent Trustees
Tara Bunch
Born in 1962. Trustee since November 2021. Principal occupation(s) during the past five years and other experience: head of global operations at Airbnb (2020–present). Vice president of AppleCare (2012–2020). Member of the board of directors of Out & Equal (2002–2006), the advisory board of the University of California, Berkeley School of Engineering (2020–present), and the advisory board
of Santa Clara University’s Leavey School of Business (2018–present).
Emerson U. Fullwood
Born in 1948. Trustee since January 2008. Principal occupation(s) during the past five years and other experience: executive chief staff and marketing officer for North America and corporate vice president (retired 2008) of Xerox Corporation (document management products and services). Former president of the Worldwide Channels Group, Latin America, and Worldwide Customer Service and executive chief staff officer of Developing Markets of Xerox. Executive in residence and 2009–2010 Distinguished Minett Professor at the Rochester Institute of Technology. Member of the board of directors of the University of Rochester Medical Center, the Monroe Community College Foundation, the United Way of Rochester, North Carolina A&T University, Roberts Wesleyan College, and the Rochester Philharmonic Orchestra. Trustee of the University of Rochester.
F. Joseph Loughrey
Born in 1949. Trustee since October 2009. Principal occupation(s) during the past five years and other experience: president and chief operating officer (retired 2009) and vice chairman of the board (2008–2009) of Cummins Inc. (industrial machinery). Chairman of the board of Hillenbrand, Inc. (specialized consumer services). Director of the V Foundation. Member of the advisory council for the College of
1 Mr. Buckley is considered an “interested person,” as defined in the Investment Company Act of 1940, because he is an officer of the Vanguard funds.
Arts and Letters at the University of Notre Dame. Chairman of the board of Saint Anselm College.
Mark Loughridge
Born in 1953. Trustee since March 2012. Principal occupation(s) during the past five years and other experience: senior vice president and chief financial officer (retired 2013) of IBM (information technology services). Fiduciary member of IBM’s Retirement Plan Committee (2004–2013), senior vice president and general manager (2002–2004) of IBM Global Financing, vice president and controller (1998–2002) of IBM, and a variety of other prior management roles at IBM. Member of the Council on Chicago Booth.
Scott C. Malpass
Born in 1962. Trustee since March 2012. Principal occupation(s) during the past five years and other experience: adjunct professor of finance at the University of Notre Dame (2020–present). Chief investment officer (retired 2020) and vice president (retired 2020) of the University of Notre Dame. Assistant professor (retired June 2020) of finance at the Mendoza College of Business, University of Notre Dame, and member of the Notre Dame 403(b) Investment Committee. Member of the board of Catholic Investment Services, Inc. (investment advisors), the board of superintendence of the Institute for the Works of Religion, and the board of directors of Paxos Trust Company (finance).
Deanna Mulligan
Born in 1963. Trustee since January 2018. Principal occupation(s) during the past five years and other experience: chief executive officer of Purposeful (advisory firm for CEOs and C-level executives; 2021–present). Board chair (2020), chief executive officer (2011–2020), and president (2010–2019) of The Guardian Life Insurance Company of America. Chief operating officer (2010–2011) and executive vice president (2008–2010) of Individual Life and Disability of the Guardian Life Insurance Company of America. Member of the board of the Economic Club of New York. Trustee of the Partnership for New York City (business leadership), Chief Executives for Corporate Purpose, and the NewYork-Presbyterian Hospital.
André F. Perold
Born in 1952. Trustee since December 2004. Principal occupation(s) during the past five years and other experience: George Gund Professor of Finance and Banking, Emeritus at the Harvard Business School (retired 2011). Chief investment officer and co-managing partner of HighVista Strategies (private investment firm). Member of the board (2018–present) of RIT Capital Partners (investment
firm). Member of the investment committee of Partners Health Care System.
Sarah Bloom Raskin
Born in 1961. Trustee since January 2018. Principal occupation(s) during the past five years and other experience: deputy secretary (2014–2017) of the United States Department of the Treasury. Governor (2010–2014) of the Federal Reserve Board. Commissioner (2007–2010) of financial regulation for the State of Maryland. Colin W. Brown Distinguished Professor of the Practice of Law (2021–present), professor (2020–present), Distinguished Fellow of the Global Financial Markets Center (2020–present), and Rubenstein Fellow (2017–2020) at Duke University. Trustee (2017–present) of Amherst College and member of Amherst College Investment Committee (2019–present). Member of the Regenerative Crisis Response Committee (2020–present).
David A. Thomas
Born in 1956. Trustee since July 2021. Principal occupation(s) during the past five years and other experience: president of Morehouse College (2018–present). Professor of business administration, emeritus at Harvard University (2017–2018). Dean (2011–2016) and professor of management (2016–2017) at the Georgetown University McDonough School of Business. Director of DTE Energy Company (2013–present). Trustee of Common Fund (2019–present).
Peter F. Volanakis
Born in 1955. Trustee since July 2009. Principal occupation(s) during the past five years and other experience: president and chief operating officer (retired 2010) of Corning Incorporated (communications equipment) and director of Corning Incorporated (2000–2010) and Dow Corning (2001–2010). Director (2012) of SPX Corporation (multi-industry manufacturing). Overseer of the Amos Tuck School of Business Administration, Dartmouth College (2001–2013). Member of the BMW Group Mobility Council.
Executive Officers
Christine M. Buchanan
Born in 1970. Principal occupation(s) during the past five years and other experience: principal of Vanguard. Chief financial officer (2021–present) and treasurer (2017–present) of each of the investment companies served by Vanguard. Partner (2005–2017) at KPMG (audit, tax, and advisory services).
John Galloway
Born in 1973. Principal occupation(s) during the past five years and other experience: principal of Vanguard. Investment stewardship officer (September 2020–present) of each of the investment companies served by Vanguard. Head of Investor Advocacy (February 2020–present) and head of Marketing Strategy and Planning (2017–2020) at Vanguard. Special assistant to the President of the United States (2015).
Ashley Grim
Born in 1984. Principal occupation(s) during the past five years and other experience: treasurer (February 2022–present) of each of the investment companies served by Vanguard. Fund transfer agent controller (2019–2022) and director of Audit Services (2017–2019) at Vanguard. Senior manager (2015–2017) at PriceWaterhouseCoopers (audit and assurance, consulting, and tax services).
Peter Mahoney
Born in 1974. Principal occupation(s) during the past five years and other experience: principal of Vanguard. Controller (2015–present) of each of the investment companies served by Vanguard. Head of International Fund Services (2008–2014) at Vanguard.
Anne E. Robinson
Born in 1970. Principal occupation(s) during the past five years and other experience: general counsel (2016–present) of Vanguard. Secretary (2016–present) of Vanguard and of each of the investment companies served by Vanguard. Managing director (2016–present) of Vanguard. Managing director and general counsel of Global Cards and Consumer Services (2014–2016) at Citigroup. Counsel (2003–2014) at American Express. Nonexecutive director of the board of National Grid (energy).
Michael Rollings
Born in 1963. Principal occupation(s) during the past five years and other experience: finance director (2017–present) and treasurer (2017) of each of the investment companies served by Vanguard. Managing director (2016–present) of Vanguard. Chief financial officer (2016–present) of Vanguard. Director (2016–present) of Vanguard Marketing Corporation. Executive vice president and chief financial officer (2006–2016) of MassMutual Financial Group.
John E. Schadl
Born in 1972. Principal occupation(s) during the past five years and other experience: principal of Vanguard. Chief compliance officer (2019–present) of Vanguard and of each of the investment companies served by Vanguard. Assistant vice president (2019–present) of Vanguard Marketing Corporation.
Vanguard Senior Management Team
| Matthew Benchener | Thomas M. Rampulla |
| Joseph Brennan | Karin A. Risi |
| Mortimer J. Buckley | Anne E. Robinson |
| Gregory Davis | Michael Rollings |
| John James | Nitin Tandon |
| Chris D. Mclsaac | Lauren Valente |
Connect with Vanguard®>vanguard.com
Fund Information > 800-662-7447
Direct Investor Account Services > 800-662-2739
Institutional Investor Services > 800-523-1036
Text Telephone for People Who Are Deaf or Hard of Hearing > 800-749-7273
This material may be used in conjunction with the offering of shares of any Vanguard fund only if preceded or accompanied by the fund’s current prospectus.
All comparative mutual fund data are from Morningstar, Inc., unless otherwise noted.
You can obtain a free copy of Vanguard’s proxy voting guidelines by visiting vanguard.com/proxyreporting or by calling Vanguard at 800-662-2739. The guidelines are also available from the SEC’s website, www.sec.gov. In addition, you may obtain a free report on how your fund voted the proxies for securities it owned during the 12 months ended June 30. To get the report, visit either vanguard.com/proxyreporting or www.sec.gov.
You can review information about your fund on the SEC’s website, and you can receive copies of this information, for a fee, by sending a request via email addressed to publicinfo@sec.gov.
Source for Bloomberg indexes: Bloomberg Index Services Limited. Copyright 2022, Bloomberg. All rights reserved.
© 2022 The Vanguard Group, Inc.
All rights reserved.
Vanguard Marketing Corporation, Distributor.
Q11940 122022
Annual Report | October 31, 2022
Vanguard International Dividend Index Funds
| Vanguard International Dividend Appreciation Index Fund |
| Vanguard International High Dividend Yield Index Fund |
Contents
Your Fund’s Performance at a Glance
| 1 |
About Your Fund’s Expenses
| 2 |
International Dividend Appreciation Index Fund
| 4 |
International High Dividend Yield Index Fund
| 27 |
Please note: The opinions expressed in this report are just that—informed opinions. They should not be considered promises or advice. Also, please keep in mind that the information and opinions cover the period through the date on the front of this report. Of course, the risks of investing in your fund are spelled out in the prospectus.
Your Fund’s Performance at a Glance
| • | The 12 months ended October 31, 2022, were a volatile, challenging period for financial markets. Returns for Vanguard International High Dividend Yield Index Fund were –15.52% for Admiral Shares and –15.16% for ETF Shares. Vanguard International Dividend Appreciation Index Fund returned –23.22% for Admiral Shares and –22.90% for ETF Shares. Returns for ETF Shares are based on net asset value. |
| • | The economic backdrop deteriorated as inflation soared to multidecade highs, fueled in part by higher energy and food prices in the wake of Russia’s invasion of Ukraine. Then price increases broadened to other categories of goods and services, adding to concerns that inflation would remain stubbornly high. That prompted aggressive tightening by many central banks to bring inflation back in check and increased fears of a recession. |
| ��� | For both funds, all the major regions detracted from the index return for the 12 months. Europe, by far the largest weighting in both indexes at more than 40%, hurt returns the most. |
| • | Among sectors, financials detracted most from the index return for the International High Dividend Yield Index Fund, followed by consumer discretionary and industrials. Only energy made a positive contribution. For the International Dividend Appreciation Index Fund, technology and industrials hurt the index return the most. The only sector to make a slightly positive contribution was telecommunications, which had a small weighting in the index. |
Market Barometer
| | Average Annual Total Returns
Periods Ended October 31, 2022 |
| | One Year | Three Years | Five Years |
| Stocks | | | |
| Russell 1000 Index (Large-caps) | -16.38% | 9.99% | 10.19% |
| Russell 2000 Index (Small-caps) | -18.54 | 7.05 | 5.56 |
| Russell 3000 Index (Broad U.S. market) | -16.52 | 9.79 | 9.87 |
| FTSE All-World ex US Index (International) | -24.20 | -1.16 | -0.18 |
| Bonds | | | |
Bloomberg U.S. Aggregate Float Adjusted Index
(Broad taxable market) | -15.69% | -3.73% | -0.50% |
Bloomberg Municipal Bond Index
(Broad tax-exempt market) | -11.98 | -2.18 | 0.37 |
| FTSE Three-Month U.S. Treasury Bill Index | 0.88 | 0.59 | 1.15 |
| CPI | | | |
| Consumer Price Index | 7.75% | 5.01% | 3.85% |
Fund returns are adjusted to reflect the 0.25% fee on purchases of fund shares. The fee does not apply to the ETF Shares.
About Your Fund’s Expenses
As a shareholder of the fund, you incur ongoing costs, which include costs for portfolio management, administrative services, and shareholder reports (like this one), among others. Operating expenses, which are deducted from a fund’s gross income, directly reduce the investment return of the fund.
A fund’s expenses are expressed as a percentage of its average net assets. This figure is known as the expense ratio. The following examples are intended to help you understand the ongoing costs (in dollars) of investing in your fund and to compare these costs with those of other mutual funds. The examples are based on an investment of $1,000 made at the beginning of the period shown and held for the entire period.
The accompanying table illustrates your fund’s costs in two ways:
| • | Based on actual fund return. This section helps you to estimate the actual expenses that you paid over the period. The ”Ending Account Value“ shown is derived from the fund‘s actual return, and the third column shows the dollar amount that would have been paid by an investor who started with $1,000 in the fund. You may use the information here, together with the amount you invested, to estimate the expenses that you paid over the period. |
To do so, simply divide your account value by $1,000 (for example, an $8,600 account value divided by $1,000 = 8.6), then multiply the result by the number given for your fund under the heading ”Expenses Paid During Period.“
| • | Based on hypothetical 5% yearly return. This section is intended to help you compare your fund‘s costs with those of other mutual funds. It assumes that the fund had a yearly return of 5% before expenses, but that the expense ratio is unchanged. In this case—because the return used is not the fund’s actual return—the results do not apply to your investment. The example is useful in making comparisons because the Securities and Exchange Commission requires all mutual funds to calculate expenses based on a 5% return. You can assess your fund’s costs by comparing this hypothetical example with the hypothetical examples that appear in shareholder reports of other funds. |
Note that the expenses shown in the table are meant to highlight and help you compare ongoing costs only and do not reflect transaction costs incurred by the fund for buying and selling securities. Further, the expenses do not include any purchase, redemption, or account service fees described in the fund prospectus. If such fees were applied to your account, your costs would be higher. Your fund does not carry a “sales load.”
The calculations assume no shares were bought or sold during the period. Your actual costs may have been higher or lower, depending on the amount of your investment and the timing of any purchases or redemptions.
You can find more information about the fund’s expenses, including annual expense ratios, in the Financial Statements section of this report. For additional information on operating expenses and other shareholder costs, please refer to your fund’s current prospectus.
| Six Months Ended October 31, 2022 | | | |
| | Beginning
Account Value
4/30/2022 | Ending
Account Value
10/31/2022 | Expenses
Paid During
Period |
| Based on Actual Fund Return | | | |
| International Dividend Appreciation Index Fund | | | |
| ETF Shares | $1,000.00 | $867.40 | $0.75 |
| Admiral™ Shares | 1,000.00 | 867.90 | 0.80 |
| International High Dividend Yield Index Fund | | | |
| ETF Shares | $1,000.00 | $884.00 | $1.09 |
| Admiral Shares | 1,000.00 | 884.40 | 1.09 |
| Based on Hypothetical 5% Yearly Return | | | |
| International Dividend Appreciation Index Fund | | | |
| ETF Shares | $1,000.00 | $1,024.40 | $0.82 |
| Admiral Shares | 1,000.00 | 1,024.35 | 0.87 |
| International High Dividend Yield Index Fund | | | |
| ETF Shares | $1,000.00 | $1,024.05 | $1.17 |
| Admiral Shares | 1,000.00 | 1,024.05 | 1.17 |
The calculations are based on expenses incurred in the most recent six-month period. The funds' annualized six-month expense ratios for that period are: for the International Dividend Appreciation Index Fund, 0.16% for ETF Shares and 0.17% for Admiral Shares; and for the International High Dividend Yield Index Fund, 0.23% for ETF Shares and 0.23% for Admiral Shares. The dollar amounts shown as “Expenses Paid" are equal to the annualized expense ratio multiplied by the average account value over the period, multiplied by the number of days in the most recent six-month period, then divided by the number of days in the most recent 12-month period (184/365).
International Dividend Appreciation Index Fund
All of the returns in this report represent past performance, which is not a guarantee of future results that may be achieved by the fund. (Current performance may be lower or higher than the performance data cited. For performance data current to the most recent month-end, visit our website at vanguard.com/performance.) Note, too, that both investment returns and principal value can fluctuate widely, so an investor’s shares, when sold, could be worth more or less than their original cost. The returns shown do not reflect taxes that a shareholder would pay on fund distributions or on the sale of fund shares.
Cumulative Performance: February 25, 2016, Through October 31, 2022
Initial Investment of $10,000
| | | Average Annual Total Returns
Periods Ended October 31, 2022 | |
| | | One
Year | Five
Years | Since
Inception
(2/25/2016) | Final Value
of a $10,000
Investment |
 | International Dividend Appreciation Index Fund ETF Shares Net Asset Value | -22.90% | 2.82% | 6.41% | $15,143 |
| | International Dividend Appreciation Index Fund ETF Shares Market Price | -22.95 | 2.80 | 6.45 | 15,183 |
 | Spliced S&P Global Ex-U.S. Dividend Growers Index | -22.87 | 3.05 | 6.71 | 15,427 |
“Since Inception” performance is calculated from the ETF Shares’ inception date for both the fund and its comparative standard(s).
Spliced S&P Global Ex-U.S. Dividend Growers Index: NASDAQ International Dividend Achievers Select Index through September 19, 2021; S&P Global Ex-U.S. Dividend Growers Index thereafter.
| | | | |
| | | One
Year | Five
Years | Since
Inception
(3/2/2016) | Final Value
of a $10,000
Investment |
| International Dividend Appreciation Index Fund Admiral Shares | -23.22% | 2.74% | 5.91% | $14,660 |
| Spliced S&P Global Ex-U.S. Dividend Growers Index | -22.87 | 3.05 | 6.25 | 14,975 |
“Since Inception” performance is calculated from the Admiral Shares’ inception date for both the fund and its comparative standard(s).
Vanguard fund returns are adjusted to reflect the 0.25% fee on purchases and redemptions. The fees do not apply to the ETF Shares.
See Financial Highlights for dividend and capital gains information.
International Dividend Appreciation Index Fund
Cumulative Returns of ETF Shares: February 25, 2016, Through October 31, 2022
| | One
Year | Five
Years | Since
Inception
(2/25/2016) |
| International Dividend Appreciation Index Fund ETF Shares Market Price | -22.95% | 14.82% | 51.83% |
| International Dividend Appreciation Index Fund ETF Shares Net Asset Value | -22.90 | 14.92 | 51.43 |
| Spliced S&P Global Ex-U.S. Dividend Growers Index | -22.87 | 16.19 | 54.27 |
"Since Inception" performance is calculated from the ETF Shares’ inception date for both the fund and its comparative standard(s).
For the ETF Shares, the market price is determined by the midpoint of the bid-offer spread as of the closing time of the New York Stock Exchange (generally 4 p.m., Eastern time). The net asset value is also determined as of the NYSE closing time. For more information about how the ETF Shares' market prices have compared with their net asset value, visit vanguard.com, select your ETF, and click on Price, and then scroll down to the Premium/Discount Chart. The ETF premium/discount analysis there shows the percentages of days on which the ETF Shares' market price was above or below the NAV.
Vanguard fund returns are adjusted to reflect the 0.25% fee on purchases and redemptions. The fees do not apply to the ETF Shares.
International Dividend Appreciation Index Fund
| Canada | 17.9% |
| Switzerland | 17.0 |
| Japan | 15.2 |
| United Kingdom | 7.8 |
| India | 7.3 |
| Denmark | 6.1 |
| France | 5.2 |
| Germany | 4.9 |
| Australia | 4.0 |
| Hong Kong | 3.6 |
| China | 3.2 |
| Sweden | 2.4 |
| Indonesia | 1.0 |
| Other | 4.4 |
The table reflects the fund’s investments, except for short-term investments and derivatives.
The fund may invest in derivatives (such as futures and swap contracts) for various reasons, including, but not limited to, attempting to remain fully invested and tracking its target index as closely as possible.
International Dividend Appreciation Index Fund
The fund files its complete schedule of portfolio holdings with the Securities and Exchange Commission (SEC) for the first and third quarters of each fiscal year as an exhibit to its reports on Form N-PORT. The fund’s Form N-PORT reports are available on the SEC’s website at www.sec.gov.
| | | Shares | Market
Value•
($000) |
| Common Stocks (99.5%) |
| Australia (4.0%) |
| | CSL Ltd. | 546,756 | 97,878 |
| | Sonic Healthcare Ltd. | 544,459 | 11,399 |
| | Computershare Ltd. (XASX) | 650,386 | 10,528 |
| | Northern Star Resources Ltd. | 1,322,652 | 7,382 |
| | carsales.com Ltd. | 398,033 | 5,156 |
| | Washington H Soul Pattinson & Co. Ltd. | 278,981 | 4,993 |
| | Steadfast Group Ltd. | 1,110,439 | 3,598 |
| | Altium Ltd. | 139,150 | 3,142 |
| | Technology One Ltd. | 315,427 | 2,427 |
| | Brickworks Ltd. | 98,835 | 1,399 |
| | AUB Group Ltd. | 105,131 | 1,391 |
| | Collins Foods Ltd. | 133,803 | 803 |
| | Dicker Data Ltd. | 66,376 | 457 |
| | | | 150,553 |
| Belgium (0.4%) |
| | UCB SA | 143,608 | 10,823 |
| | Sofina SA | 18,199 | 3,549 |
| | | | 14,372 |
| Brazil (0.2%) |
| | Raia Drogasil SA | 1,219,266 | 6,210 |
| Canada (17.8%) |
| | Toronto-Dominion Bank | 2,051,311 | 131,283 |
| | Canadian National Railway Co. | 698,739 | 82,781 |
| | Canadian Natural Resources Ltd. | 1,275,260 | 76,487 |
| | Brookfield Asset Management Inc. Class A | 1,623,407 | 64,288 |
| | Alimentation Couche-Tard Inc. | 892,795 | 39,975 |
| | Intact Financial Corp. | 198,942 | 30,229 |
| | Franco-Nevada Corp. | 217,168 | 26,833 |
| | Agnico Eagle Mines Ltd. | 517,879 | 22,782 |
| | Fortis Inc. (XTSE) | 543,515 | 21,204 |
| | Dollarama Inc. | 326,457 | 19,398 |
| | Magna International Inc. | 305,684 | 17,035 |
| | Loblaw Cos. Ltd. | 175,161 | 14,351 |
| | Metro Inc. | 270,224 | 14,156 |
| | Imperial Oil Ltd. | 222,124 | 12,083 |
| | Open Text Corp. | 306,319 | 8,873 |
| | George Weston Ltd. | 76,205 | 8,388 |
| | TFI International Inc. | 90,471 | 8,235 |
| | | Shares | Market
Value•
($000) |
| | Ritchie Bros Auctioneers Inc. | 125,616 | 8,206 |
| | CCL Industries Inc. Class B | 165,007 | 7,752 |
| | Toromont Industries Ltd. | 93,013 | 7,148 |
| 1 | Canadian Tire Corp. Ltd. Class A | 63,347 | 7,100 |
| | Saputo Inc. | 274,672 | 6,686 |
| | Stantec Inc. | 125,130 | 6,123 |
| | Empire Co. Ltd. Class A | 186,655 | 4,795 |
| | Finning International Inc. | 175,555 | 3,733 |
| | Parkland Corp. | 178,384 | 3,606 |
| | Boyd Group Services Inc. | 24,345 | 3,464 |
| | Premium Brands Holdings Corp. Class A | 42,515 | 2,508 |
| | Canadian Western Bank | 108,609 | 1,890 |
| | Stella-Jones Inc. | 61,758 | 1,860 |
| | Maple Leaf Foods Inc. | 86,105 | 1,276 |
| | Cogeco Communications Inc. | 23,180 | 1,182 |
| | goeasy Ltd. | 14,490 | 1,176 |
| | Enghouse Systems Ltd. | 48,129 | 1,070 |
| | Savaria Corp. | 53,166 | 507 |
| | Cogeco Inc. | 10,831 | 461 |
| | Hardwoods Distribution Inc. | 23,166 | 426 |
| | | | 669,350 |
| China (3.1%) |
| | Tencent Holdings Ltd. | 3,605,824 | 94,750 |
| | CSPC Pharmaceutical Group Ltd. | 9,504,000 | 9,762 |
| | Shenzhou International Group Holdings Ltd. | 908,900 | 6,311 |
| | China Tourism Group Duty Free Corp. Ltd. Class A | 176,355 | 3,875 |
| | China Resources Gas Group Ltd. | 1,024,700 | 2,624 |
| | Angel Yeast Co. Ltd. Class A | 79,000 | 393 |
| | | | 117,715 |
| Colombia (0.1%) |
| | Grupo Nutresa SA | 125,365 | 1,346 |
| | Grupo de Inversiones Suramericana SA | 120,084 | 968 |
| | Grupo Argos SA | 387,449 | 804 |
| | Grupo De Inversiones Suramericana SA Preference Shares | 63,046 | 174 |
| | | | 3,292 |
International Dividend Appreciation Index Fund
| | | Shares | Market
Value•
($000) |
| Denmark (6.1%) |
| | Novo Nordisk A/S Class B | 1,685,491 | 183,266 |
| | DSV A/S | 217,931 | 29,449 |
| | Coloplast A/S Class B | 134,783 | 15,024 |
| | | | 227,739 |
| Finland (0.1%) |
| | Huhtamaki OYJ | 108,928 | 3,915 |
| | Revenio Group OYJ | 31,133 | 1,158 |
| | | | 5,073 |
| France (5.2%) |
| | Sanofi | 1,309,661 | 112,707 |
| | Schneider Electric SE | 648,431 | 81,998 |
| | Pharmagest Interactive | 5,983 | 420 |
| | | | 195,125 |
| Germany (4.9%) |
| | SAP SE | 1,241,035 | 119,453 |
| | Symrise AG Class A | 150,927 | 15,406 |
| | Fresenius SE & Co. KGaA | 465,954 | 10,723 |
| | Brenntag SE | 176,270 | 10,696 |
| | Fresenius Medical Care AG & Co. KGaA | 227,582 | 6,295 |
| | LEG Immobilien SE (XETR) | 85,798 | 5,601 |
| | Bechtle AG | 94,677 | 3,271 |
| | Nemetschek SE | 63,617 | 3,033 |
| | Encavis AG | 138,793 | 2,584 |
| | Gerresheimer AG | 31,074 | 1,780 |
| | FUCHS PETROLUB SE Preference Shares | 59,022 | 1,690 |
| | FUCHS PETROLUB SE | 58,752 | 1,417 |
| | STRATEC SE | 8,185 | 686 |
| | TAG Immobilien AG | 96,012 | 601 |
| | Atoss Software AG | 4,745 | 578 |
| | Cewe Stiftung & Co. KGaA | 6,643 | 520 |
| | MBB SE | 2,922 | 244 |
| | | | 184,578 |
| Hong Kong (3.5%) |
| | AIA Group Ltd. | 13,552,760 | 102,659 |
| | Techtronic Industries Co. Ltd. | 2,085,064 | 19,743 |
| | Hong Kong & China Gas Co. Ltd. | 12,251,145 | 9,443 |
| | SUNeVision Holdings Ltd. | 1,570,000 | 832 |
| | | | 132,677 |
| India (7.2%) |
| | Reliance Industries Ltd. | 3,900,786 | 120,366 |
| | Infosys Ltd. ADR | 3,210,231 | 60,128 |
| | Hindustan Unilever Ltd. | 1,008,850 | 31,127 |
| | Asian Paints Ltd. | 509,476 | 19,178 |
| | Infosys Ltd. | 920,370 | 17,154 |
| | Pidilite Industries Ltd. | 171,438 | 5,361 |
| | Tata Elxsi Ltd. | 39,514 | 3,340 |
| | Persistent Systems Ltd. | 56,888 | 2,538 |
| | Astral Ltd. (XNSE) | 100,163 | 2,460 |
| | Sundaram Finance Ltd. | 75,959 | 2,158 |
| | Berger Paints India Ltd. | 273,472 | 1,939 |
| | LIC Housing Finance Ltd. | 347,080 | 1,701 |
| | KEI Industries Ltd. | 61,190 | 1,195 |
| | CRISIL Ltd. | 27,224 | 987 |
| | Relaxo Footwears Ltd. | 80,276 | 938 |
| | KEC International Ltd. | 141,401 | 753 |
| | Balaji Amines Ltd. | 11,750 | 429 |
| | Caplin Point Laboratories Ltd. | 26,722 | 234 |
| | | Shares | Market
Value•
($000) |
| * | Yes Bank Ltd. | 545,158 | 103 |
| | | | 272,089 |
| Indonesia (1.0%) |
| | Bank Central Asia Tbk PT | 62,874,000 | 35,541 |
| Ireland (0.4%) |
| | Kerry Group plc Class A | 177,065 | 15,379 |
| Israel (0.0%) |
| | Matrix IT Ltd. | 38,437 | 829 |
| Italy (0.4%) |
| | Recordati Industria Chimica e Farmaceutica SpA | 114,866 | 4,316 |
| | DiaSorin SpA | 29,825 | 3,899 |
| | Interpump Group SpA | 94,287 | 3,650 |
| | Reply SpA | 25,761 | 2,802 |
| | | | 14,667 |
| Japan (15.2%) |
| | Shin-Etsu Chemical Co. Ltd. | 472,700 | 49,128 |
| | Tokio Marine Holdings Inc. | 2,314,300 | 41,901 |
| | Nippon Telegraph & Telephone Corp. | 1,354,900 | 37,369 |
| | Murata Manufacturing Co. Ltd. | 726,380 | 34,386 |
| | Seven & i Holdings Co. Ltd. | 905,300 | 33,793 |
| | Astellas Pharma Inc. | 2,078,000 | 28,673 |
| | Terumo Corp. | 860,176 | 26,105 |
| | Kao Corp. | 538,600 | 20,118 |
| | Aeon Co. Ltd. | 987,600 | 18,419 |
| | Asahi Group Holdings Ltd. | 575,743 | 16,110 |
| | Unicharm Corp. | 500,400 | 15,208 |
| | Shionogi & Co. Ltd. | 321,300 | 14,920 |
| | M3 Inc. | 485,400 | 14,465 |
| | Sekisui House Ltd. | 772,600 | 12,827 |
| | Obic Co. Ltd. | 75,500 | 11,330 |
| | Nomura Research Institute Ltd. | 506,300 | 11,205 |
| | Yakult Honsha Co. Ltd. | 181,800 | 10,072 |
| | Pan Pacific International Holdings Corp. | 605,564 | 9,938 |
| | Nitto Denko Corp. | 171,000 | 9,009 |
| | Nitori Holdings Co. Ltd. | 98,801 | 8,953 |
| | Nissan Chemical Corp. | 159,732 | 7,190 |
| | TIS Inc. | 258,300 | 6,964 |
| | Hulic Co. Ltd. | 685,275 | 4,978 |
| | Chiba Bank Ltd. | 836,700 | 4,584 |
| | Kurita Water Industries Ltd. | 121,300 | 4,440 |
| | MonotaRO Co. Ltd. | 277,467 | 4,212 |
| | Azbil Corp. | 146,600 | 3,984 |
| | Nippon Sanso Holdings Corp. | 242,200 | 3,856 |
| | GMO Payment Gateway Inc. | 50,300 | 3,617 |
| | Kobayashi Pharmaceutical Co. Ltd. | 66,900 | 3,550 |
| | Tokyo Tatemono Co. Ltd. | 239,500 | 3,294 |
| | Nisshin Seifun Group Inc. | 297,700 | 3,217 |
| | Rinnai Corp. | 44,884 | 3,055 |
| | Nomura Real Estate Holdings Inc. | 134,980 | 3,051 |
| | Open House Co. Ltd. | 85,400 | 3,038 |
International Dividend Appreciation Index Fund
| | | Shares | Market
Value•
($000) |
| | Hitachi Transport System Ltd. | 47,100 | 2,819 |
| | Hikari Tsushin Inc. | 23,000 | 2,778 |
| | Alfresa Holdings Corp. | 235,400 | 2,710 |
| | SCSK Corp. | 174,200 | 2,570 |
| | Itochu Techno-Solutions Corp. | 108,203 | 2,509 |
| | SHO-BOND Holdings Co. Ltd. | 56,784 | 2,456 |
| | Welcia Holdings Co. Ltd. | 117,400 | 2,454 |
| | COMSYS Holdings Corp. | 134,900 | 2,210 |
| | Goldwin Inc. | 41,800 | 2,183 |
| | Zenkoku Hosho Co. Ltd. | 61,000 | 2,013 |
| | Oracle Corp. Japan | 36,800 | 1,960 |
| | Tokyo Century Corp. | 54,500 | 1,859 |
| | Sundrug Co. Ltd. | 78,724 | 1,831 |
| | EXEO Group Inc. | 117,000 | 1,714 |
| | Aica Kogyo Co. Ltd. | 79,700 | 1,713 |
| | Takara Holdings Inc. | 230,600 | 1,604 |
| | Fujitsu General Ltd. | 68,500 | 1,563 |
| | Fuyo General Lease Co. Ltd. | 25,600 | 1,423 |
| | Mani Inc. | 95,600 | 1,393 |
| | NSD Co. Ltd. | 79,400 | 1,357 |
| | TS Tech Co. Ltd. | 121,100 | 1,266 |
| | Yaoko Co. Ltd. | 28,100 | 1,222 |
| | Benefit One Inc. | 88,300 | 1,222 |
| | Nichias Corp. | 71,200 | 1,098 |
| | Maruwa Co. Ltd. | 9,200 | 1,081 |
| | DTS Corp. | 45,100 | 1,072 |
| | PALTAC Corp. | 36,254 | 1,030 |
| | Shoei Co. Ltd. | 27,700 | 1,022 |
| | Japan Material Co. Ltd. | 75,800 | 998 |
| | Funai Soken Holdings Inc. | 51,500 | 918 |
| | TKC Corp. | 35,800 | 914 |
| | Workman Co. Ltd. | 26,626 | 908 |
| | Kissei Pharmaceutical Co. Ltd. | 48,400 | 855 |
| | Takeuchi Manufacturing Co. Ltd. | 42,400 | 855 |
| | Mizuho Leasing Co. Ltd. | 39,000 | 850 |
| | Seria Co. Ltd. | 52,012 | 850 |
| | Information Services International-Dentsu Ltd. | 26,700 | 817 |
| | Raito Kogyo Co. Ltd. | 58,700 | 801 |
| | Tokyo Steel Manufacturing Co. Ltd. | 90,000 | 773 |
| | Nojima Corp. | 85,000 | 708 |
| | Noevir Holdings Co. Ltd. | 18,900 | 699 |
| | Valor Holdings Co. Ltd. | 58,812 | 680 |
| | Riken Keiki Co. Ltd. | 24,400 | 671 |
| | Create SD Holdings Co. Ltd. | 31,500 | 671 |
| | Takara Bio Inc. | 56,600 | 662 |
| | Kohnan Shoji Co. Ltd. | 31,400 | 657 |
| | Ai Holdings Corp. | 44,070 | 652 |
| | eGuarantee Inc. | 38,900 | 628 |
| | Hogy Medical Co. Ltd. | 27,400 | 608 |
| | Future Corp. | 52,847 | 593 |
| | Kameda Seika Co. Ltd. | 18,900 | 584 |
| | Elecom Co. Ltd. | 61,432 | 569 |
| | Eizo Corp. | 23,400 | 569 |
| | JCU Corp. | 29,300 | 554 |
| | Yellow Hat Ltd. | 46,000 | 552 |
| | Sekisui Jushi Corp. | 48,100 | 551 |
| | Okinawa Cellular Telephone Co. | 28,000 | 529 |
| | | Shares | Market
Value•
($000) |
| | Intage Holdings Inc. | 45,600 | 502 |
| | MCJ Co. Ltd. | 76,700 | 484 |
| | Keihanshin Building Co. Ltd. | 54,200 | 481 |
| | Mitsubishi Research Institute Inc. | 13,600 | 475 |
| | Sanyo Chemical Industries Ltd. | 16,600 | 470 |
| | Tri Chemical Laboratories Inc. | 30,900 | 462 |
| | Aeon Delight Co. Ltd. | 22,700 | 454 |
| | Shizuoka Gas Co. Ltd. | 56,900 | 417 |
| | FULLCAST Holdings Co. Ltd. | 20,500 | 410 |
| | Nippon Parking Development Co. Ltd. | 222,200 | 386 |
| | S Foods Inc. | 20,700 | 379 |
| | Tsurumi Manufacturing Co. Ltd. | 25,500 | 379 |
| | Ricoh Leasing Co. Ltd. | 15,500 | 378 |
| | Retail Partners Co. Ltd. | 41,900 | 345 |
| | Siix Corp. | 44,000 | 339 |
| | Osaka Organic Chemical Industry Ltd. | 24,800 | 331 |
| | Fujicco Co. Ltd. | 24,600 | 315 |
| | Matsuda Sangyo Co. Ltd. | 19,600 | 292 |
| | G-Tekt Corp. | 32,000 | 286 |
| | Mimasu Semiconductor Industry Co. Ltd. | 17,900 | 277 |
| | Elan Corp. | 36,100 | 277 |
| | Fukui Computer Holdings Inc. | 11,100 | 259 |
| | G-7 Holdings Inc. | 26,900 | 258 |
| | Sinko Industries Ltd. | 24,000 | 250 |
| | MarkLines Co. Ltd. | 14,100 | 243 |
| | E-Guardian Inc. | 10,400 | 213 |
| | Value HR Co. Ltd. | 17,800 | 184 |
| | Cresco Ltd. | 15,200 | 177 |
| | Digital Hearts Holdings Co. Ltd. | 12,800 | 175 |
| | WDB Holdings Co. Ltd. | 10,000 | 172 |
| | Creek & River Co. Ltd. | 12,200 | 168 |
| | Members Co. Ltd. | 9,100 | 167 |
| | CTS Co. Ltd. | 29,300 | 158 |
| | Aoyama Zaisan Networks Co. Ltd. | 25,300 | 156 |
| | Densan System Holdings Co. Ltd. | 9,100 | 144 |
| | Furukawa Battery Co. Ltd. | 18,100 | 128 |
| | Japan Best Rescue System Co. Ltd. | 18,300 | 98 |
| | Aval Data Corp. | 5,600 | 92 |
| | Ad-sol Nissin Corp. | 7,800 | 80 |
| | ULS Group Inc. | 3,700 | 78 |
| | | | 569,106 |
| Mexico (0.6%) |
| | America Movil SAB de CV Series L | 21,906,156 | 20,731 |
| | Grupo Elektra SAB de CV | 67,060 | 3,365 |
| | | | 24,096 |
| Netherlands (0.8%) |
| | Wolters Kluwer NV | 297,589 | 31,621 |
| New Zealand (0.2%) |
| | Fisher & Paykel Healthcare Corp. Ltd. | 655,968 | 7,455 |
International Dividend Appreciation Index Fund
| | | Shares | Market
Value•
($000) |
| Norway (0.2%) |
| | TOMRA Systems ASA | 266,630 | 4,307 |
| | Borregaard ASA | 114,190 | 1,535 |
| | | | 5,842 |
| South Korea (0.6%) |
| | NAVER Corp. | 169,138 | 20,063 |
| | LEENO Industrial Inc. | 10,042 | 962 |
| | AfreecaTV Co. Ltd. | 10,061 | 560 |
| | JW Pharmaceutical Corp. | 14,764 | 194 |
| | Interojo Co. Ltd. | 11,291 | 192 |
| | Hanyang Eng Co. Ltd. | 16,670 | 159 |
| | | | 22,130 |
| Sweden (2.4%) |
| | Hexagon AB Class B | 2,421,460 | 23,938 |
| | Assa Abloy AB Class B | 1,128,601 | 22,789 |
| | Swedish Match AB | 1,730,494 | 17,798 |
| | Nibe Industrier AB Class B | 1,746,841 | 13,934 |
| | Castellum AB | 334,609 | 3,826 |
| | AAK AB | 206,130 | 3,005 |
| | Wihlborgs Fastigheter AB | 319,657 | 2,094 |
| | Fabege AB | 198,883 | 1,444 |
| | Atrium Ljungberg AB Class B | 65,726 | 879 |
| | Svolder AB | 123,863 | 643 |
| | | | 90,350 |
| Switzerland (16.9%) |
| | Novartis AG (Registered) | 2,140,599 | 173,155 |
| | Nestle SA (Registered) | 1,391,208 | 151,445 |
| | Roche Holding AG | 450,667 | 149,530 |
| | Sika AG (Registered) | 174,638 | 39,377 |
| | Givaudan SA (Registered) | 9,023 | 26,951 |
| | Partners Group Holding AG | 25,809 | 23,166 |
| | Geberit AG (Registered) | 40,654 | 18,072 |
| | Chocoladefabriken Lindt & Spruengli AG Ptg. Ctf. | 1,209 | 11,603 |
| | Chocoladefabriken Lindt & Spruengli AG (Registered) | 118 | 11,468 |
| | Logitech International SA (Registered) | 196,638 | 9,779 |
| | Roche Holding AG (Bearer) | 12,965 | 5,262 |
| | EMS-Chemie Holding AG (Registered) | 7,758 | 4,878 |
| | Temenos AG (Registered) | 76,926 | 4,582 |
| | DKSH Holding AG | 40,133 | 2,895 |
| | Interroll Holding AG (Registered) | 841 | 1,772 |
| | ALSO Holding AG (Registered) | 7,113 | 1,118 |
| | Orior AG | 7,786 | 543 |
| | | | 635,596 |
| Taiwan (0.4%) |
| | Chailease Holding Co. Ltd. | 1,708,582 | 7,881 |
| | Advantech Co. Ltd. | 498,000 | 4,512 |
| | | Shares | Market
Value•
($000) |
| | Sinbon Electronics Co. Ltd. | 237,000 | 1,840 |
| | ASPEED Technology Inc. | 34,104 | 1,768 |
| | | | 16,001 |
| United Kingdom (7.8%) |
| | Diageo plc | 2,648,063 | 108,974 |
| | RELX plc | 2,250,139 | 60,440 |
| | Ashtead Group plc | 510,669 | 26,602 |
| | Croda International plc | 162,506 | 12,589 |
| | Bunzl plc | 383,282 | 12,489 |
| | Halma plc | 431,835 | 10,472 |
| | Sage Group plc | 1,250,848 | 10,426 |
| | Spirax-Sarco Engineering plc | 83,830 | 10,331 |
| | Smurfit Kappa Group plc (XDUB) | 296,077 | 9,801 |
| | DCC plc | 116,124 | 6,445 |
| | Spectris plc | 131,294 | 4,551 |
| | Diploma plc | 142,836 | 4,063 |
| | Dechra Pharmaceuticals plc | 131,166 | 3,943 |
| | B&M European Value Retail SA | 980,354 | 3,623 |
| | Genus plc | 75,431 | 2,205 |
| | Cranswick plc | 62,108 | 2,120 |
| | Sirius Real Estate Ltd. | 1,478,552 | 1,196 |
| | Clarkson plc | 32,837 | 1,039 |
| | Avon Protection plc | 36,346 | 433 |
| | | | 291,742 |
Total Common Stocks
(Cost $4,187,407) | 3,739,128 |
| Temporary Cash Investments (0.2%) |
| Money Market Fund (0.2%) |
| 2,3 | Vanguard Market Liquidity Fund, 3.117% (Cost $9,257) | 92,588 | 9,257 |
| Total Investments (99.7%) (Cost $4,196,664) | 3,748,385 |
| Other Assets and Liabilities—Net (0.3%) | 9,702 |
| Net Assets (100%) | 3,758,087 |
| Cost is in $000. |
| • | See Note A in Notes to Financial Statements. |
| * | Non-income-producing security. |
| 1 | Includes partial security positions on loan to broker-dealers. The total value of securities on loan is $6,949,000. |
| 2 | Affiliated money market fund available only to Vanguard funds and certain trusts and accounts managed by Vanguard. Rate shown is the 7-day yield. |
| 3 | Collateral of $7,378,000 was received for securities on loan. |
| | ADR—American Depositary Receipt. |
| | Ptg. Ctf.—Participating Certificates. |
International Dividend Appreciation Index Fund
Derivative Financial Instruments Outstanding as of Period End
| Futures Contracts |
| | | | ($000) |
| | Expiration | Number of
Long (Short)
Contracts | Notional
Amount | Value and
Unrealized
Appreciation
(Depreciation) |
| Long Futures Contracts | | | | |
| E-mini S&P 500 Index | December 2022 | 16 | 3,106 | 33 |
| Euro Stoxx 50 Index | December 2022 | 174 | 6,221 | 169 |
| MSCI Emerging Markets Index | December 2022 | 110 | 4,695 | (389) |
| Topix Index | December 2022 | 34 | 4,404 | 62 |
| | | | | (125) |
| Forward Currency Contracts |
| | Contract
Settlement
Date | Contract Amount (000) | Unrealized
Appreciation
($000) | Unrealized
Depreciation
($000) |
| Counterparty | Receive | Deliver |
| Bank of America, N.A. | 12/21/22 | EUR | 4,694 | USD | 4,719 | — | (60) |
| Bank of America, N.A. | 12/21/22 | INR | 242,527 | USD | 3,011 | — | (94) |
| Standard Chartered Bank | 12/21/22 | JPY | 388,888 | USD | 2,757 | — | (124) |
| Bank of America, N.A. | 12/21/22 | USD | 9,647 | CHF | 9,408 | 191 | — |
| Bank of America, N.A. | 12/21/22 | USD | 2,134 | GBP | 1,846 | 13 | — |
| State Street Bank & Trust Co. | 12/21/22 | USD | 2,137 | JPY | 306,329 | 63 | — |
| | | | | | | 267 | (278) |
| CHF—Swiss franc. |
| EUR—euro. |
| GBP—British pound. |
| INR—Indian rupee. |
| JPY—Japanese yen. |
| USD—U.S. dollar. |
See accompanying Notes, which are an integral part of the Financial Statements.
International Dividend Appreciation Index Fund
Statement of Assets and Liabilities
|
| ($000s, except shares and per-share amounts) | Amount |
| Assets | |
| Investments in Securities, at Value1 | |
| Unaffiliated Issuers (Cost $4,187,407) | 3,739,128 |
| Affiliated Issuers (Cost $9,257) | 9,257 |
| Total Investments in Securities | 3,748,385 |
| Investment in Vanguard | 144 |
| Cash Collateral Pledged—Futures Contracts | 1,265 |
| Cash Collateral Pledged—Forward Currency Contracts | 10 |
| Cash Collateral Received for ETF Capital Activity | 2,701 |
| Foreign Currency, at Value (Cost $2,319) | 2,212 |
| Receivables for Accrued Income | 14,812 |
| Receivables for Capital Shares Issued | 1,620 |
| Variation Margin Receivable—Futures Contracts | 514 |
| Unrealized Appreciation—Forward Currency Contracts | 267 |
| Total Assets | 3,771,930 |
| Liabilities | |
| Due to Custodian | 505 |
| Payables for Investment Securities Purchased | 60 |
| Collateral for Securities on Loan | 7,378 |
| Collateral for ETF Capital Activity | 2,701 |
| Payables for Capital Shares Redeemed | 72 |
| Payables to Vanguard | 327 |
| Unrealized Depreciation—Forward Currency Contracts | 278 |
| Deferred Foreign Capital Gains Taxes | 2,522 |
| Total Liabilities | 13,843 |
| Net Assets | 3,758,087 |
| 1 Includes $6,949 of securities on loan. | |
International Dividend Appreciation Index Fund
Statement of Assets and Liabilities (continued)
|
| At October 31, 2022, net assets consisted of: | |
| ($000s, except shares and per-share amounts) | Amount |
| Paid-in Capital | 4,221,762 |
| Total Distributable Earnings (Loss) | (463,675) |
| Net Assets | 3,758,087 |
| |
| ETF Shares—Net Assets | |
Applicable to 54,713,032 outstanding $.001 par value shares of
beneficial interest (unlimited authorization) | 3,508,348 |
| Net Asset Value Per Share—ETF Shares | $64.12 |
| |
| Admiral Shares—Net Assets | |
Applicable to 7,995,579 outstanding $.001 par value shares of
beneficial interest (unlimited authorization) | 249,739 |
| Net Asset Value Per Share—Admiral Shares | $31.23 |
See accompanying Notes, which are an integral part of the Financial Statements.
International Dividend Appreciation Index Fund
|
| | Year Ended
October 31, 2022 |
| | ($000) |
| Investment Income | |
| Income | |
| Dividends1 | 78,128 |
| Non-Cash Dividends | 5,109 |
| Interest2 | 50 |
| Securities Lending—Net | 154 |
| Total Income | 83,441 |
| Expenses | |
| The Vanguard Group—Note B | |
| Investment Advisory Services | 418 |
| Management and Administrative—ETF Shares | 4,690 |
| Management and Administrative—Admiral Shares | 387 |
| Marketing and Distribution—ETF Shares | 176 |
| Marketing and Distribution—Admiral Shares | 13 |
| Custodian Fees | 334 |
| Auditing Fees | 40 |
| Shareholders’ Reports—ETF Shares | 138 |
| Shareholders’ Reports—Admiral Shares | 9 |
| Trustees’ Fees and Expenses | 2 |
| Other Expenses | 112 |
| Total Expenses | 6,319 |
| Expenses Paid Indirectly | (8) |
| Net Expenses | 6,311 |
| Net Investment Income | 77,130 |
| Realized Net Gain (Loss) | |
| Investment Securities Sold2,3,4 | (14,976) |
| Futures Contracts | (4,573) |
| Forward Currency Contracts | (188) |
| Foreign Currencies | (1,432) |
| Realized Net Gain (Loss) | (21,169) |
International Dividend Appreciation Index Fund
| Statement of Operations (continued) |
| | Year Ended
October 31, 2022 |
| | ($000) |
| Change in Unrealized Appreciation (Depreciation) | |
| Investment Securities2,5 | (1,129,412) |
| Futures Contracts | (167) |
| Forward Currency Contracts | 315 |
| Foreign Currencies | (1,189) |
| Change in Unrealized Appreciation (Depreciation) | (1,130,453) |
| Net Increase (Decrease) in Net Assets Resulting from Operations | (1,074,492) |
| 1 | Dividends are net of foreign withholding taxes of $9,927,000. |
| 2 | Interest income, realized net gain (loss), capital gain distributions received, and change in unrealized appreciation (depreciation) from an affiliated company of the fund were $43,000, ($16,000), less than $1,000, and less than $1,000, respectively. Purchases and sales are for temporary cash investment purposes. |
| 3 | Realized gain (loss) is net of foreign capital gain taxes of $1,863,000. |
| 4 | Includes $2,826,000 of net gain (loss) resulting from in-kind redemptions. |
| 5 | The change in unrealized appreciation (depreciation) is net of the change in deferred foreign capital gains taxes of ($2,118,000). |
See accompanying Notes, which are an integral part of the Financial Statements.
International Dividend Appreciation Index Fund
Statement of Changes in Net Assets
|
| | Year Ended October 31, |
| | 2022
($000) | 2021
($000) |
| | | |
| Increase (Decrease) in Net Assets | | |
| Operations | | |
| Net Investment Income | 77,130 | 48,504 |
| Realized Net Gain (Loss) | (21,169) | 459,247 |
| Change in Unrealized Appreciation (Depreciation) | (1,130,453) | 351,103 |
| Net Increase (Decrease) in Net Assets Resulting from Operations | (1,074,492) | 858,854 |
| Distributions | | |
| ETF Shares | (304,771) | (39,771) |
| Admiral Shares | (23,591) | (3,300) |
| Total Distributions | (328,362) | (43,071) |
| Capital Share Transactions | | |
| ETF Shares | 662,695 | 943,215 |
| Admiral Shares | 25,028 | 38,209 |
| Net Increase (Decrease) from Capital Share Transactions | 687,723 | 981,424 |
| Total Increase (Decrease) | (715,131) | 1,797,207 |
| Net Assets | | |
| Beginning of Period | 4,473,218 | 2,676,011 |
| End of Period | 3,758,087 | 4,473,218 |
See accompanying Notes, which are an integral part of the Financial Statements.
International Dividend Appreciation Index Fund
| ETF Shares | | | | | |
For a Share Outstanding
Throughout Each Period | Year Ended October 31, |
| 2022 | 2021 | 2020 | 2019 | 2018 |
| Net Asset Value, Beginning of Period | $89.86 | $69.97 | $68.72 | $58.65 | $64.25 |
| Investment Operations | | | | | |
| Net Investment Income1 | 1.401 | 1.094 | .958 | 1.4522 | 1.196 |
| Net Realized and Unrealized Gain (Loss) on Investments3 | (20.753) | 19.776 | 1.551 | 9.578 | (5.623) |
| Total from Investment Operations | (19.352) | 20.870 | 2.509 | 11.030 | (4.427) |
| Distributions | | | | | |
| Dividends from Net Investment Income | (1.206) | (.980) | (1.259) | (.960) | (1.173) |
| Distributions from Realized Capital Gains | (5.182) | — | — | — | — |
| Total Distributions | (6.388) | (.980) | (1.259) | (.960) | (1.173) |
| Net Asset Value, End of Period | $64.12 | $89.86 | $69.97 | $68.72 | $58.65 |
| Total Return | -22.90% | 29.93% | 3.73% | 18.96% | -7.04% |
| Ratios/Supplemental Data | | | | | |
| Net Assets, End of Period (Millions) | $3,508 | $4,150 | $2,456 | $1,305 | $861 |
| Ratio of Total Expenses to Average Net Assets | 0.15%4 | 0.15% | 0.20% | 0.20% | 0.25% |
| Ratio of Net Investment Income to Average Net Assets | 1.87% | 1.28% | 1.40% | 2.24%2 | 1.83% |
| Portfolio Turnover Rate5 | 22% | 65% | 17% | 42% | 36% |
| 1 | Calculated based on average shares outstanding. |
| 2 | Net investment income per share and the ratio of net investment income to average net assets include $.388 and 0.65%, respectively, resulting from a special dividend from Naspers Ltd. in September 2019. |
| 3 | Includes increases from purchase and redemption fees of $.00, $.00, $.01, $.02, and $.02. |
| 4 | The ratio of expenses to average net assets for the period net of reduction from custody fee offset arrangements was 0.15%. |
| 5 | Excludes the value of portfolio securities received or delivered as a result of in-kind purchases or redemptions of the fund’s capital shares, including ETF Creation Units. |
See accompanying Notes, which are an integral part of the Financial Statements.
International Dividend Appreciation Index Fund
| Admiral Shares | | | | | |
For a Share Outstanding
Throughout Each Period | Year Ended October 31, |
| 2022 | 2021 | 2020 | 2019 | 2018 |
| Net Asset Value, Beginning of Period | $43.72 | $34.03 | $33.42 | $28.52 | $31.24 |
| Investment Operations | | | | | |
| Net Investment Income1 | .675 | .518 | .453 | .6862 | .576 |
| Net Realized and Unrealized Gain (Loss) on Investments3 | (10.061) | 9.645 | .765 | 4.679 | (2.727) |
| Total from Investment Operations | (9.386) | 10.163 | 1.218 | 5.365 | (2.151) |
| Distributions | | | | | |
| Dividends from Net Investment Income | (.583) | (.473) | (.608) | (.465) | (.569) |
| Distributions from Realized Capital Gains | (2.521) | — | — | — | — |
| Total Distributions | (3.104) | (.473) | (.608) | (.465) | (.569) |
| Net Asset Value, End of Period | $31.23 | $43.72 | $34.03 | $33.42 | $28.52 |
| Total Return4 | -22.85% | 29.96% | 3.72% | 18.96% | -7.03% |
| Ratios/Supplemental Data | | | | | |
| Net Assets, End of Period (Millions) | $250 | $323 | $220 | $218 | $175 |
| Ratio of Total Expenses to Average Net Assets | 0.16%5 | 0.16% | 0.20% | 0.20% | 0.25% |
| Ratio of Net Investment Income to Average Net Assets | 1.85% | 1.25% | 1.36% | 2.24%2 | 1.83% |
| Portfolio Turnover Rate6 | 22% | 65% | 17% | 42% | 36% |
| 1 | Calculated based on average shares outstanding. |
| 2 | Net investment income per share and the ratio of net investment income to average net assets include $.188 and 0.65%, respectively, resulting from a special dividend from Naspers Ltd. in September 2019. |
| 3 | Includes increases from purchase and redemption fees of $.00, $.00, $.00, $.00, and $.01. |
| 4 | Total returns do not include transaction or account service fees that may have applied in the periods shown. Fund prospectuses provide information about any applicable transaction and account service fees. |
| 5 | The ratio of expenses to average net assets for the period net of reduction from custody fee offset arrangements was 0.16%. |
| 6 | Excludes the value of portfolio securities received or delivered as a result of in-kind purchases or redemptions of the fund’s capital shares, including ETF Creation Units. |
See accompanying Notes, which are an integral part of the Financial Statements.
International Dividend Appreciation Index Fund
Notes to Financial Statements
Vanguard International Dividend Appreciation Index Fund is registered under the Investment Company Act of 1940 as an open-end investment company, or mutual fund. The fund offers two classes of shares: ETF Shares and Admiral Shares. Each of the share classes has different eligibility and minimum purchase requirements, and is designed for different types of investors. ETF Shares are listed for trading on Nasdaq; they can be purchased and sold through a broker.
The fund invests in securities of foreign issuers, which may subject it to investment risks not normally associated with investing in securities of U.S. corporations. Significant market disruptions, such as those caused by pandemics (e.g., COVID-19 pandemic), natural or environmental disasters, war (e.g., Russia’s invasion of Ukraine), acts of terrorism, or other events, can adversely affect local and global markets and normal market operations. Any such disruptions could have an adverse impact on the value of the fund’s investments and fund performance.
| A. | The following significant accounting policies conform to generally accepted accounting principles for U.S. investment companies. The fund consistently follows such policies in preparing its financial statements. |
1. Security Valuation: Securities are valued as of the close of trading on the New York Stock Exchange (generally 4 p.m., Eastern time) on the valuation date. Equity securities are valued at the latest quoted sales prices or official closing prices taken from the primary market in which each security trades; such securities not traded on the valuation date are valued at the mean of the latest quoted bid and asked prices. Securities for which market quotations are not readily available, or whose values have been affected by events occurring before the fund’s pricing time but after the close of the securities’ primary markets, are valued by methods deemed by the valuation designee to represent fair value and subject to oversight by the board of trustees. These procedures include obtaining quotations from an independent pricing service, monitoring news to identify significant market- or security-specific events, and evaluating changes in the values of foreign market proxies (for example, ADRs, futures contracts, or exchange-traded funds), between the time the foreign markets close and the fund’s pricing time. When fair-value pricing is employed, the prices of securities used by a fund to calculate its net asset value may differ from quoted or published prices for the same securities. Investments in Vanguard Market Liquidity Fund are valued at that fund's net asset value.
2. Foreign Currency: Securities and other assets and liabilities denominated in foreign currencies are translated into U.S. dollars using exchange rates obtained from an independent third party as of the fund’s pricing time on the valuation date. Realized gains (losses) and unrealized appreciation (depreciation) on investment securities include the effects of changes in exchange rates since the securities were purchased, combined with the effects of changes in security prices. Fluctuations in the value of other assets and liabilities resulting from changes in exchange rates are recorded as unrealized foreign currency gains (losses) until the assets or liabilities are settled in cash, at which time they are recorded as realized foreign currency gains (losses).
3. Futures Contracts: The fund uses index futures contracts to a limited extent, with the objectives of maintaining full exposure to the stock market, maintaining liquidity, and minimizing transaction costs. The fund may purchase futures contracts to immediately invest incoming cash in the market, or sell futures in response to cash outflows, thereby simulating a fully invested position in the underlying index while maintaining a cash balance for liquidity. The primary risks associated with the use of futures contracts are imperfect correlation between changes in market values of stocks held by the fund and the prices of futures contracts, and the possibility of an illiquid market.
International Dividend Appreciation Index Fund
Counterparty risk involving futures is mitigated because a regulated clearinghouse is the counterparty instead of the clearing broker. To further mitigate counterparty risk, the fund trades futures contracts on an exchange, monitors the financial strength of its clearing brokers and clearinghouse, and has entered into clearing agreements with its clearing brokers. The clearinghouse imposes initial margin requirements to secure the fund’s performance and requires daily settlement of variation margin representing changes in the market value of each contract. Any securities pledged as initial margin for open contracts are noted in the Schedule of Investments.
Futures contracts are valued at their quoted daily settlement prices. The notional amounts of the contracts are not recorded in the Statement of Assets and Liabilities. Fluctuations in the value of the contracts are recorded in the Statement of Assets and Liabilities as an asset (liability) and in the Statement of Operations as unrealized appreciation (depreciation) until the contracts are closed, when they are recorded as realized gains (losses) on futures contracts.
During the year ended October 31, 2022, the fund’s average investments in long and short futures contracts represented less than 1% and 0% of net assets, respectively, based on the average of the notional amounts at each quarter-end during the period.
4. Forward Currency Contracts: The fund enters into forward currency contracts to protect the value of securities and related receivables and payables against changes in future foreign exchange rates. The fund’s risks in using these contracts include movement in the values of the foreign currencies relative to the U.S. dollar and the ability of the counterparties to fulfill their obligations under the contracts. The fund mitigates its counterparty risk by entering into forward currency contracts only with a diverse group of prequalified counterparties, monitoring their financial strength, entering into master netting arrangements with its counterparties, and requiring its counterparties to transfer collateral as security for their performance. In the absence of a default, the collateral pledged or received by the fund cannot be repledged, resold, or rehypothecated. The master netting arrangements provide that, in the event of a counterparty’s default (including bankruptcy), the fund may terminate the forward currency contracts, determine the net amount owed by either party in accordance with its master netting arrangements, and sell or retain any collateral held up to the net amount owed to the fund under the master netting arrangements. The forward currency contracts contain provisions whereby a counterparty may terminate open contracts if the fund’s net assets decline below a certain level, triggering a payment by the fund if the fund is in a net liability position at the time of the termination. The payment amount would be reduced by any collateral the fund has pledged. Any securities pledged as collateral for open contracts are noted in the Schedule of Investments. The value of collateral received or pledged is compared daily to the value of the forward currency contracts exposure with each counterparty, and any difference, if in excess of a specified minimum transfer amount, is adjusted and settled within two business days.
Forward currency contracts are valued at their quoted daily prices obtained from an independent third party, adjusted for currency risk based on the expiration date of each contract. The notional amounts of the contracts are not recorded in the Statement of Assets and Liabilities. Fluctuations in the value of the contracts are recorded in the Statement of Assets and Liabilities as an asset (liability) and in the Statement of Operations as unrealized appreciation (depreciation) until the contracts are closed, when they are recorded as realized gains (losses) on forward currency contracts.
International Dividend Appreciation Index Fund
During the year ended October 31, 2022, the fund’s average investment in forward currency contracts represented 1% of net assets, based on the average of the notional amounts at each quarter-end during the period.
5. Federal Income Taxes: The fund intends to continue to qualify as a regulated investment company and distribute virtually all of its taxable income. The fund’s tax returns are open to examination by the relevant tax authorities until expiration of the applicable statute of limitations, which is generally three years after the filing of the tax return. Management has analyzed the fund’s tax positions taken for all open federal and state income tax years, and has concluded that no provision for income tax is required in the fund’s financial statements.
6. Distributions: Distributions to shareholders are recorded on the ex-dividend date. Distributions are determined on a tax basis at the fiscal year-end and may differ from net investment income and realized capital gains for financial reporting purposes.
7. Securities Lending: To earn additional income, the fund lends its securities to qualified institutional borrowers. Security loans are subject to termination by the fund at any time, and are required to be secured at all times by collateral in an amount at least equal to the market value of securities loaned. Daily market fluctuations could cause the value of loaned securities to be more or less than the value of the collateral received. When this occurs, the collateral is adjusted and settled before the opening of the market on the next business day. The fund further mitigates its counterparty risk by entering into securities lending transactions only with a diverse group of prequalified counterparties, monitoring their financial strength, and entering into master securities lending agreements with its counterparties. The master securities lending agreements provide that, in the event of a counterparty’s default (including bankruptcy), the fund may terminate any loans with that borrower, determine the net amount owed, and sell or retain the collateral up to the net amount owed to the fund; however, such actions may be subject to legal proceedings. While collateral mitigates counterparty risk, in the event of a default, the fund may experience delays and costs in recovering the securities loaned. The fund invests cash collateral received in Vanguard Market Liquidity Fund, and records a liability in the Statement of Assets and Liabilities for the return of the collateral, during the period the securities are on loan. Collateral investments in Vanguard Market Liquidity Fund are subject to market appreciation or depreciation. Securities lending income represents fees charged to borrowers plus income earned on invested cash collateral, less expenses associated with the loan. During the term of the loan, the fund is entitled to all distributions made on or in respect of the loaned securities.
8. Collateral for ETF Capital Activity: When an authorized participant fails to deliver one or more of the securities within a designated basket (in the case of a subscription), fails to deliver the fund ETF Shares (in the case of a redemption), or is required by the fund, prior to settlement, to accommodate the trading of foreign securities in local markets (in the case of redemption for an international equity ETF), the fund may require the authorized participant to deliver and maintain cash collateral in accordance with the authorized participant agreement. The fund may invest the collateral in short-term debt instruments or U.S. Treasury securities, or maintain the balance as cash. Daily market fluctuations could cause the value of the missing securities or fund ETF Shares to be more or less than the value of the collateral received; when this occurs the collateral is adjusted. The fund earns interest income from investments and/or custody fee offsets from the cash balance. The fund records an asset (cash or investment, as applicable) and a corresponding liability for the return of the collateral in the Statement of Assets and Liabilities. Interest income and custody fee offsets earned on the investment of collateral are included in the Statement of Operations.
International Dividend Appreciation Index Fund
9. Credit Facilities and Interfund Lending Program: The fund and certain other funds managed by The Vanguard Group ("Vanguard") participate in a $4.4 billion committed credit facility provided by a syndicate of lenders pursuant to a credit agreement and an uncommitted credit facility provided by Vanguard. Both facilities may be renewed annually. Each fund is individually liable for its borrowings, if any, under the credit facilities. Borrowings may be utilized for temporary or emergency purposes and are subject to the fund’s regulatory and contractual borrowing restrictions. With respect to the committed credit facility, the participating funds are charged administrative fees and an annual commitment fee of 0.10% of the undrawn committed amount of the facility, which are allocated to the funds based on a method approved by the fund’s board of trustees and included in Management and Administrative expenses on the fund’s Statement of Operations. Any borrowings under either facility bear interest at an agreed-upon spread plus the higher of the federal funds effective rate, the overnight bank funding rate, or the Daily Simple Secured Overnight Financing Rate inclusive of an additional agreed-upon spread. However, borrowings under the uncommitted credit facility may bear interest based upon an alternate rate agreed to by the fund and Vanguard.
In accordance with an exemptive order (the “Order”) from the SEC, the fund may participate in a joint lending and borrowing program that allows registered open-end Vanguard funds to borrow money from and lend money to each other for temporary or emergency purposes (the “Interfund Lending Program”), subject to compliance with the terms and conditions of the Order, and to the extent permitted by the fund’s investment objective and investment policies. Interfund loans and borrowings normally extend overnight but can have a maximum duration of seven days. Loans may be called on one business day’s notice. The interest rate to be charged is governed by the conditions of the Order and internal procedures adopted by the board of trustees. The board of trustees is responsible for overseeing the Interfund Lending Program.
For the year ended October 31, 2022, the fund did not utilize the credit facilities or the Interfund Lending Program.
10. Other: Dividend income is recorded on the ex-dividend date. Non-cash dividends included in income, if any, are recorded at the fair value of the securities received. Interest income includes income distributions received from Vanguard Market Liquidity Fund and is accrued daily. Security transactions are accounted for on the date securities are bought or sold. Costs used to determine realized gains (losses) on the sale of investment securities are those of the specific securities sold. Fees assessed on capital share transactions are credited to paid-in capital.
Taxes on foreign dividends and capital gains have been provided for in accordance with the fund's understanding of the applicable countries' tax rules and rates. Deferred foreign capital gains tax, if any, is accrued daily based upon net unrealized gains. The fund has filed tax reclaims for previously withheld taxes on dividends earned in certain European Union countries. These filings are subject to various administrative and judicial proceedings within these countries. Amounts related to these reclaims are recorded when there are no significant uncertainties as to the ultimate resolution of proceedings, the likelihood of receipt of these reclaims, and the potential timing of payment. Such tax reclaims and related professional fees, if any, are included in dividend income and other expenses, respectively.
Each class of shares has equal rights as to assets and earnings, except that each class separately bears certain class-specific expenses related to maintenance of shareholder accounts (included in Management and Administrative expenses) and shareholder reporting. Marketing and distribution expenses are allocated to each class of shares based on a method approved by the board of
International Dividend Appreciation Index Fund
trustees. Income, other non-class-specific expenses, and gains and losses on investments are allocated to each class of shares based on its relative net assets.
| B. | In accordance with the terms of a Funds' Service Agreement (the “FSA”) between Vanguard and the fund, Vanguard furnishes to the fund investment advisory, corporate management, administrative, marketing, and distribution services at Vanguard’s cost of operations (as defined by the FSA). These costs of operations are allocated to the fund based on methods and guidelines approved by the board of trustees and are generally settled twice a month. |
Upon the request of Vanguard, the fund may invest up to 0.40% of its net assets as capital in Vanguard. At October 31, 2022, the fund had contributed to Vanguard capital in the amount of $144,000, representing less than 0.01% of the fund’s net assets and 0.06% of Vanguard’s capital received pursuant to the FSA. The fund’s trustees and officers are also directors and employees, respectively, of Vanguard.
| C. | The fund’s custodian bank has agreed to reduce its fees when the fund maintains cash on deposit in the non-interest-bearing custody account. For the year ended October 31, 2022, custodian fee offset arrangements reduced the fund’s expenses by $8,000 (an annual rate of less than 0.01% of average net assets). |
| D. | Various inputs may be used to determine the value of the fund’s investments and derivatives. These inputs are summarized in three broad levels for financial statement purposes. The inputs or methodologies used to value securities are not necessarily an indication of the risk associated with investing in those securities. |
Level 1—Quoted prices in active markets for identical securities.
Level 2—Other significant observable inputs (including quoted prices for similar securities, interest rates, prepayment speeds, credit risk, etc.).
Level 3—Significant unobservable inputs (including the fund’s own assumptions used to determine the fair value of investments). Any investments and derivatives valued with significant unobservable inputs are noted on the Schedule of Investments.
International Dividend Appreciation Index Fund
The following table summarizes the market value of the fund’s investments and derivatives as of October 31, 2022, based on the inputs used to value them:
| | Level 1
($000) | Level 2
($000) | Level 3
($000) | Total
($000) |
| Investments | | | | |
| Assets | | | | |
| Common Stocks—North and South America | 702,948 | — | — | 702,948 |
| Common Stocks—Other | 60,128 | 2,976,052 | — | 3,036,180 |
| Temporary Cash Investments | 9,257 | — | — | 9,257 |
| Total | 772,333 | 2,976,052 | — | 3,748,385 |
| Derivative Financial Instruments | | | | |
| Assets | | | | |
| Futures Contracts1 | 264 | — | — | 264 |
| Forward Currency Contracts | — | 267 | — | 267 |
| Total | 264 | 267 | — | 531 |
| Liabilities | | | | |
| Futures Contracts1 | 389 | — | — | 389 |
| Forward Currency Contracts | — | 278 | — | 278 |
| Total | 389 | 278 | — | 667 |
| 1 | Includes cumulative appreciation (depreciation) on futures contracts and centrally cleared swaps, if any, as reported in the Schedule of Investments. Only current day’s variation margin is reported within the Statement of Assets and Liabilities. |
| E. | At October 31, 2022, the fair values of derivatives were reflected in the Statement of Assets and Liabilities as follows: |
| Statement of Assets and Liabilities | Equity
Contracts
($000) | Foreign
Exchange
Contracts
($000) | Total
($000) |
| Unrealized Appreciation—Futures Contracts1 | 264 | — | 264 |
| Unrealized Appreciation—Forward Currency Contracts | — | 267 | 267 |
| Total Assets | 264 | 267 | 531 |
| | | | |
| Unrealized Depreciation—Futures Contracts1 | 389 | — | 389 |
| Unrealized Depreciation—Forward Currency Contracts | — | 278 | 278 |
| Total Liabilities | 389 | 278 | 667 |
| 1 | Includes cumulative appreciation (depreciation) on futures contracts and centrally cleared swaps, if any, as reported in the Schedule of Investments. Only current day’s variation margin is reported within the Statement of Assets and Liabilities. |
International Dividend Appreciation Index Fund
Realized net gain (loss) and the change in unrealized appreciation (depreciation) on derivatives for the year ended October 31, 2022, were:
| Realized Net Gain (Loss) on Derivatives | Equity
Contracts
($000) | Foreign
Exchange
Contracts
($000) | Total
($000) |
| Futures Contracts | (4,573) | — | (4,573) |
| Forward Currency Contracts | — | (188) | (188) |
| Realized Net Gain (Loss) on Derivatives | (4,573) | (188) | (4,761) |
| Change in Unrealized Appreciation (Depreciation) on Derivatives |
| Futures Contracts | (167) | — | (167) |
| Forward Currency Contracts | — | 315 | 315 |
| Change in Unrealized Appreciation (Depreciation) on Derivatives | (167) | 315 | 148 |
| F. | Permanent differences between book-basis and tax-basis components of net assets are reclassified among capital accounts in the financial statements to reflect their tax character. These reclassifications have no effect on net assets or net asset value per share. As of period end, permanent differences primarily attributable to the accounting for applicable in-kind redemptions, foreign currency transactions, passive foreign investment companies, and tax expense on capital gains were reclassified between the following accounts: |
| | Amount
($000) |
| Paid-in Capital | 2,804 |
| Total Distributable Earnings (Loss) | (2,804) |
Temporary differences between book-basis and tax-basis components of total distributable earnings (loss) arise when certain items of income, gain, or loss are recognized in different periods for financial statement and tax purposes; these differences will reverse at some time in the future. The differences are primarily related to the deferral of losses from wash sales; the recognition of unrealized gains or losses from certain derivative contracts; and the recognition of unrealized gains from passive foreign investment companies. As of period end, the tax-basis components of total distributable earnings (loss) are detailed in the table as follows:
| | Amount
($000) |
| Undistributed Ordinary Income | 22,886 |
| Undistributed Long-Term Gains | — |
| Capital Loss Carryforwards | (27,589) |
| Qualified Late-Year Losses | — |
| Net Unrealized Gains (Losses) | (459,731) |
International Dividend Appreciation Index Fund
The tax character of distributions paid was as follows:
| | Year Ended October 31, |
| | 2022
Amount
($000) | 2021
Amount
($000) |
| Ordinary Income* | 197,526 | 43,071 |
| Long-Term Capital Gains | 130,836 | — |
| Total | 328,362 | 43,071 |
| * | Includes short-term capital gains, if any. |
As of October 31, 2022, gross unrealized appreciation and depreciation for investments and derivatives based on cost for U.S. federal income tax purposes were as follows:
| | Amount
($000) |
| Tax Cost | 4,204,800 |
| Gross Unrealized Appreciation | 274,108 |
| Gross Unrealized Depreciation | (730,462) |
| Net Unrealized Appreciation (Depreciation) | (456,354) |
| G. | During the year ended October 31, 2022, the fund purchased $1,461,909,000 of investment securities and sold $1,019,831,000 of investment securities, other than temporary cash investments. Purchases and sales include $564,139,000 and $12,559,000, respectively, in connection with in-kind purchases and redemptions of the fund's capital shares. |
| H. | Capital share transactions for each class of shares were: |
| | Year Ended October 31, | |
| | 2022 | | 2021 |
| | Amount
($000) | Shares
(000) | | Amount
($000) | Shares
(000) |
| ETF Shares | | | | | |
| Issued1 | 676,377 | 8,730 | | 1,155,426 | 13,632 |
| Issued in Lieu of Cash Distributions | — | — | | — | — |
| Redeemed2 | (13,682) | (200) | | (212,211) | (2,550) |
| Net Increase (Decrease)—ETF Shares | 662,695 | 8,530 | | 943,215 | 11,082 |
| Admiral Shares | | | | | |
| Issued1 | 65,935 | 1,814 | | 69,649 | 1,698 |
| Issued in Lieu of Cash Distributions | 20,104 | 513 | | 2,725 | 66 |
| Redeemed2 | (61,011) | (1,723) | | (34,165) | (833) |
| Net Increase (Decrease)—Admiral Shares | 25,028 | 604 | | 38,209 | 931 |
| 1 | Includes purchase fees for fiscal 2022 and 2021 of $200,000 and $175,000, respectively (fund totals). |
| 2 | Net of redemption fees for fiscal 2022 and 2021 of $203,000 and $80,000, respectively (fund totals). |
| I. | Management has determined that no events or transactions occurred subsequent to October 31, 2022, that would require recognition or disclosure in these financial statements. |
International High Dividend Yield Index Fund
All of the returns in this report represent past performance, which is not a guarantee of future results that may be achieved by the fund. (Current performance may be lower or higher than the performance data cited. For performance data current to the most recent month-end, visit our website at vanguard.com/performance.) Note, too, that both investment returns and principal value can fluctuate widely, so an investor’s shares, when sold, could be worth more or less than their original cost. The returns shown do not reflect taxes that a shareholder would pay on fund distributions or on the sale of fund shares.
Cumulative Performance: February 25, 2016, Through October 31, 2022
Initial Investment of $10,000
| | | Average Annual Total Returns
Periods Ended October 31, 2022 | |
| | | One
Year | Five
Years | Since
Inception
(2/25/2016) | Final Value
of a $10,000
Investment |
| International High Dividend Yield Index Fund ETF Shares Net Asset Value | -15.16% | 0.48% | 5.35% | $14,166 |
| | International High Dividend Yield Index Fund ETF Shares Market Price | -15.13 | 0.47 | 5.40 | 14,205 |
| FTSE All-World ex US High Dividend Yield Index | -14.91 | 0.73 | 5.75 | 14,526 |
“Since Inception” performance is calculated from the ETF Shares’ inception date for both the fund and its comparative standard(s).
| | | | |
| | | One
Year | Five
Years | Since
Inception
(3/2/2016) | Final Value
of a $10,000
Investment |
| International High Dividend Yield Index Fund Admiral Shares | -15.52% | 0.39% | 4.79% | $13,657 |
| FTSE All-World ex US High Dividend Yield Index | -14.91 | 0.73 | 5.22 | 14,040 |
“Since Inception” performance is calculated from the Admiral Shares’ inception date for both the fund and its comparative standard(s).
Vanguard fund returns are adjusted to reflect the 0.25% fee on purchases and redemptions. The fees do not apply to the ETF Shares.
See Financial Highlights for dividend and capital gains information.
International High Dividend Yield Index Fund
Cumulative Returns of ETF Shares: February 25, 2016, Through October 31, 2022
| | One
Year | Five
Years | Since
Inception
(2/25/2016) |
| International High Dividend Yield Index Fund ETF Shares Market Price | -15.13% | 2.39% | 42.05% |
| International High Dividend Yield Index Fund ETF Shares Net Asset Value | -15.16 | 2.40 | 41.66 |
| FTSE All-World ex US High Dividend Yield Index | -14.91 | 3.69 | 45.26 |
"Since Inception" performance is calculated from the ETF Shares’ inception date for both the fund and its comparative standard(s).
For the ETF Shares, the market price is determined by the midpoint of the bid-offer spread as of the closing time of the New York Stock Exchange (generally 4 p.m., Eastern time). The net asset value is also determined as of the NYSE closing time. For more information about how the ETF Shares' market prices have compared with their net asset value, visit vanguard.com, select your ETF, and click on Price, and then scroll down to the Premium/Discount Chart. The ETF premium/discount analysis there shows the percentages of days on which the ETF Shares' market price was above or below the NAV.
Vanguard fund returns are adjusted to reflect the 0.25% fee on purchases and redemptions. The fees do not apply to the ETF Shares.
International High Dividend Yield Index Fund
| United Kingdom | 13.4% |
| Japan | 12.8 |
| Canada | 8.8 |
| Australia | 8.4 |
| Switzerland | 7.2 |
| France | 6.1 |
| Germany | 6.0 |
| China | 4.8 |
| Taiwan | 4.3 |
| Brazil | 3.2 |
| Italy | 2.0 |
| Hong Kong | 1.8 |
| Spain | 1.7 |
| Saudi Arabia | 1.6 |
| Singapore | 1.5 |
| Sweden | 1.5 |
| Finland | 1.4 |
| South Korea | 1.4 |
| Netherlands | 1.3 |
| South Africa | 1.2 |
| Mexico | 1.1 |
| Norway | 1.1 |
| India | 1.0 |
| Other | 6.4 |
The table reflects the fund’s investments, except for short-term investments and derivatives.
The fund may invest in derivatives (such as futures and swap contracts) for various reasons, including, but not limited to, attempting to remain fully invested and tracking its target index as closely as possible.
International High Dividend Yield Index Fund
The fund files its complete schedule of portfolio holdings with the Securities and Exchange Commission (SEC) for the first and third quarters of each fiscal year as an exhibit to its reports on Form N-PORT. The fund’s Form N-PORT reports are available on the SEC’s website at www.sec.gov.
| | | Shares | Market
Value•
($000) |
| Common Stocks (99.5%) |
| Australia (8.4%) |
| | BHP Group Ltd. | 2,412,467 | 57,948 |
| | Commonwealth Bank of Australia | 820,786 | 55,031 |
| | National Australia Bank Ltd. | 1,521,567 | 31,606 |
| | Westpac Banking Corp. | 1,676,336 | 25,884 |
| | Australia & New Zealand Banking Group Ltd. | 1,477,674 | 24,210 |
| | Woodside Energy Group Ltd. | 909,411 | 21,024 |
| | Macquarie Group Ltd. | 165,883 | 17,995 |
| | Wesfarmers Ltd. | 541,940 | 15,727 |
| | Transurban Group (XASX) | 1,468,218 | 12,455 |
| | Rio Tinto Ltd. | 178,592 | 10,135 |
| | Amcor plc GDR | 720,723 | 8,370 |
| | Fortescue Metals Group Ltd. | 766,527 | 7,221 |
| | Coles Group Ltd. | 608,444 | 6,362 |
| | QBE Insurance Group Ltd. | 710,710 | 5,568 |
| | South32 Ltd. | 2,223,402 | 5,101 |
| | Brambles Ltd. | 662,919 | 4,963 |
| | Sonic Healthcare Ltd. | 234,922 | 4,918 |
| * | Telstra Group Ltd. | 1,956,055 | 4,905 |
| | Suncorp Group Ltd. | 599,069 | 4,382 |
| | Computershare Ltd. (XASX) | 255,140 | 4,130 |
| | ASX Ltd. | 93,542 | 4,053 |
| | APA Group | 561,388 | 3,780 |
| | Insurance Australia Group Ltd. | 1,195,604 | 3,753 |
| | Origin Energy Ltd. | 835,247 | 2,984 |
| * | Lottery Corp. Ltd. | 1,078,267 | 2,958 |
| | Atlas Arteria Ltd. | 697,572 | 2,937 |
| | Endeavour Group Ltd. | 608,395 | 2,785 |
| | Medibank Pvt Ltd. | 1,329,613 | 2,394 |
| | Incitec Pivot Ltd. | 927,315 | 2,230 |
| | Whitehaven Coal Ltd. | 381,361 | 2,215 |
| | carsales.com Ltd. | 157,348 | 2,038 |
| | Ampol Ltd. | 112,637 | 1,965 |
| | Aurizon Holdings Ltd. | 839,758 | 1,946 |
| | Orica Ltd. | 212,682 | 1,892 |
| | Lendlease Corp. Ltd. | 328,793 | 1,828 |
| | Worley Ltd. | 178,231 | 1,628 |
| | Bendigo & Adelaide Bank Ltd. | 277,514 | 1,602 |
| | Bank of Queensland Ltd. | 310,758 | 1,463 |
| | | Shares | Market
Value•
($000) |
| | JB Hi-Fi Ltd. | 51,453 | 1,410 |
| | Challenger Ltd. | 309,838 | 1,392 |
| | AGL Energy Ltd. | 317,673 | 1,384 |
| | Metcash Ltd. | 477,258 | 1,253 |
| | Ansell Ltd. | 61,985 | 1,119 |
| | Iluka Resources Ltd. | 197,103 | 1,092 |
| | Alumina Ltd. | 1,174,986 | 1,016 |
| | Downer EDI Ltd. | 324,449 | 932 |
| | Orora Ltd. | 396,112 | 769 |
| | Harvey Norman Holdings Ltd. | 277,961 | 740 |
| | CSR Ltd. | 237,174 | 703 |
| | Tabcorp Holdings Ltd. | 1,113,555 | 688 |
| | Insignia Financial Ltd. | 323,336 | 652 |
| | Deterra Royalties Ltd. | 221,886 | 582 |
| 1 | Perpetual Ltd. | 30,688 | 489 |
| | Magellan Financial Group Ltd. | 71,994 | 457 |
| | Platinum Asset Management Ltd. | 208,150 | 238 |
| | Adbri Ltd. | 197,521 | 199 |
| * | Sierra Rutile Holdings Ltd. | 6,055 | 1 |
| | | | 387,502 |
| Austria (0.2%) |
| | Erste Group Bank AG | 158,050 | 3,895 |
| | OMV AG | 68,054 | 3,134 |
| | ANDRITZ AG | 33,703 | 1,566 |
| | voestalpine AG | 57,704 | 1,253 |
| | Raiffeisen Bank International AG | 59,395 | 826 |
| | Telekom Austria AG Class A | 66,597 | 387 |
| | | | 11,061 |
| Belgium (0.4%) |
| | KBC Group NV | 132,105 | 6,620 |
| | Groupe Bruxelles Lambert SA | 51,360 | 3,787 |
| | Ageas SA | 88,339 | 3,058 |
| | Solvay SA | 33,108 | 2,988 |
| | Proximus SADP | 65,117 | 683 |
| | Etablissements Franz Colruyt NV | 23,248 | 560 |
| | | | 17,696 |
| Brazil (3.2%) |
| | Vale SA | 1,866,988 | 24,263 |
| | Petroleo Brasileiro SA Preference Shares | 2,676,983 | 15,449 |
International High Dividend Yield Index Fund
| | | Shares | Market
Value•
($000) |
| | Petroleo Brasileiro SA | 1,792,300 | 11,540 |
| | Itau Unibanco Holding SA Preference Shares | 1,548,307 | 9,112 |
| | B3 SA - Brasil Bolsa Balcao | 2,907,214 | 8,465 |
| | Banco Bradesco SA Preference Shares | 2,199,817 | 8,458 |
| | Ambev SA | 1,958,450 | 6,066 |
| | Centrais Eletricas Brasileiras SA | 563,882 | 5,439 |
| | Itausa SA Preference Shares | 2,255,925 | 4,690 |
| | JBS SA | 644,400 | 3,114 |
| | Itau Unibanco Holding SA | 606,200 | 2,983 |
| | Banco Do Brasil SA | 405,418 | 2,906 |
| | Equatorial Energia SA | 447,173 | 2,600 |
| | Gerdau SA Preference Shares | 508,400 | 2,534 |
| | Itau Unibanco Holding SA ADR | 426,251 | 2,481 |
| | Banco Bradesco SA | 630,746 | 2,032 |
| | Vibra Energia SA | 543,267 | 1,919 |
| | Cosan SA | 582,900 | 1,903 |
| | Hypera SA | 190,582 | 1,875 |
| | Cia de Saneamento Basico do Estado de Sao Paulo | 159,700 | 1,858 |
| | BB Seguridade Participacoes SA | 322,057 | 1,851 |
| | Centrais Eletricas Brasileiras SA Preference Shares | 166,400 | 1,718 |
| | Klabin SA | 366,000 | 1,532 |
| | Banco Bradesco SA ADR | 379,134 | 1,437 |
| | CCR SA | 534,110 | 1,340 |
| | Energisa SA | 121,800 | 1,143 |
| | Ultrapar Participacoes SA | 412,200 | 1,070 |
| | Banco Santander Brasil SA | 178,902 | 1,031 |
| | TIM SA | 386,154 | 987 |
| | Telefonica Brasil SA | 118,518 | 948 |
| | Cia Paranaense de Energia Preference Shares | 659,700 | 945 |
| | Sul America SA | 189,350 | 874 |
| | Transmissora Alianca de Energia Eletrica SA | 112,119 | 872 |
| | Metalurgica Gerdau SA Preference Shares | 344,400 | 750 |
| | Cia Siderurgica Nacional SA | 310,700 | 739 |
| | Cia Energetica de Minas Gerais ADR | 329,795 | 722 |
| 1 | Telefonica Brasil SA ADR | 85,163 | 680 |
| | Cielo SA | 561,600 | 647 |
| | Engie Brasil Energia SA | 81,616 | 635 |
| | Braskem SA Preference Shares | 95,200 | 621 |
| | CPFL Energia SA | 86,700 | 595 |
| | Bradespar SA Preference Shares | 125,807 | 585 |
| | Cia Energetica de Minas Gerais Preference Shares | 258,271 | 568 |
| | EDP - Energias do Brasil SA | 118,176 | 528 |
| | | Shares | Market
Value•
($000) |
| | Raizen SA Preference Shares | 588,700 | 489 |
| | Cia de Transmissao de Energia Eletrica Paulista Preference Shares | 96,408 | 457 |
| | Auren Energia SA | 157,602 | 455 |
| | Porto Seguro SA | 92,518 | 416 |
| | Caixa Seguridade Participacoes SA | 238,000 | 406 |
| | Sao Martinho SA | 77,200 | 403 |
| | Ambev SA ADR | 131,742 | 401 |
| | Neoenergia SA | 119,100 | 383 |
| | Marfrig Global Foods SA | 179,200 | 371 |
| | Usinas Siderurgicas De Minas Gerais SAUsiminas Preference Shares | 240,700 | 337 |
| | Dexco SA | 162,100 | 304 |
| | SIMPAR SA | 122,800 | 257 |
| | Odontoprev SA | 154,540 | 248 |
| | CSN Mineracao SA | 200,000 | 128 |
| | | | 147,560 |
| Canada (8.8%) |
| 1 | Royal Bank of Canada | 672,714 | 62,242 |
| | Toronto-Dominion Bank | 874,303 | 55,955 |
| 1 | Enbridge Inc. | 969,900 | 37,789 |
| | Canadian Natural Resources Ltd. | 529,439 | 31,754 |
| 1 | Bank of Montreal | 323,284 | 29,779 |
| | Bank of Nova Scotia | 578,019 | 27,939 |
| | Suncor Energy Inc. | 658,323 | 22,644 |
| | TC Energy Corp. | 483,120 | 21,221 |
| | Canadian Imperial Bank of Commerce | 423,681 | 19,241 |
| | Manulife Financial Corp. | 918,937 | 15,231 |
| | Sun Life Financial Inc. | 279,545 | 11,873 |
| | National Bank of Canada | 159,989 | 10,893 |
| | Fortis Inc. (XTSE) | 228,361 | 8,909 |
| | Pembina Pipeline Corp. | 268,971 | 8,880 |
| | Restaurant Brands International Inc. (XTSE) | 145,342 | 8,636 |
| | BCE Inc. | 147,530 | 6,654 |
| | Power Corp. of Canada | 254,577 | 6,322 |
| | Shaw Communications Inc. Class B | 203,799 | 5,234 |
| | TELUS Corp. | 227,372 | 4,748 |
| 2 | Hydro One Ltd. | 151,187 | 3,791 |
| | Great-West Lifeco Inc. | 127,492 | 2,952 |
| 1 | Canadian Utilities Ltd. Class A | 60,508 | 1,610 |
| | IGM Financial Inc. | 38,390 | 1,028 |
| | | | 405,325 |
| Chile (0.2%) |
| | Banco De Chile | 20,503,398 | 1,877 |
| | Empresas COPEC SA | 240,388 | 1,657 |
| | Enel Americas SA | 9,073,755 | 899 |
| | Banco de Credito e Inversiones SA | 26,486 | 738 |
| | Banco Santander Chile ADR | 40,199 | 580 |
| | Enel Chile SA | 12,774,794 | 450 |
| | Banco Santander Chile SA | 12,155,519 | 436 |
| | Cia Cervecerias Unidas SA | 56,236 | 309 |
International High Dividend Yield Index Fund
| | | Shares | Market
Value•
($000) |
| | Embotelladora Andina SA Preference Shares | 173,947 | 304 |
| | Colbun SA | 3,097,393 | 304 |
| | Cencosud Shopping SA | 238,310 | 260 |
| | CAP SA | 38,959 | 208 |
| | | | 8,022 |
| China (4.8%) |
| | China Construction Bank Corp. Class H | 43,952,000 | 23,325 |
| | Industrial & Commercial Bank of China Ltd. Class H | 37,653,000 | 16,348 |
| | Ping An Insurance Group Co. of China Ltd. Class H | 2,997,000 | 11,998 |
| | Bank of China Ltd. Class H | 33,978,000 | 10,944 |
| | China Merchants Bank Co. Ltd. Class H | 1,709,438 | 5,597 |
| | China Petroleum and Chemical Corp. (Sinopec) Class H | 11,366,000 | 4,505 |
| | China Shenhua Energy Co. Ltd. Class H | 1,714,000 | 4,502 |
| | China Resources Land Ltd. | 1,339,000 | 4,189 |
| | Agricultural Bank of China Ltd. Class H | 13,834,000 | 3,949 |
| | China Life Insurance Co. Ltd. Class H | 3,576,000 | 3,899 |
| | PetroChina Co. Ltd. Class H | 9,892,000 | 3,784 |
| | China Overseas Land & Investment Ltd. | 1,865,700 | 3,565 |
| | China Merchants Bank Co. Ltd. Class A | 815,342 | 3,008 |
| | PICC Property & Casualty Co. Ltd. Class H | 3,256,000 | 3,003 |
| | Zijin Mining Group Co. Ltd. Class H | 2,800,000 | 2,671 |
| | China Yangtze Power Co. Ltd. Class A | 763,200 | 2,124 |
| | China Pacific Insurance Group Co. Ltd. Class H | 1,277,200 | 2,059 |
| | Yanzhou Coal Mining Co. Ltd. Class H | 728,000 | 2,047 |
| | Citic Pacific Ltd. | 2,285,000 | 2,045 |
| 2 | Postal Savings Bank of China Co. Ltd. Class H | 4,357,000 | 2,021 |
| 2 | China Tower Corp. Ltd. Class H | 22,196,000 | 2,008 |
| | Bank of Communications Ltd. Class H | 3,606,000 | 1,759 |
| | CITIC Securities Co. Ltd. Class H | 1,165,757 | 1,742 |
| | China CITIC Bank Corp. Ltd. Class H | 4,364,620 | 1,645 |
| | Great Wall Motor Co. Ltd. Class H | 1,456,000 | 1,591 |
| | Industrial & Commercial Bank of China Ltd. Class A | 2,680,000 | 1,526 |
| | Anhui Conch Cement Co. Ltd. Class H | 588,828 | 1,516 |
| | Industrial Bank Co. Ltd. Class A | 722,200 | 1,490 |
| | | Shares | Market
Value•
($000) |
| | Tingyi Cayman Islands Holding Corp. | 949,000 | 1,483 |
| | Bank of China Ltd. Class A | 3,584,100 | 1,479 |
| | Agricultural Bank of China Ltd. Class A | 3,893,756 | 1,473 |
| | China Resources Power Holdings Co. Ltd. | 945,000 | 1,373 |
| | China Vanke Co. Ltd. Class H | 1,058,005 | 1,358 |
| | Ping An Insurance Group Co. of China Ltd. Class A | 260,600 | 1,294 |
| | Hengan International Group Co. Ltd. | 331,843 | 1,287 |
| | China Gas Holdings Ltd. | 1,423,600 | 1,263 |
| | China National Building Material Co. Ltd. Class H | 2,148,000 | 1,247 |
| | Wanhua Chemical Group Co. Ltd. Class A | 110,700 | 1,222 |
| | Sinopharm Group Co. Ltd. Class H | 603,600 | 1,145 |
| 2 | Longfor Group Holdings Ltd. | 867,620 | 1,105 |
| | People's Insurance Co. Group of China Ltd. Class H | 3,961,000 | 1,095 |
| 2 | China Feihe Ltd. | 1,885,000 | 1,086 |
| | China Resources Gas Group Ltd. | 420,000 | 1,076 |
| | Yangzijiang Shipbuilding Holdings Ltd. | 1,262,200 | 1,070 |
| 2 | Huatai Securities Co. Ltd. Class H | 1,086,400 | 1,064 |
| 2 | Fuyao Glass Industry Group Co. Ltd. Class H | 296,800 | 1,064 |
| 1 | China Minsheng Banking Corp. Ltd. Class H | 3,635,470 | 1,056 |
| | Kunlun Energy Co. Ltd. | 1,748,000 | 1,045 |
| 2 | CGN Power Co. Ltd. Class H | 5,030,000 | 1,019 |
| | China Petroleum & Chemical Corp. Class A | 1,695,100 | 947 |
| | China State Construction Engineering Corp. Ltd. Class A | 1,450,800 | 943 |
| | China Coal Energy Co. Ltd. Class H | 1,265,000 | 930 |
| | China Merchants Port Holdings Co. Ltd. | 790,000 | 926 |
| | Guangzhou Automobile Group Co. Ltd. Class H | 1,518,000 | 925 |
| | Weichai Power Co. Ltd. Class H | 929,000 | 890 |
| | Shanghai Pudong Development Bank Co. Ltd. Class A | 948,300 | 864 |
| | Kingboard Holdings Ltd. | 349,000 | 862 |
| | Guangdong Investment Ltd. | 1,348,000 | 850 |
| | Yanzhou Coal Mining Co. Ltd. Class A | 149,764 | 833 |
| | Shaanxi Coal Industry Co. Ltd. Class A | 305,000 | 829 |
International High Dividend Yield Index Fund
| | | Shares | Market
Value•
($000) |
| | China State Construction International Holdings Ltd. | 894,000 | 804 |
| | Poly Developments and Holdings Group Co. Ltd. Class A | 414,300 | 787 |
| | Haitong Securities Co. Ltd. Class H | 1,599,600 | 782 |
| * | Huaneng Power International Inc. Class H | 2,156,000 | 771 |
| | China Hongqiao Group Ltd. | 1,085,500 | 768 |
| | China Power International Development Ltd. | 2,627,370 | 759 |
| | China Construction Bank Corp. Class A | 1,022,300 | 748 |
| | Bank of Communications Co. Ltd. Class A | 1,221,800 | 746 |
| | China Railway Group Ltd. Class H | 1,646,000 | 716 |
| | Beijing Enterprises Holdings Ltd. | 275,000 | 698 |
| | Inner Mongolia Yitai Coal Co. Ltd. Class B | 468,100 | 662 |
| | China Medical System Holdings Ltd. | 593,000 | 648 |
| | New China Life Insurance Co. Ltd. Class H | 406,133 | 645 |
| | China Galaxy Securities Co. Ltd. Class H | 1,717,500 | 643 |
| | CRRC Corp. Ltd. Class H | 2,119,000 | 642 |
| | Shanghai Pharmaceuticals Holding Co. Ltd. Class H | 472,800 | 641 |
| | Minth Group Ltd. | 324,000 | 639 |
| | Fosun International Ltd. | 1,028,000 | 628 |
| | China Shenhua Energy Co. Ltd. Class A | 162,600 | 624 |
| | China Pacific Insurance Group Co. Ltd. Class A | 234,950 | 613 |
| | Bosideng International Holdings Ltd. | 1,402,000 | 606 |
| | BOE Technology Group Co. Ltd. Class A | 1,313,800 | 603 |
| | Country Garden Holdings Co. | 4,642,200 | 598 |
| | China Everbright Bank Co. Ltd. Class H | 2,292,000 | 593 |
| | China Railway Group Ltd. Class A | 853,100 | 584 |
| | China Everbright International Ltd. | 1,719,000 | 572 |
| 2 | China Merchants Securities Co. Ltd. Class H | 615,160 | 570 |
| | SAIC Motor Corp. Ltd. Class A | 301,200 | 569 |
| | Guotai Junan Securities Co. Ltd. Class A | 300,800 | 546 |
| 2 | China Resources Pharmaceutical Group Ltd. | 807,000 | 544 |
| | JOYY Inc. ADR | 20,728 | 523 |
| | | Shares | Market
Value•
($000) |
| | China Insurance International Holdings Co. Ltd. | 752,800 | 521 |
| | Far East Horizon Ltd. | 673,000 | 520 |
| | Zhejiang Expressway Co. Ltd. Class H | 838,000 | 519 |
| 2 | Guotai Junan Securities Co. Ltd. Class H | 507,600 | 513 |
| | GF Securities Co. Ltd. Class H | 503,000 | 512 |
| | Yuexiu Property Co. Ltd. | 598,600 | 511 |
| | Cosco Shipping Ports Ltd. | 988,000 | 487 |
| | Sany Heavy Industry Co. Ltd. Class A | 260,300 | 483 |
| | Shenzhen International Holdings Ltd. | 708,000 | 476 |
| | Bank of Nanjing Co. Ltd. Class A | 334,100 | 473 |
| | Haitong Securities Co. Ltd. Class A | 393,500 | 456 |
| | Nine Dragons Paper Holdings Ltd. | 766,000 | 454 |
| | China National Nuclear Power Co. Ltd. Class A | 547,300 | 453 |
| 2 | Topsports International Holdings Ltd. | 896,000 | 452 |
| | Uni-President China Holdings Ltd. | 594,000 | 439 |
| | China Merchants Shekou Industrial Zone Holdings Co. Ltd. Class A | 242,400 | 437 |
| | Postal Savings Bank of China Co. Ltd. Class A | 808,900 | 430 |
| | Bank of Shanghai Co. Ltd. Class A | 557,633 | 427 |
| * | COSCO SHIPPING Energy Transportation Co. Ltd. Class H | 584,000 | 425 |
| | Beijing Enterprises Water Group Ltd. | 2,008,000 | 422 |
| | China United Network Communications Ltd. Class A | 896,300 | 413 |
| | China Vanke Co. Ltd. Class A | 221,900 | 411 |
| | GF Securities Co. Ltd. Class A | 219,700 | 411 |
| | Jiangsu Expressway Co. Ltd. Class H | 580,000 | 409 |
| | China Jinmao Holdings Group Ltd. | 3,040,800 | 403 |
| 2 | Dali Foods Group Co. Ltd. | 976,000 | 402 |
| | China Everbright Bank Co. Ltd. Class A | 1,077,300 | 402 |
| | Greentown China Holdings Ltd. | 419,500 | 400 |
| | Baoshan Iron & Steel Co. Ltd. Class A | 596,800 | 394 |
| | China Resources Cement Holdings Ltd. | 1,082,000 | 391 |
| | Chongqing Rural Commercial Bank Co. Ltd. Class H | 1,281,000 | 388 |
| | China Lesso Group Holdings Ltd. | 472,000 | 383 |
International High Dividend Yield Index Fund
| | | Shares | Market
Value•
($000) |
| | Kingboard Laminates Holdings Ltd. | 477,500 | 381 |
| | Daqin Railway Co. Ltd. Class A | 431,900 | 379 |
| | Shanghai Lujiazui Finance & Trade Zone Development Co. Ltd. Class A | 301,220 | 377 |
| | China Communications Services Corp. Ltd. Class H | 1,336,000 | 373 |
| | Huadian Power International Corp. Ltd. Class H | 1,234,000 | 371 |
| | China Cinda Asset Management Co. Ltd. Class H | 3,955,200 | 367 |
| | China Minsheng Banking Corp. Ltd. Class A | 809,700 | 366 |
| | Citic Pacific Special Steel Group Co. Ltd. Class A | 161,702 | 357 |
| | Bank of Hangzhou Co. Ltd. Class A | 206,450 | 343 |
| | Anhui Conch Cement Co. Ltd. Class A | 101,100 | 337 |
| | China Suntien Green Energy Corp. Ltd. Class H | 870,000 | 330 |
| | Bank of Beijing Co. Ltd. Class A | 588,400 | 326 |
| | New China Life Insurance Co. Ltd. Class A | 100,600 | 323 |
| | SDIC Power Holdings Co. Ltd. Class A | 221,586 | 307 |
| 2 | CSC Financial Co. Ltd. Class H | 415,500 | 301 |
| | Sinotrans Ltd. Class H | 1,214,000 | 296 |
| | Henan Shuanghui Investment & Development Co. Ltd. Class A | 93,000 | 290 |
| | Chongqing Changan Automobile Co. Ltd. Class B | 667,316 | 289 |
| | Hopson Development Holdings Ltd. | 353,260 | 283 |
| | Sichuan Chuantou Energy Co. Ltd. Class A | 183,500 | 278 |
| | Zoomlion Heavy Industry Science and Technology Co. Ltd. Class H | 853,400 | 275 |
| | Huaxia Bank Co. Ltd. Class A | 410,700 | 270 |
| 2 | BAIC Motor Corp. Ltd. Class H | 1,206,000 | 267 |
| | TCL Technology Group Corp. Class A | 495,000 | 266 |
| 2 | China Railway Signal & Communication Corp. Ltd. Class H | 914,000 | 260 |
| * | Shanghai Electric Group Co. Ltd. Class H | 1,302,000 | 254 |
| | Metallurgical Corp. of China Ltd. Class H | 1,555,000 | 248 |
| | Sinotruk Hong Kong Ltd. | 273,760 | 244 |
| * | Yangzijiang Financial Holding | 1,110,800 | 243 |
| | | Shares | Market
Value•
($000) |
| 2 | Legend Holdings Corp. Class H | 284,800 | 239 |
| | Lee & Man Paper Manufacturing Ltd. | 758,000 | 230 |
| | Shougang Fushan Resources Group Ltd. | 844,164 | 229 |
| | Sinopec Engineering Group Co. Ltd. Class H | 638,500 | 228 |
| | Shanxi Lu'an Environmental Energy Development Co. Ltd. Class A | 98,500 | 227 |
| | China Everbright Ltd. | 420,000 | 221 |
| | Livzon Pharmaceutical Group Inc. Class H | 82,400 | 216 |
| | Lao Feng Xiang Co. Ltd. Class B | 76,200 | 214 |
| | Jiangsu Expressway Co. Ltd. Class A | 207,500 | 212 |
| | Yantai Changyu Pioneer Wine Co. Ltd. Class B | 141,000 | 202 |
| | Shanghai Lujiazui Finance & Trade Zone Development Co. Ltd. Class B | 270,462 | 201 |
| | China Merchants Securities Co. Ltd. Class A | 117,200 | 201 |
| * | Huaneng Power International Inc. Class A | 217,600 | 200 |
| | LB Group Co. Ltd. Class A | 94,400 | 199 |
| | Angang Steel Co. Ltd. Class H | 955,000 | 198 |
| | Hunan Valin Steel Co. Ltd. Class A | 359,800 | 197 |
| | Shanghai International Port Group Co. Ltd. Class A | 274,600 | 195 |
| | China National Chemical Engineering Co. Ltd. Class A | 200,400 | 195 |
| | Jinke Smart Services Group Co. Ltd. Class H | 133,200 | 195 |
| | Yanlord Land Group Ltd. | 316,800 | 194 |
| | Shenzhen Expressway Corp. Ltd. Class A | 170,400 | 192 |
| | Dongfang Electric Corp. Ltd. Class H | 125,200 | 189 |
| * | Datang International Power Generation Co. Ltd. Class H | 1,452,000 | 185 |
| | Huayu Automotive Systems Co. Ltd. Class A | 80,200 | 184 |
| | Gemdale Corp. Class A | 165,900 | 179 |
| | Metallurgical Corp. of China Ltd. Class A | 452,100 | 179 |
| | Xiamen C & D Inc. Class A | 106,800 | 176 |
| | China International Marine Containers Group Co. Ltd. Class H | 274,200 | 175 |
| | Hengli Petrochemical Co. Ltd. Class A | 82,600 | 174 |
International High Dividend Yield Index Fund
| | | Shares | Market
Value•
($000) |
| 2 | A-Living Smart City Services Co. Ltd. | 304,500 | 173 |
| | Shenzhen Overseas Chinese Town Co. Ltd. Class A | 297,500 | 172 |
| | China Reinsurance Group Corp. Class H | 3,234,000 | 171 |
| | Shanghai Industrial Holdings Ltd. | 174,000 | 170 |
| | Bank of Jiangsu Co. Ltd. Class A | 179,160 | 170 |
| | Guangzhou Baiyunshan Pharmaceutical Holdings Co. Ltd. Class H | 72,000 | 161 |
| | Sinopec Shanghai Petrochemical Co. Ltd. Class H | 1,222,720 | 160 |
| | Shui On Land Ltd. | 1,737,000 | 159 |
| | China CITIC Bank Corp. Ltd. Class A | 266,000 | 158 |
| | Bank of Guiyang Co. Ltd. Class A | 220,100 | 157 |
| 2 | Yangtze Optical Fibre and Cable Joint Stock Ltd. Co. Class H | 72,500 | 153 |
| * | Seazen Group Ltd. | 931,549 | 150 |
| | Towngas Smart Energy Co. Ltd. | 416,185 | 146 |
| | Sinopec Shanghai Petrochemical Co. Ltd. Class A | 344,300 | 145 |
| | Maanshan Iron & Steel Co. Ltd. Class A | 418,800 | 145 |
| | Guosen Securities Co. Ltd. Class A | 119,900 | 142 |
| | Huaibei Mining Holdings Co. Ltd. Class A | 79,800 | 142 |
| | Weifu High-Technology Group Co. Ltd. Class A | 59,700 | 141 |
| | Xiamen Tungsten Co. Ltd. Class A | 50,400 | 139 |
| | Zhejiang Weixing New Building Materials Co. Ltd. Class A | 57,800 | 138 |
| | China International Marine Containers Group Co. Ltd. Class A | 148,150 | 135 |
| | Shenzhen Investment Ltd. | 986,000 | 134 |
| | Jointown Pharmaceutical Group Co. Ltd. Class A | 75,600 | 130 |
| * | Seazen Holdings Co. Ltd. Class A | 71,000 | 128 |
| | Shengyi Technology Co. Ltd. Class A | 67,100 | 128 |
| | Kingfa Sci & Tech Co. Ltd. Class A | 94,900 | 126 |
| | Shanghai Pharmaceuticals Holding Co. Ltd. Class A | 51,300 | 124 |
| | Hangzhou Binjiang Real Estate Group Co. Ltd. Class A | 98,802 | 121 |
| | Beijing Jingneng Clean Energy Co. Ltd. Class H | 618,000 | 115 |
| | Agile Group Holdings Ltd. | 602,000 | 114 |
| | | Shares | Market
Value•
($000) |
| 1,3 | CIFI Holdings Group Co. Ltd. | 1,706,480 | 110 |
| | Tangshan Jidong Cement Co. Ltd. Class A | 104,600 | 109 |
| 2 | Orient Securities Co. Ltd. Class H | 290,800 | 108 |
| | Hubei Xingfa Chemicals Group Co. Ltd. Class A | 27,500 | 107 |
| 2 | Everbright Securities Co. Ltd. Class H | 196,400 | 106 |
| | Huaxin Cement Co. Ltd. Class H | 122,200 | 105 |
| | Anhui Expressway Co. Ltd. Class H | 162,000 | 104 |
| | Livzon Pharmaceutical Group Inc. Class A | 21,500 | 104 |
| | Hengyi Petrochemical Co. Ltd. Class A | 112,700 | 104 |
| | Huafon Chemical Co. Ltd. Class A | 112,800 | 103 |
| 3 | Shimao Group Holdings Ltd. | 534,000 | 102 |
| | Bank of Suzhou Co. Ltd. Class A | 107,200 | 101 |
| | Ningxia Baofeng Energy Group Co. Ltd. Class A | 63,400 | 100 |
| | Shanghai Jinjiang International Hotels Co. Ltd. Class B | 53,500 | 98 |
| | Universal Scientific Industrial Shanghai Co. Ltd. Class A | 40,900 | 98 |
| | Joyoung Co. Ltd. Class A | 47,500 | 95 |
| | China World Trade Center Co. Ltd. Class A | 48,600 | 91 |
| | Sino-Ocean Group Holding Ltd. | 1,341,000 | 89 |
| 2 | Shenwan Hongyuan Group Co. Ltd. Class H | 532,800 | 87 |
| | Tian Di Science & Technology Co. Ltd. Class A | 129,800 | 87 |
| | Tangshan Sanyou Chemical Industries Co. Ltd. Class A | 111,200 | 87 |
| *,2,3 | Evergrande Property Services Group Ltd. | 1,370,500 | 87 |
| * | Datang International Power Generation Co. Ltd. Class A | 222,100 | 86 |
| | Luolai Lifestyle Technology Co. Ltd. Class A | 65,600 | 85 |
| | Huatai Securities Co. Ltd. Class A | 51,300 | 84 |
| | Zoomlion Heavy Industry Science and Technology Co. Ltd. Class A | 113,300 | 83 |
| | Shenzhen Expressway Co. Ltd. Class H | 114,000 | 82 |
| | Shanxi Taigang Stainless Steel Co. Ltd. Class A | 150,400 | 82 |
| | Jizhong Energy Resources Co. Ltd. Class A | 95,600 | 80 |
International High Dividend Yield Index Fund
| | | Shares | Market
Value•
($000) |
| * | Suzhou Gold Mantis Construction Decoration Co. Ltd. Class A | 130,900 | 79 |
| | Xinjiang Tianshan Cement Co. Ltd. Class A | 73,600 | 78 |
| | BBMG Corp. Class H | 734,000 | 76 |
| | Pingdingshan Tianan Coal Mining Co. Ltd. Class A | 50,200 | 76 |
| | Beijing Shunxin Agriculture Co. Ltd. Class A | 26,200 | 74 |
| | Huaxin Cement Co. Ltd. Class A | 39,900 | 73 |
| | Shenzhen Gas Corp. Ltd. Class A | 79,800 | 71 |
| | Weifu High-Technology Group Co. Ltd. Class B | 46,400 | 70 |
| | Shanghai Yuyuan Tourist Mart Group Co. Ltd. Class A | 81,800 | 70 |
| | Beijing Capital Development Co. Ltd. Class A | 97,700 | 68 |
| | Tianshan Aluminum Group Co. Ltd. Class A | 78,600 | 67 |
| * | Shandong Chenming Paper Holdings Ltd. Class H | 234,000 | 66 |
| | Zhuzhou Kibing Group Co. Ltd. Class A | 60,300 | 65 |
| | G-bits Network Technology Xiamen Co. Ltd. Class A | 1,800 | 63 |
| | Chinese Universe Publishing and Media Group Co. Ltd. Class A | 48,800 | 57 |
| *,2 | Shimao Services Holdings Ltd. | 341,000 | 55 |
| | Huadian Power International Corp. Ltd. Class A | 74,000 | 55 |
| 2 | China East Education Holdings Ltd. | 171,000 | 54 |
| | Kwg Group Holdings Ltd. | 552,500 | 53 |
| * | Jiangxi Zhengbang Technology Co. Ltd. Class A | 108,700 | 52 |
| | Bank of Qingdao Co. Ltd. Class A | 116,750 | 49 |
| | Sinoma International Engineering Co. Class A | 41,200 | 48 |
| | Bank of Changsha Co. Ltd. Class A | 53,300 | 47 |
| | Bank of Chengdu Co. Ltd. Class A | 24,400 | 46 |
| | Huolinhe Opencut Coal Industry Corp. Ltd. of Inner Mongolia Class A | 26,100 | 44 |
| | Guangxi Guiguan Electric Power Co. Ltd. Class A | 51,300 | 44 |
| | China South Publishing & Media Group Co. Ltd. Class A | 33,100 | 43 |
| | | Shares | Market
Value•
($000) |
| | Shanghai Construction Group Co. Ltd. Class A | 121,100 | 43 |
| | Huafa Industrial Co. Ltd. Zhuhai Class A | 35,200 | 41 |
| * | Yango Group Co. Ltd. Class A | 170,600 | 39 |
| | Shanghai Tunnel Engineering Co. Ltd. Class A | 55,300 | 39 |
| | CSG Holding Co. Ltd. Class A | 37,000 | 35 |
| * | China Zheshang Bank Co. Ltd. Class A | 91,600 | 35 |
| | Financial Street Holdings Co. Ltd. Class A | 48,800 | 31 |
| | North Huajin Chemical Industries Co. Ltd. Class A | 33,200 | 31 |
| | Guizhou Panjiang Refined Coal Co. Ltd. Class A | 32,700 | 30 |
| | Shenzhen Jinjia Group Co. Ltd. Class A | 29,400 | 29 |
| | Zhejiang Runtu Co. Ltd. Class A | 27,500 | 28 |
| | Chongqing Rural Commercial Bank Co. Ltd. Class A | 58,700 | 28 |
| * | RiseSun Real Estate Development Co. Ltd. Class A | 96,600 | 27 |
| | Chongqing Water Group Co. Ltd. Class A | 39,200 | 27 |
| | Guangxi Liugong Machinery Co. Ltd. Class A | 30,900 | 25 |
| * | Jointo Energy Investment Co. Ltd. Hebei Class A | 35,400 | 25 |
| | Shanghai AJ Group Co. Ltd. Class A | 35,400 | 25 |
| | Nanjing Iron & Steel Co. Ltd. Class A | 54,500 | 23 |
| | Sansteel Minguang Co. Ltd. Fujian Class A | 36,500 | 21 |
| | Liuzhou Iron & Steel Co. Ltd. Class A | 38,900 | 18 |
| | Zhejiang Semir Garment Co. Ltd. Class A | 24,400 | 15 |
| | China Railway Signal & Communication Corp. Ltd. Class A | 23,250 | 14 |
| | Suofeiya Home Collection Co. Ltd. Class A | 4,000 | 8 |
| *,3 | Sunac China Holdings Ltd. | 1,231,391 | 8 |
| | | | 222,678 |
| Colombia (0.1%) |
| | Bancolombia SA ADR | 48,710 | 1,236 |
| | Bancolombia SA | 150,789 | 1,084 |
| | Ecopetrol SA ADR | 108,328 | 1,068 |
| | Interconexion Electrica SA ESP | 212,120 | 828 |
| | Grupo Aval Acciones y Valores SA Preference Shares | 1,841,569 | 201 |
| | Cementos Argos SA | 201,171 | 136 |
International High Dividend Yield Index Fund
| | | Shares | Market
Value•
($000) |
| *,3 | Bac Holding International Co. | 2,512,537 | 100 |
| | Ecopetrol SA | 101,529 | 50 |
| | | | 4,703 |
| Czech Republic (0.1%) |
| | CEZ A/S | 75,916 | 2,481 |
| 2 | Moneta Money Bank A/S | 175,453 | 512 |
| | | | 2,993 |
| Denmark (0.3%) |
| | AP Moller - Maersk A/S Class B | 2,498 | 5,219 |
| | Danske Bank A/S | 313,000 | 5,049 |
| | Tryg A/S | 172,087 | 3,722 |
| | | | 13,990 |
| Egypt (0.0%) |
| | Eastern Co. SAE | 455,657 | 225 |
| | Telecom Egypt Co. | 171,834 | 130 |
| | | | 355 |
| Finland (1.4%) |
| | Nordea Bank Abp (XHEL) | 1,721,744 | 16,454 |
| | Sampo OYJ Class A | 233,295 | 10,668 |
| | UPM-Kymmene OYJ | 255,754 | 8,598 |
| | Kone OYJ Class B | 190,872 | 7,815 |
| | Stora Enso OYJ Class R | 271,542 | 3,541 |
| | Elisa OYJ | 68,400 | 3,305 |
| | Fortum OYJ | 209,124 | 2,943 |
| | Kesko OYJ Class B | 127,883 | 2,489 |
| | Orion OYJ Class B | 49,742 | 2,289 |
| | Metso Outotec OYJ | 288,394 | 2,189 |
| | Valmet OYJ | 81,298 | 1,849 |
| | Wartsila OYJ Abp | 234,642 | 1,600 |
| | Huhtamaki OYJ | 43,115 | 1,549 |
| | | | 65,289 |
| France (6.1%) |
| | TotalEnergies SE | 1,135,001 | 61,918 |
| | Sanofi | 523,184 | 45,024 |
| | BNP Paribas SA | 512,879 | 24,051 |
| | AXA SA | 889,321 | 21,962 |
| | Vinci SA | 237,043 | 21,817 |
| | Danone SA | 291,958 | 14,510 |
| | Cie de Saint-Gobain | 218,602 | 8,937 |
| | Orange SA | 921,597 | 8,781 |
| | Cie Generale des Etablissements Michelin SCA | 337,620 | 8,604 |
| | Societe Generale SA | 362,173 | 8,307 |
| | Veolia Environnement SA | 296,378 | 6,614 |
| | Publicis Groupe SA | 107,835 | 6,039 |
| | Engie SA (XPAR) | 462,777 | 6,013 |
| | Credit Agricole SA | 576,561 | 5,231 |
| | Carrefour SA | 285,337 | 4,593 |
| | Eiffage SA | 34,579 | 3,127 |
| | Bouygues SA | 102,097 | 2,913 |
| | Engie SA | 201,086 | 2,613 |
| | Electricite de France SA (XPAR) | 201,110 | 2,375 |
| * | Sodexo SA Loyalty Shares 2026 | 26,287 | 2,329 |
| | Rexel SA | 115,675 | 2,064 |
| | Valeo | 113,308 | 1,866 |
| | Engie SA Loyalty Shares | 132,130 | 1,717 |
| 2 | La Francaise des Jeux SAEM | 40,699 | 1,326 |
| | Sodexo SA (XPAR) | 14,941 | 1,323 |
| | | Shares | Market
Value•
($000) |
| 2 | Amundi SA | 27,791 | 1,311 |
| | EDF Loyalty Shares 2024 | 103,154 | 1,218 |
| * | Faurecia SE (XPAR) | 75,619 | 1,129 |
| | Wendel SE | 13,621 | 1,067 |
| | SCOR SE | 70,825 | 1,065 |
| 2 | ALD SA | 36,984 | 395 |
| * | Euroapi SA | 20,234 | 354 |
| | | | 280,593 |
| Germany (5.9%) |
| | Siemens AG (Registered) | 361,302 | 39,457 |
| | Allianz SE (Registered) | 194,740 | 35,035 |
| | Deutsche Telekom AG (Registered) | 1,620,505 | 30,588 |
| | Bayer AG (Registered) | 470,684 | 24,749 |
| | Mercedes-Benz Group AG | 404,537 | 23,415 |
| | BASF SE | 438,739 | 19,687 |
| | Muenchener Rueckversicherungs-Gesellschaft AG in Muenchen (Registered) | 67,499 | 17,818 |
| | Deutsche Post AG (Registered) | 467,592 | 16,529 |
| | Volkswagen AG Preference Shares | 95,438 | 12,216 |
| | Bayerische Motoren Werke AG | 150,618 | 11,822 |
| | E.ON SE | 1,058,860 | 8,867 |
| | Vonovia SE | 386,409 | 8,544 |
| | Hannover Rueck SE | 28,477 | 4,634 |
| | HeidelbergCement AG | 68,273 | 3,140 |
| 2 | Covestro AG | 85,149 | 2,890 |
| | Volkswagen AG | 15,434 | 2,638 |
| | LEG Immobilien SE (XETR) | 35,207 | 2,298 |
| | Bayerische Motoren Werke AG Preference Shares | 30,639 | 2,259 |
| | Evonik Industries AG | 92,388 | 1,702 |
| | Aroundtown SA | 506,849 | 1,005 |
| | Talanx AG | 26,261 | 986 |
| | Telefonica Deutschland Holding AG | 417,432 | 910 |
| | Wacker Chemie AG | 7,209 | 839 |
| | RTL Group SA | 18,869 | 641 |
| | HOCHTIEF AG | 8,920 | 474 |
| 2 | DWS Group GmbH & Co. KGaA | 16,480 | 446 |
| | Fielmann AG | 13,544 | 431 |
| | Traton SE | 32,292 | 403 |
| 1 | Uniper SE | 41,647 | 125 |
| | | | 274,548 |
| Greece (0.1%) |
| | Hellenic Telecommunications Organization SA | 102,688 | 1,613 |
| | OPAP SA | 90,632 | 1,110 |
| | Mytilineos SA | 50,177 | 841 |
| | JUMBO SA | 52,846 | 751 |
| | Motor Oil Hellas Corinth Refineries SA | 26,485 | 455 |
| | Hellenic Petroleum SA | 30,253 | 207 |
| | | | 4,977 |
International High Dividend Yield Index Fund
| | | Shares | Market
Value•
($000) |
| Hong Kong (1.8%) |
| | Sun Hung Kai Properties Ltd. | 683,000 | 7,340 |
| | CK Hutchison Holdings Ltd. | 1,279,500 | 6,369 |
| | BOC Hong Kong Holdings Ltd. | 1,709,000 | 5,310 |
| | CLP Holdings Ltd. | 780,000 | 5,235 |
| | CK Asset Holdings Ltd. | 936,084 | 5,175 |
| | Hang Seng Bank Ltd. | 347,000 | 4,885 |
| | Jardine Matheson Holdings Ltd. | 94,904 | 4,372 |
| | Hong Kong & China Gas Co. Ltd. | 5,409,400 | 4,169 |
| | Power Assets Holdings Ltd. | 667,099 | 3,190 |
| | MTR Corp. Ltd. | 689,500 | 3,034 |
| | Lenovo Group Ltd. | 3,672,000 | 2,935 |
| | Wharf Real Estate Investment Co. Ltd. | 739,000 | 2,912 |
| | Swire Pacific Ltd. Class A | 319,288 | 2,118 |
| | Hongkong Land Holdings Ltd. | 532,900 | 2,052 |
| 2 | WH Group Ltd. | 3,825,599 | 1,932 |
| | Sino Land Co. Ltd. | 1,768,000 | 1,888 |
| | Henderson Land Development Co. Ltd. | 632,587 | 1,549 |
| | Chow Tai Fook Jewellery Group Ltd. | 903,600 | 1,547 |
| | CK Infrastructure Holdings Ltd. | 296,972 | 1,411 |
| | Want Want China Holdings Ltd. | 2,090,000 | 1,373 |
| | New World Development Co. Ltd. | 669,750 | 1,370 |
| | Xinyi Glass Holdings Ltd. | 968,000 | 1,244 |
| | Hang Lung Properties Ltd. | 858,576 | 1,080 |
| | SITC International Holdings Co. Ltd. | 591,000 | 968 |
| | Swire Properties Ltd. | 477,898 | 918 |
| | Orient Overseas International Ltd. | 61,500 | 899 |
| | ASM Pacific Technology Ltd. | 140,400 | 772 |
| | PCCW Ltd. | 2,017,793 | 771 |
| 2 | BOC Aviation Ltd. | 107,700 | 721 |
| | Hysan Development Co. Ltd. | 265,000 | 578 |
| | Bank of East Asia Ltd. | 524,580 | 503 |
| 2 | Js Global Lifestyle Co. Ltd. | 589,000 | 474 |
| | NWS Holdings Ltd. | 653,000 | 463 |
| | Kerry Properties Ltd. | 289,500 | 458 |
| | Man Wah Holdings Ltd. | 706,800 | 394 |
| | VTech Holdings Ltd. | 69,100 | 368 |
| | Dairy Farm International Holdings Ltd. | 140,900 | 316 |
| | First Pacific Co. Ltd. | 1,178,000 | 312 |
| | United Energy Group Ltd. | 3,162,000 | 306 |
| | Nexteer Automotive Group Ltd. | 415,000 | 225 |
| | Cafe de Coral Holdings Ltd. | 127,170 | 148 |
| | Johnson Electric Holdings Ltd. | 140,500 | 145 |
| | | Shares | Market
Value•
($000) |
| * | Haitong International Securities Group Ltd. | 1,701,700 | 123 |
| | Guotai Junan International Holdings Ltd. | 1,517,000 | 108 |
| | Dah Sing Financial Holdings Ltd. | 50,000 | 99 |
| | Hutchison Telecommunications Hong Kong Holdings Ltd. | 656,000 | 87 |
| | Dah Sing Banking Group Ltd. | 111,600 | 66 |
| | | | 82,712 |
| Hungary (0.1%) |
| | Richter Gedeon Nyrt | 67,396 | 1,333 |
| | MOL Hungarian Oil & Gas plc | 179,619 | 1,079 |
| | Magyar Telekom Telecommunications plc | 125,388 | 90 |
| | | | 2,502 |
| India (1.0%) |
| | HCL Technologies Ltd. | 520,192 | 6,549 |
| | ITC Ltd. | 1,410,765 | 5,948 |
| | NTPC Ltd. | 2,121,781 | 4,442 |
| | Power Grid Corp. of India Ltd. | 1,515,973 | 4,183 |
| | Oil & Natural Gas Corp. Ltd. | 1,762,361 | 2,847 |
| | Coal India Ltd. | 908,137 | 2,696 |
| | Hero MotoCorp Ltd. | 62,145 | 2,012 |
| | Vedanta Ltd. | 588,167 | 1,993 |
| | Bharat Petroleum Corp. Ltd. | 479,481 | 1,760 |
| | Indian Oil Corp. Ltd. | 2,000,786 | 1,650 |
| | Bajaj Auto Ltd. | 33,303 | 1,479 |
| | Gail India Ltd. | 1,256,721 | 1,385 |
| | Hindustan Petroleum Corp. Ltd. | 335,770 | 868 |
| | Petronet LNG Ltd. | 348,257 | 865 |
| | Power Finance Corp. Ltd. | 554,229 | 772 |
| | REC Ltd. | 575,700 | 713 |
| | NMDC Ltd. (XNSE) | 568,174 | 684 |
| | Steel Authority of India Ltd. | 645,655 | 614 |
| | NHPC Ltd. | 1,172,375 | 604 |
| | Oil India Ltd. | 175,044 | 408 |
| | Hindustan Zinc Ltd. | 112,426 | 385 |
| | Castrol India Ltd. | 247,236 | 371 |
| | Oracle Financial Services Software Ltd. | 10,338 | 364 |
| | Sun TV Network Ltd. | 44,479 | 281 |
| *,3 | NMDC Ltd. | 520,717 | 242 |
| | | | 44,115 |
| Indonesia (0.7%) |
| | Bank Rakyat Indonesia Persero Tbk PT | 31,267,359 | 9,328 |
| | Telkom Indonesia Persero Tbk PT | 22,233,500 | 6,244 |
| | Bank Mandiri Persero Tbk PT | 8,890,900 | 6,006 |
| | Astra International Tbk PT | 9,603,800 | 4,104 |
| | Adaro Energy Tbk PT | 6,007,500 | 1,533 |
| | United Tractors Tbk PT | 710,804 | 1,470 |
International High Dividend Yield Index Fund
| | | Shares | Market
Value•
($000) |
| | Indofood Sukses Makmur Tbk PT | 2,136,700 | 884 |
| | Sarana Menara Nusantara Tbk PT | 11,907,300 | 881 |
| | Unilever Indonesia Tbk PT | 2,758,400 | 821 |
| | Indofood CBP Sukses Makmur Tbk PT | 1,156,200 | 722 |
| | Bukit Asam Tbk PT | 2,034,500 | 510 |
| | Indocement Tunggal Prakarsa Tbk PT | 831,300 | 495 |
| | Gudang Garam Tbk PT | 213,200 | 329 |
| | Hanjaya Mandala Sampoerna Tbk PT | 3,247,500 | 209 |
| | Media Nusantara Citra Tbk PT | 2,425,800 | 128 |
| | Bank Danamon Indonesia Tbk PT | 153,600 | 34 |
| | | | 33,698 |
| Israel (0.5%) |
| | Bank Leumi Le-Israel BM | 740,352 | 7,063 |
| | Bank Hapoalim BM | 642,189 | 6,190 |
| | Israel Discount Bank Ltd. Class A | 584,845 | 3,325 |
| | ICL Group Ltd. | 341,351 | 3,078 |
| | Mizrahi Tefahot Bank Ltd. | 66,469 | 2,513 |
| | Phoenix Holdings Ltd. | 56,126 | 608 |
| | | | 22,777 |
| Italy (1.9%) |
| | Enel SpA | 3,731,595 | 16,670 |
| | Eni SpA | 1,171,328 | 15,384 |
| | Intesa Sanpaolo SpA | 7,938,405 | 15,135 |
| | UniCredit SpA | 943,865 | 11,705 |
| | Assicurazioni Generali SpA | 661,174 | 9,922 |
| | Snam SpA (MTAA) | 1,064,188 | 4,732 |
| | Terna - Rete Elettrica Nazionale | 670,653 | 4,448 |
| | Mediobanca Banca di Credito Finanziario SpA | 324,877 | 2,943 |
| 2 | Poste Italiane SpA | 219,517 | 1,913 |
| 2 | Infrastrutture Wireless Italiane SpA | 164,309 | 1,450 |
| | Italgas SpA | 229,516 | 1,182 |
| | Banca Mediolanum SpA | 141,349 | 1,058 |
| | Hera SpA | 376,814 | 898 |
| 2 | Pirelli & C SpA | 229,888 | 867 |
| | A2A SpA | 739,614 | 820 |
| * | Telecom Italia SpA Savings Shares | 2,775,456 | 531 |
| | UnipolSai Assicurazioni SpA | 196,994 | 444 |
| | | | 90,102 |
| Japan (12.7%) |
| | Toyota Motor Corp. | 5,821,865 | 80,776 |
| | Mitsubishi UFJ Financial Group Inc. | 5,755,900 | 27,190 |
| | KDDI Corp. | 784,200 | 23,179 |
| | Takeda Pharmaceutical Co. Ltd. | 727,600 | 19,215 |
| | Honda Motor Co. Ltd. | 811,100 | 18,495 |
| | Sumitomo Mitsui Financial Group Inc. | 621,254 | 17,446 |
| | ITOCHU Corp. | 641,684 | 16,584 |
| | Mitsui & Co. Ltd. | 745,312 | 16,493 |
| | | Shares | Market
Value•
($000) |
| | Tokio Marine Holdings Inc. | 904,702 | 16,380 |
| | Nippon Telegraph & Telephone Corp. | 566,900 | 15,636 |
| | Mitsubishi Corp. | 566,900 | 15,357 |
| | Mizuho Financial Group Inc. | 1,217,620 | 13,169 |
| | Softbank Corp. | 1,308,282 | 12,905 |
| | Canon Inc. | 472,600 | 10,018 |
| | Bridgestone Corp. | 272,730 | 9,864 |
| | Japan Tobacco Inc. | 563,800 | 9,442 |
| | Komatsu Ltd. | 435,820 | 8,538 |
| | ORIX Corp. | 573,300 | 8,420 |
| | Dai-ichi Life Holdings Inc. | 469,900 | 7,463 |
| | Japan Post Holdings Co. Ltd. | 1,030,561 | 6,930 |
| | Sumitomo Corp. | 541,838 | 6,889 |
| | Marubeni Corp. | 737,900 | 6,460 |
| | Sompo Holdings Inc. | 151,500 | 6,316 |
| | Daiwa House Industry Co. Ltd. | 311,200 | 6,270 |
| | MS&AD Insurance Group Holdings Inc. | 220,100 | 5,829 |
| | Nippon Steel Corp. | 395,400 | 5,424 |
| | Kirin Holdings Co. Ltd. | 354,600 | 5,213 |
| | Sumitomo Mitsui Trust Holdings Inc. | 171,600 | 4,937 |
| | Inpex Corp. | 479,800 | 4,842 |
| | Mitsubishi Heavy Industries Ltd. | 136,600 | 4,705 |
| | Nomura Holdings Inc. | 1,421,400 | 4,600 |
| | ENEOS Holdings Inc. | 1,381,605 | 4,557 |
| | Sekisui House Ltd. | 274,202 | 4,553 |
| | Subaru Corp. | 288,809 | 4,514 |
| | Nippon Yusen KK | 229,800 | 4,163 |
| | Resona Holdings Inc. | 1,025,100 | 3,864 |
| | Asahi Kasei Corp. | 592,300 | 3,798 |
| | Sumitomo Electric Industries Ltd. | 358,600 | 3,748 |
| | Toyota Tsusho Corp. | 104,330 | 3,502 |
| | Mitsui OSK Lines Ltd. | 157,810 | 3,124 |
| | Yamaha Motor Co. Ltd. | 150,600 | 3,109 |
| | Daito Trust Construction Co. Ltd. | 30,700 | 3,040 |
| | Isuzu Motors Ltd. | 246,400 | 2,898 |
| | Trend Micro Inc. | 57,000 | 2,874 |
| | Mitsubishi Chemical Holdings Corp. | 605,200 | 2,734 |
| | Chubu Electric Power Co. Inc. | 334,600 | 2,724 |
| | AGC Inc. | 86,400 | 2,707 |
| | Daiwa Securities Group Inc. | 688,114 | 2,685 |
| | Kansai Electric Power Co. Inc. | 346,300 | 2,623 |
| | T&D Holdings Inc. | 247,900 | 2,452 |
| | Sumitomo Chemical Co. Ltd. | 714,500 | 2,406 |
| | Taisei Corp. | 88,300 | 2,405 |
| | Idemitsu Kosan Co. Ltd. | 109,783 | 2,402 |
| | JFE Holdings Inc. | 247,800 | 2,270 |
| | Aisin Corp. | 83,300 | 2,138 |
| | Obayashi Corp. | 319,400 | 2,050 |
| | SBI Holdings Inc. | 112,700 | 2,036 |
| | Ricoh Co. Ltd. | 276,100 | 2,023 |
| | Kajima Corp. | 212,200 | 1,997 |
| | Lixil Corp. | 128,200 | 1,937 |
| | Seiko Epson Corp. | 134,300 | 1,823 |
International High Dividend Yield Index Fund
| | | Shares | Market
Value•
($000) |
| | NGK Spark Plug Co. Ltd. | 97,800 | 1,784 |
| | Sojitz Corp. | 106,700 | 1,573 |
| | Concordia Financial Group Ltd. | 514,900 | 1,571 |
| | Chiba Bank Ltd. | 286,000 | 1,567 |
| | Kyushu Railway Co. | 74,700 | 1,562 |
| | Mitsui Chemicals Inc. | 84,000 | 1,555 |
| | Shizuoka Financial Group Inc. | 240,400 | 1,518 |
| | Hulic Co. Ltd. | 208,186 | 1,512 |
| | Marui Group Co. Ltd. | 92,200 | 1,508 |
| | Nikon Corp. | 153,500 | 1,485 |
| | Tosoh Corp. | 134,600 | 1,464 |
| | NGK Insulators Ltd. | 120,200 | 1,402 |
| | Japan Post Insurance Co. Ltd. | 93,800 | 1,389 |
| | Mitsubishi HC Capital Inc. (XTKS) | 311,820 | 1,338 |
| | Japan Post Bank Co. Ltd. | 200,158 | 1,334 |
| | Nomura Real Estate Holdings Inc. | 58,000 | 1,311 |
| | Fukuoka Financial Group Inc. | 76,900 | 1,309 |
| | Haseko Corp. | 124,086 | 1,278 |
| | Tokyo Tatemono Co. Ltd. | 92,500 | 1,272 |
| | Hikari Tsushin Inc. | 10,400 | 1,256 |
| | Shimizu Corp. | 244,800 | 1,222 |
| | Showa Denko KK | 83,200 | 1,215 |
| | Kuraray Co. Ltd. | 169,300 | 1,164 |
| | Yamada Denki Co. Ltd. | 355,900 | 1,147 |
| | Kyushu Electric Power Co. Inc. | 226,700 | 1,122 |
| | Mitsubishi Gas Chemical Co. Inc. | 87,500 | 1,112 |
| | Aozora Bank Ltd. | 64,200 | 1,104 |
| | Electric Power Development Co. Ltd. | 77,900 | 1,083 |
| | Sumitomo Forestry Co. Ltd. | 68,900 | 1,078 |
| | NSK Ltd. | 202,100 | 1,068 |
| | Amada Co. Ltd. | 149,600 | 1,052 |
| | Yokohama Rubber Co. Ltd. | 67,100 | 1,049 |
| | Sumitomo Heavy Industries Ltd. | 54,800 | 1,039 |
| | Denka Co. Ltd. | 44,000 | 1,019 |
| | Iida Group Holdings Co. Ltd. | 71,400 | 991 |
| | Tohoku Electric Power Co. Inc. | 225,000 | 945 |
| | J Front Retailing Co. Ltd. | 116,800 | 944 |
| | Tokyo Century Corp. | 27,500 | 938 |
| | Mebuki Financial Group Inc. | 482,300 | 938 |
| | COMSYS Holdings Corp. | 57,000 | 934 |
| | Air Water Inc. | 83,500 | 932 |
| | Cosmo Energy Holdings Co. Ltd. | 35,940 | 926 |
| | Casio Computer Co. Ltd. | 102,500 | 891 |
| | EXEO Group Inc. | 60,200 | 882 |
| | Taiheiyo Cement Corp. | 61,600 | 837 |
| | Kamigumi Co. Ltd. | 43,300 | 823 |
| | Teijin Ltd. | 90,300 | 820 |
| | Sanwa Holdings Corp. | 94,800 | 817 |
| | JTEKT Corp. | 111,100 | 784 |
| | Lawson Inc. | 24,200 | 773 |
| | Credit Saison Co. Ltd. | 72,000 | 770 |
| | | Shares | Market
Value•
($000) |
| | INFRONEER Holdings Inc. | 105,500 | 731 |
| | Sumitomo Rubber Industries Ltd. | 84,000 | 721 |
| | Chugoku Electric Power Co. Inc. | 150,735 | 707 |
| | Nippon Electric Glass Co. Ltd. | 40,800 | 706 |
| | Pigeon Corp. | 53,900 | 706 |
| | Hachijuni Bank Ltd. | 212,400 | 677 |
| | Daicel Corp. | 118,500 | 676 |
| | Kaneka Corp. | 27,200 | 675 |
| | Ube Industries Ltd. | 52,200 | 673 |
| | DMG Mori Co. Ltd. | 57,200 | 662 |
| | Kobe Steel Ltd. | 160,000 | 656 |
| | Konica Minolta Inc. | 212,600 | 648 |
| | Toyo Tire Corp. | 53,900 | 632 |
| | DIC Corp. | 37,500 | 630 |
| | Penta-Ocean Construction Co. Ltd. | 126,400 | 629 |
| | Nippon Kayaku Co. Ltd. | 79,100 | 628 |
| | Hirogin Holdings Inc. | 152,100 | 628 |
| | Sankyo Co. Ltd. | 18,900 | 624 |
| | Toyoda Gosei Co. Ltd. | 38,100 | 609 |
| | K's Holdings Corp | 77,300 | 606 |
| | Coca-Cola Bottlers Japan Holdings Inc. | 65,900 | 595 |
| | Amano Corp. | 33,200 | 568 |
| | Seven Bank Ltd. | 312,900 | 564 |
| | Kokuyo Co. Ltd. | 44,600 | 553 |
| | Yamaguchi Financial Group Inc. | 104,100 | 548 |
| | AEON Financial Service Co. Ltd. | 54,900 | 537 |
| | Toda Corp. | 101,400 | 507 |
| | ABC-Mart Inc. | 11,100 | 495 |
| | Aica Kogyo Co. Ltd. | 23,000 | 494 |
| | Heiwa Corp. | 28,800 | 465 |
| | TS Tech Co. Ltd. | 44,400 | 464 |
| | NOK Corp. | 55,600 | 455 |
| | Fuyo General Lease Co. Ltd. | 7,800 | 434 |
| | Kaken Pharmaceutical Co. Ltd. | 16,700 | 427 |
| | Nipro Corp. | 55,400 | 418 |
| | Canon Marketing Japan Inc. | 19,500 | 412 |
| | Kyudenko Corp. | 19,400 | 412 |
| | Yamato Kogyo Co. Ltd. | 14,100 | 409 |
| | H.U. Group Holdings Inc. | 21,800 | 406 |
| | Daido Steel Co. Ltd. | 15,600 | 404 |
| | Shikoku Electric Power Co. Inc. | 74,000 | 356 |
| | Toyota Boshoku Corp. | 25,400 | 323 |
| | Lintec Corp. | 17,400 | 261 |
| | Itoham Yonekyu Holdings Inc. | 52,600 | 235 |
| | Fuji Media Holdings Inc. | 32,000 | 223 |
| | Kandenko Co. Ltd. | 39,300 | 221 |
| | Noevir Holdings Co. Ltd. | 5,800 | 214 |
| | Matsui Securities Co. Ltd. | 33,600 | 179 |
| | | | 586,351 |
International High Dividend Yield Index Fund
| | | Shares | Market
Value•
($000) |
| Kuwait (0.3%) |
| | National Bank of Kuwait SAKP | 3,414,689 | 11,883 |
| | Mobile Telecommunications Co. KSCP | 993,282 | 1,920 |
| | Gulf Bank KSCP | 805,560 | 892 |
| | Boubyan Petrochemicals Co. KSCP | 198,171 | 510 |
| | Humansoft Holding Co. KSC | 41,891 | 455 |
| | Burgan Bank SAK | 450,763 | 317 |
| | | | 15,977 |
| Malaysia (0.8%) |
| | Public Bank Bhd. | 6,800,700 | 6,431 |
| | Malayan Banking Bhd. | 3,397,997 | 6,173 |
| | CIMB Group Holdings Bhd. | 3,142,800 | 3,671 |
| | Tenaga Nasional Bhd. | 1,520,933 | 2,709 |
| | Petronas Chemicals Group Bhd. | 1,369,700 | 2,525 |
| | Hong Leong Bank Bhd. | 289,600 | 1,298 |
| | Axiata Group Bhd. | 2,128,000 | 1,281 |
| | MISC Bhd. | 834,844 | 1,278 |
| | DiGi.Com Bhd. | 1,490,100 | 1,195 |
| | Genting Bhd. | 1,117,300 | 1,050 |
| | Petronas Gas | 270,732 | 979 |
| | RHB Bank Bhd. | 735,100 | 890 |
| | Maxis Bhd. | 987,100 | 804 |
| | Sime Darby Bhd. | 1,619,700 | 771 |
| | Genting Malaysia Bhd. | 1,274,600 | 739 |
| | Telekom Malaysia Bhd. | 542,600 | 638 |
| | Petronas Dagangan Bhd. | 131,800 | 605 |
| | IJM Corp. Bhd. | 1,453,200 | 501 |
| | Alliance Bank Malaysia Bhd. | 550,400 | 431 |
| | Top Glove Corp. Bhd. | 2,312,820 | 389 |
| | YTL Corp. Bhd. | 2,370,623 | 283 |
| | Westports Holdings Bhd. | 363,700 | 258 |
| | British American Tobacco Malaysia Bhd. | 87,600 | 195 |
| | Astro Malaysia Holdings Bhd. | 736,400 | 105 |
| | | | 35,199 |
| Mexico (1.1%) |
| | America Movil SAB de CV Series L | 13,699,700 | 12,965 |
| | Grupo Financiero Banorte SAB de CV Class O | 1,386,400 | 11,269 |
| | Wal-Mart de Mexico SAB de CV | 2,472,135 | 9,549 |
| | Grupo Mexico SAB de CV Series B | 1,525,900 | 5,532 |
| | Grupo Aeroportuario del Sureste SAB de CV Class B | 96,170 | 2,251 |
| | Arca Continental SAB de CV | 213,200 | 1,746 |
| | Coca-Cola Femsa SAB de CV | 263,860 | 1,662 |
| | Alfa SAB de CV Class A | 1,703,000 | 1,130 |
| | Grupo Aeroportuario del Centro Norte SAB de CV Class B | 125,700 | 1,001 |
| 2 | Banco del Bajio SA | 348,100 | 982 |
| | Regional SAB de CV | 115,000 | 804 |
| | | Shares | Market
Value•
($000) |
| | Promotora y Operadora de Infraestructura SAB de CV | 105,140 | 791 |
| | Orbia Advance Corp. SAB de CV | 445,300 | 752 |
| | Industrias Penoles SAB de CV | 60,000 | 681 |
| | Kimberly-Clark de Mexico SAB de CV Class A | 364,300 | 575 |
| | Qualitas Controladora SAB de CV | 78,700 | 309 |
| | Megacable Holdings SAB de CV | 131,200 | 275 |
| | Alpek SAB de CV | 195,200 | 274 |
| * | Sitios Latinoamerica SAB de CV | 655,501 | 191 |
| | | | 52,739 |
| Netherlands (1.2%) |
| | ING Groep NV | 1,812,730 | 17,837 |
| | Koninklijke Ahold Delhaize NV | 485,693 | 13,545 |
| | NN Group NV | 143,253 | 6,066 |
| | Koninklijke KPN NV | 1,550,053 | 4,336 |
| | Aegon NV | 846,254 | 3,917 |
| | ASR Nederland NV | 66,065 | 2,909 |
| | Randstad NV | 53,364 | 2,660 |
| 2 | ABN AMRO Bank NV GDR | 200,321 | 1,969 |
| | BE Semiconductor Industries NV | 37,226 | 1,897 |
| 2 | Signify NV | 59,018 | 1,635 |
| | Koninklijke Vopak NV | 32,145 | 657 |
| 2 | CTP NV | 33,599 | 348 |
| | | | 57,776 |
| New Zealand (0.2%) |
| | Spark New Zealand Ltd. | 906,298 | 2,698 |
| | Meridian Energy Ltd. | 609,308 | 1,727 |
| | Contact Energy Ltd. | 371,731 | 1,631 |
| | Fletcher Building Ltd. | 372,252 | 1,111 |
| | Mercury NZ Ltd. | 321,030 | 1,085 |
| | | | 8,252 |
| Norway (1.1%) |
| | Equinor ASA | 450,527 | 16,414 |
| | DNB Bank ASA | 488,900 | 8,647 |
| | Aker BP ASA (XOSL) | 145,989 | 4,638 |
| | Norsk Hydro ASA | 638,119 | 4,050 |
| | Yara International ASA | 78,884 | 3,521 |
| | Mowi ASA | 210,303 | 3,139 |
| | Telenor ASA | 306,350 | 2,784 |
| | Orkla ASA | 357,922 | 2,414 |
| | Gjensidige Forsikring ASA | 80,401 | 1,470 |
| | Salmar ASA | 26,680 | 904 |
| | Aker ASA Class A | 11,375 | 803 |
| | Leroy Seafood Group ASA | 122,371 | 563 |
| | | | 49,347 |
| Pakistan (0.0%) |
| | Fauji Fertilizer Co. Ltd. | 602,134 | 282 |
| | Oil & Gas Development Co. Ltd. | 286,603 | 91 |
| | Habib Bank Ltd. | 260,768 | 82 |
| | | | 455 |
International High Dividend Yield Index Fund
| | | Shares | Market
Value•
($000) |
| Philippines (0.1%) |
| | International Container Terminal Services Inc. | 522,410 | 1,566 |
| | PLDT Inc. | 44,810 | 1,264 |
| | Globe Telecom Inc. | 16,729 | 674 |
| | Manila Electric Co. | 124,700 | 650 |
| | Aboitiz Power Corp. | 716,900 | 393 |
| | Semirara Mining & Power Corp. Class A | 574,220 | 349 |
| | DMCI Holdings Inc. | 1,879,400 | 310 |
| | Metro Pacific Investments Corp. | 4,851,000 | 307 |
| | LT Group Inc. | 1,353,700 | 189 |
| | | | 5,702 |
| Poland (0.1%) |
| | Polski Koncern Naftowy ORLEN SA | 271,508 | 3,118 |
| | Powszechny Zaklad Ubezpieczen SA | 268,201 | 1,502 |
| | Bank Polska Kasa Opieki SA | 72,805 | 1,193 |
| | LPP SA | 570 | 988 |
| | | | 6,801 |
| Portugal (0.2%) |
| | EDP - Energias de Portugal SA | 1,350,925 | 5,903 |
| | Galp Energia SGPS SA | 243,499 | 2,472 |
| | | | 8,375 |
| Qatar (0.5%) |
| | Qatar Islamic Bank SAQ | 867,433 | 5,804 |
| | Industries Qatar QSC | 749,677 | 3,245 |
| | Masraf Al Rayan QSC | 2,962,810 | 3,122 |
| | Commercial Bank PSQC | 1,639,300 | 2,834 |
| | Qatar International Islamic Bank QSC | 562,108 | 1,785 |
| | Qatar Fuel QSC | 278,470 | 1,459 |
| | Qatar Electricity & Water Co. QSC | 225,319 | 1,144 |
| | Ooredoo QPSC | 394,320 | 1,057 |
| | Barwa Real Estate Co. | 1,039,484 | 970 |
| | Doha Bank QPSC | 1,183,127 | 717 |
| | Qatar Aluminum Manufacturing Co. | 1,320,846 | 588 |
| | Vodafone Qatar QSC | 697,311 | 321 |
| | | | 23,046 |
| Romania (0.0%) |
| | Banca Transilvania SA | 262,656 | 899 |
| | OMV Petrom SA (XAMS) | 6,675,305 | 607 |
| | Societatea Nationala Nuclearelectrica SA | 27,902 | 226 |
| * | OMV Petrom SA | 577,620 | 53 |
| | | | 1,785 |
| Russia (0.0%) |
| *,3 | Inter Rao Ues PJSC | 11,522,470 | — |
| 3 | MMC Norilsk Nickel PJSC ADR | 53,701 | — |
| *,3 | Sberbank of Russia PJSC | 3,446,575 | — |
| *,3 | Mobile TeleSystems PJSC ADR | 132,889 | — |
| *,3 | Moscow Exchange MICEX-RTS PJSC | 482,108 | — |
| 3 | Rosneft Oil Co. PJSC (Registered) GDR | 190,781 | — |
| 3 | Magnit PJSC GDR (Registered) | 22,311 | — |
| | | Shares | Market
Value•
($000) |
| 3 | MMC Norilsk Nickel PJSC | 11,458 | — |
| 3 | LUKOIL PJSC ADR | 51,350 | — |
| *,3 | Gazprom PJSC ADR | 748,819 | — |
| 3 | Severstal PAO GDR (Registered) | 34,635 | — |
| 3 | Tatneft PJSC ADR | 44,997 | — |
| *,3 | VTB Bank PJSC GDR (Registered) | 802,016 | — |
| *,3 | Alrosa PJSC | 840,362 | — |
| 3 | PhosAgro PJSC | 7,446 | — |
| *,3 | United Co. Rusal International | 796,030 | — |
| 3 | Unipro PJSC | 4,903,000 | — |
| *,3 | Polyus PJSC | 9,549 | — |
| *,3 | RusHydro PJSC | 41,940,310 | — |
| 3 | Rostelecom PJSC | 343,830 | — |
| 3 | Tatneft PJSC | 243,415 | — |
| 3 | Novolipetskiy Metallurgicheskiy Kombinat PJSC | 373,254 | — |
| 3 | Mobile TeleSystems PJSC | 18,732 | — |
| 3 | Magnit PJSC | 20,521 | — |
| 3 | Novatek PJSC | 356,672 | — |
| 3 | Gazprom PJSC | 2,023,010 | — |
| *,3 | Mosenergo PJSC | 1,739,000 | — |
| 3 | Transneft PJSC Preference Shares | 527 | — |
| *,3 | Federal Grid Co. | 83,950,000 | — |
| 3 | Lukoil PJSC | 76,646 | — |
| 3 | Rosneft Oil Co. PJSC | 211,479 | — |
| 3 | Magnitogorsk Iron & Steel Works PJSC | 732,540 | — |
| 3 | Tatneft PJSC Preference Shares | 51,803 | — |
| *,3 | Sistema PJSFC | 903,430 | — |
| 3 | Severstal PAO PJSC | 28,686 | — |
| 3 | Surgutneftegas PJSC Preference Shares | 2,513,070 | — |
| *,3 | PhosAgro PJSC GDR | 91 | — |
| 3 | PhosAgro PJSC (Registered) GDR | 14,173 | — |
| | | | — |
| Saudi Arabia (1.6%) |
| | Saudi National Bank | 1,042,771 | 16,481 |
| 2 | Saudi Arabian Oil Co. | 1,341,043 | 12,446 |
| | Saudi Basic Industries Corp. | 431,737 | 10,137 |
| | Saudi Telecom Co. | 861,519 | 9,256 |
| | Riyad Bank | 705,309 | 6,741 |
| | SABIC Agri-Nutrients Co. | 112,309 | 4,745 |
| | Arab National Bank | 322,870 | 2,772 |
| | Sahara International Petrochemical Co. | 171,847 | 1,850 |
| | Yanbu National Petrochemical Co. | 134,322 | 1,597 |
| | Jarir Marketing Co. | 28,845 | 1,258 |
| | Bank Al-Jazira | 192,588 | 1,198 |
| | Saudi Industrial Investment Group | 177,271 | 1,059 |
| | Advanced Petrochemical Co. | 61,991 | 730 |
| | Abdullah Al Othaim Markets Co. | 21,659 | 654 |
| | Saudi Cement Co. | 35,304 | 501 |
| | Southern Province Cement Co. | 34,297 | 500 |
International High Dividend Yield Index Fund
| | | Shares | Market
Value•
($000) |
| | Qassim Cement Co. | 22,275 | 447 |
| | Saudia Dairy & Foodstuff Co. | 6,782 | 424 |
| | Yanbu Cement Co. | 36,591 | 406 |
| | Arabian Centres Co. Ltd. | 74,767 | 389 |
| | | | 73,591 |
| Singapore (1.5%) |
| | DBS Group Holdings Ltd. | 869,278 | 21,016 |
| | Oversea-Chinese Banking Corp. Ltd. | 1,679,700 | 14,419 |
| | United Overseas Bank Ltd. | 616,945 | 12,104 |
| | Singapore Telecommunications Ltd. | 3,619,688 | 6,373 |
| | Keppel Corp. Ltd. | 652,812 | 3,213 |
| | Wilmar International Ltd. | 996,200 | 2,729 |
| | Singapore Exchange Ltd. | 385,732 | 2,294 |
| | Singapore Technologies Engineering Ltd. | 736,300 | 1,717 |
| | Genting Singapore Ltd. | 2,768,600 | 1,574 |
| | Venture Corp. Ltd. | 128,100 | 1,441 |
| | Jardine Cycle & Carriage Ltd. | 52,100 | 1,094 |
| | ComfortDelGro Corp. Ltd. | 1,026,700 | 922 |
| | NetLink NBN Trust | 1,416,300 | 855 |
| | Golden Agri-Resources Ltd. | 3,124,600 | 641 |
| | Hutchison Port Holdings Trust Class U | 2,405,700 | 393 |
| | Olam Group Ltd. | 333,400 | 316 |
| | StarHub Ltd. | 273,500 | 207 |
| | Singapore Telecommunications Ltd. (XSES) | 8,800 | 15 |
| | | | 71,323 |
| South Africa (1.2%) |
| | FirstRand Ltd. | 2,409,921 | 8,425 |
| | Standard Bank Group Ltd. | 649,943 | 6,067 |
| | Absa Group Ltd. | 392,233 | 4,259 |
| | Impala Platinum Holdings Ltd. | 385,622 | 3,948 |
| | Sibanye Stillwater Ltd. | 1,340,603 | 3,140 |
| | Shoprite Holdings Ltd. | 228,570 | 2,909 |
| | Sanlam Ltd. | 840,078 | 2,449 |
| | Nedbank Group Ltd. | 198,755 | 2,353 |
| | Anglo American Platinum Ltd. | 26,483 | 2,109 |
| | Vodacom Group Ltd. | 279,801 | 1,906 |
| | Woolworths Holdings Ltd. | 450,207 | 1,544 |
| | Exxaro Resources Ltd. | 115,164 | 1,283 |
| | Old Mutual Ltd. (XZIM) | 2,137,978 | 1,214 |
| | NEPI Rockcastle NV | 230,487 | 1,159 |
| | Mr Price Group Ltd. | 119,010 | 1,145 |
| | Multichoice Group | 164,669 | 1,076 |
| | Foschini Group Ltd. | 150,705 | 942 |
| | SPAR Group Ltd. | 94,676 | 803 |
| | Tiger Brands Ltd. | 76,620 | 775 |
| | Life Healthcare Group Holdings Ltd. | 676,116 | 727 |
| | African Rainbow Minerals Ltd. | 49,401 | 696 |
| | Investec Ltd. | 132,257 | 650 |
| | | Shares | Market
Value•
($000) |
| | Momentum Metropolitan Holdings | 682,092 | 637 |
| | AVI Ltd. | 155,405 | 623 |
| | Netcare Ltd. | 726,402 | 618 |
| | Pick n Pay Stores Ltd. | 175,168 | 563 |
| | Truworths International Ltd. | 179,155 | 510 |
| | Kumba Iron Ore Ltd. | 23,927 | 450 |
| | Royal Bafokeng Platinum Ltd. | 38,794 | 312 |
| | Santam Ltd. | 15,764 | 218 |
| | | | 53,510 |
| South Korea (1.4%) |
| | KB Financial Group Inc. | 186,039 | 6,260 |
| | POSCO Holdings Inc. | 35,835 | 6,246 |
| | Shinhan Financial Group Co. Ltd. | 238,696 | 6,067 |
| | Kia Corp. | 123,378 | 5,733 |
| | Hana Financial Group Inc. | 136,487 | 3,946 |
| | KT&G Corp. | 50,855 | 3,415 |
| | SK Inc. | 17,386 | 2,605 |
| | Woori Financial Group Inc. | 301,349 | 2,487 |
| | LG Corp. | 41,978 | 2,330 |
| | Korea Zinc Co. Ltd. | 4,716 | 2,115 |
| | Samsung Fire & Marine Insurance Co. Ltd. | 13,862 | 1,944 |
| | Samsung Life Insurance Co. Ltd. | 34,951 | 1,652 |
| | S-Oil Corp. | 19,981 | 1,212 |
| | Hyundai Heavy Industries Holdings Co. Ltd. | 24,562 | 1,048 |
| | Industrial Bank of Korea | 119,934 | 879 |
| | DB Insurance Co. Ltd. | 22,186 | 876 |
| | LG Uplus Corp. | 103,377 | 830 |
| | Kumho Petrochemical Co. Ltd. | 8,545 | 783 |
| | Hyundai Motor Co. Preference Shares (XKRS) | 13,902 | 778 |
| | Lotte Chemical Corp. | 7,316 | 758 |
| | GS Holdings Corp. | 23,301 | 752 |
| | LG Chem Ltd. Preference Shares | 3,593 | 728 |
| | Hyundai Marine & Fire Insurance Co. Ltd. | 29,222 | 682 |
| | Korea Investment Holdings Co. Ltd. | 18,687 | 649 |
| | Samsung Securities Co. Ltd. | 28,616 | 637 |
| | BNK Financial Group Inc. | 138,184 | 621 |
| | Hyundai Motor Co. Preference Shares | 10,902 | 599 |
| | Cheil Worldwide Inc. | 34,495 | 591 |
| | Mirae Asset Securities Co. Ltd. | 126,466 | 563 |
| | GS Engineering & Construction Corp. | 29,795 | 453 |
| | S-1 Corp. | 9,692 | 424 |
| | Samsung Fire & Marine Insurance Co. Ltd. Preference Shares | 3,632 | 408 |
| | SK Telecom Co. Ltd. | 11,621 | 408 |
| | LOTTE Fine Chemical Co. Ltd. | 9,437 | 371 |
International High Dividend Yield Index Fund
| | | Shares | Market
Value•
($000) |
| | NH Investment & Securities Co. Ltd. | 59,018 | 371 |
| | SK Chemicals Co. Ltd. | 5,655 | 350 |
| | DGB Financial Group Inc. | 72,674 | 346 |
| | Posco International Corp. | 22,710 | 329 |
| | GS Retail Co. Ltd. | 18,469 | 329 |
| | Lotte Shopping Co. Ltd. | 4,999 | 306 |
| | Lotte Corp. | 13,296 | 304 |
| | Mirae Asset Securities Co. Ltd. Preference Shares | 111,672 | 284 |
| | Samsung Card Co. Ltd. | 12,997 | 282 |
| | Korea Gas Corp. | 11,087 | 271 |
| | DL Holdings Co. Ltd. | 6,123 | 264 |
| | Doosan Bobcat Inc. | 9,567 | 224 |
| | KEPCO Plant Service & Engineering Co. Ltd. | 9,912 | 222 |
| | SSANGYONG C&E Co. Ltd. | 41,718 | 166 |
| | SK Telecom Co. Ltd. ADR | 8,129 | 159 |
| | Hyundai Motor Co. | 983 | 113 |
| | Hanwha Corp. Preference Shares | 11,497 | 113 |
| | | | 64,283 |
| Spain (1.7%) |
| 1 | Banco Santander SA | 7,957,987 | 20,639 |
| | Banco Bilbao Vizcaya Argentaria SA | 2,929,868 | 15,115 |
| 1 | Industria de Diseno Textil SA | 504,008 | 11,440 |
| | Repsol SA | 600,494 | 8,169 |
| | CaixaBank SA | 2,071,307 | 6,868 |
| | Red Electrica Corp. SA | 205,054 | 3,317 |
| | Endesa SA | 149,015 | 2,490 |
| | Bankinter SA | 338,344 | 2,047 |
| | Acciona SA | 11,072 | 1,994 |
| | Enagas SA | 116,514 | 1,891 |
| 1 | Naturgy Energy Group SA | 70,920 | 1,820 |
| | Mapfre SA | 479,844 | 823 |
| * | Grifols SA Preference Shares | 123,111 | 770 |
| | | | 77,383 |
| Sweden (1.5%) |
| | Volvo AB Class B | 736,229 | 12,050 |
| | Telefonaktiebolaget LM Ericsson Class B | 1,405,437 | 7,813 |
| | Swedbank AB Class A | 484,336 | 7,221 |
| | Skandinaviska Enskilda Banken AB Class A | 681,016 | 7,180 |
| | Svenska Handelsbanken AB Class A | 697,164 | 6,477 |
| 1 | H & M Hennes & Mauritz AB Class B | 415,361 | 4,184 |
| | Boliden AB | 131,034 | 3,811 |
| 1 | Telia Co. AB | 1,226,277 | 3,249 |
| | Skanska AB Class B | 171,367 | 2,665 |
| | SKF AB Class B | 182,006 | 2,635 |
| | Trelleborg AB Class B | 115,024 | 2,533 |
| | Securitas AB Class B | 265,798 | 2,172 |
| | Tele2 AB Class B | 264,386 | 2,167 |
| | Castellum AB | 121,677 | 1,391 |
| 1 | Electrolux AB Class B | 102,251 | 1,261 |
| | Svenska Handelsbanken AB Class B | 29,105 | 318 |
| | | Shares | Market
Value•
($000) |
| | Telefonaktiebolaget LM Ericsson Class A | 45,736 | 272 |
| | Skandinaviska Enskilda Banken AB Class C | 5,390 | 61 |
| | | | 67,460 |
| Switzerland (7.1%) |
| | Roche Holding AG | 303,772 | 100,791 |
| | Novartis AG (Registered) | 983,094 | 79,523 |
| | Zurich Insurance Group AG | 71,571 | 30,502 |
| | UBS Group AG (Registered) | 1,468,492 | 23,282 |
| | ABB Ltd. (Registered) | 725,407 | 20,145 |
| | Holcim Ltd. | 263,010 | 11,949 |
| | Swiss Re AG | 138,438 | 10,284 |
| | Roche Holding AG (Bearer) | 24,109 | 9,786 |
| | Swiss Life Holding AG (Registered) | 14,752 | 7,143 |
| | SGS SA (Registered) | 2,811 | 6,197 |
| | Swisscom AG (Registered) | 12,521 | 6,183 |
| | Credit Suisse Group AG (Registered) | 1,244,263 | 5,154 |
| | Julius Baer Group Ltd. | 101,927 | 4,890 |
| | Baloise Holding AG (Registered) | 21,838 | 2,984 |
| | Swiss Prime Site AG (Registered) | 36,243 | 2,924 |
| | Adecco Group AG (Registered) | 74,629 | 2,336 |
| | PSP Swiss Property AG (Registered) | 20,670 | 2,208 |
| | Helvetia Holding AG (Registered) | 16,347 | 1,623 |
| | Banque Cantonale Vaudoise (Registered) | 13,453 | 1,197 |
| * | Accelleron Industries AG | 35,617 | 604 |
| | | | 329,705 |
| Taiwan (4.3%) |
| | Hon Hai Precision Industry Co. Ltd. | 5,727,000 | 18,189 |
| | MediaTek Inc. | 716,000 | 13,051 |
| | Delta Electronics Inc. | 1,038,802 | 8,266 |
| | United Microelectronics Corp. | 5,657,000 | 6,802 |
| | Chunghwa Telecom Co. Ltd. | 1,823,000 | 6,286 |
| | Nan Ya Plastics Corp. | 2,698,000 | 5,717 |
| | Fubon Financial Holding Co. Ltd. | 3,535,770 | 5,585 |
| | CTBC Financial Holding Co. Ltd. | 8,739,120 | 5,521 |
| | Mega Financial Holding Co. Ltd. | 5,363,525 | 4,969 |
| | China Steel Corp. | 5,926,000 | 4,933 |
| | Uni-President Enterprises Corp. | 2,297,000 | 4,665 |
| | Cathay Financial Holding Co. Ltd. | 3,953,388 | 4,627 |
| | Formosa Plastics Corp. | 1,789,879 | 4,611 |
| | First Financial Holding Co. Ltd. | 5,037,739 | 3,864 |
| | Taiwan Cooperative Financial Holding Co. Ltd. | 4,880,200 | 3,781 |
| | Formosa Chemicals & Fibre Corp. | 1,643,000 | 3,541 |
International High Dividend Yield Index Fund
| | | Shares | Market
Value•
($000) |
| | Yuanta Financial Holding Co. Ltd. | 5,707,690 | 3,485 |
| | Hua Nan Financial Holdings Co. Ltd. | 4,836,046 | 3,155 |
| | Chailease Holding Co. Ltd. | 659,893 | 3,044 |
| | ASE Technology Holding Co. Ltd. | 1,212,171 | 2,993 |
| | Largan Precision Co. Ltd. | 49,000 | 2,803 |
| | China Development Financial Holding Corp. | 7,573,000 | 2,756 |
| | E Ink Holdings Inc. | 432,000 | 2,745 |
| | Quanta Computer Inc. | 1,270,000 | 2,690 |
| | Taiwan Cement Corp. (XTAI) | 2,847,639 | 2,670 |
| | Sinopac Holdings Co. | 5,143,777 | 2,566 |
| | Taiwan Mobile Co. Ltd. | 835,000 | 2,462 |
| | Asustek Computer Inc. | 336,268 | 2,459 |
| | Shanghai Commercial & Savings Bank Ltd. | 1,578,000 | 2,271 |
| | Taishin Financial Holding Co. Ltd. | 5,482,788 | 2,250 |
| | President Chain Store Corp. | 267,000 | 2,220 |
| | Yageo Corp. | 192,613 | 2,184 |
| | Evergreen Marine Corp. Taiwan Ltd. | 481,800 | 2,050 |
| | Novatek Microelectronics Corp. | 272,000 | 2,027 |
| | Lite-On Technology Corp. | 1,015,194 | 2,010 |
| | Accton Technology Corp. | 254,000 | 1,910 |
| | Far Eastern New Century Corp. | 1,877,000 | 1,871 |
| | Realtek Semiconductor Corp. | 227,000 | 1,789 |
| | Pegatron Corp. | 978,000 | 1,788 |
| | Catcher Technology Co. Ltd. | 338,672 | 1,779 |
| | AU Optronics Corp. | 3,378,000 | 1,763 |
| | Formosa Petrochemical Corp. | 652,000 | 1,678 |
| | Far EasTone Telecommunications Co. Ltd. | 762,000 | 1,671 |
| | Shin Kong Financial Holdings Co. Ltd. | 6,484,000 | 1,607 |
| | Innolux Corp. | 4,023,788 | 1,476 |
| | Asia Cement Corp. | 1,192,000 | 1,378 |
| | Compal Electronics Inc. | 1,967,000 | 1,287 |
| | Eclat Textile Co. Ltd. | 96,200 | 1,262 |
| | Globalwafers Co. Ltd. | 102,000 | 1,131 |
| | Micro-Star International Co. Ltd. | 331,000 | 1,121 |
| | Wistron Corp. | 1,374,656 | 1,110 |
| | Synnex Technology International Corp. | 657,000 | 1,070 |
| | ASE Technology Holding Co. Ltd. ADR | 210,204 | 1,070 |
| | Pou Chen Corp. | 1,256,000 | 1,060 |
| | Inventec Corp. | 1,397,994 | 1,057 |
| | Feng TAY Enterprise Co. Ltd. | 206,280 | 1,024 |
| | Zhen Ding Technology Holding Ltd. | 305,000 | 1,000 |
| | Sino-American Silicon Products Inc. | 253,000 | 970 |
| | Acer Inc. | 1,381,000 | 945 |
| | Wiwynn Corp. | 41,000 | 918 |
| | | Shares | Market
Value•
($000) |
| | Cheng Shin Rubber Industry Co. Ltd. | 911,994 | 912 |
| | Taiwan High Speed Rail Corp. | 1,038,000 | 904 |
| | Vanguard International Semiconductor Corp. | 439,500 | 902 |
| | Giant Manufacturing Co. Ltd. | 137,000 | 872 |
| | Winbond Electronics Corp. | 1,340,000 | 808 |
| | Powertech Technology Inc. | 346,000 | 799 |
| | Teco Electric and Machinery Co. Ltd. | 886,000 | 783 |
| | Foxconn Technology Co. Ltd. | 542,190 | 759 |
| | Chicony Electronics Co. Ltd. | 280,370 | 696 |
| | Nanya Technology Corp. | 385,000 | 649 |
| | Taiwan Fertilizer Co. Ltd. | 362,000 | 587 |
| | Nien Made Enterprise Co. Ltd. | 69,000 | 532 |
| | Taiwan Glass Industry Corp. | 712,000 | 450 |
| | Taiwan Secom Co. Ltd. | 141,000 | 404 |
| | Formosa Taffeta Co. Ltd. | 502,000 | 399 |
| | Transcend Information Inc. | 128,000 | 256 |
| 2 | Taiwan Cement Corp. | 11,696 | 55 |
| | | | 197,750 |
| Thailand (0.8%) |
| | PTT PCL | 6,922,200 | 6,551 |
| | PTT Exploration & Production PCL | 657,330 | 3,143 |
| | Advanced Info Service PCL | 542,604 | 2,727 |
| | Siam Cement PCL (Registered) | 280,750 | 2,391 |
| | SCB X PCL Foreign | 825,900 | 2,308 |
| | Kasikornbank PCL NVDR | 574,700 | 2,211 |
| | Charoen Pokphand Foods PCL | 2,319,600 | 1,542 |
| | Krung Thai Bank PCL | 3,010,400 | 1,387 |
| | PTT Global Chemical PCL | 990,099 | 1,134 |
| | Intouch Holdings PCL Class F | 595,441 | 1,127 |
| | Bangkok Bank PCL (Registered) | 240,300 | 920 |
| | Banpu PCL (Registered) | 2,716,950 | 893 |
| | Thai Oil PCL | 606,440 | 872 |
| | BTS Group Holdings PCL | 3,906,000 | 852 |
| | Land & Houses PCL (Registered) | 3,329,900 | 805 |
| | Thai Union Group PCL Class F | 1,526,600 | 723 |
| | TMBThanachart Bank PCL | 19,433,700 | 695 |
| | Siam Cement PCL NDVR | 79,400 | 676 |
| | Ratch Group PCL | 597,050 | 643 |
| | Kasikornbank PCL | 147,500 | 568 |
| | Electricity Generating PCL | 120,800 | 542 |
| | Osotspa PCL | 596,800 | 416 |
| | IRPC PCL | 4,746,400 | 392 |
| | Bangkok Bank PCL NVDR | 95,700 | 366 |
| | Srisawad Corp. PCL | 282,400 | 305 |
International High Dividend Yield Index Fund
| | | Shares | Market
Value•
($000) |
| | Intouch Holdings PCL NVDR | 153,800 | 291 |
| | Total Access Communication PCL NDVR | 161,900 | 192 |
| | Total Access Communication PCL | 160,500 | 190 |
| | Siam Commercial Bank PCL | 65,000 | 181 |
| | Siam City Cement PCL | 36,932 | 146 |
| | Sri Trang Gloves Thailand PCL | 303,500 | 89 |
| | Land & Houses PCL NVDR | 252,900 | 61 |
| *,3 | Thai Union Group PCL | 86,575 | 40 |
| | | | 35,379 |
| Turkey (0.2%) |
| | BIM Birlesik Magazalar A/S | 212,068 | 1,527 |
| | Turkiye Sise ve Cam Fabrikalari A/S | 713,628 | 1,272 |
| | Akbank TAS | 1,463,505 | 1,150 |
| | Eregli Demir ve Celik Fabrikalari TAS | 683,348 | 1,089 |
| | Enka Insaat ve Sanayi A/S | 857,527 | 864 |
| | Haci Omer Sabanci Holding A/S | 458,494 | 826 |
| | Turkcell Iletisim Hizmetleri A/S | 548,749 | 757 |
| | Turkiye Is Bankasi A/S Class C | 1,443,414 | 723 |
| | Yapi ve Kredi Bankasi A/S | 1,281,846 | 635 |
| | Ford Otomotiv Sanayi A/S | 29,064 | 567 |
| | Turkiye Garanti Bankasi A/S | 313,621 | 396 |
| | Coca-Cola Icecek A/S | 39,385 | 364 |
| | Tofas Turk Otomobil Fabrikasi A/S | 62,127 | 328 |
| | Arcelik A/S | 63,198 | 267 |
| | Anadolu Efes Biracilik Ve Malt Sanayii A/S | 94,680 | 244 |
| | Turk Telekomunikasyon A/S | 183,798 | 123 |
| 2 | Enerjisa Enerji A/S | 86,316 | 95 |
| | Iskenderun Demir ve Celik A/S | 34,312 | 47 |
| | | | 11,274 |
| United Arab Emirates (0.5%) |
| | First Abu Dhabi Bank PJSC | 2,123,442 | 10,355 |
| | Abu Dhabi Commercial Bank PJSC | 1,320,481 | 3,399 |
| | Dubai Islamic Bank PJSC | 1,407,693 | 2,230 |
| | Aldar Properties PJSC | 1,651,514 | 1,943 |
| | Abu Dhabi Islamic Bank PJSC | 696,307 | 1,802 |
| | Abu Dhabi National Oil Co. for Distribution PJSC | 1,395,138 | 1,715 |
| | Dubai Investments PJSC | 1,030,557 | 611 |
| | Dana Gas PJSC | 1,601,727 | 410 |
| | Aramex PJSC | 192,868 | 191 |
| | | | 22,656 |
| | | Shares | Market
Value•
($000) |
| United Kingdom (13.4%) |
| | Shell plc (XLON) | 3,510,187 | 97,238 |
| | HSBC Holdings plc | 9,678,178 | 49,669 |
| | BP plc | 8,914,201 | 49,319 |
| | Unilever plc (XLON) | 937,854 | 42,630 |
| | British American Tobacco plc | 1,077,060 | 42,537 |
| | Glencore plc | 6,283,215 | 36,022 |
| | GSK plc | 1,919,587 | 31,445 |
| | Rio Tinto plc | 521,795 | 27,270 |
| | National Grid plc | 1,749,223 | 19,058 |
| | Anglo American plc | 577,619 | 17,302 |
| | Lloyds Banking Group plc | 32,804,417 | 15,755 |
| | BAE Systems plc | 1,509,462 | 14,119 |
| | Vodafone Group plc | 12,049,771 | 14,067 |
| | Barclays plc | 7,740,026 | 13,152 |
| | Unilever plc | 279,987 | 12,779 |
| | Imperial Brands plc | 454,537 | 11,072 |
| | SSE plc | 514,980 | 9,203 |
| | Tesco plc | 3,530,536 | 8,720 |
| | Legal & General Group plc | 2,839,869 | 7,597 |
| * | Haleon plc | 2,388,142 | 7,323 |
| | NatWest Group plc | 2,506,648 | 6,751 |
| | Aviva plc | 1,343,698 | 6,445 |
| | 3i Group plc | 452,425 | 6,026 |
| | BT Group plc | 3,310,345 | 4,933 |
| | WPP plc | 505,760 | 4,451 |
| | Smurfit Kappa Group plc | 123,039 | 4,058 |
| | Pearson plc | 352,216 | 3,893 |
| | Mondi plc (XLON) | 229,777 | 3,855 |
| | United Utilities Group plc | 327,189 | 3,526 |
| | Severn Trent plc | 120,096 | 3,447 |
| | Admiral Group plc | 135,196 | 3,127 |
| | St. James's Place plc | 251,030 | 3,065 |
| | M&G plc | 1,217,237 | 2,446 |
| | Kingfisher plc | 937,391 | 2,355 |
| | Phoenix Group Holdings plc | 375,901 | 2,340 |
| | Persimmon plc | 151,873 | 2,273 |
| | Coca-Cola HBC AG | 95,654 | 2,089 |
| | DS Smith plc | 625,541 | 2,086 |
| | Barratt Developments plc | 480,368 | 2,072 |
| | Johnson Matthey plc | 87,754 | 1,948 |
| | Abrdn plc | 1,017,649 | 1,854 |
| | J Sainsbury plc | 827,005 | 1,843 |
| | Taylor Wimpey plc | 1,704,243 | 1,832 |
| | HomeServe plc | 133,651 | 1,819 |
| | B&M European Value Retail SA | 443,572 | 1,639 |
| | Hargreaves Lansdown plc | 186,350 | 1,629 |
| | Intermediate Capital Group plc | 133,516 | 1,626 |
| | Direct Line Insurance Group plc | 623,528 | 1,441 |
| | Schroders plc | 296,070 | 1,329 |
| | Bellway plc | 61,394 | 1,306 |
| | Pennon Group plc | 124,167 | 1,193 |
| | Royal Mail plc | 419,687 | 971 |
| | Fresnillo plc | 85,734 | 717 |
| 3 | Evraz plc | 193,110 | — |
| | | | 616,662 |
Total Common Stocks
(Cost $5,236,895) | 4,595,979 |
International High Dividend Yield Index Fund
| | | Shares | Market
Value•
($000) |
| Temporary Cash Investments (4.1%) |
| Money Market Fund (4.1%) |
| 4,5 | Vanguard Market Liquidity Fund, 3.117% (Cost $186,099) | 1,861,413 | 186,104 |
| Total Investments (103.6%) (Cost $5,422,994) | 4,782,083 |
| Other Assets and Liabilities—Net (-3.6%) | (164,411) |
| Net Assets (100%) | 4,617,672 |
| Cost is in $000. |
| • | See Note A in Notes to Financial Statements. |
| * | Non-income-producing security. |
| 1 | Includes partial security positions on loan to broker-dealers. The total value of securities on loan is $163,968,000. |
| 2 | Security exempt from registration under Rule 144A of the Securities Act of 1933. Such securities may be sold in transactions exempt from registration, normally to qualified institutional buyers. At October 31, 2022, the aggregate value was $49,296,000, representing 1.1% of net assets. |
| 3 | Security value determined using significant unobservable inputs. |
| 4 | Affiliated money market fund available only to Vanguard funds and certain trusts and accounts managed by Vanguard. Rate shown is the 7-day yield. |
| 5 | Collateral of $184,607,000 was received for securities on loan. |
| | ADR—American Depositary Receipt. |
| | GDR—Global Depositary Receipt. |
| | NVDR—Non-Voting Depository Receipt. |
Derivative Financial Instruments Outstanding as of Period End
| Futures Contracts |
| | | | ($000) |
| | Expiration | Number of
Long (Short)
Contracts | Notional
Amount | Value and
Unrealized
Appreciation
(Depreciation) |
| Long Futures Contracts | | | | |
| MSCI EAFE Index | December 2022 | 192 | 16,857 | 604 |
| MSCI Emerging Markets Index | December 2022 | 118 | 5,036 | (155) |
| | | | | 449 |
| Forward Currency Contracts |
| | Contract
Settlement
Date | Contract Amount (000) | Unrealized
Appreciation
($000) | Unrealized
Depreciation
($000) |
| Counterparty | Receive | Deliver |
| Royal Bank of Canada | 12/21/22 | AUD | 4,662 | USD | 3,017 | — | (29) |
| State Street Bank & Trust Co. | 12/21/22 | AUD | 1,600 | USD | 1,041 | — | (16) |
| Royal Bank of Canada | 12/21/22 | GBP | 2,849 | USD | 3,050 | 223 | — |
| Bank of Montreal | 12/21/22 | USD | 5,877 | AUD | 8,665 | 325 | — |
| Barclays Bank plc | 12/21/22 | USD | 3,057 | BRL | 16,335 | — | (70) |
| Bank of America, N.A. | 12/21/22 | USD | 3,218 | CHF | 3,138 | 63 | — |
| Royal Bank of Canada | 12/21/22 | USD | 2,127 | EUR | 2,200 | — | (56) |
International High Dividend Yield Index Fund
| Forward Currency Contracts (continued) |
| | Contract
Settlement
Date | Contract Amount (000) | Unrealized
Appreciation
($000) | Unrealized
Depreciation
($000) |
| Counterparty | Receive | Deliver |
| Bank of Montreal | 12/21/22 | USD | 1,055 | EUR | 1,058 | 5 | — |
| Bank of America, N.A. | 12/21/22 | USD | 4,693 | GBP | 4,061 | 28 | — |
| Standard Chartered Bank | 12/21/22 | USD | 689 | HKD | 5,401 | 1 | — |
| State Street Bank & Trust Co. | 12/21/22 | USD | 8,094 | JPY | 1,160,341 | 237 | — |
| Bank of Montreal | 12/21/22 | USD | 671 | JPY | 94,581 | 30 | — |
| Bank of America, N.A. | 12/21/22 | USD | 1,314 | TWD | 40,457 | 52 | — |
| | | | | | | 964 | (171) |
| AUD—Australian dollar. |
| BRL—Brazilian real. |
| CHF—Swiss franc. |
| EUR—euro. |
| GBP—British pound. |
| HKD—Hong Kong dollar. |
| JPY—Japanese yen. |
| TWD—Taiwanese dollar. |
| USD—U.S. dollar. |
See accompanying Notes, which are an integral part of the Financial Statements.
International High Dividend Yield Index Fund
Statement of Assets and Liabilities
|
| ($000s, except shares and per-share amounts) | Amount |
| Assets | |
| Investments in Securities, at Value1 | |
| Unaffiliated Issuers (Cost $5,236,895) | 4,595,979 |
| Affiliated Issuers (Cost $186,099) | 186,104 |
| Total Investments in Securities | 4,782,083 |
| Investment in Vanguard | 169 |
| Cash | 2,382 |
| Cash Collateral Pledged—Futures Contracts | 1,139 |
| Foreign Currency, at Value (Cost $3,091) | 2,829 |
| Receivables for Investment Securities Sold | 8 |
| Receivables for Accrued Income | 19,134 |
| Receivables for Capital Shares Issued | 718 |
| Unrealized Appreciation—Forward Currency Contracts | 964 |
| Total Assets | 4,809,426 |
| Liabilities | |
| Payables for Investment Securities Purchased | 5,799 |
| Collateral for Securities on Loan | 184,607 |
| Payables for Capital Shares Redeemed | 121 |
| Payables to Vanguard | 533 |
| Variation Margin Payable—Futures Contracts | 129 |
| Unrealized Depreciation—Forward Currency Contracts | 171 |
| Deferred Foreign Capital Gains Taxes | 394 |
| Total Liabilities | 191,754 |
| Net Assets | 4,617,672 |
| 1 Includes $163,968 of securities on loan. | |
| At October 31, 2022, net assets consisted of: | |
| | |
| Paid-in Capital | 5,328,633 |
| Total Distributable Earnings (Loss) | (710,961) |
| Net Assets | 4,617,672 |
| |
| ETF Shares—Net Assets | |
Applicable to 76,783,522 outstanding $.001 par value shares of
beneficial interest (unlimited authorization) | 4,198,004 |
| Net Asset Value Per Share—ETF Shares | $54.67 |
| |
| Admiral Shares—Net Assets | |
Applicable to 15,828,848 outstanding $.001 par value shares of
beneficial interest (unlimited authorization) | 419,668 |
| Net Asset Value Per Share—Admiral Shares | $26.51 |
See accompanying Notes, which are an integral part of the Financial Statements.
International High Dividend Yield Index Fund
|
| | Year Ended
October 31, 2022 |
| | ($000) |
| Investment Income | |
| Income | |
| Dividends1 | 224,136 |
| Interest2 | 69 |
| Securities Lending—Net | 938 |
| Total Income | 225,143 |
| Expenses | |
| The Vanguard Group—Note B | |
| Investment Advisory Services | 417 |
| Management and Administrative—ETF Shares | 6,717 |
| Management and Administrative—Admiral Shares | 757 |
| Marketing and Distribution—ETF Shares | 185 |
| Marketing and Distribution—Admiral Shares | 18 |
| Custodian Fees | 829 |
| Auditing Fees | 40 |
| Shareholders’ Reports—ETF Shares | 110 |
| Shareholders’ Reports—Admiral Shares | 5 |
| Trustees’ Fees and Expenses | 2 |
| Other Expenses | 137 |
| Total Expenses | 9,217 |
| Expenses Paid Indirectly | (28) |
| Net Expenses | 9,189 |
| Net Investment Income | 215,954 |
| Realized Net Gain (Loss) | |
| Investment Securities Sold2,3,4 | (12,635) |
| Futures Contracts | (8,832) |
| Forward Currency Contracts | 2,415 |
| Foreign Currencies | (3,716) |
| Realized Net Gain (Loss) | (22,768) |
| Change in Unrealized Appreciation (Depreciation) | |
| Investment Securities2,5 | (920,206) |
| Futures Contracts | 345 |
| Forward Currency Contracts | 650 |
| Foreign Currencies | (671) |
| Change in Unrealized Appreciation (Depreciation) | (919,882) |
| Net Increase (Decrease) in Net Assets Resulting from Operations | (726,696) |
| 1 | Dividends are net of foreign withholding taxes of $20,072,000. |
| 2 | Interest income, realized net gain (loss), capital gain distributions received, and change in unrealized appreciation (depreciation) from an affiliated company of the fund were $57,000, ($3,000), less than $1,000, and $5,000, respectively. Purchases and sales are for temporary cash investment purposes. |
| 3 | Realized gain (loss) is net of foreign capital gain taxes of $1,189,000. |
| 4 | Includes $14,160,000 of net gain (loss) resulting from in-kind redemptions. |
| 5 | The change in unrealized appreciation (depreciation) is net of the change in deferred foreign capital gains taxes of ($993,000). |
See accompanying Notes, which are an integral part of the Financial Statements.
International High Dividend Yield Index Fund
Statement of Changes in Net Assets
|
| | Year Ended October 31, |
| | 2022
($000) | 2021
($000) |
| | | |
| Increase (Decrease) in Net Assets | | |
| Operations | | |
| Net Investment Income | 215,954 | 114,370 |
| Realized Net Gain (Loss) | (22,768) | 57,611 |
| Change in Unrealized Appreciation (Depreciation) | (919,882) | 515,631 |
| Net Increase (Decrease) in Net Assets Resulting from Operations | (726,696) | 687,612 |
| Distributions | | |
| ETF Shares | (187,355) | (90,829) |
| Admiral Shares | (20,245) | (13,898) |
| Total Distributions | (207,600) | (104,727) |
| Capital Share Transactions | | |
| ETF Shares | 1,981,919 | 1,245,225 |
| Admiral Shares | 114,673 | 35,370 |
| Net Increase (Decrease) from Capital Share Transactions | 2,096,592 | 1,280,595 |
| Total Increase (Decrease) | 1,162,296 | 1,863,480 |
| Net Assets | | |
| Beginning of Period | 3,455,376 | 1,591,896 |
| End of Period | 4,617,672 | 3,455,376 |
See accompanying Notes, which are an integral part of the Financial Statements.
International High Dividend Yield Index Fund
| ETF Shares | | | | | |
For a Share Outstanding
Throughout Each Period | Year Ended October 31, |
| 2022 | 2021 | 2020 | 2019 | 2018 |
| Net Asset Value, Beginning of Period | $67.77 | $50.47 | $61.27 | $58.85 | $65.69 |
| Investment Operations | | | | | |
| Net Investment Income1 | 3.259 | 2.824 | 2.076 | 2.746 | 2.639 |
| Net Realized and Unrealized Gain (Loss) on Investments2 | (13.260) | 16.986 | (10.944) | 2.302 | (7.097) |
| Total from Investment Operations | (10.001) | 19.810 | (8.868) | 5.048 | (4.458) |
| Distributions | | | | | |
| Dividends from Net Investment Income | (3.099) | (2.510) | (1.932) | (2.628) | (2.382) |
| Distributions from Realized Capital Gains | — | — | — | — | — |
| Total Distributions | (3.099) | (2.510) | (1.932) | (2.628) | (2.382) |
| Net Asset Value, End of Period | $54.67 | $67.77 | $50.47 | $61.27 | $58.85 |
| Total Return | -15.16% | 39.55% | -14.55% | 8.87% | -7.03% |
| Ratios/Supplemental Data | | | | | |
| Net Assets, End of Period (Millions) | $4,198 | $3,061 | $1,325 | $1,264 | $889 |
| Ratio of Total Expenses to Average Net Assets | 0.22%3 | 0.22% | 0.28%3 | 0.27% | 0.32% |
| Ratio of Net Investment Income to Average Net Assets | 5.24% | 4.29% | 3.81% | 4.59% | 4.06% |
| Portfolio Turnover Rate4 | 16% | 18% | 20% | 15% | 10% |
| 1 | Calculated based on average shares outstanding. |
| 2 | Includes increases from purchase and redemption fees of $0.01, $.00, $.03, $.01, and $.02. |
| 3 | The ratio of expenses to average net assets for the period net of reduction from custody fee offset arrangements were 0.22% and 0.27%, respectively. |
| 4 | Excludes the value of portfolio securities received or delivered as a result of in-kind purchases or redemptions of the fund’s capital shares, including ETF Creation Units. |
See accompanying Notes, which are an integral part of the Financial Statements.
International High Dividend Yield Index Fund
| Admiral Shares | | | | | |
For a Share Outstanding
Throughout Each Period | Year Ended October 31, |
| 2022 | 2021 | 2020 | 2019 | 2018 |
| Net Asset Value, Beginning of Period | $32.85 | $24.45 | $29.69 | $28.52 | $31.83 |
| Investment Operations | | | | | |
| Net Investment Income1 | 1.559 | 1.329 | 1.034 | 1.322 | 1.264 |
| Net Realized and Unrealized Gain (Loss) on Investments2 | (6.398) | 8.286 | (5.336) | 1.120 | (3.423) |
| Total from Investment Operations | (4.839) | 9.615 | (4.302) | 2.442 | (2.159) |
| Distributions | | | | | |
| Dividends from Net Investment Income | (1.501) | (1.215) | (.938) | (1.272) | (1.151) |
| Distributions from Realized Capital Gains | — | — | — | — | — |
| Total Distributions | (1.501) | (1.215) | (.938) | (1.272) | (1.151) |
| Net Asset Value, End of Period | $26.51 | $32.85 | $24.45 | $29.69 | $28.52 |
| Total Return3 | -15.11% | 39.59% | -14.59% | 8.83% | -7.00% |
| Ratios/Supplemental Data | | | | | |
| Net Assets, End of Period (Millions) | $420 | $395 | $267 | $199 | $181 |
| Ratio of Total Expenses to Average Net Assets | 0.22%4 | 0.22% | 0.28%4 | 0.27% | 0.32% |
| Ratio of Net Investment Income to Average Net Assets | 5.15% | 4.19% | 3.99% | 4.57% | 4.06% |
| Portfolio Turnover Rate5 | 16% | 18% | 20% | 15% | 10% |
| 1 | Calculated based on average shares outstanding. |
| 2 | Includes increases from purchase and redemption fees of $.00, $.00, $0.01, $0.01, and $.01. |
| 3 | Total returns do not include transaction or account service fees that may have applied in the periods shown. Fund prospectuses provide information about any applicable transaction and account service fees. |
| 4 | The ratio of expenses to average net assets for the period net of reduction from custody fee offset arrangements were 0.22% and 0.27%, respectively. |
| 5 | Excludes the value of portfolio securities received or delivered as a result of in-kind purchases or redemptions of the fund’s capital shares, including ETF Creation Units. |
See accompanying Notes, which are an integral part of the Financial Statements.
International High Dividend Yield Index Fund
Notes to Financial Statements
Vanguard International High Dividend Yield Index Fund is registered under the Investment Company Act of 1940 as an open-end investment company, or mutual fund. The fund offers two classes of shares: ETF Shares and Admiral Shares. Each of the share classes has different eligibility and minimum purchase requirements, and is designed for different types of investors. ETF Shares are listed for trading on Nasdaq; they can be purchased and sold through a broker.
The fund invests in securities of foreign issuers, which may subject it to investment risks not normally associated with investing in securities of U.S. corporations. Significant market disruptions, such as those caused by pandemics (e.g., COVID-19 pandemic), natural or environmental disasters, war (e.g., Russia’s invasion of Ukraine), acts of terrorism, or other events, can adversely affect local and global markets and normal market operations. Any such disruptions could have an adverse impact on the value of the fund’s investments and fund performance.
| A. | The following significant accounting policies conform to generally accepted accounting principles for U.S. investment companies. The fund consistently follows such policies in preparing its financial statements. |
1. Security Valuation: Securities are valued as of the close of trading on the New York Stock Exchange (generally 4 p.m., Eastern time) on the valuation date. Equity securities are valued at the latest quoted sales prices or official closing prices taken from the primary market in which each security trades; such securities not traded on the valuation date are valued at the mean of the latest quoted bid and asked prices. Securities for which market quotations are not readily available, or whose values have been affected by events occurring before the fund’s pricing time but after the close of the securities’ primary markets, are valued by methods deemed by the valuation designee to represent fair value and subject to oversight by the board of trustees. These procedures include obtaining quotations from an independent pricing service, monitoring news to identify significant market- or security-specific events, and evaluating changes in the values of foreign market proxies (for example, ADRs, futures contracts, or exchange-traded funds), between the time the foreign markets close and the fund’s pricing time. When fair-value pricing is employed, the prices of securities used by a fund to calculate its net asset value may differ from quoted or published prices for the same securities. Investments in Vanguard Market Liquidity Fund are valued at that fund's net asset value.
2. Foreign Currency: Securities and other assets and liabilities denominated in foreign currencies are translated into U.S. dollars using exchange rates obtained from an independent third party as of the fund’s pricing time on the valuation date. Realized gains (losses) and unrealized appreciation (depreciation) on investment securities include the effects of changes in exchange rates since the securities were purchased, combined with the effects of changes in security prices. Fluctuations in the value of other assets and liabilities resulting from changes in exchange rates are recorded as unrealized foreign currency gains (losses) until the assets or liabilities are settled in cash, at which time they are recorded as realized foreign currency gains (losses).
3. Futures Contracts: The fund uses index futures contracts to a limited extent, with the objectives of maintaining full exposure to the stock market, maintaining liquidity, and minimizing transaction costs. The fund may purchase futures contracts to immediately invest incoming cash in the market, or sell futures in response to cash outflows, thereby simulating a fully invested position in the underlying index while maintaining a cash balance for liquidity. The primary risks associated with the use of futures contracts are imperfect correlation between changes in market values of stocks held by the fund and the prices of futures contracts, and the possibility of an illiquid market. Counterparty risk involving futures is mitigated because a regulated clearinghouse is the
International High Dividend Yield Index Fund
counterparty instead of the clearing broker. To further mitigate counterparty risk, the fund trades futures contracts on an exchange, monitors the financial strength of its clearing brokers and clearinghouse, and has entered into clearing agreements with its clearing brokers. The clearinghouse imposes initial margin requirements to secure the fund’s performance and requires daily settlement of variation margin representing changes in the market value of each contract. Any securities pledged as initial margin for open contracts are noted in the Schedule of Investments.
Futures contracts are valued at their quoted daily settlement prices. The notional amounts of the contracts are not recorded in the Statement of Assets and Liabilities. Fluctuations in the value of the contracts are recorded in the Statement of Assets and Liabilities as an asset (liability) and in the Statement of Operations as unrealized appreciation (depreciation) until the contracts are closed, when they are recorded as realized gains (losses) on futures contracts.
During the year ended October 31, 2022, the fund’s average investments in long and short futures contracts represented 1% and 0% of net assets, respectively, based on the average of the notional amounts at each quarter-end during the period.
4. Forward Currency Contracts: The fund enters into forward currency contracts to protect the value of securities and related receivables and payables against changes in future foreign exchange rates. The fund’s risks in using these contracts include movement in the values of the foreign currencies relative to the U.S. dollar and the ability of the counterparties to fulfill their obligations under the contracts. The fund mitigates its counterparty risk by entering into forward currency contracts only with a diverse group of prequalified counterparties, monitoring their financial strength, entering into master netting arrangements with its counterparties, and requiring its counterparties to transfer collateral as security for their performance. In the absence of a default, the collateral pledged or received by the fund cannot be repledged, resold, or rehypothecated. The master netting arrangements provide that, in the event of a counterparty’s default (including bankruptcy), the fund may terminate the forward currency contracts, determine the net amount owed by either party in accordance with its master netting arrangements, and sell or retain any collateral held up to the net amount owed to the fund under the master netting arrangements. The forward currency contracts contain provisions whereby a counterparty may terminate open contracts if the fund’s net assets decline below a certain level, triggering a payment by the fund if the fund is in a net liability position at the time of the termination. The payment amount would be reduced by any collateral the fund has pledged. Any securities pledged as collateral for open contracts are noted in the Schedule of Investments. The value of collateral received or pledged is compared daily to the value of the forward currency contracts exposure with each counterparty, and any difference, if in excess of a specified minimum transfer amount, is adjusted and settled within two business days.
Forward currency contracts are valued at their quoted daily prices obtained from an independent third party, adjusted for currency risk based on the expiration date of each contract. The notional amounts of the contracts are not recorded in the Statement of Assets and Liabilities. Fluctuations in the value of the contracts are recorded in the Statement of Assets and Liabilities as an asset (liability) and in the Statement of Operations as unrealized appreciation (depreciation) until the contracts are closed, when they are recorded as realized gains (losses) on forward currency contracts.
During the year ended October 31, 2022, the fund’s average investment in forward currency contracts represented 1% of net assets, based on the average of the notional amounts at each quarter-end during the period.
International High Dividend Yield Index Fund
5. Federal Income Taxes: The fund intends to continue to qualify as a regulated investment company and distribute virtually all of its taxable income. The fund’s tax returns are open to examination by the relevant tax authorities until expiration of the applicable statute of limitations, which is generally three years after the filing of the tax return. Management has analyzed the fund’s tax positions taken for all open federal and state income tax years, and has concluded that no provision for income tax is required in the fund’s financial statements.
6. Distributions: Distributions to shareholders are recorded on the ex-dividend date. Distributions are determined on a tax basis at the fiscal year-end and may differ from net investment income and realized capital gains for financial reporting purposes.
7. Securities Lending: To earn additional income, the fund lends its securities to qualified institutional borrowers. Security loans are subject to termination by the fund at any time, and are required to be secured at all times by collateral in an amount at least equal to the market value of securities loaned. Daily market fluctuations could cause the value of loaned securities to be more or less than the value of the collateral received. When this occurs, the collateral is adjusted and settled before the opening of the market on the next business day. The fund further mitigates its counterparty risk by entering into securities lending transactions only with a diverse group of prequalified counterparties, monitoring their financial strength, and entering into master securities lending agreements with its counterparties. The master securities lending agreements provide that, in the event of a counterparty’s default (including bankruptcy), the fund may terminate any loans with that borrower, determine the net amount owed, and sell or retain the collateral up to the net amount owed to the fund; however, such actions may be subject to legal proceedings. While collateral mitigates counterparty risk, in the event of a default, the fund may experience delays and costs in recovering the securities loaned. The fund invests cash collateral received in Vanguard Market Liquidity Fund, and records a liability in the Statement of Assets and Liabilities for the return of the collateral, during the period the securities are on loan. Collateral investments in Vanguard Market Liquidity Fund are subject to market appreciation or depreciation. Securities lending income represents fees charged to borrowers plus income earned on invested cash collateral, less expenses associated with the loan. During the term of the loan, the fund is entitled to all distributions made on or in respect of the loaned securities.
8. Credit Facilities and Interfund Lending Program: The fund and certain other funds managed by The Vanguard Group ("Vanguard") participate in a $4.4 billion committed credit facility provided by a syndicate of lenders pursuant to a credit agreement and an uncommitted credit facility provided by Vanguard. Both facilities may be renewed annually. Each fund is individually liable for its borrowings, if any, under the credit facilities. Borrowings may be utilized for temporary or emergency purposes and are subject to the fund’s regulatory and contractual borrowing restrictions. With respect to the committed credit facility, the participating funds are charged administrative fees and an annual commitment fee of 0.10% of the undrawn committed amount of the facility, which are allocated to the funds based on a method approved by the fund’s board of trustees and included in Management and Administrative expenses on the fund’s Statement of Operations. Any borrowings under either facility bear interest at an agreed-upon spread plus the higher of the federal funds effective rate, the overnight bank funding rate, or the Daily Simple Secured Overnight Financing Rate inclusive of an additional agreed-upon spread. However, borrowings under the uncommitted credit facility may bear interest based upon an alternate rate agreed to by the fund and Vanguard.
In accordance with an exemptive order (the “Order”) from the SEC, the fund may participate in a joint lending and borrowing program that allows registered open-end Vanguard funds to borrow
International High Dividend Yield Index Fund
money from and lend money to each other for temporary or emergency purposes (the “Interfund Lending Program”), subject to compliance with the terms and conditions of the Order, and to the extent permitted by the fund’s investment objective and investment policies. Interfund loans and borrowings normally extend overnight but can have a maximum duration of seven days. Loans may be called on one business day’s notice. The interest rate to be charged is governed by the conditions of the Order and internal procedures adopted by the board of trustees. The board of trustees is responsible for overseeing the Interfund Lending Program.
For the year ended October 31, 2022, the fund did not utilize the credit facilities or the Interfund Lending Program.
9. Other: Dividend income is recorded on the ex-dividend date. Non-cash dividends included in income, if any, are recorded at the fair value of the securities received. Interest income includes income distributions received from Vanguard Market Liquidity Fund and is accrued daily. Security transactions are accounted for on the date securities are bought or sold. Costs used to determine realized gains (losses) on the sale of investment securities are those of the specific securities sold. Fees assessed on capital share transactions are credited to paid-in capital.
Taxes on foreign dividends and capital gains have been provided for in accordance with the fund's understanding of the applicable countries' tax rules and rates. Deferred foreign capital gains tax, if any, is accrued daily based upon net unrealized gains. The fund has filed tax reclaims for previously withheld taxes on dividends earned in certain European Union countries. These filings are subject to various administrative and judicial proceedings within these countries. Amounts related to these reclaims are recorded when there are no significant uncertainties as to the ultimate resolution of proceedings, the likelihood of receipt of these reclaims, and the potential timing of payment. Such tax reclaims and related professional fees, if any, are included in dividend income and other expenses, respectively.
Each class of shares has equal rights as to assets and earnings, except that each class separately bears certain class-specific expenses related to maintenance of shareholder accounts (included in Management and Administrative expenses) and shareholder reporting. Marketing and distribution expenses are allocated to each class of shares based on a method approved by the board of trustees. Income, other non-class-specific expenses, and gains and losses on investments are allocated to each class of shares based on its relative net assets.
| B. | In accordance with the terms of a Funds' Service Agreement (the “FSA”) between Vanguard and the fund, Vanguard furnishes to the fund investment advisory, corporate management, administrative, marketing, and distribution services at Vanguard’s cost of operations (as defined by the FSA). These costs of operations are allocated to the fund based on methods and guidelines approved by the board of trustees and are generally settled twice a month. |
Upon the request of Vanguard, the fund may invest up to 0.40% of its net assets as capital in Vanguard. At October 31, 2022, the fund had contributed to Vanguard capital in the amount of $169,000, representing less than 0.01% of the fund’s net assets and 0.07% of Vanguard’s capital received pursuant to the FSA. The fund’s trustees and officers are also directors and employees, respectively, of Vanguard.
International High Dividend Yield Index Fund
| C. | The fund’s custodian bank has agreed to reduce its fees when the fund maintains cash on deposit in the non-interest-bearing custody account. For the year ended October 31, 2022, custodian fee offset arrangements reduced the fund’s expenses by $28,000 (an annual rate of less than 0.01% of average net assets). |
| D. | Various inputs may be used to determine the value of the fund’s investments and derivatives. These inputs are summarized in three broad levels for financial statement purposes. The inputs or methodologies used to value securities are not necessarily an indication of the risk associated with investing in those securities. |
Level 1—Quoted prices in active markets for identical securities.
Level 2—Other significant observable inputs (including quoted prices for similar securities, interest rates, prepayment speeds, credit risk, etc.).
Level 3—Significant unobservable inputs (including the fund’s own assumptions used to determine the fair value of investments). Any investments and derivatives valued with significant unobservable inputs are noted on the Schedule of Investments.
The following table summarizes the market value of the fund’s investments and derivatives as of October 31, 2022, based on the inputs used to value them:
| | Level 1
($000) | Level 2
($000) | Level 3
($000) | Total
($000) |
| Investments | | | | |
| Assets | | | | |
| Common Stocks—North and South America | 610,807 | 7,442 | 100 | 618,349 |
| Common Stocks—Other | 1,752 | 3,975,289 | 589 | 3,977,630 |
| Temporary Cash Investments | 186,104 | — | — | 186,104 |
| Total | 798,663 | 3,982,731 | 689 | 4,782,083 |
| Derivative Financial Instruments | | | | |
| Assets | | | | |
| Futures Contracts1 | 604 | — | — | 604 |
| Forward Currency Contracts | — | 964 | — | 964 |
| Total | 604 | 964 | — | 1,568 |
| Liabilities | | | | |
| Futures Contracts1 | 155 | — | — | 155 |
| Forward Currency Contracts | — | 171 | — | 171 |
| Total | 155 | 171 | — | 326 |
| 1 | Includes cumulative appreciation (depreciation) on futures contracts and centrally cleared swaps, if any, as reported in the Schedule of Investments. Only current day’s variation margin is reported within the Statement of Assets and Liabilities. |
International High Dividend Yield Index Fund
| E. | At October 31, 2022, the fair values of derivatives were reflected in the Statement of Assets and Liabilities as follows: |
| Statement of Assets and Liabilities | Equity
Contracts
($000) | Foreign
Exchange
Contracts
($000) | Total
($000) |
| Unrealized Appreciation—Futures Contracts1 | 604 | — | 604 |
| Unrealized Appreciation—Forward Currency Contracts | — | 964 | 964 |
| Total Assets | 604 | 964 | 1,568 |
| | | | |
| Unrealized Depreciation—Futures Contracts1 | 155 | — | 155 |
| Unrealized Depreciation—Forward Currency Contracts | — | 171 | 171 |
| Total Liabilities | 155 | 171 | 326 |
| 1 | Includes cumulative appreciation (depreciation) on futures contracts and centrally cleared swaps, if any, as reported in the Schedule of Investments. Only current day’s variation margin is reported within the Statement of Assets and Liabilities. |
Realized net gain (loss) and the change in unrealized appreciation (depreciation) on derivatives for the year ended October 31, 2022, were:
| Realized Net Gain (Loss) on Derivatives | Equity
Contracts
($000) | Foreign
Exchange
Contracts
($000) | Total
($000) |
| Futures Contracts | (8,832) | — | (8,832) |
| Forward Currency Contracts | — | 2,415 | 2,415 |
| Realized Net Gain (Loss) on Derivatives | (8,832) | 2,415 | (6,417) |
| Change in Unrealized Appreciation (Depreciation) on Derivatives |
| Futures Contracts | 345 | — | 345 |
| Forward Currency Contracts | — | 650 | 650 |
| Change in Unrealized Appreciation (Depreciation) on Derivatives | 345 | 650 | 995 |
| F. | Permanent differences between book-basis and tax-basis components of net assets are reclassified among capital accounts in the financial statements to reflect their tax character. These reclassifications have no effect on net assets or net asset value per share. As of period end, permanent differences primarily attributable to the accounting for applicable in-kind redemptions, foreign currency transactions, passive foreign investment companies, and tax expense on capital gains were reclassified between the following accounts: |
| | Amount
($000) |
| Paid-in Capital | 14,159 |
| Total Distributable Earnings (Loss) | (14,159) |
Temporary differences between book-basis and tax-basis components of total distributable earnings (loss) arise when certain items of income, gain, or loss are recognized in different periods for financial statement and tax purposes; these differences will reverse at some time in the future. The differences are primarily related to the deferral of losses from wash sales; the recognition of
International High Dividend Yield Index Fund
unrealized gains or losses from certain derivative contracts; and the recognition of unrealized gains from passive foreign investment companies. As of period end, the tax-basis components of total distributable earnings (loss) are detailed in the table as follows:
| | Amount
($000) |
| Undistributed Ordinary Income | 31,092 |
| Undistributed Long-Term Gains | — |
| Capital Loss Carryforwards | (78,299) |
| Qualified Late-Year Losses | — |
| Net Unrealized Gains (Losses) | (664,633) |
The tax character of distributions paid was as follows:
| | Year Ended October 31, |
| | 2022
Amount
($000) | 2021
Amount
($000) |
| Ordinary Income* | 207,600 | 104,727 |
| Long-Term Capital Gains | — | — |
| Total | 207,600 | 104,727 |
| * | Includes short-term capital gains, if any. |
As of October 31, 2022, gross unrealized appreciation and depreciation for investments and derivatives based on cost for U.S. federal income tax purposes were as follows:
| | Amount
($000) |
| Tax Cost | 5,445,630 |
| Gross Unrealized Appreciation | 234,647 |
| Gross Unrealized Depreciation | (898,140) |
| Net Unrealized Appreciation (Depreciation) | (663,493) |
| G. | During the year ended October 31, 2022, the fund purchased $2,794,329,000 of investment securities and sold $696,443,000 of investment securities, other than temporary cash investments. Purchases and sales include $1,555,883,000 and $37,331,000, respectively, in connection with in-kind purchases and redemptions of the fund's capital shares. |
International High Dividend Yield Index Fund
| H. | Capital share transactions for each class of shares were: |
| | Year Ended October 31, | |
| | 2022 | | 2021 |
| | Amount
($000) | Shares
(000) | | Amount
($000) | Shares
(000) |
| ETF Shares | | | | | |
| Issued1 | 2,022,275 | 32,224 | | 1,245,225 | 18,913 |
| Issued in Lieu of Cash Distributions | — | — | | — | — |
| Redeemed2 | (40,356) | (600) | | — | — |
| Net Increase (Decrease)—ETF Shares | 1,981,919 | 31,624 | | 1,245,225 | 18,913 |
| Admiral Shares | | | | | |
| Issued1 | 184,464 | 6,153 | | 64,421 | 2,021 |
| Issued in Lieu of Cash Distributions | 11,257 | 386 | | 6,979 | 221 |
| Redeemed2 | (81,048) | (2,728) | | (36,030) | (1,151) |
| Net Increase (Decrease)—Admiral Shares | 114,673 | 3,811 | | 35,370 | 1,091 |
| 1 | Includes purchase fees for fiscal 2022 and 2021 of $643,000 and $162,000, respectively (fund totals). |
| 2 | Net of redemption fees for fiscal 2022 and 2021 of $174,000 and $88,000, respectively (fund totals). |
| I. | Management has determined that no events or transactions occurred subsequent to October 31, 2022, that would require recognition or disclosure in these financial statements. |
Report of Independent Registered Public Accounting Firm
To the Board of Trustees of Vanguard Whitehall Funds and Shareholders of Vanguard International Dividend Appreciation Index Fund and Vanguard International High Dividend Yield Index Fund
Opinions on the Financial Statements
We have audited the accompanying statements of assets and liabilities, including the schedules of investments, of Vanguard International Dividend Appreciation Index Fund and Vanguard International High Dividend Yield Index Fund (two of the funds constituting Vanguard Whitehall Funds, hereafter collectively referred to as the "Funds") as of October 31, 2022, the related statements of operations for the year ended October 31, 2022, the statements of changes in net assets for each of the two years in the period ended October 31, 2022, including the related notes, and the financial highlights for each of the five years in the period ended October 31, 2022 (collectively referred to as the "financial statements"). In our opinion, the financial statements present fairly, in all material respects, the financial position of each of the Funds as of October 31, 2022, the results of each of their operations for the year then ended, the changes in each of their net assets for each of the two years in the period ended October 31, 2022 and each of the financial highlights for each of the five years in the period ended October 31, 2022 in conformity with accounting principles generally accepted in the United States of America.
Basis for Opinions
These financial statements are the responsibility of the Funds’ management. Our responsibility is to express an opinion on the Funds’ financial statements based on our audits. We are a public accounting firm registered with the Public Company Accounting Oversight Board (United States) (PCAOB) and are required to be independent with respect to the Funds in accordance with the U.S. federal securities laws and the applicable rules and regulations of the Securities and Exchange Commission and the PCAOB.
We conducted our audits of these financial statements in accordance with the standards of the PCAOB. Those standards require that we plan and perform the audit to obtain reasonable assurance about whether the financial statements are free of material misstatement, whether due to error or fraud.
Our audits included performing procedures to assess the risks of material misstatement of the financial statements, whether due to error or fraud, and performing procedures that respond to those risks. Such procedures included examining, on a test basis, evidence regarding the amounts and disclosures in the financial statements. Our audits also included evaluating the accounting principles used and significant estimates made by management, as well as evaluating the overall presentation of the financial statements. Our procedures included confirmation of securities owned as of October 31, 2022 by correspondence with the custodian, transfer agent and brokers; when replies were not received from brokers, we performed other auditing procedures. We believe that our audits provide a reasonable basis for our opinions.
/s/PricewaterhouseCoopers LLP
Philadelphia, Pennsylvania
December 16, 2022
We have served as the auditor of one or more investment companies in The Vanguard Group of Funds since 1975.
Tax information (unaudited) for Vanguard International Dividend Appreciation Index Fund
The fund hereby designates $57,677,000, or if subsequently determined to be different, the maximum amount allowable by law, as qualified dividend income for individual shareholders for the fiscal year.
The fund hereby designates $14,000, or if subsequently determined to be different, the maximum amount allowable by law, of interest earned from obligations of the U.S. government which is generally exempt from state income tax.
For nonresident alien shareholders, 100% of short-term capital gain dividends distributed by the fund for the fiscal year are qualified short-term capital gains.
The fund distributed $130,836,000 as capital gain dividends (20% rate gain distributions) to shareholders during the fiscal year.
The fund designates to shareholders foreign source income of $92,751,000 and foreign taxes paid of $10,809,000, or if subsequently determined to be different, the maximum amounts allowable by law. Shareholders will receive more detailed information with their Form 1099-DIV to determine the calendar-year amounts to be included on their tax returns.
Tax information (unaudited) for Vanguard International High Dividend Yield Index Fund
The fund hereby designates $146,501,000, or if subsequently determined to be different, the maximum amount allowable by law, as qualified dividend income for individual shareholders for the fiscal year.
The fund hereby designates $19,000, or if subsequently determined to be different, the maximum amount allowable by law, of interest earned from obligations of the U.S. government which is generally exempt from state income tax.
The fund designates to shareholders foreign source income of $244,212,000 and foreign taxes paid of $17,221,000, or if subsequently determined to be different, the maximum amounts allowable by law. Shareholders will receive more detailed information with their Form 1099-DIV to determine the calendar-year amounts to be included on their tax returns.
The S&P Global Ex-U.S. Dividend Growers Index is a product of S&P Dow Jones Indices LLC ("S&P DJI"), a division of S&P Global ("S&P"), or its affiliates, and has been licensed for use by Vanguard. S&P® is a registered trademark of Standard & Poor’s Financial Services LLC, a division of S&P Global and Dow Jones® is a registered trademark of Dow Jones Trademark Holdings LLC (“Dow Jones”). The trademarks have been licensed to S&P DJI and have been sublicensed for use for certain purposes by Vanguard. The International Dividend Appreciation Index Fund is not sponsored, endorsed, sold, or promoted by SPDJI, Dow Jones, S&P, any of their respective affiliates (collectively, “S&P Dow Jones Indices”). S&P Dow Jones Indices make no representation or warranty, express or implied, to the owners of the International Dividend Appreciation Index Fund or any member of the public regarding the advisability of investing in securities generally or in the International Dividend Appreciation Index Fund particularly or the ability of the S&P Global Ex-U.S. Dividend Growers Index to track general market performance. S&P Dow Jones Indices’ only relationship to Vanguard with respect to the S&P Global Ex-U.S. Dividend Growers Index is the licensing of the Index and certain trademarks, service marks and/or trade names of S&P Dow Jones Indices and/or its licensors. The S&P Global Ex-U.S. Dividend Growers Index is determined, composed and calculated by S&P Dow Jones Indices without regard to Vanguard or the International Dividend Appreciation Index Fund. S&P Dow Jones Indices have no obligation to take the needs of Vanguard or the owners of the International Dividend Appreciation Index Fund into consideration in determining, composing or calculating the S&P Global Ex-U.S. Dividend Growers Index. S&P Dow Jones Indices are not responsible for and have not participated in the determination of the prices, and amount of the International Dividend Appreciation Index Fund or the timing of the issuance or sale of the International Dividend Appreciation Index Fund or in the determination or calculation of the equation by which the International Dividend Appreciation Index Fund is to be converted into cash, surrendered or redeemed, as the case may be. S&P Dow Jones Indices have no obligation or liability in connection with the administration, marketing or trading of the International Dividend Appreciation Index Fund. There is no assurance that investment products based on the S&P Global Ex-U.S. Dividend Growers Index will accurately track index performance or provide positive investment returns. S&P Dow Jones Indices LLC is not an investment advisor. Inclusion of a security within an index is not a recommendation by S&P Dow Jones Indices to buy, sell, or hold such security, nor is it considered to be investment advice.
S&P DOW JONES INDICES DOES NOT GUARANTEE THE ADEQUACY, ACCURACY, TIMELINESS AND/OR THE COMPLETENESS OF THE S&P GLOBAL EX-U.S. DIVIDEND GROWERS INDEX OR ANY DATA RELATED THERETO OR ANY COMMUNICATION, INCLUDING BUT NOT LIMITED TO, ORAL OR WRITTEN COMMUNICATION (INCLUDING ELECTRONIC COMMUNICATIONS) WITH RESPECT THERETO. S&P DOW JONES INDICES SHALL NOT BE SUBJECT TO ANY DAMAGES OR LIABILITY FOR ANY ERRORS, OMISSIONS, OR DELAYS THEREIN. S&P DOW JONES INDICES MAKE NO EXPRESS OR IMPLIED WARRANTIES, AND EXPRESSLY DISCLAIMS ALL WARRANTIES, OF MERCHANTABILITY OR FITNESS FOR A PARTICULAR PURPOSE OR USE OR AS TO RESULTS TO BE OBTAINED BY VANGUARD, OWNERS OF THE INTERNATIONAL DIVIDEND APPRECIATION INDEX FUND, OR ANY OTHER PERSON OR ENTITY FROM THE USE OF THE S&P GLOBAL EX-U.S. DIVIDEND GROWERS INDEX OR WITH RESPECT TO ANY DATA RELATED THERETO. WITHOUT LIMITING ANY OF THE FOREGOING, IN NO EVENT WHATSOEVER SHALL S&P DOW JONES INDICES BE LIABLE FOR ANY INDIRECT, SPECIAL, INCIDENTAL, PUNITIVE, OR CONSEQUENTIAL DAMAGES INCLUDING BUT NOT LIMITED TO, LOSS OF PROFITS, TRADING LOSSES, LOST TIME OR GOODWILL, EVEN IF THEY HAVE BEEN ADVISED OF THE POSSIBILITY OF SUCH DAMAGES, WHETHER IN CONTRACT, TORT, STRICT LIABILITY, OR OTHERWISE. THERE ARE NO THIRD PARTY BENEFICIARIES OF ANY AGREEMENTS OR ARRANGEMENTS BETWEEN S&P DOW JONES INDICES AND VANGUARD, OTHER THAN THE LICENSORS OF S&P DOW JONES INDICES.
London Stock Exchange Group companies include FTSE International Limited (“FTSE”), Frank Russell Company (“Russell”), MTS Next Limited (“MTS”), and FTSE TMX Global Debt Capital Markets Inc. (“FTSE TMX”). All rights reserved. “FTSE®”, “Russell®”, “MTS®”, “FTSE TMX®” and “FTSE Russell” and other service marks and trademarks related to the FTSE or Russell indexes are trademarks of the London Stock Exchange Group companies and are used by FTSE, MTS, FTSE TMX and Russell under license. All information is provided for information purposes only. Every effort is made to ensure that all information given in this publication is accurate, but no responsibility or liability can be accepted by the London Stock Exchange Group companies nor its licensors for any errors or for any loss from use of this publication. Neither the London Stock Exchange Group companies nor any of their licensors make any claim, prediction, warranty or representation whatsoever, expressly or impliedly, either as to the results to be obtained from the use of the Indices or the fitness or suitability of the Indices for any particular purpose to which they might be put. The London Stock Exchange Group companies do not provide investment advice and nothing in this document should be taken as constituting financial or investment advice. The London Stock Exchange Group companies make no representation regarding the advisability of investing in any asset. A decision to invest in any such asset should not be made in reliance on any information herein. Indexes cannot be invested in directly. Inclusion of an asset in an index is not a recommendation to buy, sell or hold that asset. The general information contained in this publication should not be acted upon without obtaining specific legal, tax, and investment advice from a licensed professional. No part of this information may be reproduced, stored in a retrieval system or transmitted in any form or by any means, electronic, mechanical, photocopying, recording or otherwise, without prior written permission of the London Stock Exchange Group companies. Distribution of the London Stock Exchange Group companies’ index values and the use of their indexes to create financial products require a license with FTSE, FTSE TMX, MTS and/or Russell and/or its licensors.
This page intentionally left blank.
The People Who Govern Your Fund
The trustees of your mutual fund are there to see that the fund is operated and managed in your best interests since, as a shareholder, you are a part owner of the fund. Your fund’s trustees also serve on the board of directors of The Vanguard Group, Inc., which is owned by the Vanguard funds and provides services to them.
A majority of Vanguard’s board members are independent, meaning that they have no affiliation with Vanguard or the funds they oversee, apart from the sizable personal investments they have made as private individuals. The independent board members have distinguished backgrounds in business, academia, and public service. Each of the trustees and executive officers oversees 206 Vanguard funds.
Information for each trustee and executive officer of the fund appears below. That information, as well as the Vanguard fund count, is as of the date on the cover of this fund report. The mailing address of the trustees and officers is P.O. Box 876, Valley Forge, PA 19482. More information about the trustees is in the Statement of Additional Information, which can be obtained, without charge, by contacting Vanguard at 800-662-7447, or online at vanguard.com.
Interested Trustee1
Mortimer J. Buckley
Born in 1969. Trustee since January 2018. Principal occupation(s) during the past five years and other experience: chairman of the board (2019–present) of Vanguard and of each of the investment companies served by Vanguard; chief executive officer (2018–present) of Vanguard; chief executive officer, president, and trustee (2018–present) of each of the investment companies served by Vanguard; president and director (2017–present) of Vanguard; and president (2018–present) of Vanguard Marketing Corporation. Chief investment officer (2013–2017), managing director (2002–2017), head of the Retail Investor Group (2006–2012), and chief information officer (2001–2006) of Vanguard. Member of the board of governors of the Investment Company Institute and the board of governors of FINRA. Trustee and vice chair of The Shipley School.
Independent Trustees
Tara Bunch
Born in 1962. Trustee since November 2021. Principal occupation(s) during the past five years and other experience: head of global operations at Airbnb (2020–present). Vice president of AppleCare (2012–2020). Member of the board of directors of Out & Equal (2002–2006), the advisory board of the University of California, Berkeley School of Engineering (2020–present), and the advisory board
of Santa Clara University’s Leavey School of Business (2018–present).
Emerson U. Fullwood
Born in 1948. Trustee since January 2008. Principal occupation(s) during the past five years and other experience: executive chief staff and marketing officer for North America and corporate vice president (retired 2008) of Xerox Corporation (document management products and services). Former president of the Worldwide Channels Group, Latin America, and Worldwide Customer Service and executive chief staff officer of Developing Markets of Xerox. Executive in residence and 2009–2010 Distinguished Minett Professor at the Rochester Institute of Technology. Member of the board of directors of the University of Rochester Medical Center, the Monroe Community College Foundation, the United Way of Rochester, North Carolina A&T University, Roberts Wesleyan College, and the Rochester Philharmonic Orchestra. Trustee of the University of Rochester.
F. Joseph Loughrey
Born in 1949. Trustee since October 2009. Principal occupation(s) during the past five years and other experience: president and chief operating officer (retired 2009) and vice chairman of the board (2008–2009) of Cummins Inc. (industrial machinery). Chairman of the board of Hillenbrand, Inc. (specialized consumer services). Director of the V Foundation. Member of the advisory council for the College of
1 Mr. Buckley is considered an “interested person,” as defined in the Investment Company Act of 1940, because he is an officer of the Vanguard funds.
Arts and Letters at the University of Notre Dame. Chairman of the board of Saint Anselm College.
Mark Loughridge
Born in 1953. Trustee since March 2012. Principal occupation(s) during the past five years and other experience: senior vice president and chief financial officer (retired 2013) of IBM (information technology services). Fiduciary member of IBM’s Retirement Plan Committee (2004–2013), senior vice president and general manager (2002–2004) of IBM Global Financing, vice president and controller (1998–2002) of IBM, and a variety of other prior management roles at IBM. Member of the Council on Chicago Booth.
Scott C. Malpass
Born in 1962. Trustee since March 2012. Principal occupation(s) during the past five years and other experience: adjunct professor of finance at the University of Notre Dame (2020–present). Chief investment officer (retired 2020) and vice president (retired 2020) of the University of Notre Dame. Assistant professor (retired June 2020) of finance at the Mendoza College of Business, University of Notre Dame, and member of the Notre Dame 403(b) Investment Committee. Member of the board of Catholic Investment Services, Inc. (investment advisors), the board of superintendence of the Institute for the Works of Religion, and the board of directors of Paxos Trust Company (finance).
Deanna Mulligan
Born in 1963. Trustee since January 2018. Principal occupation(s) during the past five years and other experience: chief executive officer of Purposeful (advisory firm for CEOs and C-level executives; 2021–present). Board chair (2020), chief executive officer (2011–2020), and president (2010–2019) of The Guardian Life Insurance Company of America. Chief operating officer (2010–2011) and executive vice president (2008–2010) of Individual Life and Disability of the Guardian Life Insurance Company of America. Member of the board of the Economic Club of New York. Trustee of the Partnership for New York City (business leadership), Chief Executives for Corporate Purpose, and the NewYork-Presbyterian Hospital.
André F. Perold
Born in 1952. Trustee since December 2004. Principal occupation(s) during the past five years and other experience: George Gund Professor of Finance and Banking, Emeritus at the Harvard Business School (retired 2011). Chief investment officer and co-managing partner of HighVista Strategies (private investment firm). Member of the board (2018–present) of RIT Capital Partners (investment
firm). Member of the investment committee of Partners Health Care System.
Sarah Bloom Raskin
Born in 1961. Trustee since January 2018. Principal occupation(s) during the past five years and other experience: deputy secretary (2014–2017) of the United States Department of the Treasury. Governor (2010–2014) of the Federal Reserve Board. Commissioner (2007–2010) of financial regulation for the State of Maryland. Colin W. Brown Distinguished Professor of the Practice of Law (2021–present), professor (2020–present), Distinguished Fellow of the Global Financial Markets Center (2020–present), and Rubenstein Fellow (2017–2020) at Duke University. Trustee (2017–present) of Amherst College and member of Amherst College Investment Committee (2019–present). Member of the Regenerative Crisis Response Committee (2020–present).
David A. Thomas
Born in 1956. Trustee since July 2021. Principal occupation(s) during the past five years and other experience: president of Morehouse College (2018–present). Professor of business administration, emeritus at Harvard University (2017–2018). Dean (2011–2016) and professor of management (2016–2017) at the Georgetown University McDonough School of Business. Director of DTE Energy Company (2013–present). Trustee of Common Fund (2019–present).
Peter F. Volanakis
Born in 1955. Trustee since July 2009. Principal occupation(s) during the past five years and other experience: president and chief operating officer (retired 2010) of Corning Incorporated (communications equipment) and director of Corning Incorporated (2000–2010) and Dow Corning (2001–2010). Director (2012) of SPX Corporation (multi-industry manufacturing). Overseer of the Amos Tuck School of Business Administration, Dartmouth College (2001–2013). Member of the BMW Group Mobility Council.
Executive Officers
Christine M. Buchanan
Born in 1970. Principal occupation(s) during the past five years and other experience: principal of Vanguard. Chief financial officer (2021–present) and treasurer (2017–present) of each of the investment companies served by Vanguard. Partner (2005–2017) at KPMG (audit, tax, and advisory services).
John Galloway
Born in 1973. Principal occupation(s) during the past five years and other experience: principal of Vanguard. Investment stewardship officer (September 2020–present) of each of the investment companies served by Vanguard. Head of Investor Advocacy (February 2020–present) and head of Marketing Strategy and Planning (2017–2020) at Vanguard. Special assistant to the President of the United States (2015).
Ashley Grim
Born in 1984. Principal occupation(s) during the past five years and other experience: treasurer (February 2022–present) of each of the investment companies served by Vanguard. Fund transfer agent controller (2019–2022) and director of Audit Services (2017–2019) at Vanguard. Senior manager (2015–2017) at PriceWaterhouseCoopers (audit and assurance, consulting, and tax services).
Peter Mahoney
Born in 1974. Principal occupation(s) during the past five years and other experience: principal of Vanguard. Controller (2015–present) of each of the investment companies served by Vanguard. Head of International Fund Services (2008–2014) at Vanguard.
Anne E. Robinson
Born in 1970. Principal occupation(s) during the past five years and other experience: general counsel (2016–present) of Vanguard. Secretary (2016–present) of Vanguard and of each of the investment companies served by Vanguard. Managing director (2016–present) of Vanguard. Managing director and general counsel of Global Cards and Consumer Services (2014–2016) at Citigroup. Counsel (2003–2014) at American Express. Nonexecutive director of the board of National Grid (energy).
Michael Rollings
Born in 1963. Principal occupation(s) during the past five years and other experience: finance director (2017–present) and treasurer (2017) of each of the investment companies served by Vanguard. Managing director (2016–present) of Vanguard. Chief financial officer (2016–present) of Vanguard. Director (2016–present) of Vanguard Marketing Corporation. Executive vice president and chief financial officer (2006–2016) of MassMutual Financial Group.
John E. Schadl
Born in 1972. Principal occupation(s) during the past five years and other experience: principal of Vanguard. Chief compliance officer (2019–present) of Vanguard and of each of the investment companies served by Vanguard. Assistant vice president (2019–present) of Vanguard Marketing Corporation.
Vanguard Senior Management Team
| Matthew Benchener | Thomas M. Rampulla |
| Joseph Brennan | Karin A. Risi |
| Mortimer J. Buckley | Anne E. Robinson |
| Gregory Davis | Michael Rollings |
| John James | Nitin Tandon |
| Chris D. Mclsaac | Lauren Valente |
Connect with Vanguard®>vanguard.com
Fund Information > 800-662-7447
Direct Investor Account Services > 800-662-2739
Institutional Investor Services > 800-523-1036
Text Telephone for People Who Are Deaf or Hard of Hearing > 800-749-7273
This material may be used in conjunction with the offering of shares of any Vanguard fund only if preceded or accompanied by the fund’s current prospectus.
All comparative mutual fund data are from Morningstar, Inc., unless otherwise noted.
You can obtain a free copy of Vanguard’s proxy voting guidelines by visiting vanguard.com/proxyreporting or by calling Vanguard at 800-662-2739. The guidelines are also available from the SEC’s website, www.sec.gov. In addition, you may obtain a free report on how your fund voted the proxies for securities it owned during the 12 months ended June 30. To get the report, visit either vanguard.com/proxyreporting or www.sec.gov.
You can review information about your fund on the SEC’s website, and you can receive copies of this information, for a fee, by sending a request via email addressed to publicinfo@sec.gov.
Source for Bloomberg indexes: Bloomberg Index Services Limited. Copyright 2022, Bloomberg. All rights reserved.
© 2022 The Vanguard Group, Inc.
All rights reserved.
U.S. Patent Nos. 6,879,964.
Vanguard Marketing Corporation, Distributor.
Q20150 122022
Annual Report | October 31, 2022
Vanguard Advice Select Global Value Fund
Contents
Please note: The opinions expressed in this report are just that—informed opinions. They should not be considered promises or advice. Also, please keep in mind that the information and opinions cover the period through the date on the front of this report. Of course, the risks of investing in your fund are spelled out in the prospectus.
Your Fund’s Performance at a Glance
| • | The 12 months ended October 31, 2022, were a volatile, challenging period for financial markets. Vanguard Advice Select Global Value Fund, which launched November 9, 2021, returned –14.01% from its inception through October 31, lagging the –12.39% return of its benchmark, the MSCI All Country World Value Index. |
| • | The economic backdrop deteriorated as inflation soared to multidecade highs, fueled in part by higher energy and food prices after Russia’s invasion of Ukraine. Then price increases broadened to other categories of goods and services, adding to concerns that inflation would remain stubbornly high. That prompted aggressive tightening by many central banks to bring inflation back in check and increased fears of a recession. |
| • | The fund posted stellar returns in energy (almost 40% on average), but they weren’t enough to offset steep declines in other sectors (most notably, communication services and information technology). Relative to the benchmark, the fund’s stock picks in consumer discretionary and financials held up better, but the fund lagged when it came to health care and communication services. |
| • | When parsed by countries, the fund had solid gains in Canada and Ireland but not enough to offset declines in other markets. Relative to the benchmark, the fund’s story was also mixed, with pockets of solid outperformance but cumulative underperformance overall. |
Market Barometer
| | Average Annual Total Returns
Periods Ended October 31, 2022 |
| | One Year | Three Years | Five Years |
| Stocks | | | |
| Russell 1000 Index (Large-caps) | -16.38% | 9.99% | 10.19% |
| Russell 2000 Index (Small-caps) | -18.54 | 7.05 | 5.56 |
| Russell 3000 Index (Broad U.S. market) | -16.52 | 9.79 | 9.87 |
| FTSE All-World ex US Index (International) | -24.20 | -1.16 | -0.18 |
| Bonds | | | |
Bloomberg U.S. Aggregate Float Adjusted Index
(Broad taxable market) | -15.69% | -3.73% | -0.50% |
Bloomberg Municipal Bond Index
(Broad tax-exempt market) | -11.98 | -2.18 | 0.37 |
| FTSE Three-Month U.S. Treasury Bill Index | 0.88 | 0.59 | 1.15 |
| CPI | | | |
| Consumer Price Index | 7.75% | 5.01% | 3.85% |
For the period from its November 9, 2021, inception through October 31, 2022, Vanguard Advice Select Global Value Fund returned –14.01%, trailing the –12.39% return of its benchmark, the MSCI All Country World Value Index. In a departure from recent years, the style factor environment during the period was characterized by the outperformance of value stocks over growth.
The period brought no shortage of macroeconomic developments, including Russia’s war in Ukraine, inflation persisting at multidecade highs, and the U.S. Federal Reserve committing to tighter monetary policies, fueling fears of a recession. As a result, market volatility remained extremely high. Amid the turmoil, our team saw wide alpha opportunities and executed on our investment process to capitalize on them. Over the fiscal year, the best performing sectors within the benchmark were energy and health care, while consumer discretionary, real estate, and information technology saw the worst results.
Sector allocation, a result of our bottom-up stock selection process, primarily drove underperformance on detractions from our overweight exposure to information technology and communication services, as well as an underweight to energy. This was partially offset by positive contribution from our underweight to financials. Stock selection also modestly detracted from relative performance. Weak results in health care, communication services, and industrials more than offset contributions from
positive selection in consumer discretionary, financials, and energy.
Stock selection decisions added the most value within consumer discretionary, with positions in Dollar Tree and Compass Group the most notable relative contributors. Shares of Dollar Tree delivered positive returns as new initiatives, including the company’s decision to move to a $1.25 price point from $1, helped combat rising inflation and improved results. Compass Group, a U.K.-based catering-services provider, saw its shares rise as the company navigated the challenging macroeconomic backdrop and drove solid organic sales growth through new business wins, in addition to managing inflationary pressure through pricing and contract structures.
Selection in the health care sector was weak. Top detractors included not holding UnitedHealth Group and an overweight position in Dentsply Sirona. Shares of Dentsply Sirona declined because of broad negative sentiment in the direct-to-consumer clear aligner space, despite it being a small part of its business, as well as concerns over its leadership transition.
Selection within communication services also hurt results, with Meta Platforms, Cable One, and United Internet the most notable detractors to relative performance. Shares of Meta Platforms, the U.S.-based social networking operator formerly named Facebook, fell after management released disappointing quarterly results as slowing growth in the e-commerce market weighed on its
advertising revenues. More recently, investors grew more concerned about the company’s comments about continued high capital commitments planned for its investments in the metaverse.
Throughout the pandemic, our team has found fortitude, investable insights, and worthwhile challenges to our base assumptions from our many diverse colleagues around the world. These include the health care team; other research-driven teams across consumer, technology, energy, and industrials; the fixed income team, which helps us to pinpoint the sources and depth of financing markets for reopening- dependent contrarian ideas; and the climate-, sustainability-, and ESG-focused teams, which assist us in assessing disadvantaged (or potentially permanently impaired) assets and the emerging risks from evolving environmental and social change.
Wellington’s macroeconomics team helps us rethink our assumptions about the business cycle, and lately that messaging has turned more cautious. Our macro team’s Global Cycle Index (a proprietary research tool incorporating seven independent variables that we use to assess the global economic cycle), continues to move lower against a backdrop of rising rates, rising inflation, and slowing growth, creating some near-term concerns. With this outlook in view, we have positioned the overall beta of the portfolio near the lower end of its longer-term range, reserving ample dry powder to deploy when we see
compelling investment opportunities created by market movements.
Stepping back, we have always believed that our best long-term opportunities are with stocks of good companies that have been discarded by other investors for reasons that we feel are temporary. There certainly have been times where the portfolio has been out of sync with marketplace fashion. We are confident that if we remain disciplined in our value approach, we will bring compensatory rewards to our patient shareholders over the long run.
David W. Palmer, CFA
Senior Managing Director and Equity Portfolio Manager
Wellington Management Company llp
November 10, 2022
About Your Fund’s Expenses
As a shareholder of the fund, you incur ongoing costs, which include costs for portfolio management, administrative services, and shareholder reports (like this one), among others. Operating expenses, which are deducted from a fund’s gross income, directly reduce the investment return of the fund.
A fund‘s expenses are expressed as a percentage of its average net assets. This figure is known as the expense ratio. The following examples are intended to help you understand the ongoing costs (in dollars) of investing in your fund and to compare these costs with those of other mutual funds. The examples are based on an investment of $1,000 made at the beginning of the period shown and held for the entire period.
The accompanying table illustrates your fund’s costs in two ways:
| • | Based on actual fund return. This section helps you to estimate the actual expenses that you paid over the period. The ”Ending Account Value“ shown is derived from the fund’s actual return, and the third column shows the dollar amount that would have been paid by an investor who started with $1,000 in the fund. You may use the information here, together with the amount you invested, to estimate the expenses that you paid over the period. |
To do so, simply divide your account value by $1,000 (for example, an $8,600 account value divided by $1,000 = 8.6), then multiply the result by the number given for your fund under the heading ”Expenses Paid During Period.“
| • | Based on hypothetical 5% yearly return. This section is intended to help you compare your fund‘s costs with those of other mutual funds. It assumes that the fund had a yearly return of 5% before expenses, but that the expense ratio is unchanged. In this case—because the return used is not the fund’s actual return—the results do not apply to your investment. The example is useful in making comparisons because the Securities and Exchange Commission requires all mutual funds to calculate expenses based on a 5% return. You can assess your fund’s costs by comparing this hypothetical example with the hypothetical examples that appear in shareholder reports of other funds. |
Note that the expenses shown in the table are meant to highlight and help you compare ongoing costs only and do not reflect transaction costs incurred by the fund for buying and selling securities. Further, the expenses do not include any purchase, redemption, or account service fees described in the fund prospectus. If such fees were applied to your account, your costs would be higher. Your fund does not carry a “sales load.”
The calculations assume no shares were bought or sold during the period. Your actual costs may have been higher or lower, depending on the amount of your investment and the timing of any purchases or redemptions.
You can find more information about the fund’s expenses, including annual expense ratios, in the Financial Statements section of this report. For additional information on operating expenses and other shareholder costs, please refer to your fund’s current prospectus.
| Six Months Ended October 31, 2022 | | | |
| Advice Select Global Value Fund | Beginning
Account Value
4/30/2022 | Ending
Account Value
10/31/2022 | Expenses
Paid During
Period |
| Based on Actual Fund Return | $1,000.00 | $940.80 | $1.96 |
| Based on Hypothetical 5% Yearly Return | 1,000.00 | 1,023.19 | 2.04 |
The calculations are based on expenses incurred in the most recent six-month period. The fund's annualized six-month expense ratio for that period is 0.40%. The dollar amounts shown as ”Expenses Paid” are equal to the annualized expense ratio multiplied by the average account value over the period, multiplied by the number of days in the most recent six-month period, then divided by the number of days in the most recent 12-month period (184/365).
Advice Select Global Value Fund
All of the returns in this report represent past performance, which is not a guarantee of future results that may be achieved by the fund. (Current performance may be lower or higher than the performance data cited. For performance data current to the most recent month-end, visit our website at vanguard.com/performance.) Note, too, that both investment returns and principal value can fluctuate widely, so an investor’s shares, when sold, could be worth more or less than their original cost. The returns shown do not reflect taxes that a shareholder would pay on fund distributions or on the sale of fund shares.
Cumulative Performance: November 9, 2021, Through October 31, 2022
Initial Investment of $10,000
| | | Total Returns
Period Ended October 31, 2022 | |
| | | Since
Inception
(11/9/2021) | Final Value
of a $10,000
Investment |
 | Advice Select Global Value Fund | -14.01% | $8,599 |
 | MSCI ACWI Value Index | -12.39 | 8,761 |
"Since Inception" performance is calculated from the fund's inception date for both the fund and its comparative standard(s).
See Financial Highlights for dividend and capital gains information.
Advice Select Global Value Fund
| |
| United States | 56.6% |
| Japan | 7.4 |
| United Kingdom | 7.4 |
| China | 3.6 |
| France | 3.4 |
| Spain | 3.2 |
| Canada | 3.1 |
| Ireland | 3.1 |
| Hong Kong | 2.7 |
| South Korea | 2.4 |
| India | 1.9 |
| Sweden | 1.1 |
| Other | 4.1 |
The table reflects the fund’s investments, except for short-term investments.
Advice Select Global Value Fund
The fund files its complete schedule of portfolio holdings with the Securities and Exchange Commission (SEC) for the first and third quarters of each fiscal year as an exhibit to its reports on Form N-PORT. The fund’s Form N-PORT reports are available on the SEC’s website at www.sec.gov.
| | | | | | Shares | Market
Value•
($000) |
| Common Stocks (98.6%) |
| Canada (3.1%) |
| | Canadian Natural Resources Ltd. | 94,263 | 5,650 |
| | Royal Bank of Canada | 42,349 | 3,918 |
| | | | | | | 9,568 |
| China (3.6%) |
| | Yum China Holdings Inc. | 85,079 | 3,518 |
| * | Trip.com Group Ltd. | 142,101 | 3,192 |
| | Haier Smart Home Co. Ltd. Class H | 487,596 | 1,220 |
| | Ping An Insurance Group Co. of China Ltd. Class H | 294,449 | 1,179 |
| 1 | CSC Financial Co. Ltd. Class H | 1,603,124 | 1,162 |
| *,1 | China Tourism Group Duty Free Corp. Ltd. Class H | 42,400 | 839 |
| | | | | | | 11,110 |
| Denmark (0.7%) |
| * | Genmab A/S | 5,979 | 2,303 |
| France (3.3%) |
| | Airbus SE | 59,335 | 6,420 |
| | Engie SA | 216,253 | 2,810 |
| | Nexity SA | 58,227 | 1,167 |
| | | | | | | 10,397 |
| Germany (0.6%) |
| | United Internet AG (Registered) | 99,761 | 1,865 |
| Hong Kong (2.7%) |
| | Techtronic Industries Co. Ltd. | 351,000 | 3,324 |
| * | Sands China Ltd. | 1,631,575 | 2,852 |
| | CK Asset Holdings Ltd. | 397,810 | 2,199 |
| | | | | | | 8,375 |
| India (1.9%) |
| | Genpact Ltd. | 63,696 | 3,089 |
| 1 | Reliance Industries Ltd. GDR | 45,808 | 2,799 |
| | | | | | | 5,888 |
| | | | | | Shares | Market
Value•
($000) |
| Ireland (3.0%) |
| | Bank of Ireland Group plc | 467,123 | 3,377 |
| | CRH plc | 93,097 | 3,344 |
| * | Ryanair Holdings plc ADR | 38,636 | 2,662 |
| | | | | | | 9,383 |
| Italy (0.9%) |
| | Banca Generali SpA | 88,856 | 2,656 |
| Japan (7.3%) |
| | T&D Holdings Inc. | 325,276 | 3,217 |
| | SoftBank Corp. | 306,599 | 3,024 |
| | Nabtesco Corp. | 113,487 | 2,411 |
| | Asahi Group Holdings Ltd. | 84,792 | 2,373 |
| | Chugai Pharmaceutical Co. Ltd. | 99,260 | 2,300 |
| | Makita Corp. | 98,459 | 1,799 |
| | Astellas Pharma Inc. | 113,449 | 1,565 |
| | Z Holdings Corp. | 566,170 | 1,461 |
| | TOTO Ltd. | 49,800 | 1,421 |
| | MatsukiyoCocokara & Co. | 37,752 | 1,375 |
| * | JTOWER Inc. | 24,998 | 1,014 |
| | SUMCO Corp. | 59,669 | 756 |
| | | | | | | 22,716 |
| Netherlands (0.6%) |
| | ING Groep NV | 197,079 | 1,939 |
| Russia (0.0%) |
| *,2 | Sberbank of Russia PJSC | 37,200 | — |
| South Korea (2.4%) |
| | Samsung Electronics Co. Ltd. GDR | 3,578 | 3,343 |
| | LG Chem Ltd. | 5,721 | 2,511 |
| * | Kangwon Land Inc. | 93,291 | 1,504 |
| | | | | | | 7,358 |
| Spain (3.2%) |
| | Iberdrola SA | 513,767 | 5,225 |
| | Almirall SA | 255,362 | 2,379 |
| 1 | Cellnex Telecom SA | 71,719 | 2,347 |
| | | | | | | 9,951 |
| Sweden (1.1%) |
| | Sandvik AB | 213,666 | 3,339 |
Advice Select Global Value Fund
| | | | | | Shares | Market
Value•
($000) |
| Switzerland (0.9%) |
| | Novartis AG ADR | 34,754 | 2,820 |
| Taiwan (0.2%) |
| | Globalwafers Co. Ltd. | 71,120 | 788 |
| United Kingdom (7.3%) |
| | Unilever plc | 117,546 | 5,343 |
| * | Haleon plc | 1,210,730 | 3,713 |
| | Rio Tinto plc | 59,213 | 3,094 |
| | Standard Chartered plc | 505,272 | 3,019 |
| | AstraZeneca plc | 24,250 | 2,845 |
| | Mondi plc | 155,512 | 2,609 |
| | Rentokil Initial plc | 328,623 | 2,051 |
| | | | | | | 22,674 |
| United States (55.8%) |
| | Schlumberger Ltd. | 150,403 | 7,826 |
| | Halliburton Co. | 181,991 | 6,628 |
| | MetLife Inc. | 65,151 | 4,770 |
| | Allstate Corp. | 37,109 | 4,685 |
| * | T-Mobile US Inc. | 30,539 | 4,629 |
| | Reliance Steel & Aluminum Co. | 22,281 | 4,489 |
| | Micron Technology Inc. | 80,368 | 4,348 |
| | Chubb Ltd. | 19,807 | 4,256 |
| * | Centene Corp. | 49,615 | 4,224 |
| * | F5 Inc. | 29,312 | 4,189 |
| | Westinghouse Air Brake Technologies Corp. | 44,736 | 4,173 |
| * | Dollar Tree Inc. | 26,319 | 4,172 |
| | VICI Properties Inc. | 129,451 | 4,145 |
| | Charles Schwab Corp. | 50,999 | 4,063 |
| | Fidelity National Information Services Inc. | 48,898 | 4,058 |
| | American International Group Inc. | 70,088 | 3,995 |
| * | GoDaddy Inc. Class A | 46,909 | 3,772 |
| | QUALCOMM Inc. | 31,513 | 3,708 |
| * | Seagen Inc. | 29,075 | 3,697 |
| * | Salesforce Inc. | 22,664 | 3,685 |
| * | Meta Platforms Inc. Class A | 38,821 | 3,617 |
| | Leidos Holdings Inc. | 35,437 | 3,600 |
| | Knight-Swift Transportation Holdings Inc. Class A | 73,161 | 3,514 |
| | Globe Life Inc. | 29,894 | 3,453 |
| | VMware Inc. Class A | 30,003 | 3,376 |
| | Exelon Corp. | 86,886 | 3,353 |
| | Electronic Arts Inc. | 26,478 | 3,335 |
| | NXP Semiconductors NV | 22,440 | 3,278 |
| * | Boston Scientific Corp. | 73,885 | 3,185 |
| | Keurig Dr Pepper Inc. | 80,795 | 3,138 |
| | Lennar Corp. Class A | 38,442 | 3,102 |
| | AES Corp. | 118,128 | 3,090 |
| | FMC Corp. | 24,826 | 2,952 |
| | | | | | Shares | Market
Value•
($000) |
| | PPG Industries Inc. | 25,490 | 2,910 |
| | Equinix Inc. | 5,051 | 2,861 |
| | TJX Cos. Inc. | 39,020 | 2,813 |
| | Americold Realty Trust Inc. | 110,012 | 2,668 |
| * | FleetCor Technologies Inc. | 13,685 | 2,547 |
| * | Avantor Inc. | 126,094 | 2,543 |
| | Raymond James Financial Inc. | 21,401 | 2,528 |
| | Cognizant Technology Solutions Corp. Class A | 39,182 | 2,439 |
| | Apollo Global Management Inc. | 44,048 | 2,439 |
| * | Match Group Inc. | 56,233 | 2,429 |
| | Cable One Inc. | 2,708 | 2,327 |
| | Philip Morris International Inc. | 24,373 | 2,239 |
| * | Charter Communications Inc. Class A | 5,953 | 2,188 |
| | DENTSPLY SIRONA Inc. | 69,279 | 2,135 |
| | Johnson Controls International plc | 35,487 | 2,053 |
| * | Airbnb Inc. Class A | 18,424 | 1,970 |
| * | CarMax Inc. | 30,252 | 1,906 |
| | | | | | | 173,500 |
Total Common Stocks
(Cost $322,976) | 306,630 |
| Temporary Cash Investments (1.9%) |
| Money Market Fund (1.9%) |
| 3 | Vanguard Market Liquidity Fund, 3.117%
(Cost $5,992) | 59,940 | 5,993 |
Total Investments (100.5%)
(Cost $328,968) | | 312,623 |
| Other Assets and Liabilities—Net (-0.5%) | | (1,579) |
| Net Assets (100%) | | 311,044 |
| • | See Note A in Notes to Financial Statements. |
| * | Non-income-producing security. |
| 1 | Security exempt from registration under Rule 144A of the Securities Act of 1933. Such securities may be sold in transactions exempt from registration, normally to qualified institutional buyers. At October 31, 2022, the aggregate value was $7,147,000, representing 2.3% of net assets. |
| 2 | Security value determined using significant unobservable inputs. |
| 3 | Affiliated money market fund available only to Vanguard funds and certain trusts and accounts managed by Vanguard. Rate shown is the 7-day yield. |
| | ADR—American Depositary Receipt. |
| | GDR—Global Depositary Receipt. |
See accompanying Notes, which are an integral part of the Financial Statements.
Advice Select Global Value Fund
Statement of Assets and Liabilities
|
| ($000s, except shares and per-share amounts) | Amount |
| Assets | |
| Investments in Securities, at Value | |
| Unaffiliated Issuers (Cost $322,976) | 306,630 |
| Affiliated Issuers (Cost $5,992) | 5,993 |
| Total Investments in Securities | 312,623 |
| Investment in Vanguard | 11 |
| Foreign Currency, at Value (Cost $51) | 51 |
| Receivables for Investment Securities Sold | 487 |
| Receivables for Accrued Income | 303 |
| Receivables for Capital Shares Issued | 2,192 |
| Total Assets | 315,667 |
| Liabilities | |
| Payables for Investment Securities Purchased | 4,400 |
| Payables for Capital Shares Redeemed | 69 |
| Payables to Investment Advisor | 128 |
| Payables to Vanguard | 26 |
| Total Liabilities | 4,623 |
| Net Assets | 311,044 |
At October 31, 2022, net assets consisted of: |
|
| | |
| Paid-in Capital | 327,032 |
| Total Distributable Earnings (Loss) | (15,988) |
| Net Assets | 311,044 |
| | |
| Net Assets | |
Applicable to 14,487,209 outstanding $.001 par value shares of
beneficial interest (unlimited authorization) | 311,044 |
| Net Asset Value Per Share | $21.47 |
See accompanying Notes, which are an integral part of the Financial Statements.
Advice Select Global Value Fund
|
| | November 9, 20211 to
October 31, 2022 |
| | ($000) |
| Investment Income | |
| Income | |
| Dividends2 | 1,992 |
| Interest3 | 68 |
| Total Income | 2,060 |
| Expenses | |
| Investment Advisory Fees—Note B | 222 |
| The Vanguard Group—Note C | |
| Management and Administrative | 40 |
| Marketing and Distribution | 6 |
| Custodian Fees | 110 |
| Auditing Fees | 42 |
| Shareholders’ Reports | 22 |
| Trustees’ Fees and Expenses | — |
| Other Expenses | 20 |
| Total Expenses | 462 |
| Expense Reduction—Note D | (17) |
| Net Expenses | 445 |
| Net Investment Income | 1,615 |
| Realized Net Gain (Loss) | |
| Investment Securities Sold3 | (1,209) |
| Foreign Currencies | (26) |
| Realized Net Gain (Loss) | (1,235) |
| Change in Unrealized Appreciation (Depreciation) | |
| Investment Securities3 | (16,345) |
| Foreign Currencies | (5) |
| Change in Unrealized Appreciation (Depreciation) | (16,350) |
| Net Increase (Decrease) in Net Assets Resulting from Operations | (15,970) |
| 1 | Inception. |
| 2 | Dividends are net of foreign withholding taxes of $136,000. |
| 3 | Interest income, realized net gain (loss), capital gain distributions received, and change in unrealized appreciation (depreciation) from an affiliated company of the fund were $68,000, less than $1,000, less than $1,000, and $1,000, respectively. Purchases and sales are for temporary cash investment purposes. |
See accompanying Notes, which are an integral part of the Financial Statements.
Advice Select Global Value Fund
Statement of Changes in Net Assets
|
| | November 9,
20211 to
October 31,
2022 |
| | ($000) |
| Increase (Decrease) in Net Assets | |
| Operations | |
| Net Investment Income | 1,615 |
| Realized Net Gain (Loss) | (1,235) |
| Change in Unrealized Appreciation (Depreciation) | (16,350) |
| Net Increase (Decrease) in Net Assets Resulting from Operations | (15,970) |
| Distributions | |
| Total Distributions | (12) |
| Capital Share Transactions | |
| Issued | 341,698 |
| Issued in Lieu of Cash Distributions | 12 |
| Redeemed | (14,684) |
| Net Increase (Decrease) from Capital Share Transactions | 327,026 |
| Total Increase (Decrease) | 311,044 |
| Net Assets | |
| Beginning of Period | — |
| End of Period | 311,044 |
See accompanying Notes, which are an integral part of the Financial Statements.
Advice Select Global Value Fund
| | November 9,
20211 to
October 31,
2022 |
For a Share Outstanding
Throughout the Period | |
| Net Asset Value, Beginning of Period | $25.00 |
| Investment Operations | |
| Net Investment Income2 | .313 |
| Net Realized and Unrealized Gain (Loss) on Investments | (3.812) |
| Total from Investment Operations | (3.499) |
| Distributions | |
| Dividends from Net Investment Income | (.031) |
| Distributions from Realized Capital Gains | — |
| Total Distributions | (.031) |
| Net Asset Value, End of Period | $21.47 |
| Total Return3 | -14.01% |
| Ratios/Supplemental Data | |
| Net Assets, End of Period (Millions) | $311 |
| Ratio of Total Expenses to Average Net Assets | 0.40%4 |
| Ratio of Net Investment Income to Average Net Assets | 1.45%4 |
| Portfolio Turnover Rate | 56% |
| 1 | Inception. |
| 2 | Calculated based on average shares outstanding. |
| 3 | Total returns do not include account service fees that may have applied in the periods shown. Fund prospectuses provide information about any applicable account service fees. |
| 4 | Annualized. |
See accompanying Notes, which are an integral part of the Financial Statements.
Advice Select Global Value Fund
Notes to Financial Statements
Vanguard Advice Select Global Value Fund is registered under the Investment Company Act of 1940 as an open-end investment company, or mutual fund. The fund invests in securities of foreign issuers, which may subject it to investment risks not normally associated with investing in securities of U.S. corporations. Significant market disruptions, such as those caused by pandemics (e.g., COVID-19 pandemic), natural or environmental disasters, war (e.g., Russia's invasion of Ukraine), acts of terrorism, or other events, can adversely affect local and global markets and normal market operations. Any such disruptions could have an adverse impact on the value of the fund's investments and fund performance.
A. The following significant accounting policies conform to generally accepted accounting principles for U.S. investment companies. The fund consistently follows such policies in preparing its financial statements.
1. Security Valuation: Securities are valued as of the close of trading on the New York Stock Exchange (generally 4 p.m., Eastern time) on the valuation date. Equity securities are valued at the latest quoted sales prices or official closing prices taken from the primary market in which each security trades; such securities not traded on the valuation date are valued at the mean of the latest quoted bid and asked prices. Securities for which market quotations are not readily available, or whose values have been affected by events occurring before the fund’s pricing time but after the close of the securities’ primary markets, are valued by methods deemed by the valuation designee to represent fair value and subject to oversight by the board of trustees. These procedures include obtaining quotations from an independent pricing service, monitoring news to identify significant market- or security-specific events, and evaluating changes in the values of foreign market proxies (for example, ADRs, futures contracts, or exchange-traded funds), between the time the foreign markets close and the fund’s pricing time. When fair-value pricing is employed, the prices of securities used by a fund to calculate its net asset value may differ from quoted or published prices for the same securities. Investments in Vanguard Market Liquidity Fund are valued at that fund's net asset value.
2. Foreign Currency: Securities and other assets and liabilities denominated in foreign currencies are translated into U.S. dollars using exchange rates obtained from an independent third party as of the fund’s pricing time on the valuation date. Realized gains (losses) and unrealized appreciation (depreciation) on investment securities include the effects of changes in exchange rates since the securities were purchased, combined with the effects of changes in security prices. Fluctuations in the value of other assets and liabilities resulting from changes in exchange rates are recorded as unrealized foreign currency gains (losses) until the assets or liabilities are settled in cash, at which time they are recorded as realized foreign currency gains (losses).
3. Federal Income Taxes: The fund intends to qualify as a regulated investment company and distribute virtually all of its taxable income. The fund’s tax returns are open to examination by the relevant tax authorities until expiration of the applicable statute of limitations, which is generally three years after the filing of the tax return. Management has analyzed the fund’s tax positions taken for all open federal and state income tax years, and has concluded that no provision for income tax is required in the fund’s financial statements.
4. Distributions: Distributions to shareholders are recorded on the ex-dividend date. Distributions are determined on a tax basis at the fiscal year-end and may differ from net investment income and realized capital gains for financial reporting purposes.
Advice Select Global Value Fund
5. Credit Facilities and Interfund Lending Program: The fund and certain other funds managed by The Vanguard Group ("Vanguard") participate in a $4.4 billion committed credit facility provided by a syndicate of lenders pursuant to a credit agreement and an uncommitted credit facility provided by Vanguard. Both facilities may be renewed annually. Each fund is individually liable for its borrowings, if any, under the credit facilities. Borrowings may be utilized for temporary or emergency purposes and are subject to the fund’s regulatory and contractual borrowing restrictions. With respect to the committed credit facility, the participating funds are charged administrative fees and an annual commitment fee of 0.10% of the undrawn committed amount of the facility, which are allocated to the funds based on a method approved by the fund’s board of trustees and included in Management and Administrative expenses on the fund’s Statement of Operations. Any borrowings under either facility bear interest at an agreed-upon spread plus the higher of the federal funds effective rate, the overnight bank funding rate, or the Daily Simple Secured Overnight Financing Rate inclusive of an additional agreed-upon spread. However, borrowings under the uncommitted credit facility may bear interest based upon an alternate rate agreed to by the fund and Vanguard.
In accordance with an exemptive order (the “Order”) from the SEC, the fund may participate in a joint lending and borrowing program that allows registered open-end Vanguard funds to borrow money from and lend money to each other for temporary or emergency purposes (the “Interfund Lending Program”), subject to compliance with the terms and conditions of the Order, and to the extent permitted by the fund’s investment objective and investment policies. Interfund loans and borrowings normally extend overnight but can have a maximum duration of seven days. Loans may be called on one business day’s notice. The interest rate to be charged is governed by the conditions of the Order and internal procedures adopted by the board of trustees. The board of trustees is responsible for overseeing the Interfund Lending Program.
For the period ended October 31, 2022, the fund did not utilize the credit facilities or the Interfund Lending Program.
6. Other: Dividend income is recorded on the ex-dividend date. Non-cash dividends included in income, if any, are recorded at the fair value of the securities received. Interest income includes income distributions received from Vanguard Market Liquidity Fund and is accrued daily. Security transactions are accounted for on the date securities are bought or sold. Costs used to determine realized gains (losses) on the sale of investment securities are those of the specific securities sold.
B. Wellington Management Company llp provides investment advisory services to the fund for a fee calculated at an annual percentage rate of average net assets. In accordance with the advisory contract entered into with Wellington Management Company llp , beginning February 1, 2023, the investment advisory fee will be subject to quarterly adjustments based on performance relative to the MSCI ACWI Value Index since January 31, 2022. For the period ended October 31, 2022, the investment advisory fee represented an effective annual basic rate of 0.20% of the fund’s average net assets.
C. In accordance with the terms of a Funds’ Service Agreement (the “FSA”) between Vanguard and the fund, Vanguard furnishes to the fund corporate management, administrative, marketing, distribution, and cash management services at Vanguard’s cost of operations (as defined by the FSA). These costs of operations are allocated to the fund based on methods and guidelines approved by the board of trustees and are generally settled twice a month.
Advice Select Global Value Fund
Upon the request of Vanguard, the fund may invest up to 0.40% of its net assets as capital in Vanguard. At October 31, 2022, the fund had contributed to Vanguard capital in the amount of $11,000, representing less than 0.01% of the fund’s net assets and less than 0.01% of Vanguard’s capital received pursuant to the FSA. The fund’s trustees and officers are also directors and employees, respectively, of Vanguard.
D. Pursuant to the terms of an agreement with a third-party service provider applicable to newly launched funds, shareholder reporting expenses of $17,000 (0.02%, on an annualized basis, of the fund's average net assets) were contractually reduced during the period.
E. Various inputs may be used to determine the value of the fund’s investments. These inputs are summarized in three broad levels for financial statement purposes. The inputs or methodologies used to value securities are not necessarily an indication of the risk associated with investing in those securities.
Level 1—Quoted prices in active markets for identical securities.
Level 2—Other significant observable inputs (including quoted prices for similar securities, interest rates, prepayment speeds, credit risk, etc.).
Level 3—Significant unobservable inputs (including the fund’s own assumptions used to determine the fair value of investments). Any investments valued with significant unobservable inputs are noted on the Schedule of Investments.
The following table summarizes the market value of the fund's investments as of October 31, 2022, based on the inputs used to value them:
| | Level 1
($000) | Level 2
($000) | Level 3
($000) | Total
($000) |
| Investments | | | | |
| Assets | | | | |
| Common Stocks—North and South America | 183,068 | — | — | 183,068 |
| Common Stocks—Other | 12,089 | 111,473 | — | 123,562 |
| Temporary Cash Investments | 5,993 | — | — | 5,993 |
| Total | 201,150 | 111,473 | — | 312,623 |
F. Permanent differences between book-basis and tax-basis components of net assets are reclassified among capital accounts in the financial statements to reflect their tax character. These reclassifications have no effect on net assets or net asset value per share. As of period end, permanent differences primarily attributable to the accounting for applicable foreign currency transactions and distributions in connection with fund share redemptions were reclassified between the following accounts:
| | Amount
($000) |
| Paid-in Capital | 6 |
| Total Distributable Earnings (Loss) | (6) |
Temporary differences between book-basis and tax-basis components of total distributable earnings (loss) arise when certain items of income, gain, or loss are recognized in different periods
Advice Select Global Value Fund
for financial statement and tax purposes; these differences will reverse at some time in the future. The differences are primarily related to the deferral of losses from wash sales. As of period end, the tax-basis components of total distributable earnings (loss) are detailed in the table as follows:
| | Amount
($000) |
| Undistributed Ordinary Income | 1,767 |
| Undistributed Long-Term Gains | — |
| Capital Loss Carryforwards | — |
| Qualified Late-Year Losses | — |
| Net Unrealized Gains (Losses) | (17,755) |
The tax character of distributions paid was as follows:
| | Period Ended
October 31, 2022 |
| | Amount
($000) |
| Ordinary Income* | 12 |
| Long-Term Capital Gains | — |
| Total | 12 |
| * | Includes short-term capital gains, if any. |
As of October 31, 2022, gross unrealized appreciation and depreciation for investments based on cost for U.S. federal income tax purposes were as follows:
| | Amount
($000) |
| Tax Cost | 330,373 |
| Gross Unrealized Appreciation | 13,995 |
| Gross Unrealized Depreciation | (31,745) |
| Net Unrealized Appreciation (Depreciation) | (17,750) |
G. During the period ended October 31, 2022, the fund purchased $391,568,000 of investment securities and sold $67,382,000 of investment securities, other than temporary cash investments.
The fund purchased securities from and sold securities to other funds or accounts managed by its investment advisor or their affiliates, in accordance with procedures adopted by the board of trustees in compliance with Rule 17a-7 of the Investment Company Act of 1940. For the period ended October 31, 2022, such purchases were $566,000 and sales were $0; these amounts, other than temporary cash investments, are included in the purchases and sales of investment securities noted above.
Advice Select Global Value Fund
H. Capital shares issued and redeemed were:
| | November 9, 20211 to
October 31, 2022 |
| | Shares
(000) |
| Issued | 15,146 |
| Issued in Lieu of Cash Distributions | 1 |
| Redeemed | (660) |
| Net Increase (Decrease) in Shares Outstanding | 14,487 |
I. Management has determined that no events or transactions occurred subsequent to October 31, 2022, that would require recognition or disclosure in these financial statements.
Report of Independent Registered
Public Accounting Firm
To the Board of Trustees of Vanguard Whitehall Funds and Shareholders of Vanguard Advice Select Global Value Fund.
Opinion on the Financial Statements
We have audited the accompanying statement of assets and liabilities, including the schedule of investments, of Vanguard Advice Select Global Value Fund (one of the funds constituting Vanguard Whitehall Funds, hereafter referred to as the "Fund") as of October 31, 2022, and the related statements of operations and changes in net assets, including the related notes, and the financial highlights for the period November 9, 2021 (inception) through October 31, 2022 (collectively referred to as the "financial statements"). In our opinion, the financial statements present fairly, in all material respects, the financial position of the Fund as of October 31, 2022, and the results of its operations, changes in its net assets, and the financial highlights for the period November 9, 2021 (inception) through October 31, 2022 in conformity with accounting principles generally accepted in the United States of America.
Basis for Opinion
These financial statements are the responsibility of the Fund's management. Our responsibility is to express an opinion on the Fund's financial statements based on our audit. We are a public accounting firm registered with the Public Company Accounting Oversight Board (United States) (PCAOB) and are required to be independent with respect to the Fund in accordance with the U.S. federal securities laws and the applicable rules and regulations of the Securities and Exchange Commission and the PCAOB.
We conducted our audit of these financial statements in accordance with the standards of the PCAOB. Those standards require that we plan and perform the audit to obtain reasonable assurance about whether the financial statements are free of material misstatement, whether due to error or fraud.
Our audit included performing procedures to assess the risks of material misstatement of the financial statements, whether due to error or fraud, and performing procedures that respond to those risks. Such procedures included examining, on a test basis, evidence regarding the amounts and disclosures in the financial statements. Our audit also included evaluating the accounting principles used and significant estimates made by management, as well as evaluating the overall presentation of the financial statements. Our procedures included confirmation of securities owned as of October 31, 2022 by correspondence with the custodian, transfer agent and brokers; when replies were not received from brokers, we performed other auditing procedures. We believe that our audit provides a reasonable basis for our opinion.
/s/PricewaterhouseCoopers LLP
Philadelphia, Pennsylvania
December 16, 2022
We have served as the auditor of one or more investment companies in The Vanguard Group of Funds since 1975.
Tax information (unaudited)
For corporate shareholders, 29.1%, or if subsequently determined to be different, the maximum percentage allowable by law, of ordinary income (dividend income plus short-term gains, if any) for the fiscal period qualified for the dividends-received deduction.
The fund hereby designates $12,000, or if subsequently determined to be different, the maximum amount allowable by law, as qualified dividend income for individual shareholders for the fiscal period.
The fund hereby designates $18,000, or if subsequently determined to be different, the maximum amount allowable by law, of interest earned from obligations of the U.S. government which is generally exempt from state income tax.
For nonresident alien shareholders, 100% of short-term capital gain dividends distributed by the fund for the fiscal period are qualified short-term capital gains.
This page intentionally left blank.
The People Who Govern Your Fund
The trustees of your mutual fund are there to see that the fund is operated and managed in your best interests since, as a shareholder, you are a part owner of the fund. Your fund’s trustees also serve on the board of directors of The Vanguard Group, Inc., which is owned by the Vanguard funds and provides services to them.
A majority of Vanguard’s board members are independent, meaning that they have no affiliation with Vanguard or the funds they oversee, apart from the sizable personal investments they have made as private individuals. The independent board members have distinguished backgrounds in business, academia, and public service. Each of the trustees and executive officers oversees 206 Vanguard funds.
Information for each trustee and executive officer of the fund appears below. That information, as well as the Vanguard fund count, is as of the date on the cover of this fund report. The mailing address of the trustees and officers is P.O. Box 876, Valley Forge, PA 19482. More information about the trustees is in the Statement of Additional Information, which can be obtained, without charge, by contacting Vanguard at 800-662-7447, or online at vanguard.com.
Interested Trustee1
Mortimer J. Buckley
Born in 1969. Trustee since January 2018. Principal occupation(s) during the past five years and other experience: chairman of the board (2019–present) of Vanguard and of each of the investment companies served by Vanguard; chief executive officer (2018–present) of Vanguard; chief executive officer, president, and trustee (2018–present) of each of the investment companies served by Vanguard; president and director (2017–present) of Vanguard; and president (2018–present) of Vanguard Marketing Corporation. Chief investment officer (2013–2017), managing director (2002–2017), head of the Retail Investor Group (2006–2012), and chief information officer (2001–2006) of Vanguard. Member of the board of governors of the Investment Company Institute and the board of governors of FINRA. Trustee and vice chair of The Shipley School.
Independent Trustees
Tara Bunch
Born in 1962. Trustee since November 2021. Principal occupation(s) during the past five years and other experience: head of global operations at Airbnb (2020–present). Vice president of AppleCare (2012–2020). Member of the board of directors of Out & Equal (2002–2006), the advisory board of the University of California, Berkeley School of Engineering (2020–present), and the advisory board of Santa Clara University’s Leavey School of Business (2018–present).
Emerson U. Fullwood
Born in 1948. Trustee since January 2008. Principal occupation(s) during the past five years and other experience: executive chief staff and marketing officer for North America and corporate vice president (retired 2008) of Xerox Corporation (document management products and services). Former president of the Worldwide Channels Group, Latin America, and Worldwide Customer Service and executive chief staff officer of Developing Markets of Xerox. Executive in residence and 2009–2010 Distinguished Minett Professor at the Rochester Institute of Technology. Member of the board of directors of the University of Rochester Medical Center, the Monroe Community College Foundation, the United Way of Rochester, North Carolina A&T University, Roberts Wesleyan College, and the Rochester Philharmonic Orchestra. Trustee of the University of Rochester.
1 Mr. Buckley is considered an “interested person,” as defined in the Investment Company Act of 1940, because he is an officer of the Vanguard funds.
F. Joseph Loughrey
Born in 1949. Trustee since October 2009. Principal occupation(s) during the past five years and other experience: president and chief operating officer (retired 2009) and vice chairman of the board (2008–2009) of Cummins Inc. (industrial machinery). Chairman of the board of Hillenbrand, Inc. (specialized consumer services). Director of the V Foundation. Member of the advisory council for the College of Arts and Letters at the University of Notre Dame. Chairman of the board of Saint Anselm College.
Mark Loughridge
Born in 1953. Trustee since March 2012. Principal occupation(s) during the past five years and other experience: senior vice president and chief financial officer (retired 2013) of IBM (information technology services). Fiduciary member of IBM’s Retirement Plan Committee (2004–2013), senior vice president and general manager (2002–2004) of IBM Global Financing, vice president and controller (1998–2002) of IBM, and a variety of other prior management roles at IBM. Member of the Council on Chicago Booth.
Scott C. Malpass
Born in 1962. Trustee since March 2012. Principal occupation(s) during the past five years and other experience: adjunct professor of finance at the University of Notre Dame (2020–present). Chief investment officer (retired 2020) and vice president (retired 2020) of the University of Notre Dame. Assistant professor (retired June 2020) of finance at the Mendoza College of Business, University of Notre Dame, and member of the Notre Dame 403(b) Investment Committee. Member of the board of Catholic Investment Services, Inc. (investment advisors), the board of superintendence of the Institute for the Works of Religion, and the board of directors of Paxos Trust Company (finance).
Deanna Mulligan
Born in 1963. Trustee since January 2018. Principal occupation(s) during the past five years and other experience: chief executive officer of Purposeful (advisory firm for CEOs and C-level executives; 2021–present). Board chair (2020), chief executive officer (2011–2020), and president (2010–2019) of The Guardian Life Insurance Company of America. Chief operating officer (2010–2011) and executive vice president (2008–2010) of Individual Life and Disability of the Guardian Life Insurance Company of America. Member of the board of the Economic Club of New York. Trustee of the Partnership for New York City (business leadership), Chief Executives for Corporate Purpose, and the NewYork-Presbyterian Hospital.
André F. Perold
Born in 1952. Trustee since December 2004. Principal occupation(s) during the past five years and other experience: George Gund Professor of Finance and Banking, Emeritus at the Harvard Business School (retired 2011). Chief investment officer and co-managing partner of HighVista Strategies (private investment firm). Member of the board (2018–present) of RIT Capital Partners (investment firm). Member of the investment committee of Partners Health Care System.
Sarah Bloom Raskin
Born in 1961. Trustee since January 2018. Principal occupation(s) during the past five years and other experience: deputy secretary (2014–2017) of the United States Department of the Treasury. Governor (2010–2014) of the Federal Reserve Board. Commissioner (2007–2010) of financial regulation for the State of Maryland. Colin W. Brown Distinguished Professor of the Practice of Law (2021–present), professor (2020–present), Distinguished Fellow of the Global Financial Markets Center (2020–present), and Rubenstein Fellow (2017–2020) at Duke University. Trustee (2017–present) of Amherst College and member of Amherst College Investment Committee (2019–present). Member of the Regenerative Crisis Response Committee (2020–present).
David A. Thomas
Born in 1956. Trustee since July 2021. Principal occupation(s) during the past five years and other experience: president of Morehouse College (2018–present). Professor of business administration, emeritus at Harvard University (2017–2018). Dean (2011–2016) and professor of management (2016–2017) at the Georgetown University McDonough School of Business. Director of DTE Energy Company (2013–present). Trustee of Common Fund (2019–present).
Peter F. Volanakis
Born in 1955. Trustee since July 2009. Principal occupation(s) during the past five years and other experience: president and chief operating officer (retired 2010) of Corning Incorporated (communications equipment) and director of Corning Incorporated (2000–2010) and Dow Corning (2001–2010). Director (2012) of SPX Corporation (multi-industry manufacturing). Overseer of the Amos Tuck School of Business Administration, Dartmouth College (2001–2013). Member of the BMW Group Mobility Council.
Executive Officers
Christine M. Buchanan
Born in 1970. Principal occupation(s) during the past five years and other experience: principal of Vanguard. Chief financial officer (2021–present) and treasurer (2017–present) of each of the investment companies served by Vanguard. Partner (2005–2017) at KPMG (audit, tax, and advisory services).
John Galloway
Born in 1973. Principal occupation(s) during the past five years and other experience: principal of Vanguard. Investment stewardship officer (September 2020–present) of each of the investment companies served by Vanguard. Head of Investor Advocacy (February 2020–present) and head of Marketing Strategy and Planning (2017–2020) at Vanguard. Special assistant to the President of the United States (2015).
Ashley Grim
Born in 1984. Principal occupation(s) during the past five years and other experience: treasurer (February 2022–present) of each of the investment companies served by Vanguard. Fund transfer agent controller (2019–2022) and director of Audit Services (2017–2019) at Vanguard. Senior manager (2015–2017) at PriceWaterhouseCoopers (audit and assurance, consulting, and tax services).
Peter Mahoney
Born in 1974. Principal occupation(s) during the past five years and other experience: principal of Vanguard. Controller (2015–present) of each of the investment companies served by Vanguard. Head of International Fund Services (2008–2014) at Vanguard.
Anne E. Robinson
Born in 1970. Principal occupation(s) during the past five years and other experience: general counsel (2016–present) of Vanguard. Secretary (2016–present) of Vanguard and of each of the investment companies served by Vanguard. Managing director (2016–present) of Vanguard. Managing director and general counsel of Global Cards and Consumer Services (2014–2016) at Citigroup. Counsel (2003–2014) at American Express. Nonexecutive director of the board of National Grid (energy).
Michael Rollings
Born in 1963. Principal occupation(s) during the past five years and other experience: finance director (2017–present) and treasurer (2017) of each of the investment companies served by Vanguard. Managing director (2016–present) of Vanguard. Chief financial officer (2016–present) of Vanguard. Director (2016–present) of Vanguard Marketing Corporation. Executive vice president and chief financial officer (2006–2016) of MassMutual Financial Group.
John E. Schadl
Born in 1972. Principal occupation(s) during the past five years and other experience: principal of Vanguard. Chief compliance officer (2019–present) of Vanguard and of each of the investment companies served by Vanguard. Assistant vice president (2019–present) of Vanguard Marketing Corporation.
Vanguard Senior Management Team
| Matthew Benchener | Thomas M. Rampulla |
| Joseph Brennan | Karin A. Risi |
| Mortimer J. Buckley | Anne E. Robinson |
| Gregory Davis | Michael Rollings |
| John James | Nitin Tandon |
| Chris D. McIsaac | Lauren Valente |
Connect with Vanguard®>vanguard.com
Fund Information > 800-662-7447
Direct Investor Account Services > 800-662-2739
Institutional Investor Services > 800-523-1036
Text Telephone for People
Who Are Deaf or Hard of Hearing > 800-749-7273
This material may be used in conjunction with the offering of shares of any Vanguard fund only if preceded or accompanied by the fund’s current prospectus.
All comparative mutual fund data are from Morningstar, Inc., unless otherwise noted.
You can obtain a free copy of Vanguard’s proxy voting guidelines by visiting vanguard.com/proxyreporting or by calling Vanguard at 800-662-2739. The guidelines are also available from the SEC’s website, www.sec.gov. In addition, you may obtain a free report on how your fund voted the proxies for securities it owned during the 12 months ended June 30. To get the report, visit either vanguard.com/proxyreporting or www.sec.gov.
You can review information about your fund on the SEC’s website, and you can receive copies of this information, for a fee, by sending a request via email addressed to publicinfo@sec.gov.
Source for Bloomberg indexes: Bloomberg Index Services Limited. Copyright 2022, Bloomberg. All rights reserved.
CFA® is a registered trademark owned by CFA Institute.
© 2022 The Vanguard Group, Inc.
All rights reserved.
Vanguard Marketing Corporation, Distributor.
Q44360 122022
Annual Report | October 31, 2022
Vanguard Advice Select International Growth Fund
Contents
Please note: The opinions expressed in this report are just that—informed opinions. They should not be considered promises or advice. Also, please keep in mind that the information and opinions cover the period through the date on the front of this report. Of course, the risks of investing in your fund are spelled out in the prospectus.
Your Fund’s Performance at a Glance
| • | The 12 months ended October 31, 2022, were a challenging period for financial markets. Vanguard Advice Select International Growth Fund, which launched November 9, 2021, returned –49.40% since inception, lagging the –32.24% return of its benchmark. |
| • | The economic backdrop deteriorated as inflation soared to multidecade highs, fueled in part by higher energy and food prices after Russia’s invasion of Ukraine. Then, price increases broadened to other categories of goods and services, adding to concerns that inflation would remain stubbornly high. That prompted aggressive tightening by many central banks to bring inflation back in check and increased fears of a recession. |
| • | It was a punishing period for growth stocks in particular, with double-digit negative returns on average across all sectors for the fund and the benchmark. Relative to the index, the fund’s stocks had steeper declines in most sectors, notably in consumer discretionary, information technology, consumer staples, and communication services. |
| • | Growth stocks in most countries posted negative returns. The fund’s stocks in China and Germany lagged those in the benchmark. The heavier weighting in the Netherlands and the U.S. also contributed to relative underperformance. (While the fund’s focus is on international markets, roughly a quarter of its assets are in U.S. stocks.) |
Market Barometer
| | Average Annual Total Returns
Periods Ended October 31, 2022 |
| | One Year | Three Years | Five Years |
| Stocks | | | |
| Russell 1000 Index (Large-caps) | -16.38% | 9.99% | 10.19% |
| Russell 2000 Index (Small-caps) | -18.54 | 7.05 | 5.56 |
| Russell 3000 Index (Broad U.S. market) | -16.52 | 9.79 | 9.87 |
| FTSE All-World ex US Index (International) | -24.20 | -1.16 | -0.18 |
| Bonds | | | |
Bloomberg U.S. Aggregate Float Adjusted Index
(Broad taxable market) | -15.69% | -3.73% | -0.50% |
Bloomberg Municipal Bond Index
(Broad tax-exempt market) | -11.98 | -2.18 | 0.37 |
| FTSE Three-Month U.S. Treasury Bill Index | 0.88 | 0.59 | 1.15 |
| CPI | | | |
| Consumer Price Index | 7.75% | 5.01% | 3.85% |
For the period since its November 9, 2021, inception through October 31, 2022, Vanguard Advice Select International Growth Fund returned –49.40%, lagging the –32.24% return of its benchmark, the MSCI ACWI ex USA Growth Index.
Environment
The welcome retreat of the global COVID-19 pandemic has left a surprisingly difficult environment for investors in growth equities. Society’s return toward normality, after an unprecedented shutdown, revealed supply-chain disruptions that were more widespread and longer-lasting than we had expected. Russia’s shocking invasion of Ukraine greatly exacerbated the inflation problem through its effect on the energy sector. It also raised fears about geopolitical instability across the Taiwan Strait.
Investors, concerned about this complex and risky environment and the steep rise in interest rates, reduced what they were willing to pay for high-growth companies, whose profits are expected to be made further into the future.
As people around the world began to reestablish their habits in shopping, entertainment, and dining, the growth of online activity slowed. This deceleration also contributed to the fall in valuations. As these headwinds developed, the share prices of many of our companies that had performed strongly during the pandemic fell back to levels of several years earlier, despite considerable progress in the interim.
Investment returns
Since we commenced management of the portfolio in November 2021, returns have been extremely weak.
The deterioration of short-term prospects for consumer internet businesses stands out. Holdings such as Zalando, Ocado, Spotify, Delivery Hero, and MercadoLibre suffered from a collapse in the market’s willingness to highly value their future cash flows. This was exacerbated by near-term concerns about how consumer behavior would adjust as pandemic restrictions are eased around the world and about inflation.
Our investment cases were developed before we had experienced lockdowns. They depend on a steady shift toward online services that are cheaper, quicker, more convenient, or offer more choice. Adoption of online consumer services rapidly accelerated during the pandemic because of the absence of an alternative. As we analyzed these businesses over the last two years, we noted that their opportunities were expanding and they were often growing stronger than their offline competition. We saw that many consumers who were trying the services for the first time were likely to become regular users.
Our judgment of how well these growth rates would stick after the pandemic was too optimistic, however.
Despite these setbacks, we are confident that our portfolio will be resilient against difficult conditions in the short term. More than 80% of our stocks generate positive
earnings or cash flow. Our portfolio’s aggregate balance sheet is also in a far stronger position than that of the wider market.
Our outlook for long-term growth investing is positive. Two difficult societal challenges are in the spotlight: climate change and health care. The tools and the willpower to tackle them are increasing. Both challenges will require massive amounts of capital and the application of emerging technologies. This should create a fertile environment to invest in growth companies, with significant change in large industries that will take place at scale and over an extended period.
Investment philosophy and process
We aim to add value for clients through patient ownership of exceptional growth companies. We are looking for outliers. Our holdings should enjoy a large growth opportunity, business characteristics that give them an edge over competitors and substitutes, and a culture that allows them to take advantage in a sustainable way.
We are patient owners of companies on behalf of our clients, with all the behaviors that implies. Our portfolio turnover is low and we take our governance responsibilities seriously. We have a clear bias toward backing the judgment of the managers of companies in which we invest. Once a company is selected for the portfolio, we do not sell shares lightly. We understand the importance of culture, of ignoring short-term noise, and of acting as responsible owners.
Exceptional companies drive stock market returns over the long run. We know this from academic research and our own experience. Our investment process is designed to identify a sufficient number of these rare businesses and own them in significant amounts for the long term. To do this, we must imagine how a given industry might evolve over the next decade and analyze how a potential investment can take advantage of that. This is primarily a creative activity. The way we recruit and train people helps us think in ways that differ from most financial market participants. We focus on what could go right in order to make the skewness of equity market returns work in our clients’ favor. We embrace uncertainty and believe change is the norm.
We embrace concentration, investing in 20 to 35 companies. We view this as a rational response to the reality that exceptional companies are rare. We do not wish to dilute the transformative potential of such companies in the name of diversification. We want every holding to matter to our clients.
Growth investing is our mantra. We are interested in two types of growth companies: those that can grow rapidly and those with durable growth prospects. The portfolio’s exposure to the two types is typically fairly balanced. In each case, we expect a holding to have the potential to double in value within a five-year horizon, and to have a chance of delivering a “right tail” outcome beyond that. We believe that markets fail to appreciate
both extreme growth and the impact of compounding over time. We maintain this committed growth style through market cycles.
We focus our stock research on three areas:
First, we consider the intrinsic characteristics of each business. We assess its growth potential and test its competitive advantage. The skill and ambition of a company’s management are central to our analysis. We prefer companies that reinvest heavily both in research and development and in capital expenditure. Our portfolio is typically tilted toward companies with high levels of inside ownership for this reason.
If the company performs well against these metrics, we then consider its relationship with key stakeholders such as employees, customers, and regulators. We believe a long-term holding cannot succeed if it has significant negative externalities. We conduct environmental, social, and governance (ESG) research as an integral part of our consideration of risk and return for each stock in the portfolio.
Finally, we assess the potential returns from an investment. We use scenario analysis that focuses on upside potential and the probability of different outcomes. We will take small initial positions, around 1% of the portfolio, in companies with substantial upside potential and a moderate chance of success. We build larger positions as our assessment of the probability of success increases. We aim to run our winners and our portfolio will
typically be concentrated in its largest holdings.
Lawrence Burns
Partner and Portfolio Manager
Spencer Adair, CFA,
Partner and Portfolio Manager
Baillie Gifford Overseas Ltd.
November 9, 2022
About Your Fund’s Expenses
As a shareholder of the fund, you incur ongoing costs, which include costs for portfolio management, administrative services, and shareholder reports (like this one), among others. Operating expenses, which are deducted from a fund’s gross income, directly reduce the investment return of the fund.
A fund‘s expenses are expressed as a percentage of its average net assets. This figure is known as the expense ratio. The following examples are intended to help you understand the ongoing costs (in dollars) of investing in your fund and to compare these costs with those of other mutual funds. The examples are based on an investment of $1,000 made at the beginning of the period shown and held for the entire period.
The accompanying table illustrates your fund’s costs in two ways:
| • | Based on actual fund return. This section helps you to estimate the actual expenses that you paid over the period. The ”Ending Account Value“ shown is derived from the fund’s actual return, and the third column shows the dollar amount that would have been paid by an investor who started with $1,000 in the fund. You may use the information here, together with the amount you invested, to estimate the expenses that you paid over the period. |
To do so, simply divide your account value by $1,000 (for example, an $8,600 account value divided by $1,000 = 8.6), then multiply the result by the number given for your fund under the heading ”Expenses Paid During Period.“
| • | Based on hypothetical 5% yearly return. This section is intended to help you compare your fund‘s costs with those of other mutual funds. It assumes that the fund had a yearly return of 5% before expenses, but that the expense ratio is unchanged. In this case—because the return used is not the fund’s actual return—the results do not apply to your investment. The example is useful in making comparisons because the Securities and Exchange Commission requires all mutual funds to calculate expenses based on a 5% return. You can assess your fund’s costs by comparing this hypothetical example with the hypothetical examples that appear in shareholder reports of other funds. |
Note that the expenses shown in the table are meant to highlight and help you compare ongoing costs only and do not reflect transaction costs incurred by the fund for buying and selling securities. Further, the expenses do not include any purchase, redemption, or account service fees described in the fund prospectus. If such fees were applied to your account, your costs would be higher. Your fund does not carry a “sales load.”
The calculations assume no shares were bought or sold during the period. Your actual costs may have been higher or lower, depending on the amount of your investment and the timing of any purchases or redemptions.
You can find more information about the fund’s expenses, including annual expense ratios, in the Financial Statements section of this report. For additional information on operating expenses and other shareholder costs, please refer to your fund’s current prospectus.
| Six Months Ended October 31, 2022 | | | |
| Advice Select International Growth Fund | Beginning
Account Value
4/30/2022 | Ending
Account Value
10/31/2022 | Expenses
Paid During
Period |
| Based on Actual Fund Return | $1,000.00 | $833.30 | $1.94 |
| Based on Hypothetical 5% Yearly Return | 1,000.00 | 1,023.09 | 2.14 |
The calculations are based on expenses incurred in the most recent six-month period. The fund's annualized six-month expense ratio for that period is 0.42%. The dollar amounts shown as ”Expenses Paid” are equal to the annualized expense ratio multiplied by the average account value over the period, multiplied by the number of days in the most recent six-month period, then divided by the number of days in the most recent 12-month period (184/365).
Advice Select International Growth Fund
All of the returns in this report represent past performance, which is not a guarantee of future results that may be achieved by the fund. (Current performance may be lower or higher than the performance data cited. For performance data current to the most recent month-end, visit our website at vanguard.com/performance.) Note, too, that both investment returns and principal value can fluctuate widely, so an investor’s shares, when sold, could be worth more or less than their original cost. The returns shown do not reflect taxes that a shareholder would pay on fund distributions or on the sale of fund shares.
Cumulative Performance: November 9, 2021, Through October 31, 2022
Initial Investment of $10,000
| | | Total Returns
Period Ended October 31, 2022 | |
| | | Since
Inception
(11/9/2021) | Final Value
of a $10,000
Investment |
 | Advice Select International Growth Fund | -49.40% | $5,060 |
 | MSCI ACWI ex USA Growth Index | -32.24 | 6,776 |
 | MSCI All Country World Index ex USA | -25.69 | 7,431 |
"Since Inception" performance is calculated from the fund's inception date for both the fund and its comparative standard(s).
See Financial Highlights for dividend and capital gains information.
Advice Select International Growth Fund
| |
| United States | 27.4% |
| Netherlands | 19.7 |
| China | 11.7 |
| France | 11.0 |
| Germany | 7.8 |
| Sweden | 5.8 |
| Denmark | 4.5 |
| Italy | 4.5 |
| Japan | 3.1 |
| United Kingdom | 3.0 |
| Canada | 1.5 |
The table reflects the fund’s investments, except for short-term investments.
Advice Select International Growth Fund
The fund files its complete schedule of portfolio holdings with the Securities and Exchange Commission (SEC) for the first and third quarters of each fiscal year as an exhibit to its reports on Form N-PORT. The fund’s Form N-PORT reports are available on the SEC’s website at www.sec.gov.
| | | | | | Shares | Market
Value•
($000) |
| Common Stocks (98.1%) |
| Canada (1.5%) |
| * | Shopify Inc. Class A | 82,387 | 2,820 |
| China (11.5%) |
| *,1 | Meituan Class B | 667,100 | 10,681 |
| | Tencent Holdings Ltd. | 222,600 | 5,849 |
| * | Alibaba Group Holding Ltd. | 478,900 | 3,723 |
| * | NIO Inc. ADR | 235,698 | 2,279 |
| | | | | | | 22,532 |
| Denmark (4.4%) |
| * | Genmab A/S | 22,498 | 8,666 |
| France (10.8%) |
| | Kering SA | 18,611 | 8,523 |
| | Hermes International | 6,538 | 8,463 |
| | L'Oreal SA | 13,366 | 4,197 |
| | | | | | | 21,183 |
| Germany (7.6%) |
| *,1 | Delivery Hero SE | 280,601 | 9,234 |
| *,1 | Zalando SE | 245,095 | 5,649 |
| | | | | | | 14,883 |
| Italy (4.4%) |
| | Ferrari NV | 43,911 | 8,657 |
| Japan (3.0%) |
| | M3 Inc. | 197,500 | 5,885 |
| Netherlands (19.3%) |
| | ASML Holding NV | 53,283 | 24,995 |
| *,1 | Adyen NV | 8,995 | 12,841 |
| | | | | | | 37,836 |
| Sweden (5.7%) |
| * | Spotify Technology SA | 73,290 | 5,906 |
| | Atlas Copco AB Class B | 349,523 | 3,380 |
| * | Kinnevik AB Class B | 148,758 | 1,838 |
| | | | | | | 11,124 |
| United Kingdom (3.0%) |
| * | Ocado Group plc | 1,072,678 | 5,815 |
| | | | | | Shares | Market
Value•
($000) |
| United States (26.9%) |
| * | MercadoLibre Inc. | 25,772 | 23,237 |
| * | Moderna Inc. | 75,889 | 11,408 |
| * | Tesla Inc. | 33,644 | 7,655 |
| * | Illumina Inc. | 30,875 | 7,065 |
| | NVIDIA Corp. | 14,007 | 1,891 |
| * | Ginkgo Bioworks Holdings Inc. | 493,092 | 1,346 |
| | | | | | | 52,602 |
Total Common Stocks
(Cost $223,532) | 192,003 |
| Temporary Cash Investments (2.2%) |
| Money Market Fund (2.2%) |
| 2 | Vanguard Market Liquidity Fund, 3.117%
(Cost $4,384) | 43,855 | 4,385 |
Total Investments (100.3%)
(Cost $227,916) | | 196,388 |
| Other Assets and Liabilities—Net (-0.3%) | | (677) |
| Net Assets (100%) | | 195,711 |
| • | See Note A in Notes to Financial Statements. |
| * | Non-income-producing security. |
| 1 | Security exempt from registration under Rule 144A of the Securities Act of 1933. Such securities may be sold in transactions exempt from registration, normally to qualified institutional buyers. At October 31, 2022, the aggregate value was $38,405,000, representing 19.6% of net assets. |
| 2 | Affiliated money market fund available only to Vanguard funds and certain trusts and accounts managed by Vanguard. Rate shown is the 7-day yield. |
| | ADR—American Depositary Receipt. |
See accompanying Notes, which are an integral part of the Financial Statements.
Advice Select International Growth Fund
Statement of Assets and Liabilities
|
| ($000s, except shares and per-share amounts) | Amount |
| Assets | |
| Investments in Securities, at Value | |
| Unaffiliated Issuers (Cost $223,532) | 192,003 |
| Affiliated Issuers (Cost $4,384) | 4,385 |
| Total Investments in Securities | 196,388 |
| Investment in Vanguard | 7 |
| Receivables for Accrued Income | 21 |
| Receivables for Capital Shares Issued | 1,546 |
| Total Assets | 197,962 |
| Liabilities | |
| Payables for Investment Securities Purchased | 2,133 |
| Payables for Capital Shares Redeemed | 8 |
| Payables to Investment Advisor | 94 |
| Payables to Vanguard | 16 |
| Total Liabilities | 2,251 |
| Net Assets | 195,711 |
At October 31, 2022, net assets consisted of: |
|
| | |
| Paid-in Capital | 229,800 |
| Total Distributable Earnings (Loss) | (34,089) |
| Net Assets | 195,711 |
| | |
| Net Assets | |
Applicable to 15,471,467 outstanding $.001 par value shares of
beneficial interest (unlimited authorization) | 195,711 |
| Net Asset Value Per Share | $12.65 |
See accompanying Notes, which are an integral part of the Financial Statements.
Advice Select International Growth Fund
|
| | November 9, 20211 to
October 31, 2022 |
| | ($000) |
| Investment Income | |
| Income | |
| Dividends2 | 215 |
| Interest3 | 47 |
| Total Income | 262 |
| Expenses | |
| Investment Advisory Fees—Note B | 161 |
| The Vanguard Group—Note C | |
| Management and Administrative | 33 |
| Marketing and Distribution | 3 |
| Custodian Fees | 50 |
| Auditing Fees | 43 |
| Shareholders’ Reports | 23 |
| Trustees’ Fees and Expenses | — |
| Other Expenses | 12 |
| Total Expenses | 325 |
| Expense Reduction—Note D | (17) |
| Net Expenses | 308 |
| Net Investment Loss | (46) |
| Realized Net Gain (Loss) | |
| Investment Securities Sold3 | (2,545) |
| Foreign Currencies | 30 |
| Realized Net Gain (Loss) | (2,515) |
| Change in Unrealized Appreciation (Depreciation) of Investment Securities3 | (31,528) |
| Net Increase (Decrease) in Net Assets Resulting from Operations | (34,089) |
| 1 | Inception. |
| 2 | Dividends are net of foreign withholding taxes of $31,000. |
| 3 | Interest income, realized net gain (loss), capital gain distributions received, and change in unrealized appreciation (depreciation) from an affiliated company of the fund were $47,000, ($1,000), less than $1,000, and $1,000, respectively. Purchases and sales are for temporary cash investment purposes. |
See accompanying Notes, which are an integral part of the Financial Statements.
Advice Select International Growth Fund
Statement of Changes in Net Assets
|
| | November 9,
20211 to
October 31,
2022 |
| | ($000) |
| Increase (Decrease) in Net Assets | |
| Operations | |
| Net Investment Loss | (46) |
| Realized Net Gain (Loss) | (2,515) |
| Change in Unrealized Appreciation (Depreciation) | (31,528) |
| Net Increase (Decrease) in Net Assets Resulting from Operations | (34,089) |
| Distributions | |
| Total Distributions | — |
| Capital Share Transactions | |
| Issued | 239,368 |
| Issued in Lieu of Cash Distributions | — |
| Redeemed | (9,568) |
| Net Increase (Decrease) from Capital Share Transactions | 229,800 |
| Total Increase (Decrease) | 195,711 |
| Net Assets | |
| Beginning of Period | — |
| End of Period | 195,711 |
See accompanying Notes, which are an integral part of the Financial Statements.
Advice Select International Growth Fund
| | November 9,
20211 to
October 31,
2022 |
For a Share Outstanding
Throughout the Period | |
| Net Asset Value, Beginning of Period | $25.00 |
| Investment Operations | |
| Net Investment Loss2 | (.009) |
| Net Realized and Unrealized Gain (Loss) on Investments | (12.341) |
| Total from Investment Operations | (12.350) |
| Distributions | |
| Dividends from Net Investment Income | — |
| Distributions from Realized Capital Gains | — |
| Total Distributions | — |
| Net Asset Value, End of Period | $12.65 |
| Total Return3 | -49.40% |
| Ratios/Supplemental Data | |
| Net Assets, End of Period (Millions) | $196 |
| Ratio of Total Expenses to Average Net Assets | 0.42%4 |
| Ratio of Net Investment Income to Average Net Assets | (0.06%)4 |
| Portfolio Turnover Rate | 11% |
| 1 | Inception. |
| 2 | Calculated based on average shares outstanding. |
| 3 | Total returns do not include account service fees that may have applied in the periods shown. Fund prospectuses provide information about any applicable account service fees. |
| 4 | Annualized. |
See accompanying Notes, which are an integral part of the Financial Statements.
Advice Select International Growth Fund
Notes to Financial Statements
Vanguard Advice Select International Growth Fund is registered under the Investment Company Act of 1940 as an open-end investment company, or mutual fund. The fund invests in securities of foreign issuers, which may subject it to investment risks not normally associated with investing in securities of U.S. corporations. Significant market disruptions, such as those caused by pandemics (e.g., COVID-19 pandemic), natural or environmental disasters, war (e.g., Russia's invasion of Ukraine), acts of terrorism, or other events, can adversely affect local and global markets and normal market operations. Any such disruptions could have an adverse impact on the value of the fund's investments and fund performance.
A. The following significant accounting policies conform to generally accepted accounting principles for U.S. investment companies. The fund consistently follows such policies in preparing its financial statements.
1. Security Valuation: Securities are valued as of the close of trading on the New York Stock Exchange (generally 4 p.m., Eastern time) on the valuation date. Equity securities are valued at the latest quoted sales prices or official closing prices taken from the primary market in which each security trades; such securities not traded on the valuation date are valued at the mean of the latest quoted bid and asked prices. Securities for which market quotations are not readily available, or whose values have been affected by events occurring before the fund’s pricing time but after the close of the securities’ primary markets, are valued by methods deemed by the valuation designee to represent fair value and subject to oversight by the board of trustees. These procedures include obtaining quotations from an independent pricing service, monitoring news to identify significant market- or security-specific events, and evaluating changes in the values of foreign market proxies (for example, ADRs, futures contracts, or exchange-traded funds), between the time the foreign markets close and the fund’s pricing time. When fair-value pricing is employed, the prices of securities used by a fund to calculate its net asset value may differ from quoted or published prices for the same securities. Investments in Vanguard Market Liquidity Fund are valued at that fund's net asset value.
2. Foreign Currency: Securities and other assets and liabilities denominated in foreign currencies are translated into U.S. dollars using exchange rates obtained from an independent third party as of the fund’s pricing time on the valuation date. Realized gains (losses) and unrealized appreciation (depreciation) on investment securities include the effects of changes in exchange rates since the securities were purchased, combined with the effects of changes in security prices. Fluctuations in the value of other assets and liabilities resulting from changes in exchange rates are recorded as unrealized foreign currency gains (losses) until the assets or liabilities are settled in cash, at which time they are recorded as realized foreign currency gains (losses).
3. Federal Income Taxes: The fund intends to qualify as a regulated investment company and distribute virtually all of its taxable income. The fund’s tax returns are open to examination by the relevant tax authorities until expiration of the applicable statute of limitations, which is generally three years after the filing of the tax return. Management has analyzed the fund’s tax positions taken for all open federal and state income tax years, and has concluded that no provision for income tax is required in the fund’s financial statements.
4. Distributions: Distributions to shareholders are recorded on the ex-dividend date. Distributions are determined on a tax basis at the fiscal year-end and may differ from net investment income and realized capital gains for financial reporting purposes.
Advice Select International Growth Fund
5. Credit Facilities and Interfund Lending Program: The fund and certain other funds managed by The Vanguard Group ("Vanguard") participate in a $4.4 billion committed credit facility provided by a syndicate of lenders pursuant to a credit agreement and an uncommitted credit facility provided by Vanguard. Both facilities may be renewed annually. Each fund is individually liable for its borrowings, if any, under the credit facilities. Borrowings may be utilized for temporary or emergency purposes and are subject to the fund’s regulatory and contractual borrowing restrictions. With respect to the committed credit facility, the participating funds are charged administrative fees and an annual commitment fee of 0.10% of the undrawn committed amount of the facility, which are allocated to the funds based on a method approved by the fund’s board of trustees and included in Management and Administrative expenses on the fund’s Statement of Operations. Any borrowings under either facility bear interest at an agreed-upon spread plus the higher of the federal funds effective rate, the overnight bank funding rate, or the Daily Simple Secured Overnight Financing Rate inclusive of an additional agreed-upon spread. However, borrowings under the uncommitted credit facility may bear interest based upon an alternate rate agreed to by the fund and Vanguard.
In accordance with an exemptive order (the “Order”) from the SEC, the fund may participate in a joint lending and borrowing program that allows registered open-end Vanguard funds to borrow money from and lend money to each other for temporary or emergency purposes (the “Interfund Lending Program”), subject to compliance with the terms and conditions of the Order, and to the extent permitted by the fund’s investment objective and investment policies. Interfund loans and borrowings normally extend overnight but can have a maximum duration of seven days. Loans may be called on one business day’s notice. The interest rate to be charged is governed by the conditions of the Order and internal procedures adopted by the board of trustees. The board of trustees is responsible for overseeing the Interfund Lending Program.
For the period ended October 31, 2022, the fund did not utilize the credit facilities or the Interfund Lending Program.
6. Other: Dividend income is recorded on the ex-dividend date. Non-cash dividends included in income, if any, are recorded at the fair value of the securities received. Interest income includes income distributions received from Vanguard Market Liquidity Fund and is accrued daily. Security transactions are accounted for on the date securities are bought or sold. Costs used to determine realized gains (losses) on the sale of investment securities are those of the specific securities sold.
B. Baillie Gifford Overseas Ltd. provides investment advisory services to the fund for a fee calculated at an annual percentage rate of average net assets. In accordance with the advisory contract entered into with Baillie Gifford Overseas Ltd., beginning February 1, 2023, the investment advisory fee will be subject to quarterly adjustments based on performance relative to the MSCI ACWI ex-USA Growth Index since January 31, 2022. For the period ended October 31, 2022, the investment advisory fee represented an effective annual basic rate of 0.22% of the fund’s average net assets.
C. In accordance with the terms of a Funds’ Service Agreement (the “FSA”) between Vanguard and the fund, Vanguard furnishes to the fund corporate management, administrative, marketing, distribution, and cash management services at Vanguard’s cost of operations (as defined by the FSA). These costs of operations are allocated to the fund based on methods and guidelines approved by the board of trustees and are generally settled twice a month.
Advice Select International Growth Fund
Upon the request of Vanguard, the fund may invest up to 0.40% of its net assets as capital in Vanguard. At October 31, 2022, the fund had contributed to Vanguard capital in the amount of $7,000, representing less than 0.01% of the fund’s net assets and less than 0.01% of Vanguard’s capital received pursuant to the FSA. The fund’s trustees and officers are also directors and employees, respectively, of Vanguard.
D. Pursuant to the terms of an agreement with a third-party service provider applicable to newly launched funds, shareholder reporting expenses of $17,000 (0.02%, on an annualized basis, of the fund's average net assets) were contractually reduced during the period.
E. Various inputs may be used to determine the value of the fund’s investments. These inputs are summarized in three broad levels for financial statement purposes. The inputs or methodologies used to value securities are not necessarily an indication of the risk associated with investing in those securities.
Level 1—Quoted prices in active markets for identical securities.
Level 2—Other significant observable inputs (including quoted prices for similar securities, interest rates, prepayment speeds, credit risk, etc.).
Level 3—Significant unobservable inputs (including the fund’s own assumptions used to determine the fair value of investments). Any investments valued with significant unobservable inputs are noted on the Schedule of Investments.
The following table summarizes the market value of the fund's investments as of October 31, 2022, based on the inputs used to value them:
| | Level 1
($000) | Level 2
($000) | Level 3
($000) | Total
($000) |
| Investments | | | | |
| Assets | | | | |
| Common Stocks—North and South America | 55,422 | — | — | 55,422 |
| Common Stocks—Other | 8,185 | 128,396 | — | 136,581 |
| Temporary Cash Investments | 4,385 | — | — | 4,385 |
| Total | 67,992 | 128,396 | — | 196,388 |
F. Permanent differences between book-basis and tax-basis components of net assets are reclassified among capital accounts in the financial statements to reflect their tax character. These reclassifications have no effect on net assets or net asset value per share. As of period end, permanent differences primarily attributable to the accounting for applicable foreign currency transactions were reclassified between the individual components of total distributable earnings (loss).
Temporary differences between book-basis and tax-basis components of total distributable earnings (loss) arise when certain items of income, gain, or loss are recognized in different periods for financial statement and tax purposes; these differences will reverse at some time in the future. The differences are primarily related to the deferral of losses from wash sales; and the deferral of
Advice Select International Growth Fund
qualified late-year losses. As of period end, the tax-basis components of total distributable earnings (loss) are detailed in the table as follows:
| | Amount
($000) |
| Undistributed Ordinary Income | — |
| Undistributed Long-Term Gains | — |
| Capital Loss Carryforwards | (32) |
| Qualified Late-Year Losses | (16) |
| Net Unrealized Gains (Losses) | (34,041) |
The tax character of distributions paid was as follows:
| | Period Ended
October 31, 2022 |
| | Amount
($000) |
| Ordinary Income* | — |
| Long-Term Capital Gains | — |
| Total | — |
| * | Includes short-term capital gains, if any. |
As of October 31, 2022, gross unrealized appreciation and depreciation for investments based on cost for U.S. federal income tax purposes were as follows:
| | Amount
($000) |
| Tax Cost | 230,429 |
| Gross Unrealized Appreciation | 6,509 |
| Gross Unrealized Depreciation | (40,550) |
| Net Unrealized Appreciation (Depreciation) | (34,041) |
G. During the period ended October 31, 2022, the fund purchased $234,713,000 of investment securities and sold $8,637,000 of investment securities, other than temporary cash investments.
H. Capital shares issued and redeemed were:
| | November 9, 20211 to
October 31, 2022 |
| | Shares
(000) |
| Issued | 16,125 |
| Issued in Lieu of Cash Distributions | — |
| Redeemed | (654) |
| Net Increase (Decrease) in Shares Outstanding | 15,471 |
Advice Select International Growth Fund
I. Management has determined that no events or transactions occurred subsequent to October 31, 2022, that would require recognition or disclosure in these financial statements.
Report of Independent Registered
Public Accounting Firm
To the Board of Trustees of Vanguard Whitehall Funds and Shareholders of Vanguard Advice Select International Growth Fund.
Opinion on the Financial Statements
We have audited the accompanying statement of assets and liabilities, including the schedule of investments, of Vanguard Advice Select International Growth Fund (one of the funds constituting Vanguard Whitehall Funds, hereafter referred to as the "Fund") as of October 31, 2022, and the related statements of operations and changes in net assets, including the related notes, and the financial highlights for the period November 9, 2021 (inception) through October 31, 2022 (collectively referred to as the "financial statements"). In our opinion, the financial statements present fairly, in all material respects, the financial position of the Fund as of October 31, 2022, and the results of its operations, changes in its net assets, and the financial highlights for the period November 9, 2021 (inception) through October 31, 2022 in conformity with accounting principles generally accepted in the United States of America.
Basis for Opinion
These financial statements are the responsibility of the Fund's management. Our responsibility is to express an opinion on the Fund's financial statements based on our audit. We are a public accounting firm registered with the Public Company Accounting Oversight Board (United States) (PCAOB) and are required to be independent with respect to the Fund in accordance with the U.S. federal securities laws and the applicable rules and regulations of the Securities and Exchange Commission and the PCAOB.
We conducted our audit of these financial statements in accordance with the standards of the PCAOB. Those standards require that we plan and perform the audit to obtain reasonable assurance about whether the financial statements are free of material misstatement, whether due to error or fraud.
Our audit included performing procedures to assess the risks of material misstatement of the financial statements, whether due to error or fraud, and performing procedures that respond to those risks. Such procedures included examining, on a test basis, evidence regarding the amounts and disclosures in the financial statements. Our audit also included evaluating the accounting principles used and significant estimates made by management, as well as evaluating the overall presentation of the financial statements. Our procedures included confirmation of securities owned as of October 31, 2022 by correspondence with the custodian, transfer agent and brokers; when replies were not received from brokers, we performed other auditing procedures. We believe that our audit provides a reasonable basis for our opinion.
/s/PricewaterhouseCoopers LLP
Philadelphia, Pennsylvania
December 16, 2022
We have served as the auditor of one or more investment companies in The Vanguard Group of Funds since 1975.
This page intentionally left blank.
The People Who Govern Your Fund
The trustees of your mutual fund are there to see that the fund is operated and managed in your best interests since, as a shareholder, you are a part owner of the fund. Your fund’s trustees also serve on the board of directors of The Vanguard Group, Inc., which is owned by the Vanguard funds and provides services to them.
A majority of Vanguard’s board members are independent, meaning that they have no affiliation with Vanguard or the funds they oversee, apart from the sizable personal investments they have made as private individuals. The independent board members have distinguished backgrounds in business, academia, and public service. Each of the trustees and executive officers oversees 206 Vanguard funds.
Information for each trustee and executive officer of the fund appears below. That information, as well as the Vanguard fund count, is as of the date on the cover of this fund report. The mailing address of the trustees and officers is P.O. Box 876, Valley Forge, PA 19482. More information about the trustees is in the Statement of Additional Information, which can be obtained, without charge, by contacting Vanguard at 800-662-7447, or online at vanguard.com.
Interested Trustee1
Mortimer J. Buckley
Born in 1969. Trustee since January 2018. Principal occupation(s) during the past five years and other experience: chairman of the board (2019–present) of Vanguard and of each of the investment companies served by Vanguard; chief executive officer (2018–present) of Vanguard; chief executive officer, president, and trustee (2018–present) of each of the investment companies served by Vanguard; president and director (2017–present) of Vanguard; and president (2018–present) of Vanguard Marketing Corporation. Chief investment officer (2013–2017), managing director (2002–2017), head of the Retail Investor Group (2006–2012), and chief information officer (2001–2006) of Vanguard. Member of the board of governors of the Investment Company Institute and the board of governors of FINRA. Trustee and vice chair of The Shipley School.
Independent Trustees
Tara Bunch
Born in 1962. Trustee since November 2021. Principal occupation(s) during the past five years and other experience: head of global operations at Airbnb (2020–present). Vice president of AppleCare (2012–2020). Member of the board of directors of Out & Equal (2002–2006), the advisory board of the University of California, Berkeley School of Engineering (2020–present), and the advisory board of Santa Clara University’s Leavey School of Business (2018–present).
Emerson U. Fullwood
Born in 1948. Trustee since January 2008. Principal occupation(s) during the past five years and other experience: executive chief staff and marketing officer for North America and corporate vice president (retired 2008) of Xerox Corporation (document management products and services). Former president of the Worldwide Channels Group, Latin America, and Worldwide Customer Service and executive chief staff officer of Developing Markets of Xerox. Executive in residence and 2009–2010 Distinguished Minett Professor at the Rochester Institute of Technology. Member of the board of directors of the University of Rochester Medical Center, the Monroe Community College Foundation, the United Way of Rochester, North Carolina A&T University, Roberts Wesleyan College, and the Rochester Philharmonic Orchestra. Trustee of the University of Rochester.
1 Mr. Buckley is considered an “interested person,” as defined in the Investment Company Act of 1940, because he is an officer of the Vanguard funds.
F. Joseph Loughrey
Born in 1949. Trustee since October 2009. Principal occupation(s) during the past five years and other experience: president and chief operating officer (retired 2009) and vice chairman of the board (2008–2009) of Cummins Inc. (industrial machinery). Chairman of the board of Hillenbrand, Inc. (specialized consumer services). Director of the V Foundation. Member of the advisory council for the College of Arts and Letters at the University of Notre Dame. Chairman of the board of Saint Anselm College.
Mark Loughridge
Born in 1953. Trustee since March 2012. Principal occupation(s) during the past five years and other experience: senior vice president and chief financial officer (retired 2013) of IBM (information technology services). Fiduciary member of IBM’s Retirement Plan Committee (2004–2013), senior vice president and general manager (2002–2004) of IBM Global Financing, vice president and controller (1998–2002) of IBM, and a variety of other prior management roles at IBM. Member of the Council on Chicago Booth.
Scott C. Malpass
Born in 1962. Trustee since March 2012. Principal occupation(s) during the past five years and other experience: adjunct professor of finance at the University of Notre Dame (2020–present). Chief investment officer (retired 2020) and vice president (retired 2020) of the University of Notre Dame. Assistant professor (retired June 2020) of finance at the Mendoza College of Business, University of Notre Dame, and member of the Notre Dame 403(b) Investment Committee. Member of the board of Catholic Investment Services, Inc. (investment advisors), the board of superintendence of the Institute for the Works of Religion, and the board of directors of Paxos Trust Company (finance).
Deanna Mulligan
Born in 1963. Trustee since January 2018. Principal occupation(s) during the past five years and other experience: chief executive officer of Purposeful (advisory firm for CEOs and C-level executives; 2021–present). Board chair (2020), chief executive officer (2011–2020), and president (2010–2019) of The Guardian Life Insurance Company of America. Chief operating officer (2010–2011) and executive vice president (2008–2010) of Individual Life and Disability of the Guardian Life Insurance Company of America. Member of the board of the Economic Club of New York. Trustee of the Partnership for New York City (business leadership), Chief Executives for Corporate Purpose, and the NewYork-Presbyterian Hospital.
André F. Perold
Born in 1952. Trustee since December 2004. Principal occupation(s) during the past five years and other experience: George Gund Professor of Finance and Banking, Emeritus at the Harvard Business School (retired 2011). Chief investment officer and co-managing partner of HighVista Strategies (private investment firm). Member of the board (2018–present) of RIT Capital Partners (investment firm). Member of the investment committee of Partners Health Care System.
Sarah Bloom Raskin
Born in 1961. Trustee since January 2018. Principal occupation(s) during the past five years and other experience: deputy secretary (2014–2017) of the United States Department of the Treasury. Governor (2010–2014) of the Federal Reserve Board. Commissioner (2007–2010) of financial regulation for the State of Maryland. Colin W. Brown Distinguished Professor of the Practice of Law (2021–present), professor (2020–present), Distinguished Fellow of the Global Financial Markets Center (2020–present), and Rubenstein Fellow (2017–2020) at Duke University. Trustee (2017–present) of Amherst College and member of Amherst College Investment Committee (2019–present). Member of the Regenerative Crisis Response Committee (2020–present).
David A. Thomas
Born in 1956. Trustee since July 2021. Principal occupation(s) during the past five years and other experience: president of Morehouse College (2018–present). Professor of business administration, emeritus at Harvard University (2017–2018). Dean (2011–2016) and professor of management (2016–2017) at the Georgetown University McDonough School of Business. Director of DTE Energy Company (2013–present). Trustee of Common Fund (2019–present).
Peter F. Volanakis
Born in 1955. Trustee since July 2009. Principal occupation(s) during the past five years and other experience: president and chief operating officer (retired 2010) of Corning Incorporated (communications equipment) and director of Corning Incorporated (2000–2010) and Dow Corning (2001–2010). Director (2012) of SPX Corporation (multi-industry manufacturing). Overseer of the Amos Tuck School of Business Administration, Dartmouth College (2001–2013). Member of the BMW Group Mobility Council.
Executive Officers
Christine M. Buchanan
Born in 1970. Principal occupation(s) during the past five years and other experience: principal of Vanguard. Chief financial officer (2021–present) and treasurer (2017–present) of each of the investment companies served by Vanguard. Partner (2005–2017) at KPMG (audit, tax, and advisory services).
John Galloway
Born in 1973. Principal occupation(s) during the past five years and other experience: principal of Vanguard. Investment stewardship officer (September 2020–present) of each of the investment companies served by Vanguard. Head of Investor Advocacy (February 2020–present) and head of Marketing Strategy and Planning (2017–2020) at Vanguard. Special assistant to the President of the United States (2015).
Ashley Grim
Born in 1984. Principal occupation(s) during the past five years and other experience: treasurer (February 2022–present) of each of the investment companies served by Vanguard. Fund transfer agent controller (2019–2022) and director of Audit Services (2017–2019) at Vanguard. Senior manager (2015–2017) at PriceWaterhouseCoopers (audit and assurance, consulting, and tax services).
Peter Mahoney
Born in 1974. Principal occupation(s) during the past five years and other experience: principal of Vanguard. Controller (2015–present) of each of the investment companies served by Vanguard. Head of International Fund Services (2008–2014) at Vanguard.
Anne E. Robinson
Born in 1970. Principal occupation(s) during the past five years and other experience: general counsel (2016–present) of Vanguard. Secretary (2016–present) of Vanguard and of each of the investment companies served by Vanguard. Managing director (2016–present) of Vanguard. Managing director and general counsel of Global Cards and Consumer Services (2014–2016) at Citigroup. Counsel (2003–2014) at American Express. Nonexecutive director of the board of National Grid (energy).
Michael Rollings
Born in 1963. Principal occupation(s) during the past five years and other experience: finance director (2017–present) and treasurer (2017) of each of the investment companies served by Vanguard. Managing director (2016–present) of Vanguard. Chief financial officer (2016–present) of Vanguard. Director (2016–present) of Vanguard Marketing Corporation. Executive vice president and chief financial officer (2006–2016) of MassMutual Financial Group.
John E. Schadl
Born in 1972. Principal occupation(s) during the past five years and other experience: principal of Vanguard. Chief compliance officer (2019–present) of Vanguard and of each of the investment companies served by Vanguard. Assistant vice president (2019–present) of Vanguard Marketing Corporation.
Vanguard Senior Management Team
| Matthew Benchener | Thomas M. Rampulla |
| Joseph Brennan | Karin A. Risi |
| Mortimer J. Buckley | Anne E. Robinson |
| Gregory Davis | Michael Rollings |
| John James | Nitin Tandon |
| Chris D. McIsaac | Lauren Valente |
Connect with Vanguard®>vanguard.com
Fund Information > 800-662-7447
Direct Investor Account Services > 800-662-2739
Institutional Investor Services > 800-523-1036
Text Telephone for People
Who Are Deaf or Hard of Hearing > 800-749-7273
This material may be used in conjunction with the offering of shares of any Vanguard fund only if preceded or accompanied by the fund’s current prospectus.
All comparative mutual fund data are from Morningstar, Inc., unless otherwise noted.
You can obtain a free copy of Vanguard’s proxy voting guidelines by visiting vanguard.com/proxyreporting or by calling Vanguard at 800-662-2739. The guidelines are also available from the SEC’s website, www.sec.gov. In addition, you may obtain a free report on how your fund voted the proxies for securities it owned during the 12 months ended June 30. To get the report, visit either vanguard.com/proxyreporting or www.sec.gov.
You can review information about your fund on the SEC’s website, and you can receive copies of this information, for a fee, by sending a request via email addressed to publicinfo@sec.gov.
Source for Bloomberg indexes: Bloomberg Index Services Limited. Copyright 2022, Bloomberg. All rights reserved.
CFA® is a registered trademark owned by CFA Institute.
© 2022 The Vanguard Group, Inc.
All rights reserved.
Vanguard Marketing Corporation, Distributor.
Q44370 122022
Annual Report | October 31, 2022
Vanguard Advice Select Dividend Growth Fund
Contents
Please note: The opinions expressed in this report are just that—informed opinions. They should not be considered promises or advice. Also, please keep in mind that the information and opinions cover the period through the date on the front of this report. Of course, the risks of investing in your fund are spelled out in the prospectus.
Your Fund’s Performance at a Glance
| • | The 12 months ended October 31, 2022, were a volatile, challenging period for financial markets. From its November 9, 2021, inception through October 31, Vanguard Advice Select Dividend Growth Fund returned –3.56%, well above the –9.40% return of its benchmark, the S&P U.S. Dividend Growers Index. |
| • | The economic backdrop deteriorated as inflation soared to multidecade highs, fueled in part by higher energy and food prices in the wake of Russia’s invasion of Ukraine. Then price increases broadened to other categories of goods and services, adding to concerns that inflation would remain stubbornly high. That prompted aggressive tightening by the Federal Reserve to bring inflation back in check and increased fears of a recession. |
| • | Value and dividend-oriented stocks held up better than their growth counterparts. In absolute terms, the fund’s stellar results in the industrials sector largely offset the negative returns of most of the other sectors. |
| • | Relative to the benchmark index, the fund’s health care stocks lagged. This was more than offset, though, by the superior performance of its industrial, financial and consumer discretionary stocks. Its underweighting in the poorly performing information technology sector also contributed to the fund’s outperformance. |
Market Barometer
| | Average Annual Total Returns
Periods Ended October 31, 2022 |
| | One Year | Three Years | Five Years |
| Stocks | | | |
| Russell 1000 Index (Large-caps) | -16.38% | 9.99% | 10.19% |
| Russell 2000 Index (Small-caps) | -18.54 | 7.05 | 5.56 |
| Russell 3000 Index (Broad U.S. market) | -16.52 | 9.79 | 9.87 |
| FTSE All-World ex US Index (International) | -24.20 | -1.16 | -0.18 |
| Bonds | | | |
Bloomberg U.S. Aggregate Float Adjusted Index
(Broad taxable market) | -15.69% | -3.73% | -0.50% |
Bloomberg Municipal Bond Index
(Broad tax-exempt market) | -11.98 | -2.18 | 0.37 |
| FTSE Three-Month U.S. Treasury Bill Index | 0.88 | 0.59 | 1.15 |
| CPI | | | |
| Consumer Price Index | 7.75% | 5.01% | 3.85% |
For the period from its November 9, 2021, inception through October 31, 2022, Vanguard Advice Select Dividend Growth Fund returned –3.56%, outperforming the –9.40% return of its benchmark, the S&P U.S. Dividend Growers Index.
The investment environment
U.S. equities declined over the 12 months ended October 31. Markets rallied early in the period on the back of robust equity inflows, strong corporate earnings, favorable economic data, and extremely accommodative financial conditions. The rapid spread of the Omicron variant led to the largest increase in U.S. COVID-19 cases since the onset of the pandemic, prompting a flurry of new restrictions and event cancellations. Inflation continued to surge against a backdrop of severe supply and labor shortages, rising energy prices, and high demand for goods and services; this heightened scrutiny of the Federal Reserve amid anxiety about a potential policy mistake.
Equity markets fell sharply in the second quarter of 2022 as rampant inflation and tighter financial conditions hurt risk sentiment and increased the probability of recession. Rapidly rising food and energy prices pushed consumer inflation to its highest level in more than four decades. Growth stocks significantly underperformed value stocks as surging U.S. Treasury yields and disappointing earnings results from some of the largest technology companies drove the Nasdaq Composite Index to its biggest quarterly loss since 2008. Equity market weakness persisted through the end of the period as
risk sentiment deteriorated on fears that aggressive interest rate hikes and tighter financial conditions would constrict economic growth and drive the U.S. into recession. Despite these concerns, Fed Chair Jerome Powell made clear that the central bank was committed to raising rates and keeping them elevated until there is clear evidence that price pressures are abating.
The extreme volatility that we continue to see across global markets is a result of several factors. Investors’ growing sophistication has produced many new ways to express opinions on various economic and financial questions through large-scale and complex financial products and derivatives. The problem, in our view, is that many of these instruments are new and untested through cycles. We have less of an understanding of their sensitivity. Further complicating the environment is the immense amount of debt (both private and public) that supports current investment markets. When we get dislocations, the compounding effect of debt makes things potentially much worse.
To be clear, innovation in financial services—particularly investing—ought to be encouraged and welcomed. After all, the true objective of the investment community is to provide a predictable series of returns for clients that meet or exceed their obligations. Retirement, home purchases, health care, and so on are real needs, and our job is to help produce the means by which to meet those needs. Exploring new ways of
creating returns through new products and some leverage is not all bad. But when the system has overinvested on the back of low rates and low inflation, there will be a reckoning.
For our part, we believe strongly in the power of economics and markets. We believe that our current investment posture is well-suited for the environment today.
The fund’s successes
Stock selection in industrials, financials, and consumer discretionary contributed most to relative performance for the period. Our overweight allocation to health care and underweight allocation to information technology also helped. Among the top absolute contributors were Northrop Grumman (industrials), Lockheed Martin (industrials), and UnitedHealth Group (health care).
Shares of Northrop Grumman, a multinational aerospace and defense technology company, rose on strength in the industry as the war in Ukraine has led to increased military spending. As with the company’s peers, growth is moderating as the B-21 and F-35 programs have plateaued, and the government is shifting from unmanned aerospace platforms to space platforms, which takes time to play out. The company maintains a positive outlook as it continues to benefit from defense spending related to the Ukraine-Russia conflict.
Defense companies have benefited this year from the war, as well as from the
better outlook for global defense spending. Lockheed Martin, a global security and aerospace company, has seen strong results from its aeronautics unit, which makes the F-35 fighter jet. The company expects demand for arms to increase because of the war.
Shares of managed-care provider UnitedHealth Group rose for the period, in part because of the perception that health care is a safe haven in a challenging economic time, and in part from continued strong performance. The company expects to see an accelerated shift to value-based care.
On a “run-rate” basis, the fund is expected to produce a mean, asset-weighted dividend growth of 12.8% for calendar year 2022. Our run-rate calculation is a rough estimate of potential dividend growth. It takes a company’s current declared dividend rate, annualizes it, and compares it with the previous calendar year’s actual dividend rate. This calculation does not accurately reflect dividend increases that may be announced later in the year, nor does it take into account the dollar amounts of the increases. Therefore, companies in the early stages of dividend growth tend to show large percentage increases even if their absolute cash dividend is small. The run-rate calculation also is not an accurate reflection of growth in the fund’s dividend payments to shareholders. Despite these shortcomings, we view this estimate as a reasonable report card.
Some holdings with a recent notable dividend run-rate increases include
Danaher (19%), Stryker (18%), and Microsoft (18.3%).
The fund’s shortfalls
Stock selection in health care was the largest detractor from relative results. Our overweight allocation to consumer discretionary and out-of-benchmark position in real estate also weighed on relative performance.
Our largest absolute detractors included Nike (consumer discretionary), Ecolab (materials), and Medtronic (health care).
Shares of athletic apparel company Nike declined for the period as lockdowns in China continued to weigh on sales. China accounts for about 20% of Nike’s sales, and the opaque approach to the timing of reopening pushed shares lower. Strategically, Nike continues to shift sales into the direct-to-consumer channel, driving higher top-line growth and gross margins. The company is grappling with difficulties in inventory management due to supply-chain disruptions and product delays.
Shares of U.S.-based chemical company Ecolab fell when growth stocks traded down after a strong run in 2021. The company has grappled with inflation and the impact of supply-chain disruptions, as well as logistics and labor costs. We continue to like Ecolab given the trend toward increased personal and water sanitization, the company’s strong position in the industry, and its exceptional brand strength.
Shares of medical device maker Medtronic declined for the period, primarily because of the impact of inflation and supply-chain issues. We continue to like the stock based on its diversified product portfolio, the highly engineered nature of its products, high switching costs, and the potential for geographic expansion.
In an ideal world, investment results would not be measured and assessed over a year, a quarter, or some shorter unit of time. The practice of investment management would benefit from ignoring the calendar altogether, but the business of investment management would not. As stewards of your capital, we owe you an ongoing assessment of how we are doing, but we think of those performance updates as being like chapters in a book. It is hard to measure a book by reading a single chapter.
The fund’s positioning and investment strategy
Our primary objective is to identify companies that we believe will steadily and reliably increase their dividend payments. We seek to achieve this by carefully building the Advice Select Dividend Growth Fund one stock at a time, giving central consideration to each company’s dividend growth prospects. Our industry and sector weightings are a result of this process. At the end of the period, the fund had significant absolute weights in industrials, health care, and consumer staples, and it had less exposure (below 5%) to communication
services, real estate, and materials. We held no stocks in utilities or energy.
Working on behalf of the fund’s shareholders, we continuously try to balance the virtue of rigid adherence to a focused approach to investment with the need to adjust and protect when necessary. We have high confidence in our investment approach and conviction that patience and careful stock picking will deliver in the long term.
Donald J. Kilbride
Senior Managing Director and Equity Portfolio Manager
Wellington Management Company llp
November 10, 2022
About Your Fund’s Expenses
As a shareholder of the fund, you incur ongoing costs, which include costs for portfolio management, administrative services, and shareholder reports (like this one), among others. Operating expenses, which are deducted from a fund’s gross income, directly reduce the investment return of the fund.
A fund‘s expenses are expressed as a percentage of its average net assets. This figure is known as the expense ratio. The following examples are intended to help you understand the ongoing costs (in dollars) of investing in your fund and to compare these costs with those of other mutual funds. The examples are based on an investment of $1,000 made at the beginning of the period shown and held for the entire period.
The accompanying table illustrates your fund’s costs in two ways:
| • | Based on actual fund return. This section helps you to estimate the actual expenses that you paid over the period. The ”Ending Account Value“ shown is derived from the fund’s actual return, and the third column shows the dollar amount that would have been paid by an investor who started with $1,000 in the fund. You may use the information here, together with the amount you invested, to estimate the expenses that you paid over the period. |
To do so, simply divide your account value by $1,000 (for example, an $8,600 account value divided by $1,000 = 8.6), then multiply the result by the number given for your fund under the heading ”Expenses Paid During Period.“
| • | Based on hypothetical 5% yearly return. This section is intended to help you compare your fund‘s costs with those of other mutual funds. It assumes that the fund had a yearly return of 5% before expenses, but that the expense ratio is unchanged. In this case—because the return used is not the fund’s actual return—the results do not apply to your investment. The example is useful in making comparisons because the Securities and Exchange Commission requires all mutual funds to calculate expenses based on a 5% return. You can assess your fund’s costs by comparing this hypothetical example with the hypothetical examples that appear in shareholder reports of other funds. |
Note that the expenses shown in the table are meant to highlight and help you compare ongoing costs only and do not reflect transaction costs incurred by the fund for buying and selling securities. Further, the expenses do not include any purchase, redemption, or account service fees described in the fund prospectus. If such fees were applied to your account, your costs would be higher. Your fund does not carry a “sales load.”
The calculations assume no shares were bought or sold during the period. Your actual costs may have been higher or lower, depending on the amount of your investment and the timing of any purchases or redemptions.
You can find more information about the fund’s expenses, including annual expense ratios, in the Financial Statements section of this report. For additional information on operating expenses and other shareholder costs, please refer to your fund’s current prospectus.
| Six Months Ended October 31, 2022 | | | |
| Advice Select Dividend Growth Fund | Beginning
Account Value
4/30/2022 | Ending
Account Value
10/31/2022 | Expenses
Paid During
Period |
| Based on Actual Fund Return | $1,000.00 | $980.00 | $2.25 |
| Based on Hypothetical 5% Yearly Return | 1,000.00 | 1,022.94 | 2.29 |
The calculations are based on expenses incurred in the most recent six-month period. The fund's annualized six-month expense ratio for that period is 0.45%. The dollar amounts shown as ”Expenses Paid” are equal to the annualized expense ratio multiplied by the average account value over the period, multiplied by the number of days in the most recent six-month period, then divided by the number of days in the most recent 12-month period (184/365).
Advice Select Dividend Growth Fund
All of the returns in this report represent past performance, which is not a guarantee of future results that may be achieved by the fund. (Current performance may be lower or higher than the performance data cited. For performance data current to the most recent month-end, visit our website at vanguard.com/performance.) Note, too, that both investment returns and principal value can fluctuate widely, so an investor’s shares, when sold, could be worth more or less than their original cost. The returns shown do not reflect taxes that a shareholder would pay on fund distributions or on the sale of fund shares.
Cumulative Performance: November 9, 2021, Through October 31, 2022
Initial Investment of $10,000
| | | Total Returns
Period Ended October 31, 2022 | |
| | | Since
Inception
(11/9/2021) | Final Value
of a $10,000
Investment |
 | Advice Select Dividend Growth Fund | -3.56% | $9,644 |
 | S&P U.S. Dividend Growers Index | -9.40 | 9,060 |
 | Dow Jones U.S. Total Stock Market Float Adjusted Index | -18.67 | 8,133 |
"Since Inception" performance is calculated from the fund's inception date for both the fund and its comparative standard(s).
See Financial Highlights for dividend and capital gains information.
Advice Select Dividend Growth Fund
| Consumer Discretionary | 14.7% |
| Consumer Staples | 15.0 |
| Financials | 12.4 |
| Health Care | 22.5 |
| Industrials | 13.2 |
| Information Technology | 11.6 |
| Materials | 8.5 |
| Real Estate | 2.1 |
The table reflects the fund’s investments, except for short-term investments. Sector categories are based on the Global Industry Classification Standard (“GICS”), except for the “Other” category (if applicable), which includes securities that have not been provided a GICS classification as of the effective reporting period.
The Global Industry Classification Standard (“GICS”) was developed by and is the exclusive property and a service mark of MSCI Inc. (“MSCI”) and Standard and Poor’s, a division of McGraw-Hill Companies, Inc. (“S&P”), and is licensed for use by Vanguard. Neither MSCI, S&P nor any third party involved in making or compiling the GICS or any GICS classification makes any express or implied warranties or representations with respect to such standard or classification (or the results to be obtained by the use thereof), and all such parties hereby expressly disclaim all warranties of originality, accuracy, completeness, merchantability or fitness for a particular purpose with respect to any such standard or classification. Without limiting any of the foregoing, in no event shall MSCI, S&P, any of its affiliates or any third party involved in making or compiling the GICS or any GICS classification have any liability for any direct, indirect, special, punitive, consequential or any other damages (including lost profits) even if notified of the possibility of such damages.
Advice Select Dividend Growth Fund
The fund files its complete schedule of portfolio holdings with the Securities and Exchange Commission (SEC) for the first and third quarters of each fiscal year as an exhibit to its reports on Form N-PORT. The fund’s Form N-PORT reports are available on the SEC’s website at www.sec.gov.
| | | | | | Shares | Market
Value•
($000) |
| Common Stocks (96.9%) |
| Consumer Discretionary (14.3%) |
| | TJX Cos. Inc. | 169,239 | 12,202 |
| | NIKE Inc. Class B | 101,304 | 9,389 |
| | McDonald's Corp. | 30,657 | 8,359 |
| | | | | | | 29,950 |
| Consumer Staples (14.5%) |
| | PepsiCo Inc. | 54,429 | 9,883 |
| | Colgate-Palmolive Co. | 118,292 | 8,735 |
| | Procter & Gamble Co. | 58,311 | 7,853 |
| | Coca-Cola Co. | 66,984 | 4,009 |
| | | | | | | 30,480 |
| Financials (12.0%) |
| | Chubb Ltd. | 44,555 | 9,574 |
| | Marsh & McLennan Cos. Inc. | 56,628 | 9,145 |
| | American Express Co. | 43,426 | 6,447 |
| | | | | | | 25,166 |
| Health Care (21.8%) |
| | UnitedHealth Group Inc. | 20,433 | 11,344 |
| | Danaher Corp. | 35,130 | 8,841 |
| | Stryker Corp. | 36,469 | 8,360 |
| | Johnson & Johnson | 40,372 | 7,024 |
| | Medtronic plc | 67,934 | 5,933 |
| | Baxter International Inc. | 80,315 | 4,365 |
| | | | | | | 45,867 |
| Industrials (12.8%) |
| | Honeywell International Inc. | 51,643 | 10,536 |
| | Northrop Grumman Corp. | 15,572 | 8,549 |
| | Union Pacific Corp. | 27,664 | 5,454 |
| | Lockheed Martin Corp. | 4,907 | 2,388 |
| | | | | | | 26,927 |
| | | | | | Shares | Market
Value•
($000) |
| Information Technology (11.2%) |
| | Visa Inc. Class A | 47,372 | 9,813 |
| | Accenture plc Class A | 25,564 | 7,258 |
| | Microsoft Corp. | 27,646 | 6,417 |
| | | | | | | 23,488 |
| Materials (8.2%) |
| | Ecolab Inc. | 55,023 | 8,643 |
| | Linde plc | 28,869 | 8,584 |
| | | | | | | 17,227 |
| Real Estate (2.1%) |
| | American Tower Corp. | 20,981 | 4,347 |
Total Common Stocks
(Cost $203,340) | 203,452 |
| Temporary Cash Investments (2.6%) |
| Money Market Fund (2.6%) |
| 1 | Vanguard Market Liquidity Fund, 3.117%
(Cost $5,515) | 55,174 | 5,516 |
Total Investments (99.5%)
(Cost $208,855) | | 208,968 |
| Other Assets and Liabilities—Net (0.5%) | | 1,052 |
| Net Assets (100%) | | 210,020 |
| • | See Note A in Notes to Financial Statements. |
| 1 | Affiliated money market fund available only to Vanguard funds and certain trusts and accounts managed by Vanguard. Rate shown is the 7-day yield. |
See accompanying Notes, which are an integral part of the Financial Statements.
Advice Select Dividend Growth Fund
Statement of Assets and Liabilities
|
| ($000s, except shares and per-share amounts) | Amount |
| Assets | |
| Investments in Securities, at Value | |
| Unaffiliated Issuers (Cost $203,340) | 203,452 |
| Affiliated Issuers (Cost $5,515) | 5,516 |
| Total Investments in Securities | 208,968 |
| Investment in Vanguard | 7 |
| Receivables for Investment Securities Sold | 1,184 |
| Receivables for Accrued Income | 199 |
| Receivables for Capital Shares Issued | 1,505 |
| Total Assets | 211,863 |
| Liabilities | |
| Payables for Investment Securities Purchased | 1,644 |
| Payables for Capital Shares Redeemed | 77 |
| Payables to Investment Advisor | 105 |
| Payables to Vanguard | 17 |
| Total Liabilities | 1,843 |
| Net Assets | 210,020 |
At October 31, 2022, net assets consisted of: |
|
| | |
| Paid-in Capital | 210,112 |
| Total Distributable Earnings (Loss) | (92) |
| Net Assets | 210,020 |
| | |
| Net Assets | |
Applicable to 8,750,645 outstanding $.001 par value shares of
beneficial interest (unlimited authorization) | 210,020 |
| Net Asset Value Per Share | $24.00 |
See accompanying Notes, which are an integral part of the Financial Statements.
Advice Select Dividend Growth Fund
|
| | November 9, 20211 to
October 31, 2022 |
| | ($000) |
| Investment Income | |
| Income | |
| Dividends | 1,205 |
| Interest2 | 55 |
| Total Income | 1,260 |
| Expenses | |
| Investment Advisory Fees—Note B | 181 |
| The Vanguard Group—Note C | |
| Management and Administrative | 81 |
| Marketing and Distribution | 3 |
| Custodian Fees | 14 |
| Auditing Fees | 30 |
| Shareholders’ Reports | 22 |
| Trustees’ Fees and Expenses | — |
| Other Expenses | 12 |
| Total Expenses | 343 |
| Expense Reduction—Note D | (17) |
| Net Expenses | 326 |
| Net Investment Income | 934 |
| Realized Net Gain (Loss) on Investment Securities Sold2 | (861) |
| Change in Unrealized Appreciation (Depreciation) of Investment Securities2 | 113 |
| Net Increase (Decrease) in Net Assets Resulting from Operations | 186 |
| 1 | Inception. |
| 2 | Interest income, realized net gain (loss), capital gain distributions received, and change in unrealized appreciation (depreciation) from an affiliated company of the fund were $55,000, ($1,000), less than $1,000, and $1,000, respectively. Purchases and sales are for temporary cash investment purposes. |
See accompanying Notes, which are an integral part of the Financial Statements.
Advice Select Dividend Growth Fund
Statement of Changes in Net Assets
|
| | November 9,
20211 to
October 31,
2022 |
| | ($000) |
| Increase (Decrease) in Net Assets | |
| Operations | |
| Net Investment Income | 934 |
| Realized Net Gain (Loss) | (861) |
| Change in Unrealized Appreciation (Depreciation) | 113 |
| Net Increase (Decrease) in Net Assets Resulting from Operations | 186 |
| Distributions | |
| Total Distributions | (274) |
| Capital Share Transactions | |
| Issued | 221,568 |
| Issued in Lieu of Cash Distributions | 248 |
| Redeemed | (11,708) |
| Net Increase (Decrease) from Capital Share Transactions | 210,108 |
| Total Increase (Decrease) | 210,020 |
| Net Assets | |
| Beginning of Period | — |
| End of Period | 210,020 |
See accompanying Notes, which are an integral part of the Financial Statements.
Advice Select Dividend Growth Fund
| | November 9,
20211 to
October 31,
2022 |
For a Share Outstanding
Throughout the Period | |
| Net Asset Value, Beginning of Period | $25.00 |
| Investment Operations | |
| Net Investment Income2 | .295 |
| Net Realized and Unrealized Gain (Loss) on Investments | (1.187) |
| Total from Investment Operations | (.892) |
| Distributions | |
| Dividends from Net Investment Income | (.108) |
| Distributions from Realized Capital Gains | — |
| Total Distributions | (.108) |
| Net Asset Value, End of Period | $24.00 |
| Total Return3 | -3.56% |
| Ratios/Supplemental Data | |
| Net Assets, End of Period (Millions) | $210 |
| Ratio of Total Expenses to Average Net Assets | 0.45%4 |
| Ratio of Net Investment Income to Average Net Assets | 1.28%4 |
| Portfolio Turnover Rate | 20% |
| 1 | Inception. |
| 2 | Calculated based on average shares outstanding. |
| 3 | Total returns do not include account service fees that may have applied in the periods shown. Fund prospectuses provide information about any applicable account service fees. |
| 4 | Annualized. |
See accompanying Notes, which are an integral part of the Financial Statements.
Advice Select Dividend Growth Fund
Notes to Financial Statements
Vanguard Advice Select Dividend Growth Fund is registered under the Investment Company Act of 1940 as an open-end investment company, or mutual fund. Significant market disruptions, such as those caused by pandemics (e.g., COVID-19 pandemic), natural or environmental disasters, war (e.g., Russia's invasion of Ukraine), acts of terrorism, or other events, can adversely affect local and global markets and normal market operations. Any such disruptions could have an adverse impact on the value of the fund's investments and fund performance.
A. The following significant accounting policies conform to generally accepted accounting principles for U.S. investment companies. The fund consistently follows such policies in preparing its financial statements.
1. Security Valuation: Securities are valued as of the close of trading on the New York Stock Exchange (generally 4 p.m., Eastern time) on the valuation date. Equity securities are valued at the latest quoted sales prices or official closing prices taken from the primary market in which each security trades; such securities not traded on the valuation date are valued at the mean of the latest quoted bid and asked prices. Securities for which market quotations are not readily available, or whose values have been affected by events occurring before the fund's pricing time but after the close of the securities’ primary markets, are valued by methods deemed by the valuation designee to represent fair value and subject to oversight by the board of trustees. Investments in Vanguard Market Liquidity Fund are valued at that fund's net asset value.
2. Federal Income Taxes: The fund intends to qualify as a regulated investment company and distribute virtually all of its taxable income. The fund’s tax returns are open to examination by the relevant tax authorities until expiration of the applicable statute of limitations, which is generally three years after the filing of the tax return. Management has analyzed the fund’s tax positions taken for all open federal and state income tax years, and has concluded that no provision for income tax is required in the fund’s financial statements.
3. Distributions: Distributions to shareholders are recorded on the ex-dividend date. Distributions are determined on a tax basis at the fiscal year-end and may differ from net investment income and realized capital gains for financial reporting purposes.
4. Credit Facilities and Interfund Lending Program: The fund and certain other funds managed by The Vanguard Group ("Vanguard") participate in a $4.4 billion committed credit facility provided by a syndicate of lenders pursuant to a credit agreement and an uncommitted credit facility provided by Vanguard. Both facilities may be renewed annually. Each fund is individually liable for its borrowings, if any, under the credit facilities. Borrowings may be utilized for temporary or emergency purposes and are subject to the fund’s regulatory and contractual borrowing restrictions. With respect to the committed credit facility, the participating funds are charged administrative fees and an annual commitment fee of 0.10% of the undrawn committed amount of the facility, which are allocated to the funds based on a method approved by the fund’s board of trustees and included in Management and Administrative expenses on the fund’s Statement of Operations. Any borrowings under either facility bear interest at an agreed-upon spread plus the higher of the federal funds effective rate, the overnight bank funding rate, or the Daily Simple Secured Overnight Financing Rate inclusive of an additional agreed-upon spread. However, borrowings under the uncommitted credit facility may bear interest based upon an alternate rate agreed to by the fund and Vanguard.
In accordance with an exemptive order (the “Order”) from the SEC, the fund may participate in a joint lending and borrowing program that allows registered open-end Vanguard funds to borrow
Advice Select Dividend Growth Fund
money from and lend money to each other for temporary or emergency purposes (the “Interfund Lending Program”), subject to compliance with the terms and conditions of the Order, and to the extent permitted by the fund’s investment objective and investment policies. Interfund loans and borrowings normally extend overnight but can have a maximum duration of seven days. Loans may be called on one business day’s notice. The interest rate to be charged is governed by the conditions of the Order and internal procedures adopted by the board of trustees. The board of trustees is responsible for overseeing the Interfund Lending Program.
For the period ended October 31, 2022, the fund did not utilize the credit facilities or the Interfund Lending Program.
5. Other: Dividend income is recorded on the ex-dividend date. Non-cash dividends included in income, if any, are recorded at the fair value of the securities received. Interest income includes income distributions received from Vanguard Market Liquidity Fund and is accrued daily. Security transactions are accounted for on the date securities are bought or sold. Costs used to determine realized gains (losses) on the sale of investment securities are those of the specific securities sold.
B. Wellington Management Company llp provides investment advisory services to the fund for a fee calculated at an annual percentage rate of average net assets. In accordance with the advisory contract entered into with Wellington Management Company llp , beginning February 1, 2023, the investment advisory fee will be subject to quarterly adjustments based on performance relative to the S&P U.S. Dividend Growers Index since January 31, 2022. For the period ended October 31, 2022, the investment advisory fee represented an effective annual basic rate of 0.25% of the fund’s average net assets.
C. In accordance with the terms of a Funds’ Service Agreement (the “FSA”) between Vanguard and the fund, Vanguard furnishes to the fund corporate management, administrative, marketing, and distribution services at Vanguard’s cost of operations (as defined by the FSA). These costs of operations are allocated to the fund based on methods and guidelines approved by the board of trustees and are generally settled twice a month.
Upon the request of Vanguard, the fund may invest up to 0.40% of its net assets as capital in Vanguard. At October 31, 2022, the fund had contributed to Vanguard capital in the amount of $7,000, representing less than 0.01% of the fund’s net assets and less than 0.01% of Vanguard’s capital received pursuant to the FSA. The fund’s trustees and officers are also directors and employees, respectively, of Vanguard.
D. Pursuant to the terms of an agreement with a third-party service provider applicable to newly launched funds, shareholder reporting expenses of $17,000 (0.02%, on an annualized basis, of the fund's average net assets) were contractually reduced during the period.
E. Various inputs may be used to determine the value of the fund’s investments. These inputs are summarized in three broad levels for financial statement purposes. The inputs or methodologies used to value securities are not necessarily an indication of the risk associated with investing in those securities.
Level 1—Quoted prices in active markets for identical securities.
Level 2—Other significant observable inputs (including quoted prices for similar securities, interest rates, prepayment speeds, credit risk, etc.).
Advice Select Dividend Growth Fund
Level 3—Significant unobservable inputs (including the fund’s own assumptions used to determine the fair value of investments). Any investments valued with significant unobservable inputs are noted on the Schedule of Investments.
At October 31, 2022, 100% of the market value of the fund's investments was determined based on Level 1 inputs.
F. Permanent differences between book-basis and tax-basis components of net assets are reclassified among capital accounts in the financial statements to reflect their tax character. These reclassifications have no effect on net assets or net asset value per share. As of period end, permanent differences primarily attributable to the accounting for applicable distributions in connection with fund share redemptions were reclassified between the following accounts:
| | Amount
($000) |
| Paid-in Capital | 4 |
| Total Distributable Earnings (Loss) | (4) |
Temporary differences between book-basis and tax-basis components of total distributable earnings (loss) arise when certain items of income, gain, or loss are recognized in different periods for financial statement and tax purposes; these differences will reverse at some time in the future. The differences are primarily related to the deferral of losses from wash sales. As of period end, the tax-basis components of total distributable earnings (loss) are detailed in the table as follows:
| | Amount
($000) |
| Undistributed Ordinary Income | 753 |
| Undistributed Long-Term Gains | — |
| Capital Loss Carryforwards | — |
| Qualified Late-Year Losses | — |
| Net Unrealized Gains (Losses) | (845) |
The tax character of distributions paid was as follows:
| | Period Ended
October 31, 2022 |
| | Amount
($000) |
| Ordinary Income* | 274 |
| Long-Term Capital Gains | — |
| Total | 274 |
| * | Includes short-term capital gains, if any. |
Advice Select Dividend Growth Fund
As of October 31, 2022, gross unrealized appreciation and depreciation for investments based on cost for U.S. federal income tax purposes were as follows:
| | Amount
($000) |
| Tax Cost | 209,813 |
| Gross Unrealized Appreciation | 9,646 |
| Gross Unrealized Depreciation | (10,491) |
| Net Unrealized Appreciation (Depreciation) | (845) |
G. During the period ended October 31, 2022, the fund purchased $220,140,000 of investment securities and sold $15,942,000 of investment securities, other than temporary cash investments.
The fund purchased securities from and sold securities to other funds or accounts managed by its investment advisor or their affiliates, in accordance with procedures adopted by the board of trustees in compliance with Rule 17a-7 of the Investment Company Act of 1940. For the period ended October 31, 2022, such purchases were $0 and sales were $107,000, resulting in net realized gain of less than $1,000; these amounts, other than temporary cash investments, are included in the purchases and sales of investment securities noted above.
H. Capital shares issued and redeemed were:
| | November 9, 20211 to
October 31, 2022 |
| | Shares
(000) |
| Issued | 9,238 |
| Issued in Lieu of Cash Distributions | 11 |
| Redeemed | (498) |
| Net Increase (Decrease) in Shares Outstanding | 8,751 |
I. Management has determined that no events or transactions occurred subsequent to October 31, 2022, that would require recognition or disclosure in these financial statements.
Report of Independent Registered
Public Accounting Firm
To the Board of Trustees of Vanguard Whitehall Funds and Shareholders of Vanguard Advice Select Dividend Growth Fund.
Opinion on the Financial Statements
We have audited the accompanying statement of assets and liabilities, including the schedule of investments, of Vanguard Advice Select Dividend Growth Fund (one of the funds constituting Vanguard Whitehall Funds, hereafter referred to as the "Fund") as of October 31, 2022, and the related statements of operations and changes in net assets, including the related notes, and the financial highlights for the period November 9, 2021 (inception) through October 31, 2022 (collectively referred to as the "financial statements"). In our opinion, the financial statements present fairly, in all material respects, the financial position of the Fund as of October 31, 2022, and the results of its operations, changes in its net assets, and the financial highlights for the period November 9, 2021 (inception) through October 31, 2022 in conformity with accounting principles generally accepted in the United States of America.
Basis for Opinion
These financial statements are the responsibility of the Fund's management. Our responsibility is to express an opinion on the Fund's financial statements based on our audit. We are a public accounting firm registered with the Public Company Accounting Oversight Board (United States) (PCAOB) and are required to be independent with respect to the Fund in accordance with the U.S. federal securities laws and the applicable rules and regulations of the Securities and Exchange Commission and the PCAOB.
We conducted our audit of these financial statements in accordance with the standards of the PCAOB. Those standards require that we plan and perform the audit to obtain reasonable assurance about whether the financial statements are free of material misstatement, whether due to error or fraud.
Our audit included performing procedures to assess the risks of material misstatement of the financial statements, whether due to error or fraud, and performing procedures that respond to those risks. Such procedures included examining, on a test basis, evidence regarding the amounts and disclosures in the financial statements. Our audit also included evaluating the accounting principles used and significant estimates made by management, as well as evaluating the overall presentation of the financial statements. Our procedures included confirmation of securities owned as of October 31, 2022 by correspondence with the custodian, transfer agent and brokers; when replies were not received from brokers, we performed other auditing procedures. We believe that our audit provides a reasonable basis for our opinion.
/s/PricewaterhouseCoopers LLP
Philadelphia, Pennsylvania
December 16, 2022
We have served as the auditor of one or more investment companies in The Vanguard Group of Funds since 1975.
Tax information (unaudited)
For corporate shareholders, 93.7%, or if subsequently determined to be different, the maximum percentage allowable by law, of ordinary income (dividend income plus short-term gains, if any) for the fiscal period qualified for the dividends-received deduction.
The fund hereby designates $274,000, or if subsequently determined to be different, the maximum amount allowable by law, as qualified dividend income for individual shareholders for the fiscal period.
The fund hereby designates $14,000, or if subsequently determined to be different, the maximum amount allowable by law, of interest earned from obligations of the U.S. government which is generally exempt from state income tax.
For nonresident alien shareholders, 100% of short-term capital gain dividends distributed by the fund for the fiscal period are qualified short-term capital gains.
This page intentionally left blank.
The People Who Govern Your Fund
The trustees of your mutual fund are there to see that the fund is operated and managed in your best interests since, as a shareholder, you are a part owner of the fund. Your fund’s trustees also serve on the board of directors of The Vanguard Group, Inc., which is owned by the Vanguard funds and provides services to them.
A majority of Vanguard’s board members are independent, meaning that they have no affiliation with Vanguard or the funds they oversee, apart from the sizable personal investments they have made as private individuals. The independent board members have distinguished backgrounds in business, academia, and public service. Each of the trustees and executive officers oversees 206 Vanguard funds.
Information for each trustee and executive officer of the fund appears below. That information, as well as the Vanguard fund count, is as of the date on the cover of this fund report. The mailing address of the trustees and officers is P.O. Box 876, Valley Forge, PA 19482. More information about the trustees is in the Statement of Additional Information, which can be obtained, without charge, by contacting Vanguard at 800-662-7447, or online at vanguard.com.
Interested Trustee1
Mortimer J. Buckley
Born in 1969. Trustee since January 2018. Principal occupation(s) during the past five years and other experience: chairman of the board (2019–present) of Vanguard and of each of the investment companies served by Vanguard; chief executive officer (2018–present) of Vanguard; chief executive officer, president, and trustee (2018–present) of each of the investment companies served by Vanguard; president and director (2017–present) of Vanguard; and president (2018–present) of Vanguard Marketing Corporation. Chief investment officer (2013–2017), managing director (2002–2017), head of the Retail Investor Group (2006–2012), and chief information officer (2001–2006) of Vanguard. Member of the board of governors of the Investment Company Institute and the board of governors of FINRA. Trustee and vice chair of The Shipley School.
Independent Trustees
Tara Bunch
Born in 1962. Trustee since November 2021. Principal occupation(s) during the past five years and other experience: head of global operations at Airbnb (2020–present). Vice president of AppleCare (2012–2020). Member of the board of directors of Out & Equal (2002–2006), the advisory board of the University of California, Berkeley School of Engineering (2020–present), and the advisory board of Santa Clara University’s Leavey School of Business (2018–present).
Emerson U. Fullwood
Born in 1948. Trustee since January 2008. Principal occupation(s) during the past five years and other experience: executive chief staff and marketing officer for North America and corporate vice president (retired 2008) of Xerox Corporation (document management products and services). Former president of the Worldwide Channels Group, Latin America, and Worldwide Customer Service and executive chief staff officer of Developing Markets of Xerox. Executive in residence and 2009–2010 Distinguished Minett Professor at the Rochester Institute of Technology. Member of the board of directors of the University of Rochester Medical Center, the Monroe Community College Foundation, the United Way of Rochester, North Carolina A&T University, Roberts Wesleyan College, and the Rochester Philharmonic Orchestra. Trustee of the University of Rochester.
1 Mr. Buckley is considered an “interested person,” as defined in the Investment Company Act of 1940, because he is an officer of the Vanguard funds.
F. Joseph Loughrey
Born in 1949. Trustee since October 2009. Principal occupation(s) during the past five years and other experience: president and chief operating officer (retired 2009) and vice chairman of the board (2008–2009) of Cummins Inc. (industrial machinery). Chairman of the board of Hillenbrand, Inc. (specialized consumer services). Director of the V Foundation. Member of the advisory council for the College of Arts and Letters at the University of Notre Dame. Chairman of the board of Saint Anselm College.
Mark Loughridge
Born in 1953. Trustee since March 2012. Principal occupation(s) during the past five years and other experience: senior vice president and chief financial officer (retired 2013) of IBM (information technology services). Fiduciary member of IBM’s Retirement Plan Committee (2004–2013), senior vice president and general manager (2002–2004) of IBM Global Financing, vice president and controller (1998–2002) of IBM, and a variety of other prior management roles at IBM. Member of the Council on Chicago Booth.
Scott C. Malpass
Born in 1962. Trustee since March 2012. Principal occupation(s) during the past five years and other experience: adjunct professor of finance at the University of Notre Dame (2020–present). Chief investment officer (retired 2020) and vice president (retired 2020) of the University of Notre Dame. Assistant professor (retired June 2020) of finance at the Mendoza College of Business, University of Notre Dame, and member of the Notre Dame 403(b) Investment Committee. Member of the board of Catholic Investment Services, Inc. (investment advisors), the board of superintendence of the Institute for the Works of Religion, and the board of directors of Paxos Trust Company (finance).
Deanna Mulligan
Born in 1963. Trustee since January 2018. Principal occupation(s) during the past five years and other experience: chief executive officer of Purposeful (advisory firm for CEOs and C-level executives; 2021–present). Board chair (2020), chief executive officer (2011–2020), and president (2010–2019) of The Guardian Life Insurance Company of America. Chief operating officer (2010–2011) and executive vice president (2008–2010) of Individual Life and Disability of the Guardian Life Insurance Company of America. Member of the board of the Economic Club of New York. Trustee of the Partnership for New York City (business leadership), Chief Executives for Corporate Purpose, and the NewYork-Presbyterian Hospital.
André F. Perold
Born in 1952. Trustee since December 2004. Principal occupation(s) during the past five years and other experience: George Gund Professor of Finance and Banking, Emeritus at the Harvard Business School (retired 2011). Chief investment officer and co-managing partner of HighVista Strategies (private investment firm). Member of the board (2018–present) of RIT Capital Partners (investment firm). Member of the investment committee of Partners Health Care System.
Sarah Bloom Raskin
Born in 1961. Trustee since January 2018. Principal occupation(s) during the past five years and other experience: deputy secretary (2014–2017) of the United States Department of the Treasury. Governor (2010–2014) of the Federal Reserve Board. Commissioner (2007–2010) of financial regulation for the State of Maryland. Colin W. Brown Distinguished Professor of the Practice of Law (2021–present), professor (2020–present), Distinguished Fellow of the Global Financial Markets Center (2020–present), and Rubenstein Fellow (2017–2020) at Duke University. Trustee (2017–present) of Amherst College and member of Amherst College Investment Committee (2019–present). Member of the Regenerative Crisis Response Committee (2020–present).
David A. Thomas
Born in 1956. Trustee since July 2021. Principal occupation(s) during the past five years and other experience: president of Morehouse College (2018–present). Professor of business administration, emeritus at Harvard University (2017–2018). Dean (2011–2016) and professor of management (2016–2017) at the Georgetown University McDonough School of Business. Director of DTE Energy Company (2013–present). Trustee of Common Fund (2019–present).
Peter F. Volanakis
Born in 1955. Trustee since July 2009. Principal occupation(s) during the past five years and other experience: president and chief operating officer (retired 2010) of Corning Incorporated (communications equipment) and director of Corning Incorporated (2000–2010) and Dow Corning (2001–2010). Director (2012) of SPX Corporation (multi-industry manufacturing). Overseer of the Amos Tuck School of Business Administration, Dartmouth College (2001–2013). Member of the BMW Group Mobility Council.
Executive Officers
Christine M. Buchanan
Born in 1970. Principal occupation(s) during the past five years and other experience: principal of Vanguard. Chief financial officer (2021–present) and treasurer (2017–present) of each of the investment companies served by Vanguard. Partner (2005–2017) at KPMG (audit, tax, and advisory services).
John Galloway
Born in 1973. Principal occupation(s) during the past five years and other experience: principal of Vanguard. Investment stewardship officer (September 2020–present) of each of the investment companies served by Vanguard. Head of Investor Advocacy (February 2020–present) and head of Marketing Strategy and Planning (2017–2020) at Vanguard. Special assistant to the President of the United States (2015).
Ashley Grim
Born in 1984. Principal occupation(s) during the past five years and other experience: treasurer (February 2022–present) of each of the investment companies served by Vanguard. Fund transfer agent controller (2019–2022) and director of Audit Services (2017–2019) at Vanguard. Senior manager (2015–2017) at PriceWaterhouseCoopers (audit and assurance, consulting, and tax services).
Peter Mahoney
Born in 1974. Principal occupation(s) during the past five years and other experience: principal of Vanguard. Controller (2015–present) of each of the investment companies served by Vanguard. Head of International Fund Services (2008–2014) at Vanguard.
Anne E. Robinson
Born in 1970. Principal occupation(s) during the past five years and other experience: general counsel (2016–present) of Vanguard. Secretary (2016–present) of Vanguard and of each of the investment companies served by Vanguard. Managing director (2016–present) of Vanguard. Managing director and general counsel of Global Cards and Consumer Services (2014–2016) at Citigroup. Counsel (2003–2014) at American Express. Nonexecutive director of the board of National Grid (energy).
Michael Rollings
Born in 1963. Principal occupation(s) during the past five years and other experience: finance director (2017–present) and treasurer (2017) of each of the investment companies served by Vanguard. Managing director (2016–present) of Vanguard. Chief financial officer (2016–present) of Vanguard. Director (2016–present) of Vanguard Marketing Corporation. Executive vice president and chief financial officer (2006–2016) of MassMutual Financial Group.
John E. Schadl
Born in 1972. Principal occupation(s) during the past five years and other experience: principal of Vanguard. Chief compliance officer (2019–present) of Vanguard and of each of the investment companies served by Vanguard. Assistant vice president (2019–present) of Vanguard Marketing Corporation.
Vanguard Senior Management Team
| Matthew Benchener | Thomas M. Rampulla |
| Joseph Brennan | Karin A. Risi |
| Mortimer J. Buckley | Anne E. Robinson |
| Gregory Davis | Michael Rollings |
| John James | Nitin Tandon |
| Chris D. McIsaac | Lauren Valente |
Connect with Vanguard®>vanguard.com
Fund Information > 800-662-7447
Direct Investor Account Services > 800-662-2739
Institutional Investor Services > 800-523-1036
Text Telephone for People
Who Are Deaf or Hard of Hearing > 800-749-7273
This material may be used in conjunction with the offering of shares of any Vanguard fund only if preceded or accompanied by the fund’s current prospectus.
All comparative mutual fund data are from Morningstar, Inc., unless otherwise noted.
You can obtain a free copy of Vanguard’s proxy voting guidelines by visiting vanguard.com/proxyreporting or by calling Vanguard at 800-662-2739. The guidelines are also available from the SEC’s website, www.sec.gov. In addition, you may obtain a free report on how your fund voted the proxies for securities it owned during the 12 months ended June 30. To get the report, visit either vanguard.com/proxyreporting or www.sec.gov.
You can review information about your fund on the SEC’s website, and you can receive copies of this information, for a fee, by sending a request via email addressed to publicinfo@sec.gov.
Source for Bloomberg indexes: Bloomberg Index Services Limited. Copyright 2022, Bloomberg. All rights reserved.
© 2022 The Vanguard Group, Inc.
All rights reserved.
Vanguard Marketing Corporation, Distributor.
Q44350 122022
Item 2: Code of Ethics.
The Registrant has adopted a code of ethics that applies to the Registrant’s principal executive officer, principal financial officer, principal accounting officer or controller or persons performing similar functions. The Code of Ethics was amended during the reporting period covered by this report to make certain technical, non-material changes.
Item 3: Audit Committee Financial Expert.
All members of the Audit Committee have been determined by the Registrant’s Board of Trustees to be Audit Committee Financial Experts and to be independent: F. Joseph Loughrey, Mark Loughridge, Sarah Bloom Raskin, and Peter F. Volanakis.
Item 4: Principal Accountant Fees and Services.
(a) Audit Fees.
Audit Fees of the Registrant.
Fiscal Year Ended October 31, 2022: $404,000
Fiscal Year Ended October 31, 2021: $326,000
Aggregate Audit Fees of Registered Investment Companies in the Vanguard Group.
Fiscal Year Ended October 31, 2022: $10,494,508
Fiscal Year Ended October 31, 2021: $11,244,694
Includes fees billed in connection with audits of the Registrant, other registered investment companies in the Vanguard complex, The Vanguard Group, Inc., and Vanguard Marketing Corporation.
(b) Audit-Related Fees.
Fiscal Year Ended October 31, 2022: $2,757,764
Fiscal Year Ended October 31, 2021: $2,955,181
Includes fees billed in connection with assurance and related services provided to the Registrant, other registered investment companies in the Vanguard complex, The Vanguard Group, Inc., and Vanguard Marketing Corporation.
(c) Tax Fees.
Fiscal Year Ended October 31, 2022: $5,202,689
Fiscal Year Ended October 31, 2021: $2,047,574
Includes fees billed in connection with tax compliance, planning, and advice services provided to the Registrant, other registered investment companies in the Vanguard complex, The Vanguard Group, Inc., and Vanguard Marketing Corporation.
(d) All Other Fees.
Fiscal Year Ended October 31, 2022: $298,000
Fiscal Year Ended October 31, 2021: $280,000
Includes fees billed for services related to tax reported information provided to the Registrant, other registered investment companies in the Vanguard complex, The Vanguard Group, Inc., and Vanguard Marketing Corporation.
(e) (1) Pre-Approval Policies. The policy of the Registrant’s Audit Committee is to consider, and, if appropriate, approve before the principal accountant is engaged for such services, all specific audit and non-audit services provided to: the Registrant, other registered investment companies in the Vanguard complex, The Vanguard Group, Inc., and entities controlled by The Vanguard Group, Inc. that provide ongoing services to the Registrant. In making a determination, the Audit Committee considers whether the services are consistent with maintaining the principal accountant’s independence.
In the event of a contingency situation in which the principal accountant is needed to provide services in between scheduled Audit Committee meetings, the Chairman of the Audit Committee would be called on to consider and, if appropriate, pre-approve audit or permitted non-audit services in an amount sufficient to complete services through the next Audit Committee meeting, and to determine if such services would be consistent with maintaining the accountant’s independence. At the next scheduled Audit Committee meeting, services and fees would be presented to the Audit Committee for formal consideration, and, if appropriate, approval by the entire Audit Committee. The Audit Committee would again consider whether such services and fees are consistent with maintaining the principal accountant’s independence.
The Registrant’s Audit Committee is informed at least annually of all audit and non-audit services provided by the principal accountant to the Vanguard complex, whether such services are provided to: the Registrant, other registered investment companies in the Vanguard complex, The Vanguard Group, Inc., or other entities controlled by The Vanguard Group, Inc. that provide ongoing services to the Registrant.
(2) No percentage of the principal accountant’s fees or services were approved pursuant to the waiver provision of paragraph (c)(7)(i)(C) of Rule 2-01 of Regulation S-X.
(f) For the most recent fiscal year, over 50% of the hours worked under the principal accountant’s engagement were not performed by persons other than full-time, permanent employees of the principal accountant.
(g) Aggregate Non-Audit Fees.
Fiscal Year Ended October 31, 2022: $5,500,689
Fiscal Year Ended October 31, 2021: $2,327,574
Includes fees billed for non-audit services provided to the Registrant, other registered investment companies in the Vanguard complex, The Vanguard Group, Inc., and Vanguard Marketing Corporation.
(h) For the most recent fiscal year, the Audit Committee has determined that the provision of all non-audit services was consistent with maintaining the principal accountant’s independence.
Item 5: Audit Committee of Listed Registrants.
The Registrant is a listed issuer as defined in rule 10A-3 under the Securities Exchange Act of 1934 (“Exchange Act”). The Registrant has a separately-designated standing audit committee established in accordance with Section 3(a)(58)(A) of the Exchange Act. The Registrant’s audit committee members are: F. Joseph Loughrey, Mark Loughridge, Sarah Bloom Raskin, and Peter F. Volanakis.
Item 6: Investments.
Not applicable. The complete schedule of investments is included as part of the report to shareholders filed under Item 1 of this Form.
Item 7: Disclosure of Proxy Voting Policies and Procedures for Closed-End Management Investment Companies.
Not applicable.
Item 8: Portfolio Managers of Closed-End Management Investment Companies.
Not applicable.
Item 9: Purchase of Equity Securities by Closed-End Management Investment Company and Affiliated Purchasers.
Not applicable.
Item 10: Submission of Matters to a Vote of Security Holders.
Not applicable.
Item 11: Controls and Procedures.
(a) Disclosure Controls and Procedures. The Principal Executive and Financial Officers concluded that the Registrant’s Disclosure Controls and Procedures are effective based on their evaluation of the Disclosure Controls and Procedures as of a date within 90 days of the filing date of this report.
(b) Internal Control Over Financial Reporting. There were no significant changes in the Registrant’s Internal Control Over Financial Reporting or in other factors that could significantly affect this control subsequent to the date of the evaluation, including any corrective actions with regard to significant deficiencies and material weaknesses.
Item 12: Disclosure of Securities Lending Activities for Closed-End Management Investment Companies.
Not applicable.
Item 13: Exhibits.
Pursuant to the requirements of the Securities Exchange Act of 1934 and the Investment Company Act of 1940, the registrant has duly caused this report to be signed on its behalf by the undersigned, thereunto duly authorized.
| | VANGUARD Whitehall FUNDS |
| | | |
| BY: | /s/ MORTIMER J. BUCKLEY* | |
| | MORTIMER J. BUCKLEY | |
| | CHIEF EXECUTIVE OFFICER | |
Date: December 19, 2022
Pursuant to the requirements of the Securities Exchange Act of 1934 and the Investment Company Act of 1940, this report has been signed below by the following persons on behalf of the registrant and in the capacities and on the dates indicated.
| | VANGUARD whitehall FUNDS |
| | | |
| BY: | /s/ MORTIMER J. BUCKLEY* | |
| | MORTIMER J. BUCKLEY | |
| | CHIEF EXECUTIVE OFFICER | |
Date: December 19, 2022
| | VANGUARD whitehall FUNDS |
| | | |
| BY: | /s/ CHRISTINE BUCHANAN* | |
| | CHRISTINE BUCHANAN | |
| | CHIEF FINANCIAL OFFICER | |
Date: December 19, 2022
| * By: | /s/ Anne E. Robinson | |
Anne E. Robinson, pursuant to a Power of Attorney filed on October 11, 2022 (see File Number 333-11763), Incorporated by Reference.