UNITED STATES
SECURITIES AND EXCHANGE COMMISSION
Washington, D.C. 20549
FORM N-CSR
CERTIFIED SHAREHOLDER REPORT
OF
REGISTERED MANAGEMENT INVESTMENT COMPANIES
Investment Company Act file number: 811-07443
| Name of Registrant: | Vanguard Whitehall Funds |
| Address of Registrant: | P.O. Box 2600 |
| | Valley Forge, PA 19482 |
| Name and address of agent for service: | Anne E. Robinson, Esquire |
| | P.O. Box 876 |
| | Valley Forge, PA 19482 |
Registrant’s telephone number, including area code: (610) 669-1000
Date of fiscal year end: October 31
Date of reporting period: November 1, 2020—October 31, 2021
Item 1: Reports to Shareholders
Annual Report | October 31, 2021
Vanguard Selected Value Fund
Contents
Your Fund’s Performance at a Glance
| 1 |
Advisors' Report
| 2 |
About Your Fund’s Expenses
| 6 |
Performance Summary
| 8 |
Financial Statements
| 10 |
Please note: The opinions expressed in this report are just that—informed opinions. They should not be considered promises or advice. Also, please keep in mind that the information and opinions cover the period through the date on the front of this report. Of course, the risks of investing in your fund are spelled out in the prospectus.
Your Fund’s Performance at a Glance
| • | For the 12 months ended October 31, 2021, Vanguard Selected Value Fund returned 56.30%, outpacing the 48.60% return of its benchmark, the Russell Midcap Value Index. |
| • | During the fiscal year, the global economy continued to recover from the sharp pandemic-induced contraction of spring 2020. Countries that were more successful in containing the coronavirus, whether through vaccinations, lockdowns, or both, generally fared better economically. Swift and extensive fiscal and monetary support from policymakers was also key to the rebound. Stock returns for the period were excellent, even amid concerns late in the fiscal year about inflation and the prospect of less accommodative monetary policy. |
| • | The broad U.S. stock market, as measured by the Russell 3000 Index, climbed 43.90%. Value stocks outperformed growth stocks, and mid- and small-capitalization stocks outperformed large-caps. |
| • | Returns were positive in all 11 industry sectors. Strong selection in industrial and consumer discretionary stocks and underweight positions in utilities and consumer staples drove outperformance relative to the benchmark. Real estate and materials detracted. |
| • | For the decade ended October 31, 2021, the fund’s average annual return of 12.34% trailed the 13.18% return of its expense-free benchmark. |
Market Barometer
| | Average Annual Total Returns
Periods Ended October 31, 2021 |
| | One Year | Three Years | Five Years |
| Stocks | | | |
| Russell 1000 Index (Large-caps) | 43.51% | 22.01% | 19.16% |
| Russell 2000 Index (Small-caps) | 50.80 | 16.47 | 15.52 |
| Russell 3000 Index (Broad U.S. market) | 43.90 | 21.62 | 18.91 |
| FTSE All-World ex US Index (International) | 30.23 | 12.42 | 10.05 |
| Bonds | | | |
Bloomberg U.S. Aggregate Bond Index
(Broad taxable market) | -0.48% | 5.63% | 3.10% |
Bloomberg Municipal Bond Index
(Broad tax-exempt market) | 2.64 | 5.17 | 3.41 |
| FTSE Three-Month U.S. Treasury Bill Index | 0.05 | 1.08 | 1.12 |
| CPI | | | |
| Consumer Price Index | 6.22% | 3.03% | 2.73% |
For the 12 months ended October 31, 2021, Vanguard Selected Value Fund returned 56.30%. It outperformed its benchmark, the Russell Midcap Value Index, which returned 48.60%.
Your fund is managed by three independent advisors, a strategy that enhances its diversification by providing exposure to distinct yet complementary investment approaches. It’s not uncommon for different advisors to have different views about individual securities or the broader investment environment.
The accompanying table lists the advisors, the amount and percentage of fund assets each manages, and brief descriptions of their investment strategies.
The advisors have provided the following assessment of the investment environment during the past 12 months and the notable successes and shortfalls in their portfolios. These comments were prepared on November 16, 2021.
Pzena Investment Management, LLC
Portfolio Managers:
Richard Pzena, Managing Principal
and Co-Chief Investment Officer
John Flynn, Principal
Ben Silver, CFA, CPA, Principal
Building on late-2020 momentum, value stocks continued to surge in the first half of 2021 as the vaccine rollout accelerated
and fiscal and monetary stimulus set the stage for a powerful rebound in the economy. Investor preference abruptly shifted from value to growth shares in June as the Federal Reserve spoke about potential tapering and the yield curve flattened significantly. Over the 12 months, the backdrop for cyclical stocks was mostly favorable, helping the portfolio outperform its benchmark, with financials, industrials, and consumer discretionary equities leading the way.
Olin, a chemical producer of chlorine derivatives and caustic soda, was the portfolio’s top individual performer. The company continues to realize pricing improvements amid tight market conditions. U.S. oil services company Halliburton outperformed on surging crude prices after Hurricane Ida hit inventories while demand remained high amid the economic reopening. Insurer American International Group was higher after reporting tangible progress in the turnaround of its core general insurance property and casualty unit and strong performance in life and retirement insurance.
Dialysis products and services provider Fresenius Medical Care, a relatively new holding, detracted amid inflation concerns and COVID-19-related excess mortality among patients. We are nonetheless optimistic about long-term industry trends, including the increase in home dialysis, which should help Fresenius boost its already dominant product business. We expect margins to ultimately revert to more normal levels through
patient volume growth, rate renegotiations, and cost cuts.
In addition to Fresenius, we added outsourced IT services company Cognizant, software solutions provider Amdocs, and footwear manufacturer Skechers to the portfolio. We fully exited engineering and construction company AECOM, rental car provider Avis Budget Group, ad agency Interpublic Group, real estate service provider Realogy, and generic drug manufacturer Viatris.
Although the portfolio has experienced strong performance over the past year, valuation spreads remain wide. We continue to be heavily skewed toward financials, consumer discretionary, and industrials, where valuations remain compelling because of investor concerns over economic malaise and rising inflation.
Cooke & Bieler, LP
Portfolio Managers:
Mehul Trivedi, CFA, Partner
and Research Analyst
William Weber, CFA, Partner
and Research Analyst
The investing environment over the 12 months was shaped by a strong first half as the post-pandemic boom continued, then a softer second half as investors faced increasing supply chain disruptions, rising input-cost inflation, and labor shortages. The combined effect was a significant absolute return for U.S. equity
markets, but with uncertainty and volatility also a consistent trend.
The team took advantage of the pandemic-related market volatility, finding opportunity in some of the worst-performing sectors such as utilities and consumer staples. Turnover was elevated compared with prior periods because of consistent market fluctuations. The portfolio took on a slightly more defensive, less cyclical tilt.
Successes and shortfalls
Consistent with themes in the broader market, our largest successes were companies that initially were at the epicenter of the pandemic shock but emerged stronger as the economy reopened and the recovery took hold. American Eagle, a teen and young adult retailer, demonstrated impressive demand trends in its Aerie concept throughout the pandemic. AerCap, a leading independent aircraft lessor, was less impacted by the shutdown of air travel than investors first thought and used the downturn to opportunistically purchase GE’s aircraft leasing business. Gildan Activewear, one of the world’s largest basic apparel manufacturers, improved margins and developed new channels of demand during the downturn.
By far, the portfolio’s biggest shortfall came from stable businesses that were not positioned to benefit from the economic recovery. In particular, insurance holdings failed to keep up with the market, with RenaissanceRe, Alleghany, and Arch all lagging. However,
these businesses are poised to generate solid returns on equity and trade at increasingly attractive valuations, making them among our more promising holdings. An underweight to energy was also a headwind. Although investors are excited about the recent rise in oil prices, we remain concerned about the industry’s pervasive lack of cash flow and the increasing risks presented by efforts at decarbonization.
Outlook
Having spent the last year pricing in an economic recovery propelled by reopening and massive fiscal and monetary stimulus, markets are now grappling with the shape of the post-pandemic landscape. In particular, the question of whether current rates of inflation are transitory or reflect deeper structural issues has increasingly dominated investors’ thinking. The prospect of persistent inflation raises questions that markets have not faced in decades; absent a ready playbook, more volatility is likely.
Donald Smith & Co., Inc.
Portfolio Managers:
Richard L. Greenberg, CFA,
Chief Executive Officer
and Co-Chief Investment Officer
Jon Hartsel, CFA,
Co-Chief Investment Officer
and Director of Research
After rebounding spectacularly in November 2020, markets continued to trend higher throughout 2021, encouraged by vaccine rollouts and the prospect of a strong post-pandemic recovery. Despite a short-lived pullback during the summer months, value stocks and our portfolio continued to rise over the 12 months ended October 31, 2021.
Top contributors included financial holdings Jefferies Financial and Fifth Third Bancorp and insurance companies Unum and American National. The stocks rose on idiosyncratic factors and a rally in the broader financial complex amid economic optimism and rising interest rates. Aircraft leasing and airline holdings AerCap and JetBlue also performed strongly as air traffic recovered from its pandemic trough. Commodity-related names such as phosphate fertilizer producer The Mosaic Company and aluminum producer Alcoa also outperformed.
Three of our holdings announced significant corporate actions during the fiscal year. The Moody family-controlled insurer American National in August announced its sale to the reinsurance arm of Brookfield Asset Management. Earlier in the year, the market responded favorably to AerCap’s plan to acquire GE’s aircraft leasing business GECAS. The recently completed transaction has made the combined entity a dominant industry leader. Pulp and paper manufacturer Domtar announced that it would be acquired by a private Canadian paper company.
Gold miners were the primary detractors. IAMGOLD experienced operational challenges, while the broader group declined as gold prices fell 6% over the 12 months amid rising nominal interest rates. Still, the outlook for gold prices continues to be positive, and gold miner valuations have become even more attractive relative to earnings and cash flow.
Despite signs of the pandemic abating, risks remain for the portfolio, including inflationary cost pressure on holdings such as airlines and homebuilders. Higher interest rates could impact home affordability, especially in light of dramatic price appreciation this year. Supply chain issues could also impede builders’ ability to deliver homes. Higher real interest
rates (if rates rise faster than inflation expectations) would be expected to hurt gold prices and miners.
Throughout the fiscal year, we sold some of the outperformers to fund new purchases across various industries, such as gold, home building, and energy. Our largest industry weightings are insurance, materials, building/real estate, metals, aircraft leasing, financials, and airlines. Currently, the portfolio trades at 107% of tangible book value and 7 times our estimate of “normalized” earnings, compared with the Standard & Poor’s 500 Index at 1623% of tangible book value and 20 times normalized earnings.
| |
| | Fund Assets Managed | |
| Investment Advisor | % | $ Million | Investment Strategy |
| Pzena Investment Management, LLC | 39 | 2,691 | Uses a fundamental, bottom-up, deep-value-oriented investment strategy. Seeks to buy good businesses at low prices, focusing exclusively on companies that are underperforming their historically demonstrated earnings power. |
| Cooke & Bieler, L.P. | 39 | 2,625 | Conducts fundamental research in seeking high-quality businesses that have a record of generating attractive and sustainable returns on capital, durable competitive advantages, and skilled and shareholder-friendly management teams. |
| Donald Smith & Co., Inc. | 20 | 1,343 | Conducts fundamental research on the lowest price-to-tangible book value companies. Research focuses on underlying quality of book value and assets, and on long-term earnings potential. |
| Cash Investments | 2 | 141 | These short-term reserves are invested by Vanguard in equity index products to simulate investment in stocks. Each advisor may also maintain a modest cash position. |
About Your Fund’s Expenses
As a shareholder of the fund, you incur ongoing costs, which include costs for portfolio management, administrative services, and shareholder reports (like this one), among others. Operating expenses, which are deducted from a fund’s gross income, directly reduce the investment return of the fund.
A fund’s expenses are expressed as a percentage of its average net assets. This figure is known as the expense ratio. The following examples are intended to help you understand the ongoing costs (in dollars) of investing in your fund and to compare these costs with those of other mutual funds. The examples are based on an investment of $1,000 made at the beginning of the period shown and held for the entire period.
The accompanying table illustrates your fund’s costs in two ways:
| • | Based on actual fund return. This section helps you to estimate the actual expenses that you paid over the period. The ”Ending Account Value“ shown is derived from the fund‘s actual return, and the third column shows the dollar amount that would have been paid by an investor who started with $1,000 in the fund. You may use the information here, together with the amount you invested, to estimate the expenses that you paid over the period. |
To do so, simply divide your account value by $1,000 (for example, an $8,600 account value divided by $1,000 = 8.6), then multiply the result by the number given for your fund under the heading ”Expenses Paid During Period.“
| • | Based on hypothetical 5% yearly return. This section is intended to help you compare your fund‘s costs with those of other mutual funds. It assumes that the fund had a yearly return of 5% before expenses, but that the expense ratio is unchanged. In this case—because the return used is not the fund’s actual return—the results do not apply to your investment. The example is useful in making comparisons because the Securities and Exchange Commission requires all mutual funds to calculate expenses based on a 5% return. You can assess your fund’s costs by comparing this hypothetical example with the hypothetical examples that appear in shareholder reports of other funds. |
Note that the expenses shown in the table are meant to highlight and help you compare ongoing costs only and do not reflect transaction costs incurred by the fund for buying and selling securities. Further, the expenses do not include any purchase, redemption, or account service fees described in the fund prospectus. If such fees were applied to your account, your costs would be higher. Your fund does not carry a “sales load.”
The calculations assume no shares were bought or sold during the period. Your actual costs may have been higher or lower, depending on the amount of your investment and the timing of any purchases or redemptions.
You can find more information about the fund’s expenses, including annual expense ratios, in the Financial Statements section of this report. For additional information on operating expenses and other shareholder costs, please refer to your fund’s current prospectus.
| Six Months Ended October 31, 2021 | | | |
| Selected Value Fund | Beginning
Account Value
4/30/2021 | Ending
Account Value
10/31/2021 | Expenses
Paid During
Period |
| Based on Actual Fund Return | $1,000.00 | $1,022.80 | $1.58 |
| Based on Hypothetical 5% Yearly Return | 1,000.00 | 1,023.64 | 1.58 |
The calculations are based on expenses incurred in the most recent six-month period. The fund’s annualized six-month expense ratio for that period is 0.31%. The dollar amounts shown as “Expenses Paid” are equal to the annualized expense ratio multiplied by the average account value over the period, multiplied by the number of days in the most recent six-month period, then divided by the number of days in the most recent 12-month period (184/365).
All of the returns in this report represent past performance, which is not a guarantee of future results that may be achieved by the fund. (Current performance may be lower or higher than the performance data cited. For performance data current to the most recent month-end, visit our website at vanguard.com/performance.) Note, too, that both investment returns and principal value can fluctuate widely, so an investor’s shares, when sold, could be worth more or less than their original cost. The returns shown do not reflect taxes that a shareholder would pay on fund distributions or on the sale of fund shares.
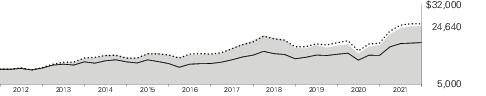
Cumulative Performance: October 31, 2011, Through October 31, 2021
Initial Investment of $10,000
| | | Average Annual Total Returns
Periods Ended October 31, 2021 | |
| | | One
Year | Five
Years | Ten
Years | Final Value
of a $10,000
Investment |
 | Selected Value Fund | 56.30% | 12.51% | 12.34% | $32,001 |
 | Russell Midcap Value Index | 48.60 | 12.30 | 13.18 | 34,491 |
 | Dow Jones U.S. Total Stock Market Float Adjusted Index | 44.07 | 18.87 | 16.04 | 44,284 |
See Financial Highlights for dividend and capital gains information.
| Communication Services | 0.8% |
| Consumer Discretionary | 15.5 |
| Consumer Staples | 1.7 |
| Energy | 4.8 |
| Financials | 26.7 |
| Health Care | 6.5 |
| Industrials | 21.3 |
| Information Technology | 9.0 |
| Materials | 8.4 |
| Real Estate | 1.5 |
| Utilities | 3.8 |
The table reflects the fund’s investments, except for short-term investments and derivatives. Sector categories are based on the Global Industry Classification Standard (“GICS”), except for the “Other” category (if applicable), which includes securities that have not been provided a GICS classification as of the effective reporting period.
Global Industry Classification Standard (“GICS”) was developed by and is the exclusive property and a service mark of MSCI Inc. (“MSCI”) and Standard and Poor’s, a division of McGraw-Hill Companies, Inc. (“S&P”), and is licensed for use by Vanguard. Neither MSCI, S&P nor any third party involved in making or compiling the GICS or any GICS classification makes any express or implied warranties or representations with respect to such standard or classification (or the results to be obtained by the use thereof), and all such parties hereby expressly disclaim all warranties of originality, accuracy, completeness, merchantability or fitness for a particular purpose with respect to any such standard or classification. Without limiting any of the foregoing, in no event shall MSCI, S&P, any of its affiliates or any third party involved in making or compiling the GICS or any GICS classification have any liability for any direct, indirect, special, punitive, consequential or any other damages (including lost profits) even if notified of the possibility of such damages.
The fund files its complete schedule of portfolio holdings with the Securities and Exchange Commission (SEC) for the first and third quarters of each fiscal year as an exhibit to its reports on Form N-PORT. The fund’s Form N-PORT reports are available on the SEC’s website at www.sec.gov.
| | | Shares | Market
Value•
($000) |
| Common Stocks (95.6%) |
| Communication Services (0.7%) |
| | Omnicom Group Inc. | 737,550 | 50,212 |
| Consumer Discretionary (14.8%) |
| | Gildan Activewear Inc. | 4,114,107 | 151,070 |
| * | Taylor Morrison Home Corp. Class A | 3,571,543 | 109,039 |
| * | Helen of Troy Ltd. | 440,350 | 99,057 |
| | Lear Corp. | 474,212 | 81,493 |
| | Gentex Corp. | 2,301,074 | 81,435 |
| | Newell Brands Inc. | 2,976,072 | 68,122 |
| * | PVH Corp. | 586,275 | 64,098 |
| | American Eagle Outfitters Inc. | 2,224,060 | 52,799 |
| * | Mohawk Industries Inc. | 277,719 | 49,215 |
| * | Skechers USA Inc. Class A | 981,430 | 45,352 |
| | Whirlpool Corp. | 214,400 | 45,202 |
| | Hasbro Inc. | 424,426 | 40,643 |
| | Hanesbrands Inc. | 2,318,600 | 39,509 |
| * | M/I Homes Inc. | 603,000 | 34,528 |
| * | Ford Motor Co. | 1,581,504 | 27,012 |
| | Gap Inc. | 783,437 | 17,776 |
| | | | 1,006,350 |
| Consumer Staples (1.6%) |
| | General Mills Inc. | 649,600 | 40,145 |
| | Spectrum Brands Holdings Inc. | 422,849 | 39,642 |
| | Ingredion Inc. | 296,500 | 28,236 |
| | | | 108,023 |
| Energy (4.6%) |
| | Halliburton Co. | 3,240,456 | 80,979 |
| | Baker Hughes Co. Class A | 2,190,681 | 54,942 |
| * | NOV Inc. | 3,759,533 | 52,709 |
| * | Bonanza Creek Energy Inc. | 586,742 | 32,940 |
| | Cenovus Energy Inc. | 2,340,593 | 28,040 |
| 1 | Euronav NV | 2,586,487 | 27,287 |
| * | TechnipFMC plc | 2,854,756 | 21,040 |
| | Murphy Oil Corp. | 645,960 | 17,977 |
| | | | 315,914 |
| Financials (25.5%) |
| | American International Group Inc. | 1,597,033 | 94,369 |
| | Unum Group | 3,668,000 | 93,424 |
| | Fifth Third Bancorp | 2,032,620 | 88,480 |
| | | Shares | Market
Value•
($000) |
| | Fidelity National Financial Inc. | 1,838,587 | 88,087 |
| * | Arch Capital Group Ltd. | 2,046,799 | 85,597 |
| | Jefferies Financial Group Inc. | 1,981,641 | 85,211 |
| | Equitable Holdings Inc. | 2,539,734 | 85,081 |
| | Globe Life Inc. | 930,302 | 82,815 |
| | FirstCash Inc. | 901,999 | 79,800 |
| | Voya Financial Inc. | 1,096,494 | 76,502 |
| | Regions Financial Corp. | 3,117,046 | 73,812 |
| | Axis Capital Holdings Ltd. | 1,343,287 | 69,945 |
| | State Street Corp. | 683,070 | 67,317 |
| * | Alleghany Corp. | 97,440 | 63,470 |
| | CNO Financial Group Inc. | 2,612,012 | 63,054 |
| | RenaissanceRe Holdings Ltd. | 390,700 | 55,401 |
| | CNA Financial Corp. | 1,217,198 | 54,603 |
| | Essent Group Ltd. | 1,131,950 | 54,334 |
| | KeyCorp. | 2,321,558 | 54,023 |
| | Progressive Corp. | 558,677 | 53,007 |
| | Webster Financial Corp. | 779,926 | 43,645 |
| | Invesco Ltd. | 1,529,420 | 38,863 |
| | American National Group Inc. | 193,300 | 36,671 |
| | Reinsurance Group of America Inc. | 285,446 | 33,705 |
| | Loews Corp. | 550,000 | 30,838 |
| | Allstate Corp. | 212,900 | 26,329 |
| | Commerce Bancshares Inc. | 343,237 | 24,202 |
| | Navient Corp. | 733,758 | 14,455 |
| | Everest Re Group Ltd. | 51,771 | 13,538 |
| * | Enact Holdings Inc. | 115,070 | 2,644 |
| | | | 1,733,222 |
| Health Care (6.3%) |
| * | Syneos Health Inc. | 831,499 | 77,612 |
| * | Integra LifeSciences Holdings Corp. | 886,675 | 58,929 |
| | DENTSPLY SIRONA Inc. | 977,000 | 55,894 |
| | Perrigo Co. plc | 1,118,104 | 50,482 |
| 1 | Fresenius Medical Care AG & Co. KGaA ADR | 1,505,518 | 50,028 |
| | Cardinal Health Inc. | 956,318 | 45,722 |
| | Baxter International Inc. | 419,900 | 33,155 |
| * | Laboratory Corp. of America Holdings | 94,600 | 27,152 |
| | McKesson Corp. | 124,152 | 25,809 |
| | | | 424,783 |
| | | Shares | Market
Value•
($000) |
| Industrials (20.3%) |
| * | AerCap Holdings NV | 3,715,879 | 219,385 |
| * | IAA Inc. | 1,448,592 | 86,409 |
| | Leidos Holdings Inc. | 833,748 | 83,358 |
| | Westinghouse Air Brake Technologies Corp. | 881,016 | 79,935 |
| * | JELD-WEN Holding Inc. | 2,476,521 | 67,881 |
| * | Colfax Corp. | 1,266,919 | 65,398 |
| * | JetBlue Airways Corp. | 4,440,529 | 62,301 |
| | Stanley Black & Decker Inc. | 342,182 | 61,500 |
| | BWX Technologies Inc. | 1,063,725 | 60,356 |
| | Woodward Inc. | 474,855 | 53,635 |
| | Huntington Ingalls Industries Inc. | 242,090 | 49,079 |
| | Terex Corp. | 1,083,477 | 48,540 |
| | Armstrong World Industries Inc. | 422,330 | 44,619 |
| | Ryder System Inc. | 495,757 | 42,115 |
| | PACCAR Inc. | 428,000 | 38,357 |
| | Triton International Ltd. | 601,700 | 37,420 |
| | AMETEK Inc. | 277,200 | 36,701 |
| | Enerpac Tool Group Corp. Class A | 1,539,856 | 32,168 |
| | Textron Inc. | 366,713 | 27,082 |
| * | Gates Industrial Corp. plc | 1,633,350 | 26,852 |
| | Acuity Brands Inc. | 126,532 | 25,993 |
| * | Atlas Air Worldwide Holdings Inc. | 314,000 | 25,472 |
| | MSC Industrial Direct Co. Inc. Class A | 261,409 | 21,977 |
| * | MasTec Inc. | 239,262 | 21,325 |
| | Steelcase Inc. Class A | 1,658,088 | 19,731 |
| * | Air France KLM ADR | 4,102,756 | 19,556 |
| | KBR Inc. | 340,972 | 14,471 |
| | Snap-on Inc. | 56,185 | 11,418 |
| | | | 1,383,034 |
| Information Technology (8.7%) |
| * | Arrow Electronics Inc. | 1,014,358 | 117,412 |
| | Amdocs Ltd. | 1,276,942 | 99,397 |
| | Avnet Inc. | 1,921,012 | 73,210 |
| | Cognizant Technology Solutions Corp. Class A | 676,602 | 52,836 |
| | TE Connectivity Ltd. | 284,950 | 41,603 |
| | Micron Technology Inc. | 563,100 | 38,910 |
| | Hewlett Packard Enterprise Co. | 2,554,563 | 37,424 |
| | MKS Instruments Inc. | 247,740 | 37,173 |
| * | Celestica Inc. | 3,181,993 | 31,247 |
| | Genpact Ltd. | 505,149 | 24,929 |
| | Juniper Networks Inc. | 686,737 | 20,273 |
| | SS&C Technologies Holdings Inc. | 183,291 | 14,566 |
| | | | 588,980 |
| Materials (8.0%) |
| | Mosaic Co. | 2,268,800 | 94,314 |
| | Olin Corp. | 1,310,406 | 74,667 |
| | | Shares | Market
Value•
($000) |
| | Dow Inc. | 1,126,419 | 63,046 |
| * | IAMGOLD Corp. | 19,855,730 | 55,000 |
| | Gold Fields Ltd. ADR | 5,428,027 | 50,372 |
| | Alcoa Corp. | 1,057,700 | 48,601 |
| | Reliance Steel & Aluminum Co. | 242,960 | 35,511 |
| | Kinross Gold Corp. | 4,592,609 | 27,602 |
| * | Domtar Corp. | 497,170 | 27,141 |
| | Schweitzer-Mauduit International Inc. | 619,100 | 21,570 |
| * | Equinox Gold Corp. | 2,671,383 | 19,815 |
| | Teck Resources Ltd. | 600,000 | 16,740 |
| | Centerra Gold Inc. | 1,398,300 | 10,487 |
| | | | 544,866 |
| Real Estate (1.4%) |
| * | Howard Hughes Corp. | 392,541 | 34,202 |
| * | Park Hotels & Resorts Inc. | 1,024,815 | 18,990 |
| * | CBRE Group Inc. Class A | 146,489 | 15,246 |
| | Vornado Realty Trust | 320,616 | 13,668 |
| * | DiamondRock Hospitality Co. | 1,502,950 | 13,587 |
| | | | 95,693 |
| Utilities (3.7%) |
| | Edison International | 1,439,312 | 90,576 |
| | NRG Energy Inc. | 2,013,528 | 80,320 |
| | Atmos Energy Corp. | 635,793 | 58,569 |
| | Entergy Corp. | 190,579 | 19,633 |
| * | PG&E Corp. | 47,400 | 550 |
| | | | 249,648 |
| Total Common Stocks (Cost $4,905,293) | 6,500,725 |
| Temporary Cash Investments (4.2%) |
| Money Market Fund (4.2%) |
| 2,3 | Vanguard Market Liquidity Fund, 0.070% (Cost $284,785) | 2,848,035 | 284,804 |
| Total Investments (99.8%) (Cost $5,190,078) | 6,785,529 |
| Other Assets and Liabilities—Net (0.2%) | 14,751 |
| Net Assets (100%) | 6,800,280 |
| Cost is in $000. |
| • | See Note A in Notes to Financial Statements. |
| * | Non-income-producing security. |
| 1 | Includes partial security positions on loan to broker-dealers. The total value of securities on loan is $2,666,000. |
| 2 | Affiliated money market fund available only to Vanguard funds and certain trusts and accounts managed by Vanguard. Rate shown is the 7-day yield. |
| 3 | Collateral of $2,799,000 was received for securities on loan. |
| | ADR—American Depositary Receipt. |
Derivative Financial Instruments Outstanding as of Period End
| Futures Contracts |
| | | | ($000) |
| | Expiration | Number of
Long (Short)
Contracts | Notional
Amount | Value and
Unrealized
Appreciation
(Depreciation) |
| Long Futures Contracts | | | | |
| E-mini S&P 500 Index | December 2021 | 619 | 142,277 | 4,286 |
See accompanying Notes, which are an integral part of the Financial Statements.
Statement of Assets and Liabilities
|
| ($000s, except shares and per-share amounts) | Amount |
| Assets | |
| Investments in Securities, at Value | |
| Unaffiliated Issuers (Cost $4,905,293) | 6,500,725 |
| Affiliated Issuers (Cost $284,785) | 284,804 |
| Total Investments in Securities | 6,785,529 |
| Investment in Vanguard | 221 |
| Cash Collateral Pledged—Futures Contracts | 7,124 |
| Receivables for Investment Securities Sold | 17,240 |
| Receivables for Accrued Income | 3,904 |
| Receivables for Capital Shares Issued | 2,561 |
| Variation Margin Receivable—Futures Contracts | 294 |
| Total Assets | 6,816,873 |
| Liabilities | |
| Foreign Currency Due to Custodian, at Value (Proceeds $3) | 3 |
| Due to Custodian | 119 |
| Payables for Investment Securities Purchased | 7,668 |
| Collateral for Securities on Loan | 2,799 |
| Payables to Investment Advisor | 2,610 |
| Payables for Capital Shares Redeemed | 2,912 |
| Payables to Vanguard | 482 |
| Total Liabilities | 16,593 |
| Net Assets | 6,800,280 |
| At October 31, 2021, net assets consisted of: | |
| | |
| Paid-in Capital | 4,734,704 |
| Total Distributable Earnings (Loss) | 2,065,576 |
| Net Assets | 6,800,280 |
| |
| Net Assets | |
Applicable to 210,777,212 outstanding $.001 par value shares of
beneficial interest (unlimited authorization) | 6,800,280 |
| Net Asset Value Per Share | $32.26 |
See accompanying Notes, which are an integral part of the Financial Statements.
|
| | Year Ended
October 31, 2021 |
| | ($000) |
| Investment Income | |
| Income | |
| Dividends1 | 103,594 |
| Interest2 | 227 |
| Securities Lending—Net | 68 |
| Total Income | 103,889 |
| Expenses | |
| Investment Advisory Fees—Note B | |
| Basic Fee | 13,943 |
| Performance Adjustment | (3,500) |
| The Vanguard Group—Note C | |
| Management and Administrative | 9,689 |
| Marketing and Distribution | 351 |
| Custodian Fees | 29 |
| Auditing Fees | 34 |
| Shareholders’ Reports | 86 |
| Trustees’ Fees and Expenses | 5 |
| Total Expenses | 20,637 |
| Expenses Paid Indirectly | (196) |
| Net Expenses | 20,441 |
| Net Investment Income | 83,448 |
| Realized Net Gain (Loss) | |
| Investment Securities Sold2 | 404,006 |
| Futures Contracts | 34,015 |
| Realized Net Gain (Loss) | 438,021 |
| Change in Unrealized Appreciation (Depreciation) | |
| Investment Securities2 | 2,078,092 |
| Futures Contracts | 6,841 |
| Change in Unrealized Appreciation (Depreciation) | 2,084,933 |
| Net Increase (Decrease) in Net Assets Resulting from Operations | 2,606,402 |
| 1 | Dividends are net of foreign withholding taxes of $568,000. |
| 2 | Interest income, realized net gain (loss), and change in unrealized appreciation (depreciation) from an affiliated company of the fund were $221,000, $10,000, and ($9,000), respectively. Purchases and sales are for temporary cash investment purposes. |
See accompanying Notes, which are an integral part of the Financial Statements.
Statement of Changes in Net Assets
|
| | Year Ended October 31, |
| | 2021
($000) | 2020
($000) |
| | | |
| Increase (Decrease) in Net Assets | | |
| Operations | | |
| Net Investment Income | 83,448 | 96,766 |
| Realized Net Gain (Loss) | 438,021 | 742,145 |
| Change in Unrealized Appreciation (Depreciation) | 2,084,933 | (1,782,293) |
| Net Increase (Decrease) in Net Assets Resulting from Operations | 2,606,402 | (943,382) |
| Distributions | | |
| Total Distributions | (550,483) | (563,718) |
| Capital Share Transactions | | |
| Issued | 1,117,513 | 671,477 |
| Issued in Lieu of Cash Distributions | 506,643 | 520,183 |
| Redeemed | (1,889,032) | (2,567,674) |
| Net Increase (Decrease) from Capital Share Transactions | (264,876) | (1,376,014) |
| Total Increase (Decrease) | 1,791,043 | (2,883,114) |
| Net Assets | | |
| Beginning of Period | 5,009,237 | 7,892,351 |
| End of Period | 6,800,280 | 5,009,237 |
See accompanying Notes, which are an integral part of the Financial Statements.
For a Share Outstanding
Throughout Each Period | Year Ended October 31, |
| 2021 | 2020 | 2019 | 2018 | 2017 |
| Net Asset Value, Beginning of Period | $22.78 | $27.59 | $27.38 | $33.15 | $27.24 |
| Investment Operations | | | | | |
| Net Investment Income1 | .389 | .368 | .493 | .493 | .449 |
| Net Realized and Unrealized Gain (Loss) on Investments | 11.737 | (3.163) | 2.392 | (3.153) | 6.760 |
| Total from Investment Operations | 12.126 | (2.795) | 2.885 | (2.660) | 7.209 |
| Distributions | | | | | |
| Dividends from Net Investment Income | (.360) | (.450) | (.506) | (.423) | (.501) |
| Distributions from Realized Capital Gains | (2.286) | (1.565) | (2.169) | (2.687) | (.798) |
| Total Distributions | (2.646) | (2.015) | (2.675) | (3.110) | (1.299) |
| Net Asset Value, End of Period | $32.26 | $22.78 | $27.59 | $27.38 | $33.15 |
| Total Return2 | 56.30% | -11.25% | 12.51% | -9.15% | 27.17% |
| Ratios/Supplemental Data | | | | | |
| Net Assets, End of Period (Millions) | $6,800 | $5,009 | $7,892 | $8,811 | $10,574 |
| Ratio of Total Expenses to Average Net Assets3 | 0.32% | 0.31% | 0.33% | 0.36% | 0.39% |
| Ratio of Net Investment Income to Average Net Assets | 1.30% | 1.58% | 1.89% | 1.61% | 1.47% |
| Portfolio Turnover Rate | 30% | 85% | 31% | 31% | 22% |
| 1 | Calculated based on average shares outstanding. |
| 2 | Total returns do not include account service fees that may have applied in the periods shown. Fund prospectuses provide information about any applicable account service fees. |
| 3 | Includes performance-based investment advisory fee increases (decreases) of (0.05%), (0.06%), (0.06%), (0.02%), and 0.00%. |
See accompanying Notes, which are an integral part of the Financial Statements.
Notes to Financial Statements
Vanguard Selected Value Fund is registered under the Investment Company Act of 1940 as an open-end investment company, or mutual fund. Market disruptions associated with the COVID-19 pandemic have had a global impact, and uncertainty exists as to the long-term implications. Such disruptions can adversely affect assets of the fund and thus fund performance.
| A. | The following significant accounting policies conform to generally accepted accounting principles for U.S. investment companies. The fund consistently follows such policies in preparing its financial statements. |
1. Security Valuation: Securities are valued as of the close of trading on the New York Stock Exchange (generally 4 p.m., Eastern time) on the valuation date. Equity securities are valued at the latest quoted sales prices or official closing prices taken from the primary market in which each security trades; such securities not traded on the valuation date are valued at the mean of the latest quoted bid and asked prices. Securities for which market quotations are not readily available, or whose values have been affected by events occurring before the fund’s pricing time but after the close of the securities’ primary markets, are valued at their fair values calculated according to procedures adopted by the board of trustees. These procedures include obtaining quotations from an independent pricing service, monitoring news to identify significant market- or security-specific events, and evaluating changes in the values of foreign market proxies (for example, ADRs, futures contracts, or exchange-traded funds), between the time the foreign markets close and the fund’s pricing time. When fair-value pricing is employed, the prices of securities used by a fund to calculate its net asset value may differ from quoted or published prices for the same securities.
Investments in Vanguard Market Liquidity Fund are valued at that fund's net asset value.
Temporary cash investments are valued using the latest bid prices or using valuations based on a matrix system (which considers such factors as security prices, yields, maturities, and ratings), both as furnished by independent pricing services.
2. Foreign Currency: Securities and other assets and liabilities denominated in foreign currencies are translated into U.S. dollars using exchange rates obtained from an independent third party as of the fund’s pricing time on the valuation date. Realized gains (losses) and unrealized appreciation (depreciation) on investment securities include the effects of changes in exchange rates since the securities were purchased, combined with the effects of changes in security prices. Fluctuations in the value of other assets and liabilities resulting from changes in exchange rates are recorded as unrealized foreign currency gains (losses) until the assets or liabilities are settled in cash, at which time they are recorded as realized foreign currency gains (losses).
3. Futures Contracts: The fund uses index futures contracts to a limited extent, with the objective of maintaining full exposure to the stock market while maintaining liquidity. The fund may purchase or sell futures contracts to achieve a desired level of investment, whether to accommodate portfolio turnover or cash flows from capital share transactions. The primary risks associated with the use of futures contracts are imperfect correlation between changes in market values of stocks held by the fund and the prices of futures contracts, and the possibility of an illiquid market. Counterparty risk involving futures is mitigated because a regulated clearinghouse is the counterparty instead of the clearing broker. To further mitigate counterparty risk, the fund trades futures contracts on an exchange, monitors the financial strength of its clearing brokers and clearinghouse, and has entered into clearing agreements with its clearing brokers. The clearinghouse imposes initial margin requirements to secure the fund’s performance and requires daily settlement of variation margin representing changes in the market value of each contract. Any securities pledged as initial margin for open contracts are noted in the Schedule of Investments.
Futures contracts are valued at their quoted daily settlement prices. The notional amounts of the contracts are not recorded in the Statement of Assets and Liabilities. Fluctuations in the value of the contracts are recorded in the Statement of Assets and Liabilities as an asset (liability) and in the Statement of Operations as unrealized appreciation (depreciation) until the contracts are closed, when they are recorded as realized gains (losses) on futures contracts.
During the year ended October 31, 2021, the fund’s average investments in long and short futures contracts represented 2% and 0% of net assets, respectively, based on the average of the notional amounts at each quarter-end during the period.
4. Federal Income Taxes: The fund intends to continue to qualify as a regulated investment company and distribute all of its taxable income. The fund’s tax returns are open to examination by the relevant tax authorities until expiration of the applicable statute of limitations, which is generally three years after the filing of the tax return. Management has analyzed the fund’s tax positions taken for all open federal and state income tax years, and has concluded that no provision for income tax is required in the fund’s financial statements.
5. Distributions: Distributions to shareholders are recorded on the ex-dividend date. Distributions are determined on a tax basis at the fiscal year-end and may differ from net investment income and realized capital gains for financial reporting purposes.
6. Securities Lending: To earn additional income, the fund lends its securities to qualified institutional borrowers. Security loans are subject to termination by the fund at any time, and are required to be secured at all times by collateral in an amount at least equal to the market value of securities loaned. Daily market fluctuations could cause the value of loaned securities to be more or less than the value of the collateral received. When this occurs, the collateral is adjusted and settled before the opening of the market on the next business day. The fund further mitigates its counterparty risk by entering into securities lending transactions only with a diverse group of prequalified counterparties, monitoring their financial strength, and entering into master securities lending agreements with its counterparties. The master securities lending agreements provide that, in the event of a counterparty’s default (including bankruptcy), the fund may terminate any loans with that borrower, determine the net amount owed, and sell or retain the collateral up to the net amount owed to the fund; however, such actions may be subject to legal proceedings. While collateral mitigates counterparty risk, in the event of a default, the fund may experience delays and costs in recovering the securities loaned. The fund invests cash collateral received in Vanguard Market Liquidity Fund, and records a liability in the Statement of Assets and Liabilities for the return of the collateral, during the period the securities are on loan. Collateral investments in Vanguard Market Liquidity Fund are subject to market appreciation or depreciation. Securities lending income represents fees charged to borrowers plus income earned on invested cash collateral, less expenses associated with the loan. During the term of the loan, the fund is entitled to all distributions made on or in respect of the loaned securities.
7. Credit Facilities and Interfund Lending Program: The fund and certain other funds managed by The Vanguard Group ("Vanguard") participate in a $4.3 billion committed credit facility provided by a syndicate of lenders pursuant to a credit agreement and an uncommitted credit facility provided by Vanguard. Both facilities may be renewed annually. Each fund is individually liable for its borrowings, if any, under the credit facilities. Borrowings may be utilized for temporary or emergency purposes, subject to the fund’s regulatory and contractual borrowing restrictions. With respect to the committed credit facility, the participating funds are charged administrative fees and an annual commitment fee of 0.10% of the undrawn committed amount of the facility; these fees
are allocated to the funds based on a method approved by the fund’s board of trustees and included in Management and Administrative expenses on the fund’s Statement of Operations. Any borrowings under either facility bear interest at a rate based upon the higher of the one-month London Interbank Offered Rate (or an acceptable alternate rate, if necessary), federal funds effective rate, or overnight bank funding rate plus an agreed-upon spread, except that borrowings under the uncommitted credit facility may bear interest based upon an alternate rate agreed to by the fund and Vanguard.
In accordance with an exemptive order (the “Order”) from the SEC, the fund may participate in a joint lending and borrowing program that allows registered open-end Vanguard funds to borrow money from and lend money to each other for temporary or emergency purposes (the “Interfund Lending Program”), subject to compliance with the terms and conditions of the Order, and to the extent permitted by the fund’s investment objective and investment policies. Interfund loans and borrowings normally extend overnight, but can have a maximum duration of seven days. Loans may be called on one business day’s notice. The interest rate to be charged is governed by the conditions of the Order and internal procedures adopted by the board of trustees. The board of trustees is responsible for overseeing the Interfund Lending Program.
For the year ended October 31, 2021, the fund did not utilize the credit facilities or the Interfund Lending Program.
8. Other: Dividend income is recorded on the ex-dividend date. Non-cash dividends included in income, if any, are recorded at the fair value of the securities received. Interest income includes income distributions received from Vanguard Market Liquidity Fund and is accrued daily. Premiums and discounts on debt securities are amortized and accreted, respectively, to interest income over the lives of the respective securities, except for premiums on certain callable debt securities that are amortized to the earliest call date. Security transactions are accounted for on the date securities are bought or sold. Costs used to determine realized gains (losses) on the sale of investment securities are those of the specific securities sold.
| B. | The investment advisory firms Cooke & Bieler, LP, Pzena Investment Management, LLC, and Donald Smith & Co., Inc., each provide investment advisory services to a portion of the fund for a fee calculated at an annual percentage rate of average net assets managed by the advisor. The basic fee of Cooke & Bieler, LP, is subject to quarterly adjustments based on performance relative to the Russell Midcap Value Index since January 31, 2020. The basic fee of Pzena Investment Management, LLC, is subject to quarterly adjustments based on performance relative to the Russell Midcap Value Index for the preceding three years. The basic fee of Donald Smith & Co., Inc., is subject to quarterly adjustments based on performance relative to the MSCI Investable Market 2500 Index for the preceding five years. |
Vanguard manages the cash reserves of the fund as described below.
For the year ended October 31, 2021, the aggregate investment advisory fee paid to all advisors represented an effective annual basic rate of 0.22% of the fund’s average net assets, before a net decrease of $3,500,000 (0.05%) based on performance.
| C. | In accordance with the terms of a Funds' Service Agreement (the “FSA”) between Vanguard and the fund, Vanguard furnishes to the fund corporate management, administrative, marketing, |
distribution and cash management services at Vanguard’s cost of operations (as defined by the FSA). These costs of operations are allocated to the fund based on methods and guidelines approved by the board of trustees and are generally settled twice a month.
Upon the request of Vanguard, the fund may invest up to 0.40% of its net assets as capital in Vanguard. At October 31, 2021, the fund had contributed to Vanguard capital in the amount of $221,000, representing less than 0.01% of the fund’s net assets and 0.09% of Vanguard’s capital received pursuant to the FSA. The fund’s trustees and officers are also directors and employees, respectively, of Vanguard.
| D. | The fund has asked its investment advisors to direct certain security trades, subject to obtaining the best price and execution, to brokers who have agreed to rebate to the fund part of the commissions generated. Such rebates are used solely to reduce the fund’s management and administrative expenses. For the year ended October 31, 2021, these arrangements reduced the fund’s expenses by $196,000 (an annual rate of less than 0.01% of average net assets). |
| E. | Various inputs may be used to determine the value of the fund’s investments and derivatives. These inputs are summarized in three broad levels for financial statement purposes. The inputs or methodologies used to value securities are not necessarily an indication of the risk associated with investing in those securities. |
Level 1—Quoted prices in active markets for identical securities.
Level 2—Other significant observable inputs (including quoted prices for similar securities, interest rates, prepayment speeds, credit risk, etc.).
Level 3—Significant unobservable inputs (including the fund’s own assumptions used to determine the fair value of investments). Any investments and derivatives valued with significant unobservable inputs are noted on the Schedule of Investments.
At October 31, 2021, 100% of the market value of the fund’s investments and derivatives was determined based on Level 1 inputs.
| F. | Permanent differences between book-basis and tax-basis components of net assets are reclassified among capital accounts in the financial statements to reflect their tax character. These reclassifications have no effect on net assets or net asset value per share. As of period end, permanent differences primarily attributable to the accounting for distributions in connection with fund share redemptions were reclassified between the following accounts: |
| | Amount
($000) |
| Paid-in Capital | 27,686 |
| Total Distributable Earnings (Loss) | (27,686) |
Temporary differences between book-basis and tax-basis components of total distributable earnings (loss) arise when certain items of income, gain, or loss are recognized in different periods for financial statement and tax purposes; these differences will reverse at some time in the future. The differences are primarily related to the deferral of losses from wash sales; and the recognition
of unrealized gains or losses from certain derivative contracts. As of period end, the tax-basis components of total distributable earnings (loss) are detailed in the table as follows:
| | Amount
($000) |
| Undistributed Ordinary Income | 147,176 |
| Undistributed Long-Term Gains | 328,722 |
| Capital Loss Carryforwards | — |
| Qualified Late-Year Losses | — |
| Net Unrealized Gains (Losses) | 1,589,678 |
The tax character of distributions paid was as follows:
| | Year Ended October 31, |
| | 2021
Amount
($000) | 2020
Amount
($000) |
| Ordinary Income* | 74,966 | 125,895 |
| Long-Term Capital Gains | 475,517 | 437,823 |
| Total | 550,483 | 563,718 |
| * | Includes short-term capital gains, if any. |
As of October 31, 2021, gross unrealized appreciation and depreciation for investments and derivatives based on cost for U.S. federal income tax purposes were as follows:
| | Amount
($000) |
| Tax Cost | 5,195,852 |
| Gross Unrealized Appreciation | 1,826,706 |
| Gross Unrealized Depreciation | (237,028) |
| Net Unrealized Appreciation (Depreciation) | 1,589,678 |
| G. | During the year ended October 31, 2021, the fund purchased $1,816,125,000 of investment securities and sold $2,595,762,000 of investment securities, other than temporary cash investments. |
| H. | Capital shares issued and redeemed were: |
| | Year Ended October 31, |
| | 2021
Shares
(000) | 2020
Shares
(000) |
| | | |
| Issued | 37,120 | 30,348 |
| Issued in Lieu of Cash Distributions | 19,853 | 19,338 |
| Redeemed | (66,137) | (115,758) |
| Net Increase (Decrease) in Shares Outstanding | (9,164) | (66,072) |
| I. | Management has determined that no events or transactions occurred subsequent to October 31, 2021, that would require recognition or disclosure in these financial statements. |
Report of Independent Registered Public Accounting Firm
To the Board of Trustees of Vanguard Whitehall Funds and Shareholders of Vanguard Selected Value Fund
Opinion on the Financial Statements
We have audited the accompanying statement of assets and liabilities, including the schedule of investments, of Vanguard Selected Value Fund (one of the funds constituting Vanguard Whitehall Funds, referred to hereafter as the "Fund") as of October 31, 2021, the related statement of operations for the year ended October 31, 2021, the statement of changes in net assets for each of the two years in the period ended October 31, 2021, including the related notes, and the financial highlights for each of the five years in the period ended October 31, 2021 (collectively referred to as the "financial statements"). In our opinion, the financial statements present fairly, in all material respects, the financial position of the Fund as of October 31, 2021, the results of its operations for the year then ended, the changes in its net assets for each of the two years in the period ended October 31, 2021 and the financial highlights for each of the five years in the period ended October 31, 2021 in conformity with accounting principles generally accepted in the United States of America.
Basis for Opinion
These financial statements are the responsibility of the Fund’s management. Our responsibility is to express an opinion on the Fund’s financial statements based on our audits. We are a public accounting firm registered with the Public Company Accounting Oversight Board (United States) (PCAOB) and are required to be independent with respect to the Fund in accordance with the U.S. federal securities laws and the applicable rules and regulations of the Securities and Exchange Commission and the PCAOB.
We conducted our audits of these financial statements in accordance with the standards of the PCAOB. Those standards require that we plan and perform the audit to obtain reasonable assurance about whether the financial statements are free of material misstatement, whether due to error or fraud.
Our audits included performing procedures to assess the risks of material misstatement of the financial statements, whether due to error or fraud, and performing procedures that respond to those risks. Such procedures included examining, on a test basis, evidence regarding the amounts and disclosures in the financial statements. Our audits also included evaluating the accounting principles used and significant estimates made by management, as well as evaluating the overall presentation of the financial statements. Our procedures included confirmation of securities owned as of October 31, 2021 by correspondence with the custodian, transfer agent and brokers; when replies were not received from the transfer agent or brokers, we performed other auditing procedures. We believe that our audits provide a reasonable basis for our opinion.
/s/PricewaterhouseCoopers LLP
Philadelphia, Pennsylvania
December 17, 2021
We have served as the auditor of one or more investment companies in The Vanguard Group of Funds since 1975.
Special 2021 tax information (unaudited) for Vanguard Selected Value Fund
This information for the fiscal year ended October 31, 2021, is included pursuant to provisions of the Internal Revenue Code.
The fund distributed $493,884,000 as capital gain dividends (20% rate gain distributions) to shareholders during the fiscal year.
For nonresident alien shareholders, 100% of short-term capital gain dividends distributed by the fund are qualified short-term capital gains.
The fund distributed $74,961,000 of qualified dividend income to shareholders during the fiscal year.
For corporate shareholders, 48.1% of investment income (dividend income plus short-term gains, if any) qualifies for the dividends-received deduction.
This page intentionally left blank.
The People Who Govern Your Fund
The trustees of your mutual fund are there to see that the fund is operated and managed in your best interests since, as a shareholder, you are a part owner of the fund. Your fund’s trustees also serve on the board of directors of The Vanguard Group, Inc., which is owned by the Vanguard funds and provides services to them.
A majority of Vanguard’s board members are independent, meaning that they have no affiliation with Vanguard or the funds they oversee, apart from the sizable personal investments they have made as private individuals. The independent board members have distinguished backgrounds in business, academia, and public service. Each of the trustees and executive officers oversees 214 Vanguard funds.
Information for each trustee and executive officer of the fund appears below. That information, as well as the Vanguard fund count, is as of the date on the cover of this fund report. The mailing address of the trustees and officers is P.O. Box 876, Valley Forge, PA 19482. More information about the trustees is in the Statement of Additional Information, which can be obtained, without charge, by contacting Vanguard at 800-662-7447, or online at vanguard.com.
Interested Trustee1
Mortimer J. Buckley
Born in 1969. Trustee since January 2018. Principal occupation(s) during the past five years and other experience: chairman of the board (2019–present) of Vanguard and of each of the investment companies served by Vanguard; chief executive officer (2018–present) of Vanguard; chief executive officer, president, and trustee (2018–present) of each of the investment companies served by Vanguard; president and director (2017–present) of Vanguard; and president (2018–present) of Vanguard Marketing Corporation. Chief investment officer (2013–2017), managing director (2002–2017), head of the Retail Investor Group (2006–2012), and chief information officer (2001–2006) of Vanguard. Chairman of the board (2011–2017) and trustee (2009–2017) of the Children’s Hospital of Philadelphia; and trustee (2018–present) and vice chair (2019–present) of The Shipley School.
Independent Trustees
Emerson U. Fullwood
Born in 1948. Trustee since January 2008. Principal occupation(s) during the past five years and other experience: executive chief staff and marketing officer for North America and corporate vice president (retired 2008) of Xerox Corporation (document management products and services). Former president of the Worldwide Channels Group, Latin
America, and Worldwide Customer Service and executive chief staff officer of Developing Markets of Xerox. Executive in residence and 2009–2010 Distinguished Minett Professor at the Rochester Institute of Technology. Director of SPX FLOW, Inc. (multi-industry manufacturing). Director of the University of Rochester Medical Center, the Monroe Community College Foundation, the United Way of Rochester, North Carolina A&T University, and Roberts Wesleyan College. Trustee of the University of Rochester.
Amy Gutmann
Born in 1949. Trustee since June 2006. Principal occupation(s) during the past five years and other experience: president (2004–present) of the University of Pennsylvania. Christopher H. Browne Distinguished Professor of Political Science, School of Arts and Sciences, and professor of communication, Annenberg School for Communication, with secondary faculty appointments in the Department of Philosophy, School of Arts and Sciences, and at the Graduate School of Education, University of Pennsylvania.
F. Joseph Loughrey
Born in 1949. Trustee since October 2009. Principal occupation(s) during the past five years and other experience: president and chief operating officer (retired 2009) and vice chairman of the board (2008–2009) of Cummins Inc. (industrial machinery). Chairman of the board of Hillenbrand, Inc. (specialized consumer services). Director of the V Foundation.
1 Mr. Buckley is considered an “interested person,” as defined in the Investment Company Act of 1940, because he is an officer of the Vanguard funds.
Member of the advisory council for the College of Arts and Letters and chair of the advisory board to the Kellogg Institute for International Studies, both at the University of Notre Dame. Chairman of the board of Saint Anselm College.
Mark Loughridge
Born in 1953. Trustee since March 2012. Principal occupation(s) during the past five years and other experience: senior vice president and chief financial officer (retired 2013) of IBM (information technology services). Fiduciary member of IBM’s Retirement Plan Committee (2004–2013), senior vice president and general manager (2002–2004) of IBM Global Financing, vice president and controller (1998–2002) of IBM, and a variety of other prior management roles at IBM. Member of the Council on Chicago Booth.
Scott C. Malpass
Born in 1962. Trustee since March 2012. Principal occupation(s) during the past five years and other experience: chief investment officer (retired June 2020) and vice president (retired June 2020) of the University of Notre Dame. Assistant professor (retired June 2020) of finance at the Mendoza College of Business, University of Notre Dame, and member of the Notre Dame 403(b) Investment Committee. Member of the board of Catholic Investment Services, Inc. (investment advisors) and the board of superintendence of the Institute for the Works of Religion.
Deanna Mulligan
Born in 1963. Trustee since January 2018. Principal occupation(s) during the past five years and other experience: board chair (2020), chief executive officer (2011–2020), and president (2010–2019) of The Guardian Life Insurance Company of America. Chief operating officer (2010–2011) and executive vice president (2008–2010) of Individual Life and Disability of the Guardian Life Insurance Company of America. Member of the board of the Economic Club of New York. Trustee of the Partnership for New York City (business leadership), Chief Executives for Corporate Purpose, NewYork-Presbyterian Hospital, and the Bruce Museum (arts and science). Member of the Advisory Council for the Stanford Graduate School of Business.
André F. Perold
Born in 1952. Trustee since December 2004. Principal occupation(s) during the past five years and other experience: George Gund Professor of Finance and Banking, Emeritus at the Harvard Business School (retired 2011). Chief investment officer and co-managing partner of HighVista Strategies (private investment firm). Member of the board
(2018–present) of RIT Capital Partners (investment firm). Member of the investment committee of Partners Health Care System.
Sarah Bloom Raskin
Born in 1961. Trustee since January 2018. Principal occupation(s) during the past five years and other experience: deputy secretary (2014–2017) of the United States Department of the Treasury. Governor (2010–2014) of the Federal Reserve Board. Commissioner (2007–2010) of financial regulation for the State of Maryland. Professor (2020–present), Distinguished Fellow of the Global Financial Markets Center (2020–present), and Rubenstein Fellow (2017–2020) at Duke University. Trustee (2017–present) of Amherst College and member of Amherst College Investment Committee (2019–present). Member of the Regenerative Crisis Response Committee (2020–present).
David A. Thomas
Born in 1956. Trustee since July 2021. Principal occupation(s) during the past five years and other experience: president of Morehouse College (2018–present). Professor of business administration, emeritus at Harvard University (2017–2018). Dean (2011–2016) and professor of management (2016–2017) at the Georgetown University McDonough School of Business. Director of DTE Energy Company (2013–present). Trustee of Common Fund (2019–present).
Peter F. Volanakis
Born in 1955. Trustee since July 2009. Principal occupation(s) during the past five years and other experience: president and chief operating officer (retired 2010) of Corning Incorporated (communications equipment) and director of Corning Incorporated (2000–2010) and Dow Corning (2001–2010). Director (2012) of SPX Corporation (multi-industry manufacturing). Overseer of the Amos Tuck School of Business Administration, Dartmouth College (2001–2013). Chairman of the board of trustees of Colby-Sawyer College. Member of the BMW Group Mobility Council.
Executive Officers
Christine M. Buchanan
Born in 1970. Principal occupation(s) during the past five years and other experience: principal of Vanguard. Chief financial officer (2021–present) and treasurer (2017–present) of each of the investment companies served by Vanguard. Partner (2005–2017) at KPMG (audit, tax, and advisory services).
David Cermak
Born in 1960. Principal occupation(s) during the past five years and other experience: principal of Vanguard. Finance director (2019–present) of each of the investment companies served by Vanguard. Managing director and head (2017–present) of Vanguard Investments Singapore. Managing director and head (2017–2019) of Vanguard Investments Hong Kong. Representative director and head (2014–2017) of Vanguard Investments Japan.
John Galloway
Born in 1973. Principal occupation(s) during the past five years and other experience: principal of Vanguard. Investment stewardship officer (September 2020–present) of each of the investment companies served by Vanguard. Head of Investor Advocacy (February 2020–present) and head of Marketing Strategy and Planning (2017–2020) at Vanguard. Deputy assistant to the President of the United States (2015).
Peter Mahoney
Born in 1974. Principal occupation(s) during the past five years and other experience: principal of Vanguard. Controller (2015–present) of each of the investment companies served by Vanguard. Head of International Fund Services (2008–2014) at Vanguard.
Anne E. Robinson
Born in 1970. Principal occupation(s) during the past five years and other experience: general counsel (2016–present) of Vanguard. Secretary (2016–present) of Vanguard and of each of the investment companies served by Vanguard. Managing director (2016–present) of Vanguard. Managing director and general counsel of Global Cards and Consumer Services (2014–2016) at Citigroup. Counsel (2003–2014) at American Express.
Michael Rollings
Born in 1963. Principal occupation(s) during the past five years and other experience: finance director (2017–present) and treasurer (2017) of each of the investment companies served by Vanguard. Managing director (2016–present) of Vanguard. Chief financial officer (2016–present) of Vanguard. Director (2016–present) of Vanguard Marketing Corporation. Executive vice president and chief financial officer (2006–2016) of MassMutual Financial Group.
John E. Schadl
Born in 1972. Principal occupation(s) during the past five years and other experience: principal of Vanguard. Chief compliance officer (2019–present) of Vanguard and of each of the investment companies served by Vanguard. Assistant vice president (2019–present) of Vanguard Marketing Corporation.
Vanguard Senior Management Team
| Matthew Benchener | Thomas M. Rampulla |
| Joseph Brennan | Karin A. Risi |
| Mortimer J. Buckley | Anne E. Robinson |
| Gregory Davis | Michael Rollings |
| John James | Nitin Tandon |
| John T. Marcante | Lauren Valente |
| Chris D. Mclsaac | |
Connect with Vanguard®>vanguard.com
Fund Information > 800-662-7447
Direct Investor Account Services > 800-662-2739
Institutional Investor Services > 800-523-1036
Text Telephone for People Who Are Deaf or Hard of Hearing > 800-749-7273
This material may be used in conjunction with the offering of shares of any Vanguard fund only if preceded or accompanied by the fund’s current prospectus.
All comparative mutual fund data are from Morningstar, Inc., unless otherwise noted.
You can obtain a free copy of Vanguard’s proxy voting guidelines by visiting vanguard.com/proxyreporting or by calling Vanguard at 800-662-2739. The guidelines are also available from the SEC’s website, www.sec.gov. In addition, you may obtain a free report on how your fund voted the proxies for securities it owned during the 12 months ended June 30. To get the report, visit either vanguard.com/proxyreporting or www.sec.gov.
You can review information about your fund on the SEC’s website, and you can receive copies of this information, for a fee, by sending a request via email addressed to publicinfo@sec.gov.
Source for Bloomberg indexes: Bloomberg Index Services Limited. Copyright 2021, Bloomberg. All rights reserved.
CFA® is a registered trademark owned by CFA Institute.
© 2021 The Vanguard Group, Inc.
All rights reserved.
Vanguard Marketing Corporation, Distributor.
Q9340 122021
Annual Report | October 31, 2021
Vanguard Mid-Cap Growth Fund
Contents
Your Fund’s Performance at a Glance
| 1 |
Advisors’ Report
| 2 |
About Your Fund’s Expenses
| 7 |
Performance Summary
| 9 |
Financial Statements
| 11 |
Please note: The opinions expressed in this report are just that—informed opinions. They should not be considered promises or advice. Also, please keep in mind that the information and opinions cover the period through the date on the front of this report. Of course, the risks of investing in your fund are spelled out in the prospectus.
Your Fund’s Performance at a Glance
| • | For the 12 months ended October 31, 2021, Vanguard Mid-Cap Growth Fund returned 37.68%, trailing the 39.43% return of its benchmark, the Russell Midcap Growth Index. |
| • | During the period, the global economy continued to recover from the sharp pandemic-induced contraction of spring 2020. Countries that were more successful in containing the coronavirus, whether through vaccinations, lockdowns, or both, generally fared better economically. Swift and extensive fiscal and monetary support from policymakers was also key to the rebound. Even amid concerns late in the fiscal year about inflation and the prospect of less accommodative monetary policy, stock returns for the period were excellent. |
| • | The broad U.S. stock market, as measured by the Russell 3000 Index, climbed 43.90%. Value stocks outperformed growth, and mid- and -small-capitalization stocks outperformed large-caps. |
| • | Underperformance relative to the benchmark in part reflected negative selection in information technology and health care, two of the fund's largest sectors. Strong selection in communication services, financials, and consumer discretionary helped returns, as did an overweight to consumer staples. |
| • | Over the decade ended October 31, the fund’s average annualized return was 15.12%, trailing the 16.86% return of its benchmark. |
Market Barometer
| | Average Annual Total Returns
Periods Ended October 31, 2021 |
| | One Year | Three Years | Five Years |
| Stocks | | | |
| Russell 1000 Index (Large-caps) | 43.51% | 22.01% | 19.16% |
| Russell 2000 Index (Small-caps) | 50.80 | 16.47 | 15.52 |
| Russell 3000 Index (Broad U.S. market) | 43.90 | 21.62 | 18.91 |
| FTSE All-World ex US Index (International) | 30.23 | 12.42 | 10.05 |
| Bonds | | | |
Bloomberg U.S. Aggregate Bond Index
(Broad taxable market) | -0.48% | 5.63% | 3.10% |
Bloomberg Municipal Bond Index
(Broad tax-exempt market) | 2.64 | 5.17 | 3.41 |
| FTSE Three-Month U.S. Treasury Bill Index | 0.05 | 1.08 | 1.12 |
| CPI | | | |
| Consumer Price Index | 6.22% | 3.03% | 2.73% |
For the 12 months ended October 31, 2021, Vanguard Mid-Cap Growth Fund returned 37.68%. It underperformed its benchmark, the Russell Midcap Growth Index, which returned 39.43%.
Your fund is managed by three independent advisors, a strategy that enhances its diversification by providing exposure to distinct yet complementary investment approaches. It’s not uncommon for different advisors to have different views about individual securities or the broader investment environment.
The accompanying table lists the advisors, the amount and percentage of fund assets each manages, and brief descriptions of their investment strategies.
The advisors have provided the following assessment of the investment environment during the past 12 months and the notable successes and shortfalls in their portfolios. These comments were prepared on November 16, 2021.
Frontier Capital Management Co., LLC
Portfolio Managers:
Christopher J. Scarpa, Vice President
Ravi Davas, Vice President
Equities rose sharply over the 12 months, powered by COVID-19 vaccine development, massive stimulus, and better-than-expected earnings. Our decision to allocate more capital to high-conviction positions during last year’s sell-off contributed to the portfolio’s
outperformance as stocks cemented their stunning recovery.
We found more undervalued companies in consumer discretionary and financials that were poised for significant earnings acceleration from a normalization of business activity. Holdings in these sectors contributed most to relative performance. We reduced exposure to consumer staples companies as they faced tough comparisons following the pandemic-fueled demand.
Positive sector allocation and solid stock selection drove the portfolio’s outperformance. An underweight position in the lagging consumer staples sector and an overweight position in financials were the two most significant contributors. These were partially offset by underweight positions in energy and technology.
Stock selection was strongest in consumer discretionary and financials, offset partly by headwinds in health care. Casino operator Caesars Entertainment (+144%) reported a record profit margin as business improved dramatically on rising vaccination rates while operating costs stayed low because of changes implemented during the pandemic. The firm’s leading position in the fast-emerging sports betting market also helped the stock’s performance.
In financials, SVB Financial Group (+147%) rallied on earnings that trounced Wall Street’s expectations thanks to strong capital markets and robust loan growth that was fueled by a nearly
twofold jump in the firm’s asset base. Private equity firm KKR & Co. (+136%) outperformed on record fundraising and acquisitions that fortified the permanence of its assets under management.
On the other side of the ledger, value-based services provider Signify Health (–38%) fell on medical reimbursement cuts related to last year’s patient cohorts not being appropriately coded for their health risks. With improving vaccination and new therapies, economies are reopening on firmer footings despite recent virus spikes; companies are posting record profits in the face of increasing input costs; and consumer finances remain healthy. We are optimistic that supply bottlenecks will subside following the peak holiday season. We remain confident about the portfolio’s performance and our ability to find companies with multiple ways to win and unrecognized earnings potential that is not reflected in the stock price.
Wellington Management Company LLP
Portfolio Manager:
Timothy N. Manning,
Senior Managing Director
and Equity Portfolio Manager
Over the 12 months ended October 31, 2021, small-capitalization stocks outperformed their large- and mid-cap counterparts as measured by the Russell 2000 Index, Russell 1000 Index, and the Russell Midcap Index, respectively. Narrowing the focus to mid-caps, value led growth by more than nine percentage points over the previous year as cyclicals
benefited from excitement around the reopening of the economy.
In this environment, our portion of the fund underperformed the Russell Midcap Growth Index. Stock selection in information technology, health care, and financials detracted from relative performance. Positive selection in consumer discretionary and communication services tempered this. Sector allocation—specifically, an overweight position in communication services and underweight position in information technology—was also a material headwind.
At the security level, top detractors included Shift4 Payments, a payment processor that provides software-enabled payment services; Incyte, a global biopharmaceutical company; and MarketAxess, an electronic fixed income trading platform. Top contributors included positions in KLA, a supplier of process control and yield management solutions for the semiconductor industry; Etsy, a peer-to-peer e-commerce website that sells crafts and vintage items; and ZoomInfo Technologies, a proprietary contributory database that helps salespeople be more effective.
In terms of sectors, the portfolio is most overweight in communication services, financials, and consumer discretionary. The portfolio is most underweight in information technology, which we are traditionally overweight, but extended valuations, particular in software, have kept us cautious. We added several new holdings, including Ceridian, a human
capital management software company. We eliminated several holdings that had left our addressable market-cap universe or exceeded our valuation comfort zone on the back of strong performance.
We seek to own stocks of companies with strong secular growth characteristics and high and sustainable return on invested capital that are inexpensive on long-term earnings power. We remain very bullish on the U.S. consumer, as high savings accumulated during the economic shutdown are likely to be deployed into services with pent-up demand. We believe that if the market gets exuberant about stellar cyclical growth, we will have opportunities to initiate and add to exposures at reasonable valuations. We remain positive on the macro backdrop in the U.S., even though we recognize there may be bumps. We believe our portfolio is well positioned for a stable growth environment, and we continue to feel optimistic about the quality of the holdings.
RS Investments
Portfolio Managers:
D. Scott Tracy, CFA,
Chief Investment Officer
Stephen J. Bishop
Melissa Chadwick-Dunn
Christopher W. Clark, CFA
Paul Leung, CFA
The portfolio’s positive absolute return was driven by the performance of
holdings in the information technology, industrials, health care, consumer discretionary, and communication services sectors. Real estate holdings were the only detracting sector in terms of absolute performance.
The largest driver of positive relative performance was materials, led in part by the performance of Scotts Miracle-Gro. Scotts is the leading manufacturer and marketer of branded lawn care products in North America, including grass seed, fertilizers, soil, mulch, herbicides, pesticides, and rodent control products. We initially purchased Scotts on the company’s steady growth in their consumer business (70% of sales), and the exposure of its Hawthorne business to the emerging cannabis market, where we model sales growth of at least 40% per year through 2022.
Relative performance was hurt by some information technology holdings such as RingCentral, a provider of software-as-a-service solutions for businesses to support modern communications. We initially purchased the stock in early 2014, on the thesis that the company operates in a huge global market of approximately $50 billion that was only 10% penetrated by cloud offerings. In late 2019, RingCentral announced a commercial agreement with Avaya Holdings, a global leader in communications, that granted access to Avaya’s installed base of 100 million customers in exchange for a new RingCentral product on Avaya’s Cloud Office. Despite strong results and
guidance, highlighted by reported revenue acceleration, the stock underwhelmed during the period. We believe the headwinds can turn into a tailwind as the company continues to execute its strategy.
Given the outsized impact of the virus globally on corporate fundamentals, fiscal/monetary response, logistics, consumer behavior, and societal norms, we believe investors should expect all companies to feel direct and indirect effects as things normalize. As a result of these effects, global equity markets will likely experience higher levels of volatility and dispersion as new companies emerge, investment sentiment shifts, and legacy companies struggle to retain their previous leadership. We feel this will create an abundance of opportunities
across sectors, industries, and markets in coming quarters and years as the economy and markets transition and recover.
Within the growth universe, opportunities appear to be especially pronounced for secular companies rather than those that are more cyclical in nature. We see continued strength in the underlying fundamentals of companies that were hurt by the market’s abrupt shift early in the period from companies with better long-term sustainable growth opportunities to areas that had been more challenged by COVID-19, especially those labeled as reopening plays. We believe we can now allocate to companies with clear paths of outsized growth and much-improved valuations compared to last fall.
Vanguard Mid-Cap Growth Fund Investment Advisors
| |
| | Fund Assets Managed | |
| Investment Advisor | % | $ Million | Investment Strategy |
| Frontier Capital Management Co., LLC | 45 | 2,388 | Frontier Capital employs a fundamental, bottom-up, research-intensive investment approach to select mid-cap growth stocks. It seeks companies with above-average mid-cap growth prospects and competitive advantages that will allow them to earn superior rates of return on capital over a business cycle. The approach attempts to balance growth prospects with reasonable valuation and is long-term in nature; investment time frames are typically three to five years. |
| Wellington Management Company LLP | 33 | 1,734 | Wellington Management uses traditional methods of stock selection—fundamental research and analysis—to identify companies that it believes have above-average growth prospects. It believes that a short-term bias in equity markets rewards near-term cyclical growth and creates opportunity for long-term growth. The team focuses on sustainable earnings power and develops bottom-up valuations based on return on investment capital forecasts, price-to-sales, and quantitative risk factors. It seeks to control risk by emphasizing larger positions in established growth stocks and smaller positions in emerging names. |
| RS Investments | 19 | 1,020 | RS Investments, a Victory Capital investment franchise, employs both fundamental analysis and quantitative screening in seeking to identify companies that the investment team believes will produce sustainable earnings growth over a multiyear horizon. Investment candidates typically exhibit some or all of the following criteria: strong organic revenue growth, expanding margins and profitability, innovative products or services, defensible competitive advantages, growing market share, and experienced management teams. |
| Cash Investments | 3 | 148 | These short-term reserves are invested by Vanguard in equity index products to simulate investment in stocks. Each advisor may also maintain a modest cash position. |
About Your Fund’s Expenses
As a shareholder of the fund, you incur ongoing costs, which include costs for portfolio management, administrative services, and shareholder reports (like this one), among others. Operating expenses, which are deducted from a fund’s gross income, directly reduce the investment return of the fund.
A fund’s expenses are expressed as a percentage of its average net assets. This figure is known as the expense ratio. The following examples are intended to help you understand the ongoing costs (in dollars) of investing in your fund and to compare these costs with those of other mutual funds. The examples are based on an investment of $1,000 made at the beginning of the period shown and held for the entire period.
The accompanying table illustrates your fund’s costs in two ways:
| • | Based on actual fund return. This section helps you to estimate the actual expenses that you paid over the period. The ”Ending Account Value“ shown is derived from the fund‘s actual return, and the third column shows the dollar amount that would have been paid by an investor who started with $1,000 in the fund. You may use the information here, together with the amount you invested, to estimate the expenses that you paid over the period. |
To do so, simply divide your account value by $1,000 (for example, an $8,600 account value divided by $1,000 = 8.6), then multiply the result by the number given for your fund under the heading ”Expenses Paid During Period.“
| • | Based on hypothetical 5% yearly return. This section is intended to help you compare your fund‘s costs with those of other mutual funds. It assumes that the fund had a yearly return of 5% before expenses, but that the expense ratio is unchanged. In this case—because the return used is not the fund’s actual return—the results do not apply to your investment. The example is useful in making comparisons because the Securities and Exchange Commission requires all mutual funds to calculate expenses based on a 5% return. You can assess your fund’s costs by comparing this hypothetical example with the hypothetical examples that appear in shareholder reports of other funds. |
Note that the expenses shown in the table are meant to highlight and help you compare ongoing costs only and do not reflect transaction costs incurred by the fund for buying and selling securities. Further, the expenses do not include any purchase, redemption, or account service fees described in the fund prospectus. If such fees were applied to your account, your costs would be higher. Your fund does not carry a “sales load.”
The calculations assume no shares were bought or sold during the period. Your actual costs may have been higher or lower, depending on the amount of your investment and the timing of any purchases or redemptions.
You can find more information about the fund’s expenses, including annual expense ratios, in the Financial Statements section of this report. For additional information on operating expenses and other shareholder costs, please refer to your fund’s current prospectus.
| Six Months Ended October 31, 2021 | | | |
| Mid-Cap Growth Fund | Beginning
Account Value
4/30/2021 | Ending
Account Value
10/31/2021 | Expenses
Paid During
Period |
| Based on Actual Fund Return | $1,000.00 | $1,075.30 | $1.67 |
| Based on Hypothetical 5% Yearly Return | 1,000.00 | 1,023.59 | 1.63 |
The calculations are based on expenses incurred in the most recent six-month period. The fund’s annualized six-month expense ratio for that period is 0.32%. The dollar amounts shown as “Expenses Paid” are equal to the annualized expense ratio multiplied by the average account value over the period, multiplied by the number of days in the most recent six-month period, then divided by the number of days in the most recent 12-month period (184/365).
All of the returns in this report represent past performance, which is not a guarantee of future results that may be achieved by the fund. (Current performance may be lower or higher than the performance data cited. For performance data current to the most recent month-end, visit our website at vanguard.com/performance.) Note, too, that both investment returns and principal value can fluctuate widely, so an investor’s shares, when sold, could be worth more or less than their original cost. The returns shown do not reflect taxes that a shareholder would pay on fund distributions or on the sale of fund shares.
Cumulative Performance: October 31, 2011, Through October 31, 2021
Initial Investment of $10,000
| | | Average Annual Total Returns
Periods Ended October 31, 2021 | |
| | | One
Year | Five
Years | Ten
Years | Final Value
of a $10,000
Investment |
 | Mid-Cap Growth Fund | 37.68% | 20.00% | 15.12% | $40,877 |
 | Russell Midcap Growth Index | 39.43 | 21.90 | 16.86 | 47,478 |
| Dow Jones U.S. Total Stock Market Float Adjusted Index | 44.07 | 18.87 | 16.04 | 44,284 |
See Financial Highlights for dividend and capital gains information.
| Communication Services | 6.6% |
| Consumer Discretionary | 19.9 |
| Consumer Staples | 1.1 |
| Energy | 0.2 |
| Financials | 9.3 |
| Health Care | 17.3 |
| Industrials | 12.0 |
| Information Technology | 32.6 |
| Materials | 1.0 |
The table reflects the fund’s investments, except for short-term investments and derivatives. Sector categories are based on the Global Industry Classification Standard (“GICS”), except for the “Other” category (if applicable), which includes securities that have not been provided a GICS classification as of the effective reporting period.
Global Industry Classification Standard (“GICS”) was developed by and is the exclusive property and a service mark of MSCI Inc. (“MSCI”) and Standard and Poor’s, a division of McGraw-Hill Companies, Inc. (“S&P”), and is licensed for use by Vanguard. Neither MSCI, S&P nor any third party involved in making or compiling the GICS or any GICS classification makes any express or implied warranties or representations with respect to such standard or classification (or the results to be obtained by the use thereof), and all such parties hereby expressly disclaim all warranties of originality, accuracy, completeness, merchantability or fitness for a particular purpose with respect to any such standard or classification. Without limiting any of the foregoing, in no event shall MSCI, S&P, any of its affiliates or any third party involved in making or compiling the GICS or any GICS classification have any liability for any direct, indirect, special, punitive, consequential or any other damages (including lost profits) even if notified of the possibility of such damages.
The fund files its complete schedule of portfolio holdings with the Securities and Exchange Commission (SEC) for the first and third quarters of each fiscal year as an exhibit to its reports on Form N-PORT. The fund’s Form N-PORT reports are available on the SEC’s website at www.sec.gov.
| | | Shares | Market
Value•
($000) |
| Common Stocks (95.3%) |
| Communication Services (6.3%) |
| * | ZoomInfo Technologies Inc. Class A | 1,259,669 | 84,675 |
| * | Match Group Inc. | 524,067 | 79,019 |
| * | Live Nation Entertainment Inc. | 436,560 | 44,158 |
| * | Roku Inc. | 134,865 | 41,120 |
| * | IAC/InterActiveCorp. | 241,208 | 36,753 |
| * | Twitter Inc. | 414,882 | 22,213 |
| * | Vimeo Inc. | 454,496 | 15,330 |
| * | Take-Two Interactive Software Inc. | 56,014 | 10,139 |
| | | | 333,407 |
| Consumer Discretionary (18.9%) |
| * | Caesars Entertainment Inc. | 1,065,725 | 116,654 |
| * | Lululemon Athletica Inc. | 249,438 | 116,241 |
| * | Mattel Inc. | 4,119,917 | 89,855 |
| * | Etsy Inc. | 344,580 | 86,383 |
| * | Chipotle Mexican Grill Inc. Class A | 34,358 | 61,124 |
| * | Hilton Worldwide Holdings Inc. | 410,501 | 59,092 |
| * | Burlington Stores Inc. | 175,863 | 48,589 |
| * | Floor & Decor Holdings Inc. Class A | 312,019 | 42,410 |
| | Wingstop Inc. | 228,448 | 39,400 |
| | Advance Auto Parts Inc. | 166,120 | 37,463 |
| * | O'Reilly Automotive Inc. | 58,130 | 36,175 |
| * | Planet Fitness Inc. Class A | 437,073 | 34,769 |
| * | Chegg Inc. | 564,312 | 33,543 |
| * | Bright Horizons Family Solutions Inc. | 192,732 | 31,993 |
| | Darden Restaurants Inc. | 193,499 | 27,891 |
| | Ross Stores Inc. | 196,405 | 22,233 |
| * | Leslie's Inc. | 824,209 | 17,045 |
| * | Chewy Inc. Class A | 204,604 | 15,509 |
| * | Carvana Co. Class A | 46,112 | 13,980 |
| | Dollar General Corp. | 59,979 | 13,287 |
| | Pool Corp. | 25,710 | 13,245 |
| | BorgWarner Inc. (XNYS) | 225,813 | 10,177 |
| * | Meritage Homes Corp. | 76,411 | 8,307 |
| * | Aptiv plc | 47,215 | 8,163 |
| | Tempur Sealy International Inc. | 157,927 | 7,023 |
| * | Farfetch Ltd. Class A | 152,657 | 5,986 |
| * | Bed Bath & Beyond Inc. | 391,689 | 5,499 |
| | | | 1,002,036 |
| | | Shares | Market
Value•
($000) |
| Consumer Staples (1.1%) |
| * | Freshpet Inc. | 366,780 | 57,185 |
| Energy (0.2%) |
| | Diamondback Energy Inc. | 107,141 | 11,484 |
| Financials (8.8%) |
| * | SVB Financial Group | 114,639 | 82,242 |
| | Hamilton Lane Inc. Class A | 706,693 | 73,857 |
| | MSCI Inc. Class A | 93,855 | 62,402 |
| | KKR & Co. Inc. | 764,952 | 60,944 |
| | Aon plc Class A (XNYS) | 166,086 | 53,134 |
| | LPL Financial Holdings Inc. | 284,066 | 46,593 |
| | MarketAxess Holdings Inc. | 112,123 | 45,821 |
| | Moody's Corp. | 42,661 | 17,241 |
| | Western Alliance Bancorp | 146,467 | 17,003 |
| | Tradeweb Markets Inc. Class A | 81,006 | 7,218 |
| | | | 466,455 |
| Health Care (16.5%) |
| * | ICON plc | 308,723 | 88,533 |
| * | Seagen Inc. | 446,306 | 78,697 |
| * | Omnicell Inc. | 430,841 | 76,754 |
| * | DexCom Inc. | 96,420 | 60,090 |
| * | Align Technology Inc. | 63,719 | 39,784 |
| * | Insulet Corp. | 127,301 | 39,466 |
| * | Veeva Systems Inc. Class A | 114,679 | 36,354 |
| * | ABIOMED Inc. | 99,515 | 33,043 |
| * | Horizon Therapeutics plc | 260,052 | 31,183 |
| * | IDEXX Laboratories Inc. | 45,648 | 30,408 |
| | Agilent Technologies Inc. | 182,269 | 28,706 |
| | West Pharmaceutical Services Inc. | 57,182 | 24,581 |
| * | Avantor Inc. | 532,637 | 21,508 |
| | Humana Inc. | 42,459 | 19,665 |
| | ResMed Inc. | 72,310 | 19,011 |
| * | Molina Healthcare Inc. | 62,066 | 18,354 |
| * | Natera Inc. | 145,556 | 16,676 |
| * | Exact Sciences Corp. | 174,386 | 16,605 |
| * | Sarepta Therapeutics Inc. | 201,942 | 15,980 |
| | Alcon Inc. | 179,545 | 14,967 |
| * | Charles River Laboratories International Inc. | 33,011 | 14,811 |
| | Teleflex Inc. | 40,621 | 14,499 |
| * | Edwards Lifesciences Corp. | 103,305 | 12,378 |
| * | Jazz Pharmaceuticals plc | 92,187 | 12,265 |
| * | Hologic Inc. | 166,945 | 12,239 |
| | AmerisourceBergen Corp. Class A | 99,012 | 12,081 |
| | | Shares | Market
Value•
($000) |
| * | Guardant Health Inc. | 99,397 | 11,609 |
| *,1 | Signify Health Inc. Class A | 709,501 | 11,402 |
| * | Illumina Inc. | 26,892 | 11,162 |
| * | Moderna Inc. | 29,787 | 10,283 |
| * | Amedisys Inc. | 58,847 | 9,965 |
| | Cooper Cos. Inc. | 19,148 | 7,983 |
| * | BioMarin Pharmaceutical Inc. | 98,310 | 7,789 |
| * | Novocure Ltd. | 63,161 | 6,478 |
| * | Intellia Therapeutics Inc. | 35,899 | 4,774 |
| * | Apellis Pharmaceuticals Inc. | 131,162 | 4,032 |
| | | | 874,115 |
| Industrials (11.5%) |
| | TransUnion | 781,866 | 90,141 |
| | Fortune Brands Home & Security Inc. | 717,788 | 72,784 |
| | BWX Technologies Inc. | 969,265 | 54,996 |
| | Cintas Corp. | 120,284 | 52,095 |
| * | Hexcel Corp. | 726,193 | 41,204 |
| | Quanta Services Inc. | 299,174 | 36,284 |
| * | Builders FirstSource Inc. | 478,743 | 27,896 |
| | Waste Connections Inc. (XTSE) | 170,285 | 23,161 |
| | Knight-Swift Transportation Holdings Inc. | 348,061 | 19,732 |
| * | MasTec Inc. | 206,113 | 18,371 |
| * | Middleby Corp. | 100,656 | 18,364 |
| * | Generac Holdings Inc. | 35,893 | 17,895 |
| * | GXO Logistics Inc. | 162,113 | 14,396 |
| * | XPO Logistics Inc. | 151,403 | 12,990 |
| | KBR Inc. | 304,906 | 12,940 |
| | Carrier Global Corp. | 244,674 | 12,779 |
| | IDEX Corp. | 54,113 | 12,044 |
| * | CoStar Group Inc. | 132,117 | 11,369 |
| * | Stericycle Inc. | 147,645 | 9,880 |
| * | WillScot Mobile Mini Holdings Corp. | 264,890 | 9,205 |
| * | Azul SA ADR | 675,228 | 8,933 |
| * | Axon Enterprise Inc. | 46,423 | 8,354 |
| | Advanced Drainage Systems Inc. | 60,889 | 6,868 |
| * | Chart Industries Inc. | 37,046 | 6,577 |
| * | Trex Co. Inc. | 56,494 | 6,011 |
| | | | 605,269 |
| Information Technology (31.1%) |
| * | Palo Alto Networks Inc. | 180,971 | 92,131 |
| | KLA Corp. | 244,920 | 91,296 |
| * | Square Inc. Class A | 337,916 | 86,000 |
| * | Paycom Software Inc. | 139,886 | 76,637 |
| * | Gartner Inc. | 207,536 | 68,883 |
| * | Avalara Inc. | 383,436 | 68,880 |
| * | Varonis Systems Inc. Class B | 1,007,928 | 65,253 |
| | CDW Corp. | 316,533 | 59,081 |
| * | Ceridian HCM Holding Inc. | 435,884 | 54,594 |
| * | Digital Turbine Inc. | 574,950 | 49,480 |
| | Skyworks Solutions Inc. | 294,007 | 49,137 |
| | Marvell Technology Inc. | 634,682 | 43,476 |
| | Microchip Technology Inc. | 564,191 | 41,801 |
| * | Guidewire Software Inc. | 331,830 | 41,721 |
| * | Shift4 Payments Inc. Class A | 649,814 | 41,023 |
| * | Advanced Micro Devices Inc. | 339,711 | 40,843 |
| * | HubSpot Inc. | 44,779 | 36,281 |
| * | MongoDB Inc. Class A | 68,902 | 35,918 |
| | | Shares | Market
Value•
($000) |
| * | Wolfspeed Inc. | 257,668 | 30,949 |
| * | Synopsys Inc. | 82,302 | 27,421 |
| * | Coupa Software Inc. | 119,969 | 27,317 |
| * | Okta Inc. | 109,402 | 27,042 |
| * | Atlassian Corp. plc Class A | 58,458 | 26,781 |
| * | RingCentral Inc. Class A | 104,367 | 25,443 |
| * | Workday Inc. Class A | 77,920 | 22,595 |
| | Genpact Ltd. | 441,993 | 21,812 |
| * | Dynatrace Inc. | 285,920 | 21,444 |
| | Lam Research Corp. | 37,205 | 20,968 |
| * | Crowdstrike Holdings Inc. Class A | 68,147 | 19,204 |
| * | Autodesk Inc. | 59,085 | 18,766 |
| * | Zscaler Inc. | 58,769 | 18,739 |
| | Amphenol Corp. Class A | 237,806 | 18,256 |
| * | DocuSign Inc. Class A | 65,205 | 18,146 |
| * | Dlocal Ltd. | 368,026 | 17,853 |
| | Entegris Inc. | 123,407 | 17,373 |
| | Monolithic Power Systems Inc. | 32,415 | 17,033 |
| | Global Payments Inc. | 118,407 | 16,931 |
| * | Freshworks Inc. Class A | 331,730 | 16,669 |
| * | AppLovin Corp. Class A | 162,930 | 16,008 |
| * | Wix.com Ltd. | 85,408 | 15,883 |
| * | Teledyne Technologies Inc. | 29,234 | 13,133 |
| * | Keysight Technologies Inc. | 70,537 | 12,698 |
| * | Trimble Inc. | 145,167 | 12,683 |
| * | Enphase Energy Inc. | 52,192 | 12,089 |
| * | Lattice Semiconductor Corp. | 167,961 | 11,663 |
| * | II-VI Inc. | 184,755 | 11,180 |
| * | Dropbox Inc. Class A | 343,774 | 10,482 |
| * | Bill.Com Holdings Inc. | 33,055 | 9,728 |
| * | BigCommerce Holdings Inc. Series 1 | 206,872 | 9,560 |
| * | Fair Isaac Corp. | 23,560 | 9,382 |
| * | Arista Networks Inc. | 22,639 | 9,275 |
| * | Repay Holdings Corp. Class A | 383,827 | 8,064 |
| * | Lightspeed Commerce Inc. | 45,337 | 4,429 |
| * | Twilio Inc. Class A | 11,769 | 3,429 |
| | | | 1,642,863 |
| Materials (0.9%) |
| | Ball Corp. | 346,967 | 31,740 |
| | Sherwin-Williams Co. | 54,593 | 17,285 |
| | | | 49,025 |
| Total Common Stocks (Cost $3,662,179) | 5,041,839 |
| | | Shares | Market
Value•
($000) |
| Temporary Cash Investments (4.5%) |
| Money Market Fund (4.5%) |
| 2,3 | Vanguard Market Liquidity Fund, 0.070% (Cost $240,027) | 2,400,516 | 240,052 |
| Total Investments (99.8%) (Cost $3,902,206) | 5,281,891 |
| Other Assets and Liabilities—Net (0.2%) | 8,486 |
| Net Assets (100%) | 5,290,377 |
| Cost is in $000. |
| • | See Note A in Notes to Financial Statements. |
| * | Non-income-producing security. |
| 1 | Includes partial security positions on loan to broker-dealers. The total value of securities on loan is $1,920,000. |
| 2 | Affiliated money market fund available only to Vanguard funds and certain trusts and accounts managed by Vanguard. Rate shown is the 7-day yield. |
| 3 | Collateral of $2,032,000 was received for securities on loan, of which $5,000 is held in Vanguard Market Liquidity Fund and $2,027,000 is held in cash. |
| | ADR—American Depositary Receipt. |
Derivative Financial Instruments Outstanding as of Period End
| Futures Contracts |
| | | | ($000) |
| | Expiration | Number of
Long (Short)
Contracts | Notional
Amount | Value and
Unrealized
Appreciation
(Depreciation) |
| Long Futures Contracts | | | | |
| E-mini S&P 500 Index | December 2021 | 643 | 147,794 | 7,669 |
See accompanying Notes, which are an integral part of the Financial Statements.
Statement of Assets and Liabilities
|
| ($000s, except shares and per-share amounts) | Amount |
| Assets | |
| Investments in Securities, at Value | |
| Unaffiliated Issuers (Cost $3,662,179) | 5,041,839 |
| Affiliated Issuers (Cost $240,027) | 240,052 |
| Total Investments in Securities | 5,281,891 |
| Investment in Vanguard | 171 |
| Cash | 2,027 |
| Cash Collateral Pledged—Futures Contracts | 7,398 |
| Receivables for Investment Securities Sold | 39,221 |
| Receivables for Accrued Income | 350 |
| Receivables for Capital Shares Issued | 2,179 |
| Variation Margin Receivable—Futures Contracts | 305 |
| Total Assets | 5,333,542 |
| Liabilities | |
| Due to Custodian | 10 |
| Payables for Investment Securities Purchased | 37,268 |
| Collateral for Securities on Loan | 2,032 |
| Payables to Investment Advisor | 1,489 |
| Payables for Capital Shares Redeemed | 1,908 |
| Payables to Vanguard | 458 |
| Total Liabilities | 43,165 |
| Net Assets | 5,290,377 |
| At October 31, 2021, net assets consisted of: | |
| | |
| Paid-in Capital | 2,707,559 |
| Total Distributable Earnings (Loss) | 2,582,818 |
| Net Assets | 5,290,377 |
| |
| Net Assets | |
Applicable to 136,616,189 outstanding $.001 par value shares of
beneficial interest (unlimited authorization) | 5,290,377 |
| Net Asset Value Per Share | $38.72 |
See accompanying Notes, which are an integral part of the Financial Statements.
|
| | Year Ended
October 31, 2021 |
| | ($000) |
| Investment Income | |
| Income | |
| Dividends | 14,427 |
| Interest1 | 140 |
| Securities Lending—Net | 26 |
| Total Income | 14,593 |
| Expenses | |
| Investment Advisory Fees—Note B | |
| Basic Fee | 9,440 |
| Performance Adjustment | (2,832) |
| The Vanguard Group—Note C | |
| Management and Administrative | 9,706 |
| Marketing and Distribution | 286 |
| Custodian Fees | 44 |
| Auditing Fees | 35 |
| Shareholders’ Reports | 40 |
| Trustees’ Fees and Expenses | 4 |
| Total Expenses | 16,723 |
| Expenses Paid Indirectly | (215) |
| Net Expenses | 16,508 |
| Net Investment Income (Loss) | (1,915) |
| Realized Net Gain (Loss) | |
| Investment Securities Sold1 | 1,256,107 |
| Futures Contracts | 35,496 |
| Realized Net Gain (Loss) | 1,291,603 |
| Change in Unrealized Appreciation (Depreciation) | |
| Investment Securities1 | 273,491 |
| Futures Contracts | 10,430 |
| Change in Unrealized Appreciation (Depreciation) | 283,921 |
| Net Increase (Decrease) in Net Assets Resulting from Operations | 1,573,609 |
| 1 | Interest income, realized net gain (loss), and change in unrealized appreciation (depreciation) from an affiliated company of the fund were $137,000, ($11,000), and less than $1,000, respectively. Purchases and sales are for temporary cash investment purposes. |
See accompanying Notes, which are an integral part of the Financial Statements.
Statement of Changes in Net Assets
|
| | Year Ended October 31, |
| | 2021
($000) | 2020
($000) |
| | | |
| Increase (Decrease) in Net Assets | | |
| Operations | | |
| Net Investment Income | (1,915) | 11,011 |
| Realized Net Gain (Loss) | 1,291,603 | 329,134 |
| Change in Unrealized Appreciation (Depreciation) | 283,921 | 373,276 |
| Net Increase (Decrease) in Net Assets Resulting from Operations | 1,573,609 | 713,421 |
| Distributions | | |
| Total Distributions | (305,267) | (446,385) |
| Capital Share Transactions | | |
| Issued | 663,839 | 747,451 |
| Issued in Lieu of Cash Distributions | 290,788 | 427,134 |
| Redeemed | (1,346,909) | (1,563,492) |
| Net Increase (Decrease) from Capital Share Transactions | (392,282) | (388,907) |
| Total Increase (Decrease) | 876,060 | (121,871) |
| Net Assets | | |
| Beginning of Period | 4,414,317 | 4,536,188 |
| End of Period | 5,290,377 | 4,414,317 |
See accompanying Notes, which are an integral part of the Financial Statements.
For a Share Outstanding
Throughout Each Period | Year Ended October 31, |
| 2021 | 2020 | 2019 | 2018 | 2017 |
| Net Asset Value, Beginning of Period | $29.89 | $27.93 | $28.08 | $26.51 | $21.75 |
| Investment Operations | | | | | |
| Net Investment Income (Loss)1 | (.013) | .068 | .074 | .114 | .093 |
| Net Realized and Unrealized Gain (Loss) on Investments | 10.957 | 4.680 | 3.027 | 2.379 | 4.817 |
| Total from Investment Operations | 10.944 | 4.748 | 3.101 | 2.493 | 4.910 |
| Distributions | | | | | |
| Dividends from Net Investment Income | (.051) | (.067) | (.099) | (.095) | (.150) |
| Distributions from Realized Capital Gains | (2.063) | (2.721) | (3.152) | (.828) | — |
| Total Distributions | (2.114) | (2.788) | (3.251) | (.923) | (.150) |
| Net Asset Value, End of Period | $38.72 | $29.89 | $27.93 | $28.08 | $26.51 |
| Total Return2 | 37.68% | 18.33% | 13.56% | 9.61% | 22.69% |
| Ratios/Supplemental Data | | | | | |
| Net Assets, End of Period (Millions) | $5,290 | $4,414 | $4,536 | $4,161 | $4,240 |
| Ratio of Total Expenses to Average Net Assets3 | 0.33% | 0.34% | 0.36% | 0.36% | 0.36% |
| Ratio of Net Investment Income (Loss) to Average Net Assets | (0.04)% | 0.25% | 0.27% | 0.40% | 0.39% |
| Portfolio Turnover Rate | 98% | 74% | 111% | 75% | 118% |
| 1 | Calculated based on average shares outstanding. |
| 2 | Total returns do not include account service fees that may have applied in the periods shown. Fund prospectuses provide information about any applicable account service fees. |
| 3 | Includes performance-based investment advisory fee increases (decreases) of (0.06%), (0.05%), (0.02%), (0.04%), and (0.05%). |
See accompanying Notes, which are an integral part of the Financial Statements.
Notes to Financial Statements
Vanguard Mid-Cap Growth Fund is registered under the Investment Company Act of 1940 as an open-end investment company, or mutual fund. Market disruptions associated with the COVID-19 pandemic have had a global impact, and uncertainty exists as to the long-term implications. Such disruptions can adversely affect assets of the fund and thus fund performance.
| A. | The following significant accounting policies conform to generally accepted accounting principles for U.S. investment companies. The fund consistently follows such policies in preparing its financial statements. |
1. Security Valuation: Securities are valued as of the close of trading on the New York Stock Exchange (generally 4 p.m., Eastern time) on the valuation date. Equity securities are valued at the latest quoted sales prices or official closing prices taken from the primary market in which each security trades; such securities not traded on the valuation date are valued at the mean of the latest quoted bid and asked prices. Securities for which market quotations are not readily available, or whose values have been materially affected by events occurring before the fund’s pricing time but after the close of the securities’ primary markets, are valued by methods deemed by the board of trustees to represent fair value. Investments in Vanguard Market Liquidity Fund are valued at that fund's net asset value. Temporary cash investments are valued using the latest bid prices or using valuations based on a matrix system (which considers such factors as security prices, yields, maturities, and ratings), both as furnished by independent pricing services.
2. Futures Contracts: The fund uses index futures contracts to a limited extent, with the objective of maintaining full exposure to the stock market while maintaining liquidity. The fund may purchase or sell futures contracts to achieve a desired level of investment, whether to accommodate portfolio turnover or cash flows from capital share transactions. The primary risks associated with the use of futures contracts are imperfect correlation between changes in market values of stocks held by the fund and the prices of futures contracts, and the possibility of an illiquid market. Counterparty risk involving futures is mitigated because a regulated clearinghouse is the counterparty instead of the clearing broker. To further mitigate counterparty risk, the fund trades futures contracts on an exchange, monitors the financial strength of its clearing brokers and clearinghouse, and has entered into clearing agreements with its clearing brokers. The clearinghouse imposes initial margin requirements to secure the fund’s performance and requires daily settlement of variation margin representing changes in the market value of each contract. Any securities pledged as initial margin for open contracts are noted in the Schedule of Investments.
Futures contracts are valued at their quoted daily settlement prices. The notional amounts of the contracts are not recorded in the Statement of Assets and Liabilities. Fluctuations in the value of the contracts are recorded in the Statement of Assets and Liabilities as an asset (liability) and in the Statement of Operations as unrealized appreciation (depreciation) until the contracts are closed, when they are recorded as realized gains (losses) on futures contracts.
During the year ended October 31, 2021, the fund’s average investments in long and short futures contracts represented 3% and 0% of net assets, respectively, based on the average of the notional amounts at each quarter-end during the period.
3. Federal Income Taxes: The fund intends to continue to qualify as a regulated investment company and distribute all of its taxable income. The fund’s tax returns are open to examination by the relevant tax authorities until expiration of the applicable statute of limitations, which is
generally three years after the filing of the tax return. Management has analyzed the fund’s tax positions taken for all open federal and state income tax years, and has concluded that no provision for income tax is required in the fund’s financial statements.
4. Distributions: Distributions to shareholders are recorded on the ex-dividend date. Distributions are determined on a tax basis at the fiscal year-end and may differ from net investment income and realized capital gains for financial reporting purposes.
5. Securities Lending: To earn additional income, the fund lends its securities to qualified institutional borrowers. Security loans are subject to termination by the fund at any time, and are required to be secured at all times by collateral in an amount at least equal to the market value of securities loaned. Daily market fluctuations could cause the value of loaned securities to be more or less than the value of the collateral received. When this occurs, the collateral is adjusted and settled before the opening of the market on the next business day. The fund further mitigates its counterparty risk by entering into securities lending transactions only with a diverse group of prequalified counterparties, monitoring their financial strength, and entering into master securities lending agreements with its counterparties. The master securities lending agreements provide that, in the event of a counterparty’s default (including bankruptcy), the fund may terminate any loans with that borrower, determine the net amount owed, and sell or retain the collateral up to the net amount owed to the fund; however, such actions may be subject to legal proceedings. While collateral mitigates counterparty risk, in the event of a default, the fund may experience delays and costs in recovering the securities loaned. The fund invests cash collateral received in Vanguard Market Liquidity Fund, and records a liability in the Statement of Assets and Liabilities for the return of the collateral, during the period the securities are on loan. Collateral investments in Vanguard Market Liquidity Fund are subject to market appreciation or depreciation. Securities lending income represents fees charged to borrowers plus income earned on invested cash collateral, less expenses associated with the loan. During the term of the loan, the fund is entitled to all distributions made on or in respect of the loaned securities.
6. Credit Facilities and Interfund Lending Program: The fund and certain other funds managed by The Vanguard Group ("Vanguard") participate in a $4.3 billion committed credit facility provided by a syndicate of lenders pursuant to a credit agreement and an uncommitted credit facility provided by Vanguard. Both facilities may be renewed annually. Each fund is individually liable for its borrowings, if any, under the credit facilities. Borrowings may be utilized for temporary or emergency purposes, subject to the fund’s regulatory and contractual borrowing restrictions. With respect to the committed credit facility, the participating funds are charged administrative fees and an annual commitment fee of 0.10% of the undrawn committed amount of the facility; these fees are allocated to the funds based on a method approved by the fund’s board of trustees and included in Management and Administrative expenses on the fund’s Statement of Operations. Any borrowings under either facility bear interest at a rate based upon the higher of the one-month London Interbank Offered Rate (or an acceptable alternate rate, if necessary), federal funds effective rate, or overnight bank funding rate plus an agreed-upon spread, except that borrowings under the uncommitted credit facility may bear interest based upon an alternate rate agreed to by the fund and Vanguard.
In accordance with an exemptive order (the “Order”) from the SEC, the fund may participate in a joint lending and borrowing program that allows registered open-end Vanguard funds to borrow money from and lend money to each other for temporary or emergency purposes (the “Interfund Lending Program”), subject to compliance with the terms and conditions of the Order, and to the extent permitted by the fund’s investment objective and investment policies. Interfund loans and
borrowings normally extend overnight, but can have a maximum duration of seven days. Loans may be called on one business day’s notice. The interest rate to be charged is governed by the conditions of the Order and internal procedures adopted by the board of trustees. The board of trustees is responsible for overseeing the Interfund Lending Program.
For the year ended October 31, 2021, the fund did not utilize the credit facilities or the Interfund Lending Program.
7. Other: Dividend income is recorded on the ex-dividend date. Non-cash dividends included in income, if any, are recorded at the fair value of the securities received. Interest income includes income distributions received from Vanguard Market Liquidity Fund and is accrued daily. Premiums and discounts on debt securities are amortized and accreted, respectively, to interest income over the lives of the respective securities, except for premiums on certain callable debt securities that are amortized to the earliest call date. Security transactions are accounted for on the date securities are bought or sold. Costs used to determine realized gains (losses) on the sale of investment securities are those of the specific securities sold.
| B. | The investment advisory firms Victory Capital Management Inc., through its RS Investments franchise, Frontier Capital Management Co., LLC, and Wellington Management Company llp, each provide investment advisory services to a portion of the fund for a fee calculated at an annual percentage rate of average net assets managed by the advisor. The basic fee of Victory Capital Management Inc. is subject to quarterly adjustments based on performance relative to the Russell Midcap Growth Index for the preceding three years. The basic fees of Frontier Capital Management Co., LLC, and Wellington Management Company llp are subject to quarterly adjustments based on performance relative to the Russell Midcap Growth Index since January 31, 2019. |
Vanguard manages the cash reserves of the fund as described below.
For the year ended October 31, 2021, the aggregate investment advisory fee paid to all advisors represented an effective annual basic rate of 0.19% of the fund’s average net assets, before a net decrease of $2,832,000 (0.06%) based on performance.
| C. | In accordance with the terms of a Funds' Service Agreement (the “FSA”) between Vanguard and the fund, Vanguard furnishes to the fund corporate management, administrative, marketing, distribution and cash management services at Vanguard’s cost of operations (as defined by the FSA). These costs of operations are allocated to the fund based on methods and guidelines approved by the board of trustees and are generally settled twice a month. |
Upon the request of Vanguard, the fund may invest up to 0.40% of its net assets as capital in Vanguard. At October 31, 2021, the fund had contributed to Vanguard capital in the amount of $171,000, representing less than 0.01% of the fund’s net assets and 0.07% of Vanguard’s capital received pursuant to the FSA. The fund���s trustees and officers are also directors and employees, respectively, of Vanguard.
| D. | The fund has asked its investment advisors to direct certain security trades, subject to obtaining the best price and execution, to brokers who have agreed to rebate to the fund part of the commissions generated. Such rebates are used solely to reduce the fund’s management and administrative expenses. For the year ended October 31, 2021, these arrangements reduced the fund’s expenses by $215,000 (an annual rate of less than 0.01% of average net assets). |
| E. | Various inputs may be used to determine the value of the fund’s investments and derivatives. These inputs are summarized in three broad levels for financial statement purposes. The inputs or methodologies used to value securities are not necessarily an indication of the risk associated with investing in those securities. |
Level 1—Quoted prices in active markets for identical securities.
Level 2—Other significant observable inputs (including quoted prices for similar securities, interest rates, prepayment speeds, credit risk, etc.).
Level 3—Significant unobservable inputs (including the fund’s own assumptions used to determine the fair value of investments). Any investments and derivatives valued with significant unobservable inputs are noted on the Schedule of Investments.
At October 31, 2021, 100% of the market value of the fund’s investments and derivatives was determined based on Level 1 inputs.
| F. | Permanent differences between book-basis and tax-basis components of net assets are reclassified among capital accounts in the financial statements to reflect their tax character. These reclassifications have no effect on net assets or net asset value per share. As of period end, permanent differences primarily attributable to the accounting for passive foreign investment companies, and distributions in connection with fund share redemptions were reclassified between the following accounts: |
| | Amount
($000) |
| Paid-in Capital | 84,270 |
| Total Distributable Earnings (Loss) | (84,270) |
Temporary differences between book-basis and tax-basis components of total distributable earnings (loss) arise when certain items of income, gain, or loss are recognized in different periods for financial statement and tax purposes; these differences will reverse at some time in the future. The differences are primarily related to the deferral of losses from wash sales; and the recognition of unrealized gains or losses from certain derivative contracts. As of period end, the tax-basis components of total distributable earnings (loss) are detailed in the table as follows:
| | Amount
($000) |
| Undistributed Ordinary Income | 318,659 |
| Undistributed Long-Term Gains | 932,128 |
| Capital Loss Carryforwards | — |
| Qualified Late-Year Losses | — |
| Net Unrealized Gains (Losses) | 1,332,031 |
The tax character of distributions paid was as follows:
| | Year Ended October 31, |
| | 2021
Amount
($000) | 2020
Amount
($000) |
| Ordinary Income* | 7,351 | 10,665 |
| Long-Term Capital Gains | 297,916 | 435,720 |
| Total | 305,267 | 446,385 |
| * | Includes short-term capital gains, if any. |
As of October 31, 2021, gross unrealized appreciation and depreciation for investments and derivatives based on cost for U.S. federal income tax purposes were as follows:
| | Amount
($000) |
| Tax Cost | 3,949,860 |
| Gross Unrealized Appreciation | 1,486,011 |
| Gross Unrealized Depreciation | (153,980) |
| Net Unrealized Appreciation (Depreciation) | 1,332,031 |
| G. | During the year ended October 31, 2021, the fund purchased $4,756,370,000 of investment securities and sold $5,482,292,000 of investment securities, other than temporary cash investments. |
| H. | Capital shares issued and redeemed were: |
| | Year Ended October 31, |
| | 2021
Shares
(000) | 2020
Shares
(000) |
| | | |
| Issued | 19,010 | 27,947 |
| Issued in Lieu of Cash Distributions | 8,647 | 16,191 |
| Redeemed | (38,747) | (58,817) |
| Net Increase (Decrease) in Shares Outstanding | (11,090) | (14,679) |
| I. | Management has determined that no events or transactions occurred subsequent to October 31, 2021, that would require recognition or disclosure in these financial statements. |
Report of Independent Registered Public Accounting Firm
To the Board of Trustees of Vanguard Whitehall Funds and Shareholders of Vanguard Mid-Cap Growth Fund
Opinion on the Financial Statements
We have audited the accompanying statement of assets and liabilities, including the schedule of investments, of Vanguard Mid-Cap Growth Fund (one of the funds constituting Vanguard Whitehall Funds, referred to hereafter as the "Fund") as of October 31, 2021, the related statement of operations for the year ended October 31, 2021, the statement of changes in net assets for each of the two years in the period ended October 31, 2021, including the related notes, and the financial highlights for each of the five years in the period ended October 31, 2021 (collectively referred to as the "financial statements"). In our opinion, the financial statements present fairly, in all material respects, the financial position of the Fund as of October 31, 2021, the results of its operations for the year then ended, the changes in its net assets for each of the two years in the period ended October 31, 2021 and the financial highlights for each of the five years in the period ended October 31, 2021 in conformity with accounting principles generally accepted in the United States of America.
Basis for Opinion
These financial statements are the responsibility of the Fund’s management. Our responsibility is to express an opinion on the Fund’s financial statements based on our audits. We are a public accounting firm registered with the Public Company Accounting Oversight Board (United States) (PCAOB) and are required to be independent with respect to the Fund in accordance with the U.S. federal securities laws and the applicable rules and regulations of the Securities and Exchange Commission and the PCAOB.
We conducted our audits of these financial statements in accordance with the standards of the PCAOB. Those standards require that we plan and perform the audit to obtain reasonable assurance about whether the financial statements are free of material misstatement, whether due to error or fraud.
Our audits included performing procedures to assess the risks of material misstatement of the financial statements, whether due to error or fraud, and performing procedures that respond to those risks. Such procedures included examining, on a test basis, evidence regarding the amounts and disclosures in the financial statements. Our audits also included evaluating the accounting principles used and significant estimates made by management, as well as evaluating the overall presentation of the financial statements. Our procedures included confirmation of securities owned as of October 31, 2021 by correspondence with the custodian, transfer agent and brokers; when replies were not received from the transfer agent or brokers, we performed other auditing procedures. We believe that our audits provide a reasonable basis for our opinion.
/s/PricewaterhouseCoopers LLP
Philadelphia, Pennsylvania
December 17, 2021
We have served as the auditor of one or more investment companies in The Vanguard Group of Funds since 1975.
Special 2021 tax information (unaudited) for Vanguard Mid-Cap Growth Fund
This information for the fiscal year ended October 31, 2021, is included pursuant to provisions of the Internal Revenue Code.
The fund distributed $360,690,000 as capital gain dividends (20% rate gain distributions) to shareholders during the fiscal year.
For nonresident alien shareholders, 100% of short-term capital gain dividends distributed by the fund are qualified short-term capital gains.
The fund distributed $7,351,000 of qualified dividend income to shareholders during the fiscal year.
For corporate shareholders, 3.8% of investment income (dividend income plus short-term gains, if any) qualifies for the dividends-received deduction.
This page intentionally left blank.
The People Who Govern Your Fund
The trustees of your mutual fund are there to see that the fund is operated and managed in your best interests since, as a shareholder, you are a part owner of the fund. Your fund’s trustees also serve on the board of directors of The Vanguard Group, Inc., which is owned by the Vanguard funds and provides services to them.
A majority of Vanguard’s board members are independent, meaning that they have no affiliation with Vanguard or the funds they oversee, apart from the sizable personal investments they have made as private individuals. The independent board members have distinguished backgrounds in business, academia, and public service. Each of the trustees and executive officers oversees 214 Vanguard funds.
Information for each trustee and executive officer of the fund appears below. That information, as well as the Vanguard fund count, is as of the date on the cover of this fund report. The mailing address of the trustees and officers is P.O. Box 876, Valley Forge, PA 19482. More information about the trustees is in the Statement of Additional Information, which can be obtained, without charge, by contacting Vanguard at 800-662-7447, or online at vanguard.com.
Interested Trustee1
Mortimer J. Buckley
Born in 1969. Trustee since January 2018. Principal occupation(s) during the past five years and other experience: chairman of the board (2019–present) of Vanguard and of each of the investment companies served by Vanguard; chief executive officer (2018–present) of Vanguard; chief executive officer, president, and trustee (2018–present) of each of the investment companies served by Vanguard; president and director (2017–present) of Vanguard; and president (2018–present) of Vanguard Marketing Corporation. Chief investment officer (2013–2017), managing director (2002–2017), head of the Retail Investor Group (2006–2012), and chief information officer (2001–2006) of Vanguard. Chairman of the board (2011–2017) and trustee (2009–2017) of the Children’s Hospital of Philadelphia; and trustee (2018–present) and vice chair (2019–present) of The Shipley School.
Independent Trustees
Emerson U. Fullwood
Born in 1948. Trustee since January 2008. Principal occupation(s) during the past five years and other experience: executive chief staff and marketing officer for North America and corporate vice president (retired 2008) of Xerox Corporation (document management products and services). Former president of the Worldwide Channels Group, Latin
America, and Worldwide Customer Service and executive chief staff officer of Developing Markets of Xerox. Executive in residence and 2009–2010 Distinguished Minett Professor at the Rochester Institute of Technology. Director of SPX FLOW, Inc. (multi-industry manufacturing). Director of the University of Rochester Medical Center, the Monroe Community College Foundation, the United Way of Rochester, North Carolina A&T University, and Roberts Wesleyan College. Trustee of the University of Rochester.
Amy Gutmann
Born in 1949. Trustee since June 2006. Principal occupation(s) during the past five years and other experience: president (2004–present) of the University of Pennsylvania. Christopher H. Browne Distinguished Professor of Political Science, School of Arts and Sciences, and professor of communication, Annenberg School for Communication, with secondary faculty appointments in the Department of Philosophy, School of Arts and Sciences, and at the Graduate School of Education, University of Pennsylvania.
F. Joseph Loughrey
Born in 1949. Trustee since October 2009. Principal occupation(s) during the past five years and other experience: president and chief operating officer (retired 2009) and vice chairman of the board (2008–2009) of Cummins Inc. (industrial machinery). Chairman of the board of Hillenbrand, Inc. (specialized consumer services). Director of the V Foundation.
1 Mr. Buckley is considered an “interested person,” as defined in the Investment Company Act of 1940, because he is an officer of the Vanguard funds.
Member of the advisory council for the College of Arts and Letters and chair of the advisory board to the Kellogg Institute for International Studies, both at the University of Notre Dame. Chairman of the board of Saint Anselm College.
Mark Loughridge
Born in 1953. Trustee since March 2012. Principal occupation(s) during the past five years and other experience: senior vice president and chief financial officer (retired 2013) of IBM (information technology services). Fiduciary member of IBM’s Retirement Plan Committee (2004–2013), senior vice president and general manager (2002–2004) of IBM Global Financing, vice president and controller (1998–2002) of IBM, and a variety of other prior management roles at IBM. Member of the Council on Chicago Booth.
Scott C. Malpass
Born in 1962. Trustee since March 2012. Principal occupation(s) during the past five years and other experience: chief investment officer (retired June 2020) and vice president (retired June 2020) of the University of Notre Dame. Assistant professor (retired June 2020) of finance at the Mendoza College of Business, University of Notre Dame, and member of the Notre Dame 403(b) Investment Committee. Member of the board of Catholic Investment Services, Inc. (investment advisors) and the board of superintendence of the Institute for the Works of Religion.
Deanna Mulligan
Born in 1963. Trustee since January 2018. Principal occupation(s) during the past five years and other experience: board chair (2020), chief executive officer (2011–2020), and president (2010–2019) of The Guardian Life Insurance Company of America. Chief operating officer (2010–2011) and executive vice president (2008–2010) of Individual Life and Disability of the Guardian Life Insurance Company of America. Member of the board of the Economic Club of New York. Trustee of the Partnership for New York City (business leadership), Chief Executives for Corporate Purpose, NewYork-Presbyterian Hospital, and the Bruce Museum (arts and science). Member of the Advisory Council for the Stanford Graduate School of Business.
André F. Perold
Born in 1952. Trustee since December 2004. Principal occupation(s) during the past five years and other experience: George Gund Professor of Finance and Banking, Emeritus at the Harvard Business School (retired 2011). Chief investment officer and co-managing partner of HighVista Strategies (private investment firm). Member of the board
(2018–present) of RIT Capital Partners (investment firm). Member of the investment committee of Partners Health Care System.
Sarah Bloom Raskin
Born in 1961. Trustee since January 2018. Principal occupation(s) during the past five years and other experience: deputy secretary (2014–2017) of the United States Department of the Treasury. Governor (2010–2014) of the Federal Reserve Board. Commissioner (2007–2010) of financial regulation for the State of Maryland. Professor (2020–present), Distinguished Fellow of the Global Financial Markets Center (2020–present), and Rubenstein Fellow (2017–2020) at Duke University. Trustee (2017–present) of Amherst College and member of Amherst College Investment Committee (2019–present). Member of the Regenerative Crisis Response Committee (2020–present).
David A. Thomas
Born in 1956. Trustee since July 2021. Principal occupation(s) during the past five years and other experience: president of Morehouse College (2018–present). Professor of business administration, emeritus at Harvard University (2017–2018). Dean (2011–2016) and professor of management (2016–2017) at the Georgetown University McDonough School of Business. Director of DTE Energy Company (2013–present). Trustee of Common Fund (2019–present).
Peter F. Volanakis
Born in 1955. Trustee since July 2009. Principal occupation(s) during the past five years and other experience: president and chief operating officer (retired 2010) of Corning Incorporated (communications equipment) and director of Corning Incorporated (2000–2010) and Dow Corning (2001–2010). Director (2012) of SPX Corporation (multi-industry manufacturing). Overseer of the Amos Tuck School of Business Administration, Dartmouth College (2001–2013). Chairman of the board of trustees of Colby-Sawyer College. Member of the BMW Group Mobility Council.
Executive Officers
Christine M. Buchanan
Born in 1970. Principal occupation(s) during the past five years and other experience: principal of Vanguard. Chief financial officer (2021–present) and treasurer (2017–present) of each of the investment companies served by Vanguard. Partner (2005–2017) at KPMG (audit, tax, and advisory services).
David Cermak
Born in 1960. Principal occupation(s) during the past five years and other experience: principal of Vanguard. Finance director (2019–present) of each of the investment companies served by Vanguard. Managing director and head (2017–present) of Vanguard Investments Singapore. Managing director and head (2017–2019) of Vanguard Investments Hong Kong. Representative director and head (2014–2017) of Vanguard Investments Japan.
John Galloway
Born in 1973. Principal occupation(s) during the past five years and other experience: principal of Vanguard. Investment stewardship officer (September 2020–present) of each of the investment companies served by Vanguard. Head of Investor Advocacy (February 2020–present) and head of Marketing Strategy and Planning (2017–2020) at Vanguard. Deputy assistant to the President of the United States (2015).
Peter Mahoney
Born in 1974. Principal occupation(s) during the past five years and other experience: principal of Vanguard. Controller (2015–present) of each of the investment companies served by Vanguard. Head of International Fund Services (2008–2014) at Vanguard.
Anne E. Robinson
Born in 1970. Principal occupation(s) during the past five years and other experience: general counsel (2016–present) of Vanguard. Secretary (2016–present) of Vanguard and of each of the investment companies served by Vanguard. Managing director (2016–present) of Vanguard. Managing director and general counsel of Global Cards and Consumer Services (2014–2016) at Citigroup. Counsel (2003–2014) at American Express.
Michael Rollings
Born in 1963. Principal occupation(s) during the past five years and other experience: finance director (2017–present) and treasurer (2017) of each of the investment companies served by Vanguard. Managing director (2016–present) of Vanguard. Chief financial officer (2016–present) of Vanguard. Director (2016–present) of Vanguard Marketing Corporation. Executive vice president and chief financial officer (2006–2016) of MassMutual Financial Group.
John E. Schadl
Born in 1972. Principal occupation(s) during the past five years and other experience: principal of Vanguard. Chief compliance officer (2019–present) of Vanguard and of each of the investment companies served by Vanguard. Assistant vice president (2019–present) of Vanguard Marketing Corporation.
Vanguard Senior Management Team
| Matthew Benchener | Thomas M. Rampulla |
| Joseph Brennan | Karin A. Risi |
| Mortimer J. Buckley | Anne E. Robinson |
| Gregory Davis | Michael Rollings |
| John James | Nitin Tandon |
| John T. Marcante | Lauren Valente |
| Chris D. Mclsaac | |
Connect with Vanguard®>vanguard.com
Fund Information > 800-662-7447
Direct Investor Account Services > 800-662-2739
Institutional Investor Services > 800-523-1036
Text Telephone for People Who Are Deaf or Hard of Hearing > 800-749-7273
This material may be used in conjunction with the offering of shares of any Vanguard fund only if preceded or accompanied by the fund’s current prospectus.
All comparative mutual fund data are from Morningstar, Inc., unless otherwise noted.
You can obtain a free copy of Vanguard’s proxy voting guidelines by visiting vanguard.com/proxyreporting or by calling Vanguard at 800-662-2739. The guidelines are also available from the SEC’s website, www.sec.gov. In addition, you may obtain a free report on how your fund voted the proxies for securities it owned during the 12 months ended June 30. To get the report, visit either vanguard.com/proxyreporting or www.sec.gov.
You can review information about your fund on the SEC’s website, and you can receive copies of this information, for a fee, by sending a request via email addressed to publicinfo@sec.gov.
Source for Bloomberg indexes: Bloomberg Index Services Limited. Copyright 2021, Bloomberg. All rights reserved.
CFA® is a registered trademark owned by CFA Institute.
© 2021 The Vanguard Group, Inc.
All rights reserved.
Vanguard Marketing Corporation, Distributor.
Q3010 122021
Annual Report | October 31, 2021
Vanguard International Explorer™ Fund
Contents
Please note: The opinions expressed in this report are just that—informed opinions. They should not be considered promises or advice. Also, please keep in mind that the information and opinions cover the period through the date on the front of this report. Of course, the risks of investing in your fund are spelled out in the prospectus.
Your Fund’s Performance at a Glance
| • | For the 12 months ended October 31, 2021, Vanguard International Explorer Fund returned 35.79%. Its benchmark, the S&P EPAC SmallCap Index, returned 34.78%. |
| • | The global economy continued to recover from the sharp pandemic-induced contraction in the spring of 2020. Countries that were more successful in containing the virus, whether through vaccinations, lockdowns, or both, generally fared better economically. Swift and extensive fiscal and monetary support from policymakers was also key to the rebound. |
| • | The fund’s four advisors invest in smaller companies––mostly from developed European and Pacific markets––that they believe have strong long-term growth prospects. |
| • | By region, Europe and emerging markets stocks boosted the fund’s performance relative to the benchmark. Results were hampered by stocks from North America and the Pacific region. |
| • | Five of the fund’s 11 industry sectors boosted relative performance; consumer discretionary and information technology stocks helped the most. Communication services and industrial stocks were the largest relative detractors. |
Market Barometer
| | Average Annual Total Returns
Periods Ended October 31, 2021 |
| | One Year | Three Years | Five Years |
| Stocks | | | |
| Russell 1000 Index (Large-caps) | 43.51% | 22.01% | 19.16% |
| Russell 2000 Index (Small-caps) | 50.80 | 16.47 | 15.52 |
| Russell 3000 Index (Broad U.S. market) | 43.90 | 21.62 | 18.91 |
| FTSE All-World ex US Index (International) | 30.23 | 12.42 | 10.05 |
| Bonds | | | |
Bloomberg U.S. Aggregate Bond Index
(Broad taxable market) | -0.48% | 5.63% | 3.10% |
Bloomberg Municipal Bond Index
(Broad tax-exempt market) | 2.64 | 5.17 | 3.41 |
| FTSE Three-Month U.S. Treasury Bill Index | 0.05 | 1.08 | 1.12 |
| CPI | | | |
| Consumer Price Index | 6.22% | 3.03% | 2.73% |
For the fiscal year ended October 31, 2021, Vanguard International Explorer Fund returned 35.79%. Your fund is managed by four independent advisors, a strategy that enhances its diversification by providing exposure to distinct yet complementary investment approaches. It is not uncommon for different advisors to have different views about individual securities or the broader investment environment.
The advisors and the amount and percentage of fund assets each manages are presented in the accompanying table. The advisors have also prepared a discussion of the investment environment that existed during the year and of how their portfolio positioning reflected that assessment. These comments were prepared on November 15, 2021.
Schroder Investment Management North America Inc.
Portfolio Manager:
Luke Biermann,
Lead Portfolio Manager
Global stocks achieved strong gains over the last 12 months as COVID-19 vaccination programs gathered steam, economies reopened, and monetary and fiscal policies backstopped growth. International small-capitalization stocks led large-caps, with the S&P EPAC SmallCap Index returning 34.78%, compared with 33.71% for the S&P EPAC LargeMidCap Index.
The combination of stock selection and regional allocation drove strong relative performance for our portion of the
portfolio. Positive stock selection, led by continental Europe and Japan, was only partially offset by selection in the United Kingdom. From a regional allocation perspective, our nonindex exposure to emerging markets and underweight to Japan added value, while underweighting the United Kingdom produced some negative offset.
Stock selection in continental Europe contributed most, driven by information technology (ASM International, Comet). Health care (Dermapharm, Arjo), materials (Borregaard), and consumer discretionary (Basic-Fit, Dalata Hotel) holdings also made notable contributions.
Selection in Japan was additive, as was our underweight toward the region. Consumer discretionary holdings (Musashi Seimitsu, Oisix ra daichi) benefited results the most. Stock selection in financials and an underweight to consumer staples also helped.
Our nonindex exposure to emerging markets aided results, with holdings in India (Apollo Hospitals, Oberoi Realty), the Philippines (Wilcon Depot), and Taiwan (Voltronic Power, Vanguard International Semiconductor) making notable contributions.
The United Kingdom was the strongest small-capitalization market, up more than 50%. Portfolio holdings failed to keep up, with the most significant area of weakness being our selection in industrials (QinetiQ, Bunzl) and an underweight to the sector. An underweight to financials and selection within the sector (Petershill Partners) also proved detrimental.
We continue to focus on high-quality companies offering above-average and relatively visible earnings growth. Our largest overweight remains in information technology, given the secular opportunity we see from digital transformation, together with the rich vein of small-caps well-positioned to service it. Conversely, we remain underweighted in financials and real estate.
Wellington Management Company llp
Portfolio Manager:
Mary L. Pryshlak, CFA,
Senior Managing Director and Head of Investment Research
International small-cap equities, as measured by the S&P EPAC SmallCap Index, returned 34.78% for the 12 months. Global equities, as measured by the MSCI All Country World Index, rose more than 37.86%. All 11 sectors in the S&P EPAC SmallCap Index posted positive returns, led by financials, industrials, and materials.
Strong stock selection in the information technology, consumer discretionary, and financial sectors contributed most to our portion of the portfolio’s relative performance. This was modestly offset by weaker selection in real estate and materials. From a regional perspective, selection within Europe and North America contributed most to relative performance, while selection within developed Asia Pacific (excluding Japan) detracted.
Among the top relative contributors were out-of-benchmark positions in Nuvei, a Canada-based global payment solutions provider, and China Longyuan Power, China’s largest renewable power producer. Top relative detractors included out-of-benchmark positions in Lifenet Insurance, a Japan-based online-only life insurance provider, and Sundrug, a Japanese drugstore and pharmacy chain.
An eventful summer has set the table for a fourth quarter rife with uncertainty as allocators seek to navigate a market with plausible bull and bear cases. Inflation remains elevated, with pockets seemingly more sustainable than expected. Labor shortages across industries are straining supply chains, and further short-term disruption is possible. Businesses that can pass on inflation to customers or support the reestablishment of efficient production lines are likely to benefit as consumer health and market demand remain strong.
Our global industry analysts continue to collaborate and seek to balance their portfolios with potential short-term beneficiaries and long-term secular winners.
TimesSquare Capital Management, LLC
Portfolio Manager:
Magnus S. Larsson,
Director,
Head of International Team
The market experienced massive shifts driven by sentiment following the depths early in the pandemic. Initially, the period saw hypergrowth significantly rewarded. Then, in the first quarter and part of the second quarter of 2021, market sentiment swung to favor deep cyclical value. Given our investment adherence to company fundamentals with a focus on profitability, cash flow, and valuation, these times were challenging for us in the short term. Amid this rapidly shifting environment, our holdings in Japan contributed to performance but were offset by those in Europe, emerging markets, and Canada. Our holdings in the consumer discretionary sector contributed most to our relative performance, while information technology holdings detracted.
In Japan, Food & Life Companies is the country’s leading conveyor-belt sushi restaurant. Strength in its same-store sales from greater takeout and delivery lifted profitability. Less positive was Elecom, a manufacturer of peripheral products for electronic devices. Shares reflected the market’s recent negative sentiment on work-from-home stocks.
We experienced mixed returns from our European holdings. Sweden-based Stillfront develops ad-supported, free-to-play digital games. New access restrictions on user data will impact the business for longer than anticipated, and we sold our holding.
More positive was U.K. wealth manager St. James’s Place. We purchased the name in early 2020 amid the COVID-related dislocation. Since then, the company has reported record inflows with
pent-up demand from accumulated consumer savings.
Our top contributor in emerging markets was Taiwan’s leading e-commerce player, momo.com. The company continued to gain share on COVID-driven demand. The region’s top detractor was Turkish e-commerce peer, D-Market. Its shares were hurt by elevated short-term expenses and increased competition. In other regions, Canada-based Real Matters operates a proprietary online network of home appraisal management solutions. We were disappointed when management discussed reallocating resources to focus on larger clients at the expense of smaller clients, so we exited the holding.
Currently, our companies are delivering on a fundamental level with positive cash flows and earnings, but not along the presently preferred market themes. Many of our companies emerged from the pandemic having learned to effectively execute under this new normal and are well-capitalized to pursue further opportunities. We remain confident about our portion of the portfolio’s prospects, especially its ability to generate better earnings growth than the market.
Baillie Gifford Overseas Ltd.
Portfolio Managers:
Brian Lum, CFA,
Chair of the International Smaller Companies Portfolio Construction Group
Steven Vaughan, CFA,
Investment Manager
We focus our investment research efforts on unearthing small businesses run by dynamic entrepreneurs, which target large end markets by way of their exposure to long-term structural trends. They might have the potential to rapidly grow their earnings thanks to innovation or have a deep competitive moat that allows them to compound their earnings over the long term. However, once they are found, we act as patient long-term shareholders, ignoring market noise and giving investments the time to realize their significant potential.
Our way of dealing with short-term market fluctuations is to concentrate on providing a broadly diversified portfolio of businesses. The idiosyncrasy of these holdings means that some of them will be enjoying cyclical tailwinds while others are finding it tougher going, but all should be heading in a broadly upward direction over the long-term periods we target.
This year, markets in general have been looking for “re-opening plays,” with a number of “old economy” type stocks (shipping, resources, etc.) performing strongly as a result. Simultaneously, technology-led stocks that performed exceptionally well during the pandemic in 2020 have fallen out of favor despite continued strong operational performance. Examples include Japanese online platforms Bengo4.Com (connecting lawyers with clients and digital document authentication), Demae-Can (food delivery), and Locondo (shoes).
Our holdings in automation, engineering, and semiconductors have performed well, including ASPEED Technology (a Taiwanese supplier of baseboard
management controllers), Sensirion (a Swiss manufacturer of environment and flow sensors), and HMS Networks (a Swedish industrial communication company).
We strongly believe that by focusing on seeking out and investing in the highest-quality and fastest-growing smaller companies internationally, we give ourselves the best chance of generating outsized returns over the long term. Our approach is unearthing an increased number of opportunities in the current market environment, where attention seems focused on economies unlocking and inflation, and not fundamental change.
Vanguard International Explorer Fund Investment Advisors
| | Fund Assets Managed | |
| Investment Advisor | % | $ Million | Investment Strategy |
| Schroder Investment Management North America Inc. | 39 | 1,101 | The advisor employs a fundamental investment approach that considers macroeconomic factors while focusing primarily on company-specific factors, including a company’s potential for long-term growth, financial condition, quality of management, and sensitivity to cyclical factors. The advisor also considers the relative value of a company’s securities compared with those of other companies and the market as a whole. |
| Wellington Management Company llp | 30 | 837 | The advisor allocates the assets in its portion of the fund to a team of global analysts who seek to add value through in-depth fundamental research and understanding of their industries. By covering the same companies over a period of many years, these investment professionals gain comprehensive insight to guide decisions for their subportfolios. |
| TimesSquare Capital Management, LLC | 19 | 538 | The advisor employs a quality growth philosophy that is based on the premise that a skilled research team—emphasizing management quality, superior business models, and valuation—contributes to a diversified portfolio that seeks to deliver superior risk-adjusted returns over the long term. |
| Baillie Gifford Overseas Ltd. | 10 | 275 | The advisor employs rigorous, fundamental, bottom-up analysis. It believes that a few companies will drive most of the market’s return over the long run and considers sustainable earnings growth and free cash flow growth to be the most important determinants of a company’s prospects. |
| Cash Investments | 2 | 64 | These short-term reserves are invested by Vanguard in equity index products to simulate investment in stocks. Each advisor also may maintain a modest cash position. |
About Your Fund’s Expenses
As a shareholder of the fund, you incur ongoing costs, which include costs for portfolio management, administrative services, and shareholder reports (like this one), among others. Operating expenses, which are deducted from a fund’s gross income, directly reduce the investment return of the fund.
A fund‘s expenses are expressed as a percentage of its average net assets. This figure is known as the expense ratio. The following examples are intended to help you understand the ongoing costs (in dollars) of investing in your fund and to compare these costs with those of other mutual funds. The examples are based on an investment of $1,000 made at the beginning of the period shown and held for the entire period.
The accompanying table illustrates your fund’s costs in two ways:
| • | Based on actual fund return. This section helps you to estimate the actual expenses that you paid over the period. The ”Ending Account Value“ shown is derived from the fund’s actual return, and the third column shows the dollar amount that would have been paid by an investor who started with $1,000 in the fund. You may use the information here, together with the amount you invested, to estimate the expenses that you paid over the period. |
To do so, simply divide your account value by $1,000 (for example, an $8,600 account value divided by $1,000 = 8.6), then multiply the result by the number given for your fund under the heading ”Expenses Paid During Period.“
| • | Based on hypothetical 5% yearly return. This section is intended to help you compare your fund‘s costs with those of other mutual funds. It assumes that the fund had a yearly return of 5% before expenses, but that the expense ratio is unchanged. In this case—because the return used is not the fund’s actual return—the results do not apply to your investment. The example is useful in making comparisons because the Securities and Exchange Commission requires all mutual funds to calculate expenses based on a 5% return. You can assess your fund’s costs by comparing this hypothetical example with the hypothetical examples that appear in shareholder reports of other funds. |
Note that the expenses shown in the table are meant to highlight and help you compare ongoing costs only and do not reflect transaction costs incurred by the fund for buying and selling securities. Further, the expenses do not include any purchase, redemption, or account service fees described in the fund prospectus. If such fees were applied to your account, your costs would be higher. Your fund does not carry a “sales load.”
The calculations assume no shares were bought or sold during the period. Your actual costs may have been higher or lower, depending on the amount of your investment and the timing of any purchases or redemptions.
You can find more information about the fund’s expenses, including annual expense ratios, in the Financial Statements section of this report. For additional information on operating expenses and other shareholder costs, please refer to your fund’s current prospectus.
| Six Months Ended October 31, 2021 | | | |
| International Explorer Fund | Beginning
Account Value
4/30/2021 | Ending
Account Value
10/31/2021 | Expenses
Paid During
Period |
| Based on Actual Fund Return | $1,000.00 | $1,031.30 | $2.05 |
| Based on Hypothetical 5% Yearly Return | 1,000.00 | 1,023.19 | 2.04 |
The calculations are based on expenses incurred in the most recent six-month period. The fund's annualized six-month expense ratio for that period is 0.40%. The dollar amounts shown as ”Expenses Paid” are equal to the annualized expense ratio multiplied by the average account value over the period, multiplied by the number of days in the most recent six-month period, then divided by the number of days in the most recent 12-month period (184/365).
International Explorer Fund
All of the returns in this report represent past performance, which is not a guarantee of future results that may be achieved by the fund. (Current performance may be lower or higher than the performance data cited. For performance data current to the most recent month-end, visit our website at vanguard.com/performance.) Note, too, that both investment returns and principal value can fluctuate widely, so an investor’s shares, when sold, could be worth more or less than their original cost. The returns shown do not reflect taxes that a shareholder would pay on fund distributions or on the sale of fund shares.
Cumulative Performance: October 31, 2011, Through October 31, 2021
Initial Investment of $10,000
| | | | Average Annual Total Returns
Periods Ended October 31, 2021 |
| | | One
Year | Five
Years | Ten
Years | Final Value
of a $10,000
Investment |
 | International Explorer Fund | 35.79% | 10.55% | 9.44% | $24,640 |
 | S&P EPAC SmallCap Index | 34.78 | 10.91 | 9.77 | 25,398 |
 | MSCI All Country World Index ex USA | 29.66 | 9.77 | 6.66 | 19,057 |
See Financial Highlights for dividend and capital gains information.
International Explorer Fund
| |
| Japan | 23.2% |
| United Kingdom | 17.2 |
| Sweden | 6.7 |
| Germany | 5.9 |
| Italy | 5.1 |
| France | 4.2 |
| Netherlands | 4.1 |
| Taiwan | 4.0 |
| Switzerland | 3.8 |
| Australia | 3.7 |
| Denmark | 2.2 |
| Hong Kong | 2.2 |
| Spain | 1.7 |
| Belgium | 1.7 |
| South Korea | 1.6 |
| India | 1.4 |
| China | 1.4 |
| Canada | 1.4 |
| Norway | 1.3 |
| Finland | 1.2 |
| Ireland | 1.0 |
| Other | 5.0 |
The table reflects the fund’s investments, except for short-term investments and derivatives.
International Explorer Fund
The fund files its complete schedule of portfolio holdings with the Securities and Exchange Commission (SEC) for the first and third quarters of each fiscal year as an exhibit to its reports on Form N-PORT. The fund’s Form N-PORT reports are available on the SEC’s website at www.sec.gov.
| | | | | | Shares | Market
Value•
($000) |
| Common Stocks (95.9%) |
| Australia (3.5%) |
| | James Hardie Industries plc | 349,401 | 13,727 |
| | Steadfast Group Ltd. | 3,162,900 | 11,128 |
| | Iluka Resources Ltd. | 1,183,573 | 8,444 |
| | Charter Hall Group | 633,109 | 8,306 |
| | IPH Ltd. | 1,205,400 | 7,829 |
| | Ingenia Communities Group | 952,943 | 4,712 |
| * | Tyro Payments Ltd. | 1,476,158 | 4,509 |
| | Deterra Royalties Ltd. | 1,467,420 | 4,316 |
| | Ansell Ltd. | 179,983 | 4,309 |
| | Orora Ltd. | 1,282,615 | 3,209 |
| | Pendal Group Ltd. | 540,214 | 2,732 |
| | Netwealth Group Ltd. | 202,407 | 2,660 |
| *,1 | Siteminder Ltd. | 645,100 | 2,455 |
| | Seven Group Holdings Ltd. | 136,942 | 2,237 |
| | Reliance Worldwide Corp. Ltd. | 488,199 | 2,147 |
| | Mineral Resources Ltd. | 63,950 | 1,880 |
| * | Pilbara Minerals Ltd. | 970,313 | 1,627 |
| | Northern Star Resources Ltd. | 214,491 | 1,485 |
| | Domino's Pizza Enterprises Ltd. | 13,932 | 1,429 |
| * | Nufarm Ltd. | 419,333 | 1,381 |
| | OZ Minerals Ltd. | 71,961 | 1,369 |
| | IGO Ltd. | 164,654 | 1,206 |
| * | Lynas Rare Earths Ltd. | 199,153 | 1,111 |
| * | Cleanspace Holdings Ltd. | 863,931 | 994 |
| | Alumina Ltd. | 650,210 | 983 |
| * | Whitehaven Coal Ltd. | 442,399 | 876 |
| * | Bellevue Gold Ltd. | 1,005,341 | 647 |
| | Worley Ltd. | 66,092 | 543 |
| | Beach Energy Ltd. | 381,625 | 401 |
| | | | | | | 98,652 |
| Austria (0.6%) |
| 2 | S&T AG | 326,318 | 7,841 |
| *,3 | BAWAG Group AG | 77,075 | 4,848 |
| | | | | | Shares | Market
Value•
($000) |
| | AT&S Austria Technologie & Systemtechnik AG | 72,800 | 2,793 |
| | Wienerberger AG | 38,493 | 1,363 |
| | | | | | | 16,845 |
| Belgium (1.6%) |
| | D'ieteren Group | 67,191 | 11,585 |
| * | Azelis Group NV | 287,575 | 9,308 |
| | Recticel SA | 431,213 | 7,964 |
| | Barco NV | 330,618 | 7,452 |
| | KBC Ancora | 85,751 | 4,471 |
| * | bpost SA | 316,281 | 2,710 |
| | Melexis NV | 19,252 | 2,220 |
| *,3 | Biocartis Group NV | 113,425 | 518 |
| | | | | | | 46,228 |
| Brazil (0.7%) |
| | TOTVS SA | 1,645,832 | 9,553 |
| *,3 | Locaweb Servicos de Internet SA | 1,463,400 | 4,745 |
| * | Afya Ltd. Class A | 158,700 | 2,769 |
| * | TIM SA | 1,167,400 | 2,321 |
| * | Cia de Saneamento Basico do Estado de Sao Paulo | 95,600 | 596 |
| * | Magazine Luiza SA | 256 | 1 |
| | | | | | | 19,985 |
| Canada (1.4%) |
| * | Nuvei Corp. | 78,762 | 9,876 |
| * | Kinaxis Inc. | 47,062 | 7,304 |
| * | Lightspeed Commerce Inc. (XTSE) | 59,795 | 5,828 |
| * | Docebo Inc. | 53,222 | 3,984 |
| * | Boat Rocker Media Inc. | 630,719 | 3,598 |
| * | Lightspeed Commerce Inc. | 34,943 | 3,414 |
| * | EcoSynthetix Inc. | 642,114 | 2,755 |
| 2 | Canacol Energy Ltd. | 395,998 | 1,241 |
| | Cargojet Inc. | 2,800 | 446 |
| | | | | | | 38,446 |
| China (1.4%) |
| | Li Ning Co. Ltd. | 608,500 | 6,715 |
International Explorer Fund
| | | | | | Shares | Market
Value•
($000) |
| | China Longyuan Power Group Corp. Ltd. Class H | 2,733,000 | 6,392 |
| 3 | IMAX China Holding Inc. | 2,892,200 | 4,229 |
| * | Tongcheng-Elong Holdings Ltd. | 1,433,600 | 3,195 |
| * | Yeahka Ltd. | 902,200 | 2,725 |
| * | Yihai International Holding Ltd. | 452,000 | 2,648 |
| | Minth Group Ltd. | 590,000 | 2,345 |
| * | Niu Technologies ADR | 82,329 | 2,155 |
| * | Chinasoft International Ltd. | 1,243,400 | 2,076 |
| | Precision Tsugami China Corp. Ltd. | 1,314,820 | 1,939 |
| * | Gracell Biotechnologies Inc. ADR | 80,616 | 863 |
| | Estun Automation Co. Ltd. Class A | 200,751 | 831 |
| | Venustech Group Inc. Class A | 201,000 | 801 |
| | China Datang Corp. Renewable Power Co. Ltd. Class H | 1,501,000 | 635 |
| | Beijing Enterprises Holdings Ltd. | 162,500 | 625 |
| *,3 | Weimob Inc. | 293,000 | 447 |
| | | | | | | 38,621 |
| Czech Republic (0.0%) |
| * | Komercni Banka A/S | 32,550 | 1,263 |
| Denmark (2.1%) |
| | Royal Unibrew A/S | 184,622 | 22,935 |
| | Topdanmark A/S | 224,983 | 11,940 |
| * | ALK-Abello A/S Class B | 24,700 | 10,705 |
| * | Ascendis Pharma A/S ADR | 33,963 | 5,149 |
| 3 | Netcompany Group A/S | 38,829 | 4,422 |
| * | Dfds A/S | 46,210 | 2,395 |
| * | Zealand Pharma A/S | 54,694 | 1,755 |
| *,1 | OW Bunker A/S | 1,000,000 | — |
| | | | | | | 59,301 |
| Finland (1.1%) |
| | Valmet OYJ | 310,000 | 12,585 |
| | Huhtamaki OYJ | 148,200 | 6,462 |
| | Kojamo OYJ | 237,338 | 5,317 |
| | Cargotec OYJ Class B | 72,326 | 3,745 |
| 2 | Kemira OYJ | 147,986 | 2,273 |
| | Wartsila OYJ Abp | 121,472 | 1,685 |
| | | | | | | 32,067 |
| France (4.0%) |
| | Nexans SA | 171,577 | 17,215 |
| | Trigano SA | 91,431 | 17,163 |
| | Kaufman & Broad SA | 277,301 | 11,125 |
| | Orpea SA | 87,900 | 9,182 |
| | | | | | Shares | Market
Value•
($000) |
| * | JCDecaux SA | 302,535 | 7,893 |
| | Sopra Steria Group SACA | 31,500 | 6,193 |
| 3 | Maisons du Monde SA | 262,944 | 5,965 |
| *,3 | Elior Group SA | 743,830 | 5,885 |
| 3 | Verallia SA | 134,800 | 4,991 |
| | Nexity SA | 103,155 | 4,716 |
| * | SOITEC | 14,648 | 3,900 |
| | IPSOS | 79,700 | 3,735 |
| | Rubis SCA | 94,958 | 3,043 |
| | Rothschild & Co. | 66,206 | 2,920 |
| * | ESI Group | 17,997 | 1,444 |
| | Valeo | 48,219 | 1,417 |
| | Vicat SA | 29,281 | 1,250 |
| | Mercialys SA | 76,918 | 836 |
| 3 | ALD SA | 54,334 | 810 |
| * | Criteo SA ADR | 23,051 | 762 |
| * | Cellectis SA | 69,272 | 752 |
| | Imerys SA | 16,289 | 706 |
| | L'Occitane International SA | 158,250 | 566 |
| * | Cellectis SA ADR | 25,800 | 278 |
| | | | | | | 112,747 |
| Germany (5.7%) |
| 3 | Befesa SA | 301,596 | 22,439 |
| | Dermapharm Holding SE | 175,803 | 17,683 |
| 2 | Gerresheimer AG | 181,105 | 16,617 |
| | Stabilus SA | 198,845 | 14,932 |
| | Aroundtown SA | 1,884,202 | 13,094 |
| * | HelloFresh SE | 135,432 | 10,975 |
| | New Work SE | 41,330 | 10,090 |
| * | Hypoport SE | 14,527 | 8,943 |
| * | CTS Eventim AG & Co. KGaA | 104,885 | 7,628 |
| * | Cherry AG | 172,281 | 5,838 |
| *,3 | Montana Aerospace AG | 159,110 | 5,686 |
| | Knorr-Bremse AG | 49,020 | 5,174 |
| | Stemmer Imaging AG | 121,118 | 5,038 |
| | Bertrandt AG | ��50,742 | 3,310 |
| | Rheinmetall AG | 24,602 | 2,387 |
| * | Friedrich Vorwerk Group SE | 50,000 | 2,232 |
| | Aurubis AG | 23,710 | 2,043 |
| * | Evotec SE | 41,098 | 1,992 |
| *,2 | Jumia Technologies AG ADR | 83,077 | 1,451 |
| | Wacker Chemie AG | 6,574 | 1,188 |
| *,3 | Aumann AG | 42,580 | 798 |
| * | thyssenkrupp AG | 68,481 | 713 |
| | Hamburger Hafen und Logistik AG | 7,681 | 172 |
| | | | | | | 160,423 |
International Explorer Fund
| | | | | | Shares | Market
Value•
($000) |
| Greece (0.2%) |
| | Hellenic Telecommunications Organization SA | 312,111 | 5,541 |
| Hong Kong (2.1%) |
| | Kerry Properties Ltd. | 3,890,500 | 10,997 |
| | Techtronic Industries Co. Ltd. | 448,500 | 9,215 |
| | Johnson Electric Holdings Ltd. | 3,771,125 | 8,347 |
| | Hang Lung Properties Ltd. | 2,860,000 | 6,638 |
| | ASM Pacific Technology Ltd. | 528,900 | 5,723 |
| | Dah Sing Financial Holdings Ltd. | 1,713,200 | 5,310 |
| | SUNeVision Holdings Ltd. | 3,227,000 | 2,963 |
| * | Mandarin Oriental International Ltd. | 1,121,100 | 2,601 |
| | HKBN Ltd. | 2,146,000 | 2,571 |
| 3 | Crystal International Group Ltd. | 6,289,500 | 2,004 |
| * | Hutchmed China Ltd. ADR | 41,676 | 1,226 |
| * | Hypebeast Ltd. | 6,015,000 | 886 |
| | | | | | | 58,481 |
| Iceland (0.3%) |
| 3 | Marel HF | 1,314,007 | 8,818 |
| India (1.4%) |
| | Apollo Hospitals Enterprise Ltd. | 207,707 | 11,848 |
| | Gujarat Pipavav Port Ltd. | 7,013,903 | 10,498 |
| * | Oberoi Realty Ltd. | 561,932 | 6,800 |
| 3 | Endurance Technologies Ltd. | 200,645 | 4,883 |
| | Alembic Pharmaceuticals Ltd. | 326,812 | 3,398 |
| * | CreditAccess Grameen Ltd. | 155,642 | 1,308 |
| | | | | | | 38,735 |
| Ireland (1.0%) |
| * | Dalata Hotel Group plc | 2,698,231 | 11,542 |
| | Smurfit Kappa Group plc | 137,583 | 7,211 |
| | Kingspan Group plc | 47,028 | 5,414 |
| * | AIB Group plc | 855,240 | 2,315 |
| * | Bank of Ireland Group plc | 206,275 | 1,229 |
| | | | | | | 27,711 |
| Israel (0.5%) |
| | Maytronics Ltd. | 266,904 | 6,309 |
| * | Melisron Ltd. | 62,147 | 5,260 |
| 2 | Caesarstone Ltd. | 133,452 | 1,665 |
| | | | | | | 13,234 |
| | | | | | Shares | Market
Value•
($000) |
| Italy (4.9%) |
| | Reply SpA | 104,461 | 20,276 |
| * | Banca Generali SpA | 353,066 | 16,610 |
| | Interpump Group SpA | 172,087 | 12,676 |
| | Recordati Industria Chimica e Farmaceutica SpA | 190,964 | 11,965 |
| * | Brunello Cucinelli SpA | 168,477 | 10,222 |
| 3 | doValue SpA | 1,004,433 | 9,632 |
| * | FinecoBank Banca Fineco SpA | 450,600 | 8,605 |
| | Moncler SpA | 107,199 | 7,715 |
| *,3 | OVS SpA | 2,552,060 | 7,331 |
| | Amplifon SpA | 111,300 | 5,664 |
| | PRADA SpA | 687,300 | 4,332 |
| | Tamburi Investment Partners SpA | 349,334 | 3,944 |
| | Italgas SpA | 612,688 | 3,893 |
| * | Stevanato Group SpA | 144,524 | 3,710 |
| * | Salvatore Ferragamo SpA | 170,970 | 3,638 |
| 3 | Technogym SpA | 259,867 | 2,731 |
| | Buzzi Unicem SpA | 91,814 | 2,141 |
| *,3 | Enav SpA | ��281,381 | 1,235 |
| *,2 | Saipem SpA | 272,181 | 596 |
| | | | | | | 136,916 |
| Japan (22.2%) |
| | Nippon Shinyaku Co. Ltd. | 250,300 | 20,053 |
| | GMO internet Inc. | 482,900 | 13,335 |
| | Fuji Corp. | 519,300 | 12,113 |
| 2 | Kobe Bussan Co. Ltd. | 320,700 | 11,047 |
| | Katitas Co. Ltd. | 292,100 | 10,666 |
| | Trusco Nakayama Corp. | 429,300 | 10,380 |
| | Musashi Seimitsu Industry Co. Ltd. | 545,600 | 10,269 |
| | Digital Garage Inc. | 211,800 | 9,894 |
| | SBI Holdings Inc. | 381,100 | 9,878 |
| | Kadokawa Corp. | 182,300 | 9,626 |
| | Aica Kogyo Co. Ltd. | 290,100 | 8,892 |
| * | Oisix ra daichi Inc. | 211,900 | 8,875 |
| | FP Corp. | 256,800 | 8,720 |
| | Horiba Ltd. | 129,500 | 8,490 |
| | Ai Holdings Corp. | 449,800 | 8,490 |
| | Tsuruha Holdings Inc. | 68,700 | 8,474 |
| * | Raksul Inc. | 153,500 | 8,445 |
| | KOMEDA Holdings Co. Ltd. | 463,100 | 8,399 |
| | Disco Corp. | 30,400 | 8,196 |
| | Daifuku Co. Ltd. | 87,700 | 8,074 |
| | Kureha Corp. | 122,800 | 7,981 |
| | Sumitomo Forestry Co. Ltd. | 416,300 | 7,952 |
| | Daibiru Corp. | 568,100 | 7,906 |
International Explorer Fund
| | | | | | Shares | Market
Value•
($000) |
| | NEC Networks & System Integration Corp. | 489,700 | 7,880 |
| | Nifco Inc. | 245,900 | 7,844 |
| | OBIC Business Consultants Co. Ltd. | 156,200 | 7,711 |
| | Outsourcing Inc. | 397,400 | 7,623 |
| | Sugi Holdings Co. Ltd. | 104,600 | 7,489 |
| | Nabtesco Corp. | 227,800 | 7,393 |
| | Zenkoku Hosho Co. Ltd. | 149,600 | 7,229 |
| | Koito Manufacturing Co. Ltd. | 127,100 | 7,211 |
| | Menicon Co. Ltd. | 188,000 | 7,058 |
| | Asahi Holdings Inc. | 394,100 | 7,034 |
| | Daiseki Co. Ltd. | 145,200 | 6,777 |
| | Asics Corp. | 266,800 | 6,649 |
| | Dip Corp. | 184,500 | 6,620 |
| | Hakuhodo DY Holdings Inc. | 405,800 | 6,616 |
| | Pola Orbis Holdings Inc. | 301,100 | 6,429 |
| | Elecom Co. Ltd. | 419,400 | 6,415 |
| | Fukushima Galilei Co. Ltd. | 159,200 | 6,329 |
| | Tri Chemical Laboratories Inc. | 209,900 | 6,278 |
| | Open House Co. Ltd. | 90,700 | 5,784 |
| | As One Corp. | 42,100 | 5,771 |
| * | Sansan Inc. | 47,536 | 5,523 |
| | Rorze Corp. | 57,500 | 5,511 |
| | Nippon Densetsu Kogyo Co. Ltd. | 342,400 | 5,278 |
| | Toyo Gosei Co. Ltd. | 37,400 | 5,204 |
| | Megachips Corp. | 161,500 | 5,106 |
| | Systena Corp. | 270,000 | 4,990 |
| 2 | Nittoku Co. Ltd. | 143,000 | 4,971 |
| | Asahi Intecc Co. Ltd. | 186,606 | 4,919 |
| * | SRE Holdings Corp. | 70,800 | 4,919 |
| | Bank of Kyoto Ltd. | 108,800 | 4,893 |
| | Fukuoka Financial Group Inc. | 261,300 | 4,694 |
| | Food & Life Cos. Ltd. | 103,100 | 4,469 |
| * | Bengo4.com Inc. | 73,600 | 4,426 |
| | Comforia Residential REIT Inc. | 1,474 | 4,296 |
| | Tsugami Corp. | 311,600 | 4,284 |
| 2 | Obara Group Inc. | 133,400 | 4,278 |
| | Kakaku.com Inc. | 121,400 | 4,029 |
| | Hino Motors Ltd. | 424,000 | 4,011 |
| | MatsukiyoCocokara & Co. | 85,900 | 3,809 |
| | Nomura Real Estate Holdings Inc. | 155,800 | 3,798 |
| | Glory Ltd. | 173,000 | 3,724 |
| | Tokyo Tatemono Co. Ltd. | 253,200 | 3,722 |
| | Tokyo Ohka Kogyo Co. Ltd. | 56,980 | 3,622 |
| | | | | | Shares | Market
Value•
($000) |
| * | JMDC Inc. | 48,100 | 3,616 |
| | Amada Co. Ltd. | 358,400 | 3,541 |
| | Sundrug Co. Ltd. | 117,000 | 3,424 |
| | Heiwa Real Estate Co. Ltd. | 106,500 | 3,362 |
| *,2 | Lifenet Insurance Co. | 337,100 | 3,358 |
| * | giftee Inc. | 97,300 | 3,289 |
| | Link & Motivation Inc. | 308,000 | 3,254 |
| *,2 | Freee KK | 44,800 | 3,216 |
| | Shinko Electric Industries Co. Ltd. | 77,148 | 3,108 |
| * | WealthNavi Inc. | 111,300 | 3,052 |
| | eGuarantee Inc. | 136,500 | 3,040 |
| | Infomart Corp. | 309,200 | 3,017 |
| | Fuso Chemical Co. Ltd. | 65,400 | 3,011 |
| | Taiyo Yuden Co. Ltd. | 57,900 | 2,935 |
| *,2 | Demae-Can Co. Ltd. | 244,200 | 2,905 |
| | Kissei Pharmaceutical Co. Ltd. | 142,700 | 2,854 |
| | Ushio Inc. | 152,100 | 2,721 |
| | Mani Inc. | 156,300 | 2,664 |
| | Kintetsu World Express Inc. | 110,100 | 2,644 |
| | Frontier Real Estate Investment Corp. | 573 | 2,535 |
| | Nichirei Corp. | 100,400 | 2,445 |
| | Ibiden Co. Ltd. | 38,700 | 2,325 |
| * | Japan Airport Terminal Co. Ltd. | 45,900 | 2,277 |
| | Ito En Ltd. | 33,700 | 2,245 |
| * | MedPeer Inc. | 73,300 | 2,203 |
| | Ebara Corp. | 39,800 | 2,172 |
| | Fancl Corp. | 71,000 | 2,153 |
| | Jeol Ltd. | 28,000 | 2,122 |
| | Yamaha Motor Co. Ltd. | 73,160 | 2,039 |
| *,2 | HEALIOS KK | 132,700 | 2,005 |
| | DMG Mori Co. Ltd. | 114,400 | 1,970 |
| | COLOPL Inc. | 256,800 | 1,855 |
| | Sojitz Corp. | 111,780 | 1,844 |
| | Iriso Electronics Co. Ltd. | 39,800 | 1,828 |
| | Kitanotatsujin Corp. | 500,600 | 1,824 |
| * | Money Forward Inc. | 26,597 | 1,807 |
| | KH Neochem Co. Ltd. | 70,100 | 1,802 |
| | Nippon Thompson Co. Ltd. | 336,400 | 1,731 |
| | Itoham Yonekyu Holdings Inc. | 276,800 | 1,688 |
| | NOF Corp. | 31,800 | 1,596 |
| | Showa Denko KK | 63,000 | 1,580 |
| | Sumitomo Heavy Industries Ltd. | 60,500 | 1,558 |
| | Air Water Inc. | 101,600 | 1,554 |
| | Kawasaki Heavy Industries Ltd. | 76,600 | 1,554 |
| | COMSYS Holdings Corp. | 61,800 | 1,530 |
International Explorer Fund
| | | | | | Shares | Market
Value•
($000) |
| | Sato Holdings Corp. | 66,100 | 1,524 |
| | EXEO Group Inc. | 65,500 | 1,514 |
| | Sumitomo Warehouse Co. Ltd. | 93,200 | 1,498 |
| | Mitsubishi Materials Corp. | 75,100 | 1,458 |
| | JSR Corp. | 39,561 | 1,435 |
| | NET One Systems Co. Ltd. | 42,800 | 1,404 |
| | Ichiyoshi Securities Co. Ltd. | 233,600 | 1,333 |
| | IHI Corp. | 56,500 | 1,320 |
| | THK Co. Ltd. | 60,200 | 1,295 |
| * | Istyle Inc. | 368,500 | 1,282 |
| | Optex Group Co. Ltd. | 96,800 | 1,233 |
| | Square Enix Holdings Co. Ltd. | 22,200 | 1,216 |
| | Inaba Denki Sangyo Co. Ltd. | 49,600 | 1,190 |
| | Anicom Holdings Inc. | 152,600 | 1,190 |
| | Fukuyama Transporting Co. Ltd. | 29,300 | 1,167 |
| | Inter Action Corp. | 54,200 | 1,167 |
| | Locondo Inc. | 100,000 | 1,163 |
| | Mirait Holdings Corp. | 60,300 | 1,160 |
| | Kyudenko Corp. | 34,500 | 1,094 |
| | Comture Corp. | 39,339 | 1,067 |
| *,2 | Chatwork Co. Ltd. | 114,000 | 1,060 |
| * | GA Technologies Co. Ltd. | 93,900 | 975 |
| * | Uzabase Inc. | 53,600 | 960 |
| | Kamakura Shinsho Ltd. | 108,300 | 875 |
| | Daikyonishikawa Corp. | 145,600 | 875 |
| | BayCurrent Consulting Inc. | 2,100 | 872 |
| | Iwatani Corp. | 14,400 | 851 |
| | Nikkon Holdings Co. Ltd. | 42,700 | 834 |
| | Tokyo Steel Manufacturing Co. Ltd. | 74,400 | 828 |
| | Kumagai Gumi Co. Ltd. | 33,300 | 824 |
| | Yodogawa Steel Works Ltd. | 37,400 | 817 |
| | Nippon Shokubai Co. Ltd. | 15,500 | 810 |
| | Shin-Etsu Polymer Co. Ltd. | 86,800 | 784 |
| | Lintec Corp. | 34,700 | 775 |
| | Sekisui Jushi Corp. | 41,400 | 771 |
| | Shibaura Machine Co. Ltd. | 33,000 | 769 |
| | Yamazen Corp. | 82,300 | 763 |
| | Yokogawa Bridge Holdings Corp. | 37,700 | 760 |
| | Maruichi Steel Tube Ltd. | 33,100 | 752 |
| | Max Co. Ltd. | 46,900 | 747 |
| | Giken Ltd. | 19,100 | 729 |
| | | | | | Shares | Market
Value•
($000) |
| | Japan Petroleum Exploration Co. Ltd. | 36,100 | 657 |
| | Sinko Industries Ltd. | 34,100 | 619 |
| *,2 | Hennge KK | 10,900 | 539 |
| | Kagome Co. Ltd. | 17,600 | 447 |
| | Toyo Construction Co. Ltd. | 81,300 | 407 |
| | Totetsu Kogyo Co. Ltd. | 18,500 | 403 |
| | Nichireki Co. Ltd. | 34,000 | 403 |
| | Hibiya Engineering Ltd. | 23,500 | 395 |
| | TOKAI Holdings Corp. | 50,500 | 383 |
| | Ichikoh Industries Ltd. | 52,800 | 262 |
| | | | | | | 625,680 |
| Luxembourg (0.2%) |
| *,2 | Arrival SA | 201,037 | 3,323 |
| 2 | Addiko Bank AG | 184,637 | 3,130 |
| | | | | | | 6,453 |
| Malaysia (0.0%) |
| | Inari Amertron Bhd. | 1,588,900 | 1,488 |
| Mexico (0.3%) |
| * | Grupo Aeroportuario del Pacifico SAB de CV Class B | 395,537 | 4,986 |
| | Corp. Inmobiliaria Vesta SAB de CV | 1,252,200 | 2,180 |
| | | | | | | 7,166 |
| Netherlands (3.9%) |
| | BE Semiconductor Industries NV | 274,335 | 25,065 |
| | ASM International NV | 40,955 | 18,535 |
| | TKH Group NV | 219,089 | 12,481 |
| | IMCD NV | 53,943 | 11,978 |
| * | AerCap Holdings NV | 166,053 | 9,804 |
| *,3 | Basic-Fit NV | 191,840 | 9,315 |
| | Arcadis NV | 137,400 | 6,697 |
| * | Merus NV | 169,520 | 4,755 |
| | SIF Holding NV | 202,178 | 3,296 |
| *,3 | DP Eurasia NV | 2,417,368 | 3,007 |
| | Corbion NV | 49,867 | 2,368 |
| | Boskalis Westminster | 68,473 | 2,042 |
| | SBM Offshore NV | 33,966 | 536 |
| | | | | | | 109,879 |
| New Zealand (0.6%) |
| * | Xero Ltd. | 97,383 | 11,104 |
| * | Pushpay Holdings Ltd. | 3,011,000 | 4,106 |
| | Fletcher Building Ltd. | 368,330 | 1,894 |
| | | | | | | 17,104 |
| Norway (1.3%) |
| | Borregaard ASA | 655,622 | 15,921 |
| | TOMRA Systems ASA | 94,620 | 6,115 |
| | Salmar ASA | 41,322 | 3,153 |
| * | LINK Mobility Group Holding ASA | 595,200 | 1,920 |
| * | Aker Solutions ASA | 665,102 | 1,887 |
International Explorer Fund
| | | | | | Shares | Market
Value•
($000) |
| | Bakkafrost P/F | 18,786 | 1,738 |
| | Kongsberg Gruppen ASA | 52,111 | 1,710 |
| * | Pexip Holding ASA | 348,783 | 1,649 |
| | Sparebanken More | 23,320 | 1,195 |
| | | | | | | 35,288 |
| Other (0.3%) |
| | iShares MSCI EAFE Small-Cap ETF | 103,621 | 7,901 |
| Philippines (0.3%) |
| | Wilcon Depot Inc. | 10,307,300 | 6,378 |
| * | Bloomberry Resorts Corp. | 20,404,500 | 2,754 |
| | | | | | | 9,132 |
| Russia (0.0%) |
| * | Ozon Holdings plc ADR | 17,379 | 782 |
| Singapore (0.4%) |
| | Venture Corp. Ltd. | 540,200 | 7,546 |
| * | SATS Ltd. | 1,249,200 | 3,885 |
| | | | | | | 11,431 |
| South Korea (1.5%) |
| | Douzone Bizon Co. Ltd. | 97,366 | 6,797 |
| * | NHN KCP Corp. | 130,758 | 6,416 |
| * | K Car Co. Ltd. | 257,400 | 5,397 |
| | PI Advanced Materials Co. Ltd. | 115,244 | 4,464 |
| | Koh Young Technology Inc. | 249,031 | 3,935 |
| | Park Systems Corp. | 34,890 | 3,544 |
| | Hanon Systems | 276,528 | 3,426 |
| | Eugene Technology Co. Ltd. | 38,418 | 1,465 |
| * | Cafe24 Corp. | 57,092 | 1,411 |
| * | Medytox Inc. | 10,249 | 1,316 |
| *,2,3 | SK IE Technology Co. Ltd. | 9,000 | 1,281 |
| | SNT Motiv Co. Ltd. | 29,493 | 1,273 |
| * | Genexine Inc. | 14,229 | 800 |
| *,1 | Kakao Pay Corp. | 5,562 | 428 |
| | | | | | | 41,953 |
| Spain (1.7%) |
| | Fluidra SA | 283,127 | 10,814 |
| | Prosegur Cia de Seguridad SA | 3,020,755 | 8,572 |
| | CIE Automotive SA | 309,757 | 8,432 |
| | Acciona SA | 37,326 | 7,168 |
| | Bankinter SA | 601,052 | 3,309 |
| | Viscofan SA | 41,574 | 2,843 |
| | Almirall SA | 162,229 | 2,412 |
| | Ebro Foods SA | 111,630 | 2,215 |
| * | Arima Real Estate SOCIMI SA | 117,519 | 1,225 |
| | | | | | | 46,990 |
| | | | | | Shares | Market
Value•
($000) |
| Sweden (6.4%) |
| | Arjo AB Class B | 1,382,221 | 18,850 |
| * | Nordic Entertainment Group AB Class B | 267,700 | 15,523 |
| | Avanza Bank Holding AB | 376,479 | 14,967 |
| | Nordnet AB publ | 731,200 | 14,016 |
| | AddTech AB Class B | 480,643 | 10,753 |
| | Loomis AB Class B | 380,567 | 10,271 |
| | Trelleborg AB Class B | 446,833 | 10,227 |
| * | Cint Group AB | 623,362 | 9,429 |
| 3 | Thule Group AB | 160,144 | 9,253 |
| * | Embracer Group AB Class B | 823,496 | 7,681 |
| | Catena AB | 121,346 | 7,393 |
| | Sweco AB Class B | 443,837 | 7,067 |
| | Fortnox AB | 92,300 | 6,535 |
| | HMS Networks AB | 90,495 | 5,167 |
| | BillerudKorsnas AB | 228,176 | 4,779 |
| | Cellavision AB | 84,333 | 3,842 |
| * | Surgical Science Sweden AB | 127,336 | 3,797 |
| * | VNV Global AB | 196,693 | 2,886 |
| | Indutrade AB | 82,670 | 2,410 |
| * | SkiStar AB | 111,861 | 2,333 |
| | INVISIO AB | 95,268 | 1,724 |
| * | Xvivo Perfusion AB | 40,451 | 1,604 |
| | Beijer Ref AB Class B | 75,287 | 1,545 |
| | Paradox Interactive AB | 101,077 | 1,485 |
| | Saab AB Class B | 51,445 | 1,434 |
| * | SSAB AB Class A | 236,691 | 1,349 |
| | Nolato AB Class B | 85,602 | 1,132 |
| * | Storytel AB | 52,822 | 1,042 |
| * | Bactiguard Holding AB Class B | 50,068 | 973 |
| | Peab AB Class B | 74,029 | 931 |
| | | | | | | 180,398 |
| Switzerland (3.6%) |
| | Julius Baer Group Ltd. | 266,305 | 19,262 |
| | Comet Holding AG (Registered) | 40,229 | 14,969 |
| * | Siegfried Holding AG (Registered) | 14,203 | 13,661 |
| * | SIG Combibloc Group AG | 407,514 | 10,658 |
| | Tecan Group AG (Registered) | 12,122 | 7,427 |
| | Straumann Holding AG (Registered) | 3,321 | 6,913 |
| *,3 | Sensirion Holding AG | 44,123 | 6,359 |
| 3 | VAT Group AG | 13,060 | 6,243 |
| *,3 | PolyPeptide Group AG | 46,823 | 5,993 |
| * | Dufry AG (Registered) | 83,837 | 4,439 |
| | Bossard Holding AG (Registered) Class A | 11,567 | 4,248 |
International Explorer Fund
| | | | | | Shares | Market
Value•
($000) |
| * | u-blox Holding AG | 13,496 | 988 |
| * | Implenia AG (Registered) | 23,196 | 473 |
| | | | | | | 101,633 |
| Taiwan (3.8%) |
| | ASPEED Technology Inc. | 158,000 | 15,850 |
| | Voltronic Power Technology Corp. | 197,252 | 11,552 |
| | Chroma ATE Inc. | 1,633,694 | 10,668 |
| | Airtac International Group | 347,983 | 10,412 |
| | Giant Manufacturing Co. Ltd. | 728,000 | 8,455 |
| | Nien Made Enterprise Co. Ltd. | 578,000 | 7,943 |
| | Vanguard International Semiconductor Corp. | 1,509,000 | 7,863 |
| | Accton Technology Corp. | 729,503 | 6,378 |
| | Global Unichip Corp. | 266,000 | 5,741 |
| | Delta Electronics Inc. | 509,000 | 4,493 |
| | Realtek Semiconductor Corp. | 220,248 | 3,962 |
| | momo.com Inc. | 42,410 | 2,733 |
| | Chang Wah Technology Co. Ltd. | 711,000 | 2,668 |
| | Parade Technologies Ltd. | 40,000 | 2,577 |
| | Advanced Wireless Semiconductor Co. | 277,000 | 1,597 |
| | TCI Co. Ltd. | 158,000 | 1,284 |
| | Hiwin Technologies Corp. | 113,140 | 1,260 |
| | ASMedia Technology Inc. | 18,000 | 1,055 |
| | Formosa Sumco Technology Corp. | 163,015 | 927 |
| | | | | | | 107,418 |
| Turkey (0.1%) |
| * | D-MARKET Elektronik Hizmetler ve Ticaret A/S ADR | 495,311 | 2,254 |
| United Kingdom (16.5%) |
| | Rotork plc | 4,247,057 | 20,531 |
| | Spectris plc | 342,299 | 17,612 |
| | Electrocomponents plc | 848,300 | 13,052 |
| | Safestore Holdings plc | 764,563 | 12,568 |
| | St. James's Place plc | 579,800 | 12,525 |
| | Future plc | 256,700 | 12,384 |
| | Bodycote plc | 1,052,700 | 11,531 |
| | Intermediate Capital Group plc | 366,439 | 10,991 |
| | HomeServe plc | 885,200 | 10,340 |
| | Keywords Studios plc | 261,285 | 10,102 |
| | Grafton Group plc | 518,377 | 9,521 |
| 3 | Auto Trader Group plc | 1,087,200 | 9,013 |
| | Savills plc | 450,804 | 8,768 |
| | | | | | Shares | Market
Value•
($000) |
| | Dechra Pharmaceuticals plc | 125,000 | 8,739 |
| | Spirent Communications plc | 2,187,500 | 8,589 |
| | Genuit Group plc | 923,878 | 8,383 |
| | Workspace Group plc | 738,373 | 8,301 |
| | RWS Holdings plc | 966,000 | 8,205 |
| | Dunelm Group plc | 450,000 | 7,890 |
| | IMI plc | 348,608 | 7,785 |
| | Segro plc | 435,000 | 7,688 |
| | Cranswick plc | 161,560 | 7,636 |
| | Lancashire Holdings Ltd. | 1,104,883 | 7,626 |
| * | Abcam plc | 297,404 | 6,767 |
| | UNITE Group plc | 447,971 | 6,689 |
| | Pets at Home Group plc | 1,000,000 | 6,599 |
| | Halma plc | 160,000 | 6,488 |
| | Softcat plc | 232,340 | 6,175 |
| | QinetiQ Group plc | 1,634,235 | 6,030 |
| *,3 | Network International Holdings plc | 1,329,702 | 5,865 |
| 3 | Avast plc | 757,000 | 5,793 |
| * | SSP Group plc | 1,564,504 | 5,512 |
| | Howden Joinery Group plc | 437,400 | 5,506 |
| | LondonMetric Property plc | 1,510,000 | 5,401 |
| * | Beazley plc | 982,208 | 5,224 |
| * | Restaurant Group plc | 4,327,227 | 5,219 |
| | Vistry Group plc | 300,000 | 5,024 |
| | AJ Bell plc | 875,432 | 4,907 |
| | Telecom Plus plc | 285,000 | 4,867 |
| * | Victoria plc | 326,318 | 4,829 |
| 3 | ConvaTec Group plc | 1,633,818 | 4,781 |
| *,3 | Petershill Partners plc | 1,142,857 | 4,694 |
| * | easyJet plc | 542,174 | 4,622 |
| | Melrose Industries plc | 2,113,160 | 4,559 |
| | Keller Group plc | 350,520 | 4,414 |
| | IG Group Holdings plc | 400,000 | 4,340 |
| | Redrow plc | 489,990 | 4,314 |
| | Weir Group plc | 180,000 | 4,270 |
| | Games Workshop Group plc | 30,951 | 4,088 |
| * | Allfunds Group plc | 199,637 | 4,030 |
| | B&M European Value Retail SA | 441,572 | 3,826 |
| | Renishaw plc | 54,000 | 3,716 |
| | Ninety One plc | 1,031,042 | 3,661 |
| * | IWG plc | 835,000 | 3,542 |
| * | Naked Wines plc | 338,630 | 3,445 |
| | Pennon Group plc | 211,287 | 3,370 |
| | Smart Metering Systems plc | 297,668 | 3,319 |
| *,3 | Trainline plc | 742,771 | 3,227 |
| * | Hyve Group plc | 2,163,772 | 3,219 |
| *,3 | Bridgepoint Group plc | 456,087 | 3,100 |
International Explorer Fund
| | | | | | Shares | Market
Value•
($000) |
| | Synthomer plc | 434,656 | 3,012 |
| | Grainger plc | 700,000 | 2,944 |
| * | FD Technologies plc | 96,821 | 2,765 |
| | NCC Group plc | 780,000 | 2,652 |
| | Tate & Lyle plc | 299,080 | 2,650 |
| * | Draper Esprit plc | 199,886 | 2,638 |
| | Alpha FX Group plc | 91,306 | 2,619 |
| | Greggs plc | 59,862 | 2,502 |
| | FDM Group Holdings plc | 152,222 | 2,501 |
| * | Team17 Group plc | 246,699 | 2,393 |
| | Conduit Holdings Ltd. | 387,200 | 2,322 |
| * | Meggitt plc | 222,633 | 2,286 |
| * | National Express Group plc | 557,171 | 1,743 |
| * | Hotel Chocolat Group plc | 234,940 | 1,700 |
| * | Wise plc Class A | 150,000 | 1,678 |
| | Travis Perkins plc | 76,114 | 1,609 |
| | Ultra Electronics Holdings plc | 29,350 | 1,301 |
| | Burford Capital Ltd. | 120,439 | 1,235 |
| | dotdigital group plc | 354,587 | 1,167 |
| | Balfour Beatty plc | 325,579 | 1,133 |
| | Centamin plc | 872,547 | 1,115 |
| * | Immunocore Holdings plc ADR | 28,572 | 1,101 |
| | Subsea 7 SA | 99,540 | 893 |
| | Marshalls plc | 88,937 | 861 |
| | Britvic plc | 67,717 | 822 |
| | Domino's Pizza Group plc | 155,161 | 822 |
| | Ferrexpo plc | 156,330 | 667 |
| | Cairn Energy plc | 190,170 | 475 |
| * | Oxford Nanopore Technologies plc | 43,500 | 332 |
| | | | | | | 465,150 |
| United States (0.3%) |
| | Patria Investments Ltd. Class A | 337,823 | 5,797 |
| * | GQG Partners Inc. | 1,555,510 | 2,340 |
| | | | | | | 8,137 |
Total Common Stocks
(Cost $2,033,517) | 2,700,251 |
| Temporary Cash Investments (4.6%) |
| Money Market Fund (4.5%) |
| 4,5 | Vanguard Market Liquidity Fund, 0.070% | 1,255,623 | 125,562 |
| | | | | | Face
Amount
($000) | Market
Value• |
| Repurchase Agreements (0.1%) |
| | Goldman Sachs & Co. 0.050%, 11/1/21
(Dated 10/29/21, Repurchase Value $3,900,000, collateralized by Ginnie Mae 4.000%, 1/15/41–7/15/47, with a value of $3,978,000) | 3,900 | 3,900 |
Total Temporary Cash Investments
(Cost $129,456) | 129,462 |
Total Investments (100.5%)
(Cost $2,162,973) | | 2,829,713 |
| Other Assets and Liabilities—Net (-0.5%) | | (14,734) |
| Net Assets (100%) | | 2,814,979 |
| Cost is in $000. |
| • | See Note A in Notes to Financial Statements. |
| * | Non-income-producing security. |
| 1 | Security value determined using significant unobservable inputs. |
| 2 | Includes partial security positions on loan to broker-dealers. The total value of securities on loan is $26,094,000. |
| 3 | Security exempt from registration under Rule 144A of the Securities Act of 1933. Such securities may be sold in transactions exempt from registration, normally to qualified institutional buyers. At October 31, 2021, the aggregate value was $180,341,000, representing 6.4% of net assets. |
| 4 | Affiliated money market fund available only to Vanguard funds and certain trusts and accounts managed by Vanguard. Rate shown is the 7-day yield. |
| 5 | Collateral of $29,057,000 was received for securities on loan, of which $28,409,000 is held in Vanguard Market Liquidity Fund and $648,000 is held in cash. |
| | ADR—American Depositary Receipt. |
| | REIT—Real Estate Investment Trust. |
International Explorer Fund
Derivative Financial Instruments Outstanding as of Period End
| Futures Contracts |
| | | | ($000) |
| | Expiration | Number of
Long (Short)
Contracts | Notional
Amount | Value and
Unrealized
Appreciation
(Depreciation) |
| Long Futures Contracts |
| MSCI EAFE Index | December 2021 | 379 | 44,336 | (254) |
| MSCI Emerging Market Index | December 2021 | 282 | 17,794 | (245) |
| | | | | (499) |
See accompanying Notes, which are an integral part of the Financial Statements.
International Explorer Fund
Statement of Assets and Liabilities
|
| ($000s, except shares and per-share amounts) | Amount |
| Assets | |
| Investments in Securities, at Value | |
| Unaffiliated Issuers (Cost $2,037,417) | 2,704,151 |
| Affiliated Issuers (Cost $125,556) | 125,562 |
| Total Investments in Securities | 2,829,713 |
| Investment in Vanguard | 94 |
| Cash | 8,136 |
| Foreign Currency, at Value (Cost $8,694) | 8,694 |
| Cash Collateral Pledged—Futures Contracts | 3,550 |
| Receivables for Investment Securities Sold | 7,056 |
| Receivables for Accrued Income | 7,171 |
| Receivables for Capital Shares Issued | 750 |
| Total Assets | 2,865,164 |
| Liabilities | |
| Payables for Investment Securities Purchased | 16,470 |
| Collateral for Securities on Loan | 29,057 |
| Payables for Capital Shares Redeemed | 2,250 |
| Payables to Investment Advisor | 1,625 |
| Payables to Vanguard | 223 |
| Variation Margin Payable—Futures Contracts | 560 |
| Total Liabilities | 50,185 |
| Net Assets | 2,814,979 |
At October 31, 2021, net assets consisted of: |
|
| | |
| Paid-in Capital | 2,051,479 |
| Total Distributable Earnings (Loss) | 763,500 |
| Net Assets | 2,814,979 |
| | |
| Net Assets | |
Applicable to 123,984,836 outstanding $.001 par value shares of
beneficial interest (unlimited authorization) | 2,814,979 |
| Net Asset Value Per Share | $22.70 |
See accompanying Notes, which are an integral part of the Financial Statements.
International Explorer Fund
|
| | Year Ended
October 31, 2021 |
| | ($000) |
| Investment Income | |
| Income | |
| Dividends1 | 46,075 |
| Interest2 | 74 |
| Securities Lending—Net | 1,186 |
| Total Income | 47,335 |
| Expenses | |
| Investment Advisory Fees—Note B | |
| Basic Fee | 7,396 |
| Performance Adjustment | (1,331) |
| The Vanguard Group—Note C | |
| Management and Administrative | 4,265 |
| Marketing and Distribution | 161 |
| Custodian Fees | 259 |
| Auditing Fees | 40 |
| Shareholders’ Reports | 290 |
| Trustees’ Fees and Expenses | 2 |
| Total Expenses | 11,082 |
| Net Investment Income | 36,253 |
| Realized Net Gain (Loss) | |
| Investment Securities Sold2 | 349,800 |
| Futures Contracts | 11,367 |
| Foreign Currencies | (1,219) |
| Realized Net Gain (Loss) | 359,948 |
| Change in Unrealized Appreciation (Depreciation) | |
| Investment Securities2 | 409,265 |
| Futures Contracts | 1,765 |
| Foreign Currencies | 344 |
| Change in Unrealized Appreciation (Depreciation) | 411,374 |
| Net Increase (Decrease) in Net Assets Resulting from Operations | 807,575 |
| 1 | Dividends are net of foreign withholding taxes of $3,769,000. |
| 2 | Interest income, realized net gain (loss), and change in unrealized appreciation (depreciation) from an affiliated company of the fund were $70,000, less than $1,000, and $1,000, respectively. Purchases and sales are for temporary cash investment purposes. |
See accompanying Notes, which are an integral part of the Financial Statements.
International Explorer Fund
Statement of Changes in Net Assets
|
| | Year Ended October 31, |
| | 2021
($000) | 2020
($000) |
| Increase (Decrease) in Net Assets | | |
| Operations | | |
| Net Investment Income | 36,253 | 34,127 |
| Realized Net Gain (Loss) | 359,948 | (78,073) |
| Change in Unrealized Appreciation (Depreciation) | 411,374 | 2,216 |
| Net Increase (Decrease) in Net Assets Resulting from Operations | 807,575 | (41,730) |
| Distributions | | |
| Total Distributions | (29,013) | (80,592) |
| Capital Share Transactions | | |
| Issued | 270,839 | 364,525 |
| Issued in Lieu of Cash Distributions | 25,535 | 72,030 |
| Redeemed | (588,908) | (1,147,784) |
| Net Increase (Decrease) from Capital Share Transactions | (292,534) | (711,229) |
| Total Increase (Decrease) | 486,028 | (833,551) |
| Net Assets | | |
| Beginning of Period | 2,328,951 | 3,162,502 |
| End of Period | 2,814,979 | 2,328,951 |
See accompanying Notes, which are an integral part of the Financial Statements.
International Explorer Fund
For a Share Outstanding
Throughout Each Period | Year Ended October 31, |
| 2021 | 2020 | 2019 | 2018 | 2017 |
| Net Asset Value, Beginning of Period | $16.90 | $17.22 | $17.86 | $21.87 | $16.82 |
| Investment Operations | | | | | |
| Net Investment Income1 | .280 | .211 | .379 | .369 | .333 |
| Net Realized and Unrealized Gain (Loss) on Investments | 5.736 | (.081) | .300 | (3.032) | 5.035 |
| Total from Investment Operations | 6.016 | .130 | .679 | (2.663) | 5.368 |
| Distributions | | | | | |
| Dividends from Net Investment Income | (.216) | (.450) | (.289) | (.447) | (.318) |
| Distributions from Realized Capital Gains | — | — | (1.030) | (.900) | — |
| Total Distributions | (.216) | (.450) | (1.319) | (1.347) | (.318) |
| Net Asset Value, End of Period | $22.70 | $16.90 | $17.22 | $17.86 | $21.87 |
| Total Return2 | 35.79% | 0.62% | 4.85% | -13.08% | 32.58% |
| Ratios/Supplemental Data | | | | | |
| Net Assets, End of Period (Millions) | $2,815 | $2,329 | $3,163 | $3,649 | $3,980 |
| Ratio of Total Expenses to Average Net Assets3 | 0.40% | 0.39% | 0.39% | 0.39% | 0.38% |
| Ratio of Net Investment Income to Average Net Assets | 1.30% | 1.29% | 2.28% | 1.75% | 1.68% |
| Portfolio Turnover Rate | 51% | 71% | 35% | 40% | 43% |
| 1 | Calculated based on average shares outstanding. |
| 2 | Total returns do not include account service fees that may have applied in the periods shown. Fund prospectuses provide information about any applicable account service fees. |
| 3 | Includes performance-based investment advisory fee increases (decreases) of (0.05%), (0.04%), (0.03%), (0.01%), and (0.01%). |
See accompanying Notes, which are an integral part of the Financial Statements.
International Explorer Fund
Notes to Financial Statements
Vanguard International Explorer Fund is registered under the Investment Company Act of 1940 as an open-end investment company, or mutual fund. The fund invests in securities of foreign issuers, which may subject it to investment risks not normally associated with investing in securities of U.S. corporations. Market disruptions associated with the COVID-19 pandemic have had a global impact, and uncertainty exists as to the long-term implications. Such disruptions can adversely affect assets of the fund and thus fund performance.
A. The following significant accounting policies conform to generally accepted accounting principles for U.S. investment companies. The fund consistently follows such policies in preparing its financial statements.
1. Security Valuation: Securities are valued as of the close of trading on the New York Stock Exchange (generally 4 p.m., Eastern time) on the valuation date. Equity securities are valued at the latest quoted sales prices or official closing prices taken from the primary market in which each security trades; such securities not traded on the valuation date are valued at the mean of the latest quoted bid and asked prices. Securities for which market quotations are not readily available, or whose values have been affected by events occurring before the fund’s pricing time but after the close of the securities’ primary markets, are valued at their fair values calculated according to procedures adopted by the board of trustees. These procedures include obtaining quotations from an independent pricing service, monitoring news to identify significant market- or security-specific events, and evaluating changes in the values of foreign market proxies (for example, ADRs, futures contracts, or exchange-traded funds), between the time the foreign markets close and the fund’s pricing time. When fair-value pricing is employed, the prices of securities used by a fund to calculate its net asset value may differ from quoted or published prices for the same securities.
Investments in Vanguard Market Liquidity Fund are valued at that fund's net asset value.
Temporary cash investments are valued using the latest bid prices or using valuations based on a matrix system (which considers such factors as security prices, yields, maturities, and ratings), both as furnished by independent pricing services.
2. Foreign Currency: Securities and other assets and liabilities denominated in foreign currencies are translated into U.S. dollars using exchange rates obtained from an independent third party as of the fund’s pricing time on the valuation date. Realized gains (losses) and unrealized appreciation (depreciation) on investment securities include the effects of changes in exchange rates since the securities were purchased, combined with the effects of changes in security prices. Fluctuations in the value of other assets and liabilities resulting from changes in exchange rates are recorded as unrealized foreign currency gains (losses) until the assets or liabilities are settled in cash, at which time they are recorded as realized foreign currency gains (losses).
3. Futures Contracts: The fund uses index futures contracts to a limited extent, with the objective of maintaining full exposure to the stock market while maintaining liquidity. The fund may purchase or sell futures contracts to achieve a desired level of investment, whether to accommodate portfolio turnover or cash flows from capital share transactions. The primary risks associated with the use of futures contracts are imperfect correlation between changes in market values of stocks held by the fund and the prices of futures contracts, and the possibility of an illiquid market. Counterparty risk involving futures is mitigated because a regulated clearinghouse is the counterparty instead of the clearing broker. To further mitigate counterparty risk, the fund trades futures contracts on an exchange, monitors the financial strength of its clearing brokers and clearinghouse, and has entered into clearing agreements with its clearing brokers. The
International Explorer Fund
clearinghouse imposes initial margin requirements to secure the fund’s performance and requires daily settlement of variation margin representing changes in the market value of each contract. Any securities pledged as initial margin for open contracts are noted in the Schedule of Investments.
Futures contracts are valued at their quoted daily settlement prices. The notional amounts of the contracts are not recorded in the Statement of Assets and Liabilities. Fluctuations in the value of the contracts are recorded in the Statement of Assets and Liabilities as an asset (liability) and in the Statement of Operations as unrealized appreciation (depreciation) until the contracts are closed, when they are recorded as realized gains (losses) on futures contracts.
During the year ended October 31, 2021, the fund’s average investments in long and short futures contracts represented 2% and 0% of net assets, respectively, based on the average of the notional amounts at each quarter-end during the period.
4. Repurchase Agreements: The fund enters into repurchase agreements with institutional counterparties. Securities pledged as collateral to the fund under repurchase agreements are held by a custodian bank until the agreements mature, and in the absence of a default, such collateral cannot be repledged, resold, or rehypothecated. Each agreement requires that the market value of the collateral be sufficient to cover payments of interest and principal. The fund further mitigates its counterparty risk by entering into repurchase agreements only with a diverse group of prequalified counterparties, monitoring their financial strength, and entering into master repurchase agreements with its counterparties. The master repurchase agreements provide that, in the event of a counterparty's default (including bankruptcy), the fund may terminate any repurchase agreements with that counterparty, determine the net amount owed, and sell or retain the collateral up to the net amount owed to the fund. Such action may be subject to legal proceedings, which may delay or limit the disposition of collateral.
5. Federal Income Taxes: The fund intends to continue to qualify as a regulated investment company and distribute all of its taxable income. The fund’s tax returns are open to examination by the relevant tax authorities until expiration of the applicable statute of limitations, which is generally three years after the filing of the tax return. Management has analyzed the fund’s tax positions taken for all open federal and state income tax years, and has concluded that no provision for income tax is required in the fund’s financial statements.
6. Distributions: Distributions to shareholders are recorded on the ex-dividend date. Distributions are determined on a tax basis at the fiscal year-end and may differ from net investment income and realized capital gains for financial reporting purposes.
7. Securities Lending: To earn additional income, the fund lends its securities to qualified institutional borrowers. Security loans are subject to termination by the fund at any time, and are required to be secured at all times by collateral in an amount at least equal to the market value of securities loaned. Daily market fluctuations could cause the value of loaned securities to be more or less than the value of the collateral received. When this occurs, the collateral is adjusted and settled before the opening of the market on the next business day. The fund further mitigates its counterparty risk by entering into securities lending transactions only with a diverse group of prequalified counterparties, monitoring their financial strength, and entering into master securities lending agreements with its counterparties. The master securities lending agreements provide that, in the event of a counterparty’s default (including bankruptcy), the fund may terminate any loans with that borrower, determine the net amount owed, and sell or retain the collateral up to the net amount owed to the fund; however, such actions may be subject to legal proceedings.
International Explorer Fund
While collateral mitigates counterparty risk, in the event of a default, the fund may experience delays and costs in recovering the securities loaned. The fund invests cash collateral received in Vanguard Market Liquidity Fund, and records a liability in the Statement of Assets and Liabilities for the return of the collateral, during the period the securities are on loan. Collateral investments in Vanguard Market Liquidity Fund are subject to market appreciation or depreciation. Securities lending income represents fees charged to borrowers plus income earned on invested cash collateral, less expenses associated with the loan. During the term of the loan, the fund is entitled to all distributions made on or in respect of the loaned securities.
8. Credit Facilities and Interfund Lending Program: The fund and certain other funds managed by The Vanguard Group ("Vanguard") participate in a $4.3 billion committed credit facility provided by a syndicate of lenders pursuant to a credit agreement and an uncommitted credit facility provided by Vanguard. Both facilities may be renewed annually. Each fund is individually liable for its borrowings, if any, under the credit facilities. Borrowings may be utilized for temporary or emergency purposes, subject to the fund’s regulatory and contractual borrowing restrictions. With respect to the committed credit facility, the participating funds are charged administrative fees and an annual commitment fee of 0.10% of the undrawn committed amount of the facility; these fees are allocated to the funds based on a method approved by the fund’s board of trustees and included in Management and Administrative expenses on the fund’s Statement of Operations. Any borrowings under either facility bear interest at a rate based upon the higher of the one-month London Interbank Offered Rate (or an acceptable alternate rate, if necessary), federal funds effective rate, or overnight bank funding rate plus an agreed-upon spread, except that borrowings under the uncommitted credit facility may bear interest based upon an alternative rate agreed to by the fund and Vanguard.
In accordance with an exemptive order (the “Order”) from the SEC, the fund may participate in a joint lending and borrowing program that allows registered open-end Vanguard funds to borrow money from and lend money to each other for temporary or emergency purposes (the “Interfund Lending Program”), subject to compliance with the terms and conditions of the Order, and to the extent permitted by the fund’s investment objective and investment policies. Interfund loans and borrowings normally extend overnight, but can have a maximum duration of seven days. Loans may be called on one business day’s notice. The interest rate to be charged is governed by the conditions of the Order and internal procedures adopted by the board of trustees. The board of trustees is responsible for overseeing the Interfund Lending Program.
For the year ended October 31, 2021, the fund did not utilize the credit facilities or the Interfund Lending Program.
9. Other: Dividend income is recorded on the ex-dividend date. Non-cash dividends included in income, if any, are recorded at the fair value of the securities received. Interest income includes income distributions received from Vanguard Market Liquidity Fund and is accrued daily. Premiums and discounts on debt securities are amortized and accreted, respectively, to interest income over the lives of the respective securities, except for premiums on certain callable debt securities that are amortized to the earliest call date. Security transactions are accounted for on the date securities are bought or sold. Costs used to determine realized gains (losses) on the sale of investment securities are those of the specific securities sold.
Taxes on foreign dividends and capital gains have been provided for in accordance with the fund’s understanding of the applicable countries’ tax rules and rates. Deferred foreign capital gains tax, if any, is accrued daily based upon applicable net unrealized gains. The fund has filed tax reclaims for
International Explorer Fund
previously withheld taxes on dividends earned in certain European Union countries. These filings are subject to various administrative and judicial proceedings within these countries. Such tax reclaims received during the year, if any, are included in dividend income. No other amounts for additional tax reclaims are reflected in the financial statements due to the uncertainty as to the ultimate resolution of proceedings, the likelihood of receipt of these reclaims, and the potential timing of payment.
B. The investment advisory firms Schroder Investment Management North America Inc., Wellington Management Company llp, TimesSquare Capital Management, LLC, and Baillie Gifford Overseas Ltd. each provide investment advisory services to a portion of the fund for a fee calculated at an annual percentage rate of average net assets managed by the advisor. The basic fees of Schroder Investment Management North America Inc., Wellington Management Company llp, and TimesSquare Capital Management, LLC, are subject to quarterly adjustments based on performance relative to the S&P EPAC SmallCap Index for the preceding three years. In accordance with the advisory contract entered into with Baillie Gifford Overseas Ltd., beginning November 1, 2021, the investment advisory fees will be subject to quarterly adjustments based on performance relative to the MSCI All Country World Index ex US Small-Cap Index since October 31,2020.
Vanguard manages the cash reserves of the fund as described below.
For the year ended October 31, 2021, the aggregate investment advisory fee represented an effective annual basic rate of 0.27% of the fund’s average net assets, before a decrease of $1,331,000 (0.05%) based on performance.
C. In accordance with the terms of a Funds’ Service Agreement (the “FSA”) between Vanguard and the fund, Vanguard furnishes to the fund corporate management, administrative, marketing, distribution, and cash management services at Vanguard’s cost of operations (as defined by the FSA). These costs of operations are allocated to the fund based on methods and guidelines approved by the board of trustees and are generally settled twice a month.
Upon the request of Vanguard, the fund may invest up to 0.40% of its net assets as capital in Vanguard. At October 31, 2021, the fund had contributed to Vanguard capital in the amount of $94,000, representing less than 0.01% of the fund’s net assets and 0.04% of Vanguard’s capital received pursuant to the FSA. The fund’s trustees and officers are also directors and employees, respectively, of Vanguard.
D. Various inputs may be used to determine the value of the fund’s investments and derivatives. These inputs are summarized in three broad levels for financial statement purposes. The inputs or methodologies used to value securities are not necessarily an indication of the risk associated with investing in those securities.
Level 1—Quoted prices in active markets for identical securities.
Level 2—Other significant observable inputs (including quoted prices for similar securities, interest rates, prepayment speeds, credit risk, etc.).
Level 3—Significant unobservable inputs (including the fund’s own assumptions used to determine the fair value of investments). Any investments and derivatives valued with significant unobservable inputs are noted on the Schedule of Investments.
International Explorer Fund
The following table summarizes the market value of the fund's investments and derivatives as of October 31, 2021, based on the inputs used to value them:
| | Level 1
($000) | Level 2
($000) | Level 3
($000) | Total
($000) |
| Investments | | | | |
| Assets | | | | |
| Common Stocks | 117,833 | 2,579,535 | 2,883 | 2,700,251 |
| Temporary Cash Investments | 125,562 | 3,900 | — | 129,462 |
| Total | 243,395 | 2,583,435 | 2,883 | 2,829,713 |
| | | | |
| Derivative Financial Instruments | | | | |
| Liabilities | | | | |
| Futures Contracts1 | 499 | — | — | 499 |
| 1 | Includes cumulative appreciation (depreciation) on futures contracts and centrally cleared swaps, if any, as reported in the Schedule of Investments. Only current day’s variation margin is reported within the Statement of Assets and Liabilities. |
E. Permanent differences between book-basis and tax-basis components of net assets are reclassified among capital accounts in the financial statements to reflect their tax character. These reclassifications have no effect on net assets or net asset value per share. As of period end, permanent differences primarily attributable to the accounting for foreign currency transactions, passive foreign investment companies, and distributions in connection with fund share redemptions were reclassified between the following accounts:
| | Amount
($000) |
| Paid-in Capital | 1,488 |
| Total Distributable Earnings (Loss) | (1,488) |
Temporary differences between book-basis and tax-basis components of total distributable earnings (loss) arise when certain items of income, gain, or loss are recognized in different periods for financial statement and tax purposes; these differences will reverse at some time in the future. The differences are primarily related to the deferral of losses from wash sales; the recognition of unrealized gains or losses from certain derivative contracts; and the recognition of unrealized gains from passive foreign investment companies. As of period end, the tax-basis components of total distributable earnings (loss) are detailed in the table as follows:
| | Amount
($000) |
| Undistributed Ordinary Income | 83,669 |
| Undistributed Long-Term Gains | 33,045 |
| Capital Loss Carryforwards | — |
| Qualified Late-Year Losses | — |
| Net Unrealized Gains (Losses) | 646,786 |
International Explorer Fund
The tax character of distributions paid was as follows:
| | Year Ended October 31, |
| | 2021
Amount
($000) | 2020
Amount
($000) |
| Ordinary Income* | 29,013 | 80,592 |
| Long-Term Capital Gains | — | — |
| Total | 29,013 | 80,592 |
| * | Includes short-term capital gains, if any. |
As of October 31, 2021, gross unrealized appreciation and depreciation for investments and derivatives based on cost for U.S. federal income tax purposes were as follows:
| | Amount
($000) |
| Tax Cost | 2,183,308 |
| Gross Unrealized Appreciation | 781,866 |
| Gross Unrealized Depreciation | (135,461) |
| Net Unrealized Appreciation (Depreciation) | 646,405 |
F. During the year ended October 31, 2021, the fund purchased $1,340,036,000 of investment securities and sold $1,652,138,000 of investment securities, other than temporary cash investments.
The fund purchased securities from and sold securities to other funds or accounts managed by its investment advisors or their affiliates, in accordance with procedures adopted by the board of trustees in compliance with Rule 17a-7 of the Investment Company Act of 1940. For the year ended October 31, 2021, such purchases were $22,000 and sales were $782,000, resulting in net realized gain of $323,000; these amounts, other than temporary cash investments, are included in the purchases and sales of investment securities noted above.
G. Capital shares issued and redeemed were:
| | Year Ended October 31, | |
| | 2021
Shares
(000) | | 2020
Shares
(000) | |
| | | |
| Issued | 12,684 | | 23,379 | |
| Issued in Lieu of Cash Distributions | 1,290 | | 4,035 | |
| Redeemed | (27,817) | | (73,281) | |
| Net Increase (Decrease) in Shares Outstanding | (13,843) | | (45,867) | |
H. Management has determined that no events or transactions occurred subsequent to October 31, 2021, that would require recognition or disclosure in these financial statements.
Report of Independent Registered
Public Accounting Firm
To the Board of Trustees of Vanguard Whitehall Funds and Shareholders of Vanguard International Explorer Fund
Opinion on the Financial Statements
We have audited the accompanying statement of assets and liabilities, including the schedule of investments, of Vanguard International Explorer Fund (one of the funds constituting Vanguard Whitehall Funds, referred to hereafter as the "Fund") as of October 31, 2021, the related statement of operations for the year ended October 31, 2021, the statement of changes in net assets for each of the two years in the period ended October 31, 2021, including the related notes, and the financial highlights for each of the five years in the period ended October 31, 2021 (collectively referred to as the "financial statements"). In our opinion, the financial statements present fairly, in all material respects, the financial position of the Fund as of October 31, 2021, the results of its operations for the year then ended, the changes in its net assets for each of the two years in the period ended October 31, 2021 and the financial highlights for each of the five years in the period ended October 31, 2021 in conformity with accounting principles generally accepted in the United States of America.
Basis for Opinion
These financial statements are the responsibility of the Fund’s management. Our responsibility is to express an opinion on the Fund’s financial statements based on our audits. We are a public accounting firm registered with the Public Company Accounting Oversight Board (United States) (PCAOB) and are required to be independent with respect to the Fund in accordance with the U.S. federal securities laws and the applicable rules and regulations of the Securities and Exchange Commission and the PCAOB.
We conducted our audits of these financial statements in accordance with the standards of the PCAOB. Those standards require that we plan and perform the audit to obtain reasonable assurance about whether the financial statements are free of material misstatement, whether due to error or fraud.
Our audits included performing procedures to assess the risks of material misstatement of the financial statements, whether due to error or fraud, and performing procedures that respond to those risks. Such procedures included examining, on a test basis, evidence regarding the amounts and disclosures in the financial statements. Our audits also included evaluating the accounting principles used and significant estimates made by management, as well as evaluating the overall presentation of the financial statements. Our procedures included confirmation of securities owned as of October 31, 2021 by correspondence with the custodian, transfer agent and brokers; when replies were not received from the transfer agent or brokers, we performed other auditing procedures. We believe that our audits provide a reasonable basis for our opinion.
/s/PricewaterhouseCoopers LLP
Philadelphia, Pennsylvania
December 17, 2021
We have served as the auditor of one or more investment companies in The Vanguard Group of Funds since 1975.
Special 2021 tax information (unaudited) for Vanguard International Explorer Fund
This information for the fiscal year ended October 31, 2021, is included pursuant to provisions of the Internal Revenue Code.
The fund distributed $409,000 as capital gain dividend (20% rate gain distributions) to shareholders during the fiscal year.
For nonresident alien shareholders, 100% of short-term capital gain dividends distributed by the fund are qualified short-term capital gains.
The fund distributed $29,013,000 of qualified dividend income to shareholders during the fiscal year.
The fund designates to shareholders foreign source income of $49,779,000 and foreign taxes paid of $3,554,000. Shareholders will receive more detailed information with their Form 1099-DIV in January 2022 to determine the calendar-year amounts to be included on their 2021 tax returns.
Trustees Approve Advisory Arrangements
The board of trustees of Vanguard International Explorer Fund has renewed the fund’s investment advisory arrangements with Baillie Gifford Overseas Limited (Baillie Gifford); Schroder Investment Management North America Inc. (Schroder Inc.), as well as the sub-advisory arrangement with Schroder Investment Management North America Limited (Schroder Ltd.); TimesSquare Capital Management, LLC (TimesSquare); and Wellington Management Company llp (Wellington Management). The board determined that renewing each of the fund’s advisory arrangements was in the best interests of the fund and its shareholders.
The board based its decisions upon an evaluation of each advisor’s investment staff, portfolio management process, and performance. This evaluation included information provided to the board by Vanguard’s Portfolio Review Department, which is responsible for fund and advisor oversight and product management. The Portfolio Review Department met regularly with the advisors and made monthly presentations to the board during the fiscal year that directed the board’s focus to relevant information and topics.
The board, or an investment committee made up of board members, also received information throughout the year during advisor presentations. For each advisor presentation, the board was provided with letters and reports that included information about, among other things, the advisory firm and the advisor’s assessment of the investment environment, portfolio performance, and portfolio characteristics.
In addition, the board received periodic reports throughout the year, which included information about the fund’s performance relative to its peers and benchmark, as applicable, and updates, as needed, on the Portfolio Review Department’s ongoing assessment of the advisors.
Prior to their meeting, the trustees were provided with a memo and materials that summarized the information they received over the course of the year. They also considered the factors discussed below, among others. However, no single factor determined whether the board approved the arrangements. Rather, it was the totality of the circumstances that drove the board’s decisions.
Nature, extent, and quality of services
The board reviewed the quality of the fund’s investment management services provided by Baillie Gifford, Schroder Inc., Schroder Ltd., TimesSquare, and Wellington Management over both the short and long term, and took into account the organizational depth and stability of each advisor. The board considered the following:
Baillie Gifford. Baillie Gifford—a unit of Baillie Gifford & Co., founded in 1908—is among the largest independently owned investment management firms in the United Kingdom. Baillie Gifford invests with a long-term perspective and has a strong preference for high-quality growth companies with sustainable competitive advantages. The investment process is driven by rigorous, fundamental, bottom-up analysis undertaken by the dedicated International Smaller Companies team. The investment team seeks significant upside in each stock it invests in and considers sustainable earnings growth and free cash flow growth to be the most important determinants of a company’s prospects. Baillie Gifford has managed a portion of the fund since 2020.
Schroder. Schroders plc, the parent company of Schroder Inc. and Schroder Ltd. (collectively, Schroder), founded in 1804, specializes in global equity and fixed income management. Schroder
employs a bottom-up, fundamental research-driven process to select stocks, with a focus on identifying companies with sustainable competitive advantages, attractive earnings growth, and compelling valuations. Stock selection responsibilities are divided among five regional leaders who make up Schroder’s International Small-Cap Committee, which is led by the portfolio manager. The regional team leverages Schroder’s extensive network of local analysts across the globe, as it believes that country factors are more important for smaller companies relative to larger companies. Schroder Inc. has advised the fund since its inception in 1996, and its affiliate Schroder Ltd. has managed a portion of the fund since 2003.
TimesSquare. TimesSquare, founded in 2000 as a small- and mid-cap growth specialist, is a strategic partner of Affiliated Managers Group, Inc. TimesSquare’s small-cap equity team is led by the portfolio manager and is made up of five experienced members. All portfolio decisions are made collectively, allowing for accountability. Value chain analysis and interactions with key stakeholders are at the core of the team’s research and idea-generation process, resulting in a portfolio made up of industry-leading companies with sustainable business models and quality management teams. TimesSquare has managed a portion of the fund since 2017.
Wellington Management. Wellington Management, founded in 1928, is among the nation’s oldest and most respected institutional investment managers. Wellington Management’s international small-cap research equity team employs a bottom-up approach that seeks to add value through in-depth fundamental research and understanding of its industries. It believes that the experience of covering the same companies over a period of many years provides the Global Industry Analysts with in-depth knowledge of their coverage, which in turn leads to better and more timely decisions and increases their potential to produce superior results. Wellington Management has managed a portion of the fund since 2010.
The board concluded that each advisor’s experience, stability, depth, and performance, among other factors, warranted continuation and approval of the advisory arrangements.
Investment performance
The board considered the short-term, long-term, and since-inception performance, as applicable, of Baillie Gifford’s, Schroder’s, TimesSquare’s, and Wellington Management’s subportfolios, including any periods of outperformance or underperformance compared with a relevant benchmark index and peer group. The board concluded that the performance was such that the advisory arrangements should continue.
Cost
The board concluded that the fund’s expense ratio was well below the average expense ratio charged by funds in its peer group and that Baillie Gifford’s, Schroder’s, TimesSquare’s, or Wellington Management’s advisory fee rates were also well below the peer-group average.
The board did not consider the profitability of Baillie Gifford, Schroder, TimesSquare, or Wellington Management in determining whether to approve the advisory fees, because the firms are independent of Vanguard and the advisory fees are the result of arm’s-length negotiations.
The benefit of economies of scale
The board concluded that the fund’s shareholders benefit from economies of scale because of breakpoints in the advisory fee schedules for Baillie Gifford, Schroder, TimesSquare, and Wellington
Management. The breakpoints reduce the effective rate of the fees as the fund’s assets managed by each advisor increase.
The board will consider whether to renew the advisory arrangements again after a one-year period.
This page intentionally left blank.
The People Who Govern Your Fund
The trustees of your mutual fund are there to see that the fund is operated and managed in your best interests since, as a shareholder, you are a part owner of the fund. Your fund’s trustees also serve on the board of directors of The Vanguard Group, Inc., which is owned by the Vanguard funds and provides services to them.
A majority of Vanguard’s board members are independent, meaning that they have no affiliation with Vanguard or the funds they oversee, apart from the sizable personal investments they have made as private individuals. The independent board members have distinguished backgrounds in business, academia, and public service. Each of the trustees and executive officers oversees 214 Vanguard funds.
Information for each trustee and executive officer of the fund appears below. That information, as well as the Vanguard fund count, is as of the date on the cover of this fund report. The mailing address of the trustees and officers is P.O. Box 876, Valley Forge, PA 19482. More information about the trustees is in the Statement of Additional Information, which can be obtained, without charge, by contacting Vanguard at 800-662-7447, or online at vanguard.com.
Interested Trustee1
Mortimer J. Buckley
Born in 1969. Trustee since January 2018. Principal occupation(s) during the past five years and other experience: chairman of the board (2019–present) of Vanguard and of each of the investment companies served by Vanguard; chief executive officer (2018–present) of Vanguard; chief executive officer, president, and trustee (2018–present) of each of the investment companies served by Vanguard; president and director (2017–present) of Vanguard; and president (2018–present) of Vanguard Marketing Corporation. Chief investment officer (2013–2017), managing director (2002–2017), head of the Retail Investor Group (2006–2012), and chief information officer (2001–2006) of Vanguard. Chairman of the board (2011–2017) and trustee (2009–2017) of the Children’s Hospital of Philadelphia; and trustee (2018–present) and vice chair (2019–present) of The Shipley School.
Independent Trustees
Emerson U. Fullwood
Born in 1948. Trustee since January 2008. Principal occupation(s) during the past five years and other experience: executive chief staff and marketing officer for North America and corporate vice president (retired 2008) of Xerox Corporation (document management products and services). Former president of the Worldwide Channels Group, Latin America, and Worldwide Customer Service and executive chief staff officer of Developing Markets of Xerox. Executive in residence and 2009–2010 Distinguished Minett Professor at the Rochester Institute of Technology. Director of SPX FLOW, Inc. (multi-industry manufacturing). Director of the University of Rochester Medical Center, the Monroe Community College Foundation, the United Way of Rochester, North Carolina A&T University, and Roberts Wesleyan College. Trustee of the University of Rochester.
Amy Gutmann
Born in 1949. Trustee since June 2006. Principal occupation(s) during the past five years and other experience: president (2004–present) of the University of Pennsylvania. Christopher H. Browne Distinguished Professor of Political Science, School of Arts and Sciences, and professor of communication, Annenberg School for Communication, with secondary faculty appointments in the Department of Philosophy, School of Arts and Sciences, and at the Graduate School of Education, University of Pennsylvania.
1 Mr. Buckley is considered an “interested person,” as defined in the Investment Company Act of 1940, because he is an officer of the Vanguard funds.
F. Joseph Loughrey
Born in 1949. Trustee since October 2009. Principal occupation(s) during the past five years and other experience: president and chief operating officer (retired 2009) and vice chairman of the board (2008–2009) of Cummins Inc. (industrial machinery). Chairman of the board of Hillenbrand, Inc. (specialized consumer services). Director of the V Foundation. Member of the advisory council for the College of Arts and Letters and chair of the advisory board to the Kellogg Institute for International Studies, both at the University of Notre Dame. Chairman of the board of Saint Anselm College.
Mark Loughridge
Born in 1953. Trustee since March 2012. Principal occupation(s) during the past five years and other experience: senior vice president and chief financial officer (retired 2013) of IBM (information technology services). Fiduciary member of IBM’s Retirement Plan Committee (2004–2013), senior vice president and general manager (2002–2004) of IBM Global Financing, vice president and controller (1998–2002) of IBM, and a variety of other prior management roles at IBM. Member of the Council on Chicago Booth.
Scott C. Malpass
Born in 1962. Trustee since March 2012. Principal occupation(s) during the past five years and other experience: chief investment officer (retired June 2020) and vice president (retired June 2020) of the University of Notre Dame. Assistant professor (retired June 2020) of finance at the Mendoza College of Business, University of Notre Dame, and member of the Notre Dame 403(b) Investment Committee. Member of the board of Catholic Investment Services, Inc. (investment advisors) and the board of superintendence of the Institute for the Works of Religion.
Deanna Mulligan
Born in 1963. Trustee since January 2018. Principal occupation(s) during the past five years and other experience: board chair (2020), chief executive officer (2011–2020), and president (2010–2019) of The Guardian Life Insurance Company of America. Chief operating officer (2010–2011) and executive vice president (2008–2010) of Individual Life and Disability of the Guardian Life Insurance Company of America. Member of the board of the Economic Club of New York. Trustee of the Partnership for New York City (business leadership), Chief Executives for Corporate Purpose, NewYork-Presbyterian Hospital, and the Bruce Museum (arts and science). Member of the Advisory Council for the Stanford Graduate School of Business.
André F. Perold
Born in 1952. Trustee since December 2004. Principal occupation(s) during the past five years and other experience: George Gund Professor of Finance and Banking, Emeritus at the Harvard Business School (retired 2011). Chief investment officer and co-managing partner of HighVista Strategies (private investment firm). Member of the board (2018–present) of RIT Capital Partners (investment firm). Member of the investment committee of Partners Health Care System.
Sarah Bloom Raskin
Born in 1961. Trustee since January 2018. Principal occupation(s) during the past five years and other experience: deputy secretary (2014–2017) of the United States Department of the Treasury. Governor (2010–2014) of the Federal Reserve Board. Commissioner (2007–2010) of financial regulation for the State of Maryland. Professor (2020–present), Distinguished Fellow of the Global Financial Markets Center (2020–present), and Rubenstein Fellow (2017–2020) at Duke University. Trustee (2017–present) of Amherst College and member of Amherst College Investment Committee (2019–present). Member of the Regenerative Crisis Response Committee (2020–present).
David A. Thomas
Born in 1956. Trustee since July 2021. Principal occupation(s) during the past five years and other experience: president of Morehouse College (2018–present). Professor of business administration, emeritus at Harvard University (2017–2018). Dean (2011–2016) and professor of management (2016–2017) at the Georgetown University McDonough School of Business. Director of DTE Energy Company (2013–present). Trustee of Common Fund (2019–present).
Peter F. Volanakis
Born in 1955. Trustee since July 2009. Principal occupation(s) during the past five years and other experience: president and chief operating officer (retired 2010) of Corning Incorporated (communications equipment) and director of Corning Incorporated (2000–2010) and Dow Corning (2001–2010). Director (2012) of SPX Corporation (multi-industry manufacturing). Overseer of the Amos Tuck School of Business Administration, Dartmouth College (2001–2013). Chairman of the board of trustees of Colby-Sawyer College. Member of the BMW Group Mobility Council.
Executive Officers
Christine M. Buchanan
Born in 1970. Principal occupation(s) during the past five years and other experience: principal of Vanguard. Chief financial officer (2021–present) and treasurer (2017–present) of each of the investment companies served by Vanguard. Partner (2005–2017) at KPMG (audit, tax, and advisory services).
David Cermak
Born in 1960. Principal occupation(s) during the past five years and other experience: principal of Vanguard. Finance director (2019–present) of each of the investment companies served by Vanguard. Managing director and head (2017–present) of Vanguard Investments Singapore. Managing director and head (2017–2019) of Vanguard Investments Hong Kong. Representative director and head (2014–2017) of Vanguard Investments Japan.
John Galloway
Born in 1973. Principal occupation(s) during the past five years and other experience: principal of Vanguard. Investment stewardship officer (September 2020–present) of each of the investment companies served by Vanguard. Head of Investor Advocacy (February 2020–present) and head of Marketing Strategy and Planning (2017–2020) at Vanguard. Deputy assistant to the President of the United States (2015).
Peter Mahoney
Born in 1974. Principal occupation(s) during the past five years and other experience: principal of Vanguard. Controller (2015–present) of each of the investment companies served by Vanguard. Head of International Fund Services (2008–2014) at Vanguard.
Anne E. Robinson
Born in 1970. Principal occupation(s) during the past five years and other experience: general counsel (2016–present) of Vanguard. Secretary (2016–present) of Vanguard and of each of the investment companies served by Vanguard. Managing director (2016–present) of Vanguard. Managing director and general counsel of Global Cards and Consumer Services (2014–2016) at Citigroup. Counsel (2003–2014) at American Express.
Michael Rollings
Born in 1963. Principal occupation(s) during the past five years and other experience: finance director (2017–present) and treasurer (2017) of each of the investment companies served by Vanguard. Managing director (2016–present) of Vanguard. Chief financial officer (2016–present) of Vanguard. Director (2016–present) of Vanguard Marketing Corporation. Executive vice president and chief financial officer (2006–2016) of MassMutual Financial Group.
John E. Schadl
Born in 1972. Principal occupation(s) during the past five years and other experience: principal of Vanguard. Chief compliance officer (2019–present) of Vanguard and of each of the investment companies served by Vanguard. Assistant vice president (2019–present) of Vanguard Marketing Corporation.
Vanguard Senior Management Team
| Matthew Benchener | Thomas M. Rampulla |
| Joseph Brennan | Karin A. Risi |
| Mortimer J. Buckley | Anne E. Robinson |
| Gregory Davis | Michael Rollings |
| John James | Nitin Tandon |
| John T. Marcante | Lauren Valente |
| Chris D. McIsaac | |
Connect with Vanguard®>vanguard.com
Fund Information > 800-662-7447
Direct Investor Account Services > 800-662-2739
Institutional Investor Services > 800-523-1036
Text Telephone for People
Who Are Deaf or Hard of Hearing > 800-749-7273
This material may be used in conjunction with the offering of shares of any Vanguard fund only if preceded or accompanied by the fund’s current prospectus.
All comparative mutual fund data are from Morningstar, Inc., unless otherwise noted.
You can obtain a free copy of Vanguard’s proxy voting guidelines by visiting vanguard.com/proxyreporting or by calling Vanguard at 800-662-2739. The guidelines are also available from the SEC’s website, www.sec.gov. In addition, you may obtain a free report on how your fund voted the proxies for securities it owned during the 12 months ended June 30. To get the report, visit either vanguard.com/proxyreporting or www.sec.gov.
You can review information about your fund on the SEC’s website, and you can receive copies of this information, for a fee, by sending a request via email addressed to publicinfo@sec.gov.
Source for Bloomberg indexes: Bloomberg Index Services Limited. Copyright 2021, Bloomberg. All rights reserved.
CFA® is a registered trademark owned by CFA Institute.
© 2021 The Vanguard Group, Inc.
All rights reserved.
Vanguard Marketing Corporation, Distributor.
Q1260 122021
Annual Report | October 31, 2021
Vanguard High Dividend Yield Index Fund
Contents
Please note: The opinions expressed in this report are just that—informed opinions. They should not be considered promises or advice. Also, please keep in mind that the information and opinions cover the period through the date on the front of this report. Of course, the risks of investing in your fund are spelled out in the prospectus.
Your Fund’s Performance at a Glance
| • | For the 12 months ended October 31, 2021, Vanguard High Dividend Yield Index Fund returned 40.50% for Admiral Shares and 40.55% for ETF shares (ETF returns are based on net asset value). The fund’s benchmark, the FTSE High Dividend Yield Index, returned 40.61%. |
| • | During the period, the global economy continued to recover from the sharp pandemic-induced contraction in the spring of 2020. Countries that were more successful in containing the virus, whether through vaccinations, lockdowns, or both, generally fared better economically. Swift and extensive fiscal and monetary support from policymakers was also key to the rebound. Even amid concerns toward the end of the fiscal year about inflation and the prospect of less accommodative monetary policy, stock returns were excellent. |
| • | Financial and energy stocks contributed most to the fund’s performance. |
| • | For the past decade, the fund’s ETF Shares posted an average annual return of 13.00%, slightly behind the 13.06% average of their benchmark. |
Market Barometer
| | Average Annual Total Returns
Periods Ended October 31, 2021 |
| | One Year | Three Years | Five Years |
| Stocks | | | |
| Russell 1000 Index (Large-caps) | 43.51% | 22.01% | 19.16% |
| Russell 2000 Index (Small-caps) | 50.80 | 16.47 | 15.52 |
| Russell 3000 Index (Broad U.S. market) | 43.90 | 21.62 | 18.91 |
| FTSE All-World ex US Index (International) | 30.23 | 12.42 | 10.05 |
| Bonds | | | |
Bloomberg U.S. Aggregate Bond Index
(Broad taxable market) | -0.48% | 5.63% | 3.10% |
Bloomberg Municipal Bond Index
(Broad tax-exempt market) | 2.64 | 5.17 | 3.41 |
| FTSE Three-Month U.S. Treasury Bill Index | 0.05 | 1.08 | 1.12 |
| CPI | | | |
| Consumer Price Index | 6.22% | 3.03% | 2.73% |
About Your Fund’s Expenses
As a shareholder of the fund, you incur ongoing costs, which include costs for portfolio management, administrative services, and shareholder reports (like this one), among others. Operating expenses, which are deducted from a fund’s gross income, directly reduce the investment return of the fund.
A fund‘s expenses are expressed as a percentage of its average net assets. This figure is known as the expense ratio. The following examples are intended to help you understand the ongoing costs (in dollars) of investing in your fund and to compare these costs with those of other mutual funds. The examples are based on an investment of $1,000 made at the beginning of the period shown and held for the entire period.
The accompanying table illustrates your fund’s costs in two ways:
| • | Based on actual fund return. This section helps you to estimate the actual expenses that you paid over the period. The ”Ending Account Value“ shown is derived from the fund’s actual return, and the third column shows the dollar amount that would have been paid by an investor who started with $1,000 in the fund. You may use the information here, together with the amount you invested, to estimate the expenses that you paid over the period. |
To do so, simply divide your account value by $1,000 (for example, an $8,600 account value divided by $1,000 = 8.6), then multiply the result by the number given for your fund under the heading ”Expenses Paid During Period.“
| • | Based on hypothetical 5% yearly return. This section is intended to help you compare your fund‘s costs with those of other mutual funds. It assumes that the fund had a yearly return of 5% before expenses, but that the expense ratio is unchanged. In this case—because the return used is not the fund’s actual return—the results do not apply to your investment. The example is useful in making comparisons because the Securities and Exchange Commission requires all mutual funds to calculate expenses based on a 5% return. You can assess your fund’s costs by comparing this hypothetical example with the hypothetical examples that appear in shareholder reports of other funds. |
Note that the expenses shown in the table are meant to highlight and help you compare ongoing costs only and do not reflect transaction costs incurred by the fund for buying and selling securities. Further, the expenses do not include any purchase, redemption, or account service fees described in the fund prospectus. If such fees were applied to your account, your costs would be higher. Your fund does not carry a “sales load.”
The calculations assume no shares were bought or sold during the period. Your actual costs may have been higher or lower, depending on the amount of your investment and the timing of any purchases or redemptions.
You can find more information about the fund’s expenses, including annual expense ratios, in the Financial Statements section of this report. For additional information on operating expenses and other shareholder costs, please refer to your fund’s current prospectus.
| Six Months Ended October 31, 2021 | | | |
| | Beginning
Account Value
4/30/2021 | Ending
Account Value
10/31/2021 | Expenses
Paid During
Period |
| Based on Actual Fund Return | | | |
| High Dividend Yield Index Fund | | | |
| ETF Shares | $1,000.00 | $1,061.70 | $0.31 |
| Admiral™ Shares | 1,000.00 | 1,061.60 | 0.42 |
| Based on Hypothetical 5% Yearly Return | | | |
| High Dividend Yield Index Fund | | | |
| ETF Shares | $1,000.00 | $1,024.90 | $0.31 |
| Admiral Shares | 1,000.00 | 1,024.80 | 0.41 |
The calculations are based on expenses incurred in the most recent six-month period. The fund's annualized six-month expense ratios for that period are 0.06% for ETF Shares and 0.08% for Admiral Shares. The dollar amounts shown as “Expenses Paid” are equal to the annualized expense ratio multiplied by the average account value over the period, multiplied by the number of days in the most recent six-month period, then divided by the number of days in the most recent 12-month period (184/365).
High Dividend Yield Index Fund
All of the returns in this report represent past performance, which is not a guarantee of future results that may be achieved by the fund. (Current performance may be lower or higher than the performance data cited. For performance data current to the most recent month-end, visit our website at vanguard.com/performance.) Note, too, that both investment returns and principal value can fluctuate widely, so an investor’s shares, when sold, could be worth more or less than their original cost. The returns shown do not reflect taxes that a shareholder would pay on fund distributions or on the sale of fund shares.
Cumulative Performance: October 31, 2011, Through October 31, 2021
Initial Investment of $10,000
| | | | Average Annual Total Returns
Periods Ended October 31, 2021 |
| | | One
Year | Five
Years | Ten
Years | Final Value
of a $10,000
Investment |
 | High Dividend Yield Index Fund
ETF Shares Net Asset Value | 40.55% | 12.30% | 13.00% | $33,944 |
| | High Dividend Yield Index Fund
ETF Shares Market Price | 40.49 | 12.29 | 12.99 | 33,916 |
 | FTSE High Dividend Yield Index | 40.61 | 12.34 | 13.06 | 34,135 |
 | Dow Jones U.S. Total Stock Market Float Adjusted Index | 44.07 | 18.87 | 16.04 | 44,284 |
| | | | |
| | | One
Year | Since
Inception
(2/7/2019) | Final Value
of a $10,000
Investment |
| High Dividend Yield Index Fund Admiral Shares | 40.50% | 13.92% | $14,272 |
| FTSE High Dividend Yield Index | 40.61 | 13.98 | 14,292 |
| Dow Jones U.S. Total Stock Market Float Adjusted Index | 44.07 | 23.64 | 17,844 |
“Since Inception” performance is calculated from the Admiral Shares’ inception date for both the fund and its comparative standard(s).
See Financial Highlights for dividend and capital gains information.
High Dividend Yield Index Fund
| Cumulative Returns of ETF Shares: October 31, 2011, Through October 31, 2021 |
| | One
Year | Five
Years | Ten
Years |
| High Dividend Yield Index Fund ETF Shares Market Price | 40.49% | 78.50% | 239.16% |
| High Dividend Yield Index Fund ETF Shares Net Asset Value | 40.55 | 78.57 | 239.44 |
| FTSE High Dividend Yield Index | 40.61 | 78.91 | 241.35 |
For the ETF Shares, the market price is determined by the midpoint of the bid-offer spread as of the closing time of the New York Stock Exchange (generally 4 p.m., Eastern time). The net asset value is also determined as of the NYSE closing time. For more information about how the ETF Shares' market prices have compared with their net asset value, visit vanguard.com, select your ETF, and then select the Price and Performance tab. The ETF premium/discount analysis there shows the percentages of days on which the ETF Shares' market price was above or below the NAV.
High Dividend Yield Index Fund
| Basic Materials | 4.3% |
| Consumer Discretionary | 8.7 |
| Consumer Staples | 12.5 |
| Energy | 7.4 |
| Financials | 23.0 |
| Health Care | 12.3 |
| Industrials | 10.0 |
| Real Estate | 0.0 |
| Technology | 7.3 |
| Telecommunications | 6.6 |
| Utilities | 7.9 |
The table reflects the fund’s investments, except for short-term investments and derivatives. Sector categories are based on the Industry Classification Benchmark (“ICB”), except for the “Other” category (if applicable), which includes securities that have not been provided an ICB classification as of the effective reporting period.
The fund may invest in derivatives (such as futures and swap contracts) for various reasons, including, but not limited to, attempting to remain fully invested and tracking its target index as closely as possible.
The Industry Classification Benchmark (“ICB”) is owned by FTSE. FTSE does not accept any liability to any person for any loss or damage arising out of any error or omission in the ICB.
High Dividend Yield Index Fund
The fund files its complete schedule of portfolio holdings with the Securities and Exchange Commission (SEC) for the first and third quarters of each fiscal year as an exhibit to its reports on Form N-PORT. The fund’s Form N-PORT reports are available on the SEC’s website at www.sec.gov.
| | | | | | Shares | Market
Value•
($000) |
| Common Stocks (99.6%) |
| Basic Materials (4.3%) |
| | Linde plc | 1,931,471 | 616,526 |
| | Air Products and Chemicals Inc. | 826,665 | 247,842 |
| | Newmont Corp. | 2,994,332 | 161,694 |
| | Dow Inc. | 2,794,478 | 156,407 |
| | International Flavors & Fragrances Inc. | 930,165 | 137,153 |
| | Nucor Corp. | 1,098,582 | 122,657 |
| | Fastenal Co. | 2,145,923 | 122,489 |
| | LyondellBasell Industries NV Class A | 984,938 | 91,422 |
| | International Paper Co. | 1,468,092 | 72,920 |
| | Celanese Corp. | 413,338 | 66,758 |
| | Eastman Chemical Co. | 511,476 | 53,209 |
| | Steel Dynamics Inc. | 721,787 | 47,696 |
| | CF Industries Holdings Inc. | 796,372 | 45,234 |
| | Reliance Steel & Aluminum Co. | 238,226 | 34,819 |
| | Olin Corp. | 534,544 | 30,458 |
| | Huntsman Corp. | 780,239 | 25,420 |
| | Scotts Miracle-Gro Co. | 152,246 | 22,602 |
| | Southern Copper Corp. | 314,020 | 18,838 |
| | Avient Corp. | 334,822 | 18,040 |
| | Chemours Co. | 614,177 | 17,209 |
| | Timken Co. | 237,494 | 16,850 |
| | Sensient Technologies Corp. | 157,352 | 15,043 |
| | Commercial Metals Co. | 441,727 | 14,215 |
| | Cabot Corp. | 216,921 | 11,573 |
| | Tronox Holdings plc Class A | 423,485 | 9,876 |
| | Compass Minerals International Inc. | 124,861 | 8,191 |
| | Worthington Industries Inc. | 123,031 | 6,683 |
| | Kaiser Aluminum Corp. | 59,452 | 5,775 |
| | Carpenter Technology Corp. | 176,636 | 5,455 |
| | | | | | Shares | Market
Value•
($000) |
| | Schweitzer-Mauduit International Inc. | 113,339 | 3,949 |
| * | Sylvamo Corp. | 132,475 | 3,730 |
| | | | | | | 2,210,733 |
| Consumer Discretionary (8.6%) |
| | Home Depot Inc. | 3,977,896 | 1,478,743 |
| | Walmart Inc. | 5,364,412 | 801,550 |
| | McDonald's Corp. | 2,794,116 | 686,095 |
| | Target Corp. | 1,858,533 | 482,512 |
| | Best Buy Co. Inc. | 934,868 | 114,278 |
| | VF Corp. | 1,212,760 | 88,386 |
| | Garmin Ltd. | 566,152 | 81,299 |
| | ViacomCBS Inc. Class B | 2,182,003 | 79,032 |
| | Genuine Parts Co. | 525,901 | 68,951 |
| | Omnicom Group Inc. | 793,251 | 54,005 |
| | Interpublic Group of Cos. Inc. | 1,471,191 | 53,801 |
| | Williams-Sonoma Inc. | 278,500 | 51,726 |
| | Whirlpool Corp. | 230,346 | 48,564 |
| | Hasbro Inc. | 476,350 | 45,615 |
| | Newell Brands Inc. | 1,416,870 | 32,432 |
| | Nielsen Holdings plc | 1,326,133 | 26,854 |
| | Polaris Inc. | 215,059 | 24,721 |
| | Leggett & Platt Inc. | 507,983 | 23,799 |
| | Hanesbrands Inc. | 1,286,003 | 21,914 |
| | Travel + Leisure Co. | 313,521 | 17,037 |
| | TEGNA Inc. | 813,799 | 15,999 |
| | Foot Locker Inc. | 334,240 | 15,933 |
| | H&R Block Inc. | 663,709 | 15,312 |
| | Rent-A-Center Inc. | 242,058 | 12,892 |
| | LCI Industries | 91,895 | 12,832 |
| | Penske Automotive Group Inc. | 117,324 | 12,442 |
| | MDC Holdings Inc. | 210,406 | 10,306 |
| | Kontoor Brands Inc. | 191,540 | 10,152 |
| | John Wiley & Sons Inc. Class A | 158,500 | 8,586 |
| | HNI Corp. | 161,019 | 6,022 |
| | Big Lots Inc. | 128,011 | 5,665 |
High Dividend Yield Index Fund
| | | | | | Shares | Market
Value•
($000) |
| | Sinclair Broadcast Group Inc. Class A | 169,068 | 4,418 |
| | Steelcase Inc. Class A | 331,653 | 3,947 |
| | | | | | | 4,415,820 |
| Consumer Staples (12.5%) |
| | Procter & Gamble Co. | 9,101,704 | 1,301,453 |
| | PepsiCo Inc. | 5,167,226 | 835,024 |
| | Coca-Cola Co. | 14,522,913 | 818,657 |
| | Philip Morris International Inc. | 5,821,835 | 550,396 |
| | CVS Health Corp. | 4,919,884 | 439,247 |
| | Mondelez International Inc. Class A | 5,210,830 | 316,506 |
| | Altria Group Inc. | 6,936,835 | 305,984 |
| | Colgate-Palmolive Co. | 3,124,491 | 238,055 |
| | Kimberly-Clark Corp. | 1,261,077 | 163,297 |
| | General Mills Inc. | 2,284,555 | 141,186 |
| | Sysco Corp. | 1,823,089 | 140,196 |
| | Archer-Daniels-Midland Co. | 2,080,369 | 133,643 |
| | Walgreens Boots Alliance Inc. | 2,683,752 | 126,190 |
| | Kroger Co. | 2,796,162 | 111,902 |
| | Hershey Co. | 547,106 | 95,935 |
| | Kraft Heinz Co. | 2,482,588 | 89,100 |
| | Tyson Foods Inc. Class A | 1,074,482 | 85,926 |
| | Clorox Co. | 464,672 | 75,746 |
| | Kellogg Co. | 937,831 | 57,489 |
| | Conagra Brands Inc. | 1,744,163 | 56,162 |
| | J M Smucker Co. | 390,139 | 47,932 |
| | Bunge Ltd. | 511,614 | 47,396 |
| | Hormel Foods Corp. | 1,054,226 | 44,615 |
| | Coca-Cola Europacific Partners plc | 749,452 | 39,459 |
| | Campbell Soup Co. | 726,887 | 29,039 |
| | Ingredion Inc. | 253,372 | 24,129 |
| | Flowers Foods Inc. | 693,747 | 17,170 |
| | Spectrum Brands Holdings Inc. | 156,546 | 14,676 |
| | Energizer Holdings Inc. | 248,592 | 9,066 |
| | Medifast Inc. | 42,768 | 8,394 |
| | Nu Skin Enterprises Inc. Class A | 186,325 | 7,481 |
| | Vector Group Ltd. | 528,059 | 7,002 |
| 1 | B&G Foods Inc. | 233,230 | 6,866 |
| | Reynolds Consumer Products Inc. | 201,346 | 5,432 |
| | Universal Corp. | 88,905 | 4,179 |
| | Weis Markets Inc. | 60,702 | 3,418 |
| | | | | | | 6,398,348 |
| Energy (7.4%) |
| | Exxon Mobil Corp. | 15,841,662 | 1,021,312 |
| | Chevron Corp. | 7,236,757 | 828,536 |
| | | | | | Shares | Market
Value•
($000) |
| | ConocoPhillips | 5,053,576 | 376,441 |
| | EOG Resources Inc. | 2,178,698 | 201,442 |
| | Schlumberger NV | 5,226,539 | 168,608 |
| | Marathon Petroleum Corp. | 2,382,394 | 157,071 |
| | Williams Cos. Inc. | 4,540,716 | 127,549 |
| | Phillips 66 | 1,637,473 | 122,450 |
| | Kinder Morgan Inc. | 7,268,815 | 121,753 |
| | Valero Energy Corp. | 1,526,878 | 118,073 |
| | ONEOK Inc. | 1,659,266 | 105,563 |
| | Devon Energy Corp. | 2,521,594 | 101,066 |
| | Diamondback Energy Inc. | 676,381 | 72,501 |
| | Baker Hughes Co. | 2,758,843 | 69,192 |
| | Coterra Energy Inc. | 2,964,888 | 63,211 |
| | Ovintiv Inc. | 971,642 | 36,456 |
| | DT Midstream Inc. | 355,059 | 17,029 |
| | Equitrans Midstream Corp. | 1,498,395 | 15,448 |
| | Murphy Oil Corp. | 545,829 | 15,190 |
| | Antero Midstream Corp. | 1,236,532 | 13,157 |
| | Helmerich & Payne Inc. | 392,773 | 12,192 |
| | Archrock Inc. | 500,678 | 4,101 |
| | | | | | | 3,768,341 |
| Financials (22.9%) |
| | JPMorgan Chase & Co. | 11,103,731 | 1,886,413 |
| | Bank of America Corp. | 27,700,479 | 1,323,529 |
| | Wells Fargo & Co. | 15,474,084 | 791,654 |
| | Citigroup Inc. | 7,583,378 | 524,466 |
| | Morgan Stanley | 5,089,414 | 523,090 |
| | BlackRock Inc. | 434,290 | 409,735 |
| | PNC Financial Services Group Inc. | 1,586,863 | 334,876 |
| | Truist Financial Corp. | 5,027,029 | 319,066 |
| | Chubb Ltd. | 1,632,204 | 318,900 |
| | US Bancorp | 5,020,813 | 303,106 |
| | CME Group Inc. | 1,339,803 | 295,494 |
| | Progressive Corp. | 2,185,012 | 207,314 |
| | American International Group Inc. | 3,208,051 | 189,564 |
| | T. Rowe Price Group Inc. | 844,105 | 183,069 |
| | Bank of New York Mellon Corp. | 2,965,552 | 175,561 |
| | MetLife Inc. | 2,709,963 | 170,186 |
| | Prudential Financial Inc. | 1,442,130 | 158,706 |
| | Travelers Cos. Inc. | 938,624 | 151,006 |
| | State Street Corp. | 1,363,154 | 134,339 |
| | Aflac Inc. | 2,474,556 | 132,809 |
| | Ameriprise Financial Inc. | 424,972 | 128,397 |
| | Arthur J Gallagher & Co. | 765,312 | 128,320 |
| | Discover Financial Services | 1,117,262 | 126,608 |
High Dividend Yield Index Fund
| | | | | | Shares | Market
Value•
($000) |
| | Fifth Third Bancorp | 2,576,874 | 112,171 |
| | Northern Trust Corp. | 769,358 | 94,662 |
| | Hartford Financial Services Group Inc. | 1,296,602 | 94,561 |
| | Huntington Bancshares Inc. | 5,490,769 | 86,425 |
| | Regions Financial Corp. | 3,578,698 | 84,744 |
| | KeyCorp | 3,578,930 | 83,282 |
| | Citizens Financial Group Inc. | 1,597,322 | 75,681 |
| | M&T Bank Corp. | 484,878 | 71,335 |
| | Cincinnati Financial Corp. | 560,547 | 68,073 |
| | Principal Financial Group Inc. | 993,742 | 66,670 |
| | Ally Financial Inc. | 1,359,398 | 64,898 |
| | Apollo Global Management Inc. | 673,975 | 51,862 |
| | Lincoln National Corp. | 702,244 | 50,667 |
| | Fidelity National Financial Inc. | 1,024,931 | 49,104 |
| | Equitable Holdings Inc. | 1,372,629 | 45,983 |
| | Ares Management Corp. Class A | 511,317 | 43,329 |
| | Comerica Inc. | 497,649 | 42,345 |
| | East West Bancorp Inc. | 524,732 | 41,706 |
| | Everest Re Group Ltd. | 147,672 | 38,616 |
| | Zions Bancorp NA | 593,568 | 37,389 |
| | Assurant Inc. | 218,148 | 35,189 |
| | Jefferies Financial Group Inc. | 813,380 | 34,975 |
| | American Financial Group Inc. | 254,910 | 34,678 |
| | First Horizon Corp. | 2,034,843 | 34,531 |
| | Carlyle Group Inc. | 604,746 | 33,956 |
| | Franklin Resources Inc. | 1,077,669 | 33,936 |
| | Credicorp Ltd. | 252,843 | 32,784 |
| | Invesco Ltd. | 1,239,998 | 31,508 |
| | Reinsurance Group of America Inc. | 252,372 | 29,800 |
| | Janus Henderson Group plc | 637,801 | 29,658 |
| | First American Financial Corp. | 397,490 | 29,072 |
| | Cullen/Frost Bankers Inc. | 213,188 | 27,608 |
| | People's United Financial Inc. | 1,588,338 | 27,224 |
| | Old Republic International Corp. | 1,039,538 | 26,851 |
| | Synovus Financial Corp. | 542,811 | 25,290 |
| | Prosperity Bancshares Inc. | 331,412 | 24,959 |
| | Popular Inc. | 294,420 | 23,978 |
| | Glacier Bancorp Inc. | 407,957 | 22,556 |
| | Evercore Inc. Class A | 143,972 | 21,861 |
| | | | | | Shares | Market
Value•
($000) |
| | Houlihan Lokey Inc. Class A | 188,040 | 21,076 |
| | Bank OZK | 467,696 | 20,892 |
| | New York Community Bancorp Inc. | 1,672,523 | 20,789 |
| | MGIC Investment Corp. | 1,283,385 | 20,740 |
| | OneMain Holdings Inc. | 390,022 | 20,597 |
| | PacWest Bancorp | 431,028 | 20,461 |
| | Cadence Bank | 697,827 | 20,251 |
| | SouthState Corp. | 257,976 | 20,145 |
| | Valley National Bancorp | 1,472,718 | 19,528 |
| | Unum Group | 757,629 | 19,297 |
| | Webster Financial Corp. | 333,326 | 18,653 |
| | Lazard Ltd. Class A | 371,638 | 18,207 |
| | CIT Group Inc. | 366,790 | 18,167 |
| | United Bankshares Inc. | 459,492 | 16,997 |
| | Umpqua Holdings Corp. | 818,704 | 16,742 |
| | Hanover Insurance Group Inc. | 132,728 | 16,724 |
| | RLI Corp. | 151,879 | 16,450 |
| | Moelis & Co. Class A | 224,765 | 16,349 |
| | Hancock Whitney Corp. | 319,643 | 15,816 |
| | Axis Capital Holdings Ltd. | 286,546 | 14,920 |
| | Assured Guaranty Ltd. | 261,836 | 14,553 |
| | Pacific Premier Bancorp Inc. | 344,305 | 14,457 |
| | Community Bank System Inc. | 197,119 | 14,128 |
| | Walker & Dunlop Inc. | 107,604 | 13,996 |
| | BankUnited Inc. | 344,062 | 13,955 |
| | FNB Corp. | 1,184,038 | 13,794 |
| | Home BancShares Inc. | 569,900 | 13,541 |
| | First Hawaiian Inc. | 484,753 | 13,374 |
| | Investors Bancorp Inc. | 842,200 | 12,886 |
| | Bank of Hawaii Corp. | 147,716 | 12,482 |
| | Associated Banc-Corp | 556,622 | 12,402 |
| | Navient Corp. | 610,098 | 12,019 |
| | Simmons First National Corp. Class A | 394,944 | 11,805 |
| | Cathay General Bancorp | 277,274 | 11,698 |
| | BOK Financial Corp. | 115,104 | 11,645 |
| | Federated Hermes Inc. Class B | 347,360 | 11,571 |
| | CNO Financial Group Inc. | 472,747 | 11,412 |
| | United Community Banks Inc. | 320,052 | 11,151 |
| | Artisan Partners Asset Management Inc. Class A | 214,409 | 10,622 |
| | Old National Bancorp | 611,920 | 10,452 |
| | First Bancorp | 758,873 | 10,359 |
| | Atlantic Union Bankshares Corp. | 283,590 | 10,172 |
High Dividend Yield Index Fund
| | | | | | Shares | Market
Value•
($000) |
| | Independent Bank Group Inc. | 138,006 | 9,976 |
| | Columbia Banking System Inc. | 289,798 | 9,891 |
| | CVB Financial Corp. | 484,717 | 9,704 |
| | Fulton Financial Corp. | 595,487 | 9,587 |
| | Washington Federal Inc. | 251,775 | 8,903 |
| | Cohen & Steers Inc. | 92,501 | 8,777 |
| | Virtu Financial Inc. Class A | 344,166 | 8,563 |
| | First Merchants Corp. | 203,524 | 8,463 |
| | First Financial Bancorp | 353,993 | 8,418 |
| | WesBanco Inc. | 238,041 | 8,277 |
| | Sandy Spring Bancorp Inc. | 173,871 | 8,252 |
| | First Midwest Bancorp Inc. | 416,196 | 8,012 |
| | Towne Bank | 252,772 | 7,967 |
| | Renasant Corp. | 204,824 | 7,662 |
| | Banner Corp. | 126,988 | 7,335 |
| | Trustmark Corp. | 229,779 | 7,309 |
| | Provident Financial Services Inc. | 279,215 | 6,913 |
| | Bank of NT Butterfield & Son Ltd. | 183,133 | 6,574 |
| | Argo Group International Holdings Ltd. | 118,184 | 6,512 |
| | Hope Bancorp Inc. | 442,100 | 6,450 |
| | Northwest Bancshares Inc. | 450,825 | 6,221 |
| | Horace Mann Educators Corp. | 157,239 | 6,161 |
| | Capitol Federal Financial Inc. | 475,900 | 5,773 |
| | NBT Bancorp Inc. | 155,118 | 5,691 |
| | Stock Yards Bancorp Inc. | 89,292 | 5,469 |
| | Mercury General Corp. | 99,899 | 5,443 |
| | Westamerica Bancorp | 96,039 | 5,355 |
| | First Commonwealth Financial Corp. | 349,249 | 5,344 |
| | American National Group Inc. | 27,518 | 5,220 |
| | Berkshire Hills Bancorp Inc. | 177,366 | 4,815 |
| | CNA Financial Corp. | 102,797 | 4,611 |
| | City Holding Co. | 57,109 | 4,545 |
| | Brookline Bancorp Inc. | 283,105 | 4,544 |
| | S&T Bancorp Inc. | 141,477 | 4,324 |
| | BancFirst Corp. | 63,130 | 4,104 |
| | Safety Insurance Group Inc. | 52,322 | 4,103 |
| | Employers Holdings Inc. | 104,929 | 4,050 |
| | Kearny Financial Corp. | 274,358 | 3,682 |
| | | | | | Shares | Market
Value•
($000) |
| | TFS Financial Corp. | 179,619 | 3,495 |
| | Washington Trust Bancorp Inc. | 62,341 | 3,408 |
| | State Auto Financial Corp. | 63,612 | 3,264 |
| | WisdomTree Investments Inc. | 508,115 | 3,247 |
| | 1st Source Corp. | 64,509 | 3,114 |
| | Community Trust Bancorp Inc. | 57,392 | 2,507 |
| | Republic Bancorp Inc. Class A | 35,735 | 1,930 |
| | | | | | | 11,699,365 |
| Health Care (12.3%) |
| | Johnson & Johnson | 9,853,392 | 1,604,920 |
| | Pfizer Inc. | 20,885,096 | 913,514 |
| | Merck & Co. Inc. | 9,478,121 | 834,549 |
| | Eli Lilly & Co. | 3,170,770 | 807,785 |
| | AbbVie Inc. | 6,609,688 | 757,933 |
| | Bristol-Myers Squibb Co. | 8,350,863 | 487,690 |
| | Amgen Inc. | 2,123,231 | 439,445 |
| | Gilead Sciences Inc. | 4,692,687 | 304,462 |
| | Cardinal Health Inc. | 1,090,519 | 52,138 |
| | Organon & Co. | 954,836 | 35,090 |
| | Perrigo Co. plc | 495,028 | 22,351 |
| | Patterson Cos. Inc. | 316,767 | 9,902 |
| | Healthcare Services Group Inc. | 272,860 | 5,236 |
| | | | | | | 6,275,015 |
| Industrials (9.9%) |
| | United Parcel Service Inc. Class B | 2,708,390 | 578,160 |
| | Raytheon Technologies Corp. | 5,669,733 | 503,812 |
| | Caterpillar Inc. | 2,048,771 | 417,970 |
| | 3M Co. | 2,163,959 | 386,656 |
| | Automatic Data Processing Inc. | 1,589,682 | 356,868 |
| | Lockheed Martin Corp. | 926,005 | 307,730 |
| | Illinois Tool Works Inc. | 1,175,628 | 267,890 |
| | Eaton Corp. plc | 1,488,454 | 245,238 |
| | Emerson Electric Co. | 2,236,446 | 216,958 |
| | Johnson Controls International plc | 2,676,134 | 196,348 |
| | General Dynamics Corp. | 931,968 | 188,957 |
| | L3Harris Technologies Inc. | 747,999 | 172,444 |
| | Paychex Inc. | 1,202,879 | 148,291 |
| | DuPont de Nemours Inc. | 1,955,555 | 136,107 |
| | Cummins Inc. | 536,199 | 128,602 |
| | PACCAR Inc. | 1,273,344 | 114,117 |
| | Synchrony Financial | 2,123,717 | 98,647 |
High Dividend Yield Index Fund
| | | | | | Shares | Market
Value•
($000) |
| | Packaging Corp. of America | 348,846 | 47,921 |
| | CH Robinson Worldwide Inc. | 491,372 | 47,658 |
| | Westrock Co. | 989,972 | 47,618 |
| | RPM International Inc. | 474,099 | 41,341 |
| | Snap-on Inc. | 198,720 | 40,386 |
| | Hubbell Inc. Class B | 201,986 | 40,270 |
| | Watsco Inc. | 121,816 | 35,275 |
| | Huntington Ingalls Industries Inc. | 146,932 | 29,788 |
| | Western Union Co. | 1,521,344 | 27,719 |
| | MDU Resources Group Inc. | 754,687 | 23,192 |
| | nVent Electric plc | 622,682 | 22,074 |
| | Sonoco Products Co. | 364,425 | 21,118 |
| | ManpowerGroup Inc. | 201,473 | 19,472 |
| | Crane Co. | 182,340 | 18,832 |
| | Ryder System Inc. | 195,243 | 16,586 |
| | Flowserve Corp. | 483,694 | 16,262 |
| | Triton International Ltd. | 245,414 | 15,262 |
| | MSC Industrial Direct Co. Inc. Class A | 165,935 | 13,950 |
| | GATX Corp. | 129,932 | 12,324 |
| | Kennametal Inc. | 309,545 | 12,304 |
| | ABM Industries Inc. | 249,684 | 10,989 |
| | Otter Tail Corp. | 152,926 | 9,483 |
| | Granite Construction Inc. | 180,966 | 6,717 |
| | McGrath RentCorp | 88,274 | 6,368 |
| | Greif Inc. Class A | 93,756 | 6,064 |
| | H&E Equipment Services Inc. | 118,887 | 5,359 |
| | ADT Inc. | 586,456 | 4,897 |
| | Greenbrier Cos. Inc. | 116,658 | 4,785 |
| | Apogee Enterprises Inc. | 92,320 | 3,871 |
| | Atlas Corp. | 220,192 | 3,083 |
| | SFL Corp. Ltd. | 385,779 | 3,051 |
| | Scorpio Tankers Inc. | 182,648 | 2,926 |
| | | | | | | 5,081,740 |
| Real Estate (0.0%) |
| | Kennedy-Wilson Holdings Inc. | 440,964 | 9,864 |
| Technology (7.2%) |
| | Broadcom Inc. | 1,493,475 | 794,036 |
| | Intel Corp. | 15,118,783 | 740,820 |
| | Texas Instruments Inc. | 3,455,664 | 647,868 |
| | QUALCOMM Inc. | 4,216,803 | 561,004 |
| | International Business Machines Corp. | 3,343,932 | 418,326 |
| | HP Inc. | 4,498,448 | 136,438 |
| | Corning Inc. | 2,847,946 | 101,301 |
| | NetApp Inc. | 833,132 | 74,399 |
| | Hewlett Packard Enterprise Co. | 4,874,632 | 71,413 |
| | | | | | Shares | Market
Value•
($000) |
| | Seagate Technology Holdings plc | 727,713 | 64,817 |
| | NortonLifeLock Inc. | 2,043,809 | 52,015 |
| | National Instruments Corp. | 492,793 | 20,929 |
| | Avnet Inc. | 367,082 | 13,990 |
| | Xerox Holdings Corp. | 527,998 | 9,398 |
| | | | | | | 3,706,754 |
| Telecommunications (6.6%) |
| | Cisco Systems Inc. | 15,808,911 | 884,825 |
| | Comcast Corp. Class A | 17,061,655 | 877,481 |
| | Verizon Communications Inc. | 15,494,954 | 821,078 |
| | AT&T Inc. | 26,726,127 | 675,102 |
| | Lumen Technologies Inc. | 4,094,228 | 48,558 |
| | Juniper Networks Inc. | 1,202,852 | 35,508 |
| | Cogent Communications Holdings Inc. | 157,989 | 12,100 |
| | Telephone & Data Systems Inc. | 369,390 | 6,922 |
| | | | | | | 3,361,574 |
| Utilities (7.9%) |
| | NextEra Energy Inc. | 7,334,229 | 625,830 |
| | Duke Energy Corp. | 2,874,147 | 293,192 |
| | Waste Management Inc. | 1,578,697 | 252,955 |
| | Southern Co. | 3,954,325 | 246,434 |
| | Dominion Energy Inc. | 3,006,709 | 228,299 |
| | Exelon Corp. | 3,655,918 | 194,458 |
| | American Electric Power Co. Inc. | 1,869,417 | 158,358 |
| | Sempra Energy | 1,193,724 | 152,355 |
| | Xcel Energy Inc. | 2,012,816 | 130,008 |
| | Public Service Enterprise Group Inc. | 1,884,792 | 120,250 |
| | Eversource Energy | 1,284,519 | 109,056 |
| | WEC Energy Group Inc. | 1,180,210 | 106,290 |
| | Consolidated Edison Inc. | 1,325,377 | 99,933 |
| | Edison International | 1,398,164 | 87,986 |
| | PPL Corp. | 2,884,232 | 83,066 |
| | DTE Energy Co. | 722,419 | 81,886 |
| | Ameren Corp. | 953,052 | 80,333 |
| | FirstEnergy Corp. | 2,041,635 | 78,664 |
| | Entergy Corp. | 751,230 | 77,392 |
| | CMS Energy Corp. | 1,075,217 | 64,889 |
| | AES Corp. | 2,460,169 | 61,824 |
| | CenterPoint Energy Inc. | 2,226,928 | 57,989 |
| | Evergy Inc. | 850,542 | 54,222 |
| | Alliant Energy Corp. | 930,560 | 52,642 |
| | Atmos Energy Corp. | 481,691 | 44,373 |
| | Essential Utilities Inc. | 842,305 | 39,647 |
| | NRG Energy Inc. | 905,722 | 36,129 |
| | NiSource Inc. | 1,458,729 | 35,987 |
High Dividend Yield Index Fund
| | | | | | Shares | Market
Value•
($000) |
| | Vistra Corp. | 1,785,453 | 34,977 |
| | UGI Corp. | 774,690 | 33,629 |
| | Pinnacle West Capital Corp. | 420,022 | 27,087 |
| | OGE Energy Corp. | 740,648 | 25,234 |
| | IDACORP Inc. | 187,270 | 19,536 |
| | National Fuel Gas Co. | 331,717 | 19,051 |
| | Portland General Electric Co. | 331,051 | 16,324 |
| | Hawaiian Electric Industries Inc. | 401,802 | 16,297 |
| | PNM Resources Inc. | 317,590 | 15,800 |
| | Black Hills Corp. | 232,919 | 15,461 |
| | Southwest Gas Holdings Inc. | 218,995 | 15,165 |
| | New Jersey Resources Corp. | 355,458 | 13,440 |
| | ONE Gas Inc. | 194,001 | 13,056 |
| | ALLETE Inc. | 193,557 | 11,912 |
| | Spire Inc. | 186,621 | 11,712 |
| | Avangrid Inc. | 220,454 | 11,618 |
| | NorthWestern Corp. | 191,504 | 10,889 |
| | Clearway Energy Inc. Class C | 302,522 | 10,734 |
| | Avista Corp. | 256,812 | 10,224 |
| | MGE Energy Inc. | 133,828 | 10,156 |
| | Covanta Holding Corp. | 447,001 | 9,020 |
| | Atlantica Sustainable Infrastructure plc | 228,774 | 9,002 |
| | South Jersey Industries Inc. | 378,956 | 8,625 |
| | | | | | Shares | Market
Value•
($000) |
| | SJW Group | 101,420 | 6,686 |
| | Northwest Natural Holding Co. | 111,233 | 5,016 |
| | Clearway Energy Inc. Class A | 132,601 | 4,375 |
| | | | | | | 4,039,473 |
Total Common Stocks
(Cost $38,990,546) | 50,967,027 |
| Temporary Cash Investments (0.2%) |
| Money Market Fund (0.2%) |
| 2,3 | Vanguard Market Liquidity Fund, 0.070%
(Cost $117,837) | 1,178,367 | 117,837 |
Total Investments (99.8%)
(Cost $39,108,383) | | 51,084,864 |
| Other Assets and Liabilities—Net (0.2%) | | 99,750 |
| Net Assets (100%) | | 51,184,614 |
| Cost is in $000. |
| • | See Note A in Notes to Financial Statements. |
| * | Non-income-producing security. |
| 1 | Includes partial security positions on loan to broker-dealers. The total value of securities on loan is $6,518,000. |
| 2 | Affiliated money market fund available only to Vanguard funds and certain trusts and accounts managed by Vanguard. Rate shown is the 7-day yield. |
| 3 | Collateral of $6,863,000 was received for securities on loan. |
High Dividend Yield Index Fund
Derivative Financial Instruments Outstanding as of Period End
| Futures Contracts |
| | | | ($000) |
| | Expiration | Number of
Long (Short)
Contracts | Notional
Amount | Value and
Unrealized
Appreciation
(Depreciation) |
| Long Futures Contracts |
| E-mini S&P 500 Index | December 2021 | 525 | 120,671 | 3,706 |
| Over-the-Counter Total Return Swaps |
| Reference Entity | Termination
Date | Counterparty | Notional
Amount
($000) | Floating
Interest
Rate
Received
(Paid)1
(%) | Value and
Unrealized
Appreciation
($000) | Value and
Unrealized
(Depreciation)
($000) |
| BlackRock Inc. | 1/31/22 | GSI | 90,726 | (0.080) | 3,618 | — |
| 1 | Based on 1M USD London Interbank Offered Rate (LIBOR) as of the most recent payment date. Floating interest payment received/paid monthly. |
| | 1M—1-month. |
| | GSI—Goldman Sachs International. |
At October 31, 2021, the counterparties had deposited in segregated accounts securities with a value of $2,944,000 in connection with open over-the-counter swap contracts.
See accompanying Notes, which are an integral part of the Financial Statements.
High Dividend Yield Index Fund
Statement of Assets and Liabilities
|
| ($000s, except shares and per-share amounts) | Amount |
| Assets | |
| Investments in Securities, at Value | |
| Unaffiliated Issuers (Cost $38,990,546) | 50,967,027 |
| Affiliated Issuers (Cost $117,837) | 117,837 |
| Total Investments in Securities | 51,084,864 |
| Investment in Vanguard | 1,649 |
| Cash | 12,200 |
| Cash Collateral Pledged—Futures Contracts | 6,042 |
| Receivables for Accrued Income | 83,318 |
| Receivables for Capital Shares Issued | 4,819 |
| Variation Margin Receivable—Futures Contracts | 249 |
| Unrealized Appreciation—Over-the-Counter Swap Contracts | 3,618 |
| Total Assets | 51,196,759 |
| Liabilities | |
| Payables for Investment Securities Purchased | 353 |
| Collateral for Securities on Loan | 6,863 |
| Payables for Capital Shares Redeemed | 3,488 |
| Payables to Vanguard | 1,441 |
| Total Liabilities | 12,145 |
| Net Assets | 51,184,614 |
High Dividend Yield Index Fund
Statement of Assets and Liabilities (continued)
|
At October 31, 2021, net assets consisted of: |
|
| ($000s, except shares and per-share amounts) | Amount |
| Paid-in Capital | 41,469,920 |
| Total Distributable Earnings (Loss) | 9,714,694 |
| Net Assets | 51,184,614 |
| |
| ETF Shares—Net Assets | |
Applicable to 366,767,987 outstanding $.001 par value shares of
beneficial interest (unlimited authorization) | 39,766,294 |
| Net Asset Value Per Share—ETF Shares | $108.42 |
| |
| Admiral Shares—Net Assets | |
Applicable to 349,252,720 outstanding $.001 par value shares of
beneficial interest (unlimited authorization) | 11,418,320 |
| Net Asset Value Per Share—Admiral Shares | $32.69 |
See accompanying Notes, which are an integral part of the Financial Statements.
High Dividend Yield Index Fund
|
| | Year Ended
October 31, 2021 |
| | ($000) |
| Investment Income | |
| Income | |
| Dividends | 1,385,683 |
| Interest 1 | 76 |
| Securities Lending—Net | 687 |
| Total Income | 1,386,446 |
| Expenses | |
| The Vanguard Group—Note B | |
| Investment Advisory Services | 2,782 |
| Management and Administrative—ETF Shares | 16,999 |
| Management and Administrative—Admiral Shares | 6,985 |
| Marketing and Distribution—ETF Shares | 1,114 |
| Marketing and Distribution—Admiral Shares | 303 |
| Custodian Fees | 330 |
| Auditing Fees | 34 |
| Shareholders’ Reports—ETF Shares | 679 |
| Shareholders’ Reports—Admiral Shares | 95 |
| Trustees’ Fees and Expenses | 13 |
| Total Expenses | 29,334 |
| Net Investment Income | 1,357,112 |
| Realized Net Gain (Loss) | |
| Investment Securities Sold1,2 | 1,159,682 |
| Futures Contracts | 18,535 |
| Swap Contracts | 27,617 |
| Realized Net Gain (Loss) | 1,205,834 |
| Change in Unrealized Appreciation (Depreciation) | |
| Investment Securities1 | 11,482,309 |
| Futures Contracts | 5,710 |
| Swap Contracts | 8,324 |
| Change in Unrealized Appreciation (Depreciation) | 11,496,343 |
| Net Increase (Decrease) in Net Assets Resulting from Operations | 14,059,289 |
| 1 | Interest income, realized net gain (loss), and change in unrealized appreciation (depreciation) from an affiliated company of the fund were $75,000, $2,000, and ($2,000), respectively. Purchases and sales are for temporary cash investment purposes. |
| 2 | Includes $1,396,682,000 of net gain (loss) resulting from in-kind redemptions. |
See accompanying Notes, which are an integral part of the Financial Statements.
High Dividend Yield Index Fund
Statement of Changes in Net Assets
|
| | Year Ended October 31, |
| | 2021
($000) | 2020
($000) |
| Increase (Decrease) in Net Assets | | |
| Operations | | |
| Net Investment Income | 1,357,112 | 1,242,802 |
| Realized Net Gain (Loss) | 1,205,834 | (23,588) |
| Change in Unrealized Appreciation (Depreciation) | 11,496,343 | (4,440,201) |
| Net Increase (Decrease) in Net Assets Resulting from Operations | 14,059,289 | (3,220,987) |
| Distributions | | |
| ETF Shares | (1,045,675) | (938,468) |
| Admiral Shares | (295,106) | (282,080) |
| Total Distributions | (1,340,781) | (1,220,548) |
| Capital Share Transactions | | |
| Investor Shares | — | (5,748) |
| ETF Shares | 3,606,248 | 2,846,525 |
| Admiral Shares | 916,264 | (91,604) |
| Net Increase (Decrease) from Capital Share Transactions | 4,522,512 | 2,749,173 |
| Total Increase (Decrease) | 17,241,020 | (1,692,362) |
| Net Assets | | |
| Beginning of Period | 33,943,594 | 35,635,956 |
| End of Period | 51,184,614 | 33,943,594 |
See accompanying Notes, which are an integral part of the Financial Statements.
High Dividend Yield Index Fund
| ETF Shares | | | | | |
For a Share Outstanding
Throughout Each Period | Year Ended October 31, |
| 2021 | 2020 | 2019 | 2018 | 2017 |
| Net Asset Value, Beginning of Period | $79.49 | $89.60 | $83.26 | $82.46 | $71.19 |
| Investment Operations | | | | | |
| Net Investment Income1 | 3.010 | 2.950 | 2.891 | 2.623 | 2.394 |
| Net Realized and Unrealized Gain (Loss) on Investments | 28.887 | (10.184) | 6.251 | .731 | 11.301 |
| Total from Investment Operations | 31.897 | (7.234) | 9.142 | 3.354 | 13.695 |
| Distributions | | | | | |
| Dividends from Net Investment Income | (2.967) | (2.876) | (2.802) | (2.554) | (2.425) |
| Distributions from Realized Capital Gains | — | — | — | — | — |
| Total Distributions | (2.967) | (2.876) | (2.802) | (2.554) | (2.425) |
| Net Asset Value, End of Period | $108.42 | $79.49 | $89.60 | $83.26 | $82.46 |
| Total Return | 40.55% | -8.17% | 11.31% | 4.05% | 19.46% |
| Ratios/Supplemental Data | | | | | |
| Net Assets, End of Period (Millions) | $39,766 | $26,279 | $26,816 | $21,328 | $20,010 |
| Ratio of Total Expenses to Average Net Assets | 0.06% | 0.06% | 0.06% | 0.06% | 0.08% |
| Ratio of Net Investment Income to Average Net Assets | 2.99% | 3.53% | 3.38% | 3.08% | 3.07% |
| Portfolio Turnover Rate2 | 8% | 11% | 7% | 13% | 9% |
| 1 | Calculated based on average shares outstanding. |
| 2 | Excludes the value of portfolio securities received or delivered as a result of in-kind purchases or redemptions of the fund’s capital shares, including ETF Creation Units. |
See accompanying Notes, which are an integral part of the Financial Statements.
High Dividend Yield Index Fund
| Admiral Shares | | | |
For a Share Outstanding
Throughout Each Period | Year Ended October 31, | February 7,
20191 to
October 31,
2019 |
| 2021 | 2020 |
| Net Asset Value, Beginning of Period | $23.97 | $27.02 | $25.00 |
| Investment Operations | | | |
| Net Investment Income2 | .902 | .887 | .624 |
| Net Realized and Unrealized Gain (Loss) on Investments | 8.707 | (3.075) | 2.010 |
| Total from Investment Operations | 9.609 | (2.188) | 2.634 |
| Distributions | | | |
| Dividends from Net Investment Income | (.889) | (.862) | (.614) |
| Distributions from Realized Capital Gains | — | — | — |
| Total Distributions | (.889) | (.862) | (.614) |
| Net Asset Value, End of Period | $32.69 | $23.97 | $27.02 |
| Total Return3 | 40.50% | -8.19% | 10.64% |
| Ratios/Supplemental Data | | | |
| Net Assets, End of Period (Millions) | $11,418 | $7,665 | $8,814 |
| Ratio of Total Expenses to Average Net Assets | 0.08% | 0.08% | 0.08% 4 |
| Ratio of Net Investment Income to Average Net Assets | 2.97% | 3.52% | 3.24% 4 |
| Portfolio Turnover Rate5 | 8% | 11% | 7% 6 |
| 1 | Inception. |
| 2 | Calculated based on average shares outstanding. |
| 3 | Total returns do not include account service fees that may have applied in the periods shown. Fund prospectuses provide information about any applicable account service fees. |
| 4 | Annualized. |
| 5 | Excludes the value of portfolio securities received or delivered as a result of in-kind purchases or redemptions of the fund’s capital shares, including ETF Creation Units. |
| 6 | Reflects the fund’s portfolio turnover for the fiscal year ended October 31, 2019. |
See accompanying Notes, which are an integral part of the Financial Statements.
High Dividend Yield Index Fund
Notes to Financial Statements
Vanguard High Dividend Yield Index Fund is registered under the Investment Company Act of 1940 as an open-end investment company, or mutual fund. The fund offers two classes of shares: ETF Shares and Admiral Shares. Each of the share classes has different eligibility and minimum purchase requirements, and is designed for different types of investors. ETF Shares are listed for trading on NYSE Arca; they can be purchased and sold through a broker. Prior to November 7, 2019, the fund offered Investor Shares. Effective at the close of business on November 7, 2019, the remaining Investor Shares were converted to Admiral Shares.
Market disruptions associated with the COVID-19 pandemic have had a global impact, and uncertainty exists as to the long-term implications. Such disruptions can adversely affect assets of the fund and thus fund performance.
A. The following significant accounting policies conform to generally accepted accounting principles for U.S. investment companies. The fund consistently follows such policies in preparing its financial statements.
1. Security Valuation: Securities are valued as of the close of trading on the New York Stock Exchange (generally 4 p.m., Eastern time) on the valuation date. Equity securities are valued at the latest quoted sales prices or official closing prices taken from the primary market in which each security trades; such securities not traded on the valuation date are valued at the mean of the latest quoted bid and asked prices. Securities for which market quotations are not readily available, or whose values have been materially affected by events occurring before the fund's pricing time but after the close of the securities’ primary markets, are valued by methods deemed by the board of trustees to represent fair value. Investments in Vanguard Market Liquidity Fund are valued at that fund's net asset value. Temporary cash investments are valued using the latest bid prices or using valuations based on a matrix system (which considers such factors as security prices, yields, maturities, and ratings), both as furnished by independent pricing services.
2. Futures Contracts: The fund uses index futures contracts to a limited extent, with the objectives of maintaining full exposure to the stock market, maintaining liquidity, and minimizing transaction costs. The fund may purchase futures contracts to immediately invest incoming cash in the market, or sell futures in response to cash outflows, thereby simulating a fully invested position in the underlying index while maintaining a cash balance for liquidity. The primary risks associated with the use of futures contracts are imperfect correlation between changes in market values of stocks held by the fund and the prices of futures contracts, and the possibility of an illiquid market. Counterparty risk involving futures is mitigated because a regulated clearinghouse is the counterparty instead of the clearing broker. To further mitigate counterparty risk, the fund trades futures contracts on an exchange, monitors the financial strength of its clearing brokers and clearinghouse, and has entered into clearing agreements with its clearing brokers. The clearinghouse imposes initial margin requirements to secure the fund’s performance and requires daily settlement of variation margin representing changes in the market value of each contract. Any securities pledged as initial margin for open contracts are noted in the Schedule of Investments.
Futures contracts are valued at their quoted daily settlement prices. The notional amounts of the contracts are not recorded in the Statement of Assets and Liabilities. Fluctuations in the value of the contracts are recorded in the Statement of Assets and Liabilities as an asset (liability) and in the Statement of Operations as unrealized appreciation (depreciation) until the contracts are closed, when they are recorded as realized gains (losses) on futures contracts.
High Dividend Yield Index Fund
During the year ended October 31, 2021, the fund’s average investments in long and short futures contracts represented less than 1% and 0% of net assets, respectively, based on the average of the notional amounts at each quarter-end during the period.
3. Swap Contracts: The fund has entered into equity swap contracts to earn the total return on selected reference stocks in the fund’s target index. Under the terms of the swaps, the fund receives the total return on the referenced stock (i.e., receiving the increase or paying the decrease in value of the selected reference stock and receiving the equivalent of any dividends in respect of the selected referenced stock) over a specified period of time, applied to a notional amount that represents the value of a designated number of shares of the selected reference stock at the beginning of the equity swap contract. The fund also pays a floating rate that is based on short-term interest rates, applied to the notional amount. At the same time, the fund generally invests an amount approximating the notional amount of the swap in high-quality temporary cash investments.
A risk associated with all types of swaps is the possibility that a counterparty may default on its obligation to pay net amounts due to the fund. The fund’s maximum amount subject to counterparty risk is the unrealized appreciation on the swap contract. The fund mitigates its counterparty risk by entering into swaps only with a diverse group of prequalified counterparties, monitoring their financial strength, entering into master netting arrangements with its counterparties, and requiring its counterparties to transfer collateral as security for their performance. In the absence of a default, the collateral pledged or received by the fund cannot be repledged, resold, or rehypothecated. In the event of a counterparty’s default (including bankruptcy), the fund may terminate any swap contracts with that counterparty, determine the net amount owed by either party in accordance with its master netting arrangements, and sell or retain any collateral held up to the net amount owed to the fund under the master netting arrangements. The swap contracts contain provisions whereby a counterparty may terminate open contracts if the fund's net assets decline below a certain level, triggering a payment by the fund if the fund is in a net liability position at the time of the termination. The payment amount would be reduced by any collateral the fund has pledged. Any securities pledged as collateral for open contracts are noted in the Schedule of Investments. The value of collateral received or pledged is compared daily to the value of the swap contracts exposure with each counterparty, and any difference, if in excess of a specified minimum transfer amount, is adjusted and settled within two business days.
The notional amounts of swap contracts are not recorded in the Statement of Assets and Liabilities. Swaps are valued daily based on market quotations received from independent pricing services or recognized dealers and the change in value is recorded in the Statement of Assets and Liabilities as an asset (liability) and in the Statement of Operations as unrealized appreciation (depreciation) until periodic payments are made or the termination of the swap, at which time realized gain (loss) is recorded.
During the year ended October 31, 2021, the fund’s average amounts of investments in total return swaps represented less than 1% of net assets, based on the average of notional amounts at each quarter-end during the period.
4. Federal Income Taxes: The fund intends to continue to qualify as a regulated investment company and distribute all of its taxable income. The fund’s tax returns are open to examination by the relevant tax authorities until expiration of the applicable statute of limitations, which is
High Dividend Yield Index Fund
generally three years after the filing of the tax return. Management has analyzed the fund’s tax positions taken for all open federal and state income tax years, and has concluded that no provision for income tax is required in the fund’s financial statements.
5. Distributions: Distributions to shareholders are recorded on the ex-dividend date. Distributions are determined on a tax basis at the fiscal year-end and may differ from net investment income and realized capital gains for financial reporting purposes.
6. Securities Lending: To earn additional income, the fund lends its securities to qualified institutional borrowers. Security loans are subject to termination by the fund at any time, and are required to be secured at all times by collateral in an amount at least equal to the market value of securities loaned. Daily market fluctuations could cause the value of loaned securities to be more or less than the value of the collateral received. When this occurs, the collateral is adjusted and settled before the opening of the market on the next business day. The fund further mitigates its counterparty risk by entering into securities lending transactions only with a diverse group of prequalified counterparties, monitoring their financial strength, and entering into master securities lending agreements with its counterparties. The master securities lending agreements provide that, in the event of a counterparty’s default (including bankruptcy), the fund may terminate any loans with that borrower, determine the net amount owed, and sell or retain the collateral up to the net amount owed to the fund; however, such actions may be subject to legal proceedings. While collateral mitigates counterparty risk, in the event of a default, the fund may experience delays and costs in recovering the securities loaned. The fund invests cash collateral received in Vanguard Market Liquidity Fund, and records a liability in the Statement of Assets and Liabilities for the return of the collateral, during the period the securities are on loan. Collateral investments in Vanguard Market Liquidity Fund are subject to market appreciation or depreciation. Securities lending income represents fees charged to borrowers plus income earned on invested cash collateral, less expenses associated with the loan. During the term of the loan, the fund is entitled to all distributions made on or in respect of the loaned securities.
7. Credit Facilities and Interfund Lending Program: The fund and certain other funds managed by The Vanguard Group ("Vanguard") participate in a $4.3 billion committed credit facility provided by a syndicate of lenders pursuant to a credit agreement and an uncommitted credit facility provided by Vanguard. Both facilities may be renewed annually. Each fund is individually liable for its borrowings, if any, under the credit facilities. Borrowings may be utilized for temporary or emergency purposes, subject to the fund’s regulatory and contractual borrowing restrictions. With respect to the committed credit facility, the participating funds are charged administrative fees and an annual commitment fee of 0.10% of the undrawn committed amount of the facility; these fees are allocated to the funds based on a method approved by the fund’s board of trustees and included in Management and Administrative expenses on the fund’s Statement of Operations. Any borrowings under either facility bear interest at a rate based upon the higher of the one-month London Interbank Offered Rate (or an acceptable alternate rate, if necessary), federal funds effective rate, or overnight bank funding rate plus an agreed-upon spread, except that borrowings under the uncommitted credit facility may bear interest based upon an alternative rate agreed to by the fund and Vanguard.
In accordance with an exemptive order (the “Order”) from the SEC, the fund may participate in a joint lending and borrowing program that allows registered open-end Vanguard funds to borrow money from and lend money to each other for temporary or emergency purposes (the “Interfund Lending Program”), subject to compliance with the terms and conditions of the Order, and to the extent permitted by the fund’s investment objective and investment policies. Interfund loans and
High Dividend Yield Index Fund
borrowings normally extend overnight, but can have a maximum duration of seven days. Loans may be called on one business day’s notice. The interest rate to be charged is governed by the conditions of the Order and internal procedures adopted by the board of trustees. The board of trustees is responsible for overseeing the Interfund Lending Program.
For the year ended October 31, 2021, the fund did not utilize the credit facilities or the Interfund Lending Program.
8. Other: Dividend income is recorded on the ex-dividend date. Non-cash dividends included in income, if any, are recorded at the fair value of the securities received. Interest income includes income distributions received from Vanguard Market Liquidity Fund and is accrued daily. Premiums and discounts on debt securities are amortized and accreted, respectively, to interest income over the lives of the respective securities, except for premiums on certain callable debt securities that are amortized to the earliest call date. Security transactions are accounted for on the date securities are bought or sold. Costs used to determine realized gains (losses) on the sale of investment securities are those of the specific securities sold.
Each class of shares has equal rights as to assets and earnings, except that each class separately bears certain class-specific expenses related to maintenance of shareholder accounts (included in Management and Administrative expenses) and shareholder reporting. Marketing and distribution expenses are allocated to each class of shares based on a method approved by the board of trustees. Income, other non-class-specific expenses, and gains and losses on investments are allocated to each class of shares based on its relative net assets.
B. In accordance with the terms of a Funds’ Service Agreement (the “FSA”) between Vanguard and the fund, Vanguard furnishes to the fund investment advisory, corporate management, administrative, marketing, and distribution services at Vanguard’s cost of operations (as defined by the FSA). These costs of operations are allocated to the fund based on methods and guidelines approved by the board of trustees and are generally settled twice a month.
Upon the request of Vanguard, the fund may invest up to 0.40% of its net assets as capital in Vanguard. At October 31, 2021, the fund had contributed to Vanguard capital in the amount of $1,649,000, representing less than 0.01% of the fund’s net assets and 0.66% of Vanguard’s capital received pursuant to the FSA. The fund’s trustees and officers are also directors and employees, respectively, of Vanguard.
C. Various inputs may be used to determine the value of the fund’s investments and derivatives. These inputs are summarized in three broad levels for financial statement purposes. The inputs or methodologies used to value securities are not necessarily an indication of the risk associated with investing in those securities.
Level 1—Quoted prices in active markets for identical securities.
Level 2—Other significant observable inputs (including quoted prices for similar securities, interest rates, prepayment speeds, credit risk, etc.).
Level 3—Significant unobservable inputs (including the fund’s own assumptions used to determine the fair value of investments). Any investments and derivatives valued with significant unobservable inputs are noted on the Schedule of Investments.
High Dividend Yield Index Fund
The following table summarizes the market value of the fund's investments and derivatives as of October 31, 2021, based on the inputs used to value them:
| | Level 1
($000) | Level 2
($000) | Level 3
($000) | Total
($000) |
| Investments | | | | |
| Assets | | | | |
| Common Stocks | 50,967,027 | — | — | 50,967,027 |
| Temporary Cash Investments | 117,837 | — | — | 117,837 |
| Total | 51,084,864 | — | — | 51,084,864 |
| | | | |
| Derivative Financial Instruments | | | | |
| Assets | | | | |
| Futures Contracts1 | 3,706 | — | — | 3,706 |
| Swap Contracts | — | 3,618 | — | 3,618 |
| Total | 3,706 | 3,618 | — | 7,324 |
| 1 | Includes cumulative appreciation (depreciation) on futures contracts and centrally cleared swaps, if any, as reported in the Schedule of Investments. Only current day’s variation margin is reported within the Statement of Assets and Liabilities. |
D. Permanent differences between book-basis and tax-basis components of net assets are reclassified among capital accounts in the financial statements to reflect their tax character. These reclassifications have no effect on net assets or net asset value per share. As of period end, permanent differences primarily attributable to the accounting for in-kind redemptions and swap agreements were reclassified between the following accounts:
| | Amount
($000) |
| Paid-in Capital | 1,396,506 |
| Total Distributable Earnings (Loss) | (1,396,506) |
Temporary differences between book-basis and tax-basis components of total distributable earnings (loss) arise when certain items of income, gain, or loss are recognized in different periods for financial statement and tax purposes; these differences will reverse at some time in the future. The differences are primarily related to the deferral of losses from wash sales; the recognition of unrealized gains or losses from certain derivative contracts; and the classification of securities for tax purposes. As of period end, the tax-basis components of total distributable earnings (loss) are detailed in the table as follows:
| | Amount
($000) |
| Undistributed Ordinary Income | 176,793 |
| Undistributed Long-Term Gains | — |
| Capital Loss Carryforwards | (2,366,038) |
| Qualified Late-Year Losses | — |
| Net Unrealized Gains (Losses) | 11,903,939 |
High Dividend Yield Index Fund
The tax character of distributions paid was as follows:
| | Year Ended October 31, |
| | 2021
Amount
($000) | 2020
Amount
($000) |
| Ordinary Income* | 1,340,781 | 1,220,548 |
| Long-Term Capital Gains | — | — |
| Total | 1,340,781 | 1,220,548 |
| * | Includes short-term capital gains, if any. |
As of October 31, 2021, gross unrealized appreciation and depreciation for investments and derivatives based on cost for U.S. federal income tax purposes were as follows:
| | Amount
($000) |
| Tax Cost | 39,180,925 |
| Gross Unrealized Appreciation | 13,271,192 |
| Gross Unrealized Depreciation | (1,367,253) |
| Net Unrealized Appreciation (Depreciation) | 11,903,939 |
E. During the year ended October 31, 2021, the fund purchased $11,626,412,000 of investment securities and sold $7,101,274,000 of investment securities, other than temporary cash investments. Purchases and sales include $6,908,112,000 and $3,669,913,000, respectively, in connection with in-kind purchases and redemptions of the fund’s capital shares.
The fund purchased securities from and sold securities to other Vanguard funds or accounts managed by Vanguard or its affiliates, in accordance with procedures adopted by the board of trustees in compliance with Rule 17a-7 of the Investment Company Act of 1940. For the year ended October 31, 2021, such purchases were $1,162,880,000 and sales were $483,610,000, resulting in net realized loss of $31,148,000; these amounts, other than temporary cash investments, are included in the purchases and sales of investment securities noted above.
F. Capital share transactions for each class of shares were:
| | Year Ended October 31, |
| | 2021 | | 2020 |
| | Amount
($000) | Shares
(000) | | Amount
($000) | Shares
(000) |
| Investor Shares | | | | | |
| Issued | — | — | | 61 | 2 |
| Issued in Lieu of Cash Distributions | — | — | | — | — |
| Redeemed 1 | — | — | | (5,809) | (161) |
| Net Increase (Decrease)—Investor Shares | — | — | | (5,748) | (159) |
High Dividend Yield Index Fund
| | Year Ended October 31, |
| | 2021 | | 2020 |
| | Amount
($000) | Shares
(000) | | Amount
($000) | Shares
(000) |
| ETF Shares | | | | | |
| Issued | 7,291,624 | 73,333 | | 6,760,136 | 79,262 |
| Issued in Lieu of Cash Distributions | — | — | | — | — |
| Redeemed | (3,685,376) | (37,150) | | (3,913,611) | (47,950) |
| Net Increase (Decrease)—ETF Shares | 3,606,248 | 36,183 | | 2,846,525 | 31,312 |
| Admiral Shares | | | | | |
| Issued 1 | 2,290,496 | 75,589 | | 1,888,385 | 75,452 |
| Issued in Lieu of Cash Distributions | 229,798 | 7,717 | | 220,883 | 8,834 |
| Redeemed | (1,604,030) | (53,826) | | (2,200,872) | (90,743) |
| Net Increase (Decrease)—Admiral Shares | 916,264 | 29,480 | | (91,604) | (6,457) |
| 1 | In November 2018, the fund announced changes to the availability and minimum investment criteria of the Investor and Admiral share classes. As a result, all of the outstanding Investor Shares automatically converted to Admiral Shares beginning in April 2019. Investor Shares—Redeemed and Admiral Shares—Issued include 4,000 and 5,000 shares, respectively, in the amount of $91,000 from the conversion during the year ended October 31, 2020. |
G. Management has determined that no events or transactions occurred subsequent to October 31, 2021, that would require recognition or disclosure in these financial statements.
Report of Independent Registered
Public Accounting Firm
To the Board of Trustees of Vanguard Whitehall Funds and Shareholders of Vanguard High Dividend Yield Index Fund
Opinion on the Financial Statements
We have audited the accompanying statement of assets and liabilities, including the schedule of investments, of Vanguard High Dividend Yield Index Fund (one of the funds constituting Vanguard Whitehall Funds, referred to hereafter as the "Fund”) as of October 31, 2021, the related statement of operations for the year ended October 31, 2021, the statement of changes in net assets for each of the two years in the period ended October 31, 2021, including the related notes, and the financial highlights for each of the periods indicated therein (collectively referred to as the “financial statements”). In our opinion, the financial statements present fairly, in all material respects, the financial position of the Fund as of October 31, 2021, the results of its operations for the year then ended, the changes in its net assets for each of the two years in the period ended October 31, 2021 and the financial highlights for each of the periods indicated therein in conformity with accounting principles generally accepted in the United States of America.
Basis for Opinion
These financial statements are the responsibility of the Fund’s management. Our responsibility is to express an opinion on the Fund’s financial statements based on our audits. We are a public accounting firm registered with the Public Company Accounting Oversight Board (United States) (PCAOB) and are required to be independent with respect to the Fund in accordance with the U.S. federal securities laws and the applicable rules and regulations of the Securities and Exchange Commission and the PCAOB.
We conducted our audits of these financial statements in accordance with the standards of the PCAOB. Those standards require that we plan and perform the audit to obtain reasonable assurance about whether the financial statements are free of material misstatement, whether due to error or fraud.
Our audits included performing procedures to assess the risks of material misstatement of the financial statements, whether due to error or fraud, and performing procedures that respond to those risks. Such procedures included examining, on a test basis, evidence regarding the amounts and disclosures in the financial statements. Our audits also included evaluating the accounting principles used and significant estimates made by management, as well as evaluating the overall presentation of the financial statements. Our procedures included confirmation of securities owned as of October 31, 2021 by correspondence with the custodian, transfer agent and brokers; when replies were not received from the transfer agent or brokers, we performed other auditing procedures. We believe that our audits provide a reasonable basis for our opinion.
/s/PricewaterhouseCoopers LLP
Philadelphia, Pennsylvania
December 17, 2021
We have served as the auditor of one or more investment companies in The Vanguard Group of Funds since 1975.
Special 2021 tax information (unaudited) for Vanguard High Dividend Yield Index Fund
This information for the fiscal year ended October 31, 2021, is included pursuant to provisions of the Internal Revenue Code.
The fund distributed $1,339,671,000 of qualified dividend income to shareholders during the fiscal year.
For corporate shareholders, 96.5% of investment income (dividend income plus short-term gains, if any) qualifies for the dividends-received deduction.
London Stock Exchange Group companies include FTSE International Limited (“FTSE”), Frank Russell Company (“Russell”), MTS Next Limited (“MTS”), and FTSE TMX Global Debt Capital Markets Inc. (“FTSE TMX”). All rights reserved. “FTSE®”, “Russell®”, “MTS®”, “FTSE TMX®” and “FTSE Russell” and other service marks and trademarks related to the FTSE or Russell indexes are trademarks of the London Stock Exchange Group companies and are used by FTSE, MTS, FTSE TMX and Russell under license. All information is provided for information purposes only. Every effort is made to ensure that all information given in this publication is accurate, but no responsibility or liability can be accepted by the London Stock Exchange Group companies nor its licensors for any errors or for any loss from use of this publication. Neither the London Stock Exchange Group companies nor any of their licensors make any claim, prediction, warranty or representation whatsoever, expressly or impliedly, either as to the results to be obtained from the use of the Indices or the fitness or suitability of the Indices for any particular purpose to which they might be put. The London Stock Exchange Group companies do not provide investment advice and nothing in this document should be taken as constituting financial or investment advice. The London Stock Exchange Group companies make no representation regarding the advisability of investing in any asset. A decision to invest in any such asset should not be made in reliance on any information herein. Indexes cannot be invested in directly. Inclusion of an asset in an index is not a recommendation to buy, sell or hold that asset. The general information contained in this publication should not be acted upon without obtaining specific legal, tax, and investment advice from a licensed professional. No part of this information may be reproduced, stored in a retrieval system or transmitted in any form or by any means, electronic, mechanical, photocopying, recording or otherwise, without prior written permission of the London Stock Exchange Group companies. Distribution of the London Stock Exchange Group companies’ index values and the use of their indexes to create financial products require a license with FTSE, FTSE TMX, MTS and/or Russell and/or its licensors.
This page intentionally left blank.
The People Who Govern Your Fund
The trustees of your mutual fund are there to see that the fund is operated and managed in your best interests since, as a shareholder, you are a part owner of the fund. Your fund’s trustees also serve on the board of directors of The Vanguard Group, Inc., which is owned by the Vanguard funds and provides services to them.
A majority of Vanguard’s board members are independent, meaning that they have no affiliation with Vanguard or the funds they oversee, apart from the sizable personal investments they have made as private individuals. The independent board members have distinguished backgrounds in business, academia, and public service. Each of the trustees and executive officers oversees 214 Vanguard funds.
Information for each trustee and executive officer of the fund appears below. That information, as well as the Vanguard fund count, is as of the date on the cover of this fund report. The mailing address of the trustees and officers is P.O. Box 876, Valley Forge, PA 19482. More information about the trustees is in the Statement of Additional Information, which can be obtained, without charge, by contacting Vanguard at 800-662-7447, or online at vanguard.com.
Interested Trustee1
Mortimer J. Buckley
Born in 1969. Trustee since January 2018. Principal occupation(s) during the past five years and other experience: chairman of the board (2019–present) of Vanguard and of each of the investment companies served by Vanguard; chief executive officer (2018–present) of Vanguard; chief executive officer, president, and trustee (2018–present) of each of the investment companies served by Vanguard; president and director (2017–present) of Vanguard; and president (2018–present) of Vanguard Marketing Corporation. Chief investment officer (2013–2017), managing director (2002–2017), head of the Retail Investor Group (2006–2012), and chief information officer (2001–2006) of Vanguard. Chairman of the board (2011–2017) and trustee (2009–2017) of the Children’s Hospital of Philadelphia; and trustee (2018–present) and vice chair (2019–present) of The Shipley School.
Independent Trustees
Emerson U. Fullwood
Born in 1948. Trustee since January 2008. Principal occupation(s) during the past five years and other experience: executive chief staff and marketing officer for North America and corporate vice president (retired 2008) of Xerox Corporation (document management products and services). Former president of the Worldwide Channels Group, Latin America, and Worldwide Customer Service and executive chief staff officer of Developing Markets of Xerox. Executive in residence and 2009–2010 Distinguished Minett Professor at the Rochester Institute of Technology. Director of SPX FLOW, Inc. (multi-industry manufacturing). Director of the University of Rochester Medical Center, the Monroe Community College Foundation, the United Way of Rochester, North Carolina A&T University, and Roberts Wesleyan College. Trustee of the University of Rochester.
Amy Gutmann
Born in 1949. Trustee since June 2006. Principal occupation(s) during the past five years and other experience: president (2004–present) of the University of Pennsylvania. Christopher H. Browne Distinguished Professor of Political Science, School of Arts and Sciences, and professor of communication, Annenberg School for Communication, with secondary faculty appointments in the Department of Philosophy, School of Arts and Sciences, and at the Graduate School of Education, University of Pennsylvania.
1 Mr. Buckley is considered an “interested person,” as defined in the Investment Company Act of 1940, because he is an officer of the Vanguard funds.
F. Joseph Loughrey
Born in 1949. Trustee since October 2009. Principal occupation(s) during the past five years and other experience: president and chief operating officer (retired 2009) and vice chairman of the board (2008–2009) of Cummins Inc. (industrial machinery). Chairman of the board of Hillenbrand, Inc. (specialized consumer services). Director of the V Foundation. Member of the advisory council for the College of Arts and Letters and chair of the advisory board to the Kellogg Institute for International Studies, both at the University of Notre Dame. Chairman of the board of Saint Anselm College.
Mark Loughridge
Born in 1953. Trustee since March 2012. Principal occupation(s) during the past five years and other experience: senior vice president and chief financial officer (retired 2013) of IBM (information technology services). Fiduciary member of IBM’s Retirement Plan Committee (2004–2013), senior vice president and general manager (2002–2004) of IBM Global Financing, vice president and controller (1998–2002) of IBM, and a variety of other prior management roles at IBM. Member of the Council on Chicago Booth.
Scott C. Malpass
Born in 1962. Trustee since March 2012. Principal occupation(s) during the past five years and other experience: chief investment officer (retired June 2020) and vice president (retired June 2020) of the University of Notre Dame. Assistant professor (retired June 2020) of finance at the Mendoza College of Business, University of Notre Dame, and member of the Notre Dame 403(b) Investment Committee. Member of the board of Catholic Investment Services, Inc. (investment advisors) and the board of superintendence of the Institute for the Works of Religion.
Deanna Mulligan
Born in 1963. Trustee since January 2018. Principal occupation(s) during the past five years and other experience: board chair (2020), chief executive officer (2011–2020), and president (2010–2019) of The Guardian Life Insurance Company of America. Chief operating officer (2010–2011) and executive vice president (2008–2010) of Individual Life and Disability of the Guardian Life Insurance Company of America. Member of the board of the Economic Club of New York. Trustee of the Partnership for New York City (business leadership), Chief Executives for Corporate Purpose, NewYork-Presbyterian Hospital, and the Bruce Museum (arts and science). Member of the Advisory Council for the Stanford Graduate School of Business.
André F. Perold
Born in 1952. Trustee since December 2004. Principal occupation(s) during the past five years and other experience: George Gund Professor of Finance and Banking, Emeritus at the Harvard Business School (retired 2011). Chief investment officer and co-managing partner of HighVista Strategies (private investment firm). Member of the board (2018–present) of RIT Capital Partners (investment firm). Member of the investment committee of Partners Health Care System.
Sarah Bloom Raskin
Born in 1961. Trustee since January 2018. Principal occupation(s) during the past five years and other experience: deputy secretary (2014–2017) of the United States Department of the Treasury. Governor (2010–2014) of the Federal Reserve Board. Commissioner (2007–2010) of financial regulation for the State of Maryland. Professor (2020–present), Distinguished Fellow of the Global Financial Markets Center (2020–present), and Rubenstein Fellow (2017–2020) at Duke University. Trustee (2017–present) of Amherst College and member of Amherst College Investment Committee (2019–present). Member of the Regenerative Crisis Response Committee (2020–present).
David A. Thomas
Born in 1956. Trustee since July 2021. Principal occupation(s) during the past five years and other experience: president of Morehouse College (2018–present). Professor of business administration, emeritus at Harvard University (2017–2018). Dean (2011–2016) and professor of management (2016–2017) at the Georgetown University McDonough School of Business. Director of DTE Energy Company (2013–present). Trustee of Common Fund (2019–present).
Peter F. Volanakis
Born in 1955. Trustee since July 2009. Principal occupation(s) during the past five years and other experience: president and chief operating officer (retired 2010) of Corning Incorporated (communications equipment) and director of Corning Incorporated (2000–2010) and Dow Corning (2001–2010). Director (2012) of SPX Corporation (multi-industry manufacturing). Overseer of the Amos Tuck School of Business Administration, Dartmouth College (2001–2013). Chairman of the board of trustees of Colby-Sawyer College. Member of the BMW Group Mobility Council.
Executive Officers
Christine M. Buchanan
Born in 1970. Principal occupation(s) during the past five years and other experience: principal of Vanguard. Chief financial officer (2021–present) and treasurer (2017–present) of each of the investment companies served by Vanguard. Partner (2005–2017) at KPMG (audit, tax, and advisory services).
David Cermak
Born in 1960. Principal occupation(s) during the past five years and other experience: principal of Vanguard. Finance director (2019–present) of each of the investment companies served by Vanguard. Managing director and head (2017–present) of Vanguard Investments Singapore. Managing director and head (2017–2019) of Vanguard Investments Hong Kong. Representative director and head (2014–2017) of Vanguard Investments Japan.
John Galloway
Born in 1973. Principal occupation(s) during the past five years and other experience: principal of Vanguard. Investment stewardship officer (September 2020–present) of each of the investment companies served by Vanguard. Head of Investor Advocacy (February 2020–present) and head of Marketing Strategy and Planning (2017–2020) at Vanguard. Deputy assistant to the President of the United States (2015).
Peter Mahoney
Born in 1974. Principal occupation(s) during the past five years and other experience: principal of Vanguard. Controller (2015–present) of each of the investment companies served by Vanguard. Head of International Fund Services (2008–2014) at Vanguard.
Anne E. Robinson
Born in 1970. Principal occupation(s) during the past five years and other experience: general counsel (2016–present) of Vanguard. Secretary (2016–present) of Vanguard and of each of the investment companies served by Vanguard. Managing director (2016–present) of Vanguard. Managing director and general counsel of Global Cards and Consumer Services (2014–2016) at Citigroup. Counsel (2003–2014) at American Express.
Michael Rollings
Born in 1963. Principal occupation(s) during the past five years and other experience: finance director (2017–present) and treasurer (2017) of each of the investment companies served by Vanguard. Managing director (2016–present) of Vanguard. Chief financial officer (2016–present) of Vanguard. Director (2016–present) of Vanguard Marketing Corporation. Executive vice president and chief financial officer (2006–2016) of MassMutual Financial Group.
John E. Schadl
Born in 1972. Principal occupation(s) during the past five years and other experience: principal of Vanguard. Chief compliance officer (2019–present) of Vanguard and of each of the investment companies served by Vanguard. Assistant vice president (2019–present) of Vanguard Marketing Corporation.
Vanguard Senior Management Team
| Matthew Benchener | Thomas M. Rampulla |
| Joseph Brennan | Karin A. Risi |
| Mortimer J. Buckley | Anne E. Robinson |
| Gregory Davis | Michael Rollings |
| John James | Nitin Tandon |
| John T. Marcante | Lauren Valente |
| Chris D. McIsaac | |
Connect with Vanguard®>vanguard.com
Fund Information > 800-662-7447
Direct Investor Account Services > 800-662-2739
Institutional Investor Services > 800-523-1036
Text Telephone for People
Who Are Deaf or Hard of Hearing > 800-749-7273
This material may be used in conjunction with the offering of shares of any Vanguard fund only if preceded or accompanied by the fund’s current prospectus.
All comparative mutual fund data are from Morningstar, Inc., unless otherwise noted.
You can obtain a free copy of Vanguard’s proxy voting guidelines by visiting vanguard.com/proxyreporting or by calling Vanguard at 800-662-2739. The guidelines are also available from the SEC’s website, www.sec.gov. In addition, you may obtain a free report on how your fund voted the proxies for securities it owned during the 12 months ended June 30. To get the report, visit either vanguard.com/proxyreporting or www.sec.gov.
You can review information about your fund on the SEC’s website, and you can receive copies of this information, for a fee, by sending a request via email addressed to publicinfo@sec.gov.
Source for Bloomberg indexes: Bloomberg Index Services Limited. Copyright 2021, Bloomberg. All rights reserved.
© 2021 The Vanguard Group, Inc.
All rights reserved.
U.S. Patent Nos. 6,879,964 and 7,720,749.
Vanguard Marketing Corporation, Distributor.
Q6230 122021
Annual Report | October 31, 2021
Vanguard Emerging Markets Government Bond Index Fund
Contents
Your Fund’s Performance at a Glance
| 1 |
About Your Fund’s Expenses
| 2 |
Performance Summary
| 4 |
Financial Statements
| 7 |
Please note: The opinions expressed in this report are just that—informed opinions. They should not be considered promises or advice. Also, please keep in mind that the information and opinions cover the period through the date on the front of this report. Of course, the risks of investing in your fund are spelled out in the prospectus.
Your Fund’s Performance at a Glance
| • | For the 12 months ended October 31, 2021, Vanguard Emerging Markets Government Bond Index Fund returned 3.26% for Admiral Shares, 3.31% for Institutional Shares, and 4.06% for ETF Shares. Its benchmark index returned 4.20%. |
| • | The global economy continued to recover from the sharp pandemic-induced contraction in the spring of 2020. Countries that were more successful in containing COVID-19—whether through vaccinations, lockdowns, or both—generally fared better economically. Swift and extensive fiscal and monetary support from policymakers was also key to the rebound. Bond yields moved higher across much of the developed world during the fiscal year amid concerns about inflation and the prospect that some developed-market central banks might scale back their bond-buying programs or raise interest rates. |
| • | Amid these conditions, U.S. dollar-denominated emerging-market debt performance was mostly positive over the period. Bonds of some of the largest issuers, including Mexico and Turkey, posted double-digit 12-month gains, while those of others such as Saudi Arabia, Indonesia, and the United Arab Emirates lagged. |
| • | At period-end, the fund’s 30-day SEC yield net of expenses—a proxy for its income-generating potential over 12 months—ranged from 4.10% for Admiral Shares to 4.12% for Institutional Shares. |
Market Barometer
| | Average Annual Total Returns
Periods Ended October 31, 2021 |
| | One Year | Three Years | Five Years |
| Stocks | | | |
| Russell 1000 Index (Large-caps) | 43.51% | 22.01% | 19.16% |
| Russell 2000 Index (Small-caps) | 50.80 | 16.47 | 15.52 |
| Russell 3000 Index (Broad U.S. market) | 43.90 | 21.62 | 18.91 |
| FTSE All-World ex US Index (International) | 30.23 | 12.42 | 10.05 |
| Bonds | | | |
Bloomberg U.S. Aggregate Bond Index
(Broad taxable market) | -0.48% | 5.63% | 3.10% |
Bloomberg Municipal Bond Index
(Broad tax-exempt market) | 2.64 | 5.17 | 3.41 |
| FTSE Three-Month U.S. Treasury Bill Index | 0.05 | 1.08 | 1.12 |
| CPI | | | |
| Consumer Price Index | 6.22% | 3.03% | 2.73% |
Fund returns are adjusted to reflect the 0.75% fee on purchases of fund shares. The fee does not apply to the ETF Shares.
About Your Fund’s Expenses
As a shareholder of the fund, you incur ongoing costs, which include costs for portfolio management, administrative services, and shareholder reports (like this one), among others. Operating expenses, which are deducted from a fund’s gross income, directly reduce the investment return of the fund.
A fund’s expenses are expressed as a percentage of its average net assets. This figure is known as the expense ratio. The following examples are intended to help you understand the ongoing costs (in dollars) of investing in your fund and to compare these costs with those of other mutual funds. The examples are based on an investment of $1,000 made at the beginning of the period shown and held for the entire period.
The accompanying table illustrates your fund’s costs in two ways:
| • | Based on actual fund return. This section helps you to estimate the actual expenses that you paid over the period. The ”Ending Account Value“ shown is derived from the fund‘s actual return, and the third column shows the dollar amount that would have been paid by an investor who started with $1,000 in the fund. You may use the information here, together with the amount you invested, to estimate the expenses that you paid over the period. |
To do so, simply divide your account value by $1,000 (for example, an $8,600 account value divided by $1,000 = 8.6), then multiply the result by the number given for your fund under the heading ”Expenses Paid During Period.“
| • | Based on hypothetical 5% yearly return. This section is intended to help you compare your fund‘s costs with those of other mutual funds. It assumes that the fund had a yearly return of 5% before expenses, but that the expense ratio is unchanged. In this case—because the return used is not the fund’s actual return—the results do not apply to your investment. The example is useful in making comparisons because the Securities and Exchange Commission requires all mutual funds to calculate expenses based on a 5% return. You can assess your fund’s costs by comparing this hypothetical example with the hypothetical examples that appear in shareholder reports of other funds. |
Note that the expenses shown in the table are meant to highlight and help you compare ongoing costs only and do not reflect transaction costs incurred by the fund for buying and selling securities. Further, the expenses do not include any purchase, redemption, or account service fees described in the fund prospectus. If such fees were applied to your account, your costs would be higher. Your fund does not carry a “sales load.”
The calculations assume no shares were bought or sold during the period. Your actual costs may have been higher or lower, depending on the amount of your investment and the timing of any purchases or redemptions.
You can find more information about the fund’s expenses, including annual expense ratios, in the Financial Statements section of this report. For additional information on operating expenses and other shareholder costs, please refer to your fund’s current prospectus.
| Six Months Ended October 31, 2021 | | | |
| | Beginning
Account Value
4/30/2021 | Ending
Account Value
10/31/2021 | Expenses
Paid During
Period |
| Based on Actual Fund Return | | | |
| Emerging Markets Government Bond Index Fund | | | |
| ETF Shares | $1,000.00 | $1,013.10 | $0.86 |
| Admiral™ Shares | 1,000.00 | 1,013.00 | 0.81 |
| Institutional Shares | 1,000.00 | 1,013.20 | 0.76 |
| Based on Hypothetical 5% Yearly Return | | | |
| Emerging Markets Government Bond Index Fund | | | |
| ETF Shares | $1,000.00 | $1,024.35 | $0.87 |
| Admiral Shares | 1,000.00 | 1,024.40 | 0.82 |
| Institutional Shares | 1,000.00 | 1,024.45 | 0.77 |
The calculations are based on expenses incurred in the most recent six-month period. The fund’s annualized six-month expense ratios for that period are 0.17% for ETF Shares, 0.16% for Admiral Shares, and 0.15% for Institutional Shares. The dollar amounts shown as “Expenses Paid” are equal to the annualized expense ratio multiplied by the average account value over the period, multiplied by the number of days in the most recent six-month period, then divided by the number of days in the most recent 12-month period (184/365).
Emerging Markets Government Bond Index Fund
All of the returns in this report represent past performance, which is not a guarantee of future results that may be achieved by the fund. (Current performance may be lower or higher than the performance data cited. For performance data current to the most recent month-end, visit our website at vanguard.com/performance.) Note, too, that both investment returns and principal value can fluctuate widely, so an investor’s shares, when sold, could be worth more or less than their original cost. The returns shown do not reflect taxes that a shareholder would pay on fund distributions or on the sale of fund shares.
Cumulative Performance: May 31, 2013, Through October 31, 2021
Initial Investment of $10,000
| | | Average Annual Total Returns
Periods Ended October 31, 2021 | |
| | | One
Year | Five
Years | Since
Inception
(5/31/2013) | Final Value
of a $10,000
Investment |
 | Emerging Markets Government Bond Index Fund
ETF Shares Net Asset Value | 4.06% | 4.03% | 4.27% | $14,219 |
| | Emerging Markets Government Bond Index Fund ETF Shares Market Price | 3.70 | 4.00 | 4.30 | 14,250 |
 | Bloomberg USD Emerging Markets Government RIC Capped Index | 4.20 | 4.11 | 4.36 | 14,323 |
 | Bloomberg Global Aggregate Index ex USD | -1.99 | 1.92 | 1.29 | 11,136 |
“Since Inception” performance is calculated from the ETF Shares’ inception date for both the fund and its comparative standard(s).
| | | | |
| | | One
Year | Five
Years | Since
Inception
(5/31/2013) | Final Value
of a $10,000
Investment |
Emerging Markets Government Bond Index Fund
Admiral Shares | 3.26% | 3.88% | 4.19% | $14,126 |
| Bloomberg USD Emerging Markets Government RIC Capped Index | 4.20 | 4.11 | 4.36 | 14,323 |
| Bloomberg Global Aggregate Index ex USD | -1.99 | 1.92 | 1.29 | 11,136 |
“Since Inception” performance is calculated from the Admiral Shares’ inception date for both the fund and its comparative standard(s).
See Financial Highlights for dividend and capital gains information.
Emerging Markets Government Bond Index Fund
| | | Average Annual Total Returns
Periods Ended October 31, 2021 | |
| | | One
Year | Five
Years | Since
Inception
(2/11/2015) 1 | Final Value
of a $5,000,000
Investment |
Emerging Markets Government Bond Index Fund
Institutional Shares | 3.31% | 3.89% | 4.91% | $6,900,820 |
| Bloomberg USD Emerging Markets Government RIC Capped Index | 4.20 | 4.11 | 5.10 | 6,982,620 |
| Bloomberg Global Aggregate Index ex USD | -1.99 | 1.92 | 2.15 | 5,767,808 |
| “Since Inception” performance is calculated from the Institutional Shares’ inception date for both the fund and its comparative standard(s). |
| 1Institutional Shares were first issued on November 25, 2014, and were redeemed shortly thereafter. Institutional Shares were next issued on February 11, 2015. The total returns shown are based on the period beginning February 11, 2015. |
Cumulative Returns of ETF Shares: May 31, 2013, Through October 31, 2021
| | One
Year | Five
Years | Since
Inception
(5/31/2013) |
| Emerging Markets Government Bond Index Fund ETF Shares Market Price | 3.70% | 21.64% | 42.50% |
| Emerging Markets Government Bond Index Fund ETF Shares Net Asset Value | 4.06 | 21.83 | 42.19 |
| Bloomberg USD Emerging Markets Government RIC Capped Index | 4.20 | 22.33 | 43.23 |
"Since Inception" performance is calculated from the ETF Shares’ inception date for both the fund and its comparative standard(s).
For the ETF Shares, the market price is determined by the midpoint of the bid-offer spread as of the closing time of the New York Stock Exchange (generally 4 p.m., Eastern time). The net asset value is also determined as of the NYSE closing time. For more information about how the ETF Shares' market prices have compared with their net asset value, visit vanguard.com, select your ETF, and then select the Price and Performance tab. The ETF premium/discount analysis there shows the percentages of days on which the ETF Shares' market price was above or below the NAV.
Vanguard fund returns are adjusted to reflect the 0.75% fee on purchases of fund shares. The fee does not apply to the ETF Shares.
Emerging Markets Government Bond Index Fund
| Mexico | 9.7% |
| Saudi Arabia | 8.5 |
| Indonesia | 6.9 |
| United Arab Emirates | 6.2 |
| Turkey | 5.6 |
| Qatar | 5.6 |
| China | 4.1 |
| Brazil | 3.8 |
| Russia | 3.7 |
| Colombia | 3.5 |
| Philippines | 2.9 |
| Peru | 2.4 |
| Oman | 2.4 |
| Egypt | 2.3 |
| Panama | 2.2 |
| Argentina | 2.0 |
| Dominican Republic | 2.0 |
| Chile | 1.8 |
| Bahrain | 1.6 |
| South Africa | 1.6 |
| Malaysia | 1.6 |
| Uruguay | 1.5 |
| Ukraine | 1.5 |
| Nigeria | 1.2 |
| Hungary | 1.0 |
| Ghana | 1.0 |
| Other | 13.4 |
The table reflects the fund’s investments, except for short-term investments and derivatives.
The fund may invest in derivatives (such as futures and swap contracts) for various reasons, including, but not limited to, attempting to remain fully invested and tracking its target index as closely as possible.
Emerging Markets Government Bond Index Fund
The fund files its complete schedule of portfolio holdings with the Securities and Exchange Commission (SEC) for the first and third quarters of each fiscal year as an exhibit to its reports on Form N-PORT. The fund’s Form N-PORT reports are available on the SEC’s website at www.sec.gov.
| | | Coupon | Maturity
Date | Face
Amount
($000) | Market
Value•
($000) |
| Corporate Bonds (14.5%) | | |
| Azerbaijan (0.2%) | | |
| 1 | Southern Gas Corridor CJSC | 6.875% | 3/24/26 | 5,350 | 6,266 |
| Brazil (0.5%) | | |
| | Petrobras Global Finance BV | 5.999% | 1/27/28 | 1,178 | 1,285 |
| | Petrobras Global Finance BV | 5.093% | 1/15/30 | 4,250 | 4,338 |
| | Petrobras Global Finance BV | 5.600% | 1/3/31 | 4,890 | 5,123 |
| | Petrobras Global Finance BV | 6.875% | 1/20/40 | 1 | 1 |
| | Petrobras Global Finance BV | 6.850% | 6/5/15 | 6,000 | 5,850 |
| | | | | | 16,597 |
| Chile (0.2%) | | |
| | Corp. Nacional del Cobre de Chile | 3.700% | 1/30/50 | 7,300 | 7,426 |
| China (2.4%) | | |
| | Bank of China Ltd. | 5.000% | 11/13/24 | 8,425 | 9,246 |
| | China Cinda Finance 2015 I Ltd. | 4.250% | 4/23/25 | 4,700 | 4,952 |
| | China Construction Bank Corp. | 4.250% | 2/27/29 | 5,300 | 5,622 |
| | China Construction Bank Corp. | 2.450% | 6/24/30 | 5,950 | 5,985 |
| | CNAC HK Finbridge Co. Ltd. | 5.125% | 3/14/28 | 4,955 | 5,631 |
| | CNOOC Finance 2013 Ltd. | 3.000% | 5/9/23 | 5,500 | 5,656 |
| | CNOOC Finance 2014 ULC | 4.250% | 4/30/24 | 6,681 | 7,162 |
| | CNOOC Finance 2015 USA LLC | 3.500% | 5/5/25 | 800 | 847 |
| | Industrial & Commercial Bank of China Ltd. | 4.875% | 9/21/25 | 5,900 | 6,477 |
| | Sinopec Group Overseas Development 2013 Ltd. | 4.375% | 10/17/23 | 4,393 | 4,679 |
| | Sinopec Group Overseas Development 2015 Ltd. | 3.250% | 4/28/25 | 5,500 | 5,803 |
| | Sinopec Group Overseas Development 2018 Ltd. | 2.700% | 5/13/30 | 4,300 | 4,396 |
| | State Grid Overseas Investment 2014 Ltd. | 4.125% | 5/7/24 | 4,420 | 4,759 |
| | State Grid Overseas Investment BVI Ltd. | 3.500% | 5/4/27 | 6,744 | 7,317 |
| | | | | | 78,532 |
| Colombia (0.7%) | | |
| | Ecopetrol SA | 5.875% | 9/18/23 | 4,940 | 5,306 |
| | Ecopetrol SA | 5.375% | 6/26/26 | 4,000 | 4,335 |
| | Ecopetrol SA | 6.875% | 4/29/30 | 5,675 | 6,551 |
| | Ecopetrol SA | 5.875% | 5/28/45 | 5,467 | 5,503 |
| | Ecopetrol SA | 5.875% | 11/2/51 | 1,612 | 1,597 |
| | | | | | 23,292 |
| Indonesia (0.4%) | | |
| | Pertamina Persero PT | 4.300% | 5/20/23 | 4,615 | 4,839 |
| | Pertamina Persero PT | 6.450% | 5/30/44 | 3,600 | 4,780 |
Emerging Markets Government Bond Index Fund
| | | Coupon | Maturity
Date | Face
Amount
($000) | Market
Value•
($000) |
| | Pertamina Persero PT | 6.500% | 11/7/48 | 400 | 539 |
| | Perusahaan Perseroan Persero PT Perusahaan Listrik Negara | 4.125% | 5/15/27 | 4,357 | 4,701 |
| | | | | | 14,859 |
| Kazakhstan (0.2%) | | |
| | KazMunayGas National Co. JSC | 6.375% | 10/24/48 | 4,160 | 5,355 |
| Malaysia (0.9%) | | |
| | Petronas Capital Ltd. | 3.500% | 3/18/25 | 4,100 | 4,369 |
| | Petronas Capital Ltd. | 3.500% | 4/21/30 | 6,300 | 6,818 |
| | Petronas Capital Ltd. | 4.500% | 3/18/45 | 4,110 | 4,989 |
| 2 | Petronas Capital Ltd. | 4.550% | 4/21/50 | 775 | 975 |
| | Petronas Capital Ltd. | 4.550% | 4/21/50 | 7,000 | 8,771 |
| 2 | Petronas Capital Ltd. | 3.404% | 4/28/61 | 4,600 | 4,761 |
| | | | | | 30,683 |
| Mexico (4.3%) | | |
| | Mexico City Airport Trust | 5.500% | 7/31/47 | 5,654 | 5,742 |
| 2 | Petroleos Mexicanos | 6.875% | 10/16/25 | 3,930 | 4,298 |
| | Petroleos Mexicanos | 6.875% | 8/4/26 | 8,500 | 9,283 |
| | Petroleos Mexicanos | 6.490% | 1/23/27 | 6,556 | 6,976 |
| | Petroleos Mexicanos | 6.500% | 3/13/27 | 14,850 | 15,830 |
| | Petroleos Mexicanos | 5.350% | 2/12/28 | 6,725 | 6,712 |
| | Petroleos Mexicanos | 6.500% | 1/23/29 | 5,680 | 5,914 |
| | Petroleos Mexicanos | 6.840% | 1/23/30 | 11,800 | 12,329 |
| | Petroleos Mexicanos | 5.950% | 1/28/31 | 8,225 | 8,094 |
| | Petroleos Mexicanos | 6.625% | 6/15/35 | 7,700 | 7,447 |
| | Petroleos Mexicanos | 6.500% | 6/2/41 | 4,250 | 3,842 |
| | Petroleos Mexicanos | 6.375% | 1/23/45 | 4,220 | 3,643 |
| | Petroleos Mexicanos | 6.750% | 9/21/47 | 16,549 | 14,568 |
| | Petroleos Mexicanos | 6.350% | 2/12/48 | 7,790 | 6,636 |
| | Petroleos Mexicanos | 7.690% | 1/23/50 | 23,749 | 22,691 |
| | Petroleos Mexicanos | 6.950% | 1/28/60 | 10,340 | 9,155 |
| | | | | | 143,160 |
| Peru (0.2%) | | |
| | Petroleos del Peru SA | 5.625% | 6/19/47 | 5,400 | 5,481 |
| Qatar (1.0%) | | |
| 2 | Qatar Petroleum | 1.375% | 9/12/26 | 4,100 | 4,048 |
| 2 | Qatar Petroleum | 2.250% | 7/12/31 | 9,300 | 9,158 |
| | Qatar Petroleum | 2.250% | 7/12/31 | 600 | 592 |
| 2 | Qatar Petroleum | 3.125% | 7/12/41 | 9,200 | 9,338 |
| | Qatar Petroleum | 3.125% | 7/12/41 | 600 | 607 |
| 2 | Qatar Petroleum | 3.300% | 7/12/51 | 10,800 | 11,074 |
| | | | | | 34,817 |
| Russia (0.5%) | ��� | |
| | Gazprom Neft OAO Via GPN Capital SA | 6.000% | 11/27/23 | 4,100 | 4,468 |
| 2 | Gazprom PJSC via Gaz Finance plc | 2.950% | 1/27/29 | 5,000 | 4,895 |
| | Gazprom PJSC via Gaz Finance plc | 2.950% | 1/27/29 | 600 | 587 |
| 2 | Gazprom PJSC via Gaz Finance plc | 3.250% | 2/25/30 | 3,200 | 3,158 |
| | Gazprom PJSC via Gaz Finance plc | 3.250% | 2/25/30 | 2,225 | 2,195 |
| | | | | | 15,303 |
| Saudi Arabia (2.1%) | | |
| 2 | SA Global Sukuk Ltd. | 1.602% | 6/17/26 | 4,000 | 3,949 |
| | SA Global Sukuk Ltd. | 1.602% | 6/17/26 | 1,150 | 1,134 |
| 2 | SA Global Sukuk Ltd. | 2.694% | 6/17/31 | 6,900 | 6,917 |
| | Saudi Arabian Oil Co. | 2.875% | 4/16/24 | 5,475 | 5,691 |
Emerging Markets Government Bond Index Fund
| | | Coupon | Maturity
Date | Face
Amount
($000) | Market
Value•
($000) |
| 2 | Saudi Arabian Oil Co. | 3.500% | 4/16/29 | 975 | 1,041 |
| | Saudi Arabian Oil Co. | 3.500% | 4/16/29 | 7,791 | 8,323 |
| 2 | Saudi Arabian Oil Co. | 2.250% | 11/24/30 | 2,575 | 2,499 |
| | Saudi Arabian Oil Co. | 2.250% | 11/24/30 | 3,650 | 3,539 |
| 2 | Saudi Arabian Oil Co. | 4.250% | 4/16/39 | 4,100 | 4,612 |
| | Saudi Arabian Oil Co. | 4.250% | 4/16/39 | 4,500 | 5,048 |
| | Saudi Arabian Oil Co. | 4.375% | 4/16/49 | 8,880 | 10,208 |
| 2 | Saudi Arabian Oil Co. | 3.250% | 11/24/50 | 2,350 | 2,263 |
| | Saudi Arabian Oil Co. | 3.250% | 11/24/50 | 3,075 | 2,953 |
| 2 | Saudi Arabian Oil Co. | 3.500% | 11/24/70 | 5,600 | 5,342 |
| | Saudi Arabian Oil Co. | 3.500% | 11/24/70 | 600 | 574 |
| | Saudi Electricity Global Sukuk Co. 3 | 4.000% | 4/8/24 | 3,850 | 4,108 |
| | | | | | 68,201 |
| United Arab Emirates (0.9%) | | |
| 3 | Abu Dhabi Crude Oil Pipeline LLC | 4.600% | 11/2/47 | 6,075 | 7,065 |
| 2 | DP World Ltd. | 6.850% | 7/2/37 | 3,840 | 5,077 |
| | DP World Ltd. | 5.625% | 9/25/48 | 675 | 824 |
| | DP World Salaam | 6.000% | 12/31/99 | 4,100 | 4,487 |
| 2 | MDGH GMTN RSC Ltd. | 3.700% | 11/7/49 | 2,000 | 2,189 |
| | MDGH GMTN RSC Ltd. | 3.700% | 11/7/49 | 1,353 | 1,475 |
| | MDGH GMTN RSC Ltd. | 3.950% | 5/21/50 | 6,400 | 7,280 |
| | | | | | 28,397 |
| Total Corporate Bonds (Cost $478,566) | | 478,369 |
| Sovereign Bonds (84.4%) | | |
| Angola (0.7%) | | |
| | Republic of Angola | 9.500% | 11/12/25 | 3,850 | 4,161 |
| | Republic of Angola | 8.250% | 5/9/28 | 6,100 | 6,141 |
| | Republic of Angola | 8.000% | 11/26/29 | 3,623 | 3,603 |
| | Republic of Angola | 9.375% | 5/8/48 | 4,750 | 4,737 |
| | Republic of Angola | 9.125% | 11/26/49 | 2,450 | 2,398 |
| 2 | Republic of Angola | 9.125% | 11/26/49 | 1,200 | 1,174 |
| | | | | | 22,214 |
| Argentina (2.0%) | | |
| 4 | Provincia de Buenos Aires, 5.2500% coupon rate effective 9/1/22 | 3.900% | 9/1/37 | 17,200 | 7,591 |
| | Republic of Argentina | 1.000% | 7/9/29 | 7,401 | 2,692 |
| 4 | Republic of Argentina, 0.7500% coupon rate effective 7/9/23 | 0.500% | 7/9/30 | 44,027 | 15,093 |
| 4 | Republic of Argentina, 1.500% coupon rate effective 7/9/22 | 1.125% | 7/9/35 | 55,979 | 17,292 |
| 4 | Republic of Argentina, 1.500% coupon rate effective 7/9/22 | 1.125% | 7/9/46 | 6,099 | 1,924 |
| 4 | Republic of Argentina, 3.500% coupon rate effective 7/9/22 | 2.500% | 7/9/41 | 28,814 | 9,957 |
| 4 | Republic of Argentina, 3.875% coupon rate effective 7/9/22 | 2.000% | 1/9/38 | 31,051 | 11,342 |
| | | | | | 65,891 |
| Armenia (0.1%) | | |
| | Republic of Armenia | 7.150% | 3/26/25 | 1,300 | 1,480 |
| | Republic of Armenia | 3.950% | 9/26/29 | 1,400 | 1,367 |
| 2 | Republic of Armenia | 3.600% | 2/2/31 | 1,150 | 1,077 |
| | Republic of Armenia | 3.600% | 2/2/31 | 850 | 798 |
| | | | | | 4,722 |
| Azerbaijan (0.2%) | | |
| | Republic of Azerbaijan | 4.750% | 3/18/24 | 3,600 | 3,864 |
| 3 | Republic of Azerbaijan | 3.500% | 9/1/32 | 2,600 | 2,661 |
Emerging Markets Government Bond Index Fund
| | | Coupon | Maturity
Date | Face
Amount
($000) | Market
Value•
($000) |
| 2,3 | Republic of Azerbaijan | 3.500% | 9/1/32 | 300 | 307 |
| | | | | | 6,832 |
| Bahamas (0.1%) | | |
| 2,3 | Commonwealth of Bahamas | 6.000% | 11/21/28 | 850 | 772 |
| 3 | Commonwealth of Bahamas | 6.000% | 11/21/28 | 500 | 454 |
| 2,3 | Commonwealth of Bahamas | 8.950% | 10/15/32 | 1,750 | 1,692 |
| 3 | Commonwealth of Bahamas | 8.950% | 10/15/32 | 800 | 770 |
| | | | | | 3,688 |
| Bahrain (1.6%) | | |
| | CBB International Sukuk Co. 5 Spc | 5.624% | 2/12/24 | 3,700 | 3,921 |
| | CBB International Sukuk Co. 6 Spc | 5.250% | 3/20/25 | 2,000 | 2,120 |
| | CBB International Sukuk Co. 6 Spc | 6.875% | 10/5/25 | 2,650 | 3,019 |
| | CBB International Sukuk Programme Co. WLL | 6.250% | 11/14/24 | 2,858 | 3,093 |
| | CBB International Sukuk Programme Co. WLL | 4.500% | 3/30/27 | 2,120 | 2,231 |
| | CBB International Sukuk Programme Co. WLL | 3.950% | 9/16/27 | 2,400 | 2,463 |
| | Kingdom of Bahrain | 6.125% | 8/1/23 | 3,902 | 4,134 |
| | Kingdom of Bahrain | 7.000% | 1/26/26 | 4,150 | 4,598 |
| | Kingdom of Bahrain | 4.250% | 1/25/28 | 500 | 492 |
| | Kingdom of Bahrain | 7.000% | 10/12/28 | 4,700 | 5,155 |
| | Kingdom of Bahrain | 6.750% | 9/20/29 | 3,900 | 4,213 |
| | Kingdom of Bahrain | 7.375% | 5/14/30 | 2,700 | 3,009 |
| | Kingdom of Bahrain | 5.625% | 9/30/31 | 2,670 | 2,661 |
| | Kingdom of Bahrain | 5.450% | 9/16/32 | 2,700 | 2,643 |
| 2 | Kingdom of Bahrain | 5.250% | 1/25/33 | 2,500 | 2,393 |
| | Kingdom of Bahrain | 5.250% | 1/25/33 | 300 | 287 |
| | Kingdom of Bahrain | 6.000% | 9/19/44 | 3,400 | 3,153 |
| | Kingdom of Bahrain | 7.500% | 9/20/47 | 2,500 | 2,585 |
| | Kingdom of Bahrain | 6.250% | 1/25/51 | 1,400 | 1,306 |
| | | | | | 53,476 |
| Belarus (0.2%) | | |
| | Republic of Belarus | 6.875% | 2/28/23 | 2,325 | 2,345 |
| | Republic of Belarus | 5.875% | 2/24/26 | 1,000 | 922 |
| | Republic of Belarus | 7.625% | 6/29/27 | 1,800 | 1,751 |
| | Republic of Belarus | 6.200% | 2/28/30 | 1,600 | 1,386 |
| 2 | Republic of Belarus | 6.378% | 2/24/31 | 750 | 649 |
| | Republic of Belarus | 6.378% | 2/24/31 | 1,400 | 1,210 |
| | | | | | 8,263 |
| Belize (0.0%) | | |
| | Republic of Belize | 4.938% | 2/20/34 | 1,473 | 754 |
| Bermuda (0.2%) | | |
| | Government of Bermuda | 3.717% | 1/25/27 | 1,550 | 1,676 |
| 2 | Government of Bermuda | 4.750% | 2/15/29 | 600 | 695 |
| | Government of Bermuda | 2.375% | 8/20/30 | 1,000 | 995 |
| 2 | Government of Bermuda | 3.375% | 8/20/50 | 1,000 | 1,002 |
| | Government of Bermuda | 3.375% | 8/20/50 | 1,000 | 1,003 |
| | | | | | 5,371 |
| Bolivia (0.1%) | | |
| | Bolivian Government | 5.950% | 8/22/23 | 1,000 | 1,046 |
| 2,3 | Bolivian Government | 4.500% | 3/20/28 | 900 | 803 |
| 3 | Bolivian Government | 4.500% | 3/20/28 | 2,000 | 1,799 |
| | | | | | 3,648 |
Emerging Markets Government Bond Index Fund
| | | Coupon | Maturity
Date | Face
Amount
($000) | Market
Value•
($000) |
| Brazil (3.2%) | | |
| | Federative Republic of Brazil | 2.625% | 1/5/23 | 5,700 | 5,823 |
| | Federative Republic of Brazil | 8.875% | 4/15/24 | 2,826 | 3,442 |
| | Federative Republic of Brazil | 4.250% | 1/7/25 | 11,953 | 12,664 |
| | Federative Republic of Brazil | 8.750% | 2/4/25 | 1,677 | 2,046 |
| | Federative Republic of Brazil | 2.875% | 6/6/25 | 5,150 | 5,151 |
| | Federative Republic of Brazil | 6.000% | 4/7/26 | 5,900 | 6,616 |
| | Federative Republic of Brazil | 10.125% | 5/15/27 | 2,056 | 2,869 |
| | Federative Republic of Brazil | 4.625% | 1/13/28 | 8,302 | 8,517 |
| | Federative Republic of Brazil | 4.500% | 5/30/29 | 5,800 | 5,803 |
| | Federative Republic of Brazil | 3.875% | 6/12/30 | 10,550 | 9,855 |
| | Federative Republic of Brazil | 3.750% | 9/12/31 | 2,750 | 2,511 |
| | Federative Republic of Brazil | 8.250% | 1/20/34 | 3,739 | 4,826 |
| | Federative Republic of Brazil | 7.125% | 1/20/37 | 4,646 | 5,439 |
| | Federative Republic of Brazil | 5.625% | 1/7/41 | 6,002 | 5,876 |
| | Federative Republic of Brazil | 5.000% | 1/27/45 | 8,986 | 8,082 |
| | Federative Republic of Brazil | 5.625% | 2/21/47 | 7,633 | 7,380 |
| | Federative Republic of Brazil | 4.750% | 1/14/50 | 11,085 | 9,489 |
| | | | | | 106,389 |
| Chile (1.6%) | | |
| | Republic of Chile | 3.125% | 1/21/26 | 1,800 | 1,909 |
| | Republic of Chile | 3.240% | 2/6/28 | 5,450 | 5,745 |
| | Republic of Chile | 2.450% | 1/31/31 | 7,850 | 7,725 |
| | Republic of Chile | 2.550% | 1/27/32 | 1,100 | 1,086 |
| | Republic of Chile | 2.550% | 7/27/33 | 6,500 | 6,281 |
| | Republic of Chile | 3.100% | 5/7/41 | 7,400 | 7,189 |
| | Republic of Chile | 3.860% | 6/21/47 | 3,525 | 3,825 |
| | Republic of Chile | 3.500% | 1/25/50 | 6,400 | 6,508 |
| | Republic of Chile | 3.500% | 4/15/53 | 4,150 | 4,215 |
| | Republic of Chile | 3.100% | 1/22/61 | 5,650 | 5,203 |
| | Republic of Chile | 3.250% | 9/21/71 | 2,700 | 2,490 |
| | | | | | 52,176 |
| China (1.6%) | | |
| | China Government Bond | 2.125% | 11/2/22 | 2,523 | 2,563 |
| | China Government Bond | 1.875% | 12/3/22 | 3,207 | 3,254 |
| | China Government Bond | 3.250% | 10/19/23 | 4,100 | 4,314 |
| | China Government Bond | 0.400% | 10/21/23 | 3,300 | 3,289 |
| | China Government Bond | 1.950% | 12/3/24 | 5,450 | 5,638 |
| | China Government Bond | 0.550% | 10/21/25 | 6,850 | 6,678 |
| | China Government Bond | 2.625% | 11/2/27 | 3,251 | 3,456 |
| | China Government Bond | 3.500% | 10/19/28 | 1,700 | 1,913 |
| | China Government Bond | 2.125% | 12/3/29 | 8,750 | 9,082 |
| | China Government Bond | 1.200% | 10/21/30 | 2,700 | 2,607 |
| | China Government Bond | 2.750% | 12/3/39 | 1,525 | 1,613 |
| | China Government Bond | 4.000% | 10/19/48 | 1,400 | 1,854 |
| 2 | China Government Bond | 2.250% | 10/21/50 | 800 | 778 |
| | China Government Bond | 2.250% | 10/21/50 | 400 | 390 |
| 2 | China Government Bond | 2.500% | 10/26/51 | 3,125 | 3,201 |
| | Export-Import Bank of China | 3.625% | 7/31/24 | 3,772 | 4,050 |
| | | | | | 54,680 |
| Colombia (2.8%) | | |
| | Republic of Colombia | 2.625% | 3/15/23 | 2,760 | 2,802 |
| | Republic of Colombia | 4.000% | 2/26/24 | 4,245 | 4,432 |
| | Republic of Colombia | 8.125% | 5/21/24 | 2,705 | 3,117 |
Emerging Markets Government Bond Index Fund
| | | Coupon | Maturity
Date | Face
Amount
($000) | Market
Value•
($000) |
| | Republic of Colombia | 4.500% | 1/28/26 | 4,067 | 4,352 |
| | Republic of Colombia | 3.875% | 4/25/27 | 5,275 | 5,469 |
| | Republic of Colombia | 4.500% | 3/15/29 | 5,400 | 5,709 |
| | Republic of Colombia | 3.000% | 1/30/30 | 4,475 | 4,231 |
| | Republic of Colombia | 3.125% | 4/15/31 | 6,980 | 6,539 |
| | Republic of Colombia | 3.250% | 4/22/32 | 5,500 | 5,143 |
| | Republic of Colombia | 7.375% | 9/18/37 | 4,912 | 6,071 |
| | Republic of Colombia | 6.125% | 1/18/41 | 6,750 | 7,480 |
| | Republic of Colombia | 4.125% | 2/22/42 | 2,750 | 2,489 |
| | Republic of Colombia | 5.625% | 2/26/44 | 6,800 | 7,166 |
| | Republic of Colombia | 5.000% | 6/15/45 | 12,675 | 12,477 |
| | Republic of Colombia | 5.200% | 5/15/49 | 7,420 | 7,465 |
| | Republic of Colombia | 4.125% | 5/15/51 | 4,000 | 3,493 |
| | Republic of Colombia | 3.875% | 2/15/61 | 3,650 | 2,993 |
| | | | | | 91,428 |
| Costa Rica (0.5%) | | |
| | Republic of Costa Rica | 4.250% | 1/26/23 | 2,582 | 2,638 |
| | Republic of Costa Rica | 4.375% | 4/30/25 | 1,400 | 1,437 |
| | Republic of Costa Rica | 6.125% | 2/19/31 | 3,225 | 3,307 |
| | Republic of Costa Rica | 5.625% | 4/30/43 | 1,700 | 1,520 |
| | Republic of Costa Rica | 7.000% | 4/4/44 | 2,930 | 2,924 |
| | Republic of Costa Rica | 7.158% | 3/12/45 | 3,451 | 3,489 |
| | | | | | 15,315 |
| Croatia (0.3%) | | |
| | Republic of Croatia | 5.500% | 4/4/23 | 4,000 | 4,262 |
| | Republic of Croatia | 6.000% | 1/26/24 | 4,800 | 5,321 |
| | | | | | 9,583 |
| Dominican Republic (2.0%) | | |
| 3 | Dominican Republic | 5.875% | 4/18/24 | 1,500 | 1,580 |
| | Dominican Republic | 5.500% | 1/27/25 | 3,700 | 4,017 |
| | Dominican Republic | 6.875% | 1/29/26 | 4,345 | 4,987 |
| | Dominican Republic | 5.950% | 1/25/27 | 4,850 | 5,422 |
| | Dominican Republic | 6.000% | 7/19/28 | 3,619 | 4,067 |
| | Dominican Republic | 4.500% | 1/30/30 | 5,856 | 5,929 |
| 2 | Dominican Republic | 4.875% | 9/23/32 | 2,250 | 2,283 |
| | Dominican Republic | 4.875% | 9/23/32 | 5,300 | 5,405 |
| 2 | Dominican Republic | 5.300% | 1/21/41 | 1,900 | 1,894 |
| | Dominican Republic | 5.300% | 1/21/41 | 2,550 | 2,540 |
| | Dominican Republic | 7.450% | 4/30/44 | 4,000 | 4,773 |
| | Dominican Republic | 6.850% | 1/27/45 | 5,644 | 6,306 |
| | Dominican Republic | 6.500% | 2/15/48 | 2,900 | 3,118 |
| | Dominican Republic | 6.400% | 6/5/49 | 3,950 | 4,202 |
| 2 | Dominican Republic | 5.875% | 1/30/60 | 850 | 830 |
| | Dominican Republic | 5.875% | 1/30/60 | 8,227 | 8,070 |
| | | | | | 65,423 |
| Ecuador (0.9%) | | |
| 2,3 | Republic of Ecuador | 0.000% | 7/31/30 | 1,075 | 576 |
| 3 | Republic of Ecuador | 0.000% | 7/31/30 | 1,700 | 911 |
| 2,4 | Republic of Ecuador, 1.500% coupon rate effective 7/31/2022 | 0.500% | 7/31/40 | 5,658 | 3,381 |
| 4 | Republic of Ecuador, 1.500% coupon rate effective 7/31/2022 | 0.500% | 7/31/40 | 3,650 | 2,181 |
| 2,4 | Republic of Ecuador, 2.500% coupon rate effective 7/31/2022 | 1.000% | 7/31/35 | 11,776 | 7,805 |
| 4 | Republic of Ecuador, 2.500% coupon rate effective 7/31/2022 | 1.000% | 7/31/35 | 11,230 | 7,443 |
| 2,4 | Republic of Ecuador, 5.500% coupon rate effective 7/31/22 | 5.000% | 7/31/30 | 2,635 | 2,192 |
Emerging Markets Government Bond Index Fund
| | | Coupon | Maturity
Date | Face
Amount
($000) | Market
Value•
($000) |
| 4 | Republic of Ecuador, 5.500% coupon rate effective 7/31/22 | 5.000% | 7/31/30 | 7,725 | 6,427 |
| | | | | | 30,916 |
| Egypt (2.3%) | | |
| | Arab Republic of Egypt | 5.577% | 2/21/23 | 3,420 | 3,510 |
| | Arab Republic of Egypt | 4.550% | 11/20/23 | 1,278 | 1,297 |
| | Arab Republic of Egypt | 6.200% | 3/1/24 | 2,200 | 2,298 |
| | Arab Republic of Egypt | 5.750% | 5/29/24 | 3,520 | 3,628 |
| | Arab Republic of Egypt | 5.875% | 6/11/25 | 4,075 | 4,178 |
| | Arab Republic of Egypt | 5.250% | 10/6/25 | 2,350 | 2,363 |
| 2 | Arab Republic of Egypt | 3.875% | 2/16/26 | 1,500 | 1,399 |
| | Arab Republic of Egypt | 7.500% | 1/31/27 | 5,304 | 5,508 |
| 2 | Arab Republic of Egypt | 5.800% | 9/30/27 | 2,300 | 2,233 |
| | Arab Republic of Egypt | 6.588% | 2/21/28 | 3,625 | 3,557 |
| | Arab Republic of Egypt | 7.600% | 3/1/29 | 5,744 | 5,773 |
| 2 | Arab Republic of Egypt | 5.875% | 2/16/31 | 1,100 | 994 |
| | Arab Republic of Egypt | 5.875% | 2/16/31 | 3,450 | 3,120 |
| | Arab Republic of Egypt | 7.053% | 1/15/32 | 5,100 | 4,784 |
| | Arab Republic of Egypt | 7.625% | 5/29/32 | 2,049 | 1,981 |
| 2 | Arab Republic of Egypt | 7.300% | 9/30/33 | 2,900 | 2,729 |
| | Arab Republic of Egypt | 6.875% | 4/30/40 | 900 | 799 |
| | Arab Republic of Egypt | 8.500% | 1/31/47 | 7,080 | 6,542 |
| | Arab Republic of Egypt | 7.903% | 2/21/48 | 4,500 | 3,959 |
| | Arab Republic of Egypt | 8.700% | 3/1/49 | 4,700 | 4,383 |
| | Arab Republic of Egypt | 8.875% | 5/29/50 | 5,440 | 5,137 |
| 2 | Arab Republic of Egypt | 8.750% | 9/30/51 | 1,200 | 1,132 |
| 2 | Arab Republic of Egypt | 8.150% | 11/20/59 | 400 | 357 |
| | Arab Republic of Egypt | 8.150% | 11/20/59 | 1,250 | 1,116 |
| 2 | Arab Republic of Egypt | 7.500% | 2/16/61 | 3,600 | 3,057 |
| | Arab Republic of Egypt | 7.500% | 2/16/61 | 400 | 340 |
| | | | | | 76,174 |
| El Salvador (0.5%) | | |
| | Republic of El Salvador | 7.750% | 1/24/23 | 2,099 | 1,854 |
| | Republic of El Salvador | 5.875% | 1/30/25 | 2,418 | 1,921 |
| | Republic of El Salvador | 6.375% | 1/18/27 | 2,262 | 1,736 |
| | Republic of El Salvador | 8.625% | 2/28/29 | 1,625 | 1,301 |
| | Republic of El Salvador | 8.250% | 4/10/32 | 1,332 | 1,048 |
| | Republic of El Salvador | 7.650% | 6/15/35 | 2,800 | 2,106 |
| | Republic of El Salvador | 7.625% | 2/1/41 | 1,718 | 1,258 |
| 2 | Republic of El Salvador | 7.125% | 1/20/50 | 650 | 465 |
| | Republic of El Salvador | 7.125% | 1/20/50 | 2,350 | 1,684 |
| 2 | Republic of El Salvador | 9.500% | 7/15/52 | 750 | 617 |
| | Republic of El Salvador | 9.500% | 7/15/52 | 1,950 | 1,609 |
| | | | | | 15,599 |
| Ethiopia (0.1%) | | |
| | Federal Republic of Ethiopia | 6.625% | 12/11/24 | 2,850 | 2,324 |
| Gabon (0.2%) | | |
| 3 | Republic of Gabon | 6.375% | 12/12/24 | 2,536 | 2,695 |
| | Republic of Gabon | 6.950% | 6/16/25 | 1,250 | 1,345 |
| 3 | Republic of Gabon | 6.625% | 2/6/31 | 1,600 | 1,596 |
| 2,3 | Republic of Gabon | 6.625% | 2/6/31 | 1,300 | 1,297 |
| | | | | | 6,933 |
Emerging Markets Government Bond Index Fund
| | | Coupon | Maturity
Date | Face
Amount
($000) | Market
Value•
($000) |
| Georgia (0.0%) | | |
| 2 | Republic of Georgia | 2.750% | 4/22/26 | 1,100 | 1,106 |
| | Republic Of Georgia | 2.750% | 4/22/26 | 200 | 201 |
| | | | | | 1,307 |
| Ghana (1.0%) | | |
| 3 | Republic of Ghana | 8.125% | 1/18/26 | 3,545 | 3,422 |
| 2,3 | Republic of Ghana | 6.375% | 2/11/27 | 200 | 180 |
| 3 | Republic of Ghana | 6.375% | 2/11/27 | 3,506 | 3,141 |
| 3 | Republic of Ghana | 7.875% | 3/26/27 | 1,930 | 1,792 |
| 3 | Republic of Ghana | 7.750% | 4/7/29 | 600 | 536 |
| 3 | Republic of Ghana | 7.625% | 5/16/29 | 4,900 | 4,332 |
| 3 | Republic of Ghana | 10.750% | 10/14/30 | 2,900 | 3,361 |
| 3 | Republic of Ghana | 8.125% | 3/26/32 | 3,900 | 3,445 |
| 2 | Republic of Ghana | 8.625% | 4/7/34 | 1,750 | 1,549 |
| | Republic of Ghana | 8.625% | 4/7/34 | 950 | 840 |
| 3 | Republic of Ghana | 7.875% | 2/11/35 | 2,700 | 2,301 |
| 2 | Republic of Ghana | 8.875% | 5/7/42 | 800 | 703 |
| 3 | Republic of Ghana | 8.627% | 6/16/49 | 2,750 | 2,315 |
| 3 | Republic of Ghana | 8.950% | 3/26/51 | 2,725 | 2,321 |
| 2,3 | Republic of Ghana | 8.750% | 3/11/61 | 600 | 507 |
| 3 | Republic of Ghana | 8.750% | 3/11/61 | 1,550 | 1,310 |
| | | | | | 32,055 |
| Guatemala (0.5%) | | |
| | Republic of Guatemala | 4.500% | 5/3/26 | 1,850 | 1,982 |
| | Republic of Guatemala | 4.375% | 6/5/27 | 1,600 | 1,706 |
| | Republic of Guatemala | 4.875% | 2/13/28 | 1,600 | 1,740 |
| 3 | Republic of Guatemala | 4.900% | 6/1/30 | 1,600 | 1,740 |
| 2 | Republic of Guatemala | 5.375% | 4/24/32 | 200 | 224 |
| | Republic of Guatemala | 5.375% | 4/24/32 | 1,400 | 1,568 |
| 2 | Republic of Guatemala | 3.700% | 10/7/33 | 1,300 | 1,289 |
| 2 | Republic of Guatemala | 4.650% | 10/7/41 | 1,300 | 1,325 |
| 3 | Republic of Guatemala | 6.125% | 6/1/50 | 3,700 | 4,364 |
| | | | | | 15,938 |
| Honduras (0.1%) | | |
| 3 | Republic of Honduras | 7.500% | 3/15/24 | 1,400 | 1,468 |
| | Republic of Honduras | 6.250% | 1/19/27 | 2,020 | 2,121 |
| 2 | Republic of Honduras | 5.625% | 6/24/30 | 650 | 648 |
| | Republic of Honduras | 5.625% | 6/24/30 | 800 | 799 |
| | | | | | 5,036 |
| Hungary (1.0%) | | |
| | Republic of Hungary | 5.375% | 2/21/23 | 4,490 | 4,762 |
| | Republic of Hungary | 5.750% | 11/22/23 | 4,740 | 5,201 |
| | Republic of Hungary | 5.375% | 3/25/24 | 5,043 | 5,552 |
| 2 | Republic of Hungary | 2.125% | 9/22/31 | 5,900 | 5,761 |
| | Republic of Hungary | 7.625% | 3/29/41 | 3,570 | 5,895 |
| 2 | Republic of Hungary | 3.125% | 9/21/51 | 5,400 | 5,280 |
| | | | | | 32,451 |
| Indonesia (6.4%) | | |
| | Perusahaan Penerbit SBSN Indonesia III | 3.300% | 11/21/22 | 2,700 | 2,775 |
| | Perusahaan Penerbit SBSN Indonesia III | 3.750% | 3/1/23 | 3,750 | 3,898 |
| | Perusahaan Penerbit SBSN Indonesia III | 3.900% | 8/20/24 | 2,050 | 2,210 |
| | Perusahaan Penerbit SBSN Indonesia III | 4.350% | 9/10/24 | 4,500 | 4,910 |
| | Perusahaan Penerbit SBSN Indonesia III | 4.325% | 5/28/25 | 5,569 | 6,149 |
| | Perusahaan Penerbit SBSN Indonesia III | 2.300% | 6/23/25 | 1,000 | 1,033 |
Emerging Markets Government Bond Index Fund
| | | Coupon | Maturity
Date | Face
Amount
($000) | Market
Value•
($000) |
| | Perusahaan Penerbit SBSN Indonesia III | 4.550% | 3/29/26 | 5,120 | 5,753 |
| 2 | Perusahaan Penerbit SBSN Indonesia III | 1.500% | 6/9/26 | 3,150 | 3,148 |
| | Perusahaan Penerbit SBSN Indonesia III | 4.150% | 3/29/27 | 4,964 | 5,529 |
| 2 | Perusahaan Penerbit SBSN Indonesia III | 4.400% | 3/1/28 | 800 | 907 |
| | Perusahaan Penerbit SBSN Indonesia III | 4.400% | 3/1/28 | 4,090 | 4,639 |
| 2 | Perusahaan Penerbit SBSN Indonesia III | 4.450% | 2/20/29 | 600 | 686 |
| | Perusahaan Penerbit SBSN Indonesia III | 4.450% | 2/20/29 | 2,885 | 3,298 |
| | Perusahaan Penerbit SBSN Indonesia III | 2.800% | 6/23/30 | 3,050 | 3,129 |
| 2 | Perusahaan Penerbit SBSN Indonesia III | 2.550% | 6/9/31 | 2,500 | 2,517 |
| | Perusahaan Penerbit SBSN Indonesia III | 2.550% | 6/9/31 | 200 | 201 |
| | Perusahaan Penerbit SBSN Indonesia III | 3.800% | 6/23/50 | 2,100 | 2,194 |
| 2 | Perusahaan Penerbit SBSN Indonesia III | 3.550% | 6/9/51 | 2,050 | 2,081 |
| | Republic of Indonesia | 2.950% | 1/11/23 | 2,605 | 2,675 |
| | Republic of Indonesia | 3.375% | 4/15/23 | 3,430 | 3,557 |
| | Republic of Indonesia | 5.375% | 10/17/23 | 2,159 | 2,349 |
| | Republic of Indonesia | 5.875% | 1/15/24 | 5,250 | 5,811 |
| | Republic of Indonesia | 4.450% | 2/11/24 | 1,250 | 1,348 |
| | Republic of Indonesia | 4.125% | 1/15/25 | 5,600 | 6,077 |
| | Republic of Indonesia | 4.750% | 1/8/26 | 6,400 | 7,205 |
| | Republic of Indonesia | 4.350% | 1/8/27 | 3,400 | 3,804 |
| | Republic of Indonesia | 3.850% | 7/18/27 | 2,950 | 3,244 |
| | Republic of Indonesia | 3.500% | 1/11/28 | 3,436 | 3,719 |
| | Republic of Indonesia | 4.100% | 4/24/28 | 2,833 | 3,167 |
| | Republic of Indonesia | 4.750% | 2/11/29 | 3,350 | 3,897 |
| | Republic of Indonesia | 3.400% | 9/18/29 | 2,250 | 2,422 |
| | Republic of Indonesia | 2.850% | 2/14/30 | 3,600 | 3,724 |
| | Republic of Indonesia | 3.850% | 10/15/30 | 4,650 | 5,185 |
| | Republic of Indonesia | 1.850% | 3/12/31 | 3,250 | 3,115 |
| | Republic of Indonesia | 2.150% | 7/28/31 | 2,125 | 2,069 |
| | Republic of Indonesia | 8.500% | 10/12/35 | 4,500 | 7,070 |
| | Republic of Indonesia | 6.625% | 2/17/37 | 4,287 | 5,878 |
| | Republic of Indonesia | 7.750% | 1/17/38 | 5,500 | 8,237 |
| | Republic of Indonesia | 5.250% | 1/17/42 | 6,200 | 7,622 |
| | Republic of Indonesia | 4.625% | 4/15/43 | 4,160 | 4,757 |
| | Republic of Indonesia | 6.750% | 1/15/44 | 5,530 | 8,012 |
| | Republic of Indonesia | 5.125% | 1/15/45 | 5,501 | 6,706 |
| | Republic of Indonesia | 5.950% | 1/8/46 | 3,641 | 4,944 |
| | Republic of Indonesia | 5.250% | 1/8/47 | 4,450 | 5,608 |
| | Republic of Indonesia | 4.750% | 7/18/47 | 2,800 | 3,329 |
| | Republic of Indonesia | 4.350% | 1/11/48 | 4,900 | 5,574 |
| | Republic of Indonesia | 5.350% | 2/11/49 | 2,873 | 3,728 |
| | Republic of Indonesia | 3.700% | 10/30/49 | 2,700 | 2,804 |
| | Republic of Indonesia | 3.500% | 2/14/50 | 2,200 | 2,236 |
| | Republic of Indonesia | 4.200% | 10/15/50 | 4,750 | 5,368 |
| | Republic of Indonesia | 3.050% | 3/12/51 | 5,000 | 4,916 |
| | Republic of Indonesia | 3.200% | 9/23/61 | 1,000 | 953 |
| | Republic of Indonesia | 4.450% | 4/15/70 | 2,600 | 2,954 |
| | Republic of Indonesia | 3.350% | 3/12/71 | 2,400 | 2,287 |
| | | | | | 211,408 |
| Iraq (0.3%) | | |
| | Republic of Iraq | 6.752% | 3/9/23 | 3,050 | 3,120 |
| 3 | Republic of Iraq | 5.800% | 1/15/28 | 5,643 | 5,504 |
| | | | | | 8,624 |
| Ivory Coast (0.2%) | | |
| 3 | Ivory Coast | 6.375% | 3/3/28 | 2,300 | 2,513 |
Emerging Markets Government Bond Index Fund
| | | Coupon | Maturity
Date | Face
Amount
($000) | Market
Value•
($000) |
| | Ivory Coast | 5.750% | 12/31/32 | 1,585 | 1,590 |
| 3 | Ivory Coast | 6.125% | 6/15/33 | 3,300 | 3,461 |
| | | | | | 7,564 |
| Jamaica (0.5%) | | |
| 3 | Jamaica | 6.750% | 4/28/28 | 3,800 | 4,443 |
| 3 | Jamaica | 8.000% | 3/15/39 | 3,398 | 4,802 |
| | Jamaica | 7.875% | 7/28/45 | 4,800 | 6,794 |
| | | | | | 16,039 |
| Jordan (0.4%) | | |
| 2 | Kingdom of Jordan | 4.950% | 7/7/25 | 300 | 313 |
| | Kingdom of Jordan | 4.950% | 7/7/25 | 200 | 209 |
| | Kingdom of Jordan | 6.125% | 1/29/26 | 3,500 | 3,778 |
| | Kingdom of Jordan | 5.750% | 1/31/27 | 2,750 | 2,941 |
| 2 | Kingdom of Jordan | 5.850% | 7/7/30 | 1,000 | 1,030 |
| | Kingdom of Jordan | 5.850% | 7/7/30 | 2,211 | 2,284 |
| | Kingdom of Jordan | 7.375% | 10/10/47 | 2,850 | 2,948 |
| | | | | | 13,503 |
| Kazakhstan (0.6%) | | |
| | Republic of Kazakhstan | 3.875% | 10/14/24 | 3,970 | 4,274 |
| | Republic of Kazakhstan | 5.125% | 7/21/25 | 6,850 | 7,785 |
| | Republic of Kazakhstan | 4.875% | 10/14/44 | 2,900 | 3,549 |
| | Republic of Kazakhstan | 6.500% | 7/21/45 | 4,030 | 5,820 |
| | | | | | 21,428 |
| Kenya (0.6%) | | |
| | Republic of Kenya | 6.875% | 6/24/24 | 5,400 | 5,825 |
| | Republic of Kenya | 7.000% | 5/22/27 | 2,475 | 2,626 |
| | Republic of Kenya | 7.250% | 2/28/28 | 2,800 | 3,012 |
| | Republic of Kenya | 8.000% | 5/22/32 | 3,200 | 3,481 |
| 2 | Republic of Kenya | 6.300% | 1/23/34 | 2,600 | 2,532 |
| | Republic of Kenya | 8.250% | 2/28/48 | 2,825 | 2,941 |
| | | | | | 20,417 |
| Kuwait (0.4%) | | |
| | Kuwait | 3.500% | 3/20/27 | 12,200 | 13,365 |
| Lebanon (0.2%) | | |
| 5 | Lebanon Republic | 6.100% | 10/4/22 | 2,690 | 413 |
| 5 | Lebanon Republic | 6.000% | 1/27/23 | 3,385 | 519 |
| 5 | Lebanon Republic | 6.650% | 4/22/24 | 2,800 | 434 |
| 5 | Lebanon Republic | 6.200% | 2/26/25 | 2,768 | 419 |
| 5 | Lebanon Republic | 6.600% | 11/27/26 | 5,090 | 783 |
| 5 | Lebanon Republic | 6.850% | 3/23/27 | 4,135 | 641 |
| 5 | Lebanon Republic | 6.750% | 11/29/27 | 3,539 | 540 |
| 5 | Lebanon Republic | 6.650% | 11/3/28 | 2,590 | 394 |
| 5 | Lebanon Republic | 6.850% | 5/25/29 | 3,252 | 487 |
| 5 | Lebanon Republic | 6.650% | 2/26/30 | 4,470 | 683 |
| 5 | Lebanon Republic | 7.000% | 3/23/32 | 3,555 | 560 |
| 5 | Lebanon Republic | 7.250% | 3/23/37 | 2,405 | 391 |
| | | | | | 6,264 |
| Malaysia (0.6%) | | |
| | 1MDB Global Investments Ltd. | 4.400% | 3/9/23 | 7,700 | 7,734 |
| | Malaysia Sovereign Sukuk Bhd. | 3.043% | 4/22/25 | 2,850 | 3,011 |
| 2 | Malaysia Sovereign Sukuk Bhd. | 2.070% | 4/28/31 | 2,000 | 1,982 |
| | Malaysia Sovereign Sukuk Bhd. | 4.236% | 4/22/45 | 1,425 | 1,787 |
| 2 | Malaysia Sovereign Sukuk Bhd. | 3.075% | 4/28/51 | 1,300 | 1,353 |
Emerging Markets Government Bond Index Fund
| | | Coupon | Maturity
Date | Face
Amount
($000) | Market
Value•
($000) |
| | Malaysia Sukuk Global Bhd. | 3.179% | 4/27/26 | 2,750 | 2,953 |
| | Malaysia Sukuk Global Bhd. | 4.080% | 4/27/46 | 1,300 | 1,596 |
| | Malaysia Wakala Sukuk Bhd | 2.070% | 4/28/31 | 250 | 249 |
| | | | | | 20,665 |
| Maldives (0.0%) | | |
| 2 | Maldives Sukuk Issuance Ltd. | 9.875% | 4/8/26 | 1,365 | 1,392 |
| Mexico (5.3%) | | |
| | United Mexican States | 4.000% | 10/2/23 | 1,456 | 1,546 |
| | United Mexican States | 3.600% | 1/30/25 | 4,950 | 5,332 |
| | United Mexican States | 3.900% | 4/27/25 | 2,300 | 2,498 |
| | United Mexican States | 4.125% | 1/21/26 | 5,762 | 6,354 |
| | United Mexican States | 4.150% | 3/28/27 | 6,470 | 7,210 |
| | United Mexican States | 3.750% | 1/11/28 | 5,300 | 5,738 |
| | United Mexican States | 4.500% | 4/22/29 | 9,236 | 10,335 |
| | United Mexican States | 3.250% | 4/16/30 | 6,325 | 6,461 |
| | United Mexican States | 2.659% | 5/24/31 | 7,607 | 7,335 |
| | United Mexican States | 8.300% | 8/15/31 | 3,350 | 4,898 |
| | United Mexican States | 4.750% | 4/27/32 | 8,565 | 9,615 |
| | United Mexican States | 7.500% | 4/8/33 | 2,110 | 2,958 |
| | United Mexican States | 6.750% | 9/27/34 | 4,576 | 6,086 |
| | United Mexican States | 6.050% | 1/11/40 | 8,199 | 10,235 |
| | United Mexican States | 4.280% | 8/14/41 | 8,820 | 9,204 |
| | United Mexican States | 4.750% | 3/8/44 | 11,106 | 12,151 |
| | United Mexican States | 5.550% | 1/21/45 | 7,659 | 9,160 |
| | United Mexican States | 4.600% | 1/23/46 | 6,926 | 7,379 |
| | United Mexican States | 4.350% | 1/15/47 | 4,176 | 4,322 |
| | United Mexican States | 4.600% | 2/10/48 | 6,323 | 6,712 |
| | United Mexican States | 4.500% | 1/31/50 | 6,900 | 7,258 |
| | United Mexican States | 5.000% | 4/27/51 | 6,875 | 7,731 |
| | United Mexican States | 3.771% | 5/24/61 | 8,703 | 8,022 |
| | United Mexican States | 3.750% | 4/19/71 | 8,100 | 7,275 |
| | United Mexican States | 5.750% | 10/12/10 | 7,300 | 8,455 |
| | | | | | 174,270 |
| Mongolia (0.2%) | | |
| | Mongolia | 5.625% | 5/1/23 | 1,200 | 1,253 |
| | Mongolia | 8.750% | 3/9/24 | 2,100 | 2,362 |
| 2 | Mongolia | 5.125% | 4/7/26 | 848 | 881 |
| | Mongolia | 5.125% | 4/7/26 | 600 | 624 |
| 2 | Mongolia | 3.500% | 7/7/27 | 1,100 | 1,064 |
| | Mongolia | 3.500% | 7/7/27 | 200 | 193 |
| 2 | Mongolia | 4.450% | 7/7/31 | 1,300 | 1,259 |
| | | | | | 7,636 |
| Morocco (0.4%) | | |
| | Kingdom of Morocco | 4.250% | 12/11/22 | 4,200 | 4,340 |
| 2 | Kingdom of Morocco | 2.375% | 12/15/27 | 300 | 294 |
| | Kingdom of Morocco | 2.375% | 12/15/27 | 1,400 | 1,368 |
| 2 | Kingdom of Morocco | 3.000% | 12/15/32 | 900 | 854 |
| | Kingdom of Morocco | 3.000% | 12/15/32 | 2,100 | 1,993 |
| | Kingdom of Morocco | 5.500% | 12/11/42 | 1,940 | 2,153 |
| 2 | Kingdom of Morocco | 4.000% | 12/15/50 | 2,450 | 2,209 |
| | Kingdom of Morocco | 4.000% | 12/15/50 | 1,250 | 1,125 |
| | | | | | 14,336 |
Emerging Markets Government Bond Index Fund
| | | Coupon | Maturity
Date | Face
Amount
($000) | Market
Value•
($000) |
| Mozambique (0.1%) | | |
| 4 | Republic of Mozambique, 9.000% coupon rate effective 9/15/23 | 5.000% | 9/15/31 | 2,400 | 2,049 |
| Namibia (0.1%) | | |
| | Repubilc of Namibia | 5.250% | 10/29/25 | 2,100 | 2,237 |
| Nigeria (1.2%) | | |
| | Republic of Nigeria | 6.375% | 7/12/23 | 1,200 | 1,248 |
| | Republic of Nigeria | 7.625% | 11/21/25 | 3,150 | 3,433 |
| | Republic of Nigeria | 6.500% | 11/28/27 | 3,950 | 4,032 |
| 2 | Republic of Nigeria | 6.125% | 9/28/28 | 3,200 | 3,176 |
| | Republic of Nigeria | 7.143% | 2/23/30 | 3,400 | 3,430 |
| | Republic of Nigeria | 8.747% | 1/21/31 | 2,900 | 3,127 |
| | Republic of Nigeria | 7.875% | 2/16/32 | 4,350 | 4,440 |
| 2 | Republic of Nigeria | 7.375% | 9/28/33 | 4,000 | 3,959 |
| | Republic of Nigeria | 7.696% | 2/23/38 | 3,692 | 3,555 |
| | Republic of Nigeria | 7.625% | 11/28/47 | 4,100 | 3,831 |
| | Republic of Nigeria | 9.248% | 1/21/49 | 2,100 | 2,234 |
| 2 | Republic of Nigeria | 8.250% | 9/28/51 | 3,150 | 3,104 |
| | | | | | 39,569 |
| Oman (2.3%) | | |
| | Oman Sovereign Sukuk Co. | 4.397% | 6/1/24 | 5,025 | 5,216 |
| 2 | Oman Sovereign Sukuk Co. | 5.932% | 10/31/25 | 400 | 442 |
| | Oman Sovereign Sukuk Co. | 5.932% | 10/31/25 | 4,200 | 4,646 |
| 2 | Oman Sovereign Sukuk Co. | 4.875% | 6/15/30 | 4,700 | 5,007 |
| | Sultanate of Oman | 4.125% | 1/17/23 | 3,300 | 3,376 |
| | Sultanate of Oman | 4.875% | 2/1/25 | 3,000 | 3,137 |
| | Sultanate of Oman | 4.750% | 6/15/26 | 6,775 | 6,979 |
| | Sultanate of Oman | 5.375% | 3/8/27 | 5,925 | 6,243 |
| | Sultanate of Oman | 6.750% | 10/28/27 | 2,540 | 2,851 |
| | Sultanate of Oman | 5.625% | 1/17/28 | 9,150 | 9,661 |
| | Sultanate of Oman | 6.000% | 8/1/29 | 5,447 | 5,848 |
| 2 | Sultanate of Oman | 6.250% | 1/25/31 | 3,300 | 3,572 |
| | Sultanate of Oman | 6.250% | 1/25/31 | 1,900 | 2,059 |
| 2 | Sultanate of Oman | 7.375% | 10/28/32 | 400 | 462 |
| | Sultanate of Oman | 7.375% | 10/28/32 | 2,137 | 2,476 |
| | Sultanate of Oman | 6.500% | 3/8/47 | 5,315 | 5,262 |
| | Sultanate of Oman | 6.750% | 1/17/48 | 7,400 | 7,501 |
| 2 | Sultanate of Oman | 7.000% | 1/25/51 | 2,300 | 2,409 |
| | Sultanate of Oman | 7.000% | 1/25/51 | 600 | 626 |
| | | | | | 77,773 |
| Pakistan (0.6%) | | |
| | Islamic Republic of Pakistan | 8.250% | 4/15/24 | 3,025 | 3,228 |
| | Islamic Republic of Pakistan | 8.250% | 9/30/25 | 1,450 | 1,575 |
| 2 | Islamic Republic of Pakistan | 6.000% | 4/8/26 | 2,400 | 2,411 |
| | Islamic Republic of Pakistan | 6.000% | 4/8/26 | 1,050 | 1,056 |
| | Islamic Republic of Pakistan | 6.875% | 12/5/27 | 4,100 | 4,196 |
| 2 | Islamic Republic of Pakistan | 7.375% | 4/8/31 | 2,400 | 2,439 |
| | Islamic Republic of Pakistan | 7.375% | 4/8/31 | 1,600 | 1,621 |
| 2 | Islamic Republic of Pakistan | 8.875% | 4/8/51 | 1,170 | 1,176 |
| | Islamic Republic of Pakistan | 8.875% | 4/8/51 | 1,000 | 1,005 |
| | Third Pakistan International Sukuk Co. Ltd. | 5.625% | 12/5/22 | 2,000 | 2,051 |
| | | | | | 20,758 |
Emerging Markets Government Bond Index Fund
| | | Coupon | Maturity
Date | Face
Amount
($000) | Market
Value•
($000) |
| Panama (2.1%) | | |
| | Republic of Panama | 4.000% | 9/22/24 | 2,250 | 2,406 |
| | Republic of Panama | 3.750% | 3/16/25 | 3,659 | 3,910 |
| | Republic of Panama | 7.125% | 1/29/26 | 2,625 | 3,193 |
| | Republic of Panama | 8.875% | 9/30/27 | 2,795 | 3,799 |
| | Republic of Panama | 3.875% | 3/17/28 | 3,533 | 3,831 |
| | Republic of Panama | 9.375% | 4/1/29 | 2,450 | 3,553 |
| | Republic of Panama | 3.160% | 1/23/30 | 4,200 | 4,339 |
| | Republic of Panama | 2.252% | 9/29/32 | 6,800 | 6,406 |
| 3 | Republic of Panama | 6.700% | 1/26/36 | 5,650 | 7,537 |
| 3 | Republic of Panama | 4.500% | 5/15/47 | 3,100 | 3,429 |
| 3 | Republic of Panama | 4.500% | 4/16/50 | 6,775 | 7,450 |
| 3 | Republic of Panama | 4.300% | 4/29/53 | 5,100 | 5,468 |
| | Republic of Panama | 4.500% | 4/1/56 | 6,775 | 7,434 |
| 3 | Republic of Panama | 3.870% | 7/23/60 | 8,050 | 8,025 |
| | | | | | 70,780 |
| Papua New Guinea (0.0%) | | |
| 2 | Papua New Guinea | 8.375% | 10/4/28 | 300 | 304 |
| | Papua New Guinea | 8.375% | 10/4/28 | 1,100 | 1,115 |
| | | | | | 1,419 |
| Paraguay (0.5%) | | |
| | Republic of Paraguay | 5.000% | 4/15/26 | 1,835 | 2,031 |
| | Republic of Paraguay | 4.700% | 3/27/27 | 1,600 | 1,764 |
| 3 | Republic of Paraguay | 4.950% | 4/28/31 | 2,800 | 3,143 |
| 2 | Republic of Paraguay | 2.739% | 1/29/33 | 933 | 897 |
| | Republic of Paraguay | 6.100% | 8/11/44 | 2,800 | 3,375 |
| | Republic of Paraguay | 5.600% | 3/13/48 | 1,650 | 1,883 |
| 3 | Republic of Paraguay | 5.400% | 3/30/50 | 3,200 | 3,632 |
| | | | | | 16,725 |
| Peru (2.2%) | | |
| | Republic of Peru | 7.350% | 7/21/25 | 4,409 | 5,292 |
| | Republic of Peru | 2.392% | 1/23/26 | 2,800 | 2,854 |
| | Republic of Peru | 4.125% | 8/25/27 | 2,347 | 2,570 |
| | Republic of Peru | 2.844% | 6/20/30 | 2,054 | 2,080 |
| | Republic of Peru | 2.783% | 1/23/31 | 10,675 | 10,643 |
| | Republic of Peru | 1.862% | 12/1/32 | 2,800 | 2,545 |
| | Republic of Peru | 8.750% | 11/21/33 | 5,916 | 9,165 |
| | Republic of Peru | 0.000% | 1/15/34 | 6,100 | 6,033 |
| 3 | Republic of Peru | 6.550% | 3/14/37 | 3,146 | 4,281 |
| | Republic of Peru | 3.300% | 3/11/41 | 3,400 | 3,344 |
| | Republic of Peru | 5.625% | 11/18/50 | 6,858 | 9,379 |
| | Republic of Peru | 3.550% | 3/10/51 | 4,800 | 4,835 |
| | Republic of Peru | 2.780% | 12/1/60 | 5,450 | 4,702 |
| | Republic of Peru | 3.600% | 1/15/72 | 2,500 | 2,401 |
| | Republic of Peru | 3.230% | 7/28/21 | 3,065 | 2,603 |
| | | | | | 72,727 |
| Philippines (2.9%) | | |
| | Republic of Philippines | 4.200% | 1/21/24 | 4,114 | 4,398 |
| 3 | Republic of Philippines | 7.500% | 9/25/24 | 1,150 | 1,289 |
| | Republic of Philippines | 10.625% | 3/16/25 | 4,375 | 5,711 |
| | Republic of Philippines | 5.500% | 3/30/26 | 2,900 | 3,380 |
| | Republic of Philippines | 3.000% | 2/1/28 | 5,550 | 5,920 |
| | Republic of Philippines | 3.750% | 1/14/29 | 4,700 | 5,269 |
| | Republic of Philippines | 9.500% | 2/2/30 | 5,300 | 8,211 |
Emerging Markets Government Bond Index Fund
| | | Coupon | Maturity
Date | Face
Amount
($000) | Market
Value•
($000) |
| | Republic of Philippines | 2.457% | 5/5/30 | 2,975 | 3,063 |
| | Republic of Philippines | 7.750% | 1/14/31 | 5,354 | 7,710 |
| | Republic of Philippines | 1.648% | 6/10/31 | 1,200 | 1,152 |
| | Republic of Philippines | 1.950% | 1/6/32 | 2,000 | 1,943 |
| | Republic of Philippines | 6.375% | 1/15/32 | 3,300 | 4,432 |
| | Republic of Philippines | 6.375% | 10/23/34 | 5,235 | 7,231 |
| | Republic of Philippines | 5.000% | 1/13/37 | 3,605 | 4,495 |
| | Republic of Philippines | 3.950% | 1/20/40 | 5,600 | 6,258 |
| | Republic of Philippines | 3.700% | 3/1/41 | 5,500 | 5,974 |
| | Republic of Philippines | 3.700% | 2/2/42 | 5,320 | 5,783 |
| | Republic of Philippines | 2.950% | 5/5/45 | 3,850 | 3,816 |
| | Republic of Philippines | 2.650% | 12/10/45 | 4,200 | 4,009 |
| | Republic of Philippines | 3.200% | 7/6/46 | 5,975 | 6,085 |
| | | | | | 96,129 |
| Poland (0.5%) | | |
| | Republic of Poland | 3.000% | 3/17/23 | 4,991 | 5,143 |
| 6 | Republic of Poland | 4.000% | 1/22/24 | 5,598 | 5,965 |
| | Republic of Poland | 3.250% | 4/6/26 | 4,875 | 5,240 |
| | | | | | 16,348 |
| Qatar (4.5%) | | |
| 7 | SoQ Sukuk A QSC | 3.241% | 1/18/23 | 5,350 | 5,528 |
| | State of Qatar | 3.875% | 4/23/23 | 8,436 | 8,841 |
| | State of Qatar | 3.375% | 3/14/24 | 5,700 | 6,012 |
| | State of Qatar | 3.400% | 4/16/25 | 5,317 | 5,692 |
| | State of Qatar | 3.250% | 6/2/26 | 9,850 | 10,564 |
| | State of Qatar | 4.500% | 4/23/28 | 8,350 | 9,639 |
| | State of Qatar | 4.000% | 3/14/29 | 11,300 | 12,759 |
| | State of Qatar | 3.750% | 4/16/30 | 9,415 | 10,511 |
| 2 | State of Qatar | 9.750% | 6/15/30 | 2,928 | 4,611 |
| 2 | State of Qatar | 6.400% | 1/20/40 | 2,595 | 3,792 |
| 2 | State of Qatar | 5.750% | 1/20/42 | 2,300 | 3,205 |
| | State of Qatar | 4.625% | 6/2/46 | 5,700 | 7,135 |
| | State of Qatar | 5.103% | 4/23/48 | 16,500 | 21,999 |
| | State of Qatar | 4.817% | 3/14/49 | 16,375 | 21,118 |
| | State of Qatar | 4.400% | 4/16/50 | 13,800 | 16,860 |
| | | | | | 148,266 |
| Romania (0.7%) | | |
| | Romania | 4.375% | 8/22/23 | 4,470 | 4,731 |
| | Romania | 4.875% | 1/22/24 | 2,670 | 2,873 |
| 2 | Romania | 3.000% | 2/14/31 | 1,300 | 1,307 |
| | Romania | 3.000% | 2/14/31 | 2,200 | 2,216 |
| | Romania | 6.125% | 1/22/44 | 2,760 | 3,603 |
| | Romania | 5.125% | 6/15/48 | 3,250 | 3,830 |
| 2 | Romania | 4.000% | 2/14/51 | 2,520 | 2,552 |
| | Romania | 4.000% | 2/14/51 | 2,944 | 2,975 |
| | | | | | 24,087 |
| Russia (3.2%) | | |
| | Russian Federation | 4.875% | 9/16/23 | 8,600 | 9,234 |
| | Russian Federation | 4.750% | 5/27/26 | 8,200 | 9,203 |
| | Russian Federation | 4.250% | 6/23/27 | 6,800 | 7,543 |
| | Russian Federation | 12.750% | 6/24/28 | 6,690 | 11,004 |
| | Russian Federation | 4.375% | 3/21/29 | 8,200 | 9,247 |
| | Russian Federation | 7.500% | 3/31/30 | 4,722 | 5,473 |
| | Russian Federation | 5.100% | 3/28/35 | 10,800 | 12,925 |
Emerging Markets Government Bond Index Fund
| | | Coupon | Maturity
Date | Face
Amount
($000) | Market
Value•
($000) |
| | Russian Federation | 5.625% | 4/4/42 | 8,200 | 10,645 |
| | Russian Federation | 5.875% | 9/16/43 | 4,200 | 5,709 |
| | Russian Federation | 5.250% | 6/23/47 | 19,200 | 24,463 |
| | | | | | 105,446 |
| Rwanda (0.1%) | | |
| 2 | Republic of Rwanda | 5.500% | 8/9/31 | 1,700 | 1,743 |
| Saudi Arabia (6.4%) | | |
| | Kingdom of Saudi Arabia | 2.875% | 3/4/23 | 8,160 | 8,405 |
| | Kingdom of Saudi Arabia | 4.000% | 4/17/25 | 12,365 | 13,455 |
| | Kingdom of Saudi Arabia | 2.900% | 10/22/25 | 6,775 | 7,163 |
| | Kingdom of Saudi Arabia | 3.250% | 10/26/26 | 15,300 | 16,406 |
| | Kingdom of Saudi Arabia | 2.500% | 2/3/27 | 3,325 | 3,425 |
| | Kingdom of Saudi Arabia | 3.625% | 3/4/28 | 13,732 | 14,933 |
| | Kingdom of Saudi Arabia | 4.375% | 4/16/29 | 10,370 | 11,871 |
| | Kingdom of Saudi Arabia | 4.500% | 4/17/30 | 9,050 | 10,512 |
| | Kingdom of Saudi Arabia | 3.250% | 10/22/30 | 4,194 | 4,464 |
| 2 | Kingdom of Saudi Arabia | 2.750% | 2/3/32 | 400 | 408 |
| | Kingdom of Saudi Arabia | 2.750% | 2/3/32 | 2,100 | 2,142 |
| 2 | Kingdom of Saudi Arabia | 2.250% | 2/2/33 | 2,900 | 2,796 |
| | Kingdom of Saudi Arabia | 2.250% | 2/2/33 | 4,600 | 4,437 |
| | Kingdom of Saudi Arabia | 4.500% | 10/26/46 | 17,950 | 20,734 |
| | Kingdom of Saudi Arabia | 4.625% | 10/4/47 | 12,405 | 14,608 |
| | Kingdom of Saudi Arabia | 5.000% | 4/17/49 | 9,925 | 12,421 |
| | Kingdom of Saudi Arabia | 5.250% | 1/16/50 | 9,192 | 11,893 |
| | Kingdom of Saudi Arabia | 3.750% | 1/21/55 | 7,748 | 8,102 |
| | Kingdom of Saudi Arabia | 4.500% | 4/22/60 | 8,100 | 9,693 |
| 2 | Kingdom of Saudi Arabia | 3.450% | 2/2/61 | 1,300 | 1,285 |
| | Kingdom of Saudi Arabia | 3.450% | 2/2/61 | 4,700 | 4,634 |
| | KSA Sukuk Ltd. | 3.628% | 4/20/27 | 12,236 | 13,301 |
| | KSA Sukuk Ltd. | 4.303% | 1/19/29 | 5,850 | 6,667 |
| | KSA Sukuk Ltd. | 2.969% | 10/29/29 | 6,340 | 6,646 |
| | | | | | 210,401 |
| Senegal (0.2%) | | |
| 3 | Republic of Senegal | 6.250% | 5/23/33 | 2,900 | 2,982 |
| 3 | Republic of Senegal | 6.750% | 3/13/48 | 2,809 | 2,789 |
| | | | | | 5,771 |
| Serbia (0.1%) | | |
| 2 | Republic of Serbia | 2.125% | 12/1/30 | 1,450 | 1,352 |
| | Republic of Serbia | 2.125% | 12/1/30 | 2,050 | 1,912 |
| | | | | | 3,264 |
| South Africa (1.6%) | | |
| | Republic of South Africa | 4.665% | 1/17/24 | 4,000 | 4,256 |
| | Republic of South Africa | 5.875% | 9/16/25 | 5,600 | 6,258 |
| | Republic of South Africa | 4.875% | 4/14/26 | 3,450 | 3,683 |
| | Republic of South Africa | 4.850% | 9/27/27 | 2,800 | 2,943 |
| | Republic of South Africa | 4.300% | 10/12/28 | 5,450 | 5,501 |
| | Republic of South Africa | 4.850% | 9/30/29 | 5,260 | 5,396 |
| | Republic of South Africa | 5.875% | 6/22/30 | 4,100 | 4,503 |
| | Republic of South Africa | 6.250% | 3/8/41 | 2,015 | 2,111 |
| | Republic of South Africa | 5.375% | 7/24/44 | 3,100 | 2,932 |
| | Republic of South Africa | 5.000% | 10/12/46 | 2,750 | 2,456 |
| | Republic of South Africa | 5.650% | 9/27/47 | 4,050 | 3,849 |
| | Republic of South Africa | 6.300% | 6/22/48 | 1,700 | 1,750 |
Emerging Markets Government Bond Index Fund
| | | Coupon | Maturity
Date | Face
Amount
($000) | Market
Value•
($000) |
| | Republic of South Africa | 5.750% | 9/30/49 | 8,150 | 7,804 |
| | | | | | 53,442 |
| Sri Lanka (0.6%) | | |
| | Republic of Sri Lanka | 5.750% | 4/18/23 | 3,450 | 2,380 |
| | Republic of Sri Lanka | 6.850% | 3/14/24 | 2,650 | 1,745 |
| | Republic of Sri Lanka | 6.350% | 6/28/24 | 1,300 | 856 |
| | Republic of Sri Lanka | 6.125% | 6/3/25 | 1,750 | 1,134 |
| | Republic of Sri Lanka | 6.850% | 11/3/25 | 4,000 | 2,590 |
| | Republic of Sri Lanka | 6.825% | 7/18/26 | 3,075 | 1,963 |
| | Republic of Sri Lanka | 6.200% | 5/11/27 | 4,150 | 2,620 |
| | Republic of Sri Lanka | 6.750% | 4/18/28 | 3,450 | 2,177 |
| | Republic of Sri Lanka | 7.850% | 3/14/29 | 3,730 | 2,366 |
| | Republic of Sri Lanka | 7.550% | 3/28/30 | 4,100 | 2,585 |
| | | | | | 20,416 |
| Suriname (0.0%) | | |
| 5 | Republic of Suriname | 9.250% | 10/26/26 | 1,500 | 1,071 |
| Tajikistan (0.0%) | | |
| 3 | Republic of Tajikistan | 7.125% | 9/14/27 | 1,375 | 1,217 |
| Trinidad & Tobago (0.2%) | | |
| | Republic of Trinidad & Tobago | 4.375% | 1/16/24 | 1,300 | 1,349 |
| 2 | Republic of Trinidad & Tobago | 4.375% | 1/16/24 | 200 | 208 |
| | Republic of Trinidad & Tobago | 4.500% | 8/4/26 | 2,600 | 2,703 |
| 2 | Republic of Trinidad & Tobago | 4.500% | 6/26/30 | 850 | 881 |
| | Republic of Trinidad & Tobago | 4.500% | 6/26/30 | 600 | 622 |
| | | | | | 5,763 |
| Tunisia (0.1%) | | |
| | Banque Centrale de Tunisie International Bond | 5.750% | 1/30/25 | 2,450 | 1,969 |
| Turkey (5.6%) | | |
| | Hazine Mustesarligi Varlik Kiralama A/S | 5.004% | 4/6/23 | 3,773 | 3,840 |
| | Hazine Mustesarligi Varlik Kiralama A/S | 4.489% | 11/25/24 | 2,478 | 2,469 |
| 2 | Hazine Mustesarligi Varlik Kiralama A/S | 5.125% | 6/22/26 | 3,900 | 3,832 |
| | Hazine Mustesarligi Varlik Kiralama A/S | 5.125% | 6/22/26 | 3,000 | 2,950 |
| | Republic of Turkey | 3.250% | 3/23/23 | 4,100 | 4,070 |
| | Republic of Turkey | 7.250% | 12/23/23 | 5,850 | 6,194 |
| | Republic of Turkey | 5.750% | 3/22/24 | 6,000 | 6,113 |
| | Republic of Turkey | 6.350% | 8/10/24 | 6,550 | 6,746 |
| | Republic of Turkey | 5.600% | 11/14/24 | 6,900 | 6,951 |
| | Republic of Turkey | 7.375% | 2/5/25 | 9,100 | 9,612 |
| | Republic of Turkey | 4.250% | 3/13/25 | 5,650 | 5,446 |
| | Republic of Turkey | 6.375% | 10/14/25 | 6,800 | 6,912 |
| | Republic of Turkey | 4.750% | 1/26/26 | 4,950 | 4,749 |
| | Republic of Turkey | 4.250% | 4/14/26 | 4,175 | 3,908 |
| | Republic of Turkey | 4.875% | 10/9/26 | 8,249 | 7,834 |
| | Republic of Turkey | 6.000% | 3/25/27 | 9,062 | 8,961 |
| | Republic of Turkey | 5.125% | 2/17/28 | 5,725 | 5,382 |
| | Republic of Turkey | 6.125% | 10/24/28 | 6,208 | 6,085 |
| | Republic of Turkey | 7.625% | 4/26/29 | 8,725 | 9,184 |
| | Republic of Turkey | 11.875% | 1/15/30 | 3,930 | 5,195 |
| | Republic of Turkey | 5.250% | 3/13/30 | 5,698 | 5,180 |
| | Republic of Turkey | 5.950% | 1/15/31 | 6,250 | 5,849 |
| | Republic of Turkey | 5.875% | 6/26/31 | 4,750 | 4,406 |
| | Republic of Turkey | 6.500% | 9/20/33 | 4,000 | 3,805 |
| | Republic of Turkey | 8.000% | 2/14/34 | 4,171 | 4,476 |
Emerging Markets Government Bond Index Fund
| | | Coupon | Maturity
Date | Face
Amount
($000) | Market
Value•
($000) |
| | Republic of Turkey | 6.875% | 3/17/36 | 7,500 | 7,264 |
| | Republic of Turkey | 7.250% | 3/5/38 | 2,725 | 2,724 |
| | Republic of Turkey | 6.750% | 5/30/40 | 5,400 | 5,069 |
| | Republic of Turkey | 6.000% | 1/14/41 | 8,265 | 7,140 |
| | Republic of Turkey | 4.875% | 4/16/43 | 8,200 | 6,391 |
| | Republic of Turkey | 6.625% | 2/17/45 | 8,200 | 7,462 |
| | Republic of Turkey | 5.750% | 5/11/47 | 9,700 | 8,012 |
| | | | | | 184,211 |
| Ukraine (1.4%) | | |
| | Ukraine | 7.750% | 9/1/23 | 3,850 | 4,105 |
| | Ukraine | 8.994% | 2/1/24 | 2,150 | 2,352 |
| | Ukraine | 7.750% | 9/1/24 | 3,910 | 4,223 |
| | Ukraine | 7.750% | 9/1/25 | 3,800 | 4,104 |
| | Ukraine | 7.750% | 9/1/26 | 3,650 | 3,935 |
| | Ukraine | 7.750% | 9/1/27 | 3,600 | 3,881 |
| | Ukraine | 9.750% | 11/1/28 | 4,350 | 5,049 |
| 2 | Ukraine | 6.876% | 5/21/29 | 2,700 | 2,749 |
| | Ukraine | 6.876% | 5/21/29 | 1,850 | 1,887 |
| 2,3 | Ukraine | 7.375% | 9/25/32 | 400 | 411 |
| 3 | Ukraine | 7.375% | 9/25/32 | 7,800 | 8,030 |
| 2 | Ukraine | 7.253% | 3/15/33 | 2,300 | 2,343 |
| | Ukraine | 7.253% | 3/15/33 | 4,850 | 4,941 |
| | | | | | 48,010 |
| United Arab Emirates (5.3%) | | |
| | Dubai DOF Sukuk Ltd. | 3.875% | 1/30/23 | 2,000 | 2,067 |
| | Dubai DOF Sukuk Ltd. | 5.000% | 4/30/29 | 4,630 | 5,393 |
| 8 | Dubai DOF Sukuk Ltd. | 2.763% | 9/9/30 | 4,150 | 4,240 |
| | Emirate of Abu Dhabi | 2.500% | 10/11/22 | 7,550 | 7,700 |
| | Emirate of Abu Dhabi | 0.750% | 9/2/23 | 5,475 | 5,485 |
| | Emirate of Abu Dhabi | 2.125% | 9/30/24 | 8,350 | 8,623 |
| | Emirate of Abu Dhabi | 2.500% | 4/16/25 | 8,400 | 8,792 |
| | Emirate of Abu Dhabi | 3.125% | 5/3/26 | 6,672 | 7,164 |
| | Emirate of Abu Dhabi | 3.125% | 10/11/27 | 11,600 | 12,497 |
| 2 | Emirate of Abu Dhabi | 1.625% | 6/2/28 | 3,300 | 3,253 |
| | Emirate of Abu Dhabi | 1.625% | 6/2/28 | 1,700 | 1,679 |
| | Emirate of Abu Dhabi | 2.500% | 9/30/29 | 8,350 | 8,676 |
| | Emirate of Abu Dhabi | 3.125% | 4/16/30 | 8,300 | 8,960 |
| | Emirate of Abu Dhabi | 1.700% | 3/2/31 | 4,050 | 3,894 |
| 2 | Emirate of Abu Dhabi | 1.875% | 9/15/31 | 5,000 | 4,864 |
| 2 | Emirate of Abu Dhabi | 2.000% | 10/19/31 | 2,700 | 2,653 |
| 2 | Emirate of Abu Dhabi | 2.875% | 10/19/41 | 2,700 | 2,676 |
| | Emirate of Abu Dhabi | 4.125% | 10/11/47 | 8,250 | 9,755 |
| | Emirate of Abu Dhabi | 3.125% | 9/30/49 | 11,100 | 11,220 |
| | Emirate of Abu Dhabi | 3.875% | 4/16/50 | 10,950 | 12,643 |
| 2 | Emirate of Abu Dhabi | 3.000% | 9/15/51 | 3,000 | 2,972 |
| 2 | Emirate of Abu Dhabi | 3.250% | 10/19/61 | 5,500 | 5,585 |
| | Emirate of Abu Dhabi | 2.700% | 9/2/70 | 4,200 | 3,797 |
| | Emirate of Dubai | 5.250% | 1/30/43 | 2,700 | 3,090 |
| | Emirate of Dubai | 3.900% | 9/9/50 | 3,417 | 3,227 |
| | Finance Department Government of Sharjah | 3.625% | 3/10/33 | 2,200 | 2,164 |
| | Finance Department Government of Sharjah | 4.000% | 7/28/50 | 3,798 | 3,427 |
| | Finance Department Government of Sharjah | 4.375% | 3/10/51 | 200 | 189 |
| | RAK Capital | 3.094% | 3/31/25 | 2,633 | 2,774 |
| | Sharjah Sukuk Ltd. | 3.764% | 9/17/24 | 800 | 849 |
| | Sharjah Sukuk Program Ltd. | 3.854% | 4/3/26 | 4,002 | 4,260 |
Emerging Markets Government Bond Index Fund
| | | Coupon | Maturity
Date | Face
Amount
($000) | Market
Value•
($000) |
| | Sharjah Sukuk Program Ltd. | 2.942% | 6/10/27 | 3,240 | 3,277 |
| | Sharjah Sukuk Program Ltd. | 4.226% | 3/14/28 | 3,300 | 3,554 |
| | Sharjah Sukuk Program Ltd. | 3.234% | 10/23/29 | 2,639 | 2,675 |
| | Sharjah Sukuk Program Ltd. | 3.200% | 7/13/31 | 1,750 | 1,754 |
| | | | | | 175,828 |
| Uruguay (1.5%) | | |
| 3 | Oriental Republic of Uruguay | 4.500% | 8/14/24 | 2,789 | 2,974 |
| 3 | Oriental Republic of Uruguay | 4.375% | 10/27/27 | 4,066 | 4,634 |
| 3 | Oriental Republic of Uruguay | 4.375% | 1/23/31 | 6,900 | 7,966 |
| | Oriental Republic of Uruguay | 7.875% | 1/15/33 | 2,300 | 3,396 |
| 3 | Oriental Republic of Uruguay | 7.625% | 3/21/36 | 2,915 | 4,382 |
| 3 | Oriental Republic of Uruguay | 4.125% | 11/20/45 | 1,870 | 2,203 |
| 3 | Oriental Republic of Uruguay | 5.100% | 6/18/50 | 10,592 | 13,815 |
| 3 | Oriental Republic of Uruguay | 4.975% | 4/20/55 | 7,159 | 9,191 |
| | | | | | 48,561 |
| Uzbekistan (0.2%) | | |
| | Republic of Uzbekistan | 4.750% | 2/20/24 | 1,345 | 1,410 |
| | Republic of Uzbekistan | 5.375% | 2/20/29 | 1,825 | 1,982 |
| | Republic of Uzbekistan | 3.700% | 11/25/30 | 1,950 | 1,889 |
| 2 | Republic of Uzbekistan | 3.900% | 10/19/31 | 950 | 931 |
| | | | | | 6,212 |
| Vietnam (0.1%) | | |
| | Socialist Republic of Vietnam | 4.800% | 11/19/24 | 2,800 | 3,079 |
| Zambia (0.2%) | | |
| 5 | Republic of Zambia | 8.500% | 4/14/24 | 2,730 | 2,179 |
| 5 | Republic of Zambia | 8.970% | 7/30/27 | 3,625 | 2,859 |
| | | | | | 5,038 |
| Total Sovereign Bonds (Cost $2,845,837) | | 2,795,806 |
| | | | | Shares | |
| Temporary Cash Investments (0.3%) | | |
| Money Market Fund (0.3%) | | |
| 9 | Vanguard Market Liquidity Fund (Cost $10,206) | 0.070% | | 102,058 | 10,206 |
| Total Investments (99.2%) (Cost $3,334,609) | | 3,284,381 |
| Other Assets and Liabilities—Net (0.8%) | | 26,391 |
| Net Assets (100.0%) | | 3,310,772 |
| Cost is in $000. | | |
| • | See Note A in Notes to Financial Statements. |
| 1 | Guaranteed by the Republic of Azerbaijan. |
| 2 | Security exempt from registration under Rule 144A of the Securities Act of 1933. Such securities may be sold in transactions exempt from registration, normally to qualified institutional buyers. At October 31, 2021, the aggregate value was $262,219,000, representing 7.9% of net assets. |
| 3 | The average or expected maturity is shorter than the final maturity shown because of the possibility of interim principal payments and prepayments or the possibility of the issue being called. |
| 4 | Step bond. |
| 5 | Non-income-producing security—security in default. |
| 6 | Securities with a value of $206,000 have been segregated as initial margin for open futures contracts. |
| 7 | Guaranteed by the State of Qatar. |
| 8 | Guaranteed by the Kingdom of United Arab Emirates. |
| 9 | Affiliated money market fund available only to Vanguard funds and certain trusts and accounts managed by Vanguard. Rate shown is the 7-day yield. |
Emerging Markets Government Bond Index Fund
Derivative Financial Instruments Outstanding as of Period End
| Futures Contracts |
| | | | ($000) |
| | Expiration | Number of
Long (Short)
Contracts | Notional
Amount | Value and
Unrealized
Appreciation
(Depreciation) |
| Long Futures Contracts | | | | |
| 2-Year U.S. Treasury Note | December 2021 | 18 | 3,947 | (4) |
| 5-Year U.S. Treasury Note | December 2021 | 30 | 3,653 | 1 |
| Ultra 10-Year U.S. Treasury Note | December 2021 | 52 | 7,542 | (54) |
| | | | | (57) |
| Short Futures Contracts | | | | |
| 10-Year U.S. Treasury Note | December 2021 | (31) | (4,052) | 59 |
| Ultra Long U.S. Treasury Bond | December 2021 | (4) | (786) | (21) |
| | | | | 38 |
| | | | | (19) |
See accompanying Notes, which are an integral part of the Financial Statements.
Emerging Markets Government Bond Index Fund
Statement of Assets and Liabilities
|
| ($000s, except shares and per-share amounts) | Amount |
| Assets | |
| Investments in Securities, at Value | |
| Unaffiliated Issuers (Cost $3,324,403) | 3,274,175 |
| Affiliated Issuers (Cost $10,206) | 10,206 |
| Total Investments in Securities | 3,284,381 |
| Investment in Vanguard | 112 |
| Cash | 885 |
| Receivables for Investment Securities Sold | 23,230 |
| Receivables for Accrued Income | 35,033 |
| Receivables for Capital Shares Issued | 125 |
| Total Assets | 3,343,766 |
| Liabilities | |
| Payables for Investment Securities Purchased | 32,448 |
| Payables for Capital Shares Redeemed | 116 |
| Payables for Distributions | 145 |
| Payables to Vanguard | 231 |
| Variation Margin Payable—Futures Contracts | 54 |
| Total Liabilities | 32,994 |
| Net Assets | 3,310,772 |
Emerging Markets Government Bond Index Fund
Statement of Assets and Liabilities (continued)
|
| At October 31, 2021, net assets consisted of: | |
| ($000s, except shares and per-share amounts) | Amount |
| Paid-in Capital | 3,427,221 |
| Total Distributable Earnings (Loss) | (116,449) |
| Net Assets | 3,310,772 |
| |
| ETF Shares—Net Assets | |
Applicable to 38,761,839 outstanding $.001 par value shares of
beneficial interest (unlimited authorization) | 3,024,139 |
| Net Asset Value Per Share—ETF Shares | $78.02 |
| |
| Admiral Shares—Net Assets | |
Applicable to 12,348,651 outstanding $.001 par value shares of
beneficial interest (unlimited authorization) | 241,810 |
| Net Asset Value Per Share—Admiral Shares | $19.58 |
| |
| Institutional Shares—Net Assets | |
Applicable to 1,427,072 outstanding $.001 par value shares of
beneficial interest (unlimited authorization) | 44,823 |
| Net Asset Value Per Share—Institutional Shares | $31.41 |
See accompanying Notes, which are an integral part of the Financial Statements.
Emerging Markets Government Bond Index Fund
|
| | Year Ended
October 31, 2021 |
| | ($000) |
| Investment Income | |
| Income | |
| Interest1 | 128,838 |
| Total Income | 128,838 |
| Expenses | |
| The Vanguard Group—Note B | |
| Investment Advisory Services | 71 |
| Management and Administrative—ETF Shares | 5,054 |
| Management and Administrative—Admiral Shares | 465 |
| Management and Administrative—Institutional Shares | 42 |
| Marketing and Distribution—ETF Shares | 103 |
| Marketing and Distribution—Admiral Shares | 9 |
| Marketing and Distribution—Institutional Shares | 1 |
| Custodian Fees | 201 |
| Auditing Fees | 49 |
| Shareholders’ Reports—ETF Shares | 85 |
| Shareholders’ Reports—Admiral Shares | 6 |
| Shareholders’ Reports—Institutional Shares | — |
| Trustees’ Fees and Expenses | 1 |
| Total Expenses | 6,087 |
| Net Investment Income | 122,751 |
| Realized Net Gain (Loss) | |
| Investment Securities Sold1,2 | 28,075 |
| Futures Contracts | (666) |
| Realized Net Gain (Loss) | 27,409 |
| Change in Unrealized Appreciation (Depreciation) | |
| Investment Securities1 | (70,823) |
| Futures Contracts | (27) |
| Change in Unrealized Appreciation (Depreciation) | (70,850) |
| Net Increase (Decrease) in Net Assets Resulting from Operations | 79,310 |
| 1 | Interest income, realized net gain (loss), and change in unrealized appreciation (depreciation) from an affiliated company of the fund were $9,000, $0, and less than $1,000, respectively. Purchases and sales are for temporary cash investment purposes. |
| 2 | Includes $31,481,000 of net gain (loss) resulting from in-kind redemptions. |
See accompanying Notes, which are an integral part of the Financial Statements.
Emerging Markets Government Bond Index Fund
Statement of Changes in Net Assets
|
| | Year Ended October 31, |
| | 2021
($000) | 2020
($000) |
| | | |
| Increase (Decrease) in Net Assets | | |
| Operations | | |
| Net Investment Income | 122,751 | 90,790 |
| Realized Net Gain (Loss) | 27,409 | (68,417) |
| Change in Unrealized Appreciation (Depreciation) | (70,850) | (23,609) |
| Net Increase (Decrease) in Net Assets Resulting from Operations | 79,310 | (1,236) |
| Distributions | | |
| ETF Shares | (106,958) | (75,818) |
| Admiral Shares | (9,798) | (12,469) |
| Institutional Shares | (1,721) | (2,266) |
| Total Distributions | (118,477) | (90,553) |
| Capital Share Transactions | | |
| ETF Shares | 1,209,882 | 394,929 |
| Admiral Shares | (1,061) | (18,654) |
| Institutional Shares | 2,461 | (7,227) |
| Net Increase (Decrease) from Capital Share Transactions | 1,211,282 | 369,048 |
| Total Increase (Decrease) | 1,172,115 | 277,259 |
| Net Assets | | |
| Beginning of Period | 2,138,657 | 1,861,398 |
| End of Period | 3,310,772 | 2,138,657 |
See accompanying Notes, which are an integral part of the Financial Statements.
Emerging Markets Government Bond Index Fund
| ETF Shares | | | | | |
For a Share Outstanding
Throughout Each Period | Year Ended October 31, |
| 2021 | 2020 | 2019 | 2018 | 2017 |
| Net Asset Value, Beginning of Period | $78.01 | $80.38 | $74.27 | $80.73 | $80.11 |
| Investment Operations | | | | | |
| Net Investment Income1 | 3.190 | 3.551 | 3.738 | 3.411 | 3.713 |
| Net Realized and Unrealized Gain (Loss) on Investments2 | (.036) | (2.322) | 6.044 | (6.445) | .589 |
| Total from Investment Operations | 3.154 | 1.229 | 9.782 | (3.034) | 4.302 |
| Distributions | | | | | |
| Dividends from Net Investment Income | (3.144) | (3.599) | (3.672) | (3.426) | (3.682) |
| Distributions from Realized Capital Gains | — | — | — | — | — |
| Total Distributions | (3.144) | (3.599) | (3.672) | (3.426) | (3.682) |
| Net Asset Value, End of Period | $78.02 | $78.01 | $80.38 | $74.27 | $80.73 |
| Total Return | 4.06% | 1.65% | 13.47% | -3.84% | 5.56% |
| Ratios/Supplemental Data | | | | | |
| Net Assets, End of Period (Millions) | $3,024 | $1,853 | $1,538 | $1,033 | $1,002 |
| Ratio of Total Expenses to Average Net Assets | 0.20% | 0.25% | 0.25% | 0.30% | 0.32% |
| Ratio of Net Investment Income to Average Net Assets | 4.02% | 4.55% | 4.79% | 4.42% | 4.67% |
| Portfolio Turnover Rate3 | 16% | 21% | 48% | 25% | 19% |
| 1 | Calculated based on average shares outstanding. |
| 2 | Includes increases from purchase fees of $.00, $.00, $.00, $0.04, and $0.07. |
| 3 | Excludes the value of portfolio securities received or delivered as a result of in-kind purchases or redemptions of the fund’s capital shares, including ETF Creation Units. |
See accompanying Notes, which are an integral part of the Financial Statements.
Emerging Markets Government Bond Index Fund
| Admiral Shares | | | | | |
For a Share Outstanding
Throughout Each Period | Year Ended October 31, |
| 2021 | 2020 | 2019 | 2018 | 2017 |
| Net Asset Value, Beginning of Period | $19.58 | $20.16 | $18.63 | $20.24 | $20.09 |
| Investment Operations | | | | | |
| Net Investment Income1 | .806 | .897 | .939 | .858 | .934 |
| Net Realized and Unrealized Gain (Loss) on Investments2 | (.015) | (.586) | 1.521 | (1.613) | .150 |
| Total from Investment Operations | .791 | .311 | 2.460 | (.755) | 1.084 |
| Distributions | | | | | |
| Dividends from Net Investment Income | (.791) | (.891) | (.930) | (.855) | (.934) |
| Distributions from Realized Capital Gains | — | — | — | — | — |
| Total Distributions | (.791) | (.891) | (.930) | (.855) | (.934) |
| Net Asset Value, End of Period | $19.58 | $19.58 | $20.16 | $18.63 | $20.24 |
| Total Return3 | 4.04% | 1.66% | 13.46% | -3.80% | 5.57% |
| Ratios/Supplemental Data | | | | | |
| Net Assets, End of Period (Millions) | $242 | $243 | $273 | $256 | $288 |
| Ratio of Total Expenses to Average Net Assets | 0.20% | 0.25% | 0.25% | 0.30% | 0.32% |
| Ratio of Net Investment Income to Average Net Assets | 4.03% | 4.57% | 4.79% | 4.42% | 4.67% |
| Portfolio Turnover Rate4 | 16% | 21% | 48% | 25% | 19% |
| 1 | Calculated based on average shares outstanding. |
| 2 | Includes increases from purchase of $.00, $.00, $.00, $0.01, and $0.02. |
| 3 | Total returns do not include transaction or account service fees that may have applied in the periods shown. Fund prospectuses provide information about any applicable transaction and account service fees. |
| 4 | Excludes the value of portfolio securities received or delivered as a result of in-kind purchases or redemptions of the fund’s capital shares, including ETF Creation Units. |
See accompanying Notes, which are an integral part of the Financial Statements.
Emerging Markets Government Bond Index Fund
| Institutional Shares | | | | | |
For a Share Outstanding
Throughout Each Period | Year Ended October 31, |
| 2021 | 2020 | 2019 | 2018 | 2017 |
| Net Asset Value, Beginning of Period | $31.40 | $32.33 | $29.88 | $32.47 | $32.24 |
| Investment Operations | | | | | |
| Net Investment Income1 | 1.298 | 1.443 | 1.522 | 1.380 | 1.508 |
| Net Realized and Unrealized Gain (Loss) on Investments2 | (.014) | (.938) | 2.425 | (2.596) | .238 |
| Total from Investment Operations | 1.284 | .505 | 3.947 | (1.216) | 1.746 |
| Distributions | | | | | |
| Dividends from Net Investment Income | (1.274) | (1.435) | (1.497) | (1.374) | (1.516) |
| Distributions from Realized Capital Gains | — | — | — | — | — |
| Total Distributions | (1.274) | (1.435) | (1.497) | (1.374) | (1.516) |
| Net Asset Value, End of Period | $31.41 | $31.40 | $32.33 | $29.88 | $32.47 |
| Total Return3 | 4.10% | 1.68% | 13.46% | -3.82% | 5.59% |
| Ratios/Supplemental Data | | | | | |
| Net Assets, End of Period (Millions) | $45 | $42 | $51 | $19 | $20 |
| Ratio of Total Expenses to Average Net Assets | 0.18% | 0.23% | 0.23% | 0.29% | 0.29% |
| Ratio of Net Investment Income to Average Net Assets | 4.05% | 4.59% | 4.81% | 4.43% | 4.70% |
| Portfolio Turnover Rate4 | 16% | 21% | 48% | 25% | 19% |
| 1 | Calculated based on average shares outstanding. |
| 2 | Includes increases from purchase fees of $.00, $.00, $.00, $0.02, and $0.03. |
| 3 | Total returns do not include transaction or account service fees that may have applied in the periods shown. Fund prospectuses provide information about any applicable transaction and account service fees. |
| 4 | Excludes the value of portfolio securities received or delivered as a result of in-kind purchases or redemptions of the fund’s capital shares, including ETF Creation Units. |
See accompanying Notes, which are an integral part of the Financial Statements.
Emerging Markets Government Bond Index Fund
Notes to Financial Statements
Vanguard Emerging Markets Government Bond Index Fund is registered under the Investment Company Act of 1940 as an open-end investment company, or mutual fund. The fund offers three classes of shares: ETF Shares, Admiral Shares, and Institutional Shares. Each of the share classes has different eligibility and minimum purchase requirements, and is designed for different types of investors. ETF Shares are listed for trading on Nasdaq; they can be purchased and sold through a broker.
The fund invests in securities of foreign issuers, which may subject it to investment risks not normally associated with investing in securities of U.S. corporations. Market disruptions associated with the COVID-19 pandemic have had a global impact, and uncertainty exists as to the long-term implications. Such disruptions can adversely affect assets of the fund and thus fund performance.
| A. | The following significant accounting policies conform to generally accepted accounting principles for U.S. investment companies. The fund consistently follows such policies in preparing its financial statements. |
1. Security Valuation: Securities are valued as of the close of trading on the New York Stock Exchange (generally 4 p.m., Eastern time) on the valuation date. Bonds and temporary cash investments are valued using the latest bid prices or using valuations based on a matrix system (which considers such factors as security prices, yields, maturities, and ratings), both as furnished by independent pricing services. Investments in Vanguard Market Liquidity Fund are valued at that fund's net asset value. Securities for which market quotations are not readily available, or whose values have been affected by events occurring before the fund’s pricing time but after the close of the securities’ primary markets, are valued by methods deemed by the board of trustees to represent fair value.
2. Futures Contracts: The fund uses futures contracts to invest in fixed income asset classes with greater efficiency and lower cost than is possible through direct investment, to add value when these instruments are attractively priced, or to adjust sensitivity to changes in interest rates. The primary risks associated with the use of futures contracts are imperfect correlation between changes in market values of bonds held by the fund and the prices of futures contracts, and the possibility of an illiquid market. Counterparty risk involving futures is mitigated because a regulated clearinghouse is the counterparty instead of the clearing broker. To further mitigate counterparty risk, the fund trades futures contracts on an exchange, monitors the financial strength of its clearing brokers and clearinghouse, and has entered into clearing agreements with its clearing brokers. The clearinghouse imposes initial margin requirements to secure the fund’s performance and requires daily settlement of variation margin representing changes in the market value of each contract. Any securities pledged as initial margin for open contracts are noted in the Schedule of Investments.
Futures contracts are valued at their quoted daily settlement prices. The notional amounts of the contracts are not recorded in the Statement of Assets and Liabilities. Fluctuations in the value of the contracts are recorded in the Statement of Assets and Liabilities as an asset (liability) and in the Statement of Operations as unrealized appreciation (depreciation) until the contracts are closed, when they are recorded as realized gains (losses) on futures contracts.
During the year ended October 31, 2021, the fund’s average investments in long and short futures contracts each represented less than 1% of net assets, based on the average of the notional amounts at each quarter-end during the period.
Emerging Markets Government Bond Index Fund
3. Federal Income Taxes: The fund intends to continue to qualify as a regulated investment company and distribute all of its taxable income. The fund’s tax returns are open to examination by the relevant tax authorities until expiration of the applicable statute of limitations, which is generally three years after the filing of the tax return. Management has analyzed the fund’s tax positions taken for all open federal and state income tax years, and has concluded that no provision for income tax is required in the fund’s financial statements.
4. Distributions: Distributions to shareholders are recorded on the ex-dividend date. Distributions are determined on a tax basis at the fiscal year-end and may differ from net investment income and realized capital gains for financial reporting purposes.
5. Credit Facilities and Interfund Lending Program: The fund and certain other funds managed by The Vanguard Group ("Vanguard") participate in a $4.3 billion committed credit facility provided by a syndicate of lenders pursuant to a credit agreement and an uncommitted credit facility provided by Vanguard. Both facilities may be renewed annually. Each fund is individually liable for its borrowings, if any, under the credit facilities. Borrowings may be utilized for temporary or emergency purposes, subject to the fund’s regulatory and contractual borrowing restrictions. With respect to the committed credit facility, the participating funds are charged administrative fees and an annual commitment fee of 0.10% of the undrawn committed amount of the facility; these fees are allocated to the funds based on a method approved by the fund’s board of trustees and included in Management and Administrative expenses on the fund’s Statement of Operations. Any borrowings under either facility bear interest at a rate based upon the higher of the one-month London Interbank Offered Rate (or an acceptable alternate rate, if necessary), federal funds effective rate, or overnight bank funding rate plus an agreed-upon spread, except that borrowings under the uncommitted credit facility may bear interest based upon an alternate rate agreed to by the fund and Vanguard.
In accordance with an exemptive order (the “Order”) from the SEC, the fund may participate in a joint lending and borrowing program that allows registered open-end Vanguard funds to borrow money from and lend money to each other for temporary or emergency purposes (the “Interfund Lending Program”), subject to compliance with the terms and conditions of the Order, and to the extent permitted by the fund’s investment objective and investment policies. Interfund loans and borrowings normally extend overnight, but can have a maximum duration of seven days. Loans may be called on one business day’s notice. The interest rate to be charged is governed by the conditions of the Order and internal procedures adopted by the board of trustees. The board of trustees is responsible for overseeing the Interfund Lending Program.
For the year ended October 31, 2021, the fund did not utilize the credit facilities or the Interfund Lending Program.
6. Other: Interest income includes income distributions received from Vanguard Market Liquidity Fund and is accrued daily. Premiums and discounts on debt securities are amortized and accreted, respectively, to interest income over the lives of the respective securities, except for premiums on certain callable debt securities that are amortized to the earliest call date. Security transactions are accounted for on the date securities are bought or sold. Costs used to determine realized gains (losses) on the sale of investment securities are those of the specific securities sold. Fees assessed on capital share transactions are credited to paid-in capital.
Each class of shares has equal rights as to assets and earnings, except that each class separately bears certain class-specific expenses related to maintenance of shareholder accounts (included in
Emerging Markets Government Bond Index Fund
Management and Administrative expenses) and shareholder reporting. Marketing and distribution expenses are allocated to each class of shares based on a method approved by the board of trustees. Income, other non-class-specific expenses, and gains and losses on investments are allocated to each class of shares based on its relative net assets.
| B. | In accordance with the terms of a Funds' Service Agreement (the “FSA”) between Vanguard and the fund, Vanguard furnishes to the fund investment advisory, corporate management, administrative, marketing, and distribution services at Vanguard’s cost of operations (as defined by the FSA). These costs of operations are allocated to the fund based on methods and guidelines approved by the board of trustees and are generally settled twice a month. |
Upon the request of Vanguard, the fund may invest up to 0.40% of its net assets as capital in Vanguard. At October 31, 2021, the fund had contributed to Vanguard capital in the amount of $112,000, representing less than 0.01% of the fund’s net assets and 0.04% of Vanguard’s capital received pursuant to the FSA. The fund’s trustees and officers are also directors and employees, respectively, of Vanguard.
| C. | Various inputs may be used to determine the value of the fund’s investments and derivatives. These inputs are summarized in three broad levels for financial statement purposes. The inputs or methodologies used to value securities are not necessarily an indication of the risk associated with investing in those securities. |
Level 1—Quoted prices in active markets for identical securities.
Level 2—Other significant observable inputs (including quoted prices for similar securities, interest rates, prepayment speeds, credit risk, etc.).
Level 3—Significant unobservable inputs (including the fund’s own assumptions used to determine the fair value of investments). Any investments and derivatives valued with significant unobservable inputs are noted on the Schedule of Investments.
The following table summarizes the market value of the fund’s investments and derivatives as of October 31, 2021, based on the inputs used to value them:
| | Level 1
($000) | Level 2
($000) | Level 3
($000) | Total
($000) |
| Investments | | | | |
| Assets | | | | |
| Corporate Bonds | — | 478,369 | — | 478,369 |
| Sovereign Bonds | — | 2,795,806 | — | 2,795,806 |
| Temporary Cash Investments | 10,206 | — | — | 10,206 |
| Total | 10,206 | 3,274,175 | — | 3,284,381 |
| Derivative Financial Instruments | | | | |
| Assets | | | | |
| Futures Contracts1 | 60 | — | — | 60 |
| Liabilities | | | | |
| Futures Contracts1 | 79 | — | — | 79 |
| 1 | Includes cumulative appreciation (depreciation) on futures contracts and centrally cleared swaps, if any, as reported in the Schedule of Investments. Only current day’s variation margin is reported within the Statement of Assets and Liabilities. |
Emerging Markets Government Bond Index Fund
| D. | Permanent differences between book-basis and tax-basis components of net assets are reclassified among capital accounts in the financial statements to reflect their tax character. These reclassifications have no effect on net assets or net asset value per share. As of period end, permanent differences primarily attributable to the accounting for in-kind redemptions were reclassified between the following accounts: |
| | Amount
($000) |
| Paid-in Capital | 31,272 |
| Total Distributable Earnings (Loss) | (31,272) |
Temporary differences between book-basis and tax-basis components of total distributable earnings (loss) arise when certain items of income, gain, or loss are recognized in different periods for financial statement and tax purposes; these differences will reverse at some time in the future. The differences are primarily related to the deferral of losses from wash sales; the recognition of unrealized gains or losses from certain derivative contracts; the inclusion of payables for distributions; and the treatment of amortization adjustments from certain fixed income securities. As of period end, the tax-basis components of total distributable earnings (loss) are detailed in the table as follows:
| | Amount
($000) |
| Undistributed Ordinary Income | 10,617 |
| Undistributed Long-Term Gains | — |
| Capital Loss Carryforwards | (76,612) |
| Qualified Late-Year Losses | — |
| Net Unrealized Gains (Losses) | (50,309) |
The tax character of distributions paid was as follows:
| | Year Ended October 31, |
| | 2021
Amount
($000) | 2020
Amount
($000) |
| Ordinary Income* | 118,477 | 90,553 |
| Long-Term Capital Gains | — | — |
| Total | 118,477 | 90,553 |
| * | Includes short-term capital gains, if any. |
As of October 31, 2021, gross unrealized appreciation and depreciation for investments and derivatives based on cost for U.S. federal income tax purposes were as follows:
| | Amount
($000) |
| Tax Cost | 3,334,690 |
| Gross Unrealized Appreciation | 75,922 |
| Gross Unrealized Depreciation | (126,231) |
| Net Unrealized Appreciation (Depreciation) | (50,309) |
Emerging Markets Government Bond Index Fund
| E. | During the year ended October 31, 2021, the fund purchased $2,157,692,000 of investment securities and sold $962,951,000 of investment securities, other than U.S. government securities and temporary cash investments. Purchases and sales of U.S. government securities were $56,369,000 and $56,358,000, respectively. Purchases and sales include $1,683,452,000 and $535,154,000, respectively, in connection with in-kind purchases and redemptions of the fund's capital shares. |
The fund purchased securities from and sold securities to other Vanguard funds or accounts managed by Vanguard or its affiliates, in accordance with procedures adopted by the board of trustees in compliance with Rule 17a-7 of the Investment Company Act of 1940. For the year ended October 31, 2021, such purchases were $502,000 and sales were $34,330,000, resulting in net realized gain of $651,000; these amounts, other than temporary cash investments, are included in the purchases and sales of investment securities noted above.
| F. | Capital share transactions for each class of shares were: |
| | Year Ended October 31, | |
| | 2021 | | 2020 |
| | Amount
($000) | Shares
(000) | | Amount
($000) | Shares
(000) |
| ETF Shares | | | | | |
| Issued1 | 1,758,897 | 22,006 | | 699,150 | 8,720 |
| Issued in Lieu of Cash Distributions | — | — | | — | — |
| Redeemed | (549,015) | (7,000) | | (304,221) | (4,100) |
| Net Increase (Decrease)—ETF Shares | 1,209,882 | 15,006 | | 394,929 | 4,620 |
| Admiral Shares | | | | | |
| Issued1 | 37,672 | 1,880 | | 72,508 | 3,636 |
| Issued in Lieu of Cash Distributions | 8,085 | 406 | | 10,430 | 535 |
| Redeemed | (46,818) | (2,342) | | (101,592) | (5,297) |
| Net Increase (Decrease)—Admiral Shares | (1,061) | (56) | | (18,654) | (1,126) |
| Institutional Shares | | | | | |
| Issued1 | 5,306 | 165 | | 12,179 | 432 |
| Issued in Lieu of Cash Distributions | 1,721 | 54 | | 2,233 | 71 |
| Redeemed | (4,566) | (144) | | (21,639) | (714) |
| Net Increase (Decrease)—Institutional Shares | 2,461 | 75 | | (7,227) | (211) |
| 1 | Includes purchase fees for fiscal 2021 and 2020 of $335,000 and $662,000, respectively (fund totals). |
| G. | Management has determined that no events or transactions occurred subsequent to October 31, 2021, that would require recognition or disclosure in these financial statements. |
Report of Independent Registered Public Accounting Firm
To the Board of Trustees of Vanguard Whitehall Funds and Shareholders of Vanguard Emerging Markets Government Bond Index Fund
Opinion on the Financial Statements
We have audited the accompanying statement of assets and liabilities, including the schedule of investments, of Vanguard Emerging Markets Government Bond Index Fund (one of the funds constituting Vanguard Whitehall Funds, referred to hereafter as the "Fund") as of October 31, 2021, the related statement of operations for the year ended October 31, 2021, the statement of changes in net assets foreach of the two years in the period ended October 31, 2021, including the related notes, and the financialhighlights for each of the five years in the period ended October 31, 2021 (collectively referred to as the "financial statements"). In our opinion, the financial statements present fairly, in all material respects, the financial position of the Fund as of October 31, 2021, the results of its operations for the year then ended, the changes in its net assets for each of the two years in the period ended October 31, 2021 and the financial highlights for each of the five years in the period ended October 31, 2021 in conformity with accounting principles generally accepted in the United States of America.
Basis for Opinion
These financial statements are the responsibility of the Fund’s management. Our responsibility is to express an opinion on the Fund’s financial statements based on our audits. We are a public accounting firm registered with the Public Company Accounting Oversight Board (United States) (PCAOB) and are required to be independent with respect to the Fund in accordance with the U.S. federal securities laws and the applicable rules and regulations of the Securities and Exchange Commission and the PCAOB.
We conducted our audits of these financial statements in accordance with the standards of the PCAOB. Those standards require that we plan and perform the audit to obtain reasonable assurance about whether the financial statements are free of material misstatement, whether due to error or fraud.
Our audits included performing procedures to assess the risks of material misstatement of the financial statements, whether due to error or fraud, and performing procedures that respond to those risks. Such procedures included examining, on a test basis, evidence regarding the amounts and disclosures in the financial statements. Our audits also included evaluating the accounting principles used and significant estimates made by management, as well as evaluating the overall presentation of the financial statements. Our procedures included confirmation of securities owned as of October 31, 2021 by correspondence with the custodian, transfer agent and brokers; when replies were not received from brokers, we performed other auditing procedures. We believe that our audits provide a reasonable basis for our opinion.
/s/PricewaterhouseCoopers LLP
Philadelphia, Pennsylvania
December 16, 2021
We have served as the auditor of one or more investment companies in The Vanguard Group of Funds since 1975.
Special 2021 tax information (unaudited) for Vanguard Emerging Markets Government Bond Index Fund
This information for the fiscal year ended October 31, 2021, is included pursuant to provisions of the Internal Revenue Code.
The percentage of the ordinary dividends reported by the fund that is treated as a Section 163(j) interest dividend and thus is eligible to be treated as interest income for purposes of Section 163(j) and the regulations thereunder is 100%.
"Bloomberg®" and Bloomberg USD Emerging Markets Government RIC Capped Index are service marks of Bloomberg Finance L.P. and its affiliates, including Bloomberg Index Services Limited (BISL), the administrator of the index (collectively, Bloomberg), and have been licensed for use for certain purposes by The Vanguard Group, Inc. (Vanguard).
The Emerging Markets Government Bond Index Fund is not sponsored, endorsed, sold or promoted by Bloomberg. Bloomberg does not make any representation or warranty, express or implied, to the owners of or counterparties to the Emerging Markets Government Bond Index Fund or any member of the public regarding the advisability of investing in securities generally or in the Emerging Markets Government Bond Index Fund particularly. The only relationship of Bloomberg to Vanguard is the licensing of certain trademarks, trade names and service marks and of the Bloomberg USD Emerging Markets Government RIC Capped Index, which is determined, composed and calculated by BISL without regard to Vanguard or the Emerging Markets Government Bond Index Fund. Bloomberg has no obligation to take the needs of Vanguard or the owners of the Emerging Markets Government Bond Index Fund into consideration in determining, composing or calculating the Bloomberg USD Emerging Markets Government RIC Capped Index. Bloomberg is not responsible for and has not participated in the determination of the timing of, prices at, or quantities of the Emerging Markets Government Bond Index Fund to be issued. Bloomberg shall not have any obligation or liability, including, without limitation, to Emerging Markets Government Bond Index Fund customers, in connection with the administration, marketing or trading of the Emerging Markets Government Bond Index Fund.
BLOOMBERG DOES NOT GUARANTEE THE ACCURACY AND/OR THE COMPLETENESS OF THE BLOOMBERG USD EMERGING MARKETS GOVERNMENT RIC CAPPED INDEX OR ANY DATA RELATED THERETO AND SHALL HAVE NO LIABILITY FOR ANY ERRORS, OMISSIONS OR INTERRUPTIONS THEREIN. BLOOMBERG DOES NOT MAKE ANY WARRANTY, EXPRESS OR IMPLIED, AS TO RESULTS TO BE OBTAINED BY VANGUARD, OWNERS OF THE EMERGING MARKETS GOVERNMENT BOND INDEX FUND OR ANY OTHER PERSON OR ENTITY FROM THE USE OF THE BLOOMBERG USD EMERGING MARKETS GOVERNMENT RIC CAPPED INDEX OR ANY DATA RELATED THERETO. BLOOMBERG DOES NOT MAKE ANY EXPRESS OR IMPLIED WARRANTIES AND EXPRESSLY DISCLAIMS ALL WARRANTIES OF MERCHANTABILITY OR FITNESS FOR A PARTICULAR PURPOSE OR USE WITH RESPECT TO THE BLOOMBERG USD EMERGING MARKETS GOVERNMENT RIC CAPPED INDEX OR ANY DATA RELATED THERETO. WITHOUT LIMITING ANY OF THE FOREGOING, TO THE MAXIMUM EXTENT ALLOWED BY LAW, BLOOMBERG, ITS LICENSORS, AND ITS AND THEIR RESPECTIVE EMPLOYEES, CONTRACTORS,AGENTS, SUPPLIERS, AND VENDORS SHALL HAVE NO LIABILITY OR RESPONSIBILITY WHATSOEVER FOR ANY INJURY OR DAMAGES—WHETHER DIRECT, INDIRECT, CONSEQUENTIAL, INCIDENTAL, PUNITIVE OR OTHERWISE—ARISING IN CONNECTION WITH THE EMERGING MARKETS GOVERNMENT BOND INDEX FUND OR BLOOMBERG USD EMERGING MARKETS GOVERNMENT RIC CAPPED INDEX OR ANY DATA OR VALUES RELATING THERETO—WHETHER ARISING FROM THEIR NEGLIGENCE OR OTHERWISE, EVEN IF NOTIFIED OF THE POSSIBILITY THEREOF.
© 2021 Bloomberg.
Used with Permission. Source: Bloomberg Index Services Limited. Copyright 2021, Bloomberg. All rights reserved.
This page intentionally left blank.
The People Who Govern Your Fund
The trustees of your mutual fund are there to see that the fund is operated and managed in your best interests since, as a shareholder, you are a part owner of the fund. Your fund’s trustees also serve on the board of directors of The Vanguard Group, Inc., which is owned by the Vanguard funds and provides services to them.
A majority of Vanguard’s board members are independent, meaning that they have no affiliation with Vanguard or the funds they oversee, apart from the sizable personal investments they have made as private individuals. The independent board members have distinguished backgrounds in business, academia, and public service. Each of the trustees and executive officers oversees 214 Vanguard funds.
Information for each trustee and executive officer of the fund appears below. That information, as well as the Vanguard fund count, is as of the date on the cover of this fund report. The mailing address of the trustees and officers is P.O. Box 876, Valley Forge, PA 19482. More information about the trustees is in the Statement of Additional Information, which can be obtained, without charge, by contacting Vanguard at 800-662-7447, or online at vanguard.com.
Interested Trustee1
Mortimer J. Buckley
Born in 1969. Trustee since January 2018. Principal occupation(s) during the past five years and other experience: chairman of the board (2019–present) of Vanguard and of each of the investment companies served by Vanguard; chief executive officer (2018–present) of Vanguard; chief executive officer, president, and trustee (2018–present) of each of the investment companies served by Vanguard; president and director (2017–present) of Vanguard; and president (2018–present) of Vanguard Marketing Corporation. Chief investment officer (2013–2017), managing director (2002–2017), head of the Retail Investor Group (2006–2012), and chief information officer (2001–2006) of Vanguard. Chairman of the board (2011–2017) and trustee (2009–2017) of the Children’s Hospital of Philadelphia; and trustee (2018–present) and vice chair (2019–present) of The Shipley School.
Independent Trustees
Emerson U. Fullwood
Born in 1948. Trustee since January 2008. Principal occupation(s) during the past five years and other experience: executive chief staff and marketing officer for North America and corporate vice president (retired 2008) of Xerox Corporation (document management products and services). Former president of the Worldwide Channels Group, Latin
America, and Worldwide Customer Service and executive chief staff officer of Developing Markets of Xerox. Executive in residence and 2009–2010 Distinguished Minett Professor at the Rochester Institute of Technology. Director of SPX FLOW, Inc. (multi-industry manufacturing). Director of the University of Rochester Medical Center, the Monroe Community College Foundation, the United Way of Rochester, North Carolina A&T University, and Roberts Wesleyan College. Trustee of the University of Rochester.
Amy Gutmann
Born in 1949. Trustee since June 2006. Principal occupation(s) during the past five years and other experience: president (2004–present) of the University of Pennsylvania. Christopher H. Browne Distinguished Professor of Political Science, School of Arts and Sciences, and professor of communication, Annenberg School for Communication, with secondary faculty appointments in the Department of Philosophy, School of Arts and Sciences, and at the Graduate School of Education, University of Pennsylvania.
F. Joseph Loughrey
Born in 1949. Trustee since October 2009. Principal occupation(s) during the past five years and other experience: president and chief operating officer (retired 2009) and vice chairman of the board (2008–2009) of Cummins Inc. (industrial machinery). Chairman of the board of Hillenbrand, Inc. (specialized consumer services). Director of the V Foundation.
1 Mr. Buckley is considered an “interested person,” as defined in the Investment Company Act of 1940, because he is an officer of the Vanguard funds.
Member of the advisory council for the College of Arts and Letters and chair of the advisory board to the Kellogg Institute for International Studies, both at the University of Notre Dame. Chairman of the board of Saint Anselm College.
Mark Loughridge
Born in 1953. Trustee since March 2012. Principal occupation(s) during the past five years and other experience: senior vice president and chief financial officer (retired 2013) of IBM (information technology services). Fiduciary member of IBM’s Retirement Plan Committee (2004–2013), senior vice president and general manager (2002–2004) of IBM Global Financing, vice president and controller (1998–2002) of IBM, and a variety of other prior management roles at IBM. Member of the Council on Chicago Booth.
Scott C. Malpass
Born in 1962. Trustee since March 2012. Principal occupation(s) during the past five years and other experience: chief investment officer (retired June 2020) and vice president (retired June 2020) of the University of Notre Dame. Assistant professor (retired June 2020) of finance at the Mendoza College of Business, University of Notre Dame, and member of the Notre Dame 403(b) Investment Committee. Member of the board of Catholic Investment Services, Inc. (investment advisors) and the board of superintendence of the Institute for the Works of Religion.
Deanna Mulligan
Born in 1963. Trustee since January 2018. Principal occupation(s) during the past five years and other experience: board chair (2020), chief executive officer (2011–2020), and president (2010–2019) of The Guardian Life Insurance Company of America. Chief operating officer (2010–2011) and executive vice president (2008–2010) of Individual Life and Disability of the Guardian Life Insurance Company of America. Member of the board of the Economic Club of New York. Trustee of the Partnership for New York City (business leadership), Chief Executives for Corporate Purpose, NewYork-Presbyterian Hospital, and the Bruce Museum (arts and science). Member of the Advisory Council for the Stanford Graduate School of Business.
André F. Perold
Born in 1952. Trustee since December 2004. Principal occupation(s) during the past five years and other experience: George Gund Professor of Finance and Banking, Emeritus at the Harvard Business School (retired 2011). Chief investment officer and co-managing partner of HighVista Strategies (private investment firm). Member of the board
(2018–present) of RIT Capital Partners (investment firm). Member of the investment committee of Partners Health Care System.
Sarah Bloom Raskin
Born in 1961. Trustee since January 2018. Principal occupation(s) during the past five years and other experience: deputy secretary (2014–2017) of the United States Department of the Treasury. Governor (2010–2014) of the Federal Reserve Board. Commissioner (2007–2010) of financial regulation for the State of Maryland. Professor (2020–present), Distinguished Fellow of the Global Financial Markets Center (2020–present), and Rubenstein Fellow (2017–2020) at Duke University. Trustee (2017–present) of Amherst College and member of Amherst College Investment Committee (2019–present). Member of the Regenerative Crisis Response Committee (2020–present).
David A. Thomas
Born in 1956. Trustee since July 2021. Principal occupation(s) during the past five years and other experience: president of Morehouse College (2018–present). Professor of business administration, emeritus at Harvard University (2017–2018). Dean (2011–2016) and professor of management (2016–2017) at the Georgetown University McDonough School of Business. Director of DTE Energy Company (2013–present). Trustee of Common Fund (2019–present).
Peter F. Volanakis
Born in 1955. Trustee since July 2009. Principal occupation(s) during the past five years and other experience: president and chief operating officer (retired 2010) of Corning Incorporated (communications equipment) and director of Corning Incorporated (2000–2010) and Dow Corning (2001–2010). Director (2012) of SPX Corporation (multi-industry manufacturing). Overseer of the Amos Tuck School of Business Administration, Dartmouth College (2001–2013). Chairman of the board of trustees of Colby-Sawyer College. Member of the BMW Group Mobility Council.
Executive Officers
Christine M. Buchanan
Born in 1970. Principal occupation(s) during the past five years and other experience: principal of Vanguard. Chief financial officer (2021–present) and treasurer (2017–present) of each of the investment companies served by Vanguard. Partner (2005–2017) at KPMG (audit, tax, and advisory services).
David Cermak
Born in 1960. Principal occupation(s) during the past five years and other experience: principal of Vanguard. Finance director (2019–present) of each of the investment companies served by Vanguard. Managing director and head (2017–present) of Vanguard Investments Singapore. Managing director and head (2017–2019) of Vanguard Investments Hong Kong. Representative director and head (2014–2017) of Vanguard Investments Japan.
John Galloway
Born in 1973. Principal occupation(s) during the past five years and other experience: principal of Vanguard. Investment stewardship officer (September 2020–present) of each of the investment companies served by Vanguard. Head of Investor Advocacy (February 2020–present) and head of Marketing Strategy and Planning (2017–2020) at Vanguard. Deputy assistant to the President of the United States (2015).
Peter Mahoney
Born in 1974. Principal occupation(s) during the past five years and other experience: principal of Vanguard. Controller (2015–present) of each of the investment companies served by Vanguard. Head of International Fund Services (2008–2014) at Vanguard.
Anne E. Robinson
Born in 1970. Principal occupation(s) during the past five years and other experience: general counsel (2016–present) of Vanguard. Secretary (2016–present) of Vanguard and of each of the investment companies served by Vanguard. Managing director (2016–present) of Vanguard. Managing director and general counsel of Global Cards and Consumer Services (2014–2016) at Citigroup. Counsel (2003–2014) at American Express.
Michael Rollings
Born in 1963. Principal occupation(s) during the past five years and other experience: finance director (2017–present) and treasurer (2017) of each of the investment companies served by Vanguard. Managing director (2016–present) of Vanguard. Chief financial officer (2016–present) of Vanguard. Director (2016–present) of Vanguard Marketing Corporation. Executive vice president and chief financial officer (2006–2016) of MassMutual Financial Group.
John E. Schadl
Born in 1972. Principal occupation(s) during the past five years and other experience: principal of Vanguard. Chief compliance officer (2019–present) of Vanguard and of each of the investment companies served by Vanguard. Assistant vice president (2019–present) of Vanguard Marketing Corporation.
Vanguard Senior Management Team
| Matthew Benchener | Thomas M. Rampulla |
| Joseph Brennan | Karin A. Risi |
| Mortimer J. Buckley | Anne E. Robinson |
| Gregory Davis | Michael Rollings |
| John James | Nitin Tandon |
| John T. Marcante | Lauren Valente |
| Chris D. Mclsaac | |
Connect with Vanguard®>vanguard.com
Fund Information > 800-662-7447
Direct Investor Account Services > 800-662-2739
Institutional Investor Services > 800-523-1036
Text Telephone for People Who Are Deaf or Hard of Hearing > 800-749-7273
This material may be used in conjunction with the offering of shares of any Vanguard fund only if preceded or accompanied by the fund’s current prospectus.
All comparative mutual fund data are from Morningstar, Inc., unless otherwise noted.
You can obtain a free copy of Vanguard’s proxy voting guidelines by visiting vanguard.com/proxyreporting or by calling Vanguard at 800-662-2739. The guidelines are also available from the SEC’s website, www.sec.gov. In addition, you may obtain a free report on how your fund voted the proxies for securities it owned during the 12 months ended June 30. To get the report, visit either vanguard.com/proxyreporting or www.sec.gov.
You can review information about your fund on the SEC’s website, and you can receive copies of this information, for a fee, by sending a request via email addressed to publicinfo@sec.gov.
© 2021 The Vanguard Group, Inc.
All rights reserved.
U.S. Patent Nos. 6,879,964 and 7,720,749.
Vanguard Marketing Corporation, Distributor.
Q11200 122021
Annual Report | October 31, 2021
Vanguard Global Minimum Volatility Fund
Contents
Your Fund’s Performance at a Glance
| 1 |
Advisor’s Report
| 2 |
About Your Fund’s Expenses
| 5 |
Performance Summary
| 7 |
Financial Statements
| 9 |
Please note: The opinions expressed in this report are just that—informed opinions. They should not be considered promises or advice. Also, please keep in mind that the information and opinions cover the period through the date on the front of this report. Of course, the risks of investing in your fund are spelled out in the prospectus.
Your Fund’s Performance at a Glance
| • | Vanguard Global Minimum Volatility Fund returned 18.51% for Investor Shares and 18.60% for Admiral Shares for the 12 months ended October 31, 2021, underperforming its benchmark, which returned 38.27%. |
| • | The global economy continued to recover from the sharp pandemic-induced contraction in the spring of 2020. Swift and extensive fiscal and monetary support from policymakers was a key to the rebound. Even amid concerns toward the end of the fiscal year about inflation and the prospect of less accommodative monetary policy, stock returns for the period were excellent. |
| • | Our positions in low-volatility stocks trailed significantly during the fiscal year. Although all 11 of the fund’s industry sectors detracted on a relative basis, real estate, utilities, and materials held up the best. By region, our positions in North America detracted the most. |
| • | The fund’s average volatility for the 12 months was nearly a third less than that of its benchmark. |
| • | The fund regularly uses derivatives to hedge portfolio risks. Its holdings in forward foreign currencies and futures detracted from performance. |
Market Barometer
| | Average Annual Total Returns
Periods Ended October 31, 2021 |
| | One Year | Three Years | Five Years |
| Stocks | | | |
| Russell 1000 Index (Large-caps) | 43.51% | 22.01% | 19.16% |
| Russell 2000 Index (Small-caps) | 50.80 | 16.47 | 15.52 |
| Russell 3000 Index (Broad U.S. market) | 43.90 | 21.62 | 18.91 |
| FTSE All-World ex US Index (International) | 30.23 | 12.42 | 10.05 |
| Bonds | | | |
Bloomberg U.S. Aggregate Bond Index
(Broad taxable market) | -0.48% | 5.63% | 3.10% |
Bloomberg Municipal Bond Index
(Broad tax-exempt market) | 2.64 | 5.17 | 3.41 |
| FTSE Three-Month U.S. Treasury Bill Index | 0.05 | 1.08 | 1.12 |
| CPI | | | |
| Consumer Price Index | 6.22% | 3.03% | 2.73% |
For the 12 months ended October 31, 2021, Vanguard Global Minimum Volatility Fund returned 18.51% for Investor Shares and 18.60% for Admiral Shares, with an annualized weekly volatility of 9.41%. Its benchmark, the FTSE Global All Cap Index (USD Hedged), returned 38.27%, with annualized weekly volatility of 13.90%. (To determine annualized weekly volatility, we calculate the standard deviation of weekly returns and multiply it by the square root of 52, the number of weeks in a year.)
Investment objective
Our objective is to create a portfolio that has broad equity exposure with less volatility than that of the global equity market. Our positions in low-volatility stocks delivered significant downside protection during the period, with the fund’s weekly volatility averaging about 23% less than that of its benchmark.
It is important to mention, as we have in the past, that we do not target a specific volatility level. Rather, we seek to provide an equity fund that has lower absolute risk than that of the broad global market. Thus, when the broad global equity market is experiencing periods of low volatility, you should expect this fund’s volatility to be much closer to that of its benchmark.
We recognize that equity-like returns are also an important outcome of an investment in this fund, but achieving a total return higher than the benchmark’s is not our objective. Although our research leads us to expect that, on average, a minimum volatility fund may hold up better than the overall global market in
sharp downturns (while still experiencing losses), the fund should be expected to trail in strong bull markets. With that in mind, because the fund is expected to have a lower level of risk than the global equity market, you should not expect it to outperform the market over the long run.
We think a reasonable comparative performance measure for the fund over the long term is its risk-adjusted return. This can be calculated by dividing the portfolio’s total return for the period by the annualized standard deviation of monthly returns. Since inception, the risk-adjusted annual return for the fund was 0.89%, much more closely in line with the 0.93% risk-adjusted return of the benchmark.
Investment strategy
In building our portfolio, we use quantitative models that evaluate a variety of factors that drive a stock’s volatility. These fundamental drivers include risk factors such as growth, value, dividend yield, size, volatility, and liquidity. In addition, our process includes estimates of each stock’s correlation—or how its factors move in relation to one another. This approach allows us to make appropriate risk/diversification trade-offs without relying solely on volatility estimates.
We also consider the effect of currency exposure. We recognize that owning companies in foreign markets involves the risk of movements in exchange rates relative to the U.S. dollar. Because of this, an optimization process that focuses solely on volatilities tied to an investor’s
home currency will tend to overweight exposures to that currency.
We aim to avoid currency-specific exposures by focusing on equity volatilities and correlations measured in local currency terms. We use currency forward contracts to hedge the resulting exposure for U.S. investors. We believe that this process can further reduce the overall volatility of the portfolio in the long run.
Finally, we apply constraints to reduce stock, sector, and country concentration risk. We find that these constraints, which allow for broader diversification and liquidity, reduce unnecessarily high risk exposures without significantly affecting our ability to lower overall volatility. Drawing from about 7,700 stocks in the FTSE index, we construct a portfolio of about 300 to 350 stocks.
The benefits of our strategy become even clearer when you remove some of the noise caused by short-term reversals in daily and weekly returns, which can increase volatility levels, and focus on monthly returns. Since inception, the fund has delivered a 21% volatility discount relative to its benchmark.
The investment environment
The world economy’s recovery from the 2020 pandemic-induced contraction was quicker than many had expected. Countries that have been better at containing the virus have generally been more successful economically. Swift and extensive fiscal and monetary support
from policymakers was also key to the rebound.
Even amid concerns toward the end of the fiscal year about inflation and the prospect of less accommodative monetary policy, stock returns were excellent. The FTSE All-World Index returned 37.59% for the 12 months.
Bond yields moved higher across much of the developed world amid concerns about inflation and the prospect that some developed-market central banks might scale back their bond-buying programs or raise interest rates.
The environment for commodities was one of the most attractive in years because of limited supply and increased demand worldwide. West Texas Intermediate Crude and natural gas, both of which were hit hard by a sharp drop in demand in 2020, recovered strongly over the 12 months. Safe-haven commodities, such as gold, lagged.
The fund’s successes and shortfalls
Our portfolio is designed to deliver equity-like returns with lower market volatility. Although the fund delivered significant downside protection during the 12 months, its performance trailed that of its benchmark. As markets recovered, investors took on more risk and low-volatility stocks fell out of favor relative to their higher-volatility counterparts.
At the sector level, our selection in health care, consumer discretionary, and consumer staples detracted the most.
Although all 11 of the fund’s industry sectors detracted on a relative basis, our positions in real estate, utilities, and materials held up the best.
Regionally, our positions in North America, which account for more than 50% of the fund’s holdings, hurt relative returns the most. Positions in the Pacific and Europe also detracted significantly.
We remain convinced in the fund's ability to deliver a strong risk/return profile over the long term. Despite the challenging environment since the pandemic, the fund has delivered a significant volatility discount to the market.
We expect our approach to portfolio construction to pay off in reduced volatility over the long run, and we will continue to focus patiently on its long-term risk-adjusted returns.
Portfolio Manager:
Antonio Picca
Vanguard Quantitative Equity Group
November 15, 2021
About Your Fund’s Expenses
As a shareholder of the fund, you incur ongoing costs, which include costs for portfolio management, administrative services, and shareholder reports (like this one), among others. Operating expenses, which are deducted from a fund’s gross income, directly reduce the investment return of the fund.
A fund’s expenses are expressed as a percentage of its average net assets. This figure is known as the expense ratio. The following examples are intended to help you understand the ongoing costs (in dollars) of investing in your fund and to compare these costs with those of other mutual funds. The examples are based on an investment of $1,000 made at the beginning of the period shown and held for the entire period.
The accompanying table illustrates your fund’s costs in two ways:
| • | Based on actual fund return. This section helps you to estimate the actual expenses that you paid over the period. The ”Ending Account Value“ shown is derived from the fund‘s actual return, and the third column shows the dollar amount that would have been paid by an investor who started with $1,000 in the fund. You may use the information here, together with the amount you invested, to estimate the expenses that you paid over the period. |
To do so, simply divide your account value by $1,000 (for example, an $8,600 account value divided by $1,000 = 8.6), then multiply the result by the number given for your fund under the heading ”Expenses Paid During Period.“
| • | Based on hypothetical 5% yearly return. This section is intended to help you compare your fund‘s costs with those of other mutual funds. It assumes that the fund had a yearly return of 5% before expenses, but that the expense ratio is unchanged. In this case—because the return used is not the fund’s actual return—the results do not apply to your investment. The example is useful in making comparisons because the Securities and Exchange Commission requires all mutual funds to calculate expenses based on a 5% return. You can assess your fund’s costs by comparing this hypothetical example with the hypothetical examples that appear in shareholder reports of other funds. |
Note that the expenses shown in the table are meant to highlight and help you compare ongoing costs only and do not reflect transaction costs incurred by the fund for buying and selling securities. Further, the expenses do not include any purchase, redemption, or account service fees described in the fund prospectus. If such fees were applied to your account, your costs would be higher. Your fund does not carry a “sales load.”
The calculations assume no shares were bought or sold during the period. Your actual costs may have been higher or lower, depending on the amount of your investment and the timing of any purchases or redemptions.
You can find more information about the fund’s expenses, including annual expense ratios, in the Financial Statements section of this report. For additional information on operating expenses and other shareholder costs, please refer to your fund’s current prospectus.
| Six Months Ended October 31, 2021 | | | |
| | Beginning
Account Value
4/30/2021 | Ending
Account Value
10/31/2021 | Expenses
Paid During
Period |
| Based on Actual Fund Return | | | |
| Global Minimum Volatility Fund | | | |
| Investor Shares | $1,000.00 | $1,035.60 | $1.08 |
| Admiral™ Shares | 1,000.00 | 1,036.30 | 0.72 |
| Based on Hypothetical 5% Yearly Return | | | |
| Global Minimum Volatility Fund | | | |
| Investor Shares | $1,000.00 | $1,024.15 | $1.07 |
| Admiral Shares | 1,000.00 | 1,024.50 | 0.71 |
The calculations are based on expenses incurred in the most recent six-month period. The fund’s annualized six-month expense ratios for that period are 0.21% for Investor Shares and 0.14% for Admiral Shares. The dollar amounts shown as “Expenses Paid” are equal to the annualized expense ratio multiplied by the average account value over the period, multiplied by the number of days in the most recent six-month period, then divided by the number of days in the most recent 12-month period (184/365).
Global Minimum Volatility Fund
All of the returns in this report represent past performance, which is not a guarantee of future results that may be achieved by the fund. (Current performance may be lower or higher than the performance data cited. For performance data current to the most recent month-end, visit our website at vanguard.com/performance.) Note, too, that both investment returns and principal value can fluctuate widely, so an investor’s shares, when sold, could be worth more or less than their original cost. The returns shown do not reflect taxes that a shareholder would pay on fund distributions or on the sale of fund shares.
Cumulative Performance: December 12, 2013, Through October 31, 2021
Initial Investment of $10,000
| | | Average Annual Total Returns
Periods Ended October 31, 2021 | |
| | | One
Year | Five
Years | Since
Inception
(12/12/2013) | Final Value
of a $10,000
Investment |
 | Global Minimum Volatility Fund Investor Shares | 18.51% | 8.38% | 8.90% | $19,593 |
 | FTSE Global All Cap Index (USD Hedged) | 38.27 | 15.36 | 12.12 | 24,644 |
“Since Inception” performance is calculated from the Investor Shares’ inception date for both the fund and its comparative standard(s).
| | | | |
| | | One
Year | Five
Years | Since
Inception
(12/12/2013) | Final Value
of a $50,000
Investment |
Global Minimum Volatility Fund
Admiral Shares | 18.60% | 8.45% | 8.99% | $98,555 |
| FTSE Global All Cap Index (USD Hedged) | 38.27 | 15.36 | 12.12 | 123,218 |
“Since Inception” performance is calculated from the Admiral Shares’ inception date for both the fund and its comparative standard(s).
See Financial Highlights for dividend and capital gains information.
Global Minimum Volatility Fund
| United States | 55.3% |
| Japan | 10.7 |
| Canada | 5.6 |
| Switzerland | 4.4 |
| Australia | 4.0 |
| United Kingdom | 3.2 |
| China | 3.1 |
| South Korea | 2.4 |
| India | 1.9 |
| Taiwan | 1.8 |
| Hong Kong | 1.6 |
| Other | 6.0 |
The table reflects the fund’s investments, except for short-term investments and derivatives.
Global Minimum Volatility Fund
The fund files its complete schedule of portfolio holdings with the Securities and Exchange Commission (SEC) for the first and third quarters of each fiscal year as an exhibit to its reports on Form N-PORT. The fund’s Form N-PORT reports are available on the SEC’s website at www.sec.gov.
| | | Shares | Market
Value•
($000) |
| Common Stocks (99.2%) |
| Australia (3.9%) |
| | Wesfarmers Ltd. | 988,756 | 42,779 |
| | Sonic Healthcare Ltd. | 476,597 | 14,462 |
| | Coles Group Ltd. | 940,197 | 12,184 |
| | ASX Ltd. | 153,195 | 9,634 |
| | Westpac Banking Corp. | 354,265 | 6,892 |
| | Woolworths Group Ltd. | 232,057 | 6,684 |
| | Commonwealth Bank of Australia | 58,797 | 4,661 |
| | Medibank Pvt Ltd. | 1,672,849 | 4,204 |
| | CSL Ltd. | 17,748 | 4,039 |
| | APA Group | 314,610 | 1,952 |
| | BWP Trust | 222,026 | 711 |
| | | | 108,202 |
| Belgium (0.3%) |
| | Etablissements Franz Colruyt NV | 137,878 | 6,770 |
| | Elia Group SA | 11,876 | 1,385 |
| | Sofina SA | 3,011 | 1,332 |
| | | | 9,487 |
| Canada (5.6%) |
| 1 | Royal Bank of Canada | 435,936 | 45,376 |
| 1 | Emera Inc. | 448,746 | 20,878 |
| | Franco-Nevada Corp. | 93,007 | 13,271 |
| | BCE Inc. | 226,127 | 11,641 |
| | Fortis Inc. (XTSE) | 212,031 | 9,438 |
| | TELUS Corp. | 382,749 | 8,780 |
| | Metro Inc. | 159,857 | 8,043 |
| 2 | Hydro One Ltd. | 299,979 | 7,167 |
| | Intact Financial Corp. | 46,530 | 6,238 |
| | Constellation Software Inc. | 2,727 | 4,793 |
| | George Weston Ltd. | 40,068 | 4,329 |
| | Quebecor Inc. Class B | 123,484 | 3,147 |
| | Loblaw Cos. Ltd. | 33,958 | 2,554 |
| | Dollarama Inc. | 56,109 | 2,536 |
| | TMX Group Ltd. | 19,420 | 2,103 |
| | Rogers Communications Inc. Class B | 28,901 | 1,344 |
| | Cogeco Communications Inc. | 13,065 | 1,122 |
| | | | 152,760 |
| China (3.1%) |
| * | JD.com Inc. Class A | 322,862 | 12,639 |
| * | Alibaba Group Holding Ltd. | 608,188 | 12,506 |
| | ZTO Express Cayman Inc. ADR | 408,155 | 11,971 |
| | | Shares | Market
Value•
($000) |
| | Ping An Insurance Group Co. of China Ltd. Class H | 1,353,500 | 9,695 |
| | NetEase Inc. | 475,905 | 9,232 |
| | Tencent Holdings Ltd. | 124,300 | 7,561 |
| | China Merchants Bank Co. Ltd. Class H | 686,000 | 5,749 |
| | China Shenhua Energy Co. Ltd. Class H | 1,440,500 | 3,098 |
| 2 | Longfor Group Holdings Ltd. | 616,000 | 2,980 |
| | China Overseas Land & Investment Ltd. | 1,212,500 | 2,674 |
| | ENN Energy Holdings Ltd. | 80,000 | 1,378 |
| | Anhui Conch Cement Co. Ltd. Class H | 240,000 | 1,187 |
| *,2 | China Literature Ltd. | 169,200 | 1,174 |
| | China Resources Land Ltd. | 258,000 | 1,002 |
| | New China Life Insurance Co. Ltd. Class H | 298,200 | 860 |
| | China Gas Holdings Ltd. | 303,000 | 756 |
| | | | 84,462 |
| Denmark (0.8%) |
| | Coloplast A/S Class B | 111,474 | 18,206 |
| | Chr Hansen Holding A/S | 18,965 | 1,510 |
| | Tryg A/S | 50,160 | 1,190 |
| | | | 20,906 |
| Finland (0.5%) |
| | Kone OYJ Class B | 191,352 | 13,050 |
| | Elisa OYJ | 28,749 | 1,735 |
| | | | 14,785 |
| France (0.1%) |
| | Vivendi SE | 256,281 | 3,302 |
| Germany (0.4%) |
| | Symrise AG Class A | 38,459 | 5,320 |
| | Knorr-Bremse AG | 32,823 | 3,464 |
| | Fielmann AG | 33,003 | 2,176 |
| | | | 10,960 |
| Hong Kong (1.6%) |
| | CLP Holdings Ltd. | 1,926,850 | 18,866 |
| | Power Assets Holdings Ltd. | 2,036,500 | 12,446 |
| | Hang Seng Bank Ltd. | 344,500 | 6,546 |
| | Want Want China Holdings Ltd. | 2,935,000 | 2,276 |
| | Chow Tai Fook Jewellery Group Ltd. | 922,800 | 1,882 |
Global Minimum Volatility Fund
| | | Shares | Market
Value•
($000) |
| | Tingyi Cayman Islands Holding Corp. | 638,000 | 1,191 |
| | CK Infrastructure Holdings Ltd. | 98,000 | 591 |
| | | | 43,798 |
| India (1.9%) |
| 3 | Infosys Ltd. ADR | 1,331,992 | 29,677 |
| | Dr Reddy's Laboratories Ltd. ADR | 215,432 | 13,236 |
| | ICICI Bank Ltd. ADR | 275,553 | 5,828 |
| | Wipro Ltd. ADR | 257,275 | 2,305 |
| 2 | Reliance Industries Ltd. GDR | 28,000 | 1,906 |
| | | | 52,952 |
| Indonesia (0.2%) |
| | Telkom Indonesia Persero Tbk PT ADR | 229,012 | 6,021 |
| Israel (0.1%) |
| | Bank Hapoalim BM | 210,697 | 2,075 |
| | Bank Leumi Le-Israel BM | 140,420 | 1,342 |
| | | | 3,417 |
| Italy (0.5%) |
| | DiaSorin SpA | 17,085 | 3,862 |
| | Terna - Rete Elettrica Nazionale | 486,458 | 3,625 |
| | Snam SpA (MTAA) | 351,100 | 1,989 |
| | UnipolSai Assicurazioni SpA | 656,555 | 1,901 |
| | Hera SpA | 270,095 | 1,105 |
| | | | 12,482 |
| Japan (10.6%) |
| | Softbank Corp. | 3,078,400 | 42,019 |
| | FUJIFILM Holdings Corp. | 453,000 | 35,007 |
| | Chugai Pharmaceutical Co. Ltd. | 621,600 | 23,241 |
| | Japan Tobacco Inc. | 930,100 | 18,259 |
| | Yamada Denki Co. Ltd. | 4,174,500 | 15,952 |
| | SG Holdings Co. Ltd. | 490,900 | 12,327 |
| | Shimano Inc. | 38,800 | 10,826 |
| | Secom Co. Ltd. | 117,900 | 8,037 |
| | Toyo Suisan Kaisha Ltd. | 178,300 | 7,683 |
| | Pan Pacific International Holdings Corp. | 342,000 | 7,181 |
| | Sawai Group Holdings Co. Ltd. | 162,600 | 7,173 |
| | Japan Post Bank Co. Ltd. | 804,500 | 6,277 |
| | Tokyo Gas Co. Ltd. | 323,600 | 5,615 |
| | Kagome Co. Ltd. | 221,000 | 5,608 |
| | KDDI Corp. | 167,800 | 5,131 |
| | Chubu Electric Power Co. Inc. | 481,200 | 4,981 |
| | Chugoku Electric Power Co. Inc. | 530,500 | 4,400 |
| | ITOCHU Corp. | 148,800 | 4,244 |
| | Odakyu Electric Railway Co. Ltd. | 193,100 | 4,186 |
| | Toho Co. Ltd. (XTKS) | 85,400 | 4,012 |
| * | Kintetsu Group Holdings Co. Ltd. | 121,500 | 3,825 |
| | Oracle Corp. Japan | 38,200 | 3,615 |
| | ABC-Mart Inc. | 72,300 | 3,475 |
| | Japan Exchange Group Inc. | 146,719 | 3,474 |
| | Keio Corp. | ��� 67,200 | 3,392 |
| | Lion Corp. | 190,900 | 3,179 |
| | Osaka Gas Co. Ltd. | 183,900 | 2,964 |
| | | Shares | Market
Value•
($000) |
| | Square Enix Holdings Co. Ltd. | 50,300 | 2,755 |
| | Nitori Holdings Co. Ltd. | 12,900 | 2,370 |
| | Calbee Inc. | 81,300 | 2,095 |
| | Ezaki Glico Co. Ltd. | 55,400 | 2,011 |
| * | Skylark Holdings Co. Ltd. | 144,800 | 1,962 |
| | Nagoya Railroad Co. Ltd. | 114,200 | 1,887 |
| | Hoshizaki Corp. | 22,300 | 1,875 |
| | Toho Gas Co. Ltd. | 62,100 | 1,840 |
| * | Hitachi Metals Ltd. | 93,700 | 1,774 |
| | MOS Food Services Inc. | 60,500 | 1,687 |
| | Asahi Intecc Co. Ltd. | 63,300 | 1,669 |
| | Mitsubishi Materials Corp. | 78,000 | 1,514 |
| | Capcom Co. Ltd. | 49,600 | 1,335 |
| | Idemitsu Kosan Co. Ltd. | 45,400 | 1,240 |
| * | PeptiDream Inc. | 48,800 | 1,180 |
| | Obic Co. Ltd. | 6,000 | 1,110 |
| | KYORIN Holdings Inc. | 68,600 | 1,054 |
| | Koei Tecmo Holdings Co. Ltd. | 21,320 | 992 |
| | Shizuoka Bank Ltd. | 97,400 | 784 |
| | Seven Bank Ltd. | 361,800 | 765 |
| | Nissin Foods Holdings Co. Ltd. | 9,500 | 726 |
| | Kewpie Corp. | 32,500 | 713 |
| | Hamamatsu Photonics KK | 11,400 | 677 |
| | Tobu Railway Co. Ltd. | 25,400 | 632 |
| | Medipal Holdings Corp. | 34,900 | 631 |
| | Lawson Inc. | 12,400 | 600 |
| | | | 291,961 |
| Mexico (0.3%) |
| | America Movil SAB de CV Class L ADR | 435,551 | 7,744 |
| Netherlands (0.2%) |
| | Universal Music Group NV | 92,179 | 2,676 |
| | Koninklijke Vopak NV | 52,061 | 2,072 |
| | | | 4,748 |
| New Zealand (0.2%) |
| | Fisher & Paykel Healthcare Corp. Ltd. | 247,537 | 5,546 |
| Norway (0.4%) |
| | Orkla ASA | 1,235,937 | 12,021 |
| Russia (0.8%) |
| | Sberbank of Russia PJSC ADR | 862,847 | 17,304 |
| | Mobile TeleSystems PJSC ADR | 240,224 | 2,208 |
| | Polyus PJSC (Registered) GDR | 12,378 | 1,224 |
| | | | 20,736 |
| Singapore (0.6%) |
| | Oversea-Chinese Banking Corp. Ltd. | 1,071,748 | 9,369 |
| | Singapore Exchange Ltd. | 921,100 | 6,611 |
| | United Overseas Bank Ltd. | 30,800 | 612 |
| | | | 16,592 |
| South Korea (2.4%) |
| | Samsung Electronics Co. Ltd. Preference Shares | 317,530 | 17,444 |
| | Korea Zinc Co. Ltd. | 33,479 | 15,414 |
| | KT&G Corp. | 221,331 | 15,373 |
| | NAVER Corp. | 24,924 | 8,666 |
| 2 | Netmarble Corp. | 28,263 | 2,993 |
| * | Studio Dragon Corp. | 25,228 | 1,864 |
Global Minimum Volatility Fund
| | | Shares | Market
Value•
($000) |
| | Maeil Dairies Co. Ltd. | 30,457 | 1,838 |
| * | CJ Logistics Corp. | 10,592 | 1,288 |
| | LEENO Industrial Inc. | 7,402 | 1,085 |
| | SSANGYONG C&E Co. Ltd. | 108,382 | 731 |
| | | | 66,696 |
| Spain (0.4%) |
| | Ferrovial SA | 210,582 | 6,648 |
| 1 | Naturgy Energy Group SA | 78,909 | 2,074 |
| | Red Electrica Corp. SA | 57,686 | 1,201 |
| | | | 9,923 |
| Sweden (0.2%) |
| | ICA Gruppen AB | 128,612 | 6,655 |
| Switzerland (4.4%) |
| | Swisscom AG (Registered) | 68,772 | 37,448 |
| | Givaudan SA (Registered) | 5,403 | 25,459 |
| | Schindler Holding AG Ptg. Ctf. | 53,265 | 13,870 |
| | Roche Holding AG | 31,270 | 12,114 |
| | Roche Holding AG (Bearer) | 17,135 | 7,370 |
| | Kuehne + Nagel International AG (Registered) | 22,805 | 7,182 |
| | EMS-Chemie Holding AG (Registered) | 4,461 | 4,425 |
| 2 | Galenica AG | 29,325 | 2,148 |
| | SGS SA (Registered) | 681 | 2,016 |
| | Allreal Holding AG (Registered) | 9,242 | 1,955 |
| | Chocoladefabriken Lindt & Spruengli AG Ptg. Ctf. | 158 | 1,863 |
| 1 | Stadler Rail AG | 32,435 | 1,424 |
| | Geberit AG (Registered) | 1,776 | 1,387 |
| | Banque Cantonale Vaudoise (Registered) | 13,949 | 1,123 |
| | | | 119,784 |
| Taiwan (1.7%) |
| | Taiwan Semiconductor Manufacturing Co. Ltd. ADR | 374,437 | 42,573 |
| | Chunghwa Telecom Co. Ltd. ADR | 142,247 | 5,619 |
| | | | 48,192 |
| United Kingdom (3.2%) |
| | GlaxoSmithKline plc | 836,626 | 17,369 |
| | Halma plc | 422,747 | 17,144 |
| | National Grid plc | 1,027,379 | 13,154 |
| | Admiral Group plc | 286,496 | 11,254 |
| | Rightmove plc | 833,125 | 7,875 |
| | Tate & Lyle plc | 601,850 | 5,333 |
| | B&M European Value Retail SA | 475,983 | 4,124 |
| | Sage Group plc | 308,425 | 3,000 |
| | Croda International plc | 21,919 | 2,837 |
| | Spirax-Sarco Engineering plc | 9,281 | 1,981 |
| | Severn Trent plc | 50,239 | 1,881 |
| | Polymetal International plc | 42,099 | 778 |
| | Smiths Group plc | 422 | 8 |
| | | | 86,738 |
| United States (54.8%) |
| | Microsoft Corp. | 152,425 | 50,547 |
| 3 | Merck & Co. Inc. | 567,312 | 49,952 |
| 3 | Republic Services Inc. Class A | 364,076 | 49,005 |
| * | Tyler Technologies Inc. | 88,075 | 47,844 |
| | | Shares | Market
Value•
($000) |
| 3 | Cisco Systems Inc. | 805,222 | 45,068 |
| 3 | Johnson & Johnson | 275,603 | 44,890 |
| | CH Robinson Worldwide Inc. | 457,377 | 44,361 |
| 3 | Walmart Inc. | 290,948 | 43,473 |
| | Amdocs Ltd. | 549,526 | 42,775 |
| 3 | Gilead Sciences Inc. | 641,520 | 41,622 |
| | Amgen Inc. | 198,278 | 41,038 |
| | AptarGroup Inc. | 338,186 | 40,846 |
| | Verizon Communications Inc. | 750,637 | 39,776 |
| 3 | Church & Dwight Co. Inc. | 424,387 | 37,074 |
| | Dollar General Corp. | 164,519 | 36,444 |
| | Chemed Corp. | 75,519 | 36,419 |
| *,4 | Equity Commonwealth | 1,169,914 | 30,336 |
| | Oracle Corp. | 306,177 | 29,375 |
| | Electronic Arts Inc. | 206,223 | 28,923 |
| | Waste Management Inc. | 176,528 | 28,285 |
| | Brown & Brown Inc. | 427,449 | 26,976 |
| 3 | Colgate-Palmolive Co. | 340,669 | 25,956 |
| | Intercontinental Exchange Inc. | 187,138 | 25,911 |
| | Broadridge Financial Solutions Inc. | 141,044 | 25,164 |
| * | Black Knight Inc. | 336,990 | 23,626 |
| 3 | Hormel Foods Corp. | 479,971 | 20,312 |
| | Citrix Systems Inc. | 211,063 | 19,994 |
| | Becton Dickinson and Co. | 81,291 | 19,477 |
| | Hawaiian Electric Industries Inc. | 476,990 | 19,347 |
| * | Vertex Pharmaceuticals Inc. | 104,477 | 19,321 |
| 3 | Clorox Co. | 112,867 | 18,398 |
| | Service Corp. International | 239,307 | 16,390 |
| | Comcast Corp. Class A | 292,110 | 15,023 |
| | Maximus Inc. | 177,601 | 15,020 |
| | Procter & Gamble Co. | 102,542 | 14,663 |
| | IDACORP Inc. | 139,874 | 14,592 |
| | Expeditors International of Washington Inc. | 115,801 | 14,274 |
| * | Amazon.com Inc. | 4,223 | 14,242 |
| | Baxter International Inc. | 174,844 | 13,806 |
| | White Mountains Insurance Group Ltd. | 12,359 | 13,039 |
| | Yum China Holdings Inc. | 227,579 | 12,990 |
| | Houlihan Lokey Inc. Class A | 114,011 | 12,778 |
| | Sonoco Products Co. | 217,116 | 12,582 |
| | Flowers Foods Inc. | 493,553 | 12,215 |
| | Washington Federal Inc. | 345,197 | 12,206 |
| * | Alphabet Inc. Class C | 3,645 | 10,809 |
| | United Parcel Service Inc. Class B | 49,567 | 10,581 |
| | Silgan Holdings Inc. | 262,040 | 10,534 |
| | Graco Inc. | 138,033 | 10,377 |
| * | Incyte Corp. | 153,081 | 10,253 |
| | Roper Technologies Inc. | 20,106 | 9,809 |
| | Kaiser Aluminum Corp. | 94,422 | 9,172 |
| | Premier Inc. Class A | 233,733 | 9,104 |
| * | Check Point Software Technologies Ltd. | 68,357 | 8,176 |
| | Consolidated Edison Inc. | 99,603 | 7,510 |
| * | Charter Communications Inc. Class A | 10,574 | 7,136 |
| | Landstar System Inc. | 39,853 | 7,007 |
| | Rollins Inc. | 193,485 | 6,817 |
| | Texas Instruments Inc. | 35,968 | 6,743 |
Global Minimum Volatility Fund
| | | Shares | Market
Value•
($000) |
| | Commerce Bancshares Inc. | 94,644 | 6,673 |
| | Bristol-Myers Squibb Co. | 113,492 | 6,628 |
| | Murphy USA Inc. | 40,333 | 6,572 |
| | American States Water Co. | 68,140 | 6,190 |
| | Royal Gold Inc. | 62,244 | 6,163 |
| | 3M Co. | 33,130 | 5,920 |
| | Jack Henry & Associates Inc. | 33,464 | 5,571 |
| | Capitol Federal Financial Inc. | 425,158 | 5,157 |
| | NewMarket Corp. | 15,088 | 5,130 |
| | Target Corp. | 18,091 | 4,697 |
| * | United Therapeutics Corp. | 23,529 | 4,488 |
| | WEC Energy Group Inc. | 48,179 | 4,339 |
| | California Water Service Group | 70,926 | 4,318 |
| | Lancaster Colony Corp. | 22,161 | 3,767 |
| | Motorola Solutions Inc. | 14,726 | 3,661 |
| | Toro Co. | 38,294 | 3,656 |
| * | FTI Consulting Inc. | 24,611 | 3,542 |
| | TFS Financial Corp. | 159,770 | 3,109 |
| * | Adobe Inc. | 4,771 | 3,103 |
| | Dolby Laboratories Inc. Class A | 33,935 | 2,998 |
| * | Netflix Inc. | 4,208 | 2,905 |
| | Progressive Corp. | 30,603 | 2,904 |
| | Ameren Corp. | 33,145 | 2,794 |
| | Cerner Corp. | 36,375 | 2,702 |
| * | Regeneron Pharmaceuticals Inc. | 4,050 | 2,592 |
| | Balchem Corp. | 16,786 | 2,570 |
| | WD-40 Co. | 9,565 | 2,171 |
| * | Vir Biotechnology Inc. | 55,003 | 2,075 |
| | Pfizer Inc. | ��43,863 | 1,919 |
| | Atmos Energy Corp. | 20,078 | 1,850 |
| | NorthWestern Corp. | 31,310 | 1,780 |
| | PS Business Parks Inc. | 8,148 | 1,448 |
| | ALLETE Inc. | 23,383 | 1,439 |
| * | Terminix Global Holdings Inc. | 34,788 | 1,408 |
| | Werner Enterprises Inc. | 28,950 | 1,312 |
| | Hanover Insurance Group Inc. | 10,025 | 1,263 |
| | Marsh & McLennan Cos. Inc. | 7,371 | 1,230 |
| * | Corcept Therapeutics Inc. | 60,919 | 1,097 |
| | Genpact Ltd. | 21,670 | 1,069 |
| | | Shares | Market
Value•
($000) |
| | Activision Blizzard Inc. | 11,255 | 880 |
| * | Qualys Inc. | 6,018 | 749 |
| | Avangrid Inc. | 14,027 | 739 |
| | BWX Technologies Inc. | 12,668 | 719 |
| | Avista Corp. | 17,090 | 680 |
| | National Fuel Gas Co. | 11,322 | 650 |
| * | Liberty Broadband Corp. Class C | 3,699 | 601 |
| | Vector Group Ltd. | 44,521 | 590 |
| | | | 1,508,201 |
Total Common Stocks
(Cost $2,243,806) | 2,729,071 |
| Temporary Cash Investments (2.7%) |
| Money Market Fund (2.7%) |
| 5,6 | Vanguard Market Liquidity Fund, 0.070% (Cost $72,759) | 727,588 | 72,759 |
| Total Investments (101.9%) (Cost $2,316,565) | 2,801,830 |
| Other Assets and Liabilities—Net (-1.9%) | (51,987) |
| Net Assets (100%) | 2,749,843 |
| Cost is in $000. |
| • | See Note A in Notes to Financial Statements. |
| * | Non-income-producing security. |
| 1 | Includes partial security positions on loan to broker-dealers. The total value of securities on loan is $65,330,000. |
| 2 | Security exempt from registration under Rule 144A of the Securities Act of 1933. Such securities may be sold in transactions exempt from registration, normally to qualified institutional buyers. At October 31, 2021, the aggregate value was $18,368,000, representing 0.7% of net assets. |
| 3 | Securities with a value of $15,553,000 have been segregated as collateral for open forward currency contracts. |
| 4 | Securities with a value of $1,134,000 have been segregated as initial margin for open futures contracts. |
| 5 | Affiliated money market fund available only to Vanguard funds and certain trusts and accounts managed by Vanguard. Rate shown is the 7-day yield. |
| 6 | Collateral of $70,254,000 was received for securities on loan. |
| | ADR—American Depositary Receipt. |
| | GDR—Global Depositary Receipt. |
| | Ptg. Ctf.—Participating Certificates. |
Global Minimum Volatility Fund
Derivative Financial Instruments Outstanding as of Period End
| Futures Contracts |
| | | | ($000) |
| | Expiration | Number of
Long (Short)
Contracts | Notional
Amount | Value and
Unrealized
Appreciation
(Depreciation) |
| Long Futures Contracts | | | | |
| E-mini S&P 500 Index | December 2021 | 37 | 8,505 | 31 |
| Euro Stoxx 50 Index | December 2021 | 6 | 294 | 6 |
| FTSE 100 Index | December 2021 | 12 | 1,186 | 36 |
| S&P ASX 200 Index | December 2021 | 6 | 822 | (14) |
| Topix Index | December 2021 | 9 | 1,573 | (41) |
| | | | | 18 |
| Forward Currency Contracts |
| | Contract
Settlement
Date | Contract Amount (000) | Unrealized
Appreciation
($000) | Unrealized
Depreciation
($000) |
| Counterparty | Receive | Deliver |
| Toronto-Dominion Bank | 11/15/21 | USD | 101,277 | AUD | 138,908 | — | (3,224) |
| Deutsche Bank AG | 11/15/21 | USD | 148,423 | CAD | 186,330 | — | (2,133) |
| Royal Bank of Canada | 11/15/21 | USD | 1,038 | CAD | 1,304 | — | (16) |
| Deutsche Bank AG | 11/15/21 | USD | 120,599 | CHF | 111,867 | — | (1,627) |
| Goldman Sachs International | 11/15/21 | USD | 5,983 | CNH | 38,691 | — | (48) |
| State Street Bank & Trust Co. | 11/15/21 | USD | 20,115 | DKK | 128,956 | 69 | — |
| State Street Bank & Trust Co. | 11/15/21 | USD | 63,574 | EUR | 54,796 | 211 | — |
| Goldman Sachs International | 11/15/21 | USD | 1,463 | EUR | 1,261 | 5 | — |
| Goldman Sachs International | 11/15/21 | USD | 84,678 | GBP | 62,110 | — | (324) |
| Royal Bank of Canada | 11/15/21 | USD | 1,365 | GBP | 1,001 | — | (6) |
| Citibank, N.A. | 11/15/21 | USD | 87,657 | HKD | 682,280 | — | (37) |
| BNP Paribas | 11/15/21 | USD | 5,583 | IDR | 79,677,364 | — | (33) |
| Goldman Sachs International | 11/15/21 | USD | 298 | IDR | 4,253,751 | — | (2) |
| Barclays Bank plc | 11/15/21 | USD | 2,804 | ILS | 9,064 | — | (60) |
| Deutsche Bank AG | 11/15/21 | USD | 653 | ILS | 2,111 | — | (14) |
| Deutsche Bank AG | 11/15/21 | USD | 49,271 | INR | 3,683,536 | 164 | — |
| Toronto-Dominion Bank | 11/15/21 | USD | 300,011 | JPY | 33,417,335 | 6,782 | — |
| Deutsche Bank AG | 11/15/21 | USD | 69,577 | KRW | 82,602,633 | — | (1,081) |
| Toronto-Dominion Bank | 11/16/21 | USD | 7,638 | MXN | 158,215 | — | (28) |
| BNP Paribas | 11/15/21 | USD | 11,229 | NOK | 95,795 | — | (110) |
| Goldman Sachs International | 11/15/21 | USD | 263 | NOK | 2,243 | — | (3) |
| Citibank, N.A. | 11/15/21 | USD | 5,314 | NZD | 7,629 | — | (152) |
| BNP Paribas | 11/15/21 | USD | 119 | PLN | 472 | — | — |
| Deutsche Bank AG | 11/15/21 | USD | 17,312 | RUB | 1,263,279 | — | (454) |
| Goldman Sachs International | 11/15/21 | USD | 2,332 | RUB | 170,140 | — | (61) |
| Citibank, N.A. | 11/15/21 | USD | 5,961 | SEK | 52,068 | — | (103) |
Global Minimum Volatility Fund
| Forward Currency Contracts (continued) |
| | Contract
Settlement
Date | Contract Amount (000) | Unrealized
Appreciation
($000) | Unrealized
Depreciation
($000) |
| Counterparty | Receive | Deliver |
| State Street Bank & Trust Co. | 11/15/21 | USD | 15,873 | SGD | 21,545 | — | (102) |
| Citibank, N.A. | 11/15/21 | USD | 47,694 | TWD | 1,329,572 | — | (117) |
| | | | | | | 7,231 | (9,735) |
| AUD—Australian dollar. |
| CAD—Canadian dollar. |
| CHF—Swiss franc. |
| CNH—Chinese yuan (offshore). |
| DKK—Danish krone. |
| EUR—euro. |
| GBP—British pound. |
| HKD—Hong Kong dollar. |
| IDR—Indonesian rupiah. |
| ILS—Israeli shekel. |
| INR—Indian rupee. |
| JPY—Japanese yen. |
| KRW—Korean won. |
| MXN—Mexican peso. |
| NOK—Norwegian krone. |
| NZD—New Zealand dollar. |
| PLN—Polish zloty. |
| RUB—Russian ruble. |
| SEK—Swedish krona. |
| SGD—Singapore dollar. |
| TWD—Taiwanese dollar. |
| USD—U.S. dollar. |
At October 31, 2021, the counterparties had deposited in segregated accounts securities with a value of $22,000 and cash of $1,889,000 in connection with open forward currency contracts.
See accompanying Notes, which are an integral part of the Financial Statements.
Global Minimum Volatility Fund
Statement of Assets and Liabilities
|
| ($000s, except shares and per-share amounts) | Amount |
| Assets | |
| Investments in Securities, at Value | |
| Unaffiliated Issuers (Cost $2,243,806) | 2,729,071 |
| Affiliated Issuers (Cost $72,759) | 72,759 |
| Total Investments in Securities | 2,801,830 |
| Investment in Vanguard | 92 |
| Foreign Currency, at Value (Cost $1,690) | 1,713 |
| Receivables for Investment Securities Sold | 12,955 |
| Receivables for Accrued Income | 6,915 |
| Receivables for Capital Shares Issued | 1,024 |
| Unrealized Appreciation—Forward Currency Contracts | 7,231 |
| Total Assets | 2,831,760 |
| Liabilities | |
| Due to Custodian | 410 |
| Payables for Investment Securities Purchased | 30 |
| Collateral for Securities on Loan | 70,254 |
| Payables for Capital Shares Redeemed | 1,268 |
| Payables to Vanguard | 179 |
| Variation Margin Payable—Futures Contracts | 41 |
| Unrealized Depreciation—Forward Currency Contracts | 9,735 |
| Total Liabilities | 81,917 |
| Net Assets | 2,749,843 |
| At October 31, 2021, net assets consisted of: | |
| | |
| Paid-in Capital | 2,266,634 |
| Total Distributable Earnings (Loss) | 483,209 |
| Net Assets | 2,749,843 |
| |
| Investor Shares—Net Assets | |
Applicable to 20,305,613 outstanding $.001 par value shares of
beneficial interest (unlimited authorization) | 301,065 |
| Net Asset Value Per Share—Investor Shares | $14.83 |
| |
| Admiral Shares—Net Assets | |
Applicable to 82,546,991 outstanding $.001 par value shares of
beneficial interest (unlimited authorization) | 2,448,778 |
| Net Asset Value Per Share—Admiral Shares | $29.67 |
See accompanying Notes, which are an integral part of the Financial Statements.
Global Minimum Volatility Fund
|
| | Year Ended
October 31, 2021 |
| | ($000) |
| Investment Income | |
| Income | |
| Dividends1 | 52,854 |
| Non-Cash Dividends | 5,931 |
| Interest2 | 7 |
| Securities Lending—Net | 398 |
| Total Income | 59,190 |
| Expenses | |
| The Vanguard Group—Note B | |
| Investment Advisory Services | 1,245 |
| Management and Administrative—Investor Shares | 489 |
| Management and Administrative—Admiral Shares | 2,362 |
| Marketing and Distribution—Investor Shares | 25 |
| Marketing and Distribution—Admiral Shares | 102 |
| Custodian Fees | 136 |
| Auditing Fees | 44 |
| Shareholders’ Reports—Investor Shares | 7 |
| Shareholders’ Reports—Admiral Shares | 19 |
| Trustees’ Fees and Expenses | 1 |
| Total Expenses | 4,430 |
| Net Investment Income | 54,760 |
| Realized Net Gain (Loss) | |
| Investment Securities Sold2 | 234,709 |
| Futures Contracts | 7,602 |
| Forward Currency Contracts | (38,738) |
| Foreign Currencies | 39,091 |
| Realized Net Gain (Loss) | 242,664 |
| Change in Unrealized Appreciation (Depreciation) | |
| Investment Securities2 | 241,739 |
| Futures Contracts | 276 |
| Forward Currency Contracts | (2,229) |
| Foreign Currencies | (76) |
| Change in Unrealized Appreciation (Depreciation) | 239,710 |
| Net Increase (Decrease) in Net Assets Resulting from Operations | 537,134 |
| 1 | Dividends are net of foreign withholding taxes of $4,728,000. |
| 2 | Interest income, realized net gain (loss), and change in unrealized appreciation (depreciation) from an affiliated company of the fund were $7,000, $0, and less than $1,000, respectively. Purchases and sales are for temporary cash investment purposes. |
See accompanying Notes, which are an integral part of the Financial Statements.
Global Minimum Volatility Fund
Statement of Changes in Net Assets
|
| | Year Ended October 31, |
| | 2021
($000) | 2020
($000) |
| | | |
| Increase (Decrease) in Net Assets | | |
| Operations | | |
| Net Investment Income | 54,760 | 83,228 |
| Realized Net Gain (Loss) | 242,664 | (321,050) |
| Change in Unrealized Appreciation (Depreciation) | 239,710 | (178,594) |
| Net Increase (Decrease) in Net Assets Resulting from Operations | 537,134 | (416,416) |
| Distributions | | |
| Investor Shares | (6,959) | (29,323) |
| Admiral Shares | (62,342) | (162,618) |
| Total Distributions | (69,301) | (191,941) |
| Capital Share Transactions | | |
| Investor Shares | (87,211) | (211,512) |
| Admiral Shares | (793,086) | (143,818) |
| Net Increase (Decrease) from Capital Share Transactions | (880,297) | (355,330) |
| Total Increase (Decrease) | (412,464) | (963,687) |
| Net Assets | | |
| Beginning of Period | 3,162,307 | 4,125,994 |
| End of Period | 2,749,843 | 3,162,307 |
See accompanying Notes, which are an integral part of the Financial Statements.
Global Minimum Volatility Fund
| Investor Shares | | | | | |
For a Share Outstanding
Throughout Each Period | Year Ended October 31, |
| 2021 | 2020 | 2019 | 2018 | 2017 |
| Net Asset Value, Beginning of Period | $12.77 | $14.71 | $13.78 | $13.57 | $11.92 |
| Investment Operations | | | | | |
| Net Investment Income1 | .252 | .293 | .428 | .374 | .324 |
| Net Realized and Unrealized Gain (Loss) on Investments | 2.085 | (1.571) | 1.403 | .148 | 1.650 |
| Total from Investment Operations | 2.337 | (1.278) | 1.831 | .522 | 1.974 |
| Distributions | | | | | |
| Dividends from Net Investment Income | (.277) | (.397) | (.300) | (.312) | (.324) |
| Distributions from Realized Capital Gains | — | (.265) | (.601) | — | — |
| Total Distributions | (.277) | (.662) | (.901) | (.312) | (.324) |
| Net Asset Value, End of Period | $14.83 | $12.77 | $14.71 | $13.78 | $13.57 |
| Total Return2 | 18.51% | -9.22% | 14.41% | 3.89% | 16.93% |
| Ratios/Supplemental Data | | | | | |
| Net Assets, End of Period (Millions) | $301 | $338 | $643 | $515 | $539 |
| Ratio of Total Expenses to Average Net Assets | 0.21% | 0.21% | 0.21% | 0.23% | 0.25% |
| Ratio of Net Investment Income to Average Net Assets | 1.77% | 2.16% | 3.09% | 2.66% | 2.54% |
| Portfolio Turnover Rate | 24% | 58% | 46% | 24% | 37% |
| 1 | Calculated based on average shares outstanding. |
| 2 | Total returns do not include account service fees that may have applied in the periods shown. Fund prospectuses provide information about any applicable account service fees. |
See accompanying Notes, which are an integral part of the Financial Statements.
Global Minimum Volatility Fund
| Admiral Shares | | | | | |
For a Share Outstanding
Throughout Each Period | Year Ended October 31, |
| 2021 | 2020 | 2019 | 2018 | 2017 |
| Net Asset Value, Beginning of Period | $25.56 | $29.45 | $27.58 | $27.15 | $23.86 |
| Investment Operations | | | | | |
| Net Investment Income1 | .520 | .608 | .878 | .758 | .668 |
| Net Realized and Unrealized Gain (Loss) on Investments | 4.177 | (3.155) | 2.819 | .297 | 3.295 |
| Total from Investment Operations | 4.697 | (2.547) | 3.697 | 1.055 | 3.963 |
| Distributions | | | | | |
| Dividends from Net Investment Income | (.587) | (.812) | (.624) | (.625) | (.673) |
| Distributions from Realized Capital Gains | — | (.531) | (1.203) | — | — |
| Total Distributions | (.587) | (1.343) | (1.827) | (.625) | (.673) |
| Net Asset Value, End of Period | $29.67 | $25.56 | $29.45 | $27.58 | $27.15 |
| Total Return2 | 18.60% | -9.18% | 14.54% | 3.93% | 16.99% |
| Ratios/Supplemental Data | | | | | |
| Net Assets, End of Period (Millions) | $2,449 | $2,824 | $3,483 | $2,542 | $1,699 |
| Ratio of Total Expenses to Average Net Assets | 0.14% | 0.14% | 0.14% | 0.15% | 0.17% |
| Ratio of Net Investment Income to Average Net Assets | 1.83% | 2.26% | 3.16% | 2.74% | 2.62% |
| Portfolio Turnover Rate | 24% | 58% | 46% | 24% | 37% |
| 1 | Calculated based on average shares outstanding. |
| 2 | Total returns do not include account service fees that may have applied in the periods shown. Fund prospectuses provide information about any applicable account service fees. |
See accompanying Notes, which are an integral part of the Financial Statements.
Global Minimum Volatility Fund
Notes to Financial Statements
Vanguard Global Minimum Volatility Fund is registered under the Investment Company Act of 1940 as an open-end investment company, or mutual fund. The fund offers two classes of shares: Investor Shares and Admiral Shares. Each of the share classes has different eligibility and minimum purchase requirements, and is designed for different types of investors.
The fund invests in securities of foreign issuers, which may subject it to investment risks not normally associated with investing in securities of U.S. corporations. To minimize the currency risk and volatility associated with investment in securities denominated in currencies other than the U.S. dollar, the fund attempts to hedge its currency exposure. Market disruptions associated with the COVID-19 pandemic have had a global impact, and uncertainty exists as to the long-term implications. Such disruptions can adversely affect assets of the fund and thus fund performance.
| A. | The following significant accounting policies conform to generally accepted accounting principles for U.S. investment companies. The fund consistently follows such policies in preparing its financial statements. |
1. Security Valuation: Securities are valued as of the close of trading on the New York Stock Exchange (generally 4 p.m., Eastern time) on the valuation date. Equity securities are valued at the latest quoted sales prices or official closing prices taken from the primary market in which each security trades; such securities not traded on the valuation date are valued at the mean of the latest quoted bid and asked prices. Securities for which market quotations are not readily available, or whose values have been affected by events occurring before the fund’s pricing time but after the close of the securities’ primary markets, are valued at their fair values calculated according to procedures adopted by the board of trustees. These procedures include obtaining quotations from an independent pricing service, monitoring news to identify significant market- or security-specific events, and evaluating changes in the values of foreign market proxies (for example, ADRs, futures contracts, or exchange-traded funds), between the time the foreign markets close and the fund’s pricing time. When fair-value pricing is employed, the prices of securities used by a fund to calculate its net asset value may differ from quoted or published prices for the same securities.
Investments in Vanguard Market Liquidity Fund are valued at that fund's net asset value.
2. Foreign Currency: Securities and other assets and liabilities denominated in foreign currencies are translated into U.S. dollars using exchange rates obtained from an independent third party as of the fund’s pricing time on the valuation date. Realized gains (losses) and unrealized appreciation (depreciation) on investment securities include the effects of changes in exchange rates since the securities were purchased, combined with the effects of changes in security prices. Fluctuations in the value of other assets and liabilities resulting from changes in exchange rates are recorded as unrealized foreign currency gains (losses) until the assets or liabilities are settled in cash, at which time they are recorded as realized foreign currency gains (losses).
3. Futures Contracts: The fund uses index futures contracts to a limited extent, with the objective of maintaining full exposure to the stock market while maintaining liquidity. The fund may purchase or sell futures contracts to achieve a desired level of investment, whether to accommodate portfolio turnover or cash flows from capital share transactions. The primary risks associated with the use of futures contracts are imperfect correlation between changes in market values of stocks held by the fund and the prices of futures contracts, and the possibility of an illiquid market. Counterparty risk involving futures is mitigated because a regulated clearinghouse is the counterparty instead of the clearing broker. To further mitigate counterparty risk, the fund trades futures contracts on an exchange, monitors the financial strength of its clearing brokers and
Global Minimum Volatility Fund
clearinghouse, and has entered into clearing agreements with its clearing brokers. The clearinghouse imposes initial margin requirements to secure the fund’s performance and requires daily settlement of variation margin representing changes in the market value of each contract. Any securities pledged as initial margin for open contracts are noted in the Schedule of Investments.
Futures contracts are valued at their quoted daily settlement prices. The notional amounts of the contracts are not recorded in the Statement of Assets and Liabilities. Fluctuations in the value of the contracts are recorded in the Statement of Assets and Liabilities as an asset (liability) and in the Statement of Operations as unrealized appreciation (depreciation) until the contracts are closed, when they are recorded as realized gains (losses) on futures contracts.
During the year ended October 31, 2021, the fund’s average investments in long and short futures contracts represented 1% and 0% of net assets, respectively, based on the average of the notional amounts at each quarter-end during the period.
4. Forward Currency Contracts: The fund enters into forward currency contracts to protect the value of securities and related receivables and payables against changes in future foreign exchange rates. The fund’s risks in using these contracts include movement in the values of the foreign currencies relative to the U.S. dollar and the ability of the counterparties to fulfill their obligations under the contracts. The fund mitigates its counterparty risk by entering into forward currency contracts only with a diverse group of prequalified counterparties, monitoring their financial strength, entering into master netting arrangements with its counterparties, and requiring its counterparties to transfer collateral as security for their performance. In the absence of a default, the collateral pledged or received by the fund cannot be repledged, resold, or rehypothecated. The master netting arrangements provide that, in the event of a counterparty’s default (including bankruptcy), the fund may terminate the forward currency contracts, determine the net amount owed by either party in accordance with its master netting arrangements, and sell or retain any collateral held up to the net amount owed to the fund under the master netting arrangements. The forward currency contracts contain provisions whereby a counterparty may terminate open contracts if the fund’s net assets decline below a certain level, triggering a payment by the fund if the fund is in a net liability position at the time of the termination. The payment amount would be reduced by any collateral the fund has pledged. Any securities pledged as collateral for open contracts are noted in the Schedule of Investments. The value of collateral received or pledged is compared daily to the value of the forward currency contracts exposure with each counterparty, and any difference, if in excess of a specified minimum transfer amount, is adjusted and settled within two business days.
Forward currency contracts are valued at their quoted daily prices obtained from an independent third party, adjusted for currency risk based on the expiration date of each contract. The notional amounts of the contracts are not recorded in the Statement of Assets and Liabilities. Fluctuations in the value of the contracts are recorded in the Statement of Assets and Liabilities as an asset (liability) and in the Statement of Operations as unrealized appreciation (depreciation) until the contracts are closed, when they are recorded as realized gains (losses) on forward currency contracts.
During the year ended October 31, 2021, the fund’s average investment in forward currency contracts represented 48% of net assets, based on the average of the notional amounts at each quarter-end during the period.
Global Minimum Volatility Fund
5. Federal Income Taxes: The fund intends to continue to qualify as a regulated investment company and distribute all of its taxable income. The fund’s tax returns are open to examination by the relevant tax authorities until expiration of the applicable statute of limitations, which is generally three years after the filing of the tax return. Management has analyzed the fund’s tax positions taken for all open federal and state income tax years, and has concluded that no provision for income tax is required in the fund’s financial statements.
6. Distributions: Distributions to shareholders are recorded on the ex-dividend date. Distributions are determined on a tax basis at the fiscal year-end and may differ from net investment income and realized capital gains for financial reporting purposes.
7. Securities Lending: To earn additional income, the fund lends its securities to qualified institutional borrowers. Security loans are subject to termination by the fund at any time, and are required to be secured at all times by collateral in an amount at least equal to the market value of securities loaned. Daily market fluctuations could cause the value of loaned securities to be more or less than the value of the collateral received. When this occurs, the collateral is adjusted and settled before the opening of the market on the next business day. The fund further mitigates its counterparty risk by entering into securities lending transactions only with a diverse group of prequalified counterparties, monitoring their financial strength, and entering into master securities lending agreements with its counterparties. The master securities lending agreements provide that, in the event of a counterparty’s default (including bankruptcy), the fund may terminate any loans with that borrower, determine the net amount owed, and sell or retain the collateral up to the net amount owed to the fund; however, such actions may be subject to legal proceedings. While collateral mitigates counterparty risk, in the event of a default, the fund may experience delays and costs in recovering the securities loaned. The fund invests cash collateral received in Vanguard Market Liquidity Fund, and records a liability in the Statement of Assets and Liabilities for the return of the collateral, during the period the securities are on loan. Collateral investments in Vanguard Market Liquidity Fund are subject to market appreciation or depreciation. Securities lending income represents fees charged to borrowers plus income earned on invested cash collateral, less expenses associated with the loan. During the term of the loan, the fund is entitled to all distributions made on or in respect of the loaned securities.
8. Credit Facilities and Interfund Lending Program: The fund and certain other funds managed by The Vanguard Group ("Vanguard") participate in a $4.3 billion committed credit facility provided by a syndicate of lenders pursuant to a credit agreement and an uncommitted credit facility provided by Vanguard. Both facilities may be renewed annually. Each fund is individually liable for its borrowings, if any, under the credit facilities. Borrowings may be utilized for temporary or emergency purposes, subject to the fund’s regulatory and contractual borrowing restrictions. With respect to the committed credit facility, the participating funds are charged administrative fees and an annual commitment fee of 0.10% of the undrawn committed amount of the facility; these fees are allocated to the funds based on a method approved by the fund’s board of trustees and included in Management and Administrative expenses on the fund’s Statement of Operations. Any borrowings under either facility bear interest at a rate based upon the higher of the one-month London Interbank Offered Rate (or an acceptable alternate rate, if necessary), federal funds effective rate, or overnight bank funding rate plus an agreed-upon spread, except that borrowings under the uncommitted credit facility may bear interest based upon an alternate rate agreed to by the fund and Vanguard.
In accordance with an exemptive order (the “Order”) from the SEC, the fund may participate in a joint lending and borrowing program that allows registered open-end Vanguard funds to borrow
Global Minimum Volatility Fund
money from and lend money to each other for temporary or emergency purposes (the “Interfund Lending Program”), subject to compliance with the terms and conditions of the Order, and to the extent permitted by the fund’s investment objective and investment policies. Interfund loans and borrowings normally extend overnight, but can have a maximum duration of seven days. Loans may be called on one business day’s notice. The interest rate to be charged is governed by the conditions of the Order and internal procedures adopted by the board of trustees. The board of trustees is responsible for overseeing the Interfund Lending Program.
For the year ended October 31, 2021, the fund did not utilize the credit facilities or the Interfund Lending Program.
9. Other: Dividend income is recorded on the ex-dividend date. Non-cash dividends included in income, if any, are recorded at the fair value of the securities received. Interest income includes income distributions received from Vanguard Market Liquidity Fund and is accrued daily. Security transactions are accounted for on the date securities are bought or sold. Costs used to determine realized gains (losses) on the sale of investment securities are those of the specific securities sold.
Taxes on foreign dividends and capital gains have been provided for in accordance with the fund's understanding of the applicable countries' tax rules and rates. Deferred foreign capital gains tax, if any, is accrued daily based upon net unrealized gains. The fund has filed tax reclaims for previously withheld taxes on dividends earned in certain European Union countries. These filings are subject to various administrative and judicial proceedings within these countries. Such tax reclaims received during the year, if any, are included in dividend income. No other amounts for additional tax reclaims are reflected in the financial statements due to the uncertainty as to the ultimate resolution of proceedings, the likelihood of receipt of these reclaims, and the potential timing of payment.
Each class of shares has equal rights as to assets and earnings, except that each class separately bears certain class-specific expenses related to maintenance of shareholder accounts (included in Management and Administrative expenses) and shareholder reporting. Marketing and distribution expenses are allocated to each class of shares based on a method approved by the board of trustees. Income, other non-class-specific expenses, and gains and losses on investments are allocated to each class of shares based on its relative net assets.
| B. | In accordance with the terms of a Funds' Service Agreement (the “FSA”) between Vanguard and the fund, Vanguard furnishes to the fund investment advisory, corporate management, administrative, marketing, and distribution services at Vanguard’s cost of operations (as defined by the FSA). These costs of operations are allocated to the fund based on methods and guidelines approved by the board of trustees and are generally settled twice a month. |
Upon the request of Vanguard, the fund may invest up to 0.40% of its net assets as capital in Vanguard. At October 31, 2021, the fund had contributed to Vanguard capital in the amount of $92,000, representing less than 0.01% of the fund’s net assets and 0.04% of Vanguard’s capital received pursuant to the FSA. The fund’s trustees and officers are also directors and employees, respectively, of Vanguard.
| C. | Various inputs may be used to determine the value of the fund’s investments and derivatives. These inputs are summarized in three broad levels for financial statement purposes. The inputs or methodologies used to value securities are not necessarily an indication of the risk associated with investing in those securities. |
Global Minimum Volatility Fund
Level 1—Quoted prices in active markets for identical securities.
Level 2—Other significant observable inputs (including quoted prices for similar securities, interest rates, prepayment speeds, credit risk, etc.).
Level 3—Significant unobservable inputs (including the fund’s own assumptions used to determine the fair value of investments). Any investments and derivatives valued with significant unobservable inputs are noted on the Schedule of Investments.
The following table summarizes the market value of the fund’s investments and derivatives as of October 31, 2021, based on the inputs used to value them:
| | Level 1
($000) | Level 2
($000) | Level 3
($000) | Total
($000) |
| Investments | | | | |
| Assets | | | | |
| Common Stocks—International | 279,942 | 940,928 | — | 1,220,870 |
| Common Stocks—United States | 1,508,201 | — | — | 1,508,201 |
| Temporary Cash Investments | 72,759 | — | — | 72,759 |
| Total | 1,860,902 | 940,928 | — | 2,801,830 |
| Derivative Financial Instruments | | | | |
| Assets | | | | |
| Futures Contracts1 | 73 | — | — | 73 |
| Forward Currency Contracts | — | 7,231 | — | 7,231 |
| Total | 73 | 7,231 | — | 7,304 |
| Liabilities | | | | |
| Futures Contracts1 | 55 | — | — | 55 |
| Forward Currency Contracts | — | 9,735 | — | 9,735 |
| Total | 55 | 9,735 | — | 9,790 |
| 1 | Includes cumulative appreciation (depreciation) on futures contracts and centrally cleared swaps, if any, as reported in the Schedule of Investments. Only current day’s variation margin is reported within the Statement of Assets and Liabilities. |
Global Minimum Volatility Fund
D.At October 31, 2021, the fair values of derivatives were reflected in the Statement of Assets and Liabilities as follows:
| Statement of Assets and Liabilities | Equity
Contracts
($000) | Foreign
Exchange
Contracts
($000) | Total
($000) |
| Unrealized Appreciation—Futures Contracts1 | 73 | — | 73 |
| Unrealized Appreciation—Forward Currency Contracts | — | 7,231 | 7,231 |
| Total Assets | 73 | 7,231 | 7,304 |
| | | | |
| Unrealized Depreciation—Futures Contracts1 | 55 | — | 55 |
| Unrealized Depreciation—Forward Currency Contracts | — | 9,735 | 9,735 |
| Total Liabilities | 55 | 9,735 | 9,790 |
| 1 | Includes cumulative appreciation (depreciation) on futures contracts and centrally cleared swaps, if any, as reported in the Schedule of Investments. Only current day’s variation margin is reported within the Statement of Assets and Liabilities. |
Realized net gain (loss) and the change in unrealized appreciation (depreciation) on derivatives for the year ended October 31, 2021, were:
| Realized Net Gain (Loss) on Derivatives | Equity
Contracts
($000) | Foreign
Exchange
Contracts
($000) | Total
($000) |
| Futures Contracts | 7,602 | — | 7,602 |
| Forward Currency Contracts | — | (38,738) | (38,738) |
| Realized Net Gain (Loss) on Derivatives | 7,602 | (38,738) | (31,136) |
| Change in Unrealized Appreciation (Depreciation) on Derivatives |
| Futures Contracts | 276 | — | 276 |
| Forward Currency Contracts | — | (2,229) | (2,229) |
| Change in Unrealized Appreciation (Depreciation) on Derivatives | 276 | (2,229) | (1,953) |
| E. | Permanent differences between book-basis and tax-basis components of net assets are reclassified among capital accounts in the financial statements to reflect their tax character. These reclassifications have no effect on net assets or net asset value per share. As of period end, permanent differences primarily attributable to the accounting for foreign currency transactions and passive foreign investment companies were reclassified between the individual components of total distributable earnings (loss). |
Temporary differences between book-basis and tax-basis components of total distributable earnings (loss) arise when certain items of income, gain, or loss are recognized in different periods for financial statement and tax purposes; these differences will reverse at some time in the future. The differences are primarily related to the deferral of losses from wash sales; the recognition of unrealized gains or losses from certain derivative contracts; and the recognition of unrealized gains
Global Minimum Volatility Fund
from passive foreign investment companies. As of period end, the tax-basis components of total distributable earnings (loss) are detailed in the table as follows:
| | Amount
($000) |
| Undistributed Ordinary Income | 82,128 |
| Undistributed Long-Term Gains | — |
| Capital Loss Carryforwards | (82,638) |
| Qualified Late-Year Losses | — |
| Net Unrealized Gains (Losses) | 483,719 |
The tax character of distributions paid was as follows:
| | Year Ended October 31, |
| | 2021
Amount
($000) | 2020
Amount
($000) |
| Ordinary Income* | 69,301 | 115,986 |
| Long-Term Capital Gains | — | 75,955 |
| Total | 69,301 | 191,941 |
| * | Includes short-term capital gains, if any. |
As of October 31, 2021, gross unrealized appreciation and depreciation for investments and derivatives based on cost for U.S. federal income tax purposes were as follows:
| | Amount
($000) |
| Tax Cost | 2,317,877 |
| Gross Unrealized Appreciation | 582,582 |
| Gross Unrealized Depreciation | (98,908) |
| Net Unrealized Appreciation (Depreciation) | 483,674 |
| F. | During the year ended October 31, 2021, the fund purchased $706,983,000 of investment securities and sold $1,587,969,000 of investment securities, other than temporary cash investments. |
The fund purchased securities from and sold securities to other Vanguard funds or accounts managed by Vanguard or its affiliates, in accordance with procedures adopted by the board of trustees in compliance with Rule 17a-7 of the Investment Company Act of 1940. For the year ended October 31, 2021, such purchases were $0 and sales were $1,425,000, resulting in net realized gain of $141,000; these amounts, other than temporary cash investments, are included in the purchases and sales of investment securities noted above.
Global Minimum Volatility Fund
| G. | Capital share transactions for each class of shares were: |
| | Year Ended October 31, | |
| | 2021 | | 2020 |
| | Amount
($000) | Shares
(000) | | Amount
($000) | Shares
(000) |
| Investor Shares | | | | | |
| Issued | 49,143 | 3,454 | | 140,652 | 10,097 |
| Issued in Lieu of Cash Distributions | 6,352 | 470 | | 27,070 | 1,872 |
| Redeemed | (142,706) | (10,122) | | (379,234) | (29,187) |
| Net Increase (Decrease)—Investor Shares | (87,211) | (6,198) | | (211,512) | (17,218) |
| Admiral Shares | | | | | |
| Issued | 439,983 | 15,585 | | 1,114,310 | 41,948 |
| Issued in Lieu of Cash Distributions | 55,463 | 2,050 | | 143,670 | 4,966 |
| Redeemed | (1,288,532) | (45,588) | | (1,401,798) | (54,668) |
| Net Increase (Decrease)—Admiral Shares | (793,086) | (27,953) | | (143,818) | (7,754) |
| H. | Management has determined that no events or transactions occurred subsequent to October 31, 2021, that would require recognition or disclosure in these financial statements. |
Report of Independent Registered Public Accounting Firm
To the Board of Trustees of Vanguard Whitehall Funds and Shareholders of Vanguard Global Minimum Volatility Fund
Opinion on the Financial Statements
We have audited the accompanying statement of assets and liabilities, including the schedule of investments, of Vanguard Global Minimum Volatility Fund (one of the funds constituting Vanguard Whitehall Funds, referred to hereafter as the "Fund") as of October 31, 2021, the related statement of operations for the year ended October 31, 2021, the statement of changes in net assets for each of the two years in the period ended October 31, 2021, including the related notes, and the financial highlights for each of the five years in the period ended October 31, 2021 (collectively referred to as the "financial statements"). In our opinion, the financial statements present fairly, in all material respects, the financial position of the Fund as of October 31, 2021, the results of its operations for the year then ended, the changes in its net assets for each of the two years in the period ended October 31, 2021 and the financial highlights for each of the five years in the period ended October 31, 2021 in conformity with accounting principles generally accepted in the United States of America.
Basis for Opinion
These financial statements are the responsibility of the Fund’s management. Our responsibility is to express an opinion on the Fund’s financial statements based on our audits. We are a public accounting firm registered with the Public Company Accounting Oversight Board (United States) (PCAOB) and are required to be independent with respect to the Fund in accordance with the U.S. federal securities laws and the applicable rules and regulations of the Securities and Exchange Commission and the PCAOB.
We conducted our audits of these financial statements in accordance with the standards of the PCAOB. Those standards require that we plan and perform the audit to obtain reasonable assurance about whether the financial statements are free of material misstatement, whether due to error or fraud.
Our audits included performing procedures to assess the risks of material misstatement of the financial statements, whether due to error or fraud, and performing procedures that respond to those risks. Such procedures included examining, on a test basis, evidence regarding the amounts and disclosures in the financial statements. Our audits also included evaluating the accounting principles used and significant estimates made by management, as well as evaluating the overall presentation of the financial statements. Our procedures included confirmation of securities owned as of October 31, 2021 by correspondence with the custodian, transfer agent and brokers; when replies were not received from the transfer agent or brokers, we performed other auditing procedures. We believe that our audits provide a reasonable basis for our opinion.
/s/PricewaterhouseCoopers LLP
Philadelphia, Pennsylvania
December 17, 2021
We have served as the auditor of one or more investment companies in The Vanguard Group of Funds since 1975.
Special 2021 tax information (unaudited) for Vanguard Global Minimum Volatility Fund
This information for the fiscal year ended October 31, 2021, is included pursuant to provisions of the Internal Revenue Code.
The fund distributed $62,896,000 of qualified dividend income to shareholders during the fiscal year.
The fund distributed $6,403,000 of qualified business income to shareholders during the fiscal year.
For corporate shareholders, 28.1% of investment income (dividend income plus short-term gains, if any) qualifies for the dividends-received deduction.
This page intentionally left blank.
The People Who Govern Your Fund
The trustees of your mutual fund are there to see that the fund is operated and managed in your best interests since, as a shareholder, you are a part owner of the fund. Your fund’s trustees also serve on the board of directors of The Vanguard Group, Inc., which is owned by the Vanguard funds and provides services to them.
A majority of Vanguard’s board members are independent, meaning that they have no affiliation with Vanguard or the funds they oversee, apart from the sizable personal investments they have made as private individuals. The independent board members have distinguished backgrounds in business, academia, and public service. Each of the trustees and executive officers oversees 214 Vanguard funds.
Information for each trustee and executive officer of the fund appears below. That information, as well as the Vanguard fund count, is as of the date on the cover of this fund report. The mailing address of the trustees and officers is P.O. Box 876, Valley Forge, PA 19482. More information about the trustees is in the Statement of Additional Information, which can be obtained, without charge, by contacting Vanguard at 800-662-7447, or online at vanguard.com.
Interested Trustee1
Mortimer J. Buckley
Born in 1969. Trustee since January 2018. Principal occupation(s) during the past five years and other experience: chairman of the board (2019–present) of Vanguard and of each of the investment companies served by Vanguard; chief executive officer (2018–present) of Vanguard; chief executive officer, president, and trustee (2018–present) of each of the investment companies served by Vanguard; president and director (2017–present) of Vanguard; and president (2018–present) of Vanguard Marketing Corporation. Chief investment officer (2013–2017), managing director (2002–2017), head of the Retail Investor Group (2006–2012), and chief information officer (2001–2006) of Vanguard. Chairman of the board (2011–2017) and trustee (2009–2017) of the Children’s Hospital of Philadelphia; and trustee (2018–present) and vice chair (2019–present) of The Shipley School.
Independent Trustees
Emerson U. Fullwood
Born in 1948. Trustee since January 2008. Principal occupation(s) during the past five years and other experience: executive chief staff and marketing officer for North America and corporate vice president (retired 2008) of Xerox Corporation (document management products and services). Former president of the Worldwide Channels Group, Latin
America, and Worldwide Customer Service and executive chief staff officer of Developing Markets of Xerox. Executive in residence and 2009–2010 Distinguished Minett Professor at the Rochester Institute of Technology. Director of SPX FLOW, Inc. (multi-industry manufacturing). Director of the University of Rochester Medical Center, the Monroe Community College Foundation, the United Way of Rochester, North Carolina A&T University, and Roberts Wesleyan College. Trustee of the University of Rochester.
Amy Gutmann
Born in 1949. Trustee since June 2006. Principal occupation(s) during the past five years and other experience: president (2004–present) of the University of Pennsylvania. Christopher H. Browne Distinguished Professor of Political Science, School of Arts and Sciences, and professor of communication, Annenberg School for Communication, with secondary faculty appointments in the Department of Philosophy, School of Arts and Sciences, and at the Graduate School of Education, University of Pennsylvania.
F. Joseph Loughrey
Born in 1949. Trustee since October 2009. Principal occupation(s) during the past five years and other experience: president and chief operating officer (retired 2009) and vice chairman of the board (2008–2009) of Cummins Inc. (industrial machinery). Chairman of the board of Hillenbrand, Inc. (specialized consumer services). Director of the V Foundation.
1 Mr. Buckley is considered an “interested person,” as defined in the Investment Company Act of 1940, because he is an officer of the Vanguard funds.
Member of the advisory council for the College of Arts and Letters and chair of the advisory board to the Kellogg Institute for International Studies, both at the University of Notre Dame. Chairman of the board of Saint Anselm College.
Mark Loughridge
Born in 1953. Trustee since March 2012. Principal occupation(s) during the past five years and other experience: senior vice president and chief financial officer (retired 2013) of IBM (information technology services). Fiduciary member of IBM’s Retirement Plan Committee (2004–2013), senior vice president and general manager (2002–2004) of IBM Global Financing, vice president and controller (1998–2002) of IBM, and a variety of other prior management roles at IBM. Member of the Council on Chicago Booth.
Scott C. Malpass
Born in 1962. Trustee since March 2012. Principal occupation(s) during the past five years and other experience: chief investment officer (retired June 2020) and vice president (retired June 2020) of the University of Notre Dame. Assistant professor (retired June 2020) of finance at the Mendoza College of Business, University of Notre Dame, and member of the Notre Dame 403(b) Investment Committee. Member of the board of Catholic Investment Services, Inc. (investment advisors) and the board of superintendence of the Institute for the Works of Religion.
Deanna Mulligan
Born in 1963. Trustee since January 2018. Principal occupation(s) during the past five years and other experience: board chair (2020), chief executive officer (2011–2020), and president (2010–2019) of The Guardian Life Insurance Company of America. Chief operating officer (2010–2011) and executive vice president (2008–2010) of Individual Life and Disability of the Guardian Life Insurance Company of America. Member of the board of the Economic Club of New York. Trustee of the Partnership for New York City (business leadership), Chief Executives for Corporate Purpose, NewYork-Presbyterian Hospital, and the Bruce Museum (arts and science). Member of the Advisory Council for the Stanford Graduate School of Business.
André F. Perold
Born in 1952. Trustee since December 2004. Principal occupation(s) during the past five years and other experience: George Gund Professor of Finance and Banking, Emeritus at the Harvard Business School (retired 2011). Chief investment officer and co-managing partner of HighVista Strategies (private investment firm). Member of the board
(2018–present) of RIT Capital Partners (investment firm). Member of the investment committee of Partners Health Care System.
Sarah Bloom Raskin
Born in 1961. Trustee since January 2018. Principal occupation(s) during the past five years and other experience: deputy secretary (2014–2017) of the United States Department of the Treasury. Governor (2010–2014) of the Federal Reserve Board. Commissioner (2007–2010) of financial regulation for the State of Maryland. Professor (2020–present), Distinguished Fellow of the Global Financial Markets Center (2020–present), and Rubenstein Fellow (2017–2020) at Duke University. Trustee (2017–present) of Amherst College and member of Amherst College Investment Committee (2019–present). Member of the Regenerative Crisis Response Committee (2020–present).
David A. Thomas
Born in 1956. Trustee since July 2021. Principal occupation(s) during the past five years and other experience: president of Morehouse College (2018–present). Professor of business administration, emeritus at Harvard University (2017–2018). Dean (2011–2016) and professor of management (2016–2017) at the Georgetown University McDonough School of Business. Director of DTE Energy Company (2013–present). Trustee of Common Fund (2019–present).
Peter F. Volanakis
Born in 1955. Trustee since July 2009. Principal occupation(s) during the past five years and other experience: president and chief operating officer (retired 2010) of Corning Incorporated (communications equipment) and director of Corning Incorporated (2000–2010) and Dow Corning (2001–2010). Director (2012) of SPX Corporation (multi-industry manufacturing). Overseer of the Amos Tuck School of Business Administration, Dartmouth College (2001–2013). Chairman of the board of trustees of Colby-Sawyer College. Member of the BMW Group Mobility Council.
Executive Officers
Christine M. Buchanan
Born in 1970. Principal occupation(s) during the past five years and other experience: principal of Vanguard. Chief financial officer (2021–present) and treasurer (2017–present) of each of the investment companies served by Vanguard. Partner (2005–2017) at KPMG (audit, tax, and advisory services).
David Cermak
Born in 1960. Principal occupation(s) during the past five years and other experience: principal of Vanguard. Finance director (2019–present) of each of the investment companies served by Vanguard. Managing director and head (2017–present) of Vanguard Investments Singapore. Managing director and head (2017–2019) of Vanguard Investments Hong Kong. Representative director and head (2014–2017) of Vanguard Investments Japan.
John Galloway
Born in 1973. Principal occupation(s) during the past five years and other experience: principal of Vanguard. Investment stewardship officer (September 2020–present) of each of the investment companies served by Vanguard. Head of Investor Advocacy (February 2020–present) and head of Marketing Strategy and Planning (2017–2020) at Vanguard. Deputy assistant to the President of the United States (2015).
Peter Mahoney
Born in 1974. Principal occupation(s) during the past five years and other experience: principal of Vanguard. Controller (2015–present) of each of the investment companies served by Vanguard. Head of International Fund Services (2008–2014) at Vanguard.
Anne E. Robinson
Born in 1970. Principal occupation(s) during the past five years and other experience: general counsel (2016–present) of Vanguard. Secretary (2016–present) of Vanguard and of each of the investment companies served by Vanguard. Managing director (2016–present) of Vanguard. Managing director and general counsel of Global Cards and Consumer Services (2014–2016) at Citigroup. Counsel (2003–2014) at American Express.
Michael Rollings
Born in 1963. Principal occupation(s) during the past five years and other experience: finance director (2017–present) and treasurer (2017) of each of the investment companies served by Vanguard. Managing director (2016–present) of Vanguard. Chief financial officer (2016–present) of Vanguard. Director (2016–present) of Vanguard Marketing Corporation. Executive vice president and chief financial officer (2006–2016) of MassMutual Financial Group.
John E. Schadl
Born in 1972. Principal occupation(s) during the past five years and other experience: principal of Vanguard. Chief compliance officer (2019–present) of Vanguard and of each of the investment companies served by Vanguard. Assistant vice president (2019–present) of Vanguard Marketing Corporation.
Vanguard Senior Management Team
| Matthew Benchener | Thomas M. Rampulla |
| Joseph Brennan | Karin A. Risi |
| Mortimer J. Buckley | Anne E. Robinson |
| Gregory Davis | Michael Rollings |
| John James | Nitin Tandon |
| John T. Marcante | Lauren Valente |
| Chris D. Mclsaac | |
Connect with Vanguard®>vanguard.com
Fund Information > 800-662-7447
Direct Investor Account Services > 800-662-2739
Institutional Investor Services > 800-523-1036
Text Telephone for People Who Are Deaf or Hard of Hearing > 800-749-7273
This material may be used in conjunction with the offering of shares of any Vanguard fund only if preceded or accompanied by the fund’s current prospectus.
All comparative mutual fund data are from Morningstar, Inc., unless otherwise noted.
You can obtain a free copy of Vanguard’s proxy voting guidelines by visiting vanguard.com/proxyreporting or by calling Vanguard at 800-662-2739. The guidelines are also available from the SEC’s website, www.sec.gov. In addition, you may obtain a free report on how your fund voted the proxies for securities it owned during the 12 months ended June 30. To get the report, visit either vanguard.com/proxyreporting or www.sec.gov.
You can review information about your fund on the SEC’s website, and you can receive copies of this information, for a fee, by sending a request via email addressed to publicinfo@sec.gov.
Source for Bloomberg indexes: Bloomberg Index Services Limited. Copyright 2021, Bloomberg. All rights reserved.
© 2021 The Vanguard Group, Inc.
All rights reserved.
Vanguard Marketing Corporation, Distributor.
Q11940 122021
Annual Report | October 31, 2021
Vanguard International Dividend Index Funds
| Vanguard International Dividend Appreciation Index Fund |
| Vanguard International High Dividend Yield Index Fund |
Contents
Your Fund’s Performance at a Glance
| 1 |
About Your Fund’s Expenses
| 2 |
International Dividend Appreciation Index Fund
| 4 |
International High Dividend Yield Index Fund
| 28 |
Please note: The opinions expressed in this report are just that—informed opinions. They should not be considered promises or advice. Also, please keep in mind that the information and opinions cover the period through the date on the front of this report. Of course, the risks of investing in your fund are spelled out in the prospectus.
Your Fund’s Performance at a Glance
| • | For the 12 months ended October 31, 2021, Vanguard International Dividend Appreciation Index returned 29.93% for ETF Shares (based on net asset value) and 29.31% for Admiral Shares. Vanguard International High Dividend Yield Index Fund returned 39.55% for ETF Shares and 38.91% for Admiral Shares. |
| • | The funds returned less than their benchmarks in part because of differences in the prices of securities used by the funds to calculate their net asset value and the quoted or published prices for the same securities.1 Differences in the way the indexes and the funds treat certain capital gains also played a role. |
| • | Of the major regional sectors, Europe was the biggest contributor to returns for both funds. |
| • | All 10 industry sectors recorded positive returns for the fiscal year. Industrial stocks contributed most to returns for the International Dividend Appreciation Index Fund. In the International High Dividend Yield Index Fund, financial stocks had the largest sector weighting and made the largest contribution to performance. |
Market Barometer
| | Average Annual Total Returns
Periods Ended October 31, 2021 |
| | One Year | Three Years | Five Years |
| Stocks | | | |
| Russell 1000 Index (Large-caps) | 43.51% | 22.01% | 19.16% |
| Russell 2000 Index (Small-caps) | 50.80 | 16.47 | 15.52 |
| Russell 3000 Index (Broad U.S. market) | 43.90 | 21.62 | 18.91 |
| FTSE All-World ex US Index (International) | 30.23 | 12.42 | 10.05 |
| Bonds | | | |
Bloomberg U.S. Aggregate Bond Index
(Broad taxable market) | -0.48% | 5.63% | 3.10% |
Bloomberg Municipal Bond Index
(Broad tax-exempt market) | 2.64 | 5.17 | 3.41 |
| FTSE Three-Month U.S. Treasury Bill Index | 0.05 | 1.08 | 1.12 |
| CPI | | | |
| Consumer Price Index | 6.22% | 3.03% | 2.73% |
Fund returns are adjusted to reflect the 0.25% fee on purchases and redemptions. The fees do not apply to the ETF Shares.
1 See Note A-1, “Security Valuation,” in the Notes to Financial Statements.
About Your Fund’s Expenses
As a shareholder of the fund, you incur ongoing costs, which include costs for portfolio management, administrative services, and shareholder reports (like this one), among others. Operating expenses, which are deducted from a fund’s gross income, directly reduce the investment return of the fund.
A fund’s expenses are expressed as a percentage of its average net assets. This figure is known as the expense ratio. The following examples are intended to help you understand the ongoing costs (in dollars) of investing in your fund and to compare these costs with those of other mutual funds. The examples are based on an investment of $1,000 made at the beginning of the period shown and held for the entire period.
The accompanying table illustrates your fund’s costs in two ways:
| • | Based on actual fund return. This section helps you to estimate the actual expenses that you paid over the period. The ”Ending Account Value“ shown is derived from the fund‘s actual return, and the third column shows the dollar amount that would have been paid by an investor who started with $1,000 in the fund. You may use the information here, together with the amount you invested, to estimate the expenses that you paid over the period. |
To do so, simply divide your account value by $1,000 (for example, an $8,600 account value divided by $1,000 = 8.6), then multiply the result by the number given for your fund under the heading ”Expenses Paid During Period.“
| • | Based on hypothetical 5% yearly return. This section is intended to help you compare your fund‘s costs with those of other mutual funds. It assumes that the fund had a yearly return of 5% before expenses, but that the expense ratio is unchanged. In this case—because the return used is not the fund’s actual return—the results do not apply to your investment. The example is useful in making comparisons because the Securities and Exchange Commission requires all mutual funds to calculate expenses based on a 5% return. You can assess your fund’s costs by comparing this hypothetical example with the hypothetical examples that appear in shareholder reports of other funds. |
Note that the expenses shown in the table are meant to highlight and help you compare ongoing costs only and do not reflect transaction costs incurred by the fund for buying and selling securities. Further, the expenses do not include any purchase, redemption, or account service fees described in the fund prospectus. If such fees were applied to your account, your costs would be higher. Your fund does not carry a “sales load.”
The calculations assume no shares were bought or sold during the period. Your actual costs may have been higher or lower, depending on the amount of your investment and the timing of any purchases or redemptions.
You can find more information about the fund’s expenses, including annual expense ratios, in the Financial Statements section of this report. For additional information on operating expenses and other shareholder costs, please refer to your fund’s current prospectus.
| Six Months Ended October 31, 2021 | | | |
| | Beginning
Account Value
4/30/2021 | Ending
Account Value
10/31/2021 | Expenses
Paid During
Period |
| Based on Actual Fund Return | | | |
| International Dividend Appreciation Index Fund | | | |
| ETF Shares | $1,000.00 | $1,070.30 | $0.63 |
| Admiral™ Shares | 1,000.00 | 1,070.30 | 0.73 |
| International High Dividend Yield Index Fund | | | |
| ETF Shares | $1,000.00 | $1,038.20 | $1.03 |
| Admiral Shares | 1,000.00 | 1,038.30 | 0.98 |
| Based on Hypothetical 5% Yearly Return | | | |
| International Dividend Appreciation Index Fund | | | |
| ETF Shares | $1,000.00 | $1,024.60 | $0.61 |
| Admiral Shares | 1,000.00 | 1,024.50 | 0.71 |
| International High Dividend Yield Index Fund | | | |
| ETF Shares | $1,000.00 | $1,024.20 | $1.02 |
| Admiral Shares | 1,000.00 | 1,024.25 | 0.97 |
The calculations are based on expenses incurred in the most recent six-month period. The funds' annualized six-month expense ratios for that period are: for the International Dividend Appreciation Index Fund, 0.12% for ETF Shares and 0.14% for Admiral Shares; and for the International High Dividend Yield Index Fund, 0.20% for ETF Shares and 0.19% for Admiral Shares. The dollar amounts shown as “Expenses Paid" are equal to the annualized expense ratio multiplied by the average account value over the period, multiplied by the number of days in the most recent six-month period, then divided by the number of days in the most recent 12-month period (184/365).
International Dividend Appreciation Index Fund
All of the returns in this report represent past performance, which is not a guarantee of future results that may be achieved by the fund. (Current performance may be lower or higher than the performance data cited. For performance data current to the most recent month-end, visit our website at vanguard.com/performance.) Note, too, that both investment returns and principal value can fluctuate widely, so an investor’s shares, when sold, could be worth more or less than their original cost. The returns shown do not reflect taxes that a shareholder would pay on fund distributions or on the sale of fund shares.
Cumulative Performance: February 25, 2016, Through October 31, 2021
Initial Investment of $10,000
| | | Average Annual Total Returns
Periods Ended October 31, 2021 | |
| | | One
Year | Five
Years | Since
Inception
(2/25/2016) | Final Value
of a $10,000
Investment |
 | International Dividend Appreciation Index Fund
ETF Shares Net Asset Value | 29.93% | 12.37% | 12.62% | $19,640 |
| | International Dividend Appreciation Index Fund ETF Shares Market Price | 30.07 | 12.36 | 12.68 | 19,704 |
 | Spliced S&P Global Ex-U.S. Dividend Growers Index | 30.70 | 12.61 | 12.98 | 20,003 |
“Since Inception” performance is calculated from the ETF Shares’ inception date for both the fund and its comparative standard(s).
Spliced S&P Global Ex-U.S. Dividend Growers Index: NASDAQ International Dividend Achievers Select Index through September 19, 2021; S&P Global Ex-U.S. Dividend Growers Index thereafter.
| | | | |
| | | One
Year | Five
Years | Since
Inception
(3/2/2016) | Final Value
of a $10,000
Investment |
International Dividend Appreciation Index Fund
Admiral Shares | 29.31% | 12.26% | 12.00% | $18,998 |
| Spliced S&P Global Ex-U.S. Dividend Growers Index | 30.70 | 12.61 | 12.43 | 19,417 |
“Since Inception” performance is calculated from the Admiral Shares’ inception date for both the fund and its comparative standard(s).
Vanguard fund returns are adjusted to reflect the 0.25% fee on purchases and redemptions. The fees do not apply to the ETF Shares.
See Financial Highlights for dividend and capital gains information.
International Dividend Appreciation Index Fund
Cumulative Returns of ETF Shares: February 25, 2016, Through October 31, 2021
| | One
Year | Five
Years | Since
Inception
(2/25/2016) |
| International Dividend Appreciation Index Fund ETF Shares Market Price | 30.07% | 79.08% | 97.04% |
| International Dividend Appreciation Index Fund ETF Shares Net Asset Value | 29.93 | 79.14 | 96.40 |
| Spliced S&P Global Ex-U.S. Dividend Growers Index | 30.70 | 81.07 | 100.03 |
"Since Inception" performance is calculated from the ETF Shares’ inception date for both the fund and its comparative standard(s).
For the ETF Shares, the market price is determined by the midpoint of the bid-offer spread as of the closing time of the New York Stock Exchange (generally 4 p.m., Eastern time). The net asset value is also determined as of the NYSE closing time. For more information about how the ETF Shares' market prices have compared with their net asset value, visit vanguard.com, select your ETF, and then select the Price and Performance tab. The ETF premium/discount analysis there shows the percentages of days on which the ETF Shares' market price was above or below the NAV.
Vanguard fund returns are adjusted to reflect the 0.25% fee on purchases and redemptions. The fees do not apply to the ETF Shares.
International Dividend Appreciation Index Fund
| Japan | 17.7% |
| Switzerland | 16.9 |
| Canada | 12.4 |
| United Kingdom | 8.5 |
| India | 7.1 |
| Denmark | 6.2 |
| Germany | 5.7 |
| China | 5.1 |
| Hong Kong | 4.2 |
| Australia | 3.2 |
| France | 2.9 |
| Sweden | 2.2 |
| South Korea | 1.2 |
| Indonesia | 1.1 |
| Other | 5.6 |
The table reflects the fund’s investments, except for short-term investments and derivatives.
The fund may invest in derivatives (such as futures and swap contracts) for various reasons, including, but not limited to, attempting to remain fully invested and tracking its target index as closely as possible.
International Dividend Appreciation Index Fund
The fund files its complete schedule of portfolio holdings with the Securities and Exchange Commission (SEC) for the first and third quarters of each fiscal year as an exhibit to its reports on Form N-PORT. The fund’s Form N-PORT reports are available on the SEC’s website at www.sec.gov.
| | | Shares | Market
Value•
($000) |
| Common Stocks (99.4%) |
| Australia (3.2%) |
| | CSL Ltd. | 460,172 | 104,708 |
| | Sonic Healthcare Ltd. | 476,686 | 14,465 |
| | Domino's Pizza Enterprises Ltd. | 62,749 | 6,436 |
| | carsales.com Ltd. | 281,370 | 5,265 |
| | Altium Ltd. | 119,497 | 3,329 |
| | Washington H Soul Pattinson & Co. Ltd. | 118,866 | 2,927 |
| | Technology One Ltd. | 253,158 | 2,351 |
| | Brickworks Ltd. | 79,007 | 1,418 |
| | AUB Group Ltd. | 76,690 | 1,264 |
| | Collins Foods Ltd. | 107,092 | 1,040 |
| | | | 143,203 |
| Austria (0.0%) |
| | CA Immobilien Anlagen AG (XWBO) | 43,760 | 1,878 |
| Belgium (0.8%) |
| | UCB SA | 128,650 | 15,377 |
| | Groupe Bruxelles Lambert SA | 99,303 | 11,522 |
| | Sofina SA | 15,477 | 6,849 |
| | Barco NV | 73,612 | 1,659 |
| | | | 35,407 |
| Brazil (0.1%) |
| | Raia Drogasil SA | 1,030,341 | 4,245 |
| Canada (12.3%) |
| | Toronto-Dominion Bank | 1,671,758 | 121,356 |
| | Brookfield Asset Management Inc. Class A | 1,345,912 | 81,259 |
| | Canadian National Railway Co. | 566,318 | 75,265 |
| | Alimentation Couche-Tard Inc. Class B | 746,120 | 27,986 |
| | Franco-Nevada Corp. | 176,035 | 25,118 |
| | Intact Financial Corp. | 156,603 | 20,994 |
| | Magna International Inc. | 254,350 | 20,690 |
| | Fortis Inc. (XTSE) | 428,332 | 19,067 |
| | Open Text Corp. | 251,932 | 12,690 |
| | Dollarama Inc. | 272,464 | 12,315 |
| | Metro Inc. | 230,294 | 11,587 |
| | Loblaw Cos. Ltd. | 152,619 | 11,478 |
| | TFI International Inc. | 84,188 | 9,335 |
| | CCL Industries Inc. Class B | 138,170 | 7,553 |
| | | Shares | Market
Value•
($000) |
| 1 | Canadian Tire Corp. Ltd. Class A | 52,441 | 7,448 |
| | Ritchie Bros Auctioneers Inc. | 106,295 | 7,265 |
| | Toromont Industries Ltd. | 80,135 | 7,130 |
| | George Weston Ltd. | 65,526 | 7,080 |
| | Imperial Oil Ltd. | 189,856 | 6,428 |
| | iA Financial Corp. Inc. | 100,433 | 5,941 |
| | Stantec Inc. | 104,153 | 5,756 |
| | Saputo Inc. | 217,774 | 5,202 |
| | Onex Corp. | 67,219 | 5,009 |
| | Finning International Inc. | 152,698 | 4,521 |
| | Empire Co. Ltd. Class A | 150,150 | 4,489 |
| | Parkland Corp. | 147,725 | 4,298 |
| | Boyd Group Services Inc. | 19,312 | 3,748 |
| | Premium Brands Holdings Corp. Class A | 30,425 | 3,288 |
| | Canadian Western Bank | 84,684 | 2,709 |
| | Innergex Renewable Energy Inc. | 145,110 | 2,415 |
| | Stella-Jones Inc. | 59,301 | 2,129 |
| | Cogeco Communications Inc. | 19,673 | 1,690 |
| | Enghouse Systems Ltd. | 38,893 | 1,687 |
| | Equitable Group Inc. | 25,171 | 1,572 |
| | Savaria Corp. | 43,503 | 687 |
| * | Brookfield Asset Management Reinsurance Partners Ltd. Class A | 8,558 | 527 |
| | Cogeco Inc. | 7,428 | 494 |
| | Hardwoods Distribution Inc. | 14,249 | 477 |
| | | | 548,683 |
| China (5.0%) |
| | Tencent Holdings Ltd. | 2,013,024 | 122,452 |
| | Ping An Insurance Group Co. of China Ltd. Class H | 6,304,000 | 45,154 |
| | Shenzhou International Group Holdings Ltd. | 784,300 | 16,897 |
| | China Tourism Group Duty Free Corp. Ltd. Class A | 159,655 | 6,687 |
| 2 | Longfor Group Holdings Ltd. | 1,360,000 | 6,580 |
| | China Gas Holdings Ltd. | 2,455,530 | 6,129 |
| | Jiangsu Hengrui Medicine Co. Ltd. Class A | 568,469 | 4,367 |
| | China Resources Gas Group Ltd. | 765,000 | 4,106 |
International Dividend Appreciation Index Fund
| | | Shares | Market
Value•
($000) |
| | Guangdong Investment Ltd. | 2,556,000 | 3,214 |
| | China State Construction Engineering Corp. Ltd. Class A | 4,188,200 | 3,047 |
| | Shanghai Pharmaceuticals Holding Co. Ltd. Class H | 772,700 | 1,414 |
| | Ping An Insurance Group Co. of China Ltd. Class A | 146,700 | 1,133 |
| | Shanghai Pharmaceuticals Holding Co. Ltd. Class A | 362,600 | 1,056 |
| | Angel Yeast Co. Ltd. Class A | 101,100 | 879 |
| | China National Accord Medicines Corp. Ltd. Class A | 148,025 | 775 |
| | Jiangzhong Pharmaceutical Co. Ltd. Class A | 152,300 | 274 |
| | | | 224,164 |
| Colombia (0.3%) |
| | Bancolombia SA ADR | 83,040 | 2,984 |
| | Bancolombia SA | 269,099 | 2,407 |
| | Grupo de Inversiones Suramericana SA | 340,802 | 1,986 |
| | Grupo Nutresa SA | 236,323 | 1,381 |
| | Grupo Argos SA | 335,361 | 1,051 |
| | Bancolombia SA Preference Shares | 116,671 | 1,047 |
| | | | 10,856 |
| Denmark (6.2%) |
| | Novo Nordisk A/S Class B | 1,586,559 | 173,974 |
| | DSV A/S | 205,331 | 47,722 |
| | Coloplast A/S Class B | 121,463 | 19,837 |
| | Novozymes A/S Class B | 199,762 | 14,694 |
| | GN Store Nord A/S | 152,897 | 9,291 |
| | SimCorp A/S | 38,846 | 4,704 |
| | Ringkjoebing Landbobank A/S | 28,729 | 3,650 |
| | ROCKWOOL International A/S Class B | 6,290 | 2,877 |
| | | | 276,749 |
| Finland (0.1%) |
| | Huhtamaki OYJ | 90,681 | 3,954 |
| | Revenio Group OYJ | 25,655 | 1,693 |
| | | | 5,647 |
| France (2.9%) |
| | Sanofi | 1,062,735 | 106,746 |
| | Teleperformance | 56,182 | 23,468 |
| | Pharmagest Interactive | 3,883 | 426 |
| | | | 130,640 |
| Germany (5.7%) |
| | SAP SE | 1,041,424 | 150,810 |
| | Fresenius SE & Co. KGaA | 392,877 | 17,858 |
| | Symrise AG Class A | 123,809 | 17,125 |
| | Brenntag SE | 138,586 | 13,185 |
| | Fresenius Medical Care AG & Co. KGaA | 192,071 | 12,759 |
| | LEG Immobilien SE (XETR) | 73,386 | 10,916 |
| | Nemetschek SE | 55,623 | 6,386 |
| | Bechtle AG | 80,671 | 6,051 |
| | TAG Immobilien AG | 141,248 | 4,291 |
| | | Shares | Market
Value•
($000) |
| | Deutsche Wohnen SE | 66,931 | 3,428 |
| | FUCHS PETROLUB SE Preference Shares | 68,927 | 3,306 |
| | Gerresheimer AG | 28,530 | 2,618 |
| | Encavis AG | 99,201 | 2,079 |
| | FUCHS PETROLUB SE | 36,883 | 1,359 |
| | STRATEC SE | 7,531 | 1,203 |
| | New Work SE | 3,287 | 802 |
| | Cewe Stiftung & Co. KGaA | 5,136 | 718 |
| | MBB SE | 1,874 | 299 |
| | | | 255,193 |
| Hong Kong (4.2%) |
| | AIA Group Ltd. | 11,301,760 | 126,659 |
| | Techtronic Industries Co. Ltd. | 1,641,484 | 33,725 |
| | Hong Kong & China Gas Co. Ltd. | 10,365,145 | 16,102 |
| | MTR Corp. Ltd. | 1,398,120 | 7,627 |
| | Swire Properties Ltd. | 934,400 | 2,505 |
| | SUNeVision Holdings Ltd. | 1,295,000 | 1,189 |
| | | | 187,807 |
| India (7.1%) |
| | Reliance Industries Ltd. | 2,967,653 | 100,708 |
| | Infosys Ltd. ADR | 3,108,369 | 69,255 |
| | Tata Consultancy Services Ltd. | 951,451 | 43,248 |
| | Hindustan Unilever Ltd. | 820,990 | 26,278 |
| | Bajaj Finance Ltd. | 241,106 | 23,910 |
| | Asian Paints Ltd. | 405,405 | 16,801 |
| | ITC Ltd. | 2,788,164 | 8,325 |
| | Pidilite Industries Ltd. | 143,445 | 4,439 |
| | Infosys Ltd. | 131,928 | 2,952 |
| | Tata Elxsi Ltd. | 32,011 | 2,515 |
| | Balkrishna Industries Ltd. | 74,040 | 2,439 |
| | Persistent Systems Ltd. | 44,459 | 2,335 |
| | Berger Paints India Ltd. | 218,611 | 2,168 |
| | Astral Ltd. (XNSE) | 71,235 | 2,083 |
| | Sundaram Finance Ltd. | 64,778 | 2,073 |
| | LIC Housing Finance Ltd. | 294,074 | 1,603 |
| | Navin Fluorine International Ltd. | 31,418 | 1,403 |
| | Relaxo Footwears Ltd. | 70,180 | 1,249 |
| | CRISIL Ltd. | 23,393 | 876 |
| | Schaeffler India Ltd. | 7,642 | 755 |
| | KEC International Ltd. | 112,119 | 717 |
| | Finolex Cables Ltd. | 72,098 | 451 |
| | Caplin Point Laboratories Ltd. | 21,355 | 234 |
| | NESCO Ltd. | 22,257 | 181 |
| * | Yes Bank Ltd. | 545,158 | 94 |
| | | | 317,092 |
| Indonesia (1.1%) |
| | Bank Central Asia Tbk PT | 54,794,400 | 28,974 |
| | Bank Rakyat Indonesia Persero Tbk PT | 65,205,100 | 19,574 |
| | | | 48,548 |
| Ireland (0.4%) |
| | Kerry Group plc Class A | 145,263 | 19,491 |
| Israel (0.0%) |
| | Matrix IT Ltd. | 28,951 | 786 |
International Dividend Appreciation Index Fund
| | | Shares | Market
Value•
($000) |
| Italy (0.3%) |
| | Recordati Industria Chimica e Farmaceutica SpA | 92,557 | 5,799 |
| | DiaSorin SpA | 20,377 | 4,607 |
| | Reply SpA | 22,355 | 4,339 |
| | | | 14,745 |
| Japan (17.6%) |
| | Keyence Corp. | 195,200 | 117,826 |
| | Murata Manufacturing Co. Ltd. | 636,600 | 47,222 |
| | KDDI Corp. | 1,542,700 | 47,176 |
| | Nippon Telegraph & Telephone Corp. | 1,237,700 | 34,679 |
| | Tokio Marine Holdings Inc. | 641,700 | 33,798 |
| | Terumo Corp. | 706,476 | 31,167 |
| | Seven & i Holdings Co. Ltd. | 724,300 | 30,410 |
| | M3 Inc. | 487,800 | 28,746 |
| | Astellas Pharma Inc. | 1,658,600 | 27,962 |
| | Kao Corp. | 464,500 | 26,276 |
| | Asahi Group Holdings Ltd. | 472,143 | 21,426 |
| | Aeon Co. Ltd. | 879,400 | 20,230 |
| | Nomura Research Institute Ltd. | 446,400 | 17,871 |
| | Shionogi & Co. Ltd. | 255,800 | 16,678 |
| | Unicharm Corp. | 410,500 | 16,602 |
| | Nitori Holdings Co. Ltd. | 89,901 | 16,516 |
| | Obic Co. Ltd. | 64,200 | 11,872 |
| | Sekisui House Ltd. | 562,400 | 11,693 |
| | Nitto Denko Corp. | 147,500 | 11,526 |
| | Pan Pacific International Holdings Corp. | 503,764 | 10,577 |
| | Yamaha Corp. | 156,700 | 9,900 |
| | Nissan Chemical Corp. | 141,200 | 7,859 |
| | Yakult Honsha Co. Ltd. | 147,900 | 7,473 |
| | GMO Payment Gateway Inc. | 48,100 | 6,094 |
| | Kansai Paint Co. Ltd. | 259,500 | 6,009 |
| | MonotaRO Co. Ltd. | 258,867 | 5,900 |
| | TIS Inc. | 214,600 | 5,846 |
| | Otsuka Corp. | 116,600 | 5,743 |
| | Hulic Co. Ltd. | 559,575 | 5,381 |
| | Kurita Water Industries Ltd. | 101,100 | 4,993 |
| | Kobayashi Pharmaceutical Co. Ltd. | 58,400 | 4,676 |
| | Hakuhodo DY Holdings Inc. | 277,000 | 4,516 |
| | Kakaku.com Inc. | 132,700 | 4,404 |
| | Open House Co. Ltd. | 66,300 | 4,228 |
| | Chiba Bank Ltd. | 680,600 | 4,219 |
| | Benefit One Inc. | 75,300 | 3,800 |
| | Rinnai Corp. | 36,384 | 3,736 |
| | Nisshin Seifun Group Inc. | 233,500 | 3,687 |
| | USS Co. Ltd. | 225,300 | 3,631 |
| | Welcia Holdings Co. Ltd. | 97,100 | 3,625 |
| | Medipal Holdings Corp. | 196,600 | 3,557 |
| | Hikari Tsushin Inc. | 20,100 | 3,098 |
| | Itochu Techno-Solutions Corp. | 96,203 | 3,039 |
| | SCSK Corp. | 150,000 | 3,036 |
| | COMSYS Holdings Corp. | 119,700 | 2,964 |
| | Alfresa Holdings Corp. | 209,700 | 2,956 |
| | Oracle Corp. Japan | 30,800 | 2,914 |
| | Relo Group Inc. | 130,400 | 2,712 |
| | | Shares | Market
Value•
($000) |
| | Tokyo Tatemono Co. Ltd. | 184,300 | 2,709 |
| | Tokyo Century Corp. | 47,000 | 2,691 |
| | Nomura Real Estate Holdings Inc. | 105,280 | 2,567 |
| | Zenkoku Hosho Co. Ltd. | 51,600 | 2,494 |
| | Sanwa Holdings Corp. | 208,900 | 2,437 |
| | EXEO Group Inc. | 105,100 | 2,429 |
| | Goldwin Inc. | 38,300 | 2,318 |
| | Nihon Unisys Ltd. | 77,600 | 2,180 |
| | Infomart Corp. | 214,200 | 2,090 |
| | SHO-BOND Holdings Co. Ltd. | 49,084 | 2,056 |
| | Sundrug Co. Ltd. | 67,624 | 1,979 |
| | Aica Kogyo Co. Ltd. | 63,400 | 1,943 |
| | en japan Inc. | 39,700 | 1,577 |
| | Seria Co. Ltd. | 47,100 | 1,555 |
| | Yaoko Co. Ltd. | 25,100 | 1,494 |
| | NEC Networks & System Integration Corp. | 88,900 | 1,430 |
| | Mani Inc. | 83,400 | 1,422 |
| | NSD Co. Ltd. | 74,500 | 1,420 |
| | PALTAC Corp. | 31,054 | 1,375 |
| | Nichias Corp. | 54,700 | 1,339 |
| | Hitachi Transport System Ltd. | 33,200 | 1,308 |
| | Fuyo General Lease Co. Ltd. | 19,800 | 1,287 |
| | TS Tech Co. Ltd. | 93,200 | 1,247 |
| | Funai Soken Holdings Inc. | 44,800 | 1,245 |
| | Takara Bio Inc. | 47,500 | 1,240 |
| | Workman Co. Ltd. | 22,900 | 1,218 |
| | Japan Material Co. Ltd. | 73,100 | 1,017 |
| | Mizuho Leasing Co. Ltd. | 31,600 | 976 |
| | Valor Holdings Co. Ltd. | 45,912 | 972 |
| | Takuma Co. Ltd. | 74,100 | 969 |
| | JCU Corp. | 22,700 | 912 |
| | Shoei Co. Ltd. | 20,400 | 908 |
| | DTS Corp. | 39,200 | 870 |
| | Takeuchi Manufacturing Co. Ltd. | 33,300 | 855 |
| | Maruwa Co. Ltd. | 7,600 | 852 |
| | Nomura Co. Ltd. | 85,500 | 843 |
| | Information Services International-Dentsu Ltd. | 23,600 | 826 |
| | Kissei Pharmaceutical Co. Ltd. | 39,800 | 796 |
| | Noevir Holdings Co. Ltd. | 16,200 | 792 |
| | Nojima Corp. | 35,700 | 783 |
| | Elecom Co. Ltd. | 50,932 | 779 |
| | eGuarantee Inc. | 33,800 | 753 |
| | MCJ Co. Ltd. | 64,600 | 727 |
| | Giken Ltd. | 18,900 | 721 |
| | BeNext-Yumeshin Group Co. | 53,800 | 701 |
| | Eizo Corp. | 18,200 | 696 |
| | Nippon Densetsu Kogyo Co. Ltd. | 43,500 | 670 |
| | San-A Co. Ltd. | 18,526 | 668 |
| | Aeon Delight Co. Ltd. | 21,300 | 654 |
| | Sekisui Jushi Corp. | 35,100 | 654 |
| | Future Corp. | 21,800 | 638 |
| | Ai Holdings Corp. | 32,670 | 617 |
| | Mitsubishi Pencil Co. Ltd. | 51,300 | 615 |
| | Riken Keiki Co. Ltd. | 22,100 | 613 |
| | Kameda Seika Co. Ltd. | 15,600 | 610 |
| | Hogy Medical Co. Ltd. | 22,000 | 603 |
| | Intage Holdings Inc. | 33,000 | 557 |
International Dividend Appreciation Index Fund
| | | Shares | Market
Value•
($000) |
| | Yellow Hat Ltd. | 32,300 | 526 |
| | Okinawa Cellular Telephone Co. | 11,300 | 509 |
| | S Foods Inc. | 17,100 | 495 |
| | FULLCAST Holdings Co. Ltd. | 20,000 | 467 |
| | Mitsubishi Research Institute Inc. | 12,500 | 467 |
| | Siix Corp. | 36,600 | 405 |
| | Ricoh Leasing Co. Ltd. | 11,600 | 368 |
| | G-7 Holdings Inc. | 20,000 | 366 |
| | Fujicco Co. Ltd. | 20,600 | 346 |
| | Sinko Industries Ltd. | 18,700 | 339 |
| | WDB Holdings Co. Ltd. | 9,500 | 299 |
| | E-Guardian Inc. | 10,100 | 277 |
| | Fukui Computer Holdings Inc. | 7,600 | 274 |
| | G-Tekt Corp. | 21,400 | 267 |
| | Cresco Ltd. | 12,600 | 231 |
| | Members Co. Ltd. | 7,300 | 222 |
| | Nippon Parking Development Co. Ltd. | 165,100 | 209 |
| | Aoyama Zaisan Networks Co. Ltd. | 20,000 | 207 |
| | CTS Co. Ltd. | 27,000 | 189 |
| * | Densan System Holdings Co. Ltd. | 8,300 | 187 |
| | Creek & River Co. Ltd. | 10,000 | 173 |
| | Ebase Co. Ltd. | 22,500 | 150 |
| | Ad-sol Nissin Corp. | 8,000 | 147 |
| | Aval Data Corp. | 4,900 | 120 |
| * | Value HR Co. Ltd. | 6,700 | 108 |
| | | | 788,294 |
| Kuwait (0.8%) |
| | National Bank of Kuwait SAKP | 6,764,746 | 22,243 |
| | Kuwait Finance House KSCP | 4,560,442 | 12,604 |
| | | | 34,847 |
| Mexico (0.5%) |
| | America Movil SAB de CV Series L | 21,803,956 | 19,434 |
| | Grupo Elektra SAB de CV | 57,865 | 4,443 |
| | | | 23,877 |
| Netherlands (0.7%) |
| | Wolters Kluwer NV | 250,289 | 26,210 |
| | Aalberts NV | 87,538 | 4,845 |
| | | | 31,055 |
| New Zealand (0.3%) |
| | Fisher & Paykel Healthcare Corp. Ltd. | 567,344 | 12,711 |
| Norway (0.2%) |
| | TOMRA Systems ASA | 110,534 | 7,144 |
| | Borregaard ASA | 87,810 | 2,132 |
| | | | 9,276 |
| South Korea (1.2%) |
| | NAVER Corp. | 146,668 | 50,994 |
| | LEENO Industrial Inc. | 9,467 | 1,388 |
| | AfreecaTV Co. Ltd. | 7,327 | 1,214 |
| | JW Pharmaceutical Corp. | 8,810 | 176 |
| | Hanyang Eng Co. Ltd. | 7,046 | 93 |
| | | | 53,865 |
| Spain (0.1%) |
| | Viscofan SA | 39,949 | 2,732 |
| | | Shares | Market
Value•
($000) |
| Sweden (2.2%) |
| | Hexagon AB Class B | 1,845,167 | 29,696 |
| | Assa Abloy AB Class B | 860,698 | 25,255 |
| | Nibe Industrier AB Class B | 1,375,661 | 20,461 |
| | Castellum AB | 212,522 | 5,664 |
| | AAK AB | 166,051 | 3,632 |
| | Wihlborgs Fastigheter AB | 129,638 | 3,073 |
| | Hexpol AB | 242,770 | 2,841 |
| | Kungsleden AB | 153,350 | 2,109 |
| | Hufvudstaden AB Class A | 112,472 | 1,800 |
| | Atrium Ljungberg AB Class B | 45,635 | 1,048 |
| | Svolder AB Class B | 22,171 | 899 |
| | | | 96,478 |
| Switzerland (16.8%) |
| | Nestle SA (Registered) | 1,475,184 | 194,587 |
| | Roche Holding AG | 485,954 | 188,256 |
| | Novartis AG (Registered) | 1,910,577 | 158,029 |
| | Sika AG (Registered) | 131,118 | 44,420 |
| | Partners Group Holding AG | 22,151 | 38,697 |
| | Givaudan SA (Registered) | 7,672 | 36,150 |
| | Geberit AG (Registered) | 33,641 | 26,272 |
| | Logitech International SA (Registered) | 186,519 | 15,603 |
| | Chocoladefabriken Lindt & Spruengli AG (Registered) | 99 | 11,893 |
| | Chocoladefabriken Lindt & Spruengli AG Ptg. Ctf. | 997 | 11,756 |
| | Temenos AG (Registered) | 62,063 | 9,502 |
| | EMS-Chemie Holding AG (Registered) | 6,683 | 6,629 |
| | Interroll Holding AG (Registered) | 709 | 3,440 |
| | DKSH Holding AG | 34,087 | 2,732 |
| | ALSO Holding AG (Registered) | 5,843 | 1,734 |
| | Kardex Holding AG (Registered) | 5,501 | 1,697 |
| | Orior AG | 6,256 | 643 |
| | Roche Holding AG (Bearer) | 612 | 263 |
| | | | 752,303 |
| Taiwan (0.8%) |
| | Chailease Holding Co. Ltd. | 1,309,650 | 12,543 |
| | E.Sun Financial Holding Co. Ltd. | 12,792,441 | 12,224 |
| | Advantech Co. Ltd. | 416,000 | 5,440 |
| | ASPEED Technology Inc. | 25,000 | 2,508 |
| | Sinbon Electronics Co. Ltd. | 190,000 | 1,572 |
| | Poya International Co. Ltd. | 66,890 | 1,198 |
| | TCI Co. Ltd. | 89,000 | 723 |
| | | | 36,208 |
| Thailand (0.1%) |
| | Krungthai Card PCL | 795,000 | 1,386 |
| | Siam Global House PCL | 1,594,900 | 983 |
| | | | 2,369 |
| United Kingdom (8.4%) |
| | Diageo plc | 2,124,517 | 105,698 |
| | RELX plc | 1,895,012 | 58,759 |
| | Experian plc | 881,400 | 40,413 |
| | Ashtead Group plc | 410,584 | 34,411 |
International Dividend Appreciation Index Fund
| | | Shares | Market
Value•
($000) |
| | Croda International plc | 135,920 | 17,592 |
| | Halma plc | 367,114 | 14,888 |
| | Spirax-Sarco Engineering plc | 67,212 | 14,348 |
| | Smurfit Kappa Group plc (XDUB) | 249,951 | 13,102 |
| | Bunzl plc | 327,706 | 12,112 |
| | Intertek Group plc | 158,410 | 10,608 |
| | Sage Group plc | 1,036,731 | 10,083 |
| | DCC plc | 94,083 | 7,850 |
| | Dechra Pharmaceuticals plc | 107,447 | 7,512 |
| | Spectris plc | 111,616 | 5,743 |
| | Diploma plc | 114,993 | 4,726 |
| | Genus plc | 62,288 | 4,723 |
| | Grainger plc | 707,770 | 2,977 |
| | Ultra Electronics Holdings plc | 65,993 | 2,924 |
| | Cranswick plc | 51,005 | 2,411 |
| | Daily Mail & General Trust plc Class A | 149,277 | 2,119 |
| | Clarkson plc | 27,760 | 1,521 |
| | Moneysupermarket.com Group plc | 509,767 | 1,480 |
| | Avon Protection plc | 28,445 | 756 |
| | | | 376,756 |
Total Common Stocks
(Cost $3,762,654) | 4,445,905 |
| | | Shares | Market
Value•
($000) |
| Temporary Cash Investments (0.4%) |
| Money Market Fund (0.4%) |
| 3,4 | Vanguard Market Liquidity Fund, 0.070% (Cost $16,951) | 169,505 | 16,951 |
| Total Investments (99.8%) (Cost $3,779,605) | 4,462,856 |
| Other Assets and Liabilities—Net (0.2%) | 10,362 |
| Net Assets (100%) | 4,473,218 |
| Cost is in $000. |
| • | See Note A in Notes to Financial Statements. |
| * | Non-income-producing security. |
| 1 | Includes partial security positions on loan to broker-dealers. The total value of securities on loan is $6,960,000. |
| 2 | Security exempt from registration under Rule 144A of the Securities Act of 1933. Such securities may be sold in transactions exempt from registration, normally to qualified institutional buyers. At October 31, 2021, the aggregate value was $6,580,000, representing 0.1% of net assets. |
| 3 | Affiliated money market fund available only to Vanguard funds and certain trusts and accounts managed by Vanguard. Rate shown is the 7-day yield. |
| 4 | Collateral of $7,399,000 was received for securities on loan. |
| | ADR—American Depositary Receipt. |
| | Ptg. Ctf.—Participating Certificates. |
Derivative Financial Instruments Outstanding as of Period End
| Futures Contracts |
| | | | ($000) |
| | Expiration | Number of
Long (Short)
Contracts | Notional
Amount | Value and
Unrealized
Appreciation
(Depreciation) |
| Long Futures Contracts | | | | |
| E-mini S&P 500 Index | December 2021 | 28 | 6,436 | 190 |
| Euro Stoxx 50 Index | December 2021 | 185 | 9,061 | 112 |
| MSCI Emerging Markets Index | December 2021 | 109 | 6,878 | (118) |
| Topix Index | December 2021 | 31 | 5,419 | (142) |
| | | | | 42 |
| Forward Currency Contracts |
| | Contract
Settlement
Date | Contract Amount (000) | Unrealized
Appreciation
($000) | Unrealized
Depreciation
($000) |
| Counterparty | Receive | Deliver |
| Bank of Montreal | 12/15/21 | EUR | 5,240 | USD | 6,213 | — | (149) |
| Bank of America, N.A. | 12/15/21 | INR | 1,366,000 | USD | 18,390 | — | (243) |
| Bank of America, N.A. | 12/15/21 | JPY | 320,474 | USD | 2,920 | — | (107) |
| Bank of America, N.A. | 12/15/21 | USD | 6,259 | CHF | 5,748 | — | (28) |
| Bank of Montreal | 12/15/21 | USD | 1,382 | GBP | 1,000 | 13 | — |
International Dividend Appreciation Index Fund
| Forward Currency Contracts (continued) |
| | Contract
Settlement
Date | Contract Amount (000) | Unrealized
Appreciation
($000) | Unrealized
Depreciation
($000) |
| Counterparty | Receive | Deliver |
| BNP Paribas | 12/15/21 | USD | 12,757 | INR | 950,000 | 137 | — |
| Goldman Sachs International | 12/15/21 | USD | 2,334 | JPY | 260,000 | 51 | — |
| | | | | | | 201 | (527) |
| CHF—Swiss franc. |
| EUR—euro. |
| GBP—British pound. |
| INR—Indian rupee. |
| JPY—Japanese yen. |
| USD—U.S. dollar. |
See accompanying Notes, which are an integral part of the Financial Statements.
International Dividend Appreciation Index Fund
Statement of Assets and Liabilities
|
| ($000s, except shares and per-share amounts) | Amount |
| Assets | |
| Investments in Securities, at Value | |
| Unaffiliated Issuers (Cost $3,762,654) | 4,445,905 |
| Affiliated Issuers (Cost $16,951) | 16,951 |
| Total Investments in Securities | 4,462,856 |
| Investment in Vanguard | 146 |
| Cash Collateral Pledged—Futures Contracts | 1,490 |
| Cash Collateral Pledged—Forward Currency Contracts | 520 |
| Cash Collateral Received for ETF Capital Activity | 34,215 |
| Foreign Currency, at Value (Cost $17,078) | 17,005 |
| Receivables for Investment Securities Sold | 6,396 |
| Receivables for Accrued Income | 13,177 |
| Receivables for Capital Shares Issued | 2,161 |
| Unrealized Appreciation—Forward Currency Contracts | 201 |
| Total Assets | 4,538,167 |
| Liabilities | |
| Due to Custodian | 1,157 |
| Payables for Investment Securities Purchased | 16,551 |
| Collateral for Securities on Loan | 7,399 |
| Collateral for ETF Capital Activity | 34,215 |
| Payables for Capital Shares Redeemed | 116 |
| Payables to Vanguard | 256 |
| Variation Margin Payable—Futures Contracts | 88 |
| Unrealized Depreciation—Forward Currency Contracts | 527 |
| Deferred Foreign Capital Gains Taxes | 4,640 |
| Total Liabilities | 64,949 |
| Net Assets | 4,473,218 |
International Dividend Appreciation Index Fund
Statement of Assets and Liabilities (continued)
|
| At October 31, 2021, net assets consisted of: | |
| ($000s, except shares and per-share amounts) | Amount |
| Paid-in Capital | 3,531,235 |
| Total Distributable Earnings (Loss) | 941,983 |
| Net Assets | 4,473,218 |
| |
| ETF Shares—Net Assets | |
Applicable to 46,183,341 outstanding $.001 par value shares of
beneficial interest (unlimited authorization) | 4,150,044 |
| Net Asset Value Per Share—ETF Shares | $89.86 |
| |
| Admiral Shares—Net Assets | |
Applicable to 7,392,475 outstanding $.001 par value shares of
beneficial interest (unlimited authorization) | 323,174 |
| Net Asset Value Per Share—Admiral Shares | $43.72 |
See accompanying Notes, which are an integral part of the Financial Statements.
International Dividend Appreciation Index Fund
|
| | Year Ended
October 31, 2021 |
| | ($000) |
| Investment Income | |
| Income | |
| Dividends1 | 54,094 |
| Interest2 | 13 |
| Securities Lending—Net | 107 |
| Total Income | 54,214 |
| Expenses | |
| The Vanguard Group—Note B | |
| Investment Advisory Services | 570 |
| Management and Administrative—ETF Shares | 4,141 |
| Management and Administrative—Admiral Shares | 382 |
| Marketing and Distribution—ETF Shares | 126 |
| Marketing and Distribution—Admiral Shares | 9 |
| Custodian Fees | 295 |
| Auditing Fees | 45 |
| Shareholders’ Reports—ETF Shares | 135 |
| Shareholders’ Reports—Admiral Shares | 6 |
| Trustees’ Fees and Expenses | 1 |
| Total Expenses | 5,710 |
| Net Investment Income | 48,504 |
| Realized Net Gain (Loss) | |
| Investment Securities Sold2,3,4 | 458,013 |
| Futures Contracts | 2,740 |
| Swap Contracts | 576 |
| Forward Currency Contracts | 277 |
| Foreign Currencies | (2,359) |
| Realized Net Gain (Loss) | 459,247 |
| Change in Unrealized Appreciation (Depreciation) | |
| Investment Securities2,5 | 350,719 |
| Futures Contracts | 584 |
| Forward Currency Contracts | (266) |
| Foreign Currencies | 66 |
| Change in Unrealized Appreciation (Depreciation) | 351,103 |
| Net Increase (Decrease) in Net Assets Resulting from Operations | 858,854 |
| 1 | Dividends are net of foreign withholding taxes of $6,853,000. |
| 2 | Interest income, realized net gain (loss), and change in unrealized appreciation (depreciation) from an affiliated company of the fund were $12,000, $1,000, and ($1,000), respectively. Purchases and sales are for temporary cash investment purposes. |
| 3 | Realized gain (loss) is net of foreign capital gain taxes of $19,351,000. |
| 4 | Includes $99,855,000 of net gain (loss) resulting from in-kind redemptions. |
| 5 | The change in unrealized appreciation (depreciation) is net of the change in deferred foreign capital gains taxes of ($1,997,000). |
See accompanying Notes, which are an integral part of the Financial Statements.
International Dividend Appreciation Index Fund
Statement of Changes in Net Assets
|
| | Year Ended October 31, |
| | 2021
($000) | 2020
($000) |
| | | |
| Increase (Decrease) in Net Assets | | |
| Operations | | |
| Net Investment Income | 48,504 | 29,753 |
| Realized Net Gain (Loss) | 459,247 | (62,560) |
| Change in Unrealized Appreciation (Depreciation) | 351,103 | 158,091 |
| Net Increase (Decrease) in Net Assets Resulting from Operations | 858,854 | 125,284 |
| Distributions | | |
| ETF Shares | (39,771) | (33,388) |
| Admiral Shares | (3,300) | (3,991) |
| Total Distributions | (43,071) | (37,379) |
| Capital Share Transactions | | |
| ETF Shares | 943,215 | 1,064,328 |
| Admiral Shares | 38,209 | 386 |
| Net Increase (Decrease) from Capital Share Transactions | 981,424 | 1,064,714 |
| Total Increase (Decrease) | 1,797,207 | 1,152,619 |
| Net Assets | | |
| Beginning of Period | 2,676,011 | 1,523,392 |
| End of Period | 4,473,218 | 2,676,011 |
See accompanying Notes, which are an integral part of the Financial Statements.
International Dividend Appreciation Index Fund
| ETF Shares | | | | | |
For a Share Outstanding
Throughout Each Period | Year Ended October 31, |
| 2021 | 2020 | 2019 | 2018 | 2017 |
| Net Asset Value, Beginning of Period | $69.97 | $68.72 | $58.65 | $64.25 | $54.43 |
| Investment Operations | | | | | |
| Net Investment Income1 | 1.094 | .958 | 1.4522 | 1.196 | 1.179 |
| Net Realized and Unrealized Gain (Loss) on Investments3 | 19.776 | 1.551 | 9.578 | (5.623) | 9.715 |
| Total from Investment Operations | 20.870 | 2.509 | 11.030 | (4.427) | 10.894 |
| Distributions | | | | | |
| Dividends from Net Investment Income | (.980) | (1.259) | (.960) | (1.173) | (1.074) |
| Distributions from Realized Capital Gains | — | — | — | — | — |
| Total Distributions | (.980) | (1.259) | (.960) | (1.173) | (1.074) |
| Net Asset Value, End of Period | $89.86 | $69.97 | $68.72 | $58.65 | $64.25 |
| Total Return | 29.93% | 3.73% | 18.96% | -7.04% | 20.19% |
| Ratios/Supplemental Data | | | | | |
| Net Assets, End of Period (Millions) | $4,150 | $2,456 | $1,305 | $861 | $634 |
| Ratio of Total Expenses to Average Net Assets | 0.15% | 0.20% | 0.20% | 0.25% | 0.25% |
| Ratio of Net Investment Income to Average Net Assets | 1.28% | 1.40% | 2.24%2 | 1.83% | 1.96% |
| Portfolio Turnover Rate4 | 65% | 17% | 42% | 36% | 9% |
| 1 | Calculated based on average shares outstanding. |
| 2 | Net investment income per share and the ratio of net investment income to average net assets include $.388 and 0.65%, respectively, resulting from a special dividend from Naspers Ltd. in September 2019. |
| 3 | Includes increases from purchase and redemption fees of $.00, $.01, $.02, $.02, and $.04. |
| 4 | Excludes the value of portfolio securities received or delivered as a result of in-kind purchases or redemptions of the fund’s capital shares, including ETF Creation Units. |
See accompanying Notes, which are an integral part of the Financial Statements.
International Dividend Appreciation Index Fund
| Admiral Shares | | | | | |
For a Share Outstanding
Throughout Each Period | Year Ended October 31, |
| 2021 | 2020 | 2019 | 2018 | 2017 |
| Net Asset Value, Beginning of Period | $34.03 | $33.42 | $28.52 | $31.24 | $26.45 |
| Investment Operations | | | | | |
| Net Investment Income1 | .518 | .453 | .6862 | .576 | .573 |
| Net Realized and Unrealized Gain (Loss) on Investments3 | 9.645 | .765 | 4.679 | (2.727) | 4.720 |
| Total from Investment Operations | 10.163 | 1.218 | 5.365 | (2.151) | 5.293 |
| Distributions | | | | | |
| Dividends from Net Investment Income | (.473) | (.608) | (.465) | (.569) | (.503) |
| Distributions from Realized Capital Gains | — | — | — | — | — |
| Total Distributions | (.473) | (.608) | (.465) | (.569) | (.503) |
| Net Asset Value, End of Period | $43.72 | $34.03 | $33.42 | $28.52 | $31.24 |
| Total Return4 | 29.96% | 3.72% | 18.96% | -7.03% | 20.18% |
| Ratios/Supplemental Data | | | | | |
| Net Assets, End of Period (Millions) | $323 | $220 | $218 | $175 | $152 |
| Ratio of Total Expenses to Average Net Assets | 0.16% | 0.20% | 0.20% | 0.25% | 0.25% |
| Ratio of Net Investment Income to Average Net Assets | 1.25% | 1.36% | 2.24%2 | 1.83% | 1.96% |
| Portfolio Turnover Rate5 | 65% | 17% | 42% | 36% | 9% |
| 1 | Calculated based on average shares outstanding. |
| 2 | Net investment income per share and the ratio of net investment income to average net assets include $.188 and 0.65%, respectively, resulting from a special dividend from Naspers Ltd. in September 2019. |
| 3 | Includes increases from purchase and redemption fees of $.00, $.00, $.00, $.01, and $.02. |
| 4 | Total returns do not include transaction or account service fees that may have applied in the periods shown. Fund prospectuses provide information about any applicable transaction and account service fees. |
| 5 | Excludes the value of portfolio securities received or delivered as a result of in-kind purchases or redemptions of the fund’s capital shares, including ETF Creation Units. |
See accompanying Notes, which are an integral part of the Financial Statements.
International Dividend Appreciation Index Fund
Notes to Financial Statements
Vanguard International Dividend Appreciation Index Fund is registered under the Investment Company Act of 1940 as an open-end investment company, or mutual fund. The fund offers two classes of shares: ETF Shares and Admiral Shares. Each of the share classes has different eligibility and minimum purchase requirements, and is designed for different types of investors. ETF Shares are listed for trading on Nasdaq; they can be purchased and sold through a broker.
The fund invests in securities of foreign issuers, which may subject it to investment risks not normally associated with investing in securities of U.S. corporations. Market disruptions associated with the COVID-19 pandemic have had a global impact, and uncertainty exists as to the long-term implications. Such disruptions can adversely affect assets of the fund and thus fund performance.
| A. | The following significant accounting policies conform to generally accepted accounting principles for U.S. investment companies. The fund consistently follows such policies in preparing its financial statements. |
1. Security Valuation: Securities are valued as of the close of trading on the New York Stock Exchange (generally 4 p.m., Eastern time) on the valuation date. Equity securities are valued at the latest quoted sales prices or official closing prices taken from the primary market in which each security trades; such securities not traded on the valuation date are valued at the mean of the latest quoted bid and asked prices. Securities for which market quotations are not readily available, or whose values have been affected by events occurring before the fund’s pricing time but after the close of the securities’ primary markets, are valued at their fair values calculated according to procedures adopted by the board of trustees. These procedures include obtaining quotations from an independent pricing service, monitoring news to identify significant market- or security-specific events, and evaluating changes in the values of foreign market proxies (for example, ADRs, futures contracts, or exchange-traded funds), between the time the foreign markets close and the fund’s pricing time. When fair-value pricing is employed, the prices of securities used by a fund to calculate its net asset value may differ from quoted or published prices for the same securities.
Investments in Vanguard Market Liquidity Fund are valued at that fund's net asset value.
Temporary cash investments are valued using the latest bid prices or using valuations based on a matrix system (which considers such factors as security prices, yields, maturities, and ratings), both as furnished by independent pricing services.
2. Foreign Currency: Securities and other assets and liabilities denominated in foreign currencies are translated into U.S. dollars using exchange rates obtained from an independent third party as of the fund’s pricing time on the valuation date. Realized gains (losses) and unrealized appreciation (depreciation) on investment securities include the effects of changes in exchange rates since the securities were purchased, combined with the effects of changes in security prices. Fluctuations in the value of other assets and liabilities resulting from changes in exchange rates are recorded as unrealized foreign currency gains (losses) until the assets or liabilities are settled in cash, at which time they are recorded as realized foreign currency gains (losses).
3. Futures Contracts: The fund uses index futures contracts to a limited extent, with the objectives of maintaining full exposure to the stock market, maintaining liquidity, and minimizing transaction costs. The fund may purchase futures contracts to immediately invest incoming cash in the market, or sell futures in response to cash outflows, thereby simulating a fully invested position in the underlying index while maintaining a cash balance for liquidity. The primary risks associated with the use of futures contracts are imperfect correlation between changes in market values of stocks held by the fund and the prices of futures contracts, and the possibility of an illiquid market.
International Dividend Appreciation Index Fund
Counterparty risk involving futures is mitigated because a regulated clearinghouse is the counterparty instead of the clearing broker. To further mitigate counterparty risk, the fund trades futures contracts on an exchange, monitors the financial strength of its clearing brokers and clearinghouse, and has entered into clearing agreements with its clearing brokers. The clearinghouse imposes initial margin requirements to secure the fund’s performance and requires daily settlement of variation margin representing changes in the market value of each contract. Any securities pledged as initial margin for open contracts are noted in the Schedule of Investments.
Futures contracts are valued at their quoted daily settlement prices. The notional amounts of the contracts are not recorded in the Statement of Assets and Liabilities. Fluctuations in the value of the contracts are recorded in the Statement of Assets and Liabilities as an asset (liability) and in the Statement of Operations as unrealized appreciation (depreciation) until the contracts are closed, when they are recorded as realized gains (losses) on futures contracts.
During the year ended October 31, 2021, the fund’s average investments in long and short futures contracts represented less than 1% and 0% of net assets, respectively, based on the average of the notional amounts at each quarter-end during the period.
4. Forward Currency Contracts: The fund enters into forward currency contracts to protect the value of securities and related receivables and payables against changes in future foreign exchange rates. The fund’s risks in using these contracts include movement in the values of the foreign currencies relative to the U.S. dollar and the ability of the counterparties to fulfill their obligations under the contracts. The fund mitigates its counterparty risk by entering into forward currency contracts only with a diverse group of prequalified counterparties, monitoring their financial strength, entering into master netting arrangements with its counterparties, and requiring its counterparties to transfer collateral as security for their performance. In the absence of a default, the collateral pledged or received by the fund cannot be repledged, resold, or rehypothecated. The master netting arrangements provide that, in the event of a counterparty’s default (including bankruptcy), the fund may terminate the forward currency contracts, determine the net amount owed by either party in accordance with its master netting arrangements, and sell or retain any collateral held up to the net amount owed to the fund under the master netting arrangements. The forward currency contracts contain provisions whereby a counterparty may terminate open contracts if the fund’s net assets decline below a certain level, triggering a payment by the fund if the fund is in a net liability position at the time of the termination. The payment amount would be reduced by any collateral the fund has pledged. Any securities pledged as collateral for open contracts are noted in the Schedule of Investments. The value of collateral received or pledged is compared daily to the value of the forward currency contracts exposure with each counterparty, and any difference, if in excess of a specified minimum transfer amount, is adjusted and settled within two business days.
Forward currency contracts are valued at their quoted daily prices obtained from an independent third party, adjusted for currency risk based on the expiration date of each contract. The notional amounts of the contracts are not recorded in the Statement of Assets and Liabilities. Fluctuations in the value of the contracts are recorded in the Statement of Assets and Liabilities as an asset (liability) and in the Statement of Operations as unrealized appreciation (depreciation) until the contracts are closed, when they are recorded as realized gains (losses) on forward currency contracts.
International Dividend Appreciation Index Fund
During the year ended October 31, 2021, the fund’s average investment in forward currency contracts represented 1% of net assets, based on the average of the notional amounts at each quarter-end during the period.
5. Swap Contracts: The fund has entered into equity swap contracts to earn the total return on selected reference stocks in the fund’s target index. Under the terms of the swaps, the fund receives the total return on the referenced stock (i.e., receiving the increase or paying the decrease in value of the selected reference stock and receiving the equivalent of any dividends in respect of the selected referenced stock) over a specified period of time, applied to a notional amount that represents the value of a designated number of shares of the selected reference stock at the beginning of the equity swap contract. The fund also pays a floating rate that is based on short-term interest rates, applied to the notional amount. At the same time, the fund generally invests an amount approximating the notional amount of the swap in high-quality temporary cash investments.
A risk associated with all types of swaps is the possibility that a counterparty may default on its obligation to pay net amounts due to the fund. The fund’s maximum amount subject to counterparty risk is the unrealized appreciation on the swap contract. The fund mitigates its counterparty risk by entering into swaps only with a diverse group of prequalified counterparties, monitoring their financial strength, entering into master netting arrangements with its counterparties, and requiring its counterparties to transfer collateral as security for their performance. In the absence of a default, the collateral pledged or received by the fund cannot be repledged, resold, or rehypothecated. In the event of a counterparty’s default (including bankruptcy), the fund may terminate any swap contracts with that counterparty, determine the net amount owed by either party in accordance with its master netting arrangements, and sell or retain any collateral held up to the net amount owed to the fund under the master netting arrangements. The swap contracts contain provisions whereby a counterparty may terminate open contracts if the fund’s net assets decline below a certain level, triggering a payment by the fund if the fund is in a net liability position at the time of the termination. The payment amount would be reduced by any collateral the fund has pledged. Any securities pledged as collateral for open contracts are noted in the Schedule of Investments. The value of collateral received or pledged is compared daily to the value of the swap contracts exposure with each counterparty, and any difference, if in excess of a specified minimum transfer amount, is adjusted and settled within two business days.
The notional amounts of swap contracts are not recorded in the Statement of Assets and Liabilities. Swaps are valued daily based on market quotations received from independent pricing services or recognized dealers and the change in value is recorded in the Statement of Assets and Liabilities as an asset (liability) and in the Statement of Operations as unrealized appreciation (depreciation) until periodic payments are made or the termination of the swap, at which time realized gain (loss) is recorded.
During the year ended October 31, 2021, the fund’s average amounts of investments in total return swaps represented less than 1% of net assets, based on the average of notional amounts at each quarter-end during the period. The fund had no open swap contracts at October 31, 2021.
6. Federal Income Taxes: The fund intends to continue to qualify as a regulated investment company and distribute all of its taxable income. The fund’s tax returns are open to examination by the relevant tax authorities until expiration of the applicable statute of limitations, which is
International Dividend Appreciation Index Fund
generally three years after the filing of the tax return. Management has analyzed the fund’s tax positions taken for all open federal and state income tax years, and has concluded that no provision for income tax is required in the fund’s financial statements.
7. Distributions: Distributions to shareholders are recorded on the ex-dividend date. Distributions are determined on a tax basis at the fiscal year-end and may differ from net investment income and realized capital gains for financial reporting purposes.
8. Securities Lending: To earn additional income, the fund lends its securities to qualified institutional borrowers. Security loans are subject to termination by the fund at any time, and are required to be secured at all times by collateral in an amount at least equal to the market value of securities loaned. Daily market fluctuations could cause the value of loaned securities to be more or less than the value of the collateral received. When this occurs, the collateral is adjusted and settled before the opening of the market on the next business day. The fund further mitigates its counterparty risk by entering into securities lending transactions only with a diverse group of prequalified counterparties, monitoring their financial strength, and entering into master securities lending agreements with its counterparties. The master securities lending agreements provide that, in the event of a counterparty’s default (including bankruptcy), the fund may terminate any loans with that borrower, determine the net amount owed, and sell or retain the collateral up to the net amount owed to the fund; however, such actions may be subject to legal proceedings. While collateral mitigates counterparty risk, in the event of a default, the fund may experience delays and costs in recovering the securities loaned. The fund invests cash collateral received in Vanguard Market Liquidity Fund, and records a liability in the Statement of Assets and Liabilities for the return of the collateral, during the period the securities are on loan. Collateral investments in Vanguard Market Liquidity Fund are subject to market appreciation or depreciation. Securities lending income represents fees charged to borrowers plus income earned on invested cash collateral, less expenses associated with the loan. During the term of the loan, the fund is entitled to all distributions made on or in respect of the loaned securities.
9. Collateral for ETF Capital Activity: When an authorized participant fails to deliver one or more of the securities within a designated basket (in the case of a subscription), fails to deliver the fund ETF Shares (in the case of a redemption), or is required by the fund, prior to settlement, to accommodate the trading of foreign securities in local markets (in the case of redemption for an international equity ETF), the fund may require the authorized participant to deliver and maintain cash collateral in accordance with the authorized participant agreement. The fund may invest the collateral in short-term debt instruments or U.S. Treasury securities, or maintain the balance as cash. Daily market fluctuations could cause the value of the missing securities or fund ETF Shares to be more or less than the value of the collateral received; when this occurs the collateral is adjusted. The fund earns interest income from investments and/or custody fee offsets from the cash balance. The fund records an asset (cash or investment, as applicable) and a corresponding liability for the return of the collateral in the Statement of Assets and Liabilities. Interest income and custody fee offsets earned on the investment of collateral are included in the Statement of Operations.
10. Credit Facilities and Interfund Lending Program: The fund and certain other funds managed by The Vanguard Group ("Vanguard") participate in a $4.3 billion committed credit facility provided by a syndicate of lenders pursuant to a credit agreement and an uncommitted credit facility provided by Vanguard. Both facilities may be renewed annually. Each fund is individually liable for its borrowings, if any, under the credit facilities. Borrowings may be utilized for temporary or emergency purposes, subject to the fund’s regulatory and contractual borrowing restrictions. With
International Dividend Appreciation Index Fund
respect to the committed credit facility, the participating funds are charged administrative fees and an annual commitment fee of 0.10% of the undrawn committed amount of the facility; these fees are allocated to the funds based on a method approved by the fund’s board of trustees and included in Management and Administrative expenses on the fund’s Statement of Operations. Any borrowings under either facility bear interest at a rate based upon the higher of the one-month London Interbank Offered Rate (or an acceptable alternate rate, if necessary), federal funds effective rate, or overnight bank funding rate plus an agreed-upon spread, except that borrowings under the uncommitted credit facility may bear interest based upon an alternate rate agreed to by the fund and Vanguard.
In accordance with an exemptive order (the “Order”) from the SEC, the fund may participate in a joint lending and borrowing program that allows registered open-end Vanguard funds to borrow money from and lend money to each other for temporary or emergency purposes (the “Interfund Lending Program”), subject to compliance with the terms and conditions of the Order, and to the extent permitted by the fund’s investment objective and investment policies. Interfund loans and borrowings normally extend overnight, but can have a maximum duration of seven days. Loans may be called on one business day’s notice. The interest rate to be charged is governed by the conditions of the Order and internal procedures adopted by the board of trustees. The board of trustees is responsible for overseeing the Interfund Lending Program.
For the year ended October 31, 2021, the fund did not utilize the credit facilities or the Interfund Lending Program.
11. Other: Dividend income is recorded on the ex-dividend date. Non-cash dividends included in income, if any, are recorded at the fair value of the securities received.Interest income includes income distributions received from Vanguard Market Liquidity Fund and is accrued daily. Premiums and discounts on debt securities are amortized and accreted, respectively, to interest income over the lives of the respective securities, except for premiums on certain callable debt securities that are amortized to the earliest call date. Security transactions are accounted for on the date securities are bought or sold. Costs used to determine realized gains (losses) on the sale of investment securities are those of the specific securities sold. Fees assessed on capital share transactions are credited to paid-in capital.
Taxes on foreign dividends and capital gains have been provided for in accordance with the fund’s understanding of the applicable countries’ tax rules and rates. Foreign capital gains tax, if any, is accrued daily based upon applicable net unrealized gains. The fund has filed tax reclaims for previously withheld taxes on dividends earned in certain European Union countries. These filings are subject to various administrative and judicial proceedings within these countries. Such tax reclaims received during the year, if any, are included in dividend income. No other amounts for additional tax reclaims are reflected in the financial statements due to the uncertainty as to the ultimate resolution of proceedings, the likelihood of receipt of these reclaims, and the potential timing of payment.
Each class of shares has equal rights as to assets and earnings, except that each class separately bears certain class-specific expenses related to maintenance of shareholder accounts (included in Management and Administrative expenses) and shareholder reporting. Marketing and distribution expenses are allocated to each class of shares based on a method approved by the board of trustees. Income, other non-class-specific expenses, and gains and losses on investments are allocated to each class of shares based on its relative net assets.
International Dividend Appreciation Index Fund
| B. | In accordance with the terms of a Funds' Service Agreement (the “FSA”) between Vanguard and the fund, Vanguard furnishes to the fund investment advisory, corporate management, administrative, marketing, and distribution services at Vanguard’s cost of operations (as defined by the FSA). These costs of operations are allocated to the fund based on methods and guidelines approved by the board of trustees and are generally settled twice a month. |
Upon the request of Vanguard, the fund may invest up to 0.40% of its net assets as capital in Vanguard. At October 31, 2021, the fund had contributed to Vanguard capital in the amount of $146,000, representing less than 0.01% of the fund’s net assets and 0.06% of Vanguard’s capital received pursuant to the FSA. The fund’s trustees and officers are also directors and employees, respectively, of Vanguard.
| C. | Various inputs may be used to determine the value of the fund’s investments and derivatives. These inputs are summarized in three broad levels for financial statement purposes. The inputs or methodologies used to value securities are not necessarily an indication of the risk associated with investing in those securities. |
Level 1—Quoted prices in active markets for identical securities.
Level 2—Other significant observable inputs (including quoted prices for similar securities, interest rates, prepayment speeds, credit risk, etc.).
Level 3—Significant unobservable inputs (including the fund’s own assumptions used to determine the fair value of investments). Any investments and derivatives valued with significant unobservable inputs are noted on the Schedule of Investments.
The following table summarizes the market value of the fund’s investments and derivatives as of October 31, 2021, based on the inputs used to value them:
| | Level 1
($000) | Level 2
($000) | Level 3
($000) | Total
($000) |
| Investments | | | | |
| Assets | | | | |
| Common Stocks—North and South America | 587,661 | — | — | 587,661 |
| Common Stocks—Other | 69,255 | 3,788,989 | — | 3,858,244 |
| Temporary Cash Investments | 16,951 | — | — | 16,951 |
| Total | 673,867 | 3,788,989 | — | 4,462,856 |
| Derivative Financial Instruments | | | | |
| Assets | | | | |
| Futures Contracts1 | 302 | — | — | 302 |
| Forward Currency Contracts | — | 201 | — | 201 |
| Total | 302 | 201 | — | 503 |
| Liabilities | | | | |
| Futures Contracts1 | 260 | — | — | 260 |
| Forward Currency Contracts | — | 527 | — | 527 |
| Total | 260 | 527 | — | 787 |
| 1 | Includes cumulative appreciation (depreciation) on futures contracts and centrally cleared swaps, if any, as reported in the Schedule of Investments. Only current day’s variation margin is reported within the Statement of Assets and Liabilities. |
International Dividend Appreciation Index Fund
| D. | At October 31, 2021, the fair values of derivatives were reflected in the Statement of Assets and Liabilities as follows: |
| Statement of Assets and Liabilities | Equity
Contracts
($000) | Foreign
Exchange
Contracts
($000) | Total
($000) |
| Unrealized Appreciation—Futures Contracts1 | 302 | — | 302 |
| Unrealized Appreciation—Forward Currency Contracts | — | 201 | 201 |
| Total Assets | 302 | 201 | 503 |
| | | | |
| Unrealized Depreciation—Futures Contracts1 | 260 | — | 260 |
| Unrealized Depreciation—Forward Currency Contracts | — | 527 | 527 |
| Total Liabilities | 260 | 527 | 787 |
| 1 | Includes cumulative appreciation (depreciation) on futures contracts and centrally cleared swaps, if any, as reported in the Schedule of Investments. Only current day’s variation margin is reported within the Statement of Assets and Liabilities. |
Realized net gain (loss) and the change in unrealized appreciation (depreciation) on derivatives for the year ended October 31, 2021, were:
| Realized Net Gain (Loss) on Derivatives | Equity
Contracts
($000) | Foreign
Exchange
Contracts
($000) | Total
($000) |
| Futures Contracts | 2,740 | — | 2,740 |
| Swap Contracts | 576 | — | 576 |
| Forward Currency Contracts | — | 277 | 277 |
| Realized Net Gain (Loss) on Derivatives | 3,316 | 277 | 3,593 |
| Change in Unrealized Appreciation (Depreciation) on Derivatives |
| Futures Contracts | 584 | — | 584 |
| Forward Currency Contracts | — | (266) | (266) |
| Change in Unrealized Appreciation (Depreciation) on Derivatives | 584 | (266) | 318 |
| E. | Permanent differences between book-basis and tax-basis components of net assets are reclassified among capital accounts in the financial statements to reflect their tax character. These reclassifications have no effect on net assets or net asset value per share. As of period end, permanent differences primarily attributable to the accounting for in-kind redemptions, foreign currency transactions, passive foreign investment companies, distributions in connection with fund share redemptions, swap agreements, and tax expense on capital gains were reclassified between the following accounts: |
| | Amount
($000) |
| Paid-in Capital | 100,610 |
| Total Distributable Earnings (Loss) | (100,610) |
Temporary differences between book-basis and tax-basis components of total distributable earnings (loss) arise when certain items of income, gain, or loss are recognized in different periods
International Dividend Appreciation Index Fund
for financial statement and tax purposes; these differences will reverse at some time in the future. The differences are primarily related to the deferral of losses from wash sales; the recognition of unrealized gains or losses from certain derivative contracts; and the recognition of unrealized gains from passive foreign investment companies. As of period end, the tax-basis components of total distributable earnings (loss) are detailed in the table as follows:
| | Amount
($000) |
| Undistributed Ordinary Income | 138,577 |
| Undistributed Long-Term Gains | 130,836 |
| Capital Loss Carryforwards | — |
| Qualified Late-Year Losses | — |
| Net Unrealized Gains (Losses) | 672,570 |
The tax character of distributions paid was as follows:
| | Year Ended October 31, |
| | 2021
Amount
($000) | 2020
Amount
($000) |
| Ordinary Income* | 43,071 | 37,379 |
| Long-Term Capital Gains | — | — |
| Total | 43,071 | 37,379 |
| * | Includes short-term capital gains, if any. |
As of October 31, 2021, gross unrealized appreciation and depreciation for investments and derivatives based on cost for U.S. federal income tax purposes were as follows:
| | Amount
($000) |
| Tax Cost | 3,785,837 |
| Gross Unrealized Appreciation | 794,125 |
| Gross Unrealized Depreciation | (117,248) |
| Net Unrealized Appreciation (Depreciation) | 676,877 |
| F. | During the year ended October 31, 2021, the fund purchased $3,580,415,000 of investment securities and sold $2,609,184,000 of investment securities, other than temporary cash investments. Purchases and sales include $999,582,000 and $212,947,000, respectively, in connection with in-kind purchases and redemptions of the fund's capital shares. |
International Dividend Appreciation Index Fund
| G. | Capital share transactions for each class of shares were: |
| | Year Ended October 31, | |
| | 2021 | | 2020 |
| | Amount
($000) | Shares
(000) | | Amount
($000) | Shares
(000) |
| ETF Shares | | | | | |
| Issued1 | 1,155,426 | 13,632 | | 1,064,328 | 16,112 |
| Issued in Lieu of Cash Distributions | — | — | | — | — |
| Redeemed2 | (212,211) | (2,550) | | — | — |
| Net Increase (Decrease)—ETF Shares | 943,215 | 11,082 | | 1,064,328 | 16,112 |
| Admiral Shares | | | | | |
| Issued1 | 69,649 | 1,698 | | 55,811 | 1,680 |
| Issued in Lieu of Cash Distributions | 2,725 | 66 | | 3,328 | 101 |
| Redeemed2 | (34,165) | (833) | | (58,753) | (1,856) |
| Net Increase (Decrease)—Admiral Shares | 38,209 | 931 | | 386 | (75) |
| 1 | Includes purchase fees for fiscal 2021 and 2020 of $175,000 and $140,000, respectively (fund totals). |
| 2 | Net of redemption fees for fiscal 2021 and 2020 of $80,000 and $129,000, respectively (fund totals). |
| H. | Management has determined that no events or transactions occurred subsequent to October 31, 2021, that would require recognition or disclosure in these financial statements. |
International High Dividend Yield Index Fund
All of the returns in this report represent past performance, which is not a guarantee of future results that may be achieved by the fund. (Current performance may be lower or higher than the performance data cited. For performance data current to the most recent month-end, visit our website at vanguard.com/performance.) Note, too, that both investment returns and principal value can fluctuate widely, so an investor’s shares, when sold, could be worth more or less than their original cost. The returns shown do not reflect taxes that a shareholder would pay on fund distributions or on the sale of fund shares.
Cumulative Performance: February 25, 2016, Through October 31, 2021
Initial Investment of $10,000
| | | Average Annual Total Returns
Periods Ended October 31, 2021 | |
| | | One
Year | Five
Years | Since
Inception
(2/25/2016) | Final Value
of a $10,000
Investment |
| International High Dividend Yield Index Fund
ETF Shares Net Asset Value | 39.55% | 8.05% | 9.45% | $16,697 |
| | International High Dividend Yield Index Fund ETF Shares Market Price | 39.27 | 8.02 | 9.49 | 16,737 |
| FTSE All-World ex US High Dividend Yield Index | 40.19 | 8.28 | 9.87 | 17,072 |
“Since Inception” performance is calculated from the ETF Shares’ inception date for both the fund and its comparative standard(s).
| | | | |
| | | One
Year | Five
Years | Since
Inception
(3/2/2016) | Final Value
of a $10,000
Investment |
International High Dividend Yield Index Fund
Admiral Shares | 38.91% | 7.95% | 8.76% | $16,086 |
| FTSE All-World ex US High Dividend Yield Index | 40.19 | 8.28 | 9.25 | 16,501 |
“Since Inception” performance is calculated from the Admiral Shares’ inception date for both the fund and its comparative standard(s).
Vanguard fund returns are adjusted to reflect the 0.25% fee on purchases and redemptions. The fees do not apply to the ETF Shares.
See Financial Highlights for dividend and capital gains information.
International High Dividend Yield Index Fund
Cumulative Returns of ETF Shares: February 25, 2016, Through October 31, 2021
| | One
Year | Five
Years | Since
Inception
(2/25/2016) |
| International High Dividend Yield Index Fund ETF Shares Market Price | 39.27% | 47.09% | 67.37% |
| International High Dividend Yield Index Fund ETF Shares Net Asset Value | 39.55 | 47.28 | 66.97 |
| FTSE All-World ex US High Dividend Yield Index | 40.19 | 48.83 | 70.72 |
"Since Inception" performance is calculated from the ETF Shares’ inception date for both the fund and its comparative standard(s).
For the ETF Shares, the market price is determined by the midpoint of the bid-offer spread as of the closing time of the New York Stock Exchange (generally 4 p.m., Eastern time). The net asset value is also determined as of the NYSE closing time. For more information about how the ETF Shares' market prices have compared with their net asset value, visit vanguard.com, select your ETF, and then select the Price and Performance tab. The ETF premium/discount analysis there shows the percentages of days on which the ETF Shares' market price was above or below the NAV.
Vanguard fund returns are adjusted to reflect the 0.25% fee on purchases and redemptions. The fees do not apply to the ETF Shares.
International High Dividend Yield Index Fund
| United Kingdom | 13.8% |
| Japan | 11.2 |
| Switzerland | 9.7 |
| Canada | 8.6 |
| Australia | 7.3 |
| Germany | 7.0 |
| China | 5.3 |
| France | 4.7 |
| Taiwan | 4.1 |
| Spain | 2.6 |
| Russia | 2.2 |
| Hong Kong | 1.9 |
| Brazil | 1.9 |
| Italy | 1.9 |
| Sweden | 1.7 |
| Finland | 1.5 |
| India | 1.3 |
| Singapore | 1.3 |
| Saudi Arabia | 1.3 |
| South Korea | 1.3 |
| Netherlands | 1.2 |
| South Africa | 1.2 |
| Other | 7.0 |
The table reflects the fund’s investments, except for short-term investments and derivatives.
The fund may invest in derivatives (such as futures and swap contracts) for various reasons, including, but not limited to, attempting to remain fully invested and tracking its target index as closely as possible.
International High Dividend Yield Index Fund
The fund files its complete schedule of portfolio holdings with the Securities and Exchange Commission (SEC) for the first and third quarters of each fiscal year as an exhibit to its reports on Form N-PORT. The fund’s Form N-PORT reports are available on the SEC’s website at www.sec.gov.
| | | Shares | Market
Value•
($000) |
| Common Stocks (99.3%) |
| Australia (7.3%) |
| | Commonwealth Bank of Australia | 483,207 | 38,300 |
| 1 | BHP Group Ltd. | 834,877 | 22,932 |
| | National Australia Bank Ltd. | 933,881 | 20,304 |
| | Westpac Banking Corp. | 1,035,797 | 20,152 |
| | Australia & New Zealand Banking Group Ltd. | 803,953 | 17,109 |
| 2 | Macquarie Group Ltd. | 93,939 | 13,868 |
| | Wesfarmers Ltd. | 319,584 | 13,827 |
| | Woolworths Group Ltd. | 343,195 | 9,886 |
| | Transurban Group (XASX) | 855,467 | 8,716 |
| | Rio Tinto Ltd. | 106,065 | 7,267 |
| | Amcor plc GDR | 432,259 | 5,232 |
| | Woodside Petroleum Ltd. | 272,063 | 4,756 |
| | Coles Group Ltd. | 361,390 | 4,683 |
| | Fortescue Metals Group Ltd. | 447,994 | 4,668 |
| | Sonic Healthcare Ltd. | 137,485 | 4,172 |
| | ASX Ltd. | 55,188 | 3,471 |
| | Telstra Corp. Ltd. | 1,179,808 | 3,410 |
| | Suncorp Group Ltd. | 367,799 | 3,255 |
| | Brambles Ltd. | 414,032 | 3,141 |
| | Insurance Australia Group Ltd. | 701,516 | 2,542 |
| | Tabcorp Holdings Ltd. | 607,562 | 2,288 |
| | APA Group | 338,522 | 2,100 |
| | Computershare Ltd. (XASX) | 147,307 | 2,096 |
| | Medibank Pvt Ltd. | 802,261 | 2,016 |
| | Origin Energy Ltd. | 484,946 | 1,857 |
| | Endeavour Group Ltd. | 360,376 | 1,852 |
| | Ampol Ltd. | 68,310 | 1,580 |
| | Lendlease Corp. Ltd. | 191,938 | 1,521 |
| | carsales.com Ltd. | 76,269 | 1,427 |
| | Atlas Arteria Ltd. | 286,711 | 1,347 |
| | JB Hi-Fi Ltd. | 34,421 | 1,314 |
| | Orica Ltd. | 113,987 | 1,308 |
| | Aurizon Holdings Ltd. | 510,112 | 1,301 |
| | Evolution Mining Ltd. | 477,061 | 1,295 |
| | Bank of Queensland Ltd. | 181,851 | �� 1,211 |
| | Mineral Resources Ltd. | 40,170 | 1,181 |
| | Alumina Ltd. | 740,755 | 1,120 |
| | Bendigo & Adelaide Bank Ltd. | 157,721 | 1,105 |
| | | Shares | Market
Value•
($000) |
| | Magellan Financial Group Ltd. | 40,390 | 1,062 |
| | Challenger Ltd. | 196,017 | 1,030 |
| | AusNet Services Ltd. | 530,402 | 986 |
| | Downer EDI Ltd. | 205,593 | 983 |
| | Metcash Ltd. | 295,205 | 910 |
| | Worley Ltd. | 105,664 | 868 |
| * | Crown Resorts Ltd. | 101,181 | 763 |
| | AGL Energy Ltd. | 169,544 | 731 |
| | Orora Ltd. | 249,189 | 623 |
| | Harvey Norman Holdings Ltd. | 151,594 | 569 |
| | CSR Ltd. | 123,075 | 552 |
| | IOOF Holdings Ltd. | 163,451 | 506 |
| | CIMIC Group Ltd. | 30,187 | 455 |
| | Deterra Royalties Ltd. | 143,484 | 422 |
| | Perpetual Ltd. | 13,393 | 383 |
| | Adbri Ltd. | 114,914 | 259 |
| | Platinum Asset Management Ltd. | 73,836 | 170 |
| | | | 250,882 |
| Austria (0.1%) |
| | OMV AG | 40,324 | 2,441 |
| | Raiffeisen Bank International AG | 41,475 | 1,212 |
| | ANDRITZ AG | 18,749 | 1,065 |
| | Telekom Austria AG Class A | 32,995 | 285 |
| | | | 5,003 |
| Belgium (0.5%) |
| | KBC Group NV | 77,688 | 7,234 |
| | Groupe Bruxelles Lambert SA | 30,480 | 3,537 |
| | Ageas SA | 50,911 | 2,477 |
| | Solvay SA | 19,971 | 2,374 |
| | Proximus SADP | 41,868 | 788 |
| | Telenet Group Holding NV | 12,988 | 467 |
| | | | 16,877 |
| Brazil (1.9%) |
| | Vale SA | 1,115,038 | 14,148 |
| | Petroleo Brasileiro SA Preference Shares | 1,549,383 | 7,481 |
| | Petroleo Brasileiro SA | 1,078,600 | 5,288 |
| | B3 SA - Brasil Bolsa Balcao | 1,742,714 | 3,678 |
| | Banco Bradesco SA Preference Shares | 914,149 | 3,223 |
International High Dividend Yield Index Fund
| | | Shares | Market
Value•
($000) |
| | Ambev SA | 890,750 | 2,682 |
| | Itau Unibanco Holding SA Preference Shares | 638,307 | 2,636 |
| | Itausa SA Preference Shares | 1,291,262 | 2,345 |
| | Itau Unibanco Holding SA | 487,000 | 1,815 |
| | Itau Unibanco Holding SA ADR | 394,759 | 1,607 |
| | Banco Bradesco SA | 494,042 | 1,488 |
| | Vibra Energia SA | 339,667 | 1,263 |
| | Banco Bradesco SA ADR | 344,668 | 1,206 |
| | Banco Do Brasil SA | 234,618 | 1,185 |
| | Equatorial Energia SA | 253,200 | 1,026 |
| | Ambev SA ADR | 336,922 | 997 |
| | Centrais Eletricas Brasileiras SA | 140,500 | 842 |
| | BB Seguridade Participacoes SA | 194,157 | 760 |
| | Centrais Eletricas Brasileiras SA Preference Shares | 116,500 | 699 |
| | CCR SA | 306,910 | 622 |
| | Banco Santander Brasil SA | 101,602 | 619 |
| | Telefonica Brasil SA ADR | 76,413 | 614 |
| | Cia de Saneamento Basico do Estado de Sao Paulo | 97,800 | 610 |
| | Bradespar SA Preference Shares | 68,147 | 588 |
| | Hypera SA | 111,582 | 555 |
| | Marfrig Global Foods SA | 102,600 | 482 |
| | Energisa SA | 67,500 | 474 |
| | Sul America SA | 102,850 | 473 |
| | Cia Energetica de Minas Gerais ADR | 207,941 | 468 |
| | Metalurgica Gerdau SA Preference Shares | 199,400 | 442 |
| | TIM SA | 211,454 | 420 |
| | Transmissora Alianca de Energia Eletrica SA | 59,919 | 389 |
| | Cia Paranaense de Energia Preference Shares | 356,400 | 374 |
| | Telefonica Brasil SA | 43,718 | 353 |
| * | Azul SA Preference Shares | 75,600 | 333 |
| | Sao Martinho SA | 48,500 | 329 |
| | Engie Brasil Energia SA | 43,416 | 299 |
| | Cia Energetica de Sao Paulo Preference Shares | 64,500 | 291 |
| | CPFL Energia SA | 56,600 | 264 |
| | Cia de Transmissao de Energia Eletrica Paulista Preference Shares | 56,708 | 244 |
| | Neoenergia SA | 85,400 | 235 |
| | Porto Seguro SA | 56,418 | 233 |
| | Fleury SA | 69,263 | 231 |
| | EDP - Energias do Brasil SA | 62,676 | 218 |
| | Odontoprev SA | 90,400 | 215 |
| | Cyrela Brazil Realty SA Empreendimentos e Participacoes | 81,900 | 204 |
| | Cia Brasileira de Distribuicao | 42,700 | 193 |
| | | Shares | Market
Value•
($000) |
| | Cia Energetica de Minas Gerais Preference Shares | 74,424 | 170 |
| | Qualicorp Consultoria e Corretora de Seguros SA | 50,600 | 153 |
| | Cielo SA | 281,484 | 109 |
| * | Getnet Adquirencia e Servicos para Meios de Pagamento SA | 25,000 | 19 |
| | | | 65,592 |
| Canada (8.6%) |
| 1 | Royal Bank of Canada | �� 404,197 | 42,072 |
| | Toronto-Dominion Bank | 514,275 | 37,332 |
| | Enbridge Inc. | 574,293 | 24,056 |
| | Bank of Nova Scotia | 342,746 | 22,471 |
| 1 | Bank of Montreal | 183,035 | 19,873 |
| | TC Energy Corp. | 276,653 | 14,966 |
| | Canadian Imperial Bank of Commerce | 123,290 | 14,960 |
| | Canadian Natural Resources Ltd. | 331,276 | 14,080 |
| | Nutrien Ltd. | 160,590 | 11,224 |
| | Suncor Energy Inc. | 421,347 | 11,082 |
| | Manulife Financial Corp. | 550,356 | 10,722 |
| | Sun Life Financial Inc. | 164,553 | 9,378 |
| | National Bank of Canada | 94,880 | 7,855 |
| | Fortis Inc. (XTSE) | 131,863 | 5,870 |
| | Intact Financial Corp. | 40,326 | 5,406 |
| | Power Corp. of Canada | 155,931 | 5,193 |
| | Pembina Pipeline Corp. | 156,288 | 5,174 |
| | Restaurant Brands International Inc. (XTSE) | 84,677 | 4,794 |
| | Rogers Communications Inc. Class B | 99,909 | 4,647 |
| | BCE Inc. | 85,860 | 4,420 |
| | Shaw Communications Inc. Class B | 121,639 | 3,503 |
| | Fairfax Financial Holdings Ltd. | 7,015 | 2,841 |
| | TELUS Corp. | 122,654 | 2,814 |
| 1 | Canadian Tire Corp. Ltd. Class A | 16,715 | 2,374 |
| | Great-West Lifeco Inc. | 75,236 | 2,213 |
| 3 | Hydro One Ltd. | 91,302 | 2,181 |
| | Imperial Oil Ltd. | 61,253 | 2,074 |
| | Canadian Utilities Ltd. Class A | 36,428 | 1,055 |
| | IGM Financial Inc. | 22,922 | 910 |
| | | | 295,540 |
| Chile (0.1%) |
| | Banco De Chile | 11,882,440 | 1,031 |
| | Banco Santander Chile ADR | 36,034 | 638 |
| | Enel Americas SA | 3,297,733 | 375 |
| | Enel Americas SA ADR | 48,887 | 277 |
| | Enel Chile SA | 5,662,034 | 232 |
| | Embotelladora Andina SA Preference Shares | 101,961 | 211 |
| | CAP SA | 18,370 | 182 |
| | Banco Santander Chile SA | 3,067,368 | 134 |
| | Colbun SA | 1,878,779 | 129 |
| | AES Andes SA | 591,568 | 61 |
| | Enel Chile SA ADR | 11,940 | 26 |
| | | | 3,296 |
International High Dividend Yield Index Fund
| | | Shares | Market
Value•
($000) |
| China (5.2%) |
| | China Construction Bank Corp. Class H | 26,297,000 | 17,897 |
| | Industrial & Commercial Bank of China Ltd. Class H | 22,698,000 | 12,442 |
| | Ping An Insurance Group Co. of China Ltd. Class H | 1,693,000 | 12,126 |
| | China Merchants Bank Co. Ltd. Class H | 987,428 | 8,275 |
| | Bank of China Ltd. Class H | 20,588,000 | 7,286 |
| | China Merchants Bank Co. Ltd. Class A | 499,700 | 4,209 |
| | Great Wall Motor Co. Ltd. Class H | 891,000 | 4,009 |
| | China Life Insurance Co. Ltd. Class H | 2,100,000 | 3,648 |
| | Agricultural Bank of China Class H | 9,443,000 | 3,209 |
| | China Resources Land Ltd. | 814,000 | 3,163 |
| | China Petroleum and Chemical Corp. (Sinopec) Class H | 6,056,000 | 2,951 |
| | PetroChina Co. Ltd. Class H | 5,876,000 | 2,833 |
| 3 | Longfor Group Holdings Ltd. | 521,100 | 2,521 |
| | China Overseas Land & Investment Ltd. | 1,091,500 | 2,407 |
| | Zijin Mining Group Co. Ltd. Class H | 1,694,000 | 2,356 |
| | China Pacific Insurance Group Co. Ltd. Class H | 687,000 | 2,101 |
| | China Shenhua Energy Co. Ltd. Class H | 949,000 | 2,041 |
| 3 | Postal Savings Bank of China Co. Ltd. Class H | 2,733,000 | 1,986 |
| | Country Garden Holdings Co. | 2,089,000 | 1,966 |
| | PICC Property & Casualty Co. Ltd. Class H | 1,980,000 | 1,843 |
| 3 | China Tower Corp. Ltd. Class H | 13,216,000 | 1,713 |
| | CITIC Securities Co. Ltd. Class H | 672,500 | 1,707 |
| | Anhui Conch Cement Co. Ltd. Class H | 324,828 | 1,606 |
| | China Vanke Co. Ltd. Class H | 616,205 | 1,440 |
| | Sunac China Holdings Ltd. | 667,554 | 1,428 |
| | China Resources Power Holdings Co. Ltd. | 550,000 | 1,424 |
| | Bank of Communications Ltd. Class H | 2,385,000 | 1,419 |
| | Citic Pacific Ltd. | 1,409,000 | 1,412 |
| | China National Building Material Co. Ltd. Class H | 1,070,000 | 1,341 |
| | China CITIC Bank Corp. Ltd. Class H | 2,930,320 | 1,285 |
| | Industrial Bank Co. Ltd. Class A | 408,300 | 1,188 |
| | | Shares | Market
Value•
($000) |
| | Hengan International Group Co. Ltd. | 216,343 | 1,131 |
| | Guangdong Investment Ltd. | 880,000 | 1,106 |
| | Bank of China Ltd. Class A | 2,304,700 | 1,098 |
| | East Money Information Co. Ltd. Class A | 195,520 | 1,005 |
| | Weichai Power Co. Ltd. Class H | 552,000 | 988 |
| | Agricultural Bank of China Ltd. Class A | 2,117,356 | 972 |
| | China Petroleum & Chemical Corp. Class A | 1,455,500 | 967 |
| | Kingboard Holdings Ltd. | 220,000 | 959 |
| | Kunlun Energy Co. Ltd. | 1,042,000 | 949 |
| | China Minsheng Banking Corp. Ltd. Class H | 2,305,100 | 914 |
| | Haitong Securities Co. Ltd. Class H | 998,800 | 889 |
| | Guangzhou Automobile Group Co. Ltd. Class H | 934,000 | 882 |
| | Sinopharm Group Co. Ltd. Class H | 370,000 | 879 |
| | China Yangtze Power Co. Ltd. Class A | 254,500 | 846 |
| | Industrial & Commercial Bank of China Ltd. Class A | 1,141,200 | 833 |
| 3 | CGN Power Co. Ltd. Class H | 3,047,000 | 820 |
| | Dongfeng Motor Group Co. Ltd. Class H | 876,000 | 816 |
| | China Pacific Insurance Group Co. Ltd. Class A | 185,700 | 793 |
| | Fosun International Ltd. | 670,000 | 785 |
| | New China Life Insurance Co. Ltd. Class H | 268,133 | 774 |
| | People's Insurance Co. Group of China Ltd. Class H | 2,456,000 | 766 |
| | Shanghai Pudong Development Bank Co. Ltd. Class A | 544,400 | 760 |
| | China Everbright International Ltd. | 1,087,000 | 747 |
| | China Hongqiao Group Ltd. | 647,500 | 719 |
| | China State Construction Engineering Corp. Ltd. Class A | 985,100 | 717 |
| | Yanzhou Coal Mining Co. Ltd. Class H | 472,000 | 700 |
| | Huaneng Power International Inc. Class H | 1,338,000 | 692 |
| 3 | Huatai Securities Co. Ltd. Class H | 464,800 | 691 |
| | Shimao Group Holdings Ltd. | 435,000 | 682 |
| | China Power International Development Ltd. | 1,343,370 | 675 |
| | Guotai Junan Securities Co. Ltd. Class A | 241,000 | 660 |
| | Bosideng International Holdings Ltd. | 818,000 | 634 |
International High Dividend Yield Index Fund
| | | Shares | Market
Value•
($000) |
| | CIFI Holdings Group Co. Ltd. | 1,138,000 | 632 |
| | China Medical System Holdings Ltd. | 372,000 | 630 |
| | SAIC Motor Corp. Ltd. Class A | 196,800 | 625 |
| | Beijing Enterprises Water Group Ltd. | 1,632,000 | 624 |
| | GF Securities Co. Ltd. Class A | 192,700 | 606 |
| | Yangzijiang Shipbuilding Holdings Ltd. | 570,100 | 602 |
| | Far East Horizon Ltd. | 622,000 | 593 |
| | China Galaxy Securities Co. Ltd. Class H | 1,043,500 | 581 |
| | China Merchants Port Holdings Co. Ltd. | 346,000 | 577 |
| | Nine Dragons Paper Holdings Ltd. | 454,000 | 571 |
| | China Jinmao Holdings Group Ltd. | 1,946,000 | 569 |
| | China Resources Cement Holdings Ltd. | 668,000 | 562 |
| | Beijing Enterprises Holdings Ltd. | 142,000 | 546 |
| | China State Construction International Holdings Ltd. | 526,000 | 539 |
| 3 | China Merchants Securities Co. Ltd. Class H | 340,560 | 538 |
| | China Railway Group Ltd. Class A | 636,100 | 522 |
| | Cosco Shipping Ports Ltd. | 614,000 | 511 |
| | CRRC Corp. Ltd. Class H | 1,105,000 | 499 |
| | Seazen Group Ltd. | 624,479 | 494 |
| | GF Securities Co. Ltd. Class H | 287,000 | 487 |
| | Poly Developments and Holdings Group Co. Ltd. Class A | 239,900 | 471 |
| | China Lesso Group Holdings Ltd. | 298,000 | 461 |
| | Shanghai Pharmaceuticals Holding Co. Ltd. Class H | 251,600 | 460 |
| | Anhui Conch Cement Co. Ltd. Class A | 77,300 | 459 |
| | Kingboard Laminates Holdings Ltd. | 284,000 | 445 |
| | China Railway Group Ltd. Class H | 907,000 | 443 |
| | China Construction Bank Corp. Class A | 477,000 | 442 |
| | China Communications Services Corp. Ltd. Class H | 760,000 | 420 |
| | China Shenhua Energy Co. Ltd. Class A | 133,600 | 416 |
| | China Cinda Asset Management Co. Ltd. Class H | 2,421,000 | 404 |
| | Baoshan Iron & Steel Co. Ltd. Class A | 360,200 | 401 |
| | China Coal Energy Co. Ltd. Class H | 620,000 | 378 |
| | | Shares | Market
Value•
($000) |
| | China Everbright Bank Co. Ltd. Class H | 1,034,000 | 364 |
| | Shenzhen International Holdings Ltd. | 297,000 | 358 |
| | Huaxia Bank Co. Ltd. Class A | 404,700 | 356 |
| 3 | A-Living Smart City Services Co. Ltd. | 106,000 | 352 |
| | Zhejiang Expressway Co. Ltd. Class H | 394,000 | 350 |
| | Guangzhou R&F Properties Co. Ltd. Class H | 557,600 | 349 |
| | China Everbright Bank Co. Ltd. Class A | 610,500 | 328 |
| | Agile Group Holdings Ltd. | 396,000 | 310 |
| | China Vanke Co. Ltd. Class A | 108,800 | 309 |
| | Bank of Communications Co. Ltd. Class A | 435,000 | 307 |
| | Sinotruk Hong Kong Ltd. | 221,000 | 305 |
| | Greentown China Holdings Ltd. | 220,500 | 304 |
| | China National Nuclear Power Co. Ltd. Class A | 281,300 | 301 |
| 3 | Dali Foods Group Co. Ltd. | 530,500 | 295 |
| 3 | CSC Financial Co. Ltd. Class H | 277,500 | 293 |
| | Chongqing Rural Commercial Bank Co. Ltd. Class H | 812,000 | 292 |
| | Logan Group Co. Ltd. | 285,000 | 285 |
| | Yuexiu Property Co. Ltd. | 324,600 | 285 |
| * | Brilliance China Automotive Holdings Ltd. | 516,000 | 282 |
| | Zoomlion Heavy Industry Science and Technology Co. Ltd. Class H | 388,600 | 280 |
| | Inner Mongolia Yitai Coal Co. Ltd. Class B | 320,700 | 278 |
| | Kwg Group Holdings Ltd. | 318,000 | 277 |
| | Shaanxi Coal Industry Co. Ltd. Class A | 141,100 | 276 |
| | Jiangsu Expressway Co. Ltd. Class H | 288,000 | 273 |
| | Bank of Nanjing Co. Ltd. Class A | 177,200 | 269 |
| *,2,3 | China Huarong Asset Management Co. Ltd. Class H | 2,028,000 | 266 |
| | Bank of Shanghai Co. Ltd. Class A | 232,733 | 265 |
| 3 | China Railway Signal & Communication Corp. Ltd. Class H | 746,000 | 262 |
| | China Everbright Ltd. | 226,000 | 254 |
| | Huaxin Cement Co. Ltd. Class B | 143,040 | 254 |
| | Metallurgical Corp. of China Ltd. Class H | 906,000 | 251 |
| | Henan Shuanghui Investment & Development Co. Ltd. Class A | 53,700 | 247 |
International High Dividend Yield Index Fund
| | | Shares | Market
Value•
($000) |
| | Shanghai Lujiazui Finance & Trade Zone Development Co. Ltd. Class B | 270,462 | 241 |
| | Bank of Beijing Co. Ltd. Class A | 348,800 | 241 |
| | China Minsheng Banking Corp. Ltd. Class A | 390,600 | 237 |
| | Sinopec Shanghai Petrochemical Co. Ltd. Class H | 1,000,000 | 233 |
| | Huayu Automotive Systems Co. Ltd. Class A | 54,800 | 230 |
| 3 | Guotai Junan Securities Co. Ltd. Class H | 167,000 | 228 |
| | Bank of Hangzhou Co. Ltd. Class A | 102,200 | 228 |
| 3 | Legend Holdings Corp. Class H | 127,200 | 224 |
| | Shougang Fushan Resources Group Ltd. | 846,164 | 223 |
| | Seazen Holdings Co. Ltd. Class A | 39,600 | 212 |
| | Shenzhen Investment Ltd. | 844,000 | 207 |
| | Huadian Power International Corp. Ltd. Class H | 552,000 | 204 |
| | Chongqing Changan Automobile Co. Ltd. Class B | 314,120 | 203 |
| | China Merchants Shekou Industrial Zone Holdings Co. Ltd. Class A | 120,900 | 197 |
| | Sinopec Engineering Group Co. Ltd. Class H | 372,000 | 196 |
| | SDIC Power Holdings Co. Ltd. Class A | 117,900 | 194 |
| | BBMG Corp. Class A | 437,400 | 192 |
| | Hengli Petrochemical Co. Ltd. Class A | 55,100 | 190 |
| 3 | BAIC Motor Corp. Ltd. Class H | 566,500 | 188 |
| | Livzon Pharmaceutical Group Inc. Class H | 57,000 | 188 |
| | Lao Feng Xiang Co. Ltd. Class B | 52,500 | 185 |
| | Guangzhou Baiyunshan Pharmaceutical Holdings Co. Ltd. Class H | 72,000 | 182 |
| | Angang Steel Co. Ltd. Class H | 335,000 | 180 |
| | Dongfang Electric Corp. Ltd. Class H | 109,200 | 174 |
| 3 | Orient Securities Co. Ltd. Class H | 210,000 | 172 |
| | Satellite Chemical Co. Ltd. Class A | 28,040 | 171 |
| | China Reinsurance Group Corp. Class H | 1,638,000 | 170 |
| | LB Group Co. Ltd. Class A | 37,400 | 166 |
| | Sino-Ocean Group Holding Ltd. | 739,500 | 161 |
| * | New Hope Liuhe Co. Ltd. Class A | 71,000 | 160 |
| | | Shares | Market
Value•
($000) |
| | Zoomlion Heavy Industry Science and Technology Co. Ltd. Class A | 140,300 | 159 |
| | China National Chemical Engineering Co. Ltd. Class A | 95,500 | 157 |
| | Sinotrans Ltd. Class H | 471,000 | 155 |
| | COSCO SHIPPING Energy Transportation Co. Ltd. Class A | 156,800 | 145 |
| | Yanzhou Coal Mining Co. Ltd. Class A | 40,500 | 144 |
| | Shanghai International Port Group Co. Ltd. Class A | 158,200 | 140 |
| | China Aoyuan Group Ltd. | 339,000 | 134 |
| | China Evergrande Group | 449,000 | 133 |
| | Metallurgical Corp. of China Ltd. Class A | 209,700 | 133 |
| | Shenzhen Expressway Co. Ltd. Class A | 84,100 | 128 |
| | Shanghai Industrial Holdings Ltd. | 85,000 | 127 |
| | Shanghai Yuyuan Tourist Mart Group Co. Ltd. Class A | 81,800 | 126 |
| * | Hongfa Technology Co. Ltd. Class A | 10,500 | 121 |
| | Sichuan Chuantou Energy Co. Ltd. Class A | 59,400 | 121 |
| | Datang International Power Generation Co. Ltd. Class H | 656,000 | 119 |
| | Yanlord Land Group Ltd. | 129,800 | 108 |
| | Shenzhen Overseas Chinese Town Co. Ltd. Class A | 109,600 | 107 |
| | Shanxi Lu'an Environmental Energy Development Co. Ltd. Class A | 52,100 | 106 |
| | Yifeng Pharmacy Chain Co. Ltd. Class A (XSHG) | 14,130 | 105 |
| | Beijing Capital Eco-Environment Protection Group Co. Ltd. Class A | 199,000 | 105 |
| | Hunan Valin Steel Co. Ltd. Class A | 124,800 | 104 |
| | Times China Holdings Ltd. | 142,000 | 97 |
| | Huaneng Power International Inc. Class A | 78,600 | 95 |
| | Zhejiang Longsheng Group Co. Ltd. Class A | 47,200 | 92 |
| | Maanshan Iron & Steel Co. Ltd. Class A | 139,300 | 92 |
| | Gemdale Corp. Class A | 57,400 | 91 |
| | Beijing Jingneng Clean Energy Co. Ltd. Class H | 302,000 | 91 |
| | Weifu High-Technology Group Co. Ltd. Class B | 47,500 | 90 |
| | Jiangsu Expressway Co. Ltd. Class A | 65,900 | 88 |
International High Dividend Yield Index Fund
| | | Shares | Market
Value•
($000) |
| | Shandong Chenming Paper Holdings Ltd. Class H | 179,000 | 86 |
| 3 | Shenwan Hongyuan Group Co. Ltd. Class H | 324,000 | 82 |
| * | Zhuzhou Kibing Group Co. Ltd. Class A | 32,900 | 82 |
| * | Guangshen Railway Co. Ltd. Class H | 462,000 | 81 |
| | Bank of Jiangsu Co. Ltd. Class A | 82,160 | 81 |
| * | Fujian Sunner Development Co. Ltd. Class A | 22,800 | 80 |
| | Jiayuan International Group Ltd. | 208,000 | 80 |
| | Health & Happiness H&H International Holdings Ltd. | 34,000 | 80 |
| | Yantai Changyu Pioneer Wine Co. Ltd. Class B | 41,400 | 74 |
| | Yonghui Superstores Co. Ltd. Class A | 120,000 | 74 |
| | Maanshan Iron & Steel Co. Ltd. Class H | 170,000 | 72 |
| | China Merchants Energy Shipping Co. Ltd. Class A | 100,440 | 72 |
| | Shenergy Co. Ltd. Class A | 74,100 | 72 |
| | Zhejiang Weixing New Building Materials Co. Ltd. Class A | 24,900 | 70 |
| | Wens Foodstuffs Group Co. Ltd. Class A | 26,100 | 67 |
| | Fujian Funeng Co. Ltd. Class A | 23,900 | 67 |
| | Bank of Changsha Co. Ltd. Class A | 53,300 | 67 |
| | Sinoma International Engineering Co. Class A | 41,200 | 67 |
| | Huaibei Mining Holdings Co. Ltd. Class A | 33,800 | 67 |
| | Pingdingshan Tianan Coal Mining Co. Ltd. Class A | 48,500 | 65 |
| | Greenland Holdings Corp. Ltd. Class A | 99,645 | 64 |
| *,3 | Red Star Macalline Group Corp. Ltd. Class H | 111,672 | 63 |
| | Shanghai Construction Group Co. Ltd. Class A | 121,100 | 62 |
| | Joyoung Co. Ltd. Class A | 16,600 | 61 |
| * | Shan Xi Hua Yang Group New Energy Co. Ltd. Class A | 36,700 | 61 |
| | China CITIC Bank Corp. Ltd. Class A | 82,800 | 59 |
| | Shenzhen Expressway Co. Ltd. Class H | 60,000 | 57 |
| | Shanghai Jinjiang International Hotels Co. Ltd. Class B | 29,200 | 56 |
| | Yutong Bus Co. Ltd. Class A | 31,800 | 56 |
| | Anhui Expressway Co. Ltd. Class H | 92,000 | 55 |
| | | Shares | Market
Value•
($000) |
| | Intco Medical Technology Co. Ltd. Class A | 6,900 | 55 |
| | Huadian Power International Corp. Ltd. Class A | 74,000 | 51 |
| | Shenzhen Jinjia Group Co. Ltd. Class A | 29,400 | 50 |
| | Jiangxi Zhengbang Technology Co. Ltd. Class A | 32,200 | 50 |
| * | Jinduicheng Molybdenum Co. Ltd. Class A | 44,000 | 50 |
| * | Suning Universal Co. Ltd. Class A | 65,600 | 49 |
| | Bank of Chengdu Co. Ltd. Class A | 24,400 | 49 |
| * | China Zheshang Bank Co. Ltd. Class A | 91,600 | 49 |
| | Xiamen C & D Inc. Class A | 39,100 | 49 |
| | Inner Mongolia MengDian HuaNeng Thermal Power Corp. Ltd. Class A | 85,400 | 48 |
| | Jinke Properties Group Co. Ltd. Class A | 66,500 | 46 |
| | Guangxi Guiguan Electric Power Co. Ltd. Class A | 51,300 | 46 |
| | Huolinhe Opencut Coal Industry Corp. Ltd. of Inner Mongolia Class A | 22,900 | 45 |
| | Financial Street Holdings Co. Ltd. Class A | 48,800 | 45 |
| * | Shenzhen Gas Corp. Ltd. Class A | 31,300 | 44 |
| | Shanghai Tunnel Engineering Co. Ltd. Class A | 55,300 | 44 |
| | China South Publishing & Media Group Co. Ltd. Class A | 33,100 | 42 |
| | Guizhou Panjiang Refined Coal Co. Ltd. Class A | 33,200 | 40 |
| | Sansteel Minguang Co. Ltd. Fujian Class A | 36,500 | 39 |
| | RiseSun Real Estate Development Co. Ltd. Class A | 58,800 | 39 |
| | Zhejiang Runtu Co. Ltd. Class A | 27,500 | 38 |
| | Sinopec Shanghai Petrochemical Co. Ltd. Class A | 61,800 | 38 |
| | Guangxi Liugong Machinery Co. Ltd. Class A | 30,900 | 36 |
| | Shanghai AJ Group Co. Ltd. Class A | 35,400 | 36 |
| | Chongqing Rural Commercial Bank Co. Ltd. Class A | 58,700 | 35 |
| | Shanghai Pharmaceuticals Holding Co. Ltd. Class A | 11,900 | 35 |
International High Dividend Yield Index Fund
| | | Shares | Market
Value•
($000) |
| | Shanghai Lujiazui Finance & Trade Zone Development Co. Ltd. Class A | 20,800 | 35 |
| | Chongqing Water Group Co. Ltd. Class A | 39,200 | 34 |
| | Liuzhou Iron & Steel Co. Ltd. Class A | 38,900 | 33 |
| | Chinese Universe Publishing and Media Group Co. Ltd. Class A | 19,500 | 32 |
| | Tangshan Jidong Cement Co. Ltd. Class A | 17,300 | 31 |
| | North Huajin Chemical Industries Co. Ltd. Class A | 33,200 | 31 |
| | Zhejiang Medicine Co. Ltd. Class A | 12,600 | 31 |
| | Nanjing Iron & Steel Co. Ltd. Class A | 54,500 | 30 |
| | Jiangsu Zhongnan Construction Group Co. Ltd. Class A | 49,400 | 30 |
| | Beijing Capital Development Co. Ltd. Class A | 39,400 | 30 |
| | Zhejiang Semir Garment Co. Ltd. Class A | 24,400 | 29 |
| 3 | Everbright Securities Co. Ltd. Class H | 37,400 | 29 |
| * | China Fortune Land Development Co. Ltd. Class A | 49,920 | 29 |
| | Huafa Industrial Co. Ltd. Zhuhai Class A | 35,200 | 29 |
| | Hangzhou Binjiang Real Estate Group Co. Ltd. Class A | 44,100 | 28 |
| | Jointo Energy Investment Co. Ltd. Hebei Class A | 35,400 | 28 |
| | Yango Group Co. Ltd. Class A | 54,400 | 27 |
| | Shanghai Shimao Co. Ltd. Class A | 54,300 | 27 |
| | China Railway Signal & Communication Corp. Ltd. Class A | 15,960 | 12 |
| * | Sichuan Languang Development Co. Ltd. Class A | 35,000 | 9 |
| | | | 181,248 |
| Colombia (0.1%) |
| | Ecopetrol SA ADR | 64,827 | 982 |
| | Interconexion Electrica SA ESP | 123,013 | 739 |
| | Cementos Argos SA | 157,203 | 265 |
| | Grupo Argos SA | 69,681 | 218 |
| | Grupo Aval Acciones y Valores SA Preference Shares | 613,904 | 188 |
| | Grupo Aval Acciones y Valores SA ADR | 18,290 | 110 |
| | Ecopetrol SA | 76,239 | 58 |
| | | | 2,560 |
| Czech Republic (0.1%) |
| | CEZ A/S | 50,146 | 1,656 |
| | | Shares | Market
Value•
($000) |
| *,3 | Moneta Money Bank A/S | 95,117 | 372 |
| | O2 Czech Republic A/S | 4,225 | 49 |
| | | | 2,077 |
| Denmark (0.1%) |
| | Danske Bank A/S | 183,587 | 3,106 |
| | Tryg A/S | 84,897 | 2,015 |
| | | | 5,121 |
| Egypt (0.0%) |
| * | Egypt Kuwait Holding Co. SAE | 218,283 | 297 |
| * | Egypt Kuwait Holding Co. SAE (XCAI) | 175,008 | 242 |
| | Eastern Co. SAE | 309,033 | 228 |
| | ElSewedy Electric Co. | 129,404 | 71 |
| | Telecom Egypt Co. | 63,313 | 55 |
| | | | 893 |
| Finland (1.5%) |
| | Nordea Bank Abp (XHEL) | 1,043,529 | 12,768 |
| | Sampo OYJ Class A | 141,173 | 7,505 |
| | Kone OYJ Class B | 109,563 | 7,472 |
| | UPM-Kymmene OYJ | 152,007 | 5,365 |
| | Fortum OYJ | 122,387 | 3,640 |
| | Stora Enso OYJ Class R | 161,866 | 2,693 |
| | Kesko OYJ Class B | 78,547 | 2,556 |
| | Elisa OYJ | 41,346 | 2,495 |
| | Wartsila OYJ Abp | 137,653 | 1,909 |
| | Metso Outotec OYJ | 175,581 | 1,764 |
| | Nokian Renkaat OYJ | 40,780 | 1,531 |
| | Orion OYJ Class B | 31,178 | 1,350 |
| | | | 51,048 |
| France (4.7%) |
| | TotalEnergies SE | 688,045 | 34,454 |
| | Sanofi | 308,680 | 31,005 |
| | AXA SA | 539,098 | 15,684 |
| | Vinci SA | 140,952 | 15,069 |
| | Danone SA | 169,733 | 11,064 |
| | Societe Generale SA | 220,326 | 7,360 |
| | Orange SA | 534,588 | 5,830 |
| | Veolia Environnement SA | 172,362 | 5,629 |
| | Credit Agricole SA | 347,964 | 5,250 |
| | Engie SA (XPAR) | 333,686 | 4,747 |
| | Publicis Groupe SA | 64,357 | 4,320 |
| | Carrefour SA | 178,786 | 3,237 |
| | Suez SA | 109,768 | 2,499 |
| | Bouygues SA | 60,803 | 2,463 |
| | Electricite de France SA (XPAR) | 144,166 | 2,125 |
| | Engie SA Loyalty Shares | 132,130 | 1,880 |
| | Rexel SA | 85,892 | 1,707 |
| | SCOR SE | 45,607 | 1,535 |
| 3 | Amundi SA | 16,194 | 1,443 |
| | CNP Assurances | 47,843 | 1,199 |
| | Wendel SE | 7,675 | 1,022 |
| | TechnipFMC plc (XNYS) | 132,497 | 986 |
| | Rubis SCA | 28,054 | 899 |
| | Imerys SA | 11,755 | 509 |
| 3 | ALD SA | 26,538 | 396 |
| | | | 162,312 |
| Germany (7.0%) |
| | Siemens AG (Registered) | 212,728 | 34,586 |
| | Allianz SE (Registered) | 116,268 | 26,999 |
| | Daimler AG (Registered) | 237,957 | 23,620 |
International High Dividend Yield Index Fund
| | | Shares | Market
Value•
($000) |
| | BASF SE | 258,537 | 18,608 |
| | Deutsche Telekom AG (Registered) | 922,746 | 17,160 |
| | Deutsche Post AG (Registered) | 276,693 | 17,129 |
| | Bayer AG (Registered) | 278,404 | 15,690 |
| | Volkswagen AG Preference Shares | 53,437 | 11,993 |
| | Muenchener Rueckversicherungs-Gesellschaft AG in Muenchen (Registered) | 39,455 | 11,682 |
| | Vonovia SE | 162,293 | 9,845 |
| | Bayerische Motoren Werke AG | 90,438 | 9,137 |
| | E.ON SE | 610,487 | 7,741 |
| | RWE AG | 176,501 | 6,794 |
| | Porsche Automobil Holding SE Preference Shares | 42,673 | 4,441 |
| | HeidelbergCement AG | 43,295 | 3,260 |
| 3 | Covestro AG | 50,793 | 3,253 |
| | Hannover Rueck SE | 17,195 | 3,140 |
| | LEG Immobilien SE (XETR) | 20,502 | 3,049 |
| | Volkswagen AG | 7,984 | 2,596 |
| | Aroundtown SA | 333,697 | 2,319 |
| | Evonik Industries AG | 56,117 | 1,818 |
| | Bayerische Motoren Werke AG Preference Shares | 17,948 | 1,530 |
| | Uniper SE | 28,452 | 1,258 |
| | Rheinmetall AG | 12,326 | 1,196 |
| | Talanx AG | 12,946 | 623 |
| | Telefonica Deutschland Holding AG | 223,669 | 583 |
| 3 | DWS Group GmbH & Co. KGaA | 10,759 | 465 |
| | HOCHTIEF AG | 5,558 | 429 |
| | METRO AG | 33,094 | 418 |
| | Traton SE | 14,018 | 362 |
| | | | 241,724 |
| Greece (0.1%) |
| | Hellenic Telecommunications Organization SA | 68,906 | 1,224 |
| | OPAP SA | 60,265 | 941 |
| | Mytilineos SA | 27,105 | 495 |
| | JUMBO SA | 27,428 | 408 |
| * | Motor Oil Hellas Corinth Refineries SA | 18,252 | 310 |
| | | | 3,378 |
| Hong Kong (1.9%) |
| | Sun Hung Kai Properties Ltd. | 408,500 | 5,416 |
| | CK Hutchison Holdings Ltd. | 738,000 | 4,948 |
| | Hong Kong & China Gas Co. Ltd. | 3,054,400 | 4,745 |
| | CLP Holdings Ltd. | 470,000 | 4,602 |
| | Hang Seng Bank Ltd. | 203,600 | 3,869 |
| | CK Asset Holdings Ltd. | 558,564 | 3,450 |
| | Jardine Matheson Holdings Ltd. | 57,000 | 3,311 |
| | BOC Hong Kong Holdings Ltd. | 1,019,500 | 3,231 |
| | | Shares | Market
Value•
($000) |
| | Wharf Real Estate Investment Co. Ltd. | 476,000 | 2,689 |
| | Power Assets Holdings Ltd. | 388,599 | 2,375 |
| | Lenovo Group Ltd. | 2,096,000 | 2,276 |
| | New World Development Co. Ltd. | 435,750 | 1,890 |
| | Hongkong Land Holdings Ltd. | 337,300 | 1,863 |
| | Henderson Land Development Co. Ltd. | 411,587 | 1,723 |
| | Xinyi Glass Holdings Ltd. | 578,000 | 1,629 |
| | Wharf Holdings Ltd. | 399,000 | 1,387 |
| | Hang Lung Properties Ltd. | 558,576 | 1,296 |
| | Want Want China Holdings Ltd. | 1,665,000 | 1,291 |
| | Sino Land Co. Ltd. | 950,000 | 1,249 |
| 3 | WH Group Ltd. | 1,759,599 | 1,234 |
| | SITC International Holdings Co. Ltd. | 354,000 | 1,196 |
| | CK Infrastructure Holdings Ltd. | 185,972 | 1,121 |
| | Swire Pacific Ltd. Class A | 173,288 | 1,089 |
| | Tingyi Cayman Islands Holding Corp. | 574,000 | 1,071 |
| | Chow Tai Fook Jewellery Group Ltd. | 505,200 | 1,030 |
| | Swire Properties Ltd. | 302,698 | 812 |
| | PCCW Ltd. | 1,248,793 | 643 |
| | Bank of East Asia Ltd. | 381,980 | 627 |
| 3 | BOC Aviation Ltd. | 61,600 | 539 |
| | Kerry Properties Ltd. | 184,500 | 522 |
| | Hysan Development Co. Ltd. | 149,000 | 517 |
| | NagaCorp Ltd. | 418,000 | 384 |
| | NWS Holdings Ltd. | 361,000 | 359 |
| | VTech Holdings Ltd. | 39,900 | 307 |
| | Lee & Man Paper Manufacturing Ltd. | 372,000 | 280 |
| | Dairy Farm International Holdings Ltd. | 76,100 | 272 |
| | Uni-President China Holdings Ltd. | 319,000 | 272 |
| | First Pacific Co. Ltd. | 622,000 | 248 |
| | Towngas China Co. Ltd. | 309,185 | 212 |
| | Haitong International Securities Group Ltd. | 678,000 | 156 |
| | Swire Pacific Ltd. Class B | 137,500 | 144 |
| * | Shun Tak Holdings Ltd. | 478,000 | 131 |
| | Cafe de Coral Holdings Ltd. | 62,000 | 113 |
| | Dah Sing Banking Group Ltd. | 106,000 | 101 |
| | Shui On Land Ltd. | 672,500 | 100 |
| | Guotai Junan International Holdings Ltd. | 427,000 | 62 |
| | Hutchison Telecommunications Hong Kong Holdings Ltd. | 152,000 | 24 |
| | | | 66,806 |
International High Dividend Yield Index Fund
| | | Shares | Market
Value•
($000) |
| Hungary (0.0%) |
| | Magyar Telekom Telecommunications plc | 74,516 | 103 |
| India (1.3%) |
| | Infosys Ltd. | 1,018,116 | 22,784 |
| | ITC Ltd. | 835,816 | 2,495 |
| | Power Grid Corp. of India Ltd. | 897,389 | 2,223 |
| | NTPC Ltd. | 1,251,305 | 2,222 |
| | Oil & Natural Gas Corp. Ltd. | 866,577 | 1,724 |
| | Bharat Petroleum Corp. Ltd. | 283,266 | 1,584 |
| | Vedanta Ltd. | 355,189 | 1,445 |
| | Indian Oil Corp. Ltd. | 754,214 | 1,291 |
| | Indus Towers Ltd. | 341,838 | 1,243 |
| | Hero MotoCorp Ltd. | 34,753 | 1,235 |
| | Coal India Ltd. | 518,566 | 1,141 |
| | Mphasis Ltd. | 25,105 | 1,089 |
| | Gail India Ltd. | 489,885 | 975 |
| | Hindustan Petroleum Corp. Ltd. | 188,856 | 784 |
| | Petronet LNG Ltd. | 213,838 | 656 |
| | Power Finance Corp. Ltd. | 347,114 | 619 |
| | REC Ltd. | 253,207 | 504 |
| | NMDC Ltd. | 213,086 | 409 |
| | Oracle Financial Services Software Ltd. | 5,872 | 348 |
| | Oil India Ltd. | 98,748 | 297 |
| | Hindustan Zinc Ltd. | 61,246 | 255 |
| | NHPC Ltd. | 605,235 | 248 |
| | Castrol India Ltd. | 130,757 | 242 |
| | Sun TV Network Ltd. | 27,777 | 209 |
| | | | 46,022 |
| Indonesia (0.5%) |
| | Bank Rakyat Indonesia Persero Tbk PT | 18,231,859 | 5,473 |
| | Telkom Indonesia Persero Tbk PT | 13,180,200 | 3,523 |
| | Bank Mandiri Persero Tbk PT | 5,315,900 | 2,687 |
| | Astra International Tbk PT | 5,812,800 | 2,476 |
| | United Tractors Tbk PT | 449,404 | 747 |
| | Indofood Sukses Makmur Tbk PT | 1,354,500 | 608 |
| | Indofood CBP Sukses Makmur Tbk PT | 587,400 | 365 |
| | Indocement Tunggal Prakarsa Tbk PT | 383,400 | 320 |
| | Hanjaya Mandala Sampoerna Tbk PT | 2,391,000 | 175 |
| | Bukit Asam Tbk PT | 875,900 | 166 |
| | Bank Danamon Indonesia Tbk PT | 153,600 | 29 |
| | | | 16,569 |
| Israel (0.3%) |
| | Bank Leumi Le-Israel BM | 413,969 | 3,955 |
| | Bank Hapoalim BM | 336,733 | 3,317 |
| | ICL Group Ltd. | 196,593 | 1,685 |
| | Gazit-Globe Ltd. | 11,649 | 94 |
| | | | 9,051 |
| | | Shares | Market
Value•
($000) |
| Italy (1.8%) |
| | Enel SpA | 2,196,622 | 18,390 |
| | Intesa Sanpaolo SpA | 4,670,143 | 13,273 |
| | Eni SpA | 707,468 | 10,140 |
| | Assicurazioni Generali SpA | 356,599 | 7,765 |
| | Snam SpA (MTAA) | 625,283 | 3,541 |
| | Terna - Rete Elettrica Nazionale | 399,051 | 2,973 |
| 3 | Poste Italiane SpA | 132,019 | 1,886 |
| 3 | Infrastrutture Wireless Italiane SpA | 95,766 | 1,058 |
| | A2A SpA | 478,189 | 1,006 |
| | Banca Mediolanum SpA | 83,609 | 843 |
| | Italgas SpA | 132,146 | 840 |
| | Hera SpA | 191,166 | 782 |
| | Telecom Italia SpA Savings Shares | 1,791,084 | 681 |
| | UnipolSai Assicurazioni SpA | 142,316 | 412 |
| | | | 63,590 |
| Japan (11.1%) |
| | Toyota Motor Corp. | 3,486,165 | 61,510 |
| | Mitsubishi UFJ Financial Group Inc. | 3,506,100 | 19,226 |
| | KDDI Corp. | 474,000 | 14,495 |
| | Honda Motor Co. Ltd. | 481,000 | 14,227 |
| | Takeda Pharmaceutical Co. Ltd. | 433,700 | 12,172 |
| | Sumitomo Mitsui Financial Group Inc. | 367,754 | 11,933 |
| | ITOCHU Corp. | 379,884 | 10,835 |
| | Mitsubishi Corp. | 339,600 | 10,799 |
| | Softbank Corp. | 767,982 | 10,483 |
| | Mitsui & Co. Ltd. | 452,312 | 10,351 |
| | Tokio Marine Holdings Inc. | 181,634 | 9,567 |
| | Nippon Telegraph & Telephone Corp. | 341,400 | 9,566 |
| | Mizuho Financial Group Inc. | 714,320 | 9,428 |
| | Bridgestone Corp. | 161,500 | 7,145 |
| | ORIX Corp. | 339,500 | 6,748 |
| | Japan Tobacco Inc. | 332,100 | 6,519 |
| | Canon Inc. | 281,100 | 6,392 |
| | Dai-ichi Life Holdings Inc. | 297,400 | 6,257 |
| | Daiwa House Industry Co. Ltd. | 180,800 | 5,965 |
| | Japan Post Holdings Co. Ltd. | 640,161 | 4,919 |
| | Sumitomo Corp. | 318,538 | 4,539 |
| | MS&AD Insurance Group Holdings Inc. | 131,000 | 4,232 |
| | Sompo Holdings Inc. | 95,500 | 4,142 |
| | Nomura Holdings Inc. | 851,500 | 4,055 |
| | Marubeni Corp. | 450,900 | 3,826 |
| | Asahi Kasei Corp. | 355,900 | 3,739 |
| | Kirin Holdings Co. Ltd. | 214,000 | 3,725 |
| | Sekisui House Ltd. | 165,202 | 3,435 |
| | ENEOS Holdings Inc. | 851,005 | 3,431 |
| | Sumitomo Mitsui Trust Holdings Inc. | 102,600 | 3,375 |
| | Nippon Yusen KK | 45,200 | 3,257 |
| | Subaru Corp. | 165,009 | 3,237 |
| | Mitsubishi Chemical Holdings Corp. | 360,500 | 2,984 |
International High Dividend Yield Index Fund
| | | Shares | Market
Value•
($000) |
| | Sumitomo Electric Industries Ltd. | 215,000 | 2,854 |
| | Toyota Tsusho Corp. | 62,000 | 2,689 |
| | AGC Inc. | 51,800 | 2,579 |
| | Daiwa Securities Group Inc. | 435,914 | 2,449 |
| | Yamaha Motor Co. Ltd. | 85,300 | 2,378 |
| | Resona Holdings Inc. | 617,000 | 2,318 |
| | Daito Trust Construction Co. Ltd. | 17,800 | 2,207 |
| | Sumitomo Chemical Co. Ltd. | 438,700 | 2,161 |
| | Inpex Corp. | 257,900 | 2,151 |
| | Mitsubishi Heavy Industries Ltd. | 83,900 | 2,146 |
| | Chubu Electric Power Co. Inc. | 203,400 | 2,105 |
| | T&D Holdings Inc. | 153,300 | 1,966 |
| | Dai Nippon Printing Co. Ltd. | 79,100 | 1,960 |
| * | Trend Micro Inc. | 34,500 | 1,950 |
| | Kansai Electric Power Co. Inc. | 208,800 | 1,922 |
| | Lixil Corp. | 73,800 | 1,896 |
| | Idemitsu Kosan Co. Ltd. | 65,353 | 1,785 |
| | Aisin Corp. | 47,700 | 1,745 |
| | SBI Holdings Inc. | 66,700 | 1,729 |
| | Obayashi Corp. | 188,000 | 1,587 |
| | Kajima Corp. | 126,900 | 1,562 |
| | Taisei Corp. | 49,600 | 1,556 |
| | Mitsui Chemicals Inc. | 49,300 | 1,466 |
| | Seiko Epson Corp. | 79,900 | 1,423 |
| | Tosoh Corp. | 80,900 | 1,362 |
| | Concordia Financial Group Ltd. | 332,300 | 1,321 |
| | Shimizu Corp. | 153,300 | 1,123 |
| | Chiba Bank Ltd. | 181,000 | 1,122 |
| | Marui Group Co. Ltd. | 57,200 | 1,122 |
| | Hulic Co. Ltd. | 116,486 | 1,120 |
| | Mitsubishi Gas Chemical Co. Inc. | 51,700 | 1,041 |
| | Iida Group Holdings Co. Ltd. | 42,200 | 1,040 |
| | Kyushu Electric Power Co. Inc. | 143,200 | 1,009 |
| | Haseko Corp. | 76,386 | 995 |
| | Japan Post Bank Co. Ltd. | 126,348 | 986 |
| | Kuraray Co. Ltd. | 105,600 | 956 |
| | Tohoku Electric Power Co. Inc. | 144,500 | 938 |
| | Denka Co. Ltd. | 27,000 | 884 |
| | Amada Co. Ltd. | 88,700 | 876 |
| | Nomura Real Estate Holdings Inc. | 35,800 | 873 |
| | NGK Spark Plug Co. Ltd. | 54,000 | 863 |
| | Fukuoka Financial Group Inc. | 47,700 | 857 |
| | Mitsubishi HC Capital Inc. (XTKS) | 166,620 | 835 |
| | Tokyo Tatemono Co. Ltd. | 56,000 | 823 |
| | Aozora Bank Ltd. | 35,000 | 801 |
| | Chugoku Electric Power Co. Inc. | 95,835 | 795 |
| | EXEO Group Inc. | 31,300 | 723 |
| | DIC Corp. | 27,100 | 717 |
| | Konica Minolta Inc. | 135,300 | 670 |
| | J Front Retailing Co. Ltd. | 69,600 | 645 |
| | | Shares | Market
Value•
($000) |
| | Electric Power Development Co. Ltd. | 48,700 | 644 |
| | Nippon Electric Glass Co. Ltd. | 24,700 | 631 |
| | Sanwa Holdings Corp. | 54,100 | 631 |
| | Mebuki Financial Group Inc. | 307,600 | 630 |
| | Lawson Inc. | 12,600 | 609 |
| | Teijin Ltd. | 44,500 | 597 |
| | Sumitomo Rubber Industries Ltd. | 47,700 | 588 |
| | Yokohama Rubber Co. Ltd. | 33,400 | 565 |
| | Penta-Ocean Construction Co. Ltd. | 79,800 | 550 |
| | Ube Industries Ltd. | 28,900 | 538 |
| | Credit Saison Co. Ltd. | 43,400 | 532 |
| | Daicel Corp. | 69,300 | 519 |
| | Hachijuni Bank Ltd. | 154,500 | 516 |
| | Kaneka Corp. | 13,300 | 510 |
| | Hirogin Holdings Inc. | 84,900 | 468 |
| | Seven Bank Ltd. | 219,700 | 464 |
| | Aica Kogyo Co. Ltd. | 13,800 | 423 |
| | Yamaguchi Financial Group Inc. | 73,700 | 411 |
| | Kaken Pharmaceutical Co. Ltd. | 10,200 | 402 |
| | AEON Financial Service Co. Ltd. | 31,600 | 401 |
| | Cosmo Energy Holdings Co. Ltd. | 17,500 | 358 |
| | Toda Corp. | 54,100 | 341 |
| | H.U. Group Holdings Inc. | 12,800 | 316 |
| | Kyudenko Corp. | 9,700 | 308 |
| | Sankyo Co. Ltd. | 12,100 | 294 |
| | Yamato Kogyo Co. Ltd. | 7,900 | 265 |
| | Lintec Corp. | 11,800 | 263 |
| | Toyota Boshoku Corp. | 13,600 | 261 |
| | Heiwa Corp. | 14,300 | 255 |
| | Tokuyama Corp. | 14,900 | 255 |
| | Shikoku Electric Power Co. Inc. | 37,400 | 244 |
| | Fuyo General Lease Co. Ltd. | 3,700 | 240 |
| | Matsui Securities Co. Ltd. | 29,600 | 212 |
| | Noevir Holdings Co. Ltd. | 2,900 | 142 |
| | Kandenko Co. Ltd. | 17,500 | 136 |
| | Tokai Rika Co. Ltd. | 9,100 | 127 |
| | Fuji Media Holdings Inc. | 6,500 | 67 |
| | Gunma Bank Ltd. | 600 | 2 |
| | SKY Perfect JSAT Holdings Inc. | 300 | 1 |
| | | | 384,311 |
| Kuwait (0.3%) |
| | National Bank of Kuwait SAKP | 1,927,146 | 6,336 |
| | Mobile Telecommunications Co. KSCP | 607,430 | 1,203 |
| | Humansoft Holding Co. KSC | 31,304 | 347 |
| | Gulf Bank KSCP | 407,216 | 333 |
| | Boubyan Petrochemicals Co. KSCP | 100,196 | 306 |
| | Burgan Bank SAK | 156,808 | 124 |
| | | | 8,649 |
International High Dividend Yield Index Fund
| | | Shares | Market
Value•
($000) |
| Malaysia (0.7%) |
| | Public Bank Bhd. | 4,423,200 | 4,456 |
| | Malayan Banking Bhd. | 1,735,397 | 3,376 |
| | Tenaga Nasional Bhd. | 1,140,733 | 2,661 |
| | CIMB Group Holdings Bhd. | 1,976,700 | 2,494 |
| | Axiata Group Bhd. | 1,239,100 | 1,184 |
| | DiGi.Com Bhd. | 1,011,300 | 1,035 |
| | Top Glove Corp. Bhd. | 1,431,700 | 940 |
| | Maxis Bhd. | 787,000 | 888 |
| | Hong Leong Bank Bhd. | 175,900 | 800 |
| | MISC Bhd. | 461,744 | 790 |
| | Genting Bhd. | 630,400 | 789 |
| | Petronas Gas | 163,532 | 662 |
| | Sime Darby Bhd. | 1,029,600 | 565 |
| | RHB Bank Bhd. | 415,000 | 560 |
| | Genting Malaysia Bhd. | 724,100 | 555 |
| | Hartalega Holdings Bhd. | 387,500 | 549 |
| | Petronas Dagangan Bhd. | 96,500 | 474 |
| | AMMB Holdings Bhd. | 511,000 | 415 |
| | Westports Holdings Bhd. | 253,900 | 274 |
| | British American Tobacco Malaysia Bhd. | 49,600 | 181 |
| | Supermax Corporation Bhd. | 385,400 | 179 |
| | Sime Darby Property Bhd. | 865,700 | 152 |
| | Astro Malaysia Holdings Bhd. | 288,500 | 69 |
| | | | 24,048 |
| Mexico (0.6%) |
| | America Movil SAB de CV Series L | 8,435,700 | 7,519 |
| | Wal-Mart de Mexico SAB de CV | 1,467,535 | 5,119 |
| | Grupo Mexico SAB de CV Series B | 894,900 | 3,926 |
| | Grupo Aeroportuario del Pacifico SAB de CV Class B | 104,154 | 1,313 |
| | Coca-Cola Femsa SAB de CV | 165,855 | 894 |
| | Orbia Advance Corp. SAB de CV | 270,100 | 702 |
| | Alfa SAB de CV Class A | 715,700 | 518 |
| | Promotora y Operadora de Infraestructura SAB de CV | 64,015 | 471 |
| | Kimberly-Clark de Mexico SAB de CV Class A | 204,600 | 323 |
| | Megacable Holdings SAB de CV | 87,600 | 258 |
| | Banco Santander Mexico SA Institucion de Banca Multiple Grupo Financiero Santand | 119,900 | 153 |
| | Grupo Lala SAB de CV | 300 | — |
| | | | 21,196 |
| Netherlands (1.2%) |
| | ING Groep NV | 1,102,699 | 16,727 |
| | Koninklijke Ahold Delhaize NV | 280,024 | 9,110 |
| | NN Group NV | 86,481 | 4,623 |
| | Koninklijke KPN NV | 958,505 | 2,864 |
| | Aegon NV | 506,898 | 2,571 |
| | | Shares | Market
Value•
($000) |
| | Randstad NV | 30,252 | 2,173 |
| | ASR Nederland NV | 40,514 | 1,894 |
| 3 | Signify NV | 35,346 | 1,713 |
| | Koninklijke Vopak NV | 18,819 | 749 |
| | | | 42,424 |
| New Zealand (0.2%) |
| | Spark New Zealand Ltd. | 543,910 | 1,781 |
| | Meridian Energy Ltd. | 357,037 | 1,279 |
| | Contact Energy Ltd. | 210,263 | 1,234 |
| | Fletcher Building Ltd. | 220,132 | 1,132 |
| | Mercury NZ Ltd. | 203,032 | 893 |
| | | | 6,319 |
| Norway (0.9%) |
| | Equinor ASA | 273,347 | 6,926 |
| | DNB Bank ASA | 290,870 | 6,922 |
| | Mowi ASA | 123,190 | 3,572 |
| | Telenor ASA | 179,480 | 2,836 |
| | Norsk Hydro ASA | 374,646 | 2,752 |
| | Yara International ASA | 46,591 | 2,435 |
| | Orkla ASA | 221,299 | 2,152 |
| | Aker BP ASA | 32,171 | 1,234 |
| | Salmar ASA | 15,704 | 1,198 |
| | Gjensidige Forsikring ASA | 44,842 | 1,117 |
| | Leroy Seafood Group ASA | 65,521 | 596 |
| | Aker ASA Class A | 6,194 | 571 |
| | | | 32,311 |
| Pakistan (0.0%) |
| | Oil & Gas Development Co. Ltd. | 255,915 | 127 |
| | Habib Bank Ltd. | 125,375 | 92 |
| | Fauji Fertilizer Co. Ltd. | 112,299 | 68 |
| | Pakistan Petroleum Ltd. | 146,680 | 65 |
| | | | 352 |
| Philippines (0.1%) |
| | International Container Terminal Services Inc. | 303,850 | 1,085 |
| | PLDT Inc. | 26,640 | 870 |
| | Globe Telecom Inc. | 8,430 | 501 |
| | Manila Electric Co. | 86,600 | 493 |
| | Metro Pacific Investments Corp. | 3,488,000 | 260 |
| | Aboitiz Power Corp. | 397,600 | 254 |
| | Semirara Mining & Power Corp. Class A | 487,720 | 251 |
| | DMCI Holdings Inc. | 1,312,100 | 207 |
| | LT Group Inc. | 740,400 | 148 |
| | | | 4,069 |
| Poland (0.1%) |
| | Polski Koncern Naftowy ORLEN SA | 89,334 | 1,927 |
| | Cyfrowy Polsat SA | 71,361 | 638 |
| | | | 2,565 |
| Portugal (0.2%) |
| | EDP - Energias de Portugal SA | 781,264 | 4,408 |
| | Galp Energia SGPS SA | 148,789 | 1,546 |
| | | | 5,954 |
| Qatar (0.5%) |
| | Qatar National Bank QPSC | 1,273,270 | 7,174 |
| | Industries Qatar QSC | 448,547 | 1,954 |
| | Qatar Islamic Bank SAQ | 319,084 | 1,615 |
International High Dividend Yield Index Fund
| | | Shares | Market
Value•
($000) |
| | Masraf Al Rayan QSC | 1,000,847 | 1,312 |
| | Commercial Bank PSQC | 539,499 | 907 |
| | Qatar Fuel QSC | 138,406 | 699 |
| | Qatar Gas Transport Co. Ltd. | 696,355 | 623 |
| | Qatar Electricity & Water Co. QSC | 122,608 | 567 |
| | Qatar International Islamic Bank QSC | 189,583 | 510 |
| | Barwa Real Estate Co. | 568,219 | 493 |
| | Ooredoo QPSC | 210,646 | 401 |
| | Doha Bank QPSC | 401,470 | 318 |
| | Vodafone Qatar QSC | 465,414 | 207 |
| | | | 16,780 |
| Romania (0.0%) |
| | Banca Transilvania SA | 1,375,322 | 807 |
| Russia (2.2%) |
| | Sberbank of Russia PJSC | 2,906,395 | 14,621 |
| | Novatek PJSC | 303,085 | 7,696 |
| | Gazprom PJSC ADR | 748,819 | 7,348 |
| | Gazprom PJSC | 1,482,736 | 7,306 |
| | Lukoil PJSC | 59,410 | 6,063 |
| | LUKOIL PJSC ADR | 49,539 | 5,050 |
| | MMC Norilsk Nickel PJSC | 8,869 | 2,769 |
| | Tatneft PJSC ADR | 44,997 | 2,058 |
| | Rosneft Oil Co. PJSC (Registered) GDR | 190,781 | 1,699 |
| | MMC Norilsk Nickel PJSC ADR | 53,701 | 1,678 |
| | Rosneft Oil Co. PJSC | 142,196 | 1,278 |
| | Alrosa PJSC | 681,612 | 1,203 |
| | Polyus PJSC | 5,994 | 1,188 |
| | Surgutneftegas PJSC Preference Shares | 2,107,560 | 1,148 |
| | Magnit PJSC | 11,992 | 1,094 |
| | Tatneft PJSC | 139,641 | 1,067 |
| | Mobile TeleSystems PJSC ADR | 112,115 | 1,030 |
| | Novolipetskiy Metallurgicheskiy Kombinat PJSC | 323,494 | 1,021 |
| | VTB Bank PJSC GDR (Registered) | 671,253 | 976 |
| | Moscow Exchange MICEX-RTS PJSC | 385,108 | 945 |
| | Transneft PJSC Preference Shares | 420 | 901 |
| | Severstal PAO GDR (Registered) | 34,635 | 792 |
| | Inter Rao Ues PJSC | 10,455,400 | 709 |
| * | United Co. Rusal International | 689,060 | 700 |
| | Magnit PJSC GDR (Registered) | 36,161 | 670 |
| | Magnitogorsk Iron & Steel Works PJSC | 592,710 | 554 |
| | Severstal PAO PJSC | 22,170 | 504 |
| | PhosAgro PJSC | 5,813 | 459 |
| | Polyus PJSC (Registered) GDR | 4,270 | 422 |
| | Tatneft PJSC Preference Shares | 49,963 | 344 |
| | RusHydro PJSC | 29,565,000 | 339 |
| | Rostelecom PJSC | 226,460 | 298 |
| | Sistema PJSFC | 720,900 | 274 |
| | | Shares | Market
Value•
($000) |
| | PhosAgro PJSC GDR (Registered) | 10,445 | 250 |
| | Federal Grid Co. | 83,950,000 | 220 |
| | Unipro PJSC | 1,744,000 | 67 |
| | Mobile TeleSystems PJSC | 13,562 | 59 |
| | Mosenergo PJSC | 1,739,000 | 55 |
| | | | 74,855 |
| Saudi Arabia (1.3%) |
| | Saudi National Bank | 617,606 | 10,842 |
| 3 | Saudi Arabian Oil Co. | 716,505 | 7,213 |
| | Saudi Basic Industries Corp. | 191,356 | 6,595 |
| | Saudi Telecom Co. | 136,049 | 4,250 |
| | Riyad Bank | 345,317 | 2,719 |
| | SABIC Agri-Nutrients Co. | 52,716 | 2,313 |
| | Saudi Electricity Co. | 226,193 | 1,721 |
| | Yanbu National Petrochemical Co. | 63,208 | 1,284 |
| | Sahara International Petrochemical Co. | 97,387 | 1,144 |
| | Arab National Bank | 164,415 | 1,010 |
| | Jarir Marketing Co. | 15,889 | 859 |
| | Saudi Industrial Investment Group | 61,287 | 620 |
| | Advanced Petrochemical Co. | 27,972 | 556 |
| | Bank Al-Jazira | 103,541 | 531 |
| | Southern Province Cement Co. | 22,809 | 435 |
| | National Petrochemical Co. | 31,590 | 406 |
| | Abdullah Al Othaim Markets Co. | 11,586 | 357 |
| | Saudi Cement Co. | 20,230 | 320 |
| | Arabian Centres Co. Ltd. | 46,632 | 317 |
| | Qassim Cement Co. | 12,249 | 266 |
| * | Seera Group Holding | 36,945 | 228 |
| | Saudia Dairy & Foodstuff Co. | 3,627 | 159 |
| | Yanbu Cement Co. | 15,587 | 159 |
| | | | 44,304 |
| Singapore (1.3%) |
| | DBS Group Holdings Ltd. | 507,178 | 11,852 |
| | Oversea-Chinese Banking Corp. Ltd. | 990,400 | 8,658 |
| | United Overseas Bank Ltd. | 361,845 | 7,193 |
| | Singapore Telecommunications Ltd. | 2,111,688 | 3,918 |
| * | Capitaland Investment Ltd. | 722,300 | 1,843 |
| | Singapore Exchange Ltd. | 244,732 | 1,756 |
| | Keppel Corp. Ltd. | 414,612 | 1,655 |
| | Singapore Technologies Engineering Ltd. | 474,500 | 1,347 |
| | Venture Corp. Ltd. | 81,900 | 1,144 |
| | Genting Singapore Ltd. | 1,789,700 | 1,035 |
| | ComfortDelGro Corp. Ltd. | 642,000 | 744 |
| 2 | Singapore Press Holdings Ltd. | 422,100 | 625 |
| | NetLink NBN Trust | 714,500 | 540 |
| | Jardine Cycle & Carriage Ltd. | 27,300 | 456 |
International High Dividend Yield Index Fund
| | | Shares | Market
Value•
($000) |
| | Sembcorp Industries Ltd. | 230,500 | 344 |
| | Golden Agri-Resources Ltd. | 1,561,900 | 306 |
| | Hutchison Port Holdings Trust Class U | 1,261,000 | 272 |
| | Olam International Ltd. | 191,600 | 242 |
| | Singapore Post Ltd. | 380,700 | 185 |
| | StarHub Ltd. | 108,700 | 100 |
| * | SIA Engineering Co. Ltd. | 47,400 | 76 |
| | Singapore Telecommunications Ltd. (XSES) | 8,800 | 16 |
| | | | 44,307 |
| South Africa (1.2%) |
| | FirstRand Ltd. | 1,403,897 | 5,333 |
| * | MTN Group Ltd. | 505,978 | 4,537 |
| | Standard Bank Group Ltd. | 359,811 | 3,188 |
| | Impala Platinum Holdings Ltd. | 230,522 | 2,983 |
| | Sibanye Stillwater Ltd. | 818,283 | 2,864 |
| | Gold Fields Ltd. | 242,087 | 2,250 |
| | Anglogold Ltd. | 116,693 | 2,153 |
| | Sanlam Ltd. | 495,157 | 2,034 |
| | Anglo American Platinum Ltd. | 16,539 | 1,676 |
| | Shoprite Holdings Ltd. | 134,866 | 1,601 |
| | Vodacom Group Ltd. | 171,311 | 1,517 |
| | Old Mutual Ltd. (XZIM) | 1,332,763 | 1,361 |
| | Remgro Ltd. | 142,513 | 1,257 |
| | Nedbank Group Ltd. | 104,813 | 1,194 |
| | Mr Price Group Ltd. | 75,296 | 983 |
| | Exxaro Resources Ltd. | 74,222 | 814 |
| | SPAR Group Ltd. | 60,660 | 774 |
| | Tiger Brands Ltd. | 54,912 | 695 |
| | Harmony Gold Mining Co. Ltd. | 150,760 | 541 |
| | AVI Ltd. | 96,149 | 498 |
| | Kumba Iron Ore Ltd. | 14,550 | 443 |
| | Investec Ltd. | 84,623 | 390 |
| | African Rainbow Minerals Ltd. | 28,805 | 385 |
| | Truworths International Ltd. | 108,301 | 382 |
| | Pick n Pay Stores Ltd. | 85,272 | 332 |
| | Momentum Metropolitan Holdings | 243,985 | 313 |
| | Coronation Fund Managers Ltd. | 64,935 | 216 |
| | Santam Ltd. | 10,009 | 166 |
| * | Liberty Holdings Ltd. | 25,253 | 149 |
| | | | 41,029 |
| South Korea (1.3%) |
| | KB Financial Group Inc. | 109,084 | 5,280 |
| | POSCO | 18,285 | 4,638 |
| | Shinhan Financial Group Co. Ltd. | 140,430 | 4,585 |
| | Hana Financial Group Inc. | 84,036 | 3,240 |
| | KT&G Corp. | 30,128 | 2,093 |
| | LG Corp. | 23,354 | 1,826 |
| | Samsung Fire & Marine Insurance Co. Ltd. | 9,185 | 1,821 |
| | SK Telecom Co. Ltd. ADR | 57,541 | 1,669 |
| | | Shares | Market
Value•
($000) |
| | Woori Financial Group Inc. | 141,929 | 1,613 |
| | Korea Electric Power Corp. | 68,950 | 1,336 |
| | Korea Zinc Co. Ltd. | 2,732 | 1,258 |
| | Samsung Life Insurance Co. Ltd. | 17,273 | 999 |
| | Korea Investment Holdings Co. Ltd. | 10,628 | 795 |
| | Hyundai Motor Co. Preference Shares (XKRS) | 8,966 | 753 |
| | Hyundai Heavy Industries Holdings Co. Ltd. | 13,283 | 720 |
| | LG Uplus Corp. | 57,528 | 708 |
| | Industrial Bank of Korea | 73,293 | 694 |
| | Kangwon Land Inc. | 29,080 | 692 |
| | Samsung Securities Co. Ltd. | 16,349 | 665 |
| | Hyundai Motor Co. Preference Shares | 7,465 | 625 |
| | Mirae Asset Securities Co. Ltd. | 82,908 | 618 |
| | GS Engineering & Construction Corp. | 17,285 | 613 |
| | DB Insurance Co. Ltd. | 11,846 | 602 |
| | BNK Financial Group Inc. | 79,640 | 600 |
| | GS Holdings Corp. | 13,122 | 475 |
| | LOTTE Fine Chemical Co. Ltd. | 5,372 | 392 |
| * | S-1 Corp. | 5,304 | 378 |
| | DGB Financial Group Inc. | 42,020 | 372 |
| | Cheil Worldwide Inc. | 17,618 | 360 |
| | NH Investment & Securities Co. Ltd. | 31,673 | 358 |
| | Hyundai Marine & Fire Insurance Co. Ltd. | 15,421 | 347 |
| | KCC Corp. | 1,129 | 323 |
| | Mirae Asset Securities Co. Ltd. Preference Shares | 75,828 | 315 |
| | Korea Gas Corp. | 8,025 | 305 |
| | Lotte Shopping Co. Ltd. | 3,009 | 271 |
| | Samsung Card Co. Ltd. | 9,105 | 267 |
| * | DL Holdings Co. Ltd. | 4,243 | 239 |
| | Posco International Corp. | 11,889 | 221 |
| | KEPCO Plant Service & Engineering Co. Ltd. | 5,835 | 209 |
| | Doosan Bobcat Inc. | 6,263 | 205 |
| | Lotte Corp. | 6,271 | 176 |
| | SSANGYONG C&E Co. Ltd. | 26,192 | 176 |
| | Samsung Fire & Marine Insurance Co. Ltd. Preference Shares | 937 | 142 |
| * | LX Holdings Corp. | 8,737 | 66 |
| | Hyundai Motor Co. | 346 | 62 |
| | Hanwha Corp. Preference Shares | 3,489 | 49 |
| | | | 44,151 |
| Spain (2.6%) |
| | Iberdrola SA (XMAD) | 1,669,333 | 19,730 |
| | Banco Santander SA | 4,827,481 | 18,311 |
| | Banco Bilbao Vizcaya Argentaria SA | 1,881,635 | 13,168 |
| | Industria de Diseno Textil SA | 299,104 | 10,835 |
International High Dividend Yield Index Fund
| | | Shares | Market
Value•
($000) |
| | Telefonica SA | 1,402,203 | 6,091 |
| | Repsol SA | 367,013 | 4,701 |
| | CaixaBank SA | 1,216,105 | 3,496 |
| | Red Electrica Corp. SA | 123,664 | 2,575 |
| 1 | Naturgy Energy Group SA | 85,301 | 2,243 |
| | Endesa SA | 91,921 | 2,120 |
| | ACS Actividades de Construccion y Servicios SA | 67,420 | 1,767 |
| | Enagas SA | 73,644 | 1,653 |
| | Acciona SA | 6,657 | 1,278 |
| | Bankinter SA | 203,104 | 1,118 |
| | Mapfre SA | 318,975 | 675 |
| | Linea Directa Aseguradora SA Cia de Seguros y Reaseguros | 205,439 | 412 |
| | Zardoya Otis SA | 324 | 3 |
| | | | 90,176 |
| Sweden (1.7%) |
| | Investor AB Class B | 511,894 | 11,811 |
| | Volvo AB Class B | 428,207 | 9,985 |
| | Skandinaviska Enskilda Banken AB Class A | 410,195 | 6,415 |
| 1 | Swedbank AB Class A | 279,778 | 6,068 |
| 1 | Svenska Handelsbanken AB Class A | 428,252 | 4,909 |
| 1 | Telia Co. AB | 739,241 | 2,912 |
| | Boliden AB | 77,069 | 2,717 |
| | Skanska AB Class B | 103,375 | 2,628 |
| | SKF AB Class B | 109,991 | 2,555 |
| | Lundin Energy AB | 53,848 | 2,127 |
| | Tele2 AB Class B | 145,707 | 2,059 |
| | Castellum AB | 62,312 | 1,661 |
| | Electrolux AB Class B | 63,942 | 1,455 |
| | Securitas AB Class B | 87,675 | 1,453 |
| | ICA Gruppen AB | 21,396 | 1,107 |
| | Skandinaviska Enskilda Banken AB Class C | 3,578 | 57 |
| | | | 59,919 |
| Switzerland (9.6%) |
| | Nestle SA (Registered) | 797,802 | 105,236 |
| | Roche Holding AG | 159,854 | 61,926 |
| | Novartis AG (Registered) | 600,616 | 49,679 |
| | Zurich Insurance Group AG | 41,773 | 18,515 |
| | Roche Holding AG (Bearer) | 40,701 | 17,506 |
| | UBS Group AG (Registered) | 921,910 | 16,781 |
| | ABB Ltd. (Registered) | 479,971 | 15,879 |
| | Swiss Re AG | 80,608 | 7,809 |
| | Holcim Ltd. | 153,877 | 7,676 |
| | Swiss Life Holding AG (Registered) | 9,106 | 4,995 |
| | SGS SA (Registered) | 1,678 | 4,968 |
| | Julius Baer Group Ltd. | 62,387 | 4,513 |
| | Swisscom AG (Registered) | 7,075 | 3,852 |
| | Adecco Group AG (Registered) | 44,475 | 2,241 |
| | Swiss Prime Site AG (Registered) | 21,988 | 2,235 |
| | Baloise Holding AG (Registered) | 13,237 | 2,109 |
| | | Shares | Market
Value•
($000) |
| | PSP Swiss Property AG (Registered) | 12,590 | 1,574 |
| | Clariant AG (Registered) | 69,962 | 1,473 |
| | Helvetia Holding AG (Registered) | 10,496 | 1,249 |
| | DKSH Holding AG | 11,288 | 905 |
| | Banque Cantonale Vaudoise (Registered) | 7,252 | 584 |
| | OC Oerlikon Corp. AG (Registered) | 47,566 | 484 |
| | Sulzer AG (Registered) | 4,425 | 435 |
| *,3 | Medmix AG | 4,405 | 211 |
| | | | 332,835 |
| Taiwan (4.0%) |
| | Hon Hai Precision Industry Co. Ltd. | 3,382,000 | 13,056 |
| | United Microelectronics Corp. | 3,319,000 | 6,890 |
| | Fubon Financial Holding Co. Ltd. | 2,380,639 | 6,293 |
| | Delta Electronics Inc. | 617,802 | 5,454 |
| | Formosa Plastics Corp. | 1,362,879 | 5,279 |
| | Nan Ya Plastics Corp. | 1,579,000 | 4,846 |
| | Cathay Financial Holding Co. Ltd. | 2,319,388 | 4,835 |
| | CTBC Financial Holding Co. Ltd. | 5,253,120 | 4,387 |
| | Chunghwa Telecom Co. Ltd. | 1,073,000 | 4,258 |
| | China Steel Corp. | 3,454,000 | 4,164 |
| | Mega Financial Holding Co. Ltd. | 3,118,000 | 3,747 |
| | Chailease Holding Co. Ltd. | 388,518 | 3,721 |
| | Uni-President Enterprises Corp. | 1,389,000 | 3,332 |
| | Formosa Chemicals & Fibre Corp. | 1,008,000 | 2,925 |
| | Yuanta Financial Holding Co. Ltd. | 3,284,360 | 2,919 |
| | Evergreen Marine Corp. Taiwan Ltd. | 748,000 | 2,692 |
| | Asustek Computer Inc. | 210,268 | 2,673 |
| | Taiwan Cement Corp. | 1,533,365 | 2,661 |
| | Realtek Semiconductor Corp. | 138,000 | 2,482 |
| | First Financial Holding Co. Ltd. | 2,881,862 | 2,373 |
| | Novatek Microelectronics Corp. | 158,000 | 2,370 |
| | ASE Technology Holding Co. Ltd. | 607,171 | 2,172 |
| | Yageo Corp. | 135,000 | 2,113 |
| | Quanta Computer Inc. | 750,000 | 2,107 |
| | Hua Nan Financial Holdings Co. Ltd. | 2,807,896 | 2,056 |
| | Taishin Financial Holding Co. Ltd. | 2,997,812 | 1,968 |
| | Taiwan Mobile Co. Ltd. | 454,000 | 1,601 |
| | Globalwafers Co. Ltd. | 57,000 | 1,564 |
| | President Chain Store Corp. | 152,000 | 1,536 |
| | Sinopac Holdings Co. | 2,936,641 | 1,496 |
| | Innolux Corp. | 2,471,000 | 1,486 |
| | Shanghai Commercial & Savings Bank Ltd. | 901,000 | 1,427 |
| | Formosa Petrochemical Corp. | 396,000 | 1,426 |
International High Dividend Yield Index Fund
| | | Shares | Market
Value•
($000) |
| | Lite-On Technology Corp. | 625,194 | 1,380 |
| | Pegatron Corp. | 561,000 | 1,373 |
| | Vanguard International Semiconductor Corp. | 249,000 | 1,297 |
| | Accton Technology Corp. | 145,000 | 1,268 |
| | ASE Technology Holding Co. Ltd. ADR | 172,889 | 1,231 |
| | Eclat Textile Co. Ltd. | 54,200 | 1,184 |
| | Catcher Technology Co. Ltd. | 201,672 | 1,169 |
| | Far Eastern New Century Corp. | 1,095,000 | 1,147 |
| | Compal Electronics Inc. | 1,174,000 | 1,033 |
| | Asia Cement Corp. | 647,000 | 1,030 |
| | Sino-American Silicon Products Inc. | 146,000 | 1,000 |
| | Far EasTone Telecommunications Co. Ltd. | 451,000 | 992 |
| | Micro-Star International Co. Ltd. | 187,000 | 944 |
| | Feng TAY Enterprise Co. Ltd. | 117,280 | 913 |
| | Pou Chen Corp. | 720,000 | 883 |
| | Wistron Corp. | 816,656 | 858 |
| | Inventec Corp. | 857,994 | 821 |
| | Foxconn Technology Co. Ltd. | 311,190 | 773 |
| | Synnex Technology International Corp. | 386,000 | 748 |
| | Acer Inc. | 767,000 | 718 |
| | Wiwynn Corp. | 22,000 | 705 |
| | Powertech Technology Inc. | 199,000 | 698 |
| | Walsin Technology Corp. | 128,000 | 697 |
| | Cheng Shin Rubber Industry Co. Ltd. | 474,994 | 583 |
| | Teco Electric and Machinery Co. Ltd. | 504,000 | 547 |
| | Zhen Ding Technology Holding Ltd. | 157,000 | 544 |
| | Nanya Technology Corp. | 224,000 | 537 |
| | Chicony Electronics Co. Ltd. | 175,370 | 501 |
| | Nien Made Enterprise Co. Ltd. | 36,000 | 495 |
| | Taiwan Fertilizer Co. Ltd. | 185,000 | 452 |
| | Formosa Taffeta Co. Ltd. | 284,000 | 307 |
| | Taiwan Secom Co. Ltd. | 81,000 | 293 |
| | Transcend Information Inc. | 72,000 | 175 |
| | | | 139,605 |
| Thailand (0.7%) |
| | PTT PCL | 3,966,800 | 4,542 |
| | Siam Commercial Bank PCL | 695,900 | 2,646 |
| | Siam Cement PCL (Registered) | 162,850 | 1,938 |
| | Advanced Info Service PCL | 333,904 | 1,904 |
| | PTT Exploration & Production PCL | 364,930 | 1,291 |
| | PTT Global Chemical PCL | 680,499 | 1,288 |
| | Kasikornbank PCL NVDR | 270,400 | 1,153 |
| | Siam Cement PCL NDVR | 79,400 | 945 |
| | | Shares | Market
Value•
($000) |
| | Intouch Holdings PCL Class F | 404,941 | 919 |
| | Charoen Pokphand Foods PCL | 1,003,000 | 763 |
| | BTS Group Holdings PCL | 2,242,300 | 646 |
| | Krung Thai Bank PCL | 1,834,100 | 637 |
| | Kasikornbank PCL | 147,500 | 629 |
| | Digital Telecommunications Infrastructure Fund Class F | 1,426,197 | 576 |
| | Banpu PCL (Registered) | 1,654,650 | 568 |
| | Bangkok Bank PCL (Registered) | 149,500 | 553 |
| | Thai Union Group PCL Class F | 771,500 | 486 |
| | Land & Houses PCL (Registered) | 1,757,100 | 448 |
| | TMBThanachart Bank PCL | 10,617,600 | 372 |
| | IRPC PCL | 2,786,700 | 361 |
| | Electricity Generating PCL | 64,600 | 348 |
| | Osotspa PCL | 328,800 | 325 |
| | Ratch Group PCL | 206,300 | 283 |
| * | Bangkok Bank PCL NVDR | 69,500 | 257 |
| | Sri Trang Gloves Thailand PCL | 213,300 | 196 |
| | Total Access Communication PCL | 160,500 | 185 |
| | Intouch Holdings PCL NVDR | 64,800 | 147 |
| | Siam City Cement PCL | 26,232 | 134 |
| | Siam Commercial Bank PCL NVDR | 30,700 | 117 |
| | Siam Makro PCL | 74,400 | 108 |
| | Bangkok Life Assurance PCL NVDR | 98,900 | 89 |
| | Land & Houses PCL NVDR | 252,900 | 64 |
| * | BTS Group Holdings PCL Warrants Exp. 9/5/22 | 85,310 | 4 |
| * | BTS Group Holdings PCL Warrants Exp. 11/7/24 | 170,620 | — |
| * | BTS Group Holdings PCL Warrants Exp. 11/20/26 | 341,240 | — |
| | | | 24,922 |
| Turkey (0.2%) |
| | BIM Birlesik Magazalar A/S | 121,482 | 786 |
| | Eregli Demir ve Celik Fabrikalari TAS | 373,795 | 780 |
| | Turkiye Garanti Bankasi A/S | 651,103 | 667 |
| | Turkcell Iletisim Hizmetleri A/S | 364,434 | 581 |
| | Akbank TAS | 826,433 | 500 |
| | Haci Omer Sabanci Holding A/S | 321,015 | 374 |
| | Ford Otomotiv Sanayi A/S | 16,546 | 319 |
| | Turkiye Sise ve Cam Fabrikalari A/S | 348,511 | 314 |
| | Turkiye Is Bankasi A/S Class C | 422,533 | 248 |
International High Dividend Yield Index Fund
| | | Shares | Market
Value•
($000) |
| | Enka Insaat ve Sanayi A/S | 183,879 | 212 |
| | Tofas Turk Otomobil Fabrikasi A/S | 27,062 | 165 |
| | Coca-Cola Icecek A/S | 15,536 | 137 |
| | Arcelik A/S | 36,074 | 127 |
| | Turk Telekomunikasyon A/S | 159,957 | 125 |
| | Anadolu Efes Biracilik Ve Malt Sanayii A/S | 41,113 | 95 |
| | Iskenderun Demir ve Celik A/S | 34,120 | 48 |
| 3 | Enerjisa Enerji A/S | 33,079 | 41 |
| | Tekfen Holding A/S | 54 | — |
| | | | 5,519 |
| United Arab Emirates (0.5%) |
| | First Abu Dhabi Bank PJSC | 1,230,667 | 5,973 |
| | Emirates Telecommunications Group Co. PJSC | 485,959 | 3,390 |
| | Emirates NBD Bank PJSC | 710,503 | 2,704 |
| | Abu Dhabi Commercial Bank PJSC | 794,447 | 1,797 |
| | Dubai Islamic Bank PJSC | 837,319 | 1,167 |
| | Aldar Properties PJSC | 1,056,542 | 1,163 |
| | Abu Dhabi Islamic Bank PJSC | 385,215 | 613 |
| | Dana Gas PJSC | 1,073,947 | 302 |
| | Dubai Investments PJSC | 585,777 | 272 |
| * | Air Arabia PJSC | 698,856 | 265 |
| | | | 17,646 |
| United Kingdom (13.7%) |
| | AstraZeneca plc | 438,658 | 54,877 |
| | HSBC Holdings plc | 5,789,668 | 34,884 |
| | GlaxoSmithKline plc | 1,402,485 | 29,117 |
| | Royal Dutch Shell plc Class A | 1,199,777 | 27,486 |
| | BP plc | 5,620,684 | 26,928 |
| | Unilever plc (XLON) | 452,455 | 24,225 |
| | Royal Dutch Shell plc Class B | 1,012,762 | 23,242 |
| | British American Tobacco plc | 648,290 | 22,550 |
| | Rio Tinto plc | 307,695 | 19,185 |
| | Glencore plc | 3,748,447 | 18,744 |
| | BHP Group plc | 588,883 | 15,553 |
| | Unilever plc | 279,987 | 14,989 |
| | Anglo American plc | 349,152 | 13,283 |
| | Barclays plc | 4,777,653 | 13,184 |
| | National Grid plc | 1,000,228 | 12,807 |
| | Vodafone Group plc | 7,867,428 | 11,595 |
| | Tesco plc | 2,155,338 | 7,958 |
| | BAE Systems plc | 915,085 | 6,900 |
| | SSE plc | 293,886 | 6,618 |
| | Legal & General Group plc | 1,677,063 | 6,614 |
| | Aviva plc | 1,118,820 | 6,037 |
| | Imperial Brands plc | 265,903 | 5,611 |
| | 3i Group plc | 271,783 | 5,076 |
| | WPP plc | 339,826 | 4,912 |
| | Natwest Group plc | 1,475,511 | 4,449 |
| | Mondi plc (XLON) | 136,715 | 3,414 |
| | St. James's Place plc | 153,390 | 3,314 |
| | Persimmon plc | 87,137 | 3,247 |
| | Sage Group plc | 310,317 | 3,018 |
| | | Shares | Market
Value•
($000) |
| | United Utilities Group plc | 191,751 | 2,725 |
| | Severn Trent plc | 68,330 | 2,559 |
| | Barratt Developments plc | 278,190 | 2,525 |
| | Admiral Group plc | 62,034 | 2,437 |
| | Intermediate Capital Group plc | 78,486 | 2,354 |
| | Abrdn plc | 628,399 | 2,184 |
| | B&M European Value Retail SA | 244,416 | 2,118 |
| | M&G plc | 749,453 | 2,048 |
| | J Sainsbury plc | 476,119 | 1,950 |
| | Polymetal International plc | 103,903 | 1,921 |
| | DS Smith plc | 354,827 | 1,861 |
| | Berkeley Group Holdings plc | 30,411 | 1,814 |
| | Pearson plc | 217,072 | 1,786 |
| | Bellway plc | 36,565 | 1,659 |
| | Schroders plc | 33,379 | 1,653 |
| | Direct Line Insurance Group plc | 413,689 | 1,653 |
| | Phoenix Group Holdings plc | 178,968 | 1,607 |
| | Evraz plc | 163,778 | 1,391 |
| | Pennon Group plc | 79,927 | 1,275 |
| | Tate & Lyle plc | 136,788 | 1,212 |
| 3 | Quilter plc | 496,405 | 1,057 |
| | NEPI Rockcastle plc | 120,947 | 809 |
| | Fresnillo plc | 54,373 | 640 |
| | Ashmore Group plc | 137,107 | 633 |
| | | | 471,688 |
Total Common Stocks
(Cost $3,150,145) | 3,430,433 |
| Temporary Cash Investments (3.2%) |
| Money Market Fund (3.2%) |
| 4,5 | Vanguard Market Liquidity Fund, 0.070% (Cost $109,865) | 1,098,647 | 109,865 |
| Total Investments (102.5%) (Cost $3,260,010) | 3,540,298 |
| Other Assets and Liabilities—Net (-2.5%) | (84,922) |
| Net Assets (100%) | 3,455,376 |
| Cost is in $000. |
| • | See Note A in Notes to Financial Statements. |
| * | Non-income-producing security. |
| 1 | Includes partial security positions on loan to broker-dealers. The total value of securities on loan is $94,784,000. |
| 2 | Security value determined using significant unobservable inputs. |
| 3 | Security exempt from registration under Rule 144A of the Securities Act of 1933. Such securities may be sold in transactions exempt from registration, normally to qualified institutional buyers. At October 31, 2021, the aggregate value was $33,785,000, representing 1.0% of net assets. |
| 4 | Affiliated money market fund available only to Vanguard funds and certain trusts and accounts managed by Vanguard. Rate shown is the 7-day yield. |
| 5 | Collateral of $103,668,000 was received for securities on loan. |
| | ADR—American Depositary Receipt. |
| | GDR—Global Depositary Receipt. |
| | NVDR—Non-Voting Depository Receipt. |
International High Dividend Yield Index Fund
Derivative Financial Instruments Outstanding as of Period End
| Futures Contracts |
| | | | ($000) |
| | Expiration | Number of
Long (Short)
Contracts | Notional
Amount | Value and
Unrealized
Appreciation
(Depreciation) |
| Long Futures Contracts | | | | |
| E-mini S&P 500 Index | December 2021 | 2 | 460 | 6 |
| MSCI EAFE Index | December 2021 | 157 | 18,366 | 177 |
| MSCI Emerging Markets Index | December 2021 | 86 | 5,427 | (79) |
| | | | | 104 |
| Forward Currency Contracts |
| | Contract
Settlement
Date | Contract Amount (000) | Unrealized
Appreciation
($000) | Unrealized
Depreciation
($000) |
| Counterparty | Receive | Deliver |
| Royal Bank of Canada | 12/15/21 | GBP | 1,202 | USD | 1,638 | 7 | — |
| Bank of America, N.A. | 12/15/21 | USD | 2,408 | CHF | 2,211 | — | (11) |
| Bank of America, N.A. | 12/15/21 | USD | 840 | EUR | 709 | 20 | — |
| Barclays Bank plc | 12/15/21 | USD | 2,630 | GBP | 1,904 | 24 | — |
| BNP Paribas | 12/15/21 | USD | 4,601 | JPY | 512,501 | 103 | — |
| | | | | | | 154 | (11) |
| CHF—Swiss franc. |
| EUR—euro. |
| GBP—British pound. |
| JPY—Japanese yen. |
| USD—U.S. dollar. |
See accompanying Notes, which are an integral part of the Financial Statements.
International High Dividend Yield Index Fund
Statement of Assets and Liabilities
|
| ($000s, except shares and per-share amounts) | Amount |
| Assets | |
| Investments in Securities, at Value | |
| Unaffiliated Issuers (Cost $3,150,145) | 3,430,433 |
| Affiliated Issuers (Cost $109,865) | 109,865 |
| Total Investments in Securities | 3,540,298 |
| Investment in Vanguard | 110 |
| Cash | 19,361 |
| Cash Collateral Pledged—Futures Contracts | 1,289 |
| Foreign Currency, at Value (Cost $3,860) | 3,812 |
| Receivables for Investment Securities Sold | 2,683 |
| Receivables for Accrued Income | 14,147 |
| Receivables for Capital Shares Issued | 247 |
| Unrealized Appreciation—Forward Currency Contracts | 154 |
| Total Assets | 3,582,101 |
| Liabilities | |
| Payables for Investment Securities Purchased | 21,038 |
| Collateral for Securities on Loan | 103,668 |
| Payables for Capital Shares Redeemed | 149 |
| Payables to Vanguard | 286 |
| Variation Margin Payable—Futures Contracts | 186 |
| Unrealized Depreciation—Forward Currency Contracts | 11 |
| Deferred Foreign Capital Gains Taxes | 1,387 |
| Total Liabilities | 126,725 |
| Net Assets | 3,455,376 |
| At October 31, 2021, net assets consisted of: | |
| | |
| Paid-in Capital | 3,217,882 |
| Total Distributable Earnings (Loss) | 237,494 |
| Net Assets | 3,455,376 |
| |
| ETF Shares—Net Assets | |
Applicable to 45,159,529 outstanding $.001 par value shares of
beneficial interest (unlimited authorization) | 3,060,541 |
| Net Asset Value Per Share—ETF Shares | $67.77 |
| |
| Admiral Shares—Net Assets | |
Applicable to 12,018,462 outstanding $.001 par value shares of
beneficial interest (unlimited authorization) | 394,835 |
| Net Asset Value Per Share—Admiral Shares | $32.85 |
See accompanying Notes, which are an integral part of the Financial Statements.
International High Dividend Yield Index Fund
|
| | Year Ended
October 31, 2021 |
| | ($000) |
| Investment Income | |
| Income | |
| Dividends1 | 119,884 |
| Interest2 | 7 |
| Securities Lending—Net | 336 |
| Total Income | 120,227 |
| Expenses | |
| The Vanguard Group—Note B | |
| Investment Advisory Services | 402 |
| Management and Administrative—ETF Shares | 4,107 |
| Management and Administrative—Admiral Shares | 655 |
| Marketing and Distribution—ETF Shares | 81 |
| Marketing and Distribution—Admiral Shares | 10 |
| Custodian Fees | 492 |
| Auditing Fees | 45 |
| Shareholders’ Reports—ETF Shares | 62 |
| Shareholders’ Reports—Admiral Shares | 2 |
| Trustees’ Fees and Expenses | 1 |
| Total Expenses | 5,857 |
| Net Investment Income | 114,370 |
| Realized Net Gain (Loss) | |
| Investment Securities Sold2,3 | 55,699 |
| Futures Contracts | 2,253 |
| Forward Currency Contracts | 79 |
| Foreign Currencies | (420) |
| Realized Net Gain (Loss) | 57,611 |
| Change in Unrealized Appreciation (Depreciation) | |
| Investment Securities2,4 | 515,195 |
| Futures Contracts | 514 |
| Forward Currency Contracts | 193 |
| Foreign Currencies | (271) |
| Change in Unrealized Appreciation (Depreciation) | 515,631 |
| Net Increase (Decrease) in Net Assets Resulting from Operations | 687,612 |
| 1 | Dividends are net of foreign withholding taxes of $11,288,000. |
| 2 | Interest income, realized net gain (loss), and change in unrealized appreciation (depreciation) from an affiliated company of the fund were $4,000, $1,000, and ($1,000), respectively. Purchases and sales are for temporary cash investment purposes. |
| 3 | Realized gain (loss) is net of foreign capital gain taxes of $245,000. |
| 4 | The change in unrealized appreciation (depreciation) is net of the change in deferred foreign capital gains taxes of $1,387,000. |
See accompanying Notes, which are an integral part of the Financial Statements.
International High Dividend Yield Index Fund
Statement of Changes in Net Assets
|
| | Year Ended October 31, |
| | 2021
($000) | 2020
($000) |
| | | |
| Increase (Decrease) in Net Assets | | |
| Operations | | |
| Net Investment Income | 114,370 | 59,565 |
| Realized Net Gain (Loss) | 57,611 | (110,009) |
| Change in Unrealized Appreciation (Depreciation) | 515,631 | (210,218) |
| Net Increase (Decrease) in Net Assets Resulting from Operations | 687,612 | (260,662) |
| Distributions | | |
| ETF Shares | (90,829) | (46,653) |
| Admiral Shares | (13,898) | (9,161) |
| Total Distributions | (104,727) | (55,814) |
| Capital Share Transactions | | |
| ETF Shares | 1,245,225 | 328,155 |
| Admiral Shares | 35,370 | 117,287 |
| Net Increase (Decrease) from Capital Share Transactions | 1,280,595 | 445,442 |
| Total Increase (Decrease) | 1,863,480 | 128,966 |
| Net Assets | | |
| Beginning of Period | 1,591,896 | 1,462,930 |
| End of Period | 3,455,376 | 1,591,896 |
See accompanying Notes, which are an integral part of the Financial Statements.
International High Dividend Yield Index Fund
| ETF Shares | | | | | |
For a Share Outstanding
Throughout Each Period | Year Ended October 31, |
| 2021 | 2020 | 2019 | 2018 | 2017 |
| Net Asset Value, Beginning of Period | $50.47 | $61.27 | $58.85 | $65.69 | $55.61 |
| Investment Operations | | | | | |
| Net Investment Income1 | 2.824 | 2.076 | 2.746 | 2.639 | 2.329 |
| Net Realized and Unrealized Gain (Loss) on Investments2 | 16.986 | (10.944) | 2.302 | (7.097) | 9.763 |
| Total from Investment Operations | 19.810 | (8.868) | 5.048 | (4.458) | 12.092 |
| Distributions | | | | | |
| Dividends from Net Investment Income | (2.510) | (1.932) | (2.628) | (2.382) | (2.012) |
| Distributions from Realized Capital Gains | — | — | — | — | — |
| Total Distributions | (2.510) | (1.932) | (2.628) | (2.382) | (2.012) |
| Net Asset Value, End of Period | $67.77 | $50.47 | $61.27 | $58.85 | $65.69 |
| Total Return | 39.55% | -14.55% | 8.87% | -7.03% | 22.03% |
| Ratios/Supplemental Data | | | | | |
| Net Assets, End of Period (Millions) | $3,061 | $1,325 | $1,264 | $889 | $598 |
| Ratio of Total Expenses to Average Net Assets | 0.22% | 0.28%3 | 0.27% | 0.32% | 0.32% |
| Ratio of Net Investment Income to Average Net Assets | 4.29% | 3.81% | 4.59% | 4.06% | 3.73% |
| Portfolio Turnover Rate4 | 18% | 20% | 15% | 10% | 8% |
| 1 | Calculated based on average shares outstanding. |
| 2 | Includes increases from purchase and redemption fees of $.00, $.03, $.01, $.02, and $.04. |
| 3 | The ratio of expenses to average net assets for the period net of reduction from custody fee offset arrangements was 0.27%. |
| 4 | Excludes the value of portfolio securities received or delivered as a result of in-kind purchases or redemptions of the fund’s capital shares, including ETF Creation Units. |
See accompanying Notes, which are an integral part of the Financial Statements.
International High Dividend Yield Index Fund
| Admiral Shares | | | | | |
For a Share Outstanding
Throughout Each Period | Year Ended October 31, |
| 2021 | 2020 | 2019 | 2018 | 2017 |
| Net Asset Value, Beginning of Period | $24.45 | $29.69 | $28.52 | $31.83 | $26.92 |
| Investment Operations | | | | | |
| Net Investment Income1 | 1.329 | 1.034 | 1.322 | 1.264 | 1.114 |
| Net Realized and Unrealized Gain (Loss) on Investments2 | 8.286 | (5.336) | 1.120 | (3.423) | 4.743 |
| Total from Investment Operations | 9.615 | (4.302) | 2.442 | (2.159) | 5.857 |
| Distributions | | | | | |
| Dividends from Net Investment Income | (1.215) | (.938) | (1.272) | (1.151) | (.947) |
| Distributions from Realized Capital Gains | — | — | — | — | — |
| Total Distributions | (1.215) | (.938) | (1.272) | (1.151) | (.947) |
| Net Asset Value, End of Period | $32.85 | $24.45 | $29.69 | $28.52 | $31.83 |
| Total Return3 | 39.59% | -14.59% | 8.83% | -7.00% | 22.04% |
| Ratios/Supplemental Data | | | | | |
| Net Assets, End of Period (Millions) | $395 | $267 | $199 | $181 | $168 |
| Ratio of Total Expenses to Average Net Assets | 0.22% | 0.28%4 | 0.27% | 0.32% | 0.32% |
| Ratio of Net Investment Income to Average Net Assets | 4.19% | 3.99% | 4.57% | 4.06% | 3.73% |
| Portfolio Turnover Rate5 | 18% | 20% | 15% | 10% | 8% |
| 1 | Calculated based on average shares outstanding. |
| 2 | Includes increases from purchase and redemption fees of $.00, $.01, $.01, $.01, and $.02. |
| 3 | Total returns do not include transaction or account service fees that may have applied in the periods shown. Fund prospectuses provide information about any applicable transaction and account service fees. |
| 4 | The ratio of expenses to average net assets for the period net of reduction from custody fee offset arrangements was 0.27%. |
| 5 | Excludes the value of portfolio securities received or delivered as a result of in-kind purchases or redemptions of the fund’s capital shares, including ETF Creation Units. |
See accompanying Notes, which are an integral part of the Financial Statements.
International High Dividend Yield Index Fund
Notes to Financial Statements
Vanguard International High Dividend Yield Index Fund is registered under the Investment Company Act of 1940 as an open-end investment company, or mutual fund. The fund offers two classes of shares: ETF Shares and Admiral Shares. Each of the share classes has different eligibility and minimum purchase requirements, and is designed for different types of investors. ETF Shares are listed for trading on Nasdaq; they can be purchased and sold through a broker.
The fund invests in securities of foreign issuers, which may subject it to investment risks not normally associated with investing in securities of U.S. corporations. Market disruptions associated with the COVID-19 pandemic have had a global impact, and uncertainty exists as to the long-term implications. Such disruptions can adversely affect assets of the fund and thus fund performance.
| A. | The following significant accounting policies conform to generally accepted accounting principles for U.S. investment companies. The fund consistently follows such policies in preparing its financial statements. |
1. Security Valuation: Securities are valued as of the close of trading on the New York Stock Exchange (generally 4 p.m., Eastern time) on the valuation date. Equity securities are valued at the latest quoted sales prices or official closing prices taken from the primary market in which each security trades; such securities not traded on the valuation date are valued at the mean of the latest quoted bid and asked prices. Securities for which market quotations are not readily available, or whose values have been affected by events occurring before the fund’s pricing time but after the close of the securities’ primary markets, are valued at their fair values calculated according to procedures adopted by the board of trustees. These procedures include obtaining quotations from an independent pricing service, monitoring news to identify significant market- or security-specific events, and evaluating changes in the values of foreign market proxies (for example, ADRs, futures contracts, or exchange-traded funds), between the time the foreign markets close and the fund’s pricing time. When fair-value pricing is employed, the prices of securities used by a fund to calculate its net asset value may differ from quoted or published prices for the same securities.
Investments in Vanguard Market Liquidity Fund are valued at that fund's net asset value.
2. Foreign Currency: Securities and other assets and liabilities denominated in foreign currencies are translated into U.S. dollars using exchange rates obtained from an independent third party as of the fund’s pricing time on the valuation date. Realized gains (losses) and unrealized appreciation (depreciation) on investment securities include the effects of changes in exchange rates since the securities were purchased, combined with the effects of changes in security prices. Fluctuations in the value of other assets and liabilities resulting from changes in exchange rates are recorded as unrealized foreign currency gains (losses) until the assets or liabilities are settled in cash, at which time they are recorded as realized foreign currency gains (losses).
3. Futures Contracts: The fund uses index futures contracts to a limited extent, with the objectives of maintaining full exposure to the stock market, maintaining liquidity, and minimizing transaction costs. The fund may purchase futures contracts to immediately invest incoming cash in the market, or sell futures in response to cash outflows, thereby simulating a fully invested position in the underlying index while maintaining a cash balance for liquidity. The primary risks associated with the use of futures contracts are imperfect correlation between changes in market values of stocks held by the fund and the prices of futures contracts, and the possibility of an illiquid market. Counterparty risk involving futures is mitigated because a regulated clearinghouse is the counterparty instead of the clearing broker. To further mitigate counterparty risk, the fund trades futures contracts on an exchange, monitors the financial strength of its clearing brokers and clearinghouse, and has entered into clearing agreements with its clearing brokers. The
International High Dividend Yield Index Fund
clearinghouse imposes initial margin requirements to secure the fund’s performance and requires daily settlement of variation margin representing changes in the market value of each contract. Any securities pledged as initial margin for open contracts are noted in the Schedule of Investments.
Futures contracts are valued at their quoted daily settlement prices. The notional amounts of the contracts are not recorded in the Statement of Assets and Liabilities. Fluctuations in the value of the contracts are recorded in the Statement of Assets and Liabilities as an asset (liability) and in the Statement of Operations as unrealized appreciation (depreciation) until the contracts are closed, when they are recorded as realized gains (losses) on futures contracts.
During the year ended October 31, 2021, the fund’s average investments in long and short futures contracts represented 1% and 0% of net assets, respectively, based on the average of the notional amounts at each quarter-end during the period.
4. Forward Currency Contracts: The fund enters into forward currency contracts to protect the value of securities and related receivables and payables against changes in future foreign exchange rates. The fund’s risks in using these contracts include movement in the values of the foreign currencies relative to the U.S. dollar and the ability of the counterparties to fulfill their obligations under the contracts. The fund mitigates its counterparty risk by entering into forward currency contracts only with a diverse group of prequalified counterparties, monitoring their financial strength, entering into master netting arrangements with its counterparties, and requiring its counterparties to transfer collateral as security for their performance. In the absence of a default, the collateral pledged or received by the fund cannot be repledged, resold, or rehypothecated. The master netting arrangements provide that, in the event of a counterparty’s default (including bankruptcy), the fund may terminate the forward currency contracts, determine the net amount owed by either party in accordance with its master netting arrangements, and sell or retain any collateral held up to the net amount owed to the fund under the master netting arrangements. The forward currency contracts contain provisions whereby a counterparty may terminate open contracts if the fund’s net assets decline below a certain level, triggering a payment by the fund if the fund is in a net liability position at the time of the termination. The payment amount would be reduced by any collateral the fund has pledged. Any securities pledged as collateral for open contracts are noted in the Schedule of Investments. The value of collateral received or pledged is compared daily to the value of the forward currency contracts exposure with each counterparty, and any difference, if in excess of a specified minimum transfer amount, is adjusted and settled within two business days.
Forward currency contracts are valued at their quoted daily prices obtained from an independent third party, adjusted for currency risk based on the expiration date of each contract. The notional amounts of the contracts are not recorded in the Statement of Assets and Liabilities. Fluctuations in the value of the contracts are recorded in the Statement of Assets and Liabilities as an asset (liability) and in the Statement of Operations as unrealized appreciation (depreciation) until the contracts are closed, when they are recorded as realized gains (losses) on forward currency contracts.
During the year ended October 31, 2021, the fund’s average investment in forward currency contracts represented less than 1% of net assets, based on the average of the notional amounts at each quarter-end during the period.
International High Dividend Yield Index Fund
5. Federal Income Taxes: The fund intends to continue to qualify as a regulated investment company and distribute all of its taxable income. The fund’s tax returns are open to examination by the relevant tax authorities until expiration of the applicable statute of limitations, which is generally three years after the filing of the tax return. Management has analyzed the fund’s tax positions taken for all open federal and state income tax years, and has concluded that no provision for income tax is required in the fund’s financial statements.
6. Distributions: Distributions to shareholders are recorded on the ex-dividend date. Distributions are determined on a tax basis at the fiscal year-end and may differ from net investment income and realized capital gains for financial reporting purposes.
7. Securities Lending: To earn additional income, the fund lends its securities to qualified institutional borrowers. Security loans are subject to termination by the fund at any time, and are required to be secured at all times by collateral in an amount at least equal to the market value of securities loaned. Daily market fluctuations could cause the value of loaned securities to be more or less than the value of the collateral received. When this occurs, the collateral is adjusted and settled before the opening of the market on the next business day. The fund further mitigates its counterparty risk by entering into securities lending transactions only with a diverse group of prequalified counterparties, monitoring their financial strength, and entering into master securities lending agreements with its counterparties. The master securities lending agreements provide that, in the event of a counterparty’s default (including bankruptcy), the fund may terminate any loans with that borrower, determine the net amount owed, and sell or retain the collateral up to the net amount owed to the fund; however, such actions may be subject to legal proceedings. While collateral mitigates counterparty risk, in the event of a default, the fund may experience delays and costs in recovering the securities loaned. The fund invests cash collateral received in Vanguard Market Liquidity Fund, and records a liability in the Statement of Assets and Liabilities for the return of the collateral, during the period the securities are on loan. Collateral investments in Vanguard Market Liquidity Fund are subject to market appreciation or depreciation. Securities lending income represents fees charged to borrowers plus income earned on invested cash collateral, less expenses associated with the loan. During the term of the loan, the fund is entitled to all distributions made on or in respect of the loaned securities.
8. Credit Facilities and Interfund Lending Program: The fund and certain other funds managed by The Vanguard Group ("Vanguard") participate in a $4.3 billion committed credit facility provided by a syndicate of lenders pursuant to a credit agreement and an uncommitted credit facility provided by Vanguard. Both facilities may be renewed annually. Each fund is individually liable for its borrowings, if any, under the credit facilities. Borrowings may be utilized for temporary or emergency purposes, subject to the fund’s regulatory and contractual borrowing restrictions. With respect to the committed credit facility, the participating funds are charged administrative fees and an annual commitment fee of 0.10% of the undrawn committed amount of the facility; these fees are allocated to the funds based on a method approved by the fund’s board of trustees and included in Management and Administrative expenses on the fund’s Statement of Operations. Any borrowings under either facility bear interest at a rate based upon the higher of the one-month London Interbank Offered Rate (or an acceptable alternate rate, if necessary), federal funds effective rate, or overnight bank funding rate plus an agreed-upon spread, except that borrowings under the uncommitted credit facility may bear interest based upon an alternate rate agreed to by the fund and Vanguard.
In accordance with an exemptive order (the “Order”) from the SEC, the fund may participate in a joint lending and borrowing program that allows registered open-end Vanguard funds to borrow
International High Dividend Yield Index Fund
money from and lend money to each other for temporary or emergency purposes (the “Interfund Lending Program”), subject to compliance with the terms and conditions of the Order, and to the extent permitted by the fund’s investment objective and investment policies. Interfund loans and borrowings normally extend overnight, but can have a maximum duration of seven days. Loans may be called on one business day’s notice. The interest rate to be charged is governed by the conditions of the Order and internal procedures adopted by the board of trustees. The board of trustees is responsible for overseeing the Interfund Lending Program.
For the year ended October 31, 2021, the fund did not utilize the credit facilities or the Interfund Lending Program.
9. Other: Dividend income is recorded on the ex-dividend date. Non-cash dividends included in income, if any, are recorded at the fair value of the securities received. Interest income includes income distributions received from Vanguard Market Liquidity Fund and is accrued daily. Security transactions are accounted for on the date securities are bought or sold. Costs used to determine realized gains (losses) on the sale of investment securities are those of the specific securities sold. Fees assessed on capital share transactions are credited to paid-in capital.
Taxes on foreign dividends and capital gains have been provided for in accordance with the fund's understanding of the applicable countries' tax rules and rates. Deferred foreign capital gains tax, if any, is accrued daily based upon net unrealized gains. The fund has filed tax reclaims for previously withheld taxes on dividends earned in certain European Union countries. These filings are subject to various administrative and judicial proceedings within these countries. Such tax reclaims received during the year, if any, are included in dividend income. No other amounts for additional tax reclaims are reflected in the financial statements due to the uncertainty as to the ultimate resolution of proceedings, the likelihood of receipt of these reclaims, and the potential timing of payment.
Each class of shares has equal rights as to assets and earnings, except that each class separately bears certain class-specific expenses related to maintenance of shareholder accounts (included in Management and Administrative expenses) and shareholder reporting. Marketing and distribution expenses are allocated to each class of shares based on a method approved by the board of trustees. Income, other non-class-specific expenses, and gains and losses on investments are allocated to each class of shares based on its relative net assets.
| B. | In accordance with the terms of a Funds' Service Agreement (the “FSA”) between Vanguard and the fund, Vanguard furnishes to the fund investment advisory, corporate management, administrative, marketing, and distribution services at Vanguard’s cost of operations (as defined by the FSA). These costs of operations are allocated to the fund based on methods and guidelines approved by the board of trustees and are generally settled twice a month. |
Upon the request of Vanguard, the fund may invest up to 0.40% of its net assets as capital in Vanguard. At October 31, 2021, the fund had contributed to Vanguard capital in the amount of $110,000, representing less than 0.01% of the fund’s net assets and 0.04% of Vanguard’s capital received pursuant to the FSA. The fund’s trustees and officers are also directors and employees, respectively, of Vanguard.
International High Dividend Yield Index Fund
| C. | Various inputs may be used to determine the value of the fund’s investments and derivatives. These inputs are summarized in three broad levels for financial statement purposes. The inputs or methodologies used to value securities are not necessarily an indication of the risk associated with investing in those securities. |
Level 1—Quoted prices in active markets for identical securities.
Level 2—Other significant observable inputs (including quoted prices for similar securities, interest rates, prepayment speeds, credit risk, etc.).
Level 3—Significant unobservable inputs (including the fund’s own assumptions used to determine the fair value of investments). Any investments and derivatives valued with significant unobservable inputs are noted on the Schedule of Investments.
The following table summarizes the market value of the fund’s investments and derivatives as of October 31, 2021, based on the inputs used to value them:
| | Level 1
($000) | Level 2
($000) | Level 3
($000) | Total
($000) |
| Investments | | | | |
| Assets | | | | |
| Common Stocks—North and South America | 388,184 | — | — | 388,184 |
| Common Stocks—Other | 4,722 | 3,022,768 | 14,759 | 3,042,249 |
| Temporary Cash Investments | 109,865 | — | — | 109,865 |
| Total | 502,771 | 3,022,768 | 14,759 | 3,540,298 |
| Derivative Financial Instruments | | | | |
| Assets | | | | |
| Futures Contracts1 | 183 | — | — | 183 |
| Forward Currency Contracts | — | 154 | — | 154 |
| Total | 183 | 154 | — | 337 |
| Liabilities | | | | |
| Futures Contracts1 | 79 | — | — | 79 |
| Forward Currency Contracts | — | 11 | — | 11 |
| Total | 79 | 11 | — | 90 |
| 1 | Includes cumulative appreciation (depreciation) on futures contracts and centrally cleared swaps, if any, as reported in the Schedule of Investments. Only current day’s variation margin is reported within the Statement of Assets and Liabilities. |
International High Dividend Yield Index Fund
| D. | At October 31, 2021, the fair values of derivatives were reflected in the Statement of Assets and Liabilities as follows: |
| Statement of Assets and Liabilities | Equity
Contracts
($000) | Foreign
Exchange
Contracts
($000) | Total
($000) |
| Unrealized Appreciation—Futures Contracts1 | 183 | — | 183 |
| Unrealized Appreciation—Forward Currency Contracts | — | 154 | 154 |
| Total Assets | 183 | 154 | 337 |
| | | | |
| Unrealized Depreciation—Futures Contracts1 | 79 | — | 79 |
| Unrealized Depreciation—Forward Currency Contracts | — | 11 | 11 |
| Total Liabilities | 79 | 11 | 90 |
| 1 | Includes cumulative appreciation (depreciation) on futures contracts and centrally cleared swaps, if any, as reported in the Schedule of Investments. Only current day’s variation margin is reported within the Statement of Assets and Liabilities. |
Realized net gain (loss) and the change in unrealized appreciation (depreciation) on derivatives for the year ended October 31, 2021, were:
| Realized Net Gain (Loss) on Derivatives | Equity
Contracts
($000) | Foreign
Exchange
Contracts
($000) | Total
($000) |
| Futures Contracts | 2,253 | — | 2,253 |
| Forward Currency Contracts | — | 79 | 79 |
| Realized Net Gain (Loss) on Derivatives | 2,253 | 79 | 2,332 |
| Change in Unrealized Appreciation (Depreciation) on Derivatives |
| Futures Contracts | 514 | — | 514 |
| Forward Currency Contracts | — | 193 | 193 |
| Change in Unrealized Appreciation (Depreciation) on Derivatives | 514 | 193 | 707 |
| E. | Permanent differences between book-basis and tax-basis components of net assets are reclassified among capital accounts in the financial statements to reflect their tax character. These reclassifications have no effect on net assets or net asset value per share. As of period end, permanent differences primarily attributable to the accounting for foreign currency transactions, passive foreign investment companies, and tax expense on capital gains were reclassified between the individual components of total distributable earnings (loss). |
Temporary differences between book-basis and tax-basis components of total distributable earnings (loss) arise when certain items of income, gain, or loss are recognized in different periods for financial statement and tax purposes; these differences will reverse at some time in the future. The differences are primarily related to the deferral of losses from wash sales; the recognition of unrealized gains or losses from certain derivative contracts; and the recognition of unrealized gains
International High Dividend Yield Index Fund
from passive foreign investment companies. As of period end, the tax-basis components of total distributable earnings (loss) are detailed in the table as follows:
| | Amount
($000) |
| Undistributed Ordinary Income | 32,567 |
| Undistributed Long-Term Gains | — |
| Capital Loss Carryforwards | (57,774) |
| Qualified Late-Year Losses | — |
| Net Unrealized Gains (Losses) | 262,701 |
The tax character of distributions paid was as follows:
| | Year Ended October 31, |
| | 2021
Amount
($000) | 2020
Amount
($000) |
| Ordinary Income* | 104,727 | 55,814 |
| Long-Term Capital Gains | — | — |
| Total | 104,727 | 55,814 |
| * | Includes short-term capital gains, if any. |
As of October 31, 2021, gross unrealized appreciation and depreciation for investments and derivatives based on cost for U.S. federal income tax purposes were as follows:
| | Amount
($000) |
| Tax Cost | 3,276,135 |
| Gross Unrealized Appreciation | 447,910 |
| Gross Unrealized Depreciation | (183,747) |
| Net Unrealized Appreciation (Depreciation) | 264,163 |
| F. | During the year ended October 31, 2021, the fund purchased $1,741,857,000 of investment securities and sold $462,132,000 of investment securities, other than temporary cash investments. Purchases and sales include $896,853,000 and $0, respectively, in connection with in-kind purchases and redemptions of the fund's capital shares. |
International High Dividend Yield Index Fund
| G. | Capital share transactions for each class of shares were: |
| | Year Ended October 31, | |
| | 2021 | | 2020 |
| | Amount
($000) | Shares
(000) | | Amount
($000) | Shares
(000) |
| ETF Shares | | | | | |
| Issued1 | 1,245,225 | 18,913 | | 377,560 | 6,711 |
| Issued in Lieu of Cash Distributions | — | — | | — | — |
| Redeemed2 | — | — | | (49,405) | (1,100) |
| Net Increase (Decrease)—ETF Shares | 1,245,225 | 18,913 | | 328,155 | 5,611 |
| Admiral Shares | | | | | |
| Issued1 | 64,421 | 2,021 | | 173,979 | 6,455 |
| Issued in Lieu of Cash Distributions | 6,979 | 221 | | 5,196 | 203 |
| Redeemed2 | (36,030) | (1,151) | | (61,888) | (2,421) |
| Net Increase (Decrease)—Admiral Shares | 35,370 | 1,091 | | 117,287 | 4,237 |
| 1 | Includes purchase fees for fiscal 2021 and 2020 of $162,000 and $728,000, respectively (fund totals). |
| 2 | Net of redemption fees for fiscal 2021 and 2020 of $88,000 and $151,000, respectively (fund totals). |
| H. | Management has determined that no events or transactions occurred subsequent to October 31, 2021, that would require recognition or disclosure in these financial statements. |
Report of Independent Registered Public Accounting Firm
To the Board of Trustees of Vanguard Whitehall Funds and Shareholders of Vanguard International Dividend Appreciation Index Fund and Vanguard International High Dividend Yield Index Fund
Opinions on the Financial Statements
We have audited the accompanying statements of assets and liabilities, including the schedules of investments, of Vanguard International Dividend Appreciation Index Fund and Vanguard International High Dividend Yield Index Fund (two of the funds constituting Vanguard Whitehall Funds, hereafter collectively referred to as the "Funds") as of October 31, 2021, the related statements of operations for the year ended October 31, 2021, the statements of changes in net assets for each of the two years in the period ended October 31, 2021, including the related notes, and the financial highlights for each of the five years in the period ended October 31, 2021 (collectively referred to as the "financial statements"). In our opinion, the financial statements present fairly, in all material respects, the financial position of each of the Funds as of October 31, 2021, the results of each of their operations for the year then ended, the changes in each of their net assets for each of the two years in the period ended October 31, 2021 and each of the financial highlights for each of the five years in the period ended October 31, 2021 in conformity with accounting principles generally accepted in the United States of America.
Basis for Opinions
These financial statements are the responsibility of the Funds’ management. Our responsibility is to express an opinion on the Funds’ financial statements based on our audits. We are a public accounting firm registered with the Public Company Accounting Oversight Board (United States) (PCAOB) and are required to be independent with respect to the Funds in accordance with the U.S. federal securities laws and the applicable rules and regulations of the Securities and Exchange Commission and the PCAOB.
We conducted our audits of these financial statements in accordance with the standards of the PCAOB. Those standards require that we plan and perform the audit to obtain reasonable assurance about whether the financial statements are free of material misstatement, whether due to error or fraud.
Our audits included performing procedures to assess the risks of material misstatement of the financial statements, whether due to error or fraud, and performing procedures that respond to those risks. Such procedures included examining, on a test basis, evidence regarding the amounts and disclosures in the financial statements. Our audits also included evaluating the accounting principles used and significant estimates made by management, as well as evaluating the overall presentation of the financial statements. Our procedures included confirmation of securities owned as of October 31, 2021 by correspondence with the custodian, transfer agent and brokers; when replies were not received from the transfer agent or brokers, we performed other auditing procedures. We believe that our audits provide a reasonable basis for our opinions.
/s/PricewaterhouseCoopers LLP
Philadelphia, Pennsylvania
December 16, 2021
We have served as the auditor of one or more investment companies in The Vanguard Group of Funds since 1975.
Special 2021 tax information (unaudited) for Vanguard International Dividend Appreciation Index Fund
This information for the fiscal year ended October 31, 2021, is included pursuant to provisions of the Internal Revenue Code.
The fund distributed $378,000 as capital gain dividends (20% rate gain distributions) to shareholders during the fiscal year.
For nonresident alien shareholders, 100% of short-term capital gain dividends distributed by the fund are qualified short-term capital gains.
The fund distributed $36,030,000 of qualified dividend income to shareholders during the fiscal year.
The fund designates to shareholders foreign source income of $60,947,000 and foreign taxes paid of $25,689,000. Shareholders will receive more detailed information with their Form 1099-DIV in January 2022 to determine the calendar-year amounts to be included on their 2021 tax returns.
Special 2021 tax information (unaudited) for Vanguard International High Dividend Yield Index Fund
This information for the fiscal year ended October 31, 2021, is included pursuant to provisions of the Internal Revenue Code.
The fund distributed $75,457,000 of qualified dividend income to shareholders during the fiscal year.
The fund designates to shareholders foreign source income of $131,172,000 and foreign taxes paid of $9,189,000. Shareholders will receive more detailed information with their Form 1099-DIV in January 2022 to determine the calendar-year amounts to be included on their 2021 tax returns.
The S&P Global Ex-U.S. Dividend Growers Index is a product of S&P Dow Jones Indices LLC ("S&P DJI"), a division of S&P Global ("S&P"), or its affiliates, and has been licensed for use by Vanguard. S&P® is a registered trademark of Standard & Poor’s Financial Services LLC, a division of S&P Global and Dow Jones® is a registered trademark of Dow Jones Trademark Holdings LLC (“Dow Jones”). The trademarks have been licensed to S&P DJI and have been sublicensed for use for certain purposes by Vanguard. The International Dividend Appreciation Index Fund is not sponsored, endorsed, sold, or promoted by SPDJI, Dow Jones, S&P, any of their respective affiliates (collectively, “S&P Dow Jones Indices”). S&P Dow Jones Indices make no representation or warranty, express or implied, to the owners of the International Dividend Appreciation Index Fund or any member of the public regarding the advisability of investing in securities generally or in the International Dividend Appreciation Index Fund particularly or the ability of the S&P Global Ex-U.S. Dividend Growers Index to track general market performance. S&P Dow Jones Indices’ only relationship to Vanguard with respect to the S&P Global Ex-U.S. Dividend Growers Index is the licensing of the Index and certain trademarks, service marks and/or trade names of S&P Dow Jones Indices and/or its licensors. The S&P Global Ex-U.S. Dividend Growers Index is determined, composed and calculated by S&P Dow Jones Indices without regard to Vanguard or the International Dividend Appreciation Index Fund. S&P Dow Jones Indices have no obligation to take the needs of Vanguard or the owners of the International Dividend Appreciation Index Fund into consideration in determining, composing or calculating the S&P Global Ex-U.S. Dividend Growers Index. S&P Dow Jones Indices are not responsible for and have not participated in the determination of the prices, and amount of the International Dividend Appreciation Index Fund or the timing of the issuance or sale of the International Dividend Appreciation Index Fund or in the determination or calculation of the equation by which the International Dividend Appreciation Index Fund is to be converted into cash, surrendered or redeemed, as the case may be. S&P Dow Jones Indices have no obligation or liability in connection with the administration, marketing or trading of the International Dividend Appreciation Index Fund. There is no assurance that investment products based on the S&P Global Ex-U.S. Dividend Growers Index will accurately track index performance or provide positive investment returns. S&P Dow Jones Indices LLC is not an investment advisor. Inclusion of a security within an index is not a recommendation by S&P Dow Jones Indices to buy, sell, or hold such security, nor is it considered to be investment advice.
S&P DOW JONES INDICES DOES NOT GUARANTEE THE ADEQUACY, ACCURACY, TIMELINESS AND/OR THE COMPLETENESS OF THE S&P GLOBAL EX-U.S. DIVIDEND GROWERS INDEX OR ANY DATA RELATED THERETO OR ANY COMMUNICATION, INCLUDING BUT NOT LIMITED TO, ORAL OR WRITTEN COMMUNICATION (INCLUDING ELECTRONIC COMMUNICATIONS) WITH RESPECT THERETO. S&P DOW JONES INDICES SHALL NOT BE SUBJECT TO ANY DAMAGES OR LIABILITY FOR ANY ERRORS, OMISSIONS, OR DELAYS THEREIN. S&P DOW JONES INDICES MAKE NO EXPRESS OR IMPLIED WARRANTIES, AND EXPRESSLY DISCLAIMS ALL WARRANTIES, OF MERCHANTABILITY OR FITNESS FOR A PARTICULAR PURPOSE OR USE OR AS TO RESULTS TO BE OBTAINED BY VANGUARD, OWNERS OF THE INTERNATIONAL DIVIDEND APPRECIATION INDEX FUND, OR ANY OTHER PERSON OR ENTITY FROM THE USE OF THE S&P GLOBAL EX-U.S. DIVIDEND GROWERS INDEX OR WITH RESPECT TO ANY DATA RELATED THERETO. WITHOUT LIMITING ANY OF THE FOREGOING, IN NO EVENT WHATSOEVER SHALL S&P DOW JONES INDICES BE LIABLE FOR ANY INDIRECT, SPECIAL, INCIDENTAL, PUNITIVE, OR CONSEQUENTIAL DAMAGES INCLUDING BUT NOT LIMITED TO, LOSS OF PROFITS, TRADING LOSSES, LOST TIME OR GOODWILL, EVEN IF THEY HAVE BEEN ADVISED OF THE POSSIBILITY OF SUCH DAMAGES, WHETHER IN CONTRACT, TORT, STRICT LIABILITY, OR OTHERWISE. THERE ARE NO THIRD PARTY BENEFICIARIES OF ANY AGREEMENTS OR ARRANGEMENTS BETWEEN S&P DOW JONES INDICES AND VANGUARD, OTHER THAN THE LICENSORS OF S&P DOW JONES INDICES.
London Stock Exchange Group companies include FTSE International Limited (“FTSE”), Frank Russell Company (“Russell”), MTS Next Limited (“MTS”), and FTSE TMX Global Debt Capital Markets Inc. (“FTSE TMX”). All rights reserved. “FTSE®”, “Russell®”, “MTS®”, “FTSE TMX®” and “FTSE Russell” and other service marks and trademarks related to the FTSE or Russell indexes are trademarks of the London Stock Exchange Group companies and are used by FTSE, MTS, FTSE TMX and Russell under license. All information is provided for information purposes only. Every effort is made to ensure that all information given in this publication is accurate, but no responsibility or liability can be accepted by the London Stock Exchange Group companies nor its licensors for any errors or for any loss from use of this publication. Neither the London Stock Exchange Group companies nor any of their licensors make any claim, prediction, warranty or representation whatsoever, expressly or impliedly, either as to the results to be obtained from the use of the Indices or the fitness or suitability of the Indices for any particular purpose to which they might be put. The London Stock Exchange Group companies do not provide investment advice and nothing in this document should be taken as constituting financial or investment advice. The London Stock Exchange Group companies make no representation regarding the advisability of investing in any asset. A decision to invest in any such asset should not be made in reliance on any information herein. Indexes cannot be invested in directly. Inclusion of an asset in an index is not a recommendation to buy, sell or hold that asset. The general information contained in this publication should not be acted upon without obtaining specific legal, tax, and investment advice from a licensed professional. No part of this information may be reproduced, stored in a retrieval system or transmitted in any form or by any means, electronic, mechanical, photocopying, recording or otherwise, without prior written permission of the London Stock Exchange Group companies. Distribution of the London Stock Exchange Group companies’ index values and the use of their indexes to create financial products require a license with FTSE, FTSE TMX, MTS and/or Russell and/or its licensors.
This page intentionally left blank.
The People Who Govern Your Fund
The trustees of your mutual fund are there to see that the fund is operated and managed in your best interests since, as a shareholder, you are a part owner of the fund. Your fund’s trustees also serve on the board of directors of The Vanguard Group, Inc., which is owned by the Vanguard funds and provides services to them.
A majority of Vanguard’s board members are independent, meaning that they have no affiliation with Vanguard or the funds they oversee, apart from the sizable personal investments they have made as private individuals. The independent board members have distinguished backgrounds in business, academia, and public service. Each of the trustees and executive officers oversees 214 Vanguard funds.
Information for each trustee and executive officer of the fund appears below. That information, as well as the Vanguard fund count, is as of the date on the cover of this fund report. The mailing address of the trustees and officers is P.O. Box 876, Valley Forge, PA 19482. More information about the trustees is in the Statement of Additional Information, which can be obtained, without charge, by contacting Vanguard at 800-662-7447, or online at vanguard.com.
Interested Trustee1
Mortimer J. Buckley
Born in 1969. Trustee since January 2018. Principal occupation(s) during the past five years and other experience: chairman of the board (2019–present) of Vanguard and of each of the investment companies served by Vanguard; chief executive officer (2018–present) of Vanguard; chief executive officer, president, and trustee (2018–present) of each of the investment companies served by Vanguard; president and director (2017–present) of Vanguard; and president (2018–present) of Vanguard Marketing Corporation. Chief investment officer (2013–2017), managing director (2002–2017), head of the Retail Investor Group (2006–2012), and chief information officer (2001–2006) of Vanguard. Chairman of the board (2011–2017) and trustee (2009–2017) of the Children’s Hospital of Philadelphia; and trustee (2018–present) and vice chair (2019–present) of The Shipley School.
Independent Trustees
Emerson U. Fullwood
Born in 1948. Trustee since January 2008. Principal occupation(s) during the past five years and other experience: executive chief staff and marketing officer for North America and corporate vice president (retired 2008) of Xerox Corporation (document management products and services). Former president of the Worldwide Channels Group, Latin
America, and Worldwide Customer Service and executive chief staff officer of Developing Markets of Xerox. Executive in residence and 2009–2010 Distinguished Minett Professor at the Rochester Institute of Technology. Director of SPX FLOW, Inc. (multi-industry manufacturing). Director of the University of Rochester Medical Center, the Monroe Community College Foundation, the United Way of Rochester, North Carolina A&T University, and Roberts Wesleyan College. Trustee of the University of Rochester.
Amy Gutmann
Born in 1949. Trustee since June 2006. Principal occupation(s) during the past five years and other experience: president (2004–present) of the University of Pennsylvania. Christopher H. Browne Distinguished Professor of Political Science, School of Arts and Sciences, and professor of communication, Annenberg School for Communication, with secondary faculty appointments in the Department of Philosophy, School of Arts and Sciences, and at the Graduate School of Education, University of Pennsylvania.
F. Joseph Loughrey
Born in 1949. Trustee since October 2009. Principal occupation(s) during the past five years and other experience: president and chief operating officer (retired 2009) and vice chairman of the board (2008–2009) of Cummins Inc. (industrial machinery). Chairman of the board of Hillenbrand, Inc. (specialized consumer services). Director of the V Foundation.
1 Mr. Buckley is considered an “interested person,” as defined in the Investment Company Act of 1940, because he is an officer of the Vanguard funds.
Member of the advisory council for the College of Arts and Letters and chair of the advisory board to the Kellogg Institute for International Studies, both at the University of Notre Dame. Chairman of the board of Saint Anselm College.
Mark Loughridge
Born in 1953. Trustee since March 2012. Principal occupation(s) during the past five years and other experience: senior vice president and chief financial officer (retired 2013) of IBM (information technology services). Fiduciary member of IBM’s Retirement Plan Committee (2004–2013), senior vice president and general manager (2002–2004) of IBM Global Financing, vice president and controller (1998–2002) of IBM, and a variety of other prior management roles at IBM. Member of the Council on Chicago Booth.
Scott C. Malpass
Born in 1962. Trustee since March 2012. Principal occupation(s) during the past five years and other experience: chief investment officer (retired June 2020) and vice president (retired June 2020) of the University of Notre Dame. Assistant professor (retired June 2020) of finance at the Mendoza College of Business, University of Notre Dame, and member of the Notre Dame 403(b) Investment Committee. Member of the board of Catholic Investment Services, Inc. (investment advisors) and the board of superintendence of the Institute for the Works of Religion.
Deanna Mulligan
Born in 1963. Trustee since January 2018. Principal occupation(s) during the past five years and other experience: board chair (2020), chief executive officer (2011–2020), and president (2010–2019) of The Guardian Life Insurance Company of America. Chief operating officer (2010–2011) and executive vice president (2008–2010) of Individual Life and Disability of the Guardian Life Insurance Company of America. Member of the board of the Economic Club of New York. Trustee of the Partnership for New York City (business leadership), Chief Executives for Corporate Purpose, NewYork-Presbyterian Hospital, and the Bruce Museum (arts and science). Member of the Advisory Council for the Stanford Graduate School of Business.
André F. Perold
Born in 1952. Trustee since December 2004. Principal occupation(s) during the past five years and other experience: George Gund Professor of Finance and Banking, Emeritus at the Harvard Business School (retired 2011). Chief investment officer and co-managing partner of HighVista Strategies (private investment firm). Member of the board
(2018–present) of RIT Capital Partners (investment firm). Member of the investment committee of Partners Health Care System.
Sarah Bloom Raskin
Born in 1961. Trustee since January 2018. Principal occupation(s) during the past five years and other experience: deputy secretary (2014–2017) of the United States Department of the Treasury. Governor (2010–2014) of the Federal Reserve Board. Commissioner (2007–2010) of financial regulation for the State of Maryland. Professor (2020–present), Distinguished Fellow of the Global Financial Markets Center (2020–present), and Rubenstein Fellow (2017–2020) at Duke University. Trustee (2017–present) of Amherst College and member of Amherst College Investment Committee (2019–present). Member of the Regenerative Crisis Response Committee (2020–present).
David A. Thomas
Born in 1956. Trustee since July 2021. Principal occupation(s) during the past five years and other experience: president of Morehouse College (2018–present). Professor of business administration, emeritus at Harvard University (2017–2018). Dean (2011–2016) and professor of management (2016–2017) at the Georgetown University McDonough School of Business. Director of DTE Energy Company (2013–present). Trustee of Common Fund (2019–present).
Peter F. Volanakis
Born in 1955. Trustee since July 2009. Principal occupation(s) during the past five years and other experience: president and chief operating officer (retired 2010) of Corning Incorporated (communications equipment) and director of Corning Incorporated (2000–2010) and Dow Corning (2001–2010). Director (2012) of SPX Corporation (multi-industry manufacturing). Overseer of the Amos Tuck School of Business Administration, Dartmouth College (2001–2013). Chairman of the board of trustees of Colby-Sawyer College. Member of the BMW Group Mobility Council.
Executive Officers
Christine M. Buchanan
Born in 1970. Principal occupation(s) during the past five years and other experience: principal of Vanguard. Chief financial officer (2021–present) and treasurer (2017–present) of each of the investment companies served by Vanguard. Partner (2005–2017) at KPMG (audit, tax, and advisory services).
David Cermak
Born in 1960. Principal occupation(s) during the past five years and other experience: principal of Vanguard. Finance director (2019–present) of each of the investment companies served by Vanguard. Managing director and head (2017–present) of Vanguard Investments Singapore. Managing director and head (2017–2019) of Vanguard Investments Hong Kong. Representative director and head (2014–2017) of Vanguard Investments Japan.
John Galloway
Born in 1973. Principal occupation(s) during the past five years and other experience: principal of Vanguard. Investment stewardship officer (September 2020–present) of each of the investment companies served by Vanguard. Head of Investor Advocacy (February 2020–present) and head of Marketing Strategy and Planning (2017–2020) at Vanguard. Deputy assistant to the President of the United States (2015).
Peter Mahoney
Born in 1974. Principal occupation(s) during the past five years and other experience: principal of Vanguard. Controller (2015–present) of each of the investment companies served by Vanguard. Head of International Fund Services (2008–2014) at Vanguard.
Anne E. Robinson
Born in 1970. Principal occupation(s) during the past five years and other experience: general counsel (2016–present) of Vanguard. Secretary (2016–present) of Vanguard and of each of the investment companies served by Vanguard. Managing director (2016–present) of Vanguard. Managing director and general counsel of Global Cards and Consumer Services (2014–2016) at Citigroup. Counsel (2003–2014) at American Express.
Michael Rollings
Born in 1963. Principal occupation(s) during the past five years and other experience: finance director (2017–present) and treasurer (2017) of each of the investment companies served by Vanguard. Managing director (2016–present) of Vanguard. Chief financial officer (2016–present) of Vanguard. Director (2016–present) of Vanguard Marketing Corporation. Executive vice president and chief financial officer (2006–2016) of MassMutual Financial Group.
John E. Schadl
Born in 1972. Principal occupation(s) during the past five years and other experience: principal of Vanguard. Chief compliance officer (2019–present) of Vanguard and of each of the investment companies served by Vanguard. Assistant vice president (2019–present) of Vanguard Marketing Corporation.
Vanguard Senior Management Team
| Matthew Benchener | Thomas M. Rampulla |
| Joseph Brennan | Karin A. Risi |
| Mortimer J. Buckley | Anne E. Robinson |
| Gregory Davis | Michael Rollings |
| John James | Nitin Tandon |
| John T. Marcante | Lauren Valente |
| Chris D. Mclsaac | |
Connect with Vanguard®>vanguard.com
Fund Information > 800-662-7447
Direct Investor Account Services > 800-662-2739
Institutional Investor Services > 800-523-1036
Text Telephone for People Who Are Deaf or Hard of Hearing > 800-749-7273
This material may be used in conjunction with the offering of shares of any Vanguard fund only if preceded or accompanied by the fund’s current prospectus.
All comparative mutual fund data are from Morningstar, Inc., unless otherwise noted.
You can obtain a free copy of Vanguard’s proxy voting guidelines by visiting vanguard.com/proxyreporting or by calling Vanguard at 800-662-2739. The guidelines are also available from the SEC’s website, www.sec.gov. In addition, you may obtain a free report on how your fund voted the proxies for securities it owned during the 12 months ended June 30. To get the report, visit either vanguard.com/proxyreporting or www.sec.gov.
You can review information about your fund on the SEC’s website, and you can receive copies of this information, for a fee, by sending a request via email addressed to publicinfo@sec.gov.
Source for Bloomberg indexes: Bloomberg Index Services Limited. Copyright 2021, Bloomberg. All rights reserved.
© 2021 The Vanguard Group, Inc.
All rights reserved.
U.S. Patent Nos. 6,879,964 and 7,720,749.
Vanguard Marketing Corporation, Distributor.
Q20150 122021
Item 2: Code of Ethics.
The Registrant has adopted a code of ethics that applies to the Registrant’s principal executive officer, principal financial officer, principal accounting officer or controller or persons performing similar functions. The Code of Ethics was amended during the reporting period covered by this report to make certain technical, non-material changes.
Item 3: Audit Committee Financial Expert.
All members of the Audit Committee have been determined by the Registrant’s Board of Trustees to be Audit Committee Financial Experts and to be independent: F. Joseph Loughrey, Mark Loughridge, Sarah Bloom Raskin, and Peter F. Volanakis.
Item 4: Principal Accountant Fees and Services.
(a) Audit Fees.
Audit Fees of the Registrant.
Fiscal Year Ended October 31, 2021: $326,000
Fiscal Year Ended October 31, 2020: $309,000
Aggregate Audit Fees of Registered Investment Companies in the Vanguard Group.
Fiscal Year Ended October 31, 2021: $11,244,694
Fiscal Year Ended October 31, 2020: $10,761,407
Includes fees billed in connection with audits of the Registrant, other registered investment companies in the Vanguard complex, The Vanguard Group, Inc., and Vanguard Marketing Corporation.
(b) Audit-Related Fees.
Fiscal Year Ended October 31, 2021: $2,955,181
Fiscal Year Ended October 31, 2020: $2,915,863
Includes fees billed in connection with assurance and related services provided to the Registrant, other registered investment companies in the Vanguard complex, The Vanguard Group, Inc., and Vanguard Marketing Corporation.
(c) Tax Fees.
Fiscal Year Ended October 31, 2021: $2,047,574
Fiscal Year Ended October 31, 2020: $247,168
Includes fees billed in connection with tax compliance, planning, and advice services provided to the Registrant, other registered investment companies in the Vanguard complex, The Vanguard Group, Inc., and Vanguard Marketing Corporation.
(d) All Other Fees.
Fiscal Year Ended October 31, 2021: $280,000
Fiscal Year Ended October 31, 2020: $115,000
Includes fees billed for services related to tax reported information provided to the Registrant, other registered investment companies in the Vanguard complex, The Vanguard Group, Inc., and Vanguard Marketing Corporation.
(e) (1) Pre-Approval Policies. The policy of the Registrant’s Audit Committee is to consider, and, if appropriate, approve before the principal accountant is engaged for such services, all specific audit and non-audit services provided to: the Registrant, other registered investment companies in the Vanguard complex, The Vanguard Group, Inc., and entities controlled by The Vanguard Group, Inc. that provide ongoing services to the Registrant. In making a determination, the Audit Committee considers whether the services are consistent with maintaining the principal accountant’s independence.
In the event of a contingency situation in which the principal accountant is needed to provide services in between scheduled Audit Committee meetings, the Chairman of the Audit Committee would be called on to consider and, if appropriate, pre-approve audit or permitted non-audit services in an amount sufficient to complete services through the next Audit Committee meeting, and to determine if such services would be consistent with maintaining the accountant’s independence. At the next scheduled Audit Committee meeting, services and fees would be presented to the Audit Committee for formal consideration, and, if appropriate, approval by the entire Audit Committee. The Audit Committee would again consider whether such services and fees are consistent with maintaining the principal accountant’s independence.
The Registrant’s Audit Committee is informed at least annually of all audit and non-audit services provided by the principal accountant to the Vanguard complex, whether such services are provided to: the Registrant, other registered investment companies in the Vanguard complex, The Vanguard Group, Inc., or other entities controlled by The Vanguard Group, Inc. that provide ongoing services to the Registrant.
(2) No percentage of the principal accountant’s fees or services were approved pursuant to the waiver provision of paragraph (c)(7)(i)(C) of Rule 2-01 of Regulation S-X.
(f) For the most recent fiscal year, over 50% of the hours worked under the principal accountant’s engagement were not performed by persons other than full-time, permanent employees of the principal accountant.
(g) Aggregate Non-Audit Fees.
Fiscal Year Ended October 31, 2021: $2,327,574
Fiscal Year Ended October 31, 2020: $362,168
Includes fees billed for non-audit services provided to the Registrant, other registered investment companies in the Vanguard complex, The Vanguard Group, Inc., and Vanguard Marketing Corporation.
(h) For the most recent fiscal year, the Audit Committee has determined that the provision of all non-audit services was consistent with maintaining the principal accountant’s independence.
Item 5: Audit Committee of Listed Registrants.
The Registrant is a listed issuer as defined in rule 10A-3 under the Securities Exchange Act of 1934 (“Exchange Act”). The Registrant has a separately-designated standing audit committee established in accordance with Section 3(a)(58)(A) of the Exchange Act. The Registrant’s audit committee members are: F. Joseph Loughrey, Mark Loughridge, Sarah Bloom Raskin, and Peter F. Volanakis.
Item 6: Investments.
Not applicable. The complete schedule of investments is included as part of the report to shareholders filed under Item 1 of this Form.
Item 7: Disclosure of Proxy Voting Policies and Procedures for Closed-End Management Investment Companies.
Not applicable.
Item 8: Portfolio Managers of Closed-End Management Investment Companies.
Not applicable.
Item 9: Purchase of Equity Securities by Closed-End Management Investment Company and Affiliated Purchasers.
Not applicable.
Item 10: Submission of Matters to a Vote of Security Holders.
Not applicable.
Item 11: Controls and Procedures.
(a) Disclosure Controls and Procedures. The Principal Executive and Financial Officers concluded that the Registrant’s Disclosure Controls and Procedures are effective based on their evaluation of the Disclosure Controls and Procedures as of a date within 90 days of the filing date of this report.
(b) Internal Control Over Financial Reporting. There were no significant changes in the Registrant’s Internal Control Over Financial Reporting or in other factors that could significantly affect this control subsequent to the date of the evaluation, including any corrective actions with regard to significant deficiencies and material weaknesses.
Item 12: Disclosure of Securities Lending Activities for Closed-End Management Investment Companies.
Not applicable.
Item 13: Exhibits.
Pursuant to the requirements of the Securities Exchange Act of 1934 and the Investment Company Act of 1940, the registrant has duly caused this report to be signed on its behalf by the undersigned, thereunto duly authorized.
| | VANGUARD WHITEHALL FUNDS |
| | | |
| BY: | /s/ MORTIMER J. BUCKLEY* | |
| | MORTIMER J. BUCKLEY | |
| | CHIEF EXECUTIVE OFFICER | |
Date: December 20, 2021
Pursuant to the requirements of the Securities Exchange Act of 1934 and the Investment Company Act of 1940, this report has been signed below by the following persons on behalf of the registrant and in the capacities and on the dates indicated.
| | VANGUARD WHITEHALL FUNDS |
| | | |
| BY: | /s/ MORTIMER J. BUCKLEY* | |
| | MORTIMER J. BUCKLEY | |
| | CHIEF EXECUTIVE OFFICER | |
Date: December 20, 2021
| | VANGUARD WHITEHALL FUNDS |
| | | |
| BY: | /s/ CHRISTINE BUCHANAN* | |
| | CHRISTINE BUCHANAN | |
| | CHIEF FINANCIAL OFFICER | |
Date: December 20, 2021
* By: /s/ Anne E. Robinson
Anne E. Robinson, pursuant to a Power of Attorney filed on November 29, 2021 (see File Number 33-64845), a Power of Attorney filed on October 12, 2021 (see File Number 33-23444), and a Power of Attorney filed on August 26, 2021 (see file Number 811-02652), Incorporated by Reference.