UNITED STATES
SECURITIES AND EXCHANGE COMMISSION
Washington, D.C. 20549
FORM N-CSR
CERTIFIED SHAREHOLDER REPORT
OF
REGISTERED MANAGEMENT INVESTMENT COMPANIES
Investment Company Act file number: 811-07443
| Name of Registrant: | Vanguard Whitehall Funds |
| Address of Registrant: | P.O. Box 2600 |
| | Valley Forge, PA 19482 |
| Name and address of agent for service: | Anne E. Robinson, Esquire |
| | P.O. Box 876 |
| | Valley Forge, PA 19482 |
Registrant’s telephone number, including area code: (610) 669-1000
Date of fiscal year end: October 31
Date of reporting period: November 1, 2019—October 31, 2020
Item 1: Reports to Shareholders
Annual Report | October 31, 2020
Vanguard Selected Value Fund
See the inside front cover for important information about access to your fund’s annual and semiannual shareholder reports.
Important information about access to shareholder reports
Beginning on January 1, 2021, as permitted by regulations adopted by the Securities and Exchange Commission, paper copies of your fund’s annual and semiannual shareholder reports will no longer be sent to you by mail, unless you specifically request them. Instead, you will be notified by mail each time a report is posted on the website and will be provided with a link to access the report.
If you have already elected to receive shareholder reports electronically, you will not be affected by this change and do not need to take any action. You may elect to receive shareholder reports and other communications from the fund electronically by contacting your financial intermediary (such as a broker-dealer or bank) or, if you invest directly with the fund, by calling Vanguard at one of the phone numbers on the back cover of this report or by logging on to vanguard.com.
You may elect to receive paper copies of all future shareholder reports free of charge. If you invest through a financial intermediary, you can contact the intermediary to request that you continue to receive paper copies. If you invest directly with the fund, you can call Vanguard at one of the phone numbers on the back cover of this report or log on to vanguard.com. Your election to receive paper copies will apply to all the funds you hold through an intermediary or directly with Vanguard.
Contents
Your Fund’s Performance at a Glance
| 1 |
Advisors' Report
| 2 |
About Your Fund’s Expenses
| 7 |
Performance Summary
| 9 |
Financial Statements
| 11 |
Please note: The opinions expressed in this report are just that—informed opinions. They should not be considered promises or advice. Also, please keep in mind that the information and opinions cover the period through the date on the front of this report. Of course, the risks of investing in your fund are spelled out in the prospectus.
Your Fund’s Performance at a Glance
| • | For the 12 months ended October 31, 2020, Vanguard Selected Value Fund returned –11.25%. It underperformed its benchmark, which returned –6.94%. |
| • | In December 2019, Cooke & Bieler, LP, was added as an advisor to the fund with a target allocation of 40% of assets. Barrow, Hanley, Mewhinney & Strauss, LLC, no longer serves as an advisor to the fund. |
| • | The period was marked by the global spread of COVID-19 and efforts to contain it. However, responses from policymakers, the start of trials for vaccines and treatments, and the easing of some pandemic-related restrictions eventually lifted investor sentiment. |
| • | The broad U.S. stock market, as measured by the Russell 3000 Index, returned 10.15%. Growth stocks outperformed value stocks, while large-capitalization stocks outperformed mid- and small-caps. |
| • | Returns were negative in nine of the fund’s 11 sectors, most notably in energy. The advisors’ holdings in materials and light weighting in real estate helped relative performance. Their holdings in industrials detracted most from relative returns. |
Market Barometer
| | Average Annual Total Returns
Periods Ended October 31, 2020 |
| | One Year | Three Years | Five Years |
| Stocks | | | |
| Russell 1000 Index (Large-caps) | 10.87% | 10.63% | 11.79% |
| Russell 2000 Index (Small-caps) | -0.14 | 2.19 | 7.27 |
| Russell 3000 Index (Broad U.S. market) | 10.15 | 10.04 | 11.48 |
| FTSE All-World ex US Index (International) | -2.17 | 0.13 | 4.52 |
| Bonds | | | |
| Bloomberg Barclays U.S. Aggregate Bond Index (Broad taxable market) | 6.19% | 5.06% | 4.08% |
Bloomberg Barclays Municipal Bond Index
(Broad tax-exempt market) | 3.59 | 4.09 | 3.70 |
| FTSE Three-Month U.S. Treasury Bill Index | 0.86 | 1.62 | 1.15 |
| CPI | | | |
| Consumer Price Index | 1.18% | 1.82% | 1.83% |
For the 12 months ended October 31, 2020, Vanguard Selected Value Fund returned –11.25%. It underperformed its benchmark, the Russell Midcap Value Index, which returned –6.94%
Your fund is managed by three independent advisors, a strategy that enhances its diversification by providing exposure to distinct yet complementary investment approaches. It’s not uncommon for different advisors to have different views about individual securities or the broader investment environment.
The accompanying table lists the advisors, the amount and percentage of fund assets each manages, and brief descriptions of their investment strategies.
The advisors have provided the following assessment of the investment environment during the past 12 months and the notable successes and shortfalls in their portfolios. These comments were prepared on November 13, 2020.
Pzena Investment Management, LLC
Portfolio Managers:
Richard Pzena, Managing Principal
and Co-Chief Investment Officer
John Flynn, Principal
Ben Silver, CFA, CPA, Principal
An easing of trade tensions between the U.S. and China propelled markets higher in the final months of 2019—but stocks
then suffered their sharpest decline on record in response to the COVID-19 pandemic and associated economic slowdowns. Value stocks, already cheap, fared the worst in this sell-off; growth stocks drove the market in its rebound, propelled by ever-lower interest rates.
The portfolio declined mostly because of its exposure to energy and financials, while holdings in industrials added to results. Opportunistic buying during the March low helped performance.
Among our energy holdings, National Oilwell Varco and TechnipFMC suffered as oil prices remained volatile. Some forecasters reduced their expectations for oil demand, both short-term and longer-term. While we expect that oil demand may never return to the growth seen historically, our research shows that the shrinkage in supply is already severe, raising the prospects of a healthy recovery in price and an increase in the industry’s profitability.
In financials, property and casualty insurer Axis Capital detracted on concerns around elevated expenses related to COVID-19 and a large increase in reserves. Management has a history of conservative reserve development, and the company and industry are now benefiting from the material price increases on insurance renewals linked to the current hard market.
Two of the largest contributors, specialty chemical maker Dow and global insurer AIG, were new positions. Dow shares rebounded after management effectively
reduced costs during the downturn. AIG shares benefited from management's increased disclosure on lines impacted by COVID-19 exposure, as well as from the life and retirement segment’s investment portfolio exposure to credit losses and rate migration. AIG recently announced it will separate its life and retirement business and establish two independent companies.
Other notable new positions included Ford Motor, NRG Energy, Olin, Textron, and Reinsurance Group of America. To help fund these purchases, notable exits included KKR, Anixter International, Carlisle Companies, Avangrid, and Legg Mason.
Persistent market volatility and widespread uncertainty have resulted in the widest valuation dispersions in the last 50 years and some of the most attractive valuations in our history. We believe our companies have the ability to manage through the uncertainty without capital impairment and will thrive as the economy continues to recover.
Cooke & Bieler, LP
Portfolio Managers:
Mehul Trivedi, CFA, Partner
and Research Analyst
William Weber, CFA, Partner
and Research Analyst
Note: On December 16, 2019, Vanguard added Cooke & Bieler as an advisor to
Vanguard Selected Value Fund. The commentary below is for the period from December 16, 2019, through October 31, 2020.
The investment environment was shaped by the global coronavirus pandemic and the economic shocks it caused. Panic selling in the first quarter of 2020 quickly gave way to a rapid recovery. Growth stocks led the way, with technology companies seen as winning from the pandemic’s fallout.
The portfolio’s top contributors were relatively immune to the challenging economic environment. Helen of Troy’s health care product portfolio—including thermometers, residential air-filtration systems, and humidifiers—benefited from increased demand, while its housewares and beauty lineup also posted strong results. Appliance manufacturer Whirlpool saw healthy demand for appliances, driven by home price appreciation and expanding home equity. IAA, an operator of marketplaces for damaged and low-value vehicles, proved relatively resilient despite declines in driving activity, as auctions shifted online and higher revenue per vehicle offset lower volumes. Positioning was broadly positive, with a lack of exposure to energy and real estate especially helpful.
The portfolio’s largest detractors—AerCap, Norwegian Cruise Lines, and Hexcel—were affected by the pandemic. AerCap, a leading lessor of aircraft, suffered amid concerns about the pandemic’s long-term impact on air traffic and demand for aircraft. Norwegian was
forced to cease operations indefinitely as cruise ships were deemed vectors for coronavirus transmission. We eliminated it from the portfolio in April. Hexcel, a manufacturer of highly engineered aircraft components, suffered a sharp decline in commercial aerospace revenues as production schedules were sharply cut. Though 2020 was a difficult year for both AerCap and Hexcel, we believe both businesses have the financial wherewithal to survive the current downturn and prosper on the other side.
Outlook
We expect the U.S. economy to recover as people return to many pre-COVID routines, driven by improving therapies and, eventually, vaccines. As the economy normalizes, we expect that investors will better appreciate the enormous valuation disparity created between stocks of companies buoyed by COVID-19 and stocks of companies that have taken a hit but remain strong, viable businesses. Reasonably valued stocks of well-positioned, financially strong companies with staying power and fundamental improvement potential should perform well.
Donald Smith & Co., Inc.
Portfolio Managers:
Richard L. Greenberg, CFA,
Chief Executive Officer
and Co-Chief Investment Officer
Jon Hartsel, CFA,
Co-Chief Investment Officer
and Director of Research
After a strong fourth quarter of 2019 and a positive beginning to the new year, markets plummeted in March with the onset of the COVID-19 pandemic and the subsequent lockdowns. Initially, there was an indiscriminate sell-off that also affected the portfolio’s holdings, particularly those in COVID-impacted areas such as travel and hospitality. While the markets and our portfolio have made some recovery since the trough in March, the pandemic is far from over, and heightened risks remain for almost every sector.
The top contributors for the period were the gold miners Gold Fields, Kinross Gold, Equinox Gold, and IAMGOLD. While the subsector declined with the broader market in the initial pandemic-driven sell-off in March, miners quickly rebounded as gold rallied in response to unprecedented monetary and fiscal stimulus. The outlook for gold and gold miners is positive, as real interest rates are expected to remain low and valuation of the miners remains attractive relative to their expected profitability and free cash flow.
New holding Mosaic was another large contributor. The fertilizer company quickly recovered from its March low as the phosphate market tightened with improved demand and supply dynamics.
Airline and aircraft leasing stocks, including Air France, AerCap, and JetBlue, detracted most, as air travel came to an
almost complete halt. News of government aid to the airline industry helped alleviate some pressure, but airline stocks remain depressed. Aircraft lessors like AerCap struggled with customer requests for lease payment deferrals and the prospect of airline bankruptcies.
Financial holdings were mixed; insurers Unum Group and CNA Financial declined, while Fifth Third Bankcorp rose. Homebuilders were also mixed. We were able to sell out of Toll Brothers at a gain, but Taylor Morrison Home declined.
Throughout the period, we sold out of certain holdings to accommodate redemption requests—but also made new purchases in commodities-related industries such as aluminum, paper, and gold, as well as in shipping, real estate, and insurance. Given the strong
performance of the gold miner group, we took gains in these names throughout the second and third quarters.
Our largest industry weightings are to insurance, metals, building and real estate, and airlines and aircraft leasing.
Our holdings are valued at 69% of tangible book value and 5.2 times our estimate of normalized earnings, compared with the Standard & Poor’s 500 Index at 1,193% of tangible book value and 16.4 times normalized earnings. This portfolio valuation is one of the most attractive levels we have seen on both an absolute and a relative basis. As the world eventually emerges from the pandemic and the economy shows signs of recovery, we believe our portfolio is positioned to perform well.
Vanguard Selected Value Fund Investment Advisors
| |
| | Fund Assets Managed | |
| Investment Advisor | % | $ Million | Investment Strategy |
| Pzena Investment Management, LLC | 40 | 2,027 | Uses a fundamental, bottom-up, deep-value-oriented investment strategy. Seeks to buy good businesses at low prices, focusing exclusively on companies that are underperforming their historically demonstrated earnings power. |
| Cooke & Bieler, L.P. | 40 | 1,967 | Conducts fundamental research in seeking high-quality businesses that have a record of generating attractive and sustainable returns on capital, durable competitive advantages, and skilled and shareholder-friendly management teams. |
| Donald Smith & Co., Inc. | 18 | 911 | Conducts fundamental research on the lowest price-to-tangible book value companies. Research focuses on underlying quality of book value and assets, and on long-term earnings potential. |
| Cash Investments | 2 | 104 | These short-term reserves are invested by Vanguard in equity index products to simulate investment in stocks. Each advisor may also maintain a cash position. |
About Your Fund’s Expenses
As a shareholder of the fund, you incur ongoing costs, which include costs for portfolio management, administrative services, and shareholder reports (like this one), among others. Operating expenses, which are deducted from a fund’s gross income, directly reduce the investment return of the fund.
A fund’s expenses are expressed as a percentage of its average net assets. This figure is known as the expense ratio. The following examples are intended to help you understand the ongoing costs (in dollars) of investing in your fund and to compare these costs with those of other mutual funds. The examples are based on an investment of $1,000 made at the beginning of the period shown and held for the entire period.
The accompanying table illustrates your fund’s costs in two ways:
| • | Based on actual fund return. This section helps you to estimate the actual expenses that you paid over the period. The ”Ending Account Value“ shown is derived from the fund‘s actual return, and the third column shows the dollar amount that would have been paid by an investor who started with $1,000 in the fund. You may use the information here, together with the amount you invested, to estimate the expenses that you paid over the period. |
To do so, simply divide your account value by $1,000 (for example, an $8,600 account value divided by $1,000 = 8.6), then multiply the result by the number given for your fund under the heading ”Expenses Paid During Period.“
| • | Based on hypothetical 5% yearly return. This section is intended to help you compare your fund‘s costs with those of other mutual funds. It assumes that the fund had a yearly return of 5% before expenses, but that the expense ratio is unchanged. In this case—because the return used is not the fund’s actual return—the results do not apply to your investment. The example is useful in making comparisons because the Securities and Exchange Commission requires all mutual funds to calculate expenses based on a 5% return. You can assess your fund’s costs by comparing this hypothetical example with the hypothetical examples that appear in shareholder reports of other funds. |
Note that the expenses shown in the table are meant to highlight and help you compare ongoing costs only and do not reflect transaction costs incurred by the fund for buying and selling securities. Further, the expenses do not include any purchase, redemption, or account service fees described in the fund prospectus. If such fees were applied to your account, your costs would be higher. Your fund does not carry a “sales load.”
The calculations assume no shares were bought or sold during the period. Your actual costs may have been higher or lower, depending on the amount of your investment and the timing of any purchases or redemptions.
You can find more information about the fund’s expenses, including annual expense ratios, in the Financial Statements section of this report. For additional information on operating expenses and other shareholder costs, please refer to your fund’s current prospectus.
| Six Months Ended October 31, 2020 | | | |
| Selected Value Fund | Beginning
Account Value
4/30/2020 | Ending
Account Value
10/31/2020 | Expenses
Paid During
Period |
| Based on Actual Fund Return | $1,000.00 | $1,167.01 | $1.63 |
| Based on Hypothetical 5% Yearly Return | 1,000.00 | 1,023.63 | 1.53 |
The calculations are based on expenses incurred in the most recent six-month period. The fund’s annualized six-month expense ratio for that period is 0.30%. The dollar amounts shown as “Expenses Paid” are equal to the annualized expense ratio multiplied by the average account value over the period, multiplied by the number of days in the most recent six-month period, then divided by the number of days in the most recent 12-month period (184/366).
All of the returns in this report represent past performance, which is not a guarantee of future results that may be achieved by the fund. (Current performance may be lower or higher than the performance data cited. For performance data current to the most recent month-end, visit our website at vanguard.com/performance.) Note, too, that both investment returns and principal value can fluctuate widely, so an investor’s shares, when sold, could be worth more or less than their original cost. The returns shown do not reflect taxes that a shareholder would pay on fund distributions or on the sale of fund shares.
Cumulative Performance: October 31, 2010, Through October 31, 2020
Initial Investment of $10,000
| | | Average Annual Total Returns
Periods Ended October 31, 2020 | |
| | | One
Year | Five
Years | Ten
Years | Final Value
of a $10,000
Investment |
 | Selected Value Fund | -11.25% | 3.35% | 8.23% | $22,058 |
 | Russell Midcap Value Index | -6.94 | 5.32 | 9.40 | 24,565 |
 | Dow Jones U.S. Total Stock Market Float Adjusted Index | 9.99 | 11.41 | 12.75 | 33,211 |
See Financial Highlights for dividend and capital gains information.
| Communication Services | 0.9% |
| Consumer Discretionary | 14.2 |
| Consumer Staples | 0.6 |
| Energy | 3.7 |
| Financials | 28.3 |
| Health Care | 6.6 |
| Industrials | 22.6 |
| Information Technology | 9.2 |
| Materials | 9.5 |
| Real Estate | 1.9 |
| Utilities | 2.5 |
The table reflects the fund’s investments, except for short-term investments and derivatives. Sector categories are based on the Global Industry Classification Standard (“GICS”), except for the “Other” category (if applicable), which includes securities that have not been provided a GICS classification as of the effective reporting period.
Global Industry Classification Standard (“GICS”) was developed by and is the exclusive property and a service mark of MSCI Inc. (“MSCI”) and Standard and Poor’s, a division of McGraw-Hill Companies, Inc. (“S&P”), and is licensed for use by Vanguard. Neither MSCI, S&P nor any third party involved in making or compiling the GICS or any GICS classification makes any express or implied warranties or representations with respect to such standard or classification (or the results to be obtained by the use thereof), and all such parties hereby expressly disclaim all warranties of originality, accuracy, completeness, merchantability or fitness for a particular purpose with respect to any such standard or classification. Without limiting any of the foregoing, in no event shall MSCI, S&P, any of its affiliates or any third party involved in making or compiling the GICS or any GICS classification have any liability for any direct, indirect, special, punitive, consequential or any other damages (including lost profits) even if notified of the possibility of such damages.
The fund files its complete schedule of portfolio holdings with the Securities and Exchange Commission (SEC) for the first and third quarters of each fiscal year as an exhibit to its reports on Form N-PORT. The fund’s Form N-PORT reports are available on the SEC’s website at www.sec.gov.
| | | Shares | Market
Value•
($000) |
| Common Stocks (95.8%) |
| Communication Services (0.9%) |
| | Omnicom Group Inc. | 692,900 | 32,705 |
| | Interpublic Group of Cos. Inc. | 585,529 | 10,592 |
| | | | 43,297 |
| Consumer Discretionary (13.6%) |
| | Gildan Activewear Inc. | 5,631,927 | 116,975 |
| * | Taylor Morrison Home Corp. Class A | 3,571,543 | 77,145 |
| | American Eagle Outfitters Inc. | 4,889,900 | 67,041 |
| | Lear Corp. | 528,357 | 63,831 |
| * | Helen of Troy Ltd. | 303,181 | 57,483 |
| | Ford Motor Co. | 6,858,769 | 53,018 |
| | Whirlpool Corp. | 239,800 | 44,353 |
| * | Mohawk Industries Inc. | 392,366 | 40,488 |
| | Hanesbrands Inc. | 2,506,100 | 40,273 |
| | Newell Brands Inc. | 2,065,477 | 36,476 |
| | Gap Inc. | 1,259,132 | 24,490 |
| | PVH Corp. | 397,619 | 23,177 |
| | Gentex Corp. | 775,300 | 21,453 |
| | Extended Stay America Inc. | 1,286,500 | 14,602 |
| | Carnival Corp. | 73,862 | 1,013 |
| | | | 681,818 |
| Consumer Staples (0.6%) |
| | Spectrum Brands Holdings Inc. | 514,869 | 29,281 |
| Energy (3.5%) |
| | Halliburton Co. | 4,945,509 | 59,643 |
| | Baker Hughes Co. Class A | 2,875,425 | 42,470 |
| | National Oilwell Varco Inc. | 4,227,629 | 35,512 |
| | Cenovus Energy Inc. | 5,167,683 | 16,950 |
| | TechnipFMC plc | 2,382,657 | 13,176 |
| | Murphy Oil Corp. | 645,960 | 4,987 |
| | Euronav NV | 309,587 | 2,279 |
| * | WPX Energy Inc. | 254,758 | 1,174 |
| | | | 176,191 |
| Financials (27.1%) |
| | Fifth Third Bancorp | 3,401,254 | 78,977 |
| | Unum Group | 4,278,000 | 75,549 |
| | CNO Financial Group Inc. | 4,031,828 | 71,565 |
| | Globe Life Inc. | 833,502 | 67,589 |
| | | Shares | Market
Value•
($000) |
| | Equitable Holdings Inc. | 3,068,136 | 65,934 |
| | Axis Capital Holdings Ltd. | 1,509,132 | 64,425 |
| | American International Group Inc. | 2,041,847 | 64,298 |
| | Regions Financial Corp. | 4,652,548 | 61,879 |
| | Voya Financial Inc. | 1,252,126 | 60,014 |
| | Alleghany Corp. | 96,500 | 52,779 |
| | TCF Financial Corp. | 1,912,000 | 52,026 |
| * | Arch Capital Group Ltd. | 1,709,700 | 51,650 |
| | KeyCorp | 3,920,749 | 50,891 |
| | Synchrony Financial | 1,954,800 | 48,909 |
| | Essent Group Ltd. | 1,188,800 | 47,374 |
| | Jefferies Financial Group Inc. | 2,346,121 | 45,773 |
| | CNA Financial Corp. | 1,536,402 | 45,769 |
| | State Street Corp. | 760,000 | 44,764 |
| | FirstCash Inc. | 809,900 | 42,147 |
| | Webster Financial Corp. | 1,132,283 | 36,471 |
| | Invesco Ltd. | 2,742,777 | 35,958 |
| | Progressive Corp. | 372,684 | 34,250 |
| | Reinsurance Group of America Inc. | 325,907 | 32,923 |
| | Fidelity National Financial Inc. | 724,400 | 22,666 |
| | Commerce Bancshares Inc. | 354,501 | 22,068 |
| | Hartford Financial Services Group Inc. | 506,455 | 19,509 |
| | American National Group Inc. | 193,300 | 13,299 |
| | Loews Corp. | 350,000 | 12,138 |
| | Allstate Corp. | 121,976 | 10,825 |
| | Everest Re Group Ltd. | 51,771 | 10,203 |
| | Hanover Insurance Group Inc. | 97,763 | 9,352 |
| | Comerica Inc. | 121,055 | 5,509 |
| | MFA Financial Inc. | 1,016,357 | 2,866 |
| | | | 1,360,349 |
| Health Care (6.3%) |
| * | Syneos Health Inc. | 925,900 | 49,147 |
| * | Integra LifeSciences Holdings Corp. | 1,083,260 | 47,772 |
| * | Laboratory Corp. of America Holdings | 233,400 | 46,626 |
| | Cardinal Health Inc. | 956,318 | 43,790 |
| | Hill-Rom Holdings Inc. | 474,100 | 43,176 |
| | Perrigo Co. plc | 901,100 | 39,531 |
| * | Mylan NV | 1,719,068 | 24,995 |
| | McKesson Corp. | 138,658 | 20,451 |
| | | | 315,488 |
| Industrials (21.7%) |
| * | AerCap Holdings NV | 4,695,200 | 116,582 |
| * | JetBlue Airways Corp. | 6,440,529 | 77,093 |
| | Terex Corp. | 2,618,814 | 64,659 |
| | Ryder System Inc. | 1,182,066 | 58,229 |
| * | IAA Inc. | 991,400 | 56,103 |
| | Snap-on Inc. | 342,869 | 54,012 |
| | BWX Technologies Inc. | 887,000 | 48,794 |
| | Westinghouse Air Brake Technologies Corp. | 807,524 | 47,886 |
| * | Colfax Corp. | 1,660,600 | 45,152 |
| | Huntington Ingalls Industries Inc. | 296,200 | 43,684 |
| | Textron Inc. | 1,179,129 | 42,213 |
| | Eaton Corp. plc | 397,600 | 41,267 |
| | Woodward Inc. | 510,600 | 40,618 |
| | Acuity Brands Inc. | 435,900 | 38,856 |
| | | Shares | Market
Value•
($000) |
| * | JELD-WEN Holding Inc. | 1,785,519 | 37,549 |
| | Enerpac Tool Group Corp. Class A | 1,717,514 | 30,623 |
| | AMETEK Inc. | 299,800 | 29,440 |
| * | Avis Budget Group Inc. | 854,586 | 28,774 |
| | Johnson Controls International plc | 680,101 | 28,707 |
| * | AECOM | 464,104 | 20,810 |
| | MSC Industrial Direct Co. Inc. Class A | 295,765 | 20,603 |
| | Stanley Black & Decker Inc. | 121,952 | 20,268 |
| * | Air France KLM ADR | 5,952,756 | 19,287 |
| * | Gates Industrial Corp. plc | 1,710,800 | 18,990 |
| | Donaldson Co. Inc. | 398,900 | 18,948 |
| | Hexcel Corp. | 514,800 | 17,236 |
| | Steelcase Inc. Class A | 1,141,585 | 11,918 |
| | Triton International Ltd. | 211,500 | 7,800 |
| * | MasTec Inc. | 300 | 15 |
| | | | 1,086,116 |
| Information Technology (8.8%) |
| * | Arrow Electronics Inc. | 1,171,913 | 91,280 |
| | Avnet Inc. | 2,266,809 | 55,922 |
| | Leidos Holdings Inc. | 574,900 | 47,717 |
| | Amdocs Ltd. | 827,300 | 46,643 |
| * | Micron Technology Inc. | 787,300 | 39,633 |
| �� | MKS Instruments Inc. | 309,300 | 33,525 |
| | TE Connectivity Ltd. | 332,900 | 32,251 |
| | Hewlett Packard Enterprise Co. | 3,137,063 | 27,104 |
| | KBR Inc. | 833,444 | 18,578 |
| | Genpact Ltd. | 505,149 | 17,362 |
| | Juniper Networks Inc. | 829,020 | 16,348 |
| * | Celestica Inc. | 2,485,719 | 14,591 |
| | | | 440,954 |
| Materials (9.1%) |
| * | IAMGOLD Corp. | 19,855,730 | 72,871 |
| | Mosaic Co. | 3,755,300 | 69,473 |
| | Reliance Steel & Aluminum Co. | 434,000 | 47,302 |
| | Gold Fields Ltd. ADR | 4,128,027 | 45,119 |
| | Olin Corp. | 2,588,526 | 42,840 |
| | Dow Inc. | 874,083 | 39,762 |
| * | Axalta Coating Systems Ltd. | 1,165,100 | 29,256 |
| * | Equinox Gold Corp. | 2,671,383 | 28,532 |
| | Domtar Corp. | 992,900 | 23,710 |
| | Schweitzer-Mauduit International Inc. | 676,200 | 22,450 |
| | Kinross Gold Corp. | 2,170,709 | 17,301 |
| * | Alcoa Corp. | 1,226,700 | 15,849 |
| | | | 454,465 |
| Real Estate (1.8%) |
| * | CBRE Group Inc. Class A | 772,800 | 38,949 |
| * | Howard Hughes Corp. | 392,541 | 24,412 |
| | Park Hotels & Resorts Inc. | 1,475,473 | 14,652 |
| * | Realogy Holdings Corp. | 1,286,639 | 14,359 |
| | | | 92,372 |
| Utilities (2.4%) |
| | Edison International | 900,709 | 50,476 |
| | NRG Energy Inc. | 1,559,325 | 49,306 |
| | | Shares | Market
Value•
($000) |
| | Entergy Corp. | 190,579 | 19,290 |
| | | | 119,072 |
| Total Common Stocks (Cost $5,282,072) | 4,799,403 |
| Temporary Cash Investments (4.1%) |
| Money Market Fund (4.0%) |
| 1 | Vanguard Market Liquidity Fund, 0.112% | 1,998,315 | 199,831 |
| | | Face
Amount
($000) | |
| U.S. Government and Agency Obligations (0.1%) |
| 2 | U.S. Treasury Bill, 0.096%, 1/28/21 | 5,520 | 5,519 |
Total Temporary Cash Investments
(Cost $205,322) | 205,350 |
| Total Investments (99.9%) (Cost $5,487,394) | 5,004,753 |
| Other Assets and Liabilities—Net (0.1%) | 4,484 |
| Net Assets (100%) | 5,009,237 |
| Cost is in $000. |
| • | See Note A in Notes to Financial Statements. |
| * | Non-income-producing security. |
| 1 | Affiliated money market fund available only to Vanguard funds and certain trusts and accounts managed by Vanguard. Rate shown is the 7-day yield. |
| 2 | Securities with a value of $5,519,000 have been segregated as initial margin for open futures contracts. |
| | ADR—American Depositary Receipt. |
Derivative Financial Instruments Outstanding as of Period End
| Futures Contracts |
| | | | ($000) |
| | Expiration | Number of
Long (Short)
Contracts | Notional
Amount | Value and
Unrealized
Appreciation
(Depreciation) |
| Long Futures Contracts | | | | |
| E-mini S&P 500 Index | December 2020 | 657 | 107,245 | (2,555) |
See accompanying Notes, which are an integral part of the Financial Statements.
Statement of Assets and Liabilities
|
| ($000s, except shares and per-share amounts) | Amount |
| Assets | |
| Investments in Securities, at Value | |
| Unaffiliated Issuers (Cost $5,287,591) | 4,804,922 |
| Affiliated Issuers (Cost $199,803) | 199,831 |
| Total Investments in Securities | 5,004,753 |
| Investment in Vanguard | 212 |
| Cash | 921 |
| Cash Collateral Pledged—Futures Contracts | 2,829 |
| Receivables for Investment Securities Sold | 8,354 |
| Receivables for Accrued Income | 2,879 |
| Receivables for Capital Shares Issued | 2,196 |
| Total Assets | 5,022,144 |
| Liabilities | |
| Foreign Currency Due to Custodian, at Value | 3 |
| Payables for Investment Securities Purchased | 3,017 |
| Payables to Investment Advisor | 2,031 |
| Payables for Capital Shares Redeemed | 6,186 |
| Payables to Vanguard | 417 |
| Variation Margin Payable—Futures Contracts | 1,253 |
| Total Liabilities | 12,907 |
| Net Assets | 5,009,237 |
| At October 31, 2020, net assets consisted of: | |
| | |
| Paid-in Capital | 4,971,894 |
| Total Distributable Earnings (Loss) | 37,343 |
| Net Assets | 5,009,237 |
| |
| Net Assets | |
Applicable to 219,941,270 outstanding $.001 par value shares of
beneficial interest (unlimited authorization) | 5,009,237 |
| Net Asset Value Per Share | $22.78 |
See accompanying Notes, which are an integral part of the Financial Statements.
|
| | Year Ended
October 31, 2020 |
| | ($000) |
| Investment Income | |
| Income | |
| Dividends—Unaffiliated Issuers1 | 111,279 |
| Dividends—Affiliated Issuers | — |
| Interest—Unaffiliated Issuers | 94 |
| Interest—Affiliated Issuers | 3,100 |
| Securities Lending—Net | 996 |
| Total Income | 115,469 |
| Expenses | |
| Investment Advisory Fees—Note B | |
| Basic Fee | 12,987 |
| Performance Adjustment | (3,926) |
| The Vanguard Group—Note C | |
| Management and Administrative | 8,817 |
| Marketing and Distribution | 642 |
| Custodian Fees | 44 |
| Auditing Fees | 32 |
| Shareholders’ Reports | 260 |
| Trustees’ Fees and Expenses | 10 |
| Total Expenses | 18,866 |
| Expenses Paid Indirectly | (163) |
| Net Expenses | 18,703 |
| Net Investment Income | 96,766 |
| Realized Net Gain (Loss) | |
| Investment Securities Sold—Unaffiliated Issuers | 710,589 |
| Investment Securities Sold—Affiliated Issuers | (10,132) |
| Futures Contracts | 41,779 |
| Foreign Currencies | (91) |
| Realized Net Gain (Loss) | 742,145 |
| Change in Unrealized Appreciation (Depreciation) | |
| Investment Securities—Unaffiliated Issuers | (1,805,345) |
| Investment Securities—Affiliated Issuers | 28,824 |
| Futures Contracts | (5,772) |
| Change in Unrealized Appreciation (Depreciation) | (1,782,293) |
| Net Increase (Decrease) in Net Assets Resulting from Operations | (943,382) |
| 1 | Dividends are net of foreign withholding taxes of $520,000. |
See accompanying Notes, which are an integral part of the Financial Statements.
Statement of Changes in Net Assets
|
| | Year Ended October 31, |
| | 2020
($000) | 2019
($000) |
| | | |
| Increase (Decrease) in Net Assets | | |
| Operations | | |
| Net Investment Income | 96,766 | 153,096 |
| Realized Net Gain (Loss) | 742,145 | 477,469 |
| Change in Unrealized Appreciation (Depreciation) | (1,782,293) | 301,384 |
| Net Increase (Decrease) in Net Assets Resulting from Operations | (943,382) | 931,949 |
| Distributions1 | | |
| Total Distributions | (563,718) | (820,440) |
| Capital Share Transactions | | |
| Issued | 671,477 | 750,115 |
| Issued in Lieu of Cash Distributions | 520,183 | 757,580 |
| Redeemed | (2,567,674) | (2,537,860) |
| Net Increase (Decrease) from Capital Share Transactions | (1,376,014) | (1,030,165) |
| Total Increase (Decrease) | (2,883,114) | (918,656) |
| Net Assets | | |
| Beginning of Period | 7,892,351 | 8,811,007 |
| End of Period | 5,009,237 | 7,892,351 |
| 1 | Certain prior-period numbers have been reclassified to conform with the current-period presentation. |
See accompanying Notes, which are an integral part of the Financial Statements.
For a Share Outstanding
Throughout Each Period | Year Ended October 31, |
| 2020 | 2019 | 2018 | 2017 | 2016 |
| Net Asset Value, Beginning of Period | $27.59 | $27.38 | $33.15 | $27.24 | $28.15 |
| Investment Operations | | | | | |
| Net Investment Income | .3681 | .4931 | .4931 | .4491 | .5271 |
| Net Realized and Unrealized Gain (Loss) on Investments | (3.163) | 2.392 | (3.153) | 6.760 | .030 |
| Total from Investment Operations | (2.795) | 2.885 | (2.660) | 7.209 | .557 |
| Distributions | | | | | |
| Dividends from Net Investment Income | (.450) | (.506) | (.423) | (.501) | (.443) |
| Distributions from Realized Capital Gains | (1.565) | (2.169) | (2.687) | (.798) | (1.024) |
| Total Distributions | (2.015) | (2.675) | (3.110) | (1.299) | (1.467) |
| Net Asset Value, End of Period | $22.78 | $27.59 | $27.38 | $33.15 | $27.24 |
| Total Return2 | -11.25% | 12.51% | -9.15% | 27.17% | 2.20% |
| Ratios/Supplemental Data | | | | | |
| Net Assets, End of Period (Millions) | $5,009 | $7,892 | $8,811 | $10,574 | $8,802 |
| Ratio of Total Expenses to Average Net Assets3 | 0.31% | 0.33% | 0.36% | 0.39% | 0.35% |
| Ratio of Net Investment Income to Average Net Assets | 1.58% | 1.89% | 1.61% | 1.47% | 2.00% |
| Portfolio Turnover Rate | 85% | 31% | 31% | 22% | 27% |
| 1 | Calculated based on average shares outstanding. |
| 2 | Total returns do not include account service fees that may have applied in the periods shown. Fund prospectuses provide information about any applicable account service fees. |
| 3 | Includes performance-based investment advisory fee increases (decreases) of (0.06%), (0.06%), (0.02%), 0.00%, and (0.04%). |
See accompanying Notes, which are an integral part of the Financial Statements.
Notes to Financial Statements
Vanguard Selected Value Fund is registered under the Investment Company Act of 1940 as an open-end investment company, or mutual fund. Market disruptions associated with the COVID-19 pandemic have had a global impact, and uncertainty exists as to the long-term implications. Such disruptions can adversely affect assets of the fund and thus fund performance.
| A. | The following significant accounting policies conform to generally accepted accounting principles for U.S. investment companies. The fund consistently follows such policies in preparing its financial statements. |
1. Security Valuation: Securities are valued as of the close of trading on the New York Stock Exchange (generally 4 p.m., Eastern time) on the valuation date. Equity securities are valued at the latest quoted sales prices or official closing prices taken from the primary market in which each security trades; such securities not traded on the valuation date are valued at the mean of the latest quoted bid and asked prices. Securities for which market quotations are not readily available, or whose values have been affected by events occurring before the fund’s pricing time but after the close of the securities’ primary markets, are valued at their fair values calculated according to procedures adopted by the board of trustees. These procedures include obtaining quotations from an independent pricing service, monitoring news to identify significant market- or security-specific events, and evaluating changes in the values of foreign market proxies (for example, ADRs, futures contracts, or exchange-traded funds), between the time the foreign markets close and the fund’s pricing time. When fair-value pricing is employed, the prices of securities used by a fund to calculate its net asset value may differ from quoted or published prices for the same securities.
Investments in Vanguard Market Liquidity Fund are valued at that fund's net asset value.
Temporary cash investments are valued using the latest bid prices or using valuations based on a matrix system (which considers such factors as security prices, yields, maturities, and ratings), both as furnished by independent pricing services.
2. Foreign Currency: Securities and other assets and liabilities denominated in foreign currencies are translated into U.S. dollars using exchange rates obtained from an independent third party as of the fund’s pricing time on the valuation date. Realized gains (losses) and unrealized appreciation (depreciation) on investment securities include the effects of changes in exchange rates since the securities were purchased, combined with the effects of changes in security prices. Fluctuations in the value of other assets and liabilities resulting from changes in exchange rates are recorded as unrealized foreign currency gains (losses) until the assets or liabilities are settled in cash, at which time they are recorded as realized foreign currency gains (losses).
3. Futures Contracts: The fund uses index futures contracts to a limited extent, with the objective of maintaining full exposure to the stock market while maintaining liquidity. The fund may purchase or sell futures contracts to achieve a desired level of investment, whether to accommodate portfolio turnover or cash flows from capital share transactions. The primary risks associated with the use of futures contracts are imperfect correlation between changes in market values of stocks held by the fund and the prices of futures contracts, and the possibility of an illiquid market. Counterparty risk involving futures is mitigated because a regulated clearinghouse is the counterparty instead of the clearing broker. To further mitigate counterparty risk, the fund trades futures contracts on an exchange, monitors the financial strength of its clearing brokers and clearinghouse, and has entered into clearing agreements with its clearing brokers.
The clearinghouse imposes initial margin requirements to secure the fund’s performance and requires daily settlement of variation margin representing changes in the market value of each contract. Any securities pledged as initial margin for open contracts are noted in the Schedule of Investments.
Futures contracts are valued at their quoted daily settlement prices. The notional amounts of the contracts are not recorded in the Statement of Assets and Liabilities. Fluctuations in the value of the contracts are recorded in the Statement of Assets and Liabilities as an asset (liability) and in the Statement of Operations as unrealized appreciation (depreciation) until the contracts are closed, when they are recorded as realized gains (losses) on future contracts.
During the year ended October 31, 2020, the fund’s average investments in long and short futures contracts represented 2% and 0% of net assets, respectively, based on the average of the notional amounts at each quarter-end during the period.
4. Federal Income Taxes: The fund intends to continue to qualify as a regulated investment company and distribute all of its taxable income. The fund’s tax returns are open to examination by the relevant tax authorities until expiration of the applicable statute of limitations, which is generally three years after the filing of the tax return. Management has analyzed the fund’s tax positions taken for all open federal and state income tax years, and has concluded that no provision for income tax is required in the fund’s financial statements.
5. Distributions: Distributions to shareholders are recorded on the ex-dividend date. Distributions are determined on a tax basis at the fiscal year-end and may differ from net investment income and realized capital gains for financial reporting purposes.
6. Securities Lending: To earn additional income, the fund lends its securities to qualified institutional borrowers. Security loans are subject to termination by the fund at any time, and are required to be secured at all times by collateral in an amount at least equal to the market value of securities loaned. Daily market fluctuations could cause the value of loaned securities to be more or less than the value of the collateral received. When this occurs, the collateral is adjusted and settled before the opening of the market on the next business day. The fund further mitigates its counterparty risk by entering into securities lending transactions only with a diverse group of prequalified counterparties, monitoring their financial strength, and entering into master securities lending agreements with its counterparties. The master securities lending agreements provide that, in the event of a counterparty’s default (including bankruptcy), the fund may terminate any loans with that borrower, determine the net amount owed, and sell or retain the collateral up to the net amount owed to the fund; however, such actions may be subject to legal proceedings. While collateral mitigates counterparty risk, in the event of a default, the fund may experience delays and costs in recovering the securities loaned. The fund invests cash collateral received in Vanguard Market Liquidity Fund, and records a liability in the Statement of Assets and Liabilities for the return of the collateral, during the period the securities are on loan. Collateral investments in Vanguard Market Liquidity Fund are subject to market appreciation or depreciation. Securities lending income represents fees charged to borrowers plus income earned on invested cash collateral, less expenses associated with the loan. During the term of the loan, the fund is entitled to all distributions made on or in respect of the loaned securities.
7. Credit Facilities and Interfund Lending Program: The fund and certain other funds managed by The Vanguard Group ("Vanguard") participate in a $4.3 billion committed credit facility provided by a syndicate of lenders pursuant to a credit agreement and an uncommitted credit facility provided by
Vanguard. Both facilities may be renewed annually. Each fund is individually liable for its borrowings, if any, under the credit facilities. Borrowings may be utilized for temporary or emergency purposes, subject to the fund’s regulatory and contractual borrowing restrictions. With respect to the committed credit facility, the participating funds are charged administrative fees and an annual commitment fee of 0.10% of the undrawn committed amount of the facility; these fees are allocated to the funds based on a method approved by the fund’s board of trustees and included in Management and Administrative expenses on the fund’s Statement of Operations. Any borrowings under either facility bear interest at a rate based upon the higher of the one-month London Interbank Offered Rate (or an acceptable alternate rate, if necessary), federal funds effective rate, or overnight bank funding rate plus an agreed-upon spread, except that borrowings under the uncommitted credit facility may bear interest based upon an alternate rate agreed to by the fund and Vanguard.
In accordance with an exemptive order (the “Order”) from the SEC, the fund may participate in a joint lending and borrowing program that allows registered open-end Vanguard funds to borrow money from and lend money to each other for temporary or emergency purposes (the “Interfund Lending Program”), subject to compliance with the terms and conditions of the Order, and to the extent permitted by the fund’s investment objective and investment policies. Interfund loans and borrowings normally extend overnight, but can have a maximum duration of seven days. Loans may be called on one business day’s notice. The interest rate to be charged is governed by the conditions of the Order and internal procedures adopted by the board of trustees. The board of trustees is responsible for overseeing the Interfund Lending Program.
For the year ended October 31, 2020, the fund did not utilize the credit facilities or the Interfund Lending Program.
8. Other: Dividend income is recorded on the ex-dividend date. Interest income includes income distributions received from Vanguard Market Liquidity Fund and is accrued daily. Premiums and discounts on debt securities are amortized and accreted, respectively, to interest income over the lives of the respective securities, except for premiums on certain callable debt securities that are amortized to the earliest call date. Security transactions are accounted for on the date securities are bought or sold. Costs used to determine realized gains (losses) on the sale of investment securities are those of the specific securities sold.
| B. | The investment advisory firms Pzena Investment Management, LLC, Donald Smith & Co., Inc., and, beginning December 2019, Cooke & Bieler, LP, each provide investment advisory services to a portion of the fund for a fee calculated at an annual percentage rate of average net assets managed by the advisor. The basic fee of Pzena Investment Management, LLC, is subject to quarterly adjustments based on performance relative to the Russell Midcap Value Index for the preceding three years. The basic fee of Donald Smith & Co., Inc., is subject to quarterly adjustments based on performance relative to the MSCI Investable Market 2500 Index for the preceding five years. In accordance with the advisory contract entered into with Cooke & Bieler, LP, beginning February 1, 2021, the investment advisory fee will be subject to quarterly adjustments based on performance relative to the Russell Midcap Value Index since January 31, 2020. Until November 2019, a portion of the fund was managed by Barrow, Hanley, Mewhinney& Strauss, LLC. The basic fee paid to Barrow, Hanley, Mewhinney & Strauss, LLC, was subject to quarterly adjustments based on performance relative to the Russell Midcap Value Index for the preceding three years. |
Vanguard manages the cash reserves of the fund as described below.
For the year ended October 31, 2020, the aggregate investment advisory fee paid to all advisors represented an effective annual basic rate of 0.21% of the fund’s average net assets, before a decrease of $3,926,000 (0.06%) based on performance.
| C. | In accordance with the terms of a Funds' Service Agreement (the “FSA”) between Vanguard and the fund, Vanguard furnishes to the fund corporate management, administrative, marketing, distribution and cash management services at Vanguard’s cost of operations (as defined by the FSA). These costs of operations are allocated to the fund based on methods and guidelines approved by the board of trustees and are generally settled twice a month. |
Upon the request of Vanguard, the fund may invest up to 0.40% of its net assets as capital in Vanguard. At October 31, 2020, the fund had contributed to Vanguard capital in the amount of $212,000, representing less than 0.01% of the fund’s net assets and 0.08% of Vanguard’s capital received pursuant to the FSA. The fund’s trustees and officers are also directors and employees, respectively, of Vanguard.
| D. | The fund has asked its investment advisors to direct certain security trades, subject to obtaining the best price and execution, to brokers who have agreed to rebate to the fund part of the commissions generated. Such rebates are used solely to reduce the fund’s management and administrative expenses. The fund’s custodian bank has also agreed to reduce its fees when the fund maintains cash on deposit in the non-interest-bearing custody account. For the year ended October 31, 2020, these arrangements reduced the fund’s management and administrative expenses by $163,000 and custodian fees by less than $1,000. The total expense reduction represented an effective annual rate of less than 0.01% of the fund’s average net assets. |
| E. | Various inputs may be used to determine the value of the fund’s investments and derivatives. These inputs are summarized in three broad levels for financial statement purposes. The inputs or methodologies used to value securities are not necessarily an indication of the risk associated with investing in those securities. |
Level 1—Quoted prices in active markets for identical securities.
Level 2—Other significant observable inputs (including quoted prices for similar securities, interest rates, prepayment speeds, credit risk, etc.).
Level 3—Significant unobservable inputs (including the fund’s own assumptions used to determine the fair value of investments). Any investments and derivatives valued with significant unobservable inputs are noted on the Schedule of Investments.
The following table summarizes the market value of the fund’s investments and derivatives as of October 31, 2020, based on the inputs used to value them:
| | Level 1
($000) | Level 2
($000) | Level 3
($000) | Total
($000) |
| Investments | | | | |
| Assets | | | | |
| Common Stocks | 4,799,403 | — | — | 4,799,403 |
| Temporary Cash Investments | 199,831 | 5,519 | — | 205,350 |
| Total | 4,999,234 | 5,519 | — | 5,004,753 |
| Derivative Financial Instruments | | | | |
| Liabilities | | | | |
| Future Contracts1 | 1,253 | — | — | 1,253 |
| 1 | Represents variation margin on the last day of the reporting period. |
| F. | Permanent differences between book-basis and tax-basis components of net assets are reclassified among capital accounts in the financial statements to reflect their tax character. These reclassifications have no effect on net assets or net asset value per share. As of period end, permanent differences primarily attributable to the accounting for foreign currency transactions and distributions in connection with fund share redemptions were reclassified between the following accounts: |
| | Amount
($000) |
| Paid-in Capital | 282,846 |
| Total Distributable Earnings (Loss) | (282,846) |
Temporary differences between book-basis and tax-basis components of total distributable earnings (losses) arise when certain items of income, gain, or loss are recognized in different periods for financial statement and tax purposes; these differences will reverse at some time in the future. The differences are primarily related to the deferral of losses from wash sales; and the recognition of unrealized gains or losses from certain derivative contracts. As of period end, the tax-basis components of total distributable earnings (losses) are detailed in the table as follows:
| | Amount
($000) |
| Undistributed Ordinary Income | 56,303 |
| Undistributed Long-Term Gains | 475,465 |
| Capital Loss Carryforwards | — |
| Qualified Late-Year Losses | — |
| Net Unrealized Gains (Losses) | (494,425) |
The tax character of distributions paid was as follows:
| | Year Ended October 31, |
| | 2020
Amount
($000) | 2019
Amount
($000) |
| Ordinary Income* | 125,895 | 155,280 |
| Long-Term Capital Gains | 437,823 | 665,160 |
| Total | 563,718 | 820,440 |
| * | Includes short-term capital gains, if any. |
As of October 31, 2020, gross unrealized appreciation and depreciation for investments based on cost for U.S. federal income tax purposes were as follows:
| | Amount
($000) |
| Tax Cost | 5,499,179 |
| Gross Unrealized Appreciation | 546,163 |
| Gross Unrealized Depreciation | (1,040,588) |
| Net Unrealized Appreciation (Depreciation) | (494,425) |
| G. | During the year ended October 31, 2020, the fund purchased $4,948,910,000 of investment securities and sold $6,631,450,000 of investment securities, other than temporary cash investments. |
| H. | Capital shares issued and redeemed were: |
| | Year Ended October 31, |
| | 2020 | 2019 |
| | Shares
(000) | Shares
(000) |
| Issued | 30,348 | 29,246 |
| Issued in Lieu of Cash Distributions | 19,338 | 33,010 |
| Redeemed | (115,758) | (98,003) |
| Net Increase (Decrease) in Shares Outstanding | (66,072) | (35,747) |
| I. | Certain of the fund’s investments are in companies that are considered to be affiliated companies of the fund because the fund owns more than 5% of the outstanding voting securities of the company or the issuer is another member of The Vanguard Group. Transactions during the period in securities of these companies were as follows: |
| | | Current Period Transactions | |
| | Oct. 31,
2019
Market
Value
($000) | Purchases
at Cost
($000) | Proceeds
from
Securities
Sold
($000) | Realized
Net
Gain
(Loss)
($000) | Change in
Unrealized
App. (Dep.)
($000) | Income
($000) | Capital Gain
Distributions
Received
($000) | Oct. 31,
2020
Market
Value
($000) |
| IAMGOLD Corp. | 117,209 | — | 48,538 | (6,454) | 10,654 | — | — | NA1 |
| SeaWorld Entertainment Inc. | 110,455 | 8,385 | 133,259 | (3,731) | 18,150 | — | — | — |
| Vanguard Market Liquidity Fund | 317,137 | NA2 | NA2 | 53 | 20 | 3,100 | — | 199,831 |
| Total | 544,801 | | | (10,132) | 28,824 | 3,100 | — | 199,831 |
| 1 | Not applicable—at October 31, 2020, the security was still held, but the issuer was no longer an affiliated company of the fund. |
| 2 | Not applicable—purchases and sales are for temporary cash investment purposes. |
| J. | Management has determined that no other events or transactions occurred subsequent to October 31, 2020, that would require recognition or disclosure in these financial statements. |
Report of Independent Registered Public Accounting Firm
To the Board of Trustees of Vanguard Whitehall Funds and Shareholders of Vanguard Selected Value Fund
Opinion on the Financial Statements
We have audited the accompanying statement of assets and liabilities, including the schedule of investments, of Vanguard Selected Value Fund (one of the funds constituting Vanguard Whitehall Funds, referred to hereafter as the "Fund”) as of October 31, 2020, the related statement of operations for the year ended October 31, 2020, the statement of changes in net assets for each of the two years in the period ended October 31, 2020, including the related notes, and the financial highlights for each of the five years in the period ended October 31, 2020 (collectively referred to as the “financial statements”). In our opinion, the financial statements present fairly, in all material respects, the financial position of the Fund as of October 31, 2020, the results of its operations for the year then ended, the changes in its net assets for each of the two years in the period ended October 31, 2020 and the financial highlights for each of the five years in the period ended October 31, 2020 in conformity with accounting principles generally accepted in the United States of America.
Basis for Opinion
These financial statements are the responsibility of the Fund’s management. Our responsibility is to express an opinion on the Fund’s financial statements based on our audits. We are a public accounting firm registered with the Public Company Accounting Oversight Board (United States) (“PCAOB”) and are required to be independent with respect to the Fund in accordance with the U.S. federal securities laws and the applicable rules and regulations of the Securities and Exchange Commission and the PCAOB.
We conducted our audits of these financial statements in accordance with the standards of the PCAOB. Those standards require that we plan and perform the audit to obtain reasonable assurance about whether the financial statements are free of material misstatement, whether due to error or fraud.
Our audits included performing procedures to assess the risks of material misstatement of the financial statements, whether due to error or fraud, and performing procedures that respond to those risks. Such procedures included examining, on a test basis, evidence regarding the amounts and disclosures in the financial statements. Our audits also included evaluating the accounting principles used and significant estimates made by management, as well as evaluating the overall presentation of the financial statements. Our procedures included confirmation of securities owned as of October 31, 2020 by correspondence with the custodian and brokers and by agreement to the underlying ownership records of the transfer agent; when replies were not received from brokers, we performed other auditing procedures. We believe that our audits provide a reasonable basis for our opinion.
/s/PricewaterhouseCoopers LLP
Philadelphia, Pennsylvania
December 17, 2020
We have served as the auditor of one or more investment companies in The Vanguard Group of Funds since 1975.
Special 2020 tax information (unaudited) for Vanguard Selected Value Fund
This information for the fiscal year ended October 31, 2020, is included pursuant to provisions of the Internal Revenue Code.
The fund distributed $710,522,000 as capital gain dividends (20% rate gain distributions) to shareholders during the fiscal year.
The fund distributed $121,300,000 of qualified dividend income to shareholders during the fiscal year.
The fund distributed $4,595,000 of qualified business income to shareholders during the fiscal year.
For corporate shareholders, 100% of investment income (dividend income plus short-term gains, if any) qualifies for the dividends-received deduction.
This page intentionally left blank.
The People Who Govern Your Fund
The trustees of your mutual fund are there to see that the fund is operated and managed in your best interests since, as a shareholder, you are a part owner of the fund. Your fund’s trustees also serve on the board of directors of The Vanguard Group, Inc., which is owned by the Vanguard funds and provides services to them.
A majority of Vanguard’s board members are independent, meaning that they have no affiliation with Vanguard or the funds they oversee, apart from the sizable personal investments they have made as private individuals. The independent board members have distinguished backgrounds in business, academia, and public service. Each of the trustees and executive officers oversees 213 Vanguard funds.
Information for each trustee and executive officer of the fund appears below. That information, as well as the Vanguard fund count, is as of the date on the cover of this fund report. The mailing address of the trustees and officers is P.O. Box 876, Valley Forge, PA 19482. More information about the trustees is in the Statement of Additional Information, which can be obtained, without charge, by contacting Vanguard at 800-662-7447, or online at vanguard.com.
Interested Trustee1
Mortimer J. Buckley
Born in 1969. Trustee since January 2018. Principal occupation(s) during the past five years and other experience: chairman of the board (2019–present) of Vanguard and of each of the investment companies served by Vanguard; chief executive officer (2018–present) of Vanguard; chief executive officer, president, and trustee (2018–present) of each of the investment companies served by Vanguard; president and director (2017–present) of Vanguard; and president (2018–present) of Vanguard Marketing Corporation. Chief investment officer (2013–2017), managing director (2002–2017), head of the Retail Investor Group (2006–2012), and chief information officer (2001–2006) of Vanguard. Chairman of the board (2011–2017) and trustee (2009–2017) of the Children’s Hospital of Philadelphia; and trustee (2018–present) and vice chair (2019–present) of The Shipley School.
Independent Trustees
Emerson U. Fullwood
Born in 1948. Trustee since January 2008. Principal occupation(s) during the past five years and other experience: executive chief staff and marketing officer for North America and corporate vice president (retired 2008) of Xerox Corporation (document management products and services). Former president of the Worldwide Channels Group, Latin
America, and Worldwide Customer Service and executive chief staff officer of Developing Markets of Xerox. Executive in residence and 2009–2010 Distinguished Minett Professor at the Rochester Institute of Technology. Director of SPX FLOW, Inc. (multi-industry manufacturing). Director of the University of Rochester Medical Center, the Monroe Community College Foundation, the United Way of Rochester, North Carolina A&T University, and Roberts Wesleyan College. Trustee of the University of Rochester.
Amy Gutmann
Born in 1949. Trustee since June 2006. Principal occupation(s) during the past five years and other experience: president (2004–present) of the University of Pennsylvania. Christopher H. Browne Distinguished Professor of Political Science, School of Arts and Sciences, and professor of communication, Annenberg School for Communication, with secondary faculty appointments in the Department of Philosophy, School of Arts and Sciences, and at the Graduate School of Education, University of Pennsylvania.
F. Joseph Loughrey
Born in 1949. Trustee since October 2009. Principal occupation(s) during the past five years and other experience: president and chief operating officer (retired 2009) and vice chairman of the board (2008–2009) of Cummins Inc. (industrial machinery). Chairman of the board of Hillenbrand, Inc. (specialized consumer services) and the Lumina Foundation.
1 Mr. Buckley is considered an “interested person,” as defined in the Investment Company Act of 1940, because he is an officer of the Vanguard funds.
Director of the V Foundation. Member of the advisory council for the College of Arts and Letters and chair of the advisory board to the Kellogg Institute for International Studies, both at the University of Notre Dame.
Mark Loughridge
Born in 1953. Trustee since March 2012. Principal occupation(s) during the past five years and other experience: senior vice president and chief financial officer (retired 2013) of IBM (information technology services). Fiduciary member of IBM’s Retirement Plan Committee (2004–2013), senior vice president and general manager (2002–2004) of IBM Global Financing, vice president and controller (1998–2002) of IBM, and a variety of other prior management roles at IBM. Member of the Council on Chicago Booth.
Scott C. Malpass
Born in 1962. Trustee since March 2012. Principal occupation(s) during the past five years and other experience: chief investment officer (retired June 2020) and vice president (retired June 2020) of the University of Notre Dame. Assistant professor of finance at the Mendoza College of Business, University of Notre Dame, and member of the Notre Dame 403(b) Investment Committee (retired June 2020). Member of the board of Catholic Investment Services, Inc. (investment advisors) and the board of superintendence of the Institute for the Works of Religion.
Deanna Mulligan
Born in 1963. Trustee since January 2018. Principal occupation(s) during the past five years and other experience: board chair (2020–present), chief executive officer (2011–2020), and president (2010–2019) of The Guardian Life Insurance Company of America. Chief operating officer (2010–2011) and executive vice president (2008–2010) of the individual life and disability division of Guardian Life. Member of the board of the American Council of Life Insurers and the board of the Economic Club of New York. Trustee of the Partnership for New York City (business leadership), Chief Executives for Corporate Purpose, NewYork-Presbyterian Hospital, Catalyst, and the Bruce Museum (arts and science). Member of the Advisory Council for the Stanford Graduate School of Business.
André F. Perold
Born in 1952. Trustee since December 2004. Principal occupation(s) during the past five years and other experience: George Gund Professor of Finance and Banking, Emeritus at the Harvard Business School (retired 2011). Chief investment officer and co-managing partner of HighVista Strategies (private investment firm). Member of the board of advisors and member of the investment committee of the Museum of Fine Arts Boston. Member of the board (2018–present) of RIT Capital Partners (investment firm). Member of the investment committee of Partners Health Care System.
Sarah Bloom Raskin
Born in 1961. Trustee since January 2018. Principal occupation(s) during the past five years and other experience: deputy secretary (2014–2017) of the United States Department of the Treasury. Governor (2010–2014) of the Federal Reserve Board. Commissioner (2007–2010) of financial regulation for the State of Maryland. Member of the board of directors (2012–2014) of Neighborhood Reinvestment Corporation. Director (2017–present) of i(x) Investments, LLC; director (2017–present) of Reserve Trust. Rubenstein Fellow (2017–present) of Duke University; trustee (2017–present) of Amherst College, and trustee (2019–present) of the Folger Shakespeare Library.
Peter F. Volanakis
Born in 1955. Trustee since July 2009. Principal occupation(s) during the past five years and other experience: president and chief operating officer (retired 2010) of Corning Incorporated (communications equipment) and director of Corning Incorporated (2000–2010) and Dow Corning (2001–2010). Director (2012) of SPX Corporation (multi-industry manufacturing). Overseer of the Amos Tuck School of Business Administration, Dartmouth College (2001–2013). Chairman of the board of trustees of Colby-Sawyer College. Member of the board of Hypertherm Inc. (industrial cutting systems, software, and consumables).
Executive Officers
John Bendl
Born in 1970. Principal occupation(s) during the past five years and other experience: principal of Vanguard. Chief financial officer (2019–present) of each of the investment companies served by Vanguard. Chief accounting officer, treasurer, and controller of Vanguard (2017–present). Partner (2003–2016) at KPMG (audit, tax, and advisory services).
Christine M. Buchanan
Born in 1970. Principal occupation(s) during the past five years and other experience: principal of Vanguard. Treasurer (2017–present) of each of the investment companies served by Vanguard. Partner (2005–2017) at KPMG (audit, tax, and advisory services).
David Cermak
Born in 1960. Principal occupation(s) during the past five years and other experience: principal of Vanguard. Finance director (2019–present) of each of the investment companies served by Vanguard. Managing director and head (2017–present) of Vanguard Investments Singapore. Managing director and head (2017–2019) of Vanguard Investments Hong Kong. Representative director and head (2014–2017) of Vanguard Investments Japan.
John Galloway
Born in 1973. Principal occupation(s) during the past five years and other experience: principal of Vanguard. Investment stewardship officer (September 2020–present) of each of the investment companies served by Vanguard. Head of Investor Advocacy (February 2020–present) and head of Marketing Strategy and Planning (2017–2020) at Vanguard. Deputy assistant to the President of the United States (2015).
Thomas J. Higgins
Born in 1957. Principal occupation(s) during the past five years and other experience: principal of Vanguard. Finance director (2019–present), chief financial officer (2008–2019), and treasurer (1998–2008) of each of the investment companies served by Vanguard.
Peter Mahoney
Born in 1974. Principal occupation(s) during the past five years and other experience: principal of Vanguard. Controller (2015–present) of each of the investment companies served by Vanguard. Head of International Fund Services (2008–2014) at Vanguard.
Anne E. Robinson
Born in 1970. Principal occupation(s) during the past five years and other experience: general counsel (2016–present) of Vanguard. Secretary (2016–present) of Vanguard and of each of the investment companies served by Vanguard. Managing director (2016–present) of Vanguard. Managing director and general counsel of Global Cards and Consumer Services (2014–2016) at Citigroup. Counsel (2003–2014) at American Express.
Michael Rollings
Born in 1963. Principal occupation(s) during the past five years and other experience: finance director (2017–present) and treasurer (2017) of each of the investment companies served by Vanguard. Managing director (2016–present) of Vanguard. Chief financial officer (2016–present) of Vanguard. Director (2016–present) of Vanguard Marketing Corporation. Executive vice president and chief financial officer (2006–2016) of MassMutual Financial Group.
John E. Schadl
Born in 1972. Principal occupation(s) during the past five years and other experience: principal of Vanguard. Chief compliance officer (2019–present) of Vanguard and of each of the investment companies served by Vanguard. Assistant vice president (2019–present) of Vanguard Marketing Corporation.
Vanguard Senior Management Team
| Joseph Brennan | James M. Norris |
| Mortimer J. Buckley | Thomas M. Rampulla |
| Gregory Davis | Karin A. Risi |
| John James | Anne E. Robinson |
| John T. Marcante | Michael Rollings |
| Chris D. McIsaac | Lauren Valente |
Connect with Vanguard®>vanguard.com
Fund Information > 800-662-7447
Direct Investor Account Services > 800-662-2739
Institutional Investor Services > 800-523-1036
Text Telephone for People Who Are Deaf or Hard of Hearing > 800-749-7273
This material may be used in conjunction with the offering of shares of any Vanguard fund only if preceded or accompanied by the fund’s current prospectus.
All comparative mutual fund data are from Lipper, a Thomson Reuters Company, or Morningstar, Inc., unless otherwise noted.
You can obtain a free copy of Vanguard’s proxy voting guidelines by visiting vanguard.com/proxyreporting or by calling Vanguard at 800-662-2739. The guidelines are also available from the SEC’s website, www.sec.gov. In addition, you may obtain a free report on how your fund voted the proxies for securities it owned during the 12 months ended June 30. To get the report, visit either vanguard.com/proxyreporting or www.sec.gov.
You can review information about your fund on the SEC’s website, and you can receive copies of this information, for a fee, by sending a request via email addressed to publicinfo@sec.gov.
Source for Bloomberg Barclays indexes: Bloomberg Index Services Limited. Copyright 2020, Bloomberg. All rights reserved.
CFA® is a registered trademark owned by CFA Institute.
© 2020 The Vanguard Group, Inc.
All rights reserved.
Vanguard Marketing Corporation, Distributor.
Q9340 122020
Annual Report | October 31, 2020
Vanguard Mid-Cap Growth Fund
See the inside front cover for important information about access to your fund’s annual and semiannual shareholder reports.
Important information about access to shareholder reports
Beginning on January 1, 2021, as permitted by regulations adopted by the Securities and Exchange Commission, paper copies of your fund’s annual and semiannual shareholder reports will no longer be sent to you by mail, unless you specifically request them. Instead, you will be notified by mail each time a report is posted on the website and will be provided with a link to access the report.
If you have already elected to receive shareholder reports electronically, you will not be affected by this change and do not need to take any action. You may elect to receive shareholder reports and other communications from the fund electronically by contacting your financial intermediary (such as a broker-dealer or bank) or, if you invest directly with the fund, by calling Vanguard at one of the phone numbers on the back cover of this report or by logging on to vanguard.com.
You may elect to receive paper copies of all future shareholder reports free of charge. If you invest through a financial intermediary, you can contact the intermediary to request that you continue to receive paper copies. If you invest directly with the fund, you can call Vanguard at one of the phone numbers on the back cover of this report or log on to vanguard.com. Your election to receive paper copies will apply to all the funds you hold through an intermediary or directly with Vanguard.
Contents
Your Fund’s Performance at a Glance
| 1 |
Advisors' Report
| 2 |
About Your Fund’s Expenses
| 7 |
Performance Summary
| 9 |
Financial Statements
| 11 |
Please note: The opinions expressed in this report are just that—informed opinions. They should not be considered promises or advice. Also, please keep in mind that the information and opinions cover the period through the date on the front of this report. Of course, the risks of investing in your fund are spelled out in the prospectus.
Your Fund’s Performance at a Glance
| • | For the 12 months ended October 31, 2020, Vanguard Mid-Cap Growth Fund returned 18.33%. It underperformed its benchmark, the Russell Midcap Growth Index, which returned 21.14%. |
| • | The period was marked by the global spread of COVID-19 and efforts to contain it, including lockdowns, the shuttering of nonessential businesses, and travel restrictions. However, responses from policymakers, the start of trials for vaccines and treatments, and the easing of some pandemic-related restrictions eventually lifted investor sentiment. The U.S. stock market rebounded more strongly than emerging markets and much more than developed markets outside the United States. |
| • | The broad U.S. stock market, as measured by the Russell 3000 Index, returned 10.15% for the 12 months. Growth stocks outperformed value, and large-capitalization stocks outperformed mid- and small-caps. |
| • | Returns were propelled especially by strong advisor selections in information technology, the fund’s largest weighting. The fund’s health care sector, its second-largest weighting, had a double-digit return but did only about half as well as its counterpart in the benchmark, which hurt relative performance. |
| • | Over the decade ended October 31, the fund’s average annualized return was 12.64%, trailing that of its expense-free benchmark by about 1.5 percentage points. |
Market Barometer
| | Average Annual Total Returns
Periods Ended October 31, 2020 |
| | One Year | Three Years | Five Years |
| Stocks | | | |
| Russell 1000 Index (Large-caps) | 10.87% | 10.63% | 11.79% |
| Russell 2000 Index (Small-caps) | -0.14 | 2.19 | 7.27 |
| Russell 3000 Index (Broad U.S. market) | 10.15 | 10.04 | 11.48 |
| FTSE All-World ex US Index (International) | -2.17 | 0.13 | 4.52 |
| Bonds | | | |
| Bloomberg Barclays U.S. Aggregate Bond Index (Broad taxable market) | 6.19% | 5.06% | 4.08% |
Bloomberg Barclays Municipal Bond Index
(Broad tax-exempt market) | 3.59 | 4.09 | 3.70 |
| FTSE Three-Month U.S. Treasury Bill Index | 0.86 | 1.62 | 1.15 |
| CPI | | | |
| Consumer Price Index | 1.18% | 1.82% | 1.83% |
For the 12 months ended October 31, 2020, Vanguard Mid-Cap Growth Fund returned 18.33%. It underperformed its benchmark, the Russell Midcap Growth Index, which returned 21.14%.
Your fund is managed by three independent advisors, a strategy that enhances its diversification by providing exposure to distinct yet complementary investment approaches. It’s not uncommon for different advisors to have different views about individual securities or the broader investment environment.
The accompanying table lists the advisors, the amount and percentage of fund assets each manages, and brief descriptions of their investment strategies.
The advisors have provided the following assessment of the investment environment during the past 12 months and the notable successes and shortfalls in their portfolios. These comments were prepared on November 13, 2020.
RS Investments
Portfolio Managers:
D. Scott Tracy, CFA,
Chief Investment Officer
Stephen J. Bishop
Melissa Chadwick-Dunn
Christopher W. Clark, CFA
Paul Leung, CFA
The portfolio’s positive absolute return was driven by the performance of mid-capitalization growth companies in the information technology, health care, materials, and communication services sectors. The largest absolute detractors were holdings in energy and real estate.
Among our holdings, the IT sector provided the largest positive relative contribution.
RingCentral, which provides software-as-a-service, cloud-based business communications solutions, was the largest contributor. It offers a single-user identity across multiple locations and devices that benefited from the unprecedented work-from-home shift during the COVID-19 pandemic. The outlook for the company remains strong.
The biggest individual detractor was Sage Therapeutics, a clinical-stage biopharmaceutical company that develops and commercializes novel medicines to treat central nervous system disorders. Sage sold off sharply in the fourth quarter of 2019 following disappointing trial results for its SAGE-217 drug. Underlying data suggested the drug works, but the trial was poorly run. As a result, we thought the decline in the stock was too severe for what we viewed as a setback, rather than failure, for the drug.
Given the outsized impact of the coronavirus globally, we believe investors should expect all companies to feel some level of direct and secondary economic effects. We expect ongoing volatility in equity markets, which we feel will create
an abundance of opportunities in many sectors. We do not have a clear view or projection as to how prolonged the impact will be. However, we believe there are clear pockets of the economy that are and will continue to be better positioned than others because of the ability of their workers to remain productive (remotely or on-site). End-customer demand is likely to remain relatively strong for their products and services.
In this environment, we will focus further on companies with flexible business models that offer innovative products and services and are poised to take market share from legacy companies that may be more challenged by conditions. Now is the time when an active approach should shine. Our “farm team” approach seeks to identify and monitor premier companies in each index but then wait for a favorable price. We are confident that our process will allow us to take advantage of the current environment and will pay off handsomely when markets and the broader economy are eventually more normal.
Frontier Capital Management Co., LLC
Portfolio Managers:
Christopher J. Scarpa, Vice President
Ravi Davas, Vice President
The COVID-19 pandemic and the U.S. response to combat its aftermath dominated the past 12 months. The Russell Midcap Growth Index plummeted
approximately 35% from its peak before surging dramatically to gain more than 21% for the period, buoyed by massive stimulus and near-zero interest rates. Our portfolio trailed primarily because of pandemic-related headwinds in the health care and consumer discretionary sectors.
Entering the year, we had positioned the portfolio for “social interaction,” consistent with our view of improving economic activity, rather than “social distancing.” When the pandemic erupted, we pivoted by increasing technology and health care weightings while reducing exposure to consumer discretionary and cyclical industries.
An overweight position in the lagging financial sector and a modest underweighting in technology were the two most significant underperformers. These were partially offset by a favorable underweight position in consumer staples.
Stock selection detracted in health care and consumer discretionary but contributed in industrials and technology. In health care, medical device makers Teleflex and Edwards Lifesciences each underwent a significant revenue drop because of a sharp decline in elective surgeries. Contact lens manufacturers Cooper Companies and Alcon underperformed as demand shrank with people working from home. In consumer discretionary, luxury retailer Capri Holdings fell 59% because of store closures.
Among our information technology holdings, payment processor Square Inc. posted a 129% gain as it strengthened its seller ecosystem through new offerings while rapidly growing its cash app business. Computer chip designer Advanced Micro Devices was a standout with a return of 122% on continued share gains.
The markets remain resilient despite significant uncertainty that includes the control of the U.S. Senate, the fate of a coronavirus stimulus bill, and a resurgent virus that threatens economic recovery. American businesses and consumers are adapting to the pandemic and marching ahead with extraordinary ingenuity. Development of a COVID-19 vaccine is on track, and the Federal Reserve remains supportive. Against this backdrop, we are optimistic as we look for market-leading companies with defendable business models that offer multiple ways to win.
Wellington Management Company llp
Portfolio Manager:
Timothy N. Manning,
Senior Managing Director
and Equity Portfolio Manager
Over the 12 months, large-capitalization stocks (as measured by the S&P 500 Index) outperformed small-cap (as measured by the Russell 2000 Index) and mid-cap stocks (as measured by the S&P MidCap 400 Index). By style factor, growth outperformed value.
Our performance was almost entirely driven by stock selection, particularly in consumer discretionary and industrials. Notable detractors included Hexcel, an industrial materials company specializing in aerospace-grade carbon fiber; Aramark, a provider of uniform and food services to a broad base of customers; and Expedia Group, a U.S.-based online travel services company that offers a range of travel shopping and reservation services.
Top relative contributors included positions in DocuSign, an electronic signature solutions company; Monolithic Power Systems, a maker of power circuits for a wide range of industries; and Square, a mobile payment solutions provider enabling small businesses to accept digital payment methods.
The portfolio continues to have meaningful overweight positions in the consumer discretionary and industrial sectors but has reduced exposure to information technology, now the largest underweight. It is underweighted in consumer staples and has no exposure to materials, real estate, energy, or utilities.
Over the period, we added several new holdings, including J.B. Hunt Transport Services and Hamilton Lane, an alternative investment manager providing innovative private-market services. We also eliminated several holdings that left our market-cap universe or exceeded our valuation comfort zone on the back of strong performance.
While we do not profess to know how the next phase of the pandemic will unfold,
we take some comfort in knowing that there should be a more defined playbook to facilitate an effective response. In other words, the uncertainty surrounding many elements of COVID-19 in the first quarter has been reduced. We now have a strong and ongoing monetary and fiscal response, many companies are learning how to manage in this new environment, progress toward a vaccine is being made, and consumers are showing signs that they are eager to revert to old spending habits.
We remain balanced between short-term winners and losers, with a little more weight added to stocks that have underperformed this year and less to the winners at extreme valuation highs. In our view, there are a large number of terrific alpha opportunities in front of us, and we will continue to use volatility to position for success in the coming two- to three-year period.
Vanguard Mid-Cap Growth Fund Investment Advisors
| |
| | Fund Assets Managed | |
| Investment Advisor | % | $ Million | Investment Strategy |
| RS Investments | 46 | 1,979 | RS Investments, a Victory Capital investment franchise, employs both fundamental analysis and quantitative screening in seeking to identify companies that the investment team believes will produce sustainable earnings growth over a multiyear horizon. Investment candidates typically exhibit some or all of the following criteria: strong organic revenue growth, expanding margins and profitability, innovative products or services, defensible competitive advantages, growing market share, and experienced management teams. |
| Frontier Capital Management Co., LLC | 44 | 1,963 | Frontier Capital employs a fundamental, bottom-up, research-intensive investment approach to select mid-cap growth stocks. It seeks companies with above-average mid-cap growth prospects and competitive advantages that will allow them to earn superior rates of return on capital over a business cycle. The approach attempts to balance growth prospects with reasonable valuation and is long-term in nature; investment time frames are typically three to five years. |
| Wellington Management Company LLP | 8 | 372 | Wellington Management uses traditional methods of stock selection—fundamental research and analysis—to identify companies that it believes have above-average growth prospects. It believes that a short-term bias in equity markets rewards near-term cyclical growth and creates opportunity for long-term growth. The team focuses on sustainable earnings power and develops bottom-up valuations based on return on investment capital forecasts, price-to-sales, and quantitative risk factors. It seeks to control risk by emphasizing larger positions in established growth stocks and smaller positions in emerging names. |
| Cash Investments | 2 | 100 | These short-term reserves are invested by Vanguard in equity index products to simulate investment in stocks. Each advisor may also maintain a modest cash position. |
About Your Fund’s Expenses
As a shareholder of the fund, you incur ongoing costs, which include costs for portfolio management, administrative services, and shareholder reports (like this one), among others. Operating expenses, which are deducted from a fund’s gross income, directly reduce the investment return of the fund.
A fund’s expenses are expressed as a percentage of its average net assets. This figure is known as the expense ratio. The following examples are intended to help you understand the ongoing costs (in dollars) of investing in your fund and to compare these costs with those of other mutual funds. The examples are based on an investment of $1,000 made at the beginning of the period shown and held for the entire period.
The accompanying table illustrates your fund’s costs in two ways:
| • | Based on actual fund return. This section helps you to estimate the actual expenses that you paid over the period. The ”Ending Account Value“ shown is derived from the fund‘s actual return, and the third column shows the dollar amount that would have been paid by an investor who started with $1,000 in the fund. You may use the information here, together with the amount you invested, to estimate the expenses that you paid over the period. |
To do so, simply divide your account value by $1,000 (for example, an $8,600 account value divided by $1,000 = 8.6), then multiply the result by the number given for your fund under the heading ”Expenses Paid During Period.“
| • | Based on hypothetical 5% yearly return. This section is intended to help you compare your fund‘s costs with those of other mutual funds. It assumes that the fund had a yearly return of 5% before expenses, but that the expense ratio is unchanged. In this case—because the return used is not the fund’s actual return—the results do not apply to your investment. The example is useful in making comparisons because the Securities and Exchange Commission requires all mutual funds to calculate expenses based on a 5% return. You can assess your fund’s costs by comparing this hypothetical example with the hypothetical examples that appear in shareholder reports of other funds. |
Note that the expenses shown in the table are meant to highlight and help you compare ongoing costs only and do not reflect transaction costs incurred by the fund for buying and selling securities. Further, the expenses do not include any purchase, redemption, or account service fees described in the fund prospectus. If such fees were applied to your account, your costs would be higher. Your fund does not carry a “sales load.”
The calculations assume no shares were bought or sold during the period. Your actual costs may have been higher or lower, depending on the amount of your investment and the timing of any purchases or redemptions.
You can find more information about the fund’s expenses, including annual expense ratios, in the Financial Statements section of this report. For additional information on operating expenses and other shareholder costs, please refer to your fund’s current prospectus.
| Six Months Ended October 31, 2020 | | | |
| Mid-Cap Growth Fund | Beginning
Account Value
4/30/2020 | Ending
Account Value
10/31/2020 | Expenses
Paid During
Period |
| Based on Actual Fund Return | $1,000.00 | $1,239.22 | $1.86 |
| Based on Hypothetical 5% Yearly Return | 1,000.00 | 1,023.48 | 1.68 |
The calculations are based on expenses incurred in the most recent six-month period. The fund’s annualized six-month expense ratio for that period is 0.33%. The dollar amounts shown as “Expenses Paid” are equal to the annualized expense ratio multiplied by the average account value over the period, multiplied by the number of days in the most recent six-month period, then divided by the number of days in the most recent 12-month period (184/366).
All of the returns in this report represent past performance, which is not a guarantee of future results that may be achieved by the fund. (Current performance may be lower or higher than the performance data cited. For performance data current to the most recent month-end, visit our website at vanguard.com/performance.) Note, too, that both investment returns and principal value can fluctuate widely, so an investor’s shares, when sold, could be worth more or less than their original cost. The returns shown do not reflect taxes that a shareholder would pay on fund distributions or on the sale of fund shares.
Cumulative Performance: October 31, 2010, Through October 31, 2020
Initial Investment of $10,000
| | | Average Annual Total Returns
Periods Ended October 31, 2020 | |
| | | One
Year | Five
Years | Ten
Years | Final Value
of a $10,000
Investment |
 | Mid-Cap Growth Fund | 18.33% | 11.30% | 12.64% | $32,872 |
 | Russell Midcap Growth Index | 21.14 | 14.15 | 14.13 | 37,485 |
 | Dow Jones U.S. Total Stock Market Float Adjusted Index | 9.99 | 11.41 | 12.75 | 33,211 |
See Financial Highlights for dividend and capital gains information.
| Communication Services | 4.9% |
| Consumer Discretionary | 15.6 |
| Consumer Staples | 1.5 |
| Financials | 5.7 |
| Health Care | 20.3 |
| Industrials | 11.9 |
| Information Technology | 35.8 |
| Materials | 3.3 |
| Real Estate | 1.0 |
The table reflects the fund’s investments, except for short-term investments and derivatives. Sector categories are based on the Global Industry Classification Standard (“GICS”), except for the “Other” category (if applicable), which includes securities that have not been provided a GICS classification as of the effective reporting period.
Global Industry Classification Standard (“GICS”) was developed by and is the exclusive property and a service mark of MSCI Inc. (“MSCI”) and Standard and Poor’s, a division of McGraw-Hill Companies, Inc. (“S&P”), and is licensed for use by Vanguard. Neither MSCI, S&P nor any third party involved in making or compiling the GICS or any GICS classification makes any express or implied warranties or representations with respect to such standard or classification (or the results to be obtained by the use thereof), and all such parties hereby expressly disclaim all warranties of originality, accuracy, completeness, merchantability or fitness for a particular purpose with respect to any such standard or classification. Without limiting any of the foregoing, in no event shall MSCI, S&P, any of its affiliates or any third party involved in making or compiling the GICS or any GICS classification have any liability for any direct, indirect, special, punitive, consequential or any other damages (including lost profits) even if notified of the possibility of such damages.
The fund files its complete schedule of portfolio holdings with the Securities and Exchange Commission (SEC) for the first and third quarters of each fiscal year as an exhibit to its reports on Form N-PORT. The fund’s Form N-PORT reports are available on the SEC’s website at www.sec.gov.
| | | Shares | Market
Value•
($000) |
| Common Stocks (96.0%) |
| Communication Services (4.7%) |
| * | Twitter Inc. | 1,397,989 | 57,821 |
| * | IAC/Inter Active Corp. | 399,222 | 48,194 |
| * | Match Group Inc. | 352,732 | 41,192 |
| * | Take-Two Interactive Software Inc. | 241,123 | 37,355 |
| * | Electronic Arts Inc. | 129,154 | 15,477 |
| * | ZoomInfo Technologies Inc. Class A | 178,848 | 6,794 |
| | | | 206,833 |
| Consumer Discretionary (14.9%) |
| | Dollar General Corp. | 312,685 | 65,260 |
| * | O'Reilly Automotive Inc. | 146,912 | 64,142 |
| * | Caesars Entertainment Inc. | 1,231,901 | 55,214 |
| * | Burlington Stores Inc. | 278,197 | 53,853 |
| * | Bright Horizons Family Solutions Inc. | 339,942 | 53,728 |
| * | Lululemon Athletica Inc. | 163,107 | 52,078 |
| * | Chipotle Mexican Grill Inc. Class A | 33,820 | 40,634 |
| | Pool Corp. | 101,330 | 35,448 |
| * | Mattel Inc. | 2,551,062 | 35,128 |
| * | Floor & Decor Holdings Inc. Class A | 358,708 | 26,186 |
| | Domino's Pizza Inc. | 62,411 | 23,611 |
| * | Carvana Co. Class A | 117,635 | 21,804 |
| * | Chewy Inc. Class A | 331,480 | 20,419 |
| | Wendy's Co. | 867,320 | 18,951 |
| * | CarMax Inc. | 211,570 | 18,288 |
| | Ross Stores Inc. | 206,926 | 17,624 |
| | Advance Auto Parts Inc. | 110,413 | 16,262 |
| * | Planet Fitness Inc. Class A | 197,077 | 11,681 |
| | Aramark | 382,291 | 10,605 |
| | Vail Resorts Inc. | 42,754 | 9,921 |
| * | Etsy Inc. | 67,565 | 8,215 |
| | | | 659,052 |
| Consumer Staples (1.4%) |
| * | Boston Beer Co. Inc. Class A | 21,820 | 22,675 |
| * | Beyond Meat Inc. | 152,580 | 21,732 |
| | Church & Dwight Co. Inc. | 168,500 | 14,894 |
| * | Freshpet Inc. | 25,097 | 2,873 |
| | | | 62,174 |
| | | Shares | Market
Value•
($000) |
| Financials (5.5%) |
| | MSCI Inc. Class A | 166,539 | 58,262 |
| * | SVB Financial Group | 110,406 | 32,095 |
| | Aon plc Class A | 166,827 | 30,698 |
| | KKR & Co. Inc. | 868,429 | 29,657 |
| | MarketAxess Holdings Inc. | 40,060 | 21,586 |
| | Nasdaq Inc. | 150,819 | 18,248 |
| | Moody's Corp. | 68,391 | 17,980 |
| | Hamilton Lane Inc. Class A | 221,353 | 15,428 |
| | FactSet Research Systems Inc. | 32,610 | 9,995 |
| | Tradeweb Markets Inc. Class A | 156,781 | 8,541 |
| | | | 242,490 |
| Health Care (19.5%) |
| * | Insulet Corp. | 251,653 | 55,930 |
| * | Veeva Systems Inc. Class A | 182,573 | 49,304 |
| * | IDEXX Laboratories Inc. | 104,146 | 44,243 |
| * | DexCom Inc. | 127,383 | 40,709 |
| * | Exact Sciences Corp. | 300,217 | 37,176 |
| * | Horizon Therapeutics plc | 487,030 | 36,493 |
| | West Pharmaceutical Services Inc. | 128,250 | 34,893 |
| | Royalty Pharma plc Class A | 842,490 | 30,919 |
| * | Charles River Laboratories International Inc. | 131,030 | 29,836 |
| * | Seagen Inc. | 178,402 | 29,757 |
| * | Incyte Corp. | 334,861 | 29,012 |
| * | Align Technology Inc. | 65,920 | 28,087 |
| | AmerisourceBergen Corp. Class A | 232,310 | 22,318 |
| | Teleflex Inc. | 66,678 | 21,219 |
| * | Masimo Corp. | 93,460 | 20,918 |
| | STERIS plc | 112,428 | 19,921 |
| | Encompass Health Corp. | 288,170 | 17,668 |
| * | Mirati Therapeutics Inc. | 80,150 | 17,404 |
| * | Centene Corp. | 290,293 | 17,156 |
| | ResMed Inc. | 86,052 | 16,517 |
| * | Iovance Biotherapeutics Inc. | 460,410 | 16,427 |
| * | ABIOMED Inc. | 62,372 | 15,710 |
| * | Bluebird Bio Inc. | 292,078 | 15,103 |
| * | Hologic Inc. | 211,707 | 14,570 |
| * | Mettler-Toledo International Inc. | 14,567 | 14,537 |
| | Humana Inc. | 33,958 | 13,559 |
| * | Fate Therapeutics Inc. | 304,900 | 13,538 |
| * | BioMarin Pharmaceutical Inc. | 181,748 | 13,528 |
| * | 10X Genomics Inc. Class A | 97,340 | 13,326 |
| * | Sage Therapeutics Inc. | 179,570 | 13,177 |
| * | Neurocrine Biosciences Inc. | 124,780 | 12,312 |
| * | Apellis Pharmaceuticals Inc. | 381,330 | 12,164 |
| * | ICON plc | 66,007 | 11,901 |
| * | Ascendis Pharma A/S ADR | 66,570 | 10,874 |
| | Cooper Cos. Inc. | 30,449 | 9,715 |
| * | Edwards Lifesciences Corp. | 127,167 | 9,117 |
| * | Moderna Inc. | 131,713 | 8,887 |
| * | Alcon Inc. | 149,459 | 8,495 |
| | Agilent Technologies Inc. | 82,956 | 8,469 |
| * | Illumina Inc. | 26,036 | 7,621 |
| * | Penumbra Inc. | 26,755 | 6,984 |
| * | Allogene Therapeutics Inc. | 202,100 | 6,855 |
| | | Shares | Market
Value•
($000) |
| * | ACADIA Pharmaceuticals Inc. | 100,695 | 4,677 |
| * | Abcam plc ADR | 35,000 | 665 |
| | | | 861,691 |
| Industrials (11.4%) |
| | IHS Markit Ltd. | 612,657 | 49,546 |
| | Cintas Corp. | 121,831 | 38,322 |
| | Quanta Services Inc. | 528,683 | 33,006 |
| | TransUnion | 353,086 | 28,127 |
| | Nordson Corp. | 129,920 | 25,130 |
| * | CoStar Group Inc. | 30,460 | 25,087 |
| | Pentair plc | 503,530 | 25,056 |
| * | Generac Holdings Inc. | 108,880 | 22,881 |
| | Rockwell Automation Inc. | 93,485 | 22,167 |
| | Verisk Analytics Inc. Class A | 120,070 | 21,369 |
| | Knight-Swift Transportation Holdings Inc. | 511,438 | 19,429 |
| | L3Harris Technologies Inc. | 111,823 | 18,016 |
| | IDEX Corp. | 103,900 | 17,703 |
| | Waste Connections Inc. | 173,300 | 17,212 |
| | BWX Technologies Inc. | 290,107 | 15,959 |
| | Old Dominion Freight Line Inc. | 78,750 | 14,992 |
| * | Trex Co. Inc. | 200,450 | 13,939 |
| * | Stericycle Inc. | 223,045 | 13,896 |
| | JB Hunt Transport Services Inc. | 110,474 | 13,449 |
| | Trane Technologies plc | 96,790 | 12,849 |
| * | FTI Consulting Inc. | 129,490 | 12,750 |
| * | Builders FirstSource Inc. | 382,315 | 11,584 |
| | Fortune Brands Home & Security Inc. | 108,836 | 8,801 |
| | Masco Corp. | 147,760 | 7,920 |
| | Hexcel Corp. | 224,853 | 7,528 |
| | Roper Technologies Inc. | 19,663 | 7,302 |
| | | | 504,020 |
| Information Technology (34.4%) |
| * | RingCentral Inc. Class A | 449,402 | 116,098 |
| * | Square Inc. Class A | 539,603 | 83,574 |
| * | Paycom Software Inc. | 187,393 | 68,228 |
| | Microchip Technology Inc. | 614,628 | 64,585 |
| * | Twilio Inc. Class A | 218,600 | 60,983 |
| | KLA Corp. | 285,559 | 56,306 |
| * | Coupa Software Inc. | 204,229 | 54,672 |
| | Amphenol Corp. Class A | 457,045 | 51,573 |
| * | Wix.com Ltd. | 203,510 | 50,332 |
| * | Synopsys Inc. | 233,890 | 50,020 |
| | Monolithic Power Systems Inc. | 150,078 | 47,965 |
| * | Splunk Inc. | 239,601 | 47,451 |
| | Marvell Technology Group Ltd. | 1,230,768 | 46,166 |
| * | DocuSign Inc. Class A | 219,370 | 44,368 |
| * | Okta Inc. | 211,179 | 44,312 |
| * | Advanced Micro Devices Inc. | 565,839 | 42,602 |
| | Global Payments Inc. | 263,351 | 41,541 |
| | Lam Research Corp. | 102,917 | 35,206 |
| * | GoDaddy Inc. Class A | 437,439 | 30,944 |
| * | MongoDB Inc. | 133,957 | 30,605 |
| * | Dropbox Inc. Class A | 1,601,732 | 29,248 |
| * | Zendesk Inc. | 244,050 | 27,075 |
| * | Five9 Inc. | 174,645 | 26,497 |
| | | Shares | Market
Value•
($000) |
| | Entegris Inc. | 350,630 | 26,217 |
| | Jack Henry & Associates Inc. | 160,000 | 23,720 |
| * | Atlassian Corp. plc Class A | 119,106 | 22,823 |
| * | Keysight Technologies Inc. | 200,480 | 21,024 |
| * | Fair Isaac Corp. | 51,840 | 20,293 |
| * | Trimble Inc. | 412,470 | 19,852 |
| | Xilinx Inc. | 154,879 | 18,383 |
| | CDW Corp. | 148,189 | 18,168 |
| * | Black Knight Inc. | 199,878 | 17,579 |
| * | Workday Inc. Class A | 78,895 | 16,577 |
| * | Autodesk Inc. | 65,958 | 15,536 |
| | Leidos Holdings Inc. | 185,389 | 15,387 |
| | SS&C Technologies Holdings Inc. | 250,603 | 14,841 |
| * | Proofpoint Inc. | 152,870 | 14,636 |
| * | Cree Inc. | 217,352 | 13,824 |
| | Dolby Laboratories Inc. Class A | 172,690 | 12,965 |
| * | Guidewire Software Inc. | 124,543 | 11,970 |
| * | Dynatrace Inc. | 336,072 | 11,867 |
| | Genpact Ltd. | 339,897 | 11,682 |
| * | Medallia Inc. | 386,516 | 10,996 |
| * | Tyler Technologies Inc. | 22,178 | 8,525 |
| | Booz Allen Hamilton Holding Corp. Class A | 104,132 | 8,174 |
| * | Avalara Inc. | 53,235 | 7,935 |
| | Teradyne Inc. | 64,261 | 5,645 |
| | | | 1,518,970 |
| Materials (3.2%) |
| | Ball Corp. | 455,120 | 40,506 |
| | FMC Corp. | 298,950 | 30,714 |
| | Scotts Miracle-Gro Co. | 193,820 | 29,083 |
| | Sherwin-Williams Co. | 30,862 | 21,232 |
| | Vulcan Materials Co. | 118,781 | 17,204 |
| | | | 138,739 |
| Real Estate (1.0%) |
| | SBA Communications Corp. Class A | 152,324 | 44,230 |
| Total Common Stocks (Cost $3,132,031) | 4,238,199 |
| Temporary Cash Investments (4.2%) |
| Money Market Fund (3.9%) |
| 1,2 | Vanguard Market Liquidity Fund, 0.112% | 1,722,290 | 172,229 |
| | | Face
Amount
($000) | |
| U.S. Government and Agency Obligations (0.3%) |
| 3 | U.S. Cash Management Bill, 0.097%, 1/5/21 | 6,548 | 6,547 |
| 3 | U.S. Cash Management Bill, 0.091%, 2/16/21 | 612 | 612 |
| 3 | U.S. Treasury Bill, 0.094%, 11/3/20 | 3,400 | 3,400 |
| | | Face
Amount
($000) | Market
Value•
($000) |
| 3 | U.S. Treasury Bill, 0.122%, 12/15/20 | 80 | 80 |
| | | | 10,639 |
Total Temporary Cash Investments
(Cost $182,842) | 182,868 |
| Total Investments (100.2%) (Cost $3,314,873) | 4,421,067 |
| Other Assets and Liabilities—Net (-0.2%) | (6,750) |
| Net Assets (100%) | 4,414,317 |
| Cost is in $000. |
| • | See Note A in Notes to Financial Statements. |
| * | Non-income-producing security. |
| 1 | Affiliated money market fund available only to Vanguard funds and certain trusts and accounts managed by Vanguard. Rate shown is the 7-day yield. |
| 2 | Collateral of $2,098,000 was received for securities on loan, of which $201,000 is held in Vanguard Market Liquidity Fund and $1,897,000 is held in cash. |
| 3 | Securities with a value of $7,820,000 have been segregated as initial margin for open futures contracts. |
| | ADR—American Depositary Receipt. |
Derivative Financial Instruments Outstanding as of Period End
| Futures Contracts |
| | | | ($000) |
| | Expiration | Number of
Long (Short)
Contracts | Notional
Amount | Value and
Unrealized
Appreciation
(Depreciation) |
| Long Futures Contracts | | | | |
| E-mini S&P 500 Index | December 2020 | 628 | 102,512 | (2,761) |
See accompanying Notes, which are an integral part of the Financial Statements.
Statement of Assets and Liabilities
|
| ($000s, except shares and per-share amounts) | Amount |
| Assets | |
| Investments in Securities, at Value | |
| Unaffiliated Issuers (Cost $3,142,669) | 4,248,838 |
| Affiliated Issuers (Cost $172,204) | 172,229 |
| Total Investments in Securities | 4,421,067 |
| Investment in Vanguard | 190 |
| Cash | 1,897 |
| Receivables for Investment Securities Sold | 39,968 |
| Receivables for Accrued Income | 330 |
| Receivables for Capital Shares Issued | 2,552 |
| Total Assets | 4,466,004 |
| Liabilities | |
| Due to Custodian | 10,291 |
| Payables for Investment Securities Purchased | 31,862 |
| Collateral for Securities on Loan | 2,098 |
| Payables to Investment Advisor | 1,516 |
| Payables for Capital Shares Redeemed | 4,240 |
| Payables to Vanguard | 461 |
| Variation Margin Payable—Futures Contracts | 1,210 |
| Other Liabilities | 9 |
| Total Liabilities | 51,687 |
| Net Assets | 4,414,317 |
| At October 31, 2020, net assets consisted of: | |
| | |
| Paid-in Capital | 3,015,571 |
| Total Distributable Earnings (Loss) | 1,398,746 |
| Net Assets | 4,414,317 |
| |
| Net Assets | |
Applicable to 147,706,340 outstanding $.001 par value shares of
beneficial interest (unlimited authorization) | 4,414,317 |
| Net Asset Value Per Share | $29.89 |
See accompanying Notes, which are an integral part of the Financial Statements.
|
| | Year Ended
October 31, 2020 |
| | ($000) |
| Investment Income | |
| Income | |
| Dividends | 23,264 |
| Interest1 | 1,380 |
| Securities Lending—Net | 1,163 |
| Total Income | 25,807 |
| Expenses | |
| Investment Advisory Fees—Note B | |
| Basic Fee | 8,359 |
| Performance Adjustment | (2,230) |
| The Vanguard Group—Note C | |
| Management and Administrative | 8,331 |
| Marketing and Distribution | 367 |
| Custodian Fees | 28 |
| Auditing Fees | 33 |
| Shareholders’ Reports | 101 |
| Trustees’ Fees and Expenses | 6 |
| Total Expenses | 14,995 |
| Expenses Paid Indirectly | (199) |
| Net Expenses | 14,796 |
| Net Investment Income | 11,011 |
| Realized Net Gain (Loss) | |
| Investment Securities Sold1 | 326,896 |
| Futures Contracts | 2,238 |
| Realized Net Gain (Loss) | 329,134 |
| Change in Unrealized Appreciation (Depreciation) | |
| Investment Securities1 | 376,806 |
| Futures Contracts | (3,530) |
| Change in Unrealized Appreciation (Depreciation) | 373,276 |
| Net Increase (Decrease) in Net Assets Resulting from Operations | 713,421 |
| 1 | Interest income, realized net gain (loss), and change in unrealized appreciation (depreciation) from an affiliated company of the fund were $1,327,000, ($57,000), and $13,000, respectively. Purchases and sales are for temporary cash investment purposes. |
See accompanying Notes, which are an integral part of the Financial Statements.
Statement of Changes in Net Assets
|
| | Year Ended October 31, |
| | 2020
($000) | 2019
($000) |
| | | |
| Increase (Decrease) in Net Assets | | |
| Operations | | |
| Net Investment Income | 11,011 | 12,097 |
| Realized Net Gain (Loss) | 329,134 | 495,739 |
| Change in Unrealized Appreciation (Depreciation) | 373,276 | 39,055 |
| Net Increase (Decrease) in Net Assets Resulting from Operations | 713,421 | 546,891 |
| Distributions1 | | |
| Total Distributions | (446,385) | (480,130) |
| Capital Share Transactions | | |
| Issued | 747,451 | 877,078 |
| Issued in Lieu of Cash Distributions | 427,134 | 461,067 |
| Redeemed | (1,563,492) | (1,029,526) |
| Net Increase (Decrease) from Capital Share Transactions | (388,907) | 308,619 |
| Total Increase (Decrease) | (121,871) | 375,380 |
| Net Assets | | |
| Beginning of Period | 4,536,188 | 4,160,808 |
| End of Period | 4,414,317 | 4,536,188 |
| 1 | Certain prior-period numbers have been reclassified to conform with the current-period presentation. |
See accompanying Notes, which are an integral part of the Financial Statements.
For a Share Outstanding
Throughout Each Period | Year Ended October 31, |
| 2020 | 2019 | 2018 | 2017 | 2016 |
| Net Asset Value, Beginning of Period | $27.93 | $28.08 | $26.51 | $21.75 | $24.88 |
| Investment Operations | | | | | |
| Net Investment Income | .0681 | .0741 | .1141 | .0931 | .1472 |
| Net Realized and Unrealized Gain (Loss) on Investments | 4.680 | 3.027 | 2.379 | 4.817 | (1.437) |
| Total from Investment Operations | 4.748 | 3.101 | 2.493 | 4.910 | (1.290) |
| Distributions | | | | | |
| Dividends from Net Investment Income | (.067) | (.099) | (.095) | (.150) | (.070) |
| Distributions from Realized Capital Gains | (2.721) | (3.152) | (.828) | — | (1.770) |
| Total Distributions | (2.788) | (3.251) | (.923) | (.150) | (1.840) |
| Net Asset Value, End of Period | $29.89 | $27.93 | $28.08 | $26.51 | $21.75 |
| Total Return3 | 18.33% | 13.56% | 9.61% | 22.69% | -5.49% |
| Ratios/Supplemental Data | | | | | |
| Net Assets, End of Period (Millions) | $4,414 | $4,536 | $4,161 | $4,240 | $3,980 |
| Ratio of Total Expenses to Average Net Assets4 | 0.34% | 0.36% | 0.36% | 0.36% | 0.36% |
| Ratio of Net Investment Income to Average Net Assets | 0.25% | 0.27% | 0.40% | 0.39% | 0.64%2 |
| Portfolio Turnover Rate | 74% | 111% | 75% | 118% | 91% |
| 1 | Calculated based on average shares outstanding. |
| 2 | Net investment income per share and the ratio of net investment income to average net assets include $0.018 and 0.08%, respectively, resulting from a special dividend from Transdigm Group in October 2016. |
| 3 | Total returns do not include account service fees that may have applied in the periods shown. Fund prospectuses provide information about any applicable account service fees. |
| 4 | Includes performance-based investment advisory fee increases (decreases) of (0.05%), (0.02%), (0.04%), (0.05%), and (0.04%). |
Notes to Financial Statements
Vanguard Mid-Cap Growth Fund is registered under the Investment Company Act of 1940 as an open-end investment company, or mutual fund. Market disruptions associated with the COVID-19 pandemic have had a global impact, and uncertainty exists as to the long-term implications. Such disruptions can adversely affect assets of the fund and thus fund performance.
| A. | The following significant accounting policies conform to generally accepted accounting principles for U.S. investment companies. The fund consistently follows such policies in preparing its financial statements. |
1. Security Valuation: Securities are valued as of the close of trading on the New York Stock Exchange (generally 4 p.m., Eastern time) on the valuation date. Equity securities are valued at the latest quoted sales prices or official closing prices taken from the primary market in which each security trades; such securities not traded on the valuation date are valued at the mean of the latest quoted bid and asked prices. Securities for which market quotations are not readily available, or whose values have been materially affected by events occurring before the fund’s pricing time but after the close of the securities’ primary markets, are valued by methods deemed by the board of trustees to represent fair value. Investments in Vanguard Market Liquidity Fund are valued at that fund's net asset value. Temporary cash investments are valued using the latest bid prices or using valuations based on a matrix system (which considers such factors as security prices, yields, maturities, and ratings), both as furnished by independent pricing services.
2. Futures Contracts: The fund uses index futures contracts to a limited extent, with the objective of maintaining full exposure to the stock market while maintaining liquidity. The fund may purchase or sell futures contracts to achieve a desired level of investment, whether to accommodate portfolio turnover or cash flows from capital share transactions. The primary risks associated with the use of futures contracts are imperfect correlation between changes in market values of stocks held by the fund and the prices of futures contracts, and the possibility of an illiquid market. Counterparty risk involving futures is mitigated because a regulated clearinghouse is the counterparty instead of the clearing broker. To further mitigate counterparty risk, the fund trades futures contracts on an exchange, monitors the financial strength of its clearing brokers and clearinghouse, and has entered into clearing agreements with its clearing brokers.
The clearinghouse imposes initial margin requirements to secure the fund’s performance and requires daily settlement of variation margin representing changes in the market value of each contract. Any securities pledged as initial margin for open contracts are noted in the Schedule of Investments.
Futures contracts are valued at their quoted daily settlement prices. The notional amounts of the contracts are not recorded in the Statement of Assets and Liabilities. Fluctuations in the value of the contracts are recorded in the Statement of Assets and Liabilities as an asset (liability) and in the Statement of Operations as unrealized appreciation (depreciation) until the contracts are closed, when they are recorded as realized gains (losses) on future contracts.
During the year ended October 31, 2020, the fund’s average investments in long and short futures contracts represented 2% and 0% of net assets, respectively, based on the average of the notional amounts at each quarter-end during the period.
3. Federal Income Taxes: The fund intends to continue to qualify as a regulated investment company and distribute all of its taxable income. The fund’s tax returns are open to examination by the relevant tax authorities until expiration of the applicable statute of limitations, which is
generally three years after the filing of the tax return. Management has analyzed the fund’s tax positions taken for all open federal and state income tax years, and has concluded that no provision for income tax is required in the fund’s financial statements.
4. Distributions: Distributions to shareholders are recorded on the ex-dividend date. Distributions are determined on a tax basis at the fiscal year-end and may differ from net investment income and realized capital gains for financial reporting purposes.
5. Securities Lending: To earn additional income, the fund lends its securities to qualified institutional borrowers. Security loans are subject to termination by the fund at any time, and are required to be secured at all times by collateral in an amount at least equal to the market value of securities loaned. Daily market fluctuations could cause the value of loaned securities to be more or less than the value of the collateral received. When this occurs, the collateral is adjusted and settled before the opening of the market on the next business day. The fund further mitigates its counterparty risk by entering into securities lending transactions only with a diverse group of prequalified counterparties, monitoring their financial strength, and entering into master securities lending agreements with its counterparties. The master securities lending agreements provide that, in the event of a counterparty’s default (including bankruptcy), the fund may terminate any loans with that borrower, determine the net amount owed, and sell or retain the collateral up to the net amount owed to the fund; however, such actions may be subject to legal proceedings. While collateral mitigates counterparty risk, in the event of a default, the fund may experience delays and costs in recovering the securities loaned. The fund invests cash collateral received in Vanguard Market Liquidity Fund, and records a liability in the Statement of Assets and Liabilities for the return of the collateral, during the period the securities are on loan. Collateral investments in Vanguard Market Liquidity Fund are subject to market appreciation or depreciation. Securities lending income represents fees charged to borrowers plus income earned on invested cash collateral, less expenses associated with the loan. During the term of the loan, the fund is entitled to all distributions made on or in respect of the loaned securities.
6. Credit Facilities and Interfund Lending Program: The fund and certain other funds managed by The Vanguard Group ("Vanguard") participate in a $4.3 billion committed credit facility provided by a syndicate of lenders pursuant to a credit agreement and an uncommitted credit facility provided by Vanguard. Both facilities may be renewed annually. Each fund is individually liable for its borrowings, if any, under the credit facilities. Borrowings may be utilized for temporary or emergency purposes, subject to the fund’s regulatory and contractual borrowing restrictions. With respect to the committed credit facility, the participating funds are charged administrative fees and an annual commitment fee of 0.10% of the undrawn committed amount of the facility; these fees are allocated to the funds based on a method approved by the fund’s board of trustees and included in Management and Administrative expenses on the fund’s Statement of Operations. Any borrowings under either facility bear interest at a rate based upon the higher of the one-month London Interbank Offered Rate (or an acceptable alternate rate, if necessary), federal funds effective rate, or overnight bank funding rate plus an agreed-upon spread, except that borrowings under the uncommitted credit facility may bear interest based upon an alternate rate agreed to by the fund and Vanguard.
In accordance with an exemptive order (the “Order”) from the SEC, the fund may participate in a joint lending and borrowing program that allows registered open-end Vanguard funds to borrow money from and lend money to each other for temporary or emergency purposes (the “Interfund Lending Program”), subject to compliance with the terms and conditions of the Order, and to the extent permitted by the fund’s investment objective and investment policies. Interfund loans and
borrowings normally extend overnight, but can have a maximum duration of seven days. Loans may be called on one business day’s notice. The interest rate to be charged is governed by the conditions of the Order and internal procedures adopted by the board of trustees. The board of trustees is responsible for overseeing the Interfund Lending Program.
For the year ended October 31, 2020, the fund did not utilize the credit facilities or the Interfund Lending Program.
7. Other: Dividend income is recorded on the ex-dividend date. Interest income includes income distributions received from Vanguard Market Liquidity Fund and is accrued daily. Premiums and discounts on debt securities are amortized and accreted, respectively, to interest income over the lives of the respective securities, except for premiums on certain callable debt securities that are amortized to the earliest call date. Security transactions are accounted for on the date securities are bought or sold. Costs used to determine realized gains (losses) on the sale of investment securities are those of the specific securities sold.
| B. | The investment advisory firms Victory Capital Management Inc., through its RS Investments franchise, Frontier Capital Management Co., LLC, and Wellington Management Company llp, each provide investment advisory services to a portion of the fund for a fee calculated at an annual percentage rate of average net assets managed by the advisor. The basic fee of Victory Capital Management Inc. is subject to quarterly adjustments based on performance relative to the Russell Midcap Growth Index for the preceding three years. The basic fees of Frontier Capital Management Co., LLC, and Wellington Management Company llp are subject to quarterly adjustments based on performance relative to the Russell Midcap Growth Index since January 31, 2019. |
Vanguard manages the cash reserves of the fund as described below.
For the year ended October 31, 2020, the aggregate investment advisory fee paid to all advisors represented an effective annual basic rate of 0.19% of the fund’s average net assets, before a decrease of $2,230,000 (0.05%) based on performance.
| C. | In accordance with the terms of a Funds' Service Agreement (the “FSA”) between Vanguard and the fund, Vanguard furnishes to the fund corporate management, administrative, marketing, distribution and cash management services at Vanguard’s cost of operations (as defined by the FSA). These costs of operations are allocated to the fund based on methods and guidelines approved by the board of trustees and are generally settled twice a month. |
Upon the request of Vanguard, the fund may invest up to 0.40% of its net assets as capital in Vanguard. At October 31, 2020, the fund had contributed to Vanguard capital in the amount of $190,000, representing less than 0.01% of the fund’s net assets and 0.08% of Vanguard’s capital received pursuant to the FSA. The fund’s trustees and officers are also directors and employees, respectively, of Vanguard.
| D. | The fund has asked its investment advisors to direct certain security trades, subject to obtaining the best price and execution, to brokers who have agreed to rebate to the fund part of the commissions generated. Such rebates are used solely to reduce the fund’s management and administrative expenses. For the year ended October 31, 2020, these arrangements reduced the fund’s expenses by $199,000 (an annual rate of less than 0.01%% of average net assets). |
| E. | Various inputs may be used to determine the value of the fund’s investments and derivatives. These inputs are summarized in three broad levels for financial statement purposes. The inputs or methodologies used to value securities are not necessarily an indication of the risk associated with investing in those securities. |
Level 1—Quoted prices in active markets for identical securities.
Level 2—Other significant observable inputs (including quoted prices for similar securities, interest rates, prepayment speeds, credit risk, etc.).
Level 3—Significant unobservable inputs (including the fund’s own assumptions used to determine the fair value of investments). Any investments and derivatives valued with significant unobservable inputs are noted on the Schedule of Investments.
The following table summarizes the market value of the fund’s investments and derivatives as of October 31, 2020, based on the inputs used to value them:
| | Level 1
($000) | Level 2
($000) | Level 3
($000) | Total
($000) |
| Investments | | | | |
| Assets | | | | |
| Common Stocks | 4,238,199 | — | — | 4,238,199 |
| Temporary Cash Investments | 172,229 | 10,639 | — | 182,868 |
| Total | 4,410,428 | 10,639 | — | 4,421,067 |
| Derivative Financial Instruments | | | | |
| Liabilities | | | | |
| Future Contracts1 | 1,210 | — | — | 1,210 |
| 1 | Represents variation margin on the last day of the reporting period. |
| F. | Permanent differences between book-basis and tax-basis components of net assets are reclassified among capital accounts in the financial statements to reflect their tax character. These reclassifications have no effect on net assets or net asset value per share. As of period end, permanent differences primarily attributable to the accounting for passive foreign investment companies and distributions in connection with fund share redemptions were reclassified between the following accounts: |
| | Amount
($000) |
| Paid-in Capital | 35,193 |
| Total Distributable Earnings (Loss) | (35,193) |
Temporary differences between book-basis and tax-basis components of total distributable earnings (losses) arise when certain items of income, gain, or loss are recognized in different periods for financial statement and tax purposes; these differences will reverse at some time in the future. The differences are primarily related to the deferral of losses from wash sales; the recognition of unrealized gains or losses from certain derivative contracts; and the recognition of
unrealized gains from passive foreign investment companies. As of period end, the tax-basis components of total distributable earnings (losses) are detailed in the table as follows:
| | Amount
($000) |
| Undistributed Ordinary Income | 6,112 |
| Undistributed Long-Term Gains | 297,697 |
| Capital Loss Carryforwards | — |
| Qualified Late-Year Losses | — |
| Net Unrealized Gains (Losses) | 1,094,937 |
The tax character of distributions paid was as follows:
| | Year Ended October 31, |
| | 2020
Amount
($000) | 2019
Amount
($000) |
| Ordinary Income* | 10,665 | 66,068 |
| Long-Term Capital Gains | 435,720 | 414,062 |
| Total | 446,385 | 480,130 |
| * | Includes short-term capital gains, if any. |
As of October 31, 2020, gross unrealized appreciation and depreciation for investments and derivatives based on cost for U.S. federal income tax purposes were as follows:
| | Amount
($000) |
| Tax Cost | 3,326,129 |
| Gross Unrealized Appreciation | 1,196,463 |
| Gross Unrealized Depreciation | (101,526) |
| Net Unrealized Appreciation (Depreciation) | 1,094,937 |
| G. | During the year ended October 31, 2020, the fund purchased $3,139,994,000 of investment securities and sold $3,942,080,000 of investment securities, other than temporary cash investments. |
| H. | Capital shares issued and redeemed were: |
| | Year Ended October 31, |
| | 2020 | 2019 |
| | Shares
(000) | Shares
(000) |
| Issued | 27,947 | 32,573 |
| Issued in Lieu of Cash Distributions | 16,191 | 20,099 |
| Redeemed | (58,817) | (38,454) |
| Net Increase (Decrease) in Shares Outstanding | (14,679) | 14,218 |
| I. | Management has determined that no events or transactions occurred subsequent to October 31, 2020, that would require recognition or disclosure in these financial statements. |
Report of Independent Registered Public Accounting Firm
To the Board of Trustees of Vanguard Whitehall Funds and Shareholders of Vanguard Mid-Cap Growth Fund
Opinion on the Financial Statements
We have audited the accompanying statement of assets and liabilities, including the schedule of investments, of Vanguard Mid-Cap Growth Fund (one of the funds constituting Vanguard Whitehall Funds, referred to hereafter as the "Fund”) as of October 31, 2020, the related statement of operations for the year ended October 31, 2020, the statement of changes in net assets for each of the two years in the period ended October 31, 2020, including the related notes, and the financial highlights for each of the five years in the period ended October 31, 2020 (collectively referred to as the “financial statements”). In our opinion, the financial statements present fairly, in all material respects, the financial position of the Fund as of October 31, 2020, the results of its operations for the year then ended, the changes in its net assets for each of the two years in the period ended October 31, 2020 and the financial highlights for each of the five years in the period ended October 31, 2020 in conformity with accounting principles generally accepted in the United States of America.
Basis for Opinion
These financial statements are the responsibility of the Fund’s management. Our responsibility is to express an opinion on the Fund’s financial statements based on our audits. We are a public accounting firm registered with the Public Company Accounting Oversight Board (United States) (“PCAOB”) and are required to be independent with respect to the Fund in accordance with the U.S. federal securities laws and the applicable rules and regulations of the Securities and Exchange Commission and the PCAOB.
We conducted our audits of these financial statements in accordance with the standards of the PCAOB. Those standards require that we plan and perform the audit to obtain reasonable assurance about whether the financial statements are free of material misstatement, whether due to error or fraud.
Our audits included performing procedures to assess the risks of material misstatement of the financial statements, whether due to error or fraud, and performing procedures that respond to those risks. Such procedures included examining, on a test basis, evidence regarding the amounts and disclosures in the financial statements. Our audits also included evaluating the accounting principles used and significant estimates made by management, as well as evaluating the overall presentation of the financial statements. Our procedures included confirmation of securities owned as of October 31, 2020 by correspondence with the custodian and brokers and by agreement to the underlying ownership records of the transfer agent; when replies were not received from brokers, we performed other auditing procedures. We believe that our audits provide a reasonable basis for our opinion.
/s/PricewaterhouseCoopers LLP
Philadelphia, Pennsylvania
December 17, 2020
We have served as the auditor of one or more investment companies in The Vanguard Group of Funds since 1975.
Special 2020 tax information (unaudited) for Vanguard Mid-Cap Growth Fund
This information for the fiscal year ended October 31, 2020, is included pursuant to provisions of the Internal Revenue Code.
The fund distributed $469,435,000 as capital gain dividends (20% rate gain distributions) to shareholders during the fiscal year.
The fund distributed $10,665,000 of qualified dividend income to shareholders during the fiscal year.
For corporate shareholders, 100% of investment income (dividend income plus short-term gains, if any) qualifies for the dividends-received deduction.
This page intentionally left blank.
The People Who Govern Your Fund
The trustees of your mutual fund are there to see that the fund is operated and managed in your best interests since, as a shareholder, you are a part owner of the fund. Your fund’s trustees also serve on the board of directors of The Vanguard Group, Inc., which is owned by the Vanguard funds and provides services to them.
A majority of Vanguard’s board members are independent, meaning that they have no affiliation with Vanguard or the funds they oversee, apart from the sizable personal investments they have made as private individuals. The independent board members have distinguished backgrounds in business, academia, and public service. Each of the trustees and executive officers oversees 213 Vanguard funds.
Information for each trustee and executive officer of the fund appears below. That information, as well as the Vanguard fund count, is as of the date on the cover of this fund report. The mailing address of the trustees and officers is P.O. Box 876, Valley Forge, PA 19482. More information about the trustees is in the Statement of Additional Information, which can be obtained, without charge, by contacting Vanguard at 800-662-7447, or online at vanguard.com.
Interested Trustee1
Mortimer J. Buckley
Born in 1969. Trustee since January 2018. Principal occupation(s) during the past five years and other experience: chairman of the board (2019–present) of Vanguard and of each of the investment companies served by Vanguard; chief executive officer (2018–present) of Vanguard; chief executive officer, president, and trustee (2018–present) of each of the investment companies served by Vanguard; president and director (2017–present) of Vanguard; and president (2018–present) of Vanguard Marketing Corporation. Chief investment officer (2013–2017), managing director (2002–2017), head of the Retail Investor Group (2006–2012), and chief information officer (2001–2006) of Vanguard. Chairman of the board (2011–2017) and trustee (2009–2017) of the Children’s Hospital of Philadelphia; and trustee (2018–present) and vice chair (2019–present) of The Shipley School.
Independent Trustees
Emerson U. Fullwood
Born in 1948. Trustee since January 2008. Principal occupation(s) during the past five years and other experience: executive chief staff and marketing officer for North America and corporate vice president (retired 2008) of Xerox Corporation (document management products and services). Former president of the Worldwide Channels Group, Latin
America, and Worldwide Customer Service and executive chief staff officer of Developing Markets of Xerox. Executive in residence and 2009–2010 Distinguished Minett Professor at the Rochester Institute of Technology. Director of SPX FLOW, Inc. (multi-industry manufacturing). Director of the University of Rochester Medical Center, the Monroe Community College Foundation, the United Way of Rochester, North Carolina A&T University, and Roberts Wesleyan College. Trustee of the University of Rochester.
Amy Gutmann
Born in 1949. Trustee since June 2006. Principal occupation(s) during the past five years and other experience: president (2004–present) of the University of Pennsylvania. Christopher H. Browne Distinguished Professor of Political Science, School of Arts and Sciences, and professor of communication, Annenberg School for Communication, with secondary faculty appointments in the Department of Philosophy, School of Arts and Sciences, and at the Graduate School of Education, University of Pennsylvania.
F. Joseph Loughrey
Born in 1949. Trustee since October 2009. Principal occupation(s) during the past five years and other experience: president and chief operating officer (retired 2009) and vice chairman of the board (2008–2009) of Cummins Inc. (industrial machinery). Chairman of the board of Hillenbrand, Inc. (specialized consumer services) and the Lumina Foundation.
1 Mr. Buckley is considered an “interested person,” as defined in the Investment Company Act of 1940, because he is an officer of the Vanguard funds.
Director of the V Foundation. Member of the advisory council for the College of Arts and Letters and chair of the advisory board to the Kellogg Institute for International Studies, both at the University of Notre Dame.
Mark Loughridge
Born in 1953. Trustee since March 2012. Principal occupation(s) during the past five years and other experience: senior vice president and chief financial officer (retired 2013) of IBM (information technology services). Fiduciary member of IBM’s Retirement Plan Committee (2004–2013), senior vice president and general manager (2002–2004) of IBM Global Financing, vice president and controller (1998–2002) of IBM, and a variety of other prior management roles at IBM. Member of the Council on Chicago Booth.
Scott C. Malpass
Born in 1962. Trustee since March 2012. Principal occupation(s) during the past five years and other experience: chief investment officer (retired June 2020) and vice president (retired June 2020) of the University of Notre Dame. Assistant professor of finance at the Mendoza College of Business, University of Notre Dame, and member of the Notre Dame 403(b) Investment Committee (retired June 2020). Member of the board of Catholic Investment Services, Inc. (investment advisors) and the board of superintendence of the Institute for the Works of Religion.
Deanna Mulligan
Born in 1963. Trustee since January 2018. Principal occupation(s) during the past five years and other experience: board chair (2020–present), chief executive officer (2011–2020), and president (2010–2019) of The Guardian Life Insurance Company of America. Chief operating officer (2010–2011) and executive vice president (2008–2010) of the individual life and disability division of Guardian Life. Member of the board of the American Council of Life Insurers and the board of the Economic Club of New York. Trustee of the Partnership for New York City (business leadership), Chief Executives for Corporate Purpose, NewYork-Presbyterian Hospital, Catalyst, and the Bruce Museum (arts and science). Member of the Advisory Council for the Stanford Graduate School of Business.
André F. Perold
Born in 1952. Trustee since December 2004. Principal occupation(s) during the past five years and other experience: George Gund Professor of Finance and Banking, Emeritus at the Harvard Business School (retired 2011). Chief investment officer and co-managing partner of HighVista Strategies (private investment firm). Member of the board of advisors and member of the investment committee of the Museum of Fine Arts Boston. Member of the board (2018–present) of RIT Capital Partners (investment firm). Member of the investment committee of Partners Health Care System.
Sarah Bloom Raskin
Born in 1961. Trustee since January 2018. Principal occupation(s) during the past five years and other experience: deputy secretary (2014–2017) of the United States Department of the Treasury. Governor (2010–2014) of the Federal Reserve Board. Commissioner (2007–2010) of financial regulation for the State of Maryland. Member of the board of directors (2012–2014) of Neighborhood Reinvestment Corporation. Director (2017–present) of i(x) Investments, LLC; director (2017–present) of Reserve Trust. Rubenstein Fellow (2017–present) of Duke University; trustee (2017–present) of Amherst College, and trustee (2019–present) of the Folger Shakespeare Library.
Peter F. Volanakis
Born in 1955. Trustee since July 2009. Principal occupation(s) during the past five years and other experience: president and chief operating officer (retired 2010) of Corning Incorporated (communications equipment) and director of Corning Incorporated (2000–2010) and Dow Corning (2001–2010). Director (2012) of SPX Corporation (multi-industry manufacturing). Overseer of the Amos Tuck School of Business Administration, Dartmouth College (2001–2013). Chairman of the board of trustees of Colby-Sawyer College. Member of the board of Hypertherm Inc. (industrial cutting systems, software, and consumables).
Executive Officers
John Bendl
Born in 1970. Principal occupation(s) during the past five years and other experience: principal of Vanguard. Chief financial officer (2019–present) of each of the investment companies served by Vanguard. Chief accounting officer, treasurer, and controller of Vanguard (2017–present). Partner (2003–2016) at KPMG (audit, tax, and advisory services).
Christine M. Buchanan
Born in 1970. Principal occupation(s) during the past five years and other experience: principal of Vanguard. Treasurer (2017–present) of each of the investment companies served by Vanguard. Partner (2005–2017) at KPMG (audit, tax, and advisory services).
David Cermak
Born in 1960. Principal occupation(s) during the past five years and other experience: principal of Vanguard. Finance director (2019–present) of each of the investment companies served by Vanguard. Managing director and head (2017–present) of Vanguard Investments Singapore. Managing director and head (2017–2019) of Vanguard Investments Hong Kong. Representative director and head (2014–2017) of Vanguard Investments Japan.
John Galloway
Born in 1973. Principal occupation(s) during the past five years and other experience: principal of Vanguard. Investment stewardship officer (September 2020–present) of each of the investment companies served by Vanguard. Head of Investor Advocacy (February 2020–present) and head of Marketing Strategy and Planning (2017–2020) at Vanguard. Deputy assistant to the President of the United States (2015).
Thomas J. Higgins
Born in 1957. Principal occupation(s) during the past five years and other experience: principal of Vanguard. Finance director (2019–present), chief financial officer (2008–2019), and treasurer (1998–2008) of each of the investment companies served by Vanguard.
Peter Mahoney
Born in 1974. Principal occupation(s) during the past five years and other experience: principal of Vanguard. Controller (2015–present) of each of the investment companies served by Vanguard. Head of International Fund Services (2008–2014) at Vanguard.
Anne E. Robinson
Born in 1970. Principal occupation(s) during the past five years and other experience: general counsel (2016–present) of Vanguard. Secretary (2016–present) of Vanguard and of each of the investment companies served by Vanguard. Managing director (2016–present) of Vanguard. Managing director and general counsel of Global Cards and Consumer Services (2014–2016) at Citigroup. Counsel (2003–2014) at American Express.
Michael Rollings
Born in 1963. Principal occupation(s) during the past five years and other experience: finance director (2017–present) and treasurer (2017) of each of the investment companies served by Vanguard. Managing director (2016–present) of Vanguard. Chief financial officer (2016–present) of Vanguard. Director (2016–present) of Vanguard Marketing Corporation. Executive vice president and chief financial officer (2006–2016) of MassMutual Financial Group.
John E. Schadl
Born in 1972. Principal occupation(s) during the past five years and other experience: principal of Vanguard. Chief compliance officer (2019–present) of Vanguard and of each of the investment companies served by Vanguard. Assistant vice president (2019–present) of Vanguard Marketing Corporation.
Vanguard Senior Management Team
| Joseph Brennan | James M. Norris |
| Mortimer J. Buckley | Thomas M. Rampulla |
| Gregory Davis | Karin A. Risi |
| John James | Anne E. Robinson |
| John T. Marcante | Michael Rollings |
| Chris D. McIsaac | Lauren Valente |
Connect with Vanguard®>vanguard.com
Fund Information > 800-662-7447
Direct Investor Account Services > 800-662-2739
Institutional Investor Services > 800-523-1036
Text Telephone for People Who Are Deaf or Hard of Hearing > 800-749-7273
This material may be used in conjunction with the offering of shares of any Vanguard fund only if preceded or accompanied by the fund’s current prospectus.
All comparative mutual fund data are from Lipper, a Thomson Reuters Company, or Morningstar, Inc., unless otherwise noted.
You can obtain a free copy of Vanguard’s proxy voting guidelines by visiting vanguard.com/proxyreporting or by calling Vanguard at 800-662-2739. The guidelines are also available from the SEC’s website, www.sec.gov. In addition, you may obtain a free report on how your fund voted the proxies for securities it owned during the 12 months ended June 30. To get the report, visit either vanguard.com/proxyreporting or www.sec.gov.
You can review information about your fund on the SEC’s website, and you can receive copies of this information, for a fee, by sending a request via email addressed to publicinfo@sec.gov.
Source for Bloomberg Barclays indexes: Bloomberg Index Services Limited. Copyright 2020, Bloomberg. All rights reserved.
CFA® is a registered trademark owned by CFA Institute.
© 2020 The Vanguard Group, Inc.
All rights reserved.
Vanguard Marketing Corporation, Distributor.
Q3010 122020

| | |
| | |
| | |
| Annual Report | October 31, 2020 | |
| | |
| | |
| Vanguard International Explorer™ Fund |
| | |
| | |
| | |
| | |
| | |
| | |
| | |
| | |
| | |
| | |
| | |
| | |
| | |
| | |
| | |
| | |
| | |
| | |
| | |
| | |
| | |
| | |
| | |
| | |
| | |
| | |
| | |
| | |
| | |
| | |
| | |
| | |
| | |
| | |
| | |
| | |
| See the inside front cover for important information about access to your fund’s annual and semiannual shareholder reports. |
| | |
Important information about access to shareholder reports
Beginning on January 1, 2021, as permitted by regulations adopted by the Securities and Exchange Commission, paper copies of your fund’s annual and semiannual shareholder reports will no longer be sent to you by mail, unless you specifically request them. Instead, you will be notified by mail each time a report is posted on the website and will be provided with a link to access the report.
If you have already elected to receive shareholder reports electronically, you will not be affected by this change and do not need to take any action. You may elect to receive shareholder reports and other communications from the fund electronically by contacting your financial intermediary (such as a broker-dealer or bank) or, if you invest directly with the fund, by calling Vanguard at one of the phone numbers on the back cover of this report or by logging on to vanguard.com.
You may elect to receive paper copies of all future shareholder reports free of charge. If you invest through a financial intermediary, you can contact the intermediary to request that you continue to receive paper copies. If you invest directly with the fund, you can call Vanguard at one of the phone numbers on the back cover of this report or log on to vanguard.com. Your election to receive paper copies will apply to all the funds you hold through an intermediary or directly with Vanguard.
| Contents | |
| |
| Your Fund’s Performance at a Glance | 1 |
| |
| Advisors’ Report | 2 |
| |
| About Your Fund’s Expenses | 8 |
| |
| Performance Summary | 10 |
| |
| Financial Statements | 12 |
| |
| Trustees Approve Advisory Arrangements | 35 |
Please note: The opinions expressed in this report are just that—informed opinions. They should not be considered promises or advice. Also, please keep in mind that the information and opinions cover the period through the date on the front of this report. Of course, the risks of investing in your fund are spelled out in the prospectus.
Your Fund’s Performance at a Glance
· For the 12 months ended October 31, 2020, Vanguard International Explorer Fund returned 0.62%. Its benchmark, the S&P EPAC SmallCap Index, returned –0.92%.
· In August, Baillie Gifford Overseas Limited was added as an advisor to the fund, managing 11% of assets. The fund’s four advisors invest in smaller companies—mostly from developed European and Pacific markets—that they believe have strong long-term growth prospects.
· The period was marked by the global spread of COVID-19 and efforts to contain it, including lockdowns, the shuttering of nonessential businesses, and travel restrictions. However, responses from policymakers, the start of trials for vaccines and treatments, and the easing of some pandemic-related restrictions eventually lifted investor sentiment. The U.S. stock market rebounded more strongly than emerging markets and much more than developed markets outside the United States.
· Stocks from emerging markets and Europe boosted the fund’s relative performance. Results were hampered by underweight allocations to North America and the Pacific region.
· Six of the fund’s 11 industry sectors boosted performance relative to the benchmark; real estate helped the most. Materials, consumer discretionary, and utilities were the largest relative detractors.
Market Barometer
| | | Average Annual Total Returns |
| | | Periods Ended October 31, 2020 |
| | One Year | Three Years | Five Years |
| Stocks | | | |
| Russell 1000 Index (Large-caps) | 10.87% | 10.63% | 11.79% |
| Russell 2000 Index (Small-caps) | -0.14 | 2.19 | 7.27 |
| Russell 3000 Index (Broad U.S. market) | 10.15 | 10.04 | 11.48 |
| FTSE All-World ex US Index (International) | -2.17 | 0.13 | 4.52 |
| | | | |
| Bonds | | | |
| Bloomberg Barclays U.S. Aggregate Bond Index (Broad taxable market) | 6.19% | 5.06% | 4.08% |
| Bloomberg Barclays Municipal Bond Index (Broad tax-exempt market) | 3.59 | 4.09 | 3.70 |
| FTSE Three-Month U.S. Treasury Bill Index | 0.86 | 1.62 | 1.15 |
| | | | |
| CPI | | | |
| Consumer Price Index | 1.18% | 1.82% | 1.83% |
Advisors’ Report
For the fiscal year ended October 31, 2020, Vanguard International Explorer Fund returned 0.62%. Your fund is managed by four independent advisors, a strategy that enhances its diversification by providing exposure to distinct yet complementary investment approaches. It is not uncommon for different advisors to have different views about individual securities or the broader investment environment.
The advisors and the amount and percentage of fund assets each manages are presented in the accompanying table. The advisors have also prepared a discussion of the investment environment that existed during the year and of how their portfolio positioning reflected that assessment. These comments were prepared on November 19, 2020.
Schroder Investment Management North America Inc.
Portfolio Managers:
Matthew F. Dobbs,
Head of Global Small Companies
Luke Biermann,
Co-manager
Given the momentous events of the fiscal year surrounding the emergence of the global COVID-19 pandemic, it is perhaps surprising to report that international small-capitalization stocks largely held their ground, registering a marginal decline and returning –0.9% as measured by the S&P EPAC SmallCap Index. Indeed, smaller-company stocks outperformed their larger-cap peers, as the S&P Large-Midcap EPAC Index returned –5.2%. Small-cap health care was especially strong, but small-caps also benefited from lower exposure to energy and financials, where sentiment was particularly impacted by the pandemic.
For the period, we had strong stock selection in every region. The biggest contribution came from Japan, where a number of our holdings in the industrial (Daifuku, Nabtesco) and information technology (GMO Internet, NEC Networks & System Integration, Disco) sectors performed well.
The contribution from the United Kingdom, where our holdings proved defensive in a poorly performing market, was not far behind. This was most evident in industrials (Bunzl), real estate (thanks to the focus on residential and warehouse distribution), and financials (IG Group, which benefited from market volatility). Consumer cyclicals remained a difficult area given pandemic-related lockdowns, although Pets at Home and Dunelm bucked the trend.
After a difficult couple of years, it is a relief to report strong numbers from our continental European segment. Within consumer cyclicals, Hello Fresh benefited from increased dining at home. Other notable performers included Trigano (recreational vehicles), Arjo (medical
equipment), Recordati (pharmaceuticals), and Logitech (computer and gaming peripherals).
Stock selection in Asia ex-Japan and emerging markets also contributed, with notable strength in Techtronic Industries (cordless power tools), Li-Ning (Chinese sportswear retailer), and Voltronic Power Technology, a Taiwanese manufacturer of uninterrupted power supply equipment.
In many ways, the last year has accelerated structural trends evident in prior years, such as the increased penetration of online commerce, digital payments, and more automation and technology in our lives. We believe that well-placed smaller companies can provide attractive exposure to the dynamism of the global economy.
Wellington Management Company LLP
Portfolio Manager:
Mary L. Pryshlak, CFA,
Senior Managing Director and Head of
Investment Research
For the 12 months ended October 31, 2020, international small-cap equities returned –0.9% as measured by the S&P EPAC SmallCap Index, while global equities rose more than 5.4%, as measured by the MSCI All Country World Index.
In the fourth quarter of 2019, declining recession fears and forecasts for improving global growth helped bolster risk sentiment, while geopolitics and trade disputes continued to be major drivers of market volatility. The U.S. canceled tariffs that were scheduled to take effect in December, in an effort to secure a phase one trade deal with China.
International equities ended the first quarter of 2020 sharply lower as the coronavirus spread rapidly, causing unprecedented disruptions to financial markets and economies. Most governments took extraordinary measures to limit financial market stress and mitigate the economic fallout. In the second quarter, international equities surged, as markets were fueled by optimism about successful early stage trials for a potential COVID-19 vaccine, ongoing fiscal and monetary stimulus, and signs that global economic activity was improving. In the third quarter, markets were bolstered by the impact of the massive fiscal and monetary stimulus, further signs of a recovery in global economic growth, and encouraging progress with vaccines.
In our portion of the fund, stock selection in the consumer discretionary, industrials, and materials sectors detracted most from relative performance. This was partly offset by positive selection in health care and financials. Among regions, selection within Europe and Japan detracted the most from relative performance.
Among the top relative detractors were Autogrill, Dufry, and Elior Group. Shares of Autogrill, an Italian food and beverage operator with global exposure to airports and motorways, declined on reduced travel demand because of COVID-19. We like the long-term fundamentals of the business but have reduced the size of our position significantly. Dufry, a Swiss operator of duty-free and duty-paid shops in airports, train stations, and other transportation centers, faced similar challenges given the physical footprint of its stores. We remain confident in the company’s long-term trajectory and are encouraged by its dominant market share in airport retail worldwide. Shares of Elior Group, a France-based concession catering services company, fell after the company reported declines in multiple quarterly earnings. COVID-19 affected demand across its business segments: health care, education and business and industry. We continue to hold our position and believe that the long-term trend of dining away from home remains intact and that revenues should recover once a vaccine is introduced.
Top relative contributors included STRATEC, DiaSorin, and Shandong Weigao. STRATEC is a German life science company and automation provider for in vitro diagnostics; its shares rose as the company stands to benefit from increasing COVID-19 testing. DiaSorin is an Italy-based global leader in laboratory diagnostics, specializing in immuno- and molecular diagnostics. Shares rose after the company announced that its new coronavirus test would slash the wait time for results. Shandong Weigao is a market leader in medical consumables and orthopedics in China. The company benefited from an increase in the export of masks and other relevant products to combat the spread of COVID-19. We eliminated our positions in DiaSorin and Shandong Weigao on strength and continue to hold a position in STRATEC.
Equity markets have seen both a historic drop and remarkable recovery in 2020. Throughout this turbulent period, various sectors have led and lagged as allocators attempted to navigate when and to what degree economies will shift in a post-COVID world. The lasting impacts of COVID-19 on enterprise and consumer behavior are key topics for debate among our global industry analysts (GIAs) and broader market participants. Our GIAs remain focused on identifying companies within their coverage areas that are best positioned for growth in both the current environment and years to come.
TimesSquare Capital Management, LLC
Portfolio Manager:
Magnus S. Larsson,
Director, Head of International Team
In early 2020, COVID-19 infected all aspects of the global economy, leading to a precipitous sell-off. As the world gradually emerged from lockdowns,
signs of recovery in economic activities and fiscal stimulus measures restored positive sentiment to the markets. Amid this rapidly shifting environment, contributions were strongest from our holdings in Japan and Europe, though they were offset by Asia/Pacific ex-Japan and emerging markets.
In Japan, discount supermarket chain Kobe Bussan benefited from pandemic-stimulated household demand. The company continues to garner share from mom-and-pop supermarkets that lack its buying power and breadth of product offerings. Also positive was Sushiro, Japan’s leader in conveyor-belt sushi restaurants. Although same-store sales declined in March and April, fundamentals improved in May as the government eased its state of emergency.
In Europe, Melrose Industries is a U.K.-based industrial holding company that focuses on acquiring fundamentally good, but mismanaged, assets. Shares detracted from performance on the back of its exposure to the more cyclical aerospace and automotive end markets. Also negative was Rubis, a French company that provides bulk storage and distribution of petroleum. Its shares fell as fuel distribution volumes were hurt by lockdowns and on concerns about its exposure to oil prices.
Offsetting the negative trend was Keywords Studios, a provider of outsourced creative and technical services to the video game industry. Increased play by gamers during the pandemic has been an impetus for video game companies to increase the cadence of content development. Also contributing to performance was Italian online financial services firm FinecoBank, which benefited from the industry’s structural digital migration.
Our Australian financial services holdings also faced challenges. Notable was Challenger, the leader in fixed income products to the underpenetrated Australian market, as regulatory changes weighed on its local annuity sales. Declining interest rates also hurt the company’s investment returns.
Weakness in the emerging markets resulted from our holdings in the Americas. Shares in Regional SAB, a Mexican bank focused on small and medium-sized enterprises, retreated on rising concerns of a decline in asset quality and the impact of low interest rates on profitability. Recognizing those risks, we sold out of the name.
Given our strong valuation discipline, we took profits in some of our top contributors and opportunistically added to high-conviction ideas on undue weakness. As the unique environment accelerated the pathway to profitability for some companies, this provided an opportunity to enhance our holdings in select leaders that emphasize digitalization and still have significant runway for growth in a post-COVID world. Uncertainty remains regarding the outlook for COVID-19 and
economic activities. Those abrupt changes can disconnect stock prices from company fundamentals, which may provide opportunities for our bottom-up approach.
Baillie Gifford Overseas Ltd.
Portfolio Managers:
Brian Lum, CFA,
Chair of the International Smaller
Companies Portfolio Construction Group
Steven Vaughan, CFA
Investment Manager
We aim to invest with the mindset of an owner and a focus on growth. Therefore, it’s no surprise that our portfolio consists of many companies that are beneficiaries of powerful long-term megatrends. Industrial automation, health care innovation, big data, and digitization are well-represented in our portion of the portfolio.
COVID-19 is proving a powerful accelerator of these megatrends. The pandemic has prompted a period of rapid adaptation for individuals, companies, and societies at large, with inertia to change being shattered and new habits forming. This is particularly significant as customer inertia is often the key bottleneck to growth for the portfolio’s more innovative holdings, and we’ve seen its removal positively impact share-price performance.
Since we joined the fund as an advisor in August, the top contributors to performance have been three Japanese online businesses: Raksul (logistics and printing platform), Bengo4.com (a platform connecting lawyers with clients and a fast-growing digital signature business), and Demae-Can (a food delivery platform). This year’s challenges have highlighted the value of their propositions and will likely lead to a long-term improvement in these companies’ prospects.
Of course, not all holdings fared as well. Locondo (a Japanese online shoe retailer) and Dialog Semiconductor (a European semiconductor designer) were among the leading detractors, because of weaker-than-expected earnings. Hypoport (a German financial services business) also detracted, although this share-price fall seems more attributable to sentiment and speculation than to operational reasons.
Looking forward, we’re focused on generating the new ideas and insights required to capture the second-order effects of this period. In our experience, the most exciting smaller companies are nimbler and more entrepreneurial than their large-cap competitors, meaning they are often uniquely able to tackle novel challenges. Given this, we are enthusiastic about our opportunity set and are motivated to find new, exciting businesses for the portfolio.
Vanguard International Explorer Fund Investment Advisors
| | Fund Assets Managed | |
| Investment Advisor | % | $ Million | Investment Strategy |
Schroder Investment
Management North America Inc. | 39 | 906 | The advisor employs a fundamental investment approach that considers macroeconomic factors while focusing primarily on company-specific factors, including a company’s potential for long-term growth, financial condition, quality of management, and sensitivity to cyclical factors. The advisor also considers the relative value of a company’s securities compared with those of other companies and the market as a whole. |
Wellington Management
Company LLP | 29 | 668 | The advisor allocates the assets in its portion of the fund to a team of global analysts who seek to add value through in-depth fundamental research and understanding of their industries. By covering the same companies over a period of many years, these investment professionals gain comprehensive insight to guide decisions for their subportfolios. |
TimesSquare Capital
Management, LLC | 19 | 453 | The advisor employs a quality growth philosophy that is based on the premise that a skilled research team—emphasizing management quality, superior business models, and valuation—contributes to a diversified portfolio that seeks to deliver superior risk-adjusted returns over the long term. |
| Baillie Gifford Overseas Ltd. | 11 | 265 | The advisor employs rigorous, fundamental, bottom-up analysis. It believes that a few companies will drive most of the market’s return over the long run and considers sustainable earnings growth and free cash flow growth to be the most important determinants of a company’s prospects. |
| Cash Investments | 2 | 37 | These short-term reserves are invested by Vanguard in equity index products to simulate investment in stocks. Each advisor also may maintain a modest cash position. |
About Your Fund’s Expenses
As a shareholder of the fund, you incur ongoing costs, which include costs for portfolio management, administrative services, and shareholder reports (like this one), among others. Operating expenses, which are deducted from a fund’s gross income, directly reduce the investment return of the fund.
A fund’s expenses are expressed as a percentage of its average net assets. This figure is known as the expense ratio. The following examples are intended to help you understand the ongoing costs (in dollars) of investing in your fund and to compare these costs with those of other mutual funds. The examples are based on an investment of $1,000 made at the beginning of the period shown and held for the entire period.
The accompanying table illustrates your fund’s costs in two ways:
• Based on actual fund return. This section helps you to estimate the actual expenses that you paid over the period. The ”Ending Account Value“ shown is derived from the fund‘s actual return, and the third column shows the dollar amount that would have been paid by an investor who started with $1,000 in the fund. You may use the information here, together with the amount you invested, to estimate the expenses that you paid over the period.
To do so, simply divide your account value by $1,000 (for example, an $8,600 account value divided by $1,000 = 8.6), then multiply the result by the number given for your fund under the heading ”Expenses Paid During Period.“
• Based on hypothetical 5% yearly return. This section is intended to help you compare your fund‘s costs with those of other mutual funds. It assumes that the fund had a yearly return of 5% before expenses, but that the expense ratio is unchanged. In this case—because the return used is not the fund’s actual return—the results do not apply to your investment. The example is useful in making comparisons because the Securities and Exchange Commission requires all mutual funds to calculate expenses based on a 5% return. You can assess your fund’s costs by comparing this hypothetical example with the hypothetical examples that appear in shareholder reports of other funds.
Note that the expenses shown in the table are meant to highlight and help you compare ongoing costs only and do not reflect transaction costs incurred by the fund for buying and selling securities. Further, the expenses do not include any purchase, redemption, or account service fees described in the fund prospectus. If such fees were applied to your account, your costs would be higher. Your fund does not carry a “sales load.”
The calculations assume no shares were bought or sold during the period. Your actual costs may have been higher or lower, depending on the amount of your investment and the timing of any purchases or redemptions.
You can find more information about the fund’s expenses, including annual expense ratios, in the Financial Statements section of this report. For additional information on operating expenses and other shareholder costs, please refer to your fund’s current prospectus.
Six Months Ended October 31, 2020
| | Beginning | Ending | Expenses |
| | Account Value | Account Value | Paid During |
| International Explorer Fund | 4/30/2020 | 10/31/2020 | Period |
| Based on Actual Fund Return | $1,000.00 | $1,190.14 | $2.20 |
| Based on Hypothetical 5% Yearly Return | 1,000.00 | 1,023.13 | 2.03 |
The calculations are based on expenses incurred in the most recent six-month period. The fund’s annualized six-month expense ratio for that period is 0.40%. The dollar amounts shown as “Expenses Paid” are equal to the annualized expense ratio multiplied by the average account value over the period, multiplied by the number of days in the most recent six-month period, then divided by the number of days in the most recent 12-month period (184/366).
International Explorer Fund
Performance Summary
All of the returns in this report represent past performance, which is not a guarantee of future results that may be achieved by the fund. (Current performance may be lower or higher than the performance data cited. For performance data current to the most recent month-end, visit our website at vanguard.com/performance.) Note, too, that both investment returns and principal value can fluctuate widely, so an investor’s shares, when sold, could be worth more or less than their original cost. The returns shown do not reflect taxes that a shareholder would pay on fund distributions or on the sale of fund shares.
Cumulative Performance: October 31, 2010, Through October 31, 2020
Initial Investment of $10,000
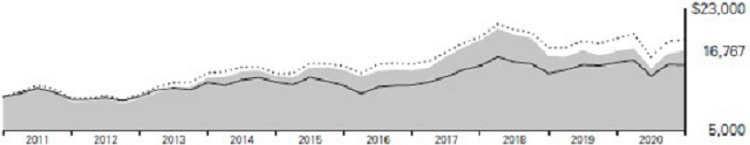
| | | Average Annual Total Returns | |
| | | Periods Ended October 31, 2020 | |
| | | | | | Final Value |
| | | One | Five | Ten | of a $10,000 |
| | | Year | Years | Years | Investment |
 | International Explorer Fund | 0.62% | 3.97% | 5.30% | $16,767 |
 | S&P EPAC SmallCap Index | -0.92 | 4.88 | 6.28 | 18,389 |
 | MSCI All Country World Index ex USA | -2.19 | 4.76 | 3.91 | 14,671 |
See Financial Highlights for dividend and capital gains information.
International Explorer Fund
Fund Allocation
As of October 31, 2020
| Communication Services | 6.9% |
| Consumer Discretionary | 14.2 |
| Consumer Staples | 4.6 |
| Energy | 0.4 |
| Financials | 9.7 |
| Health Care | 9.8 |
| Industrials | 20.2 |
| Information Technology | 21.3 |
| Materials | 4.3 |
| Other | 0.4 |
| Real Estate | 7.0 |
| Utilities | 1.2 |
The table reflects the fund’s investments, except for short-term investments and derivatives. Sector categories are based on the Global Industry Classification Standard ("GICS"), except for the "Other" category (if applicable), which includes securities that have not been provided a GICS classification as of the effective reporting period.
The Global Industry Classification Standard (“GICS”) was developed by and is the exclusive property and a service mark of MSCI Inc. (“MSCI”) and Standard and Poor’s, a division of McGraw-Hill Companies, Inc. (“S&P”), and is licensed for use by Vanguard. Neither MSCI, S&P nor any third party involved in making or compiling the GICS or any GICS classification makes any express or implied warranties or representations with respect to such standard or classification (or the results to be obtained by the use thereof), and all such parties hereby expressly disclaim all warranties of originality, accuracy, completeness, merchantability or fitness for a particular purpose with respect to any such standard or classification. Without limiting any of the foregoing, in no event shall MSCI, S&P, any of its affiliates or any third party involved in making or compiling the GICS or any GICS classification have any liability for any direct, indirect, special, punitive, consequential or any other damages (including lost profits) even if notified of the possibility of such damages.
International Explorer Fund
Financial Statements
Schedule of Investments
As of October 31, 2020
The fund files its complete schedule of portfolio holdings with the Securities and Exchange Commission (SEC) for the first and third quarters of each fiscal year as an exhibit to its reports on Form N-PORT. The fund’s Form N-PORT reports are available on the SEC’s website at www.sec.gov.
| | | | Market |
| | | | Value· |
| | | Shares | ($000) |
| Common Stocks (96.6%) | | |
| Australia (3.8%) | | |
| | Steadfast Group Ltd. | 3,860,700 | 9,680 |
| | James Hardie Industries plc | 330,415 | 8,022 |
| | Link Administration Holdings Ltd. | 1,996,800 | 6,714 |
| | IPH Ltd. | 1,337,900 | 6,201 |
| * | NEXTDC Ltd. | 668,044 | 5,982 |
| ^ | Bingo Industries Ltd. | 3,389,068 | 5,867 |
| | Challenger Ltd. | 1,620,800 | 5,479 |
| | Ansell Ltd. | 179,983 | 5,089 |
| | Iluka Resources Ltd. | 1,144,991 | 4,149 |
| | Netwealth Group Ltd. | 264,512 | 3,213 |
| * | Deterra Royalties Ltd. | 1,144,991 | 3,163 |
| | Northern Star Resources Ltd. | 287,113 | 3,033 |
| | AUB Group Ltd. | 240,097 | 2,814 |
| * | Saracen Mineral Holdings Ltd. | 678,686 | 2,712 |
| | Orora Ltd. | 1,440,892 | 2,611 |
| | Seven Group Holdings Ltd. | 145,656 | 1,989 |
| | Altium Ltd. | 74,910 | 1,966 |
| | Mineral Resources Ltd. | 102,193 | 1,795 |
| | Reliance Worldwide Corp. Ltd. | 592,971 | 1,712 |
| * | Tyro Payments Ltd. | 650,286 | 1,700 |
| * | Nufarm Ltd. | 419,333 | 1,014 |
| | Alumina Ltd. | 650,210 | 657 |
| * | Karoon Energy Ltd. | 1,166,087 | 635 |
| *,^ | Mesoblast Ltd. | 288,017 | 619 |
| | Beach Energy Ltd. | 724,843 | 601 |
| ^ | Whitehaven Coal Ltd. | 543,140 | 407 |
| | | | 87,824 |
| Austria (0.2%) | | |
| *,1 | BAWAG Group AG | 94,815 | 3,482 |
| | Wienerberger AG | 45,330 | 1,144 |
| | Palfinger AG | 41,100 | 952 |
| | | | 5,578 |
| Belgium (1.0%) | | |
| | Barco NV | 785,116 | 12,316 |
| | bpost SA | 341,853 | 3,029 |
| * | Argenx SE ADR | 11,601 | 2,879 |
| * | KBC Ancora | 93,183 | 2,641 |
| | Melexis NV | 23,312 | 1,775 |
| * | Argenx SE | 4,638 | 1,157 |
| *,^,1 | Biocartis Group NV | 148,357 | 645 |
| | | | 24,442 |
| Brazil (0.8%) | | |
| * | StoneCo Ltd. Class A | 102,091 | 5,364 |
| *,1 | Locaweb Servicos de Internet SA | 355,200 | 4,281 |
| | Afya Ltd. Class A | 121,500 | 2,916 |
| | Boa Vista Servicos SA | 1,012,100 | 2,393 |
| | Totvs SA | 508,200 | 2,391 |
| * | Braskem SA Preference Shares | 313,200 | 1,247 |
| | Cia de Saneamento do Parana | 164,300 | 678 |
| | | | 19,270 |
| Canada (0.6%) | | |
| * | Kinaxis Inc. | 53,087 | 8,104 |
| | Real Matters Inc. | 147,500 | 2,576 |
| * | EcoSynthetix Inc. | 705,853 | 1,415 |
| * | Nuvei Corp. | 36,063 | 1,340 |
| | Canacol Energy Ltd. | 421,774 | 1,143 |
| | | | 14,578 |
| China (3.7%) | | |
| | Li Ning Co. Ltd. | 1,351,000 | 7,041 |
| ^ | HUYA Inc. ADR | 310,400 | 6,953 |
| | Haitian International Holdings Ltd. | 2,547,000 | 6,313 |
| *,1 | Tongcheng-Elong Holdings Ltd. | 3,784,400 | 6,299 |
| * | New Oriental Education & Technology Group Inc. ADR | 38,147 | 6,118 |
| | Shenzhou International Group Holdings Ltd. | 344,800 | 5,999 |
International Explorer Fund
| | | | Market |
| | | | Value· |
| | | Shares | ($000) |
| | Kingdee International Software Group Co. Ltd. | 1,964,000 | 5,185 |
| * | 51job Inc. ADR | 68,811 | 4,824 |
| * | Zai Lab Ltd. ADR | 55,075 | 4,519 |
| 1 | A-Living Services Co. Ltd. Class H | 1,060,550 | 4,466 |
| | Chinasoft International Ltd. | 6,131,300 | 4,451 |
| | China Longyuan Power Group Corp. Ltd. Class H | 4,549,000 | 3,118 |
| | Yeahka Ltd. | 562,800 | 3,031 |
| | Wuhan Raycus Fiber Laser Technologies Co. Ltd. Class A | 234,297 | 2,622 |
| | Kingboard Holdings Ltd. | 731,000 | 2,476 |
| * | Niu Technologies ADR | 82,789 | 2,175 |
| | Sinopec Shanghai Petrochemical Co. Ltd. Class H | 11,058,000 | 2,044 |
| ^ | Nexteer Automotive Group Ltd. | 2,343,000 | 1,957 |
| | BEST Inc. ADR | 727,400 | 1,869 |
| * | Tencent Music Entertainment Group ADR | 119,610 | 1,780 |
| * | Hutchison China MediTech Ltd. ADR | 46,379 | 1,365 |
| * | Tongdao Liepin Group | 524,800 | 1,294 |
| | Ningbo Joyson Electronic Corp. Class A | 147,900 | 530 |
| * | Baozun Inc. Class A | 37,700 | 454 |
| | | | 86,883 |
| Denmark (2.4%) | | |
| | Royal Unibrew A/S | 206,924 | 20,177 |
| | Topdanmark A/S | 263,583 | 10,322 |
| * | Ascendis Pharma A/S ADR | 30,328 | 4,954 |
| | SimCorp A/S | 38,613 | 4,606 |
| * | ALK-Abello A/S | 12,779 | 4,276 |
| | ROCKWOOL International A/S Class B | 9,544 | 3,736 |
| *,1 | Netcompany Group A/S | 44,092 | 3,667 |
| * | Dfds A/S | 77,235 | 2,889 |
| * | Zealand Pharma A/S | 43,497 | 1,459 |
| | | | 56,086 |
| Finland (0.4%) | | |
| * | Kojamo Oyj | 224,150 | 4,620 |
| | Cargotec Oyj Class B | 89,843 | 3,088 |
| | Kemira Oyj | 116,697 | 1,442 |
| | | | 9,150 |
| France (5.1%) | | |
| | Teleperformance | 60,473 | 18,153 |
| | Rubis SCA | 420,763 | 13,835 |
| | Trigano SA | 100,406 | 13,331 |
| | Kaufman & Broad SA | 322,138 | 11,480 |
| *,^ | Solutions 30 SE | 499,376 | 8,896 |
| | Orpea | 77,900 | 7,781 |
| * | Ubisoft Entertainment SA | 87,072 | 7,691 |
| * | JCDecaux SA | 353,122 | 5,450 |
| *,1 | Maisons du Monde SA | 325,871 | 4,360 |
| * | Criteo SA ADR | 250,690 | 4,302 |
| 1 | Elior Group SA | 1,077,874 | 4,065 |
| | Nexity SA | 142,165 | 3,991 |
| | Gaztransport Et Technigaz SA | 30,300 | 2,904 |
| | Ipsos | 110,000 | 2,704 |
| * | Soitec | 17,958 | 2,548 |
| * | Scor Se | 97,577 | 2,370 |
| *,1 | Smcp SA | 494,739 | 1,937 |
| * | Cellectis SA | 88,883 | 1,412 |
| * | ESI Group | 23,825 | 1,082 |
| | Vicat SA | 31,706 | 975 |
| * | Rothschild & Co. | 3,501 | 90 |
| | | | 119,357 |
| Germany (7.0%) | | |
| | Gerresheimer AG | 168,193 | 16,908 |
| * | HelloFresh SE | 296,211 | 15,829 |
| 1 | Befesa SA | 342,882 | 14,121 |
| | Grand City Properties SA | 530,250 | 12,036 |
| | Stabilus SA | 199,987 | 11,338 |
| | Deutsche Wohnen SE | 219,790 | 11,093 |
| | New Work SE | 41,251 | 10,763 |
| * | Hypoport SE | 19,054 | 9,976 |
| *,^ | S&T AG (XETR) | 464,390 | 8,403 |
| * | CTS Eventim AG & Co. KGaA | 188,204 | 8,343 |
| * | Knaus Tabbert AG | 85,696 | 6,038 |
| * | Aroundtown SA | 1,086,120 | 5,210 |
| | STRATEC SE | 34,020 | 4,993 |
| | Dermapharm Holding SE | 88,846 | 4,315 |
| * | Dialog Semiconductor plc | 90,074 | 3,434 |
| | Nemetschek SE | 40,100 | 2,903 |
| | Stemmer Imaging AG | 139,662 | 2,578 |
| * | Zooplus AG | 15,668 | 2,512 |
| | Rheinmetall AG | 28,536 | 2,085 |
| | Siltronic AG | 21,411 | 2,026 |
| | Bertrandt AG | 57,358 | 1,967 |
| | Aurubis AG | 28,414 | 1,818 |
| *,^ | Jumia Technologies AG ADR | 109,895 | 1,644 |
| 1 | Brockhaus Capital Management AG | 37,300 | 1,299 |
| *,1 | Aumann AG | 28,781 | 305 |
International Explorer Fund
| | | | Market |
| | | | Value· |
| | | Shares | ($000) |
| | Hamburger Hafen und Logistik AG | 13,821 | 232 |
| * | S&T AG (XWBO) | 9,129 | 165 |
| | | | 162,334 |
| Greece (0.1%) | | |
| | Hellenic Telecommunications Organization SA | 172,192 | 2,284 |
| | | | |
| Hong Kong (2.0%) | | |
| | Johnson Electric Holdings Ltd. | 3,137,625 | 6,492 |
| | ASM Pacific Technology Ltd. | 634,300 | 6,397 |
| | Techtronic Industries Co. Ltd. | 446,000 | 6,007 |
| | Kerry Logistics Network Ltd. | 2,828,500 | 5,907 |
| | Hang Lung Properties Ltd. | 1,888,000 | 4,596 |
| | Kerry Properties Ltd. | 1,603,500 | 3,934 |
| | SUNeVision Holdings Ltd. | 3,607,000 | 3,166 |
| | Minth Group Ltd. | 736,000 | 3,046 |
| | Dah Sing Financial Holdings Ltd. | 1,163,200 | 2,897 |
| * | Mandarin Oriental International Ltd. | 981,000 | 1,794 |
| 1 | Crystal International Group Ltd. | 5,465,500 | 1,509 |
| * | Hypebeast Ltd. | 8,202,500 | 787 |
| | Singamas Container Holdings Ltd. | 2,848,248 | 121 |
| | | | 46,653 |
| Iceland (0.4%) | | |
| ^,1 | Marel HF | 1,710,357 | 8,268 |
| | | | |
| India (0.8%) | | |
| | Gujarat Pipavav Port Ltd. | 6,724,221 | 8,024 |
| | Apollo Hospitals Enterprise Ltd. | 197,838 | 5,655 |
| | Alembic Pharmaceuticals Ltd. | 308,301 | 4,012 |
| | Tube Investments of India Ltd. | 32,845 | 290 |
| | | | 17,981 |
| Indonesia (0.0%) | | |
| | Link Net Tbk PT | 5,388,400 | 769 |
| | | | |
| Ireland (1.4%) | | |
| * | Dalata Hotel Group plc | 5,050,786 | 14,230 |
| | Smurfit Kappa Group plc | 271,811 | 10,242 |
| * | Kingspan Group plc | 105,689 | 9,223 |
| | | | 33,695 |
| Israel (0.4%) | | |
| | Maytronics Ltd. | 357,755 | 5,455 |
| *,^ | UroGen Pharma Ltd. | 84,910 | 1,912 |
| | Caesarstone Ltd. | 146,112 | 1,410 |
| | | | 8,777 |
| Italy (6.8%) | | |
| | Recordati Industria Chimica e Farmaceutica SPA | 303,409 | 15,730 |
| | Reply SPA | 144,837 | 15,561 |
| * | Cerved Group SPA | 2,037,293 | 14,415 |
| | FinecoBank Banca Fineco SPA | 1,023,300 | 14,050 |
| | Interpump Group SPA | 298,497 | 11,275 |
| * | Banca Generali SPA | 390,159 | 11,110 |
| *,1 | doValue SPA | 1,139,022 | 10,548 |
| *,1 | Nexi SPA | 599,790 | 9,233 |
| | Amplifon SPA | 249,100 | 9,057 |
| * | Prada SpA | 1,646,800 | 6,518 |
| 1 | Infrastrutture Wireless Italiane SPA | 543,159 | 5,867 |
| * | Moncler SPA | 145,157 | 5,808 |
| *,^ | Brunello Cucinelli SPA | 192,085 | 5,768 |
| | Italgas SPA | 743,851 | 4,299 |
| | Tamburi Investment Partners SPA | 399,034 | 2,488 |
| *,^ | Salvatore Ferragamo SPA | 187,005 | 2,412 |
| *,1 | Technogym SPA | 322,972 | 2,402 |
| | Buzzi Unicem SPA | 101,965 | 2,206 |
| *,^,1 | Ovs SpA | 2,418,667 | 2,181 |
| | Piaggio & C SPA | 731,173 | 1,995 |
| * | Autogrill SPA | 467,899 | 1,754 |
| * | Astm SpA | 74,436 | 1,385 |
| 1 | Enav SPA | 300,771 | 1,044 |
| | Datalogic SPA | 85,600 | 986 |
| | | | 158,092 |
| Japan (25.1%) | | |
| | Katitas Co. Ltd. | 652,500 | 18,512 |
| | Disco Corp. | 67,600 | 18,246 |
| ^ | Kobe Bussan Co. Ltd. | 615,200 | 17,309 |
| | Nippon Shinyaku Co. Ltd. | 238,600 | 17,049 |
| * | Bengo4.com Inc. | 119,100 | 15,763 |
| | Digital Garage Inc. | 402,600 | 14,315 |
| | GMO Internet Inc. | 484,600 | 12,925 |
| | SBI Holdings Inc. | 557,400 | 12,849 |
| | Sushiro Global Holdings Ltd. | 471,200 | 12,791 |
International Explorer Fund
| | | | Market |
| | | | Value· |
| | | Shares | ($000) |
| | Sumitomo Forestry Co. Ltd. | 714,700 | 11,258 |
| | Nabtesco Corp. | 286,300 | 10,696 |
| | Nifco Inc. | 335,800 | 10,051 |
| | Tsugami Corp. | 678,100 | 9,459 |
| *,^ | Raksul Inc. | 190,600 | 9,273 |
| * | Demae-Can Co. Ltd. | 293,100 | 8,691 |
| | Ai Holdings Corp. | 487,800 | 8,577 |
| | Zenkoku Hosho Co. Ltd. | 207,300 | 8,175 |
| | Tri Chemical Laboratories Inc. | 67,200 | 8,070 |
| | Koito Manufacturing Co. Ltd. | 167,000 | 8,053 |
| | Daibiru Corp. | 664,300 | 7,522 |
| | Tsuruha Holdings Inc. | 53,700 | 7,519 |
| | Musashi Seimitsu Industry Co. Ltd. | 665,500 | 6,956 |
| | Comforia Residential REIT Inc. | 2,404 | 6,875 |
| | Trusco Nakayama Corp. | 264,600 | 6,824 |
| | Aica Kogyo Co. Ltd. | 201,800 | 6,797 |
| | Harmonic Drive Systems Inc. | 102,200 | 6,769 |
| | Systena Corp. | 364,900 | 6,621 |
| | Elecom Co. Ltd. | 131,400 | 6,581 |
| | Kakaku.com Inc. | 247,800 | 6,549 |
| | FP Corp. | 163,700 | 6,529 |
| | Nippon Densetsu Kogyo Co. Ltd. | 320,100 | 6,202 |
| | Sugi Holdings Co. Ltd. | 93,300 | 6,161 |
| | Mani Inc. | 245,300 | 6,137 |
| | Asics Corp. | 487,400 | 6,089 |
| | Daifuku Co. Ltd. | 58,300 | 6,012 |
| | en-japan Inc. | 268,700 | 5,908 |
| | GMO Payment Gateway Inc. | 46,600 | 5,710 |
| | Megachips Corp. | 204,000 | 5,427 |
| | Asahi Intecc Co. Ltd. | 173,106 | 5,364 |
| | Hakuhodo DY Holdings Inc. | 411,400 | 5,242 |
| | LaSalle Logiport REIT | 3,337 | 5,195 |
| | MedPeer Inc. | 105,600 | 5,130 |
| ^ | Japan Airport Terminal Co. Ltd. | 114,100 | 4,956 |
| | Outsourcing Inc. | 533,300 | 4,946 |
| | Infomart Corp. | 586,700 | 4,852 |
| | Kureha Corp. | 112,700 | 4,784 |
| | Fukushima Galilei Co. Ltd. | 126,500 | 4,734 |
| | Aruhi Corp. | 254,400 | 4,568 |
| * | Lifenet Insurance Co | 306,700 | 4,517 |
| | Bank of Kyoto Ltd. | 101,400 | 4,478 |
| | OBIC Business Consultants Co. Ltd. | 82,500 | 4,440 |
| | Sundrug Co. Ltd. | 118,900 | 4,415 |
| | Dip Corp. | 225,300 | 4,329 |
| | Iriso Electronics Co. Ltd. | 113,000 | 4,302 |
| | Rorze Corp. | 94,600 | 4,213 |
| | Tokyo Tatemono Co. Ltd. | 348,800 | 4,012 |
| | eGuarantee Inc. | 177,000 | 3,942 |
| | NEC Networks & System Integration Corp. | 217,900 | 3,778 |
| | As One Corp. | 26,100 | 3,772 |
| | Obara Group Inc. | 107,200 | 3,720 |
| | Pola Orbis Holdings Inc. | 181,500 | 3,579 |
| *,^ | giftee Inc. | 129,800 | 3,512 |
| | Kissei Pharmaceutical Co. Ltd. | 176,100 | 3,465 |
| | KOMEDA Holdings Co. Ltd. | 186,700 | 3,300 |
| | Horiba Ltd. | 66,300 | 3,261 |
| | Amada Co. Ltd. | 364,700 | 3,174 |
| | Ito En Ltd. | 49,300 | 3,122 |
| | JSR Corp. | 138,000 | 3,119 |
| * | JMDC Inc. | 59,400 | 3,116 |
| | Glory Ltd. | 146,400 | 3,086 |
| | Fancl Corp. | 97,700 | 3,079 |
| ^ | Ichigo Office REIT Investment Corp. | 4,741 | 3,066 |
| | Kitanotatsujin Corp. | 636,400 | 2,965 |
| * | Locondo Inc. | 123,600 | 2,958 |
| | Ichigo Inc. | 1,037,830 | 2,942 |
| | Nichirei Corp. | 116,600 | 2,938 |
| | COLOPL Inc. | 336,400 | 2,900 |
| | Ryohin Keikaku Co. Ltd. | 128,400 | 2,695 |
| | JAFCO Group Co. ltd | 59,400 | 2,686 |
| | Taiyo Yuden Co. Ltd. | 70,800 | 2,619 |
| | Tokyo Ohka Kogyo Co. Ltd. | 43,080 | 2,551 |
| | THK Co. Ltd. | 95,400 | 2,532 |
| | Kintetsu World Express Inc. | 116,600 | 2,479 |
| | Lasertec Corp. | 28,400 | 2,460 |
| * | Uzabase Inc. | 71,400 | 2,423 |
| | Ushio Inc. | 210,000 | 2,346 |
| * | Healios Kk | 123,100 | 2,223 |
| | DMG Mori Co. Ltd. | 158,700 | 2,122 |
| * | Freee KK | 27,100 | 2,121 |
| | KH Neochem Co. Ltd. | 89,100 | 2,085 |
| | Itoham Yonekyu Holdings Inc. | 299,500 | 2,005 |
| | Nippon Television Holdings Inc. | 186,100 | 1,964 |
| | Anicom Holdings Inc. | 183,600 | 1,939 |
| | Optex Group Co. Ltd. | 123,400 | 1,839 |
| | Shiga Bank Ltd. | 81,800 | 1,767 |
| | MINEBEA MITSUMI Inc. | 96,600 | 1,745 |
| | Mitsubishi UFJ Lease & Finance Co. Ltd. | 402,000 | 1,703 |
| | Sato Holdings Corp. | 87,400 | 1,664 |
International Explorer Fund
| | | | Market |
| | | | Value· |
| | | Shares | ($000) |
| | San-In Godo Bank Ltd. | 329,000 | 1,656 |
| | Toyo Gosei Co. Ltd. | 16,400 | 1,610 |
| | Arcs Co. Ltd. | 72,400 | 1,603 |
| * | Istyle Inc. | 458,600 | 1,588 |
| * | Sansan Inc. | 23,824 | 1,578 |
| | Senko Group Holdings Co. Ltd. | 176,400 | 1,578 |
| | Link And Motivation Inc. | 397,300 | 1,506 |
| | Hitachi Transport System Ltd. | 44,600 | 1,414 |
| | TechMatrix Corp. | 66,300 | 1,413 |
| | Fukuyama Transporting Co. Ltd. | 31,800 | 1,333 |
| * | GA Technologies Co. Ltd. | 46,200 | 1,282 |
| | Nitto Boseki Co. Ltd. | 33,500 | 1,230 |
| | Ichiyoshi Securities Co. Ltd. | 302,300 | 1,209 |
| | SUMCO Corp. | 76,200 | 1,162 |
| *,^ | Inter Action Corp. | 69,300 | 1,160 |
| | SMS Co. Ltd. | 38,600 | 1,136 |
| *,^ | Money Forward Inc. | 11,324 | 1,024 |
| | NET One Systems Co. Ltd. | 32,700 | 978 |
| | Daikyonishikawa Corp. | 173,600 | 962 |
| | Jeol Ltd. | 30,000 | 956 |
| | TPR Co. Ltd. | 74,600 | 893 |
| | Nikkon Holdings Co. Ltd. | 45,900 | 878 |
| | Comture Corp. | 32,939 | 838 |
| | Rakus Co. Ltd. | 35,800 | 704 |
| | CyberAgent Inc. | 10,000 | 629 |
| | | | 584,809 |
| Kazakhstan (0.1%) | | |
| | JSC National Atomic Company Kazatomprom GDR | 114,773 | 1,630 |
| *,§,1 | Kaspi.KZ JSC GDR | 21,200 | 716 |
| | | | 2,346 |
| Luxembourg (0.1%) | | |
| * | Addiko Bank AG | 176,665 | 1,516 |
| | | | |
| Malaysia (0.1%) | | |
| | Inari Amertron Bhd. | 2,227,600 | 1,363 |
| | | | |
| Mexico (0.4%) | | |
| | Grupo Aeroportuario del | | |
| | Pacifico SAB de CV Class B | 726,586 | 6,047 |
| | Orbia Advance Corp. SAB de CV | 1,241,700 | 2,196 |
| | Alpek SAB de CV | 2,185,700 | 1,634 |
| | | | 9,877 |
| Netherlands (2.1%) | | |
| | ASM International NV | 83,578 | 11,937 |
| * | SIF Holding NV | 543,258 | 9,328 |
| *,1 | Basic-Fit NV | 348,807 | 8,463 |
| | Imcd NV | 63,634 | 7,365 |
| | TKH Group NV | 134,978 | 4,346 |
| | Corbion NV | 60,596 | 2,752 |
| * | Boskalis Westminster | 81,294 | 1,635 |
| | BE Semiconductor Industries NV | 40,171 | 1,619 |
| *,1 | DP Eurasia NV | 3,046,310 | 1,320 |
| * | ProQR Therapeutics NV | 189,167 | 698 |
| | | | 49,463 |
| New Zealand (0.6%) | | |
| * | Xero Ltd. | 86,013 | 6,673 |
| | Kiwi Property Group Ltd. | 4,913,036 | 3,994 |
| | Pushpay Holdings Ltd. | 374,100 | 2,250 |
| | | | 12,917 |
| Norway (1.2%) | | |
| | Borregaard ASA | 868,467 | 11,634 |
| | TOMRA Systems ASA | 170,170 | 6,872 |
| | LINK Mobility Group Holding ASA | 628,700 | 3,359 |
| * | Salmar ASA | 48,985 | 2,487 |
| | Pexip Holding ASA | 270,600 | 1,911 |
| * | Bakkafrost P/F | 20,557 | 1,176 |
| *,1 | Aker Solutions ASA | 757,668 | 741 |
| * | Aker Carbon Capture AS | 409,561 | 302 |
| * | Aker Offshore Wind Holding AS | 409,561 | 151 |
| | | | 28,633 |
| Other (0.6%) | | |
| *,^ | iShares MSCI EAFE Small-Cap ETF | 247,024 | 14,068 |
| | | | |
| Philippines (0.1%) | | |
| | Bloomberry Resorts Corp. | 16,758,200 | 2,450 |
| | International Container Terminal Services Inc. | 306,020 | 726 |
| | | | 3,176 |
| Russia (0.1%) | | |
| * | HeadHunter Group plc ADR | 37,226 | 854 |
| | Mail.Ru Group Ltd. GDR | 17,969 | 471 |
| | | | 1,325 |
| Singapore (0.8%) | | |
| | Mapletree Industrial Trust | 2,068,500 | 4,610 |
| | Venture Corp. Ltd. | 303,000 | 4,271 |
| | Keppel DC REIT | 1,632,000 | 3,465 |
| | Frasers Centrepoint Trust | 2,078,219 | 3,217 |
| | SATS Ltd. | 839,900 | 1,832 |
| | NetLink NBN Trust | 1,812,000 | 1,275 |
| | | | 18,670 |
International Explorer Fund
| | | | Market |
| | | | Value· |
| | | Shares | ($000) |
| South Korea (1.8%) | | |
| | Douzone Bizon Co. Ltd. | 164,514 | 14,505 |
| | Koh Young Technology Inc. | 133,284 | 9,380 |
| * | NHN KCP Corp. | 64,914 | 3,856 |
| ^ | Hanon Systems | 365,392 | 3,623 |
| | Tokai Carbon Korea Co. Ltd. | 33,300 | 2,723 |
| | S&T Motiv Co. Ltd. | 43,247 | 1,933 |
| * | Cafe24 Corp. | 38,053 | 1,886 |
| * | Genexine Inc. | 17,530 | 1,754 |
| | LG Uplus Corp. | 163,685 | 1,603 |
| | Com2uSCorp | 5,701 | 562 |
| | | | 41,825 |
| Spain (1.3%) | | |
| | Prosegur Cia de Seguridad SA | 3,078,055 | 7,051 |
| | Viscofan SA | 98,421 | 6,645 |
| | CIE Automotive SA | 198,557 | 3,886 |
| * | Melia Hotels International SA | 960,931 | 3,561 |
| *,1 | Unicaja Banco SA | 4,478,627 | 2,868 |
| | Ebro Foods SA | 118,803 | 2,660 |
| * | Arima Real Estate SOCIMI SA | 189,061 | 1,713 |
| 1 | Global Dominion Access SA | 245,774 | 874 |
| | | | 29,258 |
| Sweden (5.1%) | | |
| | Arjo AB | 2,287,760 | 16,263 |
| * | Embracer Group AB Class B | 674,100 | 13,567 |
| | Nordic Entertainment Group AB Class B | 301,200 | 10,752 |
| ^ | Intrum AB | 352,900 | 8,624 |
| * | Trelleborg AB Class B | 440,421 | 7,328 |
| * | Loomis AB Class B | 326,800 | 7,289 |
| | Catena AB | 176,072 | 7,166 |
| | AddTech AB | 548,696 | 6,064 |
| * | Nibe Industrier AB Class B | 234,155 | 5,638 |
| *,1 | Thule Group AB | 136,726 | 4,473 |
| * | Fastighets AB Balder Class B | 77,301 | 3,638 |
| | Modern Times Group MTG AB Class B | 265,600 | 3,537 |
| * | HMS Networks AB | 159,652 | 3,497 |
| | Karnov Group AB | 545,700 | 3,351 |
| | SkiStar AB | 254,042 | 2,848 |
| | BillerudKorsnas AB | 136,941 | 2,139 |
| | Paradox Interactive AB | 60,689 | 1,881 |
| * | VNV Global AB | 216,760 | 1,877 |
| * | Indutrade AB | 32,859 | 1,664 |
| * | Storytel AB Class B | 68,422 | 1,651 |
| * | Xvivo Perfusion AB | 50,446 | 1,280 |
| * | Saab AB Class B | 51,445 | 1,180 |
| | Sweco AB Class B | 23,026 | 1,159 |
| * | Bactiguard Holding AB | 66,682 | 1,089 |
| * | Cellavision AB | 31,097 | 972 |
| * | INVISIO AB | 827 | 15 |
| *,§ | OW Bunker A/S | 1,000,000 | — |
| | | | 118,942 |
| Switzerland (3.3%) | | |
| | Logitech International SA | 147,426 | 12,402 |
| | Julius Baer Group Ltd. | 238,390 | 10,610 |
| | Straumann Holding AG | 8,005 | 8,356 |
| 1 | VAT Group AG | 43,802 | 8,218 |
| | Tecan Group AG | 16,804 | 7,974 |
| | Comet Holding AG | 55,056 | 7,740 |
| | Bossard Holding AG | 28,611 | 4,648 |
| *,^ | Dufry AG | 115,879 | 4,376 |
| *,1 | Sensirion Holding AG | 57,698 | 3,176 |
| | Cembra Money Bank AG | 26,526 | 2,947 |
| | Ascom Holding AG | 187,900 | 2,253 |
| | Zur Rose Group AG | 5,100 | 1,419 |
| | OC Oerlikon Corp. AG | 135,550 | 943 |
| | u-blox Holding AG | 18,097 | 910 |
| | | | 75,972 |
| Taiwan (3.8%) | | |
| | Airtac International Group | 461,000 | 12,411 |
| | Chroma ATE Inc. | 2,027,694 | 9,661 |
| | ASPEED Technology Inc. | 177,000 | 8,567 |
| | Accton Technology Corp. | 885,703 | 6,435 |
| | Ennoconn Corp. | 762,422 | 6,019 |
| | Voltronic Power Technology Corp. | 173,252 | 5,943 |
| | Nien Made Enterprise Co. Ltd. | 484,000 | 5,457 |
| | Delta Electronics Inc. | 806,000 | 5,363 |
| | momo.com Inc. | 189,700 | 4,540 |
| | Globalwafers Co. Ltd. | 279,000 | 4,063 |
| | Global Unichip Corp. | 349,000 | 3,168 |
| | Realtek Semiconductor Corp. | 234,248 | 2,918 |
| | Sino-American Silicon Products Inc. | 633,000 | 2,211 |
| | Formosa Sumco Technology Corp. | 518,000 | 2,050 |
| | TCI Co. Ltd. | 200,000 | 1,597 |
| | Far Eastern New Century Corp. | 1,769,000 | 1,597 |
| | ITEQ Corp. | 320,000 | 1,344 |
| | Advanced Wireless Semiconductor Co. | 378,000 | 1,307 |
| | Parade Technologies Ltd. | 31,000 | 1,185 |
| | Alchip Technologies Ltd. | 62,000 | 1,052 |
| | ASMedia Technology Inc. | 20,000 | 1,004 |
| | Genius Electronic Optical Co. Ltd. | 44,000 | 865 |
International Explorer Fund
| | | | Market |
| | | | Value· |
| | | Shares | ($000) |
| | LandMark Optoelectronics Corp. | 80,000 | 742 |
| | | | 89,499 |
| United Kingdom (12.8%) | | |
| * | Keywords Studios plc | 452,014 | 12,417 |
| | Spectris plc | 368,995 | 11,843 |
| | Electrocomponents plc | 1,249,300 | 10,969 |
| | St. James’s Place plc | 931,700 | 10,859 |
| | Safestore Holdings plc | 990,175 | 10,308 |
| | Abcam plc | 490,137 | 9,351 |
| | Bodycote plc | 1,078,800 | 9,097 |
| | Intermediate Capital Group plc | 543,527 | 8,256 |
| 1 | Auto Trader Group plc | 1,078,900 | 8,112 |
| | Dechra Pharmaceuticals plc | 167,000 | 7,555 |
| | Pets at Home Group plc | 1,498,639 | 7,526 |
| | UDG Healthcare plc | 712,600 | 6,698 |
| | Melrose Industries plc | 4,313,700 | 6,692 |
| * | Dunelm Group plc | 391,500 | 6,619 |
| | Polypipe Group plc | 1,095,200 | 6,521 |
| | Rotork plc | 1,744,267 | 6,355 |
| 1 | ConvaTec Group plc | 2,311,502 | 5,411 |
| | Games Workshop Group plc | 39,630 | 5,328 |
| | Cranswick plc | 125,284 | 5,223 |
| | Halma plc | 160,000 | 4,910 |
| * | First Derivatives plc | 127,034 | 4,830 |
| | Howden Joinery Group plc | 582,300 | 4,807 |
| | B&M European Value Retail SA | 745,933 | 4,681 |
| | FDM Group Holdings plc | 362,109 | 4,675 |
| | Telecom Plus plc | 252,000 | 4,341 |
| | LondonMetric Property plc | 1,510,000 | 4,222 |
| * | Renishaw plc | 57,000 | 4,135 |
| * | IWG plc | 1,200,000 | 3,936 |
| | Segro plc | 335,000 | 3,914 |
| | QinetiQ Group plc | 1,247,700 | 3,822 |
| * | Greggs plc | 225,000 | 3,758 |
| | IG Group Holdings plc | 370,000 | 3,651 |
| * | UNITE Group plc | 336,746 | 3,634 |
| | Softcat plc | 246,419 | 3,592 |
| *,1 | Network International Holdings plc | 1,227,639 | 3,523 |
| | Lancashire Holdings Ltd. | 393,948 | 3,251 |
| | Beazley plc | 830,059 | 3,164 |
| * | Team17 Group plc | 313,876 | 2,889 |
| * | Horizon Discovery Group plc | 2,430,993 | 2,797 |
| | Grainger plc | 770,000 | 2,790 |
| | Next plc | 36,000 | 2,719 |
| * | Vistry Group plc | 380,000 | 2,681 |
| | Workspace Group plc | 335,277 | 2,680 |
| * | Victoria plc | 432,273 | 2,625 |
| | Tate & Lyle plc | 334,411 | 2,578 |
| | SSP Group plc | 1,043,031 | 2,526 |
| | Synthomer plc | 515,502 | 2,519 |
| * | Draper Esprit plc | 305,307 | 2,392 |
| * | Redrow plc | 442,784 | 2,387 |
| * | Restaurant Group plc | 4,495,450 | 2,361 |
| | Sanne Group plc | 285,784 | 2,246 |
| | Smart Metering Systems plc | 284,152 | 2,137 |
| | Naked Wines plc | 347,370 | 2,093 |
| | Keller Group plc | 305,520 | 2,010 |
| | AJ Bell plc | 367,980 | 2,009 |
| | Bunzl plc | 61,000 | 1,896 |
| * | Ninety One plc | 703,666 | 1,892 |
| | Domino’s Pizza Group plc | 433,531 | 1,861 |
| | easyJet plc | 268,354 | 1,760 |
| * | Alpha FX Group plc | 117,009 | 1,590 |
| | Codemasters Group Holdings plc | 289,000 | 1,557 |
| | Centamin plc | 872,547 | 1,403 |
| * | Hotel Chocolat Group plc | 302,383 | 1,352 |
| *,1 | Trainline plc | 377,984 | 1,348 |
| * | Travis Perkins plc | 83,938 | 1,153 |
| * | Balfour Beatty plc | 357,547 | 988 |
| | KAZ Minerals plc | 119,298 | 973 |
| | dotdigital group plc | 487,310 | 936 |
| | HomeServe plc | 65,000 | 932 |
| * | Cairn Energy plc | 517,510 | 930 |
| * | Meggitt plc | 256,660 | 909 |
| * | Hyve Group plc | 1,304,971 | 862 |
| * | Freeline Therapeutics Holdings plc ADR | 38,286 | 663 |
| 1 | John Laing Group plc | 176,080 | 643 |
| | Ultra Electronics Holdings plc | 25,628 | 625 |
| * | Grafton Group plc | 64,392 | 560 |
| | Ferrexpo plc | 186,149 | 459 |
| | | | 297,717 |
| United States (0.3%) | | |
| * | Clarivate plc | 175,016 | 4,857 |
| * | ACM Research Inc. Class A | 12,952 | 912 |
| * | Merus NV | 65,790 | 801 |
| | Kosmos Energy Ltd. | 189,382 | 188 |
| | | | 6,758 |
| Total Common Stocks | | |
| (Cost $1,992,686) | | 2,250,155 |
International Explorer Fund
| | | | | Market |
| | | | | Value· |
| | | Shares | | ($000) |
| Temporary Cash Investments (4.6%) | | | |
| Money Market Fund (4.2%) | | | |
| 2,3 | Vanguard Market Liquidity Fund, 0.112% | 975,555 | | 975,555 |
| | | | | |
| | | Face | | |
| | | Amount | | |
| | | ($000) | | |
| Repurchase Agreement (0.2%) | | | |
| | Goldman Sachs & Co., 0.080%, 11/2/20 (Dated 10/30/20, Repurchase Value $3,900,000 collateralized by Federal Home Loan Mortgage Corp. 3.000%– 4.000%, 7/01/36–9/01/48, Federal National Mortgage Assn. 3.500%–6.000%, 7/01/40–1/01/48, and U.S. Treasury Note/Bond 3.000%, 2/15/49, with a value of $3,978,000) | 3,900 | | 3,900 |
| | | | | |
| U.S. Government and Agency Obligations (0.2%) | | | |
| 4 | United States Cash Management Bill, 0.115%, 2/16/21 | 1,007 | | 1,007 |
| 4 | United States Treasury Bill, 0.109%, 12/31/20 | 2,032 | | 2,032 |
| 4 | United States Treasury Bill, 0.095%, 1/28/21 | 1,763 | | 1,763 |
| | | | | 4,801 |
| Total Temporary Cash Investments | | | |
| (Cost $106,250) | | | 106,256 |
| Total Investments (101.2%) | | | |
| (Cost $2,098,936) | | | 2,356,411 |
| Other Assets and Liabilities—Net (-1.2%) | | | (27,460) |
| Net Assets (100%) | | | 2,328,951 |
Cost is in $000.
| • | See Note A in Notes to Financial Statements. |
| * | Non-income-producing security. |
| ^ | Includes partial security positions on loan to broker-dealers. The total value of securities on loan is $37,365,000. |
| § | Security value determined using significant unobservable inputs. |
| 1 | Security exempt from registration under Rule 144A of the Securities Act of 1933. Such securities may be sold in transactions exempt from registration, normally to qualified institutional buyers. At October 31, 2020, the aggregate value of these securities was 139,865,000, representing 6.0% of net assets. |
| 2 | Collateral of $45,735,000 was received for securities on loan. |
| 3 | Affiliated money market fund available only to Vanguard funds and certain trusts and accounts managed by Vanguard. Rate shown is the 7-day yield. |
| 4 | Securities with a value of $3,461,000 have been segregated as initial margin for open futures contracts. |
| | ADR—American Depositary Receipt.
GDR—Global Depositary Receipt.
REIT—Real Estate Investment Trust. |
International Explorer Fund
Derivative Financial Instruments Outstanding as of Period End
Futures Contracts
| | | | | | | ($000) |
| | | | | | | Value and |
| | | Number of | | | | Unrealized |
| | | Long (Short) | | Notional | | Appreciation |
| | Expiration | Contracts | | Amount | | (Depreciation) |
| Long Futures Contracts | | | | | | |
| MSCI EAFE Index | December 2020 | 347 | | 30,951 | | (2,003) |
| MSCI Emerging Market Index | December 2020 | 179 | | 9,862 | | (261) |
| | | | | | | (2,264) |
See accompanying Notes, which are an integral part of the Financial Statements.
International Explorer Fund
Statement of Assets and Liabilities
As of October 31, 2020
| ($000s, except shares and per-share amounts) | Amount |
| Assets | |
| Investments in Securities, at Value | |
| Unaffiliated Issuers (Cost $2,001,386) | 2,258,856 |
| Affiliated Issuers (Cost $97,550) | 97,555 |
| Total Investments in Securities | 2,356,411 |
| Investment in Vanguard | 103 |
| Cash | 84 |
| Foreign Currency, at Value (Cost $17,896) | 17,844 |
| Receivables for Investment Securities Sold | 5,090 |
| Receivables for Accrued Income | 5,598 |
| Receivables for Capital Shares Issued | 813 |
| Total Assets | 2,385,943 |
| Liabilities | |
| Payables for Investment Securities Purchased | 7,810 |
| Collateral for Securities on Loan | 45,735 |
| Payables to Investment Advisor | 1,362 |
| Payables for Capital Shares Redeemed | 1,569 |
| Payables to Vanguard | 216 |
| Variation Margin Payable—Futures Contracts | 300 |
| Total Liabilities | 56,992 |
| Net Assets | 2,328,951 |
| | |
| | |
| At October 31, 2020, net assets consisted of: | |
| | |
| Paid-in Capital | 2,342,525 |
| Total Distributable Earnings (Loss) | (13,574) |
| Net Assets | 2,328,951 |
| | |
| Net Assets | |
| Applicable to 137,827,733 outstanding $.001 par value shares of beneficial interest (unlimited authorization) | 2,328,951 |
| Net Asset Value Per Share | $16.90 |
See accompanying Notes, which are an integral part of the Financial Statements.
International Explorer Fund
Statement of Operations
| | Year Ended |
| | October 31, 2020 |
| | ($000) |
| Investment Income | |
| Income | |
| Dividends—Unaffiliated Issuers1 | 41,065 |
| Dividends—Affiliated Issuers | 34 |
| Interest—Unaffiliated Issuers | 115 |
| Interest—Affiliated Issuers | 719 |
| Securities Lending—Net | 2,519 |
| Total Income | 44,452 |
| Expenses | |
| Investment Advisory Fees—Note B | |
| Basic Fee | 6,734 |
| Performance Adjustment | (1,171) |
| The Vanguard Group—Note C | |
| Management and Administrative | 4,019 |
| Marketing and Distribution | 314 |
| Custodian Fees | 252 |
| Auditing Fees | 37 |
| Shareholders’ Reports | 135 |
| Trustees’ Fees and Expenses | 5 |
| Total Expenses | 10,325 |
| Net Investment Income | 34,127 |
| Realized Net Gain (Loss) | |
| Investment Securities Sold—Unaffiliated Issuers | (75,332) |
| Investment Securities Sold—Affiliated Issuers | 3,699 |
| Futures Contracts | (4,751) |
| Forward Currency Contracts | (1,345) |
| Foreign Currencies | (344) |
| Realized Net Gain (Loss) | (78,073) |
| Change in Unrealized Appreciation (Depreciation) | |
| Investment Securities—Unaffiliated Issuers | 9,001 |
| Investment Securities—Affiliated Issuers | (2,607) |
| Futures Contracts | (3,253) |
| Forward Currency Contracts | (736) |
| Foreign Currencies | (189) |
| Change in Unrealized Appreciation (Depreciation) | 2,216 |
| Net Increase (Decrease) in Net Assets Resulting from Operations | (41,730) |
| 1 | Dividends are net of foreign withholding taxes of $4,052,000. |
See accompanying Notes, which are an integral part of the Financial Statements.
International Explorer Fund
Statement of Changes in Net Assets
| | Year Ended October 31, |
| | 2020 | 2019 |
| | ($000) | ($000) |
| Increase (Decrease) in Net Assets | | |
| Operations | | |
| Net Investment Income | 34,127 | 75,420 |
| Realized Net Gain (Loss) | (78,073) | (181,046) |
| Change in Unrealized Appreciation (Depreciation) | 2,216 | 237,965 |
| Net Increase (Decrease) in Net Assets Resulting from Operations | (41,730) | 132,339 |
| Distributions1 | | |
| Total Distributions | (80,592) | (262,165) |
| Capital Share Transactions | | |
| Issued | 364,525 | 549,998 |
| Issued in Lieu of Cash Distributions | 72,030 | 237,472 |
| Redeemed | (1,147,784) | (1,144,536) |
| Net Increase (Decrease) from Capital Share Transactions | (711,229) | (357,066) |
| Total Increase (Decrease) | (833,551) | (486,892) |
| Net Assets | | |
| Beginning of Period | 3,162,502 | 3,649,394 |
| End of Period | 2,328,951 | 3,162,502 |
1 Certain prior-period numbers have been reclassified to conform with the current-period presentation.
See accompanying Notes, which are an integral part of the Financial Statements.
International Explorer Fund
Financial Highlights
| For a Share Outstanding | | | Year Ended October 31, |
| Throughout Each Period | 2020 | 2019 | 2018 | 2017 | 2016 |
| Net Asset Value, Beginning of Period | $17.22 | $17.86 | $21.87 | $16.82 | $17.76 |
| Investment Operations | | | | | |
| Net Investment Income | .2111 | .3791 | .3691 | .3331 | .318 |
| Net Realized and Unrealized Gain (Loss) | | | | | |
| on Investments | (.081) | .300 | (3.032) | 5.035 | (.334) |
| Total from Investment Operations | .130 | .679 | (2.663) | 5.368 | (.016) |
| Distributions | | | | | |
| Dividends from Net Investment Income | (.450) | (.289) | (.447) | (.318) | (.263) |
| Distributions from Realized Capital Gains | — | (1.030) | (.900) | — | (.661) |
| Total Distributions | (.450) | (1.319) | (1.347) | (.318) | (.924) |
| Net Asset Value, End of Period | $16.90 | $17.22 | $17.86 | $21.87 | $16.82 |
| | | | | | |
| Total Return2 | 0.62% | 4.85% | -13.08% | 32.58% | -0.06% |
| | | | | | |
| Ratios/Supplemental Data | | | | | |
| Net Assets, End of Period (Millions) | $2,329 | $3,163 | $3,649 | $3,980 | $2,829 |
| Ratio of Total Expenses to Average Net Assets3 | 0.39% | 0.39% | 0.39% | 0.38% | 0.41% |
| Ratio of Net Investment Income to | | | | | |
| Average Net Assets | 1.29% | 2.28% | 1.75% | 1.68% | 1.83% |
| Portfolio Turnover Rate | 71% | 35% | 40% | 43% | 37% |
| 1 | Calculated based on average shares outstanding. |
| 2 | Total returns do not include account service fees that may have applied in the periods shown. Fund prospectuses provide information about any applicable account service fees. |
| 3 | Includes performance-based investment advisory fee increases (decreases) of (0.04%), (0.03%), (0.01%), (0.01%), and 0.00%. |
See accompanying Notes, which are an integral part of the Financial Statements.
International Explorer Fund
Notes to Financial Statements
Vanguard International Explorer Fund is registered under the Investment Company Act of 1940 as an open-end investment company, or mutual fund. The fund invests in securities of foreign issuers, which may subject it to investment risks not normally associated with investing in securities of U.S. corporations. Further, at October 31, 2020, the fund had a concentration of its investments in securities issued in Japan, and the performance of such investments may be impacted by the country’s social, political, and economic conditions. Market disruptions associated with the COVID-19 pandemic have had a global impact, and uncertainty exists as to the long-term implications. Such disruptions can adversely affect assets of the fund and thus fund performance.
A. The following significant accounting policies conform to generally accepted accounting principles for U.S. investment companies. The fund consistently follows such policies in preparing its financial statements.
1. Security Valuation: Securities are valued as of the close of trading on the New York Stock Exchange (generally 4 p.m., Eastern time) on the valuation date. Equity securities are valued at the latest quoted sales prices or official closing prices taken from the primary market in which each security trades; such securities not traded on the valuation date are valued at the mean of the latest quoted bid and asked prices. Securities for which market quotations are not readily available, or whose values have been affected by events occurring before the fund’s pricing time but after the close of the securities’ primary markets, are valued at their fair values calculated according to procedures adopted by the board of trustees. These procedures include obtaining quotations from an independent pricing service, monitoring news to identify significant market- or security-specific events, and evaluating changes in the values of foreign market proxies (for example, ADRs, futures contracts, or exchange-traded funds), between the time the foreign markets close and the fund’s pricing time. When fair-value pricing is employed, the prices of securities used by a fund to calculate its net asset value may differ from quoted or published prices for the same securities. Investments in Vanguard Market Liquidity Fund are valued at that fund’s net asset value. Temporary cash investments are valued using the latest bid prices or using valuations based on a matrix system (which considers such factors as security prices, yields, maturities, and ratings), both as furnished by independent pricing services.
2. Foreign Currency: Securities and other assets and liabilities denominated in foreign currencies are translated into U.S. dollars using exchange rates obtained from an independent third party as of the fund’s pricing time on the valuation date. Realized gains (losses) and unrealized appreciation (depreciation) on investment securities include the effects of changes in exchange rates since the securities were purchased, combined with the effects of changes in security prices. Fluctuations in the value of other assets and liabilities resulting from changes in exchange rates are recorded as unrealized foreign currency gains (losses) until the assets or liabilities are settled in cash, at which time they are recorded as realized foreign currency gains (losses).
3. Futures Contracts: The fund uses index futures contracts to a limited extent, with the objective of maintaining full exposure to the stock market while maintaining liquidity. The fund may purchase or sell futures contracts to achieve a desired level of investment, whether to accommodate portfolio turnover or cash flows from capital share transactions. The primary risks associated with the use of futures contracts are imperfect correlation between changes in market values of stocks held by the fund and the prices of futures contracts, and the possibility of an illiquid market. Counterparty risk involving futures is mitigated because a regulated clearinghouse is the counterparty instead of the clearing broker. To further mitigate counterparty risk, the fund trades futures contracts on
International Explorer Fund
an exchange, monitors the financial strength of its clearing brokers and clearinghouse, and has entered into clearing agreements with its clearing brokers. The clearinghouse imposes initial margin requirements to secure the fund’s performance and requires daily settlement of variation margin representing changes in the market value of each contract. Any securities pledged as initial margin for open contracts are noted in the Schedule of Investments.
Futures contracts are valued at their quoted daily settlement prices. The notional amounts of the contracts are not recorded in the Statement of Assets and Liabilities. Fluctuations in the value of the contracts are recorded in the Statement of Assets and Liabilities as an asset (liability) and in the Statement of Operations as unrealized appreciation (depreciation) until the contracts are closed, when they are recorded as realized gains (losses) on futures contracts.
During the year ended October 31, 2020, the fund’s average investments in long and short futures contracts represented 2% and 0% of net assets, respectively, based on the average of the notional amounts at each quarter-end during the period.
4. Forward Currency Contracts: The fund enters into forward currency contracts to protect the value of securities and related receivables and payables against changes in future foreign exchange rates. The fund’s risks in using these contracts include movement in the values of the foreign currencies relative to the U.S. dollar and the ability of the counterparties to fulfill their obligations under the contracts. The fund mitigates its counterparty risk by entering into forward currency contracts only with a diverse group of prequalified counterparties, monitoring their financial strength, entering into master netting arrangements with its counterparties, and requiring its counterparties to transfer collateral as security for their performance. In the absence of a default, the collateral pledged or received by the fund cannot be repledged, resold, or rehypothecated. The master netting arrangements provide that, in the event of a counterparty’s default (including bankruptcy), the fund may terminate the forward currency contracts, determine the net amount owed by either party in accordance with its master netting arrangements, and sell or retain any collateral held up to the net amount owed to the fund under the master netting arrangements. The forward currency contracts contain provisions whereby a counterparty may terminate open contracts if the fund’s net assets decline below a certain level, triggering a payment by the fund if the fund is in a net liability position at the time of the termination. The payment amount would be reduced by any collateral the fund has pledged. Any securities pledged as collateral for open contracts are noted in the Schedule of Investments. The value of collateral received or pledged is compared daily to the value of the forward currency contracts exposure with each counterparty, and any difference, if in excess of a specified minimum transfer amount, is adjusted and settled within two business days.
Forward currency contracts are valued at their quoted daily prices obtained from an independent third party, adjusted for currency risk based on the expiration date of each contract. The notional amounts of the contracts are not recorded in the Statement of Assets and Liabilities. Fluctuations in the value of the contracts are recorded in the Statement of Assets and Liabilities as an asset (liability) and in the Statement of Operations as unrealized appreciation (depreciation) until the contracts are closed, when they are recorded as realized gains (losses) on forward currency contracts.
During the year ended October 31, 2020, the fund’s average investment in forward currency contracts represented 9% of net assets, based on the average of notional amounts at each quarter-end during the period.
International Explorer Fund
5. Repurchase Agreements: The fund enters into repurchase agreements with institutional counterparties. Securities pledged as collateral to the fund under repurchase agreements are held by a custodian bank until the agreements mature, and in the absence of a default, such collateral cannot be repledged, resold, or rehypothecated. Each agreement requires that the market value of the collateral be sufficient to cover payments of interest and principal. The fund further mitigates its counterparty risk by entering into repurchase agreements only with a diverse group of prequalified counterparties, monitoring their financial strength, and entering into master repurchase agreements with its counterparties. The master repurchase agreements provide that, in the event of a counterparty’s default (including bankruptcy), the fund may terminate any repurchase agreements with that counterparty, determine the net amount owed, and sell or retain the collateral up to the net amount owed to the fund. Such action may be subject to legal proceedings, which may delay or limit the disposition of collateral.
6. Federal Income Taxes: The fund intends to continue to qualify as a regulated investment company and distribute all of its taxable income. The fund’s tax returns are open to examination by the relevant tax authorities until expiration of the applicable statute of limitations, which is generally three years after the filing of the tax return. Management has analyzed the fund’s tax positions taken for all open federal and state income tax years, and has concluded that no provision for income tax is required in the fund’s financial statements.
7. Distributions: Distributions to shareholders are recorded on the ex-dividend date. Distributions are determined on a tax basis at the fiscal year-end and may differ from net investment income and realized capital gains for financial reporting purposes.
8. Securities Lending: To earn additional income, the fund lends its securities to qualified institutional borrowers. Security loans are subject to termination by the fund at any time, and are required to be secured at all times by collateral in an amount at least equal to the market value of securities loaned. Daily market fluctuations could cause the value of loaned securities to be more or less than the value of the collateral received. When this occurs, the collateral is adjusted and settled before the opening of the market on the next business day. The fund further mitigates its counterparty risk by entering into securities lending transactions only with a diverse group of prequalified counterparties, monitoring their financial strength, and entering into master securities lending agreements with its counterparties. The master securities lending agreements provide that, in the event of a counterparty’s default (including bankruptcy), the fund may terminate any loans with that borrower, determine the net amount owed, and sell or retain the collateral up to the net amount owed to the fund; however, such actions may be subject to legal proceedings. While collateral mitigates counterparty risk, in the event of a default, the fund may experience delays and costs in recovering the securities loaned. The fund invests cash collateral received in Vanguard Market Liquidity Fund, and records a liability in the Statement of Assets and Liabilities for the return of the collateral, during the period the securities are on loan. Collateral investments in Vanguard Market Liquidity Fund are subject to market appreciation or depreciation. Securities lending income represents fees charged to borrowers plus income earned on invested cash collateral, less expenses associated with the loan. During the term of the loan, the fund is entitled to all distributions made on or in respect of the loaned securities.
International Explorer Fund
9. Credit Facilities and Interfund Lending Program: The fund and certain other funds managed by The Vanguard Group (“Vanguard”) participate in a $4.3 billion committed credit facility provided by a syndicate of lenders pursuant to a credit agreement and an uncommitted credit facility provided by Vanguard. Both facilities may be renewed annually. Each fund is individually liable for its borrowings, if any, under the credit facilities. Borrowings may be utilized for temporary or emergency purposes, subject to the fund’s regulatory and contractual borrowing restrictions. With respect to the committed credit facility, the participating funds are charged administrative fees and an annual commitment fee of 0.10% of the undrawn committed amount of the facility; these fees are allocated to the funds based on a method approved by the fund’s board of trustees and included in Management and Administrative expenses on the fund’s Statement of Operations. Any borrowings under either facility bear interest at a rate based upon the higher of the one-month London Interbank Offered Rate (or an acceptable alternate rate, if necessary), federal funds effective rate, or overnight bank funding rate plus an agreed-upon spread, except that borrowings under the uncommitted credit facility may bear interest based upon an alternative rate agreed to by the fund and Vanguard.
In accordance with an exemptive order (the “Order”) from the SEC, the fund may participate in a joint lending and borrowing program that allows registered open-end Vanguard funds to borrow money from and lend money to each other for temporary or emergency purposes (the “Interfund Lending Program”), subject to compliance with the terms and conditions of the Order, and to the extent permitted by the fund’s investment objective and investment policies. Interfund loans and borrowings normally extend overnight, but can have a maximum duration of seven days. Loans may be called on one business day’s notice. The interest rate to be charged is governed by the conditions of the Order and internal procedures adopted by the board of trustees. The board of trustees is responsible for overseeing the Interfund Lending Program.
For the year ended October 31, 2020, the fund did not utilize the credit facilities or the Interfund Lending Program.
10. Other: Dividend income is recorded on the ex-dividend date. Interest income includes income distributions received from Vanguard Market Liquidity Fund and is accrued daily. Premiums and discounts on debt securities are amortized and accreted, respectively, to interest income over the lives of the respective securities, except for premiums on certain callable debt securities that are amortized to the earliest call date. Security transactions are accounted for on the date securities are bought or sold. Costs used to determine realized gains (losses) on the sale of investment securities are those of the specific securities sold.
Withholding taxes on foreign dividends and capital gains have been provided for in accordance with the fund’s understanding of the applicable countries’ tax rules and rates. The fund has filed tax reclaims for previously withheld taxes on dividends earned in certain European Union countries. These filings are subject to various administrative and judicial proceedings within these countries. Such tax reclaims received during the year, if any, are included in dividend income. No other amounts for additional tax reclaims are reflected in the financial statements due to the uncertainty as to the ultimate resolution of proceedings, the likelihood of receipt of these reclaims, and the potential timing of payment.
International Explorer Fund
B. The investment advisory firms Schroder Investment Management North America Inc., Wellington Management Company LLP, TimesSquare Capital Management, LLC, and, beginning August 2020, Baillie Gifford Overseas Ltd. each provide investment advisory services to a portion of the fund for a fee calculated at an annual percentage rate of average net assets managed by the advisor. The basic fees of Schroder Investment Management North America Inc., Wellington Management Company LLP, and TimesSquare Capital Management, LLC, are subject to quarterly adjustments based on performance relative to the S&P EPAC SmallCap Index for the preceding three years. In accordance with the advisory contract entered into with Baillie Gifford Overseas Ltd., beginning November 1, 2021, the investment advisory fees will be subject to quarterly adjustments based on performance relative to the MSCI All Country World Index ex US Small-Cap since October 31, 2020.
Vanguard manages the cash reserves of the fund as described below.
For the year ended October 31, 2020, the aggregate investment advisory fee represented an effective annual basic rate of 0.25% of the fund’s average net assets, before a decrease of $1,171,000 (-0.04%) based on performance.
C. In accordance with the terms of a Funds’ Service Agreement (the “FSA”) between Vanguard and the fund, Vanguard furnishes to the fund corporate management, administrative, marketing, distribution, and cash management services at Vanguard’s cost of operations (as defined by the FSA). These costs of operations are allocated to the fund based on methods and guidelines approved by the board of trustees and are generally settled twice a month.
Upon the request of Vanguard, the fund may invest up to 0.40% of its net assets as capital in Vanguard. At October 31, 2020, the fund had contributed to Vanguard capital in the amount of $103,000, representing less than 0.01% of the fund’s net assets and 0.04% of Vanguard’s capital received pursuant to the FSA. The fund’s trustees and officers are also directors and employees, respectively, of Vanguard.
D. Various inputs may be used to determine the value of the fund’s investments and derivatives. These inputs are summarized in three broad levels for financial statement purposes. The inputs or methodologies used to value securities are not necessarily an indication of the risk associated with investing in those securities.
Level 1—Quoted prices in active markets for identical securities.
Level 2—Other significant observable inputs (including quoted prices for similar securities, interest rates, prepayment speeds, credit risk, etc.).
Level 3—Significant unobservable inputs (including the fund’s own assumptions used to determine the fair value of investments). Any investments and derivatives valued with significant unobservable inputs are noted on the Schedule of Investments.
International Explorer Fund
The following table summarizes the market value of the fund’s investments and derivatives as of October 31, 2020, based on the inputs used to value them:
| | Level 1 | Level 2 | Level 3 | Total |
| | ($000) | ($000) | ($000) | ($000) |
| Investments | | | | |
| Assets | | | | |
| Common Stocks—International | 106,712 | 2,135,969 | 716 | 2,243,397 |
| Common Stocks—United States | 6,758 | — | — | 6,758 |
| Temporary Cash Investments | 97,555 | 8,701 | — | 106,256 |
| Total | 211,025 | 2,144,670 | 716 | 2,356,411 |
| Derivative Financial Instruments | | | | |
| Liabilities | | | | |
| Futures Contracts1 | 300 | — | — | 300 |
1 Represents variation margin on the last day of the reporting period.
E. Permanent differences between book-basis and tax-basis components of net assets are reclassified among capital accounts in the financial statements to reflect their tax character. These reclassifications have no effect on net assets or net asset value per share. As of period end, permanent differences primarily attributable to the accounting for foreign currency transactions, passive foreign investment companies, and tax expense on capital gains were reclassified between the individual components of total distributable earnings (loss).
Temporary differences between book-basis and tax-basis components of total distributable earnings (loss) arise when certain items of income, gain, or loss are recognized in different periods for financial statement and tax purposes; these differences will reverse at some time in the future. The differences are primarily related to the deferral of losses from wash sales, the recognition of unrealized gains or losses from certain derivative contracts and the recognition of unrealized gains from passive foreign investment companies. As of period end, the tax-basis components of total distributable earnings (loss) are detailed in the table as follows:
| | Amount |
| | ($000) |
| Undistributed Ordinary Income | 25,610 |
| Undistributed Long-Term Gains | — |
| Capital Loss Carryforwards | (291,149) |
| Qualified Late-Year Losses | — |
| Net Unrealized Gains (Losses) | 251,965 |
International Explorer Fund
The tax character of distributions paid was as follows:
| | Year Ended | October 31, |
| | 2020 | 2019 |
| | Amount | Amount |
| | ($000) | ($000) |
| Ordinary Income* | 80,592 | 97,615 |
| Long-Term Capital Gains | — | 164,550 |
| Total | 80,592 | 262,165 |
* Includes short-term capital gains, if any.
As of October 31, 2020, gross unrealized appreciation and depreciation for investments and derivatives based on cost for U.S. federal income tax purposes were as follows:
| | Amount |
| | ($000) |
| Tax Cost | 2,104,482 |
| Gross Unrealized Appreciation | 450,605 |
| Gross Unrealized Depreciation | (198,675) |
| Net Unrealized Appreciation (Depreciation) | 251,930 |
F. During the year ended October 31, 2020, the fund purchased $1,791,838,000 of investment securities and sold $2,520,360,000 of investment securities, other than temporary cash investments. Purchases include $364,000 in connection with in-kind purchases of the fund’s capital shares.
| G. | Capital shares issued and redeemed were: |
| | Year Ended October 31, |
| | 2020 | 2019 |
| | Shares | Shares |
| | (000) | (000) |
| Issued | 23,379 | 33,619 |
| Issued in Lieu of Cash Distributions | 4,035 | 15,758 |
| Redeemed | (73,281) | (70,018) |
| Net Increase (Decrease) in Shares Outstanding | (45,867) | (20,641) |
International Explorer Fund
H. Transactions during the period in investments where the issuer is another member of The Vanguard Group were as follows:
| | | | | | Current Period Transactions | |
| | Oct. 31, | | Proceeds | Realized | | | | Oct. 31, |
| | 2019 | | from | Net | Change in | | Capital Gain | 2020 |
| | Market | Purchases | Securities | Gain | Unrealized | Distributions | Market |
| | Value | at Cost | Sold | (Loss) | App. (Dep.) | Income | Received | Value |
| | ($000) | ($000) | ($000) | ($000) | ($000) | ($000) | ($000) | ($000) |
| Vanguard FTSE | | | | | | | | |
| All World ex-US | | | | | | | | |
| Small-Cap ETF | 22,452 | — | 23,530 | 3,677 | (2,599) | 34 | — | — |
| Vanguard Market | | | | | | | | |
| Liquidity Fund | 173,092 | NA1 | NA1 | 22 | (8) | 719 | — | 97,555 |
| Total | 195,544 | | | 3,699 | (2,607) | 753 | — | 97,555 |
1 Not applicable—purchases and sales are for temporary cash investment purposes.
I. Management has determined that no events or transactions occurred subsequent to October 31, 2020, that would require recognition or disclosure in these financial statements.
Report of Independent Registered
Public Accounting Firm
To the Board of Trustees of Vanguard Whitehall Funds and Shareholders of Vanguard International Explorer Fund
Opinion on the Financial Statements
We have audited the accompanying statement of assets and liabilities, including the schedule of investments, of Vanguard International Explorer Fund (one of the funds constituting Vanguard Whitehall Funds, referred to hereafter as the “Fund”) as of October 31, 2020, the related statement of operations for the year ended October 31, 2020, the statement of changes in net assets for each of the two years in the period ended October 31, 2020, including the related notes, and the financial highlights for each of the five years in the period ended October 31, 2020 (collectively referred to as the “financial statements”). In our opinion, the financial statements present fairly, in all material respects, the financial position of the Fund as of October 31, 2020, the results of its operations for the year then ended, the changes in its net assets for each of the two years in the period ended October 31, 2020 and the financial highlights for each of the five years in the period ended October 31, 2020 in conformity with accounting principles generally accepted in the United States of America.
Basis for Opinion
These financial statements are the responsibility of the Fund’s management. Our responsibility is to express an opinion on the Fund’s financial statements based on our audits. We are a public accounting firm registered with the Public Company Accounting Oversight Board (United States) (“PCAOB”) and are required to be independent with respect to the Fund in accordance with the U.S. federal securities laws and the applicable rules and regulations of the Securities and Exchange Commission and the PCAOB.
We conducted our audits of these financial statements in accordance with the standards of the PCAOB. Those standards require that we plan and perform the audit to obtain reasonable assurance about whether the financial statements are free of material misstatement, whether due to error or fraud.
��
Our audits included performing procedures to assess the risks of material misstatement of the financial statements, whether due to error or fraud, and performing procedures that respond to those risks. Such procedures included examining, on a test basis, evidence regarding the amounts and disclosures in the financial statements. Our audits also included evaluating the accounting principles used and significant estimates made by management, as well as evaluating the overall presentation of the financial statements. Our procedures included confirmation of securities owned as of October 31, 2020 by correspondence with the custodian and brokers and by agreement to the underlying ownership records of the transfer agent; when replies were not received from brokers, we performed other auditing procedures. We believe that our audits provide a reasonable basis
for our opinion.
/s/PricewaterhouseCoopers LLP
Philadelphia, Pennsylvania
December 17, 2020
We have served as the auditor of one or more investment companies in The Vanguard Group of Funds since 1975.
Special 2020 tax information (unaudited) for Vanguard International Explorer Fund
This information for the fiscal year ended October 31, 2020, is included pursuant to provisions of the Internal Revenue Code.
For nonresident alien shareholders, 100% of short-term capital gain dividends distributed by the fund are qualified short-term capital gains.
The fund distributed qualified dividend income of $69,430,000 to shareholders during the fiscal year.
The fund designates to shareholders foreign source income of $45,241,000 and foreign taxes paid of $3,635,000. Shareholders will receive more detailed information with their Form 1099-DIV in January 2021 to determine the calendar-year amounts to be included on their 2020 tax returns.
Trustees Approve Advisory Arrangements
The board of trustees of Vanguard International Explorer Fund has renewed the fund’s investment advisory arrangements with TimesSquare Capital Management, LLC (TimesSquare), Wellington Management Company LLP (Wellington Management), and Schroder Investment Management North America Inc. (Schroder Inc.), as well as the sub-advisory arrangement with Schroder Investment Management North America Limited (Schroder Ltd.). Effective August 2020, the board also approved a restructuring of the fund’s investment advisory arrangements whereby Baillie Gifford Overseas Limited (Baillie Gifford) has been added as an advisor to the fund. The board determined that the foregoing actions were in the best interests of the fund and its shareholders.
The board based its decision upon an evaluation of each advisor’s investment staff, portfolio management process, and performance. This evaluation included information provided to the board by Vanguard’s Portfolio Review Department, which is responsible for fund and advisor oversight and product management. The Portfolio Review Department met regularly with the advisors and made monthly presentations to the board during the fiscal year that directed the board’s focus to relevant information and topics.
The board, or an investment committee made up of board members, also received information throughout the year during advisor presentations. For each advisor presentation, the board was provided with letters and reports that included information about, among other things, the advisory firm and the advisor’s assessment of the investment environment, portfolio performance, and portfolio characteristics.
In addition, the board received monthly reports, which included a Market and Economic Report, a Fund Dashboard Monthly Summary, and a Fund Performance Report.
Prior to their meeting, the trustees were provided with a memo and materials that summarized the information they received over the course of the year. They also considered the factors discussed below, among others. However, no single factor determined whether the board approved the arrangements. Rather, it was the totality of the circumstances that drove the board’s decision.
Nature, extent, and quality of services
The board considered the quality of the investment management services to be provided to the fund by Baillie Gifford, reviewed the quality of the fund’s investment management services over both the short and long term, and took into account the organizational depth and stability of each advisor. The board considered the following:
Baillie Gifford. Baillie Gifford—a unit of Baillie Gifford & Co., founded in 1908—is among the largest independently owned investment management firms in the United Kingdom. Baillie Gifford’s international small-cap team is a natural evolution of the firm’s expertise and proven track record in global and regional small-cap strategies, with a five-member Portfolio Construction Group (“PCG”). The International Smaller Companies PCG was formed in 2017 to capitalize on two of Baillie’s core competencies: international and small-cap investing. The team believes that mispricing in the small-cap space is even more pronounced given the heightened behavioral, analytical, and informational challenges. Within this universe, the team aims to unearth the most exceptional small companies, with the belief that a few names will drive most of the market’s return over the long run. The portfolio’s holdings fall under four different categories of growth companies (Rapid, Cyclical, Enduring, and Transformational Growth), and are an output of the team’s bottom-up
process. It uses a disciplined, multistep approach to take a long-term view on the rare subset of smaller companies with the competitive positioning and management vision to exponentially scale their business models. Baillie Gifford has managed a portion of the fund since 2020.
Schroder. Schroders plc, the parent company of Schroder Inc. and Schroder Ltd. (collectively, Schroder), founded in 1804, specializes in global equity and fixed income management. Schroder employs a bottom-up, fundamental research-driven process to select stocks, with a focus on identifying companies with sustainable competitive advantages, attractive earnings growth, and compelling valuations. Stock selection responsibilities are divided among five regional leaders who make up Schroder’s International Small-Cap Committee, which is led by the portfolio manager. The regional team leverages Schroder’s extensive network of local analysts across the globe, as it believes that country factors are more important for smaller companies relative to larger companies. Schroder Inc. has advised the fund since its inception in 1996, and its affiliate Schroder Ltd. has advised the fund since 2003.
TimesSquare. TimesSquare, founded in 2000 as a small- and mid-cap growth specialist, is a strategic partner of Affiliated Managers Group, Inc. TimesSquare’s small-cap equity team is led by the portfolio manager and is made up of five experienced members. All portfolio decisions are made collectively, allowing for accountability. Value chain analysis and interactions with key stakeholders are at the core of the team’s research and idea-generation process, resulting in a portfolio made up of industry-leading companies with sustainable business models and quality management teams. TimesSquare has managed a portion of the fund since 2017.
Wellington Management. Wellington Management, founded in 1928, is among the nation’s oldest and most respected institutional investment managers. Wellington Management’s international small-cap research equity team employs a bottom-up approach that seeks to add value through in-depth fundamental research and understanding of its industries. It believes that the experience of covering the same companies over a period of many years provides its Global Industry Analysts with in-depth knowledge of their coverage, which in turn leads to better and more timely decisions and increases their potential to produce superior results. The strategy combines a blend of investment disciplines; this diversifies investment style risk, as individual analysts have developed valuation methodologies that are relevant to their particular industries. The country weights are determined by the stock selection process. Wellington Management has managed a portion of the fund since 2010.
The board concluded that each advisor’s experience, stability, depth, and performance, among other factors, warranted continuation and approval of the advisory arrangements.
Investment performance
The board considered the short- and long-term performance of Schroder’s, TimesSquare’s, and Wellington Management’s subportfolios, including any periods of outperformance or underperformance compared with a relevant benchmark index and peer group. The board concluded that the performance was such that the advisory arrangements should continue. The board also concluded that Baillie Gifford, in its management of other Vanguard funds, has a track record of consistent performance and disciplined investment processes.
Cost
The board concluded that the fund’s expense ratio was well below the average expense ratio charged by funds in its peer group and that Schroder’s, TimesSquare’s, and Wellington Management’s advisory fee rates were also well below the peer-group average. The board also concluded that the advisory fee rate to be paid to Baillie Gifford is well below the fund’s peer-group average.
The board did not consider the profitability of Baillie Gifford, Schroder, TimesSquare, or Wellington Management in determining whether to approve the advisory fees, because the firms are independent of Vanguard and the advisory fees are the result of arm’s-length negotiations.
The benefit of economies of scale
The board concluded that the fund’s shareholders benefit from economies of scale because of breakpoints in the advisory fee schedules for Baillie Gifford, Schroder, TimesSquare, and Wellington Management. The breakpoints reduce the effective rate of the fees as the fund’s assets managed by each advisor increase.
The board will consider whether to renew the advisory arrangements again after a one-year period.
This page intentionally left blank.
The People Who Govern Your Fund
The trustees of your mutual fund are there to see that the fund is operated and managed in your best interests since, as a shareholder, you are a part owner of the fund. Your fund’s trustees also serve on the board of directors of The Vanguard Group, Inc., which is owned by the Vanguard funds and provides services to them.
A majority of Vanguard’s board members are independent, meaning that they have no affiliation with Vanguard or the funds they oversee, apart from the sizable personal investments they have made as private individuals. The independent board members have distinguished backgrounds in business, academia, and public service. Each of the trustees and executive officers oversees 213 Vanguard funds.
Information for each trustee and executive officer of the fund appears below. That information, as well as the Vanguard fund count, is as of the date on the cover of this fund report. The mailing address of the trustees and officers is P.O. Box 876, Valley Forge, PA 19482. More information about the trustees is in the Statement of Additional Information, which can be obtained, without charge, by contacting Vanguard at 800-662-7447, or online at vanguard.com.
Interested Trustee1
Mortimer J. Buckley
Born in 1969. Trustee since January 2018. Principal occupation(s) during the past five years and other experience: chairman of the board (2019–present) of Vanguard and of each of the investment companies served by Vanguard; chief executive officer (2018– present) of Vanguard; chief executive officer, president, and trustee (2018–present) of each of the investment companies served by Vanguard; president and director (2017–present) of Vanguard; and president (2018–present) of Vanguard Marketing Corporation. Chief investment officer (2013–2017), managing director (2002–2017), head of the Retail Investor Group (2006–2012), and chief information officer (2001–2006) of Vanguard. Chairman of the board (2011–2017) and trustee (2009–2017) of the Children’s Hospital of Philadelphia; and trustee (2018–present) and vice chair (2019–present) of The Shipley School.
Independent Trustees
Emerson U. Fullwood
Born in 1948. Trustee since January 2008. Principal occupation(s) during the past five years and other experience: executive chief staff and marketing officer for North America and corporate vice president (retired 2008) of Xerox Corporation (document management products and services). Former president of the Worldwide Channels Group, Latin America, and Worldwide Customer Service and executive chief staff officer of Developing Markets of Xerox. Executive in residence and 2009–2010 Distinguished Minett Professor at the Rochester Institute of Technology. Director of SPX FLOW, Inc. (multi-industry manufacturing). Director of the University of Rochester Medical Center, the Monroe Community College Foundation, the United Way of Rochester, North Carolina A&T University, and Roberts Wesleyan College. Trustee of the University of Rochester.
Amy Gutmann
Born in 1949. Trustee since June 2006. Principal occupation(s) during the past five years and other experience: president (2004–present) of the University of Pennsylvania. Christopher H. Browne Distinguished Professor of Political Science, School of Arts and Sciences, and professor of communication, Annenberg School for Communication, with secondary faculty appointments in the Department of Philosophy, School of Arts and Sciences, and at the Graduate School of Education, University of Pennsylvania.
F. Joseph Loughrey
Born in 1949. Trustee since October 2009. Principal occupation(s) during the past five years and other experience: president and chief operating officer (retired 2009) and vice chairman of the board (2008–2009) of Cummins Inc. (industrial machinery). Chairman of the board of Hillenbrand, Inc. (specialized consumer services) and the Lumina Foundation. Director of the V Foundation. Member of the advisory
1 Mr. Buckley is considered an “interested person,” as defined in the Investment Company Act of 1940, because he is an officer of the Vanguard funds.
council for the College of Arts and Letters and chair of the advisory board to the Kellogg Institute for International Studies, both at the University of Notre Dame.
Mark Loughridge
Born in 1953. Trustee since March 2012. Principal occupation(s) during the past five years and other experience: senior vice president and chief financial officer (retired 2013) of IBM (information technology services). Fiduciary member of IBM’s Retirement Plan Committee (2004–2013), senior vice president and general manager (2002–2004) of IBM Global Financing, vice president and controller (1998–2002) of IBM, and a variety of other prior management roles at IBM. Member of the Council on Chicago Booth.
Scott C. Malpass
Born in 1962. Trustee since March 2012. Principal occupation(s) during the past five years and other experience: chief investment officer (retired June 2020) and vice president (retired June 2020) of the University of Notre Dame. Assistant professor of finance at the Mendoza College of Business, University of Notre Dame, and member of the Notre Dame 403(b) Investment Committee (retired June 2020). Member of the board of Catholic Investment Services, Inc. (investment advisors) and the board of superintendence of the Institute for the Works of Religion.
Deanna Mulligan
Born in 1963. Trustee since January 2018. Principal occupation(s) during the past five years and other experience: board chair (2020–present), chief executive officer (2011–2020), and president (2010–2019) of The Guardian Life Insurance Company of America. Chief operating officer (2010–2011) and executive vice president (2008–2010) of the individual life and disability division of Guardian Life. Member of the board of the American Council of Life Insurers and the board of the Economic Club of New York. Trustee of the Partnership for New York City (business leadership), Chief Executives for Corporate Purpose, NewYork-Presbyterian Hospital, Catalyst, and the Bruce Museum (arts and science). Member of the Advisory Council for the Stanford Graduate School of Business.
André F. Perold
Born in 1952. Trustee since December 2004. Principal occupation(s) during the past five years and other experience: George Gund Professor of Finance and Banking, Emeritus at the Harvard Business School (retired 2011). Chief investment officer and co-managing partner of HighVista Strategies (private investment firm). Member of the board of advisors and member of the investment committee of the Museum of Fine Arts Boston. Member of the board (2018–present) of RIT Capital Partners (investment firm). Member of the investment committee of Partners Health Care System.
Sarah Bloom Raskin
Born in 1961. Trustee since January 2018. Principal occupation(s) during the past five years and other experience: deputy secretary (2014–2017) of the United States Department of the Treasury. Governor (2010–2014) of the Federal Reserve Board. Commissioner (2007–2010) of financial regulation for the State of Maryland. Member of the board of directors (2012–2014) of Neighborhood Reinvestment Corporation. Director (2017–present) of i(x) Investments, LLC; director (2017–present) of Reserve Trust. Rubenstein Fellow (2017–present) of Duke University; trustee (2017–present) of Amherst College, and trustee (2019–present) of the Folger Shakespeare Library.
Peter F. Volanakis
Born in 1955. Trustee since July 2009. Principal occupation(s) during the past five years and other experience: president and chief operating officer (retired 2010) of Corning Incorporated (communications equipment) and director of Corning Incorporated (2000–2010) and Dow Corning (2001–2010). Director (2012) of SPX Corporation (multi-industry manufacturing). Overseer of the Amos Tuck School of Business Administration, Dartmouth College (2001–2013). Chairman of the board of trustees of Colby-Sawyer College. Member of the board of Hypertherm Inc. (industrial cutting systems, software, and consumables).
Executive Officers
John Bendl
Born in 1970. Principal occupation(s) during the past five years and other experience: principal of Vanguard. Chief financial officer (2019–present) of each of the investment companies served by Vanguard. Chief accounting officer, treasurer, and controller of Vanguard (2017–present). Partner (2003–2016) at KPMG (audit, tax, and advisory services).
Christine M. Buchanan
Born in 1970. Principal occupation(s) during the past five years and other experience: principal of Vanguard. Treasurer (2017–present) of each of the investment companies served by Vanguard. Partner (2005–2017) at KPMG (audit, tax, and advisory services).
David Cermak
Born in 1960. Principal occupation(s) during the past five years and other experience: principal of Vanguard. Finance director (2019–present) of each of the investment companies served by Vanguard. Managing director and head (2017–present) of Vanguard Investments Singapore. Managing director and head (2017–2019) of Vanguard Investments Hong Kong. Representative director and head (2014–2017) of Vanguard Investments Japan.
John Galloway
Born in 1973. Principal occupation(s) during the past five years and other experience: principal of Vanguard. Investment stewardship officer (September 2020–present) of each of the investment companies served by Vanguard. Head of Investor Advocacy (February 2020–present) and head of Marketing Strategy and Planning (2017–2020) at Vanguard. Deputy assistant to the President of the United States (2015).
Thomas J. Higgins
Born in 1957. Principal occupation(s) during the past five years and other experience: principal of Vanguard. Finance director (2019–present), chief financial officer (2008–2019), and treasurer (1998–2008) of each of the investment companies served by Vanguard.
Peter Mahoney
Born in 1974. Principal occupation(s) during the past five years and other experience: principal of Vanguard. Controller (2015–present) of each of the investment companies served by Vanguard. Head of International Fund Services (2008–2014) at Vanguard.
Anne E. Robinson
Born in 1970. Principal occupation(s) during the past five years and other experience: general counsel (2016–present) of Vanguard. Secretary (2016–present) of Vanguard and of each of the investment companies served by Vanguard. Managing director (2016–present) of Vanguard. Managing director and general counsel of Global Cards and Consumer Services (2014–2016) at Citigroup. Counsel (2003–2014) at American Express.
Michael Rollings
Born in 1963. Principal occupation(s) during the past five years and other experience: finance director (2017–present) and treasurer (2017) of each of the investment companies served by Vanguard. Managing director (2016–present) of Vanguard. Chief financial officer (2016–present) of Vanguard. Director (2016–present) of Vanguard Marketing Corporation. Executive vice president and chief financial officer (2006–2016) of MassMutual Financial Group.
John E. Schadl
Born in 1972. Principal occupation(s) during the past five years and other experience: principal of Vanguard. Chief compliance officer (2019–present) of Vanguard and of each of the investment companies served by Vanguard. Assistant vice president (2019–present) of Vanguard Marketing Corporation.
Vanguard Senior Management Team
| Joseph Brennan | James M. Norris |
| Mortimer J. Buckley | Thomas M. Rampulla |
| Gregory Davis | Karin A. Risi |
| John James | Anne E. Robinson |
| John T. Marcante | Michael Rollings |
| Chris D. McIsaac | Lauren Valente |
Connect with Vanguard® > vanguard.com
Fund Information > 800-662-7447
Direct Investor Account Services > 800-662-2739
Institutional Investor Services > 800-523-1036
Text Telephone for People
Who Are Deaf or Hard of Hearing > 800-749-7273
This material may be used in conjunction with the offering of shares of any Vanguard fund only if preceded or accompanied by the fund’s current prospectus.
All comparative mutual fund data are from Morningstar, Inc., unless otherwise noted.
You can obtain a free copy of Vanguard’s proxy voting guidelines by visiting vanguard.com/proxyreporting or by calling Vanguard at 800-662-2739. The guidelines are also available from the SEC’s website, www.sec.gov. In addition, you may obtain a free report on how your fund voted the proxies for securities it owned during the 12 months ended June 30. To get the report, visit either vanguard.com/proxyreporting or www.sec.gov.
You can review information about your fund on the SEC’s website, and you can receive copies of this information, for a fee, by sending a request via email addressed to publicinfo@sec.gov.
Source for Bloomberg Barclays indexes: Bloomberg Index Services Limited. Copyright 2020, Bloomberg. All rights reserved.
| | © 2020 The Vanguard Group, Inc.
All rights reserved. |
| | Vanguard Marketing Corporation, Distributor. |
| | |
| | Q1260 122020 |
Annual Report | October 31, 2020
Vanguard High Dividend Yield Index Fund
See the inside front cover for important information about access to your fund’s annual and semiannual shareholder reports.
Important information about access to shareholder reports
Beginning on January 1, 2021, as permitted by regulations adopted by the Securities and Exchange Commission, paper copies of your fund’s annual and semiannual shareholder reports will no longer be sent to you by mail, unless you specifically request them. Instead, you will be notified by mail each time a report is posted on the website and will be provided with a link to access the report.
If you have already elected to receive shareholder reports electronically, you will not be affected by this change and do not need to take any action. You may elect to receive shareholder reports and other communications from the fund electronically by contacting your financial intermediary (such as a broker-dealer or bank) or, if you invest directly with the fund, by calling Vanguard at one of the phone numbers on the back cover of this report or by logging on to vanguard.com.
You may elect to receive paper copies of all future shareholder reports free of charge. If you invest through a financial intermediary, you can contact the intermediary to request that you continue to receive paper copies. If you invest directly with the fund, you can call Vanguard at one of the phone numbers on the back cover of this report or log on to vanguard.com. Your election to receive paper copies will apply to all the funds you hold through an intermediary or directly with Vanguard.
Contents
Please note: The opinions expressed in this report are just that—informed opinions. They should not be considered promises or advice. Also, please keep in mind that the information and opinions cover the period through the date on the front of this report. Of course, the risks of investing in your fund are spelled out in the prospectus.
Your Fund’s Performance at a Glance
| • | For the 12 months ended October 31, 2020, Vanguard High Dividend Yield Index Fund returned –8.19% for Admiral Shares and –8.17% for ETF shares. The fund’s benchmark, the FTSE High Dividend Yield Index, returned –8.16%. |
| • | The broad U.S. stock market advanced about 10% for the year. The period was marked by the global spread of COVID-19 and efforts to contain it, including lockdowns, the shuttering of nonessential businesses, and travel restrictions. However, responses from policymakers, the start of trials for vaccines and treatments, and the easing of some pandemic-related restrictions eventually lifted investor sentiment. |
| • | The fund emphasizes large-capitalization stocks that are forecasted to have above-average dividend yields, and these underperformed the broad U.S. market. Some established dividend-paying companies cut or suspended their payouts during the pandemic to conserve cash. Investors generally continued to favor growth stocks. |
| • | Financial and oil and gas stocks hurt returns the most, followed by telecommunications. Technology, basic materials, and industrials offset a bit of the declines. |
| • | For the past decade, the fund’s ETF Shares posted an average annual return of 10.45%, in line with the average return of its benchmark. |
Market Barometer
| | Average Annual Total Returns
Periods Ended October 31, 2020 |
| | One Year | Three Years | Five Years |
| Stocks | | | |
| Russell 1000 Index (Large-caps) | 10.87% | 10.63% | 11.79% |
| Russell 2000 Index (Small-caps) | -0.14 | 2.19 | 7.27 |
| Russell 3000 Index (Broad U.S. market) | 10.15 | 10.04 | 11.48 |
| FTSE All-World ex US Index (International) | -2.17 | 0.13 | 4.52 |
| Bonds | | | |
| Bloomberg Barclays U.S. Aggregate Bond Index (Broad taxable market) | 6.19% | 5.06% | 4.08% |
| Bloomberg Barclays Municipal Bond Index (Broad tax-exempt market) | 3.59 | 4.09 | 3.70 |
| FTSE Three-Month U.S. Treasury Bill Index | 0.86 | 1.62 | 1.15 |
| CPI | | | |
| Consumer Price Index | 1.18% | 1.82% | 1.83% |
About Your Fund’s Expenses
As a shareholder of the fund, you incur ongoing costs, which include costs for portfolio management, administrative services, and shareholder reports (like this one), among others. Operating expenses, which are deducted from a fund’s gross income, directly reduce the investment return of the fund.
A fund‘s expenses are expressed as a percentage of its average net assets. This figure is known as the expense ratio. The following examples are intended to help you understand the ongoing costs (in dollars) of investing in your fund and to compare these costs with those of other mutual funds. The examples are based on an investment of $1,000 made at the beginning of the period shown and held for the entire period.
The accompanying table illustrates your fund’s costs in two ways:
| • | Based on actual fund return. This section helps you to estimate the actual expenses that you paid over the period. The ”Ending Account Value“ shown is derived from the fund’s actual return, and the third column shows the dollar amount that would have been paid by an investor who started with $1,000 in the fund. You may use the information here, together with the amount you invested, to estimate the expenses that you paid over the period. |
To do so, simply divide your account value by $1,000 (for example, an $8,600 account value divided by $1,000 = 8.6), then multiply the result by the number given for your fund under the heading ”Expenses Paid During Period.“
| • | Based on hypothetical 5% yearly return. This section is intended to help you compare your fund‘s costs with those of other mutual funds. It assumes that the fund had a yearly return of 5% before expenses, but that the expense ratio is unchanged. In this case—because the return used is not the fund’s actual return—the results do not apply to your investment. The example is useful in making comparisons because the Securities and Exchange Commission requires all mutual funds to calculate expenses based on a 5% return. You can assess your fund’s costs by comparing this hypothetical example with the hypothetical examples that appear in shareholder reports of other funds. |
Note that the expenses shown in the table are meant to highlight and help you compare ongoing costs only and do not reflect transaction costs incurred by the fund for buying and selling securities. Further, the expenses do not include any purchase, redemption, or account service fees described in the fund prospectus. If such fees were applied to your account, your costs would be higher. Your fund does not carry a “sales load.”
The calculations assume no shares were bought or sold during the period. Your actual costs may have been higher or lower, depending on the amount of your investment and the timing of any purchases or redemptions.
You can find more information about the fund’s expenses, including annual expense ratios, in the Financial Statements section of this report. For additional information on operating expenses and other shareholder costs, please refer to your fund’s current prospectus.
| Six Months Ended October 31, 2020 | | | |
| | Beginning
Account Value
4/30/2020 | Ending
Account Value
10/31/2020 | Expenses
Paid During
Period |
| Based on Actual Fund Return | | | |
| High Dividend Yield Index Fund | | | |
| ETF Shares | $1,000.00 | $1,037.80 | $0.31 |
| AdmiralTM Shares | 1,000.00 | 1,037.30 | 0.41 |
| Based on Hypothetical 5% Yearly Return | | | |
| High Dividend Yield Index Fund | | | |
| ETF Shares | $1,000.00 | $1,024.84 | $0.31 |
| Admiral Shares | 1,000.00 | 1,024.73 | 0.41 |
The calculations are based on expenses incurred in the most recent six-month period. The fund's annualized six-month expense ratios for that period are: 0.06% for ETF Shares and 0.08% for Admiral Shares. The dollar amounts shown as “Expenses Paid” are equal to the annualized expense ratio multiplied by the average account value over the period, multiplied by the number of days in the most recent six-month period, then divided by the number of days in the most recent 12-month period (184/366).
High Dividend Yield Index Fund
All of the returns in this report represent past performance, which is not a guarantee of future results that may be achieved by the fund. (Current performance may be lower or higher than the performance data cited. For performance data current to the most recent month-end, visit our website at vanguard.com/performance.) Note, too, that both investment returns and principal value can fluctuate widely, so an investor’s shares, when sold, could be worth more or less than their original cost. The returns shown do not reflect taxes that a shareholder would pay on fund distributions or on the sale of fund shares.
Cumulative Performance: October 31, 2010, Through October 31, 2020
Initial Investment of $10,000
| | | | Average Annual Total Returns
Periods Ended October 31, 2020 |
| | | One
Year | Five
Years | Ten
Years | Final Value
of a $10,000
Investment |
 | High Dividend Yield Index Fund
ETF Shares Net Asset Value | -8.17% | 6.57% | 10.45% | $27,021 |
| | High Dividend Yield Index Fund
ETF Shares Market Price | -8.19 | 6.56 | 10.45 | 27,013 |
 | FTSE High Dividend Yield Index | -8.16 | 6.61 | 10.52 | 27,199 |
 | Dow Jones U.S. Total Stock Market Float Adjusted Index | 9.99 | 11.41 | 12.75 | 33,211 |
| | | | |
| | | One
Year | Since
Inception
(2/7/2019) | Final Value
of a $10,000
Investment |
| High Dividend Yield Index Fund Admiral Shares | -8.19% | 0.91% | $10,158 |
| FTSE High Dividend Yield Index | -8.16 | 0.95 | 10,165 |
| Dow Jones U.S. Total Stock Market Float Adjusted Index | 9.99 | 13.17 | 12,385 |
“Since Inception” performance is calculated from the Admiral Shares’ inception date for both the fund and its comparative standard(s).
See Financial Highlights for dividend and capital gains information.
High Dividend Yield Index Fund
| Cumulative Returns of ETF Shares: October 31, 2010, Through October 31, 2020 |
| | One
Year | Five
Years | Ten
Years |
| High Dividend Yield Index Fund ETF Shares Market Price | -8.19% | 37.39% | 170.13% |
| High Dividend Yield Index Fund ETF Shares Net Asset Value | -8.17 | 37.44 | 170.21 |
| FTSE High Dividend Yield Index | -8.16 | 37.74 | 171.99 |
For the ETF Shares, the market price is determined by the midpoint of the bid-offer spread as of the closing time of the New York Stock Exchange (generally 4 p.m., Eastern time). The net asset value is also determined as of the NYSE closing time. For more information about how the ETF Shares' market prices have compared with their net asset value, visit vanguard.com, select your ETF, and then select the Price and Performance tab. The ETF premium/discount analysis there shows the percentages of days on which the ETF Shares' market price was above or below the NAV.
High Dividend Yield Index Fund
| Basic Materials | 3.8% |
| Consumer Discretionary | 6.4 |
| Consumer Staples | 14.3 |
| Energy | 5.2 |
| Financials | 18.9 |
| Health Care | 14.1 |
| Industrials | 10.3 |
| Real Estate | 0.0 |
| Technology | 8.7 |
| Telecommunications | 8.2 |
| Utilities | 10.1 |
The table reflects the fund’s investments, except for short-term investments and derivatives. Sector categories are based on the Industry Classification Benchmark (“ICB”), except for the “Other” category (if applicable), which includes securities that have not been provided an ICB classification as of the effective reporting period.
The fund may invest in derivatives (such as futures and swap contracts) for various reasons, including, but not limited to, attempting to remain fully invested and tracking its target index as closely as possible.
The Industry Classification Benchmark (“ICB”) is owned by FTSE. FTSE does not accept any liability to any person for any loss or damage arising out of any error or omission in the ICB.
High Dividend Yield Index Fund
The fund files its complete schedule of portfolio holdings with the Securities and Exchange Commission (SEC) for the first and third quarters of each fiscal year as an exhibit to its reports on Form N-PORT. The fund’s Form N-PORT reports are available on the SEC’s website at www.sec.gov.
| | | | | | Shares | Market
Value•
($000) |
| Common Stocks (99.6%) |
| Basic Materials (3.8%) |
| | Linde plc | 1,845,313 | 406,596 |
| | Air Products & Chemicals Inc. | 774,548 | 213,961 |
| | Dow Inc. | 2,600,003 | 118,274 |
| | Fastenal Co. | 2,005,229 | 86,686 |
| | LyondellBasell Industries NV Class A | 897,217 | 61,414 |
| | International Paper Co. | 1,377,435 | 60,263 |
| | Nucor Corp. | 1,053,625 | 50,321 |
| | Celanese Corp. Class A | 411,768 | 46,740 |
| | Eastman Chemical Co. | 475,024 | 38,401 |
| | Reliance Steel & Aluminum Co. | 222,176 | 24,215 |
| | Steel Dynamics Inc. | 702,500 | 22,115 |
| | Scotts Miracle-Gro Co. | 141,930 | 21,297 |
| | CF Industries Holdings Inc. | 748,262 | 20,660 |
| | Huntsman Corp. | 701,774 | 17,046 |
| | Southern Copper Corp. | 289,309 | 15,142 |
| | Timken Co. | 221,693 | 13,235 |
| | Chemours Co. | 572,464 | 11,529 |
| | Avient Corp. | 318,433 | 9,894 |
| | Sensient Technologies Corp. | 147,863 | 9,675 |
| | Commercial Metals Co. | 414,977 | 8,569 |
| | Olin Corp. | 500,222 | 8,279 |
| | Cabot Corp. | 195,256 | 7,422 |
| | Compass Minerals International Inc. | 119,222 | 7,199 |
| | Worthington Industries Inc. | 124,974 | 6,150 |
| | Trinseo SA | 130,122 | 4,140 |
| | Schweitzer-Mauduit International Inc. | 110,477 | 3,668 |
| | Kaiser Aluminum Corp. | 54,821 | 3,450 |
| | Tronox Holdings plc Class A | 312,326 | 3,051 |
| | | | | | Shares | Market
Value•
($000) |
| | Carpenter Technology Corp. | 165,670 | 2,896 |
| 1 | Nexa Resources SA | 160,849 | 973 |
| | | | | | | 1,303,261 |
| Consumer Discretionary (6.4%) |
| | Walmart Inc. | 4,892,200 | 678,793 |
| | McDonald's Corp. | 2,614,336 | 556,854 |
| | Target Corp. | 1,755,153 | 267,169 |
| | Best Buy Co. Inc. | 800,185 | 89,261 |
| | VF Corp. | 1,129,364 | 75,893 |
| | Garmin Ltd. | 524,239 | 54,531 |
| | ViacomCBS Inc. Class B | 1,897,411 | 54,209 |
| | Genuine Parts Co. | 492,772 | 44,561 |
| | Whirlpool Corp. | 213,119 | 39,419 |
| | Hasbro Inc. | 445,452 | 36,848 |
| | Omnicom Group Inc. | 744,141 | 35,123 |
| | Interpublic Group of Cos. Inc. | 1,360,299 | 24,608 |
| | Williams-Sonoma Inc. | 269,072 | 24,542 |
| | Newell Brands Inc. | 1,345,592 | 23,763 |
| | Hanesbrands Inc. | 1,215,181 | 19,528 |
| | Leggett & Platt Inc. | 462,408 | 19,296 |
| | Polaris Inc. | 203,575 | 18,497 |
| | Nielsen Holdings plc | 1,248,640 | 16,869 |
| | H&R Block Inc. | 676,080 | 11,669 |
| | Wyndham Destinations Inc. | 294,612 | 9,613 |
| | LCI Industries | 85,910 | 9,421 |
| | TEGNA Inc. | 764,304 | 9,195 |
| | MDC Holdings Inc. | 177,007 | 7,703 |
| | Extended Stay America Inc. | 621,187 | 7,051 |
| | Big Lots Inc. | 134,879 | 6,420 |
| | Rent-A-Center Inc. | 168,970 | 5,221 |
| | HNI Corp. | 147,124 | 4,789 |
| | John Wiley & Sons Inc. Class A | 151,300 | 4,684 |
| | Steelcase Inc. Class A | 300,841 | 3,141 |
| | Sinclair Broadcast Group Inc. Class A | 153,475 | 2,852 |
High Dividend Yield Index Fund
| | | | | | Shares | Market
Value•
($000) |
| | Knoll Inc. | 166,794 | 1,911 |
| | National Presto Industries Inc. | 18,624 | 1,548 |
| | | | | | | 2,164,982 |
| Consumer Staples (14.3%) |
| | Procter & Gamble Co. | 8,553,020 | 1,172,619 |
| | Coca-Cola Co. | 13,574,872 | 652,408 |
| | PepsiCo Inc. | 4,872,632 | 649,473 |
| | Philip Morris International Inc. | 5,464,829 | 388,112 |
| | CVS Health Corp. | 4,587,216 | 257,297 |
| | Altria Group Inc. | 6,524,463 | 235,403 |
| | Colgate-Palmolive Co. | 2,956,825 | 233,264 |
| | Kimberly-Clark Corp. | 1,191,149 | 157,935 |
| | General Mills Inc. | 2,126,166 | 125,699 |
| | Sysco Corp. | 1,698,759 | 93,958 |
| | Clorox Co. | 441,607 | 91,523 |
| | Archer-Daniels-Midland Co. | 1,941,559 | 89,778 |
| | Corteva Inc. | 2,630,157 | 86,743 |
| | Walgreens Boots Alliance Inc. | 2,538,585 | 86,414 |
| | Hershey Co. | 517,210 | 71,096 |
| | Kraft Heinz Co. | 2,265,816 | 69,311 |
| | Conagra Brands Inc. | 1,705,475 | 59,845 |
| | Tyson Foods Inc. Class A | 1,006,013 | 57,574 |
| | Kellogg Co. | 879,805 | 55,331 |
| | J M Smucker Co. | 387,023 | 43,424 |
| | Campbell Soup Co. | 615,455 | 28,723 |
| | Bunge Ltd. | 475,062 | 26,950 |
| | Coca-Cola European Partners plc | 695,667 | 24,842 |
| | Ingredion Inc. | 235,198 | 16,673 |
| | Flowers Foods Inc. | 682,788 | 16,100 |
| | Nu Skin Enterprises Inc. Class A | 179,829 | 8,875 |
| | Energizer Holdings Inc. | 217,291 | 8,551 |
| | Spectrum Brands Holdings Inc. | 148,657 | 8,454 |
| 1 | B&G Foods Inc. | 221,429 | 5,881 |
| | Medifast Inc. | 39,314 | 5,523 |
| | Vector Group Ltd. | 487,714 | 4,482 |
| | Universal Corp. | 82,920 | 3,304 |
| | Weis Markets Inc. | 31,542 | 1,432 |
| | | | | | | 4,836,997 |
| Energy (5.1%) |
| | Exxon Mobil Corp. | 14,867,303 | 484,971 |
| | Chevron Corp. | 6,764,072 | 470,103 |
| | ConocoPhillips | 3,765,868 | 107,779 |
| | Williams Cos. Inc. | 4,260,548 | 81,760 |
| | Kinder Morgan Inc. | 6,820,095 | 81,159 |
| | Schlumberger NV | 4,867,313 | 72,718 |
| | Phillips 66 | 1,528,144 | 71,303 |
| | Marathon Petroleum Corp. | 2,268,811 | 66,930 |
| | Valero Energy Corp. | 1,429,492 | 55,193 |
| | | | | | Shares | Market
Value•
($000) |
| | ONEOK Inc. | 1,536,059 | 44,546 |
| | Halliburton Co. | 3,067,249 | 36,991 |
| | Baker Hughes Co. Class A | 2,300,324 | 33,976 |
| | Occidental Petroleum Corp. | 2,938,035 | 26,824 |
| | Diamondback Energy Inc. | 553,519 | 14,369 |
| | Targa Resources Corp. | 807,132 | 12,955 |
| | Devon Energy Corp. | 1,337,240 | 11,942 |
| | Apache Corp. | 1,322,950 | 10,981 |
| | Equitrans Midstream Corp. | 1,429,570 | 10,379 |
| | HollyFrontier Corp. | 522,817 | 9,677 |
| | Cimarex Energy Co. | 351,847 | 8,926 |
| | Ovintiv Inc. | 911,674 | 8,387 |
| | Antero Midstream Corp. | 1,004,613 | 5,756 |
| | Helmerich & Payne Inc. | 366,669 | 5,452 |
| | Murphy Oil Corp. | 509,423 | 3,933 |
| | Archrock Inc. | 437,972 | 2,597 |
| | Delek US Holdings Inc. | 217,797 | 2,191 |
| | CVR Energy Inc. | 107,767 | 1,187 |
| | | | | | | 1,742,985 |
| Financials (18.8%) |
| | JPMorgan Chase & Co. | 10,634,919 | 1,042,647 |
| | Bank of America Corp. | 27,170,907 | 643,950 |
| | Citigroup Inc. | 7,317,591 | 303,095 |
| | Wells Fargo & Co. | 13,173,175 | 282,565 |
| | BlackRock Inc. | 416,885 | 249,802 |
| | Morgan Stanley | 4,678,200 | 225,255 |
| | Chubb Ltd. | 1,576,804 | 204,843 |
| | Truist Financial Corp. | 4,735,288 | 199,450 |
| | Progressive Corp. | 2,050,167 | 188,410 |
| | CME Group Inc. | 1,245,155 | 187,670 |
| | US Bancorp | 4,767,231 | 185,684 |
| | PNC Financial Services Group Inc. | 1,487,058 | 166,372 |
| | Travelers Cos. Inc. | 886,598 | 107,021 |
| | MetLife Inc. | 2,695,676 | 102,031 |
| | T. Rowe Price Group Inc. | 792,695 | 100,403 |
| | Bank of New York Mellon Corp. | 2,798,371 | 96,152 |
| | American International Group Inc. | 3,021,688 | 95,153 |
| | Prudential Financial Inc. | 1,386,816 | 88,784 |
| | Aflac Inc. | 2,488,413 | 84,482 |
| | State Street Corp. | 1,233,189 | 72,635 |
| | Discover Financial Services | 1,074,541 | 69,856 |
| | Arthur J Gallagher & Co. | 660,140 | 68,463 |
| | Ameriprise Financial Inc. | 421,337 | 67,764 |
| | Fifth Third Bancorp | 2,488,190 | 57,776 |
| | Northern Trust Corp. | 671,767 | 52,579 |
| | Hartford Financial Services Group Inc. | 1,249,884 | 48,146 |
| | M&T Bank Corp. | 447,982 | 46,402 |
| | Regions Financial Corp. | 3,361,818 | 44,712 |
| | KeyCorp | 3,399,994 | 44,132 |
High Dividend Yield Index Fund
| | | | | | Shares | Market
Value•
($000) |
| | Citizens Financial Group Inc. | 1,490,718 | 40,622 |
| | Principal Financial Group Inc. | 951,182 | 37,305 |
| | Cincinnati Financial Corp. | 523,534 | 37,035 |
| | Huntington Bancshares Inc. | 3,533,712 | 36,892 |
| | Ally Financial Inc. | 1,308,327 | 34,906 |
| | Credicorp Ltd. | 280,604 | 32,180 |
| | Equitable Holdings Inc. | 1,424,281 | 30,608 |
| | Fidelity National Financial Inc. | 961,194 | 30,076 |
| | Everest Re Group Ltd. | 137,956 | 27,188 |
| | Reinsurance Group of America Inc. | 236,298 | 23,871 |
| | Lincoln National Corp. | 674,998 | 23,692 |
| | Eaton Vance Corp. | 388,234 | 23,213 |
| | Comerica Inc. | 487,127 | 22,169 |
| | First Horizon National Corp. | 1,915,187 | 19,937 |
| | American Financial Group Inc. | 254,305 | 19,058 |
| | Zions Bancorp NA | 564,331 | 18,211 |
| | East West Bancorp Inc. | 491,203 | 17,919 |
| | Franklin Resources Inc. | 950,319 | 17,818 |
| | Invesco Ltd. | 1,321,892 | 17,330 |
| | Prosperity Bancshares Inc. | 313,626 | 17,284 |
| | First American Financial Corp. | 379,976 | 16,943 |
| | Old Republic International Corp. | 992,106 | 16,151 |
| | People's United Financial Inc. | 1,481,938 | 15,812 |
| | Jefferies Financial Group Inc. | 794,136 | 15,494 |
| | South State Corp. | 243,798 | 14,969 |
| | Ares Management Corp. Class A | 343,540 | 14,532 |
| | TCF Financial Corp. | 529,316 | 14,403 |
| | Cullen/Frost Bankers Inc. | 195,679 | 13,750 |
| | Synovus Financial Corp. | 514,705 | 13,382 |
| | New York Community Bancorp Inc. | 1,575,600 | 13,093 |
| | Janus Henderson Group plc | 537,150 | 13,053 |
| | Unum Group | 712,373 | 12,581 |
| | Axis Capital Holdings Ltd. | 290,747 | 12,412 |
| | Popular Inc. | 289,915 | 12,234 |
| | RLI Corp. | 137,963 | 11,961 |
| | Glacier Bancorp Inc. | 333,718 | 11,947 |
| | MGIC Investment Corp. | 1,182,707 | 11,898 |
| | Lazard Ltd. Class A | 353,325 | 11,896 |
| | United Bankshares Inc. | 431,416 | 11,316 |
| | Evercore Inc. Class A | 138,356 | 11,005 |
| | Community Bank System Inc. | 183,601 | 10,647 |
| | | | | | Shares | Market
Value•
($000) |
| | Valley National Bancorp | 1,389,141 | 10,613 |
| | Bank OZK | 427,875 | 10,603 |
| | CIT Group Inc. | 343,840 | 10,126 |
| | Webster Financial Corp. | 313,773 | 10,107 |
| | Umpqua Holdings Corp. | 773,596 | 9,716 |
| | Home BancShares Inc. | 533,217 | 8,851 |
| | CNO Financial Group Inc. | 488,903 | 8,678 |
| | FNB Corp. | 1,131,488 | 8,554 |
| | Bank of Hawaii Corp. | 138,300 | 8,387 |
| | BancorpSouth Bank | 345,340 | 8,084 |
| | BankUnited Inc. | 320,103 | 8,083 |
| | Federated Hermes Inc. Class B | 336,635 | 8,046 |
| | Old National Bancorp | 572,227 | 8,000 |
| | OneMain Holdings Inc. | 227,665 | 7,943 |
| | CVB Financial Corp. | 450,708 | 7,887 |
| | PacWest Bancorp | 409,784 | 7,884 |
| | First Hawaiian Inc. | 454,548 | 7,846 |
| | Artisan Partners Asset Management Inc. Class A | 191,271 | 7,662 |
| | Associated Banc-Corp | 531,839 | 7,281 |
| | Assured Guaranty Ltd. | 282,919 | 7,223 |
| | Columbia Banking System Inc. | 250,418 | 7,114 |
| | Pacific Premier Bancorp Inc. | 276,578 | 7,053 |
| | Moelis & Co. Class A | 185,310 | 6,894 |
| | Hancock Whitney Corp. | 300,731 | 6,878 |
| | Atlantic Union Bankshares Corp. | 271,912 | 6,877 |
| | Investors Bancorp Inc. | 803,569 | 6,798 |
| | Independent Bank Group Inc. | 128,840 | 6,646 |
| | BOK Financial Corp. | 109,742 | 6,446 |
| | Simmons First National Corp. Class A | 377,454 | 6,413 |
| | Cathay General Bancorp | 264,916 | 6,233 |
| | Walker & Dunlop Inc. | 98,542 | 6,196 |
| | Fulton Financial Corp. | 559,856 | 6,153 |
| | United Community Banks Inc. | 272,612 | 5,708 |
| | Washington Federal Inc. | 263,060 | 5,601 |
| | WesBanco Inc. | 226,962 | 5,513 |
| | Renasant Corp. | 189,877 | 5,413 |
| | Santander Consumer USA Holdings Inc. | 264,276 | 5,375 |
| | Navient Corp. | 666,909 | 5,342 |
| | Capitol Federal Financial Inc. | 460,969 | 5,292 |
| | Trustmark Corp. | 220,082 | 5,148 |
| | First Midwest Bancorp Inc. | 397,861 | 4,993 |
| | First Merchants Corp. | 188,277 | 4,916 |
| | Cadence Bancorp Class A | 437,500 | 4,909 |
| | Horace Mann Educators Corp. | 143,941 | 4,881 |
High Dividend Yield Index Fund
| | | | | | Shares | Market
Value•
($000) |
| | First Bancorp | 749,708 | 4,866 |
| | First Financial Bancorp | 338,757 | 4,844 |
| | Cohen & Steers Inc. | 84,516 | 4,759 |
| | Westamerica Bancorp | 90,454 | 4,737 |
| | Virtu Financial Inc. Class A | 218,315 | 4,668 |
| | Bank of NT Butterfield & Son Ltd. | 174,363 | 4,614 |
| | Banner Corp. | 121,249 | 4,470 |
| | Northwest Bancshares Inc. | 409,675 | 4,371 |
| | Towne Bank | 233,698 | 4,249 |
| | Sandy Spring Bancorp Inc. | 160,578 | 4,071 |
| | Argo Group International Holdings Ltd. | 113,349 | 4,044 |
| | NBT Bancorp Inc. | 147,029 | 4,026 |
| | Mercury General Corp. | 94,041 | 3,828 |
| | Safety Insurance Group Inc. | 50,191 | 3,513 |
| | Waddell & Reed Financial Inc. Class A | 225,069 | 3,455 |
| | Provident Financial Services Inc. | 248,558 | 3,373 |
| | Hope Bancorp Inc. | 409,956 | 3,308 |
| | City Holding Co. | 53,347 | 3,224 |
| | Employers Holdings Inc. | 98,542 | 3,154 |
| | First Commonwealth Financial Corp. | 347,683 | 2,997 |
| | CNA Financial Corp. | 100,341 | 2,989 |
| | Brightsphere Investment Group Inc. | 212,768 | 2,936 |
| | BancFirst Corp. | 65,528 | 2,913 |
| | ProAssurance Corp. | 180,570 | 2,786 |
| | Stock Yards Bancorp Inc. | 72,551 | 2,773 |
| | Brookline Bancorp Inc. | 275,077 | 2,635 |
| | TFS Financial Corp. | 167,649 | 2,634 |
| | S&T Bancorp Inc. | 130,161 | 2,576 |
| | Great Western Bancorp Inc. | 187,637 | 2,437 |
| | Kearny Financial Corp. | 277,136 | 2,328 |
| | Berkshire Hills Bancorp Inc. | 160,067 | 2,086 |
| | Washington Trust Bancorp Inc. | 59,936 | 2,024 |
| | 1st Source Corp. | 57,121 | 1,913 |
| | WisdomTree Investments Inc. | 507,246 | 1,846 |
| | Boston Private Financial Holdings Inc. | 297,496 | 1,839 |
| | Community Trust Bancorp Inc. | 54,858 | 1,746 |
| | TrustCo Bank Corp. | 314,593 | 1,729 |
| | American National Group Inc. | 25,068 | 1,725 |
| | FBL Financial Group Inc. Class A | 32,208 | 1,600 |
| | United Fire Group Inc. | 73,528 | 1,510 |
| | | | | | Shares | Market
Value•
($000) |
| | Republic Bancorp Inc. Class A | 36,077 | 1,202 |
| | Charles Schwab Corp. | 114 | 5 |
| | | | | | | 6,374,196 |
| Health Care (14.1%) |
| | Johnson & Johnson | 9,255,473 | 1,269,018 |
| | Pfizer Inc. | 19,523,630 | 692,698 |
| | Merck & Co. Inc. | 8,868,409 | 666,993 |
| | AbbVie Inc. | 6,185,033 | 526,346 |
| | Bristol-Myers Squibb Co. | 7,949,152 | 464,628 |
| | Amgen Inc. | 2,066,721 | 448,355 |
| | Eli Lilly & Co. | 2,957,874 | 385,884 |
| | Gilead Sciences Inc. | 4,405,455 | 256,177 |
| | Cardinal Health Inc. | 1,025,620 | 46,963 |
| | Patterson Cos. Inc. | 297,958 | 7,412 |
| | Healthcare Services Group Inc. | 260,205 | 5,954 |
| | | | | | | 4,770,428 |
| Industrials (10.2%) |
| | United Parcel Service Inc. Class B | 2,476,511 | 389,085 |
| | 3M Co. | 1,974,584 | 315,854 |
| | Lockheed Martin Corp. | 869,256 | 304,353 |
| | Caterpillar Inc. | 1,899,619 | 298,335 |
| | Raytheon Technologies Corp. | 5,000,627 | 271,634 |
| | Automatic Data Processing Inc. | 1,507,779 | 238,169 |
| | Illinois Tool Works Inc. | 1,104,099 | 216,271 |
| | DuPont de Nemours Inc. | 2,578,030 | 146,638 |
| | Eaton Corp. plc | 1,402,546 | 145,570 |
| | Emerson Electric Co. | 2,087,497 | 135,249 |
| | General Dynamics Corp. | 889,511 | 116,819 |
| | Cummins Inc. | 518,907 | 114,102 |
| | Johnson Controls International plc | 2,610,222 | 110,177 |
| | PACCAR Inc. | 1,188,725 | 101,493 |
| | Paychex Inc. | 1,123,843 | 92,436 |
| | Synchrony Financial | 2,038,976 | 51,015 |
| | CH Robinson Worldwide Inc. | 463,697 | 41,005 |
| | RPM International Inc. | 447,501 | 37,890 |
| | Packaging Corp. of America | 328,234 | 37,580 |
| | Westrock Co. | 899,179 | 33,764 |
| | Snap-on Inc. | 188,373 | 29,674 |
| | Western Union Co. | 1,437,131 | 27,938 |
| | Hubbell Inc. Class B | 188,939 | 27,493 |
| | Watsco Inc. | 114,081 | 25,570 |
| | Sonoco Products Co. | 350,815 | 17,151 |
| | MDU Resources Group Inc. | 698,459 | 16,595 |
| | ManpowerGroup Inc. | 202,884 | 13,770 |
| | Flowserve Corp. | 455,489 | 13,264 |
High Dividend Yield Index Fund
| | | | | | Shares | Market
Value•
($000) |
| | MSC Industrial Direct Co. Inc. Class A | 156,342 | 10,891 |
| | nVent Electric plc | 544,210 | 9,823 |
| | Ryder System Inc. | 183,700 | 9,049 |
| | Kennametal Inc. | 289,342 | 8,970 |
| | Crane Co. | 170,170 | 8,636 |
| | GATX Corp. | 121,193 | 8,275 |
| | ABM Industries Inc. | 233,610 | 8,111 |
| | Triton International Ltd. | 210,284 | 7,755 |
| | Otter Tail Corp. | 142,310 | 5,458 |
| | McGrath RentCorp | 84,189 | 4,806 |
| | Greif Inc. Class A | 87,271 | 3,542 |
| | Granite Construction Inc. | 163,370 | 3,155 |
| | Greenbrier Cos. Inc. | 110,923 | 2,993 |
| | Atlas Corp. | 289,776 | 2,501 |
| | H&E Equipment Services Inc. | 108,922 | 2,292 |
| | SFL Corp. Ltd. | 335,509 | 2,184 |
| | Apogee Enterprises Inc. | 89,735 | 2,144 |
| | Scorpio Tankers Inc. | 178,147 | 1,571 |
| | | | | | | 3,471,050 |
| Real Estate (0.0%) |
| | Kennedy-Wilson Holdings Inc. | 425,605 | 5,609 |
| | Newmark Group Inc. Class A | 497,903 | 2,358 |
| | | | | | | 7,967 |
| Technology (8.7%) |
| | Intel Corp. | 14,880,959 | 658,929 |
| | QUALCOMM Inc. | 3,951,698 | 487,481 |
| | Broadcom Inc. | 1,370,657 | 479,223 |
| | Texas Instruments Inc. | 3,223,052 | 466,021 |
| | International Business Machines Corp. | 3,120,766 | 348,465 |
| | KLA Corp. | 543,626 | 107,192 |
| | HP Inc. | 5,009,786 | 89,976 |
| | Corning Inc. | 2,628,641 | 84,037 |
| | Maxim Integrated Products Inc. | 931,037 | 64,847 |
| | Seagate Technology plc | 896,119 | 42,852 |
| | Hewlett Packard Enterprise Co. | 4,520,150 | 39,054 |
| | NetApp Inc. | 775,630 | 34,042 |
| | National Instruments Corp. | 451,501 | 14,123 |
| | Xerox Holdings Corp. | 633,813 | 11,016 |
| | Avnet Inc. | 343,540 | 8,475 |
| | Xperi Holding Corp. | 368,766 | 4,573 |
| | | | | | | 2,940,306 |
| Telecommunications (8.2%) |
| | Verizon Communications Inc. | 14,544,448 | 828,888 |
| | AT&T Inc. | 25,043,481 | 676,675 |
| | Comcast Corp. Class A | 15,911,524 | 672,103 |
| | Cisco Systems Inc. | 14,910,419 | 535,284 |
| | | | | | Shares | Market
Value•
($000) |
| | CenturyLink Inc. | 3,827,611 | 32,994 |
| | Juniper Networks Inc. | 1,151,674 | 22,711 |
| | Cogent Communications Holdings Inc. | 148,100 | 8,264 |
| | Telephone & Data Systems Inc. | 352,647 | 5,995 |
| | | | | | | 2,782,914 |
| Utilities (10.0%) |
| | NextEra Energy Inc. | 6,872,041 | 503,102 |
| | Duke Energy Corp. | 2,580,352 | 237,676 |
| | Dominion Energy Inc. | 2,941,448 | 236,316 |
| | Southern Co. | 3,709,711 | 213,123 |
| | Waste Management Inc. | 1,480,383 | 159,748 |
| | American Electric Power Co. Inc. | 1,743,885 | 156,828 |
| | Exelon Corp. | 3,419,102 | 136,388 |
| | Xcel Energy Inc. | 1,840,762 | 128,908 |
| | Sempra Energy | 1,015,751 | 127,334 |
| | WEC Energy Group Inc. | 1,106,742 | 111,283 |
| | Eversource Energy | 1,202,834 | 104,971 |
| | Public Service Enterprise Group Inc. | 1,771,503 | 103,013 |
| | Consolidated Edison Inc. | 1,174,172 | 92,161 |
| | DTE Energy Co. | 672,575 | 83,009 |
| | PPL Corp. | 2,702,000 | 74,305 |
| | Entergy Corp. | 703,937 | 71,252 |
| | Edison International | 1,252,830 | 70,209 |
| | Ameren Corp. | 863,400 | 70,039 |
| | CMS Energy Corp. | 1,001,801 | 63,444 |
| | FirstEnergy Corp. | 1,900,887 | 56,494 |
| | Alliant Energy Corp. | 879,193 | 48,602 |
| | AES Corp. | 2,315,472 | 45,152 |
| | Evergy Inc. | 791,901 | 43,713 |
| | Atmos Energy Corp. | 423,983 | 38,866 |
| | CenterPoint Energy Inc. | 1,764,528 | 37,284 |
| | Essential Utilities Inc. | 859,782 | 35,423 |
| | Pinnacle West Capital Corp. | 393,955 | 32,135 |
| | NiSource Inc. | 1,339,747 | 30,774 |
| | Vistra Corp. | 1,709,704 | 29,697 |
| | NRG Energy Inc. | 851,750 | 26,932 |
| | UGI Corp. | 728,657 | 23,565 |
| | OGE Energy Corp. | 699,406 | 21,521 |
| | IDACORP Inc. | 176,400 | 15,476 |
| | PNM Resources Inc. | 276,654 | 13,833 |
| | Southwest Gas Holdings Inc. | 195,083 | 12,821 |
| | ONE Gas Inc. | 182,557 | 12,604 |
| | Black Hills Corp. | 219,022 | 12,410 |
| | Hawaiian Electric Industries Inc. | 374,912 | 12,387 |
| | Portland General Electric Co. | 313,458 | 12,319 |
| | National Fuel Gas Co. | 308,225 | 12,317 |
| | Avangrid Inc. | 198,734 | 9,805 |
| | Spire Inc. | 174,751 | 9,793 |
High Dividend Yield Index Fund
| | | | | | Shares | Market
Value•
($000) |
| | New Jersey Resources Corp. | 332,183 | 9,693 |
| | ALLETE Inc. | 181,614 | 9,368 |
| | NorthWestern Corp. | 176,734 | 9,213 |
| | Avista Corp. | 234,534 | 7,791 |
| | Clearway Energy Inc. Class C | 270,617 | 7,621 |
| | South Jersey Industries Inc. | 350,713 | 6,758 |
| | Atlantica Sustainable Infrastructure plc | 198,950 | 5,867 |
| | Northwest Natural Holding Co. | 106,171 | 4,718 |
| | Covanta Holding Corp. | 401,384 | 3,645 |
| | Clearway Energy Inc. Class A | 129,251 | 3,388 |
| | | | | | | 3,405,094 |
Total Common Stocks
(Cost $33,306,010) | 33,800,180 |
| | | | | | | |
| Temporary Cash Investments (0.2%) |
| Money Market Fund (0.2%) |
| 2,3 | Vanguard Market Liquidity Fund, 0.112% | 772,961 | 77,295 |
| | | | | | Face
Amount
($000) | Market
Value•
($000) |
| U.S. Government and Agency Obligations (0.0%) |
| 4 | United States Treasury Bill, 0.145%, 12/15/20 | 1,400 | 1,400 |
| 4 | United States Treasury Bill, 0.097%, 1/5/21 | 565 | 565 |
| 4 | United States Treasury Bill, 0.095%, 1/28/21 | 3,879 | 3,878 |
| | | | | | | 5,843 |
Total Temporary Cash Investments
(Cost $83,136) | 83,138 |
Total Investments (99.8%)
(Cost $33,389,146) | | 33,883,318 |
| Other Assets and Liabilities—Net (0.2%) | | 60,276 |
| Net Assets (100%) | | 33,943,594 |
| Cost is in $000. |
| • | See Note A in Notes to Financial Statements. |
| 1 | Includes partial security positions on loan to broker-dealers. The total value of securities on loan is $3,484,000. |
| 2 | Affiliated money market fund available only to Vanguard funds and certain trusts and accounts managed by Vanguard. Rate shown is the 7-day yield. |
| 3 | Collateral of $3,758,000 was received for securities on loan. |
| 4 | Securities with a value of $5,843,000 have been segregated as initial margin for open futures contracts. |
Derivative Financial Instruments Outstanding as of Period End
| Futures Contracts |
| | | | ($000) |
| | Expiration | Number of
Long (Short)
Contracts | Notional
Amount | Value and
Unrealized
Appreciation
(Depreciation) |
| Long Futures Contracts | | | | |
| E-mini S&P 500 Index | December 2020 | 526 | 85,862 | (2,004) |
| Over-the-Counter Total Return Swaps |
| Reference Entity | Termination
Date | Counterparty | Notional
Amount
($000) | Floating
Interest
Rate
Received
(Paid)1
(%) | Value and
Unrealized
Appreciation
($000) | Value and
Unrealized
(Depreciation)
($000) |
| BlackRock Inc. | 2/2/21 | GSI | 64,624 | (0.147) | — | (4,706) |
| 1 | Based on 1-month USD London Interbank Offered Rate (LIBOR) as of the most recent payment date. Floating interest payment received/paid monthly. |
| | GSI—Goldman Sachs International. |
See accompanying Notes, which are an integral part of the Financial Statements.
High Dividend Yield Index Fund
Statement of Assets and Liabilities
|
| ($000s, except shares and per-share amounts) | Amount |
| Assets | |
| Investments in Securities, at Value | |
| Unaffiliated Issuers (Cost $33,311,853) | 33,806,023 |
| Affiliated Issuers (Cost $77,293) | 77,295 |
| Total Investments in Securities | 33,883,318 |
| Investment in Vanguard | 1,440 |
| Cash | 10,392 |
| Cash Collateral Pledged—Futures Contracts | 529 |
| Cash Collateral Pledged—Over-the-Counter Swap Contracts | 4,560 |
| Receivables for Accrued Income | 72,043 |
| Receivables for Capital Shares Issued | 8,529 |
| Total Assets | 33,980,811 |
| Liabilities | |
| Payables for Investment Securities Purchased | 18,397 |
| Collateral for Securities on Loan | 3,758 |
| Payables for Capital Shares Redeemed | 8,313 |
| Payables to Vanguard | 1,054 |
| Variation Margin Payable—Futures Contracts | 989 |
| Unrealized Depreciation—Over-the-Counter Swap Contracts | 4,706 |
| Total Liabilities | 37,217 |
| Net Assets | 33,943,594 |
| At October 31, 2020, net assets consisted of: | |
| | |
| Paid-in Capital | 35,550,902 |
| Total Distributable Earnings (Loss) | (1,607,308) |
| Net Assets | 33,943,594 |
| |
| ETF Shares—Net Assets | |
Applicable to 330,584,633 outstanding $.001 par value shares of beneficial interest
(unlimited authorization) | 26,278,729 |
| Net Asset Value Per Share—ETF Shares | $79.49 |
| |
| Admiral Shares—Net Assets | |
Applicable to 319,772,589 outstanding $.001 par value shares of beneficial interest
(unlimited authorization) | 7,664,865 |
| Net Asset Value Per Share—Admiral Shares | $23.97 |
See accompanying Notes, which are an integral part of the Financial Statements.
High Dividend Yield Index Fund
|
| | Year Ended
October 31, 2020 |
| | ($000) |
| Investment Income | |
| Income | |
| Dividends | 1,264,851 |
| Interest1 | 258 |
| Securities Lending—Net | 452 |
| Total Income | 1,265,561 |
| Expenses | |
| The Vanguard Group—Note B | |
| Investment Advisory Services | 2,529 |
| Management and Administrative—ETF Shares | 11,309 |
| Management and Administrative—Admiral Shares | 5,490 |
| Marketing and Distribution—ETF Shares | 1,370 |
| Marketing and Distribution—Admiral Shares | 362 |
| Custodian Fees | 403 |
| Auditing Fees | 32 |
| Shareholders’ Reports—ETF Shares | 1,187 |
| Shareholders’ Reports—Admiral Shares | 54 |
| Trustees’ Fees and Expenses | 23 |
| Total Expenses | 22,759 |
| Net Investment Income | 1,242,802 |
| Realized Net Gain (Loss) | |
| Investment Securities Sold1,2 | (48,577) |
| Futures Contracts | 13,889 |
| Swap Contracts | 11,100 |
| Realized Net Gain (Loss) | (23,588) |
| Change in Unrealized Appreciation (Depreciation) | |
| Investment Securities1 | (4,432,569) |
| Futures Contracts | (2,926) |
| Swap Contracts | (4,706) |
| Change in Unrealized Appreciation (Depreciation) | (4,440,201) |
| Net Increase (Decrease) in Net Assets Resulting from Operations | (3,220,987) |
| 1 | Interest income, realized net gain (loss), and change in unrealized appreciation (depreciation) from an affiliated company of the fund were $225,000, $35,000, and $2,000, respectively. Purchases and sales are for temporary cash investment purposes. |
| 2 | Includes $1,208,010,000 of the net gain (loss) resulting from in-kind redemptions. |
See accompanying Notes, which are an integral part of the Financial Statements.
High Dividend Yield Index Fund
Statement of Changes in Net Assets
|
| | Year Ended October 31, |
| | 2020
($000) | 2019
($000) |
| Increase (Decrease) in Net Assets | | |
| Operations | | |
| Net Investment Income | 1,242,802 | 1,077,014 |
| Realized Net Gain (Loss) | (23,588) | 903,905 |
| Change in Unrealized Appreciation (Depreciation) | (4,440,201) | 1,477,708 |
| Net Increase (Decrease) in Net Assets Resulting from Operations | (3,220,987) | 3,458,627 |
| Distributions1 | | |
| Investor Shares | — | (136,910) |
| ETF Shares | (938,468) | (785,436) |
| Admiral Shares | (282,080) | (131,730) |
| Total Distributions | (1,220,548) | (1,054,076) |
| Capital Share Transactions | | |
| Investor Shares | (5,748) | (8,358,258) |
| ETF Shares | 2,846,525 | 3,714,888 |
| Admiral Shares | (91,604) | 8,543,837 |
| Net Increase (Decrease) from Capital Share Transactions | 2,749,173 | 3,900,467 |
| Total Increase (Decrease) | (1,692,362) | 6,305,018 |
| Net Assets | | |
| Beginning of Period | 35,635,956 | 29,330,938 |
| End of Period | 33,943,594 | 35,635,956 |
| 1 | Certain prior-period numbers have been reclassified to conform with the current-period presentation. |
See accompanying Notes, which are an integral part of the Financial Statements.
High Dividend Yield Index Fund
| Investor Shares | | | | | |
For a Share Outstanding
Throughout Each Period | November 1,
2019 to
November 7,
20191 | Year Ended October 31, | | | | |
| 2019 | 2018 | 2017 | 2016 |
| Net Asset Value, Beginning of Period | $35.50 | $32.98 | $32.67 | $28.20 | $26.89 |
| Investment Operations | | | | | |
| Net Investment Income | .0372 | 1.1412 | 1.0112 | .9272 | .854 |
| Net Realized and Unrealized Gain (Loss) on Investments | .623 | 2.461 | .284 | 4.472 | 1.286 |
| Total from Investment Operations | .660 | 3.602 | 1.295 | 5.399 | 2.140 |
| Distributions | | | | | |
| Dividends from Net Investment Income | — | (1.082) | (.985) | (.929) | (.830) |
| Distributions from Realized Capital Gains | — | — | — | — | — |
| Total Distributions | — | (1.082) | (.985) | (.929) | (.830) |
| Net Asset Value, End of Period | $36.161 | $35.50 | $32.98 | $32.67 | $28.20 |
| Total Return3 | 1.86% | 11.20% | 3.96% | 19.37% | 8.11% |
| Ratios/Supplemental Data | | | | | |
| Net Assets, End of Period (Millions) | — | $6 | $8,003 | $7,590 | $5,879 |
| Ratio of Total Expenses to Average Net Assets | 0.14%4 | 0.14% | 0.14% | 0.15% | 0.15% |
| Ratio of Net Investment Income to Average Net Assets | 5.42%4 | 3.43% | 3.00% | 3.00% | 3.19% |
| Portfolio Turnover Rate5 | 11%6 | 7% | 13% | 9% | 7% |
| 1 | Net asset value as of November 7, 2019, on which date the remaining Investor shares were converted to Admiral Shares. |
| 2 | Calculated based on average shares outstanding. |
| 3 | Total returns do not include account service fees that may have applied in the periods shown. Fund prospectuses provide information about any applicable account service fees. |
| 4 | Annualized. |
| 5 | Excludes the value of portfolio securities received or delivered as a result of in-kind purchases or redemptions of the fund’s capital shares, including ETF Creation Units. |
| 6 | Reflects the fund’s portfolio turnover for the fiscal year ended October 31, 2020. |
See accompanying Notes, which are an integral part of the Financial Statements.
High Dividend Yield Index Fund
| ETF Shares | | | | | |
For a Share Outstanding
Throughout Each Period | Year Ended October 31, |
| 2020 | 2019 | 2018 | 2017 | 2016 |
| Net Asset Value, Beginning of Period | $89.60 | $83.26 | $82.46 | $71.19 | $67.88 |
| Investment Operations | | | | | |
| Net Investment Income | 2.9501 | 2.8911 | 2.6231 | 2.3941 | 2.203 |
| Net Realized and Unrealized Gain (Loss) on Investments | (10.184) | 6.251 | .731 | 11.301 | 3.245 |
| Total from Investment Operations | (7.234) | 9.142 | 3.354 | 13.695 | 5.448 |
| Distributions | | | | | |
| Dividends from Net Investment Income | (2.876) | (2.802) | (2.554) | (2.425) | (2.138) |
| Distributions from Realized Capital Gains | — | — | — | — | — |
| Total Distributions | (2.876) | (2.802) | (2.554) | (2.425) | (2.138) |
| Net Asset Value, End of Period | $79.49 | $89.60 | $83.26 | $82.46 | $71.19 |
| Total Return | -8.17% | 11.31% | 4.05% | 19.46% | 8.18% |
| Ratios/Supplemental Data | | | | | |
| Net Assets, End of Period (Millions) | $26,279 | $26,816 | $21,328 | $20,010 | $15,497 |
| Ratio of Total Expenses to Average Net Assets | 0.06% | 0.06% | 0.06% | 0.08% | 0.08% |
| Ratio of Net Investment Income to Average Net Assets | 3.53% | 3.38% | 3.08% | 3.07% | 3.26% |
| Portfolio Turnover Rate2 | 11% | 7% | 13% | 9% | 7% |
| 1 | Calculated based on average shares outstanding. |
| 2 | Excludes the value of portfolio securities received or delivered as a result of in-kind purchases or redemptions of the fund’s capital shares, including ETF Creation Units. |
See accompanying Notes, which are an integral part of the Financial Statements.
High Dividend Yield Index Fund
| Admiral Shares | | |
For a Share Outstanding
Throughout Each Period | Year Ended October 31, | February 7,
20191 to
October 31,
2019 |
| 2020 |
| Net Asset Value, Beginning of Period | $27.02 | $25.00 |
| Investment Operations | | |
| Net Investment Income2 | .887 | .624 |
| Net Realized and Unrealized Gain (Loss) on Investments | (3.075) | 2.010 |
| Total from Investment Operations | (2.188) | 2.634 |
| Distributions | | |
| Dividends from Net Investment Income | (.862) | (.614) |
| Distributions from Realized Capital Gains | — | — |
| Total Distributions | (.862) | (.614) |
| Net Asset Value, End of Period | $23.97 | $27.02 |
| Total Return3 | -8.19% | 10.64% |
| Ratios/Supplemental Data | | |
| Net Assets, End of Period (Millions) | $7,665 | $8,814 |
| Ratio of Total Expenses to Average Net Assets | 0.08% | 0.08%4 |
| Ratio of Net Investment Income to Average Net Assets | 3.52% | 3.24%4 |
| Portfolio Turnover Rate5 | 11% | 7%6 |
| 1 | Inception. |
| 2 | Calculated based on average shares outstanding. |
| 3 | Total returns do not include account service fees that may have applied in the periods shown. Fund prospectuses provide information about any applicable account service fees. |
| 4 | Annualized. |
| 5 | Excludes the value of portfolio securities received or delivered as a result of in-kind purchases or redemptions of the fund’s capital shares, including ETF Creation Units. |
| 6 | Reflects the fund’s portfolio turnover for the fiscal year ended October 31, 2019. |
See accompanying Notes, which are an integral part of the Financial Statements.
High Dividend Yield Index Fund
Notes to Financial Statements
Vanguard High Dividend Yield Index Fund is registered under the Investment Company Act of 1940 as an open-end investment company, or mutual fund. The fund offers two classes of shares: ETF Shares and Admiral Shares. Each of the share classes has different eligibility and minimum purchase requirements, and is designed for different types of investors. ETF Shares are listed for trading on NYSE Arca; they can be purchased and sold through a broker. Prior to November 7, 2019, the fund offered Investor Shares. Effective at the close of business on November 7, 2019, the remaining Investor Shares were converted to Admiral Shares.
Market disruptions associated with the COVID-19 pandemic have had a global impact, and uncertainty exists as to the long-term implications. Such disruptions can adversely affect assets of the fund and thus fund performance.
A. The following significant accounting policies conform to generally accepted accounting principles for U.S. investment companies. The fund consistently follows such policies in preparing its financial statements.
1. Security Valuation: Securities are valued as of the close of trading on the New York Stock Exchange (generally 4 p.m., Eastern time) on the valuation date. Equity securities are valued at the latest quoted sales prices or official closing prices taken from the primary market in which each security trades; such securities not traded on the valuation date are valued at the mean of the latest quoted bid and asked prices. Securities for which market quotations are not readily available, or whose values have been materially affected by events occurring before the fund's pricing time but after the close of the securities’ primary markets, are valued by methods deemed by the board of trustees to represent fair value. Investments in Vanguard Market Liquidity Fund are valued at that fund's net asset value. Temporary cash investments are valued using the latest bid prices or using valuations based on a matrix system (which considers such factors as security prices, yields, maturities, and ratings), both as furnished by independent pricing services.
2. Futures Contracts: The fund uses index futures contracts to a limited extent, with the objectives of maintaining full exposure to the stock market, maintaining liquidity, and minimizing transaction costs. The fund may purchase futures contracts to immediately invest incoming cash in the market, or sell futures in response to cash outflows, thereby simulating a fully invested position in the underlying index while maintaining a cash balance for liquidity. The primary risks associated with the use of futures contracts are imperfect correlation between changes in market values of stocks held by the fund and the prices of futures contracts, and the possibility of an illiquid market. Counterparty risk involving futures is mitigated because a regulated clearinghouse is the counterparty instead of the clearing broker. To further mitigate counterparty risk, the fund trades futures contracts on an exchange, monitors the financial strength of its clearing brokers and clearinghouse, and has entered into clearing agreements with its clearing brokers. The clearinghouse imposes initial margin requirements to secure the fund’s performance and requires daily settlement of variation margin representing changes in the market value of each contract. Any securities pledged as initial margin for open contracts are noted in the Schedule of Investments.
Futures contracts are valued at their quoted daily settlement prices. The notional amounts of the contracts are not recorded in the Statement of Assets and Liabilities. Fluctuations in the value of the contracts are recorded in the Statement of Assets and Liabilities as an asset (liability) and in the Statement of Operations as unrealized appreciation (depreciation) until the contracts are closed, when they are recorded as realized gains (losses) on futures contracts.
High Dividend Yield Index Fund
During the year ended October 31, 2020, the fund’s average investments in long and short futures contracts represented less than 1% and 0% of net assets, respectively, based on the average of the notional amounts at each quarter-end during the period.
3. Swap Contracts: The fund has entered into equity swap contracts to earn the total return on selected reference stocks in the fund’s target index. Under the terms of the swaps, the fund receives the total return on the referenced stock (i.e., receiving the increase or paying the decrease in value of the selected reference stock and receiving the equivalent of any dividends in respect of the selected referenced stock) over a specified period of time, applied to a notional amount that represents the value of a designated number of shares of the selected reference stock at the beginning of the equity swap contract. The fund also pays a floating rate that is based on short-term interest rates, applied to the notional amount. At the same time, the fund generally invests an amount approximating the notional amount of the swap in high-quality temporary cash investments.
A risk associated with all types of swaps is the possibility that a counterparty may default on its obligation to pay net amounts due to the fund. The fund’s maximum amount subject to counterparty risk is the unrealized appreciation on the swap contract. The fund mitigates its counterparty risk by entering into swaps only with a diverse group of prequalified counterparties, monitoring their financial strength, entering into master netting arrangements with its counterparties, and requiring its counterparties to transfer collateral as security for their performance. In the absence of a default, the collateral pledged or received by the fund cannot be repledged, resold, or rehypothecated. In the event of a counterparty’s default (including bankruptcy), the fund may terminate any swap contracts with that counterparty, determine the net amount owed by either party in accordance with its master netting arrangements, and sell or retain any collateral held up to the net amount owed to the fund under the master netting arrangements. The swap contracts contain provisions whereby a counterparty may terminate open contracts if the fund's net assets decline below a certain level, triggering a payment by the fund if the fund is in a net liability position at the time of the termination. The payment amount would be reduced by any collateral the fund has pledged. Any securities pledged as collateral for open contracts are noted in the Schedule of Investments. The value of collateral received or pledged is compared daily to the value of the swap contracts exposure with each counterparty, and any difference, if in excess of a specified minimum transfer amount, is adjusted and settled within two business days.
The notional amounts of the swap contracts are not recorded in the Statement of Assets and Liabilities. Swaps are valued daily based on market quotations received from independent pricing services or recognized dealers and the change in value is recorded in the Statement of Assets and Liabilities as an asset (liability) and in the Statement of Operations as unrealized appreciation (depreciation) until periodic payments are made or the termination of the swap, at which time realized gain (loss) is recorded.
During the year ended October 31, 2020, the fund’s average amounts of investments in total return swaps represented less than 1% of net assets, based on the average of notional amounts at each quarter-end during the period.
4. Federal Income Taxes: The fund intends to continue to qualify as a regulated investment company and distribute all of its taxable income. The fund’s tax returns are open to examination by the relevant tax authorities until expiration of the applicable statute of limitations, which is
High Dividend Yield Index Fund
generally three years after the filing of the tax return. Management has analyzed the fund’s tax positions taken for all open federal and state income tax years, and has concluded that no provision for income tax is required in the fund’s financial statements.
5. Distributions: Distributions to shareholders are recorded on the ex-dividend date. Distributions are determined on a tax basis at the fiscal year-end and may differ from net investment income and realized capital gains for financial reporting purposes.
6. Securities Lending: To earn additional income, the fund lends its securities to qualified institutional borrowers. Security loans are subject to termination by the fund at any time, and are required to be secured at all times by collateral in an amount at least equal to the market value of securities loaned. Daily market fluctuations could cause the value of loaned securities to be more or less than the value of the collateral received. When this occurs, the collateral is adjusted and settled before the opening of the market on the next business day. The fund further mitigates its counterparty risk by entering into securities lending transactions only with a diverse group of prequalified counterparties, monitoring their financial strength, and entering into master securities lending agreements with its counterparties. The master securities lending agreements provide that, in the event of a counterparty’s default (including bankruptcy), the fund may terminate any loans with that borrower, determine the net amount owed, and sell or retain the collateral up to the net amount owed to the fund; however, such actions may be subject to legal proceedings. While collateral mitigates counterparty risk, in the event of a default, the fund may experience delays and costs in recovering the securities loaned. The fund invests cash collateral received in Vanguard Market Liquidity Fund, and records a liability in the Statement of Assets and Liabilities for the return of the collateral, during the period the securities are on loan. Collateral investments in Vanguard Market Liquidity Fund are subject to market appreciation or depreciation. Securities lending income represents fees charged to borrowers plus income earned on invested cash collateral, less expenses associated with the loan. During the term of the loan, the fund is entitled to all distributions made on or in respect of the loaned securities.
7. Credit Facilities and Interfund Lending Program: The fund and certain other funds managed by The Vanguard Group ("Vanguard") participate in a $4.3 billion committed credit facility provided by a syndicate of lenders pursuant to a credit agreement and an uncommitted credit facility provided by Vanguard. Both facilities may be renewed annually. Each fund is individually liable for its borrowings, if any, under the credit facilities. Borrowings may be utilized for temporary or emergency purposes, subject to the fund’s regulatory and contractual borrowing restrictions. With respect to the committed credit facility, the participating funds are charged administrative fees and an annual commitment fee of 0.10% of the undrawn committed amount of the facility; these fees are allocated to the funds based on a method approved by the fund’s board of trustees and included in Management and Administrative expenses on the fund’s Statement of Operations. Any borrowings under either facility bear interest at a rate based upon the higher of the one-month London Interbank Offered Rate (or an acceptable alternate rate, if necessary), federal funds effective rate, or overnight bank funding rate plus an agreed-upon spread, except that borrowings under the uncommitted credit facility may bear interest based upon an alternative rate agreed to by the fund and Vanguard.
In accordance with an exemptive order (the “Order”) from the SEC, the fund may participate in a joint lending and borrowing program that allows registered open-end Vanguard funds to borrow money from and lend money to each other for temporary or emergency purposes (the “Interfund Lending Program”), subject to compliance with the terms and conditions of the Order, and to the extent permitted by the fund’s investment objective and investment policies. Interfund loans and
High Dividend Yield Index Fund
borrowings normally extend overnight, but can have a maximum duration of seven days. Loans may be called on one business day’s notice. The interest rate to be charged is governed by the conditions of the Order and internal procedures adopted by the board of trustees. The board of trustees is responsible for overseeing the Interfund Lending Program.
For the year ended October 31, 2020, the fund did not utilize the credit facilities or the Interfund Lending Program.
8. Other: Dividend income is recorded on the ex-dividend date. Interest income includes income distributions received from Vanguard Market Liquidity Fund and is accrued daily. Premiums and discounts on debt securities are amortized and accreted, respectively, to interest income over the lives of the respective securities, except for premiums on certain callable debt securities that are amortized to the earliest call date. Security transactions are accounted for on the date securities are bought or sold. Costs used to determine realized gains (losses) on the sale of investment securities are those of the specific securities sold.
Each class of shares has equal rights as to assets and earnings, except that each class separately bears certain class-specific expenses related to maintenance of shareholder accounts (included in Management and Administrative expenses) and shareholder reporting. Marketing and distribution expenses are allocated to each class of shares based on a method approved by the board of trustees. Income, other non-class-specific expenses, and gains and losses on investments are allocated to each class of shares based on its relative net assets.
B. In accordance with the terms of a Funds’ Service Agreement (the “FSA”) between Vanguard and the fund, Vanguard furnishes to the fund investment advisory, corporate management, administrative, marketing, and distribution services at Vanguard’s cost of operations (as defined by the FSA). These costs of operations are allocated to the fund based on methods and guidelines approved by the board of trustees and are generally settled twice a month.
Upon the request of Vanguard, the fund may invest up to 0.40% of its net assets as capital in Vanguard. At October 31, 2020, the fund had contributed to Vanguard capital in the amount of $1,440,000, representing less than 0.01% of the fund’s net assets and 0.58% of Vanguard’s capital received pursuant to the FSA. The fund’s trustees and officers are also directors and employees, respectively, of Vanguard.
C. Various inputs may be used to determine the value of the fund’s investments and derivatives. These inputs are summarized in three broad levels for financial statement purposes. The inputs or methodologies used to value securities are not necessarily an indication of the risk associated with investing in those securities.
Level 1—Quoted prices in active markets for identical securities.
Level 2—Other significant observable inputs (including quoted prices for similar securities, interest rates, prepayment speeds, credit risk, etc.).
Level 3—Significant unobservable inputs (including the fund’s own assumptions used to determine the fair value of investments). Any investments and derivatives valued with significant unobservable inputs are noted on the Schedule of Investments.
High Dividend Yield Index Fund
The following table summarizes the market value of the fund's investments and derivatives as of October 31, 2020, based on the inputs used to value them:
| | Level 1
($000) | Level 2
($000) | Level 3
($000) | Total
($000) |
| Investments | | | | |
| Assets | | | | |
| Common Stocks | 33,800,180 | — | — | 33,800,180 |
| Temporary Cash Investments | 77,295 | 5,843 | — | 83,138 |
| Total | 33,877,475 | 5,843 | — | 33,883,318 |
| | | | |
| Derivative Financial Instruments | | | | |
| Liabilities | | | | |
| Futures Contracts1 | 989 | — | — | 989 |
| Swap Contracts | — | 4,706 | — | 4,706 |
| Total | 989 | 4,706 | — | 5,695 |
| 1 | Represents variation margin on the last day of the reporting period. |
D. Permanent differences between book-basis and tax-basis components of net assets are reclassified among capital accounts in the financial statements to reflect their tax character. These reclassifications have no effect on net assets or net asset value per share. As of period end, permanent differences primarily attributable to the accounting for in-kind redemptions, passive foreign investment companies, and swap agreements were reclassified between the following accounts:
| | Amount
($000) |
| Paid-in Capital | 1,207,673 |
| Total Distributable Earnings (Loss) | (1,207,673) |
Temporary differences between book-basis and tax-basis components of total distributable earnings (losses) arise when certain items of income, gain, or loss are recognized in different periods for financial statement and tax purposes; these differences will reverse at some time in the future. The differences are primarily related to the deferral of losses from wash sales; the recognition of unrealized gains or losses from certain derivative contracts; and the classification of securities for tax purposes. As of period end, the tax-basis components of total distributable earnings (losses) are detailed in the table as follows:
| | Amount
($000) |
| Undistributed Ordinary Income | 124,744 |
| Undistributed Long-Term Gains | — |
| Capital Loss Carryforwards | (2,184,173) |
| Qualified Late-Year Losses | — |
| Net Unrealized Gains (Losses) | 452,121 |
High Dividend Yield Index Fund
The tax character of distributions paid was as follows:
| | Year Ended October 31, |
| | 2020
Amount
($000) | 2019
Amount
($000) |
| Ordinary Income* | 1,220,548 | 1,054,076 |
| Long-Term Capital Gains | — | — |
| Total | 1,220,548 | 1,054,076 |
| * | Includes short-term capital gains, if any. |
As of October 31, 2020, gross unrealized appreciation and depreciation for investments and derivatives based on cost for U.S. federal income tax purposes were as follows:
| | Amount
($000) |
| Tax Cost | 33,431,197 |
| Gross Unrealized Appreciation | 5,122,231 |
| Gross Unrealized Depreciation | (4,670,110) |
| Net Unrealized Appreciation (Depreciation) | 452,121 |
E. During the year ended October 31, 2020, the fund purchased $10,498,110,000 of investment securities and sold $7,783,788,000 of investment securities, other than temporary cash investments. Purchases and sales include $6,187,071,000 and $3,914,883,000, respectively, in connection with in-kind purchases and redemptions of the fund’s capital shares.
The fund purchased securities from and sold securities to other Vanguard funds or accounts managed by Vanguard or its affiliates, in accordance with procedures adopted by the board of trustees in compliance with Rule 17a-7 of the Investment Company Act of 1940. For the year ended October 31, 2020, such purchases and sales were $973,346,000 and $807,082,000, respectively; these amounts, other than temporary cash investments, are included in the purchases and sales of investment securities noted above.
F. Capital share transactions for each class of shares were:
| | Year Ended October 31, | |
| | 2020 | | 2019 |
| | Amount
($000) | Shares
(000) | | Amount
($000) | Shares
(000) |
| Investor Shares | | | | | |
| Issued | 61 | 2 | | 1,187,273 | 35,128 |
| Issued in Lieu of Cash Distributions | — | — | | 112,567 | 3,539 |
| Redeemed1 | (5,809) | (161) | | (9,658,098) | (281,141) |
| Net Increase (Decrease)—Investor Shares | (5,748) | (159) | | (8,358,258) | (242,474) |
High Dividend Yield Index Fund
| | Year Ended October 31, | |
| | 2020 | | 2019 |
| | Amount
($000) | Shares
(000) | | Amount
($000) | Shares
(000) |
| ETF Shares | | | | | |
| Issued | 6,760,136 | 79,262 | | 7,516,552 | 88,367 |
| Issued in Lieu of Cash Distributions | — | — | | — | — |
| Redeemed | (3,913,611) | (47,950) | | (3,801,664) | (45,250) |
| Net Increase (Decrease)—ETF Shares | 2,846,525 | 31,312 | | 3,714,888 | 43,117 |
| Admiral Shares2 | | | | | |
| Issued1 | 1,888,385 | 75,452 | | 9,304,199 | 355,228 |
| Issued in Lieu of Cash Distributions | 220,883 | 8,834 | | 100,934 | 3,824 |
| Redeemed | (2,200,872) | (90,743) | | (861,296) | (32,822) |
| Net Increase (Decrease)—Admiral Shares | (91,604) | (6,457) | | 8,543,837 | 326,230 |
| 1 | In November 2018, the fund announced changes to the availability and minimum investment criteria of the Investor and Admiral share classes. As a result, all of the outstanding Investor Shares automatically converted to Admiral Shares beginning in April 2019, with the exception of those held by Vanguard funds and certain other institutional investors. Investor Shares—Redeemed and Admiral Shares—Issued include 4,000 and 5,000 shares, respectively, in the amount of $91,000 from the conversion during the year ended October 31, 2020. Investor Shares—Redeemed and Admiral Shares—Issued include 244,521,000 and 321,285,000 shares, respectively, in the amount of $8,204,425,000 from the conversion during the year ended October 31, 2019. |
| 2 | Inception was February 7, 2019, for Admiral Shares. |
G. Management has determined that no events or transactions occurred subsequent to October 31, 2020, that would require recognition or disclosure in these financial statements.
Report of Independent Registered
Public Accounting Firm
To the Board of Trustees of Vanguard Whitehall Funds and Shareholders of Vanguard High Dividend Yield Index Fund
Opinion on the Financial Statements
We have audited the accompanying statement of assets and liabilities, including the schedule of investments, of Vanguard High Dividend Yield Index Fund (one of the funds constituting Vanguard Whitehall Funds, referred to hereafter as the "Fund”) as of October 31, 2020, the related statement of operations for the year ended October 31, 2020, the statement of changes in net assets for each of the two years in the period ended October 31, 2020, including the related notes, and the financial highlights for each of the periods indicated therein (collectively referred to as the “financial statements”). In our opinion, the financial statements present fairly, in all material respects, the financial position of the Fund as of October 31, 2020, the results of its operations for the year then ended, the changes in its net assets for each of the two years in the period ended October 31, 2020 and the financial highlights for each of the periods indicated therein in conformity with accounting principles generally accepted in the United States of America.
Basis for Opinion
These financial statements are the responsibility of the Fund’s management. Our responsibility is to express an opinion on the Fund’s financial statements based on our audits. We are a public accounting firm registered with the Public Company Accounting Oversight Board (United States) (“PCAOB”) and are required to be independent with respect to the Fund in accordance with the U.S. federal securities laws and the applicable rules and regulations of the Securities and Exchange Commission and the PCAOB.
We conducted our audits of these financial statements in accordance with the standards of the PCAOB. Those standards require that we plan and perform the audit to obtain reasonable assurance about whether the financial statements are free of material misstatement, whether due to error or fraud.
Our audits included performing procedures to assess the risks of material misstatement of the financial statements, whether due to error or fraud, and performing procedures that respond to those risks. Such procedures included examining, on a test basis, evidence regarding the amounts and disclosures in the financial statements. Our audits also included evaluating the accounting principles used and significant estimates made by management, as well as evaluating the overall presentation of the financial statements. Our procedures included confirmation of securities owned as of October 31, 2020 by correspondence with the custodian and brokers and by agreement to the underlying ownership records of the transfer agent; when replies were not received from brokers, we performed other auditing procedures. We believe that our audits provide a reasonable basis for our opinion.
/s/PricewaterhouseCoopers LLP
Philadelphia, Pennsylvania
December 21, 2020
We have served as the auditor of one or more investment companies in The Vanguard Group of Funds since 1975.
Special 2020 tax information (unaudited) for Vanguard High Dividend Yield Index Fund
This information for the fiscal year ended October 31, 2020, is included pursuant to provisions of the Internal Revenue Code.
The fund distributed $1,220,548,000 of qualified dividend income to shareholders during the fiscal year.
For corporate shareholders, 98.1% of investment income (dividend income plus short-term gains, if any) qualifies for the dividends-received deduction.
London Stock Exchange Group companies include FTSE International Limited (“FTSE”), Frank Russell Company (“Russell”), MTS Next Limited (“MTS”), and FTSE TMX Global Debt Capital Markets Inc. (“FTSE TMX”). All rights reserved. “FTSE®”, “Russell®”, “MTS®”, “FTSE TMX®” and “FTSE Russell” and other service marks and trademarks related to the FTSE or Russell indexes are trademarks of the London Stock Exchange Group companies and are used by FTSE, MTS, FTSE TMX and Russell under license. All information is provided for information purposes only. Every effort is made to ensure that all information given in this publication is accurate, but no responsibility or liability can be accepted by the London Stock Exchange Group companies nor its licensors for any errors or for any loss from use of this publication. Neither the London Stock Exchange Group companies nor any of their licensors make any claim, prediction, warranty or representation whatsoever, expressly or impliedly, either as to the results to be obtained from the use of the Indices or the fitness or suitability of the Indices for any particular purpose to which they might be put. The London Stock Exchange Group companies do not provide investment advice and nothing in this document should be taken as constituting financial or investment advice. The London Stock Exchange Group companies make no representation regarding the advisability of investing in any asset. A decision to invest in any such asset should not be made in reliance on any information herein. Indexes cannot be invested in directly. Inclusion of an asset in an index is not a recommendation to buy, sell or hold that asset. The general information contained in this publication should not be acted upon without obtaining specific legal, tax, and investment advice from a licensed professional. No part of this information may be reproduced, stored in a retrieval system or transmitted in any form or by any means, electronic, mechanical, photocopying, recording or otherwise, without prior written permission of the London Stock Exchange Group companies. Distribution of the London Stock Exchange Group companies’ index values and the use of their indexes to create financial products require a license with FTSE, FTSE TMX, MTS and/or Russell and/or its licensors.
This page intentionally left blank.
The People Who Govern Your Fund
The trustees of your mutual fund are there to see that the fund is operated and managed in your best interests since, as a shareholder, you are a part owner of the fund. Your fund’s trustees also serve on the board of directors of The Vanguard Group, Inc., which is owned by the Vanguard funds and provides services to them.
A majority of Vanguard’s board members are independent, meaning that they have no affiliation with Vanguard or the funds they oversee, apart from the sizable personal investments they have made as private individuals. The independent board members have distinguished backgrounds in business, academia, and public service. Each of the trustees and executive officers oversees 213 Vanguard funds.
Information for each trustee and executive officer of the fund appears below. That information, as well as the Vanguard fund count, is as of the date on the cover of this fund report. The mailing address of the trustees and officers is P.O. Box 876, Valley Forge, PA 19482. More information about the trustees is in the Statement of Additional Information, which can be obtained, without charge, by contacting Vanguard at 800-662-7447, or online at vanguard.com.
Interested Trustee1
Mortimer J. Buckley
Born in 1969. Trustee since January 2018. Principal occupation(s) during the past five years and other experience: chairman of the board (2019–present) of Vanguard and of each of the investment companies served by Vanguard; chief executive officer (2018–present) of Vanguard; chief executive officer, president, and trustee (2018–present) of each of the investment companies served by Vanguard; president and director (2017–present) of Vanguard; and president (2018–present) of Vanguard Marketing Corporation. Chief investment officer (2013–2017), managing director (2002–2017), head of the Retail Investor Group (2006–2012), and chief information officer (2001–2006) of Vanguard. Chairman of the board (2011–2017) and trustee (2009–2017) of the Children’s Hospital of Philadelphia; and trustee (2018–present) and vice chair (2019–present) of The Shipley School.
Independent Trustees
Emerson U. Fullwood
Born in 1948. Trustee since January 2008. Principal occupation(s) during the past five years and other experience: executive chief staff and marketing officer for North America and corporate vice president (retired 2008) of Xerox Corporation (document management products and services). Former president of the Worldwide Channels Group, Latin America, and Worldwide Customer Service and executive chief staff officer of Developing Markets of Xerox. Executive in residence and 2009–2010 Distinguished Minett Professor at the Rochester Institute of Technology. Director of SPX FLOW, Inc. (multi-industry manufacturing). Director of the University of Rochester Medical Center, the Monroe Community College Foundation, the United Way of Rochester, North Carolina A&T University, and Roberts Wesleyan College. Trustee of the University of Rochester.
Amy Gutmann
Born in 1949. Trustee since June 2006. Principal occupation(s) during the past five years and other experience: president (2004–present) of the University of Pennsylvania. Christopher H. Browne Distinguished Professor of Political Science, School of Arts and Sciences, and professor of communication, Annenberg School for Communication, with secondary faculty appointments in the Department of Philosophy, School of Arts and Sciences, and at the Graduate School of Education, University of Pennsylvania.
1 Mr. Buckley is considered “interested person,” as defined in the Investment Company Act of 1940, because he is an officer of the Vanguard funds.
F. Joseph Loughrey
Born in 1949. Trustee since October 2009. Principal occupation(s) during the past five years and other experience: president and chief operating officer (retired 2009) and vice chairman of the board (2008–2009) of Cummins Inc. (industrial machinery). Chairman of the board of Hillenbrand, Inc. (specialized consumer services) and the Lumina Foundation. Director of the V Foundation. Member of the advisory council for the College of Arts and Letters and chair of the advisory board to the Kellogg Institute for International Studies, both at the University of Notre Dame.
Mark Loughridge
Born in 1953. Trustee since March 2012. Principal occupation(s) during the past five years and other experience: senior vice president and chief financial officer (retired 2013) of IBM (information technology services). Fiduciary member of IBM’s Retirement Plan Committee (2004–2013), senior vice president and general manager (2002–2004) of IBM Global Financing, vice president and controller (1998–2002) of IBM, and a variety of other prior management roles at IBM. Member of the Council on Chicago Booth.
Scott C. Malpass
Born in 1962. Trustee since March 2012. Principal occupation(s) during the past five years and other experience: chief investment officer (retired June 2020) and vice president (retired June 2020) of the University of Notre Dame. Assistant professor of finance at the Mendoza College of Business, University of Notre Dame, and member of the Notre Dame 403(b) Investment Committee (retired June 2020). Member of the board of Catholic Investment Services, Inc. (investment advisors) and the board of superintendence of the Institute for the Works of Religion.
Deanna Mulligan
Born in 1963. Trustee since January 2018. Principal occupation(s) during the past five years and other experience: board chair (2020–present), chief executive officer (2011–2020), and president (2010–2019) of The Guardian Life Insurance Company of America. Chief operating officer (2010–2011) and executive vice president (2008–2010) of the individual life and disability division of Guardian Life. Member of the board of the American Council of Life Insurers and the board of the Economic Club of New York. Trustee of the Partnership for New York City (business leadership), Chief Executives for Corporate Purpose, NewYork-Presbyterian Hospital, Catalyst, and the Bruce Museum (arts and science). Member of the Advisory Council for the Stanford Graduate School of Business.
André F. Perold
Born in 1952. Trustee since December 2004. Principal occupation(s) during the past five years and other experience: George Gund Professor of Finance and Banking, Emeritus at the Harvard Business School (retired 2011). Chief investment officer and co-managing partner of HighVista Strategies (private investment firm). Member of the board of advisors and member of the investment committee of the Museum of Fine Arts Boston. Member of the board (2018–present) of RIT Capital Partners (investment firm). Member of the investment committee of Partners Health Care System.
Sarah Bloom Raskin
Born in 1961. Trustee since January 2018. Principal occupation(s) during the past five years and other experience: deputy secretary (2014–2017) of the United States Department of the Treasury. Governor (2010–2014) of the Federal Reserve Board. Commissioner (2007–2010) of financial regulation for the State of Maryland. Member of the board of directors (2012–2014) of Neighborhood Reinvestment Corporation. Director (2017–present) of i(x) Investments, LLC; director (2017–present) of Reserve Trust. Rubenstein Fellow (2017–present) of Duke University; trustee (2017–present) of Amherst College, and trustee (2019–present) of the Folger Shakespeare Library.
Peter F. Volanakis
Born in 1955. Trustee since July 2009. Principal occupation(s) during the past five years and other experience: president and chief operating officer (retired 2010) of Corning Incorporated (communications equipment) and director of Corning Incorporated (2000–2010) and Dow Corning (2001–2010). Director (2012) of SPX Corporation (multi-industry manufacturing). Overseer of the Amos Tuck School of Business Administration, Dartmouth College (2001–2013). Chairman of the board of trustees of Colby-Sawyer College. Member of the board of Hypertherm Inc. (industrial cutting systems, software, and consumables).
Executive Officers
John Bendl
Born in 1970. Principal occupation(s) during the past five years and other experience: principal of Vanguard. Chief financial officer (2019–present) of each of the investment companies served by Vanguard. Chief accounting officer, treasurer, and controller of Vanguard (2017–present). Partner (2003–2016) at KPMG (audit, tax, and advisory services).
Christine M. Buchanan
Born in 1970. Principal occupation(s) during the past five years and other experience: principal of Vanguard. Treasurer (2017–present) of each of the investment companies served by Vanguard. Partner (2005–2017) at KPMG (audit, tax, and advisory services).
David Cermak
Born in 1960. Principal occupation(s) during the past five years and other experience: principal of Vanguard. Finance director (2019–present) of each of the investment companies served by Vanguard. Managing director and head (2017–present) of Vanguard Investments Singapore. Managing director and head (2017–2019) of Vanguard Investments Hong Kong. Representative director and head (2014–2017) of Vanguard Investments Japan.
John Galloway
Born in 1973. Principal occupation(s) during the past five years and other experience: principal of Vanguard. Investment stewardship officer (September 2020–present) of each of the investment companies served by Vanguard. Head of Investor Advocacy (February 2020–present) and head of Marketing Strategy and Planning (2017–2020) at Vanguard. Deputy assistant to the President of the United States (2015).
Thomas J. Higgins
Born in 1957. Principal occupation(s) during the past five years and other experience: principal of Vanguard. Finance director (2019–present), chief financial officer (2008–2019), and treasurer (1998–2008) of each of the investment companies served by Vanguard.
Peter Mahoney
Born in 1974. Principal occupation(s) during the past five years and other experience: principal of Vanguard. Controller (2015–present) of each of the investment companies served by Vanguard. Head of International Fund Services (2008–2014) at Vanguard.
Anne E. Robinson
Born in 1970. Principal occupation(s) during the past five years and other experience: general counsel (2016–present) of Vanguard. Secretary (2016–present) of Vanguard and of each of the investment companies served by Vanguard. Managing director (2016–present) of Vanguard. Managing director and general counsel of Global Cards and Consumer Services (2014–2016) at Citigroup. Counsel (2003–2014) at American Express.
Michael Rollings
Born in 1963. Principal occupation(s) during the past five years and other experience: finance director (2017–present) and treasurer (2017) of each of the investment companies served by Vanguard. Managing director (2016–present) of Vanguard. Chief financial officer (2016–present) of Vanguard. Director (2016–present) of Vanguard Marketing Corporation. Executive vice president and chief financial officer (2006–2016) of MassMutual Financial Group.
John E. Schadl
Born in 1972. Principal occupation(s) during the past five years and other experience: principal of Vanguard. Chief compliance officer (2019–present) of Vanguard and of each of the investment companies served by Vanguard. Assistant vice president (2019–present) of Vanguard Marketing Corporation.
Vanguard Senior Management Team
| Joseph Brennan | James M. Norris |
| Mortimer J. Buckley | Thomas M. Rampulla |
| Gregory Davis | Karin A. Risi |
| John James | Anne E. Robinson |
| John T. Marcante | Michael Rollings |
| Chris D. McIsaac | Lauren Valente |
Connect with Vanguard®>vanguard.com
Fund Information > 800-662-7447
Direct Investor Account Services > 800-662-2739
Institutional Investor Services > 800-523-1036
Text Telephone for People
Who Are Deaf or Hard of Hearing > 800-749-7273
This material may be used in conjunction with the offering of shares of any Vanguard fund only if preceded or accompanied by the fund’s current prospectus.
All comparative mutual fund data are from Lipper, a Thomson Reuters Company, or Morningstar, Inc., unless otherwise noted.
You can obtain a free copy of Vanguard’s proxy voting guidelines by visiting vanguard.com/proxyreporting or by calling Vanguard at 800-662-2739. The guidelines are also available from the SEC’s website, www.sec.gov. In addition, you may obtain a free report on how your fund voted the proxies for securities it owned during the 12 months ended June 30. To get the report, visit either vanguard.com/proxyreporting or www.sec.gov.
You can review information about your fund on the SEC’s website, and you can receive copies of this information, for a fee, by sending a request via email addressed to publicinfo@sec.gov.
© 2020 The Vanguard Group, Inc.
All rights reserved.
U.S. Pat. Nos. 6,879,964; 7,337,138; 7,720,749;
7,925,573; 8,090,646; 8,417,623; and 8,626,636.
Vanguard Marketing Corporation, Distributor.
Q6230 122020

| |
| |
| |
| Annual Report | October 31, 2020 |
| |
| |
| Vanguard Emerging Markets Government Bond Index Fund |
| |
| |
| |
| |
| |
| |
| |
| |
| |
| |
| |
| |
| |
| |
| |
| |
| |
| |
| |
| |
| |
| |
| |
| |
| |
| |
| |
| |
| |
| |
| |
| See the inside front cover for important information about access to your fund’s annual and semiannual shareholder reports. |
| |
Important information about access to shareholder reports
Beginning on January 1, 2021, as permitted by regulations adopted by the Securities and Exchange Commission, paper copies of your fund’s annual and semiannual shareholder reports will no longer be sent to you by mail, unless you specifically request them. Instead, you will be notified by mail each time a report is posted on the website and will be provided with a link to access the report.
If you have already elected to receive shareholder reports electronically, you will not be affected by this change and do not need to take any action. You may elect to receive shareholder reports and other communications from the fund electronically by contacting your financial intermediary (such as a broker-dealer or bank) or, if you invest directly with the fund, by calling Vanguard at one of the phone numbers on the back cover of this report or by logging on to vanguard.com.
You may elect to receive paper copies of all future shareholder reports free of charge. If you invest through a financial intermediary, you can contact the intermediary to request that you continue to receive paper copies. If you invest directly with the fund, you can call Vanguard at one of the phone numbers on the back cover of this report or log on to vanguard.com. Your election to receive paper copies will apply to all the funds you hold through an intermediary or directly with Vanguard.
| Contents | |
| | |
| Your Fund’s Performance at a Glance | 1 |
| About Your Fund’s Expenses | 2 |
| Performance Summary | 4 |
| Financial Statements | 7 |
Please note: The opinions expressed in this report are just that—informed opinions. They should not be considered promises or advice. Also, please keep in mind that the information and opinions cover the period through the date on the front of this report. Of course, the risks of investing in your fund are spelled out in the prospectus.
Your Fund’s Performance at a Glance
· For the 12 months ended October 31, 2020, Vanguard Emerging Markets Government Bond Index Fund returned 1.65% for ETF Shares. Its benchmark index returned 1.61%.
· The global spread of COVID-19 and efforts to contain it marked the fiscal year, prompting volatility in the bond markets and an erosion of liquidity. Central banks slashed interest rates and enacted stimulus programs to blunt the economic impact.
· The yield premiums of emerging-market government bonds, relative to U.S. Treasuries, more than doubled in the spring but retraced much of their move by October 31. Investors’ concerns about financially weak governments remained evident, however: On average, speculative-grade issues yielded roughly 2 percentage points more than investment-grade issues on October 31, up from roughly a half percentage point at the start of 2020.
· Amid these conditions, the performance of U.S. dollar-denominated emerging-market debt varied dramatically. Some large issuers saw their bonds post solid single-digit 12-month gains, but the bonds of some small issuers plummeted.
· At period-end, the fund’s 30-day SEC yield net of expenses was 3.90% for Admiral and ETF Shares and 3.93% for Institutional Shares.
| Market Barometer | | | |
| | Average Annual Total Returns |
| | Periods Ended October 31, 2020 |
| | One Year | Three Years | Five Years |
| Stocks | | | |
| Russell 1000 Index (Large-caps) | 10.87% | 10.63% | 11.79% |
| Russell 2000 Index (Small-caps) | -0.14 | 2.19 | 7.27 |
| Russell 3000 Index (Broad U.S. market) | 10.15 | 10.04 | 11.48 |
| FTSE All-World ex US Index (International) | -2.17 | 0.13 | 4.52 |
| | | | |
| Bonds | | | |
| Bloomberg Barclays U.S. Aggregate Bond Index (Broad taxable market) | 6.19% | 5.06% | 4.08% |
| Bloomberg Barclays Municipal Bond Index (Broad tax-exempt market) | 3.59 | 4.09 | 3.70 |
| FTSE Three-Month U.S. Treasury Bill Index | 0.86 | 1.62 | 1.15 |
| | | | |
| CPI | | | |
| Consumer Price Index | 1.18% | 1.82% | 1.83% |
Fund returns are adjusted to reflect the 0.75% fee on purchases of fund shares. The fee does not apply to the ETF Shares.
About Your Fund’s Expenses
As a shareholder of the fund, you incur ongoing costs, which include costs for portfolio management, administrative services, and shareholder reports (like this one), among others. Operating expenses, which are deducted from a fund’s gross income, directly reduce the investment return of the fund.
A fund’s expenses are expressed as a percentage of its average net assets. This figure is known as the expense ratio. The following examples are intended to help you understand the ongoing costs (in dollars) of investing in your fund and to compare these costs with those of other mutual funds. The examples are based on an investment of $1,000 made at the beginning of the period shown and held for the entire period.
The accompanying table illustrates your fund’s costs in two ways:
· Based on actual fund return. This section helps you to estimate the actual expenses that you paid over the period. The “Ending Account Value” shown is derived from the fund’s actual return, and the third column shows the dollar amount that would have been paid by an investor who started with $1,000 in the fund. You may use the information here, together with the amount you invested, to estimate the expenses that you paid over the period.
To do so, simply divide your account value by $1,000 (for example, an $8,600 account value divided by $1,000 = 8.6), then multiply the result by the number given for your fund under the heading “Expenses Paid During Period.”
· Based on hypothetical 5% yearly return. This section is intended to help you compare your fund’s costs with those of other mutual funds. It assumes that the fund had a yearly return of 5% before expenses, but that the expense ratio is unchanged. In this case—because the return used is not the fund’s actual return—the results do not apply to your investment. The example is useful in making comparisons because the Securities and Exchange Commission requires all mutual funds to calculate expenses based on a 5% return. You can assess your fund’s costs by comparing this hypothetical example with the hypothetical examples that appear in shareholder reports of other funds.
Note that the expenses shown in the table are meant to highlight and help you compare ongoing costs only and do not reflect transaction costs incurred by the fund for buying and selling securities. Further, the expenses do not include any purchase, redemption, or account service fees described in the fund prospectus. If such fees were applied to your account, your costs would be higher. Your fund does not carry a “sales load.”
The calculations assume no shares were bought or sold during the period. Your actual costs may have been higher or lower, depending on the amount of your investment and the timing of any purchases or redemptions.
You can find more information about the fund’s expenses, including annual expense ratios, in the Financial Statements section of this report. For additional information on operating expenses and other shareholder costs, please refer to your fund’s current prospectus.
| Six Months Ended October 31, 2020 | | | |
| | | | |
| | Beginning | Ending | Expenses |
| | Account Value | Account Value | Paid During |
| Emerging Markets Government Bond Index Fund | 4/30/2020 | 10/31/2020 | Period |
| Based on Actual Fund Return | | | |
| ETF Shares | $1,000.00 | $1,115.57 | $1.33 |
| Admiral™ Shares | 1,000.00 | 1,115.39 | 1.33 |
| Institutional Shares | 1,000.00 | 1,115.54 | 1.17 |
| Based on Hypothetical 5% Yearly Return | | | |
| ETF Shares | $1,000.00 | $1,023.88 | $1.27 |
| Admiral Shares | 1,000.00 | 1,023.88 | 1.27 |
| Institutional Shares | 1,000.00 | 1,024.03 | 1.12 |
The calculations are based on expenses incurred in the most recent six-month period. The fund’s annualized six-month expense ratios for that period are 0.25% for ETF Shares, 0.25% for Admiral Shares, and 0.22% for Institutional Shares. The dollar amounts shown as “Expenses Paid” are equal to the annualized expense ratio multiplied by the average account value over the period, multiplied by the number of days in the most recent six-month period, then divided by the number of days in the most recent 12-month period (184/366).
Emerging Markets Government Bond Index Fund
Performance Summary
All of the returns in this report represent past performance, which is not a guarantee of future results that may be achieved by the fund. (Current performance may be lower or higher than the performance data cited. For performance data current to the most recent month-end, visit our website at vanguard.com/performance.) Note, too, that both investment returns and principal value can fluctuate widely, so an investor’s shares, when sold, could be worth more or less than their original cost. The returns shown do not reflect taxes that a shareholder would pay on fund distributions or on the sale of fund shares.
Cumulative Performance: May 31, 2013, Through October 31, 2020
Initial Investment of $10,000
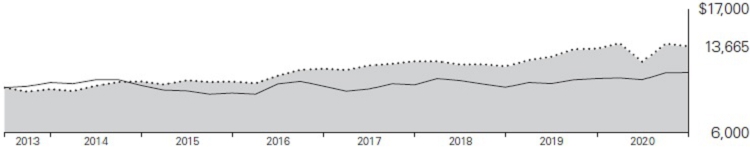
| | | Average Annual Total Returns | |
| | | Periods Ended October 31, 2020 | |
| | | | | Since | Final Value |
| | | One | Five | Inception | of a $10,000 |
| | | Year | Years | (5/31/2013) | Investment |
 | Emerging Markets Government Bond Index Fund ETF Shares Net Asset Value | 1.65% | 5.35% | 4.30% | $13,665 |
| | Emerging Markets Government Bond Index Fund ETF Shares Market Price | 1.61 | 5.39 | 4.38 | 13,741 |
 | Bloomberg Barclays USD Emerging Markets Government RIC Capped Index | 1.61 | 5.45 | 4.38 | 13,745 |
 | Bloomberg Barclays Global Aggregate Index ex USD | 4.96 | 3.62 | 1.74 | 11,362 |
“Since Inception” performance is calculated from the ETF Shares’ inception date for both the fund and its comparative standard(s).
See Financial Highlights for dividend and capital gains information.
Emerging Markets Government Bond Index Fund
| | Average Annual Total Returns | |
| | Periods Ended October 31, 2020 | |
| | | | Since | Final Value |
| | One | Five | Inception | of a $10,000 |
| | Year | Years | (5/31/2013) | Investment |
| Emerging Markets Government Bond Index Fund Admiral Shares | 0.90% | 5.21% | 4.21% | $13,577 |
| Bloomberg Barclays USD Emerging Markets Government RIC Capped Index | 1.61 | 5.45 | 4.38 | 13,745 |
| Bloomberg Barclays Global Aggregate Index ex USD | 4.96 | 3.62 | 1.74 | 11,362 |
“Since Inception” performance is calculated from the Admiral Shares’ inception date for both the fund and its comparative standard(s).
| | | | Since | Final Value |
| | One | Five | Inception | of a $5,000,000 |
| | Year | Years | (2/11/2015)1 | Investment |
| Emerging Markets Government Bond Index Fund Institutional Shares | 0.91% | 5.22% | 5.06% | $6,629,320 |
| Bloomberg Barclays USD Emerging Markets Government RIC Capped Index | 1.61 | 5.45 | 5.25 | 6,700,942 |
| Bloomberg Barclays Global Aggregate Index ex USD | 4.96 | 3.62 | 2.89 | 5,884,927 |
“Since Inception” performance is calculated from the Institutional Shares’ inception date for both the fund and its comparative standard(s).
1institutional Shares were first issued on November 25, 2014, and were redeemed shortly thereafter. Institutional Shares were next issued on February 11, 2015. The total returns shown are based on the period beginning February 11, 2015.
Cumulative Returns of ETF Shares: May 31, 2013, Through October 31, 2020
| | | | Since |
| | One | Five | Inception |
| | Year | Years | (5/31/2013) |
| Emerging Markets Government Bond Index Fund ETF Shares Market Price | 1.61% | 30.05% | 37.41% |
| Emerging Markets Government Bond Index Fund ETF Shares Net Asset Value | 1.65 | 29.77 | 36.65 |
| Bloomberg Barclays USD Emerging Markets Government RIC Capped Index | 1.61 | 30.36 | 37.45 |
“Since Inception” performance is calculated from the ETF Shares’ inception date for both the fund and its comparative standard(s).
For the ETF Shares, the market price is determined by the midpoint of the bid-offer spread as of the closing time of the New York Stock Exchange (generally 4 p.m., Eastern time). The net asset value is also determined as of the NYSE closing time. For more information about how the ETF Shares’ market prices have compared with their net asset value, visit vanguard.com, select your ETF, and then select the Price and Performance tab. The ETF premium/discount analysis there shows the percentages of days on which the ETF Shares’ market price was above or below the NAV.
Vanguard fund returns are adjusted to reflect the 0.75% fee on purchases of fund shares. The fee does not apply to the ETF Shares.
Emerging Markets Government Bond Index Fund
Fund Allocation
As of October 31, 2020
| Mexico | 9.5% |
| Saudi Arabia | 8.3 |
| Indonesia | 7.2 |
| United Arab Emirates | 5.7 |
| Brazil | 5.5 |
| Turkey | 5.4 |
| Qatar | 5.2 |
| China | 4.8 |
| Russia | 4.7 |
| Colombia | 3.6 |
| Philippines | 2.8 |
| Egypt | 2.3 |
| Panama | 2.2 |
| Argentina | 2.2 |
| Oman | 1.9 |
| Dominican Republic | 1.8 |
| South Africa | 1.8 |
| Bahrain | 1.7 |
| Uruguay | 1.6 |
| Peru | 1.5 |
| Malaysia | 1.4 |
| Ukraine | 1.4 |
| Chile | 1.2 |
| Romania | 1.0 |
| Other | 15.3 |
The table reflects the fund’s investments, except for short-term investments and derivatives.
The fund may invest in derivatives (such as futures and swap contracts) for various reasons, including, but not limited to, attempting to remain fully invested and tracking its target index as closely as possible.
Emerging Markets Government Bond Index Fund
Financial Statements
Schedule of Investments
As of October 31, 2020
The fund files its complete schedule of portfolio holdings with the Securities and Exchange Commission (SEC) for the first and third quarters of each fiscal year as an exhibit to its reports on Form N-PORT. The fund’s Form N-PORT reports are available on the SEC’s website at www.sec.gov.
| | | | | Face | Market |
| | | | Maturity | Amount | Value· |
| | | Coupon | Date | ($000) | ($000) |
| Angola (0.6%) | | | | |
| Sovereign Bonds (0.6%) | | | | |
| | Republic of Angola | 9.500% | 11/12/25 | 2,750 | 2,387 |
| | Republic of Angola | 8.250% | 5/9/28 | 3,550 | 2,793 |
| | Republic of Angola | 8.000% | 11/26/29 | 200 | 156 |
| 1 | Republic of Angola | 8.000% | 11/26/29 | 3,000 | 2,319 |
| | Republic of Angola | 9.375% | 5/8/48 | 3,300 | 2,538 |
| 1 | Republic of Angola | 9.125% | 11/26/49 | 2,300 | 1,748 |
| Total Angola (Cost $15,229) | | | | 11,941 |
| Argentina (2.1%) | | | | |
| Sovereign Bonds (2.1%) | | | | |
| 2 | Argentine Republic | 1.000% | 7/9/29 | 4,631 | 1,899 |
| 2 | Argentine Republic | 0.125% | 7/9/30 | 31,063 | 11,299 |
| 2 | Argentine Republic | 0.125% | 7/9/35 | 38,870 | 12,633 |
| 2 | Argentine Republic | 0.125% | 1/9/38 | 21,603 | 7,993 |
| 2 | Argentine Republic | 0.125% | 7/9/41 | 19,564 | 6,725 |
| 2 | Argentine Republic | 0.125% | 7/9/46 | 3,999 | 1,319 |
| 2 | YPF SA | 8.750% | 4/4/24 | 2,920 | 1,933 |
| | YPF SA | 8.500% | 7/28/25 | 2,887 | 1,717 |
| Total Argentina (Cost $60,729) | | | | 45,518 |
| Armenia (0.1%) | | | | |
| Sovereign Bonds (0.1%) | | | | |
| | Republic of Armenia | 7.150% | 3/26/25 | 900 | 966 |
| 1 | Republic of Armenia | 3.950% | 9/26/29 | 300 | 283 |
| | Republic of Armenia | 3.950% | 9/26/29 | 800 | 751 |
| Total Armenia (Cost $2,048) | | | | 2,000 |
| Azerbaijan (0.4%) | | | | |
| Sovereign Bonds (0.4%) | | | | |
| | Republic of Azerbaijan | 4.750% | 3/18/24 | 2,200 | 2,326 |
| 1 | Republic of Azerbaijan | 4.750% | 3/18/24 | 200 | 211 |
| 1,2 | Republic of Azerbaijan | 3.500% | 9/1/32 | 700 | 677 |
| 2 | Republic of Azerbaijan | 3.500% | 9/1/32 | 1,550 | 1,499 |
| 3 | Southern Gas Corridor CJSC | 6.875% | 3/24/26 | 3,600 | 4,082 |
| Total Azerbaijan (Cost $8,474) | | | | 8,795 |
Emerging Markets Government Bond Index Fund
| | | | | Face | Market |
| | | | Maturity | Amount | Value· |
| | | Coupon | Date | ($000) | ($000) |
| Bahamas (0.1%) | | | | |
| Sovereign Bonds (0.1%) | | | | |
| 1,2 | Commonwealth of the Bahamas | 6.000% | 11/21/28 | 850 | 735 |
| 2 | Commonwealth of the Bahamas | 6.000% | 11/21/28 | 500 | 435 |
| 1,2 | Commonwealth of the Bahamas | 8.950% | 10/15/32 | 1,150 | 1,117 |
| Total Bahamas (Cost $2,524) | | | | 2,287 |
| Bahrain (1.7%) | | | | |
| Sovereign Bonds (1.7%) | | | | |
| | CBB International Sukuk Co. 5 SPC | 5.624% | 2/12/24 | 2,250 | 2,369 |
| | CBB International Sukuk Co. 6 SPC | 5.250% | 3/20/25 | 1,400 | 1,464 |
| | CBB International Sukuk Co. 7 SPC | 6.875% | 10/5/25 | 1,900 | 2,142 |
| | CBB International Sukuk Programme Co. SPC | 6.250% | 11/14/24 | 700 | 754 |
| 1 | CBB International Sukuk Programme Co. SPC | 6.250% | 11/14/24 | 1,750 | 1,885 |
| 1 | CBB International Sukuk Programme Co. SPC | 4.500% | 3/30/27 | 800 | 816 |
| | CBB International Sukuk Programme Co. SPC | 4.500% | 3/30/27 | 200 | 204 |
| 1 | CBB International Sukuk Programme Co. SPC | 3.950% | 9/16/27 | 1,800 | 1,786 |
| 1 | Kingdom of Bahrain | 6.125% | 7/5/22 | 2,600 | 2,707 |
| 1 | Kingdom of Bahrain | 6.125% | 8/1/23 | 150 | 159 |
| | Kingdom of Bahrain | 6.125% | 8/1/23 | 2,775 | 2,951 |
| | Kingdom of Bahrain | 7.000% | 1/26/26 | 1,950 | 2,197 |
| | Kingdom of Bahrain | 7.000% | 10/12/28 | 2,900 | 3,195 |
| | Kingdom of Bahrain | 6.750% | 9/20/29 | 3,000 | 3,241 |
| | Kingdom of Bahrain | 7.375% | 5/14/30 | 800 | 885 |
| 1 | Kingdom of Bahrain | 7.375% | 5/14/30 | 1,500 | 1,663 |
| 1 | Kingdom of Bahrain | 5.625% | 9/30/31 | 1,900 | 1,879 |
| 1 | Kingdom of Bahrain | 5.450% | 9/16/32 | 1,800 | 1,771 |
| | Kingdom of Bahrain | 6.000% | 9/19/44 | 2,400 | 2,237 |
| | Kingdom of Bahrain | 7.500% | 9/20/47 | 1,400 | 1,477 |
| Total Bahrain (Cost $35,187) | | | | 35,782 |
| Belarus (0.3%) | | | | |
| Sovereign Bonds (0.3%) | | | | |
| | Republic of Belarus | 6.875% | 2/28/23 | 1,475 | 1,455 |
| 1 | Republic of Belarus | 5.875% | 2/24/26 | 900 | 854 |
| | Republic of Belarus | 7.625% | 6/29/27 | 1,000 | 991 |
| | Republic of Belarus | 6.200% | 2/28/30 | 1,000 | 942 |
| | Republic of Belarus Ministry of Finance | 6.378% | 2/24/31 | 400 | 377 |
| 1 | Republic of Belarus Ministry of Finance | 6.378% | 2/24/31 | 1,350 | 1,269 |
| Total Belarus (Cost $6,158) | | | | 5,888 |
| Belize (0.0%) | | | | |
| Sovereign Bonds (0.0%) | | | | |
| 2 | Belize | 4.938% | 2/20/34 | 1,000 | 445 |
| Total Belize (Cost $692) | | | | 445 |
| Bermuda (0.2%) | | | | |
| Sovereign Bonds (0.2%) | | | | |
| 2 | Bermuda | 3.717% | 1/25/27 | 1,350 | 1,495 |
| 1,2 | Bermuda | 4.750% | 2/15/29 | 600 | 720 |
| 2 | Bermuda | 4.750% | 2/15/29 | 200 | 240 |
| 1,2 | Bermuda | 3.375% | 8/20/50 | 1,200 | 1,218 |
| 2 | Bermuda | 3.375% | 8/20/50 | 200 | 208 |
| Total Bermuda (Cost $3,636) | | | | 3,881 |
Emerging Markets Government Bond Index Fund
| | | | | Face | Market |
| | | | Maturity | Amount | Value· |
| | | Coupon | Date | ($000) | ($000) |
| Bolivia (0.2%) | | | | |
| Sovereign Bonds (0.2%) | | | | |
| | Plurinational State of Bolivia | 4.875% | 10/29/22 | 800 | 782 |
| | Plurinational State of Bolivia | 5.950% | 8/22/23 | 800 | 791 |
| 1,2 | Plurinational State of Bolivia | 4.500% | 3/20/28 | 1,200 | 1,039 |
| 2 | Plurinational State of Bolivia | 4.500% | 3/20/28 | 800 | 695 |
| Total Bolivia (Cost $3,614) | | | | 3,307 |
| Brazil (5.4%) | | | | |
| Sovereign Bonds (5.4%) | | | | |
| | Banco do Brasil SA | 3.875% | 10/10/22 | 3,326 | 3,422 |
| | Cemig Geracao e Transmissao SA | 9.250% | 12/5/24 | 2,800 | 3,150 |
| | Federative Republic of Brazil | 2.625% | 1/5/23 | 4,061 | 4,188 |
| | Federative Republic of Brazil | 8.875% | 4/15/24 | 1,925 | 2,375 |
| | Federative Republic of Brazil | 4.250% | 1/7/25 | 8,328 | 9,015 |
| | Federative Republic of Brazil | 8.750% | 2/4/25 | 877 | 1,091 |
| | Federative Republic of Brazil | 2.875% | 6/6/25 | 2,450 | 2,467 |
| | Federative Republic of Brazil | 6.000% | 4/7/26 | 4,380 | 5,086 |
| | Federative Republic of Brazil | 10.125% | 5/15/27 | 1,456 | 2,026 |
| 2 | Federative Republic of Brazil | 4.625% | 1/13/28 | 6,052 | 6,539 |
| 2 | Federative Republic of Brazil | 4.500% | 5/30/29 | 3,900 | 4,183 |
| | Federative Republic of Brazil | 3.875% | 6/12/30 | 3,950 | 4,016 |
| | Federative Republic of Brazil | 8.250% | 1/20/34 | 2,589 | 3,514 |
| | Federative Republic of Brazil | 7.125% | 1/20/37 | 3,236 | 4,077 |
| | Federative Republic of Brazil | 5.625% | 1/7/41 | 4,177 | 4,589 |
| | Federative Republic of Brazil | 5.000% | 1/27/45 | 5,886 | 6,033 |
| | Federative Republic of Brazil | 5.625% | 2/21/47 | 5,183 | 5,695 |
| 2 | Federative Republic of Brazil | 4.750% | 1/14/50 | 4,935 | 4,849 |
| | Petrobras Global Finance BV | 7.375% | 1/17/27 | 3,670 | 4,418 |
| | Petrobras Global Finance BV | 5.999% | 1/27/28 | 4,513 | 5,043 |
| | Petrobras Global Finance BV | 5.093% | 1/15/30 | 7,402 | 7,763 |
| | Petrobras Global Finance BV | 5.600% | 1/3/31 | 4,600 | 4,968 |
| | Petrobras Global Finance BV | 7.250% | 3/17/44 | 2,755 | 3,196 |
| | Petrobras Global Finance BV | 6.900% | 3/19/49 | 3,950 | 4,454 |
| | Petrobras Global Finance BV | 6.750% | 6/3/50 | 3,700 | 4,079 |
| | Petrobras Global Finance BV | 6.850% | 6/5/15 | 5,030 | 5,407 |
| Total Brazil (Cost $108,410) | | | | 115,643 |
| Cameroon (0.1%) | | | | |
| Sovereign Bonds (0.1%) | | | | |
| 2 | Republic of Cameroon | 9.500% | 11/19/25 | 1,350 | 1,412 |
| Total Cameroon (Cost $1,398) | | | | 1,412 |
| Chile (1.1%) | | | | |
| Sovereign Bonds (1.1%) | | | | |
| | Corp. Nacional del Cobre de Chile | 3.625% | 8/1/27 | 2,700 | 2,945 |
| 1 | Corp. Nacional del Cobre de Chile | 3.625% | 8/1/27 | 200 | 219 |
| | Corp. Nacional del Cobre de Chile | 3.700% | 1/30/50 | 3,600 | 3,736 |
| | Republic of Chile | 3.125% | 1/21/26 | 1,290 | 1,420 |
| 2 | Republic of Chile | 3.240% | 2/6/28 | 3,550 | 3,938 |
| | Republic of Chile | 2.450% | 1/31/31 | 3,000 | 3,126 |
| 2 | Republic of Chile | 2.550% | 1/27/32 | 1,300 | 1,350 |
| | Republic of Chile | 3.860% | 6/21/47 | 2,450 | 2,848 |
| 2 | Republic of Chile | 3.500% | 1/25/50 | 4,350 | 4,784 |
| Total Chile (Cost $23,116) | | | | 24,366 |
Emerging Markets Government Bond Index Fund
| | | | | Face | Market |
| | | | Maturity | Amount | Value· |
| | | Coupon | Date | ($000) | ($000) |
| China (4.7%) | | | | |
| Sovereign Bonds (4.7%) | | | | |
| | Bank of China Ltd. | 5.000% | 11/13/24 | 5,750 | 6,383 |
| | China Cinda Finance 2015 I Ltd. | 4.250% | 4/23/25 | 3,300 | 3,623 |
| 2 | China Construction Bank Corp. | 4.250% | 2/27/29 | 3,636 | 3,893 |
| 2 | China Construction Bank Corp. | 2.450% | 6/24/30 | 3,800 | 3,817 |
| | CNAC HK Finbridge Co. Ltd. | 3.500% | 7/19/22 | 2,998 | 3,073 |
| | CNAC HK Finbridge Co. Ltd. | 4.125% | 7/19/27 | 680 | 728 |
| | CNAC HK Finbridge Co. Ltd. | 5.125% | 3/14/28 | 2,500 | 2,825 |
| | CNOOC Curtis Funding No 1 Pty Ltd. | 4.500% | 10/3/23 | 3,314 | 3,632 |
| 1 | CNOOC Finance 2012 Ltd. | 3.875% | 5/2/22 | 1,600 | 1,666 |
| | CNOOC Finance 2013 Ltd. | 3.000% | 5/9/23 | 3,324 | 3,481 |
| | CNOOC Finance 2015 USA LLC | 3.500% | 5/5/25 | 3,026 | 3,306 |
| | CNOOC Nexen Finance 2014 ULC | 4.250% | 4/30/24 | 3,160 | 3,480 |
| | Export-Import Bank of China | 3.625% | 7/31/24 | 2,777 | 3,027 |
| 2 | Huarong Finance 2017 Co. Ltd. | 4.500% | 12/31/49 | 1,450 | 1,469 |
| 2 | Huarong Finance II Co. Ltd. | 2.875% | 12/31/49 | 1,200 | 1,191 |
| | Industrial & Commercial Bank of China Ltd. | 4.875% | 9/21/25 | 3,850 | 4,338 |
| | People’s Republic of China | 2.125% | 11/2/22 | 5,473 | 5,656 |
| | People’s Republic of China | 3.250% | 10/19/23 | 3,600 | 3,901 |
| 1 | People’s Republic of China | 0.400% | 10/21/23 | 700 | 701 |
| | People’s Republic of China | 1.950% | 12/3/24 | 6,000 | 6,309 |
| | People’s Republic of China | 2.625% | 11/2/27 | 2,651 | 2,902 |
| | People’s Republic of China | 3.500% | 10/19/28 | 1,500 | 1,753 |
| | People’s Republic of China | 2.125% | 12/3/29 | 5,450 | 5,827 |
| | People’s Republic of China | 2.750% | 12/3/39 | 900 | 945 |
| | People’s Republic of China | 4.000% | 10/19/48 | 1,100 | 1,452 |
| 1 | People’s Republic of China | 2.250% | 10/21/50 | 800 | 773 |
| | Sinopec Group Overseas Development 2012 Ltd. | 3.900% | 5/17/22 | 800 | 836 |
| 1 | Sinopec Group Overseas Development 2012 Ltd. | 3.900% | 5/17/22 | 1,569 | 1,637 |
| | Sinopec Group Overseas Development 2013 Ltd. | 4.375% | 10/17/23 | 2,693 | 2,942 |
| | Sinopec Group Overseas Development 2015 Ltd. | 3.250% | 4/28/25 | 3,300 | 3,554 |
| | Sinopec Group Overseas Development 2018 Ltd. | 2.700% | 5/13/30 | 800 | 831 |
| 1 | Sinopec Group Overseas Development 2018 Ltd. | 2.700% | 5/13/30 | 2,300 | 2,387 |
| | State Grid Overseas Investment 2014 Ltd. | 4.125% | 5/7/24 | 3,070 | 3,376 |
| 1 | State Grid Overseas Investment 2016 Ltd. | 3.500% | 5/4/27 | 800 | 889 |
| | State Grid Overseas Investment 2016 Ltd. | 3.500% | 5/4/27 | 3,675 | 4,074 |
| Total China (Cost $96,341) | | | | 100,677 |
| Colombia (3.5%) | | | | |
| Sovereign Bonds (3.5%) | | | | |
| | Ecopetrol SA | 5.875% | 9/18/23 | 3,335 | 3,689 |
| | Ecopetrol SA | 4.125% | 1/16/25 | 300 | 316 |
| | Ecopetrol SA | 5.375% | 6/26/26 | 2,940 | 3,245 |
| | Ecopetrol SA | 6.875% | 4/29/30 | 3,500 | 4,200 |
| | Ecopetrol SA | 7.375% | 9/18/43 | 100 | 126 |
| | Ecopetrol SA | 5.875% | 5/28/45 | 3,905 | 4,235 |
| 2 | Republic of Colombia | 2.625% | 3/15/23 | 1,760 | 1,807 |
Emerging Markets Government Bond Index Fund
| | | | | Face | Market |
| | | | Maturity | Amount | Value· |
| | | Coupon | Date | ($000) | ($000) |
| 2 | Republic of Colombia | 4.000% | 2/26/24 | 3,845 | 4,099 |
| | Republic of Colombia | 8.125% | 5/21/24 | 2,080 | 2,514 |
| 2 | Republic of Colombia | 4.500% | 1/28/26 | 2,767 | 3,064 |
| 2 | Republic of Colombia | 3.875% | 4/25/27 | 4,425 | 4,769 |
| 2 | Republic of Colombia | 4.500% | 3/15/29 | 3,900 | 4,365 |
| 2 | Republic of Colombia | 3.000% | 1/30/30 | 3,200 | 3,296 |
| 2 | Republic of Colombia | 3.125% | 4/15/31 | 1,900 | 1,952 |
| | Republic of Colombia | 7.375% | 9/18/37 | 3,337 | 4,688 |
| | Republic of Colombia | 6.125% | 1/18/41 | 4,957 | 6,364 |
| 2 | Republic of Colombia | 5.625% | 2/26/44 | 4,584 | 5,654 |
| 2 | Republic of Colombia | 5.000% | 6/15/45 | 8,350 | 9,694 |
| | Republic of Colombia | 5.200% | 5/15/49 | 3,470 | 4,170 |
| 2 | Republic of Colombia | 4.125% | 5/15/51 | 2,900 | 3,061 |
| Total Colombia (Cost $70,445) | | | | 75,308 |
| Costa Rica (0.4%) | | | | |
| Sovereign Bonds (0.4%) | | | | |
| | Republic of Costa Rica | 4.250% | 1/26/23 | 1,982 | 1,803 |
| | Republic of Costa Rica | 4.375% | 4/30/25 | 1,000 | 845 |
| 2 | Republic of Costa Rica | 6.125% | 2/19/31 | 400 | 333 |
| 1,2 | Republic of Costa Rica | 6.125% | 2/19/31 | 1,550 | 1,279 |
| | Republic of Costa Rica | 5.625% | 4/30/43 | 1,000 | 729 |
| | Republic of Costa Rica | 7.000% | 4/4/44 | 1,930 | 1,517 |
| | Republic of Costa Rica | 7.158% | 3/12/45 | 2,551 | 2,022 |
| Total Costa Rica (Cost $10,060) | | | | 8,528 |
| Cote d’Ivoire (0.3%) | | | | |
| Sovereign Bonds (0.3%) | | | | |
| 2 | Republic of Cote d’Ivoire | 6.375% | 3/3/28 | 1,900 | 1,991 |
| 2 | Republic of Cote d’Ivoire | 5.750% | 12/31/32 | 2,178 | 2,125 |
| 2 | Republic of Cote d’Ivoire | 6.125% | 6/15/33 | 2,500 | 2,523 |
| Total Cote d’Ivoire (Cost $6,418) | | | | 6,639 |
| Croatia (0.3%) | | | | |
| Sovereign Bonds (0.3%) | | | | |
| | Republic of Croatia | 5.500% | 4/4/23 | 3,000 | 3,311 |
| | Republic of Croatia | 6.000% | 1/26/24 | 3,400 | 3,916 |
| Total Croatia (Cost $6,899) | | | | 7,227 |
| Dominican Republic (1.8%) | | | | |
| Sovereign Bonds (1.8%) | | | | |
| | Dominican Republic | 6.600% | 1/28/24 | 1,175 | 1,287 |
| 2 | Dominican Republic | 5.875% | 4/18/24 | 1,850 | 1,957 |
| | Dominican Republic | 5.500% | 1/27/25 | 3,160 | 3,378 |
| | Dominican Republic | 6.875% | 1/29/26 | 2,795 | 3,152 |
| | Dominican Republic | 5.950% | 1/25/27 | 3,300 | 3,595 |
| 1 | Dominican Republic | 6.000% | 7/19/28 | 800 | 878 |
| | Dominican Republic | 6.000% | 7/19/28 | 1,519 | 1,671 |
| | Dominican Republic | 4.500% | 1/30/30 | 300 | 302 |
| 1 | Dominican Republic | 4.500% | 1/30/30 | 800 | 804 |
| 1 | Dominican Republic | 4.875% | 9/23/32 | 3,550 | 3,603 |
| | Dominican Republic | 7.450% | 4/30/44 | 2,665 | 3,044 |
| 2 | Dominican Republic | 6.850% | 1/27/45 | 3,994 | 4,285 |
| 1 | Dominican Republic | 6.500% | 2/15/48 | 525 | 538 |
Emerging Markets Government Bond Index Fund
| | | | | Face | Market |
| | | | Maturity | Amount | Value· |
| | | Coupon | Date | ($000) | ($000) |
| | Dominican Republic | 6.500% | 2/15/48 | 1,400 | 1,441 |
| 1 | Dominican Republic | 6.400% | 6/5/49 | 1,945 | 1,969 |
| | Dominican Republic | 6.400% | 6/5/49 | 950 | 965 |
| | Dominican Republic | 5.875% | 1/30/60 | 3,900 | 3,733 |
| 1 | Dominican Republic | 5.875% | 1/30/60 | 2,450 | 2,340 |
| Total Dominican Republic (Cost $38,230) | | | | 38,942 |
| Ecuador (0.8%) | | | | |
| Sovereign Bonds (0.8%) | | | | |
| 1,2 | Republic of Ecuador | 0.000% | 7/31/30 | 1,991 | 896 |
| 1,2 | Republic of Ecuador | 0.500% | 7/31/30 | 6,385 | 4,224 |
| 2 | Republic of Ecuador | 0.500% | 7/31/30 | 100 | 66 |
| 1,2 | Republic of Ecuador | 0.500% | 7/31/35 | 16,324 | 8,979 |
| 1,2 | Republic of Ecuador | 0.500% | 7/31/40 | 6,648 | 3,299 |
| Total Ecuador (Cost $20,412) | | | | 17,464 |
| Egypt (2.2%) | | | | |
| Sovereign Bonds (2.2%) | | | | |
| | Arab Republic of Egypt | 6.125% | 1/31/22 | 4,653 | 4,786 |
| | Arab Republic of Egypt | 5.577% | 2/21/23 | 2,350 | 2,417 |
| | Arab Republic of Egypt | 4.550% | 11/20/23 | 478 | 479 |
| 1 | Arab Republic of Egypt | 4.550% | 11/20/23 | 500 | 501 |
| | Arab Republic of Egypt | 6.200% | 3/1/24 | 1,400 | 1,449 |
| | Arab Republic of Egypt | 5.750% | 5/29/24 | 1,200 | 1,228 |
| 1 | Arab Republic of Egypt | 5.750% | 5/29/24 | 1,800 | 1,845 |
| | Arab Republic of Egypt | 5.875% | 6/11/25 | 2,475 | 2,535 |
| 1 | Arab Republic of Egypt | 5.250% | 10/6/25 | 1,400 | 1,391 |
| | Arab Republic of Egypt | 7.500% | 1/31/27 | 4,150 | 4,397 |
| | Arab Republic of Egypt | 6.588% | 2/21/28 | 2,225 | 2,239 |
| | Arab Republic of Egypt | 7.600% | 3/1/29 | 3,200 | 3,327 |
| | Arab Republic of Egypt | 7.053% | 1/15/32 | 3,800 | 3,710 |
| 1 | Arab Republic of Egypt | 7.053% | 1/15/32 | 1,350 | 1,318 |
| | Arab Republic of Egypt | 6.875% | 4/30/40 | 800 | 748 |
| | Arab Republic of Egypt | 8.500% | 1/31/47 | 4,780 | 4,750 |
| | Arab Republic of Egypt | 7.903% | 2/21/48 | 3,100 | 2,935 |
| | Arab Republic of Egypt | 8.700% | 3/1/49 | 2,950 | 2,964 |
| | Arab Republic of Egypt | 8.875% | 5/29/50 | 890 | 898 |
| 1 | Arab Republic of Egypt | 8.875% | 5/29/50 | 2,900 | 2,929 |
| 1 | Arab Republic of Egypt | 8.150% | 11/20/59 | 800 | 754 |
| Total Egypt (Cost $47,799) | | | | 47,600 |
| El Salvador (0.5%) | | | | |
| Sovereign Bonds (0.5%) | | | | |
| | Republic of El Salvador | 7.750% | 1/24/23 | 1,499 | 1,366 |
| | Republic of El Salvador | 5.875% | 1/30/25 | 1,618 | 1,337 |
| | Republic of El Salvador | 6.375% | 1/18/27 | 1,462 | 1,198 |
| | Republic of El Salvador | 8.625% | 2/28/29 | 1,200 | 1,044 |
| | Republic of El Salvador | 8.250% | 4/10/32 | 982 | 815 |
| | Republic of El Salvador | 7.650% | 6/15/35 | 1,840 | 1,464 |
| | Republic of El Salvador | 7.625% | 2/1/41 | 1,218 | 940 |
| 1,2 | Republic of El Salvador | 7.125% | 1/20/50 | 1,600 | 1,200 |
| 2 | Republic of El Salvador | 7.125% | 1/20/50 | 400 | 302 |
| 2 | Republic of El Salvador | 9.500% | 7/15/52 | 300 | 260 |
| 1,2 | Republic of El Salvador | 9.500% | 7/15/52 | 1,750 | 1,518 |
| Total El Salvador (Cost $14,030) | | | | 11,444 |
Emerging Markets Government Bond Index Fund
| | | | | Face | Market |
| | | | Maturity | Amount | Value· |
| | | Coupon | Date | ($000) | ($000) |
| Ethiopia (0.1%) | | | | |
| Sovereign Bonds (0.1%) | | | | |
| | Federal Democratic Republic of Ethiopia | 6.625% | 12/11/24 | 1,750 | 1,756 |
| Total Ethiopia (Cost $1,748) | | | | 1,756 |
| Gabon (0.2%) | | | | |
| Sovereign Bonds (0.2%) | | | | |
| 2 | Gabonese Republic | 6.375% | 12/12/24 | 1,786 | 1,698 |
| | Gabonese Republic | 6.950% | 6/16/25 | 1,250 | 1,181 |
| 2 | Gabonese Republic | 6.625% | 2/6/31 | 200 | 178 |
| 1,2 | Gabonese Republic | 6.625% | 2/6/31 | 1,700 | 1,511 |
| Total Gabon (Cost $4,871) | | | | 4,568 |
| Ghana (0.9%) | | | | |
| Sovereign Bonds (0.9%) | | | | |
| 2 | Republic of Ghana | 8.125% | 1/18/26 | 1,995 | 2,001 |
| 2 | Republic of Ghana | 6.375% | 2/11/27 | 600 | 557 |
| 1,2 | Republic of Ghana | 6.375% | 2/11/27 | 2,500 | 2,319 |
| 2 | Republic of Ghana | 7.875% | 3/26/27 | 930 | 900 |
| 2 | Republic of Ghana | 7.625% | 5/16/29 | 1,800 | 1,664 |
| 2 | Republic of Ghana | 10.750% | 10/14/30 | 1,800 | 2,205 |
| 2 | Republic of Ghana | 8.125% | 3/26/32 | 2,500 | 2,287 |
| 2 | Republic of Ghana | 7.875% | 2/11/35 | 200 | 177 |
| 1,2 | Republic of Ghana | 7.875% | 2/11/35 | 1,900 | 1,686 |
| 1,2 | Republic of Ghana | 8.627% | 6/16/49 | 800 | 702 |
| 2 | Republic of Ghana | 8.627% | 6/16/49 | 1,550 | 1,359 |
| 2 | Republic of Ghana | 8.950% | 3/26/51 | 1,700 | 1,519 |
| 1,2 | Republic of Ghana | 8.750% | 3/11/61 | 1,100 | 968 |
| Total Ghana (Cost $19,579) | | | | 18,344 |
| Guatemala (0.5%) | | | | |
| Sovereign Bonds (0.5%) | | | | |
| | Republic of Guatemala | 5.750% | 6/6/22 | 1,903 | 2,013 |
| | Republic of Guatemala | 4.500% | 5/3/26 | 1,500 | 1,638 |
| | Republic of Guatemala | 4.375% | 6/5/27 | 1,200 | 1,315 |
| | Republic of Guatemala | 4.875% | 2/13/28 | 800 | 899 |
| 1,2 | Republic of Guatemala | 4.900% | 6/1/30 | 400 | 453 |
| 2 | Republic of Guatemala | 4.900% | 6/1/30 | 200 | 227 |
| 2 | Republic of Guatemala | 5.375% | 4/24/32 | 200 | 236 |
| 1,2 | Republic of Guatemala | 5.375% | 4/24/32 | 800 | 941 |
| 2 | Republic of Guatemala | 6.125% | 6/1/50 | 2,700 | 3,330 |
| Total Guatemala (Cost $9,939) | | | | 11,052 |
| Honduras (0.2%) | | | | |
| Sovereign Bonds (0.2%) | | | | |
| 2 | Republic of Honduras | 7.500% | 3/15/24 | 1,000 | 1,101 |
| | Republic of Honduras | 6.250% | 1/19/27 | 1,270 | 1,427 |
| 1 | Republic of Honduras | 5.625% | 6/24/30 | 1,150 | 1,269 |
| Total Honduras (Cost $3,553) | | | | 3,797 |
| Hungary (0.8%) | | | | |
| Sovereign Bonds (0.8%) | | | | |
| | Republic of Hungary | 6.375% | 3/29/21 | 5 | 5 |
| | Republic of Hungary | 5.375% | 2/21/23 | 3,090 | 3,410 |
Emerging Markets Government Bond Index Fund
| | | | | Face | Market |
| | | | Maturity | Amount | Value· |
| | | Coupon | Date | ($000) | ($000) |
| | Republic of Hungary | 5.750% | 11/22/23 | 3,454 | 3,959 |
| | Republic of Hungary | 5.375% | 3/25/24 | 4,193 | 4,805 |
| | Republic of Hungary | 7.625% | 3/29/41 | 2,220 | 3,939 |
| Total Hungary (Cost $14,899) | | | | 16,118 |
| Indonesia (7.1%) | | | | |
| Sovereign Bonds (7.1%) | | | | |
| | Pertamina Persero PT | 4.875% | 5/3/22 | 750 | 792 |
| 1 | Pertamina Persero PT | 4.300% | 5/20/23 | 430 | 461 |
| | Pertamina Persero PT | 4.300% | 5/20/23 | 2,000 | 2,143 |
| 1 | Pertamina Persero PT | 5.625% | 5/20/43 | 200 | 233 |
| | Pertamina Persero PT | 6.450% | 5/30/44 | 2,100 | 2,722 |
| | Pertamina Persero PT | 6.500% | 11/7/48 | 400 | 529 |
| 1 | Perusahaan Listrik Negara PT | 4.125% | 5/15/27 | 1,250 | 1,361 |
| | Perusahaan Listrik Negara PT | 4.125% | 5/15/27 | 1,817 | 1,978 |
| | Perusahaan Penerbit SBSN Indonesia III | 3.400% | 3/29/22 | 2,100 | 2,173 |
| | Perusahaan Penerbit SBSN Indonesia III | 3.300% | 11/21/22 | 804 | 842 |
| 1 | Perusahaan Penerbit SBSN Indonesia III | 3.750% | 3/1/23 | 800 | 850 |
| 4 | Perusahaan Penerbit SBSN Indonesia III | 3.750% | 3/1/23 | 2,200 | 2,337 |
| 4 | Perusahaan Penerbit SBSN Indonesia III | 3.900% | 8/20/24 | 1,950 | 2,138 |
| | Perusahaan Penerbit SBSN Indonesia III | 4.350% | 9/10/24 | 2,900 | 3,226 |
| 1 | Perusahaan Penerbit SBSN Indonesia III | 4.350% | 9/10/24 | 400 | 445 |
| | Perusahaan Penerbit SBSN Indonesia III | 4.325% | 5/28/25 | 4,469 | 5,028 |
| | Perusahaan Penerbit SBSN Indonesia III | 4.550% | 3/29/26 | 3,585 | 4,096 |
| | Perusahaan Penerbit SBSN Indonesia III | 4.150% | 3/29/27 | 4,450 | 4,995 |
| 4 | Perusahaan Penerbit SBSN Indonesia III | 4.400% | 3/1/28 | 2,182 | 2,493 |
| 1 | Perusahaan Penerbit SBSN Indonesia III | 4.400% | 3/1/28 | 900 | 1,028 |
| 4 | Perusahaan Penerbit SBSN Indonesia III | 4.450% | 2/20/29 | 600 | 693 |
| 1,4 | Perusahaan Penerbit SBSN Indonesia III | 4.450% | 2/20/29 | 1,000 | 1,155 |
| 4 | Perusahaan Penerbit SBSN Indonesia III | 2.800% | 6/23/30 | 1,900 | 1,957 |
| | Perusahaan Penerbit SBSN Indonesia III | 3.800% | 6/23/50 | 1,400 | 1,491 |
| | Republic of Indonesia | 3.700% | 1/8/22 | 1,200 | 1,239 |
| | Republic of Indonesia | 3.750% | 4/25/22 | 3,750 | 3,900 |
| | Republic of Indonesia | 3.375% | 4/15/23 | 4,600 | 4,861 |
| | Republic of Indonesia | 5.375% | 10/17/23 | 1,859 | 2,092 |
| | Republic of Indonesia | 5.875% | 1/15/24 | 4,150 | 4,760 |
| | Republic of Indonesia | 4.450% | 2/11/24 | 1,200 | 1,329 |
| | Republic of Indonesia | 4.125% | 1/15/25 | 3,800 | 4,227 |
| | Republic of Indonesia | 4.750% | 1/8/26 | 4,400 | 5,085 |
| | Republic of Indonesia | 4.350% | 1/8/27 | 2,235 | 2,555 |
| | Republic of Indonesia | 3.850% | 7/18/27 | 1,950 | 2,182 |
| | Republic of Indonesia | 3.500% | 1/11/28 | 2,336 | 2,555 |
| | Republic of Indonesia | 4.100% | 4/24/28 | 1,958 | 2,222 |
| | Republic of Indonesia | 4.750% | 2/11/29 | 2,400 | 2,850 |
| | Republic of Indonesia | 3.400% | 9/18/29 | 1,800 | 1,967 |
| | Republic of Indonesia | 2.850% | 2/14/30 | 2,300 | 2,418 |
| | Republic of Indonesia | 3.850% | 10/15/30 | 3,150 | 3,591 |
| | Republic of Indonesia | 8.500% | 10/12/35 | 3,000 | 4,800 |
| | Republic of Indonesia | 6.625% | 2/17/37 | 2,887 | 4,025 |
| | Republic of Indonesia | 7.750% | 1/17/38 | 3,888 | 5,991 |
| | Republic of Indonesia | 5.250% | 1/17/42 | 3,950 | 4,963 |
| | Republic of Indonesia | 4.625% | 4/15/43 | 2,875 | 3,359 |
| | Republic of Indonesia | 6.750% | 1/15/44 | 3,830 | 5,748 |
| | Republic of Indonesia | 5.125% | 1/15/45 | 3,969 | 4,977 |
Emerging Markets Government Bond Index Fund
| | | | | Face | Market |
| | | | Maturity | Amount | Value· |
| | | Coupon | Date | ($000) | ($000) |
| | Republic of Indonesia | 5.950% | 1/8/46 | 1,160 | 1,636 |
| | Republic of Indonesia | 5.250% | 1/8/47 | 3,200 | 4,162 |
| | Republic of Indonesia | 4.750% | 7/18/47 | 2,050 | 2,508 |
| | Republic of Indonesia | 4.350% | 1/11/48 | 3,450 | 3,976 |
| | Republic of Indonesia | 5.350% | 2/11/49 | 2,300 | 3,068 |
| | Republic of Indonesia | 3.700% | 10/30/49 | 2,100 | 2,231 |
| | Republic of Indonesia | 3.500% | 2/14/50 | 1,600 | 1,684 |
| | Republic of Indonesia | 4.200% | 10/15/50 | 2,700 | 3,108 |
| | Republic of Indonesia | 4.450% | 4/15/70 | 2,200 | 2,591 |
| Total Indonesia (Cost $139,470) | | | | 151,826 |
| Iraq (0.3%) | | | | |
| Sovereign Bonds (0.3%) | | | | |
| | Republic of Iraq | 6.752% | 3/9/23 | 1,950 | 1,812 |
| 1 | Republic of Iraq | 6.752% | 3/9/23 | 200 | 186 |
| 2 | Republic of Iraq | 5.800% | 1/15/28 | 4,636 | 3,984 |
| Total Iraq (Cost $6,563) | | | | 5,982 |
| Jamaica (0.5%) | | | | |
| Sovereign Bonds (0.5%) | | | | |
| | Jamaica | 6.750% | 4/28/28 | 2,950 | 3,400 |
| 2 | Jamaica | 8.000% | 3/15/39 | 2,448 | 3,241 |
| | Jamaica | 7.875% | 7/28/45 | 3,250 | 4,233 |
| Total Jamaica (Cost $10,263) | | | | 10,874 |
| Jordan (0.4%) | | | | |
| Sovereign Bonds (0.4%) | | | | |
| 1 | Hashemite Kingdom of Jordan | 4.950% | 7/7/25 | 900 | 913 |
| | Hashemite Kingdom of Jordan | 6.125% | 1/29/26 | 2,000 | 2,100 |
| | Hashemite Kingdom of Jordan | 5.750% | 1/31/27 | 1,814 | 1,867 |
| 1 | Hashemite Kingdom of Jordan | 5.850% | 7/7/30 | 2,200 | 2,214 |
| | Hashemite Kingdom of Jordan | 7.375% | 10/10/47 | 2,050 | 2,117 |
| Total Jordan (Cost $8,988) | | | | 9,211 |
| Kazakhstan (0.9%) | | | | |
| Sovereign Bonds (0.9%) | | | | |
| | KazMunayGas National Co. JSC | 5.750% | 4/19/47 | 900 | 1,115 |
| 1 | KazMunayGas National Co. JSC | 6.375% | 10/24/48 | 900 | 1,200 |
| | KazMunayGas National Co. JSC | 6.375% | 10/24/48 | 1,200 | 1,592 |
| | Republic of Kazakhstan | 3.875% | 10/14/24 | 2,970 | 3,249 |
| | Republic of Kazakhstan | 5.125% | 7/21/25 | 4,750 | 5,518 |
| | Republic of Kazakhstan | 4.875% | 10/14/44 | 1,900 | 2,517 |
| | Republic of Kazakhstan | 6.500% | 7/21/45 | 2,630 | 4,143 |
| Total Kazakhstan (Cost $17,135) | | | | 19,334 |
| Kenya (0.6%) | | | | |
| Sovereign Bonds (0.6%) | | | | |
| | Republic of Kenya | 6.875% | 6/24/24 | 3,900 | 4,117 |
| 2 | Republic of Kenya | 7.000% | 5/22/27 | 1,425 | 1,478 |
| | Republic of Kenya | 7.250% | 2/28/28 | 2,000 | 2,086 |
| 2 | Republic of Kenya | 8.000% | 5/22/32 | 2,400 | 2,519 |
| | Republic of Kenya | 8.250% | 2/28/48 | 1,825 | 1,874 |
| Total Kenya (Cost $11,597) | | | | 12,074 |
Emerging Markets Government Bond Index Fund
| | | | | Face | Market |
| | | | Maturity | Amount | Value· |
| | | Coupon | Date | ($000) | ($000) |
| Kuwait (0.8%) | | | | |
| Sovereign Bonds (0.8%) | | | | |
| | State of Kuwait | 2.750% | 3/20/22 | 6,375 | 6,542 |
| | State of Kuwait | 3.500% | 3/20/27 | 8,800 | 9,946 |
| Total Kuwait (Cost $15,565) | | | | 16,488 |
| Lebanon (0.2%) | | | | |
| Sovereign Bonds (0.2%) | | | | |
| 5 | Republic of Lebanon | 6.100% | 10/4/22 | 3,439 | 490 |
| 5 | Republic of Lebanon | 6.000% | 1/27/23 | 2,010 | 287 |
| 5 | Republic of Lebanon | 6.650% | 4/22/24 | 1,891 | 269 |
| 5 | Republic of Lebanon | 6.200% | 2/26/25 | 1,760 | 250 |
| 5 | Republic of Lebanon | 6.250% | 6/12/25 | 400 | 56 |
| 5 | Republic of Lebanon | 6.600% | 11/27/26 | 3,805 | 537 |
| 5 | Republic of Lebanon | 6.850% | 3/23/27 | 2,750 | 389 |
| 5 | Republic of Lebanon | 6.750% | 11/29/27 | 2,411 | 341 |
| 5 | Republic of Lebanon | 6.650% | 11/3/28 | 2,040 | 286 |
| 5 | Republic of Lebanon | 6.850% | 5/25/29 | 1,800 | 253 |
| 5 | Republic of Lebanon | 6.650% | 2/26/30 | 3,225 | 456 |
| 5 | Republic of Lebanon | 7.000% | 3/23/32 | 2,550 | 355 |
| 5 | Republic of Lebanon | 7.050% | 11/2/35 | 500 | 71 |
| 5 | Republic of Lebanon | 7.250% | 3/23/37 | 1,905 | 269 |
| Total Lebanon (Cost $24,585) | | | | 4,309 |
| Malaysia (1.4%) | | | | |
| Sovereign Bonds (1.4%) | | | | |
| | 1MDB Global Investments Ltd. | 4.400% | 3/9/23 | 5,700 | 5,662 |
| | Malaysia Sovereign Sukuk Bhd. | 3.043% | 4/22/25 | 1,850 | 2,010 |
| | Malaysia Sovereign Sukuk Bhd. | 4.236% | 4/22/45 | 975 | 1,251 |
| | Malaysia Sukuk Global Bhd. | 3.179% | 4/27/26 | 2,000 | 2,217 |
| | Malaysia Sukuk Global Bhd. | 4.080% | 4/27/46 | 700 | 886 |
| | Petronas Capital Ltd. | 3.500% | 3/18/25 | 2,800 | 3,079 |
| | Petronas Capital Ltd. | 3.500% | 4/21/30 | 3,000 | 3,347 |
| | Petronas Capital Ltd. | 3.500% | 4/21/30 | 200 | 223 |
| 1 | Petronas Capital Ltd. | 3.500% | 4/21/30 | 1,400 | 1,564 |
| | Petronas Capital Ltd. | 4.500% | 3/18/45 | 3,000 | 3,799 |
| | Petronas Capital Ltd. | 4.550% | 4/21/50 | 200 | 249 |
| 1 | Petronas Capital Ltd. | 4.550% | 4/21/50 | 4,800 | 6,041 |
| Total Malaysia (Cost $28,223) | | | | 30,328 |
| Mexico (9.3%) | | | | |
| Sovereign Bonds (9.3%) | | | | |
| | Mexico City Airport Trust | 5.500% | 7/31/47 | 3,954 | 3,395 |
| 1 | Mexico City Airport Trust | 5.500% | 7/31/47 | 190 | 163 |
| 1 | Petroleos Mexicanos | 6.875% | 10/16/25 | 2,150 | 2,129 |
| | Petroleos Mexicanos | 6.875% | 8/4/26 | 5,957 | 5,701 |
| | Petroleos Mexicanos | 6.490% | 1/23/27 | 3,816 | 3,551 |
| | Petroleos Mexicanos | 6.500% | 3/13/27 | 10,787 | 10,025 |
| | Petroleos Mexicanos | 5.350% | 2/12/28 | 4,750 | 4,053 |
| | Petroleos Mexicanos | 6.500% | 1/23/29 | 3,675 | 3,277 |
| | Petroleos Mexicanos | 6.840% | 1/23/30 | 8,059 | 7,192 |
| | Petroleos Mexicanos | 5.950% | 1/28/31 | 6,920 | 5,792 |
| | Petroleos Mexicanos | 6.625% | 6/15/35 | 5,114 | 4,199 |
| | Petroleos Mexicanos | 6.500% | 6/2/41 | 3,410 | 2,638 |
Emerging Markets Government Bond Index Fund
| | | | | Face | Market |
| | | | Maturity | Amount | Value· |
| | | Coupon | Date | ($000) | ($000) |
| | Petroleos Mexicanos | 6.375% | 1/23/45 | 3,380 | 2,584 |
| | Petroleos Mexicanos | 6.750% | 9/21/47 | 11,079 | 8,623 |
| | Petroleos Mexicanos | 6.350% | 2/12/48 | 5,980 | 4,568 |
| | Petroleos Mexicanos | 7.690% | 1/23/50 | 14,914 | 12,392 |
| | Petroleos Mexicanos | 6.950% | 1/28/60 | 7,200 | 5,630 |
| | United Mexican States | 3.625% | 3/15/22 | 3,073 | 3,191 |
| | United Mexican States | 8.000% | 9/24/22 | 1,373 | 1,544 |
| | United Mexican States | 4.000% | 10/2/23 | 5,426 | 5,891 |
| | United Mexican States | 3.600% | 1/30/25 | 4,299 | 4,636 |
| 2 | United Mexican States | 3.900% | 4/27/25 | 2,100 | 2,302 |
| | United Mexican States | 4.125% | 1/21/26 | 4,062 | 4,523 |
| | United Mexican States | 4.150% | 3/28/27 | 5,020 | 5,593 |
| | United Mexican States | 3.750% | 1/11/28 | 3,705 | 3,992 |
| | United Mexican States | 4.500% | 4/22/29 | 6,761 | 7,624 |
| 2 | United Mexican States | 3.250% | 4/16/30 | 6,375 | 6,549 |
| | United Mexican States | 8.300% | 8/15/31 | 1,800 | 2,608 |
| 2 | United Mexican States | 4.750% | 4/27/32 | 4,415 | 5,025 |
| | United Mexican States | 7.500% | 4/8/33 | 1,110 | 1,539 |
| | United Mexican States | 6.750% | 9/27/34 | 3,376 | 4,524 |
| | United Mexican States | 6.050% | 1/11/40 | 5,999 | 7,533 |
| | United Mexican States | 4.750% | 3/8/44 | 7,996 | 8,828 |
| | United Mexican States | 5.550% | 1/21/45 | 5,304 | 6,453 |
| | United Mexican States | 4.600% | 1/23/46 | 5,281 | 5,711 |
| | United Mexican States | 4.350% | 1/15/47 | 3,326 | 3,485 |
| | United Mexican States | 4.600% | 2/10/48 | 4,923 | 5,301 |
| 2 | United Mexican States | 4.500% | 1/31/50 | 5,200 | 5,576 |
| 2 | United Mexican States | 5.000% | 4/27/51 | 4,775 | 5,432 |
| | United Mexican States | 5.750% | 10/12/10 | 5,142 | 5,991 |
| Total Mexico (Cost $206,428) | | | | 199,763 |
| Mongolia (0.3%) | | | | |
| Sovereign Bonds (0.3%) | | | | |
| | Mongolia | 5.125% | 12/5/22 | 2,509 | 2,572 |
| 1 | Mongolia | 5.625% | 5/1/23 | 200 | 208 |
| | Mongolia | 8.750% | 3/9/24 | 1,200 | 1,366 |
| 1 | Mongolia | 5.125% | 4/7/26 | 1,248 | 1,288 |
| Total Mongolia (Cost $5,198) | | | | 5,434 |
| Morocco (0.2%) | | | | |
| Sovereign Bonds (0.2%) | | | | |
| | Kingdom of Morocco | 4.250% | 12/11/22 | 2,800 | 2,930 |
| | Kingdom of Morocco | 5.500% | 12/11/42 | 1,340 | 1,609 |
| Total Morocco (Cost $4,299) | | | | 4,539 |
| Mozambique (0.1%) | | | | |
| Sovereign Bonds (0.1%) | | | | |
| 2 | Republic of Mozambique | 5.000% | 9/15/31 | 1,500 | 1,232 |
| Total Mozambique (Cost $1,424) | | | | 1,232 |
| Namibia (0.1%) | | | | |
| Sovereign Bonds (0.1%) | | | | |
| | Republic of Namibia | 5.500% | 11/3/21 | 900 | 912 |
| | Republic of Namibia | 5.250% | 10/29/25 | 1,350 | 1,363 |
| Total Namibia (Cost $2,261) | | | | 2,275 |
Emerging Markets Government Bond Index Fund
| | | | | Face | Market |
| | | | Maturity | Amount | Value· |
| | | Coupon | Date | ($000) | ($000) |
| Nigeria (0.9%) | | | | |
| Sovereign Bonds (0.9%) | | | | |
| | Federal Republic of Nigeria | 6.375% | 7/12/23 | 1,000 | 1,039 |
| | Federal Republic of Nigeria | 7.625% | 11/21/25 | 1,550 | 1,626 |
| 1 | Federal Republic of Nigeria | 7.625% | 11/21/25 | 400 | 420 |
| | Federal Republic of Nigeria | 6.500% | 11/28/27 | 2,800 | 2,711 |
| | Federal Republic of Nigeria | 7.143% | 2/23/30 | 2,600 | 2,508 |
| | Federal Republic of Nigeria | 8.747% | 1/21/31 | 200 | 207 |
| 1 | Federal Republic of Nigeria | 8.747% | 1/21/31 | 900 | 933 |
| | Federal Republic of Nigeria | 7.875% | 2/16/32 | 3,450 | 3,343 |
| 1 | Federal Republic of Nigeria | 7.875% | 2/16/32 | 300 | 291 |
| 1 | Federal Republic of Nigeria | 7.696% | 2/23/38 | 1,700 | 1,564 |
| | Federal Republic of Nigeria | 7.696% | 2/23/38 | 800 | 736 |
| | Federal Republic of Nigeria | 7.625% | 11/28/47 | 2,300 | 2,096 |
| | Federal Republic of Nigeria | 9.248% | 1/21/49 | 1,700 | 1,726 |
| Total Nigeria (Cost $19,837) | | | | 19,200 |
| Oman (1.8%) | | | | |
| Sovereign Bonds (1.8%) | | | | |
| | Oman Sovereign Sukuk SAOC | 4.397% | 6/1/24 | 3,600 | 3,600 |
| 1 | Oman Sovereign Sukuk SAOC | 5.932% | 10/31/25 | 700 | 736 |
| | Oman Sovereign Sukuk SAOC | 5.932% | 10/31/25 | 1,900 | 1,997 |
| | Sultanate of Oman | 3.875% | 3/8/22 | 1,750 | 1,724 |
| | Sultanate of Oman | 4.125% | 1/17/23 | 2,800 | 2,747 |
| 1 | Sultanate of Oman | 4.125% | 1/17/23 | 650 | 637 |
| | Sultanate of Oman | 4.875% | 2/1/25 | 200 | 192 |
| 1 | Sultanate of Oman | 4.875% | 2/1/25 | 450 | 433 |
| | Sultanate of Oman | 4.750% | 6/15/26 | 4,775 | 4,367 |
| | Sultanate of Oman | 5.375% | 3/8/27 | 4,025 | 3,680 |
| 1 | Sultanate of Oman | 6.750% | 10/28/27 | 2,300 | 2,268 |
| | Sultanate of Oman | 5.625% | 1/17/28 | 5,000 | 4,560 |
| 1 | Sultanate of Oman | 6.000% | 8/1/29 | 3,800 | 3,468 |
| 1 | Sultanate of Oman | 7.375% | 10/28/32 | 1,400 | 1,339 |
| | Sultanate of Oman | 6.500% | 3/8/47 | 3,915 | 3,159 |
| 1 | Sultanate of Oman | 6.750% | 1/17/48 | 1,450 | 1,184 |
| | Sultanate of Oman | 6.750% | 1/17/48 | 3,900 | 3,182 |
| Total Oman (Cost $41,600) | | | | 39,273 |
| Pakistan (0.4%) | | | | |
| Sovereign Bonds (0.4%) | | | | |
| | Islamic Republic of Pakistan | 8.250% | 4/15/24 | 2,150 | 2,237 |
| | Islamic Republic of Pakistan | 8.250% | 9/30/25 | 1,150 | 1,204 |
| 1 | Islamic Republic of Pakistan | 6.875% | 12/5/27 | 750 | 731 |
| | Islamic Republic of Pakistan | 6.875% | 12/5/27 | 2,050 | 2,000 |
| | Third Pakistan International Sukuk Co. Ltd. | 5.625% | 12/5/22 | 1,600 | 1,592 |
| Total Pakistan (Cost $7,893) | | | | 7,764 |
| Panama (2.2%) | | | | |
| Sovereign Bonds (2.2%) | | | | |
| 2 | Republic of Panama | 4.000% | 9/22/24 | 2,500 | 2,731 |
| 2 | Republic of Panama | 3.750% | 3/16/25 | 2,609 | 2,850 |
| | Republic of Panama | 7.125% | 1/29/26 | 2,025 | 2,557 |
| | Republic of Panama | 8.875% | 9/30/27 | 1,995 | 2,853 |
| 2 | Republic of Panama | 3.875% | 3/17/28 | 2,133 | 2,416 |
Emerging Markets Government Bond Index Fund
| | | | | Face | Market |
| | | | Maturity | Amount | Value· |
| | | Coupon | Date | ($000) | ($000) |
| | Republic of Panama | 9.375% | 4/1/29 | 1,550 | 2,379 |
| 2 | Republic of Panama | 3.160% | 1/23/30 | 2,900 | 3,161 |
| 2 | Republic of Panama | 2.252% | 9/29/32 | 2,200 | 2,238 |
| 2 | Republic of Panama | 6.700% | 1/26/36 | 3,745 | 5,430 |
| 2 | Republic of Panama | 4.500% | 5/15/47 | 2,200 | 2,706 |
| 2 | Republic of Panama | 4.500% | 4/16/50 | 3,200 | 3,936 |
| 2 | Republic of Panama | 4.300% | 4/29/53 | 3,450 | 4,149 |
| 2 | Republic of Panama | 4.500% | 4/1/56 | 4,800 | 5,904 |
| 2 | Republic of Panama | 3.870% | 7/23/60 | 3,500 | 3,942 |
| Total Panama (Cost $43,500) | | | | 47,252 |
| Papua New Guinea (0.0%) | | | | |
| Sovereign Bonds (0.0%) | | | | |
| | Papua New Guinea | 8.375% | 10/4/28 | 700 | 688 |
| 1 | Papua New Guinea | 8.375% | 10/4/28 | 300 | 293 |
| Total Papua New Guinea (Cost $1,029) | | | | 981 |
| Paraguay (0.6%) | | | | |
| Sovereign Bonds (0.6%) | | | | |
| | Republic of Paraguay | 4.625% | 1/25/23 | 1,672 | 1,773 |
| | Republic of Paraguay | 5.000% | 4/15/26 | 1,385 | 1,573 |
| | Republic of Paraguay | 4.700% | 3/27/27 | 900 | 1,016 |
| 2 | Republic of Paraguay | 4.950% | 4/28/31 | 600 | 701 |
| 1,2 | Republic of Paraguay | 4.950% | 4/28/31 | 1,000 | 1,182 |
| | Republic of Paraguay | 6.100% | 8/11/44 | 1,700 | 2,195 |
| | Republic of Paraguay | 5.600% | 3/13/48 | 1,450 | 1,788 |
| 1,2 | Republic of Paraguay | 5.400% | 3/30/50 | 1,300 | 1,586 |
| 2 | Republic of Paraguay | 5.400% | 3/30/50 | 400 | 486 |
| Total Paraguay (Cost $11,243) | | | | 12,300 |
| Peru (1.5%) | | | | |
| Sovereign Bonds (1.5%) | | | | |
| | Republic of Peru | 7.350% | 7/21/25 | 2,759 | 3,521 |
| 2 | Republic of Peru | 2.392% | 1/23/26 | 1,925 | 2,023 |
| | Republic of Peru | 4.125% | 8/25/27 | 2,047 | 2,376 |
| | Republic of Peru | 2.844% | 6/20/30 | 2,054 | 2,238 |
| 2 | Republic of Peru | 2.783% | 1/23/31 | 3,290 | 3,597 |
| | Republic of Peru | 8.750% | 11/21/33 | 3,586 | 6,049 |
| 2 | Republic of Peru | 6.550% | 3/14/37 | 2,246 | 3,405 |
| | Republic of Peru | 5.625% | 11/18/50 | 4,977 | 7,909 |
| Total Peru (Cost $27,800) | | | | 31,118 |
| Philippines (2.7%) | | | | |
| Sovereign Bonds (2.7%) | | | | |
| | Republic of the Philippines | 4.200% | 1/21/24 | 3,014 | 3,346 |
| 2 | Republic of the Philippines | 7.500% | 9/25/24 | 1,150 | 1,374 |
| | Republic of the Philippines | 10.625% | 3/16/25 | 2,459 | 3,486 |
| | Republic of the Philippines | 5.500% | 3/30/26 | 1,850 | 2,282 |
| | Republic of the Philippines | 3.000% | 2/1/28 | 3,950 | 4,325 |
| | Republic of the Philippines | 3.750% | 1/14/29 | 2,800 | 3,236 |
| | Republic of the Philippines | 9.500% | 2/2/30 | 3,500 | 5,736 |
| | Republic of the Philippines | 2.457% | 5/5/30 | 2,100 | 2,244 |
| | Republic of the Philippines | 7.750% | 1/14/31 | 3,454 | 5,233 |
| | Republic of the Philippines | 6.375% | 1/15/32 | 2,050 | 2,888 |
Emerging Markets Government Bond Index Fund
| | | | | Face | Market |
| | | | Maturity | Amount | Value· |
| | | Coupon | Date | ($000) | ($000) |
| | Republic of the Philippines | 6.375% | 10/23/34 | 3,635 | 5,257 |
| | Republic of the Philippines | 5.000% | 1/13/37 | 2,780 | 3,624 |
| | Republic of the Philippines | 3.950% | 1/20/40 | 3,550 | 4,162 |
| | Republic of the Philippines | 3.700% | 3/1/41 | 3,750 | 4,289 |
| | Republic of the Philippines | 3.700% | 2/2/42 | 3,920 | 4,478 |
| | Republic of the Philippines | 2.950% | 5/5/45 | 2,400 | 2,509 |
| Total Philippines (Cost $54,296) | | | | 58,469 |
| Poland (0.8%) | | | | |
| Sovereign Bonds (0.8%) | | | | |
| | Republic of Poland | 5.000% | 3/23/22 | 4,869 | 5,192 |
| 6 | Republic of Poland | 3.000% | 3/17/23 | 3,778 | 4,004 |
| | Republic of Poland | 4.000% | 1/22/24 | 3,983 | 4,431 |
| | Republic of Poland | 3.250% | 4/6/26 | 3,560 | 4,011 |
| Total Poland (Cost $16,717) | | | | 17,638 |
| Qatar (5.2%) | | | | |
| Sovereign Bonds (5.2%) | | | | |
| | SoQ Sukuk A QSC | 3.241% | 1/18/23 | 3,635 | 3,830 |
| 1 | State of Qatar | 4.500% | 1/20/22 | 3,200 | 3,344 |
| 1 | State of Qatar | 3.875% | 4/23/23 | 100 | 107 |
| | State of Qatar | 3.875% | 4/23/23 | 6,275 | 6,728 |
| | State of Qatar | 3.375% | 3/14/24 | 3,900 | 4,201 |
| | State of Qatar | 3.400% | 4/16/25 | 2,200 | 2,412 |
| 1 | State of Qatar | 3.400% | 4/16/25 | 1,850 | 2,030 |
| | State of Qatar | 3.250% | 6/2/26 | 6,750 | 7,449 |
| 1 | State of Qatar | 4.500% | 4/23/28 | 5,100 | 6,108 |
| | State of Qatar | 4.500% | 4/23/28 | 600 | 719 |
| | State of Qatar | 4.000% | 3/14/29 | 7,700 | 9,015 |
| | State of Qatar | 3.750% | 4/16/30 | 6,550 | 7,599 |
| | State of Qatar | 9.750% | 6/15/30 | 600 | 1,010 |
| 1 | State of Qatar | 9.750% | 6/15/30 | 1,250 | 2,094 |
| | State of Qatar | 6.400% | 1/20/40 | 728 | 1,124 |
| 1 | State of Qatar | 6.400% | 1/20/40 | 925 | 1,420 |
| | State of Qatar | 5.750% | 1/20/42 | 1,200 | 1,761 |
| 1 | State of Qatar | 5.750% | 1/20/42 | 716 | 1,044 |
| | State of Qatar | 4.625% | 6/2/46 | 3,850 | 5,045 |
| | State of Qatar | 5.103% | 4/23/48 | 11,100 | 15,302 |
| | State of Qatar | 4.817% | 3/14/49 | 12,000 | 15,990 |
| | State of Qatar | 4.400% | 4/16/50 | 9,300 | 11,844 |
| Total Qatar (Cost $99,193) | | | | 110,176 |
| Romania (1.0%) | | | | |
| Sovereign Bonds (1.0%) | | | | |
| | Republic of Romania | 6.750% | 2/7/22 | 3,532 | 3,792 |
| | Republic of Romania | 4.375% | 8/22/23 | 2,604 | 2,835 |
| | Republic of Romania | 4.875% | 1/22/24 | 1,880 | 2,087 |
| | Republic of Romania | 3.000% | 2/14/31 | 600 | 619 |
| 1 | Republic of Romania | 3.000% | 2/14/31 | 2,600 | 2,685 |
| | Republic of Romania | 6.125% | 1/22/44 | 1,970 | 2,637 |
| 1 | Republic of Romania | 5.125% | 6/15/48 | 80 | 96 |
| | Republic of Romania | 5.125% | 6/15/48 | 2,250 | 2,713 |
| 1 | Republic of Romania | 4.000% | 2/14/51 | 3,500 | 3,545 |
| Total Romania (Cost $20,199) | | | | 21,009 |
Emerging Markets Government Bond Index Fund
| | | | | Face | Market |
| | | | Maturity | Amount | Value· |
| | | Coupon | Date | ($000) | ($000) |
| Russia (4.7%) | | | | |
| Sovereign Bonds (4.7%) | | | | |
| | Gazprom Neft OAO Via GPN Capital SA | 4.375% | 9/19/22 | 3,150 | 3,280 |
| 1 | Gazprom Neft OAO Via GPN Capital SA | 6.000% | 11/27/23 | 200 | 222 |
| | Gazprom Neft OAO Via GPN Capital SA | 6.000% | 11/27/23 | 2,100 | 2,332 |
| 1 | Gazprom PJSC Via Gaz Finance plc | 3.250% | 2/25/30 | 3,600 | 3,587 |
| | Rosneft Oil Co. Via Rosneft International Finance DAC | 4.199% | 3/6/22 | 3,927 | 4,032 |
| | Russian Federation | 4.500% | 4/4/22 | 3,800 | 3,977 |
| | Russian Federation | 4.875% | 9/16/23 | 5,800 | 6,350 |
| 1 | Russian Federation | 4.875% | 9/16/23 | 250 | 274 |
| | Russian Federation | 4.750% | 5/27/26 | 5,800 | 6,623 |
| | Russian Federation | 4.250% | 6/23/27 | 4,800 | 5,390 |
| | Russian Federation | 12.750% | 6/24/28 | 4,985 | 8,497 |
| | Russian Federation | 4.375% | 3/21/29 | 6,000 | 6,855 |
| 2 | Russian Federation | 7.500% | 3/31/30 | 3,191 | 3,675 |
| | Russian Federation | 5.100% | 3/28/35 | 7,600 | 9,235 |
| | Russian Federation | 5.625% | 4/4/42 | 5,000 | 6,585 |
| | Russian Federation | 5.875% | 9/16/43 | 3,400 | 4,641 |
| | Russian Federation | 5.250% | 6/23/47 | 11,600 | 15,203 |
| 1 | Russian Federation | 5.250% | 6/23/47 | 1,600 | 2,097 |
| | Sberbank of Russia Via SB Capital SA | 6.125% | 2/7/22 | 2,800 | 2,943 |
| | Sberbank of Russia Via SB Capital SA | 5.125% | 10/29/22 | 3,924 | 4,117 |
| Total Russia (Cost $91,395) | | | | 99,915 |
| Saudi Arabia (8.1%) | | | | |
| Sovereign Bonds (8.1%) | | | | |
| | Kingdom of Saudi Arabia | 2.875% | 3/4/23 | 5,610 | 5,854 |
| | Kingdom of Saudi Arabia | 4.000% | 4/17/25 | 6,465 | 7,172 |
| 1 | Kingdom of Saudi Arabia | 4.000% | 4/17/25 | 1,750 | 1,941 |
| | Kingdom of Saudi Arabia | 2.900% | 10/22/25 | 2,800 | 2,991 |
| 1 | Kingdom of Saudi Arabia | 2.900% | 10/22/25 | 2,500 | 2,669 |
| | Kingdom of Saudi Arabia | 3.250% | 10/26/26 | 6,800 | 7,408 |
| 1 | Kingdom of Saudi Arabia | 3.250% | 10/26/26 | 3,595 | 3,916 |
| | Kingdom of Saudi Arabia | 2.500% | 2/3/27 | 1,750 | 1,834 |
| 1 | Kingdom of Saudi Arabia | 3.625% | 3/4/28 | 2,000 | 2,218 |
| | Kingdom of Saudi Arabia | 3.625% | 3/4/28 | 7,550 | 8,365 |
| | Kingdom of Saudi Arabia | 4.375% | 4/16/29 | 5,420 | 6,374 |
| 1 | Kingdom of Saudi Arabia | 4.375% | 4/16/29 | 2,100 | 2,470 |
| | Kingdom of Saudi Arabia | 4.500% | 4/17/30 | 3,950 | 4,728 |
| 1 | Kingdom of Saudi Arabia | 4.500% | 4/17/30 | 1,750 | 2,094 |
| | Kingdom of Saudi Arabia | 3.250% | 10/22/30 | 3,094 | 3,370 |
| 1 | Kingdom of Saudi Arabia | 2.750% | 2/3/32 | 1,800 | 1,882 |
| | Kingdom of Saudi Arabia | 4.500% | 10/26/46 | 12,200 | 14,452 |
| | Kingdom of Saudi Arabia | 4.625% | 10/4/47 | 8,680 | 10,485 |
| | Kingdom of Saudi Arabia | 5.000% | 4/17/49 | 6,725 | 8,584 |
| | Kingdom of Saudi Arabia | 5.250% | 1/16/50 | 4,350 | 5,753 |
| 1 | Kingdom of Saudi Arabia | 5.250% | 1/16/50 | 2,100 | 2,777 |
| | Kingdom of Saudi Arabia | 3.750% | 1/21/55 | 5,300 | 5,654 |
| | Kingdom of Saudi Arabia | 4.500% | 4/22/60 | 5,500 | 6,692 |
| | KSA Sukuk Ltd. | 2.894% | 4/20/22 | 6,157 | 6,331 |
| 1 | KSA Sukuk Ltd. | 2.894% | 4/20/22 | 2,000 | 2,057 |
| 7 | KSA Sukuk Ltd. | 3.628% | 4/20/27 | 9,300 | 10,325 |
| | KSA Sukuk Ltd. | 4.303% | 1/19/29 | 3,250 | 3,797 |
Emerging Markets Government Bond Index Fund
| | | | | Face | Market |
| | | | Maturity | Amount | Value· |
| | | Coupon | Date | ($000) | ($000) |
| 1 | KSA Sukuk Ltd. | 4.303% | 1/19/29 | 750 | 874 |
| 1 | KSA Sukuk Ltd. | 2.969% | 10/29/29 | 3,500 | 3,731 |
| | KSA Sukuk Ltd. | 2.969% | 10/29/29 | 1,028 | 1,097 |
| 1 | Saudi Arabian Oil Co. | 2.875% | 4/16/24 | 1,000 | 1,044 |
| | Saudi Arabian Oil Co. | 2.875% | 4/16/24 | 2,700 | 2,823 |
| 1 | Saudi Arabian Oil Co. | 3.500% | 4/16/29 | 4,200 | 4,607 |
| | Saudi Arabian Oil Co. | 3.500% | 4/16/29 | 2,200 | 2,415 |
| 1 | Saudi Arabian Oil Co. | 4.250% | 4/16/39 | 5,100 | 5,788 |
| | Saudi Arabian Oil Co. | 4.375% | 4/16/49 | 5,880 | 6,872 |
| 1 | Saudi Electricity Global Sukuk Co. 3 | 4.000% | 4/8/24 | 250 | 270 |
| | Saudi Electricity Global Sukuk Co. 3 | 4.000% | 4/8/24 | 2,350 | 2,541 |
| Total Saudi Arabia (Cost $160,014) | | | | 174,255 |
| Senegal (0.2%) | | | | |
| Sovereign Bonds (0.2%) | | | | |
| | Republic of Senegal | 6.250% | 7/30/24 | 800 | 840 |
| 2 | Republic of Senegal | 6.250% | 5/23/33 | 2,500 | 2,540 |
| 2 | Republic of Senegal | 6.750% | 3/13/48 | 1,800 | 1,757 |
| Total Senegal (Cost $5,035) | | | | 5,137 |
| South Africa (1.7%) | | | | |
| Sovereign Bonds (1.7%) | | | | |
| | Republic of South Africa | 5.875% | 5/30/22 | 1,821 | 1,928 |
| | Republic of South Africa | 4.665% | 1/17/24 | 2,600 | 2,704 |
| | Republic of South Africa | 5.875% | 9/16/25 | 3,950 | 4,311 |
| | Republic of South Africa | 4.875% | 4/14/26 | 2,650 | 2,745 |
| | Republic of South Africa | 4.850% | 9/27/27 | 2,100 | 2,134 |
| | Republic of South Africa | 4.300% | 10/12/28 | 3,150 | 3,057 |
| | Republic of South Africa | 4.850% | 9/30/29 | 4,150 | 4,111 |
| | Republic of South Africa | 5.875% | 6/22/30 | 2,800 | 2,955 |
| | Republic of South Africa | 6.250% | 3/8/41 | 1,500 | 1,473 |
| | Republic of South Africa | 5.375% | 7/24/44 | 1,900 | 1,679 |
| | Republic of South Africa | 5.000% | 10/12/46 | 1,700 | 1,433 |
| | Republic of South Africa | 5.650% | 9/27/47 | 2,600 | 2,347 |
| | Republic of South Africa | 6.300% | 6/22/48 | 1,500 | 1,439 |
| | Republic of South Africa | 5.750% | 9/30/49 | 5,650 | 5,093 |
| Total South Africa (Cost $38,177) | | | | 37,409 |
| Sri Lanka (0.7%) | | | | |
| Sovereign Bonds (0.7%) | | | | |
| | Democratic Socialist Republic of Sri Lanka | 5.750% | 1/18/22 | 950 | 646 |
| | Democratic Socialist Republic of Sri Lanka | 5.875% | 7/25/22 | 1,950 | 1,220 |
| 1 | Democratic Socialist Republic of Sri Lanka | 5.750% | 4/18/23 | 900 | 521 |
| | Democratic Socialist Republic of Sri Lanka | 5.750% | 4/18/23 | 1,050 | 600 |
| | Democratic Socialist Republic of Sri Lanka | 6.850% | 3/14/24 | 1,900 | 1,081 |
| | Democratic Socialist Republic of Sri Lanka | 6.350% | 6/28/24 | 1,100 | 620 |
| | Democratic Socialist Republic of Sri Lanka | 6.125% | 6/3/25 | 1,600 | 893 |
| | Democratic Socialist Republic of Sri Lanka | 6.850% | 11/3/25 | 3,550 | 1,983 |
| | Democratic Socialist Republic of Sri Lanka | 6.825% | 7/18/26 | 2,050 | 1,122 |
| | Democratic Socialist Republic of Sri Lanka | 6.200% | 5/11/27 | 2,050 | 1,101 |
| | Democratic Socialist Republic of Sri Lanka | 6.750% | 4/18/28 | 2,450 | 1,316 |
| | Democratic Socialist Republic of Sri Lanka | 7.850% | 3/14/29 | 1,930 | 1,042 |
| | Democratic Socialist Republic of Sri Lanka | 7.550% | 3/28/30 | 3,550 | 1,912 |
| Total Sri Lanka (Cost $24,266) | | | | 14,057 |
Emerging Markets Government Bond Index Fund
| | | | | Face | Market |
| | | | Maturity | Amount | Value· |
| | | Coupon | Date | ($000) | ($000) |
| Suriname (0.0%) | | | | |
| Sovereign Bonds (0.0%) | | | | |
| | Republic of Suriname | 9.250% | 10/26/26 | 1,100 | 558 |
| Total Suriname (Cost $1,065) | | | | 558 |
| Tajikistan (0.0%) | | | | |
| Sovereign Bonds (0.0%) | | | | |
| 2 | Republic of Tajikistan | 7.125% | 9/14/27 | 775 | 583 |
| Total Tajikistan (Cost $723) | | | | 583 |
| Trinidad & Tobago (0.2%) | | | | |
| Sovereign Bonds (0.2%) | | | | |
| 1 | Republic of Trinidad & Tobago | 4.375% | 1/16/24 | 400 | 412 |
| | Republic of Trinidad & Tobago | 4.375% | 1/16/24 | 600 | 619 |
| | Republic of Trinidad & Tobago | 4.500% | 8/4/26 | 1,800 | 1,881 |
| 1,2 | Republic of Trinidad & Tobago | 4.500% | 6/26/30 | 1,100 | 1,111 |
| Total Trinidad & Tobago (Cost $3,924) | | | | 4,023 |
| Tunisia (0.1%) | | | | |
| Sovereign Bonds (0.1%) | | | | |
| | Banque Centrale de Tunisie International Bond | 5.750% | 1/30/25 | 1,650 | 1,394 |
| Total Tunisia (Cost $1,554) | | | | 1,394 |
| Turkey (5.3%) | | | | |
| Sovereign Bonds (5.3%) | | | | |
| | Hazine Mustesarligi Varlik Kiralama AS | 5.800% | 2/21/22 | 3,850 | 3,839 |
| | Hazine Mustesarligi Varlik Kiralama AS | 5.004% | 4/6/23 | 2,175 | 2,122 |
| 8 | Hazine Mustesarligi Varlik Kiralama AS | 4.489% | 11/25/24 | 1,200 | 1,133 |
| 1 | Hazine Mustesarligi Varlik Kiralama AS | 4.489% | 11/25/24 | 600 | 566 |
| | Republic of Turkey | 5.125% | 3/25/22 | 2,025 | 2,011 |
| | Republic of Turkey | 6.250% | 9/26/22 | 4,861 | 4,874 |
| | Republic of Turkey | 3.250% | 3/23/23 | 2,926 | 2,761 |
| | Republic of Turkey | 7.250% | 12/23/23 | 3,950 | 4,030 |
| | Republic of Turkey | 5.750% | 3/22/24 | 4,613 | 4,487 |
| | Republic of Turkey | 6.350% | 8/10/24 | 4,400 | 4,334 |
| | Republic of Turkey | 5.600% | 11/14/24 | 5,350 | 5,135 |
| | Republic of Turkey | 7.375% | 2/5/25 | 6,250 | 6,378 |
| | Republic of Turkey | 4.250% | 3/13/25 | 3,900 | 3,555 |
| | Republic of Turkey | 6.375% | 10/14/25 | 3,900 | 3,807 |
| | Republic of Turkey | 4.250% | 4/14/26 | 1,150 | 1,021 |
| | Republic of Turkey | 4.875% | 10/9/26 | 6,050 | 5,455 |
| | Republic of Turkey | 6.000% | 3/25/27 | 6,212 | 5,861 |
| | Republic of Turkey | 5.125% | 2/17/28 | 3,800 | 3,375 |
| | Republic of Turkey | 6.125% | 10/24/28 | 4,200 | 3,916 |
| | Republic of Turkey | 7.625% | 4/26/29 | 5,575 | 5,611 |
| | Republic of Turkey | 11.875% | 1/15/30 | 2,805 | 3,604 |
| | Republic of Turkey | 5.250% | 3/13/30 | 3,550 | 3,089 |
| | Republic of Turkey | 8.000% | 2/14/34 | 2,700 | 2,773 |
| | Republic of Turkey | 6.875% | 3/17/36 | 5,400 | 4,960 |
| | Republic of Turkey | 7.250% | 3/5/38 | 2,150 | 2,028 |
| | Republic of Turkey | 6.750% | 5/30/40 | 3,540 | 3,134 |
| | Republic of Turkey | 6.000% | 1/14/41 | 5,607 | 4,543 |
| | Republic of Turkey | 4.875% | 4/16/43 | 5,819 | 4,238 |
Emerging Markets Government Bond Index Fund
| | | | | Face | Market |
| | | | Maturity | Amount | Value· |
| | | Coupon | Date | ($000) | ($000) |
| | Republic of Turkey | 6.625% | 2/17/45 | 5,950 | 5,104 |
| | Republic of Turkey | 5.750% | 5/11/47 | 6,825 | 5,282 |
| Total Turkey (Cost $119,429) | | | | 113,026 |
| Ukraine (1.3%) | | | | |
| Sovereign Bonds (1.3%) | | | | |
| | Ukraine | 7.750% | 9/1/22 | 1,950 | 2,030 |
| | Ukraine | 7.750% | 9/1/23 | 2,500 | 2,597 |
| | Ukraine | 8.994% | 2/1/24 | 1,350 | 1,433 |
| | Ukraine | 7.750% | 9/1/24 | 2,510 | 2,596 |
| | Ukraine | 7.750% | 9/1/25 | 2,200 | 2,257 |
| | Ukraine | 7.750% | 9/1/26 | 2,750 | 2,781 |
| | Ukraine | 7.750% | 9/1/27 | 2,550 | 2,559 |
| | Ukraine | 9.750% | 11/1/28 | 2,550 | 2,776 |
| 1 | Ukraine | 9.750% | 11/1/28 | 450 | 490 |
| 1,2 | Ukraine | 7.375% | 9/25/32 | 1,600 | 1,533 |
| 2 | Ukraine | 7.375% | 9/25/32 | 4,350 | 4,164 |
| | Ukraine | 7.253% | 3/15/33 | 200 | 188 |
| 1 | Ukraine | 7.253% | 3/15/33 | 3,500 | 3,288 |
| Total Ukraine (Cost $28,459) | | | | 28,692 |
| United Arab Emirates (5.7%) | | | | |
| Sovereign Bonds (5.7%) | | | | |
| 2 | Abu Dhabi Crude Oil Pipeline LLC | 4.600% | 11/2/47 | 2,125 | 2,533 |
| 1,2 | Abu Dhabi Crude Oil Pipeline LLC | 4.600% | 11/2/47 | 2,050 | 2,430 |
| 1 | DP World plc | 6.850% | 7/2/37 | 3,340 | 4,160 |
| 2 | DP World Salaam | 6.000% | 1/1/69 | 2,900 | 3,030 |
| | Dubai DOF Sukuk Ltd. | 6.450% | 5/2/22 | 1,000 | 1,077 |
| | Dubai DOF Sukuk Ltd. | 2.763% | 9/9/30 | 1,800 | 1,795 |
| | Emirate of Abu Dhabi | 2.500% | 10/11/22 | 5,250 | 5,430 |
| 1 | Emirate of Abu Dhabi | 0.750% | 9/2/23 | 3,600 | 3,593 |
| 1 | Emirate of Abu Dhabi | 2.125% | 9/30/24 | 4,500 | 4,704 |
| | Emirate of Abu Dhabi | 2.125% | 9/30/24 | 1,050 | 1,096 |
| | Emirate of Abu Dhabi | 2.500% | 4/16/25 | 6,700 | 7,105 |
| 1 | Emirate of Abu Dhabi | 2.500% | 4/16/25 | 300 | 318 |
| 1 | Emirate of Abu Dhabi | 3.125% | 5/3/26 | 450 | 495 |
| | Emirate of Abu Dhabi | 3.125% | 5/3/26 | 4,707 | 5,176 |
| 1 | Emirate of Abu Dhabi | 3.125% | 10/11/27 | 300 | 333 |
| | Emirate of Abu Dhabi | 3.125% | 10/11/27 | 7,050 | 7,838 |
| 1 | Emirate of Abu Dhabi | 2.500% | 9/30/29 | 3,790 | 4,025 |
| | Emirate of Abu Dhabi | 2.500% | 9/30/29 | 2,000 | 2,128 |
| | Emirate of Abu Dhabi | 3.125% | 4/16/30 | 2,700 | 3,006 |
| 1 | Emirate of Abu Dhabi | 3.125% | 4/16/30 | 3,150 | 3,507 |
| | Emirate of Abu Dhabi | 1.700% | 3/2/31 | 450 | 444 |
| 1 | Emirate of Abu Dhabi | 1.700% | 3/2/31 | 2,400 | 2,365 |
| | Emirate of Abu Dhabi | 4.125% | 10/11/47 | 5,500 | 6,751 |
| | Emirate of Abu Dhabi | 3.125% | 9/30/49 | 7,500 | 7,896 |
| | Emirate of Abu Dhabi | 3.875% | 4/16/50 | 7,500 | 8,902 |
| 1 | Emirate of Abu Dhabi | 2.700% | 9/2/70 | 2,800 | 2,539 |
| | Emirate of Dubai | 3.875% | 1/30/23 | 1,600 | 1,679 |
| | Emirate of Dubai | 5.250% | 1/30/43 | 1,000 | 1,138 |
| | Emirate of Dubai | 3.900% | 9/9/50 | 1,900 | 1,771 |
| 1 | Emirate of Sharjah | 4.000% | 7/28/50 | 1,750 | 1,736 |
| 1 | MDGH - GMTN BV | 5.500% | 3/1/22 | 2,510 | 2,673 |
Emerging Markets Government Bond Index Fund
| | | | | Face | Market |
| | | | Maturity | Amount | Value· |
| | | Coupon | Date | ($000) | ($000) |
| 1 | MDGH - GMTN BV | 3.700% | 11/7/49 | 2,600 | 2,835 |
| | MDGH - GMTN BV | 3.950% | 5/21/50 | 4,400 | 5,061 |
| | RAK Capital | 3.094% | 3/31/25 | 1,600 | 1,693 |
| | Sharjah Sukuk Ltd. | 3.764% | 9/17/24 | 800 | 857 |
| | Sharjah Sukuk Programme Ltd. | 3.854% | 4/3/26 | 2,600 | 2,811 |
| | Sharjah Sukuk Programme Ltd. | 2.942% | 6/10/27 | 2,000 | 2,059 |
| | Sharjah Sukuk Programme Ltd. | 4.226% | 3/14/28 | 2,300 | 2,552 |
| | Sharjah Sukuk Programme Ltd. | 3.234% | 10/23/29 | 1,300 | 1,350 |
| Total United Arab Emirates (Cost $115,967) | | | | 120,891 |
| Uruguay (1.6%) | | | | |
| Sovereign Bonds (1.6%) | | | | |
| 2 | Oriental Republic of Uruguay | 4.500% | 8/14/24 | 1,889 | 2,066 |
| 2 | Oriental Republic of Uruguay | 4.375% | 10/27/27 | 2,984 | 3,488 |
| 2 | Oriental Republic of Uruguay | 4.375% | 1/23/31 | 3,773 | 4,556 |
| | Oriental Republic of Uruguay | 7.875% | 1/15/33 | 1,496 | 2,319 |
| 2 | Oriental Republic of Uruguay | 7.625% | 3/21/36 | 1,865 | 2,916 |
| 2 | Oriental Republic of Uruguay | 4.125% | 11/20/45 | 1,505 | 1,800 |
| 2 | Oriental Republic of Uruguay | 5.100% | 6/18/50 | 7,125 | 9,519 |
| 2 | Oriental Republic of Uruguay | 4.975% | 4/20/55 | 5,230 | 6,917 |
| Total Uruguay (Cost $28,770) | | | | 33,581 |
| Uzbekistan (0.1%) | | | | |
| Sovereign Bonds (0.1%) | | | | |
| | Republic of Uzbekistan | 4.750% | 2/20/24 | 1,145 | 1,198 |
| | Republic of Uzbekistan | 5.375% | 2/20/29 | 975 | 1,075 |
| Total Uzbekistan (Cost $2,167) | | | | 2,273 |
| Vietnam (0.1%) | | | | |
| Sovereign Bonds (0.1%) | | | | |
| | Socialist Republic of Vietnam | 4.800% | 11/19/24 | 1,800 | 2,011 |
| Total Vietnam (Cost $1,842) | | | | 2,011 |
| Zambia (0.1%) | | | | |
| Sovereign Bonds (0.1%) | | | | |
| | Republic of Zambia | 5.375% | 9/20/22 | 1,350 | 580 |
| | Republic of Zambia | 8.500% | 4/14/24 | 1,800 | 784 |
| | Republic of Zambia | 8.970% | 7/30/27 | 2,325 | 991 |
| Total Zambia (Cost $4,612) | | | | 2,355 |
Emerging Markets Government Bond Index Fund
| | | | Market |
| | | | Value· |
| | Coupon | Shares | ($000) |
| Temporary Cash Investments (0.6%) | | | |
| Money Market Fund (0.6%) | | | |
| 9 | Vanguard Market Liquidity Fund | 0.112% | 128,919 | 12,892 |
| Total Temporary Cash Investments (Cost $12,892) | | | 12,892 |
| Total Investments (99.3%) (Cost $2,102,035) | | | 2,122,630 |
| Other Assets and Liabilities—Net (0.7%) | | | 16,027 |
| Net Assets (100%) | | | 2,138,657 |
Cost is in $000.
| · | See Note A in Notes to Financial Statements. |
| 1 | Security exempt from registration under Rule 144A of the Securities Act of 1933. Such securities may be sold in transactions exempt from registration, normally to qualified institutional buyers. At October 31, 2020, the aggregate value of these securities was $232,371,000, representing 10.9% of net assets. |
| 2 | The average or expected maturity is shorter than the final maturity shown because of the possibility of interim principal payments and prepayments or the possibility of the issue being called. |
| 3 | Guaranteed by the Republic of Azerbaijan. |
| 4 | Guaranteed by the Republic of Indonesia. |
| 5 | Non-income-producing security—security in default. |
| 6 | Securities with a value of $36,000 have been segregated as initial margin for open futures contracts. |
| 7 | Guaranteed by the Kingdom of Saudi Arabia. |
| 8 | Guaranteed by the Republic of Turkey. |
| 9 | Affiliated money market fund available only to Vanguard funds and certain trusts and accounts managed by Vanguard. Rate shown is the 7-day yield. |
| Derivative Financial Instruments Outstanding as of Period End | | | |
| | | | | | |
| Futures Contracts | | | | | |
| | | | | | ($000) |
| | | | | | Value and |
| | | Number of | | | Unrealized |
| | | Long (Short) | Notional | | Appreciation |
| | Expiration | Contracts | Amount | | (Depreciation) |
| Long Futures Contracts | | | | | |
| Ultra 10-Year U.S. Treasury Note | December 2020 | 24 | 3,775 | | 1 |
| 2-Year U.S. Treasury Note | December 2020 | 13 | 2,871 | | — |
| 30-Year U.S. Treasury Bond | December 2020 | 8 | 1,380 | | — |
| Ultra Long U.S. Treasury Bond | December 2020 | 5 | 1,075 | | — |
| 5-Year U.S. Treasury Note | December 2020 | 3 | 377 | | — |
| | | | | | 1 |
| | | | | | |
| Short Futures Contracts | | | | | |
| 10-Year U.S. Treasury Note | December 2020 | (26) | (3,594) | | 7 |
| | | | | | 8 |
See accompanying Notes, which are an integral part of the Financial Statements.
Emerging Markets Government Bond Index Fund
Statement of Assets and Liabilities
As of October 31, 2020
| ($000s, except shares and per-share amounts) | Amount |
| Assets | |
| Investments in Securities, at Value | |
| Unaffiliated Issuers (Cost $2,089,143) | 2,109,738 |
| Affiliated Issuers (Cost $12,892) | 12,892 |
| Total Investments in Securities | 2,122,630 |
| Investment in Vanguard | 88 |
| Cash Collateral Pledged—Futures Contracts | 20 |
| Receivables for Investment Securities Sold | 38,012 |
| Receivables for Accrued Income | 22,207 |
| Receivables for Capital Shares Issued | 456 |
| Variation Margin Receivable—Futures Contracts | 30 |
| Total Assets | 2,183,443 |
| Liabilities | |
| Due to Custodian | 164 |
| Payables for Investment Securities Purchased | 19,922 |
| Payables for Capital Shares Redeemed | 24,250 |
| Payables for Distributions | 138 |
| Payables to Vanguard | 268 |
| Variation Margin Payable—Futures Contracts | 44 |
| Total Liabilities | 44,786 |
| Net Assets | 2,138,657 |
| | |
| | |
| | |
| At October 31, 2020, net assets consisted of: | |
| | |
| Paid-in Capital | 2,184,667 |
| Total Distributable Earnings (Loss) | (46,010) |
| Net Assets | 2,138,657 |
| | |
| ETF Shares—Net Assets | |
| Applicable to 23,756,269 outstanding $.001 par value shares of beneficial interest (unlimited authorization) | 1,853,322 |
| Net Asset Value Per Share—ETF Shares | $78.01 |
| | |
| Admiral Shares—Net Assets | |
| Applicable to 12,405,038 outstanding $.001 par value shares of beneficial interest (unlimited authorization) | 242,869 |
| Net Asset Value Per Share—Admiral Shares | $19.58 |
Emerging Markets Government Bond Index Fund
Statement of Assets and Liabilities (continued)
| ($000s, except shares and per-share amounts) | Amount |
| Institutional Shares—Net Assets | |
| Applicable to 1,352,283 outstanding $.001 par value shares of beneficial interest (unlimited authorization) | 42,466 |
| Net Asset Value Per Share—Institutional Shares | $31.40 |
See accompanying Notes, which are an integral part of the Financial Statements.
Emerging Markets Government Bond Index Fund
Statement of Operations
| | Year Ended |
| | October 31, 2020 |
| | ($000) |
| Investment Income | |
| Income | |
| Interest1 | 95,766 |
| Total Income | 95,766 |
| Expenses | |
| The Vanguard Group—Note B | |
| Investment Advisory Services | 53 |
| Management and Administrative—ETF Shares | 3,849 |
| Management and Administrative—Admiral Shares | 646 |
| Management and Administrative—Institutional Shares | 111 |
| Marketing and Distribution—ETF Shares | 89 |
| Marketing and Distribution—Admiral Shares | 18 |
| Marketing and Distribution—Institutional Shares | 2 |
| Custodian Fees | 40 |
| Auditing Fees | 46 |
| Shareholders’ Reports—ETF Shares | 113 |
| Shareholders’ Reports—Admiral Shares | 8 |
| Shareholders’ Reports—Institutional Shares | — |
| Trustees’ Fees and Expenses | 1 |
| Total Expenses | 4,976 |
| Net Investment Income | 90,790 |
| Realized Net Gain (Loss) | |
| Investment Securities Sold1,2 | (68,407) |
| Futures Contracts | (10) |
| Realized Net Gain (Loss) | (68,417) |
| Change in Unrealized Appreciation (Depreciation) | |
| Investment Securities1 | (23,562) |
| Futures Contracts | (47) |
| Change in Unrealized Appreciation (Depreciation) | (23,609) |
| Net Increase (Decrease) in Net Assets Resulting from Operations | (1,236) |
| 1 | Interest income, realized net gain (loss), and change in unrealized appreciation (depreciation) from an affiliated company of the fund were $77,000, $12,000, and $0, respectively. Purchases and sales are for temporary cash investment purposes. |
| | |
| 2 | Includes $679,000 of net gain (loss) resulting from in-kind redemptions. |
See accompanying Notes, which are an integral part of the Financial Statements.
Emerging Markets Government Bond Index Fund
Statement of Changes in Net Assets
| | Year Ended October 31, |
| | 2020 | 2019 |
| | ($000) | ($000) |
| Increase (Decrease) in Net Assets | | |
| Operations | | |
| Net Investment Income | 90,790 | 74,770 |
| Realized Net Gain (Loss) | (68,417) | 6,368 |
| Change in Unrealized Appreciation (Depreciation) | (23,609) | 109,704 |
| Net Increase (Decrease) in Net Assets Resulting from Operations | (1,236) | 190,842 |
| Distributions1 | | |
| Investor Shares | — | (224) |
| ETF Shares | (75,818) | (58,791) |
| Admiral Shares | (12,469) | (12,340) |
| Institutional Shares | (2,266) | (1,568) |
| Total Distributions | (90,553) | (72,923) |
| Capital Share Transactions | | |
| Investor Shares | — | (10,529) |
| ETF Shares | 394,929 | 409,733 |
| Admiral Shares | (18,654) | (3,148) |
| Institutional Shares | (7,227) | 29,042 |
| Net Increase (Decrease) from Capital Share Transactions | 369,048 | 425,098 |
| Total Increase (Decrease) | 277,259 | 543,017 |
| Net Assets | | |
| Beginning of Period | 1,861,398 | 1,318,381 |
| End of Period | 2,138,657 | 1,861,398 |
1 Certain prior-period numbers have been reclassified to conform with the current-period presentation.
See accompanying Notes, which are an integral part of the Financial Statements.
Emerging Markets Government Bond Index Fund
Financial Highlights
ETF Shares
| For a Share Outstanding | | Year Ended October 31, |
| Throughout Each Period | 2020 | 2019 | 2018 | 2017 | 2016 |
| Net Asset Value, Beginning of Period | $80.38 | $74.27 | $80.73 | $80.11 | $75.81 |
| Investment Operations | | | | | |
| Net Investment Income | 3.5511 | 3.7381 | 3.4111 | 3.7131 | 3.753 |
| Net Realized and Unrealized Gain (Loss) on Investments2 | (2.322) | 6.044 | (6.445) | .589 | 4.228 |
| Total from Investment Operations | 1.229 | 9.782 | (3.034) | 4.302 | 7.981 |
| Distributions | | | | | |
| Dividends from Net Investment Income | (3.599) | (3.672) | (3.426) | (3.682) | (3.681) |
| Distributions from Realized Capital Gains | — | — | — | — | — |
| Total Distributions | (3.599) | (3.672) | (3.426) | (3.682) | (3.681) |
| Net Asset Value, End of Period | $78.01 | $80.38 | $74.27 | $80.73 | $80.11 |
| | | | | | |
| Total Return | 1.65% | 13.47% | -3.84% | 5.56% | 10.84% |
| | | | | | |
| Ratios/Supplemental Data | | | | | |
| Net Assets, End of Period (Millions) | $1,853 | $1,538 | $1,033 | $1,002 | $874 |
| Ratio of Total Expenses to Average Net Assets | 0.25% | 0.25% | 0.30% | 0.32% | 0.32% |
Ratio of Net Investment Income to Average Net Assets | 4.55% | 4.79% | 4.42% | 4.67% | 4.89% |
| Portfolio Turnover Rate3 | 21% | 48% | 25% | 19% | 24% |
| 1 | Calculated based on average shares outstanding. |
| | |
| 2 | Includes increases from purchase fees of $.00, $.00, $.04, $.07, and $.04. |
| | |
| 3 | Excludes the value of portfolio securities received or delivered as a result of in-kind purchases or redemptions of the fund’s capital shares, including ETF Creation Units. |
See accompanying Notes, which are an integral part of the Financial Statements.
Emerging Markets Government Bond Index Fund
Financial Highlights
Admiral Shares
| For a Share Outstanding | | Year Ended October 31, |
| Throughout Each Period | 2020 | 2019 | 2018 | 2017 | 2016 |
| Net Asset Value, Beginning of Period | $20.16 | $18.63 | $20.24 | $20.09 | $19.00 |
| Investment Operations | | | | | |
| Net Investment Income | .8971 | .9391 | .8581 | .9341 | .941 |
| Net Realized and Unrealized Gain (Loss) on Investments2 | (.586) | 1.521 | (1.613) | .150 | 1.076 |
| Total from Investment Operations | .311 | 2.460 | (.755) | 1.084 | 2.017 |
| Distributions | | | | | |
| Dividends from Net Investment Income | (.891) | (.930) | (.855) | (.934) | (.927) |
| Distributions from Realized Capital Gains | — | — | — | — | — |
| Total Distributions | (.891) | (.930) | (.855) | (.934) | (.927) |
| Net Asset Value, End of Period | $19.58 | $20.16 | $18.63 | $20.24 | $20.09 |
| | | | | | |
| Total Return3 | 1.66% | 13.46% | -3.80% | 5.57% | 10.89% |
| | | | | | |
| Ratios/Supplemental Data | | | | | |
| Net Assets, End of Period (Millions) | $243 | $273 | $256 | $288 | $191 |
| Ratio of Total Expenses to Average Net Assets | 0.25% | 0.25% | 0.30% | 0.32% | 0.32% |
| Ratio of Net Investment Income to Average Net Assets | 4.57% | 4.79% | 4.42% | 4.67% | 4.89% |
| Portfolio Turnover Rate4 | 21% | 48% | 25% | 19% | 24% |
| 1 | Calculated based on average shares outstanding. |
| 2 | Includes increases from purchase fees of $.00, $.00, $.01, $.02, and $.01. |
| 3 | Total returns do not include transaction or account service fees that may have applied in the periods shown. Fund prospectuses provide information about any applicable transaction and account service fees. |
| 4 | Excludes the value of portfolio securities received or delivered as a result of in-kind purchases or redemptions of the fund’s capital shares, including ETF Creation Units. |
See accompanying Notes, which are an integral part of the Financial Statements.
Emerging Markets Government Bond Index Fund
Financial Highlights
Institutional Shares
| For a Share Outstanding | | | Year Ended October 31, |
| Throughout Each Period | 2020 | 2019 | 2018 | 2017 | 2016 |
| Net Asset Value, Beginning of Period | $32.33 | $29.88 | $32.47 | $32.24 | $30.50 |
| Investment Operations | | | | | |
| Net Investment Income | 1.4431 | 1.5221 | 1.3801 | 1.5081 | 1.521 |
| Net Realized and Unrealized Gain (Loss) on Investments2 | (.938) | 2.425 | (2.596) | .238 | 1.715 |
| Total from Investment Operations | .505 | 3.947 | (1.216) | 1.746 | 3.236 |
| Distributions | | | | | |
| Dividends from Net Investment Income | (1.435) | (1.497) | (1.374) | (1.516) | (1.496) |
| Distributions from Realized Capital Gains | — | — | — | — | — |
| Total Distributions | (1.435) | (1.497) | (1.374) | (1.516) | (1.496) |
| Net Asset Value, End of Period | $31.40 | $32.33 | $29.88 | $32.47 | $32.24 |
| | | | | | |
| Total Return3 | 1.68% | 13.46% | -3.82% | 5.59% | 10.89% |
| | | | | | |
| Ratios/Supplemental Data | | | | | |
| Net Assets, End of Period (Millions) | $42 | $51 | $19 | $20 | $21 |
| Ratio of Total Expenses to Average Net Assets | 0.23% | 0.23% | 0.29% | 0.29% | 0.29% |
| Ratio of Net Investment Income to Average Net Assets | 4.59% | 4.81% | 4.43% | 4.70% | 4.92% |
| Portfolio Turnover Rate4 | 21% | 48% | 25% | 19% | 24% |
| 1 | Calculated based on average shares outstanding. |
| 2 | Includes increases from purchase fees of $.00, $.00, $.02, $.03, and $.02. |
| 3 | Total returns do not include transaction or account service fees that may have applied in the periods shown. Fund prospectuses provide information about any applicable transaction and account service fees. |
| 4 | Excludes the value of portfolio securities received or delivered as a result of in-kind purchases or redemptions of the fund’s capital shares, including ETF Creation Units. |
See accompanying Notes, which are an integral part of the Financial Statements.
Emerging Markets Government Bond Index Fund
Notes to Financial Statements
Vanguard Emerging Markets Government Bond Index Fund is registered under the Investment Company Act of 1940 as an open-end investment company, or mutual fund. The fund offers three classes of shares: ETF Shares, Admiral Shares, and Institutional Shares. Each of the share classes has different eligibility and minimum purchase requirements, and is designed for different types of investors. ETF Shares are listed for trading on Nasdaq; they can be purchased and sold through a broker.
The fund invests in securities of foreign issuers, which may subject it to investment risks not normally associated with investing in securities of U.S. corporations. Market disruptions associated with the COVID-19 pandemic have had a global impact, and uncertainty exists as to the long-term implications. Such disruptions can adversely affect assets of the fund and thus fund performance.
A. The following significant accounting policies conform to generally accepted accounting principles for U.S. investment companies. The fund consistently follows such policies in preparing its financial statements.
1. Security Valuation: Securities are valued as of the close of trading on the New York Stock Exchange (generally 4 p.m., Eastern time) on the valuation date. Bonds and temporary cash investments are valued using the latest bid prices or using valuations based on a matrix system (which considers such factors as security prices, yields, maturities, and ratings), both as furnished by independent pricing services. Investments in Vanguard Market Liquidity Fund are valued at that fund’s net asset value. Securities for which market quotations are not readily available, or whose values have been affected by events occurring before the fund’s pricing time but after the close of the securities’ primary markets, are valued at their fair values calculated according to procedures adopted by the board of trustees. These procedures include obtaining quotations from an independent pricing service, monitoring news to identify significant market- or security-specific events, and evaluating changes in the values of foreign market proxies (for example, ADRs, futures contracts, or exchange-traded funds), between the time the foreign markets close and the fund’s pricing time. When fair-value pricing is employed, the prices of securities used by a fund to calculate its net asset value may differ from quoted or published prices for the same securities.
2. Futures Contracts: The fund uses futures contracts to invest in fixed income asset classes with greater efficiency and lower cost than is possible through direct investment, to add value when these instruments are attractively priced, or to adjust sensitivity to changes in interest rates. The primary risks associated with the use of futures contracts are imperfect correlation between changes in market values of bonds held by the fund and the prices of futures contracts, and the possibility of an illiquid market. Counterparty risk involving futures is mitigated because a regulated clearinghouse is the counterparty instead of the clearing broker. To further mitigate counterparty risk, the fund trades futures contracts on an exchange, monitors the financial strength of its clearing brokers and clearinghouse, and has entered into clearing agreements with its clearing brokers. The clearinghouse imposes initial margin requirements to secure the fund’s performance and requires daily settlement of variation margin representing changes in the market value of each contract. Any securities pledged as initial margin for open contracts are noted in the Schedule of Investments.
Emerging Markets Government Bond Index Fund
Futures contracts are valued at their quoted daily settlement prices. The notional amounts of the contracts are not recorded in the Statement of Assets and Liabilities. Fluctuations in the value of the contracts are recorded in the Statement of Assets and Liabilities as an asset (liability) and in the Statement of Operations as unrealized appreciation (depreciation) until the contracts are closed, when they are recorded as realized gains (losses) on futures contracts.
During the year ended October 31, 2020, the fund’s average investments in long and short futures contracts each represented less than 1% of net assets, based on the average of the notional amounts at each quarter-end during the period.
3. Federal Income Taxes: The fund intends to continue to qualify as a regulated investment company and distribute all of its taxable income. The fund’s tax returns are open to examination by the relevant tax authorities until expiration of the applicable statute of limitations, which is generally three years after the filing of the tax return. Management has analyzed the fund’s tax positions taken for all open federal and state income tax years, and has concluded that no provision for income tax is required in the fund’s financial statements.
4. Distributions: Distributions to shareholders are recorded on the ex-dividend date. Distributions are determined on a tax basis at the fiscal year-end and may differ from net investment income and realized capital gains for financial reporting purposes.
5. Credit Facilities and Interfund Lending Program: The fund and certain other funds managed by The Vanguard Group (“Vanguard”) participate in a $4.3 billion committed credit facility provided by a syndicate of lenders pursuant to a credit agreement and an uncommitted credit facility provided by Vanguard. Both facilities may be renewed annually. Each fund is individually liable for its borrowings, if any, under the credit facilities. Borrowings may be utilized for temporary or emergency purposes, subject to the fund’s regulatory and contractual borrowing restrictions. With respect to the committed credit facility, the participating funds are charged administrative fees and an annual commitment fee of 0.10% of the undrawn committed amount of the facility; these fees are allocated to the funds based on a method approved by the fund’s board of trustees and included in Management and Administrative expenses on the fund’s Statement of Operations. Any borrowings under either facility bear interest at a rate based upon the higher of the one-month London Interbank Offered Rate (or an acceptable alternate rate, if necessary), federal funds effective rate, or overnight bank funding rate plus an agreed-upon spread, except that borrowings under the uncommitted credit facility may bear interest based upon an alternative rate agreed to by the fund and Vanguard.
In accordance with an exemptive order (the “Order”) from the SEC, the fund may participate in a joint lending and borrowing program that allows registered open-end Vanguard funds to borrow money from and lend money to each other for temporary or emergency purposes (the “Interfund Lending Program”), subject to compliance with the terms and conditions of the Order, and to the extent permitted by the fund’s investment objective and investment policies. Interfund loans and borrowings normally extend overnight, but can have a maximum duration of seven days. Loans may be called on one business day’s notice. The interest rate to be charged is governed by the conditions of the Order and internal procedures adopted by the board of trustees. The board of trustees is responsible for overseeing the Interfund Lending Program.
Emerging Markets Government Bond Index Fund
For the year ended October 31, 2020, the fund did not utilize the credit facilities or the Interfund Lending Program.
6. Other: Interest income includes income distributions received from Vanguard Market Liquidity Fund and is accrued daily. Premiums and discounts on debt securities are amortized and accreted, respectively, to interest income over the lives of the respective securities, except for premiums on certain callable debt securities that are amortized to the earliest call date. Security transactions are accounted for on the date securities are bought or sold. Costs used to determine realized gains (losses) on the sale of investment securities are those of the specific securities sold. Fees assessed on capital share transactions are credited to paid-in capital.
Each class of shares has equal rights as to assets and earnings, except that each class separately bears certain class-specific expenses related to maintenance of shareholder accounts (included in Management and Administrative expenses) and shareholder reporting. Marketing and distribution expenses are allocated to each class of shares based on a method approved by the board of trustees. Income, other non-class-specific expenses, and gains and losses on investments are allocated to each class of shares based on its relative net assets.
B. In accordance with the terms of a Funds’ Service Agreement (the “FSA”) between Vanguard and the fund, Vanguard furnishes to the fund investment advisory, corporate management, administrative, marketing, and distribution services at Vanguard’s cost of operations (as defined by the FSA). These costs of operations are allocated to the fund based on methods and guidelines approved by the board of trustees and are generally settled twice a month.
Upon the request of Vanguard, the fund may invest up to 0.40% of its net assets as capital in Vanguard. At October 31, 2020, the fund had contributed to Vanguard capital in the amount of $88,000, representing less than 0.01% of the fund’s net assets and 0.04% of Vanguard’s capital received pursuant to the FSA. The fund’s trustees and officers are also directors and employees, respectively, of Vanguard.
C. Various inputs may be used to determine the value of the fund’s investments and derivatives. These inputs are summarized in three broad levels for financial statement purposes. The inputs or methodologies used to value securities are not necessarily an indication of the risk associated with investing in those securities.
Level 1—Quoted prices in active markets for identical securities.
Level 2—Other significant observable inputs (including quoted prices for similar securities, interest rates, prepayment speeds, credit risk, etc.).
Level 3—Significant unobservable inputs (including the fund’s own assumptions used to determine the fair value of investments). Any investments and derivatives valued with significant unobservable inputs are noted on the Schedule of Investments.
Emerging Markets Government Bond Index Fund
The following table summarizes the market value of the fund’s investments and derivatives as of October 31, 2020, based on the inputs used to value them:
| | Level 1 | Level 2 | Level 3 | Total |
| | ($000) | ($000) | ($000) | ($000) |
| Investments | | | | |
| Assets | | | | |
| Sovereign Bonds | — | 2,109,738 | — | 2,109,738 |
| Temporary Cash Investments | 12,892 | — | — | 12,892 |
| Total | 12,892 | 2,109,738 | — | 2,122,630 |
| Derivative Financial Instruments | | | | |
| Assets | | | | |
| Futures Contracts1 | 30 | — | — | 30 |
| Liabilities | | | | |
| Futures Contracts1 | 44 | — | — | 44 |
1 Represents variation margin on the last day of the reporting period.
D. Permanent differences between book-basis and tax-basis components of net assets are reclassified among capital accounts in the financial statements to reflect their tax character. These reclassifications have no effect on net assets or net asset value per share. As of period end, permanent differences primarily attributable to the accounting for in-kind redemptions were reclassified between the following accounts:
| | Amount |
| | ($000) |
| Paid-in Capital | 679 |
| Total Distributable Earnings (Loss) | (679) |
Temporary differences between book-basis and tax-basis components of total distributable earnings (loss) arise when certain items of income, gain, or loss are recognized in different periods for financial statement and tax purposes; these differences will reverse at some time in the future. The differences are primarily related to the deferral of losses from wash sales; the deferral of losses from straddles; the recognition of unrealized gains or losses from certain derivative contracts; and the inclusion of payables for distributions. As of period end, the tax-basis components of total distributable earnings (loss) are detailed in the table as follows:
| | Amount |
| | ($000) |
| Undistributed Ordinary Income | 6,326 |
| Undistributed Long-Term Gains | — |
| Capital Loss Carryforwards | (72,605) |
| Qualified Late-Year Losses | — |
| Net Unrealized Gains (Losses) | 20,407 |
Emerging Markets Government Bond Index Fund
The tax character of distributions paid was as follows:
| | Year Ended October 31, |
| | 2020 | 2019 |
| | Amount | Amount |
| | ($000) | ($000) |
| Ordinary Income* | 90,553 | 72,923 |
| Long-Term Capital Gains | — | — |
| Total | 90,553 | 72,923 |
*Includes short-term capital gains, if any.
As of October 31, 2020, gross unrealized appreciation and depreciation for investments and derivatives based on cost for U.S. federal income tax purposes were as follows:
| | Amount |
| | ($000) |
| Tax Cost | 2,102,223 |
| Gross Unrealized Appreciation | 114,766 |
| Gross Unrealized Depreciation | (94,359) |
| Net Unrealized Appreciation (Depreciation) | 20,407 |
E. During the year ended October 31, 2020, the fund purchased $1,041,103,000 of investment securities and sold $746,099,000 of investment securities, other than U.S. government securities and temporary cash investments. Purchases and sales of U.S. government securities were $29,746,000 and $32,474,000, respectively. Total purchases and sales include $662,291,000 and $298,204,000, respectively, in connection with in-kind purchases and redemptions of the fund’s capital shares.
Emerging Markets Government Bond Index Fund
F. Capital share transactions for each class of shares were:
| | | | | Year Ended October 31, |
| | | 2020 | | | 2019 |
| | Amount | Shares | | Amount | Shares |
| | ($000) | (000) | | ($000) | (000) |
| Investor Shares | | | | | |
| Issued1 | — | — | | 1,019 | 106 |
| Issued in Lieu of Cash Distributions | — | — | | 207 | 22 |
| Redeemed2 | — | — | | (11,755) | (1,203) |
| Net Increase (Decrease)—Investor Shares | — | — | | (10,529) | (1,075) |
| ETF Shares | | | | | |
| Issued1 | 699,150 | 8,720 | | 417,149 | 5,319 |
| Issued in Lieu of Cash Distributions | — | — | | — | — |
| Redeemed | (304,221) | (4,100) | | (7,416) | (100) |
| Net Increase (Decrease)—ETF Shares | 394,929 | 4,620 | | 409,733 | 5,219 |
| Admiral Shares | | | | | |
| Issued1,2 | 72,508 | 3,636 | | 63,817 | 3,263 |
| Issued in Lieu of Cash Distributions | 10,430 | 535 | | 10,121 | 516 |
| Redeemed | (101,592) | (5,297) | | (77,086) | (3,967) |
| Net Increase (Decrease)—Admiral Shares | (18,654) | (1,126) | | (3,148) | (188) |
| Institutional Shares | | | | | |
| Issued1 | 12,179 | 432 | | 28,354 | 892 |
| Issued in Lieu of Cash Distributions | 2,233 | 71 | | 1,568 | 50 |
| Redeemed | (21,639) | (714) | | (880) | (27) |
| Net Increase (Decrease)—Institutional Shares | (7,227) | (211) | | 29,042 | 915 |
| 1 | Includes purchase fees for fiscal 2020 and 2019 of $662,000 and $532,000, respectively (fund totals). |
| 2 | In November 2018, the fund announced changes to the availability and minimum investment criteria of the Investor and Admiral share classes. As a result, all of the outstanding Investor Shares automatically converted to Admiral Shares beginning in April 2019. Investor Shares—Redeemed and Admiral Shares—Issued include 981,000 and 490,000 shares, respectively, in the amount of $9,638,000 from the conversion during the year ended October 31, 2019. |
G. Management has determined that no events or transactions occurred subsequent to October 31, 2020, that would require recognition or disclosure in these financial statements.
Report of Independent Registered Public Accounting Firm
To the Board of Trustees of Vanguard Whitehall Funds and Shareholders of Vanguard Emerging Markets Government Bond Index Fund
Opinion on the Financial Statements
We have audited the accompanying statement of assets and liabilities, including the schedule of investments, of Vanguard Emerging Markets Government Bond Index Fund (one of the funds constituting Vanguard Whitehall Funds, referred to hereafter as the “Fund”) as of October 31, 2020, the related statement of operations for the year ended October 31, 2020, the statement of changes in net assets for each of the two years in the period ended October 31, 2020, including the related notes, and the financial highlights for each of the five years in the period ended October 31, 2020 (collectively referred to as the “financial statements”). In our opinion, the financial statements present fairly, in all material respects, the financial position of the Fund as of October 31, 2020, the results of its operations for the year then ended, the changes in its net assets for each of the two years in the period ended October 31, 2020 and the financial highlights for each of the five years in the period ended October 31, 2020 in conformity with accounting principles generally accepted in the United States of America.
Basis for Opinion
These financial statements are the responsibility of the Fund’s management. Our responsibility is to express an opinion on the Fund’s financial statements based on our audits. We are a public accounting firm registered with the Public Company Accounting Oversight Board (United States) (“PCAOB”) and are required to be independent with respect to the Fund in accordance with the U.S. federal securities laws and the applicable rules and regulations of the Securities and Exchange Commission and the PCAOB.
We conducted our audits of these financial statements in accordance with the standards of the PCAOB. Those standards require that we plan and perform the audit to obtain reasonable assurance about whether the financial statements are free of material misstatement, whether due to error or fraud.
Our audits included performing procedures to assess the risks of material misstatement of the financial statements, whether due to error or fraud, and performing procedures that respond to those risks. Such procedures included examining, on a test basis, evidence regarding the amounts and disclosures in the financial statements. Our audits also included evaluating the accounting principles used and significant estimates made by management, as well as evaluating the overall presentation of the financial statements. Our procedures included confirmation of securities owned as of October 31, 2020 by correspondence with the custodian, transfer agent and brokers; when replies were not received from brokers, we performed other auditing procedures. We believe that our audits provide a reasonable basis for our opinion.
/s/PricewaterhouseCoopers LLP
Philadelphia, Pennsylvania
December 15, 2020
We have served as the auditor of one or more investment companies in The Vanguard Group of Funds since 1975.
BLOOMBERG is a trademark and service mark of Bloomberg Finance L.P. BARCLAYS is a trademark and service mark of Barclays Bank Plc, used under license. Bloomberg Finance L.P. and its affiliates, including Bloomberg Index Services Limited (BISL) (collectively, Bloomberg), or Bloomberg’s licensors, own all proprietary rights in the Bloomberg Barclays USD Emerging Markets Government RIC Capped Index (Index or Bloomberg Barclays Index).
Neither Barclays Bank Plc, Barclays Capital Inc., or any affiliate (collectively Barclays) or Bloomberg is the issuer or producer of the Emerging Markets Government Bond Index Fund and neither Bloomberg nor Barclays has any responsibilities, obligations or duties to investors in the Emerging Markets Government Bond Index Fund. The Index is licensed for use by The Vanguard Group, Inc. (Vanguard) as the sponsor of the Emerging Markets Government Bond Index Fund. Bloomberg and Barclays’ only relationship with Vanguard in respect of the Index is the licensing of the Index, which is determined, composed and calculated by BISL, or any successor thereto, without regard to the Issuer or the Emerging Markets Government Bond Index Fund or the owners of the Emerging Markets Government Bond Index Fund.
Additionally, Vanguard may for itself execute transaction(s) with Barclays in or relating to the Index in connection with the Emerging Markets Government Bond Index Fund. Investors acquire the Emerging Markets Government Bond Index Fund from Vanguard and investors neither acquire any interest in the Index nor enter into any relationship of any kind whatsoever with Bloomberg or Barclays upon making an investment in the Emerging Markets Government Bond Index Fund. The Emerging Markets Government Bond Index Fund is not sponsored, endorsed, sold or promoted by Bloomberg or Barclays. Neither Bloomberg nor Barclays makes any representation or warranty, express or implied regarding the advisability of investing in the Emerging Markets Government Bond Index Fund or the advisability of investing in securities generally or the ability of the Index to track corresponding or relative market performance. Neither Bloomberg nor Barclays has passed on the legality or suitability of the Emerging Markets Government Bond Index Fund with respect to any person or entity. Neither Bloomberg nor Barclays is responsible for and has not participated in the determination of the timing of, prices at, or quantities of the Emerging Markets Government Bond Index Fund to be issued. Neither Bloomberg nor Barclays has any obligation to take the needs of the Issuer or the owners of the Emerging Markets Government Bond Index Fund or any other third party into consideration in determining, composing or calculating the Index. Neither Bloomberg nor Barclays has any obligation or liability in connection with administration, marketing or trading of the Emerging Markets Government Bond Index Fund.
The licensing agreement between Bloomberg and Barclays is solely for the benefit of Bloomberg and Barclays and not for the benefit of the owners of the Emerging Markets Government Bond Index Fund, investors or other third parties. In addition, the licensing agreement between Vanguard and Bloomberg is solely for the benefit of Vanguard and Bloomberg and not for the benefit of the owners of the Emerging Markets Government Bond Index Fund, investors or other third parties.
NEITHER BLOOMBERG NOR BARCLAYS SHALL HAVE ANY LIABILITY TO THE ISSUER, INVESTORS OR TO OTHER THIRD PARTIES FOR THE QUALITY, ACCURACY AND/OR COMPLETENESS OF THE BLOOMBERG BARCLAYS INDEX OR ANY DATA INCLUDED THEREIN OR FOR INTERRUPTIONS IN THE DELIVERY OF THE BLOOMBERG BARCLAYS INDEX. NEITHER BLOOMBERG NOR BARCLAYS MAKES ANY WARRANTY, EXPRESS OR IMPLIED, AS TO RESULTS TO BE OBTAINED BY THE ISSUER, THE INVESTORS OR ANY OTHER PERSON OR ENTITY FROM THE USE OF THE BLOOMBERG BARCLAYS INDEX OR ANY DATA INCLUDED THEREIN. NEITHER BLOOMBERG NOR BARCLAYS MAKES ANY EXPRESS OR IMPLIED WARRANTIES, AND EACH HEREBY EXPRESSLY DISCLAIMS ALL WARRANTIES OF MERCHANTABILITY OR FITNESS FOR A PARTICULAR PURPOSE OR USE WITH RESPECT TO THE BLOOMBERG BARCLAYS INDEX OR ANY DATA INCLUDED THEREIN. BLOOMBERG RESERVES THE RIGHT TO CHANGE THE METHODS OF CALCULATION OR PUBLICATION, OR TO CEASE THE CALCULATION OR PUBLICATION OF THE BLOOMBERG BARCLAYS INDEX, AND NEITHER BLOOMBERG NOR BARCLAYS SHALL BE LIABLE FOR ANY MISCALCULATION OF OR ANY INCORRECT, DELAYED OR INTERRUPTED PUBLICATION WITH RESPECT TO THE BLOOMBERG BARCLAYS INDEX. NEITHER BLOOMBERG NOR BARCLAYS SHALL BE LIABLE FOR ANY DAMAGES, INCLUDING, WITHOUT LIMITATION, ANY SPECIAL, INDIRECT OR CONSEQUENTIAL DAMAGES, OR ANY LOST PROFITS AND EVEN IF ADVISED OF THE POSSIBILITY OF SUCH, RESULTING FROM THE USE OF THE BLOOMBERG BARCLAYS INDEX OR ANY DATA INCLUDED THEREIN OR WITH RESPECT TO THE EMERGING MARKETS GOVERNMENT BOND INDEX FUND.
None of the information supplied by Bloomberg or Barclays and used in this publication may be reproduced in any manner without the prior written permission of both Bloomberg and Barclays Capital, the investment banking division of Barclays Bank Plc. Barclays Bank Plc is registered in England No. 1026167. Registered office 1 Churchill Place London E14 5HP.
© 2020 Bloomberg. Used with Permission.
Source: Bloomberg Index Services Limited. Copyright 2020, Bloomberg. All rights reserved.
The People Who Govern Your Fund
The trustees of your mutual fund are there to see that the fund is operated and managed in your best interests since, as a shareholder, you are a part owner of the fund. Your fund’s trustees also serve on the board of directors of The Vanguard Group, Inc., which is owned by the Vanguard funds and provides services to them.
A majority of Vanguard’s board members are independent, meaning that they have no affiliation with Vanguard or the funds they oversee, apart from the sizable personal investments they have made as private individuals. The independent board members have distinguished backgrounds in business, academia, and public service. Each of the trustees and executive officers oversees 213 Vanguard funds.
Information for each trustee and executive officer of the fund appears below. That information, as well as the Vanguard fund count, is as of the date on the cover of this fund report. The mailing address of the trustees and officers is P.O. Box 876, Valley Forge, PA 19482. More information about the trustees is in the Statement of Additional Information, which can be obtained, without charge, by contacting Vanguard at 800-662-7447, or online at vanguard.com.
Interested Trustee1
Mortimer J. Buckley
Born in 1969. Trustee since January 2018. Principal occupation(s) during the past five years and other experience: chairman of the board (2019–present) of Vanguard and of each of the investment companies served by Vanguard; chief executive officer (2018–present) of Vanguard; chief executive officer, president, and trustee (2018–present) of each of the investment companies served by Vanguard; president and director (2017–present) of Vanguard; and president (2018–present) of Vanguard Marketing Corporation. Chief investment officer (2013–2017), managing director (2002–2017), head of the Retail Investor Group (2006–2012), and chief information officer (2001–2006) of Vanguard. Chairman of the board (2011–2017) and trustee (2009–2017) of the Children’s Hospital of Philadelphia; and trustee (2018–present) and vice chair (2019–present) of The Shipley School.
Independent Trustees
Emerson U. Fullwood
Born in 1948. Trustee since January 2008. Principal occupation(s) during the past five years and other experience: executive chief staff and marketing officer for North America and corporate vice president (retired 2008) of Xerox Corporation (document management products and services). Former president of the Worldwide Channels Group, Latin America, and Worldwide Customer Service and executive chief staff officer of Developing Markets of Xerox. Executive in residence and 2009–2010 Distinguished Minett Professor at the Rochester Institute of Technology. Director of SPX FLOW, Inc. (multi-industry manufacturing). Director of the University of Rochester Medical Center, the Monroe Community College Foundation, the United Way of Rochester, North Carolina A&T University, and Roberts Wesleyan College. Trustee of the University of Rochester.
Amy Gutmann
Born in 1949. Trustee since June 2006. Principal occupation(s) during the past five years and other experience: president (2004–present) of the University of Pennsylvania. Christopher H. Browne Distinguished Professor of Political Science, School of Arts and Sciences, and professor of communication, Annenberg School for Communication, with secondary faculty appointments in the Department of Philosophy, School of Arts and Sciences, and at the Graduate School of Education, University of Pennsylvania.
F. Joseph Loughrey
Born in 1949. Trustee since October 2009. Principal occupation(s) during the past five years and other experience: president and chief operating officer (retired 2009) and vice chairman of the board (2008–2009) of Cummins Inc. (industrial machinery). Chairman of the board of Hillenbrand, Inc. (specialized consumer services) and the Lumina Foundation. Director of the V Foundation. Member of the advisory
| 1 | Mr. Buckley is considered an “interested person,” as defined in the Investment Company Act of 1940, because he is an officer of the Vanguard funds. |
council for the College of Arts and Letters and chair of the advisory board to the Kellogg Institute for International Studies, both at the University of Notre Dame.
Mark Loughridge
Born in 1953. Trustee since March 2012. Principal occupation(s) during the past five years and other experience: senior vice president and chief financial officer (retired 2013) of IBM (information technology services). Fiduciary member of IBM’s Retirement Plan Committee (2004–2013), senior vice president and general manager (2002–2004) of IBM Global Financing, vice president and controller (1998–2002) of IBM, and a variety of other prior management roles at IBM. Member of the Council on Chicago Booth.
Scott C. Malpass
Born in 1962. Trustee since March 2012. Principal occupation(s) during the past five years and other experience: chief investment officer (retired June 2020) and vice president (retired June 2020) of the University of Notre Dame. Assistant professor of finance at the Mendoza College of Business, University of Notre Dame, and member of the Notre Dame 403(b) Investment Committee (retired June 2020). Member of the board of Catholic Investment Services, Inc. (investment advisors) and the board of superintendence of the Institute for the Works of Religion.
Deanna Mulligan
Born in 1963. Trustee since January 2018. Principal occupation(s) during the past five years and other experience: board chair (2020–present), chief executive officer (2011–2020), and president (2010–2019) of The Guardian Life Insurance Company of America. Chief operating officer (2010–2011) and executive vice president (2008–2010) of the individual life and disability division of Guardian Life. Member of the board of the American Council of Life Insurers and the board of the Economic Club of New York. Trustee of the Partnership for New York City (business leadership), Chief Executives for Corporate Purpose, NewYork-Presbyterian Hospital, Catalyst, and the Bruce Museum (arts and science). Member of the Advisory Council for the Stanford Graduate School of Business.
André F. Perold
Born in 1952. Trustee since December 2004. Principal occupation(s) during the past five years and other experience: George Gund Professor of Finance and Banking, Emeritus at the Harvard Business School (retired 2011). Chief investment officer and co-managing partner of HighVista Strategies (private investment firm). Member of the board of advisors and member of the investment committee of the Museum of Fine Arts Boston. Member of the board (2018–present) of RIT Capital Partners (investment firm). Member of the investment committee of Partners Health Care System.
Sarah Bloom Raskin
Born in 1961. Trustee since January 2018. Principal occupation(s) during the past five years and other experience: deputy secretary (2014–2017) of the United States Department of the Treasury. Governor (2010–2014) of the Federal Reserve Board. Commissioner (2007–2010) of financial regulation for the State of Maryland. Member of the board of directors (2012–2014) of Neighborhood Reinvestment Corporation. Director (2017–present) of i(x) Investments, LLC; director (2017–present) of Reserve Trust. Rubenstein Fellow (2017–present) of Duke University; trustee (2017–present) of Amherst College, and trustee (2019–present) of the Folger Shakespeare Library.
Peter F. Volanakis
Born in 1955. Trustee since July 2009. Principal occupation(s) during the past five years and other experience: president and chief operating officer (retired 2010) of Corning Incorporated (communications equipment) and director of Corning Incorporated (2000–2010) and Dow Corning (2001–2010). Director (2012) of SPX Corporation (multi-industry manufacturing). Overseer of the Amos Tuck School of Business Administration, Dartmouth College (2001–2013). Chairman of the board of trustees of Colby-Sawyer College. Member of the board of Hypertherm Inc. (industrial cutting systems, software, and consumables).
Executive Officers
John Bendl
Born in 1970. Principal occupation(s) during the past five years and other experience: principal of Vanguard. Chief financial officer (2019–present) of each of the investment companies served by Vanguard. Chief accounting officer, treasurer, and controller of Vanguard (2017–present). Partner (2003–2016) at KPMG (audit, tax, and advisory services).
Christine M. Buchanan
Born in 1970. Principal occupation(s) during the past five years and other experience: principal of Vanguard. Treasurer (2017–present) of each of the investment companies served by Vanguard. Partner (2005–2017) at KPMG (audit, tax, and advisory services).
David Cermak
Born in 1960. Principal occupation(s) during the past five years and other experience: principal of Vanguard. Finance director (2019–present) of each of the investment companies served by Vanguard. Managing director and head (2017–present) of Vanguard Investments Singapore. Managing director and head (2017–2019) of Vanguard Investments Hong Kong. Representative director and head (2014–2017) of Vanguard Investments Japan.
John Galloway
Born in 1973. Principal occupation(s) during the past five years and other experience: principal of Vanguard. Investment stewardship officer (September 2020–present) of each of the investment companies served by Vanguard. Head of Investor Advocacy (February 2020–present) and head of Marketing Strategy and Planning (2017–2020) at Vanguard. Deputy assistant to the President of the United States (2015).
Thomas J. Higgins
Born in 1957. Principal occupation(s) during the past five years and other experience: principal of Vanguard. Finance director (2019–present), chief financial officer (2008–2019), and treasurer (1998–2008) of each of the investment companies served by Vanguard.
Peter Mahoney
Born in 1974. Principal occupation(s) during the past five years and other experience: principal of Vanguard. Controller (2015–present) of each of the investment companies served by Vanguard. Head of International Fund Services (2008–2014) at Vanguard.
Anne E. Robinson
Born in 1970. Principal occupation(s) during the past five years and other experience: general counsel (2016–present) of Vanguard. Secretary (2016–present) of Vanguard and of each of the investment companies served by Vanguard. Managing director (2016–present) of Vanguard. Managing director and general counsel of Global Cards and Consumer Services (2014–2016) at Citigroup. Counsel (2003–2014) at American Express.
Michael Rollings
Born in 1963. Principal occupation(s) during the past five years and other experience: finance director (2017–present) and treasurer (2017) of each of the investment companies served by Vanguard. Managing director (2016–present) of Vanguard. Chief financial officer (2016–present) of Vanguard. Director (2016–present) of Vanguard Marketing Corporation. Executive vice president and chief financial officer (2006–2016) of MassMutual Financial Group.
John E. Schadl
Born in 1972. Principal occupation(s) during the past five years and other experience: principal of Vanguard. Chief compliance officer (2019–present) of Vanguard and of each of the investment companies served by Vanguard. Assistant vice president (2019–
present) of Vanguard Marketing Corporation.
Vanguard Senior Management Team
| Joseph Brennan | | James M. Norris |
| Mortimer J. Buckley | | Thomas M. Rampulla |
| Gregory Davis | | Karin A. Risi |
| John James | | Anne E. Robinson |
| John T. Marcante | | Michael Rollings |
| Chris D. McIsaac | | Lauren Valente |
| | | |

Connect with Vanguard® > vanguard.com
Fund Information > 800-662-7447
Direct Investor Account Services > 800-662-2739
Institutional Investor Services > 800-523-1036
Text Telephone for People Who Are Deaf or Hard of Hearing > 800-749-7273
This material may be used in conjunction with the offering of shares of any Vanguard fund only if preceded or accompanied by the fund’s current prospectus.
All comparative mutual fund data are from Morningstar, Inc., unless otherwise noted.
You can obtain a free copy of Vanguard’s proxy voting guidelines by visiting vanguard.com/proxyreporting or by calling Vanguard at 800-662-2739. The guidelines are also available from the SEC’s website, www.sec.gov. In addition, you may obtain a free report on how your fund voted the proxies for securities it owned during the 12 months ended June 30. To get the report, visit either vanguard.com/proxyreporting or www.sec.gov.
You can review information about your fund on the SEC’s website, and you can receive copies of this information, for a fee, by sending a request via email addressed to publicinfo@sec.gov.
| | © 2020 The Vanguard Group, Inc. |
| | All rights reserved. |
| | U.S. Patent Nos. 6,879,964; 7,337,138; 7,720,749; 7,925,573; 8,090,646; 8,417,623; and 8,626,636. |
| | Vanguard Marketing Corporation, Distributor. |
| | |
| | Q11200 122020 |

| | |
| | |
| | |
| | |
| Annual Report | October 31, 2020 | |
| | |
| | |
| Vanguard Global Minimum Volatility Fund |
| | |
| | |
| | |
| | |
| | |
| | |
| | |
| | |
| | |
| | |
| | |
| | |
| | |
| | |
| | |
| | |
| | |
| | |
| | |
| | |
| | |
| | |
| | |
| | |
| | |
| | |
| | |
| | |
| | |
| | |
| | |
| | |
| | |
| | |
| | |
| | |
| | |
| See the inside front cover for important information about access to your fund’s annual and semiannual shareholder reports. |
| | |
Important information about access to shareholder reports
Beginning on January 1, 2021, as permitted by regulations adopted by the Securities and Exchange Commission, paper copies of your fund’s annual and semiannual shareholder reports will no longer be sent to you by mail, unless you specifically request them. Instead, you will be notified by mail each time a report is posted on the website and will be provided with a link to access the report.
If you have already elected to receive shareholder reports electronically, you will not be affected by this change and do not need to take any action. You may elect to receive shareholder reports and other communications from the fund electronically by contacting your financial intermediary (such as a broker-dealer or bank) or, if you invest directly with the fund, by calling Vanguard at one of the phone numbers on the back cover of this report or by logging on to vanguard.com.
You may elect to receive paper copies of all future shareholder reports free of charge. If you invest through a financial intermediary, you can contact the intermediary to request that you continue to receive paper copies. If you invest directly with the fund, you can call Vanguard at one of the phone numbers on the back cover of this report or log on to vanguard.com. Your election to receive paper copies will apply to all the funds you hold through an intermediary or directly with Vanguard.
Contents
| Your Fund’s Performance at a Glance | 1 |
| | |
| Advisor’s Report | 2 |
| | |
| About Your Fund’s Expenses | 5 |
| | |
| Performance Summary | 7 |
| | |
| Financial Statements | 9 |
Please note: The opinions expressed in this report are just that—informed opinions. They should not be considered promises or advice. Also, please keep in mind that the information and opinions cover the period through the date on the front of this report. Of course, the risks of investing in your fund are spelled out in the prospectus.
Your Fund’s Performance at a Glance
• Vanguard Global Minimum Volatility Fund returned –9.22% for Investor Shares and –9.18% for Admiral Shares for the 12 months ended October 31, 2020, underperforming its benchmark, the FTSE Global All Cap Index (USD Hedged).
• The fiscal year was marked by the global spread of COVID-19. After a sharp, pandemic-related decline earlier in 2020, global stocks began a rebound in March that continued throughout much of the rest of the period.
• Our positions in low-volatility stocks trailed during the rebound. As stock correlations rose during the market downturn, defensive sectors such as utilities and consumer staples sold off, and they have been relatively flat since.
• Aided by an underweight to energy and positions in emerging markets and the Middle East. The fund’s weekly volatility averaged slightly less than that of its benchmark.
• The fund regularly uses derivatives to hedge portfolio risks. On balance, the fund’s holdings of forward currency contracts and equity index futures contracts contributed to performance.
Market Barometer
| | Average Annual Total Returns |
| | Periods Ended October 31, 2020 |
| | One Year | Three Years | Five Years |
| Stocks | | | |
| Russell 1000 Index (Large-caps) | 10.87% | 10.63% | 11.79% |
| Russell 2000 Index (Small-caps) | -0.14 | 2.19 | 7.27 |
| Russell 3000 Index (Broad U.S. market) | 10.15 | 10.04 | 11.48 |
| FTSE All-World ex US Index (International) | -2.17 | 0.13 | 4.52 |
| | | | |
| Bonds | | | |
| Bloomberg Barclays U.S. Aggregate Bond Index (Broad taxable market) | 6.19% | 5.06% | 4.08% |
| Bloomberg Barclays Municipal Bond Index (Broad tax-exempt market) | 3.59 | 4.09 | 3.70 |
| FTSE Three-Month U.S. Treasury Bill Index | 0.86 | 1.62 | 1.15 |
| | | | |
| CPI | | | |
| Consumer Price Index | 1.18% | 1.82% | 1.83% |
Advisor’s Report
For the 12 months ended October 31, 2020, Vanguard Global Minimum Volatility Fund returned –9.22% for Investor Shares and –9.18% for Admiral Shares, with an annualized weekly volatility of 26.66%. Its benchmark, the FTSE Global All Cap Index (USD Hedged), returned 4.66%, with an annualized weekly volatility of 27.54%. (To determine annualized weekly volatility, we calculate the standard deviation of weekly returns and multiply it by the square root of 52, the number of weeks in a year.)
Investment objective
Our objective is to create a portfolio that has broad equity exposure with less volatility than that of the global equity market. Though our positions in low-volatility stocks did not deliver as much downside protection as they have in the past, the fund’s weekly volatility still averaged about 3% less than that of its benchmark.
It is important to mention, as we have in the past, that we do not target a specific volatility level. Rather, we seek to provide an equity fund that has lower absolute risk than that of the broad global market. Thus, when the broad global equity market is experiencing periods of low volatility, you should expect this fund’s volatility to be much closer to that of its benchmark.
We recognize that equity-like returns are also an important outcome of an investment in this fund, but achieving a total return higher than the benchmark’s is not our objective. Although our research leads us to expect that, on average, a minimum volatility fund may hold up better than the overall global market in sharp downturns (while still experiencing losses), the fund should be expected to trail in strong bull markets. With that in mind, because the fund is expected to have a lower level of risk than the global equity market, you should not expect it to outperform the market over the long run.
We think a reasonable comparative performance measure for the fund over the long term is its risk-adjusted return. This can be calculated by dividing the portfolio’s total return for the period by the annualized standard deviation of weekly returns. Since inception, the risk-adjusted return was about 0.70, compared with 0.65 for the benchmark.
Investment strategy
In building our portfolio, we use quantitative models that evaluate a variety of factors that drive a stock’s volatility. These fundamental drivers include risk factors such as growth, value, dividend yield, size, volatility, and liquidity. In addition, our process includes estimates of each stock’s correlation—or how its factors move in relation to one another. This approach allows us to make appropriate risk/diversification trade-offs without relying solely on volatility estimates.
We also consider the effect of currency exposure. We recognize that owning companies in foreign markets involves the risk of movements in exchange rates relative to the U.S. dollar. Because of this, an optimization process that focuses solely on volatilities tied to an investor’s home currency will tend to overweight exposures to that currency.
We aim to avoid currency-specific exposures by focusing on equity volatilities and correlations measured in local currency terms. We use currency forward contracts to hedge the resulting exposure for U.S. investors. We believe this process can further reduce the overall volatility of the portfolio in the long run.
Finally, we apply constraints to reduce stock, sector, and country concentration risk. We find that these constraints, which allow for broader diversification and liquidity, reduce unnecessarily high risk exposures without significantly affecting our ability to lower overall volatility. Drawing from about 7,700 stocks in the FTSE index, we construct a portfolio of about 300 to 400 stocks.
The benefits of our strategy become even clearer when you remove some of the noise caused by short-term reversals in daily and weekly returns, which can increase volatility levels, and focus on monthly returns. Since inception, the fund has delivered about a 19% reduction in the annualized volatility of monthly returns relative to its benchmark.
The investment environment
Global stocks declined early in 2020 but rebounded in March. For the 12 months, the FTSE Global All Cap Index (unhedged) returned 4.69%. The U.S. stock market returned 9.71%, as measured by the Standard & Poor’s 500 Index, outperforming emerging markets and especially developed markets outside the United States. Large-capitalization stocks beat mid- and small-caps, and growth stocks outpaced value.
Massive fiscal and monetary support from governments and central banks, signs of economic healing, and reported progress toward a COVID-19 vaccine all buoyed the markets. As they rebounded after the March sell-off, most of the buying volume occurred in higher-volatility areas such as distressed securities and mega-cap technology companies.
Global bond yields ended significantly lower—and bond prices higher—amid unprecedented action from policymakers and the dimmer outlook for economic activity. Investment-grade U.S. bonds, as measured by the Bloomberg Barclays U.S. Aggregate Float Adjusted Index, returned 6.31% and outpaced their counterparts abroad.
The fund’s successes and shortfalls
Our portfolio is designed to deliver equity-like returns with lower market volatility. While the fund has delivered on this objective over the long term, it did not
provide significant downside protection during the period because of the highly unusual market environment.
As stock correlations rose during the sell-off, defensive sectors such as utilities and consumer staples sold off with the rest of the market and remained relatively flat through October 31. Large-cap, low-volatility stocks trailed during the rebound, but the largest detractors were our positions in mid- and small-cap, low-volatility stocks.
At the sector level, our selection in information technology stocks, in particular software firms and technology hardware and storage companies, detracted the most. Our selection in financials and health care also lagged significantly. An underweight to energy, in particular oil and gas companies, aided performance and helped lower volatility.
Regionally, our positions in North America, which account for more than 50% of the fund’s holdings, hurt relative returns the most. Positions in emerging markets and the Middle East helped reduce volatility.
We remain convinced in the fund’s ability to deliver a strong risk/return profile over the long term. Despite the challenging environment since the pandemic, the fund continued to deliver a small volatility discount to the market. This discount has been better over the long term—15% over the last three years and 19% since the fund’s inception.
We expect our approach to portfolio construction to pay off in reduced volatility over the long run and expect the fund to rebound once normal market liquidity and long-term investor confidence are restored. We will continue to focus patiently on its long-term risk-adjusted returns.
Portfolio Manager:
Antonio Picca
Vanguard Quantitative Equity Group
November 18, 2020
About Your Fund’s Expenses
As a shareholder of the fund, you incur ongoing costs, which include costs for portfolio management, administrative services, and shareholder reports (like this one), among others. Operating expenses, which are deducted from a fund’s gross income, directly reduce the investment return of the fund.
A fund’s expenses are expressed as a percentage of its average net assets. This figure is known as the expense ratio. The following examples are intended to help you understand the ongoing costs (in dollars) of investing in your fund and to compare these costs with those of other mutual funds. The examples are based on an investment of $1,000 made at the beginning of the period shown and held for the entire period.
The accompanying table illustrates your fund’s costs in two ways:
Ÿ Based on actual fund return. This section helps you to estimate the actual expenses that you paid over the period. The ”Ending Account Value“ shown is derived from the fund‘s actual return, and the third column shows the dollar amount that would have been paid by an investor who started with $1,000 in the fund. You may use the information here, together with the amount you invested, to estimate the expenses that you paid over the period.
To do so, simply divide your account value by $1,000 (for example, an $8,600 account value divided by $1,000 = 8.6), then multiply the result by the number given for your fund under the heading ”Expenses Paid During Period.“
Ÿ Based on hypothetical 5% yearly return. This section is intended to help you compare your fund‘s costs with those of other mutual funds. It assumes that the fund had a yearly return of 5% before expenses, but that the expense ratio is unchanged. In this case—because the return used is not the fund’s actual return—the results do not apply to your investment. The example is useful in making comparisons because the Securities and Exchange Commission requires all mutual funds to calculate expenses based on a 5% return. You can assess your fund’s costs by comparing this hypothetical example with the hypothetical examples that appear in shareholder reports of other funds.
Note that the expenses shown in the table are meant to highlight and help you compare ongoing costs only and do not reflect transaction costs incurred by the fund for buying and selling securities. Further, the expenses do not include any purchase, redemption, or account service fees described in the fund prospectus. If such fees were applied to your account, your costs would be higher. Your fund does not carry a “sales load.”
The calculations assume no shares were bought or sold during the period. Your actual costs may have been higher or lower, depending on the amount of your investment and the timing of any purchases or redemptions.
You can find more information about the fund’s expenses, including annual expense ratios, in the Financial Statements section of this report. For additional information on operating expenses and other shareholder costs, please refer to your fund’s current prospectus.
Six Months Ended October 31, 2020
| | Beginning | Ending | Expenses |
| | Account Value | Account Value | Paid During |
| Global Minimum Volatility Fund | 4/30/2020 | 10/31/2020 | Period |
| Based on Actual Fund Return | | | |
| Investor Shares | $1,000.00 | $1,033.17 | $1.07 |
| Admiral™ Shares | 1,000.00 | 1,033.14 | 0.72 |
| Based on Hypothetical 5% Yearly Return | | | |
| Investor Shares | $1,000.00 | $1,024.08 | $1.07 |
| Admiral Shares | 1,000.00 | 1,024.43 | 0.71 |
The calculations are based on expenses incurred in the most recent six-month period. The fund’s annualized six-month expense ratios for that period are 0.21% for Investor Shares and 0.14% for Admiral Shares. The dollar amounts shown as “Expenses Paid” are equal to the annualized expense ratio multiplied by the average account value over the period, multiplied by the number of days in the most recent six-month period, then divided by the number of days in the most recent 12-month period (184/366).
Global Minimum Volatility Fund
Performance Summary
All of the returns in this report represent past performance, which is not a guarantee of future results that may be achieved by the fund. (Current performance may be lower or higher than the performance data cited. For performance data current to the most recent month-end, visit our website at vanguard.com/performance.) Note, too, that both investment returns and principal value can fluctuate widely, so an investor’s shares, when sold, could be worth more or less than their original cost. The returns shown do not reflect taxes that a shareholder would pay on fund distributions or on the sale of fund shares.
Cumulative Performance: December 12, 2013, Through October 31, 2020
Initial Investment of $10,000
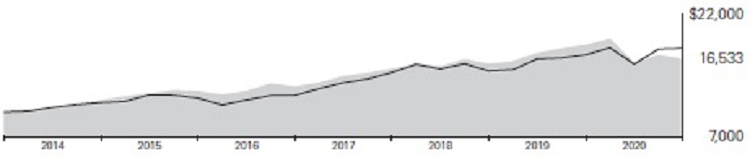
| | Average Annual Total Returns | |
| | Periods Ended October 31, 2020 | |
| | | | Since | Final Value |
| | One | Five | Inception | of a $10,000 |
| | Year | Years | (12/12/2013) | Investment |
 Global Minimum Volatility Fund Investor Shares Global Minimum Volatility Fund Investor Shares | -9.22% | 5.63% | 7.58% | $16,533 |
 FTSE Global All Cap Index (USD Hedged) FTSE Global All Cap Index (USD Hedged) | 4.66 | 8.78 | 8.76 | 17,823 |
"Since Inception" performance is calculated from the Investor Shares’ inception date for both the fund and its comparative standard(s).
| | | | Since | Final Value |
| | One | Five | Inception | of a $50,000 |
| | Year | Years | (12/12/2013) | Investment |
| Global Minimum Volatility Fund Admiral Shares | -9.18% | 5.72% | 7.66% | $83,098 |
| FTSE Global All Cap Index (USD Hedged) | 4.66 | 8.78 | 8.76 | 89,115 |
"Since Inception" performance is calculated from the Admiral Shares’ inception date for both the fund and its comparative standard(s).
See Financial Highlights for dividend and capital gains information.
Global Minimum Volatility Fund
Fund Allocation
As of October 31, 2020
| Communication Services | 13.1% |
| Consumer Discretionary | 9.8 |
| Consumer Staples | 12.2 |
| Energy | 0.1 |
| Financials | 8.5 |
| Health Care | 16.4 |
| Industrials | 9.6 |
| Information Technology | 18.1 |
| Materials | 4.9 |
| Real Estate | 1.1 |
| Utilities | 6.2 |
The table reflects the fund’s investments, except for short-term investments and derivatives. Sector categories are based on the Global Industry Classification Standard ("GICS"), except for the "Other" category (if applicable), which includes securities that have not been provided a GICS classification as of the effective reporting period.
The Global Industry Classification Standard (“GICS”) was developed by and is the exclusive property and a service mark of MSCI Inc. (“MSCI”) and Standard and Poor’s, a division of McGraw-Hill Companies, Inc. (“S&P”), and is licensed for use by Vanguard. Neither MSCI, S&P nor any third party involved in making or compiling the GICS or any GICS classification makes any express or implied warranties or representations with respect to such standard or classification (or the results to be obtained by the use thereof), and all such parties hereby expressly disclaim all warranties of originality, accuracy, completeness, merchantability or fitness for a particular purpose with respect to any such standard or classification. Without limiting any of the foregoing, in no event shall MSCI, S&P, any of its affiliates or any third party involved in making or compiling the GICS or any GICS classification have any liability for any direct, indirect, special, punitive, consequential or any other damages (including lost profits) even if notified of the possibility of such damages.
Global Minimum Volatility Fund
Financial Statements
Schedule of Investments
As of October 31, 2020
The fund files its complete schedule of portfolio holdings with the Securities and Exchange Commission (SEC) for the first and third quarters of each fiscal year as an exhibit to its reports on Form N-PORT. The fund’s Form N-PORT reports are available on the SEC’s website at www.sec.gov.
| | | | Market |
| | | | Value• |
| | | Shares | ($000) |
| Common Stocks (99.4%) | | |
| Australia (4.0%) | | |
| | Wesfarmers Ltd. | 1,293,621 | 41,874 |
| | Woolworths Group Ltd. | 1,082,125 | 29,110 |
| | Sonic Healthcare Ltd. | 828,117 | 20,283 |
| | Coles Group Ltd. | 1,488,555 | 18,595 |
| | AGL Energy Ltd. | 659,672 | 5,782 |
| | Commonwealth Bank of Australia | 101,259 | 4,916 |
| | ASX Ltd. | 76,822 | 4,302 |
| | Newcrest Mining Ltd. | 32,193 | 668 |
| | BWP Trust | 222,026 | 626 |
| | | | 126,156 |
| Belgium (0.3%) | | |
| | Etablissements Franz Colruyt | 137,878 | 8,156 |
| | Elia Group SA | 11,876 | 1,149 |
| | Sofina SA | 4,201 | 1,092 |
| | | | 10,397 |
| Brazil (0.4%) | | |
| | Telefonica Brasil SA ADR 1,588,519 | 11,691 |
| | | |
| Canada (3.4%) | | |
| ^ | Emera Inc. | 426,915 | 17,031 |
| | BCE Inc. | 375,928 | 15,107 |
| ^ | Shaw Communications Inc. Class B | 696,579 | 11,476 |
| | Franco-Nevada Corp. | 81,181 | 11,065 |
| | TELUS Corp. | 622,765 | 10,648 |
| | Intact Financial Corp. | 73,870 | 7,630 |
| | Royal Bank of Canada | 100,621 | 7,036 |
| | Metro Inc. | 116,208 | 5,421 |
| | George Weston Ltd. | 69,311 | 4,861 |
| | Agnico Eagle Mines Ltd. | 56,977 | 4,511 |
| | Dollarama Inc. | 121,740 | 4,192 |
| | Loblaw Cos. Ltd. | 76,082 | 3,787 |
| | Fortis Inc. | 36,359 | 1,436 |
| 1 | Hydro One Ltd. | 44,707 | 977 |
| | WSP Global Inc. | 11,914 | 754 |
| | | | 105,932 |
| Chile (0.1%) | | |
| | Enel Americas SA ADR | 531,771 | 3,456 |
| | Banco Santander Chile ADR | 53,157 | 738 |
| | | | 4,194 |
| China (7.2%) | | |
| * | Alibaba Group Holding Ltd. ADR | 173,389 | 52,830 |
| | ZTO Express Cayman Inc. ADR | 1,428,056 | 41,385 |
| * | JD.com Inc. ADR | 370,445 | 30,199 |
| | China Mobile Ltd. ADR | 979,712 | 30,107 |
| | NetEase Inc. ADR | 292,485 | 25,385 |
| * | Tencent Music Entertainment Group ADR | 1,627,454 | 24,216 |
| * | TAL Education Group ADR | 194,154 | 12,903 |
| * | China Biologic Products Holdings Inc. | 86,750 | 10,081 |
| * | Baidu Inc. ADR | 15,128 | 2,013 |
| | | | 229,119 |
| Denmark (0.9%) | | |
| | Coloplast A/S Class B | 88,255 | 12,906 |
| | Novo Nordisk A/S Class B | 137,139 | 8,745 |
| | Tryg A/S | 101,509 | 2,817 |
| 1 | Orsted A/S | 14,194 | 2,253 |
| | Chr Hansen Holding A/S | 18,965 | 1,914 |
| | | | 28,635 |
| Finland (0.6%) | | |
| | Kone Oyj Class B | 203,261 | 16,182 |
| | Elisa Oyj | 82,626 | 4,063 |
| | | | 20,245 |
| Germany (0.2%) | | |
| * | Fielmann AG | 35,351 | 2,678 |
| * | Qiagen NV | 53,496 | 2,540 |
| | Knorr-Bremse AG | 16,437 | 1,904 |
| | | | 7,122 |
| Hong Kong (1.8%) | | |
| | CLP Holdings Ltd. | 2,527,850 | 23,293 |
| | Power Assets Holdings Ltd. | 2,706,000 | 13,935 |
Global Minimum Volatility Fund
| | | | Market |
| | | | Value• |
| | | Shares | ($000) |
| | Hang Seng Bank Ltd. | 796,100 | 12,265 |
| | Want Want China Holdings Ltd. | 2,935,000 | 1,944 |
| | Jardine Matheson Holdings Ltd. | 35,000 | 1,551 |
| | Chow Tai Fook Jewellery Group Ltd. | 1,131,200 | 1,446 |
| | MTR Corp. Ltd. | 159,500 | 790 |
| | CK Infrastructure Holdings Ltd. | 136,500 | 644 |
| | | | 55,868 |
| India (1.5%) | | |
| | Infosys Ltd. ADR | 1,545,169 | 22,050 |
| | Dr Reddy’s Laboratories Ltd. ADR | 232,974 | 15,099 |
| * | ICICI Bank Ltd. ADR | 849,861 | 8,966 |
| | | | 46,115 |
| Ireland (0.1%) | | |
| | Kerry Group plc Class A | 37,465 | 4,485 |
| | | | |
| Israel (0.3%) | | |
| * | Bank Hapoalim BM | 950,870 | 5,551 |
| | Bank Leumi Le-Israel BM | 502,855 | 2,370 |
| | | | 7,921 |
| Italy (0.5%) | | |
| | Assicurazioni Generali SPA | 818,762 | 10,983 |
| | Hera SPA | 543,844 | 1,708 |
| | UnipolSai Assicurazioni SPA | 656,555 | 1,525 |
| | | | 14,216 |
| Japan (11.9%) | | |
| | Japan Tobacco Inc. | 2,349,500 | 44,234 |
| | Chugai Pharmaceutical Co. Ltd. | 880,800 | 33,999 |
| | SoftBank Corp. | 1,939,500 | 22,571 |
| | Yamada Holdings Co. Ltd. | 4,179,600 | 20,379 |
| | FUJIFILM Holdings Corp. | 311,900 | 15,905 |
| | Pan Pacific International Holdings Corp. | 699,000 | 14,832 |
| | Canon Inc. | 804,000 | 13,995 |
| | SG Holdings Co. Ltd. | 490,900 | 11,841 |
| | Secom Co. Ltd. | 131,500 | 11,109 |
| | Toyo Suisan Kaisha Ltd. | 203,300 | 10,117 |
| | Sawai Pharmaceutical Co. Ltd. | 168,600 | 8,126 |
| | Kagome Co. Ltd. | 221,000 | 7,570 |
| | Sysmex Corp. | 72,800 | 6,838 |
| | Nitori Holdings Co. Ltd. | 33,200 | 6,824 |
| | Chugoku Electric Power Co. Inc. | 530,500 | 6,665 |
| | Daikin Industries Ltd. | 34,600 | 6,475 |
| | ITOCHU Corp. | 268,000 | 6,437 |
| | Ajinomoto Co. Inc. | 310,100 | 6,230 |
| | ABC-Mart Inc. | 106,400 | 5,397 |
| ^ | Skylark Holdings Co. Ltd. | 363,500 | 5,184 |
| | Kintetsu Group Holdings Co. Ltd. | 121,500 | 4,855 |
| | Odakyu Electric Railway Co. Ltd. | 195,100 | 4,708 |
| | Kyocera Corp. | 85,200 | 4,692 |
| | KDDI Corp. | 167,800 | 4,540 |
| | Japan Post Bank Co. Ltd. | 567,000 | 4,522 |
| | Shimano Inc. | 19,100 | 4,368 |
| | East Japan Railway Co. | 80,100 | 4,189 |
| | Japan Exchange Group Inc. | 171,400 | 4,184 |
| | Square Enix Holdings Co. Ltd. | 67,700 | 3,934 |
| | Nissin Foods Holdings Co. Ltd. | 45,200 | 3,914 |
| | Nippon Telegraph & Telephone Corp. | 183,900 | 3,868 |
| | Oracle Corp. Japan | 38,200 | 3,818 |
| | Chubu Electric Power Co. Inc. | 320,700 | 3,592 |
| | Calbee Inc. | 104,300 | 3,200 |
| | Keio Corp. | 54,000 | 3,138 |
| | Capcom Co. Ltd. | 54,900 | 3,003 |
| | Tokyo Gas Co. Ltd. | 127,200 | 2,882 |
| | Mitsubishi Materials Corp. | 155,900 | 2,861 |
| | Toho Gas Co. Ltd. | 53,000 | 2,736 |
| | Toho Co. Ltd. | 66,900 | 2,649 |
| | Trend Micro Inc. | 46,600 | 2,610 |
| | Asahi Intecc Co. Ltd. | 83,600 | 2,591 |
| | Nagoya Railroad Co. Ltd. | 93,000 | 2,479 |
| | Ezaki Glico Co. Ltd. | 55,400 | 2,298 |
| | Hoshizaki Corp. | 28,300 | 2,260 |
| | Terumo Corp. | 56,100 | 2,065 |
| | MS&AD Insurance Group Holdings Inc. | 74,000 | 2,025 |
| | MOS Food Services Inc. | 60,500 | 1,650 |
| | Unicharm Corp. | 33,100 | 1,532 |
| | Lion Corp. | 73,800 | 1,505 |
| | West Japan Railway Co. | 33,700 | 1,446 |
| | Obic Co. Ltd. | 8,000 | 1,416 |
| | Osaka Gas Co. Ltd. | 74,000 | 1,405 |
| | KYORIN Holdings Inc. | 68,600 | 1,241 |
| | MediPal Holdings Corp. | 60,600 | 1,080 |
| | Kyowa Kirin Co. Ltd. | 43,000 | 1,068 |
| | Kewpie Corp. | 46,300 | 948 |
| | Suzuken Co. Ltd. | 24,500 | 884 |
| | Tokyu Corp. | 70,400 | 835 |
| | Koei Tecmo Holdings Co. Ltd. | 16,400 | 801 |
Global Minimum Volatility Fund
| | | | Market |
| | | | Value• |
| | | Shares | ($000) |
| | Lawson Inc. | 17,400 | 799 |
| | Keihan Holdings Co. Ltd. | 19,900 | 756 |
| | Nippon Shinyaku Co. Ltd. | 8,800 | 629 |
| | | | 374,704 |
| Netherlands (0.0%) | | |
| | Koninklijke Vopak NV | 24,772 | 1,287 |
| | | | |
| New Zealand (0.2%) | | |
| | Fisher & Paykel Healthcare Corp. Ltd. | 217,213 | 5,025 |
| | | | |
| Norway (0.4%) | | |
| | Orkla ASA | 1,356,340 | 12,804 |
| | | | |
| Poland (0.1%) | | |
| * | Powszechny Zaklad Ubezpieczen SA | 372,979 | 2,038 |
| * | Powszechna Kasa Oszczednosci Bank Polski SA | 279,275 | 1,340 |
| * | Bank Polska Kasa Opieki SA | 87,920 | 941 |
| | | | 4,319 |
| Russia (0.3%) | | |
| | Sberbank of Russia PJSC ADR | 791,635 | 7,997 |
| | Polyus PJSC GDR | 18,594 | 1,829 |
| | | | 9,826 |
| Singapore (0.6%) | | |
| | Oversea-Chinese | | |
| | Banking Corp. Ltd. | 1,943,548 | 11,987 |
| | Singapore Exchange Ltd. | 570,200 | 3,617 |
| | United Overseas Bank Ltd. | 240,900 | 3,347 |
| | Singapore Technologies Engineering Ltd. | 241,500 | 617 |
| | | | 19,568 |
| South Korea (1.9%) | | |
| | Korea Zinc Co. Ltd. | 50,052 | 16,928 |
| | KT&G Corp. | 235,748 | 16,833 |
| *,1 | Netmarble Corp. | 67,849 | 7,049 |
| Samsung Electronics Co. Ltd. | 137,365 | 6,905 |
| | SK Telecom Co. Ltd. | 27,516 | 5,218 |
| | Samsung Electronics Co. Ltd. Preference Shares | 57,101 | 2,540 |
| | Yuhan Corp. | 43,185 | 2,273 |
| | Maeil Dairies Co. Ltd. | 32,805 | 1,926 |
| * | CJ Logistics Corp. | 5,983 | 844 |
| | | | 60,516 |
| Spain (0.7%) | | |
| * | Ferrovial SA | 416,679 | 9,024 |
| * | Iberdrola SA | 415,155 | 4,902 |
| *,1 | Aena SME SA | 26,948 | 3,631 |
| | Endesa SA | 115,800 | 3,107 |
| | Red Electrica Corp. SA | 57,686 | 1,016 |
| | | | 21,680 |
| Sweden (0.2%) | | |
| | ICA Gruppen AB | 110,632 | 5,237 |
| | | | |
| Switzerland (3.4%) | | |
| | Swisscom AG | 78,142 | 39,743 |
| | Kuehne & Nagel International AG | 53,321 | 10,657 |
| | Schindler Holding AG | 39,059 | 10,006 |
| | Geberit AG | 16,853 | 9,592 |
| | Roche Holding AG | 22,360 | 7,185 |
| | Nestle SA | 50,386 | 5,667 |
| | Givaudan SA | 1,325 | 5,403 |
| | Roche Holding AG (Bearer) | 11,222 | 3,616 |
| | Chocoladefabriken Lindt & Spruengli AG | 444 | 3,520 |
| | Baloise Holding AG | 22,037 | 3,014 |
| | EMS-Chemie Holding AG | 2,557 | 2,249 |
| | Allreal Holding AG | 9,242 | 1,958 |
| | Banque Cantonale Vaudoise | 13,949 | 1,352 |
| | Novartis AG | 16,173 | 1,260 |
| 1 | Galenica AG | 19,891 | 1,254 |
| * | SIG Combibloc Group AG | 49,850 | 1,025 |
| | Stadler Rail AG | 16,644 | 662 |
| | | | 108,163 |
| Taiwan (1.8%) | | |
| | Taiwan Semiconductor | | |
| | Manufacturing Co. Ltd. ADR | 630,997 | 52,922 |
| | Chunghwa Telecom Co. Ltd. ADR | 142,247 | 5,374 |
| | | | 58,296 |
| United Kingdom (3.6%) | | |
| | GlaxoSmithKline plc | 1,757,826 | 29,353 |
| | Halma plc | 441,797 | 13,558 |
| | Wm Morrison Supermarkets plc | 4,976,066 | 10,504 |
| | National Grid plc | 820,503 | 9,760 |
| | Admiral Group plc | 264,087 | 9,408 |
| * | Rightmove plc | 1,081,767 | 8,658 |
| | Polymetal International plc | 282,111 | 5,996 |
| | B&M European Value Retail SA | 909,469 | 5,708 |
| | Tate & Lyle plc | 711,276 | 5,483 |
| | Smith & Nephew plc | 301,945 | 5,243 |
| | Sage Group plc | 522,131 | 4,296 |
| | Reckitt Benckiser Group plc | 37,979 | 3,345 |
Global Minimum Volatility Fund
| | | | Market |
| | | | Value• |
| | | Shares | ($000) |
| | Smiths Group plc | 94,738 | 1,632 |
| | DCC plc | 13,033 | 847 |
| | | | 113,791 |
| United States (53.0%) | | |
| Communication Services (5.4%) | |
| | Verizon Communications Inc. | 845,578 | 48,189 |
| | Activision Blizzard Inc. | 524,295 | 39,705 |
| * | Liberty Broadband Corp. | 186,381 | 26,412 |
| * | Electronic Arts Inc. | 206,223 | 24,712 |
| * | Alphabet Inc. Class C | 7,763 | 12,584 |
| | Cable One Inc. | 5,406 | 9,362 |
| | Telekomunikasi Indonesia Persero Tbk PT ADR | 245,736 | 4,200 |
| * | Yandex NV Class A | 59,043 | 3,399 |
| | America Movil SAB de CV ADR | 111,309 | 1,327 |
| | John Wiley & Sons Inc. Class A | 19,924 | 617 |
| | | | 170,507 |
| Consumer Discretionary (3.1%) | |
| Dollar General Corp. | 251,418 | 52,474 |
| Service Corp. International | 373,245 | 17,285 |
| Yum China Holdings Inc. | 187,880 | 10,001 |
| * | Amazon.com Inc. | 3,083 | 9,360 |
| * | Murphy USA Inc. | 40,333 | 4,932 |
| | Pool Corp. | 6,216 | 2,175 |
| | Graham Holdings Co. Class B | 2,963 | 1,127 |
| | | | 97,354 |
| Consumer Staples (5.1%) | | |
| 2 | Walmart Inc. | 384,885 | 53,403 |
| 2 | Clorox Co. | 112,867 | 23,392 |
| 2 | Hormel Foods Corp. | 411,921 | 20,056 |
| | Church & Dwight Co. Inc. | 200,621 | 17,733 |
| | Colgate-Palmolive Co. | 176,445 | 13,920 |
| | Flowers Foods Inc. | 381,799 | 9,003 |
| | Lancaster Colony Corp. | 30,625 | 5,088 |
| | Kimberly-Clark Corp. | 34,755 | 4,608 |
| | Fomento Economico Mexicano SAB de CV ADR | 71,884 | 3,865 |
| | Costco Wholesale Corp. | 8,267 | 2,957 |
| | Procter & Gamble Co. | 18,238 | 2,500 |
| | WD-40 Co. | 9,565 | 2,328 |
| | Vector Group Ltd. | 151,140 | 1,389 |
| | | | 160,242 |
| Financials (4.4%) | | |
| | Brown & Brown Inc. | 658,622 | 28,657 |
| | White Mountains Insurance Group Ltd. | 18,715 | 16,999 |
| | Arthur J Gallagher & Co. | 108,771 | 11,281 |
| | Washington Federal Inc. | 511,691 | 10,894 |
| | RenaissanceRe Holdings Ltd. | 64,812 | 10,481 |
| | Intercontinental Exchange Inc. | 101,131 | 9,547 |
| | First Republic Bank | 64,243 | 8,104 |
| | Progressive Corp. | 76,006 | 6,985 |
| | Commerce Bancshares Inc. | 90,138 | 5,611 |
| | Capitol Federal Financial Inc. | 455,900 | 5,234 |
| | Houlihan Lokey Inc. Class A | 77,597 | 4,865 |
| | Hanover Insurance Group Inc. | 46,655 | 4,463 |
| | MarketAxess Holdings Inc. | 6,064 | 3,267 |
| | Bank of Hawaii Corp. | 52,132 | 3,161 |
| | W R Berkley Corp. | 49,689 | 2,987 |
| | TFS Financial Corp. | 185,083 | 2,908 |
| | Morningstar Inc. | 5,049 | 961 |
| | Marsh & McLennan Cos. Inc. | 7,371 | 763 |
| | Northwest Bancshares Inc. | 68,948 | 736 |
| | First Financial Bankshares Inc. | 23,617 | 704 |
| | Community Bank System Inc. | 11,131 | 645 |
| | | | 139,253 |
| Health Care (10.5%) | | |
| | Chemed Corp. | 112,866 | 53,986 |
| 2 | Johnson & Johnson | 363,571 | 49,849 |
| 2 | Merck & Co. Inc. | 644,826 | 48,497 |
| | Amgen Inc. | 223,443 | 48,474 |
| 2 | Gilead Sciences Inc. | 694,426 | 40,381 |
| * | Vertex Pharmaceuticals Inc. | 117,240 | 24,428 |
| | Quest Diagnostics Inc. | 106,506 | 13,009 |
| | Baxter International Inc. | 129,897 | 10,076 |
| | AbbVie Inc. | 110,377 | 9,393 |
| * | Vir Biotechnology Inc. | 271,171 | 8,526 |
| | Becton Dickinson and Co. | 29,070 | 6,719 |
| * | Incyte Corp. | 64,497 | 5,588 |
| | Premier Inc. Class A | 146,648 | 4,800 |
| | AmerisourceBergen Corp. Class A | 27,233 | 2,616 |
| * | Regeneron Pharmaceuticals Inc. | 4,050 | 2,201 |
| * | HMS Holdings Corp. | 76,551 | 2,038 |
| * | United Therapeutics Corp. | 13,197 | 1,771 |
| | | | 332,352 |
| Industrials (4.2%) | | |
| | Republic Services Inc. Class A | 484,392 | 42,709 |
| | CH Robinson Worldwide Inc. | 426,039 | 37,675 |
| | Waste Management Inc. | 107,750 | 11,627 |
| | Rollins Inc. | 160,067 | 9,260 |
Global Minimum Volatility Fund
| | | | Market |
| | | | Value• |
| | | Shares | ($000) |
| | Expeditors International of Washington Inc. | 102,433 | 9,052 |
| | United Parcel Service Inc. Class B | 55,088 | 8,655 |
| | Graco Inc. | 59,356 | 3,674 |
| | Landstar System Inc. | 27,602 | 3,442 |
| | BWX Technologies Inc. | 53,779 | 2,958 |
| | National Presto Industries Inc. | 17,011 | 1,414 |
| | Carlisle Cos. Inc. | 8,552 | 1,059 |
| | Valmont Industries Inc. | 5,440 | 772 |
| | | | 132,297 |
| Information Technology (13.3%) | |
| 2 | Oracle Corp. | 913,443 | 51,253 |
| | Amdocs Ltd. | 868,865 | 48,987 |
| * | Tyler Technologies Inc. | 116,111 | 44,631 |
| | Microsoft Corp. | 220,213 | 44,587 |
| | Citrix Systems Inc. | 355,619 | 40,281 |
| * | Black Knight Inc. | 455,689 | 40,078 |
| 2 | Jack Henry & Associates Inc. | 248,454 | 36,833 |
| | Cisco Systems Inc. | 541,007 | 19,422 |
| | Broadridge Financial Solutions Inc. | 141,044 | 19,408 |
| | MAXIMUS Inc. | 256,805 | 17,355 |
| 2 | Paychex Inc. | 181,924 | 14,963 |
| | Genpact Ltd. | 419,581 | 14,421 |
| | Dolby Laboratories Inc. Class A | 89,433 | 6,715 |
| * | Qualys Inc. | 62,107 | 5,456 |
| | Motorola Solutions Inc. | 33,970 | 5,369 |
| | United Microelectronics Corp. ADR | 995,508 | 5,276 |
| | Texas Instruments Inc. | 28,269 | 4,087 |
| * | Check Point Software Technologies Ltd. | 22,984 | 2,610 |
| | InterDigital Inc. | 11,218 | 628 |
| | | | 422,360 |
| Materials (3.2%) | | |
| | AptarGroup Inc. | 348,914 | 39,807 |
| | Newmont Corp. | 364,756 | 22,921 |
| | Royal Gold Inc. | 89,595 | 10,645 |
| | Sonoco Products Co. | 172,413 | 8,429 |
| | Kaiser Aluminum Corp. | 118,810 | 7,477 |
| | Silgan Holdings Inc. | 208,181 | 7,172 |
| | NewMarket Corp. | 9,897 | 3,540 |
| | Reliance Steel & Aluminum Co. | 11,212 | 1,222 |
| | | | 101,213 |
| Real Estate (1.0%) | | |
| 3 | Equity Commonwealth | 1,061,488 | 28,045 |
| | PS Business Parks Inc. | 22,687 | 2,587 |
| | Terreno Realty Corp. | 11,095 | 624 |
| | Rayonier Inc. | 24,505 | 622 |
| | | | 31,878 |
| Utilities (2.8%) | | |
| | Hawaiian Electric Industries Inc. | 499,501 | 16,504 |
| | IDACORP Inc. | 183,611 | 16,108 |
| | Ameren Corp. | 151,963 | 12,327 |
| | WEC Energy Group Inc. | 98,743 | 9,929 |
| | Consolidated Edison Inc. | 99,603 | 7,818 |
| | NorthWestern Corp. | 124,094 | 6,469 |
| | ALLETE Inc. | 99,234 | 5,118 |
| | CMS Energy Corp. | 61,727 | 3,909 |
| | American States Water Co. | 50,027 | 3,737 |
| | Alliant Energy Corp. | 47,673 | 2,635 |
| | California Water Service Group | 51,048 | 2,275 |
| | Avista Corp. | 54,230 | 1,802 |
| | | 88,631 |
| Total United States | | 1,676,087 |
| Total Common Stocks | | |
| (Cost $2,899,873) | | 3,143,399 |
| Temporary Cash Investment (1.4%) | |
| Money Market Fund (1.4%) | | |
| 4,5 | Vanguard Market Liquidity Fund, 0.112% (Cost $42,954) | 429,544 | 42,954 |
| Total Investments (100.8%) | | |
| (Cost $2,942,827) | | 3,186,353 |
| Other Assets and Liabilities—Net (-0.8%) | | (24,046) |
| Net Assets (100%) | | 3,162,307 |
Cost is in $000.
| • | See Note A in Notes to Financial Statements. |
| ^ | Includes partial security positions on loan to broker-dealers. The total value of securities on loan is $26,042,000. |
| * | Non-income-producing security. |
| 1 | Security exempt from registration under Rule 144A of the Securities Act of 1933. Such securities may be sold in transactions exempt from registration, normally to qualified institutional buyers. At October 31, 2020, the aggregate value of these securities was $15,164,000, representing 0.5% of net assets. |
| 2 | Securities with a value of $13,790,000 have been segregated as collateral for open forward currency contracts. |
| 3 | Securities with a value of $10,000 have been segregated as initial margin for open futures contracts. |
| 4 | Affiliated money market fund available only to Vanguard funds and certain trusts and accounts managed by Vanguard. Rate shown is the 7-day yield. |
| 5 | Collateral of $28,792,000 was received for securities on loan. |
| | ADR—American Depositary Receipt. |
| | GDR—Global Depositary Receipt. |
Global Minimum Volatility Fund
Derivative Financial Instruments Outstanding as of Period End
Futures Contracts
| | | | | | | ($000) |
| | | | | | | Value and |
| | | Number of | | | | Unrealized |
| | | Long (Short) | | Notional | | Appreciation |
| | Expiration | Contracts | | Amount | | (Depreciation) |
| Long Futures Contracts | | | | | | |
| E-mini S&P 500 Index | December 2020 | 72 | | 11,753 | | (146) |
| Topix Index | December 2020 | 9 | | 1,352 | | (22) |
| FTSE 100 Index | December 2020 | 12 | | 865 | | (64) |
| S&P ASX 200 Index | December 2020 | 6 | | 621 | | (2) |
| Dow Jones EURO STOXX 50 Index | December 2020 | 6 | | 207 | | (24) |
| | | | | | | (258) |
| Forward Currency Contracts | | | | | | | | |
| | Contract | | | | | | Unrealized | Unrealized |
| Settlement | | Contract Amount (000) | Appreciation | (Depreciation) |
| Counterparty | Date | | | Receive | | Deliver | ($000) | ($000) |
| Barclays Bank plc | 11/16/20 | | GBP | 12,019 | USD | 15,520 | 52 | — |
| Deutsche Bank AG | 11/16/20 | | EUR | 12,442 | USD | 14,511 | — | (15) |
| BNP Paribas | 11/16/20 | | JPY | 902,992 | USD | 8,546 | 80 | — |
| Royal Bank of Canada | 11/16/20 | | CAD | 10,687 | USD | 8,027 | — | (6) |
| BNP Paribas | 11/16/20 | | USD | 354,525 | JPY | 37,517,841 | — | (3,895) |
| BNP Paribas | 11/16/20 | | USD | 241,753 | HKD | 1,873,988 | 28 | — |
| Royal Bank of Canada | 11/16/20 | | USD | 130,969 | AUD | 183,341 | 2,088 | — |
| BNP Paribas | 11/16/20 | | USD | 129,060 | GBP | 100,095 | — | (625) |
| Toronto-Dominion Bank | 11/16/20 | | USD | 115,786 | CAD | 153,708 | 410 | — |
| Toronto-Dominion Bank | 11/16/20 | | USD | 106,233 | CHF | 97,233 | 144 | — |
| BNP Paribas | 11/16/20 | | USD | 92,365 | EUR | 78,392 | 1,033 | — |
| BNP Paribas | 11/16/20 | | USD | 67,950 | TWD | 1,935,666 | 275 | — |
| BNP Paribas | 11/16/20 | | USD | 65,795 | KRW | 76,177,686 | — | (1,336) |
| BNP Paribas | 11/17/20 | | USD | 46,335 | INR | 3,408,451 | 410 | — |
| Deutsche Bank AG | 11/16/20 | | USD | 34,937 | CNH | 235,747 | — | (228) |
| BNP Paribas | 11/16/20 | | USD | 29,196 | DKK | 184,406 | 336 | — |
| Deutsche Bank AG | 11/16/20 | | USD | 23,986 | JPY | 2,500,962 | 94 | — |
| Goldman Sachs International | 11/16/20 | | USD | 21,624 | SGD | 29,381 | 114 | — |
| Barclays Bank plc | 11/16/20 | | USD | 13,600 | NOK | 126,417 | 359 | — |
| Deutsche Bank AG | 11/16/20 | | USD | 12,574 | BRL | 70,178 | 354 | — |
| BNP Paribas | 11/16/20 | | USD | 10,488 | RUB | 822,563 | 150 | — |
| BNP Paribas | 11/16/20 | | USD | 7,703 | ILS | 26,213 | 20 | — |
| Royal Bank of Canada | 11/16/20 | | USD | 7,368 | CHF | 6,744 | 9 | — |
| Goldman Sachs International | 11/17/20 | | USD | 7,119 | MXN | 153,285 | — | (93) |
Global Minimum Volatility Fund
Forward Currency Contracts (continued)
| | Contract | | | | | | | Unrealized | Unrealized |
| | Settlement | | Contract Amount (000) | | Appreciation | (Depreciation) |
| Counterparty | Date | | | Receive | | Deliver | ($000) | ($000) |
| Deutsche Bank AG | 11/16/20 | | USD | 6,298 | JPY | 666,614 | | — | (71) |
| Barclays Bank plc | 11/16/20 | | USD | 5,185 | PLN | 19,731 | 200 | — |
| Toronto-Dominion Bank | 11/16/20 | | USD | 4,762 | SEK | 42,358 | 1 | — |
| BNP Paribas | 11/16/20 | | USD | 4,704 | IDR | 69,446,468 | | — | (38) |
| Royal Bank of Canada | 11/16/20 | | USD | 4,190 | CLP | 3,330,990 | | — | (117) |
| BNP Paribas | 11/16/20 | | USD | 2,847 | NZD | 4,316 | | — | (7) |
| Royal Bank of Canada | 11/16/20 | | USD | 1,055 | NZD | 1,599 | | — | (2) |
| Barclays Bank plc | 11/16/20 | | USD | 923 | SEK | 8,211 | | — | — |
| Deutsche Bank AG | 11/16/20 | | USD | 242 | ILS | 822 | 1 | — |
| | | | | | | | | 6,158 | (6,433) |
AUD—Australian dollar.
BRL—Brazilian real.
CAD—Canadian dollar.
CHF—Swiss franc.
CLP—Chilean peso.
CNH—Chinese yuan (offshore).
DKK—Danish krone.
EUR—euro.
GBP—British pound.
HKD—Hong Kong dollar.
IDR—Indonesian rupiah.
ILS—Israeli shekel.
INR—Indian rupee.
JPY—Japanese yen.
KRW—Korean won.
MXN—Mexican peso.
NOK—Norwegian krone.
NZD—New Zealand dollar.
PLN—Polish zloty.
RUB—Russian ruble.
SEK—Swedish krona.
SGD—Singapore dollar.
TWD—Taiwanese dollar.
USD—U.S. dollar.
At October 31, 2020, the counterparties had deposited in segregated accounts securities with a value of $544,000 and cash of $2,700,000 in connection with open forward currency contracts.
See accompanying Notes, which are an integral part of the Financial Statements.
Global Minimum Volatility Fund
Statement of Assets and Liabilities
As of October 31, 2020
| ($000s, except shares and per-share amounts) | Amount |
| Assets | |
| Investments in Securities, at Value | |
| Unaffiliated Issuers (Cost $2,899,873) | 3,143,399 |
| Affiliated Issuers (Cost $42,954) | 42,954 |
| Total Investments in Securities | 3,186,353 |
| Investment in Vanguard | 138 |
| Cash | 80 |
| Cash Collateral Pledged—Futures Contracts | 430 |
| Foreign Currency, at Value (Cost $2,558) | 2,549 |
| Receivables for Investment Securities Sold | 78,149 |
| Receivables for Accrued Income | 6,750 |
| Receivables for Capital Shares Issued | 1,154 |
| Unrealized Appreciation—Forward Currency Contracts | 6,158 |
| Total Assets | 3,281,761 |
| Liabilities | |
| Payables for Investment Securities Purchased | 79,698 |
| Collateral for Securities on Loan | 28,792 |
| Payables for Capital Shares Redeemed | 4,160 |
| Payables to Vanguard | 238 |
| Variation Margin Payable—Futures Contracts | 133 |
| Unrealized Depreciation—Forward Currency Contracts | 6,433 |
| Total Liabilities | 119,454 |
| Net Assets | 3,162,307 |
| | |
| | |
| At October 31, 2020, net assets consisted of: | |
| | |
| Paid-in Capital | 3,146,931 |
| Total Distributable Earnings (Loss) | 15,376 |
| Net Assets | 3,162,307 |
| | |
| Investor Shares—Net Assets | |
| Applicable to 26,503,745 outstanding $.001 par value shares of beneficial interest (unlimited authorization) | 338,351 |
| Net Asset Value Per Share—Investor Shares | $12.77 |
| | |
| Admiral Shares—Net Assets | |
| Applicable to 110,499,885 outstanding $.001 par value shares of beneficial interest (unlimited authorization) | 2,823,956 |
| Net Asset Value Per Share—Admiral Shares | $25.56 |
See accompanying Notes, which are an integral part of the Financial Statements.
Global Minimum Volatility Fund
Statement of Operations
| | Year Ended |
| | October 31, 2020 |
| | ($000) |
| Investment Income | |
| Income | |
| Dividends1 | 88,150 |
| Interest2 | 189 |
| Securities Lending—Net | 434 |
| Total Income | 88,773 |
| Expenses | |
| The Vanguard Group—Note B | |
| Investment Advisory Services | 1,191 |
| Management and Administrative—Investor Shares | 766 |
| Management and Administrative—Admiral Shares | 3,002 |
| Marketing and Distribution—Investor Shares | 66 |
| Marketing and Distribution—Admiral Shares | 206 |
| Custodian Fees | 178 |
| Auditing Fees | 42 |
| Shareholders’ Reports—Investor Shares | 35 |
| Shareholders’ Reports—Admiral Shares | 56 |
| Trustees’ Fees and Expenses | 3 |
| Total Expenses | 5,545 |
| Net Investment Income | 83,228 |
| Realized Net Gain (Loss) | |
| Investment Securities Sold2 | (316,517) |
| Futures Contracts | 11,210 |
| Forward Currency Contracts | (14,823) |
| Foreign Currencies | (920) |
| Realized Net Gain (Loss) | (321,050) |
| Change in Unrealized Appreciation (Depreciation) | |
| Investment Securities2 | (215,825) |
| Futures Contracts | (517) |
| Forward Currency Contracts | 37,663 |
| Foreign Currencies | 85 |
| Change in Unrealized Appreciation (Depreciation) | (178,594) |
| Net Increase (Decrease) in Net Assets Resulting from Operations | (416,416) |
| 1 | Dividends are net of foreign withholding taxes of $5,272,000. |
| 2 | Interest income, realized net gain (loss), and change in unrealized appreciation (depreciation) from an affiliated company of the fund were $189,000, $81,000, and ($3,000), respectively. Purchases and sales are for temporary cash investment purposes. |
See accompanying Notes, which are an integral part of the Financial Statements.
Global Minimum Volatility Fund
Statement of Changes in Net Assets
| | Year Ended October 31, |
| | 2020 | 2019 |
| | ($000) | ($000) |
| Increase (Decrease) in Net Assets | | |
| Operations | | |
| Net Investment Income | 83,228 | 113,271 |
| Realized Net Gain (Loss) | (321,050) | 130,264 |
| Change in Unrealized Appreciation (Depreciation) | (178,594) | 244,996 |
| Net Increase (Decrease) in Net Assets Resulting from Operations | (416,416) | 488,531 |
| Distributions1 | | |
| Investor Shares | (29,323) | (33,498) |
| Admiral Shares | (162,618) | (181,298) |
| Total Distributions | (191,941) | (214,796) |
| Capital Share Transactions | | |
| Investor Shares | (211,512) | 84,477 |
| Admiral Shares | (143,818) | 710,035 |
| Net Increase (Decrease) from Capital Share Transactions | (355,330) | 794,512 |
| Total Increase (Decrease) | (963,687) | 1,068,247 |
| Net Assets | | |
| Beginning of Period | 4,125,994 | 3,057,747 |
| End of Period | 3,162,307 | 4,125,994 |
1 Certain prior-period numbers have been reclassified to conform with the current-period presentation.
See accompanying Notes, which are an integral part of the Financial Statements.
Global Minimum Volatility Fund
Financial Highlights
Investor Shares
| For a Share Outstanding | | | Year Ended October 31, |
| Throughout Each Period | 2020 | 2019 | 2018 | 2017 | 2016 |
| Net Asset Value, Beginning of Period | $14.71 | $13.78 | $13.57 | $11.92 | $11.81 |
| Investment Operations | | | | | |
| Net Investment Income | .2931 | .4281 | .3741 | .3241 | .293 |
| Net Realized and Unrealized Gain (Loss) | | | | | |
| on Investments | (1.571) | 1.403 | .148 | 1.650 | .181 |
| Total from Investment Operations | (1.278) | 1.831 | .522 | 1.974 | .474 |
| Distributions | | | | | |
| Dividends from Net Investment Income | (.397) | (.300) | (.312) | (.324) | (.205) |
| Distributions from Realized Capital Gains | (.265) | (.601) | — | — | (.159) |
| Total Distributions | (.662) | (.901) | (.312) | (.324) | (.364) |
| Net Asset Value, End of Period | $12.77 | $14.71 | $13.78 | $13.57 | $11.92 |
| | | | | | |
| Total Return2 | -9.22% | 14.41% | 3.89% | 16.93% | 4.23% |
| | | | | | |
| Ratios/Supplemental Data | | | | | |
| Net Assets, End of Period (Millions) | $338 | $643 | $515 | $539 | $419 |
| Ratio of Total Expenses to Average Net Assets | 0.21% | 0.21% | 0.23% | 0.25% | 0.25% |
| Ratio of Net Investment Income to | | | | | |
| Average Net Assets | 2.16% | 3.09% | 2.66% | 2.54% | 2.63% |
| Portfolio Turnover Rate | 58% | 46% | 24% | 37% | 58% |
| 1 | Calculated based on average shares outstanding. |
| 2 | Total returns do not include account service fees that may have applied in the periods shown. Fund prospectuses provide information about any applicable account service fees. |
See accompanying Notes, which are an integral part of the Financial Statements.
Global Minimum Volatility Fund
Financial Highlights
Admiral Shares
| For a Share Outstanding | | | Year Ended October 31, |
| Throughout Each Period | 2020 | 2019 | 2018 | 2017 | 2016 |
| Net Asset Value, Beginning of Period | $29.45 | $27.58 | $27.15 | $23.86 | $23.62 |
| Investment Operations | | | | | |
| Net Investment Income | .6081 | .8781 | .7581 | .6681 | .608 |
| Net Realized and Unrealized Gain (Loss) | | | | | |
| on Investments | (3.155) | 2.819 | .297 | 3.295 | .377 |
| Total from Investment Operations | (2.547) | 3.697 | 1.055 | 3.963 | .985 |
| Distributions | | | | | |
| Dividends from Net Investment Income | (.812) | (.624) | (.625) | (.673) | (.427) |
| Distributions from Realized Capital Gains | (.531) | (1.203) | — | — | (.318) |
| Total Distributions | (1.343) | (1.827) | (.625) | (.673) | (.745) |
| Net Asset Value, End of Period | $25.56 | $29.45 | $27.58 | $27.15 | $23.86 |
| | | | | | |
| Total Return2 | -9.18% | 14.54% | 3.93% | 16.99% | 4.39% |
| | | | | | |
| Ratios/Supplemental Data | | | | | |
| Net Assets, End of Period (Millions) | $2,824 | $3,483 | $2,542 | $1,699 | $1,152 |
| Ratio of Total Expenses to Average Net Assets | 0.14% | 0.14% | 0.15% | 0.17% | 0.17% |
| Ratio of Net Investment Income to | | | | | |
| Average Net Assets | 2.26% | 3.16% | 2.74% | 2.62% | 2.71% |
| Portfolio Turnover Rate | 58% | 46% | 24% | 37% | 58% |
| 1 | Calculated based on average shares outstanding. |
| 2 | Total returns do not include account service fees that may have applied in the periods shown. Fund prospectuses provide information about any applicable account service fees. |
See accompanying Notes, which are an integral part of the Financial Statements.
Global Minimum Volatility Fund
Notes to Financial Statements
Vanguard Global Minimum Volatility Fund is registered under the Investment Company Act of 1940 as an open-end investment company, or mutual fund. The fund offers two classes of shares: Investor Shares and Admiral Shares. Each of the share classes has different eligibility and minimum purchase requirements, and is designed for different types of investors.
The fund invests in securities of foreign issuers, which may subject it to investment risks not normally associated with investing in securities of U.S. corporations. To minimize the currency risk and volatility associated with investment in securities denominated in currencies other than the U.S. dollar, the fund attempts to hedge its currency exposure. Market disruptions associated with the COVID-19 pandemic have had a global impact, and uncertainty exists as to the long-term implications. Such disruptions can adversely affect assets of the fund and thus fund performance.
A. The following significant accounting policies conform to generally accepted accounting principles for U.S. investment companies. The fund consistently follows such policies in preparing its financial statements.
1. Security Valuation: Securities are valued as of the close of trading on the New York Stock Exchange (generally 4 p.m., Eastern time) on the valuation date. Equity securities are valued at the latest quoted sales prices or official closing prices taken from the primary market in which each security trades; such securities not traded on the valuation date are valued at the mean of the latest quoted bid and asked prices. Securities for which market quotations are not readily available, or whose values have been affected by events occurring before the fund’s pricing time but after the close of the securities’ primary markets, are valued at their fair values calculated according to procedures adopted by the board of trustees. These procedures include obtaining quotations from an independent pricing service, monitoring news to identify significant market- or security-specific events, and evaluating changes in the values of foreign market proxies (for example, ADRs, futures contracts, or exchange-traded funds), between the time the foreign markets close and the fund’s pricing time. When fair-value pricing is employed, the prices of securities used by a fund to calculate its net asset value may differ from quoted or published prices for the same securities. Investments in Vanguard Market Liquidity Fund are valued at that fund’s net asset value.
2. Foreign Currency: Securities and other assets and liabilities denominated in foreign currencies are translated into U.S. dollars using exchange rates obtained from an independent third party as of the fund’s pricing time on the valuation date. Realized gains (losses) and unrealized appreciation (depreciation) on investment securities include the effects of changes in exchange rates since the securities were purchased, combined with the effects of changes in security prices. Fluctuations in the value of other assets and liabilities resulting from changes in exchange rates are recorded as unrealized foreign currency gains (losses) until the assets or liabilities are settled in cash, at which time they are recorded as realized foreign currency gains (losses).
3. Futures Contracts: The fund uses index futures contracts to a limited extent, with the objective of maintaining full exposure to the stock market while maintaining liquidity. The fund may purchase or sell futures contracts to achieve a desired level of investment, whether to accommodate portfolio turnover or cash flows from capital share transactions. The primary risks associated with the use of futures contracts are imperfect correlation between changes in market values of stocks held by the fund and the prices of futures contracts, and the possibility of an illiquid market. Counterparty risk involving futures is mitigated because a regulated clearinghouse is the counterparty instead of the clearing broker. To further mitigate counterparty risk, the fund trades futures contracts on an exchange, monitors the financial strength of its clearing brokers
Global Minimum Volatility Fund
and clearinghouse, and has entered into clearing agreements with its clearing brokers. The clearinghouse imposes initial margin requirements to secure the fund’s performance and requires daily settlement of variation margin representing changes in the market value of each contract. Any securities pledged as initial margin for open contracts are noted in the Schedule of Investments.
Futures contracts are valued at their quoted daily settlement prices. The notional amounts of the contracts are not recorded in the Statement of Assets and Liabilities. Fluctuations in the value of the contracts are recorded in the Statement of Assets and Liabilities as an asset (liability) and in the Statement of Operations as unrealized appreciation (depreciation) until the contracts are closed, when they are recorded as realized gains (losses) on futures contracts.
During the year ended October 31, 2020, the fund’s average investments in long and short futures contracts represented less than 1% and 0% of net assets, respectively, based on the average of the notional amounts at each quarter-end during the period.
4. Forward Currency Contracts: The fund enters into forward currency contracts to protect the value of securities and related receivables and payables against changes in future foreign exchange rates. The fund’s risks in using these contracts include movement in the values of the foreign currencies relative to the U.S. dollar and the ability of the counterparties to fulfill their obligations under the contracts. The fund mitigates its counterparty risk by entering into forward currency contracts only with a diverse group of prequalified counterparties, monitoring their financial strength, entering into master netting arrangements with its counterparties, and requiring its counterparties to transfer collateral as security for their performance. In the absence of a default, the collateral pledged or received by the fund cannot be repledged, resold, or rehypothecated. The master netting arrangements provide that, in the event of a counterparty’s default (including bankruptcy), the fund may terminate the forward currency contracts, determine the net amount owed by either party in accordance with its master netting arrangements, and sell or retain any collateral held up to the net amount owed to the fund under the master netting arrangements. The forward currency contracts contain provisions whereby a counterparty may terminate open contracts if the fund’s net assets decline below a certain level, triggering a payment by the fund if the fund is in a net liability position at the time of the termination. The payment amount would be reduced by any collateral the fund has pledged. Any securities pledged as collateral for open contracts are noted in the Schedule of Investments. The value of collateral received or pledged is compared daily to the value of the forward currency contracts exposure with each counterparty, and any difference, if in excess of a specified minimum transfer amount, is adjusted and settled within two business days.
Forward currency contracts are valued at their quoted daily prices obtained from an independent third party, adjusted for currency risk based on the expiration date of each contract. The notional amounts of the contracts are not recorded in the Statement of Assets and Liabilities. Fluctuations in the value of the contracts are recorded in the Statement of Assets and Liabilities as an asset (liability) and in the Statement of Operations as unrealized appreciation (depreciation) until the contracts are closed, when they are recorded as realized gains (losses) on forward currency contracts.
During the year ended October 31, 2020, the fund’s average investment in forward currency contracts represented 48% of net assets, based on the average of notional amounts at each quarter-end during the period.
Global Minimum Volatility Fund
5. Federal Income Taxes: The fund intends to continue to qualify as a regulated investment company and distribute all of its taxable income. The fund’s tax returns are open to examination by the relevant tax authorities until expiration of the applicable statute of limitations, which is generally three years after the filing of the tax return. Management has analyzed the fund’s tax positions taken for all open federal and state income tax years, and has concluded that no provision for income tax is required in the fund’s financial statements.
6. Distributions: Distributions to shareholders are recorded on the ex-dividend date. Distributions are determined on a tax basis at the fiscal year-end and may differ from net investment income and realized capital gains for financial reporting purposes.
7. Securities Lending: To earn additional income, the fund lends its securities to qualified institutional borrowers. Security loans are subject to termination by the fund at any time, and are required to be secured at all times by collateral in an amount at least equal to the market value of securities loaned. Daily market fluctuations could cause the value of loaned securities to be more or less than the value of the collateral received. When this occurs, the collateral is adjusted and settled before the opening of the market on the next business day. The fund further mitigates its counterparty risk by entering into securities lending transactions only with a diverse group of prequalified counterparties, monitoring their financial strength, and entering into master securities lending agreements with its counterparties. The master securities lending agreements provide that, in the event of a counterparty’s default (including bankruptcy), the fund may terminate any loans with that borrower, determine the net amount owed, and sell or retain the collateral up to the net amount owed to the fund; however, such actions may be subject to legal proceedings. While collateral mitigates counterparty risk, in the event of a default, the fund may experience delays and costs in recovering the securities loaned. The fund invests cash collateral received in Vanguard Market Liquidity Fund, and records a liability in the Statement of Assets and Liabilities for the return of the collateral, during the period the securities are on loan. Collateral investments in Vanguard Market Liquidity Fund are subject to market appreciation or depreciation. Securities lending income represents fees charged to borrowers plus income earned on invested cash collateral, less expenses associated with the loan. During the term of the loan, the fund is entitled to all distributions made on or in respect of the loaned securities.
8. Credit Facilities and Interfund Lending Program: The fund and certain other funds managed by The Vanguard Group (“Vanguard”) participate in a $4.3 billion committed credit facility provided by a syndicate of lenders pursuant to a credit agreement and an uncommitted credit facility provided by Vanguard. Both facilities may be renewed annually. Each fund is individually liable for its borrowings, if any, under the credit facilities. Borrowings may be utilized for temporary or emergency purposes, subject to the fund’s regulatory and contractual borrowing restrictions. With respect to the committed credit facility, the participating funds are charged administrative fees and an annual commitment fee of 0.10% of the undrawn committed amount of the facility; these fees are allocated to the funds based on a method approved by the fund’s board of trustees and included in Management and Administrative expenses on the fund’s Statement of Operations. Any borrowings under either facility bear interest at a rate based upon the higher of the one-month London Interbank Offered Rate (or an acceptable alternate rate, if necessary), federal funds effective rate, or overnight bank funding rate plus an agreed-upon spread, except that borrowings under the uncommitted credit facility may bear interest based upon an alternative rate agreed to by the fund and Vanguard.
Global Minimum Volatility Fund
In accordance with an exemptive order (the “Order”) from the SEC, the fund may participate in a joint lending and borrowing program that allows registered open-end Vanguard funds to borrow money from and lend money to each other for temporary or emergency purposes (the “Interfund Lending Program”), subject to compliance with the terms and conditions of the Order, and to the extent permitted by the fund’s investment objective and investment policies. Interfund loans and borrowings normally extend overnight, but can have a maximum duration of seven days. Loans may be called on one business day’s notice. The interest rate to be charged is governed by the conditions of the Order and internal procedures adopted by the board of trustees. The board of trustees is responsible for overseeing the Interfund Lending Program.
For the year ended October 31, 2020, the fund did not utilize the credit facilities or the Interfund Lending Program.
9. Other: Dividend income is recorded on the ex-dividend date. Interest income includes income distributions received from Vanguard Market Liquidity Fund and is accrued daily. Security transactions are accounted for on the date securities are bought or sold. Costs used to determine realized gains (losses) on the sale of investment securities are those of the specific securities sold.
Withholding taxes on foreign dividends and capital gains have been provided for in accordance with the fund’s understanding of the applicable countries’ tax rules and rates. The fund has filed tax reclaims for previously withheld taxes on dividends earned in certain European Union countries. These filings are subject to various administrative and judicial proceedings within these countries. Such tax reclaims received during the year, if any, are included in dividend income. No other amounts for additional tax reclaims are reflected in the financial statements due to the uncertainty as to the ultimate resolution of proceedings, the likelihood of receipt of these reclaims, and the potential timing of payment.
Each class of shares has equal rights as to assets and earnings, except that each class separately bears certain class-specific expenses related to maintenance of shareholder accounts (included in Management and Administrative expenses) and shareholder reporting. Marketing and distribution expenses are allocated to each class of shares based on a method approved by the board of trustees. Income, other non-class-specific expenses, and gains and losses on investments are allocated to each class of shares based on its relative net assets.
B. In accordance with the terms of a Funds’ Service Agreement (the “FSA”) between Vanguard and the fund, Vanguard furnishes to the fund investment advisory, corporate management, administrative, marketing, and distribution services at Vanguard’s cost of operations (as defined by the FSA). These costs of operations are allocated to the fund based on methods and guidelines approved by the board of trustees and are generally settled twice a month.
Upon the request of Vanguard, the fund may invest up to 0.40% of its net assets as capital in Vanguard. At October 31, 2020, the fund had contributed to Vanguard capital in the amount of $138,000, representing less than 0.01% of the fund’s net assets and 0.06% of Vanguard’s capital received pursuant to the FSA. The fund’s trustees and officers are also directors and employees, respectively, of Vanguard.
C. Various inputs may be used to determine the value of the fund’s investments and derivatives. These inputs are summarized in three broad levels for financial statement purposes. The inputs or methodologies used to value securities are not necessarily an indication of the risk associated with investing in those securities.
Global Minimum Volatility Fund
Level 1—Quoted prices in active markets for identical securities.
Level 2—Other significant observable inputs (including quoted prices for similar securities, interest rates, prepayment speeds, credit risk, etc.).
Level 3—Significant unobservable inputs (including the fund’s own assumptions used to determine the fair value of investments). Any investments and derivatives valued with significant unobservable inputs are noted on the Schedule of Investments.
The following table summarizes the market value of the fund’s investments and derivatives as of October 31, 2020, based on the inputs used to value them:
| | Level 1 | Level 2 | Level 3 | Total |
| | ($000) | ($000) | ($000) | ($000) |
| Investments | | | | |
| Assets | | | | |
| Common Stocks—United States | 1,676,087 | — | — | 1,676,087 |
| Common Stocks—International | 455,347 | 1,011,965 | — | 1,467,312 |
| Temporary Cash Investments | 42,954 | — | — | 42,954 |
| Total | 2,174,388 | 1,011,965 | — | 3,186,353 |
| Derivative Financial Instruments | | | | |
| Assets | | | | |
| Forward Currency Contracts | — | 6,158 | — | 6,158 |
| Liabilities | | | | |
| Futures Contracts1 | 133 | — | — | 133 |
| Forward Currency Contracts | — | 6,433 | — | 6,433 |
| Total | 133 | 6,433 | — | 6,566 |
1 Represents variation margin on the last day of the reporting period.
D. At October 31, 2020, the fair values of derivatives were reflected in the Statement of Assets and Liabilities as follows:
| | | Foreign | |
| | Equity | Exchange | |
| | Contracts | Contracts | Total |
| Statement of Assets and Liabilities Caption | ($000) | ($000) | ($000) |
| Unrealized Appreciation—Forward Currency Contracts | — | 6,158 | 6,158 |
| Total Assets | — | 6,158 | 6,158 |
| | | | |
| Variation Margin Payable—Futures Contracts | 133 | — | 133 |
| Unrealized Depreciation—Forward Currency Contracts | — | 6,433 | 6,433 |
| Total Liabilities | 133 | 6,433 | 6,566 |
Global Minimum Volatility Fund
Realized net gain (loss) and the change in unrealized appreciation (depreciation) on derivatives for the year ended October 31, 2020, were:
| | | Foreign | |
| | Equity | Exchange | |
| | Contracts | Contracts | Total |
| Realized Net Gain (Loss) on Derivatives | ($000) | ($000) | ($000) |
| Futures Contracts | 11,210 | — | 11,210 |
| Forward Currency Contracts | — | (14,823) | (14,823) |
| Realized Net Gain (Loss) on Derivatives | 11,210 | (14,823) | (3,613) |
| | | | |
| Change in Unrealized Appreciation (Depreciation) on Derivatives | | | |
| Futures Contracts | (517) | — | (517) |
| Forward Currency Contracts | — | 37,663 | 37,663 |
| Change in Unrealized Appreciation (Depreciation) on Derivatives | (517) | 37,663 | 37,146 |
E. Permanent differences between book-basis and tax-basis components of net assets are reclassified among capital accounts in the financial statements to reflect their tax character. These reclassifications have no effect on net assets or net asset value per share. As of period end, permanent differences primarily attributable to the accounting for foreign currency transactions and passive foreign investment companies were reclassified between the individual components of total distributable earnings (loss).
Temporary differences between book-basis and tax-basis components of total distributable earnings (loss) arise when certain items of income, gain, or loss are recognized in different periods for financial statement and tax purposes; these differences will reverse at some time in the future. The differences are primarily related to the deferral of losses from wash sales; the recognition of unrealized gains or losses from certain derivative contracts; and the recognition of unrealized gains from passive foreign investment companies. As of period end, the tax-basis components of total distributable earnings (loss) are detailed in the table as follows:
| | Amount |
| | ($000) |
| Undistributed Ordinary Income | 56,780 |
| Undistributed Long-Term Gains | — |
| Capital Loss Carryforwards | (284,887) |
| Qualified Late-Year Losses | — |
| Net Unrealized Gains (Losses) | 243,483 |
Global Minimum Volatility Fund
The tax character of distributions paid was as follows:
| | Year Ended October 31, |
| | 2020 | 2019 |
| | Amount | Amount |
| | ($000) | ($000) |
| Ordinary Income* | 115,986 | 117,531 |
| Long-Term Capital Gains | 75,955 | 97,265 |
| Total | 191,941 | 214,796 |
* Includes short-term capital gains, if any.
As of October 31, 2020, gross unrealized appreciation and depreciation for investments and derivatives based on cost for U.S. federal income tax purposes were as follows:
| | Amount |
| | ($000) |
| Tax Cost | 2,943,683 |
| Gross Unrealized Appreciation | 443,032 |
| Gross Unrealized Depreciation | (199,669) |
| Net Unrealized Appreciation (Depreciation) | 243,363 |
F. During the year ended October 31, 2020, the fund purchased $2,137,891,000 of investment securities and sold $2,541,818,000 of investment securities, other than temporary cash investments.
G. Capital share transactions for each class of shares were:
| | | | | Year Ended October 31, |
| | | 2020 | | | 2019 |
| | Amount | Shares | | Amount | Shares |
| | ($000) | (000) | | ($000) | (000) |
| Investor Shares | | | | | |
| Issued | 140,652 | 10,097 | | 205,945 | 14,903 |
| Issued in Lieu of Cash Distributions | 27,070 | 1,872 | | 31,225 | 2,486 |
| Redeemed | (379,234) | (29,187) | | (152,693) | (11,079) |
| Net Increase (Decrease)—Investor Shares | (211,512) | (17,218) | | 84,477 | 6,310 |
| Admiral Shares | | | | | |
| Issued | 1,114,310 | 41,948 | | 1,109,795 | 40,175 |
| Issued in Lieu of Cash Distributions | 143,670 | 4,966 | | 163,610 | 6,511 |
| Redeemed | (1,401,798) | (54,668) | | (563,370) | (20,615) |
| Net Increase (Decrease)—Admiral Shares | (143,818) | (7,754) | | 710,035 | 26,071 |
H. Management has determined that no events or transactions occurred subsequent to October 31, 2020, that would require recognition or disclosure in these financial statements.
Report of Independent Registered
Public Accounting Firm
To the Board of Trustees of Vanguard Whitehall Funds and Shareholders of Vanguard Global Minimum Volatility Fund
Opinion on the Financial Statements
We have audited the accompanying statement of assets and liabilities, including the schedule of investments, of Vanguard Global Minimum Volatility Fund (one of the funds constituting Vanguard Whitehall Funds, referred to hereafter as the “Fund”) as of October 31, 2020, the related statement of operations for the year ended October 31, 2020, the statement of changes in net assets for each of the two years in the period ended October 31, 2020, including the related notes, and the financial highlights for each of the five years in the period ended October 31, 2020 (collectively referred to as the “financial statements”). In our opinion, the financial statements present fairly, in all material respects, the financial position of the Fund as of October 31, 2020, the results of its operations for the year then ended, the changes in its net assets for each of the two years in the period ended October 31, 2020 and the financial highlights for each of the five years in the period ended October 31, 2020 in conformity with accounting principles generally accepted in the United States of America.
Basis for Opinion
These financial statements are the responsibility of the Fund’s management. Our responsibility is to express an opinion on the Fund’s financial statements based on our audits. We are a public accounting firm registered with the Public Company Accounting Oversight Board (United States) (“PCAOB”) and are required to be independent with respect to the Fund in accordance with the U.S. federal securities laws and the applicable rules and regulations of the Securities and Exchange Commission and the PCAOB.
We conducted our audits of these financial statements in accordance with the standards of the PCAOB. Those standards require that we plan and perform the audit to obtain reasonable assurance about whether the financial statements are free of material misstatement, whether due to error or fraud.
Our audits included performing procedures to assess the risks of material misstatement of the financial statements, whether due to error or fraud, and performing procedures that respond to those risks. Such procedures included examining, on a test basis, evidence regarding the amounts and disclosures in the financial statements. Our audits also included evaluating the accounting principles used and significant estimates made by management, as well as evaluating the overall presentation of the financial statements. Our procedures included confirmation of securities owned as of October 31, 2020 by correspondence with the custodian and brokers and by agreement to the underlying ownership records of the transfer agent; when replies were not received from brokers, we performed other auditing procedures. We believe that our audits provide a reasonable basis for our opinion.
/s/PricewaterhouseCoopers LLP
Philadelphia, Pennsylvania
December 17, 2020
We have served as the auditor of one or more investment companies in The Vanguard Group of Funds since 1975.
Special 2020 tax information (unaudited) for Vanguard Global Minimum Volatility Fund
This information for the fiscal year ended October 31, 2020, is included pursuant to provisions of the Internal Revenue Code.
The fund distributed $75,955,000 as capital gain dividends (20% rate gain distributions) to shareholders during the fiscal year.
The fund distributed $67,718,000 of qualified dividend income to shareholders during the fiscal year.
For corporate shareholders, 31.7% of investment income (dividend income plus short-term gains, if any) qualifies for the dividends-received deduction.
The fund distributed $13,970,000 of qualified business income to shareholders during the fiscal year.
This page intentionally left blank.
The People Who Govern Your Fund
The trustees of your mutual fund are there to see that the fund is operated and managed in your best interests since, as a shareholder, you are a part owner of the fund. Your fund’s trustees also serve on the board of directors of The Vanguard Group, Inc., which is owned by the Vanguard funds and provides services to them.
A majority of Vanguard’s board members are independent, meaning that they have no affiliation with Vanguard or the funds they oversee, apart from the sizable personal investments they have made as private individuals. The independent board members have distinguished backgrounds in business, academia, and public service. Each of the trustees and executive officers oversees 213 Vanguard funds.
Information for each trustee and executive officer of the fund appears below. That information, as well as the Vanguard fund count, is as of the date on the cover of this fund report. The mailing address of the trustees and officers is P.O. Box 876, Valley Forge, PA 19482. More information about the trustees is in the Statement of Additional Information, which can be obtained, without charge, by contacting Vanguard at 800-662-7447, or online at vanguard.com.
Interested Trustee1
Mortimer J. Buckley
Born in 1969. Trustee since January 2018. Principal occupation(s) during the past five years and other experience: chairman of the board (2019–present) of Vanguard and of each of the investment companies served by Vanguard; chief executive officer (2018– present) of Vanguard; chief executive officer, president, and trustee (2018–present) of each of the investment companies served by Vanguard; president and director (2017–present) of Vanguard; and president (2018–present) of Vanguard Marketing Corporation. Chief investment officer (2013–2017), managing director (2002–2017), head of the Retail Investor Group (2006–2012), and chief information officer (2001–2006) of Vanguard. Chairman of the board (2011–2017) and trustee (2009–2017) of the Children’s Hospital of Philadelphia; and trustee (2018–present) and vice chair (2019–present) of The Shipley School.
Independent Trustees
Emerson U. Fullwood
Born in 1948. Trustee since January 2008. Principal occupation(s) during the past five years and other experience: executive chief staff and marketing officer for North America and corporate vice president (retired 2008) of Xerox Corporation (document management products and services). Former president of the Worldwide Channels Group, Latin America, and Worldwide Customer Service and executive chief staff officer of Developing Markets of Xerox. Executive in residence and 2009–2010 Distinguished Minett Professor at the Rochester Institute of Technology. Director of SPX FLOW, Inc. (multi-industry manufac-turing). Director of the University of Rochester Medical Center, the Monroe Community College Foundation, the United Way of Rochester, North Carolina A&T University, and Roberts Wesleyan College. Trustee of the University of Rochester.
Amy Gutmann
Born in 1949. Trustee since June 2006. Principal occupation(s) during the past five years and other experience: president (2004–present) of the University of Pennsylvania. Christopher H. Browne Distinguished Professor of Political Science, School of Arts and Sciences, and professor of communication, Annenberg School for Communication, with secondary faculty appointments in the Department of Philosophy, School of Arts and Sciences, and at the Graduate School of Education, University of Pennsylvania.
F. Joseph Loughrey
Born in 1949. Trustee since October 2009. Principal occupation(s) during the past five years and other experience: president and chief operating officer (retired 2009) and vice chairman of the board (2008–2009) of Cummins Inc. (industrial machinery). Chairman of the board of Hillenbrand, Inc. (specialized consumer services) and the Lumina Foundation. Director of the V Foundation. Member of the advisory
| 1 | Mr. Buckley is considered an “interested person,” as defined in the Investment Company Act of 1940, because he is an officer of the Vanguard funds. |
council for the College of Arts and Letters and chair of the advisory board to the Kellogg Institute for International Studies, both at the University of Notre Dame.
Mark Loughridge
Born in 1953. Trustee since March 2012. Principal occupation(s) during the past five years and other experience: senior vice president and chief financial officer (retired 2013) of IBM (information technology services). Fiduciary member of IBM’s Retirement Plan Committee (2004–2013), senior vice president and general manager (2002–2004) of IBM Global Financing, vice president and controller (1998–2002) of IBM, and a variety of other prior management roles at IBM. Member of the Council on Chicago Booth.
Scott C. Malpass
Born in 1962. Trustee since March 2012. Principal occupation(s) during the past five years and other experience: chief investment officer (retired June 2020) and vice president (retired June 2020) of the University of Notre Dame. Assistant professor of finance at the Mendoza College of Business, University of Notre Dame, and member of the Notre Dame 403(b) Investment Committee (retired June 2020). Member of the board of Catholic Investment Services, Inc. (investment advisors) and the board of superintendence of the Institute for the Works of Religion.
Deanna Mulligan
Born in 1963. Trustee since January 2018. Principal occupation(s) during the past five years and other experience: board chair (2020–present), chief executive officer (2011–2020), and president (2010–2019) of The Guardian Life Insurance Company of America. Chief operating officer (2010–2011) and executive vice president (2008–2010) of the individual life and disability division of Guardian Life. Member of the board of the American Council of Life Insurers and the board of the Economic Club of New York. Trustee of the Partnership for New York City (business leadership), Chief Executives for Corporate Purpose, NewYork-Presbyterian Hospital, Catalyst, and the Bruce Museum (arts and science). Member of the Advisory Council for the Stanford Graduate School of Business.
André F. Perold
Born in 1952. Trustee since December 2004. Principal occupation(s) during the past five years and other experience: George Gund Professor of Finance and Banking, Emeritus at the Harvard Business School (retired 2011). Chief investment officer and co-managing partner of HighVista Strategies (private investment firm). Member of the board of advisors and member of the investment committee of the Museum of Fine Arts Boston. Member of the board (2018–present) of RIT Capital Partners (investment firm). Member of the investment committee of Partners Health Care System.
Sarah Bloom Raskin
Born in 1961. Trustee since January 2018. Principal occupation(s) during the past five years and other experience: deputy secretary (2014–2017) of the United States Department of the Treasury. Governor (2010–2014) of the Federal Reserve Board. Commissioner (2007–2010) of financial regulation for the State of Maryland. Member of the board of directors (2012–2014) of Neighborhood Reinvestment Corporation. Director (2017–present) of i(x) Investments, LLC; director (2017–present) of Reserve Trust. Rubenstein Fellow (2017–present) of Duke University; trustee (2017–present) of Amherst College, and trustee (2019–present) of the Folger Shakespeare Library.
Peter F. Volanakis
Born in 1955. Trustee since July 2009. Principal occupation(s) during the past five years and other experience: president and chief operating officer (retired 2010) of Corning Incorporated (communications equipment) and director of Corning Incorporated (2000–2010) and Dow Corning (2001–2010). Director (2012) of SPX Corporation (multi-industry manufacturing). Overseer of the Amos Tuck School of Business Administration, Dartmouth College (2001–2013). Chairman of the board of trustees of Colby-Sawyer College. Member of the board of Hypertherm Inc. (industrial cutting systems, software, and consumables).
Executive Officers
John Bendl
Born in 1970. Principal occupation(s) during the past five years and other experience: principal of Vanguard. Chief financial officer (2019–present) of each of the investment companies served by Vanguard. Chief accounting officer, treasurer, and controller of Vanguard (2017–present). Partner (2003–2016) at KPMG (audit, tax, and advisory services).
Christine M. Buchanan
Born in 1970. Principal occupation(s) during the past five years and other experience: principal of Vanguard. Treasurer (2017–present) of each of the investment companies served by Vanguard. Partner (2005–2017) at KPMG (audit, tax, and advisory services).
David Cermak
Born in 1960. Principal occupation(s) during the past five years and other experience: principal of Vanguard. Finance director (2019–present) of each of the investment companies served by Vanguard. Managing director and head (2017–present) of Vanguard Investments Singapore. Managing director and head (2017–2019) of Vanguard Investments Hong Kong. Representative director and head (2014–2017) of Vanguard Investments Japan.
John Galloway
Born in 1973. Principal occupation(s) during the past five years and other experience: principal of Vanguard. Investment stewardship officer (September 2020–present) of each of the investment companies served by Vanguard. Head of Investor Advocacy (February 2020–present) and head of Marketing Strategy and Planning (2017–2020) at Vanguard. Deputy assistant to the President of the United States (2015).
Thomas J. Higgins
Born in 1957. Principal occupation(s) during the past five years and other experience: principal of Vanguard. Finance director (2019–present), chief financial officer (2008–2019), and treasurer (1998–2008) of each of the investment companies served by Vanguard.
Peter Mahoney
Born in 1974. Principal occupation(s) during the past five years and other experience: principal of Vanguard. Controller (2015–present) of each of the investment companies served by Vanguard. Head of International Fund Services (2008–2014) at Vanguard.
Anne E. Robinson
Born in 1970. Principal occupation(s) during the past five years and other experience: general counsel (2016–present) of Vanguard. Secretary (2016–present) of Vanguard and of each of the investment companies served by Vanguard. Managing director (2016–present) of Vanguard. Managing director and general counsel of Global Cards and Consumer Services (2014–2016) at Citigroup. Counsel (2003–2014) at American Express.
Michael Rollings
Born in 1963. Principal occupation(s) during the past five years and other experience: finance director (2017–present) and treasurer (2017) of each of the investment companies served by Vanguard. Managing director (2016–present) of Vanguard. Chief financial officer (2016–present) of Vanguard. Director (2016–present) of Vanguard Marketing Corporation. Executive vice president and chief financial officer (2006–2016) of MassMutual Financial Group.
John E. Schadl
Born in 1972. Principal occupation(s) during the past five years and other experience: principal of Vanguard. Chief compliance officer (2019–present) of Vanguard and of each of the investment companies served by Vanguard. Assistant vice president (2019–present) of Vanguard Marketing Corporation.
Vanguard Senior Management Team
| Joseph Brennan | James M. Norris |
| Mortimer J. Buckley | Thomas M. Rampulla |
| Gregory Davis | Karin A. Risi |
| John James | Anne E. Robinson |
| John T. Marcante | Michael Rollings |
| Chris D. McIsaac | Lauren Valente |

Connect with Vanguard® > vanguard.com
Fund Information > 800-662-7447
Direct Investor Account Services > 800-662-2739
Institutional Investor Services > 800-523-1036
Text Telephone for People
Who Are Deaf or Hard of Hearing > 800-749-7273
This material may be used in conjunction with the offering of shares of any Vanguard fund only if preceded or accompanied by the fund’s current prospectus.
All comparative mutual fund data are from Morningstar, Inc., unless otherwise noted.
You can obtain a free copy of Vanguard’s proxy voting guidelines by visiting vanguard.com/proxyreporting or by calling Vanguard at 800-662-2739. The guidelines are also available from the SEC’s website, www.sec.gov. In addition, you may obtain a free report on how your fund voted the proxies for securities it owned during the 12 months ended June 30. To get the report, visit either vanguard.com/proxyreporting or www.sec.gov.
You can review information about your fund on the SEC’s website, and you can receive copies of this information, for a fee, by sending a request via email addressed to publicinfo@sec.gov.
Source for Bloomberg Barclays indexes: Bloomberg Index Services Limited. Copyright 2020, Bloomberg. All rights reserved.
| | © 2020 The Vanguard Group, Inc.
All rights reserved. |
| | Vanguard Marketing Corporation, Distributor. |
| | |
| | Q11940 122020 |

| |
| |
| |
| Annual Report | October 31, 2020 |
| |
| |
| Vanguard International Dividend Index Funds |
| |
| |
| |
| |
| |
| |
| |
| |
| Vanguard International Dividend Appreciation Index Fund |
| |
| Vanguard International High Dividend Yield Index Fund |
| |
| |
| |
| |
| |
| |
| |
| |
| |
| |
| |
| |
| |
| |
| |
| |
| |
| |
| |
| |
| |
| |
| |
| |
| See the inside front cover for important information about access to your fund’s annual and semiannual shareholder reports. |
| |
Important information about access to shareholder reports
Beginning on January 1, 2021, as permitted by regulations adopted by the Securities and Exchange Commission, paper copies of your fund’s annual and semiannual shareholder reports will no longer be sent to you by mail, unless you specifically request them. Instead, you will be notified by mail each time a report is posted on the website and will be provided with a link to access the report.
If you have already elected to receive shareholder reports electronically, you will not be affected by this change and do not need to take any action. You may elect to receive shareholder reports and other communications from the fund electronically by contacting your financial intermediary (such as a broker-dealer or bank) or, if you invest directly with the fund, by calling Vanguard at one of the phone numbers on the back cover of this report or by logging on to vanguard.com.
You may elect to receive paper copies of all future shareholder reports free of charge. If you invest through a financial intermediary, you can contact the intermediary to request that you continue to receive paper copies. If you invest directly with the fund, you can call Vanguard at one of the phone numbers on the back cover of this report or log on to vanguard.com. Your election to receive paper copies will apply to all the funds you hold through an intermediary or directly with Vanguard.
| Contents | |
| | |
| Your Fund’s Performance at a Glance | 1 |
| | |
| About Your Fund’s Expenses | 2 |
| | |
| International Dividend Appreciation Index Fund | 4 |
| | |
| International High Dividend Yield Index Fund | 28 |
Please note: The opinions expressed in this report are just that—informed opinions. They should not be considered promises or advice. Also, please keep in mind that the information and opinions cover the period through the date on the front of this report. Of course, the risks of investing in your fund are spelled out in the prospectus.
Your Fund’s Performance at a Glance
· For the 12 months ended October 31, 2020, Vanguard International Dividend Appreciation Fund returned 3.21% for Admiral Shares and 3.73% for ETF Shares. Vanguard International High Dividend Yield Index Fund returned –15.01% for Admiral Shares and –14.55% for ETF Shares.
· The performance difference between the funds reflected investors’ longstanding preference for faster-growing companies over slower-growing ones that pay higher dividends.
· The period was marked by the global spread of COVID-19 and efforts to contain it, including lockdowns, the shuttering of nonessential businesses, and travel restrictions. However, responses from policymakers, the start of trials for vaccines and treatments, and the easing of some pandemic-related restrictions eventually lifted investor sentiment. The U.S. stock market rebounded more strongly than emerging markets and much more than developed markets outside the United States.
· Of the major regional sectors, Europe was the biggest contributor to returns for the International Dividend Appreciation Index Fund and, conversely, the biggest detractor for the International High Dividend Yield Index Fund.
· For both funds, the technology sector contributed most to performance, while financial stocks detracted most.
Market Barometer
| | | Average Annual Total Returns |
| | | Periods Ended October 31, 2020 |
| | One Year | Three Years | Five Years |
| Stocks | | | |
| Russell 1000 Index (Large-caps) | 10.87% | 10.63% | 11.79% |
| Russell 2000 Index (Small-caps) | -0.14 | 2.19 | 7.27 |
| Russell 3000 Index (Broad U.S. market) | 10.15 | 10.04 | 11.48 |
| FTSE All-World ex US Index (International) | -2.17 | 0.13 | 4.52 |
| | | | |
| Bonds | | | |
| Bloomberg Barclays U.S. Aggregate Bond Index (Broad taxable market) | 6.19% | 5.06% | 4.08% |
| Bloomberg Barclays Municipal Bond Index (Broad tax-exempt market) | 3.59 | 4.09 | 3.70 |
| FTSE Three-Month U.S. Treasury Bill Index | 0.86 | 1.62 | 1.15 |
| | | | |
| CPI | | | |
| Consumer Price Index | 1.18% | 1.82% | 1.83% |
Fund returns are adjusted to reflect the 0.25% fee on purchases and redemptions. The fees do not apply to the ETF Shares.
About Your Fund’s Expenses
As a shareholder of the fund, you incur ongoing costs, which include costs for portfolio management, administrative services, and shareholder reports (like this one), among others. Operating expenses, which are deducted from a fund’s gross income, directly reduce the investment return of the fund.
A fund’s expenses are expressed as a percentage of its average net assets. This figure is known as the expense ratio. The following examples are intended to help you understand the ongoing costs (in dollars) of investing in your fund and to compare these costs with those of other mutual funds. The examples are based on an investment of $1,000 made at the beginning of the period shown and held for the entire period.
The accompanying table illustrates your fund’s costs in two ways:
· Based on actual fund return. This section helps you to estimate the actual expenses that you paid over the period. The ‘‘Ending Account Value’’ shown is derived from the fund’s actual return, and the third column shows the dollar amount that would have been paid by an investor who started with $1,000 in the fund. You may use the information here, together with the amount you invested, to estimate the expenses that you paid over the period.
To do so, simply divide your account value by $1,000 (for example, an $8,600 account value divided by $1,000 = 8.6), then multiply the result by the number given for your fund under the heading “Expenses Paid During Period.”
· Based on hypothetical 5% yearly return. This section is intended to help you compare your fund’s costs with those of other mutual funds. It assumes that the fund had a yearly return of 5% before expenses, but that the expense ratio is unchanged. In this case—because the return used is not the fund’s actual return—the results do not apply to your investment. The example is useful in making comparisons because the Securities and Exchange Commission requires all mutual funds to calculate expenses based on a 5% return. You can assess your fund’s costs by comparing this hypothetical example with the hypothetical examples that appear in shareholder reports of other funds.
Note that the expenses shown in the table are meant to highlight and help you compare ongoing costs only and do not reflect transaction costs incurred by the fund for buying and selling securities. Further, the expenses do not include any purchase, redemption, or account service fees described in the fund prospectus. If such fees were applied to your account, your costs would be higher. Your fund does not carry a “sales load.”
The calculations assume no shares were bought or sold during the period. Your actual costs may have been higher or lower, depending on the amount of your investment and the timing of any purchases or redemptions.
You can find more information about the fund’s expenses, including annual expense ratios, in the Financial Statements section of this report. For additional information on operating expenses and other shareholder costs, please refer to your fund’s current prospectus.
Six Months Ended October 31, 2020
| | Beginning | Ending | Expenses |
| | Account Value | Account Value | Paid During |
| | 4/30/2020 | 10/31/2020 | Period |
| Based on Actual Fund Return | | | |
| International Dividend Appreciation Index Fund | | | |
| ETF Shares | $1,000.00 | $1,128.26 | $1.07 |
| Admiral™ Shares | 1,000.00 | 1,128.34 | 1.07 |
| International High Dividend Yield Index Fund | | | |
| ETF Shares | $1,000.00 | $1,067.21 | $1.40 |
| Admiral Shares | 1,000.00 | 1,067.17 | 1.40 |
| Based on Hypothetical 5% Yearly Return | | | |
| International Dividend Appreciation Index Fund | | | |
| ETF Shares | $1,000.00 | $1,024.13 | $1.02 |
| Admiral Shares | 1,000.00 | 1,024.13 | 1.02 |
| International High Dividend Yield Index Fund | | | |
| ETF Shares | $1,000.00 | $1,023.78 | $1.37 |
| Admiral Shares | 1,000.00 | 1,023.78 | 1.37 |
The calculations are based on expenses incurred in the most recent six-month period. The funds’ annualized six-month expense ratios for that period are: for the International Dividend Appreciation Index Fund, 0.20% for ETF Shares and 0.20% for Admiral Shares; and for the International High Dividend Yield Index Fund, 0.27% for ETF Shares and 0.27% for Admiral Shares. The dollar amounts shown as “Expenses Paid” are equal to the annualized expense ratio multiplied by the average account value over the period, multiplied by the number of days in the six-month period, then divided by the number of days in the most recent 12-month period (184/366).
International Dividend Appreciation Index Fund
Performance Summary
All of the returns in this report represent past performance, which is not a guarantee of future results that may be achieved by the fund. (Current performance may be lower or higher than the performance data cited. For performance data current to the most recent month-end, visit our website at vanguard.com/performance.) Note, too, that both investment returns and principal value can fluctuate widely, so an investor’s shares, when sold, could be worth more or less than their original cost. The returns shown do not reflect taxes that a shareholder would pay on fund distributions or on the sale of fund shares.
Cumulative Performance: February 25, 2016, Through October 31, 2020
Initial Investment of $10,000

| | | Average Annual Total Returns | |
| | | Periods Ended October 31, 2020 | |
| | | | Since | Final Value |
| | | One | Inception | of a $10,000 |
| | | Year | (2/25/2016) | Investment |
 | International Dividend Appreciation Index Fund ETF Shares Net Asset Value | 3.73% | 9.23% | $15,116 |
| | International Dividend Appreciation Index Fund ETF Shares Market Price | 3.78 | 9.28 | 15,149 |
 | NASDAQ International Dividend Achievers Select Index | 3.62 | 9.52 | 15,305 |
“Since Inception” performance is calculated from the ETF Shares’ inception date for both the fund and its comparative standard(s).
| | | Since | Final Value |
| | One | Inception | of a $10,000 |
| | Year | (3/2/2016) | Investment |
| International Dividend Appreciation Index Fund Admiral Shares | 3.21% | 8.48% | $14,618 |
| NASDAQ International Dividend Achievers Select Index | 3.62 | 8.86 | 14,856 |
“Since Inception” performance is calculated from the Admiral Shares’ inception date for both the fund and its comparative standard(s).
Vanguard fund returns are adjusted to reflect the 0.25% fee on purchases and redemptions. The fees do not apply to the ETF Shares.
See Financial Highlights for dividend and capital gains information.
International Dividend Appreciation Index Fund
Cumulative Returns of ETF Shares: February 25, 2016, Through October 31, 2020
| | | Since |
| | One | Inception |
| | Year | (2/25/2016) |
| International Dividend Appreciation Index Fund ETF Shares Market Price | 3.78% | 51.49% |
| International Dividend Appreciation Index Fund ETF Shares Net Asset Value | 3.73 | 51.16 |
| NASDAQ International Dividend Achievers Select Index | 3.62 | 53.05 |
“Since Inception” performance is calculated from the ETF Shares’ inception date for both the fund and its comparative standard(s).
For the ETF Shares, the market price is determined by the midpoint of the bid-offer spread as of the closing time of the New York Stock Exchange (generally 4 p.m., Eastern time). The net asset value is also determined as of the NYSE closing time. For more information about how the ETF Shares’ market prices have compared with their net asset value, visit vanguard.com, select your ETF, and then select the Price and Performance tab. The ETF premium/discount analysis there shows the percentages of days on which the ETF Shares’ market price was above or below the NAV.
Vanguard fund returns are adjusted to reflect the 0.25% fee on purchases and redemptions. The fee does not apply to the ETF Shares.
International Dividend Appreciation Index Fund
Fund Allocation
As of October 31, 2020
| Basic Materials | 2.9% |
| Consumer Discretionary | 16.1 |
| Consumer Staples | 6.8 |
| Energy | 3.0 |
| Financials | 12.8 |
| Health Care | 12.2 |
| Industrials | 15.0 |
| Other | 8.4 |
| Real Estate | 2.4 |
| Technology | 18.6 |
| Telecommunications | 0.7 |
| Utilities | 1.1 |
The table reflects the fund’s investments, except for short-term investments and derivatives. Sector categories are based on the Industry Classification Benchmark (“ICB”), except for the “Other” category (if applicable), which includes securities that have not been provided an ICB classification as of the effective reporting period.
The fund may invest in derivatives (such as futures and swap contracts) for various reasons, including, but not limited to, attempting to remain fully invested and tracking its target index as closely as possible.
The Industry Classification Benchmark (“ICB”) is owned by FTSE. FTSE does not accept any liability to any person for any loss or damage arising out of any error or omission in the ICB.
International Dividend Appreciation Index Fund
Financial Statements
Schedule of Investments
As of October 31, 2020
The fund files its complete schedule of portfolio holdings with the Securities and Exchange Commission (SEC) for the first and third quarters of each fiscal year as an exhibit to its reports on Form N-PORT. The fund’s Form N-PORT reports are available on the SEC’s website at www.sec.gov.
| | | | Market |
| | | | Value· |
| | | Shares | ($000) |
| Common Stocks (99.5%) | | |
| Australia (2.3%) | | |
| | CSL Ltd. | 190,187 | 38,505 |
| | Aristocrat Leisure Ltd. | 270,461 | 5,446 |
| | REA Group Ltd. | 56,171 | 4,671 |
| | Brambles Ltd. | 651,081 | 4,391 |
| | Ramsay Health Care Ltd. | 93,311 | 4,088 |
| | Domino’s Pizza Enterprises Ltd. | 37,020 | 2,205 |
| | Qube Holdings Ltd. | 792,469 | 1,475 |
| | Technology One Ltd. | 117,153 | 740 |
| | Corporate Travel Management Ltd. | 55,052 | 565 |
| | Credit Corp. Group Ltd. | 25,512 | 329 |
| | | | 62,415 |
| Belgium (0.8%) | | |
| | UCB SA | 81,307 | 8,031 |
| | Groupe Bruxelles Lambert SA | 67,940 | 5,572 |
| | Sofina SA | 14,444 | 3,754 |
| * | Ackermans & van Haaren NV | 14,348 | 1,766 |
| | Melexis NV | 17,464 | 1,329 |
| | Barco NV | 38,272 | 600 |
| * | Kinepolis Group NV | 10,943 | 278 |
| | | | 21,330 |
| Canada (5.4%) | | |
| | Canadian National Railway Co. | 299,050 | 29,708 |
| | Brookfield Asset Management Inc. Class A | 659,553 | 19,599 |
| | Alimentation Couche-Tard Inc. Class B | 362,976 | 11,178 |
| | Franco-Nevada Corp. | 79,176 | 10,792 |
| | Loblaw Cos. Ltd. | 150,824 | 7,508 |
| | Magna International Inc. | 127,465 | 6,509 |
| | Intact Financial Corp. | 60,091 | 6,207 |
| | Metro Inc. | 106,103 | 4,950 |
| | George Weston Ltd. | 64,576 | 4,529 |
| | Dollarama Inc. | 130,219 | 4,484 |
| | Saputo Inc. | 172,061 | 4,188 |
| | Imperial Oil Ltd. | 312,423 | 4,155 |
| | Ritchie Bros Auctioneers Inc. | 46,830 | 2,839 |
| ^ | Canadian Tire Corp. Ltd. Class A | 24,583 | 2,745 |
| | CCL Industries Inc. Class B | 70,757 | 2,698 |
| | Toromont Industries Ltd. | 35,062 | 2,183 |
| | Empire Co. Ltd. | 72,538 | 1,979 |
| | CAE Inc. | 113,353 | 1,937 |
| | Onex Corp. | 42,809 | 1,851 |
| | Gildan Activewear Inc. | 85,260 | 1,766 |
| | TFI International Inc. | 37,741 | 1,680 |
| | Parkland Corp. | 63,206 | 1,544 |
| | Stantec Inc. | 48,020 | 1,379 |
| | Boyd Group Services Inc. | 8,672 | 1,244 |
| | Atco Ltd. Class I | 43,828 | 1,220 |
| | Premium Brands Holdings Corp. | 16,055 | 1,145 |
| | Enghouse Systems Ltd. | 20,923 | 1,038 |
| | Cogeco Communications Inc. | 14,391 | 1,002 |
| | Finning International Inc. | 62,898 | 957 |
| | Stella-Jones Inc. | 25,393 | 826 |
| | Richelieu Hardware Ltd. | 20,549 | 553 |
| | Equitable Group Inc. | 6,667 | 426 |
| | Cogeco Inc. | 5,809 | 347 |
| | | | 145,166 |
| China (9.5%) | | |
| | Tencent Holdings Ltd. | 2,005,624 | 153,241 |
| | Ping An Insurance Group Co. of China Ltd. | 3,120,500 | 32,265 |
| 1 | Longfor Group Holdings Ltd. | 2,496,500 | 13,679 |
| | China Resources Land Ltd. | 2,992,000 | 12,236 |
| | China Overseas Land & Investment Ltd. | 4,582,619 | 11,511 |
| | China Merchants Bank Co. Ltd. Class H | 1,922,000 | 10,011 |
| | China Gas Holdings Ltd. | 2,194,800 | 6,745 |
International Dividend Appreciation Index Fund
| | | | Market |
| | | | Value· |
| | | Shares | ($000) |
| | China Resources Gas Group Ltd. | 1,005,000 | 4,367 |
| | Guangdong Investment Ltd. | 2,774,000 | 4,114 |
| | Sinopharm Group Co. Ltd. Class H | 567,100 | 1,303 |
| | China Medical System Holdings Ltd. | 1,074,000 | 1,129 |
| | China Aoyuan Group Ltd. | 1,176,000 | 1,106 |
| | China Railway Group Ltd. Class H | 1,694,000 | 780 |
| | Shanghai Pharmaceuticals Holding Co. Ltd. Class H | 349,100 | 542 |
| | | | 253,029 |
| Colombia (0.2%) | | |
| | Grupo Nutresa SA | 195,530 | 1,078 |
| | Grupo de Inversiones Suramericana SA | 201,756 | 1,048 |
| | Bancolombia SA ADR | 38,974 | 993 |
| | Grupo Argos SA | 266,293 | 731 |
| | Cementos Argos SA | 477,906 | 562 |
| | Bancolombia SA Preference Shares | 30,924 | 196 |
| | | | 4,608 |
| Denmark (1.8%) | | |
| | DSV Panalpina A/S | 98,512 | 15,983 |
| | Coloplast A/S Class B | 83,030 | 12,143 |
| | Novozymes A/S | 99,822 | 6,004 |
| | Chr Hansen Holding A/S | 55,400 | 5,590 |
| | GN Store Nord A/S | 60,312 | 4,342 |
| | SimCorp A/S | 17,431 | 2,079 |
| | ROCKWOOL International A/S Class B | 4,670 | 1,828 |
| | Ringkjoebing Landbobank A/S | 11,213 | 854 |
| | | | 48,823 |
| Finland (0.1%) | | |
| | Huhtamaki Oyj | 46,044 | 2,249 |
| | | | |
| France (12.6%) | | |
| | LVMH Moet Hennessy Louis Vuitton SE | 211,773 | 99,269 |
| | L’Oreal SA | 128,705 | 41,596 |
| | Hermes International | 44,189 | 41,145 |
| * | Airbus SE | 328,562 | 24,040 |
| * | EssilorLuxottica SA | 183,436 | 22,647 |
| | L’Oreal SA Loyalty Shares | 59,093 | 19,098 |
| | Dassault Systemes SE | 109,988 | 18,754 |
| | L’Oreal SA Loyalty Shares 2021 | 46,336 | 14,975 |
| | Sartorius Stedim Biotech | 38,600 | 14,643 |
| | Legrand SA | 111,037 | 8,219 |
| | Teleperformance | 24,660 | 7,403 |
| * | Eurofins Scientific SE | 7,507 | 5,978 |
| | Arkema SA | 32,042 | 3,138 |
| * | Getlink SE | 232,335 | 3,125 |
| * | Orpea | 27,169 | 2,714 |
| | SEB SA | 11,806 | 1,919 |
| | Wendel SE | 18,696 | 1,618 |
| * | Eurazeo SE | 33,356 | 1,517 |
| | Cie Plastic Omnium SA | 63,406 | 1,443 |
| | Rubis SCA | 42,364 | 1,393 |
| | SEB SA Loyalty Shares | 5,369 | 873 |
| | SEB SA Loyalty Shares 2021 | 4,013 | 652 |
| | Ipsos | 17,426 | 428 |
| | | | 336,587 |
| Germany (4.5%) | | |
| | SAP SE | 514,767 | 54,918 |
| | Fresenius Medical Care AG & Co. KGaA | 127,438 | 9,732 |
| | Fresenius SE & Co. KGaA | 233,611 | 8,665 |
| | Henkel AG & Co. KGaA Preference Shares | 74,661 | 7,265 |
| | Symrise AG Class A | 56,849 | 7,010 |
| | Sartorius AG Preference Shares | 15,715 | 6,652 |
| | HeidelbergCement AG | 83,437 | 4,772 |
| | Brenntag AG | 65,187 | 4,167 |
| | Rational AG | 4,829 | 3,622 |
| | Bechtle AG | 17,829 | 3,062 |
| * | Fielmann AG | 35,516 | 2,690 |
| * | CTS Eventim AG & Co. KGaA | 40,996 | 1,817 |
| | Fuchs Petrolub SE Preference Shares | 29,630 | 1,525 |
| | Gerresheimer AG | 13,466 | 1,354 |
| | Encavis AG | 53,171 | 1,042 |
| ^ | Grenke AG | 19,727 | 770 |
| | Norma Group SE | 12,581 | 391 |
| | Cewe Stiftung & Co. KGaA | 2,708 | 258 |
| | | | 119,712 |
| Hong Kong (3.1%) | | |
| | AIA Group Ltd. | 5,072,560 | 48,276 |
| | MTR Corp. Ltd. | 2,588,120 | 12,825 |
| | Hong Kong & China Gas Co. Ltd. | 7,399,260 | 10,676 |
| | Techtronic Industries Co. Ltd. | 766,984 | 10,331 |
| | Vitasoy International Holdings Ltd. | 436,000 | 1,763 |
| | | | 83,871 |
| India (11.6%) | | |
| | Reliance Industries Ltd. | 2,653,388 | 73,565 |
| | Tata Consultancy Services Ltd. | 1,568,665 | 56,535 |
International Dividend Appreciation Index Fund
| | | | Market |
| | | | Value· |
| | | Shares | ($000) |
| * | HDFC Bank Ltd. ADR | 683,965 | 39,287 |
| | Hindustan Unilever Ltd. | 904,413 | 25,288 |
| | Infosys Ltd. ADR | 1,679,294 | 23,963 |
| | Housing Development Finance Corp. Ltd. | 723,382 | 18,767 |
| * | Kotak Mahindra Bank Ltd. | 799,900 | 16,693 |
| | Asian Paints Ltd. | 399,736 | 11,923 |
| | ITC Ltd. | 5,123,871 | 11,450 |
| | Bajaj Finance Ltd. | 251,621 | 11,224 |
| | Larsen & Toubro Ltd. | 586,064 | 7,343 |
| | Pidilite Industries Ltd. | 210,881 | 4,466 |
| | Berger Paints India Ltd. | 399,970 | 3,360 |
| | Infosys Ltd. | 131,928 | 1,890 |
| | Container Corp. Of India Ltd. | 253,906 | 1,337 |
| | Page Industries Ltd. | 4,650 | 1,259 |
| | Sundaram Finance Ltd. | 44,258 | 864 |
| | LIC Housing Finance Ltd. | 202,043 | 771 |
| | Persistent Systems Ltd. | 30,591 | 479 |
| * | Yes Bank Ltd. | 545,158 | 91 |
| | | | 310,555 |
| Indonesia (1.2%) | | |
| | Bank Central Asia Tbk PT | 10,204,100 | 20,078 |
| | Bank Rakyat Indonesia Persero Tbk PT | 51,199,100 | 11,590 |
| | | | 31,668 |
| Ireland (0.6%) | | |
| | Kerry Group plc Class A | 74,050 | 8,864 |
| * | Kingspan Group plc | 76,427 | 6,670 |
| | Total Produce plc | 139,516 | 182 |
| | | | 15,716 |
| Israel (0.1%) | | |
| | Azrieli Group Ltd. | 51,612 | 2,422 |
| | | | |
| Italy (0.3%) | | |
| | DiaSorin SPA | 23,443 | 5,147 |
| | Reply SPA | 15,743 | 1,691 |
| | | | 6,838 |
| Japan (12.6%) | | |
| | Keyence Corp. | 100,700 | 45,700 |
| | Daikin Industries Ltd. | 126,400 | 23,654 |
| | Murata Manufacturing Co. Ltd. | 285,600 | 20,029 |
| | M3 Inc. | 286,500 | 19,349 |
| | Tokio Marine Holdings Inc. | 298,000 | 13,319 |
| | Terumo Corp. | 321,676 | 11,839 |
| | Seven & i Holdings Co. Ltd. | 372,100 | 11,310 |
| | Nitori Holdings Co. Ltd. | 51,401 | 10,566 |
| | Sysmex Corp. | 86,830 | 8,156 |
| | Obic Co. Ltd. | 40,700 | 7,206 |
| | Shionogi & Co. Ltd. | 135,000 | 6,368 |
| | Asahi Group Holdings Ltd. | 205,543 | 6,361 |
| | MonotaRO Co. Ltd. | 108,699 | 6,012 |
| | Pan Pacific International Holdings Corp. | 270,064 | 5,730 |
| | Oracle Corp. Japan | 56,500 | 5,647 |
| | Hikari Tsushin Inc. | 18,100 | 4,245 |
| | Yamaha Corp. | 79,600 | 3,773 |
| | Otsuka Corp. | 82,000 | 3,768 |
| | Welcia Holdings Co. Ltd. | 95,000 | 3,723 |
| | Shimadzu Corp. | 127,577 | 3,648 |
| | Itochu Techno-Solutions Corp. | 106,903 | 3,627 |
| | GMO Payment Gateway Inc. | 29,100 | 3,566 |
| | Yakult Honsha Co. Ltd. | 73,300 | 3,547 |
| | Asahi Intecc Co. Ltd. | 114,400 | 3,545 |
| | West Japan Railway Co. | 80,005 | 3,432 |
| | TOTO Ltd. | 74,300 | 3,392 |
| | Nissan Chemical Corp. | 63,300 | 3,359 |
| | Koito Manufacturing Co. Ltd. | 68,300 | 3,294 |
| | Sekisui Chemical Co. Ltd. | 210,700 | 3,284 |
| | Kansai Paint Co. Ltd. | 118,900 | 3,065 |
| | Kose Corp. | 23,400 | 2,983 |
| | Tokyo Century Corp. | 54,500 | 2,672 |
| | Ryohin Keikaku Co. Ltd. | 122,000 | 2,561 |
| | USS Co. Ltd. | 136,900 | 2,504 |
| | SCSK Corp. | 47,800 | 2,377 |
| | Stanley Electric Co. Ltd. | 79,000 | 2,250 |
| | Hakuhodo DY Holdings Inc. | 170,600 | 2,174 |
| | Sundrug Co. Ltd. | 53,224 | 1,976 |
| | MediPal Holdings Corp. | 108,200 | 1,929 |
| | Chiba Bank Ltd. | 371,300 | 1,918 |
| | Rinnai Corp. | 18,884 | 1,861 |
| | Alfresa Holdings Corp. | 100,000 | 1,831 |
| | Marui Group Co. Ltd. | 99,800 | 1,804 |
| | OBIC Business Consultants Co. Ltd. | 32,800 | 1,765 |
| | Yokogawa Electric Corp. | 117,900 | 1,733 |
| | Benefit One Inc. | 69,100 | 1,729 |
| | NGK Spark Plug Co. Ltd. | 95,300 | 1,676 |
| | Relo Group Inc. | 67,100 | 1,610 |
| | Persol Holdings Co. Ltd. | 105,500 | 1,598 |
| | Kurita Water Industries Ltd. | 52,000 | 1,547 |
| | NOF Corp. | 40,600 | 1,526 |
| | Nomura Real Estate Holdings Inc. | 86,180 | 1,505 |
| | Takara Bio Inc. | 53,500 | 1,457 |
| | SHO-BOND Holdings Co. Ltd. | 29,884 | 1,442 |
| | Kewpie Corp. | 68,200 | 1,396 |
International Dividend Appreciation Index Fund
| | | | Market |
| | | | Value· |
| | | Shares | ($000) |
| | Goldwin Inc. | 17,800 | 1,328 |
| | PALTAC Corp. | 23,354 | 1,306 |
| | Sanwa Holdings Corp. | 110,700 | 1,263 |
| | Kyowa Exeo Corp. | 52,600 | 1,213 |
| | Seven Bank Ltd. | 524,400 | 1,203 |
| | NEC Networks & System Integration Corp. | 62,300 | 1,080 |
| | Yaoko Co. Ltd. | 14,700 | 1,041 |
| | TS Tech Co. Ltd. | 34,400 | 952 |
| | Infomart Corp. | 104,800 | 867 |
| | Aica Kogyo Co. Ltd. | 24,800 | 835 |
| | Elecom Co. Ltd. | 16,000 | 801 |
| | J Front Retailing Co. Ltd. | 101,600 | 774 |
| | Horiba Ltd. | 15,600 | 767 |
| | Fuyo General Lease Co. Ltd. | 11,100 | 637 |
| | Lintec Corp. | 28,400 | 630 |
| | NSD Co. Ltd. | 34,600 | 608 |
| | Nagase & Co. Ltd. | 46,400 | 605 |
| | Nichias Corp. | 24,900 | 539 |
| | Kotobuki Spirits Co. Ltd. | 11,400 | 529 |
| | Nojima Corp. | 18,800 | 528 |
| | Aeon Delight Co. Ltd. | 19,900 | 524 |
| | Kyoritsu Maintenance Co. Ltd. | 14,400 | 515 |
| | Senko Group Holdings Co. Ltd. | 57,160 | 511 |
| | San-A Co. Ltd. | 12,126 | 505 |
| | Japan Material Co. Ltd. | 38,700 | 500 |
| | Valor Holdings Co. Ltd. | 20,012 | 493 |
| | Glory Ltd. | 23,000 | 485 |
| | Starts Corp. Inc. | 20,842 | 485 |
| | Maruwa Co. Ltd. | 4,500 | 468 |
| | Takuma Co. Ltd. | 30,500 | 467 |
| | Hazama Ando Corp. | 73,400 | 456 |
| | Mizuho Leasing Co. Ltd. | 17,800 | 454 |
| | Nippon Densetsu Kogyo Co. Ltd. | 22,500 | 436 |
| | Funai Soken Holdings Inc. | 19,400 | 420 |
| | Prestige International Inc. | 46,800 | 398 |
| | en-japan Inc. | 18,100 | 398 |
| | Takeuchi Manufacturing Co. Ltd. | 17,800 | 388 |
| | Ai Holdings Corp. | 21,570 | 379 |
| | S Foods Inc. | 11,300 | 376 |
| | Kissei Pharmaceutical Co. Ltd. | 19,000 | 374 |
| | Kameda Seika Co. Ltd. | 8,200 | 371 |
| | eGuarantee Inc. | 15,600 | 347 |
| | Sekisui Jushi Corp. | 17,200 | 347 |
| | Hogy Medical Co. Ltd. | 11,700 | 343 |
| | Modec Inc. | 21,800 | 317 |
| | JCU Corp. | 10,000 | 314 |
| | Shoei Co. Ltd. | 10,100 | 308 |
| | Fukushima Galilei Co. Ltd. | 8,100 | 303 |
| | Yellow Hat Ltd. | 18,400 | 302 |
| | Future Corp. | 17,600 | 301 |
| | Ricoh Leasing Co. Ltd. | 11,100 | 298 |
| | Mitsubishi Pencil Co. Ltd. | 22,700 | 292 |
| | Mandom Corp. | 17,500 | 261 |
| | Fujicco Co. Ltd. | 12,900 | 247 |
| | Musashi Seimitsu Industry Co. Ltd. | 23,400 | 245 |
| | Sato Holdings Corp. | 12,600 | 240 |
| | Kitanotatsujin Corp. | 51,400 | 239 |
| | Hiday Hidaka Corp. | 13,862 | 226 |
| | Monogatari Corp. | 2,200 | 225 |
| | Mitsubishi Research Institute Inc. | 6,100 | 221 |
| | Siix Corp. | 18,100 | 214 |
| | WDB Holdings Co. Ltd. | 7,300 | 212 |
| | Hamakyorex Co. Ltd. | 6,800 | 193 |
| | Kyokuto Kaihatsu Kogyo Co. Ltd. | 15,500 | 191 |
| | G-Tekt Corp. | 15,700 | 177 |
| | Tosei Corp. | 17,000 | 170 |
| | Tosho Co. Ltd. | 13,800 | 160 |
| | Link And Motivation Inc. | 40,700 | 154 |
| | Nippon Parking Development Co. Ltd. | 125,200 | 154 |
| | Yondoshi Holdings Inc. | 8,600 | 146 |
| | Sun Frontier Fudousan Co. Ltd. | 17,500 | 141 |
| | Sinko Industries Ltd. | 10,000 | 140 |
| | BeNEXT Group Inc. | 14,700 | 138 |
| | Tanseisha Co. Ltd. | 17,400 | 118 |
| | Takara Leben Co. Ltd. | 42,100 | 118 |
| | Kito Corp. | 9,500 | 117 |
| | Koshidaka Holdings Co. Ltd. | 29,600 | 111 |
| | | | 337,277 |
| Malaysia (0.0%) | | |
| | My EG Services Bhd. | 1,369,000 | 453 |
| | | | |
| Mexico (0.8%) | | |
| | America Movil SAB de CV | 18,784,556 | 11,433 |
| | Grupo Elektra SAB DE CV | 98,585 | 5,586 |
| * | Grupo Financiero Inbursa SAB de CV | 2,836,555 | 2,101 |
| | Grupo Carso SAB de CV | 971,404 | 1,799 |
| * | Grupo Aeroportuario del Sureste SAB de CV Class B | 118,168 | 1,365 |
| * | Regional SAB de CV | 132,900 | 359 |
| | | | 22,643 |
International Dividend Appreciation Index Fund
| | | | Market |
| | | | Value· |
| | | Shares | ($000) |
| Morocco (0.1%) | | |
| * | Attijariwafa Bank | 88,131 | 3,615 |
| | | | |
| Netherlands (3.8%) | | |
| | ASML Holding NV | 178,453 | 64,565 |
| ^ | Unilever NV | 612,815 | 34,547 |
| | Aalberts NV | 47,843 | 1,605 |
| | | | 100,717 |
| New Zealand (0.2%) | | |
| | Ryman Healthcare Ltd. | 211,596 | 1,958 |
| | Mainfreight Ltd. | 39,881 | 1,422 |
| | Port of Tauranga Ltd. | 293,313 | 1,404 |
| | | | 4,784 |
| Norway (0.1%) | | |
| | TOMRA Systems ASA | 62,475 | 2,523 |
| | | | |
| Philippines (0.7%) | | |
| | SM Investments Corp. | 503,435 | 9,873 |
| | Ayala Land Inc. | 6,169,270 | 4,200 |
| | International Container Terminal Services Inc. | 839,570 | 1,991 |
| | Jollibee Foods Corp. | 469,438 | 1,646 |
| | | | 17,710 |
| South Africa (1.6%) | | |
| * | Naspers Ltd. | 184,687 | 36,056 |
| * | Capitec Bank Holdings Ltd. | 48,587 | 3,415 |
| | Clicks Group Ltd. | 105,898 | 1,532 |
| | Remgro Ltd. | 227,273 | 1,212 |
| | Bidvest Group Ltd. | 146,125 | 1,202 |
| | PSG Group Ltd. | 101,399 | 328 |
| | Netcare Ltd. | 24,622 | 19 |
| | | | 43,764 |
| South Korea (0.0%) | | |
| | LEENO Industrial Inc. | 6,020 | 648 |
| | AfreecaTV Co. Ltd. | 4,356 | 231 |
| | | | 879 |
| Spain (1.6%) | | |
| ^ | Industria de Diseno Textil SA | 1,306,327 | 32,253 |
| | Amadeus IT Group SA | 181,427 | 8,644 |
| | Grupo Catalana Occidente SA | 48,704 | 1,124 |
| | Vidrala SA | 10,432 | 996 |
| * | Vidrala SA Rights Exp. 11/05/2020 | 10,432 | 50 |
| | | | 43,067 |
| Sweden (1.9%) | | |
| | Investor AB Class B | 191,044 | 11,451 |
| * | Hexagon AB Class B | 147,789 | 10,833 |
| | Assa Abloy AB Class B | 442,915 | 9,493 |
| * | Svenska Cellulosa AB SCA Class B | 269,612 | 3,647 |
| * | L E Lundbergforetagen AB Class B | 64,657 | 2,906 |
| | Castellum AB | 116,726 | 2,430 |
| * | Aak Ab | 108,386 | 2,109 |
| * | Trelleborg AB Class B | 106,258 | 1,768 |
| * | Hexpol AB | 134,233 | 1,182 |
| | Hufvudstaden AB Class A | 89,577 | 1,169 |
| | Wihlborgs Fastigheter AB | 64,575 | 1,164 |
| * | AF Poyry AB | 47,909 | 1,095 |
| | Atrium Ljungberg AB | 52,620 | 850 |
| * | Nolato AB Class B | 9,146 | 761 |
| * | Loomis AB Class B | 30,890 | 689 |
| * | Biotage AB | 23,722 | 395 |
| | | | 51,942 |
| Switzerland (13.9%) | | |
| | Nestle SA | 971,068 | 109,224 |
| | Roche Holding AG | 294,462 | 94,620 |
| | Novartis AG | 1,058,040 | 82,445 |
| | Givaudan SA | 3,851 | 15,704 |
| | Cie Financiere Richemont SA | 236,270 | 14,768 |
| | Sika AG | 58,988 | 14,511 |
| | Partners Group Holding AG | 11,121 | 10,012 |
| | EMS-Chemie Holding AG | 9,809 | 8,628 |
| | Geberit AG | 15,129 | 8,611 |
| * | Sonova Holding AG | 27,117 | 6,437 |
| | Chocoladefabriken Lindt & Spruengli AG | 488 | 3,869 |
| | ALSO Holding AG | 5,467 | 1,279 |
| | Interroll Holding AG | 332 | 892 |
| | Orior AG | 2,376 | 173 |
| | | | 371,173 |
| Taiwan (0.2%) | | |
| | E.Sun Financial Holding Co. Ltd. | 5,215,230 | 4,434 |
| | Bizlink Holding Inc. | 51,000 | 392 |
| | | | 4,826 |
| Turkey (0.1%) | | |
| | BIM Birlesik Magazalar AS | 253,166 | 2,002 |
| | | | |
| United Kingdom (7.7%) | | |
| | Diageo plc | 979,881 | 31,668 |
| | RELX plc | 812,159 | 16,071 |
| | Experian plc | 382,006 | 13,994 |
| | Prudential plc | 1,091,849 | 13,354 |
| | Compass Group plc | 750,623 | 10,274 |
| * | Ferguson plc | 94,896 | 9,425 |
International Dividend Appreciation Index Fund
| | | | Market |
| | | | Value· |
| | | Shares | ($000) |
| | Associated British Foods plc | 332,947 | 7,322 |
| | Ashtead Group plc | 189,749 | 6,857 |
| * | Rentokil Initial plc | 781,083 | 5,318 |
| | Intertek Group plc | 68,695 | 4,948 |
| | Halma plc | 160,821 | 4,935 |
| | Spirax-Sarco Engineering plc | 31,013 | 4,534 |
| | Bunzl plc | 142,629 | 4,434 |
| | Croda International plc | 54,612 | 4,268 |
| | JD Sports Fashion plc | 410,792 | 3,952 |
| * | InterContinental Hotels Group plc | 76,588 | 3,891 |
| | Smurfit Kappa Group plc | 101,653 | 3,830 |
| | Hikma Pharmaceuticals plc | 112,618 | 3,662 |
| | Burberry Group plc | 173,832 | 3,053 |
| * | Rightmove plc | 376,081 | 3,010 |
| | Smiths Group plc | 170,069 | 2,930 |
| | DCC plc | 41,729 | 2,712 |
| | Johnson Matthey plc | 82,987 | 2,310 |
| * | Howden Joinery Group plc | 262,194 | 2,165 |
| | Dechra Pharmaceuticals plc | 44,504 | 2,013 |
| | Intermediate Capital Group plc | 123,242 | 1,872 |
| | Abcam plc | 87,886 | 1,677 |
| | Spectris plc | 50,725 | 1,628 |
| | Diploma plc | 54,604 | 1,572 |
| * | Hiscox Ltd. | 144,682 | 1,546 |
| | Genus plc | 28,235 | 1,501 |
| * | Travis Perkins plc | 107,890 | 1,482 |
| * | Dunelm Group plc | 86,756 | 1,467 |
| * | IWG plc | 422,861 | 1,387 |
| | Rotork plc | 378,993 | 1,381 |
| * | Meggitt plc | 336,975 | 1,194 |
| | Britvic plc | 120,356 | 1,150 |
| | Beazley plc | 254,446 | 970 |
| | Cranswick plc | 22,580 | 941 |
| | Grainger plc | 254,101 | 921 |
| * | Grafton Group plc | 99,910 | 869 |
| | JET2 plc | 75,516 | 832 |
| * | GB Group plc | 71,369 | 822 |
| | Victrex plc | 32,681 | 781 |
| | RWS Holdings plc | 104,268 | 754 |
| | Domino’s Pizza Group plc | 175,052 | 752 |
| | WH Smith plc | 53,894 | 697 |
| | Daily Mail & General Trust plc | 78,986 | 692 |
| | QinetiQ Group plc | 217,620 | 667 |
| | Ultra Electronics Holdings plc | 26,855 | 655 |
| | Bodycote plc | 73,345 | 618 |
| | Avon Rubber plc | 11,639 | 593 |
| * | Savills plc | 52,303 | 563 |
| * | National Express Group plc | 259,345 | 503 |
| | Hill & Smith Holdings plc | 29,395 | 457 |
| | Hilton Food Group plc | 29,886 | 448 |
| | CVS Group plc | 26,047 | 418 |
| | Rathbone Brothers plc | 20,642 | 389 |
| | St. Modwen Properties plc | 84,226 | 362 |
| | Smart Metering Systems plc | 44,043 | 331 |
| | EMIS Group plc | 23,209 | 299 |
| * | 4imprint Group plc | 10,800 | 290 |
| | James Fisher & Sons plc | 19,651 | 289 |
| | Clarkson plc | 11,054 | 288 |
| * | AG Barr plc | 41,140 | 251 |
| | DiscoverIE Group plc | 33,219 | 247 |
| | Greencore Group plc | 174,986 | 205 |
| | Helical plc | 45,512 | 200 |
| * | Restore plc | 47,555 | 197 |
| | Alliance Pharma plc | 193,839 | 185 |
| | Rank Group plc | 155,411 | 181 |
| | Speedy Hire plc | 191,131 | 131 |
| * | Vitec Group plc | 4,235 | 39 |
| | Brooks Macdonald Group plc | 615 | 13 |
| | | | 206,637 |
| United States (0.1%) | | |
| | Autoliv Inc. | 37,163 | 2,802 |
| | Burford Capital Ltd. | 89,652 | 764 |
| | | | 3,566 |
| Total Common Stocks | | |
| (Cost $2,328,039) | | 2,662,567 |
| Temporary Cash Investments (2.9%) | |
| Money Market Fund (2.9%) | | |
| 2,3 | Vanguard Market Liquidity Fund, 0.112% | 765,129 | 76,513 |
International Dividend Appreciation Index Fund
| | | Face | Market |
| | | Amount | Value· |
| | | ($000) | ($000) |
| U.S. Government and Agency Obligations (0.0%) |
| 4 | United States Treasury Bill, 0.095%, 1/28/2021 | 737 | 737 |
Total Temporary Cash Investments
(Cost $77,249) | | 77,250 |
Total Investments (102.4%)
(Cost $2,405,288) | | 2,739,817 |
| Other Assets and Liabilities–Net (-2.4%) | | (63,806) |
| Net Assets (100%) | | 2,676,011 |
Cost is in $000.
| · | See Note A in Notes to Financial Statements. |
| * | Non-income-producing security. |
| ^ | Includes partial security positions on loan to broker-dealers. The total value of securities on loan is $63,212,000. |
| 1 | Security exempt from registration under Rule 144A of the Securities Act of 1933. Such securities may be sold in transactions exempt from registration, normally to qualified institutional buyers. At October 31, 2020, the value of this security represented 0.5% of net assets. |
| 2 | Affiliated money market fund available only to Vanguard funds and certain trusts and accounts managed by Vanguard. Rate shown is the 7-day yield. |
| 3 | Collateral of $68,543,000 was received for securities on loan. |
| 4 | Securities with a value of $737,000 have been segregated as initial margin for open futures contracts. |
ADR—American Depositary Receipt.
| Derivative Financial Instruments Outsstanding as of Period End | | |
| | | | | |
| Futures Contracts | | | | |
| | | | | ($000) |
| | | | | Value and |
| | | Number of | | Unrealized |
| | | Long (Short) | Notional | Appreciation |
| | Expiration | Contracts | Amount | (Depreciation) |
| Long Futures Contracts | | | | |
| MSCI Emerging Market Index | December 2020 | 89 | 4,903 | (37) |
| Dow Jones EURO STOXX 50 Index | December 2020 | 121 | 4,170 | (435) |
| Topix Index | December 2020 | 12 | 1,803 | (32) |
| E-mini S&P 500 Index | December 2020 | 8 | 1,306 | (38) |
| | | | | (542) |
International Dividend Appreciation Index Fund
| Forward Currency Contracts | | | | | | | | |
| | Contract | | | | | | Unrealized | Unrealized |
| | Settlement | | Contract Amount (000) | Appreciation | (Depreciation) |
| Counterparty | Date | | Receive | | Deliver | ($000) | ($000) |
| Royal Bank of Canada | 1/14/21 | EUR | 1,565 | USD | 1,857 | — | (31) |
| Goldman Sachs International | 1/14/21 | JPY | 56,767 | USD | 543 | — | — |
| Standard Chartered Bank | 1/14/21 | USD | 2,942 | CHF | 2,718 | — | (29) |
| | | | | | | | — | (60) |
CHF—Swiss franc.
EUR—euro.
JPY—Japanese yen.
USD—U.S. dollar.
See accompanying Notes, which are an integral part of the Financial Statements.
International Dividend Appreciation Index Fund
Statement of Assets and Liabilities
As of October 31, 2020
| ($000s, except shares and per-share amounts) | Amount |
| Assets | |
| Investments in Securities, at Value | |
| Unaffiliated Issuers (Cost $2,328,776) | 2,663,304 |
| Affiliated Issuers (Cost $76,512) | 76,513 |
| Total Investments in Securities | 2,739,817 |
| Investment in Vanguard | 114 |
| Cash Collateral Pledged—Futures Contracts | 403 |
| Foreign Currency, at Value (Cost $3,611) | 3,664 |
| Receivables for Accrued Income | 7,004 |
| Receivables for Capital Shares Issued | 723 |
| Total Assets | 2,751,725 |
| Liabilities | |
| Due to Custodian | 55 |
| Collateral for Securities on Loan | 68,543 |
| Payables for Capital Shares Redeemed | 70 |
| Payables to Vanguard | 273 |
| Variation Margin Payable—Futures Contracts | 76 |
| Unrealized Depreciation—Forward Currency Contracts | 60 |
| Deferred Foreign Capital Gain Taxes | 6,637 |
| Total Liabilities | 75,714 |
| Net Assets | 2,676,011 |
| | |
| | |
| At October 31, 2020, net assets consisted of: | |
| | |
| Paid-in Capital | 2,449,201 |
| Total Distributable Earnings (Loss) | 226,810 |
| Net Assets | 2,676,011 |
| | |
| ETF Shares—Net Assets | |
| Applicable to 35,100,721 outstanding $.001 par value shares of beneficial interest (unlimited authorization) | 2,456,120 |
| Net Asset Value Per Share—ETF Shares | $69.97 |
| | |
| Admiral Shares—Net Assets | |
| Applicable to 6,461,340 outstanding $.001 par value shares of beneficial interest (unlimited authorization) | 219,891 |
| Net Asset Value Per Share—Admiral Shares | $34.03 |
See accompanying Notes, which are an integral part of the Financial Statements.
International Dividend Appreciation Index Fund
Statement of Operations
| | Year Ended |
| | October 31, 2020 |
| | ($000) |
| Investment Income | |
| Income | |
| Dividends1 | 33,856 |
| Interest2 | 49 |
| Securities Lending—Net | 108 |
| Total Income | 34,013 |
| Expenses | |
| The Vanguard Group—Note B | |
| Investment Advisory Services | 320 |
| Management and Administrative—ETF Shares | 3,122 |
| Management and Administrative—Admiral Shares | 362 |
| Marketing and Distribution—ETF Shares | 104 |
| Marketing and Distribution—Admiral Shares | 13 |
| Custodian Fees | 272 |
| Auditing Fees | 42 |
| Shareholders’ Reports—ETF Shares | 102 |
| Shareholders’ Reports—Admiral Shares | 7 |
| Trustees’ Fees and Expenses | 1 |
| Total Expenses | 4,345 |
| Expenses Paid Indirectly | (85) |
| Net Expenses | 4,260 |
| Net Investment Income | 29,753 |
| Realized Net Gain (Loss) | |
| Investment Securities Sold2 | (62,710) |
| Futures Contracts | 257 |
| Forward Currency Contracts | (511) |
| Foreign Currencies | 404 |
| Realized Net Gain (Loss) | (62,560) |
| Change in Unrealized Appreciation (Depreciation) | |
| Investment Securities2,3 | 158,624 |
| Futures Contracts | (704) |
| Forward Currency Contracts | (76) |
| Foreign Currencies | 247 |
| Change in Unrealized Appreciation (Depreciation) | 158,091 |
| Net Increase (Decrease) in Net Assets Resulting from Operations | 125,284 |
| 1 | Dividends are net of foreign withholding taxes of $4,336,000. |
| 2 | Interest income, realized net gain (loss), and change in unrealized appreciation (depreciation) from an affiliated company of the fund were $42,000, $5,000, and $0, respectively. Purchases and sales are for temporary cash investment purposes. |
| 3 | The change in unrealized appreciation (depreciation) is net of deferred foreign capital gains taxes of $2,612,000. |
See accompanying Notes, which are an integral part of the Financial Statements.
International Dividend Appreciation Index Fund
Statement of Changes in Net Assets
| | Year Ended October 31, |
| | 2020 | 2019 |
| | ($000) | ($000) |
| Increase (Decrease) in Net Assets | | |
| Operations | | |
| Net Investment Income | 29,753 | 28,631 |
| Realized Net Gain (Loss) | (62,560) | (23,897) |
| Change in Unrealized Appreciation (Depreciation) | 158,091 | 214,847 |
| Net Increase (Decrease) in Net Assets Resulting from Operations | 125,284 | 219,581 |
| Distributions1 | | |
| Investor Shares | — | (90) |
| ETF Shares | (33,388) | (16,043) |
| Admiral Shares | (3,991) | (2,897) |
| Total Distributions | (37,379) | (19,030) |
| Capital Share Transactions | | |
| Investor Shares | — | (12,733) |
| ETF Shares | 1,064,328 | 275,183 |
| Admiral Shares | 386 | 13,443 |
| Net Increase (Decrease) from Capital Share Transactions | 1,064,714 | 275,893 |
| Total Increase (Decrease) | 1,152,619 | 476,444 |
| Net Assets | | |
| Beginning of Period | 1,523,392 | 1,046,948 |
| End of Period | 2,676,011 | 1,523,392 |
1 Certain prior-period numbers have been reclassified to conform with the current-period presentation.
See accompanying Notes, which are an integral part of the Financial Statements.
International Dividend Appreciation Index Fund
Financial Highlights
| ETF Shares | | | | | |
| | | | | | Feb. 25, |
| | | | | | 20161 to |
| For a Share Outstanding | | Year Ended October 31, | Oct. 31, |
| Throughout Each Period | 2020 | 2019 | 2018 | 2017 | 2016 |
| Net Asset Value, Beginning of Period | $68.72 | $58.65 | $64.25 | $54.43 | $50.00 |
| Investment Operations | | | | | |
| Net Investment Income2 | .958 | 1.4523 | 1.196 | 1.179 | .662 |
| Net Realized and Unrealized Gain (Loss) on Investments4 | 1.551 | 9.578 | (5.623) | 9.715 | 4.154 |
| Total from Investment Operations | 2.509 | 11.030 | (4.427) | 10.894 | 4.816 |
| Distributions | | | | | |
| Dividends from Net Investment Income | (1.259) | (.960) | (1.173) | (1.074) | (.386) |
| Distributions from Realized Capital Gains | — | — | — | — | — |
| Total Distributions | (1.259) | (.960) | (1.173) | (1.074) | (.386) |
| Net Asset Value, End of Period | $69.97 | $68.72 | $58.65 | $64.25 | $54.43 |
| | | | | | |
| Total Return | 3.73% | 18.96% | -7.04% | 20.19% | 9.64% |
| | | | | | |
| Ratios/Supplemental Data | | | | | |
| Net Assets, End of Period (Millions) | $2,456 | $1,305 | $861 | $634 | $147 |
| Ratio of Total Expenses to Average Net Assets | 0.20% | 0.20% | 0.25% | 0.25% | 0.25%5 |
| Ratio of Net Investment Income to Average Net Assets | 1.40% | 2.24%3 | 1.83% | 1.96% | 1.60%5 |
| Portfolio Turnover Rate6 | 17% | 42% | 36% | 9% | 8% |
| 2 | Calculated based on average shares outstanding. |
| 3 | Net investment income per share and the ratio of net investment income to average net assets include $.388 and 0.65%, respectively, resulting from a special dividend from Naspers Ltd. in September 2019. |
| 4 | Includes increases from purchase and redemption fees of $.01 for 2020, $.02 for 2019, $.02 for 2018, and $.04 for 2017. |
| 6 | Excludes the value of portfolio securities received or delivered as a result of in-kind purchases or redemptions of the fund’s capital shares, including ETF Creation Units. |
See accompanying Notes, which are an integral part of the Financial Statements.
International Dividend Appreciation Index Fund
Financial Highlights
| Admiral Shares | | | | | |
| | | | | | March 2, |
| | | | | | 20161 to |
| For a Share Outstanding | | Year Ended October 31, | Oct. 31, |
| Throughout Each Period | 2020 | 2019 | 2018 | 2017 | 2016 |
| Net Asset Value, Beginning of Period | $33.42 | $28.52 | $31.24 | $26.45 | $25.00 |
| Investment Operations | | | | | |
| Net Investment Income2 | .453 | .6863 | .576 | .573 | .285 |
| Net Realized and Unrealized Gain (Loss) on Investments4 | .765 | 4.679 | (2.727) | 4.720 | 1.352 |
| Total from Investment Operations | 1.218 | 5.365 | (2.151) | 5.293 | 1.637 |
| Distributions | | | | | |
| Dividends from Net Investment Income | (.608) | (.465) | (.569) | (.503) | (.187) |
| Distributions from Realized Capital Gains | — | — | — | — | — |
| Total Distributions | (.608) | (.465) | (.569) | (.503) | (.187) |
| Net Asset Value, End of Period | $34.03 | $33.42 | $28.52 | $31.24 | $26.45 |
| | | | | | |
| Total Return5 | 3.72%6 | 18.96%6 | -7.03%6 | 20.18%6 | 6.54% |
| | | | | | |
| Ratios/Supplemental Data | | | | | |
| Net Assets, End of Period (Millions) | $220 | $218 | $175 | $152 | $77 |
| Ratio of Total Expenses to Average Net Assets | 0.20% | 0.20% | 0.25% | 0.25% | 0.25%7 |
| Ratio of Net Investment Income to Average Net Assets | 1.36% | 2.24%3 | 1.83% | 1.96% | 1.60%7 |
| Portfolio Turnover Rate8 | 17% | 42% | 36% | 9% | 8% |
| 2 | Calculated based on average shares outstanding. |
| 3 | Net investment income per share and the ratio of net investment income to average net assets include $.188 and 0.65%, respectively, resulting from a special dividend from Naspers Ltd. in September 2019. |
| 4 | Includes increases from purchase and redemption fees of $.00 for 2020, $.01 for 2019, $.01 for 2018, and $.02 for 2017. |
| 5 | Total returns do not include account service fees that may have applied in the periods shown. Fund prospectuses provide information about any applicable account service fees. |
| 6 | Total returns do not include transaction fees that may have applied in the periods shown. Fund prospectuses provide information about any applicable transaction fees. |
| 8 | Excludes the value of portfolio securities received or delivered as a result of in-kind purchases or redemptions of the fund’s capital shares, including ETF Creation Units. |
See accompanying Notes, which are an integral part of the Financial Statements.
International Dividend Appreciation Index Fund
Notes to Financial Statements
Vanguard International Dividend Appreciation Index Fund is registered under the Investment Company Act of 1940 as an open-end investment company, or mutual fund. The fund offers two classes of shares: ETF Shares and Admiral Shares. Each of the share classes has different eligibility and minimum purchase requirements, and is designed for different types of investors. ETF Shares are listed for trading on Nasdaq; they can be purchased and sold through a broker.
The fund invests in securities of foreign issuers, which may subject it to investment risks not normally associated with investing in securities of U.S. corporations. Market disruptions associated with the COVID-19 pandemic have had a global impact, and uncertainty exists as to the long-term implications. Such disruptions can adversely affect assets of the fund and thus fund performance.
A. The following significant accounting policies conform to generally accepted accounting principles for U.S. investment companies. The fund consistently follows such policies in preparing its financial statements.
1. Security Valuation: Securities are valued as of the close of trading on the New York Stock Exchange (generally 4 p.m., Eastern time) on the valuation date. Equity securities are valued at the latest quoted sales prices or official closing prices taken from the primary market in which each security trades; such securities not traded on the valuation date are valued at the mean of the latest quoted bid and asked prices. Securities for which market quotations are not readily available, or whose values have been affected by events occurring before the fund’s pricing time but after the close of the securities’ primary markets, are valued at their fair values calculated according to procedures adopted by the board of trustees. These procedures include obtaining quotations from an independent pricing service, monitoring news to identify significant market- or security-specific events, and evaluating changes in the values of foreign market proxies (for example, ADRs, futures contracts, or exchange-traded funds), between the time the foreign markets close and the fund’s pricing time. When fair-value pricing is employed, the prices of securities used by a fund to calculate its net asset value may differ from quoted or published prices for the same securities. Investments in Vanguard Market Liquidity Fund are valued at that fund’s net asset value. Temporary cash investments are valued using the latest bid prices or using valuations based on a matrix system (which considers such factors as security prices, yields, maturities, and ratings), both as furnished by independent pricing services.
2. Foreign Currency: Securities and other assets and liabilities denominated in foreign currencies are translated into U.S. dollars using exchange rates obtained from an independent third party as of the fund’s pricing time on the valuation date. Realized gains (losses) and unrealized appreciation (depreciation) on investment securities include the effects of changes in exchange rates since the securities were purchased, combined with the effects of changes in security prices. Fluctuations in the value of other assets and liabilities resulting from changes in exchange rates are recorded as unrealized foreign currency gains (losses) until the assets or liabilities are settled in cash, at which time they are recorded as realized foreign currency gains (losses).
3. Futures Contracts: The fund uses index futures contracts to a limited extent, with the objectives of maintaining full exposure to the stock market, maintaining liquidity, and minimizing transaction costs. The fund may purchase futures contracts to immediately invest incoming cash in the market, or sell futures in response to cash outflows, thereby simulating a fully invested position in the underlying index while maintaining a cash balance for liquidity. The primary risks associated with the use of futures contracts are imperfect correlation between changes in market values of stocks held by the fund and the prices of futures contracts, and the possibility of an illiquid market. Counterparty risk involving futures is mitigated because a regulated clearinghouse is the
International Dividend Appreciation Index Fund
counterparty instead of the clearing broker. To further mitigate counterparty risk, the fund trades futures contracts on an exchange, monitors the financial strength of its clearing brokers and clearinghouse, and has entered into clearing agreements with its clearing brokers. The clearinghouse imposes initial margin requirements to secure the fund’s performance and requires daily settlement of variation margin representing changes in the market value of each contract. Any securities pledged as initial margin for open contracts are noted in the Schedule of Investments.
Futures contracts are valued at their quoted daily settlement prices. The notional amounts of the contracts are not recorded in the Statement of Assets and Liabilities. Fluctuations in the value of the contracts are recorded in the Statement of Assets and Liabilities as an asset (liability) and in the Statement of Operations as unrealized appreciation (depreciation) until the contracts are closed, when they are recorded as realized gains (losses) on futures contracts.
During the year ended October 31, 2020, the fund’s average investments in long and short futures contracts represented less than 1% and 0% of net assets, respectively, based on the average of the notional amounts at each quarter-end during the period.
4. Forward Currency Contracts: The fund enters into forward currency contracts to provide the appropriate currency exposure related to any open futures contracts. The fund’s risks in using these contracts include movement in the values of the foreign currencies relative to the U.S. dollar and the ability of the counterparties to fulfill their obligations under the contracts. The fund mitigates its counterparty risk by entering into forward currency contracts only with a diverse group of prequalified counterparties, monitoring their financial strength, entering into master netting arrangements with its counterparties, and requiring its counterparties to transfer collateral as security for their performance. In the absence of a default, the collateral pledged or received by the fund cannot be repledged, resold, or rehypothecated. The master netting arrangements provide that, in the event of a counterparty’s default (including bankruptcy), the fund may terminate the forward currency contracts, determine the net amount owed by either party in accordance with its master netting arrangements, and sell or retain any collateral held up to the net amount owed to the fund under the master netting arrangements. The forward currency contracts contain provisions whereby a counterparty may terminate open contracts if the fund’s net assets decline below a certain level, triggering a payment by the fund if the fund is in a net liability position at the time of the termination. The payment amount would be reduced by any collateral the fund has pledged. Any securities pledged as collateral for open contracts are noted in the Schedule of Investments. The value of collateral received or pledged is compared daily to the value of the forward currency contracts exposure with each counterparty, and any difference, if in excess of a specified minimum transfer amount, is adjusted and settled within two business days.
Forward currency contracts are valued at their quoted daily prices obtained from an independent third party, adjusted for currency risk based on the expiration date of each contract. The notional amounts of the contracts are not recorded in the Statement of Assets and Liabilities. Fluctuations in the value of the contracts are recorded in the Statement of Assets and Liabilities as an asset (liability) and in the Statement of Operations as unrealized appreciation (depreciation) until the contracts are closed, when they are recorded as realized gains (losses) on forward currency contracts.
The fund’s average investment in forward currency contracts represented less than 1% of net assets, based on the average of the notional amounts at each quarter-end during the period.
International Dividend Appreciation Index Fund
5. Federal Income Taxes: The fund intends to continue to qualify as a regulated investment company and distribute all of its taxable income. The fund’s tax returns are open to examination by the relevant tax authorities until expiration of the applicable statute of limitations, which is generally three years after the filing of the tax return. Management has analyzed the fund’s tax positions taken for all open federal and state income tax years, and has concluded that no provision for income tax is required in the fund’s financial statements.
6. Distributions: Distributions to shareholders are recorded on the ex-dividend date. Distributions are determined on a tax basis at the fiscal year-end and may differ from net investment income and realized capital gains for financial reporting purposes.
7. Securities Lending: To earn additional income, the fund lends its securities to qualified institutional borrowers. Security loans are subject to termination by the fund at any time, and are required to be secured at all times by collateral in an amount at least equal to the market value of securities loaned. Daily market fluctuations could cause the value of loaned securities to be more or less than the value of the collateral received. When this occurs, the collateral is adjusted and settled before the opening of the market on the next business day. The fund further mitigates its counterparty risk by entering into securities lending transactions only with a diverse group of prequalified counterparties, monitoring their financial strength, and entering into master securities lending agreements with its counterparties. The master securities lending agreements provide that, in the event of a counterparty’s default (including bankruptcy), the fund may terminate any loans with that borrower, determine the net amount owed, and sell or retain the collateral up to the net amount owed to the fund; however, such actions may be subject to legal proceedings. While collateral mitigates counterparty risk, in the event of a default, the fund may experience delays and costs in recovering the securities loaned. The fund invests cash collateral received in Vanguard Market Liquidity Fund, and records a liability in the Statement of Assets and Liabilities for the return of the collateral, during the period the securities are on loan. Collateral investments in Vanguard Market Liquidity Fund are subject to market appreciation or depreciation. Securities lending income represents fees charged to borrowers plus income earned on invested cash collateral, less expenses associated with the loan. During the term of the loan, the fund is entitled to all distributions made on or in respect of the loaned securities.
8. Credit Facilities and Interfund Lending Program: The fund and certain other funds managed by The Vanguard Group (“Vanguard”) participate in a $4.3 billion committed credit facility provided by a syndicate of lenders pursuant to a credit agreement and an uncommitted credit facility provided by Vanguard. Both facilities may be renewed annually. Each fund is individually liable for its borrowings, if any, under the credit facilities. Borrowings may be utilized for temporary or emergency purposes, subject to the fund’s regulatory and contractual borrowing restrictions. With respect to the committed credit facility, the participating funds are charged administrative fees and an annual commitment fee of 0.10% of the undrawn committed amount of the facility; these fees are allocated to the funds based on a method approved by the fund’s board of trustees and included in Management and Administrative expenses on the fund’s Statement of Operations. Any borrowings under either facility bear interest at a rate based upon the higher of the one-month London Interbank Offered Rate (or an acceptable alternate rate, if necessary), federal funds effective rate, or overnight bank funding rate plus an agreed-upon spread, except that borrowings under the uncommitted credit facility may bear interest based upon an alternative rate agreed to by the fund and Vanguard.
International Dividend Appreciation Index Fund
In accordance with an exemptive order (the “Order”) from the SEC, the fund may participate in a joint lending and borrowing program that allows registered open-end Vanguard funds to borrow money from and lend money to each other for temporary or emergency purposes (the “Interfund Lending Program”), subject to compliance with the terms and conditions of the Order, and to the extent permitted by the fund’s investment objective and investment policies. Interfund loans and borrowings normally extend overnight, but can have a maximum duration of seven days. Loans may be called on one business day’s notice. The interest rate to be charged is governed by the conditions of the Order and internal procedures adopted by the board of trustees. The board of trustees is responsible for overseeing the Interfund Lending Program.
For the year ended October 31, 2020, the fund did not utilize the credit facilities or the Interfund Lending Program.
9. Other: Dividend income is recorded on the ex-dividend date. Interest income includes income distributions received from Vanguard Market Liquidity Fund and is accrued daily. Premiums and discounts on debt securities are amortized and accreted, respectively, to interest income over the lives of the respective securities, except for premiums on certain callable debt securities that are amortized to the earliest call date. Security transactions are accounted for on the date securities are bought or sold. Costs used to determine realized gains (losses) on the sale of investment securities are those of the specific securities sold. Fees assessed on capital share transactions are credited to paid-in capital.
Taxes on foreign dividends and capital gains have been provided for in accordance with the fund’s understanding of the applicable countries’ tax rules and rates. Foreign capital gains tax, if any, is accrued daily based upon applicable net unrealized gains. The fund has filed tax reclaims for previously withheld taxes on dividends earned in certain European Union countries. These filings are subject to various administrative and judicial proceedings within these countries. Such tax reclaims received during the year, if any, are included in dividend income. No other amounts for additional tax reclaims are reflected in the financial statements due to the uncertainty as to the ultimate resolution of proceedings, the likelihood of receipt of these reclaims, and the potential timing of payment.
Each class of shares has equal rights as to assets and earnings, except that each class separately bears certain class-specific expenses related to maintenance of shareholder accounts (included in Management and Administrative expenses) and shareholder reporting. Marketing and distribution expenses are allocated to each class of shares based on a method approved by the board of trustees. Income, other non-class-specific expenses, and gains and losses on investments are allocated to each class of shares based on its relative net assets.
B. In accordance with the terms of a Funds’ Service Agreement (the “FSA”) between Vanguard and the fund, Vanguard furnishes to the fund investment advisory, corporate management, administrative, marketing, and distribution services at Vanguard’s cost of operations (as defined by the FSA). These costs of operations are allocated to the fund based on methods and guidelines approved by the board of trustees and are generally settled twice a month.
Upon the request of Vanguard, the fund may invest up to 0.40% of its net assets as capital in Vanguard. At October 31, 2020, the fund had contributed to Vanguard capital in the amount of $114,000, representing less than 0.01% of the fund’s net assets and 0.05% of Vanguard’s capital received pursuant to the FSA. The fund’s trustees and officers are also directors and employees, respectively, of Vanguard.
International Dividend Appreciation Index Fund
C. The fund’s custodian bank has agreed to reduce its fees when the fund maintains cash on deposit in the non-interest-bearing custody account. For the year ended October 31, 2020, custodian fee offset arrangements reduced the fund’s expenses by $85,000 (an annual rate of less than 0.01% of average net assets).
D. Various inputs may be used to determine the value of the fund’s investments and derivatives. These inputs are summarized in three broad levels for financial statement purposes. The inputs or methodologies used to value securities are not necessarily an indication of the risk associated with investing in those securities.
Level 1—Quoted prices in active markets for identical securities.
Level 2—Other significant observable inputs (including quoted prices for similar securities, interest rates, prepayment speeds, credit risk, etc.).
Level 3—Significant unobservable inputs (including the fund’s own assumptions used to determine the fair value of investments). Any investments and derivatives valued with significant unobservable inputs are noted on the Schedule of Investments.
The following table summarizes the market value of the fund’s investments and derivatives as of October 31, 2020, based on the inputs used to value them:
| | Level 1 | Level 2 | Level 3 | Total |
| | ($000) | ($000) | ($000) | ($000) |
| Investments | | | | |
| Assets | | | | |
| Common Stocks | 235,667 | 2,426,900 | — | 2,662,567 |
| Temporary Cash Investments | 76,513 | 737 | — | 77,250 |
| Total | 312,180 | 2,427,637 | — | 2,739,817 |
| Derivative Financial Instruments | | | | |
| Liabilities | | | | |
| Futures Contracts1 | 76 | — | — | 76 |
| Forward Currency Contracts | — | 60 | — | 60 |
| Total | 76 | 60 | — | 136 |
1 Represents variation margin on the last day of the reporting period.
International Dividend Appreciation Index Fund
E. At October 31, 2020, the fair values of derivatives were reflected in the Statement of Assets and Liabilities as follows:
| | | | Foreign | | |
| | Equity | | Exchange | | |
| | Contracts | | Contracts | | Total |
| Statement of Assets and Liabilities Caption | ($000) | | ($000) | | ($000) |
| Variation Margin Payable—Futures Contracts | 76 | | — | | 76 |
| Unrealized Depreciation—Forward Currency Contracts | — | | 60 | | 60 |
| Total Liabilities | 76 | | 60 | | 136 |
Realized net gain (loss) and the change in unrealized appreciation (depreciation) on derivatives for the year ended October 31, 2020, were:
| | | | Foreign | | |
| | Equity | | Exchange | | |
| | Contracts | | Contracts | | Total |
| Realized Net Gain (Loss) on Derivatives | ($000) | | ($000) | | ($000) |
| Futures Contracts | 257 | | — | | 257 |
| Forward Currency Contracts | — | | (511) | | (511) |
| Realized Net Gain (Loss) on Derivatives | 257 | | (511) | | (254) |
| | | | | | |
| Change in Unrealized Appreciation (Depreciation) on Derivatives | | | | | |
| Futures Contracts | (704) | | — | | (704) |
| Forward Currency Contracts | — | | (76) | | (76) |
| Change in Unrealized Appreciation (Depreciation) on Derivatives | (704) | | (76) | | (780) |
F. Permanent differences between book-basis and tax-basis components of net assets are reclassified among capital accounts in the financial statements to reflect their tax character. These reclassifications have no effect on net assets or net asset value per share. As of period end, permanent differences primarily attributable to the accounting for foreign currency transactions, passive foreign investment companies, and tax expense on capital gains were reclassified between the individual components of total distributable earnings (loss).
Temporary differences between book-basis and tax-basis components of total distributable earnings (loss) arise when certain items of income, gain, or loss are recognized in different periods for financial statement and tax purposes; these differences will reverse at some time in the future. The differences are primarily related to the deferral of losses from wash sales; the recognition of
International Dividend Appreciation Index Fund
unrealized gains or losses from certain derivative contracts; and the recognition of unrealized gains from passive foreign investment companies. As of period end, the tax-basis components of total distributable earnings (loss) are detailed in the table as follows:
| | Amount |
| | ($000) |
| Undistributed Ordinary Income | 12,863 |
| Undistributed Long-Term Gains | — |
| Capital Loss Carryforwards | (104,829) |
| Qualified Late-Year Losses | — |
| Net Unrealized Gains (Losses) | 318,776 |
The tax character of distributions paid was as follows:
| | Year Ended October 31, |
| | 2020 | | 2019 |
| | Amount | | Amount |
| | ($000) | | ($000) |
| Ordinary Income* | 37,379 | | 19,030 |
| Long-Term Capital Gains | — | | — |
| Total | 37,379 | | 19,030 |
* Includes short-term capital gains, if any.
As of October 31, 2020, gross unrealized appreciation and depreciation for investments and derivatives based on cost for U.S. federal income tax purposes were as follows:
| | Amount |
| | ($000) |
| Tax Cost | 2,414,639 |
| Gross Unrealized Appreciation | 481,319 |
| Gross Unrealized Depreciation | (156,173) |
| Net Unrealized Appreciation (Depreciation) | 325,146 |
G. During the year ended October 31, 2020, the fund purchased $1,393,726,000 of investment securities and sold $348,673,000 of investment securities, other than temporary cash investments. Purchases and sales include $903,669,000 and $0, respectively, in connection with in-kind purchases and redemptions of the fund’s capital shares.
International Dividend Appreciation Index Fund
H. Capital share transactions for each class of shares were:
| | Year Ended October 31, |
| | 2020 | | 2019 |
| | Amount | | Shares | | Amount | | Shares |
| | ($000) | | (000) | | ($000) | | (000) |
| Investor Shares | | | | | | | |
| Issued1 | — | | — | | 1,629 | | 66 |
| Issued in Lieu of Cash Distributions | — | | — | | 85 | | 3 |
| Redeemed2,3 | — | | — | | (14,447) | | (553) |
| Net Increase (Decrease)—Investor Shares | — | | — | | (12,733) | | (484) |
| ETF Shares | | | | | | | |
| Issued1 | 1,064,328 | | 16,112 | | 275,183 | | 4,314 |
| Issued in Lieu of Cash Distributions | — | | — | | — | | — |
| Redeemed2 | — | | — | | — | | — |
| Net Increase (Decrease)—ETF Shares | 1,064,328 | | 16,112 | | 275,183 | | 4,314 |
| Admiral Shares | | | | | | | |
| Issued1,3 | 55,811 | | 1,680 | | 55,427 | | 1,777 |
| Issued in Lieu of Cash Distributions | 3,328 | | 101 | | 2,382 | | 78 |
| Redeemed2 | (58,753) | | (1,856) | | (44,366) | | (1,449) |
| Net Increase (Decrease)—Admiral Shares | 386 | | (75) | | 13,443 | | 406 |
| 1 | Includes purchase fees for fiscal 2020 and 2019 of $140,000 and $197,000, respectively (fund totals). |
| 2 | Net of redemption fees for fiscal 2020 and 2019 of $129,000 and $105,000, respectively (fund totals). |
| 3 | In November 2018, the fund announced changes to the availability and minimum investment criteria of the Investor and Admiral share classes. As a result, all of the outstanding Investor Shares automatically converted to Admiral Shares beginning in April 2019. Investor Shares—Redeemed and Admiral Shares—Issued include 487,000 and 400,000 shares, respectively, in the amount of $12,787,000 from the conversion during the year ended October 31, 2019. |
I. Management has determined that no events or transactions occurred subsequent to October 31, 2020, that would require recognition or disclosure in these financial statements.
International High Dividend Yield Index Fund
Performance Summary
All of the returns in this report represent past performance, which is not a guarantee of future results that may be achieved by the fund. (Current performance may be lower or higher than the performance data cited. For performance data current to the most recent month-end, visit our website at vanguard.com/performance.) Note, too, that both investment returns and principal value can fluctuate widely, so an investor’s shares, when sold, could be worth more or less than their original cost. The returns shown do not reflect taxes that a shareholder would pay on fund distributions or on the sale of fund shares.
Cumulative Performance: February 25, 2016, Through October 31, 2020
Initial Investment of $10,000
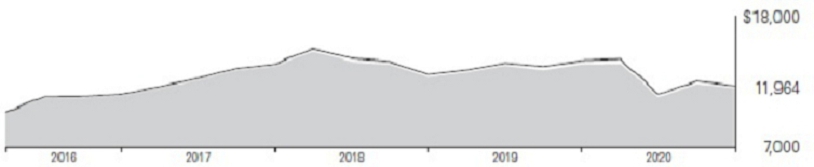
| | | Average Annual Total Returns | |
| | | Periods Ended October 31, 2020 | |
| | | | Since | Final Value |
| | | One | Inception | of a $10,000 |
| | | Year | (2/25/2016) | Investment |
 | International High Dividend Yield Index Fund ETF Shares Net Asset Value | -14.55% | 3.91% | $11,964 |
| | International High Dividend Yield Index Fund ETF Shares Market Price | -14.32 | 4.00 | 12,017 |
 | FTSE All-World ex US High Dividend Yield Index | -14.72 | 4.30 | 12,178 |
“Since Inception” performance is calculated from the ETF Shares’ inception date for both the fund and its comparative standard(s).
| | | Since | Final Value |
| | One | Inception | of a $10,000 |
| | Year | (3/2/2016) | Investment |
| International High Dividend Yield Index Fund Admiral Shares | -15.01% | 3.09% | $11,523 |
| FTSE All-World ex US High Dividend Yield Index | -14.72 | 3.56 | 11,770 |
“Since Inception” performance is calculated from the Admiral Shares’ inception date for both the fund and its comparative standard(s).
Vanguard fund returns are adjusted to reflect the 0.25% fee on purchases and redemptions. The fees do not apply to the ETF Shares.
See Financial Highlights for dividend and capital gains information.
International High Dividend Yield Index Fund
Cumulative Returns of ETF Shares: February 25, 2016, Through October 31, 2020
| | | Since |
| | One | Inception |
| | Year | (2/25/2016) |
| International High Dividend Yield Index Fund ETF Shares Market Price | -14.32% | 20.17% |
| International High Dividend Yield Index Fund ETF Shares Net Asset Value | -14.55 | 19.64 |
| FTSE All-World ex US High Dividend Yield Index | -14.72 | 21.78 |
“Since Inception” performance is calculated from the ETF Shares’ inception date for both the fund and its comparative standard(s).
For the ETF Shares, the market price is determined by the midpoint of the bid-offer spread as of the closing time of the New York Stock Exchange (generally 4 p.m., Eastern time). The net asset value is also determined as of the NYSE closing time. For more information about how the ETF Shares’ market prices have compared with their net asset value, visit vanguard.com, select your ETF, and then select the Price and Performance tab. The ETF premium/discount analysis there shows the percentages of days on which the ETF Shares’ market price was above or below the NAV.
Vanguard fund returns are adjusted to reflect the 0.25% fee on purchases and redemptions. The fees do not apply to the ETF Shares.
International High Dividend Yield Index Fund
Fund Allocation
As of October 31, 2020
| Basic Materials | 8.0% |
| Consumer Discretionary | 7.7 |
| Consumer Staples | 6.4 |
| Energy | 8.3 |
| Financials | 29.8 |
| Health Care | 3.7 |
| Industrials | 9.8 |
| Other | 2.5 |
| Real Estate | 2.9 |
| Technology | 7.5 |
| Telecommunications | 6.9 |
| Utilities | 6.5 |
The table reflects the fund’s investments, except for short-term investments and derivatives. Sector categories are based on the Industry Classification Benchmark (“ICB”), except for the “Other” category (if applicable), which includes securities that have not been provided an ICB classification as of the effective reporting period.
The fund may invest in derivatives (such as futures and swap contracts) for various reasons, including, but not limited to, at-tempting to remain fully invested and tracking its target index as closely as possible.
The Industry Classification Benchmark (“ICB”) is owned by FTSE. FTSE does not accept any liability to any person for any loss or damage arising out of any error or omission in the ICB.
International High Dividend Yield Index Fund
Financial Statements
Schedule of Investments
As of October 31, 2020
The fund files its complete schedule of portfolio holdings with the Securities and Exchange Commission (SEC) for the first and third quarters of each fiscal year as an exhibit to its reports on Form N-PORT. The fund’s Form N-PORT reports are available on the SEC’s website at www.sec.gov.
| | | | | Market |
| | | | | Value· |
| | | Shares | | ($000) |
| Common Stocks (99.3%) | | | |
| Australia (6.9%) | | | |
| | Commonwealth Bank of Australia | 332,648 | | 16,151 |
| | BHP Group Ltd. | 553,355 | | 13,265 |
| | Westpac Banking Corp. | 678,754 | | 8,591 |
| | National Australia Bank Ltd. | 618,044 | | 8,086 |
| | Wesfarmers Ltd. | 212,787 | | 6,888 |
| | Woolworths Group Ltd. | 237,519 | | 6,389 |
| | Macquarie Group Ltd. | 61,478 | | 5,481 |
| | Transurban Group | 514,249 | | 4,870 |
| | Rio Tinto Ltd. | 69,781 | | 4,540 |
| | Fortescue Metals Group Ltd. | 298,052 | | 3,646 |
| | Amcor plc | 294,541 | | 3,067 |
| | Coles Group Ltd. | 238,541 | | 2,980 |
| | Sonic Healthcare Ltd. | 89,420 | | 2,190 |
| | APA Group | 221,795 | | 1,635 |
| | QBE Insurance Group Ltd. | 275,142 | | 1,591 |
| | Telstra Corp. Ltd. | 780,707 | | 1,470 |
| | Insurance Australia Group Ltd. | 435,159 | | 1,461 |
| | Suncorp Group Ltd. | 238,745 | | 1,379 |
| | AGL Energy Ltd. | 118,151 | | 1,036 |
| | Magellan Financial Group Ltd. | 25,909 | | 1,004 |
| | Medibank Pvt Ltd. | 520,202 | | 977 |
| | Origin Energy Ltd. | 333,061 | | 937 |
| | Aurizon Holdings Ltd. | 346,816 | | 920 |
| | Tabcorp Holdings Ltd. | 389,053 | | 899 |
| | Ampol Ltd. | 47,587 | | 868 |
| | Coca-Cola Amatil Ltd. | 98,760 | | 863 |
| | Boral Ltd. | 231,654 | | 742 |
| | JB Hi-Fi Ltd. | 21,707 | | 725 |
| | Atlas Arteria Ltd. | 180,085 | | 713 |
| | Incitec Pivot Ltd. | 367,016 | | 495 |
| | AusNet Services | 342,917 | | 482 |
| | Alumina Ltd. | 475,708 | | 480 |
| | Bendigo & Adelaide Bank Ltd. | 100,177 | | 471 |
| | Challenger Ltd. | 122,595 | | 414 |
| | Worley Ltd. | 60,042 | | 400 |
| | Bank of Queensland Ltd. | 86,567 | | 391 |
| | Crown Resorts Ltd. | 66,537 | | 387 |
| | Downer EDI Ltd. | 124,413 | | 385 |
| | Metcash Ltd. | 179,579 | | 372 |
| | Star Entertainment Grp Ltd. | 151,762 | | 350 |
| | Orora Ltd. | 185,695 | | 337 |
| | CSR Ltd. | 92,981 | | 288 |
| * | CIMIC Group Ltd. | 16,692 | | 252 |
| | IOOF Holdings Ltd. | 119,804 | | 246 |
| | Perpetual Ltd. | 10,000 | | 191 |
| | Adbri Ltd. | 76,451 | | 152 |
| | Whitehaven Coal Ltd. | 163,028 | | 122 |
| | Platinum Asset Management Ltd. | 55,866 | | 120 |
| | | | | 109,699 |
| Austria (0.1%) | | | |
| | OMV AG | 27,176 | | 628 |
| | voestalpine AG | 22,107 | | 615 |
| * | Raiffeisen Bank International AG | 24,925 | | 360 |
| | Telekom Austria AG Class A | 23,095 | | 155 |
| | | | | 1,758 |
| Belgium (0.3%) | | | |
| | Groupe Bruxelles Lambert SA | 20,100 | | 1,648 |
| ^ | Ageas | 33,496 | | 1,349 |
| | Solvay SA Class A | 13,054 | | 1,061 |
| | Proximus SADP | 26,398 | | 513 |
| | Telenet Group Holding NV | 8,376 | | 322 |
| | | | | 4,893 |
| Brazil (2.1%) | | | |
| | Vale SA | 613,938 | | 6,479 |
| | B3 SA - Brasil Bolsa Balcao | 381,238 | | 3,392 |
| | Petroleo Brasileiro SA Preference Shares | 850,683 | | 2,808 |
| | Itau Unibanco Holding SA ADR | 576,729 | | 2,359 |
International High Dividend Yield Index Fund
| | | | | Market |
| | | | | Value· |
| | | Shares | | ($000) |
| | Banco Bradesco SA Preference Shares | 442,581 | | 1,555 |
| | Itau Unibanco Holding SA Preference Shares | 370,007 | | 1,514 |
| | Banco Bradesco SA ADR | 409,699 | | 1,434 |
| | Itausa - Investimentos Itau SA Preference Shares | 843,062 | | 1,336 |
| | Ambev SA ADR | 517,922 | | 1,108 |
| | Banco do Brasil SA | 163,918 | | 851 |
| | JBS SA | 187,869 | | 637 |
| | Banco BTG Pactual SA | 46,233 | | 584 |
| | Ambev SA | 263,950 | | 560 |
| | BB Seguridade Participacoes SA | 126,057 | | 520 |
| | Banco Bradesco SA | 158,039 | | 500 |
| | Telefonica Brasil SA ADR | 63,266 | | 466 |
| | Petrobras Distribuidora SA | 135,367 | | 452 |
| | Cia Siderurgica Nacional SA | 119,900 | | 429 |
| | Banco Santander Brasil SA | 72,502 | | 405 |
| | CCR SA | 208,110 | | 405 |
| | Hypera SA | 78,482 | | 382 |
| | Bradespar SA Preference Shares | 41,315 | | 336 |
| | TIM SA | 157,854 | | 326 |
| | Centrais Eletricas Brasileiras SA Preference Shares | 51,600 | | 279 |
| | Qualicorp Consultoria e Corretora de Seguros SA | 45,700 | | 253 |
| ^ | Cia Energetica de Minas Gerais ADR | 133,241 | | 244 |
| | Klabin SA | 55,664 | | 230 |
| | Engie Brasil Energia SA | 32,516 | | 226 |
| | YDUQS Participacoes SA | 56,014 | | 224 |
| | Cia Paranaense de Energia Preference Shares | 19,850 | | 214 |
| | Cyrela Brazil Realty SA Empreendimentos e Participacoes | 53,300 | | 212 |
| | Fleury SA | 44,063 | | 210 |
| | Transmissora Alianca de Energia Eletrica SA | 40,419 | | 198 |
| | Cia de Saneamento do Parana | 44,800 | | 185 |
| | CPFL Energia SA | 37,400 | | 182 |
| | EDP - Energias do Brasil SA | 61,076 | | 181 |
| | Cia Energetica de Sao Paulo Preference Shares | 35,200 | | 164 |
| | Cia de Transmissao de Energia Eletrica Paulista Preference Shares | 35,408 | | 145 |
| | Porto Seguro SA | 17,209 | | 142 |
| | Cielo SA | 201,884 | | 119 |
| | Odontoprev SA | 53,900 | | 118 |
| | Telefonica Brasil SA Preference Shares | 14,518 | | 108 |
| | Cia Energetica de Minas Gerais Preference Shares | 50,645 | | 90 |
| | Banco do Estado do Rio Grande do Sul SA Preference Shares | 38,086 | | 80 |
| | CVC Brasil Operadora e Agencia de Viagens SA | 4,018 | | 9 |
| | Cia Energetica de Minas Gerais | 996 | | 2 |
| * | CVC Brasil Operadora e Agencia de Viagens SA Warrants Exp. 01/29/2021 | 3,573 | | 1 |
| | | | | 32,654 |
| Canada (7.8%) | | | |
| | Royal Bank of Canada | 267,317 | | 18,692 |
| | Toronto-Dominion Bank | 339,398 | | 14,974 |
| | Enbridge Inc. | 379,982 | | 10,470 |
| | Bank of Nova Scotia | 226,961 | | 9,429 |
| ^ | Bank of Montreal | 120,179 | | 7,156 |
| | TC Energy Corp. | 176,490 | | 6,947 |
| | Canadian Imperial Bank of Commerce | 83,434 | | 6,224 |
| | Manulife Financial Corp. | 364,167 | | 4,936 |
| | Sun Life Financial Inc. | 110,048 | | 4,379 |
| | Nutrien Ltd. | 107,085 | | 4,353 |
| | Canadian Natural Resources Ltd. | 217,165 | | 3,456 |
| | Fortis Inc. | 87,073 | | 3,440 |
| | Suncor Energy Inc. | 286,719 | | 3,234 |
| | National Bank of Canada | 62,948 | | 3,021 |
| | Restaurant Brands International Inc. | 54,781 | | 2,847 |
| | Rogers Communications Inc. Class B | 65,642 | | 2,666 |
| | Magna International Inc. | 51,727 | | 2,641 |
| | BCE Inc. | 56,694 | | 2,278 |
| | Pembina Pipeline Corp. | 103,198 | | 2,160 |
| | Power Corp. of Canada | 103,074 | | 1,963 |
| | Shaw Communications Inc. Class B | 87,080 | | 1,435 |
| | TELUS Corp. | 79,901 | | 1,366 |
| | Fairfax Financial Holdings Ltd. | 5,120 | | 1,346 |
| 1 | Hydro One Ltd. | 59,825 | | 1,307 |
| ^ | Canadian Tire Corp. Ltd. Class A | 10,612 | | 1,185 |
International High Dividend Yield Index Fund
| | | | | Market |
| | | | | Value· |
| | | Shares | | ($000) |
| | Great-West Lifeco Inc. | 51,071 | | 1,041 |
| | Imperial Oil Ltd. | 42,011 | | 559 |
| | Canadian Utilities Ltd. Class A | 22,817 | | 533 |
| | IGM Financial Inc. | 14,261 | | 313 |
| | Inter Pipeline Ltd. | 915 | | 8 |
| | | | | 124,359 |
| Chile (0.2%) | | | |
| | Banco de Chile | 8,013,313 | | 619 |
| | Sociedad Quimica y Minera de Chile SA Preference Shares Class B | 15,831 | | 578 |
| | Enel Americas SA ADR | 82,103 | | 534 |
| | Banco Santander Chile ADR | 31,277 | | 434 |
| | Enel Chile SA | 4,356,860 | | 292 |
| | Banco de Credito e Inversiones SA | 8,291 | | 260 |
| | Sociedad Quimica y Minera de Chile SA ADR | 6,384 | | 236 |
| | Enel Americas SA | 1,605,919 | | 213 |
| | Colbun SA | 1,294,706 | | 195 |
| | Aguas Andinas SA Class A | 456,848 | | 119 |
| | Engie Energia Chile SA | 91,249 | | 96 |
| | Embotelladora Andina SA Preference Shares | 38,870 | | 81 |
| | AES Gener SA | 476,901 | | 74 |
| | Itau CorpBanca Chile SA | 27,283,485 | | 72 |
| | Enel Chile SA ADR | 11,940 | | 40 |
| | | | | 3,843 |
| China (8.0%) | | | |
| | China Construction Bank Corp. Class H | 17,547,000 | | 12,092 |
| | Ping An Insurance Group Co. of China Ltd. | 1,028,500 | | 10,634 |
| | Industrial & Commercial Bank of China Ltd. Class H | 15,300,000 | | 8,688 |
| | China Mobile Ltd. | 992,419 | | 6,070 |
| | Bank of China Ltd. Class H | 14,876,000 | | 4,699 |
| | China Merchants Bank Co. Ltd. Class H | 689,928 | | 3,594 |
| | China Life Insurance Co. Ltd. Class H | 1,399,000 | | 3,053 |
| | CNOOC Ltd. | 2,993,000 | | 2,738 |
| | China Resources Land Ltd. | 518,000 | | 2,118 |
| | Agricultural Bank of China Ltd. Class H | 5,931,000 | | 2,018 |
| | China Petroleum & Chemical Corp. Class H | 4,952,000 | | 1,934 |
| | China Overseas Land & Investment Ltd. | 724,500 | | 1,820 |
| 1 | Longfor Group Holdings Ltd. | 325,000 | | 1,781 |
| | Sunac China Holdings Ltd. | 467,554 | | 1,733 |
| | China Merchants Bank Co. Ltd. Class A | 290,900 | | 1,731 |
| | Country Garden Holdings Co. Ltd. | 1,398,000 | | 1,728 |
| | China Pacific Insurance Group Co. Ltd. Class H | 515,400 | | 1,613 |
| | Anhui Conch Cement Co. Ltd. Class H | 234,828 | | 1,469 |
| | Xinyi Solar Holdings Ltd. | 752,800 | | 1,375 |
| | China Vanke Co. Ltd. Class H | 384,205 | | 1,193 |
| | China Shenhua Energy Co. Ltd. Class H | 678,000 | | 1,175 |
| | Great Wall Motor Co. Ltd. Class H | 585,500 | | 948 |
| | Shimao Group Holdings Ltd. | 267,000 | | 946 |
| | CITIC Securities Co. Ltd. Class H | 427,000 | | 926 |
| | Hengan International Group Co. Ltd. | 132,343 | | 923 |
| | China Evergrande Group | 453,000 | | 903 |
| 1 | Postal Savings Bank of China Co. Ltd. Class H | 1,770,000 | | 869 |
| | PICC Property & Casualty Co. Ltd. Class H | 1,266,000 | | 859 |
| | China National Building Material Co. Ltd. Class H | 730,000 | | 840 |
| | Guangdong Investment Ltd. | 544,000 | | 807 |
| | China Telecom Corp. Ltd. Class H | 2,560,000 | | 804 |
| | Zijin Mining Group Co. Ltd. Class H | 1,084,000 | | 790 |
| | Agricultural Bank of China Ltd. Class A | 1,670,156 | | 786 |
| | Industrial Bank Co. Ltd. Class A | 280,200 | | 745 |
| | China CITIC Bank Corp. Ltd. Class H | 1,811,320 | | 737 |
| | Bank of Communications Co. Ltd. Class H | 1,459,000 | | 718 |
International High Dividend Yield Index Fund
| | | | | Market |
| | | | | Value· |
| | | Shares | | ($000) |
| | Gree Electric Appliances Inc. of Zhuhai Class A | 81,000 | | 710 |
| | China Minsheng Banking Corp. Ltd. Class H | 1,284,600 | | 703 |
| | Weichai Power Co. Ltd. Class H | 369,000 | | 700 |
| | China Unicom Hong Kong Ltd. | 1,100,000 | | 678 |
| | CITIC Ltd. | 923,000 | | 660 |
| | New China Life Insurance Co. Ltd. Class H | 163,600 | | 654 |
| | Guangzhou Automobile Group Co. Ltd. Class H | 598,000 | | 615 |
| | China Jinmao Holdings Group Ltd. | 1,136,000 | | 576 |
| | Shanghai Pudong Development Bank Co. Ltd. Class A | 399,200 | | 552 |
| * | Haitong Securities Co. Ltd. Class H | 650,000 | | 551 |
| | China Resources Cement Holdings Ltd. | 420,000 | | 550 |
| | Sinopharm Group Co. Ltd. Class H | 235,200 | | 540 |
| | China Yangtze Power Co. Ltd. Class A | 187,600 | | 532 |
| | Fosun International Ltd. | 422,000 | | 510 |
| | Kingboard Holdings Ltd. | 139,500 | | 472 |
| | China Communications Construction Co. Ltd. Class H | 901,000 | | 472 |
| | Industrial & Commercial Bank of China Ltd. Class A | 629,800 | | 463 |
| | CIFI Holdings Group Co. Ltd. | 664,000 | | 460 |
| 1 | Huatai Securities Co. Ltd. Class H | 282,800 | | 458 |
| | China State Construction Engineering Corp. Ltd. Class A | 594,900 | | 455 |
| | China Vanke Co. Ltd. Class A | 108,800 | | 449 |
| 1 | People’s Insurance Co. Group of China Ltd. Class H | 1,504,000 | | 448 |
| 1 | CGN Power Co. Ltd. Class H | 2,085,000 | | 447 |
| | SAIC Motor Corp. Ltd. Class A | 120,600 | | 418 |
| | Far East Horizon Ltd. | 402,000 | | 397 |
| | Beijing Enterprises Water Group Ltd. | 1,042,000 | | 396 |
| | Nine Dragons Paper Holdings Ltd. | 297,000 | | 396 |
| 1 | China Galaxy Securities Co. Ltd. Class H | 701,500 | | 385 |
| | China Resources Power Holdings Co. Ltd. | 364,000 | | 379 |
| | Dongfeng Motor Group Co. Ltd. Class H | 524,000 | | 369 |
| | Agile Group Holdings Ltd. | 266,000 | | 365 |
| | Kunlun Energy Co. Ltd. | 546,000 | | 353 |
| | GF Securities Co. Ltd. Class H | 270,200 | | 349 |
| | China Everbright Environment Group Ltd. | 683,000 | | 345 |
| | Poly Developments and Holdings Group Co. Ltd. Class A | 148,000 | | 340 |
| | China Pacific Insurance Group Co. Ltd. Class A | 69,600 | | 332 |
| | Anhui Conch Cement Co. Ltd. Class A | 42,900 | | 327 |
| | KWG Group Holdings Ltd. | 246,000 | | 326 |
| | China Everbright Bank Co. Ltd. Class A | 556,900 | | 326 |
| | China Hongqiao Group Ltd. | 450,500 | | 326 |
| 1 | Fuyao Glass Industry Group Co. Ltd. Class H | 76,400 | | 324 |
| | Kingboard Laminates Holdings Ltd. | 202,000 | | 323 |
| | China Cinda Asset Management Co. Ltd. Class H | 1,701,000 | | 319 |
| | Sinotruk Hong Kong Ltd. | 122,000 | | 312 |
| | China Minsheng Banking Corp. Ltd. Class A | 390,600 | | 308 |
| | China Railway Group Ltd. Class H | 658,000 | | 303 |
| | Huaneng Power International Inc. Class H | 806,000 | | 301 |
| | Hopson Development Holdings Ltd. | 116,000 | | 297 |
| | Bank of Communications Co. Ltd. Class A | 435,000 | | 294 |
| | Logan Group Co. Ltd. | 186,000 | | 292 |
| | Bank of China Ltd. Class A | 605,100 | | 287 |
| | China Lesso Group Holdings Ltd. | 177,000 | | 287 |
| | Henan Shuanghui Investment & Development Co. Ltd. Class A | 38,100 | | 285 |
International High Dividend Yield Index Fund
| | | | | Market |
| | | | | Value· |
| | | Shares | | ($000) |
| | Beijing Enterprises Holdings Ltd. | 92,500 | | 279 |
| | Seazen Group Ltd. | 370,479 | | 278 |
| | CRRC Corp. Ltd. Class H | 703,000 | | 273 |
| *,1 | China Merchants Securities Co. Ltd. Class H | 214,360 | | 266 |
| | Guangzhou R&F Properties Co. Ltd. Class H | 208,400 | | 265 |
| | Yanzhou Coal Mining Co. Ltd. Class H | 364,000 | | 265 |
| | Shenzhen International Holdings Ltd. | 167,500 | | 261 |
| | Yangzijiang Shipbuilding Holdings Ltd. | 377,200 | | 254 |
| | China Merchants Port Holdings Co. Ltd. | 238,000 | | 253 |
| | China Communications Services Corp. Ltd. Class H | 420,000 | | 245 |
| 1 | Dali Foods Group Co. Ltd. | 382,000 | | 237 |
| | Greentown China Holdings Ltd. | 145,500 | | 236 |
| | Shanghai Pharmaceuticals Holding Co. Ltd. Class H | 150,600 | | 234 |
| | China Medical System Holdings Ltd. | 220,000 | | 231 |
| | Bosideng International Holdings Ltd. | 518,000 | | 228 |
| | China State Construction International Holdings Ltd. | 328,000 | | 228 |
| | Yuexiu Property Co. Ltd. | 1,160,000 | | 225 |
| | Zoomlion Heavy Industry Science and Technology Co. Ltd. Class H | 245,200 | | 216 |
| 1 | China Huarong Asset Management Co. Ltd. Class H | 2,028,000 | | 212 |
| | Bank of Shanghai Co. Ltd. Class A | 180,641 | | 212 |
| | China Petroleum & Chemical Corp. Class A | 363,500 | | 212 |
| | Fuyao Glass Industry Group Co. Ltd. Class A | 37,400 | | 210 |
| | China Railway Construction Corp. Ltd. Class H | 303,000 | | 205 |
| | China Everbright Ltd. | 154,000 | | 204 |
| | China Aoyuan Group Ltd. | 216,000 | | 203 |
| | China Merchants Shekou Industrial Zone Holdings Co. Ltd. Class A | 94,600 | | 199 |
| | Jiangsu Expressway Co. Ltd. Class H | 198,000 | | 198 |
| | Shenzhen Investment Ltd. | 646,000 | | 197 |
| | Baoshan Iron & Steel Co. Ltd. Class A | 247,000 | | 197 |
| | Huaxin Cement Co. Ltd. Class B | 93,040 | | 194 |
| | COSCO SHIPPING Ports Ltd. | 330,000 | | 193 |
| | Bank of Beijing Co. Ltd. Class A | 273,200 | | 191 |
| | Huayu Automotive Systems Co. Ltd. Class A | 40,700 | | 189 |
| | Daqin Railway Co. Ltd. Class A | 197,400 | | 189 |
| | Chongqing Rural Commercial Bank Co. Ltd. Class H | 448,000 | | 179 |
| | Zhejiang Expressway Co. Ltd. Class H | 262,000 | | 179 |
| | Huaxia Bank Co. Ltd. Class A | 197,500 | | 179 |
| | China Everbright Bank Co. Ltd. Class H | 503,000 | | 174 |
| | China Shenhua Energy Co. Ltd. Class A | 69,300 | | 173 |
| | Shanghai Lujiazui Finance & Trade Zone Development Co. Ltd. Class B | 206,362 | | 170 |
| | Times China Holdings Ltd. | 125,000 | | 167 |
| 1 | Guotai Junan Securities Co. Ltd. Class H | 127,400 | | 166 |
| | Xinjiang Goldwind Science & Technology Co. Ltd. Class H | 122,200 | | 161 |
| | China Power International Development Ltd. | 831,370 | | 160 |
| | China Traditional Chinese Medicine Holdings Co. Ltd. | 396,000 | | 158 |
| 1 | BAIC Motor Corp. Ltd. Class H | 418,000 | | 155 |
| | COSCO SHIPPING Energy Transportation Co. Ltd. Class A | 156,800 | | 154 |
| | Bank of Nanjing Co. Ltd. Class A | 131,700 | | 151 |
| | Seazen Holdings Co. Ltd. | 30,800 | | 150 |
| | Bank of Hangzhou Co. Ltd. Class A | 76,800 | | 149 |
International High Dividend Yield Index Fund
| | | | | Market |
| | | | | Value· |
| | | Shares | | ($000) |
| | Citic Pacific Special Steel Group Co. Ltd. Class A | 60,800 | | 147 |
| | China National Nuclear Power Co. Ltd. Class A | 217,800 | | 144 |
| | Shaanxi Coal Industry Co. Ltd. Class A | 102,100 | | 134 |
| 1 | Legend Holdings Corp. Class H | 97,500 | | 131 |
| | BBMG Corp. Class A | 281,200 | | 127 |
| | Livzon Pharmaceutical Group Inc. Class H | 28,400 | | 126 |
| | Hengli Petrochemical Co. Ltd. Class A | 42,900 | | 124 |
| | SDIC Power Holdings Co. Ltd. Class A | 89,100 | | 123 |
| | Shougang Fushan Resources Group Ltd. | 524,164 | | 123 |
| | Inner Mongolia Yitai Coal Co. Ltd. Class B | 191,900 | | 120 |
| | Sinopec Shanghai Petrochemical Co. Ltd. Class H | 650,000 | | 120 |
| | China Reinsurance Group Corp. Class H | 1,242,000 | | 119 |
| * | Chongqing Changan Automobile Co. Ltd. Class B | 172,300 | | 118 |
| | Gemdale Corp. Class A | 57,400 | | 115 |
| | Shanghai Industrial Holdings Ltd. | 85,000 | | 114 |
| | Lao Feng Xiang Co. Ltd. Class B | 38,200 | | 113 |
| | Sinotrans Ltd. Class H | 375,000 | | 111 |
| 1 | Qingdao Port International Co. Ltd. Class H | 193,000 | | 110 |
| | Shenzhen Overseas Chinese Town Co. Ltd. Class A | 109,600 | | 108 |
| 1 | Sinopec Engineering Group Co. Ltd. Class H | 273,000 | | 106 |
| | China Fortune Land Development Co. Ltd. Class A | 49,920 | | 105 |
| | Sino-Ocean Group Holding Ltd. | 541,500 | | 104 |
| | China Construction Bank Corp. Class A | 108,800 | | 102 |
| | Poly Property Group Co. Ltd. | 354,000 | | 102 |
| | Lomon Billions Group Co. Ltd. Class A | 27,100 | | 100 |
| | Shanghai International Port Group Co. Ltd. Class A | 158,200 | | 99 |
| | Yanlord Land Group Ltd. | 123,800 | | 95 |
| *,§ | KWG Living Group Holdings Ltd. | 120,750 | | 95 |
| | Zhejiang Longsheng Group Co. Ltd. Class A | 47,200 | | 94 |
| | Sichuan Chuantou Energy Co. Ltd. Class A | 59,400 | | 89 |
| | Jiayuan International Group Ltd. | 208,000 | | 89 |
| 1 | Orient Securities Co. Ltd. Class H | 134,400 | | 89 |
| | Greenland Holdings Corp. Ltd. Class A | 94,900 | | 88 |
| | Weifu High-Technology Group Co. Ltd. Class B | 47,500 | | 87 |
| | Beijing Jingneng Clean Energy Co. Ltd. Class H | 302,000 | | 85 |
| | Metallurgical Corp. of China Ltd. Class H | 528,000 | | 85 |
| | Zoomlion Heavy Industry Science and Technology Co. Ltd. Class A | 74,500 | | 83 |
| | Jiangxi Zhengbang Technology Co. Ltd. Class A | 32,200 | | 82 |
| | GD Power Development Co. Ltd. Class A | 279,100 | | 82 |
| | Metallurgical Corp. of China Ltd. Class A | 209,700 | | 81 |
| | Zhejiang Chint Electrics Co. Ltd. Class A | 18,500 | | 81 |
| 1 | Shenwan Hongyuan Group Co. Ltd. Class H | 309,600 | | 79 |
| | Angang Steel Co. Ltd. Class H | 267,000 | | 78 |
| | Huadian Power International Corp. Ltd. Class H | 312,000 | | 77 |
| | Jinke Properties Group Co. Ltd. Class A | 66,500 | | 77 |
| | Zhengzhou Yutong Bus Co. Ltd. Class A | 31,800 | | 76 |
| | Shenzhen Expressway Co. Ltd. Class A | 57,100 | | 75 |
| | Yantai Changyu Pioneer Wine Co. Ltd. Class B | 41,400 | | 74 |
| | Wens Foodstuffs Group Co. Ltd. | 26,100 | | 74 |
| 1 | China Railway Signal & Communication Corp. Ltd. Class H | 221,000 | | 73 |
| | China Merchants Energy Shipping Co. Ltd. Class A | 83,700 | | 72 |
International High Dividend Yield Index Fund
| | | | | Market |
| | | | | Value· |
| | | Shares | | ($000) |
| | Bank of Changsha Co. Ltd. Class A | 53,300 | | 72 |
| | Datang International Power Generation Co. Ltd. Class H | 556,000 | | 70 |
| | Sichuan Swellfun Co. Ltd. Class A | 7,075 | | 70 |
| | Zhejiang Weixing New Building Materials Co. Ltd. Class A | 24,900 | | 70 |
| | China Coal Energy Co. Ltd. Class H | 284,000 | | 69 |
| | Jiangsu Zhongnan Construction Group Co. Ltd. Class A | 49,400 | | 67 |
| | China Gezhouba Group Co. Ltd. Class A | 62,600 | | 65 |
| 1 | Red Star Macalline Group Corp. Ltd. Class H | 106,872 | | 64 |
| | China National Chemical Engineering Co. Ltd. Class A | 81,300 | | 64 |
| | Jiangsu Expressway Co. Ltd. Class A | 45,900 | | 63 |
| | China CITIC Bank Corp. Ltd. Class A | 82,800 | | 62 |
| | RiseSun Real Estate Development Co. Ltd. Class A | 58,800 | | 62 |
| | Hunan Valin Steel Co. Ltd. Class A | 80,500 | | 61 |
| | Shenergy Co. Ltd. Class A | 74,100 | | 58 |
| | Huaneng Power International Inc. Class A | 78,600 | | 57 |
| | Bank of Jiangsu Co. Ltd. Class A | 63,200 | | 57 |
| * | China Zhongwang Holdings Ltd. | 275,600 | | 56 |
| | Yango Group Co. Ltd. Class A | 54,400 | | 56 |
| | China Communications Construction Co. Ltd. Class A | 49,900 | | 55 |
| | Shanghai Construction Group Co. Ltd. Class A | 121,100 | | 55 |
| | Shenzhen Expressway Co. Ltd. Class H | 60,000 | | 54 |
| | China South Publishing & Media Group Co. Ltd. Class A | 33,100 | | 52 |
| | Huaibei Mining Holdings Co. Ltd. Class A | 33,800 | | 51 |
| | Shanghai Jinjiang International Hotels Co. Ltd. Class B | 29,200 | | 50 |
| | Xiamen C & D Inc. Class A | 39,100 | | 49 |
| | Financial Street Holdings Co. Ltd. Class A | 48,800 | | 49 |
| | Shanghai Shimao Co. Ltd. Class A | 54,300 | | 47 |
| | Shanghai Tunnel Engineering Co. Ltd. Class A | 55,300 | | 46 |
| | Shanxi Lu’an Environmental Energy Development Co. Ltd. Class A | 52,100 | | 46 |
| § | Sinoma International Engineering Co. Class A | 41,200 | | 46 |
| | Anhui Expressway Co. Ltd. Class H | 92,000 | | 44 |
| | Guangshen Railway Co. Ltd. Class H | 264,000 | | 44 |
| | Shanghai AJ Group Co. Ltd. Class A | 35,400 | | 42 |
| | Shenzhen Jinjia Group Co. Ltd. Class A | 29,400 | | 39 |
| | Chongqing Rural Commercial Bank Co. Ltd. Class A | 58,700 | | 39 |
| | Tangshan Jidong Cement Co. Ltd. Class A | 17,300 | | 39 |
| | Pingdingshan Tianan Coal Mining Co. Ltd. Class A | 48,500 | | 38 |
| | Bank of Chengdu Co. Ltd. Class A | 24,400 | | 38 |
| | Huadian Power International Corp. Ltd. Class A | 74,000 | | 37 |
| | Zhejiang Runtu Co. Ltd. Class A | 27,500 | | 37 |
| | Sichuan Expressway Co. Ltd. Class H | 168,000 | | 36 |
| | Beijing Capital Development Co. Ltd. Class A | 39,400 | | 36 |
| | Sansteel Minguang Co. Ltd. Fujian Class A | 36,500 | | 36 |
| | Shanghai Lujiazui Finance & Trade Zone Development Co. Ltd. Class A | 20,800 | | 36 |
| * | Polaris Bay Group Co. Ltd. Class A | 19,600 | | 34 |
| | Huafa Industrial Co. Ltd. Zhuhai Class A | 35,200 | | 34 |
International High Dividend Yield Index Fund
| | | | | Market |
| | | | | Value· |
| | | Shares | | ($000) |
| | Guangxi Guiguan Electric Power Co. Ltd. Class A | 51,300 | | 34 |
| | Chinese Universe Publishing and Media Group Co. Ltd. Class A | 19,500 | | 34 |
| | Huolinhe Opencut Coal Industry Corp. Ltd. of Inner Mongolia Class A | 22,900 | | 33 |
| | Dongfang Electric Corp. Ltd. Class H | 47,200 | | 33 |
| | Inner Mongolia MengDian HuaNeng Thermal Power Corp. Ltd. Class A | 85,400 | | 33 |
| | Guangxi Liugong Machinery Co. Ltd. Class A | 30,900 | | 33 |
| | Hangzhou Binjiang Real Estate Group Co. Ltd. Class A | 44,100 | | 32 |
| | Chongqing Water Group Co. Ltd. Class A | 39,200 | | 31 |
| | Sinopec Shanghai Petrochemical Co. Ltd. Class A | 61,800 | | 31 |
| | Zhejiang Semir Garment Co. Ltd. Class A | 24,400 | | 30 |
| 1 | Everbright Securities Co. Ltd. Class H | 37,400 | | 30 |
| | Maanshan Iron & Steel Co. Ltd. Class A | 78,400 | | 30 |
| | Guizhou Panjiang Refined Coal Co. Ltd. Class A | 33,200 | | 30 |
| | China Machinery Engineering Corp. Class H | 154,000 | | 30 |
| | Jointo Energy Investment Co. Ltd. Hebei Class A | 35,400 | | 29 |
| | Shandong Chenming Paper Holdings Ltd. Class A | 35,800 | | 28 |
| | Fujian Funeng Co. Ltd. Class A | 23,900 | | 27 |
| | Liuzhou Iron & Steel Co. Ltd. Class A | 38,900 | | 27 |
| | Zhejiang Medicine Co. Ltd. Class A | 12,600 | | 27 |
| | Sichuan Languang Development Co. Ltd. Class A | 35,000 | | 26 |
| | North Huajin Chemical Industries Co. Ltd. Class A | 33,200 | | 25 |
| | Nanjing Iron & Steel Co. Ltd. Class A | 54,500 | | 24 |
| | Rainbow Digital Commercial Co. Ltd. Class A | 18,800 | | 23 |
| | Maanshan Iron & Steel Co. Ltd. Class H | 60,000 | | 14 |
| | Shandong Chenming Paper Holdings Ltd. Class H | 33,500 | | 13 |
| | Jiangling Motors Corp. Ltd. Class A | 3,500 | | 10 |
| *,1 | Shimao Services Holdings Ltd. | 4,327 | | 9 |
| | Shanghai Industrial Urban Development Group Ltd. | 17,000 | | 2 |
| | | | | 127,062 |
| Colombia (0.2%) | | | |
| | Interconexion Electrica SA ESP | 81,711 | | 441 |
| | Bancolombia SA ADR | 16,845 | | 429 |
| | Bancolombia SA | 66,462 | | 421 |
| | Ecopetrol SA ADR | 45,328 | | 419 |
| | Grupo Energia Bogota SA ESP | 497,712 | | 309 |
| | Grupo Argos SA | 51,909 | | 143 |
| | Grupo Aval Acciones y Valores Preference Shares | 592,640 | | 136 |
| | Cementos Argos SA | 97,491 | | 115 |
| | Grupo Aval Acciones y Valores SA ADR | 7,552 | | 34 |
| | Ecopetrol SA | 54,855 | | 25 |
| | | | | 2,472 |
| Czech Republic (0.1%) | | | |
| | CEZ AS | 30,616 | | 579 |
| * | Komercni banka AS | 14,456 | | 294 |
| 1 | Moneta Money Bank AS | 95,021 | | 216 |
| | | | | 1,089 |
| Denmark (0.1%) | | | |
| | Pandora A/S | 17,021 | | 1,350 |
| | Tryg A/S | 23,037 | | 640 |
| | | | | 1,990 |
| Egypt (0.0%) | | | |
| | Egypt Kuwait Holding Co. SAE | 151,933 | | 157 |
| | Eastern Co. SAE | 172,285 | | 130 |
| | Talaat Moustafa Group | 181,115 | | 70 |
| | ElSewedy Electric Co. | 129,404 | | 61 |
| | Telecom Egypt Co. | 63,313 | | 48 |
| | | | | 466 |
| Finland (1.6%) | | | |
| | Kone Oyj Class B | 73,473 | | 5,849 |
| * | Nordea Bank Abp | 603,608 | | 4,546 |
| | Sampo Oyj Class A | 94,408 | | 3,563 |
International High Dividend Yield Index Fund
| | | | | Market |
| | | | | Value· |
| | | Shares | | ($000) |
| | UPM-Kymmene Oyj | 99,937 | | 2,824 |
| | Stora Enso Oyj | 108,468 | | 1,583 |
| | Fortum Oyj | 81,276 | | 1,528 |
| | Elisa Oyj | 26,841 | | 1,320 |
| | Kesko Oyj Class B | 50,896 | | 1,306 |
| | Orion Oyj Class B | 19,658 | | 841 |
| | Metso Outotec Oyj | 114,753 | | 809 |
| | Nokian Renkaat Oyj | 25,541 | | 785 |
| | Wartsila Oyj Abp | 92,811 | | 738 |
| | Neles Oyj | 18,883 | | 253 |
| | | | | 25,945 |
| France (4.6%) | | | |
| | Sanofi | 204,448 | | 18,460 |
| | TOTAL SA | 454,913 | | 13,783 |
| | Schneider Electric SE | 98,683 | | 11,991 |
| | Danone SA | 112,525 | | 6,241 |
| | Orange SA | 359,956 | | 4,042 |
| * | Engie SA (XPAR) | 178,334 | | 2,157 |
| * | Societe Generale SA | 145,376 | | 1,975 |
| * | Peugeot SA | 102,172 | | 1,835 |
| | Veolia Environnement SA | 94,392 | | 1,757 |
| | Carrefour SA | 109,041 | | 1,695 |
| | Publicis Groupe SA | 40,657 | | 1,413 |
| | Bouygues SA | 40,028 | | 1,313 |
| | Suez SA | 70,159 | | 1,284 |
| * | Engie | 66,418 | | 803 |
| * | Engie SA Loyalty Shares 2021 | 65,712 | | 795 |
| * | Scor SE | 29,669 | | 721 |
| *,1 | Amundi SA | 10,647 | | 698 |
| * | Rexel SA | 57,052 | | 601 |
| | Rubis SCA | 17,908 | | 589 |
| | TechnipFMC plc | 87,475 | | 482 |
| | Imerys SA | 6,994 | | 209 |
| 1 | ALD SA | 15,026 | | 162 |
| | | | | 73,006 |
| Germany (6.2%) | | | |
| | Siemens AG | 143,513 | | 16,837 |
| | Allianz SE | 77,963 | | 13,734 |
| | BASF SE | 171,847 | | 9,410 |
| | Deutsche Telekom AG | 605,963 | | 9,210 |
| | Bayer AG | 184,667 | | 8,678 |
| | Vonovia SE | 106,145 | | 6,779 |
| | Muenchener Rueckversicherungs-Gesellschaft AG in Muenchen | 26,301 | | 6,164 |
| | Volkswagen AG Preference Shares | 33,892 | | 4,937 |
| | RWE AG | 118,302 | | 4,378 |
| | E.On SE | 406,410 | | 4,232 |
| | Bayerische Motoren Werke AG | 60,703 | | 4,148 |
| | Hannover Rueck SE | 11,278 | | 1,639 |
| | HeidelbergCement AG | 28,278 | | 1,617 |
| 1 | Covestro AG | 33,846 | | 1,615 |
| * | Siemens Energy AG | 70,848 | | 1,551 |
| | Evonik Industries AG | 36,556 | | 880 |
| | Uniper SE | 21,093 | | 630 |
| | Bayerische Motoren Werke AG Preference Shares | 10,118 | | 523 |
| | Metro AG | 31,682 | | 310 |
| | Telefonica Deutschland Holding AG | 117,206 | | 296 |
| | Talanx AG | 9,721 | | 287 |
| | Hochtief AG | 3,774 | | 278 |
| | Volkswagen AG | 487 | | 76 |
| | | | | 98,209 |
| Greece (0.1%) | | | |
| | Hellenic Telecommunications Organization SA | 43,716 | | 580 |
| | Opap SA | 39,827 | | 322 |
| | Jumbo SA | 18,988 | | 266 |
| | Mytilineos SA | 20,388 | | 224 |
| | Motor Oil Hellas Corinth Refineries SA | 9,390 | | 88 |
| | Hellenic Petroleum SA | 11,760 | | 57 |
| | | | | 1,537 |
| Hong Kong (2.4%) | | | |
| | Sun Hung Kai Properties Ltd. | 268,000 | | 3,450 |
| | CK Hutchison Holdings Ltd. | 501,000 | | 3,026 |
| | CLP Holdings Ltd. | 308,500 | | 2,843 |
| | CK Asset Holdings Ltd. | 502,500 | | 2,333 |
| | Hang Seng Bank Ltd. | 135,600 | | 2,089 |
| | BOC Hong Kong Holdings Ltd. | 682,500 | | 1,896 |
| | Jardine Matheson Holdings Ltd. | 39,000 | | 1,729 |
| | Sands China Ltd. | 454,800 | | 1,596 |
| | Power Assets Holdings Ltd. | 257,099 | | 1,324 |
| | New World Development Co. Ltd. | 267,750 | | 1,278 |
| 1 | WH Group Ltd. | 1,593,139 | | 1,255 |
| | Wharf Real Estate Investment Co. Ltd. | 308,000 | | 1,185 |
| | Hang Lung Properties Ltd. | 386,576 | | 941 |
| | Lenovo Group Ltd. | 1,400,000 | | 879 |
| | Henderson Land Development Co. Ltd. | 243,587 | | 860 |
| | Xinyi Glass Holdings Ltd. | 382,000 | | 839 |
| | Hongkong Land Holdings Ltd. | 217,300 | | 798 |
International High Dividend Yield Index Fund
| | | | | Market |
| | | | | Value· |
| | | Shares | | ($000) |
| | Sino Land Co. Ltd. | 614,000 | | 728 |
| | Want Want China Holdings Ltd. | 1,023,000 | | 677 |
| | Tingyi Cayman Islands Holding Corp. | 354,000 | | 648 |
| | Wharf Holdings Ltd. | 274,000 | | 567 |
| | CK Infrastructure Holdings Ltd. | 118,972 | | 561 |
| | Swire Properties Ltd. | 192,098 | | 516 |
| | PCCW Ltd. | 782,000 | | 470 |
| | Swire Pacific Ltd. Class A | 101,288 | | 462 |
| | Bank of East Asia Ltd. | 235,180 | | 424 |
| | Hysan Development Co. Ltd. | 125,000 | | 399 |
| | Chow Tai Fook Jewellery Group Ltd. | 311,800 | | 399 |
| * | Wynn Macau Ltd. | 284,400 | | 393 |
| | SITC International Holdings Co. Ltd. | 212,000 | | 327 |
| | NagaCorp Ltd. | 278,000 | | 288 |
| | Kerry Properties Ltd. | 111,000 | | 272 |
| 1 | BOC Aviation Ltd. | 38,300 | | 237 |
| | NWS Holdings Ltd. | 262,000 | | 230 |
| | Yue Yuen Industrial Holdings Ltd. | 131,000 | | 213 |
| | Dairy Farm International Holdings Ltd. | 56,300 | | 212 |
| | Lee & Man Paper Manufacturing Ltd. | 273,000 | | 207 |
| | VTech Holdings Ltd. | 30,000 | | 199 |
| | Uni-President China Holdings Ltd. | 194,000 | | 168 |
| | First Pacific Co. Ltd. | 424,000 | | 132 |
| | Cafe de Coral Holdings Ltd. | 62,000 | | 128 |
| | Nexteer Automotive Group Ltd. | 137,612 | | 115 |
| | Swire Pacific Ltd. Class B | 137,500 | | 112 |
| | Haitong International Securities Group Ltd. | 480,000 | | 109 |
| | Shui On Land Ltd. | 642,500 | | 85 |
| * | Lifestyle International Holdings Ltd. | 92,500 | | 73 |
| | Towngas China Co. Ltd. | 157,185 | | 71 |
| | Dah Sing Financial Holdings Ltd. | 27,600 | | 69 |
| | Dah Sing Banking Group Ltd. | 66,400 | | 57 |
| | Guotai Junan International Holdings Ltd. | 409,000 | | 52 |
| | Hutchison Telecommunications Hong Kong Holdings Ltd. | 152,000 | | 23 |
| * | Jiayuan International Group Ltd. Rights | 2,536 | | — |
| | | | | 37,944 |
| Hungary (0.0%) | | | |
| * | MOL Hungarian Oil & Gas plc | 80,031 | | 389 |
| | Magyar Telekom Telecommunications plc | 73,542 | | 81 |
| | | | | 470 |
| India (1.3%) | | | |
| | Infosys Ltd. | 674,450 | | 9,663 |
| | ITC Ltd. | 553,247 | | 1,236 |
| | Bharat Petroleum Corp. Ltd. | 187,718 | | 897 |
| | Power Grid Corp. of India Ltd. | 364,511 | | 841 |
| | Hero MotoCorp Ltd. | 19,662 | | 742 |
| | NTPC Ltd. | 541,230 | | 640 |
| | Oil & Natural Gas Corp. Ltd. | 566,804 | | 496 |
| | Indian Oil Corp. Ltd. | 419,453 | | 450 |
| | Coal India Ltd. | 285,607 | | 440 |
| | Vedanta Ltd. | 303,961 | | 393 |
| | Bharti Infratel Ltd. | 156,354 | | 391 |
| | Petronet LNG Ltd. | 111,672 | | 348 |
| | Hindustan Petroleum Corp. Ltd. | 121,673 | | 308 |
| | GAIL India Ltd. | 232,633 | | 266 |
| | Mphasis Ltd. | 14,190 | | 264 |
| | Ashok Leyland Ltd. | 224,978 | | 239 |
| * | Federal Bank Ltd. | 283,498 | | 193 |
| | LIC Housing Finance Ltd. | 47,801 | | 182 |
| | Oracle Financial Services Software Ltd. | 4,192 | | 178 |
| | REC Ltd. | 123,280 | | 171 |
| | Power Finance Corp. Ltd. | 142,133 | | 167 |
| * | Mahindra & Mahindra Financial Services Ltd. | 100,986 | | 167 |
| | Bharat Electronics Ltd. | 131,513 | | 154 |
| | NMDC Ltd. | 136,953 | | 152 |
| | Tata Power Co. Ltd. | 207,047 | | 146 |
| | Hindustan Zinc Ltd. | 43,111 | | 119 |
| | Indiabulls Housing Finance Ltd. | 61,642 | | 116 |
| | NHPC Ltd. | 385,489 | | 103 |
| | Sun TV Network Ltd. | 15,984 | | 91 |
| | Cummins India Ltd. | 15,315 | | 90 |
| * | Bank of Baroda | 147,103 | | 83 |
| * | Bharat Heavy Electricals Ltd. | 186,977 | | 70 |
| | Oil India Ltd. | 48,227 | | 56 |
International High Dividend Yield Index Fund
| | | | | Market |
| | | | | Value· |
| | | Shares | | ($000) |
| * | Punjab National Bank | 146,770 | | 53 |
| | JSW Energy Ltd. | 52,973 | | 43 |
| | | | | 19,948 |
| Indonesia (0.5%) | | | |
| | Bank Rakyat Indonesia Persero Tbk PT | 9,899,500 | | 2,241 |
| | Telekomunikasi Indonesia Persero Tbk PT | 8,808,900 | | 1,560 |
| | Astra International Tbk PT | 3,778,600 | | 1,380 |
| | Bank Mandiri Persero Tbk PT | 3,461,400 | | 1,348 |
| | Bank Negara Indonesia Persero Tbk PT | 1,400,700 | | 446 |
| | United Tractors Tbk PT | 290,504 | | 415 |
| | Indofood Sukses Makmur Tbk PT | 811,100 | | 384 |
| * | Gudang Garam Tbk PT | 79,600 | | 222 |
| | Tower Bersama Infrastructure Tbk PT | 1,953,700 | | 198 |
| | Hanjaya Mandala Sampoerna Tbk PT | 1,495,700 | | 143 |
| | Surya Citra Media Tbk PT | 1,071,500 | | 107 |
| | Bukit Asam Tbk PT | 794,800 | | 104 |
| * | Media Nusantara Citra Tbk PT | 920,900 | | 51 |
| | Bank Danamon Indonesia Tbk PT | 153,600 | | 25 |
| | | | | 8,624 |
| Israel (0.2%) | | | |
| | Bank Leumi Le-Israel BM | 268,789 | | 1,267 |
| * | Bank Hapoalim BM | 206,616 | | 1,206 |
| | ICL Group Ltd. | 126,047 | | 457 |
| | Gazit-Globe Ltd. | 10,908 | | 45 |
| | | | | 2,975 |
| Italy (2.0%) | | | |
| | Enel SPA | 1,460,774 | | 11,614 |
| | Eni SPA | 456,653 | | 3,199 |
| | Assicurazioni Generali SPA | 235,946 | | 3,165 |
| * | Fiat Chrysler Automobiles NV | 206,786 | | 2,537 |
| | Snam SPA | 409,717 | | 1,998 |
| | Terna Rete Elettrica Nazionale SPA | 260,263 | | 1,757 |
| * | FinecoBank Banca Fineco SPA | 114,236 | | 1,569 |
| * | Atlantia SPA | 92,375 | | 1,418 |
| | Mediobanca Banca di Credito Finanziario SPA | 145,625 | | 1,034 |
| 1 | Poste Italiane SPA | 86,146 | | 703 |
| | Italgas SPA | 92,129 | | 532 |
| | Tenaris SA | 90,790 | | 433 |
| | Telecom Italia SPA (Bearer) | 1,137,491 | | 414 |
| | A2A SPA | 304,925 | | 387 |
| | Banca Mediolanum SPA | 49,034 | | 335 |
| | UnipolSai Assicurazioni SPA | 88,557 | | 206 |
| | | | | 31,301 |
| Japan (13.4%) | | | |
| | Toyota Motor Corp. | 462,013 | | 30,330 |
| | Mitsubishi UFJ Financial Group Inc. | 2,343,600 | | 9,238 |
| | Takeda Pharmaceutical Co. Ltd. | 286,000 | | 8,838 |
| | KDDI Corp. | 318,600 | | 8,620 |
| | NTT DOCOMO Inc. | 212,400 | | 7,909 |
| | Honda Motor Co. Ltd. | 321,600 | | 7,607 |
| | Sumitomo Mitsui Financial Group Inc. | 243,954 | | 6,753 |
| | ITOCHU Corp. | 252,784 | | 6,072 |
| | SoftBank Corp. | 515,082 | | 5,994 |
| | Mizuho Financial Group Inc. | 477,420 | | 5,878 |
| | Tokio Marine Holdings Inc. | 122,134 | | 5,459 |
| | Mitsubishi Corp. | 224,300 | | 5,004 |
| | Nippon Telegraph & Telephone Corp. | 232,900 | | 4,899 |
| | Mitsui & Co. Ltd. | 311,012 | | 4,872 |
| | Japan Tobacco Inc. | 221,900 | | 4,178 |
| | Komatsu Ltd. | 172,300 | | 3,885 |
| | Bridgestone Corp. | 107,900 | | 3,517 |
| | Canon Inc. | 187,700 | | 3,267 |
| | Daiwa House Industry Co. Ltd. | 120,600 | | 3,169 |
| | Dai-ichi Life Holdings Inc. | 204,000 | | 3,047 |
| | ORIX Corp. | 236,100 | | 2,761 |
| | Nomura Holdings Inc. | 566,000 | | 2,535 |
| | MS&AD Insurance Group Holdings Inc. | 90,300 | | 2,471 |
| | Sompo Holdings Inc. | 63,700 | | 2,378 |
| | Sumitomo Corp. | 210,838 | | 2,307 |
| | Subaru Corp. | 114,409 | | 2,100 |
| | Asahi Kasei Corp. | 233,900 | | 2,027 |
| | ENEOS Holdings Inc. | 563,805 | | 1,902 |
| | Sumitomo Mitsui Trust Holdings Inc. | 68,200 | | 1,834 |
| | Sekisui House Ltd. | 107,902 | | 1,793 |
| | Japan Post Holdings Co. Ltd. | 249,174 | | 1,710 |
| | Sumitomo Electric Industries Ltd. | 140,900 | | 1,556 |
| | Marubeni Corp. | 295,100 | | 1,541 |
International High Dividend Yield Index Fund
| | | | | Market |
| | | | | Value· |
| | | Shares | | ($000) |
| | Chubu Electric Power Co. Inc. | 130,800 | | 1,465 |
| | Mitsubishi Chemical Holdings Corp. | 240,200 | | 1,352 |
| | Resona Holdings Inc. | 408,500 | | 1,347 |
| | Kansai Electric Power Co. Inc. | 137,400 | | 1,250 |
| | Toyota Tsusho Corp. | 42,500 | | 1,186 |
| | Mitsubishi Heavy Industries Ltd. | 54,100 | | 1,162 |
| | Taisei Corp. | 37,100 | | 1,154 |
| | Daiwa Securities Group Inc. | 282,314 | | 1,144 |
| | AGC Inc. | 35,400 | | 1,105 |
| | Daito Trust Construction Co. Ltd. | 12,000 | | 1,092 |
| | LIXIL Group Corp. | 49,500 | | 1,075 |
| | T&D Holdings Inc. | 102,900 | | 1,028 |
| | SBI Holdings Inc. | 43,000 | | 991 |
| | Sumitomo Chemical Co. Ltd. | 286,900 | | 939 |
| | Kajima Corp. | 85,100 | | 909 |
| | Idemitsu Kosan Co. Ltd. | 44,353 | | 897 |
| | Tosoh Corp. | 52,400 | | 849 |
| | Ricoh Co. Ltd. | 127,800 | | 839 |
| | Mitsui Chemicals Inc. | 32,500 | | 832 |
| | Inpex Corp. | 173,700 | | 824 |
| | Tohoku Electric Power Co. Inc. | 87,900 | | 776 |
| | Yamaha Motor Co. Ltd. | 53,300 | | 762 |
| | Kyushu Electric Power Co. Inc. | 88,900 | | 745 |
| | Shimizu Corp. | 103,400 | | 718 |
| | Chugoku Electric Power Co. Inc. | 56,835 | | 714 |
| | Marui Group Co. Ltd. | 39,400 | | 712 |
| | Concordia Financial Group Ltd. | 212,300 | | 701 |
| | NSK Ltd. | 84,100 | | 673 |
| | NGK Spark Plug Co. Ltd. | 36,100 | | 635 |
| | Mitsubishi Gas Chemical Co. Inc. | 34,200 | | 623 |
| | Japan Post Bank Co. Ltd. | 77,348 | | 617 |
| | Chiba Bank Ltd. | 116,800 | | 603 |
| | Haseko Corp. | 50,286 | | 603 |
| | Kuraray Co. Ltd. | 65,100 | | 602 |
| | Seiko Epson Corp. | 51,400 | | 597 |
| | Tokyo Century Corp. | 11,200 | | 549 |
| | Japan Post Insurance Co. Ltd. | 34,300 | | 544 |
| | Amada Co. Ltd. | 59,200 | | 515 |
| | Sojitz Corp. | 232,800 | | 512 |
| | Denka Co. Ltd. | 16,600 | | 511 |
| | Fukuoka Financial Group Inc. | 30,500 | | 510 |
| | Iida Group Holdings Co. Ltd. | 25,600 | | 463 |
| | Sumitomo Heavy Industries Ltd. | 21,200 | | 454 |
| | Showa Denko KK | 26,600 | | 452 |
| | Kyowa Exeo Corp. | 19,000 | | 438 |
| | Electric Power Development Co. Ltd. | 30,600 | | 414 |
| | Sanwa Holdings Corp. | 35,200 | | 402 |
| | DIC Corp. | 15,700 | | 382 |
| | Nikon Corp. | 60,500 | | 369 |
| | Aozora Bank Ltd. | 22,200 | | 365 |
| | Mebuki Financial Group Inc. | 179,800 | | 361 |
| | Nomura Real Estate Holdings Inc. | 20,500 | | 358 |
| | J Front Retailing Co. Ltd. | 46,000 | | 351 |
| | Penta-Ocean Construction Co. Ltd. | 52,800 | | 335 |
| | Mitsubishi UFJ Lease & Finance Co. Ltd. | 78,600 | | 333 |
| | JTEKT Corp. | 41,500 | | 331 |
| | Aica Kogyo Co. Ltd. | 9,600 | | 323 |
| | Sumitomo Rubber Industries Ltd. | 35,100 | | 309 |
| | Credit Saison Co. Ltd. | 28,000 | | 303 |
| | Ube Industries Ltd. | 17,400 | | 299 |
| | Hachijuni Bank Ltd. | 79,800 | | 295 |
| | Nippon Electric Glass Co. Ltd. | 14,800 | | 291 |
| | Hirogin Holdings Inc. | 52,900 | | 288 |
| | IHI Corp. | 23,600 | | 286 |
| | Kaneka Corp. | 10,200 | | 285 |
| | Yokohama Rubber Co. Ltd. | 19,300 | | 277 |
| | Seven Bank Ltd. | 120,500 | | 277 |
| | Yamaguchi Financial Group Inc. | 42,500 | | 276 |
| | Pola Orbis Holdings Inc. | 13,900 | | 274 |
| | DMG Mori Co. Ltd. | 18,700 | | 250 |
| | H.U. Group Holdings Inc. | 9,700 | | 247 |
| | Ushio Inc. | 20,900 | | 233 |
| | Gunma Bank Ltd. | 73,000 | | 232 |
| | Toda Corp. | 40,100 | | 229 |
| | AEON Financial Service Co. Ltd. | 21,700 | | 222 |
| | Hokuhoku Financial Group Inc. | 23,300 | | 221 |
| | Konica Minolta Inc. | 86,100 | | 219 |
| * | Mitsubishi Motors Corp. | 116,900 | | 214 |
| | Sankyo Co. Ltd. | 8,200 | | 209 |
International High Dividend Yield Index Fund
| | | | | Market |
| | | | | Value· |
| | | Shares | | ($000) |
| | Shikoku Electric Power Co. Inc. | 27,500 | | 198 |
| | Kyudenko Corp. | 6,900 | | 188 |
| | Wacoal Holdings Corp. | 10,000 | | 181 |
| | Hitachi Capital Corp. | 8,200 | | 173 |
| | Nisshinbo Holdings Inc. | 26,000 | | 173 |
| | Cosmo Energy Holdings Co. Ltd. | 11,600 | | 170 |
| | Toyota Boshoku Corp. | 11,000 | | 160 |
| | Matsui Securities Co. Ltd. | 19,700 | | 158 |
| | Yamato Kogyo Co. Ltd. | 6,300 | | 151 |
| | Heiwa Corp. | 8,900 | | 144 |
| | Tokai Rika Co. Ltd. | 9,100 | | 143 |
| | Noevir Holdings Co. Ltd. | 2,900 | | 129 |
| | SKY Perfect JSAT Holdings Inc. | 22,700 | | 97 |
| | Fuji Media Holdings Inc. | 6,500 | | 63 |
| | | | | 214,108 |
| Kuwait (0.3%) | | | |
| | National Bank of Kuwait SAKP | 1,194,707 | | 3,301 |
| | Mobile Telecommunications Co. KSC | 393,508 | | 751 |
| | Ahli United Bank BSC | 945,615 | | 727 |
| | Gulf Bank KSCP | 317,721 | | 230 |
| | Boubyan Petrochemicals Co. KSCP | 65,339 | | 114 |
| | Burgan Bank SAK | 149,341 | | 101 |
| | | | | 5,224 |
| Malaysia (0.7%) | | | |
| | Public Bank Bhd. (Local) | 572,600 | | 2,077 |
| | Malayan Banking Bhd. | 1,116,997 | | 1,881 |
| | Tenaga Nasional Bhd. | 723,933 | | 1,662 |
| | CIMB Group Holdings Bhd. | 1,311,000 | | 930 |
| | DiGi.Com Bhd. | 671,700 | | 609 |
| | Maxis Bhd. | 513,900 | | 594 |
| | MISC Bhd. | 268,600 | | 426 |
| | Hong Leong Bank Bhd. | 116,900 | | 417 |
| | Petronas Gas Bhd. | 104,532 | | 397 |
| | Sime Darby Bhd. | 659,400 | | 382 |
| | Gamuda Bhd. | 407,300 | | 326 |
| | Genting Bhd. | 423,000 | | 302 |
| | RHB Bank Bhd. | 289,500 | | 295 |
| | AMMB Holdings Bhd. | 356,500 | | 245 |
| | Genting Malaysia Bhd. | 487,000 | | 234 |
| | Westports Holdings Bhd. | 203,500 | | 191 |
| | YTL Corp. Bhd. | 870,446 | | 152 |
| | Alliance Bank Malaysia Bhd. | 203,500 | | 107 |
| | British American Tobacco Malaysia Bhd. | 26,200 | | 64 |
| | IOI Properties Group Bhd. | 291,500 | | 60 |
| 1 | Astro Malaysia Holdings Bhd. | 288,500 | | 51 |
| | | | | 11,402 |
| Mexico (0.7%) | | | |
| * | Grupo Financiero Banorte SAB de CV | 546,946 | | 2,437 |
| | Wal-Mart de Mexico SAB de CV | 972,035 | | 2,349 |
| | Grupo Mexico SAB de CV Class B | 594,900 | | 1,690 |
| | Grupo Aeroportuario del Pacifico SAB de CV Class B | 72,954 | | 607 |
| | Coca-Cola Femsa SAB de CV | 106,300 | | 402 |
| | Industrias Penoles SAB de CV | 22,920 | | 365 |
| | Alfa SAB de CV Class A | 538,400 | | 360 |
| * | Grupo Aeroportuario del Sureste SAB de CV Class B | 30,500 | | 352 |
| | Orbia Advance Corp. SAB de CV | 188,800 | | 334 |
| | Infraestructura Energetica Nova SAB de CV | 95,200 | | 318 |
| * | Grupo Financiero Inbursa SAB de CV | 411,400 | | 305 |
| * | Grupo Aeroportuario del Centro Norte SAB de CV | 59,400 | | 268 |
| | Promotora y Operadora de Infraestructura SAB de CV | 39,790 | | 261 |
| 1 | GMexico Transportes SAB de CV | 217,040 | | 257 |
| | Kimberly-Clark de Mexico SAB de CV Class A | 155,100 | | 230 |
| | Banco Santander Mexico SA Institucion de Banca Multiple Grupo Financiero Santand | 111,500 | | 82 |
| | Grupo Lala SAB de CV | 76,600 | | 47 |
| | | | | 10,664 |
| Netherlands (1.8%) | | | |
| ^ | Unilever NV | 272,643 | | 15,370 |
| | Koninklijke Ahold Delhaize NV | 201,503 | | 5,524 |
| * | ING Groep NV | 733,089 | | 5,022 |
| | Koninklijke KPN NV | 623,287 | | 1,683 |
| | Aegon NV | 332,704 | | 895 |
| | ASR Nederland NV | 25,887 | | 786 |
| | | | | 29,280 |
International High Dividend Yield Index Fund
| | | | | Market |
| | | | | Value· |
| | | Shares | | ($000) |
| New Zealand (0.2%) | | | |
| | Spark New Zealand Ltd. | 347,104 | | 1,030 |
| | Meridian Energy Ltd. | 231,987 | | 813 |
| | Contact Energy Ltd. | 138,173 | | 674 |
| | Mercury NZ Ltd. | 117,389 | | 415 |
| | SKYCITY Entertainment Group Ltd. | 138,664 | | 256 |
| | | | | 3,188 |
| Norway (0.6%) | | | |
| | Equinor ASA | 180,562 | | 2,304 |
| | Telenor ASA | 117,514 | | 1,816 |
| | Orkla ASA | 144,116 | | 1,360 |
| | Mowi ASA | 80,389 | | 1,270 |
| | Yara International ASA | 32,592 | | 1,141 |
| * | Salmar ASA | 9,752 | | 495 |
| | Aker BP ASA | 19,186 | | 299 |
| | Leroy Seafood Group ASA | 47,729 | | 224 |
| | Aker ASA | 4,542 | | 183 |
| | | | | 9,092 |
| Pakistan (0.0%) | | | |
| | Habib Bank Ltd. | 125,375 | | 102 |
| | Pakistan Petroleum Ltd. | 146,680 | | 76 |
| | Fauji Fertilizer Co. Ltd. | 112,299 | | 74 |
| | Oil & Gas Development Co. Ltd. | 119,600 | | 71 |
| | | | | 323 |
| Philippines (0.1%) | | | |
| | PLDT Inc. | 16,905 | | 461 |
| | Manila Electric Co. | 50,380 | | 312 |
| | Globe Telecom Inc. | 5,405 | | 226 |
| | Metro Pacific Investments Corp. | 2,712,000 | | 224 |
| | Aboitiz Power Corp. | 303,200 | | 169 |
| | DMCI Holdings Inc. | 702,800 | | 64 |
| | Semirara Mining & Power Corp. | 185,720 | | 41 |
| | | | | 1,497 |
| Poland (0.2%) | | | |
| | Powszechna Kasa Oszczednosci Bank Polski SA | 163,280 | | 783 |
| * | Powszechny Zaklad Ubezpieczen SA | 105,213 | | 575 |
| | Polski Koncern Naftowy ORLEN SA | 59,480 | | 573 |
| | Cyfrowy Polsat SA | 47,867 | | 299 |
| * | Santander Bank Polska SA | 5,513 | | 172 |
| | Grupa Lotos SA | 16,698 | | 118 |
| | | | | 2,520 |
| Portugal (0.2%) | | | |
| | EDP - Energias de Portugal SA | 527,350 | | 2,602 |
| | Galp Energia SGPS SA | 97,547 | | 792 |
| | | | | 3,394 |
| Qatar (0.6%) | | | |
| | Qatar National Bank QPSC | 828,900 | | 4,024 |
| | Qatar Islamic Bank SAQ | 216,046 | | 962 |
| | Industries Qatar QSC | 375,169 | | 926 |
| | Masraf Al Rayan QSC | 687,656 | | 810 |
| | Qatar Electricity & Water Co. QSC | 92,606 | | 424 |
| | Commercial Bank PSQC | 360,718 | | 423 |
| | Qatar Fuel QSC | 87,352 | | 412 |
| | Qatar Gas Transport Co. Ltd. | 499,306 | | 368 |
| | Barwa Real Estate Co. | 353,987 | | 324 |
| | Qatar International Islamic Bank QSC | 138,107 | | 314 |
| | Ooredoo QPSC | 154,022 | | 280 |
| * | Doha Bank QPSC | 289,407 | | 193 |
| | Qatar Insurance Co. SAQ | 299,825 | | 189 |
| | Vodafone Qatar QSC | 295,369 | | 105 |
| | | | | 9,754 |
| Russia (1.7%) | | | |
| | Sberbank of Russia PJSC | 1,917,910 | | 4,861 |
| | Gazprom PJSC ADR | 767,521 | | 2,940 |
| | LUKOIL PJSC ADR | 56,208 | | 2,876 |
| | Novatek PJSC | 197,263 | | 2,375 |
| | Tatneft PJSC ADR | 42,383 | | 1,317 |
| | MMC Norilsk Nickel PJSC ADR | 49,035 | | 1,169 |
| | MMC Norilsk Nickel PJSC | 4,858 | | 1,156 |
| | Gazprom PJSC | 446,205 | | 869 |
| | Lukoil PJSC | 15,726 | | 804 |
| | Rosneft Oil Co. PJSC GDR | 180,067 | | 786 |
| | Mobile TeleSystems PJSC ADR | 85,480 | | 668 |
| | Surgutneftegas OAO Preference Shares | 1,433,577 | | 655 |
| | Polyus PJSC | 3,061 | | 599 |
| | AK Transneft OAO Preference Shares | 298 | | 496 |
| | Magnit PJSC (XLON) | 34,481 | | 476 |
| | Novolipetsk Steel PJSC | 198,538 | | 466 |
| | Moscow Exchange MICEX-RTS PJSC | 269,756 | | 456 |
| | Severstal PAO GDR | 32,055 | | 438 |
| | Polyus PJSC GDR | 4,270 | | 420 |
| | Inter RAO UES PJSC | 6,521,000 | | 418 |
| | Alrosa PJSC | 450,950 | | 406 |
International High Dividend Yield Index Fund
| | | | | Market |
| | | | | Value· |
| | | Shares | | ($000) |
| | Magnit PJSC (MISX) | 6,284 | | 374 |
| | Rostelecom PJSC | 188,410 | | 220 |
| | RusHydro PJSC | 21,425,000 | | 195 |
| | Tatneft PAO Preference Shares | 37,113 | | 186 |
| | Sistema PJSFC | 519,100 | | 165 |
| | Magnitogorsk Iron & Steel Works PJSC | 320,000 | | 152 |
| | Rosneft Oil Co. PJSC | 33,650 | | 149 |
| | PhosAgro PJSC GDR | 10,445 | | 120 |
| | Federal Grid Co. Unified Energy System PJSC | 48,020,000 | | 115 |
| | PhosAgro PJSC | 3,043 | | 108 |
| | Tatneft PJSC | 13,843 | | 72 |
| * | Aeroflot PJSC | 91,779 | | 66 |
| | Unipro PJSC | 1,744,000 | | 57 |
| | Mosenergo PJSC | 1,739,000 | | 44 |
| | Severstal PAO | 2,705 | | 37 |
| | Mobile TeleSystems PJSC | 9,210 | | 36 |
| | | | | 26,747 |
| Saudi Arabia (1.8%) | | | |
| 1 | Saudi Arabian Oil Co. | 477,400 | | 4,283 |
| | Saudi Basic Industries Corp. | 168,559 | | 4,043 |
| | Al Rajhi Bank | 229,525 | | 4,028 |
| | Saudi Telecom Co. | 112,338 | | 2,984 |
| | National Commercial Bank | 252,116 | | 2,618 |
| | Samba Financial Group | 181,309 | | 1,332 |
| | Riyad Bank | 271,120 | | 1,300 |
| | Banque Saudi Fransi | 108,584 | | 858 |
| | Saudi Arabian Fertilizer Co. | 37,422 | | 752 |
| * | Alinma Bank | 181,600 | | 738 |
| | Saudi Electricity Co. | 144,785 | | 730 |
| | Yanbu National Petrochemical Co. | 43,697 | | 669 |
| | Arab National Bank | 119,520 | | 603 |
| | Jarir Marketing Co. | 11,324 | | 522 |
| | Advanced Petrochemical Co. | 18,557 | | 286 |
| | Bank Al-Jazira | 76,846 | | 266 |
| * | Sahara International Petrochemical Co. | 63,120 | | 245 |
| | Southern Province Cement Co. | 11,925 | | 214 |
| | Saudi Industrial Investment Group | 38,745 | | 209 |
| * | Dar Al Arkan Real Estate Development Co. | 91,794 | | 195 |
| | Saudi Cement Co. | 13,227 | | 191 |
| | Arabian Centres Co. Ltd. | 28,464 | | 184 |
| | National Petrochemical Co. | 21,060 | | 152 |
| | Qassim Cement Co. | 8,259 | | 151 |
| | Saudi Airlines Catering Co. | 6,838 | | 142 |
| | Yanbu Cement Co. | 14,407 | | 127 |
| * | Seera Group Holding | 28,116 | | 125 |
| | | | | 27,947 |
| Singapore (1.3%) | | | |
| | DBS Group Holdings Ltd. | 336,378 | | 5,011 |
| | Oversea-Chinese Banking Corp. Ltd. | 646,100 | | 3,985 |
| | United Overseas Bank Ltd. | 242,245 | | 3,366 |
| | Singapore Telecommunications Ltd. (Ordinary Shares) | 1,393,588 | | 2,072 |
| | Singapore Exchange Ltd. | 154,532 | | 980 |
| | CapitaLand Ltd. | 473,200 | | 890 |
| | Keppel Corp. Ltd. | 267,512 | | 860 |
| | Singapore Technologies Engineering Ltd. | 295,700 | | 756 |
| | Venture Corp. Ltd. | 48,600 | | 685 |
| | Genting Singapore Ltd. | 1,112,600 | | 525 |
| | ComfortDelGro Corp. Ltd. | 394,100 | | 390 |
| | SATS Ltd. | 108,800 | | 237 |
| | Jardine Cycle & Carriage Ltd. | 17,400 | | 226 |
| | Singapore Press Holdings Ltd. | 286,700 | | 208 |
| | Sembcorp Industries Ltd. | 177,200 | | 205 |
| | Singapore Post Ltd. | 281,700 | | 137 |
| | Hutchison Port Holdings Trust | 893,200 | | 130 |
| | Golden Agri-Resources Ltd. | 1,185,700 | | 122 |
| | Olam International Ltd. | 103,800 | | 97 |
| | StarHub Ltd. | 107,500 | | 92 |
| | Frasers Property Ltd. | 72,500 | | 58 |
| | SIA Engineering Co. Ltd. | 47,400 | | 57 |
| | Singapore Telecommunications Ltd. | 8,800 | | 13 |
| | | | | 21,102 |
| South Africa (1.0%) | | | |
| | FirstRand Ltd. | 875,307 | | 2,032 |
| | Standard Bank Group Ltd. | 242,481 | | 1,586 |
| | Impala Platinum Holdings Ltd. | 140,115 | | 1,247 |
| | MTN Group Ltd. | 338,415 | | 1,208 |
| | Sanlam Ltd. | 315,946 | | 922 |
| | Vodacom Group Ltd. | 111,775 | | 842 |
| | Anglo American Platinum Ltd. | 11,661 | | 772 |
International High Dividend Yield Index Fund
| | | | | Market |
| | | | | Value· |
| | | Shares | | ($000) |
| | MultiChoice Group | 84,708 | | 699 |
| * | Sasol Ltd. | 104,931 | | 548 |
| | Bidvest Group Ltd. | 65,921 | | 542 |
| | Old Mutual Ltd. | 867,864 | | 503 |
| | Nedbank Group Ltd. | 67,250 | | 398 |
| | SPAR Group Ltd. | 35,694 | | 378 |
| | Tiger Brands Ltd. | 29,901 | | 371 |
| | Mr Price Group Ltd. | 48,641 | | 368 |
| | Woolworths Holdings Ltd. | 164,484 | | 353 |
| | Foschini Group Ltd. | 58,672 | | 313 |
| | Exxaro Resources Ltd. | 45,993 | | 310 |
| | Kumba Iron Ore Ltd. | 9,590 | | 285 |
| | African Rainbow Minerals Ltd. | 19,430 | | 273 |
| | AVI Ltd. | 57,372 | | 260 |
| | Life Healthcare Group Holdings Ltd. | 253,127 | | 253 |
| | Rand Merchant Investment Holdings Ltd. | 138,957 | | 243 |
| | NEPI Rockcastle plc | 64,225 | | 228 |
| | Netcare Ltd. | 265,681 | | 210 |
| | Pick n Pay Stores Ltd. | 65,373 | | 206 |
| | Truworths International Ltd. | 79,746 | | 154 |
| | Momentum Metropolitan Holdings | 161,434 | | 129 |
| | Barloworld Ltd. | 35,411 | | 124 |
| | Coronation Fund Managers Ltd. | 50,185 | | 116 |
| | Santam Ltd. | 7,512 | | 113 |
| | Investec Ltd. | 47,127 | | 87 |
| | Distell Group Holdings Ltd. | 15,365 | | 77 |
| | Liberty Holdings Ltd. | 21,815 | | 72 |
| | | | | 16,222 |
| South Korea (2.0%) | | | |
| | Samsung Electronics Co. Ltd. Preference Shares | 154,423 | | 6,870 |
| | Hyundai Motor Co. | 26,959 | | 3,946 |
| | KB Financial Group Inc. | 72,457 | | 2,592 |
| | Posco | 12,801 | | 2,363 |
| | Shinhan Financial Group Co. Ltd. | 84,881 | | 2,303 |
| | KT&G Corp. | 20,494 | | 1,463 |
| | Hana Financial Group Inc. | 53,458 | | 1,444 |
| | LG Corp. | 16,507 | | 988 |
| | Samsung Fire & Marine Insurance Co. Ltd. | 6,199 | | 980 |
| | SK Telecom Co. Ltd. ADR | 41,889 | | 882 |
| | Woori Financial Group Inc. | 101,725 | | 803 |
| | Samsung Life Insurance Co. Ltd. | 11,745 | | 657 |
| | Korea Zinc Co. Ltd. | 1,795 | | 607 |
| | Mirae Asset Daewoo Co. Ltd. | 80,504 | | 600 |
| | Korea Investment Holdings Co. Ltd. | 7,090 | | 433 |
| | Hyundai Heavy Industries Holdings Co. Ltd. | 1,941 | | 369 |
| | Industrial Bank of Korea | 50,051 | | 363 |
| | Kangwon Land Inc. | 19,115 | | 357 |
| | Hyundai Motor Co. 2nd Preference Shares | 4,831 | | 342 |
| | Samsung Securities Co. Ltd. | 11,689 | | 333 |
| | DB Insurance Co. Ltd. | 8,027 | | 314 |
| | Hyundai Motor Co. Preference Shares | 4,123 | | 288 |
| | GS Holdings Corp. | 9,489 | | 277 |
| | BNK Financial Group Inc. | 54,555 | | 267 |
| | Cheil Worldwide Inc. | 13,341 | | 247 |
| | GS Engineering & Construction Corp. | 9,817 | | 233 |
| | Hyundai Marine & Fire Insurance Co. Ltd. | 11,183 | | 230 |
| | NH Investment & Securities Co. Ltd. | 24,405 | | 207 |
| | DGB Financial Group Inc. | 28,091 | | 154 |
| | Samsung Card Co. Ltd. | 5,849 | | 152 |
| | LS Corp. | 3,113 | | 143 |
| | Lotte Shopping Co. Ltd. | 1,870 | | 139 |
| | LOTTE Fine Chemical Co. Ltd. | 3,199 | | 137 |
| | Korea Gas Corp. | 5,303 | | 128 |
| | Doosan Bobcat Inc. | 4,110 | | 105 |
| | KEPCO Plant Service & Engineering Co. Ltd. | 4,297 | | 104 |
| | KCC Corp. | 759 | | 103 |
| | Ssangyong Cement Industrial Co. Ltd. | 19,061 | | 93 |
| | Posco International Corp. | 7,507 | | 89 |
| | LG Electronics Inc. Preference Shares | 3,020 | | 86 |
| | Hanwha Life Insurance Co. Ltd. | 45,162 | | 62 |
| | Hanwha Corp. Preference Shares | 3,489 | | 40 |
| | Mirae Asset Daewoo Co. Ltd. Preference Shares | 9,728 | | 39 |
| | Samsung Fire & Marine Insurance Co. Ltd. Preference Shares | 243 | | 31 |
| | | | | 32,363 |
| Spain (2.3%) | | | |
| | Iberdrola SA | 1,114,574 | | 13,161 |
| * | Banco Santander SA (XMAD) | 3,007,146 | | 6,022 |
| | Banco Bilbao Vizcaya Argentaria SA | 1,255,131 | | 3,621 |
International High Dividend Yield Index Fund
| | | | | Market |
| | | | | Value· |
| | | Shares | | ($000) |
| | Telefonica SA | 884,205 | | 2,876 |
| | Repsol SA | 267,223 | | 1,678 |
| | Endesa SA | 59,129 | | 1,586 |
| | Red Electrica Corp. SA | 80,799 | | 1,423 |
| | CaixaBank SA | 676,184 | | 1,234 |
| | Naturgy Energy Group SA | 56,679 | | 1,053 |
| | ACS Actividades de Construccion y Servicios SA | 43,960 | | 1,045 |
| | Enagas SA | 46,928 | | 1,013 |
| | Bankinter SA | 130,190 | | 489 |
| | Acciona SA | 3,807 | | 385 |
| | Bankia SA | 221,359 | | 272 |
| | Mapfre SA | 179,741 | | 271 |
| | Zardoya Otis SA | 33,009 | | 202 |
| * | Banco Santander SA (XMEX) | 77,341 | | 150 |
| | | | | 36,481 |
| Sweden (1.7%) | | | |
| * | Volvo AB Class B | 281,259 | | 5,467 |
| | Investor AB Class B | 85,124 | | 5,102 |
| * | Swedbank AB Class A | 188,032 | | 2,944 |
| | Hennes & Mauritz AB Class B | 164,742 | | 2,679 |
| * | Skandinaviska Enskilda Banken AB Class A | 270,292 | | 2,319 |
| ^ | Telia Co. AB | 483,888 | | 1,851 |
| | SKF AB | 72,366 | | 1,481 |
| | Boliden AB | 51,586 | | 1,407 |
| ^ | Skanska AB Class B | 67,453 | | 1,265 |
| | Tele2 AB | 100,041 | | 1,181 |
| | Castellum AB | 50,783 | | 1,057 |
| | Lundin Energy AB | 35,924 | | 687 |
| * | Skandinaviska Enskilda Banken AB Class C | 2,473 | | 23 |
| | | | | 27,463 |
| Switzerland (5.2%) | | | |
| | Novartis AG | 403,454 | | 31,438 |
| | Zurich Insurance Group AG | 27,962 | | 9,287 |
| | ABB Ltd. | 335,377 | | 8,138 |
| | UBS Group AG | 629,648 | | 7,330 |
| | LafargeHolcim Ltd. | 96,357 | | 4,136 |
| | Swiss Re AG | 52,724 | | 3,784 |
| | SGS SA | 1,115 | | 2,785 |
| | Swisscom AG | 4,777 | | 2,430 |
| | Swiss Life Holding AG | 5,944 | | 2,000 |
| | Julius Baer Group Ltd. | 40,875 | | 1,819 |
| | Roche Holding AG (Bearer) | 4,982 | | 1,605 |
| | Adecco Group AG | 29,171 | | 1,430 |
| | Swiss Prime Site AG | 14,134 | | 1,189 |
| | Baloise Holding AG | 8,510 | | 1,164 |
| | PSP Swiss Property AG | 8,034 | | 972 |
| | Clariant AG | 37,860 | | 650 |
| | Helvetia Holding AG | 6,572 | | 515 |
| | Banque Cantonale Vaudoise | 5,196 | | 503 |
| | DKSH Holding AG | 6,497 | | 418 |
| | Sulzer AG | 3,306 | | 242 |
| | OC Oerlikon Corp. AG | 33,215 | | 231 |
| | | | | 82,066 |
| Taiwan (8.1%) | | | |
| | Taiwan Semiconductor Manufacturing Co. Ltd. | 4,507,953 | | 68,204 |
| | Hon Hai Precision Industry Co. Ltd. | 2,247,000 | | 6,094 |
| | Delta Electronics Inc. | 408,802 | | 2,720 |
| | Formosa Plastics Corp. | 915,879 | | 2,535 |
| | Nan Ya Plastics Corp. | 1,048,000 | | 2,153 |
| | CTBC Financial Holding Co. Ltd. | 3,392,120 | | 2,142 |
| | Cathay Financial Holding Co. Ltd. | 1,551,388 | | 2,085 |
| | Mega Financial Holding Co. Ltd. | 2,029,000 | | 1,955 |
| | Fubon Financial Holding Co. Ltd. | 1,365,000 | | 1,944 |
| | Uni-President Enterprises Corp. | 890,000 | | 1,908 |
| | United Microelectronics Corp. ADR | 337,407 | | 1,788 |
| | Chunghwa Telecom Co. Ltd. ADR | 45,810 | | 1,731 |
| | Formosa Chemicals & Fibre Corp. | 639,000 | | 1,539 |
| | Yuanta Financial Holding Co. Ltd. | 2,157,360 | | 1,341 |
| | Taiwan Cement Corp. | 943,365 | | 1,339 |
| | First Financial Holding Co. Ltd. | 1,902,973 | | 1,335 |
| | Quanta Computer Inc. | 492,000 | | 1,241 |
| | Chailease Holding Co. Ltd. | 235,494 | | 1,144 |
| | Asustek Computer Inc. | 132,268 | | 1,124 |
| | Hua Nan Financial Holdings Co. Ltd. | 1,813,468 | | 1,091 |
| | Realtek Semiconductor Corp. | 87,000 | | 1,084 |
| | Taiwan Mobile Co. Ltd. | 308,000 | | 1,052 |
| | Yageo Corp. | 83,000 | | 1,034 |
| | Novatek Microelectronics Corp. | 106,000 | | 991 |
| | Chunghwa Telecom Co. Ltd. | 234,000 | | 878 |
| | Catcher Technology Co. Ltd. | 136,672 | | 864 |
| | Taishin Financial Holding Co. Ltd. | 1,927,982 | | 850 |
International High Dividend Yield Index Fund
| | | | | Market |
| | | | | Value· |
| | | Shares | | ($000) |
| | Pegatron Corp. | 372,000 | | 802 |
| | Shanghai Commercial & Savings Bank Ltd. | 613,000 | | 795 |
| | ASE Technology Holding Co. Ltd. | 327,171 | | 734 |
| | SinoPac Financial Holdings Co. Ltd. | 1,959,641 | | 734 |
| | Accton Technology Corp. | 99,000 | | 719 |
| | ASE Technology Holding Co. Ltd. ADR | 156,643 | | 716 |
| | Formosa Petrochemical Corp. | 253,000 | | 696 |
| | Far Eastern New Century Corp. | 736,000 | | 664 |
| | Lite-On Technology Corp. | 399,194 | | 650 |
| | Asia Cement Corp. | 434,000 | | 625 |
| | Far EasTone Telecommunications Co. Ltd. | 297,000 | | 623 |
| | Globalwafers Co. Ltd. | 39,000 | | 568 |
| | Vanguard International Semiconductor Corp. | 167,000 | | 546 |
| | Wistron Corp. | 518,656 | | 519 |
| | Walsin Technology Corp. | 88,000 | | 504 |
| | Compal Electronics Inc. | 760,000 | | 495 |
| | Feng TAY Enterprise Co. Ltd. | 81,280 | | 493 |
| | Eclat Textile Co. Ltd. | 36,200 | | 482 |
| | Acer Inc. | 541,000 | | 452 |
| | Zhen Ding Technology Holding Ltd. | 106,000 | | 449 |
| | Inventec Corp. | 564,994 | | 447 |
| | Pou Chen Corp. | 495,000 | | 437 |
| | Cheng Shin Rubber Industry Co. Ltd. | 342,994 | | 433 |
| | United Microelectronics Corp. | 365,000 | | 392 |
| | Synnex Technology International Corp. | 260,000 | | 386 |
| | Wiwynn Corp. | 15,000 | | 382 |
| | Foxconn Technology Co. Ltd. | 216,190 | | 379 |
| | Teco Electric and Machinery Co. Ltd. | 347,000 | | 363 |
| | Chicony Electronics Co. Ltd. | 111,370 | | 336 |
| | Nanya Technology Corp. | 151,000 | | 306 |
| | Taiwan Fertilizer Co. Ltd. | 141,000 | | 253 |
| | Formosa Taffeta Co. Ltd. | 176,000 | | 193 |
| | Eva Airways Corp. | 457,000 | | 173 |
| | Taiwan Secom Co. Ltd. | 53,000 | | 163 |
| | Transcend Information Inc. | 52,000 | | 116 |
| | Taiwan Semiconductor Manufacturing Co. Ltd. ADR | 534 | | 45 |
| | | | | 129,236 |
| Thailand (0.8%) | | | |
| | PTT PCL (Foreign) | 2,542,900 | | 2,527 |
| | Advanced Info Service PCL (Foreign) | 203,804 | | 1,127 |
| | Siam Commercial Bank PCL (Foreign) | 434,700 | | 905 |
| | Siam Cement PCL NVDR | 79,400 | | 860 |
| | Siam Cement PCL (Foreign) | 77,750 | | 843 |
| | PTT Exploration & Production PCL (Foreign) | 271,230 | | 685 |
| | Intouch Holdings PCL (Foreign) | 336,106 | | 577 |
| | PTT Global Chemical PCL | 408,599 | | 524 |
| | Kasikornbank PCL (Foreign) | 203,500 | | 497 |
| | Delta Electronics Thailand PCL | 80,100 | | 460 |
| | Digital Telecommunications Infrastructure Fund | 1,107,997 | | 451 |
| | Krung Thai Bank PCL (Foreign) | 1,432,100 | | 397 |
| | Bangkok Bank PCL (Foreign) | 105,400 | | 326 |
| | Kasikornbank PCL | 126,300 | | 308 |
| | Thai Union Frozen Products PCL (Foreign) | 613,100 | | 299 |
| | TMB Bank PCL | 8,808,600 | | 229 |
| | Land & Houses PCL (Foreign) | 1,066,500 | | 219 |
| | Ratchaburi Electricity Generating Holding PCL (Foreign) | 137,000 | | 204 |
| | Thai Oil PCL (Foreign) | 181,500 | | 199 |
| | Banpu PCL | 921,100 | | 194 |
| | IRPC PCL (Foreign) | 1,931,900 | | 125 |
| | Intouch Holdings PCL NVDR | 65,000 | | 111 |
| | Land & Houses PCL | 345,100 | | 71 |
| | Siam Commercial Bank PCL | 30,700 | | 64 |
| | Siam City Cement PCL (Foreign) | 16,332 | | 62 |
| | Bangkok Life Assurance PCL | 98,900 | | 57 |
| * | SCG Packaging PCL | 11,191 | | 13 |
| | | | | 12,334 |
International High Dividend Yield Index Fund
| | | | | Market |
| | | | | Value· |
| | | Shares | | ($000) |
| Turkey (0.1%) | | | |
| * | Turkcell Iletisim Hizmetleri AS | 203,724 | | 353 |
| | Eregli Demir ve Celik Fabrikalari TAS | 262,970 | | 301 |
| * | Akbank TAS | 480,105 | | 272 |
| * | Tupras Turkiye Petrol Rafinerileri AS | 24,830 | | 222 |
| | Turkiye Sise ve Cam Fabrikalari AS | 272,151 | | 199 |
| | Ford Otomotiv Sanayi AS | 11,710 | | 151 |
| | Haci Omer Sabanci Holding AS (Bearer) | 149,449 | | 147 |
| | Enka Insaat ve Sanayi AS | 137,729 | | 119 |
| * | Petkim Petrokimya Holding AS | 192,894 | | 94 |
| | Anadolu Efes Biracilik Ve Malt Sanayii AS | 33,333 | | 77 |
| | Tofas Turk Otomobil Fabrikasi AS | 22,707 | | 73 |
| | Coca-Cola Icecek AS | 12,545 | | 67 |
| | TAV Havalimanlari Holding AS | 34,939 | | 58 |
| | Tekfen Holding AS | 36,475 | | 57 |
| | Iskenderun Demir ve Celik AS | 20,117 | | 18 |
| | | | | 2,208 |
| United Arab Emirates (0.4%) | | | |
| | First Abu Dhabi Bank PJSC | 804,548 | | 2,479 |
| | Emirates Telecommunications Group Co. PJSC | 322,571 | | 1,478 |
| § | Abu Dhabi Commercial Bank PJSC | 484,910 | | 772 |
| | Aldar Properties PJSC | 712,878 | | 527 |
| | Dubai Islamic Bank PJSC | 329,778 | | 373 |
| | Abu Dhabi Islamic Bank PJSC | 268,424 | | 316 |
| | Air Arabia PJSC | 448,581 | | 133 |
| | Dubai Investments PJSC | 388,932 | | 119 |
| | Dana Gas PJSC | 637,959 | | 117 |
| * | DAMAC Properties Dubai Co. PJSC | 265,462 | | 78 |
| | | | | 6,392 |
| United Kingdom (9.4%) | | | |
| | GlaxoSmithKline plc | 925,910 | | 15,461 |
| | British American Tobacco plc | 424,589 | | 13,458 |
| | Unilever plc | 204,692 | | 11,665 |
| | Rio Tinto plc | 203,771 | | 11,526 |
| | Royal Dutch Shell plc Class A | 772,816 | | 9,722 |
| | BP plc | 3,724,155 | | 9,499 |
| | Royal Dutch Shell plc Class B | 693,846 | | 8,367 |
| | National Grid plc | 658,767 | | 7,836 |
| | BHP Group plc | 390,339 | | 7,562 |
| | Vodafone Group plc | 5,029,675 | | 6,709 |
| | Anglo American plc | 230,927 | | 5,418 |
| | Tesco plc | 1,810,529 | | 4,819 |
| | SSE plc | 194,422 | | 3,188 |
| | BAE Systems plc | 603,460 | | 3,102 |
| | Imperial Brands plc | 176,771 | | 2,798 |
| | Legal & General Group plc | 1,107,742 | | 2,656 |
| | 3i Group plc | 179,656 | | 2,244 |
| | BT Group plc | 1,634,715 | | 2,147 |
| * | Kingfisher plc | 397,687 | | 1,479 |
| | United Utilities Group plc | 127,408 | | 1,424 |
| | Severn Trent plc | 44,411 | | 1,398 |
| | Admiral Group plc | 38,786 | | 1,382 |
| | Polymetal International plc | 63,874 | | 1,358 |
| | Standard Life Aberdeen plc | 416,284 | | 1,213 |
| | St. James’s Place plc | 100,414 | | 1,170 |
| | Berkeley Group Holdings plc | 21,945 | | 1,154 |
| | Pennon Group plc | 80,038 | | 1,030 |
| | Johnson Matthey plc | 35,779 | | 996 |
| | Pearson plc | 139,870 | | 924 |
| | M&G plc | 484,454 | | 922 |
| | Wm Morrison Supermarkets plc | 418,805 | | 884 |
| | Phoenix Group Holdings plc | 102,582 | | 881 |
| | J Sainsbury plc | 309,450 | | 808 |
| | Intermediate Capital Group plc | 53,111 | | 807 |
| | Schroders plc | 20,981 | | 711 |
| | Bellway plc | 23,383 | | 707 |
| | Tate & Lyle plc | 86,663 | | 668 |
| 1 | Quilter plc | 334,142 | | 530 |
| | Evraz plc | 110,441 | | 514 |
| | Ashmore Group plc | 84,109 | | 389 |
| * | TUI AG | 82,076 | | 322 |
| | British American Tobacco plc ADR | 4,220 | | 135 |
| | Carnival plc | 338 | | 4 |
| | | | | 149,987 |
Total Common Stocks
(Cost $1,817,533) | | | 1,581,238 |
International High Dividend Yield Index Fund
| | | | Market |
| | | | Value· |
| | Shares | | ($000) |
| Temporary Cash Investment | (1.9%) | | |
| Money Market Fund (1.9%) | | | |
| 2,3 | Vanguard Market Liquidity Fund, 0.112%
(Cost $29,746) | 297,475 | | 29,747 |
Total Investments (101.2%)
(Cost $1,847,279) | | | 1,610,985 |
| Other Assets and Liabilities—Net (-1.2%) | | | (19,089) |
| Net Assets (100%) | | | 1,591,896 |
Cost is in $000.
| · | See Note A in Notes to Financial Statements. |
| * | Non-income-producing security. |
| ^ | Includes partial security positions on loan to broker-dealers. The total value of securities on loan is $26,160,000. |
| § | Security value determined using significant unobservable inputs. |
| 1 | Security exempt from registration under Rule 144A of the Securities Act of 1933. Such securities may be sold in transactions exempt from registration, normally to qualified institutional buyers. At October 31, 2020, the aggregate value of these securities was $17,753,000, representing 1.1% of net assets. |
| 2 | Affiliated money market fund available only to Vanguard funds and certain trusts and accounts managed by Vanguard. Rate shown is the 7-day yield. |
| 3 | Collateral of $28,456,000 was received for securities on loan. |
| | ADR—American Depositary Receipt. |
| | GDR—Global Depositary Receipt. |
| | NVDR—Non-Voting Depository Receipt. |
International High Dividend Yield Index Fund
| Derivative Financial Instruments Outstanding as of Period End | | |
| | | | | |
| Futures Contracts | | | | |
| | | | | ($000) |
| | | | | Value and |
| | | Number of | | Unrealized |
| | | Long (Short) | Notional | Appreciation |
| | Expiration | Contracts | Amount | (Depreciation) |
| Long Futures Contracts | | | | |
| MSCI EAFE Index | December 2020 | 67 | 5,976 | (376) |
| MSCI Emerging Market Index | December 2020 | 53 | 2,920 | (3) |
| E-mini S&P 500 Index | December 2020 | 6 | 979 | (31) |
| | | | | (410) |
| Forward Currency Contracts | | | | | | | |
| | Contract | | | | | Unrealized | Unrealized |
| | Settlement | | Contract Amount (000) | Appreciation | (Depreciation) |
| Counterparty | Date | | Receive | | Deliver | ($000) | ($000) |
| Standard Chartered Bank | 1/14/21 | USD | 2,713 | JPY | 286,289 | — | (24) |
| Standard Chartered Bank | 1/14/21 | USD | 1,768 | CHF | 1,634 | — | (18) |
| Bank of America, N.A. | 1/14/21 | USD | 1,202 | GBP | 936 | — | (11) |
| Standard Chartered Bank | 1/14/21 | USD | 921 | EUR | 785 | 5 | — |
| Royal Bank of Canada | 1/14/21 | USD | 312 | JPY | 32,835 | — | (2) |
| Bank of America, N.A. | 1/14/21 | USD | 270 | HKD | 2,094 | — | — |
| | | | | | | 5 | (55) |
CHF—Swiss franc.
EUR—euro.
GBP—British pound.
HKD—Hong Kong dollar.
JPY—Japanese yen.
USD—U.S. dollar.
See accompanying Notes, which are an integral part of the Financial Statements.
International High Dividend Yield Index Fund
Statement of Assets and Liabilities
As of October 31, 2020
| ($000s, except shares and per-share amounts) | Amount |
| Assets | |
| Investments in Securities, at Value | |
| Unaffiliated Issuers (Cost $1,817,533) | 1,581,238 |
| Affiliated Issuers (Cost $29,746) | 29,747 |
| Total Investments in Securities | 1,610,985 |
| Investment in Vanguard | 68 |
| Cash | 593 |
| Cash Collateral Pledged—Futures Contracts | 856 |
| Cash Collateral Received for ETF Capital Activity | 5,441 |
| Foreign Currency, at Value (Cost $2,639) | 2,677 |
| Receivables for Accrued Income | 7,141 |
| Receivables for Capital Shares Issued | 97 |
| Unrealized Appreciation—Forward Currency Contracts | 5 |
| Total Assets | 1,627,863 |
| Liabilities | |
| Payables for Investment Securities Purchased | 1,682 |
| Collateral for Securities on Loan | 28,456 |
| Collateral for ETF Capital Activity | 5,441 |
| Payables for Capital Shares Redeemed | 32 |
| Payables to Vanguard | 219 |
| Variation Margin Payable—Futures Contracts | 82 |
| Unrealized Depreciation—Forward Currency Contracts | 55 |
| Total Liabilities | 35,967 |
| Net Assets | 1,591,896 |
| | |
| | |
| At October 31, 2020, net assets consisted of: | |
| | |
| Paid-in Capital | 1,937,287 |
| Total Distributable Earnings (Loss) | (345,391) |
| Net Assets | 1,591,896 |
| | |
| ETF Shares—Net Assets | |
| Applicable to 26,247,396 outstanding $.001 par value shares of beneficial interest (unlimited authorization) | 1,324,705 |
| Net Asset Value Per Share—ETF Shares | $50.47 |
International High Dividend Yield Index Fund
| Statement of Assets and Liabilities (continued) | |
| | |
| ($000s, except shares and per-share amounts) | Amount |
| Admiral Shares—Net Assets | |
| Applicable to 10,926,935 outstanding $.001 par value shares of beneficial interest (unlimited authorization) | 267,191 |
| Net Asset Value Per Share—Admiral Shares | $24.45 |
See accompanying Notes, which are an integral part of the Financial Statements.
International High Dividend Yield Index Fund
Statement of Operations
| | Year Ended |
| | October 31, 2020 |
| | ($000) |
| Investment Income | |
| Income | |
| Dividends1 | 63,383 |
| Interest2 | 48 |
| Securities Lending—Net | 325 |
| Total Income | 63,756 |
| Expenses | |
| The Vanguard Group—Note B | |
| Investment Advisory Services | 233 |
| Management and Administrative—ETF Shares | 2,806 |
| Management and Administrative—Admiral Shares | 540 |
| Marketing and Distribution—ETF Shares | 74 |
| Marketing and Distribution—Admiral Shares | 15 |
| Custodian Fees | 504 |
| Auditing Fees | 45 |
| Shareholders’ Reports—ETF Shares | 83 |
| Shareholders’ Reports—Admiral Shares | 5 |
| Trustees’ Fees and Expenses | 1 |
| Total Expenses | 4,306 |
| Expenses Paid Indirectly | (115) |
| Net Expenses | 4,191 |
| Net Investment Income | 59,565 |
| Realized Net Gain (Loss) | |
| Investment Securities Sold2,3 | (111,863) |
| Futures Contracts | 1,814 |
| Forward Currency Contracts | (71) |
| Foreign Currencies | 111 |
| Realized Net Gain (Loss) | (110,009) |
| Change in Unrealized Appreciation (Depreciation) | |
| Investment Securities2 | (209,790) |
| Futures Contracts | (519) |
| Forward Currency Contracts | (60) |
| Foreign Currencies | 151 |
| Change in Unrealized Appreciation (Depreciation) | (210,218) |
| Net Increase (Decrease) in Net Assets Resulting from Operations | (260,662) |
| 1 | Dividends are net of foreign withholding taxes of $6,129,000. |
| 2 | Interest income, realized net gain (loss), and change in unrealized appreciation (depreciation) from an affiliated company of the fund were $43,000, $25,000, and $1,000, respectively. Purchases and sales are for temporary cash investment purposes. |
| 3 | Includes $4,817,000 of net gain (loss) resulting from in-kind redemptions. |
See accompanying Notes, which are an integral part of the Financial Statements.
International High Dividend Yield Index Fund
Statement of Changes in Net Assets
| | Year Ended October 31, |
| | 2020 | 2019 |
| | ($000) | ($000) |
| Increase (Decrease) in Net Assets | | |
| Operations | | |
| Net Investment Income | 59,565 | 57,030 |
| Realized Net Gain (Loss) | (110,009) | 1,260 |
| Change in Unrealized Appreciation (Depreciation) | (210,218) | 49,570 |
| Net Increase (Decrease) in Net Assets Resulting from Operations | (260,662) | 107,860 |
| Distributions1 | | |
| Investor Shares | — | (149) |
| ETF Shares | (46,653) | (46,829) |
| Admiral Shares | (9,161) | (8,233) |
| Total Distributions | (55,814) | (55,211) |
| Capital Share Transactions | | |
| Investor Shares | — | (8,751) |
| ETF Shares | 328,155 | 329,989 |
| Admiral Shares | 117,287 | 10,466 |
| Net Increase (Decrease) from Capital Share Transactions | 445,442 | 331,704 |
| Total Increase (Decrease) | 128,966 | 384,353 |
| Net Assets | | |
| Beginning of Period | 1,462,930 | 1,078,577 |
| End of Period | 1,591,896 | 1,462,930 |
1 Certain prior-period numbers have been reclassified to conform with the current-period presentation
See accompanying Notes, which are an integral part of the Financial Statements.
International High Dividend Yield Index Fund
Financial Highlights
ETF Shares
| | | | | | Feb. 25, |
| | | | | | 20161 to |
| For a Share Outstanding | | Year Ended October 31, | Oct. 31, |
| Throughout Each Period | 2020 | 2019 | 2018 | 2017 | 2016 |
| Net Asset Value, Beginning of Period | $61.27 | $58.85 | $65.69 | $55.61 | $50.00 |
| Investment Operations | | | | | |
| Net Investment Income2 | 2.076 | 2.746 | 2.639 | 2.329 | 1.323 |
| Net Realized and Unrealized Gain (Loss) on Investments3 | (10.944) | 2.302 | (7.097) | 9.763 | 5.305 |
| Total from Investment Operations | (8.868) | 5.048 | (4.458) | 12.092 | 6.628 |
| Distributions | | | | | |
| Dividends from Net Investment Income | (1.932) | (2.628) | (2.382) | (2.012) | (1.018) |
| Distributions from Realized Capital Gains | — | — | — | — | — |
| Total Distributions | (1.932) | (2.628) | (2.382) | (2.012) | (1.018) |
| Net Asset Value, End of Period | $50.47 | $61.27 | $58.85 | $65.69 | $55.61 |
| | | | | | |
| Total Return | -14.55% | 8.87% | -7.03% | 22.03% | 13.37% |
| | | | | | |
| Ratios/Supplemental Data | | | | | |
| Net Assets, End of Period (Millions) | $1,325 | $1,264 | $889 | $598 | $117 |
| Ratio of Total Expenses to Average Net Assets | 0.28%4 | 0.27% | 0.32% | 0.32% | 0.32%5,6 |
| Ratio of Net Investment Income to Average Net Assets | 3.81% | 4.59% | 4.06% | 3.73% | 3.65%5 |
| Portfolio Turnover Rate7 | 20% | 15% | 10% | 8% | 6% |
| 2 | Calculated based on average shares outstanding. |
| 3 | Includes increases from purchase and redemption fees of of $.03 for 2020, $.01 for 2019, $.02 for 2018, and $.04 for 2017. |
| 4 | The ratio of expenses to average net assets for the period net of reduction from custody fee offset arrangements was 0.27%. |
| 6 | The ratio of total expenses to average net assets before an expense reimbursement of 0.31% was 0.63%. The expense reimbursement was due to higher-than-anticipated custody costs associated with a higher volume of securities transactions, which included transactions from a rebalance of the benchmark index shortly after the fund’s inception. The fund is not obligated to repay this amount to Vanguard. |
| 7 | Excludes the value of portfolio securities received or delivered as a result of in-kind purchases or redemptions of the fund’s capital shares, including ETF Creation Units. |
See accompanying Notes, which are an integral part of the Financial Statements.
International High Dividend Yield Index Fund
Financial Highlights
Admiral Shares
| | | | | | March 2, |
| | | | | | 20161 to |
| For a Share Outstanding | | Year Ended October 31, | Oct. 31, |
| Throughout Each Period | 2020 | 2019 | 2018 | 2017 | 2016 |
| Net Asset Value, Beginning of Period | $29.69 | $28.52 | $31.83 | $26.92 | $25.00 |
| Investment Operations | | | | | |
| Net Investment Income2 | 1.034 | 1.322 | 1.264 | 1.114 | .597 |
| Net Realized and Unrealized Gain (Loss) on Investments3 | (5.336) | 1.120 | (3.423) | 4.743 | 1.817 |
| Total from Investment Operations | (4.302) | 2.442 | (2.159) | 5.857 | 2.414 |
| Distributions | | | | | |
| Dividends from Net Investment Income | (.938) | (1.272) | (1.151) | (.947) | (.494) |
| Distributions from Realized Capital Gains | — | — | — | — | — |
| Total Distributions | (.938) | (1.272) | (1.151) | (.947) | (.494) |
| Net Asset Value, End of Period | $24.45 | $29.69 | $28.52 | $31.83 | $26.92 |
| | | | | | |
| Total Return4 | -14.59%5 | 8.83%5 | -7.00%5 | 22.04%5 | 9.73% |
| | | | | | |
| Ratios/Supplemental Data | | | | | |
| Net Assets, End of Period (Millions) | $267 | $199 | $181 | $168 | $84 |
| Ratio of Total Expenses to Average Net Assets | 0.28%6 | 0.27% | 0.32% | 0.32% | 0.32%7,8 |
| Ratio of Net Investment Income to Average Net Assets | 3.99% | 4.57% | 4.06% | 3.73% | 3.65% |
| Portfolio Turnover Rate9 | 20% | 15% | 10% | 8% | 6% |
| 2 | Calculated based on average shares outstanding. |
| 3 | Includes increases from purchase and redemption fees of $.01 for 2020, $.01 for 2019, $.01 for 2018, and $.02 for 2017. |
| 4 | Total returns do not include account service fees that may have applied in the periods shown. Fund prospectuses provide information about any applicable account service fees. |
| 5 | Total returns do not include transaction fees that may have applied in the periods shown. Fund prospectuses provide information about any applicable transaction fees. |
| 6 | The ratio of expenses to average net assets for the period net of reduction from custody fee offset arrangements was 0.27%. |
| 8 | The ratio of total expenses to average net assets before an expense reimbursement of 0.31% was 0.63%. The expense reimbursement was due to higher-than-anticipated custody costs associated with a higher volume of securities transactions, which included transactions from a rebalance of the benchmark index shortly after the fund’s inception. The fund is not obligated to repay this amount to Vanguard. |
| 9 | Excludes the value of portfolio securities received or delivered as a result of in-kind purchases or redemptions of the fund’s capital shares, including ETF Creation Units. |
See accompanying Notes, which are an integral part of the Financial Statements.
International High Dividend Yield Index Fund
Notes to Financial Statements
Vanguard International High Dividend Yield Index Fund is registered under the Investment Company Act of 1940 as an open-end investment company, or mutual fund. The fund offers two classes of shares: ETF Shares and Admiral Shares. Each of the share classes has different eligibility and minimum purchase requirements, and is designed for different types of investors. ETF Shares are listed for trading on Nasdaq; they can be purchased and sold through a broker.
The fund invests in securities of foreign issuers, which may subject it to investment risks not normally associated with investing in U.S. corporations. Market disruptions associated with the COVID-19 pandemic have had a global impact, and uncertainty exists as to the long-term implications. Such disruptions can adversely affect assets of the fund and thus fund performance.
A. The following significant accounting policies conform to generally accepted accounting principles for U.S. investment companies. The fund consistently follows such policies in preparing its financial statements.
1. Security Valuation: Securities are valued as of the close of trading on the New York Stock Exchange (generally 4 p.m., Eastern time) on the valuation date. Equity securities are valued at the latest quoted sales prices or official closing prices taken from the primary market in which each security trades; such securities not traded on the valuation date are valued at the mean of the latest quoted bid and asked prices. Securities for which market quotations are not readily available, or whose values have been affected by events occurring before the fund’s pricing time but after the close of the securities’ primary markets, are valued at their fair values calculated according to procedures adopted by the board of trustees. These procedures include obtaining quotations from an independent pricing service, monitoring news to identify significant market- or security-specific events, and evaluating changes in the values of foreign market proxies (for example, ADRs, futures contracts, or exchange-traded funds), between the time the foreign markets close and the fund’s pricing time. When fair-value pricing is employed, the prices of securities used by a fund to calculate its net asset value may differ from quoted or published prices for the same securities. Investments in Vanguard Market Liquidity Fund are valued at that fund’s net asset value. Temporary cash investments are valued using the latest bid prices or using valuations based on a matrix system (which considers such factors as security prices, yields, maturities, and ratings), both as furnished by independent pricing services.
2. Foreign Currency: Securities and other assets and liabilities denominated in foreign currencies are translated into U.S. dollars using exchange rates obtained from an independent third party as of the fund’s pricing time on the valuation date. Realized gains (losses) and unrealized appreciation (depreciation) on investment securities include the effects of changes in exchange rates since the securities were purchased, combined with the effects of changes in security prices. Fluctuations in the value of other assets and liabilities resulting from changes in exchange rates are recorded as unrealized foreign currency gains (losses) until the assets or liabilities are settled in cash, at which time they are recorded as realized foreign currency gains (losses).
3. Futures Contracts: The fund uses index futures contracts to a limited extent, with the objectives of maintaining full exposure to the stock market, maintaining liquidity, and minimizing transaction costs. The fund may purchase futures contracts to immediately invest incoming cash in the market, or sell futures in response to cash outflows, thereby simulating a fully invested position in the underlying index while maintaining a cash balance for liquidity. The primary risks associated with the use of futures contracts are imperfect correlation between changes in market values of stocks
International High Dividend Yield Index Fund
held by the fund and the prices of futures contracts, and the possibility of an illiquid market. Counterparty risk involving futures is mitigated because a regulated clearinghouse is the counterparty instead of the clearing broker. To further mitigate counterparty risk, the fund trades futures contracts on an exchange, monitors the financial strength of its clearing brokers and clearinghouse, and has entered into clearing agreements with its clearing brokers. The clearing-house imposes initial margin requirements to secure the fund’s performance and requires daily settlement of variation margin representing changes in the market value of each contract. Any securities pledged as initial margin for open contracts are noted in the Schedule of Investments.
Futures contracts are valued at their quoted daily settlement prices. The notional amounts of the contracts are not recorded in the Statement of Assets and Liabilities. Fluctuations in the value of the contracts are recorded in the Statement of Assets and Liabilities as an asset (liability) and in the Statement of Operations as unrealized appreciation (depreciation) until the contracts are closed, when they are recorded as realized gains (losses) on futures contracts.
During the year ended October 31, 2020, the fund’s average investments in long and short futures contracts represented less than 1% and 0% of net assets, respectively, based on the average of the notional amounts at each quarter-end during the period.
4. Forward Currency Contracts: The fund enters into forward currency contracts to provide the appropriate currency exposure related to any open futures contracts. The fund’s risks in using these contracts include movement in the values of the foreign currencies relative to the U.S. dollar and the ability of the counterparties to fulfill their obligations under the contracts. The fund mitigates its counterparty risk by entering into forward currency contracts only with a diverse group of prequalified counterparties, monitoring their financial strength, entering into master netting arrangements with its counterparties, and requiring its counterparties to transfer collateral as security for their performance. In the absence of a default, the collateral pledged or received by the fund cannot be repledged, resold, or rehypothecated. The master netting arrangements provide that, in the event of a counterparty’s default (including bankruptcy), the fund may terminate the forward currency contracts, determine the net amount owed by either party in accordance with its master netting arrangements, and sell or retain any collateral held up to the net amount owed to the fund under the master netting arrangements. The forward currency contracts contain provisions whereby a counterparty may terminate open contracts if the fund’s net assets decline below a certain level, triggering a payment by the fund if the fund is in a net liability position at the time of the termination. The payment amount would be reduced by any collateral the fund has pledged. Any securities pledged as collateral for open contracts are noted in the Schedule of Investments. The value of collateral received or pledged is compared daily to the value of the forward currency contracts exposure with each counterparty, and any difference, if in excess of a specified minimum transfer amount, is adjusted and settled within two business days.
Forward currency contracts are valued at their quoted daily prices obtained from an independent third party, adjusted for currency risk based on the expiration date of each contract. The notional amounts of the contracts are not recorded in the Statement of Assets and Liabilities. Fluctuations in the value of the contracts are recorded in the Statement of Assets and Liabilities as an asset (liability) and in the Statement of Operations as unrealized appreciation (depreciation) until the contracts are closed, when they are recorded as realized gains (losses) on forward currency contracts.
International High Dividend Yield Index Fund
During the year ended October 31, 2020, the fund’s average investment in forward currency contracts represented less than 1% of net assets, based on the average of notional amounts at each quarter-end during the period.
5. Federal Income Taxes: The fund intends to continue to qualify as a regulated investment company and distribute all of its taxable income. The fund’s tax returns are open to examination by the relevant tax authorities until expiration of the applicable statute of limitations, which is generally three years after the filing of the tax return. Management has analyzed the fund’s tax positions taken for all open federal and state income tax years, and has concluded that no provision for income tax is required in the fund’s financial statements.
6. Distributions: Distributions to shareholders are recorded on the ex-dividend date. Distributions are determined on a tax basis at the fiscal year-end and may differ from net investment income and realized capital gains for financial reporting purposes.
7. Securities Lending: To earn additional income, the fund lends its securities to qualified institutional borrowers. Security loans are subject to termination by the fund at any time, and are required to be secured at all times by collateral in an amount at least equal to the market value of securities loaned. Daily market fluctuations could cause the value of loaned securities to be more or less than the value of the collateral received. When this occurs, the collateral is adjusted and settled before the opening of the market on the next business day. The fund further mitigates its counterparty risk by entering into securities lending transactions only with a diverse group of prequalified counterparties, monitoring their financial strength, and entering into master securities lending agreements with its counterparties. The master securities lending agreements provide that, in the event of a counterparty’s default (including bankruptcy), the fund may terminate any loans with that borrower, determine the net amount owed, and sell or retain the collateral up to the net amount owed to the fund; however, such actions may be subject to legal proceedings. While collateral mitigates counterparty risk, in the event of a default, the fund may experience delays and costs in recovering the securities loaned. The fund invests cash collateral received in Vanguard Market Liquidity Fund, and records a liability in the Statement of Assets and Liabilities for the return of the collateral, during the period the securities are on loan. Collateral investments in Vanguard Market Liquidity Fund are subject to market appreciation or depreciation. Securities lending income represents fees charged to borrowers plus income earned on invested cash collateral, less expenses associated with the loan. During the term of the loan, the fund is entitled to all distributions made on or in respect of the loaned securities.
8. Collateral for ETF Capital Activity: When an authorized participant fails to deliver one or more of the securities within a designated basket (in the case of a subscription), fails to deliver the fund ETF Shares (in the case of a redemption), or is required by the fund, prior to settlement, to accommodate the trading of foreign securities in local markets (in the case of redemption for an international equity ETF), the fund may require the authorized participant to deliver and maintain cash collateral in accordance with the authorized participant agreement. The fund may invest the collateral in short-term debt instruments or U.S. Treasury securities, or maintain the balance as cash. Daily market fluctuations could cause the value of the missing securities or fund ETF Shares to be more or less than the value of the collateral received; when this occurs the collateral is adjusted. The fund earns interest income from investments and/or custody fee offsets from the cash balance. The fund records an asset (cash or investment, as applicable) and a corresponding
International High Dividend Yield Index Fund
liability for the return of the collateral in the Statement of Assets and Liabilities. Interest income and custody fee offsets earned on the investment of collateral are included in the Statement of Operations.
9. Credit Facilities and Interfund Lending Program: The fund and certain other funds managed by The Vanguard Group (“Vanguard”) participate in a $4.3 billion committed credit facility provided by a syndicate of lenders pursuant to a credit agreement and an uncommitted credit facility provided by Vanguard. Both facilities may be renewed annually. Each fund is individually liable for its borrowings, if any, under the credit facilities. Borrowings may be utilized for temporary or emergency purposes, subject to the fund’s regulatory and contractual borrowing restrictions. With respect to the committed credit facility, the participating funds are charged administrative fees and an annual commitment fee of 0.10% of the undrawn committed amount of the facility; these fees are allocated to the funds based on a method approved by the fund’s board of trustees and included in Management and Administrative expenses on the fund’s Statement of Operations. Any borrowings under either facility bear interest at a rate based upon the higher of the one-month London Interbank Offered Rate (or an acceptable alternate rate, if necessary), federal funds effective rate, or overnight bank funding rate plus an agreed-upon spread, except that borrowings under the uncommitted credit facility may bear interest based upon an alternative rate agreed to by the fund and Vanguard.
In accordance with an exemptive order (the “Order”) from the SEC, the fund may participate in a joint lending and borrowing program that allows registered open-end Vanguard funds to borrow money from and lend money to each other for temporary or emergency purposes (the “Interfund Lending Program”), subject to compliance with the terms and conditions of the Order, and to the extent permitted by the fund’s investment objective and investment policies. Interfund loans and borrowings normally extend overnight, but can have a maximum duration of seven days. Loans may be called on one business day’s notice. The interest rate to be charged is governed by the conditions of the Order and internal procedures adopted by the board of trustees. The board of trustees is responsible for overseeing the Interfund Lending Program.
For the year ended October 31, 2020, the fund did not utilize the credit facilities or the Interfund Lending Program.
10. Other: Dividend income is recorded on the ex-dividend date. Interest income includes income distributions received from Vanguard Market Liquidity Fund and is accrued daily. Premiums and discounts on debt securities are amortized and accreted, respectively, to interest income over the lives of the respective securities, except for premiums on certain callable debt securities that are amortized to the earliest call date. Security transactions are accounted for on the date securities are bought or sold. Costs used to determine realized gains (losses) on the sale of investment securities are those of the specific securities sold. Fees assessed on capital share transactions are credited to paid-in capital.
Taxes on foreign dividends and capital gains have been provided for in accordance with the fund’s understanding of the applicable countries’ tax rules and rates. Foreign capital gains tax, if any, is accrued daily based upon applicable net unrealized gains. The fund has filed tax reclaims for previously withheld taxes on dividends earned in certain European Union countries. These filings are subject to various administrative and judicial proceedings within these countries. Such tax reclaims received
International High Dividend Yield Index Fund
during the year, if any, are included in dividend income. No other amounts for additional tax reclaims are reflected in the financial statements due to the uncertainty as to the ultimate resolution of proceedings, the likelihood of receipt of these reclaims, and the potential timing of payment.
Each class of shares has equal rights as to assets and earnings, except that each class separately bears certain class-specific expenses related to maintenance of shareholder accounts (included in Management and Administrative expenses) and shareholder reporting. Marketing and distribution expenses are allocated to each class of shares based on a method approved by the board of trustees. Income, other non-class-specific expenses, and gains and losses on investments are allocated to each class of shares based on its relative net assets.
B. In accordance with the terms of a Funds’ Service Agreement (the “FSA”) between Vanguard and the fund, Vanguard furnishes to the fund investment advisory, corporate management, administrative, marketing, and distribution services at Vanguard’s cost of operations (as defined by the FSA). These costs of operations are allocated to the fund based on methods and guidelines approved by the board of trustees and are generally settled twice a month.
Upon the request of Vanguard, the fund may invest up to 0.40% of its net assets as capital in Vanguard. At October 31, 2020, the fund had contributed to Vanguard capital in the amount of $68,000, representing less than 0.01% of the fund’s net assets and 0.03% of Vanguard’s capital received pursuant to the FSA. The fund’s trustees and officers are also directors and employees, respectively, of Vanguard.
C. The fund’s custodian bank has agreed to reduce its fees when the fund maintains cash on deposit in the non-interest-bearing custody account. For the year ended October 31, 2020, custodian fee offset arrangements reduced the fund’s expenses by $115,000 (an annual rate of 0.01% of average net assets).
D. Various inputs may be used to determine the value of the fund’s investments and derivatives. These inputs are summarized in three broad levels for financial statement purposes. The inputs or methodologies used to value securities are not necessarily an indication of the risk associated with investing in those securities.
Level 1—Quoted prices in active markets for identical securities.
Level 2—Other significant observable inputs (including quoted prices for similar securities, interest rates, prepayment speeds, credit risk, etc.).
Level 3—Significant unobservable inputs (including the fund’s own assumptions used to determine the fair value of investments). Any investments and derivatives valued with significant unobservable inputs are noted on the Schedule of Investments.
International High Dividend Yield Index Fund
The following table summarizes the market value of the fund’s investments and derivatives as of October 31, 2020, based on the inputs used to value them:
| | Level 1 | | Level 2 | | Level 3 | | Total |
| | ($000) | | ($000) | | ($000) | | ($000) |
| Investments | | | | | | | |
| Assets | | | | | | | |
| Common Stocks—North and South America | 173,991 | | 1 | | — | | 173,992 |
| Common Stocks—Other | 6,115 | | 1,400,218 | | 913 | | 1,407,246 |
| Temporary Cash Investments | 29,747 | | — | | — | | 29,747 |
| Total | 209,853 | | 1,400,219 | | 913 | | 1,610,985 |
| Derivative Financial Instruments | | | | | | | |
| Assets | | | | | | | |
| Forward Currency Contracts | — | | 5 | | — | | 5 |
| Liabilities | | | | | | | |
| Futures Contracts1 | 82 | | — | | — | | 82 |
| Forward Currency Contracts | — | | 55 | | — | | 55 |
| Total | 82 | | 55 | | — | | 137 |
1 Represents variation margin on the last day of the reporting period.
E. At October 31, 2020, the fair values of derivatives were reflected in the Statement of Assets and Liabilities as follows:
| | | | Foreign | | |
| | Equity | | Exchange | | |
| | Contracts | | Contracts | | Total |
| Statement of Assets and Liabilities Caption | ($000) | | ($000) | | ($000) |
| Unrealized Appreciation—Forward Currency Contracts | — | | 5 | | 5 |
| | | | | | |
| Variation Margin Payable—Futures Contracts | 82 | | — | | 82 |
| Unrealized Depreciation—Forward Currency Contracts | — | | 55 | | 55 |
| Total Liabilities | 82 | | 55 | | 137 |
International High Dividend Yield Index Fund
Realized net gain (loss) and the change in unrealized appreciation (depreciation) on derivatives for the year ended October 31, 2020, were:
| | | | Foreign | | |
| | Equity | | Exchange | | |
| | Contracts | | Contracts | | Total |
| Realized Net Gain (Loss) on Derivatives | ($000) | | ($000) | | ($000) |
| Futures Contracts | 1,814 | | — | | 1,814 |
| Forward Currency Contracts | — | | (71) | | (71) |
| Realized Net Gain (Loss) on Derivatives | 1,814 | | (71) | | 1,743 |
| | | | | | |
| Change in Unrealized Appreciation (Depreciation) on Derivatives | | | | | |
| Futures Contracts | (519) | | — | | (519) |
| Forward Currency Contracts | — | | (60) | | (60) |
| Change in Unrealized Appreciation (Depreciation) on Derivatives | (519) | | (60) | | (579) |
F. Permanent differences between book-basis and tax-basis components of net assets are reclassified among capital accounts in the financial statements to reflect their tax character. These reclassifications have no effect on net assets or net asset value per share. As of period end, permanent differences primarily attributable to the accounting for in-kind redemptions, foreign currency transactions, passive foreign investment companies, and tax expense on capital gains were reclassified between the following accounts:
| | Amount |
| | ($000) |
| Paid-in Capital | 4,701 |
| Total Distributable Earnings (Loss) | (4,701) |
Temporary differences between book-basis and tax-basis components of total distributable earnings (loss) arise when certain items of income, gain, or loss are recognized in different periods for financial statement and tax purposes; these differences will reverse at some time in the future. The differences are primarily related to the deferral of losses from wash sales; the recognition of unrealized gains or losses from certain derivative contracts; and the recognition of unrealized gains from passive foreign investment companies. As of period end, the tax-basis components of total distributable earnings (loss) are detailed in the table as follows:
| | Amount |
| | ($000) |
| Undistributed Ordinary Income | 12,020 |
| Undistributed Long-Term Gains | — |
| Capital Loss Carryforwards | (119,212) |
| Qualified Late-Year Losses | — |
| Net Unrealized Gains (Losses) | (238,199) |
International High Dividend Yield Index Fund
The tax character of distributions paid was as follows:
| | Year Ended October 31, |
| | 2020 | | 2019 |
| | Amount | | Amount |
| | ($000) | | ($000) |
| Ordinary Income* | 55,814 | | 55,211 |
| Long-Term Capital Gains | — | | — |
| Total | 55,814 | | 55,211 |
* Includes short-term capital gains, if any.
As of October 31, 2020, gross unrealized appreciation and depreciation for investments and derivatives based on cost for U.S. federal income tax purposes were as follows:
| | Amount |
| | ($000) |
| Tax Cost | 1,849,380 |
| Gross Unrealized Appreciation | 117,663 |
| Gross Unrealized Depreciation | (356,058) |
| Net Unrealized Appreciation (Depreciation) | (238,395) |
G. During the year ended October 31, 2020, the fund purchased $792,908,000 of investment securities and sold $344,429,000 of investment securities, other than temporary cash investments. Purchases and sales include $301,435,000 and $42,888,000, respectively, in connection with in-kind purchases and redemptions of the fund’s capital shares.
International High Dividend Yield Index Fund
H. Capital share transactions for each class of shares were:
| | Year Ended October 31, |
| | 2020 | | 2019 |
| | Amount | | Shares | | Amount | | Shares |
| | ($000) | | (000) | | ($000) | | (000) |
| Investor Shares | | | | | | | |
| Issued1 | — | | — | | 452 | | 19 |
| Issued in Lieu of Cash Distributions | — | | — | | 140 | | 6 |
| Redeemed2,3 | — | | — | | (9,343) | | (388) |
| Net Increase (Decrease)—Investor Shares | — | | — | | (8,751) | | (363) |
| ETF Shares | | | | | | | |
| Issued1 | 377,560 | | 6,711 | | 329,989 | | 5,526 |
| Issued in Lieu of Cash Distributions | — | | — | | — | | — |
| Redeemed2 | (49,405) | | (1,100) | | — | | — |
| Net Increase (Decrease)—ETF Shares | 328,155 | | 5,611 | | 329,989 | | 5,526 |
| Admiral Shares | | | | | | | |
| Issued1,3 | 173,979 | | 6,455 | | 50,620 | | 1,746 |
| Issued in Lieu of Cash Distributions | 5,196 | | 203 | | 6,920 | | 243 |
| Redeemed2 | (61,888) | | (2,421) | | (47,074) | | (1,635) |
| Net Increase (Decrease)—Admiral Shares | 117,287 | | 4,237 | | 10,466 | | 354 |
| 1 | Includes purchase fees for fiscal 2020 and 2019 of $728,000 and $193,000, respectively (fund totals). |
| 2 | Net of redemption fees for fiscal 2020 and 2019 of $151,000 and $102,000, respectively (fund totals). |
| 3 | In November 2018, the fund announced changes to the availability and minimum investment criteria of the Investor and Admiral share classes. As a result, all of the outstanding Investor Shares automatically converted to Admiral Shares beginning in April 2019. Investor Shares—Redeemed and Admiral Shares—Issued include 316,000 and 261,000 shares, respectively, in the amount of $7,630,000 from the conversion during the year ended October 31, 2019. |
I. Management has determined that no events or transactions occurred subsequent to October 31, 2020, that would require recognition or disclosure in these financial statements.
Report of Independent Registered Public Accounting Firm
To the Board of Trustees of Vanguard Whitehall Funds and Shareholders of Vanguard International Dividend Appreciation Index Fund and Vanguard International High Dividend Yield Index Fund
Opinions on the Financial Statements
We have audited the accompanying statements of assets and liabilities, including the schedules of investments, of Vanguard International Dividend Appreciation Index Fund and Vanguard International High Dividend Yield Index Fund (two of the funds constituting Vanguard Whitehall Funds, hereafter collectively referred to as the “Funds”) as of October 31, 2020, the related statements of operations for the year ended October 31, 2020, the statements of changes in net assets for each of the two years in the period ended October 31, 2020, including the related notes, and the financial highlights for each of the periods indicated therein (collectively referred to as the “financial statements”). In our opinion, the financial statements present fairly, in all material respects, the financial position of each of the Funds as of October 31, 2020, the results of each of their operations for the year then ended, the changes in each of their net assets for each of the two years in the period ended October 31, 2020 and each of the financial highlights for each of the periods indicated therein in conformity with accounting principles generally accepted in the United States of America.
Basis for Opinions
These financial statements are the responsibility of the Funds’ management. Our responsibility is to express an opinion on the Funds’ financial statements based on our audits. We are a public accounting firm registered with the Public Company Accounting Oversight Board (United States) (“PCAOB”) and are required to be independent with respect to the Funds in accordance with the U.S. federal securities laws and the applicable rules and regulations of the Securities and Exchange Commission and the PCAOB.
We conducted our audits of these financial statements in accordance with the standards of the PCAOB. Those standards require that we plan and perform the audit to obtain reasonable assurance about whether the financial statements are free of material misstatement, whether due to error or fraud.
Our audits included performing procedures to assess the risks of material misstatement of the financial statements, whether due to error or fraud, and performing procedures that respond to those risks. Such procedures included examining, on a test basis, evidence regarding the amounts and disclosures in the financial statements. Our audits also included evaluating the accounting principles used and significant estimates made by management, as well as evaluating the overall presentation of the financial statements. Our procedures included confirmation of securities owned as of October 31, 2020 by correspondence with the custodian and brokers and by agreement to the underlying ownership records of the transfer agent; when replies were not received from brokers, we performed other auditing procedures. We believe that our audits provide a reasonable basis for our opinions.
/s/PricewaterhouseCoopers LLP
Philadelphia, Pennsylvania
December 15, 2020
We have served as the auditor of one or more investment companies in The Vanguard Group of Funds since 1975.
Special 2020 tax information (unaudited) for Vanguard International Dividend Appreciation Index Fund
This information for the fiscal year ended October 31, 2020, is included pursuant to provisions of the Internal Revenue Code.
The fund distributed $29,423,000 of qualified dividend income to shareholders during the fiscal year.
The fund designates to shareholders foreign source income of $38,177,000 and foreign taxes paid of $3,812,000. Shareholders will receive more detailed information with their Form 1099-DIV in January 2021 to determine the calendar-year amounts to be included on their 2020 tax returns.
Special 2020 tax information (unaudited) for Vanguard International High Dividend Yield Index Fund
This information for the fiscal year ended October 31, 2020, is included pursuant to provisions of the Internal Revenue Code.
The fund distributed $40,923,000 of qualified dividend income to shareholders during the fiscal year.
The fund designates to shareholders foreign source income of $69,509,000 and foreign taxes paid of $4,745,000. Shareholders will receive more detailed information with their Form 1099-DIV in January 2021 to determine the calendar-year amounts to be included on their 2020 tax returns.
London Stock Exchange Group companies include FTSE International Limited (“FTSE”), Frank Russell Company (“Russell”), MTS Next Limited (“MTS”), and FTSE TMX Global Debt Capital Markets Inc. (“FTSE TMX”). All rights reserved. “FTSE®”, “Russell®”, “MTS®”, “FTSE TMX®” and “FTSE Russell” and other service marks and trademarks related to the FTSE or Russell indexes are trademarks of the London Stock Exchange Group companies and are used by FTSE, MTS, FTSE TMX and Russell under license. All information is provided for information purposes only. Every effort is made to ensure that all information given in this publication is accurate, but no responsibility or liability can be accepted by the London Stock Exchange Group companies nor its licensors for any errors or for any loss from use of this publication. Neither the London Stock Exchange Group companies nor any of their licensors make any claim, prediction, warranty or representation whatsoever, expressly or impliedly, either as to the results to be obtained from the use of the Indices or the fitness or suitability of the Indices for any particular purpose to which they might be put. The London Stock Exchange Group companies do not provide investment advice and nothing in this document should be taken as constituting financial or investment advice. The London Stock Exchange Group companies make no representation regarding the advisability of investing in any asset. A decision to invest in any such asset should not be made in reliance on any information herein. Indexes cannot be invested in directly. Inclusion of an asset in an index is not a recommendation to buy, sell or hold that asset. The general information contained in this publication should not be acted upon without obtaining specific legal, tax, and investment advice from a licensed professional. No part of this information may be reproduced, stored in a retrieval system or transmitted in any form or by any means, electronic, mechanical, photocopying, recording or otherwise, without prior written permission of the London Stock Exchange Group companies. Distribution of the London Stock Exchange Group companies’ index values and the use of their indexes to create financial products require a license with FTSE, FTSE TMX, MTS and/or Russell and/or its licensors.
This page intentionally left blank.
The People Who Govern Your Fund
The trustees of your mutual fund are there to see that the fund is operated and managed in your best interests since, as a shareholder, you are a part owner of the fund. Your fund’s trustees also serve on the board of directors of The Vanguard Group, Inc., which is owned by the Vanguard funds and provides services to them.
A majority of Vanguard’s board members are independent, meaning that they have no affiliation with Vanguard or the funds they oversee, apart from the sizable personal investments they have made as private individuals. The independent board members have distinguished backgrounds in business, academia, and public service. Each of the trustees and executive officers oversees 213 Vanguard funds.
Information for each trustee and executive officer of the fund appears below. That information, as well as the Vanguard fund count, is as of the date on the cover of this fund report. The mailing address of the trustees and officers is P.O. Box 876, Valley Forge, PA 19482. More information about the trustees is in the Statement of Additional Information, which can be obtained, without charge, by contacting Vanguard at 800-662-7447, or online at vanguard.com.
Interested Trustee1
Mortimer J. Buckley
Born in 1969. Trustee since January 2018. Principal occupation(s) during the past five years and other experience: chairman of the board (2019–present) of Vanguard and of each of the investment companies served by Vanguard; chief executive officer (2018–present) of Vanguard; chief executive officer, president, and trustee (2018–present) of each of the investment companies served by Vanguard; president and director (2017–present) of Vanguard; and president (2018–present) of Vanguard Marketing Corporation. Chief investment officer (2013–2017), managing director (2002–2017), head of the Retail Investor Group (2006–2012), and chief information officer (2001–2006) of Vanguard. Chairman of the board (2011–2017) and trustee (2009–2017) of the Children’s Hospital of Philadelphia; and trustee (2018–present) and vice chair (2019–present) of The Shipley School.
Independent Trustees
Emerson U. Fullwood
Born in 1948. Trustee since January 2008. Principal occupation(s) during the past five years and other experience: executive chief staff and marketing officer for North America and corporate vice president (retired 2008) of Xerox Corporation (document management products and services). Former president of the Worldwide Channels Group, Latin America, and Worldwide Customer Service and executive chief staff officer of Developing Markets of Xerox. Executive in residence and 2009–2010 Distinguished Minett Professor at the Rochester Institute of Technology. Director of SPX FLOW, Inc. (multi-industry manufacturing). Director of the University of Rochester Medical Center, the Monroe Community College Foundation, the United Way of Rochester, North Carolina A&T University, and Roberts Wesleyan College. Trustee of the University of Rochester.
Amy Gutmann
Born in 1949. Trustee since June 2006. Principal occupation(s) during the past five years and other experience: president (2004–present) of the University of Pennsylvania. Christopher H. Browne Distinguished Professor of Political Science, School of Arts and Sciences, and professor of communication, Annenberg School for Communication, with secondary faculty appointments in the Department of Philosophy, School of Arts and Sciences, and at the Graduate School of Education, University of Pennsylvania.
F. Joseph Loughrey
Born in 1949. Trustee since October 2009. Principal occupation(s) during the past five years and other experience: president and chief operating officer (retired 2009) and vice chairman of the board (2008–2009) of Cummins Inc. (industrial machinery). Chairman of the board of Hillenbrand, Inc. (specialized consumer services) and the Lumina Foundation. Director of the V Foundation. Member of the advisory
| 1 | Mr. Buckley is considered an “interested person,” as defined in the Investment Company Act of 1940, because he is an officer of the Vanguard funds. |
council for the College of Arts and Letters and chair of the advisory board to the Kellogg Institute for International Studies, both at the University of Notre Dame.
Mark Loughridge
Born in 1953. Trustee since March 2012. Principal occupation(s) during the past five years and other experience: senior vice president and chief financial officer (retired 2013) of IBM (information technology services). Fiduciary member of IBM’s Retirement Plan Committee (2004–2013), senior vice president and general manager (2002–2004) of IBM Global Financing, vice president and controller (1998–2002) of IBM, and a variety of other prior management roles at IBM. Member of the Council on Chicago Booth.
Scott C. Malpass
Born in 1962. Trustee since March 2012. Principal occupation(s) during the past five years and other experience: chief investment officer (retired June 2020) and vice president (retired June 2020) of the University of Notre Dame. Assistant professor of finance at the Mendoza College of Business, University of Notre Dame, and member of the Notre Dame 403(b) Investment Committee (retired June 2020). Member of the board of Catholic Investment Services, Inc. (investment advisors) and the board of superintendence of the Institute for the Works of Religion.
Deanna Mulligan
Born in 1963. Trustee since January 2018. Principal occupation(s) during the past five years and other experience: board chair (2020–present), chief executive officer (2011–2020), and president (2010–2019) of The Guardian Life Insurance Company of America. Chief operating officer (2010–2011) and executive vice president (2008–2010) of the individual life and disability division of Guardian Life. Member of the board of the American Council of Life Insurers and the board of the Economic Club of New York. Trustee of the Partnership for New York City (business leadership), Chief Executives for Corporate Purpose, NewYork- Presbyterian Hospital, Catalyst, and the Bruce Museum (arts and science). Member of the Advisory Council for the Stanford Graduate School of Business.
André F. Perold
Born in 1952. Trustee since December 2004. Principal occupation(s) during the past five years and other experience: George Gund Professor of Finance and Banking, Emeritus at the Harvard Business School (retired 2011). Chief investment officer and co-managing partner of HighVista Strategies (private investment firm). Member of the board of advisors and member of the investment committee of the Museum of Fine Arts Boston. Member of the board (2018–present) of RIT Capital Partners (investment firm). Member of the investment committee of Partners Health Care System.
Sarah Bloom Raskin
Born in 1961. Trustee since January 2018. Principal occupation(s) during the past five years and other experience: deputy secretary (2014–2017) of the United States Department of the Treasury. Governor (2010–2014) of the Federal Reserve Board. Commissioner (2007–2010) of financial regulation for the State of Maryland. Member of the board of directors (2012–2014) of Neighborhood Reinvestment Corporation. Director (2017–present) of i(x) Investments, LLC; director (2017–present) of Reserve Trust. Rubenstein Fellow (2017–present) of Duke University; trustee (2017–present) of Amherst College, and trustee (2019–present) of the Folger Shakespeare Library.
Peter F. Volanakis
Born in 1955. Trustee since July 2009. Principal occupation(s) during the past five years and other experience: president and chief operating officer (retired 2010) of Corning Incorporated (communications equipment) and director of Corning Incorporated (2000–2010) and Dow Corning (2001–2010). Director (2012) of SPX Corporation (multi-industry manufacturing). Overseer of the Amos Tuck School of Business Administration, Dartmouth College (2001–2013). Chairman of the board of trustees of Colby-Sawyer College. Member of the board of Hypertherm Inc. (industrial cutting systems, software, and consumables).
Executive Officers
John Bendl
Born in 1970. Principal occupation(s) during the past five years and other experience: principal of Vanguard. Chief financial officer (2019–present) of each of the investment companies served by Vanguard. Chief accounting officer, treasurer, and controller of Vanguard (2017–present). Partner (2003–2016) at KPMG (audit, tax, and advisory services).
Christine M. Buchanan
Born in 1970. Principal occupation(s) during the past five years and other experience: principal of Vanguard. Treasurer (2017–present) of each of the investment companies served by Vanguard. Partner (2005–2017) at KPMG (audit, tax, and advisory services).
David Cermak
Born in 1960. Principal occupation(s) during the past five years and other experience: principal of Vanguard. Finance director (2019–present) of each of the investment companies served by Vanguard. Managing director and head (2017–present) of Vanguard Investments Singapore. Managing director and head (2017–2019) of Vanguard Investments Hong Kong. Representative director and head (2014–2017) of Vanguard Investments Japan.
John Galloway
Born in 1973. Principal occupation(s) during the past five years and other experience: principal of Vanguard. Investment stewardship officer (September 2020–present) of each of the investment companies served by Vanguard. Head of Investor Advocacy (February 2020–present) and head of Marketing Strategy and Planning (2017–2020) at Vanguard. Deputy assistant to the President of the United States (2015).
Thomas J. Higgins
Born in 1957. Principal occupation(s) during the past five years and other experience: principal of Vanguard. Finance director (2019–present), chief financial officer (2008–2019), and treasurer (1998–2008) of each of the investment companies served by Vanguard.
Peter Mahoney
Born in 1974. Principal occupation(s) during the past five years and other experience: principal of Vanguard. Controller (2015–present) of each of the investment companies served by Vanguard. Head of International Fund Services (2008–2014) at Vanguard.
Anne E. Robinson
Born in 1970. Principal occupation(s) during the past five years and other experience: general counsel (2016–present) of Vanguard. Secretary (2016–present) of Vanguard and of each of the investment companies served by Vanguard. Managing director (2016–present) of Vanguard. Managing director and general counsel of Global Cards and Consumer Services (2014–2016) at Citigroup. Counsel (2003–2014) at American Express.
Michael Rollings
Born in 1963. Principal occupation(s) during the past five years and other experience: finance director (2017–present) and treasurer (2017) of each of the investment companies served by Vanguard. Managing director (2016–present) of Vanguard. Chief financial officer (2016–present) of Vanguard. Director (2016–present) of Vanguard Marketing Corporation. Executive vice president and chief financial officer (2006–2016) of MassMutual Financial Group.
John E. Schadl
Born in 1972. Principal occupation(s) during the past five years and other experience: principal of Vanguard. Chief compliance officer (2019–present) of Vanguard and of each of the investment companies served by Vanguard. Assistant vice president (2019–present) of Vanguard Marketing Corporation.
Vanguard Senior Management Team
| Joseph Brennan | James M. Norris |
| Mortimer J. Buckley | Thomas M. Rampulla |
| Gregory Davis | Karin A. Risi |
| John James | Anne E. Robinson |
| John T. Marcante | Michael Rollings |
| Chris D. McIsaac | Lauren Valente |

Connect with Vanguard® > vanguard.com
Fund Information > 800-662-7447
Direct Investor Account Services > 800-662-2739
Institutional Investor Services > 800-523-1036
Text Telephone for People Who Are Deaf or Hard of Hearing > 800-749-7273
This material may be used in conjunction with the offering of shares of any Vanguard fund only if preceded or accompanied by the fund’s current prospectus.
All comparative mutual fund data are from Morningstar, Inc., unless otherwise noted.
You can obtain a free copy of Vanguard’s proxy voting guidelines by visiting vanguard.com/proxyreporting or by calling Vanguard at 800-662-2739. The guidelines are also available from the SEC’s website, www.sec.gov. In addition, you may obtain a free report on how your fund voted the proxies for securities it owned during the 12 months ended June 30. To get the report, visit either vanguard.com/proxyreporting or www.sec.gov.
You can review information about your fund on the SEC’s website, and you can receive copies of this information, for a fee, by sending a request via email addressed to publicinfo@sec.gov.
Source for Bloomberg Barclays indexes: Bloomberg Index Services Limited. Copyright 2020, Bloomberg. All rights reserved.
“Dividend Achievers” is a trademark of The NASDAQ OMX Group, Inc. (collectively, with its affiliates “NASDAQ OMX”), and has been licensed for use by The Vanguard Group, Inc. Vanguard mutual funds are not sponsored, endorsed, sold, or promoted by NASDAQ OMX and NASDAQ OMX makes no representation regarding the advisability of investing in the funds. NASDAQ OMX MAKES NO WARRANTIES AND BEARS NO LIABILITY WITH RESPECT TO THE VANGUARD MUTUAL FUNDS.
| | © 2020 The Vanguard Group, Inc. |
| | All rights reserved. |
| | U.S. Patent Nos. 6,879,964; 7,337,138; |
| | 7,720,749; 7,925,573; 8,090,646; 8,417,623; and 8,626,636. |
| | Vanguard Marketing Corporation, Distributor. |
| | |
| | Q20150 122020 |
Item 2: Code of Ethics. The Registrant has adopted a code of ethics that applies to the Registrant’s principal executive officer, principal financial officer, principal accounting officer or controller or persons performing similar functions. The Code of Ethics was amended during the reporting period covered by this report to make certain technical, non-material changes.
Item 3: Audit Committee Financial Expert. All members of the Audit Committee have been determined by the Registrant’s Board of Trustees to be Audit Committee Financial Experts and to be independent: F. Joseph Loughrey, Mark Loughridge, Sarah Bloom Raskin, and Peter F. Volanakis.
Item 4: Principal Accountant Fees and Services.
(a) Audit Fees.
Audit Fees of the Registrant.
Fiscal Year Ended October 31, 2020: $309,000
Fiscal Year Ended October 31, 2019: $317,000
Aggregate Audit Fees of Registered Investment Companies in the Vanguard Group.
Fiscal Year Ended October 31, 2020: $10,761,407
Fiscal Year Ended October 31, 2019: $9,568,215
Includes fees billed in connection with audits of the Registrant, other registered investment companies in the Vanguard complex, The Vanguard Group, Inc., and Vanguard Marketing Corporation.
(b) Audit-Related Fees.
Fiscal Year Ended October 31, 2020: $2,915,863
Fiscal Year Ended October 31, 2019: $3,012,031
Includes fees billed in connection with assurance and related services provided to the Registrant, other registered investment companies in the Vanguard complex, The Vanguard Group, Inc., and Vanguard Marketing Corporation.
(c) Tax Fees.
Fiscal Year Ended October 31, 2020: $247,168
Fiscal Year Ended October 31, 2019: $357,238
Includes fees billed in connection with tax compliance, planning, and advice services provided to the Registrant, other registered investment companies in the Vanguard complex, The Vanguard Group, Inc., and Vanguard Marketing Corporation.
(d) All Other Fees.
Fiscal Year Ended October 31, 2020: $115,000
Fiscal Year Ended October 31, 2019: $0
Includes fees billed for services related to tax reported information provided to the Registrant, other registered investment companies in the Vanguard complex, The Vanguard Group, Inc., and Vanguard Marketing Corporation.
(e) (1) Pre-Approval Policies. The policy of the Registrant’s Audit Committee is to consider, and, if appropriate, approve before the principal accountant is engaged for such services, all specific audit and non-audit services provided to: the Registrant, other registered investment companies in the Vanguard complex, The Vanguard Group, Inc., and entities controlled by The Vanguard Group, Inc. that provide ongoing services to the Registrant. In making a determination, the Audit Committee considers whether the services are consistent with maintaining the principal accountant’s independence.
In the event of a contingency situation in which the principal accountant is needed to provide services in between scheduled Audit Committee meetings, the Chairman of the Audit Committee would be called on to consider and, if appropriate, pre-approve audit or permitted non-audit services in an amount sufficient to complete services through the next Audit Committee meeting, and to determine if such services would be consistent with maintaining the accountant’s independence. At the next scheduled Audit Committee meeting, services and fees would be presented to the Audit Committee for formal consideration, and, if appropriate, approval by the entire Audit Committee. The Audit Committee would again consider whether such services and fees are consistent with maintaining the principal accountant’s independence.
The Registrant’s Audit Committee is informed at least annually of all audit and non-audit services provided by the principal accountant to the Vanguard complex, whether such services are provided to: the Registrant, other registered investment companies in the Vanguard complex, The Vanguard Group, Inc., or other entities controlled by The Vanguard Group, Inc. that provide ongoing services to the Registrant.
(2) No percentage of the principal accountant’s fees or services were approved pursuant to the waiver provision of paragraph (c)(7)(i)(C) of Rule 2-01 of Regulation S-X.
(f) For the most recent fiscal year, over 50% of the hours worked under the principal accountant’s engagement were not performed by persons other than full-time, permanent employees of the principal accountant.
(g) Aggregate Non-Audit Fees.
Fiscal Year Ended October 31, 2020: $362,168
Fiscal Year Ended October 31, 2019: $357,238
Includes fees billed for non-audit services provided to the Registrant, other registered investment companies in the Vanguard complex, The Vanguard Group, Inc., and Vanguard Marketing Corporation.
(h) For the most recent fiscal year, the Audit Committee has determined that the provision of all non-audit services was consistent with maintaining the principal accountant’s independence.
Item 5: Audit Committee of Listed Registrants.
The Registrant is a listed issuer as defined in rule 10A-3 under the Securities Exchange Act of 1934 (“Exchange Act”). The Registrant has a separately-designated standing audit committee established in accordance with Section 3(a)(58)(A) of the Exchange Act. The Registrant’s audit committee members are: F. Joseph Loughrey, Mark Loughridge, Sarah Bloom Raskin, and Peter F. Volanakis.
Item 6: Investments.
Not applicable.
Item 7: Disclosure of Proxy Voting Policies and Procedures for Closed-End Management Investment Companies.
Not applicable.
Item 8: Portfolio Managers of Closed-End Management Investment Companies.
Not applicable.
Item 9: Purchase of Equity Securities by Closed-End Management Investment Company and Affiliated Purchasers.
Not applicable.
Item 10: Submission of Matters to a Vote of Security Holders.
Not applicable.
Item 11: Controls and Procedures.
(a) Disclosure Controls and Procedures. The Principal Executive and Financial Officers concluded that the Registrant’s Disclosure Controls and Procedures are effective based on their evaluation of the Disclosure Controls and Procedures as of a date within 90 days of the filing date of this report.
(b) Internal Control Over Financial Reporting. In March 2020, a third-party service provider began performing certain administrative and accounting services for Vanguard High Dividend Yield Index Fund. In September 2020, a third-party service provider began performing certain administrative and accounting services for Vanguard Mid-Cap Growth Fund and Vanguard Selected Value Fund. There were no other significant changes in the Registrant’s Internal Control Over Financial Reporting or in other factors that could significantly affect this control subsequent to the date of the evaluation, including any corrective actions with regard to significant deficiencies and material weaknesses.
Item 12: Disclosure of Securities Lending Activities for Closed-End Management Investment Companies.
Not applicable.
Item 13: Exhibits.
Pursuant to the requirements of the Securities Exchange Act of 1934 and the Investment Company Act of 1940, the registrant has duly caused this report to be signed on its behalf by the undersigned, thereunto duly authorized.
| | VANGUARD WHITEHALL FUNDS |
| | | |
| BY: | /s/ MORTIMER J. BUCKLEY* | |
| | MORTIMER J. BUCKLEY |
| | CHIEF EXECUTIVE OFFICER |
Date: December 18, 2020
Pursuant to the requirements of the Securities Exchange Act of 1934 and the Investment Company Act of 1940, this report has been signed below by the following persons on behalf of the registrant and in the capacities and on the dates indicated.
| | VANGUARD WHITEHALL FUNDS |
| | | |
| BY: | /s/ MORTIMER J. BUCKLEY* | |
| | MORTIMER J. BUCKLEY |
| | CHIEF EXECUTIVE OFFICER |
Date: December 18, 2020
| | VANGUARD WHITEHALL FUNDS |
| | | |
| BY: | /s/ JOHN BENDL* | |
| | JOHN BENDL |
| | CHIEF FINANCIAL OFFICER |
Date: December 18, 2020
* By: /s/ Anne E. Robinson
Anne E. Robinson, pursuant to a Power of Attorney filed on December 18, 2020 (see File Number 33-64845), Incorporated by Reference.