UNITED STATES
SECURITIES AND EXCHANGE COMMISSION
Washington, D.C. 20549
FORM N-CSR
CERTIFIED SHAREHOLDER REPORT
OF
REGISTERED MANAGEMENT INVESTMENT COMPANIES
| | |
| Investment Company Act file number: | 811-07443 |
Name of Registrant: | Vanguard Whitehall Funds |
Address of Registrant: | P.O. Box 2600 |
| | Valley Forge, PA 19482 |
Name and address of agent for service: | Heidi Stam, Esquire |
| | P.O. Box 876 |
| | Valley Forge, PA 19482 |
Registrant’s telephone number, including area code: (610) 669-1000 |
Date of fiscal year end: October 31 |
Date of reporting period: November 1, 2014 – October 31, 2015 |
Item 1: Reports to Shareholders |


Annual Report | October 31, 2015
Vanguard Selected Value Fund
Vanguard’s Principles for Investing Success
We want to give you the best chance of investment success. These principles, grounded in Vanguard’s research and experience, can put you on the right path.
Goals. Create clear, appropriate investment goals.
Balance. Develop a suitable asset allocation using broadly diversified funds. Cost. Minimize cost.
Discipline. Maintain perspective and long-term discipline.
A single theme unites these principles: Focus on the things you can control.
We believe there is no wiser course for any investor.
| |
| Contents | |
| Your Fund’s Total Returns. | 1 |
| Chairman’s Letter. | 2 |
| Advisors’ Report. | 8 |
| Fund Profile. | 13 |
| Performance Summary. | 14 |
| Financial Statements. | 16 |
| Your Fund’s After-Tax Returns. | 28 |
| About Your Fund’s Expenses. | 29 |
| Glossary. | 31 |
Please note: The opinions expressed in this report are just that—informed opinions. They should not be considered promises or advice.
Also, please keep in mind that the information and opinions cover the period through the date on the front of this report. Of course, the
risks of investing in your fund are spelled out in the prospectus.
See the Glossary for definitions of investment terms used in this report.
About the cover: Pictured is a sailing block on the Brilliant, a 1932 schooner docked in Mystic, Connecticut. A type of pulley, the
sailing block helps coordinate the setting of the sails. At Vanguard, the intricate coordination of technology and people allows
us to help millions of clients around the world reach their financial goals.
Your Fund’s Total Returns
| |
| Fiscal Year Ended October 31, 2015 | |
| | Total |
| | Returns |
| Vanguard Selected Value Fund | 0.88% |
| Russell Midcap Value Index | 0.47 |
| Mid-Cap Value Funds Average | 0.92 |
| Mid-Cap Value Funds Average: Derived from data provided by Lipper, a Thomson Reuters Company. |
| | | | |
| Your Fund’s Performance at a Glance | | | | |
| October 31, 2014, Through October 31, 2015 | | | | |
| |
| | | | Distributions Per Share |
| | Starting | Ending | | |
| | Share | Share | Income | Capital |
| | Price | Price | Dividends | Gains |
| Vanguard Selected Value Fund | $29.49 | $28.15 | $0.404 | $1.169 |
1

Chairman’s Letter
Dear Shareholder,
Compared with the previous few years, U.S. stock returns were generally restrained for the 12 months ended October 31, 2015. Neither mid-capitalization nor value stocks, which are the focus of Vanguard Selected Value Fund, measured up to the broad market. The fund returned close to 1%, a bit better than its benchmark, the Russell Midcap Value Index, and about the same as the average return of its mid-cap value peers.
The fund and its benchmark traveled very different routes to reach those results. Selected Value far outdistanced its benchmark in the consumer discretionary, consumer staples, and health care sectors, but lagged in financials, energy, and information technology. Selected Value’s cash position, about 6% as of the end of the period, weighed slightly on returns. (The advisors have the flexibility to hold cash when they cannot find attractive stocks that meet their strict valuation criteria.)
If you hold shares in a taxable account, you may wish to review the table and discussion on after-tax returns for the fiscal year that appear later in this report.
On a separate note, I’d like to recognize Vanguard Selected Value Fund’s tenth anniversary with advisor Donald Smith & Co., Inc., and portfolio managers Don Smith and Rich Greenberg. The fund launched in 1996 and Donald and his namesake firm, along with Richard, began advising it in 2005.
2
U.S. stock market fluctuated on its way to modest returns
The broad U.S. stock market returned more than 4% for the fiscal year ended October 31. Stocks generally climbed during the first nine months before dropping sharply in August and September. Fears surfaced in late summer that slower economic growth in China would spread across the globe.
In October, however, stocks rallied as the Federal Reserve maintained its historically low short-term interest rates. Central banks in Europe and Asia also signaled or implemented additional stimulus measures to counter sluggish growth and low inflation. Corporate earnings, although generally lower than in the past couple of years, mostly exceeded expectations.
The strength of the U.S. dollar against foreign currencies contributed to a return of about –4% for international stocks. Returns for the developed markets of the Pacific region and Europe were essentially flat. Stocks tumbled in emerging markets, where concerns about China seemed to weigh most heavily.
| | | |
| Market Barometer | | | |
| |
| | Average Annual Total Returns |
| | Periods Ended October 31, 2015 |
| | One | Three | Five |
| | Year | Years | Years |
| Stocks | | | |
| Russell 1000 Index (Large-caps) | 4.86% | 16.28% | 14.32% |
| Russell 2000 Index (Small-caps) | 0.34 | 13.90 | 12.06 |
| Russell 3000 Index (Broad U.S. market) | 4.49 | 16.09 | 14.14 |
| FTSE All-World ex US Index (International) | -3.83 | 5.20 | 2.99 |
| |
| Bonds | | | |
| Barclays U.S. Aggregate Bond Index (Broad taxable market) | 1.96% | 1.65% | 3.03% |
| Barclays Municipal Bond Index (Broad tax-exempt market) | 2.87 | 2.91 | 4.28 |
| Citigroup Three-Month U.S. Treasury Bill Index | 0.02 | 0.02 | 0.04 |
| |
| CPI | | | |
| Consumer Price Index | 0.17% | 0.93% | 1.69% |
3
The consumer sectors soared; financials and energy soured
Selected Value’s three advisors––Barrow, Hanley, Mewhinney & Strauss, Donald Smith & Co., and Pzena Investment Management––manage their respective portions of the fund separately.
They all have extensive experience as value-oriented investors and rely on deep research to find stocks of companies that, in their view, haven’t been adequately recognized or rewarded by the markets. They make a solid commitment when they invest in a stock, tucking it firmly into the portfolio until its fundamentals change or it no longer meets their strict criteria.
The fund performed well in the consumer discretionary and consumer staples sectors. Its consumer discretionary stocks returned about 24%, almost four times as much as their benchmark counterparts. Several apparel companies led the way, helped by cruise lines and auto parts firms. Outperformance was even more striking in consumer staples: Returns in this lightly held sector approached 60% and lifted the fund’s overall results, while the benchmark’s holdings returned 10%.
Health care is not a mainstay of the fund, as it isn’t traditionally considered a source of value-oriented stocks. For this fiscal year, however, Selected Value got a
| | |
| Expense Ratios | | |
| Your Fund Compared With Its Peer Group | | |
| |
| | | Peer Group |
| | Fund | Average |
| Selected Value Fund | 0.44% | 1.29% |
The fund expense ratio shown is from the prospectus dated February 25, 2015, and represents estimated costs for the current fiscal year. For
the fiscal year ended October 31, 2015, the fund’s expense ratio was 0.39%. The peer-group expense ratio is derived from data provided by
Lipper, a Thomson Reuters Company, and captures information through year-end 2014.
Peer group: Mid-Cap Value Funds.
4
boost from its holdings in the health care providers and services segment. Its technology stocks returned less than 2%, lagging the benchmark by nearly 5 percentage points. Strong results from IT services firms offset poor results from semiconductor companies.
The fund recorded negative returns in five of the nine industry sectors it had exposure to. Most dramatic was the troubled energy sector, where low oil prices plagued most of the industry. The fund’s holdings returned about –50%, while their benchmark counterparts returned –37%.
Financials, which at almost 30% of assets is the fund’s largest sector weighting, returned about –3%, behind the benchmark’s return of almost 5%. Selected Value’s consumer finance firms and REITs (real estate investment trusts) had the most difficulties; its multiline insurance and asset management segments also hit rough patches.
You can find more information on the fund’s positioning and performance in the Advisors’ Report that follows this letter.
| |
| Total Returns | |
| Ten Years Ended October 31, 2015 | |
| | Average |
| | Annual Return |
| Selected Value Fund | 8.63% |
| Russell Midcap Value Index | 8.39 |
| Mid-Cap Value Funds Average | 7.52 |
| Mid-Cap Value Funds Average: Derived from data provided by Lipper, a Thomson Reuters Company. |
The figures shown represent past performance, which is not a guarantee of future results. (Current performance may be
lower or higher than the performance data cited. For performance data current to the most recent month-end, visit our
website at vanguard.com/performance.) Note, too, that both investment returns and principal value can fluctuate widely, so
an investor’s shares, when sold, could be worth more or less than their original cost.
5
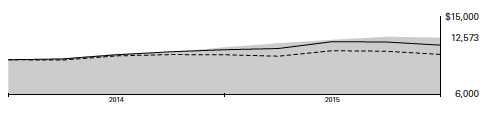
|
| Staying the course can help you stay closer to your fund’s return |
| |
| When stock markets are highly volatile, as in recent months, it’s tempting to run for cover. |
| But the price of panic can be high. |
| |
| A rough measure of what can be lost from attempts to time the market is the difference |
| between the returns produced by a fund and the returns earned by the fund’s investors. |
| |
| The results shown in your fund’s Performance Summary later in this report are its time- |
| weighted returns—the average annual returns investors would have earned if they had |
| invested a lump sum in the fund at the start of the period and reinvested any distributions |
| they received. Their actual returns, however, depend on whether they subsequently bought |
| or sold any shares. There’s often a gap between this dollar-weighted return for investors and |
| the fund’s time-weighted return, as shown below. |
| |
| Many sensible investment behaviors can contribute to the difference in returns, but industry |
| cash flow data suggest that one important factor is the generally counterproductive effort to |
| buy and sell at the “right” time. Keeping your emotions in check can help narrow the gap. |
| |
| Mutual fund returns and investor returns over the last decade |
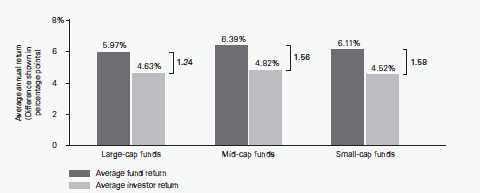
| Notes: Data are as of September 30, 2015. The average fund returns and average investor returns are from Morningstar. The average fund |
| returns are the average of the funds’ time-weighted returns in each category. The average investor returns assume that the growth of a |
| fund’s total net assets for a given period is driven by market returns and investor cash flow. To calculate investor return, a fund’s change |
| in assets for the period is discounted by the return of the fund to isolate how much of the asset growth was driven by cash flow. A model, |
| similar to an internal rate-of-return calculation, is then used to calculate a constant growth rate that links the beginning total net assets |
| and periodic cash flows to the ending total net assets. Amounts may not add up exactly because of rounding. |
| Sources: Vanguard and Morningstar, Inc. |
6
Dips and detours are common as fund strives for strong returns
The advisors’ patient approach, along with a relatively concentrated portfolio, results in a collection of stocks that looks significantly different than those held by the benchmark. At times, the advisors’ conviction and enduring investment process can result in short-term underperformance, an occurrence that can be frustrating but is sometimes necessary for the fund to achieve its desired long-term outcome.
For the ten years ended October 31, Selected Value Fund produced an average annual return of 8.63%. Its benchmark (which bears no expenses) returned 8.39% over the same period; its peer group, 7.52%.
Selected Value is served well by the advisors’ experience, skill, and knowledge, and by its low costs, which allow you to keep more of the fund’s return.
A dose of discipline is crucial when markets become volatile
The developments over the past few months remind us that nobody can control the direction of the markets or reliably predict where they’ll go in the short term. However, investors can control how they react to unstable and turbulent markets.
During periods of market adversity, it’s more important than ever to keep sight of one of Vanguard’s key principles: Maintain perspective and long-term discipline. Whether you’re investing for yourself or on behalf of clients, your success is affected greatly by how you respond—or don’t respond—during turbulent markets. (You can read Vanguard’s Principles for Investing Success at vanguard.com/research.)
As I’ve written in the past, the best course for long-term investors is generally to ignore daily market moves and not make decisions based on emotion. This is also a good time to evaluate your portfolio and make sure your asset allocation is aligned with your time horizon, goals, and risk tolerance.
The markets are unpredictable and often confounding. Keeping your long-term plans clearly in focus can help you weather these periodic storms.
As always, thank you for investing with Vanguard.
Sincerely,

F. William McNabb III
Chairman and Chief Executive Officer
November 17, 2015
7
Advisors’ Report
For the fiscal year ended October 31, 2015, Vanguard Selected Value Fund returned 0.88%. Your fund is managed by three independent advisors. This provides exposure to distinct yet complementary investment approaches, enhancing the fund’s diversification. It is not uncommon for different advisors to have different views about individual securities or the broader investment environment.
The advisors, the percentage and amount of fund assets each manages, and a brief description of their investment strategies are presented in the table below. The advisors have also prepared a discussion of the investment environment that existed during the fiscal period and of how portfolio positioning reflects this assessment. (Please note that the Pzena Investment Management discussion refers to industry sectors as defined by Russell classifications, rather than by the Global Industry Classification Standard used elsewhere in this report.) These comments were prepared on November 19, 2015.
| | | |
| Vanguard Selected Value Fund Investment Advisors | |
| |
| | Fund Assets Managed | |
| Investment Advisor | % | $ Million | Investment Strategy |
| Barrow, Hanley, Mewhinney & | 63 | 6,133 | Conducts fundamental research on individual stocks |
| Strauss, LLC | | | exhibiting traditional value characteristics: |
| | | | price/earnings and price/book ratios below the market |
| | | | average and dividend yields above the market average. |
| Donald Smith & Co., Inc. | 21 | 2,066 | Conducts fundamental research on the lowest |
| | | | price-to-tangible book value companies. Research |
| | | | focuses on underlying quality of book value and assets, |
| | | | and on long-term earnings potential. |
| Pzena Investment Management, | 13 | 1,300 | Uses a fundamental, bottom-up, deep-value-oriented |
| LLC | | | investment strategy. Seeks to buy good businesses at |
| | | | low prices, focusing exclusively on companies that are |
| | | | underperforming their historically demonstrated |
| | | | earnings power. |
| Cash Investments | 3 | 164 | These short-term reserves are invested by Vanguard in |
| | | | equity index products to simulate investment in stocks. |
| | | | Each advisor may also maintain a cash position. |
8
Barrow, Hanley, Mewhinney &
Strauss, LLC
Portfolio Managers:
James P. Barrow,
Executive Director
Mark Giambrone,
Managing Director
Stocks advanced moderately in the last 12 months as the market struggled to balance improving economic data with the prospects for rising interest rates and the strong dollar. This type of environment often produces solid results for value stocks with high dividend yields, and our return was better than that of the market. Because we have positioned our portfolio in anticipation of continued modest economic data and the rising rates that should follow, our largest positions are in the financial sector, where higher rates will mean higher profits, and in those sectors that thrive during economic uplifts, such as industrials and consumer discretionary.
We continue to benefit from a pickup in merger and acquisition (M&A) activity, with take-outs of two of our holdings announced during the period. Our positioning in health care has been especially fruitful, as Omnicare and Cigna were targeted for acquisition during the past year. If we are finding good companies with attractive valuations and cash flow, and the market
doesn’t recognize this, we consider it a proof statement of the efficacy of our process to then see a financial or strategic buyer come along. We expect to continue to see additional activity over time, as First Niagara Financial Group and New York Community Bancorp were also involved in M&A activity after the end of the fiscal year.
Our financial holdings detracted meaningfully from returns, mainly because of continued low interest rates. We have been underweighted in REITs (real estate investment trusts) and overweighted in companies focused on lending. REITs have done well, as their valuations rise on low interest rates, while lending-center companies have suffered, as they need rate increases to improve margins. Thus, low interest rates have hindered returns over the last few years. If economic data remain good, however, we expect that rising rates will help returns.
We are underweighted in information technology, utilities, materials, and, as noted above, REITs. We believe that traditional yield plays like utilities and REITs have had substantial runs because of the continued low interest rate environment and now have very little room for valuation upside or meaningful yield relative to their own histories. We also see considerable risk to their valuation levels should interest rates rise.
9
Donald Smith & Co., Inc.
Portfolio Managers:
Donald G. Smith, President
and Chief Investment Officer
Richard L. Greenberg, CFA,
Senior Vice President
The portfolio continues to meet our criteria of owning a concentrated selection of low price-to-tangible book value stocks with attractive long-term earnings potential. It currently sells at 95% of tangible book value and 7.6 times our estimate of normalized earnings. In contrast, the Standard & Poor’s 500 Index sells at over 5 times tangible book value and 16 times normalized earnings.
During the last year, the portfolio’s largest detractor by far was Micron Technology, which declined 50% over the past year after a spectacular run that saw its stock rise 400% from the beginning of 2013. Slackening demand for personal computers led to pricing weakness in PC DRAM (dynamic random access memory), a product that accounts for over 20% of Micron’s sales. We still believe that the memory industry has undergone a structural change, shrinking to only a handful of competitors, and that the magnitude of industry pricing downturns will be less steep than in past cycles. The interest shown by a Chinese company in buying Micron highlights the inherent value of the company’s assets and technology.
Commodity stocks––namely, energy and precious metals––were the other large losers for the portfolio; their decline mirrored that of oil and gold prices.
WPX Energy (–64.1%) and Yamana Gold (–43.8%) detracted most. Commodity companies constitute over 40% of the lowest price/book value decile, and they account for the majority of the poor performance of the decile over the last year. Thanks to our long-standing caution over oil prices, we have been underweighted in energy stocks relative to this decile, preferring gas-oriented companies; any exposure to this area, however, has hurt performance. On the positive side, JetBlue Airways (+115.2%) benefited from both lower oil prices and internal profit enhancement actions, as did Royal Caribbean Cruises (+47.0%).
We sold our positions in Peabody Energy and Exelon. We purchased Aspen Insurance Holdings, a reinsurance and insurance company, at about book value. Meeting its stated goal of an 11% return on equity in 2015 would likely drive the stock to a premium to book value. Aspen is a prime takeover target; in 2014, the company rejected an offer from Endurance at a substantial premium to book value. We purchased MFA Financial, a mortgage REIT, at 89% of tangible book value. The stock yields 11.4%, and the company is one of the mortgage REITs least vulnerable to rising interest rates.
10
Our largest position is in AerCap. The stock sells at approximately book value, below fair market value, and 7 times current earnings. We expect the company to be able to restart its stock buyback program by first quarter 2016. Insurance is the largest industry weighting. On average, our insurance holdings sell at about book value and 11 times earnings. Other large weightings include airlines/ aircraft leasing and technology.
We believe that rising interest rates that result from strengthening worldwide economies would generally benefit the portfolio. Insurers would earn more on their investments, while technology and commodity companies would be helped by stronger demand. Until this growth is evident, it is possible that investors will continue to seek safe havens in the narrow universe of large-cap growth companies—though we believe their high valuations make these stocks anything but safe. In this uncertain environment, we are comforted by the generally strong balance sheets and cash flows exhibited by most of our holdings; the fact that over one-half of our holdings have active stock buyback programs is evidence of strong balance sheets, as well as managements’ belief in the undervaluation of their assets.
Pzena Investment Management, LLC
Portfolio Managers:
Richard S. Pzena, Founder,
Chief Executive Officer, and
Co-Chief Investment Officer
Manoj Tandon, Principal,
Co-Director of Research
Eli Rabinowich, Principal
Stocks were generally strong in the first half of the year, only to reverse most of their gains in the second half. As a result, the Russell Midcap Value Index, the fund’s benchmark, was up slightly in a year where investor behavior was influenced by oil prices, which declined sharply, and anticipation of a rise in the short-term interest rate. Over the past year, our portfolio benefited from stock selection in the materials and processing, technology, and financial services sectors. These results were slightly offset by positioning in producer durables and consumer staples.
Strong results were spread broadly across the portfolio. The largest individual contributor was ON Semiconductor Corporation, which performed well in a year that featured strong design wins, market share gains in the automotive and computing space, and positive guidance for 2017 targets.
11
Our managed health care holdings performed well, led by Cigna and Aetna. HMOs were up as investors gained comfort with the sustainability of earnings growth after the implementation of the Affordable Care Act, and on better-than-expected medical cost trends. Cigna’s shares further increased on the takeover offer by Anthem. Within financials, property and casualty insurance holdings performed well, led by Progressive, which benefited from strong results as net premiums written grew by 16%. Owens Corning, a roofing and insulation manufacturer, issued strong results and above-consensus guidance, resulting in a solid 12-month return. The business continued to show revenue growth and margin improvement amid a recovery in new residential construction.
The largest detractors were Murphy Oil and Superior Energy Services, reflecting the depressed oil prices. We continue to
believe that Murphy Oil has a solid mix of assets and a balance sheet that can withstand a prolonged period of low oil prices. Superior Energy also has a strong balance sheet and is well positioned to participate in an eventual rebound in capital spending by energy companies. We took advantage of the weakness to add to our positions. Another top detractor was producer durable holding Terex. Its price fell because of the firm’s exposure to the oil and gas sector (margins in the aerial work platform division were weaker than expected), and because its merger partner, Konecranes, issued a profit warning.
Overall, the portfolio continues to consist of companies that we believe are of high quality. Our largest exposure is to the insurance, advertising, and technology segments, where we believe valuations are attractive.
12
Selected Value Fund
Fund Profile
As of October 31, 2015
| | | |
| Portfolio Characteristics | | |
| | | | DJ |
| | | | U.S. |
| | | Russell | Total |
| | | Midcap | Market |
| | | Value | FA |
| | Fund | Index | Index |
| Number of Stocks | 123 | 558 | 3,971 |
| Median Market Cap | $9.9B | $10.3B | $51.0B |
| Price/Earnings Ratio | 16.8x | 22.4x | 21.9x |
| Price/Book Ratio | 1.7x | 1.7x | 2.7x |
| Return on Equity | 13.5% | 10.2% | 17.2% |
| Earnings Growth | | | |
| Rate | 9.4% | 6.7% | 9.9% |
| Dividend Yield | 2.2% | 2.3% | 2.0% |
| Foreign Holdings | 8.1% | 0.0% | 0.0% |
| Turnover Rate | 24% | — | — |
| Ticker Symbol | VASVX | — | — |
| Expense Ratio1 | 0.44% | — | — |
| 30-Day SEC Yield | 1.47% | — | — |
| Short-Term | | | |
| Reserves | 5.5% | — | — |
| | | |
| Sector Diversification (% of equity exposure) |
| | | Russell | DJ |
| | | Midcap | U.S. Total |
| | | Value | Market |
| | Fund | Index | FA Index |
| Consumer | | | |
| Discretionary | 18.0% | 8.4% | 13.7% |
| Consumer Staples | 3.6 | 3.9 | 8.5 |
| Energy | 5.0 | 9.2 | 6.5 |
| Financials | 28.8 | 33.3 | 17.9 |
| Health Care | 6.7 | 5.9 | 14.2 |
| Industrials | 20.4 | 9.8 | 10.7 |
| Information | | | |
| Technology | 8.6 | 9.9 | 20.1 |
| Materials | 4.8 | 6.3 | 3.3 |
| Telecommunication | | | |
| Services | 0.1 | 1.6 | 2.1 |
| Utilities | 4.0 | 11.7 | 3.0 |
| | |
| Volatility Measures | | |
| | Russell | DJ |
| | Midcap | U.S. Total |
| | Value | Market |
| | Index | FA Index |
| R-Squared | 0.86 | 0.90 |
| Beta | 0.96 | 0.98 |
| These measures show the degree and timing of the fund’s fluctuations compared with the indexes over 36 months. |
| | |
| Ten Largest Holdings (% of total net assets) |
| Royal Caribbean Cruises | Hotels, Resorts & | |
| Ltd. | Cruise Lines | 3.2% |
| Reynolds American Inc. | Tobacco | 3.0 |
| Hanesbrands Inc. | Apparel, Accessories | |
| | & Luxury Goods | 2.8 |
| Stanley Black & Decker | | |
| Inc. | Industrial Machinery | 2.5 |
| Total System Services | Data Processing & | |
| Inc. | Outsourced Services | 2.5 |
| Owens Corning | Building Products | 2.5 |
| Cigna Corp. | Managed Health | |
| | Care | 2.3 |
| Delphi Automotive plc | Auto Parts & | |
| | Equipment | 2.3 |
| Cardinal Health Inc. | Health Care | |
| | Distributors | 2.1 |
| Norwegian Cruise Line | Hotels, Resorts & | |
| Holdings Ltd. | Cruise Lines | 1.9 |
| Top Ten | | 25.1% |
| The holdings listed exclude any temporary cash investments and equity index products. |
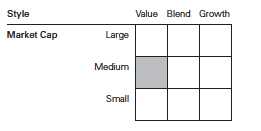
Investment Focus
1 The expense ratio shown is from the prospectus dated February 25, 2015, and represents estimated costs for the current fiscal year. For the fiscal
year ended October 31, 2015, the expense ratio was 0.39%.
13
Selected Value Fund
Performance Summary
All of the returns in this report represent past performance, which is not a guarantee of future results that may be achieved by the fund. (Current performance may be lower or higher than the performance data cited. For performance data current to the most recent month-end, visit our website at vanguard.com/performance.) Note, too, that both investment returns and principal value can fluctuate widely, so an investor’s shares, when sold, could be worth more or less than their original cost. The returns shown do not reflect taxes that a shareholder would pay on fund distributions or on the sale of fund shares.
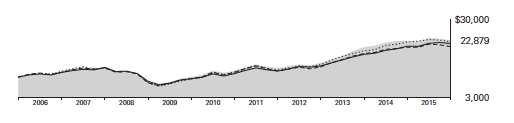
Cumulative Performance: October 31, 2005, Through October 31, 2015
Initial Investment of $10,000
| | | | | |
| | | Average Annual Total Returns | |
| | | Periods Ended October 31, 2015 | |
| | | | | | Final Value |
| | | One | Five | Ten | of a $10,000 |
| | | Year | Years | Years | Investment |
| | Selected Value Fund* | 0.88% | 13.35% | 8.63% | $22,879 |
| •••••••• | Russell Midcap Value Index | 0.47 | 13.64 | 8.39 | 22,388 |
| – – – – | Mid-Cap Value Funds Average | 0.92 | 12.15 | 7.52 | 20,654 |
| | Dow Jones U.S. Total Stock Market | | | | |
| | Float Adjusted Index | 4.40 | 14.11 | 8.07 | 21,735 |
| Mid-Cap Value Funds Average: Derived from data provided by Lipper, a Thomson Reuters Company. |
See Financial Highlights for dividend and capital gains information.
14
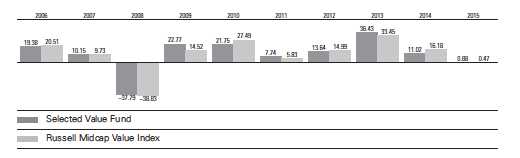
Selected Value Fund
Fiscal-Year Total Returns (%): October 31, 2005, Through October 31, 2015
Average Annual Total Returns: Periods Ended September 30, 2015
This table presents returns through the latest calendar quarter—rather than through the end of the fiscal period.
Securities and Exchange Commission rules require that we provide this information.
| | | | |
| | Inception | One | Five | Ten |
| | Date | Year | Years | Years |
| Selected Value Fund | 2/15/1996 | -4.25% | 12.65% | 7.54% |
15
Selected Value Fund
Financial Statements
Statement of Net Assets
As of October 31, 2015
The fund reports a complete list of its holdings in regulatory filings four times in each fiscal year, at the quarter-ends. For the second and fourth fiscal quarters, the lists appear in the fund’s semiannual and annual reports to shareholders. For the first and third fiscal quarters, the fund files the lists with the Securities and Exchange Commission on Form N-Q. Shareholders can look up the fund’s Forms N-Q on the SEC’s website at sec.gov. Forms N-Q may also be reviewed and copied at the SEC’s Public Reference Room (see the back cover of this report for further information).
| | | |
| | | | Market |
| | | | Value• |
| | | Shares | ($000) |
| Common Stocks (93.3%)1 | | |
| Consumer Discretionary (16.9%) | |
| | Royal Caribbean Cruises | | |
| | Ltd. | 3,167,345 | 311,508 |
| | Hanesbrands Inc. | 8,348,700 | 266,658 |
| | Delphi Automotive plc | 2,714,000 | 225,778 |
| * | Norwegian Cruise Line | | |
| | Holdings Ltd. | 2,864,200 | 182,220 |
| | L Brands Inc. | 1,889,800 | 181,383 |
| | Whirlpool Corp. | 1,018,900 | 163,167 |
| 2 | SeaWorld Entertainment | | |
| | Inc. | 5,141,400 | 102,468 |
| | Interpublic Group of Cos. | | |
| | Inc. | 1,881,994 | 43,154 |
| | Omnicom Group Inc. | 533,025 | 39,934 |
| | News Corp. Class A | 2,298,100 | 35,391 |
| | Dana Holding Corp. | 1,489,275 | 25,020 |
| | Staples Inc. | 1,802,725 | 23,417 |
| | Meredith Corp. | 394,800 | 18,564 |
| | News Corp. Class B | 643,700 | 9,964 |
| | | | 1,628,626 |
| Consumer Staples (3.2%) | | |
| | Reynolds American Inc. | 6,063,476 | 292,987 |
| | Kellogg Co. | 296,600 | 20,916 |
| | | | 313,903 |
| Energy (4.6%) | | |
| | Golar LNG Ltd. | 4,370,308 | 126,783 |
| | PBF Energy Inc. Class A | 2,275,752 | 77,375 |
| * | WPX Energy Inc. | 6,469,194 | 44,379 |
| ^ | Noble Corp. plc | 3,160,316 | 42,569 |
| | Murphy Oil Corp. | 892,850 | 25,384 |
| *,^ | Seadrill Ltd. | 3,301,300 | 21,359 |
| | Superior Energy Services | | |
| | Inc. | 1,481,750 | 20,982 |
| | Cenovus Energy Inc. | 1,359,400 | 20,269 |
| | Apache Corp. | 424,625 | 20,013 |
| | Rowan Cos. plc Class A | 730,525 | 14,377 |
| | Baker Hughes Inc. | 222,550 | 11,724 |
| | Nabors Industries Ltd. | 885,000 | 8,885 |
| | | |
| | Valero Energy Corp. | 106,000 | 6,987 |
| | Tidewater Inc. | 556,400 | 6,871 |
| ^ | Paragon Offshore plc | 870,105 | 209 |
| | | | 448,166 |
| Financials (27.0%) | | |
| | Discover Financial | | |
| | Services | 3,217,300 | 180,877 |
| | XL Group plc Class A | 4,603,630 | 175,306 |
| | Capital One Financial | | |
| | Corp. | 2,207,600 | 174,180 |
| | Fifth Third Bancorp | 8,598,775 | 163,807 |
| | Ameriprise Financial Inc. | 1,314,700 | 151,664 |
| | New York Community | | |
| | Bancorp Inc. | 9,056,200 | 149,608 |
| | Unum Group | 4,292,805 | 148,746 |
| | Willis Group Holdings plc | 2,974,975 | 132,714 |
| | Host Hotels & Resorts | | |
| | Inc. | 7,130,600 | 123,573 |
| | Navient Corp. | 8,676,447 | 114,442 |
| | People’s United Financial | | |
| | Inc. | 6,554,600 | 104,546 |
| | CNA Financial Corp. | 2,259,996 | 82,625 |
| | Everest Re Group Ltd. | 429,037 | 76,356 |
| | First Niagara Financial | | |
| | Group Inc. | 6,784,200 | 70,217 |
| | Validus Holdings Ltd. | 1,557,005 | 68,975 |
| | Corporate Office | | |
| | Properties Trust | 2,812,800 | 64,694 |
| | Valley National Bancorp | 6,006,800 | 63,071 |
| * | Element Financial Corp. | 4,215,200 | 54,511 |
| | Lamar Advertising Co. | | |
| | Class A | 752,150 | 42,444 |
| | Axis Capital Holdings Ltd. | 690,000 | 37,260 |
| | Progressive Corp. | 1,072,450 | 35,530 |
| | Torchmark Corp. | 598,608 | 34,725 |
| * | SLM Corp. | 4,507,900 | 31,826 |
| | Aspen Insurance Holdings | | |
| | Ltd. | 649,830 | 31,588 |
| | Franklin Resources Inc. | 653,100 | 26,620 |
16
Selected Value Fund
| | | |
| | | | Market |
| | | | Value• |
| | | Shares | ($000) |
| | American National | | |
| | Insurance Co. | 254,722 | 26,308 |
| | Voya Financial Inc. | 627,465 | 25,456 |
| | Webster Financial Corp. | 583,775 | 21,658 |
| | Legg Mason Inc. | 439,100 | 19,650 |
| | Regions Financial Corp. | 2,088,100 | 19,524 |
| | Comerica Inc. | 438,450 | 19,029 |
| | Hospitality Properties | | |
| | Trust | 583,800 | 15,669 |
| | Invesco Ltd. | 465,650 | 15,446 |
| | Hartford Financial Services | |
| | Group Inc. | 313,800 | 14,516 |
| | Endurance Specialty | | |
| | Holdings Ltd. | 219,125 | 13,833 |
| | EPR Properties | 239,975 | 13,633 |
| | Synovus Financial Corp. | 420,221 | 13,292 |
| | Allstate Corp. | 207,575 | 12,845 |
| | KeyCorp | 916,525 | 11,383 |
| | MFA Financial Inc. | 1,600,100 | 11,073 |
| | Assurant Inc. | 80,045 | 6,526 |
| | Primerica Inc. | 96,553 | 4,599 |
| * | Genworth Financial Inc. | | |
| | Class A | 914,500 | 4,280 |
| | Citizens Financial Group | | |
| | Inc. | 151,150 | 3,673 |
| | | | 2,612,298 |
| Health Care (6.1%) | | |
| | Cigna Corp. | 1,689,957 | 226,522 |
| | Cardinal Health Inc. | 2,448,100 | 201,234 |
| | St. Jude Medical Inc. | 2,276,100 | 145,238 |
| | Aetna Inc. | 109,575 | 12,577 |
| | | | 585,571 |
| Industrials (19.2%) | | |
| | Stanley Black & Decker | | |
| | Inc. | 2,310,375 | 244,854 |
| | Owens Corning | 5,268,572 | 239,878 |
| * | AerCap Holdings NV | 4,273,188 | 177,337 |
| * | JetBlue Airways Corp. | 6,138,340 | 152,476 |
| * | Spirit AeroSystems | | |
| | Holdings Inc. Class A | 2,421,507 | 127,710 |
| | Eaton Corp. plc | 2,283,000 | 127,643 |
| | Tyco International plc | 3,124,100 | 113,842 |
| ^ | CNH Industrial NV | 16,692,100 | 113,339 |
| | KBR Inc. | 5,925,975 | 109,275 |
| *,2 | SPX FLOW Inc. | 2,496,500 | 84,631 |
| | Xylem Inc. | 2,091,600 | 76,155 |
| | Ryder System Inc. | 954,800 | 68,536 |
| *,^ | Air France-KLM ADR | 7,538,085 | 54,915 |
| | Joy Global Inc. | 2,192,800 | 37,672 |
| * | AECOM | 1,122,860 | 33,091 |
| | Parker-Hannifin Corp. | 272,375 | 28,518 |
| | Terex Corp. | 1,250,765 | 25,090 |
| | Dover Corp. | 310,525 | 20,007 |
| | Actuant Corp. Class A | 840,675 | 19,168 |
| | | | 1,854,137 |
| | | | |
| Information Technology (7.8%) | |
| | Total System Services | | |
| | Inc. | | 4,661,479 | 244,495 |
| | Ingram Micro Inc. | | 5,098,784 | 151,842 |
| * | Micron Technology Inc. | 8,980,588 | 148,718 |
| | Hewlett-Packard Co. | 1,416,150 | 38,179 |
| | Avnet Inc. | | 738,866 | 33,567 |
| * | ON Semiconductor Corp. | 2,880,421 | 31,685 |
| * | Flextronics International | | |
| | Ltd. | | 2,423,850 | 27,608 |
| * | Celestica Inc. | | 2,206,793 | 24,760 |
| * | Genpact Ltd. | | 760,452 | 18,844 |
| | Jabil Circuit Inc. | | 553,840 | 12,727 |
| * | Arrow Electronics Inc. | 227,954 | 12,535 |
| | CDW Corp. | | 173,790 | 7,767 |
| | | | | 752,727 |
| Materials (4.5%) | | | |
| | CRH plc ADR | | 5,655,100 | 154,724 |
| | FMC Corp. | | 2,696,300 | 109,766 |
| * | Kinross Gold Corp. | | 49,757,791 | 100,013 |
| | Yamana Gold Inc. | | | |
| | (New York Shares) | 24,088,851 | 52,755 |
| * | New Gold Inc. | | 4,949,152 | 12,125 |
| * | Coeur Mining Inc. | | 825,000 | 2,227 |
| | | | | 431,610 |
| Other (0.3%) | | | |
| ^,3 | Vanguard Mid-Cap Value | | |
| | ETF | | 334,800 | 29,626 |
| |
| Utilities (3.7%) | | | |
| | Pinnacle West Capital | | |
| | Corp. | | 2,203,500 | 139,944 |
| | Xcel Energy Inc. | | 3,348,437 | 119,305 |
| | CenterPoint Energy Inc. | 2,234,617 | 41,452 |
| | Edison International | 438,475 | 26,537 |
| | PG&E Corp. | | 262,800 | 14,034 |
| | NRG Energy Inc. | | 796,234 | 10,263 |
| | Exelon Corp. | | 333,668 | 9,316 |
| | | | | 360,851 |
| Total Common Stocks | | |
| (Cost $7,211,152) | | | 9,017,515 |
| Temporary Cash Investments (7.4%)1 | |
| Money Market Fund (7.3%) | | |
| 4,5 | Vanguard Market | | | |
| | Liquidity Fund, | | | |
| | 0.207% | 708,714,719 | 708,715 |
17
Selected Value Fund
| | |
| | Face | Market |
| | Amount | Value• |
| | ($000) | ($000) |
| U.S. Government and Agency Obligations (0.1%) |
| 6,7 Federal Home Loan | | |
| Bank Discount Notes, | | |
| 0.208%, 12/9/15 | 8,000 | 7,999 |
| Total Temporary Cash Investments | |
| (Cost $716,713) | | 716,714 |
| Total Investments (100.7%) | | |
| (Cost $7,927,865) | | 9,734,229 |
| |
| | | Amount |
| | | ($000) |
| Other Assets and Liabilities (-0.7%) | |
| Other Assets | | |
| Investment in Vanguard | | 835 |
| Receivables for Investment Securities Sold 91,560 |
| Receivables for Accrued Income | 8,074 |
| Receivables for Capital Shares Issued | 4,676 |
| Other Assets | | 192 |
| Total Other Assets | | 105,337 |
| Liabilities | | |
| Payables for Investment Securities | |
| Purchased | | (94,811) |
| Collateral for Securities on Loan | (61,521) |
| Payables to Investment Advisor | (4,859) |
| Payables for Capital Shares Redeemed | (3,845) |
| Payables to Vanguard | | (10,811) |
| Other Liabilities | | (373) |
| Total Liabilities | | (176,220) |
| Net Assets (100%) | | |
| Applicable to 343,231,365 outstanding | |
| $.001 par value shares of beneficial | |
| interest (unlimited authorization) | 9,663,346 |
| Net Asset Value Per Share | | $28.15 |
| |
| At October 31, 2015, net assets consisted of: |
| | Amount |
| | ($000) |
| Paid-in Capital | 7,402,921 |
| Undistributed Net Investment Income | 106,036 |
| Accumulated Net Realized Gains | 341,870 |
| Unrealized Appreciation (Depreciation) | |
| Investment Securities | 1,806,364 |
| Futures Contracts | 6,155 |
| Net Assets | 9,663,346 |
• See Note A in Notes to Financial Statements.
* Non-income-producing security.
^ Includes partial security positions on loan to broker-dealers. The total value of securities on loan is $57,913,000.
1 The fund invests a portion of its cash reserves in equity markets through the use of index futures contracts. After giving effect to futures
investments, the fund’s effective common stock and temporary cash investment positions represent 94.7% and 6.0%, respectively,
of net assets.
2 Considered an affiliated company of the fund as the fund owns more than 5% of the outstanding voting securities of such company.
3 Considered an affiliated company of the fund as the issuer is another member of The Vanguard Group.
4 Affiliated money market fund available only to Vanguard funds and certain trusts and accounts managed by Vanguard. Rate shown is the
7-day yield.
5 Includes $61,521,000 of collateral received for securities on loan.
6 The issuer operates under a congressional charter; its securities are generally neither guaranteed by the U.S. Treasury nor backed by the
full faith and credit of the U.S. government.
7 Securities with a value of $6,299,000 have been segregated as initial margin for open futures contracts.
ADR—American Depositary Receipt.
See accompanying Notes, which are an integral part of the Financial Statements.
18
Selected Value Fund
Statement of Operations
| |
| | Year Ended |
| | October 31, 2015 |
| | ($000) |
| Investment Income | |
| Income | |
| Dividends1 | 200,674 |
| Interest | 1,200 |
| Securities Lending | 833 |
| Total Income | 202,707 |
| Expenses | |
| Investment Advisory Fees—Note B | |
| Basic Fee | 21,513 |
| Performance Adjustment | (1,625) |
| The Vanguard Group—Note C | |
| Management and Administrative | 16,562 |
| Marketing and Distribution | 2,261 |
| Custodian Fees | 104 |
| Auditing Fees | 34 |
| Shareholders’ Reports | 182 |
| Trustees’ Fees and Expenses | 16 |
| Total Expenses | 39,047 |
| Expenses Paid Indirectly | (130) |
| Net Expenses | 38,917 |
| Net Investment Income | 163,790 |
| Realized Net Gain (Loss) | |
| Investment Securities Sold | 377,949 |
| Futures Contracts | 1,807 |
| Foreign Currencies | (34) |
| Realized Net Gain (Loss) | 379,722 |
| Change in Unrealized Appreciation (Depreciation) | |
| Investment Securities | (449,907) |
| Futures Contracts | 5,317 |
| Change in Unrealized Appreciation (Depreciation) | (444,590) |
| Net Increase (Decrease) in Net Assets Resulting from Operations | 98,922 |
| 1 Dividends are net of foreign withholding taxes of $212,000. |
See accompanying Notes, which are an integral part of the Financial Statements.
19
Selected Value Fund
Statement of Changes in Net Assets
| | |
| | Year Ended October 31, |
| | 2015 | 2014 |
| | ($000) | ($000) |
| Increase (Decrease) in Net Assets | | |
| Operations | | |
| Net Investment Income | 163,790 | 136,639 |
| Realized Net Gain (Loss) | 379,722 | 447,397 |
| Change in Unrealized Appreciation (Depreciation) | (444,590) | 260,276 |
| Net Increase (Decrease) in Net Assets Resulting from Operations | 98,922 | 844,312 |
| Distributions | | |
| Net Investment Income | (138,609) | (86,230) |
| Realized Capital Gain1 | (401,073) | (318,790) |
| Total Distributions | (539,682) | (405,020) |
| Capital Share Transactions | | |
| Issued | 1,787,330 | 3,609,195 |
| Issued in Lieu of Cash Distributions | 496,488 | 371,698 |
| Redeemed | (2,333,003) | (1,285,461) |
| Net Increase (Decrease) from Capital Share Transactions | (49,185) | 2,695,432 |
| Total Increase (Decrease) | (489,945) | 3,134,724 |
| Net Assets | | |
| Beginning of Period | 10,153,291 | 7,018,567 |
| End of Period2 | 9,663,346 | 10,153,291 |
| 1 Includes fiscal 2015 and 2014 short-term gain distributions totaling $33,623,000 and $0, respectively. Short-term gain distributions are treated as ordinary income dividends for tax purposes. |
| 2 Net Assets—End of Period includes undistributed (overdistributed) net investment income of $106,036,000 and $96,293,000. |
See accompanying Notes, which are an integral part of the Financial Statements.
20
Selected Value Fund
Financial Highlights
| | | | | |
| For a Share Outstanding | Year Ended October 31, |
| Throughout Each Period | 2015 | 2014 | 2013 | 2012 | 2011 |
| Net Asset Value, Beginning of Period | $29.49 | $28.07 | $21.01 | $18.81 | $17.73 |
| Investment Operations | | | | | |
| Net Investment Income | . 478 | .415 | .395 | .405 | .334 |
| Net Realized and Unrealized Gain (Loss) | | | | | |
| on Investments | (. 245) | 2.555 | 7.105 | 2.122 | 1.037 |
| Total from Investment Operations | . 233 | 2.970 | 7.500 | 2.527 | 1.371 |
| Distributions | | | | | |
| Dividends from Net Investment Income | (.404) | (.330) | (.440) | (. 327) | (.291) |
| Distributions from Realized Capital Gains | (1.169) | (1.220) | — | — | — |
| Total Distributions | (1.573) | (1.550) | (.440) | (. 327) | (.291) |
| Net Asset Value, End of Period | $28.15 | $29.49 | $28.07 | $21.01 | $18.81 |
| |
| Total Return1 | 0.88% | 11.02% | 36.43% | 13.64% | 7.74% |
| |
| Ratios/Supplemental Data | | | | | |
| Net Assets, End of Period (Millions) | $9,663 | $10,153 | $7,019 | $4,337 | $3,956 |
| Ratio of Total Expenses to Average Net Assets2 | 0.39% | 0.41% | 0.43% | 0.38% | 0.45% |
| Ratio of Net Investment Income to | | | | | |
| Average Net Assets | 1.62% | 1.53% | 1.70% | 2.00% | 1.74% |
| Portfolio Turnover Rate | 24% | 18% | 27% | 18% | 25% |
| 1 Total returns do not include account service fees that may have applied in the periods shown. Fund prospectuses provide information about any applicable account service fees. |
| 2 Includes performance-based investment advisory fee increases (decreases) of (0.02%), 0.01%, 0.02%, (0.03%), and 0.04%. |
See accompanying Notes, which are an integral part of the Financial Statements.
21
Selected Value Fund
Notes to Financial Statements
Vanguard Selected Value Fund is registered under the Investment Company Act of 1940 as an open-end investment company, or mutual fund.
A. The following significant accounting policies conform to generally accepted accounting principles for U.S. investment companies. The fund consistently follows such policies in preparing its financial statements.
1. Security Valuation: Securities are valued as of the close of trading on the New York Stock Exchange (generally 4 p.m., Eastern time) on the valuation date. Equity securities are valued at the latest quoted sales prices or official closing prices taken from the primary market in which each security trades; such securities not traded on the valuation date are valued at the mean of the latest quoted bid and asked prices. Securities for which market quotations are not readily available, or whose values have been affected by events occurring before the fund’s pricing time but after the close of the securities’ primary markets, are valued at their fair values calculated according to procedures adopted by the board of trustees. These procedures include obtaining quotations from an independent pricing service, monitoring news to identify significant market- or security-specific events, and evaluating changes in the values of foreign market proxies (for example, ADRs, futures contracts, or exchange-traded funds), between the time the foreign markets close and the fund’s pricing time. When fair-value pricing is employed, the prices of securities used by a fund to calculate its net asset value may differ from quoted or published prices for the same securities. Investments in Vanguard Market Liquidity Fund are valued at that fund’s net asset value. Temporary cash investments acquired over 60 days to maturity are valued using the latest bid prices or using valuations based on a matrix system (which considers such factors as security prices, yields, maturities, and ratings), both as furnished by independent pricing services. Other temporary cash investments are valued at amortized cost, which approximates market value.
2. Futures Contracts: The fund uses index futures contracts to a limited extent, with the objective of maintaining full exposure to the stock market while maintaining liquidity. The fund may purchase or sell futures contracts to achieve a desired level of investment, whether to accommodate portfolio turnover or cash flows from capital share transactions. The primary risks associated with the use of futures contracts are imperfect correlation between changes in market values of stocks held by the fund and the prices of futures contracts, and the possibility of an illiquid market. Counterparty risk involving futures is mitigated because a regulated clearinghouse is the counterparty instead of the clearing broker. To further mitigate counterparty risk, the fund trades futures contracts on an exchange, monitors the financial strength of its clearing brokers and clearinghouse, and has entered into clearing agreements with its clearing brokers. The clearinghouse imposes initial margin requirements to secure the fund’s performance and requires daily settlement of variation margin representing changes in the market value of each contract.
Futures contracts are valued at their quoted daily settlement prices. The aggregate settlement values of the contracts are not recorded in the Statement of Net Assets. Fluctuations in the value of the contracts are recorded in the Statement of Net Assets as an asset (liability) and in the Statement of Operations as unrealized appreciation (depreciation) until the contracts are closed, when they are recorded as realized futures gains (losses).
During the year ended October 31, 2015, the fund’s average investments in long and short futures contracts represented 2% and 0% of net assets, respectively, based on the average of aggregate settlement values at each quarter-end during the period.
22
Selected Value Fund
3. Federal Income Taxes: The fund intends to continue to qualify as a regulated investment company and distribute all of its taxable income. Management has analyzed the fund’s tax positions taken for all open federal income tax years (October 31, 2012–2015), and has concluded that no provision for federal income tax is required in the fund’s financial statements.
4. Distributions: Distributions to shareholders are recorded on the ex-dividend date.
5. Securities Lending: To earn additional income, the fund lends its securities to qualified institutional borrowers. Security loans are required to be secured at all times by collateral in an amount at least equal to the market value of securities loaned. Daily market fluctuations could cause the value of loaned securities to be more or less than the value of the collateral received. When this occurs, the collateral is adjusted and settled on the next business day. The fund further mitigates its counterparty risk by entering into securities lending transactions only with a diverse group of prequalified counterparties, monitoring their financial strength, and entering into master securities lending agreements with its counterparties. The master securities lending agreements provide that, in the event of a counterparty’s default (including bankruptcy), the fund may terminate any loans with that borrower, determine the net amount owed, and sell or retain the collateral up to the net amount owed to the fund; however, such actions may be subject to legal proceedings. While collateral mitigates counterparty risk, in the absence of a default the fund may experience delays and costs in recovering the securities loaned. The fund invests cash collateral received in Vanguard Market Liquidity Fund, and records a liability in the Statement of Net Assets for the return of the collateral, during the period the securities are on loan. Securities lending income represents fees charged to borrowers plus income earned on invested cash collateral, less expenses associated with the loan.
6. Credit Facility: The fund and certain other funds managed by The Vanguard Group (“Vanguard”) participate in a $3 billion committed credit facility provided by a syndicate of lenders pursuant to a credit agreement that may be renewed annually; each fund is individually liable for its borrowings, if any, under the credit facility. Borrowings may be utilized for temporary and emergency purposes, and are subject to the fund’s regulatory and contractual borrowing restrictions. The participating funds are charged administrative fees and an annual commitment fee of 0.06% of the undrawn amount of the facility; these fees are allocated to the funds based on a method approved by the fund’s board of trustees and included in Management and Administrative expenses on the fund’s Statement of Operations. Any borrowings under this facility bear interest at a rate equal to the higher of the federal funds rate or LIBOR reference rate plus an agreed-upon spread.
The fund had no borrowings outstanding at October 31, 2015, or at any time during the period then ended.
7. Other: Dividend income is recorded on the ex-dividend date. Interest income includes income distributions received from Vanguard Market Liquidity Fund and is accrued daily. Premiums and discounts on debt securities purchased are amortized and accreted, respectively, to interest income over the lives of the respective securities. Security transactions are accounted for on the date securities are bought or sold. Costs used to determine realized gains (losses) on the sale of investment securities are those of the specific securities sold.
23
Selected Value Fund
B. The investment advisory firms Barrow, Hanley, Mewhinney & Strauss, LLC, Donald Smith & Co., Inc., and Pzena Investment Management, LLC, each provide investment advisory services to a portion of the fund for a fee calculated at an annual percentage rate of average net assets managed by the advisor. The basic fee of Barrow, Hanley, Mewhinney & Strauss, LLC, is subject to quarterly adjustments based on performance relative to the Russell Midcap Value Index for the preceding three years. The basic fee of Donald Smith & Co., Inc., is subject to quarterly adjustments based on performance relative to the MSCI Investable Market 2500 Index for the preceding five years. The basic fee of Pzena Investment Management, LLC, is subject to quarterly adjustments based on performance relative to the Russell Midcap Value Index since April 30, 2014.
Vanguard manages the cash reserves of the fund as described below.
For the year ended October 31, 2015, the aggregate investment advisory fee represented an effective annual basic rate of 0.21% of the fund’s average net assets, before a decrease of $1,625,000 (0.02%) based on performance.
C. In accordance with the terms of a Funds’ Service Agreement (the “FSA”) between Vanguard and the fund, Vanguard furnishes to the fund corporate management, administrative, marketing, distribution and cash management services at Vanguard’s cost of operations (as defined by the FSA). These costs of operations are allocated to the fund based on methods and guidelines approved by the board of trustees. Vanguard does not require reimbursement in the current period for certain costs of operations (such as deferred compensation/benefits and risk/insurance costs); the fund’s liability for these costs of operations is included in Payables to Vanguard on the Statement of Net Assets.
Upon the request of Vanguard, the fund may invest up to 0.40% of its net assets as capital in Vanguard. At October 31, 2015, the fund had contributed to Vanguard capital in the amount of $835,000, representing 0.01% of the fund’s net assets and 0.33% of Vanguard’s capitalization. The fund’s trustees and officers are also directors and employees, respectively, of Vanguard.
D. The fund has asked its investment advisors to direct certain security trades, subject to obtaining the best price and execution, to brokers who have agreed to rebate to the fund part of the commissions generated. Such rebates are used solely to reduce the fund’s management and administrative expenses. For the year ended October 31, 2015, these arrangements reduced the fund’s expenses by $130,000 (an annual rate of 0.00% of average net assets).
E. Various inputs may be used to determine the value of the fund’s investments. These inputs are summarized in three broad levels for financial statement purposes. The inputs or methodologies used to value securities are not necessarily an indication of the risk associated with investing in those securities.
Level 1—Quoted prices in active markets for identical securities.
Level 2—Other significant observable inputs (including quoted prices for similar securities, interest rates, prepayment speeds, credit risk, etc.).
Level 3—Significant unobservable inputs (including the fund’s own assumptions used to determine the fair value of investments).
24
Selected Value Fund
The following table summarizes the market value of the fund’s investments as of October 31, 2015, based on the inputs used to value them:
| | | |
| | Level 1 | Level 2 | Level 3 |
| Investments | ($000) | ($000) | ($000) |
| Common Stocks | 9,017,515 | — | — |
| Temporary Cash Investments | 708,715 | 7,999 | — |
| Futures Contracts—Assets1 | 10 | — | — |
| Futures Contracts—Liabilities1 | (373) | — | — |
| Total | 9,725,867 | 7,999 | — |
| 1 Represents variation margin on the last day of the reporting period. |
F. At October 31, 2015, the aggregate settlement value of open futures contracts and the related unrealized appreciation (depreciation) were:
| | | | |
| | | | | ($000) |
| | | | Aggregate | |
| | | Number of | Settlement | Unrealized |
| | | Long (Short) | Value | Appreciation |
| Futures Contracts | Expiration | Contracts | Long (Short) | (Depreciation) |
| S&P 500 Index | December 2015 | 144 | 74,653 | 4,665 |
| E-mini S&P MidCap 400 Index | December 2015 | 336 | 48,431 | 1,417 |
| E-mini S&P 500 Index | December 2015 | 67 | 6,947 | 50 |
| E-mini Russell 2000 Index | December 2015 | 26 | 3,012 | 23 |
| | | | | 6,155 |
Unrealized appreciation (depreciation) on open futures contracts is required to be treated as realized gain (loss) for tax purposes.
G. Distributions are determined on a tax basis and may differ from net investment income and realized capital gains for financial reporting purposes. Differences may be permanent or temporary. Permanent differences are reclassified among capital accounts in the financial statements to reflect their tax character. Temporary differences arise when certain items of income, expense, gain, or loss are recognized in different periods for financial statement and tax purposes. These differences will reverse at some time in the future. Differences in classification may also result from the treatment of short-term gains as ordinary income for tax purposes.
During the year ended October 31, 2015, the fund realized net foreign currency losses of $34,000, which decreased distributable net income for tax purposes; accordingly, such losses have been reclassified from accumulated net realized gains to undistributed net investment income.
The fund used a tax accounting practice to treat a portion of the price of capital shares redeemed during the year as distributions from net investment income and realized capital gains. Accordingly, the fund has reclassified $15,404,000 from undistributed net investment income, and $35,902,000 from accumulated net realized gains, to paid-in capital.
For tax purposes, at October 31, 2015, the fund had $145,261,000 of ordinary income and $318,665,000 of long-term capital gains available for distribution.
25
Selected Value Fund
At October 31, 2015, the cost of investment securities for tax purposes was $7,927,865,000. Net unrealized appreciation of investment securities for tax purposes was $1,806,364,000, consisting of unrealized gains of $2,728,478,000 on securities that had risen in value since their purchase and $922,114,000 in unrealized losses on securities that had fallen in value since their purchase.
H. During the year ended October 31, 2015, the fund purchased $2,223,146,000 of investment securities and sold $2,328,198,000 of investment securities, other than temporary cash investments.
I. Capital shares issued and redeemed were:
| | |
| | Year Ended October 31, |
| | 2015 | 2014 |
| | Shares | Shares |
| | (000) | (000) |
| Issued | 62,441 | 125,298 |
| Issued in Lieu of Cash Distributions | 17,943 | 13,610 |
| Redeemed | (81,402) | (44,653) |
| Net Increase (Decrease) in Shares Outstanding | (1,018) | 94,255 |
J. Certain of the fund’s investments are in companies that are considered to be affiliated companies of the fund because the fund owns more than 5% of the outstanding voting securities of the company or the issuer is another member of Vanguard. Transactions during the period in securities of these companies were as follows:
| | | | | | |
| | | Current Period Transactions | |
| | Oct. 31, | | Proceeds | | | Oct. 31, |
| | 2014 | | from | | Capital Gain | 2015 |
| | Market | Purchases | Securities | | Distributions | Market |
| | Value | at Cost | Sold1 | Income | Received | Value |
| | ($000) | ($000) | ($000) | ($000) | ($000) | ($000) |
| SeaWorld Entertainment Inc. | 101,339 | — | 2,423 | 4,398 | — | 102,468 |
| SPX FLOW Inc. | — | 39,492 | — | — | — | 84,631 |
| Vanguard Market Liquidity Fund | 942,982 | NA2 | NA 2 | 1,185 | — | 708,715 |
| Vanguard Mid-Cap Value ETF | 29,436 | — | — | 901 | — | 29,626 |
| Total | 1,073,757 | | | 6,484 | — | 925,440 |
| 1 Includes net realized gain (loss) on affiliated investment securities sold of $1,108,000. |
| 2 Not applicable—purchases and sales are for temporary cash investment purposes. |
K. Management has determined that no material events or transactions occurred subsequent to October 31, 2015, that would require recognition or disclosure in these financial statements.
26
Report of Independent Registered
Public Accounting Firm
To the Board of Trustees of Vanguard Whitehall Funds and the Shareholders of Vanguard Selected Value Fund: In our opinion, the accompanying statement of net assets and the related statements of operations and of changes in net assets and the financial highlights present fairly, in all material respects, the financial position of Vanguard Selected Value Fund (constituting a separate portfolio of Vanguard Whitehall Funds, hereafter referred to as the “Fund”) at October 31, 2015, the results of its operations for the year then ended, the changes in its net assets for each of the two years in the period then ended, and the financial highlights for each of the five years in the period then ended, in conformity with accounting principles generally accepted in the United States of America. These financial statements and financial highlights (hereafter referred to as “financial statements”) are the responsibility of the Fund’s management. Our responsibility is to express an opinion on these financial statements based on our audits. We conducted our audits of these financial statements in accordance with the standards of the Public Company Accounting Oversight Board (United States). Those standards require that we plan and perform the audit to obtain reasonable assurance about whether the financial statements are free of material misstatement. An audit includes examining, on a test basis, evidence supporting the amounts and disclosures in the financial statements, assessing the accounting principles used and significant estimates made by management, and evaluating the overall financial statement presentation. We believe that our audits, which included confirmation of securities at October 31, 2015 by correspondence with the custodian and brokers, by agreement to the underlying ownership records of the transfer agent and the application of alternative auditing procedures where securities purchased had not been received, provide a reasonable basis for our opinion.
/s/PricewaterhouseCoopers LLP
Philadelphia, Pennsylvania
December 10, 2015
Special 2015 tax information (unaudited) for Vanguard Selected Value Fund
This information for the fiscal year ended October 31, 2015, is included pursuant to provisions of
the Internal Revenue Code.
The fund distributed $400,319,000 as capital gain dividends (20% rate gain distributions) to
shareholders during the fiscal year.
For nonresident alien shareholders, 100% of short-term capital gain dividends distributed by the
fund are qualified short-term capital gains.
The fund distributed $156,930,000 of qualified dividend income to shareholders during the fiscal year.
For corporate shareholders, 73.7% of investment income (dividend income plus short-term gains,
if any) qualifies for the dividends-received deduction.
27
Your Fund’s After-Tax Returns
This table presents returns for your fund both before and after taxes. The after-tax returns are shown in two ways: (1) assuming that an investor owned the fund during the entire period and paid taxes on the fund’s distributions, and (2) assuming that an investor paid taxes on the fund’s distributions and sold all shares at the end of each period.
Calculations are based on the highest individual federal income tax and capital gains tax rates in effect at the times of the distributions and the hypothetical sales. State and local taxes were not considered. After-tax returns reflect any qualified dividend income, using actual prior-year figures and estimates for 2015. (In the example, returns after the sale of fund shares may be higher than those assuming no sale. This occurs when the sale would have produced a capital loss. The calculation assumes that the investor received a tax deduction for the loss.) Please note that your actual after-tax returns will depend on your tax situation and may differ from those shown. Also note that if you own the fund in a tax-deferred account, such as an individual retirement account or a 401(k) plan, this information does not apply to you. Such accounts are not subject to current taxes.
Finally, keep in mind that a fund’s performance—whether before or after taxes—does not guarantee future results.
| | | |
| Average Annual Total Returns: Selected Value Fund | | | |
| Periods Ended October 31, 2015 | | | |
| | One | Five | Ten |
| | Year | Years | Years |
| Returns Before Taxes | 0.88% | 13.35% | 8.63% |
| Returns After Taxes on Distributions | -0.44 | 12.58 | 7.76 |
| Returns After Taxes on Distributions and Sale of Fund Shares | 1.50 | 10.69 | 6.95 |
28
About Your Fund’s Expenses
As a shareholder of the fund, you incur ongoing costs, which include costs for portfolio management, administrative services, and shareholder reports (like this one), among others. Operating expenses, which are deducted from a fund’s gross income, directly reduce the investment return of the fund.
A fund’s expenses are expressed as a percentage of its average net assets. This figure is known as the expense ratio. The following examples are intended to help you understand the ongoing costs (in dollars) of investing in your fund and to compare these costs with those of other mutual funds. The examples are based on an investment of $1,000 made at the beginning of the period shown and held for the entire period.
The accompanying table illustrates your fund’s costs in two ways:
• Based on actual fund return. This section helps you to estimate the actual expenses that you paid over the period. The ”Ending Account Value“ shown is derived from the fund‘s actual return, and the third column shows the dollar amount that would have been paid by an investor who started with $1,000 in the fund. You may use the information here, together with the amount you invested, to estimate the expenses that you paid over the period.
To do so, simply divide your account value by $1,000 (for example, an $8,600 account value divided by $1,000 = 8.6), then multiply the result by the number given for your fund under the heading ”Expenses Paid During Period.“
• Based on hypothetical 5% yearly return. This section is intended to help you compare your fund‘s costs with those of other mutual funds. It assumes that the fund had a yearly return of 5% before expenses, but that the expense ratio is unchanged. In this case—because the return used is not the fund’s actual return—the results do not apply to your investment. The example is useful in making comparisons because the Securities and Exchange Commission requires all mutual funds to calculate expenses based on a 5% return. You can assess your fund’s costs by comparing this hypothetical example with the hypothetical examples that appear in shareholder reports of other funds.
Note that the expenses shown in the table are meant to highlight and help you compare ongoing costs only and do not reflect transaction costs incurred by the fund for buying and selling securities. Further, the expenses do not include any purchase, redemption, or account service fees described in the fund prospectus. If such fees were applied to your account, your costs would be higher. Your fund does not carry a “sales load.”
The calculations assume no shares were bought or sold during the period. Your actual costs may have been higher or lower, depending on the amount of your investment and the timing of any purchases or redemptions.
You can find more information about the fund’s expenses, including annual expense ratios, in the Financial Statements section of this report. For additional information on operating expenses and other shareholder costs, please refer to your fund’s current prospectus.
29
| | | |
| Six Months Ended October 31, 2015 | | | |
| | Beginning | Ending | Expenses |
| | Account Value | Account Value | Paid During |
| Selected Value Fund | 4/30/2015 | 10/31/2015 | Period |
| Based on Actual Fund Return | $1,000.00 | $968.02 | $1.98 |
| Based on Hypothetical 5% Yearly Return | 1,000.00 | 1,023.19 | 2.04 |
The calculations are based on expenses incurred in the most recent six-month period. The fund’s annualized six-month expense ratio for that
period is 0.40%. The dollar amounts shown as “Expenses Paid” are equal to the annualized expense ratio multiplied by the average account
value over the period, multiplied by the number of days in the most recent six-month period, then divided by the number of days in the most
recent 12-month period (184/365).
30
Glossary
30-Day SEC Yield. A fund’s 30-day SEC yield is derived using a formula specified by the U.S. Securities and Exchange Commission. Under the formula, data related to the fund’s security holdings in the previous 30 days are used to calculate the fund’s hypothetical net income for that period, which is then annualized and divided by the fund’s estimated average net assets over the calculation period. For the purposes of this calculation, a security’s income is based on its current market yield to maturity (for bonds), its actual income (for asset-backed securities), or its projected dividend yield (for stocks). Because the SEC yield represents hypothetical annualized income, it will differ—at times significantly—from the fund’s actual experience. As a result, the fund’s income distributions may be higher or lower than implied by the SEC yield.
Beta. A measure of the magnitude of a fund’s past share-price fluctuations in relation to the ups and downs of a given market index. The index is assigned a beta of 1.00. Compared with a given index, a fund with a beta of 1.20 typically would have seen its share price rise or fall by 12% when the index rose or fell by 10%. For this report, beta is based on returns over the past 36 months for both the fund and the index. Note that a fund’s beta should be reviewed in conjunction with its R-squared (see definition). The lower the R-squared, the less correlation there is between the fund and the index, and the less reliable beta is as an indicator of volatility.
Dividend Yield. Dividend income earned by stocks, expressed as a percentage of the aggregate market value (or of net asset value, for a fund). The yield is determined by dividing the amount of the annual dividends by the aggregate value (or net asset value) at the end of the period. For a fund, the dividend yield is based solely on stock holdings and does not include any income produced by other investments.
Earnings Growth Rate. The average annual rate of growth in earnings over the past five years for the stocks now in a fund.
Equity Exposure. A measure that reflects a fund’s investments in stocks and stock futures. Any holdings in short-term reserves are excluded.
Expense Ratio. A fund’s total annual operating expenses expressed as a percentage of the fund’s average net assets. The expense ratio includes management and administrative expenses, but does not include the transaction costs of buying and selling portfolio securities.
Foreign Holdings. The percentage of a fund represented by securities or depositary receipts of companies based outside the United States.
Inception Date. The date on which the assets of a fund (or one of its share classes) are first invested in accordance with the fund’s investment objective. For funds with a subscription period, the inception date is the day after that period ends. Investment performance is measured from the inception date.
Median Market Cap. An indicator of the size of companies in which a fund invests; the midpoint of market capitalization (market price x shares outstanding) of a fund’s stocks, weighted by the proportion of the fund’s assets invested in each stock. Stocks representing half of the fund’s assets have market capitalizations above the median, and the rest are below it.
Price/Book Ratio. The share price of a stock divided by its net worth, or book value, per share. For a fund, the weighted average price/book ratio of the stocks it holds.
31
Price/Earnings Ratio. The ratio of a stock’s current price to its per-share earnings over the past year. For a fund, the weighted average P/E of the stocks it holds. P/E is an indicator of market expectations about corporate prospects; the higher the P/E, the greater the expectations for a company’s future growth.
R-Squared. A measure of how much of a fund’s past returns can be explained by the returns from the market in general, as measured by a given index. If a fund’s total returns were precisely synchronized with an index’s returns, its R-squared would be 1.00. If the fund’s returns bore no relationship to the index’s returns, its R-squared would be 0. For this report, R-squared is based on returns over the past 36 months for both the fund and the index.
Return on Equity. The annual average rate of return generated by a company during the past five years for each dollar of shareholder’s equity (net income divided by shareholder’s equity). For a fund, the weighted average return on equity for the companies whose stocks it holds.
Short-Term Reserves. The percentage of a fund invested in highly liquid, short-term securities that can be readily converted to cash.
Turnover Rate. An indication of the fund’s trading activity. Funds with high turnover rates incur higher transaction costs and may be more likely to distribute capital gains (which may be taxable to investors). The turnover rate excludes in-kind transactions, which have minimal impact on costs.
32
This page intentionally left blank.
This page intentionally left blank.
This page intentionally left blank.
The People Who Govern Your Fund
The trustees of your mutual fund are there to see that the fund is operated and managed in your best interests since, as a shareholder, you are a part owner of the fund. Your fund’s trustees also serve on the board of directors of The Vanguard Group, Inc., which is owned by the Vanguard funds and provides services to them on an at-cost basis.
A majority of Vanguard’s board members are independent, meaning that they have no affiliation with Vanguard or the funds they oversee, apart from the sizable personal investments they have made as private individuals. The independent board members have distinguished backgrounds in business, academia, and public service. Each of the trustees and executive officers oversees 194 Vanguard funds.
The following table provides information for each trustee and executive officer of the fund. More information about the trustees is in the Statement of Additional Information, which can be obtained, without charge, by contacting Vanguard at 800-662-7447, or online at vanguard.com.
| |
| InterestedTrustee1 | Rajiv L. Gupta |
| | Born 1945. Trustee Since December 2001.2 Principal |
| F. William McNabb III | Occupation(s) During the Past Five Years and Other |
| Born 1957. Trustee Since July 2009. Chairman of | Experience: Chairman and Chief Executive Officer |
| the Board. Principal Occupation(s) During the Past | (retired 2009) and President (2006–2008) of |
| Five Years and Other Experience: Chairman of the | Rohm and Haas Co. (chemicals); Director of Tyco |
| Board of The Vanguard Group, Inc., and of each of | International PLC (diversified manufacturing and |
| the investment companies served by The Vanguard | services), Hewlett-Packard Co. (electronic computer |
| Group, since January 2010; Director of The Vanguard | manufacturing), and Delphi Automotive PLC |
| Group since 2008; Chief Executive Officer and | (automotive components); Senior Advisor at New |
| President of The Vanguard Group, and of each of | Mountain Capital. |
| the investment companies served by The Vanguard | |
| Group, since 2008; Director of Vanguard Marketing | Amy Gutmann |
| Corporation; Managing Director of The Vanguard | Born 1949. Trustee Since June 2006. Principal |
| Group (1995–2008). | Occupation(s) During the Past Five Years and |
| | Other Experience: President of the University of |
| IndependentTrustees | Pennsylvania; Christopher H. Browne Distinguished |
| | Professor of Political Science, School of Arts and |
| Emerson U. Fullwood | Sciences, and Professor of Communication, Annenberg |
| Born 1948. Trustee Since January 2008. Principal | School for Communication, with secondary faculty |
| Occupation(s) During the Past Five Years and | appointments in the Department of Philosophy, School |
| Other Experience: Executive Chief Staff and | of Arts and Sciences, and at the Graduate School of |
| Marketing Officer for North America and Corporate | Education, University of Pennsylvania; Trustee of the |
| Vice President (retired 2008) of Xerox Corporation | National Constitution Center; Chair of the Presidential |
| (document management products and services); | Commission for the Study of Bioethical Issues. |
| Executive in Residence and 2009–2010 Distinguished | |
| Minett Professor at the Rochester Institute of | JoAnn Heffernan Heisen |
| Technology; Director of SPX Corporation (multi-industry | Born 1950. Trustee Since July 1998. Principal |
| manufacturing), the United Way of Rochester, the | Occupation(s) During the Past Five Years and |
| University of Rochester Medical Center, Monroe | Other Experience: Corporate Vice President and |
| Community College Foundation, and North Carolina | Chief Global Diversity Officer (retired 2008) and |
| A&T University. | Member of the Executive Committee (1997–2008) |
| | of Johnson & Johnson (pharmaceuticals/medical |
| | devices/consumer products); Director of Skytop |
| | Lodge Corporation (hotels) and the Robert Wood |
| | Johnson Foundation; Member of the Advisory |
| | Board of the Institute for Women’s Leadership |
| | at Rutgers University. |
| | |
| F. Joseph Loughrey | Executive Officers | |
| Born 1949. Trustee Since October 2009. Principal | | |
| Occupation(s) During the Past Five Years and Other | Glenn Booraem | |
| Experience: President and Chief Operating Officer | Born 1967. Treasurer Since May 2015. Principal |
| (retired 2009) of Cummins Inc. (industrial machinery); | Occupation(s) During the Past Five Years and |
| Chairman of the Board of Hillenbrand, Inc. (specialized | Other Experience: Principal of The Vanguard Group, |
| consumer services), and of Oxfam America; Director | Inc.; Treasurer of each of the investment companies |
| of SKF AB (industrial machinery), Hyster-Yale Materials | served by The Vanguard Group; Controller of each of |
| Handling, Inc. (forklift trucks), the Lumina Foundation | the investment companies served by The Vanguard |
| for Education, and the V Foundation for Cancer | Group (2010–2015); Assistant Controller of each of |
| Research; Member of the Advisory Council for the | the investment companies served by The Vanguard |
| College of Arts and Letters and of the Advisory Board | Group (2001–2010). | |
| to the Kellogg Institute for International Studies, both | | |
| at the University of Notre Dame. | Thomas J. Higgins | |
| Born 1957. Chief Financial Officer Since September |
| Mark Loughridge | 2008. Principal Occupation(s) During the Past Five |
| Born 1953. Trustee Since March 2012. Principal | Years and Other Experience: Principal of The Vanguard |
| Occupation(s) During the Past Five Years and Other | Group, Inc.; Chief Financial Officer of each of the |
| Experience: Senior Vice President and Chief Financial | investment companies served by The Vanguard Group; |
| Officer (retired 2013) at IBM (information technology | Treasurer of each of the investment companies served |
| services); Fiduciary Member of IBM’s Retirement Plan | by The Vanguard Group (1998–2008). |
| Committee (2004–2013); Director of the Dow Chemical | | |
| Company; Member of the Council on Chicago Booth. | Peter Mahoney | |
| Born 1974. Controller Since May 2015. Principal |
| Scott C. Malpass | Occupation(s) During the Past Five Years and |
| Born 1962. Trustee Since March 2012. Principal | Other Experience: Head of Global Fund Accounting |
| Occupation(s) During the Past Five Years and Other | at The Vanguard Group, Inc.; Controller of each of the |
| Experience: Chief Investment Officer and Vice | investment companies served by The Vanguard Group; |
| President at the University of Notre Dame; Assistant | Head of International Fund Services at The Vanguard |
| Professor of Finance at the Mendoza College of | Group (2008–2014). | |
| Business at Notre Dame; Member of the Notre Dame | | |
| 403(b) Investment Committee; Board Member of | Heidi Stam | |
| TIFF Advisory Services, Inc., and Catholic Investment | Born 1956. Secretary Since July 2005. Principal |
| Services, Inc. (investment advisors); Member of | Occupation(s) During the Past Five Years and Other |
| the Investment Advisory Committee of Major | Experience: Managing Director of The Vanguard |
| League Baseball. | Group, Inc.; General Counsel of The Vanguard Group; |
| Secretary of The Vanguard Group and of each of the |
| André F. Perold | investment companies served by The Vanguard Group; |
| Born 1952. Trustee Since December 2004. Principal | Director and Senior Vice President of Vanguard |
| Occupation(s) During the Past Five Years and Other | Marketing Corporation. | |
| Experience: George Gund Professor of Finance and | | |
| Banking, Emeritus at the Harvard Business School | Vanguard Senior ManagementTeam |
| (retired 2011); Chief Investment Officer and Managing | Mortimer J. Buckley | Chris D. McIsaac |
| Partner of HighVista Strategies LLC (private investment | Kathleen C. Gubanich | James M. Norris |
| firm); Director of Rand Merchant Bank; Overseer of | Paul A. Heller | Thomas M. Rampulla |
| the Museum of Fine Arts Boston. | Martha G. King | Glenn W. Reed |
| John T. Marcante | Karin A. Risi |
| Peter F. Volanakis | | |
| Born 1955. Trustee Since July 2009. Principal | | |
| Occupation(s) During the Past Five Years and Other | Chairman Emeritus and Senior Advisor |
| Experience: President and Chief Operating Officer | John J. Brennan | |
| (retired 2010) of Corning Incorporated (communications | Chairman, 1996–2009 | |
| equipment); Trustee of Colby-Sawyer College; | Chief Executive Officer and President, 1996–2008 |
| Member of the Advisory Board of the Norris Cotton | | |
| Cancer Center and of the Advisory Board of the | | |
| Parthenon Group (strategy consulting). | Founder | |
| | John C. Bogle | |
| | Chairman and Chief Executive Officer, 1974–1996 |
1 Mr. McNabb is considered an “interested person,” as defined in the Investment Company Act of 1940, because he is an officer of the
Vanguard funds.
2 December 2002 for Vanguard Equity Income Fund, the Vanguard Municipal Bond Funds, and the Vanguard State Tax-Exempt Funds.
|  |
| | P.O. Box 2600 |
| | Valley Forge, PA 19482-2600 |
| |
| |
| |
| Connect with Vanguard® > vanguard.com | |
| |
| |
| |
| Fund Information > 800-662-7447 | CFA® is a registered trademark owned by CFA Institute. |
| Direct Investor Account Services > 800-662-2739 | |
| Institutional Investor Services > 800-523-1036 | |
| Text Telephone for People | |
| Who Are Deaf or Hard of Hearing> 800-749-7273 | |
| |
| This material may be used in conjunction | |
| with the offering of shares of any Vanguard | |
| fund only if preceded or accompanied by | |
| the fund’s current prospectus. | |
| |
| All comparative mutual fund data are from Lipper, a | |
| Thomson Reuters Company, or Morningstar, Inc., unless | |
| otherwise noted. | |
| |
| You can obtain a free copy of Vanguard’s proxy voting | |
| guidelines by visiting vanguard.com/proxyreporting or by | |
| calling Vanguard at 800-662-2739. The guidelines are | |
| also available from the SEC’s website, sec.gov. In | |
| addition, you may obtain a free report on how your fund | |
| voted the proxies for securities it owned during the 12 | |
| months ended June 30. To get the report, visit either | |
| vanguard.com/proxyreporting or sec.gov. | |
| |
| You can review and copy information about your fund at | |
| the SEC’s Public Reference Room in Washington, D.C. To | |
| find out more about this public service, call the SEC at | |
| 202-551-8090. Information about your fund is also | |
| available on the SEC’s website, and you can receive | |
| copies of this information, for a fee, by sending a | |
| request in either of two ways: via email addressed to | |
| publicinfo@sec.gov or via regular mail addressed to the | |
| Public Reference Section, Securities and Exchange | |
| Commission, Washington, DC 20549-1520. | |
| |
| | © 2015 The Vanguard Group, Inc. |
| | All rights reserved. |
| | Vanguard Marketing Corporation, Distributor. |
| |
| | Q9340 122015 |


Annual Report | October 31, 2015
Vanguard Mid-Cap Growth Fund
Vanguard’s Principles for Investing Success
We want to give you the best chance of investment success. These principles, grounded in Vanguard’s research and experience, can put you on the right path.
Goals. Create clear, appropriate investment goals.
Balance. Develop a suitable asset allocation using broadly diversified funds. Cost. Minimize cost.
Discipline. Maintain perspective and long-term discipline.
A single theme unites these principles: Focus on the things you can control.
We believe there is no wiser course for any investor.
| |
| Contents | |
| Your Fund’s Total Returns. | 1 |
| Chairman’s Letter. | 2 |
| Advisors’ Report. | 8 |
| Fund Profile. | 12 |
| Performance Summary. | 13 |
| Financial Statements. | 15 |
| Your Fund’s After-Tax Returns. | 27 |
| About Your Fund’s Expenses. | 28 |
| Glossary. | 30 |
Please note: The opinions expressed in this report are just that—informed opinions. They should not be considered promises or advice.
Also, please keep in mind that the information and opinions cover the period through the date on the front of this report. Of course, the
risks of investing in your fund are spelled out in the prospectus.
See the Glossary for definitions of investment terms used in this report.
About the cover: Pictured is a sailing block on the Brilliant, a 1932 schooner docked in Mystic, Connecticut. A type of pulley, the
sailing block helps coordinate the setting of the sails. At Vanguard, the intricate coordination of technology and people allows
us to help millions of clients around the world reach their financial goals.
Your Fund’s Total Returns
| |
| Fiscal Year Ended October 31, 2015 | |
| | Total |
| | Returns |
| Vanguard Mid-Cap Growth Fund | 6.68% |
| Russell Midcap Growth Index | 4.94 |
| Mid-Cap Growth Funds Average | 2.85 |
| Mid-Cap Growth Funds Average: Derived from data provided by Lipper, a Thomson Reuters Company. |
| | | | |
| Your Fund’s Performance at a Glance | | | | |
| October 31, 2014, Through October 31, 2015 | | | |
| |
| | | | Distributions Per Share |
| | Starting | Ending | | |
| | Share | Share | Income | Capital |
| | Price | Price | Dividends | Gains |
| Vanguard Mid-Cap Growth Fund | $26.40 | $24.88 | $0.038 | $3.171 |

Chairman’s Letter
Dear Shareholder,
Vanguard Mid-Cap Growth Fund extracted solid results from challenging stock markets over the fiscal year ended October 31, 2015. Growth stocks outpaced their value counterparts, and mid-capitalization stocks trailed large-caps but finished ahead of small-caps.
Your fund benefited from its growth-oriented style as well as the advisors’ choices. Mid-Cap Growth’s return approached 7%, close to 2 percentage points better than the benchmark Russell Midcap Growth Index and almost 4 percentage points ahead of the average of its mid-cap growth fund peers. The information technology sector led the fund’s advance.
If you own shares of the fund in a taxable account, you may wish to review the information about after-tax returns presented later in this report.
U.S. stock market fluctuated on its way to modest returns
The broad U.S. stock market returned more than 4% for the fiscal year ended October 31. Stocks generally climbed during the first nine months before dropping sharply in August and September. Fears surfaced in late summer that slower economic growth in China would spread across the globe.
2
In October, however, stocks rallied as the Federal Reserve maintained its historically low short-term interest rates. Central banks in Europe and Asia also signaled or implemented additional stimulus measures to counter sluggish growth and low inflation. Corporate earnings, although generally lower than in the past couple of years, mostly exceeded expectations.
The strength of the U.S. dollar against foreign currencies contributed to a return of about –4% for international stocks. Returns for the developed markets of the Pacific region and Europe were essentially flat. Stocks tumbled in emerging markets, where concerns about China seemed to weigh most heavily.
A focus on five sectors fueled the fund’s returns
Growth and value stocks will take turns leading the broader market, and in unpredictable ways. Large-, mid-, and small-cap stocks also take the lead in what can seem like a random rotation. Throughout the market’s fluctuations, Vanguard Mid-Cap Growth Fund’s two advisors––Chartwell Investment Partners, LLC, and William Blair Investment Management, LLC––stick to their
| | | |
| Market Barometer | | | |
| |
| | Average Annual Total Returns |
| | Periods Ended October 31, 2015 |
| | One | Three | Five |
| | Year | Years | Years |
| Stocks | | | |
| Russell 1000 Index (Large-caps) | 4.86% | 16.28% | 14.32% |
| Russell 2000 Index (Small-caps) | 0.34 | 13.90 | 12.06 |
| Russell 3000 Index (Broad U.S. market) | 4.49 | 16.09 | 14.14 |
| FTSE All-World ex US Index (International) | -3.83 | 5.20 | 2.99 |
| |
| Bonds | | | |
| Barclays U.S. Aggregate Bond Index (Broad taxable market) | 1.96% | 1.65% | 3.03% |
| Barclays Municipal Bond Index (Broad tax-exempt market) | 2.87 | 2.91 | 4.28 |
| Citigroup Three-Month U.S. Treasury Bill Index | 0.02 | 0.02 | 0.04 |
| |
| CPI | | | |
| Consumer Price Index | 0.17% | 0.93% | 1.69% |
3
strategy of investing in mid-size companies they believe have potential for long-term growth and superior earnings.
On average, over the period, the fund held about 85% of its assets in five of the ten industry sectors: information technology, consumer discretionary, health care, financials, and industrials. Returns were positive in all five of the sectors, and the advisors’ holdings boosted performance in four of the five, the exception being health care.
The information technology sector contributed the most to the fund’s returns. Mid-Cap Growth’s technology stocks advanced nearly 18%, approximately double those of the benchmark. IT services firms powered most of the results, with software and electronic equipment firms helping out. Overall, the advisors’ top technology companies thrived with innovative products and solutions that served unique industry needs.
Mid-Cap Growth’s consumer discretionary stocks also stood out. While the economy’s slow but steady rebound since the recession has boosted shoppers’ billfolds and spirits, they’re still discriminating about their spending. The advisors were in tune with certain consumer trends and the companies that are capitalizing on them. The fund’s holdings in cruise lines, apparel retailers, and automotive retailers did well overall.
| | |
| Expense Ratios | | |
| Your Fund Compared With Its Peer Group | | |
| |
| | | Peer Group |
| | Fund | Average |
| Mid-Cap Growth Fund | 0.46% | 1.31% |
The fund expense ratio shown is from the prospectus dated February 25, 2015, and represents estimated costs for the current fiscal year. For
the fiscal year ended October 31, 2015, the fund’s expense ratio was 0.43%. The peer-group expense ratio is derived from data provided by
Lipper, a Thomson Reuters Company, and captures information through year-end 2014.
Peer group: Mid-Cap Growth Funds.
4
Within the health care sector, the advisors’ holdings among biotechnology, equipment firms and suppliers, and providers and service companies excelled, but the sector’s technology and pharmaceutical stocks suffered.
Mid-Cap Growth’s energy stocks declined about 40% as low oil prices weighed on most of the sector, but the fund’s limited allocation minimized the damage. The fund’s consumer staples stocks returned nearly –30% compared with a rise of almost 11% for those in the benchmark. Most of the weakness, however, was isolated among a few stocks with small exposure.
You can find more information on the fund’s positioning and performance in the Advisors’ Report that follows this letter.
Over an eventful ten years, the fund yielded solid results
Chartwell Investment Partners and William Blair Investment Management take a fundamental approach to investing and employ extensive research in their search for the stocks of quality companies that hold competitive advantages in the marketplace.
While mid-cap growth stocks weren’t always in favor over the past decade, and the financial crisis of 2008–2009 punished
| |
| Total Returns | |
| Ten Years Ended October 31, 2015 | |
| | Average |
| | Annual Return |
| Mid-Cap Growth Fund | 9.64% |
| Russell Midcap Growth Index | 9.08 |
| Mid-Cap Growth Funds Average | 7.54 |
| Mid-Cap Growth Funds Average: Derived from data provided by Lipper, a Thomson Reuters Company. |
The figures shown represent past performance, which is not a guarantee of future results. (Current performance may be
lower or higher than the performance data cited. For performance data current to the most recent month-end, visit our
website at vanguard.com/performance.) Note, too, that both investment returns and principal value can fluctuate widely, so
an investor’s shares, when sold, could be worth more or less than their original cost.
5
|
| Staying the course can help you stay closer to your fund’s return |
| |
| When stock markets are highly volatile, as in recent months, it’s tempting to run for cover. |
| But the price of panic can be high. |
| |
| A rough measure of what can be lost from attempts to time the market is the difference |
| between the returns produced by a fund and the returns earned by the fund’s investors. |
| |
| The results shown in your fund’s Performance Summary later in this report are its time- |
| weighted returns—the average annual returns investors would have earned if they had |
| invested a lump sum in the fund at the start of the period and reinvested any distributions |
| they received. Their actual returns, however, depend on whether they subsequently bought |
| or sold any shares. There’s often a gap between this dollar-weighted return for investors and |
| the fund’s time-weighted return, as shown below. |
| |
| Many sensible investment behaviors can contribute to the difference in returns, but industry |
| cash flow data suggest that one important factor is the generally counterproductive effort to |
| buy and sell at the “right” time. Keeping your emotions in check can help narrow the gap. |
| |
| Mutual fund returns and investor returns over the last decade |
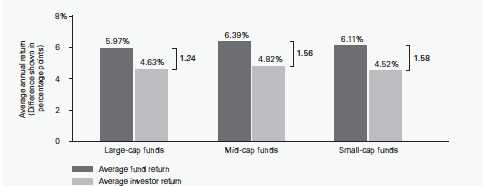
| Notes: Data are as of September 30, 2015. The average fund returns and average investor returns are from Morningstar. The average fund |
| returns are the average of the funds’ time-weighted returns in each category. The average investor returns assume that the growth of a |
| fund’s total net assets for a given period is driven by market returns and investor cash flow. To calculate investor return, a fund’s change |
| in assets for the period is discounted by the return of the fund to isolate how much of the asset growth was driven by cash flow. A model, |
| similar to an internal rate-of-return calculation, is then used to calculate a constant growth rate that links the beginning total net assets |
| and periodic cash flows to the ending total net assets. Amounts may not add up exactly because of rounding. |
| Sources: Vanguard and Morningstar, Inc. |
6
stocks of all capitalizations and styles, the fund forged a commendable record. Its average annual return of close to 10% was about half a percentage point better than its benchmark index (which bears no expenses) and about 2 percentage points ahead of its mid-cap growth peer average.
Mid-Cap Growth was aided by the combined talents of two advisors. Each has had distinct periods of superior performance in the past decade, and the combination has smoothed your Fund’s progress toward a benchmark-beating return.
A dose of discipline is crucial when markets become volatile
The developments over the past few months remind us that nobody can control the direction of the markets or reliably predict where they’ll go in the short term. However, investors can control how they react to unstable and turbulent markets.
During periods of market adversity, it’s more important than ever to keep sight of one of Vanguard’s key principles: Maintain perspective and long-term discipline. Whether you’re investing for yourself or on behalf of clients, your success is affected greatly by how you respond—or don’t respond—during turbulent markets. (You can read Vanguard’s Principles for Investing Success at vanguard.com/research.)
As I’ve written in the past, the best course for long-term investors is generally to ignore daily market moves and not make decisions based on emotion. This is also a good time to evaluate your portfolio and make sure your asset allocation is aligned with your time horizon, goals, and risk tolerance.
The markets are unpredictable and often confounding. Keeping your long-term plans clearly in focus can help you weather these periodic storms.
As always, thank you for investing with Vanguard.
Sincerely,

F. William McNabb III
Chairman and Chief Executive Officer
November 17, 2015
7
Advisors’ Report
During the fiscal year ended October 31, 2015, Vanguard Mid-Cap Growth Fund returned 6.68%. Your fund is managed by two independent advisors, a strategy that enhances the fund’s diversification by providing exposure to distinct yet complementary investment approaches. It’s not uncommon for different advisors to have different views about individual securities or the broader investment environment.
The advisors, the percentage of fund assets each manages, and brief descriptions of their investment strategies are presented in the table below. The advisors have also prepared a discussion of the investment environment that existed during the fiscal year and of how their portfolio positioning reflects this assessment. These comments were prepared on November 18, 2015.
Please note that both William Blair & Company, L.L.C., and Chartwell Investment Partners, Inc., underwent internal restructurings. As a result, the names of the firms managing portions of the Mid-Cap Growth Fund assets are now William Blair Investment Management, LLC, and Chartwell Investment Partners, LLC.
| | | |
| Vanguard Mid-Cap Growth Fund Investment Advisors |
| |
| | Fund Assets Managed | |
| Investment Advisor | % | $ Million | Investment Strategy |
| Chartwell Investment Partners, | 49 | 2,104 | Uses a bottom-up, fundamental, research-driven |
| LLC | | | stock-selection strategy focusing on companies with |
| | | | sustainable growth, strong management teams, |
| | | | competitive positions, and outstanding product and |
| | | | service offerings. These companies should continually |
| | | | demonstrate growth in earnings per share. |
| William Blair Investment | 49 | 2,097 | Uses a fundamental investment approach in pursuit of |
| Management, LLC | | | superior long-term investment results from |
| | | | growth-oriented companies with leadership positions |
| | | | and strong market presence. |
| Cash Investments | 2 | 116 | These short-term reserves are invested by Vanguard in |
| | | | equity index products to simulate investment in stocks. |
| | | | Each advisor may also maintain a modest cash |
| | | | position. |
8
Chartwell Investment Partners, LLC
Portfolio Manager:
John A. Heffern, Managing Partner and
Senior Portfolio Manager
Equity markets delivered only modest performance in the last 12 months. And recently, renewed concerns about global growth led to increased market volatility and price weakness in major indexes. Domestically, the markets digested the implications of a later rate liftoff by the Federal Reserve, which remains consistent in its expectation for a slow, gradual path toward higher interest rates. More than ever, stock selection seems central to investment performance. Accordingly, we are navigating these uncertain times with a portfolio focused on mid-capitalization companies that demonstrate above-average growth potential supported by good products and expanding markets. This approach leads to portfolio decisions that steadfastly reflect our bias toward quality, leadership, defensible margins, and a pattern of successful execution using growth-oriented business models.
The portfolio had success in stock selection in our top-performing segments: consumer cyclical, business services, and technology. Global cruise ship operators helped. Norwegian Cruise Line experienced lower fuel costs and improved pricing discipline, product execution, and cost management. Its competitor Royal Caribbean reported solid quarterly results and a steadily improving
outlook characterized by increased bookings at better prices. Advance Auto Parts, an aftermarket parts retailer, overcame acquisition integration issues to meet its full-year outlook and increase its long-term profit goal. ManpowerGroup, an international provider of blue- and white-collar staffing services, reported solid quarterly results despite macroeconomic concerns in Europe and Asia. The company also offered a positive outlook based on strong sales, cost containment, and stepped-up capital allocation. SEI Investments, a provider of investment programs and processing to the asset management industry, posted solid overall results and showed signs of strengthening new sales execution. Vantiv, which provides processing services, outperformed expectations through improved sales and capital allocation. Healthy results drove price appreciation for Avago Technologies, thanks to Apple demand, higher guidance, and other factors.
The portfolio also benefited from our investments in Allergan, BioMarin Pharmaceutical, and Brunswick. Allergan plans to sell its generic-pharmaceutical business to Teva Pharmaceutical and the majority of the cash proceeds are expected to be used for acquisitions. Near the end of the fiscal year, Pfizer approached Allergan to begin preliminary merger discussions. The strength of BioMarin’s pipeline is becoming more apparent to investors since potential approval of a drug for Duchenne muscular dystrophy has accelerated and a treatment for hemophilia has shown
9
promising results. Strong demand for new product rollouts aided Brunswick, the recreational products manufacturer.
Consumer-related sectors detracted most from performance. Results were weaker than expected, despite improving employment and wage growth, as consumer confidence remains uncertain. Discount retailer Dollar General was hurt by soft same-store sales. PVH, an apparel and accessories company, was hurt by concerns that warmer weather would disrupt fall retail trends. Despite steady to improving trends in the United States for MGM Resorts International, results in China for the casino resort owner and operator were pressured by anti-corruption initiatives.
Earnings estimates were lowered for Superior Energy Services and its peers in oil field services and equipment after exploration and production companies continued to reduce activity and pressure service companies to lower pricing. Shares of generic-drug company Akorn underperformed after debates about drug-pricing control and uncertainty over recently identified reporting errors on prior-year results. Finally, fears about Cypress Semiconductor’s ability to accelerate organic growth and the potential impact of those concerns on future margins drove the stock price down. As a result, the company increased exposure to healthier end markets.
William Blair Investment
Management, LLC
Portfolio Managers:
Robert C. Lanphier, Partner
David Ricci, CFA, Partner
For the 12-month period ended October 31, 2015, the Mid-Cap Growth Fund’s 6.68% return compared with the Russell Midcap Growth Index’s return of 4.94%.
The broad equity market advanced over the 12 months as strong consumer confidence, an improving labor market, and solid housing data suggested continued health of the U.S. economy. In addition, the equity market was supported by strong mergers and acquisitions activity driven by healthy corporate balance sheets, the continued availability of cheap debt financing, and a generally favorable market response to deal announcements. However, late in the summer, volatility spiked. Downdrafts in August and September, driven by concerns about slowing growth in China and its potential effects on global economic growth, weighed significantly on market returns. The equity market rebounded strongly in October and volatility eased, resulting in an overall positive market return for the fiscal year.
In terms of portfolio performance, stock selection in the period was mixed. Positive selection in information technology and
10
industrials contributed to performance; positions in Vantiv and Equifax were our top contributors in those sectors, respectively. Also within industrials, our bias toward business services companies and away from more cyclical industrials added value. Other notable contributors to return included BioMarin Pharmaceutical (health care), O’Reilly Automotive (consumer discretionary), and Sirona Dental Systems (health care). Consumer staples was an area of weakness and our position in Keurig Green Mountain was a notable laggard within the sector. Other major detractors included HMS Holdings (health care), Michael Kors (consumer discretionary), Polaris Industries (consumer discretionary), and Borg Warner (consumer discretionary). From a style perspective, our bias toward companies with less volatile fundamentals helped, as the market seemed to favor stocks of companies with more consistent business models.
We expect the U.S. economic expansion to continue on its slow but steady path. The Fed’s stance on monetary policy implementation remains data-dependent. We do not attempt to predict when the Fed will begin raising rates, but we do
believe rates are likely to stay lower for longer than they otherwise would. Economic risks abroad and excess capacity in many parts of the global economy are likely to limit inflationary pressures. Among these risks, China remains the most notable. China has been overly dependent on fixed asset investment in real estate, manufacturing capacity, and infrastructure to drive economic growth. It faces a difficult transition from an industrial economy to a consumer-led economy. China’s trajectory on this front will have important implications for other emerging markets, particularly commodity-driven economies reliant on Chinese demand.
From our bottom-up perspective, we remain optimistic about U.S. corporate earnings, albeit against a backdrop of low revenue growth. Broadly speaking, we do not see signs of exuberance from company managements; they have remained disciplined in hiring and capital expenditure, and balance sheets continue to be healthy. We are optimistic about our portfolio of high-quality companies whose stocks trade at attractive valuations relative to the expected growth and consistency of the businesses.
11
Mid-Cap Growth Fund
Fund Profile
As of October 31, 2015
| | | |
| Portfolio Characteristics | | |
| | | | DJ |
| | | | U.S. |
| | | Russell | Total |
| | | Midcap | Market |
| | | Growth | FA |
| | Fund | Index | Index |
| Number of Stocks | 97 | 506 | 3,971 |
| Median Market Cap | $8.6B | $12.1B | $51.0B |
| Price/Earnings Ratio | 27.0x | 28.5x | 21.9x |
| Price/Book Ratio | 3.6x | 5.4x | 2.7x |
| Return on Equity | 17.1% | 20.2% | 17.2% |
| Earnings Growth | | | |
| Rate | 18.7% | 14.8% | 9.9% |
| Dividend Yield | 0.8% | 1.1% | 2.0% |
| Foreign Holdings | 0.9% | 0.0% | 0.0% |
| Turnover Rate | 93% | — | — |
| Ticker Symbol | VMGRX | — | — |
| Expense Ratio1 | 0.46% | — | — |
| 30-Day SEC Yield | 0.20% | — | — |
| Short-Term | | | |
| Reserves | 2.8% | — | — |
| | | |
| Sector Diversification (% of equity exposure) |
| | | Russell | DJ |
| | | Midcap | U.S. Total |
| | | Growth | Market |
| | Fund | Index | FA Index |
| Consumer | | | |
| Discretionary | 29.3% | 25.0% | 13.7% |
| Consumer Staples | 1.5 | 7.9 | 8.5 |
| Energy | 2.2 | 0.9 | 6.5 |
| Financials | 16.9 | 11.4 | 17.9 |
| Health Care | 13.6 | 13.0 | 14.2 |
| Industrials | 16.8 | 15.8 | 10.7 |
| Information | | | |
| Technology | 16.0 | 20.3 | 20.1 |
| Materials | 1.9 | 5.2 | 3.3 |
| Telecommunication | | | |
| Services | 1.8 | 0.4 | 2.1 |
| Utilities | 0.0 | 0.1 | 3.0 |
| | |
| Volatility Measures | | |
| | Russell | DJ |
| | Midcap | U.S. Total |
| | Growth | Market |
| | Index | FA Index |
| R-Squared | 0.96 | 0.85 |
| Beta | 0.99 | 1.00 |
| These measures show the degree and timing of the fund’s fluctuations compared with the indexes over 36 months. |
| | |
| Ten Largest Holdings (% of total net assets) |
| |
| Brunswick Corp. | Leisure Products | 3.2% |
| Old Dominion Freight | | |
| Line Inc. | Trucking | 2.9 |
| Intercontinental | | |
| Exchange Inc. | Specialized Finance | 2.4 |
| Hanesbrands Inc. | Apparel, Accessories | |
| | & Luxury Goods | 2.3 |
| Hilton Worldwide | Hotels, Resorts & | |
| Holdings Inc. | Cruise Lines | 2.3 |
| Vantiv Inc. | Data Processing & | |
| | Outsourced Services | 2.1 |
| ManpowerGroup Inc. | Human Resource & | |
| | Employment | |
| | Services | 2.0 |
| Norwegian Cruise Line | Hotels, Resorts & | |
| Holdings Ltd. | Cruise Lines | 1.9 |
| SEI Investments Co. | Asset Management | |
| | & Custody Banks | 1.8 |
| SBA Communications | Wireless | |
| Corp. | Telecommunication | |
| | Services | 1.7 |
| Top Ten | | 22.6% |
| The holdings listed exclude any temporary cash investments and equity index products. |
Investment Focus
1 The expense ratio shown is from the prospectus dated February 25, 2015, and represents estimated costs for the current fiscal year. For the fiscal
year ended October 31, 2015, the expense ratio was 0.43%.
12
Mid-Cap Growth Fund
Performance Summary
All of the returns in this report represent past performance, which is not a guarantee of future results that may be achieved by the fund. (Current performance may be lower or higher than the performance data cited. For performance data current to the most recent month-end, visit our website at vanguard.com/performance.) Note, too, that both investment returns and principal value can fluctuate widely, so an investor’s shares, when sold, could be worth more or less than their original cost. The returns shown do not reflect taxes that a shareholder would pay on fund distributions or on the sale of fund shares.
Cumulative Performance: October 31, 2005, Through October 31, 2015
Initial Investment of $10,000
| | | | | |
| | | Average Annual Total Returns | |
| | | Periods Ended October 31, 2015 | |
| | | | | | Final Value |
| | | One | Five | Ten | of a $10,000 |
| | | Year | Years | Years | Investment |
| | Mid-Cap Growth Fund* | 6.68% | 13.99% | 9.64% | $25,099 |
| •••••••• | Russell Midcap Growth Index | 4.94 | 14.10 | 9.08 | 23,844 |
| |
| – – – – | Dow Mid-Cap Jones Growth U.S. Total Funds Stock Average Market | 2.85 | 11.67 | 7.54 | 20,685 |
| | Float Adjusted Index | 4.40 | 14.11 | 8.07 | 21,735 |
| Mid-Cap Growth Funds Average: Derived from data provided by Lipper, a Thomson Reuters Company. |
See Financial Highlights for dividend and capital gains information.
13
Mid-Cap Growth Fund
Fiscal-Year Total Returns (%): October 31, 2005, Through October 31, 2015
Average Annual Total Returns: Periods Ended September 30, 2015
This table presents returns through the latest calendar quarter—rather than through the end of the fiscal period.
Securities and Exchange Commission rules require that we provide this information.
| | | | |
| | Inception | One | Five | Ten |
| | Date | Year | Years | Years |
| Mid-Cap Growth Fund | 12/31/1997 | 5.41% | 13.82% | 8.76% |
14
Mid-Cap Growth Fund
Financial Statements
Statement of Net Assets
As of October 31, 2015
The fund reports a complete list of its holdings in regulatory filings four times in each fiscal year, at the quarter-ends. For the second and fourth fiscal quarters, the lists appear in the fund’s semiannual and annual reports to shareholders. For the first and third fiscal quarters, the fund files the lists with the Securities and Exchange Commission on Form N-Q. Shareholders can look up the fund’s Forms N-Q on the SEC’s website at sec.gov. Forms N-Q may also be reviewed and copied at the SEC’s Public Reference Room (see the back cover of this report for further information).
| | | |
| | | | Market |
| | | | Value• |
| | | Shares | ($000) |
| Common Stocks (94.9%)1 | | |
| Consumer Discretionary (27.8%) | |
| | Brunswick Corp. | 2,571,480 | 138,371 |
| | Hanesbrands Inc. | 3,174,065 | 101,380 |
| | Hilton Worldwide | | |
| | Holdings Inc. | 3,936,820 | 98,381 |
| * | Norwegian Cruise Line | | |
| | Holdings Ltd. | 1,258,690 | 80,078 |
| | Tractor Supply Co. | 767,585 | 70,917 |
| | Dollar General Corp. | 978,626 | 66,322 |
| | Royal Caribbean Cruises | | |
| | Ltd. | 633,730 | 62,327 |
| | BorgWarner Inc. | 1,453,804 | 62,252 |
| | Advance Auto Parts Inc. | 288,820 | 57,311 |
| | Polaris Industries Inc. | 460,000 | 51,676 |
| | Ross Stores Inc. | 847,100 | 42,846 |
| | Williams-Sonoma Inc. | 571,133 | 42,121 |
| * | Burlington Stores Inc. | 864,239 | 41,553 |
| | PVH Corp. | 444,340 | 40,413 |
| | Newell Rubbermaid Inc. | 930,696 | 39,489 |
| * | O’Reilly Automotive Inc. | 136,021 | 37,577 |
| | L Brands Inc. | 293,200 | 28,141 |
| | Six Flags Entertainment | | |
| | Corp. | 538,500 | 28,024 |
| | Nordstrom Inc. | 338,795 | 22,093 |
| | Lennar Corp. Class A | 416,575 | 20,858 |
| * | Sally Beauty Holdings Inc. | 781,892 | 18,382 |
| | Harman International | | |
| | Industries Inc. | 138,865 | 15,270 |
| * | Chipotle Mexican Grill Inc. | | |
| | Class A | 23,330 | 14,937 |
| | Carter’s Inc. | 117,550 | 10,683 |
| * | Steven Madden Ltd. | 272,150 | 9,484 |
| | | | 1,200,886 |
| Consumer Staples (1.3%) | | |
| | Keurig Green Mountain Inc. | 615,650 | 31,244 |
| * | Monster Beverage Corp. | 189,700 | 25,860 |
| | | | 57,104 |
| | | |
| Energy (2.1%) | | |
| | Superior Energy Services | | |
| | Inc. | 2,993,070 | 42,382 |
| * | Diamondback Energy Inc. | 372,140 | 27,479 |
| * | Concho Resources Inc. | 170,600 | 19,774 |
| | | | 89,635 |
| Financials (16.1%) | | |
| | Intercontinental Exchange | | |
| | Inc. | 416,490 | 105,122 |
| | SEI Investments Co. | 1,516,290 | 78,574 |
| | Lazard Ltd. Class A | 1,418,183 | 65,690 |
| * | E*TRADE Financial Corp. | 2,229,458 | 63,562 |
| | Popular Inc. | 2,130,021 | 62,985 |
| * | Affiliated Managers Group | | |
| | Inc. | 325,390 | 58,655 |
| | Moody’s Corp. | 521,300 | 50,128 |
| * | Signature Bank | 332,284 | 49,484 |
| | Assured Guaranty Ltd. | 1,474,825 | 40,469 |
| | Jones Lang LaSalle Inc. | 215,490 | 35,924 |
| * | MGIC Investment Corp. | 3,784,260 | 35,572 |
| ^ | LPL Financial Holdings Inc. | 623,514 | 26,562 |
| | IBERIABANK Corp. | 338,817 | 20,542 |
| | | | 693,269 |
| Health Care (12.9%) | | |
| * | BioMarin Pharmaceutical | | |
| | Inc. | 549,820 | 64,351 |
| * | Cerner Corp. | 879,700 | 58,315 |
| * | MEDNAX Inc. | 795,300 | 56,045 |
| * | Endo International plc | 821,975 | 49,310 |
| * | Sirona Dental Systems Inc. | 423,858 | 46,256 |
| * | Align Technology Inc. | 538,100 | 35,224 |
| * | Mettler-Toledo | | |
| | International Inc. | 112,300 | 34,924 |
| * | Team Health Holdings Inc. | 526,650 | 31,425 |
| * | IDEXX Laboratories Inc. | 444,158 | 30,478 |
| * | Charles River Laboratories | | |
| | International Inc. | 463,726 | 30,254 |
| * | Quintiles Transnational | | |
| | Holdings Inc. | 452,097 | 28,776 |
15
Mid-Cap Growth Fund
| | | |
| | | | Market |
| | | | Value• |
| | | Shares | ($000) |
| | Perrigo Co. plc | 164,410 | 25,934 |
| * | Medivation Inc. | 561,300 | 23,608 |
| * | Health Net Inc. | 336,810 | 21,643 |
| * | HCA Holdings Inc. | 120,434 | 8,285 |
| * | Incyte Corp. | 66,660 | 7,835 |
| * | Akorn Inc. | 128,101 | 3,425 |
| | | | 556,088 |
| Industrials (15.9%) | | |
| * | Old Dominion Freight Line | | |
| | Inc. | 2,027,140 | 125,561 |
| | ManpowerGroup Inc. | 927,060 | 85,086 |
| | Towers Watson & Co. | | |
| | Class A | 577,830 | 71,397 |
| | KAR Auction Services Inc. | 1,699,585 | 65,264 |
| | Delta Air Lines Inc. | 1,127,495 | 57,322 |
| | Rockwell Collins Inc. | 592,200 | 51,356 |
| | AMETEK Inc. | 779,910 | 42,755 |
| | Equifax Inc. | 361,165 | 38,489 |
| | Carlisle Cos. Inc. | 400,500 | 34,843 |
| * | TransDigm Group Inc. | 131,700 | 28,954 |
| * | Verisk Analytics Inc. | | |
| | Class A | 366,400 | 26,238 |
| * | Middleby Corp. | 201,200 | 23,528 |
| * | HD Supply Holdings Inc. | 783,145 | 23,330 |
| * | IHS Inc. Class A | 103,525 | 12,375 |
| | | | 686,498 |
| Information Technology (15.1%) | |
| * | Vantiv Inc. Class A | 1,839,609 | 92,256 |
| * | Red Hat Inc. | 826,000 | 65,345 |
| * | Cognizant Technology | | |
| | Solutions Corp. Class A | 950,880 | 64,765 |
| * | Genpact Ltd. | 2,182,222 | 54,076 |
| * | ANSYS Inc. | 494,400 | 47,121 |
| * | CoStar Group Inc. | 225,679 | 45,829 |
| * | Guidewire Software Inc. | 672,700 | 39,171 |
| * | NXP Semiconductors NV | 474,690 | 37,192 |
| | SS&C Technologies | | |
| | Holdings Inc. | 421,016 | 31,218 |
| * | IPG Photonics Corp. | 325,432 | 26,887 |
| * | Pandora Media Inc. | 1,740,410 | 20,032 |
| * | Akamai Technologies Inc. | 303,772 | 18,475 |
| | Avago Technologies Ltd. | | |
| | Class A | 144,400 | 17,780 |
| | Cypress Semiconductor | | |
| | Corp. | 1,628,480 | 17,164 |
| * | Manhattan Associates Inc. | 230,310 | 16,778 |
| * | PTC Inc. | 439,880 | 15,589 |
| | Monolithic Power | | |
| | Systems Inc. | 177,745 | 11,095 |
| | Belden Inc. | 163,305 | 10,457 |
| *,^ | NeuStar Inc. Class A | 350,277 | 9,524 |
| | MAXIMUS Inc. | 138,865 | 9,471 |
| | | | 650,225 |
| | | |
| Materials (1.8%) | | |
| | Vulcan Materials Co. | 471,400 | 45,528 |
| | Airgas Inc. | 346,900 | 33,358 |
| | | | 78,886 |
| Other (0.2%) | | |
| 2 | Vanguard Mid-Cap Growth | |
| | ETF | 100,223 | 10,295 |
| |
| Telecommunication Services (1.7%) | |
| * | SBA Communications | | |
| | Corp. Class A | 628,845 | 74,845 |
| Total Common Stocks | | |
| (Cost $3,652,053) | | 4,097,731 |
| Temporary Cash Investments (4.9%)1 | |
| Money Market Fund (4.7%) | | |
| 3,4 | Vanguard Market | | |
| | Liquidity Fund, | | |
| | 0.207% | 204,525,886 | 204,526 |
| |
| | | Face | |
| | | Amount | |
| | | ($000) | |
| U.S. Government and Agency Obligations (0.2%) |
| 5,6 | Federal Home Loan Bank | |
| | Discount Notes, 0.180%, | |
| | 11/4/15 | 6,000 | 6,000 |
| 5,6 | Federal Home Loan Bank | |
| | Discount Notes, 0.182%, | |
| | 11/25/15 | 2,000 | 2,000 |
| | | | 8,000 |
| Total Temporary Cash Investments | |
| (Cost $212,522) | | 212,526 |
| Total Investments (99.8%) | | |
| (Cost $3,864,575) | | 4,310,257 |
16
Mid-Cap Growth Fund
| |
| | Amount |
| | ($000) |
| Other Assets and Liabilities (0.2%) | |
| Other Assets | |
| Investment in Vanguard | 368 |
| Receivables for Investment Securities Sold 34,566 |
| Receivables for Accrued Income | 986 |
| Receivables for Capital Shares Issued | 13,999 |
| Other Assets | 1,124 |
| Total Other Assets | 51,043 |
| Liabilities | |
| Payables for Investment Securities | |
| Purchased | (26,079) |
| Collateral for Securities on Loan | (9,074) |
| Payables to Investment Advisor | (1,928) |
| Payables for Capital Shares Redeemed | (1,756) |
| Payables to Vanguard | (4,889) |
| Other Liabilities | (171) |
| Total Liabilities | (43,897) |
| Net Assets (100%) | |
| Applicable to 173,551,238 outstanding | |
| $.001 par value shares of beneficial | |
| interest (unlimited authorization) | 4,317,403 |
| Net Asset Value Per Share | $24.88 |
| |
| At October 31, 2015, net assets consisted of: |
| | Amount |
| | ($000) |
| Paid-in Capital | 3,564,655 |
| Undistributed Net Investment Income | 4,532 |
| Accumulated Net Realized Gains | 298,474 |
| Unrealized Appreciation (Depreciation) | |
| Investment Securities | 445,682 |
| Futures Contracts | 4,060 |
| Net Assets | 4,317,403 |
• See Note A in Notes to Financial Statements.
* Non-income-producing security.
^ Includes partial security positions on loan to broker-dealers. The total value of securities on loan is $8,790,000.
1 The fund invests a portion of its cash reserves in equity markets through the use of index futures contracts. After giving effect to futures
investments, the fund’s effective common stock and temporary cash investment positions represent 97.3% and 2.5%, respectively,
of net assets.
2 Considered an affiliated company of the fund as the issuer is another member of The Vanguard Group.
3 Affiliated money market fund available only to Vanguard funds and certain trusts and accounts managed by Vanguard. Rate shown is the
7-day yield.
4 Includes $9,074,000 of collateral received for securities on loan.
5 The issuer operates under a congressional charter; its securities are generally neither guaranteed by the U.S. Treasury nor backed by the full
faith and credit of the U.S. government.
6 Securities with a value of $4,500,000 have been segregated as initial margin for open futures contracts.
See accompanying Notes, which are an integral part of the Financial Statements.
17
Mid-Cap Growth Fund
Statement of Operations
| |
| | Year Ended |
| | October 31, 2015 |
| | ($000) |
| Investment Income | |
| Income | |
| Dividends1 | 25,722 |
| Interest1 | 322 |
| Securities Lending | 146 |
| Total Income | 26,190 |
| Expenses | |
| Investment Advisory Fees—Note B | |
| Basic Fee | 7,636 |
| Performance Adjustment | (318) |
| The Vanguard Group—Note C | |
| Management and Administrative | 8,556 |
| Marketing and Distribution | 739 |
| Custodian Fees | 44 |
| Auditing Fees | 34 |
| Shareholders’ Reports | 36 |
| Trustees’ Fees and Expenses | 7 |
| Total Expenses | 16,734 |
| Expenses Paid Indirectly | (139) |
| Net Expenses | 16,595 |
| Net Investment Income | 9,595 |
| Realized Net Gain (Loss) | |
| Investment Securities Sold1 | 347,399 |
| Futures Contracts | (4,019) |
| Realized Net Gain (Loss) | 343,380 |
| Change in Unrealized Appreciation (Depreciation) | |
| Investment Securities | (141,728) |
| Futures Contracts | 4,375 |
| Change in Unrealized Appreciation (Depreciation) | (137,353) |
| Net Increase (Decrease) in Net Assets Resulting from Operations | 215,622 |
| 1 Dividend income, interest income, and realized net gain (loss) from affiliated companies of the fund were $125,000, $313,000, and $0, respectively. |
See accompanying Notes, which are an integral part of the Financial Statements.
18
Mid-Cap Growth Fund
Statement of Changes in Net Assets
| | |
| | Year Ended October 31, |
| | 2015 | 2014 |
| | ($000) | ($000) |
| Increase (Decrease) in Net Assets | | |
| Operations | | |
| Net Investment Income | 9,595 | 5,069 |
| Realized Net Gain (Loss) | 343,380 | 446,093 |
| Change in Unrealized Appreciation (Depreciation) | (137,353) | (63,181) |
| Net Increase (Decrease) in Net Assets Resulting from Operations | 215,622 | 387,981 |
| Distributions | | |
| Net Investment Income | (4,856) | (782) |
| Realized Capital Gain1 | (405,208) | (278,523) |
| Total Distributions | (410,064) | (279,305) |
| Capital Share Transactions | | |
| Issued | 1,505,655 | 619,821 |
| Issued in Lieu of Cash Distributions | 398,819 | 271,718 |
| Redeemed | (711,728) | (517,710) |
| Net Increase (Decrease) from Capital Share Transactions | 1,192,746 | 373,829 |
| Total Increase (Decrease) | 998,304 | 482,505 |
| Net Assets | | |
| Beginning of Period | 3,319,099 | 2,836,594 |
| End of Period2 | 4,317,403 | 3,319,099 |
1 Includes fiscal 2015 and 2014 short-term gain distributions totaling $80,760,000 and $86,619,000, respectively. Short-term gain distributions
are treated as ordinary income dividends for tax purposes.
2 Net Assets—End of Period includes undistributed (overdistributed) net investment income of $4,532,000 and $788,000.
See accompanying Notes, which are an integral part of the Financial Statements.
19
Mid-Cap Growth Fund
Financial Highlights
| | | | | |
| For a Share Outstanding | Year Ended October 31, |
| Throughout Each Period | 2015 | 2014 | 2013 | 2012 | 2011 |
| Net Asset Value, Beginning of Period | $26.40 | $25.72 | $20.95 | $19.40 | $17.54 |
| Investment Operations | | | | | |
| Net Investment Income | . 0641 | .045 | .048 | .041 | .0402 |
| Net Realized and Unrealized Gain (Loss) | | | | | |
| on Investments | 1.625 | 3.134 | 5.965 | 1.892 | 1.840 |
| Total from Investment Operations | 1.689 | 3.179 | 6.013 | 1.933 | 1.880 |
| Distributions | | | | | |
| Dividends from Net Investment Income | (.038) | (.007) | (.075) | (. 030) | (. 020) |
| Distributions from Realized Capital Gains | (3.171) | (2.492) | (1.168) | (.353) | — |
| Total Distributions | (3.209) | (2.499) | (1.243) | (. 383) | (.020) |
| Net Asset Value, End of Period | $24.88 | $26.40 | $25.72 | $20.95 | $19.40 |
| |
| Total Return3 | 6.68% | 13.42% | 30.32% | 10.24% | 10.72% |
| |
| Ratios/Supplemental Data | | | | | |
| Net Assets, End of Period (Millions) | $4,317 | $3,319 | $2,837 | $2,129 | $1,804 |
| Ratio of Total Expenses to Average Net Assets4 | 0.43% | 0.46% | 0.51% | 0.54% | 0.53% |
| Ratio of Net Investment Income to | | | | | |
| Average Net Assets | 0.25%1 | 0.16% | 0.19% | 0.19% | 0.20%2 |
| Portfolio Turnover Rate | 93% | 82% | 83% | 97% | 127% |
1 Net investment income per share and the ratio of net investment income to average net assets include $.006 and 0.03%, respectively,
resulting from a special dividend from Lazard Ltd. in February 2015.
2 Net investment income per share and the ratio of net investment income to average net assets include $.02 and 0.11%, respectively,
resulting from a special dividend from VeriSign Inc. in December 2010.
3 Total returns do not include account service fees that may have applied in the periods shown. Fund prospectuses provide information about
any applicable account service fees.
4 Includes performance-based investment advisory fee increases (decreases) of (0.01%), (0.02%), 0.02%, 0.04%, and 0.01%.
See accompanying Notes, which are an integral part of the Financial Statements.
20
Mid-Cap Growth Fund
Notes to Financial Statements
Vanguard Mid-Cap Growth Fund is registered under the Investment Company Act of 1940 as an open-end investment company, or mutual fund.
A. The following significant accounting policies conform to generally accepted accounting principles for U.S. investment companies. The fund consistently follows such policies in preparing its financial statements.
1. Security Valuation: Securities are valued as of the close of trading on the New York Stock Exchange (generally 4 p.m., Eastern time) on the valuation date. Equity securities are valued at the latest quoted sales prices or official closing prices taken from the primary market in which each security trades; such securities not traded on the valuation date are valued at the mean of the latest quoted bid and asked prices. Securities for which market quotations are not readily available, or whose values have been materially affected by events occurring before the fund’s pricing time but after the close of the securities’ primary markets, are valued by methods deemed by the board of trustees to represent fair value. Investments in Vanguard Market Liquidity Fund are valued at that fund’s net asset value. Temporary cash investments acquired over 60 days to maturity are valued using the latest bid prices or using valuations based on a matrix system (which considers such factors as security prices, yields, maturities, and ratings), both as furnished by independent pricing services. Other temporary cash investments are valued at amortized cost, which approximates market value.
2. Futures Contracts: The fund uses index futures contracts to a limited extent, with the objective of maintaining full exposure to the stock market while maintaining liquidity. The fund may purchase or sell futures contracts to achieve a desired level of investment, whether to accommodate portfolio turnover or cash flows from capital share transactions. The primary risks associated with the use of futures contracts are imperfect correlation between changes in market values of stocks held by the fund and the prices of futures contracts, and the possibility of an illiquid market. Counterparty risk involving futures is mitigated because a regulated clearinghouse is the counterparty instead of the clearing broker. To further mitigate counterparty risk, the fund trades futures contracts on an exchange, monitors the financial strength of its clearing brokers and clearinghouse, and has entered into clearing agreements with its clearing brokers. The clearinghouse imposes initial margin requirements to secure the fund’s performance and requires daily settlement of variation margin representing changes in the market value of each contract.
Futures contracts are valued at their quoted daily settlement prices. The aggregate settlement values of the contracts are not recorded in the Statement of Net Assets. Fluctuations in the value of the contracts are recorded in the Statement of Net Assets as an asset (liability) and in the Statement of Operations as unrealized appreciation (depreciation) until the contracts are closed, when they are recorded as realized futures gains (losses).
During the year ended October 31, 2015, the fund’s average investments in long and short futures contracts represented 2% and 0% of net assets, respectively, based on the average of aggregate settlement values at each quarter-end during the period.
3. Federal Income Taxes: The fund intends to continue to qualify as a regulated investment company and distribute all of its taxable income. Management has analyzed the fund’s tax positions taken for all open federal income tax years (October 31, 2012–2015), and has concluded that no provision for federal income tax is required in the fund’s financial statements.
4. Distributions: Distributions to shareholders are recorded on the ex-dividend date.
21
Mid-Cap Growth Fund
5. Securities Lending: To earn additional income, the fund lends its securities to qualified institutional borrowers. Security loans are required to be secured at all times by collateral in an amount at least equal to the market value of securities loaned. Daily market fluctuations could cause the value of loaned securities to be more or less than the value of the collateral received. When this occurs, the collateral is adjusted and settled on the next business day. The fund further mitigates its counterparty risk by entering into securities lending transactions only with a diverse group of prequalified counterparties, monitoring their financial strength, and entering into master securities lending agreements with its counterparties. The master securities lending agreements provide that, in the event of a counterparty’s default (including bankruptcy), the fund may terminate any loans with that borrower, determine the net amount owed, and sell or retain the collateral up to the net amount owed to the fund; however, such actions may be subject to legal proceedings. While collateral mitigates counterparty risk, in the absence of a default the fund may experience delays and costs in recovering the securities loaned. The fund invests cash collateral received in Vanguard Market Liquidity Fund, and records a liability in the Statement of Net Assets for the return of the collateral, during the period the securities are on loan. Securities lending income represents fees charged to borrowers plus income earned on invested cash collateral, less expenses associated with the loan.
6. Credit Facility: The fund and certain other funds managed by The Vanguard Group (“Vanguard”) participate in a $3 billion committed credit facility provided by a syndicate of lenders pursuant to a credit agreement that may be renewed annually; each fund is individually liable for its borrowings, if any, under the credit facility. Borrowings may be utilized for temporary and emergency purposes, and are subject to the fund’s regulatory and contractual borrowing restrictions. The participating funds are charged administrative fees and an annual commitment fee of 0.06% of the undrawn amount of the facility; these fees are allocated to the funds based on a method approved by the fund’s board of trustees and included in Management and Administrative expenses on the fund’s Statement of Operations. Any borrowings under this facility bear interest at a rate equal to the higher of the federal funds rate or LIBOR reference rate plus an agreed-upon spread.
The fund had no borrowings outstanding at October 31, 2015, or at any time during the period then ended.
7. Other: Dividend income is recorded on the ex-dividend date. Interest income includes income distributions received from Vanguard Market Liquidity Fund and is accrued daily. Premiums and discounts on debt securities purchased are amortized and accreted, respectively, to interest income over the lives of the respective securities. Security transactions are accounted for on the date securities are bought or sold. Costs used to determine realized gains (losses) on the sale of investment securities are those of the specific securities sold.
B. The investment advisory firms Chartwell Investment Partners, LLC, and William Blair Investment Management, LLC, each provide investment advisory services to a portion of the fund for a fee calculated at an annual percentage rate of average net assets managed by the advisor. The basic fee of Chartwell Investment Partners, LLC, is subject to quarterly adjustments based on performance relative to the Russell Midcap Growth Index for the preceding three years. The basic fee of William Blair Investment Management, LLC, is subject to quarterly adjustments based on performance relative to the Russell Midcap Growth Index for the preceding five years.
22
Mid-Cap Growth Fund
Vanguard manages the cash reserves of the fund as described below.
For the year ended October 31, 2015, the aggregate investment advisory fee represented an effective annual basic rate of 0.20% of the fund’s average net assets, before a net decrease of $318,000 (0.01%) based on performance.
C. In accordance with the terms of a Funds’ Service Agreement (the “FSA”) between Vanguard and the fund, Vanguard furnishes to the fund corporate management, administrative, marketing, distribution and cash management services at Vanguard’s cost of operations (as defined by the FSA). These costs of operations are allocated to the fund based on methods and guidelines approved by the board of trustees. Vanguard does not require reimbursement in the current period for certain costs of operations (such as deferred compensation/benefits and risk/insurance costs); the fund’s liability for these costs of operations is included in Payables to Vanguard on the Statement of Net Assets.
Upon the request of Vanguard, the fund may invest up to 0.40% of its net assets as capital in Vanguard. At October 31, 2015, the fund had contributed to Vanguard capital in the amount of $368,000, representing 0.01% of the fund’s net assets and 0.15% of Vanguard’s capitalization. The fund’s trustees and officers are also directors and employees, respectively, of Vanguard.
D. The fund has asked its investment advisors to direct certain security trades, subject to obtaining the best price and execution, to brokers who have agreed to rebate to the fund part of the commissions generated. Such rebates are used solely to reduce the fund’s management and administrative expenses. For the year ended October 31, 2015, these arrangements reduced the fund’s expenses by $139,000 (an annual rate of 0.00% of average net assets).
E. Various inputs may be used to determine the value of the fund’s investments. These inputs are summarized in three broad levels for financial statement purposes. The inputs or methodologies used to value securities are not necessarily an indication of the risk associated with investing in those securities.
Level 1—Quoted prices in active markets for identical securities.
Level 2—Other significant observable inputs (including quoted prices for similar securities, interest rates, prepayment speeds, credit risk, etc.).
Level 3—Significant unobservable inputs (including the fund’s own assumptions used to determine the fair value of investments).
The following table summarizes the market value of the fund’s investments as of October 31, 2015, based on the inputs used to value them:
| | | |
| | Level 1 | Level 2 | Level 3 |
| Investments | ($000) | ($000) | ($000) |
| Common Stocks | 4,097,731 | — | — |
| Temporary Cash Investments | 204,526 | 8,000 | — |
| Futures Contracts—Assets1 | 24 | — | — |
| Futures Contracts—Liabilities1 | (71) | — | — |
| Total | 4,302,210 | 8,000 | — |
| 1 Represents variation margin on the last day of the reporting period. |
23
Mid-Cap Growth Fund
F. At October 31, 2015, the aggregate settlement value of open futures contracts and the related unrealized appreciation (depreciation) were:
| | | | |
| | | | | ($000) |
| | | | Aggregate | |
| | | Number of | Settlement | Unrealized |
| | | Long (Short) | Value | Appreciation |
| Futures Contracts | Expiration | Contracts | Long (Short) | (Depreciation) |
| E-mini S&P Mid-Cap 400 Index | December 2015 | 546 | 78,700 | 3,720 |
| E-mini S&P 500 Index | December 2015 | 253 | 26,232 | 340 |
| | | | | 4,060 |
Unrealized appreciation (depreciation) on open futures contracts is required to be treated as realized gain (loss) for tax purposes.
G. Distributions are determined on a tax basis and may differ from net investment income and realized capital gains for financial reporting purposes. Differences may be permanent or temporary. Permanent differences are reclassified among capital accounts in the financial statements to reflect their tax character. Temporary differences arise when certain items of income, expense, gain, or loss are recognized in different periods for financial statement and tax purposes. These differences will reverse at some time in the future. Differences in classification may also result from the treatment of short-term gains as ordinary income for tax purposes.
The fund used a tax accounting practice to treat a portion of the price of capital shares redeemed during the year as distributions from net investment income and realized capital gains. Accordingly, the fund has reclassified $995,000 from undistributed net investment income, and $44,726,000 from accumulated net realized gains, to paid-in capital.
For tax purposes, at October 31, 2015, the fund had $24,069,000 of ordinary income and $296,340,000 of long-term capital gains available for distribution.
At October 31, 2015, the cost of investment securities for tax purposes was $3,873,529,000. Net unrealized appreciation of investment securities for tax purposes was $436,728,000, consisting of unrealized gains of $599,967,000 on securities that had risen in value since their purchase and $163,239,000 in unrealized losses on securities that had fallen in value since their purchase.
H. During the year ended October 31, 2015, the fund purchased $4,192,369,000 of investment securities and sold $3,412,659,000 of investment securities, other than temporary cash investments.
24
Mid-Cap Growth Fund
I. Capital shares issued and redeemed were:
| | |
| | Year Ended October 31, |
| | 2015 | 2014 |
| | Shares | Shares |
| | (000) | (000) |
| Issued | 59,434 | 24,664 |
| Issued in Lieu of Cash Distributions | 16,399 | 11,417 |
| Redeemed | (28,005) | (20,664) |
| Net Increase (Decrease) in Shares Outstanding | 47,828 | 15,417 |
J. Management has determined that no material events or transactions occurred subsequent to October 31, 2015, that would require recognition or disclosure in these financial statements.
25
Report of Independent Registered
Public Accounting Firm
To the Board of Trustees of Vanguard Whitehall Funds and the Shareholders of Vanguard Mid-Cap Growth Fund:
In our opinion, the accompanying statement of net assets and the related statements of operations and of changes in net assets and the financial highlights present fairly, in all material respects, the financial position of Vanguard Mid-Cap Growth Fund (constituting a separate portfolio of Vanguard Whitehall Funds, hereafter referred to as the “Fund”) at October 31, 2015, the results of its operations for the year then ended, the changes in its net assets for each of the two years in the period then ended, and the financial highlights for each of the five years in the period then ended, in conformity with accounting principles generally accepted in the United States of America. These financial statements and financial highlights (hereafter referred to as “financial statements”) are the responsibility of the Fund’s management. Our responsibility is to express an opinion on these financial statements based on our audits. We conducted our audits of these financial statements in accordance with the standards of the Public Company Accounting Oversight Board (United States). Those standards require that we plan and perform the audit to obtain reasonable assurance about whether the financial statements are free of material misstatement. An audit includes examining, on a test basis, evidence supporting the amounts and disclosures in the financial statements, assessing the accounting principles used and significant estimates made by management, and evaluating the overall financial statement presentation. We believe that our audits, which included confirmation of securities at October 31, 2015 by correspondence with the custodian and brokers, by agreement to the underlying ownership records of the transfer agent and the application of alternative auditing procedures where securities purchased had not been received, provide a reasonable basis for our opinion.
/s/PricewaterhouseCoopers LLP
Philadelphia, Pennsylvania
December 10, 2015
Special 2015 tax information (unaudited) for Vanguard Mid-Cap Growth Fund
This information for the fiscal year ended October 31, 2015, is included pursuant to provisions of the
Internal Revenue Code.
The fund distributed $367,444,000 as capital gain dividends (20% rate gain distributions) to
shareholders during the fiscal year.
For nonresident alien shareholders, 100% of short-term capital gain dividends distributed by the fund
are qualified short-term capital gains.
The fund distributed $17,212,000 of qualified dividend income to shareholders during the fiscal year.
For corporate shareholders, 76.6% of investment income (dividend income plus short-term gains,
if any) qualifies for the dividends-received deduction.
26
Your Fund’s After-Tax Returns
This table presents returns for your fund both before and after taxes. The after-tax returns are shown in two ways: (1) assuming that an investor owned the fund during the entire period and paid taxes on the fund’s distributions, and (2) assuming that an investor paid taxes on the fund’s distributions and sold all shares at the end of each period.
Calculations are based on the highest individual federal income tax and capital gains tax rates in effect at the times of the distributions and the hypothetical sales. State and local taxes were not considered. After-tax returns reflect any qualified dividend income, using actual prior-year figures and estimates for 2015. (In the example, returns after the sale of fund shares may be higher than those assuming no sale. This occurs when the sale would have produced a capital loss. The calculation assumes that the investor received a tax deduction for the loss.)
Please note that your actual after-tax returns will depend on your tax situation and may differ from those shown. Also note that if you own the fund in a tax-deferred account, such as an individual retirement account or a 401(k) plan, this information does not apply to you. Such accounts are not subject to current taxes.
Finally, keep in mind that a fund’s performance—whether before or after taxes—does not guarantee future results.
Average Annual Total Returns: Mid-Cap Growth Fund
Periods Ended October 31, 2015
| | | |
| | One | Five | Ten |
| | Year | Years | Years |
| Returns Before Taxes | 6.68% | 13.99% | 9.64% |
| Returns After Taxes on Distributions | 3.31 | 12.31 | 8.42 |
| Returns After Taxes on Distributions and Sale of Fund Shares | 5.72 | 10.93 | 7.68 |
27
About Your Fund’s Expenses
As a shareholder of the fund, you incur ongoing costs, which include costs for portfolio management, administrative services, and shareholder reports (like this one), among others. Operating expenses, which are deducted from a fund’s gross income, directly reduce the investment return of the fund.
A fund’s expenses are expressed as a percentage of its average net assets. This figure is known as the expense ratio. The following examples are intended to help you understand the ongoing costs (in dollars) of investing in your fund and to compare these costs with those of other mutual funds. The examples are based on an investment of $1,000 made at the beginning of the period shown and held for the entire period.
The accompanying table illustrates your fund’s costs in two ways:
• Based on actual fund return. This section helps you to estimate the actual expenses that you paid over the period. The ”Ending Account Value“ shown is derived from the fund‘s actual return, and the third column shows the dollar amount that would have been paid by an investor who started with $1,000 in the fund. You may use the information here, together with the amount you invested, to estimate the expenses that you paid over the period.
To do so, simply divide your account value by $1,000 (for example, an $8,600 account value divided by $1,000 = 8.6), then multiply the result by the number given for your fund under the heading ”Expenses Paid During Period.“
• Based on hypothetical 5% yearly return. This section is intended to help you compare your fund‘s costs with those of other mutual funds. It assumes that the fund had a yearly return of 5% before expenses, but that the expense ratio is unchanged. In this case—because the return used is not the fund’s actual return—the results do not apply to your investment. The example is useful in making comparisons because the Securities and Exchange Commission requires all mutual funds to calculate expenses based on a 5% return. You can assess your fund’s costs by comparing this hypothetical example with the hypothetical examples that appear in shareholder reports of other funds.
Note that the expenses shown in the table are meant to highlight and help you compare ongoing costs only and do not reflect transaction costs incurred by the fund for buying and selling securities. Further, the expenses do not include any purchase, redemption, or account service fees described in the fund prospectus. If such fees were applied to your account, your costs would be higher. Your fund does not carry a “sales load.”
The calculations assume no shares were bought or sold during the period. Your actual costs may have been higher or lower, depending on the amount of your investment and the timing of any purchases or redemptions.
You can find more information about the fund’s expenses, including annual expense ratios, in the Financial Statements section of this report. For additional information on operating expenses and other shareholder costs, please refer to your fund’s current prospectus.
28
| | | |
| Six Months Ended October 31, 2015 | | | |
| | Beginning | Ending | Expenses |
| | Account Value | Account Value | Paid During |
| Mid-Cap Growth Fund | 4/30/2015 | 10/31/2015 | Period |
| Based on Actual Fund Return | $1,000.00 | $976.84 | $2.09 |
| Based on Hypothetical 5% Yearly Return | 1,000.00 | 1,023.09 | 2.14 |
The calculations are based on expenses incurred in the most recent six-month period. The fund’s annualized six-month expense ratio for that
period is 0.42%. The dollar amounts shown as “Expenses Paid” are equal to the annualized expense ratio multiplied by the average account
value over the period, multiplied by the number of days in the most recent six-month period, then divided by the number of days in the most
recent 12-month period (184/365).
29
Glossary
30-Day SEC Yield. A fund’s 30-day SEC yield is derived using a formula specified by the U.S. Securities and Exchange Commission. Under the formula, data related to the fund’s security holdings in the previous 30 days are used to calculate the fund’s hypothetical net income for that period, which is then annualized and divided by the fund’s estimated average net assets over the calculation period. For the purposes of this calculation, a security’s income is based on its current market yield to maturity (for bonds), its actual income (for asset-backed securities), or its projected dividend yield (for stocks). Because the SEC yield represents hypothetical annualized income, it will differ—at times significantly—from the fund’s actual experience. As a result, the fund’s income distributions may be higher or lower than implied by the SEC yield.
Beta. A measure of the magnitude of a fund’s past share-price fluctuations in relation to the ups and downs of a given market index. The index is assigned a beta of 1.00. Compared with a given index, a fund with a beta of 1.20 typically would have seen its share price rise or fall by 12% when the index rose or fell by 10%. For this report, beta is based on returns over the past 36 months for both the fund and the index. Note that a fund’s beta should be reviewed in conjunction with its R-squared (see definition). The lower the R-squared, the less correlation there is between the fund and the index, and the less reliable beta is as an indicator of volatility.
Dividend Yield. Dividend income earned by stocks, expressed as a percentage of the aggregate market value (or of net asset value, for a fund). The yield is determined by dividing the amount of the annual dividends by the aggregate value (or net asset value) at the end of the period. For a fund, the dividend yield is based solely on stock holdings and does not include any income produced by other investments.
Earnings Growth Rate. The average annual rate of growth in earnings over the past five years for the stocks now in a fund.
Equity Exposure. A measure that reflects a fund’s investments in stocks and stock futures. Any holdings in short-term reserves are excluded.
Expense Ratio. A fund’s total annual operating expenses expressed as a percentage of the fund’s average net assets. The expense ratio includes management and administrative expenses, but does not include the transaction costs of buying and selling portfolio securities.
Foreign Holdings. The percentage of a fund represented by securities or depositary receipts of companies based outside the United States.
Inception Date. The date on which the assets of a fund (or one of its share classes) are first invested in accordance with the fund’s investment objective. For funds with a subscription period, the inception date is the day after that period ends. Investment performance is measured from the inception date.
Median Market Cap. An indicator of the size of companies in which a fund invests; the midpoint of market capitalization (market price x shares outstanding) of a fund’s stocks, weighted by the proportion of the fund’s assets invested in each stock. Stocks representing half of the fund’s assets have market capitalizations above the median, and the rest are below it.
Price/Book Ratio. The share price of a stock divided by its net worth, or book value, per share. For a fund, the weighted average price/book ratio of the stocks it holds.
30
Price/Earnings Ratio. The ratio of a stock’s current price to its per-share earnings over the past year. For a fund, the weighted average P/E of the stocks it holds. P/E is an indicator of market expectations about corporate prospects; the higher the P/E, the greater the expectations for a company’s future growth.
R-Squared. A measure of how much of a fund’s past returns can be explained by the returns from the market in general, as measured by a given index. If a fund’s total returns were precisely synchronized with an index’s returns, its R-squared would be 1.00. If the fund’s returns bore no relationship to the index’s returns, its R-squared would be 0. For this report, R-squared is based on returns over the past 36 months for both the fund and the index.
Return on Equity. The annual average rate of return generated by a company during the past five years for each dollar of shareholder’s equity (net income divided by shareholder’s equity). For a fund, the weighted average return on equity for the companies whose stocks it holds.
Short-Term Reserves. The percentage of a fund invested in highly liquid, short-term securities that can be readily converted to cash.
Turnover Rate. An indication of the fund’s trading activity. Funds with high turnover rates incur higher transaction costs and may be more likely to distribute capital gains (which may be taxable to investors). The turnover rate excludes in-kind transactions, which have minimal impact on costs.
31
The People Who Govern Your Fund
The trustees of your mutual fund are there to see that the fund is operated and managed in your best interests since, as a shareholder, you are a part owner of the fund. Your fund’s trustees also serve on the board of directors of The Vanguard Group, Inc., which is owned by the Vanguard funds and provides services to them on an at-cost basis.
A majority of Vanguard’s board members are independent, meaning that they have no affiliation with Vanguard or the funds they oversee, apart from the sizable personal investments they have made as private individuals. The independent board members have distinguished backgrounds in business, academia, and public service. Each of the trustees and executive officers oversees 194 Vanguard funds.
The following table provides information for each trustee and executive officer of the fund. More information about the trustees is in the Statement of Additional Information, which can be obtained, without charge, by contacting Vanguard at 800-662-7447, or online at vanguard.com.
| |
| InterestedTrustee1 | Rajiv L. Gupta |
| | Born 1945. Trustee Since December 2001.2 Principal |
| F. William McNabb III | Occupation(s) During the Past Five Years and Other |
| Born 1957. Trustee Since July 2009. Chairman of | Experience: Chairman and Chief Executive Officer |
| the Board. Principal Occupation(s) During the Past | (retired 2009) and President (2006–2008) of |
| Five Years and Other Experience: Chairman of the | Rohm and Haas Co. (chemicals); Director of Tyco |
| Board of The Vanguard Group, Inc., and of each of | International PLC (diversified manufacturing and |
| the investment companies served by The Vanguard | services), Hewlett-Packard Co. (electronic computer |
| Group, since January 2010; Director of The Vanguard | manufacturing), and Delphi Automotive PLC |
| Group since 2008; Chief Executive Officer and | (automotive components); Senior Advisor at New |
| President of The Vanguard Group, and of each of | Mountain Capital. |
| the investment companies served by The Vanguard | |
| Group, since 2008; Director of Vanguard Marketing | Amy Gutmann |
| Corporation; Managing Director of The Vanguard | Born 1949. Trustee Since June 2006. Principal |
| Group (1995–2008). | Occupation(s) During the Past Five Years and |
| | Other Experience: President of the University of |
| IndependentTrustees | Pennsylvania; Christopher H. Browne Distinguished |
| | Professor of Political Science, School of Arts and |
| Emerson U. Fullwood | Sciences, and Professor of Communication, Annenberg |
| Born 1948. Trustee Since January 2008. Principal | School for Communication, with secondary faculty |
| Occupation(s) During the Past Five Years and | appointments in the Department of Philosophy, School |
| Other Experience: Executive Chief Staff and | of Arts and Sciences, and at the Graduate School of |
| Marketing Officer for North America and Corporate | Education, University of Pennsylvania; Trustee of the |
| Vice President (retired 2008) of Xerox Corporation | National Constitution Center; Chair of the Presidential |
| (document management products and services); | Commission for the Study of Bioethical Issues. |
| Executive in Residence and 2009–2010 Distinguished | |
| Minett Professor at the Rochester Institute of | JoAnn Heffernan Heisen |
| Technology; Director of SPX Corporation (multi-industry | Born 1950. Trustee Since July 1998. Principal |
| manufacturing), the United Way of Rochester, the | Occupation(s) During the Past Five Years and |
| University of Rochester Medical Center, Monroe | Other Experience: Corporate Vice President and |
| Community College Foundation, and North Carolina | Chief Global Diversity Officer (retired 2008) and |
| A&T University. | Member of the Executive Committee (1997–2008) |
| | of Johnson & Johnson (pharmaceuticals/medical |
| | devices/consumer products); Director of Skytop |
| | Lodge Corporation (hotels) and the Robert Wood |
| | Johnson Foundation; Member of the Advisory |
| | Board of the Institute for Women’s Leadership |
| | at Rutgers University. |
| | |
| F. Joseph Loughrey | Executive Officers | |
| Born 1949. Trustee Since October 2009. Principal | | |
| Occupation(s) During the Past Five Years and Other | Glenn Booraem | |
| Experience: President and Chief Operating Officer | Born 1967. Treasurer Since May 2015. Principal |
| (retired 2009) of Cummins Inc. (industrial machinery); | Occupation(s) During the Past Five Years and |
| Chairman of the Board of Hillenbrand, Inc. (specialized | Other Experience: Principal of The Vanguard Group, |
| consumer services), and of Oxfam America; Director | Inc.; Treasurer of each of the investment companies |
| of SKF AB (industrial machinery), Hyster-Yale Materials | served by The Vanguard Group; Controller of each of |
| Handling, Inc. (forklift trucks), the Lumina Foundation | the investment companies served by The Vanguard |
| for Education, and the V Foundation for Cancer | Group (2010–2015); Assistant Controller of each of |
| Research; Member of the Advisory Council for the | the investment companies served by The Vanguard |
| College of Arts and Letters and of the Advisory Board | Group (2001–2010). | |
| to the Kellogg Institute for International Studies, both | | |
| at the University of Notre Dame. | Thomas J. Higgins | |
| Born 1957. Chief Financial Officer Since September |
| Mark Loughridge | 2008. Principal Occupation(s) During the Past Five |
| Born 1953. Trustee Since March 2012. Principal | Years and Other Experience: Principal of The Vanguard |
| Occupation(s) During the Past Five Years and Other | Group, Inc.; Chief Financial Officer of each of the |
| Experience: Senior Vice President and Chief Financial | investment companies served by The Vanguard Group; |
| Officer (retired 2013) at IBM (information technology | Treasurer of each of the investment companies served |
| services); Fiduciary Member of IBM’s Retirement Plan | by The Vanguard Group (1998–2008). |
| Committee (2004–2013); Director of the Dow Chemical | | |
| Company; Member of the Council on Chicago Booth. | Peter Mahoney | |
| Born 1974. Controller Since May 2015. Principal |
| Scott C. Malpass | Occupation(s) During the Past Five Years and |
| Born 1962. Trustee Since March 2012. Principal | Other Experience: Head of Global Fund Accounting |
| Occupation(s) During the Past Five Years and Other | at The Vanguard Group, Inc.; Controller of each of the |
| Experience: Chief Investment Officer and Vice | investment companies served by The Vanguard Group; |
| President at the University of Notre Dame; Assistant | Head of International Fund Services at The Vanguard |
| Professor of Finance at the Mendoza College of | Group (2008–2014). | |
| Business at Notre Dame; Member of the Notre Dame | | |
| 403(b) Investment Committee; Board Member of | Heidi Stam | |
| TIFF Advisory Services, Inc., and Catholic Investment | Born 1956. Secretary Since July 2005. Principal |
| Services, Inc. (investment advisors); Member of | Occupation(s) During the Past Five Years and Other |
| the Investment Advisory Committee of Major | Experience: Managing Director of The Vanguard |
| League Baseball. | Group, Inc.; General Counsel of The Vanguard Group; |
| Secretary of The Vanguard Group and of each of the |
| André F. Perold | investment companies served by The Vanguard Group; |
| Born 1952. Trustee Since December 2004. Principal | Director and Senior Vice President of Vanguard |
| Occupation(s) During the Past Five Years and Other | Marketing Corporation. | |
| Experience: George Gund Professor of Finance and | | |
| Banking, Emeritus at the Harvard Business School | Vanguard Senior ManagementTeam |
| (retired 2011); Chief Investment Officer and Managing | Mortimer J. Buckley | Chris D. McIsaac |
| Partner of HighVista Strategies LLC (private investment | Kathleen C. Gubanich | James M. Norris |
| firm); Director of Rand Merchant Bank; Overseer of | Paul A. Heller | Thomas M. Rampulla |
| the Museum of Fine Arts Boston. | Martha G. King | Glenn W. Reed |
| John T. Marcante | Karin A. Risi |
| Peter F. Volanakis | | |
| Born 1955. Trustee Since July 2009. Principal | | |
| Occupation(s) During the Past Five Years and Other | Chairman Emeritus and Senior Advisor |
| Experience: President and Chief Operating Officer | | |
| (retired 2010) of Corning Incorporated (communications | John J. Brennan | |
| equipment); Trustee of Colby-Sawyer College; | Chairman, 1996–2009 | |
| Member of the Advisory Board of the Norris Cotton | Chief Executive Officer and President, 1996–2008 |
| Cancer Center and of the Advisory Board of the | | |
| Parthenon Group (strategy consulting). | Founder | |
| | John C. Bogle | |
| | Chairman and Chief Executive Officer, 1974–1996 |
1 Mr. McNabb is considered an “interested person,” as defined in the Investment Company Act of 1940, because he is an officer of the Vanguard funds.
2 December 2002 for Vanguard Equity Income Fund, the Vanguard Municipal Bond Funds, and the Vanguard State Tax-Exempt Funds.
|  |
| | P.O. Box 2600 |
| | Valley Forge, PA 19482-2600 |
| |
| |
| |
| Connect with Vanguard® > vanguard.com | |
| |
| |
| |
| Fund Information > 800-662-7447 | CFA® is a registered trademark owned by CFA Institute. |
| Direct Investor Account Services > 800-662-2739 | |
| Institutional Investor Services > 800-523-1036 | |
| Text Telephone for People | |
| Who Are Deaf or Hard of Hearing> 800-749-7273 | |
| |
| This material may be used in conjunction | |
| with the offering of shares of any Vanguard | |
| fund only if preceded or accompanied by | |
| the fund’s current prospectus. | |
| |
| All comparative mutual fund data are from Lipper, a | |
| Thomson Reuters Company, or Morningstar, Inc., unless | |
| otherwise noted. | |
| |
| You can obtain a free copy of Vanguard’s proxy voting | |
| guidelines by visiting vanguard.com/proxyreporting or by | |
| calling Vanguard at 800-662-2739. The guidelines are | |
| also available from the SEC’s website, sec.gov. In | |
| addition, you may obtain a free report on how your fund | |
| voted the proxies for securities it owned during the 12 | |
| months ended June 30. To get the report, visit either | |
| vanguard.com/proxyreporting or sec.gov. | |
| |
| You can review and copy information about your fund at | |
| the SEC’s Public Reference Room in Washington, D.C. To | |
| find out more about this public service, call the SEC at | |
| 202-551-8090. Information about your fund is also | |
| available on the SEC’s website, and you can receive | |
| copies of this information, for a fee, by sending a | |
| request in either of two ways: via email addressed to | |
| publicinfo@sec.gov or via regular mail addressed to the | |
| Public Reference Section, Securities and Exchange | |
| Commission, Washington, DC 20549-1520. | |
| |
| | © 2015 The Vanguard Group, Inc. |
| | All rights reserved. |
| | Vanguard Marketing Corporation, Distributor. |
| |
| | Q3010 122015 |

Annual Report | October 31, 2015
Vanguard International Explorer™ Fund
Vanguard’s Principles for Investing Success
We want to give you the best chance of investment success. These principles, grounded in Vanguard’s research and experience, can put you on the right path.
Goals. Create clear, appropriate investment goals.
Balance. Develop a suitable asset allocation using broadly diversified funds. Cost. Minimize cost.
Discipline. Maintain perspective and long-term discipline.
A single theme unites these principles: Focus on the things you can control.
We believe there is no wiser course for any investor.
| |
| Contents | |
| Your Fund’s Total Returns. | 1 |
| Chairman’s Letter. | 2 |
| Advisors’ Report. | 9 |
| Fund Profile. | 13 |
| Performance Summary. | 15 |
| Financial Statements. | 17 |
| Your Fund’s After-Tax Returns. | 35 |
| About Your Fund’s Expenses. | 36 |
| Trustees Approve Advisory Arrangements. | 38 |
| Glossary. | 40 |
Please note: The opinions expressed in this report are just that—informed opinions. They should not be considered promises or advice.
Also, please keep in mind that the information and opinions cover the period through the date on the front of this report. Of course, the
risks of investing in your fund are spelled out in the prospectus.
See the Glossary for definitions of investment terms used in this report.
About the cover: Pictured is a sailing block on the Brilliant, a 1932 schooner docked in Mystic, Connecticut. A type of pulley, the
sailing block helps coordinate the setting of the sails. At Vanguard, the intricate coordination of technology and people allows
us to help millions of clients around the world reach their financial goals.
Your Fund’s Total Returns
| |
| Fiscal Year Ended October 31, 2015 | |
| | Total |
| | Returns |
| Vanguard International Explorer Fund | 5.65% |
| S&P EPAC SmallCap Index | 8.09 |
| International Small-Cap Funds Average | 3.87 |
| International Small-Cap Funds Average: Derived from data provided by Lipper, a Thomson Reuters Company. |
| | | | |
| Your Fund’s Performance at a Glance | | | | |
| October 31, 2014, Through October 31, 2015 | | | |
| |
| | | | Distributions Per Share |
| | Starting | Ending | | |
| | Share | Share | Income | Capital |
| | Price | Price | Dividends | Gains |
| Vanguard International Explorer Fund | $18.26 | $17.76 | $0.326 | $1.096 |

Chairman’s Letter
Dear Shareholder,
The troubled global economy weighed on international financial markets during the fiscal year ended October 31, 2015, and small-capitalization international stocks outperformed their large-cap counterparts for the period. Vanguard International Explorer Fund returned almost 6%, more than 2 percentage points behind its benchmark, the S&P EPAC SmallCap Index, and almost 2 percentage points ahead of the average return of its international small-cap fund peers.
Relative to its index, the fund’s shortfall reflected a combination of underperforming investment selections and fair-value pricing adjustments. These adjustments, which are required by the Securities and Exchange Commission, address pricing discrepancies that may arise because of time-zone differences among global stock markets. From a sector standpoint, the fund recorded positive results in nine of its ten industry sectors.
Results also would have been higher for U.S.-based investors had the dollar not strengthened against a number of currencies, including the euro and yen, during the period.
If you hold shares in a taxable account, you may wish to review the table and discussion on after-tax returns for the fiscal year that appear later in this report.
2
Global stock markets struggled, and some failed to advance
The broad U.S. stock market returned more than 4% for the fiscal year ended October 31. The market traveled a bumpy road to that result. Fears surfaced in late summer that slower economic growth in China would spread across the globe. A sharp drop in August erased the market’s earlier gains and stocks slid further in September.
In October, however, U.S. stocks staged a robust rally as the Federal Reserve maintained its historically low short-term interest rates. Corporate earnings, although lower than in recent years, mostly exceeded expectations. In Europe and Asia, central banks signaled or implemented additional stimulus measures to counter sluggish growth and low inflation.
The broad international stock market returned about –4% for U.S. investors as the dollar’s strength weighed on local-market returns. Solid gains in the developed markets of the Pacific region and Europe were essentially flat when translated into dollars. Stocks tumbled in emerging markets, where concerns about China seemed to weigh most heavily.
The search for a safe haven gave bonds a bit of a boost
The broad U.S. taxable bond market, which returned 1.96% for the fiscal year, benefited from investors’ desire for safe-
| | | |
| Market Barometer | | | |
| |
| | Average Annual Total Returns |
| | Periods Ended October 31, 2015 |
| | One | Three | Five |
| | Year | Years | Years |
| Stocks | | | |
| Russell 1000 Index (Large-caps) | 4.86% | 16.28% | 14.32% |
| Russell 2000 Index (Small-caps) | 0.34 | 13.90 | 12.06 |
| Russell 3000 Index (Broad U.S. market) | 4.49 | 16.09 | 14.14 |
| FTSE All-World ex US Index (International) | -3.83 | 5.20 | 2.99 |
| |
| Bonds | | | |
| Barclays U.S. Aggregate Bond Index (Broad taxable market) | 1.96% | 1.65% | 3.03% |
| Barclays Municipal Bond Index (Broad tax-exempt market) | 2.87 | 2.91 | 4.28 |
| Citigroup Three-Month U.S. Treasury Bill Index | 0.02 | 0.02 | 0.04 |
| |
| CPI | | | |
| Consumer Price Index | 0.17% | 0.93% | 1.69% |
3
haven assets during periods of stock market volatility. The yield of the 10-year U.S. Treasury note ended October at 2.17%, down from 2.31% a year earlier. (Bond prices and yields move in opposite directions.)
International bond markets (as measured by the Barclays Global Aggregate Index ex USD) returned about –7%, also held back by the strong dollar. Without this currency effect, international bond returns were positive.
Returns for money market funds and savings accounts continued to be constrained by the Fed’s 0%–0.25% target for short-term interest rates.
International small-cap stocks offer opportunities to diversify
Vanguard International Explorer Fund invests in small-capitalization international growth stocks, particularly those of the developed markets of Europe and the Pacific region. Wellington Management Company and Schroder Investment Management North America—the fund’s two advisors––search for stocks of quality companies that are attractively valued.
The advisors use a “bottom-up” process in choosing stocks, evaluating individual companies rather than trying to identify which industry sectors or countries will perform best. They conduct fundamental analysis of companies in every market in pursuit of those that appear promising
| | |
| Expense Ratios | | |
| Your Fund Compared With Its Peer Group | | |
| |
| | | Peer Group |
| | Fund | Average |
| International Explorer Fund | 0.40% | 1.61% |
The fund expense ratio shown is from the prospectus dated February 25, 2015, and represents estimated costs for the current fiscal year. For
the fiscal year ended October 31, 2015, the fund’s expense ratio was 0.42%. This increase from the estimated expense ratio reflects a
performance-based investment advisory fee adjustment. When the performance adjustment is positive, the fund’s expenses increase; when it
is negative, expenses decrease. The peer-group expense ratio is derived from data provided by Lipper, a Thomson Reuters Company, and
captures information through year-end 2014.
Peer group: International Small-Cap Funds.
4
yet not overvalued. A diverse range of industries and countries make up the portfolio.
With investments in more than 300 stocks representing more than 30 countries, your fund remained broadly diversified over the fiscal year. At the period’s end, about 60% of its assets were in Europe, more than 30% in the developed Pacific region, and about 10% in emerging markets and North America combined.
Notably, the European Central Bank embarked on a stimulative bond-buying program that led to negative rates on some European sovereign bonds and a weaker euro. This program, along with a generally improving economic outlook, was welcomed by many European stock
markets. The fund did well in the Italian financial, industrial, and consumer discretionary sectors and in the Irish consumer, industrial, and materials sectors; its holdings beat their benchmark counterparts by a significant amount. On the other side of the ledger, the fund’s Dutch and Norwegian financial firms did worse than their benchmark counterparts (which also performed poorly).
Japan, the country with the largest weighting in the fund, was a bright spot. The Bank of Japan’s aggressive stimulus efforts boosted stocks. In addition, the weaker yen relative to the U.S. dollar made Japan’s products less expensive for consumers abroad, which helped exports. Most sectors delivered double-digit gains for both the fund and the index, and the
| |
| Total Returns | |
| Ten Years Ended October 31, 2015 | |
| | Average |
| | Annual Return |
| International Explorer Fund | 6.42% |
| S&P EPAC SmallCap Index | 6.34 |
| International Small-Cap Funds Average | 6.14 |
International Small-Cap Funds Average: Derived from data provided by Lipper, a Thomson Reuters Company.
The figures shown represent past performance, which is not a guarantee of future results. (Current performance may be
lower or higher than the performance data cited. For performance data current to the most recent month-end, visit our
website at vanguard.com/performance.) Note, too, that both investment returns and principal value can fluctuate widely, so
an investor’s shares, when sold, could be worth more or less than their original cost.
5
advisors’ selection generally boosted performance. Consumer discretionary stocks from Hong Kong also shined, outperforming the benchmark. Australian energy, information technology, and consumer staples companies, however, weighed on returns.
Notwithstanding the fund’s small allocation to them, emerging markets (which are barely represented in the benchmark) hurt performance. The fund’s stocks in beleaguered China held up relatively well, but these results were offset by broad-based setbacks in Brazil, as well as by poor returns from Indian financial and telecommunication services companies.
From a sector perspective, industrials contributed the most to relative returns. International Explorer’s large allocation to the sector, as well as the advisors’
|
| Staying the course can help you stay closer to your fund’s return |
| When stock markets are highly volatile, as in |
| recent months, it’s tempting to run for cover. |
| But the price of panic can be high. |
| |
| A rough measure of what can be lost from |
| attempts to time the market is the difference |
| between the returns produced by a fund and |
| the returns earned by the fund’s investors. |
| |
| The results shown in your fund’s Perfor- |
| mance Summary later in this report are its |
| time-weighted returns—the average annual |
| returns investors would have earned if they |
| had invested a lump sum in the fund at |
| the start of the period and reinvested any |
| distributions they received. Their actual |
| returns, however, depend on whether they |
| subsequently bought or sold any shares. |
| There’s often a gap between this dollar- |
| weighted return for investors and the |
| fund’s time-weighted return, as shown |
| in the figure to the right. |
| |
| Many sensible investment behaviors can |
| contribute to the difference in returns, but |
| industry cash flow data suggest that one |
| important factor is the generally counter- |
| productive effort to buy and sell at the |
| “right” time. Keeping your emotions in |
| check can help narrow the gap. |
| |
| Fund returns vs. investor returns |
| Notes: Data are for the decade ended September 30, 2015. The average |
| fund return and average investor return are from Morningstar, based on |
| U.S. -domiciled international equity funds that have reported ten-year |
| returns. The average fund return is the average of the international |
| stock funds’ time-weighted returns. The average investor return assumes |
| that the growth of a fund’s total net assets for a given period is driven |
| by market returns and investor cash ‚ow. To calculate investor return, |
| a fund’s change in assets for the period is discounted by the return of |
| the fund to isolate how much of the asset growth was driven by cash |
| ‚ow. A model similar to an internal rate-of-return calculation is then |
| used to calculate a constant growth rate that links the beginning total |
| net assets and periodic cash ‚ows to the ending total net assets. |
| Sources: Vanguard and Morningstar, Inc. |
6
selection within it, gave the fund a distinct advantage. Financials detracted the most from relative returns. Energy was the fund’s worst performer, declining more than –40% as continued low oil prices plagued most areas of the industry.
You can find more information on the fund’s positioning and performance in the Advisors’ Report that follows this letter.
The fund’s ten-year record is a tribute to its advisors’ skill
The benefits of including international holdings in an investment program usually become more apparent in the long run, as differences emerge in the economic and financial performances of various countries.
International small-cap stocks may also offer diversification benefits beyond their large-cap counterparts, since more of their revenue comes from their home markets rather than the United States, where larger global multinationals compete. With its focus on small-cap stocks, International Explorer can provide exposure to rapidly growing companies outside the United States.
For the ten years ended October 31, 2015 the fund recorded an average annual return of 6.42% per year, slightly ahead of both its benchmark index (which carries no expenses) and the average return of its peers.
Both advisors are experienced in identifying promising small-company stocks that they believe will grow faster than the overall market. In addition, the fund isn’t burdened by a high expense ratio that would take away from investors’ returns.
A dose of discipline is crucial when markets become volatile
The developments over the past few months remind us that nobody can control the direction of the markets or reliably predict where they’ll go in the short term. However, investors can control how they react to unstable and turbulent markets.
During periods of market adversity, it’s more important than ever to keep sight of one of Vanguard’s key principles: Maintain perspective and long-term discipline. Whether you’re investing for yourself or on behalf of clients, your success is affected greatly by how you respond—or don’t respond—during turbulent markets. (You can read Vanguard’s Principles for Investing Success at vanguard.com/research.)
As I’ve written in the past, the best course for long-term investors is generally to ignore daily market moves and not make decisions based on emotion. This is also
7
a good time to evaluate your portfolio and make sure your asset allocation is aligned with your time horizon, goals, and risk tolerance.
The markets are unpredictable and often confounding. Keeping your long-term plans clearly in focus can help you weather these periodic storms.
As always, thank you for investing with Vanguard.
Sincerely,

F. William McNabb III
Chairman and Chief Executive Officer
November 17, 2015
8
Advisors’ Report
For the fiscal year ended October 31, 2015, Vanguard International Explorer Fund returned 5.65%. Your fund is managed by two independent advisors, a strategy that enhances its diversification by providing exposure to distinct yet complementary investment approaches. It is not uncommon for different advisors to have different views about individual securities or the broader investment environment.
The advisors, the amount and percentage of fund assets each manages, and brief descriptions of their investment strategies are presented in the table below. The advisors have also prepared a discussion of the investment environment that existed during the year and of how their portfolio
positioning reflects this assessment. These comments were prepared on November 20, 2015.
Schroder Investment Management North America Inc.
Portfolio Manager: Matthew F. Dobbs,
Head of Global Small Companies
International small-company equities rose modestly over the period, with the S&P EPAC SmallCap Index returning 8.1%. This result outpaced that of larger-capitalization equities, as the S&P EPAC Large/MidCap Index was flat (–0.3%).
Vanguard International Explorer Fund Investment Advisors
| | | |
| | Fund Assets Managed | |
| Investment Advisor | % | $ Million | Investment Strategy |
| Schroder Investment | 72 | 2,086 | The advisor employs a fundamental investment |
| Management North America Inc. | | | approach that considers macroeconomic factors while |
| | | | focusing primarily on company-specific factors, |
| | | | including a company’s potential for long-term growth, |
| | | | financial condition, quality of management, and |
| | | | sensitivity to cyclical factors. The advisor also |
| | | | considers the relative value of a company’s securities |
| | | | compared with those of other companies and the |
| | | | market as a whole. |
| Wellington Management | 25 | 708 | The advisor employs a traditional, bottom-up approach |
| Company LLP | | | that is opportunistic in nature, relying on global and |
| | | | regional research resources to identify both |
| | | | growth-oriented and neglected or misunderstood |
| | | | companies. |
| Cash Investments | 3 | 93 | These short-term reserves are invested by Vanguard in |
| | | | equity index products to simulate investment in stocks. |
| | | | Each advisor also may maintain a modest cash |
| | | | position. |
9
The bulk of the gains came in the first half of the fiscal year, supported in Japan by continued earnings momentum and hopes for improvements in corporate governance, and in Europe by further action from the European Central Bank.
The outperformance by smaller companies was particularly pronounced in Europe, and there was a distinct sectorial influence, as this outperformance was most notable in financials and materials. Smaller financial companies largely avoided the regulatory and capital adequacy concerns surrounding the large banks. In materials, greater diversity stood smaller companies in good stead, as weaker commodity prices weighed on the large-cap mining companies. Smaller-caps also outperformed larger-caps in the Pacific region excluding Japan, although overall returns were still negative in dollar terms, as a result of widespread deflationary pressure and slowing regional economies (especially China).
In contrast to last year, emerging markets have detracted the most from relative performance, with returns falling significantly short of developed market averages. Notable areas of weakness included financials (BR Properties, LPN Development), information technology (Chroma ATE), and telecommunications (Idea Cellular). Health care was our lone positive contributor in emerging markets, with good returns from Indian holdings Apollo Hospitals Enterprise and Ipca Laboratories.
In the United Kingdom, selection also detracted from returns, mainly because of sector positioning, most notably overweighting energy and industrials and underweighting financials and consumer cyclicals. These losses were partly offset by strong selection within industrials (DCC, Ricardo) and materials (ECO Animal Health Group, Alent).
In Japan, stock selection contributed most to relative performance, particularly in health care (Nichi-iko Pharmaceutical), industrials (Kuroda Electric, Trusco Nakayama, Nippon Densetsu Kogyo) and information technology (OBIC Business Consultants, Kakaku.com). In materials, plastics firm JSP performed strongly, thanks to robust operating results and an offer to buy shares made by its major shareholder.
Continental Europe outperformed modestly, despite major challenges in energy and financials. The collapse of Danish fuel supplier OW Bunker within months of its IPO serves as a reminder of the importance of diversification in small-cap investing. In financials, our positive stance on insurance proved misplaced amid regulatory flux and low long-term interest rates, both of which took a toll on our holdings Delta Lloyd, FBD Holdings, and Storebrand.
These disappointments were more than compensated by strong performances across a range of other sectors, notably industrials (Maire Tecnimont, Stabilus),
10
information technology (XING, Ubisoft Entertainment), materials (Smurfit Kappa Group, Braas Monier Building Group), and consumer staples (Glanbia).
We have witnessed an extended period of outperformance by international smaller companies, and this outperformance has continued through recent months despite a cautious tone to equity markets overall. Despite this strong showing, we take comfort from the fact that small-cap valuations relative to large-cap are still well within the historic range. In a low-growth and perhaps inherently deflationary world, real growth will be highly prized. We will continue to seek well-positioned smaller companies that can thrive within small but expanding niches that benefit from rapid change across a range of sectors and geographies.
Wellington Management Company llp
Portfolio Manager: Simon H. Thomas,
Senior Managing Director and Equity Portfolio Manager
Global equities (+2.3%) rose modestly during the period. Weakness during the second half of the fiscal year offset earlier gains as worries about a slowdown in China, the world’s second-largest economy, took center stage. Risk appetites were also dampened by the European Central Bank’s cut in its euro zone economic and inflation outlook and the downgrading of Brazil’s debt to below investment grade. Falling commodity prices and uncertainty over the timing of the Federal Reserve’s first rate hike further muddied the waters.
Our portfolio benefited from strong stock selection within the industrial, financial, and health care sectors. Gains in these sectors were partially offset by weaker selection within consumer discretionary and energy. Sector allocation, which is largely a result of the bottom-up stock selection process, weighed on performance, with our overweighting of the lagging industrials sector the main driver of results. At a regional level, an underweighting of the Pacific region excluding Japan contributed positively to relative results, as did selection within Europe and Japan.
Top contributors to relative performance included Gategroup Holdings, Asahi Intecc, and Anima Holding. Switzerland-based Gategroup is a leading provider of catering, hospitality, and logistics services to the travel industry. The stock rallied as lower oil prices were seen as helping the travel business. We maintain a position as of the end of the period; we believe that Gategroup’s business is steady and stable and that its stock is attractively valued. Shares of Japan-based medical devices company Asahi Intecc, which produces guidewires and catheters, climbed on investor optimism about the increasing demand for the company’s products. We continue to hold the stock. Anima Holding is an Italy-based asset management
11
company. It was created to purchase the investment management divisions of regional Italian banks as they attempted to repair their balance sheets following the financial crisis. The company has benefited from continued inflows as Italy undergoes a secular shift away from a low savings rate. We continue to hold the stock.
The largest detractors from relative performance during the period included IHI, Magazine Luiza, and Pacific Exploration and Production (which in August changed its name from Pacific Rubiales). IHI, a Japan-based producer of transport-related machinery, performed poorly as the company downgraded its full-year guidance following a series of cost overruns within its social infrastructure and offshore divisions. Despite recent weakness, the company’s fundamentals, in our opinion, remain strong and we continue to hold our position. Brazil-based white goods company Magazine Luiza underperformed, as did Brazilian equities in general, amid concerns about Brazil’s slowing economy, confusion over recent elections, and the Petrobras corruption scandal. In addition, investors worried that rising interest rates
in Brazil would weigh on Magazine Luiza’s sales, which are largely based on credit. We trimmed our position but continue to hold the stock, because we believe the company’s fundamentals will continue to improve. Declining oil prices weighed on shares of Pacific Exploration and Production, a Canadian oil and natural gas exploration and production company focused on reserves in Colombia and Peru. We eliminated the position on temporary share strength in the second quarter following a takeout offer by Mexico-based conglomerate Alfa.
We ended the year most overweighted in industrials and consumer discretionary, and most underweighted in information technology and consumer staples. On a regional basis, our greatest overweight position relative to the benchmark at the end of the period was Japan. We were most underweighted in the Pacific region excluding Japan, though we continue to look for high-quality companies there that have been neglected by the market and thus offer attractive investment opportunities.
12
International Explorer Fund
Fund Profile
As of October 31, 2015
| | | |
| Portfolio Characteristics | | |
| | | S&P | MSCI AC |
| | | EPAC | World |
| | | SmallCap | Index ex |
| | Fund | Index | USA |
| Number of Stocks | 330 | 3,848 | 1,831 |
| Median Market Cap | $1.8B | $1.7B | $30.5B |
| Price/Earnings Ratio | 21.5x | 20.3x | 17.3x |
| Price/Book Ratio | 1.9x | 1.6x | 1.7x |
| Return on Equity | 12.5% | 11.0% | 15.2% |
| Earnings Growth | | | |
| Rate | 11.6% | 12.3% | 11.0% |
| Dividend Yield | 1.9% | 2.1% | 3.0% |
| Turnover Rate | 42% | — | — |
| Ticker Symbol | VINEX | — | — |
| Expense Ratio1 | 0.40% | — | — |
| Short-Term Reserves | 2.5% | — | — |
| | | |
| Sector Diversification (% of equity exposure) |
| | | | MSCI |
| | | S&P | AC |
| | | EPAC | World |
| | | SmallCap | Index |
| | Fund | Index | ex USA |
| Consumer | | | |
| Discretionary | 21.3% | 17.1% | 12.1% |
| Consumer Staples | 5.4 | 6.5 | 10.8 |
| Energy | 1.1 | 1.9 | 6.5 |
| Financials | 20.1 | 22.2 | 27.1 |
| Health Care | 7.7 | 7.8 | 9.3 |
| Industrials | 24.6 | 22.2 | 11.3 |
| Information | | | |
| Technology | 7.8 | 10.7 | 7.4 |
| Materials | 8.8 | 8.6 | 6.8 |
| Telecommunication | | | |
| Services | 1.5 | 1.2 | 5.2 |
| Utilities | 1.7 | 1.8 | 3.5 |
| | |
| Volatility Measures | | |
| | | MSCI |
| | S&P | AC |
| | EPAC | World |
| | SmallCap | Index ex |
| | Index | USA |
| R-Squared | 0.93 | 0.85 |
| Beta | 0.89 | 0.78 |
| These measures show the degree and timing of the fund’s fluctuations compared with the indexes over 36 months. |
| | |
| Ten Largest Holdings (% of total net assets) |
| Anima Holding SPA | Asset Management | |
| | & Custody Banks | 1.2% |
| Cerved Information | | |
| Solutions SPA | Specialized Finance | 1.0 |
| Rubis SCA | Gas Utilities | 1.0 |
| OVS SPA | Apparel, Accessories | |
| | & Luxury Goods | 1.0 |
| BRAAS Monier Building | Construction | |
| Group SA | Materials | 0.9 |
| Smurfit Kappa Group plc Paper Packaging | 0.9 |
| Helvetia Holding AG | Multi-line Insurance | 0.9 |
| UBISOFT Entertainment | Home Entertainment | |
| | Software | 0.8 |
| Matas A/S | Specialty Stores | 0.8 |
| Dalata Hotel Group plc | Hotels, Resorts & | |
| | Cruise Lines | 0.8 |
| Top Ten | | 9.3% |
| The holdings listed exclude any temporary cash investments and equity index products. |
Allocation by Region (% of equity exposure)
1 The expense ratio shown is from the prospectus dated February 25, 2015, and represents estimated costs for the current fiscal year. For the fiscal
year ended October 31, 2015, the expense ratio was 0.42%.
13
International Explorer Fund
| | | |
| Market Diversification (% of equity exposure) |
| | | S&P | MSCI |
| | | EPAC | AC World |
| | | SmallCap | Index ex |
| | Fund | Index | USA |
| Europe | | | |
| United Kingdom | 18.8% | 17.8% | 14.8% |
| Italy | 9.0 | 2.3 | 1.8 |
| France | 7.5 | 8.4 | 7.4 |
| Ireland | 4.8 | 0.2 | 0.3 |
| Germany | 3.9 | 7.9 | 6.7 |
| Switzerland | 3.9 | 8.2 | 6.9 |
| Denmark | 2.2 | 1.4 | 1.2 |
| Sweden | 2.1 | 3.2 | 2.1 |
| Netherlands | 1.7 | 1.7 | 2.1 |
| Norway | 1.5 | 0.6 | 0.4 |
| Austria | 1.2 | 0.2 | 0.1 |
| Other | 2.1 | 4.7 | 4.3 |
| Subtotal | 58.7% | 56.6% | 48.1% |
| Pacific | | | |
| Japan | 23.7% | 23.2% | 16.9% |
| Australia | 3.7 | 5.6 | 4.7 |
| Hong Kong | 1.8 | 2.4 | 2.2 |
| South Korea | 1.5 | 3.9 | 3.3 |
| Other | 1.1 | 1.3 | 1.0 |
| Subtotal | 31.8% | 36.4% | 28.1% |
| Emerging Markets | | | |
| India | 3.1% | 0.0% | 1.7% |
| China | 2.1 | 0.9 | 4.9 |
| Taiwan | 1.3 | 0.0 | 2.5 |
| Other | 1.8 | 0.0 | 7.8 |
| Subtotal | 8.3% | 0.9% | 16.9% |
| North America | | | |
| United States | 1.1% | 0.2% | 6.2% |
| Other | 0.1 | 0.0 | 0.0 |
| Subtotal | 1.2% | 0.2% | 6.2% |
| Middle East | 0.0% | 0.6% | 0.5% |
| Other | 0.0 | 5.3 | 0.2 |
| "Other" represents securities that are not classified by the fund's benchmark index. |
14
International Explorer Fund
Performance Summary
All of the returns in this report represent past performance, which is not a guarantee of future results that may be achieved by the fund. (Current performance may be lower or higher than the performance data cited. For performance data current to the most recent month-end, visit our website at vanguard.com/performance.) Note, too, that both investment returns and principal value can fluctuate widely, so an investor’s shares, when sold, could be worth more or less than their original cost. The returns shown do not reflect taxes that a shareholder would pay on fund distributions or on the sale of fund shares.
Cumulative Performance: October 31, 2005, Through October 31, 2015
Initial Investment of $10,000
| | | | | |
| | | Average Annual Total Returns | |
| | | Periods Ended October 31, 2015 | |
| | | | | | Final Value |
| | | One | Five | Ten | of a $10,000 |
| | | Year | Years | Years | Investment |
| | International Explorer Fund* | 5.65% | 6.65% | 6.42% | $18,638 |
| •••••••• | S&P EPAC SmallCap Index | 8.09 | 7.70 | 6.34 | 18,498 |
| – – – – | MSCI International All Country Small-Cap World Funds Index Average ex USA | -4.26 3.87 | 3.06 6.75 | 4.62 6.14 | 15,713 18,138 |
| International Small-Cap Funds Average: Derived from data provided by Lipper, a Thomson Reuters Company. |
See Financial Highlights for dividend and capital gains information.
15
International Explorer Fund
Fiscal-Year Total Returns (%): October 31, 2005, Through October 31, 2015
Average Annual Total Returns: Periods Ended September 30, 2015
This table presents returns through the latest calendar quarter—rather than through the end of the fiscal period.
Securities and Exchange Commission rules require that we provide this information.
| | | | |
| | Inception | One | Five | Ten |
| | Date | Year | Years | Years |
| International Explorer Fund | 11/4/1996 | -0.52% | 6.46% | 5.50% |
16
International Explorer Fund
Financial Statements
Statement of Net Assets
As of October 31, 2015
The fund reports a complete list of its holdings in regulatory filings four times in each fiscal year, at the quarter-ends. For the second and fourth fiscal quarters, the lists appear in the fund’s semiannual and annual reports to shareholders. For the first and third fiscal quarters, the fund files the lists with the Securities and Exchange Commission on Form N-Q. Shareholders can look up the fund’s Forms N-Q on the SEC’s website at sec.gov. Forms N-Q may also be reviewed and copied at the SEC’s Public Reference Room (see the back cover of this report for further information).
| | | |
| | | | Market |
| | | | Value• |
| | | Shares | ($000) |
| Common Stocks (95.3%)1 | | |
| Australia (3.3%) | | |
| | Computershare Ltd. | 1,339,861 | 10,333 |
| | Spotless Group | | |
| | Holdings Ltd. | 6,516,983 | 9,905 |
| | Iluka Resources Ltd. | 2,094,685 | 9,595 |
| | Mirvac Group | 7,419,796 | 9,555 |
| | Asaleo Care Ltd. | 6,618,650 | 8,256 |
| | Incitec Pivot Ltd. | 2,439,068 | 6,873 |
| | Ansell Ltd. | 464,023 | 6,598 |
| | Amcor Ltd. | 651,293 | 6,302 |
| | oOh!media Ltd. | 2,295,537 | 5,500 |
| ^ | Super Retail Group Ltd. | 754,689 | 5,201 |
| | Tox Free Solutions Ltd. | 2,247,753 | 4,617 |
| | SAI Global Ltd. | 1,197,989 | 3,752 |
| | Domino’s Pizza | | |
| | Enterprises Ltd. | 78,950 | 2,633 |
| | Mantra Group Ltd. | 817,763 | 2,409 |
| ^,* | Karoon Gas Australia Ltd. | 1,005,321 | 1,256 |
| * | Link Administration | | |
| | Holdings Ltd. | 262,865 | 1,194 |
| | | | 93,979 |
| Austria (1.1%) | | |
| | ANDRITZ AG | 405,642 | 20,422 |
| | BUWOG AG | 158,759 | 3,377 |
| | Wienerberger AG | 166,685 | 3,072 |
| | Schoeller-Bleckmann | | |
| | Oilfield Equipment AG | 45,800 | 2,750 |
| | CA Immobilien Anlagen AG | 119,342 | 2,339 |
| | Kapsch TrafficCom AG | 10,964 | 397 |
| | | | 32,357 |
| Belgium (0.5%) | | |
| | Ackermans | | |
| | & van Haaren NV | 32,845 | 4,997 |
| | Cie d’Entreprises CFE | 38,668 | 4,793 |
| | D’ieteren SA | 140,831 | 4,766 |
| | | | 14,556 |
| | | |
| Brazil (0.2%) | | |
| | BR Properties SA | 1,692,688 | 5,179 |
| | Magazine Luiza SA | 15,511 | 48 |
| | | | 5,227 |
| China (2.0%) | | |
| | ANTA Sports | | |
| | Products Ltd. | 3,901,000 | 10,882 |
| | Shenzhou International | | |
| | Group Holdings Ltd. | 2,009,000 | 9,871 |
| | New Oriental Education | | |
| | & Technology Group Inc. | |
| | ADR | 347,121 | 9,549 |
| | E-House China | | |
| | Holdings Ltd. ADR | 762,600 | 4,728 |
| | Dah Chong Hong | | |
| | Holdings Ltd. | 10,202,000 | 4,621 |
| | Haitian International | | |
| | Holdings Ltd. | 2,600,000 | 4,545 |
| ^ | Baoxin Auto Group Ltd. | 9,677,000 | 4,012 |
| ^ | Phoenix Healthcare | | |
| | Group Co. Ltd. | 2,411,000 | 3,654 |
| | CSPC Pharmaceutical | | |
| | Group Ltd. | 3,548,000 | 3,299 |
| | China Medical System | | |
| | Holdings Ltd. | 1,647,000 | 2,250 |
| ^,* | Daphne International | | |
| | Holdings Ltd. | 4,536,000 | 815 |
| | | | 58,226 |
| Denmark (2.1%) | | |
| | Matas A/S | 1,375,000 | 24,915 |
| ^ | FLSmidth & Co. A/S | 425,000 | 16,063 |
| * | H Lundbeck A/S | 318,709 | 9,358 |
| | DSV A/S | 142,386 | 5,761 |
| ^,* | Ambu A/S Class B | 158,000 | 4,280 |
| * | OW Bunker A/S | 1,000,000 | — |
| | | | 60,377 |
| Finland (0.1%) | | |
| | Vaisala Oyj | 90,000 | 2,403 |
17
International Explorer Fund
| | | |
| | | | Market |
| | | | Value• |
| | | Shares | ($000) |
| France (7.1%) | | |
| | Rubis SCA | 360,611 | 28,905 |
| * | UBISOFT Entertainment | 837,093 | 25,073 |
| | Montupet | 295,993 | 23,214 |
| | Elis SA | 1,000,000 | 16,939 |
| * | SPIE SA | 1,000,000 | 16,921 |
| * | Marie Brizard | | |
| | Wine & Spirits SA | 675,000 | 14,501 |
| * | Naturex | 135,000 | 9,497 |
| | Euler Hermes Group | 97,619 | 9,146 |
| | Imerys SA | 118,436 | 8,102 |
| | Eurofins Scientific SE | 22,000 | 7,954 |
| | Lectra | 600,000 | 7,088 |
| * | ID Logistics Group | 50,824 | 6,589 |
| | Korian SA | 170,000 | 6,428 |
| | Eurazeo SA | 86,536 | 6,093 |
| | Virbac SA | 26,615 | 5,299 |
| | Albioma SA | 300,000 | 4,879 |
| | Wendel SA | 32,864 | 3,940 |
| | Coface SA | 445,176 | 3,603 |
| * | Inside Secure SA | 83,885 | 124 |
| | Vallourec SA | 1 | — |
| | | | 204,295 |
| Germany (3.6%) | | |
| | BRAAS Monier | | |
| | Building Group SA | 1,073,732 | 28,074 |
| | XING AG | 89,567 | 17,642 |
| | Zeal Network SE | 318,921 | 14,606 |
| | RIB Software AG | 700,000 | 8,641 |
| * | Tom Tailor Holding AG | 890,000 | 5,889 |
| * | GRENKELEASING AG | 31,291 | 5,738 |
| * | STRATEC Biomedical AG | 93,707 | 5,451 |
| | Freenet AG | 150,000 | 5,061 |
| | Grand City Properties SA | 248,515 | 4,962 |
| | SAF-Holland SA | 237,201 | 3,461 |
| | ElringKlinger AG | 149,075 | 3,338 |
| | Takkt AG | 120,000 | 2,231 |
| | | | 105,094 |
| Hong Kong (1.8%) | | |
| | Techtronic | | |
| | Industries Co. Ltd. | 6,414,000 | 23,409 |
| | Johnson Electric | | |
| | Holdings Ltd. | 2,472,625 | 9,066 |
| * | HKBN Ltd. | 7,152,000 | 8,591 |
| | Hysan | | |
| | Development Co. Ltd. | 1,501,000 | 6,645 |
| | Yue Yuen Industrial | | |
| | Holdings Ltd. | 1,068,000 | 3,893 |
| | | | 51,604 |
| India (3.0%) | | |
| * | Gujarat Pipavav Port Ltd. | 9,210,502 | 22,653 |
| | Apollo Hospitals | | |
| | Enterprise Ltd. | 1,011,984 | 20,280 |
| | Idea Cellular Ltd. | 8,449,659 | 18,045 |
| | Ipca Laboratories Ltd. | 679,132 | 8,073 |
| | Phoenix Mills Ltd. | 1,438,800 | 7,326 |
| | | |
| | Container Corp. | | |
| | Of India Ltd. | 188,617 | 3,820 |
| | Federal Bank Ltd. | 3,921,892 | 3,247 |
| | Multi Commodity | | |
| | Exchange of India Ltd. | 205,558 | 2,795 |
| | | | 86,239 |
| Indonesia (0.4%) | | |
| | Matahari Department | | |
| | Store Tbk PT | 6,010,500 | 7,238 |
| | Ciputra Property Tbk PT | 74,669,491 | 2,529 |
| | Gajah Tunggal Tbk PT | 19,561,990 | 839 |
| | | | 10,606 |
| Ireland (4.7%) | | |
| | Smurfit Kappa Group plc | 950,000 | 27,051 |
| * | Dalata Hotel Group plc | 4,958,136 | 24,711 |
| | Paddy Power plc | 180,000 | 20,808 |
| | Glanbia plc | 1,000,000 | 19,379 |
| | Irish Residential | | |
| | Properties REIT plc | 8,400,000 | 10,348 |
| | Origin Enterprises plc | 1,250,000 | 9,388 |
| | Irish Continental | | |
| | Group plc | 1,600,000 | 8,737 |
| | IFG Group plc | 2,622,895 | 6,364 |
| | FBD Holdings plc | 725,000 | 5,538 |
| * | Cairn Homes plc | 1,982,437 | 2,200 |
| | | | 134,524 |
| Italy (8.7%) | | |
| 2 | Anima Holding SPA | 3,697,490 | 36,311 |
| | Cerved Information | | |
| | Solutions SPA | 4,063,766 | 30,777 |
| *,2 | OVS SPA | 4,149,732 | 28,573 |
| * | Maire Tecnimont SPA | 7,400,000 | 21,381 |
| | Banca Popolare | | |
| | dell’Emilia Romagna SC | 2,600,000 | 20,952 |
| | Credito Emiliano SPA | 2,125,000 | 15,187 |
| | FinecoBank Banca | | |
| | Fineco SPA | 1,500,000 | 11,320 |
| *,2 | Banca Sistema SPA | 2,371,523 | 11,004 |
| * | Yoox Net-A-Porter | | |
| | Group SPA | 280,000 | 9,479 |
| | Moncler SPA | 564,712 | 9,103 |
| ^,* | RCS MediaGroup SPA | 10,250,000 | 8,192 |
| ^ | Salvatore Ferragamo SPA | 273,514 | 7,433 |
| * | Autogrill SPA | 732,234 | 6,807 |
| | DiaSorin SPA | 143,708 | 6,432 |
| ^ | Brunello Cucinelli SPA | 352,544 | 6,386 |
| ^ | Industria Macchine | | |
| | Automatiche SPA | 120,523 | 6,234 |
| *,2 | Infrastrutture Wireless | | |
| | Italiane SPA | 1,154,435 | 6,001 |
| | Beni Stabili SpA SIIQ | 6,219,860 | 5,115 |
| | Banca Generali SPA | 103,796 | 3,202 |
| | Immobiliare Grande | | |
| | Distribuzione SIIQ SPA | 2,660,435 | 2,656 |
| | | | 252,545 |
18
International Explorer Fund
| | | |
| | | | Market |
| | | | Value• |
| | | Shares | ($000) |
| Japan (22.7%) | | |
| | Nippon Shinyaku Co. Ltd. | 566,000 | 22,124 |
| | Tsuruha Holdings Inc. | 237,835 | 18,834 |
| | Trusco Nakayama Corp. | 477,500 | 16,676 |
| | Nitta Corp. | 608,300 | 16,501 |
| | Hitachi Transport | | |
| | System Ltd. | 942,400 | 16,496 |
| | Tokai Tokyo Financial | | |
| | Holdings Inc. | 2,712,300 | 16,397 |
| | Nippon Densetsu | | |
| | Kogyo Co. Ltd. | 807,600 | 15,229 |
| | NEC Networks & System | | |
| | Integration Corp. | 811,900 | 15,175 |
| | OBIC Business | | |
| | Consultants Co. Ltd. | 239,000 | 14,626 |
| | Kakaku.com Inc. | 780,800 | 14,580 |
| | Digital Garage Inc. | 898,300 | 13,960 |
| | Unipres Corp. | 592,500 | 13,436 |
| | JSP Corp. | 616,800 | 13,183 |
| | Lintec Corp. | 555,500 | 12,958 |
| | Kuroda Electric Co. Ltd. | 598,900 | 12,109 |
| | Musashi Seimitsu | | |
| | Industry Co. Ltd. | 586,600 | 11,840 |
| | Aica Kogyo Co. Ltd. | 593,200 | 11,727 |
| | Zenkoku Hosho Co. Ltd. | 342,955 | 11,547 |
| | Arcs Co. Ltd. | 566,500 | 11,414 |
| | Kissei | | |
| | Pharmaceutical Co. Ltd. | 431,000 | 11,053 |
| | Ai Holdings Corp. | 455,100 | 11,046 |
| | SCSK Corp. | 266,800 | 10,219 |
| | Nippon Shokubai Co. Ltd. | 130,161 | 10,158 |
| | Daibiru Corp. | 1,195,400 | 10,148 |
| ^ | Kureha Corp. | 2,663,000 | 10,147 |
| | Shinmaywa | | |
| | Industries Ltd. | 914,000 | 9,957 |
| ^ | Kumiai Chemical | | |
| | Industry Co. Ltd. | 1,179,200 | 9,460 |
| | TPR Co. Ltd. | 387,000 | 9,414 |
| | Koito | | |
| | Manufacturing Co. Ltd. | 244,500 | 9,231 |
| | Eagle Industry Co. Ltd. | 458,300 | 9,197 |
| | Glory Ltd. | 358,200 | 9,023 |
| | Shinsei Bank Ltd. | 4,312,235 | 9,004 |
| | Asahi Intecc Co. Ltd. | 228,470 | 8,771 |
| | Iida Group | | |
| | Holdings Co. Ltd. | 436,985 | 8,162 |
| | Mitsubishi UFJ | | |
| | Lease & Finance | | |
| | Co. Ltd. | 1,534,095 | 8,025 |
| | Takasago | | |
| | International Corp. | 299,400 | 7,845 |
| | DMG Mori Co. Ltd. | 527,515 | 7,457 |
| | Sumitomo Real | | |
| | Estate Sales Co. Ltd. | 313,500 | 7,204 |
| | Mitsui Sugar Co. Ltd. | 1,767,000 | 7,100 |
| ^ | Welcia Holdings Co. Ltd. | 139,400 | 6,838 |
| | | |
| | Daikyonishikawa Corp. | 128,100 | 6,793 |
| | Asahi Diamond | | |
| | Industrial Co. Ltd. | 624,000 | 6,570 |
| | Fukushima Industries Corp. | 301,600 | 6,540 |
| | Nihon Parkerizing Co. Ltd. | 706,700 | 6,276 |
| ^ | Message Co. Ltd. | 252,380 | 6,222 |
| | H2O Retailing Corp. | 317,700 | 6,167 |
| | Temp Holdings Co. Ltd. | 408,000 | 6,078 |
| | Nabtesco Corp. | 297,400 | 5,956 |
| | Denyo Co. Ltd. | 368,611 | 5,942 |
| | Nippon Soda Co. Ltd. | 739,000 | 5,703 |
| | Kyudenko Corp. | 277,000 | 5,690 |
| | IHI Corp. | 1,923,245 | 5,420 |
| | Tokyo TY Financial | | |
| | Group Inc. | 173,843 | 5,419 |
| | Mitsubishi Materials Corp. 1,522,000 | 5,281 |
| | Sanwa Holdings Corp. | 651,165 | 5,234 |
| | Hoshizaki Electric Co. Ltd. | 71,255 | 5,150 |
| ^ | Jamco Corp. | 122,900 | 5,116 |
| | Taiheiyo Cement Corp. | 1,529,000 | 5,025 |
| | Ferrotec Corp. | 516,700 | 5,009 |
| * | Leopalace21 Corp. | 916,100 | 4,864 |
| | Teijin Ltd. | 1,373,000 | 4,831 |
| | Shimadzu Corp. | 303,000 | 4,697 |
| | Showa Denko KK | 3,519,000 | 4,421 |
| | Tsutsumi Jewelry Co. Ltd. | 217,700 | 4,327 |
| | TechnoPro Holdings Inc. | 153,800 | 4,097 |
| | Tokyo Steel | | |
| | Manufacturing Co. Ltd. | 570,000 | 3,792 |
| | Kenedix Inc. | 1,031,400 | 3,710 |
| | Yamato Kogyo Co. Ltd. | 137,620 | 3,658 |
| | CyberAgent Inc. | 88,910 | 3,646 |
| ^ | Zuiko Corp. | 95,560 | 3,587 |
| | Sumco Corp. | 353,800 | 3,551 |
| | Tenma Corp. | 208,400 | 3,517 |
| | Obara Group Inc. | 83,400 | 3,485 |
| | Kobe Steel Ltd. | 2,747,000 | 3,452 |
| | Toyo Tire | | |
| | & Rubber Co. Ltd. | 161,600 | 3,393 |
| | Resorttrust Inc. | 128,500 | 3,293 |
| | IBJ Leasing Co. Ltd. | 152,565 | 3,201 |
| | Yushin Precision | | |
| | Equipment Co. Ltd. | 175,200 | 3,171 |
| | Miura Co. Ltd. | 236,100 | 2,808 |
| | EPS Holdings Inc. | 74,000 | 722 |
| | | | 654,085 |
| Luxembourg (0.9%) | | |
| | B&M European | | |
| | Value Retail SA | 1,975,858 | 10,132 |
| * | Stabilus SA | 190,000 | 7,304 |
| | Reinet Investments SCA | 219,250 | 5,160 |
| | L’Occitane International SA | 1,829,000 | 3,673 |
| 2 | O’Key Group SA GDR | 294,369 | 618 |
| | | | 26,887 |
19
International Explorer Fund
| | | |
| | | | Market |
| | | | Value• |
| | | Shares | ($000) |
| Malaysia (0.3%) | | |
| | Bursa Malaysia Bhd. | 4,245,200 | 8,353 |
| |
| Netherlands (1.6%) | | |
| ^ | Delta Lloyd NV | 1,574,985 | 12,390 |
| | Sligro Food Group NV | 225,000 | 8,268 |
| *,2 | Refresco Gerber NV | 500,000 | 8,175 |
| ^ | Beter Bed Holding NV | 250,000 | 5,972 |
| | USG People NV | 286,195 | 4,548 |
| | IMCD Group NV | 110,085 | 4,116 |
| *,2 | Intertrust NV | 170,563 | 3,370 |
| * | Constellium NV Class A | 59,494 | 224 |
| | | | 47,063 |
| New Zealand (0.3%) | | |
| | Fletcher Building Ltd. | 1,475,159 | 7,447 |
| |
| Norway (1.5%) | | |
| * | Storebrand ASA | 6,600,000 | 23,069 |
| | Borregaard ASA | 2,200,000 | 11,720 |
| | Kongsberg Gruppen ASA | 424,968 | 6,647 |
| | Tomra Systems ASA | 84,500 | 901 |
| | | | 42,337 |
| Other (0.8%) | | |
| 3 | Vanguard FTSE All World | | |
| | ex-US Small-Cap ETF | 249,010 | 23,646 |
| |
| Singapore (0.8%) | | |
| | UOL Group Ltd. | 2,533,300 | 11,851 |
| | First Resources Ltd. | 5,310,000 | 7,103 |
| | Mapletree | | |
| | Industrial Trust | 3,914,480 | 4,259 |
| | | | 23,213 |
| South Africa (0.2%) | | |
| | Brait SE | 420,840 | 4,810 |
| |
| South Korea (1.4%) | | |
| | Hanon Systems | 337,355 | 13,261 |
| | S-1 Corp. | 84,304 | 7,317 |
| ^ | Nexen Tire Corp. | 512,126 | 5,909 |
| | Medy-Tox Inc. | 10,895 | 4,618 |
| ^ | Hotel Shilla Co. Ltd. | 35,614 | 3,418 |
| ^ | Sung Kwang Bend Co. Ltd. | 386,521 | 3,169 |
| | CJ O Shopping Co. Ltd. | 17,510 | 2,709 |
| | | | 40,401 |
| Spain (0.4%) | | |
| | Applus Services SA | 600,000 | 5,339 |
| ^ | Melia Hotels | | |
| | International SA | 349,452 | 5,044 |
| | Naturhouse Health SAU | 500,000 | 2,529 |
| | | | 12,912 |
| Sweden (2.0%) | | |
| | Loomis AB Class B | 800,000 | 20,733 |
| † | Bufab Holding AB | 2,354,089 | 12,344 |
| | Modern Times Group | | |
| | MTG AB Class B | 275,000 | 7,786 |
| | | |
| *,2 | Coor Service Management | |
| | Holding AB | 1,250,000 | 5,092 |
| | AAK AB | 70,000 | 5,033 |
| | Opus Group AB | 6,665,454 | 4,352 |
| | Concentric AB | 339,087 | 3,917 |
| | | | 59,257 |
| Switzerland (3.7%) | | |
| | Helvetia Holding AG | 50,000 | 26,156 |
| | OC Oerlikon Corp. AG | 2,123,003 | 20,352 |
| | Gategroup Holding AG | 406,294 | 15,226 |
| | Ascom Holding AG | 600,000 | 11,373 |
| | Interroll Holding AG | 14,000 | 10,831 |
| | Komax Holding AG | 55,000 | 9,158 |
| | Kuoni Reisen Holding AG | 22,000 | 4,552 |
| | Comet Holding AG | 4,500 | 3,085 |
| * | Dufry AG | 24,488 | 2,861 |
| | Tecan Group AG | 17,155 | 2,336 |
| | Orior AG | 40,000 | 2,245 |
| | | | 108,175 |
| Taiwan (1.2%) | | |
| | Giant Manufacturing | | |
| | Co. Ltd. | 2,060,000 | 15,489 |
| | Chroma ATE Inc. | 3,824,000 | 6,808 |
| | Gourmet Master Co. Ltd. | 995,000 | 6,026 |
| | CTCI Corp. | 4,336,000 | 5,638 |
| | | | 33,961 |
| Thailand (0.3%) | | |
| | LPN Development PCL | 14,565,300 | 7,310 |
| |
| United Arab Emirates (0.2%) | |
| * | Lamprell plc | 3,650,000 | 6,754 |
| |
| United Kingdom (17.4%) | | |
| | DCC plc | 250,000 | 20,036 |
| | Kennedy Wilson Europe | | |
| | Real Estate plc | 1,047,503 | 19,297 |
| | Grainger plc | 4,915,405 | 18,837 |
| | Dechra | | |
| | Pharmaceuticals plc | 1,100,000 | 16,422 |
| | Grafton Group plc | 1,425,000 | 14,778 |
| ^,* | SuperGroup plc | 610,647 | 13,735 |
| | IG Group Holdings plc | 1,023,416 | 11,905 |
| | Redrow plc | 1,563,146 | 11,164 |
| | Ricardo plc | 800,000 | 11,152 |
| ^ | Telecom Plus plc | 685,216 | 11,096 |
| | Elementis plc | 3,008,656 | 10,855 |
| | SSP Group plc | 2,226,437 | 10,333 |
| | Micro Focus | | |
| | International plc | 527,605 | 10,199 |
| | Alent plc | 1,327,137 | 10,199 |
| | Keller Group plc | 768,445 | 9,651 |
| | Millennium | | |
| | & Copthorne Hotels plc | 1,300,000 | 9,641 |
| | Mitie Group plc | 1,933,062 | 9,566 |
| | Pets at Home Group plc | 2,142,073 | 9,511 |
20
International Explorer Fund
| | | |
| | | | Market |
| | | | Value• |
| | | Shares | ($000) |
| | Photo-Me | | |
| | International plc | 3,750,000 | 9,183 |
| | Berendsen plc | 575,000 | 9,071 |
| * | HomeServe plc | 1,450,993 | 9,027 |
| | Investec plc | 1,050,000 | 8,758 |
| | Hikma Pharmaceuticals plc | 239,795 | 7,990 |
| | Halma plc | 675,000 | 7,934 |
| | WS Atkins plc | 372,931 | 7,906 |
| | UNITE Group plc | 754,287 | 7,719 |
| | Inchcape plc | 600,000 | 7,376 |
| | Just Retirement | | |
| | Group plc | 2,873,343 | 7,313 |
| ^ | Eco Animal Health | | |
| | Group plc | 1,608,166 | 7,277 |
| | N Brown Group plc | 1,239,419 | 7,159 |
| | Kier Group plc | 337,223 | 7,146 |
| | Polypipe Group plc | 1,457,821 | 7,072 |
| | Tyman plc | 1,749,943 | 6,926 |
| | London Stock Exchange | | |
| | Group plc | 171,795 | 6,721 |
| | Big Yellow Group plc | 561,466 | 6,480 |
| | Bodycote plc | 804,535 | 6,379 |
| | AA plc | 1,484,485 | 6,322 |
| | Soco International plc | 2,311,526 | 6,286 |
| | Abcam plc | 674,296 | 6,235 |
| | Restaurant Group plc | 546,909 | 6,038 |
| | Victrex plc | 209,256 | 5,951 |
| | Crest Nicholson | | |
| | Holdings plc | 644,595 | 5,395 |
| | Mears Group plc | 838,387 | 5,348 |
| | A.G.Barr plc | 650,000 | 5,300 |
| | QinetiQ Group plc | 1,522,465 | 5,249 |
| | Northgate plc | 822,693 | 5,133 |
| | Consort Medical plc | 328,186 | 4,934 |
| | Saga plc | 1,543,596 | 4,934 |
| | Michael Page | | |
| | International plc | 641,438 | 4,881 |
| | Savills plc | 344,950 | 4,862 |
| | Senior plc | 1,359,368 | 4,742 |
| * | Findel plc | 1,104,252 | 4,253 |
| | Ashtead Group plc | 275,639 | 4,241 |
| | Hansteen Holdings plc | 2,179,503 | 4,163 |
| | Brewin Dolphin | | |
| | Holdings plc | 984,495 | 4,093 |
| | SIG plc | 1,975,000 | 4,055 |
| | Hays plc | 1,675,783 | 3,634 |
| * | LMS Capital plc | 3,097,813 | 3,434 |
| | Berkeley Group | | |
| | Holdings plc | 65,147 | 3,325 |
| | Laird plc | 588,080 | 3,064 |
| | Genus plc | 133,295 | 2,985 |
| ^ | Electra Private Equity plc | 46,200 | 2,643 |
| | LondonMetric | | |
| | Property plc | 1,000,000 | 2,603 |
| | James Fisher & Sons plc | 173,718 | 2,568 |
| * | Premier Oil plc | 2,300,000 | 2,414 |
| | | | |
| | Cineworld Group plc | 266,299 | 2,264 |
| | Ultra Electronics | | | |
| | Holdings plc | | 79,017 | 2,048 |
| * | Ophir Energy plc | | 1,238,267 | 1,829 |
| | | | | 501,040 |
| United States (1.0%) | | | |
| * | LivaNova plc | | 264,320 | 17,519 |
| | Samsonite | | | |
| | International SA | | 4,324,500 | 12,729 |
| | | | | 30,248 |
| Total Common Stocks | | | |
| (Cost $2,453,736) | | | 2,749,931 |
| Temporary Cash Investments (7.6%)1 | |
| Money Market Fund (7.2%) | | |
| 4,5 | Vanguard Market | | | |
| | Liquidity Fund, | | | |
| | 0.207% | 208,877,978 | 208,878 |
| |
| | | | Face | |
| | | | Amount | |
| | | | ($000) | |
| Repurchase Agreement (0.2%) | |
| | Goldman Sachs & Co. | | |
| | 0.080%, 11/2/15 | | | |
| | (Dated 10/30/15, | | | |
| | Repurchase Value | | | |
| | $4,800,000 collateralized | | |
| | by Federal Home Loan | | |
| | Mortgage Assn. 3.042%– | | |
| | 4.000%, 8/1/26–12/1/41, | | |
| | and Federal National | | |
| | Mortgage Assn. 5.000%, | | |
| | 11/1/41, with a value | | |
| | of $4,896,000) | | 4,800 | 4,800 |
| |
| U.S. Government and Agency Obligations (0.2%) |
| 6,7 | Fannie Mae Discount | | |
| | Notes, 0.250%, 4/20/16 | 500 | 500 |
| 7,8 | Federal Home Loan | | | |
| | Bank Discount Notes, | | |
| | 0.180%, 11/4/15 | | 3,000 | 3,000 |
| 8,9 | Federal Home Loan | | | |
| | Bank Discount Notes, | | |
| | 0.245%, 4/20/16 | | 3,000 | 2,997 |
| 6,7 | Freddie Mac Discount | | |
| | Notes, 0.220%, 4/15/16 | 900 | 899 |
| | | | | 7,396 |
| Total Temporary Cash Investments | |
| (Cost $221,073) | | | 221,074 |
| Total Investments (102.9%) | | |
| (Cost $2,674,809) | | | 2,971,005 |
21
International Explorer Fund
| |
| | Amount |
| | ($000) |
| Other Assets and Liabilities (-2.9%) | |
| Other Assets | |
| Investment in Vanguard | 250 |
| Receivables for Investment Securities Sold 6,553 |
| Receivables for Accrued Income | 6,541 |
| Receivables for Capital Shares Issued | 3,437 |
| Other Assets | 1,084 |
| Total Other Assets | 17,865 |
| Liabilities | |
| Payables for Investment Securities | |
| Purchased | (396) |
| Collateral for Securities on Loan | (91,055) |
| Payables to Investment Advisor | (1,533) |
| Payables for Capital Shares Redeemed | (2,383) |
| Payables to Vanguard | (4,603) |
| Other Liabilities | (2,172) |
| Total Liabilities | (102,142) |
| Net Assets (100%) | |
| Applicable to 162,550,194 outstanding | |
| $.001 par value shares of beneficial | |
| interest (unlimited authorization) | 2,886,728 |
| Net Asset Value Per Share | $17.76 |
| |
| At October 31, 2015, net assets consisted of: |
| | Amount |
| | ($000) |
| Paid-in Capital | 2,476,009 |
| Undistributed Net Investment Income | 4,878 |
| Accumulated Net Realized Gains | 107,188 |
| Unrealized Appreciation (Depreciation) | |
| Investment Securities | 296,196 |
| Futures Contracts | 3,172 |
| Forward Currency Contracts | (428) |
| Foreign Currencies | (287) |
| Net Assets | 2,886,728 |
• See Note A in Notes to Financial Statements.
^ Includes partial security positions on loan to broker-dealers. The total value of securities on loan is $86,926,000.
* Non-income-producing security.
† Considered an affiliated company of the fund as the fund owns more than 5% of the outstanding voting securities of such company.
1 The fund invests a portion of its cash reserves in equity markets through the use of index futures contracts. After giving effect to futures
investments, the fund’s effective common stock and temporary cash investment positions represent 97.6% and 5.3%, respectively,
of net assets.
2 Security exempt from registration under Rule 144A of the Securities Act of 1933. Such securities may be sold in transactions exempt from
registration, normally to qualified institutional buyers. At October 31, 2015, the aggregate value of these securities was $99,144,000,
representing 3.4% of net assets.
3 Considered an affiliated company of the fund as the issuer is another member of The Vanguard Group.
4 Affiliated money market fund available only to Vanguard funds and certain trusts and accounts managed by Vanguard. Rate shown is the
7-day yield.
5 Includes $91,055,000 of collateral received for securities on loan.
6 The issuer was placed under federal conservatorship in September 2008; since that time, its daily operations have been managed by the
Federal Housing Finance Agency and it receives capital from the U.S. Treasury, as needed to maintain a positive net worth, in exchange for
senior preferred stock.
7 Securities with a value of $4,199,000 have been segregated as initial margin for open futures contracts.
8 The issuer operates under a congressional charter; its securities are generally neither guaranteed by the U.S. Treasury nor backed by the full
faith and credit of the U.S. government.
9 Securities with a value of $927,000 have been segregated as collateral for open forward currency contracts.
ADR—American Depositary Receipt.
GDR—Global Depositary Receipt.
REIT—Real Estate Investment Trust.
See accompanying Notes, which are an integral part of the Financial Statements.
22
International Explorer Fund
Statement of Operations
| |
| | Year Ended |
| | October 31, 2015 |
| | ($000) |
| Investment Income | |
| Income | |
| Dividends1 | 50,771 |
| Interest | 215 |
| Securities Lending | 1,492 |
| Total Income | 52,478 |
| Expenses | |
| Investment Advisory Fees—Note B | |
| Basic Fee | 5,794 |
| Performance Adjustment | 113 |
| The Vanguard Group—Note C | |
| Management and Administrative | 4,367 |
| Marketing and Distribution | 474 |
| Custodian Fees | 504 |
| Auditing Fees | 39 |
| Shareholders’ Reports | 29 |
| Trustees’ Fees and Expenses | 5 |
| Total Expenses | 11,325 |
| Net Investment Income | 41,153 |
| Realized Net Gain (Loss) | |
| Investment Securities Sold | 131,305 |
| Futures Contracts | (2,672) |
| Foreign Currencies and Forward Currency Contracts | (7,048) |
| Realized Net Gain (Loss) | 121,585 |
| Change in Unrealized Appreciation (Depreciation) | |
| Investment Securities | (31,958) |
| Futures Contracts | 1,212 |
| Foreign Currencies and Forward Currency Contracts | 1,671 |
| Change in Unrealized Appreciation (Depreciation) | (29,075) |
| Net Increase (Decrease) in Net Assets Resulting from Operations | 133,663 |
| 1 Dividends are net of foreign withholding taxes of $3,428,000. |
See accompanying Notes, which are an integral part of the Financial Statements.
23
International Explorer Fund
Statement of Changes in Net Assets
| | |
| | Year Ended October 31, |
| | 2015 | 2014 |
| | ($000) | ($000) |
| Increase (Decrease) in Net Assets | | |
| Operations | | |
| Net Investment Income | 41,153 | 43,712 |
| Realized Net Gain (Loss) | 121,585 | 172,966 |
| Change in Unrealized Appreciation (Depreciation) | (29,075) | (166,772) |
| Net Increase (Decrease) in Net Assets Resulting from Operations | 133,663 | 49,906 |
| Distributions | | |
| Net Investment Income | (45,599) | (52,360) |
| Realized Capital Gain1 | (153,304) | (35,904) |
| Total Distributions | (198,903) | (88,264) |
| Capital Share Transactions | | |
| Issued | 712,308 | 653,367 |
| Issued in Lieu of Cash Distributions | 183,328 | 81,125 |
| Redeemed | (541,440) | (379,732) |
| Net Increase (Decrease) from Capital Share Transactions | 354,196 | 354,760 |
| Total Increase (Decrease) | 288,956 | 316,402 |
| Net Assets | | |
| Beginning of Period | 2,597,772 | 2,281,370 |
| End of Period2 | 2,886,728 | 2,597,772 |
| 1 Includes fiscal 2015 and 2014 short-term gain distributions totaling $26,297,000 and $17,079,000 respectively. Short-term gain distribution |
| are treated as ordinary income dividends for tax purposes |
| 2 Net Assets—End of Period includes undistributed (overdistributed) net investment income of $4,878,000 and $13,317,000. |
See accompanying Notes, which are an integral part of the Financial Statements.
24
International Explorer Fund
Financial Highlights
| | | | | |
| For a Share Outstanding | Year Ended October 31, |
| Throughout Each Period | 2015 | 2014 | 2013 | 2012 | 2011 |
| Net Asset Value, Beginning of Period | $18.26 | $18.50 | $14.50 | $14.41 | $15.81 |
| Investment Operations | | | | | |
| Net Investment Income | . 287 | .335 | .327 | .362 | .322 |
| Net Realized and Unrealized Gain (Loss) | | | | | |
| on Investments | .635 | .133 | 4.078 | .287 | (1.498) |
| Total from Investment Operations | .922 | .468 | 4.405 | .649 | (1.176) |
| Distributions | | | | | |
| Dividends from Net Investment Income | (.326) | (.420) | (. 405) | (.346) | (. 224) |
| Distributions from Realized Capital Gains | (1.096) | (.288) | — | (.213) | — |
| Total Distributions | (1.422) | (.708) | (.405) | (. 559) | (. 224) |
| Net Asset Value, End of Period | $17.76 | $18.26 | $18.50 | $14.50 | $14.41 |
| |
| Total Return1 | 5.65% | 2.66% | 31.13% | 5.02% | -7.60% |
| |
| Ratios/Supplemental Data | | | | | |
| Net Assets, End of Period (Millions) | $2,887 | $2,598 | $2,281 | $1,819 | $2,187 |
| Ratio of Total Expenses to Average Net Assets2 | 0.42% | 0.40% | 0.36% | 0.43% | 0.42% |
| Ratio of Net Investment Income to | | | | | |
| Average Net Assets | 1.53% | 1.69% | 2.03% | 2.35% | 1.93% |
| Portfolio Turnover Rate | 42% | 39% | 36% | 28% | 43% |
| 1 Total returns do not include transaction or account service fees that may have applied in the periods shown. Fund prospectuses provide |
| information about any applicable transaction and account service fees. |
| 2 Includes performance-based investment advisory fee increases (decreases) of 0.00%, 0.00%, (0.05%), 0.02%, and 0.03%. |
See accompanying Notes, which are an integral part of the Financial Statements.
25
International Explorer Fund
Notes to Financial Statements
Vanguard International Explorer Fund is registered under the Investment Company Act of 1940 as an open-end investment company, or mutual fund. The fund invests in securities of foreign issuers, which may subject it to investment risks not normally associated with investing in securities of U.S. corporations.
A. The following significant accounting policies conform to generally accepted accounting principles for U.S. investment companies. The fund consistently follows such policies in preparing its financial statements.
1. Security Valuation: Securities are valued as of the close of trading on the New York Stock Exchange (generally 4 p.m., Eastern time) on the valuation date. Equity securities are valued at the latest quoted sales prices or official closing prices taken from the primary market in which each security trades; such securities not traded on the valuation date are valued at the mean of the latest quoted bid and asked prices. Securities for which market quotations are not readily available, or whose values have been affected by events occurring before the fund’s pricing time but after the close of the securities’ primary markets, are valued at their fair values calculated according to procedures adopted by the board of trustees. These procedures include obtaining quotations from an independent pricing service, monitoring news to identify significant market- or security-specific events, and evaluating changes in the values of foreign market proxies (for example, ADRs, futures contracts, or exchange-traded funds), between the time the foreign markets close and the fund’s pricing time. When fair-value pricing is employed, the prices of securities used by a fund to calculate its net asset value may differ from quoted or published prices for the same securities. Investments in Vanguard Market Liquidity Fund are valued at that fund’s net asset value. Temporary cash investments acquired over 60 days to maturity are valued using the latest bid prices or using valuations based on a matrix system (which considers such factors as security prices, yields, maturities, and ratings), both as furnished by independent pricing services. Other temporary cash investments are valued at amortized cost, which approximates market value.
2. Foreign Currency: Securities and other assets and liabilities denominated in foreign currencies are translated into U.S. dollars using exchange rates obtained from an independent third party as of the fund’s pricing time on the valuation date. Realized gains (losses) and unrealized appreciation (depreciation) on investment securities include the effects of changes in exchange rates since the securities were purchased, combined with the effects of changes in security prices. Fluctuations in the value of other assets and liabilities resulting from changes in exchange rates are recorded as unrealized foreign currency gains (losses) until the assets or liabilities are settled in cash, at which time they are recorded as realized foreign currency gains (losses).
3. Futures and Forward Currency Contracts: The fund uses index futures contracts to a limited extent, with the objective of maintaining full exposure to the stock market while maintaining liquidity. The fund may purchase or sell futures contracts to achieve a desired level of investment, whether to accommodate portfolio turnover or cash flows from capital share transactions. The primary risks associated with the use of futures contracts are imperfect correlation between changes in market values of stocks held by the fund and the prices of futures contracts, and the possibility of an illiquid market. Counterparty risk involving futures is mitigated because a regulated clearinghouse is the counterparty instead of the clearing broker. To further mitigate counterparty risk, the fund trades futures contracts on an exchange, monitors the financial strength of its clearing brokers and clearing-house, and has entered into clearing agreements with its clearing brokers. The clearinghouse imposes initial margin requirements to secure the fund’s performance and requires daily settlement of variation margin representing changes in the market value of each contract.
26
International Explorer Fund
The fund enters into forward currency contracts to provide the appropriate currency exposure related to any open futures contracts or to protect the value of securities and related receivables and payables against changes in foreign exchange rates. The fund’s risks in using these contracts include movement in the values of the foreign currencies relative to the U.S. dollar and the ability of the counterparties to fulfill their obligations under the contracts. The fund mitigates its counterparty risk by entering into forward currency contracts only with a diverse group of prequalified counterparties, monitoring their financial strength, entering into master netting arrangements with its counterparties, and requiring its counterparties to transfer collateral as security for their performance. The master netting arrangements provide that, in the event of a counterparty’s default (including bankruptcy), the fund may terminate the forward currency contracts, determine the net amount owed by either party in accordance with its master netting arrangements, and sell or retain any collateral held up to the net amount owed to the fund under the master netting arrangements. The forward currency contracts contain provisions whereby a counterparty may terminate open contracts if the fund’s net assets decline below a certain level, triggering a payment by the fund if the fund is in a net liability position at the time of the termination. The payment amount would be reduced by any collateral the fund has pledged. Any assets pledged as collateral for open contracts are noted in the Statement of Net Assets. The value of collateral received or pledged is compared daily to the value of the forward currency contracts exposure with each counterparty, and any difference, if in excess of a specified minimum transfer amount, is adjusted and settled within two business days.
Futures contracts are valued at their quoted daily settlement prices. Forward currency contracts are valued at their quoted daily prices obtained from an independent third party, adjusted for currency risk based on the expiration date of each contract. The aggregate settlement values and notional amounts of the contracts are not recorded in the Statement of Net Assets. Fluctuations in the value of the contracts are recorded in the Statement of Net Assets as an asset (liability) and in the Statement of Operations as unrealized appreciation (depreciation) until the contracts are closed, when they are recorded as realized gains (losses) on futures or forward currency contracts.
During the year ended October 31, 2015, the fund’s average investments in long and short futures contracts represented 2% and 0% of net assets, respectively, based on the average of aggregate settlement values at each quarter-end during the period. The fund’s average investment in forward currency contracts represented 3% of net assets, based on the average of notional amounts at each quarter-end during the period.
4. Repurchase Agreements: The fund enters into repurchase agreements with institutional counter-parties. Securities pledged as collateral to the fund under repurchase agreements are held by a custodian bank until the agreements mature. Each agreement requires that the market value of the collateral be sufficient to cover payments of interest and principal. The fund further mitigates its counterparty risk by entering into repurchase agreements only with a diverse group of prequalified counterparties, monitoring their financial strength, and entering into master repurchase agreements with its counterparties. The master repurchase agreements provide that, in the event of a counter-party’s default (including bankruptcy), the fund may terminate any repurchase agreements with that counterparty, determine the net amount owed, and sell or retain the collateral up to the net amount owed to the fund. Such action may be subject to legal proceedings, which may delay or limit the disposition of collateral.
5. Federal Income Taxes: The fund intends to continue to qualify as a regulated investment company and distribute all of its taxable income. Management has analyzed the fund’s tax positions taken for all open federal income tax years (October 31, 2012–2015), and has concluded that no provision for federal income tax is required in the fund’s financial statements.
27
International Explorer Fund
6. Distributions: Distributions to shareholders are recorded on the ex-dividend date.
7. Securities Lending: To earn additional income, the fund lends its securities to qualified institutional borrowers. Security loans are required to be secured at all times by collateral in an amount at least equal to the market value of securities loaned. Daily market fluctuations could cause the value of loaned securities to be more or less than the value of the collateral received. When this occurs, the collateral is adjusted and settled on the next business day. The fund further mitigates its counterparty risk by entering into securities lending transactions only with a diverse group of prequalified counter-parties, monitoring their financial strength, and entering into master securities lending agreements with its counterparties. The master securities lending agreements provide that, in the event of a counterparty’s default (including bankruptcy), the fund may terminate any loans with that borrower, determine the net amount owed, and sell or retain the collateral up to the net amount owed to the fund; however, such actions may be subject to legal proceedings. While collateral mitigates counter-party risk, in the absence of a default the fund may experience delays and costs in recovering the securities loaned. The fund invests cash collateral received in Vanguard Market Liquidity Fund, and records a liability in the Statement of Net Assets for the return of the collateral, during the period the securities are on loan. Securities lending income represents fees charged to borrowers plus income earned on invested cash collateral, less expenses associated with the loan.
8. Credit Facility: The fund and certain other funds managed by The Vanguard Group (“Vanguard”) participate in a $3 billion committed credit facility provided by a syndicate of lenders pursuant to a credit agreement that may be renewed annually; each fund is individually liable for its borrowings, if any, under the credit facility. Borrowings may be utilized for temporary and emergency purposes, and are subject to the fund’s regulatory and contractual borrowing restrictions. The participating funds are charged administrative fees and an annual commitment fee of 0.06% of the undrawn amount of the facility; these fees are allocated to the funds based on a method approved by the fund’s board of trustees and included in Management and Administrative expenses on the fund’s Statement of Operations. Any borrowings under this facility bear interest at a rate equal to the higher of the federal funds rate or LIBOR reference rate plus an agreed-upon spread.
The fund had no borrowings outstanding at October 31, 2015, or at any time during the period then ended.
9. Other: Dividend income is recorded on the ex-dividend date. Interest income includes income distributions received from Vanguard Market Liquidity Fund and is accrued daily. Premiums and discounts on debt securities purchased are amortized and accreted, respectively, to interest income over the lives of the respective securities. Security transactions are accounted for on the date securities are bought or sold. Costs used to determine realized gains (losses) on the sale of investment securities are those of the specific securities sold.
Withholding taxes on foreign dividends and capital gains have been provided for in accordance with the fund’s understanding of the applicable countries’ tax rules and rates. In consideration of recent decisions rendered by European courts, the fund has filed additional tax reclaims for previously withheld taxes on dividends earned in certain European Union countries. These filings are subject to various administrative and judicial proceedings within these countries. Such tax reclaims received during the year are included in dividend income. No other amounts for additional tax reclaims are reflected in the financial statements due to the uncertainty as to the ultimate resolution of proceedings, the likelihood of receipt of these reclaims, and the potential timing of payment.
28
International Explorer Fund
B. The investment advisory firms Schroder Investment Management North America Inc. and Wellington Management Company LLP each provide investment advisory services to a portion of the fund for a fee calculated at an annual percentage rate of average net assets managed by the advisor. The basic fees of Schroder Investment Management North America Inc. and Wellington Management Company LLP are subject to quarterly adjustments based on performance relative to the S&P EPAC SmallCap Index for the preceding three years.
Vanguard manages the cash reserves of the fund as described below.
For the year ended October 31, 2015, the aggregate investment advisory fee represented an effective annual basic rate of 0.22% of the fund’s average net assets, before an increase of $113,000 (0.00%) based on performance.
C. In accordance with the terms of a Funds’ Service Agreement (the “FSA”) between Vanguard and the fund, Vanguard furnishes to the fund corporate management, administrative, marketing, distribution and cash management services at Vanguard’s cost of operations (as defined by the FSA). These costs of operations are allocated to the fund based on methods and guidelines approved by the board of trustees. Vanguard does not require reimbursement in the current period for certain costs of operations (such as deferred compensation/benefits and risk/insurance costs); the fund’s liability for these costs of operations is included in Payables to Vanguard on the Statement of Net Assets.
Upon the request of Vanguard, the fund may invest up to 0.40% of its net assets as capital in Vanguard. At October 31, 2015, the fund had contributed to Vanguard capital in the amount of $250,000, representing 0.01% of the fund’s net assets and 0.10% of Vanguard’s capitalization. The fund’s trustees and officers are also directors and employees, respectively, of Vanguard.
D. Various inputs may be used to determine the value of the fund’s investments. These inputs are summarized in three broad levels for financial statement purposes. The inputs or methodologies used to value securities are not necessarily an indication of the risk associated with investing in those securities.
Level 1—Quoted prices in active markets for identical securities.
Level 2—Other significant observable inputs (including quoted prices for similar securities, interest rates, prepayment speeds, credit risk, etc.).
Level 3—Significant unobservable inputs (including the fund’s own assumptions used to determine the fair value of investments).
The following table summarizes the market value of the fund’s investments as of October 31, 2015, based on the inputs used to value them:
| | | |
| | Level 1 | Level 2 | Level 3 |
| Investments | ($000) | ($000) | ($000) |
| Common Stocks | 55,666 | 2,693,071 | 1,194 |
| Temporary Cash Investments | 208,878 | 12,196 | — |
| Futures Contracts—Assets1 | 140 | — | — |
| Futures Contracts—Liabilities1 | (203) | — | — |
| Forward Currency Contracts—Assets | — | 806 | — |
| Forward Currency Contracts—Liabilities | — | (1,234) | — |
| Total | 264,481 | 2,704,839 | 1,194 |
| 1 Represents variation margin on the last day of the reporting period. |
29
International Explorer Fund
E. At October 31, 2015, the fair values of derivatives were reflected in the Statement of Net Assets as follows:
| | | |
| | | Foreign | |
| | Equity | Exchange | |
| | Contracts | Contracts | Total |
| Statement of Net Assets Caption | ($000) | ($000) | ($000) |
| Other Assets | 140 | 806 | 946 |
| Other Liabilities | (203) | (1,234) | (1,437) |
Realized net gain (loss) and the change in unrealized appreciation (depreciation) on derivatives for the year ended October 31, 2015, were:
| | | |
| | | Foreign | |
| | Equity | Exchange | |
| | Contracts | Contracts | Total |
| Realized Net Gain (Loss) on Derivatives | ($000) | ($000) | ($000) |
| Futures Contracts | (2,672) | — | (2,672) |
| Forward Currency Contracts | — | (5,939) | (5,939) |
| Realized Net Gain (Loss) on Derivatives | (2,672) | (5,939) | (8,611) |
| |
| Change in Unrealized Appreciation (Depreciation) on Derivatives | | | |
| Futures Contracts | 1,212 | — | 1,212 |
| Forward Currency Contracts | — | 1,737 | 1,737 |
| Change in Unrealized Appreciation (Depreciation) on Derivatives | 1,212 | 1,737 | 2,949 |
At October 31, 2015, the aggregate settlement value of open futures contracts and the related unrealized appreciation (depreciation) were:
| | | | |
| | | | ($000) |
| | | | Aggregate | |
| | | Number of | Settlement | Unrealized |
| | | Long (Short) | Value | Appreciation |
| Futures Contracts | Expiration | Contracts | Long (Short) | (Depreciation) |
| FTSE 100 Index | December 2015 | 283 | 27,623 | 753 |
| Topix Index | December 2015 | 143 | 18,468 | 1,183 |
| Dow Jones EURO STOXX 50 Index | December 2015 | 357 | 13,420 | 934 |
| S&P ASX 200 Index | December 2015 | 102 | 9,526 | 302 |
| | | | | 3,172 |
Unrealized appreciation (depreciation) on open FTSE 100 Index and Dow Jones EURO STOXX
50 Index futures contracts is required to be treated as realized gain (loss) for tax purposes.
30
International Explorer Fund
At October 31, 2015, the fund had open forward currency contracts to receive and deliver currencies as follows. Unrealized appreciation (depreciation) on open forward currency contracts is treated as realized gain (loss) for tax purposes.
| | | | | | |
| | | | | | | Unrealized |
| | Contract | | | | | Appreciation |
| | Settlement | Contract Amount (000) | (Depreciation) |
| Counterparty | Date | Receive | Deliver | ($000) |
| BNP Paribas | 12/23/15 | GBP | 23,495 | USD | 36,126 | 86 |
| BNP Paribas | 12/15/15 | JPY | 3,460,848 | USD | 28,929 | (227) |
| BNP Paribas | 12/23/15 | EUR | 18,084 | USD | 20,457 | (553) |
| BNP Paribas | 12/22/15 | AUD | 19,303 | USD | 13,671 | 57 |
| Bank of America N.A. | 12/23/15 | GBP | 2,281 | USD | 3,469 | 46 |
| BNP Paribas | 12/23/15 | GBP | 2,213 | USD | 3,412 | (1) |
| Citibank, N.A. | 12/23/15 | GBP | 2,165 | USD | 3,327 | 11 |
| Citibank, N.A. | 12/23/15 | EUR | 2,888 | USD | 3,275 | (95) |
| Citibank, N.A. | 12/15/15 | JPY | 243,920 | USD | 2,035 | (12) |
| UBS AG | 12/22/15 | AUD | 2,622 | USD | 1,890 | (26) |
| UBS AG | 12/23/15 | GBP | 1,199 | USD | 1,851 | (2) |
| UBS AG | 12/23/15 | GBP | 1,180 | USD | 1,790 | 29 |
| Morgan Stanley Capital Services LLC | 12/22/15 | AUD | 2,349 | USD | 1,713 | (43) |
| Bank of America, N.A. | 12/15/15 | JPY | 131,535 | USD | 1,095 | (4) |
| Citibank, N.A. | 12/23/15 | USD | 12,397 | GBP | 8,017 | 40 |
| Goldman Sachs International | 12/23/15 | USD | 11,228 | GBP | 7,403 | (182) |
| UBS AG | 12/15/15 | USD | 8,073 | JPY | 958,750 | 122 |
| Citibank, N.A. | 12/15/15 | USD | 6,706 | JPY | 809,115 | (5) |
| Goldman Sachs International | 12/23/15 | USD | 5,821 | EUR | 5,073 | 237 |
| Credit Suisse International | 12/23/15 | USD | 4,876 | EUR | 4,358 | 79 |
| UBS AG | 12/22/15 | USD | 4,333 | AUD | 6,212 | (84) |
| Morgan Stanley Capital Services LLC | 12/22/15 | USD | 3,870 | AUD | 5,303 | 99 |
| | | | | | | (428) |
| AUD—Australian dollar. |
| EUR—Euro. |
| GBP—British pound. |
| USD—U.S. dollar. |
F. Distributions are determined on a tax basis and may differ from net investment income and realized capital gains for financial reporting purposes. Differences may be permanent or temporary. Permanent differences are reclassified among capital accounts in the financial statements to reflect their tax character. Temporary differences arise when certain items of income, expense, gain, or loss are recognized in different periods for financial statement and tax purposes. These differences will reverse at some time in the future. Differences in classification may also result from the treatment of short-term gains as ordinary income for tax purposes.
31
International Explorer Fund
During the year ended October 31, 2015, the fund realized net foreign currency losses of $1,109,000, which decreased distributable net income for tax purposes; accordingly, such losses have been reclassified from accumulated net realized gains to undistributed net investment income. Certain of the fund’s investments are in securities considered to be passive foreign investment companies, for which any unrealized appreciation and/or realized gains are required to be included in distributable net income for tax purposes. During the year ended October 31, 2015, the fund realized gains on the sale of passive foreign investment companies of $1,710,000, which have been included in current and prior periods’ taxable income; accordingly, such gains have been reclassified from accumulated net realized gains to undistributed net investment income. Passive foreign investment companies held at October 31, 2015, had unrealized appreciation of $30,408,000, of which $24,809,000 has been distributed and is reflected in the balance of undistributed net investment income.
The fund received a net refund of capital gains taxes paid in certain foreign countries in the amount of $149,000. Refunds of capital gains taxes increase realized gains for financial statement purposes but are treated as an expense reduction for tax purposes. Accordingly, the net refund of capital gains tax has been reclassified from accumulated net realized gain to undistributed net investment income.
The fund used a tax accounting practice to treat a portion of the price of capital shares redeemed during the year as distributions from net investment income and realized capital gains. Accordingly, the fund has reclassified $4,743,000 from undistributed net investment income, and $14,747,000 from accumulated net realized gains, to paid-in capital.
For tax purposes, at October 31, 2015, the fund had $39,619,000 of ordinary income and $109,724,000 of long-term capital gains available for distribution.
At October 31, 2015, the cost of investment securities for tax purposes was $2,706,518,000. Net unrealized appreciation of investment securities for tax purposes was $264,487,000, consisting of unrealized gains of $502,555,000 on securities that had risen in value since their purchase and $238,068,000 in unrealized losses on securities that had fallen in value since their purchase.
G. During the year ended October 31, 2015, the fund purchased $1,230,741,000 of investment securities and sold $1,060,675,000 of investment securities, other than temporary cash investments.
H. Capital shares issued and redeemed were:
| | |
| | Year Ended October 31, |
| | 2015 | 2014 |
| | Shares | Shares |
| | (000) | (000) |
| Issued | 39,930 | 34,696 |
| Issued in Lieu of Cash Distributions | 11,118 | 4,589 |
| Redeemed | (30,786) | (20,296) |
| Net Increase (Decrease) in Shares Outstanding | 20,262 | 18,989 |
32
International Explorer Fund
I. Certain of the fund’s investments are in companies that are considered to be affiliated companies of the fund because the fund owns more than 5% of the outstanding voting securities of the company or the issuer is another member of The Vanguard Group. Transactions during the period in securities of these companies were as follows:
| | | | | | |
| | | Current Period Transactions | |
| | Oct. 31, | | Proceeds | | | Oct. 31, |
| | 2014 | | from | | Capital Gain | 2015 |
| | Market | Purchases | Securities | | Distributions | Market |
| | Value | at Cost | Sold | Income | Received | Value |
| | ($000) | ($000) | ($000) | ($000) | ($000) | ($000) |
| Bufab Holding AB | NA1 | 4,538 | — | 337 | — | 12,344 |
| Vanguard FTSE All World | | | | | | |
| ex-US Small-Cap ETF | — | 23,030 | — | 113 | — | 23,646 |
| Vanguard Market Liquidity Fund | 151,072 | NA2 | NA 2 | 197 | — | 208,878 |
| Total | 151,072 | | | 647 | — | 244,868 |
| 1 Not applicable—at October 31, 2014, the issuer was not an affiliated company of the fund. |
| 2 Not applicable—purchases and sales are for temporary cash investment purposes. |
J. Management has determined that no material events or transactions occurred subsequent to October 31, 2015, that would require recognition or disclosure in these financial statements.
33
Report of Independent Registered
Public Accounting Firm
To the Board of Trustees of Vanguard Whitehall Funds and the Shareholders of Vanguard International Explorer Fund:
In our opinion, the accompanying statement of net assets and the related statements of operations and of changes in net assets and the financial highlights present fairly, in all material respects, the financial position of Vanguard International Explorer Fund (constituting a separate portfolio of Vanguard Whitehall Funds, hereafter referred to as the “Fund”) at October 31, 2015, the results of its operations for the year then ended, the changes in its net assets for each of the two years in the period then ended, and the financial highlights for each of the five years in the period then ended, in conformity with accounting principles generally accepted in the United States of America. These financial statements and financial highlights (hereafter referred to as “financial statements”) are the responsibility of the Fund’s management. Our responsibility is to express an opinion on these financial statements based on our audits. We conducted our audits of these financial statements in accordance with the standards of the Public Company Accounting Oversight Board (United States). Those standards require that we plan and perform the audit to obtain reasonable assurance about whether the financial statements are free of material misstatement. An audit includes examining, on a test basis, evidence supporting the amounts and disclosures in the financial statements, assessing the accounting principles used and significant estimates made by management, and evaluating the overall financial statement presentation. We believe that our audits, which included confirmation of securities at October 31, 2015 by correspondence with the custodian and brokers, by agreement to the underlying ownership records of the transfer agent and the application of alternative auditing procedures where securities purchased had not been received, provide a reasonable basis for our opinion.
/s/PricewaterhouseCoopers LLP
Philadelphia, Pennsylvania
December 15, 2015
Special 2015 tax information (unaudited) for Vanguard International Explorer Fund
This information for the fiscal year ended October 31, 2015, is included pursuant to provisions of the
Internal Revenue Code.
The fund distributed $141,753,000 as capital gain dividends (20% rate gain distributions) to
shareholders during the fiscal year.
For nonresident alien shareholders, 100% of short-term capital gain dividends distributed by the fund
are qualified short-term capital gains.
The fund distributed $37,829,000 of qualified dividend income to shareholders during the fiscal year.
The fund designates to shareholders foreign source income of $50,129,000 and foreign taxes paid
of $3,775,000. Shareholders will receive more detailed information with their Form 1099-DIV in
January 2016 to determine the calendar-year amounts to be included on their 2015 tax returns.
34
Your Fund’s After-Tax Returns
This table presents returns for your fund both before and after taxes. The after-tax returns are shown in two ways: (1) assuming that an investor owned the fund during the entire period and paid taxes on the fund’s distributions, and (2) assuming that an investor paid taxes on the fund’s distributions and sold all shares at the end of each period.
Calculations are based on the highest individual federal income tax and capital gains tax rates in effect at the times of the distributions and the hypothetical sales. State and local taxes were not considered. After-tax returns reflect any qualified dividend income, using actual prior-year figures and estimates for 2015. (In the example, returns after the sale of fund shares may be higher than those assuming no sale. This occurs when the sale would have produced a capital loss. The calculation assumes that the investor received a tax deduction for the loss.)
Please note that your actual after-tax returns will depend on your tax situation and may differ from those shown. Also note that if you own the fund in a tax-deferred account, such as an individual retirement account or a 401(k) plan, this information does not apply to you. Such accounts are not subject to current taxes.
Finally, keep in mind that a fund’s performance—whether before or after taxes—does not guarantee future results.
| | | |
| Average Annual Total Returns: International Explorer Fund | | | |
| Periods Ended October 31, 2015 | | | |
| | One | Five | Ten |
| | Year | Years | Years |
| Returns Before Taxes | 5.65% | 6.65% | 6.42% |
| Returns After Taxes on Distributions | 3.44 | 5.69 | 5.22 |
| Returns After Taxes on Distributions and Sale of Fund Shares | 4.44 | 5.10 | 5.17 |
35
About Your Fund’s Expenses
As a shareholder of the fund, you incur ongoing costs, which include costs for portfolio management, administrative services, and shareholder reports (like this one), among others. Operating expenses, which are deducted from a fund’s gross income, directly reduce the investment return of the fund.
A fund’s expenses are expressed as a percentage of its average net assets. This figure is known as the expense ratio. The following examples are intended to help you understand the ongoing costs (in dollars) of investing in your fund and to compare these costs with those of other mutual funds. The examples are based on an investment of $1,000 made at the beginning of the period shown and held for the entire period.
The accompanying table illustrates your fund’s costs in two ways:
• Based on actual fund return. This section helps you to estimate the actual expenses that you paid over the period. The ”Ending Account Value“ shown is derived from the fund‘s actual return, and the third column shows the dollar amount that would have been paid by an investor who started with $1,000 in the fund. You may use the information here, together with the amount you invested, to estimate the expenses that you paid over the period.
To do so, simply divide your account value by $1,000 (for example, an $8,600 account value divided by $1,000 = 8.6), then multiply the result by the number given for your fund under the heading ”Expenses Paid During Period.“
• Based on hypothetical 5% yearly return. This section is intended to help you compare your fund‘s costs with those of other mutual funds. It assumes that the fund had a yearly return of 5% before expenses, but that the expense ratio is unchanged. In this case—because the return used is not the fund’s actual return—the results do not apply to your investment. The example is useful in making comparisons because the Securities and Exchange Commission requires all mutual funds to calculate expenses based on a 5% return. You can assess your fund’s costs by comparing this hypothetical example with the hypothetical examples that appear in shareholder reports of other funds.
Note that the expenses shown in the table are meant to highlight and help you compare ongoing costs only and do not reflect transaction costs incurred by the fund for buying and selling securities. Further, the expenses do not include any purchase, redemption, or account service fees described in the fund prospectus. If such fees were applied to your account, your costs would be higher. Your fund does not carry a “sales load.”
The calculations assume no shares were bought or sold during the period. Your actual costs may have been higher or lower, depending on the amount of your investment and the timing of any purchases or redemptions.
You can find more information about the fund’s expenses, including annual expense ratios, in the Financial Statements section of this report. For additional information on operating expenses and other shareholder costs, please refer to your fund’s current prospectus.
36
| | | |
| Six Months Ended October 31, 2015 | | | |
| | Beginning | Ending | Expenses |
| | Account Value | Account Value | Paid During |
| International Explorer Fund | 4/30/2015 | 10/31/2015 | Period |
| Based on Actual Fund Return | $1,000.00 | $971.55 | $2.09 |
| Based on Hypothetical 5% Yearly Return | 1,000.00 | 1,023.09 | 2.14 |
The calculations are based on expenses incurred in the most recent six-month period. The fund’s annualized six-month expense ratio for that
period is 0.42%. The dollar amounts shown as “Expenses Paid” are equal to the annualized expense ratio multiplied by the average account
value over the period, multiplied by the number of days in the most recent six-month period, then divided by the number of days in the most
recent 12-month period (184/365).
37
Trustees Approve Advisory Arrangements
The board of trustees of Vanguard International Explorer Fund has renewed the fund’s investment advisory arrangements with Schroder Investment Management North America Inc. (Schroder Inc.) and Wellington Management Company LLP (Wellington Management), as well as a sub-advisory arrangement with Schroder Investment Management North America Limited (Schroder Ltd.). The board determined that renewing the fund’s advisory arrangements was in the best interests of the fund and its shareholders.
The board based its decision upon an evaluation of each advisor’s investment staff, portfolio management process, and performance. The trustees considered the factors discussed below, among others. However, no single factor determined whether the board approved the arrangements. Rather, it was the totality of the circumstances that drove the board’s decision.
Nature, extent, and quality of services
The board reviewed the quality of the fund’s investment management services over both the short and long term, and took into account the organizational depth and stability of each advisor. The board considered the following:
Schroder. Schroders plc, the parent company of Schroder Inc. and Schroder Ltd. (collectively, Schroder), founded in 1804, specializes in global equity and fixed income management. Schroder employs a bottom-up, fundamental research-driven process to select stocks. Schroder’s International Small-Cap Committee is responsible for the management of its portion of the fund, and leverages Schroder’s extensive network of local analysts across the globe, as it believes that country factors are more important for smaller companies relative to larger companies. Schroder focuses on identifying companies with sustainable competitive advantages, attractive earnings growth, and compelling valuations. Schroder Inc. has advised the fund since its inception in 1996, and its affiliate Schroder Ltd. has advised a portion of the Fund since 2003.
Wellington Management. Wellington Management, founded in 1928, is among the nation’s oldest and most respected institutional investment managers. Wellington Management’s international small-cap team uses a traditional, bottom-up investment process that attempts to discover a company’s intrinsic value. In valuing a company, it believes that the same valuation metric should be applied on an industry-by-industry basis. Although the team’s valuation discipline is essential to the process, its philosophy is not biased toward growth or value as it invests in both extended growth opportunities and neglected or misunderstood companies. The firm has advised a portion of the fund since 2010.
The board concluded that each advisor’s experience, stability, depth, and performance, among other factors, warranted continuation of the advisory arrangements.
Investment performance
The board considered the short- and long-term performance of the fund and each advisor, including any periods of outperformance or underperformance relative to a benchmark index and peer group. The board concluded that the performance was such that the advisory arrangements should continue. Information about the fund’s most recent performance can be found in the Performance Summary section of this report.
38
Cost
The board concluded that the fund’s expense ratio was well below the average expense ratio charged by funds in its peer group and that the fund’s advisory fee rate was also well below its peer-group average. Information about the fund’s expense ratio appears in the About Your Fund’s Expenses section of this report as well as in the Financial Statements section, which also includes information about the fund’s advisory fee rate.
The board did not consider profitability of Schroder or Wellington Management in determining whether to approve the advisory fees, because the firms are independent of Vanguard, and the advisory fee is the result of arm’s-length negotiations.
The benefit of economies of scale
The board concluded that the fund’s shareholders benefit from economies of scale because of breakpoints in the advisory fee schedule for Schroder and Wellington Management. The breakpoints reduce the effective rate of the fee as the fund’s assets managed by each advisor increase.
The board will consider whether to renew the advisory arrangements again after a one-year period.
39
Glossary
Beta. A measure of the magnitude of a fund’s past share-price fluctuations in relation to the ups and downs of a given market index. The index is assigned a beta of 1.00. Compared with a given index, a fund with a beta of 1.20 typically would have seen its share price rise or fall by 12% when the index rose or fell by 10%. For this report, beta is based on returns over the past 36 months for both the fund and the index. Note that a fund’s beta should be reviewed in conjunction with its R-squared (see definition). The lower the R-squared, the less correlation there is between the fund and the index, and the less reliable beta is as an indicator of volatility.
Dividend Yield. Dividend income earned by stocks, expressed as a percentage of the aggregate market value (or of net asset value, for a fund). The yield is determined by dividing the amount of the annual dividends by the aggregate value (or net asset value) at the end of the period. For a fund, the dividend yield is based solely on stock holdings and does not include any income produced by other investments.
Earnings Growth Rate. The average annual rate of growth in earnings over the past five years for the stocks now in a fund.
Equity Exposure. A measure that reflects a fund’s investments in stocks and stock futures. Any holdings in short-term reserves are excluded.
Expense Ratio. A fund’s total annual operating expenses expressed as a percentage of the fund’s average net assets. The expense ratio includes management and administrative expenses, but does not include the transaction costs of buying and selling portfolio securities.
Inception Date. The date on which the assets of a fund (or one of its share classes) are first invested in accordance with the fund’s investment objective. For funds with a subscription period, the inception date is the day after that period ends. Investment performance is measured from the inception date.
Median Market Cap. An indicator of the size of companies in which a fund invests; the midpoint of market capitalization (market price x shares outstanding) of a fund’s stocks, weighted by the proportion of the fund’s assets invested in each stock. Stocks representing half of the fund’s assets have market capitalizations above the median, and the rest are below it.
Price/Book Ratio. The share price of a stock divided by its net worth, or book value, per share. For a fund, the weighted average price/book ratio of the stocks it holds.
Price/Earnings Ratio. The ratio of a stock’s current price to its per-share earnings over the past year. For a fund, the weighted average P/E of the stocks it holds. P/E is an indicator of market expectations about corporate prospects; the higher the P/E, the greater the expectations for a company’s future growth.
R-Squared. A measure of how much of a fund’s past returns can be explained by the returns from the market in general, as measured by a given index. If a fund’s total returns were precisely synchronized with an index’s returns, its R-squared would be 1.00. If the fund’s returns bore no relationship to the index’s returns, its R-squared would be 0. For this report, R-squared is based on returns over the past 36 months for both the fund and the index.
40
Return on Equity. The annual average rate of return generated by a company during the past five years for each dollar of shareholder’s equity (net income divided by shareholder’s equity). For a fund, the weighted average return on equity for the companies whose stocks it holds.
Short-Term Reserves. The percentage of a fund invested in highly liquid, short-term securities that can be readily converted to cash.
Turnover Rate. An indication of the fund’s trading activity. Funds with high turnover rates incur higher transaction costs and may be more likely to distribute capital gains (which may be taxable to investors). The turnover rate excludes in-kind transactions, which have minimal impact on costs.
41
This page intentionally left blank.
This page intentionally left blank.
The People Who Govern Your Fund
The trustees of your mutual fund are there to see that the fund is operated and managed in your best interests since, as a shareholder, you are a part owner of the fund. Your fund’s trustees also serve on the board of directors of The Vanguard Group, Inc., which is owned by the Vanguard funds and provides services to them on an at-cost basis.
A majority of Vanguard’s board members are independent, meaning that they have no affiliation with Vanguard or the funds they oversee, apart from the sizable personal investments they have made as private individuals. The independent board members have distinguished backgrounds in business, academia, and public service. Each of the trustees and executive officers oversees 194 Vanguard funds.
The following table provides information for each trustee and executive officer of the fund. More information about the trustees is in the Statement of Additional Information, which can be obtained, without charge, by contacting Vanguard at 800-662-7447, or online at vanguard.com.
| |
| InterestedTrustee1 | Rajiv L. Gupta |
| | Born 1945. Trustee Since December 2001.2 Principal |
| F. William McNabb III | Occupation(s) During the Past Five Years and Other |
| Born 1957. Trustee Since July 2009. Chairman of | Experience: Chairman and Chief Executive Officer |
| the Board. Principal Occupation(s) During the Past | (retired 2009) and President (2006–2008) of |
| Five Years and Other Experience: Chairman of the | Rohm and Haas Co. (chemicals); Director of Tyco |
| Board of The Vanguard Group, Inc., and of each of | International PLC (diversified manufacturing and |
| the investment companies served by The Vanguard | services), Hewlett-Packard Co. (electronic computer |
| Group, since January 2010; Director of The Vanguard | manufacturing), and Delphi Automotive PLC |
| Group since 2008; Chief Executive Officer and | (automotive components); Senior Advisor at New |
| President of The Vanguard Group, and of each of | Mountain Capital. |
| the investment companies served by The Vanguard | |
| Group, since 2008; Director of Vanguard Marketing | Amy Gutmann |
| Corporation; Managing Director of The Vanguard | Born 1949. Trustee Since June 2006. Principal |
| Group (1995–2008). | Occupation(s) During the Past Five Years and |
| | Other Experience: President of the University of |
| IndependentTrustees | Pennsylvania; Christopher H. Browne Distinguished |
| | Professor of Political Science, School of Arts and |
| Emerson U. Fullwood | Sciences, and Professor of Communication, Annenberg |
| Born 1948. Trustee Since January 2008. Principal | School for Communication, with secondary faculty |
| Occupation(s) During the Past Five Years and | appointments in the Department of Philosophy, School |
| Other Experience: Executive Chief Staff and | of Arts and Sciences, and at the Graduate School of |
| Marketing Officer for North America and Corporate | Education, University of Pennsylvania; Trustee of the |
| Vice President (retired 2008) of Xerox Corporation | National Constitution Center; Chair of the Presidential |
| (document management products and services); | Commission for the Study of Bioethical Issues. |
| Executive in Residence and 2009–2010 Distinguished | |
| Minett Professor at the Rochester Institute of | JoAnn Heffernan Heisen |
| Technology; Director of SPX Corporation (multi-industry | Born 1950. Trustee Since July 1998. Principal |
| manufacturing), the United Way of Rochester, the | Occupation(s) During the Past Five Years and |
| University of Rochester Medical Center, Monroe | Other Experience: Corporate Vice President and |
| Community College Foundation, and North Carolina | Chief Global Diversity Officer (retired 2008) and |
| A&T University. | Member of the Executive Committee (1997–2008) |
| | of Johnson & Johnson (pharmaceuticals/medical |
| | devices/consumer products); Director of Skytop |
| | Lodge Corporation (hotels) and the Robert Wood |
| | Johnson Foundation; Member of the Advisory |
| | Board of the Institute for Women’s Leadership |
| | at Rutgers University. |
| | |
| F. Joseph Loughrey | Executive Officers | |
| Born 1949. Trustee Since October 2009. Principal | | |
| Occupation(s) During the Past Five Years and Other | Glenn Booraem | |
| Experience: President and Chief Operating Officer | Born 1967. Treasurer Since May 2015. Principal |
| (retired 2009) of Cummins Inc. (industrial machinery); | Occupation(s) During the Past Five Years and |
| Chairman of the Board of Hillenbrand, Inc. (specialized | Other Experience: Principal of The Vanguard Group, |
| consumer services), and of Oxfam America; Director | Inc.; Treasurer of each of the investment companies |
| of SKF AB (industrial machinery), Hyster-Yale Materials | served by The Vanguard Group; Controller of each of |
| Handling, Inc. (forklift trucks), the Lumina Foundation | the investment companies served by The Vanguard |
| for Education, and the V Foundation for Cancer | Group (2010–2015); Assistant Controller of each of |
| Research; Member of the Advisory Council for the | the investment companies served by The Vanguard |
| College of Arts and Letters and of the Advisory Board | Group (2001–2010). | |
| to the Kellogg Institute for International Studies, both | | |
| at the University of Notre Dame. | Thomas J. Higgins | |
| Born 1957. Chief Financial Officer Since September |
| Mark Loughridge | 2008. Principal Occupation(s) During the Past Five |
| Born 1953. Trustee Since March 2012. Principal | Years and Other Experience: Principal of The Vanguard |
| Occupation(s) During the Past Five Years and Other | Group, Inc.; Chief Financial Officer of each of the |
| Experience: Senior Vice President and Chief Financial | investment companies served by The Vanguard Group; |
| Officer (retired 2013) at IBM (information technology | Treasurer of each of the investment companies served |
| services); Fiduciary Member of IBM’s Retirement Plan | by The Vanguard Group (1998–2008). |
| Committee (2004–2013); Director of the Dow Chemical | | |
| Company; Member of the Council on Chicago Booth. | Peter Mahoney | |
| Born 1974. Controller Since May 2015. Principal |
| Scott C. Malpass | Occupation(s) During the Past Five Years and |
| Born 1962. Trustee Since March 2012. Principal | Other Experience: Head of Global Fund Accounting |
| Occupation(s) During the Past Five Years and Other | at The Vanguard Group, Inc.; Controller of each of the |
| Experience: Chief Investment Officer and Vice | investment companies served by The Vanguard Group; |
| President at the University of Notre Dame; Assistant | Head of International Fund Services at The Vanguard |
| Professor of Finance at the Mendoza College of | Group (2008–2014). | |
| Business at Notre Dame; Member of the Notre Dame | | |
| 403(b) Investment Committee; Board Member of | Heidi Stam | |
| TIFF Advisory Services, Inc., and Catholic Investment | Born 1956. Secretary Since July 2005. Principal |
| Services, Inc. (investment advisors); Member of | Occupation(s) During the Past Five Years and Other |
| the Investment Advisory Committee of Major | Experience: Managing Director of The Vanguard |
| League Baseball. | Group, Inc.; General Counsel of The Vanguard Group; |
| Secretary of The Vanguard Group and of each of the |
| André F. Perold | investment companies served by The Vanguard Group; |
| Born 1952. Trustee Since December 2004. Principal | Director and Senior Vice President of Vanguard |
| Occupation(s) During the Past Five Years and Other | Marketing Corporation. | |
| Experience: George Gund Professor of Finance and | | |
| Banking, Emeritus at the Harvard Business School | Vanguard Senior ManagementTeam |
| (retired 2011); Chief Investment Officer and Managing | Mortimer J. Buckley | Chris D. McIsaac |
| Partner of HighVista Strategies LLC (private investment | Kathleen C. Gubanich | James M. Norris |
| firm); Director of Rand Merchant Bank; Overseer of | Paul A. Heller | Thomas M. Rampulla |
| the Museum of Fine Arts Boston. | Martha G. King | Glenn W. Reed |
| John T. Marcante | Karin A. Risi |
| Peter F. Volanakis | | |
| Born 1955. Trustee Since July 2009. Principal | | |
| Occupation(s) During the Past Five Years and Other | Chairman Emeritus and Senior Advisor |
| Experience: President and Chief Operating Officer | | |
| (retired 2010) of Corning Incorporated (communications | John J. Brennan | |
| equipment); Trustee of Colby-Sawyer College; | Chairman, 1996–2009 | |
| Member of the Advisory Board of the Norris Cotton | Chief Executive Officer and President, 1996–2008 |
| Cancer Center and of the Advisory Board of the | | |
| Parthenon Group (strategy consulting). | Founder | |
| | John C. Bogle | |
| | Chairman and Chief Executive Officer, 1974–1996 |
1 Mr. McNabb is considered an “interested person,” as defined in the Investment Company Act of 1940, because he is an officer of the Vanguard funds.
2 December 2002 for Vanguard Equity Income Fund, the Vanguard Municipal Bond Funds, and the Vanguard State Tax-Exempt Funds.
|  |
| | P.O. Box 2600 |
| | Valley Forge, PA 19482-2600 |
| |
| |
| |
| Connect with Vanguard® > vanguard.com |
| |
| |
| |
| Fund Information > 800-662-7447 | |
| Direct Investor Account Services > 800-662-2739 | |
| Institutional Investor Services > 800-523-1036 | |
| Text Telephone for People | |
| Who Are Deaf or Hard of Hearing> 800-749-7273 | |
| |
| This material may be used in conjunction | |
| with the offering of shares of any Vanguard | |
| fund only if preceded or accompanied by | |
| the fund’s current prospectus. | |
| |
| All comparative mutual fund data are from Lipper, a | |
| Thomson Reuters Company, or Morningstar, Inc., unless | |
| otherwise noted. | |
| |
| You can obtain a free copy of Vanguard’s proxy voting | |
| guidelines by visiting vanguard.com/proxyreporting or by | |
| calling Vanguard at 800-662-2739. The guidelines are | |
| also available from the SEC’s website, sec.gov. In | |
| addition, you may obtain a free report on how your fund | |
| voted the proxies for securities it owned during the 12 | |
| months ended June 30. To get the report, visit either | |
| vanguard.com/proxyreporting or sec.gov. | |
| |
| You can review and copy information about your fund at | |
| the SEC’s Public Reference Room in Washington, D.C. To | |
| find out more about this public service, call the SEC at | |
| 202-551-8090. Information about your fund is also | |
| available on the SEC’s website, and you can receive | |
| copies of this information, for a fee, by sending a | |
| request in either of two ways: via email addressed to | |
| publicinfo@sec.gov or via regular mail addressed to the | |
| Public Reference Section, Securities and Exchange | |
| Commission, Washington, DC 20549-1520. | |
| |
| | © 2015 The Vanguard Group, Inc. |
| | All rights reserved. |
| | Vanguard Marketing Corporation, Distributor. |
| |
| | Q1260 122015 |

Annual Report | October 31, 2015
Vanguard High Dividend Yield Index Fund
Vanguard’s Principles for Investing Success
We want to give you the best chance of investment success. These principles, grounded in Vanguard’s research and experience, can put you on the right path.
Goals. Create clear, appropriate investment goals.
Balance. Develop a suitable asset allocation using broadly diversified funds. Cost. Minimize cost.
Discipline. Maintain perspective and long-term discipline.
A single theme unites these principles: Focus on the things you can control.
We believe there is no wiser course for any investor.
| |
| Contents | |
| Your Fund’s Total Returns. | 1 |
| Chairman’s Letter. | 2 |
| Fund Profile. | 8 |
| Performance Summary. | 10 |
| Financial Statements. | 12 |
| Your Fund’s After-Tax Returns. | 29 |
| About Your Fund’s Expenses. | 30 |
| Glossary. | 32 |
Please note: The opinions expressed in this report are just that—informed opinions. They should not be considered promises or advice.
Also, please keep in mind that the information and opinions cover the period through the date on the front of this report. Of course, the
risks of investing in your fund are spelled out in the prospectus.
See the Glossary for definitions of investment terms used in this report.
About the cover: Pictured is a sailing block on the Brilliant, a 1932 schooner docked in Mystic, Connecticut. A type of pulley, the
sailing block helps coordinate the setting of the sails. At Vanguard, the intricate coordination of technology and people allows
us to help millions of clients around the world reach their financial goals.
Your Fund’s Total Returns
| |
| Fiscal Year Ended October 31, 2015 | |
| | Total |
| | Returns |
| Vanguard High Dividend Yield Index Fund | |
| Investor Shares | 2.78% |
| ETF Shares | |
| Market Price | 2.90 |
| Net Asset Value | 2.84 |
| FTSE High Dividend Yield Index | 2.91 |
| Equity Income Funds Average | -0.09 |
Equity Income Funds Average: Derived from data provided by Lipper, a Thomson Reuters Company.
The Vanguard ETF® Shares shown are traded on the NYSE Arca exchange and are available only through brokers. The table provides ETF
returns based on both the NYSE Arca market price and the net asset value for a share. U.S. Pat. Nos. 6,879,964; 7,337,138; 7,720,749;
7,925,573; 8,090,646; and 8,417,623.
For the ETF Shares, the market price is determined by the midpoint of the bid-offer spread as of the closing time of the New York Stock
Exchange (generally 4 p.m., Eastern time). The net asset value is also determined as of the NYSE closing time. For more information about
how the ETF Shares' market prices have compared with their net asset value, visit vanguard.com, select your ETF, and then select the Price
and Performance tab. The ETF premium/discount analysis there shows the percentages of days on which the ETF Shares' market price was
above or below the NAV.
Your Fund’s Performance at a Glance
October 31, 2014, Through October 31, 2015
| | | | |
| | | | Distributions Per Share |
| | Starting | Ending | | |
| | Share | Share | Income | Capital |
| | Price | Price | Dividends | Gains |
| Vanguard High Dividend Yield Index Fund | | | | |
| Investor Shares | $26.98 | $26.89 | $0.817 | $0.000 |
| ETF Shares | 68.11 | 67.88 | 2.112 | 0.000 |
1

Chairman’s Letter
Dear Shareholder,
The stock market moved higher over the 12 months ended October 31, 2015, despite some bouts of volatility. Uncertainty about when the Federal Reserve might begin raising interest rates weighed on market sentiment at times, as did the slide in the price of oil and other commodities, twists and turns in Greek debt negotiations, and mounting signs of a marked slowdown in China.
Dividend-paying stocks didn’t quite keep pace with the broad market. Vanguard High Dividend Yield Index Fund closely tracked its target index, however, returning 2.78% for the fiscal year, compared with the 2.91% return of the FTSE High Dividend Yield Index. (All returns and yields cited in this letter are for Investor Shares.) The fund’s results exceeded the average return of its equity income peers (–0.09%).
At the period’s close, the fund’s 30-day SEC yield was 3.09%, compared with the 1.81% yield of the broad stock market, as measured by Vanguard Total Stock Market Index Fund.
Results for the High Dividend Yield Index Fund varied widely by market sector. Technology and consumer goods were the top performers; their gains more than offset a double-digit decline in oil and gas, as well as negative results in telecommunications and basic materials.
2
The U.S. stock market fluctuated on its way to modest returns
The broad U.S. stock market returned more than 4% for the fiscal year. Stocks generally climbed during the first nine months before dropping sharply in August and September amid fears that slower economic growth in China would spread across the globe.
In October, however, stocks rallied as the Fed maintained its historically low short-term interest rates. Corporate earnings, although generally lower than in the past couple of years, mostly exceeded expectations.
The broad international stock market returned about –4% for U.S. investors, as the dollar’s strength weighed on local-market returns. Returns for the developed markets of the Pacific region and Europe were essentially flat despite central bank stimulus to counter sluggish growth and low inflation. Stocks tumbled in emerging markets, where the concerns about China seemed to weigh most heavily.
The search for a safe haven gave bonds a bit of a boost
The broad U.S. taxable bond market, which returned 1.96% over the fiscal year, benefited from investors’ desire for safe-haven assets during periods of stock market volatility. The yield of the 10-year Treasury note ended October at 2.17%, down from 2.31% a year earlier. (Bond prices and yields move in opposite directions.)
| | | |
| Market Barometer | | | |
| |
| | Average Annual Total Returns |
| | Periods Ended October 31, 2015 |
| | One | Three | Five |
| | Year | Years | Years |
| Stocks | | | |
| Russell 1000 Index (Large-caps) | 4.86% | 16.28% | 14.32% |
| Russell 2000 Index (Small-caps) | 0.34 | 13.90 | 12.06 |
| Russell 3000 Index (Broad U.S. market) | 4.49 | 16.09 | 14.14 |
| FTSE All-World ex US Index (International) | -3.83 | 5.20 | 2.99 |
| |
| Bonds | | | |
| Barclays U.S. Aggregate Bond Index (Broad taxable market) | 1.96% | 1.65% | 3.03% |
| Barclays Municipal Bond Index (Broad tax-exempt market) | 2.87 | 2.91 | 4.28 |
| Citigroup Three-Month U.S. Treasury Bill Index | 0.02 | 0.02 | 0.04 |
| |
| CPI | | | |
| Consumer Price Index | 0.17% | 0.93% | 1.69% |
3
International bond markets (as measured by the Barclays Global Aggregate Index ex USD) returned –6.74%, held back by the dollar’s strength. Without this currency effect, international bond returns were positive.
The Fed’s 0%–0.25% target for short-term interest rates continued to constrain returns for money market funds and savings accounts.
Technology stocks shone during the fiscal year
Vanguard High Dividend Yield Index Fund gives investors broad exposure to stocks of U.S. companies that are expected to pay above-average dividends. Not surprisingly, traditionally high-yielding sectors such as utilities and consumer goods are well represented in the fund relative to the broad market. In recent years, however, as many technology companies have grown in size and matured, their stocks have become one of the largest components of the fund. The percentage of fund assets held in technology stocks rose from less than 1% at the close of the fund’s first fiscal year, in 2007, to more than 13% at the close of the latest fiscal year.
The technology sector was also the fund’s best performer for the period under review, returning more than 13%. While results were strong in a number of segments, the biggest contributions came from large-capitalization stocks active in networking equipment, tablets and smartphones, and software.
| | | |
| Expense Ratios | | | |
| Your Fund Compared With Its Peer Group | | | |
| |
| |
| | Investor | ETF | Peer Group |
| | Shares | Shares | Average |
| High Dividend Yield Index Fund | 0.18% | 0.10% | 1.22% |
The fund expense ratios shown are from the prospectus dated February 25, 2015, and represent estimated costs for the current fiscal year.
For the fiscal year ended October 31, 2015, the fund’s expense ratios were 0.16% for Investor Shares and 0.09% for ETF Shares. The
peer-group expense ratio is derived from data provided by Lipper, a Thomson Reuters Company, and captures information through year-end
2014.
Peer group: Equity Income Funds.
4
Consumer goods was another bright spot, returning more than 9% as sales were helped by an improving labor market and a drop in the price of gasoline. The strongest pockets of performance were among food producers, beverage makers, and tobacco companies.
In contrast, the oil and gas sector (–17%) continued to suffer from the slide in prices that began last summer. The oil equipment and services segment fared even worse than oil producers.
Basic materials returned about –6%. While some segments, including gold mining and chemicals, posted positive returns, the slump in commodity prices hurt industrial metals and mining stocks. Telecommunications also produced a negative return.
Over the longer term, your fund has tracked its benchmark index
Vanguard High Dividend Yield Index Fund was launched just about nine years ago. That period covered some wide swings in the stock market, including the precipitous fall in the 2008–2009 financial crisis as well as some heady times before and after that. Through those market ups and downs, the fund has produced an average annual return of 6.44% for Investor Shares, which is in line with the 6.66% return of its expense-free benchmark. These results are a testament to both the indexing skills of the fund’s advisor and the merits of our low-cost structure.
| |
| Total Returns | |
| Inception Through October 31, 2015 | |
| | Average |
| | Annual Return |
| High Dividend Yield Index Fund Investor Shares (Returns since inception: 11/16/2006) | 6.44% |
| FTSE High Dividend Yield Index | 6.66 |
| Equity Income Funds Average | 5.17 |
| Equity Income Funds Average: Derived from data provided by Lipper, a Thomson Reuters Company. |
The figures shown represent past performance, which is not a guarantee of future results. (Current performance may be
lower or higher than the performance data cited. For performance data current to the most recent month-end, visit our
website at vanguard.com/performance.) Note, too, that both investment returns and principal value can fluctuate widely, so
an investor’s shares, when sold, could be worth more or less than their original cost.
5
|
| Staying the course can help you stay closer to your fund’s return |
| |
| When stock markets are highly volatile, as in recent months, it’s tempting to run for cover. |
| But the price of panic can be high. |
| |
| A rough measure of what can be lost from attempts to time the market is the difference |
| between the returns produced by a fund and the returns earned by the fund’s investors. |
| |
| The results shown in your fund’s Performance Summary later in this report are its time- |
| weighted returns—the average annual returns investors would have earned if they had |
| invested a lump sum in the fund at the start of the period and reinvested any distributions |
| they received. Their actual returns, however, depend on whether they subsequently bought |
| or sold any shares. There’s often a gap between this dollar-weighted return for investors and |
| the fund’s time-weighted return, as shown below. |
| |
| Many sensible investment behaviors can contribute to the difference in returns, but industry |
| cash flow data suggest that one important factor is the generally counterproductive effort to |
| buy and sell at the “right” time. Keeping your emotions in check can help narrow the gap. |
| |
| Mutual fund returns and investor returns over the last decade |
| Notes: Data are as of September 30, 2015. The average fund returns and average investor returns are from Morningstar. The average fund |
| returns are the average of the funds’ time-weighted returns in each category. The average investor returns assume that the growth of a |
| fund’s total net assets for a given period is driven by market returns and investor cash flow. To calculate investor return, a fund’s change |
| in assets for the period is discounted by the return of the fund to isolate how much of the asset growth was driven by cash flow. A model, |
| similar to an internal rate-of-return calculation, is then used to calculate a constant growth rate that links the beginning total net assets |
| and periodic cash flows to the ending total net assets. Amounts may not add up exactly because of rounding. |
| Sources: Vanguard and Morningstar, Inc. |
6
Since inception, the fund has also outpaced the average annual return of 5.17% for its peers.
A dose of discipline is crucial when markets become volatile
The developments over the past few months remind us that nobody can control the direction of the markets or reliably predict where they’ll go in the short term. However, investors can control how they react to unstable and turbulent markets.
During periods of market adversity, it’s more important than ever to keep sight of one of Vanguard’s key principles: Maintain perspective and long-term discipline. Whether you’re investing for yourself or on behalf of clients, your success is affected greatly by how you respond—or don’t respond—during turbulent markets. (You can read Vanguard’s Principles for Investing Success at vanguard.com/research.)
As I’ve written in the past, the best course for long-term investors is generally to ignore daily market moves and not make decisions based on emotion. This is also a good time to evaluate your portfolio and make sure your asset allocation is aligned with your time horizon, goals, and risk tolerance.
The markets are unpredictable and often confounding. Keeping your long-term plans clearly in focus can help you weather these periodic storms.
As always, thank you for investing with Vanguard.
Sincerely,

F. William McNabb III
Chairman and Chief Executive Officer
November 17, 2015
7
High Dividend Yield Index Fund
Fund Profile
As of October 31, 2015
| | |
| Share-Class Characteristics | |
| |
| |
| | Investor | ETF |
| | Shares | Shares |
| Ticker Symbol | VHDYX | VYM |
| Expense Ratio1 | 0.18% | 0.10% |
| 30-Day SEC | | |
| Yield | 3.09% | 3.14% |
| | | |
| Portfolio Characteristics | | |
| | | | DJ |
| | | | U.S. |
| | | FTSE High | Total |
| | | Dividend | Market |
| | | Yield | FA |
| | Fund | Index | Index |
| Number of Stocks | 435 | 430 | 3,971 |
| Median Market Cap | $109.9B | $109.9B | $51.0B |
| Price/Earnings Ratio | 19.3x | 19.3x | 21.9x |
| Price/Book Ratio | 2.6x | 2.6x | 2.7x |
| Return on Equity | 18.0% | 18.0% | 17.2% |
| Earnings Growth | | | |
| Rate | 4.0% | 4.0% | 9.9% |
| Dividend Yield | 3.3% | 3.3% | 2.0% |
| Foreign Holdings | 0.0% | 0.0% | 0.0% |
| Turnover Rate | 11% | — | — |
| Short-Term | | | |
| Reserves | 0.0% | — | — |
| | |
| Volatility Measures | | |
| | FTSE High | DJ |
| | Dividend | U.S. Total |
| | Yield | Market |
| | Index | FA Index |
| R-Squared | 1.00 | 0.89 |
| Beta | 1.00 | 0.93 |
| These measures show the degree and timing of the fund’s fluctuations compared with the indexes over 36 months. |
| | |
| Ten Largest Holdings (% of total net assets) |
| Microsoft Corp. | Software | 4.5% |
| Exxon Mobil Corp. | Integrated Oil & Gas | 4.1 |
| General Electric Co. | Diversified Industrials | 3.5 |
| Wells Fargo & Co. | Banks | 3.3 |
| Johnson & Johnson | Pharmaceuticals | 3.3 |
| JPMorgan Chase & Co. | Banks | 2.8 |
| Procter & Gamble Co. | Nondurable | |
| | Household Products | 2.5 |
| Pfizer Inc. | Pharmaceuticals | 2.5 |
| AT&T Inc. | Fixed Line | |
| | Telecommunications | 2.5 |
| Verizon Communications Fixed Line | |
| Inc. | Telecommunications | 2.3 |
| Top Ten | | 31.3% |
| The holdings listed exclude any temporary cash investments and equity index products. |
Investment Focus
1 The expense ratios shown are from the prospectus dated February 25, 2015, and represent estimated costs for the current fiscal year. For the fiscal
year ended October 31, 2015, the expense ratios were 0.16% for Investor Shares and 0.09% for ETF Shares.
8
High Dividend Yield Index Fund
| | | |
| Sector Diversification (% of equity exposure) |
| | | FTSE High | DJ |
| | | Dividend | U.S. Total |
| | | Yield | Market |
| | Fund | Index | FA Index |
| Basic Materials | 3.1% | 3.1% | 2.5% |
| Consumer Goods | 15.2 | 15.3 | 10.2 |
| Consumer Services | 6.2 | 6.1 | 14.2 |
| Financials | 14.3 | 14.3 | 19.2 |
| Health Care | 11.9 | 11.9 | 13.5 |
| Industrials | 12.1 | 12.1 | 12.4 |
| Oil & Gas | 10.9 | 10.9 | 6.5 |
| Technology | 13.5 | 13.5 | 16.4 |
| Telecommunications | 5.1 | 5.1 | 2.1 |
| Utilities | 7.7 | 7.7 | 3.0 |
9
High Dividend Yield Index Fund
Performance Summary
All of the returns in this report represent past performance, which is not a guarantee of future results that may be achieved by the fund. (Current performance may be lower or higher than the performance data cited. For performance data current to the most recent month-end, visit our website at vanguard.com/performance.) Note, too, that both investment returns and principal value can fluctuate widely, so an investor’s shares, when sold, could be worth more or less than their original cost. The returns shown do not reflect taxes that a shareholder would pay on fund distributions or on the sale of fund shares.
Cumulative Performance: November 16, 2006, Through October 31, 2015
Initial Investment of $10,000
| | | | | |
| | | Average Annual Total Returns | |
| | | Periods Ended October 31, 2015 | |
| | | | | Since | Final Value |
| | | One | Five | Inception | of a $10,000 |
| | | Year | Years | (11/16/2006) | Investment |
| | High Dividend Yield Index | | | | |
| | Fund*Investor Shares | 2.78% | 14.37% | 6.44% | $17,485 |
| •••••••• | FTSE High Dividend Yield Index | 2.91 | 14.58 | 6.66 | 17,817 |
| |
| – – – – | Dow Equity Jones Income U.S. Funds Total Average Stock Market | -0.09 | 10.95 | 5.17 | 15,711 |
| | Float Adjusted Index | 4.40 | 14.11 | 6.98 | 18,293 |
| Equity Income Funds Average: Derived from data provided by Lipper, a Thomson Reuters Company. |
| "Since Inception" performance is calculated from the Investor Shares’ inception date for both the fund and its comparative standards. |
| | | | |
| | | | Since | Final Value |
| | One | Five | Inception | of a $10,000 |
| | Year | Years | (11/10/2006) | Investment |
| High Dividend Yield Index Fund | | | | |
| ETF Shares Net Asset Value | 2.84% | 14.48% | 6.64% | $17,810 |
| FTSE High Dividend Yield Index | 2.91 | 14.58 | 6.75 | 17,967 |
| Dow Jones U.S. Total Stock Market Float | | | | |
| Adjusted Index | 4.40 | 14.11 | 7.15 | 18,576 |
| "Since Inception" performance is calculated from the ETF Shares’ inception date for both the fund and its comparative standards. |
See Financial Highlights for dividend and capital gains information.
10
High Dividend Yield Index Fund
Cumulative Returns of ETF Shares: November 10, 2006, Through October 31, 2015
| | | |
| | | | Since |
| | One | Five | Inception |
| | Year | Years | (11/10/2006) |
| High Dividend Yield Index Fund ETF Shares Market | | | |
| Price | 2.90% | 96.62% | 78.19% |
| High Dividend Yield Index Fund ETF Shares Net | | | |
| Asset Value | 2.84 | 96.60 | 78.10 |
| FTSE High Dividend Yield Index | 2.91 | 97.46 | 79.67 |
| "Since Inception" performance is calculated from the ETF Shares’ inception date for both the fund and its comparative standards. |
Fiscal-Year Total Returns (%): November 16, 2006, Through October 31, 2015
Average Annual Total Returns: Periods Ended September 30, 2015
This table presents returns through the latest calendar quarter—rather than through the end of the fiscal period.
Securities and Exchange Commission rules require that we provide this information.
| | | | |
| | Inception | One | Five | Since |
| | Date | Year | Years | Inception |
| Investor Shares | 11/16/2006 | -2.68% | 13.26% | 5.54% |
| ETF Shares | 11/10/2006 | | | |
| Market Price | | -2.67 | 13.36 | 5.75 |
| Net Asset Value | | -2.60 | 13.37 | 5.75 |
11
High Dividend Yield Index Fund
Financial Statements
Statement of Net Assets
As of October 31, 2015
The fund reports a complete list of its holdings in regulatory filings four times in each fiscal year, at the quarter-ends. For the second and fourth fiscal quarters, the lists appear in the fund’s semiannual and annual reports to shareholders. For the first and third fiscal quarters, the fund files the lists with the Securities and Exchange Commission on Form N-Q. Shareholders can look up the fund’s Forms N-Q on the SEC’s website at sec.gov. Forms N-Q may also be reviewed and copied at the SEC’s Public Reference Room (see the back cover of this report for further information).
| | |
| | | Market |
| | | Value• |
| | Shares | ($000) |
| Common Stocks (99.5%)1 | | |
| Basic Materials (3.1%) | | |
| Dow Chemical Co. | 2,090,625 | 108,023 |
| EI du Pont de Nemours | | |
| & Co. | 1,685,544 | 106,864 |
| LyondellBasell Industries | | |
| NV Class A | 728,091 | 67,647 |
| Air Products & | | |
| Chemicals Inc. | 398,702 | 55,412 |
| International Paper Co. | 783,161 | 33,433 |
| Nucor Corp. | 589,007 | 24,915 |
| Freeport-McMoRan Inc. | 1,931,880 | 22,738 |
| RPM International Inc. | 247,197 | 11,299 |
| Avery Dennison Corp. | 169,806 | 11,032 |
| Steel Dynamics Inc. | 424,872 | 7,847 |
| Reliance Steel & | | |
| Aluminum Co. | 127,018 | 7,616 |
| Olin Corp. | 294,958 | 5,657 |
| Compass Minerals | | |
| International Inc. | 62,593 | 5,085 |
| Domtar Corp. | 109,997 | 4,536 |
| Huntsman Corp. | 305,912 | 4,029 |
| Worthington Industries Inc. | 95,800 | 2,941 |
| Commercial Metals Co. | 191,403 | 2,751 |
| Chemours Co. | 337,170 | 2,337 |
| A Schulman Inc. | 54,481 | 1,955 |
| Innophos Holdings Inc. | 36,267 | 1,541 |
| Tronox Ltd. Class A | 122,706 | 762 |
| | | 488,420 |
| Consumer Goods (15.2%) | | |
| Procter & Gamble Co. | 5,057,197 | 386,269 |
| Coca-Cola Co. | 7,688,549 | 325,610 |
| PepsiCo Inc. | 2,710,511 | 276,987 |
| Philip Morris International | | |
| Inc. | 2,906,353 | 256,922 |
| Altria Group Inc. | 3,647,907 | 220,589 |
| Ford Motor Co. | 7,228,316 | 107,051 |
| General Motors Co. | 2,721,176 | 94,996 |
| Kraft Heinz Co. | 1,095,255 | 85,397 |
| | | |
| | Kimberly-Clark Corp. | 677,307 | 81,080 |
| | Reynolds American Inc. | 1,542,347 | 74,526 |
| | General Mills Inc. | 1,109,027 | 64,446 |
| | ConAgra Foods Inc. | 803,314 | 32,574 |
| | Kellogg Co. | 458,305 | 32,320 |
| | Dr Pepper Snapple Group | | |
| | Inc. | 356,757 | 31,883 |
| | Stanley Black & Decker | | |
| | Inc. | 285,157 | 30,221 |
| | Clorox Co. | 244,092 | 29,765 |
| | Genuine Parts Co. | 281,921 | 25,587 |
| | Molson Coors Brewing | | |
| | Co. Class B | 257,472 | 22,683 |
| | Coca-Cola Enterprises Inc. | 426,052 | 21,874 |
| ^ | Autoliv Inc. | 163,695 | 19,846 |
| | Campbell Soup Co. | 337,810 | 17,157 |
| | Hasbro Inc. | 210,396 | 16,165 |
| | Coach Inc. | 509,961 | 15,911 |
| | Mattel Inc. | 629,509 | 15,473 |
| | Ingredion Inc. | 121,672 | 11,566 |
| | Leggett & Platt Inc. | 255,364 | 11,499 |
| | Pinnacle Foods Inc. | 213,594 | 9,415 |
| | Flowers Foods Inc. | 325,143 | 8,779 |
| | Tupperware Brands Corp. | 82,600 | 4,863 |
| | Scotts Miracle-Gro Co. | | |
| | Class A | 65,615 | 4,341 |
| | B&G Foods Inc. | 107,815 | 3,913 |
| | Vector Group Ltd. | 157,437 | 3,818 |
| | Nu Skin Enterprises Inc. | | |
| | Class A | 92,495 | 3,534 |
| | Avon Products Inc. | 804,610 | 3,243 |
| | Steelcase Inc. Class A | 166,664 | 3,235 |
| | Snyder’s-Lance Inc. | 86,191 | 3,063 |
| | Universal Corp. | 41,898 | 2,263 |
| | Schweitzer-Mauduit | | |
| | International Inc. | 53,526 | 2,078 |
| | Knoll Inc. | 79,819 | 1,855 |
| | MDC Holdings Inc. | 67,999 | 1,767 |
| | Briggs & Stratton Corp. | 75,636 | 1,344 |
12
High Dividend Yield Index Fund
| | | |
| | | | Market |
| | | | Value• |
| | | Shares | ($000) |
| | National Presto Industries | | |
| | Inc. | 9,968 | 878 |
| | Superior Industries | | |
| | International Inc. | 42,529 | 837 |
| | Cosan Ltd. | 226,833 | 794 |
| | | | 2,368,417 |
| Consumer Services (6.1%) | | |
| | McDonald’s Corp. | 1,752,320 | 196,698 |
| | Wal-Mart Stores Inc. | 2,982,266 | 170,705 |
| | Time Warner Cable Inc. | 522,619 | 98,984 |
| | Target Corp. | 1,189,129 | 91,777 |
| | Sysco Corp. | 1,093,663 | 45,114 |
| | Carnival Corp. | 775,374 | 41,932 |
| | L Brands Inc. | 406,067 | 38,974 |
| | Las Vegas Sands Corp. | 746,093 | 36,939 |
| | Omnicom Group Inc. | 454,566 | 34,056 |
| | H&R Block Inc. | 438,650 | 16,344 |
| | Kohl’s Corp. | 342,273 | 15,786 |
| | Staples Inc. | 1,190,064 | 15,459 |
| | Darden Restaurants Inc. | 233,967 | 14,480 |
| | Cablevision Systems Corp. | | |
| | Class A | 364,187 | 11,869 |
| | TEGNA Inc. | 419,838 | 11,352 |
| ^ | Wynn Resorts Ltd. | 152,976 | 10,701 |
| | KAR Auction Services Inc. | 260,511 | 10,004 |
| | Six Flags Entertainment | | |
| | Corp. | 176,528 | 9,187 |
| ^ | GameStop Corp. Class A | 199,393 | 9,186 |
| | Cinemark Holdings Inc. | 194,105 | 6,879 |
| ^ | Cracker Barrel Old Country | | |
| | Store Inc. | 41,611 | 5,720 |
| | American Eagle Outfitters | | |
| | Inc. | 339,919 | 5,194 |
| | Time Inc. | 202,801 | 3,768 |
| | Hillenbrand Inc. | 116,184 | 3,447 |
| | Gannett Co. Inc. | 213,852 | 3,383 |
| | International Game | | |
| | Technology plc | 206,390 | 3,348 |
| | Meredith Corp. | 69,989 | 3,291 |
| | Regal Entertainment Group | | |
| | Class A | 150,031 | 2,908 |
| | Abercrombie & Fitch Co. | 129,278 | 2,739 |
| | DineEquity Inc. | 32,106 | 2,679 |
| | Guess? Inc. | 118,407 | 2,492 |
| | SeaWorld Entertainment | | |
| | Inc. | 124,083 | 2,473 |
| | Extended Stay America Inc. | 106,040 | 2,036 |
| | Rent-A-Center Inc. | 97,551 | 1,794 |
| | Bob Evans Farms Inc. | 40,889 | 1,769 |
| | National CineMedia Inc. | 114,637 | 1,628 |
| ^ | Buckle Inc. | 44,660 | 1,583 |
| | Cato Corp. Class A | 41,686 | 1,574 |
| | New Media Investment | | |
| | Group Inc. | 79,350 | 1,278 |
| | Weis Markets Inc. | 23,675 | 974 |
| | |
| Capella Education Co. | 20,779 | 938 |
| ^ Copa Holdings SA Class A | 15,636 | 790 |
| Stage Stores Inc. | 50,924 | 495 |
| Speedway Motorsports Inc. | 26,566 | 491 |
| Harte-Hanks Inc. | 64 | — |
| | | 943,218 |
| Financials (14.2%) | | |
| Wells Fargo & Co. | 9,619,273 | 520,787 |
| JPMorgan Chase & Co. | 6,911,610 | 444,071 |
| PNC Financial Services | | |
| Group Inc. | 963,237 | 86,942 |
| MetLife Inc. | 1,681,774 | 84,728 |
| BlackRock Inc. | 229,712 | 80,852 |
| Prudential Financial Inc. | 842,775 | 69,529 |
| ACE Ltd. | 607,721 | 69,001 |
| Travelers Cos. Inc. | 579,092 | 65,374 |
| CME Group Inc. | 593,967 | 56,112 |
| Marsh & McLennan Cos. | | |
| Inc. | 986,313 | 54,977 |
| BB&T Corp. | 1,449,566 | 53,851 |
| Aflac Inc. | 775,161 | 49,416 |
| T. Rowe Price Group Inc. | 457,652 | 34,608 |
| M&T Bank Corp. | 257,062 | 30,809 |
| Fifth Third Bancorp | 1,506,142 | 28,692 |
| Principal Financial Group | | |
| Inc. | 548,812 | 27,528 |
| Invesco Ltd. | 797,877 | 26,466 |
| Regions Financial Corp. | 2,463,973 | 23,038 |
| Western Union Co. | 960,299 | 18,486 |
| FNF Group | 510,653 | 18,016 |
| Huntington Bancshares | | |
| Inc. | 1,503,833 | 16,497 |
| Cincinnati Financial Corp. | 264,033 | 15,903 |
| Willis Group Holdings plc | 334,272 | 14,912 |
| Arthur J Gallagher & Co. | 324,304 | 14,182 |
| New York Community | | |
| Bancorp Inc. | 786,327 | 12,990 |
| PartnerRe Ltd. | 88,796 | 12,343 |
| Axis Capital Holdings Ltd. | 176,466 | 9,529 |
| PacWest Bancorp | 210,875 | 9,498 |
| People’s United Financial | | |
| Inc. | 576,253 | 9,191 |
| Navient Corp. | 695,986 | 9,180 |
| Lazard Ltd. Class A | 193,138 | 8,946 |
| Old Republic International | | |
| Corp. | 447,069 | 8,065 |
| Eaton Vance Corp. | 213,213 | 7,699 |
| First American Financial | | |
| Corp. | 201,748 | 7,693 |
| Endurance Specialty | | |
| Holdings Ltd. | 113,696 | 7,178 |
| Cullen/Frost Bankers Inc. | 101,788 | 6,966 |
| Hanover Insurance Group | | |
| Inc. | 81,724 | 6,885 |
| Umpqua Holdings Corp. | 409,519 | 6,839 |
13
High Dividend Yield Index Fund
| | |
| | | Market |
| | | Value• |
| | Shares | ($000) |
| First Niagara Financial | | |
| Group Inc. | 633,994 | 6,562 |
| BankUnited Inc. | 174,854 | 6,501 |
| FirstMerit Corp. | 302,566 | 5,685 |
| Validus Holdings Ltd. | 126,331 | 5,596 |
| Janus Capital Group Inc. | 345,832 | 5,371 |
| ProAssurance Corp. | 99,922 | 5,292 |
| Waddell & Reed Financial | | |
| Inc. Class A | 142,980 | 5,282 |
| Federated Investors Inc. | | |
| Class B | 168,349 | 5,173 |
| Bank of Hawaii Corp. | 77,952 | 5,104 |
| IBERIABANK Corp. | 75,183 | 4,558 |
| Fulton Financial Corp. | 328,654 | 4,411 |
| Washington Federal Inc. | 175,610 | 4,380 |
| Valley National Bancorp | 412,331 | 4,329 |
| United Bankshares Inc. | 109,241 | 4,320 |
| FNB Corp. | 309,138 | 4,164 |
| RLI Corp. | 67,898 | 4,132 |
| Hancock Holding Co. | 144,883 | 3,999 |
| Glacier Bancorp Inc. | 139,828 | 3,826 |
| Columbia Banking System | | |
| Inc. | 106,830 | 3,560 |
| Capitol Federal Financial | | |
| Inc. | 259,768 | 3,372 |
| National Penn Bancshares | | |
| Inc. | 256,827 | 3,092 |
| Old National Bancorp | 215,320 | 3,014 |
| CVB Financial Corp. | 166,515 | 2,906 |
| Community Bank System | | |
| Inc. | 68,487 | 2,792 |
| Mercury General Corp. | 50,729 | 2,740 |
| Trustmark Corp. | 112,754 | 2,709 |
| BGC Partners Inc. Class A | 312,656 | 2,704 |
| Horace Mann Educators | | |
| Corp. | 76,302 | 2,613 |
| Artisan Partners Asset | | |
| Management Inc. Class A | 67,976 | 2,600 |
| BOK Financial Corp. | 38,401 | 2,580 |
| Northwest Bancshares Inc. | 189,175 | 2,546 |
| Renasant Corp. | 70,543 | 2,443 |
| Chemical Financial Corp. | 70,723 | 2,400 |
| Kemper Corp. | 66,260 | 2,367 |
| Provident Financial | | |
| Services Inc. | 116,060 | 2,358 |
| BBCN Bancorp Inc. | 138,821 | 2,331 |
| NBT Bancorp Inc. | 81,738 | 2,298 |
| Simmons First National | | |
| Corp. Class A | 44,296 | 2,283 |
| First Financial Bancorp | 112,768 | 2,174 |
| WesBanco Inc. | 65,249 | 2,130 |
| Park National Corp. | 22,755 | 2,064 |
| Independent Bank Corp. | 43,896 | 2,052 |
| Westamerica | | |
| Bancorporation | 43,881 | 1,940 |
| | |
| S&T Bancorp Inc. | 58,754 | 1,873 |
| CNA Financial Corp. | 50,272 | 1,838 |
| Boston Private Financial | | |
| Holdings Inc. | 154,263 | 1,768 |
| American National | | |
| Insurance Co. | 16,006 | 1,653 |
| Safety Insurance Group | | |
| Inc. | 27,994 | 1,622 |
| NRG Yield Inc. | 110,272 | 1,592 |
| Maiden Holdings Ltd. | 101,508 | 1,578 |
| Brookline Bancorp Inc. | 131,797 | 1,496 |
| United Fire Group Inc. | 38,641 | 1,437 |
| First Commonwealth | | |
| Financial Corp. | 149,456 | 1,373 |
| Greenhill & Co. Inc. | 51,938 | 1,341 |
| Oritani Financial Corp. | 82,421 | 1,312 |
| FBL Financial Group Inc. | | |
| Class A | 20,706 | 1,302 |
| City Holding Co. | 26,994 | 1,291 |
| Sandy Spring Bancorp Inc. | 45,476 | 1,251 |
| Cohen & Steers Inc. | 36,189 | 1,107 |
| Tompkins Financial Corp. | 19,847 | 1,077 |
| Flushing Financial Corp. | 51,133 | 1,076 |
| Washington Trust | | |
| Bancorp Inc. | 27,543 | 1,069 |
| TrustCo Bank Corp. NY | 167,086 | 1,041 |
| 1st Source Corp. | 30,300 | 962 |
| Community Trust | | |
| Bancorp Inc. | 27,199 | 938 |
| Dime Community | | |
| Bancshares Inc. | 53,862 | 934 |
| BancFirst Corp. | 14,713 | 907 |
| NRG Yield Inc. Class A | 63,715 | 875 |
| Stock Yards Bancorp Inc. | 23,185 | 874 |
| First Financial Corp. | 19,163 | 657 |
| OFG Bancorp | 67,673 | 623 |
| Republic Bancorp Inc. | | |
| Class A | 19,196 | 488 |
| Baldwin & Lyons Inc. | 8 | — |
| | | 2,215,887 |
| Health Care (11.8%) | | |
| Johnson & Johnson | 5,109,350 | 516,198 |
| Pfizer Inc. | 11,402,764 | 385,641 |
| Merck & Co. Inc. | 5,240,334 | 286,437 |
| Bristol-Myers Squibb Co. | 3,102,372 | 204,601 |
| AbbVie Inc. | 3,201,708 | 190,662 |
| Eli Lilly & Co. | 1,850,062 | 150,910 |
| Baxter International Inc. | 1,008,318 | 37,701 |
| Baxalta Inc. | 1,008,353 | 34,748 |
| Quest Diagnostics Inc. | 267,156 | 18,153 |
| Healthcare Services | | |
| Group Inc. | 132,809 | 4,948 |
| Owens & Minor Inc. | 110,713 | 3,969 |
| Kindred Healthcare Inc. | 155,723 | 2,087 |
| Meridian Bioscience Inc. | 77,605 | 1,475 |
14
High Dividend Yield Index Fund
| | | |
| | | | Market |
| | | | Value• |
| | | Shares | ($000) |
| ^ | Theravance Inc. | 161,847 | 1,421 |
| ^ | PDL BioPharma Inc. | 304,388 | 1,394 |
| | | | 1,840,345 |
| Industrials (12.1%) | | |
| ^ | General Electric Co. | 18,666,983 | 539,849 |
| | 3M Co. | 1,162,319 | 182,728 |
| | Boeing Co. | 1,150,421 | 170,343 |
| | United Parcel Service Inc. | | |
| | Class B | 1,299,471 | 133,872 |
| | Lockheed Martin Corp. | 577,670 | 126,989 |
| | Caterpillar Inc. | 1,126,487 | 82,222 |
| | Automatic Data | | |
| | Processing Inc. | 873,435 | 75,980 |
| | Raytheon Co. | 564,728 | 66,299 |
| | Emerson Electric Co. | 1,222,614 | 57,744 |
| | Eaton Corp. plc | 868,914 | 48,581 |
| | Deere & Co. | 584,067 | 45,557 |
| | Waste Management Inc. | 841,348 | 45,231 |
| | Norfolk Southern Corp. | 560,671 | 44,871 |
| | PACCAR Inc. | 657,761 | 34,631 |
| | Paychex Inc. | 608,635 | 31,393 |
| | Republic Services Inc. | | |
| | Class A | 535,806 | 23,436 |
| | Fastenal Co. | 496,539 | 19,445 |
| | Xerox Corp. | 1,987,834 | 18,666 |
| | CH Robinson Worldwide | | |
| | Inc. | 263,752 | 18,299 |
| | Packaging Corp. of | | |
| | America | 183,095 | 12,533 |
| ^ | ADT Corp. | 318,288 | 10,516 |
| | Bemis Co. Inc. | 181,354 | 8,302 |
| | Sonoco Products Co. | 174,150 | 7,434 |
| | MDU Resources Group | | |
| | Inc. | 360,139 | 6,792 |
| | RR Donnelley & Sons Co. | 386,225 | 6,516 |
| | MSC Industrial Direct Co. | | |
| | Inc. Class A | 90,271 | 5,666 |
| | National Instruments Corp. | 185,076 | 5,639 |
| | Timken Co. | 128,301 | 4,054 |
| | Covanta Holding Corp. | 200,297 | 3,357 |
| | GATX Corp. | 66,776 | 3,118 |
| | Scorpio Tankers Inc. | 322,887 | 2,945 |
| | ABM Industries Inc. | 100,704 | 2,860 |
| | Aircastle Ltd. | 124,801 | 2,828 |
| | MSA Safety Inc. | 58,009 | 2,522 |
| | Teekay Corp. | 78,015 | 2,507 |
| | Applied Industrial | | |
| | Technologies Inc. | 60,317 | 2,492 |
| ^ | Nordic American Tankers | | |
| | Ltd. | 157,178 | 2,402 |
| | Ship Finance International | | |
| | Ltd. | 109,468 | 1,871 |
| | Brady Corp. Class A | 79,971 | 1,819 |
| | Otter Tail Corp. | 60,820 | 1,669 |
| | Harsco Corp. | 149,094 | 1,600 |
| | | |
| | Greif Inc. Class A | 47,661 | 1,562 |
| | Seaspan Corp. Class A | 92,887 | 1,514 |
| | General Cable Corp. | 90,636 | 1,395 |
| | ManTech International | | |
| | Corp. Class A | 46,826 | 1,353 |
| | AVX Corp. | 97,290 | 1,313 |
| | Raven Industries Inc. | 70,694 | 1,287 |
| | McGrath RentCorp | 39,309 | 1,181 |
| | TAL International Group | | |
| | Inc. | 61,587 | 1,045 |
| | H&E Equipment Services | | |
| | Inc. | 51,622 | 997 |
| | American Railcar | | |
| | Industries Inc. | 17,114 | 988 |
| | GasLog Ltd. | 74,826 | 866 |
| | Schnitzer Steel Industries | | |
| | Inc. | 49,321 | 832 |
| | Daktronics Inc. | 84,061 | 815 |
| | Textainer Group Holdings | | |
| | Ltd. | 39,240 | 768 |
| | Myers Industries Inc. | 43,089 | 673 |
| | Acacia Research Corp. | 97,488 | 649 |
| | Powell Industries Inc. | 17,204 | 573 |
| ^ | Navios Maritime Holdings | | |
| | Inc. | 144,028 | 304 |
| | American Science & | | |
| | Engineering Inc. | 16 | 1 |
| | | | 1,883,694 |
| Oil & Gas (10.9%) | | |
| | Exxon Mobil Corp. | 7,757,329 | 641,841 |
| | Chevron Corp. | 3,517,281 | 319,651 |
| | ConocoPhillips | 2,284,330 | 121,869 |
| | Occidental Petroleum | | |
| | Corp. | 1,421,482 | 105,957 |
| | Kinder Morgan Inc. | 3,466,476 | 94,808 |
| | Phillips 66 | 1,007,770 | 89,742 |
| | Valero Energy Corp. | 924,984 | 60,975 |
| | Williams Cos. Inc. | 1,390,592 | 54,845 |
| | Spectra Energy Corp. | 1,238,409 | 35,381 |
| | National Oilwell Varco Inc. | 714,292 | 26,886 |
| | Marathon Oil Corp. | 1,257,351 | 23,110 |
| | HollyFrontier Corp. | 350,668 | 17,172 |
| | Columbia Pipeline Group | | |
| | Inc. | 585,556 | 12,162 |
| | Helmerich & Payne Inc. | 189,986 | 10,691 |
| | OGE Energy Corp. | 370,500 | 10,563 |
| | Murphy Oil Corp. | 302,181 | 8,591 |
| | Ensco plc Class A | 433,834 | 7,215 |
| | PBF Energy Inc. Class A | 178,720 | 6,076 |
| ^ | Noble Corp. plc | 449,624 | 6,056 |
| | Targa Resources Corp. | 94,915 | 5,424 |
| | Western Refining Inc. | 122,527 | 5,100 |
| | Golar LNG Ltd. | 171,608 | 4,978 |
| | Patterson-UTI Energy Inc. | 269,154 | 4,008 |
| | SemGroup Corp. Class A | 77,920 | 3,549 |
15
High Dividend Yield Index Fund
| | | |
| | | | Market |
| | | | Value• |
| | | Shares | ($000) |
| | Delek US Holdings Inc. | 98,281 | 2,673 |
| | Pattern Energy Group Inc. | | |
| | Class A | 103,614 | 2,424 |
| | Denbury Resources Inc. | 665,611 | 2,356 |
| | Atwood Oceanics Inc. | 120,416 | 1,993 |
| | CVR Energy Inc. | 32,513 | 1,446 |
| | RPC Inc. | 117,529 | 1,296 |
| | Frank’s International NV | 60,019 | 1,030 |
| | Tidewater Inc. | 78,385 | 968 |
| | CARBO Ceramics Inc. | 37,248 | 653 |
| | Ocean Rig UDW Inc. | 139,715 | 299 |
| ^ | W&T Offshore Inc. | 57,630 | 188 |
| | | | 1,691,976 |
| Other (0.0%)2 | | |
| * | Safeway Inc. CVR | | |
| | (Casa Ley) | | |
| | Exp. 01/30/2018 | 364 | — |
| * | Safeway Inc. CVR | | |
| | (PDC) Exp. 01/30/2017 | 364 | — |
| |
| Technology (13.4%) | | |
| | Microsoft Corp. | 13,392,188 | 704,965 |
| | Intel Corp. | 8,811,539 | 298,359 |
| | Cisco Systems Inc. | 9,462,189 | 272,984 |
| | International Business | | |
| | Machines Corp. | 1,832,074 | 256,637 |
| | QUALCOMM Inc. | 2,923,170 | 173,695 |
| | Texas Instruments Inc. | 1,909,648 | 108,315 |
| | Analog Devices Inc. | 583,140 | 35,058 |
| | Symantec Corp. | 1,268,974 | 26,141 |
| | Xilinx Inc. | 480,959 | 22,903 |
| | Maxim Integrated | | |
| | Products Inc. | 529,830 | 21,712 |
| | Seagate Technology plc | 539,247 | 20,524 |
| | Linear Technology Corp. | 443,618 | 19,706 |
| | KLA-Tencor Corp. | 293,231 | 19,682 |
| | Microchip Technology Inc. | 390,706 | 18,867 |
| | Harris Corp. | 230,138 | 18,211 |
| | CA Inc. | 617,671 | 17,116 |
| | Pitney Bowes Inc. | 376,202 | 7,769 |
| | Garmin Ltd. | 200,840 | 7,124 |
| | Cypress Semiconductor | | |
| | Corp. | 616,790 | 6,501 |
| | Leidos Holdings Inc. | 114,407 | 6,014 |
| | Diebold Inc. | 120,137 | 4,429 |
| | Lexmark International Inc. | | |
| | Class A | 114,290 | 3,713 |
| | Science Applications | | |
| | International Corp. | 70,558 | 3,236 |
| | Intersil Corp. Class A | 202,732 | 2,747 |
| | West Corp. | 110,288 | 2,626 |
| | Cogent Communications | | |
| | Holdings Inc. | 80,457 | 2,472 |
| | Brooks Automation Inc. | 117,147 | 1,293 |
| | Quality Systems Inc. | 83,004 | 1,166 |
| | |
| Computer Programs & | | |
| Systems Inc. | 20,729 | 788 |
| Epiq Systems Inc. | 56,646 | 782 |
| Comtech | | |
| Telecommunications Corp. | 31,389 | 758 |
| | | 2,086,293 |
| Telecommunications (5.0%) | | |
| AT&T Inc. | 11,496,415 | 385,245 |
| Verizon Communications | | |
| Inc. | 7,590,885 | 355,861 |
| CenturyLink Inc. | 1,048,341 | 29,574 |
| Frontier Communications | | |
| Corp. | 2,174,701 | 11,178 |
| Consolidated | | |
| Communications | | |
| Holdings Inc. | 93,409 | 2,064 |
| EarthLink Holdings Corp. | 155,980 | 1,333 |
| Windstream Holdings Inc. | 193,979 | 1,263 |
| | | 786,518 |
| Utilities (7.7%) | | |
| Duke Energy Corp. | 1,286,723 | 91,962 |
| NextEra Energy Inc. | 841,275 | 86,365 |
| Dominion Resources Inc. | 1,101,932 | 78,711 |
| Southern Co. | 1,690,083 | 76,223 |
| American Electric Power | | |
| Co. Inc. | 905,958 | 51,323 |
| PG&E Corp. | 910,427 | 48,617 |
| Sempra Energy | 457,614 | 46,864 |
| Exelon Corp. | 1,593,381 | 44,487 |
| PPL Corp. | 1,236,925 | 42,550 |
| Public Service Enterprise | | |
| Group Inc. | 946,616 | 39,086 |
| Edison International | 606,192 | 36,687 |
| Consolidated Edison Inc. | 540,848 | 35,561 |
| Xcel Energy Inc. | 940,545 | 33,512 |
| WEC Energy Group Inc. | 591,456 | 30,495 |
| Eversource Energy | 588,348 | 29,970 |
| DTE Energy Co. | 333,739 | 27,230 |
| FirstEnergy Corp. | 785,618 | 24,511 |
| Entergy Corp. | 335,650 | 22,878 |
| Ameren Corp. | 449,606 | 19,639 |
| American Water Works | | |
| Co. Inc. | 332,935 | 19,097 |
| CMS Energy Corp. | 514,182 | 18,547 |
| CenterPoint Energy Inc. | 794,801 | 14,744 |
| SCANA Corp. | 239,263 | 14,169 |
| AES Corp. | 1,269,430 | 13,900 |
| ONEOK Inc. | 386,648 | 13,115 |
| Pinnacle West Capital | | |
| Corp. | 205,642 | 13,060 |
| AGL Resources Inc. | 208,528 | 13,033 |
| Pepco Holdings Inc. | 466,990 | 12,436 |
| Alliant Energy Corp. | 209,945 | 12,391 |
| Atmos Energy Corp. | 188,573 | 11,880 |
16
High Dividend Yield Index Fund
| | |
| | | Market |
| | | Value• |
| | Shares | ($000) |
| UGI Corp. | 321,458 | 11,788 |
| TECO Energy Inc. | 434,029 | 11,719 |
| NiSource Inc. | 585,584 | 11,220 |
| Westar Energy Inc. Class A | 262,515 | 10,422 |
| Piedmont Natural Gas Co. | | |
| Inc. | 146,208 | 8,379 |
| Aqua America Inc. | 269,747 | 7,715 |
| Great Plains Energy Inc. | 270,624 | 7,442 |
| Vectren Corp. | 151,995 | 6,911 |
| Questar Corp. | 326,575 | 6,744 |
| IDACORP Inc. | 92,850 | 6,207 |
| Portland General Electric | | |
| Co. | 165,048 | 6,120 |
| Cleco Corp. | 112,313 | 5,953 |
| WGL Holdings Inc. | 92,466 | 5,754 |
| Hawaiian Electric | | |
| Industries Inc. | 190,669 | 5,579 |
| Southwest Gas Corp. | 87,093 | 5,353 |
| UIL Holdings Corp. | 103,031 | 5,254 |
| New Jersey Resources | | |
| Corp. | 159,197 | 5,043 |
| ONE Gas Inc. | 97,827 | 4,778 |
| NorthWestern Corp. | 87,382 | 4,735 |
| Laclede Group Inc. | 75,097 | 4,398 |
| ALLETE Inc. | 84,686 | 4,252 |
| PNM Resources Inc. | 148,094 | 4,164 |
| Avista Corp. | 115,737 | 3,918 |
| Black Hills Corp. | 82,625 | 3,783 |
| South Jersey Industries Inc. | 127,392 | 3,377 |
| El Paso Electric Co. | 74,409 | 2,877 |
| American States Water Co. | 69,941 | 2,850 |
| MGE Energy Inc. | 63,654 | 2,627 |
| Northwest Natural Gas Co. | 50,290 | 2,402 |
| California Water Service | | |
| Group | 87,579 | 1,958 |
| Empire District Electric Co. | 80,801 | 1,822 |
| Abengoa Yield plc | 89,688 | 1,662 |
| * Talen Energy Corp. | 119,186 | 1,035 |
| SJW Corp. | 29,036 | 921 |
| | | 1,202,205 |
| Total Common Stocks | | |
| (Cost $13,461,284) | | 15,506,973 |
| | | |
| Temporary Cash Investments (0.7%)1 | |
| Money Market Fund (0.7%) | | |
| 3,4 | Vanguard Market | | |
| | Liquidity Fund, 0.207% 99,986,319 | 99,986 |
| |
| | | Face | |
| | | Amount | |
| | | ($000) | |
| U.S. Government and Agency Obligations (0.0%) |
| 5,6 | Federal Home Loan Bank | | |
| | Discount Notes, 0.150%, | | |
| | 11/13/15 | 2,000 | 2,000 |
| 5,6 | Federal Home Loan Bank | | |
| | Discount Notes, 0.182%, | | |
| | 11/25/15 | 500 | 500 |
| 5,6 | Federal Home Loan Bank | | |
| | Discount Notes, 0.145%, | | |
| | 12/28/15 | 4,000 | 3,999 |
| | | | 6,499 |
| Total Temporary Cash Investments | |
| (Cost $106,485) | | 106,485 |
| Total Investments (100.2%) | | |
| (Cost $13,567,769) | | 15,613,458 |
| |
| | | | Amount |
| | | | ($000) |
| Other Assets and Liabilities (-0.2%) | |
| Other Assets | | |
| Investment in Vanguard | | 1,321 |
| Receivables for Accrued Income | | 27,610 |
| Receivables for Capital Shares Issued | 3,284 |
| Other Assets | | 3,296 |
| Total Other Assets | | 35,511 |
| Liabilities | | |
| Payables for Investment Securities | |
| Purchased | | (9,350) |
| Collateral for Securities on Loan | | (49,765) |
| Payables for Capital Shares Redeemed | (2,166) |
| Payables to Vanguard | | (5,608) |
| Other Liabilities | | (390) |
| Total Liabilities | | (67,279) |
| Net Assets (100%) | | 15,581,690 |
17
High Dividend Yield Index Fund
| |
| At October 31, 2015, net assets consisted of: |
| | Amount |
| | ($000) |
| Paid-in Capital | 13,586,160 |
| Undistributed Net Investment Income | 34,148 |
| Accumulated Net Realized Losses | (88,781) |
| Unrealized Appreciation (Depreciation) | |
| Investment Securities | 2,045,689 |
| Futures Contracts | 4,474 |
| Net Assets | 15,581,690 |
| |
| |
| Investor Shares—Net Assets | |
| Applicable to 162,446,969 outstanding | |
| $.001 par value shares of beneficial | |
| interest (unlimited authorization) | 4,367,737 |
| Net Asset Value Per Share— | |
| Investor Shares | $26.89 |
| |
| |
| ETF Shares—Net Assets | |
| Applicable to 165,197,120 outstanding | |
| $.001 par value shares of beneficial | |
| interest (unlimited authorization) | 11,213,953 |
| Net Asset Value Per Share— | |
| ETF Shares | $67.88 |
• See Note A in Notes to Financial Statements.
^ Includes partial security positions on loan to broker-dealers. The total value of securities on loan is $48,307,000.
* Non-income-producing security.
1 The fund invests a portion of its cash reserves in equity markets through the use of index futures contracts. After giving effect to futures
investments, the fund’s effective common stock and temporary cash investment positions represent 100.0% and 0.2%, respectively,
of net assets.
2 “Other” represents securities that are not classified by the fund’s benchmark index.
3 Affiliated money market fund available only to Vanguard funds and certain trusts and accounts managed by Vanguard. Rate shown is the
7-day yield.
4 Includes $49,765,000 of collateral received for securities on loan.
5 The issuer operates under a congressional charter; its securities are generally neither guaranteed by the U.S. Treasury nor backed by the full
faith and credit of the U.S. government.
6 Securities with a value of $3,800,000 have been segregated as initial margin for open futures contracts.
See accompanying Notes, which are an integral part of the Financial Statements.
18
High Dividend Yield Index Fund
Statement of Operations
| |
| | Year Ended |
| | October 31, 2015 |
| | ($000) |
| Investment Income | |
| Income | |
| Dividends | 487,551 |
| Interest1 | 63 |
| Securities Lending | 495 |
| Total Income | 488,109 |
| Expenses | |
| The Vanguard Group—Note B | |
| Investment Advisory Services | 1,937 |
| Management and Administrative—Investor Shares | 5,403 |
| Management and Administrative—ETF Shares | 6,488 |
| Marketing and Distribution—Investor Shares | 751 |
| Marketing and Distribution—ETF Shares | 1,279 |
| Custodian Fees | 377 |
| Auditing Fees | 34 |
| Shareholders’ Reports—Investor Shares | 33 |
| Shareholders’ Reports—ETF Shares | 264 |
| Trustees’ Fees and Expenses | 10 |
| Total Expenses | 16,576 |
| Net Investment Income | 471,533 |
| Realized Net Gain (Loss) | |
| Investment Securities Sold | 704,918 |
| Futures Contracts | 4,105 |
| Realized Net Gain (Loss) | 709,023 |
| Change in Unrealized Appreciation (Depreciation) | |
| Investment Securities | (762,297) |
| Futures Contracts | 3,717 |
| Change in Unrealized Appreciation (Depreciation) | (758,580) |
| Net Increase (Decrease) in Net Assets Resulting from Operations | 421,976 |
| 1 Interest income from an affiliated company of the fund was $58,000. |
See accompanying Notes, which are an integral part of the Financial Statements.
19
|
| High Dividend Yield Index Fund |
Statement of Changes in Net Assets
| | |
| | Year Ended October 31, |
| | 2015 | 2014 |
| | ($000) | ($000) |
| Increase (Decrease) in Net Assets | | |
| Operations | | |
| Net Investment Income | 471,533 | 341,438 |
| Realized Net Gain (Loss) | 709,023 | 338,215 |
| Change in Unrealized Appreciation (Depreciation) | (758,580) | 1,092,881 |
| Net Increase (Decrease) in Net Assets Resulting from Operations | 421,976 | 1,772,534 |
| Distributions | | |
| Net Investment Income | | |
| Investor Shares | (131,007) | (98,372) |
| ETF Shares | (338,220) | (235,932) |
| Realized Capital Gain | | |
| Investor Shares | — | — |
| ETF Shares | — | — |
| Total Distributions | (469,227) | (334,304) |
| Capital Share Transactions | | |
| Investor Shares | 316,638 | 614,733 |
| ETF Shares | 1,464,202 | 1,858,114 |
| Net Increase (Decrease) from Capital Share Transactions | 1,780,840 | 2,472,847 |
| Total Increase (Decrease) | 1,733,589 | 3,911,077 |
| Net Assets | | |
| Beginning of Period | 13,848,101 | 9,937,024 |
| End of Period1 | 15,581,690 | 13,848,101 |
| 1 Net Assets—End of Period includes undistributed (overdistributed) net investment income of $34,148,000 and $31,793,000. |
See accompanying Notes, which are an integral part of the Financial Statements.
20
High Dividend Yield Index Fund
Financial Highlights
| | | | | |
| Investor Shares | | | | | |
| |
| For a Share Outstanding | Year Ended October 31, |
| Throughout Each Period | 2015 | 2014 | 2013 | 2012 | 2011 |
| Net Asset Value, Beginning of Period | $26.98 | $23.83 | $19.76 | $17.30 | $15.94 |
| Investment Operations | | | | | |
| Net Investment Income | . 815 | .727 | .667 | .579 | .489 |
| Net Realized and Unrealized Gain (Loss) | | | | | |
| on Investments | (.088) | 3.147 | 4.063 | 2.446 | 1.355 |
| Total from Investment Operations | .727 | 3.874 | 4.730 | 3.025 | 1.844 |
| Distributions | | | | | |
| Dividends from Net Investment Income | (.817) | (.724) | (. 660) | (. 565) | (. 484) |
| Distributions from Realized Capital Gains | — | — | — | — | — |
| Total Distributions | (.817) | (.724) | (. 660) | (. 565) | (. 484) |
| Net Asset Value, End of Period | $26.89 | $26.98 | $23.83 | $19.76 | $17.30 |
| |
| Total Return1 | 2.78% | 16.48% | 24.35% | 17.69% | 11.70% |
| |
| Ratios/Supplemental Data | | | | | |
| Net Assets, End of Period (Millions) | $4,368 | $4,066 | $3,019 | $1,596 | $761 |
| Ratio of Total Expenses to Average Net Assets | 0.16% | 0.18% | 0.19% | 0.20% | 0.25% |
| Ratio of Net Investment Income to | | | | | |
| Average Net Assets | 3.06% | 2.92% | 3.10% | 3.22% | 3.04% |
| Portfolio Turnover Rate2 | 11% | 12% | 13% | 11% | 16% |
| 1 Total returns do not include account service fees that may have applied in the periods shown. Fund prospectuses provide information about any applicable account service fees. |
| 2 Excludes the value of portfolio securities received or delivered as a result of in-kind purchases or redemptions of the fund’s capital shares, including ETF Creation Units. |
See accompanying Notes, which are an integral part of the Financial Statements.
21
High Dividend Yield Index Fund
Financial Highlights
| | | | | |
| ETF Shares | | | | | |
| |
| For a Share Outstanding | Year Ended October 31, |
| Throughout Each Period | 2015 | 2014 | 2013 | 2012 | 2011 |
| Net Asset Value, Beginning of Period | $68.11 | $60.16 | $49.89 | $43.68 | $40.22 |
| Investment Operations | | | | | |
| Net Investment Income | 2.104 | 1.885 | 1.732 | 1.506 | 1.283 |
| Net Realized and Unrealized Gain (Loss) | | | | | |
| on Investments | (.222) | 7.943 | 10.247 | 6.180 | 3.442 |
| Total from Investment Operations | 1.882 | 9.828 | 11.979 | 7.686 | 4.725 |
| Distributions | | | | | |
| Dividends from Net Investment Income | (2.112) | (1.878) | (1.709) | (1.476) | (1.265) |
| Distributions from Realized Capital Gains | — | — | — | — | — |
| Total Distributions | (2.112) | (1.878) | (1.709) | (1.476) | (1.265) |
| Net Asset Value, End of Period | $67.88 | $68.11 | $60.16 | $49.89 | $43.68 |
| |
| Total Return | 2.84% | 16.56% | 24.43% | 17.80% | 11.88% |
| |
| Ratios/Supplemental Data | | | | | |
| Net Assets, End of Period (Millions) | $11,214 | $9,782 | $6,918 | $4,203 | $1,984 |
| Ratio of Total Expenses to Average Net Assets | 0.09% | 0.10% | 0.10% | 0.10% | 0.13% |
| Ratio of Net Investment Income to | | | | | |
| Average Net Assets | 3.13% | 3.00% | 3.19% | 3.32% | 3.16% |
| Portfolio Turnover Rate1 | 11% | 12% | 13% | 11% | 16% |
| 1 Excludes the value of portfolio securities received or delivered as a result of in-kind purchases or redemptions of the fund’s capital shares, including ETF Creation Units. |
See accompanying Notes, which are an integral part of the Financial Statements.
22
High Dividend Yield Index Fund
Notes to Financial Statements
Vanguard High Dividend Yield Index Fund is registered under the Investment Company Act of 1940 as an open-end investment company, or mutual fund. The fund offers two classes of shares: Investor and ETF Shares. Investor Shares are available to any investor who meets the fund’s minimum purchase requirements. ETF Shares are listed for trading on NYSE Arca; they can be purchased and sold through a broker.
A. The following significant accounting policies conform to generally accepted accounting principles for U.S. investment companies. The fund consistently follows such policies in preparing its financial statements.
1. Security Valuation: Securities are valued as of the close of trading on the New York Stock Exchange (generally 4 p.m., Eastern time) on the valuation date. Equity securities are valued at the latest quoted sales prices or official closing prices taken from the primary market in which each security trades; such securities not traded on the valuation date are valued at the mean of the latest quoted bid and asked prices. Securities for which market quotations are not readily available, or whose values have been materially affected by events occurring before the fund’s pricing time but after the close of the securities’ primary markets, are valued by methods deemed by the board of trustees to represent fair value. Investments in Vanguard Market Liquidity Fund are valued at that fund’s net asset value. Temporary cash investments acquired over 60 days to maturity are valued using the latest bid prices or using valuations based on a matrix system (which considers such factors as security prices, yields, maturities, and ratings), both as furnished by independent pricing services. Other temporary cash investments are valued at amortized cost, which approximates market value.
2. Futures Contracts: The fund uses index futures contracts to a limited extent, with the objectives of maintaining full exposure to the stock market, enhancing returns, maintaining liquidity, and minimizing transaction costs. The fund may purchase futures contracts to immediately invest incoming cash in the market, or sell futures in response to cash outflows, thereby simulating a fully invested position in the underlying index while maintaining a cash balance for liquidity. The fund may seek to enhance returns by using futures contracts instead of the underlying securities when futures are believed to be priced more attractively than the underlying securities. The primary risks associated with the use of futures contracts are imperfect correlation between changes in market values of stocks held by the fund and the prices of futures contracts, and the possibility of an illiquid market. Counterparty risk involving futures is mitigated because a regulated clearinghouse is the counterparty instead of the clearing broker. To further mitigate counterparty risk, the fund trades futures contracts on an exchange, monitors the financial strength of its clearing brokers and clearinghouse, and has entered into clearing agreements with its clearing brokers. The clearinghouse imposes initial margin requirements to secure the fund’s performance and requires daily settlement of variation margin representing changes in the market value of each contract.
Futures contracts are valued at their quoted daily settlement prices. The aggregate settlement values of the contracts are not recorded in the Statement of Net Assets. Fluctuations in the value of the contracts are recorded in the Statement of Net Assets as an asset (liability) and in the Statement of Operations as unrealized appreciation (depreciation) until the contracts are closed, when they are recorded as realized futures gains (losses).
During the year ended October 31, 2015, the fund’s average investments in long and short futures contracts represented less than 1% and 0% of net assets, respectively, based on the average of aggregate settlement values at each quarter-end during the period.
23
High Dividend Yield Index Fund
3. Federal Income Taxes: The fund intends to continue to qualify as a regulated investment company and distribute all of its taxable income. Management has analyzed the fund’s tax positions taken for all open federal income tax years (October 31, 2012–2015), and has concluded that no provision for federal income tax is required in the fund’s financial statements.
4. Distributions: Distributions to shareholders are recorded on the ex-dividend date.
5. Securities Lending: To earn additional income, the fund lends its securities to qualified institutional borrowers. Security loans are required to be secured at all times by collateral in an amount at least equal to the market value of securities loaned. Daily market fluctuations could cause the value of loaned securities to be more or less than the value of the collateral received. When this occurs, the collateral is adjusted and settled on the next business day. The fund further mitigates its counterparty risk by entering into securities lending transactions only with a diverse group of prequalified counter-parties, monitoring their financial strength, and entering into master securities lending agreements with its counterparties. The master securities lending agreements provide that, in the event of a counterparty’s default (including bankruptcy), the fund may terminate any loans with that borrower, determine the net amount owed, and sell or retain the collateral up to the net amount owed to the fund; however, such actions may be subject to legal proceedings. While collateral mitigates counter-party risk, in the absence of a default the fund may experience delays and costs in recovering the securities loaned. The fund invests cash collateral received in Vanguard Market Liquidity Fund, and records a liability in the Statement of Net Assets for the return of the collateral, during the period the securities are on loan. Securities lending income represents fees charged to borrowers plus income earned on invested cash collateral, less expenses associated with the loan.
6. Credit Facility: The fund and certain other funds managed by The Vanguard Group (“Vanguard”) participate in a $3 billion committed credit facility provided by a syndicate of lenders pursuant to a credit agreement that may be renewed annually; each fund is individually liable for its borrowings, if any, under the credit facility. Borrowings may be utilized for temporary and emergency purposes, and are subject to the fund’s regulatory and contractual borrowing restrictions. The participating funds are charged administrative fees and an annual commitment fee of 0.06% of the undrawn amount of the facility; these fees are allocated to the funds based on a method approved by the fund’s board of trustees and included in Management and Administrative expenses on the fund’s Statement of Operations. Any borrowings under this facility bear interest at a rate equal to the higher of the federal funds rate or LIBOR reference rate plus an agreed-upon spread.
The fund had no borrowings outstanding at October 31, 2015, or at any time during the period then ended.
7. Other: Dividend income is recorded on the ex-dividend date. Interest income includes income distributions received from Vanguard Market Liquidity Fund and is accrued daily. Premiums and discounts on debt securities purchased are amortized and accreted, respectively, to interest income over the lives of the respective securities. Security transactions are accounted for on the date securities are bought or sold. Costs used to determine realized gains (losses) on the sale of investment securities are those of the specific securities sold.
Each class of shares has equal rights as to assets and earnings, except that each class separately bears certain class-specific expenses related to maintenance of shareholder accounts (included in Management and Administrative expenses) and shareholder reporting. Marketing and distribution expenses are allocated to each class of shares based on a method approved by the board of trustees. Income, other non-class-specific expenses, and gains and losses on investments are allocated to each class of shares based on its relative net assets.
24
High Dividend Yield Index Fund
B. In accordance with the terms of a Funds’ Service Agreement (the “FSA”) between Vanguard and the fund, Vanguard furnishes to the fund investment advisory, corporate management, administrative, marketing, and distribution services at Vanguard’s cost of operations (as defined by the FSA). These costs of operations are allocated to the fund based on methods and guidelines approved by the board of trustees. Vanguard does not require reimbursement in the current period for certain costs of operations (such as deferred compensation/benefits and risk/insurance costs); the fund’s liability for these costs of operations is included in Payables to Vanguard on the Statement of Net Assets.
Upon the request of Vanguard, the fund may invest up to 0.40% of its net assets as capital in Vanguard. At October 31, 2015, the fund had contributed to Vanguard capital in the amount of $1,321,000, representing 0.01% of the fund’s net assets and 0.53% of Vanguard’s capitalization. The fund’s trustees and officers are also directors and employees, respectively, of Vanguard.
C. Various inputs may be used to determine the value of the fund’s investments. These inputs are summarized in three broad levels for financial statement purposes. The inputs or methodologies used to value securities are not necessarily an indication of the risk associated with investing in those securities.
Level 1—Quoted prices in active markets for identical securities.
Level 2—Other significant observable inputs (including quoted prices for similar securities, interest rates, prepayment speeds, credit risk, etc.).
Level 3—Significant unobservable inputs (including the fund’s own assumptions used to determine the fair value of investments).
The following table summarizes the market value of the fund’s investments as of October 31, 2015, based on the inputs used to value them:
| | | |
| | Level 1 | Level 2 | Level 3 |
| Investments | ($000) | ($000) | ($000) |
| Common Stocks | 15,506,973 | — | — |
| Temporary Cash Investments | 99,986 | 6,499 | — |
| Futures Contracts—Assets1 | 31 | — | — |
| Futures Contracts—Liabilities1 | (389) | — | — |
| Total | 15,606,601 | 6,499 | — |
| 1 Represents variation margin on the last day of the reporting period. |
D. At October 31, 2015, the aggregate settlement value of open futures contracts and the related unrealized appreciation (depreciation) were:
| | | | |
| | | | ($000) |
| | | | Aggregate | |
| | | Number of | Settlement | Unrealized |
| | | Long (Short) | Value | Appreciation |
| Futures Contracts | Expiration | Contracts | Long (Short) | (Depreciation) |
| S&P 500 Index | December 2015 | 136 | 70,506 | 4,406 |
| E-mini S&P 500 Index | December 2015 | 11 | 1,140 | 68 |
| | | | | 4,474 |
Unrealized appreciation (depreciation) on open futures contracts is required to be treated as realized gain (loss) for tax purposes.
25
High Dividend Yield Index Fund
E. Distributions are determined on a tax basis and may differ from net investment income and realized capital gains for financial reporting purposes. Differences may be permanent or temporary. Permanent differences are reclassified among capital accounts in the financial statements to reflect their tax character. Temporary differences arise when certain items of income, expense, gain, or loss are recognized in different periods for financial statement and tax purposes. These differences will reverse at some time in the future. Differences in classification may also result from the treatment of short-term gains as ordinary income for tax purposes.
Certain of the fund’s investments are in securities considered to be passive foreign investment companies, for which any unrealized appreciation and/or realized gains are required to be included in distributable net income for tax purposes. During the year ended October 31, 2015, the fund realized gains on the sale of passive foreign investment companies of $49,000, which have been included in current and prior periods’ taxable income; accordingly, such gains have been reclassified from accumulated net realized losses to undistributed net investment income. Passive foreign investment companies held at October 31, 2015, had unrealized appreciation of $921,000, of which $577,000 has been distributed and is reflected in the balance of undistributed net investment income.
During the year ended October 31, 2015, the fund realized $772,464,000 of net capital gains resulting from in-kind redemptions—in which shareholders exchanged fund shares for securities held by the fund rather than for cash. Because such gains are not taxable to the fund, and are not distributed to shareholders, they have been reclassified from accumulated net realized losses to paid-in capital.
For tax purposes, at October 31, 2015, the fund had $39,587,000 of ordinary income available for distribution. At October 31, 2015, the fund had available capital losses totaling $84,307,000 to offset future net capital gains. Of this amount, $18,315,000 is subject to expiration on October 31, 2018. Capital losses of $65,992,000 realized beginning in fiscal 2012 may be carried forward indefinitely under the Regulated Investment Company Modernization Act of 2010, but must be used before any expiring loss carryforwards.
At October 31, 2015, the cost of investment securities for tax purposes was $13,568,690,000. Net unrealized appreciation of investment securities for tax purposes was $2,044,768,000, consisting of unrealized gains of $2,614,629,000 on securities that had risen in value since their purchase and $569,861,000 in unrealized losses on securities that had fallen in value since their purchase.
F. During the year ended October 31, 2015, the fund purchased $5,594,628,000 of investment securities and sold $3,826,174,000 of investment securities, other than temporary cash investments. Purchases and sales include $3,210,873,000 and $2,188,717,000, respectively, in connection with in-kind purchases and redemptions of the fund’s capital shares.
26
High Dividend Yield Index Fund
G. Capital share transactions for each class of shares were:
| | | | |
| | Year Ended October 31, |
| | 2015 | 2014 |
| | Amount | Shares | Amount | Shares |
| | ($000) | (000) | ($000) | (000) |
| Investor Shares | | | | |
| Issued | 1,160,012 | 43,020 | 1,212,378 | 47,724 |
| Issued in Lieu of Cash Distributions | 106,677 | 4,039 | 79,918 | 3,136 |
| Redeemed | (950,051) | (35,330) | (677,563) | (26,847) |
| Net Increase (Decrease)—Investor Shares | 316,638 | 11,729 | 614,733 | 24,013 |
| ETF Shares | | | | |
| Issued | 3,664,582 | 53,660 | 2,875,637 | 44,821 |
| Issued in Lieu of Cash Distributions | — | — | — | — |
| Redeemed | (2,200,380) | (32,075) | (1,017,523) | (16,200) |
| Net Increase (Decrease) —ETF Shares | 1,464,202 | 21,585 | 1,858,114 | 28,621 |
H. Management has determined that no material events or transactions occurred subsequent to October 31, 2015, that would require recognition or disclosure in these financial statements.
27
Report of Independent Registered
Public Accounting Firm
To the Board of Trustees of Vanguard Whitehall Funds and the Shareholders of Vanguard High Dividend Yield Index Fund:
In our opinion, the accompanying statement of net assets and the related statements of operations and of changes in net assets and the financial highlights present fairly, in all material respects, the financial position of Vanguard High Dividend Yield Index Fund (constituting a separate portfolio of Vanguard Whitehall Funds, hereafter referred to as the “Fund”) at October 31, 2015, the results of its operations for the year then ended, the changes in its net assets for each of the two years in the period then ended, and the financial highlights for each of the five years in the period then ended, in conformity with accounting principles generally accepted in the United States of America. These financial statements and financial highlights (hereafter referred to as “financial statements”) are the responsibility of the Fund’s management. Our responsibility is to express an opinion on these financial statements based on our audits. We conducted our audits of these financial statements in accordance with the standards of the Public Company Accounting Oversight Board (United States). Those standards require that we plan and perform the audit to obtain reasonable assurance about whether the financial statements are free of material misstatement. An audit includes examining, on a test basis, evidence supporting the amounts and disclosures in the financial statements, assessing the accounting principles used and significant estimates made by management, and evaluating the overall financial statement presentation. We believe that our audits, which included confirmation of securities at October 31, 2015 by correspondence with the custodian and brokers, by agreement to the underlying ownership records of the transfer agent and the application of alternative auditing procedures where securities purchased had not been received, provide a reasonable basis for our opinion.
/s/PricewaterhouseCoopers LLP
Philadelphia, Pennsylvania
December 10, 2015
Special 2015 tax information (unaudited) for Vanguard High Dividend Yield Index Fund
This information for the fiscal year ended October 31, 2015, is included pursuant to provisions of the
Internal Revenue Code.
The fund distributed $469,227,000 of qualified dividend income to shareholders during the fiscal year.
For corporate shareholders, 100% of investment income (dividend income plus short-term gains,
if any) qualifies for the dividends-received deduction.
28
Your Fund’s After-Tax Returns
This table presents returns for your fund both before and after taxes. The after-tax returns are shown in two ways: (1) assuming that an investor owned the fund during the entire period and paid taxes on the fund’s distributions, and (2) assuming that an investor paid taxes on the fund’s distributions and sold all shares at the end of each period.
Calculations are based on the highest individual federal income tax and capital gains tax rates in effect at the times of the distributions and the hypothetical sales. State and local taxes were not considered. After-tax returns reflect any qualified dividend income, using actual prior-year figures and estimates for 2015. (In the example, returns after the sale of fund shares may be higher than those assuming no sale. This occurs when the sale would have produced a capital loss. The calculation assumes that the investor received a tax deduction for the loss.)
The table shows returns for Investor Shares only; returns for other share classes will differ. Please note that your actual after-tax returns will depend on your tax situation and may differ from those shown. Also note that if you own the fund in a tax-deferred account, such as an individual retirement account or a 401(k) plan, this information does not apply to you. Such accounts are not subject to current taxes.
Finally, keep in mind that a fund’s performance—whether before or after taxes—does not guarantee future results.
Average Annual Total Returns: High Dividend Yield Index Fund Investor Shares
Periods Ended October 31, 2015
| | | |
| | | | Since |
| | One | Five | Inception |
| | Year | Years | (11/16/2006) |
| Returns Before Taxes | 2.78% | 14.37% | 6.44% |
| Returns After Taxes on Distributions | 2.04 | 13.70 | 5.89 |
| Returns After Taxes on Distributions and Sale of Fund Shares | 2.16 | 11.55 | 5.13 |
29
About Your Fund’s Expenses
As a shareholder of the fund, you incur ongoing costs, which include costs for portfolio management, administrative services, and shareholder reports (like this one), among others. Operating expenses, which are deducted from a fund’s gross income, directly reduce the investment return of the fund.
A fund’s expenses are expressed as a percentage of its average net assets. This figure is known as the expense ratio. The following examples are intended to help you understand the ongoing costs (in dollars) of investing in your fund and to compare these costs with those of other mutual funds. The examples are based on an investment of $1,000 made at the beginning of the period shown and held for the entire period.
The accompanying table illustrates your fund’s costs in two ways:
• Based on actual fund return. This section helps you to estimate the actual expenses that you paid over the period. The ”Ending Account Value“ shown is derived from the fund‘s actual return, and the third column shows the dollar amount that would have been paid by an investor who started with $1,000 in the fund. You may use the information here, together with the amount you invested, to estimate the expenses that you paid over the period.
To do so, simply divide your account value by $1,000 (for example, an $8,600 account value divided by $1,000 = 8.6), then multiply the result by the number given for your fund under the heading ”Expenses Paid During Period.“
• Based on hypothetical 5% yearly return. This section is intended to help you compare your fund‘s costs with those of other mutual funds. It assumes that the fund had a yearly return of 5% before expenses, but that the expense ratio is unchanged. In this case—because the return used is not the fund’s actual return—the results do not apply to your investment. The example is useful in making comparisons because the Securities and Exchange Commission requires all mutual funds to calculate expenses based on a 5% return. You can assess your fund’s costs by comparing this hypothetical example with the hypothetical examples that appear in shareholder reports of other funds.
Note that the expenses shown in the table are meant to highlight and help you compare ongoing costs only and do not reflect transaction costs incurred by the fund for buying and selling securities. Further, the expenses do not include any purchase, redemption, or account service fees described in the fund prospectus. If such fees were applied to your account, your costs would be higher. Your fund does not carry a “sales load.”
The calculations assume no shares were bought or sold during the period. Your actual costs may have been higher or lower, depending on the amount of your investment and the timing of any purchases or redemptions.
You can find more information about the fund’s expenses, including annual expense ratios, in the Financial Statements section of this report. For additional information on operating expenses and other shareholder costs, please refer to your fund’s current prospectus.
30
| | | |
| Six Months Ended October 31, 2015 | | | |
| | Beginning | Ending | Expenses |
| | Account Value | Account Value | Paid During |
| High Dividend Yield Index Fund | 4/30/2015 | 10/31/2015 | Period |
| Based on Actual Fund Return | | | |
| Investor Shares | $1,000.00 | $993.78 | $0.80 |
| ETF Shares | 1,000.00 | 993.85 | 0.45 |
| Based on Hypothetical 5% Yearly Return | | | |
| Investor Shares | $1,000.00 | $1,024.40 | $0.82 |
| ETF Shares | 1,000.00 | 1,024.75 | 0.46 |
The calculations are based on expenses incurred in the most recent six-month period. The fund’s annualized six-month expense ratios for that
period are 0.16% for Investor Shares and 0.09% for ETF Shares. The dollar amounts shown as “Expenses Paid” are equal to the annualized
expense ratio multiplied by the average account value over the period, multiplied by the number of days in the most recent six-month period,
then divided by the number of days in the most recent 12-month period (184/365).
31
Glossary
30-Day SEC Yield. A fund’s 30-day SEC yield is derived using a formula specified by the U.S. Securities and Exchange Commission. Under the formula, data related to the fund’s security holdings in the previous 30 days are used to calculate the fund’s hypothetical net income for that period, which is then annualized and divided by the fund’s estimated average net assets over the calculation period. For the purposes of this calculation, a security’s income is based on its current market yield to maturity (for bonds), its actual income (for asset-backed securities), or its projected dividend yield (for stocks). Because the SEC yield represents hypothetical annualized income, it will differ—at times significantly—from the fund’s actual experience. As a result, the fund’s income distributions may be higher or lower than implied by the SEC yield.
Beta. A measure of the magnitude of a fund’s past share-price fluctuations in relation to the ups and downs of a given market index. The index is assigned a beta of 1.00. Compared with a given index, a fund with a beta of 1.20 typically would have seen its share price rise or fall by 12% when the index rose or fell by 10%. For this report, beta is based on returns over the past 36 months for both the fund and the index. Note that a fund’s beta should be reviewed in conjunction with its R-squared (see definition). The lower the R-squared, the less correlation there is between the fund and the index, and the less reliable beta is as an indicator of volatility.
Dividend Yield. Dividend income earned by stocks, expressed as a percentage of the aggregate market value (or of net asset value, for a fund). The yield is determined by dividing the amount of the annual dividends by the aggregate value (or net asset value) at the end of the period. For a fund, the dividend yield is based solely on stock holdings and does not include any income produced by other investments.
Earnings Growth Rate. The average annual rate of growth in earnings over the past five years for the stocks now in a fund.
Equity Exposure. A measure that reflects a fund’s investments in stocks and stock futures. Any holdings in short-term reserves are excluded.
Expense Ratio. A fund’s total annual operating expenses expressed as a percentage of the fund’s average net assets. The expense ratio includes management and administrative expenses, but does not include the transaction costs of buying and selling portfolio securities.
Foreign Holdings. The percentage of a fund represented by securities or depositary receipts of companies based outside the United States.
Inception Date. The date on which the assets of a fund (or one of its share classes) are first invested in accordance with the fund’s investment objective. For funds with a subscription period, the inception date is the day after that period ends. Investment performance is measured from the inception date.
Median Market Cap. An indicator of the size of companies in which a fund invests; the midpoint of market capitalization (market price x shares outstanding) of a fund’s stocks, weighted by the proportion of the fund’s assets invested in each stock. Stocks representing half of the fund’s assets have market capitalizations above the median, and the rest are below it.
Price/Book Ratio. The share price of a stock divided by its net worth, or book value, per share. For a fund, the weighted average price/book ratio of the stocks it holds.
32
Price/Earnings Ratio. The ratio of a stock’s current price to its per-share earnings over the past year. For a fund, the weighted average P/E of the stocks it holds. P/E is an indicator of market expectations about corporate prospects; the higher the P/E, the greater the expectations for a company’s future growth.
R-Squared. A measure of how much of a fund’s past returns can be explained by the returns from the market in general, as measured by a given index. If a fund’s total returns were precisely synchronized with an index’s returns, its R-squared would be 1.00. If the fund’s returns bore no relationship to the index’s returns, its R-squared would be 0. For this report, R-squared is based on returns over the past 36 months for both the fund and the index.
Return on Equity. The annual average rate of return generated by a company during the past five years for each dollar of shareholder’s equity (net income divided by shareholder’s equity). For a fund, the weighted average return on equity for the companies whose stocks it holds.
Short-Term Reserves. The percentage of a fund invested in highly liquid, short-term securities that can be readily converted to cash.
Turnover Rate. An indication of the fund’s trading activity. Funds with high turnover rates incur higher transaction costs and may be more likely to distribute capital gains (which may be taxable to investors). The turnover rate excludes in-kind transactions, which have minimal impact on costs.
33
This page intentionally left blank.
This page intentionally left blank.
The People Who Govern Your Fund
The trustees of your mutual fund are there to see that the fund is operated and managed in your best interests since, as a shareholder, you are a part owner of the fund. Your fund’s trustees also serve on the board of directors of The Vanguard Group, Inc., which is owned by the Vanguard funds and provides services to them on an at-cost basis.
A majority of Vanguard’s board members are independent, meaning that they have no affiliation with Vanguard or the funds they oversee, apart from the sizable personal investments they have made as private individuals. The independent board members have distinguished backgrounds in business, academia, and public service. Each of the trustees and executive officers oversees 194 Vanguard funds.
The following table provides information for each trustee and executive officer of the fund. More information about the trustees is in the Statement of Additional Information, which can be obtained, without charge, by contacting Vanguard at 800-662-7447, or online at vanguard.com.
| |
| InterestedTrustee1 | Rajiv L. Gupta |
| | Born 1945. Trustee Since December 2001.2 Principal |
| F. William McNabb III | Occupation(s) During the Past Five Years and Other |
| Born 1957. Trustee Since July 2009. Chairman of | Experience: Chairman and Chief Executive Officer |
| the Board. Principal Occupation(s) During the Past | (retired 2009) and President (2006–2008) of |
| Five Years and Other Experience: Chairman of the | Rohm and Haas Co. (chemicals); Director of Tyco |
| Board of The Vanguard Group, Inc., and of each of | International PLC (diversified manufacturing and |
| the investment companies served by The Vanguard | services), Hewlett-Packard Co. (electronic computer |
| Group, since January 2010; Director of The Vanguard | manufacturing), and Delphi Automotive PLC |
| Group since 2008; Chief Executive Officer and | (automotive components); Senior Advisor at New |
| President of The Vanguard Group, and of each of | Mountain Capital. |
| the investment companies served by The Vanguard | |
| Group, since 2008; Director of Vanguard Marketing | Amy Gutmann |
| Corporation; Managing Director of The Vanguard | Born 1949. Trustee Since June 2006. Principal |
| Group (1995–2008). | Occupation(s) During the Past Five Years and |
| | Other Experience: President of the University of |
| IndependentTrustees | Pennsylvania; Christopher H. Browne Distinguished |
| | Professor of Political Science, School of Arts and |
| Emerson U. Fullwood | Sciences, and Professor of Communication, Annenberg |
| Born 1948. Trustee Since January 2008. Principal | School for Communication, with secondary faculty |
| Occupation(s) During the Past Five Years and | appointments in the Department of Philosophy, School |
| Other Experience: Executive Chief Staff and | of Arts and Sciences, and at the Graduate School of |
| Marketing Officer for North America and Corporate | Education, University of Pennsylvania; Trustee of the |
| Vice President (retired 2008) of Xerox Corporation | National Constitution Center; Chair of the Presidential |
| (document management products and services); | Commission for the Study of Bioethical Issues. |
| Executive in Residence and 2009–2010 Distinguished | |
| Minett Professor at the Rochester Institute of | JoAnn Heffernan Heisen |
| Technology; Director of SPX Corporation (multi-industry | Born 1950. Trustee Since July 1998. Principal |
| manufacturing), the United Way of Rochester, the | Occupation(s) During the Past Five Years and |
| University of Rochester Medical Center, Monroe | Other Experience: Corporate Vice President and |
| Community College Foundation, and North Carolina | Chief Global Diversity Officer (retired 2008) and |
| A&T University. | Member of the Executive Committee (1997–2008) |
| | of Johnson & Johnson (pharmaceuticals/medical |
| | devices/consumer products); Director of Skytop |
| | Lodge Corporation (hotels) and the Robert Wood |
| | Johnson Foundation; Member of the Advisory |
| | Board of the Institute for Women’s Leadership |
| | at Rutgers University. |
| | |
| F. Joseph Loughrey | Executive Officers | |
| Born 1949. Trustee Since October 2009. Principal | | |
| Occupation(s) During the Past Five Years and Other | Glenn Booraem | |
| Experience: President and Chief Operating Officer | Born 1967. Treasurer Since May 2015. Principal |
| (retired 2009) of Cummins Inc. (industrial machinery); | Occupation(s) During the Past Five Years and |
| Chairman of the Board of Hillenbrand, Inc. (specialized | Other Experience: Principal of The Vanguard Group, |
| consumer services), and of Oxfam America; Director | Inc.; Treasurer of each of the investment companies |
| of SKF AB (industrial machinery), Hyster-Yale Materials | served by The Vanguard Group; Controller of each of |
| Handling, Inc. (forklift trucks), the Lumina Foundation | the investment companies served by The Vanguard |
| for Education, and the V Foundation for Cancer | Group (2010–2015); Assistant Controller of each of |
| Research; Member of the Advisory Council for the | the investment companies served by The Vanguard |
| College of Arts and Letters and of the Advisory Board | Group (2001–2010). | |
| to the Kellogg Institute for International Studies, both | | |
| at the University of Notre Dame. | Thomas J. Higgins | |
| Born 1957. Chief Financial Officer Since September |
| Mark Loughridge | 2008. Principal Occupation(s) During the Past Five |
| Born 1953. Trustee Since March 2012. Principal | Years and Other Experience: Principal of The Vanguard |
| Occupation(s) During the Past Five Years and Other | Group, Inc.; Chief Financial Officer of each of the |
| Experience: Senior Vice President and Chief Financial | investment companies served by The Vanguard Group; |
| Officer (retired 2013) at IBM (information technology | Treasurer of each of the investment companies served |
| services); Fiduciary Member of IBM’s Retirement Plan | by The Vanguard Group (1998–2008). |
| Committee (2004–2013); Director of the Dow Chemical | | |
| Company; Member of the Council on Chicago Booth. | Peter Mahoney | |
| Born 1974. Controller Since May 2015. Principal |
| Scott C. Malpass | Occupation(s) During the Past Five Years and |
| Born 1962. Trustee Since March 2012. Principal | Other Experience: Head of Global Fund Accounting |
| Occupation(s) During the Past Five Years and Other | at The Vanguard Group, Inc.; Controller of each of the |
| Experience: Chief Investment Officer and Vice | investment companies served by The Vanguard Group; |
| President at the University of Notre Dame; Assistant | Head of International Fund Services at The Vanguard |
| Professor of Finance at the Mendoza College of | Group (2008–2014). | |
| Business at Notre Dame; Member of the Notre Dame | | |
| 403(b) Investment Committee; Board Member of | Heidi Stam | |
| TIFF Advisory Services, Inc., and Catholic Investment | Born 1956. Secretary Since July 2005. Principal |
| Services, Inc. (investment advisors); Member of | Occupation(s) During the Past Five Years and Other |
| the Investment Advisory Committee of Major | Experience: Managing Director of The Vanguard |
| League Baseball. | Group, Inc.; General Counsel of The Vanguard Group; |
| Secretary of The Vanguard Group and of each of the |
| André F. Perold | investment companies served by The Vanguard Group; |
| Born 1952. Trustee Since December 2004. Principal | Director and Senior Vice President of Vanguard |
| Occupation(s) During the Past Five Years and Other | Marketing Corporation. | |
| Experience: George Gund Professor of Finance and | | |
| Banking, Emeritus at the Harvard Business School | Vanguard Senior ManagementTeam |
| (retired 2011); Chief Investment Officer and Managing | Mortimer J. Buckley | Chris D. McIsaac |
| Partner of HighVista Strategies LLC (private investment | Kathleen C. Gubanich | James M. Norris |
| firm); Director of Rand Merchant Bank; Overseer of | Paul A. Heller | Thomas M. Rampulla |
| the Museum of Fine Arts Boston. | Martha G. King | Glenn W. Reed |
| John T. Marcante | Karin A. Risi |
| Peter F. Volanakis | | |
| Born 1955. Trustee Since July 2009. Principal | | |
| Occupation(s) During the Past Five Years and Other | Chairman Emeritus and Senior Advisor |
| Experience: President and Chief Operating Officer | | |
| (retired 2010) of Corning Incorporated (communications | John J. Brennan | |
| equipment); Trustee of Colby-Sawyer College; | Chairman, 1996–2009 | |
| Member of the Advisory Board of the Norris Cotton | Chief Executive Officer and President, 1996–2008 |
| Cancer Center and of the Advisory Board of the | | |
| Parthenon Group (strategy consulting). | Founder | |
| | John C. Bogle | |
| | Chairman and Chief Executive Officer, 1974–1996 |
1 Mr. McNabb is considered an “interested person,” as defined in the Investment Company Act of 1940, because he is an officer of the Vanguard funds.
2 December 2002 for Vanguard Equity Income Fund, the Vanguard Municipal Bond Funds, and the Vanguard State Tax-Exempt Funds.
|  |
| | P.O. Box 2600 |
| | Valley Forge, PA 19482-2600 |
| |
| |
| |
| Connect with Vanguard® > vanguard.com |
| |
| |
| |
| Fund Information > 800-662-7447 | All rights in a FTSE index (the “Index”) vest in FTSE |
| Direct Investor Account Services > 800-662-2739 | International Limited (“FTSE”). “FTSE®” is a trademark |
| | of London Stock Exchange Group companies and is |
| Institutional Investor Services > 800-523-1036 | used by FTSE under licence. The Vanguard fund (the |
| Text Telephone for People | “Product”) has been developed solely by Vanguard. The |
| Who Are Deaf or Hard of Hearing> 800-749-7273 | Index is calculated by FTSE or its agent. FTSE and its |
| | licensors are not connected to and do not sponsor, |
| This material may be used in conjunction | advise, recommend, endorse, or promote the Product |
| with the offering of shares of any Vanguard | and do not accept any liability whatsoever to any |
| fund only if preceded or accompanied by | person arising out of (a) the use of, reliance on, or any |
| | error in the Index or (b) investment in or operation of |
| the fund’s current prospectus. | the Product. FTSE makes no claim, prediction, warranty, |
| All comparative mutual fund data are from Lipper, a | or representation either as to the results to be obtained |
| Thomson Reuters Company, or Morningstar, Inc., unless | from the Product or the suitability of the Index for the |
| otherwise noted. | purpose to which it is being put by Vanguard. |
| |
| You can obtain a free copy of Vanguard’s proxy voting | |
| guidelines by visiting vanguard.com/proxyreporting or by | |
| calling Vanguard at 800-662-2739. The guidelines are | |
| also available from the SEC’s website, sec.gov. In | |
| addition, you may obtain a free report on how your fund | |
| voted the proxies for securities it owned during the 12 | |
| months ended June 30. To get the report, visit either | |
| vanguard.com/proxyreporting or sec.gov. | |
| |
| You can review and copy information about your fund at | |
| the SEC’s Public Reference Room in Washington, D.C. To | |
| find out more about this public service, call the SEC at | |
| 202-551-8090. Information about your fund is also | |
| available on the SEC’s website, and you can receive | |
| copies of this information, for a fee, by sending a | |
| request in either of two ways: via email addressed to | |
| publicinfo@sec.gov or via regular mail addressed to the | |
| Public Reference Section, Securities and Exchange | |
| Commission, Washington, DC 20549-1520. | |
| |
| | © 2015 The Vanguard Group, Inc. |
| | All rights reserved. |
| | Vanguard Marketing Corporation, Distributor. |
| |
| | Q6230 122015 |

Annual Report | October 31, 2015
Vanguard Emerging Markets
Government Bond Index Fund
Vanguard’s Principles for Investing Success
We want to give you the best chance of investment success. These principles, grounded in Vanguard’s research and experience, can put you on the right path.
Goals. Create clear, appropriate investment goals.
Balance. Develop a suitable asset allocation using broadly diversified funds. Cost. Minimize cost.
Discipline. Maintain perspective and long-term discipline.
A single theme unites these principles: Focus on the things you can control.
We believe there is no wiser course for any investor.
| |
| Contents | |
| Your Fund’s Total Returns. | 1 |
| Chairman’s Letter. | 2 |
| Fund Profile. | 7 |
| Performance Summary. | 9 |
| Financial Statements. | 12 |
| About Your Fund’s Expenses. | 46 |
| Glossary. | 48 |
Please note: The opinions expressed in this report are just that—informed opinions. They should not be considered promises or advice.
Also, please keep in mind that the information and opinions cover the period through the date on the front of this report. Of course, the
risks of investing in your fund are spelled out in the prospectus.
See the Glossary for definitions of investment terms used in this report.
About the cover: Pictured is a sailing block on the Brilliant, a 1932 schooner docked in Mystic, Connecticut. A type of pulley, the
sailing block helps coordinate the setting of the sails. At Vanguard, the intricate coordination of technology and people allows
us to help millions of clients around the world reach their financial goals.
Your Fund’s Total Returns
| | | | |
| Fiscal Year Ended October 31, 2015 | | | | |
| |
| | 30-Day SEC | Income | Capital | Total |
| | Yield | Returns | Returns | Returns |
| Vanguard Emerging Markets Government Bond Index Fund | | | |
| Investor Shares | 4.75% | 4.36% | -4.52% | -0.16% |
| ETF Shares | 4.78 | | | |
| Market Price | | | | -0.36 |
| Net Asset Value | | | | -0.01 |
| Admiral™ Shares | 4.79 | 4.52 | -4.52 | 0.00 |
| Institutional Shares (Inception: 2/11/2015)1 | 4.81 | 3.54 | -0.72 | 2.82 |
| Barclays USD Emerging Markets Government RIC | | | | |
| Capped Index | | | | -0.02 |
| Emerging Markets Hard Currency Debt Funds | | | | |
| Average | | | | -5.08 |
Emerging Markets Hard Currency Debt Funds Average: Derived from data provided by Lipper, a Thomson Reuters Company.
Admiral Shares carry lower expenses and are available to investors who meet certain account-balance requirements. The Vanguard ETF®
Shares shown are traded on the Nasdaq exchange and are available only through brokers. The table provides ETF returns based on both the
Nasdaq market price and the net asset value for a share. U.S. Pat. Nos. 6,879,964; 7,337,138; 7,720,749; 7,925,573; 8,090,646; and 8,417,623.
For the ETF Shares, the market price is determined by the midpoint of the bid-offer spread as of the closing time of the New York Stock
Exchange (generally 4 p.m., Eastern time). The net asset value is also determined as of the NYSE closing time. For more information about
how the ETF Shares' market prices have compared with their net asset value, visit vanguard.com, select your ETF, and then select the Price
and Performance tab. The ETF premium/discount analysis there shows the percentages of days on which the ETF Shares' market price was
above or below the NAV.
Your Fund’s Performance at a Glance
October 31, 2014, Through October 31, 2015
| | | | |
| | | | Distributions Per Share |
| | Starting | Ending | | |
| | Share | Share | Income | Capital |
| | Price | Price | Dividends | Gains |
| Vanguard Emerging Markets Government Bond | | | | |
| Index Fund | | | | |
| Investor Shares | $9.95 | $9.50 | $0.430 | $0.000 |
| ETF Shares | 79.40 | 75.81 | 3.550 | 0.000 |
| Admiral Shares | 19.90 | 19.00 | 0.891 | 0.000 |
| Institutional Shares (Inception: 2/11/2015)1 | 30.72 | 30.50 | 1.188 | 0.000 |
1 Institutional Shares were first issued on November 25, 2014, and were redeemed shortly thereafter. Institutional Shares were next issued
on February 11, 2015. The total return shown is based on the period beginning February 11, 2015.
1

Chairman’s Letter
Dear Shareholder,
Emerging-market government bonds followed a rocky path to a virtually flat return for the 12 months ended October 31, 2015. Some of the bumps along the way were related to the drop in the price of oil and other commodities. The strengthening of the U.S. dollar affected the finances of many emerging-market governments, and country-specific concerns came into play as well.
Investor Shares of Vanguard Emerging Markets Government Bond Index Fund returned –0.16% as a price decline in the portfolio’s securities totaled a little more than the income they produced. The fund’s other share classes, with lower expense ratios, performed slightly better. (Institutional Shares, which recommenced in February, returned significantly more because they avoided the price drops of last November and December.)
The fund came close to matching the –0.02% return of its expense-free benchmark, the Barclays USD Emerging Markets Government RIC Capped Index. The index only includes bonds issued in U.S. dollars to avoid currency risk for U.S.-based investors. And because its “RIC cap” limits its exposure to any single issuer, its holdings remain sufficiently diversified to meet Internal Revenue Service standards for a registered investment company.
The fund placed well ahead of the –5.08% average return of its peers. That group consists of emerging-market debt funds
2
that may invest in securities issued in major currencies other than the U.S. dollar. This difference may well have contributed to the peers’ underperformance as the dollar strengthened against the euro, the British pound, and the yen. However, your fund could be at a disadvantage to those funds if the dollar were to weaken.
As bond prices and yields move in opposite directions, the fund’s 30-day SEC yield for Investor Shares stood at 4.75% at the close of the fiscal year, up from 4.39% a year earlier. That yield was more than double that of the broad U.S. bond market (as measured by Vanguard Total Bond Market Index Fund), reflecting the higher risk of emerging-market debt.
The search for a safe haven gave bonds a bit of a boost
The broad U.S. taxable bond market, which returned 1.96% over the fiscal year, benefited from investors’ desire for safe-haven assets during periods of stock market volatility. The yield of the 10-year Treasury note ended October at 2.17%, down from 2.31% a year earlier.
As I noted, currency exchange rates had a big effect on the returns of non-U.S. bonds. Unhedged, international bond markets (as measured by the Barclays Global Aggregate Index ex USD) returned –6.74%, held back by the dollar’s strength against many foreign currencies. Without this currency effect, international bond returns were positive.
| | | |
| Market Barometer | | | |
| | Average Annual Total Returns |
| | Periods Ended October 31, 2015 |
| | One | Three | Five |
| | Year | Years | Years |
| Bonds | | | |
| Barclays U.S. Aggregate Bond Index (Broad taxable | | | |
| market) | 1.96% | 1.65% | 3.03% |
| Barclays Municipal Bond Index (Broad tax-exempt market) | 2.87 | 2.91 | 4.28 |
| Citigroup Three-Month U.S. Treasury Bill Index | 0.02 | 0.02 | 0.04 |
| |
| Stocks | | | |
| Russell 1000 Index (Large-caps) | 4.86% | 16.28% | 14.32% |
| Russell 2000 Index (Small-caps) | 0.34 | 13.90 | 12.06 |
| Russell 3000 Index (Broad U.S. market) | 4.49 | 16.09 | 14.14 |
| FTSE All-World ex US Index (International) | -3.83 | 5.20 | 2.99 |
| |
| CPI | | | |
| Consumer Price Index | 0.17% | 0.93% | 1.69% |
3
Returns for money market funds and savings accounts continued to be constrained by the Federal Reserve’s 0%–0.25% target for short-term interest rates.
The U.S. stock market fluctuated on its way to modest returns
The broad U.S. stock market returned more than 4% for the fiscal year ended October 31. Stocks generally climbed during the first nine months before dropping sharply in August and September. Fears surfaced in late summer that slower economic growth in China would spread across the globe.
In October, however, stocks rallied as the Federal Reserve maintained its historically low short-term interest rates. Corporate earnings, although generally lower than in the past couple of years, mostly exceeded expectations.
The strength of the U.S. dollar against foreign currencies contributed to a return of about –4% for international stocks. Returns for the developed markets of the Pacific region and Europe were essentially flat despite central bank stimulus to counter sluggish growth and low inflation. Stocks tumbled in emerging markets, where concerns about China seemed to weigh most heavily.
Weak commodity prices and a strong dollar hurt returns
Tepid or stagnant growth in many developed economies and a marked slowdown in China contributed to a drop
| | | | | |
| Expense Ratios | | | | | |
| Your Fund Compared With Its Peer Group | | | | | |
| |
| |
| | Investor | ETF | Admiral | Institutional | Peer Group |
| | Shares | Shares | Shares | Shares | Average |
| Emerging Markets Government Bond Index | | | | | |
| Fund | 0.49% | 0.34% | 0.34% | 0.30% | 1.25% |
The fund expense ratios shown are from the prospectus dated February 25, 2015, and represent estimated costs for the current fiscal year.
For the fiscal year ended October 31, 2015, the expense ratios were 0.49% for Investor Shares, 0.34% for ETF Shares, 0.33% for Admiral
Shares, and 0.29% for Institutional Shares. The peer-group expense ratio is derived from data provided by Lipper, a Thomson Reuters
Company, and captures information through year-end 2014.
Peer group: Emerging Markets Hard Currency Debt Funds.
4
in the price of oil, as did abundant supply. Oil continued the slide that began in June of last year, falling from more than $100 per barrel to less than $50 by the end of October this year. Many other commodity prices dropped sharply as well, hurting the finances of emerging markets that rely on exporting these products.
At the same time, the strengthening of the U.S. dollar against many currencies made it more expensive for some emerging-market governments to service their dollar-denominated debt.
These developments contributed to slackening demand for emerging-market government bonds. The prices of the securities held by the fund’s Investor Shares declined by about 4.5% over the period, offsetting their earned income of about 4.4%.
As investors seemed less willing to take on risk, short-term bonds generally fared better than their longer-term counterparts. Bonds with maturities of 1 to 3 years, for example, returned a little more than 2%, while those maturing in more than 20 years returned roughly –5%. The picture was more mixed with regard to credit quality, but higher-quality bonds generally managed to stay in positive territory.
Because emerging markets are a very diverse group, performances by country varied widely. Russian government bonds, which accounted for about 7% of the fund’s assets on average over the period, significantly outperformed. After falling hard amid the implementation of Western sanctions, low oil prices, conflict in Ukraine, and rating agency downgrades, they began to recover some ground beginning in February.
In contrast, Brazilian government bonds, another heavyweight component of the fund, posted a double-digit decline. Downgrades by credit rating agencies and the drop in commodity prices were part of the story, but a corruption scandal involving politicians and the country’s largest oil company played a role as well.
As these swings show, investing in emerging markets as part of a diversified portfolio is suitable for those willing to accept a higher level of volatility than one might expect from developed markets. Nevertheless, emerging-market government bonds displayed far less volatility overall than their equity counterparts.
As measured by the FTSE Emerging Index, the worst monthly return for emerging-market stocks over the fiscal year was –9.4% in August, compared with –2.7% for Investor Shares of your fund in December.
The fund is off to a good start
The objective of every index fund is to closely track the performance of its target index, which has a leg up from the start as it incurs no expenses. In the case of emerging-market bond funds, meeting that objective can be especially challenging. The cost of buying and selling securities tends to be relatively high in less developed foreign markets, and their bonds don’t trade on central exchanges the way stocks do.
5
The fund’s task was additionally complex because its assets almost doubled over the fiscal year.
For the more than two years since the fund’s inception, its average annual return of 2.03% for Investor Shares is close to the 2.29% return of its expense-free benchmark over the same period. And it has outpaced its peers’ average return of –1.24%. That’s a testament to the skill and experience of the team overseeing the fund—it has a decades-long track record of index investing, including more than ten years of work with international funds.
A dose of discipline is crucial when markets become volatile
The developments over the past few months remind us that nobody can control the direction of markets or reliably predict where they’ll go in the short term. However, investors can control how they react to unstable and turbulent markets.
During periods of market adversity, it’s more important than ever to keep sight of one of Vanguard’s key principles: Maintain perspective and long-term discipline. Whether you’re investing for yourself or on behalf of clients, your success is affected greatly by how you respond—or don’t respond—during turbulent markets. (You can read Vanguard’s Principles for Investing Success at vanguard.com/research.)
As I’ve written in the past, the best course for long-term investors is generally to ignore daily market moves and not make decisions based on emotion. This is also a good time to evaluate your portfolio and make sure your asset allocation is aligned with your time horizon, goals, and risk tolerance.
The markets are unpredictable and often confounding. Keeping your long-term plans clearly in focus can help you weather these periodic storms.
As always, thank you for investing with Vanguard.
Sincerely,

F. William McNabb III
Chairman and Chief Executive Officer
November 17, 2015
6
Emerging Markets Government Bond Index Fund
Fund Profile
As of October 31, 2015
| | | | |
| Share-Class Characteristics | | | | |
| |
| | Investor | | Admiral | Institutional |
| | Shares | ETF Shares | Shares | Shares |
| Ticker Symbol | VGOVX | VWOB | VGAVX | VGIVX |
| Expense Ratio1 | 0.49% | 0.34% | 0.34% | 0.30% |
| 30-Day SEC Yield | 4.75% | 4.78% | 4.79% | 4.81% |
| | |
| Financial Attributes | | |
| |
| | | Barclays USD |
| | | Emerging Mkts |
| | | Government |
| | Fund | RIC Capped Idx |
| Number of Bonds | 866 | 852 |
| Yield to Maturity | | |
| (before expenses) | 5.7% | 5.7% |
| Average Coupon | 5.6% | 5.7% |
| Average Duration | 6.3 years | 6.2 years |
| Average Effective | | |
| Maturity | 10.2 years | 10.1 years |
| Short-Term Reserves | 2.2% | — |
| |
| |
| Sector Diversification (% of portfolio) |
| Foreign Government | | 100.0% |
The agency and mortgage-backed securities sectors may include issues from government-sponsored enterprises; such issues are
generally not backed by the full faith and credit of the U.S. government.
| |
| Distribution by Effective Maturity | |
| (% of portfolio) | |
| Under 1 Year | 0.3% |
| 1 - 3 Years | 13.7 |
| 3 - 5 Years | 22.3 |
| 5 - 10 Years | 38.4 |
| 10 - 20 Years | 9.4 |
| 20 - 30 Years | 13.9 |
| Over 30 Years | 2.0 |
| |
| Distribution by Credit Quality (% of portfolio) |
| Aa | 11.0 |
| A | 10.9 |
| Baa | 45.6 |
| Less Than Baa | 32.5 |
Credit-quality ratings are obtained from Barclays and are from Moody's, Fitch, and S&P. When ratings from all three agencies are
used, the median rating is shown. When ratings from two of the agencies are used, the lower rating for each issue is shown. "Not
Rated" is used to classify securities for which a rating is not available. Not rated securities include a fund's investment in
Vanguard Market Liquidity Fund or Vanguard Municipal Cash Management Fund, each of which invests in high-quality money
market instruments and may serve as a cash management vehicle for the Vanguard funds, trusts, and accounts. For more information
about these ratings, see the Glossary entry for Credit Quality.
1 The expense ratios shown are from the prospectus dated February 25, 2015, and represent estimated costs for the current fiscal year. For the fiscal
year ended October 31, 2015, the expense ratios were 0.49% for Investor Shares, 0.34% for ETF Shares, 0.33% for Admiral Shares, and 0.29% for
Institutional Shares.
7
Emerging Markets Government Bond Index Fund
| |
| Market Diversification (% of portfolio ) | |
| | Fund |
| Emerging Markets | |
| China | 12.5% |
| Mexico | 8.4 |
| Brazil | 8.0 |
| Russia | 7.3 |
| Indonesia | 5.9 |
| Turkey | 5.8 |
| United Arab Emirates | 5.3 |
| Qatar | 3.4 |
| Colombia | 3.3 |
| Philippines | 3.0 |
| Venezuela | 2.9 |
| Kazakhstan | 2.1 |
| Hungary | 2.0 |
| India | 1.9 |
| Lebanon | 1.9 |
| Chile | 1.9 |
| Argentina | 1.7 |
| South Africa | 1.7 |
| Poland | 1.5 |
| Peru | 1.4 |
| Malaysia | 1.3 |
| Ukraine | 1.2 |
| Uruguay | 1.0 |
| Croatia | 1.0 |
| Other | 12.4 |
| Subtotal | 98.8% |
| Other | |
| Panama | 1.2% |
8
Emerging Markets Government Bond Index Fund
Performance Summary
All of the returns in this report represent past performance, which is not a guarantee of future results that may be achieved by the fund. (Current performance may be lower or higher than the performance data cited. For performance data current to the most recent month-end, visit our website at vanguard.com/performance.) Note, too, that both investment returns and principal value can fluctuate widely, so an investor’s shares, when sold, could be worth more or less than their original cost. The returns shown do not reflect taxes that a shareholder would pay on fund distributions or on the sale of fund shares.
Cumulative Performance: May 31, 2013, Through October 31, 2015
Initial Investment of $10,000
| | | | |
| | | Average Annual Total Returns | |
| | | Periods Ended October 31, 2015 | |
| | | | Since | Final Value |
| | | One | Inception | of a $10,000 |
| | | Year | (5/31/2013) | Investment |
| | Emerging Markets Government Bond | | | |
| | Index Fund Investor Shares | -0.91% | 1.71% | $10,419 |
| | Barclays USD Emerging Markets | | | |
| •••••••• | Government RIC Capped Index | -0.02 | 2.29 | 10,564 |
| |
| – – – – | Emerging Markets Hard Currency | | | |
| |
| | Barclays Debt Funds Global Average Aggregate Index | -5.08 | -1.24 | 9,703 |
| | ex USD | -6.74 | -2.06 | 9,509 |
| Emerging Markets Hard Currency Debt Funds Average: Derived from data provided by Lipper, a Thomson Reuters Company. |
| "Since Inception" performance is calculated from the Investor Shares’ inception date for both the fund and its comparative standards. |
| | | |
| | | Since | Final Value |
| | One | Inception | of a $10,000 |
| | Year | (5/31/2013) | Investment |
| Emerging Markets Government Bond Index | | | |
| Fund ETF Shares Net Asset Value | -0.01% | 2.16% | $10,530 |
| Emerging Markets Government Bond Index | | | |
| Fund ETF Shares Market Price | -0.36% | 2.30% | 10,604 |
| Barclays USD Emerging Markets Government | | | |
| RIC Capped Index | -0.02 | 2.29 | 10,564 |
| Barclays Global Aggregate Index ex USD | -6.74 | -2.06 | 9,509 |
| "Since Inception" performance is calculated from the ETF Shares’ inception date for both the fund and its comparative standards. |
| Vanguard fund returns are adjusted to reflect the 0.75% fee on purchases of fund shares. The fee does not apply to the ETF Shares. The |
| Fiscal-Year Total Returns table is not adjusted for fees. |
| See Financial Highlights for dividend and capital gains information. |
9
Emerging Markets Government Bond Index Fund
| | | |
| | Average Annual Total Returns | |
| | Periods Ended October 31, 2015 | |
| |
| | | Since | Final Value |
| | One | Inception | of a $10,000 |
| | Year | (5/31/2013) | Investment |
| Emerging Markets Government Bond Index | | | |
| Fund Admiral Shares | -0.75% | 1.85% | $10,453 |
| Barclays USD Emerging Markets Government | | | |
| RIC Capped Index | -0.02 | 2.29 | 10,564 |
| Barclays Global Aggregate Index ex USD | -6.74 | -2.06 | 9,509 |
| "Since Inception" performance is calculated from the Admiral Shares’ inception date for both the fund and its comparative standard. |
| | |
| | Since | Final Value |
| | Inception | of a $5,000,000 |
| | (2/11/2015)1 | Investment |
| Emerging Markets Government Bond Index | | |
| Fund Institutional Shares | 2.05% | $5,102,603 |
| Barclays USD Emerging Markets | | |
| Government RIC Capped Index | 3.03 | 5,151,446 |
| "Since Inception" performance is calculated from the Institutional Shares’ inception date for both the fund and its comparative standard. |
| 1 Institutional Shares were first issued on November 25, 2014, and were redeemed shortly thereafter. Institutional Shares were next issued |
| on February 11, 2015. The total return shown is based on the period beginning February 11, 2015. |
| | |
| Cumulative Returns of ETF Shares: May 31, 2013, Through October 31, 2015 | |
| |
| | | Since |
| | One | Inception |
| | Year | (5/31/2013) |
| Emerging Markets Government Bond Index Fund | | |
| ETF Shares Market Price | -0.36% | 5.66% |
| Emerging Markets Government Bond Index Fund | | |
| ETF Shares Net Asset Value | -0.01 | 5.30 |
| Barclays USD Emerging Markets Government RIC | | |
| Capped Index | -0.02 | 5.64 |
| "Since Inception" performance is calculated from the ETF Shares’ inception date for both the fund and its comparative standards. |
Vanguard fund returns are adjusted to reflect the 0.75% fee on purchases of fund shares. The fee does not apply to the ETF Shares. The
Fiscal-Year Total Returns table is not adjusted for fees.
10
Emerging Markets Government Bond Index Fund
Fiscal-Year Total Returns (%): May 31, 2013, Through October 31, 2015
| | | | |
| | | | | Barclays USD |
| | | | | Emerging Mkts |
| | | | | Government |
| | | | Investor Shares | RIC Capped Idx |
| Fiscal Year | Income Returns | Capital Returns | Total Returns | Total Returns |
| 2013 | 1.51% | -2.89% | -1.38% | -1.30% |
| 2014 | 4.46 | 2.16 | 6.62 | 7.06 |
| 2015 | 4.36 | -4.52 | -0.16 | -0.02 |
Total Returns: Periods Ended September 30, 2015
This table presents returns through the latest calendar quarter—rather than through the end of the fiscal period.
Securities and Exchange Commission rules require that we provide this information.
| | | | | |
| | | | | | Since Inception |
| | Inception Date | One Year | Income | Capital | Total |
| Investor Shares | 5/31/2013 | -1.81% | 4.20% | -3.41% | 0.79% |
| Fee-Adjusted Returns | | -2.54 | | | 0.46 |
| ETF Shares | 5/31/2013 | | | | |
| Market Price | | -1.37 | | | 1.28 |
| Net Asset Value | | -1.59 | | | 0.92 |
| Admiral Shares | 5/31/2013 | -1.55 | 4.35 | -3.41 | 0.94 |
| Fee-Adjusted Returns | | -2.29 | | | 0.62 |
| Institutional Shares | 2/11/20151 | — | 3.07 | -3.32 | -0.25 |
| Fee-Adjusted Returns | | — | | | -1.00 |
| 1 Institutional Shares were first issued on November 25, 2014, and were redeemed shortly thereafter. Institutional Shares were next issued |
| on February 11, 2015. The total return shown is based on the period beginning February 11, 2015. |
Vanguard fund returns are adjusted to reflect the 0.75% fee on purchases of fund shares. The fee does not apply to the ETF Shares. The
Fiscal-Year Total Returns table is not adjusted for fees.
11
Emerging Markets Government Bond Index Fund
Financial Statements
Statement of Net Assets
As of October 31, 2015
The fund reports a complete list of its holdings in regulatory filings four times in each fiscal year, at the quarter-ends. For the second and fourth fiscal quarters, the lists appear in the fund’s semiannual and annual reports to shareholders. For the first and third fiscal quarters, the fund files the lists with the Securities and Exchange Commission on Form N-Q. Shareholders can look up the fund’s Forms N-Q on the SEC’s website at sec.gov. Forms N-Q may also be reviewed and copied at the SEC’s Public Reference Room (see the back cover of this report for further information).
| | | | | |
| | | | | Face | Market |
| | | | Maturity | Amount | Value• |
| | | Coupon | Date | ($000) | ($000) |
| Angola (0.1%) | | | | |
| Sovereign Bond (U.S. Dollar-Denominated) (0.1%) | | | | |
| 1 | Republic of Angola Via Northern Lights III BV | 7.000% | 8/16/19 | 750 | 731 |
| Total Angola (Cost $767) | | | | 731 |
| Argentina (1.6%) | | | | |
| Sovereign Bonds (U.S. Dollar-Denominated) (1.6%) | | | | |
| 1 | City of Buenos Aires Argentina | 8.950% | 2/19/21 | 200 | 209 |
| 1 | Provincia de Buenos Aires | 10.875% | 1/26/21 | 350 | 371 |
| 1 | Provincia de Buenos Aires | 9.950% | 6/9/21 | 200 | 206 |
| 1,2 | Provincia de Buenos Aires | 9.950% | 6/9/21 | 400 | 412 |
| | Provincia de Cordoba | 12.375% | 8/17/17 | 500 | 515 |
| 3 | Republic of Argentina | 8.750% | 6/2/17 | 1,050 | 1,144 |
| 3 | Republic of Argentina | 8.280% | 12/31/33 | 1,891 | 2,099 |
| 3 | Republic of Argentina | 8.280% | 12/31/33 | 1,012 | 1,096 |
| 1,3 | Republic of Argentina | 2.500% | 12/31/38 | 3,464 | 2,182 |
| 2 | YPF SA | 8.875% | 12/19/18 | 50 | 52 |
| | YPF SA | 8.875% | 12/19/18 | 450 | 467 |
| 1 | YPF SA | 8.750% | 4/4/24 | 1,000 | 1,010 |
| | YPF SA | 8.500% | 7/28/25 | 975 | 965 |
| Total Argentina (Cost $9,242) | | | | 10,728 |
| Armenia (0.1%) | | | | |
| Sovereign Bonds (U.S. Dollar-Denominated) (0.1%) | | | | |
| | Republic of Armenia | 6.000% | 9/30/20 | 200 | 197 |
| 2 | Republic of Armenia | 6.000% | 9/30/20 | 200 | 198 |
| | Republic of Armenia | 7.150% | 3/26/25 | 200 | 198 |
| Total Armenia (Cost $587) | | | | 593 |
| Azerbaijan (0.3%) | | | | |
| Sovereign Bonds (U.S. Dollar-Denominated) (0.3%) | | | | |
| | Republic of Azerbaijan | 4.750% | 3/18/24 | 300 | 286 |
| 2 | Republic of Azerbaijan | 4.750% | 3/18/24 | 400 | 385 |
| | State Oil Co. of the Azerbaijan Republic | 5.450% | 2/9/17 | 200 | 203 |
| | State Oil Co. of the Azerbaijan Republic | 4.750% | 3/13/23 | 1,300 | 1,136 |
| | State Oil Co. of the Azerbaijan Republic | 6.950% | 3/18/30 | 200 | 187 |
| Total Azerbaijan (Cost $2,360) | | | | 2,197 |
12
| | | | |
| Emerging Markets Government Bond Index Fund | | | | |
| |
| |
| |
| | | | Face | Market |
| | | Maturity | Amount | Value• |
| | Coupon | Date | ($000) | ($000) |
| Bahrain (0.8%) | | | | |
| Sovereign Bonds (U.S. Dollar-Denominated) (0.8%) | | | | |
| Bahrain Mumtalakat Holding Co. BSC | 4.000% | 11/25/21 | 250 | 248 |
| Batelco International Finance No. 1 Ltd. | 4.250% | 5/1/20 | 200 | 199 |
| Kingdom of Bahrain | 6.273% | 11/22/18 | 550 | 601 |
| 2 Kingdom of Bahrain | 5.500% | 3/31/20 | 1,650 | 1,749 |
| 2 Kingdom of Bahrain | 6.125% | 7/5/22 | 800 | 842 |
| 2 Kingdom of Bahrain | 6.125% | 8/1/23 | 150 | 158 |
| Kingdom of Bahrain | 6.125% | 8/1/23 | 425 | 447 |
| 2 Kingdom of Bahrain | 6.000% | 9/19/44 | 500 | 415 |
| Kingdom of Bahrain | 6.000% | 9/19/44 | 400 | 330 |
| Total Bahrain (Cost $5,161) | | | | 4,989 |
| Belarus (0.1%) | | | | |
| Sovereign Bond (U.S. Dollar-Denominated) (0.1%) | | | | |
| Republic of Belarus | 8.950% | 1/26/18 | 350 | 361 |
| Total Belarus (Cost $329) | | | | 361 |
| Belize (0.0%) | | | | |
| Sovereign Bond (U.S. Dollar-Denominated) (0.0%) | | | | |
| 1 Belize | 5.000% | 2/20/38 | 200 | 143 |
| Total Belize (Cost $140) | | | | 143 |
| Bermuda (0.1%) | | | | |
| Sovereign Bonds (U.S. Dollar-Denominated) (0.1%) | | | | |
| 2 Bermuda | 5.603% | 7/20/20 | 200 | 221 |
| Bermuda | 4.854% | 2/6/24 | 400 | 415 |
| 2 Bermuda | 4.854% | 2/6/24 | 150 | 157 |
| Total Bermuda (Cost $782) | | | | 793 |
| Bolivia (0.1%) | | | | |
| Sovereign Bonds (U.S. Dollar-Denominated) (0.1%) | | | | |
| Plurinational State of Bolivia | 4.875% | 10/29/22 | 200 | 202 |
| Plurinational State of Bolivia | 5.950% | 8/22/23 | 200 | 212 |
| Total Bolivia (Cost $395) | | | | 414 |
| Brazil (7.5%) | | | | |
| Sovereign Bonds (U.S. Dollar-Denominated) (7.5%) | | | | |
| Banco do Brasil SA | 3.875% | 1/23/17 | 94 | 94 |
| Banco do Brasil SA | 6.000% | 1/22/20 | 200 | 203 |
| Banco do Brasil SA | 5.375% | 1/15/21 | 775 | 728 |
| Banco do Brasil SA | 5.875% | 1/26/22 | 800 | 715 |
| Banco do Brasil SA | 3.875% | 10/10/22 | 975 | 819 |
| Banco do Brasil SA | 5.875% | 1/19/23 | 450 | 396 |
| 1 Banco do Brasil SA | 8.500% | 10/29/49 | 650 | 587 |
| Banco Nacional de Desenvolvimento | | | | |
| Economico e Social | 6.369% | 6/16/18 | 1,075 | 1,095 |
| Banco Nacional de Desenvolvimento | | | | |
| Economico e Social | 4.000% | 4/14/19 | 500 | 469 |
| 2 Banco Nacional de Desenvolvimento | | | | |
| Economico e Social | 4.000% | 4/14/19 | 450 | 422 |
| Banco Nacional de Desenvolvimento | | | | |
| Economico e Social | 6.500% | 6/10/19 | 1,150 | 1,156 |
| Banco Nacional de Desenvolvimento | | | | |
| Economico e Social | 5.500% | 7/12/20 | 100 | 95 |
13
| | | | |
| Emerging Markets Government Bond Index Fund | | | | |
| |
| |
| |
| | | | Face | Market |
| | | Maturity | Amount | Value• |
| | Coupon | Date | ($000) | ($000) |
| 2 Banco Nacional de Desenvolvimento | | | | |
| Economico e Social | 5.500% | 7/12/20 | 100 | 95 |
| Banco Nacional de Desenvolvimento | | | | |
| Economico e Social | 5.750% | 9/26/23 | 400 | 354 |
| 2 Banco Nacional de Desenvolvimento | | | | |
| Economico e Social | 5.750% | 9/26/23 | 300 | 267 |
| Caixa Economica Federal | 2.375% | 11/6/17 | 775 | 730 |
| 2 Caixa Economica Federal | 4.500% | 10/3/18 | 200 | 192 |
| Caixa Economica Federal | 4.500% | 10/3/18 | 600 | 575 |
| Caixa Economica Federal | 4.250% | 5/13/19 | 1,000 | 924 |
| Caixa Economica Federal | 3.500% | 11/7/22 | 150 | 122 |
| Centrais Eletricas Brasileiras SA | 6.875% | 7/30/19 | 550 | 489 |
| Centrais Eletricas Brasileiras SA | 5.750% | 10/27/21 | 800 | 638 |
| Federative Republic of Brazil | 6.000% | 1/17/17 | 875 | 910 |
| Federative Republic of Brazil | 5.875% | 1/15/19 | 820 | 872 |
| Federative Republic of Brazil | 8.875% | 10/14/19 | 175 | 207 |
| Federative Republic of Brazil | 4.875% | 1/22/21 | 2,406 | 2,367 |
| Federative Republic of Brazil | 2.625% | 1/5/23 | 2,634 | 2,177 |
| Federative Republic of Brazil | 8.875% | 4/15/24 | 707 | 841 |
| Federative Republic of Brazil | 4.250% | 1/7/25 | 2,172 | 1,928 |
| Federative Republic of Brazil | 8.750% | 2/4/25 | 350 | 417 |
| Federative Republic of Brazil | 10.125% | 5/15/27 | 1,416 | 1,866 |
| Federative Republic of Brazil | 8.250% | 1/20/34 | 1,725 | 1,837 |
| Federative Republic of Brazil | 7.125% | 1/20/37 | 1,440 | 1,400 |
| Federative Republic of Brazil | 5.625% | 1/7/41 | 1,091 | 889 |
| Federative Republic of Brazil | 5.000% | 1/27/45 | 1,661 | 1,258 |
| 4 Petrobras Global Finance BV | 1.953% | 5/20/16 | 350 | 344 |
| Petrobras Global Finance BV | 2.000% | 5/20/16 | 400 | 390 |
| 4 Petrobras Global Finance BV | 2.694% | 3/17/17 | 550 | 518 |
| Petrobras Global Finance BV | 3.250% | 3/17/17 | 800 | 763 |
| 4 Petrobras Global Finance BV | 2.460% | 1/15/19 | 750 | 604 |
| Petrobras Global Finance BV | 3.000% | 1/15/19 | 965 | 800 |
| Petrobras Global Finance BV | 4.875% | 3/17/20 | 1,925 | 1,578 |
| Petrobras Global Finance BV | 4.375% | 5/20/23 | 1,150 | 834 |
| Petrobras Global Finance BV | 6.250% | 3/17/24 | 1,750 | 1,404 |
| Petrobras Global Finance BV | 5.625% | 5/20/43 | 100 | 66 |
| Petrobras Global Finance BV | 7.250% | 3/17/44 | 200 | 150 |
| Petrobras Global Finance BV | 6.850% | 6/5/15 | 2,875 | 1,969 |
| Petrobras International Finance Co. SA | 6.125% | 10/6/16 | 400 | 402 |
| Petrobras International Finance Co. SA | 3.500% | 2/6/17 | 850 | 818 |
| Petrobras International Finance Co. SA | 5.875% | 3/1/18 | 2,255 | 2,128 |
| Petrobras International Finance Co. SA | 8.375% | 12/10/18 | 350 | 342 |
| Petrobras International Finance Co. SA | 7.875% | 3/15/19 | 1,600 | 1,516 |
| Petrobras International Finance Co. SA | 5.750% | 1/20/20 | 1,800 | 1,539 |
| Petrobras International Finance Co. SA | 5.375% | 1/27/21 | 3,190 | 2,600 |
| Petrobras International Finance Co. SA | 6.875% | 1/20/40 | 965 | 692 |
| Petrobras International Finance Co. SA | 6.750% | 1/27/41 | 2,077 | 1,475 |
| Total Brazil (Cost $54,931) | | | | 49,066 |
| Chile (1.8%) | | | | |
| Sovereign Bonds (U.S. Dollar-Denominated) (1.8%) | | | | |
| 2 Banco del Estado de Chile | 2.000% | 11/9/17 | 385 | 385 |
| 2 Banco del Estado de Chile | 4.125% | 10/7/20 | 200 | 210 |
| 2 Banco del Estado de Chile | 3.875% | 2/8/22 | 425 | 429 |
| 2 Corp. Nacional del Cobre de Chile | 7.500% | 1/15/19 | 800 | 915 |
| 2 Corp. Nacional del Cobre de Chile | 3.750% | 11/4/20 | 300 | 306 |
| Corp. Nacional del Cobre de Chile | 3.750% | 11/4/20 | 300 | 306 |
14
| | | | |
| Emerging Markets Government Bond Index Fund | | | | |
| |
| |
| |
| | | | Face | Market |
| | | Maturity | Amount | Value• |
| | Coupon | Date | ($000) | ($000) |
| 2 Corp. Nacional del Cobre de Chile | 3.875% | 11/3/21 | 800 | 813 |
| Corp. Nacional del Cobre de Chile | 3.875% | 11/3/21 | 400 | 404 |
| Corp. Nacional del Cobre de Chile | 3.000% | 7/17/22 | 200 | 189 |
| 2 Corp. Nacional del Cobre de Chile | 3.000% | 7/17/22 | 150 | 142 |
| Corp. Nacional del Cobre de Chile | 4.500% | 8/13/23 | 1,100 | 1,124 |
| 2 Corp. Nacional del Cobre de Chile | 4.500% | 8/13/23 | 150 | 153 |
| 2 Corp. Nacional del Cobre de Chile | 5.625% | 9/21/35 | 300 | 306 |
| 2 Corp. Nacional del Cobre de Chile | 6.150% | 10/24/36 | 100 | 108 |
| 2 Corp. Nacional del Cobre de Chile | 4.250% | 7/17/42 | 400 | 327 |
| Corp. Nacional del Cobre de Chile | 5.625% | 10/18/43 | 900 | 897 |
| 2 Corp. Nacional del Cobre de Chile | 5.625% | 10/18/43 | 200 | 200 |
| 2 Corp. Nacional del Cobre de Chile | 4.875% | 11/4/44 | 400 | 359 |
| Corp. Nacional del Cobre de Chile | 4.875% | 11/4/44 | 600 | 532 |
| 2 Empresa de Transporte de Pasajeros Metro SA | 4.750% | 2/4/24 | 200 | 208 |
| 2 Empresa Nacional del Petroleo | 5.250% | 8/10/20 | 200 | 211 |
| 2 Empresa Nacional del Petroleo | 4.750% | 12/6/21 | 200 | 207 |
| Empresa Nacional del Petroleo | 4.375% | 10/30/24 | 250 | 250 |
| Republic of Chile | 3.875% | 8/5/20 | 516 | 554 |
| Republic of Chile | 3.250% | 9/14/21 | 275 | 287 |
| Republic of Chile | 2.250% | 10/30/22 | 350 | 340 |
| Republic of Chile | 3.125% | 3/27/25 | 1,275 | 1,286 |
| Republic of Chile | 3.625% | 10/30/42 | 300 | 267 |
| Total Chile (Cost $11,725) | | | | 11,715 |
| China (11.8%) | | | | |
| Sovereign Bonds (U.S. Dollar-Denominated) (11.8%) | | | | |
| Agricultural Bank of China | 2.000% | 5/21/18 | 500 | 500 |
| Agricultural Bank of China | 2.750% | 5/21/20 | 250 | 250 |
| Agricultural Bank of China Ltd. | 2.250% | 12/9/17 | 500 | 503 |
| Amber Circle Funding Ltd. | 2.000% | 12/4/17 | 200 | 200 |
| Amber Circle Funding Ltd. | 3.250% | 12/4/22 | 600 | 598 |
| Amipeace Ltd. | 2.000% | 12/6/16 | 250 | 250 |
| Bank of China Ltd. | 2.125% | 1/23/17 | 600 | 603 |
| Bank of China Ltd. | 3.125% | 1/23/19 | 200 | 205 |
| Bank of China Ltd. | 2.875% | 6/30/20 | 1,400 | 1,412 |
| 2 Bank of China Ltd. | 5.000% | 11/13/24 | 500 | 517 |
| Bank of China Ltd. | 5.000% | 11/13/24 | 1,500 | 1,561 |
| Bank of China Ltd. | 3.875% | 6/30/25 | 1,000 | 1,006 |
| Bao-trans Enterprises Ltd. | 3.750% | 12/12/18 | 225 | 229 |
| Beijing State-Owned Assets Management | | | | |
| Hong Kong | 3.250% | 3/17/20 | 800 | 798 |
| Beijing State-Owned Assets Management | | | | |
| Hong Kong | 4.125% | 5/26/25 | 500 | 490 |
| Bluestar Finance Holdings Ltd. | 3.500% | 6/11/18 | 1,000 | 993 |
| BOC Aviation Pte Ltd. | 2.875% | 10/10/17 | 300 | 302 |
| BOC Aviation Pte Ltd. | 3.000% | 3/30/20 | 400 | 396 |
| BOC Aviation Pte Ltd. | 4.375% | 5/2/23 | 200 | 204 |
| 1 CCCI Treasure Ltd. | 3.500% | 12/29/49 | 550 | 543 |
| Century Master Investment Co. Ltd. | 4.750% | 9/19/18 | 200 | 209 |
| CGNPC International Ltd. | 4.000% | 5/19/25 | 500 | 502 |
| Charming Light Investments Ltd. | 3.750% | 9/3/19 | 1,050 | 1,064 |
| China Cinda Finance 2014 Ltd. | 4.000% | 5/14/19 | 500 | 510 |
| China Cinda Finance 2014 Ltd. | 5.625% | 5/14/24 | 200 | 210 |
| China Cinda Finance 2015 I Ltd. | 3.125% | 4/23/20 | 1,000 | 981 |
| China Cinda Finance 2015 I Ltd. | 4.250% | 4/23/25 | 900 | 857 |
| China Construction Bank Asia Corp. Ltd. | 3.250% | 7/2/19 | 700 | 716 |
| 1 China Construction Bank Asia Corp. Ltd. | 4.250% | 8/20/24 | 400 | 403 |
15
| | | | | |
| Emerging Markets Government Bond Index Fund | | | | |
| |
| |
| |
| | | | | Face | Market |
| | | | Maturity | Amount | Value• |
| | | Coupon | Date | ($000) | ($000) |
| 1 | China Construction Bank Corp. | 3.875% | 5/13/25 | 1,000 | 991 |
| | China Great Wall International Holdings Ltd. | 2.500% | 9/17/17 | 200 | 201 |
| 2 | China Resources Gas Group Ltd. | 4.500% | 4/5/22 | 400 | 416 |
| | China Resources Land Ltd. | 4.375% | 2/27/19 | 450 | 469 |
| | China Resources Land Ltd. | 6.000% | 2/27/24 | 400 | 446 |
| | China Shenhua Overseas Capital Co. Ltd. | 3.125% | 1/20/20 | 450 | 451 |
| | China Shenhua Overseas Capital Co. Ltd. | 3.875% | 1/20/25 | 400 | 397 |
| | CNOOC Curtis Funding No 1 pty Ltd. | 4.500% | 10/3/23 | 1,620 | 1,693 |
| 2 | CNOOC Curtis Funding No 1 Pty Ltd. | 4.500% | 10/3/23 | 300 | 314 |
| 2 | CNOOC Finance 2011 Ltd. | 4.250% | 1/26/21 | 1,138 | 1,199 |
| 2 | CNOOC Finance 2011 Ltd. | 5.750% | 1/26/41 | 200 | 233 |
| 2 | CNOOC Finance 2012 Ltd. | 3.875% | 5/2/22 | 1,200 | 1,228 |
| 2 | CNOOC Finance 2012 Ltd. | 5.000% | 5/2/42 | 200 | 211 |
| | CNOOC Finance 2013 Ltd. | 1.750% | 5/9/18 | 200 | 198 |
| | CNOOC Finance 2013 Ltd. | 3.000% | 5/9/23 | 850 | 806 |
| | CNOOC Finance 2013 Ltd. | 4.250% | 5/9/43 | 200 | 187 |
| | CNOOC Finance 2015 Australia Pty Ltd. | 2.625% | 5/5/20 | 750 | 740 |
| | CNOOC Finance 2015 USA LLC | 3.500% | 5/5/25 | 600 | 583 |
| | CNOOC Nexen Finance 2014 ULC | 1.625% | 4/30/17 | 800 | 798 |
| | CNOOC Nexen Finance 2014 ULC | 4.250% | 4/30/24 | 2,560 | 2,643 |
| | CNOOC Nexen Finance 2014 ULC | 4.875% | 4/30/44 | 900 | 916 |
| 2 | CNPC General Capital Ltd. | 2.750% | 4/19/17 | 50 | 51 |
| | CNPC General Capital Ltd. | 1.209% | 5/14/17 | 500 | 499 |
| 2,4 | CNPC General Capital Ltd. | 1.209% | 5/14/17 | 200 | 199 |
| | CNPC General Capital Ltd. | 1.950% | 4/16/18 | 350 | 348 |
| | CNPC General Capital Ltd. | 2.750% | 5/14/19 | 450 | 451 |
| 2 | CNPC General Capital Ltd. | 2.750% | 5/14/19 | 200 | 200 |
| | CNPC General Capital Ltd. | 2.700% | 11/25/19 | 1,200 | 1,201 |
| 2 | CNPC General Capital Ltd. | 3.950% | 4/19/22 | 200 | 205 |
| | CNPC General Capital Ltd. | 3.400% | 4/16/23 | 250 | 245 |
| 2 | CNPC HK Overseas Capital Ltd. | 4.500% | 4/28/21 | 675 | 718 |
| 2 | CNPC HK Overseas Capital Ltd. | 5.950% | 4/28/41 | 400 | 475 |
| | COSCO Finance 2011 Ltd. | 4.000% | 12/3/22 | 400 | 397 |
| 2 | COSL Finance BVI Ltd. | 3.250% | 9/6/22 | 550 | 526 |
| 1 | CRCC Yupeng Ltd. | 3.950% | 2/28/49 | 300 | 303 |
| | CRCC Yuxiang Ltd. | 3.500% | 5/16/23 | 450 | 439 |
| | CSSC Capital 2013 Ltd. | 2.750% | 12/12/16 | 350 | 353 |
| 1 | Dianjian Haixing Ltd. | 4.050% | 10/29/49 | 200 | 202 |
| | Eastern Creation II Investment Holdings Ltd. | 2.625% | 11/20/17 | 400 | 401 |
| 2 | Export-Import Bank of China | 2.500% | 7/31/19 | 700 | 706 |
| | Export-Import Bank of China | 2.500% | 7/31/19 | 410 | 414 |
| 2 | Export-Import Bank of China/ | | | | |
| | The via Avi Funding Co. Ltd. | 2.850% | 9/16/20 | 1,400 | 1,406 |
| | Export-Import Bank of China/ | | | | |
| | The via Avi Funding Co. Ltd. | 3.800% | 9/16/25 | 500 | 505 |
| | Franshion Brilliant Ltd. | 5.750% | 3/19/19 | 200 | 214 |
| 2 | Franshion Development Ltd. | 6.750% | 4/15/21 | 500 | 554 |
| | Franshion Investment Ltd. | 4.700% | 10/26/17 | 200 | 206 |
| | Hebei Iron & Steel Hong Kong | | | | |
| | International Trade Co. Ltd. | 2.750% | 10/27/17 | 200 | 201 |
| | Huarong Finance Co. Ltd. | 4.000% | 7/17/19 | 700 | 715 |
| | Huarong Finance II Co. Ltd. | 3.500% | 1/16/18 | 250 | 255 |
| | Huarong Finance II Co. Ltd. | 4.500% | 1/16/20 | 500 | 520 |
| | Huarong Finance II Co. Ltd. | 5.500% | 1/16/25 | 1,300 | 1,366 |
| | Industrial & Commercial Bank of China Asia Ltd. | 5.125% | 11/30/20 | 700 | 752 |
| | Industrial & Commercial Bank of China Ltd. | 2.351% | 11/13/17 | 1,000 | 1,006 |
| | Industrial & Commercial Bank of China Ltd. | 2.500% | 11/21/17 | 600 | 606 |
16
| | | | | |
| Emerging Markets Government Bond Index Fund | | | | |
| |
| |
| |
| | | | | Face | Market |
| | | | Maturity | Amount | Value• |
| | | Coupon | Date | ($000) | ($000) |
| | Industrial & Commercial Bank of China Ltd. | 3.231% | 11/13/19 | 500 | 511 |
| | Industrial & Commercial Bank of China Ltd. | 4.875% | 9/21/25 | 1,300 | 1,313 |
| | King Power Capital Ltd. | 5.625% | 11/3/24 | 300 | 314 |
| | MCC Holding Hong Kong Corp. Ltd. | 2.625% | 6/16/17 | 200 | 201 |
| | MCC Holding Hong Kong Corp. Ltd. | 2.500% | 8/28/17 | 400 | 401 |
| | Minmetals Bounteous Finance BVI Ltd. | 4.750% | 7/30/25 | 600 | 605 |
| | Nexen Energy ULC | 7.875% | 3/15/32 | 100 | 133 |
| | Nexen Energy ULC | 5.875% | 3/10/35 | 308 | 346 |
| | Nexen Energy ULC | 6.400% | 5/15/37 | 425 | 506 |
| | Nexen Energy ULC | 7.500% | 7/30/39 | 300 | 397 |
| | Prosperous Ray Ltd. | 3.000% | 11/12/18 | 400 | 403 |
| | Sino-Ocean Land Treasure Finance I Ltd. | 4.625% | 7/30/19 | 1,100 | 1,129 |
| | Sino-Ocean Land Treasure Finance I Ltd. | 6.000% | 7/30/24 | 350 | 363 |
| | Sino-Ocean Land Treasure Finance II Ltd. | 4.450% | 2/4/20 | 400 | 407 |
| | Sino-Ocean Land Treasure Finance II Ltd. | 5.950% | 2/4/27 | 250 | 253 |
| 1,2 | Sinochem Global Capital Co. Ltd. | 5.000% | 12/29/49 | 200 | 204 |
| 2 | Sinochem Offshore Capital Co. Ltd. | 3.250% | 4/29/19 | 200 | 203 |
| | Sinochem Offshore Capital Co. Ltd. | 3.250% | 4/29/19 | 200 | 203 |
| 2 | Sinochem Overseas Capital Co. Ltd. | 4.500% | 11/12/20 | 875 | 921 |
| 2 | Sinochem Overseas Capital Co. Ltd. | 6.300% | 11/12/40 | 450 | 541 |
| | Sinopec Capital 2013 Ltd. | 1.875% | 4/24/18 | 600 | 595 |
| | Sinopec Capital 2013 Ltd. | 3.125% | 4/24/23 | 1,000 | 961 |
| 2 | Sinopec Capital 2013 Ltd. | 3.125% | 4/24/23 | 400 | 384 |
| | Sinopec Capital 2013 Ltd. | 4.250% | 4/24/43 | 200 | 188 |
| | Sinopec Group Overseas Development | 3.900% | 5/17/22 | 407 | 417 |
| 2 | Sinopec Group Overseas Development 2012 Ltd. | 2.750% | 5/17/17 | 775 | 786 |
| 2 | Sinopec Group Overseas Development 2012 Ltd. | 3.900% | 5/17/22 | 1,119 | 1,149 |
| 2 | Sinopec Group Overseas Development 2012 Ltd. | 4.875% | 5/17/42 | 575 | 592 |
| | Sinopec Group Overseas Development 2013 Ltd. | 2.500% | 10/17/18 | 300 | 303 |
| | Sinopec Group Overseas Development 2013 Ltd. | 4.375% | 10/17/23 | 825 | 863 |
| | Sinopec Group Overseas Development 2013 Ltd. | 5.375% | 10/17/43 | 200 | 222 |
| | Sinopec Group Overseas Development 2014 Ltd. | 1.101% | 4/10/17 | 600 | 599 |
| 2 | Sinopec Group Overseas Development 2014 Ltd. | 1.750% | 4/10/17 | 1,000 | 1,000 |
| | Sinopec Group Overseas Development 2014 Ltd. | 1.750% | 4/10/17 | 225 | 225 |
| 2 | Sinopec Group Overseas Development 2014 Ltd. | 2.750% | 4/10/19 | 400 | 405 |
| | Sinopec Group Overseas Development 2014 Ltd. | 4.375% | 4/10/24 | 800 | 836 |
| | Sinopec Group Overseas Development 2015 Ltd. | 2.500% | 4/28/20 | 2,800 | 2,764 |
| | Sinopec Group Overseas Development 2015 Ltd. | 3.250% | 4/28/25 | 700 | 672 |
| | Sinopec Group Overseas Development 2015 Ltd. | 4.100% | 4/28/45 | 600 | 549 |
| | State Elite Global Ltd. | 3.125% | 1/20/20 | 850 | 862 |
| 2 | State Grid Overseas Investment 2013 Ltd. | 1.750% | 5/22/18 | 200 | 199 |
| | State Grid Overseas Investment 2013 Ltd. | 3.125% | 5/22/23 | 910 | 900 |
| 2 | State Grid Overseas Investment 2013 Ltd. | 4.375% | 5/22/43 | 200 | 202 |
| 2 | State Grid Overseas Investment 2014 Ltd. | 2.750% | 5/7/19 | 700 | 711 |
| | State Grid Overseas Investment 2014 Ltd. | 2.750% | 5/7/19 | 300 | 305 |
| | State Grid Overseas Investment 2014 Ltd. | 4.125% | 5/7/24 | 1,100 | 1,167 |
| 2 | State Grid Overseas Investment 2014 Ltd. | 4.850% | 5/7/44 | 350 | 374 |
| | Three Gorges Finance I Cayman Islands Ltd. | 3.700% | 6/10/25 | 500 | 510 |
| Total China (Cost $76,429) | | | | 76,865 |
| Colombia (3.2%) | | | | |
| Sovereign Bonds (U.S. Dollar-Denominated) (3.2%) | | | | |
| | Ecopetrol SA | 7.625% | 7/23/19 | 1,050 | 1,180 |
| | Ecopetrol SA | 5.875% | 9/18/23 | 865 | 876 |
| | Ecopetrol SA | 4.125% | 1/16/25 | 675 | 592 |
| | Ecopetrol SA | 5.375% | 6/26/26 | 1,350 | 1,256 |
17
| | | | |
| Emerging Markets Government Bond Index Fund | | | | |
| |
| |
| |
| | | | Face | Market |
| | | Maturity | Amount | Value• |
| | Coupon | Date | ($000) | ($000) |
| Ecopetrol SA | 7.375% | 9/18/43 | 700 | 669 |
| Ecopetrol SA | 5.875% | 5/28/45 | 1,000 | 815 |
| Empresas Publicas de Medellin ESP | 7.625% | 7/29/19 | 300 | 342 |
| Oleoducto Central SA | 4.000% | 5/7/21 | 200 | 196 |
| Republic of Colombia | 7.375% | 1/27/17 | 725 | 779 |
| Republic of Colombia | 7.375% | 3/18/19 | 1,135 | 1,294 |
| Republic of Colombia | 11.750% | 2/25/20 | 500 | 664 |
| Republic of Colombia | 4.375% | 7/12/21 | 1,334 | 1,374 |
| 1 Republic of Colombia | 2.625% | 3/15/23 | 675 | 612 |
| Republic of Colombia | 4.000% | 2/26/24 | 2,345 | 2,307 |
| Republic of Colombia | 8.125% | 5/21/24 | 540 | 670 |
| 1 Republic of Colombia | 4.500% | 1/28/26 | 1,500 | 1,492 |
| Republic of Colombia | 7.375% | 9/18/37 | 750 | 876 |
| Republic of Colombia | 6.125% | 1/18/41 | 1,507 | 1,568 |
| 1 Republic of Colombia | 5.625% | 2/26/44 | 1,734 | 1,695 |
| 1 Republic of Colombia | 5.000% | 6/15/45 | 1,200 | 1,074 |
| Transportadora de Gas Internacional SA ESP | 5.700% | 3/20/22 | 200 | 207 |
| Total Colombia (Cost $21,529) | | | | 20,538 |
| Costa Rica (0.7%) | | | | |
| Sovereign Bonds (U.S. Dollar-Denominated) (0.7%) | | | | |
| Banco de Costa Rica | 5.250% | 8/12/18 | 250 | 253 |
| Banco Nacional de Costa Rica | 4.875% | 11/1/18 | 400 | 401 |
| 2 Banco Nacional de Costa Rica | 4.875% | 11/1/18 | 200 | 201 |
| Instituto Costarricense de Electricidad | 6.950% | 11/10/21 | 475 | 485 |
| Instituto Costarricense de Electricidad | 6.375% | 5/15/43 | 200 | 155 |
| Republic of Costa Rica | 4.250% | 1/26/23 | 900 | 810 |
| Republic of Costa Rica | 4.375% | 4/30/25 | 1,100 | 951 |
| Republic of Costa Rica | 5.625% | 4/30/43 | 200 | 154 |
| Republic of Costa Rica | 7.000% | 4/4/44 | 600 | 540 |
| Republic of Costa Rica | 7.158% | 3/12/45 | 600 | 544 |
| Total Costa Rica (Cost $4,739) | | | | 4,494 |
| Cote D’Ivoire (0.4%) | | | | |
| Sovereign Bonds (U.S. Dollar-Denominated) (0.4%) | | | | |
| Republic of Cote d’Ivoire | 5.375% | 7/23/24 | 250 | 224 |
| 1 Republic of Cote d’Ivoire | 6.375% | 3/3/28 | 500 | 460 |
| 1 Republic of Cote d’Ivoire | 5.750% | 12/31/32 | 1,845 | 1,644 |
| Total Cote D’Ivoire (Cost $2,462) | | | | 2,328 |
| Croatia (1.0%) | | | | |
| Sovereign Bonds (U.S. Dollar-Denominated) (1.0%) | | | | |
| Republic of Croatia | 6.250% | 4/27/17 | 712 | 746 |
| Republic of Croatia | 6.750% | 11/5/19 | 1,000 | 1,086 |
| Republic of Croatia | 6.625% | 7/14/20 | 894 | 971 |
| Republic of Croatia | 6.375% | 3/24/21 | 1,300 | 1,401 |
| Republic of Croatia | 5.500% | 4/4/23 | 700 | 722 |
| Republic of Croatia | 6.000% | 1/26/24 | 1,335 | 1,417 |
| Total Croatia (Cost $6,298) | | | | 6,343 |
| Dominican Republic (0.9%) | | | | |
| Sovereign Bonds (U.S. Dollar-Denominated) (0.9%) | | | | |
| 1 Dominican Republic | 7.500% | 5/6/21 | 752 | 823 |
| Dominican Republic | 6.600% | 1/28/24 | 250 | 266 |
| 1 Dominican Republic | 5.875% | 4/18/24 | 1,650 | 1,683 |
| Dominican Republic | 5.500% | 1/27/25 | 1,450 | 1,432 |
18
| | | | | |
| Emerging Markets Government Bond Index Fund | | | | |
| |
| |
| |
| | | | | Face | Market |
| | | | Maturity | Amount | Value• |
| | | Coupon | Date | ($000) | ($000) |
| | Dominican Republic | 7.450% | 4/30/44 | 450 | 476 |
| 1 | Dominican Republic | 6.850% | 1/27/45 | 444 | 442 |
| 2 | Dominican Republic | 6.850% | 1/27/45 | 1,000 | 997 |
| Total Dominican Republic (Cost $6,158) | | | | 6,119 |
| Ecuador (0.3%) | | | | |
| Sovereign Bonds (U.S. Dollar-Denominated) (0.3%) | | | | |
| | Republic of Ecuador | 7.950% | 6/20/24 | 1,550 | 1,190 |
| | Repulic of Ecuador | 10.500% | 3/24/20 | 900 | 742 |
| Total Ecuador (Cost $2,323) | | | | 1,932 |
| Egypt (0.4%) | | | | |
| Sovereign Bonds (U.S. Dollar-Denominated) (0.4%) | | | | |
| | African Export-Import Bank | 3.875% | 6/4/18 | 250 | 251 |
| | African Export-Import Bank | 4.750% | 7/29/19 | 200 | 205 |
| | Arab Republic of Egypt | 5.750% | 4/29/20 | 812 | 835 |
| | Arab Republic of Egypt | 5.875% | 6/11/25 | 1,000 | 935 |
| | Arab Republic of Egypt | 6.875% | 4/30/40 | 300 | 270 |
| Total Egypt (Cost $2,583) | | | | 2,496 |
| El Salvador (0.5%) | | | | |
| Sovereign Bonds (U.S. Dollar-Denominated) (0.5%) | | | | |
| | Republic of El Salvador | 7.375% | 12/1/19 | 345 | 352 |
| | Republic of El Salvador | 7.750% | 1/24/23 | 450 | 457 |
| | Republic of El Salvador | 5.875% | 1/30/25 | 300 | 266 |
| 2 | Republic of El Salvador | 6.375% | 1/18/27 | 300 | 267 |
| | Republic of El Salvador | 8.250% | 4/10/32 | 578 | 572 |
| | Republic of El Salvador | 7.650% | 6/15/35 | 900 | 816 |
| | Republic of El Salvador | 7.625% | 2/1/41 | 308 | 276 |
| Total El Salvador (Cost $3,336) | | | | 3,006 |
| Ethiopia (0.1%) | | | | |
| Sovereign Bond (U.S. Dollar-Denominated) (0.1%) | | | | |
| | Federal Democratic Republic of Ethiopia | 6.625% | 12/11/24 | 450 | 419 |
| Total Ethiopia (Cost $447) | | | | 419 |
| Gabon (0.2%) | | | | |
| Sovereign Bonds (U.S. Dollar-Denominated) (0.2%) | | | | |
| 1,2 | Gabonese Republic | 6.375% | 12/12/24 | 400 | 346 |
| 1 | Gabonese Republic | 6.375% | 12/12/24 | 661 | 570 |
| | Gabonese Republic | 6.950% | 6/16/25 | 200 | 175 |
| Total Gabon (Cost $1,262) | | | | 1,091 |
| Georgia (0.1%) | | | | |
| Sovereign Bonds (U.S. Dollar-Denominated) (0.1%) | | | | |
| | Georgian Railway JSC | 7.750% | 7/11/22 | 200 | 209 |
| | Republic of Georgia | 6.875% | 4/12/21 | 200 | 215 |
| Total Georgia (Cost $445) | | | | 424 |
| Ghana (0.3%) | | | | |
| Sovereign Bonds (U.S. Dollar-Denominated) (0.3%) | | | | |
| | Republic of Ghana | 8.500% | 10/4/17 | 300 | 302 |
| 2 | Republic of Ghana | 7.875% | 8/7/23 | 400 | 345 |
| 1,2 | Republic of Ghana | 8.125% | 1/18/26 | 300 | 255 |
| 1 | Republic of Ghana | 8.125% | 1/18/26 | 1,500 | 1,283 |
| Total Ghana (Cost $2,293) | | | | 2,185 |
19
| | | | | |
| Emerging Markets Government Bond Index Fund | | | | |
| |
| |
| |
| | | | | Face | Market |
| | | | Maturity | Amount | Value• |
| | | Coupon | Date | ($000) | ($000) |
| Guatemala (0.1%) | | | | |
| Sovereign Bonds (U.S. Dollar-Denominated) (0.1%) | | | | |
| | Republic of Guatemala | 5.750% | 6/6/22 | 200 | 212 |
| | Republic of Guatemala | 4.875% | 2/13/28 | 400 | 389 |
| Total Guatemala (Cost $608) | | | | 601 |
| Honduras (0.1%) | | | | |
| Sovereign Bonds (U.S. Dollar-Denominated) (0.1%) | | | | |
| | Republic of Honduras | 8.750% | 12/16/20 | 200 | 223 |
| 1 | Republic of Honduras | 7.500% | 3/15/24 | 200 | 213 |
| Total Honduras (Cost $399) | | | | 436 |
| Hungary (1.9%) | | | | |
| Sovereign Bonds (U.S. Dollar-Denominated) (1.9%) | | | | |
| 5 | Magyar Export-Import Bank Zrt | 5.500% | 2/12/18 | 750 | 797 |
| 2,5 | MFB Magyar Fejlesztesi Bank Zrt | 6.250% | 10/21/20 | 200 | 223 |
| | Republic of Hungary | 4.125% | 2/19/18 | 1,330 | 1,394 |
| | Republic of Hungary | 4.000% | 3/25/19 | 500 | 524 |
| | Republic of Hungary | 6.250% | 1/29/20 | 1,115 | 1,261 |
| | Republic of Hungary | 6.375% | 3/29/21 | 1,772 | 2,040 |
| | Republic of Hungary | 5.375% | 2/21/23 | 1,362 | 1,501 |
| | Republic of Hungary | 5.750% | 11/22/23 | 1,420 | 1,601 |
| | Republic of Hungary | 5.375% | 3/25/24 | 1,410 | 1,560 |
| | Republic of Hungary | 7.625% | 3/29/41 | 1,050 | 1,432 |
| Total Hungary (Cost $11,920) | | | | 12,333 |
| India (1.9%) | | | | |
| Sovereign Bonds (U.S. Dollar-Denominated) (1.9%) | | | | |
| | Bank of Baroda | 4.875% | 7/23/19 | 575 | 614 |
| | Bank of India | 3.625% | 9/21/18 | 350 | 358 |
| | Bank of India | 3.125% | 5/6/20 | 400 | 398 |
| | Bank of India | 6.250% | 2/16/21 | 400 | 452 |
| | Bharat Petroleum Corp. Ltd. | 4.625% | 10/25/22 | 200 | 208 |
| | Bharat Petroleum Corp. Ltd. | 4.000% | 5/8/25 | 400 | 393 |
| | Canara Bank | 5.250% | 10/18/18 | 200 | 213 |
| | Export-Import Bank of India | 4.000% | 8/7/17 | 875 | 904 |
| | Export-Import Bank of India | 2.750% | 4/1/20 | 1,000 | 992 |
| | Export-Import Bank of India | 4.000% | 1/14/23 | 400 | 409 |
| | IDBI Bank Ltd. | 4.375% | 3/26/18 | 200 | 205 |
| | IDBI Bank Ltd. | 3.750% | 1/25/19 | 200 | 201 |
| | Indian Oil Corp. Ltd. | 5.625% | 8/2/21 | 500 | 547 |
| | Indian Oil Corp. Ltd. | 5.750% | 8/1/23 | 200 | 219 |
| | Indian Railway Finance Corp. Ltd. | 3.917% | 2/26/19 | 200 | 207 |
| | NTPC Ltd. | 5.625% | 7/14/21 | 400 | 440 |
| | NTPC Ltd. | 4.750% | 10/3/22 | 200 | 211 |
| | NTPC Ltd. | 4.375% | 11/26/24 | 400 | 407 |
| | Oil India Ltd. | 3.875% | 4/17/19 | 200 | 206 |
| | Oil India Ltd. | 5.375% | 4/17/24 | 250 | 271 |
| | ONGC Videsh Ltd. | 3.250% | 7/15/19 | 700 | 707 |
| | ONGC Videsh Ltd. | 3.750% | 5/7/23 | 400 | 393 |
| | ONGC Videsh Ltd. | 4.625% | 7/15/24 | 250 | 258 |
| | Power Grid Corp. of India Ltd. | 3.875% | 1/17/23 | 200 | 199 |
| | State Bank of India | 4.125% | 8/1/17 | 250 | 259 |
| | State Bank of India | 3.250% | 4/18/18 | 700 | 714 |
| | State Bank of India | 3.622% | 4/17/19 | 800 | 823 |
| 2 | State Bank of India | 4.875% | 4/17/24 | 400 | 429 |
20
| | | | |
| Emerging Markets Government Bond Index Fund | | | | |
| |
| |
| |
| | | | Face | Market |
| | | Maturity | Amount | Value• |
| | Coupon | Date | ($000) | ($000) |
| Syndicate Bank | 4.750% | 11/6/16 | 250 | 256 |
| Syndicate Bank | 4.125% | 4/12/18 | 200 | 206 |
| Total India (Cost $11,920) | | | | 12,099 |
| Indonesia (5.6%) | | | | |
| Sovereign Bonds (U.S. Dollar-Denominated) (5.6%) | | | | |
| Bank Negara Indonesia Persero Tbk PT | 4.125% | 4/27/17 | 200 | 204 |
| Lembaga Pembiayaan Ekspor Indonesia | 3.750% | 4/26/17 | 300 | 305 |
| Majapahit Holding BV | 7.250% | 6/28/17 | 200 | 214 |
| Majapahit Holding BV | 8.000% | 8/7/19 | 350 | 395 |
| Majapahit Holding BV | 7.750% | 1/20/20 | 1,025 | 1,155 |
| Majapahit Holding BV | 7.875% | 6/29/37 | 300 | 334 |
| 2 Pelabuhan Indonesia II PT | 4.250% | 5/5/25 | 600 | 552 |
| Pelabuhan Indonesia II PT | 4.250% | 5/5/25 | 400 | 367 |
| 2 Pelabuhan Indonesia III PT | 4.875% | 10/1/24 | 200 | 198 |
| Pertamina Persero PT | 5.250% | 5/23/21 | 450 | 459 |
| Pertamina Persero PT | 4.875% | 5/3/22 | 1,650 | 1,617 |
| 2 Pertamina Persero PT | 4.300% | 5/20/23 | 430 | 408 |
| Pertamina Persero PT | 6.500% | 5/27/41 | 200 | 187 |
| 2 Pertamina Persero PT | 6.000% | 5/3/42 | 750 | 647 |
| Pertamina Persero PT | 6.000% | 5/3/42 | 1,250 | 1,087 |
| 2 Pertamina Persero PT | 5.625% | 5/20/43 | 200 | 167 |
| Pertamina Persero PT | 5.625% | 5/20/43 | 425 | 354 |
| Pertamina Persero PT | 6.450% | 5/30/44 | 700 | 660 |
| 2 Perusahaan Gas Negara Persero Tbk PT | 5.125% | 5/16/24 | 400 | 401 |
| Perusahaan Gas Negara Persero Tbk PT | 5.125% | 5/16/24 | 400 | 394 |
| Perusahaan Listrik Negara PT | 5.500% | 11/22/21 | 750 | 772 |
| Perusahaan Listrik Negara PT | 5.250% | 10/24/42 | 500 | 411 |
| Perusahaan Penerbit SBSN Indonesia II | 4.000% | 11/21/18 | 600 | 629 |
| Perusahaan Penerbit SBSN Indonesia III | 6.125% | 3/15/19 | 400 | 439 |
| 2 Perusahaan Penerbit SBSN Indonesia III | 6.125% | 3/15/19 | 200 | 220 |
| Perusahaan Penerbit SBSN Indonesia III | 3.300% | 11/21/22 | 628 | 594 |
| 2 Perusahaan Penerbit SBSN Indonesia III | 4.350% | 9/10/24 | 600 | 584 |
| 6 Perusahaan Penerbit SBSN Indonesia III | 4.325% | 5/28/25 | 950 | 927 |
| Republic of Indonesia | 6.875% | 3/9/17 | 450 | 481 |
| Republic of Indonesia | 6.875% | 1/17/18 | 1,257 | 1,386 |
| Republic of Indonesia | 11.625% | 3/4/19 | 2,386 | 3,054 |
| Republic of Indonesia | 5.875% | 3/13/20 | 1,290 | 1,430 |
| 2 Republic of Indonesia | 5.875% | 3/13/20 | 350 | 388 |
| Republic of Indonesia | 4.875% | 5/5/21 | 1,650 | 1,735 |
| Republic of Indonesia | 3.750% | 4/25/22 | 950 | 938 |
| Republic of Indonesia | 3.375% | 4/15/23 | 800 | 760 |
| Republic of Indonesia | 5.375% | 10/17/23 | 709 | 759 |
| Republic of Indonesia | 5.875% | 1/15/24 | 750 | 823 |
| 2 Republic of Indonesia | 4.125% | 1/15/25 | 200 | 195 |
| Republic of Indonesia | 8.500% | 10/12/35 | 1,200 | 1,572 |
| Republic of Indonesia | 6.625% | 2/17/37 | 1,267 | 1,391 |
| Republic of Indonesia | 7.750% | 1/17/38 | 1,260 | 1,553 |
| Republic of Indonesia | 5.250% | 1/17/42 | 1,100 | 1,044 |
| Republic of Indonesia | 4.625% | 4/15/43 | 2,175 | 1,955 |
| Republic of Indonesia | 6.750% | 1/15/44 | 950 | 1,066 |
| 2 Republic of Indonesia | 6.750% | 1/15/44 | 100 | 113 |
| Republic of Indonesia | 5.125% | 1/15/45 | 1,300 | 1,212 |
| Total Indonesia (Cost $37,116) | | | | 36,536 |
21
| | | | |
| Emerging Markets Government Bond Index Fund | | | | |
| |
| |
| |
| | | | Face | Market |
| | | Maturity | Amount | Value• |
| | Coupon | Date | ($000) | ($000) |
| Iraq (0.2%) | | | | |
| Sovereign Bond (U.S. Dollar-Denominated) (0.2%) | | | | |
| Republic of Iraq | 5.800% | 1/15/28 | 1,610 | 1,179 |
| Total Iraq (Cost $1,389) | | | | 1,179 |
| Jamaica (0.4%) | | | | |
| Sovereign Bonds (U.S. Dollar-Denominated) (0.4%) | | | | |
| 1 Jamaica | 8.000% | 6/24/19 | 550 | 594 |
| 1 Jamaica | 7.625% | 7/9/25 | 450 | 491 |
| Jamaica | 6.750% | 4/28/28 | 600 | 610 |
| 1 Jamaica | 8.000% | 3/15/39 | 225 | 243 |
| Jamaica | 7.875% | 7/28/45 | 600 | 603 |
| Total Jamaica (Cost $2,461) | | | | 2,541 |
| Kazakhstan (2.0%) | | | | |
| Sovereign Bonds (U.S. Dollar-Denominated) (2.0%) | | | | |
| Development Bank of Kazakhstan JSC | 4.125% | 12/10/22 | 1,600 | 1,400 |
| Intergas Finance BV | 6.375% | 5/14/17 | 150 | 155 |
| KazAgro National Management Holding JSC | 4.625% | 5/24/23 | 600 | 486 |
| 2 Kazakhstan Temir Zholy Finance BV | 6.375% | 10/6/20 | 700 | 690 |
| Kazakhstan Temir Zholy Finance BV | 6.950% | 7/10/42 | 600 | 492 |
| KazMunayGas National Co. JSC | 9.125% | 7/2/18 | 925 | 1,021 |
| KazMunayGas National Co. JSC | 7.000% | 5/5/20 | 1,160 | 1,211 |
| KazMunayGas National Co. JSC | 6.375% | 4/9/21 | 1,230 | 1,246 |
| KazMunayGas National Co. JSC | 4.400% | 4/30/23 | 425 | 376 |
| KazMunayGas National Co. JSC | 4.875% | 5/7/25 | 200 | 177 |
| KazMunayGas National Co. JSC | 5.750% | 4/30/43 | 1,110 | 863 |
| 2 KazMunayGas National Co. JSC | 5.750% | 4/30/43 | 225 | 174 |
| KazMunayGas National Co. JSC | 6.000% | 11/7/44 | 300 | 238 |
| 2 KazMunayGas National Co. JSC | 6.000% | 11/7/44 | 200 | 157 |
| Republic of Kazakhstan | 3.875% | 10/14/24 | 1,400 | 1,316 |
| Republic of Kazakhstan | 5.125% | 7/21/25 | 1,500 | 1,492 |
| 2 Republic of Kazakhstan | 4.875% | 10/14/44 | 400 | 328 |
| Republic of Kazakhstan | 6.500% | 7/21/45 | 1,000 | 975 |
| Total Kazakhstan (Cost $13,530) | | | | 12,797 |
| Kenya (0.2%) | | | | |
| Sovereign Bonds (U.S. Dollar-Denominated) (0.2%) | | | | |
| 2 Republic of Kenya | 5.875% | 6/24/19 | 200 | 193 |
| Republic of Kenya | 6.875% | 6/24/24 | 1,200 | 1,119 |
| 2 Republic of Kenya | 6.875% | 6/24/24 | 200 | 185 |
| Total Kenya (Cost $1,677) | | | | 1,497 |
| Lebanon (1.8%) | | | | |
| Sovereign Bonds (U.S. Dollar-Denominated) (1.8%) | | | | |
| Republic of Lebanon | 4.750% | 11/2/16 | 250 | 250 |
| Republic of Lebanon | 9.000% | 3/20/17 | 500 | 527 |
| Republic of Lebanon | 5.000% | 10/12/17 | 825 | 821 |
| Republic of Lebanon | 5.150% | 6/12/18 | 150 | 149 |
| Republic of Lebanon | 5.150% | 11/12/18 | 475 | 469 |
| Republic of Lebanon | 5.500% | 4/23/19 | 50 | 50 |
| Republic of Lebanon | 6.000% | 5/20/19 | 450 | 454 |
| Republic of Lebanon | 5.450% | 11/28/19 | 925 | 911 |
| Republic of Lebanon | 6.375% | 3/9/20 | 1,066 | 1,087 |
| Republic of Lebanon | 8.250% | 4/12/21 | 1,380 | 1,515 |
| Republic of Lebanon | 6.100% | 10/4/22 | 708 | 703 |
22
| | | | |
| Emerging Markets Government Bond Index Fund | | | | |
| |
| |
| |
| | | | Face | Market |
| | | Maturity | Amount | Value• |
| | Coupon | Date | ($000) | ($000) |
| Republic of Lebanon | 6.000% | 1/27/23 | 1,185 | 1,166 |
| Republic of Lebanon | 6.200% | 2/26/25 | 100 | 98 |
| Republic of Lebanon | 6.250% | 6/12/25 | 400 | 392 |
| Republic of Lebanon | 6.600% | 11/27/26 | 1,100 | 1,103 |
| Republic of Lebanon | 6.750% | 11/29/27 | 961 | 968 |
| Republic of Lebanon | 6.650% | 2/26/30 | 1,100 | 1,089 |
| Total Lebanon (Cost $11,910) | | | | 11,752 |
| Malaysia (1.4%) | | | | |
| Sovereign Bonds (U.S. Dollar-Denominated) (1.4%) | | | | |
| Cagamas Global plc | 2.745% | 12/10/19 | 200 | 201 |
| Export-Import Bank of Malaysia Bhd. | 2.875% | 12/14/17 | 200 | 203 |
| 2 Federation of Malaysia | 4.646% | 7/6/21 | 250 | 272 |
| 1 Malayan Banking Berhad | 3.250% | 9/20/22 | 400 | 400 |
| Malaysia Sovereign Sukuk Bhd. | 3.043% | 4/22/25 | 700 | 675 |
| 7 Malaysia Sovereign Sukuk Bhd. | 4.236% | 4/22/45 | 550 | 510 |
| Petroliam Nasional Bhd. | 7.625% | 10/15/26 | 430 | 563 |
| Petronas Capital Ltd. | 5.250% | 8/12/19 | 863 | 943 |
| 2 Petronas Capital Ltd. | 5.250% | 8/12/19 | 1,423 | 1,552 |
| Petronas Capital Ltd. | 7.875% | 5/22/22 | 610 | 761 |
| 2 Petronas Capital Ltd. | 7.875% | 5/22/22 | 750 | 934 |
| Petronas Capital Ltd. | 3.500% | 3/18/25 | 650 | 629 |
| Petronas Capital Ltd. | 4.500% | 3/18/45 | 650 | 618 |
| Petronas Global Sukuk Ltd. | 2.707% | 3/18/20 | 600 | 597 |
| SSG Resources Ltd. | 4.250% | 10/4/22 | 400 | 398 |
| Total Malaysia (Cost $9,398) | | | | 9,256 |
| Mexico (8.0%) | | | | |
| Sovereign Bonds (U.S. Dollar-Denominated) (8.0%) | | | | |
| Banco Nacional de Comercio Exterior SNC | 4.375% | 10/14/25 | 500 | 501 |
| Comision Federal de Electricidad | 4.875% | 5/26/21 | 550 | 578 |
| Comision Federal de Electricidad | 4.875% | 1/15/24 | 400 | 408 |
| 2 Comision Federal de Electricidad | 4.875% | 1/15/24 | 600 | 619 |
| Comision Federal de Electricidad | 5.750% | 2/14/42 | 200 | 188 |
| 2 Comision Federal de Electricidad | 6.125% | 6/16/45 | 200 | 195 |
| Petroleos Mexicanos | 5.750% | 3/1/18 | 925 | 983 |
| Petroleos Mexicanos | 3.500% | 7/18/18 | 800 | 812 |
| Petroleos Mexicanos | 8.000% | 5/3/19 | 2,148 | 2,449 |
| Petroleos Mexicanos | 6.000% | 3/5/20 | 200 | 216 |
| 2 Petroleos Mexicanos | 3.500% | 7/23/20 | 300 | 297 |
| Petroleos Mexicanos | 5.500% | 1/21/21 | 1,289 | 1,376 |
| Petroleos Mexicanos | 4.875% | 1/24/22 | 1,950 | 1,991 |
| Petroleos Mexicanos | 3.500% | 1/30/23 | 1,350 | 1,252 |
| Petroleos Mexicanos | 4.875% | 1/18/24 | 1,569 | 1,568 |
| 2 Petroleos Mexicanos | 4.250% | 1/15/25 | 1,625 | 1,547 |
| 2 Petroleos Mexicanos | 4.500% | 1/23/26 | 1,200 | 1,151 |
| Petroleos Mexicanos | 6.625% | 6/15/35 | 2,005 | 1,987 |
| Petroleos Mexicanos | 6.500% | 6/2/41 | 1,770 | 1,700 |
| 2 Petroleos Mexicanos | 5.500% | 6/27/44 | 500 | 425 |
| Petroleos Mexicanos | 5.500% | 6/27/44 | 2,011 | 1,710 |
| Petroleos Mexicanos | 6.375% | 1/23/45 | 1,460 | 1,389 |
| Petroleos Mexicanos | 5.625% | 1/23/46 | 172 | 149 |
| 2 Petroleos Mexicanos | 5.625% | 1/23/46 | 1,900 | 1,644 |
| United Mexican States | 5.625% | 1/15/17 | 1,340 | 1,409 |
| United Mexican States | 5.950% | 3/19/19 | 1,195 | 1,351 |
| United Mexican States | 8.125% | 12/30/19 | 850 | 1,084 |
| United Mexican States | 5.125% | 1/15/20 | 1,580 | 1,750 |
23
| | | | | |
| Emerging Markets Government Bond Index Fund | | | | |
| |
| |
| |
| | | | | Face | Market |
| | | | Maturity | Amount | Value• |
| | | Coupon | Date | ($000) | ($000) |
| | United Mexican States | 3.500% | 1/21/21 | 675 | 694 |
| | United Mexican States | 3.625% | 3/15/22 | 2,632 | 2,689 |
| | United Mexican States | 4.000% | 10/2/23 | 1,841 | 1,902 |
| | United Mexican States | 3.600% | 1/30/25 | 2,549 | 2,540 |
| | United Mexican States | 8.300% | 8/15/31 | 720 | 1,058 |
| | United Mexican States | 7.500% | 4/8/33 | 490 | 656 |
| | United Mexican States | 6.750% | 9/27/34 | 906 | 1,118 |
| | United Mexican States | 6.050% | 1/11/40 | 1,764 | 1,993 |
| | United Mexican States | 4.750% | 3/8/44 | 2,420 | 2,312 |
| | United Mexican States | 5.550% | 1/21/45 | 2,085 | 2,234 |
| | United Mexican States | 4.600% | 1/23/46 | 1,875 | 1,754 |
| | United Mexican States | 5.750% | 10/12/10 | 2,200 | 2,163 |
| Total Mexico (Cost $53,511) | | | | 51,842 |
| Mongolia (0.2%) | | | | |
| Sovereign Bonds (U.S. Dollar-Denominated) (0.2%) | | | | |
| 8 | Development Bank of Mongolia LLC | 5.750% | 3/21/17 | 500 | 486 |
| | Mongolia | 4.125% | 1/5/18 | 200 | 186 |
| | Mongolia | 5.125% | 12/5/22 | 850 | 709 |
| 2,8 | Trade & Development Bank of Mongolia LLC | 9.375% | 5/19/20 | 200 | 200 |
| Total Mongolia (Cost $1,628) | | | | 1,581 |
| Morocco (0.6%) | | | | |
| Sovereign Bonds (U.S. Dollar-Denominated) (0.6%) | | | | |
| | Kingdom of Morocco | 4.250% | 12/11/22 | 1,300 | 1,306 |
| | Kingdom of Morocco | 5.500% | 12/11/42 | 425 | 427 |
| 2 | OCP SA | 5.625% | 4/25/24 | 100 | 104 |
| | OCP SA | 5.625% | 4/25/24 | 700 | 731 |
| 2 | OCP SA | 4.500% | 10/22/25 | 450 | 434 |
| | OCP SA | 4.500% | 10/22/25 | 500 | 478 |
| 2 | OCP SA | 6.875% | 4/25/44 | 200 | 208 |
| Total Morocco (Cost $3,680) | | | | 3,688 |
| Mozambique (0.0%) | | | | |
| Sovereign Bond (U.S. Dollar-Denominated) (0.0%) | | | | |
| 1,9 | Mozambique EMATUM Finance 2020 BV | 6.305% | 9/11/20 | 364 | 323 |
| Total Mozambique (Cost $352) | | | | 323 |
| Namibia (0.1%) | | | | |
| Sovereign Bonds (U.S. Dollar-Denominated) (0.1%) | | | | |
| | Republic of Namibia | 5.500% | 11/3/21 | 200 | 208 |
| | Republic of Namibia | 5.250% | 10/29/25 | 400 | 396 |
| Total Namibia (Cost $601) | | | | 604 |
| Nigeria (0.2%) | | | | |
| Sovereign Bonds (U.S. Dollar-Denominated) (0.2%) | | | | |
| 2 | Africa Finance Corp. | 4.375% | 4/29/20 | 350 | 354 |
| 2 | Federal Republic of Nigeria | 5.125% | 7/12/18 | 200 | 198 |
| | Federal Republic of Nigeria | 6.750% | 1/28/21 | 250 | 246 |
| | Federal Republic of Nigeria | 6.375% | 7/12/23 | 200 | 188 |
| Total Nigeria (Cost $1,012) | | | | 986 |
| Oman (0.1%) | | | | |
| Sovereign Bond (U.S. Dollar-Denominated) (0.1%) | | | | |
| | Lamar Funding Ltd. | 3.958% | 5/7/25 | 500 | 468 |
| Total Oman (Cost $503) | | | | 468 |
24
| | | | | |
| Emerging Markets Government Bond Index Fund | | | | |
| |
| |
| |
| | | | | Face | Market |
| | | | Maturity | Amount | Value• |
| | | Coupon | Date | ($000) | ($000) |
| Pakistan (0.4%) | | | | |
| Sovereign Bonds (U.S. Dollar-Denominated) (0.4%) | | | | |
| | Islamic Republic of Pakistan | 6.875% | 6/1/17 | 375 | 389 |
| | Islamic Republic of Pakistan | 7.250% | 4/15/19 | 600 | 624 |
| 2 | Islamic Republic of Pakistan | 7.250% | 4/15/19 | 400 | 415 |
| | Islamic Republic of Pakistan | 6.750% | 12/3/19 | 400 | 415 |
| | Islamic Republic of Pakistan | 8.250% | 4/15/24 | 400 | 425 |
| 2 | Islamic Republic of Pakistan | 8.250% | 4/15/24 | 250 | 266 |
| | Islamic Republic of Pakistan | 8.250% | 9/30/25 | 200 | 212 |
| Total Pakistan (Cost $2,670) | | | | 2,746 |
| Panama (1.1%) | | | | |
| Sovereign Bonds (U.S. Dollar-Denominated) (1.1%) | | | | |
| | Republic of Panama | 5.200% | 1/30/20 | 1,073 | 1,175 |
| 1 | Republic of Panama | 4.000% | 9/22/24 | 550 | 564 |
| 1 | Republic of Panama | 3.750% | 3/16/25 | 1,100 | 1,096 |
| | Republic of Panama | 7.125% | 1/29/26 | 500 | 633 |
| | Republic of Panama | 8.875% | 9/30/27 | 625 | 886 |
| | Republic of Panama | 9.375% | 4/1/29 | 450 | 665 |
| 1 | Republic of Panama | 6.700% | 1/26/36 | 1,647 | 2,043 |
| 1 | Republic of Panama | 4.300% | 4/29/53 | 400 | 357 |
| Total Panama (Cost $7,345) | | | | 7,419 |
| Paraguay (0.2%) | | | | |
| | Republic of Paraguay | 4.625% | 1/25/23 | 800 | 808 |
| | Republic of Paraguay | 6.100% | 8/11/44 | 500 | 508 |
| Total Paraguay (Cost $1,348) | | | | 1,316 |
| Peru (1.3%) | | | | |
| Sovereign Bonds (U.S. Dollar-Denominated) (1.3%) | | | | |
| 2 | Corp Financiera de Desarrollo SA | 3.250% | 7/15/19 | 250 | 250 |
| | Corp. Financiera de Desarrollo SA | 4.750% | 2/8/22 | 200 | 208 |
| | Fondo MIVIVIENDA SA | 3.500% | 1/31/23 | 500 | 477 |
| | Republic of Peru | 7.125% | 3/30/19 | 471 | 546 |
| | Republic of Peru | 7.350% | 7/21/25 | 1,268 | 1,638 |
| | Republic of Peru | 4.125% | 8/25/27 | 700 | 706 |
| | Republic of Peru | 8.750% | 11/21/33 | 1,510 | 2,214 |
| 1 | Republic of Peru | 6.550% | 3/14/37 | 661 | 801 |
| | Republic of Peru | 5.625% | 11/18/50 | 1,793 | 1,925 |
| Total Peru (Cost $8,925) | | | | 8,765 |
| Philippines (2.9%) | | | | |
| Sovereign Bonds (U.S. Dollar-Denominated) (2.9%) | | | | |
| 10 | Power Sector Assets & Liabilities | | | | |
| | Management Corp. | 6.875% | 11/2/16 | 200 | 210 |
| 10 | Power Sector Assets & Liabilities | | | | |
| | Management Corp. | 7.250% | 5/27/19 | 1,064 | 1,244 |
| 10 | Power Sector Assets & Liabilities | | | | |
| | Management Corp. | 7.390% | 12/2/24 | 600 | 787 |
| | Republic of the Philippines | 9.875% | 1/15/19 | 450 | 565 |
| | Republic of the Philippines | 8.375% | 6/17/19 | 816 | 1,006 |
| | Republic of the Philippines | 6.500% | 1/20/20 | 300 | 354 |
| | Republic of the Philippines | 4.000% | 1/15/21 | 910 | 992 |
| | Republic of the Philippines | 4.200% | 1/21/24 | 1,464 | 1,621 |
| | Republic of the Philippines | 10.625% | 3/16/25 | 584 | 932 |
| | Republic of the Philippines | 5.500% | 3/30/26 | 1,050 | 1,263 |
25
| | | | | |
| Emerging Markets Government Bond Index Fund | | | | |
| |
| |
| |
| | | | | Face | Market |
| | | | Maturity | Amount | Value• |
| | | Coupon | Date | ($000) | ($000) |
| | Republic of the Philippines | 9.500% | 2/2/30 | 953 | 1,534 |
| | Republic of the Philippines | 7.750% | 1/14/31 | 1,554 | 2,238 |
| | Republic of the Philippines | 6.375% | 1/15/32 | 800 | 1,048 |
| | Republic of the Philippines | 6.375% | 10/23/34 | 1,450 | 1,938 |
| | Republic of the Philippines | 5.000% | 1/13/37 | 1,480 | 1,765 |
| | Republic of the Philippines | 3.950% | 1/20/40 | 1,200 | 1,242 |
| Total Philippines (Cost $18,208) | | | | 18,739 |
| Poland (1.4%) | | | | |
| Sovereign Bonds (U.S. Dollar-Denominated) (1.4%) | | | | |
| | Republic of Poland | 6.375% | 7/15/19 | 2,191 | 2,542 |
| | Republic of Poland | 5.125% | 4/21/21 | 1,210 | 1,369 |
| | Republic of Poland | 5.000% | 3/23/22 | 2,234 | 2,515 |
| | Republic of Poland | 3.000% | 3/17/23 | 1,175 | 1,187 |
| | Republic of Poland | 4.000% | 1/22/24 | 1,668 | 1,778 |
| Total Poland (Cost $9,165) | | | | 9,391 |
| Qatar (3.3%) | | | | |
| Sovereign Bonds (U.S. Dollar-Denominated) (3.3%) | | | | |
| 1,2 | Nakilat Inc. | 6.067% | 12/31/33 | 500 | 578 |
| 2 | Ooredoo International Finance Ltd. | 7.875% | 6/10/19 | 300 | 359 |
| 2 | Ooredoo International Finance Ltd. | 4.750% | 2/16/21 | 500 | 554 |
| 2 | Ooredoo International Finance Ltd. | 3.250% | 2/21/23 | 650 | 646 |
| 2 | Ooredoo International Finance Ltd. | 5.000% | 10/19/25 | 700 | 767 |
| 2 | Ooredoo International Finance Ltd. | 3.875% | 1/31/28 | 1,750 | 1,703 |
| | Ooredoo Tamweel Ltd. | 3.039% | 12/3/18 | 225 | 230 |
| 2,11 Qatari Diar Finance QSC | 5.000% | 7/21/20 | 950 | 1,065 |
| | QNB Finance Ltd. | 3.375% | 2/22/17 | 1,050 | 1,072 |
| | QNB Finance Ltd. | 2.125% | 2/14/18 | 200 | 200 |
| | QNB Finance Ltd. | 2.750% | 10/31/18 | 400 | 404 |
| | QNB Finance Ltd. | 2.875% | 4/29/20 | 1,200 | 1,226 |
| 1,2 | Ras Laffan Liquefied Natural Gas Co. Ltd. II | 5.298% | 9/30/20 | 263 | 284 |
| 2 | Ras Laffan Liquefied Natural Gas Co. Ltd. III | 6.750% | 9/30/19 | 250 | 293 |
| 1,2 | Ras Laffan Liquefied Natural Gas Co. Ltd. III | 5.838% | 9/30/27 | 770 | 875 |
| 1,2 | Ras Laffan Liquefied Natural Gas Co. Ltd. III | 6.332% | 9/30/27 | 250 | 294 |
| 2 | State of Qatar | 3.125% | 1/20/17 | 1,025 | 1,052 |
| 11 | State of Qatar | 2.099% | 1/18/18 | 1,700 | 1,734 |
| 2 | State of Qatar | 6.550% | 4/9/19 | 450 | 526 |
| 2 | State of Qatar | 5.250% | 1/20/20 | 1,207 | 1,362 |
| | State of Qatar | 5.250% | 1/20/20 | 1,100 | 1,243 |
| 2 | State of Qatar | 4.500% | 1/20/22 | 1,050 | 1,167 |
| 11 | State of Qatar | 3.241% | 1/18/23 | 575 | 598 |
| 2 | State of Qatar | 9.750% | 6/15/30 | 600 | 984 |
| | State of Qatar | 9.750% | 6/15/30 | 75 | 123 |
| 2 | State of Qatar | 6.400% | 1/20/40 | 500 | 665 |
| | State of Qatar | 6.400% | 1/20/40 | 102 | 135 |
| 2 | State of Qatar | 5.750% | 1/20/42 | 616 | 766 |
| | State of Qatar | 5.750% | 1/20/42 | 200 | 248 |
| Total Qatar (Cost $20,657) | | | | 21,153 |
| Romania (0.6%) | | | | |
| Sovereign Bonds (U.S. Dollar-Denominated) (0.6%) | | | | |
| | Republic of Romania | 6.750% | 2/7/22 | 1,726 | 2,056 |
| | Republic of Romania | 4.375% | 8/22/23 | 1,254 | 1,318 |
| 2 | Republic of Romania | 4.875% | 1/22/24 | 100 | 109 |
26
| | | | |
| Emerging Markets Government Bond Index Fund | | | | |
| |
| |
| |
| | | | Face | Market |
| | | Maturity | Amount | Value• |
| | Coupon | Date | ($000) | ($000) |
| 2 Republic of Romania | 6.125% | 1/22/44 | 200 | 237 |
| Republic of Romania | 6.125% | 1/22/44 | 320 | 379 |
| Total Romania (Cost $3,960) | | | | 4,099 |
| Russia (9.2%) | | | | |
| Sovereign Bonds (U.S. Dollar-Denominated) (9.2%) | | | | |
| AK Transneft OJSC Via TransCapitalInvest Ltd. | 8.700% | 8/7/18 | 420 | 464 |
| Gazprom Neft OAO Via GPN Capital SA | 4.376% | 9/19/22 | 600 | 534 |
| Gazprom Neft OAO Via GPN Capital SA | 6.000% | 11/27/23 | 950 | 920 |
| 2 Gazprom Neft OAO Via GPN Capital SA | 6.000% | 11/27/23 | 200 | 193 |
| Gazprom OAO Via Gaz Capital SA | 6.212% | 11/22/16 | 495 | 513 |
| Gazprom OAO Via Gaz Capital SA | 8.146% | 4/11/18 | 900 | 976 |
| Gazprom OAO Via Gaz Capital SA | 9.250% | 4/23/19 | 2,100 | 2,362 |
| Gazprom OAO Via Gaz Capital SA | 3.850% | 2/6/20 | 678 | 641 |
| Gazprom OAO Via Gaz Capital SA | 5.999% | 1/23/21 | 700 | 709 |
| Gazprom OAO Via Gaz Capital SA | 6.510% | 3/7/22 | 925 | 962 |
| Gazprom OAO Via Gaz Capital SA | 4.950% | 7/19/22 | 350 | 338 |
| Gazprom OAO Via Gaz Capital SA | 4.950% | 2/6/28 | 650 | 574 |
| Gazprom OAO Via Gaz Capital SA | 8.625% | 4/28/34 | 525 | 599 |
| Gazprom OAO Via Gaz Capital SA | 7.288% | 8/16/37 | 725 | 740 |
| Gazprombank OJSC Via GPB | | | | |
| Eurobond Finance plc | 5.625% | 5/17/17 | 600 | 611 |
| Gazprombank OJSC Via GPB | | | | |
| Eurobond Finance plc | 7.250% | 5/3/19 | 200 | 203 |
| Gazprombank OJSC Via GPB | | | | |
| Eurobond Finance plc | 4.960% | 9/5/19 | 900 | 878 |
| Rosneft Finance SA | 6.625% | 3/20/17 | 500 | 516 |
| 2 Rosneft Finance SA | 7.875% | 3/13/18 | 100 | 107 |
| Rosneft Finance SA | 7.875% | 3/13/18 | 850 | 901 |
| Rosneft Finance SA | 7.250% | 2/2/20 | 200 | 211 |
| Rosneft Oil Co. via Rosneft | | | | |
| International Finance Ltd. | 3.149% | 3/6/17 | 800 | 788 |
| Rosneft Oil Co. via Rosneft | | | | |
| International Finance Ltd. | 4.199% | 3/6/22 | 977 | 874 |
| Russian Agricultural Bank OJSC | | | | |
| Via RSHB Capital SA | 6.299% | 5/15/17 | 300 | 306 |
| Russian Agricultural Bank OJSC | | | | |
| Via RSHB Capital SA | 5.298% | 12/27/17 | 618 | 623 |
| Russian Agricultural Bank OJSC | | | | |
| Via RSHB Capital SA | 7.750% | 5/29/18 | 400 | 425 |
| Russian Agricultural Bank OJSC | | | | |
| Via RSHB Capital SA | 5.100% | 7/25/18 | 1,500 | 1,496 |
| 2 Russian Agricultural Bank OJSC | | | | |
| Via RSHB Capital SA | 5.100% | 7/25/18 | 100 | 100 |
| Russian Federation | 3.250% | 4/4/17 | 1,000 | 1,009 |
| Russian Federation | 11.000% | 7/24/18 | 1,803 | 2,159 |
| Russian Federation | 3.500% | 1/16/19 | 600 | 605 |
| 2 Russian Federation | 3.500% | 1/16/19 | 300 | 302 |
| Russian Federation | 5.000% | 4/29/20 | 2,400 | 2,526 |
| Russian Federation | 4.500% | 4/4/22 | 1,200 | 1,230 |
| Russian Federation | 4.875% | 9/16/23 | 2,200 | 2,280 |
| 2 Russian Federation | 4.875% | 9/16/23 | 200 | 206 |
| Russian Federation | 12.750% | 6/24/28 | 1,375 | 2,241 |
| 1 Russian Federation | 7.500% | 3/31/30 | 8,338 | 9,914 |
| Russian Federation | 5.625% | 4/4/42 | 2,200 | 2,200 |
| Russian Federation | 5.875% | 9/16/43 | 800 | 824 |
27
| | | | |
| Emerging Markets Government Bond Index Fund | | | | |
| |
| |
| |
| | | | Face | Market |
| | | Maturity | Amount | Value• |
| | Coupon | Date | ($000) | ($000) |
| Russian Railways via RZD Capital plc | 5.739% | 4/3/17 | 636 | 653 |
| Russian Railways via RZD Capital plc | 5.700% | 4/5/22 | 1,100 | 1,093 |
| Sberbank of Russia Via SB Capital SA | 4.950% | 2/7/17 | 825 | 837 |
| Sberbank of Russia Via SB Capital SA | 5.400% | 3/24/17 | 1,150 | 1,176 |
| Sberbank of Russia Via SB Capital SA | 5.180% | 6/28/19 | 750 | 760 |
| Sberbank of Russia Via SB Capital SA | 5.717% | 6/16/21 | 800 | 804 |
| Sberbank of Russia Via SB Capital SA | 6.125% | 2/7/22 | 800 | 819 |
| Sberbank of Russia Via SB Capital SA | 5.125% | 10/29/22 | 974 | 911 |
| SCF Capital Ltd. | 5.375% | 10/27/17 | 200 | 198 |
| Vnesheconombank Via VEB Finance plc | 5.375% | 2/13/17 | 300 | 303 |
| Vnesheconombank Via VEB Finance plc | 4.224% | 11/21/18 | 1,000 | 973 |
| Vnesheconombank Via VEB Finance plc | 6.902% | 7/9/20 | 550 | 562 |
| Vnesheconombank Via VEB Finance plc | 6.025% | 7/5/22 | 725 | 703 |
| Vnesheconombank Via VEB Finance plc | 5.942% | 11/21/23 | 1,125 | 1,077 |
| 2 Vnesheconombank Via VEB Finance plc | 5.942% | 11/21/23 | 200 | 191 |
| Vnesheconombank Via VEB Finance plc | 6.800% | 11/22/25 | 450 | 441 |
| VTB Bank OJSC Via VTB Capital SA | 6.000% | 4/12/17 | 925 | 949 |
| VTB Bank OJSC Via VTB Capital SA | 6.315% | 2/22/18 | 400 | 414 |
| VTB Bank OJSC Via VTB Capital SA | 6.875% | 5/29/18 | 875 | 918 |
| VTB Bank OJSC Via VTB Capital SA | 6.551% | 10/13/20 | 1,050 | 1,085 |
| VTB Bank OJSC Via VTB Capital SA | 6.950% | 10/17/22 | 975 | 932 |
| Total Russia (Cost $58,212) | | | | 59,859 |
| Saudi Arabia (0.7%) | | | | |
| Sovereign Bonds (U.S. Dollar-Denominated) (0.7%) | | | | |
| SABIC Capital II BV | 2.625% | 10/3/18 | 400 | 403 |
| Saudi Electricity Global Sukuk Co. | 2.665% | 4/3/17 | 400 | 404 |
| Saudi Electricity Global Sukuk Co. | 4.211% | 4/3/22 | 625 | 659 |
| Saudi Electricity Global Sukuk Co. 2 | 3.473% | 4/8/23 | 550 | 551 |
| Saudi Electricity Global Sukuk Co. 2 | 5.060% | 4/8/43 | 700 | 632 |
| 2 Saudi Electricity Global Sukuk Co. 3 | 4.000% | 4/8/24 | 650 | 667 |
| Saudi Electricity Global Sukuk Co. 3 | 4.000% | 4/8/24 | 350 | 359 |
| Saudi Electricity Global Sukuk Co. 3 | 5.500% | 4/8/44 | 500 | 476 |
| 2 Saudi Electricity Global Sukuk Co. 3 | 5.500% | 4/8/44 | 300 | 290 |
| Total Saudi Arabia (Cost $4,525) | | | | 4,441 |
| Senegal (0.1%) | | | | |
| Sovereign Bonds (U.S. Dollar-Denominated) (0.1%) | | | | |
| Republic of Senegal | 8.750% | 5/13/21 | 500 | 539 |
| Republic of Senegal | 6.250% | 7/30/24 | 200 | 187 |
| Total Senegal (Cost $743) | | | | 726 |
| Serbia, Republic Of (0.6%) | | | | |
| Sovereign Bonds (U.S. Dollar-Denominated) (0.6%) | | | | |
| Republic of Serbia | 5.250% | 11/21/17 | 720 | 752 |
| Republic of Serbia | 5.875% | 12/3/18 | 800 | 849 |
| 2 Republic of Serbia | 5.875% | 12/3/18 | 200 | 212 |
| Republic of Serbia | 4.875% | 2/25/20 | 400 | 414 |
| Republic of Serbia | 7.250% | 9/28/21 | 1,600 | 1,832 |
| Total Serbia, Republic Of (Cost $3,964) | | | | 4,059 |
| Singapore (0.2%) | | | | |
| Sovereign Bond (U.S. Dollar-Denominated) (0.2%) | | | | |
| COSL Singapore Capital Ltd. | 3.500% | 7/30/20 | 1,000 | 1,017 |
| Total Singapore (Cost $1,018) | | | | 1,017 |
28
| | | | | |
| Emerging Markets Government Bond Index Fund | | | | |
| |
| |
| |
| | | | | Face | Market |
| | | | Maturity | Amount | Value• |
| | | Coupon | Date | ($000) | ($000) |
| South Africa (1.6%) | | | | |
| Sovereign Bonds (U.S. Dollar-Denominated) (1.6%) | | | | |
| | Eskom Holdings SOC Ltd. | 5.750% | 1/26/21 | 1,500 | 1,399 |
| | Eskom Holdings SOC Ltd. | 6.750% | 8/6/23 | 880 | 819 |
| 2 | Eskom Holdings SOC Ltd. | 7.125% | 2/11/25 | 200 | 187 |
| | Eskom Holdings SOC Ltd. | 7.125% | 2/11/25 | 450 | 419 |
| | Republic of South Africa | 6.875% | 5/27/19 | 1,295 | 1,441 |
| | Republic of South Africa | 5.500% | 3/9/20 | 1,020 | 1,091 |
| | Republic of South Africa | 5.875% | 5/30/22 | 571 | 627 |
| | Republic of South Africa | 4.665% | 1/17/24 | 900 | 908 |
| | Republic of South Africa | 5.875% | 9/16/25 | 1,600 | 1,736 |
| | Republic of South Africa | 6.250% | 3/8/41 | 561 | 624 |
| | Republic of South Africa | 5.375% | 7/24/44 | 500 | 491 |
| 2 | Transnet SOC Ltd. | 4.000% | 7/26/22 | 600 | 567 |
| Total South Africa (Cost $10,552) | | | | 10,309 |
| Sri Lanka (0.8%) | | | | |
| Sovereign Bonds (U.S. Dollar-Denominated) (0.8%) | | | | |
| | Bank of Ceylon | 6.875% | 5/3/17 | 250 | 255 |
| | Bank of Ceylon | 5.325% | 4/16/18 | 200 | 200 |
| 2 | Democratic Socialist Republic of Sri Lanka | 6.000% | 1/14/19 | 200 | 201 |
| | Democratic Socialist Republic of Sri Lanka | 6.000% | 1/14/19 | 400 | 400 |
| 2 | Democratic Socialist Republic of Sri Lanka | 5.125% | 4/11/19 | 250 | 246 |
| | Democratic Socialist Republic of Sri Lanka | 6.250% | 10/4/20 | 632 | 631 |
| | Democratic Socialist Republic of Sri Lanka | 6.250% | 7/27/21 | 1,150 | 1,137 |
| | Democratic Socialist Republic of Sri Lanka | 5.875% | 7/25/22 | 800 | 766 |
| | Democratic Socialist Republic of Sri Lanka | 6.850% | 11/3/25 | 1,000 | 994 |
| | National Savings Bank | 8.875% | 9/18/18 | 400 | 428 |
| Total Sri Lanka (Cost $5,362) | | | | 5,258 |
| Thailand (0.2%) | | | | |
| Sovereign Bonds (U.S. Dollar-Denominated) (0.2%) | | | | |
| | Krung Thai Bank PCL | 2.250% | 9/11/18 | 200 | 198 |
| 1 | Krung Thai Bank PCL | 5.200% | 12/26/24 | 450 | 459 |
| | PTT PCL | 4.500% | 10/25/42 | 400 | 364 |
| | PTT Public Co. Ltd. | 3.375% | 10/25/22 | 225 | 222 |
| Total Thailand (Cost $1,237) | | | | 1,243 |
| Trinidad And Tobago (0.1%) | | | | |
| Sovereign Bonds (U.S. Dollar-Denominated) (0.1%) | | | | |
| 2 | Petroleum Co. of Trinidad & Tobago Ltd. | 9.750% | 8/14/19 | 300 | 322 |
| 2 | Republic of Trinidad & Tobago | 4.375% | 1/16/24 | 200 | 214 |
| Total Trinidad And Tobago (Cost $558) | | | | 536 |
| Tunisia (0.1%) | | | | |
| Sovereign Bond (U.S. Dollar-Denominated) (0.1%) | | | | |
| | Banque Centrale de Tunisie SA | 5.750% | 1/30/25 | 1,000 | 935 |
| Total Tunisia (Cost $989) | | | | 935 |
| Turkey (5.6%) | | | | |
| Sovereign Bonds (U.S. Dollar-Denominated) (5.6%) | | | | |
| | Export Credit Bank of Turkey | 5.375% | 11/4/16 | 450 | 463 |
| | Export Credit Bank of Turkey | 5.875% | 4/24/19 | 600 | 629 |
| 2 | Export Credit Bank of Turkey | 5.000% | 9/23/21 | 400 | 398 |
| | Export Credit Bank of Turkey | 5.000% | 9/23/21 | 500 | 499 |
| | Hazine Mustesarligi Varlik Kiralama AS | 4.557% | 10/10/18 | 250 | 260 |
29
| | | | | |
| Emerging Markets Government Bond Index Fund | | | | |
| |
| |
| |
| | | | | Face | Market |
| | | | Maturity | Amount | Value• |
| | | Coupon | Date | ($000) | ($000) |
| 2 | Hazine Mustesarligi Varlik Kiralama AS | 4.489% | 11/25/24 | 400 | 392 |
| | Republic of Turkey | 7.500% | 7/14/17 | 1,591 | 1,724 |
| 12 | Republic of Turkey | 2.803% | 3/26/18 | 700 | 696 |
| | Republic of Turkey | 6.750% | 4/3/18 | 1,287 | 1,401 |
| 2 | Republic of Turkey | 4.557% | 10/10/18 | 150 | 156 |
| | Republic of Turkey | 7.000% | 3/11/19 | 2,040 | 2,280 |
| | Republic of Turkey | 7.500% | 11/7/19 | 2,166 | 2,494 |
| | Republic of Turkey | 7.000% | 6/5/20 | 630 | 716 |
| | Republic of Turkey | 5.625% | 3/30/21 | 901 | 972 |
| | Republic of Turkey | 5.125% | 3/25/22 | 825 | 863 |
| | Republic of Turkey | 6.250% | 9/26/22 | 1,404 | 1,562 |
| | Republic of Turkey | 3.250% | 3/23/23 | 1,201 | 1,117 |
| | Republic of Turkey | 5.750% | 3/22/24 | 1,650 | 1,784 |
| | Republic of Turkey | 7.375% | 2/5/25 | 2,700 | 3,233 |
| | Republic of Turkey | 4.250% | 4/14/26 | 200 | 192 |
| | Republic of Turkey | 11.875% | 1/15/30 | 775 | 1,295 |
| | Republic of Turkey | 8.000% | 2/14/34 | 702 | 902 |
| | Republic of Turkey | 6.875% | 3/17/36 | 2,298 | 2,651 |
| | Republic of Turkey | 7.250% | 3/5/38 | 335 | 404 |
| | Republic of Turkey | 6.750% | 5/30/40 | 1,110 | 1,270 |
| | Republic of Turkey | 6.000% | 1/14/41 | 1,800 | 1,900 |
| | Republic of Turkey | 4.875% | 4/16/43 | 2,466 | 2,224 |
| | Republic of Turkey | 6.625% | 2/17/45 | 900 | 1,038 |
| 2 | TC Ziraat Bankasi AS | 4.250% | 7/3/19 | 200 | 198 |
| | Turkiye Halk Bankasi AS | 4.875% | 7/19/17 | 425 | 436 |
| 2 | Turkiye Halk Bankasi AS | 4.750% | 6/4/19 | 250 | 250 |
| | Turkiye Halk Bankasi AS | 3.875% | 2/5/20 | 400 | 383 |
| | Turkiye Halk Bankasi AS | 4.750% | 2/11/21 | 200 | 195 |
| | Turkiye Vakiflar Bankasi Tao | 5.750% | 4/24/17 | 200 | 208 |
| | Turkiye Vakiflar Bankasi Tao | 3.750% | 4/15/18 | 200 | 198 |
| | Turkiye Vakiflar Bankasi Tao | 5.000% | 10/31/18 | 200 | 203 |
| | Turkiye Vakiflar Bankasi Tao | 6.000% | 11/1/22 | 400 | 380 |
| 1 | Turkiye Vakiflar Bankasi Tao | 6.875% | 2/3/25 | 200 | 195 |
| Total Turkey (Cost $36,065) | | | | 36,161 |
| Ukraine (1.1%) | | | | |
| Sovereign Bonds (U.S. Dollar-Denominated) (1.1%) | | | | |
| 13 | Financing of Infrastructural Projects | | | | |
| | State Enterprise | 8.375% | 11/3/17 | 500 | 390 |
| 13 | Financing of Infrastructural Projects | | | | |
| | State Enterprise | 9.000% | 12/7/17 | 200 | 156 |
| 13 | Financing of Infrastructural Projects | | | | |
| | State Enterprise | 7.400% | 4/20/18 | 200 | 156 |
| 1 | Oschadbank Via SSB #1 plc | 9.625% | 3/20/25 | 500 | 433 |
| 2 | Oschadbank Via SSB #1 plc | 9.625% | 3/20/25 | 200 | 173 |
| | Ukraine | 6.580% | 11/21/16 | 723 | 564 |
| | Ukraine | 9.250% | 7/24/17 | 1,328 | 1,036 |
| | Ukraine | 6.750% | 11/14/17 | 800 | 624 |
| 3 | Ukraine | 7.750% | 9/23/20 | 1,227 | 957 |
| | Ukraine | 7.950% | 2/23/21 | 650 | 507 |
| | Ukraine | 7.800% | 11/28/22 | 1,180 | 920 |
| 3 | Ukraine | 7.500% | 4/17/23 | 800 | 634 |
| 2 | Ukraine Railways via Shortline plc | 9.500% | 5/21/18 | 200 | 159 |
| 1 | Ukreximbank Via Biz Finance plc | 9.625% | 4/27/22 | 600 | 544 |
| 1,2 | Ukreximbank Via Biz Finance plc | 9.750% | 1/22/25 | 200 | 177 |
| Total Ukraine (Cost $7,604) | | | | 7,430 |
30
| | | | | |
| Emerging Markets Government Bond Index Fund | | | | |
| |
| |
| |
| | | | | Face | Market |
| | | | Maturity | Amount | Value• |
| | | Coupon | Date | ($000) | ($000) |
| United Arab Emirates (5.0%) | | | | |
| Sovereign Bonds (U.S. Dollar-Denominated) (5.0%) | | | | |
| 2 | Abu Dhabi National Energy Co. PJSC | 5.875% | 10/27/16 | 685 | 712 |
| 2 | Abu Dhabi National Energy Co. PJSC | 4.125% | 3/13/17 | 400 | 412 |
| 2 | Abu Dhabi National Energy Co. PJSC | 6.165% | 10/25/17 | 850 | 916 |
| 2 | Abu Dhabi National Energy Co. PJSC | 2.500% | 1/12/18 | 400 | 401 |
| 2 | Abu Dhabi National Energy Co. PJSC | 6.250% | 9/16/19 | 275 | 311 |
| 2 | Abu Dhabi National Energy Co. PJSC | 5.875% | 12/13/21 | 200 | 226 |
| 2 | Abu Dhabi National Energy Co. PJSC | 3.625% | 1/12/23 | 1,800 | 1,773 |
| | Abu Dhabi National Energy Co. PJSC | 3.875% | 5/6/24 | 200 | 197 |
| 2 | Abu Dhabi National Energy Co. PJSC | 6.500% | 10/27/36 | 825 | 1,022 |
| | ADCB Finance Cayman Ltd. | 1.619% | 1/9/17 | 200 | 200 |
| | ADCB Finance Cayman Ltd. | 2.500% | 3/6/18 | 1,000 | 1,006 |
| | ADCB Finance Cayman Ltd. | 3.000% | 3/4/19 | 400 | 407 |
| | ADCB Finance Cayman Ltd. | 2.625% | 3/10/20 | 400 | 399 |
| | ADCB Finance Cayman Ltd. | 4.500% | 3/6/23 | 425 | 431 |
| | ADCB Islamic Finance Cayman Ltd. | 4.071% | 11/22/16 | 720 | 738 |
| | AHB Sukuk Co. Ltd. | 3.267% | 10/8/18 | 200 | 206 |
| | DEWA Sukuk 2013 Ltd. | 3.000% | 3/5/18 | 650 | 666 |
| 1,2 | Dolphin Energy Ltd. | 5.888% | 6/15/19 | 263 | 282 |
| 2 | Dolphin Energy Ltd. | 5.500% | 12/15/21 | 620 | 699 |
| | DP World Ltd. | 3.250% | 5/18/20 | 1,250 | 1,256 |
| 2 | DP World Ltd. | 6.850% | 7/2/37 | 950 | 1,017 |
| 2 | DP World Sukuk Ltd. | 6.250% | 7/2/17 | 670 | 714 |
| | Dubai DOF Sukuk Ltd. | 6.450% | 5/2/22 | 200 | 237 |
| 2 | Dubai Electricity & Water Authority | 7.375% | 10/21/20 | 775 | 934 |
| 2 | Emirate of Abu Dhabi | 6.750% | 4/8/19 | 1,625 | 1,910 |
| | Emirate of Dubai | 4.900% | 5/2/17 | 200 | 210 |
| | Emirate of Dubai | 7.750% | 10/5/20 | 500 | 614 |
| | Emirate of Dubai | 3.875% | 1/30/23 | 600 | 615 |
| | Emirate of Dubai | 5.250% | 1/30/43 | 200 | 175 |
| 1,2 | Emirates Airline | 4.500% | 2/6/25 | 326 | 331 |
| | Emirates NBD PJSC | 4.625% | 3/28/17 | 675 | 697 |
| | Emirates NBD PJSC | 3.250% | 11/19/19 | 335 | 340 |
| 1 | Emirates NBD PJSC | 4.875% | 3/28/23 | 450 | 465 |
| | Emirates Telecommunications Corp. | 2.375% | 6/18/19 | 600 | 601 |
| | Emirates Telecommunications Corp. | 3.500% | 6/18/24 | 200 | 205 |
| | ICD Sukuk Co. Ltd. | 3.508% | 5/21/20 | 250 | 249 |
| 2 | IPIC GMTN Ltd. | 3.750% | 3/1/17 | 945 | 972 |
| 2 | IPIC GMTN Ltd. | 5.000% | 11/15/20 | 900 | 1,006 |
| 2 | IPIC GMTN Ltd. | 5.500% | 3/1/22 | 710 | 808 |
| 2 | IPIC GMTN Ltd. | 6.875% | 11/1/41 | 400 | 536 |
| | Jafz Sukuk Ltd. | 7.000% | 6/19/19 | 400 | 453 |
| 2 | MDC-GMTN B.V. | 7.625% | 5/6/19 | 500 | 590 |
| 2 | MDC-GMTN B.V. | 5.500% | 4/20/21 | 450 | 513 |
| | MDC-GMTN B.V. | 3.250% | 4/28/22 | 500 | 509 |
| 2 | MDC-GMTN B.V. | 3.250% | 4/28/22 | 200 | 204 |
| 1 | Medjool Ltd. | 3.875% | 3/19/23 | 284 | 289 |
| 2 | Mubadala GE Capital Ltd. | 3.000% | 11/10/19 | 200 | 199 |
| | National Bank of Abu Dhabi PJSC | 3.250% | 3/27/17 | 400 | 408 |
| | National Bank of Abu Dhabi PJSC | 3.000% | 8/13/19 | 400 | 412 |
| | National Bank of Abu Dhabi PJSC | 2.250% | 2/11/20 | 425 | 425 |
| 2 | NOVA Chemicals Corp. | 5.250% | 8/1/23 | 400 | 402 |
| | RAK Capital | 3.297% | 10/21/18 | 200 | 206 |
| | RAK Capital | 3.094% | 3/31/25 | 500 | 484 |
| | RAKFunding Cayman Ltd. | 3.250% | 6/24/19 | 950 | 950 |
31
| | | | | |
| Emerging Markets Government Bond Index Fund | | | | |
| |
| |
| |
| | | | | Face | Market |
| | | | Maturity | Amount | Value• |
| | | Coupon | Date | ($000) | ($000) |
| 1 | Ruwais Power Co. PJSC | 6.000% | 8/31/36 | 400 | 451 |
| | Sharjah Sukuk Ltd. | 3.764% | 9/17/24 | 400 | 418 |
| | Union National Bank PJSC | 3.875% | 11/10/16 | 200 | 203 |
| 1,2 | Waha Aerospace BV | 3.925% | 7/28/20 | 740 | 772 |
| Total United Arab Emirates (Cost $32,570) | | | | 32,784 |
| United States (0.0%) | | | | |
| U.S. Government and Agency Obligations (0.0%) | | | | |
| | United States Treasury Note/Bond | 5.125% | 5/15/16 | 15 | 16 |
| | United States Treasury Note/Bond | 0.500% | 2/28/17 | 20 | 20 |
| | United States Treasury Note/Bond | 0.875% | 2/28/17 | 5 | 5 |
| | United States Treasury Note/Bond | 3.000% | 2/28/17 | 10 | 10 |
| | United States Treasury Note/Bond | 2.125% | 8/15/21 | 5 | 5 |
| | United States Treasury Note/Bond | 2.750% | 2/15/24 | 35 | 37 |
| | United States Treasury Note/Bond | 3.750% | 8/15/41 | 5 | 6 |
| Total United States (Cost $98) | | | | 99 |
| Uruguay (1.0%) | | | | |
| Sovereign Bonds (U.S. Dollar-Denominated) (1.0%) | | | | |
| 1 | Kingdom of Uruguay | 4.375% | 10/27/27 | 375 | 373 |
| 1 | Oriental Republic of Uruguay | 8.000% | 11/18/22 | 738 | 932 |
| 1 | Oriental Republic of Uruguay | 4.500% | 8/14/24 | 1,221 | 1,262 |
| | Oriental Republic of Uruguay | 7.875% | 1/15/33 | 346 | 447 |
| 1 | Oriental Republic of Uruguay | 7.625% | 3/21/36 | 686 | 872 |
| 1 | Oriental Republic of Uruguay | 4.125% | 11/20/45 | 350 | 286 |
| 1 | Oriental Republic of Uruguay | 5.100% | 6/18/50 | 2,470 | 2,223 |
| Total Uruguay (Cost $6,614) | | | | 6,395 |
| Venezuela (2.8%) | | | | |
| Sovereign Bonds (U.S. Dollar-Denominated) (2.8%) | | | | |
| | Bolivarian Republic of Venezuela | 13.625% | 8/15/18 | 566 | 340 |
| | Bolivarian Republic of Venezuela | 7.000% | 12/1/18 | 1,010 | 434 |
| | Bolivarian Republic of Venezuela | 7.750% | 10/13/19 | 2,956 | 1,157 |
| | Bolivarian Republic of Venezuela | 6.000% | 12/9/20 | 1,956 | 729 |
| 1 | Bolivarian Republic of Venezuela | 12.750% | 8/23/22 | 640 | 304 |
| | Bolivarian Republic of Venezuela | 9.000% | 5/7/23 | 1,651 | 640 |
| | Bolivarian Republic of Venezuela | 8.250% | 10/13/24 | 859 | 321 |
| | Bolivarian Republic of Venezuela | 7.650% | 4/21/25 | 1,350 | 503 |
| | Bolivarian Republic of Venezuela | 11.750% | 10/21/26 | 1,427 | 621 |
| | Bolivarian Republic of Venezuela | 9.250% | 9/15/27 | 1,972 | 850 |
| | Bolivarian Republic of Venezuela | 9.250% | 5/7/28 | 540 | 208 |
| 1 | Bolivarian Republic of Venezuela | 11.950% | 8/5/31 | 3,329 | 1,453 |
| | Bolivarian Republic of Venezuela | 9.375% | 1/13/34 | 700 | 271 |
| | Bolivarian Republic of Venezuela | 7.000% | 3/31/38 | 1,375 | 481 |
| | CA La Electricidad de Caracas | 8.500% | 4/10/18 | 200 | 85 |
| 2 | CITGO Holding Inc. | 10.750% | 2/15/20 | 650 | 653 |
| | CITGO Holding Inc. | 10.750% | 2/15/20 | 100 | 100 |
| | CITGO Petroleum Corp. | 6.250% | 8/15/22 | 100 | 98 |
| 2 | CITGO Petroleum Corp. | 6.250% | 8/15/22 | 200 | 197 |
| | Petroleos de Venezuela SA | 5.250% | 4/12/17 | 1,750 | 983 |
| 1 | Petroleos de Venezuela SA | 8.500% | 11/2/17 | 3,408 | 2,062 |
| 1 | Petroleos de Venezuela SA | 9.000% | 11/17/21 | 1,858 | 776 |
| 1 | Petroleos de Venezuela SA | 12.750% | 2/17/22 | 1,805 | 893 |
| 1 | Petroleos de Venezuela SA | 6.000% | 5/16/24 | 2,500 | 888 |
| 1 | Petroleos de Venezuela SA | 6.000% | 11/15/26 | 3,166 | 1,108 |
| | Petroleos de Venezuela SA | 5.375% | 4/12/27 | 3,345 | 1,146 |
32
| | | | | |
| Emerging Markets Government Bond Index Fund | | | | |
| |
| |
| | | | | Face | Market |
| | | | Maturity | Amount | Value• |
| | | Coupon | Date | ($000) | ($000) |
| 1 | Petroleos de Venezuela SA | 9.750% | 5/17/35 | 2,063 | 856 |
| | Petroleos de Venezuela SA | 5.500% | 4/12/37 | 1,160 | 394 |
| Total Venezuela (Cost $25,294) | | | | 18,551 |
| Vietnam (0.2%) | | | | |
| Sovereign Bonds (U.S. Dollar-Denominated) (0.2%) | | | | |
| | Socialist Republic of Vietnam | 6.750% | 1/29/20 | 519 | 574 |
| | Socialist Republic of Vietnam | 4.800% | 11/19/24 | 800 | 780 |
| 2 | Socialist Republic of Vietnam | 4.800% | 11/19/24 | 200 | 196 |
| Total Vietnam (Cost $1,557) | | | | 1,550 |
| Zambia (0.3%) | | | | |
| Sovereign Bonds (U.S. Dollar-Denominated) (0.3%) | | | | |
| | Republic of Zambia | 5.375% | 9/20/22 | 725 | 539 |
| 2 | Republic of Zambia | 8.500% | 4/14/24 | 450 | 380 |
| | Republic of Zambia | 8.500% | 4/14/24 | 600 | 506 |
| 1 | Republic of Zambia | 8.970% | 7/30/27 | 300 | 253 |
| Total Zambia (Cost $1,962) | | | | 1,678 |
| |
| | | | | Shares | |
| Temporary Cash Investments (1.2%) | | | | |
| 14 | Vanguard Market Liquidity Fund (Cost $7,970) | 0.207% | | 7,970,128 | 7,970 |
| Total Temporary Cash Investments (Cost $7,970) | | | | 7,970 |
| Total Investments (99.2%) (Cost $659,510) | | | | 645,118 |
| |
| | | | | | Amount |
| | | | | | ($000) |
| Other Assets and Liabilities (0.8%) | | | | |
| Other Assets | | | | |
| Investment in Vanguard | | | | 57 |
| Receivables for Investment Securities Sold | | | | 4,033 |
| Receivables for Accrued Income | | | | 8,903 |
| Receivables for Capital Shares Issued | | | | 42 |
| Total Other Assets | | | | 13,035 |
| Liabilities | | | | |
| Payables for Investment Securities Purchased | | | | (6,875) |
| Payables for Capital Shares Redeemed | | | | (44) |
| Payables for Distributions | | | | (77) |
| Payables to Vanguard | | | | (184) |
| Other Liabilities | | | | (423) |
| Total Liabilities | | | | (7,603) |
| Net Assets (100%) | | | | 650,550 |
33
| |
| Emerging Markets Government Bond Index Fund | |
| |
| |
| At October 31, 2015, net assets consisted of: | |
| | Amount |
| | ($000) |
| Paid-in Capital | 667,178 |
| Undistributed Net Investment Income | 1,443 |
| Accumulated Net Realized Losses | (3,679) |
| Unrealized Appreciation (Depreciation) | (14,392) |
| Net Assets | 650,550 |
| |
| Investor Shares—Net Assets | |
| Applicable to 950,264 outstanding $.001 par value shares of | |
| beneficial interest (unlimited authorization) | 9,030 |
| Net Asset Value Per Share—Investor Shares | $9.50 |
| |
| ETF Shares—Net Assets | |
| Applicable to 6,604,981 outstanding $.001 par value shares of | |
| beneficial interest (unlimited authorization) | 500,693 |
| Net Asset Value Per Share—ETF Shares | $75.81 |
| |
| Admiral Shares—Net Assets | |
| Applicable to 6,873,774 outstanding $.001 par value shares of | |
| beneficial interest (unlimited authorization) | 130,623 |
| Net Asset Value Per Share—Admiral Shares | $19.00 |
| |
| Institutional Shares—Net Assets | |
| Applicable to 334,597 outstanding $.001 par value shares of | |
| beneficial interest (unlimited authorization) | 10,204 |
| Net Asset Value Per Share—Institutional Shares | $30.50 |
• See Note A in Notes to Financial Statements.
1 The average or expected maturity is shorter than the final maturity shown because of the possibility of interim principal payments
and prepayments or the possibility of the issue being called.
2 Security exempt from registration under Rule 144A of the Securities Act of 1933. Such securities may be sold in transactions exempt
from registration, normally to qualified institutional buyers. At October 31, 2015, the aggregate value of these securities was
$86,683,000, representing 13.3% of net assets.
3 Non-income-producing security—security in default.
4 Adjustable-rate security.
5 Guaranteed by the Republic of Hungary.
6 Guaranteed by the Republic of Indonesia.
7 Guaranteed by the Federation of Malaysia.
8 Guaranteed by the Government of Mongolia.
9 Guaranteed by the Republic of Mozambique.
10 Guaranteed by the Republic of the Philippines.
11 Guaranteed by the State of Qatar.
12 Guaranteed by the Republic of Turkey.
13 Guaranteed by the Govenment of the Ukraine.
14 Affiliated money market fund available only to Vanguard funds and certain trusts and accounts managed by Vanguard. Rate shown is
the 7-day yield.
See accompanying Notes, which are an integral part of the Financial Statements.
34
Emerging Markets Government Bond Index Fund
Statement of Operations
| |
| | Year Ended |
| | October 31, 2015 |
| | ($000) |
| Investment Income | |
| Income | |
| Interest1 | 24,234 |
| Total Income | 24,234 |
| Expenses | |
| The Vanguard Group—Note B | |
| Investment Advisory Services | 11 |
| Management and Administrative—Investor Shares | 35 |
| Management and Administrative—ETF Shares | 1,043 |
| Management and Administrative—Admiral Shares | 365 |
| Management and Administrative—Institutional Shares | 22 |
| Marketing and Distribution—Investor Shares | — |
| Marketing and Distribution—ETF Shares | 37 |
| Marketing and Distribution—Admiral Shares | 10 |
| Marketing and Distribution—Institutional Shares | — |
| Custodian Fees | 37 |
| Auditing Fees | 45 |
| Shareholders’ Reports—Investor Shares | 7 |
| Shareholders’ Reports—ETF Shares | 9 |
| Shareholders’ Reports—Admiral Shares | — |
| Shareholders’ Reports—Institutional Shares | — |
| Total Expenses | 1,621 |
| Net Investment Income | 22,613 |
| Realized Net Gain (Loss) | |
| Investment Securities Sold | (3,830) |
| Futures Contracts | 4 |
| Realized Net Gain (Loss) | (3,826) |
| Change in Unrealized Appreciation (Depreciation) of Investment Securities | (18,102) |
| Net Increase (Decrease) in Net Assets Resulting from Operations | 685 |
| 1 Interest income from an affiliated company of the fund was $5,000. |
See accompanying Notes, which are an integral part of the Financial Statements.
35
Emerging Markets Government Bond Index Fund
Statement of Changes in Net Assets
| | |
| | Year Ended October 31, |
| | 2015 | 2014 |
| | ($000) | ($000) |
| Increase (Decrease) in Net Assets | | |
| Operations | | |
| Net Investment Income | 22,613 | 11,445 |
| Realized Net Gain (Loss) | (3,826) | 282 |
| Change in Unrealized Appreciation (Depreciation) | (18,102) | 6,002 |
| Net Increase (Decrease) in Net Assets Resulting from Operations | 685 | 17,729 |
| Distributions | | |
| Net Investment Income | | |
| Investor Shares | (399) | (251) |
| ETF Shares | (15,477) | (6,640) |
| Admiral Shares | (5,622) | (4,147) |
| Institutional Shares | (388) | — |
| Realized Capital Gain | | |
| Investor Shares | — | — |
| ETF Shares | — | — |
| Admiral Shares | — | — |
| Institutional Shares | — | — |
| Total Distributions | (21,886) | (11,038) |
| Capital Share Transactions | | |
| Investor Shares | 2,155 | 2,919 |
| ETF Shares | 292,555 | 132,526 |
| Admiral Shares | 18,272 | 61,205 |
| Institutional Shares | 10,675 | — |
| Net Increase (Decrease) from Capital Share Transactions | 323,657 | 196,650 |
| Total Increase (Decrease) | 302,456 | 203,341 |
| Net Assets | | |
| Beginning of Period | 348,094 | 144,753 |
| End of Period1 | 650,550 | 348,094 |
| 1 Net Assets—End of Period includes undistributed net investment income of $1,443,000 and $716,000. |
See accompanying Notes, which are an integral part of the Financial Statements.
36
Emerging Markets Government Bond Index Fund
Financial Highlights
| | | |
| Investor Shares | | | |
| | | | May 14, |
| | Year Ended | 20131 to |
| | October 31, | Oct. 31, |
| For a Share Outstanding Throughout Each Period | 2015 | 2014 | 2013 |
| Net Asset Value, Beginning of Period | $9.95 | $9.74 | $10.00 |
| Investment Operations | | | |
| Net Investment Income | . 427 | . 417 | .149 |
| Net Realized and Unrealized Gain (Loss) on Investments2 | (. 447) | . 213 | (. 261) |
| Total from Investment Operations | (. 020) | . 630 | (.112) |
| Distributions | | | |
| Dividends from Net Investment Income | (.430) | (.420) | (.148) |
| Distributions from Realized Capital Gains | — | — | — |
| Total Distributions | (. 430) | (.420) | (.148) |
| Net Asset Value, End of Period | $9.50 | $9.95 | $9.74 |
| |
| Total Return3 | -0.16% | 6.62% | -1.38% |
| |
| Ratios/Supplemental Data | | | |
| Net Assets, End of Period (Millions) | $9 | $7 | $4 |
| Ratio of Total Expenses to Average Net Assets | 0.49% | 0.49% | 0.49% 4 |
| Ratio of Net Investment Income to Average Net Assets | 4.52% | 4.35% | 3.81%4 |
| Portfolio Turnover Rate 5 | 20% | 27% | 38% |
1 Subscription period for the fund was May 14, 2013, to May 30, 2013, during which time all assets were held in money market instruments.
Performance measurement began May 31, 2013, at a net asset value of $10.03.
2 Includes increases from purchase fees of $.01, $.00, and $.03.
3 Total returns do not include transaction or account service fees that may have applied in the periods shown. Fund prospectuses provide
information about any applicable transaction and account service fees.
4 Annualized.
5 Excludes the value of portfolio securities received or delivered as a result of in-kind purchases or redemptions of the fund’s capital shares,
including ETF Creation Units.
See accompanying Notes, which are an integral part of the Financial Statements.
37
Emerging Markets Government Bond Index Fund
Financial Highlights
| | | |
| ETF Shares | | | |
| | | | May 31, |
| | Year Ended | 20131 to |
| | October 31, | Oct. 31, |
| For a Share Outstanding Throughout Each Period | 2015 | 2014 | 2013 |
| Net Asset Value, Beginning of Period | $79.40 | $77.71 | $79.52 |
| Investment Operations | | | |
| Net Investment Income | 3.516 | 3.429 | 1.217 |
| Net Realized and Unrealized Gain (Loss) on Investments2 | (3.556) | 1.700 | (2.086) |
| Total from Investment Operations | (.040) | 5.129 | (. 869) |
| Distributions | | | |
| Dividends from Net Investment Income | (3.550) | (3.439) | (.941) |
| Distributions from Realized Capital Gains | — | — | — |
| Total Distributions | (3.550) | (3.439) | (.941) |
| Net Asset Value, End of Period | $75.81 | $79.40 | $77.71 |
| |
| Total Return | -0.01% | 6.79% | -1.39% |
| |
| Ratios/Supplemental Data | | | |
| Net Assets, End of Period (Millions) | $501 | $222 | $85 |
| Ratio of Total Expenses to Average Net Assets | 0.34% | 0.34% | 0.35%3 |
| Ratio of Net Investment Income to Average Net Assets | 4.67% | 4.50% | 3.95%3 |
| Portfolio Turnover Rate 4 | 20% | 27% | 38% |
1 Inception.
2 Includes increases from purchase fees of $.06, $.01, and $.30.
3 Annualized.
4 Excludes the value of portfolio securities received or delivered as a result of in-kind purchases or redemptions of the fund’s capital shares,
including ETF Creation Units.
See accompanying Notes, which are an integral part of the Financial Statements.
38
Emerging Markets Government Bond Index Fund
Financial Highlights
| | | |
| Admiral Shares | | | |
| | | | May 14, |
| | Year Ended | 20131 to |
| | October 31, | Oct. 31, |
| For a Share Outstanding Throughout Each Period | 2015 | 2014 | 2013 |
| Net Asset Value, Beginning of Period | $19.90 | $19.48 | $20.00 |
| Investment Operations | | | |
| Net Investment Income | . 885 | . 863 | . 309 |
| Net Realized and Unrealized Gain (Loss) on Investments2 | (. 894) | .427 | (. 522) |
| Total from Investment Operations | (.009) | 1.290 | (.213) |
| Distributions | | | |
| Dividends from Net Investment Income | (. 891) | (. 870) | (. 307) |
| Distributions from Realized Capital Gains | — | — | — |
| Total Distributions | (. 891) | (. 870) | (. 307) |
| Net Asset Value, End of Period | $19.00 | $19.90 | $19.48 |
| |
| Total Return3 | 0% | 6.78% | -1.37% |
| |
| Ratios/Supplemental Data | | | |
| Net Assets, End of Period (Millions) | $131 | $118 | $55 |
| Ratio of Total Expenses to Average Net Assets | 0.33% | 0.34% | 0.34%4 |
| Ratio of Net Investment Income to Average Net Assets | 4.68% | 4.50% | 3.96%4 |
| Portfolio Turnover Rate 5 | 20% | 27% | 38% |
1 Subscription period for the fund was May 14, 2013, to May 30, 2013, during which time all assets were held in money market instruments.
Performance measurement began May 31, 2013, at a net asset value of $20.07.
2 Includes increases from purchase fees of $.02, $.00, and $.06.
3 Total returns do not include transaction or account service fees that may have applied in the periods shown. Fund prospectuses provide
information about any applicable transaction and account service fees.
4 Annualized.
5 Excludes the value of portfolio securities received or delivered as a result of in-kind purchases or redemptions of the fund’s capital shares,
including ETF Creation Units.
See accompanying Notes, which are an integral part of the Financial Statements.
39
Emerging Markets Government Bond Index Fund
Financial Highlights
| | |
| Institutional Shares | | |
| | Feb. 11, | Nov. 25, |
| | 20151 to | 20141 to |
| | Oct. 31, | Dec. 18, |
| For a Share Outstanding Throughout Each Period | 2015 | 2014 |
| Net Asset Value, Beginning of Period | $30.72 | $31.53 |
| Investment Operations | | |
| Net Investment Income | 1.019 | .108 |
| Net Realized and Unrealized Gain (Loss) on Investments2 | (.159) | (1.240) |
| Total from Investment Operations | .860 | (1.132) |
| Distributions | | |
| Dividends from Net Investment Income | (1.080) | (.108) |
| Distributions from Realized Capital Gains | — | — |
| Total Distributions | (1.080) | (.108) |
| Net Asset Value, End of Period | $30.50 | $30.29 |
| |
| Total Return 3 | 2.82% | -3.60% |
| |
| Ratios/Supplemental Data | | |
| Net Assets, End of Period (Millions) | $10 | $0 |
| Ratio of Total Expenses to Average Net Assets | 0.29% | 0.30% |
| Ratio of Net Investment Income to Average Net Assets | 4.75% | 4.72% |
| Portfolio Turnover Rate4 | 20%5 | 20%5 |
The expense ratio and net income ratio for the periods presented have been annualized.
1 The class commenced operations on November 25, 2014. On December 18, 2014, all outstanding shares were redeemed and the Net Asset
Value represents the per share amount at which such shares were redeemed. On February 11, 2015 the class recommenced operations.
2 Aggregate purchase fees for the periods presented are $.04.
3 Total returns do not include transaction or account service fees that may have applied in the period shown. Fund prospectuses provide
information about any applicable transaction and account service fees.
4 Excludes the value of portfolio securities received or delivered as a result of in-kind purchases or redemptions of the fund’s capital shares,
including ETF Creation Units.
5 Reflects the fund’s portfolio turnover for the fiscal year ended October 31, 2015.
See accompanying Notes, which are an integral part of the Financial Statements.
40
Emerging Markets Government Bond Index Fund
Notes to Financial Statements
Vanguard Emerging Markets Government Bond Index Fund is registered under the Investment Company Act of 1940 as an open-end investment company, or mutual fund. The fund invests in securities of foreign issuers, which may subject it to investment risks not normally associated with investing in securities of U.S. corporations. The fund offers four classes of shares: Investor Shares, ETF Shares, Admiral Shares, and Institutional Shares. Investor Shares are available to any investor who meets the fund’s minimum purchase requirements. ETF Shares are listed for trading on Nasdaq; they can be purchased and sold through a broker. Admiral Shares and Institutional Shares are designed for investors who meet certain administrative, service, and account-size criteria. Institutional Shares were first issued on November 25, 2014, and were redeemed shortly thereafter. Institutional Shares were next issued on February 11, 2015.
A. The following significant accounting policies conform to generally accepted accounting principles for U.S. investment companies. The fund consistently follows such policies in preparing its financial statements.
1. Security Valuation: Securities are valued as of the close of trading on the New York Stock Exchange (generally 4 p.m., Eastern time) on the valuation date. Bonds, and temporary cash investments acquired over 60 days to maturity, are valued using the latest bid prices or using valuations based on a matrix system (which considers such factors as security prices, yields, maturities, and ratings), both as furnished by independent pricing services. Investments in Vanguard Market Liquidity Fund are valued at that fund’s net asset value. Other temporary cash investments are valued at amortized cost, which approximates market value. Securities for which market quotations are not readily available, or whose values have been affected by events occurring before the fund’s pricing time but after the close of the securities’ primary markets, are valued at their fair values calculated according to procedures adopted by the board of trustees. These procedures include obtaining quotations from an independent pricing service, monitoring news to identify significant market- or security-specific events, and evaluating changes in the values of foreign market proxies (for example, ADRs, futures contracts, or exchange-traded funds), between the time the foreign markets close and the fund’s pricing time. When fair-value pricing is employed, the prices of securities used by a fund to calculate its net asset value may differ from quoted or published prices for the same securities.
2. Futures Contracts: The fund uses futures contracts to invest in fixed income asset classes with greater efficiency and lower cost than is possible through direct investment, to add value when these instruments are attractively priced, or to adjust sensitivity to changes in interest rates. The primary risks associated with the use of futures contracts are imperfect correlation between changes in market values of bonds held by the fund and the prices of futures contracts, and the possibility of an illiquid market. Counterparty risk involving futures is mitigated because a regulated clearinghouse is the counterparty instead of the clearing broker. To further mitigate counterparty risk, the fund trades futures contracts on an exchange, monitors the financial strength of its clearing brokers and clearing-house, and has entered into clearing agreements with its clearing brokers. The clearinghouse imposes initial margin requirements to secure the fund’s performance and requires daily settlement of variation margin representing changes in the market value of each contract.
Futures contracts are valued at their quoted daily settlement prices. The aggregate settlement values of the contracts are not recorded in the Statement of Net Assets. Fluctuations in the value of the contracts are recorded in the Statement of Net Assets as an asset (liability) and in the Statement of Operations as unrealized appreciation (depreciation) until the contracts are closed, when they are recorded as realized futures gains (losses).
41
Emerging Markets Government Bond Index Fund
During the year ended October 31, 2015, the fund’s average investments in long and short futures contracts each represented less than 1% of net assets, based on the average of aggregate settlement values at each quarter-end during the period. The fund had no open futures contracts at October 31, 2015.
3. Federal Income Taxes: The fund intends to continue to qualify as a regulated investment company and distribute all of its taxable income. Management has analyzed the fund’s tax positions taken for all open federal income tax years (October 31, 2013–2015), and has concluded that no provision for federal income tax is required in the fund’s financial statements.
4. Distributions: Distributions to shareholders are recorded on the ex-dividend date.
5. Credit Facility: The fund and certain other funds managed by The Vanguard Group (“Vanguard”) participate in a $3 billion committed credit facility provided by a syndicate of lenders pursuant to a credit agreement that may be renewed annually; each fund is individually liable for its borrowings, if any, under the credit facility. Borrowings may be utilized for temporary and emergency purposes, and are subject to the fund’s regulatory and contractual borrowing restrictions. The participating funds are charged administrative fees and an annual commitment fee of 0.06% of the undrawn amount of the facility; these fees are allocated to the funds based on a method approved by the fund’s board of trustees and included in Management and Administrative expenses on the fund’s Statement of Operations. Any borrowings under this facility bear interest at a rate equal to the higher of the federal funds rate or LIBOR reference rate plus an agreed-upon spread.
The fund had no borrowings outstanding at October 31, 2015, or at any time during the period then ended.
6. Other: Interest income includes income distributions received from Vanguard Market Liquidity Fund and is accrued daily. Premiums and discounts on debt securities purchased are amortized and accreted, respectively, to interest income over the lives of the respective securities. Security transactions are accounted for on the date securities are bought or sold. Costs used to determine realized gains (losses) on the sale of investment securities are those of the specific securities sold. Fees assessed on capital share transactions are credited to paid-in capital.
Each class of shares has equal rights as to assets and earnings, except that each class separately bears certain class-specific expenses related to maintenance of shareholder accounts (included in Management and Administrative expenses) and shareholder reporting. Marketing and distribution expenses are allocated to each class of shares based on a method approved by the board of trustees. Income, other non-class-specific expenses, and gains and losses on investments are allocated to each class of shares based on its relative net assets.
B. In accordance with the terms of a Funds’ Service Agreement (the “FSA”) between Vanguard and the fund, Vanguard furnishes to the fund investment advisory, corporate management, administrative, marketing, and distribution services at Vanguard’s cost of operations (as defined by the FSA). These costs of operations are allocated to the fund based on methods and guidelines approved by the board of trustees. Vanguard does not require reimbursement in the current period for certain costs of operations (such as deferred compensation/benefits and risk/insurance costs); the fund’s liability for these costs of operations is included in Payables to Vanguard on the Statement of Net Assets.
42
Emerging Markets Government Bond Index Fund
Upon the request of Vanguard, the fund may invest up to 0.40% of its net assets as capital in Vanguard. At October 31, 2015, the fund had contributed to Vanguard capital in the amount of $57,000, representing 0.01% of the fund’s net assets and 0.02% of Vanguard’s capitalization. The fund’s trustees and officers are also directors and employees, respectively, of Vanguard.
C. Various inputs may be used to determine the value of the fund’s investments. These inputs are summarized in three broad levels for financial statement purposes. The inputs or methodologies used to value securities are not necessarily an indication of the risk associated with investing in those securities.
Level 1—Quoted prices in active markets for identical securities.
Level 2—Other significant observable inputs (including quoted prices for similar securities, interest rates, prepayment speeds, credit risk, etc.).
Level 3—Significant unobservable inputs (including the fund’s own assumptions used to determine the fair value of investments).
The following table summarizes the market value of the fund’s investments as of October 31, 2015, based on the inputs used to value them:
| | | |
| | Level 1 | Level 2 | Level 3 |
| Investments | ($000) | ($000) | ($000) |
| U.S. Government and Agency Obligations | — | 99 | — |
| Sovereign Bonds | — | 637,049 | — |
| Temporary Cash Investments | 7,970 | — | — |
| Total | 7,970 | 637,148 | — |
D. Distributions are determined on a tax basis and may differ from net investment income and realized capital gains for financial reporting purposes. Differences may be permanent or temporary. Permanent differences are reclassified among capital accounts in the financial statements to reflect their tax character. Temporary differences arise when certain items of income, expense, gain, or loss are recognized in different periods for financial statement and tax purposes. These differences will reverse at some time in the future. Differences in classification may also result from the treatment of short-term gains as ordinary income for tax purposes.
During the year ended October 31, 2015, the fund realized $531,000 of net capital losses resulting from in-kind redemptions—in which shareholders exchanged fund shares for securities held by the fund rather than for cash. Because such losses are not taxable losses to the fund, they have been reclassified from accumulated net realized losses to paid-in capital.
For tax purposes, at October 31, 2015, the fund had available capital losses totaling $3,679,000 that may be carried forward indefinitely to offset future net capital gains.
At October 31, 2015, the cost of investment securities for tax purposes was $659,510,000. Net unrealized depreciation of investment securities for tax purposes was $14,392,000, consisting of unrealized gains of $8,460,000 on securities that had risen in value since their purchase and $22,852,000 in unrealized losses on securities that had fallen in value since their purchase.
43
Emerging Markets Government Bond Index Fund
E. During the year ended October 31, 2015, the fund purchased $454,101,000 of investment securities and sold $138,702,000 of investment securities, other than U.S. government securities and temporary cash investments. Purchases and sales of U.S. government securities were $1,451,000 and $1,416,000, respectively. Total purchases and sales include $294,300,000 and $44,716,000, respectively, in connection with in-kind purchases and redemptions of the fund’s capital shares.
F. Capital share transactions for each class of shares were:
| | | | |
| | Year Ended October 31, |
| | 2015 | 2014 |
| | Amount | Shares | Amount | Shares |
| | ($000) | (000) | ($000) | 000) |
| Investor Shares | | | | |
| Issued1 | 6,261 | 646 | 7,000 | 712 |
| Issued in Lieu of Cash Distributions | 339 | 35 | 234 | 24 |
| Redeemed | (4,445) | (461) | (4,315) | (438) |
| Net Increase (Decrease)—Investor Shares | 2,155 | 220 | 2,919 | 298 |
| ETF Shares | | | | |
| Issued1 | 338,399 | 4,403 | 148,304 | 1,902 |
| Issued in Lieu of Cash Distributions | — | — | — | — |
| Redeemed | (45,844) | (600) | (15,778) | (200) |
| Net Increase (Decrease)—ETF Shares | 292,555 | 3,803 | 132,526 | 1,702 |
| Admiral Shares | | | | |
| Issued1 | 53,419 | 2,758 | 78,630 | 4,007 |
| Issued in Lieu of Cash Distributions | 4,782 | 249 | 3,473 | 176 |
| Redeemed | (39,929) | (2,079) | (20,898) | (1,063) |
| Net Increase (Decrease)—Admiral Shares | 18,272 | 928 | 61,205 | 3,120 |
| Institutional Shares2 | | | | |
| Issued1 | 19,856 | 637 | — | — |
| Issued in Lieu of Cash Distributions | 354 | 12 | — | — |
| Redeemed | (9,535) | (315) | — | — |
| Net Increase (Decrease)—Institutional Shares | 10,675 | 334 | — | — |
| 1 Includes purchase fees for fiscal 2015 and 2014 of $592,000 and $62,000, respectively (fund totals). |
| 2 Institutional shares were first issued on November 25, 2014, and were redeemed shortly thereafter. Institutional shares were next issued |
| on February 11, 2015. The table reflects all Institutional transactions beginning November 25, 2014. |
G. Management has determined that no material events or transactions occurred subsequent to October 31, 2015, that would require recognition or disclosure in these financial statements.
44
Report of Independent Registered
Public Accounting Firm
To the Board of Trustees of Vanguard Whitehall Funds and the Shareholders of Vanguard Emerging Markets Government Bond Index Fund: In our opinion, the accompanying statement of net assets and the related statements of operations and of changes in net assets and the financial highlights present fairly, in all material respects, the financial position of Vanguard Emerging Markets Government Bond Index Fund (constituting a separate portfolio of Vanguard Whitehall Funds, hereafter referred to as the “Fund”) at October 31, 2015, the results of its operations for the year then ended, the changes in its net assets for each of the two years in the period then ended, and the financial highlights for each of the periods indicated, in conformity with accounting principles generally accepted in the United States of America. These financial statements and financial highlights (hereafter referred to as “financial statements”) are the responsibility of the Fund’s management. Our responsibility is to express an opinion on these financial statements based on our audits. We conducted our audits of these financial statements in accordance with the standards of the Public Company Accounting Oversight Board (United States). Those standards require that we plan and perform the audit to obtain reasonable assurance about whether the financial statements are free of material misstatement. An audit includes examining, on a test basis, evidence supporting the amounts and disclosures in the financial statements, assessing the accounting principles used and significant estimates made by management, and evaluating the overall financial statement presentation. We believe that our audits, which included confirmation of securities at October 31, 2015 by correspondence with the custodian and brokers, by agreement to the underlying ownership records of the transfer agent and the application of alternative auditing procedures where securities purchased had not been received, provide a reasonable basis for our opinion.
/s/PricewaterhouseCoopers LLP
Philadelphia, Pennsylvania
December 15, 2015
45
About Your Fund’s Expenses
As a shareholder of the fund, you incur ongoing costs, which include costs for portfolio management, administrative services, and shareholder reports (like this one), among others. Operating expenses, which are deducted from a fund’s gross income, directly reduce the investment return of the fund.
A fund’s expenses are expressed as a percentage of its average net assets. This figure is known as the expense ratio. The following examples are intended to help you understand the ongoing costs (in dollars) of investing in your fund and to compare these costs with those of other mutual funds. The examples are based on an investment of $1,000 made at the beginning of the period shown and held for the entire period.
The accompanying table illustrates your fund’s costs in two ways:
• Based on actual fund return. This section helps you to estimate the actual expenses that you paid over the period. The ”Ending Account Value“ shown is derived from the fund‘s actual return, and the third column shows the dollar amount that would have been paid by an investor who started with $1,000 in the fund. You may use the information here, together with the amount you invested, to estimate the expenses that you paid over the period.
To do so, simply divide your account value by $1,000 (for example, an $8,600 account value divided by $1,000 = 8.6), then multiply the result by the number given for your fund under the heading ”Expenses Paid During Period.“
• Based on hypothetical 5% yearly return. This section is intended to help you compare your fund‘s costs with those of other mutual funds. It assumes that the fund had a yearly return of 5% before expenses, but that the expense ratio is unchanged. In this case—because the return used is not the fund’s actual return—the results do not apply to your investment. The example is useful in making comparisons because the Securities and Exchange Commission requires all mutual funds to calculate expenses based on a 5% return. You can assess your fund’s costs by comparing this hypothetical example with the hypothetical examples that appear in shareholder reports of other funds.
Note that the expenses shown in the table are meant to highlight and help you compare ongoing costs only and do not reflect transaction costs incurred by the fund for buying and selling securities. Further, the expenses do not include any purchase, redemption, or account service fees described in the fund prospectus. If such fees were applied to your account, your costs would be higher. Your fund does not carry a “sales load.”
The calculations assume no shares were bought or sold during the period. Your actual costs may have been higher or lower, depending on the amount of your investment and the timing of any purchases or redemptions.
You can find more information about the fund’s expenses, including annual expense ratios, in the Financial Statements section of this report. For additional information on operating expenses and other shareholder costs, please refer to your fund’s current prospectus.
46
| | | |
| Six Months Ended October 31, 2015 | | | |
| | Beginning | Ending | Expenses |
| | Account Value | Account Value | Paid During |
| Emerging Markets Government Bond Index Fund | 4/30/2015 | 10/31/2015 | Period |
| Based on Actual Fund Return | | | |
| Investor Shares | $1,000.00 | $988.37 | $2.46 |
| ETF Shares | 1,000.00 | 988.93 | 1.75 |
| Admiral Shares | 1,000.00 | 988.64 | 1.70 |
| Institutional Shares | 1,000.00 | 989.29 | 1.50 |
| Based on Hypothetical 5% Yearly Return | | | |
| Investor Shares | $1,000.00 | $1,022.74 | $2.50 |
| ETF Shares | 1,000.00 | 1,023.44 | 1.79 |
| Admiral Shares | 1,000.00 | 1,023.49 | 1.73 |
| Institutional Shares | 1,000.00 | 1,023.69 | 1.53 |
The calculations are based on expenses incurred in the most recent six-month period. The fund’s annualized six-month expense ratios for that
period are 0.49% for Investor Shares, 0.35% for ETF Shares, 0.34% for Admiral Shares, and 0.30% for Institutional Shares. The dollar
amounts shown as “Expenses Paid” are equal to the annualized expense ratio multiplied by the average account value over the period,
multiplied by the number of days in the most recent six-month period, then divided by the number of days in the most recent 12-month period
(184/365).
47
Glossary
30-Day SEC Yield. A fund’s 30-day SEC yield is derived using a formula specified by the U.S. Securities and Exchange Commission. Under the formula, data related to the fund’s security holdings in the previous 30 days are used to calculate the fund’s hypothetical net income for that period, which is then annualized and divided by the fund’s estimated average net assets over the calculation period. For the purposes of this calculation, a security’s income is based on its current market yield to maturity (for bonds), its actual income (for asset-backed securities), or its projected dividend yield (for stocks). Because the SEC yield represents hypothetical annualized income, it will differ—at times significantly—from the fund’s actual experience. As a result, the fund’s income distributions may be higher or lower than implied by the SEC yield.
Average Coupon. The average interest rate paid on the fixed income securities held by a fund. It is expressed as a percentage of face value.
Average Duration. An estimate of how much the value of the bonds held by a fund will fluctuate in response to a change in interest rates. To see how the value could change, multiply the average duration by the change in rates. If interest rates rise by 1 percentage point, the value of the bonds in a fund with an average duration of five years would decline by about 5%. If rates decrease by a percentage point, the value would rise by 5%.
Average Effective Maturity. The average length of time until fixed income securities held by a fund reach maturity and are repaid, taking into consideration the possibility that the issuer may call the bond before its maturity date. The figure reflects the proportion of fund assets represented by each security; it also reflects any futures contracts held. In general, the longer the average effective maturity, the more a fund’s share price will fluctuate in response to changes in market interest rates.
Credit Quality. Credit-quality ratings are measured on a scale that generally ranges from AAA (highest) to D (lowest). U.S. Treasury, U.S. Agency, and U.S. Agency mortgage-backed securities appear under “U.S. Government.” Credit-quality ratings are obtained from Barclays and are from Moody’s, Fitch, and S&P. When ratings from all three agencies are used, the median rating is shown. When ratings from two of the agencies are used, the lower rating for each issue is shown. “Not Rated” is used to classify securities for which a rating is not available. Not rated securities include a fund’s investment in Vanguard Market Liquidity Fund or Vanguard Municipal Cash Management Fund, each of which invests in high-quality money market instruments and may serve as a cash management vehicle for the Vanguard funds, trusts, and accounts.
Expense Ratio. A fund’s total annual operating expenses expressed as a percentage of the fund’s average net assets. The expense ratio includes management and administrative expenses, but does not include the transaction costs of buying and selling portfolio securities.
Inception Date. The date on which the assets of a fund (or one of its share classes) are first invested in accordance with the fund’s investment objective. For funds with a subscription period, the inception date is the day after that period ends. Investment performance is measured from the inception date.
Short-Term Reserves. The percentage of a fund invested in highly liquid, short-term securities that can be readily converted to cash.
48
Yield to Maturity. The rate of return an investor would receive if the fixed income securities held by a fund were held to their maturity dates.
49
Vanguard Emerging Markets Government Bond Index Fund is not sponsored, endorsed, issued, sold, or promoted by Barclays
Capital Inc. or any of its affiliates (“Barclays”). Barclays makes no representation or warranty, express or implied, to the
owners or purchasers of the fund or any member of the public regarding the advisability of investing in securities generally
or in the fund particularly or the ability of the Barclays index to track general bond market performance. Barclays has not
passed on the legality or suitability of the fund with respect to any person or entity. Barclays’ only relationship to Vanguard
and the fund is the licensing of the Barclays index, which is determined, composed, and calculated by Barclays without regard
to Vanguard or the fund or any owners or purchasers of the fund. Barclays has no obligation to take the needs of Vanguard, the
fund, or the owners of the fund into consideration in determining, composing, or calculating the Barclays index. Barclays is
not responsible for and has not participated in the determination of the timing of, prices at, or quantities of the fund to be
issued. Barclays has no obligation or liability in connection with the administration, marketing, or trading of the fund.
Barclays shall have no liability to third parties for the quality, accuracy, and/or completeness of the index or any data included
therein or for interruptions in the delivery of the index. Barclays makes no warranty, express or implied, as to results to be
obtained by owners of the fund or any other person or entity from the use of the index or any data included therein in connection
with the rights licensed hereunder or for any other use. Barclays reserves the right to change the methods of calculation or
publication, or to cease the calculation or publication of the Barclays USD Emerging Markets Government RIC Capped Index,
and Barclays shall not be liable for any miscalculation of or any incorrect, delayed, or interrupted publication with respect to
the index. Barclays makes no express or implied warranties, and hereby expressly disclaims all warranties of merchantability
or fitness for a particular purpose or use with respect to the index or any data included therein. Barclays shall not be liable for
any damages, including, without limitation, any indirect or consequential damages resulting from the use of the index or any
data included therein.
50
This page intentionally left blank.
The People Who Govern Your Fund
The trustees of your mutual fund are there to see that the fund is operated and managed in your best interests since, as a shareholder, you are a part owner of the fund. Your fund’s trustees also serve on the board of directors of The Vanguard Group, Inc., which is owned by the Vanguard funds and provides services to them on an at-cost basis.
A majority of Vanguard’s board members are independent, meaning that they have no affiliation with Vanguard or the funds they oversee, apart from the sizable personal investments they have made as private individuals. The independent board members have distinguished backgrounds in business, academia, and public service. Each of the trustees and executive officers oversees 194 Vanguard funds.
The following table provides information for each trustee and executive officer of the fund. More information about the trustees is in the Statement of Additional Information, which can be obtained, without charge, by contacting Vanguard at 800-662-7447, or online at vanguard.com.
| |
| InterestedTrustee1 | Rajiv L. Gupta |
| | Born 1945. Trustee Since December 2001.2 Principal |
| F. William McNabb III | Occupation(s) During the Past Five Years and Other |
| Born 1957. Trustee Since July 2009. Chairman of | Experience: Chairman and Chief Executive Officer |
| the Board. Principal Occupation(s) During the Past | (retired 2009) and President (2006–2008) of |
| Five Years and Other Experience: Chairman of the | Rohm and Haas Co. (chemicals); Director of Tyco |
| Board of The Vanguard Group, Inc., and of each of | International PLC (diversified manufacturing and |
| the investment companies served by The Vanguard | services), Hewlett-Packard Co. (electronic computer |
| Group, since January 2010; Director of The Vanguard | manufacturing), and Delphi Automotive PLC |
| Group since 2008; Chief Executive Officer and | (automotive components); Senior Advisor at New |
| President of The Vanguard Group, and of each of | Mountain Capital. |
| the investment companies served by The Vanguard | |
| Group, since 2008; Director of Vanguard Marketing | Amy Gutmann |
| Corporation; Managing Director of The Vanguard | Born 1949. Trustee Since June 2006. Principal |
| Group (1995–2008). | Occupation(s) During the Past Five Years and |
| | Other Experience: President of the University of |
| IndependentTrustees | Pennsylvania; Christopher H. Browne Distinguished |
| | Professor of Political Science, School of Arts and |
| Emerson U. Fullwood | Sciences, and Professor of Communication, Annenberg |
| Born 1948. Trustee Since January 2008. Principal | School for Communication, with secondary faculty |
| Occupation(s) During the Past Five Years and | appointments in the Department of Philosophy, School |
| Other Experience: Executive Chief Staff and | of Arts and Sciences, and at the Graduate School of |
| Marketing Officer for North America and Corporate | Education, University of Pennsylvania; Trustee of the |
| Vice President (retired 2008) of Xerox Corporation | National Constitution Center; Chair of the Presidential |
| (document management products and services); | Commission for the Study of Bioethical Issues. |
| Executive in Residence and 2009–2010 Distinguished | |
| Minett Professor at the Rochester Institute of | JoAnn Heffernan Heisen |
| Technology; Director of SPX Corporation (multi-industry | Born 1950. Trustee Since July 1998. Principal |
| manufacturing), the United Way of Rochester, the | Occupation(s) During the Past Five Years and |
| University of Rochester Medical Center, Monroe | Other Experience: Corporate Vice President and |
| Community College Foundation, and North Carolina | Chief Global Diversity Officer (retired 2008) and |
| A&T University. | Member of the Executive Committee (1997–2008) |
| | of Johnson & Johnson (pharmaceuticals/medical |
| | devices/consumer products); Director of Skytop |
| | Lodge Corporation (hotels) and the Robert Wood |
| | Johnson Foundation; Member of the Advisory |
| | Board of the Institute for Women’s Leadership |
| | at Rutgers University. |
| | |
| F. Joseph Loughrey | Executive Officers | |
| Born 1949. Trustee Since October 2009. Principal | | |
| Occupation(s) During the Past Five Years and Other | Glenn Booraem | |
| Experience: President and Chief Operating Officer | Born 1967. Treasurer Since May 2015. Principal |
| (retired 2009) of Cummins Inc. (industrial machinery); | Occupation(s) During the Past Five Years and |
| Chairman of the Board of Hillenbrand, Inc. (specialized | Other Experience: Principal of The Vanguard Group, |
| consumer services), and of Oxfam America; Director | Inc.; Treasurer of each of the investment companies |
| of SKF AB (industrial machinery), Hyster-Yale Materials | served by The Vanguard Group; Controller of each of |
| Handling, Inc. (forklift trucks), the Lumina Foundation | the investment companies served by The Vanguard |
| for Education, and the V Foundation for Cancer | Group (2010–2015); Assistant Controller of each of |
| Research; Member of the Advisory Council for the | the investment companies served by The Vanguard |
| College of Arts and Letters and of the Advisory Board | Group (2001–2010). | |
| to the Kellogg Institute for International Studies, both | | |
| at the University of Notre Dame. | Thomas J. Higgins | |
| Born 1957. Chief Financial Officer Since September |
| Mark Loughridge | 2008. Principal Occupation(s) During the Past Five |
| Born 1953. Trustee Since March 2012. Principal | Years and Other Experience: Principal of The Vanguard |
| Occupation(s) During the Past Five Years and Other | Group, Inc.; Chief Financial Officer of each of the |
| Experience: Senior Vice President and Chief Financial | investment companies served by The Vanguard Group; |
| Officer (retired 2013) at IBM (information technology | Treasurer of each of the investment companies served |
| services); Fiduciary Member of IBM’s Retirement Plan | by The Vanguard Group (1998–2008). |
| Committee (2004–2013); Director of the Dow Chemical | | |
| Company; Member of the Council on Chicago Booth. | Peter Mahoney | |
| Born 1974. Controller Since May 2015. Principal |
| Scott C. Malpass | Occupation(s) During the Past Five Years and |
| Born 1962. Trustee Since March 2012. Principal | Other Experience: Head of Global Fund Accounting |
| Occupation(s) During the Past Five Years and Other | at The Vanguard Group, Inc.; Controller of each of the |
| Experience: Chief Investment Officer and Vice | investment companies served by The Vanguard Group; |
| President at the University of Notre Dame; Assistant | Head of International Fund Services at The Vanguard |
| Professor of Finance at the Mendoza College of | Group (2008–2014). | |
| Business at Notre Dame; Member of the Notre Dame | | |
| 403(b) Investment Committee; Board Member of | Heidi Stam | |
| TIFF Advisory Services, Inc., and Catholic Investment | Born 1956. Secretary Since July 2005. Principal |
| Services, Inc. (investment advisors); Member of | Occupation(s) During the Past Five Years and Other |
| the Investment Advisory Committee of Major | Experience: Managing Director of The Vanguard |
| League Baseball. | Group, Inc.; General Counsel of The Vanguard Group; |
| Secretary of The Vanguard Group and of each of the |
| André F. Perold | investment companies served by The Vanguard Group; |
| Born 1952. Trustee Since December 2004. Principal | Director and Senior Vice President of Vanguard |
| Occupation(s) During the Past Five Years and Other | Marketing Corporation. | |
| Experience: George Gund Professor of Finance and | | |
| Banking, Emeritus at the Harvard Business School | Vanguard Senior ManagementTeam |
| (retired 2011); Chief Investment Officer and Managing | Mortimer J. Buckley | Chris D. McIsaac |
| Partner of HighVista Strategies LLC (private investment | Kathleen C. Gubanich | James M. Norris |
| firm); Director of Rand Merchant Bank; Overseer of | Paul A. Heller | Thomas M. Rampulla |
| the Museum of Fine Arts Boston. | Martha G. King | Glenn W. Reed |
| John T. Marcante | Karin A. Risi |
| Peter F. Volanakis | | |
| Born 1955. Trustee Since July 2009. Principal | | |
| Occupation(s) During the Past Five Years and Other | Chairman Emeritus and Senior Advisor |
| Experience: President and Chief Operating Officer | | |
| (retired 2010) of Corning Incorporated (communications | John J. Brennan | |
| equipment); Trustee of Colby-Sawyer College; | Chairman, 1996–2009 | |
| Member of the Advisory Board of the Norris Cotton | Chief Executive Officer and President, 1996–2008 |
| Cancer Center and of the Advisory Board of the | | |
| Parthenon Group (strategy consulting). | Founder | |
| | John C. Bogle | |
| | Chairman and Chief Executive Officer, 1974–1996 |
1 Mr. McNabb is considered an “interested person,” as defined in the Investment Company Act of 1940, because he is an officer of the Vanguard funds.
2 December 2002 for Vanguard Equity Income Fund, the Vanguard Municipal Bond Funds, and the Vanguard State Tax-Exempt Funds.
|  |
| | P.O. Box 2600 |
| | Valley Forge, PA 19482-2600 |
| |
| |
| |
| Connect with Vanguard® > vanguard.com |
| |
| |
| |
| Fund Information > 800-662-7447 | |
| Direct Investor Account Services > 800-662-2739 | |
| Institutional Investor Services > 800-523-1036 | |
| Text Telephone for People | |
| Who Are Deaf or Hard of Hearing> 800-749-7273 | |
| |
| This material may be used in conjunction | |
| with the offering of shares of any Vanguard | |
| fund only if preceded or accompanied by | |
| the fund’s current prospectus. | |
| |
| All comparative mutual fund data are from Lipper, a | |
| Thomson Reuters Company, or Morningstar, Inc., unless | |
| otherwise noted. | |
| |
| You can obtain a free copy of Vanguard’s proxy voting | |
| guidelines by visiting vanguard.com/proxyreporting or by | |
| calling Vanguard at 800-662-2739. The guidelines are | |
| also available from the SEC’s website, sec.gov. In | |
| addition, you may obtain a free report on how your fund | |
| voted the proxies for securities it owned during the 12 | |
| months ended June 30. To get the report, visit either | |
| vanguard.com/proxyreporting or sec.gov. | |
| |
| You can review and copy information about your fund at | |
| the SEC’s Public Reference Room in Washington, D.C. To | |
| find out more about this public service, call the SEC at | |
| 202-551-8090. Information about your fund is also | |
| available on the SEC’s website, and you can receive | |
| copies of this information, for a fee, by sending a | |
| request in either of two ways: via email addressed to | |
| publicinfo@sec.gov or via regular mail addressed to the | |
| Public Reference Section, Securities and Exchange | |
| Commission, Washington, DC 20549-1520. | |
| |
| | © 2015 The Vanguard Group, Inc. |
| | All rights reserved. |
| | Vanguard Marketing Corporation, Distributor. |
| |
| | Q11200 122015 |

Annual Report | October 31, 2015
Vanguard Global Minimum Volatility Fund
Vanguard’s Principles for Investing Success
We want to give you the best chance of investment success. These principles, grounded in Vanguard’s research and experience, can put you on the right path.
Goals. Create clear, appropriate investment goals.
Balance. Develop a suitable asset allocation using broadly diversified funds. Cost. Minimize cost.
Discipline. Maintain perspective and long-term discipline.
A single theme unites these principles: Focus on the things you can control.
We believe there is no wiser course for any investor.
| |
| Contents | |
| Your Fund’s Total Returns. | 1 |
| Chairman’s Letter. | 2 |
| Advisor’s Report. | 8 |
| Fund Profile. | 11 |
| Performance Summary. | 13 |
| Financial Statements. | 15 |
| About Your Fund’s Expenses. | 35 |
| Glossary. | 37 |
Please note: The opinions expressed in this report are just that—informed opinions. They should not be considered promises or advice.
Also, please keep in mind that the information and opinions cover the period through the date on the front of this report. Of course, the
risks of investing in your fund are spelled out in the prospectus.
See the Glossary for definitions of investment terms used in this report.
About the cover: Pictured is a sailing block on the Brilliant, a 1932 schooner docked in Mystic, Connecticut. A type of pulley, the
sailing block helps coordinate the setting of the sails. At Vanguard, the intricate coordination of technology and people allows
us to help millions of clients around the world reach their financial goals.
Your Fund’s Total Returns
| |
| Fiscal Year Ended October 31, 2015 | |
| | Total |
| | Returns |
| Vanguard Global Minimum Volatility Fund | |
| Investor Shares | 9.93% |
| Admiral™ Shares | 10.00 |
| FTSE Global All Cap Index (USD Hedged) | 4.79 |
| Global Funds Average | 0.35 |
| Global Funds Average: Derived from data provided by Lipper, a Thomson Reuters Company. |
| | | | |
| Your Fund’s Performance at a Glance | | | | |
| October 31, 2014, Through October 31, 2015 | | | | |
| | | | Distributions Per Share |
| | Starting | Ending | | |
| | Share | Share | Income | Capital |
| | Price | Price | Dividends | Gains |
| Vanguard Global Minimum Volatility Fund | | | | |
| Investor Shares | $11.41 | $11.81 | $0.280 | $0.403 |
| Admiral Shares | 22.83 | 23.62 | 0.585 | 0.806 |
1

Chairman’s Letter
Dear Shareholder,
For the 12 months ended October 31, 2015, Vanguard Global Minimum Volatility Fund returned 9.93% for Investor Shares and 10.00% for Admiral Shares, well ahead of the 4.79% return of its benchmark index. As I’ve noted in previous reports, however, you should evaluate this fund based on whether it met its objective of delivering a smoother ride than the global stock market as a whole—and over this period, it did.
Your fund’s annualized daily volatility over its first full fiscal year was nearly 20% less than that of the benchmark, the FTSE Global All Cap Index (USD Hedged). We assess volatility using standard deviation, a calculation of the degree to which the fund’s return in a given period varies from its average return.
Another indicator of your fund’s success is its risk-adjusted return—its return divided by the standard deviation of its returns. This is a measure of return earned per unit of risk taken, so the higher the better. For the 12 months, the fund’s risk-adjusted return of 0.94 was more than double that of its benchmark.
Global stock markets struggled, and some failed to advance
The broad U.S. stock market returned more than 4% for the fiscal year. The market traveled a bumpy road to that result. Fears surfaced in late summer that slower economic growth in China
2
would spread across the globe. A sharp drop in August erased the market’s earlier gains, and stocks slid further in September.
In October, however, stocks staged a robust rally as the Federal Reserve kept short-term interest rates at historical lows. Central banks in Europe and Asia signaled or enacted more stimulus measures to counter sluggish growth and low inflation. Corporate earnings, while lower than in the recent past, mostly exceeded expectations.
The broad international stock market returned about –4% for U.S. investors, as the dollar’s strength weighed on local-market returns. Solid gains in the developed markets of the Pacific region and Europe were essentially flat when translated into dollars. Stocks tumbled in emerging markets, where the concerns about China seemed to weigh most heavily.
The search for a safe haven gave bonds a bit of a boost
The broad U.S. taxable bond market, which returned 1.96%, benefited from investors’ desire for safe-haven assets during periods of stock market volatility. The yield of the 10-year Treasury note ended October at 2.17%, down from 2.31% a year earlier. (Bond prices and yields move in opposite directions.)
International bond markets (as measured by the Barclays Global Aggregate Index ex USD) returned about –7%, also held
| | | |
| Market Barometer | | | |
| |
| | Average Annual Total Returns |
| | Periods Ended October 31, 2015 |
| | One | Three | Five |
| | Year | Years | Years |
| Stocks | | | |
| Russell 1000 Index (Large-caps) | 4.86% | 16.28% | 14.32% |
| Russell 2000 Index (Small-caps) | 0.34 | 13.90 | 12.06 |
| Russell 3000 Index (Broad U.S. market) | 4.49 | 16.09 | 14.14 |
| FTSE All-World ex US Index (International) | -3.83 | 5.20 | 2.99 |
| |
| Bonds | | | |
| Barclays U.S. Aggregate Bond Index (Broad taxable market) | 1.96% | 1.65% | 3.03% |
| Barclays Municipal Bond Index (Broad tax-exempt market) | 2.87 | 2.91 | 4.28 |
| Citigroup Three-Month U.S. Treasury Bill Index | 0.02 | 0.02 | 0.04 |
| |
| CPI | | | |
| Consumer Price Index | 0.17% | 0.93% | 1.69% |
3
back by the strong dollar. Without this currency effect, international bond returns were positive.
The Fed’s 0%–0.25% target for short-term interest rates continued to constrain returns for money market funds and savings accounts.
As stocks zigged and zagged, your fund rounded the edges
Although the global stock market ended the fiscal year on a strong upswing, we shouldn’t lose sight of several developments that contributed to many ups and downs along the way. When the period began last November, the Fed had just concluded its stimulative bond-buying, and attention turned to when it might begin to raise short-term rates. That remained a key question on investors’ minds and a source of stock market volatility as rate-hike prospects periodically approached, then receded.
In addition, the European Central Bank embarked on a major, multiyear bond-buying program, Greece negotiated another bailout with more austerity measures, the price of oil and other commodities continued to fall, and mainland China’s stock markets swooned.
Amid these and other market-moving events, your fund’s below-market volatility for the 12 months is a testament to the disciplined and rigorous investment processes of its advisor, Vanguard Quantitative Equity Group. QEG uses quantitative models to evaluate all
| | | |
| Expense Ratios | | | |
| Your Fund Compared With Its Peer Group | | | |
| |
| | Investor | Admiral | Peer Group |
| | Shares | Shares | Average |
| Global Minimum Volatility Fund | 0.30% | 0.20% | 1.33% |
The fund expense ratios shown are from the prospectus dated February 25, 2015, and represent estimated costs for the current fiscal year.
For the fiscal year ended October 31, 2015, the fund’s expense ratios were 0.27% for Investor Shares and 0.21% for Admiral Shares. The
peer-group expense ratio is derived from data provided by Lipper, a Thomson Reuters Company, and captures information through year-end
2014.
Peer group: Global Funds.
4
the stocks in nearly 50 developed- and emerging-market countries represented in the benchmark. Your advisor’s selection process considers estimates of expected volatility and correlations (how stocks move in relation to one another) to help identify stocks with less volatility.
Foreign currency hedging is an important element of managing volatility, because about half the fund’s assets are invested in the stocks of non-U.S. companies. Hedging doesn’t materially affect your fund’s performance versus its benchmark, which is similarly hedged. But as the U.S. dollar strengthened against a basket of major currencies during much of the period, currency hedging helped your fund outpace the average return of its global peers. (The vast majority don’t pursue investment strategies focused on volatility and don’t hedge currency exposure.) Keep in mind that when the dollar weakens, hedging trims returns, as you can see in the box on page 5.
The fund’s holdings in North America and Europe, which together make up about three-quarters of its assets, were some of its best performers. They also notably helped lift the fund’s total return above that of its benchmark. Emerging markets produced more modest gains but also boosted relative results; India was a standout, but Brazil continued to struggle amid lower prices for oil and other resources. Holdings in the developed Pacific region modestly held back results.
Among industry groups, the fund’s health care holdings bested those in the benchmark. A lighter stake in the struggling, and more volatile, energy sector was also beneficial.
Launched on December 12, 2013, the Global Minimum Volatility Fund has a track record just shy of two years. Although Vanguard recommends that investors view results through a long-term lens, I am encouraged by your fund’s success to date. Since inception, the fund’s volatility has been about one-third lower than that of its benchmark, highlighting QEG’s ability to achieve the fund’s lower-volatility objective across market cycles. And your fund’s risk-adjusted return has been about 80% higher than that of its benchmark.
The Advisor’s Report that follows this letter provides more information on the management of the fund.
A dose of discipline is crucial when markets become volatile
The developments over the past few months remind us that nobody can control the direction of the markets or reliably predict where they’ll go in the short term. However, investors can control how they react to unstable and turbulent markets.
During periods of market adversity, it’s more important than ever to keep sight of one of Vanguard’s key principles: Maintain perspective and long-term discipline.
5
|
| Foreign currency hedging cuts both ways |
| |
| Actively managed stock funds typically seek to earn a return higher than that of a specific |
| index. But Vanguard Global Minimum Volatility Fund has a different primary objective: |
| lower volatility than its benchmark. |
| |
| One way we seek to achieve this is by hedging back to the U.S. dollar the foreign currency |
| exposure of the fund’s non-U.S. stocks, which make up more than half its assets. When that |
| exposure is not hedged, a stronger dollar trims foreign stocks’ returns—and adds to their |
| volatility—when they are translated into dollars for U.S.-based investors. A weaker dollar |
| enhances foreign stocks’ returns but still makes them more volatile. |
| |
| We use currency forward contracts to eliminate most of this “noise” from fluctuating exchange |
| rates. Forward contracts are a way to lock in future exchange rates, helping us to reduce risk. |
| |
| While lowering volatility, hedging has also boosted the fund’s cumulative return since inception, |
| because the dollar has generally strengthened. But hedging hurt results in months when the |
| dollar weakened. |
| |
| The chart below shows the monthly difference in returns of the fund’s hedged benchmark |
| versus its unhedged counterpart. In April 2015, for example, when the dollar slid against |
| a basket of currencies, the hedged index lagged its unhedged counterpart by more than |
| 1 percentage point. |
| |
| Vanguard doesn’t “bet” on the direction of currency moves. Even if we expected the dollar |
| to weaken, we’d still hedge—to lower volatility. |
| |
| Hedging dampens returns when the dollar weakens |
| Note: The hedged versus unhedged return represents the difference between the monthly total return of the fund’s benchmark—the FTSE |
| Global All Cap Index (USD Hedged) —and its unhedged counterpart. |
| Source: Vanguard. |
6
Whether you’re investing for yourself or on behalf of clients, your success is affected greatly by how you respond—or don’t respond—during turbulent markets. (You can read Vanguard’s Principles for Investing Success at vanguard.com/research.)
As I’ve written in the past, the best course for long-term investors is generally to ignore daily market moves and not make decisions based on emotion. This is also a good time to evaluate your portfolio and make sure your asset allocation is aligned with your time horizon, goals, and risk tolerance.
The markets are unpredictable and often confounding. Keeping your long-term plans clearly in focus can help you weather these periodic storms.
As always, thank you for investing with Vanguard.
Sincerely,

F. William McNabb III
Chairman and Chief Executive Officer
November 17, 2015
7
Advisor’s Report
For the 12 months ended October 31, 2015, Vanguard Global Minimum Volatility Fund returned 9.93% for Investor Shares and 10.00% for Admiral Shares with an annualized daily volatility of 10.54%. By comparison, its benchmark, the FTSE Global All Cap Index (USD Hedged), returned 4.79% with an annualized daily volatility of 12.86%. (To get the annualized daily volatility, we calculate the standard deviation of daily returns and multiply it by the square root of 252, generally the number of trading days in a year.)
Investment objective
Our objective is to create a portfolio that has broad equity exposure with less volatility than the global equity market. We achieved this over the performance period, as the fund’s daily volatility averaged about 18% less than that of its benchmark.
It is important to mention, as we have in the past, that we do not target a specific volatility level. Rather, we seek to provide an equity fund that has lower absolute risk than the broad global market. Thus, when the broad global equity market is experiencing periods with spikes in volatility, you should expect this fund’s volatility to rise as well—just not by the same magnitude.
We recognize that equity-like returns are also an important outcome of an investment in this fund, but achieving a total return higher than the benchmark’s is not an objective of our approach. Although our research leads us to expect that, on average, a minimum volatility fund may outperform the overall global market in
sharp downturns (while still experiencing losses), the fund should be expected to trail in strong bull markets. With that in mind, because the fund is expected to have a lower level of risk than the global equity market, you should not expect it to outperform the market over the long run.
We think an acceptable comparative performance measure in the long term is the fund’s risk-adjusted return. This can be calculated by dividing the portfolio’s total return for the period by the annualized standard deviation of daily returns. We view 12 months to be a relatively short time, but for the most recent fiscal year, the risk-adjusted return was 0.94, compared with 0.37 for the benchmark. Over a slightly longer period—since the fund’s inception on December 12, 2013—its risk-adjusted return was 1.44, compared with 0.79 for the benchmark.
Investment strategy
In building our portfolio, we use quantitative models that evaluate a variety of factors that drive a stock’s volatility in addition to estimates of their correlation—or how the factors move in relation to one another. This approach allows us to make appropriate risk/ diversification trade-offs, while not relying solely on volatility estimates.
Our process also approaches currency exposure and its impact on a portfolio in a specific manner. We recognize that owning companies in foreign markets involves the risk of movements in foreign currency exchange rates relative to the U.S. dollar. Because of this, an optimization process that focuses solely on volatilities tied to
8
an investor’s home currency will tend to overweight exposures to that currency. We aim to avoid such currency-specific exposures by focusing on equity volatilities and correlations measured in local currency terms. Then we use currency forward contracts to hedge the resulting exposure for U.S. investors. We believe this process can further reduce the volatility of the portfolio overall in the long run.
Finally, when constructing the portfolio, we apply constraints to reduce stock, sector, and country concentration risk. We find that these constraints, which allow for broader diversification and liquidity, reduce unnecessarily high risk exposures without significantly affecting our ability to reduce overall volatility. Drawing from the universe of about 7,700 stocks in the FTSE benchmark index, we construct a portfolio of 400–450 stocks.
The investment environment
The performance of unhedged global equities, while slightly positive for the fiscal year, cooled off significantly after a sell-off that started in May and lasted through September. Most developed markets managed to stay positive, except for the Asia Pacific region excluding Japan (which returned about –13% as measured by the FTSE Developed Asia Pacific ex Japan Index). In addition, the FTSE Emerging Index was down more than 15%. Performance within the fund’s benchmark was mixed, as only four of the ten market sectors generated positive returns. Results were best in consumer discretionary, while energy was the worst performer.
Amid uncertainty over the Federal Reserve’s interest rate plans and a slowdown in growth prospects, the markets reacted with increased volatility over the period. Volatility levels, however, stayed at the lower end of the historical range. For example, the Chicago Board Options Exchange Volatility Index (VIX), a measure of implied volatility of S&P 500 Index options, had a ten-year average level of 20.33, compared with 16.30 for the second half of the latest fiscal year. Volatility levels experienced a few notable spikes. For example, in August, the VIX topped 40 for the first time in four years.
The fund’s successes and shortfalls
We have cautioned that during periods of low volatility (which was the average environment for the fund over the fiscal year), expectations for the size of the portfolio’s volatility discount relative to the market should be tempered. Despite the market’s overall low volatility, though, the fund met its lower-volatility objective for the period. We had previously highlighted daily volatilities, but if you look at volatility over longer periods—for example, monthly returns—the benefits become clearer. For the fiscal year, the fund’s annualized volatility of monthly returns was 7.95%, compared with 12.55% for the benchmark—a 37% discount. Since inception, the fund has delivered a 32% reduction in the annualized volatility of monthly returns relative to its benchmark.
9
A combination of factors helped reduce the fund’s volatility during the fiscal year. Our strategy of holding stocks that have lower correlations with one another provided diversification benefits. Among sectors, on average we were overweighted in less volatile ones such as consumer staples and telecommunication services and underweighted in two of the benchmark’s more volatile industry groups, energy and materials. As for country allocations, we benefited by limiting our exposure to Greece, one of the period’s most volatile countries. However, our volatility estimates led to small overweight positions in South Korea and India, both of which proved more volatile than anticipated, modestly trimming our results.
We continue to see our approach to portfolio construction pay off in reduced volatility. The portfolio also outperformed
the benchmark in terms of relative return, but as we’ve noted, a strategy such as ours can reward or fall short of investor expectations over shorter periods. With this in mind, we find that focusing on the long-term risk-adjusted returns of the portfolio relative to the benchmark realigns expectations with the fund’s objective. We thank you for your investment and look forward to the new fiscal year.
Portfolio Managers:
James D. Troyer, CFA, Principal
James P. Stetler, Principal
Michael R. Roach, CFA
Vanguard Quantitative Equity Group
November 18, 2015
10
Global Minimum Volatility Fund
Fund Profile
As of October 31, 2015
| | |
| Share-Class Characteristics | |
| |
| | Investor | Admiral |
| | Shares | Shares |
| Ticker Symbol | VMVFX | VMNVX |
| Expense Ratio1 | 0.30% | 0.20% |
| | |
| Portfolio Characteristics | | |
| | | FTSE Global |
| | | All Cap Index |
| | Fund | (USD Hedged) |
| Number of Stocks | 438 | 7,728 |
| Median Market Cap | $6.6B | $33.7B |
| Price/Earnings Ratio | 22.1x | 19.6x |
| Price/Book Ratio | 2.4x | 2.1x |
| Return on Equity | 15.5% | 16.0% |
| Earnings Growth | | |
| Rate | 6.6% | 10.5% |
| Dividend Yield | 2.8% | 2.4% |
| Turnover Rate | 57% | — |
| Short-Term Reserves | 0.4% | — |
| | |
| Sector Diversification (% of equity exposure) |
| | | FTSE Global |
| | | All Cap Index |
| | Fund (USD Hedged) |
| Consumer Discretionary | 12.8% | 13.2% |
| Consumer Staples | 13.6 | 9.4 |
| Energy | 2.1 | 6.4 |
| Financials | 19.3 | 21.8 |
| Health Care | 12.9 | 11.8 |
| Industrials | 9.5 | 11.4 |
| Information Technology | 10.0 | 14.3 |
| Materials | 5.0 | 5.2 |
| Telecommunication Services | 7.3 | 3.3 |
| Utilities | 7.5 | 3.2 |
| | |
| Ten Largest Holdings (% of total net assets) |
| Next plc | Department Stores | 1.5% |
| CLP Holdings Ltd. | Electric Utilities | 1.4 |
| BCE Inc. | Integrated | |
| | Telecommunication | |
| | Services | 1.4 |
| Galenica AG | Pharmaceuticals | 1.4 |
| Clorox Co. | Household Products | 1.4 |
| Church & Dwight Co. | | |
| Inc. | Household Products | 1.4 |
| Jack Henry & Associates Data Processing & | |
| Inc. | Outsourced Services | 1.4 |
| Kaiser Aluminum Corp. | Aluminum | 1.4 |
| Kimberly-Clark Corp. | Household Products | 1.3 |
| Dr Reddy's Laboratories | | |
| Ltd. | Pharmaceuticals | 1.3 |
| Top Ten | | 13.9% |
| The holdings listed exclude any temporary cash investments and equity index products. |
Allocation by Region (% of equity exposure)
1 The expense ratios shown are from the prospectus dated February 25, 2015, and represent estimated costs for the current fiscal year. For the fiscal
year ended October 31, 2015, the expense ratios were 0.27% for Investor Shares and 0.21% for Admiral Shares.
11
Global Minimum Volatility Fund
| | |
| Market Diversification (% of equity exposure) |
| | | FTSE |
| | | Global |
| | | All Cap |
| | | Index |
| | | (USD |
| | Fund | Hedged) |
| Europe | | |
| United Kingdom | 11.2% | 7.1% |
| Switzerland | 5.8 | 3.0 |
| Other | 3.6 | 12.0 |
| Subtotal | 20.6% | 22.1% |
| Pacific | | |
| Australia | 4.5% | 2.2% |
| Japan | 3.5 | 8.3 |
| Hong Kong | 3.3 | 1.2 |
| South Korea | 3.1 | 1.6 |
| Other | 0.9 | 0.6 |
| Subtotal | 15.3% | 13.9% |
| Emerging Markets | | |
| India | 2.2% | 1.1% |
| Taiwan | 1.3 | 1.3 |
| Brazil | 1.0 | 0.6 |
| Other | 2.0 | 5.2 |
| Subtotal | 6.5% | 8.2% |
| North America | | |
| United States | 51.2% | 52.6% |
| Canada | 5.9 | 2.9 |
| Subtotal | 57.1% | 55.5% |
| Middle East | 0.5% | 0.3% |
12
Global Minimum Volatility Fund
Performance Summary
All of the returns in this report represent past performance, which is not a guarantee of future results that may be achieved by the fund. (Current performance may be lower or higher than the performance data cited. For performance data current to the most recent month-end, visit our website at vanguard.com/performance.) Note, too, that both investment returns and principal value can fluctuate widely, so an investor’s shares, when sold, could be worth more or less than their original cost. The returns shown do not reflect taxes that a shareholder would pay on fund distributions or on the sale of fund shares.
Cumulative Performance: December 12, 2013, Through October 31, 2015
Initial Investment of $10,000
| | | | |
| | | Average Annual Total Returns | |
| | | Periods Ended October 31, 2015 | |
| |
| | | | Since | Final Value |
| | | One | Inception | of a $10,000 |
| | | Year | (12/12/2013) | Investment |
| |
| | Global Minimum Volatility | | | |
| | Fund*Investor Shares | 9.93% | 12.91% | $12,573 |
| | FTSE Global All Cap Index (USD | | | |
| | Hedged) | 4.79 | 8.69 | 11,701 |
| |
| – – – – | Global Funds Average | 0.35 | 3.25 | 10,621 |
Global Funds Average: Derived from data provided by Lipper, a Thomson Reuters Company.
"Since Inception" performance is calculated from the Investor Shares’ inception date for both the fund and its comparative standards.
| | | |
| | | Since | Final Value |
| | One | Inception | of a $50,000 |
| | Year | (12/12/2013) | Investment |
| Global Minimum Volatility Fund Admiral Shares | 10.00% | 12.98% | $62,932 |
| FTSE Global All Cap Index (USD Hedged) | 4.79 | 8.69 | 58,505 |
| "Since Inception" performance is calculated from the Admiral Shares’ inception date for both the fund and its comparative standards. |
See Financial Highlights for dividend and capital gains information.
13
Global Minimum Volatility Fund
Fiscal-Year Total Returns (%): December 12, 2013, Through October 31, 2015
Total Returns: Periods Ended September 30, 2015
This table presents returns through the latest calendar quarter—rather than through the end of the fiscal period.
Securities and Exchange Commission rules require that we provide this information.
| | | |
| | Inception | One | Since |
| | Date | Year | Inception |
| Investor Shares | 12/12/2013 | 9.39% | 11.14% |
| Admiral Shares | 12/12/2013 | 9.41 | 11.23 |
14
Global Minimum Volatility Fund
Financial Statements
Statement of Net Assets
As of October 31, 2015
The fund reports a complete list of its holdings in regulatory filings four times in each fiscal year, at the quarter-ends. For the second and fourth fiscal quarters, the lists appear in the fund’s semiannual and annual reports to shareholders. For the first and third fiscal quarters, the fund files the lists with the Securities and Exchange Commission on Form N-Q. Shareholders can look up the fund’s Forms N-Q on the SEC’s website at sec.gov. Forms N-Q may also be reviewed and copied at the SEC’s Public Reference Room (see the back cover of this report for further information).
| | |
| | | Market |
| | | Value• |
| | Shares | ($000) |
| Common Stocks (99.0%)1 | | |
| Australia (4.4%) | | |
| Transurban Group | 956,746 | 7,125 |
| AGL Energy Ltd. | 525,165 | 6,268 |
| Telstra Corp. Ltd. | 1,519,900 | 5,855 |
| Sonic Healthcare Ltd. | 330,620 | 4,547 |
| DUET Group | 2,412,205 | 4,061 |
| Sydney Airport | 846,260 | 3,894 |
| Wesfarmers Ltd. | 87,692 | 2,451 |
| ASX Ltd. | 65,038 | 1,913 |
| BWP Trust | 796,405 | 1,829 |
| JB Hi-Fi Ltd. | 134,642 | 1,725 |
| Challenger Ltd. | 274,163 | 1,610 |
| Coca-Cola Amatil Ltd. | 239,873 | 1,559 |
| GPT Group | 454,735 | 1,539 |
| Stockland | 473,818 | 1,369 |
| Ramsay Health Care Ltd. | 29,551 | 1,297 |
| Aristocrat Leisure Ltd. | 179,915 | 1,196 |
| Boral Ltd. | 198,116 | 762 |
| Cochlear Ltd. | 11,555 | 733 |
| Charter Hall Retail REIT | 191,055 | 578 |
| Suncorp Group Ltd. | 56,877 | 528 |
| Vicinity Centers | 251,047 | 521 |
| Insurance Australia Group | | |
| Ltd. | 113,925 | 452 |
| Sims Metal Management | | |
| Ltd. | 54,808 | 385 |
| Bendigo & Adelaide Bank | | |
| Ltd. | 44,000 | 336 |
| Abacus Property Group | 142,425 | 332 |
| Mirvac Group | 187,271 | 241 |
| | | 53,106 |
| Belgium (0.3%) | | |
| Elia System Operator | | |
| SA/NV | 23,212 | 1,123 |
| Sofina SA | 9,541 | 1,072 |
| Cofinimmo SA | 5,474 | 610 |
| Proximus SADP | 16,363 | 566 |
| UCB SA | 2,802 | 242 |
| | | 3,613 |
| | | |
| Brazil (1.0%) | | |
| | BRF SA ADR | 432,358 | 6,628 |
| | Embraer SA ADR | 119,283 | 3,503 |
| | Ultrapar Participacoes SA | | |
| | ADR | 81,272 | 1,407 |
| | Ambev SA ADR | 150,033 | 731 |
| | | | 12,269 |
| Canada (5.8%) | | |
| | BCE Inc. | 399,143 | 17,253 |
| | Dollarama Inc. | 142,237 | 9,608 |
| ^ | Shaw Communications Inc. | | |
| | Class B | 443,460 | 9,208 |
| | TELUS Corp. | 237,842 | 7,938 |
| ^ | Emera Inc. | 153,109 | 5,016 |
| ^ | Canadian Tire Corp. Ltd. | | |
| | Class A | 48,820 | 4,294 |
| | Fortis Inc. | 106,169 | 3,073 |
| | Intact Financial Corp. | 30,112 | 2,151 |
| | Manitoba Telecom Services | | |
| | Inc. | 90,200 | 1,982 |
| ^ | Cineplex Inc. | 49,300 | 1,900 |
| | Rogers Communications | | |
| | Inc. Class B | 45,111 | 1,795 |
| | Thomson Reuters Corp. | 39,800 | 1,634 |
| | RioCan REIT | 54,246 | 1,058 |
| ^ | H&R REIT | 63,400 | 1,017 |
| ^ | Parkland Fuel Corp. | 45,600 | 793 |
| | Husky Energy Inc. | 39,951 | 540 |
| | Loblaw Cos. Ltd. | 6,500 | 342 |
| ^ | Extendicare Inc. | 42,000 | 276 |
| ^ | Boardwalk REIT | 5,900 | 242 |
| | Cominar REIT | 14,100 | 166 |
| | George Weston Ltd. | 1,134 | 96 |
| | | | 70,382 |
| Chile (0.2%) | | |
| | Enersis SA ADR | 99,774 | 1,322 |
| | Cia Cervecerias Unidas SA | | |
| | ADR | 29,000 | 695 |
| | Banco Santander Chile ADR | 23,500 | 446 |
| | | | 2,463 |
15
Global Minimum Volatility Fund
| | | |
| | | | Market |
| | | | Value• |
| | | Shares | ($000) |
| Denmark (0.1%) | | |
| * | William Demant Holding A/S | 11,062 | 960 |
| * | Royal Unibrew A/S | 9,785 | 386 |
| | GN Store Nord A/S | 14,520 | 264 |
| | | | 1,610 |
| France (0.3%) | | |
| * | UBISOFT Entertainment | 61,958 | 1,856 |
| | BioMerieux | 7,524 | 874 |
| | Sodexo SA | 5,000 | 444 |
| | | | 3,174 |
| Germany (0.7%) | | |
| | Fielmann AG | 39,184 | 2,745 |
| | Celesio AG | 61,654 | 1,714 |
| ^ | RHOEN-KLINIKUM AG | 49,613 | 1,479 |
| | MTU Aero Engines AG | 15,632 | 1,447 |
| | adidas AG | 12,886 | 1,155 |
| | Suedzucker AG | 15,222 | 284 |
| | | | 8,824 |
| Hong Kong (3.2%) | | |
| | CLP Holdings Ltd. | 1,992,350 | 17,327 |
| | Want Want China | | |
| | Holdings Ltd. | 8,952,000 | 7,431 |
| | Hang Seng Bank Ltd. | 180,500 | 3,305 |
| | Yuexiu REIT | 6,177,000 | 3,262 |
| | Link REIT | 404,500 | 2,403 |
| | Hong Kong & China Gas | | |
| | Co. Ltd. | 897,000 | 1,818 |
| | Chow Tai Fook Jewellery | | |
| | Group Ltd. | 1,969,600 | 1,681 |
| | Hopewell Highway | | |
| | Infrastructure Ltd. | 1,879,500 | 864 |
| | Cheung Kong | | |
| | Infrastructure Holdings | | |
| | Ltd. | 90,000 | 836 |
| | VTech Holdings Ltd. | 20,700 | 251 |
| | TCC International Holdings | | |
| | Ltd. | 1,000 | — |
| | | | 39,178 |
| India (2.1%) | | |
| | Dr Reddy’s Laboratories | | |
| | Ltd. ADR | 242,607 | 15,718 |
| | Infosys Ltd. ADR | 441,624 | 8,020 |
| | HDFC Bank Ltd. ADR | 34,937 | 2,136 |
| | | | 25,874 |
| Indonesia (0.2%) | | |
| | Telekomunikasi Indonesia | | |
| | Persero Tbk PT ADR | 59,800 | 2,378 |
| |
| Ireland (0.3%) | | |
| | Paddy Power plc | 35,122 | 4,060 |
| |
| Israel (0.5%) | | |
| | Teva Pharmaceutical | | |
| | Industries Ltd. ADR | 26,908 | 1,593 |
| | | |
| | Teva Pharmaceutical | | |
| | Industries Ltd. | 22,999 | 1,366 |
| | Bezeq The Israeli | | |
| | Telecommunication Corp. | | |
| | Ltd. | 571,912 | 1,228 |
| | Paz Oil Co. Ltd. | 5,690 | 849 |
| * | Bank Leumi Le-Israel BM | 79,040 | 300 |
| | Ituran Location and Control | | |
| | Ltd. | 10,962 | 225 |
| | | | 5,561 |
| Italy (0.5%) | | |
| | Davide Campari-Milano | | |
| | SPA | 326,327 | 2,790 |
| | Terna Rete Elettrica | | |
| | Nazionale SPA | 341,089 | 1,734 |
| | Parmalat SPA | 493,741 | 1,284 |
| | Italcementi SPA | 30,181 | 335 |
| | | | 6,143 |
| Japan (3.4%) | | |
| | Takeda Pharmaceutical Co. | | |
| | Ltd. | 180,200 | 8,760 |
| | Ricoh Co. Ltd. | 437,000 | 4,698 |
| | Sawai Pharmaceutical Co. | | |
| | Ltd. | 68,900 | 4,380 |
| ^ | Kagome Co. Ltd. | 225,700 | 3,829 |
| | TonenGeneral Sekiyu KK | 250,000 | 2,598 |
| | Bandai Namco Holdings Inc. | 69,100 | 1,693 |
| | Sega Sammy Holdings Inc. | 135,600 | 1,422 |
| | Canon Inc. | 43,900 | 1,311 |
| | MOS Food Services Inc. | 56,200 | 1,216 |
| * | Kappa Create Co. Ltd. | 94,500 | 931 |
| | Rohto Pharmaceutical Co. | | |
| | Ltd. | 51,000 | 837 |
| | Showa Shell Sekiyu KK | 91,300 | 802 |
| | Sankyo Co. Ltd. | 18,600 | 715 |
| | Ringer Hut Co. Ltd. | 28,800 | 586 |
| | Studio Alice Co. Ltd. | 30,300 | 569 |
| | Hitachi Metals Ltd. | 49,100 | 554 |
| | Kisoji Co. Ltd. | 32,100 | 531 |
| | Earth Chemical Co. Ltd. | 13,200 | 520 |
| | Takashimaya Co. Ltd. | 57,000 | 508 |
| * | Fujiya Co. Ltd. | 309,000 | 504 |
| | Matsuya Foods Co. Ltd. | 23,000 | 464 |
| | Kumagai Gumi Co. Ltd. | 154,000 | 461 |
| * | Kyushu Financial Group Inc. | 58,800 | 452 |
| | Key Coffee Inc. | 27,900 | 445 |
| | Nitto Kohki Co. Ltd. | 18,200 | 383 |
| ^ | Keiyo Co. Ltd. | 80,900 | 332 |
| | Seiko Epson Corp. | 21,700 | 330 |
| | Sakata Seed Corp. | 15,600 | 330 |
| ^ | Rock Field Co. Ltd. | 13,500 | 327 |
| | Sagami Chain Co. Ltd. | 29,000 | 298 |
| | Senshukai Co. Ltd. | 34,200 | 227 |
| | Daisyo Corp. | 18,000 | 212 |
| | Kourakuen Holdings Corp. | 15,900 | 202 |
| | | | 41,427 |
16
Global Minimum Volatility Fund
| | | |
| | | | Market |
| | | | Value• |
| | | Shares | ($000) |
| Mexico (0.9%) | | |
| | Fomento Economico | | |
| | Mexicano SAB de CV ADR | 67,665 | 6,705 |
| | Grupo Aeroportuario del | | |
| | Pacifico SAB de CV ADR | 41,018 | 3,735 |
| | | | 10,440 |
| Netherlands (0.1%) | | |
| | Wereldhave NV | 12,582 | 784 |
| * | SBM Offshore NV | 32,078 | 439 |
| | | | 1,223 |
| Norway (0.5%) | | |
| ^ | Telenor ASA | 163,364 | 3,075 |
| | Norsk Hydro ASA | 409,316 | 1,465 |
| | Orkla ASA | 115,610 | 983 |
| | | | 5,523 |
| Russia (0.7%) | | |
| | Novatek OAO GDR | 35,599 | 3,258 |
| | Rosneft OAO GDR | 419,781 | 1,674 |
| | Gazprom PAO ADR | 363,137 | 1,530 |
| | MMC Norilsk Nickel PJSC | | |
| | ADR | 74,968 | 1,111 |
| | Sberbank PAO ADR | 65,505 | 400 |
| 2 | VTB Bank PJSC GDR | 65,837 | 144 |
| | | | 8,117 |
| Singapore (0.9%) | | |
| | Keppel Corp. Ltd. | 860,600 | 4,320 |
| | Singapore | | |
| | Telecommunications Ltd. | 870,100 | 2,463 |
| | Oversea-Chinese Banking | | |
| | Corp. Ltd. | 326,648 | 2,097 |
| | Singapore Airlines Ltd. | 183,800 | 1,413 |
| | CapitaLand Mall Trust | 270,700 | 382 |
| | Singapore Press Holdings | | |
| | Ltd. | 79,400 | 226 |
| | StarHub Ltd. | 68,000 | 174 |
| | United Overseas Bank Ltd. | 7,000 | 101 |
| | | | 11,176 |
| South Korea (3.1%) | | |
| * | KT Corp. | 522,754 | 13,530 |
| | Korea Zinc Co. Ltd. | 12,928 | 5,371 |
| | KT&G Corp. | 40,414 | 4,039 |
| | GS Holdings Corp. | 54,230 | 2,376 |
| | NAVER Corp. | 3,448 | 1,809 |
| | Woori Bank | 207,707 | 1,802 |
| | POSCO | 7,778 | 1,248 |
| | Kia Motors Corp. | 23,182 | 1,131 |
| | Kangwon Land Inc. | 25,990 | 963 |
| | Macquarie Korea | | |
| | Infrastructure Fund | 106,880 | 749 |
| | SK Telecom Co. Ltd. | 3,469 | 735 |
| | Grand Korea Leisure Co. Ltd. | 24,951 | 692 |
| | LG Corp. | 11,712 | 678 |
| | Lotte Confectionery Co. Ltd. | 371 | 646 |
| | Hyundai Marine & Fire | | |
| | Insurance Co. Ltd. | 18,627 | 554 |
| | | |
| | Samsung Life Insurance Co. | | |
| | Ltd. | 2,881 | 275 |
| | Hyundai Glovis Co. Ltd. | 1,230 | 212 |
| | | | 36,810 |
| Spain (0.2%) | | |
| | Tecnicas Reunidas SA | 19,500 | 869 |
| | Viscofan SA | 9,941 | 580 |
| | Ebro Foods SA | 17,809 | 338 |
| | Endesa SA | 14,960 | 333 |
| | | | 2,120 |
| Sweden (0.5%) | | |
| | Swedish Match AB | 94,400 | 2,967 |
| | Svenska Cellulosa AB SCA | | |
| | Class B | 53,959 | 1,591 |
| | ICA Gruppen AB | 25,896 | 921 |
| * | Axfood AB | 17,947 | 324 |
| | | | 5,803 |
| Switzerland (5.8%) | | |
| | Galenica AG | 11,761 | 17,217 |
| | Swisscom AG | 27,749 | 14,288 |
| | Sonova Holding AG | 68,073 | 9,281 |
| | Logitech International SA | 622,863 | 9,154 |
| | dorma&kaba Holding AG | 5,720 | 3,567 |
| | Kuehne & Nagel | | |
| | International AG | 21,283 | 2,948 |
| | Chocoladefabriken Lindt & | | |
| | Spruengli AG | 360 | 2,195 |
| | Swatch Group AG (Bearer) | 4,646 | 1,814 |
| | Sika AG | 497 | 1,628 |
| | Allreal Holding AG | 9,242 | 1,225 |
| | Baloise Holding AG | 8,492 | 1,018 |
| * | Dufry AG | 8,125 | 949 |
| | Flughafen Zuerich AG | 1,138 | 861 |
| | EMS-Chemie Holding AG | 1,975 | 835 |
| | Temenos Group AG | 17,010 | 795 |
| | Siegfried Holding AG | 3,851 | 771 |
| | Straumann Holding AG | 2,352 | 665 |
| | Chocoladefabriken Lindt & | | |
| | Spruengli AG Registered | | |
| | Shares | 5 | 371 |
| | Alpiq Holding AG | 3,343 | 353 |
| | Swiss Re AG | 2,424 | 225 |
| | | | 70,160 |
| Taiwan (1.3%) | | |
| | Taiwan Semiconductor | | |
| | Manufacturing Co. Ltd. | | |
| | ADR | 263,600 | 5,789 |
| ^ | Chunghwa Telecom Co. | | |
| | Ltd. ADR | 161,501 | 4,948 |
| | Siliconware Precision | | |
| | Industries Co. Ltd. ADR | 486,505 | 3,255 |
| | United Microelectronics | | |
| | Corp. ADR | 649,400 | 1,201 |
| | | | 15,193 |
17
Global Minimum Volatility Fund
| | | |
| | | | Market |
| | | | Value• |
| | | Shares | ($000) |
| United Kingdom (11.1%) | | |
| | Next plc | 149,174 | 18,360 |
| | National Grid plc | 709,038 | 10,092 |
| | Direct Line Insurance | | |
| | Group plc | 1,462,746 | 8,882 |
| | Marks & Spencer Group | | |
| | plc | 973,993 | 7,690 |
| | Royal Mail plc | 980,132 | 6,720 |
| | RELX plc | 367,557 | 6,570 |
| | Inmarsat plc | 396,346 | 6,007 |
| | DCC plc | 66,217 | 5,307 |
| | British American Tobacco | | |
| | plc | 75,852 | 4,502 |
| | Greene King plc | 304,496 | 3,767 |
| 2 | Merlin Entertainments plc | 549,396 | 3,506 |
| | Amec Foster Wheeler plc | 314,480 | 3,436 |
| | GlaxoSmithKline plc | 145,330 | 3,130 |
| | AstraZeneca plc | 47,300 | 3,019 |
| | Howden Joinery Group plc | 419,688 | 2,995 |
| | Fresnillo plc | 241,470 | 2,711 |
| | Land Securities Group plc | 118,995 | 2,453 |
| | SSE plc | 88,552 | 2,065 |
| | Reckitt Benckiser Group plc | 20,794 | 2,029 |
| | Imperial Tobacco Group plc | 33,952 | 1,829 |
| | Centrica plc | 517,361 | 1,801 |
| | Meggitt plc | 312,267 | 1,700 |
| | Sage Group plc | 185,452 | 1,555 |
| | Bunzl plc | 54,290 | 1,553 |
| | BT Group plc | 214,142 | 1,531 |
| | William Hill plc | 309,877 | 1,513 |
| | Regus plc | 286,213 | 1,474 |
| * | Sports Direct International | | |
| | plc | 134,704 | 1,446 |
| | Indivior plc | 434,830 | 1,375 |
| | G4Splc | 348,376 | 1,301 |
| | UK Commercial Property | | |
| | Trust Ltd. | 946,030 | 1,274 |
| | Compass Group plc | 73,630 | 1,268 |
| | Kingfisher plc | 228,018 | 1,239 |
| | F&C Commercial Property | | |
| | Trust Ltd. | 537,029 | 1,180 |
| | BAE Systems plc | 171,174 | 1,159 |
| | Inchcape plc | 82,750 | 1,017 |
| | UBM plc | 107,460 | 846 |
| | Dixons Carphone plc | 115,000 | 817 |
| | Randgold Resources Ltd. | 12,133 | 813 |
| | Rightmove plc | 13,460 | 795 |
| | Melrose Industries plc | 190,448 | 780 |
| | Tate & Lyle plc | 65,251 | 600 |
| | Severn Trent plc | 14,055 | 485 |
| | Ultra Electronics Holdings | | |
| | plc | 17,786 | 461 |
| | Playtech plc | 27,488 | 362 |
| | Derwent London plc | 5,835 | 348 |
| | Hammerson plc | 26,771 | 262 |
| | | | 134,025 |
| | | |
| United States (50.9%) | | |
| Consumer Discretionary (3.8%) | | |
| | Chico’s FAS Inc. | 461,026 | 6,371 |
| * | Markit Ltd. | 165,221 | 5,039 |
| | Signet Jewelers Ltd. | 29,571 | 4,463 |
| | Service Corp. International | 140,000 | 3,956 |
| | Pool Corp. | 43,893 | 3,579 |
| * | Panera Bread Co. Class A | 18,045 | 3,201 |
| | John Wiley & Sons Inc. | | |
| | Class A | 50,800 | 2,658 |
| | Churchill Downs Inc. | 17,600 | 2,584 |
| * | LKQ Corp. | 73,800 | 2,185 |
| | Monro Muffler Brake Inc. | 29,134 | 2,161 |
| | Williams-Sonoma Inc. | 22,000 | 1,622 |
| * | AutoZone Inc. | 2,050 | 1,608 |
| | Core-Mark Holding Co. Inc. | 15,230 | 1,238 |
| | Vail Resorts Inc. | 9,300 | 1,062 |
| | DineEquity Inc. | 12,299 | 1,026 |
| * | Murphy USA Inc. | 11,192 | 687 |
| | New York Times Co. | | |
| | Class A | 45,523 | 605 |
| * | Krispy Kreme Doughnuts | | |
| | Inc. | 42,344 | 580 |
| | Big Lots Inc. | 12,311 | 568 |
| | Foot Locker Inc. | 6,300 | 427 |
| * | Hibbett Sports Inc. | 8,900 | 304 |
| | Nordstrom Inc. | 4,000 | 261 |
| * | Bed Bath & Beyond Inc. | 3,700 | 221 |
| | | | 46,406 |
| Consumer Staples (8.4%) | | |
| | Clorox Co. | 141,155 | 17,212 |
| | Church & Dwight Co. Inc. | 196,012 | 16,875 |
| | Kimberly-Clark Corp. | 131,329 | 15,721 |
| | Vector Group Ltd. | 487,228 | 11,815 |
| | Spectrum Brands Holdings | | |
| | Inc. | 96,700 | 9,269 |
| | Colgate-Palmolive Co. | 90,100 | 5,978 |
| | B&G Foods Inc. | 153,747 | 5,580 |
| | Kellogg Co. | 69,002 | 4,866 |
| | Altria Group Inc. | 56,300 | 3,405 |
| | Procter & Gamble Co. | 37,521 | 2,866 |
| | Philip Morris International | | |
| | Inc. | 31,600 | 2,793 |
| | JM Smucker Co. | 14,400 | 1,690 |
| | Energizer Holdings Inc. | 28,300 | 1,212 |
| | Flowers Foods Inc. | 32,475 | 877 |
| | J&J Snack Foods Corp. | 4,400 | 540 |
| | McCormick & Co. Inc. | 5,400 | 454 |
| | | | 101,153 |
| Energy (0.3%) | | |
| | World Fuel Services Corp. | 46,382 | 2,062 |
| | Ship Finance International | | |
| | Ltd. | 61,900 | 1,058 |
| * | SEACOR Holdings Inc. | 11,445 | 669 |
| | | | 3,789 |
18
Global Minimum Volatility Fund
| | | |
| | | | Market |
| | | | Value• |
| | | Shares | ($000) |
| Financials (14.6%) | | |
| | New York Community | | |
| | Bancorp Inc. | 877,267 | 14,492 |
| | People’s United Financial | | |
| | Inc. | 783,150 | 12,491 |
| * | Beneficial Bancorp Inc. | 791,607 | 10,980 |
| | Two Harbors Investment | | |
| | Corp. | 957,400 | 8,100 |
| | Brown & Brown Inc. | 216,900 | 6,999 |
| | Rayonier Inc. | 272,400 | 6,170 |
| | Capitol Federal Financial | | |
| | Inc. | 455,900 | 5,918 |
| | Lamar Advertising Co. | | |
| | Class A | 99,072 | 5,591 |
| | Starwood Property Trust | | |
| | Inc. | 265,842 | 5,341 |
| | ProAssurance Corp. | 98,183 | 5,200 |
| | RenaissanceRe Holdings | | |
| | Ltd. | 46,730 | 5,123 |
| | Washington Federal Inc. | 195,396 | 4,873 |
| * | Essent Group Ltd. | 200,000 | 4,820 |
| 3 | Hudson Pacific Properties | | |
| | Inc. | 156,400 | 4,468 |
| | WP Carey Inc. | 67,700 | 4,290 |
| | TFS Financial Corp. | 219,700 | 3,858 |
| * | Markel Corp. | 4,314 | 3,745 |
| | New York REIT Inc. | 322,194 | 3,673 |
| | Radian Group Inc. | 247,310 | 3,579 |
| | Mack-Cali Realty Corp. | 155,545 | 3,385 |
| | Oritani Financial Corp. | 206,400 | 3,286 |
| | Chimera Investment Corp. | 201,983 | 2,844 |
| | Blackstone Mortgage Trust | | |
| | Inc. Class A | 102,500 | 2,821 |
| | Marsh & McLennan Cos. | | |
| | Inc. | 46,600 | 2,597 |
| | Piedmont Office Realty | | |
| | Trust Inc. Class A | 120,630 | 2,338 |
| | Capstead Mortgage Corp. | 241,849 | 2,334 |
| | MFA Financial Inc. | 337,000 | 2,332 |
| * | Arch Capital Group Ltd. | 29,230 | 2,189 |
| | EverBank Financial Corp. | 113,559 | 1,960 |
| | Hatteras Financial Corp. | 136,900 | 1,959 |
| | Acadia Realty Trust | 56,000 | 1,842 |
| | Valley National Bancorp | 151,917 | 1,595 |
| | Education Realty Trust Inc. | 43,935 | 1,578 |
| | Northwest Bancshares Inc. | 97,172 | 1,308 |
| | Ramco-Gershenson | | |
| | Properties Trust | 76,300 | 1,282 |
| | Healthcare Realty Trust Inc. | 45,174 | 1,191 |
| | Post Properties Inc. | 19,000 | 1,135 |
| | Parkway Properties Inc. | 62,400 | 1,044 |
| | Medical Properties Trust | | |
| | Inc. | 91,400 | 1,033 |
| | Chambers Street Properties | 138,100 | 978 |
| | | |
| | Urstadt Biddle Properties | | |
| | Inc. Class A | 47,000 | 945 |
| | Invesco Mortgage Capital | | |
| | Inc. | 77,300 | 931 |
| | Franklin Street Properties | | |
| | Corp. | 87,350 | 910 |
| | Brookline Bancorp Inc. | 68,100 | 773 |
| | EastGroup Properties Inc. | 13,400 | 752 |
| | Astoria Financial Corp. | 46,712 | 745 |
| | DuPont Fabros Technology | | |
| | Inc. | 21,323 | 684 |
| | Investors Bancorp Inc. | 54,095 | 677 |
| | Investors Real Estate Trust | 82,500 | 670 |
| * | Equity Commonwealth | 22,653 | 650 |
| | Equity One Inc. | 24,100 | 641 |
| | American Homes 4 Rent | | |
| | Class A | 38,400 | 634 |
| | Cousins Properties Inc. | 62,700 | 629 |
| | Government Properties | | |
| | Income Trust | 36,000 | 586 |
| | National Health Investors | | |
| | Inc. | 9,400 | 552 |
| | Alexandria Real Estate | | |
| | Equities Inc. | 5,900 | 529 |
| | Colony Capital Inc. Class A | 24,429 | 497 |
| | Liberty Property Trust | 13,800 | 469 |
| | American Financial Group | | |
| | Inc. | 6,444 | 465 |
| | Universal Health Realty | | |
| | Income Trust | 8,800 | 437 |
| | Dime Community | | |
| | Bancshares Inc. | 25,000 | 434 |
| | Safety Insurance Group Inc. | 6,600 | 382 |
| * | MGIC Investment Corp. | 40,600 | 382 |
| | Arthur J Gallagher & Co. | 7,700 | 337 |
| | Aspen Insurance Holdings | | |
| | Ltd. | 6,200 | 301 |
| | Hersha Hospitality Trust | | |
| | Class A | 10,900 | 262 |
| | Camden Property Trust | 3,300 | 243 |
| | Retail Properties of | | |
| | America Inc. | 14,600 | 219 |
| | Plum Creek Timber Co. Inc. | 4,913 | 200 |
| | | | 176,678 |
| Health Care (6.2%) | | |
| * | MEDNAX Inc. | 172,953 | 12,188 |
| * | Henry Schein Inc. | 64,164 | 9,734 |
| | Owens & Minor Inc. | 245,920 | 8,816 |
| | Patterson Cos. Inc. | 183,000 | 8,674 |
| | Chemed Corp. | 50,626 | 7,963 |
| | Teleflex Inc. | 48,900 | 6,504 |
| | Hill-Rom Holdings Inc. | 115,900 | 6,107 |
| * | Sirona Dental Systems Inc. | 46,300 | 5,053 |
| | Johnson & Johnson | 45,700 | 4,617 |
19
Global Minimum Volatility Fund
| | | |
| | | | Market |
| | | | Value• |
| | | Shares | ($000) |
| * | DaVita HealthCare Partners | | |
| | Inc. | 38,000 | 2,945 |
| * | Bio-Rad Laboratories Inc. | | |
| | Class A | 5,785 | 807 |
| | Analogic Corp. | 4,269 | 374 |
| * | ICU Medical Inc. | 2,983 | 328 |
| | ResMed Inc. | 3,485 | 201 |
| | | | 74,311 |
| Industrials (4.8%) | | |
| | United Parcel Service Inc. | | |
| | Class B | 90,900 | 9,365 |
| | Rollins Inc. | 230,100 | 6,171 |
| | Herman Miller Inc. | 142,617 | 4,525 |
| | Waste Connections Inc. | 80,240 | 4,372 |
| * | Stericycle Inc. | 35,143 | 4,265 |
| | Republic Services Inc. | | |
| | Class A | 91,195 | 3,989 |
| | Danaher Corp. | 36,900 | 3,443 |
| | General Dynamics Corp. | 20,100 | 2,986 |
| | Waste Management Inc. | 51,148 | 2,750 |
| | Healthcare Services Group | | |
| | Inc. | 66,991 | 2,496 |
| | Expeditors International of | | |
| | Washington Inc. | 48,400 | 2,410 |
| | 3M Co. | 14,100 | 2,217 |
| | National Presto Industries | | |
| | Inc. | 24,000 | 2,113 |
| | Carlisle Cos. Inc. | 19,800 | 1,723 |
| * | Teledyne Technologies Inc. | 17,400 | 1,553 |
| | Matthews International | | |
| | Corp. Class A | 22,400 | 1,293 |
| | Rockwell Collins Inc. | 8,803 | 763 |
| | Cubic Corp. | 11,200 | 502 |
| | Universal Forest Products | | |
| | Inc. | 3,367 | 245 |
| | BWX Technologies Inc. | 8,318 | 235 |
| | Steelcase Inc. Class A | 11,662 | 226 |
| | Toro Co. | 2,864 | 216 |
| | | | 57,858 |
| Information Technology (6.5%) | | |
| | Jack Henry & Associates | | |
| | Inc. | 216,534 | 16,747 |
| 3 | Amdocs Ltd. | 172,400 | 10,270 |
| * | CACI International Inc. | | |
| | Class A | 91,500 | 8,879 |
| | Paychex Inc. | 121,700 | 6,277 |
| | MAXIMUS Inc. | 73,989 | 5,046 |
| | Motorola Solutions Inc. | 68,600 | 4,800 |
| * | VeriSign Inc. | 55,500 | 4,473 |
| | j2 Global Inc. | 51,900 | 4,025 |
| * | Polycom Inc. | 278,148 | 3,833 |
| | Diebold Inc. | 70,974 | 2,617 |
| | Total System Services Inc. | 35,639 | 1,869 |
| | | |
| | FactSet Research Systems | | |
| | Inc. | 8,900 | 1,559 |
| * | Check Point Software | | |
| | Technologies Ltd. | 15,540 | 1,320 |
| | CSG Systems International | | |
| | Inc. | 34,060 | 1,142 |
| * | Electronics For Imaging Inc. | 23,668 | 1,099 |
| * | Genpact Ltd. | 40,800 | 1,011 |
| * | Gartner Inc. | 9,500 | 861 |
| * | NETGEAR Inc. | 17,064 | 706 |
| | National Instruments Corp. | 19,000 | 579 |
| * | WebMD Health Corp. | 13,248 | 539 |
| * | QLogic Corp. | 38,911 | 483 |
| * | Progress Software Corp. | 19,000 | 461 |
| | | | 78,596 |
| Materials (3.5%) | | |
| | Kaiser Aluminum Corp. | 204,467 | 16,621 |
| | Compass Minerals | | |
| | International Inc. | 191,756 | 15,578 |
| | AptarGroup Inc. | 113,700 | 8,364 |
| | Silgan Holdings Inc. | 16,625 | 846 |
| | Carpenter Technology Corp. | 12,216 | 407 |
| | Sonoco Products Co. | 8,206 | 350 |
| | | | 42,166 |
| Telecommunication Services (0.2%) | |
| | Cogent Communications | | |
| | Holdings Inc. | 61,213 | 1,880 |
| | Verizon Communications Inc. | 6,800 | 319 |
| | | | 2,199 |
| Utilities (2.6%) | | |
| | Portland General Electric | | |
| | Co. | 146,147 | 5,419 |
| | Vectren Corp. | 91,408 | 4,156 |
| | ALLETE Inc. | 74,053 | 3,718 |
| 3 | Southern Co. | 68,700 | 3,098 |
| | IDACORP Inc. | 43,998 | 2,941 |
| | OGE Energy Corp. | 67,790 | 1,933 |
| | Avista Corp. | 52,000 | 1,760 |
| | Laclede Group Inc. | 29,904 | 1,752 |
| | NorthWestern Corp. | 29,928 | 1,622 |
| | Ameren Corp. | 36,454 | 1,592 |
| | Empire District Electric Co. | 62,100 | 1,400 |
| | Duke Energy Corp. | 18,700 | 1,337 |
| | Great Plains Energy Inc. | 21,700 | 597 |
| | Dominion Resources Inc. | 6,600 | 472 |
| | | | 31,797 |
| | | | 614,953 |
| Total Common Stocks | | |
| (Cost $1,156,550) | | 1,195,605 |
20
Global Minimum Volatility Fund
| | |
| | | Market |
| | | Value• |
| | Shares | ($000) |
| Temporary Cash Investment (3.6%)1 | |
| Money Market Fund (3.6%) | |
| 4,5 Vanguard Market Liquidity | |
| Fund, 0.207% | | |
| (Cost $43,671) | 43,670,726 | 43,671 |
| Total Investments (102.6%) | |
| (Cost $1,200,221) | | 1,239,276 |
| |
| | | Amount |
| | | ($000) |
| Other Assets and Liabilities (-2.6%) | |
| Other Assets | | |
| Investment in Vanguard | | 98 |
| Receivables for Investment Securities Sold 595 |
| Receivables for Accrued Income | 1,896 |
| Receivables for Capital Shares Issued | 8,857 |
| Other Assets | | 4,628 |
| Total Other Assets | | 16,074 |
| Liabilities | | |
| Payables for Investment Securities | |
| Purchased | | (14,376) |
| Collateral for Securities on Loan | (30,131) |
| Payables for Capital Shares Redeemed | (479) |
| Payables to Vanguard | | (253) |
| Other Liabilities | | (1,799) |
| Total Liabilities | | (47,038) |
| Net Assets (100%) | | 1,208,312 |
| |
| At October 31, 2015, net assets consisted of: |
| | Amount |
| | ($000) |
| Paid-in Capital | 1,136,007 |
| Undistributed Net Investment Income | 15,621 |
| Accumulated Net Realized Gains | 15,553 |
| Unrealized Appreciation (Depreciation) | |
| Investment Securities | 39,055 |
| Futures Contracts | 231 |
| Forward Currency Contracts | 1,859 |
| Foreign Currencies | (14) |
| Net Assets | 1,208,312 |
| |
| |
| Investor Shares—Net Assets | |
| Applicable to 38,201,137 outstanding | |
| $.001 par value shares of beneficial | |
| interest (unlimited authorization) | 450,985 |
| Net Asset Value Per Share— | |
| Investor Shares | $11.81 |
| |
| |
| Admiral Shares—Net Assets | |
| Applicable to 32,058,490 outstanding | |
| $.001 par value shares of beneficial | |
| interest (unlimited authorization) | 757,327 |
| Net Asset Value Per Share— | |
| Admiral Shares | $23.62 |
• See Note A in Notes to Financial Statements.
^ Includes partial security positions on loan to broker-dealers. The total value of securities on loan is $27,574,000.
* Non-income-producing security.
1 The fund invests a portion of its cash reserves in equity markets through the use of index futures contracts. After giving effect to futures
investments, the fund’s effective common stock and temporary cash investment positions represent 99.4% and 3.2%, respectively,
of net assets.
2 Security exempt from registration under Rule 144A of the Securities Act of 1933. Such securities may be sold in transactions exempt from
registration, normally to qualified institutional buyers. At October 31, 2015, the aggregate value of these securities was $3,650,000,
representing 0.3% of net assets.
3 Securities with a value of $1,104,000 have been segregated as initial margin for open futures contracts.
4 Affiliated money market fund available only to Vanguard funds and certain trusts and accounts managed by Vanguard. Rate shown is the
7-day yield.
5 Includes $30,131,000 of collateral received for securities on loan.
ADR—American Depositary Receipt.
GDR—Global Depositary Receipt.
REIT—Real Estate Investment Trust.
See accompanying Notes, which are an integral part of the Financial Statements.
21
| |
| Global Minimum Volatility Fund | |
| |
| |
| Statement of Operations | |
| |
| | Year Ended |
| | October 31, 2015 |
| | ($000) |
| Investment Income | |
| Income | |
| Dividends1 | 22,901 |
| Interest2 | 19 |
| Securities Lending | 261 |
| Total Income | 23,181 |
| Expenses | |
| The Vanguard Group—Note B | |
| Investment Advisory Services | 510 |
| Management and Administrative—Investor Shares | 676 |
| Management and Administrative—Admiral Shares | 430 |
| Marketing and Distribution—Investor Shares | 73 |
| Marketing and Distribution—Admiral Shares | 38 |
| Custodian Fees | 202 |
| Auditing Fees | 38 |
| Shareholders’ Reports—Investor Shares | 5 |
| Shareholders’ Reports—Admiral Shares | 3 |
| Trustees’ Fees and Expenses | 1 |
| Total Expenses | 1,976 |
| Net Investment Income | 21,205 |
| Realized Net Gain (Loss) | |
| Investment Securities Sold | (2,815) |
| Futures Contracts | 172 |
| Foreign Currencies and Forward Currency Contracts | 34,208 |
| Realized Net Gain (Loss) | 31,565 |
| Change in Unrealized Appreciation (Depreciation) | |
| Investment Securities | 19,052 |
| Futures Contracts | (22) |
| Foreign Currencies and Forward Currency Contracts | (7,266) |
| Change in Unrealized Appreciation (Depreciation) | 11,764 |
| Net Increase (Decrease) in Net Assets Resulting from Operations | 64,534 |
| 1 Dividends are net of foreign withholding taxes of $672,000. |
| 2 Interest income from an affiliated company of the fund was $19,000. |
See accompanying Notes, which are an integral part of the Financial Statements.
22
Global Minimum Volatility Fund
Statement of Changes in Net Assets
| | |
| | | December 12, |
| | Year Ended | 20131 to |
| | October 31, | October 31, |
| | 2015 | 2014 |
| | ($000) | ($000) |
| Increase (Decrease) in Net Assets | | |
| Operations | | |
| Net Investment Income | 21,205 | 10,742 |
| Realized Net Gain (Loss) | 31,565 | 9,575 |
| Change in Unrealized Appreciation (Depreciation) | 11,764 | 29,367 |
| Net Increase (Decrease) in Net Assets Resulting from Operations | 64,534 | 49,684 |
| Distributions | | |
| Net Investment Income | | |
| Investor Shares | (9,075) | (703) |
| Admiral Shares | (3,883) | (27) |
| Realized Capital Gain 2 | | |
| Investor Shares | (13,061) | — |
| Admiral Shares | (5,350) | — |
| Total Distributions | (31,369) | (730) |
| Capital Share Transactions | | |
| Investor Shares | 73,567 | 318,348 |
| Admiral Shares | 626,768 | 107,510 |
| Net Increase (Decrease) from Capital Share Transactions | 700,335 | 425,858 |
| Total Increase (Decrease) | 733,500 | 474,812 |
| Net Assets | | |
| Beginning of Period | 474,812 | — |
| End of Period3 | 1,208,312 | 474,812 |
| 1 Inception. |
| 2 Includes fiscal 2015 short-term gain distributions totaling $13,523,000. Short-term gain distributions are treated as ordinary income dividends for tax purposes. |
| 3 Net Assets—End of Period includes undistributed (overdistributed) net investment income of $15,621,000 and $9,648,000. |
See accompanying Notes, which are an integral part of the Financial Statements.
23
Global Minimum Volatility Fund
Financial Highlights
| | |
| Investor Shares | | |
| | Year | Dec. 12, |
| | Ended | 20131 to |
| | Oct. 31, | Oct. 31, |
| For a Share Outstanding Throughout Each Period | 2015 | 2014 |
| Net Asset Value, Beginning of Period | $11.41 | $10.00 |
| Investment Operations | | |
| Net Investment Income | . 288 2 | .262 |
| Net Realized and Unrealized Gain (Loss) on Investments | .795 | 1.172 |
| Total from Investment Operations | 1.083 | 1.434 |
| Distributions | | |
| Dividends from Net Investment Income | (.280) | (.024) |
| Distributions from Realized Capital Gains | (.403) | — |
| Total Distributions | (.683) | (.024) |
| Net Asset Value, End of Period | $11.81 | $11.41 |
| |
| Total Return3 | 9.93% | 14.37% |
| |
| Ratios/Supplemental Data | | |
| Net Assets, End of Period (Millions) | $451 | $360 |
| Ratio of Total Expenses to Average Net Assets | 0.27% | 0.30%4 |
| Ratio of Net Investment Income to Average Net Assets | 2.52% | 3.18%4 |
| Portfolio Turnover Rate | 57% | 49% |
| 1 Inception. |
| 2 Calculated based on average shares outstanding. |
| 3 Total returns do not include account service fees that may have applied in the periods shown. Fund prospectuses provide information about any applicable account service fees. |
| 4 Annualized. |
See accompanying Notes, which are an integral part of the Financial Statements.
24
Global Minimum Volatility Fund
Financial Highlights
| | |
| Admiral Shares | | |
| | Year | Dec. 12, |
| | Ended | 20131 to |
| | Oct. 31, | Oct. 31, |
| For a Share Outstanding Throughout Each Period | 2015 | 2014 |
| Net Asset Value, Beginning of Period | $22.83 | $20.00 |
| Investment Operations | | |
| Net Investment Income | . 605 2 | .546 |
| Net Realized and Unrealized Gain (Loss) on Investments | 1.576 | 2.332 |
| Total from Investment Operations | 2.181 | 2.878 |
| Distributions | | |
| Dividends from Net Investment Income | (.585) | (.048) |
| Distributions from Realized Capital Gains | (.806) | — |
| Total Distributions | (1.391) | (.048) |
| Net Asset Value, End of Period | $23.62 | $22.83 |
| |
| Total Return3 | 10.00% | 14.42% |
| |
| Ratios/Supplemental Data | | |
| Net Assets, End of Period (Millions) | $757 | $115 |
| Ratio of Total Expenses to Average Net Assets | 0.21% | 0.20%4 |
| Ratio of Net Investment Income to Average Net Assets | 2.58% | 3.28%4 |
| Portfolio Turnover Rate | 57% | 49% |
| 1 Inception. |
| 2 Calculated based on average shares outstanding. |
| 3 Total returns do not include account service fees that may have applied in the periods shown. Fund prospectuses provide information about any applicable account service fees. |
| 4 Annualized. |
See accompanying Notes, which are an integral part of the Financial Statements.
25
Global Minimum Volatility Fund
Notes to Financial Statements
Vanguard Global Minimum Volatility Fund is registered under the Investment Company Act of 1940 as an open-end investment company, or mutual fund. The fund invests in securities of foreign issuers, which may subject it to investment risks not normally associated with investing in securities of U.S. corporations. To minimize the currency risk and volatility associated with investment in securities denominated in currencies other than the U.S. dollar, the fund attempts to hedge its currency exposure. The fund offers two classes of shares: Investor Shares and Admiral Shares. Investor Shares are available to any investor who meets the fund’s minimum purchase requirements. Admiral Shares are designed for investors who meet certain administrative, service, and account-size criteria.
A. The following significant accounting policies conform to generally accepted accounting principles for U.S. investment companies. The fund consistently follows such policies in preparing its financial statements.
1. Security Valuation: Securities are valued as of the close of trading on the New York Stock Exchange (generally 4 p.m., Eastern time) on the valuation date. Equity securities are valued at the latest quoted sales prices or official closing prices taken from the primary market in which each security trades; such securities not traded on the valuation date are valued at the mean of the latest quoted bid and asked prices. Securities for which market quotations are not readily available, or whose values have been affected by events occurring before the fund’s pricing time but after the close of the securities’ primary markets, are valued at their fair values calculated according to procedures adopted by the board of trustees. These procedures include obtaining quotations from an independent pricing service, monitoring news to identify significant market- or security-specific events, and evaluating changes in the values of foreign market proxies (for example, ADRs, futures contracts, or exchange-traded funds), between the time the foreign markets close and the fund’s pricing time. When fair-value pricing is employed, the prices of securities used by a fund to calculate its net asset value may differ from quoted or published prices for the same securities. Investments in Vanguard Market Liquidity Fund are valued at that fund’s net asset value.
2. Foreign Currency: Securities and other assets and liabilities denominated in foreign currencies are translated into U.S. dollars using exchange rates obtained from an independent third party as of the fund’s pricing time on the valuation date. Realized gains (losses) and unrealized appreciation (depreciation) on investment securities include the effects of changes in exchange rates since the securities were purchased, combined with the effects of changes in security prices. Fluctuations in the value of other assets and liabilities resulting from changes in exchange rates are recorded as unrealized foreign currency gains (losses) until the assets or liabilities are settled in cash, at which time they are recorded as realized foreign currency gains (losses).
3. Futures and Forward Currency Contracts: The fund uses index futures contracts to a limited extent, with the objective of maintaining full exposure to the stock market while maintaining liquidity. The fund may purchase or sell futures contracts to achieve a desired level of investment, whether to accommodate portfolio turnover or cash flows from capital share transactions. The primary risks associated with the use of futures contracts are imperfect correlation between changes in market values of stocks held by the fund and the prices of futures contracts, and the possibility of an illiquid market. Counterparty risk involving futures is mitigated because a regulated clearinghouse is the counterparty instead of the clearing broker. To further mitigate counterparty risk, the fund trades futures contracts on an exchange, monitors the financial strength of its clearing brokers and clearinghouse, and has entered into clearing agreements with its clearing brokers. The clearinghouse imposes initial margin requirements to secure the fund’s performance and requires daily settlement of variation margin representing changes in the market value of each contract.
26
Global Minimum Volatility Fund
The fund enters into forward currency contracts to protect the value of securities and related receivables and payables against changes in future foreign exchange rates. The fund’s risks in using these contracts include movement in the values of the foreign currencies relative to the U.S. dollar and the ability of the counterparties to fulfill their obligations under the contracts. The fund mitigates its counterparty risk by entering into forward currency contracts only with a diverse group of prequalified counterparties, monitoring their financial strength, entering into master netting arrangements with its counterparties, and requiring its counterparties to transfer collateral as security for their performance. The master netting arrangements provide that, in the event of a counterparty’s default (including bankruptcy), the fund may terminate the forward currency contracts, determine the net amount owed by either party in accordance with its master netting arrangements, and sell or retain any collateral held up to the net amount owed to the fund under the master netting arrangements. The forward currency contracts contain provisions whereby a counterparty may terminate open contracts if the fund’s net assets decline below a certain level, triggering a payment by the fund if the fund is in a net liability position at the time of the termination. The payment amount would be reduced by any collateral the fund has pledged. Any assets pledged as collateral for open contracts are noted in the Statement of Net Assets. The value of collateral received or pledged is compared daily to the value of the forward currency contracts exposure with each counterparty, and any difference, if in excess of a specified minimum transfer amount, is adjusted and settled within two business days.
Futures contracts are valued at their quoted daily settlement prices. Forward currency contracts are valued at their quoted daily prices obtained from an independent third party, adjusted for currency risk based on the expiration date of each contract. The aggregate settlement values and notional amounts of the contracts are not recorded in the Statement of Net Assets. Fluctuations in the value of the contracts are recorded in the Statement of Net Assets as an asset (liability) and in the Statement of Operations as unrealized appreciation (depreciation) until the contracts are closed, when they are recorded as realized gains (losses) on futures or forward currency contracts.
During the year ended October 31, 2015, the fund’s average investments in long and short futures contracts represented less than 1% and 0% of net assets, respectively, based on the average of aggregate settlement values at each quarter-end during the period. The fund’s average investment in forward currency contracts represented 44% of net assets, based on the average of notional amounts at each quarter-end during the period.
4. Federal Income Taxes: The fund intends to continue to qualify as a regulated investment company and distribute all of its taxable income. Management has analyzed the fund’s tax positions taken for all open federal income tax years (October 31, 2014–2015), and has concluded that no provision for federal income tax is required in the fund’s financial statements.
5. Distributions: Distributions to shareholders are recorded on the ex-dividend date.
6. Securities Lending: To earn additional income, the fund lends its securities to qualified institutional borrowers. Security loans are required to be secured at all times by collateral in an amount at least equal to the market value of securities loaned. Daily market fluctuations could cause the value of loaned securities to be more or less than the value of the collateral received. When this occurs, the collateral is adjusted and settled on the next business day. The fund further mitigates its counterparty risk by entering into securities lending transactions only with a diverse group of prequalified counterparties, monitoring their financial strength, and entering into master securities lending agreements with its counterparties. The master securities lending agreements provide
27
Global Minimum Volatility Fund
that, in the event of a counterparty’s default (including bankruptcy), the fund may terminate any loans with that borrower, determine the net amount owed, and sell or retain the collateral up to the net amount owed to the fund; however, such actions may be subject to legal proceedings. While collateral mitigates counterparty risk, in the absence of a default the fund may experience delays and costs in recovering the securities loaned. The fund invests cash collateral received in Vanguard Market Liquidity Fund, and records a liability in the Statement of Net Assets for the return of the collateral, during the period the securities are on loan. Securities lending income represents fees charged to borrowers plus income earned on invested cash collateral, less expenses associated with the loan.
7. Credit Facility: The fund and certain other funds managed by The Vanguard Group (“Vanguard”) participate in a $3 billion committed credit facility provided by a syndicate of lenders pursuant to a credit agreement that may be renewed annually; each fund is individually liable for its borrowings, if any, under the credit facility. Borrowings may be utilized for temporary and emergency purposes, and are subject to the fund’s regulatory and contractual borrowing restrictions. The participating funds are charged administrative fees and an annual commitment fee of 0.06% of the undrawn amount of the facility; these fees are allocated to the funds based on a method approved by the fund’s board of trustees and included in Management and Administrative expenses on the fund’s Statement of Operations. Any borrowings under this facility bear interest at a rate equal to the higher of the federal funds rate or LIBOR reference rate plus an agreed-upon spread.
The fund had no borrowings outstanding at October 31, 2015, or at any time during the period then ended.
8. Other: Dividend income is recorded on the ex-dividend date. Interest income includes income distributions received from Vanguard Market Liquidity Fund and is accrued daily. Security transactions are accounted for on the date securities are bought or sold. Costs used to determine realized gains (losses) on the sale of investment securities are those of the specific securities sold.
Each class of shares has equal rights as to assets and earnings, except that each class separately bears certain class-specific expenses related to maintenance of shareholder accounts (included in Management and Administrative expenses) and shareholder reporting. Marketing and distribution expenses are allocated to each class of shares based on a method approved by the board of trustees. Income, other non-class-specific expenses, and gains and losses on investments are allocated to each class of shares based on its relative net assets.
B. In accordance with the terms of a Funds’ Service Agreement (the “FSA”) between Vanguard and the fund, Vanguard furnishes to the fund investment advisory, corporate management, administrative, marketing, and distribution services at Vanguard’s cost of operations (as defined by the FSA). These costs of operations are allocated to the fund based on methods and guidelines approved by the board of trustees. Vanguard does not require reimbursement in the current period for certain costs of operations (such as deferred compensation/benefits and risk/insurance costs); the fund’s liability for these costs of operations is included in Payables to Vanguard on the Statement of Net Assets.
28
Global Minimum Volatility Fund
Upon the request of Vanguard, the fund may invest up to 0.40% of its net assets as capital in Vanguard. At October 31, 2015, the fund had contributed to Vanguard capital in the amount of $98,000, representing 0.01% of the fund’s net assets and 0.04% of Vanguard’s capitalization. The fund’s trustees and officers are also directors and employees, respectively, of Vanguard.
C. Various inputs may be used to determine the value of the fund’s investments. These inputs are summarized in three broad levels for financial statement purposes. The inputs or methodologies used to value securities are not necessarily an indication of the risk associated with investing in those securities.
Level 1—Quoted prices in active markets for identical securities.
Level 2—Other significant observable inputs (including quoted prices for similar securities, interest rates, prepayment speeds, credit risk, etc.).
Level 3—Significant unobservable inputs (including the fund’s own assumptions used to determine the fair value of investments).
The following table summarizes the market value of the fund’s investments as of October 31, 2015, based on the inputs used to value them:
| | | |
| | Level 1 | Level 2 | Level 3 |
| Investments | ($000) | ($000) | ($000) |
| Common Stocks—International | 140,592 | 440,060 | — |
| Common Stocks—United States | 614,953 | — | — |
| Temporary Cash Investments | 43,671 | — | — |
| Futures Contracts—Assets1 | 4 | — | — |
| Futures Contracts—Liabilities1 | (17) | — | — |
| Forward Currency Contracts—Assets | — | 3,641 | — |
| Forward Currency Contracts—Liabilities | — | (1,782) | — |
| Total | 799,203 | 441,919 | — |
| 1 Represents variation margin on the last day of the reporting period. |
D. At October 31, 2015, the fair values of derivatives were reflected in the Statement of Net Assets as follows:
| | | |
| | | Foreign | |
| | Equity | Exchange | |
| | Contracts | Contracts | Total |
| Statement of Net Assets Caption | ($000) | ($000) | ($000) |
| Other Assets | 4 | 3,641 | 3,645 |
| Other Liabilities | (17) | (1,782) | (1,799) |
29
Global Minimum Volatility Fund
Realized net gain (loss) and the change in unrealized appreciation (depreciation) on derivatives for the year ended October 31, 2015, were:
| | | |
| | | Foreign | |
| | Equity | Exchange | |
| | Contracts | Contracts | Total |
| Realized Net Gain (Loss) on Derivatives | ($000) | ($000) | ($000) |
| Futures Contracts | 172 | — | 172 |
| Forward Currency Contracts | — | 34,447 | 34,447 |
| Realized Net Gain (Loss) on Derivatives | 172 | 34,447 | 34,619 |
| |
| Change in Unrealized Appreciation (Depreciation) on Derivatives | | | |
| Futures Contracts | (22) | — | (22) |
| Forward Currency Contracts | — | (7,301) | (7,301) |
| Change in Unrealized Appreciation (Depreciation) on Derivatives | (22) | (7,301) | (7,323) |
At October 31, 2015, the aggregate settlement value of open futures contracts and the related unrealized appreciation (depreciation) were:
| | | | |
| | | | ($000) |
| | | | Aggregate | |
| | | Number of | Settlement | Unrealized |
| | | Long (Short) | Value | Appreciation |
| Futures Contracts | Expiration | Contracts | Long (Short) | (Depreciation) |
| S&P 500 Index | December 2015 | 4 | 2,074 | 129 |
| Dow Jones EURO STOXX 50 Index | December 2015 | 17 | 639 | 42 |
| E-mini S&P 500 Index | December 2015 | 6 | 622 | 15 |
| FTSE 100 Index | December 2015 | 6 | 586 | 8 |
| Topix Index | December 2015 | 4 | 517 | 31 |
| S&P ASX 200 Index | December 2015 | 4 | 373 | 6 |
| | | | | 231 |
Unrealized appreciation (depreciation) on open S&P 500 Index, Dow Jones EURO STOXX 50 Index, E-mini S&P 500 Index, and FTSE 100 Index futures contracts is required to be treated as realized gain (loss) for tax purposes.
At October 31, 2015, the fund had open forward currency contracts to receive and deliver currencies as follows. Unrealized appreciation (depreciation) on open forward currency contracts, except for Indonesian rupiah, Singapore dollar, and Taiwanese dollar contracts, is treated as realized gain (loss) for tax purposes.
30
| | | | | | |
| Global Minimum Volatility Fund | | | | | | |
| |
| |
| |
| |
| | | | | | | Unrealized |
| | Contract | | | | | Appreciation |
| | Settlement | Contract Amount (000) | (Depreciation) |
| Counterparty | Date | Receive | Deliver | ($000) |
| Goldman Sachs International | 11/13/15 | ZAR | 87,031 | USD | 6,536 | (262) |
| BNP Paribas | 11/13/15 | USD | 126,786 | GBP | 82,806 | (859) |
| BNP Paribas | 11/13/15 | USD | 65,688 | CHF | 63,760 | 1,157 |
| Credit Suisse International | 11/13/15 | USD | 64,974 | CAD | 84,728 | 182 |
| BNP Paribas | 11/13/15 | USD | 50,933 | AUD | 70,762 | 507 |
| BNP Paribas | 11/13/15 | USD | 40,560 | JPY | 4,861,249 | 270 |
| BNP Paribas | 11/13/15 | USD | 34,011 | KRW | 39,308,112 | (453) |
| Credit Suisse International | 11/13/15 | USD | 28,666 | EUR | 25,502 | 618 |
| BNP Paribas | 11/13/15 | USD | 23,917 | INR | 1,561,568 | 76 |
| BNP Paribas | 11/13/15 | USD | 14,606 | TWD | 472,789 | 42 |
| BNP Paribas | 11/13/15 | USD | 12,153 | BRL | 47,140 | (16) |
| Credit Suisse International | 11/13/15 | USD | 10,413 | SGD | 14,693 | (71) |
| Goldman Sachs International | 11/13/15 | USD | 9,627 | MXN | 159,978 | (49) |
| BNP Paribas | 11/13/15 | USD | 7,640 | RUB | 481,746 | 122 |
| Goldman Sachs International | 11/13/15 | USD | 6,452 | ZAR | 87,031 | 177 |
| BNP Paribas | 11/13/15 | USD | 5,497 | NOK | 45,158 | 183 |
| Deutsche Bank AG | 11/13/15 | USD | 5,391 | ILS | 20,733 | 32 |
| Credit Suisse International | 11/13/15 | USD | 5,267 | GBP | 3,407 | 14 |
| Credit Suisse International | 11/13/15 | USD | 4,502 | CHF | 4,414 | 35 |
| Goldman Sachs International | 11/13/15 | USD | 4,484 | CAD | 5,901 | (28) |
| Goldman Sachs International | 11/13/15 | USD | 4,256 | SEK | 35,061 | 151 |
| Goldman Sachs International | 11/13/15 | USD | 3,024 | AUD | 4,242 | 1 |
| BNP Paribas | 11/13/15 | USD | 3,005 | KRW | 3,403,054 | 22 |
| Goldman Sachs International | 11/13/15 | USD | 2,413 | CAD | 3,127 | 22 |
| BNP Paribas | 11/13/15 | USD | 2,271 | IDR | 31,808,423 | (44) |
| BNP Paribas | 11/13/15 | USD | 1,907 | CLP | 1,299,827 | 30 |
| | | | | | | 1,859 |
| AUD—Australian dollar. JPY—Japanese yen. |
| BRL—Brazilian real. KRW—Korean won. |
| CAD—Canadian dollar. MXN—Mexican peso. |
| CHF—Swiss franc. NOK—Norwegian krone. |
| CLP—Chilean peso. RUB—Russian ruble. |
| EUR—Euro. SEK—Swedish krona. |
| GBP—British pound. SGD—Singapore dollar. |
| IDR—Indonesian rupiah. TWD—Taiwanese dollar. |
| ILS—Israeli shekel. USD—U.S. dollar. |
| INR—Indian rupee. ZAR—South African rand. |
At October 31, 2015, the counterparty had deposited in segregated accounts securities and cash with a value of $2,980,000 in connection with amounts due to the fund for open forward currency contracts.
31
Global Minimum Volatility Fund
The following table summarizes the fund’s derivative assets and liabilities by counterparty for derivatives subject to arrangements that provide for offsetting assets and liabilities. Exchange traded derivatives are listed separately.
| | | | | | |
| | | | | | |
| | Assets | Liabilities | | Amounts not Offset in the | Net |
| Reflected in | Reflected in | Net Amount | Statement of Net Assets | Exposure3 |
| Statement of | Statement of | Receivable | Collateral | Collateral | (not less |
| Net Assets1 | Net Assets1 | (Payable) | Pledged 2 | Received 2 | than $0) |
| | ($000) | ($000) | ($000) | ($000) | ($000) | ($000) |
| Forwards subject to offsetting | | | | | | |
| arrangements, by counterparty | | | | | | |
| BNP Paribas | 2,409 | (1,372) | 1,037 | — | 1,269 | — |
| Credit Suisse International | 849 | (71) | 778 | — | 1,590 | — |
| Deutsche Bank AG | 32 | — | 32 | — | — | 32 |
| Goldman Sachs International | 351 | (339) | 12 | — | 121 | — |
| Exchange Traded Futures Contracts | 4 | (17) | (13) | 1,104 | — | — |
| Total | 3,645 | (1,799) | 1,846 | 1,104 | 2,980 | 32 |
1 Absent an event of default or early termination, derivative assets and liabilities are presented gross and not offset in the Statement of Net Assets.
2 Securities or other assets pledged as collateral are noted in the Statement of Net Assets. Securities or other assets received as collateral
are held in a segregated account and not included in the fund’s security holdings in the Statement of Net Assets.
3 Net Exposure represents the net amount receivable from the counterparty in the event of default. Counterparties are not required to
exchange collateral if amount is below a specified minimum transfer amount.
E. Distributions are determined on a tax basis and may differ from net investment income and realized capital gains for financial reporting purposes. Differences may be permanent or temporary. Permanent differences are reclassified among capital accounts in the financial statements to reflect their tax character. Temporary differences arise when certain items of income, expense, gain, or loss are recognized in different periods for financial statement and tax purposes. These differences will reverse at some time in the future. Differences in classification may also result from the treatment of short-term gains as ordinary income for tax purposes.
During the year ended October 31, 2015, the fund realized net foreign currency losses of $239,000, which decreased distributable net income for tax purposes; accordingly, such losses have been reclassified from accumulated net realized gains to undistributed net investment income. Certain of the fund’s investments are in securities considered to be passive foreign investment companies, for which any unrealized appreciation and/or realized gains are required to be included in distributable net income for tax purposes. During the year ended October 31, 2015, the fund realized gains on the sale of passive foreign investment companies of $106,000, which have been included in current and prior periods’ taxable income; accordingly, such gains have been reclassified from accumulated net realized gains to undistributed net investment income. Passive foreign investment companies held at October 31, 2015, had unrealized appreciation of $833,000.
The fund used a tax accounting practice to treat a portion of the price of capital shares redeemed during the year as distributions from net investment income and realized capital gains. Accordingly, the fund has reclassified $2,141,000 from undistributed net investment income, and $6,809,000 from accumulated net realized gains, to paid-in capital.
32
Global Minimum Volatility Fund
For tax purposes, at October 31, 2015, the fund had $19,430,000 of ordinary income and $14,832,000 of long-term capital gains available for distribution.
At October 31, 2015, the cost of investment securities for tax purposes was $1,201,054,000. Net unrealized appreciation of investment securities for tax purposes was $38,222,000, consisting of unrealized gains of $85,534,000 on securities that had risen in value since their purchase and $47,312,000 in unrealized losses on securities that had fallen in value since their purchase.
F. During the year ended October 31, 2015, the fund purchased $1,190,984,000 of investment securities and sold $467,574,000 of investment securities, other than temporary cash investments.
G. Capital share transactions for each class of shares were:
| | | | |
| | Year Ended | December 12, 20131 to |
| | October 31, 2015 | October 31, 2014 |
| | Amount | Shares | Amount | Shares |
| | ($000) | (000) | ($000) | (000) |
| Investor Shares | | | | |
| Issued | 259,472 | 22,420 | 352,372 | 34,751 |
| Issued in Lieu of Cash Distributions | 21,996 | 2,000 | 702 | 69 |
| Redeemed | (207,901) | (17,760) | (34,726) | (3,279) |
| Net Increase (Decrease)—Investor Shares | 73,567 | 6,660 | 318,348 | 31,541 |
| Admiral Shares | | | | |
| Issued | 772,864 | 33,351 | 130,196 | 6,096 |
| Issued in Lieu of Cash Distributions | 8,043 | 366 | 26 | 1 |
| Redeemed | (154,139) | (6,699) | (22,712) | (1,057) |
| Net Increase (Decrease) —Admiral Shares | 626,768 | 27,018 | 107,510 | 5,040 |
| 1 Inception. |
H. Management has determined that no material events or transactions occurred subsequent to
October 31, 2015, that would require recognition or disclosure in these financial statements.
33
Report of Independent Registered
Public Accounting Firm
To the Board of Trustees of Vanguard Whitehall Funds and the Shareholders of Vanguard Global Minimum Volatility Fund: In our opinion, the accompanying statement of net assets and the related statements of operations and of changes in net assets and the financial highlights present fairly, in all material respects, the financial position of Vanguard Global Minimum Volatility Fund (constituting a separate portfolio of Vanguard Whitehall Funds, hereafter referred to as the “Fund”) at October 31, 2015, the results of its operations for the year then ended and the changes in its net assets and the financial highlights for each of the periods indicated, in conformity with accounting principles generally accepted in the United States of America. These financial statements and financial highlights (hereafter referred to as “financial statements”) are the responsibility of the Fund’s management. Our responsibility is to express an opinion on these financial statements based on our audits. We conducted our audits of these financial statements in accordance with the standards of the Public Company Accounting Oversight Board (United States). Those standards require that we plan and perform the audit to obtain reasonable assurance about whether the financial statements are free of material misstatement. An audit includes examining, on a test basis, evidence supporting the amounts and disclosures in the financial statements, assessing the accounting principles used and significant estimates made by management, and evaluating the overall financial statement presentation. We believe that our audits, which included confirmation of securities at October 31, 2015 by correspondence with the custodian and brokers, by agreement to the underlying ownership records of the transfer agent and the application of alternative auditing procedures where securities purchased had not been received, provide a reasonable basis for our opinion.
/s/PricewaterhouseCoopers LLP
Philadelphia, Pennsylvania
December 15, 2015

Special 2015 tax information (unaudited) for Vanguard Global Minimum Volatility Fund
This information for the fiscal year ended October 31, 2015, is included pursuant to provisions of the
Internal Revenue Code.
The fund distributed $11,375,000 as capital gain dividends (20% rate gain distributions) to shareholders
during the fiscal year.
For nonresident alien shareholders, 100% of short-term capital gain dividends distributed by the fund
are qualified short-term capital gains.
The fund distributed $8,096,000 of qualified dividend income to shareholders during the fiscal year.
For corporate shareholders, 30.3% of investment income (dividend income plus short-term gains,
if any) qualifies for the dividends-received deduction.
The fund designates to shareholders foreign source income of $11,741,000 and foreign taxes paid of
$639,000. Shareholders will receive more detailed information with their Form 1099-DIV in January
2016 to determine the calendar-year amounts to be included on their 2015 tax returns.
34
About Your Fund’s Expenses
As a shareholder of the fund, you incur ongoing costs, which include costs for portfolio management, administrative services, and shareholder reports (like this one), among others. Operating expenses, which are deducted from a fund’s gross income, directly reduce the investment return of the fund.
A fund’s expenses are expressed as a percentage of its average net assets. This figure is known as the expense ratio. The following examples are intended to help you understand the ongoing costs (in dollars) of investing in your fund and to compare these costs with those of other mutual funds. The examples are based on an investment of $1,000 made at the beginning of the period shown and held for the entire period.
The accompanying table illustrates your fund’s costs in two ways:
• Based on actual fund return. This section helps you to estimate the actual expenses that you paid over the period. The ”Ending Account Value“ shown is derived from the fund‘s actual return, and the third column shows the dollar amount that would have been paid by an investor who started with $1,000 in the fund. You may use the information here, together with the amount you invested, to estimate the expenses that you paid over the period.
To do so, simply divide your account value by $1,000 (for example, an $8,600 account value divided by $1,000 = 8.6), then multiply the result by the number given for your fund under the heading ”Expenses Paid During Period.“
• Based on hypothetical 5% yearly return. This section is intended to help you compare your fund‘s costs with those of other mutual funds. It assumes that the fund had a yearly return of 5% before expenses, but that the expense ratio is unchanged. In this case—because the return used is not the fund’s actual return—the results do not apply to your investment. The example is useful in making comparisons because the Securities and Exchange Commission requires all mutual funds to calculate expenses based on a 5% return. You can assess your fund’s costs by comparing this hypothetical example with the hypothetical examples that appear in shareholder reports of other funds.
Note that the expenses shown in the table are meant to highlight and help you compare ongoing costs only and do not reflect transaction costs incurred by the fund for buying and selling securities. Further, the expenses do not include any purchase, redemption, or account service fees described in the fund prospectus. If such fees were applied to your account, your costs would be higher. Your fund does not carry a “sales load.”
The calculations assume no shares were bought or sold during the period. Your actual costs may have been higher or lower, depending on the amount of your investment and the timing of any purchases or redemptions.
You can find more information about the fund’s expenses, including annual expense ratios, in the Financial Statements section of this report. For additional information on operating expenses and other shareholder costs, please refer to your fund’s current prospectus.
35
| | | |
| Six Months Ended October 31, 2015 | | | |
| | Beginning | Ending | Expenses |
| | Account Value | Account Value | Paid During |
| Global Minimum Volatility Fund | 4/30/2015 | 10/31/2015 | Period |
| Based on Actual Fund Return | | | |
| Investor Shares | $1,000.00 | $1,020.74 | $1.32 |
| Admiral Shares | 1,000.00 | 1,020.74 | 1.07 |
| Based on Hypothetical 5% Yearly Return | | | |
| Investor Shares | $1,000.00 | $1,023.89 | $1.33 |
| Admiral Shares | 1,000.00 | 1,024.15 | 1.07 |
The calculations are based on expenses incurred in the most recent six-month period. The fund’s annualized six-month expense ratios for that
period are 0.26% for Investor Shares and 0.21% for Admiral Shares. The dollar amounts shown as “Expenses Paid” are equal to the
annualized expense ratio multiplied by the average account value over the period, multiplied by the number of days in the most recent
six-month period, then divided by the number of days in the most recent 12-month period (184/365).
36
Glossary
Dividend Yield. Dividend income earned by stocks, expressed as a percentage of the aggregate market value (or of net asset value, for a fund). The yield is determined by dividing the amount of the annual dividends by the aggregate value (or net asset value) at the end of the period. For a fund, the dividend yield is based solely on stock holdings and does not include any income produced by other investments.
Earnings Growth Rate. The average annual rate of growth in earnings over the past five years for the stocks now in a fund.
Equity Exposure. A measure that reflects a fund’s investments in stocks and stock futures. Any holdings in short-term reserves are excluded.
Expense Ratio. A fund’s total annual operating expenses expressed as a percentage of the fund’s average net assets. The expense ratio includes management and administrative expenses, but does not include the transaction costs of buying and selling portfolio securities.
Inception Date. The date on which the assets of a fund (or one of its share classes) are first invested in accordance with the fund’s investment objective. For funds with a subscription period, the inception date is the day after that period ends. Investment performance is measured from the inception date.
Median Market Cap. An indicator of the size of companies in which a fund invests; the midpoint of market capitalization (market price x shares outstanding) of a fund’s stocks, weighted by the proportion of the fund’s assets invested in each stock. Stocks representing half of the fund’s assets have market capitalizations above the median, and the rest are below it.
Price/Book Ratio. The share price of a stock divided by its net worth, or book value, per share. For a fund, the weighted average price/book ratio of the stocks it holds.
Price/Earnings Ratio. The ratio of a stock’s current price to its per-share earnings over the past year. For a fund, the weighted average P/E of the stocks it holds. P/E is an indicator of market expectations about corporate prospects; the higher the P/E, the greater the expectations for a company’s future growth.
Return on Equity. The annual average rate of return generated by a company during the past five years for each dollar of shareholder’s equity (net income divided by shareholder’s equity). For a fund, the weighted average return on equity for the companies whose stocks it holds.
Short-Term Reserves. The percentage of a fund invested in highly liquid, short-term securities that can be readily converted to cash.
Turnover Rate. An indication of the fund’s trading activity. Funds with high turnover rates incur higher transaction costs and may be more likely to distribute capital gains (which may be taxable to investors). The turnover rate excludes in-kind transactions, which have minimal impact on costs.
37
This page intentionally left blank.
This page intentionally left blank.
The People Who Govern Your Fund
The trustees of your mutual fund are there to see that the fund is operated and managed in your best interests since, as a shareholder, you are a part owner of the fund. Your fund’s trustees also serve on the board of directors of The Vanguard Group, Inc., which is owned by the Vanguard funds and provides services to them on an at-cost basis.
A majority of Vanguard’s board members are independent, meaning that they have no affiliation with Vanguard or the funds they oversee, apart from the sizable personal investments they have made as private individuals. The independent board members have distinguished backgrounds in business, academia, and public service. Each of the trustees and executive officers oversees 194 Vanguard funds.
The following table provides information for each trustee and executive officer of the fund. More information about the trustees is in the Statement of Additional Information, which can be obtained, without charge, by contacting Vanguard at 800-662-7447, or online at vanguard.com.
| |
| InterestedTrustee1 | Rajiv L. Gupta |
| | Born 1945. Trustee Since December 2001.2 Principal |
| F. William McNabb III | Occupation(s) During the Past Five Years and Other |
| Born 1957. Trustee Since July 2009. Chairman of | Experience: Chairman and Chief Executive Officer |
| the Board. Principal Occupation(s) During the Past | (retired 2009) and President (2006–2008) of |
| Five Years and Other Experience: Chairman of the | Rohm and Haas Co. (chemicals); Director of Tyco |
| Board of The Vanguard Group, Inc., and of each of | International PLC (diversified manufacturing and |
| the investment companies served by The Vanguard | services), Hewlett-Packard Co. (electronic computer |
| Group, since January 2010; Director of The Vanguard | manufacturing), and Delphi Automotive PLC |
| Group since 2008; Chief Executive Officer and | (automotive components); Senior Advisor at New |
| President of The Vanguard Group, and of each of | Mountain Capital. |
| the investment companies served by The Vanguard | |
| Group, since 2008; Director of Vanguard Marketing | Amy Gutmann |
| Corporation; Managing Director of The Vanguard | Born 1949. Trustee Since June 2006. Principal |
| Group (1995–2008). | Occupation(s) During the Past Five Years and |
| | Other Experience: President of the University of |
| IndependentTrustees | Pennsylvania; Christopher H. Browne Distinguished |
| | Professor of Political Science, School of Arts and |
| Emerson U. Fullwood | Sciences, and Professor of Communication, Annenberg |
| Born 1948. Trustee Since January 2008. Principal | School for Communication, with secondary faculty |
| Occupation(s) During the Past Five Years and | appointments in the Department of Philosophy, School |
| Other Experience: Executive Chief Staff and | of Arts and Sciences, and at the Graduate School of |
| Marketing Officer for North America and Corporate | Education, University of Pennsylvania; Trustee of the |
| Vice President (retired 2008) of Xerox Corporation | National Constitution Center; Chair of the Presidential |
| (document management products and services); | Commission for the Study of Bioethical Issues. |
| Executive in Residence and 2009–2010 Distinguished | |
| Minett Professor at the Rochester Institute of | JoAnn Heffernan Heisen |
| Technology; Director of SPX Corporation (multi-industry | Born 1950. Trustee Since July 1998. Principal |
| manufacturing), the United Way of Rochester, the | Occupation(s) During the Past Five Years and |
| University of Rochester Medical Center, Monroe | Other Experience: Corporate Vice President and |
| Community College Foundation, and North Carolina | Chief Global Diversity Officer (retired 2008) and |
| A&T University. | Member of the Executive Committee (1997–2008) |
| | of Johnson & Johnson (pharmaceuticals/medical |
| | devices/consumer products); Director of Skytop |
| | Lodge Corporation (hotels) and the Robert Wood |
| | Johnson Foundation; Member of the Advisory |
| | Board of the Institute for Women’s Leadership |
| | at Rutgers University. |
| | |
| F. Joseph Loughrey | Executive Officers | |
| Born 1949. Trustee Since October 2009. Principal | | |
| Occupation(s) During the Past Five Years and Other | Glenn Booraem | |
| Experience: President and Chief Operating Officer | Born 1967. Treasurer Since May 2015. Principal |
| (retired 2009) of Cummins Inc. (industrial machinery); | Occupation(s) During the Past Five Years and |
| Chairman of the Board of Hillenbrand, Inc. (specialized | Other Experience: Principal of The Vanguard Group, |
| consumer services), and of Oxfam America; Director | Inc.; Treasurer of each of the investment companies |
| of SKF AB (industrial machinery), Hyster-Yale Materials | served by The Vanguard Group; Controller of each of |
| Handling, Inc. (forklift trucks), the Lumina Foundation | the investment companies served by The Vanguard |
| for Education, and the V Foundation for Cancer | Group (2010–2015); Assistant Controller of each of |
| Research; Member of the Advisory Council for the | the investment companies served by The Vanguard |
| College of Arts and Letters and of the Advisory Board | Group (2001–2010). | |
| to the Kellogg Institute for International Studies, both | | |
| at the University of Notre Dame. | Thomas J. Higgins | |
| Born 1957. Chief Financial Officer Since September |
| Mark Loughridge | 2008. Principal Occupation(s) During the Past Five |
| Born 1953. Trustee Since March 2012. Principal | Years and Other Experience: Principal of The Vanguard |
| Occupation(s) During the Past Five Years and Other | Group, Inc.; Chief Financial Officer of each of the |
| Experience: Senior Vice President and Chief Financial | investment companies served by The Vanguard Group; |
| Officer (retired 2013) at IBM (information technology | Treasurer of each of the investment companies served |
| services); Fiduciary Member of IBM’s Retirement Plan | by The Vanguard Group (1998–2008). |
| Committee (2004–2013); Director of the Dow Chemical | | |
| Company; Member of the Council on Chicago Booth. | Peter Mahoney |
| Born 1974. Controller Since May 2015. Principal |
| Scott C. Malpass | Occupation(s) During the Past Five Years and |
| Born 1962. Trustee Since March 2012. Principal | Other Experience: Head of Global Fund Accounting |
| Occupation(s) During the Past Five Years and Other | at The Vanguard Group, Inc.; Controller of each of the |
| Experience: Chief Investment Officer and Vice | investment companies served by The Vanguard Group; |
| President at the University of Notre Dame; Assistant | Head of International Fund Services at The Vanguard |
| Professor of Finance at the Mendoza College of | Group (2008–2014). | |
| Business at Notre Dame; Member of the Notre Dame | | |
| 403(b) Investment Committee; Board Member of | Heidi Stam | |
| TIFF Advisory Services, Inc., and Catholic Investment | Born 1956. Secretary Since July 2005. Principal |
| Services, Inc. (investment advisors); Member of | Occupation(s) During the Past Five Years and Other |
| the Investment Advisory Committee of Major | Experience: Managing Director of The Vanguard |
| League Baseball. | Group, Inc.; General Counsel of The Vanguard Group; |
| Secretary of The Vanguard Group and of each of the |
| André F. Perold | investment companies served by The Vanguard Group; |
| Born 1952. Trustee Since December 2004. Principal | Director and Senior Vice President of Vanguard |
| Occupation(s) During the Past Five Years and Other | Marketing Corporation. | |
| Experience: George Gund Professor of Finance and | | |
| Banking, Emeritus at the Harvard Business School | Vanguard Senior ManagementTeam |
| (retired 2011); Chief Investment Officer and Managing | Mortimer J. Buckley | Chris D. McIsaac |
| Partner of HighVista Strategies LLC (private investment | Kathleen C. Gubanich | James M. Norris |
| firm); Director of Rand Merchant Bank; Overseer of | Paul A. Heller | Thomas M. Rampulla |
| the Museum of Fine Arts Boston. | Martha G. King | Glenn W. Reed |
| John T. Marcante | Karin A. Risi |
| Peter F. Volanakis | | |
| Born 1955. Trustee Since July 2009. Principal | | |
| Occupation(s) During the Past Five Years and Other | Chairman Emeritus and Senior Advisor |
| Experience: President and Chief Operating Officer | | |
| (retired 2010) of Corning Incorporated (communications | John J. Brennan | |
| equipment); Trustee of Colby-Sawyer College; | Chairman, 1996–2009 | |
| Member of the Advisory Board of the Norris Cotton | Chief Executive Officer and President, 1996–2008 |
| Cancer Center and of the Advisory Board of the | | |
| Parthenon Group (strategy consulting). | Founder | |
| | John C. Bogle | |
| | Chairman and Chief Executive Officer, 1974–1996 |
1 Mr. McNabb is considered an “interested person,” as defined in the Investment Company Act of 1940, because he is an officer of the Vanguard funds.
2 December 2002 for Vanguard Equity Income Fund, the Vanguard Municipal Bond Funds, and the Vanguard State Tax-Exempt Funds.
|  |
| | P.O. Box 2600 |
| | Valley Forge, PA 19482-2600 |
| |
| |
| |
| Connect with Vanguard® > vanguard.com |
| |
| |
| |
| Fund Information > 800-662-7447 | CFA® is a registered trademark owned by CFA Institute. |
| Direct Investor Account Services > 800-662-2739 | |
| Institutional Investor Services > 800-523-1036 | |
| Text Telephone for People | |
| Who Are Deaf or Hard of Hearing> 800-749-7273 | |
| |
| This material may be used in conjunction | |
| with the offering of shares of any Vanguard | |
| fund only if preceded or accompanied by | |
| the fund’s current prospectus. | |
| |
| All comparative mutual fund data are from Lipper, a | |
| Thomson Reuters Company, or Morningstar, Inc., unless | |
| otherwise noted. | |
| |
| You can obtain a free copy of Vanguard’s proxy voting | |
| guidelines by visiting vanguard.com/proxyreporting or by | |
| calling Vanguard at 800-662-2739. The guidelines are | |
| also available from the SEC’s website, sec.gov. In | |
| addition, you may obtain a free report on how your fund | |
| voted the proxies for securities it owned during the 12 | |
| months ended June 30. To get the report, visit either | |
| vanguard.com/proxyreporting or sec.gov. | |
| |
| You can review and copy information about your fund at | |
| the SEC’s Public Reference Room in Washington, D.C. To | |
| find out more about this public service, call the SEC at | |
| 202-551-8090. Information about your fund is also | |
| available on the SEC’s website, and you can receive | |
| copies of this information, for a fee, by sending a | |
| request in either of two ways: via email addressed to | |
| publicinfo@sec.gov or via regular mail addressed to the | |
| Public Reference Section, Securities and Exchange | |
| Commission, Washington, DC 20549-1520. | |
| |
| | © 2015 The Vanguard Group, Inc. |
| | All rights reserved. |
| | Vanguard Marketing Corporation, Distributor. |
| |
| | Q11940 122015 |
Item 2: Code of Ethics. The Registrant has adopted a code of ethics that applies to the Registrant’s principal executive officer, principal financial officer, principal accounting officer or controller or persons performing similar functions. The Code of Ethics was amended during the reporting period covered by this report to make certain technical, non-material changes.
Item 3: Audit Committee Financial Expert. The following members of the Audit Committee have been determined by the Registrant’s Board of Trustees to be Audit Committee Financial Experts serving on its Audit Committee, and to be independent: Rajiv L. Gupta, Amy Gutmann, JoAnn Heffernan Heisen, F. Joseph Loughrey, Mark Loughridge, Scott C. Malpass, and André F. Perold.
Item 4: Principal Accountant Fees and Services.
(a) Audit Fees.
Audit Fees of the Registrant
Fiscal Year Ended October 31, 2015: $224,000
Fiscal Year Ended October 31, 2014: $212,000
Aggregate Audit Fees of Registered Investment Companies in the Vanguard Group.
Fiscal Year Ended October 31, 2015: $7,000,200
Fiscal Year Ended October 31, 2014: $6,605,127
Includes fees billed in connection with audits of the Registrant, other registered investment companies in the Vanguard complex, The Vanguard Group, Inc. and Vanguard Marketing Corporation.
(b) Audit-Related Fees.
Fiscal Year Ended October 31, 2015: $2,899,096
Fiscal Year Ended October 31, 2014: $2,176,479
Includes fees billed in connection with assurance and related services provided to the Registrant, other registered investment companies in the Vanguard complex, The Vanguard Group, Inc., and Vanguard Marketing Corporation.
(c) Tax Fees.
Fiscal Year Ended October 31, 2015: $353,389
Fiscal Year Ended October 31, 2014: $316,869
Includes fees billed in connection with tax compliance, planning, and advice services provided to the Registrant, other registered investment companies in the Vanguard complex, The Vanguard Group, Inc., and Vanguard Marketing Corporation.
(d) All Other Fees.
Fiscal Year Ended October 31, 2015: $202,313 Fiscal Year Ended October 31, 2014: $198,163
Includes fees billed for services related to tax reported information provided to the Registrant, other registered investment companies in the Vanguard complex, The Vanguard Group, Inc., and Vanguard Marketing Corporation.
(e) (1) Pre-Approval Policies. The policy of the Registrant’s Audit Committee is to consider and, if appropriate, approve before the principal accountant is engaged for such services, all specific audit and non-audit services provided to: the Registrant, other registered investment companies in the Vanguard complex, The Vanguard Group, Inc., and entities controlled by The Vanguard Group, Inc. that provide ongoing services to the Registrant. In making a determination, the Audit Committee considers whether the services are consistent with maintaining the principal accountant’s independence.
In the event of a contingency situation in which the principal accountant is needed to provide services in between scheduled Audit Committee meetings, the Chairman of the Audit Committee would be called on to consider and, if appropriate, pre-approve audit or permitted non-audit services in an amount sufficient to complete services through the next Audit Committee meeting, and to determine if such services would be consistent with maintaining the accountant’s independence. At the next scheduled Audit Committee meeting, services and fees would be presented to the Audit Committee for formal consideration, and, if appropriate, approval by the entire Audit Committee. The Audit Committee would again consider whether such services and fees are consistent with maintaining the principal accountant’s independence.
The Registrant’s Audit Committee is informed at least annually of all audit and non-audit services provided by the principal accountant to the Vanguard complex, whether such services are provided to: the Registrant, other registered investment companies in the Vanguard complex, The Vanguard Group, Inc., or other entities controlled by The Vanguard Group, Inc. that provide ongoing services to the Registrant.
(2) No percentage of the principal accountant’s fees or services were approved pursuant to the waiver provision of paragraph (c)(7)(i)(C) of Rule 2-01 of Regulation S-X.
(f) For the most recent fiscal year, over 50% of the hours worked under the principal accountant’s engagement were not performed by persons other than full-time, permanent employees of the principal accountant.
(g) Aggregate Non-Audit Fees.
Fiscal Year Ended October 31, 2015: $555,702
Fiscal Year Ended October 31, 2014: $515,032
Includes fees billed for non-audit services provided to the Registrant, other registered investment companies in the Vanguard complex, The Vanguard Group, Inc., and Vanguard Marketing Corporation.
(h) For the most recent fiscal year, the Audit Committee has determined that the provision of all non-audit services was consistent with maintaining the principal accountant’s independence.
Item 5: Audit Committee of Listed Registrants.
Not Applicable.
Item 6: Investments.
Not Applicable.
Item 7: Disclosure of Proxy Voting Policies and Procedures for Closed-End Management
Investment Companies.
Not Applicable.
Item 8: Portfolio Managers of Closed-End Management Investment Companies.
Not Applicable.
Item 9: Purchase of Equity Securities by Closed-End Management Investment Company and
Affiliated Purchasers.
Not Applicable.
Item 10: Submission of Matters to a Vote of Security Holders.
Not Applicable.
Item 11: Controls and Procedures.
(a) Disclosure Controls and Procedures. The Principal Executive and Financial Officers concluded that the Registrant’s Disclosure Controls and Procedures are effective based on their evaluation of the Disclosure Controls and Procedures as of a date within 90 days of the filing date of this report.
(b) Internal Control Over Financial Reporting. There were no significant changes in Registrant’s Internal Control Over Financial Reporting or in other factors that could significantly affect this control subsequent to the date of the evaluation, including any corrective actions with regard to significant deficiencies and material weaknesses.
Item 12: Exhibits.
(a) Code of Ethics.
(b) Certifications.
Pursuant to the requirements of the Securities Exchange Act of 1934 and the Investment Company Act of 1940, the registrant has duly caused this report to be signed on its behalf by the undersigned, thereunto duly authorized.
| |
| | VANGUARD WHITEHALL FUNDS |
| |
| |
| BY: | /s/ F. WILLIAM MCNABB III* |
| | F. WILLIAM MCNABB III |
| | CHIEF EXECUTIVE OFFICER |
| |
| Date: December 18, 2015 |
Pursuant to the requirements of the Securities Exchange Act of 1934 and the Investment Company Act of 1940, this report has been signed below by the following persons on behalf of the registrant and in the capacities and on the dates indicated.
| |
| | VANGUARD WHITEHALL FUNDS |
BY: | /s/ F. WILLIAM MCNABB III* |
| | F. WILLIAM MCNABB III |
| | CHIEF EXECUTIVE OFFICER |
Date: December 18, 2015 |
| VANGUARD WHITEHALL FUNDS |
BY: | /s/ THOMAS J. HIGGINS* |
| THOMAS J. HIGGINS |
| | CHIEF FINANCIAL OFFICER |
Date: December 18, 2015 |
* By: /s/ Heidi Stam
Heidi Stam, pursuant to a Power of Attorney filed on April 22, 2014 see file Number 2-17620, Incorporated by Reference.