| UNITED STATES SECURITIES AND EXCHANGE COMMISSION | ||
| Washington, D.C. 20549 | ||
FORM N-CSR | ||
| CERTIFIED SHAREHOLDER REPORT OF REGISTERED MANAGEMENT INVESTMENT COMPANIES | ||
| Investment Company Act file number: | (811-07513) |
| Exact name of registrant as specified in charter: | Putnam Funds Trust |
| Address of principal executive offices: | 100 Federal Street, Boston, Massachusetts 02110 |
| Name and address of agent for service: | Stephen Tate, Vice President 100 Federal Street Boston, Massachusetts 02110 |
| Copy to: | Bryan Chegwidden, Esq. Ropes & Gray LLP 1211 Avenue of the Americas New York, New York 10036 |
| James E. Thomas, Esq. Ropes & Gray LLP 800 Boylston Street Boston, Massachusetts 02199 |
| Registrant’s telephone number, including area code: | (617) 292-1000 |
| Date of fiscal year end: | May 31, 2024 |
| Date of reporting period: | June 1 , 2023 – May 31, 2024 |
Item 1. Report to Stockholders: |
| The following is a copy of the report transmitted to stockholders pursuant to Rule 30e-1 under the Investment Company Act of 1940: | |||
Putnam Dynamic Asset Allocation Equity Fund |  | |
Class A true | ||
| Annual Shareholder Report | May 31, 2024 | ||
 | ||
You can find additional information about the Fund at https://www.franklintempleton.com/regulatory-internalusefunds-documents. You can also request this information by contacting us at (800) 225-1581.
Class Name | Costs of a $10,000 investment | Costs paid as a percentage of a $10,000 investment* |
| Class A | $78 | 0.68% |
| * | Reflects fee waivers and/or expense reimbursements, without which expenses would have been higher. |
Top contributors to performance: | |
| Security selection decisions within these strategies: | |
| ↑ | Quantitative U.S. Large Cap Core Strategy |
| ↑ | Quantitative International Equity Strategy |
| ↑ | Fundamental U.S. Large Cap Value Strategy |
Top detractors from performance: | |
| ↓ | Allocation decisions within the Fundamental Emerging Market Equity Strategy |
| Putnam Dynamic Asset Allocation Equity Fund | ||
| NOT FDIC INSURED | MAY LOSE VALUE | NO BANK GUARANTEE | PAGE 1 | Internal Use-0724 |
Class A 5/31/2014 — 5/31/2024
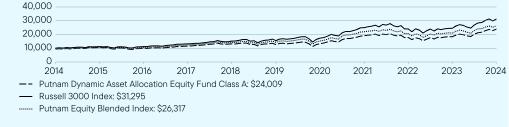
1 Year | 5 Year | 10 Year | |
Class A (without sales charge) | 30.58 | 13.61 | 9.80 |
Class A (with sales charge) | 23.07 | 12.28 | 9.15 |
Russell 3000 Index | 27.58 | 15.00 | 12.09 |
Putnam Equity Blended Index | 24.94 | 13.06 | 10.16 |
Total Net Assets | $15,063,651 |
Total Number of Portfolio Holdings* | 640 |
Total Management Fee Paid | $0 |
Portfolio Turnover Rate | 64% |
| * | Includes derivatives, if applicable. |
| Putnam Dynamic Asset Allocation Equity Fund | ||
| NOT FDIC INSURED | MAY LOSE VALUE | NO BANK GUARANTEE | PAGE 2 | Internal Use-0724 |

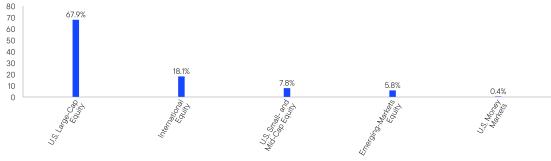
| U.S. Money Markets, if any, represent the market value weights of cash, short-term securities, and derivative notional offsets in the portfolio. Holdings and allocations may vary over time. |
January 1, 2024. As part of the Transaction, your Fund’s investment advisor, Putnam Investment Management, LLC (“Putnam Management”), a wholly-owned subsidiary of Putnam Holdings, and your Fund’s sub-advisors, Putnam Investments Limited (“PIL”) and The Putnam Advisory Company, LLC (“PAC”), both indirect, wholly-owned subsidiaries of Putnam Holdings, became indirect, wholly-owned subsidiaries of Franklin Resources. In connection with the Transaction, shareholders of your Fund approved a new management contract with Putnam Management and new sub-advisory contracts with PIL and PAC. The new contracts are identical to the previous contracts, except for the effective dates, initial terms, updates to fund names as necessary to reflect previous name changes, the addition of a provision specifying that there are no third-party beneficiaries to the contracts, and (in some cases) certain non-substantive changes.
 | WHERE CAN I FIND ADDITIONAL INFORMATION ABOUT THE FUND? |
Additional information is available on https://www.franklintempleton.com/regulatory-internalusefunds-documents, including its: | |
| • proxy voting information • financial information • holdings • tax information |
| Putnam Dynamic Asset Allocation Equity Fund | ||
| NOT FDIC INSURED | MAY LOSE VALUE | NO BANK GUARANTEE | PAGE 3 | Internal Use-0724 |
Putnam Dynamic Asset Allocation Equity Fund |  | |
Class P true | ||
| Annual Shareholder Report | May 31, 2024 | ||
 | ||
You can find additional information about the Fund at https://www.franklintempleton.com/regulatory-internalusefunds-documents. You can also request this information by contacting us at (800) 225-1581.
Class Name | Costs of a $10,000 investment | Costs paid as a percentage of a $10,000 investment* |
| Class P | $69 | 0.60% |
| * | Reflects fee waivers and/or expense reimbursements, without which expenses would have been higher. |
Top contributors to performance: | |
| Security selection decisions within these strategies: | |
| ↑ | Quantitative U.S. Large Cap Core Strategy |
| ↑ | Quantitative International Equity Strategy |
| ↑ | Fundamental U.S. Large Cap Value Strategy |
Top detractors from performance: | |
| ↓ | Allocation decisions within the Fundamental Emerging Market Equity Strategy |
| Putnam Dynamic Asset Allocation Equity Fund | ||
| NOT FDIC INSURED | MAY LOSE VALUE | NO BANK GUARANTEE | PAGE 1 | Internal Use-0724 |
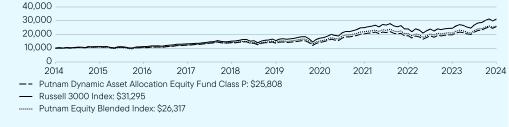
1 Year | 5 Year | 10 Year | |
Class P (without sales charge) | 30.55 | 13.75 | 9.94 |
Class P (with sales charge) | 30.55 | 13.75 | 9.94 |
Russell 3000 Index | 27.58 | 15.00 | 12.09 |
Putnam Equity Blended Index | 24.94 | 13.06 | 10.16 |
Total Net Assets | $15,063,651 |
Total Number of Portfolio Holdings* | 640 |
Total Management Fee Paid | $0 |
Portfolio Turnover Rate | 64% |
| * | Includes derivatives, if applicable. |
| Putnam Dynamic Asset Allocation Equity Fund | ||
| NOT FDIC INSURED | MAY LOSE VALUE | NO BANK GUARANTEE | PAGE 2 | Internal Use-0724 |
| U.S. Money Markets, if any, represent the market value weights of cash, short-term securities, and derivative notional offsets in the portfolio. Holdings and allocations may vary over time. |
January 1, 2024. As part of the Transaction, your Fund’s investment advisor, Putnam Investment Management, LLC (“Putnam Management”), a wholly-owned subsidiary of Putnam Holdings, and your Fund’s sub-advisors, Putnam Investments Limited (“PIL”) and The Putnam Advisory Company, LLC (“PAC”), both indirect, wholly-owned subsidiaries of Putnam Holdings, became indirect, wholly-owned subsidiaries of Franklin Resources. In connection with the Transaction, shareholders of your Fund approved a new management contract with Putnam Management and new sub-advisory contracts with PIL and PAC. The new contracts are identical to the previous contracts, except for the effective dates, initial terms, updates to fund names as necessary to reflect previous name changes, the addition of a provision specifying that there are no third-party beneficiaries to the contracts, and (in some cases) certain non-substantive changes.
 | WHERE CAN I FIND ADDITIONAL INFORMATION ABOUT THE FUND? |
Additional information is available on https://www.franklintempleton.com/regulatory-internalusefunds-documents, including its: | |
| • proxy voting information • financial information • holdings • tax information |
| Putnam Dynamic Asset Allocation Equity Fund | ||
| NOT FDIC INSURED | MAY LOSE VALUE | NO BANK GUARANTEE | PAGE 3 | Internal Use-0724 |
| Item 2. Code of Ethics: |
| (a) The fund’s principal executive, financial and accounting officers are employees of Putnam Investment Management, LLC, the Fund’s investment manager. As such they are subject to a comprehensive Code of Ethics adopted and administered by Putnam Investments which is designed to protect the interests of the firm and its clients. The Fund has adopted a Code of Ethics which incorporates the Code of Ethics of Putnam Investments (Code of Ethics of Franklin Templeton effective March 4, 2024) with respect to all of its officers and Trustees who are employees of Putnam Investment Management, LLC. For this reason, the Fund has not adopted a separate code of ethics governing its principal executive, financial and accounting officers. |
| (c) In connection with the acquisition of Putnam Investments by Franklin Templeton, the Putnam Investments Code of Ethics was amended effective January 1, 2024 to reflect revised compliance processes, including: (i) Compliance with the Putnam Investments Code of Ethics will be viewed as compliance with the Franklin Templeton Code for certain Putnam employees who are dual-hatted in Franklin Templeton advisory entities (ii) Certain Franklin Templeton employees are required to hold shares of Putnam mutual funds at Putnam Investor Services, Inc. and (iii) Certain provisions of the Putnam Investments Code of Ethics are amended that are no longer needed due to organizational changes. Effective March 4, 2024, the majority of legacy Putnam employees transitioned to Franklin Templeton policies outlined in the Franklin Templeton Code. |
| Item 3. Audit Committee Financial Expert: |
| The Funds’ Audit, Compliance and Risk Committee is comprised solely of Trustees who are “independent” (as such term has been defined by the Securities and Exchange Commission (“SEC”) in regulations implementing Section 407 of the Sarbanes-Oxley Act (the “Regulations”)). The Trustees believe that each member of the Audit, Compliance and Risk Committee also possesses a combination of knowledge and experience with respect to financial accounting matters, as well as other attributes, that qualifies him or her for service on the Committee. In addition, the Trustees have determined that each of Dr. Hill and Mr. Singh qualifies as an “audit committee financial expert” (as such term has been defined by the Regulations) based on their review of his or her pertinent experience and education.The SEC has stated, and the funds’ amended and restated agreement and Declaration of Trust provides, that the designation or identification of a person as an audit committee financial expert pursuant to this Item 3 of Form N-CSR does not impose on such person any duties, obligations or liability that are greater than the duties, obligations and liability imposed on such person as a member of the Audit, Compliance and Risk Committee and the Board of Trustees in the absence of such designation or identification. |
| Item 4. Principal Accountant Fees and Services: |
| The following table presents fees billed in each of the last two fiscal years for services rendered to the fund by the fund’s independent auditor: |
| Fiscal year ended | Audit Fees | Audit-Related Fees | Tax Fees | All Other Fees | |
| May 31, 2024 | $82,209 | $ — | $23,398 | $ — | |
| May 31, 2023 | $61,418 | $ — | $20,765 | $ — | |
| For the fiscal years ended May 31, 2024 and May 31, 2023, the fund’s independent auditor billed aggregate non-audit fees in the amounts of $687,761 and $262,508 respectively, to the fund, Putnam Management and any entity controlling, controlled by or under common control with Putnam Management that provides ongoing services to the fund. |
| Audit Fees represent fees billed for the fund’s last two fiscal years relating to the audit and review of the financial statements included in annual reports and registration statements, and other services that are normally provided in connection with statutory and regulatory filings or engagements. |
| Audit-Related Fees represent fees billed in the fund’s last two fiscal years for services traditionally performed by the fund’s auditor, including accounting consultation for proposed transactions or concerning financial accounting and reporting standards and other audit or attest services not required by statute or regulation. |
| Tax Fees represent fees billed in the fund’s last two fiscal years for tax compliance, tax planning and tax advice services. Tax planning and tax advice services include assistance with tax audits, employee benefit plans and requests for rulings or technical advice from taxing authorities. |
| Pre-Approval Policies of the Audit, Compliance and Risk Committee. The Audit, Compliance and Risk Committee of the Putnam funds has determined that, as a matter of policy, all work performed for the funds by the funds’ independent auditors will be pre-approved by the Committee itself and thus will generally not be subject to pre-approval procedures. |
| The Audit, Compliance and Risk Committee also has adopted a policy to pre-approve the engagement by Putnam Management and certain of its affiliates of the funds’ independent auditors, even in circumstances where pre-approval is not required by applicable law. Any such requests by Putnam Management or certain of its affiliates are typically submitted in writing to the Committee and explain, among other things, the nature of the proposed engagement, the estimated fees, and why this work should be performed by that particular audit firm as opposed to another one. In reviewing such requests, the Committee considers, among other things, whether the provision of such services by the audit firm are compatible with the independence of the audit firm. |
| The following table presents fees billed by the fund’s independent auditor for services required to be approved pursuant to paragraph (c)(7)(ii) of Rule 2–01 of Regulation S-X. |
| Fiscal year ended | Audit-Related Fees | Tax Fees | All Other Fees | Total Non-Audit Fees | |
| May 31, 2024 | $ — | $664,363 | $ — | $ — | |
| May 31, 2023 | $ — | $241,743 | $ — | $ — | |
| (i) Not applicable |
| (j) Not applicable |
| Item 5. Audit Committee of Listed Registrants |
| Not applicable |
| Item 6. Investments: |
| The registrant’s schedule of investments in unaffiliated issuers is included in the Financial Statements and Other Important Information in Item 7 below. |
| Item 7. Financial Statements and Financial Highlights for Open-End Management Investment Companies. |

Putnam
Dynamic Asset Allocation Equity Fund
Financial Statements and Other Important Information
Annual | May 31, 2024

Table of Contents
| Financial Statements and Other Important Information—Annual | franklintempleton.com |
Report of Independent Registered Public Accounting Firm
To the Board of Trustees of Putnam Funds Trust and Shareholders of Putnam Dynamic Asset Allocation Equity Fund:
Opinion on the Financial Statements
We have audited the accompanying statement of assets and liabilities, including the fund’s portfolio, of Putnam Dynamic Asset Allocation Equity Fund (one of the funds constituting Putnam Funds Trust, referred to hereafter as the “Fund”) as of May 31, 2024, the related statement of operations for the year ended May 31, 2024, the statement of changes in net assets for each of the two years in the period ended May 31, 2024, including the related notes, and the financial highlights for each of the five years in the period ended May 31, 2024 (collectively referred to as the “financial statements”). In our opinion, the financial statements present fairly, in all material respects, the financial position of the Fund as of May 31, 2024, the results of its operations for the year then ended, the changes in its net assets for each of the two years in the period ended May 31, 2024 and the financial highlights for each of the five years in the period ended May 31, 2024 in conformity with accounting principles generally accepted in the United States of America.
Basis for Opinion
These financial statements are the responsibility of the Fund’s management. Our responsibility is to express an opinion on the Fund’s financial statements based on our audits. We are a public accounting firm registered with the Public Company Accounting Oversight Board (United States) (“PCAOB”) and are required to be independent with respect to the Fund in accordance with the U.S. federal securities laws and the applicable rules and regulations of the Securities and Exchange Commission and the PCAOB.
We conducted our audits of these financial statements in accordance with the standards of the PCAOB. Those standards require that we plan and perform the audit to obtain reasonable assurance about whether the financial statements are free of material misstatement, whether due to error or fraud.
Our audits included performing procedures to assess the risks of material misstatement of the financial statements, whether due to error or fraud, and performing procedures that respond to those risks. Such procedures included examining, on a test basis, evidence regarding the amounts and disclosures in the financial statements. Our audits also included evaluating the accounting principles used and significant estimates made by management, as well as evaluating the overall presentation of the financial statements. Our procedures included confirmation of securities owned as of May 31, 2024 by correspondence with the custodian, transfer agent and brokers; when replies were not received from brokers, we performed other auditing procedures. We believe that our audits provide a reasonable basis for our opinion.
PricewaterhouseCoopers LLP
Boston, Massachusetts
July 17, 2024
We have served as the auditor of one or more investment companies in the Putnam Funds family of funds since at least 1957. We have not been able to determine the specific year we began serving as auditor.
| Dynamic Asset Allocation Equity Fund 1 |
| The fund’s portfolio 5/31/24 | ||
| COMMON STOCKS (86.5%)* | Shares | Value |
| Advertising and marketing services (0.2%) | ||
| Publicis Groupe SA (France) | 169 | $19,010 |
| Trade Desk, Inc. (The) Class A † | 92 | 8,536 |
| 27,546 | ||
| Aerospace and defense (0.9%) | ||
| Airbus SE (France) | 87 | 14,770 |
| BAE Systems PLC (United Kingdom) | 317 | 5,645 |
| Boeing Co. (The) † | 61 | 10,834 |
| Curtiss-Wright Corp. | 23 | 6,505 |
| Dassault Aviation SA (France) | 20 | 4,336 |
| Huntington Ingalls Industries, Inc. | 21 | 5,315 |
| Lockheed Martin Corp. | 42 | 19,754 |
| Northrop Grumman Corp. | 57 | 25,694 |
| RTX Corp. | 214 | 23,071 |
| TransDigm Group, Inc. | 14 | 18,805 |
| 134,729 | ||
| Agriculture (0.5%) | ||
| Archer-Daniels-Midland Co. | 925 | 57,757 |
| Corteva, Inc. | 378 | 21,145 |
| 78,902 | ||
| Airlines (0.3%) | ||
| Copa Holdings SA Class A (Panama) | 127 | 12,348 |
| Qantas Airways, Ltd. (voting rights) (Australia) † | 3,480 | 14,329 |
| Southwest Airlines Co. | 417 | 11,192 |
| 37,869 | ||
| Automotive (1.4%) | ||
| BYD Co., Ltd. Class H (China) | 500 | 14,064 |
| Daimler Truck Holding AG (Germany) | 91 | 3,882 |
| Ford Motor Co. | 526 | 6,380 |
| General Motors Co. | 630 | 28,344 |
| Kia Corp. (South Korea) | 263 | 22,472 |
| PACCAR, Inc. | 60 | 6,450 |
| Stellantis NV (Italy) | 492 | 10,939 |
| Subaru Corp. (Japan) | 800 | 17,856 |
| Tesla, Inc. † | 300 | 53,424 |
| Toyota Motor Corp. (Japan) | 300 | 6,514 |
| United Rentals, Inc. | 25 | 16,735 |
| Volvo AB Class B (Sweden) | 640 | 17,273 |
| 204,333 | ||
| Banking (5.6%) | ||
| Abu Dhabi Islamic Bank PJSC (United Arab Emirates) † | 5,033 | 15,369 |
| AIB Group PLC (Ireland) | 673 | 3,840 |
| Alinma Bank (Saudi Arabia) | 2,100 | 17,226 |
| Banco Bilbao Vizcaya Argentaria SA (Spain) | 2,023 | 22,014 |
| Banco do Brasil SA (Brazil) | 3,200 | 16,527 |
| Banco Santander SA (Spain) | 4,367 | 23,063 |
| Bank Central Asia Tbk PT (Indonesia) | 25,000 | 14,222 |
| Bank Hapoalim MB (Israel) | 1,028 | 9,478 |
| Bank Mandiri Persero Tbk PT (Indonesia) | 47,600 | 17,271 |
| Bank of America Corp. | 1,574 | 62,944 |
| Bank of China, Ltd. Class H (China) | 88,000 | 41,785 |
| Bank of New York Mellon Corp. (The) | 768 | 45,780 |
| Citigroup, Inc. | 2,086 | 129,978 |
| Commonwealth Bank of Australia (Australia) | 12 | 964 |
| Danske Bank A/S (Denmark) | 37 | 1,138 |
| DBS Group Holdings, Ltd. (Singapore) | 670 | 17,881 |
| Erste Group Bank AG (Czech Republic) | 206 | 10,122 |
| Grupo Financiero Banorte SAB de CV Class O (Mexico) | 3,766 | 35,774 |
| HSBC Holdings PLC (United Kingdom) | 2,569 | 23,019 |
| ICICI Bank, Ltd. (India) | 4,082 | 55,109 |
2 Dynamic Asset Allocation Equity Fund | |
| COMMON STOCKS (86.5%)* cont. | Shares | Value |
| Banking cont. | ||
| Intesa Sanpaolo SpA (Italy) | 2,776 | $10,943 |
| JPMorgan Chase & Co. | 571 | 115,701 |
| Mizrahi Tefahot Bank, Ltd. (Israel) | 197 | 7,210 |
| National Australia Bank, Ltd. (Australia) | 158 | 3,591 |
| Nordea Bank ABP (Finland) | 1,634 | 20,100 |
| Northern Trust Corp. | 398 | 33,528 |
| NU Holdings, Ltd./Cayman Islands Class A (Brazil) † | 518 | 6,154 |
| Oversea-Chinese Banking Corp., Ltd. (Singapore) | 1,500 | 16,195 |
| PNC Financial Services Group, Inc. (The) | 140 | 22,035 |
| State Street Corp. | 175 | 13,228 |
| UniCredit SpA (Italy) | 466 | 18,536 |
| Webster Financial Corp. | 148 | 6,545 |
| Wells Fargo & Co. | 111 | 6,651 |
| 843,921 | ||
| Beverage (1.1%) | ||
| Boston Beer Co., Inc. (The) Class A † | 22 | 6,901 |
| Carlsberg A/S Class B (Denmark) | 21 | 2,840 |
| Coca-Cola Co. (The) | 2,014 | 126,741 |
| Coca-Cola HBC AG (Italy) | 367 | 12,462 |
| Molson Coors Beverage Co. Class B | 109 | 5,974 |
| Monster Beverage Corp. † | 160 | 8,307 |
| 163,225 | ||
| Biotechnology (1.3%) | ||
| Alnylam Pharmaceuticals, Inc. † | 42 | 6,234 |
| Amgen, Inc. | 22 | 6,729 |
| Exelixis, Inc. † | 601 | 13,036 |
| Incyte Corp. † | 371 | 21,440 |
| Neurocrine Biosciences, Inc. † | 53 | 7,177 |
| Regeneron Pharmaceuticals, Inc. † | 54 | 52,929 |
| Vertex Pharmaceuticals, Inc. † | 190 | 86,515 |
| 194,060 | ||
| Building materials (0.2%) | ||
| Owens Corning | 36 | 6,519 |
| Trane Technologies PLC | 78 | 25,542 |
| 32,061 | ||
| Cable television (0.6%) | ||
| Charter Communications, Inc. Class A † | 39 | 11,198 |
| Comcast Corp. Class A | 2,016 | 80,701 |
| 91,899 | ||
| Chemicals (1.1%) | ||
| Arkema SA (France) | 59 | 6,087 |
| Axalta Coating Systems, Ltd. † | 173 | 6,157 |
| CF Industries Holdings, Inc. | 90 | 7,176 |
| Dow, Inc. | 112 | 6,455 |
| DuPont de Nemours, Inc. | 193 | 15,857 |
| Eastman Chemical Co. | 168 | 17,023 |
| Hansol Chemical Co., Ltd. (South Korea) | 73 | 10,024 |
| Huntsman Corp. | 263 | 6,522 |
| Linde PLC | 12 | 5,226 |
| LyondellBasell Industries NV Class A | 63 | 6,263 |
| Mosaic Co. (The) | 200 | 6,186 |
| NewMarket Corp. | 10 | 5,351 |
| PPG Industries, Inc. | 144 | 18,923 |
| RPM International, Inc. | 53 | 5,941 |
| Sherwin-Williams Co. (The) | 71 | 21,569 |
| Shin-Etsu Chemical Co., Ltd. (Japan) | 500 | 18,619 |
| Yara International ASA (Norway) | 27 | 836 |
| 164,215 |
Dynamic Asset Allocation Equity Fund 3 | |
| COMMON STOCKS (86.5%)* cont. | Shares | Value |
| Commercial and consumer services (3.1%) | ||
| Automatic Data Processing, Inc. | 364 | $89,151 |
| Block, Inc. Class A † | 90 | 5,767 |
| Booking Holdings, Inc. | 22 | 83,080 |
| CoStar Group, Inc. † | 118 | 9,224 |
| Ecolab, Inc. | 31 | 7,198 |
| Equifax, Inc. | 53 | 12,264 |
| Euronet Worldwide, Inc. † | 56 | 6,528 |
| Expedia Group, Inc. † | 356 | 40,178 |
| Mastercard, Inc. Class A | 303 | 135,462 |
| PayPal Holdings, Inc. † | 1,175 | 74,013 |
| Verisk Analytics, Inc. | 12 | 3,033 |
| 465,898 | ||
| Communications equipment (0.2%) | ||
| arista Networks, Inc. † | 22 | 6,548 |
| Motorola Solutions, Inc. | 53 | 19,340 |
| 25,888 | ||
| Computers (5.0%) | ||
| Apple, Inc. | 3,375 | 648,831 |
| Cisco Systems, Inc. | 424 | 19,716 |
| CrowdStrike Holdings, Inc. Class A † | 20 | 6,273 |
| Dropbox, Inc. Class A † | 264 | 5,948 |
| NetApp, Inc. | 61 | 7,346 |
| RingCentral, Inc. Class A † | 217 | 7,421 |
| ServiceNow, Inc. † | 7 | 4,599 |
| Smartsheet, Inc. Class A † | 153 | 5,661 |
| Snowflake, Inc. Class A † | 42 | 5,720 |
| SS&C Technologies Holdings, Inc. | 101 | 6,267 |
| Synopsys, Inc. † | 54 | 30,283 |
| Teradata Corp. † | 208 | 6,783 |
| Zoom Video Communications, Inc. Class A † | 104 | 6,379 |
| 761,227 | ||
| Conglomerates (1.2%) | ||
| 3M Co. | 922 | 92,329 |
| AMETEK, Inc. | 182 | 30,864 |
| Marubeni Corp. (Japan) | 400 | 7,820 |
| Mitsubishi Corp. (Japan) | 1,100 | 23,171 |
| Mitsui & Co., Ltd. (Japan) | 500 | 25,416 |
| 179,600 | ||
| Construction (1.1%) | ||
| Builders FirstSource, Inc. † | 120 | 19,295 |
| Cie de Saint-Gobain SA (France) | 237 | 21,004 |
| CRH PLC | 257 | 21,012 |
| CRH PLC (London Exchange) | 100 | 7,883 |
| Fortune Brands Innovations, Inc. | 93 | 6,516 |
| HeidelbergCement AG (Germany) | 154 | 16,017 |
| Holcim AG (Switzerland) | 219 | 19,156 |
| Kingspan Group PLC (Ireland) | 59 | 5,699 |
| Larsen & Toubro, Ltd. (India) | 512 | 22,595 |
| ROCKWOOL International A/S (Denmark) | 10 | 4,229 |
| UltraTech Cement, Ltd. (India) | 168 | 19,973 |
| 163,379 | ||
| Consumer (0.3%) | ||
| Clorox Co. (The) | 44 | 5,789 |
| Kimberly-Clark Corp. | 49 | 6,532 |
| LVMH Moet Hennessy Louis Vuitton SA (France) | 6 | 4,822 |
| MSA Safety, Inc. | 33 | 5,940 |
| Pandora A/S (Denmark) | 100 | 16,444 |
| 39,527 |
4 Dynamic Asset Allocation Equity Fund | |
| COMMON STOCKS (86.5%)* cont. | Shares | Value |
| Consumer finance (1.0%) | ||
| American Express Co. | 31 | $7,440 |
| Capital One Financial Corp. | 241 | 33,169 |
| Discover Financial Services | 462 | 56,669 |
| OneMain Holdings, Inc. | 130 | 6,386 |
| SLM Corp. | 275 | 5,902 |
| Synchrony Financial | 136 | 5,957 |
| Visa, Inc. Class A | 155 | 42,231 |
| 157,754 | ||
| Consumer goods (1.0%) | ||
| Colgate-Palmolive Co. | 621 | 57,728 |
| Henkel AG & Co. KGaA Vorzug (Preference) (Germany) | 40 | 3,615 |
| Kenvue, Inc. | 248 | 4,786 |
| L’Oreal SA (France) | 37 | 18,257 |
| Procter & Gamble Co. (The) | 228 | 37,515 |
| Reckitt Benckiser Group PLC (United Kingdom) | 36 | 2,057 |
| Ulta Beauty, Inc. † | 17 | 6,717 |
| Unilever PLC (United Kingdom) | 312 | 17,095 |
| 147,770 | ||
| Consumer services (1.3%) | ||
| Auto Trader Group PLC (United Kingdom) | 1,358 | 14,281 |
| DoorDash, Inc. Class A † | 66 | 7,267 |
| Etsy, Inc. † | 106 | 6,728 |
| MakeMyTrip, Ltd. (India) † | 122 | 9,222 |
| Maplebear, Inc. † | 192 | 5,852 |
| MercadoLibre, Inc. (Brazil) † | 10 | 17,256 |
| PDD Holdings, Inc. ADR (China) † | 208 | 31,154 |
| Sea, Ltd. ADR (Singapore) † | 132 | 8,913 |
| Uber Technologies, Inc. † | 1,409 | 90,966 |
| Zomato, Ltd. (India) † | 4,412 | 9,515 |
| 201,154 | ||
| Containers (0.1%) | ||
| Ball Corp. | 147 | 10,206 |
| Berry Global Group, Inc. | 104 | 6,228 |
| 16,434 | ||
| Distribution (—%) | ||
| Sysco Corp. | 87 | 6,335 |
| 6,335 | ||
| Electric utilities (1.5%) | ||
| Constellation Energy Corp. | 135 | 29,329 |
| Dominion Energy, Inc. | 118 | 6,363 |
| DTE Energy Co. | 56 | 6,526 |
| Duke Energy Corp. | 60 | 6,214 |
| E.ON SE (Germany) | 1,258 | 16,774 |
| Edison International | 91 | 6,993 |
| Enel SpA (Italy) | 2,240 | 16,248 |
| Entergy Corp. | 56 | 6,299 |
| Eversource Energy | 105 | 6,219 |
| Exelon Corp. | 154 | 5,783 |
| Kansai Electric Power Co., Inc. (The) (Japan) | 600 | 10,840 |
| NextEra Energy, Inc. | 441 | 35,289 |
| NTPC, Ltd. (India) | 4,782 | 20,673 |
| PG&E Corp. | 1,082 | 20,060 |
| PPL Corp. | 522 | 15,310 |
| Public Service Enterprise Group, Inc. | 89 | 6,743 |
| RWE AG (Germany) | 109 | 4,123 |
| Southern Co. (The) | 83 | 6,652 |
| Xcel Energy, Inc. | 124 | 6,876 |
| 233,314 |
Dynamic Asset Allocation Equity Fund 5 | |
| COMMON STOCKS (86.5%)* cont. | Shares | Value |
| Electrical equipment (0.6%) | ||
| ABB, Ltd. (Switzerland) | 427 | $23,408 |
| Eaton Corp. PLC | 19 | 6,324 |
| Fortive Corp. | 83 | 6,179 |
| Honeywell International, Inc. | 106 | 21,432 |
| KEI Industries, Ltd. (India) | 515 | 25,435 |
| Legrand SA (France) | 44 | 4,756 |
| 87,534 | ||
| Electronics (8.0%) | ||
| Advanced Micro Devices, Inc. † | 167 | 27,872 |
| Broadcom, Inc. | 76 | 100,970 |
| Cirrus Logic, Inc. † | 75 | 8,603 |
| Dexerials Corp. (Japan) | 200 | 8,419 |
| Hon Hai Precision Industry Co., Ltd. (Taiwan) | 4,000 | 21,265 |
| Hoya Corp. (Japan) | 200 | 24,343 |
| Keysight Technologies, Inc. † | 45 | 6,232 |
| MediaTek, Inc. (Taiwan) | 1,000 | 37,998 |
| Monolithic Power Systems, Inc. | 8 | 5,885 |
| NVIDIA Corp. | 575 | 630,390 |
| NXP Semiconductors NV | 51 | 13,877 |
| Qorvo, Inc. † | 65 | 6,395 |
| Qualcomm, Inc. | 802 | 163,648 |
| Samsung Electronics Co., Ltd. (South Korea) | 1,254 | 67,174 |
| Sinbon Electronics Co., Ltd. (Taiwan) | 2,000 | 18,207 |
| SK Hynix, Inc. (South Korea) | 310 | 42,477 |
| TD SYNNEX Corp. | 24 | 3,140 |
| Vontier Corp. | 244 | 9,755 |
| Woodward, Inc. | 39 | 7,274 |
| 1,203,924 | ||
| Energy (oil field) (0.1%) | ||
| Baker Hughes Co. | 207 | 6,930 |
| Schlumberger, Ltd. | 210 | 9,637 |
| 16,567 | ||
| Engineering and construction (0.1%) | ||
| Sembcorp Industries, Ltd. (Singapore) | 300 | 1,135 |
| Vinci SA (France) | 169 | 21,174 |
| 22,309 | ||
| Entertainment (0.1%) | ||
| Live Nation Entertainment, Inc. † | 89 | 8,343 |
| Panasonic Holdings Corp. (Japan) | 200 | 1,763 |
| 10,106 | ||
| Environmental (0.1%) | ||
| Veralto Corp. | 86 | 8,478 |
| 8,478 | ||
| Financial (0.8%) | ||
| 3i Group PLC (United Kingdom) | 563 | 20,771 |
| Ally Financial, Inc. | 152 | 5,923 |
| Apollo Global Management, Inc. | 217 | 25,207 |
| CME Group, Inc. | 31 | 6,292 |
| Deutsche Boerse AG (Germany) | 6 | 1,192 |
| Eurazeo SE (France) | 25 | 2,113 |
| Euronext NV (France) | 88 | 8,676 |
| Intercontinental Exchange, Inc. | 48 | 6,427 |
| Japan Exchange Group, Inc. (Japan) | 300 | 7,054 |
| Jefferies Financial Group, Inc. | 146 | 6,792 |
| LPL Financial Holdings, Inc. | 21 | 6,010 |
| MGIC Investment Corp. | 321 | 6,741 |
| REC, Ltd. (India) | 3,104 | 20,113 |
| 123,311 |
6 Dynamic Asset Allocation Equity Fund | |
| COMMON STOCKS (86.5%)* cont. | Shares | Value |
| Food (0.5%) | ||
| CK Hutchison Holdings, Ltd. (Hong Kong) | 1,000 | $4,887 |
| Dino Polska SA (Poland) † | 102 | 10,187 |
| Ingredion, Inc. | 53 | 6,232 |
| Jeronimo Martins SGPS SA (Portugal) | 18 | 403 |
| Nestle SA (Switzerland) | 101 | 10,694 |
| Nissin Food Products Co., Ltd. (Japan) | 300 | 7,575 |
| Shoprite Holdings, Ltd. (South Africa) | 966 | 12,849 |
| Sumber Alfaria Trijaya Tbk PT (Indonesia) | 47,100 | 7,679 |
| Tesco PLC (United Kingdom) | 2,597 | 10,345 |
| WH Group, Ltd. (Hong Kong) | 6,000 | 4,092 |
| 74,943 | ||
| Forest products and packaging (0.2%) | ||
| AptarGroup, Inc. | 44 | 6,498 |
| Packaging Corp. of America | 37 | 6,789 |
| Weyerhaeuser Co. R | 346 | 10,390 |
| 23,677 | ||
| Gaming and lottery (0.3%) | ||
| Aristocrat Leisure, Ltd. (Australia) | 588 | 17,707 |
| DraftKings, Inc. Class A † | 338 | 11,874 |
| La Francaise des Jeux SAEM (France) | 101 | 3,633 |
| Las Vegas Sands Corp. | 137 | 6,169 |
| 39,383 | ||
| Health care services (1.7%) | ||
| Apollo Hospitals Enterprise, Ltd. (India) | 222 | 15,557 |
| Bio-Rad Laboratories, Inc. Class A † | 11 | 3,155 |
| Cardinal Health, Inc. | 64 | 6,353 |
| Cigna Group (The) | 216 | 74,438 |
| CVS Health Corp. | 123 | 7,331 |
| Elevance Health, Inc. | 7 | 3,769 |
| Eurofins Scientific (Luxembourg) | 17 | 1,028 |
| Fresenius SE & Co. KGaA (Germany) † | 302 | 9,605 |
| HCA Healthcare, Inc. | 21 | 7,135 |
| M3, Inc. (Japan) | 400 | 3,889 |
| McKesson Corp. | 74 | 42,149 |
| Medpace Holdings, Inc. † | 15 | 5,795 |
| Teladoc Health, Inc. † | 272 | 3,057 |
| Tenet Healthcare Corp. † | 49 | 6,626 |
| UnitedHealth Group, Inc. | 119 | 58,949 |
| 248,836 | ||
| Homebuilding (0.3%) | ||
| Lennar Corp. Class A | 43 | 6,895 |
| PulteGroup, Inc. | 303 | 35,548 |
| Taylor Wimpey PLC (United Kingdom) | 1,403 | 2,660 |
| Toll Brothers, Inc. | 51 | 6,204 |
| 51,307 | ||
| Household furniture and appliances (—%) | ||
| Hoshizaki Corp. (Japan) | 100 | 3,587 |
| Rational AG (Germany) | 4 | 3,396 |
| 6,983 | ||
| Industrial (0.1%) | ||
| Johnson Controls International PLC | 222 | 15,964 |
| 15,964 | ||
| Insurance (2.3%) | ||
| AIA Group, Ltd. (Hong Kong) | 2,800 | 21,762 |
| Allianz SE (Germany) | 43 | 12,526 |
| Allstate Corp. (The) | 39 | 6,533 |
| American International Group, Inc. | 341 | 26,878 |
| AXA SA (France) | 554 | 19,987 |
| Axis Capital Holdings, Ltd. | 93 | 6,871 |
Dynamic Asset Allocation Equity Fund 7 | |
| COMMON STOCKS (86.5%)* cont. | Shares | Value |
| Insurance cont. | ||
| Berkshire Hathaway, Inc. Class B † | 48 | $19,891 |
| Chubb, Ltd. | 24 | 6,500 |
| Equitable Holdings, Inc. | 757 | 31,408 |
| Everest Group, Ltd. | 17 | 6,646 |
| Globe Life, Inc. | 77 | 6,373 |
| Loews Corp. | 75 | 5,760 |
| Marsh & McLennan Cos., Inc. | 30 | 6,227 |
| MetLife, Inc. | 906 | 65,567 |
| Muenchener Rueckversicherungs-Gesellschaft AG in Muenchen (Germany) | 47 | 23,384 |
| NN Group NV (Netherlands) | 140 | 6,527 |
| Old Republic International Corp. | 219 | 6,960 |
| Principal Financial Group, Inc. | 78 | 6,399 |
| QBE Insurance Group, Ltd. (Australia) | 263 | 3,122 |
| Reinsurance Group of America, Inc. | 65 | 13,637 |
| Talanx AG (Germany) | 34 | 2,695 |
| Travelers Cos., Inc. (The) | 29 | 6,255 |
| Unum Group | 126 | 6,786 |
| Willis Towers Watson PLC | 23 | 5,872 |
| Zurich Insurance Group AG (Switzerland) | 30 | 15,766 |
| 340,332 | ||
| Investment banking/Brokerage (1.1%) | ||
| Affiliated Managers Group, Inc. | 39 | 6,341 |
| Ameriprise Financial, Inc. | 14 | 6,113 |
| BlackRock, Inc. | 7 | 5,404 |
| Charles Schwab Corp. (The) | 360 | 26,381 |
| Exor NV (Netherlands) | 45 | 5,064 |
| Goldman Sachs Group, Inc. (The) | 112 | 51,130 |
| HDFC Asset Management Co., Ltd. (India) | 204 | 9,481 |
| Investor AB Class B (Sweden) | 832 | 22,618 |
| Meritz Financial Group, Inc. (South Korea) | 211 | 11,797 |
| Morgan Stanley | 72 | 7,044 |
| Nomura Holdings, Inc. (Japan) | 100 | 605 |
| SEI Investments Co. | 91 | 6,162 |
| Virtu Financial, Inc. Class A | 302 | 6,644 |
| 164,784 | ||
| Lodging/Tourism (0.6%) | ||
| H World Group, Ltd. ADR (China) | 545 | 20,290 |
| Hilton Worldwide Holdings, Inc. | 117 | 23,470 |
| Host Hotels & Resorts, Inc. R | 372 | 6,674 |
| Indian Hotels Co., Ltd. (India) | 4,075 | 27,342 |
| InterContinental Hotels Group PLC (United Kingdom) | 48 | 4,870 |
| MGM Resorts International † | 151 | 6,066 |
| 88,712 | ||
| Machinery (0.9%) | ||
| Atlas Copco AB Class A (Sweden) | 446 | 8,569 |
| Caterpillar, Inc. | 18 | 6,093 |
| Cummins, Inc. | 23 | 6,480 |
| Deere & Co. | 16 | 5,996 |
| Donaldson Co., Inc. | 79 | 5,821 |
| HD Hyundai Electric Co., Ltd. (South Korea) | 61 | 13,308 |
| Hitachi, Ltd. (Japan) | 100 | 10,311 |
| Ingersoll Rand, Inc. | 244 | 22,704 |
| Schindler Holding AG (Switzerland) | 28 | 7,301 |
| Vertiv Holdings Co. Class A | 569 | 55,802 |
| 142,385 | ||
| Manufacturing (0.4%) | ||
| A.O. Smith Corp. | 73 | 6,106 |
| Elite Material Co., Ltd. (Taiwan) | 1,000 | 12,574 |
| Flowserve Corp. | 134 | 6,660 |
| GEA Group AG (Germany) | 129 | 5,360 |
| Graco, Inc. | 41 | 3,311 |
8 Dynamic Asset Allocation Equity Fund | |
| COMMON STOCKS (86.5%)* cont. | Shares | Value |
| Manufacturing cont. | ||
| ITT, Inc. | 45 | $5,980 |
| Parker Hannifin Corp. | 12 | 6,378 |
| Smiths Group PLC (United Kingdom) | 220 | 4,850 |
| Textron, Inc. | 77 | 6,746 |
| 57,965 | ||
| Media (1.0%) | ||
| Netflix, Inc. † | 211 | 135,382 |
| Universal Music Group NV (Netherlands) | 368 | 11,511 |
| 146,893 | ||
| Medical technology (1.7%) | ||
| 10x Genomics, Inc. Class A † | 256 | 5,740 |
| Abbott Laboratories | 300 | 30,657 |
| Boston Scientific Corp. † | 687 | 51,917 |
| Danaher Corp. | 105 | 26,964 |
| Demant A/S (Denmark) † | 149 | 7,183 |
| Edwards Lifesciences Corp. † | 76 | 6,604 |
| FUJIFILM Holdings Corp. (Japan) | 300 | 6,758 |
| Hologic, Inc. † | 90 | 6,640 |
| IDEXX Laboratories, Inc. † | 26 | 12,920 |
| Inspire Medical Systems, Inc. † | 25 | 3,970 |
| Insulet Corp. † | 35 | 6,202 |
| Intuitive Surgical, Inc. † | 74 | 29,757 |
| Medtronic PLC | 82 | 6,672 |
| Olympus Corp. (Japan) | 100 | 1,566 |
| Solventum Corp. † | 100 | 5,934 |
| Sonic Healthcare, Ltd. (Australia) | 156 | 2,546 |
| Stryker Corp. | 18 | 6,140 |
| Thermo Fisher Scientific, Inc. | 54 | 30,671 |
| West Pharmaceutical Services, Inc. | 8 | 2,651 |
| 251,492 | ||
| Metals (1.1%) | ||
| ArcelorMittal SA (France) | 623 | 16,557 |
| BHP Group, Ltd. (ASE Exchange) (Australia) | 409 | 12,124 |
| BHP Group, Ltd. (London Exchange) (Australia) | 62 | 1,845 |
| Cleveland-Cliffs, Inc. † | 188 | 3,249 |
| Fortescue, Ltd. (Australia) | 1,114 | 18,290 |
| Freeport-McMoRan, Inc. | 688 | 36,278 |
| Glencore PLC (United Kingdom) | 1,535 | 9,464 |
| Northern Star Resources, Inc. (Australia) | 227 | 2,155 |
| Nucor Corp. | 36 | 6,079 |
| Prysmian SpA (Italy) | 146 | 9,623 |
| Reliance, Inc. | 20 | 6,016 |
| Rio Tinto PLC (United Kingdom) | 224 | 15,733 |
| Steel Dynamics, Inc. | 47 | 6,292 |
| Vat Group AG (Switzerland) | 5 | 2,742 |
| Zijin Mining Group Co., Ltd. Class H (China) | 8,000 | 16,851 |
| 163,298 | ||
| Natural gas utilities (0.3%) | ||
| Centrica PLC (United Kingdom) | 5,906 | 10,728 |
| China Resources Gas Group, Ltd. (China) | 3,300 | 11,494 |
| Eni SpA (Italy) | 216 | 3,406 |
| National Fuel Gas co. | 113 | 6,459 |
| Osaka Gas Co., Ltd. (Japan) | 100 | 2,276 |
| Tokyo Gas Co., Ltd. (Japan) | 400 | 8,954 |
| UGI Corp. | 262 | 6,671 |
| 49,988 | ||
| Oil and gas (3.1%) | ||
| BP PLC (United Kingdom) | 4,287 | 26,852 |
| Cheniere Energy, Inc. | 499 | 78,737 |
| Chevron Corp. | 42 | 6,817 |
| ConocoPhillips | 246 | 28,654 |
Dynamic Asset Allocation Equity Fund 9 | |
| COMMON STOCKS (86.5%)* cont. | Shares | Value |
| Oil and gas cont. | ||
| Coterra Energy, Inc. | 218 | $6,217 |
| DCC PLC (Ireland) | 69 | 5,027 |
| Devon Energy Corp. | 134 | 6,577 |
| Eneos Holdings, Inc. (Japan) | 900 | 4,652 |
| Equinor ASA (Norway) | 687 | 19,965 |
| Exxon Mobil Corp. | 414 | 48,546 |
| HF Sinclair Corp. | 124 | 6,849 |
| INPEX Corp. (Japan) | 200 | 3,086 |
| Marathon Oil Corp. | 2,754 | 79,756 |
| Marathon Petroleum Corp. | 237 | 41,857 |
| PetroChina Co., Ltd. Class H (China) | 32,000 | 32,661 |
| PRIO SA (Brazil) | 600 | 4,755 |
| Repsol SA (Spain) | 298 | 4,893 |
| Shell PLC (United Kingdom) | 629 | 22,826 |
| Shell PLC (United Kingdom) | 156 | 5,629 |
| Targa Resources Corp. | 55 | 6,503 |
| TotalEnergies SE (France) | 83 | 6,060 |
| Valero Energy Corp. | 168 | 26,399 |
| 473,318 | ||
| Pharmaceuticals (4.9%) | ||
| AbbVie, Inc. | 454 | 73,203 |
| AstraZeneca PLC (United Kingdom) | 237 | 36,854 |
| AstraZeneca PLC ADR (United Kingdom) | 285 | 22,236 |
| Becton, Dickinson and Co. | 28 | 6,495 |
| Bristol-Myers Squibb Co. | 585 | 24,038 |
| Chugai Pharmaceutical Co., Ltd. (Japan) | 400 | 12,195 |
| Dexcom, Inc. † | 207 | 24,586 |
| Eli Lilly and Co. | 251 | 205,905 |
| GSK PLC (United Kingdom) | 1,181 | 26,494 |
| Ipsen SA (France) | 40 | 5,254 |
| Johnson & Johnson | 47 | 6,893 |
| Lonza Group AG (Switzerland) | 21 | 11,454 |
| Merck & Co., Inc. | 1,157 | 145,250 |
| Novartis AG (Switzerland) | 376 | 38,882 |
| Novo Nordisk A/S Class B (Denmark) | 454 | 61,389 |
| Ono Pharmaceutical Co., Ltd. (Japan) | 300 | 4,348 |
| Roche Holding AG (Switzerland) | 12 | 3,074 |
| Sanofi SA (France) | 128 | 12,507 |
| Shionogi & Co., Ltd. (Japan) | 100 | 4,505 |
| Sun Pharmaceutical Industries, Ltd. (India) | 648 | 11,349 |
| 736,911 | ||
| Power producers (0.4%) | ||
| NRG Energy, Inc. | 372 | 30,132 |
| Vistra Corp. | 358 | 35,471 |
| 65,603 | ||
| Publishing (0.2%) | ||
| S&P Global, Inc. | 35 | 14,963 |
| TOPPAN Holdings, Inc. (Japan) | 300 | 7,783 |
| 22,746 | ||
| Railroads (0.6%) | ||
| Aurizon Holdings, Ltd. (Australia) | 1,832 | 4,497 |
| Canadian Pacific Kansas City, Ltd. (Canada) | 243 | 19,284 |
| CSX Corp. | 183 | 6,176 |
| Norfolk Southern Corp. | 25 | 5,620 |
| Union Pacific Corp. | 239 | 55,644 |
| 91,221 | ||
| Real estate (1.2%) | ||
| AvalonBay Communities, Inc. R | 30 | 5,780 |
| Brixmor Property Group, Inc. R | 279 | 6,280 |
| EPR Properties R | 148 | 6,074 |
| Equity Residential R | 90 | 5,853 |
10 Dynamic Asset Allocation Equity Fund | |
| COMMON STOCKS (86.5%)* cont. | Shares | Value |
| Real estate cont. | ||
| First Industrial Realty Trust, Inc. R | 132 | $6,220 |
| Gaming and Leisure Properties, Inc. R | 283 | 12,707 |
| Goodman Group (Australia) R | 292 | 6,583 |
| Klepierre SA (France) R | 318 | 9,195 |
| Mid-America Apartment Communities, Inc. R | 46 | 6,151 |
| Park Hotels & Resorts, Inc. | 412 | 6,534 |
| Phoenix Mills, Ltd. (The) (India) | 575 | 21,468 |
| Public Storage R | 23 | 6,298 |
| Sekisui Chemical Co., Ltd. (Japan) | 200 | 2,871 |
| Simon Property Group, Inc. R | 416 | 62,945 |
| Vornado Realty Trust R | 362 | 8,876 |
| 173,835 | ||
| Regional Bells (0.3%) | ||
| AT&T, Inc. | 2,073 | 37,770 |
| 37,770 | ||
| Restaurants (0.3%) | ||
| Alsea SAB de CV (Mexico) | 2,039 | 8,082 |
| Chipotle Mexican Grill, Inc. † | 9 | 28,166 |
| McDonald’s Corp. | 21 | 5,437 |
| Starbucks Corp. | 87 | 6,979 |
| 48,664 | ||
| Retail (5.6%) | ||
| Amazon.com, Inc. † | 2,403 | 423,985 |
| Associated British Foods PLC (United Kingdom) | 371 | 12,170 |
| AutoZone, Inc. † | 2 | 5,540 |
| BJ’s Wholesale Club Holdings, Inc. † | 119 | 10,480 |
| Costco Wholesale Corp. | 25 | 20,247 |
| Home Depot, Inc. (The) | 114 | 38,175 |
| Industria de Diseno Textil SA (Spain) | 469 | 22,342 |
| Koninklijke Ahold Delhaize NV (Netherlands) | 518 | 16,077 |
| Lululemon Athletica, Inc. (Canada) † | 43 | 13,416 |
| Next PLC (United Kingdom) | 78 | 9,343 |
| O’Reilly Automotive, Inc. † | 33 | 31,788 |
| Ross Stores, Inc. | 156 | 21,803 |
| Target Corp. | 147 | 22,956 |
| TJX Cos., Inc. (The) | 158 | 16,290 |
| WalMart de Mexico (Walmex) SAB de CV (Mexico) | 2,416 | 9,078 |
| Walmart, Inc. | 2,514 | 165,321 |
| Williams-Sonoma, Inc. | 21 | 6,158 |
| 845,169 | ||
| Semiconductor (2.8%) | ||
| Applied Materials, Inc. | 192 | 41,295 |
| ASML Holding NV (Netherlands) | 59 | 56,562 |
| Disco Corp. (Japan) | 100 | 39,340 |
| KLA Corp. | 88 | 66,839 |
| Lam Research Corp. | 8 | 7,460 |
| Novatek Microelectronics Corp. (Taiwan) | 1,000 | 18,269 |
| Renesas Electronics Corp. (Japan) | 700 | 13,152 |
| Taiwan Semiconductor Manufacturing Co., Ltd. (Taiwan) | 7,000 | 176,677 |
| 419,594 | ||
| Shipping (0.4%) | ||
| FedEx Corp. | 120 | 30,475 |
| International Container Terminal Services, Inc. (Philippines) | 3,660 | 21,404 |
| Kawasaki Kisen Kaisha, Ltd. (Japan) | 100 | 1,484 |
| United Parcel Service, Inc. Class B | 46 | 6,391 |
| Westinghouse Air Brake Technologies Corp. | 36 | 6,092 |
| 65,846 | ||
| Software (6.7%) | ||
| Adobe, Inc. † | 184 | 81,836 |
| Amdocs, Ltd. | 41 | 3,239 |
| Atlassian Corp. Class A † | 36 | 5,647 |
Dynamic Asset Allocation Equity Fund 11 | |
| COMMON STOCKS (86.5%)* cont. | Shares | Value |
| Software cont. | ||
| Autodesk, Inc. † | 26 | $5,242 |
| Cadence Design Systems, Inc. † | 376 | 107,653 |
| F5, Inc. † | 35 | 5,914 |
| HubSpot, Inc. † | 36 | 21,998 |
| Manhattan Associates, Inc. † | 29 | 6,367 |
| Microsoft Corp. | 1,506 | 625,185 |
| Nexon Co., Ltd. (Japan) | 100 | 1,723 |
| Oracle Corp. | 447 | 52,384 |
| Paycom Software, Inc. | 37 | 5,377 |
| Pegasystems, Inc. | 98 | 5,631 |
| ROBLOX Corp. Class A † | 158 | 5,312 |
| SAP SE (Germany) | 11 | 1,982 |
| Square Enix Holdings Co., Ltd. (Japan) | 200 | 5,975 |
| Tata Consultancy Services, Ltd. (India) | 664 | 29,314 |
| TIS, Inc. (Japan) | 200 | 3,656 |
| Veeva Systems, Inc. Class A † | 262 | 45,654 |
| Workday, Inc. Class A † | 26 | 5,498 |
| 1,025,587 | ||
| Staffing (0.2%) | ||
| Benefit Systems SA (Poland) | 9 | 6,701 |
| Recruit Holdings Co., Ltd. (Japan) | 400 | 20,304 |
| Robert Half, Inc. | 99 | 6,359 |
| 33,364 | ||
| Technology services (6.1%) | ||
| Accenture PLC Class A | 21 | 5,928 |
| Alibaba Group Holding, Ltd. (China) | 1,877 | 18,371 |
| Alphabet, Inc. Class A † | 1,529 | 263,753 |
| Alphabet, Inc. Class C † | 692 | 120,380 |
| DocuSign, Inc. † | 306 | 16,750 |
| eBay, Inc. | 126 | 6,832 |
| Fair Isaac Corp. † | 11 | 14,189 |
| GoDaddy, Inc. Class A † | 43 | 6,004 |
| Leidos Holdings, Inc. | 44 | 6,470 |
| Meta Platforms, Inc. Class A | 567 | 264,693 |
| Pinterest, Inc. Class A † | 164 | 6,804 |
| Prosus NV (China) | 295 | 10,815 |
| Roku, Inc. † | 100 | 5,740 |
| Salesforce, Inc. | 162 | 37,980 |
| Spotify Technology SA (Sweden) † | 43 | 12,762 |
| Tencent Holdings, Ltd. (China) | 2,400 | 111,335 |
| VeriSign, Inc. † | 35 | 6,101 |
| Western Union Co. (The) | 453 | 5,798 |
| 920,705 | ||
| Telecommunications (0.6%) | ||
| American Tower Corp. R | 189 | 36,995 |
| Crown Castle, Inc. R | 68 | 6,970 |
| Iridium Communications, Inc. | 198 | 5,962 |
| T-Mobile US, Inc. | 124 | 21,695 |
| Telstra Group, Ltd. (Australia) | 3,579 | 8,304 |
| TIM SA/Brazil (Brazil) | 2,800 | 8,457 |
| 88,383 | ||
| Telephone (0.4%) | ||
| KDDI Corp. (Japan) | 800 | 22,219 |
| Verizon Communications, Inc. | 1,106 | 45,512 |
| 67,731 | ||
| Textiles (0.5%) | ||
| Deckers Outdoor Corp. † | 6 | 6,564 |
| Hermes International (France) | 9 | 21,330 |
| PRADA SpA (Italy) | 2,600 | 21,473 |
| Shenzhou International Group Holdings, Ltd. (China) | 2,700 | 27,098 |
| 76,465 |
12 Dynamic Asset Allocation Equity Fund | |
| COMMON STOCKS (86.5%)* cont. | Shares | Value |
| Tobacco (0.4%) | ||
| Imperial Brands PLC (United Kingdom) | 770 | $19,113 |
| Philip Morris International, Inc. | 388 | 39,335 |
| 58,448 | ||
| Toys (0.1%) | ||
| JUMBO SA (Greece) | 201 | 5,775 |
| Nintendo Co., Ltd. (Japan) | 200 | 10,912 |
| 16,687 | ||
| Transportation services (0.2%) | ||
| Aena SME SA (Spain) | 42 | 8,223 |
| Deutsche Post AG (Germany) | 243 | 10,199 |
| Expeditors International of Washington, Inc. | 57 | 6,891 |
| 25,313 | ||
| Trucks and parts (0.1%) | ||
| Allison Transmission Holdings, Inc. | 76 | 5,762 |
| Gentex Corp. | 174 | 6,090 |
| 11,852 | ||
| Waste Management (0.1%) | ||
| Waste Connections, Inc. | 92 | 15,117 |
| Waste Management, Inc. | 15 | 3,161 |
| 18,278 | ||
| Total common stocks (cost $8,156,834) | $13,033,701 | |
| INVESTMENT COMPANIES (1.3%)* | Shares | Value |
| iShares Core MSCI Emerging Markets ETF | 1,890 | $99,395 |
| iShares MSCI India ETF (India) | 323 | 17,122 |
| iShares MSCI Taiwan ETF (Taiwan) | 202 | 10,165 |
| SPDR S&P 500 ETF Trust | 116 | 61,175 |
| SPDR S&P MidCap 400 ETF Trust | 15 | 8,193 |
| Total investment companies (cost $189,166) | $196,050 | |
| SHORT-TERM INVESTMENTS (12.4%)* | Principal amount/ shares | Value | |
| Putnam Government Money Market Fund Class G Ω | Shares | 827,446 | $827,446 |
| Putnam Short Term Investment Fund Class P 5.46% L | Shares | 835,656 | 835,656 |
| U.S. Treasury Bills 5.379%, 8/27/24 # | $200,000 | 197,530 | |
| Total short-term investments (cost $1,860,574) | $1,860,632 | ||
| TOTAL INVESTMENTS | ||
| Total investments (cost $10,206,574) | $15,090,383 | |
| Key to holding’s abbreviations | |||
| ADR | American Depository Receipts: Represents ownership of foreign securities on deposit with a custodian bank. | ||
| ETF | Exchange Traded Fund | ||
| PJSC | Public Joint Stock Company | ||
| SPDR | S&P Depository Receipts | ||
| Notes to the fund’s portfolio | |||
| Unless noted otherwise, the notes to the fund’s portfolio are for the close of the fund’s reporting period, which ran from June 1, 2023 through May 31, 2024 (the reporting period). Within the following notes to the portfolio, references to “Putnam Management” represent Putnam Investment Management, LLC, the fund’s manager, an indirect wholly-owned subsidiary of Franklin Resources, Inc., and references to “ASC 820” represent Accounting Standards Codification 820 Fair Value Measurements and Disclosures. | |||
| * | Percentages indicated are based on net assets of $15,063,651. | ||
| † | This security is non-income-producing. | ||
| Ω | Affiliated company (Note 5). | ||
| # | This security, in part or in entirety, was pledged and segregated with the broker to cover margin requirements for futures contracts at the close of the reporting period. Collateral at period end totaled $99,687 and is included in Investments in securities on the Statement of assets and liabilities (Notes 1 and 8). | ||
| L | Affiliated company (Note 5). The rate quoted in the security description is the annualized 7-day yield of the fund at the close of the reporting period. | ||
| R | Real Estate Investment Trust. | ||
| Unless otherwise noted, the rates quoted in Short-term investments security descriptions represent the weighted average yield to maturity. | |||
| The dates shown on debt obligations are the original maturity dates. | |||
| DIVERSIFICATION BY COUNTRY | ||||||||
| Distribution of investments by country of risk at the close of the reporting period, excluding collateral received, if any (as a percentage of Portfolio Value): | ||||||||
| United States | 78.6% | Germany | 0.8% | |||||
| Japan | 2.4 | Italy | 0.7 | |||||
| China | 2.2 | Australia | 0.6 | |||||
| United Kingdom | 2.1 | Netherlands | 0.6 | |||||
| India | 2.1 | Denmark | 0.6 | |||||
| Taiwan | 2.0 | Spain | 0.5 | |||||
| France | 1.5 | Other | 3.3 | |||||
| South Korea | 1.1 | Total | 100.0% | |||||
| Switzerland | 0.9 | |||||||
Dynamic Asset Allocation Equity Fund 13 | |
| FORWARD CURRENCY CONTRACTS at 5/31/24 (aggregate face value $1,096,565) | ||||||
| Counterparty | Currency | Contract type* | Delivery date | Value | Aggregate face value | Unrealized appreciation/ (depreciation) |
| Bank of America N.A. | ||||||
| British Pound | Buy | 6/20/24 | $9,048 | $9,047 | $1 | |
| British Pound | Sell | 6/20/24 | 9,048 | 9,041 | (7) | |
| Euro | Buy | 6/20/24 | 53,312 | 53,159 | 153 | |
| Euro | Sell | 6/20/24 | 53,312 | 53,337 | 25 | |
| New Taiwan Dollar | Sell | 8/21/24 | 23,790 | 23,690 | (100) | |
| Barclays Bank PLC | ||||||
| Hong Kong Dollar | Sell | 8/21/24 | 3,947 | 3,972 | 25 | |
| Polish Zloty | Buy | 6/20/24 | 533 | 534 | (1) | |
| Polish Zloty | Sell | 6/20/24 | 533 | 533 | — | |
| Citibank, N.A. | ||||||
| Australian Dollar | Buy | 7/17/24 | 21,651 | 21,520 | 131 | |
| Danish Krone | Sell | 6/20/24 | 10,279 | 10,365 | 86 | |
| Hong Kong Dollar | Sell | 8/21/24 | 9,431 | 9,441 | 10 | |
| Israeli Shekel | Sell | 7/17/24 | 919 | 913 | (6) | |
| Japanese Yen | Buy | 8/21/24 | 17,463 | 17,841 | (378) | |
| Goldman Sachs International | ||||||
| Brazilian Real | Buy | 7/2/24 | 26,317 | 27,555 | (1,238) | |
| Euro | Buy | 6/20/24 | 7,058 | 7,061 | (3) | |
| Euro | Sell | 6/20/24 | 7,058 | 7,082 | 24 | |
| Indian Rupee | Sell | 8/21/24 | 41,081 | 41,029 | (52) | |
| Israeli Shekel | Buy | 7/17/24 | 3,245 | 3,163 | 82 | |
| Polish Zloty | Sell | 6/20/24 | 914 | 900 | (14) | |
| Singapore Dollar | Sell | 8/21/24 | 1,040 | 1,040 | — | |
| HSBC Bank USA, National Association | ||||||
| Chinese Yuan (Offshore) | Buy | 8/21/24 | 84,258 | 84,819 | (561) | |
| Danish Krone | Sell | 6/20/24 | 1,281 | 1,280 | (1) | |
| Euro | Buy | 6/20/24 | 7,166 | 7,170 | (4) | |
| Euro | Sell | 6/20/24 | 7,166 | 7,194 | 28 | |
| Hong Kong Dollar | Sell | 8/21/24 | 1,871 | 1,874 | 3 | |
| Japanese Yen | Buy | 8/21/24 | 8,166 | 8,343 | (177) | |
| Singapore Dollar | Buy | 8/21/24 | 2,674 | 2,675 | (1) | |
| South African Rand | Buy | 7/17/24 | 25,929 | 25,868 | 61 | |
| Swedish Krona | Buy | 6/20/24 | 3,091 | 3,154 | (63) | |
| JPMorgan Chase Bank N.A. | ||||||
| Danish Krone | Sell | 6/20/24 | 13,672 | 13,576 | (96) | |
| Japanese Yen | Buy | 8/21/24 | 11,509 | 11,759 | (250) | |
| Norwegian Krone | Sell | 6/20/24 | 5,680 | 5,661 | (19) | |
| South Korean Won | Buy | 8/21/24 | 31,020 | 31,523 | (503) | |
| Swiss Franc | Buy | 6/20/24 | 1,665 | 1,666 | (1) | |
| Swiss Franc | Sell | 6/20/24 | 1,665 | 1,663 | (2) | |
14 Dynamic Asset Allocation Equity Fund | |
| FORWARD CURRENCY CONTRACTS at 5/31/24 (aggregate face value $1,096,565) cont. | ||||||
| Counterparty | Currency | Contract type* | Delivery date | Value | Aggregate face value | Unrealized appreciation/ (depreciation) |
| Morgan Stanley & Co. International PLC | ||||||
| Australian Dollar | Buy | 7/17/24 | $3,131 | $3,120 | $11 | |
| British Pound | Buy | 6/20/24 | 38,995 | 38,925 | 70 | |
| British Pound | Sell | 6/20/24 | 38,995 | 38,673 | (322) | |
| Danish Krone | Sell | 6/20/24 | 6,712 | 6,642 | (70) | |
| Euro | Buy | 6/20/24 | 21,173 | 21,170 | 3 | |
| Euro | Sell | 6/20/24 | 21,173 | 21,139 | (34) | |
| Hong Kong Dollar | Sell | 8/21/24 | 4,754 | 4,766 | 12 | |
| Japanese Yen | Buy | 8/21/24 | 41,974 | 43,058 | (1,084) | |
| New Zealand Dollar | Sell | 7/17/24 | 61 | 59 | (2) | |
| Norwegian Krone | Sell | 6/20/24 | 3,174 | 3,055 | (119) | |
| Polish Zloty | Buy | 6/20/24 | 1,142 | 1,140 | 2 | |
| Polish Zloty | Sell | 6/20/24 | 1,142 | 1,143 | 1 | |
| Singapore Dollar | Sell | 8/21/24 | 1,486 | 1,486 | — | |
| South African Rand | Buy | 7/17/24 | 5,029 | 5,104 | (75) | |
| Swedish Krona | Buy | 6/20/24 | 5,030 | 5,626 | (596) | |
| Swiss Franc | Buy | 6/20/24 | 13,767 | 14,584 | (817) | |
| NatWest Markets PLC | ||||||
| Danish Krone | Sell | 6/20/24 | 6,625 | 6,711 | 86 | |
| Swedish Krona | Buy | 6/20/24 | 7,722 | 7,727 | (5) | |
| Swedish Krona | Sell | 6/20/24 | 7,722 | 7,748 | 26 | |
| Swiss Franc | Buy | 6/20/24 | 6,106 | 6,108 | (2) | |
| Swiss Franc | Sell | 6/20/24 | 6,106 | 6,024 | (82) | |
| State Street Bank and Trust Co. | ||||||
| Australian Dollar | Sell | 7/17/24 | 3,397 | 3,377 | (20) | |
| British Pound | Sell | 6/20/24 | 21,537 | 21,474 | (63) | |
| British Pound | Sell | 9/18/24 | 3,187 | 3,186 | (1) | |
| Chinese Yuan (Offshore) | Buy | 8/21/24 | 25,432 | 25,603 | (171) | |
| Euro | Buy | 6/20/24 | 31,379 | 31,994 | (615) | |
| Euro | Buy | 9/18/24 | 4,797 | 4,797 | — | |
| Japanese Yen | Buy | 8/21/24 | 908 | 1,118 | (210) | |
| Mexican Peso | Sell | 7/17/24 | 9,443 | 9,584 | 141 | |
| New Zealand Dollar | Buy | 7/17/24 | 1,291 | 1,284 | 7 | |
| Polish Zloty | Buy | 6/20/24 | 1,903 | 1,899 | 4 | |
| Polish Zloty | Sell | 6/20/24 | 1,903 | 1,903 | — | |
| South African Rand | Buy | 7/17/24 | 2,467 | 2,517 | (50) | |
| Swiss Franc | Buy | 6/20/24 | 5,662 | 5,663 | (1) | |
| Swiss Franc | Sell | 6/20/24 | 5,662 | 5,867 | 205 | |
| Toronto-Dominion Bank | ||||||
| Canadian Dollar | Sell | 7/17/24 | 20,562 | 20,794 | 232 | |
| UBS AG | ||||||
| Australian Dollar | Sell | 7/17/24 | 733 | 656 | (77) | |
| British Pound | Buy | 6/20/24 | 27,144 | 27,121 | 23 | |
| British Pound | Sell | 6/20/24 | 27,144 | 26,717 | (427) | |
| Canadian Dollar | Sell | 7/17/24 | 12,337 | 12,477 | 140 | |
| Euro | Buy | 6/20/24 | 38,437 | 38,458 | (21) | |
| Euro | Sell | 6/20/24 | 38,437 | 38,867 | 430 | |
| Hong Kong Dollar | Sell | 8/21/24 | 11,405 | 11,417 | 12 | |
| Norwegian Krone | Buy | 6/20/24 | 829 | 826 | 3 | |
| Norwegian Krone | Sell | 6/20/24 | 829 | 811 | (18) | |
| South African Rand | Buy | 7/17/24 | 5,145 | 5,140 | 5 | |
| Swiss Franc | Buy | 6/20/24 | 16,764 | 16,651 | 113 | |
| Thai Baht | Buy | 8/21/24 | 22,955 | 22,908 | 47 | |
| Unrealized appreciation | 2,202 | |||||
| Unrealized (depreciation) | (8,359) | |||||
| Total | $(6,157) | |||||
| * The exchange currency for all contracts listed is the United States Dollar. | ||||||
Dynamic Asset Allocation Equity Fund 15 | |
| FUTURES CONTRACTS OUTSTANDING at 5/31/24 | ||||||
| Number of contracts | Notional amount | Value | Expiration date | Unrealized appreciation/ (depreciation) | ||
| MSCI EAFE Index (Long) | 7 | $824,486 | $829,570 | Jun-24 | $13,070 | |
| MSCI Emerging Markets Index (Short) | 12 | 629,377 | 633,900 | Jun-24 | (3,988) | |
| Russell 2000 Index E-Mini (Long) | 7 | 724,544 | 726,530 | Jun-24 | (11,813) | |
| S&P 500 Index E-Mini (Long) | 3 | 791,627 | 794,325 | Jun-24 | 17,686 | |
| Unrealized appreciation | 30,756 | |||||
| Unrealized (depreciation) | (15,801) | |||||
| Total | $14,955 | |||||
ASC 820 establishes a three-level hierarchy for disclosure of fair value measurements. The valuation hierarchy is based upon the transparency of inputs to the valuation of the fund’s investments. The three levels are defined as follows:
Level 1: Valuations based on quoted prices for identical securities in active markets.
Level 2: Valuations based on quoted prices in markets that are not active or for which all significant inputs are observable, either directly or indirectly.
Level 3: Valuations based on inputs that are unobservable and significant to the fair value measurement.
The following is a summary of the inputs used to value the fund’s net assets as of the close of the reporting period:
| Valuation inputs | |||
| Investments in securities: | Level 1 | Level 2 | Level 3 |
| Common stocks*: | |||
| Basic materials | $335,965 | $257,506 | $— |
| Capital goods | 352,996 | 162,932 | — |
| Communication services | 255,260 | 30,523 | — |
| Conglomerates | 123,193 | 56,407 | — |
| Consumer cyclicals | 1,689,521 | 347,971 | — |
| Consumer staples | 559,199 | 211,028 | — |
| Energy | 358,234 | 131,651 | — |
| Financials | 1,199,491 | 604,446 | — |
| Health care | 1,154,862 | 276,437 | — |
| Technology | 3,649,871 | 707,054 | — |
| Transportation | 160,113 | 60,136 | — |
| Utilities and power | 243,389 | 105,516 | — |
| Total common stocks | 10,082,094 | 2,951,607 | — |
| Investment companies | 196,050 | — | — |
| Short-term investments | — | 1,860,632 | — |
| Totals by level | $10,278,144 | $4,812,239 | $— |
| Valuation inputs | |||
| Other financial instruments: | Level 1 | Level 2 | Level 3 |
| Forward currency contracts | $— | $(6,157) | $— |
| Futures contracts | 14,955 | — | — |
| Totals by level | $14,955 | $(6,157) | $— |
The accompanying notes are an integral part of these financial statements.
16 Dynamic Asset Allocation Equity Fund | |
Financial Statements
Statement of assets and liabilities
5/31/24
| ASSETS | |
| Investment in securities, at value (Notes 1 and 8): | |
| Unaffiliated issuers (identified cost $8,543,472) | $13,427,281 |
| Affiliated issuers (identified cost $1,663,102) (Note 5) | 1,663,102 |
| Foreign currency (cost $1,599) (Note 1) | 1,666 |
| Dividends, interest and other receivables | 28,218 |
| Foreign tax reclaim | 28,605 |
| Receivable for shares of the fund sold | 2,075 |
| Receivable for investments sold | 163,868 |
| Receivable from Manager (Note 2) | 43,108 |
| Receivable for variation margin on futures contracts (Note 1) | 25,401 |
| Unrealized appreciation on forward currency contracts (Note 1) | 2,202 |
| Prepaid assets | 13,245 |
| Total assets | 15,398,771 |
| LIABILITIES | |
| Payable for investments purchased | 178,739 |
| Payable for custodian fees (Note 2) | 28,431 |
| Payable for investor servicing fees (Note 2) | 1,492 |
| Payable for Trustee compensation and expenses (Note 2) | 5,619 |
| Payable for administrative services (Note 2) | 48 |
| Payable for auditing and tax fees | 89,894 |
| Unrealized depreciation on forward currency contracts (Note 1) | 8,359 |
| Other accrued expenses | 22,538 |
| Total liabilities | 335,120 |
| Net assets | $15,063,651 |
| Represented by | |
| Paid-in capital (Unlimited shares authorized) (Notes 1 and 4) | $9,490,425 |
| Total distributable earnings (Note 1) | 5,573,226 |
| Total — Representing net assets applicable to capital shares outstanding | $15,063,651 |
| COMPUTATION OF NET ASSET VALUE AND OFFERING PRICE | |
| Net asset value and redemption price per class A share ($6,665,473 divided by 465,579 shares) | $14.32 |
| Offering price per class A share (100/94.25 of $14.32)* | $15.19 |
| Net asset value, offering price and redemption price per class P share ($8,398,178 divided by 588,440 shares) | $14.27 |
| * | On single retail sales of less than $50,000. On sales of $50,000 or more the offering price is reduced. |
The accompanying notes are an integral part of these financial statements.
Dynamic Asset Allocation Equity Fund 17
Statement of operations
Year ended 5/31/24
| Investment income | |
| Dividends (net of foreign tax of $10,570) | $172,348 |
| Interest (including interest income of $48,557 from investments in affiliated issuers) (Note 5) | 67,874 |
| Total investment income | 240,222 |
| EXPENSES | |
| Compensation of Manager (Note 2) | 69,280 |
| Investor servicing fees (Note 2) | 5,284 |
| Custodian fees (Note 2) | 55,607 |
| Trustee compensation and expenses (Note 2) | 583 |
| Administrative services (Note 2) | 315 |
| Reports to shareholders | 17,403 |
| Auditing and tax fees | 110,336 |
| Blue sky expense | 22,885 |
| Other | 6,657 |
| Fees waived and reimbursed by Manager (Note 2) | (212,753) |
| Total expenses | 75,597 |
| Expense reduction (Note 2) | (113) |
| Net expenses | 75,484 |
| Net investment income | 164,738 |
| REALIZED AND UNREALIZED GAIN (LOSS) | |
| Net realized gain (loss) on: | |
| Securities from unaffiliated issuers (net of foreign tax of $1,092) (Notes 1 and 3) | 886,200 |
| Foreign currency transactions (Note 1) | (1,271) |
| Forward currency contracts (Note 1) | (21,023) |
| Futures contracts (Note 1) | 228,401 |
| Written options (Note 1) | 2,150 |
| Total net realized gain | 1,094,457 |
| Change in net unrealized appreciation (depreciation) on: | |
| Securities from unaffiliated issuers (net of increase in deferred foreign taxes of $8,668) | 1,946,516 |
| Assets and liabilities in foreign currencies | 774 |
| Forward currency contracts | 852 |
| Futures contracts | (7,178) |
| Written options | (2,150) |
| Total change in net unrealized appreciation | 1,938,814 |
| Net gain on investments | 3,033,271 |
| Net increase in net assets resulting from operations | $3,198,009 |
The accompanying notes are an integral part of these financial statements.
18 Dynamic Asset Allocation Equity Fund
Statement of changes in net assets
| Year ended 5/31/24 | Year ended 5/31/23 | |
| Increase (decrease) in net assets | ||
| Operations | ||
| Net investment income | $164,738 | $749,329 |
| Net realized gain on investments and foreign currency transactions | 1,094,457 | 11,104,302 |
| Change in net unrealized appreciation (depreciation) of investments and assets and liabilities in foreign currencies | 1,938,814 | (10,739,086) |
| Net increase in net assets resulting from operations | 3,198,009 | 1,114,545 |
| Distributions to shareholders (Note 1): | ||
| From ordinary income | ||
| Net investment income | ||
| Class A | (27,427) | (195) |
| Class P | (32,414) | (920,111) |
| Net realized short-term gain on investments | ||
| Class A | (18,742) | — |
| Class P | (19,823) | — |
| Net realized long-term gain on investments | ||
| Class A | (60,339) | (3,332) |
| Class P | (63,819) | (11,943,379) |
| From return of capital | ||
| Class A | — | (543) |
| Class P | — | (1,947,691) |
| Increase (decrease) from capital share transactions (Note 4) | 2,299,820 | (56,095,521) |
| Total increase (decrease) in net assets | 5,275,265 | (69,796,227) |
| Net assets | ||
| Beginning of year | 9,788,386 | 79,584,613 |
| End of year | $15,063,651 | $9,788,386 |
The accompanying notes are an integral part of these financial statements.
Dynamic Asset Allocation Equity Fund 19
Financial highlights
(For a common share outstanding throughout the period)
| INVESTMENT OPERATIONS | LESS DISTRIBUTIONS | RATIOS AND SUPPLEMENTAL DATA | ||||||||||||
| Period ended | Net asset value, beginning of period | Net investment income (loss) a | Net realized and unrealized gain (loss) on investments | Total from investment operations | From net investment income | From net realized gain on investments | From return of capital | Total distributions | Net asset value, end of period | Total return at net asset value (%) b | Net assets, end of period (in thousands) | Ratio of expenses to average net assets (%) c,d | Ratio of net investment income (loss) to average net assets (%) d | Portfolio turnover (%) |
| Class A | ||||||||||||||
| May 31, 2024 | $11.17 | .17 | 3.21 | 3.38 | (.06) | (.17) | — | (0.23) | $14.32 | 30.58 | $6,665 | .68 | 1.34 | 64 |
| May 31, 2023 | 13.01 | .28 | .09 | .37 | (.11) | (1.81) | (.29) | (2.21) | 11.17 | 3.23 | 5,108 | .70 | 2.67 | 67 |
| May 31, 2022 | 15.86 | .13 | (.96) | (.83) | (.10) | (1.92) | — | (2.02) | 13.01 | (6.69) | 28 | .83 | .82 | 76 |
| May 31, 2021 | 11.45 | .11 | 4.73 | 4.84 | (.10) | (.33) | — | (0.43) | 15.86 | 42.70 | 31 | .86 | .81 | 64 |
| May 31, 2020 | 11.07 | .16 | .46 | .62 | (.16) | (.08) | — | (0.24) | 11.45 | 5.47 | 21 | .85 | 1.36 | 89 |
| Class P | ||||||||||||||
| May 31, 2024 | $11.14 | .18 | 3.19 | 3.37 | (.07) | (.17) | — | (0.24) | $14.27 | 30.55 | $8,398 | .60 | 1.44 | 64 |
| May 31, 2023 | 12.99 | .15 | .24 | .39 | (.14) | (1.81) | (.29) | (2.24) | 11.14 | 3.45 | 4,680 | .62 | 1.26 | 67 |
| May 31, 2022 | 15.86 | .16 | (.97) | (.81) | (.14) | (1.92) | — | (2.06) | 12.99 | (6.61) | 79,557 | .61 | 1.04 | 76 |
| May 31, 2021 | 11.45 | .14 | 4.73 | 4.87 | (.13) | (.33) | — | (0.46) | 15.86 | 42.98 | 78,855 | .62 | 1.05 | 64 |
| May 31, 2020 | 11.09 | .18 | .46 | .64 | (.20) | (.08) | — | (0.28) | 11.45 | 5.61 | 62,820 | .62 | 1.58 | 89 |
a Per share net investment income (loss) has been determined on the basis of the weighted average number of shares outstanding during the period.
b Total return assumes dividend reinvestment and does not reflect the effect of sales charges.
c Includes amounts paid through expense offset and/or brokerage service arrangements, if any (Note 2). Also excludes acquired fund fees and expenses, if any.
d Reflects an involuntary contractual expense limitation in effect during the period. As a result of such limitation, the expenses of each class reflect a reduction of the following amounts (Note 2):
| Percentage of average net assets | |
| May 31, 2024 | 1.80% |
| May 31, 2023 | 0.38 |
| May 31, 2022 | 0.29 |
| May 31, 2021 | 0.35 |
| May 31, 2020 | 0.32 |
The accompanying notes are an integral part of these financial statements.
20 Dynamic Asset Allocation Equity Fund
Notes to financial statements 5/31/24
Unless otherwise noted, the “reporting period” represents the period from June 1, 2023 through May 31, 2024. The following table defines commonly used references within the Notes to financial statements:
| References to | Represent |
| Franklin Advisers | Franklin Advisers, Inc, a wholly-owned subsidiary of Franklin Templeton |
| Franklin Templeton | Franklin Resources, Inc. |
| Franklin Templeton Services | Franklin Templeton Services, LLC, a wholly-owned subsidiary of Franklin Templeton and an affiliate of Putnam Management |
| JPMorgan | JPMorgan Chase Bank, N.A. |
| OTC | Over-the-counter |
| PAC | The Putnam Advisory Company, LLC, an affiliate of Putnam Management |
| PIL | Putnam Investments Limited, an affiliate of Putnam Management |
| Putnam Management | Putnam Investment Management, LLC, the fund’s manager, an indirect wholly-owned subsidiary of Franklin Templeton |
| SEC | Securities and Exchange Commission |
| State Street | State Street Bank and Trust Company |
Putnam Dynamic Asset Allocation Equity Fund (the fund) is a diversified series of Putnam Funds Trust (the Trust), a Massachusetts business trust registered under the 1940 Act as an open-end management investment company. The goal of the fund is to seek long-term growth. The fund invests mainly in common stocks (growth or value stocks or both) of large and midsize companies worldwide. Under normal circumstances, Putnam Management invests at least 80% of the fund’s net assets in common stocks. This policy may be changed only after 60 days’ notice to shareholders. Putnam Management may consider, among other factors, a company’s valuation, financial strength, growth potential, competitive position in its industry, projected future earnings, cash flows and dividends when deciding whether to buy or sell investments. Putnam Management may also consider other factors that Putnam Managements believes will cause the stock price to rise. While Putnam Management typically allocates approximately 75% of the fund’s assets to investments in U.S. companies, and 25% of the fund’s assets to investments in international companies, these allocations may vary. Putnam Management invests mainly in developed countries, but may invest in emerging markets. The fund may also use derivatives, such as certain foreign currency transactions, futures, options, warrants and swap contracts, for both hedging and non-hedging purposes. For example, the fund typically uses foreign currency forward contracts in connection with the fund’s investments in foreign securities in order to hedge the fund’s currency exposure relative to the fund’s benchmark index.
The fund offers the following share classes. The expenses for each class of shares may differ based on the distribution and investor servicing fees of each class, which are identified in Note 2.
| Share class | Sales charge | Contingent deferred sales charge | Conversion feature |
| Class A | Up to 5.75% | 1.00% on certain redemptions of shares bought with no initial sales charge | None |
| Class PΔ | None | None | None |
| Δ Only available to other Putnam funds and other accounts managed by Putnam Management or its affiliates. | |||
In the normal course of business, the fund enters into contracts that may include agreements to indemnify another party under given circumstances. The fund’s maximum exposure under these arrangements is unknown as this would involve future claims that may be, but have not yet been, made against the fund. However, the fund’s management team expects the risk of material loss to be remote.
The fund has entered into contractual arrangements with an investment adviser, administrator, distributor, shareholder servicing agent and custodian, who each provide services to the fund. Unless expressly stated otherwise, shareholders are not parties to, or intended beneficiaries of these contractual arrangements, and these contractual arrangements are not intended to create any shareholder right to enforce them against the service providers or to seek any remedy under them against the service providers, either directly or on behalf of the fund.
Under the Trust’s Agreement and Declaration of Trust, any claims asserted by a shareholder against or on behalf of the Trust (or its series), including claims against Trustees and Officers, must be brought in courts located within the Commonwealth of Massachusetts.
Note 1: Significant accounting policies
The fund follows the accounting and reporting guidance in Financial Accounting Standards Board (FASB) Accounting Standards Codification Topic 946, Financial Services – Investment Companies (ASC 946) and applies the specialized accounting and reporting guidance in U.S. Generally Accepted Accounting Principles (U.S. GAAP), including, but not limited to, ASC 946. The following is a summary of significant accounting policies consistently followed by the fund in the preparation of its financial statements. The preparation of financial statements is in conformity with accounting principles generally accepted in the United States of America and requires management to make estimates and assumptions that affect the reported amounts of assets and liabilities in the financial statements and the reported amounts of increases and decreases in net assets from operations. Actual results could differ from those estimates. Subsequent events after the Statement of assets and liabilities date through the date that the financial statements were issued have been evaluated in the preparation of the financial statements.
Investment income, realized and unrealized gains and losses and expenses of the fund are borne pro-rata based on the relative net assets of each class to the total net assets of the fund, except that each class bears expenses unique to that class (including the distribution fees applicable to such classes). Each class votes as a class only with respect to its own distribution plan or other matters on which a class vote is required by law or determined by the Trustees. If the fund were liquidated, shares of each class would receive their pro-rata share of the net assets of the fund. In addition, the Trustees declare separate dividends on each class of shares.
Security valuation Portfolio securities and other investments are valued using policies and procedures adopted by the Board of Trustees (Trustees). The Trustees have formed a Pricing Committee to oversee the implementation of these procedures. Under compliance policies and procedures approved by the Trustees, the Trustees have designated the fund’s investment manager as the valuation designee and has responsibility for oversight of valuation. The investment manager is assisted by the fund’s administrator in performing this responsibility, including leading the cross-functional Valuation Committee (VC). The VC is responsible for making fair value determinations, evaluating the effectiveness of the pricing policies of the fund and reporting to the Trustees.
Investments for which market quotations are readily available are valued at the last reported sales price on their principal exchange, or official closing price for certain markets, and are classified as Level 1 securities under Accounting Standards Codification 820 Fair Value Measurements and Disclosures (ASC 820). If no sales are reported, as in the case of some securities that are traded OTC, a security is valued at its last reported bid price and is generally categorized as a Level 2 security.
Investments in open-end investment companies (excluding exchange-traded funds), if any, which can be classified as Level 1 or Level 2 securities, are valued based on their net asset value. The net asset value of such investment companies equals the total value of their assets less their liabilities and divided by the number of their outstanding shares.
Market quotations are not considered to be readily available for certain debt obligations (including short-term investments with remaining maturities of 60 days or less) and other investments; such investments are valued on the basis of valuations furnished by an independent pricing service approved by the Trustees or dealers selected by Putnam Management. Such services or dealers determine valuations for normal institutional-size trading units of such securities using methods based on market transactions for comparable securities and various relationships, generally recognized by institutional traders, between securities (which consider such factors as security prices, yields, maturities and ratings). These securities will generally be categorized as Level 2.
Many securities markets and exchanges outside the U.S. close prior to the scheduled close of the New York Stock Exchange and therefore the closing prices for securities in such markets or on such exchanges may not fully reflect events that occur after such close but before the scheduled close of the New York Stock Exchange. Accordingly, on certain days, the fund will fair value certain foreign
Dynamic Asset Allocation Equity Fund 21
equity securities taking into account multiple factors including movements in the U.S. securities markets, currency valuations and comparisons to the valuation of American Depository Receipts, exchange-traded funds and futures contracts. The foreign equity securities, which would generally be classified as Level 1 securities, will be transferred to Level 2 of the fair value hierarchy when they are valued at fair value. The number of days on which fair value prices will be used will depend on market activity and it is possible that fair value prices will be used by the fund to a significant extent. At the close of the reporting period, fair value pricing was used for certain foreign securities in the portfolio. Securities quoted in foreign currencies, if any, are translated into U.S. dollars at the current exchange rate.
To the extent a pricing service or dealer is unable to value a security or provides a valuation that Putnam Management does not believe accurately reflects the security’s fair value, the security will be valued at fair value by Putnam Management, which has been designated as valuation designee pursuant to Rule 2a–5 under the 1940 Act, in accordance with policies and procedures approved by the Trustees. Certain investments, including certain restricted and illiquid securities and derivatives, are also valued at fair value following procedures approved by the Trustees. These valuations consider such factors as significant market or specific security events such as interest rate or credit quality changes, various relationships with other securities, discount rates, U.S. Treasury, U.S. swap and credit yields, index levels, convexity exposures, recovery rates, sales and other multiples and resale restrictions. These securities are classified as Level 2 or as Level 3 depending on the priority of the significant inputs.
To assess the continuing appropriateness of fair valuations, the Valuation Committee reviews and affirms the reasonableness of such valuations on a regular basis after considering all relevant information that is reasonably available. Such valuations and procedures are reviewed periodically by the Trustees. The fair value of securities is generally determined as the amount that the fund could reasonably expect to realize from an orderly disposition of such securities over a reasonable period of time. By its nature, a fair value price is a good faith estimate of the value of a security in a current sale and does not reflect an actual market price, which may be different by a material amount.
Joint trading account Pursuant to an exemptive order from the SEC, the fund may transfer uninvested cash balances into a joint trading account along with the cash of other registered investment companies and certain other accounts managed by Putnam Management. These balances may be invested in issues of short-term investments having maturities of up to 90 days.
Repurchase agreements The fund, or any joint trading account, through its custodian, receives delivery of the underlying securities, the fair value of which at the time of purchase is required to be in an amount at least equal to the resale price, including accrued interest. Collateral for certain tri-party repurchase agreements is held at the counterparty’s custodian in a segregated account for the benefit of the fund and the counterparty. Putnam Management is responsible for determining that the value of these underlying securities is at all times at least equal to the resale price, including accrued interest. In the event of default or bankruptcy by the other party to the agreement, retention of the collateral may be subject to legal proceedings.
Security transactions and related investment income Security transactions are recorded on the trade date (the date the order to buy or sell is executed). Gains or losses on securities sold are determined on the identified cost basis.
Interest income, net of any applicable withholding taxes, if any, is recorded on the accrual basis. Amortization and accretion of premiums and discounts on debt securities, if any, is recorded on the accrual basis. Dividend income, net of any applicable withholding taxes, is recognized on the ex-dividend date except that certain dividends from foreign securities, if any, are recognized as soon as the fund is informed of the ex-dividend date. Non-cash dividends, if any, are recorded at the fair value of the securities received. Dividends representing a return of capital or capital gains, if any, are reflected as a reduction of cost and/or as a realized gain.
Foreign currency translation The accounting records of the fund are maintained in U.S. dollars. The fair value of foreign securities, currency holdings, and other assets and liabilities is recorded in the books and records of the fund after translation to U.S. dollars based on the exchange rates on that day. The cost of each security is determined using historical exchange rates. Income and withholding taxes are translated at prevailing exchange rates when earned or incurred. The fund does not isolate that portion of realized or unrealized gains or losses resulting from changes in the foreign exchange rate on investments from fluctuations arising from changes in the market prices of the securities. Such gains and losses are included with the net realized and unrealized gain or loss on investments. Net realized gains and losses on foreign currency transactions represent net realized exchange gains or losses on disposition of foreign currencies, currency gains and losses realized between the trade and settlement dates on securities transactions and the difference between the amount of investment income and foreign withholding taxes recorded on the fund’s books and the U.S. dollar equivalent amounts actually received or paid. Net unrealized appreciation and depreciation of assets and liabilities in foreign currencies arise from changes in the value of assets and liabilities other than investments at the period end, resulting from changes in the exchange rate.
Options contracts The fund uses options contracts to enhance the returns on securities owned, to gain exposure to securities and to manage downside risks.
The potential risk to the fund is that the change in value of options contracts may not correspond to the change in value of the hedged instruments. In addition, losses may arise from changes in the value of the underlying instruments if there is an illiquid secondary market for the contracts, if interest or exchange rates move unexpectedly or if the counterparty to the contract is unable to perform. Realized gains and losses on purchased options are included in realized gains and losses on investment securities. If a written call option is exercised, the premium originally received is recorded as an addition to sales proceeds. If a written put option is exercised, the premium originally received is recorded as a reduction to the cost of investments.
Exchange-traded options are valued at the last sale price or, if no sales are reported, the last bid price for purchased options and the last ask price for written options. OTC traded options are valued using prices supplied by dealers.
Options on swaps are similar to options on securities except that the premium paid or received is to buy or grant the right to enter into a previously agreed upon interest rate or credit default contract. Forward premium swap option contracts include premiums that have extended settlement dates. The delayed settlement of the premiums is factored into the daily valuation of the option contracts. In the case of interest rate cap and floor contracts, in return for a premium, ongoing payments between two parties are based on interest rates exceeding a specified rate, in the case of a cap contract, or falling below a specified rate in the case of a floor contract.
Written option contracts outstanding at period end, if any, are listed after the fund’s portfolio.
Futures contracts The fund uses futures contracts to manage exposure to market risk and to equitize cash.
The potential risk to the fund is that the change in value of futures contracts may not correspond to the change in value of the hedged instruments. In addition, losses may arise from changes in the value of the underlying instruments, if there is an illiquid secondary market for the contracts, if interest or exchange rates move unexpectedly or if the counterparty to the contract is unable to perform. With futures, there is minimal counterparty credit risk to the fund since futures are exchange traded and the exchange’s clearinghouse, as counterparty to all exchange traded futures, guarantees the futures against default. Risks may exceed amounts recognized on the Statement of assets and liabilities. When the contract is closed, the fund records a realized gain or loss equal to the difference between the value of the contract at the time it was opened and the value at the time it was closed.
Futures contracts are valued at the quoted daily settlement prices established by the exchange on which they trade. The fund and the broker agree to exchange an amount of cash equal to the daily fluctuation in the value of the futures contract. Such receipts or payments are known as “variation margin.”
Futures contracts outstanding at period end, if any, are listed after the fund’s portfolio.
Forward currency contracts The fund buys and sells forward currency contracts, which are agreements between two parties to buy and sell currencies at a set price on a future date. These contracts are used to hedge foreign exchange risk.
The U.S. dollar value of forward currency contracts is determined using current forward currency exchange rates supplied by a quotation service. The fair value of the contract will fluctuate with changes in currency exchange rates. The contract is marked to market daily and the change in fair value is recorded as an unrealized gain or loss. The fund records a realized gain or loss equal to the difference between the value of the contract at the time it was opened and the value at the time it was closed when the contract matures or by delivery of the currency. The fund could be exposed to risk if the value of the currency changes unfavorably, if the counterparties to the contracts are unable to meet the terms of their contracts or if the fund is unable to enter into a closing position. Risks may exceed amounts recognized on the Statement of assets and liabilities.
Forward currency contracts outstanding at period end, if any, are listed after the fund’s portfolio.
22 Dynamic Asset Allocation Equity Fund
Master agreements The fund is a party to ISDA (International Swaps and Derivatives Association, Inc.) Master Agreements that govern OTC derivative and foreign exchange contracts and Master Securities Forward Transaction Agreements that govern transactions involving mortgage-backed and other asset-backed securities that may result in delayed delivery (Master Agreements) with certain counterparties entered into from time to time. The Master Agreements may contain provisions regarding, among other things, the parties’ general obligations, representations, agreements, collateral requirements, events of default and early termination. With respect to certain counterparties, in accordance with the terms of the Master Agreements, collateral pledged to the fund is held in a segregated account by the fund’s custodian and, with respect to those amounts which can be sold or repledged, are presented in the fund’s portfolio.
Collateral pledged by the fund is segregated by the fund’s custodian and identified in the fund’s portfolio. Collateral can be in the form of cash or debt securities issued by the U.S. Government or related agencies or other securities as agreed to by the fund and the applicable counterparty. Collateral requirements are determined based on the fund’s net position with each counterparty.
With respect to ISDA Master Agreements, termination events applicable to the fund may occur upon a decline in the fund’s net assets below a specified threshold over a certain period of time. Termination events applicable to counterparties may occur upon a decline in the counterparty’s long-term or short-term credit ratings below a specified level. In each case, upon occurrence, the other party may elect to terminate early and cause settlement of all derivative and foreign exchange contracts outstanding, including the payment of any losses and costs resulting from such early termination, as reasonably determined by the terminating party. Any decision by one or more of the fund’s counterparties to elect early termination could impact the fund’s future derivative activity.
At the close of the reporting period, the fund had a net liability position of $6,738 on open derivative contracts subject to the Master Agreements. There was no collateral pledged by the fund at period end for these agreements.
Interfund lending The fund, along with other Putnam funds, may participate in an interfund lending program pursuant to an exemptive order issued by the SEC. This program allows the fund to borrow from or lend to other Putnam funds that permit such transactions. Interfund lending transactions are subject to each fund’s investment policies and borrowing and lending limits. Interest earned or paid on the interfund lending transaction will be based on the average of certain current market rates. During the reporting period, the fund did not utilize the program.
Lines of credit The fund participates, along with other Putnam funds, in a $320 million syndicated unsecured committed line of credit, provided by State Street ($160 million) and JPMorgan ($160 million), and a $235.5 million unsecured uncommitted line of credit, provided by State Street. Borrowings may be made for temporary or emergency purposes, including the funding of shareholder redemption requests and trade settlements. Interest is charged to the fund based on the fund’s borrowing at a rate equal to 1.25% plus the higher of (1) the Federal Funds rate and (2) the Overnight Bank Funding Rate for the committed line of credit and 1.30% plus the higher of (1) the Federal Funds rate and (2) the Overnight Bank Funding Rate for the uncommitted line of credit. A closing fee equal to 0.04% of the committed line of credit and 0.04% of the uncommitted line of credit has been paid by the participating funds and a $75,000 fee has been paid by the participating funds to State Street as agent of the syndicated committed line of credit. In addition, a commitment fee of 0.21% per annum on any unutilized portion of the committed line of credit is allocated to the participating funds based on their relative net assets and paid quarterly. During the reporting period, the fund had no borrowings against these arrangements.
Federal taxes It is the policy of the fund to distribute all of its taxable income within the prescribed time period and otherwise comply with the provisions of the Internal Revenue Code of 1986, as amended (the Code), applicable to regulated investment companies. It is also the intention of the fund to distribute an amount sufficient to avoid imposition of any excise tax under Section 4982 of the Code.
The fund is subject to the provisions of Accounting Standards Codification 740 Income Taxes (ASC 740). ASC 740 sets forth a minimum threshold for financial statement recognition of the benefit of a tax position taken or expected to be taken in a tax return. The fund did not have a liability to record for any unrecognized tax benefits in the accompanying financial statements. No provision has been made for federal taxes on income, capital gains or unrealized appreciation on securities held nor for excise tax on income and capital gains. Each of the fund’s federal tax returns for the prior three fiscal years remains subject to examination by the Internal Revenue Service.
The fund may also be subject to taxes imposed by governments of countries in which it invests. Such taxes are generally based on either income or gains earned or repatriated. The fund accrues and applies such taxes to net investment income, net realized gains and net unrealized gains as income and/or capital gains are earned. In some cases, the fund may be entitled to reclaim all or a portion of such taxes, and such reclaim amounts, if any, are reflected as an asset on the fund’s books. In many cases, however, the fund may not receive such amounts for an extended period of time, depending on the country of investment.
Distributions to shareholders Distributions to shareholders from net investment income, if any, are recorded by the fund on the ex-dividend date. Distributions from capital gains, if any, are recorded on the ex-dividend date and paid at least annually. The amount and character of income and gains to be distributed are determined in accordance with income tax regulations, which may differ from generally accepted accounting principles. These differences include temporary and/or permanent differences from losses on wash sale transactions, from foreign currency gains and losses, from unrealized gains and losses on certain futures contracts, from realized gains and losses on passive foreign investment companies, from unrealized gains and losses on passive foreign investment companies and from straddle loss deferrals substantial overlap. Reclassifications are made to the fund’s capital accounts to reflect income and gains available for distribution (or available capital loss carryovers) under income tax regulations. At the close of the reporting period, the fund reclassified $15,114 to increase undistributed net investment income, $117 to decrease paid-in capital and $14,997 to decrease accumulated net realized gain.
Tax cost of investments includes adjustments to net unrealized appreciation (depreciation) which may not necessarily be final tax cost basis adjustments, but closely approximate the tax basis unrealized gains and losses that may be realized and distributed to shareholders. The tax basis components of distributable earnings and the federal tax cost as of the close of the reporting period were as follows:
| Unrealized appreciation | $4,736,688 |
| Unrealized depreciation | (194,522) |
| Net unrealized appreciation | 4,542,166 |
| Undistributed ordinary income | 120,087 |
| Undistributed long-term gains | 601,522 |
| Undistributed short-term gains | 322,539 |
| Cost for federal income tax purposes | $10,557,015 |
Expenses of the Trust Expenses directly charged or attributable to any fund will be paid from the assets of that fund. Generally, expenses of the Trust will be allocated among and charged to the assets of each fund on a basis that the Trustees deem fair and equitable, which may be based on the relative assets of each fund or the nature of the services performed and relative applicability to each fund.
Note 2: Management fee, administrative services and other transactions
The fund pays Putnam Management a management fee (based on the fund’s average net assets and computed and paid monthly) at annual rates that may vary based on the average of the aggregate net assets of all open-end mutual funds sponsored by Putnam Management (excluding net assets of funds that are invested in, or that are invested in by, other Putnam funds to the extent necessary to avoid “double counting” of those assets). Such annual rates may vary as follows:
| 0.750% | of the first $5 billion, |
| 0.700% | of the next $5 billion, |
| 0.650% | of the next $10 billion, |
| 0.600% | of the next $10 billion, |
| 0.550% | of the next $50 billion, |
| 0.530% | of the next $50 billion, |
| 0.520% | of the next $100 billion and |
| 0.515% | of any excess thereafter. |
For the reporting period, the management fee represented an effective rate (excluding the impact from any expense waivers in effect) of 0.586% of the fund’s average net assets.
Effective July 15, 2024, Putnam Management transferred its management contract with the fund to Franklin Advisers. As a result of the transfer, Franklin Advisers replaced Putnam Management as the investment adviser of the fund. In addition, effective July 15, 2024, Franklin Advisers has retained Putnam Management as a sub-adviser for the fund pursuant to a new sub-advisory agreement between Franklin Advisers and Putnam Management.
Putnam Management has contractually agreed, through September 30, 2025, to waive fees and/or reimburse the fund’s expenses to the extent necessary to limit the cumulative expenses of the fund, exclusive of brokerage, interest, taxes, investment-related expenses, extraordinary expenses, acquired fund fees and expenses and payments under the fund’s investor servicing contract, investment
Dynamic Asset Allocation Equity Fund 23
management contract and distribution plans, on a fiscal year-to-date basis to an annual rate of 0.02% of the fund’s average net assets over such fiscal year-to-date period. During the reporting period, the fund’s expenses were reduced by $211,287 as a result of this limit.
The fund invests in Putnam Government Money Market Fund, an open-end management investment company managed by Putnam Management. Management fees paid by the fund are reduced by an amount equal to the management fees paid by Putnam Government Money Market Fund with respect to assets invested by the fund in Putnam Government Money Market Fund. For the reporting period, management fees paid were reduced by $1,466 relating to the fund’s investment in Putnam Government Money Market Fund.
PIL is authorized by the Trustees to manage a separate portion of the assets of the fund as determined by Putnam Management from time to time. Putnam Management pays a quarterly sub-management fee to PIL for its services at an annual rate of 0.25% of the average net assets of the portion of the fund managed by PIL. Effective July 15, 2024, Putnam Management transferred its sub-management contract with PIL in respect of the fund to Franklin Advisers.
PAC is authorized by the Trustees to manage a separate portion of the assets of the fund, as designated from time to time by Putnam Management or PIL. PAC did not manage any portion of the assets of the fund during the reporting period. If Putnam Management or PIL were to engage the services of PAC, Putnam Management or PIL, as applicable, would pay a quarterly sub-advisory fee to PAC for its services at the annual rate of 0.25% of the average net assets of the portion of the fund’s assets for which PAC is engaged as sub-adviser. Effective July 15, 2024, Putnam Management transferred the sub-advisory contract among Putnam Management, PIL and PAC in respect of the fund to Franklin Advisers.
On January 1, 2024, a subsidiary of Franklin Templeton acquired Putnam U.S. Holdings I, LLC (“Putnam Holdings”), the parent company of Putnam Management, PIL and PAC, in a stock and cash transaction (the “Transaction”). As a result of the Transaction, Putnam Management, PIL and PAC became indirect, wholly-owned subsidiaries of Franklin Templeton. The Transaction also resulted in the automatic termination of the investment management contract between the fund and Putnam Management, the sub-management contract for the fund between Putnam Management and PIL, and the sub-advisory contract for the fund among Putnam Management, PIL and PAC that were in place for the fund before the Transaction (together, the “Previous Advisory Contracts”). However, Putnam Management, PIL and PAC continue to provide uninterrupted services with respect to the fund pursuant to new investment management, sub-management, and sub-advisory contracts that were approved by fund shareholders at a shareholder meeting held in connection with the Transaction and that took effect on January 1, 2024 (together, the “New Advisory Contracts”). The terms of the New Advisory Contracts are substantially similar to those of the Previous Advisory Contracts, and the fee rates payable under the New Advisory Contracts are the same as the fee rates under the Previous Advisory Contracts.
Effective June 1, 2024, under an agreement with Putnam Management, Franklin Templeton Services will provide certain administrative services to the fund. The fee for those services will be paid by Putnam Management based on the fund’s average daily net assets and is not an additional expense of the fund.
The fund reimburses Putnam Management an allocated amount for the compensation and related expenses of certain officers of the fund and their staff who provide administrative services to the fund. The aggregate amount of all such reimbursements is determined annually by the Trustees.
Custodial functions for the fund’s assets are provided by State Street. Custody fees are based on the fund’s asset level, the number of its security holdings and transaction volumes.
Putnam Investor Services, Inc., an affiliate of Putnam Management, provides investor servicing agent functions to the fund. Putnam Investor Services, Inc. received fees for investor servicing for class A and class P shares that included (1) a per account fee for each direct and underlying non-defined contribution account (retail account) of the fund; (2) a specified rate of the fund’s assets attributable to defined contribution plan accounts; and (3) a specified rate based on the average net assets in retail accounts. Putnam Investor Services, Inc. has agreed that the aggregate investor servicing fees for each fund’s retail and defined contribution accounts for these share classes will not exceed an annual rate of 0.25% of the fund’s average assets attributable to such accounts.
Class P shares paid a monthly fee based on the average net assets of class P shares at an annual rate of 0.01%.
During the reporting period, the expenses for each class of shares related to investor servicing fees were as follows:
| Class A | $4,684 |
| Class P | 600 |
| Total | $5,284 |
The fund has entered into expense offset arrangements with Putnam Investor Services, Inc. and State Street whereby Putnam Investor Services, Inc.’s and State Street’s fees are reduced by credits allowed on cash balances. For the reporting period, the fund’s expenses were reduced by $113 under the expense offset arrangements.
Each Independent Trustee of the fund receives an annual Trustee fee, of which $11 as a quarterly retainer, has been allocated to the fund, and an additional fee for each Trustees meeting attended. Trustees also are reimbursed for expenses they incur relating to their services as Trustees.
The fund has adopted a Trustee Fee Deferral Plan (the Deferral Plan) which allows the Trustees to defer the receipt of all or a portion of Trustees fees payable from July 1, 1995 through December 31, 2023. The deferred fees remain invested in certain Putnam funds until distribution in accordance with the Deferral Plan.
The fund has adopted an unfunded noncontributory defined benefit pension plan (the Pension Plan) covering all Trustees of the fund who have served as a Trustee for at least five years and were first elected prior to 2004. Benefits under the Pension Plan are equal to 50% of the Trustee’s average annual attendance and retainer fees for the three years ended December 31, 2005. The retirement benefit is payable during a Trustee’s lifetime, beginning the year following retirement, for the number of years of service through December 31, 2006. Pension expense for the fund is included in Trustee compensation and expenses in the Statement of operations. Accrued pension liability is included in Payable for Trustee compensation and expenses in the Statement of assets and liabilities. The Trustees have terminated the Pension Plan with respect to any Trustee first elected after 2003.
The fund has adopted a distribution plan (the Plan) pursuant to Rule 12b–1 under the Investment Company Act of 1940. The purpose of the Plan is to compensate Putnam Retail Management Limited Partnership, an indirect wholly-owned subsidiary of Franklin Resources, Inc., for services provided and expenses incurred in distributing shares of the fund. The Plan provides for payment by the fund to Putnam Retail Management Limited Partnership at an annual rate of up to 0.35% of the average net assets attributable to class A shares. The Trustees currently have not approved payments under the Plan.
For the reporting period, Putnam Retail Management Limited Partnership, acting as underwriter, received no monies for net commissions from the sale of class A shares.
A deferred sales charge of up to 1.00% is assessed on certain redemptions of class A shares. For the reporting period, Putnam Retail Management Limited Partnership, acting as underwriter, received no monies on class A redemptions.
24 Dynamic Asset Allocation Equity Fund
Note 3: Purchases and sales of securities
During the reporting period, the cost of purchases and the proceeds from sales, excluding short-term investments, were as follows:
| Cost of purchases | Proceeds from sales | |
| Investments in securities (Long-term) | $8,377,296 | $6,724,145 |
| U.S. government securities (Long-term) | — | — |
| Total | $8,377,296 | $6,724,145 |
The fund may purchase or sell investments from or to other Putnam funds in the ordinary course of business, which can reduce the fund’s transaction costs, at prices determined in accordance with SEC requirements and policies approved by the Trustees. During the reporting period, purchases or sales of long-term securities from or to other Putnam funds, if any, did not represent more than 5% of the fund’s total cost of purchases and/or total proceeds from sales. Beginning in January 2024 the fund was restricted from participating in the interfund trading program.
Note 4: Capital shares
At the close of the reporting period, there were an unlimited number of shares of beneficial interest authorized. Transactions, including, if applicable, direct exchanges pursuant to share conversions, in capital shares were as follows:
| YEAR ENDED 5/31/24 | YEAR ENDED 5/31/23 | |||
| Class A | Shares | Amount | Shares | Amount |
| Shares sold | — | $— | 454,959 | $5,000,002 |
| Shares issued in connection with reinvestment of distributions | 8,467 | 106,508 | 362 | 4,070 |
| 8,467 | 106,508 | 455,321 | 5,004,072 | |
| Shares repurchased | — | — | (369) | (4,419) |
| Net increase | 8,467 | $106,508 | 454,952 | $4,999,653 |
| YEAR ENDED 5/31/24 | YEAR ENDED 5/31/23 | |||
| Class P | Shares | Amount | Shares | Amount |
| Shares sold | 327,402 | $4,215,249 | 2,066,597 | $25,271,980 |
| Shares issued in connection with reinvestment of distributions | 9,255 | 116,056 | 1,322,023 | 14,811,180 |
| 336,657 | 4,331,305 | 3,388,620 | 40,083,160 | |
| Shares repurchased | (168,358) | (2,137,993) | (9,090,811) | (101,178,334) |
| Net increase (decrease) | 168,299 | $2,193,312 | (5,702,191) | $(61,095,174) |
At the close of the reporting period, Putnam Investment Holdings, LLC owned 465,128 class A shares of the fund (99.9% of class A shares outstanding), valued at $6,660,633.
At the close of the reporting period, the Putnam Retirement Advantage Funds owned 55.8% of the outstanding shares of the fund.
Note 5: Affiliated transactions
Transactions during the reporting period with any company which is under common ownership or control were as follows:
| Name of affiliate | Fair value as of 5/31/23 | Purchase cost | Sale proceeds | Investment income | Shares outstanding and fair value as of 5/31/24 |
| Short-term investments | |||||
| Putnam Government Money Market Fund Class G† | $— | $2,888,648 | $2,061,202 | $26,925 | $827,446 |
| Putnam Short Term Investment Fund Class P‡ | 444,243 | 943,810 | 552,397 | 21,632 | 835,656 |
| Total Short-term investments | $444,243 | $3,832,458 | $2,613,599 | $48,557 | $1,663,102 |
| † Management fees paid by the fund are reduced by an amount equal to the management fees paid by Putnam Government Money Market Fund with respect to assets invested by the fund in Putnam Government Money Market Fund (Note 2). There were no realized or unrealized gains or losses during the period. | |||||
| ‡ Management fees charged to Putnam Short Term Investment Fund have been waived by Putnam Management. There were no realized or unrealized gains or losses during the period. | |||||
Note 6: Market, credit and other risks
In the normal course of business, the fund trades financial instruments and enters into financial transactions where risk of potential loss exists due to changes in the market (market risk) or failure of the contracting party to the transaction to perform (credit risk). The fund may be exposed to additional credit risk that an institution or other entity with which the fund has unsettled or open transactions will default. Investments in foreign securities involve certain risks, including those related to economic instability, unfavorable political developments, and currency fluctuations.
Dynamic Asset Allocation Equity Fund 25
Note 7: Summary of derivative activity
The volume of activity for the reporting period for any derivative type that was held during the period is listed below and was based on an average of the holdings at the end of each fiscal quarter:
| Purchased equity option contracts (contract amount) | $10 |
| Written equity option contracts (contract amount) | $10 |
| Futures contracts (number of contracts) | 30 |
| Forward currency contracts (contract amount) | $860,000 |
The following is a summary of the fair value of derivative instruments as of the close of the reporting period:
| Fair value of derivative instruments as of the close of the reporting period | ||||
| Asset derivatives | Liability derivatives | |||
| Derivatives not accounted for as hedging instruments under ASC 815 | Statement of assets and liabilities location | Fair value | Statement of assets and liabilities location | Fair value |
| Foreign exchange contracts | Receivables | $2,202 | Payables | $8,359 |
| Equity contracts | Receivables, Net assets — Unrealized appreciation | 30,756* | Payables, Net assets — Unrealized depreciation | 15,801* |
| Total | $32,958 | $24,160 | ||
| * Includes cumulative appreciation/depreciation of futures contracts as reported in the fund’s portfolio. Only current day’s variation margin is reported within the Statement of assets and liabilities. | ||||
The following is a summary of realized and change in unrealized gains or losses of derivative instruments in the Statement of operations for the reporting period (Note 1):
| Amount of realized gain or (loss) on derivatives recognized in net gain or (loss) on investments | ||||
| Derivatives not accounted for as hedging instruments under ASC 815 | Options | Futures | Forward currency contracts | Total |
| Foreign exchange contracts | $— | $— | $(21,023) | $(21,023) |
| Equity contracts | (838) | 228,401 | — | $227,563 |
| Total | $(838) | $228,401 | $(21,023) | $206,540 |
| Change in unrealized appreciation or (depreciation) on derivatives recognized in net gain or (loss) on investments | ||||
| Derivatives not accounted for as hedging instruments under ASC 815 | Options | Futures | Forward currency contracts | Total |
| Foreign exchange contracts | $— | $— | $852 | $852 |
| Equity contracts | 838 | (7,178) | — | $(6,340) |
| Total | $838 | $(7,178) | $852 | $(5,488) |
26 Dynamic Asset Allocation Equity Fund
Note 8: Offsetting of financial and derivative assets and liabilities
The following table summarizes any derivatives, repurchase agreements and reverse repurchase agreements, at the end of the reporting period, that are subject to an enforceable master netting agreement or similar agreement. For securities lending transactions or borrowing transactions associated with securities sold short, if any, see Note 1. For financial reporting purposes, the fund does not offset financial assets and financial liabilities that are subject to the master netting agreements in the Statement of assets and liabilities.
| Bank of America N.A. | Barclays Bank PLC | BofA Securities, Inc. | Citibank, N.A. | Goldman Sachs International | HSBC Bank USA, National Association | JPMorgan Chase Bank N.A. | |
| Assets: | |||||||
| Futures contracts§ | $— | $— | $25,401 | $— | $— | $— | $— |
| Forward currency contracts# | 179 | 25 | — | 227 | 106 | 92 | — |
| Total Assets | $179 | $25 | $25,401 | $227 | $106 | $92 | $— |
| Liabilities: | |||||||
| Futures contracts§ | — | — | — | — | — | — | — |
| Forward currency contracts# | 107 | 1 | — | 384 | 1,307 | 807 | 871 |
| Total Liabilities | $107 | $1 | $— | $384 | $1,307 | $807 | $871 |
| Total Financial and Derivative Net Assets | $72 | $24 | $25,401 | $(157) | $(1,201) | $(715) | $(871) |
| Total collateral received (pledged)†## | $— | $— | $— | $— | $— | $— | $— |
| Net amount | $72 | $24 | $25,401 | $(157) | $(1,201) | $(715) | $(871) |
| Controlled collateral received (including TBA commitments)** | $— | $— | $— | $— | $— | $— | $— |
| Uncontrolled collateral received | $— | $— | $— | $— | $— | $— | $— |
| Collateral (pledged) (including TBA commitments)** | $— | $— | $— | $— | $— | $— | $— |
Dynamic Asset Allocation Equity Fund 27
| Morgan Stanley & Co. International PLC | NatWest Markets PLC | State Street Bank and Trust Co. | Toronto-Dominion Bank | UBS AG | Total | |
| Assets: | ||||||
| Futures contracts§ | $— | $— | $— | $— | $— | $25,401 |
| Forward currency contracts# | 99 | 112 | 357 | 232 | 773 | 2,202 |
| Total Assets | $99 | $112 | $357 | $232 | $773 | $27,603 |
| Liabilities: | ||||||
| Futures contracts§ | — | — | — | — | — | — |
| Forward currency contracts# | 3,119 | 89 | 1,131 | — | 543 | 8,359 |
| Total Liabilities | $3,119 | $89 | $1,131 | $— | $543 | $8,359 |
| Total Financial and Derivative Net Assets | $(3,020) | $23 | $(774) | $232 | $230 | $19,244 |
| Total collateral received (pledged)†## | $— | $— | $— | $— | $— | |
| Net amount | $(3,020) | $23 | $(774) | $232 | $230 | |
| Controlled collateral received (including TBA commitments)** | $— | $— | $— | $— | $— | $— |
| Uncontrolled collateral received | $— | $— | $— | $— | $— | $— |
| Collateral (pledged) (including TBA commitments)** | $— | $— | $— | $— | $— | $— |
| ** | Included with Investments in securities on the Statement of assets and liabilities. |
| † | Additional collateral may be required from certain brokers based on individual agreements. |
| # | Covered by master netting agreement (Note 1). |
| ## | Any over-collateralization of total financial and derivative net assets is not shown. Collateral may include amounts related to unsettled agreements. |
| § | Includes current day’s variation margin only as reported on the Statement of assets and liabilities, which is not collateralized. Cumulative appreciation/(depreciation) for futures contracts is represented in the tables listed after the fund’s portfolio. Collateral pledged for initial margin on futures contracts, which is not included in the table above, amounted to $99,687. |
28 Dynamic Asset Allocation Equity Fund
Federal tax information (Unaudited)
Pursuant to §852 of the Internal Revenue Code, as amended, the fund hereby designates $798,248 as a capital gain dividend with respect to the taxable year ended May 31, 2024, or, if subsequently determined to be different, the net capital gain of such year.
The fund designated $92,091 of income eligible as qualifying for the dividends received deduction for corporations.
For the reporting period, the fund hereby designates $150,929, or the maximum amount allowable, of its taxable ordinary income earned as qualified dividends taxed at the individual net capital gain rates.
The Form 1099 that will be mailed to you in January 2025 will show the tax status of all distributions paid to your account in calendar 2024.
| Dynamic Asset Allocation Equity Fund 29 |
Changes in and disagreements with accountants
Not applicable
Results of any shareholder votes (Unaudited)
October 20, 2023 special meeting
At the meeting, a new Management Contract for your fund with Putnam Investment Management, LLC was approved, as follows:
| Votes for | Votes against | Abstentions/Votes withheld |
| 879,271 | — | — |
At the meeting, a new Sub-Management Contract for your fund between Putnam Investment Management, LLC and Putnam Investments Limited was approved, as follows:
| Votes for | Votes against | Abstentions/Votes withheld |
| 879,271 | — | — |
At the meeting, a new Sub-advisory Contract for your fund between Putnam Investment Management, LLC, Putnam Investments Limited and The Putnam Advisory Company, LLC was approved, as follows:
| Votes for | Votes against | Abstentions/Votes withheld |
| 879,271 | — | — |
All tabulations are rounded to the nearest whole number.
Remuneration paid to directors, officers, and others
Remuneration paid to directors, officers, and others is included in the Notes to financial statements above.
Board approval of management and subadvisory agreements
Not applicable
| 30 Dynamic Asset Allocation Equity Fund |
 | ||
| © 2024 Franklin Templeton. All rights reserved. | 39117-AFSOI 07/24 | |
| Item 8. Changes in and Disagreements with Accountants for Open-End Management Investment Companies. |
| Included in Item 7 above. |
| Item 9. Proxy Disclosure for Open-End Management Investment Companies. |
| Included in Item 7 above. |
| Item 10. Remuneration Paid to Directors, Officers, and Others of Open-End Management Investment Companies. |
| Included in Item 7 above. |
| Item 11. Statement Regarding Basis for Approval of Investment Advisory Contract. |
| Included in Item 7 above. |
| Item 12. Disclosure of Proxy Voting Policies and Procedures For Closed-End Management Investment Companies: |
| Not applicable |
| Item 13. Portfolio Managers of Closed-End Investment Companies |
| Not Applicable |
| Item 14. Purchases of Equity Securities by Closed-End Management Investment Companies and Affiliated Purchasers: |
| Not applicable |
| Item 15. Submission of Matters to a Vote of Security Holders: |
| Not applicable |
| Item 16. Controls and Procedures: |
| (a) The registrant’s principal executive officer and principal financial officer have concluded, based on their evaluation of the effectiveness of the design and operation of the registrant’s disclosure controls and procedures as of a date within 90 days of the filing date of this report, that the design and operation of such procedures are generally effective to provide reasonable assurance that information required to be disclosed by the registrant in this report is recorded, processed, summarized and reported within the time periods specified in the Commission’s rules and forms. |
| (b) Changes in internal control over financial reporting: Not applicable |
| Item 17. Disclosures of Securities Lending Activities for Closed-End Investment Companies: |
| Not Applicable |
| Item 18. Recovery of Erroneously Awarded Compensation. |
| (a) No |
| (b) No |
| Item 19. Exhibits: |
| (a)(1) The Code of Ethics of The Putnam Funds, which incorporates the Code of Ethics of Putnam Investments, is filed herewith. |
| (a)(2) Any policy required by the listing standards adopted pursuant to Rule 10D-1 under the Exchange Act (17 CFR 240.10D-1) by the registered national securities exchange or registered national securities association upon which the registrant’s securities are listed. Not Applicable |
| (b) The certifications required by Rule 30a-2(b) under the Investment Company Act of 1940, as amended, are filed herewith. |
| SIGNATURES |
| Pursuant to the requirements of the Securities Exchange Act of 1934 and the Investment Company Act of 1940, the registrant has duly caused this report to be signed on its behalf by the undersigned, thereunto duly authorized. |
| Putnam Funds Trust |
| By (Signature and Title): |
| /s/ Jeffrey White Jeffrey White Principal Accounting Officer |
| Date: July 30, 2024 |
| Pursuant to the requirements of the Securities Exchange Act of 1934 and the Investment Company Act of 1940, this report has been signed below by the following persons on behalf of the registrant and in the capacities and on the dates indicated. |
| By (Signature and Title): |
| /s/ Jonathan S. Horwitz Jonathan S. Horwitz Principal Executive Officer |
| Date: July 30, 2024 |
| By (Signature and Title): |
| /s/ Jeffrey White Jeffrey White Principal Financial Officer |
| Date: July 30, 2024 |