| UNITED STATES SECURITIES AND EXCHANGE COMMISSION | ||
| Washington, D.C. 20549 | ||
FORM N-CSR | ||
| CERTIFIED SHAREHOLDER REPORT OF REGISTERED MANAGEMENT INVESTMENT COMPANIES | ||
| Investment Company Act file number: | (811-07513) |
| Exact name of registrant as specified in charter: | Putnam Funds Trust |
| Address of principal executive offices: | 100 Federal Street, Boston, Massachusetts 02110 |
| Name and address of agent for service: | Stephen Tate, Vice President 100 Federal Street Boston, Massachusetts 02110 |
| Copy to: | Bryan Chegwidden, Esq. Ropes & Gray LLP 1211 Avenue of the Americas New York, New York 10036 |
| James E. Thomas, Esq. Ropes & Gray LLP 800 Boylston Street Boston, Massachusetts 02199 |
| Registrant’s telephone number, including area code: | (617) 292-1000 |
| Date of fiscal year end: | May 31, 2024 |
| Date of reporting period: | June 1, 2023 – May 31, 2024 |
Item 1. Report to Stockholders: |
| The following is a copy of the report transmitted to stockholders pursuant to Rule 30e-1 under the Investment Company Act of 1940: | |||
Putnam Mortgage Opportunities Fund |  | |
| Class A [PMORX] | ||
| Annual Shareholder Report | May 31, 2024 | ||
 | ||
You can find additional information about the Fund at https://www.franklintempleton.com/regulatory-fund-documents. You can also request this information by contacting us at (800) 225-1581.
Class Name | Costs of a $10,000 investment | Costs paid as a percentage of a $10,000 investment* |
| Class A | $92 | 0.86% |
| * | Reflects fee waivers and/or expense reimbursements, without which expenses would have been higher. |
Top contributors to performance: | |
| ↑ | Exposure to commercial mortgage-backed securities (CMBS), which benefited from higher-than-anticipated payoff rates and refinancings, as well as sufficient property cash flows; spreads tightened notably since the regional bank-fueled selloff in early 2023. |
| ↑ | Residential mortgage-backed securities (RMBS), led by agency credit risk transfer (CRT) holdings. Borrower fundamentals remained strong and the housing market proved resilient despite affordability pressures and near record-low inventory. Spreads tightened across RMBS subsectors. |
| ↑ | Prepayment strategies, largely from agency interest-only (IO) securities. Prepayment speeds remained at historic lows and expectations for higher-for-longer interest rates supported a stable outlook during the period. |
| ↑ | A tactical overweight in mortgage basis positioning in the latter half of 2023 enabled the Fund to capitalize on the difference between longer-term U.S. Treasury yields and the interest rates on 30-year home mortgages when the basis tightened, and interest rates rallied. |
Top detractors from performance: | |
| ↓ | There were no significant detractors. |
| Putnam Mortgage Opportunities Fund | ||
| NOT FDIC INSURED | MAY LOSE VALUE | NO BANK GUARANTEE | PAGE 1 | 39234-ATSA-0724 |
Class A 4/7/2015 — 5/31/2024
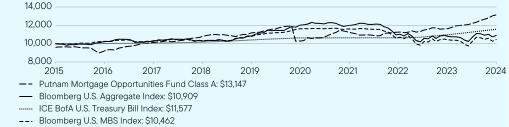
1 Year | 5 Year | Since Inception (4/7/2015) | |
Class A (without sales charge) | 12.91 | 3.24 | 3.50 |
Class A (with sales charge) | 8.39 | 2.40 | 3.03 |
Bloomberg U.S. Aggregate Index | 1.31 | -0.17 | 0.96 |
ICE BofA U.S. Treasury Bill Index | 5.46 | 2.12 | 1.61 |
Bloomberg U.S. MBS Index | 0.50 | -0.85 | 0.50 |
Total Net Assets | $543,213,623 |
Total Number of Portfolio Holdings* | 528 |
Total Management Fee Paid | $1,370,273 |
Portfolio Turnover Rate | 1,243% |
| * | Includes derivatives, if applicable. |
| Putnam Mortgage Opportunities Fund | ||
| NOT FDIC INSURED | MAY LOSE VALUE | NO BANK GUARANTEE | PAGE 2 | 39234-ATSA-0724 |

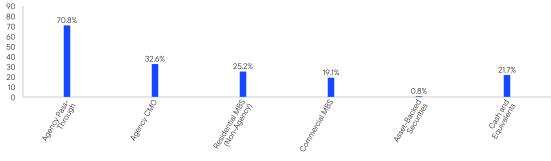
| Cash and Equivalents, if any, represent the market value weights of cash, derivatives, short-term securities, and other unclassified assets in the portfolio. Allocations may not total 100% because the chart includes the notional value of certain derivatives (the economic value for purposes of calculating periodic payment obligations), in addition to the market value of securities. Holdings and allocations may vary over time. |
January 1, 2024. As part of the Transaction, your Fund’s investment advisor, Putnam Investment Management, LLC (“Putnam Management”), a wholly-owned subsidiary of Putnam Holdings, and your Fund’s sub-advisor, Putnam Investments Limited (“PIL”), an indirect, wholly-owned subsidiary of Putnam Holdings, became indirect, wholly-owned subsidiaries of Franklin Resources. In connection with the Transaction, shareholders of your Fund approved a new management contract with Putnam Management and a new sub-advisory contract with PIL. The new contracts are identical to the previous contracts, except for the effective dates, initial terms, updates to fund names as necessary to reflect previous name changes, the addition of a provision specifying that there are no third-party beneficiaries to the contracts, and (in some cases) certain non-substantive changes.
 | WHERE CAN I FIND ADDITIONAL INFORMATION ABOUT THE FUND? |
Additional information is available on https://www.franklintempleton.com/regulatory-fund-documents, including its: | |
| • prospectus • proxy voting information • financial information • holdings • tax information |
| Putnam Mortgage Opportunities Fund | ||
| NOT FDIC INSURED | MAY LOSE VALUE | NO BANK GUARANTEE | PAGE 3 | 39234-ATSA-0724 |
Putnam Mortgage Opportunities Fund |  | |
| Class C [PMOZX] | ||
| Annual Shareholder Report | May 31, 2024 | ||
 | ||
You can find additional information about the Fund at https://www.franklintempleton.com/regulatory-fund-documents. You can also request this information by contacting us at (800) 225-1581.
Class Name | Costs of a $10,000 investment | Costs paid as a percentage of a $10,000 investment* |
| Class C | $171 | 1.61% |
| * | Reflects fee waivers and/or expense reimbursements, without which expenses would have been higher. |
Top contributors to performance: | |
| ↑ | Exposure to commercial mortgage-backed securities (CMBS), which benefited from higher-than-anticipated payoff rates and refinancings, as well as sufficient property cash flows; spreads tightened notably since the regional bank-fueled selloff in early 2023. |
| ↑ | Residential mortgage-backed securities (RMBS), led by agency credit risk transfer (CRT) holdings. Borrower fundamentals remained strong and the housing market proved resilient despite affordability pressures and near record-low inventory. Spreads tightened across RMBS subsectors. |
| ↑ | Prepayment strategies, largely from agency interest-only (IO) securities. Prepayment speeds remained at historic lows and expectations for higher-for-longer interest rates supported a stable outlook during the period. |
| ↑ | A tactical overweight in mortgage basis positioning in the latter half of 2023 enabled the Fund to capitalize on the difference between longer-term U.S. Treasury yields and the interest rates on 30-year home mortgages when the basis tightened, and interest rates rallied. |
Top detractors from performance: | |
| ↓ | There were no significant detractors. |
| Putnam Mortgage Opportunities Fund | ||
| NOT FDIC INSURED | MAY LOSE VALUE | NO BANK GUARANTEE | PAGE 1 | 39234-ATSC-0724 |
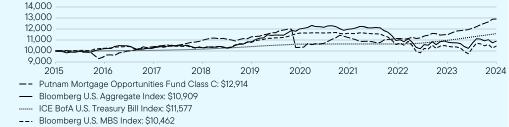
1 Year | 5 Year | Since Inception (4/7/2015) | |
Class C (without sales charge) | 12.06 | 2.49 | 2.83 |
Class C (with sales charge) | 11.06 | 2.49 | 2.83 |
Bloomberg U.S. Aggregate Index | 1.31 | -0.17 | 0.96 |
ICE BofA U.S. Treasury Bill Index | 5.46 | 2.12 | 1.61 |
Bloomberg U.S. MBS Index | 0.50 | -0.85 | 0.50 |
Total Net Assets | $543,213,623 |
Total Number of Portfolio Holdings* | 528 |
Total Management Fee Paid | $1,370,273 |
Portfolio Turnover Rate | 1,243% |
| * | Includes derivatives, if applicable. |
| Putnam Mortgage Opportunities Fund | ||
| NOT FDIC INSURED | MAY LOSE VALUE | NO BANK GUARANTEE | PAGE 2 | 39234-ATSC-0724 |

| Cash and Equivalents, if any, represent the market value weights of cash, derivatives, short-term securities, and other unclassified assets in the portfolio. Allocations may not total 100% because the chart includes the notional value of certain derivatives (the economic value for purposes of calculating periodic payment obligations), in addition to the market value of securities. Holdings and allocations may vary over time. |
January 1, 2024. As part of the Transaction, your Fund’s investment advisor, Putnam Investment Management, LLC (“Putnam Management”), a wholly-owned subsidiary of Putnam Holdings, and your Fund’s sub-advisor, Putnam Investments Limited (“PIL”), an indirect, wholly-owned subsidiary of Putnam Holdings, became indirect, wholly-owned subsidiaries of Franklin Resources. In connection with the Transaction, shareholders of your Fund approved a new management contract with Putnam Management and a new sub-advisory contract with PIL. The new contracts are identical to the previous contracts, except for the effective dates, initial terms, updates to fund names as necessary to reflect previous name changes, the addition of a provision specifying that there are no third-party beneficiaries to the contracts, and (in some cases) certain non-substantive changes.
 | WHERE CAN I FIND ADDITIONAL INFORMATION ABOUT THE FUND? |
Additional information is available on https://www.franklintempleton.com/regulatory-fund-documents, including its: | |
| • prospectus • proxy voting information • financial information • holdings • tax information |
| Putnam Mortgage Opportunities Fund | ||
| NOT FDIC INSURED | MAY LOSE VALUE | NO BANK GUARANTEE | PAGE 3 | 39234-ATSC-0724 |
Putnam Mortgage Opportunities Fund |  | |
| Class I [PMOTX] | ||
| Annual Shareholder Report | May 31, 2024 | ||
 | ||
You can find additional information about the Fund at https://www.franklintempleton.com/regulatory-fund-documents. You can also request this information by contacting us at (800) 225-1581.
Class Name | Costs of a $10,000 investment | Costs paid as a percentage of a $10,000 investment* |
| Class I | $50 | 0.47% |
| * | Reflects fee waivers and/or expense reimbursements, without which expenses would have been higher. |
Top contributors to performance: | |
| ↑ | Exposure to commercial mortgage-backed securities (CMBS), which benefited from higher-than-anticipated payoff rates and refinancings, as well as sufficient property cash flows; spreads tightened notably since the regional bank-fueled selloff in early 2023. |
| ↑ | Residential mortgage-backed securities (RMBS), led by agency credit risk transfer (CRT) holdings. Borrower fundamentals remained strong and the housing market proved resilient despite affordability pressures and near record-low inventory. Spreads tightened across RMBS subsectors. |
| ↑ | Prepayment strategies, largely from agency interest-only (IO) securities. Prepayment speeds remained at historic lows and expectations for higher-for-longer interest rates supported a stable outlook during the period. |
| ↑ | A tactical overweight in mortgage basis positioning in the latter half of 2023 enabled the Fund to capitalize on the difference between longer-term U.S. Treasury yields and the interest rates on 30-year home mortgages when the basis tightened, and interest rates rallied. |
Top detractors from performance: | |
| ↓ | There were no significant detractors. |
| Putnam Mortgage Opportunities Fund | ||
| NOT FDIC INSURED | MAY LOSE VALUE | NO BANK GUARANTEE | PAGE 1 | 39234-ATSI-0724 |
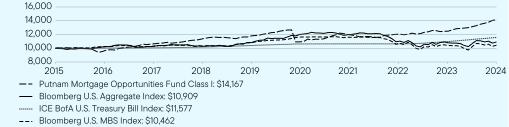
1 Year | 5 Year | Since Inception (4/7/2015) | |
Class I (without sales charge) | 13.45 | 3.63 | 3.88 |
Class I (with sales charge) | 13.45 | 3.63 | 3.88 |
Bloomberg U.S. Aggregate Index | 1.31 | -0.17 | 0.96 |
ICE BofA U.S. Treasury Bill Index | 5.46 | 2.12 | 1.61 |
Bloomberg U.S. MBS Index | 0.50 | -0.85 | 0.50 |
Total Net Assets | $543,213,623 |
Total Number of Portfolio Holdings* | 528 |
Total Management Fee Paid | $1,370,273 |
Portfolio Turnover Rate | 1,243% |
| * | Includes derivatives, if applicable. |
| Putnam Mortgage Opportunities Fund | ||
| NOT FDIC INSURED | MAY LOSE VALUE | NO BANK GUARANTEE | PAGE 2 | 39234-ATSI-0724 |
| Cash and Equivalents, if any, represent the market value weights of cash, derivatives, short-term securities, and other unclassified assets in the portfolio. Allocations may not total 100% because the chart includes the notional value of certain derivatives (the economic value for purposes of calculating periodic payment obligations), in addition to the market value of securities. Holdings and allocations may vary over time. |
January 1, 2024. As part of the Transaction, your Fund’s investment advisor, Putnam Investment Management, LLC (“Putnam Management”), a wholly-owned subsidiary of Putnam Holdings, and your Fund’s sub-advisor, Putnam Investments Limited (“PIL”), an indirect, wholly-owned subsidiary of Putnam Holdings, became indirect, wholly-owned subsidiaries of Franklin Resources. In connection with the Transaction, shareholders of your Fund approved a new management contract with Putnam Management and a new sub-advisory contract with PIL. The new contracts are identical to the previous contracts, except for the effective dates, initial terms, updates to fund names as necessary to reflect previous name changes, the addition of a provision specifying that there are no third-party beneficiaries to the contracts, and (in some cases) certain non-substantive changes.
 | WHERE CAN I FIND ADDITIONAL INFORMATION ABOUT THE FUND? |
Additional information is available on https://www.franklintempleton.com/regulatory-fund-documents, including its: | |
| • prospectus • proxy voting information • financial information • holdings • tax information |
| Putnam Mortgage Opportunities Fund | ||
| NOT FDIC INSURED | MAY LOSE VALUE | NO BANK GUARANTEE | PAGE 3 | 39234-ATSI-0724 |
Putnam Mortgage Opportunities Fund |  | |
| Class R6 [PMOLX] | ||
| Annual Shareholder Report | May 31, 2024 | ||
 | ||
You can find additional information about the Fund at https://www.franklintempleton.com/regulatory-fund-documents. You can also request this information by contacting us at (800) 225-1581.
Class Name | Costs of a $10,000 investment | Costs paid as a percentage of a $10,000 investment* |
| Class R6 | $54 | 0.51% |
| * | Reflects fee waivers and/or expense reimbursements, without which expenses would have been higher. |
Top contributors to performance: | |
| ↑ | Exposure to commercial mortgage-backed securities (CMBS), which benefited from higher-than-anticipated payoff rates and refinancings, as well as sufficient property cash flows; spreads tightened notably since the regional bank-fueled selloff in early 2023. |
| ↑ | Residential mortgage-backed securities (RMBS), led by agency credit risk transfer (CRT) holdings. Borrower fundamentals remained strong and the housing market proved resilient despite affordability pressures and near record-low inventory. Spreads tightened across RMBS subsectors. |
| ↑ | Prepayment strategies, largely from agency interest-only (IO) securities. Prepayment speeds remained at historic lows and expectations for higher-for-longer interest rates supported a stable outlook during the period. |
| ↑ | A tactical overweight in mortgage basis positioning in the latter half of 2023 enabled the Fund to capitalize on the difference between longer-term U.S. Treasury yields and the interest rates on 30-year home mortgages when the basis tightened, and interest rates rallied. |
Top detractors from performance: | |
| ↓ | There were no significant detractors. |
| Putnam Mortgage Opportunities Fund | ||
| NOT FDIC INSURED | MAY LOSE VALUE | NO BANK GUARANTEE | PAGE 1 | 39234-ATSR6-0724 |

1 Year | 5 Year | Since Inception (4/7/2015) | |
Class R6 (without sales charge) | 13.40 | 3.60 | 3.84 |
Class R6 (with sales charge) | 13.40 | 3.60 | 3.84 |
Bloomberg U.S. Aggregate Index | 1.31 | -0.17 | 0.96 |
ICE BofA U.S. Treasury Bill Index | 5.46 | 2.12 | 1.61 |
Bloomberg U.S. MBS Index | 0.50 | -0.85 | 0.50 |
Total Net Assets | $543,213,623 |
Total Number of Portfolio Holdings* | 528 |
Total Management Fee Paid | $1,370,273 |
Portfolio Turnover Rate | 1,243% |
| * | Includes derivatives, if applicable. |
| Putnam Mortgage Opportunities Fund | ||
| NOT FDIC INSURED | MAY LOSE VALUE | NO BANK GUARANTEE | PAGE 2 | 39234-ATSR6-0724 |

| Cash and Equivalents, if any, represent the market value weights of cash, derivatives, short-term securities, and other unclassified assets in the portfolio. Allocations may not total 100% because the chart includes the notional value of certain derivatives (the economic value for purposes of calculating periodic payment obligations), in addition to the market value of securities. Holdings and allocations may vary over time. |
January 1, 2024. As part of the Transaction, your Fund’s investment advisor, Putnam Investment Management, LLC (“Putnam Management”), a wholly-owned subsidiary of Putnam Holdings, and your Fund’s sub-advisor, Putnam Investments Limited (“PIL”), an indirect, wholly-owned subsidiary of Putnam Holdings, became indirect, wholly-owned subsidiaries of Franklin Resources. In connection with the Transaction, shareholders of your Fund approved a new management contract with Putnam Management and a new sub-advisory contract with PIL. The new contracts are identical to the previous contracts, except for the effective dates, initial terms, updates to fund names as necessary to reflect previous name changes, the addition of a provision specifying that there are no third-party beneficiaries to the contracts, and (in some cases) certain non-substantive changes.
 | WHERE CAN I FIND ADDITIONAL INFORMATION ABOUT THE FUND? |
Additional information is available on https://www.franklintempleton.com/regulatory-fund-documents, including its: | |
| • prospectus • proxy voting information • financial information • holdings • tax information |
| Putnam Mortgage Opportunities Fund | ||
| NOT FDIC INSURED | MAY LOSE VALUE | NO BANK GUARANTEE | PAGE 3 | 39234-ATSR6-0724 |
Putnam Mortgage Opportunities Fund |  | |
| Class Y [PMOYX] | ||
| Annual Shareholder Report | May 31, 2024 | ||
 | ||
You can find additional information about the Fund at https://www.franklintempleton.com/regulatory-fund-documents. You can also request this information by contacting us at (800) 225-1581.
Class Name | Costs of a $10,000 investment | Costs paid as a percentage of a $10,000 investment* |
| Class Y | $65 | 0.61% |
| * | Reflects fee waivers and/or expense reimbursements, without which expenses would have been higher. |
Top contributors to performance: | |
| ↑ | Exposure to commercial mortgage-backed securities (CMBS), which benefited from higher-than-anticipated payoff rates and refinancings, as well as sufficient property cash flows; spreads tightened notably since the regional bank-fueled selloff in early 2023. |
| ↑ | Residential mortgage-backed securities (RMBS), led by agency credit risk transfer (CRT) holdings. Borrower fundamentals remained strong and the housing market proved resilient despite affordability pressures and near record-low inventory. Spreads tightened across RMBS subsectors. |
| ↑ | Prepayment strategies, largely from agency interest-only (IO) securities. Prepayment speeds remained at historic lows and expectations for higher-for-longer interest rates supported a stable outlook during the period. |
| ↑ | A tactical overweight in mortgage basis positioning in the latter half of 2023 enabled the Fund to capitalize on the difference between longer-term U.S. Treasury yields and the interest rates on 30-year home mortgages when the basis tightened, and interest rates rallied. |
Top detractors from performance: | |
| ↓ | There were no significant detractors. |
| Putnam Mortgage Opportunities Fund | ||
| NOT FDIC INSURED | MAY LOSE VALUE | NO BANK GUARANTEE | PAGE 1 | 39234-ATSY-0724 |

1 Year | 5 Year | Since Inception (4/7/2015) | |
Class Y (without sales charge) | 13.21 | 3.48 | 3.75 |
Class Y (with sales charge) | 13.21 | 3.48 | 3.75 |
Bloomberg U.S. Aggregate Index | 1.31 | -0.17 | 0.96 |
ICE BofA U.S. Treasury Bill Index | 5.46 | 2.12 | 1.61 |
Bloomberg U.S. MBS Index | 0.50 | -0.85 | 0.50 |
Total Net Assets | $543,213,623 |
Total Number of Portfolio Holdings* | 528 |
Total Management Fee Paid | $1,370,273 |
Portfolio Turnover Rate | 1,243% |
| * | Includes derivatives, if applicable. |
| Putnam Mortgage Opportunities Fund | ||
| NOT FDIC INSURED | MAY LOSE VALUE | NO BANK GUARANTEE | PAGE 2 | 39234-ATSY-0724 |

| Cash and Equivalents, if any, represent the market value weights of cash, derivatives, short-term securities, and other unclassified assets in the portfolio. Allocations may not total 100% because the chart includes the notional value of certain derivatives (the economic value for purposes of calculating periodic payment obligations), in addition to the market value of securities. Holdings and allocations may vary over time. |
January 1, 2024. As part of the Transaction, your Fund’s investment advisor, Putnam Investment Management, LLC (“Putnam Management”), a wholly-owned subsidiary of Putnam Holdings, and your Fund’s sub-advisor, Putnam Investments Limited (“PIL”), an indirect, wholly-owned subsidiary of Putnam Holdings, became indirect, wholly-owned subsidiaries of Franklin Resources. In connection with the Transaction, shareholders of your Fund approved a new management contract with Putnam Management and a new sub-advisory contract with PIL. The new contracts are identical to the previous contracts, except for the effective dates, initial terms, updates to fund names as necessary to reflect previous name changes, the addition of a provision specifying that there are no third-party beneficiaries to the contracts, and (in some cases) certain non-substantive changes.
 | WHERE CAN I FIND ADDITIONAL INFORMATION ABOUT THE FUND? |
Additional information is available on https://www.franklintempleton.com/regulatory-fund-documents, including its: | |
| • prospectus • proxy voting information • financial information • holdings • tax information |
| Putnam Mortgage Opportunities Fund | ||
| NOT FDIC INSURED | MAY LOSE VALUE | NO BANK GUARANTEE | PAGE 3 | 39234-ATSY-0724 |
| Item 2. Code of Ethics: |
| (a) The fund’s principal executive, financial and accounting officers are employees of Putnam Investment Management, LLC, the Fund’s investment manager. As such they are subject to a comprehensive Code of Ethics adopted and administered by Putnam Investments which is designed to protect the interests of the firm and its clients. The Fund has adopted a Code of Ethics which incorporates the Code of Ethics of Putnam Investments (Code of Ethics of Franklin Templeton effective March 4, 2024) with respect to all of its officers and Trustees who are employees of Putnam Investment Management, LLC. For this reason, the Fund has not adopted a separate code of ethics governing its principal executive, financial and accounting officers. |
| (c) In connection with the acquisition of Putnam Investments by Franklin Templeton, the Putnam Investments Code of Ethics was amended effective January 1, 2024 to reflect revised compliance processes, including: (i) Compliance with the Putnam Investments Code of Ethics will be viewed as compliance with the Franklin Templeton Code for certain Putnam employees who are dual-hatted in Franklin Templeton advisory entities (ii) Certain Franklin Templeton employees are required to hold shares of Putnam mutual funds at Putnam Investor Services, Inc. and (iii) Certain provisions of the Putnam Investments Code of Ethics are amended that are no longer needed due to organizational changes. Effective March 4, 2024, the majority of legacy Putnam employees transitioned to Franklin Templeton policies outlined in the Franklin Templeton Code. |
| Item 3. Audit Committee Financial Expert: |
| The Funds’ Audit, Compliance and Risk Committee is comprised solely of Trustees who are “independent” (as such term has been defined by the Securities and Exchange Commission (“SEC”) in regulations implementing Section 407 of the Sarbanes-Oxley Act (the “Regulations”)). The Trustees believe that each member of the Audit, Compliance and Risk Committee also possesses a combination of knowledge and experience with respect to financial accounting matters, as well as other attributes, that qualifies him or her for service on the Committee. In addition, the Trustees have determined that each of Dr. Hill and Mr. Singh qualifies as an “audit committee financial expert” (as such term has been defined by the Regulations) based on their review of his or her pertinent experience and education.The SEC has stated, and the funds’ amended and restated agreement and Declaration of Trust provides, that the designation or identification of a person as an audit committee financial expert pursuant to this Item 3 of Form N-CSR does not impose on such person any duties, obligations or liability that are greater than the duties, obligations and liability imposed on such person as a member of the Audit, Compliance and Risk Committee and the Board of Trustees in the absence of such designation or identification. |
| Item 4. Principal Accountant Fees and Services: |
| The following table presents fees billed in each of the last two fiscal years for services rendered to the fund by the fund’s independent auditor: |
| Fiscal year ended | Audit Fees | Audit-Related Fees | Tax Fees | All Other Fees | |
| May 31, 2024 | $144,691 | $ — | $12,376 | $ — | |
| May 31, 2023 | $106,354 | $ — | $12,016 | $ — | |
| For the fiscal years ended May 31, 2024 and May 31, 2023, the fund’s independent auditor billed aggregate non-audit fees in the amounts of $676,739 and $253,759 respectively, to the fund, Putnam Management and any entity controlling, controlled by or under common control with Putnam Management that provides ongoing services to the fund. |
| Audit Fees represent fees billed for the fund’s last two fiscal years relating to the audit and review of the financial statements included in annual reports and registration statements, and other services that are normally provided in connection with statutory and regulatory filings or engagements. |
| Audit-Related Fees represent fees billed in the fund’s last two fiscal years for services traditionally performed by the fund’s auditor, including accounting consultation for proposed transactions or concerning financial accounting and reporting standards and other audit or attest services not required by statute or regulation. |
| Tax Fees represent fees billed in the fund’s last two fiscal years for tax compliance, tax planning and tax advice services. Tax planning and tax advice services include assistance with tax audits, employee benefit plans and requests for rulings or technical advice from taxing authorities. |
| Pre-Approval Policies of the Audit, Compliance and Risk Committee. The Audit, Compliance and Risk Committee of the Putnam funds has determined that, as a matter of policy, all work performed for the funds by the funds’ independent auditors will be pre-approved by the Committee itself and thus will generally not be subject to pre-approval procedures. |
| The Audit, Compliance and Risk Committee also has adopted a policy to pre-approve the engagement by Putnam Management and certain of its affiliates of the funds’ independent auditors, even in circumstances where pre-approval is not required by applicable law. Any such requests by Putnam Management or certain of its affiliates are typically submitted in writing to the Committee and explain, among other things, the nature of the proposed engagement, the estimated fees, and why this work should be performed by that particular audit firm as opposed to another one. In reviewing such requests, the Committee considers, among other things, whether the provision of such services by the audit firm are compatible with the independence of the audit firm. |
| The following table presents fees billed by the fund’s independent auditor for services required to be approved pursuant to paragraph (c)(7)(ii) of Rule 2–01 of Regulation S-X. |
| Fiscal year ended | Audit-Related Fees | Tax Fees | All Other Fees | Total Non-Audit Fees | |
| May 31, 2024 | $ — | $664,363 | $ — | $ — | |
| May 31, 2023 | $ — | $241,743 | $ — | $ — | |
| (i) Not applicable |
| (j) Not applicable |
| Item 5. Audit Committee of Listed Registrants |
| Not applicable |
| Item 6. Investments: |
| The registrant’s schedule of investments in unaffiliated issuers is included in the Financial Statements and Other Important Information in Item 7 below. |
| Item 7. Financial Statements and Financial Highlights for Open-End Management Investment Companies. |

Putnam
Mortgage Opportunities Fund
Financial Statements and Other Important Information
Annual | May 31, 2024

Table of Contents
| Financial Statements and Other Important Information—Annual | franklintempleton.com |
Report of Independent Registered Public Accounting Firm
To the Board of Trustees of Putnam Funds Trust and Shareholders of Putnam Mortgage Opportunities Fund:
Opinion on the Financial Statements
We have audited the accompanying statement of assets and liabilities, including the fund’s portfolio, of Putnam Mortgage Opportunities Fund (one of the funds constituting Putnam Funds Trust, referred to hereafter as the “Fund”) as of May 31, 2024, the related statement of operations for the year ended May 31, 2024, the statement of changes in net assets for each of the two years in the period ended May 31, 2024, including the related notes, and the financial highlights for each of the periods indicated therein (collectively referred to as the “financial statements”). In our opinion, the financial statements present fairly, in all material respects, the financial position of the Fund as of May 31, 2024, the results of its operations for the year then ended, the changes in its net assets for each of the two years in the period ended May 31, 2024 and the financial highlights for each of the periods indicated therein in conformity with accounting principles generally accepted in the United States of America.
Basis for Opinion
These financial statements are the responsibility of the Fund’s management. Our responsibility is to express an opinion on the Fund’s financial statements based on our audits. We are a public accounting firm registered with the Public Company Accounting Oversight Board (United States) (“PCAOB”) and are required to be independent with respect to the Fund in accordance with the U.S. federal securities laws and the applicable rules and regulations of the Securities and Exchange Commission and the PCAOB.
We conducted our audits of these financial statements in accordance with the standards of the PCAOB. Those standards require that we plan and perform the audit to obtain reasonable assurance about whether the financial statements are free of material misstatement, whether due to error or fraud.
Our audits included performing procedures to assess the risks of material misstatement of the financial statements, whether due to error or fraud, and performing procedures that respond to those risks. Such procedures included examining, on a test basis, evidence regarding the amounts and disclosures in the financial statements. Our audits also included evaluating the accounting principles used and significant estimates made by management, as well as evaluating the overall presentation of the financial statements. Our procedures included confirmation of securities owned as of May 31, 2024 by correspondence with the custodian, transfer agent and brokers; when replies were not received from brokers, we performed other auditing procedures. We believe that our audits provide a reasonable basis for our opinion.
PricewaterhouseCoopers LLP
Boston, Massachusetts
July 18, 2024
We have served as the auditor of one or more investment companies in the Putnam Funds family of funds since at least 1957. We have not been able to determine the specific year we began serving as auditor.
| Mortgage Opportunities Fund 1 |
| The fund’s portfolio 5/31/24 | ||
| U.S. GOVERNMENT AND AGENCY MORTGAGE OBLIGATIONS (80.2%)* | Principal amount | Value |
| U.S. Government Guaranteed Mortgage Obligations (4.8%) | ||
| Government National Mortgage Association Pass-Through Certificates | ||
| 5.50%, TBA, 6/1/54 | $13,000,000 | $12,892,472 |
| 4.50%, TBA, 6/1/54 | 8,000,000 | 7,557,862 |
| 4.00%, TBA, 6/1/54 | 6,000,000 | 5,509,955 |
| 25,960,289 | ||
| U.S. Government Agency Mortgage Obligations (75.4%) | ||
| Uniform Mortgage-Backed Securities | ||
| 6.50%, TBA, 6/1/54 | 32,000,000 | 32,526,246 |
| 6.00%, TBA, 6/1/54 | 255,000,000 | 255,328,593 |
| 5.50%, TBA, 6/1/54 | 104,000,000 | 102,297,780 |
| 5.00%, TBA, 6/1/54 | 10,000,000 | 9,620,310 |
| 4.50%, TBA, 6/1/54 | 1,000,000 | 936,133 |
| 3.50%, TBA, 6/1/54 | 1,000,000 | 876,289 |
| 3.00%, TBA, 6/1/54 | 4,000,000 | 3,362,188 |
| 2.50%, TBA, 6/1/54 | 6,000,000 | 4,841,485 |
| 409,789,024 | ||
| Total U.S. government and agency mortgage obligations (cost $435,057,930) | $435,749,313 | |
| MORTGAGE-BACKED SECURITIES (77.0%)* | Principal amount | Value | |
| Agency collateralized mortgage obligations (32.3%) | |||
| Federal Home Loan Mortgage Corporation | |||
| REMICs Ser. 4976, Class MI, IO, 4.50%, 5/25/50 | $2,590,329 | $597,950 | |
| REMICs Ser. 5125, Class IL, IO, 4.50%, 11/15/47 | 19,969,732 | 4,296,955 | |
| REMICs Ser. 4949, IO, 4.00%, 1/25/50 | 12,372,136 | 2,918,497 | |
| REMICs Ser. 23-5349, Class IB, IO, 4.00%, 12/15/46 | 376,359 | 77,334 | |
| REMICs Ser. 4193, Class PI, IO, 4.00%, 3/15/43 | 152,981 | 21,867 | |
| REMICs Ser. 5065, Class MI, IO, 3.50%, 1/25/51 | 3,242,476 | 604,560 | |
| REMICs Ser. 5018, IO, 3.50%, 10/25/50 | 10,506,792 | 1,889,677 | |
| REMICs Ser. 5119, Class IB, IO, 3.00%, 6/25/41 | 4,805,562 | 519,481 | |
| REMICs Ser. 5274, IO, 2.50%, 1/25/51 | 14,020,391 | 2,301,254 | |
| REMICs Ser. 5034, Class IJ, IO, 2.50%, 11/25/50 | 12,768,469 | 2,098,370 | |
| REMICs IFB Ser. 4839, Class WS, IO, ((-1 x US 30 Day Average SOFR) + 5.99%), 0.662%, 8/15/56 | 6,623,027 | 741,183 | |
| REMICs IFB Ser. 4979, Class SN, IO, ((-1 x US 30 Day Average SOFR) + 5.94%), 0.612%, 6/25/50 | 2,060,630 | 189,642 | |
| REMICs IFB Ser. 4915, Class SD, IO, ((-1 x US 30 Day Average SOFR) + 5.94%), 0.612%, 9/25/49 | 1,704,003 | 146,391 | |
| REMICs IFB Ser. 4631, Class SA, IO, ((-1 x US 30 Day Average SOFR) + 5.89%), 0.562%, 11/15/46 | 26,800,901 | 2,730,076 | |
| Federal National Mortgage Association | |||
| REMICs Ser. 17-8, IO, 6.00%, 2/25/47 | 348,357 | 77,837 | |
| REMICs Ser. 16-3, Class NI, IO, 6.00%, 2/25/46 | 38,823 | 6,542 | |
| REMICs Ser. 15-69, IO, 6.00%, 9/25/45 | 188,023 | 40,344 | |
| REMICs Ser. 12-132, Class PI, IO, 5.00%, 10/25/42 | 497,624 | 82,530 | |
| REMICs Ser. 21-56, Class QI, IO, 4.50%, 9/25/51 | 3,230,936 | 827,582 | |
| REMICs Ser. 21-15, Class JI, IO, 4.50%, 4/25/51 | 2,287,378 | 568,362 | |
| REMICs Ser. 21-17, Class KI, IO, 4.50%, 4/25/51 | 2,417,911 | 561,874 | |
| REMICs Ser. 20-98, Class OI, IO, 4.50%, 1/25/51 | 9,477,005 | 2,245,755 | |
| REMICs Ser. 20-50, IO, 4.50%, 3/25/50 | 6,160,337 | 1,499,056 | |
| REMICs Ser. 21-17, Class GI, IO, 4.00%, 2/25/51 | 1,943,052 | 395,599 | |
| REMICs Ser. 21-25, Class IJ, IO, 3.50%, 5/25/51 | 5,219,486 | 1,026,777 | |
| REMICs Ser. 21-8, Class ID, IO, 3.50%, 3/25/51 | 7,093,992 | 1,548,589 | |
| REMICs Ser. 21-5, Class PI, IO, 3.50%, 2/25/51 | 2,828,167 | 545,763 | |
| REMICs Ser. 21-25, Class HI, IO, 3.50%, 7/25/50 | 6,035,988 | 1,046,001 | |
| REMICs Ser. 20-99, Class IB, IO, 3.50%, 5/25/50 | 8,525,277 | 1,523,467 | |
| REMICs Ser. 22-13, Class CI, IO, 3.00%, 12/25/51 | 14,282,471 | 2,168,153 | |
| REMICs Ser. 21-67, Class IG, IO, 3.00%, 10/25/51 | 3,380,139 | 565,663 | |
| REMICs Ser. 22-13, IO, 2.50%, 12/25/51 | 7,522,729 | 901,742 | |
| REMICs Ser. 21-3, Class IB, IO, 2.50%, 2/25/51 | 10,636,080 | 1,744,849 | |
| REMICs IFB Ser. 19-58, Class SA, IO, ((-1 x US 30 Day Average SOFR) + 5.94%), 0.612%, 10/25/49 | 9,449,488 | 868,873 | |
| REMICs IFB Ser. 23-57, Class SC, IO, ((-1 x US 30 Day Average SOFR) + 5.89%), 0.562%, 10/25/49 | 33,145,797 | 2,807,250 | |
2 Mortgage Opportunities Fund | |
| MORTGAGE-BACKED SECURITIES (77.0%)* cont. | Principal amount | Value | |
| Agency collateralized mortgage obligations cont. | |||
| Federal National Mortgage Association | |||
| REMICs IFB Ser. 16-54, Class SD, IO, ((-1 x US 30 Day Average SOFR) + 5.89%), 0.562%, 8/25/46 | $3,227,230 | $274,573 | |
| REMICs IFB Ser. 22-43, Class SB, IO, ((-1 x US 30 Day Average SOFR) + 5.40%), 0.076%, 7/25/52 | 15,686,528 | 744,608 | |
| Government National Mortgage Association | |||
| Ser. 16-75, Class LI, IO, 6.00%, 1/20/40 | 24,736 | 4,064 | |
| Ser. 21-176, Class IK, IO, 5.50%, 10/20/51 | 5,370,625 | 1,088,626 | |
| Ser. 21-59, Class IK, IO, 5.00%, 4/20/51 | 6,403,811 | 1,221,171 | |
| Ser. 17-179, Class WI, IO, 5.00%, 12/20/47 | 273,998 | 63,861 | |
| Ser. 15-89, Class LI, IO, 5.00%, 12/20/44 | 364,595 | 74,884 | |
| Ser. 14-132, IO, 5.00%, 9/20/44 | 608,557 | 127,371 | |
| Ser. 15-105, Class LI, IO, 5.00%, 10/20/39 | 397,367 | 80,654 | |
| Ser. 15-79, Class GI, IO, 5.00%, 10/20/39 | 42,259 | 8,236 | |
| Ser. 15-79, Class GI, IO, 5.00%, 10/20/39 | 5,377,690 | 1,153,803 | |
| Ser. 21-209, Class TG, IO, 4.50%, 11/20/51 | 7,040,679 | 1,505,992 | |
| Ser. 22-139, IO, 4.50%, 9/20/49 | 7,518,043 | 1,538,846 | |
| Ser. 21-122, Class GI, IO, 4.50%, 11/20/47 | 8,487,721 | 1,785,647 | |
| Ser. 16-17, Class IA, IO, 4.50%, 3/20/45 | 135,199 | 25,112 | |
| Ser. 13-34, Class HI, IO, 4.50%, 3/20/43 | 85,012 | 15,189 | |
| Ser. 21-162, Class IO, IO, 4.00%, 9/20/51 | 3,515,371 | 666,514 | |
| Ser. 17-104, Class GI, IO, 4.00%, 7/20/47 | 4,457,943 | 859,454 | |
| Ser. 15-149, Class KI, IO, 4.00%, 10/20/45 | 26,400 | 4,796 | |
| Ser. 18-72, Class IC, IO, 4.00%, 5/20/45 | 1,430,544 | 248,114 | |
| Ser. 15-53, Class MI, IO, 4.00%, 4/16/45 | 65,686 | 12,671 | |
| Ser. 15-89, Class IP, IO, 4.00%, 2/20/45 | 20,681 | 2,639 | |
| Ser. 14-188, Class IB, IO, 4.00%, 12/20/44 | 1,841,986 | 256,441 | |
| Ser. 21-214, Class DI, IO, 3.50%, 12/20/51 | 9,345,878 | 1,731,115 | |
| Ser. 21-197, Class BI, IO, 3.50%, 11/20/51 | 19,416,636 | 2,471,035 | |
| Ser. 21-176, Class IA, IO, 3.50%, 10/20/51 | 14,145,560 | 2,576,642 | |
| Ser. 21-177, Class IG, IO, 3.50%, 10/20/51 | 20,241,007 | 3,096,489 | |
| Ser. 21-91, Class AI, IO, 3.50%, 5/20/51 | 19,004,568 | 3,569,126 | |
| Ser. 20-167, Class PI, IO, 3.50%, 11/20/50 | 2,274,662 | 427,195 | |
| Ser. 20-32, Class IM, IO, 3.50%, 3/16/50 | 10,997,321 | 2,065,787 | |
| Ser. 19-158, Class PI, IO, 3.50%, 12/20/49 | 1,460,440 | 275,205 | |
| Ser. 16-75, Class EI, IO, 3.50%, 8/20/45 | 274,323 | 41,307 | |
| Ser. 15-168, Class IG, IO, 3.50%, 3/20/43 | 15,580 | 1,966 | |
| Ser. 13-14, IO, 3.50%, 12/20/42 | 19,848 | 2,469 | |
| Ser. 22-12, Class JI, IO, 3.00%, 1/20/52 | 16,178,441 | 2,059,354 | |
| Ser. 21-188, Class IU, IO, 3.00%, 10/20/51 | 11,226,129 | 2,034,443 | |
| Ser. 21-191, Class HI, IO, 3.00%, 10/20/51 | 2,986,362 | 461,689 | |
| Ser. 21-146, Class QI, IO, 3.00%, 8/20/51 | 16,072,963 | 2,381,168 | |
| Ser. 21-42, Class IG, IO, 3.00%, 3/20/51 | 2,211,625 | 360,243 | |
| Ser. 21-7, Class MI, IO, 2.50%, 1/20/51 | 16,556,380 | 2,190,797 | |
| Ser. 20-173, Class MI, IO, 2.50%, 11/20/50 | 16,385,673 | 2,319,556 | |
| Ser. 20-151, Class MI, IO, 2.50%, 10/20/50 | 4,341,561 | 614,591 | |
| Ser. 20-162, Class UI, IO, 2.50%, 10/20/50 | 14,022,139 | 1,944,791 | |
| Ser. 16-H24, IO, 2.153%, 9/20/66 W | 202,773 | 14,551 | |
| Ser. 17-H19, Class MI, IO, 2.102%, 4/20/67 W | 1,931,165 | 95,013 | |
| Ser. 15-H23, Class DI, IO, 1.893%, 9/20/65 W | 74,517 | 2,988 | |
| Ser. 15-H25, Class EI, IO, 1.86%, 10/20/65 W | 66,368 | 2,217 | |
| Ser. 15-H20, Class AI, IO, 1.829%, 8/20/65 W | 78,852 | 2,200 | |
| Ser. 15-H10, Class CI, IO, 1.807%, 4/20/65 W | 85,088 | 2,663 | |
| Ser. 15-H23, Class BI, IO, 1.756%, 9/20/65 W | 51,325 | 1,273 | |
| Ser. 17-H06, Class DI, IO, 1.749%, 2/20/67 W | 380,291 | 9,773 | |
| Ser. 15-H26, Class EI, IO, 1.738%, 10/20/65 W | 94,174 | 3,532 | |
| IFB Ser. 24-19, Class ES, IO, ((-1 x US 30 Day Average SOFR) + 7.00%), 1.677%, 2/20/54 | 51,103,871 | 3,366,197 | |
| IFB Ser. 24-4, Class SW, IO, ((-1 x US 30 Day Average SOFR) + 7.00%), 1.677%, 1/20/54 | 30,268,989 | 1,517,124 | |
| IFB Ser. 23-20, Class SB, IO, ((-1 x US 30 Day Average SOFR) + 7.00%), 1.677%, 2/20/53 | 23,580,526 | 1,714,292 | |
| IFB Ser. 23-20, Class SP, IO, ((-1 x US 30 Day Average SOFR) + 7.00%), 1.677%, 2/20/53 | 35,185,531 | 2,121,941 | |
| Ser. 14-H25, Class BI, IO, 1.669%, 12/20/64 W | 856,234 | 19,276 | |
| Ser. 16-H24, Class CI, IO, 1.668%, 10/20/66 W | 2,477,548 | 63,425 | |
| IFB Ser. 24-4, Class AS, IO, ((-1 x US 30 Day Average SOFR) + 6.95%), 1.627%, 1/20/54 | 25,062,041 | 1,947,659 | |
Mortgage Opportunities Fund 3 | |
| MORTGAGE-BACKED SECURITIES (77.0%)* cont. | Principal amount | Value | |
| Agency collateralized mortgage obligations cont. | |||
| Government National Mortgage Association | |||
| IFB Ser. 24-4, Class ES, IO, ((-1 x US 30 Day Average SOFR) + 6.95%), 1.627%, 1/20/54 | $42,638,144 | $2,751,329 | |
| IFB Ser. 23-173, Class ES, IO, ((-1 x US 30 Day Average SOFR) + 6.95%), 1.627%, 11/20/53 | 29,254,644 | 1,566,396 | |
| Ser. 15-H25, Class AI, IO, 1.60%, 9/20/65 W | 127,150 | 2,734 | |
| Ser. 17-H03, Class HI, IO, 1.59%, 1/20/67 W | 4,585,203 | 117,072 | |
| Ser. 15-H01, Class BI, IO, 1.56%, 1/20/65 W | 2,496,914 | 58,231 | |
| Ser. 17-H04, Class BI, IO, 1.432%, 2/20/67 W | 2,391,268 | 100,261 | |
| Ser. 17-H06, Class BI, IO, 1.353%, 2/20/67 W | 596,239 | 17,060 | |
| IFB Ser. 24-44, Class KS, IO, ((-1 x US 30 Day Average SOFR) + 6.65%), 1.327%, 3/20/54 | 12,976,348 | 1,104,399 | |
| Ser. 17-H08, Class NI, IO, 1.324%, 3/20/67 W | 246,793 | 8,613 | |
| Ser. 16-H09, Class BI, IO, 1.308%, 4/20/66 W | 3,763,400 | 176,503 | |
| IFB Ser. 13-182, Class SP, IO, ((-1 x CME Term SOFR 1 Month) + 6.59%), 1.265%, 12/20/43 | 587,901 | 54,428 | |
| Ser. 17-H06, Class MI, IO, 1.241%, 2/20/67 W | 779,841 | 30,236 | |
| Ser. 18-H02, Class HI, IO, 1.236%, 1/20/68 W | 2,484,204 | 120,151 | |
| Ser. 18-H02, Class IM, IO, 1.234%, 2/20/68 W | 1,518,652 | 91,594 | |
| Ser. 18-H05, Class BI, IO, 1.232%, 2/20/68 W | 1,065,039 | 48,006 | |
| Ser. 17-H09, IO, 1.215%, 4/20/67 W | 264,737 | 7,559 | |
| IFB Ser. 11-156, Class SK, IO, ((-1 x CME Term SOFR 1 Month) + 6.49%), 1.165%, 4/20/38 | 26,755 | 2,566 | |
| Ser. 16-H11, Class KI, IO, 1.127%, 5/20/66 W | 62,489,131 | 2,114,847 | |
| IFB Ser. 23-149, Class SE, IO, ((-1 x US 30 Day Average SOFR) + 6.45%), 1.127%, 9/20/63 | 41,030,120 | 1,493,193 | |
| IFB Ser. 23-35, Class SH, IO, ((-1 x US 30 Day Average SOFR) + 6.45%), 1.127%, 2/20/53 | 14,714,772 | 985,226 | |
| Ser. 17-H03, Class EI, IO, 1.10%, 1/20/67 W | 332,167 | 17,573 | |
| IFB Ser. 24-11, Class S, IO, ((-1 x US 30 Day Average SOFR) + 6.40%), 1.077%, 1/20/54 | 40,724,541 | 1,884,341 | |
| IFB Ser. 23-183, Class JS, IO, ((-1 x US 30 Day Average SOFR) + 6.40%), 1.077%, 12/20/53 | 16,096,411 | 668,777 | |
| Ser. 17-H10, Class MI, IO, 1.049%, 4/20/67 W | 2,759,031 | 82,219 | |
| Ser. 17-H02, Class BI, IO, 0.989%, 1/20/67 W | 1,413,279 | 46,590 | |
| IFB Ser. 23-152, Class SL, IO, ((-1 x US 30 Day Average SOFR) + 6.30%), 0.977%, 10/20/53 | 32,834,930 | 1,788,292 | |
| IFB Ser. 23-40, Class SC, IO, ((-1 x US 30 Day Average SOFR) + 6.30%), 0.977%, 3/20/53 | 19,014,518 | 782,714 | |
| Ser. 22-H09, Class GI, IO, 0.975%, 4/20/72 W | 23,089,266 | 1,223,240 | |
| Ser. 22-H01, Class EI, IO, 0.966%, 1/20/72 W | 5,397,191 | 286,957 | |
| Ser. 17-H11, Class DI, IO, 0.96%, 5/20/67 W | 171,041 | 9,060 | |
| IFB Ser. 23-43, Class SB, IO, ((-1 x US 30 Day Average SOFR) + 6.27%), 0.947%, 3/20/53 | 55,361,826 | 2,328,380 | |
| Ser. 15-H10, Class HI, IO, 0.944%, 4/20/65 W | 81,556 | 3,344 | |
| IFB Ser. 23-24, Class SQ, IO, ((-1 x US 30 Day Average SOFR) + 6.25%), 0.927%, 2/20/53 | 15,255,412 | 816,424 | |
| IFB Ser. 23-13, Class SB, IO, ((-1 x US 30 Day Average SOFR) + 6.25%), 0.927%, 1/20/53 | 34,622,440 | 1,813,066 | |
| IFB Ser. 23-13, Class SL, IO, ((-1 x US 30 Day Average SOFR) + 6.25%), 0.927%, 1/20/53 | 22,068,230 | 1,198,093 | |
| IFB Ser. 23-14, Class BS, IO, ((-1 x US 30 Day Average SOFR) + 6.25%), 0.927%, 1/20/53 | 27,362,876 | 1,631,055 | |
| IFB Ser. 23-147, Class SH, IO, ((-1 x US 30 Day Average SOFR) + 6.25%), 0.927%, 4/20/51 | 21,804,696 | 2,496,125 | |
| IFB Ser. 21-96, Class SQ, IO, ((-1 x CME Term SOFR 1 Month) + 6.24%), 0.915%, 6/20/51 | 1,977,459 | 207,556 | |
| Ser. 18-H01, Class AI, IO, 0.885%, 1/20/68 W | 8,109,664 | 389,264 | |
| Ser. 20-H04, Class AI, IO, 0.882%, 2/20/70 W | 7,893,124 | 371,790 | |
| Ser. 19-H12, Class GI, IO, 0.879%, 7/20/69 W | 8,917,279 | 328,543 | |
| IFB Ser. 23-35, Class ES, IO, ((-1 x US 30 Day Average SOFR) + 6.20%), 0.877%, 2/20/53 | 17,459,228 | 1,008,253 | |
| Ser. 16-H18, Class QI, IO, 0.873%, 6/20/66 W | 864,622 | 45,548 | |
| IFB Ser. 21-98, Class SK, IO, ((-1 x CME Term SOFR 1 Month) + 6.19%), 0.865%, 6/20/51 | 10,134,146 | 1,081,111 | |
| IFB Ser. 21-49, Class SB, IO, ((-1 x CME Term SOFR 1 Month) + 6.19%), 0.865%, 3/20/51 | 2,648,144 | 292,925 | |
| IFB Ser. 21-57, Class SD, IO, ((-1 x CME Term SOFR 1 Month) + 6.19%), 0.865%, 3/20/51 | 9,483,398 | 1,057,806 | |
| IFB Ser. 21-1, Class ST, IO, ((-1 x CME Term SOFR 1 Month) + 6.19%), 0.865%, 1/20/51 | 14,016,273 | 1,602,408 | |
| IFB Ser. 20-167, Class SC, IO, ((-1 x CME Term SOFR 1 Month) + 6.19%), 0.865%, 11/20/50 | 14,613,802 | 1,822,009 | |
| IFB Ser. 20-112, Class MS, IO, ((-1 x CME Term SOFR 1 Month) + 6.19%), 0.865%, 8/20/50 | 7,165,441 | 788,880 | |
| FRB Ser. 16-H19, Class AI, IO, 0.859%, 9/20/66 W | 3,580,857 | 148,953 | |
| Ser. 19-H02, Class DI, IO, 0.857%, 11/20/68 W | 14,918,787 | 717,379 | |
| IFB Ser. 23-56, Class AS, IO, ((-1 x US 30 Day Average SOFR) + 6.16%), 0.837%, 4/20/53 | 34,318,966 | 1,867,195 | |
| Ser. 16-H24, Class HI, IO, 0.834%, 9/20/66 W | 9,940,514 | 586,375 | |
| Ser. 15-H16, Class DI, IO, 0.828%, 7/20/65 W | 2,207,437 | 134,380 | |
| IFB Ser. 22-90, Class SB, IO, ((-1 x US 30 Day Average SOFR) + 6.15%), 0.827%, 5/20/52 | 13,736,676 | 722,386 | |
| Ser. 18-H20, Class BI, IO, 0.826%, 6/20/68 W | 5,093,339 | 224,301 | |
| IFB Ser. 10-26, Class QS, IO, ((-1 x CME Term SOFR 1 Month) + 6.14%), 0.815%, 2/20/40 | 18,195,261 | 1,540,957 | |
| Ser. 19-H14, Class IB, IO, 0.811%, 8/20/69 W | 201,829 | 9,376 | |
| Ser. 22-H09, Class IG, IO, 0.804%, 4/20/72 W | 17,759,191 | 836,436 | |
| Ser. 16-H23, Class NI, IO, 0.777%, 10/20/66 W | 117,800 | 4,877 | |
4 Mortgage Opportunities Fund | |
| MORTGAGE-BACKED SECURITIES (77.0%)* cont. | Principal amount | Value | |
| Agency collateralized mortgage obligations cont. | |||
| Government National Mortgage Association | |||
| IFB Ser. 14-131, Class BS, IO, ((-1 x CME Term SOFR 1 Month) + 6.09%), 0.766%, 9/16/44 | $2,271,681 | $238,016 | |
| Ser. 16-H15, Class AI, IO, 0.749%, 7/20/66 W | 8,047,811 | 312,142 | |
| Ser. 19-H07, Class EI, IO, 0.736%, 3/20/69 W | 17,639,509 | 750,367 | |
| IFB Ser. 23-114, Class SB, IO, ((-1 x US 30 Day Average SOFR) + 6.05%), 0.727%, 8/20/53 | 45,639,365 | 2,316,052 | |
| IFB Ser. 19-158, Class AS, IO, ((-1 x CME Term SOFR 1 Month) + 6.04%), 0.716%, 9/16/43 | 3,558,447 | 288,215 | |
| Ser. 17-H16, Class JI, IO, 0.683%, 8/20/67 W | 324,686 | 15,439 | |
| IFB Ser. 23-101, Class HS, IO, ((-1 x US 30 Day Average SOFR) + 6.00%), 0.677%, 7/20/53 | 26,510,811 | 1,376,908 | |
| IFB Ser. 23-103, Class SK, IO, ((-1 x US 30 Day Average SOFR) + 6.00%), 0.677%, 7/20/53 | 56,901,178 | 2,814,383 | |
| IFB Ser. 23-98, Class SA, IO, ((-1 x US 30 Day Average SOFR) + 6.00%), 0.677%, 7/20/53 | 45,247,688 | 1,639,690 | |
| IFB Ser. 23-82, Class CS, IO, ((-1 x US 30 Day Average SOFR) + 6.00%), 0.677%, 6/20/53 | 24,141,220 | 978,016 | |
| FRB Ser. 15-H16, Class XI, IO, 0.675%, 7/20/65 W | 4,895,873 | 256,054 | |
| IFB Ser. 22-179, Class SD, IO, ((-1 x CME Term SOFR 1 Month) + 5.99%), 0.665%, 11/20/49 | 12,661,564 | 943,806 | |
| IFB Ser. 19-96, Class SY, IO, ((-1 x CME Term SOFR 1 Month) + 5.99%), 0.665%, 8/20/49 | 2,429,993 | 227,617 | |
| IFB Ser. 20-77, Class KS, IO, ((-1 x CME Term SOFR 1 Month) + 5.99%), 0.665%, 5/20/49 | 15,104,131 | 1,354,443 | |
| IFB Ser. 23-183, Class VS, IO, ((-1 x US 30 Day Average SOFR) + 5.95%), 0.627%, 12/20/53 | 32,748,408 | 1,481,941 | |
| IFB Ser. 20-189, Class S, IO, ((-1 x CME Term SOFR 1 Month) + 5.94%), 0.615%, 12/20/49 | 16,561,008 | 1,409,292 | |
| IFB Ser. 19-103, Class SC, IO, ((-1 x CME Term SOFR 1 Month) + 5.94%), 0.615%, 8/20/49 | 13,177,114 | 1,181,809 | |
| IFB Ser. 19-98, Class SC, IO, ((-1 x CME Term SOFR 1 Month) + 5.94%), 0.615%, 8/20/49 | 1,543,809 | 142,024 | |
| Ser. 16-H27, Class EI, IO, 0.573%, 12/20/66 W | 17,551,803 | 545,879 | |
| IFB Ser. 19-121, Class SD, IO, ((-1 x CME Term SOFR 1 Month) + 5.89%), 0.565%, 10/20/49 | 3,225,158 | 331,975 | |
| IFB Ser. 19-4, Class S, IO, ((-1 x CME Term SOFR 1 Month) + 5.89%), 0.565%, 1/20/49 | 13,675,160 | 884,550 | |
| IFB Ser. 20-47, Class SA, IO, ((-1 x CME Term SOFR 1 Month) + 5.89%), 0.565%, 5/20/44 | 3,383,352 | 246,342 | |
| Ser. 15-H13, Class AI, IO, 0.559%, 6/20/65 W | 135,559 | 5,792 | |
| Ser. 15-H20, Class CI, IO, 0.539%, 8/20/65 W | 1,052,379 | 56,618 | |
| IFB Ser. 23-114, Class SK, IO, ((-1 x US 30 Day Average SOFR) + 5.85%), 0.527%, 8/20/53 | 43,714,091 | 2,009,261 | |
| Ser. 7569, Class SE, IO, ((-1 x US 30 Day Average SOFR) + 5.80%), 0.477%, 6/20/54 ## | 53,701,315 | 3,103,410 | |
| IFB Ser. 22-45, Class SP, IO, ((-1 x US 30 Day Average SOFR) + 5.80%), 0.477%, 5/20/50 | 36,838,525 | 2,591,542 | |
| Ser. 15-H26, Class DI, IO, 0.455%, 10/20/65 W | 54,817 | 2,284 | |
| Ser. 17-H22, Class DI, IO, 0.449%, 11/20/67 W | 2,047,340 | 119,037 | |
| Ser. 15-H25, Class CI, IO, 0.429%, 10/20/65 W | 57,906 | 2,119 | |
| IFB Ser. 23-20, Class PS, IO, ((-1 x US 30 Day Average SOFR) + 5.75%), 0.427%, 2/20/53 | 71,839,466 | 2,226,679 | |
| Ser. 17-H20, Class AI, IO, 0.384%, 10/20/67 W | 1,774,785 | 81,679 | |
| IFB Ser. 24-4, Class GS, IO, ((-1 x US 30 Day Average SOFR) + 5.70%), 0.377%, 1/20/54 | 26,624,833 | 1,204,803 | |
| IFB Ser. 23-40, Class SH, IO, ((-1 x US 30 Day Average SOFR) + 5.70%), 0.377%, 3/20/53 | 19,683,921 | 630,673 | |
| Ser. 17-H20, Class HI, IO, 0.371%, 10/20/67 W | 637,963 | 35,124 | |
| Ser. 19-H15, Class IH, IO, 0.361%, 9/20/69 W | 11,588,388 | 451,513 | |
| Ser. 16-H04, Class KI, IO, 0.306%, 2/20/66 W | 11,090,704 | 217,669 | |
| IFB Ser. 22-63, Class SB, IO, ((-1 x US 30 Day Average SOFR) + 5.60%), 0.277%, 11/20/46 | 4,143,049 | 296,585 | |
| Ser. 15-H04, Class AI, IO, 0.242%, 12/20/64 W | 1,725,991 | 50,599 | |
| IFB Ser. 23-166, Class SJ, IO, ((-1 x US 30 Day Average SOFR) + 5.50%), 0.177%, 11/20/53 | 49,095,725 | 846,877 | |
| IFB Ser. 23-76, Class SA, IO, ((-1 x US 30 Day Average SOFR) + 5.50%), 0.177%, 5/20/53 | 75,555,406 | 1,997,300 | |
| Ser. 14-H21, Class AI, IO, 0.148%, 10/20/64 W | 683,390 | 21,978 | |
| FRB Ser. 23-149, Class SQ, IO, ((-1 x US 30 Day Average SOFR) + 5.45%), 0.127%, 10/20/53 | 52,474,691 | 1,526,536 | |
| FRB Ser. 21-H08, IO, zero %, 1/20/71 W | 24,886,081 | 952,913 | |
| 175,339,516 | |||
| Commercial mortgage-backed securities (19.6%) | |||
| BANK | |||
| FRB Ser. 20-BN30, Class XA, IO, 1.29%, 12/15/53 W | 9,498,071 | 567,629 | |
| FRB Ser. 20-BN26, Class XA, IO, 1.206%, 3/15/63 W | 14,452,853 | 708,404 | |
| BANK 144A Ser. 18-BN11, Class D, 3.00%, 3/15/61 | 609,000 | 407,500 | |
| Barclays Commercial Mortgage Trust 144A | |||
| Ser. 19-C4, Class D, 3.25%, 8/15/52 | 1,010,000 | 706,498 | |
| Ser. 19-C4, Class E, 3.25%, 8/15/52 | 793,000 | 478,212 | |
| FRB Ser. 19-C5, Class F, 2.606%, 11/15/52 W | 1,261,000 | 674,179 | |
| Ser. 19-C5, Class E, 2.50%, 11/15/52 | 867,000 | 606,151 | |
| BDS, Ltd. 144A FRB Ser. 21-FL9, Class A, (CME Term SOFR 1 Month + 1.18%), 6.505%, 11/16/38 (Cayman Islands) | 1,349,309 | 1,339,395 | |
| Benchmark Mortgage Trust FRB Ser. 18-B1, Class C, 4.176%, 1/15/51 W | 712,000 | 531,632 | |
Mortgage Opportunities Fund 5 | |
| MORTGAGE-BACKED SECURITIES (77.0%)* cont. | Principal amount | Value | |
| Commercial mortgage-backed securities cont. | |||
| Benchmark Mortgage Trust 144A | |||
| FRB Ser. 18-B3, Class D, 3.021%, 4/10/51 W | $1,753,000 | $1,090,801 | |
| Ser. 19-B11, Class D, 3.00%, 5/15/52 | 963,000 | 621,001 | |
| Ser. 18-B1, Class D, 2.75%, 1/15/51 | 2,021,000 | 1,086,782 | |
| Ser. 19-B13, Class D, 2.50%, 8/15/57 | 1,295,000 | 759,777 | |
| BWAY Mortgage Trust 144A FRB Ser. 22-26BW, Class F, 4.866%, 2/10/44 W | 580,000 | 358,014 | |
| Cantor Commercial Real Estate Lending FRB Ser. 19-CF3, Class XA, IO, 0.691%, 1/15/53 W | 12,962,826 | 371,458 | |
| Cantor Commercial Real Estate Lending 144A Ser. 19-CF2, Class D, 2.50%, 11/15/52 | 313,000 | 215,626 | |
| CD Commercial Mortgage Trust | |||
| FRB Ser. 17-CD3, Class C, 4.538%, 2/10/50 W | 615,000 | 319,293 | |
| Ser. 17-CD3, Class B, 3.984%, 2/10/50 W | 888,000 | 623,216 | |
| CD Commercial Mortgage Trust 144A | |||
| Ser. 17-CD3, Class D, 3.25%, 2/10/50 | 889,000 | 198,582 | |
| Ser. 19-CD8, Class D, 3.00%, 8/15/57 | 507,000 | 301,130 | |
| Citigroup Commercial Mortgage Trust | |||
| FRB Ser. 15-GC27, Class C, 4.419%, 2/10/48 W | 989,000 | 944,476 | |
| FRB Ser. 17-P7, Class C, 4.384%, 4/14/50 W | 373,000 | 286,293 | |
| FRB Ser. 15-P1, Class C, 4.369%, 9/15/48 W | 725,000 | 682,269 | |
| Ser. 14-GC21, Class B, 4.328%, 5/10/47 W | 1,749,000 | 1,661,550 | |
| Ser. 16-P3, Class B, 4.271%, 4/15/49 W | 1,630,000 | 1,499,078 | |
| FRB Ser. 15-GC31, Class D, 4.033%, 6/10/48 W | 1,541,000 | 1,008,135 | |
| Citigroup Commercial Mortgage Trust 144A | |||
| FRB Ser. 12-GC8, Class C, 5.433%, 9/10/45 W | 627,421 | 570,279 | |
| FRB Ser. 13-GC17, Class D, 5.09%, 11/10/46 W | 834,359 | 763,439 | |
| FRB Ser. 15-GC27, Class D, 4.419%, 2/10/48 W | 631,000 | 582,168 | |
| Ser. 14-GC25, Class D, 3.548%, 10/10/47 | 239,000 | 179,255 | |
| Ser. 15-P1, Class D, 3.225%, 9/15/48 | 611,000 | 536,701 | |
| Ser. 15-GC27, Class E, 3.00%, 2/10/48 | 1,555,000 | 1,116,766 | |
| COMM Mortgage Trust | |||
| FRB Ser. 13-CR13, Class C, 4.948%, 11/10/46 W | 360,794 | 339,378 | |
| FRB Ser. 14-CR16, Class C, 4.89%, 4/10/47 W | 1,226,000 | 1,138,341 | |
| FRB Ser. 14-CR17, Class C, 4.692%, 5/10/47 W | 1,917,500 | 1,740,848 | |
| FRB Ser. 14-UBS3, Class C, 4.646%, 6/10/47 W | 301,000 | 217,193 | |
| FRB Ser. 14-UBS4, Class C, 4.635%, 8/10/47 W | 324,000 | 248,537 | |
| Ser. 14-LC17, Class B, 4.49%, 10/10/47 W | 634,000 | 622,641 | |
| FRB Ser. 14-UBS6, Class C, 4.431%, 12/10/47 W | 334,000 | 298,578 | |
| Ser. 14-CR17, Class B, 4.377%, 5/10/47 | 652,000 | 607,990 | |
| Ser. 13-CR12, Class AM, 4.30%, 10/10/46 | 1,463,055 | 1,343,268 | |
| Ser. 15-DC1, Class B, 4.035%, 2/10/48 W | 1,263,000 | 1,180,881 | |
| FRB Ser. 14-CR14, Class C, 3.711%, 2/10/47 W | 650,000 | 591,938 | |
| FRB Ser. 15-CR26, Class D, 3.464%, 10/10/48 W | 875,000 | 689,219 | |
| COMM Mortgage Trust 144A | |||
| FRB Ser. 13-LC13, Class D, 5.391%, 8/10/46 W | 278,000 | 231,376 | |
| FRB Ser. 13-CR13, Class D, 4.948%, 11/10/46 W | 1,860,000 | 1,248,356 | |
| FRB Ser. 14-CR17, Class D, 4.756%, 5/10/47 W | 1,247,000 | 926,609 | |
| FRB Ser. 14-CR17, Class E, 4.756%, 5/10/47 W | 1,366,000 | 958,386 | |
| FRB Ser. 14-CR19, Class D, 4.641%, 8/10/47 W | 597,000 | 552,358 | |
| FRB Ser. 13-CR7, Class D, 4.243%, 3/10/46 W | 994,324 | 925,219 | |
| FRB Ser. 15-LC19, Class E, 4.212%, 2/10/48 W | 1,070,000 | 811,262 | |
| FRB Ser. 14-CR15, Class D, 3.98%, 2/10/47 W | 923,000 | 830,700 | |
| FRB Ser. 14-CR14, Class D, 3.711%, 2/10/47 W | 1,479,000 | 1,131,477 | |
| Ser. 12-CR4, Class B, 3.703%, 10/15/45 | 2,145,000 | 1,341,000 | |
| Ser. 13-LC6, Class E, 3.50%, 1/10/46 | 460,000 | 417,637 | |
| FRB Ser. 16-COR1, Class D, 3.325%, 10/10/49 W | 1,501,500 | 1,079,868 | |
| Ser. 17-COR2, Class D, 3.00%, 9/10/50 | 1,656,000 | 1,225,440 | |
| Ser. 15-LC19, Class D, 2.867%, 2/10/48 | 1,769,000 | 1,602,091 | |
| CSAIL Commercial Mortgage Trust | |||
| FRB Ser. 15-C3, Class C, 4.349%, 8/15/48 W | 1,168,000 | 997,337 | |
| FRB Ser. 15-C2, Class C, 4.173%, 6/15/57 W | 1,299,000 | 1,147,504 | |
| FRB Ser. 15-C2, Class D, 4.173%, 6/15/57 W | 1,355,000 | 960,802 | |
| CSAIL Commercial Mortgage Trust 144A Ser. 19-C17, Class D, 2.50%, 9/15/52 | 594,000 | 386,513 | |
6 Mortgage Opportunities Fund | |
| MORTGAGE-BACKED SECURITIES (77.0%)* cont. | Principal amount | Value | |
| Commercial mortgage-backed securities cont. | |||
| Federal Home Loan Mortgage Corporation 144A | |||
| Multifamily Structured Credit Risk FRB Ser. 21-MN3, Class M2, 9.324%, 11/25/51 | $2,059,000 | $2,073,341 | |
| Multifamily Structured Credit Risk FRB Ser. 21-MN1, Class M2, 9.074%, 1/25/51 | 758,000 | 761,346 | |
| Government National Mortgage Association FRB Ser. 24-32, IO, 0.706%, 6/16/63 | 16,810,917 | 833,825 | |
| GS Mortgage Securities Corp., II 144A FRB Ser. 13-GC10, Class D, 4.537%, 2/10/46 W | 471,000 | 439,157 | |
| GS Mortgage Securities Trust 144A | |||
| FRB Ser. 10-C1, Class D, 6.36%, 8/10/43 W | 397,000 | 332,304 | |
| FRB Ser. 14-GC24, Class D, 4.515%, 9/10/47 W | 2,089,000 | 1,177,380 | |
| FRB Ser. 13-GC13, Class D, 3.843%, 7/10/46 W | 739,000 | 451,845 | |
| Ser. 17-GS5, Class D, 3.509%, 3/10/50 W | 3,043,000 | 1,462,384 | |
| Ser. 19-GC38, Class D, 3.00%, 2/10/52 | 439,000 | 340,721 | |
| JPMBB Commercial Mortgage Securities Trust | |||
| FRB Ser. 14-C22, Class B, 4.554%, 9/15/47 W | 399,000 | 369,316 | |
| FRB Ser. 14-C22, Class C, 4.554%, 9/15/47 W | 354,000 | 322,795 | |
| JPMBB Commercial Mortgage Securities Trust 144A | |||
| FRB Ser. 14-C19, Class C19, 4.885%, 4/15/47 W | 239,054 | 238,011 | |
| FRB Ser. 14-C18, Class D, 4.627%, 2/15/47 W | 1,135,000 | 928,424 | |
| FRB Ser. 13-C12, Class E, 3.958%, 7/15/45 W | 625,000 | 443,438 | |
| FRB Ser. 14-C25, Class D, 3.932%, 11/15/47 W | 1,390,000 | 1,012,027 | |
| Ser. 13-C14, Class F, 3.598%, 8/15/46 W | 402,000 | 32,080 | |
| JPMCC Commercial Mortgage Securities Trust 144A FRB Ser. 17-JP7, Class D, 4.373%, 9/15/50 W | 388,000 | 280,947 | |
| JPMDB Commercial Mortgage Securities Trust Ser. 17-C5, Class C, 4.512%, 3/15/50 W | 566,000 | 419,007 | |
| JPMDB Commercial Mortgage Securities Trust 144A FRB Ser. 16-C2, Class D, 3.325%, 6/15/49 W | 1,101,000 | 607,831 | |
| JPMorgan Chase Commercial Mortgage Securities Trust | |||
| FRB Ser. 13-LC11, Class D, 4.158%, 4/15/46 W | 740,000 | 318,957 | |
| FRB Ser. 13-C10, Class C, 4.074%, 12/15/47 W | 582,924 | 536,868 | |
| JPMorgan Chase Commercial Mortgage Securities Trust 144A | |||
| FRB Ser. 11-C3, Class D, 5.525%, 2/15/46 W | 450,000 | 346,807 | |
| FRB Ser. 13-LC11, Class E, 3.25%, 4/15/46 (In default) † W | 643,000 | 160,036 | |
| Ser. 12-C6, Class G, 2.972%, 5/15/45 W | 100,000 | 69,231 | |
| Morgan Stanley Bank of America Merrill Lynch Trust | |||
| Ser. 12-C6, Class C, 4.536%, 11/15/45 W | 917,499 | 888,007 | |
| FRB Ser. 15-C25, Class C, 4.517%, 10/15/48 W | 1,646,000 | 1,444,022 | |
| FRB Ser. 14-C17, Class B, 4.464%, 8/15/47 W | 1,060,000 | 1,051,823 | |
| FRB Ser. 15-C22, Class C, 4.199%, 4/15/48 W | 1,125,000 | 1,040,429 | |
| FRB Ser. 17-C34, Class C, 4.17%, 11/15/52 W | 691,000 | 573,123 | |
| FRB Ser. 15-C23, Class B, 4.138%, 7/15/50 W | 967,000 | 924,760 | |
| Ser. 14-C19, Class C, 4.00%, 12/15/47 | 787,000 | 755,369 | |
| FRB Ser. 13-C9, Class C, 3.725%, 5/15/46 W | 269,000 | 234,607 | |
| Ser. 13-C9, Class B, 3.708%, 5/15/46 W | 1,009,231 | 924,190 | |
| Morgan Stanley Bank of America Merrill Lynch Trust 144A | |||
| FRB Ser. 13-C12, Class D, 4.686%, 10/15/46 W | 1,139,000 | 989,222 | |
| FRB Ser. 13-C12, Class E, 4.686%, 10/15/46 W | 405,000 | 316,022 | |
| FRB Ser. 14-C17, Class D, 4.644%, 8/15/47 W | 1,641,500 | 1,513,049 | |
| FRB Ser. 12-C6, Class G, 4.50%, 11/15/45 W | 1,441,000 | 510,979 | |
| FRB Ser. 12-C6, Class E, 4.389%, 11/15/45 W | 1,303,000 | 573,320 | |
| FRB Ser. 15-C24, Class E, 4.322%, 5/15/48 W | 677,000 | 514,926 | |
| FRB Ser. 15-C23, Class D, 4.138%, 7/15/50 W | 1,242,000 | 1,146,441 | |
| FRB Ser. 13-C10, Class F, 3.984%, 7/15/46 W | 1,286,000 | 79,805 | |
| FRB Ser. 13-C9, Class D, 3.813%, 5/15/46 W | 881,000 | 729,165 | |
| FRB Ser. 13-C9, Class G, 3.813%, 5/15/46 W | 1,500,000 | 518,400 | |
| Ser. 14-C19, Class D, 3.25%, 12/15/47 | 574,000 | 496,006 | |
| Ser. 17-C34, Class D, 2.70%, 11/15/52 | 663,000 | 390,454 | |
| Morgan Stanley Capital I Trust | |||
| Ser. 06-HQ10, Class B, 5.448%, 11/12/41 W | 24,032 | 20,427 | |
| FRB Ser. 18-H3, Class C, 4.85%, 7/15/51 W | 1,174,000 | 1,044,759 | |
| Ser. 15-UBS8, Class B, 4.315%, 12/15/48 W | 2,528,000 | 2,348,815 | |
| FRB Ser. 16-UB12, Class C, 4.125%, 12/15/49 W | 498,000 | 326,649 | |
| FRB Ser. 15-MS1, Class C, 4.023%, 5/15/48 W | 1,270,000 | 1,101,467 | |
| FRB Ser. 16-BNK2, Class C, 3.881%, 11/15/49 W | 571,000 | 425,064 | |
Mortgage Opportunities Fund 7 | |
| MORTGAGE-BACKED SECURITIES (77.0%)* cont. | Principal amount | Value | |
| Commercial mortgage-backed securities cont. | |||
| Morgan Stanley Capital I Trust 144A | |||
| FRB Ser. 12-C4, Class D, 5.164%, 3/15/45 W | $621,531 | $583,028 | |
| FRB Ser. 12-C4, Class E, 5.164%, 3/15/45 W | 392,000 | 285,572 | |
| FRB Ser. 11-C3, Class G, 4.943%, 7/15/49 W | 753,000 | 655,283 | |
| Ser. 18-L1, Class D, 3.00%, 10/15/51 | 2,079,000 | 1,378,377 | |
| PFP, Ltd. 144A | |||
| FRB Ser. 23-10, Class AS, 8.345%, 9/16/38 (Bermuda) | 593,000 | 596,726 | |
| FRB Ser. 22-9, Class AS, 8.103%, 8/19/35 (Bermuda) | 768,000 | 771,488 | |
| Shelter Growth CRE Issuer, Ltd. 144A FRB Ser. 23-FL5, Class A, 8.074%, 5/19/38 (Bermuda) | 815,000 | 816,236 | |
| UBS Commercial Mortgage Trust | |||
| FRB Ser. 18-C11, Class C, 4.882%, 6/15/51 W | 641,000 | 522,798 | |
| FRB Ser. 17-C3, Class C, 4.385%, 8/15/50 W | 1,552,000 | 1,287,379 | |
| UBS Commercial Mortgage Trust 144A | |||
| FRB Ser. 12-C1, Class E, 5.00%, 5/10/45 W | 503,044 | 460,179 | |
| FRB Ser. 17-C1, Class D, 4.864%, 6/15/50 W | 1,223,000 | 991,328 | |
| FRB Ser. 18-C11, Class D, 3.00%, 6/15/51 W | 2,527,000 | 1,307,607 | |
| Wells Fargo Commercial Mortgage Trust | |||
| FRB Ser. 16-NXS5, Class D, 4.976%, 1/15/59 W | 371,000 | 278,789 | |
| FRB Ser. 15-C31, Class C, 4.594%, 11/15/48 W | 711,000 | 662,752 | |
| FRB Ser. 15-SG1, Class B, 4.452%, 9/15/48 W | 980,000 | 907,761 | |
| FRB Ser. 15-C29, Class D, 4.218%, 6/15/48 W | 1,670,000 | 1,469,994 | |
| Ser. 15-C31, Class D, 3.852%, 11/15/48 | 1,322,000 | 1,085,081 | |
| FRB Ser. 19-C52, Class XA, IO, 1.589%, 8/15/52 W | 9,512,186 | 571,210 | |
| FRB Ser. 21-C59, Class XA, IO, 1.514%, 4/15/54 W | 23,670,251 | 1,693,962 | |
| Wells Fargo Commercial Mortgage Trust 144A | |||
| FRB Ser. 15-C31, Class E, 4.594%, 11/15/48 W | 783,000 | 526,649 | |
| FRB Ser. 15-C30, Class D, 4.493%, 9/15/58 W | 1,040,000 | 897,384 | |
| FRB Ser. 13-LC12, Class D, 3.952%, 7/15/46 W | 381,000 | 133,378 | |
| Ser. 14-LC16, Class D, 3.938%, 8/15/50 | 274,212 | 32,905 | |
| Ser. 17-RB1, Class D, 3.401%, 3/15/50 | 1,618,000 | 862,305 | |
| Ser. 16-C33, Class D, 3.123%, 3/15/59 | 1,519,000 | 1,182,973 | |
| Ser. 19-C50, Class D, 3.00%, 5/15/52 | 437,000 | 322,343 | |
| Ser. 20-C55, Class D, 2.50%, 2/15/53 | 919,000 | 588,370 | |
| WF-RBS Commercial Mortgage Trust Ser. 14-C21, Class C, 4.234%, 8/15/47 W | 816,000 | 775,216 | |
| WF-RBS Commercial Mortgage Trust 144A | |||
| Ser. 11-C4, Class E, 4.978%, 6/15/44 W | 806,022 | 620,224 | |
| FRB Ser. 12-C9, Class D, 4.719%, 11/15/45 W | 2,783 | 2,707 | |
| FRB Ser. 13-C15, Class D, 4.188%, 8/15/46 W | 1,324,000 | 531,056 | |
| FRB Ser. 13-C11, Class D, 4.061%, 3/15/45 W | 1,510,000 | 1,243,897 | |
| 106,472,771 | |||
| Residential mortgage-backed securities (non-agency) (25.1%) | |||
| A&D Mortgage Trust 144A | |||
| Ser. 23-NQM5, Class A1, 7.049%, 11/25/68 | 1,957,598 | 1,972,581 | |
| Ser. 24-NQM1, Class A1, 6.195%, 2/25/69 | 2,324,474 | 2,304,862 | |
| Ser. 23-NQM2, Class A1, 6.132%, 5/25/68 | 1,296,232 | 1,288,069 | |
| American Home Mortgage Investment Trust FRB Ser. 07-1, Class GA1C, (CME Term SOFR 1 Month + 0.30%), 5.629%, 5/25/47 | 1,416,526 | 827,693 | |
| Arroyo Mortgage Trust 144A Ser. 20-1, Class M1, 4.277%, 3/25/55 | 442,000 | 365,592 | |
| Bear Stearns Alt-A Trust | |||
| FRB Ser. 05-10, Class 11A1, (CME Term SOFR 1 Month + 0.61%), 5.939%, 1/25/36 | 87,758 | 79,060 | |
| FRB Ser. 05-8, Class 21A1, 5.285%, 10/25/35 W | 265,220 | 219,243 | |
| Bear Stearns Mortgage Funding Trust FRB Ser. 06-AR2, Class 2A1, (CME Term SOFR 1 Month + 0.57%), 5.899%, 9/25/46 | 1,828,176 | 1,553,911 | |
| BRAVO Residential Funding Trust 144A | |||
| Ser. 23-NQM8, Class A1, 6.394%, 10/25/63 | 1,463,489 | 1,468,896 | |
| Ser. 24-NQM2, Class A1, stepped-coupon 6.285% (7.285%, 2/1/28), 2/25/64 †† | 3,538,261 | 3,541,962 | |
| Cascade Funding Mortgage Trust, LLC 144A FRB Ser. 24-HB13, Class M1, 3.00%, 5/25/34 W | 3,750,000 | 3,356,250 | |
| Chevy Chase Funding, LLC Mortgage-Backed Certificates 144A FRB Ser. 06-4A, Class A2, (CME Term SOFR 1 Month + 0.29%), 5.619%, 11/25/47 | 779,026 | 584,922 | |
| Citigroup Mortgage Loan Trust, Inc. FRB Ser. 07-AMC3, Class A2D, (CME Term SOFR 1 Month + 0.46%), 5.789%, 3/25/37 | 154,716 | 126,519 | |
8 Mortgage Opportunities Fund | |
| MORTGAGE-BACKED SECURITIES (77.0%)* cont. | Principal amount | Value | |
| Residential mortgage-backed securities (non-agency) cont. | |||
| Countrywide Alternative Loan Trust | |||
| FRB Ser. 05-38, Class A1, (Federal Reserve US 12 Month Cumulative Avg 1 yr CMT + 1.50%), 6.615%, 9/25/35 | $603,382 | $519,571 | |
| Ser. 06-43CB, Class 1A10, 6.00%, 2/25/37 | 3,528,758 | 1,878,809 | |
| FRB Ser. 06-OA10, Class 3A1, (CME Term SOFR 1 Month + 0.49%), 5.819%, 8/25/46 | 185,713 | 167,734 | |
| FRB Ser. 06-OA10, Class 4A1, (CME Term SOFR 1 Month + 0.49%), 5.819%, 8/25/46 | 204,592 | 174,704 | |
| FRB Ser. 06-OA19, Class A1, (CME Term SOFR 1 Month + 0.29%), 5.615%, 2/20/47 | 1,064,526 | 811,530 | |
| Countrywide Home Loans Mortgage Pass-Through Trust FRB Ser. 06-OA5, Class 2A1, (CME Term SOFR 1 Month + 0.51%), 5.839%, 4/25/46 | 28,296 | 23,526 | |
| Credit Suisse Mortgage Capital Certificates 144A FRB Ser. 20-SPT1, Class M1, 3.388%, 4/25/65 W | 392,000 | 353,916 | |
| CSMC Mortgaged-Backed Trust FRB Ser. 07-1, Class 1A3, 5.989%, 2/25/37 W | 5,568,255 | 1,235,770 | |
| CSMC Trust 144A FRB Ser. 20-RPL2, Class A12, 3.614%, 2/25/60 W | 3,203,718 | 3,250,269 | |
| Deutsche Alt-B Securities Mortgage Loan Trust Ser. 06-AB4, Class A4B, 6.50%, 10/25/36 | 2,026,731 | 1,655,362 | |
| Federal Home Loan Mortgage Corporation | |||
| Structured Agency Credit Risk Debt FRN Ser. 15-HQA2, Class B, (US 30 Day Average SOFR + 10.61%), 15.938%, 5/25/28 | 247,903 | 271,154 | |
| Structured Agency Credit Risk Debt FRN Ser. 17-DNA1, Class B2, (US 30 Day Average SOFR + 10.00%), 15.438%, 7/25/29 | 518,476 | 589,341 | |
| Structured Agency Credit Risk Debt FRN Ser. 16-DNA1, Class B, (US 30 Day Average SOFR + 10.11%), 15.438%, 7/25/28 | 245,707 | 272,349 | |
| Structured Agency Credit Risk Debt FRN Ser. 15-DNA3, Class B, (US 30 Day Average SOFR + 9.46%), 14.788%, 4/25/28 | 294,039 | 322,046 | |
| Structured Agency Credit Risk Debt FRN Ser. 15-HQA1, Class B, (US 30 Day Average SOFR + 8.91%), 14.238%, 3/25/28 | 368,599 | 384,709 | |
| Structured Agency Credit Risk Debt FRN Ser. 15-DNA2, Class B, (US 30 Day Average SOFR + 7.66%), 12.988%, 12/25/27 | 1,152,341 | 1,208,409 | |
| Seasoned Credit Risk Transfer Trust Ser. 18-1, Class M, 4.75%, 5/25/57 W | 761,997 | 726,147 | |
| Federal Home Loan Mortgage Corporation 144A | |||
| Structured Agency Credit Risk Trust FRB Ser. 19-HQA1, Class B2, (US 30 Day Average SOFR + 12.36%), 17.688%, 2/25/49 | 2,642,000 | 3,373,704 | |
| Structured Agency Credit Risk Trust FRB Ser. 18-HQA2, Class B2, (US 30 Day Average SOFR + 11.11%), 16.438%, 10/25/48 | 3,028,000 | 3,849,415 | |
| Structured Agency Credit Risk Trust REMICs FRB Ser. 22-HQA1, Class B2, (US 30 Day Average SOFR + 11.00%), 16.324%, 3/25/42 | 2,600,000 | 3,048,500 | |
| Structured Agency Credit Risk Trust FRB Ser. 19-DNA1, Class B2, (US 30 Day Average SOFR + 10.86%), 16.188%, 1/25/49 | 439,000 | 558,134 | |
| Structured Agency Credit Risk Trust FRB Ser. 19-DNA2, Class B2, (US 30 Day Average SOFR + 10.61%), 15.938%, 3/25/49 | 755,000 | 919,037 | |
| Structured Agency Credit Risk Trust REMICs FRB Ser. 20-DNA3, Class B2, (US 30 Day Average SOFR + 9.46%), 14.788%, 6/25/50 | 750,000 | 985,430 | |
| Structured Agency Credit Risk Trust FRB Ser. 19-FTR1, Class B2, (US 30 Day Average SOFR + 8.46%), 13.788%, 1/25/48 | 3,900,000 | 4,651,007 | |
| Structured Agency Credit Risk Trust FRB Ser. 18-DNA3, Class B2, (US 30 Day Average SOFR + 7.86%), 13.188%, 9/25/48 | 1,318,000 | 1,545,496 | |
| Structured Agency Credit Risk Trust REMICs FRB Ser. 20-HQA2, Class B2, (US 30 Day Average SOFR + 7.71%), 13.038%, 3/25/50 | 3,000,000 | 3,609,924 | |
| Structured Agency Credit Risk Trust FRB Ser. 19-HQA3, Class B2, (US 30 Day Average SOFR + 7.61%), 12.938%, 9/25/49 | 1,000,000 | 1,151,152 | |
| Structured Agency Credit Risk Debt FRN Ser. 22-DNA5, Class M2, (US 30 Day Average SOFR + 6.75%), 12.08%, 6/25/42 | 1,471,000 | 1,670,936 | |
| Structured Agency Credit Risk Trust REMICs FRB Ser. 21-DNA3, Class B2, (US 30 Day Average SOFR + 6.25%), 11.574%, 10/25/33 | 2,879,000 | 3,390,802 | |
| Structured Agency Credit Risk Trust REMICs FRB Ser. 20-HQA4, Class B1, (US 30 Day Average SOFR + 5.36%), 10.688%, 9/25/50 | 346,018 | 387,721 | |
| Structured Agency Credit Risk Trust REMICs FRB Ser. 22-HQA3, Class M2, (US 30 Day Average SOFR + 5.35%), 10.674%, 8/25/42 | 3,160,000 | 3,452,078 | |
| Structured Agency Credit Risk Trust REMICs FRB Ser. 22-HQA1, Class M2, (US 30 Day Average SOFR + 5.25%), 10.574%, 3/25/42 | 2,759,000 | 2,986,618 | |
| Structured Agency Credit Risk Trust REMICs FRB Ser. 20-HQA1, Class B2, (US 30 Day Average SOFR + 5.21%), 10.538%, 1/25/50 | 800,000 | 865,000 | |
| Structured Agency Credit Risk Trust FRB Ser. 19-FTR3, Class FTR3, (US 30 Day Average SOFR + 4.91%), 10.245%, 9/25/47 | 800,000 | 846,000 | |
| Structured Agency Credit Risk Trust REMICs FRB Ser. 20-DNA5, Class B1, (US 30 Day Average SOFR + 4.80%), 10.124%, 10/25/50 | 2,476,000 | 2,828,154 | |
Mortgage Opportunities Fund 9 | |
| MORTGAGE-BACKED SECURITIES (77.0%)* cont. | Principal amount | Value | |
| Residential mortgage-backed securities (non-agency) cont. | |||
| Federal Home Loan Mortgage Corporation 144A | |||
| Structured Agency Credit Risk Trust REMICs FRB Ser. 21-DNA1, Class B2, (US 30 Day Average SOFR + 4.75%), 10.074%, 1/25/51 | $1,100,000 | $1,177,688 | |
| Structured Agency Credit Risk Trust REMICs FRB Ser. 20-HQA2, Class B1, (US 30 Day Average SOFR + 4.21%), 9.538%, 3/25/50 | 2,544,000 | 2,879,585 | |
| Structured Agency Credit Risk Debt FRN Ser. 22-HQA2, Class M1B, (US 30 Day Average SOFR + 4.00%), 9.324%, 7/25/42 | 800,000 | 854,152 | |
| Structured Agency Credit Risk Debt FRN Ser. 22-DNA2, Class M2, (US 30 Day Average SOFR + 3.75%), 9.074%, 2/25/42 | 1,975,000 | 2,076,219 | |
| Structured Agency Credit Risk Trust REMICs FRB Ser. 22-DNA1, Class M2, (US 30 Day Average SOFR + 2.50%), 7.824%, 1/25/42 | 3,097,000 | 3,154,947 | |
| Seasoned Credit Risk Transfer Trust Ser. 19-2, Class M, 4.75%, 8/25/58 W | 244,000 | 228,766 | |
| Seasoned Credit Risk Transfer Trust Ser. 17-3, Class M2, 4.75%, 7/25/56 W | 400,000 | 381,005 | |
| Seasoned Credit Risk Transfer Trust Ser. 19-4, Class M, 4.50%, 2/25/59 W | 1,799,000 | 1,633,349 | |
| Seasoned Credit Risk Transfer Trust FRB Ser. 20-1, Class M, 4.25%, 8/25/59 W | 1,120,000 | 1,026,070 | |
| Federal National Mortgage Association | |||
| Connecticut Avenue Securities FRB Ser. 16-C03, Class 2B, (US 30 Day Average SOFR + 12.86%), 18.188%, 10/25/28 | 814,615 | 959,215 | |
| Connecticut Avenue Securities FRB Ser. 16-C03, Class 1B, (US 30 Day Average SOFR + 11.86%), 17.188%, 10/25/28 | 338,257 | 392,426 | |
| Connecticut Avenue Securities FRB Ser. 16-C01, Class 1B, (US 30 Day Average SOFR + 11.86%), 17.188%, 8/25/28 | 26,501 | 30,301 | |
| Connecticut Avenue Securities FRB Ser. 16-C04, Class 1B, (US 30 Day Average SOFR + 10.36%), 15.688%, 1/25/29 | 572,467 | 651,830 | |
| Connecticut Avenue Securities FRB Ser. 16-C07, Class 2B, (US 30 Day Average SOFR + 9.61%), 14.938%, 5/25/29 | 596,665 | 679,022 | |
| Connecticut Avenue Securities FRB Ser. 16-C06, Class 1B, (US 30 Day Average SOFR + 9.36%), 14.688%, 4/25/29 | 1,552,676 | 1,761,211 | |
| Federal National Mortgage Association 144A | |||
| Connecticut Avenue Securities Trust FRB Ser. 22-R06, Class 1B2, (US 30 Day Average SOFR + 10.60%), 15.924%, 5/25/42 | 500,000 | 593,750 | |
| Connecticut Avenue Securities Trust FRB Ser. 22-R09, Class 2B1, (US 30 Day Average SOFR + 6.75%), 12.074%, 9/25/42 | 500,000 | 556,390 | |
| Connecticut Avenue Securities Trust FRB Ser. 23-R03, Class 2B1, (US 30 Day Average SOFR + 6.35%), 11.674%, 4/25/43 | 850,000 | 961,700 | |
| Connecticut Avenue Securities Trust FRB Ser. 22-R04, Class 1B1, (US 30 Day Average SOFR + 5.25%), 10.574%, 3/25/42 | 500,000 | 543,391 | |
| Connecticut Avenue Securities Trust FRB Ser. 22-R09, Class 2M2, (US 30 Day Average SOFR + 4.75%), 10.074%, 9/25/42 | 1,000,000 | 1,093,851 | |
| Connecticut Avenue Securities Trust FRB Ser. 22-R05, Class 2B1, (US 30 Day Average SOFR + 4.50%), 9.824%, 4/25/42 | 2,540,000 | 2,709,939 | |
| Connecticut Avenue Securities Trust FRB Ser. 22-R02, Class 2B1, (US 30 Day Average SOFR + 4.50%), 9.824%, 1/25/42 | 2,146,000 | 2,261,348 | |
| Connecticut Avenue Securities Trust FRB Ser. 19-R03, Class 1B1, (US 30 Day Average SOFR + 4.21%), 9.538%, 9/25/31 | 1,169,825 | 1,248,997 | |
| Connecticut Avenue Securities Trust FRB Ser. 23-R08, Class 1B1, (US 30 Day Average SOFR + 3.55%), 8.874%, 10/25/43 | 1,500,000 | 1,568,438 | |
| Connecticut Avenue Securities Trust FRB Ser. 22-R02, Class 2M2, (US 30 Day Average SOFR + 3.00%), 8.324%, 1/25/42 | 2,727,000 | 2,805,401 | |
| Connecticut Avenue Securities FRB Ser. 21-R02, Class 2M2, (US 30 Day Average SOFR + 2.00%), 7.324%, 11/25/41 | 3,100,000 | 3,127,125 | |
| GS Mortgage-Backed Securities Trust 144A FRB Ser. 24-HE1, Class A1, (US 30 Day Average SOFR + 1.60%), 6.924%, 7/25/54 | 4,000,000 | 4,000,000 | |
| GSAA Home Equity Trust | |||
| Ser. 07-2, Class AF4A, 6.483%, 3/25/37 | 1,175,636 | 326,827 | |
| FRB Ser. 06-8, Class 2A2, (CME Term SOFR 1 Month + 0.47%), 5.799%, 5/25/36 | 74,820 | 16,745 | |
| FRB Ser. 06-1, Class A1, (CME Term SOFR 1 Month + 0.29%), 5.619%, 1/25/36 | 1,024,036 | 302,091 | |
| FRB Ser. 06-17, Class A1, (CME Term SOFR 1 Month + 0.23%), 5.559%, 11/25/36 | 8,480,655 | 1,936,563 | |
| GSR Mortgage Loan Trust FRB Ser. 07-OA1, Class 2A3A, (CME Term SOFR 1 Month + 0.42%), 5.749%, 5/25/37 | 300,348 | 164,155 | |
| Home Re, Ltd. 144A FRB Ser. 22-1, Class B1, (US 30 Day Average SOFR + 9.00%), 14.324%, 10/25/34 (Bermuda) | 900,000 | 1,043,545 | |
| Imperial Fund Mortgage Trust 144A Ser. 22-NQM4, Class A3, 5.04%, 6/25/67 | 1,209,675 | 1,158,502 | |
| IndyMac INDX Mortgage Loan Trust FRB Ser. 06-AR11, Class 2A1, 4.128%, 6/25/36 W | 22,399 | 18,909 | |
10 Mortgage Opportunities Fund | |
| MORTGAGE-BACKED SECURITIES (77.0%)* cont. | Principal amount | Value | |
| Residential mortgage-backed securities (non-agency) cont. | |||
| JPMorgan Mortgage Trust 144A FRB Ser. 24-HE2, Class A1, (US 30 Day Average SOFR + 1.20%), 6.524%, 10/25/54 | $1,343,000 | $1,343,000 | |
| Lehman XS Trust FRB Ser. 06-17, Class 1A4A, (CME Term SOFR 1 Month + 0.45%), 5.779%, 8/25/46 | 3,047,323 | 2,707,492 | |
| LHOME Mortgage Trust 144A | |||
| Ser. 23-RTL4, Class A1, 7.628%, 11/25/28 | 1,045,000 | 1,040,709 | |
| Ser. 21-RTL3, Class A1, 3.363%, 9/25/26 | 317,484 | 314,137 | |
| Merrill Lynch Mortgage Investors Trust FRB Ser. 06-HE3, Class A4, (CME Term SOFR 1 Month + 0.61%), 5.939%, 6/25/37 | 780,017 | 191,155 | |
| MFA Trust 144A Ser. 23-NQM3, Class A1, 6.617%, 7/25/68 | 628,310 | 629,903 | |
| Morgan Stanley Re-REMIC Trust 144A FRB Ser. 10-R4, Class 4B, (CME Term SOFR 1 Month + 0.34%), 3.498%, 2/26/37 | 349,024 | 300,209 | |
| Morgan Stanley Residential Mortgage Loan Trust 144A Ser. 24-NQM2, Class A1, stepped-coupon 6.386% (7.386%, 5/1/28), 5/25/69 †† | 3,982,000 | 3,978,249 | |
| Oaktown Re III, Ltd. 144A | |||
| FRB Ser. 19-1A, Class B1B, (US 30 Day Average SOFR + 4.46%), 9.788%, 7/25/29 (Bermuda) | 191,000 | 191,064 | |
| FRB Ser. 19-1A, Class B1A, (US 30 Day Average SOFR + 3.61%), 8.938%, 7/25/29 (Bermuda) | 159,000 | 159,067 | |
| Saluda Grade Alternative Mortgage Trust 144A | |||
| Ser. 24-RTL5, Class A1, stepped-coupon 7.762% (9.262%, 9/1/26), 4/25/30 †† | 2,384,000 | 2,399,722 | |
| Ser. 24-RTL4, Class A1, stepped-coupon 7.50% (8.50%, 7/1/26), 2/25/30 †† | 1,023,000 | 1,015,558 | |
| Structured Asset Mortgage Investments II Trust | |||
| FRB Ser. 07-AR1, Class 2A1, (CME Term SOFR 1 Month + 0.47%), 5.799%, 1/25/37 | 24,254 | 20,966 | |
| FRB Ser. 06-AR7, Class A1BG, (CME Term SOFR 1 Month + 0.23%), 5.559%, 8/25/36 | 146,546 | 127,329 | |
| Toorak Mortgage Corp., Ltd. 144A Ser. 21-1, Class A2, 5.105%, 6/25/24 | 2,120,000 | 2,064,951 | |
| Towd Point HE Trust 144A Ser. 21-HE1, Class A1, 0.918%, 2/25/63 W | 1,111,354 | 1,059,259 | |
| Unlock Hea Trust 144A Ser. 23-1, Class A, 7.00%, 10/25/38 | 717,241 | 705,437 | |
| Verus Securitization Trust 144A FRB Ser. 23-INV3, Class A1, 6.876%, 11/25/68 W | 2,208,044 | 2,251,397 | |
| WaMu Mortgage Pass-Through Certificates Trust FRB Ser. 05-AR13, Class A1C4, (CME Term SOFR 1 Month + 0.97%), 6.299%, 10/25/45 | 35,596 | 33,607 | |
| 136,510,678 | |||
| Total mortgage-backed securities (cost $432,353,706) | $418,322,965 | ||
| ASSET-BACKED SECURITIES (0.8%)* | Principal amount | Value | |
| Mello Warehouse Securitization Trust 144A | |||
| FRB Ser. 21-3, Class F, (CME Term SOFR 1 Month + 5.26%), 10.589%, 10/22/24 | $425,000 | $424,239 | |
| FRB Ser. 21-3, Class E, (CME Term SOFR 1 Month + 3.36%), 8.689%, 10/22/24 | 2,010,000 | 2,012,513 | |
| FRB Ser. 21-3, Class D, (CME Term SOFR 1 Month + 2.11%), 7.439%, 10/22/24 | 1,225,000 | 1,223,303 | |
| Station Place Securitization Trust 144A FRB Ser. 24-2, Class A, (CME Term SOFR 1 Month + 0.90%), 6.222%, 6/22/25 | 900,000 | 900,819 | |
| Total asset-backed securities (cost $4,527,821) | $4,560,874 | ||
| SHORT-TERM INVESTMENTS (19.7%)* | Principal amount/ shares | Value | |
| Putnam Short Term Investment Fund Class P 5.46% L | Shares | 94,133,636 | $94,133,636 |
| State Street Institutional U.S. Government Money Market Fund, Premier Class 5.26% P | Shares | 1,670,000 | 1,670,000 |
| U.S. Treasury Bills 5.379%, 7/23/24 ∆ Φ | $3,712,000 | 3,684,803 | |
| U.S. Treasury Bills 5.379%, 8/27/24 # Φ | 7,500,000 | 7,407,385 | |
| Total short-term investments (cost $106,892,772) | $106,895,824 | ||
| TOTAL INVESTMENTS | ||
| Total investments (cost $978,832,229) | $965,528,976 | |
| Key to holding’s abbreviations | |||
| bp | Basis Points | ||
| CME | Chicago Mercantile Exchange | ||
| CMT | U.S. Constant Maturity Treasury | ||
| FRB | Floating Rate Bonds: The rate shown is the current interest rate at the close of the reporting period. Rates may be subject to a cap or floor. For certain securities, the rate may represent a fixed rate currently in place at the close of the reporting period. | ||
| FRN | Floating Rate Notes: The rate shown is the current interest rate or yield at the close of the reporting period. Rates may be subject to a cap or floor. For certain securities, the rate may represent a fixed rate currently in place at the close of the reporting period. | ||
Mortgage Opportunities Fund 11 | |
| IFB | Inverse Floating Rate Bonds, which are securities that pay interest rates that vary inversely to changes in the market interest rates. As interest rates rise, inverse floaters produce less current income. The rate shown is the current interest rate at the close of the reporting period. Rates may be subject to a cap or floor. | ||
| IO | Interest Only | ||
| OTC | Over-the-counter | ||
| REMICs | Real Estate Mortgage Investment Conduits | ||
| SOFR | Secured Overnight Financing Rate | ||
| TBA | To Be Announced Commitments | ||
| Notes to the fund’s portfolio | |||
| Unless noted otherwise, the notes to the fund’s portfolio are for the close of the fund’s reporting period, which ran from June 1, 2023 through May 31, 2024 (the reporting period). Within the following notes to the portfolio, references to “Putnam Management” represent Putnam Investment Management, LLC, the fund’s manager, an indirect wholly-owned subsidiary of Franklin Resources, Inc., and references to “ASC 820” represent Accounting Standards Codification 820 Fair Value Measurements and Disclosures. | |||
| * | Percentages indicated are based on net assets of $543,213,623. | ||
| † | This security is non-income-producing. | ||
| †† | The interest rate and date shown parenthetically represent the new interest rate to be paid and the date the fund will begin accruing interest at this rate. | ||
| # | This security, in part or in entirety, was pledged and segregated with the broker to cover margin requirements for futures contracts at the close of the reporting period. Collateral at period end totaled $7,204,113 and is included in Investments in securities on the Statement of assets and liabilities (Notes 1 and 8). | ||
| ∆ | This security, in part or in entirety, was pledged and segregated with the custodian for collateral on certain derivative contracts at the close of the reporting period. Collateral at period end totaled $2,442,796 and is included in Investments in securities on the Statement of assets and liabilities (Notes 1 and 8). | ||
| Φ | This security, in part or in entirety, was pledged and segregated with the custodian for collateral on certain TBA commitments at the close of the reporting period. Collateral at period end totaled $1,233,251 and is included in Investments in securities on the Statement of assets and liabilities (Notes 1 and 8). | ||
| ## | Forward commitment, in part or in entirety (Note 1). | ||
| L | Affiliated company (Note 5). The rate quoted in the security description is the annualized 7-day yield of the fund at the close of the reporting period. | ||
| P | This security was pledged, or purchased with cash that was pledged, to the fund for collateral on certain derivative contracts and TBA commitments. The rate quoted in the security description is the annualized 7-day yield of the fund at the close of the reporting period. | ||
| W | The rate shown represents the weighted average coupon associated with the underlying mortgage pools. Rates may be subject to a cap or floor. | ||
| Unless otherwise noted, the rates quoted in Short-term investments security descriptions represent the weighted average yield to maturity. | |||
| 144A after the name of an issuer represents securities exempt from registration under Rule 144A of the Securities Act of 1933, as amended. These securities may be resold in transactions exempt from registration, normally to qualified institutional buyers. | |||
| See Note 1 to the financial statements regarding TBA commitments. | |||
| The dates shown on debt obligations are the original maturity dates. | |||
| FUTURES CONTRACTS OUTSTANDING at 5/31/24 | ||||||
| Number of contracts | Notional amount | Value | Expiration date | Unrealized appreciation | ||
| U.S. Treasury Note 2 yr (Short) | 1,909 | $388,869,268 | $388,869,268 | Sep-24 | $176,063 | |
| U.S. Treasury Note 5 yr (Short) | 445 | 47,079,609 | 47,079,609 | Sep-24 | 41,043 | |
| U.S. Treasury Note Ultra 10 yr (Short) | 1,327 | 148,665,469 | 148,665,469 | Sep-24 | 390,737 | |
| Unrealized appreciation | 607,843 | |||||
| Unrealized (depreciation) | — | |||||
| Total | $607,843 | |||||
| FORWARD PREMIUM SWAP OPTION CONTRACTS OUTSTANDING at 5/31/24 | ||||||
| Counterparty Fixed right or obligation % to receive or (pay)/Floating rate index/ Maturity date | Expiration date/strike | Notional/ Contract amount | Premium receivable/ (payable) | Unrealized appreciation/ (depreciation) | ||
| Bank of America N.A. | ||||||
| (4.225)/US SOFR/Nov-36 (Purchased) | Nov-26/4.225 | $10,656,000 | $(1,273,149) | $(97,822) | ||
| 3.725/US SOFR/Nov-36 (Purchased) | Nov-26/3.725 | 10,656,000 | (1,215,957) | (68,305) | ||
| Citibank, N.A. | ||||||
| (3.855)/US SOFR/Jul-29 (Purchased) | Jul-24/3.855 | 188,174,700 | (1,848,816) | 1,418,837 | ||
| 3.355/US SOFR/Jul-29 (Purchased) | Jul-24/3.355 | 188,174,700 | (1,900,564) | (1,844,112) | ||
| Mizuho Capital Markets LLC | ||||||
| (4.0475)/US SOFR/Aug-36 (Purchased) | Aug-26/4.0475 | 9,023,700 | (469,232) | (62,805) | ||
| 3.5475/US SOFR/Aug-36 (Purchased) | Aug-26/3.5475 | 9,023,700 | (451,636) | (138,965) | ||
| Unrealized appreciation | 1,418,837 | |||||
| Unrealized (depreciation) | (2,212,009) | |||||
| Total | $(793,172) | |||||
12 Mortgage Opportunities Fund | |
| TBA SALE COMMITMENTS OUTSTANDING at 5/31/24 (proceeds receivable $51,053,594) | |||
| Agency | Principal amount | Settlement date | Value |
| Government National Mortgage Association, 3.50%, 6/1/54 | $1,000,000 | 6/20/24 | $891,997 |
| Uniform Mortgage-Backed Securities, 6.00%, 6/1/54 | 26,000,000 | 6/13/24 | 26,033,503 |
| Uniform Mortgage-Backed Securities, 5.50%, 6/1/54 | 19,000,000 | 6/13/24 | 18,689,018 |
| Uniform Mortgage-Backed Securities, 4.00%, 6/1/54 | 6,000,000 | 6/13/24 | 5,441,951 |
| Total | $51,056,469 | ||
| CENTRALLY CLEARED INTEREST RATE SWAP CONTRACTS OUTSTANDING at 5/31/24 | |||||||
| Notional amount | Value | Upfront premium received (paid) | Termination date | Payments made by fund | Payments received by fund | Unrealized appreciation/ (depreciation) | |
| $524,000 | $5,523 E | $8,766 | 6/20/29 | US SOFR — Annually | 4.00% — Annually | $3,243 | |
| 822,114,000 | 8,385,563 E | (4,323,384) | 6/20/26 | 4.20% — Annually | US SOFR — Annually | 4,062,181 | |
| 59,959,000 | 1,486,983 E | (1,796,605) | 6/20/34 | 3.80% — Annually | US SOFR — Annually | (309,623) | |
| 26,951,000 | 1,300,116 E | 1,177,854 | 6/20/54 | US SOFR — Annually | 3.60% — Annually | (122,262) | |
| 3,878,000 | 80,507 E | (28,516) | 6/20/34 | US SOFR — Annually | 3.85% — Annually | (109,024) | |
| 4,064,000 | 160,812 E | (23,973) | 6/20/54 | 3.65% — Annually | US SOFR — Annually | 136,839 | |
| Total | $(4,985,858) | $3,661,354 | |||||
| E Extended effective date. | |||||||
| OTC CREDIT DEFAULT CONTRACTS OUTSTANDING — PROTECTION SOLD at 5/31/24 | ||||||||
| Swap counterparty/ Referenced debt* | Rating*** | Upfront premium received (paid)** | Notional amount | Value | Termi- nation date | Payments received by fund | Unrealized appreciation/ (depreciation) | |
| Barclays Bank PLC | ||||||||
| CMBX NA BBB−.7 Index | BB+/P | $34 | $2,857 | $486 | 1/17/47 | 300 bp — Monthly | $(451) | |
| Citigroup Global Markets, Inc. | ||||||||
| CMBX NA BB.13 Index | BB−/P | 2,024,057 | 4,734,000 | 1,615,241 | 12/16/72 | 500 bp — Monthly | 413,420 | |
| CMBX NA BB.6 Index | B/P | 647,506 | 1,944,457 | 489,614 | 5/11/63 | 500 bp — Monthly | 159,785 | |
| CMBX NA BB.7 Index | B/P | 351,309 | 881,557 | 275,399 | 1/17/47 | 500 bp — Monthly | 76,773 | |
| CMBX NA BB.9 Index | B-/P | 273,850 | 651,000 | 254,150 | 9/17/58 | 500 bp — Monthly | 20,332 | |
| CMBX NA BBB−.13 Index | BBB−/P | 72,438 | 253,000 | 53,510 | 12/16/72 | 300 bp — Monthly | 19,076 | |
| CMBX NA BBB−.16 Index | BBB−/P | 276,187 | 1,215,000 | 184,194 | 4/17/65 | 300 bp — Monthly | 92,702 | |
| Credit Suisse International | ||||||||
| CMBX NA A.7 Index | A/P | 110 | 865 | 147 | 1/17/47 | 200 bp — Monthly | (36) | |
| CMBX NA BB.7 Index | B/P | 44,810 | 249,638 | 77,987 | 1/17/47 | 500 bp — Monthly | (32,933) | |
| CMBX NA BBB−.7 Index | BB+/P | 1,379 | 9,999 | 1,701 | 1/17/47 | 300 bp — Monthly | (316) | |
| Goldman Sachs International | ||||||||
| CMBX NA BB.9 Index | B-/P | 171,648 | 429,000 | 167,482 | 9/17/58 | 500 bp — Monthly | 4,584 | |
| CMBX NA BBB−.16 Index | BBB−/P | 23,410 | 114,000 | 17,282 | 4/17/65 | 300 bp — Monthly | 6,194 | |
| CMBX NA BBB−.7 Index | BB+/P | 43,515 | 169,988 | 28,915 | 1/17/47 | 300 bp — Monthly | 14,699 | |
| JPMorgan Securities LLC | ||||||||
| CMBX NA BB.10 Index | B-/P | 23,189 | 289,000 | 115,311 | 5/11/63 | 500 bp — Monthly | (91,841) | |
| CMBX NA BB.6 Index | B/P | 806,690 | 818,197 | 206,022 | 5/11/63 | 500 bp — Monthly | 601,464 | |
| CMBX NA BBB−.7 Index | BB+/P | 21,129 | 42,854 | 7,289 | 1/17/47 | 300 bp — Monthly | 13,864 | |
| CMBX NA BBB−.8 Index | B+/P | 19,336 | 124,000 | 12,363 | 10/17/57 | 300 bp — Monthly | 7,046 | |
| Merrill Lynch International | ||||||||
| CMBX NA BB.6 Index | B/P | 22,364 | 104,428 | 26,295 | 5/11/63 | 500 bp — Monthly | (3,830) | |
| CMBX NA BB.7 Index | B/P | 16,216 | 99,855 | 31,195 | 1/17/47 | 500 bp — Monthly | (14,881) | |
| CMBX NA BB.7 Index | B/P | 27,163 | 213,869 | 66,813 | 1/17/47 | 500 bp — Monthly | (39,441) | |
| Morgan Stanley & Co. International PLC | ||||||||
| CMBX NA BB.11 Index | B+/P | 2,116 | 25,000 | 6,998 | 11/18/54 | 500 bp — Monthly | (4,857) | |
| CMBX NA BB.13 Index | BB−/P | 830,316 | 1,841,000 | 628,149 | 12/16/72 | 500 bp — Monthly | 203,957 | |
Mortgage Opportunities Fund 13 | |
| OTC CREDIT DEFAULT CONTRACTS OUTSTANDING — PROTECTION SOLD at 5/31/24 cont. | ||||||||
| Swap counterparty/ Referenced debt* | Rating*** | Upfront premium received (paid)** | Notional amount | Value | Termi- nation date | Payments received by fund | Unrealized appreciation/ (depreciation) | |
| Morgan Stanley & Co. International PLC cont. | ||||||||
| CMBX NA BB.15 Index | BB/P | $284,725 | $1,766,000 | $439,381 | 11/18/64 | 500 bp — Monthly | $(152,939) | |
| CMBX NA BBB−.16 Index | BBB−/P | 25,914 | 114,000 | 17,282 | 4/17/65 | 300 bp — Monthly | 8,698 | |
| Upfront premium received | 6,009,411 | Unrealized appreciation | 1,642,594 | |||||
| Upfront premium (paid) | — | Unrealized (depreciation) | (341,525) | |||||
| Total | $6,009,411 | Total | $1,301,069 | |||||
| * Payments related to the referenced debt are made upon a credit default event. | ||||||||
| ** Upfront premium is based on the difference between the original spread on issue and the market spread on day of execution. | ||||||||
| *** Ratings for an underlying index represent the average of the ratings of all the securities included in that index. The Moody’s, Standard & Poor’s or Fitch ratings are believed to be the most recent ratings available at May 31, 2024. Securities rated by Fitch are indicated by “/F.” Securities rated by Putnam are indicated by “/P.” The Putnam rating categories are comparable to the Standard & Poor’s classifications. | ||||||||
| OTC CREDIT DEFAULT CONTRACTS OUTSTANDING — PROTECTION PURCHASED at 5/31/24 | ||||||||
| Swap counterparty/ Referenced debt* | Upfront premium received (paid)** | Notional amount | Value | Termi- nation date | Payments (paid) by fund | Unrealized appreciation/ (depreciation) | ||
| Citigroup Global Markets, Inc. | ||||||||
| CMBX NA A.7 Index | $(22) | $865 | $147 | 1/17/47 | (200 bp) — Monthly | $124 | ||
| CMBX NA BB.10 Index | (225,536) | 486,000 | 193,914 | 11/17/59 | (500 bp) — Monthly | (32,095) | ||
| CMBX NA BB.11 Index | (10,042) | 25,000 | 6,998 | 11/18/54 | (500 bp) — Monthly | (3,068) | ||
| CMBX NA BB.8 Index | (249,406) | 553,966 | 200,259 | 10/17/57 | (500 bp) — Monthly | (49,686) | ||
| CMBX NA BBB−.12 Index | (290,603) | 1,024,000 | 200,397 | 8/17/61 | (300 bp) — Monthly | (90,803) | ||
| CMBX NA BBB−.7 Index | (60,818) | 225,698 | 38,391 | 1/17/47 | (300 bp) — Monthly | (22,559) | ||
| CMBX NA BBB−.8 Index | (344,624) | 1,784,000 | 177,865 | 10/17/57 | (300 bp) — Monthly | (167,800) | ||
| Credit Suisse International | ||||||||
| CMBX NA BB.10 Index | (50,421) | 424,000 | 169,176 | 11/17/59 | (500 bp) — Monthly | 118,343 | ||
| CMBX NA BB.10 Index | (27,719) | 223,000 | 88,977 | 11/17/59 | (500 bp) — Monthly | 61,042 | ||
| Goldman Sachs International | ||||||||
| CMBX NA BB.10 Index | (376,522) | 836,000 | 333,564 | 11/17/59 | (500 bp) — Monthly | (43,771) | ||
| CMBX NA BBB−.12 Index | (1,275,086) | 4,835,000 | 946,210 | 8/17/61 | (300 bp) — Monthly | (331,697) | ||
| CMBX NA BBB−.13 Index | (66,827) | 251,000 | 53,087 | 12/16/72 | (300 bp) — Monthly | (13,887) | ||
| JPMorgan Securities LLC | ||||||||
| CMBX NA BB.7 Index | (694,821) | 1,057,422 | 330,339 | 1/17/47 | (500 bp) — Monthly | (365,517) | ||
| CMBX NA BBB−.8 Index | (10,823) | 78,000 | 7,777 | 10/17/57 | (300 bp) — Monthly | (3,091) | ||
| Merrill Lynch International | ||||||||
| CMBX NA BB.10 Index | (2,674) | 47,000 | 18,753 | 11/17/59 | (500 bp) — Monthly | 16,033 | ||
| Morgan Stanley & Co. International PLC | ||||||||
| CMBX NA BB.7 Index | (157,231) | 387,498 | 121,054 | 1/17/47 | (500 bp) — Monthly | (36,556) | ||
| CMBX NA BB.8 Index | (143,186) | 313,529 | 113,341 | 10/17/57 | (500 bp) — Monthly | (30,150) | ||
| CMBX NA BB.9 Index | (457,405) | 1,080,000 | 421,632 | 9/17/58 | (500 bp) — Monthly | (36,823) | ||
| CMBX NA BBB−.12 Index | (403,340) | 1,268,000 | 248,148 | 8/17/61 | (300 bp) — Monthly | (155,932) | ||
| CMBX NA BBB−.13 Index | (636) | 2,000 | 423 | 12/16/72 | (300 bp) — Monthly | (214) | ||
| CMBX NA BBB−.8 Index | (781,830) | 3,798,000 | 378,661 | 10/17/57 | (300 bp) — Monthly | (405,385) | ||
| Upfront premium received | — | Unrealized appreciation | 195,542 | |||||
| Upfront premium (paid) | (5,629,572) | Unrealized (depreciation) | (1,789,034) | |||||
| Total | $(5,629,572) | Total | $(1,593,492) | |||||
| * Payments related to the referenced debt are made upon a credit default event. | ||||||||
| ** Upfront premium is based on the difference between the original spread on issue and the market spread on day of execution. | ||||||||
14 Mortgage Opportunities Fund | |
ASC 820 establishes a three-level hierarchy for disclosure of fair value measurements. The valuation hierarchy is based upon the transparency of inputs to the valuation of the fund’s investments. The three levels are defined as follows:
Level 1: Valuations based on quoted prices for identical securities in active markets.
Level 2: Valuations based on quoted prices in markets that are not active or for which all significant inputs are observable, either directly or indirectly.
Level 3: Valuations based on inputs that are unobservable and significant to the fair value measurement.
The following is a summary of the inputs used to value the fund’s net assets as of the close of the reporting period:
| Valuation inputs | |||
| Investments in securities: | Level 1 | Level 2 | Level 3 |
| Asset-backed securities | $— | $4,560,874 | $— |
| Mortgage-backed securities | — | 418,322,965 | — |
| U.S. government and agency mortgage obligations | — | 435,749,313 | — |
| Short-term investments | 1,670,000 | 105,225,824 | — |
| Totals by level | $1,670,000 | $963,858,976 | $— |
| Valuation inputs | |||
| Other financial instruments: | Level 1 | Level 2 | Level 3 |
| Futures contracts | $607,843 | $— | $— |
| Forward premium swap option contracts | — | (793,172) | — |
| TBA sale commitments | — | (51,056,469) | — |
| Interest rate swap contracts | — | 8,647,212 | — |
| Credit default contracts | — | (672,262) | — |
| Totals by level | $607,843 | $(43,874,691) | $— |
The accompanying notes are an integral part of these financial statements.
Mortgage Opportunities Fund 15 | |
Financial Statements
Statement of assets and liabilities
5/31/24
| ASSETS | |
| Investment in securities, at value (Notes 1 and 8): | |
| Unaffiliated issuers (identified cost $884,698,593) | $871,395,340 |
| Affiliated issuers (identified cost $94,133,636) (Note 5) | 94,133,636 |
| Cash | 614,794 |
| Interest and other receivables | 3,702,077 |
| Receivable for shares of the fund sold | 9,597,854 |
| Receivable for investments sold | 304,341 |
| Receivable for sales of TBA securities (Note 1) | 32,430,128 |
| Receivable for variation margin on centrally cleared swap contracts (Note 1) | 2,776,928 |
| Unrealized appreciation on forward premium swap option contracts (Note 1) | 1,418,837 |
| Unrealized appreciation on OTC swap contracts (Note 1) | 1,838,136 |
| Premium paid on OTC swap contracts (Note 1) | 5,629,572 |
| Deposits with broker (Note 1) | 16,766,557 |
| Prepaid assets | 52,990 |
| Total assets | 1,040,661,190 |
| LIABILITIES | |
| Payable for investments purchased | 8,179,990 |
| Payable for purchases of delayed delivery securities (Note 1) | 3,152,249 |
| Payable for purchases of TBA securities (Note 1) | 417,205,520 |
| Payable for shares of the fund repurchased | 293,469 |
| Payable for compensation of Manager (Note 2) | 214,559 |
| Payable for custodian fees (Note 2) | 17,123 |
| Payable for investor servicing fees (Note 2) | 100,443 |
| Payable for Trustee compensation and expenses (Note 2) | 6,971 |
| Payable for administrative services (Note 2) | 1,574 |
| Payable for distribution fees (Note 2) | 9,795 |
| Payable for variation margin on futures contracts (Note 1) | 750,554 |
| Payable for variation margin on centrally cleared swap contracts (Note 1) | 3,304,368 |
| Unrealized depreciation on forward premium swap option contracts (Note 1) | 2,212,009 |
| Unrealized depreciation on OTC swap contracts (Note 1) | 2,130,559 |
| Premium received on OTC swap contracts (Note 1) | 6,009,411 |
| TBA sale commitments, at value (proceeds receivable $51,053,594) (Note 1) | 51,056,469 |
| Collateral on certain derivative contracts and TBA commitments, at value (Notes 1 and 8) | 1,670,000 |
| Payable to broker (Note 1) | 913,563 |
| Other accrued expenses | 218,941 |
| Total liabilities | 497,447,567 |
| Net assets | $543,213,623 |
| Represented by | |
| Paid-in capital (Unlimited shares authorized) (Notes 1 and 4) | $579,026,281 |
| Total distributable earnings (Note 1) | (35,812,658) |
| Total — Representing net assets applicable to capital shares outstanding | $543,213,623 |
| COMPUTATION OF NET ASSET VALUE AND OFFERING PRICE | |
| Net asset value and redemption price per class A share ($15,859,562 divided by 1,786,258 shares) | $8.88 |
| Offering price per class A share (100/96.00 of $8.88)* | $9.25 |
| Net asset value and offering price per class C share ($2,660,534 divided by 298,940 shares)** | $8.90 |
| Net asset value and offering price per class I share ($186,433,146 divided by 20,954,758 shares) | $8.90 |
| Net asset value, offering price and redemption price per class R6 share ($1,365,579 divided by 153,491 shares) | $8.90 |
| Net asset value, offering price and redemption price per class Y share ($336,894,802 divided by 37,917,099 shares) | $8.89 |
| * | On single retail sales of less than $100,000. On sales of $100,000 or more the offering price is reduced. |
| ** | Redemption price per share is equal to net asset value less any applicable contingent deferred sales charge. |
The accompanying notes are an integral part of these financial statements.
16 Mortgage Opportunities Fund
Statement of operations
Year ended 5/31/24
| Investment income | |
| Interest (including interest income of $1,796,861 from investments in affiliated issuers) (Note 5) | $31,484,514 |
| Total investment income | 31,484,514 |
| EXPENSES | |
| Compensation of Manager (Note 2) | 2,201,167 |
| Investor servicing fees (Note 2) | 357,438 |
| Custodian fees (Note 2) | 63,931 |
| Trustee compensation and expenses (Note 2) | 18,933 |
| Distribution fees (Note 2) | 46,561 |
| Administrative services (Note 2) | 10,441 |
| Auditing and tax fees | 159,698 |
| Other | 222,966 |
| Fees waived and reimbursed by Manager (Note 2) | (830,894) |
| Total expenses | 2,250,241 |
| Expense reduction (Note 2) | (13,636) |
| Net expenses | 2,236,605 |
| Net investment income | 29,247,909 |
| REALIZED AND UNREALIZED GAIN (LOSS) | |
| Net realized gain (loss) on: | |
| Securities from unaffiliated issuers (Notes 1 and 3) | (19,190,736) |
| Futures contracts (Note 1) | 27,975,795 |
| Swap contracts (Note 1) | (1,153,067) |
| Written options (Note 1) | 115,940 |
| Total net realized gain | 7,747,932 |
| Change in net unrealized appreciation on: | |
| Securities from unaffiliated issuers and TBA sale commitments | 8,379,439 |
| Futures contracts | 1,730,752 |
| Swap contracts | 3,868,984 |
| Total change in net unrealized appreciation | 13,979,175 |
| Net gain on investments | 21,727,107 |
| Net increase in net assets resulting from operations | $50,975,016 |
The accompanying notes are an integral part of these financial statements.
Mortgage Opportunities Fund 17
Statement of changes in net assets
| Year ended 5/31/24 | Year ended 5/31/23 | |
| Increase in net assets | ||
| Operations | ||
| Net investment income | $29,247,909 | $23,797,501 |
| Net realized gain (loss) on investments | 7,747,932 | (3,957,720) |
| Change in net unrealized appreciation (depreciation) of investments | 13,979,175 | (6,592,072) |
| Net increase in net assets resulting from operations | 50,975,016 | 13,247,709 |
| Distributions to shareholders (Note 1): | ||
| From ordinary income | ||
| Net investment income | ||
| Class A | (920,881) | (942,840) |
| Class C | (135,862) | (89,144) |
| Class I | (15,382,476) | (10,329,786) |
| Class R6 | (330,810) | (248,094) |
| Class Y | (17,850,699) | (16,123,649) |
| Net realized short-term gain on investments | ||
| Class A | — | (100,663) |
| Class C | — | (9,190) |
| Class I | — | (857,087) |
| Class R6 | — | (20,720) |
| Class Y | — | (1,532,912) |
| Increase from capital share transactions (Note 4) | 165,759,136 | 108,001,065 |
| Total increase in net assets | 182,113,424 | 90,994,689 |
| Net assets | ||
| Beginning of year | 361,100,199 | 270,105,510 |
| End of year | $543,213,623 | $361,100,199 |
The accompanying notes are an integral part of these financial statements.
18 Mortgage Opportunities Fund
Financial highlights
(For a common share outstanding throughout the period)
| INVESTMENT OPERATIONS | LESS DISTRIBUTIONS | RATIOS AND SUPPLEMENTAL DATA | ||||||||||||
| Period ended | Net asset value, beginning of period | Net investment income (loss) a | Net realized and unrealized gain (loss) on investments | Total from investment operations | From net investment income | From realized gain | From return of capital | Total distributions | Net asset value, end of period | Total return at net asset value (%) b | Net assets, end of period (in thousands) | Ratio of expenses to average net assets excluding interest expense (%) c,d | Ratio of net investment income (loss) to average net assets (%) d | Portfolio turnover (%) e |
| Class A | ||||||||||||||
| May 31, 2024 | $8.55 | .61 | .44 | 1.05 | (.72) | — | — | (0.72) | $8.88 | 12.91 | $15,860 | .86 | 7.02 | 1,243 |
| May 31, 2023 | 8.90 | .53 | (.24) | .29 | (.59) | (.05) | — | (0.64) | 8.55 | 3.37 | 10,291 | .86 | 6.03 | 1,412 |
| May 31, 2022 | 9.41 | .39 | (.33) | .06 | (.57) | — | — | (0.57) | 8.90 | .81 | 3,693 | .78 | 4.28 | 1,790 |
| May 31, 2021 | 9.01 | .34 | .39 | .73 | (.32) | — | (.01) | (0.33) | 9.41 | 8.19 | 1,660 | .75 | 3.64 | 1,058 |
| May 31, 2020 † | 10.51 | .31 | (1.11) | (.80) | (.69) | — | (.01) | (0.70) | 9.01 | (8.32)* | 2,805 | .71* | 3.11* | 1,311 |
| Class C | ||||||||||||||
| May 31, 2024 | $8.57 | .55 | .44 | .99 | (.66) | — | — | (0.66) | $8.90 | 12.06 | $2,661 | 1.61 | 6.26 | 1,243 |
| May 31, 2023 | 8.92 | .47 | (.24) | .23 | (.53) | (.05) | — | (0.58) | 8.57 | 2.60 | 1,836 | 1.61 | 5.37 | 1,412 |
| May 31, 2022 | 9.42 | .32 | (.32) | — f | (.50) | — | — | (0.50) | 8.92 | .07 | $382 | 1.53 | 3.47 | 1,790 |
| May 31, 2021 | 9.01 | .28 | .39 | .67 | (.26) | — | — f | (0.26) | 9.42 | 7.48 | 260 | 1.50 | 2.93 | 1,058 |
| May 31, 2020 † | 10.51 | .24 | (1.11) | (.87) | (.62) | — | (.01) | (0.63) | 9.01 | (8.91)* | 337 | 1.40* | 2.46* | 1,311 |
| Class I | ||||||||||||||
| May 31, 2024 | $8.56 | .64 | .46 | 1.10 | (.76) | — | — | (0.76) | $8.90 | 13.45 | $186,433 | .47 | 7.39 | 1,243 |
| May 31, 2023 | 8.91 | .55 | (.23) | .32 | (.62) | (.05) | — | (0.67) | 8.56 | 3.74 | 147,651 | .47 | 6.27 | 1,412 |
| May 31, 2022 | 9.43 | .41 | (.33) | .08 | (.60) | — | — | (0.60) | 8.91 | .97 | 141,000 | .47 | 4.55 | 1,790 |
| May 31, 2021 | 9.02 | .37 | .40 | .77 | (.35) | — | (.01) | (0.36) | 9.43 | 8.58 | 135,399 | .47 | 3.94 | 1,058 |
| May 31, 2020 | 10.46 | .36 | (1.08) | (.72) | (.71) | — | (.01) | (0.72) | 9.02 | (7.40) | 196,765 | .47 | 3.50 | 1,311 |
| Class R6 | ||||||||||||||
| May 31, 2024 | $8.56 | .63 | .46 | 1.09 | (.75) | — | — | (0.75) | $8.90 | 13.40 | $1,366 | .51 | 7.31 | 1,243 |
| May 31, 2023 | 8.91 | .55 | (.23) | .32 | (.62) | (.05) | — | (0.67) | 8.56 | 3.70 | 3,548 | .51 | 6.30 | 1,412 |
| May 31, 2022 | 9.43 | .41 | (.33) | .08 | (.60) | — | — | (0.60) | 8.91 | .96 | 1,157 | .51 | 4.51 | 1,790 |
| May 31, 2021 # | 9.02 | .38 | .39 | .77 | (.35) | — | (.01) | (0.36) | 9.43 | 8.56 | 1,017 | .51 | 4.01 | 1,058 |
| Class Y | ||||||||||||||
| May 31, 2024 | $8.55 | .63 | .46 | 1.09 | (.75) | — | — | (0.75) | $8.89 | 13.34 | $336,895 | .61 | 7.26 | 1,243 |
| May 31, 2023 | 8.90 | .55 | (.24) | .31 | (.61) | (.05) | — | (0.66) | 8.55 | 3.63 | 197,774 | .61 | 6.29 | 1,412 |
| May 31, 2022 | 9.42 | .41 | (.33) | .08 | (.60) | — | — | (0.60) | 8.90 | .96 | 123,873 | .53 | 4.52 | 1,790 |
| May 31, 2021 | 9.02 | .37 | .39 | .76 | (.35) | — | (.01) | (0.36) | 9.42 | 8.46 | 43,483 | .50 | 3.93 | 1,058 |
| May 31, 2020 † | 10.51 | .33 | (1.11) | (.78) | (.70) | — | (.01) | (0.71) | 9.02 | (8.10)* | 54,750 | .48* | 3.40* | 1,311 |
The accompanying notes are an integral part of these financial statements.
Mortgage Opportunities Fund 19
Financial highlights cont.
* Not annualized.
# For the period June 1, 2020 (commencement of operations) to May 31, 2021.
† For the period July 1, 2019 (commencement of operations) to May 31, 2020.
a Per share net investment income (loss) has been determined on the basis of the weighted average number of shares outstanding during the period.
b Total return assumes dividend reinvestment and does not reflect the effect of sales charges.
c Includes amounts paid through expense offset and/or brokerage service arrangements, if any (Note 2). Also excludes acquired fund fees and expenses, if any.
d Reflects an involuntary contractual expense limitations in effect during the period. As a result of such limitations, the expenses of each class reflect a reduction of the following amount (Note 2):
| Percentage of average net assets | |||||
| 5/31/24 | 5/31/23 | 5/31/22 | 5/31/21 | 5/31/20 | |
| Class A | 0.21% | 0.20% | 0.28% | 0.27% | 0.20% |
| Class C | 0.21 | 0.20 | 0.28 | 0.27 | 0.20 |
| Class I | 0.21 | 0.20 | 0.28 | 0.27 | 0.22 |
| Class R6 | 0.21 | 0.20 | 0.28 | 0.27 | N/A |
| Class Y | 0.21 | 0.20 | 0.28 | 0.27 | 0.20 |
e Portfolio turnover includes TBA purchase and sale commitments.
f Represents less than $0.01 per share.
The accompanying notes are an integral part of these financial statements.
Mortgage Opportunities Fund 19
Notes to financial statements 5/31/24
Unless otherwise noted, the “reporting period” represents the period from June 1, 2023 through May 31, 2024. The following table defines commonly used references within the Notes to financial statements:
| References to | Represent |
| 1940 Act | Investment Company Act of 1940, as amended |
| Franklin Advisers | Franklin Advisers, Inc., a wholly-owned subsidiary of Franklin Templeton |
| Franklin Templeton | Franklin Resources, Inc. |
| Franklin Templeton Services | Franklin Templeton Services, LLC, a wholly-owned subsidiary of Franklin Templeton and an affiliate of Putnam Management |
| JPMorgan | JPMorgan Chase Bank, N.A. |
| OTC | Over-the-counter |
| PIL | Putnam Investments Limited, an affiliate of Putnam Management |
| Putnam Management | Putnam Investment Management, LLC, the fund’s manager, an indirect wholly-owned subsidiary of Franklin Templeton |
| SEC | Securities and Exchange Commission |
| State Street | State Street Bank and Trust Company |
Putnam Mortgage Opportunities Fund (the fund) is a diversified series of Putnam Funds Trust (the Trust), a Massachusetts business trust registered under the 1940 Act as an open-end management investment company. The goal of the fund is to maximize total return consistent with what Putnam Management believes to be prudent risk. Total return is composed of capital appreciation and income. The fund invests mainly in mortgage-related fixed income securities and related derivatives that are either investment-grade or below-investment-grade in quality (sometimes referred to as “junk bonds”). Under normal circumstances, the fund invests at least 80% of its net assets in mortgages, mortgage-related fixed income securities and related derivatives (i.e., derivatives used to acquire exposure to, or whose underlying securities are, mortgages or mortgage-related securities). The fund generally uses the net unrealized gain or loss, or market value, of mortgage-related derivatives for purposes of this policy, but may use the notional value of a derivative if that is determined to be a more appropriate measure of the fund’s investment exposure. This policy may be changed only after 60 days’ notice to shareholders. Putnam Management expects to invest in lower-rated, higher-yielding mortgage-backed securities, including non-agency residential mortgage-backed securities (which may be backed by non-qualified or “sub-prime” mortgages), commercial mortgage-backed securities, collateralized mortgage obligations (including interest only, principal only, and other prepayment derivatives), and agency mortgage-backed securities. The fund currently has significant investment exposure to commercial mortgage-backed securities. Non-agency (i.e., privately issued) securities typically are lower-rated and higher yielding than securities issued or backed by agencies such as Ginnie Mae, Fannie Mae or Freddie Mac. While Putnam Management’s emphasis will be on mortgage-backed securities, Putnam Management may also invest to a lesser extent in other types of asset-backed securities. Putnam Management may consider, among other factors, credit, interest rate, prepayment and liquidity risks, as well as general market conditions, when deciding whether to buy or sell investments. Putnam Management typically uses to a significant extent derivatives, including interest rate swaps, forward delivery contracts and total return swaps, options and swaptions on mortgage-backed securities and indices, for both hedging and non-hedging purposes, including to obtain or adjust exposure to mortgage-backed investments.
The fund offers the following share classes. The expenses for each class of shares may differ based on the distribution and investor servicing fees of each class, which are identified in Note 2.
| Share class | Sales charge | Contingent deferred sales charge | Conversion feature |
| Class A | Up to 4.00% | 1.00% on certain redemptions of shares bought with no initial sales charge | None |
| Class C | None | 1.00% eliminated after one year | Converts to class A shares after 8 years |
| Class I§ | None | None | None |
| Class R6† | None | None | None |
| Class Y† | None | None | None |
| † Not available to all investors. | |||
| § Intended for institutional and other investors who meet the $5,000,000 minimum investment and who are not purchasing through an intermediary. | |||
In the normal course of business, the fund enters into contracts that may include agreements to indemnify another party under given circumstances. The fund’s maximum exposure under these arrangements is unknown as this would involve future claims that may be, but have not yet been, made against the fund. However, the fund’s management team expects the risk of material loss to be remote.
The fund has entered into contractual arrangements with an investment adviser, administrator, distributor, shareholder servicing agent and custodian, who each provide services to the fund. Unless expressly stated otherwise, shareholders are not parties to, or intended beneficiaries of these contractual arrangements, and these contractual arrangements are not intended to create any shareholder right to enforce them against the service providers or to seek any remedy under them against the service providers, either directly or on behalf of the fund.
Under the Trust’s Agreement and Declaration of Trust, any claims asserted by a shareholder against or on behalf of the Trust (or its series), including claims against Trustees and Officers, must be brought in courts located within the Commonwealth of Massachusetts.
Note 1: Significant accounting policies
The fund follows the accounting and reporting guidance in Financial Accounting Standards Board (FASB) Accounting Standards Codification Topic 946, Financial Services – Investment Companies (ASC 946) and applies the specialized accounting and reporting guidance in U.S. Generally Accepted Accounting Principles (U.S. GAAP), including, but not limited to, ASC 946. The following is a summary of significant accounting policies consistently followed by the fund in the preparation of its financial statements. The preparation of financial statements is in conformity with accounting principles generally accepted in the United States of America and requires management to make estimates and assumptions that affect the reported amounts of assets and liabilities in the financial statements and the reported amounts of increases and decreases in net assets from operations. Actual results could differ from those estimates. Subsequent events after the Statement of assets and liabilities date through the date that the financial statements were issued have been evaluated in the preparation of the financial statements.
Investment income, realized and unrealized gains and losses and expenses of the fund are borne pro-rata based on the relative net assets of each class to the total net assets of the fund, except that each class bears expenses unique to that class (including the distribution fees applicable to such classes). Each class votes as a class only with respect to its own distribution plan or other matters on which a class vote is required by law or determined by the Trustees. If the fund were liquidated, shares of each class would receive their pro-rata share of the net assets of the fund. In addition, the Trustees declare separate dividends on each class of shares.
Mortgage Opportunities Fund 21
Security valuation Portfolio securities and other investments are valued using policies and procedures adopted by the Board of Trustees (Trustees). The Trustees have formed a Pricing Committee to oversee the implementation of these procedures. Under compliance policies and procedures approved by the Trustees, the Trustees have designated the fund’s investment manager as the valuation designee and has responsibility for oversight of valuation. The investment manager is assisted by the fund’s administrator in performing this responsibility, including leading the cross-functional Valuation Committee (VC). The VC is responsible for making fair value determinations, evaluating the effectiveness of the pricing policies of the fund and reporting to the Trustees.
Market quotations are not considered to be readily available for certain debt obligations (including short-term investments with remaining maturities of 60 days or less) and other investments; such investments are valued on the basis of valuations furnished by an independent pricing service approved by the Trustees or dealers selected by Putnam Management. Such services or dealers determine valuations for normal institutional-size trading units of such securities using methods based on market transactions for comparable securities and various relationships, generally recognized by institutional traders, between securities (which consider such factors as security prices, yields, maturities and ratings). These securities will generally be categorized as Level 2. Securities quoted in foreign currencies, if any, are translated into U.S. dollars at the current exchange rate.
Investments in open-end investment companies (excluding exchange-traded funds), if any, which can be classified as Level 1 or Level 2 securities, are valued based on their net asset value. The net asset value of such investment companies equals the total value of their assets less their liabilities and divided by the number of their outstanding shares.
To the extent a pricing service or dealer is unable to value a security or provides a valuation that Putnam Management does not believe accurately reflects the security’s fair value, the security will be valued at fair value by Putnam Management, which has been designated as valuation designee pursuant to Rule 2a–5 under the 1940 Act, in accordance with policies and procedures approved by the Trustees. Certain investments, including certain restricted and illiquid securities and derivatives, are also valued at fair value following procedures approved by the Trustees. These valuations consider such factors as significant market or specific security events such as interest rate or credit quality changes, various relationships with other securities, discount rates, U.S. Treasury, U.S. swap and credit yields, index levels, convexity exposures, recovery rates, sales and other multiples and resale restrictions. These securities are classified as Level 2 or as Level 3 depending on the priority of the significant inputs.
To assess the continuing appropriateness of fair valuations, the Valuation Committee reviews and affirms the reasonableness of such valuations on a regular basis after considering all relevant information that is reasonably available. Such valuations and procedures are reviewed periodically by the Trustees. Certain securities may be valued on the basis of a price provided by a single source. The fair value of securities is generally determined as the amount that the fund could reasonably expect to realize from an orderly disposition of such securities over a reasonable period of time. By its nature, a fair value price is a good faith estimate of the value of a security in a current sale and does not reflect an actual market price, which may be different by a material amount.
Security transactions and related investment income Security transactions are recorded on the trade date (the date the order to buy or sell is executed). Gains or losses on securities sold are determined on the identified cost basis.
Interest income, net of any applicable withholding taxes, if any, is recorded on the accrual basis. Amortization and accretion of premiums and discounts on debt securities, if any, is recorded on the accrual basis.
Securities purchased or sold on a (forward commitment or delayed delivery) basis may be settled at a future date beyond customary settlement time; interest income is accrued based on the terms of the securities. Losses may arise due to changes in the fair value of the underlying securities or if the counterparty does not perform under the contract.
Stripped securities The fund may invest in stripped securities which represent a participation in securities that may be structured in classes with rights to receive different portions of the interest and principal. Interest-only securities receive all of the interest and principal-only securities receive all of the principal. If the interest-only securities experience greater than anticipated prepayments of principal, the fund may fail to recoup fully its initial investment in these securities. Conversely, principal-only securities increase in value if prepayments are greater than anticipated and decline if prepayments are slower than anticipated. The fair value of these securities is highly sensitive to changes in interest rates.
Options contracts The fund uses options contracts for hedging duration and convexity, for isolating prepayment risk and for managing downside risks.
The potential risk to the fund is that the change in value of options contracts may not correspond to the change in value of the hedged instruments. In addition, losses may arise from changes in the value of the underlying instruments if there is an illiquid secondary market for the contracts, if interest or exchange rates move unexpectedly or if the counterparty to the contract is unable to perform. Realized gains and losses on purchased options are included in realized gains and losses on investment securities. If a written call option is exercised, the premium originally received is recorded as an addition to sales proceeds. If a written put option is exercised, the premium originally received is recorded as a reduction to the cost of investments.
Exchange-traded options are valued at the last sale price or, if no sales are reported, the last bid price for purchased options and the last ask price for written options. OTC traded options are valued using prices supplied by dealers.
Options on swaps are similar to options on securities except that the premium paid or received is to buy or grant the right to enter into a previously agreed upon interest rate or credit default contract. Forward premium swap option contracts include premiums that have extended settlement dates. The delayed settlement of the premiums is factored into the daily valuation of the option contracts. In the case of interest rate cap and floor contracts, in return for a premium, ongoing payments between two parties are based on interest rates exceeding a specified rate, in the case of a cap contract, or falling below a specified rate in the case of a floor contract.
Written option contracts outstanding at period end, if any, are listed after the fund’s portfolio.
Futures contracts The fund uses futures contracts for hedging treasury term structure risk and for yield curve positioning.
The potential risk to the fund is that the change in value of futures contracts may not correspond to the change in value of the hedged instruments. In addition, losses may arise from changes in the value of the underlying instruments, if there is an illiquid secondary market for the contracts, if interest or exchange rates move unexpectedly or if the counterparty to the contract is unable to perform. With futures, there is minimal counterparty credit risk to the fund since futures are exchange traded and the exchange’s clearinghouse, as counterparty to all exchange traded futures, guarantees the futures against default. Risks may exceed amounts recognized on the Statement of assets and liabilities. When the contract is closed, the fund records a realized gain or loss equal to the difference between the value of the contract at the time it was opened and the value at the time it was closed.
Futures contracts are valued at the quoted daily settlement prices established by the exchange on which they trade. The fund and the broker agree to exchange an amount of cash equal to the daily fluctuation in the value of the futures contract. Such receipts or payments are known as “variation margin.”
Futures contracts outstanding at period end, if any, are listed after the fund’s portfolio.
Interest rate swap contracts The fund entered into OTC and/or centrally cleared interest rate swap contracts, which are arrangements between two parties to exchange cash flows based on a notional principal amount for hedging term structure risk and for yield curve positioning.
An OTC and centrally cleared interest rate swap can be purchased or sold with an upfront premium. For OTC interest rate swap contracts, an upfront payment received by the fund is recorded as a liability on the fund’s books. An upfront payment made by the fund is recorded as an asset on the fund’s books. OTC and centrally cleared interest rate swap contracts are marked to market daily based upon quotations from an independent pricing service or market makers. Any change is recorded as an unrealized gain or loss on OTC interest rate swaps. Daily fluctuations in the value of centrally cleared interest rate swaps are settled through a central clearing agent and are recorded in variation margin on the Statement of assets and liabilities and recorded as unrealized gain or loss. Payments, including upfront premiums, received or made are recorded as realized gains or losses at the reset date or the closing of the contract. Certain OTC and centrally cleared interest rate swap contracts may include extended effective dates. Payments related to these swap contracts are accrued based on the terms of the contract.
The fund could be exposed to credit or market risk due to unfavorable changes in the fluctuation of interest rates or if the counterparty defaults, in the case of OTC interest rate contracts, or the central clearing agency or a clearing member defaults, in the case of centrally cleared interest rate swap contracts, on its
22 Mortgage Opportunities Fund
respective obligation to perform under the contract. The fund’s maximum risk of loss from counterparty risk or central clearing risk is the fair value of the contract. This risk may be mitigated for OTC interest rate swap contracts by having a master netting arrangement between the fund and the counterparty and for centrally cleared interest rate swap contracts through the daily exchange of variation margin. There is minimal counterparty risk with respect to centrally cleared interest rate swap contracts due to the clearinghouse guarantee fund and other resources that are available in the event of a clearing member default. Risk of loss may exceed amounts recognized on the Statement of assets and liabilities.
OTC and centrally cleared interest rate swap contracts outstanding, including their respective notional amounts at period end, if any, are listed after the fund’s portfolio.
At the close of the reporting period, the fund has deposited cash valued at $16,766,557 in a segregated account to cover margin requirements on open centrally cleared interest rate swap contracts.
Credit default contracts The fund entered into OTC and/or centrally cleared credit default contracts for hedging credit risk, for hedging market risk and for gaining exposure to specific sectors.
In OTC and centrally cleared credit default contracts, the protection buyer typically makes a periodic stream of payments to a counterparty, the protection seller, in exchange for the right to receive a contingent payment upon the occurrence of a credit event on the reference obligation or all other equally ranked obligations of the reference entity. Credit events are contract specific but may include bankruptcy, failure to pay, restructuring and obligation acceleration. For OTC credit default contracts, an upfront payment received by the fund is recorded as a liability on the fund’s books. An upfront payment made by the fund is recorded as an asset on the fund’s books. Centrally cleared credit default contracts provide the same rights to the protection buyer and seller except the payments between parties, including upfront premiums, are settled through a central clearing agent through variation margin payments. Upfront and periodic payments received or paid by the fund for OTC and centrally cleared credit default contracts are recorded as realized gains or losses at the reset date or close of the contract. The OTC and centrally cleared credit default contracts are marked to market daily based upon quotations from an independent pricing service or market makers. Any change in value of OTC credit default contracts is recorded as an unrealized gain or loss. Daily fluctuations in the value of centrally cleared credit default contracts are recorded in variation margin on the Statement of assets and liabilities and recorded as unrealized gain or loss. Upon the occurrence of a credit event, the difference between the par value and fair value of the reference obligation, net of any proportional amount of the upfront payment, is recorded as a realized gain or loss.
In addition to bearing the risk that the credit event will occur, the fund could be exposed to market risk due to unfavorable changes in interest rates or in the price of the underlying security or index or the possibility that the fund may be unable to close out its position at the same time or at the same price as if it had purchased the underlying reference obligations. In certain circumstances, the fund may enter into offsetting OTC and centrally cleared credit default contracts which would mitigate its risk of loss. Risks of loss may exceed amounts recognized on the Statement of assets and liabilities. The fund’s maximum risk of loss from counterparty risk, either as the protection seller or as the protection buyer, is the fair value of the contract. This risk may be mitigated for OTC credit default contracts by having a master netting arrangement between the fund and the counterparty and for centrally cleared credit default contracts through the daily exchange of variation margin. Counterparty risk is further mitigated with respect to centrally cleared credit default swap contracts due to the clearinghouse guarantee fund and other resources that are available in the event of a clearing member default. Where the fund is a seller of protection, the maximum potential amount of future payments the fund may be required to make is equal to the notional amount.
OTC and centrally cleared credit default contracts outstanding, including their respective notional amounts at period end, if any, are listed after the fund’s portfolio.
TBA commitments The fund may enter into TBA (to be announced) commitments to purchase securities for a fixed unit price at a future date beyond customary settlement time. Although the unit price and par amount have been established, the actual securities have not been specified. However, it is anticipated that the amount of the commitments will not significantly differ from the principal amount. The fund holds, and maintains until settlement date, cash or high-grade debt obligations in an amount sufficient to meet the purchase price, or the fund may enter into offsetting contracts for the forward sale of other securities it owns. Income on the securities will not be earned until settlement date.
The fund may also enter into TBA sale commitments to hedge its portfolio positions, to sell mortgage-backed securities it owns under delayed delivery arrangements or to take a short position in mortgage-backed securities. Proceeds of TBA sale commitments are not received until the contractual settlement date. During the time a TBA sale commitment is outstanding, either equivalent deliverable securities or an offsetting TBA purchase commitment deliverable on or before the sale commitment date are held as “cover” for the transaction, or other liquid assets in an amount equal to the notional value of the TBA sale commitment are segregated. If the TBA sale commitment is closed through the acquisition of an offsetting TBA purchase commitment, the fund realizes a gain or loss. If the fund delivers securities under the commitment, the fund realizes a gain or a loss from the sale of the securities based upon the unit price established at the date the commitment was entered into.
TBA commitments, which are accounted for as purchase and sale transactions, may be considered securities themselves, and involve a risk of loss due to changes in the value of the security prior to the settlement date as well as the risk that the counterparty to the transaction will not perform its obligations. Counterparty risk is mitigated by having a master agreement between the fund and the counterparty.
Unsettled TBA commitments are valued at their fair value according to the procedures described under “Security valuation” above. The contract is marked to market daily and the change in fair value is recorded by the fund as an unrealized gain or loss. Based on market circumstances, Putnam Management will determine whether to take delivery of the underlying securities or to dispose of the TBA commitments prior to settlement.
TBA purchase commitments outstanding at period end, if any, are listed within the fund’s portfolio and TBA sale commitments outstanding at period end, if any, are listed after the fund’s portfolio.
Master agreements The fund is a party to ISDA (International Swaps and Derivatives Association, Inc.) Master Agreements that govern OTC derivative and foreign exchange contracts and Master Securities Forward Transaction Agreements that govern transactions involving mortgage-backed and other asset-backed securities that may result in delayed delivery (Master Agreements) with certain counterparties entered into from time to time. The Master Agreements may contain provisions regarding, among other things, the parties’ general obligations, representations, agreements, collateral requirements, events of default and early termination. With respect to certain counterparties, in accordance with the terms of the Master Agreements, collateral pledged to the fund is held in a segregated account by the fund’s custodian and, with respect to those amounts which can be sold or repledged, are presented in the fund’s portfolio.
Collateral pledged by the fund is segregated by the fund’s custodian and identified in the fund’s portfolio. Collateral can be in the form of cash or debt securities issued by the U.S. Government or related agencies or other securities as agreed to by the fund and the applicable counterparty. Collateral requirements are determined based on the fund’s net position with each counterparty.
With respect to ISDA Master Agreements, termination events applicable to the fund may occur upon a decline in the fund’s net assets below a specified threshold over a certain period of time. Termination events applicable to counterparties may occur upon a decline in the counterparty’s long-term or short-term credit ratings below a specified level. In each case, upon occurrence, the other party may elect to terminate early and cause settlement of all derivative and foreign exchange contracts outstanding, including the payment of any losses and costs resulting from such early termination, as reasonably determined by the terminating party. Any decision by one or more of the fund’s counterparties to elect early termination could impact the fund’s future derivative activity.
At the close of the reporting period, the fund had a net liability position of $2,949,715 on open derivative contracts subject to the Master Agreements. Collateral pledged by the fund at period end for these agreements totaled $2,442,796 and may include amounts related to unsettled agreements.
Interfund lending The fund, along with other Putnam funds, may participate in an interfund lending program pursuant to an exemptive order issued by the SEC. This program allows the fund to borrow from or lend to other Putnam funds that permit such transactions. Interfund lending transactions are subject to each fund’s investment policies and borrowing and lending limits. Interest earned or paid on the interfund lending transaction will be based on the average of certain current market rates. During the reporting period, the fund did not utilize the program.
Lines of credit The fund participates, along with other Putnam funds, in a $320 million syndicated unsecured committed line of credit, provided by State Street ($160 million) and JPMorgan ($160 million), and a $235.5 million unsecured uncommitted line of credit, provided by State Street. Borrowings may be made for
Mortgage Opportunities Fund 23
temporary or emergency purposes, including the funding of shareholder redemption requests and trade settlements. Interest is charged to the fund based on the fund’s borrowing at a rate equal to 1.25% plus the higher of (1) the Federal Funds rate and (2) the Overnight Bank Funding Rate for the committed line of credit and 1.30% plus the higher of (1) the Federal Funds rate and (2) the Overnight Bank Funding Rate for the uncommitted line of credit. A closing fee equal to 0.04% of the committed line of credit and 0.04% of the uncommitted line of credit has been paid by the participating funds and a $75,000 fee has been paid by the participating funds to State Street as agent of the syndicated committed line of credit. In addition, a commitment fee of 0.21% per annum on any unutilized portion of the committed line of credit is allocated to the participating funds based on their relative net assets and paid quarterly. During the reporting period, the fund had no borrowings against these arrangements.
Federal taxes It is the policy of the fund to distribute all of its taxable income within the prescribed time period and otherwise comply with the provisions of the Internal Revenue Code of 1986, as amended (the Code), applicable to regulated investment companies. It is also the intention of the fund to distribute an amount sufficient to avoid imposition of any excise tax under Section 4982 of the Code.
The fund is subject to the provisions of Accounting Standards Codification 740 Income Taxes (ASC 740). ASC 740 sets forth a minimum threshold for financial statement recognition of the benefit of a tax position taken or expected to be taken in a tax return. The fund did not have a liability to record for any unrecognized tax benefits in the accompanying financial statements. No provision has been made for federal taxes on income, capital gains or unrealized appreciation on securities held nor for excise tax on income and capital gains. Each of the fund’s federal tax returns for the prior three fiscal years remains subject to examination by the Internal Revenue Service.
Under the Regulated Investment Company Modernization Act of 2010, the fund will be permitted to carry forward capital losses incurred for an unlimited period and the carry forwards will retain their character as either short-term or long-term capital losses. At May 31, 2024, the fund had the following capital loss carryovers available, to the extent allowed by the Code, to offset future net capital gain, if any:
| Loss carryover | ||
| Short-term | Long-term | Total |
| $7,057,671 | $3,667,141 | $10,724,812 |
Pursuant to federal income tax regulations applicable to regulated investment companies, the fund has elected to defer $2,015,928 to its fiscal year ending May 31, 2025 of late year ordinary losses ((i) ordinary losses recognized between January 1, 2024 and May 31, 2024, and/or (ii) specified ordinary and currency losses recognized between November 1, 2023 and May 31, 2024).
Distributions to shareholders Distributions to shareholders from net investment income, if any, are recorded by the fund on the ex-dividend date. Distributions from capital gains, if any, are recorded on the ex-dividend date and paid at least annually. The amount and character of income and gains to be distributed are determined in accordance with income tax regulations, which may differ from generally accepted accounting principles. These differences include temporary and/or permanent differences from late year loss deferrals, from unrealized gains and losses on certain futures contracts, from income on swap contracts, from interest-only securities and from distributions in excess. Reclassifications are made to the fund’s capital accounts to reflect income and gains available for distribution (or available capital loss carryovers) under income tax regulations. At the close of the reporting period, the fund reclassified $3,716,892 to decrease distributions in excess of net investment income, $4,247,840 to decrease paid-in capital and $530,948 to decrease accumulated net realized loss.
Tax cost of investments includes adjustments to net unrealized appreciation (depreciation) which may not necessarily be final tax cost basis adjustments, but closely approximate the tax basis unrealized gains and losses that may be realized and distributed to shareholders. The tax basis components of distributable earnings and the federal tax cost as of the close of the reporting period were as follows:
| Unrealized appreciation | $27,675,782 |
| Unrealized depreciation | (50,736,676) |
| Net unrealized depreciation | (23,060,894) |
| Capital loss carryforward | (10,724,812) |
| Late year ordinary loss deferral | (2,015,928) |
| Cost for federal income tax purposes | $945,323,022 |
Expenses of the Trust Expenses directly charged or attributable to any fund will be paid from the assets of that fund. Generally, expenses of the Trust will be allocated among and charged to the assets of each fund on a basis that the Trustees deem fair and equitable, which may be based on the relative assets of each fund or the nature of the services performed and relative applicability to each fund.
Note 2: Management fee, administrative services and other transactions
The fund pays Putnam Management for management and investment advisory services monthly based on the average net assets of the fund. Such fee is based on the following annual rates:
0.550% of the first $500 million of average net assets, 0.500% of the next $500 million of average net assets 0.450% of any excess thereafter
For the reporting period, the management fee represented an effective rate (excluding the impact from any expense waivers in effect) of 0.550% of the fund’s average net assets.
Effective July 15, 2024, Putnam Management transferred its management contract with the fund to Franklin Advisers. As a result of the transfer, Franklin Advisers replaced Putnam Management as the investment adviser of the fund. In addition, effective July 15, 2024, Franklin Advisers has retained Putnam Management as a sub-adviser for the fund pursuant to a new sub-advisory agreement between Franklin Advisers and Putnam Management.
Putnam Management has contractually agreed, through September 30, 2025, to waive fees and/or reimburse the fund’s expenses to the extent necessary to limit the cumulative expenses of the fund, exclusive of brokerage, interest, taxes, investment-related expenses, extraordinary expenses, acquired fund fees and expenses and payments under the fund’s investor servicing contract, investment management contract and distribution plans, on a fiscal year-to-date basis to an annual rate of 0.20% of the fund’s average net assets over such fiscal year-to-date period. During the reporting period, the fund’s expenses were not reduced as a result of this limit.
Putnam Management has also contractually agreed to waive fees (and, to the extent necessary, bear other expenses) of the fund through September 30, 2025, to the extent that total expenses of the fund (excluding brokerage, interest, taxes, investment-related expenses, payments under distribution plans, extraordinary expenses, payments under the fund’s investor servicing contract and acquired fund fees and expenses, but including payments under the fund’s investment management contract) would exceed an annual rate of 0.46% of the fund’s average net assets. During the reporting period, the fund’s expenses were reduced by $830,894 as a result of this limit.
PIL is authorized by the Trustees to manage a separate portion of the assets of the fund as determined by Putnam Management from time to time. PIL did not manage any portion of the assets of the fund during the reporting period. If Putnam Management were to engage the services of PIL, Putnam Management would pay a quarterly sub-management fee to PIL for its services at an annual rate of 0.20% of the average net assets of the portion of the fund managed by PIL. Effective July 15, 2024, Putnam Management transferred its sub-management contract with PIL in respect of the fund to Franklin Advisers.
On January 1, 2024, a subsidiary of Franklin Templeton acquired Putnam U.S. Holdings I, LLC (“Putnam Holdings”), the parent company of Putnam Management and PIL, in a stock and cash transaction (the “Transaction”). As a result of the Transaction, Putnam Management and PIL became indirect, wholly-owned subsidiaries of Franklin Templeton. The Transaction also resulted in the automatic termination of the investment management contract between the fund and Putnam Management and the sub-management contract for the fund between Putnam Management and PIL that were in place for the fund before the Transaction (together, the “Previous Advisory Contracts”). However, Putnam Management and PIL continue to provide uninterrupted services with respect to the fund pursuant to new investment management and sub-management contracts that were approved by fund shareholders at a shareholder meeting held in connection with the Transaction and that took effect on January 1, 2024 (together, the “New Advisory Contracts”). The terms of the New Advisory Contracts are substantially similar to those of the Previous Advisory Contracts, and the fee rates payable under the New Advisory Contracts are the same as the fee rates under the Previous Advisory Contracts.
Effective June 1, 2024, under an agreement with Putnam Management, Franklin Templeton Services will provide certain administrative services to the fund. The fee for those services will be paid by Putnam Management based on the fund’s average daily net assets and is not an additional expense of the fund.
24 Mortgage Opportunities Fund
The fund reimburses Putnam Management an allocated amount for the compensation and related expenses of certain officers of the fund and their staff who provide administrative services to the fund. The aggregate amount of all such reimbursements is determined annually by the Trustees.
Custodial functions for the fund’s assets are provided by State Street. Custody fees are based on the fund’s asset level, the number of its security holdings and transaction volumes.
Putnam Investor Services, Inc., an affiliate of Putnam Management, provides investor servicing agent functions to the fund. Putnam Investor Services, Inc. received fees for investor servicing for class A, class C and class Y shares that included (1) a per account fee for each direct and underlying non-defined contribution account (retail account) of the fund; (2) a specified rate of the fund’s assets attributable to defined contribution plan accounts; and (3) a specified rate based on the average net assets in retail accounts. Putnam Investor Services, Inc. has agreed that the aggregate investor servicing fees for each fund’s retail and defined contribution accounts for these share classes will not exceed an annual rate of 0.25% of the fund’s average assets attributable to such accounts.
Class I shares paid a monthly fee based on the average net assets of class I shares at an annual rate of 0.01%.
Class R6 shares paid a monthly fee based on the average net assets of class R6 shares at an annual rate of 0.05%.
During the reporting period, the expenses for each class of shares related to investor servicing fees were as follows:
| Class A | $17,114 |
| Class C | 2,731 |
| Class I | 17,204 |
| Class R6 | 1,866 |
| Class Y | 318,523 |
| Total | $357,438 |
The fund has entered into expense offset arrangements with Putnam Investor Services, Inc. and State Street whereby Putnam Investor Services, Inc.’s and State Street’s fees are reduced by credits allowed on cash balances. For the reporting period, the fund’s expenses were reduced by $13,636 under the expense offset arrangements.
Each Independent Trustee of the fund receives an annual Trustee fee, of which $336, as a quarterly retainer, has been allocated to the fund, and an additional fee for each Trustees meeting attended. Trustees also are reimbursed for expenses they incur relating to their services as Trustees.
The fund has adopted a Trustee Fee Deferral Plan (the Deferral Plan) which allows the Trustees to defer the receipt of all or a portion of Trustees fees payable from July 1, 1995 through December 31, 2023. The deferred fees remain invested in certain Putnam funds until distribution in accordance with the Deferral Plan.
The fund has adopted an unfunded noncontributory defined benefit pension plan (the Pension Plan) covering all Trustees of the fund who have served as a Trustee for at least five years and were first elected prior to 2004. Benefits under the Pension Plan are equal to 50% of the Trustee’s average annual attendance and retainer fees for the three years ended December 31, 2005. The retirement benefit is payable during a Trustee’s lifetime, beginning the year following retirement, for the number of years of service through December 31, 2006. Pension expense for the fund is included in Trustee compensation and expenses in the Statement of operations. Accrued pension liability is included in Payable for Trustee compensation and expenses in the Statement of assets and liabilities. The Trustees have terminated the Pension Plan with respect to any Trustee first elected after 2003.
The fund has adopted distribution plans (the Plans) with respect to the following share classes pursuant to Rule 12b–1 under the 1940 Act. The purpose of the Plans is to compensate Putnam Retail Management Limited Partnership, an indirect wholly-owned subsidiary of Franklin Templeton, for services provided and expenses incurred in distributing shares of the fund. The Plans provide payments by the fund to Putnam Retail Management Limited Partnership at an annual rate of up to the following amounts (Maximum%) of the average net assets attributable to each class. The Trustees have approved payment by the fund at the following annual rate (Approved%) of the average net assets attributable to each class. During the reporting period, the class-specific expenses related to distribution fees were as follows:
| Maximum% | Approved% | Amount | |
| Class A | 0.35% | 0.25% | $28,414 |
| Class C | 1.00% | 1.00% | 18,147 |
| Total | $46,561 |
For the reporting period, Putnam Retail Management Limited Partnership, acting as underwriter, received net commissions of $7,101 from the sale of class A shares and received $655 in contingent deferred sales charges from redemptions of class C shares.
A deferred sales charge of up to 1.00% is assessed on certain redemptions of class A shares. For the reporting period, Putnam Retail Management Limited Partnership, acting as underwriter, received $2 on class A redemptions.
Note 3: Purchases and sales of securities
During the reporting period, the cost of purchases and the proceeds from sales, excluding short-term investments, were as follows:
| Cost of purchases | Proceeds from sales | |
| Investments in securities, including TBA commitments (Long-term) | $8,329,824,589 | $8,253,809,331 |
| U.S. government securities (Long-term) | — | — |
| Total | $8,329,824,589 | $8,253,809,331 |
The fund may purchase or sell investments from or to other Putnam funds in the ordinary course of business, which can reduce the fund’s transaction costs, at prices determined in accordance with SEC requirements and policies approved by the Trustees. During the reporting period, purchases or sales of long-term securities from or to other Putnam funds, if any, did not represent more than 5% of the fund’s total cost of purchases and/or total proceeds from sales.
Note 4: Capital shares
At the close of the reporting period, there were an unlimited number of shares of beneficial interest authorized. Transactions, including, if applicable, direct exchanges pursuant to share conversions, in capital shares were as follows:
| YEAR ENDED 5/31/24 | YEAR ENDED 5/31/23 | |||
| Class A | Shares | Amount | Shares | Amount |
| Shares sold | 1,056,215 | $9,208,735 | 2,137,657 | $18,897,268 |
| Shares issued in connection with reinvestment of distributions | 105,132 | 907,044 | 119,414 | 1,036,072 |
| 1,161,347 | 10,115,779 | 2,257,071 | 19,933,340 | |
| Shares repurchased | (579,326) | (5,051,055) | (1,467,943) | (12,769,740) |
| Net increase | 582,021 | $5,064,724 | 789,128 | $7,163,600 |
Mortgage Opportunities Fund 25
| YEAR ENDED 5/31/24 | YEAR ENDED 5/31/23 | |||
| Class C | Shares | Amount | Shares | Amount |
| Shares sold | 161,092 | $1,412,851 | 206,995 | $1,825,824 |
| Shares issued in connection with reinvestment of distributions | 15,714 | 135,862 | 11,297 | 98,177 |
| 176,806 | 1,548,713 | 218,292 | 1,924,001 | |
| Shares repurchased | (92,135) | (799,028) | (46,881) | (405,143) |
| Net increase | 84,671 | $749,685 | 171,411 | $1,518,858 |
| YEAR ENDED 5/31/24 | YEAR ENDED 5/31/23 | |||
| Class I | Shares | Amount | Shares | Amount |
| Shares sold | 4,440,600 | $38,500,000 | 566,251 | $5,000,001 |
| Shares issued in connection with reinvestment of distributions | 999,221 | 8,630,450 | 856,279 | 7,451,936 |
| 5,439,821 | 47,130,450 | 1,422,530 | 12,451,937 | |
| Shares repurchased | (1,729,925) | (15,000,000) | — | — |
| Net increase | 3,709,896 | $32,130,450 | 1,422,530 | $12,451,937 |
| YEAR ENDED 5/31/24 | YEAR ENDED 5/31/23 | |||
| Class R6 | Shares | Amount | Shares | Amount |
| Shares sold | 207,293 | $1,804,964 | 421,901 | $3,751,121 |
| Shares issued in connection with reinvestment of distributions | 35,343 | 304,987 | 30,073 | 261,755 |
| 242,636 | 2,109,951 | 451,974 | 4,012,876 | |
| Shares repurchased | (503,544) | (4,415,158) | (167,452) | (1,463,441) |
| Net increase (decrease) | (260,908) | $(2,305,207) | 284,522 | $2,549,435 |
| YEAR ENDED 5/31/24 | YEAR ENDED 5/31/23 | |||
| Class Y | Shares | Amount | Shares | Amount |
| Shares sold | 26,015,650 | $227,510,200 | 34,477,256 | $303,904,569 |
| Shares issued in connection with reinvestment of distributions | 1,979,273 | 17,082,895 | 1,807,519 | 15,690,275 |
| 27,994,923 | 244,593,095 | 36,284,775 | 319,594,844 | |
| Shares repurchased | (13,200,718) | (114,473,611) | (27,072,474) | (235,277,609) |
| Net increase | 14,794,205 | $130,119,484 | 9,212,301 | $84,317,235 |
At the close of the reporting period, three shareholders of record owned 12.0%, 10.4% and 9.2% respectively, of the outstanding shares of the fund.
Note 5: Affiliated transactions
Transactions during the reporting period with any company which is under common ownership or control were as follows:
| Name of affiliate | Fair value as of 5/31/23 | Purchase cost | Sale proceeds | Investment income | Shares outstanding and fair value as of 5/31/24 |
| Short-term investments | |||||
| Putnam Short Term Investment Fund Class P‡ | $20,223,800 | $379,057,596 | $305,147,760 | $1,796,861 | $94,133,636 |
| Total Short-term investments | $20,223,800 | $379,057,596 | $305,147,760 | $1,796,861 | $94,133,636 |
| ‡ Management fees charged to Putnam Short Term Investment Fund have been waived by Putnam Management. There were no realized or unrealized gains or losses during the period. | |||||
Note 6: Market, credit and other risks
In the normal course of business, the fund trades financial instruments and enters into financial transactions where risk of potential loss exists due to changes in the market (market risk) or failure of the contracting party to the transaction to perform (credit risk). The fund may be exposed to additional credit risk that an institution or other entity with which the fund has unsettled or open transactions will default. The fund may invest in higher-yielding, lower-rated bonds that may have a higher rate of default. The fund may invest a significant portion of its assets in securitized debt instruments, including mortgage-backed and asset-backed investments. The yields and values of these investments are sensitive to changes in interest rates, the rate of principal payments on the underlying assets and the market’s perception of the issuers. The market for these investments may be volatile and limited, which may make them difficult to buy or sell.
Note 7: Summary of derivative activity
The volume of activity for the reporting period for any derivative type that was held during the period is listed below and was based on an average of the holdings at the end of each fiscal quarter:
| Purchased swap option contracts (contract amount) | $254,000,000 |
| Written swap option contracts (contract amount) | $—* |
| Futures contracts (number of contracts) | 4,000 |
| Centrally cleared interest rate swap contracts (notional) | $796,700,000 |
| OTC credit default contracts (notional) | $44,400,000 |
| * For the reporting period, there were no holdings at the end of each fiscal quarter and the transactions were considered minimal. |
26 Mortgage Opportunities Fund
The following is a summary of the fair value of derivative instruments as of the close of the reporting period:
| Fair value of derivative instruments as of the close of the reporting period | ||||
| Asset derivatives | Liability derivatives | |||
| Derivatives not accounted for as hedging instruments under ASC 815 | Statement of assets and liabilities location | Fair value | Statement of assets and liabilities location | Fair value |
| Credit contracts | Receivables | $4,036,080 | Payables | $4,708,342 |
| Interest rate contracts | Receivables, Net assets — Unrealized appreciation | 12,060,039* | Payables, Net assets — Unrealized depreciation | 3,598,156* |
| Total | $16,096,119 | $8,306,498 | ||
| * Includes cumulative appreciation/depreciation of futures contracts and/or centrally cleared swaps as reported in the fund’s portfolio. Only current day’s variation margin is reported within the Statement of assets and liabilities. | ||||
The following is a summary of realized and change in unrealized gains or losses of derivative instruments in the Statement of operations for the reporting period (Note 1):
| Amount of realized gain or (loss) on derivatives recognized in net gain or (loss) on investments | ||||
| Derivatives not accounted for as hedging instruments under ASC 815 | Options | Futures | Swaps | Total |
| Credit contracts | $— | $— | $1,348,382 | $1,348,382 |
| Interest rate contracts | (978,972) | 27,975,795 | (2,501,449) | $24,495,374 |
| Total | $(978,972) | $27,975,795 | $(1,153,067) | $25,843,756 |
| Change in unrealized appreciation or (depreciation) on derivatives recognized in net gain or (loss) on investments | ||||
| Derivatives not accounted for as hedging instruments under ASC 815 | Options | Futures | Swaps | Total |
| Credit contracts | $— | $— | $(516,131) | $(516,131) |
| Interest rate contracts | 239,129 | 1,730,752 | 4,385,115 | $6,354,996 |
| Total | $239,129 | $1,730,752 | $3,868,984 | $5,838,865 |
Mortgage Opportunities Fund 27
Note 8: Offsetting of financial and derivative assets and liabilities
The following table summarizes any derivatives, repurchase agreements and reverse repurchase agreements, at the end of the reporting period, that are subject to an enforceable master netting agreement or similar agreement. For securities lending transactions or borrowing transactions associated with securities sold short, if any, see Note 1. For financial reporting purposes, the fund does not offset financial assets and financial liabilities that are subject to the master netting agreements in the Statement of assets and liabilities.
| Bank of America N.A. | Barclays Bank PLC | Barclays Capital, Inc. (clearing broker) | BofA Securities, Inc. | Citibank, N.A. | Citigroup Global Markets, Inc. | Credit Suisse International | |
| Assets: | |||||||
| Centrally cleared interest rate swap contracts§ | $— | $— | $2,776,928 | $— | $— | $— | $— |
| OTC Credit default contracts — protection sold*# | — | — | — | — | — | — | — |
| OTC Credit default contracts — protection purchased*# | — | — | — | — | — | 815,164 | 257,525 |
| Futures contracts§ | — | — | — | — | — | — | — |
| Forward premium swap option contracts# | — | — | — | — | 1,418,837 | — | — |
| Total Assets | $— | $— | $2,776,928 | $— | $1,418,837 | $815,164 | $257,525 |
| Liabilities: | |||||||
| Centrally cleared interest rate swap contracts§ | — | — | 3,304,368 | — | — | — | — |
| OTC Credit default contracts — protection sold*# | — | 485 | — | — | — | 2,863,259 | 79,584 |
| OTC Credit default contracts — protection purchased*# | — | — | — | — | — | — | — |
| Futures contracts§ | — | — | — | — | — | — | — |
| Forward premium swap option contracts# | 166,127 | — | — | — | 1,844,112 | — | — |
| Total Liabilities | $166,127 | $485 | $3,304,368 | $— | $1,844,112 | $2,863,259 | $79,584 |
| Total Financial and Derivative Net Assets | $(166,127) | $(485) | $(527,440) | $— | $(425,275) | $(2,048,095) | $177,941 |
| Total collateral received (pledged)†## | $(134,939) | $— | $— | $— | $150,000 | $(2,048,095) | $110,000 |
| Net amount | $(31,188) | $(485) | $(527,440) | $— | $(575,275) | $— | $67,941 |
| Controlled collateral received (including TBA commitments)** | $— | $— | $— | $— | $150,000 | $— | $110,000 |
| Uncontrolled collateral received | $— | $— | $— | $— | $— | $— | $— |
| Collateral (pledged) (including TBA commitments)** | $(134,939) | $— | $— | $(264,864) | $— | $(2,473,554) | $— |
28 Mortgage Opportunities Fund
Note 8: Offsetting of financial and derivative assets and liabilities cont.
| Goldman Sachs International | JPMorgan Securities LLC | Merrill Lynch International | Mizuho Capital Markets LLC | Morgan Stanley & Co. International PLC | Wells Fargo Bank, N.A. | Total | |
| Assets: | |||||||
| Centrally cleared interest rate swap contracts§ | $— | $— | $— | $— | $— | $— | $2,776,928 |
| OTC Credit default contracts — protection sold*# | — | — | — | — | — | — | — |
| OTC Credit default contracts — protection purchased*# | 1,329,080 | 337,036 | 18,707 | — | 1,278,568 | — | 4,036,080 |
| Futures contracts§ | — | — | — | — | — | — | — |
| Forward premium swap option contracts# | — | — | — | — | — | — | 1,418,837 |
| Total Assets | $1,329,080 | $337,036 | $18,707 | $— | $1,278,568 | $— | $8,231,845 |
| Liabilities: | |||||||
| Centrally cleared interest rate swap contracts§ | — | — | — | — | — | — | 3,304,368 |
| OTC Credit default contracts — protection sold*# | 213,096 | 339,811 | 123,895 | — | 1,088,212 | — | 4,708,342 |
| OTC Credit default contracts — protection purchased*# | — | — | — | — | — | — | — |
| Futures contracts§ | — | 750,554 | — | — | — | — | 750,554 |
| Forward premium swap option contracts# | — | — | — | 201,770 | — | — | 2,212,009 |
| Total Liabilities | $213,096 | $1,090,365 | $123,895 | $201,770 | $1,088,212 | $— | $10,975,273 |
| Total Financial and Derivative Net Assets | $1,115,984 | $(753,329) | $(105,188) | $(201,770) | $190,356 | $— | $(2,743,428) |
| Total collateral received (pledged)†## | $1,050,000 | $— | $(105,188) | $(116,087) | $190,356 | $— | |
| Net amount | $65,984 | $(753,329) | $— | $(85,683) | $— | $— | |
| Controlled collateral received (including TBA commitments)** | $1,050,000 | $160,000 | $— | $— | $200,000 | $— | $1,670,000 |
| Uncontrolled collateral received | $— | $— | $— | $— | $— | $— | $— |
| Collateral (pledged) (including TBA commitments)** | $— | $— | $(112,119) | $(116,087) | $— | $(574,484) | $(3,676,047) |
| * | Excludes premiums, if any. Included in unrealized appreciation and depreciation on OTC swap contracts on the Statement of assets and liabilities. |
| ** | Included with Investments in securities on the Statement of assets and liabilities. |
| † | Additional collateral may be required from certain brokers based on individual agreements. |
| # | Covered by master netting agreement (Note 1). |
| ## | Any over-collateralization of total financial and derivative net assets is not shown. Collateral may include amounts related to unsettled agreements. |
| § | Includes current day’s variation margin only as reported on the Statement of assets and liabilities, which is not collateralized. Cumulative appreciation/(depreciation) for futures contracts and centrally cleared swap contracts is represented in the tables listed after the fund’s portfolio. Collateral pledged for initial margin on futures contracts and centrally cleared swap contracts, which is not included in the table above, amounted to $7,204,113 and $16,766,557, respectively. |
Mortgage Opportunities Fund 29
Federal tax information (Unaudited)
The Form 1099 that will be mailed to you in January 2025 will show the tax status of all distributions paid to your account in calendar 2024.
| 30 Mortgage Opportunities Fund |
Changes in and disagreements with accountants
Not applicable
Results of any shareholder votes (Unaudited)
November 17, 2023 special meeting
At the meeting, a new Management Contract for your fund with Putnam Investment Management, LLC was approved, as follows:
| Votes for | Votes against | Abstentions/Votes withheld |
| 20,600,149 | 46,770 | 859,955 |
At the meeting, a new Sub-Management Contract for your fund between Putnam Investment Management, LLC and Putnam Investments Limited was approved, as follows:
| Votes for | Votes against | Abstentions/Votes withheld |
| 20,590,574 | 56,996 | 859,304 |
All tabulations are rounded to the nearest whole number.
Remuneration paid to directors, officers, and others
Remuneration paid is included in the Notes to financial statements above.
Board approval of management and subadvisory agreements
Not applicable
| Mortgage Opportunities Fund 31 |
 | ||
| © 2024 Franklin Templeton. All rights reserved. | 39234-AFSOI 07/24 | |
| Item 8. Changes in and Disagreements with Accountants for Open-End Management Investment Companies. |
| Included in Item 7 above. |
| Item 9. Proxy Disclosure for Open-End Management Investment Companies. |
| Included in Item 7 above. |
| Item 10. Remuneration Paid to Directors, Officers, and Others of Open-End Management Investment Companies. |
| Included in Item 7 above. |
| Item 11. Statement Regarding Basis for Approval of Investment Advisory Contract. |
| Included in Item 7 above. |
| Item 12. Disclosure of Proxy Voting Policies and Procedures For Closed-End Management Investment Companies: |
| Not applicable |
| Item 13. Portfolio Managers of Closed-End Investment Companies |
| Not Applicable |
| Item 14. Purchases of Equity Securities by Closed-End Management Investment Companies and Affiliated Purchasers: |
| Not applicable |
| Item 15. Submission of Matters to a Vote of Security Holders: |
| Not applicable |
| Item 16. Controls and Procedures: |
| (a) The registrant’s principal executive officer and principal financial officer have concluded, based on their evaluation of the effectiveness of the design and operation of the registrant’s disclosure controls and procedures as of a date within 90 days of the filing date of this report, that the design and operation of such procedures are generally effective to provide reasonable assurance that information required to be disclosed by the registrant in this report is recorded, processed, summarized and reported within the time periods specified in the Commission’s rules and forms. |
| (b) Changes in internal control over financial reporting: Not applicable |
| Item 17. Disclosures of Securities Lending Activities for Closed-End Investment Companies: |
| Not Applicable |
| Item 18. Recovery of Erroneously Awarded Compensation. |
| (a) No |
| (b) No |
| Item 19. Exhibits: |
| (a)(1) The Code of Ethics of The Putnam Funds, which incorporates the Code of Ethics of Putnam Investments, is filed herewith. |
| (a)(2) Any policy required by the listing standards adopted pursuant to Rule 10D-1 under the Exchange Act (17 CFR 240.10D-1) by the registered national securities exchange or registered national securities association upon which the registrant’s securities are listed. Not Applicable |
| (b) The certifications required by Rule 30a-2(b) under the Investment Company Act of 1940, as amended, are filed herewith. |
| SIGNATURES |
| Pursuant to the requirements of the Securities Exchange Act of 1934 and the Investment Company Act of 1940, the registrant has duly caused this report to be signed on its behalf by the undersigned, thereunto duly authorized. |
| Putnam Funds Trust |
| By (Signature and Title): |
| /s/ Jeffrey White Jeffrey White Principal Accounting Officer |
| Date: July 30, 2024 |
| Pursuant to the requirements of the Securities Exchange Act of 1934 and the Investment Company Act of 1940, this report has been signed below by the following persons on behalf of the registrant and in the capacities and on the dates indicated. |
| By (Signature and Title): |
| /s/ Jonathan S. Horwitz Jonathan S. Horwitz Principal Executive Officer |
| Date: July 30, 2024 |
| By (Signature and Title): |
| /s/ Jeffrey White Jeffrey White Principal Financial Officer |
| Date: July 30, 2024 |