UNITED STATES
SECURITIES AND EXCHANGE COMMISSION
Washington, D.C. 20549
FORM N-CSR
CERTIFIED SHAREHOLDER REPORT
OF
REGISTERED MANAGEMENT INVESTMENT COMPANIES
Investment Company Act file number: 811-07537
Name of Registrant: Royce Capital Fund
Address of Registrant: 1414 Avenue of the Americas
New York, NY 10019
| Name and address of agent for service: | John E. Denneen, Esquire 1414 Avenue of the Americas New York, NY 10019 |
Registrant’s telephone number, including area code: (212) 486-1445
Date of fiscal year end: December 31
Date of reporting period: January 1, 2003 - June 30, 2003
| Item 1: Reports to Shareholders |
| 2003 Semiannual Report | ||
| |
| TheRoyceFundsSM VALUE INVESTING IN SMALL COMPANIES FOR MORE THAN 25 YEARS ROYCE CAPITAL FUND |
MICRO-CAP PORTFOLIO SMALL-CAP PORTFOLIO | ||
SEMIANNUAL REPORT REFERENCE GUIDE
| LETTER TO OUR SHAREHOLDERS | 2 | ||
| PERFORMANCE AND PORTFOLIO REVIEWS | 4 | ||
| NOTES TO PERFORMANCE AND FORWARD–LOOKING STATEMENTS | 8 | ||
| SCHEDULES OF INVESTMENTS AND OTHER FINANCIAL STATEMENTS | 9 | ||
| TRUSTEES AND OFFICERS | 18 | ||
For more than 25 years, our approach has focused on evaluating a company’s current worth — our assessment of what we believe a knowledgeable buyer might pay to acquire the entire company, or what we think the value of the company should be in the stock market. This analysis takes into consideration a number of relevant factors, including the company’s future prospects.We select these securities using a risk-averse value approach, with the expectation that their market prices should increase toward our estimate of their current worth, resulting in capital appreciation for Fund investors. |
LETTER TO OUR SHAREHOLDERS As any viewer of the film The Matrix: Reloaded can testify, perceptions are often mistaken and reality is not always what it appears to be. One needs to be careful not to confuse what might feel real with what actually is real. As experienced investors, we would never confuse a three-month market rally with a substantial recovery for equities, yet even we were stunned by the market’s reversal of direction during the opening half of 2003. It was a period marked by extreme events, both in the stock market and the wider world. Initially, the equity market eerily reflected the mood of the country. Information about the war was instantly mirrored in the movements of the market. Prices were wildly volatile, though mostly falling, in the weeks leading up to the invasion of Iraq, giving most equity securities negative first-quarter returns. Once the fighting began, equity prices stabilized until it looked for a brief moment as if “Shock and Awe” was not running as smoothly as planned, which sent prices plummeting once again. Shortly after victory seemed assured, stocks shared in the celebration by moving higher. With victory came the perception that the stock market had somehow righted itself after the long bear market. When several companies reported modest earnings growth around the time that Baghdad fell, the stage was set for a full-scale rally. Prices continued to climb through April, and by mid-May some genuine momentum had been established. Like the omnipresent computer program that gives The Matrix its name, the market proved relentless and nearly impossible to stop once it was up and running again. |
In fact, it would not surprise us to see the pace of the rally slacken substantially. We measure full market cycle periods from peak to peak. As of 6/30/03, the Russell 2000 was still off 22.6% from its previous peak on 3/9/00. In order to surpass this previous peak (thus completing the market cycle), the small-cap index would need to return more than 29% from the end of June onward. The critical question, then, is not whether the rally will continue—we believe that the market will almost certainly find a new | ||
The perception of many is that the stock market is in great shape again, the bear market is over and all is well. The reality may not be quite so fabulous. |
2 | ROYCE CAPITAL FUND SEMIANNUAL REPORT 2003 |
| 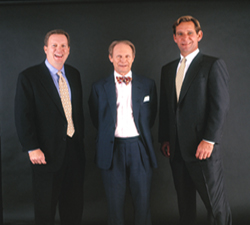 (l-r) Jack Fockler, Chuck Royce and Whitney George | |
| The rally has made it difficult to find value in the market. We have not been very aggressive buyers lately because so little looks attractive to us. However, there are always companies that, for one reason or another, are being penalized disproportionately. Recently, the number of companies that fit that description has been low, but they are out there and an increase in volatility should create greater buying opportunities. This supports our contention that careful stock picking should continue to bear fruit in the years ahead. | ||
We appreciate your continued support. | ||
| Sincerely, | ||
 |  |  |
| Charles M. Royce President | W. Whitney George Vice President | Jack E. Fockler, Jr. Vice President |
| July 31, 2003 | ||
ROYCE CAPITAL FUND SEMIANNUAL REPORT 2003 | 3 |
ROYCE CAPITAL FUND — MICRO-CAP PORTFOLIO |
| Average Annual Total Returns Through 6/30/03 | Portfolio Diagnostics | |||
| January — June * | 16.97% | Median Market Capitalization | $239 million | |
| One-Year | -3.55 | Weighted Average P/B Ratio | 1.5x | |
| Three-Year | 13.79 | Weighted Average Yield | 0.3% | |
| Five-Year | 14.53 | Number of Holdings | 199 | |
| Since Inception (12/27/96) | 15.38 | Fund Net Assets | $166 million | |
| * Not annualized. | ||||
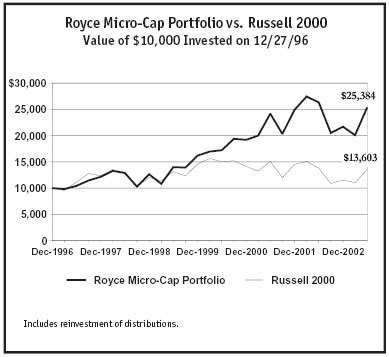
| MANAGER’S DISCUSSION Micro-cap stocks were among the primary beneficiaries in the rally that got underway in 2003’s second quarter, and Royce Capital Fund — Micro-Cap Portfolio (RCM) received a boost as well, with a 26.3% second-quarter return. Unfortunately, it was not enough to help the Portfolio outperform its small-cap benchmark, the Russell 2000, for the year-to-date period ended 6/30/03. RCM was up 17.0% in 2003’s first half, while the Russell 2000 was up 17.9% for the same period. It was not surprising that the Portfolio trailed its benchmark in such a dynamic up market, though we were satisfied with its absolute performance in the first half. We were also pleased with RCM’s long-term outperformance of the Russell 2000. From the small-cap market peak on 3/9/00 through 6/30/03, the Portfolio was up 52.0% versus a loss of 22.6% for the benchmark. In addition, RCM was ahead of the Russell 2000 for the three-year, five-year and since inception (12/27/96) periods ended 6/30/03. The Portfolio’s average annual total return since inception was 15.4%. Holdings in Health, RCM’s largest sector, made the largest contribution to performance. Unlike Technology stocks, which were stirring back to life late in 2002 and earlier this year, the prices of many Health stocks in the market did not begin to get in shape until late March 2003. We believe that the gains made by holdings in the Health sector will prove lasting in the months to come, when we anticipate more market volatility. Many of these companies spent time trading at prices at, near or below their cash value per share, marking a dramatic bottom. We also expect spending on healthcare to increase over the next few years, helped by an aging Baby Boomer population. Zila provides pharmaceutical, biomedical, dental and nutritional products to medical professionals and consumers. New management came aboard in 2002 and, while more work remains to be done, it has helped turn the company’s fortunes around. Its price tripled in the second quarter. TLC Vision is an eye surgery services company that focuses on laser vision correction services. Its fast-growing business and increased earnings had investors seeing the light — by late June, its price had risen five times above its March 2003 lows. We are also holding on to our stake in Lexicon Genetics, which uses gene knockout technology to systematically discover the physiological functions and medical uses of genes. The company received some extra attention from Wall Street that seemed to give a boost to its stock price. Cornell Companies provides privatized correctional, treatment and educational services outsourced by federal, state and local government agencies. The firm successfully rehabilitated itself from management and accounting issues. Investors took notice of improved earnings and increased opportunities for privatization in a recessionary economy. We took some gains between May and early June. We purchased a large share of our position in drug and diagnostic discovery company Compugen at a price approximating 75% of its cash value per share. Our attention was as much drawn to the firm’s developing technologies, important intellectual property and strong, well-established corporate partners as it was to its depressed price. The firm’s growing business helped its price to more than triple between March and June. Perceptron manufactures specialty electronic components as well as information-based process improvement solutions for various businesses. We like its niche business, low debt and growing profitability, characteristics that may have attracted investors to the stock in the second quarter. |
| 4 | ROYCE CAPITAL FUND SEMIANNUAL REPORT 2003 |
PERFORMANCE AND PORTFOLIO REVIEW |
 | |||
| Top 10 Positions | % of Net Assets | ||
| ProAssurance Corporation | 1.3% | ||
| Lexicon Genetics | 1.2 | ||
| Cato Cl. A | 1.2 | ||
| PetroCorp | 1.1 | ||
| Powell Industries | 1.0 | ||
| Ventiv Health | 1.0 | ||
| Young Innovations | 1.0 | ||
| Transaction Systems Architects Cl. A | 1.0 | ||
| Wescast Industries Cl. A | 1.0 | ||
| Denison International ADR | 1.0 | ||
| Portfolio Sector Breakdown | % of Net Assets | ||
| Health | 21.0% | ||
| Technology | 19.1 | ||
| Natural Resources | 10.4 | ||
| Industrial Products | 8.8 | ||
| Industrial Services | 5.9 | ||
| Consumer Services | 5.2 | ||
| Financial Intermediaries | 4.9 | ||
| Consumer Products | 4.6 | ||
| Financial Services | 1.3 | ||
| Diversified Investment Companies | 0.2 | ||
| Miscellaneous | 4.5 | ||
| Preferred Stock | 0.2 | ||
| Cash and Cash Equivalents | 13.9 | ||
| GOOD IDEAS THAT WORKED Net Realized and Unrealized Gain Year-to-Date Through 6/30/03 | GOOD IDEAS AT THE TIME Net Realized and Unrealized Loss Year-to-Date Through 6/30/03 | |||
| E-LOAN | $1,228,064 | Daisytek International | $633,296 | |
| PC-Tel | 953,476 | On Assignment | 458,453 | |
| Cornell Companies | 936,832 | Somera Communications | 432,388 | |
| Perceptron | 936,332 | Clark | 336,735 | |
| Performance Technologies | 901,103 | PXRE Group | 314,900 | |
E-LOAN — We first began to buy shares of this online provider of consumer loans, mortgages, car loans, credit cards and small business loans late in 2001 because we liked the prospects for its business. It has become that rarest of gems, an internet company that has not simply survived, but thrived. We reduced our position in the spring. PC-Tel — In June, we began to sell shares at a substantial gain in this soft modem manufacturer, as its stock was making a strong connection with investors. | Daisytek International — This distributor of computer printing supplies undertook what we felt was an overly ambitious distribution plan. It tried both to expand its product line and its distribution reach simultaneously. The resulting increased debt prompted us to take our losses and move on. On Assignment — We began to build our position in this medical staffing services company in the Fund’s portfolio during the summer of 2002 because we liked its balance sheet and its excellent reputation. However, its earnings have been disappointing as its industry continues to struggle. We remain hopeful for a turnaround. | |||
| ROYCE CAPITAL FUND SEMIANNUAL REPORT 2003 | 5 |
ROYCE CAPITAL FUND — SMALL-CAP PORTFOLIO |
| Average Annual Total Returns Through 6/30/03 | Portfolio Diagnostics | |||
| January – June * | 12.08% | Median Market Capitalization | $551 million | |
| One-Year | -8.22 | Weighted Average P/E Ratio | 15.8x | |
| Three-Year | 10.87 | Weighted Average P/B Ratio | 1.8x | |
| Five-Year | 10.53 | Weighted Average Yield | 0.4% | |
| Since Inception (12/27/96) | 12.66 | Number of Holdings | 80 | |
| * Not annualized. | Fund Net Assets | $34 million | ||
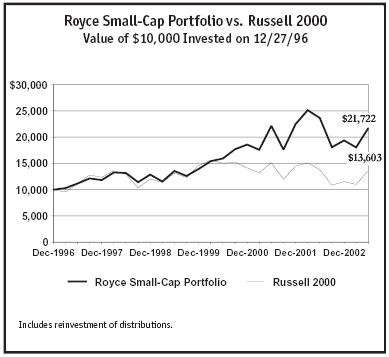
| MANAGER’S DISCUSSION Most of the action in the small-cap universe during 2003’s first half was in micro-cap and growth-oriented stocks. Although Royce Capital Fund — Small-Cap Portfolio (RCS) did well on an absolute basis, it could not keep pace with the high-octane returns shown by other asset classes and more speculative, growth-oriented issues. For the year-to-date period ended 6/30/03, the Portfolio was up 12.1%, compared to its small-cap benchmark, the Russell 2000, which was up 17.9% for the same period. We are never happy when we trail the small-cap index, but we were satisfied with RCS’s opening performance period on an absolute basis. We were also pleased that the Portfolio held a performance edge over its benchmark from the small-cap market peak on 3/9/00 through 6/30/03. During this period, RCS was up 49.3% versus a loss of 22.6% for the Russell 2000. In addition, the Portfolio outperformed its benchmark for the three-year, five-year and since inception (12/27/96) periods ended 6/30/03. RCS’s average annual total return since inception was 12.7%. While holdings in Health — the Fund’s largest sector — and Technology scored the most significant gains, successes occurred in all sectors and industry groups, testifying to the considerable breadth of the recent rally. In terms of both the number of companies and the overall effect on the Portfolio, stocks with gains were well ahead of those with losses, with the unfortunate exception of Orthodontic Centers of America. We were drawn to the long-term prospects for strong-performer, TSX Group, a Canadian firm that operates the Toronto Stock Exchange (the third largest exchange in North America) as well as exchanges in Vancouver, Alberta and Winnipeg. We like the firm’s solid dividend and large amount of cash per share. Last May, we first bought shares of eFunds Corporation, a company that provides electronic transaction processing, ATM outsourcing and risk management services to financial institutions, retailers, electronic funds networks and government agencies. We like both the firm’s cash flow level and its four interesting niche businesses (two of which are profitable). In our view, its long-term prospects are promising. Another firm for which we have a positive outlook is AMERIGROUP Corporation, a multi-state managed healthcare company focused on providing medical services primarily to people eligible for Medicaid. We believe that the company provides a well-run and potentially cost effective way to provide medical care to the poor. Although its price has been climbing since it beat Wall Street’s earnings expectations, we continue to hold a large stake in drug provider Perrigo Company. Its opportunities to develop low-cost generic medicines remain plentiful in our estimation. We also think highly of the niche business of Brooktrout, a firm that supplies media processing, network interface, call control and signal processing products that enable such applications as checking e-mail by telephone. We increased our stake throughout the first half, as we did in top holding Curative Health Services, a company whose businesses include the distribution of injectable medications for hemophiliacs and wound care management. We first began to buy shares as the firm was emerging from a management shake up and other difficulties. Its profitable wound care business and fast-growing specialty distribution business to pharmacies are keeping us interested. |
| 6 | ROYCE CAPITAL FUND SEMIANNUAL REPORT 2003 |
PERFORMANCE AND PORTFOLIO REVIEW |
 | |||
| Top 10 Positions | % of Net Assets | ||
| Curative Health Services | 2.2% | ||
| eFunds Corporation | 2.1 | ||
| Houston Exploration | 1.9 | ||
| Simpson Manufacturing | 1.9 | ||
| Glamis Gold | 1.9 | ||
| Callaway Golf | 1.9 | ||
| Hecla Mining | 1.8 | ||
| Nu Skin Enterprises Cl. A | 1.7 | ||
| Remington Oil & Gas | 1.7 | ||
| JAKKS Pacific | 1.6 | ||
| Portfolio Sector Breakdown | % of Net Assets | ||
| Health | 14.6% | ||
| Consumer Products | 13.4 | ||
| Technology | 13.2 | ||
| Natural Resources | 12.5 | ||
| Industrial Products | 7.6 | ||
| Consumer Services | 4.1 | ||
| Financial Intermediaries | 4.1 | ||
| Financial Services | 2.8 | ||
| Industrial Services | 0.7 | ||
| Miscellaneous | 4.5 | ||
| Cash and Cash Equivalents | 22.5 | ||
| GOOD IDEAS THAT WORKED Net Realized and Unrealized Gain Year-to-Date Through 6/30/03 | GOOD IDEAS AT THE TIME Net Realized and Unrealized Loss Year-to-Date Through 6/30/03 | |||
| E*TRADE Group | $151,454 | Orthodontic Centers of America | $94,514 | |
| Scientific-Atlanta | 119,724 | On Assignment | 59,270 | |
| TSX Group | 108,389 | Natuzzi ADR | 52,450 | |
| West Corporation | 106,076 | ECtel | 47,235 | |
| Brooktrout | 105,501 | RehabCare Group | 42,496 | |
E*TRADE Group — We like the way this leader in the online discount brokerage business has moved into banking and other financial services. In a market that loved Technology companies and liked financial stocks, the stock of what we think is a well-run business fully participated in the rally. We sold our shares in June. Scientific-Atlanta — This company provides a variety of products for cable television and broadband networks, including cable TV boxes. Its stock price climbed upward in the second quarter, in part the result of looming profitability and resulting attention from Wall Street. We sold our shares between April and June. | Orthodontic Centers of America — This manager of orthodontic practices made what now looks like an ill-advised acquisition of a major competitor that put a cavity in its business. We sold our shares in May. On Assignment — We began to build our position in this medical staffing services company in the Fund’s portfolio during the summer of 2002 because we liked its balance sheet and its excellent reputation. However, its earnings have been disappointing as its industry continues to struggle. We remain hopeful for a turnaround. | |||
| ROYCE CAPITAL FUND SEMIANNUAL REPORT 2003 | 7 |
NOTES TO PERFORMANCE AND STATISTICAL INFORMATION |
| NOTES TO PERFORMANCE AND STATISTICAL INFORMATION |
| All performance information is presented on a total return basis and reflects the reinvestment of distributions. Past performance is no guarantee of future results or volatility. Investment return and principal value will fluctuate, so that shares may be worth more or less than their original cost when redeemed. The Royce Funds invest primarily in securities of small-cap and/or micro-cap companies that may involve considerably more risk than investments in securities of larger-cap companies (see “Primary Risks for Fund Investors” in the prospectus). The thoughts expressed in this report concerning recent market movements and future prospects for small company stocks are solely the current opinion of Royce, and, of course, historical market trends are not necessarily indicative of future market movements. Statements regarding the future prospects for particular securities held in the Funds’ portfolios and Royce’s investment intentions with respect to those securities reflect Royce’s opinions as of June 30, 2003 and are subject to change at any time without notice. There can be no assurance that securities mentioned in this report will be included in any Royce-managed portfolio in the future. |
| The Russell 2000 is an unmanaged index of domestic small-cap common stocks. Royce has not independently verified the above described information. The Royce Funds is a service mark of The Royce Funds. |
| FORWARD - LOOKING STATEMENTS | ||
This material contains forward-looking statements within the meaning of the Securities Exchange Act of 1934, as amended (the “Exchange Act”), that involve risks and uncertainties, including, among others, statements as to:
| ||
| This report uses words such as “anticipates,” “believes,” “expects,” “future,” “intends,” and similar expressions to identify forward-looking statements. Actual results may differ materially from those projected in the forward-looking statements for any reason. | ||
The Royce Funds have based the forward-looking statements included in this report on information available to us on the date of the report, and we assume no obligation to update any such forward-looking statements. Although The Royce Funds undertake no obligation to revise or update any forward-looking statements, whether as a result of new information, future events or otherwise, you are advised to consult any additional disclosures that we may make through future shareholder communications or reports. |
| 8 | ROYCE CAPITAL FUND SEMIANNUAL REPORT 2003 |
SCHEDULES OF INVESTMENTS | JUNE 30, 2003 (UNAUDITED) |
| ROYCE CAPITAL FUND — MICRO-CAP PORTFOLIO | ||||||||||||
| COMMON STOCKS – 85.9% | ||||||||||||
| SHARES | VALUE | SHARES | VALUE | |||||||||
Consumer Products – 4.6% | PXRE Group | 67,000 | $ | 1,326,600 | ||||||||
| Apparel and Shoes - 0.8% | ProAssurance Corporation a | 79,000 | 2,132,210 | |||||||||
Cutter & Buck a | 86,000 | $ | 437,740 | United Fire & Casualty Company | 30,000 | 974,700 | ||||||
Nautica Enterprises a | 65,700 | 842,931 | ||||||||||
Total (Cost $5,224,679) | 8,137,970 | |||||||||||
| 1,280,671 | ||||||||||||
Financial Services – 1.3% | ||||||||||||
| Collectibles - 0.2% | Information and Processing - 0.2% | |||||||||||
Action Performance d | 15,000 | 285,000 | 13,049 | 340,318 | ||||||||
| Food/Beverage/Tobacco - 0.5% | Insurance Brokers - 0.3% | |||||||||||
Boston Beer Company Cl. A a | 36,400 | 524,160 | CorVel a | 11,250 | 405,000 | |||||||
| 30,000 | 390,000 | |||||||||||
| Investment Management - 0.1% | ||||||||||||
| 914,160 | BKF Capital Group a | 9,800 | 213,934 | |||||||||
| Home Furnishing/Appliances - 0.1% | Other Financial Services - 0.7% | |||||||||||
| Bassett Furniture Industries | 12,500 | 166,000 | Electro Rent a | 103,300 | 1,113,574 | |||||||
| Sports and Recreation - 1.3% | Total (Cost $1,833,510) | 2,072,826 | ||||||||||
| Arctic Cat | 42,500 | 814,300 | ||||||||||
| 17,000 | 260,610 | Health – 21.0% | ||||||||||
| Thor Industries | 25,900 | 1,057,238 | Commercial Services - 5.9% | |||||||||
BioReliance Corporation a | 55,800 | 1,182,960 | ||||||||||
| 2,132,148 | 221,800 | 1,182,194 | ||||||||||
Compugen a | 199,500 | 1,009,470 | ||||||||||
| Other Consumer Products - 1.7% | Discovery Partners International a | 263,200 | 1,168,608 | |||||||||
Concord Camera a | 45,600 | 323,304 | 75,000 | 1,046,250 | ||||||||
| Matthews International Cl. A | 33,600 | 831,936 | The TriZetto Group a | 126,600 | 764,664 | |||||||
Meade Instruments a | 134,000 | 428,800 | Ventiv Health a | 408,600 | 1,675,669 | |||||||
| 72,000 | 1,224,720 | Young Innovations a | 58,250 | 1,660,125 | ||||||||
| 2,808,760 | 9,689,940 | |||||||||||
Total (Cost $5,962,238) | 7,586,739 | Drugs and Biotech - 7.1% | ||||||||||
| 110,700 | 1,275,264 | |||||||||||
Consumer Services – 5.2% | 50,500 | 335,320 | ||||||||||
| Leisure/Entertainment - 0.4% | BioSource International a | 129,100 | 890,790 | |||||||||
| 28,200 | 719,100 | BioSphere Medical a | 25,000 | 150,000 | ||||||||
| 50,200 | 1,349,878 | |||||||||||
| Restaurants/Lodgings - 0.8% | 348,100 | 838,921 | ||||||||||
Benihana Cl. A a | 46,145 | 609,114 | DUSA Pharmaceuticals a | 62,300 | 156,373 | |||||||
| 68,500 | 685,000 | 97,600 | 351,360 | |||||||||
Lexicon Genetics a | 291,100 | 1,953,281 | ||||||||||
| 1,294,114 | 36,500 | 188,340 | ||||||||||
Maxim Pharmaceuticals a | 53,000 | 304,750 | ||||||||||
| Retail Stores - 3.6% | Maxygen a | 78,000 | 855,660 | |||||||||
Buckle (The) a | 53,400 | 1,026,882 | Pharmacyclics a | 100,700 | 477,318 | |||||||
Cato Cl. A | 91,000 | 1,918,280 | Seattle Genetics a | 48,300 | 248,745 | |||||||
| 27,900 | 563,022 | 29,900 | 651,222 | |||||||||
Finish Line (The) Cl. A a | 28,800 | 639,648 | 231,000 | 1,187,340 | ||||||||
| 26,100 | 374,274 | Zila a | 213,700 | 614,601 | ||||||||
Sport Chalet a | 107,500 | 781,525 | ||||||||||
| 123,450 | 632,064 | 11,829,163 | ||||||||||
| 5,935,695 | Health Services - 4.0% | |||||||||||
| 80,100 | 1,056,519 | |||||||||||
| Other Consumer Services - 0.4% | 70,600 | 1,200,200 | ||||||||||
| 122,900 | 716,507 | First Consulting Group a | 194,800 | 909,716 | ||||||||
| 167,200 | 998,184 | |||||||||||
Total (Cost $6,837,660) | 8,665,416 | On Assignment a | 65,500 | 262,000 | ||||||||
| 65,200 | 751,756 | |||||||||||
Diversified Investment Companies – 0.2% | RehabCare Group a | 28,600 | 418,990 | |||||||||
| Closed-End Mutual Funds - 0.2% | 218,500 | 1,079,390 | ||||||||||
| ASA | 9,250 | 349,188 | ||||||||||
| 6,676,755 | ||||||||||||
Total (Cost $258,500) | 349,188 | |||||||||||
Financial Intermediaries – 4.9% | ||||||||||||
| Insurance - 4.9% | ||||||||||||
Argonaut Group a | 27,000 | 332,910 | ||||||||||
NYMAGIC | 68,400 | 1,385,784 | ||||||||||
Navigators Group a | 41,300 | 1,231,566 | ||||||||||
PMA Capital Cl. A d | 60,000 | 754,200 | ||||||||||
| THE ACCOMPANYING NOTES ARE AN INTEGRAL PART OF THESE FINANCIAL STATEMENTS. | ROYCE CAPITAL FUND SEMIANNUAL REPORT 2003 | 9 |
SCHEDULES OF INVESTMENTS | |
| ROYCE CAPITAL FUND — MICRO-CAP PORTFOLIO (continued) | ||||||||||||
| SHARES | VALUE | SHARES | VALUE | |||||||||
Health (continued) | New Horizons Worldwide a | 75,700 | $ | 323,996 | ||||||||
| Personal Care - 0.8% | RCM Technologies a | 61,300 | 239,070 | |||||||||
| 65,200 | $ | 1,294,220 | 54,100 | 499,343 | ||||||||
Wackenhut Corrections a | 47,900 | 656,709 | ||||||||||
| Surgical Products and Devices - 3.2% | ||||||||||||
| 81,600 | 1,056,720 | 4,754,954 | ||||||||||
ArthroCare a | 14,500 | 243,020 | ||||||||||
Exactech a | 15,000 | 216,000 | Food/Tobacco Processors - 0.3% | |||||||||
Interpore International a | 30,000 | 381,900 | MGP Ingredients | 49,800 | 435,003 | |||||||
Novoste a | 87,100 | 522,600 | ||||||||||
OrthoLogic Corporation a | 132,200 | 606,798 | Printing - 1.6% | |||||||||
Orthofix International a | 16,800 | 550,032 | Courier Corporation | 11,200 | 576,800 | |||||||
| 118,000 | 920,400 | Ennis Business Forms | 55,500 | 807,525 | ||||||||
Theragenics Corporation a | 89,400 | 384,420 | New England Business Service | 42,800 | 1,284,000 | |||||||
Thoratec Corporation a | 32,200 | 479,780 | ||||||||||
| 2,668,325 | ||||||||||||
| 5,361,670 | ||||||||||||
| Transportation and Logistics - 0.7% | ||||||||||||
Total (Cost $29,893,808) | 34,851,748 | 224,500 | 909,225 | |||||||||
Frozen Food Express Industries a | 91,700 | 289,772 | ||||||||||
Industrial Products – 8.8% | ||||||||||||
| Building Systems and Components - 1.3% | 1,198,997 | |||||||||||
| LSI Industries | 55,000 | 610,500 | ||||||||||
| Preformed Line Products Company | 49,500 | 725,423 | Other Industrial Services - 0.4% | |||||||||
Simpson Manufacturing a | 24,000 | 878,400 | Team a | 81,200 | 649,600 | |||||||
| 2,214,323 | Total (Cost $9,272,362) | 9,706,879 | ||||||||||
| Construction Materials - 0.6% | Natural Resources – 10.4% | |||||||||||
| Florida Rock Industries | 10,000 | 412,800 | Energy Services - 4.1% | |||||||||
| Gibraltar Steel | 30,100 | 616,448 | Carbo Ceramics | 18,000 | 670,500 | |||||||
Dril-Quip a | 47,000 | 855,400 | ||||||||||
| 1,029,248 | Gulf Island Fabrication a | 82,800 | 1,400,976 | |||||||||
Input/Output a | 243,600 | 1,310,568 | ||||||||||
| Industrial Components - 2.0% | NATCO Group Cl. A a | 146,300 | 999,229 | |||||||||
Aaon a | 75,000 | 1,389,000 | TETRA Technologies a | 51,650 | 1,531,422 | |||||||
DuraSwitch Industries a | 90,000 | 184,500 | Willbros Group a | 6,200 | 64,418 | |||||||
Powell Industries a | 115,500 | 1,690,920 | ||||||||||
| 6,832,513 | ||||||||||||
| 3,264,420 | ||||||||||||
| Oil and Gas - 2.0% | ||||||||||||
| Machinery - 0.3% | PetroCorp a | 164,000 | 1,828,600 | |||||||||
| Woodward Governor | 13,200 | 567,600 | Prima Energy a | 27,900 | 582,552 | |||||||
| 50,000 | 919,000 | |||||||||||
| Pumps, Valves and Bearings - 1.4% | ||||||||||||
| 85,500 | 1,645,875 | 3,330,152 | ||||||||||
| Sun Hydraulics | 73,100 | 589,186 | ||||||||||
| Precious Metals and Mining - 4.3% | ||||||||||||
| 2,235,061 | Apex Silver Mines a | 83,000 | 1,224,250 | |||||||||
| 52,000 | 596,440 | |||||||||||
| Specialty Chemicals and Materials – 0.5% | 407,900 | 1,076,856 | ||||||||||
CFC International a | 108,600 | 586,440 | 371,000 | 1,569,330 | ||||||||
| Hawkins | 19,300 | 193,386 | 187,000 | 1,114,483 | ||||||||
| 16,500 | 354,585 | |||||||||||
| 779,826 | Stillwater Mining a | 107,700 | 553,578 | |||||||||
Twin Mining a | 558,000 | 115,242 | ||||||||||
| Other Industrial Products – 2.7% | Wheaton River Minerals a | 305,100 | 387,477 | |||||||||
| BHA Group Holdings | 14,300 | 283,283 | ||||||||||
NS Group a | 70,500 | 687,375 | 6,992,241 | |||||||||
Peerless Mfg. a | 52,200 | 576,810 | ||||||||||
| Quixote Corporation | 50,800 | 1,296,924 | Total (Cost $15,070,083) | 17,154,906 | ||||||||
Wescast Industries Cl. A | 66,200 | 1,647,056 | ||||||||||
Technology – 19.1% | ||||||||||||
| 4,491,448 | Aerospace/Defense - 1.5% | |||||||||||
| Curtiss-Wright | 11,200 | 707,840 | ||||||||||
Total (Cost $13,329,246) | 14,581,926 | Ducommun a | 81,700 | 1,151,970 | ||||||||
| 31,800 | 632,184 | |||||||||||
Industrial Services – 5.9% | ||||||||||||
| Commercial Services - 2.9% | 2,491,994 | |||||||||||
Carlisle Holdings a | 159,000 | 524,700 | ||||||||||
Cornell Companies a | 59,900 | 906,886 | Components and Systems - 4.0% | |||||||||
Exponent a | 103,500 | 1,604,250 | CSP a | 100,700 | 324,254 | |||||||
Catapult Communications a | 64,450 | 684,459 | ||||||||||
| 10 | ROYCE CAPITAL FUND SEMIANNUAL REPORT 2003 | THE ACCOMPANYING NOTES ARE AN INTEGRAL PART OF THESE FINANCIAL STATEMENTS. |
JUNE 30, 2003 (UNAUDITED) | |
| SHARES | VALUE | SHARES | VALUE | |||||||||
Technology (continued) | Telecommunication - 4.3% | |||||||||||
| Components and Systems (continued) | Brooktrout a | 81,750 | $ | 634,543 | ||||||||
Excel Technology a | 60,000 | $ | 1,369,800 | COMARCO a | 60,700 | 430,970 | ||||||
| MOCON | 72,400 | 524,900 | 99,000 | 801,900 | ||||||||
Perceptron a | 147,600 | 885,600 | Globecomm Systems a | 76,500 | 250,920 | |||||||
Performance Technologies a | 169,700 | 1,238,810 | 9,000 | 142,110 | ||||||||
| 125,850 | 875,916 | Lightbridge a | 83,650 | 732,774 | ||||||||
TTM Technologies a | 151,200 | 709,128 | PC-Tel a | 49,100 | 582,326 | |||||||
PECO II a | 170,000 | 106,760 | ||||||||||
| 6,612,867 | 348,700 | 509,102 | ||||||||||
SpectraLink Corporation a | 79,800 | 788,424 | ||||||||||
| Distribution - 1.6% | Sunrise Telecom a | 94,000 | 166,380 | |||||||||
CompuCom Systems a | 69,500 | 314,140 | 112,800 | 1,617,552 | ||||||||
Jaco Electronics a | 200,500 | 970,219 | Wireless Facilities a | 30,000 | 357,000 | |||||||
Richardson Electronics | 170,000 | 1,377,000 | ||||||||||
| 7,120,761 | ||||||||||||
| 2,661,359 | ||||||||||||
Total (Cost $33,492,269) | 31,589,240 | |||||||||||
| Internet Software and Services - 1.4% | ||||||||||||
| 151,400 | 1,132,472 | Miscellaneous – 4.5% | ||||||||||
CyberSource Corporation a | 245,750 | 673,355 | Total (Cost $6,114,066) | 7,505,672 | ||||||||
| 72,200 | 288,800 | |||||||||||
| 13,000 | 188,630 | TOTAL COMMON STOCKS | ||||||||||
| (Cost $127,288,421) | 142,202,510 | |||||||||||
| 2,283,257 | ||||||||||||
PREFERRED STOCK – 0.2% | ||||||||||||
| IT Services - 1.7% | United Fire & Casualty Company | |||||||||||
Analysts International a | 195,600 | 487,435 | 6.375% Conv. | 15,000 | 423,750 | |||||||
Forrester Research a | 85,100 | 1,392,236 | ||||||||||
Syntel a | 46,150 | 725,940 | TOTAL PREFERRED STOCK | |||||||||
| 35,800 | 277,450 | (Cost $375,000) | 423,750 | |||||||||
| 2,883,061 | REPURCHASE AGREEMENT – 12.9% | |||||||||||
| State Street Bank & Trust Company, 0.30% dated 6/30/03, due 7/1/03, maturity value $21,310,178 (collateralized by U.S. Treasury Notes, 3.00% due 2/29/04, valued at $21,739,331) | ||||||||||||
| Semiconductors and Equipment - 2.2% | ||||||||||||
Integrated Silicon Solution a | 50,000 | 347,000 | ||||||||||
| 250,000 | 640,000 | |||||||||||
| 51,460 | 364,337 | (Cost $21,310,000) | 21,310,000 | |||||||||
| 155,400 | 1,266,510 | |||||||||||
QuickLogic Corporation a | 100,000 | 322,000 | TOTAL INVESTMENTS – 99.0% | |||||||||
Semitool a | 76,300 | 376,159 | (Cost $148,973,421) | 163,936,260 | ||||||||
Trikon Technologies a | 69,700 | 252,314 | ||||||||||
CASH AND OTHER ASSETS | ||||||||||||
| 3,568,320 | LESS LIABILITIES – 1.0% | 1,621,055 | ||||||||||
| Software - 2.4% | NET ASSETS – 100.0% | $ | 165,557,315 | |||||||||
Lightspan a | 703,700 | 477,109 | ||||||||||
PLATO Learning a | 130,000 | 747,500 | ||||||||||
SPSS a | 65,000 | 1,088,100 | ||||||||||
Transaction Systems Architects Cl. A a | 184,700 | 1,654,912 | ||||||||||
| 3,967,621 | ||||||||||||
| THE ACCOMPANYING NOTES ARE AN INTEGRAL PART OF THESE FINANCIAL STATEMENTS. | ROYCE CAPITAL FUND SEMIANNUAL REPORT 2003 | 11 |
SCHEDULES OF INVESTMENTS | |
| ROYCE CAPITAL FUND — SMALL-CAP PORTFOLIO | ||||||||||||
| COMMON STOCKS – 77.5% | ||||||||||||
| SHARES | VALUE | SHARES | VALUE | |||||||||
Consumer Products – 13.4% | Health Services - 10.7% | |||||||||||
| Apparel and Shoes - 3.7% | 43,100 | $ | 547,370 | |||||||||
Steven Madden a | 14,100 | $ | 307,944 | AMERIGROUP Corporation a | 10,400 | 386,880 | ||||||
Maxwell Shoe Company Cl. A a | 25,900 | 372,960 | Centene Corporation a | 8,600 | 334,540 | |||||||
Nautica Enterprises a | 17,300 | 221,959 | Curative Health Services a | 43,700 | 742,900 | |||||||
| Polo Ralph Lauren Cl. A | 13,300 | 343,007 | Healthcare Services Group a | 10,900 | 156,633 | |||||||
Horizon Health a | 15,900 | 257,580 | ||||||||||
| 1,245,870 | On Assignment a | 68,000 | 272,000 | |||||||||
Option Care a | 14,900 | 171,797 | ||||||||||
| Food/Beverage/Tobacco - 0.9% | RehabCare Group a | 16,000 | 234,400 | |||||||||
| 30,900 | 306,550 | 23,900 | 494,730 | |||||||||
| Home Furnishing/Appliances - 0.9% | 3,598,830 | |||||||||||
Natuzzi ADR b | 37,200 | 298,344 | ||||||||||
| Personal Care - 0.7% | ||||||||||||
| Sports and Recreation - 2.7% | Ocular Sciences a | 12,400 | 246,140 | |||||||||
Callaway Golf | 48,200 | 637,204 | ||||||||||
†Winnebago Industries | 7,000 | 265,300 | Total (Cost $4,359,269) | 4,913,901 | ||||||||
| 902,504 | Industrial Products – 7.6% | |||||||||||
| Building Systems and Components - 1.9% | ||||||||||||
| Other Consumer Products - 5.2% | Simpson Manufacturing a | 17,500 | 640,500 | |||||||||
| Blyth | 10,600 | 288,320 | ||||||||||
JAKKS Pacific a | 41,700 | 554,193 | Construction Materials - 1.2% | |||||||||
RC2 Corporation a | 22,200 | 377,622 | Florida Rock Industries | 9,600 | 396,288 | |||||||
| 23,000 | 534,060 | |||||||||||
| Machinery - 2.9% | ||||||||||||
| 1,754,195 | Lincoln Electric Holdings | 15,400 | 314,314 | |||||||||
| Thomas Industries | 11,400 | 308,370 | ||||||||||
Total (Cost $4,271,067) | 4,507,463 | Woodward Governor | 8,200 | 352,600 | ||||||||
Consumer Services – 4.1% | 975,284 | |||||||||||
| Direct Marketing - 1.7% | ||||||||||||
Nu Skin Enterprises Cl. A | 56,500 | 590,425 | Pumps, Valves and Bearings - 0.9% | |||||||||
| 14,800 | 284,900 | |||||||||||
| Leisure/Entertainment - 1.6% | ||||||||||||
| Dover Downs Gaming & Entertainment | 25,400 | 234,950 | ||||||||||
Multimedia Games a | 12,200 | 311,100 | Other Industrial Products - 0.7% | |||||||||
Strattec Security a | 4,700 | 250,040 | ||||||||||
| 546,050 | ||||||||||||
Total (Cost $2,381,676) | 2,547,012 | |||||||||||
| Retail Stores - 0.8% | ||||||||||||
Big Lots a | 17,200 | 258,688 | Industrial Services – 0.7% | |||||||||
| Commercial Services - 0.7% | ||||||||||||
Total (Cost $1,277,488) | 1,395,163 | Covance a | 13,100 | 237,110 | ||||||||
Financial Intermediaries – 4.1% | Total (Cost $235,210) | 237,110 | ||||||||||
| Insurance - 2.9% | ||||||||||||
ProAssurance Corporation a | 14,100 | 380,559 | Natural Resources – 12.5% | |||||||||
| Scottish Annuity & Life Holdings | 16,400 | 331,444 | Energy Services - 0.8% | |||||||||
Universal American Financial a | 42,100 | 268,177 | TETRA Technologies a | 8,600 | 254,990 | |||||||
| 980,180 | Oil and Gas - 6.5% | |||||||||||
Cimarex Energy a | 14,318 | 340,052 | ||||||||||
| Other Financial Intermediaries - 1.2% | Houston Exploration a | 18,500 | 641,950 | |||||||||
†TSX Group | 19,000 | 385,396 | Remington Oil & Gas a | 30,700 | 564,266 | |||||||
| St. Mary Land & Exploration Company | 10,900 | 297,570 | ||||||||||
Total (Cost $1,069,632) | 1,365,576 | Unit Corporation a | 16,900 | 353,379 | ||||||||
Financial Services – 2.8% | 2,197,217 | |||||||||||
| Information and Processing - 2.8% | ||||||||||||
eFunds Corporation a | 62,400 | 719,472 | Precious Metals and Mining - 5.2% | |||||||||
National Processing a | 13,800 | 221,904 | 55,600 | 637,732 | ||||||||
†Goldcorp | 40,200 | 482,400 | ||||||||||
Total (Cost $826,112) | 941,376 | 145,200 | 614,196 | |||||||||
Health – 14.6% | 1,734,328 | |||||||||||
| Drugs and Biotech - 3.2% | ||||||||||||
Antigenics a | 21,700 | 249,984 | Total (Cost $3,717,884) | 4,186,535 | ||||||||
Lexicon Genetics a | 21,300 | 142,923 | ||||||||||
Perrigo Company | 24,400 | 381,616 | Technology – 13.2% | |||||||||
Serologicals Corporation a | 21,600 | 294,408 | Aerospace/Defense - 0.8% | |||||||||
| Curtiss-Wright | 4,100 | 259,120 | ||||||||||
| 1,068,931 | ||||||||||||
| 12 | ROYCE CAPITAL FUND SEMIANNUAL REPORT 2003 | THE ACCOMPANYING NOTES ARE AN INTEGRAL PART OF THESE FINANCIAL STATEMENTS. |
JUNE 30, 2003 (UNAUDITED) | |
| SHARES | VALUE | VALUE | |||||||
Technology (continued) | Miscellaneous – 4.5% | ||||||||
| Components and Systems - 2.5% | Total (Cost $1,418,723) | $ | 1,530,389 | ||||||
| 39,000 | $ | 271,440 | |||||||
TTM Technologies a | 55,300 | 259,357 | TOTAL COMMON STOCKS | ||||||
Tektronix a | 14,700 | 317,520 | (Cost $23,410,467) | 26,052,969 | |||||
| 848,317 | REPURCHASE AGREEMENT – 12.7% | ||||||||
| State Street Bank & Trust Company, 0.30% dated 6/30/03, due 7/1/03, maturity value $4,283,036 (collateralized by U.S. Treasury Bonds, 8.50% due 2/15/20, valued at $4,371,759) | |||||||||
| IT Services - 3.4% | |||||||||
American Management Systems a | 21,300 | 304,164 | |||||||
MAXIMUS a | 12,400 | 342,612 | |||||||
Perot Systems Cl. A a | 30,000 | 340,800 | (Cost $4,283,000) | 4,283,000 | |||||
Syntel a | 10,100 | 158,873 | |||||||
TOTAL INVESTMENTS – 90.2% | |||||||||
| 1,146,449 | (Cost $27,693,467) | 30,335,969 | |||||||
| Semiconductors and Equipment - 2.1% | CASH AND OTHER ASSETS | ||||||||
ESS Technology a | 15,800 | 154,050 | LESS LIABILITIES – 9.8% | 3,282,372 | |||||
Entegris a | 23,600 | 317,184 | |||||||
Semitool a | 46,200 | 227,766 | NET ASSETS – 100.0% | $ | 33,618,341 | ||||
| 699,000 | |||||||||
| Software - 1.3% | |||||||||
Pervasive Software a | 31,500 | 168,525 | |||||||
Sybase a | 19,600 | 272,636 | |||||||
| 441,161 | |||||||||
| Telecommunication - 3.1% | |||||||||
Brooktrout a | 56,400 | 437,777 | |||||||
ECtel a | 51,800 | 318,052 | |||||||
Lightbridge a | 31,800 | 278,568 | |||||||
| 1,034,397 | |||||||||
Total (Cost $3,853,406) | 4,428,444 | ||||||||
| THE ACCOMPANYING NOTES ARE AN INTEGRAL PART OF THESE FINANCIAL STATEMENTS. | ROYCE CAPITAL FUND SEMIANNUAL REPORT 2003 | 13 |
STATEMENTS OF ASSETS AND LIABILITIES | JUNE 30, 2003 (UNAUDITED) | |||
| Micro-Cap | Small-Cap | |||||||
| Portfolio | Portfolio | |||||||
| ASSETS: | ||||||||
| Investments at value* | $ | 142,626,260 | $ | 26,052,969 | ||||
| Repurchase agreement (at cost and value) | 21,310,000 | 4,283,000 | ||||||
| Cash | 23,909 | 897 | ||||||
| Collateral from brokers on securities loaned** | 19,140,408 | – | ||||||
| Receivable for investments sold | 132,974 | 833,648 | ||||||
| Receivable for capital shares sold | 2,121,485 | 2,794,113 | ||||||
| Receivable for dividends and interest | 35,664 | 18,695 | ||||||
| Prepaid expenses and other assets | 619 | 19 | ||||||
| Total Assets | 185,391,319 | 33,983,341 | ||||||
| LIABILITIES: | ||||||||
| Payable for collateral on securities loaned | 19,140,408 | – | ||||||
| Payable for investments purchased | 328,607 | 308,641 | ||||||
| Payable for capital shares redeemed | 175,625 | 13,131 | ||||||
| Payable for investment advisory fees | 135,972 | 25,904 | ||||||
| Accrued expenses | 53,392 | 17,324 | ||||||
| Total Liabilities | 19,834,004 | 365,000 | ||||||
| Net Assets | $ | 165,557,315 | $ | 33,618,341 | ||||
| ANALYSIS OF NET ASSETS: | ||||||||
| Accumulated net investment loss | $ | (614,202 | ) | $ | (82,480 | ) | ||
| Accumulated net realized gain on investments | 2,142,301 | 1,207,677 | ||||||
| Net unrealized appreciation on investments | 14,962,839 | 2,642,532 | ||||||
| Capital shares | 18,620 | 5,256 | ||||||
| Additional paid-in capital | 149,047,757 | 29,845,356 | ||||||
| Net Assets | $ | 165,557,315 | $ | 33,618,341 | ||||
| SHARES OUTSTANDING: | ||||||||
| (unlimited number of $.001 par value shares authorized for each Fund) | 18,620,063 | 5,255,836 | ||||||
NET ASSET VALUES: | ||||||||
| (Net Assets ÷ Shares Outstanding) (offering and redemption price per share) | $8.89 | $6.40 | ||||||
| *Investments at identified cost | $ | 127,663,421 | $ | 23,410,467 | ||||
| **Market value of securities loaned | $ | 18,462,088 | ||||||
| 14 | ROYCE CAPITAL FUND SEMIANNUAL REPORT 2003 | THE ACCOMPANYING NOTES ARE AN INTEGRAL PART OF THESE FINANCIAL STATEMENTS. | |
STATEMENTS OF CHANGES IN NET ASSETS |
| Micro-Cap Portfolio | Small-Cap Portfolio | |||||||||||||||
| Six months ended June 30, 2003 (unaudited) | Year ended December 31, 2002 | Six months ended June 30, 2003 (unaudited) | Year ended December 31, 2002 | |||||||||||||
| INVESTMENT OPERATIONS: | ||||||||||||||||
| Net investment loss | $ | (614,202 | ) | $ | (1,149,111 | ) | $ | (82,480 | ) | $ | (45,080 | ) | ||||
| Net realized gain on investments | 683,941 | 5,249,519 | 1,185,178 | 133,914 | ||||||||||||
| Net change in unrealized appreciation (depreciation) on investments | 23,022,580 | (24,735,990 | ) | 2,518,722 | (342,408 | ) | ||||||||||
| Net increase (decrease) in net assets from investment operations | 23,092,319 | (20,635,582 | ) | 3,621,420 | (253,574 | ) | ||||||||||
DISTRIBUTIONS: | ||||||||||||||||
| Net realized gain on investments | – | (4,048,790 | ) | – | (93,010 | ) | ||||||||||
| Total distributions | – | (4,048,790 | ) | – | (93,010 | ) | ||||||||||
CAPITAL SHARE TRANSACTIONS: | ||||||||||||||||
| Value of shares sold | 17,463,935 | 69,226,599 | 15,473,721 | 18,217,779 | ||||||||||||
| Distributions reinvested | – | 4,048,790 | – | 93,010 | ||||||||||||
| Value of shares redeemed | (8,942,544 | ) | (21,148,246 | ) | (3,667,188 | ) | (3,097,742 | ) | ||||||||
| Net increase in net assets from capital share transactions | 8,521,391 | 52,127,143 | 11,806,533 | 15,213,047 | ||||||||||||
NET INCREASE IN NET ASSETS | 31,613,710 | 27,442,771 | 15,427,953 | 14,866,463 | ||||||||||||
NET ASSETS: | ||||||||||||||||
| Beginning of period | 133,943,605 | 106,500,834 | 18,190,388 | 3,323,925 | ||||||||||||
| End of period | $ | 165,557,315 | $ | 133,943,605 | $ | 33,618,341 | $ | 18,190,388 | ||||||||
ACCUMULATED NET INVESTMENT LOSS AT END OF PERIOD | $ | (614,202 | ) | $ | – | $ | (82,480 | ) | $ | – | ||||||
CAPITAL SHARE TRANSACTIONS (IN SHARES): | ||||||||||||||||
| Shares sold | 2,201,800 | 7,690,913 | 2,685,942 | 3,151,824 | ||||||||||||
| Shares issued for reinvestment of distributions | – | 535,559 | – | 16,404 | ||||||||||||
| Shares redeemed | (1,198,525 | ) | (2,449,579 | ) | (616,865 | ) | (480,516 | ) | ||||||||
| Net increase in shares outstanding | 1,003,275 | 5,776,893 | 2,069,077 | 2,687,712 | ||||||||||||
| THE ACCOMPANYING NOTES ARE AN INTEGRAL PART OF THESE FINANCIAL STATEMENTS. | ROYCE CAPITAL FUND SEMIANNUAL REPORT 2003 | 15 |
STATEMENTS OF OPERATIONS | SIX MONTHS ENDED JUNE 30, 2003 (UNAUDITED) | |||
| Micro-Cap Portfolio | Small-Cap Portfolio | |||||||
| INVESTMENT INCOME: | ||||||||
| Income: | ||||||||
| Dividends | $ | 225,730 | $ | 55,153 | ||||
| Interest | 76,741 | 6,670 | ||||||
| Total income | 302,471 | 61,823 | ||||||
| Expenses: | ||||||||
| Investment advisory fees | 848,217 | 110,122 | ||||||
| Custody | 36,167 | 20,544 | ||||||
| Shareholder reports | 24,067 | 966 | ||||||
| Administrative and office facilities | 10,407 | 1,265 | ||||||
| Shareholder servicing | 7,268 | 5,776 | ||||||
| Audit | 6,000 | 2,500 | ||||||
| Trustees’ fees | 5,356 | 759 | ||||||
| Legal | 3,768 | 469 | ||||||
| Other expenses | 5,678 | 1,902 | ||||||
| Total expenses | 946,928 | 144,303 | ||||||
| Fees waived by investment adviser | (30,255 | ) | – | |||||
| Net expenses | 916,673 | 144,303 | ||||||
| Net investment loss | (614,202 | ) | (82,480 | ) | ||||
REALIZED AND UNREALIZED GAIN ON INVESTMENTS: | ||||||||
| Net realized gain on investments | 683,941 | 1,185,178 | ||||||
| Net change in unrealized appreciation (depreciation) on investments | 23,022,580 | 2,518,722 | ||||||
| Net realized and unrealized gain on investments | 23,706,521 | 3,703,900 | ||||||
NET INCREASE IN NET ASSETS FROM INVESTMENT OPERATIONS | $ | 23,092,319 | $ | 3,621,420 | ||||
FINANCIAL HIGHLIGHTS |
| This table is presented to show selected data for a share outstanding throughout each period, and to assist shareholders in evaluating a Fund’s performance for the periods presented. |
| Net Asset Value, Beginning of Period | Net Investment Loss | Net Realized and Unrealized Gain (Loss) on Investments | Distributions From Net Investment Income | Distributions From Net Realized Gain on Investments | Net Asset Value, End of Period | Total Return | Net Assets, End of Period (in thousands) | Ratio of Expenses to Average Net Assets | Ratio of Net Investment Loss to Average Net Assets | Portfolio Turnover Rate | ||||||||||||||||||||||||||||||||||
| MICRO-CAP PORTFOLIO (a) | ||||||||||||||||||||||||||||||||||||||||||||
| †2003 (c) | $7.60 | ($0.03) | $ 1.32 | $ | – | $ | – | $8.89 | 17.0 | %** | $ | 165,557 | 1.35 | %* | (0.91 | )%* | 22% | |||||||||||||||||||||||||||
| 2002 (c) | 9.00 | (0.08) | (1.08 | ) | – | (0.24 | ) | 7.60 | (12.9 | )% | 133,944 | 1.35 | % | (0.88 | )% | 27% | ||||||||||||||||||||||||||||
| 2001 | 7.05 | (0.03) | 2.12 | – | (0.14 | ) | 9.00 | 29.7 | % | 106,501 | 1.35 | % | (0.61 | )% | 18% | |||||||||||||||||||||||||||||
| 2000 | 6.13 | (0.01) | 1.14 | – | (0.21 | ) | 7.05 | 18.6 | % | 35,437 | 1.35 | % | (0.14 | )% | 31% | |||||||||||||||||||||||||||||
| 1999 | 5.24 | (0.02) | 1.46 | – | (0.55 | ) | 6.13 | 28.1 | % | 7,468 | 1.35 | % | (0.53 | )% | 102% | |||||||||||||||||||||||||||||
| 1998 | 5.80 | (0.03) | 0.23 | – | (0.76 | ) | 5.24 | 4.1 | % | 3,337 | 1.35 | % | (0.79 | )% | 88% | |||||||||||||||||||||||||||||
| SMALL-CAP PORTFOLIO (b) | ||||||||||||||||||||||||||||||||||||||||||||
| †2003 (c) | $5.71 | ($0.02) | $ 0.71 | $ | – | $ | – | $6.40 | 12.1 | %** | $ | 33,618 | 1.31 | %* | (0.75 | )%* | 60% | |||||||||||||||||||||||||||
| 2002 (c) | 6.66 | (0.05) | (0.87 | ) | – | (0.03 | ) | 5.71 | (13.8 | )% | 18,190 | 1.35 | % | (0.80 | )% | 53% | ||||||||||||||||||||||||||||
| 2001 | 6.40 | (0.04) | 1.34 | – | (1.04 | ) | 6.66 | 21.0 | % | 3,324 | 1.35 | % | (0.74 | )% | 188% | |||||||||||||||||||||||||||||
| 2000 | 5.23 | (0.01) | 1.73 | – | (0.55 | ) | 6.40 | 33.3 | % | 1,440 | 1.35 | % | (0.26 | )% | 116% | |||||||||||||||||||||||||||||
| 1999 | 5.47 | – | 0.43 | – | (0.67 | ) | 5.23 | 8.2 | % | 428 | 1.35 | % | (0.06 | )% | 70% | |||||||||||||||||||||||||||||
| 1998 | 5.37 | – | 0.47 | – | (0.37 | ) | 5.47 | 8.9 | % | 374 | 1.35 | % | (0.08 | )% | 109% | |||||||||||||||||||||||||||||
| 16 | ROYCE CAPITAL FUND SEMIANNUAL REPORT 2003 | THE ACCOMPANYING NOTES ARE AN INTEGRAL PART OF THESE FINANCIAL STATEMENTS. |
NOTES TO FINANCIAL STATEMENTS (UNAUDITED) |
SUMMARY OF SIGNIFICANT ACCOUNTING POLICIES: Royce Micro-Cap Portfolio and Royce Small-Cap Portfolio (the “Fund” or “Funds”) are the two series of Royce Capital Fund (the “Trust”), a diversified open-end management investment company organized as a Delaware business trust. Shares of the Funds are offered to life insurance companies for allocation to certain separate accounts established for the purpose of funding qualified and non-qualified variable annuity contracts and variable life insurance contracts, and may also be offered directly to certain pension plans and retirement plans and accounts permitting accumulation of assets on a tax-deferred basis. Micro-Cap Portfolio and Small-Cap Portfolio commenced operations on December 27, 1996. The preparation of financial statements in conformity with generally accepted accounting principles requires management to make estimates and assumptions that affect the reported amounts of assets and liabilities and the disclosure of contingent assets and liabilities at the date of the financial statements, and the reported amounts of income and expenses during the reporting period. Actual results could differ from those estimates. Valuation of investments: Securities are valued as of the close of trading on the New York Stock Exchange (generally 4:00 p.m. Eastern time) on the valuation date. Securities listed on an exchange or the Nasdaq National Market System (NMS) are valued at their last reported sales price or official closing price taken from the primary market in which each security trades or, if no sale is reported for such day, at their bid price for exchange-listed securities and at the average of their bid and asked prices for Nasdaq NMS securities. Other over-the-counter securities for which market quotations are readily available are valued at their bid price. Securities for which market quotations are not readily available are valued at their fair value under procedures established by the Board of Trustees. Bonds and other fixed income securities may be valued by reference to other securities with comparable ratings, interest rates and maturities, using established independent pricing services. Investment transactions and related investment income: Investment transactions are accounted for on the trade date. Dividend income is recorded on the ex-dividend date and any non-cash dividend income is recorded at the fair market value of the securities received. Interest income is recorded on the accrual basis. Realized gains and losses from investment transactions are determined on the basis of identified cost for book and tax purposes. Expenses: The Funds incur direct and indirect expenses. Expenses directly attributable to a Fund are charged to the Fund’s operations, while expenses applicable to more than one series of the Trust are allocated equitably. Allocated personnel and occupancy costs related to the Royce Funds are included in administrative and office facilities expenses. | paid annually in December. Because federal income tax regulations differ from generally accepted accounting principles, income and capital gains distributions determined in accordance with tax regulations may differ from net investment income and realized gains recognized for financial reporting purposes. Accordingly, the character of distributions and composition of net assets for tax purposes differs from those reflected in the accompanying financial statements. The Funds intend to retain realized capital gains that may be offset against capital loss carryforwards for federal income tax purposes. There were no capital loss carryforwards for the year ended December 31, 2002. Repurchase agreements: The Funds enter into repurchase agreements with respect to portfolio securities solely with State Street Bank and Trust Company (“SSB&T”), the custodian of the Funds’ assets. Each Fund restricts repurchase agreements to maturities of no more than seven days. Securities pledged as collateral for repurchase agreements, which are held by SSB&T until maturity of the repurchase agreements, are marked-to-market daily and maintained at a value at least equal to the principal amount of the repurchase agreement (including accrued interest). Repurchase agreements could involve certain risks in the event of default or insolvency of SSB&T, including possible delays or restrictions upon the ability of each Fund to dispose of its underlying securities. Securities lending: The Funds loan securities to qualified institutional investors for the purpose of realizing additional income. This income is included in interest income. Collateral on all securities loaned for the Funds is accepted in cash and cash equivalents and invested temporarily by the custodian. The collateral is equal to at least 100% of the current market value of the loaned securities. INVESTMENT ADVISER: Under the Trust’s investment advisory agreements with Royce & Associates, LLC (“Royce”), Royce is entitled to receive management fees that are computed daily and payable monthly, at an annual rate of 1.25% and 1.0% of the average net assets of Micro-Cap Portfolio and Small-Cap Portfolio, respectively. Royce has contractually committed to waive its fees and reimburse expenses to the extent necessary to maintain the net annual operating expense ratios to average net assets at or below 1.35% for each Fund through December 31, 2003. For the six months ended June 30, 2003, Micro-Cap Portfolio recorded advisory fees of $817,962 (net of waivers of $30,255) and Small-Cap Portfolio recorded advisory fees of $110,122. PURCHASES AND SALES OF INVESTMENT SECURITIES: For the six months ended June 30, 2003, the cost of purchases and the proceeds from sales of investment securities, other than short-term securities, were as follows: | |||
| Distributions and Taxes: As qualified regulated investment companies under Subchapter M of the Internal Revenue Code, the Funds are not subject to income taxes to the extent that each Fund distributes substantially all of its taxable income for its fiscal year. Any dividend and capital gain distributions are | ||||
| Purchases | Sales | |||
| Micro-Cap Portfolio | $27,178,075 | $26,472,952 | ||
| Small-Cap Portfolio | $17,729,550 | $11,600,671 | ||
ROYCE CAPITAL FUND SEMIANNUAL REPORT 2003 | 17 |
TRUSTEES AND OFFICERS |
All Trustees and Officers may be reached c/o The Royce Funds, 1414 Avenue of the Americas, New York, NY 10019 |
| NAME AND POSITION: Charles M. Royce, Trustee,* President | NAME AND POSITION: David L. Meister, Trustee | |||||
| Age: 63 | No. of Funds Overseen: 18 | Age: 63 | No. of Funds Overseen: 18 | |||
| Tenure: Since 1982 | Non-Royce Directorships: None | Tenure: Since 1982 | Non-Royce Directorships: None | |||
Principal Occupation(s) During Past Five Years: President, Chief Investment Officer and Member of Board of Managers of Royce & Associates, LLC (“Royce”), the Trust’s investment adviser. | Principal Occupation(s) During Past Five Years: Chairman and Chief Executive Officer of The Tennis Channel (since June 2000). Chief Executive Officer of Seniorlife.com (from December 1999 to May 2000). Mr. Meister’s prior business experience includes having served as a consultant to the communications industry, President of Financial News Network, Senior Vice President of HBO, President of Time-Life Films and Head of Broadcasting for Major League Baseball. | |||||
NAME AND POSITION: Mark R. Fetting, Trustee * | ||||||
| Age: 48 | No. of Funds Overseen: 18 | |||||
| Tenure: Since 2001 | Non-Royce Directorships: Director/Trustee of registered investment companies constituting the 22 Legg Mason Funds. | |||||
Principal Occupation(s) During Past Five Years: Executive Vice President of Legg Mason, Inc.; Member of Board of Managers of Royce; Division President and Senior Officer, Prudential Financial Group, Inc. and related companies, including Fund Boards and consulting services to subsidiary companies (from 1991 to 2000). Mr. Fetting’s prior business experience includes having served as Partner, Greenwich Associates and Vice President, T. Rowe Price Group, Inc. | Age: 57 | No. of Funds Overseen: 18 | ||||
| Tenure: Since 2001 | Non-Royce Directorships: Director/Trustee of registered investment companies constituting the 22 Legg Mason Funds. Director of Renaissance Capital Greenwich Fund. | |||||
Principal Occupation(s) During Past Five Years: Trustee of Colgate University; Director of Renaissance Capital Greenwich Funds; Vice President of Hill House, Inc.; Managing Director/Equity Capital Markets Group of Merrill Lynch & Co. (from 1971 to 1999). NAME AND POSITION: John D. Diederich, Vice President and Treasurer Age: 52 Tenure: Since 2001 Principal Occupation(s) During Past Five Years: Managing Director, Chief Operating Officer and Member of Board of Managers of Royce (since October 2001); Director of Administration of the Trust since April 1993. NAME AND POSITION: Jack E. Fockler, Jr., Vice President Age: 44 Tenure: Since 1995 Principal Occupation(s) During Past Five Years: Managing Director and Vice President of Royce, having been employed by Royce since October 1989. NAME AND POSITION: W. Whitney George, Vice President Age: 45 Tenure: Since 1995 Principal Occupation(s) During Past Five Years: Managing Director and Vice President of Royce, having been employed by Royce since October 1991. NAME AND POSITION: Daniel A. O’Byrne, Vice President and Assistant Secretary Age: 41 Tenure: Since 1994 Principal Occupation(s) During Past Five Years: Principal and Vice President of Royce, having been employed by Royce since October 1986. NAME AND POSITION: John E. Denneen, Secretary Age: 36 Tenure: 1996-2001 and Since April 2002 Principal Occupation(s) During Past Five Years: General Counsel (Deputy General Counsel prior to 2003), Principal, Chief Legal and Compliance Officer and Secretary of Royce; Principal of Credit Suisse First Boston Private Equity (2001-2002). | ||||||
| NAME AND POSITION: Donald R. Dwight, Trustee | ||||||
| Age: 72 | No. of Funds Overseen: 18 | |||||
| Tenure: Since 1998 | Non-Royce Directorships: None | |||||
Principal Occupation(s) During Past Five Years: President of Dwight Partners, Inc., corporate communications consultant; Chairman (from 1982 to March 1998) and Chairman Emeritus (since March 1998) of Newspapers of New England, Inc. Mr. Dwight’s prior experience includes having served as Lieutenant Governor of the Commonwealth of Massachusetts, as President and Publisher of Minneapolis Star and Tribune Company and as a Trustee of the registered investment companies constituting the 94 Eaton Vance Funds. | ||||||
| NAME AND POSITION: Richard M. Galkin, Trustee | ||||||
| Age: 65 | No. of Funds Overseen: 18 | |||||
| Tenure: Since 1982 | Non-Royce Directorships: None | |||||
Principal Occupation(s) During Past Five Years: Private investor. Mr. Galkin’s prior business experience includes having served as President of Richard M. Galkin Associates, Inc., telecommunications consultants, President of Manhattan Cable Television (a subsidiary of Time, Inc.), President of Haverhills Inc. (another Time, Inc. subsidiary), President of Rhode Island Cable Television and Senior Vice President of Satellite Television Corp. (a subsidiary of Comsat). | ||||||
| NAME AND POSITION: Stephen L. Isaacs, Trustee | ||||||
| Age: 63 | No. of Funds Overseen: 18 | |||||
| Tenure: Since 1989 | Non-Royce Directorships: None | |||||
Principal Occupation(s) During Past Five Years: President of The Center for Health and Social Policy (since September 1996); Attorney and President of Health Policy Associates, Inc., consultants. Mr. Isaacs’s prior business experience includes having served as Director of Columbia University Development Law and Policy Program and Professor at Columbia University (until August 1996). | ||||||
| NAME AND POSITION: William L. Koke, Trustee | ||||||
| Age: 68 | No. of Funds Overseen: 18 | |||||
| Tenure: Since 1996 | Non-Royce Directorships: None | |||||
Principal Occupation(s) During Past Five Years: Financial planner with Shoreline Financial Consultants. Mr. Koke’s prior business experience includes having served as Director of Financial Relations of SONAT, Inc., Treasurer of Ward Foods, Inc. and President of CFC, Inc. | ||||||
18 | ROYCE CAPITAL FUND SEMIANNUAL REPORT 2003 |
Item 2: Code(s) of Ethics - Not applicable to this semi-annual report.
Item 3: Audit Committee Financial Expert - Not applicable to this semi-annual report.
Item 4: Principal Accountant Fees and Services - Not applicable to this semi-annual report.
Item 5: Reserved.
Item 6: Reserved.
Item 7: Not applicable.
Item 8: Reserved.
Item 9: Controls and Procedures.
(a) Disclosure Controls and Procedures. The Principal Executive and Financial Officers concluded that the Registrant’s Disclosure Controls and Procedures are effective based on their evaluation of the Disclosure Controls and Procedures as of a date within 90 days of the filing date of this report.
(b) Internal Controls. There were no significant changes in Registrant’s internal controls or in other factors that could significantly affect these controls subsequent to the date of their evaluation, including any corrective actions with regard to significant deficiencies and material weaknesses.
Item 10: Exhibits attached hereto. (Attach certifications as exhibits)Pursuant to the requirements of the Securities Exchange Act of 1934 and the Investment Company Act of 1940, the registrant has duly caused this report to be signed on its behalf by the undersigned, thereunto duly authorized.
ROYCE CAPITAL FUND
| BY: | /s/ Charles M. Royce |
| Charles M. Royce | |
| President |
Date: August 20, 2003
Pursuant to the requirements of the Securities Exchange Act of 1934 and the Investment Company Act of 1940, this report has been signed below by the following persons on behalf of the registrant and in the capacities and on the dates indicated.
ROYCE CAPITAL FUND
| BY: | /s/ Charles M. Royce |
| Charles M. Royce | |
| President |
Date: August 20, 2003
ROYCE CAPITAL FUND
| BY: | /s/ John D. Diederich |
| John D. Diederich | |
| Chief Financial Officer |
Date: August 20, 2003