UNITED STATES
SECURITIES AND EXCHANGE COMMISSION
Washington, D.C. 20549
FORM N-CSR
CERTIFIED SHAREHOLDER REPORT
OF
REGISTERED MANAGEMENT INVESTMENT COMPANIES
Investment Company Act file number: 811-07537
Name of Registrant: Royce Capital Fund
Address of Registrant: 1414 Avenue of the Americas
New York, NY 10019
| Name and address of agent for service: | John E. Denneen, Esquire | |
| 1414 Avenue of the Americas | ||
| New York, NY 10019 |
Registrant’s telephone number, including area code: (212) 486-1445
Date of fiscal year end: December 31
Date of reporting period: January 1, 2006 - June 30, 2006
Item 1: Reports to Shareholders
| 2006 Semiannual Review and Report to Shareholders | ||
| |
| TheRoyceFunds VALUE INVESTING IN SMALL COMPANIES FOR MORE THAN 30 YEARS ROYCE CAPITAL FUND |
MICRO-CAP PORTFOLIO SMALL-CAP PORTFOLIO | ||
| SEMIANNUAL REVIEW | |||
| LETTER TO OUR SHAREHOLDERS | 2 | ||
| SEMIANNUAL REPORT TO SHAREHOLDERS | |||
| MANAGER’S DISCUSSION OF FUND PERFORMANCE | 6 | ||
| NOTES TO PERFORMANCE AND OTHER IMPORTANT INFORMATION | 10 | ||
| FINANCIAL STATEMENTS | 11 | ||
| UNDERSTANDING YOUR FUND’S EXPENSES | 22 | ||
| BOARD APPROVAL OF INVESTMENT ADVISORY AGREEMENTS | 23 | ||
| ||
| ||
LETTER TO OUR SHAREHOLDERS Value In Vogue? |
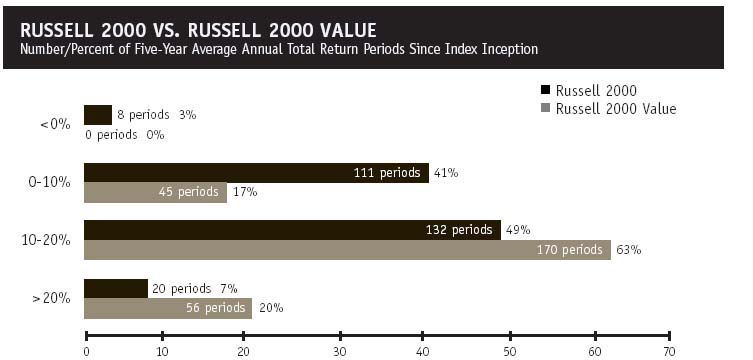
We do not expect anything resembling the previous 10 years in terms of the time span of asset-class leadership or the breadth in performance spreads. We continue to believe that the stock market will be characterized by frequent leadership rotation and low returns. |
2 | THIS PAGE IS NOT PART OF THE 2006 SEMIANNUAL REPORT TO SHAREHOLDERS |
|
THIS PAGE IS NOT PART OF THE 2006 SEMIANNUAL REPORT TO SHAREHOLDERS | 3 |
LETTER TO OUR SHAREHOLDERS small-cap world, although the number of bargains as of this writing is still not as plentiful as we would like. |
4 | THIS PAGE IS NOT PART OF THE 2006 SEMIANNUAL REPORT TO SHAREHOLDERS |
|
|
Sincerely, | |||
 |  |  | |
Charles M. Royce | W. Whitney George | Jack E. Fockler, Jr. | |
July 31, 2006 | |||
THIS PAGE IS NOT PART OF THE 2006 SEMIANNUAL REPORT TO SHAREHOLDERS | 5 |
ROYCE CAPITAL FUND — MICRO-CAP PORTFOLIO† |
| Average Annual Total Returns | Through 6/30/06 | Portfolio Diagnostics | ||||
| January — June 2006* | 11.38% | Average Market Capitalization | $294 million | |||
| One-Year | 28.09 | Weighted Average P/E Ratio | 17.6x* | |||
| Three-Year | 21.75 | Weighted Average P/B Ratio | 1.8x | |||
| Five-Year | 13.63 | Weighted Average Yield | 0.4% | |||
| Since Inception (12/27/96) | 17.36 | Number of Holdings | 217 | |||
| Fund Net Assets | $492 million | |||||
| * Not annualized. | * Excludes 28% of portfolio holdings with zero or negative earnings as of 6/30/06. | |||||
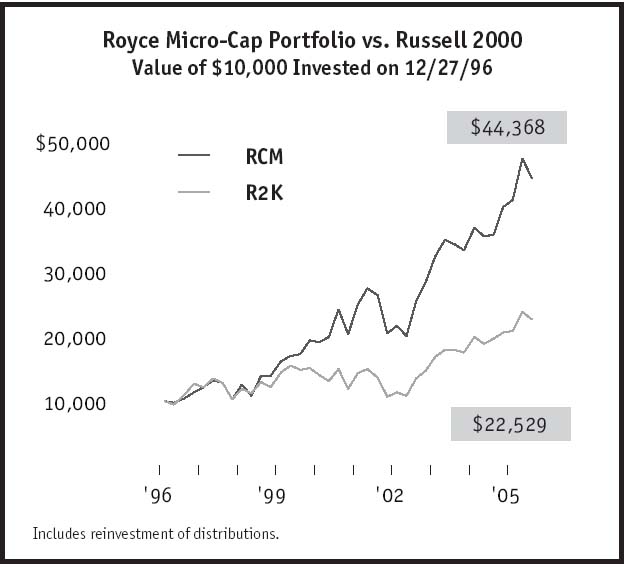
| MANAGER’S DISCUSSION OF FUND PERFORMANCE Royce Capital Fund—Micro-Cap Portfolio (RCM) gained 11.4% for the year-to-date period ended 6/30/06, ahead of its small-cap benchmark, the Russell 2000, which finished the same period with an 8.2% return. A combination of strong upmarket results and solid down-market performance did the trick. In the bullish first quarter, RCM gained 15.4% versus 13.9% for its benchmark. When the bull began to give way to the bear in the second quarter, the Fund lost 3.5% versus a decline of 5.0% for the small-cap index. From the most recent small-cap peak on 5/5/06 through 6/30/06, RCM also fared slightly better than the Russell 2000 (-6.8% versus -7.1%). We have been struck by the ability of certain micro-cap companies to successfully withstand the recent onset of falling stock prices, in marked contrast to their reputation for volatility and vulnerability. However, these accomplishments would mean little to us if they did not contribute to strong absolute performance for the Fund over long-term and market cycle periods. Fortunately, this has been the case. From the previous small-cap peak on 3/9/00 through 6/30/06, RCM gained 174.3% (compared to the Russell 2000’s 29.5% return for the same period). Considering its value approach, the Fund’s strong showing in the bullish period from the small-cap market trough on 10/9/02 through 6/30/06 was arguably even more impressive. During this time, RCM was up 141.6% versus 131.8% for the Russell 2000. The Fund also outperformed the Russell 2000 for the one-, three-, five-year and since inception (12/27/96) periods ended 6/30/06. The Fund’s average annual total return since inception was 17.4%. Holdings in the Natural Resources sector were the primary contributors to first-half performance and were once again far ahead of the Fund’s other equity sectors in terms of dollar-based net gains. The difference in the first half was the sterling performance of holdings in the precious metals and mining industry, which held six of the Fund’s top-ten gainers. Although results in this industry improved in 2005, they ran just behind RCM’s holdings in the energy services industry for the calendar year. In 2006’s opening half, however, the precious metals and mining industry’s dollar-based net gains were not only more than triple that of the energy services industry, but also outgained that of each of the portfolio’s equity sectors. We were very pleased that many of these holdings managed to avoid serious second-quarter losses. In fact, certain precious metals and mining positions posted gains in the second-quarter downturn. The Health sector was home to one terrific performer and two that did not work out quite so well. Bioveris Corporation makes bio-detection devices for various diagnostic applications. We liked its business and its good-sized cash position, but its success in the portfolio seemed more the result of fortuitously timed purchases than anything else. A stumbling stock price for Orchid Cellmark allowed us to build a position in a DNA testing firm whose accounting woes we hope are short-lived. NitroMed’s new drug candidates failed to make much progress, which led us to take our losses and move on. All performance information in this Report reflects past performance, is presented on a total return basis and reflects the reinvestment of distributions. Past performance is no guarantee of future results. Investment return and principal value of an investment will fluctuate, so that shares may be worth more or less than their original cost when redeemed. Current performance may be higher or lower than performance quoted. Current month-end performance may be obtained at www.roycefunds.com. The Fund’s total returns do not reflect any deduction for charges or expenses of the variable contracts or retirement plans investing in the Fund. |
| † | All performance information reflects Investment Class results. Shares of RCM’s Service Class bear an annual distribution expense that is not borne by the Investment Class. |
| 6 | ROYCE CAPITAL FUND 2006 SEMIANNUAL REPORT TO SHAREHOLDERS |
PERFORMANCE AND PORTFOLIO REVIEW |
 | |||
| Top 10 Positions | % of Net Assets | ||
| Bioveris Corporation | 1.4% | ||
| Exponent | 1.3 | ||
| TETRA Technologies | 1.1 | ||
| Tesco Corporation | 1.1 | ||
| Drew Industries | 1.1 | ||
| Olympic Steel | 1.0 | ||
| Pason Systems | 1.0 | ||
| Harris Steel Group | 1.0 | ||
| Northern Orion Resources | 1.0 | ||
| NovaGold Resources | 1.0 | ||
| Portfolio Sector Breakdown | % of Net Assets | ||
| Technology | 18.5% | ||
| Natural Resources | 17.0 | ||
| Health | 14.3 | ||
| Industrial Products | 10.4 | ||
| Industrial Services | 8.1 | ||
| Consumer Services | 4.7 | ||
| Financial Intermediaries | 4.2 | ||
| Consumer Products | 3.0 | ||
| Financial Services | 0.8 | ||
| Miscellaneous | 4.2 | ||
| Cash and Cash Equivalents | 14.8 | ||
| GOOD IDEAS THAT WORKED Net Realized and Unrealized Gain Through 6/30/06 | |
| Western Silver | $4,381,589 |
| Bioveris Corporation | 3,456,846 |
| TETRA Technologies | 2,761,763 |
| Metallica Resources | 2,016,367 |
| TTM Technologies | 1,653,519 |
| | |
| GOOD IDEAS AT THE TIME Net Realized and Unrealized Loss Through 6/30/06 | |
| Orchid Cellmark | $2,019,882 |
| BB Holdings | 1,561,362 |
| NitroMed | 1,205,409 |
| Steel Technologies | 981,541 |
| Gene Logic | 854,661 |
| | |
| ROYCE CAPITAL FUND 2006 SEMIANNUAL REPORT TO SHAREHOLDERS | 7 |
ROYCE CAPITAL FUND — SMALL-CAP PORTFOLIO† |
| Average Annual Total Returns† | Through 6/30/06 | Portfolio Diagnostics | |||||||||||||
January — June 2006* | 4.65 | % | Average Market Capitalization | $842 million | |||||||||||
One-Year | 9.01 | Weighted Average P/E Ratio | 16.6x | ||||||||||||
Three-Year | 21.35 | Weighted Average P/B Ratio | 2.2x | ||||||||||||
Five-Year | 11.87 | Weighted Average Yield | 0.6% | ||||||||||||
Since Inception (12/27/96) | 15.33 | Number of Holdings | 95 | ||||||||||||
Fund Net Assets | $244 million | ||||||||||||||
MANAGER’S DISCUSSION OF FUND PERFORMANCE
Although Royce Capital Fund—Small Cap Portfolio (RCS) enjoyed a solid first half on an absolute basis, the Fund trailed its small-cap benchmark, the Russell 2000, with a gain of 4.7% versus 8.2% for its benchmark. Unfortunately, the Fund underperformed during both the bullish first quarter (+11.7% versus +13.9%) and the more bearish second quarter (-6.3% versus -5.0%). In addition, from the most recent small-cap peak on 5/5/06 through 6/30/06, RCS again fell behind the Russell 2000 (-7.7% versus -7.1%). We would always prefer to outperform our benchmark. Although not doing so over short-term periods generally does not give us cause for concern, RCS’s first-half results were disappointing nonetheless.
However, over market cycle and other long-term periods, results were much more encouraging on both an absolute and relative basis. These are the periods which we believe are most significant in evaluating performance. From the previous small-cap peak on 3/9/00 through 6/30/06, RCS gained 166.7%, compared to a 29.5% return for the Russell 2000. Considering its value approach, the Fund’s strong showing in the bullish period from the small-cap market trough on 10/9/02 through 6/30/06 was arguably even more impressive. During this time, RCS was up 138.5% versus 131.8% for the benchmark. The Fund also outperformed the Russell 2000 for the three-year, five-year and since inception (12/27/96) periods ended 6/30/06. The Fund’s average annual total return since inception was 15.3%.
Holdings in the Technology sector were loss leaders on a dollar basis during the first half. MAXIMUS provides consulting, as well as systems and operations management, to federal, state and local government agencies and private-sector clients. Its price plummeted in the wake of a now-settled lawsuit and a problematic contract. We were left with our own uncertainty about the company’s ability to manage its way successfully through these difficulties. Sigmatel designs and manufactures proprietary mixed-signal integrated circuits. A precipitous drop in sales for the first quarter sent its stock price into such a dramatic tailspin that we stopped buying and began selling.
Natural Resources once again led all of the Fund’s sectors in dollar-based net gains. Although the precious metals and mining as well as the oil and gas industries posted positive performance, top honors in the sector went to energy services companies, whose net gains outstripped seven sectors on a dollar basis. Leading the way was the Fund’s top performer, energy services and chemical company TETRA Technologies. Its share price soared on news of two consecutive quarters of record earnings, as the good times for many energy-related companies continued. Elsewhere in the portfolio, we were pleased by the strong performance of long-term holding, welding and cutting products manufacturer Lincoln Electric Holdings, which we first purchased in RCS’s portfolio in 1998. The firm posted strong earnings and record revenues for both the fiscal year and fourth quarter ended 12/31/05 and the fiscal first quarter of 2006.
All performance information in this Report reflects past performance, is presented on a total return basis and reflects the reinvestment of distributions. Past performance is no guarantee of future results. Investment return and principal value of an investment will fluctuate, so that shares may be worth more or less than their original cost when redeemed. Current performance may be higher or lower than performance quoted. Current month-end performance may be obtained at www.roycefunds.com. The Fund’s total returns do not reflect any deduction for charges or expenses of the variable contracts or retirement plans investing in the Fund. The Fund’s P/E Ratio calculations exclude companies with zero or negative earnings.
† All performance information reflects Investment Class results. Shares of RCS’s Service Class bear an annual distribution expense that is not borne by the Service Class Investment Class.
| 8 | ROYCE CAPITAL FUND 2006 SEMIANNUAL REPORT TO SHAREHOLDERS |
PERFORMANCE AND PORTFOLIO REVIEW |
| Top 10 Positions | % of Net Assets | 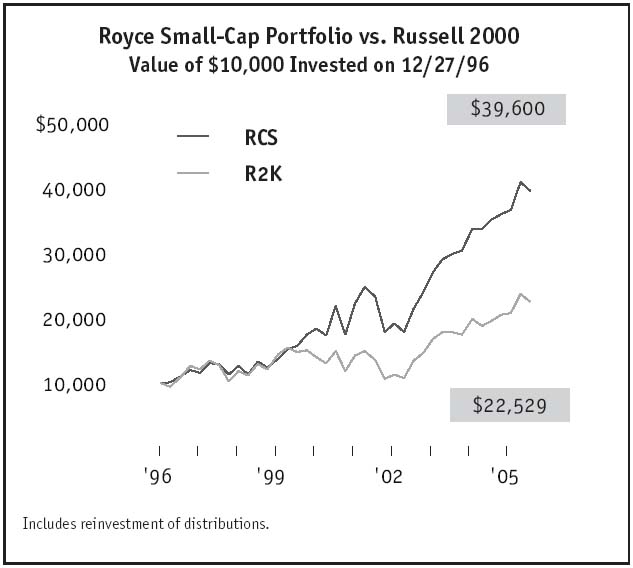 | |||
| NETGEAR | 2.0 | % | |||
| Perot Systems Cl. A | 2.0 | ||||
| RC2 Corporation | 1.9 | ||||
| AmerUs Group | 1.9 | ||||
| Unit Corporation | 1.9 | ||||
| TETRA Technologies | 1.8 | ||||
| Rofin-Sinar Technologies | 1.6 | ||||
| LECG Corporation | 1.6 | ||||
| Applebee’s International | 1.6 | ||||
| St. Mary Land & Exploration Company | 1.5 | ||||
| Portfolio Sector Breakdown | % of Net Assets | ||||
| Technology | 19.6 | % | |||
| Consumer Products | 15.3 | ||||
| Consumer Services | 12.4 | ||||
| Natural Resources | 11.6 | ||||
| Industrial Products | 9.2 | ||||
| Industrial Services | 7.1 | ||||
| Health | 5.2 | ||||
| Financial Intermediaries | 4.4 | ||||
| Financial Services | 2.0 | ||||
| Miscellaneous | 4.9 | ||||
| Cash and Cash Equivalents | 8.3 | ||||
| GOOD IDEAS THAT WORKED | |||
| Net Realized and Unrealized Gain Through 6/30/06 | |||
| TETRA Technologies | $ | 2,308,635 | |
| Agnico-Eagle Mines | 1,398,600 | ||
| Dover Downs Gaming & Entertainment | 1,330,647 | ||
| Lincoln Electric Holdings | 1,111,121 | ||
| Rofin-Sinar Technologies | 908,861 | ||
| GOOD IDEAS AT THE TIME | |||
| Net Realized and Unrealized Loss Through 6/30/06 | |||
| MAXIMUS | $ | 1,938,916 | |
| Sigmatel | 1,707,211 | ||
| Finish Line (The) Cl. A | 1,210,245 | ||
| Applebee’s International | 747,063 | ||
| NuSkin Enterprises Cl. A | 612,334 | ||
| ROYCE CAPITAL FUND 2006 SEMIANNUAL REPORT TO SHAREHOLDERS | 9 |
| N O T E S T O P E R F O R M A N C E A N D O T H E R I M P O R T A N T I N F O R M A T I O N |
Notes To Performance And Statistical Information
All performance information in this Review and Report reflects past performance, is presented on a total return basis and reflects the reinvestment of distributions. Past performance is no guarantee of future results or volatility. Current performance may be higher or lower than performance quoted. Returns as of the most recent month-end may be obtained at www.roycefunds.com. The Fund’s total returns do not reflect any deduction for charges or expenses of the variable contracts or retirement plans investing in the Fund. Investment return and principal value will fluctuate, so that shares may be worth more or less than their original cost when redeemed. The Royce Funds invest primarily in securities of small-cap and/or micro-cap companies that may involve considerably more risk than investments in securities of larger-cap companies (see “Primary Risks for Fund Investors” in the prospectus).
The thoughts expressed in this Review and Report concerning recent market movements and future prospects for small company stocks are solely the opinion of Royce at June 30, 2006, and, of course, historical market trends are not necessarily indicative of future market movements. Statements regarding the future prospects for particular securities held in the Funds’ portfolios and Royce’s investment intentions with respect to those securities reflect Royce’s opinions as of June 30, 2006 and are subject to change at any time without notice. All publicly released material information is always disclosed by the Funds on the website at www.roycefunds.com. There can be no assurance that securities mentioned in this Review and Report will be included in any Royce-managed portfolio in the future.
The Russell 2000, Russell 2000 Value, Russell 2000 Growth, Nasdaq Composite and S&P 500 are unmanaged indices of domestic small-cap common stocks. Returns for the market indices used in this Review and Report were based on information supplied to Royce by Frank Russell. Royce has not independently verified the above described information. The Royce Funds is a service mark of The Royce Funds. Distributor: Royce Fund Services, Inc.
Forward-looking Statements
This material contains forward-looking statements within the meaning of the Securities Exchange Act of 1934, as amended (the “Exchange Act”), that involve risks and uncertainties, including, among others, statements as to:
| • | the Funds’ future operating results | |
| • | the prospects of the Funds’ portfolio companies | |
| • | the impact of investments that the Funds have made or may make | |
| • | the dependence of the Funds’ future success on the general economy and its impact on the companies and industries in which the Funds invest, and | |
| • | the ability of the Funds’ portfolio companies to achieve their objectives. |
This Review and Report uses words such as “anticipates,” “believes,” “expects,” “future,” “intends,” and similar expressions to identify forward-looking statements. Actual results may differ materially from those projected in the forward-looking statements for any reason.
The Royce Funds have based the forward-looking statements included in this Review and Report on information available to us on the date of the Review and Report, and we assume no obligation to update any such forward-looking statements. Although The Royce Funds undertake no obligation to revise or update any forward-looking statements, whether as a result of new information, future events or otherwise, you are advised to consult any additional disclosures that we may make through future shareholder communications or reports.
Proxy Voting
A copy of the policies and procedures that The Royce Funds use to determine how to vote proxies relating to portfolio securities is available, without charge, by calling 1-800-221-4268 (toll-free) and on the website of the Securities and Exchange Commission (“SEC”), at www.sec.gov. Information regarding how each of The Royce Funds voted proxies relating to portfolio securities during the most recent 12-month period ended June 30 is also available without charge, by calling 1-800-221-4268 (toll-free), on the website of the SEC, at www.sec.gov., and on The Royce Funds’ website at www.roycefunds.com.
Form N-Q Filing
The Funds file their complete schedules of investments with the SEC for the first and third quarters of each fiscal year on Form N-Q. The Funds’ Forms N-Q are available on The Royce Funds’ website at www.roycefunds.com and on the SEC’s website at www.sec.gov. The Funds’ Forms N-Q may also be reviewed and copied at the SEC’s Public Reference Room in Washington, D.C. To find out more about this public service, call the SEC at (202) 942-8090. The Funds’ complete schedules of investments are updated quarterly, and are available at www.roycefunds.com.
| 10 | ROYCE CAPITAL FUND 2006 SEMIANNUAL REPORT TO SHAREHOLDERS |
SCHEDULES OF INVESTMENTS | JUNE 30, 2006 (Unaudited) |
| Royce Capital Fund – Micro-Cap Portfolio |
| SHARES | VALUE | SHARES | VALUE | ||||||||||
COMMON STOCKS – 85.2% | Financial Services – 0.8% | ||||||||||||
Investment Management - 0.8% | |||||||||||||
Consumer Products – 3.0% | ADDENDA Capital | 59,500 | $ | 1,367,173 | |||||||||
Apparel and Shoes - 0.9% | 112,200 | 2,373,030 | |||||||||||
| 271,700 | $ | 1,967,108 | |||||||||||
Stride Rite | 197,600 | 2,606,344 | Total (Cost $3,767,401) | 3,740,203 | |||||||||
| 4,573,452 | Health – 14.3% | ||||||||||||
Commercial Services - 0.5% | |||||||||||||
Food/Beverage/Tobacco - 0.6% | First Consulting Groupa | 260,100 | 2,299,284 | ||||||||||
| 34,400 | 1,007,576 | ||||||||||||
| 23,000 | 923,910 | Drugs and Biotech - 5.6% | |||||||||||
| 210,100 | 1,237,489 | 168,500 | 1,101,990 | ||||||||||
| 161,700 | 1,429,428 | ||||||||||||
| 3,168,975 | 285,500 | 1,433,210 | |||||||||||
| 278,400 | 1,984,992 | ||||||||||||
Sports and Recreation - 0.9% | Compugena | 162,900 | 470,781 | ||||||||||
Arctic Cat | 73,000 | 1,424,230 | 279,800 | 1,354,232 | |||||||||
| 466,000 | 2,912,500 | Discovery Partners Internationala | 467,700 | 1,216,020 | |||||||||
| 462,649 | 2,613,967 | ||||||||||||
| 4,336,730 | 312,300 | 918,162 | |||||||||||
| 494,300 | 1,334,610 | ||||||||||||
Other Consumer Products - 0.6% | 528,400 | 2,319,676 | |||||||||||
| 74,800 | 2,891,768 | 183,000 | 1,368,840 | ||||||||||
| 72,400 | 1,828,100 | ||||||||||||
Total (Cost $11,076,012) | 14,970,925 | Neogen Corporationa | 111,700 | 2,135,704 | |||||||||
| 783,700 | 2,186,523 | ||||||||||||
Consumer Services – 4.7% | VIVUSa | 430,500 | 1,657,425 | ||||||||||
Direct Marketing - 0.1% | 728,900 | 2,361,636 | |||||||||||
| 37,000 | 315,521 | ||||||||||||
| 27,715,296 | |||||||||||||
Leisure and Entertainment - 1.9% | |||||||||||||
| 104,000 | 1,684,800 | Health Services - 1.7% | |||||||||||
| 123,000 | 1,993,830 | 327,200 | 1,348,064 | ||||||||||
| 208,700 | 2,114,131 | 54,600 | 993,174 | ||||||||||
New Frontier Mediaa | 310,900 | 2,229,153 | 71,880 | 770,554 | |||||||||
Progressive Gaming Internationala | 182,100 | 1,420,380 | 548,700 | 1,673,535 | |||||||||
Horizon Healtha | 72,500 | 1,513,800 | |||||||||||
| 9,442,294 | 136,400 | 1,996,896 | |||||||||||
Restaurants and Lodgings - 0.4% | 8,296,023 | ||||||||||||
Benihana Cl. Aa | 45,045 | 1,222,521 | |||||||||||
| 29,900 | 821,652 | Medical Products and Devices - 6.1% | |||||||||||
| 98,600 | 1,382,372 | ||||||||||||
| 2,044,173 | 116,000 | 1,122,880 | |||||||||||
| 844,400 | 6,797,420 | ||||||||||||
Retail Stores - 2.1% | Bruker BioSciencesa | 722,800 | 3,874,208 | ||||||||||
| 174,100 | 2,839,571 | Caliper Life Sciencesa | 301,700 | 1,505,483 | |||||||||
Buckle (The) | 52,900 | 2,214,923 | 134,200 | 1,845,250 | |||||||||
Cachea | 114,600 | 1,987,164 | Langera | 460,300 | 1,887,230 | ||||||||
Cato Corporation Cl. A | 124,500 | 3,218,325 | 113,600 | 1,563,136 | |||||||||
| 279,400 | 1,156,716 | ||||||||||||
| 10,259,983 | 143,700 | 1,438,437 | |||||||||||
Orthofix Internationala | 30,000 | 1,143,900 | |||||||||||
Other Consumer Services - 0.2% | 156,200 | 1,376,122 | |||||||||||
First Cash Financial Servicesa | 52,000 | 1,027,000 | Shamir Optical Industrya | 145,700 | 1,311,300 | ||||||||
| 84,900 | 834,567 | ||||||||||||
Total (Cost $16,877,527) | 23,088,971 | Young Innovations | 74,100 | 2,610,543 | |||||||||
Financial Intermediaries – 4.2% | 29,849,564 | ||||||||||||
Banking - 1.5% | |||||||||||||
| 86,525 | 2,163,990 | Personal Care - 0.4% | |||||||||||
Canadian Western Bank | 75,400 | 2,890,907 | Nutraceutical Internationala | 129,500 | 1,985,235 | ||||||||
†Endeavour Mining Capital | 351,700 | 2,479,512 | |||||||||||
Total (Cost $68,654,479) | 70,145,402 | ||||||||||||
| 7,534,409 | |||||||||||||
Insurance - 2.7% | |||||||||||||
American Safety Insurance Holdingsa | 149,200 | 2,461,800 | |||||||||||
| 108,000 | 3,244,320 | ||||||||||||
NYMAGIC | 89,900 | 2,611,595 | |||||||||||
| 56,300 | 2,467,066 | ||||||||||||
United Fire & Casualty Company | 78,630 | 2,369,122 | |||||||||||
| 13,153,903 | |||||||||||||
Total (Cost $12,044,459) | 20,688,312 | ||||||||||||
| THE ACCOMPANYING NOTES ARE AN INTEGRAL PART OF THESE FINANCIAL STATEMENTS. | ROYCE CAPITAL FUND 2006 SEMIANNUAL REPORT TO SHAREHOLDERS | 11 |
| SCHEDULES OF INVESTMENTS |
| Royce Capital Fund – Micro-Cap Portfolio (continued) |
| SHARES | VALUE | SHARES | VALUE | ||||||||||
Industrial Products – 10.4% | Transportation and Logistics - 2.4% | ||||||||||||
Automotive - 0.6% | 115,049 | $ | 2,501,165 | ||||||||||
Aftermarket Technologya | 80,000 | $ | 1,988,000 | 60,000 | 1,733,400 | ||||||||
Wescast Industries Cl. A | 64,100 | 841,804 | Patriot Transportation Holdinga,b | 39,800 | 3,453,844 | ||||||||
| Vitran Corporation Cl. Aa,b | 176,950 | 4,156,555 | |||||||||||
| 2,829,804 | |||||||||||||
| 11,844,964 | |||||||||||||
Building Systems and Components - 2.5% | |||||||||||||
Aaonb | 144,550 | 3,709,153 | Total (Cost $31,997,370) | 39,866,288 | |||||||||
| 160,600 | 5,203,440 | ||||||||||||
| 74,900 | 751,247 | Natural Resources – 17.0% | |||||||||||
LSI Industries | 158,250 | 2,688,667 | Energy Services - 7.2% | ||||||||||
Dawson Geophysicala | 75,700 | 2,329,289 | |||||||||||
| 12,352,507 | Enerflex Systems | 33,900 | 845,754 | ||||||||||
Gulf Island Fabrication | 166,700 | 3,340,668 | |||||||||||
Industrial Components - 0.6% | 380,600 | 3,596,670 | |||||||||||
Powell Industriesa | 118,700 | 2,840,491 | Pason Systems | 330,200 | 4,836,307 | ||||||||
RPC | 62,850 | 1,525,998 | |||||||||||
Machinery - 0.7% | TGC Industriesa | 222,075 | 2,385,086 | ||||||||||
| 78,600 | 1,101,972 | 259,600 | 5,378,912 | ||||||||||
Key Technologya | 153,200 | 1,922,660 | 183,750 | 5,565,788 | |||||||||
Tennant Company | 9,300 | 467,604 | Total Energy Services Trust | 287,700 | 4,133,932 | ||||||||
Western Lakota Energy Servicesa | 100,600 | 1,324,751 | |||||||||||
| 3,492,236 | |||||||||||||
| 35,263,155 | |||||||||||||
Metal Fabrication and Distribution - 4.4% | |||||||||||||
Harris Steel Group | 188,000 | 4,757,682 | Oil and Gas - 1.6% | ||||||||||
Metal Management | 125,600 | 3,845,872 | 81,500 | 1,628,370 | |||||||||
Novamerican Steela | 108,400 | 4,386,948 | 85,000 | 906,100 | |||||||||
Olympic Steelb | 143,600 | 5,082,004 | 212,200 | 746,944 | |||||||||
Steel Technologies | 174,200 | 3,386,448 | Pioneer Drilling Companya | 152,500 | 2,354,600 | ||||||||
Savanna Energy Servicesa | 101,700 | 2,083,561 | |||||||||||
| 21,458,954 | |||||||||||||
| 7,719,575 | |||||||||||||
Specialty Chemicals and Materials - 0.3% | |||||||||||||
Hawkins | 123,300 | 1,726,817 | Precious Metals and Mining - 8.2% | ||||||||||
African Platinuma | 900,000 | 549,213 | |||||||||||
Other Industrial Products - 1.3% | Alamos Golda | 379,200 | 3,057,243 | ||||||||||
| 79,900 | 1,510,909 | Eldorado Golda | 400,000 | 1,932,000 | |||||||||
Distributed Energy Systemsa | 292,600 | 1,512,742 | 298,100 | 929,309 | |||||||||
Electro Renta | 95,100 | 1,523,502 | Entree Golda | 688,700 | 661,152 | ||||||||
Peerless Manufacturinga | 53,300 | 1,276,535 | Etruscan Resourcesa | 659,000 | 1,977,649 | ||||||||
Quixote Corporation | 44,700 | 805,494 | 691,900 | 2,628,018 | |||||||||
Gammon Lake Resourcesa | 285,900 | 3,942,561 | |||||||||||
| 6,629,182 | 320,500 | 1,682,625 | |||||||||||
Kingsgate Consolidated | 786,175 | 3,002,822 | |||||||||||
Total (Cost $38,471,001) | 51,329,991 | Metallica Resourcesa | 1,018,500 | 3,147,165 | |||||||||
Mexgold Resourcesa | 300,100 | 1,932,920 | |||||||||||
Industrial Services – 8.1% | 338,000 | 1,250,600 | |||||||||||
Commercial Services - 3.0% | North Atlantic Resourcesa | 100,000 | 282,182 | ||||||||||
BB Holdingsa | 693,924 | 2,630,571 | Northern Orion Resourcesa | 976,800 | 4,747,248 | ||||||||
Bennett Environmentala | 124,100 | 354,926 | NovaGold Resourcesa | 368,400 | 4,722,888 | ||||||||
Collectors Universeb | 177,807 | 2,485,742 | Spur Venturesa | 892,570 | 759,600 | ||||||||
| 71,250 | 1,781,250 | 289,800 | 2,448,810 | ||||||||||
| 369,600 | 6,246,240 | 681,600 | 689,965 | ||||||||||
PDIa | 104,700 | 1,506,633 | |||||||||||
| 40,343,970 | |||||||||||||
| 15,005,362 | |||||||||||||
| Total (Cost $45,291,717) | 83,326,700 | ||||||||||||
Engineering and Construction - 0.8% | |||||||||||||
Cavco Industriesa | 48,581 | 2,158,940 | Technology – 18.5% | ||||||||||
| 62,000 | 1,711,200 | Aerospace and Defense - 1.8% | |||||||||||
| 148,600 | 2,239,402 | ||||||||||||
| 3,870,140 | Ducommun a | 122,900 | 2,276,108 | ||||||||||
Integral Systems | 96,200 | 2,581,046 | |||||||||||
Food and Tobacco Processors - 0.8% | 504,490 | 1,780,850 | |||||||||||
| 283,000 | 1,635,740 | ||||||||||||
Zapata Corporationa | 305,600 | 2,123,920 | 8,877,406 | ||||||||||
| 3,759,660 | |||||||||||||
Printing - 1.1% | |||||||||||||
CSS Industries | 43,000 | 1,236,250 | |||||||||||
Courier Corporation | 63,618 | 2,545,992 | |||||||||||
Ennis | 81,500 | 1,603,920 | |||||||||||
| 5,386,162 | |||||||||||||
| 12 | ROYCE CAPITAL FUND 2006 SEMIANNUAL REPORT TO SHAREHOLDERS | THE ACCOMPANYING NOTES ARE AN INTEGRAL PART OF THESE FINANCIAL STATEMENTS. |
| JUNE 30, 2006 (Unaudited) |
| SHARES | VALUE | SHARES | VALUE | ||||||||||
Technology (continued) | 126,900 | $ | 1,383,210 | ||||||||||
Components and Systems - 3.7% | 55,800 | 1,027,836 | |||||||||||
| 209,400 | $ | 2,623,782 | Globecomm Systemsa | 232,700 | 1,733,615 | ||||||||
Excel Technologya | 85,400 | 2,555,168 | 204,800 | 1,122,304 | |||||||||
| 84,500 | 1,268,345 | 138,900 | 1,619,574 | ||||||||||
OSI Systemsa | 72,300 | 1,284,771 | 317,360 | 3,294,197 | |||||||||
Perceptrona | 147,600 | 1,189,656 | PC-Tela | 125,000 | 1,067,500 | ||||||||
| 167,400 | 1,155,060 | ||||||||||||
Richardson Electronics | 231,500 | 1,701,525 | 15,801,880 | ||||||||||
| 114,700 | 2,342,174 | ||||||||||||
SimpleTecha | 320,600 | 1,202,250 | Total (Cost $81,447,226) | 90,869,176 | |||||||||
TTM Technologiesa | 205,100 | 2,967,797 | |||||||||||
Miscellaneous(c) – 4.2% | |||||||||||||
| 18,290,528 | Total (Cost $19,382,769) | 20,837,259 | |||||||||||
Distribution - 0.2% | TOTAL COMMON STOCKS | ||||||||||||
Jaco Electronicsa | 180,100 | 673,574 | (Cost $329,009,961) | 418,863,227 | |||||||||
Internet Software and Services - 1.5% | REPURCHASE AGREEMENTS – 14.9% | ||||||||||||
| 136,500 | 1,299,480 | State Street Bank & Trust Company, | |||||||||||
CryptoLogic | 83,900 | 2,032,058 | 5.10% dated 6/30/06, due 7/3/06, | ||||||||||
| 292,000 | 1,372,400 | maturity value $33,109,065 (collateralized | |||||||||||
Inforte Corporationa | 315,600 | 1,495,944 | by obligations of various U.S. Government | ||||||||||
| 330,100 | 1,300,594 | Agencies, valued at $33,924,975) | |||||||||||
(Cost $33,095,000) | 33,095,000 | ||||||||||||
| 7,500,476 | |||||||||||||
Lehman Brothers (Tri-Party), | |||||||||||||
IT Services - 1.5% | 4.85% dated 6/30/06, due 7/3/06, | ||||||||||||
| 247,700 | 998,231 | maturity value $40,016,167 (collateralized | |||||||||||
| 332,450 | 3,115,056 | by obligations of various U.S. Government | |||||||||||
| 471,600 | 1,608,156 | Agencies, valued at $40,817,178) | |||||||||||
Forrester Researcha | 62,400 | 1,745,952 | (Cost $40,000,000) | 40,000,000 | |||||||||
| 7,467,395 | TOTAL REPURCHASE AGREEMENTS | ||||||||||||
(Cost $73,095,000) | 73,095,000 | ||||||||||||
Semiconductors and Equipment - 3.2% | |||||||||||||
| 160,100 | 2,119,724 | PRINCIPAL | |||||||||||
| 138,100 | 1,582,626 | AMOUNT | |||||||||||
CEVAa | 335,300 | 1,938,034 | COLLATERAL RECEIVED FOR SECURITIES | ||||||||||
| 223,700 | 1,232,587 | LOANED – 11.1% | |||||||||||
| 165,600 | 1,005,192 | U.S. Treasury Bonds | |||||||||||
| 116,200 | 1,442,042 | 8.125% due 8/15/19 | $74,627 | 96,109 | |||||||||
QuickLogic Corporationa | 170,800 | 835,212 | Money Market Funds | ||||||||||
| 222,000 | 2,002,440 | State Street Navigator Securities Lending | |||||||||||
| 441,200 | 2,144,232 | Prime Portfolio (7 day yield-5.0651%) | 54,390,767 | ||||||||||
White Electronic Designsa | 264,000 | 1,341,120 | |||||||||||
TOTAL COLLATERAL RECEIVED FOR SECURITIES | |||||||||||||
| 15,643,209 | LOANED | ||||||||||||
(Cost $54,486,876) | 54,486,876 | ||||||||||||
Software - 3.4% | |||||||||||||
| 240,000 | 883,200 | TOTAL INVESTMENTS – 111.2% | |||||||||||
| 125,000 | 1,226,250 | (Cost $456,591,837) | 546,445,103 | ||||||||||
| 151,500 | 1,480,155 | ||||||||||||
| 430,500 | 2,410,800 | LIABILITIES LESS CASH | |||||||||||
Moldflow Corporationa | 90,500 | 1,059,755 | AND OTHER ASSETS – (11.2)% | (54,827,295 | ) | ||||||||
| 188,700 | 1,683,204 | ||||||||||||
| 65,100 | 899,682 | NET ASSETS – 100.0% | $ | 491,617,808 | |||||||||
| 164,055 | 659,501 | ||||||||||||
| 424,658 | 2,641,373 | ||||||||||||
| 58,200 | 2,426,358 | ||||||||||||
| 125,700 | 1,244,430 | ||||||||||||
| 16,614,708 | |||||||||||||
Telecommunications - 3.2% | |||||||||||||
| 107,900 | 2,210,871 | ||||||||||||
Atlantic Tele-Network | 88,250 | 1,838,248 | |||||||||||
| 108,500 | 504,525 | ||||||||||||
| THE ACCOMPANYING NOTES ARE AN INTEGRAL PART OF THESE FINANCIAL STATEMENTS. | ROYCE CAPITAL FUND 2006 SEMIANNUAL REPORT TO SHAREHOLDERS | 13 |
SCHEDULES OF INVESTMENTS
Royce Capital Fund – Small-Cap Portfolio |
| SHARES | VALUE | SHARES | VALUE | |||||||||||
| COMMON STOCKS – 91.7% | Financial Services – 2.0% | |||||||||||||
| Information and Processing - 1.3% | ||||||||||||||
| Consumer Products – 15.3% | eFunds Corporationa | 148,700 | $ | 3,278,835 | ||||||||||
Apparel and Shoes - 7.3% | ||||||||||||||
Kenneth Cole Productions Cl. A | 132,200 | $ | 2,952,026 | Investment Management - 0.7% | ||||||||||
Columbia Sportswear Companya | 51,000 | 2,308,260 | Cohen & Steers | 71,800 | 1,694,480 | |||||||||
Cutter & Buck | 238,349 | 2,733,863 | ||||||||||||
K-Swiss Cl. A | 121,100 | 3,233,370 | Total (Cost $3,311,023) | 4,973,315 | ||||||||||
Polo Ralph Lauren Cl. A | 16,500 | 905,850 | ||||||||||||
Stride Rite | 247,800 | 3,268,482 | Health – 5.2% | |||||||||||
Timberland Company Cl. Aa | 89,000 | 2,322,900 | Health Services - 1.9% | |||||||||||
Horizon Healtha | 115,200 | 2,405,376 | ||||||||||||
| 17,724,751 | U.S. Physical Therapya | 152,200 | 2,228,208 | |||||||||||
| Home Furnishing and Appliances - 4.0% | 4,633,584 | |||||||||||||
American Woodmark | 28,600 | 1,002,144 | ||||||||||||
Ethan Allen Interiors | 94,100 | 3,439,355 | Personal Care - 3.3% | |||||||||||
Hooker Furniture | 157,500 | 2,641,275 | CNS | 125,700 | 3,079,650 | |||||||||
Stanley Furniture Company | 113,900 | 2,730,183 | Inter Parfums | 143,300 | 2,467,626 | |||||||||
Nutraceutical Internationala | 169,104 | 2,592,364 | ||||||||||||
| 9,812,957 | ||||||||||||||
| 8,139,640 | ||||||||||||||
| Sports and Recreation - 1.0% | ||||||||||||||
Winnebago Industries | 78,600 | 2,439,744 | Total (Cost $11,843,392) | 12,773,224 | ||||||||||
| Other Consumer Products - 3.0% | Industrial Products – 9.2% | |||||||||||||
RC2 Corporationa | 122,420 | 4,732,757 | Automotive - 0.7% | |||||||||||
Radica Games | 267,300 | 2,729,133 | Strattec Securitya | 31,500 | 1,569,015 | |||||||||
| 7,461,890 | Building Systems and Components - 2.6% | |||||||||||||
Drew Industriesa | 104,600 | 3,389,040 | ||||||||||||
| Total (Cost $36,149,612) | 37,439,342 | Simpson Manufacturing | 81,700 | 2,945,285 | ||||||||||
| Consumer Services – 12.4% | 6,334,325 | |||||||||||||
| Direct Marketing - 1.3% | ||||||||||||||
Nu Skin Enterprises Cl. A | 220,300 | 3,271,455 | Construction Materials - 0.4% | |||||||||||
Florida Rock Industries | 21,600 | 1,072,872 | ||||||||||||
| Leisure and Entertainment - 1.0% | ||||||||||||||
†International Speedway Cl. A | 53,000 | 2,457,610 | Machinery - 4.5% | |||||||||||
Graco | 28,500 | 1,310,430 | ||||||||||||
| Restaurants and Lodgings - 3.3% | Lincoln Electric Holdings | 50,500 | 3,163,825 | |||||||||||
Applebee’s International | 204,200 | 3,924,724 | Rofin-Sinar Technologiesa | 69,100 | 3,971,177 | |||||||||
CEC Entertainmenta | 76,000 | 2,441,120 | Woodward Governor Company | 83,200 | 2,538,432 | |||||||||
Ruby Tuesday | 63,700 | 1,554,917 | ||||||||||||
| 10,983,864 | ||||||||||||||
| 7,920,761 | ||||||||||||||
| Metal Fabrication and Distribution - 1.0% | ||||||||||||||
| Retail Stores - 6.8% | Metal Management | 81,900 | 2,507,778 | |||||||||||
BJ’s Wholesale Cluba | 93,800 | 2,659,230 | ||||||||||||
Buckle (The) | 65,200 | 2,729,924 | Total (Cost $15,308,138) | 22,467,854 | ||||||||||
Cato Corporation Cl. A | 111,000 | 2,869,350 | ||||||||||||
Claire’s Stores | 80,400 | 2,051,004 | Industrial Services – 7.1% | |||||||||||
†Finish Line (The) Cl. A | 218,900 | 2,589,587 | Commercial Services - 5.8% | |||||||||||
| 142,500 | 2,555,025 | FTI Consultinga | 96,200 | 2,575,274 | ||||||||||
Pier 1 Imports | 169,400 | 1,182,412 | 84,500 | 2,859,480 | ||||||||||
Korn/Ferry Internationala | 140,100 | 2,744,559 | ||||||||||||
| 16,636,532 | LECG Corporationa | 214,000 | 3,952,580 | |||||||||||
SM&Aa | 332,700 | 2,029,470 | ||||||||||||
| Total (Cost $33,335,720) | 30,286,358 | |||||||||||||
| 14,161,363 | ||||||||||||||
| Financial Intermediaries – 4.4% | ||||||||||||||
| Insurance - 3.5% | Transportation and Logistics - 1.3% | |||||||||||||
AmerUs Group | 80,600 | 4,719,130 | †Arkansas Best | 60,500 | 3,037,705 | |||||||||
Assured Guaranty | 121,200 | 3,074,844 | ||||||||||||
ProAssurance Corporationa | 14,100 | 679,338 | Total (Cost $16,834,600) | 17,199,068 | ||||||||||
| 8,473,312 | Natural Resources – 11.6% | |||||||||||||
Energy Services - 3.0% | ||||||||||||||
| Securities Brokers - 0.9% | Ensign Energy Services | 101,200 | 2,079,663 | |||||||||||
| 147,400 | 2,244,902 | Patterson-UTI Energy | 35,400 | 1,002,174 | ||||||||||
TETRA Technologiesa | 142,500 | 4,316,325 | ||||||||||||
| Total (Cost $9,547,294) | 10,718,214 | |||||||||||||
| 7,398,162 | ||||||||||||||
14 | ROYCE CAPITAL FUND 2006 SEMIANNUAL REPORT TO SHAREHOLDERS | THE ACCOMPANYING NOTES ARE AN INTEGRAL PART OF THESE FINANCIAL STATEMENTS. |
JUNE 30, 2006 (Unaudited)
| SHARES | VALUE | SHARES | VALUE | ||||||||||||
| Natural Resources (continued) | Software - 2.9% | ||||||||||||||
| Oil and Gas – 5.6% | InterVideo a | 167,916 | $ | 1,640,540 | |||||||||||
Cimarex Energy | 58,518 | $ | 2,516,274 | iPass a | 428,972 | 2,402,243 | |||||||||
| 154,000 | 2,828,980 | ManTech International Cl. Aa | 83,500 | 2,576,810 | |||||||||||
St. Mary Land & Exploration Company | 91,400 | 3,678,850 | Pervasive Softwarea | 126,066 | 506,785 | ||||||||||
Unit Corporationa | 81,100 | 4,613,779 | |||||||||||||
| 7,126,378 | |||||||||||||||
| 13,637,883 | |||||||||||||||
| Telecommunications - 5.7% | |||||||||||||||
| Precious Metals and Mining - 3.0% | Catapult Communicationsa | 188,000 | 2,049,200 | ||||||||||||
Agnico-Eagle Mines | 105,000 | 3,473,400 | Foundry Networksa | 234,900 | 2,504,034 | ||||||||||
Glamis Golda | 47,100 | 1,783,206 | Intervoice a | 277,000 | 1,972,240 | ||||||||||
Pan American Silvera | 118,200 | 2,126,418 | NETGEARa | 225,400 | 4,879,910 | ||||||||||
Premiere Global Servicesa | 327,800 | 2,474,890 | |||||||||||||
| 7,383,024 | |||||||||||||||
| 13,880,274 | |||||||||||||||
| Total (Cost $16,231,510) | 28,419,069 | ||||||||||||||
| Total (Cost $50,831,922) | 47,876,389 | ||||||||||||||
| Technology – 19.6% | |||||||||||||||
| Components and Systems - 2.6% | Miscellaneous(c) – 4.9% | ||||||||||||||
Digi Internationala | 217,800 | 2,729,034 | Total (Cost $12,187,288) | 11,871,980 | |||||||||||
Neoware a | 14,200 | 174,518 | |||||||||||||
Rimage Corporationa | 83,697 | 1,709,093 | TOTAL COMMON STOCKS | ||||||||||||
Tektronix | 59,600 | 1,753,432 | (Cost $205,580,499) | 224,024,813 | |||||||||||
| 6,366,077 | REPURCHASE AGREEMENT – 8.6% | ||||||||||||||
| State Street Bank & Trust Company, | |||||||||||||||
| Distribution - 1.0% | 5.10% dated 6/30/06, due 7/3/06, | ||||||||||||||
| 130,500 | 2,486,025 | maturity value $21,058,946 (collateralized | |||||||||||||
by obligations of various U.S. Government | |||||||||||||||
| Internet Software and Services - 0.2% | Agencies, valued at $21,578,156) | ||||||||||||||
Corillian Corporationa | 149,800 | 447,902 | (Cost $21,050,000) | 21,050,000 | |||||||||||
| IT Services - 3.4% | |||||||||||||||
MAXIMUS | 155,200 | 3,592,880 | TOTAL INVESTMENTS – 100.3% | ||||||||||||
Perot Systems Cl. Aa | 329,200 | 4,766,816 | (Cost $226,630,499) | 245,074,813 | |||||||||||
| 8,359,696 | LIABILITIES LESS CASH | ||||||||||||||
AND OTHER ASSETS – (0.3)% | (741,251 | ) | |||||||||||||
| Semiconductors and Equipment - 3.8% | |||||||||||||||
Entegris a | 248,600 | 2,369,158 | NET ASSETS – 100.0% | $ | 244,333,562 | ||||||||||
Fairchild Semiconductor Internationala | 84,100 | 1,528,097 | |||||||||||||
IXYS Corporationa | 82,100 | 788,160 | |||||||||||||
MIPS Technologiesa | 210,400 | 1,277,128 | |||||||||||||
Semitool a | 281,250 | 2,536,875 | |||||||||||||
Sigmatel a | 172,900 | 710,619 | |||||||||||||
| 9,210,037 | |||||||||||||||
| THE ACCOMPANYING NOTES ARE AN INTEGRAL PART OF THESE FINANCIAL STATEMENTS. | ROYCE CAPITAL FUND 2006 SEMIANNUAL REPORT TO SHAREHOLDERS | 15 |
| STATEMENTS OF ASSETS AND LIABILITIES | JUNE 30, 2006 (Unaudited) | |||||||||||
| Micro-Cap | Small-Cap | |||||||
| Portfolio | Portfolio | |||||||
| ASSETS: | ||||||||
| Investments at value (including collateral on loaned securities)* | $ | 473,350,103 | $ | 224,024,813 | ||||
| Repurchase agreements (at cost and value) | 73,095,000 | 21,050,000 | ||||||
| Cash | 71,489 | 4,060 | ||||||
| Receivable for investments sold | 582,245 | 93,673 | ||||||
| Receivable for capital shares sold | 823,975 | 1,371,725 | ||||||
| Receivable for dividends and interest | 115,237 | 49,595 | ||||||
| Prepaid expenses and other assets | 2,903 | 1,225 | ||||||
Total Assets | 548,040,952 | 246,595,091 | ||||||
| LIABILITIES: | ||||||||
| Payable for collateral on loaned securities | 54,486,876 | – | ||||||
| Payable for investments purchased | 1,086,804 | 1,187,978 | ||||||
| Payable for capital shares redeemed | 265,086 | 825,950 | ||||||
| Payable for investment advisory fees | 489,954 | 193,977 | ||||||
| Accrued expenses | 94,424 | 53,624 | ||||||
Total Liabilities | 56,423,144 | 2,261,529 | ||||||
Net Assets | $ | 491,617,808 | $ | 244,333,562 | ||||
| ANALYSIS OF NET ASSETS: | ||||||||
| Paid-in capital | $ | 347,062,618 | $ | 201,706,089 | ||||
| Undistributed net investment income (loss) | (5,601,234 | ) | 89,014 | |||||
| Accumulated net realized gain (loss) on investments | 60,303,158 | 24,094,145 | ||||||
| Net unrealized appreciation (depreciation) on investments | 89,853,266 | 18,444,314 | ||||||
Net Assets | $ | 491,617,808 | $ | 244,333,562 | ||||
| Investment Class | $ | 491,523,879 | $ | 244,240,312 | ||||
| Service Class | $ | 93,929 | $ | 93,250 | ||||
| SHARES OUTSTANDING: | ||||||||
| (unlimited number of $.001 par value shares authorized for each Fund) | ||||||||
| Investment Class | 35,113,264 | 24,140,336 | ||||||
| Service Class | 6,711 | 9,217 | ||||||
| NET ASSET VALUES: | ||||||||
| (Net Assets ÷ Shares Outstanding) (offering and redemption price per share) | ||||||||
| Investment Class | $14.00 | $10.12 | ||||||
| Service Class | $14.00 | $10.12 | ||||||
| *Investments at identified cost | $ | 383,496,837 | $ | 205,580,499 | ||||
| Market value of loaned securities | $ | 54,093,418 | $ | – | ||||
16 | ROYCE CAPITAL FUND 2006 SEMIANNUAL REPORT TO SHAREHOLDERS | THE ACCOMPANYING NOTES ARE AN INTEGRAL PART OF THESE FINANCIAL STATEMENTS. |
| STATEMENTS OF CHANGES IN NET ASSETS | ||||||||||||
| Micro-Cap Portfolio | Small-Cap Portfolio | |||||||||||||||||||||||
| Six months ended | Six months ended | |||||||||||||||||||||||
| 6/30/06 | Year ended | 6/30/06 | Year ended | |||||||||||||||||||||
| (unaudited) | 12/31/05 | (unaudited) | 12/31/05 | |||||||||||||||||||||
| INVESTMENT OPERATIONS: | ||||||||||||||||||||||||
| Net investment income (loss) | $ | (519,979 | ) | $ | (1,775,813 | ) | $ | (71,237 | ) | $ | 160,086 | |||||||||||||
| Net realized gain (loss) on investments | 31,608,564 | 28,956,930 | 12,140,669 | 11,965,241 | ||||||||||||||||||||
| Net change in unrealized appreciation | ||||||||||||||||||||||||
(depreciation) on investments | 12,097,040 | 12,203,221 | (4,623,466 | ) | 726,771 | |||||||||||||||||||
| Net increase (decrease) in net assets | ||||||||||||||||||||||||
from investment operations | 43,185,625 | 39,384,338 | 7,445,966 | 12,852,098 | ||||||||||||||||||||
| DISTRIBUTIONS: | ||||||||||||||||||||||||
| Net investment income | ||||||||||||||||||||||||
Investment Class | – | (1,950,328 | ) | – | – | |||||||||||||||||||
Service Class | – | – | ||||||||||||||||||||||
| Net realized gain on investments | ||||||||||||||||||||||||
Investment Class | – | (5,892,672 | ) | – | (1,915,818 | ) | ||||||||||||||||||
Service Class | – | – | ||||||||||||||||||||||
| Total distributions | – | (7,843,000 | ) | – | (1,915,818 | ) | ||||||||||||||||||
| CAPITAL SHARE TRANSACTIONS: | ||||||||||||||||||||||||
| Value of shares sold | ||||||||||||||||||||||||
Investment Class | 97,929,664 | 66,452,688 | 59,960,641 | 76,001,944 | ||||||||||||||||||||
Service Class | 100,000 | 100,000 | ||||||||||||||||||||||
| Distributions reinvested | ||||||||||||||||||||||||
Investment Class | – | 7,842,998 | – | 1,915,817 | ||||||||||||||||||||
Service Class | – | – | ||||||||||||||||||||||
| Value of shares redeemed | ||||||||||||||||||||||||
Investment Class | (33,666,914 | ) | (67,266,801 | ) | (10,211,597 | ) | (12,726,716 | ) | ||||||||||||||||
Service Class | – | – | ||||||||||||||||||||||
| Net increase (decrease) in net assets | ||||||||||||||||||||||||
from capital share transactions | 64,362,750 | 7,028,885 | 49,849,044 | 65,191,045 | ||||||||||||||||||||
| NET INCREASE (DECREASE) IN NET ASSETS | 107,548,375 | 38,570,223 | 57,295,010 | 76,127,325 | ||||||||||||||||||||
| NET ASSETS: | ||||||||||||||||||||||||
Beginning of period | 384,069,433 | 345,499,210 | 187,038,552 | 110,911,227 | ||||||||||||||||||||
End of period | $ | 491,617,808 | $ | 384,069,433 | $ | 244,333,562 | $ | 187,038,552 | ||||||||||||||||
| UNDISTRIBUTED NET INVESTMENT | ||||||||||||||||||||||||
INCOME (LOSS) AT END OF PERIOD | $ | (5,601,234 | ) | $ | (5,081,255 | ) | $ | 89,014 | $ | 160,251 | ||||||||||||||
| THE ACCOMPANYING NOTES ARE AN INTEGRAL PART OF THESE FINANCIAL STATEMENTS. | ROYCE CAPITAL FUND 2006 SEMIANNUAL REPORT TO SHAREHOLDERS | 17 |
| STATEMENTS OF OPERATIONS | SIX MONTHS ENDED JUNE 30, 2006 (Unaudited) | |||||||||||
| Micro-Cap | Small-Cap | |||||||
| Portfolio | Portfolio | |||||||
| INVESTMENT INCOME: | ||||||||
| Income: | ||||||||
Dividends | $ | 661,406 | $ | 649,170 | ||||
Interest | 1,683,658 | 486,293 | ||||||
Securities lending | 117,466 | – | ||||||
| Total income | 2,462,530 | 1,135,463 | ||||||
| Expenses: | ||||||||
Investment advisory fees | 2,831,736 | 1,114,438 | ||||||
Distribution fees | 37 | 37 | ||||||
Custody | 57,233 | 36,844 | ||||||
Shareholder reports | 38,219 | 19,073 | ||||||
Administrative and office facilities | 16,366 | 7,775 | ||||||
Audit | 12,500 | 12,500 | ||||||
Shareholder servicing | 11,983 | 10,064 | ||||||
Trustees’ fees | 11,132 | 5,541 | ||||||
Registration | 6,620 | 5,585 | ||||||
Legal | 2,401 | 1,144 | ||||||
Other expenses | 12,269 | 7,390 | ||||||
| Total expenses | 3,000,496 | 1,220,391 | ||||||
| Compensating balance credits | (14,449 | ) | (10,157 | ) | ||||
| Expenses reimbursed by investment adviser – Service Class | (3,538 | ) | (3,534 | ) | ||||
| Net expenses | 2,982,509 | 1,206,700 | ||||||
| Net investment income (loss) | (519,979 | ) | (71,237 | ) | ||||
| REALIZED AND UNREALIZED GAIN (LOSS) ON INVESTMENTS: | ||||||||
| Net realized gain (loss) on investments | 31,608,564 | 12,140,669 | ||||||
| Net change in unrealized appreciation (depreciation) on investments | 12,097,040 | (4,623,466 | ) | |||||
| Net realized and unrealized gain (loss) on investments | 43,705,604 | 7,517,203 | ||||||
| NET INCREASE (DECREASE) IN NET ASSETS | ||||||||
FROM INVESTMENT OPERATIONS | $ | 43,185,625 | $ | 7,445,966 | ||||
| 18 | ROYCE CAPITAL FUND 2006 SEMIANNUAL REPORT TO SHAREHOLDERS | THE ACCOMPANYING NOTES ARE AN INTEGRAL PART OF THESE FINANCIAL STATEMENTS. |
| FINANCIAL HIGHLIGHTS | |||||||||||||||||||||||||||||||||||||||||||||||||||||||||
This table is presented to show selected data for a share outstanding throughout each period, and to assist shareholders in evaluating a Fund’s performance for the periods presented. | |||||||||||||||||||||||||||||||||||||||||||||||||||||||||
| Ratio of Expenses | |||||||||||||||||||||||||||||||||||||||||||||||||||||||||
| Net | Net | Net Realized | Distributions | Distributions | to Average Net Assets | Ratio of Net Investment | |||||||||||||||||||||||||||||||||||||||||||||||||||
| Asset Value, | Investment | and Unrealized | Total from | from Net | from Net | Net Asset | Net Assets, | Prior to Fee | Prior | Net of | Income (Loss) | Portfolio | |||||||||||||||||||||||||||||||||||||||||||||
| Beginning | Income | Gain (Loss) on | Investment | Investment | Realized Gain | Total | Value, End | Total | End of Period | Waivers and | to Fee | Fee | to Average | Turnover | |||||||||||||||||||||||||||||||||||||||||||
| of Period | (Loss) | Investments | Operations | Income | on Investments | Distributions | of Period | Return | (in thousands) | Balance Credits | Waivers | Waivers | Net Assets | Rate | |||||||||||||||||||||||||||||||||||||||||||
| MICRO-CAP PORTFOLIO – INVESTMENT CLASS | |||||||||||||||||||||||||||||||||||||||||||||||||||||||||
| †2006(b) | $ | 12.57 | $ | (0.02 | ) | $ | 1.45 | $ | 1.43 | $ | – | $ | – | $ | – | $ | 14.00 | 11.38 | %** | $ | 491,524 | 1.32 | %* | 1.32 | %* | 1.32 | % | (0.23 | )%* | 20 | % | ||||||||||||||||||||||||||
| 2005(b) | 11.50 | (0.05 | ) | 1.38 | 1.33 | (0.06 | ) | (0.20 | ) | (0.26 | ) | 12.57 | 11.61 | % | 384,069 | 1.33 | % | 1.33 | % | 1.33 | % | (0.51 | )% | 38 | % | ||||||||||||||||||||||||||||||||
| 2004(b) | 10.90 | (0.09 | ) | 1.58 | 1.49 | – | (0.89 | ) | (0.89 | ) | 11.50 | 13.85 | % | 345,499 | 1.34 | % | 1.34 | % | 1.34 | % | (0.78 | )% | 38 | % | |||||||||||||||||||||||||||||||||
| 2003(b) | 7.60 | (0.08 | ) | 3.80 | 3.72 | – | (0.42 | ) | (0.42 | ) | 10.90 | 49.16 | % | 249,652 | 1.36 | % | 1.36 | % | 1.35 | % | (0.84 | )% | 41 | % | |||||||||||||||||||||||||||||||||
| 2002(b) | 9.00 | (0.08 | ) | (1.08 | ) | (1.16 | ) | – | (0.24 | ) | (0.24 | ) | 7.60 | (12.87 | )% | 133,944 | 1.38 | % | 1.38 | % | 1.35 | % | (0.88 | )% | 27 | % | |||||||||||||||||||||||||||||||
| 2001 | 7.05 | (0.03 | ) | 2.12 | 2.09 | – | (0.14 | ) | (0.14 | ) | 9.00 | (29.71 | % | 106,501 | 1.58 | % | 1.58 | % | 1.35 | % | (0.61 | )% | 18 | % | |||||||||||||||||||||||||||||||||
| MICRO-CAP PORTFOLIO – SERVICE CLASS (a) | |||||||||||||||||||||||||||||||||||||||||||||||||||||||||
| †2006(b) | $ | 14.90 | $ | (0.01 | ) | $ | (0.89 | ) | $ | (0.90 | ) | $ | – | $ | – | $ | – | $ | 14.00 | (6.04 | )%** | $ | 94 | 25.23 | %* | 25.22 | %* | 1.58 | %* | (0.24 | )%* | 20 | % | ||||||||||||||||||||||||
| SMALL-CAP PORTFOLIO – INVESTMENT CLASS | |||||||||||||||||||||||||||||||||||||||||||||||||||||||||
| †2006(b) | $ | 9.67 | $ | (0.00 | ) | $ | 0.45 | $ | 0.45 | $ | – | $ | – | $ | – | $ | 10.12 | 4.65 | %** | $ | 244,240 | 1.09 | %* | 1.08 | %* | 1.08 | %* | (0.06 | )%* | 24 | % | ||||||||||||||||||||||||||
| 2005(b) | 9.00 | 0.01 | 0.76 | 0.77 | – | (0.10 | ) | (0.10 | ) | 9.67 | 8.56 | % | 187,039 | 1.11 | % | 1.11 | % | 1.11 | % | 0.11 | % | 45 | % | ||||||||||||||||||||||||||||||||||
| 2004(b) | 7.59 | (0.05 | ) | 1.93 | 1.88 | – | (0.47 | ) | (0.47 | ) | 9.00 | 24.95 | % | 110,911 | 1.14 | % | 1.14 | % | 1.14 | % | (0.62 | )% | 47 | % | |||||||||||||||||||||||||||||||||
| 2003(b) | 5.71 | (0.04 | ) | 2.38 | 2.34 | – | (0.46 | ) | (0.46 | ) | 7.59 | 41.10 | % | 57,391 | 1.21 | % | 1.21 | % | 1.21 | % | (0.55 | )% | 70 | % | |||||||||||||||||||||||||||||||||
| 2002(b) | 6.66 | (0.05 | ) | (0.87 | ) | (0.92 | ) | – | (0.03 | ) | (0.03 | ) | 5.71 | (13.81 | )% | 18,190 | 1.87 | % | 1.87 | % | 1.35 | % | (0.80 | )% | 53 | % | |||||||||||||||||||||||||||||||
| 2001(b) | 6.40 | (0.04 | ) | 1.34 | 1.30 | – | (1.04 | ) | (1.04 | ) | 6.66 | 20.97 | % | 3,324 | 2.20 | % | 2.20 | % | 1.35 | % | (0.74 | )% | 188 | % | |||||||||||||||||||||||||||||||||
| SMALL-CAP PORTFOLIO – SERVICE CLASS (a) | |||||||||||||||||||||||||||||||||||||||||||||||||||||||||
| †2006(b) | $ | 10.85 | $ | (0.00 | ) | $ | (0.73 | ) | $ | (0.73 | ) | $ | – | $ | – | $ | – | $ | 10.12 | (6.73 | )%** | $ | 93 | 24.90 | %* | 24.90 | %* | 1.36 | %* | (0.21 | )%* | 24 | % | ||||||||||||||||||||||||
| (a) | The Class commenced operations on May 2, 2006. | |
| (b) | Per share amounts have been determined on the basis of the weighted average number of shares outstanding during the period. | |
| * | Annualized. | |
| ** | Not annualized. | |
| † | Six months ended June 30, 2006 (unaudited). |
| THE ACCOMPANYING NOTES ARE AN INTEGRAL PART OF THESE FINANCIAL STATEMENTS. | ROYCE CAPITAL FUND 2006 SEMIANNUAL REPORT TO SHAREHOLDERS | 19 |
| NOTES TO FINANCIAL STATEMENTS (Unaudited) | ||||||||||||
Summary of Significant Accounting Policies: Royce Micro-Cap Portfolio and Royce Small-Cap Portfolio (the “Fund” or “Funds”) are the two series of Royce Capital Fund (the “Trust”), a diversified open-end management investment company organized as a Delaware business trust. Shares of the Funds are offered to life insurance companies for allocation to certain separate accounts established for the purpose of funding qualified and non-qualified variable annuity contracts and variable life insurance contracts, and may also be offered directly to certain pension plans and retirement plans and accounts permitting accumulation of assets on a tax-deferred basis. Micro-Cap Portfolio and Small-Cap Portfolio commenced operations on December 27, 1996. Classes of shares have equal rights as to earnings and assets, except that each class may bear different fees and expenses for distribution, shareholder servicing, registration and shareholder reports, compensating balance credits and different expense reimbursements. Investment income, realized and unrealized capital gains or losses on investments, and expenses other than those attributable to a specific class are allocated to each class of shares based on its relative net assets. The preparation of financial statements in conformity with accounting principles generally accepted in the United States requires management to make estimates and assumptions that affect the reported amounts of assets and liabilities and the disclosure of contingent assets and liabilities at the date of the financial statements, and the reported amounts of income and expenses during the reporting period. Actual results could differ from those estimates. Valuation of Investments: Securities are valued as of the close of trading on the New York Stock Exchange (generally 4:00 p.m. Eastern time) on the valuation date. Securities that trade on an exchange or Nasdaq, and securities traded on Nasdaq's Electronic Bulletin Board, are valued at their last reported sales price or Nasdaq official closing price taken from the primary market in which each security trades or, if no sale is reported for such day, at their bid price. Other over-the-counter securities for which market quotations are readily available are valued at their bid price. Securities for which market quotations are not readily available are valued at their fair value under procedures established by the Board of Trustees. Bonds and other fixed income securities may be valued by reference to other securities with comparable ratings, interest rates and maturities, using established independent pricing services. Investments in money market funds are valued at net asset value per share. Investment Transactions and Related Investment Income: Investment transactions are accounted for on the trade date. Dividend income is recorded on the ex-dividend date and any non-cash dividend income is recorded at the fair market value of the securities received. Interest income is recorded on an accrual basis. Realized gains and losses from investment transactions are determined on the basis of identified cost for book and tax purposes. | Expenses: The Funds incur direct and indirect expenses. Expenses directly attributable to a Fund are charged to the Fund's operations, while expenses applicable to more than one series of the Trust are allocated equitably. Allocated personnel and occupancy costs related to the Royce Funds are included in administrative and office facilities expenses. The Fund has adopted a deferred fee agreement that allows the Trustees to defer the receipt of all or a portion of Trustees Fees otherwise payable. The deferred fees are invested in certain Royce Funds until distribution in accordance with the agreement. Compensating Balance Credits: The Fund has arrangements with its custodian bank and transfer agent, whereby a portion of the custodian's fee and transfer agent fee is paid indirectly by credits earned on the Fund's cash on deposit with the bank and transfer agent. These deposit arrangements are an alternative to purchasing overnight investments. Distributions and Taxes: As qualified regulated investment companies under Subchapter M of the Internal Revenue Code, the Funds are not subject to income taxes to the extent that each Fund distributes substantially all of its taxable income for its fiscal year. The Funds pay any dividends and capital gain distributions annually in December. Because federal income tax regulations differ from generally accepted accounting principles, income and capital gain distributions determined in accordance with tax regulations may differ from net investment income and realized gains recognized for financial reporting purposes. Accordingly, the character of distributions and composition of net assets for tax purposes differs from those reflected in the accompanying financial statements. Repurchase Agreements: The Funds may enter into repurchase agreements with institutions that the Funds' investment adviser has determined are creditworthy. Each Fund restricts repurchase agreements to maturities of no more than seven days. Securities pledged as collateral for repurchase agreements, which are held until maturity of the repurchase agreements, are marked-to-market daily and maintained at a value at least equal to the principal amount of the repurchase agreement (including accrued interest). Repurchase agreements could involve certain risks in the event of default or insolvency of the counter-party, including possible delays or restrictions upon the ability of each Fund to dispose of its underlying securities. Securities Lending: The Funds loan securities to qualified institutional investors for the purpose of realizing additional income. Collateral on all securities loaned for the Funds is accepted in cash and cash equivalents and invested temporarily by the custodian. The collateral is equal to at least 100% of the current market value of the loaned securities. The market value of the loaned securities is determined at the close of business of the Funds and any additional required collateral is delivered to the Funds on the next business day. |
20 | ROYCE CAPITAL FUND 2006 SEMIANNUAL REPORT TO SHAREHOLDERS |
| NOTES TO FINANCIAL STATEMENTS (Unaudited) (Continued) | ||||||||||||
Line of Credit:
The Funds, along with certain other Royce Funds, participate in a $75 million line of credit (“Credit Agreement”) to be used for temporary or emergency purposes. Pursuant to the Credit Agreement, each participating Fund is liable only for principal and interest payments related to borrowings made by that Fund. Borrowings under the Credit Agreement bear interest at a rate equal to the prevailing federal funds rate plus the federal funds rate margin. The Funds did not utilize the line of credit during the six months ended June 30, 2006.
Capital Share Transactions (In Shares):
| Shares issued for | Shares | Net increase (decrease) in | ||||||||||||||||||||||||||||||
| Shares sold | reinvestment of distributions | redeemed | shares outstanding | |||||||||||||||||||||||||||||
| Period ended | Period ended | Period ended | Period ended | |||||||||||||||||||||||||||||
| 6/30/06 | Period ended | 6/30/06 | Period ended | 6/30/06 | Period ended | 6/30/06 | Period ended | |||||||||||||||||||||||||
| (unaudited) | 12/31/05 | (unaudited) | 12/31/05 | (unaudited) | 12/31/05 | (unaudited) | 12/31/05 | |||||||||||||||||||||||||
| Micro-Cap Portfolio | ||||||||||||||||||||||||||||||||
| Investment Class | 6,981,628 | 5,712,620 | – | 627,942 | (2,419,201 | ) | (5,844,926 | ) | 4,562,427 | 495,636 | ||||||||||||||||||||||
| Service Class | 6,711 | – | – | 6,711 | ||||||||||||||||||||||||||||
| Small-Cap Portfolio | ||||||||||||||||||||||||||||||||
| Investment Class | 5,795,028 | 8,192,874 | – | 194,499 | (996,289 | ) | (1,376,051 | ) | 4,798,739 | 7,011,322 | ||||||||||||||||||||||
| Service Class | 9,217 | – | – | 9,217 | ||||||||||||||||||||||||||||
Investment Adviser and Distributor:
Under the Trust’s investment advisory agreements with Royce & Associates, LLC (“Royce”), Royce is entitled to receive management fees that are computed daily and payable monthly, at an annual rate of 1.25% and 1.0% of the average net assets of Micro-Cap Portfolio and Small-Cap Portfolio, respectively. For the six months ended June 30, 2006, Micro-Cap Portfolio recorded advisory fees of $2,831,736 and Small-Cap Portfolio recorded advisory fees of $1,114,438.
Royce Fund Services, Inc.(“RFS”), the distributor of the Trust’s shares, is a wholly owned subsidiary of Royce. RFS is entitled to receive distribution fees from each Fund’s Service Class that are computed daily and payable monthly, at an annual rate of 0.25% of the average net assets of each Fund. For the six months ended June 30, 2006, Micro-Cap Portfolio-Service Class recorded distribution fees of $37 and Small-Cap Portfolio-Service Class recorded distribution fees of $37.
Purchases and Sales of Investment Securities:
For the six months ended June 30, 2006, the cost of purchases and the proceeds from sales of investment securities, other than short-term securities and collateral received for securities loaned, were as follows:
| Purchases | Sales | ||||||
| Micro-Cap Portfolio | $ | 125,554,627 | $ | 79,251,755 | |||
| Small-Cap Portfolio | $ | 102,367,160 | $ | 49,581,104 | |||
| Class Specific Expenses: | |||||||
Class specific expenses were as follows: | |||||||
| Expenses | ||||||||||||||||||||||||||||
| Reimbursed by | ||||||||||||||||||||||||||||
| Distribution | Shareholder | Shareholder | Balance | Investment | ||||||||||||||||||||||||
| Fees | Servicing | Reports | Registration | Credits | Total | Adviser | ||||||||||||||||||||||
| Micro-Cap Portfolio - Investment Class | $ | – | $ | 8,663 | $ | 38,007 | $ | 6,609 | $ | (12,470 | ) | $ | 40,809 | $ | – | |||||||||||||
| Micro-Cap Portfolio - Service Class | 37 | 3,320 | 212 | 11 | (1 | ) | 3,579 | 3,538 | ||||||||||||||||||||
| 37 | 11,983 | 38,219 | 6,620 | (12,471 | ) | |||||||||||||||||||||||
| Small-Cap Portfolio - Investment Class | – | 6,743 | 18,865 | 5,574 | (9,060 | ) | 22,122 | – | ||||||||||||||||||||
| Small-Cap Portfolio - Service Class | 37 | 3,321 | 208 | 11 | (1 | ) | 3,576 | 3,534 | ||||||||||||||||||||
| 37 | 10,064 | 19,073 | 5,585 | (9,061 | ) | |||||||||||||||||||||||
Tax Information:
At June 30, 2006, net unrealized appreciation (depreciation) based on identified cost for tax purposes was as follows:
| Net Unrealized | Gross Unrealized | |||||||||||||||
| Appreciation | ||||||||||||||||
| Tax Basis Cost | (Depreciation) | Appreciation | Depreciation | |||||||||||||
| Micro-Cap Portfolio | $456,624,979 | $ | 89,820,124 | $ | 111,841,994 | $ | 22,021,870 | |||||||||
| Small-Cap Portfolio | 226,655,006 | 18,419,807 | 32,602,582 | 14,182,775 | ||||||||||||
The primary difference between book and tax basis cost is the timing of the recognition of losses on securities sold for book and tax purposes.
ROYCE CAPITAL FUND 2006 SEMIANNUAL REPORT TO SHAREHOLDERS | 21
| UNDERSTANDING YOUR FUND’ EXPENSES (Unaudited) | ||||||||||||
As a shareholder of a mutual fund, you pay ongoing expenses, including management fees and other Fund expenses including, for some funds, distribution and/or service (12b-1) fees. Using the information below, you can estimate how these ongoing expenses (in dollars) affect your investment and compare them with the ongoing expenses of other funds. You may also incur one-time transaction expenses, including redemption fees, which are not shown in this section and would result in higher total costs. The example is based on an investment of $1,000 invested at January 1, 2006 and held for the entire six-month period ended June 30, 2006. Service Class shares are generally available only through certain brokers or retirement plan administrators who receive distribution and/or service fees from the Fund for services that they perform. Actual Expenses The first part of the table below provides information about actual account values and actual expenses. You may use the information in this section, together with the amount you invested, to estimate the expenses that you paid over the period. Simply divide your account value at June 30, 2006 by $1,000 (for example, an $8,600 account value divided by $1,000 = 8.6), then multiply the result by the number | under the heading entitled “Expenses Paid During the Period” to estimate the expenses you paid on your account during this period. Hypothetical Example for Comparison Purposes The second part of the table below provides information about hypothetical account values and hypothetical expenses based on the Fund’s actual expense ratio and an assumed rate of return of 5% per year before expenses, which is not the Fund’s actual return. The hypothetical account values and expenses may not be used to estimate the actual ending account balance or expenses you paid for the period. You may use this information to compare the ongoing costs of investing in the Fund and other funds. To do so, compare this 5% hypothetical example with the 5% hypothetical examples that appear in the shareholder reports of the other funds. Please note that the expenses shown in the table are meant to highlight your ongoing costs only and do not reflect any transactional costs, such as sales charges (loads), redemption fees, or exchange fees. Therefore, this section is useful in comparing ongoing costs only, and will not help you determine the relative total costs of owning different funds. In addition, if these transactional costs were included, your costs would have been higher. |
| HYPOTHETICAL | |||||||||||||||||||||||||||||
| ACTUAL | (5% per year return before expenses) | ||||||||||||||||||||||||||||
| Beginning | Ending | Expenses Paid | Beginning | Ending | Expenses Paid | Annualized | |||||||||||||||||||||||
| Account Value | Account Value | During the | Account Value | Account Value | During the | Expense | |||||||||||||||||||||||
| 1/1/06 | 6/30/06 | Period (1) | 1/1/06 | 6/30/06 | Period (1) | Ratio (2) | |||||||||||||||||||||||
| Investment Class | |||||||||||||||||||||||||||||
| Micro-Cap Portfolio | $ | 1,000.00 | $ | 1,113.80 | $ | 6.92 | $ | 1,000.00 | $ | 1,018.25 | $ | 6.61 | 1.32 | % | |||||||||||||||
| Small-Cap Portfolio | 1,000.00 | 1,046.50 | 5.48 | 1,000.00 | 1,019.44 | 5.41 | 1.08 | % | |||||||||||||||||||||
| Service Class | |||||||||||||||||||||||||||||
| Micro-Cap Portfolio | 1,000.00 | 939.60 | 7.60 | 1,000.00 | 1,016.96 | 7.90 | 1.58 | % | |||||||||||||||||||||
| Small-Cap Portfolio | 1,000.00 | 932.70 | 6.52 | 1,000.00 | 1,018.05 | 6.80 | 1.36 | % | |||||||||||||||||||||
22 | ROYCE CAPITAL FUND 2006 SEMIANNUAL REPORT TO SHAREHOLDERS |
B O A R D AP P R O V A L OF IN V E S T M E N T AD V I S O R Y AG R E E M E N T S
At meetings held on June 7-8, 2006, Royce Capital Fund’s Board of Trustees, including all of the non-interested trustees, approved the continuance of the Investment Advisory Agreements between Royce & Associates, LLC (“R&A”) and each of Royce Micro-Cap Portfolio and Royce Small-Cap Portfolio (the “Funds”). In reaching these decisions, the Board reviewed the materials provided by R&A, which included, among other things, information prepared internally by R&A and independently by Morningstar Associates, LLC (“Morningstar”) containing detailed expense ratio and investment performance comparisons for each of the Funds with other mutual funds in their “peer group,” information regarding the past performance of Funds managed by R&A and a memorandum outlining the legal duties of the Board prepared by independent counsel to the non-interested trustees. R&A also provided the trustees with an analysis of its profitability with respect to providing investment advisory services to each of the Funds. In addition, the Board took into account information furnished throughout the year at regular Board meetings, including reports on investment performance, shareholder services, regulatory compliance, brokerage commissions and research, brokerage and execution products and services provided to the Funds. The Board also considered other matters it deemed important to the approval process such as payments made to R&A or its affiliates relating to allocation of Fund brokerage fees, and other direct and indirect benefits to R&A and its affiliates, from their relationship with the Funds. The trustees also met throughout the year with investment advisory personnel from R&A. The Board, in its deliberations, recognized that, for many of the Funds’ shareholders, the decision to purchase Fund shares included a decision to select R&A as the investment adviser and that there was a strong association in the minds of Fund shareholders between R&A and each Fund. In considering factors relating to the approval of the continuance of the Investment Advisory Agreements, the non-interested trustees received assistance and advice from, and met separately with, their independent counsel. While the Investment Advisory Agreements for the Funds were considered at the same Board meetings, the trustees dealt with each agreement separately. Among other factors, the trustees considered the following:
The nature, extent and quality of services provided by R&A: The trustees considered the following factors to be of fundamental importance to their consideration of whether to approve the continuance of the Funds’ Investment Advisory Agreements: (i) R&A’s more than 30 years of small-cap value investing experience and track record; (ii) R&A’s sole focus on mid-cap, small-cap and micro-cap value investing; (iii) the consistency of R&A’s approach to managing mutual funds over more than 30 years; (iv) the integrity and high ethical standards adhered to at R&A; (v) R&A’s specialized experience in the area of trading small- and micro-cap securities; (vi) R&A’s historical ability to attract and retain portfolio management talent and (vii) R&A’s focus on shareholder interests as exemplified by capping expenses on smaller funds, closing funds to new investors when R&A believed such closings were in the best interests of shareholders and expansive shareholder reporting and communications. The trustees reviewed the services that R&A provides to the Funds, including, but not limited to, managing each Fund’s investments in accordance with the stated policies of each Fund. The trustees determined that the services to be provided to each Fund by R&A would be the same as those it previously provided to the Funds. They also took into consideration the histories, reputations and backgrounds of R&A’s portfolio managers for the Funds, finding that these would likely have an impact on the continued success of the Funds. Lastly, the trustees noted R&A’s ability to attract quality and experienced personnel. The trustees concluded that the services provided by R&A to each Fund compared favorably to services provided by R&A to other R&A client accounts, including other funds, in both nature and quality, and that the scope of services provided by R&A would continue to be suitable for each Fund.
Investment performance of the Funds and R&A: In light of R&A’s risk-averse approach to investing, the trustees believe that risk-adjusted performance continues to be an appropriate measure of each Fund’s investment performance. One measure of risk-adjusted performance the trustees have historically used in their review of the Funds’ performance is the Sharpe Ratio. The Sharpe Ratio is a risk-adjusted measure of performance developed by Nobel Laureate William Sharpe. It is calculated by dividing a fund’s annualized excess returns by its annualized standard deviation to determine reward per unit of risk. The higher the Sharpe Ratio, the better a fund’s historical risk-adjusted performance. The Board attaches primary importance to risk-adjusted performance over relatively long periods of time, typically three to five years. The trustees noted that Royce Micro-Cap Portfolio’s Sharpe Ratio for the three- and five-year periods ended December 31, 2005 placed it in the 3rd quartile and 1st quartile, respectively, among its Morningstar micro-cap fund peer group, and Royce Small-Cap Portfolio placed in the 1st quartile for the three-year period and the 2nd quartile for the five-year period within Morningstar’s small blend category. The trustees noted that Royce Micro-Cap Portfolio’s 3-year Sharpe Ratio fell in the middle quintile within its small blend category (59th percentile). The Fund’s 2004 performance lagged on a relative basis as small caps strongly outpaced micro-caps.
The trustees noted that R&A manages a number of funds that invest in small-cap and micro-cap issuers, many of which were outperforming the Russell 2000 Index and their competitors. Although the trustees recognized that past performance is not necessarily an indicator of future results, they found that R&A had the necessary qualifications, experience and track record in managing small-cap and micro-cap securities to manage the Funds. The trustees determined that R&A continued to be an appropriate investment adviser for the Funds and concluded that each Fund’s performance supported the renewal of its Investment Advisory Agreement.
ROYCE CAPITAL FUND 2006 SEMIANNUAL REPORT TO SHAREHOLDERS | 23 |
B O A R D A P P R O V A L OF IN V E S T M E N T AD V I S O R Y AG R E E M E N T S (continued)
All Cost of the services provided and profits realized by R&A from its relationship with each Fund: The trustees considered the cost of the services provided by R&A and profits realized by R&A from its relationship with each Fund. As part of the analysis, the Board discussed with R&A its methodology in allocating its costs to each Fund and concluded that its allocations were reasonable. The trustees concluded that R&A’s profits were reasonable in relation to the nature and quality of services provided.
The extent to which economies of scale would be realized as the Funds grow and whether fee levels would reflect such economies of scale: The trustees considered whether there have been economies of scale in respect of the management of the Funds, whether the Funds have appropriately benefited from any economies of scale and whether there is potential for realization of any further economies of scale. The trustees noted the time and effort involved in managing portfolios of small- and micro-cap stocks and that they did not involve the same efficiencies as do portfolios of large cap stocks. The trustees concluded that the current fee structure for each Fund was reasonable, and that no changes were currently necessary.
Comparison of services to be rendered and fees to be paid to those under other investment advisory contracts, such as contracts of the same and other investment advisers or other clients: The trustees reviewed the investment advisory fee paid by each Fund and compared both the services to be rendered and the fees to be paid under the Investment Advisory Agreements to other contracts of R&A and to contracts of other investment advisers to registered investment companies investing in small- and micro-cap stocks, as provided by Morningstar. The trustees noted the importance of the net expense ratio in measuring a fund’s efficiency, particularly in light of the variations in the mutual fund industry as to who is responsible for which expenses. It was noted that Royce Micro-Cap Portfolio placed essentially at the median (52nd and 48th percentiles) among its peers within its category, respectively, and Royce Small-Cap Portfolio placed in the top quartile both among its peers and within its category.
The trustees noted that R&A had, from time to time, waived advisory fees in order to maintain expense ratios at competitive levels. The trustees also considered fees charged by R&A to institutional and other clients and noted that the Funds’ advisory fees compared favorably to these other accounts. After the non-interested trustees deliberated in executive session, the entire Board, including all the non-interested trustees, approved the renewal of the existing Investment Advisory Agreements, concluding that a contract renewal on the existing terms was in the best interest of the shareholders of each Fund and that each investment advisory fee rate was reasonable in relation to the services provided.
24 | ROYCE CAPITAL FUND 2006 SEMIANNUAL REPORT TO SHAREHOLDERS |
Item 2: Code(s) of Ethics – Not applicable to this semi-annual report.
Item 3: Audit Committee Financial Expert – Not applicable to this semi-annual report.
Item 4: Principal Accountant Fees and Services – Not applicable to this semi-annual report.
Item 5: Audit Committee of Listed Registrants – Not applicable.
Item 6: Schedule of Investments – See Item 1.
Item 7: Disclosure of Proxy Voting Policies and Procedures for Closed-End Management Investment Companies – Not applicable.
Item 8: Portfolio Managers of Closed-End Management Investment Companies – Not applicable.
Item 9: Purchases of Equity Securities by Closed-End Management Investment Company and Affiliated Purchasers – Not applicable.
Item 10: Submission of Matters to a Vote of Security Holders – None.
Item 11: Controls and Procedures.
(a) Disclosure Controls and Procedures. The Principal Executive and Financial Officers concluded that the Registrant’s Disclosure Controls and Procedures are effective based on their evaluation of the Disclosure Controls and Procedures as of a date within 90 days of the filing date of this report.
(b) Internal Control over Financial Reporting. There were no significant changes in Registrant’s internal control over financial reporting or in other factors that could significantly affect this control subsequent to the date of the evaluation, including any corrective actions with regard to significant deficiencies and material weaknesses during the second fiscal quarter of the period covered by this report.
Item 12: Exhibits attached hereto.
(a)(1) Not applicable.
(a)(2) Separate certifications by the Registrant’s Principal Executive Officer and Principal Financial Officer as required by Rule 30a-2(a) under the Investment Company Act of 1940.
(a)(3) Not Applicable
(b) Separate certifications by the Registrant’s Principal Executive Officer and Principal Financial Officer, pursuant to Section 906 of the Sarbanes-Oxley Act of 2002 and required by Rule 30a-2(b) under the Investment Company Act of 1940.
Pursuant to the requirements of the Securities Exchange Act of 1934 and the Investment Company Act of 1940, the registrant has duly caused this report to be signed on its behalf by the undersigned, thereunto duly authorized.
| ROYCE CAPITAL FUND | |
| BY: | /s/ Charles M. Royce |
| Charles M. Royce | |
| President | |
| Date: | August 28, 2006 |
Pursuant to the requirements of the Securities Exchange Act of 1934 and the Investment Company Act of 1940, this report has been signed below by the following persons on behalf of the registrant and in the capacities and on the dates indicated.
| ROYCE CAPITAL FUND | ROYCE CAPITAL FUND | |||
| BY | :/s/ Charles M. Royce | BY: | /s/ John D. Diederich | |
| Charles M. Royce | John D. Diederich | |||
| President | Chief Financial Officer | |||
| Date: | August 28, 2006 | Date: | August 28, 2006 | |