SECURITIES AND EXCHANGE COMMISSION
FORM N-CSR
CERTIFIED SHAREHOLDER REPORT
OF
REGISTERED MANAGEMENT INVESTMENT COMPANIES
Investment Company Act file number: 811-07537
Name of Registrant: Royce Capital Fund
Address of Registrant: 745 Fifth Avenue
New York, NY 10151
| Name and address of agent for service: | John E. Denneen, Esquire | |
| 745 Fifth Avenue | ||
| New York, NY 10151 | ||
Registrant’s telephone number, including area code: (212) 508-4500
Date of fiscal year end: December 31
Date of reporting period: January 1, 2009 – June 30, 2009
Item 1. Reports to Shareholders.
 | |||||
| Royce Capital Fund— Micro-Cap Portfolio Royce Capital Fund— Small-Cap Portfolio | SEMIANNUAL REVIEW AND REPORT TO SHAREHOLDERS | ||||
www.roycefunds.com |  | ||||
| Performance and Expenses | Through June 30, 2009 |
| Average Annual Total Returns | |||||||||||||||||||||
| Since | Annual Operating | ||||||||||||||||||||
Fund | YTD | 1-Year | 5-Year | 10-Year | Inception | Expenses | |||||||||||||||
| Royce Capital Fund—Micro-Cap Portfolio | 21.56 | % | -25.81 | % | 0.82 | % | 9.82 | % | 10.71 | % | (12/27/96) | 1.49 | % | ||||||||
| Royce Capital Fund—Small-Cap Portfolio | 7.32 | % | -23.31 | 1.66 | 9.23 | 9.96 | (12/27/96) | 1.09 | |||||||||||||
| Russell 2000 | 2.64 | % | -25.01 | -1.71 | 2.38 | 4.16 | * | n.a. | |||||||||||||
| * Since Royce Capital Fund’s inception on 12/27/96. | |||||||||||||||||||||
Important Performance, Expense and Risk Information
All performance information in this Review and Report reflects past performance, is presented on a total return basis and reflects the reinvestment of distributions. Past performance is no guarantee of future results. Investment return and principal value of an investment will fluctuate, so that shares may be worth more or less than their original cost when redeemed. Current performance may be higher or lower than performance quoted. Current month-end performance may be obtained at www.roycefunds.com. The performance information in the table above, and in the graphs and tables appearing on pages 10-13 does not reflect any deduction for charges or expenses of the variable contracts or retirement plans investing in the Fund. All performance and expense information reflects results for each Fund’s Investment Class Shares. Service Class Shares bear an annual distribution expense that is not borne by the Investment Class. Operating expenses reflect the Fund’s total annual operating expenses for the Investment Class, as of the Fund’s most current prospectus, and include management fees, other expenses and, in the case of Royce Capital Fund—Micro-Cap Portfolio, acquired fund fees and expenses. Acquired fund fees and expenses are those incurred indirectly as a result of investment in one or more acquired funds, including mutual funds, hedge funds, private equity funds and other pooled investment vehicles.
Royce Capital Fund invests primarily in securities of small- and/or micro-cap companies, which may involve considerably more risk than investments in securities of larger-cap companies (see “Primary Risks for Fund Investors” in the Prospectus). Please read the Prospectus carefully before investing or sending money. The Russell 2000 is an unmanaged, capitalization-weighted index of domestic small-cap stocks. It measures the performance of the 2,000 smallest publicly traded U.S. companies in the Russell 3000 index.
| This page is not part of the 2009 Semiannual Report to Shareholders |
| Table of Contents | |
| Semiannual Review | |
| Performance and Expenses | Inside Cover |
| Letter to Our Shareholders | 2 |
| Semiannual Report to Shareholders | 8 |
| This page is not part of the 2009 Semiannual Report to Shareholders | 1 |
 What do people do when they buy stocks? What are their motives and expectations? These may seem like odd, or at least very simple, questions, but we think that they are worth asking in pursuit of a larger, more important point. After all, myriad factors can lead a company’s stock price to higher levels— increased demand for the company’s existing products and/or services, a rapidly expanding business, a higher public profile, an innovative new product, etc. But none of these events ensures that the share-price gains will last. To us, the critical question is, what kind of companies are most likely to experience a sustainable increase in their business value, and thus an increase in share price? As long-term investors with a disciplined value approach, we are therefore less concerned with what may or may not make a stock price climb, particularly in the short run. Short-term gains for our portfolio holdings are always welcome, but our focus is on identifying companies Continued on page 4... | Letter to Our Shareholders  Simple Twist of Fate It was one year ago that, taking a cue from a Bob Dylan song, we wrote that something significant was happening in the markets, but the nature and degree of the event had not yet become clear. The intervening 12 months have certainly clarified things, in about as painful and destructive a fashion as possible from an investment standpoint. Back in March 2008, the fall of Bear Stearns was initially hoped to be, with fingers crossed in one hand and the other knocking on wood, an isolated, anomalous event. It took a few months, but the ongoing implosion of the subprime mortgage market sent shock waves throughout the global financial system. A significant correction in housing prices probably would have created some thorny economic problems in and of itself, but as fate would have it, many of these ill-awarded mortgages were securitized, packaged, ‘tranched’ and traded in a dizzying array of complicated arrangements that may never be completely understood. And once September rolled around, the once-slow pace of decline picked up so quickly that matters barely had time to escalate from bad to disastrous. | ||
| 2 | This page is not part of the 2009 Semiannual Report to Shareholders |
| Lacking the fatalism that has characterized many observers’ forecasts for the economy and the stock market, we believe in the cyclicality of markets and the resourcefulness of our economy, both of which should be factors in the next year as we make our way by fits and starts to better days. | |
Modern Times | ||
As for those days most recently passed, they were definitely better, as the market spent much of the period from March through June rallying from the worrisome depths it had tested in the fall and winter months. The better days began after the most recent market trough on March 9 and continued mostly unimpeded through the end of June, though there were notable sell-offs, particularly late in June and early in July. However, even the most fatalistic observer was likely cheered by the year-to-date results for the major equity indices: The small-cap Russell 2000 was up 2.6% through June 30, 2009, while the large-cap S&P 500 gained 3.2% and the more tech-laden Nasdaq Composite shot up 16.4%. | In such a volatile environment, the question of where market leadership will next reside remains an open one, as does the question of how long any such leadership period is likely to last. |
| This page is not part of the 2009 Semiannual Report to Shareholders | 3 |
capable of long-term success as both businesses and stocks. There are several methods that we use to try to determine this. The first critical step entails a close examination of a company’s financial profile and history. We search for evidence of our definition of quality—a strong balance sheet, a history of solid earnings, the ability to generate positive cash flow and high returns on invested capital. While it’s true that a company possessing each of these qualities is hardly guaranteed positive stock performance (as returns for our Funds in 2008 made painfully clear), we think that businesses with these characteristics are most likely to be solid, if not strong, performers over long-term time horizons. Another route is of particular significance to us, though it may at first seem counterintuitive: A company can achieve an attractive long-term record by losing less during economic or market downturns. Our years of research bear out that those attributes that we value so highly can help a firm to weather these storms— profitable companies with low debt and plentiful cash have historically been stalwarts in poor markets and/or economies (the recent bear market notwithstanding). In other words, we are seeking great companies, not just great stocks. Continued on page 6... | |||
Letter to Our Shareholders all within a compact six months. During the first quarter, the Russell 2000 was down 15.0%, the S&P 500 fell 11.0% and the Nasdaq Composite slipped “only” 3.1%. It should be remembered that these results included the beginning of the recent rally, more than three weeks’ worth of mostly rising stock prices that closed out the quarter and saw each index posting positive double-digit returns from March 9 through March 31, 2009. That the rally then took up almost the entire second quarter was thus a more than welcome development, especially as results for the four indices referenced above represented the largest respective quarterly advances since the second quarter of 2003. Yet we are still a long way from celebration. For the periods ended June 30, 2009, one-year, three-year and five-year average annual returns for all three indices remained negative. Market leadership remains unclear. Consider the following: The Russell 2000 trailed the S&P 500 in the first quarter, outperformed in the second quarter, but remained behind its large-cap counterpart for the year-to-date period ended June 30, 2009. The small-cap index led its large-cap sibling for the one-year period through the end of June, trailed in the three-year period, and led in the five- and 10-year periods. Small-cap stocks also significantly outperformed large-caps for the decade-to-date period, with the Russell 2000 gaining 14.0% versus the S&P 500’s decline of 25.9% from December 31, 1999 through June 30, 2009. With dramatic and well-defined bear and bull periods over the last two years, none of us needs a reminder that market volatility has been very much the norm. However, we think that another important example of its omnipresence can be seen in the near-regular rotation of small- and large-cap leadership over recent shorter-term calendar-based periods. In such an environment, the question of where market leadership will next reside remains an open one, as does the question of how long any such leadership period is likely to last. | ||
It Takes Growth to Laugh, It Takes Value to Cry Within the small-cap universe, the current leadership issue is more than settled. Small-cap growth, as measured by the Russell 2000 Growth index, remained in the top spot over small-cap value, as measured by the Russell 2000 Value index. For the year-to-date period ended June 30, 2009, the Russell 2000 Growth index gained 11.4%, while the Russell 2000 Value index fell 5.2%. Both small-cap indices enjoyed robust results in the second quarter, but the Russell 2000 Value index’s 18.0% gain trailed its growth counterpart’s 23.4% return, so the turn in the tide of stock prices did little to help the small-cap value index to narrow the performance gap. Small-cap growth first gained its advantage in 2009 by outperforming in the bearish first quarter, down 9.7% compared to a decline of 19.6% for small-cap value, which marked the third consecutive quarter | ||
| 4 | This page is not part of the 2009 Semiannual Report to Shareholders |
| Quality is likely to be a lingering presence—a constant in a solid bull market that should otherwise see regular rotations in leadership. | ||
Things Have Changed | |||
The significant question, of course, is what happens next? Late June and early July saw just enough selling for many observers to be convinced that the rally might have breathed its last, at least until more compelling evidence of a growing economy surfaces. Our own take is that the first phase of the bull market is probably complete. The rally that began in March was characterized by dynamic, double-digit returns, and stocks of all sizes in nearly all sectors and industries benefiting greatly. Around the middle of June, the market fell into a corrective period, almost as if it were catching its breath after the wild run-up of stock prices. This period could last for another few months or could be over by the time this Semiannual Review and Report is being read. We would expect |
| This page is not part of the 2009 Semiannual Report to Shareholders | 5 |
At first, this may appear to be a distinction without a difference, but the difference is very real to us because we see ourselves as business buyers. We have always taken very seriously the simple truth that when one buys even one share of stock, one becomes a stakeholder in a business. This is why our approach generally requires developing a deep understanding of what a company does and how it operates. In addition to our discussions with a company’s management, we often speak to suppliers, customers and competitors in order to expand our knowledge of the company. To be sure, we buy stocks to make money, but the means to that sought-after end are very specific. We are looking for the happy marriage of a strong financial profile with a wonderful business that we think we know well. This necessitates a commitment to a disciplined process, one that demands we know as much about these businesses as we possibly can. It involves making an investment in a business as if we were purchasing the entire company, as if we were owners, because, after all, that is what we become when we buy stocks. | Letter to Our Shareholders an overall modest decline in the range of 10%-15%, regardless of the time frame. We also expect the next phase in the current cycle to be different—still bullish, but with returns that will not be as lofty. It seems to us we will see more historically typical performance patterns, frequent sector and industry rotation and greater discrimination on the part of investors for quality companies. We also feel confident that stocks of higher quality companies—those with solid earnings, high returns on invested capital and/or that pay dividends—should take the lead in the next bull phase. Our reasoning is that enough investors should begin to focus on company quality now that the period of momentum-driven results appears to be behind us and a recovering economy in front of us, though no one knows how far ahead it lies. Recent selling has been driven more by fundamentals than liquidity, which is a good sign for the stability of equities as a whole. Without the sense of panic that was so prevalent in the last four months of 2008, investors would be free to think more about factors such as risk, long-term performance and sustainable growth. In such a setting, we think that quality stocks would do well across virtually all asset classes and in all industries where they can be found. So we may see, for example, small-cap leadership for a short time, then a period of large-cap outperformance, etc. However, quality is likely to be a lingering presence—a constant in a solid bull market that should otherwise see regular rotations in leadership. Beyond Here Lies... The economy is the elephant in the room. The recent rally was fueled in large part by investors’ expectations of an economic recovery that, perhaps needless to say, has thus far not materialized. We suspect that some investors may have confused economic stabilization with economic recovery, something that surely helped the prices of certain stocks to run ahead of what their fundamentals might suggest, which in part explains why the rally lost steam in June. From an equity investor’s standpoint, economic recovery is necessary for the market’s bullish moves to be sustained. Rancorous debate about where the economy is and where it is going will continue. There will be plenty of disappointment and cynicism, as well as an ample supply of naysayers braying along the road to economic recovery, which we think will proceed slowly, at times at a pace of two steps forward one step back, to the point that within a year a recovery should be well under way. We do not think that it will be as driven by consumer spending, but instead will be led by revived industrial activity, natural resources and perhaps even financial services. Consumer activity will still play an important role, but we expect consumer spending to account for far less of GDP than it did prior to the recession, which will be a positive development. | ||
| 6 | This page is not part of the 2009 Semiannual Report to Shareholders |
| |||||||
| |||||||
| |||||||
|  |  | |||||
Charles M. Royce | W. Whitney George | Jack E. Fockler, Jr. | |||||
President | Vice President | Vice President | |||||
July 31, 2009 | |||||||


| This page is not part of the 2009 Semiannual Report to Shareholders | 7 |
| Table of Contents | ||||||||||||||||||||
Semiannual Report to Shareholders | ||||||||||||||||||||
| Notes to Performance and Other Important Information | 9 | |||||||||||||||||||
| Managers’ Discussions of Fund Performance | ||||||||||||||||||||
| Royce Capital Fund—Micro-Cap Portfolio | 10 | |||||||||||||||||||
| Royce Capital Fund—Small-Cap Portfolio | 12 | |||||||||||||||||||
| Schedules of Investments and Financial Statements | 14 | |||||||||||||||||||
| Notes to Financial Statements | 24 | |||||||||||||||||||
| Understanding Your Fund’s Expenses | 27 | |||||||||||||||||||
| Board Approval of Investment Advisory Agreements | 28 | |||||||||||||||||||
| 8 | Royce Capital Fund 2009 Semiannual Report to Shareholders |
Notes to Performance and Other Important Information
The thoughts expressed in this report concerning recent market movements and future prospects for small company stocks are solely the opinion of Royce at June 30, 2009, and, of course, historical market trends are not necessarily indicative of future market movements. Statements regarding the future prospects for particular securities held in the Funds’ portfolios and Royce’s investment intentions with respect to those securities reflect Royce’s opinions as of June 30, 2009 and are subject to change at any time without notice. There can be no assurance that securities mentioned in this report will be included in any Royce-managed portfolio in the future. The Russell 2000 is an index of domestic small-cap stocks. It measures the performance of the 2,000 smallest publicly traded U.S. companies in the Russell 3000 index. The Russell 2000 Value and Growth indices consist of the respective value and growth stocks within the Russell 2000 as determined by Russell Investments. The S&P 500 is an index of U.S. large-cap stocks selected by Standard & Poor’s based on market size, liquidity and industry grouping, among other factors. The Nasdaq Composite is an index of the more than 3,000 common equities listed on the Nasdaq stock exchange. Returns for the market indices used in this report were based on information supplied to Royce by Russell Investments. Royce has not independently verified the above described information. The Royce Funds is a service mark of The Royce Funds. Distributor: Royce Fund Services, Inc. Royce Capital Fund—Micro-Cap Portfolio invests primarily in securities of micro-cap companies and Royce Capital Fund—Small-Cap Portfolio invests primarily in securities of small-cap companies that may involve considerably more risk than investments in securities of larger-cap companies (Please see “Primary Risks for Fund Investors” in the prospectus). The Funds may invest up to 25% of their respective |
| assets in foreign securities that may involve political, economic, currency and other risks not encountered in U.S. investments. Please read the prospectus carefully before investing or sending money. | ||
| Forward-Looking Statements | ||
| This material contains forward-looking statements within the meaning of the Securities Exchange Act of 1934, as amended (the “Exchange Act”), that involve risks and uncertainties, including, among others, statements as to: | ||
| • | the Funds’ future operating results, | |
| • | the prospects of the Funds’ portfolio companies, | |
| • | the impact of investments that the Funds have made or may make, | |
| • | the dependence of the Funds’ future success on the general economy and its impact on the companies and industries in which the Funds invest, and | |
| • | the ability of the Funds’ portfolio companies to achieve their objectives. | |
| This review and report use words such as “anticipates,” “believes,” “expects,” “future,” “intends,” and similar expressions to identify forward-looking statements. Actual results may differ materially from those projected in the forward looking statements for any reason. | ||
The Royce Funds have based the forward-looking statements included in this review and report on information available to us on the date of the report, and we assume no obligation to update any such forward-looking statements. Although The Royce Funds undertake no obligation to revise or update any forward-looking statements, whether as a result of new information, future events or otherwise, you are advised to consult any additional disclosures that we may make through future shareholder communications or reports. | ||
| Proxy Voting | ||
A copy of the policies and procedures that The Royce Funds use to determine how to vote proxies relating to portfolio securities and information regarding how each of The Royce Funds voted proxies relating to portfolio securities during the most recent 12-month period ended June 30 is available, without charge, on The Royce Funds’ website at www.roycefunds.com, by calling (800) 221-4268 (toll-free) and on the website of the Securities and Exchange Commission (“SEC”), at www.sec.gov. | ||
| Form N-Q Filing | ||
The Funds file their complete schedules of investments with the SEC for the first and third quarters of each fiscal year on Form N-Q. The Funds’ Forms N-Q are available on The Royce Funds’ website at www.roycefunds.com and on the SEC’s website at www.sec.gov. The Funds’ Forms N-Q may also be reviewed and copied at the SEC’s Public Reference Room in Washington, D.C. To find out more about this public service, call the SEC at (202) 942-8090. The Funds’ complete schedules of investments are updated quarterly, and are available at www.roycefunds.com. | ||
Royce Capital Fund 2009 Semiannual Report to Shareholders | 9 |
| AVERAGE ANNUAL TOTAL RETURNS Through 6/30/09 | ||||||||||||
| Jan - June 2009* | 21.56 | % | ||||||||||
| One-Year | -25.81 | |||||||||||
| Three-Year | -7.97 | |||||||||||
| Five-Year | 0.82 | |||||||||||
| 10-Year | 9.82 | |||||||||||
| Since Inception (12/27/96) | 10.71 | |||||||||||
| ANNUAL EXPENSE RATIO | ||||||||||||
| Operating Expenses | 1.49 | % | ||||||||||
| * Not annualized | ||||||||||||
| CALENDAR YEAR TOTAL RETURNS | ||||||||||||
| Year | RCM | Year | RCM | |||||||||
| 2008 | -43.3 | % | 2002 | -12.9 | % | |||||||
| 2007 | 4.0 | 2001 | 29.7 | |||||||||
| 2006 | 21.1 | 2000 | 18.5 | |||||||||
| 2005 | 11.6 | 1999 | 28.1 | |||||||||
| 2004 | 13.8 | 1998 | 4.1 | |||||||||
| 2003 | 49.2 | 1997 | 21.2 | |||||||||
| TOP 10 POSITIONS % of Net Assets | ||||||||||||
| Atlantic Tele-Network | 1.4 | % | ||||||||||
| Olympic Steel | 1.4 | |||||||||||
| Patriot Transportation Holding | 1.1 | |||||||||||
| Allied Nevada Gold | 1.1 | |||||||||||
| Kennedy-Wilson | 1.1 | |||||||||||
| Cavco Industries | 1.0 | |||||||||||
| Fronteer Development Group | 1.0 | |||||||||||
| Anaren | 1.0 | |||||||||||
| Semperit AG Holding | 1.0 | |||||||||||
| Silvercorp Metals | 1.0 | |||||||||||
| PORTFOLIO SECTOR BREAKDOWN % of Net Assets | ||||||||||||
| Natural Resources | 16.5 | % | ||||||||||
| Technology | 15.5 | |||||||||||
| Industrial Services | 13.8 | |||||||||||
| Industrial Products | 11.2 | |||||||||||
| Health | 10.7 | |||||||||||
| Consumer Products | 8.2 | |||||||||||
| Consumer Services | 5.9 | |||||||||||
| Financial Intermediaries | 4.2 | |||||||||||
| Financial Services | 3.4 | |||||||||||
| Miscellaneous | 3.4 | |||||||||||
| Preferred Stock | 0.5 | |||||||||||
| Cash and Cash Equivalents | 6.7 | |||||||||||
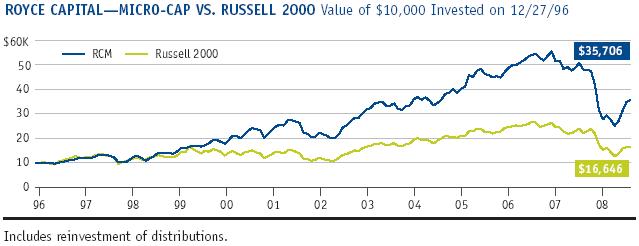
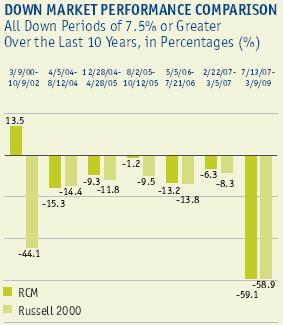
Royce Capital Fund—Micro-Cap Portfolio  Managers’ Discussion Managers’ DiscussionIf not for the stubborn and unfortunate fact that we are still in a bear market, recent performance for Royce Capital Fund—Micro-Cap Portfolio (RCM) would be nothing less than spectacular. As things stand, we will settle for ‘highly encouraging.’ The Fund gained 21.6% for the year-to-date period ended 6/30/09, well ahead of its small-cap benchmark, the Russell 2000, which was up 2.6%, and the Russell Microcap index, which rose 6.0%, for the same period. The Fund’s first-half outperformance was a near-ideal combination of a strong relative showing in the first-quarter downturn and a terrific absolute and relative result in the second-quarter upswing. RCM lost 7.5% in the opening quarter of 2009, compared to respective declines of 15.0% and 15.2% for the Russell 2000 and Russell Microcap indices. When stock prices rose in the second quarter, the Fund was up an impressive 31.4% versus a gain of 20.7% for its small-cap benchmark and 25.0% for the micro-cap index. | |||||||||||||
The Fund also showed much-improved relative returns in the recent market cycle. First, in the rally that began following the small-cap low on 3/9/09 through 6/30/09, RCM was up 56.6% versus gains of 48.9% for the Russell 2000 and 54.6% for the Russell Microcap index. For the market cycle period that began with the most recent small-cap peak on 7/13/07 (and thus marked the beginning of the current bear market) through 6/30/09, RCM fell 35.9%, again outperforming its benchmark, which lost 38.8%, and the micro-cap index, which declined 44.7%. As welcome as the bullish period was, we were even more pleased to see the Fund lose less than its benchmark through the first two-plus months of 2009. Over longer-term periods, the news remained positive. From the previous small-cap market peak on 3/9/00 through 6/30/09, RCM handily outpaced the Russell 2000, up 113.8% versus a loss of 5.2%. (Data for the Russell Microcap index only goes back to 2002.) Similarly, the Fund was ahead of its benchmark during the most recently completed small-cap market cycle, which ran from 3/9/00 through 7/13/07, a period in which RCM rose 233.6%, while the Russell 2000 was up 54.9%. The Fund’s strong market cycle returns were a critical factor in beating its benchmark for the three-, five-, 10-year and since inception (12/27/96) periods ended 6/30/09. RCM’s average annual total return since inception was 10.7%. Technology and Natural Resources, the Fund’s two largest sectors at the end of June, also made the most significant positive contributions to performance in the first half. Within | GOOD IDEAS THAT WORKED Top Contributors To Performance Year-to-Date Through 6/30/09* | ||||||||||||
| Fuqi International | 1.26% | ||||||||||||
| Stein Mart | 0.84 | ||||||||||||
| Buckle (The) | 0.69 | ||||||||||||
| Allied Nevada Gold | 0.66 | ||||||||||||
| Sipef | 0.65 | ||||||||||||
| *Includes Dividends | |||||||||||||
Important Performance and Expense Information All performance information in this Report reflects past performance, is presented on a total return basis and reflects the reinvestment of distributions. Past performance is no guarantee of future results. Investment return and principal value of an investment will fluctuate, so that shares may be worth more or less than their original cost when redeemed. Current performance may be higher or lower than performance quoted. The Fund’s total returns do not reflect any deduction for charges or expenses of the variable contracts of retirement plans investing in the Fund. Returns as of the recent month-end may be obtained at www.roycefunds.com. All performance and risk information for RCM reflects Investment Class results. Shares of RCM’s Service Class bear an annual distribution expense that is not borne by the Investment Class. Operating expenses reflect the Fund’s total annual operating expenses for the Investment Class, as of the date of the Fund’s most current prospectus, and include management fees, other expenses and acquired fund fees and expenses. Acquired fund fees and expenses are those incurred indirectly as a result of investment in one or more acquired funds, including mutual funds, hedge funds, private equity funds and other pooled investment vehicles. | |||||||||||||
10 | Royce Capital Fund 2009 Semiannual Report to Shareholders
Performance and Portfolio Review Natural Resources, precious metals and mining dominated, the result of stable or rising commodity prices and a decline in the costs of mining. There was also greater access to capital, as improved commodity prices seemed to make financing easier to obtain. Each of these factors played a role in the mostly rising share prices of several mining stocks in the portfolio, including Allied Nevada Gold, Fronteer Development Group, U.S. Gold and Silvercorp Metals. We liked the ongoing prospects for the industry and also thought that, first-half gains notwithstanding, several holdings still had ample room for growth. Allied Nevada Gold, Fronteer Development Group and Silvercorp Metals were top-ten positions at the end of June. Net gains in the Technology sector were mostly clustered in three industries—semiconductors and equipment, telecommunications, and components and systems. Few areas of the market held lower expectations heading into 2009 than consumer stocks. Hit hard at each stage of the bear market, they were also subject to grim forecasts about how little consumers across the globe would be spending during the recession. In part because most | ||||
| consumer stocks were (at least in our view) wildly oversold into early 2009 and in part because several businesses reported results in 2009 that, while not quite good, were far from disastrous, many rallied in the first half. Fuqi International designs and sells precious metal jewelry in China. Its recent earnings were actually both positive and better than expected, which drove its share price to lofty heights. We reduced our position substantially in June. We also trimmed our stake in clothing and accessories retailer The Buckle and sold shares in fashion merchandiser Stein Mart as their stock prices climbed. Sipef is a holding company that, among other things, operates rubber and palm oil plantations. Much of its profit comes from its palm oil business, which we think offers terrific growth potential in China, India and elsewhere in Asia. After palm oil prices fell dramatically in the second half of 2008, they rebounded in the first half of 2009, helping Sipef ’s stock price to do the same. It was the Fund’s twelfth largest holding at the end of June. Media company Journal Communications proved a disappointment in a market where we saw what we deemed sounder opportunities elsewhere. We sold our shares in March. Key Technology makes process automation systems that integrate electro-optical inspection, sorting, and product preparation equipment. Its business and share price have been hurt by the recession, but we like its balance sheet and its prospects, especially as it seeks to introduce its products into the pharmaceutical industry. | ||||
GOOD IDEAS AT THE TIME | ||||
| Journal Communications Cl. A | -0.64% | |||
| Key Technology | -0.60 | |||
| LaCrosse Footwear | -0.38 | |||
| United Fire & Casualty | -0.35 | |||
| Dyax Corporation | -0.29 | |||
| *Net of Dividends | ||||
 | ||||
| FUND INFORMATION AND PORTFOLIO DIAGNOSTICS | |||||||
| Average Market Capitalization* | $252 million | ||||||
| Weighted Average P/B Ratio | 1.2x | ||||||
| Weighted Average Portfolio Yield | 2.0% | ||||||
| Fund Net Assets | $400 million | ||||||
| Turnover Rate | 20% | ||||||
| U.S. Investments (% of Net Assets) | 68.7% | ||||||
| Non-U.S. Investments (% of Net Assets) | 24.6% | ||||||
| Number of Holdings | 205 | ||||||
| Symbol | |||||||
| Investment Class | RCMCX | ||||||
| Service Class | RCMSX | ||||||
| * Geometrically calculated | |||||||
 | |||||||
Royce Capital Fund 2009 Semiannual Report to Shareholders | 11
| ||||||||||||
| AVERAGE ANNUAL TOTAL RETURNS Through 6/30/09 | ||||||||||||
| Jan - June 2009* | -7.32 | % | ||||||||||
| One-Year | -23.31 | |||||||||||
| Three-Year | -5.47 | |||||||||||
| Five-Year | 1.66 | |||||||||||
| 10-Year | 9.23 | |||||||||||
| Since Inception (12/27/96) | 9.96 | |||||||||||
| ANNUAL EXPENSE RATIO | ||||||||||||
| Operating Expenses | 1.09 | % | ||||||||||
| * Not annualized | ||||||||||||
| CALENDAR YEAR TOTAL RETURNS | ||||||||||||
| Year | RCS | Year | RCS | |||||||||
| 2008 | -27.2 | % | 2002 | -13.8 | % | |||||||
| 2007 | -2.1 | 2001 | 21.0 | |||||||||
| 2006 | 15.6 | 2000 | 33.3 | |||||||||
| 2005 | 8.6 | 1999 | 8.2 | |||||||||
| 2004 | 25.0 | 1998 | 8.9 | |||||||||
| 2003 | 41.1 | 1997 | 17.1 | |||||||||
| TOP 10 POSITIONS % of Net Assets | ||||||||||||
| Knight Capital Group Cl. A | 2.3 | % | ||||||||||
| Oil States International | 2.3 | |||||||||||
| NBTY | 2.3 | |||||||||||
| Federated Investors Cl. B | 2.3 | |||||||||||
| Steven Madden | 2.1 | |||||||||||
| Aspen Insurance Holdings | 2.1 | |||||||||||
| Wolverine World Wide | 2.0 | |||||||||||
| Dress Barn (The) | 1.9 | |||||||||||
| Comtech Telecommunications | 1.8 | |||||||||||
| Buckle (The) | 1.8 | |||||||||||
| PORTFOLIO SECTOR BREAKDOWN % of Net Assets | ||||||||||||
| Financial Intermediaries | 15.1 | % | ||||||||||
| Natural Resources | 13.9 | |||||||||||
| Industrial Services | 10.8 | |||||||||||
| Technology | 10.4 | |||||||||||
| Industrial Products | 10.1 | |||||||||||
| Consumer Services | 9.4 | |||||||||||
| Consumer Products | 9.4 | |||||||||||
| Health | 8.2 | |||||||||||
| Financial Services | 2.3 | |||||||||||
| Miscellaneous | 1.8 | |||||||||||
| Cash and Cash Equivalents | 8.6 | |||||||||||
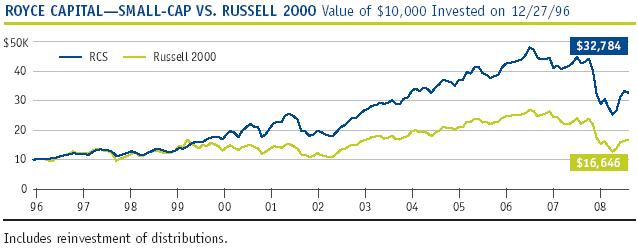
Royce Capital Fund—Small-Cap Portfolio  Manager’s Discussion Manager’s DiscussionThe welcome recovery in stock prices showed much of its favor to lower-quality issues, but that did not prevent a solid performance for the limited portfolio of Royce Capital Fund–Small-Cap Portfolio (RCS), which includes what we believe are small-cap stocks of the highest quality. (We define quality as companies with strong balance sheets, the ability to generate free cash flow and high returns on invested capital.) The Fund rose 7.3% for the year-to-date period ended 6/30/09, ahead of its small-cap benchmark, the Russell 2000, which was up 2.6% for the same period. A more-than-respectable absolute and relative performance was satisfying enough, but we were even more pleased by the way in which the Fund achieved its edge, with solid relative down market results and strong absolute and relative up market performance. In the dreary first quarter, a period in which the Russell 2000 declined 15.0%, RCS lost 12.5%. Stock prices began to recover in March, spurring the second-quarter rally. Between April and June, when the small-cap index was up 20.7%, the Fund gained 22.6%. | |||||||||||||
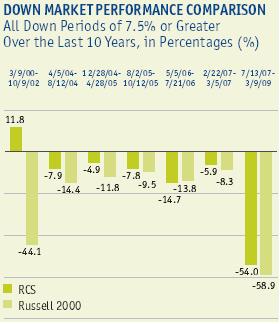
RCS’s strong first half helped to improve its recent market cycle performance. From the small-cap peak on 7/13/07 through the most recent low on 3/9/09, the Fund lost 54.0% while the Russell 2000 declined 58.9%. For the period beginning with that same small-cap peak through 6/30/09, which reflects the rally that kicked off on 3/9/09, RCS was down 32.4% versus a loss of 38.8% for the Russell 2000. The Fund’s showing in the recent upswing was impressive, though it trailed its benchmark. From 3/9/09 through 6/30/09, RCS was up 46.9% versus a gain of 48.9% for the small-cap index. The Fund’s market cycle and other long-term results were also solid. From the previous small-cap peak on 3/9/00 through 6/30/09, the Fund handily trounced the Russell 2000, up 125.3% versus the benchmark’s loss of 5.2%. This strong performance helped RCS to best the small-cap index for the one-, three-, five-, 10-year and since inception (12/27/96) periods ended 6/30/09.The Fund’s average annual total return since inception was 10.0%. After the relative and absolute disappointments of 2008, we were pleased to see reversals in the stock prices of many portfolio holdings. Perhaps none was less expected than the dynamic rebound of companies in the Fund’s two consumer sectors. Seven of RCS’s 20 best-performing holdings in the first half came from either the Consumer Services or Consumer Products sectors. While some of these stocks showed impressive growth through the still-recessionary first half, nearly all had been, in our view, thoroughly oversold by the end of | GOOD IDEAS THAT WORKED Top Contributors To Performance Year-to-Date Through 6/30/09* | ||||||||||||
| NBTY | 1.10% | ||||||||||||
| Buckle (The) | 0.93 | ||||||||||||
| American Eagle Outfitters | 0.75 | ||||||||||||
| Federated Investors Cl. B | 0.72 | ||||||||||||
| Sims Metal Management ADR | 0.69 | ||||||||||||
| *Includes Dividends | |||||||||||||
Important Performance and Expense Information All performance information in this Report reflects past performance, is presented on a total return basis and reflects the reinvestment of distributions. Past performance is no guarantee of future results. Investment return and principal value of an investment will fluctuate, so that shares may be worth more or less than their original cost when redeemed. Current performance may be higher or lower than performance quoted. The Fund’s total returns do not reflect any deduction for charges or expenses of the variable contracts of retirement plans investing in the Fund. Returns as of the recent month-end may be obtained at www.roycefunds.com. All performance and risk information for RCS reflects Investment Class results. Shares of RCS’s Service Class bear an annual distribution expense that is not borne by the Investment Class. Operating expenses reflect the Fund’s total annual operating expenses for the Investment Class, as of the date of the Fund’s most current prospectus, and include management fees and other expenses. | |||||||||||||
12 | Royce Capital Fund 2009 Semiannual Report to Shareholders
Performance and Portfolio Review 2008. Their recovery, then, was surprising but not shocking—some recovery after such a violent sell-off seemed appropriate, if only in hindsight. The Fund’s strongest-performing industry was retail stores, which was dominated by strong results from three companies. The Buckle operates as a retailer of casual apparel, footwear and accessories for younger people. We first bought shares in RCS in 2001 and have held a position continuously since 2004. We began to re-build our stake in October 2008, still confident that, as a well-managed company with ample cash, it was capable of enduring through the recession and thriving in an economic recovery. Its growth has slowed, but recent earnings remained positive as the firm continued to prove that it could offer sought-after merchandise. It was a top-ten position at the end of June. Another large holding that we built during some of the darkest days of the bear market was The Dress Barn, which operates a chain of women’s apparel specialty stores. It too has been an effective survivor of a brutal market for retailers that we think could benefit from an economic | ||||
| turnaround. The price of American Eagle Outfitters hit single digits through most of the period between October and March, and we re-built our position between October and February. Better-than-expected results began to attract investors later in March. We sold some shares during April and May. NBTY makes and distributes nutritional supplements. The company went through an awful latter half of 2008, battling increases in the cost of raw materials needed to make vitamins and sagging sales. In 2009, sales growth resumed, raw materials costs fell and the firm bought a competitor out of bankruptcy, all of which seemed to convince investors of its overall good health. It was RCS’s third-largest holding at the end of June. When mobile-data communications equipment maker Comtech Telecommunications reduced its sales and profit outlook for fiscal 2009 in March, its stock price suffered its worst decline in 29 years. We were thinking more about the company’s strong balance sheet and attractive long-term prospects, especially in the areas of satellite and mobile-tracking equipment that it provides to the U.S. military, both of which made adding to our stake a simple decision. Aircraft and industrial parts maker Woodward Governor saw its stock price plummet, which, along with a 2008 acquisition that caused more dilution to its balance sheet than we would have liked, led us to begin reducing our position in March. | ||||
GOOD IDEAS AT THE TIME | ||||
| Comtech Telecommunications | -1.32% | |||
| Woodward Governor | -0.77 | |||
| Entegris | -0.57 | |||
| Lincoln Electric Holdings | -0.47 | |||
| Montpelier Re Holdings | -0.40 | |||
| *Net of Dividends | ||||
 | ||||
| FUND INFORMATION AND PORTFOLIO DIAGNOSTICS | |||||||
| Average Market Capitalization* | $924 million | ||||||
| Weighted Average P/E Ratio** | 11.2x | ||||||
| Weighted Average P/B Ratio | 1.3x | ||||||
| Weighted Average Portfolio Yield | 1.2% | ||||||
| U.S. Investments (% of Net Assets) | 88.9% | ||||||
| Non-U.S. Investments (% of Net Assets) | 2.5% | ||||||
| Fund Net Assets | $347 million | ||||||
| Turnover Rate | 23% | ||||||
| Number of Holdings | 92 | ||||||
| Symbol | |||||||
| Investment Class | RCPFX | ||||||
| Service Class | RCSSX | ||||||
| * Geometrically calculated | |||||||
** The Fund’s P/E calculation excludes companies with zero or negative earnings (21% of portfolio holdings as of 6/30/09). | |||||||
 | |||||||
Royce Capital Fund 2009 Semiannual Report to Shareholders | 13
Schedules of Investments
Royce Capital Fund – Micro-Cap Portfolio |
| SHARES | VALUE | |||||
COMMON STOCKS – 92.8% | ||||||
Consumer Products – 8.2% | ||||||
Apparel, Shoes and Accessories - 2.9% | ||||||
| 64,999 | $ | 1,346,129 | ||||
LaCrosse Footwear | 277,231 | 2,592,110 | ||||
| 135,400 | 3,019,420 | |||||
Van De Velde | 42,950 | 1,569,155 | ||||
| 258,800 | 3,235,000 | |||||
| 11,761,814 | ||||||
Food/Beverage/Tobacco - 2.6% | ||||||
Anglo-Eastern Plantations | 187,700 | 1,105,516 | ||||
Asian Citrus Holdings | 654,000 | 2,233,781 | ||||
HQ Sustainable Maritime Industries b | 167,000 | 1,528,050 | ||||
Sipef | 79,000 | 3,787,711 | ||||
Societe Internationale de Plantations d’Heveas | 50,600 | 1,876,904 | ||||
| 10,531,962 | ||||||
Health, Beauty and Nutrition - 0.4% | ||||||
Nutraceutical International b | 146,500 | 1,522,135 | ||||
Home Furnishing and Appliances - 1.0% | ||||||
AS Creation Tapeten | 90,810 | 2,163,308 | ||||
Ekornes | 72,500 | 965,911 | ||||
| 44,800 | 706,048 | |||||
| 3,835,267 | ||||||
Sports and Recreation - 1.3% | ||||||
Arctic Cat b | 556,360 | 2,247,694 | ||||
Piscines Desjoyaux | 155,181 | 979,195 | ||||
RC2 Corporation b | 157,000 | 2,077,110 | ||||
| 5,303,999 | ||||||
Total (Cost $44,741,397) | 32,955,177 | |||||
Consumer Services – 5.9% | ||||||
Direct Marketing - 0.4% | ||||||
Manutan International | 32,666 | 1,627,284 | ||||
Leisure and Entertainment - 0.6% | ||||||
Multimedia Games b | 500,538 | 2,482,668 | ||||
Online Commerce - 0.6% | ||||||
CryptoLogic | 397,000 | 2,429,640 | ||||
Restaurants and Lodgings - 0.8% | ||||||
| 61,314 | 417,548 | |||||
| 127,930 | 808,518 | |||||
City Lodge Hotels | 222,000 | 1,989,454 | ||||
| 3,215,520 | ||||||
Retail Stores - 3.5% | ||||||
A.C. Moore Arts & Crafts b | 127,300 | 478,648 | ||||
Buckle (The) | 104,025 | 3,304,874 | ||||
Cache b | 438,250 | 1,700,410 | ||||
Cato Corporation (The) Cl. A | 116,400 | 2,030,016 | ||||
| 82,800 | 2,853,288 | |||||
Lewis Group | 231,000 | 1,447,512 | ||||
| SHARES | VALUE | |||||
Consumer Services (continued) | ||||||
Retail Stores (continued) | ||||||
Stein Mart b | 230,343 | $ | 2,040,839 | |||
| 13,855,587 | ||||||
Total (Cost $22,213,584) | 23,610,699 | |||||
Financial Intermediaries – 4.2% | ||||||
Banking - 1.0% | ||||||
Bancorp (The) b | 127,528 | 765,168 | ||||
BCB Holdings b | 743,907 | 1,530,279 | ||||
Canadian Western Bank | 128,600 | 1,872,917 | ||||
| 4,168,364 | ||||||
Insurance - 2.0% | ||||||
American Physicians Service Group | 40,000 | 907,600 | ||||
American Safety Insurance Holdings b | 143,200 | 1,948,952 | ||||
Argo Group International Holdings b | 70,027 | 1,976,162 | ||||
Navigators Group b | 42,500 | 1,888,275 | ||||
United Fire & Casualty | 78,630 | 1,348,505 | ||||
| 8,069,494 | ||||||
Securities Brokers - 1.2% | ||||||
Sanders Morris Harris Group | 529,400 | 2,911,700 | ||||
Thomas Weisel Partners Group b | 281,400 | 1,694,028 | ||||
| 4,605,728 | ||||||
Total (Cost $21,310,190) | 16,843,586 | |||||
Financial Services – 3.4% | ||||||
Investment Management - 3.4% | ||||||
Brait | 744,000 | 1,515,837 | ||||
CapMan Cl. B b | 1,126,855 | 1,586,527 | ||||
Deutsche Beteiligungs | 197,700 | 3,383,639 | ||||
Endeavour Financial a | 722,900 | 870,103 | ||||
† Gluskin Sheff + Associates | 187,900 | 2,600,859 | ||||
Sprott Resource b | 928,100 | 2,457,592 | ||||
U.S. Global Investors Cl. A | 112,300 | 1,039,898 | ||||
Total (Cost $26,692,321) | 13,454,455 | |||||
Health – 10.7% | ||||||
Commercial Services - 0.2% | ||||||
PDI b | 197,700 | 810,570 | ||||
Drugs and Biotech - 3.9% | ||||||
Anika Therapeutics b | 133,252 | 632,947 | ||||
| 160,800 | 1,125,600 | |||||
Dyax Corporation b | 493,516 | 1,056,124 | ||||
Fornix Biosciences | 106,128 | 969,444 | ||||
Genoptix b | 79,624 | 2,547,172 | ||||
Lexicon Pharmaceuticals b | 1,718,686 | 2,131,171 | ||||
Maxygen b | 117,200 | 787,584 | ||||
| 326,400 | 2,738,496 | |||||
Orchid Cellmark b | 884,200 | 1,414,720 | ||||
| 2,077,690 | 332,430 | |||||
Vetoquinol | 70,000 | 1,454,634 | ||||
YM Biosciences b | 737,800 | 413,168 | ||||
| 15,603,490 | ||||||
| 14 | Royce Capital Fund 2009 Semiannual Report to Shareholders | THE ACCOMPANYING NOTES ARE AN INTEGRAL PART OF THESE FINANCIAL STATEMENTS. |
| SHARES | VALUE | |||||
Health (continued) | ||||||
Health Services - 1.7% | ||||||
Bio-Imaging Technologies b | 272,023 | $ | 973,842 | |||
Computer Programs and Systems | 59,300 | 2,271,783 | ||||
CorVel Corporation b | 66,225 | 1,507,943 | ||||
U.S. Physical Therapy b | 141,960 | 2,093,910 | ||||
| 6,847,478 | ||||||
Medical Products and Devices - 4.9% | ||||||
Bruker Corporation b | 178,406 | 1,652,040 | ||||
Cerus Corporation b | 400,000 | 412,000 | ||||
Cynosure Cl. A b | 198,900 | 1,521,585 | ||||
Exactech b | 115,900 | 1,680,550 | ||||
Merit Medical Systems b | 42,000 | 684,600 | ||||
Neogen Corporation b | 119,950 | 3,476,151 | ||||
NMT Medical b | 174,800 | 391,552 | ||||
SenoRx b | 327,833 | 1,098,240 | ||||
Shamir Optical Industry b | 145,700 | 738,699 | ||||
Solta Medical b | 415,761 | 648,587 | ||||
STRATEC Biomedical Systems | 36,000 | 911,481 | ||||
Syneron Medical b | 448,294 | 3,236,683 | ||||
| 30,925 | 279,253 | |||||
Young Innovations | 131,465 | 2,864,622 | ||||
| 19,596,043 | ||||||
Total (Cost $61,218,887) | 42,857,581 | |||||
Industrial Products – 11.2% | ||||||
Automotive - 0.9% | ||||||
Landi Renzo | 797,000 | 3,609,376 | ||||
Building Systems and Components - 1.9% | ||||||
AAON | 126,704 | 2,523,944 | ||||
Drew Industries b | 276,533 | 3,365,407 | ||||
LSI Industries | 308,599 | 1,681,864 | ||||
| 7,571,215 | ||||||
Industrial Components - 0.8% | ||||||
Graham Corporation | 169,900 | 2,259,670 | ||||
| 205,600 | 771,000 | |||||
| 3,030,670 | ||||||
Machinery - 2.2% | ||||||
Burckhardt Compression Holding | 27,000 | 3,498,361 | ||||
Kadant b | 198,531 | 2,241,415 | ||||
Key Technology b | 217,429 | 2,150,373 | ||||
Manitou BF b | 60,802 | 725,606 | ||||
Technotrans b | 46,775 | 253,098 | ||||
| 8,868,853 | ||||||
Metal Fabrication and Distribution - 2.7% | ||||||
Castle (A.M.) & Co. | 181,221 | 2,189,150 | ||||
Foster (L.B.) Company Cl. A b | 90,976 | 2,735,648 | ||||
Olympic Steel | 221,500 | 5,420,105 | ||||
Samuel Manu-Tech | 231,000 | 659,348 | ||||
| 11,004,251 | ||||||
Miscellaneous Manufacturing - 1.0% | ||||||
Semperit AG Holding | 148,713 | 3,976,568 | ||||
Pumps, Valves and Bearings - 0.7% | ||||||
Pfeiffer Vacuum Technology | 38,000 | 2,788,016 | ||||
| SHARES | VALUE | |||||
Industrial Products (continued) | ||||||
Specialty Chemicals and Materials - 1.0% | ||||||
American Vanguard | 164,133 | $ | 1,854,703 | |||
Phoscan Chemical b | 1,681,800 | 578,360 | ||||
Victrex | 160,000 | 1,488,036 | ||||
| 3,921,099 | ||||||
Total (Cost $52,633,806) | 44,770,048 | |||||
Industrial Services – 13.8% | ||||||
Commercial Services - 5.7% | ||||||
ATC Technology b | 157,937 | 2,290,086 | ||||
Barrett Business Services | 84,099 | 883,039 | ||||
Begbies Traynor | 923,700 | 1,573,115 | ||||
Brunel International | 116,346 | 2,663,843 | ||||
CRA International b | 60,106 | 1,668,543 | ||||
Electro Rent | 148,200 | 1,406,418 | ||||
Forrester Research b | 44,200 | 1,085,110 | ||||
GP Strategies b | 535,700 | 3,155,273 | ||||
Healthcare Locums | 410,000 | 1,289,196 | ||||
Heritage-Crystal Clean b | 90,267 | 1,096,744 | ||||
Intersections b | 278,445 | 1,291,985 | ||||
Kforce b | 263,833 | 2,181,899 | ||||
Lincoln Educational Services b | 79,735 | 1,668,853 | ||||
Willdan Group b | 277,700 | 541,515 | ||||
| 22,795,619 | ||||||
Engineering and Construction - 2.7% | ||||||
| 159,804 | 4,047,835 | |||||
Exponent b | 128,988 | 3,161,496 | ||||
Layne Christensen b | 73,200 | 1,496,940 | ||||
Sterling Construction b | 136,700 | 2,086,042 | ||||
| 10,792,313 | ||||||
Food, Tobacco and Agriculture - 0.6% | ||||||
Zapata Corporation b | 344,300 | 2,344,683 | ||||
Industrial Distribution - 0.3% | ||||||
Houston Wire & Cable | 110,400 | 1,314,864 | ||||
Printing - 1.8% | ||||||
Courier Corporation | 159,618 | 2,435,771 | ||||
CSS Industries | 84,300 | 1,718,034 | ||||
Domino Printing Sciences | 349,352 | 1,448,282 | ||||
Ennis | 140,600 | 1,751,876 | ||||
| 7,353,963 | ||||||
Transportation and Logistics - 2.7% | ||||||
Euroseas | 488,628 | 2,335,642 | ||||
Marten Transport b | 80,049 | 1,661,817 | ||||
Patriot Transportation Holding b | 61,281 | 4,469,224 | ||||
Vitran Corporation b | 224,050 | 2,218,095 | ||||
| 10,684,778 | ||||||
Total (Cost $65,740,829) | 55,286,220 | |||||
Natural Resources – 16.5% | ||||||
Energy Services - 5.8% | ||||||
Boots & Coots b | 1,311,500 | 1,822,985 | ||||
Dawson Geophysical b | 104,502 | 3,119,385 | ||||
Gulf Island Fabrication | 106,900 | 1,692,227 | ||||
Lamprell | 1,426,100 | 2,696,533 | ||||
| THE ACCOMPANYING NOTES ARE AN INTEGRAL PART OF THESE FINANCIAL STATEMENTS. | Royce Capital Fund 2009 Semiannual Report to Shareholders | 15 |
Schedules of Investments
Royce Capital Fund – Micro-Cap Portfolio (continued) |
| SHARES | VALUE | |||||
Natural Resources (continued) | ||||||
Energy Services (continued) | ||||||
OYO Geospace b | 65,308 | $ | 1,675,803 | |||
Pioneer Drilling b | 145,900 | 698,861 | ||||
Superior Well Services b | 131,100 | 780,045 | ||||
T-3 Energy Services b | 225,345 | 2,683,859 | ||||
Tesco Corporation b | 166,980 | 1,325,821 | ||||
TGC Industries b | 645,356 | 3,142,884 | ||||
Total Energy Services | 570,900 | 2,139,986 | ||||
World Energy Solutions b | 230,700 | 1,199,640 | ||||
| 22,978,029 | ||||||
Oil and Gas - 0.9% | ||||||
Approach Resources b | 235,200 | 1,622,880 | ||||
Gran Tierra Energy b | 560,100 | 1,932,345 | ||||
| 163,200 | 0 | |||||
| 3,555,225 | ||||||
Precious Metals and Mining - 8.8% | ||||||
Alamos Gold b | 391,800 | 3,220,228 | ||||
Allied Nevada Gold b | 554,429 | 4,468,698 | ||||
Aquiline Resources b | 1,146,900 | 1,794,573 | ||||
Bear Creek Mining b | 372,200 | 697,585 | ||||
Crosshair Exploration & Mining b | 1,299,500 | 246,905 | ||||
Eldorado Gold b | 183,000 | 1,637,850 | ||||
| 586,300 | 1,008,436 | |||||
Entree Gold b | 988,700 | 988,700 | ||||
Fronteer Development Group b | 1,173,600 | 4,025,448 | ||||
Gammon Gold b | 244,847 | 1,633,130 | ||||
Great Basin Gold b | 1,086,500 | 1,485,221 | ||||
Horsehead Holding b | 335,300 | 2,497,985 | ||||
Lumina Copper b | 1,004,400 | 630,367 | ||||
Quaterra Resources b | 542,500 | 284,508 | ||||
Red Back Mining b | 234,000 | 2,039,943 | ||||
Silvercorp Metals | 1,100,100 | 3,872,352 | ||||
US Gold b | 1,336,796 | 3,529,141 | ||||
Western Copper b | 1,611,200 | 1,038,903 | ||||
| 35,099,973 | ||||||
Real Estate - 0.6% | ||||||
Kennedy-Wilson b | 74,000 | 2,516,000 | ||||
Other Natural Resources - 0.4% | ||||||
| 1,352,300 | 1,743,928 | |||||
Total (Cost $81,292,762) | 65,893,155 | |||||
Technology – 15.5% | ||||||
Aerospace and Defense - 0.5% | ||||||
Ducommun | 115,800 | 2,175,882 | ||||
Components and Systems - 1.9% | ||||||
LaCie | 297,079 | 1,021,302 | ||||
SMART Modular Technologies (WWH) b | 594,340 | 1,349,152 | ||||
Super Micro Computer b | 320,911 | 2,458,178 | ||||
Vaisala Cl. A | 21,730 | 768,279 | ||||
Xyratex b | 417,000 | 2,080,830 | ||||
| 7,677,741 | ||||||
Distribution - 0.7% | ||||||
Diploma | 1,278,000 | 2,798,449 | ||||
| SHARES | VALUE | |||||
Technology (continued) | ||||||
IT Services - 0.6% | ||||||
Neurones | 300,000 | $ | 2,601,480 | |||
Semiconductors and Equipment - 6.2% | ||||||
Advanced Energy Industries b | 160,200 | 1,440,198 | ||||
ATMI b | 183,900 | 2,855,967 | ||||
CEVA b | 379,500 | 3,294,060 | ||||
GSI Technology b | 482,500 | 1,862,450 | ||||
Ikanos Communications b | 309,400 | 495,040 | ||||
| 158,499 | 2,263,366 | |||||
Rudolph Technologies b | 159,500 | 880,440 | ||||
Semitool b | 317,400 | 1,466,388 | ||||
| 66,125 | 1,060,645 | |||||
Smartrac b | 85,000 | 1,528,244 | ||||
Supertex b | 122,300 | 3,070,953 | ||||
TTM Technologies b | 484,800 | 3,859,008 | ||||
Wolfson Microelectronics b | 338,143 | 549,207 | ||||
| 24,625,966 | ||||||
Software - 1.6% | ||||||
Double-Take Software b | 248,850 | 2,152,553 | ||||
Fundtech b | 184,900 | 1,867,490 | ||||
Pervasive Software b | 224,400 | 1,366,596 | ||||
Phoenix Technologies b | 335,088 | 908,088 | ||||
| 6,294,727 | ||||||
Telecommunications - 4.0% | ||||||
Anaren b | 225,158 | 3,980,793 | ||||
Atlantic Tele-Network | 145,450 | 5,714,731 | ||||
Ceragon Networks b | 376,702 | 2,497,534 | ||||
Digi International b | 265,200 | 2,585,700 | ||||
KVH Industries b | 188,400 | 1,286,772 | ||||
| 16,065,530 | ||||||
Total (Cost $69,476,933) | 62,239,775 | |||||
Miscellaneous e – 3.4% | ||||||
Total (Cost $11,829,597) | 13,684,842 | |||||
TOTAL COMMON STOCKS | ||||||
(Cost $457,150,306) | 371,595,538 | |||||
PREFERRED STOCK – 0.5% | ||||||
(Cost $2,408,000) | 2,408 | 1,949,332 | ||||
REPURCHASE AGREEMENT – 6.8% | ||||||
State Street Bank & Trust Company, 0.01% dated 6/30/09, due 7/1/09, maturity value $27,184,008 (collateralized by obligations of various U.S. Government Agencies, 3.75% due 8/18/09-9/1/09, valued at $27,866,331) | ||||||
(Cost $27,184,000) | 27,184,000 | |||||
| 16 | Royce Capital Fund 2009 Semiannual Report to Shareholders | THE ACCOMPANYING NOTES ARE AN INTEGRAL PART OF THESE FINANCIAL STATEMENTS. |
| Royce Capital Fund – Small-Cap Portfolio |
| VALUE | ||||||
COLLATERAL RECEIVED FOR SECURITIES LOANED – 2.1% | ||||||
| Money Market Funds | ||||||
Federated Government Obligations Fund | ||||||
(7 day yield-0.1864%) | ||||||
(Cost $8,211,572) | $ | 8,211,572 | ||||
TOTAL INVESTMENTS – 102.2% | ||||||
(Cost $494,953,878) | 408,940,442 | |||||
LIABILITIES LESS CASH AND OTHER ASSETS – (2.2)% | (8,731,102 | ) | ||||
NET ASSETS – 100.0% | $ | 400,209,340 | ||||
| SHARES | VALUE | |||||
COMMON STOCKS – 91.4% | ||||||
Consumer Products – 9.4% | ||||||
Apparel, Shoes and Accessories - 5.1% | ||||||
Guess? | 134,800 | $ | 3,475,144 | |||
Steven Madden b | 285,928 | 7,276,868 | ||||
Wolverine World Wide | 318,702 | 7,030,566 | ||||
| 17,782,578 | ||||||
Health, Beauty and Nutrition - 4.3% | ||||||
Inter Parfums | 316,296 | 2,321,613 | ||||
NBTY b | 278,800 | 7,839,856 | ||||
Nu Skin Enterprises Cl. A | 117,500 | 1,797,750 | ||||
Nutraceutical International b | 285,104 | 2,962,230 | ||||
| 14,921,449 | ||||||
Total (Cost $31,327,129) | 32,704,027 | |||||
Consumer Services – 9.4% | ||||||
Leisure and Entertainment - 2.3% | ||||||
International Speedway Cl. A | 169,700 | 4,346,017 | ||||
World Wrestling Entertainment Cl. A | 291,159 | 3,656,957 | ||||
| 8,002,974 | ||||||
Restaurants and Lodgings - 0.2% | ||||||
Ark Restaurants b | 65,332 | 816,650 | ||||
Retail Stores - 6.9% | ||||||
Abercrombie & Fitch Cl. A | 114,100 | 2,896,999 | ||||
American Eagle Outfitters | 282,600 | 4,004,442 | ||||
Buckle (The) | 196,100 | 6,230,097 | ||||
Cato Corporation (The) Cl. A | 240,900 | 4,201,296 | ||||
Dress Barn (The) b | 458,400 | 6,555,120 | ||||
| 23,887,954 | ||||||
Total (Cost $32,653,162) | 32,707,578 | |||||
Financial Intermediaries – 15.1% | ||||||
Insurance - 12.8% | ||||||
† Allied World Assurance Company Holdings | 99,100 | 4,046,253 | ||||
| 213,060 | 2,899,747 | |||||
Amerisafe b | 149,200 | 2,321,552 | ||||
Aspen Insurance Holdings | 319,500 | 7,137,630 | ||||
EMC Insurance Group | 67,464 | 1,403,926 | ||||
Harleysville Group | 122,970 | 3,470,213 | ||||
Max Capital Group | 233,303 | 4,306,773 | ||||
Meadowbrook Insurance Group | 526,600 | 3,438,698 | ||||
Montpelier Re Holdings a | 419,377 | 5,573,520 | ||||
Reinsurance Group of America | 150,600 | 5,257,446 | ||||
State Auto Financial | 50,454 | 882,945 | ||||
Validus Holdings a | 172,300 | 3,787,154 | ||||
| 44,525,857 | ||||||
Securities Brokers - 2.3% | ||||||
Knight Capital Group Cl. A b | 472,000 | 8,047,600 | ||||
Total (Cost $55,038,538) | 52,573,457 | |||||
| THE ACCOMPANYING NOTES ARE AN INTEGRAL PART OF THESE FINANCIAL STATEMENTS. | Royce Capital Fund 2009 Semiannual Report to Shareholders | 17 |
Schedules of Investments
Royce Capital Fund – Small-Cap Portfolio (continued) |
| SHARES | VALUE | |||||
Financial Services – 2.3% | ||||||
Investment Management - 2.3% | ||||||
Federated Investors Cl. B | 325,100 | $ | 7,831,659 | |||
Total (Cost $6,915,985) | 7,831,659 | |||||
Health – 8.2% | ||||||
Drugs and Biotech - 2.2% | ||||||
Emergent Biosolutions b | 241,600 | 3,462,128 | ||||
Obagi Medical Products b | 583,424 | 4,253,161 | ||||
| 7,715,289 | ||||||
Health Services - 3.9% | ||||||
| 244,100 | 4,017,886 | |||||
| 133,000 | 5,603,290 | |||||
U.S. Physical Therapy b | 270,600 | 3,991,350 | ||||
| 13,612,526 | ||||||
Medical Products and Devices - 2.1% | ||||||
Home Diagnostics b | 494,755 | 3,037,796 | ||||
| 189,700 | 4,116,490 | |||||
| 7,154,286 | ||||||
Total (Cost $27,366,693) | 28,482,101 | |||||
Industrial Products – 10.1% | ||||||
Automotive - 0.8% | ||||||
Dorman Products b | 208,259 | 2,880,222 | ||||
Building Systems and Components - 1.0% | ||||||
Drew Industries b | 35,300 | 429,601 | ||||
Simpson Manufacturing | 139,485 | 3,015,666 | ||||
| 3,445,267 | ||||||
Industrial Components - 0.2% | ||||||
Bel Fuse Cl. A | 49,762 | 698,658 | ||||
Machinery - 2.0% | ||||||
Lincoln Electric Holdings | 78,300 | 2,821,932 | ||||
Robbins & Myers | 206,300 | 3,971,275 | ||||
| 6,793,207 | ||||||
Metal Fabrication and Distribution - 2.7% | ||||||
Schnitzer Steel Industries Cl. A | 51,100 | 2,701,146 | ||||
Sims Metal Management ADR | 232,470 | 4,793,531 | ||||
Universal Stainless & Alloy Products b | 124,754 | 2,029,748 | ||||
| 9,524,425 | ||||||
Pumps, Valves and Bearings - 3.1% | ||||||
Gardner Denver b | 229,249 | 5,770,197 | ||||
IDEX Corporation | 54,200 | 1,331,694 | ||||
Kaydon Corporation | 106,600 | 3,470,896 | ||||
| 10,572,787 | ||||||
Other Industrial Products - 0.3% | ||||||
MTS Systems | 54,309 | 1,121,481 | ||||
Total (Cost $39,989,299) | 35,036,047 | |||||
Industrial Services – 10.8% | ||||||
Commercial Services - 8.9% | ||||||
ATC Technology b | 327,459 | 4,748,155 | ||||
Barrett Business Services | 206,126 | 2,164,323 | ||||
Heidrick & Struggles International | 146,500 | 2,673,625 | ||||
| SHARES | VALUE | |||||
Industrial Services (continued) | ||||||
Commercial Services (continued) | ||||||
Kforce b | 314,800 | $ | 2,603,396 | |||
Korn/Ferry International b | 354,000 | 3,766,560 | ||||
ManTech International Cl. A b | 130,400 | 5,612,416 | ||||
MAXIMUS | 90,200 | 3,720,750 | ||||
Resources Connection b | 151,700 | 2,604,689 | ||||
TrueBlue b | 366,300 | 3,076,920 | ||||
| 30,970,834 | ||||||
Industrial Distribution - 0.4% | ||||||
Applied Industrial Technologies | 66,000 | 1,300,200 | ||||
Transportation and Logistics - 1.5% | ||||||
Star Bulk Carriers a | 445,053 | 1,633,345 | ||||
Tidewater | 82,100 | 3,519,627 | ||||
| 5,152,972 | ||||||
Total (Cost $49,222,658) | 37,424,006 | |||||
Natural Resources – 13.9% | ||||||
Energy Services - 9.5% | ||||||
Ensign Energy Services | 276,200 | 4,036,797 | ||||
Helmerich & Payne | 100,700 | 3,108,609 | ||||
Major Drilling Group International | 69,900 | 1,097,342 | ||||
Oil States International b | 330,500 | 8,001,405 | ||||
Patterson-UTI Energy | 174,700 | 2,246,642 | ||||
Pioneer Drilling b | 514,464 | 2,464,283 | ||||
Rowan Companies b | 244,200 | 4,717,944 | ||||
Trican Well Service | 151,400 | 1,304,241 | ||||
Unit Corporation b | 223,300 | 6,156,381 | ||||
| 33,133,644 | ||||||
Oil and Gas - 2.3% | ||||||
Cimarex Energy | 157,818 | 4,472,562 | ||||
† Energen Corporation | 88,600 | 3,535,140 | ||||
| 8,007,702 | ||||||
Precious Metals and Mining - 2.1% | ||||||
Agnico-Eagle Mines | 55,500 | 2,912,640 | ||||
Pan American Silver b | 124,900 | 2,289,417 | ||||
Red Back Mining b | 238,000 | 2,074,814 | ||||
| 7,276,871 | ||||||
Total (Cost $52,685,225) | 48,418,217 | |||||
Technology – 10.4% | ||||||
Components and Systems - 1.7% | ||||||
Rimage Corporation b | 244,045 | 4,053,588 | ||||
| 240,291 | 1,840,629 | |||||
| 5,894,217 | ||||||
IT Services - 1.1% | ||||||
Total System Services | 277,200 | 3,711,708 | ||||
Semiconductors and Equipment - 4.5% | ||||||
Advanced Energy Industries b | 305,702 | 2,748,261 | ||||
MKS Instruments b | 243,300 | 3,209,127 | ||||
OmniVision Technologies b | 88,414 | 918,621 | ||||
Rofin-Sinar Technologies b | 148,394 | 2,969,364 | ||||
Varian Semiconductor Equipment Associates b | 122,800 | 2,945,972 | ||||
| 18 | Royce Capital Fund 2009 Semiannual Report to Shareholders | THE ACCOMPANYING NOTES ARE AN INTEGRAL PART OF THESE FINANCIAL STATEMENTS. |
| SHARES | VALUE | |||||
Technology (continued) | ||||||
Semiconductors and Equipment (continued) | ||||||
Verigy b | 224,200 | $ | 2,728,514 | |||
| 15,519,859 | ||||||
Telecommunications - 3.1% | ||||||
Comtech Telecommunications b | 195,866 | 6,244,208 | ||||
NETGEAR b | 327,600 | 4,720,716 | ||||
| 10,964,924 | ||||||
Total (Cost $46,198,053) | 36,090,708 | |||||
Miscellaneous e – 1.8% | ||||||
Total (Cost $5,356,481) | 6,103,455 | |||||
TOTAL COMMON STOCKS | ||||||
(Cost $346,753,223) | 317,371,255 | |||||
REPURCHASE AGREEMENT – 9.0% | ||||||
State Street Bank & Trust Company, 0.01% dated 6/30/09, due 7/1/09, maturity value $31,314,009 (collateralized by obligations of various U.S. Government Agencies, 1.62% due 12/30/09, valued at $32,101,287) | ||||||
(Cost $31,314,000) | 31,314,000 | |||||
COLLATERAL RECEIVED FOR SECURITIES LOANED – 1.6% | ||||||
| Money Market Funds | ||||||
Federated Government Obligations Fund | ||||||
(7 day yield-0.1864%) | ||||||
(Cost $5,723,721) | 5,723,721 | |||||
TOTAL INVESTMENTS – 102.0% | ||||||
(Cost $383,790,944) | 354,408,976 | |||||
LIABILITIES LESS CASH AND OTHER ASSETS – (2.0)% | (7,051,757 | ) | ||||
NET ASSETS – 100.0% | $ | 347,357,219 | ||||
| THE ACCOMPANYING NOTES ARE AN INTEGRAL PART OF THESE FINANCIAL STATEMENTS. | Royce Capital Fund 2009 Semiannual Report to Shareholders | 19 |
| Statements of Assets and Liabilities | June 30, 2009 (unaudited) |
| Micro-Cap | Small-Cap | ||||||
| Portfolio | Portfolio | ||||||
| ASSETS: | |||||||
| Investments at value | |||||||
(including collateral on loaned securities)* | $ | 381,756,442 | $ | 323,094,976 | |||
| Repurchase agreements (at cost and value) | 27,184,000 | 31,314,000 | |||||
| Cash and foreign currency | 14,907 | 34,261 | |||||
| Receivable for investments sold | 1,501,379 | 847,300 | |||||
| Receivable for capital shares sold | 547,895 | 909,752 | |||||
| Receivable for dividends and interest | 246,856 | 190,343 | |||||
| Prepaid expenses and other assets | 3,201 | 2,055 | |||||
Total Assets | 411,254,680 | 356,392,687 | |||||
| LIABILITIES: | |||||||
| Payable for collateral on loaned securities | 8,211,572 | 5,723,721 | |||||
| Payable for investments purchased | 1,920,092 | 747,299 | |||||
| Payable for capital shares redeemed | 407,272 | 2,186,538 | |||||
| Payable for investment advisory fees | 411,399 | 291,277 | |||||
| Accrued expenses | 95,005 | 86,633 | |||||
Total Liabilities | 11,045,340 | 9,035,468 | |||||
Net Assets | $ | 400,209,340 | $ | 347,357,219 | |||
| ANALYSIS OF NET ASSETS: | |||||||
| Paid-in capital | $ | 538,190,838 | $ | 429,302,685 | |||
| Undistributed net investment income (loss) | 397,563 | 234,273 | |||||
| Accumulated net realized gain (loss) on investments and foreign currency | (52,367,813 | ) | (52,797,234 | ) | |||
| Net unrealized appreciation (depreciation) on investments and foreign currency | (86,011,248 | ) | (29,382,505 | ) | |||
Net Assets | $ | 400,209,340 | $ | 347,357,219 | |||
Investment Class | $ | 395,670,716 | $ | 345,458,286 | |||
Service Class | 4,538,624 | 1,898,933 | |||||
| SHARES OUTSTANDING: | |||||||
| (unlimited number of $.001 par value shares authorized for each Fund) | |||||||
Investment Class | 53,949,045 | 50,160,422 | |||||
Service Class | 620,485 | 276,729 | |||||
| NET ASSET VALUES: | |||||||
| (Net Assets ÷ Shares Outstanding) | |||||||
(offering and redemption price per share) | |||||||
Investment Class | $ | 7.33 | $ | 6.89 | |||
Service Class | 7.31 | 6.86 | |||||
| * Investments at identified cost | $ | 467,769,878 | $ | 352,476,944 | |||
| Market value of loaned securities | 7,928,777 | 5,523,747 | |||||
| 20 | Royce Capital Fund 2009 Semiannual Report to Shareholders | THE ACCOMPANYING NOTES ARE AN INTEGRAL PART OF THESE FINANCIAL STATEMENTS. |
Statements of Changes in Net Assets
| Micro-Cap Portfolio | Small-Cap Portfolio | |||||||||||||||
| Six months ended | Six months ended | |||||||||||||||
| 6/30/09 | Year ended | 6/30/09 | Year ended | |||||||||||||
| (unaudited) | 12/31/08 | (unaudited) | 12/31/08 | |||||||||||||
| INVESTMENT OPERATIONS: | ||||||||||||||||
| Net investment income (loss) | $ | 467,849 | $ | 5,317,872 | $ | 227,059 | $ | 246,375 | ||||||||
| Net realized gain (loss) on investments and foreign currency | (22,382,891 | ) | (21,207,803 | ) | (42,768,717 | ) | (8,246,378 | ) | ||||||||
| Net change in unrealized appreciation (depreciation) on | ||||||||||||||||
investments and foreign currency | 91,250,716 | (244,986,123 | ) | 66,892,367 | (94,474,073 | ) | ||||||||||
| Net increase (decrease) in net assets from investment operations | 69,335,674 | (260,876,054 | ) | 24,350,709 | (102,474,076 | ) | ||||||||||
| DISTRIBUTIONS: | ||||||||||||||||
| Net investment income | ||||||||||||||||
Investment Class | – | (13,058,155 | ) | – | (2,337,827 | ) | ||||||||||
Service Class | – | (90,960 | ) | – | (6,931 | ) | ||||||||||
| Net realized gain on investments and foreign currency | ||||||||||||||||
Investment Class | – | (54,721,733 | ) | – | (30,054,260 | ) | ||||||||||
Service Class | – | (414,258 | ) | – | (152,571 | ) | ||||||||||
| Total distributions | – | (68,285,106 | ) | – | (32,551,589 | ) | ||||||||||
| CAPITAL SHARE TRANSACTIONS: | ||||||||||||||||
| Value of shares sold | ||||||||||||||||
Investment Class | 42,421,730 | 96,537,277 | 67,464,632 | 105,771,986 | ||||||||||||
Service Class | 332,632 | 3,214,943 | 1,330,686 | 526,046 | ||||||||||||
| Distributions reinvested | ||||||||||||||||
Investment Class | – | 67,779,888 | – | 32,392,087 | ||||||||||||
Service Class | – | 505,218 | – | 159,502 | ||||||||||||
| Value of shares redeemed | ||||||||||||||||
Investment Class | (43,318,809 | ) | (139,333,402 | ) | (38,005,674 | ) | (57,692,282 | ) | ||||||||
Service Class | (346,097 | ) | (1,226,979 | ) | (1,119,187 | ) | (189,298 | ) | ||||||||
Net increase (decrease) in net assets from capital share transactions | (910,544 | ) | 27,476,945 | 29,670,457 | 80,968,041 | |||||||||||
| NET INCREASE (DECREASE) IN NET ASSETS | 68,425,130 | (301,684,215 | ) | 54,021,166 | (54,057,624 | ) | ||||||||||
| NET ASSETS: | ||||||||||||||||
Beginning of period | 331,784,210 | 633,468,425 | 293,336,052 | 347,393,676 | ||||||||||||
End of period | $ | 400,209,340 | $ | 331,784,210 | $ | 347,357,218 | $ | 293,336,052 | ||||||||
| UNDISTRIBUTED NET INVESTMENT | ||||||||||||||||
INCOME (LOSS) AT END OF PERIOD | $ | 397,563 | $ | (70,286 | ) | $ | 234,273 | $ | 7,214 | |||||||
| THE ACCOMPANYING NOTES ARE AN INTEGRAL PART OF THESE FINANCIAL STATEMENTS. | Royce Capital Fund 2009 Semiannual Report to Shareholders | 21 |
| Statements of Operations | Six Months Ended June 30, 2009 (unaudited) |
| Micro-Cap | Small-Cap | |||||||
| Portfolio | Portfolio | |||||||
| INVESTMENT INCOME: | ||||||||
| Income: | ||||||||
Dividends | $ | 2,588,083 | $ | 1,818,952 | ||||
Interest | 12,113 | 11,644 | ||||||
Securities lending | 109,388 | 4,856 | ||||||
| Total income | 2,709,584 | 1,835,452 | ||||||
| Expenses: | ||||||||
Investment advisory fees | 2,074,867 | 1,476,433 | ||||||
Distribution fees | 4,743 | 2,104 | ||||||
Custody | 47,025 | 17,850 | ||||||
Shareholder reports | 32,067 | 34,898 | ||||||
Administrative and office facilities | 26,779 | 22,274 | ||||||
Audit | 17,500 | 17,500 | ||||||
Trustees’ fees | 16,243 | 14,710 | ||||||
Shareholder servicing | 9,875 | 9,693 | ||||||
Legal | 4,655 | 3,693 | ||||||
Registration | 1,083 | 4,763 | ||||||
Other expenses | 11,678 | 8,772 | ||||||
| Total expenses | 2,246,515 | 1,612,690 | ||||||
| Compensating balance credits | – | (31 | ) | |||||
| Expenses reimbursed by investment adviser | (4,780 | ) | (4,266 | ) | ||||
| Net expenses | 2,241,735 | 1,608,393 | ||||||
| Net investment income (loss) | 467,849 | 227,059 | ||||||
| REALIZED AND UNREALIZED GAIN (LOSS) ON INVESTMENTS AND FOREIGN CURRENCY: | ||||||||
| Net realized gain (loss): | ||||||||
Investments | (22,384,585 | ) | (42,768,222 | ) | ||||
Foreign currency transactions | 1,694 | (495 | ) | |||||
| Net change in unrealized appreciation (depreciation): | ||||||||
Investments and foreign currency translations | 91,240,553 | 66,892,369 | ||||||
Other assets and liabilities denominated in foreign currency | 10,163 | (2 | ) | |||||
| Net realized and unrealized gain (loss) on investments and foreign currency | 68,867,825 | 24,123,650 | ||||||
| NET INCREASE (DECREASE) IN NET ASSETS FROM INVESTMENT OPERATIONS | $ | 69,335,674 | $ | 24,350,709 | ||||
| 22 | Royce Capital Fund 2009 Semiannual Report to Shareholders | THE ACCOMPANYING NOTES ARE AN INTEGRAL PART OF THESE FINANCIAL STATEMENTS. |
| This table is presented to show selected data for a share outstanding throughout each period, and to assist shareholders in evaluating a Fund’s performance for the periods presented. Per share amounts have been determined on the basis of the weighted average number of shares outstanding during the period. | |||||||||||||||||||||||||||||||||||||||||||||||||||||||||
| Net Realized and | Distributions from Net | Ratio of Expenses to Average Net Assets | Ratio of Net Investment | ||||||||||||||||||||||||||||||||||||||||||||||||||||||
| Net Asset Value, Beginning of Period | Net Investment Income (Loss) | Unrealized Gain (Loss) on Investments and Foreign Currency | Total from Investment Operations | Distributions from Net Investment Income | Realized Gain on Investments and Foreign Currency | Total Distributions | Net Asset Value, End of Period | Total Return | Net Assets, End of Period (in thousands) | Prior to Fee Waivers and Balance Credits | Prior to Fee Waivers | Net of Fee Waivers | Income (Loss) to Average Net Assets | Portfolio Turnover Rate | |||||||||||||||||||||||||||||||||||||||||||
| Micro-Cap Portfolio – Investment Class | |||||||||||||||||||||||||||||||||||||||||||||||||||||||||
| †2009 | $ | 6.03 | $ | 0.01 | $ | 1.29 | $ | 1.30 | $ | – | $ | – | $ | – | $ | 7.33 | 21.56 | %# | $ | 395,671 | 1.35 | %* | 1.35 | %* | 1.35 | %* | 0.28 | %* | 20 | % | |||||||||||||||||||||||||||
| 2008 | 13.47 | 0.13 | (5.99 | ) | (5.86 | ) | (0.30 | ) | (1.28 | ) | (1.58 | ) | 6.03 | (43.27 | ) | 328,059 | 1.32 | 1.32 | 1.32 | 1.05 | 51 | ||||||||||||||||||||||||||||||||||||
| 2007 | 14.40 | 0.03 | 0.53 | 0.56 | (0.22 | ) | (1.27 | ) | (1.49 | ) | 13.47 | 3.98 | 629,953 | 1.31 | 1.31 | 1.31 | 0.19 | 47 | |||||||||||||||||||||||||||||||||||||||
| 2006 | 12.57 | 0.01 | 2.63 | 2.64 | (0.03 | ) | (0.78 | ) | (0.81 | ) | 14.40 | 21.07 | 561,257 | 1.32 | 1.31 | 1.31 | (0.09 | ) | 41 | ||||||||||||||||||||||||||||||||||||||
| 2005 | 11.50 | (0.05 | ) | 1.38 | 1.33 | (0.06 | ) | (0.20 | ) | (0.26 | ) | 12.57 | 11.61 | 384,069 | 1.33 | 1.33 | 1.33 | (0.51 | ) | 38 | |||||||||||||||||||||||||||||||||||||
| 2004 | 10.90 | (0.09 | ) | 1.58 | 1.49 | – | (0.89 | ) | (0.89 | ) | 11.50 | 13.85 | 345,499 | 1.34 | 1.34 | 1.34 | (0.78 | ) | 38 | ||||||||||||||||||||||||||||||||||||||
| Micro-Cap Portfolio – Service Class(a) | |||||||||||||||||||||||||||||||||||||||||||||||||||||||||
| †2009 | $ | 6.02 | $ | 0.00 | $ | 1.29 | $ | 1.29 | $ | – | $ | – | $ | – | $ | 7.31 | 21.43 | %# | $ | 4,538 | 1.83 | %* | 1.83 | %* | 1.58 | %* | 0.06 | %* | 20 | % | |||||||||||||||||||||||||||
| 2008 | 13.45 | 0.05 | (5.92 | ) | (5.87 | ) | (0.28 | ) | (1.28 | ) | (1.56 | ) | 6.02 | (43.44 | ) | 3,725 | 1.92 | 1.92 | 1.58 | 0.70 | 51 | ||||||||||||||||||||||||||||||||||||
| 2007 | 14.39 | (0.06 | ) | 0.58 | 0.52 | (0.19 | ) | (1.27 | ) | (1.46 | ) | 13.45 | 3.71 | 3,515 | 2.11 | 2.11 | 1.58 | (0.06 | ) | 47 | |||||||||||||||||||||||||||||||||||||
| 2006 | 14.90 | (0.04 | ) | 0.34 | 0.30 | (0.02 | ) | (0.79 | ) | (0.81 | ) | 14.39 | 2.06 | # | 1,262 | 8.67 | * | 8.67 | * | 1.58 | * | 0.16 | * | 41 | |||||||||||||||||||||||||||||||||
| Small-Cap Portfolio – Investment Class | |||||||||||||||||||||||||||||||||||||||||||||||||||||||||
| †2009 | $ | 6.42 | $ | 0.00 | $ | 0.47 | $ | 0.47 | $ | – | $ | – | $ | – | $ | 6.89 | 7.32 | %# | $ | 345,458 | 1.09 | %* | 1.09 | %* | 1.09 | %* | 0.16 | %* | 23 | % | |||||||||||||||||||||||||||
| 2008 | 9.96 | 0.00 | (2.72 | ) | (2.72 | ) | (0.06 | ) | (0.76 | ) | (0.82 | ) | 6.42 | (27.18 | ) | 291,898 | 1.07 | 1.07 | 1.07 | 0.07 | 45 | ||||||||||||||||||||||||||||||||||||
| 2007 | 10.67 | 0.07 | (0.30 | ) | (0.23 | ) | (0.00 | ) | (0.48 | ) | (0.48 | ) | 9.96 | (2.14 | ) | 345,747 | 1.09 | 1.08 | 1.08 | 0.60 | 64 | ||||||||||||||||||||||||||||||||||||
| 2006 | 9.67 | 0.00 | 1.51 | 1.51 | (0.01 | ) | (0.50 | ) | (0.51 | ) | 10.67 | 15.57 | 274,089 | 1.08 | 1.08 | 1.08 | 0.08 | 54 | |||||||||||||||||||||||||||||||||||||||
| 2005 | 9.00 | 0.01 | 0.76 | 0.77 | – | (0.10 | ) | (0.10 | ) | 9.67 | 8.56 | 187,039 | 1.11 | 1.11 | 1.11 | 0.11 | 45 | ||||||||||||||||||||||||||||||||||||||||
| 2004 | 7.59 | (0.05 | ) | 1.93 | 1.88 | – | (0.47 | ) | (0.47 | ) | 9.00 | 24.95 | 110,911 | 1.14 | 1.14 | 1.14 | (0.62 | ) | 47 | ||||||||||||||||||||||||||||||||||||||
| Small-Cap Portfolio – Service Class(a) | |||||||||||||||||||||||||||||||||||||||||||||||||||||||||
| †2009 | $ | 6.40 | $ | (0.00 | ) | $ | 0.46 | $ | 0.46 | $ | – | $ | – | $ | – | $ | 6.86 | 7.19 | %# | $ | 1,899 | 1.86 | %* | 1.86 | %* | 1.36 | %* | (0.08 | )%* | 23 | % | ||||||||||||||||||||||||||
| 2008 | 9.94 | (0.02 | ) | (2.73 | ) | (2.75 | ) | (0.03 | ) | (0.76 | ) | (0.79 | ) | 6.40 | (27.50 | ) | 1,438 | 1.96 | 1.96 | 1.36 | (0.21 | ) | 45 | ||||||||||||||||||||||||||||||||||
| 2007 | 10.67 | 0.03 | (0.28 | ) | (0.25 | ) | – | (0.48 | ) | (0.48 | ) | 9.94 | (2.37 | ) | 1,647 | 2.09 | 2.09 | 1.36 | 0.23 | 64 | |||||||||||||||||||||||||||||||||||||
| 2006 | 10.85 | (0.01 | ) | 0.33 | 0.32 | – | (0.50 | ) | (0.50 | ) | 10.67 | 2.94 | # | 103 | 15.77 | * | 15.77 | * | 1.36 | * | (0.12 | )* | 54 | ||||||||||||||||||||||||||||||||||
| (a) | The Class commenced operations on May 2, 2006. | |
| * | Annualized. | |
| # | Not annualized. | |
| † | Six months ended June 30, 2009 (unaudited). |
| THE ACCOMPANYING NOTES ARE AN INTEGRAL PART OF THESE FINANCIAL STATEMENTS. | Royce Capital Fund 2009 Semiannual Report to Shareholders | 23 |
| Notes to Financial Statements (unaudited) | |
| Various inputs are used in determining the value of each Fund’s investments, as noted above. These inputs are summarized in the three broad levels below: | ||
| Level 1 – quoted prices in active markets for identical securities | ||
| Level 2 – other significant observable inputs (including quoted prices for similar securities, foreign securities that may be fair valued and repurchase agreements) | ||
| Level 3 – significant unobservable inputs (including each Fund’s own assumptions in determining the fair value of investments) | ||
| The inputs or methodology used for valuing securities are not necessarily an indication of the risk associated with investing in those securities. | ||
| The following is a summary of the inputs used to value each Fund’s investments as of June 30, 2009: | ||
| Level 1 | Level 2 | Level 3 | Total | ||||||||
| Micro-Cap Portfolio | |||||||||||
Equities | $266,466,833 | $103,384,777 | $3,693,260 | $373,544,870 | |||||||
Cash equivalents | – | 35,395,572 | – | 35,395,572 | |||||||
| Small-Cap Portfolio | |||||||||||
Equities | 308,858,061 | 8,513,194 | – | 317,371,255 | |||||||
Cash equivalents | – | 37,037,721 | – | 37,037,721 | |||||||
Level 3 Reconciliation: |
| Balance as of 12/31/08 | Change in unrealized (depreciation) | Purchases | Balance as of 6/30/09 | ||||||||
| Micro-Cap Portfolio | |||||||||||
Equities | $1,949,331 | $(15,549) | $1,759,478 | $3,693,260 |
| 24 | Royce Capital Fund 2009 Semiannual Report to Shareholders |
Foreign Currency:
Securities Lending:
Distributions and Taxes:
Investment Transactions and Related Investment Income:
Expenses:
Compensating Balance Credits:
Line of Credit:
| Shares issued for | ||||||||||||||||||||||||||
| Shares sold | reinvestment of distributions | Shares redeemed | Net increase (decrease) in shares outstanding | |||||||||||||||||||||||
| Period ended | Period ended | Period ended | Period ended | |||||||||||||||||||||||
| 6/30/09 | Year ended | 6/30/09 | Year ended | 6/30/09 | Year ended | 6/30/09 | Year ended | |||||||||||||||||||
| (unaudited) | 12/31/08 | (unaudited) | 12/31/08 | (unaudited) | 12/31/08 | (unaudited) | 12/31/08 | |||||||||||||||||||
| Micro-Cap Portfolio | ||||||||||||||||||||||||||
Investment Class | 6,834,915 | 8,756,498 | – | 11,468,678 | (7,258,136 | ) | (12,618,795 | ) | (423,221 | ) | 7,606,381 | |||||||||||||||
Service Class | 55,708 | 391,826 | – | 85,630 | (53,618 | ) | (120,467 | ) | 2,090 | 356,989 | ||||||||||||||||
| Small-Cap Portfolio | ||||||||||||||||||||||||||
Investment Class | 10,930,454 | 12,033,099 | – | 5,149,775 | (6,260,662 | ) | (6,394,795 | ) | 4,669,792 | 10,788,079 | ||||||||||||||||
Service Class | 253,240 | 55,764 | – | 25,398 | (201,149 | ) | (22,258 | ) | 52,091 | 58,904 | ||||||||||||||||
| Royce Capital Fund 2009 Semiannual Report to Shareholders | 25 |
Notes to Financial Statements (unaudited) (continued)
Investment Adviser and Distributor:
Investment Adviser: Under the Trust’s investment advisory agreements with Royce, Royce is entitled to receive Investment Advisory fees that are computed daily and payable monthly, at an annual rate of 1.25% and 1.00% of the average net assets of Micro-Cap Portfolio and Small-Cap Portfolio, respectively. Royce has contractually committed to reimburse expenses (excluding acquired fund fees and expenses) to the extent necessary to maintain the net annual operating expense ratios to average net assets at or below 1.58% and 1.36% for the Service Classes of Micro- Cap Portfolio and Small-Cap Portfolio, respectively, through December 31, 2009. For the six months ended June 30, 2009, Micro-Cap Portfolio recorded advisory fees of $2,074,867 and Small-Cap Portfolio recorded advisory fees of $1,476,433.
Distributor: Royce Fund Services, Inc. (“RFS”), the distributor of the Trust’s shares, is a wholly owned subsidiary of Royce. RFS is entitled to receive distribution fees from each Fund’s Service Class that are computed daily and payable monthly, at an annual rate of 0.25% of the average net assets of each Class. For the six months ended June 30, 2009, Micro-Cap Portfolio-Service Class recorded net distribution fees of $4,743 and Small-Cap Portfolio-Service Class recorded net distribution fees of $2,104.
| Purchases | Sales | |||
| Micro-Cap Portfolio | $62,390,349 | $70,738,236 | ||
| Small-Cap Portfolio | 82,515,385 | 62,291,606 |
Class Specific Expenses:
Class specific expenses were as follows for the six months ended June 30, 2009:
| Expenses | |||||||||||||||||||||||||||||
| Transfer | Reimbursed | ||||||||||||||||||||||||||||
| Net | Agent | by | |||||||||||||||||||||||||||
| Distribution | Shareholder | Shareholder | Balance | Investment | |||||||||||||||||||||||||
| Fees | Servicing | Reports | Registration | Credits | Total | Adviser | |||||||||||||||||||||||
| Micro-Cap Portfolio – Investment Class | $ | – | $ | 5,759 | $ | 31,398 | $ | 982 | $ | – | $ | 38,139 | $ | – | |||||||||||||||
| Micro-Cap Portfolio – Service Class | 4,743 | 4,116 | 669 | 101 | – | 9,629 | 4,780 | ||||||||||||||||||||||
| 4,743 | 9,875 | 32,067 | 1,083 | – | 4,780 | ||||||||||||||||||||||||
| Small-Cap Portfolio – Investment Class | – | 5,585 | 34,363 | 4,735 | – | 44,683 | – | ||||||||||||||||||||||
| Small-Cap Portfolio – Service Class | 2,104 | 4,108 | 535 | 28 | – | 6,775 | 4,266 | ||||||||||||||||||||||
| 2,104 | 9,693 | 34,898 | 4,763 | – | 4,266 | ||||||||||||||||||||||||
| Net Unrealized | Gross Unrealized | |||||||||||||
| Appreciation | ||||||||||||||
| Tax Basis Cost | (Depreciation) | Appreciation | Depreciation | |||||||||||
| Micro-Cap Portfolio | $495,273,977 | $(86,333,535 | ) | $49,078,928 | $135,412,463 | |||||||||
| Small-Cap Portfolio | 383,860,339 | (29,451,363 | ) | 28,032,093 | 57,483,456 | |||||||||
The primary difference between book and tax basis cost is the timing of the recognition of losses on securities sold.
Restricted Securities:
Certain of the Funds’ investments are restricted as to resale and are valued at their fair value under procedures established by the Funds’ Board of Trustees.
| Number | Acquisition | Fair Value at | |||||||||||
| Security | of Shares | Dates | Cost | 6/30/09 | Percent of Net Assets | Distributions Received | |||||||
| Micro-Cap Portfolio | |||||||||||||
| Kennedy-Wilson Conv. | 2,408 | 5/08, 9/08 | $2,408,000 | $1,949,332 | 0.5% | $42,140 | |||||||
| Magma Energy | 1,352,300 | 6/09 | 1,759,478 | 1,743,928 | 0.4 | – |
| 26 | Royce Capital Fund 2009 Semiannual Report to Shareholders |
Understanding Your Fund’s Expenses (unaudited)
As a shareholder of a mutual fund, you pay ongoing expenses, including management fees and other Fund expenses including, for some funds, distribution and/or service (12b-1) fees. Using the information below, you can estimate how these ongoing expenses (in dollars) affect your investment and compare them with the ongoing expenses of other funds. You may also incur one-time transaction expenses which are not shown in this section and would result in higher total costs. The example is based on an investment of $1,000 invested at January 1, 2009 and held for the entire six-month period ended June 30, 2009. Service Class shares are generally available only through certain insurance companies, brokers or retirement plan administrators who receive service fees from the Fund for services that they perform.
Actual Expenses
The first part of the table below provides information about actual account values and actual expenses. You may use the information in this section, together with the amount you invested, to estimate the expenses that you paid over the period. Simply divide your account value at June 30, 2009 by $1,000 (for example, an $8,600 account value divided by $1,000 = 8.6), then multiply the result by the number under the heading entitled “Expenses Paid During the Period” to estimate the expenses you paid on your account during this period.
Hypothetical Example for Comparison Purposes
The second part of the table below provides information about hypothetical account values and hypothetical expenses based on the Fund’s actual expense ratio and an assumed rate of return of 5% per year before expenses, which is not the Fund’s actual return. The hypothetical account values and expenses may not be used to estimate the actual ending account balance or expenses you paid for the period. You may use this information to compare the ongoing costs of investing in the Fund and other funds. To do so, compare this 5% hypothetical example with the 5% hypothetical examples that appear in the shareholder reports of the other funds.
Please note that the expenses shown in the table are meant to highlight your ongoing costs only and do not reflect any transactional costs, such as sales charges (loads), redemption fees, or exchange fees. Therefore, this section is useful in comparing ongoing costs only, and will not help you determine the relative total costs of owning different funds. In addition, if these transactional costs were included, your costs would have been higher.
| Actual | Hypothetical (5% per year return before expenses) | |||||||||||||||||||||||||||
| Beginning | Ending | Expenses Paid | Beginning | Ending | Expenses Paid | Annualized | ||||||||||||||||||||||
| Account Value | Account Value | During the | Account Value | Account Value | During the | Expense | ||||||||||||||||||||||
| 1/1/09 | 6/30/09 | Period(1) | 1/1/09 | 6/30/09 | Period(1) | Ratio(2) | ||||||||||||||||||||||
| Investment Class | ||||||||||||||||||||||||||||
| Micro-Cap Portfolio | $ | 1,000.00 | $ | 1,215.59 | $ | 7.42 | $ | 1,000.00 | $ | 1,018.10 | $ | 6.76 | 1.35 | % | ||||||||||||||
| Small-Cap Portfolio | 1,000.00 | 1,073.21 | 5.60 | 1,000.00 | 1,019.39 | 5.46 | 1.09 | % | ||||||||||||||||||||
| Service Class | ||||||||||||||||||||||||||||
| Micro-Cap Portfolio | 1,000.00 | 1,214.29 | 8.67 | 1,000.00 | 1,016.96 | 7.90 | 1.58 | % | ||||||||||||||||||||
| Small-Cap Portfolio | 1,000.00 | 1,071.88 | 6.99 | 1,000.00 | 1,018.05 | 6.80 | 1.36 | % | ||||||||||||||||||||
| Royce Capital Fund 2009 Semiannual Report to Shareholders | 27 |
Board Approval of Investment Advisory Agreements
At meetings held on June 10-11, 2009, Royce Capital Fund’s Board of Trustees, including all of the non-interested trustees, approved the continuance of the Investment Advisory Agreements between Royce & Associates, LLC (“R&A”) and Royce Capital Fund relating to each of Royce Micro-Cap Portfolio and Royce Small-Cap Portfolio (the “Funds”). In reaching these decisions, the Board reviewed the materials provided by R&A, which included, among other things, information prepared internally by R&A and independently by Morningstar Associates, LLC (“Morningstar”) containing detailed expense ratio and investment performance comparisons for each Fund with other mutual funds in their “peer group” and “category”, information regarding the past performance of Funds managed by R&A and a memorandum outlining the legal duties of the Board prepared by independent counsel to the non-interested trustees. R&A also provided the trustees with an analysis of its profitability with respect to providing investment advisory services to each of the Funds. In addition, the Board took into account information furnished throughout the year at regular Board meetings, including reports on investment performance, shareholder services, distribution fees and expenses, regulatory compliance, brokerage commissions and research, and brokerage and execution products and services provided to the Funds. The Board also considered other matters it deemed important to the approval process such as allocation of brokerage commissions, payments made to R&A or its affiliates relating to distribution of Fund shares and other direct and indirect benefits to R&A and its affiliates, from their relationship with the Funds. The trustees also met throughout the year with investment advisory personnel from R&A. The Board, in its deliberations, recognized that, for many of the Funds’ shareholders, the decision to purchase Fund shares included a decision to select R&A as the investment adviser and that there was a strong association in the minds of Fund shareholders between R&A and each Fund. In considering factors relating to the approval of the continuance of the Investment Advisory Agreements, the non-interested trustees received assistance and advice from, and met separately with, their independent legal counsel. While the Investment Advisory Agreements for the Funds were considered at the same meetings, the trustees dealt with each agreement separately. Among other factors, the trustees noted that they considered the following: The nature, extent and quality of services provided by R&A: The trustees considered the following factors to be of fundamental importance to their consideration of whether to approve the continuance of the Funds’ Investment Advisory Agreements: (i) R&A’s more than 35 years of value investing experience and track record; (ii) the history of long-tenured R&A portfolio managers managing The Royce Funds; (iii) R&A’s focus on mid-cap, small-cap and micro-cap value investing; (iv) the consistency of R&A’s approach to managing The Royce Funds over more than 35 years; (v) the integrity and high ethical standards adhered to at R&A; (vi) R&A’s specialized experience in the area of trading small- and micro-cap securities; (vii) R&A’s historical ability to attract and retain portfolio management talent and (viii) R&A’s focus on shareholder interests. The trustees reviewed the services that R&A provides to the Funds, including, but not limited to, managing each Fund’s investments in accordance with the stated policies of each Fund. The Board considered the fact that R&A provided certain administrative services to the Fund at cost pursuant to the Administration Agreement between the Fund and R&A which went into effect on January 1, 2008. The trustees determined that the services to be provided to each Fund by R&A would be the same as those it | previously provided to the Funds. They also took into consideration the histories, reputations and backgrounds of R&A’s portfolio managers for the Funds, finding that these would likely have an impact on the continued success of the Funds. Lastly, the trustees noted R&A’s ability to attract and retain quality and experienced personnel. The trustees concluded that the investment advisory services provided by R&A to each Fund compared favorably to services provided by R&A to other R&A client accounts, including other funds, in both nature and quality, and that the scope of services provided by R&A would continue to be suitable for each Fund. Investment performance of the Funds and R&A: In light of R&A’s risk-averse approach to investing, the trustees believe that risk-adjusted performance continues to be an appropriate measure of each Fund’s investment performance. One measure of risk-adjusted performance the trustees have historically used in their review of the Funds’ performance is the Sharpe Ratio. The Sharpe Ratio is a risk-adjusted measure of performance developed by Nobel Laureate William Sharpe. It is calculated by dividing a fund’s annualized excess returns by its annualized standard deviation to determine reward per unit of risk. The higher the Sharpe Ratio, the better a fund’s historical risk-adjusted performance. The Board attaches primary importance to risk-adjusted performance over relatively long periods of time, typically three to ten years. The trustees noted that Royce Micro-Cap Portfolio’s Sharpe Ratio placed in the 2nd quartile within Morningstar’s small blend category for the three- and five-year periods and in the 1st quartile for the ten-year period ended December 31, 2008, and Royce Small-Cap Portfolio placed in the 1st quartile for the three-year, five-year and ten-year periods within Morningstar’s small blend category. The trustees noted that R&A manages a number of funds that invest in small-cap and micro-cap issuers, many of which were outperforming the Russell 2000 Index and their competitors. Although the trustees recognized that past performance is not necessarily an indicator of future results, they found that R&A had the necessary qualifications, experience and track record in managing small-cap and micro-cap securities to manage the Funds. The trustees determined that R&A continued to be an appropriate investment adviser for the Funds and concluded that each Fund’s performance supported the renewal of its Investment Advisory Agreement. Cost of the services provided and profits realized by R&A from its relationship with each Fund: The trustees considered the cost of the services provided by R&A and profits realized by R&A from its relationship with each Fund. As part of the analysis, the Board discussed with R&A its methodology in allocating its costs to each Fund and concluded that its allocations were reasonable. The trustees concluded that R&A’s profits were reasonable in relation to the nature and quality of services provided. The extent to which economies of scale would be realized as the Funds grow and whether fee levels would reflect such economies of scale: The trustees considered whether there have been economies of scale in respect of the management of the Funds, whether each of the Funds has appropriately benefited from any economies of scale and whether there is potential for realization of any further economies of scale. The trustees noted the time and effort involved in managing portfolios of small- and micro-cap stocks and that they did not involve the same efficiencies as do portfolios of large cap stocks. The trustees concluded that the current fee structure for each Fund was reasonable, and that no changes were currently necessary. |
| 28 | Royce Capital Fund 2009 Semiannual Report to Shareholders |
Comparison of services to be rendered and fees to be paid to those under other investment advisory contracts, such as contracts of the same and other investment advisers or other clients: The trustees reviewed the investment advisory fee paid by each Fund and compared both the services to be rendered and the fees to be paid under the Investment Advisory Agreements to other contracts of R&A and to contracts of other investment advisers to registered investment companies investing in small- and micro-cap stocks, as provided by Morningstar. The trustees noted the importance of the net expense ratio in measuring a fund’s efficiency, particularly in light of the variations in the mutual fund industry as to who is responsible for which expenses. It was noted that each of Royce Micro-Cap Portfolio and Royce Small-Cap Portfolio placed in the 2nd quartile among its respective peers. | The trustees noted that R&A had, from time to time, waived advisory fees in order to maintain expense ratios at competitive levels. The trustees also considered fees charged by R&A to institutional and other clients and noted that the Funds’ advisory fees compared favorably to these other accounts. The entire Board, including all the non-interested trustees, approved the renewal of the existing Investment Advisory Agreements, concluding that a contract renewal on the existing terms was in the best interest of the shareholders of each Fund and that each investment advisory fee rate was reasonable in relation to the services provided. |
| Royce Capital Fund 2009 Semiannual Report to Shareholders |
Wealth Of Experience With approximately $22 billion in open- and closed-end fund assets under management, Royce & Associates is committed to the same smaller-company investing principles that have served us well for more than 35 years. Charles M. Royce, our President and Co-Chief Investment Officer, enjoys one of the longest tenures of any active mutual fund manager. Royce’s investment staff also includes Co-Chief Investment Officer W. Whitney George, 15 Portfolio Managers, nine assistant portfolio managers and analysts, and eight traders. Multiple Funds, Common Focus Our goal is to offer both individual and institutional investors the best available smaller-cap portfolios. Unlike a lot of mutual fund groups with broad product offerings, we have chosen to concentrate on smaller-company investing by providing investors with a range of funds that take full advantage of this large and diverse sector. Consistent Discipline Our approach emphasizes paying close attention to risk and maintaining the same discipline, regardless of market movements and trends. The price we pay for a security must be significantly below our appraisal of its current worth. This requires a thorough analysis of the financial and business dynamics of an enterprise, as though we were purchasing the entire company. Co-Ownership Of Funds It is important that our employees and shareholders share a common financial goal; our officers, employees and their families currently have approximately $82 million invested in The Royce Funds. | |||||
| This review and report must be accompanied or preceded by a current prospectus for the Funds. Please read the prospectus carefully before investing or sending money. | |||||
| TheRoyceFunds | |||||
| 745 Fifth Avenue | New York, NY 10151 | P(800) 221-4268 | www.roycefunds.com | |||||
| General Information | |||||
| Additional Report Copies | |||||
| and Prospectus Inquiries | |||||
| (800) 221-4268 | |||||
 |  | ||||
Item 2. Code(s) of Ethics. Not applicable to this semi-annual report.
Item 3. Audit Committee Financial Expert. Not applicable to this semi-annual report.
Item 4. Principal Accountant Fees and Services. Not applicable to this semi-annual report.
Item 5. Audit Committee of Listed Registrants. Not applicable.
Item 6. Investments.
(a) See Item 1.
(b) Not applicable.
Item 7. Disclosure of Proxy Voting Policies and Procedures for Closed-End Management Investment Companies. Not applicable.
Item 8. Portfolio Managers of Closed-End Management Investment Companies. Not applicable.
Item 9. Purchases of Equity Securities by Closed-End Management Investment Company and Affiliated Purchasers. Not applicable.
Item 10. Submission of Matters to a Vote of Security Holders. Not applicable.
Item 11. Controls and Procedures.
(a) Disclosure Controls and Procedures. The Principal Executive and Financial Officers concluded that the Registrant’s Disclosure Controls and Procedures are effective based on their evaluation of the Disclosure Controls and Procedures as of a date within 90 days of the filing date of this report.
(b) Internal Control over Financial Reporting. There were no significant changes in Registrant’s internal control over financial reporting or in other factors that could significantly affect this control subsequent to the date of the evaluation, including any corrective actions with regard to significant deficiencies and material weaknesses during the second fiscal quarter of the period covered by this report.
Item 12. Exhibits. Attached hereto.
(a)(1) Not applicable.
(a)(2) Separate certifications by the Registrant’s Principal Executive Officer and Principal Financial Officer as required by Rule 30a-2(a) under the Investment Company Act of 1940.
(a)(3) Not applicable
(b) Separate certifications by the Registrant’s Principal Executive Officer and Principal Financial Officer, pursuant to Section 906 of the Sarbanes-Oxley Act of 2002 and required by Rule 30a-2(b) under the Investment Company Act of 1940.
Pursuant to the requirements of the Securities Exchange Act of 1934 and the Investment Company Act of 1940, the registrant has duly caused this report to be signed on its behalf by the undersigned, thereunto duly authorized.
| ROYCE CAPITAL FUND | |
| BY: | /s/Charles M. Royce |
| Charles M. Royce | |
| President | |
| Date: | August 25, 2009 |
Pursuant to the requirements of the Securities Exchange Act of 1934 and the Investment Company Act of 1940, this report has been signed below by the following persons on behalf of the registrant and in the capacities and on the dates indicated.
| ROYCE CAPITAL FUND | ROYCE CAPITAL FUND | |||
| BY: | /s/Charles M. Royce | BY: | /s/John D. Diederich | |
| Charles M. Royce | John D. Diederich | |||
| President | Chief Financial Officer | |||
| Date: | August 25, 2009 | Date: | August 25, 2009 | |