SECURITIES AND EXCHANGE COMMISSION
FORM N-CSR
CERTIFIED SHAREHOLDER REPORT
OF
REGISTERED MANAGEMENT INVESTMENT COMPANIES
Investment Company Act file number: 811-07537
Name of Registrant: Royce Capital Fund
Address of Registrant: 745 Fifth Avenue
New York, NY 10151
| Name and address of agent for service: | John E. Denneen, Esquire | |
| 745 Fifth Avenue | ||
| New York, NY 10151 |
Registrant’s telephone number, including area code: (212) 508-4500
Date of fiscal year end: December 31
Date of reporting period: January 1, 2010 – June 30, 2010
Item 1. Reports to Shareholders.
 | |||||
| Royce Capital Fund— Micro-Cap Portfolio Royce Capital Fund— Small-Cap Portfolio | SEMIANNUAL REVIEW AND REPORT TO SHAREHOLDERS | ||||
www.roycefunds.com |  | ||||
| Performance and Expenses | Through June 30, 2010 |
| Average Annual Total Returns | |||||||||||||||||||||
| Since | Annual Operating | ||||||||||||||||||||
| Fund | YTD1 | 1-Year | 5-Year | 10-Year | Inception | Expenses | |||||||||||||||
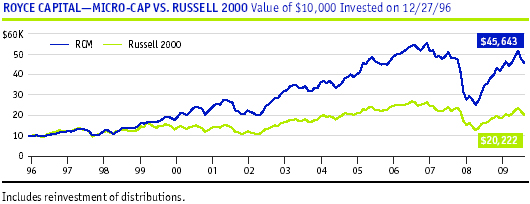
| Royce Capital Fund—Micro-Cap Portfolio | -1.58 | % | 27.83 | % | 5.00 | % | 10.23 | % | 11.90 | % | (12/27/96) | 1.58 | % | ||||||||
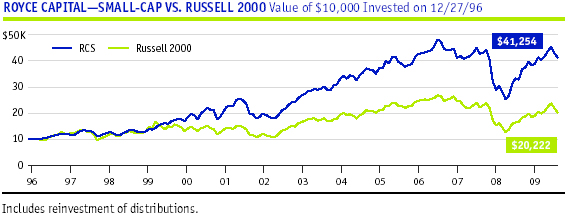
| Royce Capital Fund—Small-Cap Portfolio | -0.12 | % | 25.83 | 2.99 | 9.98 | 11.06 | (12/27/96) | 1.07 | |||||||||||||
| Russell 2000 | -1.95 | % | 21.48 | 0.37 | 3.00 | 5.35 | 2 | n.a. | |||||||||||||
| 1Not annualized | |||||||||||||||||||||
| 2Since Royce Capital Fund’s inception on 12/27/96. | |||||||||||||||||||||
Important Performance, Expense and Risk Information
All performance information in this Review and Report reflects past performance, is presented on a total return basis and reflects the reinvestment of distributions. Past performance is no guarantee of future results. Investment return and principal value of an investment will fluctuate, so that shares may be worth more or less than their original cost when redeemed. Current performance may be higher or lower than performance quoted. Current month-end performance may be obtained at www.roycefunds.com. The Fund’s total returns do not reflect any deduction for charges or expenses of the variable contracts or retirement plans investing in the Fund. All performance and expense information reflects results for each Fund’s Investment Class Shares. Service Class Shares bear an annual distribution expense that is not borne by the Investment Class. Operating expenses reflect the Fund’s total annual operating expenses for the Investment Class, as of the Fund’s most current prospectus, and include management fees, other expenses and, in the case of Royce Capital Fund—Micro-Cap Portfolio, acquired fund fees and expenses. Acquired fund fees and expenses reflect the estimated amount of the fees and expenses incurred indirectly by the Fund through its investments in mutual funds, hedge funds, private equity funds and other investment companies.
Royce Capital Fund invests primarily in securities of small-cap and micro-cap companies, which may involve considerably more risk than investments in securities of larger-cap companies. (Please see “Primary Risks for Fund Investors” in the prospectus.) Each Fund may invest up to 25% of its respective net assets in foreign securities, which may involve political, economic, currency and other risks not encountered in U.S. investments. (Please see “Investing in Foreign Securities” in the prospectus.) Please read the prospectus carefully before investing or sending money. The Russell 2000 is an unmanaged, capitalization-weighted index of domestic small-cap stocks. It measures the performance of the 2,000 smallest publicly traded U.S. companies in the Russell 3000 index.
| This page is not part of the 2010 Semiannual Report to Shareholders |
| Table of Contents | |
| Semiannual Review | |
| Performance and Expense Table | Inside Cover |
| Letter to Our Shareholders | 2 |
| Semiannual Report to Shareholders | 8 |
| This page is not part of the 2010 Semiannual Report to Shareholders | 1 |
 Using mostly broad brush strokes, indexes offer a very useful picture of the markets (or areas of the market) that they represent at specific moments in time. Like every mutual fund manager, we also use indexes as benchmarks against which we compare our own Funds’ performances. Comparisons are made not simply to calendar-based periods, but to down market and full market cycle periods. We do this because of our long-held conviction that how a portfolio performs in difficult market environments can have an enormous effect on long-term returns, especially those results achieved over full market cycles, which have generally lasted from two to seven years. We also make use of our various benchmark indexes to compare volatility scores, such as Standard Deviation and Return Efficiency. For each Royce Capital Fund portfolio, we use the small-cap Russell 2000, a broad-based index of domestic small-cap stocks. As useful and important as benchmark indexes are, they play no role in our portfolio management practices. Their primary significance for us is in providing a measure of how our results stack up vis-à-vis a close approximation to the market in which a particular portfolio invests. Continued on page 4... | Letter to Our Shareholders  Fear and Trembling Life can only be understood backwards; but it must be lived forwards. – Sören Kierkegaard Thirty-five years ago this summer, the film Jaws opened and quickly chomped its way into celluloid history, while also inspiring legions of sweaty beachgoers to stick to the safety of their towels. Yet it’s a paraphrase of the ad from the classic Spielberg film’s deservedly forgotten sequel—the subtly named Jaws 2—that provides the most apt description of investors’ attitudes here in the summer of 2010: “Just when you thought it was safe to go back in the market...” After all, in roughly two years, we have moved from a market collapse due in part to a widespread failure to heed Warren Buffett’s advice to “beware of geeks bearing formulas” to a market malaise driven by heightened fears about Greeks—to say nothing of Californians or any number of others—bearing debt. In between the financial crisis of late 2008-early 2009 and the market’s current struggles (the latter arguably a sequel to the earlier calamity), there was a dynamic market rebound that lasted—at least as of this writing—from the market low on March 9, 2009 through the interim small-cap market high on April 23, 2010. Unfortunately, many equity investors seemed to regard this rally as an all-too-brief respite from a world of ever-declining stock prices and acute economic anxiety. | ||
| 2 | This page is not part of the 2010 Semiannual Report to Shareholders |
| We find much to like on a stock-by-stock basis and believe that there is ample proof in the form of strong fundamentals for potentially better days. Investment decisions should not be approached with fear and trembling, but with conviction, confidence and, in our view, an outlook that measures time in years, not months and quarters. | |
The Concept of Anxiety | ||
Regardless of the length of one’s outlook, recent results for the three major equity indexes were mostly uninspiring and did much to reinforce investors’ anxiety. For the year-to-date period ended June 30, 2010, small-caps, as measured by the Russell 2000 index, owned a performance edge relative to their peers, as the small-cap index was down 1.9%, while the large-cap S&P 500 lost 6.7% and the more tech-oriented Nasdaq Composite fell 7.1%. These were obviously |
| This page is not part of the 2010 Semiannual Report to Shareholders | 3 |
However, the investable universe of securities for our portfolios tends to be larger than the number of stocks that constitute an index at any given time, which is why we do not limit ourselves to the stocks that comprise an index. We prefer the freedom of look- ing for what we think are attractively valued smaller companies wherever we may find them. For example, as of June 30, 2010, the number of U.S.- domiciled companies with market capitalizations up to $2.5 billion exceeded 4,500 names, according to FactSet, more than twice the number included in the Russell 2000. In addition, indexes are fluid entities just as actively managed mutual fund portfolios are, though generally to a lesser degree. Standard & Poor’s rebalances their indexes, including the large-cap S&P 500 and the S&P SmallCap 600, on a quarterly basis, as does MSCI. Russell Investments rebalances, or reconstitutes, as they call it, less frequently—doing so on an annual basis. Still, important changes can occur, even in an annual reconstitution. Based on data released from Russell Investments in June 2010, we found some notable changes to the index between June 2009 and June 2010: The index gained an impressive 33.6% for the 12-month period ended May 31, 2010,which helped to increase the index’s overall market capitaliza- tion 37.9% from 2009 to $1.2 trillion. Russell went on to report, “The median market capitalization for the index increased to $441.3 million, Continued on page 6... | |||
| Letter to Our Shareholders | ||
disappointing results, not merely because of the negative performance, but also because they interrupted the much-needed rally that began with the market low on March 9, 2009. The year opened with a less damaging correction that the market had shaken off by early February. First-quarter results were positive for all three indexes—the Russell 2000 gained 8.9% versus 5.4% for the S&P 500 and 5.7% for the Nasdaq Composite. The revived rally did not last long, however. Small-cap stock prices peaked on April 23, 2010, and the Russell 2000 slipped 17.6% from that date through the end of June. While the rally had seen other downturns, each had fallen in the range of 9%-10%, making this latest decline easily the most severe for small-caps since the worst days of the financial crisis. These losses lent more than a bearish tint to second-quarter returns, which were negative across the board, putting an end to four consecutive quarters of positive performance for all three domestic indexes. For the second quarter, the Russell 2000 was down 9.9%, the S&P 500 fell 11.4%, and the Nasdaq Composite declined 12.0%. Markets outside the U.S. fared no better. The MSCI EAFE (Europe, Australasia and Far East) index was down 13.2% versus a loss of 6.3% for the MSCI World ex USA Small Core index for the six months ended June 30, 2010. So while returns from the U.S. market bottom on March 9, 2009 through June 30, 2010 remained strong, with each major index up more than 55%, trailing three-year returns ended June 30, 2010 for the three domestic and two non-U.S. indexes were negative, and five-year and 10-year returns were mixed. For the 10-year period, small-caps did best, as the Russell 2000 and MSCI World ex USA Small Core indexes were the top performers. Within small-cap, growth and value indexes suffered second-quarter losses: the Russell 2000 Value index fell 10.6% versus a loss of 9.2% for the Russell 2000 Growth index. However, year-to-date and one-year results ended June 30, 2010 favored value; three- and five-year results favored growth; and 10-, 15-, 20-, and 25-year results were decidedly won by the Russell 2000 Value index. Micro-cap companies provided better relative results, outperforming the small-cap index in both the second quarter, in which the Russell Microcap index was down 8.9%, and year-to-date period, when it rose 0.1% through June 30, 2010. Within the micro-cap index, value underperformed in the second quarter (-9.7% versus -7.9%), but outperformed for the six months ended June 30, 2010 (+1.9% versus -1.9%). | ||
An Edifying Discourse What, then, inspires our confidence in the long-term prospects for stocks? As is often the case, we look to history for some instruction, while keeping in mind that investing must be done looking forward, not backward. We never expect the past to repeat itself, though we do believe that historical patterns are relevant when it | ||
| 4 | This page is not part of the 2010 Semiannual Report to Shareholders |
| Looking forward, we believe that volatility will continue to be above average, but that small-cap, both domestic and non-U.S., can provide attractive returns over the next three to five years. | ||
| |||
| Any business that looks to be capable of swimming ahead of the pace of the economy as a whole is going to be in high demand, and we can see that benefiting the kind of small-caps that fit our selection criteria—those that boast strong balance sheets, high returns on invested capital and the ability to generate free cash flow. | ||
| This page is not part of the 2010 Semiannual Report to Shareholders | 5 |
a 45% increase over the median capitalization of $304 million in 2009. The weighted average market capitali- zation also increased significantly, jumping 34.7% to $1.0B from $0.7B in 2009.” The index’s composition is also reflective of the growing global nature of the equity world: “As a result of Russell’s new methodology rule determining country assignment, all companies that are incorporated, headquartered, and traded in the U.S. are eligible for the Russell U.S. Indexes... Ten of the new adds [of which there were a total of 321 in 2010] are due to the new country rule.” Indexes change, and, interestingly, they change in an effort to better reflect the market they are meant to represent. In other words, they change their constituents in order not to change their market representation. We have high regard for indexes, especially the efforts they make to remain truly representative of their markets. However, we also see critical differences between the kind of work that we as active, disciplined small-cap managers do and what an index does. We do not focus our efforts on creating representative small-cap portfolios (or micro-cap, mid-cap or global smaller-company portfolios). Our task is to find what we judge to be high-quality companies trading at attractive discounts to our estimate of their worth as a business (or intrinsic value). We see indexes, then, as a bellwether to guide us as we strive to improve our skill as disciplined stock pickers. No more and no less than that. | Letter to Our Shareholders  Either/Or Admittedly, our long-term perspective has been even less in style lately than usual. We have recently been witnessing a stampede out of equities and into fixed income to such a degree that we would not be surprised to see a bubble in fixed income investments in the coming months. (Even bond king Bill Gross is bullish on stocks!) For our part, we remain convinced that stocks should provide stronger returns, particularly inflation-adjusted returns, over the next five-year and 10-year periods. It seems reasonable to us that the current decade will end up with annualized equity returns somewhere in the high single digits. Taking advantage of current volatility is, for us, critical toward building strong results for the decade, as well as other long-term periods. For example, we believe that investors should be encouraged, though not too excited, by the recent earnings picture, bearing in mind that recent earnings look strong in relation to where companies were in 2008 and early 2009, when most were coming off an historically terrible period. (In other words, the bar for earnings improvement was set awfully low.) Still, we think that this is encouraging because it shows that many U.S. corporations did what needed to be done—they grew leaner and meaner and effectively dealt with a financial crisis, which is being reflected in stronger earnings. While the perception seems to be that it is once again struggling, we think the economy is on the right track. We are not wildly enthusiastic, but we are optimistic. | ||
| 6 | This page is not part of the 2010 Semiannual Report to Shareholders |
| It is important to remember that long-term growth is not a straight-line phenomenon. Short-term setbacks are a common occurrence in the journey to more lasting success. We are ever-cautious, and in our view it is safe to go back in the water. | ||||||
| |||||||
|  |  | |||||
Charles M. Royce | W. Whitney George | Jack E. Fockler, Jr. | |||||
President | Vice President | Vice President | |||||
July 31, 2010 | |||||||
| |||||||

| This page is not part of the 2010 Semiannual Report to Shareholders | 7 |
| Table of Contents | ||||||||||||||||||||
Semiannual Report to Shareholders | ||||||||||||||||||||
| Notes to Performance and Other Important Information | 9 | |||||||||||||||||||
| Managers’ Discussions of Fund Performance | ||||||||||||||||||||
| Royce Capital Fund—Micro-Cap Portfolio | 10 | |||||||||||||||||||
| Royce Capital Fund—Small-Cap Portfolio | 12 | |||||||||||||||||||
| Schedules of Investments and Financial Statements | 14 | |||||||||||||||||||
| Notes to Financial Statements | 24 | |||||||||||||||||||
| Understanding Your Fund’s Expenses | 27 | |||||||||||||||||||
| Board Approval of Investment Advisory Agreements | 28 | |||||||||||||||||||
| 8 | Royce Capital Fund 2010 Semiannual Report to Shareholders |
The thoughts expressed in this report concerning recent market movements and future prospects for small company stocks are solely the opinion of Royce at June 30, 2010, and, of course, historical market trends are not necessarily indicative of future market movements. Statements regarding the future prospects for particular securities held in the Funds’ portfolios and Royce’s investment intentions with respect to those securities reflect Royce’s opinions as of June 30, 2010 and are subject to change at any time without notice. There can be no assurance that securities mentioned in this report will be included in any Royce-managed portfolio in the future. | Royce Capital Fund–Micro-Cap Portfolio invests primarily in securities of micro-cap companies and Royce Capital Fund-Small-Cap Portfolio invests primarily in securities of small-cap companies that may involve considerably more risk than investments in securities of larger-cap companies. (Please see “Primary Risks for Fund Investors” in the prospectus.) The Funds may invest up to 25% of their respective assets in foreign securities that may involve political, economic, currency and other risks not encountered in U.S. investments. (Please see “Investing in Foreign Securities” in the prospectus.) Please read the prospectus carefully before investing or sending money. Forward-Looking Statements This material contains forward-looking statements within the meaning of the Securities Exchange Act of 1934, as amended (the “Exchange Act”), that involve risks and uncertainties, including, among others, statements as to: | ||
| • | the Funds’ future operating results, | ||
| • | the prospects of the Funds’ portfolio companies, | ||
| • | the impact of investments that the Funds have made or may make, | ||
| • | the dependence of the Funds’ future success on the general economy and its impact on the companies and industries in which the Funds invest, and | ||
| • | the ability of the Funds’ portfolio companies to achieve their objectives. | ||
This review and report use words such as “anticipates,” “believes,” “expects,” “future,” “intends,” and similar expressions to identify forward-looking statements. Actual results may differ materially from those projected in the forward-looking statements for any reason. | |||
| Proxy Voting | ||
A copy of the policies and procedures that The Royce Funds use to determine how to vote proxies relating to portfolio securities and information regarding how each of The Royce Funds voted proxies relating to portfolio securities during the most recent 12-month period ended June 30 is available, without charge, on The Royce Funds’ website at www.roycefunds.com, by calling (800) 221-4268 (toll-free) and on the website of the Securities and Exchange Commission (“SEC”), at www.sec.gov. | ||
| Form N-Q Filing | ||
The Funds file their complete schedules of investments with the SEC for the first and third quarters of each fiscal year on Form N-Q. The Funds’ Forms N-Q are available on The Royce Funds’ website at www.roycefunds.com and on the SEC’s website at www.sec.gov. The Funds’ Forms N-Q may also be reviewed and copied at the SEC’s Public Reference Room in Washington, D.C. To find out more about this public service, call the SEC at (202) 942-8090. The Funds’ complete schedules of investments are updated quarterly, and are available at www.roycefunds.com. | ||
| Royce Capital Fund 2010 Semiannual Report to Shareholders | 9 |
| ||||||||||||
| AVERAGE ANNUAL TOTAL RETURNS Through 6/30/10 | ||||||||||||
| Jan - June 2010* | -1.58 | % | ||||||||||
| One-Year | 27.83 | |||||||||||
| Three-Year | -5.70 | |||||||||||
| Five-Year | 5.00 | |||||||||||
| 10-Year | 10.23 | |||||||||||
| Since Inception (12/27/96) | 11.90 | |||||||||||
| ANNUAL EXPENSE RATIO | ||||||||||||
| Operating Expenses | 1.58 | % | ||||||||||
| * Not annualized | ||||||||||||
| CALENDAR YEAR TOTAL RETURNS | ||||||||||||
| Year | RCM | Year | RCM | |||||||||
| 2009 | 57.9 | % | 2002 | -12.9 | % | |||||||
| 2008 | -43.3 | 2001 | 29.7 | |||||||||
| 2007 | 4.0 | 2000 | 18.5 | |||||||||
| 2006 | 21.1 | 1999 | 28.1 | |||||||||
| 2005 | 11.6 | 1998 | 4.1 | |||||||||
| 2004 | 13.8 | 1997 | 21.2 | |||||||||
| 2003 | 49.2 | |||||||||||
| TOP 10 POSITIONS % of Net Assets | ||||||||||||
| US Gold | 1.2 | % | ||||||||||
| Fronteer Gold | 1.2 | |||||||||||
| Syneron Medical | 1.1 | |||||||||||
| Volcom | 1.1 | |||||||||||
| Silvercorp Metals | 1.1 | |||||||||||
| Cavco Industries | 1.0 | |||||||||||
| Patriot Transportation Holding | 1.0 | |||||||||||
| Lamprell | 1.0 | |||||||||||
| Atlantic Tele-Network | 1.0 | |||||||||||
| Allied Nevada Gold | 1.0 | |||||||||||
| PORTFOLIO SECTOR BREAKDOWN % of Net Assets | ||||||||||||
| Natural Resources | 17.7 | % | ||||||||||
| Industrial Products | 14.3 | |||||||||||
| Health | 12.6 | |||||||||||
| Technology | 12.4 | |||||||||||
| Industrial Services | 10.7 | |||||||||||
| Consumer Products | 8.7 | |||||||||||
| Financial Services | 3.8 | |||||||||||
| Financial Intermediaries | 3.8 | |||||||||||
| Consumer Services | 3.2 | |||||||||||
| Miscellaneous | 4.8 | |||||||||||
| Cash and Cash Equivalents | 8.0 | |||||||||||
 Manager’s Discussion Manager’s DiscussionMicro-cap stocks are often volatile and unpredictable, but they were no more noticeably capricious than their larger peers in the first half of 2010, an observation reflected in the performance of Royce Capital Fund–Micro-Cap Portfolio (RCM). The Fund was down 1.6% for the year-to-date period ended June 30, 2010, ahead of its small-cap benchmark, the Russell 2000, which fell 1.9%, but behind the Russell Microcap index, which managed a slight gain of 0.1% for the same period. Although RCM’s absolute return of 5.2% in 2010’s first quarter was more than respectable, it lagged its benchmark (+8.9%) and the micro-cap index (+9.9%). This relative lag at a time when stock prices were mostly rising was not entirely a surprise following the Fund’s performance in 2009, which was strong on both an absolute and relative basis. When the rally began to lose serious steam following the interim small-cap high on April 23, 2010, the Fund more than held its own. From that date through the end of June, RCM lost 12.9% versus respective losses of 17.6% and 18.1% | |||||||||||||
for the Russell 2000 and Russell Microcap indexes. This stronger down market turn helped the Fund to also lose less during the second quarter. Between April and June, RCM was down 6.4%, while the Russell 2000 declined 9.9% and the Russell Microcap index fell 8.9%. So while negative returns are never ideal, they are understandable in the context of the currently anxious and uncertain market, particularly in light of the Fund holding its value during declines better than its benchmark and the Russell Microcap index. We were also cheered somewhat by the fact that RCM held an advantage over both indexes from the market low on March 9, 2009 through the end of June 2010, gaining 100.2% versus 80.9% for the Russell 2000 and 86.2% for the micro-cap index. This outperformance was consistent with calendar-based, longer-term periods. The Fund beat the Russell Microcap index—for which data goes back to 2000—for the one-, three-, five- and 10-year periods ended June 30, 2010. RCM also beat the Russell 2000 for each of the aforementioned periods, as well from the since inception (12/27/96) period ended June 30, 2010. The Fund’s average annual total return since inception was 11.9%. Natural Resources—the Fund’s best-performing sector in 2009—was also its most significant contributor to net gains in the first half of 2010, dominated by holdings in the precious metals and mining industry. As was the case in 2009, this industry outpaced all of | |||||||||||||
| GOOD IDEAS THAT WORKED Top Contributors To Performance* Year-to-Date Through 6/30/10 | |||||||||||||
| US Gold | 0.55% | ||||||||||||
| Red Back Mining | 0.44 | ||||||||||||
| Fronteer Gold | 0.39 | ||||||||||||
| Allied Nevada Gold | 0.36 | ||||||||||||
| Boots & Coots | 0.31 | ||||||||||||
| *Includes Dividends | |||||||||||||
Important Performance and Expense Information All performance information in this Report reflects past performance, is presented on a total return basis and reflects the reinvestment of distributions. Past performance is no guarantee of future results. Investment return and principal value of an investment will fluctuate, so that shares may be worth more or less than their original cost when redeemed. Current performance may be higher or lower than performance quoted. The Fund’s total returns do not reflect any deduction for charges or expenses of the variable contracts of retirement plans investing in the Fund. Returns as of the most recent month-end may be obtained at www.roycefunds.com. All performance and risk information for RCM reflects Investment Class results. Shares of RCM’s Service Class bear an annual distribution expense that is not borne by the Investment Class. Operating expenses reflect the Fund’s total annual operating expenses for the Investment Class, as of the Fund’s most current prospectus, and include management fees, other expenses and acquired fund fees and expenses. Acquired fund fees and expenses reflect the estimated amount of the fees and expenses incurred indirectly by the Fund through its investments in mutual funds, hedge funds, private equity funds and other investment companies. The sum of all contributions and detractions for all securities would approximate the Fund’s year-to-date performance for 2010. | |||||||||||||
10 | Royce Capital Fund 2010 Semiannual Report to Shareholders
Performance and Portfolio Review the Fund’s other sectors and industry groups, although, given the state of the market, this was admittedly a less daunting task in 2010’s first six months than it was in 2009. Still, we were very pleased with the performance of these companies, which accounted for four of RMC’s five top gainers year-to-date through June 30, 2010. Rising gold prices were the primary spur to the increase in share prices, as the debt crisis in Europe and fiscal challenges on the home front drove investors to the perceived safety of gold. Red Back Mining successfully managed the growth of its mines in Ghana and Mauritania after evolving from a purely exploratory company into one that produced metals as well. We built two other positions near the end of 2008 and in the first quarter of 2009, when they were falling into the micro-cap capitalization range: Fronteer Gold reaped a golden harvest from recent discoveries in its home base of Nevada, while Allied Nevada Gold also managed the transition from explorer to producer with success. In contrast to these stocks, we began to build our stake a bit later in the Fund’s top performer, Nevada-based exploration and production company, US Gold. Its share price went against the market, rising most sharply during the second quarter, when investor anxiety was growing most acute. We held a good-sized position in each company at the end of June. | |||
| Genoptix provides specialized laboratory services that focus on personalized, comprehensive diagnostics to cancer sufferers. These suites of services are primarily sold to oncologists and hematologists. We liked its interesting niche, its balance sheets and impressive margins, but in retrospect we may have begun to buy too soon, making large buys in the summer of 2009 and spring of 2010. Its share price began to slip precipitously in late April on an earnings miss and unexpected spending increases before falling further when the firm revised full-year revenue guidance in June. We are holding on in the expectation that the firm can right itself. Horsehead Holding offers a different kind of niche. The firm produces zinc, primarily by the low-cost method of recycling steel dust. Steel businesses, such as Olympic Steel, had a rough first half, as did many industrial companies, but we were drawn to Horsehead’s strong fundamentals and think that it deserves our patience. We were somewhat mystified by the dismal performance of Atlantic Tele-Network, which provides wireless voice and data services to retail customers in Bermuda, Guyana, and Turks and Caicos, as well as wireless voice and data roaming services in the U.S. Its earnings were lower early in 2010, but it remains in our view a very well-run business with a low-debt balance sheet and positive cash flow. | |||
GOOD IDEAS AT THE TIME | |||
| Genoptix | -0.48% | ||
| Horsehead Holding Corporation | -0.43 | ||
| Atlantic Tele-Network | -0.38 | ||
| Olympic Steel | -0.33 | ||
| Sterling Construction | -0.29 | ||
| *Net of Dividends | |||
 | |||
| FUND INFORMATION AND PORTFOLIO DIAGNOSTICS | |||||||||||
| Average Market Capitalization* | $320 million | ||||||||||
| Weighted Average P/E Ratio** | 11.8x | ||||||||||
| Weighted Average P/B Ratio | 1.5x | ||||||||||
| U.S. Investments (% of Net Assets) | 67.1% | ||||||||||
| Non-U.S. Investments (% of Net Assets) | 24.7% | ||||||||||
| Fund Net Assets | $515 million | ||||||||||
| Turnover Rate | 21% | ||||||||||
| Number of Holdings | 213 | ||||||||||
| Symbol | |||||||||||
| Investment Class | RCMCX | ||||||||||
| Service Class | RCMSX | ||||||||||
| * Geometrically calculated | |||||||||||
** The Fund’s P/E calculation excludes companies with zero or negative earnings (26% of portfolio holdings as of 6/30/10). | |||||||||||
| RISK/RETURN COMPARISON Five-Year Period Ended 6/30/10 | |||||||||||
| Average Annual Total Return | Standard Deviation | Return Efficiency* | |||||||||
| RCM | 5.00% | 22.08 | 0.23 | ||||||||
| Russell 2000 | 0.37 | 21.97 | 0.02 | ||||||||
* Return Efficiency is the average annual total return divided by the annualized standard deviation over a designated time period. Please read the prospectus for a more complete discussion of risk. | |||||||||||
| |||||||||||
| |||||||||||
 | |||||||||||
Royce Capital Fund 2010 Semiannual Report to Shareholders | 11
| ||||||||||||
| AVERAGE ANNUAL TOTAL RETURNS Through 6/30/10 | ||||||||||||
| Jan - June 2010* | -0.12 | % | ||||||||||
| One-Year | 25.83 | |||||||||||
| Three-Year | -4.53 | |||||||||||
| Five-Year | 2.99 | |||||||||||
| 10-Year | 9.98 | |||||||||||
| Since Inception (12/27/96) | 11.06 | |||||||||||
| ANNUAL EXPENSE RATIO | ||||||||||||
| Operating Expenses | 1.07 | % | ||||||||||
| * Not annualized | ||||||||||||
| CALENDAR YEAR TOTAL RETURNS | ||||||||||||
| Year | RCS | Year | RCS | |||||||||
| 2009 | 35.2 | % | 2002 | -13.8 | % | |||||||
| 2008 | -27.2 | 2001 | 21.0 | |||||||||
| 2007 | -2.1 | 2000 | 33.3 | |||||||||
| 2006 | 15.6 | 1999 | 8.2 | |||||||||
| 2005 | 8.6 | 1998 | 8.9 | |||||||||
| 2004 | 25.0 | 1997 | 17.1 | |||||||||
| 2003 | 41.1 | |||||||||||
| TOP 10 POSITIONS % of Net Assets | ||||||||||||
| Steven Madden | 2.8 | % | ||||||||||
| Dress Barn (The) | 2.8 | |||||||||||
| Jos. A. Bank Clothiers | 2.4 | |||||||||||
| ManTech International Cl. A | 2.3 | |||||||||||
| Allied World Assurance Company Holdings | 2.2 | |||||||||||
| Federated Investors Cl. B | 2.1 | |||||||||||
| Buckle (The) | 2.1 | |||||||||||
| MAXIMUS | 2.0 | |||||||||||
| NBTY | 2.0 | |||||||||||
| Comtech Telecommunications | 1.8 | |||||||||||
| PORTFOLIO SECTOR BREAKDOWN % of Net Assets | ||||||||||||
| Financial Intermediaries | 15.2 | % | ||||||||||
| Consumer Products | 12.3 | |||||||||||
| Natural Resources | 12.3 | |||||||||||
| Consumer Services | 11.0 | |||||||||||
| Health | 10.8 | |||||||||||
| Technology | 7.2 | |||||||||||
| Industrial Products | 6.1 | |||||||||||
| Industrial Services | 5.5 | |||||||||||
| Financial Services | 3.8 | |||||||||||
| Miscellaneous | 3.3 | |||||||||||
| Cash and Cash Equivalents | 12.5 | |||||||||||
 Manager’s Discussion Manager’s DiscussionAfter posting stellar results on both an absolute and relative basis in 2009, the first half of 2010 was a bit less luminous, at least on an absolute basis, for the portfolio of mostly small-cap stocks that make up Royce Capital Fund-Small-Cap Portfolio (RCS). The Fund fell 0.1% for the year-to-date period ended June 30, 2010, ahead of its small-cap benchmark, the Russell 2000, which declined 1.9% during the same period. While negative performance, even slightly negative performance during short-term periods, is never welcome, the highly challenging market and ongoing anxiety about the economy made results through the year’s first six months not entirely surprising. After a brief down period that lasted through early February, the bull market that began in March 2009 resumed its strong run. For the first quarter, RCS gained 6.0%, a fine return on an absolute basis, though it lagged its benchmark’s gain of 8.9%. The Fund thus established its first-half performance advantage over its benchmark in the bearish second quarter, which saw a very different market, particularly following the interim small-cap high on April 23. The Fund lost 5.8% between April and June, while the small-cap index declined 9.9%. From the late April high through the end of June, RCS again lost less than the Russell 2000, falling 11.4% compared to a loss of 17.6% for the benchmark. The Fund also stayed ahead of the small-cap index from the market low on March 9, 2009 through the end of June, gaining 84.9% versus 80.9% for its benchmark. | |||||||||||||
Over longer-term periods, the Fund’s results continued to be strong on a relative basis, while one-, five-, 10-year and since inception (12/27/96) returns were equally sturdy on an absolute basis. RCS outpaced the Russell 2000 for the one-, three-, five-, 10-year and since inception periods ended June 30, 2010. The Fund’s average annual total return since inception was 11.1%. The Fund’s most significant detractor, ATC Technology, is an industrial company that operates two primary businesses. Its Drivetrain business, which focuses on rebuilding auto transmissions and other parts, has struggled. Its Logistics business, which provides outsourced supply chain logistics services and engineering solutions to consumer electronics companies, had also been slow, but has recently shown improvement. The latter business attracted most of our interest. The company’s stock price fell most dramatically when the firm posted a slightly lower first-quarter profit. While it beat Wall Street forecasts, lower first-quarter profit drove | |||||||||||||
| GOOD IDEAS THAT WORKED Top Contributors To Performance* Year-to-date Through 6/30/10 | |||||||||||||
| American Italian Pasta Cl. A | 0.63% | ||||||||||||
| Home Diagnostics | 0.56 | ||||||||||||
| Red Back Mining | 0.52 | ||||||||||||
| Steven Madden | 0.39 | ||||||||||||
| Jos. A. Bank Clothiers | 0.33 | ||||||||||||
| *Includes Dividends | |||||||||||||
Important Performance and Expense Information All performance information in this Report reflects past performance, is presented on a total return basis and reflects the reinvestment of distributions. Past performance is no guarantee of future results. Investment return and principal value of an investment will fluctuate, so that shares may be worth more or less than their original cost when redeemed. Current performance may be higher or lower than performance quoted. The Fund’s total returns do not reflect any deduction for charges or expenses of the variable contracts of retirement plans investing in the Fund. Returns as of the most recent month-end may be obtained at www.roycefunds.com. All performance and risk information for RCS reflects Investment Class results. Shares of RCS’s Service Class bear an annual distribution expense that is not borne by the Investment Class. Operating expenses reflect the Fund’s total annual operating expenses for the Investment Class, as of the Fund’s most current prospectus, and include management fees and other expenses. The sum of all contributions and detractions for all securities would approximate the Fund’s year-to-date performance for 2010. | |||||||||||||
12 | Royce Capital Fund 2010 Semiannual Report to Shareholders
Performance and Portfolio Review investors away. We chose instead to build our stake in June. Federated Investors is a family-run asset manager specializing in money markets. We have long been admirers of the company. The declining interest rate environment put a crimp in the profitability of its money market funds, but we like the firm’s roster of bond and equity portfolios, which now account for much of its business, and also anticipate that interest rates will rise in the next three to five years, both of which were factors in our decision to build our stake in the first half. One of 2009’s largest contributors to performance, drug and nutritional supplement maker and distributor NBTY, saw its stock price weaken through the first half. We continued to have high regard for its business and balance sheet. However, the likelihood of a price war in the private-label vitamin business and a fiscal second-quarter earnings disappointment conspired to make its share price tumble. This led us to build our position between April and June. (In mid-July, a private equity firm announced that it was buying NBTY at a 57% premium to the company’s share price between mid-June and mid-July.) | |||
Mobile-data communications equipment maker Comtech Telecommunications had already suffered through a tough year in 2009. Its stock price began to rally in November 2009 before slipping again in January 2010. It fell further on revised revenue guidance in March and was not helped when news of a planned acquisition broke in May. Thinking that this acquisition can help the company to diversify its business away from two large military contracts that may expire, we think it is a favorable development. At the end of June, we also believed that this conservatively capitalized business was worth the risk. It was a top-10 position at the end of June. American Italian Pasta had the right recipe for first-half success. When first buying shares at the end of 2009, we liked its improved balance sheet, impressive margins and prospects for sustained growth. Our enthusiasm was shared by diversified food maker Ralcorp Holdings, which announced plans to acquire the dry pasta maker at an attractive premium near the end of June. This news led us to sell our shares after building our stake through the beginning of that same month. The urge to merge also benefited the stock price of Home Diagnostics, a manufacturer of diabetes testing supplies. In February, news broke that the company would merge with a Japanese healthcare company at a large premium to Home Diagnostics’ stock price. We sold our shares as its price rose on this report. | |||
GOOD IDEAS AT THE TIME | |||
| ATC Technology | -0.48% | ||
| Federated Investors Cl. B | -0.41 | ||
| Tidewater | -0.38 | ||
| NBTY | -0.37 | ||
| Comtech Telecommunications | -0.35 | ||
| *Net of Dividends | |||
 | |||
| FUND INFORMATION AND PORTFOLIO DIAGNOSTICS | |||||||||||
| Average Market Capitalization* | $1,186 million | ||||||||||
| Weighted Average P/E Ratio** | 10.6x | ||||||||||
| Weighted Average P/B Ratio | 1.5x | ||||||||||
| U.S. Investments (% of Net Assets) | 87.7% | ||||||||||
| Non-U.S. Investments (% of Net Assets) | 2.5% | ||||||||||
| Fund Net Assets | $523 million | ||||||||||
| Turnover Rate | 19% | ||||||||||
| Number of Holdings | 86 | ||||||||||
| Symbol | |||||||||||
| Investment Class | RCPFX | ||||||||||
| Service Class | RCSSX | ||||||||||
| * Geometrically calculated | |||||||||||
** The Fund’s P/E calculation excludes companies with zero or negative earnings (2% of portfolio holdings as of 6/30/10). | |||||||||||
| RISK/RETURN COMPARISON Five-Year Period Ended 6/30/10 | |||||||||||
| Average Annual Total Return | Standard Deviation | Return Efficiency* | |||||||||
| RCS | 2.99% | 19.94 | 0.15 | ||||||||
| Russell 2000 | 0.37 | 21.97 | 0.02 | ||||||||
* Return Efficiency is the average annual total return divided by the annualized standard deviation over a designated time period. Please read the prospectus for a more complete discussion of risk. | |||||||||||
| |||||||||||
| |||||||||||
 | |||||||||||
Royce Capital Fund 2010 Semiannual Report to Shareholders | 13
Schedules of Investments
Royce Capital Fund – Micro-Cap Portfolio |
| SHARES | VALUE | ||||
| COMMON STOCKS – 92.0% | |||||
| Consumer Products – 8.7% | |||||
| Apparel, Shoes and Accessories - 3.2% | |||||
LaCrosse Footwear | 253,231 | $ | 4,264,410 | ||
Luk Fook Holdings (International) | 2,228,700 | 2,797,097 | |||
True Religion Apparel a | 98,000 | 2,162,860 | |||
Van De Velde | 42,076 | 1,643,639 | |||
Volcom a | 295,625 | 5,489,756 | |||
| 16,357,762 | |||||
| Food/Beverage/Tobacco - 2.8% | |||||
Asian Citrus Holdings | 5,540,000 | 4,056,515 | |||
Binggrae Company | 51,000 | 2,098,439 | |||
Sipef | 71,855 | 4,125,072 | |||
Societe Internationale de Plantations d’Heveas | 59,000 | 3,866,130 | |||
| 14,146,156 | |||||
| Health, Beauty and Nutrition - 0.3% | |||||
Nutraceutical International a | 104,500 | 1,594,670 | |||
| Home Furnishing and Appliances - 0.6% | |||||
AS Creation Tapeten | 61,000 | 2,219,252 | |||
Lumber Liquidators Holdings a | 44,800 | 1,045,184 | |||
| 3,264,436 | |||||
| Sports and Recreation - 1.3% | |||||
Arctic Cat a | 249,944 | 2,276,990 | |||
Piscines Desjoyaux | 187,391 | 1,661,492 | |||
RC2 Corporation a | 168,600 | 2,716,146 | |||
| 6,654,628 | |||||
| Other Consumer Products - 0.5% | |||||
CSS Industries | 84,300 | 1,390,950 | |||
Shamir Optical Industry | 145,700 | 1,164,143 | |||
| 2,555,093 | |||||
| Total (Cost $42,048,722) | 44,572,745 | ||||
| Consumer Services – 3.2% | |||||
| Direct Marketing - 0.4% | |||||
Manutan International | 41,000 | 2,071,620 | |||
| Leisure and Entertainment - 0.2% | |||||
Multimedia Games a | 175,882 | 791,469 | |||
| Online Commerce - 0.8% | |||||
CryptoLogic a | 385,000 | 739,200 | |||
GS Home Shopping | 29,100 | 1,817,740 | |||
Vitacost.com a | 177,100 | 1,592,129 | |||
| 4,149,069 | |||||
| Retail Stores - 1.8% | |||||
Buckle (The) | 76,025 | 2,464,731 | |||
Cato Corporation (The) Cl. A | 124,300 | 2,737,086 | |||
Jos. A. Bank Clothiers a | 44,780 | 2,417,672 | |||
Lewis Group | 231,000 | 1,768,169 | |||
| 9,387,658 | |||||
| Total (Cost $13,895,542) | 16,399,816 | ||||
| SHARES | VALUE | ||||
| Financial Intermediaries – 3.8% | |||||
| Banking - 1.0% | |||||
Bancorp (The) a | 202,528 | $ | 1,585,794 | ||
BCB Holdings a | 1,303,907 | 1,802,056 | |||
Pacific Continental | 165,600 | 1,568,232 | |||
| 4,956,082 | |||||
| Insurance - 1.5% | |||||
American Physicians Service Group | 24,581 | 601,005 | |||
American Safety Insurance Holdings a | 144,200 | 2,266,824 | |||
Argo Group International Holdings | 50,027 | 1,530,326 | |||
Navigators Group a | 42,500 | 1,748,025 | |||
United Fire & Casualty | 78,630 | 1,558,447 | |||
| 7,704,627 | |||||
| Securities Brokers - 1.1% | |||||
FBR Capital Markets a | 465,829 | 1,551,211 | |||
GMP Capital | 203,600 | 1,780,579 | |||
Sanders Morris Harris Group | 420,000 | 2,331,000 | |||
| 5,662,790 | |||||
| Securities Exchanges - 0.2% | |||||
Hellenic Exchanges | 237,000 | 1,248,941 | |||
| Total (Cost $23,374,464) | 19,572,440 | ||||
| Financial Services – 3.8% | |||||
| Investment Management - 2.4% | |||||
CapMan Cl. B | 687,000 | 1,164,460 | |||
Deutsche Beteiligungs | 49,000 | 1,116,013 | |||
Endeavour Financial | 1,472,900 | 3,043,896 | |||
Gluskin Sheff + Associates | 187,900 | 3,000,611 | |||
Sprott Resource a | 977,500 | 3,691,278 | |||
U.S. Global Investors Cl. A | 112,300 | 623,265 | |||
| 12,639,523 | |||||
| Special Purpose Acquisition Corporation - 0.4% | |||||
Harbinger Group a | 344,300 | 2,162,204 | |||
| Other Financial Services - 1.0% | |||||
Kennedy-Wilson Holdings a | 495,814 | 5,007,722 | |||
| Total (Cost $25,218,905) | 19,809,449 | ||||
| Health – 12.6% | |||||
| Commercial Services - 0.8% | |||||
PDI a | 478,720 | 3,963,801 | |||
| Drugs and Biotech - 3.6% | |||||
Anika Therapeutics a | 133,252 | 784,854 | |||
Bukwang Pharmaceutical | 204,000 | 2,324,614 | |||
CombiMatrix Corporation a | 68,182 | 175,228 | |||
Dyax Corporation a | 504,916 | 1,146,159 | |||
Lexicon Pharmaceuticals a | 1,491,286 | 1,908,846 | |||
Maxygen a | 117,200 | 648,116 | |||
Orchid Cellmark a | 864,200 | 1,460,498 | |||
Simcere Pharmaceutical Group ADR a | 239,000 | 1,978,920 | |||
Sinovac Biotech a | 621,000 | 2,875,230 | |||
3SBio ADR a | 117,000 | 1,360,710 | |||
Vetoquinol | 105,990 | 3,020,658 | |||
YM Biosciences a | 737,800 | 833,714 | |||
| 18,517,547 | |||||
| 14 | Royce Capital Fund 2010 Semiannual Report to Shareholders | THE ACCOMPANYING NOTES ARE AN INTEGRAL PART OF THESE FINANCIAL STATEMENTS. |
| SHARES | VALUE | ||||
| Health (continued) | |||||
| Health Services - 2.4% | |||||
BioClinica a | 292,123 | $ | 1,197,704 | ||
CorVel Corporation a | 69,725 | 2,356,008 | |||
†EPS Company | 1,215 | 3,055,050 | |||
Genoptix a | 205,874 | 3,541,033 | |||
U.S. Physical Therapy a | 141,960 | 2,396,285 | |||
| 12,546,080 | |||||
| Medical Products and Devices - 5.8% | |||||
ArthroCare Corporation a | 63,600 | 1,949,340 | |||
Cerus Corporation a | 400,000 | 1,264,000 | |||
Cynosure Cl. A a | 222,800 | 2,399,556 | |||
Exactech a | 163,499 | 2,792,563 | |||
Merit Medical Systems a | 229,168 | 3,682,730 | |||
Neogen Corporation a | 63,739 | 1,660,401 | |||
| 391,000 | 205,157 | ||||
SenoRx a | 279,833 | 3,072,566 | |||
| 571,323 | 1,085,514 | ||||
STRATEC Biomedical Systems | 42,000 | 1,396,704 | |||
| 146,746 | 2,408,102 | ||||
Syneron Medical a | 550,385 | 5,657,958 | |||
Young Innovations | 86,153 | 2,425,207 | |||
| 29,999,798 | |||||
| Total (Cost $71,862,392) | 65,027,226 | ||||
| Industrial Products – 14.3% | |||||
| Automotive - 0.6% | |||||
| 86,500 | 2,244,675 | ||||
| 118,000 | 981,760 | ||||
| 3,226,435 | |||||
| Building Systems and Components - 2.0% | |||||
AAON | 122,404 | 2,853,237 | |||
Drew Industries a | 235,733 | 4,761,807 | |||
LSI Industries | 459,413 | 2,241,935 | |||
WaterFurnace Renewable Energy | 20,000 | 501,057 | |||
| 10,358,036 | |||||
| Industrial Components - 1.4% | |||||
Graham Corporation | 264,431 | 3,963,821 | |||
| 355,075 | 1,118,486 | ||||
Voltamp Transformers | 111,140 | 2,246,895 | |||
| 7,329,202 | |||||
| Machinery - 3.5% | |||||
Burckhardt Compression Holding | 25,500 | 4,493,804 | |||
| 148,674 | 2,616,662 | ||||
FreightCar America | 130,891 | 2,960,754 | |||
Jinpan International | 156,000 | 2,364,960 | |||
Kadant a | 162,831 | 2,836,516 | |||
Key Technology a | 207,429 | 2,800,292 | |||
| 18,072,988 | |||||
| Metal Fabrication and Distribution - 4.2% | |||||
Castle (A.M.) & Co. a | 181,221 | 2,517,160 | |||
Foster (L.B.) Company Cl. A a | 105,176 | 2,726,162 | |||
| 310,300 | 2,538,254 | ||||
Horsehead Holding Corporation a | 496,500 | 3,753,540 | |||
Olympic Steel | 211,500 | 4,858,155 | |||
| SHARES | VALUE | ||||
| Industrial Products (continued) | |||||
| Metal Fabrication and Distribution (continued) | |||||
RBC Bearings a | 153,244 | $ | 4,442,544 | ||
Samuel Manu-Tech a | 231,000 | 867,972 | |||
| 21,703,787 | |||||
| Miscellaneous Manufacturing - 0.9% | |||||
Semperit AG Holding | 127,713 | 4,366,721 | |||
| Pumps, Valves and Bearings - 0.5% | |||||
Pfeiffer Vacuum Technology | 32,400 | 2,386,169 | |||
| Specialty Chemicals and Materials - 1.2% | |||||
American Vanguard | 164,133 | 1,301,575 | |||
†Huchems Fine Chemical | 102,908 | 2,193,944 | |||
Phoscan Chemical a | 1,681,800 | 639,827 | |||
Victrex | 119,000 | 1,933,461 | |||
| 6,068,807 | |||||
| Total (Cost $73,717,082) | 73,512,145 | ||||
| Industrial Services – 10.7% | |||||
| Advertising and Publishing - 0.3% | |||||
Saraiva SA Livreiros Editores | 63,200 | 1,306,017 | |||
| Commercial Services - 4.2% | |||||
ATC Technology a | 241,731 | 3,896,704 | |||
Begbies Traynor | 947,000 | 797,671 | |||
CRA International a | 176,706 | 3,327,374 | |||
Electro Rent | 101,200 | 1,294,348 | |||
Exponent a | 115,829 | 3,789,925 | |||
Forrester Research a | 44,200 | 1,337,492 | |||
GP Strategies a | 532,700 | 3,867,402 | |||
Heritage-Crystal Clean a | 407,667 | 3,281,719 | |||
| 21,592,635 | |||||
| Engineering and Construction - 2.1% | |||||
Cavco Industries a | 150,804 | 5,305,285 | |||
Layne Christensen a | 83,200 | 2,019,264 | |||
Sterling Construction a | 284,552 | 3,682,103 | |||
| 11,006,652 | |||||
| Food, Tobacco and Agriculture - 0.2% | |||||
BioExx Specialty Proteins a | 770,000 | 1,142,830 | |||
| Industrial Distribution - 0.3% | |||||
Houston Wire & Cable | 133,400 | 1,447,390 | |||
| Printing - 1.2% | |||||
Courier Corporation | 125,518 | 1,532,575 | |||
Domino Printing Sciences | 349,352 | 2,367,043 | |||
Ennis | 140,600 | 2,110,406 | |||
| 6,010,024 | |||||
| Transportation and Logistics - 2.4% | |||||
Euroseas | 711,757 | 2,533,855 | |||
Marten Transport a | 222,880 | 4,631,446 | |||
Patriot Transportation Holding a | 65,480 | 5,297,987 | |||
| 12,463,288 | |||||
| Total (Cost $56,445,235) | 54,968,836 | ||||
| Natural Resources – 17.7% | |||||
| Energy Services - 6.5% | |||||
†Canadian Energy Services & Technology | 142,000 | 2,196,928 | |||
Dawson Geophysical a | 137,429 | 2,923,115 | |||
| THE ACCOMPANYING NOTES ARE AN INTEGRAL PART OF THESE FINANCIAL STATEMENTS. | Royce Capital Fund 2010 Semiannual Report to Shareholders | 15 |
Schedules of Investments
Royce Capital Fund – Micro-Cap Portfolio (continued) |
| SHARES | VALUE | ||||
| Natural Resources (continued) | |||||
| Energy Services (continued) | |||||
Gulf Island Fabrication | 170,246 | $ | 2,642,218 | ||
Lamprell | 1,642,000 | 5,225,523 | |||
OYO Geospace a | 99,109 | 4,804,804 | |||
Pioneer Drilling a | 170,000 | 963,900 | |||
T-3 Energy Services a | 105,745 | 2,950,286 | |||
Tesco Corporation a | 266,980 | 3,278,514 | |||
TGC Industries a | 726,133 | 2,200,183 | |||
Total Energy Services | 538,900 | 4,171,280 | |||
Union Drilling a | 249,269 | 1,373,472 | |||
World Energy Solutions a | 230,700 | 666,723 | |||
| 33,396,946 | |||||
| Oil and Gas - 1.1% | |||||
Gran Tierra Energy a | 444,100 | 2,202,736 | |||
VAALCO Energy a | 383,000 | 2,144,800 | |||
Vantage Drilling a | 1,030,400 | 1,391,040 | |||
| 5,738,576 | |||||
| Precious Metals and Mining - 9.8% | |||||
Alamos Gold | 313,300 | 4,805,964 | |||
Allied Nevada Gold a | 261,229 | 5,140,987 | |||
Bear Creek Mining a | 372,200 | 1,482,437 | |||
Crosshair Exploration & Mining a | 3,247,500 | 349,106 | |||
Eldorado Gold | 183,000 | 3,286,680 | |||
| 586,300 | 1,981,694 | ||||
Entree Gold a | 873,700 | 1,616,345 | |||
Fronteer Gold a | 1,031,200 | 6,135,640 | |||
Gammon Gold a | 211,147 | 1,152,863 | |||
Great Basin Gold a | 1,354,175 | 2,302,435 | |||
Keegan Resources a | 346,800 | 1,843,866 | |||
Lumina Copper a | 1,004,400 | 1,122,761 | |||
Quaterra Resources a | 777,900 | 884,184 | |||
Red Back Mining a | 145,100 | 3,667,879 | |||
Silvercorp Metals | 826,900 | 5,474,078 | |||
| 2,437,800 | 967,807 | ||||
US Gold a | 1,231,796 | 6,171,298 | |||
Victoria Gold a | 2,015,000 | 1,249,260 | |||
Western Copper a | 720,000 | 608,708 | |||
| 50,243,992 | |||||
| Other Natural Resources - 0.3% | |||||
Magma Energy a | 1,352,300 | 1,689,501 | |||
| Total (Cost $71,228,160) | 91,069,015 | ||||
| Technology – 12.4% | |||||
| Aerospace and Defense - 0.7% | |||||
Ducommun | 116,800 | 1,997,280 | |||
LaBarge a | 159,699 | 1,822,166 | |||
| 3,819,446 | |||||
| Components and Systems - 1.6% | |||||
SMART Modular Technologies (WWH) a | 515,572 | 3,016,096 | |||
Super Micro Computer a | 125,511 | 1,694,398 | |||
Vaisala Cl. A | 82,000 | 1,862,796 | |||
Xyratex a | 115,800 | 1,638,570 | |||
| 8,211,860 | |||||
| SHARES | VALUE | ||||
| Technology (continued) | |||||
| Distribution - 0.7% | |||||
Diploma | 990,438 | $ | 3,349,359 | ||
| Internet Software and Services - 0.4% | |||||
| 369,330 | 2,278,766 | ||||
| IT Services - 0.9% | |||||
iGATE Corporation | 216,924 | 2,780,966 | |||
Neurones | 235,150 | 1,936,637 | |||
| 4,717,603 | |||||
| Semiconductors and Equipment - 3.9% | |||||
Advanced Energy Industries a | 140,200 | 1,723,058 | |||
ATMI a | 224,900 | 3,292,536 | |||
CEVA a | 263,979 | 3,326,135 | |||
GSI Technology a | 341,561 | 1,953,729 | |||
Inficon Holding | 17,000 | 2,191,890 | |||
Rudolph Technologies a | 274,541 | 2,072,784 | |||
| 305,364 | 3,056,694 | ||||
Supertex a | 102,300 | 2,522,718 | |||
| 20,139,544 | |||||
| Software - 1.6% | |||||
Fundtech a | 178,100 | 1,850,459 | |||
Pervasive Software a | 126,100 | 625,456 | |||
Phoenix Technologies a | 503,475 | 1,455,043 | |||
PROS Holdings a | 204,323 | 1,328,099 | |||
Smith Micro Software a | 293,954 | 2,795,503 | |||
| 8,054,560 | |||||
| Telecommunications - 2.6% | |||||
Anaren a | 228,038 | 3,406,888 | |||
Atlantic Tele-Network | 125,650 | 5,189,345 | |||
Digi International a | 242,200 | 2,002,994 | |||
KVH Industries a | 214,000 | 2,657,880 | |||
| 13,257,107 | |||||
| Total (Cost $57,579,443) | 63,828,245 | ||||
| Miscellaneous c – 4.8% | |||||
| Total (Cost $26,699,992) | 24,832,752 | ||||
| TOTAL COMMON STOCKS | |||||
(Cost $462,069,937) | 473,592,669 | ||||
| REPURCHASE AGREEMENT – 8.2% | |||||
State Street Bank & Trust Company, | 42,096,000 | ||||
| 16 | Royce Capital Fund 2010 Semiannual Report to Shareholders | THE ACCOMPANYING NOTES ARE AN INTEGRAL PART OF THESE FINANCIAL STATEMENTS. |
| Royce Capital Fund – Small-Cap Portfolio |
| VALUE | ||||||
| COLLATERAL RECEIVED FOR SECURITIES LOANED – 1.3% | ||||||
Money Market Funds | $ | 6,880,519 | ||||
| TOTAL INVESTMENTS – 101.5% | ||||||
(Cost $511,046,456) | 522,569,188 | |||||
| LIABILITIES LESS CASH AND OTHER ASSETS – (1.5)% | (7,505,004 | ) | ||||
| NET ASSETS – 100.0% | $ | 515,064,184 | ||||
| SHARES | VALUE | ||||
| COMMON STOCKS – 87.5% | |||||
| Consumer Products – 12.3% | |||||
| Apparel, Shoes and Accessories - 6.2% | |||||
| 203,424 | $ | 5,339,880 | |||
Guess? | 87,845 | 2,744,278 | |||
Steven Madden a | 467,612 | 14,739,130 | |||
Wolverine World Wide | 371,952 | 9,380,630 | |||
| 32,203,918 | |||||
| Food/Beverage/Tobacco - 2.4% | |||||
J & J Snack Foods | 170,408 | 7,174,177 | |||
Lancaster Colony | 98,626 | 5,262,683 | |||
| 12,436,860 | |||||
| Health, Beauty and Nutrition - 3.7% | |||||
Inter Parfums | 332,696 | 4,734,264 | |||
NBTY a | 310,200 | 10,549,902 | |||
Nutraceutical International a | 285,104 | 4,350,687 | |||
| 19,634,853 | |||||
| Total (Cost $50,961,878) | 64,275,631 | ||||
| Consumer Services – 11.0% | |||||
| Leisure and Entertainment - 2.2% | |||||
International Speedway Cl. A | 242,600 | 6,249,376 | |||
World Wrestling Entertainment Cl. A | 333,459 | 5,188,622 | |||
| 11,437,998 | |||||
| Retail Stores - 8.8% | |||||
American Eagle Outfitters | 101,200 | 1,189,100 | |||
Buckle (The) | 337,319 | 10,935,882 | |||
Cato Corporation (The) Cl. A | 303,600 | 6,685,272 | |||
Dress Barn (The) a | 613,097 | 14,597,840 | |||
Jos. A. Bank Clothiers a | 231,800 | 12,514,882 | |||
| 45,922,976 | |||||
| Total (Cost $49,009,151) | 57,360,974 | ||||
| Financial Intermediaries – 15.2% | |||||
| Insurance - 13.5% | |||||
Allied World Assurance Company Holdings | 252,400 | 11,453,912 | |||
Alterra Capital Holdings | 351,163 | 6,594,841 | |||
American Safety Insurance Holdings a | 171,660 | 2,698,495 | |||
Amerisafe a | 311,848 | 5,472,932 | |||
Aspen Insurance Holdings | 376,200 | 9,307,188 | |||
Donegal Group Cl. A | 11,211 | 137,783 | |||
EMC Insurance Group | 40,178 | 881,104 | |||
Endurance Specialty Holdings | 37,900 | 1,422,387 | |||
Harleysville Group | 157,070 | 4,873,882 | |||
Meadowbrook Insurance Group | 687,860 | 5,936,232 | |||
Montpelier Re Holdings | 332,277 | 4,960,896 | |||
Reinsurance Group of America | 150,600 | 6,883,926 | |||
†StanCorp Financial Group | 118,300 | 4,795,882 | |||
State Auto Financial | 10,538 | 163,444 | |||
Validus Holdings | 194,513 | 4,750,008 | |||
| 70,332,912 | |||||
| THE ACCOMPANYING NOTES ARE AN INTEGRAL PART OF THESE FINANCIAL STATEMENTS. | Royce Capital Fund 2010 Semiannual Report to Shareholders | 17 |
Schedules of Investments
Royce Capital Fund – Small-Cap Portfolio (continued) |
| SHARES | VALUE | ||||
| Financial Intermediaries (continued) | |||||
| Securities Brokers - 1.7% | |||||
Knight Capital Group Cl. A a | 660,400 | $ | 9,106,916 | ||
| Total (Cost $76,914,334) | 79,439,828 | ||||
| Financial Services – 3.8% | |||||
| Information and Processing - 0.8% | |||||
Total System Services | 302,200 | 4,109,920 | |||
| Insurance Brokers - 0.9% | |||||
Brown & Brown | 244,385 | 4,677,529 | |||
| Investment Management - 2.1% | |||||
Federated Investors Cl. B | 541,400 | 11,212,394 | |||
| Total (Cost $19,998,667) | 19,999,843 | ||||
| Health – 10.8% | |||||
Drugs and Biotech - 1.4% | |||||
Emergent Biosolutions a | 454,796 | 7,431,366 | |||
| Health Services - 6.8% | |||||
Almost Family a | 259,783 | 9,074,220 | |||
Chemed Corporation | 113,400 | 6,196,176 | |||
| 277,550 | 7,702,013 | ||||
MEDNAX a | 142,000 | 7,896,620 | |||
U.S. Physical Therapy a | 277,600 | 4,685,888 | |||
| 35,554,917 | |||||
| Medical Products and Devices - 2.6% | |||||
Kensey Nash a | 80,929 | 1,918,826 | |||
Obagi Medical Products a | 539,880 | 6,381,382 | |||
Patterson Companies | 189,700 | 5,412,141 | |||
| 13,712,349 | |||||
| Total (Cost $47,817,602) | 56,698,632 | ||||
| Industrial Products – 6.1% | |||||
| Automotive - 0.8% | |||||
Dorman Products a | 210,867 | 4,286,926 | |||
| Building Systems and Components - 0.7% | |||||
Simpson Manufacturing | 139,485 | 3,424,357 | |||
| Industrial Components - 1.7% | |||||
GrafTech International a | 601,600 | 8,795,392 | |||
| Machinery - 0.5% | |||||
Lincoln Electric Holdings | 48,299 | 2,462,766 | |||
| Metal Fabrication and Distribution - 0.9% | |||||
Schnitzer Steel Industries Cl. A | 51,100 | 2,003,120 | |||
Sims Metal Management ADR | 205,570 | 2,910,871 | |||
| 4,913,991 | |||||
| Paper and Packaging - 0.4% | |||||
Orchids Paper Products a | 177,700 | 2,310,100 | |||
| Pumps, Valves and Bearings - 1.1% | |||||
Gardner Denver | 133,249 | 5,941,573 | |||
| Total (Cost $27,269,300) | 32,135,105 | ||||
| Industrial Services – 5.5% | |||||
| Commercial Services - 4.3% | |||||
ATC Technology a | 333,159 | 5,370,523 | |||
FTI Consulting a | 147,000 | 6,407,730 | |||
| SHARES | VALUE | ||||
| Industrial Services (continued) | |||||
| Commercial Services (continued) | |||||
MAXIMUS | 182,900 | $ | 10,584,423 | ||
| 22,362,676 | |||||
| Transportation and Logistics - 1.2% | |||||
Kirby Corporation a | 162,300 | 6,207,975 | |||
| Total (Cost $25,473,389) | 28,570,651 | ||||
| Natural Resources – 12.3% | |||||
| Energy Services - 7.9% | |||||
| 212,700 | 5,428,104 | ||||
Ensign Energy Services | 276,200 | 3,248,343 | |||
Helmerich & Payne | 34,400 | 1,256,288 | |||
Oil States International a | 143,100 | 5,663,898 | |||
Rowan Companies a | 283,400 | 6,217,796 | |||
Tidewater | 229,300 | 8,878,496 | |||
Trican Well Service | 151,400 | 1,938,455 | |||
Unit Corporation a | 219,300 | 8,901,387 | |||
| 41,532,767 | |||||
| Oil and Gas - 1.7% | |||||
Cimarex Energy | 67,118 | 4,804,307 | |||
Energen Corporation | 88,600 | 3,927,638 | |||
| 8,731,945 | |||||
| Precious Metals and Mining - 2.7% | |||||
Agnico-Eagle Mines | 55,500 | 3,373,290 | |||
Major Drilling Group International | 69,900 | 1,424,199 | |||
Pan American Silver | 124,900 | 3,157,472 | |||
Red Back Mining a | 238,000 | 6,016,232 | |||
| 13,971,193 | |||||
| Total (Cost $52,134,498) | 64,235,905 | ||||
| Technology – 7.2% | |||||
| Components and Systems - 0.8% | |||||
Rimage Corporation a | 254,598 | 4,030,286 | |||
| Internet Software and Services - 1.4% | |||||
EarthLink | 918,700 | 7,312,852 | |||
| IT Services - 2.3% | |||||
ManTech International Cl. A a | 286,203 | 12,183,662 | |||
| Semiconductors and Equipment - 0.9% | |||||
MKS Instruments a | 243,300 | 4,554,576 | |||
| Telecommunications - 1.8% | |||||
Comtech Telecommunications a | 318,366 | 9,528,694 | |||
| Total (Cost $42,730,150) | 37,610,070 | ||||
| Miscellaneous c – 3.3% | |||||
| Total (Cost $16,954,635) | 17,029,346 | ||||
| TOTAL COMMON STOCKS | |||||
(Cost $409,263,604) | 457,355,985 | ||||
| 18 | Royce Capital Fund 2010 Semiannual Report to Shareholders | THE ACCOMPANYING NOTES ARE AN INTEGRAL PART OF THESE FINANCIAL STATEMENTS. |
| VALUE | |||||
| REPURCHASE AGREEMENT – 10.4% | |||||
State Street Bank & Trust Company, | $ | 54,556,000 | |||
| TOTAL INVESTMENTS – 97.9% | |||||
(Cost $463,819,604) | 511,911,985 | ||||
| CASH AND OTHER ASSETS LESS LIABILITIES – 2.1% | 11,167,240 | ||||
| NET ASSETS – 100.0% | $ | 523,079,225 | |||
| THE ACCOMPANYING NOTES ARE AN INTEGRAL PART OF THESE FINANCIAL STATEMENTS. | Royce Capital Fund 2010 Semiannual Report to Shareholders | 19 |
| Statements of Assets and Liabilities | June 30, 2010 (unaudited) |
| Micro-Cap | Small-Cap | |||||||
| Portfolio | Portfolio | |||||||
| ASSETS: | ||||||||
| Investments at value | ||||||||
(including collateral on loaned securities)* | $ | 480,473,188 | $ | 457,355,985 | ||||
| Repurchase agreements (at cost and value) | 42,096,000 | 54,556,000 | ||||||
| Cash and foreign currency | 8,869 | 510 | ||||||
| Receivable for investments sold | 509,103 | 63,259 | ||||||
| Receivable for capital shares sold | 65,725 | 17,440,692 | ||||||
| Receivable for dividends and interest | 271,803 | 180,840 | ||||||
| Prepaid expenses and other assets | 2,784 | 2,482 | ||||||
Total Assets | 523,427,472 | 529,599,768 | ||||||
| LIABILITIES: | ||||||||
| Payable for collateral on loaned securities | 6,880,519 | – | ||||||
| Payable for investments purchased | 233,031 | 5,076,479 | ||||||
| Payable for capital shares redeemed | 561,754 | 943,044 | ||||||
| Payable for investment advisory fees | 550,474 | 430,096 | ||||||
| Accrued expenses | 137,510 | 70,924 | ||||||
Total Liabilities | 8,363,288 | 6,520,543 | ||||||
Net Assets | $ | 515,064,184 | $ | 523,079,225 | ||||
| ANALYSIS OF NET ASSETS: | ||||||||
| Paid-in capital | $ | 540,789,412 | $ | 514,542,487 | ||||
| Undistributed net investment income (loss) | 3,523,703 | 1,742,606 | ||||||
| Accumulated net realized gain (loss) on investments and foreign currency | (40,722,232 | ) | (41,297,354 | ) | ||||
| Net unrealized appreciation (depreciation) on investments and foreign currency | 11,473,301 | 48,091,486 | ||||||
Net Assets | $ | 515,064,184 | $ | 523,079,225 | ||||
Investment Class | $ | 505,443,577 | $ | 503,647,073 | ||||
Service Class | 9,620,607 | 19,432,152 | ||||||
| SHARES OUTSTANDING: | ||||||||
| (unlimited number of $.001 par value shares authorized for each Fund) | ||||||||
Investment Class | 53,926,650 | 58,121,764 | ||||||
Service Class | 1,030,367 | 2,257,328 | ||||||
| NET ASSET VALUES: | ||||||||
| (Net Assets ÷ Shares Outstanding) | ||||||||
(offering and redemption price per share) | ||||||||
Investment Class | $9.37 | $8.67 | ||||||
Service Class | 9.34 | 8.61 | ||||||
| * Investments at identified cost | $ | 468,950,456 | $ | 409,263,604 | ||||
| Market value of loaned securities | 6,555,247 | |||||||
| 20 | Royce Capital Fund 2010 Semiannual Report to Shareholders | THE ACCOMPANYING NOTES ARE AN INTEGRAL PART OF THESE FINANCIAL STATEMENTS. |
Statements of Changes in Net Assets
| Micro-Cap Portfolio | Small-Cap Portfolio | |||||||||||||||
| Six months ended | Six months ended | |||||||||||||||
| 6/30/10 | Year ended | 6/30/10 | Year ended | |||||||||||||
| (unaudited) | 12/31/09 | (unaudited) | 12/31/09 | |||||||||||||
| INVESTMENT OPERATIONS: | ||||||||||||||||
| Net investment income (loss) | $ | (573,197 | ) | $ | (543,220 | ) | $ | 1,016,118 | $ | 716,107 | ||||||
| Net realized gain (loss) on investments and foreign currency | 16,976,867 | (23,003,771 | ) | 17,725,179 | (48,995,588 | ) | ||||||||||
| Net change in unrealized appreciation (depreciation) on investments and foreign currency | (24,726,097 | ) | 213,461,362 | (22,066,976 | ) | 166,433,333 | ||||||||||
| Net increase (decrease) in net assets from investment operations | (8,322,427 | ) | 189,914,371 | (3,325,679 | ) | 118,153,852 | ||||||||||
| DISTRIBUTIONS: | ||||||||||||||||
| Net investment income | ||||||||||||||||
Investment Class | – | – | – | – | ||||||||||||
Service Class | – | – | – | – | ||||||||||||
| Net realized gain on investments and foreign currency | ||||||||||||||||
Investment Class | – | – | – | – | ||||||||||||
Service Class | – | – | – | – | ||||||||||||
| Total distributions | – | – | – | – | ||||||||||||
| CAPITAL SHARE TRANSACTIONS: | ||||||||||||||||
| Value of shares sold | ||||||||||||||||
Investment Class | 55,924,063 | 104,625,551 | 84,309,657 | 152,785,352 | ||||||||||||
Service Class | 3,363,831 | 2,464,138 | 16,714,382 | 4,334,197 | ||||||||||||
| Distributions reinvested | ||||||||||||||||
Investment Class | – | – | – | – | ||||||||||||
Service Class | – | – | – | – | ||||||||||||
| Value of shares redeemed | ||||||||||||||||
Investment Class | (64,525,930 | ) | (98,326,323 | ) | (45,516,195 | ) | (94,541,635 | ) | ||||||||
Service Class | (374,710 | ) | (1,462,590 | ) | (1,664,402 | ) | (1,506,356 | ) | ||||||||
| Net increase (decrease) in net assets from capital share transactions | (5,612,746 | ) | 7,300,776 | 53,843,442 | 61,071,558 | |||||||||||
| NET INCREASE (DECREASE) IN NET ASSETS | (13,935,173 | ) | 197,215,147 | 50,517,763 | 179,225,410 | |||||||||||
| NET ASSETS: | ||||||||||||||||
Beginning of period | 528,999,357 | 331,784,210 | 472,561,462 | 293,336,052 | ||||||||||||
End of period | $ | 515,064,184 | $ | 528,999,357 | $ | 523,079,225 | $ | 472,561,462 | ||||||||
UNDISTRIBUTED NET INVESTMENT INCOME (LOSS) AT END OF PERIOD | $ | 3,523,703 | $ | 4,096,900 | $ | 1,742,606 | $ | 726,488 | ||||||||
| THE ACCOMPANYING NOTES ARE AN INTEGRAL PART OF THESE FINANCIAL STATEMENTS. | Royce Capital Fund 2010 Semiannual Report to Shareholders | 21 |
| Statements of Operations | Six Months Ended June 30, 2010 (unaudited) |
| Micro-Cap | Small-Cap | |||||||
| Portfolio | Portfolio | |||||||
| INVESTMENT INCOME: | ||||||||
| Income: | ||||||||
Dividends | $ | 2,924,600 | $ | 3,559,141 | ||||
Interest | 14,403 | 17,524 | ||||||
Securities lending | 77,619 | 108,375 | ||||||
| Total income | 3,016,622 | 3,685,040 | ||||||
| Expenses: | ||||||||
Investment advisory fees | 3,389,319 | 2,523,463 | ||||||
Distribution fees | 10,208 | 16,149 | ||||||
Custody | 74,411 | 26,731 | ||||||
Shareholder reports | 35,760 | 11,098 | ||||||
Administrative and office facilities | 29,460 | 26,679 | ||||||
Audit | 19,026 | 18,000 | ||||||
Trustees’ fees | 17,933 | 16,549 | ||||||
Shareholder servicing | 8,018 | 12,998 | ||||||
Legal | 6,128 | 5,541 | ||||||
Registration | 458 | 3,211 | ||||||
Other expenses | 9,322 | 9,050 | ||||||
| Total expenses | 3,600,043 | 2,669,469 | ||||||
| Compensating balance credits | (16 | ) | (2 | ) | ||||
| Fees waived by distributor | (10,208 | ) | – | |||||
| Expenses reimbursed by investment adviser | – | (545 | ) | |||||
| Net expenses | 3,589,819 | 2,668,922 | ||||||
| Net investment income (loss) | (573,197 | ) | 1,016,118 | |||||
| REALIZED AND UNREALIZED GAIN (LOSS) ON INVESTMENTS AND FOREIGN CURRENCY: | ||||||||
| Net realized gain (loss): | ||||||||
Investments | 16,948,744 | 17,724,439 | ||||||
Foreign currency transactions | 28,123 | 740 | ||||||
| Net change in unrealized appreciation (depreciation): | ||||||||
Investments and foreign currency translations | (24,705,129 | ) | (22,065,644 | ) | ||||
Other assets and liabilities denominated in foreign currency | (20,968 | ) | (1,332 | ) | ||||
| Net realized and unrealized gain (loss) on investments and foreign currency | (7,749,230 | ) | (4,341,797 | ) | ||||
| NET INCREASE (DECREASE) IN NET ASSETS FROM INVESTMENT OPERATIONS | $ | (8,322,427 | ) | $ | (3,325,679 | ) | ||
| 22 | Royce Capital Fund 2010 Semiannual Report to Shareholders | THE ACCOMPANYING NOTES ARE AN INTEGRAL PART OF THESE FINANCIAL STATEMENTS. |
| This table is presented to show selected data for a share outstanding throughout each period, and to assist shareholders in evaluating a Fund’s performance for the periods presented. Per share amounts have been determined on the basis of the weighted average number of shares outstanding during the period. | |||||||||||||||||||||||||||||||||||||||||||||||||||||||||
| Net Realized | Distributions from Net | Ratio of Expenses to Average Net Assets | Ratio of Net | ||||||||||||||||||||||||||||||||||||||||||||||||||||||
| Net Asset Value, Beginning of Period | Net Investment Income (Loss) | and Unrealized Gain (Loss) on Investments and Foreign Currency | Total from Investment Operations | Distributions from Net Investment Income | Realized Gain on Investments and Foreign Currency | Total Distributions | Net Asset Value, End of Period | Total Return | Net Assets, End of Period (in thousands) | Prior to Fee Waivers and Balance Credits | Prior to Fee Waivers | Net of Fee Waivers | Investment Income (Loss) to Average Net Assets | Portfolio Turnover Rate | |||||||||||||||||||||||||||||||||||||||||||
| Micro-Cap Portfolio – Investment Class | |||||||||||||||||||||||||||||||||||||||||||||||||||||||||
| †2010 | $ | 9.52 | $ | (0.01 | ) | $ | (0.14 | ) | $ | (0.15 | ) | $ | – | $ | – | $ | – | $ | 9.37 | (1.58 | )%# | $ | 505,443 | 1.32 | %# # | 1.32 | %# # | 1.32 | %# # | (0.21 | %# # | 21 | % | ||||||||||||||||||||||||
| 2009 | 6.03 | (0.01 | ) | 3.50 | 3.49 | – | – | – | 9.52 | 57.88 | 522,092 | 1.33 | 1.33 | 1.33 | (0.13 | ) | 33 | ||||||||||||||||||||||||||||||||||||||||
| 2008 | 13.47 | 0.13 | (5.99 | ) | (5.86 | ) | (0.30 | ) | (1.28 | ) | (1.58 | ) | 6.03 | (43.27 | ) | 328,059 | 1.32 | 1.32 | 1.32 | 1.05 | 51 | ||||||||||||||||||||||||||||||||||||
| 2007 | 14.40 | 0.03 | 0.53 | 0.56 | (0.22 | ) | (1.27 | ) | (1.49 | ) | 13.47 | 3.98 | 629,953 | 1.31 | 1.31 | 1.31 | 0.19 | 47 | |||||||||||||||||||||||||||||||||||||||
| 2006 | 12.57 | 0.01 | 2.63 | 2.64 | (0.03 | ) | (0.78 | ) | (0.81 | ) | 14.40 | 21.07 | 561,257 | 1.32 | 1.31 | 1.31 | (0.09 | ) | 41 | ||||||||||||||||||||||||||||||||||||||
| 2005 | 11.50 | (0.05 | ) | 1.38 | 1.33 | (0.06 | ) | (0.20 | ) | (0.26 | ) | 12.57 | 11.61 | 384,069 | 1.33 | 1.33 | 1.33 | (0.51 | ) | 38 | |||||||||||||||||||||||||||||||||||||
| Micro-Cap Portfolio – Service Class(a) | |||||||||||||||||||||||||||||||||||||||||||||||||||||||||
| †2010 | $ | 9.49 | $ | (0.01 | ) | $ | (0.14 | ) | $ | (0.15 | ) | $ | – | $ | – | $ | – | $ | 9.34 | (1.58 | )%# | $ | 9,621 | 1.65 | %# # | 1.65 | %# # | 1.40 | %# # | (0.26 | )%# # | 21 | % | ||||||||||||||||||||||||
| 2009 | 6.02 | (0.03 | ) | 3.50 | 3.47 | – | – | – | 9.49 | 57.64 | 6,907 | 1.73 | 1.73 | 1.58 | (0.36 | ) | 33 | ||||||||||||||||||||||||||||||||||||||||
| 2008 | 13.45 | 0.05 | (5.92 | ) | (5.87 | ) | (0.28 | ) | (1.28 | ) | (1.56 | ) | 6.02 | (43.44 | ) | 3,725 | 1.92 | 1.92 | 1.58 | 0.70 | 51 | ||||||||||||||||||||||||||||||||||||
| 2007 | 14.39 | (0.06 | ) | 0.58 | 0.52 | (0.19 | ) | (1.27 | ) | (1.46 | ) | 13.45 | 3.71 | 3,515 | 2.11 | 2.11 | 1.58 | (0.06 | ) | 47 | |||||||||||||||||||||||||||||||||||||
| 2006 | 14.90 | (0.04 | ) | 0.34 | 0.30 | ) | (0.02 | ) | (0.79 | ) | (0.81 | ) | 14.39 | 2.06 | # | 1,262 | 8.67 | # # | 8.67 | # # | 1.58 | # # | 0.16 | # # | 41 | ||||||||||||||||||||||||||||||||
| Small-Cap Portfolio – Investment Class | |||||||||||||||||||||||||||||||||||||||||||||||||||||||||
| †2010 | $ | 8.68 | $ | 0.02 | $ | (0.03 | ) | $ | (0.01 | ) | $ | – | $ | – | $ | – | $ | 8.67 | (0.12 | )%# | $ | 503,647 | 1.05 | %# # | 1.05 | %# # | 1.05 | %# # | 0.41 | %# # | 19 | % | |||||||||||||||||||||||||
| 2009 | 6.42 | 0.01 | 2.25 | 2.26 | – | – | – | 8.68 | 35.20 | 467,401 | 1.07 | 1.07 | 1.07 | 0.20 | 46 | ||||||||||||||||||||||||||||||||||||||||||
| 2008 | 9.96 | 0.00 | (2.72 | ) | (2.72 | ) | (0.06 | ) | (0.76 | ) | (0.82 | ) | 6.42 | (27.18 | ) | 291,898 | 1.07 | 1.07 | 1.07 | 0.07 | 45 | ||||||||||||||||||||||||||||||||||||
| 2007 | 10.67 | 0.07 | (0.30 | ) | (0.23 | ) | (0.00 | ) | (0.48 | ) | (0.48 | ) | 9.96 | (2.14 | ) | 345,747 | 1.09 | 1.08 | 1.08 | 0.60 | 64 | ||||||||||||||||||||||||||||||||||||
| 2006 | 9.67 | 0.00 | 1.51 | 1.51 | (0.01 | ) | (0.50 | ) | (0.51 | ) | 10.67 | 15.57 | 274,089 | 1.08 | 1.08 | 1.08 | 0.08 | 54 | |||||||||||||||||||||||||||||||||||||||
| 2005 | 9.00 | 0.01 | 0.76 | 0.77 | – | (0.10 | ) | (0.10 | ) | 9.67 | 8.56 | 187,039 | 1.11 | 1.11 | 1.11 | 0.11 | 45 | ||||||||||||||||||||||||||||||||||||||||
| Small-Cap Portfolio – Service Class(a) | |||||||||||||||||||||||||||||||||||||||||||||||||||||||||
| †2010 | $ | 8.64 | $ | 0.01 | $ | (0.04 | ) | $ | (0.03 | ) | $ | – | $ | – | $ | – | $ | 8.61 | (0.35 | )%# | $ | 19,432 | 1.37 | %# # | 1.37 | %# # | 1.36 | %# # | 0.19 | %# # | 19 | % | |||||||||||||||||||||||||
| 2009 | 6.40 | (0.00 | ) | 2.24 | 2.24 | – | – | – | 8.64 | 35.00 | 5,160 | 1.62 | 1.62 | 1.36 | (0.04 | ) | 46 | ||||||||||||||||||||||||||||||||||||||||
| 2008 | 9.94 | (0.02 | ) | (2.73 | ) | (2.75 | ) | (0.03 | ) | (0.76 | ) | (0.79 | ) | 6.40 | (27.50 | ) | 1,438 | 1.96 | 1.96 | 1.36 | (0.21 | ) | 45 | ||||||||||||||||||||||||||||||||||
| 2007 | 10.67 | 0.03 | (0.28 | ) | (0.25 | ) | – | (0.48 | ) | (0.48 | ) | 9.94 | (2.37 | ) | 1,647 | 2.09 | 2.09 | 1.36 | 0.23 | 64 | |||||||||||||||||||||||||||||||||||||
| 2006 | 10.85 | (0.01 | ) | 0.33 | 0.32 | – | (0.50 | ) | (0.50 | ) | 10.67 | 2.94 | # | 103 | 15.77 | # # | 15.77 | # # | 1.36 | # # | (0.12 | )# # | 54 | ||||||||||||||||||||||||||||||||||
| (a) | The Class commenced operations on May 2, 2006. | |
| # | Not Annualized | |
| # # | Annualized | |
| † | Six months ended June 30, 2010 (unaudited) |
| THE ACCOMPANYING NOTES ARE AN INTEGRAL PART OF THESE FINANCIAL STATEMENTS. | Royce Capital Fund 2010 Semiannual Report to Shareholders | 23 |
| Notes to Financial Statements (unaudited) | |
| Summary of Significant Accounting Policies: |
Royce Micro-Cap Portfolio and Royce Small-Cap Portfolio (the “Fund” or “Funds”) are the two series of Royce Capital Fund (the “Trust”), a diversified open-end management investment company organized as a Delaware statutory trust. Shares of the Funds are offered to life insurance companies for allocation to certain separate accounts established for the purpose of funding qualified and non-qualified variable annuity contracts and variable life insurance contracts, and may also be offered directly to certain pension plans and retirement plans and accounts permitting accumulation of assets on a tax-deferred basis. Micro-Cap Portfolio and Small-Cap Portfolio commenced operations on December 27, 1996. |
Valuation of Investments: |
Securities are valued as of the close of trading on the New York Stock Exchange (NYSE) (generally 4:00 p.m. Eastern time) on the valuation date. Securities that trade on an exchange, and securities traded on Nasdaq’s Electronic Bulletin Board, are valued at their last reported sales price or Nasdaq official closing price taken from the primary market in which each security trades or, if no sale is reported for such day, at their bid price. Other over-the-counter securities for which market quotations are readily available are valued at their highest bid price, except in the case of some bonds and other fixed income securities which may be valued by reference to other securities with comparable ratings, interest rates and maturities, using established independent pricing services. The Funds value their non-U.S. dollar denominated securities in U.S. dollars daily at the prevailing foreign currency exchange rates as quoted by a major bank. Securities for which market quotations are not readily available are valued at their fair value under procedures established by the Board of Trustees. In addition, if, between the time trading ends on a particular security and the close of the customary trading session on the NYSE, events occur that are significant and may make the closing price unreliable, a Fund may fair value the security. The Funds use an independent pricing service to provide fair value estimates for relevant non-U.S. equity securities on days when the U.S. market volatility exceeds a certain threshold. This pricing service uses proprietary correlations it has developed between the movement of prices of non-U.S. equity securities and indices of U.S.-traded securities, futures contracts and other indications to estimate the fair value of relevant non-U.S. securities. When fair value pricing is employed, the prices of securities used by a Fund may differ from quoted or published prices for the same security. Investments in money market funds are valued at net asset value per share. |
Various inputs are used in determining the value of each Fund’s investments, as noted above. These inputs are summarized in the three broad levels below: | |||
Level 1 – quoted prices in active markets for identical securities | |||
Level 2 – other significant observable inputs (including quoted prices for similar securities, foreign securities that may be fair valued and repurchase agreements) | Level 3 – significant unobservable inputs (including each Fund’s own assumptions in determining the fair value of investments) | The inputs or methodology used for valuing securities are not necessarily an indication of the risk associated with investing in those securities. | The following is a summary of the inputs used to value each Fund’s investments as of June 30, 2010: |
| Level 1 | Level 2 | Level 3 | Total | ||||||||||
| Micro-Cap Portfolio | |||||||||||||
Common stocks | $336,950,102 | $136,642,567 | $– | $473,592,669 | |||||||||
Cash equivalents | 6,880,519 | 42,096,000 | – | 48,976,519 | |||||||||
| Small-Cap Portfolio | |||||||||||||
Common stocks | 444,728,756 | 12,627,229 | – | 457,355,985 | |||||||||
Cash equivalents | – | 54,556,000 | – | 54,556,000 | |||||||||
| 24 | Royce Capital Fund 2010 Semiannual Report to Shareholders |
The Funds pay any dividends and capital gain distributions annually in December. Dividends from net investment income are determined at a class level and distributions from capital gains are determined at a Fund level. Because federal income tax regulations differ from generally accepted accounting principles, income and capital gain distributions determined in accordance with tax regulations may differ from net investment income and realized gains recognized for financial reporting purposes. Accordingly, the character of distributions and composition of net assets for tax purposes differ from those reflected in the accompanying financial statements.
| Royce Capital Fund 2010 Semiannual Report to Shareholders | 25 |
Notes to Financial Statements (unaudited) (continued)
Capital Share Transactions (in shares):
| Shares issued for | Net increase (decrease) from | |||||||||||||||||||||||||||||||
| Shares sold | reinvestment of distributions | Shares redeemed | capital share transactions | |||||||||||||||||||||||||||||
| Period ended | Period ended | Period ended | Period ended | |||||||||||||||||||||||||||||
| 6/30/10 | Year ended | 6/30/10 | Year ended | 6/30/10 | Year ended | 6/30/10 | Year ended | |||||||||||||||||||||||||
| (unaudited) | 12/31/09 | (unaudited) | 12/31/09 | (unaudited) | 12/31/09 | (unaudited) | 12/31/09 | |||||||||||||||||||||||||
| Micro-Cap Portfolio | ||||||||||||||||||||||||||||||||
Investment Class | ||||||||||||||||||||||||||||||||
Service Class
Investment Class
Service Class
| Investment Adviser and Distributor: |
Investment Adviser: Under the Trust’s investment advisory agreements with Royce, Royce is entitled to receive Investment Advisory fees that are computed daily and payable monthly, at an annual rate of 1.25% and 1.00% of the average net assets of Micro-Cap Portfolio and Small-Cap Portfolio, respectively. Royce has contractually committed to reimburse class-specific expenses (excluding acquired fund fees and expenses) to the extent necessary to maintain the net annual operating expense ratios to average net assets at or below 1.58% and 1.36% for the Service Classes of Micro-Cap Portfolio and Small-Cap Portfolio, respectively, through April 30, 2011. For the six months ended June 30, 2010, Micro-Cap Portfolio recorded advisory fees of $3,389,319 and Small-Cap Portfolio recorded advisory fees of $2,523,463. |
Distributor: Royce Fund Services, Inc. (“RFS”), the distributor of the Trust’s shares, is a wholly owned subsidiary of Royce. RFS is entitled to receive distribution fees from each Fund’s Service Class that are computed daily and payable monthly, at an annual rate of 0.25% of the average net assets of each Class. For the six months ended June 30, 2010, Micro-Cap Portfolio-Service Class recorded net distribution fees of $0 and Small-Cap Portfolio-Service Class recorded net distribution fees of $16,149. |
Purchases and Sales of Investment Securities: |
| For the six months ended June 30, 2010, the costs of purchases and the proceeds from sales of investment securities, other than short-term securities and collateral received for securities loaned, were as follows: |
| Purchases | Sales | |||||
| Micro-Cap Portfolio | $104,663,514 | $106,687,738 | ||||
| Small-Cap Portfolio | 127,368,817 | 82,502,595 |
| Expenses | |||||||||||||||||||||||
| Net | Transfer Agent | Reimbursed by | |||||||||||||||||||||
| Distribution | Shareholder | Shareholder | Balance | Investment | |||||||||||||||||||
| Fees | Servicing | Reports | Registration | Credits | Total | Adviser | |||||||||||||||||
| Micro-Cap Portfolio – Investment Class | $ | – | $ 5,061 | $ 35,556 | $ 126 | $ (1 | ) | $ | 40,742 | $ | – | ||||||||||||
| Micro-Cap Portfolio – Service Class | – | 2,957 | 204 | 332 | (1 | ) | 3,492 | – | |||||||||||||||
| – | 8,018 | 35,760 | 458 | (2 | ) | ||||||||||||||||||
| Small-Cap Portfolio – Investment Class | – | 10,035 | 10,694 | 1,782 | (1 | ) | 22,510 | – | |||||||||||||||
| Small-Cap Portfolio – Service Class | 16,149 | 2,963 | 404 | 1,429 | (1 | ) | 20,944 | 545 | |||||||||||||||
| 16,149 | 12,998 | 11,098 | 3,211 | (2 | ) | 545 | |||||||||||||||||
Tax Information:
At June 30, 2010, net unrealized appreciation (depreciation) based on identified cost for tax purposes was as follows:
| Net Unrealized | |||||||||||||
| Appreciation | Gross Unrealized | ||||||||||||
| Tax Basis Cost | (Depreciation) | Appreciation | Depreciation | ||||||||||
| Micro-Cap Portfolio | $511,350,921 | $11,218,267 | $92,079,488 | $80,861,221 | |||||||||
| Small-Cap Portfolio | 463,970,247 | 47,941,738 | 67,732,649 | 19,790,911 | |||||||||
The primary difference between book and tax basis cost is the timing of the recognition of losses on securities sold.
| 26 | Royce Capital Fund 2010 Semiannual Report to Shareholders |
| Understanding Your Fund’s Expenses (unaudited) | |
As a shareholder of a mutual fund, you pay ongoing expenses, including management fees and other Fund expenses including, for some funds, distribution and/or service (12b-1) fees. Using the information below, you can estimate how these ongoing expenses (in dollars) affect your investment and compare them with the ongoing expenses of other funds. You may also incur one-time transaction expenses which are not shown in this section and would result in higher total costs. The example is based on an investment of $1,000 invested at January 1, 2010 and held for the entire six-month period ended June 30, 2010. Service Class shares are generally available only through certain insurance companies, brokers or retirement plan administrators who receive service fees from the Fund for services that they perform. |
| Actual Expenses |
The first part of the table below provides information about actual account values and actual expenses. You may use the information in this section, together with the amount you invested, to estimate the expenses that you paid over the period. Simply divide your account value at June 30, 2010 by $1,000 (for example, an $8,600 account value divided by $1,000 = 8.6), then multiply the result by the number under the heading entitled “Expenses Paid During the Period” to estimate the expenses you paid on your account during this period. |
| Hypothetical Example for Comparison Purposes |
The second part of the table below provides information about hypothetical account values and hypothetical expenses based on the Fund’s actual expense ratio and an assumed rate of return of 5% per year before expenses, which is not the Fund’s actual return. The hypothetical account values and expenses may not be used to estimate the actual ending account balance or expenses you paid for the period. You may use this information to compare the ongoing costs of investing in the Fund and other funds. To do so, compare this 5% hypothetical example with the 5% hypothetical examples that appear in the shareholder reports of the other funds. |
Please note that the expenses shown in the table are meant to highlight your ongoing costs only and do not reflect any transactional costs, such as sales charges (loads), redemption fees, or exchange fees. Therefore, this section is useful in comparing ongoing costs only, and will not help you determine the relative total costs of owning different funds. In addition, if these transactional costs were included, your costs would have been higher. |
| Actual | Hypothetical (5% per year return before expenses) | ||||||||||||||||||||||
| Beginning | Ending | Expenses Paid | Beginning | Ending | Expenses Paid | Annualized | |||||||||||||||||
| Account Value | Account Value | During the | Account Value | Account Value | During the | Expense | |||||||||||||||||
| 1/1/10 | 6/30/10 | Period(1) | 1/1/10 | 6/30/10 | Period(1) | Ratio(2) | |||||||||||||||||
| Investment Class | |||||||||||||||||||||||
| Micro-Cap Portfolio | $1,000.00 | $984.24 | $6.49 | $1,000.00 | $1,018.25 | $6.61 | 1.32% | ||||||||||||||||
| Small-Cap Portfolio | 1,000.00 | 998.85 | 5.20 | 1,000.00 | 1,019.59 | 5.26 | 1.05% | ||||||||||||||||
| Service Class | |||||||||||||||||||||||
| Micro-Cap Portfolio | 1,000.00 | 984.19 | 6.89 | 1,000.00 | 1,017.85 | 7.00 | 1.40% | ||||||||||||||||
| Small-Cap Portfolio | 1,000.00 | 996.53 | 6.73 | 1,000.00 | 1,018.05 | 6.80 | 1.36% | ||||||||||||||||
| Royce Capital Fund 2010 Semiannual Report to Shareholders | 27 |
At meetings held on June 9-10, 2010, Royce Capital Fund’s Board of Trustees, including all of the non-interested trustees, approved the continuance of the Investment Advisory Agreements between Royce & Associates, LLC (“R&A”) and Royce Capital Fund relating to each of Royce Micro-Cap Portfolio and Royce Small-Cap Portfolio (the “Funds”). In reaching these decisions, the Board reviewed the materials provided by R&A, which included, among other things, information prepared internally by R&A and independently by Morningstar Associates, LLC (“Morningstar”) containing detailed expense ratio and investment performance comparisons for each Fund with other mutual funds in their “peer group” and “category”, information regarding the past performance of Funds managed by R&A and a memorandum outlining the legal duties of the Board prepared by independent counsel to the non-interested trustees. R&A also provided the trustees with an analysis of its profitability with respect to providing investment advisory services to each of the Funds. In addition, the Board took into account information furnished throughout the year at regular Board meetings, including reports on investment performance, shareholder services, distribution fees and expenses, regulatory compliance, brokerage commissions and research, and brokerage and execution products and services provided to the Funds. The Board also considered other matters it deemed important to the approval process such as allocation of brokerage commissions, payments made to R&A or its affiliates relating to distribution of Fund shares and other direct and indirect benefits to R&A and its affiliates, from their relationship with the Funds. The trustees also met throughout the year with investment advisory personnel from R&A. The Board, in its deliberations, recognized that, for many of the Funds’ shareholders, the decision to purchase Fund shares included a decision to select R&A as the investment adviser and that there was a strong association in the minds of Fund shareholders between R&A and each Fund. In considering factors relating to the approval of the continuance of the Investment Advisory Agreements, the non–interested trustees received assistance and advice from, and met separately with, their independent legal counsel. While the Investment Advisory Agreements for the Funds were considered at the same meetings, the trustees dealt with each agreement separately. Among other factors, the trustees noted that they considered the following: | |
The nature, extent and quality of services provided by R&A: The trustees considered the following factors to be of fundamental importance to their consideration of whether to approve the continuance of the Funds’ Investment Advisory Agreements: (i) R&A’s more than 35 years of value investing experience and track record; (ii) the history of long-tenured R&A portfolio managers managing The Royce Funds; (iii) R&A’s focus on mid-cap, small-cap and micro-cap value investing; (iv) the consistency of R&A’s approach to managing The Royce Funds over more than 35 years; (v) the integrity and high ethical standards adhered to at R&A; (vi) R&A’s specialized experience in the area of trading small- and micro-cap securities; (vii) R&A’s historical ability to attract and retain portfolio management talent and (viii) R&A’s focus on shareholder interests. The trustees reviewed the services that R&A provides to the Funds, including, but not limited to, managing each Fund’s investments in accordance with the stated policies of each Fund. The Board considered the fact that R&A provided certain administrative services to the Fund at cost pursuant to the | |
Administration Agreement between the Fund and R&A which went into effect on January 1, 2008. The trustees determined that the services to be provided to each Fund by R&A would be the same as those it previously provided to the Funds. They also took into consideration the histories, reputations and backgrounds of R&A’s portfolio managers for the Funds, finding that these would likely have an impact on the continued success of the Funds. Lastly, the trustees noted R&A’s ability to attract quality and experienced personnel. The trustees concluded that the investment advisory services provided by R&A to each Fund compared favorably to services provided by R&A to other R&A client accounts, including other funds, in both nature and quality, and that the scope of services provided by R&A would continue to be suitable for each Fund. Investment performance of the Funds and R&A: In light of R&A’s risk-averse approach to investing, the trustees believe that risk-adjusted performance continues to be an appropriate measure of each Fund’s investment performance. One measure of risk-adjusted performance the trustees have historically used in their review of the Funds’ performance is the Sharpe Ratio. The Sharpe Ratio is a risk-adjusted measure of performance developed by Nobel Laureate William Sharpe. It is calculated by dividing a fund’s annualized excess returns by its annualized standard deviation to determine reward per unit of risk. The higher the Sharpe Ratio, the better a fund’s historical risk-adjusted performance. The Board attaches primary importance to risk-adjusted performance over relatively long periods of time, typically three to ten years. The trustees noted that Royce Micro-Cap Portfolio’s Sharpe Ratio placed in the first quartile within Morningstar’s micro-cap category for the three-, five- and ten-year periods ended December 31, 2009, and Royce Small-Cap Portfolio placed in the first quartile for the three-year, five-year and ten-year periods within Morningstar’s small blend category. The trustees noted that R&A manages a number of funds that invest in small-cap and micro-cap issuers, many of which were out-performing the Russell 2000 Index and their competitors. Although the trustees recognized that past performance is not necessarily an indicator of future results, they found that R&A had the necessary qualifications, experience and track record in managing small-cap and micro-cap securities to manage the Funds. The trustees determined that R&A continued to be an appropriate investment adviser for the Funds and concluded that each Fund’s performance supported the renewal of its Investment Advisory Agreement. Cost of the services provided and profits realized by R&A from its relationship with each Fund: The trustees considered the cost of the services provided by R&A and profits realized by R&A from its relationship with each Fund. As part of the analysis, the Board discussed with R&A its methodology in allocating its costs to each Fund and concluded that its allocations were reasonable. The trustees concluded that R&A’s profits were reasonable in relation to the nature and quality of services provided. The extent to which economies of scale would be realized as the Funds grow and whether fee levels would reflect such economies of scale: The trustees considered whether there have been economies of scale in respect of the management of the Funds, whether each of the Funds has appropriately benefited from any economies of scale and whether there is potential for realization of any further economies of |
| 28 | Royce Capital Fund 2010 Semiannual Report to Shareholders |
| scale. The trustees noted the time and effort involved in managing portfolios of small- and micro-cap stocks and that they did not involve the same efficiencies as do portfolios of large cap stocks. The trustees concluded that the current fee structure for each Fund was reasonable, and that no changes were currently necessary. | |
Comparison of services to be rendered and fees to be paid to those under other investment advisory contracts, such as contracts of the same and other investment advisers or other clients: The trustees reviewed the investment advisory fee paid by each Fund and compared both the services to be rendered and the fees to be paid under the Investment Advisory Agreements to other contracts of R&A and to contracts of other investment advisers to registered investment companies investing in small- and micro-cap stocks, as provided by Morningstar. The trustees noted the importance of the net expense ratio in measuring a fund’s efficiency, particularly in light of the variations in the mutual fund industry as to who is responsible for which expenses. It was noted that each of Royce Micro-Cap Portfolio and Royce Small-Cap Portfolio placed in the middle quintile among its respective peers. | |
| The trustees noted that R&A had, from time to time, waived advisory fees in order to maintain expense ratios at competitive levels. The trustees also considered fees charged by R&A to institutional and other clients and noted, given the greater levels of services that R&A provides to registered investment companies such as the Funds compare to other accounts, the Funds’ advisory fees compared favorably to these other accounts. The entire Board, including all the non-interested trustees, approved the renewal of the existing Investment Advisory Agreements, concluding that a contract renewal on the existing terms was in the best interest of the shareholders of each Fund and that each investment advisory fee rate was reasonable in relation to the services provided. |
| Royce Capital Fund 2010 Semiannual Report to Shareholders |
Wealth Of Experience With approximately $29 billion in open- and closed-end fund assets under management, Royce & Associates is committed to the same small-company investing principles that have served us well for more than 35 years. Charles M. Royce, our President and Co-Chief Investment Officer, enjoys one of the longest tenures of any active mutual fund manager. Royce’s investment staff also includes Co-Chief Investment Officer W. Whitney George, 15 Portfolio Managers, 11 assistant portfolio managers and analysts, and eight traders. Multiple Funds, Common Focus Our goal is to offer both individual and institutional investors the best available smaller-cap portfolios. Unlike a lot of mutual fund groups with broad product offerings, we have chosen to concentrate on smaller-company investing by providing investors with a range of funds that take full advantage of this large and diverse sector. Consistent Discipline Our approach emphasizes paying close attention to risk and maintaining the same discipline, regardless of market movements and trends. The price we pay for a security must be significantly below our appraisal of its current worth. This requires a thorough analysis of the financial and business dynamics of an enterprise, as though we were purchasing the entire company. Co-Ownership Of Funds It is important that our employees and shareholders share a common financial goal; our officers, employees and their families currently have approximately $113 million invested in The Royce Funds. | |||||
| This review and report must be accompanied or preceded by a current prospectus for the Funds. Please read the prospectus carefully before investing or sending money. | |||||
| | | | | | |
| | | | | | |
| 745 Fifth Avenue | New York, NY 10151 | P (800) 221-4268 | www.roycefunds.com | |||||
| General Information | |||||
| Additional Report Copies | |||||
| and Prospectus Inquiries | |||||
| (800) 221-4268 | |||||
 |  | ||||
Item 2. Code(s) of Ethics. Not applicable to this semi-annual report.
Item 3. Audit Committee Financial Expert. Not applicable to this semi-annual report.
Item 4. Principal Accountant Fees and Services. Not applicable to this semi-annual report.
Item 5. Audit Committee of Listed Registrants. Not applicable.
Item 6. Investments.
(a) See Item 1.
(b) Not applicable.
Item 7. Disclosure of Proxy Voting Policies and Procedures for Closed-End Management Investment Companies. Not applicable.
Item 8. Portfolio Managers of Closed-End Management Investment Companies. Not applicable.
Item 9. Purchases of Equity Securities by Closed-End Management Investment Company and Affiliated Purchasers. Not applicable.
Item 10. Submission of Matters to a Vote of Security Holders. Not applicable.
Item 11. Controls and Procedures.
(a) Disclosure Controls and Procedures. The Principal Executive and Financial Officers concluded that the Registrant’s Disclosure Controls and Procedures are effective based on their evaluation of the Disclosure Controls and Procedures as of a date within 90 days of the filing date of this report.
(b) Internal Control over Financial Reporting. There were no significant changes in Registrant’s internal control over financial reporting or in other factors that could significantly affect this control subsequent to the date of the evaluation, including any corrective actions with regard to significant deficiencies and material weaknesses during the second fiscal quarter of the period covered by this report.
Item 12. Exhibits. Attached hereto.
(a)(1) Not applicable to this semi-annual report.
(a)(2) Separate certifications by the Registrant’s Principal Executive Officer and Principal Financial Officer as required by Rule 30a-2(a) under the Investment Company Act of 1940.
(a)(3) Not applicable
(b) Separate certifications by the Registrant’s Principal Executive Officer and Principal Financial Officer, pursuant to Section 906 of the Sarbanes-Oxley Act of 2002 and required by Rule 30a-2(b) under the Investment Company Act of 1940.
Pursuant to the requirements of the Securities Exchange Act of 1934 and the Investment Company Act of 1940, the registrant has duly caused this report to be signed on its behalf by the undersigned, thereunto duly authorized.
ROYCE CAPITAL FUND
| BY: | /s/Charles M. Royce |
| Charles M. Royce | |
| President |
Date: August 23, 2010
Pursuant to the requirements of the Securities Exchange Act of 1934 and the Investment Company Act of 1940, this report has been signed below by the following persons on behalf of the registrant and in the capacities and on the dates indicated.
| ROYCE CAPITAL FUND | ROYCE CAPITAL FUND | |||
| BY: | /s/Charles M. Royce | BY: | /s/John D. Diederich | |
| Charles M. Royce | John D. Diederich | |||
| President | Chief Financial Officer | |||
| Date: August 23, 2010 | Date: August 23, 2010 | |||