| UNITED STATES |
| SECURITIES AND EXCHANGE COMMISSION |
| Washington, D.C. 20549 |
| FORM N-CSR |
| CERTIFIED SHAREHOLDER REPORT |
| OF |
| REGISTERED MANAGEMENT INVESTMENT COMPANIES |
| Investment Company Act file number: 811-07537 |
| Name of Registrant: Royce Capital Fund |
| Address of Registrant: 745 Fifth Avenue |
| New York, NY 10151 |
| Name and address of agent for service: | John E. Denneen, Esq. | |||
| 745 Fifth Avenue | ||||
| New York, NY 10151 |
| Registrant’s telephone number, including area code: (212) 508-4500 |
| Date of fiscal year end: December 31, 2012 |
| Date of reporting period: January 1, 2012 – June 30, 2012 |
Item 1. Reports to Shareholders.
|

SEMIANNUAL
REVIEW AND REPORT
TO SHAREHOLDERS
Royce Capital Fund– Micro-Cap Portfolio Royce Capital Fund– Small-Cap Portfolio | |||
www.roycefunds.com |  | ||
| Performance and Expenses | Through June 30, 2012 |
| Average Annual Total Returns | Annual | ||||||||||||||||||||
| Since Inception | Operating | ||||||||||||||||||||
| Fund | Year-to-Date1 | One-Year | Five-Year | 10-Year | 15-Year | (12/27/96) | Expenses | ||||||||||||||
| Royce Capital Fund–Micro-Cap Portfolio | 2.40 | % | -12.43 | % | -0.05 | % | 7.51 | % | 11.63% | 11.53 | % | 1.34 | % | ||||||||
| Royce Capital Fund–Small-Cap Portfolio | 5.16 | -3.37 | 1.32 | 7.90 | 10.59 | 11.03 | 1.05 | ||||||||||||||
| Russell Microcap Index | 13.01 | -0.54 | -2.19 | 5.89 | n.a. | n.a.2 | n.a. | ||||||||||||||
| Russell 2000 Index | 8.53 | -2.08 | 0.54 | 7.00 | 6.14 | 6.673 | n.a. | ||||||||||||||
Important Performance, Expense and Risk Information
All performance information in this Review and Report reflects past performance, is presented on a total return basis and reflects the reinvestment of distributions. Past performance is no guarantee of future results. Investment return and principal value of an investment will fluctuate, so that shares may be worth more or less than their original cost when redeemed. Current performance may be higher or lower than performance quoted. Current month-end performance may be obtained at www.roycefunds.com. The Fund’s total returns do not reflect any deduction for charges or expenses of the variable contracts or retirement plans investing in the Fund. All performance and expense information reflects results for each Fund’s Investment Class Shares. Service Class Shares bear an annual distribution expense that is not borne by the Investment Class. Operating expenses reflect the Fund’s total annual operating expenses for the Investment Class as of the Fund’s most current prospectus and include management fees, other expenses and, in the case of Royce Capital Fund–Micro-Cap Portfolio, acquired fund fees and expenses. Acquired fund fees and expenses reflect the estimated amount of the fees and expenses incurred indirectly by the Fund through its investments in mutual funds, hedge funds, private equity funds and other investment companies. Series of Royce Capital Fund invest primarily in securities of small-cap and micro-cap companies, which may involve considerably more risk than investments in securities of larger-cap companies. (Please see “Primary Risks for Fund Investors” in the prospectus.) Royce Capital Fund–Micro-Cap Portfolio may invest up to 35% of its net assets in foreign securities and Royce Capital Fund–Small-Cap Portfolio may invest up to 25% of its net assets in foreign securities. Investments in foreign securities may involve political, economic, currency and other risks not encountered in U.S. investments. (Please see “Investing in Foreign Securities” in the prospectus.) Please read the prospectus carefully before investing or sending money. Russell Investment Group is the source and owner of the trademarks, service marks and copyrights related to the Russell Indexes. Russell® is a trademark of Russell Investment Group. The Russell Microcap Index includes 1,000 of the smallest securities in the small-cap Russell 2000 Index. The Russell 2000 Index is an unmanaged, capitalization-weighted index of domestic small-cap stocks. It measures the performance of the 2,000 smallest publicly traded U.S. companies in the Russell 3000 Index. Index returns include net reinvested dividends and/or interest income. Distributor: Royce Fund Services, Inc. |
| This page is not part of the 2012 Semiannual Report to Shareholders |
| Table of Contents | |
| Semiannual Review | |
| Performance and Expense Table | Inside Cover |
| Letter to Our Shareholders | 2 |
| Semiannual Report to Shareholders | 7 |
 | |
| This page is not part of the 2012 Semiannual Report to Shareholders | 1 |
 Charles M. Royce, President We have often stressed the importance of capital preservation in asset management, arguing that not losing money is as critical as making it grow. Implicit in this belief is the idea that capital preservation is mostly synonymous with preserving purchasing power. However, we now find ourselves in a very non-traditional investment environment, an age marked by near-zero interest rates; regular, short-term bursts of volatility for equities; and relentless money printing on the part of the developed world’s central banks. While this has not altered our view of the significance of risk aversion, it has led us to ask if at this moment in history capital preservation and preservation of purchasing power should be defined differently. The answer approaches what we think is one of the most underappreciated risks to which investors are now subject: the potential for meaningful loss in the future purchasing power of investments. With so much attention being paid to preservation of capital, too little has been placed on what that capital, once returned, will actually be worth. Continued on page 4... | Letter to Our Shareholders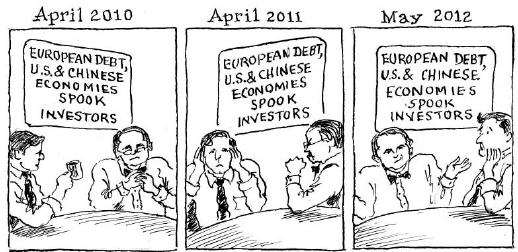 “I Read the News Today, Oh Boy.” Another dismal summer has dawned with spring having brought a wave of worries back to the market for the third consecutive year. Karl Marx—as canny an observer of the global scene as he was a checkered prognosticator of its future—wrote in 1852 that all events in history occur twice: the first time as tragedy the second as farce. Allowing for the accuracy of this observation, what are we then to make of this third round of wobbly recovery, sluggish markets, panic-stuffed headlines, and the by now reflexive anxiety about the potential horrors of European debt for the world economy? What lies beyond farce, other than lousy returns, high correlation, and growing numbers of investors disenchanted with equities? To this kind of question, too many investors have no answer, having lost not only their belief in the viability of investing in stocks, but also in the prospects for the global economy. Indeed, one unfortunate result of the contagion of uncertainty has been the erosion of confidence in the ability of equities to deliver returns that will beat inflation and build wealth over the long term. On May 7, a USA Today headline asked and answered, “Invest in stocks? Forget About It.” It was not quite as damning as the now infamous Business Week cover from August 1979 that proclaimed “The Death of Equities,” but the overall message was not much happier: “Wall Street’s long-running story about how stocks are the best way to build wealth seems tired, dated and less believable to many individual investors.” And the USA Today piece was published early in May, just before the current bear bit down most sharply. The implicit assumption that the best days for the stock market may be (way) behind it seems to us to be the distinguishing feature of this third round of poor results for most equities. Panic has given way to a shrug of resignation. This stance sees equity investing as a mug’s game, even if the alternatives—Treasuries, bonds, money markets, etc.—are not much more attractive or profitable. Such a belief—as ultimately wrong-headed as we think it is—has the advantage that recent history, as far back as five years, is on its side. With a few exceptions, there is simply not much of a defense for equity investing as a whole since the respective index peaks in 2007. The explanation for why the market has been so troublesome and unprofitable seems simple: The world is still emerging from the most serious economic crisis since the Great Depression. Yet this account may be in equal parts true and unhelpful, at least to anyone who had been looking for a way to safely and effectively grow capital during the last few | ||
| 2 | This page is not part of the 2012 Semiannual Report to Shareholders |
years, which helps to explain why panic and resignation are symptoms of the same fatalism that has gripped investors since the early days of the mortgage and banking crisis in 2008. | ||||
We understand the pessimism and the unwillingness to take risks on the part of so many investors today. At the same time, we still see many of the same positive signs that have been inspiring our confidence about stocks and the economy as a whole since the spring of 2010. By taking the long view (a common perspective for us), we can offer, in addition to a Nostra Culpa for much recent fund performance, the benefit of nearly 40 years of small-cap value investing. Our collective experience tells us that this highly volatile, tightly correlated, range-bound market will be remembered as being as anomalous as it has been painful, one that tends to occur once or twice a century. It does not, in our view, change the fact that stocks remain the single best way of building wealth over the long run. We know that in the current environment these words may sound hollow or even self-serving. We are more than willing to assume that risk in the hope that investors will continue to look to equities (and to our portfolios) as effective and ultimately successful ways to invest in the years to come. | Our collective experience tells us that this highly volatile, tightly correlated, range-bound market will be remembered as being as anomalous as it has been painful, one that tends to occur once or twice a century. It does not, in our view, change the fact that stocks remain the single best way of building wealth over the long run. | |||
“They’ve Been Going in and out of Style” The kind of dynamic rally that ushered out the first half of 2012 is always guaranteed to raise a smile, even if it could not completely erase earlier losses in the second quarter, losses that spoiled a promising upswing that lasted through most of the year’s opening quarter. Indeed, lack of direction has arguably been the most distinguishing characteristic of the recent market. Still, the major U.S. indexes finished the year-to-date period ended June 30, 2012 in decent condition, as did their overseas counterparts. Domestic small-caps brought up the rear. The Russell 2000 Index was up 8.5% in the first half, compared to respective gains of 9.4% and 9.5% for the large-cap Russell 1000 and S&P 500 Indexes and an electrifying 12.7% for the Nasdaq Composite. It was an interesting road for each index. The first quarter extended a rally that began following the October 2011 lows. Small-cap trailed, though its 12.4% gain was its best opening quarter since 2006. It was also not far behind its large-cap counterparts. The Russell 1000 rose 12.9%, and the S&P 500 gained 12.6%. The Nasdaq was especially impressive, notching an 18.7% increase for the quarter. We were among those hopeful souls who saw a nearly six-month bull run and thought that maybe the market was ready for some consistent recovery. Yet April and May were cruel months, the latter especially so, as the now-traditional spring downturn caused by concerns about European debt and the state of the American and Chinese economies spoiled the party and tamped down returns. (If not for the rally on the final trading day of June, that month would also have been less solidly in the black.) That rally was welcome—they always are—but second-quarter returns were still negative. The Nasdaq led on the downside, falling 5.1%, while the Russell 2000 slipped 3.5%. Large-caps held their value a bit better, with the Russell 1000 losing 3.1% and the S&P 500 declining 2.8%. So the first half concluded with a bang, but still left investors whimpering about the future. | Our expectation is for a less extreme, more historically normal phase, without so many of the stomach-churning drops followed by equally steep upticks that we saw last summer and fall, and have seen so far in 2012. It is worth noting that a more historically normal range is one in which we think our funds can generate strong absolute and relative performance over the long run. | |||
| This page is not part of the 2012 Semiannual Report to Shareholders | 3 |
For more than three decades, an investment vehicle provided highly consistent returns with such low volatility that they were nearly devoid of risk—U.S. government bonds, specifically Treasury securities. They were the instruments that possessed that highly desired standard, “the risk-free rate of return.” The currently volatile investment climate has greatly expanded the appeal of this designation. Investors trying to cope with the economic uncertainty and asset-price volatility caused by the bursting credit bubble have grown increasingly sensitive to the possibilities of capital loss. Yet if history is any proxy—and we believe that it is—a healthy degree of skepticism should greet the notion that Treasuries remain risk free or provide an acceptable rate of return. If nothing else, the lens through which we see them needs to be adjusted to include the growing uncertainty of ultimate purchasing power (of real goods and services) of the currency in which they are denominated. This risk, one for which we have a healthy respect over the intermediate term, is the ominous combination of ongoing currency debasement and acceleration in inflationary pressures. These could erode the purchasing power of non-productive assets. Central banks around the world, with the U.S. Federal Reserve a primary contributor, have been pumping liquidity into the capital markets through a combination of Continued on page 6... | |||
| Letter to Our Shareholders | ||
Looking at longer-term returns, this uncertainty has been well-earned. While three- and 10-year average annual total returns for the major indexes were solid-to-strong, one-, five-, and 12-year results for the periods ended June 30, 2012 were generally poor. The 12-year period—not a period that we, or anyone else, usually discusses—is instructive because it encompasses the Internet Bubble, the subsequent recovery, the recession that was followed by the financial crisis, and the market’s herky-jerky, volatile aftermath. So we think it is worth pointing out that for the 12-year period ended December 31, 2011, the average annual total return for the S&P 500 was its the lowest since the end of World War II (beginning with the period from the end of 1945 through the end of 1957). Small-cap returns for that same period ended December 31, 2011 for the Russell 2000 and the CRSP 6-10, a small-cap proxy that dates back to the 1920s, were among the worst for both since the launch of the Russell 2000 on December 31, 1978 and since the end of 1945 for the CRSP 6-10. Recent performance for the two non-U.S. indexes that we track followed patterns similar to their domestic cousins, though with more muted results. This was not entirely surprising considering both Europe’s ongoing travails and worries about the pace of growth in China. Non-U.S. small-caps enjoyed an advantage over their large-cap siblings, with the Russell Global ex-U.S. Small Cap up 4.8% for the year-to-date period ended June 30, 2012 versus a 2.7% gain for the Russell Global ex-U.S. Large Cap Index. Both indexes enjoyed strong first-quarter results. The Russell Global ex-U.S. Small Cap Index rose 14.4%, and the Russell Global ex-U.S. Large Cap Index was up 11.5% in the first three months of 2012. Each index’s second quarter was far more difficult, as Europe’s troubles registered more dramatically outside the U.S. Small-cap lost a bit more in the downturn, with the Russell Global ex-U.S. Small Cap Index falling 8.5%, while the Russell Global ex-U.S. Large Cap Index was down 7.9%. U.S. mid-caps performed well on an absolute basis, though they were behind the domestic micro-cap, small-cap, and large-cap indexes in the first half. The Russell Midcap Index gained 8.0% through the end of June. Like the domestic indexes, they enjoyed a strong first quarter, up 12.9%, before slipping in the second quarter with a loss of 4.4%. Considering both the significant volatility and the unpopularity of stocks, the strength of micro-cap stocks was something of a surprise in the first half. Year-to-date through June 30, 2012, the Russell Microcap Index gained an impressive 13.0%. That the index accomplished this feat with stronger and steadier quarterly performances was equally notable: the Russell Microcap climbed 15.3% in the first quarter and fell only 2.0% in the bearish second. | ||
“The Act You’ve Known for all these Years...” Our goal has always been strong absolute performance over long-term periods. If we met that standard, then relative results would most likely not be an issue, at least over long-term time spans. We have also been glad to accept the historical trade-off in which underperformance was more common for our Funds during short-term periods of 18 months or less, while outperformance was more typical over full market cycle and other long-term periods of three years or more. For too many time periods ended June 30, 2012, however, that history has become too exclusively long-term, even for us, with strong relative and absolute results coming only in periods of 10 years or longer. Three-year results were fine on an absolute basis in most cases, but trailed on a relative score, while the five-year returns were more | ||
| 4 | This page is not part of the 2012 Semiannual Report to Shareholders |
| Through all manner of markets—many of which were thought to establish a “New Normal”—we have never wavered in our convictions. We still believe that equities remain the best way—maybe the only way—to beat inflation and build wealth over the long term. It is easy to talk about the importance of patience and discipline when markets are solid and portfolios are doing well. Yet at some point, these things will change, and both will be tested, as they have been in this market. It has been a very difficult time, but we believe it will pass. When it does, our disciplined approach will remain and, we believe, be effective. |
| This page is not part of the 2012 Semiannual Report to Shareholders | 5 |
historically low interest rates and quantitative easing or, more simply stated, money printing. Headline inflation numbers have remained subdued due to the continuing struggles in the labor market and stubbornly weak housing markets, but commodity inflation has been on the rise. With the recent uptick in U.S. leading economic indicators and encouraging signs of stability and improvement in the housing market, it would not take much to see a more broad-based uptick in inflation. So while U.S. government bonds are likely to continue to pay their meager coupons and return principal on schedule, the value of what is being returned to investors will be declining. For the first time in almost 30 years, we think that investors risk meaningful losses in that portion of their investment portfolio they deem to be the safest. Commodities offer one possible way to protect against the loss of purchasing power caused by currency debasement. Unsurprisingly, however, we prefer assets that are inherently productive and flexible and can adjust quickly to changing pricing environments. To us, investments in quality companies that possess embedded pricing power and high returns on their invested capital look to be some of the best investments to protect, and grow, purchasing power. We believe they need much broader representation in investors’ asset allocation. | Letter to Our Shareholders  Good Morning, Good Morning Obviously, we would all like to reach a more hospitable market climate soon. As always, patience is critical. Indeed, the ability to be patient is probably the single most important quality that an investor who seeks strong long-term returns can possess. It is easy to talk about the importance of patience and discipline when markets are solid and portfolios are doing well. Yet at some point, these things will change, and both will be tested, as they have been in this market. It has been a very difficult time, but we believe it will pass. When it does, our disciplined approach will remain and, we believe, be effective. As we approach our 40th anniversary as a firm this coming November, we look back at what we have seen—the “Nifty Fifty” market of the ’70s, Black Friday in the ’80s, the first stirrings of the Internet boom in the ’90s, the horrific events of 9/11, our current era of uncertainty, and much, much more. Through all manner of markets—many of which were thought to establish a “New Normal”—we have never wavered in our convictions. We still believe that equities remain the best way—maybe the only way—to beat inflation and build wealth over the long term. (We also think that equities are capable of beating the fixed income markets over the next five years.) Our guess is that stocks can deliver returns in the mid- to upper-single digits, which we think would be respectable on an absolute basis and, equally important, higher than the rate of inflation. When things are working well, the underlying parts of an equity portfolio, the companies themselves, can act as compounding machines—compounding book value, returns on equity, etc. We are confident that we have created portfolios that can grow commendably, especially in the more historically typical market climate that we believe we will eventually see. Sincerely, | ||||||
 |  |  | |||||
| Charles M. Royce | W. Whitney George | Jack E. Fockler, Jr. | |||||
| President | Vice President | Vice President | |||||
| July 31, 2012 | |||||||
| 6 | This page is not part of the 2012 Semiannual Report to Shareholders |
| Table of Contents |
| Semiannual Report to Shareholders | ||||||||||
| Managers’ Discussions of Fund Performance | ||||||||||
| Royce Capital Fund–Micro-Cap Portfolio | 8 | |||||||||
| Royce Capital Fund–Small-Cap Portfolio | 10 | |||||||||
| Schedules of Investments and Financial Statements | 12 | |||||||||
| Notes to Financial Statements | 22 | |||||||||
| Understanding Your Fund’s Expenses | 25 | |||||||||
| Trustees and Officers | 26 | |||||||||
| Notes to Performance and Other Important Information | 27 | |||||||||
| Board Approval of Investment Advisory Agreement | 28 | |||||||||
| Royce Capital Fund 2012 Semiannual Report to Shareholders | 7 |
| Royce Capital Fund–Micro-Cap Portfolio |
AVERAGE ANNUAL TOTAL RETURNS Through 6/30/12 | |||||||||||
| Jan-June 20121 | 2.40 | % | |||||||||
| One-Year | -12.43 | ||||||||||
| Three-Year | 15.00 | ||||||||||
| Five-Year | -0.05 | ||||||||||
| 10-Year | 7.51 | ||||||||||
| 15-Year | 11.63 | ||||||||||
| Since Inception (12/27/96) | 11.53 | ||||||||||
| ANNUAL EXPENSE RATIO | |||||||||||
| Operating Expenses | 1.34 | % | |||||||||
| 1 Not annualized | |||||||||||
| CALENDAR YEAR TOTAL RETURNS | |||||||||||
| Year | RCM | Year | RCM | ||||||||
| 2011 | -12.1 | % | 2003 | 49.2 | % | ||||||
| 2010 | 30.1 | 2002 | -12.9 | ||||||||
| 2009 | 57.9 | 2001 | 29.7 | ||||||||
| 2008 | -43.3 | 2000 | 18.5 | ||||||||
| 2007 | 4.0 | 1999 | 28.1 | ||||||||
| 2006 | 21.1 | 1998 | 4.1 | ||||||||
| 2005 | 11.6 | 1997 | 21.2 | ||||||||
| 2004 | 13.8 | ||||||||||
| TOP 10 POSITIONS % of Net Assets | |||||||||||
| GP Strategies | 1.4 | % | |||||||||
| Anaren | 1.3 | ||||||||||
| Marten Transport | 1.2 | ||||||||||
| Drew Industries | 1.2 | ||||||||||
| Global Power Equipment Group | 1.1 | ||||||||||
| Perry Ellis International | 1.1 | ||||||||||
| Universal Stainless & Alloy Products | 1.1 | ||||||||||
| Kennedy-Wilson Holdings | 1.1 | ||||||||||
| Cavco Industries | 1.1 | ||||||||||
| Graham Corporation | 1.0 | ||||||||||
| PORTFOLIO SECTOR BREAKDOWN % of Net Assets | |||||||||||
| Industrials | 19.6 | % | |||||||||
| Information Technology | 14.0 | ||||||||||
| Materials | 13.8 | ||||||||||
| Consumer Discretionary | 13.4 | ||||||||||
| Health Care | 9.3 | ||||||||||
| Energy | 8.3 | ||||||||||
| Financials | 6.1 | ||||||||||
| Consumer Staples | 3.0 | ||||||||||
| Telecommunication Services | 1.5 | ||||||||||
| Utilities | 0.1 | ||||||||||
| Miscellaneous | 3.9 | ||||||||||
| Cash and Cash Equivalents | 7.0 | ||||||||||
 | |||||||||
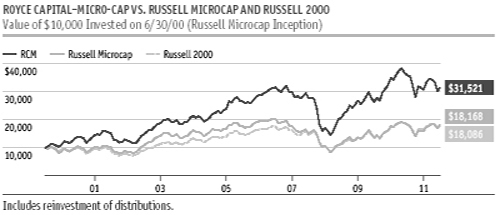
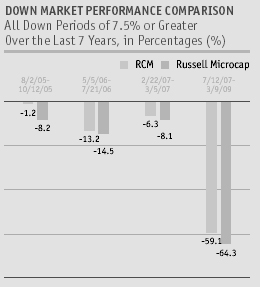
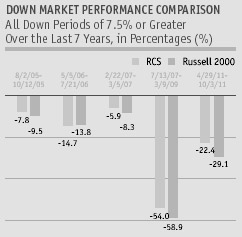
Manager’s Discussion The diversified portfolio of Royce Capital Fund–Micro-Cap Portfolio (RCM) gained 2.4% for the year-to-date period ended June 30, 2012 compared to gains of 13.0% for its benchmark, the Russell Microcap Index, and 8.5% for the small-cap Russell 2000 Index for the same period. The year started on a slightly more promising note. Following the rally that began off the most recent small-cap low on October 3, 2011, the Fund continued to lag in the bullish first quarter, though it did narrow the gap. RCM was up 11.9% between the beginning of January and the end of March versus respective gains of 15.3% and 12.4% for the Russell micro-cap and small-cap indexes. The rally slackened after small-caps reached a first-half high on March 26, for the third straight year thrown off course by the same three worries—sovereign debt in Europe and the pace of economic growth in the U.S. and China. These anxieties drove share prices down through most of the second quarter, with May seeing the largest losses. RCM fell 8.5% in the second quarter, while the Russell Microcap lost 2.0% and the Russell 2000 was off 3.5%. It also helped to erode some of the Fund’s recent market cycle advantage, though RCM remained ahead of its benchmark from the last micro-cap peak on July 12, 2007 through June 30, 2012, down 2.6% versus a decline of 12.2% for the micro-cap index. For the periods ended June 30, 2012, the Fund was ahead of the Russell Microcap for the five- and 10-year periods, while also beating the Russell 2000 for the 10-, 15-year and since inception (12/27/96) periods. (Data for the micro-cap index goes back only as far as 2000.) The Fund’s average annual total return since inception was 11.5%. Correlation and a relatively narrow performance range have hindered recent results for equities in general, but RCM’s poor relative performance had less to do with those phenomena and more to do with two other factors. First, two areas that helped to drive the terrific results for the Russell Microcap Index during the first half were areas that the Fund has avoided through its long history: banks and REITs (real estate investment trusts). The former were beaten down to very low valuations during late 2008 and early 2009, but the lack of balance sheet strength and other fundamental factors led us to avoid making any significant investments in the industry. Similarly, REITs often boast attractive yields, which was a key driver of first-half results, but do not offer much else in the way of strong business fundamentals, so we have generally steered clear. The second, more important | |||||||||
| 8 | Royce Capital Fund 2012 Semiannual Report to Shareholders |
Performance and Portfolio Review reason is that many of those companies in which we have been seeing attractive valuations and excellent potential over the last year fell further out of favor in a market that has been largely indifferent to quality and uninterested in those sectors in which we have seen the most compelling bargains. Seven of the Fund’s 10 equity sectors were net contributors to first-half returns, with Health Care leading by a wide margin, followed by Information Technology and Consumer Discretionary sectors. The top gainer for the period was Exton, PA-based biomedical device company Kensey Nash. Its acquisition by a larger Dutch competitor at a healthy premium was announced in early May, which led us to begin selling our stake in earnest. We had been drawn to its attractive niche in absorbable medical devices and its strong balance sheet. GP Strategies provides customized training services for a wide variety of industries in the U.S. and the U.K. We have long admired both its business and its ability to execute successfully in oft-times challenging markets for its industry. It made several acquisitions over the last few years that helped its business to improve, something increasing numbers of investors began to notice. Both the Materials and Energy sectors posted net losses. We still hold a favorable view of the long-term prospects for both areas, though recent disappointments have been frustrating. Commodity-based businesses are often among the most volatile, which is one reason why we prefer the relative safety of energy services businesses. Yet neither the metals & mining group nor the energy equipment & services industry offered Fund investors much in the way of defense or high stock prices through the market’s recent attempts to make sense of global economic uncertainty, which included sluggish oil and natural gas prices and flattish gold and silver prices. Lamprell remains a leader in the repair and refurbishment of drilling rigs, but has endured issues with suppliers in its more recent efforts to enter the rig construction business. More seriously, its share price fell dramatically in May when the company issued a profit warning on the heels of insider selling that had followed a series of investor meetings which were initially seen as unusually positive and encouraging. Our thought was that this well-run business could learn from these missteps and recover. E-learning services business ChinaCast Education, a U.S.-listed company did not inspire similar confidence after disputes among Board members resulted in a hostile proxy battle. The resulting disarray prompted us to exit our position. |
 |
| FUND INFORMATION AND PORTFOLIO DIAGNOSTICS | |||
| Fund Net Assets | $590 million | ||
| Number of Holdings | 219 | ||
| Turnover Rate | 10% | ||
| Average Market Capitalization1 | $347 million | ||
| Weighted Average P/E Ratio2,3 | 13.5x | ||
| Weighted Average P/B Ratio2 | 1.4x | ||
| U.S. Investments (% of Net Assets) | 63.8% | ||
| Non-U.S. Investments (% of Net Assets) | 29.2% | ||
| Ticker Symbol | |||
| Investment Class | RCMCX | ||
| Service Class | RCMSX | ||
| 1 Geometric average | |||
| RISK/RETURN COMPARISON Five-Year Period Ended 6/30/12 | |||
| Average Annual Total Return | Standard Deviation | Return Efficiency1 | |
| RCM | -0.05% | 25.04 | 0.00 |
| Russell Microcap | -2.19 | 25.95 | -0.08 |
1 Return Efficiency is the average annual total return divided by the annualized standard deviation over a designated time period. Please read the prospectus for a more complete discussion of risk. | |||
 | |||
| Royce Capital Fund 2012 Semiannual Report to Shareholders | 9 |
| Royce Capital Fund–Small-Cap Portfolio |
AVERAGE ANNUAL TOTAL RETURNS Through 6/30/12 | ||||||||||
| Jan-June 20121 | 5.16 | % | ||||||||
| One-Year | -3.37 | |||||||||
| Three-Year | 15.59 | |||||||||
| Five-Year | 1.32 | |||||||||
| 10-Year | 7.90 | |||||||||
| 15-Year | 10.59 | |||||||||
| Since Inception (12/27/96) | 11.03 | |||||||||
| ANNUAL EXPENSE RATIO | ||||||||||
| Operating Expenses | 1.05 | % | ||||||||
| 1 Not annualized | ||||||||||
| CALENDAR YEAR TOTAL RETURNS | ||||||||||
| Year | RCS | Year | RCS | |||||||
| 2011 | -3.3 | % | 2003 | 41.1 | % | |||||
| 2010 | 20.5 | 2002 | -13.8 | |||||||
| 2009 | 35.2 | 2001 | 21.0 | |||||||
| 2008 | -27.2 | 2000 | 33.3 | |||||||
| 2007 | -2.1 | 1999 | 8.2 | |||||||
| 2006 | 15.6 | 1998 | 8.9 | |||||||
| 2005 | 8.6 | 1997 | 17.1 | |||||||
| 2004 | 25.0 | |||||||||
| TOP 10 POSITIONS % of Net Assets | ||||||||||
| Chemed Corporation | 2.9 | % | ||||||||
| Shoe Carnival | 2.9 | |||||||||
| Jos. A. Bank Clothiers | 2.8 | |||||||||
| Buckle (The) | 2.8 | |||||||||
| Ascena Retail Group | 2.8 | |||||||||
| Unit Corporation | 2.7 | |||||||||
| NETGEAR | 2.7 | |||||||||
| Cubic Corporation | 2.7 | |||||||||
| Dorman Products | 2.6 | |||||||||
| Innospec | 2.4 | |||||||||
| PORTFOLIO SECTOR BREAKDOWN % of Net Assets | ||||||||||
| Consumer Discretionary | 28.5 | % | ||||||||
| Information Technology | 21.5 | |||||||||
| Financials | 15.8 | |||||||||
| Health Care | 10.4 | |||||||||
| Energy | 8.1 | |||||||||
| Industrials | 5.9 | |||||||||
| Consumer Staples | 3.3 | |||||||||
| Materials | 2.9 | |||||||||
| Miscellaneous | 3.3 | |||||||||
| Cash and Cash Equivalents | 0.3 | |||||||||
 |
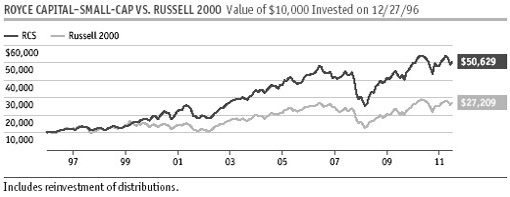
Manager’s Discussion Royce Capital Fund–Small-Cap Portfolio (RCS) enjoyed a solid showing on an absolute basis during the first half, though it was underwhelming on a relative basis. The Fund was up 5.2% for the year-to-date period ended June 30, 2012 versus a gain of 8.5% for its small-cap benchmark, the Russell 2000 Index for the same period. For the last two years, and for the last 18 months in particular, the equity markets have seen high levels of correlation within a comparatively narrow range of returns. This has made for a frustrating market for investors, perhaps best exemplified by the growing numbers who chose to stay away from stocks entirely in the first half of 2012. Our own challenges have been made greater by the market’s general indifference to quality, as measured by companies with strong balance sheets, high returns on invested capital, and ample free cash flow. However, by the end of June the market appeared more interesting to us on a risk-reward basis than it has in many months. While opportunities are not as plentiful as we have seen in the past, we have seen enough old favorites that we still believe are high-quality businesses knocked around to a large enough degree to make the months ahead especially intriguing. The first quarter was a robustly bullish period that extended the run from last year’s small-cap low on October 3. This rally lasted for almost the entire first quarter, as small-caps reached a first-half high on March 26. Having lost ground to the Russell 2000 in 2011’s fourth quarter, the Fund began to narrow the spread during this year’s opening quarter, rising 12.0% compared to a gain of 12.4% for the small-cap index. However, RCS then lost ground again during the bearish second quarter, falling 6.1% while the Russell 2000 was down 3.5%. The Fund has historically held its value more effectively during downturns, even brief ones, which made results from March 26 through June 30 that much more disappointing. Longer-term results were better, mostly the result of a stronger relative showing over the last full market cycle. From the previous small-cap market peak on July 13, 2007 through the small-cap high on March 26, 2012, RCS was up 13.5% compared to 5.6% for the Russell 2000. Once more starting from the previous peak in July 2007 through the end of June 2012, the Fund was up 4.4%, while its benchmark managed a miniscule gain of 0.04% over the same span. RCS also beat the Russell 2000 for the five-, 10-, 15-year, and since inception (12/27/96) periods ended June 30, 2012. The Fund’s average annual total return since inception was 11.0%. |
Important Performance and Expense Information All performance information in this Report reflects past performance, is presented on a total return basis and reflects the reinvestment of distributions. Past performance is no guarantee of future results. Investment return and principal value of an investment will fluctuate, so that shares may be worth more or less than their original cost when redeemed. Current performance may be higher or lower than performance quoted. The Fund’s total returns do not reflect any deduction for charges or expenses of the variable contracts of retirement plans investing in the Fund. Returns as of the most recent month-end may be obtained at www.roycefunds.com. All performance and risk information reflects results of the Investment Class (its oldest class). Shares of RCS’s Service Class bear an annual distribution expense that is not borne by the Investment Class. Operating expenses reflect the Fund’s total annual operating expenses for the Investment Class as of the Fund’s most current prospectus and include management fees and other expenses. Regarding the two “Good Ideas” tables shown above, the sum of all contributors to, and all detractors from, performance for all securities in the portfolio would approximate the Fund’s year-to-date performance for 2012. |
| 10 | Royce Capital Fund 2012 Semiannual Report to Shareholders |
Performance and Portfolio Review |
Seven of the Fund’s nine equity sectors finished the year-to-date period in the black, with the largest contributions coming from the Consumer Discretionary, Financials, and Health Care sectors. Each of these areas saw successes in several industry groups, led by specialty retail and insurance companies. Women’s fashion retailer Ascena Retail Group is an old Royce favorite and was a top-ten position at the end of June. Already successfully operating stores under the dressbarn, maurices, and Justice brands, the firm completed a buyout in June of Charming Shoppes, which runs Lane Bryant. We continue to have confidence in what we think is a very well-run business with a proven ability to execute profitably during difficult times for most retailers. We were also optimistic about the long-term prospects for asset manager and money market specialist Federated Investors, which we first began to buy in the teeth of the financial crisis during October 2008. New regulations that will affect money market funds are a ‘when,’ not an ‘if,’ but the consensus is that the longer they take to materialize, the less draconian they are likely to be. In other words, no news was good news on that front in the first half, which boosted its share price. It was the portfolio’s eleventh largest holding at the end of June. Allied World Assurance Company Holdings offers casualty and liability insurance. The company had a history of over-reserving, but more recently began to release these into earnings, which helped its stock price to rise in the first half and led us to trim our stake. An increasingly healthy share price also encouraged us to take gains in Obagi Medical Products, a specialty pharmaceutical company that develops aesthetic and therapeutic prescription skin care products. We liked its products, valuation, and low-debt balance sheet, first buying shares in the midst of plunging prices. Takeover rumors have been swirling around the company for the last several months, leading more investors to the stock. Unit Corporation primarily engages in contract drilling, while also exploring for oil and gas, and doing midstream transport and processing work. A long-time holding that we have owned since 2002 in the portfolio, it suffered in the general downturn for energy companies, which grew worse in the second quarter when oil prices slipped. We love its long-term record of success as a business and took advantage of lower stock prices to build our stake in the first half. ManTech International provides a variety of technological solutions for the security and defense industries. The company has been faced with several challenges lately, including delays in government contracts and a margin-trimming Pentagon. While these have depressed its shares, we see long-term potential in its growing cyber-technology arm, contracts with the FBI, and a developing business in healthcare data. |
 |
| FUND INFORMATION AND PORTFOLIO DIAGNOSTICS | |||||
| Fund Net Assets | $590 million | ||||
| Number of Holdings | 77 | ||||
| Turnover Rate | 31% | ||||
| Average Market Capitalization1 | $1,129 million | ||||
| Weighted Average P/E Ratio2,3 | 12.1x | ||||
| Weighted Average P/B Ratio2 | 1.5x | ||||
| U.S. Investments (% of Net Assets) | 89.6% | ||||
| Non-U.S. Investments (% of Net Assets) | 10.1% | ||||
| Ticker Symbol | |||||
| Investment Class | RCPFX | ||||
| Service Class | RCSSX | ||||
| 1 Geometric average | |||||
| 3 The Fund’s P/E calculation excludes companies with zero or negative earnings (2% of portfolio holdings as of 6/30/12). | |||||
| RISK/RETURN COMPARISON Five-Year Period Ended 6/30/12 | |||||
| Average Annual Total Return | Standard Deviation | Return Efficiency1 | |||
| RCS | 1.32% | 21.84 | 0.06 | ||
| Russell 2000 | 0.54 | 24.90 | 0.02 | ||
1 Return Efficiency is the average annual total return divided by the annualized standard deviation over a designated | |||||
 | |||||
| Royce Capital Fund 2012 Semiannual Report to Shareholders | 11 |
Schedules of Investments
| Royce Capital Fund–Micro-Cap Portfolio |
| SHARES | VALUE | ||||
| COMMON STOCKS – 93.0% | |||||
| Consumer Discretionary – 13.4% | |||||
| Auto Components - 1.3% | |||||
Drew Industries 1 | 255,088 | $ | 7,104,201 | ||
Fuel Systems Solutions 1,2 | 31,000 | 517,390 | |||
| 7,621,591 | |||||
| Diversified Consumer Services - 0.9% | |||||
Lincoln Educational Services | 816,293 | 5,305,905 | |||
| Household Durables - 1.1% | |||||
Cavco Industries 1 | 124,104 | 6,364,053 | |||
| Internet & Catalog Retail - 0.7% | |||||
GS Home Shopping | 20,200 | 1,703,499 | |||
Manutan International | 35,900 | 1,363,411 | |||
Vitacost.com 1 | 177,100 | 1,044,890 | |||
| 4,111,800 | |||||
| Leisure Equipment & Products - 0.6% | |||||
Callaway Golf | 440,912 | 2,605,790 | |||
Piscines Desjoyaux | 210,000 | 1,291,111 | |||
| 3,896,901 | |||||
| Media - 0.2% | |||||
Saraiva S/A Livreiros Editores | 105,300 | 1,163,883 | |||
| Specialty Retail - 5.5% | |||||
Buckle (The) | 76,025 | 3,008,309 | |||
Cato Corporation (The) Cl. A | 124,300 | 3,786,178 | |||
Citi Trends 1 | 95,736 | 1,478,164 | |||
hhgregg 1,2 | 229,243 | 2,592,738 | |||
Jos. A. Bank Clothiers 1 | 63,570 | 2,699,182 | |||
Kirkland’s 1 | 371,977 | 4,184,741 | |||
Lewis Group | 42,839 | 369,200 | |||
Luk Fook Holdings (International) | 315,300 | 661,511 | |||
Padini Holdings | 6,207,900 | 3,620,624 | |||
Shoe Carnival | 238,300 | 5,121,067 | |||
Stein Mart 1 | 624,610 | 4,965,650 | |||
| 32,487,364 | |||||
| Textiles, Apparel & Luxury Goods - 3.1% | |||||
Calida Holding | 41,800 | 1,120,420 | |||
K-Swiss Cl. A 1 | 379,515 | 1,168,906 | |||
LaCrosse Footwear | 267,399 | 2,911,975 | |||
Maidenform Brands 1 | 109,700 | 2,185,224 | |||
Perry Ellis International 1 | 323,304 | 6,708,558 | |||
True Religion Apparel | 111,500 | 3,231,270 | |||
Van de Velde | 22,050 | 951,580 | |||
| 18,277,933 | |||||
| Total (Cost $72,091,498) | 79,229,430 | ||||
| Consumer Staples – 3.0% | |||||
| Food Products - 2.0% | |||||
Asian Citrus Holdings | 4,118,000 | 2,318,788 | |||
Binggrae | 29,300 | 1,842,332 | |||
Legumex Walker 1 | 343,800 | 2,026,127 | |||
Sipef | 30,900 | 2,225,509 | |||
Super Group | 2,000,000 | 3,324,864 | |||
Waterloo Investment Holdings 1,3 | 1,303,907 | 183,851 | |||
| 11,921,471 | |||||
| Personal Products - 1.0% | |||||
Nutraceutical International 1 | 115,400 | 1,759,850 | |||
USANA Health Sciences 1,2 | 93,663 | 3,851,423 | |||
| 5,611,273 | |||||
| Total (Cost $13,588,067) | 17,532,744 | ||||
| Energy – 8.3% | |||||
| Energy Equipment & Services - 6.3% | |||||
Canadian Energy Services & Technology | 491,500 | 4,726,240 | |||
Dawson Geophysical 1 | 109,429 | 2,606,599 | |||
GASFRAC Energy Services 1 | 80,600 | 244,626 | |||
Geodrill 1 | 852,000 | 1,799,234 | |||
Gulf Island Fabrication | 174,688 | 4,927,948 | |||
Lamprell | 1,230,600 | 1,946,567 | |||
Natural Gas Services Group 1 | 204,100 | 3,024,762 | |||
OYO Geospace 1 | 44,516 | 4,005,995 | |||
Tesco Corporation 1 | 288,180 | 3,458,160 | |||
TGC Industries 1 | 518,877 | 5,038,296 | |||
Total Energy Services | 349,200 | 4,935,653 | |||
Union Drilling 1 | 112,469 | 503,861 | |||
| 37,217,941 | |||||
| Oil, Gas & Consumable Fuels - 2.0% | |||||
Gran Tierra Energy 1 | 444,100 | 2,180,531 | |||
†Renewable Energy Group 1 | 218,200 | 1,621,226 | |||
Sprott Resource 1 | 1,128,300 | 4,399,715 | |||
Triangle Petroleum 1,2 | 539,198 | 3,008,725 | |||
Uranium Resources 1,2 | 551,225 | 341,870 | |||
| 11,552,067 | |||||
| Total (Cost $37,519,499) | 48,770,008 | ||||
| Financials – 6.1% | |||||
| Capital Markets - 2.1% | |||||
FBR & Co. 1 | 575,709 | 1,594,714 | |||
Gluskin Sheff + Associates | 207,300 | 2,693,821 | |||
GMP Capital | 295,700 | 1,623,576 | |||
INTL FCStone 1 | 233,469 | 4,517,625 | |||
U.S. Global Investors Cl. A | 112,300 | 490,751 | |||
Westwood Holdings Group | 44,427 | 1,655,350 | |||
| 12,575,837 | |||||
| Commercial Banks - 0.7% | |||||
Bancorp (The) 1 | 202,528 | 1,913,890 | |||
BCB Holdings 1 | 1,303,907 | 388,002 | |||
Pacific Continental | 178,800 | 1,585,956 | |||
| 3,887,848 | |||||
| Diversified Financial Services - 0.2% | |||||
Hellenic Exchanges | 369,300 | 1,265,397 | |||
| Insurance - 1.5% | |||||
American Safety Insurance Holdings 1 | 135,000 | 2,531,250 | |||
eHealth 1 | 316,841 | 5,104,308 | |||
| 12 | Royce Capital Fund 2012 Semiannual Report to Shareholders | THE ACCOMPANYING NOTES ARE AN INTEGRAL PART OF THESE FINANCIAL STATEMENTS. |
June 30, 2012 (unaudited) |
| SHARES | VALUE | ||||
| Financials (continued) | |||||
| Insurance (continued) | |||||
Navigators Group 1 | 29,536 | $ | 1,478,277 | ||
| 9,113,835 | |||||
| Real Estate Management & Development - 1.6% | |||||
Kennedy-Wilson Holdings | 458,930 | 6,429,609 | |||
Midland Holdings | 4,189,000 | 2,047,938 | |||
Syswin ADR 1,2 | 550,568 | 880,909 | |||
| 9,358,456 | |||||
| Total (Cost $42,511,419) | 36,201,373 | ||||
| Health Care – 9.3% | |||||
| Biotechnology - 1.0% | |||||
Burcon NutraScience 1 | 140,303 | 829,190 | |||
Dyax Corporation 1 | 717,416 | 1,528,096 | |||
Lexicon Pharmaceuticals 1 | 1,530,279 | 3,443,128 | |||
| 5,800,414 | |||||
| Health Care Equipment & Supplies - 4.0% | |||||
Anika Therapeutics 1 | 58,583 | 796,143 | |||
Cerus Corporation 1,2 | 555,557 | 1,844,449 | |||
CryoLife 1 | 258,805 | 1,353,550 | |||
Exactech 1 | 211,298 | 3,543,468 | |||
Merit Medical Systems 1 | 186,035 | 2,569,143 | |||
STRATEC Biomedical | 24,000 | 1,066,267 | |||
SurModics 1 | 240,146 | 4,154,526 | |||
Syneron Medical 1 | 454,485 | 4,717,554 | |||
Young Innovations | 47,053 | 1,622,858 | |||
†ZELTIQ Aesthetics 1,2 | 303,069 | 1,697,186 | |||
| 23,365,144 | |||||
| Health Care Providers & Services - 1.8% | |||||
CorVel Corporation 1 | 63,023 | 3,088,127 | |||
PDI 1 | 528,720 | 4,356,653 | |||
U.S. Physical Therapy | 132,160 | 3,360,829 | |||
| 10,805,609 | |||||
| Health Care Technology - 0.2% | |||||
Epocrates 1,2 | 109,300 | 876,586 | |||
| Life Sciences Tools & Services - 1.1% | |||||
BG Medicine 1,2 | 183,550 | 1,281,179 | |||
BioClinica 1 | 231,085 | 1,116,141 | |||
EPS | 1,500 | 4,101,095 | |||
| 6,498,415 | |||||
| Pharmaceuticals - 1.2% | |||||
Unichem Laboratories | 524,000 | 1,205,188 | |||
Vetoquinol | 194,675 | 5,059,487 | |||
Zogenix 1,2 | 439,978 | 1,091,145 | |||
| 7,355,820 | |||||
| Total (Cost $49,720,791) | 54,701,988 | ||||
| Industrials – 19.6% | |||||
| Aerospace & Defense - 0.4% | |||||
American Science & Engineering | 22,000 | 1,241,900 | |||
Ducommun 1 | 125,873 | 1,234,814 | |||
| 2,476,714 | |||||
| Building Products - 1.6% | |||||
AAON | 200,156 | 3,772,941 | |||
Quanex Building Products | 197,500 | 3,531,300 | |||
WaterFurnace Renewable Energy | 132,500 | 2,114,846 | |||
| 9,419,087 | |||||
| Commercial Services & Supplies - 1.1% | |||||
Courier Corporation | 135,418 | 1,794,288 | |||
Ennis | 241,449 | 3,713,486 | |||
Viad Corporation | 54,351 | 1,087,020 | |||
| 6,594,794 | |||||
| Construction & Engineering - 1.9% | |||||
Layne Christensen 1 | 181,169 | 3,748,387 | |||
Raubex Group | 1,639,236 | 2,683,990 | |||
Severfield-Rowen | 696,305 | 1,683,482 | |||
Sterling Construction 1 | 317,947 | 3,249,418 | |||
| 11,365,277 | |||||
| Electrical Equipment - 2.9% | |||||
Elektrobudowa | 28,812 | 839,776 | |||
Global Power Equipment Group | 307,888 | 6,724,274 | |||
Graphite India | 2,332,200 | 3,763,736 | |||
LSI Industries | 502,413 | 3,577,180 | |||
Voltamp Transformers | 233,138 | 1,984,525 | |||
| 16,889,491 | |||||
| Machinery - 6.7% | |||||
AIA Engineering | 146,793 | 909,768 | |||
Burckhardt Compression Holding | 14,000 | 3,593,565 | |||
CB Industrial Product Holding | 1,838,000 | 1,480,611 | |||
Foster (L.B.) Company | 116,576 | 3,335,239 | |||
FreightCar America | 181,591 | 4,171,145 | |||
Gorman-Rupp Company | 44,670 | 1,331,166 | |||
Graham Corporation | 313,678 | 5,840,684 | |||
Kadant 1 | 165,331 | 3,877,012 | |||
Key Technology 1 | 216,129 | 2,161,290 | |||
Pfeiffer Vacuum Technology | 32,400 | 3,297,969 | |||
RBC Bearings 1 | 99,798 | 4,720,446 | |||
Semperit AG Holding | 136,013 | 4,970,536 | |||
| 39,689,431 | |||||
| Marine - 0.1% | |||||
Euroseas | 623,344 | 735,546 | |||
| Professional Services - 2.6% | |||||
CRA International 1 | 176,706 | 2,595,811 | |||
Exponent 1 | 76,068 | 4,018,672 | |||
GP Strategies 1 | 458,851 | 8,474,978 | |||
| 15,089,461 | |||||
| Road & Rail - 2.1% | |||||
Marten Transport | 344,080 | 7,315,141 | |||
Patriot Transportation Holding 1 | 207,440 | 4,881,063 | |||
| 12,196,204 | |||||
| Trading Companies & Distributors - 0.2% | |||||
Houston Wire & Cable | 133,400 | 1,458,062 | |||
| Total (Cost $107,571,841) | 115,914,067 | ||||
| THE ACCOMPANYING NOTES ARE AN INTEGRAL PART OF THESE FINANCIAL STATEMENTS. | Royce Capital Fund 2012 Semiannual Report to Shareholders | 13 |
Schedules of Investments
| Royce Capital Fund–Micro-Cap Portfolio (continued) |
| SHARES | VALUE | ||||
| Information Technology – 14.0% | |||||
| Communications Equipment - 2.8% | |||||
Anaren 1,2 | 378,236 | $ | 7,413,426 | ||
Digi International 1 | 335,810 | 3,438,694 | |||
KVH Industries 1 | 258,000 | 3,225,000 | |||
Parrot 1 | 89,720 | 2,645,330 | |||
| 16,722,450 | |||||
| Computers & Peripherals - 1.2% | |||||
Avid Technology 1 | 82,093 | 609,951 | |||
Novatel Wireless 1 | 1,285,436 | 3,200,736 | |||
Super Micro Computer 1 | 204,211 | 3,238,786 | |||
| 7,049,473 | |||||
| Electronic Equipment, Instruments & Components - 1.9% | |||||
Diploma | 300,000 | 2,095,771 | |||
Domino Printing Sciences | 154,852 | 1,310,711 | |||
Electro Rent | 127,600 | 2,070,948 | |||
Fabrinet 1 | 145,469 | 1,825,636 | |||
Inficon Holding | 7,662 | 1,563,536 | |||
Nice | 187,682 | 613,924 | |||
Vaisala Cl. A | 87,416 | 1,659,212 | |||
| 11,139,738 | |||||
| Internet Software & Services - 0.5% | |||||
Envestnet 1 | 129,400 | 1,552,800 | |||
World Energy Solutions 1,2 | 358,700 | 1,115,557 | |||
| 2,668,357 | |||||
| IT Services - 0.5% | |||||
CSE Global | 1,637,500 | 1,032,541 | |||
Neurones | 160,000 | 1,649,443 | |||
| 2,681,984 | |||||
| Semiconductors & Semiconductor Equipment - 5.6% | |||||
Advanced Energy Industries 1 | 319,200 | 4,283,664 | |||
ATMI 1 | 244,100 | 5,021,137 | |||
AXT 1 | 951,747 | 3,759,401 | |||
GSI Technology 1 | 471,561 | 2,235,199 | |||
Integrated Silicon Solution 1 | 485,700 | 4,900,713 | |||
Mindspeed Technologies 1 | 360,200 | 886,092 | |||
Rudolph Technologies 1 | 664,693 | 5,796,123 | |||
Sigma Designs 1 | 652,564 | 4,163,358 | |||
Ultra Clean Holdings 1 | 351,976 | 2,263,206 | |||
| 33,308,893 | |||||
| Software - 1.5% | |||||
Monotype Imaging Holdings 1 | 216,117 | 3,624,282 | |||
VASCO Data Security International 1 | 643,630 | 5,264,894 | |||
| 8,889,176 | |||||
| Total (Cost $81,267,864) | 82,460,071 | ||||
| Materials – 13.8% | |||||
| Chemicals - 2.2% | |||||
C. Uyemura & Co. | 60,800 | 2,300,232 | |||
Huchems Fine Chemical | 145,000 | 2,869,449 | |||
Quaker Chemical | 105,859 | 4,891,745 | |||
Societe Internationale de Plantations d’Heveas | 30,285 | 2,574,902 | |||
| 12,636,328 | |||||
| Construction Materials - 0.1% | |||||
Mardin Cimento Sanayii | 158,000 | 487,966 | |||
| Metals & Mining - 11.5% | |||||
Alamos Gold | 240,200 | 3,751,282 | |||
Allied Nevada Gold 1 | 167,329 | 4,748,797 | |||
Argonaut Gold 1 | 241,200 | 1,819,483 | |||
Aureus Mining 1 | 653,000 | 564,424 | |||
Bear Creek Mining 1 | 518,300 | 1,450,894 | |||
Castle (A.M.) & Co. 1 | 229,663 | 2,439,021 | |||
Endeavour Mining 1 | 1,472,900 | 3,211,706 | |||
Endeavour Silver 1 | 544,100 | 4,418,092 | |||
Entree Gold 1 | 873,700 | 559,168 | |||
Goldgroup Mining 1 | 767,100 | 316,454 | |||
Great Basin Gold 1 | 1,288,675 | 873,378 | |||
Great Panther Silver 1,2 | 263,400 | 439,878 | |||
Horsehead Holding Corporation 1 | 511,100 | 5,090,556 | |||
Imdex | 782,292 | 1,423,541 | |||
International Tower Hill Mines 1 | 329,800 | 916,844 | |||
Lumina Copper 1 | 406,200 | 3,730,449 | |||
Materion Corporation | 65,300 | 1,503,859 | |||
McEwen Mining 1,2 | 804,196 | 2,420,630 | |||
NorthIsle Copper and Gold 1,2 | 360,000 | 49,504 | |||
Olympic Steel | 264,228 | 4,338,624 | |||
Phoscan Chemical 1 | 2,968,200 | 830,897 | |||
Pilot Gold 1 | 1,469,325 | 1,587,523 | |||
Quaterra Resources 1 | 895,000 | 378,008 | |||
Revett Minerals 1 | 133,341 | 438,692 | |||
Richmont Mines 1 | 489,300 | 2,265,459 | |||
Saracen Mineral Holdings 1 | 3,750,000 | 2,148,393 | |||
Scorpio Mining 1 | 1,094,600 | 688,090 | |||
Silvercorp Metals | 416,600 | 2,303,798 | |||
Soltoro 1 | 810,400 | 286,557 | |||
Synalloy Corporation | 93,641 | 1,067,507 | |||
Timmins Gold 1 | 935,000 | 1,711,050 | |||
Torex Gold Resources 1 | 1,009,000 | 1,635,252 | |||
Universal Stainless & Alloy Products 1 | 159,236 | 6,544,600 | |||
Village Main Reef 1 | 3,750,000 | 825,892 | |||
Western Copper and Gold 1 | 720,000 | 540,000 | |||
Wildcat Silver 1 | 986,200 | 716,813 | |||
| 68,035,115 | |||||
| Total (Cost $78,324,803) | 81,159,409 | ||||
| Telecommunication Services – 1.5% | |||||
| Diversified Telecommunication Services - 1.5% | |||||
Atlantic Tele-Network | 136,505 | 4,604,314 | |||
Neutral Tandem 1 | 312,330 | 4,116,509 | |||
| Total (Cost $6,021,621) | 8,720,823 | ||||
| Utilities – 0.1% | |||||
| Independent Power Producers & Energy Traders - 0.1% | |||||
Alterra Power 1 | 1,844,000 | 824,104 | |||
| Total (Cost $2,120,432) | 824,104 | ||||
| 14 | Royce Capital Fund 2012 Semiannual Report to Shareholders | THE ACCOMPANYING NOTES ARE AN INTEGRAL PART OF THESE FINANCIAL STATEMENTS. |
June 30, 2012 (unaudited) |
| VALUE | ||||||||
| Miscellaneous 4 – 3.9% | ||||||||
| Total (Cost $23,194,601) | $ | 23,060,494 | ||||||
| TOTAL COMMON STOCKS | ||||||||
(Cost $513,932,436) | 548,574,511 | |||||||
| REPURCHASE AGREEMENT – 6.6% | ||||||||
| Fixed Income Clearing Corporation, | ||||||||
0.11% dated 6/29/12, due 7/2/12, | ||||||||
maturity value $39,066,358 (collateralized | ||||||||
by obligations of various U.S. Government | ||||||||
Agencies, 0.875%-2.125% due 11/30/14-11/30/16, | ||||||||
valued at $39,852,275) | ||||||||
(Cost $39,066,000) | 39,066,000 | |||||||
| COLLATERAL RECEIVED FOR SECURITIES | ||||||||
LOANED – 2.2% | ||||||||
| Money Market Funds | ||||||||
Federated Government Obligations Fund | ||||||||
(7 day yield-0.0115%) | ||||||||
(Cost $13,080,368) | 13,080,368 | |||||||
| TOTAL INVESTMENTS – 101.8% | ||||||||
(Cost $566,078,804) | 600,720,879 | |||||||
| LIABILITIES LESS CASH | ||||||||
AND OTHER ASSETS – (1.8)% | (10,581,047 | ) | ||||||
| NET ASSETS - 100.0% | $ | 590,139,832 | ||||||
| Royce Capital Fund–Small-Cap Portfolio | |||||||||
| SHARES | VALUE | ||||||||
| COMMON STOCKS – 99.7% | |||||||||
| Consumer Discretionary – 28.5% | |||||||||
| Auto Components - 2.6% | |||||||||
Dorman Products 1 | 604,526 | $ | 15,167,557 | ||||||
| Hotels, Restaurants & Leisure - 0.9% | |||||||||
International Speedway Cl. A | 207,876 | 5,442,194 | |||||||
| Media - 0.9% | |||||||||
World Wrestling Entertainment Cl. A | 662,796 | 5,183,065 | |||||||
| Specialty Retail - 17.8% | |||||||||
American Eagle Outfitters | 611,715 | 12,069,137 | |||||||
Ascena Retail Group 1 | 878,480 | 16,357,298 | |||||||
Buckle (The) | 413,841 | 16,375,688 | |||||||
Cato Corporation (The) Cl. A | 368,692 | 11,230,358 | |||||||
Guess? | 386,445 | 11,736,335 | |||||||
Jos. A. Bank Clothiers 1 | 388,376 | 16,490,445 | |||||||
Shoe Carnival | 786,043 | 16,892,064 | |||||||
Stein Mart 1 | 508,070 | 4,039,156 | |||||||
| 105,190,481 | |||||||||
| Textiles, Apparel & Luxury Goods - 6.3% | |||||||||
Barry (R.G.) | 137,910 | 1,874,197 | |||||||
G-III Apparel Group 1 | 410,344 | 9,721,049 | |||||||
Maidenform Brands 1,2 | 611,025 | 12,171,618 | |||||||
Steven Madden 1 | 327,342 | 10,393,109 | |||||||
†Vera Bradley 1,2 | 151,700 | 3,197,836 | |||||||
| 37,357,809 | |||||||||
| Total (Cost $129,007,826) | 168,341,106 | ||||||||
| Consumer Staples – 3.3% | |||||||||
| Food & Staples Retailing - 0.5% | |||||||||
Village Super Market Cl. A | 83,411 | 2,717,531 | |||||||
| Food Products - 0.7% | |||||||||
J&J Snack Foods | 67,672 | 3,999,415 | |||||||
| Personal Products - 2.1% | |||||||||
Inter Parfums | 536,625 | 9,267,514 | |||||||
Nu Skin Enterprises Cl. A | 69,027 | 3,237,366 | |||||||
| 12,504,880 | |||||||||
| Total (Cost $14,836,998) | 19,221,826 | ||||||||
| Energy – 8.1% | |||||||||
| Energy Equipment & Services - 6.8% | |||||||||
Atwood Oceanics 1 | 234,600 | 8,877,264 | |||||||
Helmerich & Payne | 34,400 | 1,495,712 | |||||||
Matrix Service 1 | 760,665 | 8,633,548 | |||||||
Oil States International 1 | 78,700 | 5,209,940 | |||||||
Unit Corporation 1 | 428,475 | 15,806,443 | |||||||
| 40,022,907 | |||||||||
| Oil, Gas & Consumable Fuels - 1.3% | |||||||||
Cimarex Energy | 67,118 | 3,699,544 | |||||||
Energen Corporation | 87,800 | 3,962,414 | |||||||
| 7,661,958 | |||||||||
| Total (Cost $40,926,602) | 47,684,865 | ||||||||
| THE ACCOMPANYING NOTES ARE AN INTEGRAL PART OF THESE FINANCIAL STATEMENTS. | Royce Capital Fund 2012 Semiannual Report to Shareholders | 15 |
Schedules of Investments
| Royce Capital Fund–Small-Cap Portfolio (continued) | |||||||||
| SHARES | VALUE | ||||||||
| Financials – 15.8% | |||||||||
| Capital Markets - 2.3% | |||||||||
Federated Investors Cl. B | 634,697 | $ | 13,868,129 | ||||||
| Commercial Banks - 1.4% | |||||||||
City Holding Company | 244,540 | 8,238,553 | |||||||
| Insurance - 11.0% | |||||||||
Allied World Assurance Company | |||||||||
Holdings | 161,834 | 12,860,948 | |||||||
Alterra Capital Holdings | 329,203 | 7,686,890 | |||||||
Aspen Insurance Holdings | 392,869 | 11,353,914 | |||||||
Endurance Specialty Holdings | 62,189 | 2,383,083 | |||||||
Meadowbrook Insurance Group | 840,074 | 7,384,250 | |||||||
Montpelier Re Holdings | 364,777 | 7,766,102 | |||||||
Reinsurance Group of America | 150,600 | 8,013,426 | |||||||
StanCorp Financial Group | 184,200 | 6,844,872 | |||||||
Validus Holdings | 12,085 | 387,083 | |||||||
| 64,680,568 | |||||||||
| Thrifts & Mortgage Finance - 1.1% | |||||||||
Genworth MI Canada | 359,700 | 6,514,947 | |||||||
| Total (Cost $78,021,511) | 93,302,197 | ||||||||
| Health Care – 10.4% | |||||||||
| Biotechnology - 0.4% | |||||||||
Emergent Biosolutions 1 | 168,511 | 2,552,942 | |||||||
| Health Care Equipment & Supplies - 0.5% | |||||||||
ICU Medical 1,2 | 49,175 | 2,624,962 | |||||||
| Health Care Providers & Services - 7.8% | |||||||||
Chemed Corporation | 284,198 | 17,176,927 | |||||||
Magellan Health Services 1 | 164,967 | 7,477,954 | |||||||
MEDNAX 1 | 201,409 | 13,804,573 | |||||||
U.S. Physical Therapy | 286,319 | 7,281,092 | |||||||
| 45,740,546 | |||||||||
| Pharmaceuticals - 1.7% | |||||||||
Obagi Medical Products 1 | 671,494 | 10,253,713 | |||||||
| Total (Cost $44,530,280) | 61,172,163 | ||||||||
| Industrials – 5.9% | |||||||||
| Aerospace & Defense - 2.7% | |||||||||
Cubic Corporation | 326,800 | 15,712,544 | |||||||
| Electrical Equipment - 1.0% | |||||||||
AZZ | 96,555 | 5,914,959 | |||||||
| Machinery - 0.1% | |||||||||
Miller Industries | 51,976 | 827,978 | |||||||
| Trading Companies & Distributors - 2.1% | |||||||||
Applied Industrial Technologies | 332,097 | 12,237,774 | |||||||
| Total (Cost $28,745,030) | 34,693,255 | ||||||||
| Information Technology – 21.5% | |||||||||
| Communications Equipment - 4.5% | |||||||||
NETGEAR 1 | 457,432 | 15,785,978 | |||||||
Plantronics | 323,200 | 10,794,880 | |||||||
| 26,580,858 | |||||||||
| Computers & Peripherals - 1.1% | |||||||||
Super Micro Computer 1 | 420,445 | 6,668,258 | |||||||
| Electronic Equipment, Instruments & Components - 6.8% | |||||||||
Fabrinet 1 | 830,022 | 10,416,776 | |||||||
Littelfuse | 182,116 | 10,360,579 | |||||||
Multi-Fineline Electronix 1 | 216,029 | 5,322,955 | |||||||
Rofin-Sinar Technologies 1 | 267,853 | 5,070,457 | |||||||
†Vishay Intertechnology 1 | 968,200 | 9,130,126 | |||||||
| 40,300,893 | |||||||||
| IT Services - 3.0% | |||||||||
†Convergys Corporation | 355,900 | 5,256,643 | |||||||
ManTech International Cl. A | 492,080 | 11,549,118 | |||||||
MAXIMUS | 13,154 | 680,719 | |||||||
| 17,486,480 | |||||||||
| Semiconductors & Semiconductor Equipment - 6.1% | |||||||||
GSI Technology 1 | 842,188 | 3,991,971 | |||||||
Integrated Silicon Solution 1 | 233,816 | 2,359,203 | |||||||
IXYS Corporation 1 | 504,793 | 5,638,538 | |||||||
MKS Instruments | 460,572 | 13,324,348 | |||||||
Teradyne 1 | 460,000 | 6,467,600 | |||||||
Ultra Clean Holdings 1 | 607,204 | 3,904,322 | |||||||
| 35,685,982 | |||||||||
| Total (Cost $134,952,204) | 126,722,471 | ||||||||
| Materials – 2.9% | |||||||||
| Chemicals - 2.4% | |||||||||
Innospec 1 | 477,488 | 14,138,420 | |||||||
| Containers & Packaging - 0.5% | |||||||||
UFP Technologies 1,2 | 183,866 | 3,107,335 | |||||||
| Total (Cost $17,417,907) | 17,245,755 | ||||||||
| Miscellaneous 4 – 3.3% | |||||||||
| Total (Cost $18,693,427) | 19,569,905 | ||||||||
| TOTAL COMMON STOCKS | |||||||||
(Cost $507,131,785) | 587,953,543 | ||||||||
| REPURCHASE AGREEMENT – 0.3% | |||||||||
| Fixed Income Clearing Corporation, | |||||||||
0.11% dated 6/29/12, due 7/2/12, | |||||||||
maturity value $2,164,020 (collateralized | |||||||||
by obligations of various U.S. Government | |||||||||
Agencies, 1.75% due 5/7/13, valued at $2,208,397) | |||||||||
(Cost $2,164,000) | 2,164,000 | ||||||||
| 16 | Royce Capital Fund 2012 Semiannual Report to Shareholders | THE ACCOMPANYING NOTES ARE AN INTEGRAL PART OF THESE FINANCIAL STATEMENTS. |
June 30, 2012 (unaudited) |
| VALUE | |||||||||
| COLLATERAL RECEIVED FOR SECURITIES | |||||||||
LOANED – 0.4% | |||||||||
| Money Market Funds | |||||||||
Federated Government Obligations Fund | |||||||||
(7 day yield-0.0115%) | |||||||||
(Cost $2,298,734) | $ | 2,298,734 | |||||||
| TOTAL INVESTMENTS – 100.4% | |||||||||
(Cost $511,594,519) | 592,416,277 | ||||||||
| LIABILITIES LESS CASH | |||||||||
AND OTHER ASSETS – (0.4)% | (2,632,771 | ) | |||||||
| NET ASSETS – 100.0% | $ | 589,783,506 | |||||||
| † | New additions in 2012. | |
| 1 | Non-income producing. | |
| 2 | All or a portion of these securities were on loan at June 30, 2012. | |
| 3 | A security for which market quotations are not readily available represents 0.0% of net assets for Royce Micro-Cap Portfolio. This security has been valued at its fair value under procedures approved by the Fund’s Board of Trustees. This security is defined as a Level 3 security due to the use of significant unobservable inputs in the determination of fair value. See Notes to Financial Statements. | |
| 4 | Includes securities first acquired in 2012 and less than 1% of net assets. | |
| Bold indicates a Fund’s 20 largest equity holdings in terms of June 30, 2012, market value. | ||
| THE ACCOMPANYING NOTES ARE AN INTEGRAL PART OF THESE FINANCIAL STATEMENTS. | Royce Capital Fund 2012 Semiannual Report to Shareholders | 17 |
| Statements of Assets and Liabilities | June 30, 2012 (unaudited) |
| Micro-Cap | Small-Cap | |||||||
| Portfolio | Portfolio | |||||||
| ASSETS: | ||||||||
| Investments at value | ||||||||
(including collateral on loaned securities) | $ | 561,654,879 | $ | 590,252,277 | ||||
| Repurchase agreements (at cost and value) | 39,066,000 | 2,164,000 | ||||||
| Cash and foreign currency | 324,596 | 948 | ||||||
| Receivable for investments sold | 3,102,749 | 5,447,366 | ||||||
| Receivable for capital shares sold | 105,353 | 545,064 | ||||||
| Receivable for dividends and interest | 360,538 | 218,155 | ||||||
| Prepaid expenses and other assets | 2,881 | 2,951 | ||||||
Total Assets | 604,616,996 | 598,630,761 | ||||||
| LIABILITIES: | ||||||||
| Payable for collateral on loaned securities | 13,080,368 | 2,298,734 | ||||||
| Payable for investments purchased | 94,626 | 5,517,782 | ||||||
| Payable for capital shares redeemed | 590,106 | 456,739 | ||||||
| Payable for investment advisory fees | 589,643 | 463,593 | ||||||
| Accrued expenses | 122,421 | 110,407 | ||||||
Total Liabilities | 14,477,164 | 8,847,255 | ||||||
Net Assets | $ | 590,139,832 | $ | 589,783,506 | ||||
| ANALYSIS OF NET ASSETS: | ||||||||
| Paid-in capital | $ | 541,001,276 | $ | 452,947,033 | ||||
| Undistributed net investment income (loss) | (3,289,566 | ) | 498,931 | |||||
| Accumulated net realized gain (loss) on investments and foreign currency | 17,794,010 | 55,515,785 | ||||||
| Net unrealized appreciation (depreciation) on investments and foreign currency | 34,634,112 | 80,821,757 | ||||||
Net Assets | $ | 590,139,832 | $ | 589,783,506 | ||||
Investment Class | $ | 558,570,152 | $ | 482,833,494 | ||||
Service Class | 31,569,680 | 106,950,012 | ||||||
| SHARES OUTSTANDING (unlimited number of $.001 par value): | ||||||||
Investment Class | 52,377,736 | 45,609,489 | ||||||
Service Class | 2,978,431 | 10,206,819 | ||||||
| NET ASSET VALUES (Net Assets ÷ Shares Outstanding): | ||||||||
(offering and redemption price per share) | ||||||||
Investment Class | $ | 10.66 | $ | 10.59 | ||||
Service Class | 10.60 | 10.48 | ||||||
Investments at identified cost | $ | 527,012,804 | $ | 509,430,519 | ||||
Market value of loaned securities | 12,823,715 | 2,310,706 | ||||||
| 18 | Royce Capital Fund 2012 Semiannual Report to Shareholders | THE ACCOMPANYING NOTES ARE AN INTEGRAL PART OF THESE FINANCIAL STATEMENTS. |
| Statements of Changes in Net Assets |
| Micro-Cap Portfolio | Small-Cap Portfolio | |||||||||||||||
| Six months ended | Six months ended | |||||||||||||||
| 6/30/12 | Year ended | 6/30/12 | Year ended | |||||||||||||
| (unaudited) | 12/31/11 | (unaudited) | 12/31/11 | |||||||||||||
| INVESTMENT OPERATIONS: | ||||||||||||||||
| Net investment income (loss) | $ | (219,356 | ) | $ | (2,109,524 | ) | $ | (206,428 | ) | $ | 709,733 | |||||
| Net realized gain (loss) on investments and foreign currency | 11,770,488 | 38,186,298 | 36,743,764 | 39,241,303 | ||||||||||||
| Net change in unrealized appreciation (depreciation) on | ||||||||||||||||
investments and foreign currency | 3,544,560 | (120,194,095 | ) | 9,482,189 | (66,446,967 | ) | ||||||||||
| Net increase (decrease) in net assets from investment operations | 15,095,692 | (84,117,321 | ) | 46,019,525 | (26,495,931 | ) | ||||||||||
| DISTRIBUTIONS: | ||||||||||||||||
| Net investment income | ||||||||||||||||
Investment Class | – | (15,334,079 | ) | – | (2,311,678 | ) | ||||||||||
Service Class | – | (670,256 | ) | – | (235,077 | ) | ||||||||||
| Net realized gain on investments and foreign currency | ||||||||||||||||
Investment Class | – | – | – | – | ||||||||||||
Service Class | – | – | – | – | ||||||||||||
| Total distributions | – | (16,004,335 | ) | – | (2,546,755 | ) | ||||||||||
| CAPITAL SHARE TRANSACTIONS: | ||||||||||||||||
| Value of shares sold | ||||||||||||||||
Investment Class | 38,630,057 | 129,890,186 | 50,068,235 | 167,658,571 | ||||||||||||
Service Class | 8,985,001 | 16,617,956 | 25,067,053 | 50,306,363 | ||||||||||||
| Distributions reinvested | ||||||||||||||||
Investment Class | – | 15,334,079 | – | 2,311,678 | ||||||||||||
Service Class | – | 670,256 | – | 235,077 | ||||||||||||
| Value of shares redeemed | ||||||||||||||||
Investment Class | (64,238,823 | ) | (156,102,760 | ) | (260,672,966 | ) | (123,030,315 | ) | ||||||||
Service Class | (3,925,618 | ) | (4,370,394 | ) | (1,506,624 | ) | (9,362,167 | ) | ||||||||
| Net increase (decrease) in net assets from capital share | ||||||||||||||||
transactions | (20,549,383 | ) | 2,039,323 | (187,044,302 | ) | 88,119,207 | ||||||||||
| NET INCREASE (DECREASE) IN NET ASSETS | (5,453,691 | ) | (98,082,333 | ) | (141,024,777 | ) | 59,076,521 | |||||||||
| NET ASSETS: | ||||||||||||||||
Beginning of period | 595,593,523 | 693,675,856 | 730,808,283 | 671,731,762 | ||||||||||||
End of period | $ | 590,139,832 | $ | 595,593,523 | $ | 589,783,506 | $ | 730,808,283 | ||||||||
| UNDISTRIBUTED NET INVESTMENT | ||||||||||||||||
INCOME (LOSS) AT END OF PERIOD | $ | (3,289,566 | ) | $ | (3,070,211 | ) | $ | 498,931 | $ | 705,358 | ||||||
| THE ACCOMPANYING NOTES ARE AN INTEGRAL PART OF THESE FINANCIAL STATEMENTS. | Royce Capital Fund 2012 Semiannual Report to Shareholders | 19 |
| Statements of Operations | Six Months Ended June 30, 2012 (unaudited) |
| Micro-Cap | Small-Cap | |||||||
| Portfolio | Portfolio | |||||||
| INVESTMENT INCOME: | ||||||||
| Income: | ||||||||
Dividends | $ | 3,812,753 | $ | 3,318,623 | ||||
Interest | 8,990 | 6,781 | ||||||
Securities lending | 104,769 | 497 | ||||||
| Total income | 3,926,512 | 3,325,901 | ||||||
| Expenses: | ||||||||
Investment advisory fees | 3,874,217 | 3,241,416 | ||||||
Distribution fees | 37,592 | 117,777 | ||||||
Custody | 100,696 | 37,333 | ||||||
Shareholder reports | 42,142 | 43,507 | ||||||
Administrative and office facilities | 34,195 | 37,464 | ||||||
Audit | 27,173 | 14,991 | ||||||
Trustees’ fees | 20,017 | 22,095 | ||||||
Shareholder servicing | 7,522 | 9,817 | ||||||
Legal | 7,199 | 7,578 | ||||||
Registration | 499 | 2,948 | ||||||
Other expenses | 8,663 | 9,072 | ||||||
| Total expenses | 4,159,915 | 3,543,998 | ||||||
| Compensating balance credits | (219 | ) | (6 | ) | ||||
| Fees waived by distributor | (13,828 | ) | (11,663 | ) | ||||
| Net expenses | 4,145,868 | 3,532,329 | ||||||
| Net investment income (loss) | (219,356 | ) | (206,428 | ) | ||||
| REALIZED AND UNREALIZED GAIN (LOSS) ON INVESTMENTS AND FOREIGN CURRENCY: | ||||||||
| Net realized gain (loss): | ||||||||
Investments | 11,797,406 | 36,746,345 | ||||||
Foreign currency transactions | (26,918 | ) | (2,581 | ) | ||||
| Net change in unrealized appreciation (depreciation): | ||||||||
Investments and foreign currency translations | 3,546,655 | 9,482,189 | ||||||
Other assets and liabilities denominated in foreign currency | (2,095 | ) | – | |||||
| Net realized and unrealized gain (loss) on investments and foreign currency | 15,315,048 | 46,225,953 | ||||||
| NET INCREASE (DECREASE) IN NET ASSETS FROM INVESTMENT OPERATIONS | $ | 15,095,692 | $ | 46,019,525 | ||||
| 20 | Royce Capital Fund 2012 Semiannual Report to Shareholders | THE ACCOMPANYING NOTES ARE AN INTEGRAL PART OF THESE FINANCIAL STATEMENTS. |
| This table is presented to show selected data for a share outstanding throughout each period, and to assist shareholders in evaluating a Fund’s performance for the periods presented. Per share amounts have been determined on the basis of the weighted average number of shares outstanding during the period. | |||||||||||||||||||||||||||||||||||||||||||||||||||||||||||
| Net Realized | Distributions from Net | Ratio of Expenses to Average Net Assets | Ratio of Net | ||||||||||||||||||||||||||||||||||||||||||||||||||||||||
| Net Asset Value, Beginning of Period | Net Investment Income (Loss) | and Unrealized Gain (Loss) on Investments and Foreign Currency | Total from Investment Operations | Distributions from Net Investment Income | Realized Gain on Investments and Foreign Currency | Total Distributions | Net Asset Value, End of Period | Total Return | Net Assets, End of Period (in thousands) | Prior to Fee Waivers and Balance Credits | Prior to Fee Waivers | Net of Fee Waivers | Investment Income (Loss) to Average Net Assets | Portfolio Turnover Rate | |||||||||||||||||||||||||||||||||||||||||||||
| Micro-Cap Portfolio – Investment Class | |||||||||||||||||||||||||||||||||||||||||||||||||||||||||||
| † 2012 | $ | 10.41 | $ | (0.00 | ) | $ | 0.25 | $ | 0.25 | $ | – | $ | – | $ | – | $ | 10.66 | 2.40 | % 1 | $ | 558,570 | 1.33 | % 2 | 1.33 | % 2 | 1.33 | % 2 | (0.06 | )% 2 | 10 | % | ||||||||||||||||||||||||||||
| 2011 | 12.18 | (0.03 | ) | (1.45 | ) | (1.48 | ) | (0.29 | ) | – | (0.29 | ) | 10.41 | (12.10 | ) | 569,498 | 1.32 | 1.32 | 1.32 | (0.31 | ) | 35 | |||||||||||||||||||||||||||||||||||||
| 2010 | 9.52 | (0.01 | ) | 2.87 | 2.86 | (0.20 | ) | – | (0.20 | ) | 12.18 | 30.10 | 676,654 | 1.32 | 1.32 | 1.32 | (0.09 | ) | 35 | ||||||||||||||||||||||||||||||||||||||||
| 2009 | 6.03 | (0.01 | ) | 3.50 | 3.49 | – | – | – | 9.52 | 57.88 | 522,092 | 1.33 | 1.33 | 1.33 | (0.13 | ) | 33 | ||||||||||||||||||||||||||||||||||||||||||
| 2008 | 13.47 | 0.13 | (5.99 | ) | (5.86 | ) | (0.30 | ) | (1.28 | ) | (1.58 | ) | 6.03 | (43.27 | ) | 328,059 | 1.32 | 1.32 | 1.32 | 1.05 | 51 | ||||||||||||||||||||||||||||||||||||||
| 2007 | 14.40 | 0.03 | 0.53 | 0.56 | (0.22 | ) | (1.27 | ) | (1.49 | ) | 13.47 | 3.98 | 629,953 | 1.31 | 1.31 | 1.31 | 0.19 | 47 | |||||||||||||||||||||||||||||||||||||||||
| Micro-Cap Portfolio – Service Class | |||||||||||||||||||||||||||||||||||||||||||||||||||||||||||
| † 2012 | $ | 10.35 | $ | (0.01 | ) | $ | 0.26 | $ | 0.25 | $ | – | $ | – | $ | – | $ | 10.60 | 2.42 | % 1 | $ | 31,570 | 1.59 | % 2 | 1.59 | % 2 | 1.50 | % 2 | (0.20 | )% 2 | 10 | % | ||||||||||||||||||||||||||||
| 2011 | 12.13 | (0.11 | ) | (1.39 | ) | (1.50 | ) | (0.28 | ) | – | (0.28 | ) | 10.35 | (12.26 | ) | 26,096 | 1.60 | 1.60 | 1.49 | (0.46 | ) | 35 | |||||||||||||||||||||||||||||||||||||
| 2010 | 9.49 | (0.08 | ) | 2.91 | 2.83 | (0.19 | ) | – | (0.19 | ) | 12.13 | 29.90 | 17,022 | 1.63 | 1.63 | 1.40 | (0.12 | ) | 35 | ||||||||||||||||||||||||||||||||||||||||
| 2009 | 6.02 | (0.03 | ) | 3.50 | 3.47 | – | – | – | 9.49 | 57.64 | 6,907 | 1.73 | 1.73 | 1.58 | (0.36 | ) | 33 | ||||||||||||||||||||||||||||||||||||||||||
| 2008 | 13.45 | 0.05 | (5.92 | ) | (5.87 | ) | (0.28 | ) | (1.28 | ) | (1.56 | ) | 6.02 | (43.44 | ) | 3,725 | 1.92 | 1.92 | 1.58 | 0.70 | 51 | ||||||||||||||||||||||||||||||||||||||
| 2007 | 14.39 | (0.06 | ) | 0.58 | 0.52 | (0.19 | ) | (1.27 | ) | (1.46 | ) | 13.45 | 3.71 | 3,515 | 2.11 | 2.11 | 1.58 | (0.06 | ) | 47 | |||||||||||||||||||||||||||||||||||||||
| Small-Cap Portfolio – Investment Class | |||||||||||||||||||||||||||||||||||||||||||||||||||||||||||
| † 2012 | $ | 10.07 | $ | (0.00 | ) | $ | 0.52 | $ | 0.52 | $ | – | $ | – | $ | – | $ | 10.59 | 5.16 | % 1 | $ | 482,834 | 1.06 | % 2 | 1.06 | % 2 | 1.06 | % 2 | (0.04 | )% 2 | 31 | % | ||||||||||||||||||||||||||||
| 2011 | 10.45 | 0.01 | (0.35 | ) | (0.34 | ) | (0.04 | ) | – | (0.04 | ) | 10.07 | (3.28 | ) | 651,243 | 1.05 | 1.05 | 1.05 | 0.11 | 36 | |||||||||||||||||||||||||||||||||||||||
| 2010 | 8.68 | 0.04 | 1.74 | 1.78 | (0.01 | ) | – | (0.01 | ) | 10.45 | 20.52 | 630,227 | 1.06 | 1.06 | 1.06 | 0.47 | 34 | ||||||||||||||||||||||||||||||||||||||||||
| 2009 | 6.42 | 0.01 | 2.25 | 2.26 | – | – | – | 8.68 | 35.20 | 467,401 | 1.07 | 1.07 | 1.07 | 0.20 | 46 | ||||||||||||||||||||||||||||||||||||||||||||
| 2008 | 9.96 | 0.00 | (2.72 | ) | (2.72 | ) | (0.06 | ) | (0.76 | ) | (0.82 | ) | 6.42 | (27.18 | ) | 291,898 | 1.07 | 1.07 | 1.07 | 0.07 | 45 | ||||||||||||||||||||||||||||||||||||||
| 2007 | 10.67 | 0.07 | (0.30 | ) | (0.23 | ) | (0.00 | ) | (0.48 | ) | (0.48 | ) | 9.96 | (2.14 | ) | 345,747 | 1.09 | 1.08 | 1.08 | 0.60 | 64 | ||||||||||||||||||||||||||||||||||||||
| Small-Cap Portfolio – Service Class | |||||||||||||||||||||||||||||||||||||||||||||||||||||||||||
| † 2012 | $ | 9.98 | $ | (0.01 | ) | $ | 0.51 | $ | 0.50 | $ | – | $ | – | $ | – | $ | 10.48 | 5.01 | % 1 | $ | 106,950 | 1.31 | % 2 | 1.31 | % 2 | 1.28 | % 2 | (0.21 | )% 2 | 31 | % | ||||||||||||||||||||||||||||
| 2011 | 10.38 | (0.01 | ) | (0.36 | ) | (0.37 | ) | (0.03 | ) | – | (0.03 | ) | 9.98 | (3.55 | ) | 79,565 | 1.30 | 1.30 | 1.26 | (0.02 | ) | 36 | |||||||||||||||||||||||||||||||||||||
| 2010 | 8.64 | 0.03 | 1.72 | 1.75 | (0.01 | ) | – | (0.01 | ) | 10.38 | 20.26 | 41,505 | 1.34 | 1.34 | 1.30 | 0.36 | 34 | ||||||||||||||||||||||||||||||||||||||||||
| 2009 | 6.40 | (0.00 | ) | 2.24 | 2.24 | – | – | – | 8.64 | 35.00 | 5,160 | 1.62 | 1.62 | 1.36 | (0.04 | ) | 46 | ||||||||||||||||||||||||||||||||||||||||||
| 2008 | 9.94 | (0.02 | ) | (2.73 | ) | (2.75 | ) | (0.03 | ) | (0.76 | ) | (0.79 | ) | 6.40 | (27.50 | ) | 1,438 | 1.96 | 1.96 | 1.36 | (0.21 | ) | 45 | ||||||||||||||||||||||||||||||||||||
| 2007 | 10.67 | 0.03 | (0.28 | ) | (0.25 | ) | – | (0.48 | ) | (0.48 | ) | 9.94 | (2.37 | ) | 1,647 | 2.09 | 2.09 | 1.36 | 0.23 | 64 | |||||||||||||||||||||||||||||||||||||||
| THE ACCOMPANYING NOTES ARE AN INTEGRAL PART OF THESE FINANCIAL STATEMENTS. | Royce Capital Fund 2012 Semiannual Report to Shareholders | 21 |
| Notes to Financial Statements (unaudited) | |
| Summary of Significant Accounting Policies: |
Royce Micro-Cap Portfolio and Royce Small-Cap Portfolio (the “Fund” or “Funds”) are the two series of Royce Capital Fund (the “Trust”), a diversified open-end management investment company organized as a Delaware statutory trust. Shares of the Funds are offered to life insurance companies for allocation to certain separate accounts established for the purpose of funding qualified and non-qualified variable annuity contracts and variable life insurance contracts, and may also be offered directly to certain pension plans and retirement plans and accounts permitting accumulation of assets on a tax-deferred basis. Micro-Cap Portfolio and Small-Cap Portfolio commenced operations on December 27, 1996. |
Valuation of Investments: |
Securities are valued as of the close of trading on the New York Stock Exchange (NYSE) (generally 4:00 p.m. Eastern time) on the valuation date. Securities that trade on an exchange, and securities traded on Nasdaq’s Electronic Bulletin Board, are valued at their last reported sales price or Nasdaq official closing price taken from the primary market in which each security trades or, if no sale is reported for such day, at their bid price. Other over-the-counter securities for which market quotations are readily available are valued at their highest bid price, except in the case of some bonds and other fixed income securities which may be valued by reference to other securities with comparable ratings, interest rates and maturities, using established independent pricing services. The Funds value their non-U.S. dollar denominated securities in U.S. dollars daily at the prevailing foreign currency exchange rates as quoted by a major bank. Securities for which market quotations are not readily available are valued at their fair value in accordance with the provisions of the 1940 Act, under procedures approved by the Fund’s Board of Trustees, and are reported as Level 3 securities. As a general principle, the fair value of a security is the amount which the Fund might reasonably expect to receive for the security upon its current sale. However, in light of the judgment involved in fair valuations, there can be no assurance that a fair value assigned to a particular security will be the amount which the Fund might be able to receive upon its current sale. In addition, if, between the time trading ends on a particular security and the close of the customary trading session on the NYSE, events occur that are significant and may make the closing price unreliable, a Fund may fair value the security. The Funds use an independent pricing service to provide fair value estimates for relevant non-U.S. equity securities on days when the U.S. market volatility exceeds a certain threshold. This pricing service uses proprietary correlations it has developed between the movement of prices of non-U.S. equity securities and indices of U.S.-traded securities, futures contracts and other indications to estimate the fair value of relevant non-U.S. securities. When fair value pricing is employed, the prices of securities used by a Fund may differ from quoted or published prices for the same security. Investments in money market funds are valued at net asset value per share. |
Various inputs are used in determining the value of each Fund’s investments, as noted above. These inputs are summarized in the three broad levels below: | |||
Level 1 – quoted prices in active markets for identical securities. | |||
Level 2 – other significant observable inputs (including quoted prices for similar securities, foreign securities that may be fair valued and repurchase agreements). The table below includes all Level 2 securities. Any Level 2 securities with values based on quoted prices for similar securities would be noted in the Schedules of Investments. | |||
Level 3 – significant unobservable inputs (including last trade price before trading was suspended, or at a discount thereto for lack of marketability or otherwise, market price information regarding other securities, information received from the company and/or published documents, including SEC filings and financial statements, or other publicly available information). | |||
The inputs or methodology used for valuing securities are not necessarily an indication of the risk associated with investing in those securities. | |||
The following is a summary of the inputs used to value each Fund’s investments as of June 30, 2012. For a detailed breakout of common stocks by sector classification, please refer to the Schedules of Investments. | |||
| Level 1 | Level 2 | Level 3 | Total | ||||||||||
| Micro-Cap Portfolio | |||||||||||||
Common Stocks | $404,517,522 | $143,873,138 | $183,851 | $548,574,511 | |||||||||
Cash Equivalents | 13,080,368 | 39,066,000 | – | 52,146,368 | |||||||||
| Small-Cap Portfolio | |||||||||||||
Common Stocks | 581,438,596 | 6,514,947 | – | 587,953,543 | |||||||||
Cash Equivalents | 2,298,734 | 2,164,000 | – | 4,462,734 | |||||||||
| 22 | Royce Capital Fund 2012 Semiannual Report to Shareholders |
| Valuation of Investments (continued): |
| Level 3 Reconciliation: | ||||||||||
| Realized and Unrealized | ||||||||||
| Balance as of 12/31/11 | Gain (Loss) 1 | Balance as of 6/30/12 | ||||||||
| Micro-Cap Portfolio | ||||||||||
Common Stocks | $182,286 | $1,565 | $183,851 | |||||||
| 1 | The net change in unrealized appreciation (depreciation) is included in the accompanying Statement of Operations. Change in unrealized appreciation (depreciation) includes net unrealized appreciation (depreciation) resulting from changes in investment values during the reporting period and the reversal of previously recorded unrealized appreciation (depreciation) when gains or losses are realized. Net realized gain (loss) from investments and foreign currency transactions is included in the accompanying Statement of Operations. | |
The Funds pay any dividends and capital gain distributions annually in December. Dividends from net investment income are determined at a class level and distributions from capital gains are determined at a Fund level. Because federal income tax regulations differ from generally accepted accounting principles, income and capital gain distributions determined in accordance with tax regulations may differ from net investment income and realized gains recognized for financial reporting purposes. Accordingly, the character of distributions and composition of net assets for tax purposes differ from those reflected in the accompanying financial statements.
| Royce Capital Fund 2012 Semiannual Report to Shareholders | 23 |
Notes to Financial Statements (unaudited) (continued)
Capital Share Transactions (in shares):
| Shares issued for | Net increase (decrease) in | |||||||||||||||||||||||||||||||
| Shares sold | reinvestment of distributions | Shares redeemed | shares outstanding | |||||||||||||||||||||||||||||
| Period ended | Period ended | Period ended | Period ended | |||||||||||||||||||||||||||||
| 6/30/12 | Year ended | 6/30/12 | Year ended | 6/30/12 | Year ended | 6/30/12 | Year ended | |||||||||||||||||||||||||
| (unaudited) | 12/31/11 | (unaudited) | 12/31/11 | (unaudited) | 12/31/11 | (unaudited) | 12/31/11 | |||||||||||||||||||||||||
| Micro-Cap Portfolio | ||||||||||||||||||||||||||||||||
Investment Class | 3,453,614 | 10,881,521 | – | 1,518,226 | (5,800,387 | ) | (13,235,099 | ) | (2,346,773 | ) | (835,352 | ) | ||||||||||||||||||||
Service Class | 809,626 | 1,414,914 | – | 66,692 | (352,030 | ) | (363,651 | ) | 457,596 | 1,117,955 | ||||||||||||||||||||||
| Small-Cap Portfolio | ||||||||||||||||||||||||||||||||
Investment Class | 4,665,957 | 15,958,086 | – | 236,126 | (23,727,687 | ) | (11,804,762 | ) | (19,061,730 | ) | 4,389,450 | |||||||||||||||||||||
Service Class | 2,374,970 | 4,873,500 | – | 24,234 | (142,361 | ) | (923,986 | ) | 2,232,609 | 3,973,748 | ||||||||||||||||||||||
| Investment Adviser and Distributor: |
Investment Adviser: Under the Trust’s investment advisory agreements with Royce, Royce is entitled to receive Investment Advisory fees that are computed daily and payable monthly, at an annual rate of 1.25% and 1.00% of the average net assets of Micro-Cap Portfolio and Small-Cap Portfolio, respectively. Royce has contractually committed to reimburse class-specific expenses (excluding acquired fund fees and expenses) to the extent necessary to maintain the net annual operating expense ratios to average net assets at or below 1.58% for the Service Class of Micro-Cap Portfolio through April 30, 2013. For the six months ended June 30, 2012, Micro-Cap Portfolio recorded advisory fees of $3,874,217 and Small-Cap Portfolio recorded advisory fees of $3,241,416. |
Distributor: Royce Fund Services, Inc. (“RFS”), the distributor of the Trust’s shares, is a wholly owned subsidiary of Royce. RFS is entitled to receive distribution fees from each Fund’s Service Class that are computed daily and payable monthly, at an annual rate of 0.25% of the average net assets of each Class. For the six months ended June 30, 2012, Micro-Cap Portfolio-Service Class recorded net distribution fees of $23,764 and Small-Cap Portfolio-Service Class recorded net distribution fees of $106,114. |
Purchases and Sales of Investment Securities: |
| For the six months ended June 30, 2012, the costs of purchases and the proceeds from sales of investment securities, other than short-term securities and collateral received for securities loaned, were as follows: |
| Purchases | Sales | |||||
| Micro-Cap Portfolio | $ 60,630,345 | $ 91,789,201 | ||||
| Small-Cap Portfolio | 192,769,504 | 323,257,944 |
| Net | Transfer Agent | |||||||||||||||||||
| Distribution | Shareholder | Shareholder | Balance | |||||||||||||||||
| Fees | Servicing | Reports | Registration | Credits | Total | |||||||||||||||
| Micro-Cap Portfolio – Investment Class | $ | – | $4,542 | $41,681 | $ – | $ (1 | ) | $ | 46,222 | |||||||||||
| Micro-Cap Portfolio – Service Class | 23,764 | 2,980 | 461 | 499 | – | 27,704 | ||||||||||||||
| 23,764 | 7,522 | 42,142 | 499 | (1 | ) | |||||||||||||||
| Small-Cap Portfolio – Investment Class | – | 6,807 | 41,954 | 1,529 | (1 | ) | 50,289 | |||||||||||||
| Small-Cap Portfolio – Service Class | 106,114 | 3,010 | 1,553 | 1,419 | – | 112,096 | ||||||||||||||
| 106,114 | 9,817 | 43,507 | 2,948 | (1 | ) | |||||||||||||||
Tax Information:
At June 30, 2012, net unrealized appreciation (depreciation) based on identified cost for tax purposes was as follows:
| Net Unrealized | |||||||||||||
| Appreciation | Gross Unrealized | ||||||||||||
| Tax Basis Cost | (Depreciation) | Appreciation | Depreciation | ||||||||||
| Micro-Cap Portfolio | $566,256,478 | $34,464,401 | $117,769,489 | $83,305,088 | |||||||||
| Small-Cap Portfolio | 512,035,235 | 80,381,042 | 108,211,486 | 27,830,444 | |||||||||
The primary difference between book and tax basis cost is the timing of the recognition of losses on securities sold.
| 24 | Royce Capital Fund 2012 Semiannual Report to Shareholders |
| Understanding Your Fund’s Expenses (unaudited) | |
As a shareholder of a mutual fund, you pay ongoing expenses, including management fees and other Fund expenses including, for some funds, distribution and/or service (12b-1) fees. Using the information below, you can estimate how these ongoing expenses (in dollars) affect your investment and compare them with the ongoing expenses of other funds. You may also incur one-time transaction expenses which are not shown in this section and would result in higher total costs. The example is based on an investment of $1,000 invested at January 1, 2012, and held for the entire six-month period ended June 30, 2012. Service Class shares are generally available only through certain insurance companies, brokers or retirement plan administrators who receive service fees from the Fund for services that they perform. |
| Actual Expenses |
The first part of the table below provides information about actual account values and actual expenses. You may use the information in this section, together with the amount you invested, to estimate the expenses that you paid over the period. Simply divide your account value at June 30, 2012, by $1,000 (for example, an $8,600 account value divided by $1,000 = 8.6), then multiply the result by the number under the heading entitled “Expenses Paid During the Period” to estimate the expenses you paid on your account during this period. |
| Hypothetical Example for Comparison Purposes |
The second part of the table below provides information about hypothetical account values and hypothetical expenses based on the Fund’s actual expense ratio and an assumed rate of return of 5% per year before expenses, which is not the Fund’s actual return. The hypothetical account values and expenses may not be used to estimate the actual ending account balance or expenses you paid for the period. You may use this information to compare the ongoing costs of investing in the Fund and other funds. To do so, compare this 5% hypothetical example with the 5% hypothetical examples that appear in the shareholder reports of the other funds. |
Please note that the expenses shown in the table are meant to highlight your ongoing costs only and do not reflect any transactional costs, such as sales charges (loads), redemption fees, or exchange fees. Therefore, this section is useful in comparing ongoing costs only, and will not help you determine the relative total costs of owning different funds. In addition, if these transactional costs were included, your costs would have been higher. |
| Actual | Hypothetical (5% per year return before expenses) | ||||||||||||||||||||||
| Beginning | Ending | Expenses Paid | Beginning | Ending | Expenses Paid | Annualized | |||||||||||||||||
| Account Value | Account Value | During the | Account Value | Account Value | During the | Expense | |||||||||||||||||
| 1/1/12 | 6/30/12 | Period 1 | 1/1/12 | 6/30/12 | Period 1 | Ratio 2 | |||||||||||||||||
| Investment Class | |||||||||||||||||||||||
| Micro-Cap Portfolio | $1,000.00 | $1,024.02 | $6.69 | $1,000.00 | $1,018.25 | $6.67 | 1.33% | ||||||||||||||||
| Small-Cap Portfolio | 1,000.00 | 1,051.64 | 5.41 | 1,000.00 | 1,019.59 | 5.32 | 1.06% | ||||||||||||||||
| Service Class | |||||||||||||||||||||||
| Micro-Cap Portfolio | 1,000.00 | 1,024.15 | 7.55 | 1,000.00 | 1,017.40 | 7.52 | 1.50% | ||||||||||||||||
| Small-Cap Portfolio | 1,000.00 | 1,050.10 | 6.52 | 1,000.00 | 1,018.50 | 6.42 | 1.28% | ||||||||||||||||
| Royce Capital Fund 2012 Semiannual Report to Shareholders | 25 |
| Trustees and Officers |
| All Trustees and Officers may be reached c/o The Royce Funds, 745 Fifth Avenue, New York, NY 10151 |
| Charles M. Royce, Trustee 1, President |
| Age: 72 | Number of Funds Overseen: 35 | Tenure: Since 1982 |
| Non-Royce Directorships: Director of TICC Capital Corp. |
Principal Occupation(s) During Past Five Years: President, Co-Chief Investment Officer and Member of Board of Managers of Royce & Associates, LLC (“Royce”), the Trust’s investment adviser. |
| Mark R. Fetting, Trustee 1 |
| Age: 57 | Number of Funds Overseen: 49 | Tenure: Since 2001 |
Non-Royce Directorships: Director of Legg Mason, Inc.; Director/Trustee of registered investment companies constituting the 14 Legg Mason Funds. |
Principal Occupation(s) During Past 5 Years: President, CEO, Chairman and Director of Legg Mason, Inc. and Chairman of Legg Mason Funds. Mr. Fetting’s prior business experience includes having served as a member of the Board of Managers of Royce; President of all Legg Mason Funds; Senior Executive Vice President of Legg Mason, Inc.; Director and/or officer of various Legg Mason, Inc. affiliates; Division President and Senior Officer of Prudential Financial Group, Inc. and related companies. |
| Patricia W. Chadwick, Trustee |
| Age: 63 | Number of Funds Overseen: 35 | Tenure: Since 2009 |
Non-Royce Directorships: Trustee of ING Mutual Funds and Director of Wisconsin Energy Corp. |
Principal Occupation(s) During Past 5 Years: Consultant and President of Ravengate Partners LLC (since 2000). |
| Richard M. Galkin, Trustee |
| Age: 74 | Number of Funds Overseen: 35 | Tenure: Since 1982 |
| Non-Royce Directorships: None |
Principal Occupation(s) During Past Five Years: Private investor. Mr. Galkin’s prior business experience includes having served as President of Richard M. Galkin Associates, Inc., telecommunications consultants, President of Manhattan Cable Television (a subsidiary of Time, Inc.), President of Haverhills Inc. (another Time, Inc. subsidiary), President of Rhode Island Cable Television and Senior Vice President of Satellite Television Corp. (a subsidiary of Comsat). |
| Stephen L. Isaacs, Trustee |
| Age: 72 | Number of Funds Overseen: 35 | Tenure: Since 1989 |
| Non-Royce Directorships: None |
Principal Occupation(s) During Past Five Years: President of The Center for Health and Social Policy (since September 1996); Attorney and President of Health Policy Associates, Inc., consultants. Mr. Isaacs’s prior business experience includes having served as Director of Columbia University Development Law and Policy Program and Professor at Columbia University (until August 1996). |
| Arthur S. Mehlman, Trustee |
| Age: 70 | Number of Funds Overseen: 49 | Tenure: Since 2004 |
Non-Royce Directorships: Director/Trustee of registered investment companies constituting the 14 Legg Mason Funds. |
Principal Occupation(s) During Past Five Years: Director of The League for People with Disabilities, Inc.; Director of University of Maryland Foundation (non-profits). Formerly: Director of Municipal Mortgage & Equity, LLC (from October 2004 to April 2011); Director of University of Maryland College Park Foundation (non-profit) (from 1998 to 2005); Partner, KPMG LLP (international accounting firm) (from 1972 to 2002); Director of Maryland Business Roundtable for Education (from July 1984 to June 2002). |
| David L. Meister, Trustee |
| Age: 72 | Number of Funds Overseen: 35 | Tenure: Since 1982 |
| Non-Royce Directorships: None |
Principal Occupation(s) During Past Five Years: Consultant. Chairman and Chief Executive Officer of The Tennis Channel (from June 2000 to March 2005). Mr. Meister’s prior business experience includes having served as Chief Executive Officer of Seniorlife.com, a consultant to the communications industry, President of Financial News Network, Senior Vice President of HBO, President of Time-Life Films and Head of Broadcasting for Major League Baseball. |
| G. Peter O’Brien, Trustee |
| Age: 66 | Number of Funds Overseen: 51 | Tenure: Since 2001 |
Non-Royce Directorships: Director/Trustee of registered investment companies constituting the 16 Legg Mason Funds; Director of TICC Capital Corp. |
Principal Occupation(s) During Past Five Years: Trustee Emeritus of Colgate University (since 2005); Board Member of Hill House, Inc. (since 1999); Formerly: Trustee of Colgate University (from 1996 to 2005), President of Hill House, Inc. (from 2001 to 2005) and Managing Director/Equity Capital Markets Group of Merrill Lynch & Co. (from 1971 to 1999). |
| John D. Diederich, Vice President and Treasurer |
| Age: 60 | Tenure: Since 2001 |
Principal Occupation(s) During Past Five Years: Chief Operating Officer, Managing Director and member of the Board of Managers of Royce; Chief Financial Officer of Royce; Director of Administration of the Trust; and President of RFS, having been employed by Royce since April 1993. |
| Jack E. Fockler, Jr., Vice President |
| Age: 53 | Tenure: Since 1995 |
Principal Occupation(s) During Past Five Years: Managing Director and Vice President of Royce, and Vice President of RFS, having been employed by Royce since October 1989. |
| W. Whitney George, Vice President |
| Age: 54 | Tenure: Since 1995 |
Principal Occupation(s) During Past Five Years: Co-Chief Investment Officer, Managing Director and Vice President of Royce, having been employed by Royce since October 1991. |
Daniel A. O’Byrne, Vice President and Assistant Secretary |
| Age: 50 | Tenure: Since 1994 |
Principal Occupation(s) During Past Five Years: Principal and Vice President of Royce, having been employed by Royce since October 1986. |
| John E. Denneen, Secretary and Chief Legal Officer |
| Age: 45 | Tenure: 1996-2001 and Since April 2002 |
Principal Occupation(s) During Past Five Years: General Counsel, Principal, Chief Legal and Compliance Officer and Secretary of Royce; Secretary and Chief Legal Officer of The Royce Funds. |
| Lisa Curcio, Chief Compliance Officer |
| Age: 52 | Tenure: Since 2004 |
Principal Occupation(s) During Past Five Years: Chief Compliance Officer of The Royce Funds (since October 2004) and Compliance Officer of Royce (since June 2004). |
| 1 Interested Trustee. |
Trustees will hold office until their successors have been duly elected and qualified or until their earlier resignation or removal. The Statement of Additional Information, which contains additional information about the Trust’s trustees and officers, is available and can be obtained without charge at www.roycefunds.com or by calling (800) 221-4268. |
| 26 | Royce Capital Fund 2012 Semiannual Report to Shareholders |
| Notes to Performance and Other Important Information |
The thoughts expressed in this report concerning recent market movements and future prospects for small company stocks are solely the opinion of Royce at June 30, 2012, and, of course, historical market trends are not necessarily indicative of future market movements. Statements regarding the future prospects for particular securities held in the Funds’ portfolios and Royce’s investment intentions with respect to those securities reflect Royce’s opinions as of June 30, 2012 and are subject to change at any time without notice. There can be no assurance that securities mentioned in this report will be included in any Royce-managed portfolio in the future. Sector weightings are determined using the Global Industry Classification Standard (“GICS”). GICS was developed by, and is the exclusive property of, Standard & Poor’s Financial Services LLC (“S&P”) and MSCI Inc. (“MSCI”). GICS is the trademark of S&P and MSCI. “Global Industry Classification Standard (GICS)” and “GICS Direct” are service marks of S&P and MSCI. Standard deviation is a statistical measure within which a fund’s total returns have varied over time. The greater the standard deviation, the greater a fund’s volatility. All indexes referenced are unmanaged and capitalization weighted. Each indexes’s returns include net reinvested dividends and/or interest income. Russell Investment Group is the source and owner of the trademarks, service marks and copyrights related to the Russell Indexes. Russell® is a trademark of Russell Investment Group. The Russell 2000 is an index of domestic small-cap stocks. It measures the performance of the 2,000 smallest publicly traded U.S. companies in the Russell 3000 Index. The Russell Microcap Index includes 1,000 of the smallest securities in the small-cap Russell 2000 Index. The Russell Midcap Index measures the performance of the mid-cap segment of the U.S. equity universe. It includes approximately 800 of the smallest securities in the Russell 1000 Index. The Russell 1000 Index is an index of domestic large-cap stocks. It measures the performance of the 1,000 largest publicly traded U.S. companies in the Russell 3000 Index. The Russell Global ex-U.S. Small Cap Index is an index of global small-cap stocks, excluding the United States. The Russell Global ex-U.S. Large-Cap Index is an index of global large-cap stocks, excluding the United States. The S&P 500 is an index of U.S. large-cap stocks selected by Standard & Poor’s based on market size, liquidity and industry grouping, among other factors. The Nasdaq Composite is an index of the more than 3,000 common equities listed on the Nasdaq stock exchange. Returns for the market indexes used in this report were based on information supplied to Royce by Russell Investments. The CRSP (Center for Research in Security Pricing) equally divides the companies listed on the NYSE into 10 deciles based on market capitalization. Deciles 1-5 represent the largest domestic equity companies and Deciles 6-10 represent the smallest. CRSP then sorts all listed domestic equity companies based on these market cap ranges. By way of comparison, the CRSP 1-5 would have similar capitalization parameters to the S&P 500 Index and the CRSP 6-10 would have similar capitalization parameters to those of the Russell 2000 Index. Royce has not independently verified the above described information. The Royce Funds is a service mark of The Royce Funds. Distributor: Royce Fund Services, Inc. Royce Capital Fund–Micro-Cap Portfolio invests primarily in securities of micro-cap companies and Royce Capital Fund–Small-Cap Portfolio invests primarily in securities of small-cap companies that may involve considerably more risk than investments in securities of larger-cap companies. (Please see “Primary Risks for Fund Investors” in the prospectus.) Royce Capital Fund–Micro-Cap Portfolio (up to 35%) and Royce Capital Fund–Small-Cap Portfolio (up to 25%) may each invest its assets in foreign securities that may involve political, economic, currency and other risks not encountered in U.S. investments. (Please see “Investing in Foreign Securities” in the prospectus.) Please read the prospectus carefully before investing or sending money. |
| Forward-Looking Statements | |
This material contains forward-looking statements within the meaning of the Securities Exchange Act of 1934, as amended (the “Exchange Act”), that involve risks and uncertainties, including, among others, statements as to: | |
| • | the Funds’ future operating results, |
| • | the prospects of the Funds’ portfolio companies, |
| • | the impact of investments that the Funds have made or may make, |
| • | the dependence of the Funds’ future success on the general economy and its impact on the companies and industries in which the Funds invest, and |
| • | the ability of the Funds’ portfolio companies to achieve their objectives. |
This review and report use words such as “anticipates,” “believes,” “expects,” “future,” “intends,” and similar expressions to identify forward-looking statements. Actual results may differ materially from those projected in the forward-looking statements for any reason. | |
The Royce Funds have based the forward-looking statements included in this review and report on information available to us on the date of the report, and we assume no obligation to update any such forwardlooking statements. Although The Royce Funds undertake no obligation to revise or update any forward-looking statements, whether as a result of new information, future events or otherwise, you are advised to consult any additional disclosures that we may make through future shareholder communications or reports. | |
| Proxy Voting | ||
A copy of the policies and procedures that The Royce Funds use to determine how to vote proxies relating to portfolio securities and information regarding how each of The Royce Funds voted proxies relating to portfolio securities during the most recent 12-month period ended June 30 is available, without charge, on The Royce Funds’ website at www.roycefunds.com, by calling (800) 221-4268 (toll-free) and on the website of the Securities and Exchange Commission (“SEC”), at www.sec.gov. | ||
| Form N-Q Filing | ||
The Funds file their complete schedules of investments with the SEC for the first and third quarters of each fiscal year on Form N-Q. The Funds’ Forms N-Q are available on The Royce Funds’ website at www.roycefunds.com and on the SEC’s website at www.sec.gov. The Funds’ Forms N-Q may also be reviewed and copied at the SEC’s Public Reference Room in Washington, D.C. To find out more about this public service, call the SEC at (202) 942-8090. The Funds’ complete schedules of investments are updated quarterly, and are available at www.roycefunds.com. | ||
| Royce Capital Fund 2012 Semiannual Report to Shareholders | 27 |
| Board Approval of Investment Advisory Agreement |
At meetings held on June 6-7, 2012, Royce Capital Fund’s Board of Trustees, including all of the non-interested trustees, approved the continuance of the Investment Advisory Agreements between Royce & Associates, LLC (“R&A”) and Royce Capital Fund relating to each of Royce Micro-Cap Portfolio and Royce Small-Cap Portfolio (the “Funds”). In reaching these decisions, the Board reviewed the materials provided by R&A, which included, among other things, information prepared internally by R&A and independently by Morningstar Associates, LLC (“Morningstar”) containing detailed expense ratio and investment performance comparisons for each Fund with other mutual funds in their “peer group” and “category”, information regarding the past performance of Funds and other registered investment companies managed by R&A and a memorandum outlining the legal duties of the Board prepared by independent counsel to the non-interested trustees. R&A also provided the trustees with an analysis of its profitability with respect to providing investment advisory services to each of the Funds. In addition, the Board took into account information furnished throughout the year at regular Board meetings, including reports on investment performance, shareholder services, distribution fees and expenses, regulatory compliance, brokerage commissions and research, and brokerage and execution products and services provided to the Funds. The Board also considered other matters they deemed important to the approval process such as allocation of brokerage commissions, “soft dollar” research services R&A receives, payments made to R&A or its affiliates relating to distribution of Fund shares and other direct and indirect benefits to R&A and its affiliates, from their relationship with the Funds. The trustees also met throughout the year with investment advisory personnel from R&A. The Board, in its deliberations, recognized that, for many of the Funds’ shareholders, the decision to purchase Fund shares included a decision to select R&A as the investment adviser and that there was a strong association in the minds of Fund shareholders between R&A and each Fund. In considering factors relating to the approval of the continuance of the Investment Advisory Agreements, the non-interested trustees received with assistance and advice from, and met separately with, their independent legal counsel. While the Investment Advisory Agreements for the Funds were considered at the same meeting, the trustees dealt with each agreement separately. Among other factors, the trustees noted that they considered the following: |
| The nature, extent and quality of services provided by R&A: | |
The trustees considered the following factors to be of fundamental importance to their consideration of whether to approve the continuance of the Funds’ Investment Advisory Agreements: (i) R&A’s more than 35 years of value investing experience and track record; (ii) the history of long-tenured R&A portfolio managers managing The Royce Funds; (iii) R&A’s focus on mid-cap, small-cap and micro-cap value investing; (iv) the consistency of R&A’s approach to The Royce Funds over more than 35 years; (v) the integrity and high ethical standards adhered to at R&A; (vi) R&A’s specialized experience in the area of trading small- and micro-cap securities; (vii) R&A’s historical ability to attract and retain portfolio management talent and (viii) R&A’s focus on shareholder interests as exemplified by capping expenses on smaller funds and expansive shareholder reporting and communications. The trustees reviewed the services that R&A provides to the Funds, including, but not limited to, managing each Fund’s investments in accordance with the stated policies of each Fund. The Board considered the fact that R&A provided certain administrative services to the Funds at cost pursuant to the Administration Agreement between the Funds and R&A which went into effect on January 1, 2008. The trustees determined that the services to be provided to each Fund by R&A would be the same as those it previously provided to the Funds. They also took into consideration the histories, reputations and backgrounds of R&A’s portfolio managers for the Funds, finding that these would likely have an impact on the continued success of the Funds. Lastly, the trustees noted R&A’s ability to attract quality and experienced personnel. The trustees concluded that the investment advisory services provided by R&A to each Fund compared favorably to services provided by R&A to other R&A client accounts, including other funds, in both nature and quality, and that the scope of services provided by R&A would continue to be suitable for each Fund. | |
| Investment performance of the Funds and R&A: | |
In light of R&A’s risk-averse approach to investing, the trustees believe that risk-adjusted performance continues to be an appropriate measure of each Fund’s investment performance. One measure of risk-adjusted performance the trustees have historically used in their review of the Funds’ performance is the Sharpe Ratio. The Sharpe Ratio is a risk-adjusted measure of performance developed by Nobel Laureate William Sharpe. It is calculated by dividing a fund’s annualized excess returns by its annualized standard deviation to determine reward per unit of risk. The higher the Sharpe Ratio, the better a fund’s historical risk-adjusted performance. The Board attaches primary importance to risk-adjusted performance over relatively long periods of time, typically three to ten years. The trustees noted that Royce Micro-Cap Portfolio’s (“RCM”) and Royce Small-Cap Portfolio’s (“RCS”) Sharpe Ratio placed in the second quartile within Morningstar’s small-blend category for the three-, and five- periods ended December 31, 2011, and in the first quartile for the ten-year period ended December 31, 2011. The trustees noted that R&A manages a number of funds that invest in small-cap and micro-cap issuers, many of which were outperforming their indexes and their competitors. Although the trustees recognized that past performance is not necessarily an indicator of future results, they found that R&A had the necessary qualifications, experience and track record in managing small-cap and micro-cap securities to manage the Funds. The trustees determined that R&A continued to be an appropriate investment adviser for the Funds and concluded that each Fund’s performance supported the renewal of its Investment Advisory Agreement. | |
| Cost of the services provided and profits realized by R&A from its relationship with each Fund: | |
The trustees considered the cost of the services provided by R&A and profits realized by R&A from its relationship with each Fund. As part of the analysis, the Board discussed with R&A its methodology in allocating its costs to each Fund and concluded that its allocations were reasonable. The trustees concluded that R&A’s profits were reasonable in relation to the nature and quality of services provided. |
| 28 | Royce Capital Fund 2012 Semiannual Report to Shareholders |
| The extent to which economies of scale would be realized as the Funds grow and whether fee levels would reflect such economies of scale: | |
The trustees considered whether there have been economies of scale in respect of the management of the Funds, whether each of the Funds has appropriately benefited from any economies of scale and whether there is potential for realization of any further economies of scale. The trustees noted the time and effort involved in managing portfolios of small- and micro-cap stocks and that they did not involve the same efficiencies as do portfolios of large cap stocks. The trustees concluded that the current fee structure for each Fund was reasonable, and that no changes were currently necessary. | |
| Comparison of services to be rendered and fees to be paid to those under other investment advisory contracts, such as contracts of the same and other investment advisers or other clients: | |
The trustees reviewed the investment advisory fee paid by each Fund and compared both the services to be rendered and the fees to be paid under the Investment Advisory Agreements to other contracts of R&A and to contracts of other investment advisers to registered investment companies investing in small- and micro-cap stocks, as provided by Morningstar. The trustees noted the importance of the net expense ratio in measuring a fund’s efficiency, particularly in light of the variations in the mutual fund industry as to who is responsible for which expenses. It was noted that RCM’s expense ratio placed in the second quartile within its peer group. The trustees noted that RCS’s expense ratio placed in the fourth quartile, higher than its peer group and category medians due to its higher advisory fee compared to its peer group median. The trustees noted that R&A had, from time to time, waived advisory fees in order to maintain expense ratios at competitive levels. The trustees also considered fees charged by R&A to institutional and other clients and noted that, given the greater levels of service that R&A provides to registered investment companies such as the Fund as compared to other accounts, the Funds’ advisory fees compared favorably to these other accounts. It was noted that no single factor was cited as determinative to the decision of the Board. Rather, after weighing all of the considerations and conclusions discussed above, the entire Board, including all the non-interested trustees, determined to approve the renewal of the existing Investment Advisory Agreements, concluding that a contract renewal on the existing terms was in the best interest of the shareholders of each Fund and that each investment advisory fee rate was reasonable in relation to the services provided. |
| Royce Capital Fund 2012 Semiannual Report to Shareholders |
 | |||||||||||||||||||
 | |||||||||||||||||||
About The Royce Funds This review and report must be accompanied or preceded by a current prospectus for the Funds. Please read the prospectus carefully before investing or sending money. | |||||||||||||||||||
| Contact Us | |||||||||||||||||||
| General Information Additional Report Copies and Prospectus Inquiries (800) 221-4268 |  | ||||||||||||||||||
Item 2. Code(s) of Ethics. Not applicable to this semi-annual report.
Item 3. Audit Committee Financial Expert. Not applicable to this semi-annual report.
Item 4. Principal Accountant Fees and Services. Not applicable to this semi-annual report.
Item 5. Audit Committee of Listed Registrants. Not Applicable
Item 6. Investments.
(a) See Item 1.
(b) Not Applicable
Item 7. Disclosure of Proxy Voting Policies and Procedures for Closed-End Management Investment Companies. Not Applicable.
Item 8. Portfolio Managers of Closed-End Management Investment Companies. Not Applicable.
Item 9. Purchases of Equity Securities by Closed-End Management Investment Company and Affiliated Purchasers. Not Applicable
Item 10. Submission of Matters to a Vote of Security Holders. Not Applicable.
Item 11. Controls and Procedures.
(a) Disclosure Controls and Procedures. The Principal Executive and Financial Officers concluded that the Registrant’s Disclosure Controls and Procedures are effective based on their evaluation of the Disclosure Controls and Procedures as of a date within 90 days of the filing date of this report.
(b) Internal Control over Financial Reporting. There were no significant changes in Registrant’s internal control over financial reporting or in other factors that could significantly affect this control subsequent to the date of the evaluation, including any corrective actions with regard to significant deficiencies and material weaknesses during the second fiscal quarter of the period covered by this report.
Item 12. Exhibits. Attached hereto.
(a)(1) Not applicable to this semi-annual report.
(a)(2) Separate certifications by the Registrant’s Principal Executive Officer and Principal Financial Officer as required by Rule 30a-2(a) under the Investment Company Act of 1940.
(a)(3) Not Applicable
(b) Separate certifications by the Registrant’s Principal Executive Officer and Principal Financial Officer, pursuant to Section 906 of the Sarbanes-Oxley Act of 2002 and required by Rule 30a-2(b) under the Investment Company Act of 1940.
Pursuant to the requirements of the Securities Exchange Act of 1934 and the Investment Company Act of 1940, the registrant has duly caused this report to be signed on its behalf by the undersigned, thereunto duly authorized.
| ROYCE CAPITAL FUND |
| BY: /s/ Charles M. Royce |
Charles M. Royce |
President |
| Date: August 15, 2012 |
Pursuant to the requirements of the Securities Exchange Act of 1934 and the Investment Company Act of 1940, this report has been signed below by the following persons on behalf of the registrant and in the capacities and on the dates indicated.
| ROYCE CAPITAL FUND | ROYCE CAPITAL FUND | |
| BY: /s/ Charles M. Royce | BY: /s/ John D. Diederich | |
Charles M. Royce | John D. Diederich | |
President | Chief Financial Officer | |
| Date: August 15, 2012 | Date: August 15, 2012 | |