| UNITED STATES |
| SECURITIES AND EXCHANGE COMMISSION |
| Washington, D.C. 20549 |
| | | | |
| FORM N-CSR |
| | | | |
| CERTIFIED SHAREHOLDER REPORT |
| OF |
| REGISTERED MANAGEMENT INVESTMENT COMPANIES |
| | | | |
| Investment Company Act file number: 811-07537 |
| | | | |
| Name of Registrant: Royce Capital Fund |
| | | | |
| Address of Registrant: 745 Fifth Avenue |
| New York, NY 10151 |
| | | | |
| Name and address of agent for service: | | John E. Denneen, Esq. | |
| | | 745 Fifth Avenue | |
| | | New York, NY 10151 | |
| | | | |
| Registrant’s telephone number, including area code: (212) 508-4500 |
| Date of fiscal year end: December 31, 2015 |
| Date of reporting period: January 1, 2015 – June 30, 2015 |
Item 1. Reports to Shareholders.
| | | JUNE 30, 2015 |
| | | |
| | | |
| | | |
| | | 2015 Semiannual |
| | | Review and Report to Shareholders |
| | | |
| | | |
| | | |
| | | |
| | | |
| | | |
| | | |
| | | Royce Capital Fund– |
| | | Micro-Cap Portfolio |
| | | | |
| | | Royce Capital Fund– |
| | | Small-Cap Portfolio |
| | | | |
| | | | |
| | | | |
| | | | |
| | | | |
| | | | |
| | | | |
| | | | |
| | | | |
| | | | |
| | | | |
| | | | |
| | | | |
| | | | |
| | | | |
| | | roycefunds.com |  |
| | | | |
| | | | |
| | | | |
| Table of Contents | | | |
| | | | |
| | | | |
| Semiannual Review | | | |
| | | | |
| Letter to Our Shareholders | | 1 | |
| | | | |
| Performance and Expenses | | 5 | |
| | | | |
| | | | |
| Semiannual Report to Shareholders | | | |
| | | | |
| Managers’ Discussions of Fund Performance | | | |
| | | | |
Royce Capital Fund–Micro-Cap Portfolio | | 6 | |
| | | | |
Royce Capital Fund–Small-Cap Portfolio | | 8 | |
| | | | |
| Schedules of Investments and Financial Statements | | 10 | |
| | | | |
| Notes to Financial Statements | | 19 | |
| | | | |
| Understanding Your Fund’s Expenses | | 23 | |
| | | | |
| Trustees and Officers | | 24 | |
| | | | |
| Board Approval of Investment Advisory Agreements | | 25 | |
| | | | |
| Notes to Performance and Other Important Information | | 27 | |

| This page is not part of the Royce Capital Fund 2015 Semiannual Report to Shareholders |
Letter to Our Shareholders

“THE TIME IS OUT OF JOINT”
Anyone reestablishing contact with the wider world at the end of June would no doubt be pleased by the numbers that guide the financial and economic parts of our lives. The economy, following a first-quarter stumble in which GDP is estimated to have grown by 0.6%, appears once again to be growing at a faster clip. One could argue that its pace could be livelier, but healthy employment numbers, improving wages, and robust housing and auto markets would seem to promise a quickening in the coming months. Inflation is, for now, not a matter of great concern. Interest rates remain low—and will remain that way on an absolute basis, even with an increase (or two) in short-term rates likely before the end of 2015. And a Fed-led increase in short rates may cause long-term rates to back up as well, which would be bad news for the bond markets, though perhaps not for stocks.
One could find positive developments in the equity markets through the first half of the year—or so it would seem. Returns for each of the major domestic indexes were in the black through the end of June, while a welcome recovery finally arrived for many non-U.S. stocks in the year’s first six months. Three- and five-year average annualized returns for the small-cap Russell 2000 |
Index, the Nasdaq Composite, and the large-cap Russell 1000 and S&P 500 Indexes all topped 17%, well above the rolling three- and five-year historical averages for each index. It would appear that we are living through good times for the economy and possibly great ones for equities.
Why, then, have we purloined a line from Hamlet to introduce our own take on stocks in the first half, one in which the titular protagonist warns of a troubling dislocation in the world around him? Some of the reasons are clear enough: Positive results for the first half notwithstanding, global equities were rocked by the highly publicized Greek default late in June. On the second-to-last trading day of the first half, many stocks gave away most, if not all, of their second-quarter gains. Markets in China faced arguably even more significant problems, considering how much larger and more important that nation’s economy is to the world compared to that of Greece. Chinese stocks plummeted 30% in the three weeks leading up to our Independence Day, making what seemed like a typical correction in June far more worrisome. A cut in interest rates and more relaxed rules for margin trading—both hastily put in place late in June—did little to stem the tide of selling. |
| This page is not part of the Royce Capital Fund 2015 Semiannual Report to Shareholders | 1 |
LETTER TO OUR SHAREHOLDERS
The small-cap market has thus moved from the tightly correlated markets of 2011-2013 into a new phase of wide divergence and constricted leadership. From our perspective, then, the market is indeed out of joint.
Closer to home, there is the matter of how thoroughly disjointed results were for domestic equities. Large-cap returns, for example, were paltry—as can be seen from the table below—brought even lower by the Greek drama that ushered out the month of June. Performance for small-caps and the Nasdaq looked appreciably better, but in each case looks are almost assuredly deceiving. Health Care was by far the dominant sector in every market cap range, from micro to large, that Russell Investments tracks. Yet the rule in the first half seemed to be the smaller—and more growth-driven—the company, the loftier the results, especially if it was involved in biotech, the industry that has reigned supreme within the Russell 2000 over much of the last two years. This has had the effect of creating decidedly narrow market leadership within the small-cap space. Outside of biotech, strong first-half performances were mostly limited to a handful of other Health Care industries, software companies, and a few outliers such as construction materials and tobacco. The small-cap market has thus moved from the tightly correlated markets of 2011-2013 into a new phase of wide divergence and constricted leadership. From our perspective, then, the market is indeed out of joint. |
“MORE THINGS IN HEAVEN AND EARTH...”
We have actually been arguing that the market has been disjointed for some time now. Fed policies designed to keep the economy and capital markets above water, which included multiple rounds of QE and keeping interest rates at or near zero, had other, unintended consequences that had an outsized effect on the small-cap market. For example, it became both easy and affordable for businesses to add debt, essentially eroding the risk differential between lower- and higher-quality businesses. Lower-quality and more highly levered companies then began a historically atypical period of outperformance in which our funds mostly did not participate. The Fed’s zero-interest-rate policy (“ZIRP”) also stoked an intense hunger for yield, which drove up values for bond-proxy equities such as REITs and Utilities, regardless of their underlying quality or profitability, that have only recently begun to correct. These actions also boosted stock correlations and reduced volatility, making it harder to find the kind of mispriced opportunities that have always been our stock in trade.
Finally, there were significant runs for high-growth, non-earning, and more speculative businesses, many with negative EBIT. This continues into the present day with the recent contraction of small-cap leadership, which represents more of a bet on long-duration assets than current profitability. In each of these cases, our more qualitative, risk-conscious approaches have in general kept us away from these areas. While we are confident |
|
| Equity Indexes |
| As of June 30, 2015 (%) |
| | | |
| • | | Greek Drama Creates Underwhelming Results—The Greek default late in June eroded gains—giving equities second-quarter results that more closely hugged the flat line. The tech-oriented Nasdaq Composite was the leader, up 1.8%, followed by the small-cap Russell 2000 Index, which finished the quarter with a gain of 0.4%. The large-cap S&P 500 and Russell 1000 Indexes rose 0.3% and 0.1%, respectively. |
| | | |
| • | | Long-Term Returns in Excess—Both large-cap and small-cap indexes’ three- and five-year average annual total returns for the periods ended 6/30/15 were above 17%, well in excess of each index’s historical average. |
| | | |
| • | | Healthy and Informed—Health Care and Information Technology were the best performing sectors in the Russell 2000 year-to-date through 6/30/15—the former led by a wide margin—while Utilities and Materials were the worst performers in the year’s first half. |
| | | |
| |
| | | YTD1 | | 1-YR | | 3-YR | | 5-YR | | 10-YR | |
| |
| Russell 2000 | | 4.75 | | 6.49 | | 17.81 | | 17.08 | | 8.40 | |
| |
| S&P 500 | | 1.23 | | 7.42 | | 17.31 | | 17.34 | | 7.89 | |
| |
| Russell 1000 | | 1.71 | | 7.37 | | 17.73 | | 17.58 | | 8.13 | |
| |
| Nasdaq Composite | | 5.30 | | 13.13 | | 19.33 | | 18.78 | | 9.26 | |
| |
| Russell Midcap | | 2.35 | | 6.63 | | 19.26 | | 18.23 | | 9.40 | |
| |
| Russell Microcap | | 6.03 | | 8.21 | | 19.25 | | 17.48 | | 7.07 | |
| |
| Russell Global ex-U.S. Small Cap | | 7.74 | | -3.46 | | 11.35 | | 8.99 | | 7.07 | |
| |
| Russell Global ex-U.S. Large Cap | | 4.23 | | -5.02 | | 9.96 | | 8.13 | | 5.80 | |
| |
| |
| 1Not annualized |
| For details on The Royce Funds’ performance in the period, please turn to the Managers’ Discussions that begin on page 6. |
| 2 | This page is not part of the Royce Capital Fund 2015 Semiannual Report to Shareholders |
LETTER TO OUR SHAREHOLDERS
that this trend will fade and that speculative bubbles will burst, we also understand the frustrations that have built over the last few years as active managers such as ourselves have continued to lag our respective benchmarks.
We have seen enough signs, both economically and in the market, which suggest that stocks are slowly moving back to what we would call their historical norm—lower overall returns, higher volatility, and long-term advantages for companies with consistent profits and high returns on invested capital.
So do these challenges mean that something is rotten in the state of small-cap, if only in some of its actively managed precincts? That is the question, more or less, that we have been wrestling with of late. To be sure, we ran the gamut in the first half from disappointment to optimism to frustration as investor preferences moved around. They first showed favor to long-duration assets, then looked, if only briefly, toward consistently profitable and/or conservatively capitalized companies before shifting back again. However, we have seen enough signs, both economically and in the market, which suggest that stocks are slowly moving back to what we would call their historical norm—lower overall returns, higher volatility, and long-term advantages for companies with consistent profits and high returns on invested capital.
Most notably, there was a positive directional trend dating from the first-half low for the 10-year Treasury on January 30 through the end of the first half. During this period, which included the bearish month of April, we were pleased with the way many of our portfolios either outperformed their benchmarks or began to narrow the gap. This was very clear during the growth scare engendered by (at the time) negative first-quarter GDP numbers, which led many companies to begin revising their earnings expectations downward. Of course, when it became clear that much of what put a drag on first-quarter numbers was temporary, including such factors as the awful winter weather, the West Coast port strike, and the plunge in oil prices, things began to pick up again fairly quickly, at least for the more speculative areas within Health Care and a few other narrow equity locales. |
“THE READINESS IS ALL”
Yet this period also offered a potential preview of how the landscape for stocks will look when short-term interest rates begin to rise—which is likely to be later this year. We see higher rates breeding more uncertainty, be it about inflation, the cost of capital, or a number of other issues. This in turn typically leads to more mispricing in the short run, which creates precisely the opportunities that we crave as risk-conscious bargain hunters. To us, high rates are synonymous with higher risk. A higher-risk environment also tends to benefit quality companies (by which we mean conservatively capitalized, profitable businesses with high returns on invested capital and effective, shareholder-friendly management). So we have no worries about rising rates or greater volatility in the markets. In fact, we welcome both.
High rates are synonymous with higher risk. A higher-risk environment also tends to benefit quality companies (by which we mean conservatively capitalized, profitable businesses with high returns on invested capital and effective, shareholder-friendly management). So we have no worries about rising rates or greater volatility in the markets. In fact, we welcome both.
We see quality differentiating itself when risk premiums rise because quality businesses are better businesses—as profitable, financially sound enterprises, they are purpose-built and run to survive periods of higher risk and/or greater uncertainty, which helps to explain why the market of the last several years has seen many of these companies disadvantaged in the easy-money, ZIRP environment. In a phase in which few if any of the traditional penalties were paid for larding leverage onto corporate balance sheets, there were also scant advantages that have historically accrued to higher-quality, more conservatively capitalized companies.
We feel confident that this era is over. Our expectation is for lower returns for stocks as a whole, but relatively better returns for both high-quality companies and more cyclical, less defensive sectors. We suspect that in a few years market observers will look back at 2015—and perhaps the longer |
| This page is not part of the Royce Capital Fund 2015 Semiannual Report to Shareholders | 3 |
LETTER TO OUR SHAREHOLDERS
| span covering 2013-2015—as a hinge period in which the gradual sun-setting of interventionist Fed policies, coupled with the steady growth of the economy, restored the capital markets to something closer to more familiar historical patterns of performance and volatility. This is why we have been patiently holding so many companies in cyclical sectors, such as Industrials, Materials, and, more recently, Energy—they boast many attractive characteristics that the market has not yet fully recognized, a phenomenon we expect will change as the economy heats up. In our estimation their profitability, growth prospects, and reasonable to attractive valuations make them coiled springs. Until then, we wait. |
| To be sure, it has been a cycle of, at times, seemingly endless challenges for our active and risk-conscious approaches. Our collective patience has been sorely tested as we have waited (and waited) for many of our highest-confidence holdings to turn around. Of course, transitions are never easy, and the turn we have been anticipating has taken longer, after a few false starts, than any of us initially anticipated. Change, however, can take time—and we are often aware that a dramatic turn has occurred only in retrospect. We are content, then, to continue investing in the same way that we have for more than four decades—with a close eye on risk as we look for the intersection of attractive valuation and organic growth potential. |
 | |  | |  |
| Charles M. Royce | | Christopher D. Clark | | Francis D. Gannon |
| Chief Executive Officer, | | President and Co-Chief Investment Officer, | | Co-Chief Investment Officer, |
| Royce & Associates, LLC | | Royce & Associates, LLC | | Royce & Associates, LLC |
| | | | | |
| July 31, 2015 | | | | |
| 4 | This page is not part of the Royce Capital Fund 2015 Semiannual Report to Shareholders |
Performance and Expenses
| |
| |
| Performance and Expenses |
| As of June 30, 2015 |
| | | | AVERAGE ANNUAL TOTAL RETURNS (%) | | |
| | | | | | | | | | | | | | | | SINCE INCEPTION | | ANNUAL OPERATING |
| | | | YTD1 | | 1-YR | | 3-YR | | 5-YR | | 10-YR | | 15-YR | | (12/27/96) | | EXPENSES (%) |
| |
| Royce Capital Fund–Micro-Cap Portfolio | | -1.06 | | -5.55 | | 6.65 | | 7.61 | | 6.30 | | 9.35 | | 10.72 | | 1.31 |
| |
| Royce Capital Fund–Small-Cap Portfolio | | -0.32 | | 0.95 | | 14.05 | | 12.73 | | 7.75 | | 10.89 | | 11.51 | | 1.05 |
| |
INDEX | | | | | | | | | | | | | | | | |
| |
| Russell Microcap Index2 | | 6.03 | | 8.21 | | 19.25 | | 17.48 | | 7.07 | | 7.79 | | n.a. | | n.a. |
| |
| Russell 2000 Index | | 4.75 | | 6.49 | | 17.81 | | 17.08 | | 8.40 | | 7.50 | | 8.40 | | n.a. |
| |
1 Not annualized
2 Data for the Russell Microcap Index goes back only to 6/30/00.
Important Performance, Expense, and Risk Information
All performance information in this Review and Report reflects past performance, is presented on a total return basis, reflects the reinvestment of distributions, and does not reflect the deduction of taxes that a shareholder would pay on fund distributions or the redemption of fund shares. Past performance is no guarantee of future results. Investment return and principal value of an investment will fluctuate, so that shares may be worth more or less than their original cost when redeemed. Current performance may be higher or lower than performance quoted and may be obtained at www.roycefunds.com. The Funds’ total returns do not reflect any deduction for charges or expenses of the variable contracts investing in the Funds. All performance and expense information reflects the result for each Fund’s Investment Class Shares. Service Class Shares bear an annual distribution expense that is not borne by the Investment Class; if the expenses were reflected, total returns would have been lower. Operating expenses reflect the Funds’ total annual operating expenses for the Investment Class as of the Funds’ most current prospectus and include management fees, other expenses, and, in the case of Royce Capital Fund–Micro-Cap Portfolio, acquired fund fees and expenses. Acquired fund fees and expenses reflect the estimated amount of the fees and expenses incurred indirectly by the Fund through its investments in mutual funds, hedge funds, private equity funds, and other investment companies.
Royce Micro-Cap Portfolio invests primarily in micro-cap companies while Royce Small-Cap Portfolio invests primarily in small-cap companies. Investments in micro-cap and small-cap companies may involve considerably more risk than investments in securities of larger-cap companies. (Please see “Primary Risks for Fund Investors” in the prospectus.) Each series of Royce Capital Fund may invest up to 25% of its respective net assets in foreign securities. Investments in foreign securities may involve political, economic, currency, and other risks not encountered in U.S. investments. (Please see “Investing in Foreign Securities” in the prospectus.) As of 6/30/15, Royce Small-Cap Portfolio invested a significant portion of its assets in a limited number of stocks, which may involve considerably more risk than more broadly diversified portfolio because a decline in the value of any one of these stocks would cause the Portfolio’s overall value to decline to a greater degree. (Please see “Primary Risks for Fund Investors” in the prospectus.) Please read the prospectus carefully before investing or sending money. Russell Investment Group is the source and owner of the trademarks, service marks, and copyrights related to the Russell Indexes. Russell® is a trademark of Russell Investment Group. The Russell Microcap Index includes 1,000 of the smallest securities in the small-cap Russell 2000 Index along with the next smallest eligible securities as determined by Russell. The Russell 2000 Index is an unmanaged, capitalization-weighted index of domestic small-cap stocks. It measures the performance of the 2,000 smallest publicly traded U.S. companies in the Russell 3000 Index. The performance of an index does not represent exactly any particular investment, as you cannot invest directly in an index. Distributor: Royce Fund Services, Inc.
This page is not part of the Royce Capital Fund 2015 Semiannual Report to Shareholders | 5
| MANAGERS’ DISCUSSION |
| Royce Capital Fund–Micro-Cap Portfolio (RCM) |
 |
| Jenifer Taylor and Jim Stoeffel |
| |
FUND PERFORMANCE
Royce Capital Fund–Micro-Cap Portfolio fell 1.1% for the year-to-date period ended June 30, 2015, lagging both its benchmark, the Russell Microcap Index, and the small-cap Russell 2000 Index, which advanced 6.0% and 4.8%, respectively, for the same period. The Fund was again challenged by its lack of participation in a bullish period for both micro-cap and small-cap stocks. However, it should be noted that returns within each asset class were narrower than the pleasing year-to-date results for the respective indexes might suggest, with biotech remaining a primary driver of returns during the first half of 2015.
In the first quarter, Royce Micro-Cap Portfolio fell 0.2%, a disappointing result that was mostly due to a dismal and bearish January. Positive returns for the Fund in both February and March could not push the portfolio into the black for the quarter. By contrast, the Russell Microcap gained 3.1% for the first quarter while the Russell 2000 rose 4.3% for that same period. The Fund’s performance worsened in the second quarter, especially hurt by the wave of volatility that the Greek default sent through the markets at the end of June. The Fund lost 0.9% for the second quarter while the micro-cap index and small-cap index increased 2.8% and 0.4%, respectively. Longer-term relative results were better. Royce Micro-Cap Portfolio outperformed the Russell Microcap for the 15-year period ended June 30, 2015 and beat the Russell 2000 for the 15-year and since inception (12/27/96) periods ended June 30, 2015. (Data for the Russell Microcap only goes back to June 30, 2000.) The Fund’s average annual total return since inception was 10.7%. We are very proud of the Fund’s long-term performance history. |
| WHAT WORKED... AND WHAT DIDN’T |
Health Care was something of a double-edged sword for the portfolio. The sector comfortably led both the Fund and the Russell Microcap in the first half. Returns for the index, however, were dominated by stratospheric results for biotech stocks as well as hearty returns for pharmaceuticals companies. Most of these businesses lack either the conservative capitalization or earnings profile that we look for when building our portfolio. The Fund was therefore significantly underweight in Health Care during the first half and had little exposure to biotech and pharmaceuticals. Net gains came primarily from companies in the health care equipment & supplies and the health care providers & services industries. So while the sector was by far the portfolio’s top contributor in the first half, its net gains were not as vigorous as were those for the sector within the Russell Microcap.
Firearms maker Smith & Wesson Holding Corporation was the Fund’s best-performing position in the first half. The company continued to gain market share while recent sizable investments in R&D have been driving significant product innovation. Its shares also benefited from effective cash flow allocation into strategic acquisitions that are providing vertical manufacturing integration as well as adjacent product offerings. The stock of financial services business INTL FCStone began to climb in February. It has a growing niche in automated international currency settlements and was thus rewarded in an increasingly volatile global currency market. |
| |
| Of the Fund’s five sectors that finished the semiannual period in the red, only Energy and Materials posted sizable net losses. Gulf Island Fabrication fabricates offshore drilling and production platforms, as well as other steel structures for the oil and gas and marine industries. Recent results have been hurt by the decline in commodity prices, which has led to a slowdown in its business. Still, we like how this low-debt, asset-strong firm has been executing through a highly challenging phase for its industry. We held a good-sized position at the end of June. Exposure to the energy industry also played a role in poor results for Global Power Equipment Group, which makes gas turbine generation equipment. Other factors contributing to the decline in its stock price were the resignation of its CEO in March and the announcement in May that it would need to restate financial statements. While this was a clearly disappointing turn of events, we chose to hold our position, at least for the short term. The company’s highly attractive valuation and strong balance sheet offered enough interest for us to allow the dust to settle around a business that we like for the long-term. Two for-profit education businesses were also among the portfolio’s top detractors in the first half—American Public Education and Capella Education. The industry has been under fire of late and is enduring a round of new, more stringent federal regulations. We think each of these companies has the management talent and fundamental strength to survive these challenges. |
| | | | | |
| | Top Contributors to Performance
Year-to-Date Through 6/30/15 (%)1 | | | |
| | | | | |
| | Smith & Wesson Holding | | | |
| | Corporation | | 0.54 | |
| | | |
| | INTL FCStone | | 0.45 | |
| | | |
| | LSI Industries | | 0.38 | |
| | | |
| | Culp | | 0.32 | |
| | | |
| | Ennis | | 0.29 | |
| | | |
| | 1 Includes dividends | | | |
| | | | | |
| | | | | |
| | Top Detractors from Performance
Year-to-Date Through 6/30/15 (%)2 | | | |
| | | | | |
| | Gulf Island Fabrication | | -0.54 | |
| | | |
| | American Public Education | | -0.34 | |
| | | |
| | Capella Education | | -0.33 | |
| | | |
| | Global Power Equipment Group | | -0.33 | |
| | | |
| | Graham Corporation | | -0.29 | |
| | | |
| | 2 Net of dividends | | | |
| | | | | |
| CURRENT POSITIONING AND OUTLOOK |
| Sector weightings at the end of June were relatively unchanged from where they have stood over the last 18-24 months. This is due to our ongoing preference for more economically sensitive sectors, such as the Fund’s three largest at the end of the period—Industrials, Information Technology, and Consumer Discretionary. We maintain the belief that many portfolio holdings in these (and other) sectors should benefit from a faster-growing economy that also could reward disciplined approaches that focus on fundamentals. So while the Fund’s recent performances have fallen below our expectations, we remain confident about its prospects going forward. We are also pleased to announce that on May 1, 2015, Royce veteran Jim Stoeffel joined Jenifer Taylor as the Fund’s co-portfolio manager. Jen has been involved in the Fund’s management for more than 12 years while Jim joined Royce in 2007 as a portfolio manager. |
| 6 | Royce Capital Fund 2015 Semiannual Report to Shareholders |
| PERFORMANCE AND PORTFOLIO REVIEW | | TICKER SYMBOLS RCMCX RCMSX |
| Performance and Expenses |
| Average Annual Total Return (%) Through 6/30/15 |
| | | JAN-JUN 2015* | | 1-YR | | 3-YR | | 5-YR | | 10-YR | | 15-YR | | SINCE INCEPTION (12/27/96) |
| |
| RCM | | -1.06 | | -5.55 | | 6.65 | | 7.61 | | 6.30 | | 9.35 | | 10.72 |
| |
| Annual Operating Expenses: 1.31% | | | | | | | | | |
| |
| * Not Annualized | | | | | | | | | | | | | | |
Relative Returns: Monthly Rolling Average Annual Return PeriodsSince Russell Microcap’s Inception (6/30/00) Through 6/30/15
| On a monthly rolling basis, the Fund outperformed the Russell Microcap in 90% of all 10-year periods; 75% of all 5-year periods; and 55% of all 1-year periods. |
| |
| | | PERIODS BEATING THE INDEX | | | | FUND AVG (%)* | | INDEX AVG (%)* |
| |
| 10-year | | 55/61 | | | | | 90% | | 8.8 | | 6.7 |
| |
| 5-year | | 91/121 | | | | | 75% | | 9.0 | | 7.1 |
| |
| 1-year | | 93/169 | | | | | 55% | | 11.6 | | 10.9 |
| |
*Average of monthly rolling average annual total returns over the specified periods.

The Morningstar Style Map is the Morningstar Style BoxTM with the center 75% of fund holdings plotted as the Morningstar Ownership ZoneTM. The Morningstar Style Box is designed to reveal a fund’s investment strategy. The Morningstar Ownership Zone provides detail about a portfolio’s investment style by showing the range of stock sizes and styles. The Ownership Zone is derived by plotting each stock in the portfolio within the proprietary Morningstar Style Box. Over time, the shape and location of a fund’s ownership zone may vary. See page 27 for additional information. |
Value of $10,000Invested on 6/30/00 (Russell Microcap Inception) as of 6/30/15 ($)
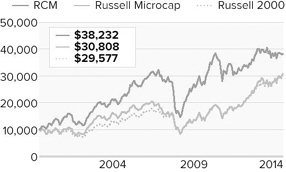
Includes reinvestment of distributions.
|
| Top 10 Positions | | |
| % of Net Assets | | |
| | | |
| Total Energy Services | | 1.0 |
| |
| Resources Connection | | 1.0 |
| |
| Shoe Carnival | | 1.0 |
| |
| Haynes International | | 0.9 |
| |
| Kirkland’s | | 0.9 |
| |
| ORBCOMM | | 0.9 |
| |
| Key Technology | | 0.9 |
| |
| Culp | | 0.9 |
| |
| Photronics | | 0.9 |
| |
| Smith & Wesson Holding Corporation | | 0.9 |
| |
|
| Portfolio Sector Breakdown | | |
| % of Net Assets | | |
| | | |
| Industrials | | 21.6 |
| |
| Information Technology | | 18.2 |
| |
| Consumer Discretionary | | 13.2 |
| |
| Health Care | | 10.8 |
| |
| Financials | | 9.1 |
| |
| Materials | | 6.2 |
| |
| Energy | | 5.5 |
| |
| Consumer Staples | | 1.4 |
| |
| Telecommunication Services | | 1.2 |
| |
| Miscellaneous | | 5.0 |
| |
| Cash and Cash Equivalents | | 7.8 |
| |
|
| Calendar Year Total Returns (%) | | |
| | | |
| YEAR | | RCM |
| |
| 2014 | | -3.6 |
| |
| 2013 | | 21.0 |
| |
| 2012 | | 7.6 |
| |
| 2011 | | -12.1 |
| |
| 2010 | | 30.1 |
| |
| 2009 | | 57.9 |
| |
| 2008 | | -43.3 |
| |
| 2007 | | 4.0 |
| |
| 2006 | | 21.1 |
| |
| 2005 | | 11.6 |
| |
| 2004 | | 13.8 |
| |
| 2003 | | 49.2 |
| |
| 2002 | | -12.9 |
| |
| 2001 | | 29.7 |
| |
| 2000 | | 18.5 |
| |
|
| Upside/Downside Capture Ratios | | | | |
| Periods Ended 6/30/15 (%) | | | | |
| | | UPSIDE | | DOWNSIDE |
| |
| 10-Year | | 88 | | 88 |
| |
From 6/30/00 (Russell
Microcap Inception) | | 90 | | 77 |
| |
|
| Portfolio Diagnostics | | |
| | | |
| Fund Net Assets | | $476 million |
| |
| Number of Holdings | | 218 |
| |
| Turnover Rate | | 26% |
| |
| Average Market Capitalization1 | | $412 million |
| |
| Weighted Average P/E Ratio2,3 | | 22.7x |
| |
| Weighted Average P/B Ratio2 | | 2.1x |
| |
| Holdings ≥ 75% of Total Investments | | 115 |
| |
| Active Share4 | | 89% |
| |
| U.S. Investments (% of Net Assets) | | 79.1% |
| |
| Non-U.S. Investments (% of Net Assets) | | 13.1% |
| |
| 1 | Geometric Average. This weighted calculation uses each portfolio holding’s market cap in a way designed to not skew the effect of very large or small holdings; instead, it aims to better identify the portfolio’s center, which Royce believes offers a more accurate measure of average market cap than a simple mean or median. |
| 2 | Harmonic Average. This weighted calculation evaluates a portfolio as if it were a single stock and measures it overall. It compares the total market value of the portfolio to the portfolio’s share in the earnings or book value, as the case may be, of its underlying stocks. |
| 3 | The Fund’s P/E ratio calculation excludes companies with zero or negative earnings (24% of portfolio holdings as of 6/30/15). |
| 4 | Active Share is the sum of the absolute values of the different weightings of each holding in the Fund versus each holding in the benchmark, divided by two. |
| Important Performance and Expense Information All performance information in this Report reflects past performance, is presented on a total return basis, reflects the reinvestment of distributions, and does not reflect the deduction of taxes that a shareholder would pay on fund distributions or the redemption of fund shares. Past performance is no guarantee of future results. Investment return and principal value of an investment will fluctuate, so that shares may be worth more or less than their original cost when redeemed. Current performance may be higher or lower than performance quoted. The Fund’s total returns do not reflect any deduction for charges or expenses of the variable contracts investing in the Fund. Returns as of the most recent month-end may be obtained at www.roycefunds.com. All performance and risk information reflects the result of the Investment Class (its oldest class). Shares of RCM’s Service Class bear an annual distribution expense that is not borne by the Investment Class. Operating expenses reflect the Fund’s total annual operating expenses for the Investment Class as of the Fund’s most current prospectus and include management fees, other expenses, and acquired fund fees and expenses. Acquired fund fees and expenses reflect the estimated amount of the fees and expenses incurred indirectly by the Fund through its investments in mutual funds, hedge funds, private equity funds, and other investment companies. Regarding the “Top Contributors” and “Top Detractors” tables shown above, the sum of all contributors to, and all detractors from, performance for all securities in the portfolio would approximate the Fund’s year-to-date performance for 2015. Upside Capture Ratio measures a manager’s performance in up markets relative to the Fund’s benchmark. It is calculated by measuring the Fund’s performance in quarters when the benchmark went up and dividing it by the benchmark’s return in those quarters. Downside Capture Ratio measures a Manager’s performance in down markets relative to the Fund’s benchmark (Russell Microcap). It is calculated by measuring the Fund’s performance in quarters when the benchmark goes down and dividing it by the benchmark’s return in those quarters. |
| Royce Capital Fund 2015 Semiannual Report to Shareholders | 7 |
| | | MANAGER’S DISCUSSION |
| Royce Capital Fund–Small-Cap Portfolio (RCS) | | |
 |
| Jay Kaplan, CFA |
FUND PERFORMANCE
It was a difficult first half for Royce Capital Fund–Small-Cap Portfolio. The Fund was down 0.3% for the year-to-date period ended June 30, 2015, well behind its small-cap benchmark, the Russell 2000 Index, which advanced 4.8% for the same period. This was particularly frustrating in light of the fact that the Fund, while behind, had been much closer to the small-cap index in four of the last five calendar years while also posting strong absolute returns during a market cycle that has been largely inhospitable to our valuation-focused, quality-centric, and highly disciplined approach. |
| |
| As was the case in 2014, the first half of the year looked quietly bullish. The key differences were both more volatility and narrower market leadership through the first six months of 2015. The second of these developments played a large role in the Fund’s first-half underperformance. The year began with most stocks trending down, though small-cap growth stocks generally—and uncharacteristically—fared better than their value counterparts. This short-term anomaly can be added to a growing list of the historical deviations that have marked the current small-cap cycle. |
| |
For the first quarter Royce Small-Cap Portfolio rose 3.0% versus a 4.3% gain for its benchmark. The second quarter was less bullish and, at least through the fourth week of June, somewhat less volatile. Small-cap shares stumbled in April. They were recovering nicely through May and into the last days of June before the second-to-last trading day of the quarter brought a wave of volatility from the Greek default that washed over the market and plunged many stock prices into the red for the quarter. The Fund fell 3.2% for the second quarter versus a gain of 0.4% for the Russell 2000. Longer time spans saw better relative results for the Fund. Royce Small-Cap Portfolio outpaced the Russell 2000 for the 15-year and since inception (12/27/96) periods ended June 30, 2015. The Fund’s average annual total return since inception was 11.5%, a long-term record that gives us great pride. |
| |
| WHAT WORKED... AND WHAT DIDN’T |
| The Fund’s worst-performing sector in the first half was Energy, just as it was in 2014 when the price of oil collapsed. The lion’s share of the sector’s net losses in the first half of this year occurred in the first quarter as the arrival of spring saw some recovery in commodity prices. Our own long-term outlook for the sector remains positive. One of the portfolio’s larger detractors was long-time holding Unit Corporation, which operates several energy businesses. Primarily a contract driller, Unit also explores for and produces oil and natural gas while engaging in midstream activities. The decline in energy prices badly hurt its stock, which was beginning to show signs of life early in 2015’s second quarter until May, when the company announced a first-quarter loss that depressed its shares. We were more focused on its record oil production, improved dayrates, and other positive developments. |
| |
| Two technology companies were the Fund’s two largest detractors in the first half. Top-five position Vishay Intertechnology makes semiconductors and components. It’s a conservatively capitalized, cash-rich business with a long history of successful and profitable execution. Its stock began to slip in March in the context of an uncertain and more volatile market for many tech issues. The firm’s good-sized exposure to an equally uncertain Europe appears to have been a factor. TESSCO Technologies distributes specialized equipment for cell phone towers. The decision of one of its major customers to curtail spending had a chilling effect on its shares, which plummeted further in early May when the firm announced fiscal fourth-quarter and 2015 earnings that were not to Wall Street’s liking. |
| |
| Top-ten position Genesco, another detractor, is a specialty footwear retailer that also sells licensed and branded headwear and licensed sports apparel. The company lowered its fiscal year earnings outlook late in May, leading its stock to slump. The firm has a number of attractive businesses but has recently struggled to turn around business at its Lids hat and Locker Room stores. Shares of Genworth MI Canada bottomed out in April though its subsequent second-quarter recovery was not robust enough to lift it out of the red for the first half. This Canadian mortgage insurer was a top-10 holding at the end of June. |
| |
| The Fund’s best performer in the first half was Steven Madden, which designs and sells name brand and private label shoes for women, men, and children. The rising price of its shares seems to have been influenced by the perception that consumers were turning toward more fashionable footwear. Call-center specialist Convergys Corporation benefited from steadily improving execution, which spurred earnings improvement. Long-time holding Nu Skin Enterprises, which makes and markets personal care products, saw its shares rise through much of the first half as the firm won back investor confidence after it settled issues with the Chinese government—Asia is its largest market—and restructured its debt covenants. Its stock pulled back in the second quarter on an earnings miss and concerns over currency headwinds. |
| | Top Contributors to Performance
Year-to-Date Through 6/30/15 (%)1 | | | |
| | | |
| Steven Madden | | 0.67 |
| |
| Convergys Corporation | | 0.47 |
| |
| Nu Skin Enterprises Cl. A | | 0.46 |
| |
| Ascena Retail Group | | 0.36 |
| |
| MYR Group | | 0.31 |
| |
| 1 Includes dividends | | |
| | Top Detractors from Performance
Year-to-Date Through 6/30/15 (%)2 | | | |
| | | |
| Vishay Intertechnology | | -0.54 |
| |
| TESSCO Technologies | | -0.49 |
| |
| Genesco | | -0.45 |
| |
| Genworth MI Canada | | -0.43 |
| |
| Unit Corporation | | -0.42 |
| |
| 2 Net of dividends | | |
| CURRENT POSITIONING AND OUTLOOK |
| At the end of June, the portfolio remained heavily overweight in the Consumer Discretionary, Information Technology, and Energy sectors, though its exposure to the latter in the portfolio was relatively low. These weightings reflected our expectation for slow but mostly steady economic growth. We also anticipate a possible increase in interest rates. However, even in the event of an increase rates will remain historically low. The portfolio is positioned for a market that more consistently rewards quality companies with low leverage and high returns on invested capital. |
| 8 | Royce Capital Fund 2015 Semiannual Report to Shareholders | |
| PERFORMANCE AND PORTFOLIO REVIEW | TICKER SYMBOLS RCPFX RCSSX |
|
| Performance and Expenses | | | | | | | | | | | | | | |
| Average Annual Total Return (%) Through 6/30/15 | | | | | | | | | | |
| | | JAN-JUN 2015* | | 1-YR | | 3-YR | | 5-YR | | 10-YR | | 15-YR | | SINCE INCEPTION (12/27/96) |
|
| RCS | | -0.32 | | 0.95 | | 14.05 | | 12.73 | | 7.75 | | 10.89 | | 11.51 |
| |
| Annual Operating Expenses: 1.05% | | | | | | | | | | | |
| |
| * Not Annualized | | | | | | | | | | | | | | |
Relative Returns: Monthly Rolling Average Annual Return PeriodsSince Inception Through 6/30/15
| On a monthly rolling basis, the Fund outperformed the Russell 2000 in 95% of all 10-year periods; 82% of all 5-year periods; and 57% of all 1-year periods. |
| |
| | | PERIODS BEATING THE INDEX | | | | | FUND AVG (%)* | | INDEX AVG (%)* |
| |
| 10-year | | 98/103 | | | | | | 95% | | 10.7 | | 6.9 |
| |
| 5-year | | 134/163 | | | | | | 82% | | 11.3 | | 7.2 |
| |
| 1-year | | 120/211 | | | | | | 57% | | 13.0 | | 9.9 |
| |
*Average of monthly rolling average annual total returns over the specified periods.

| The Morningstar Style Map is the Morningstar Style BoxTM with the center 75% of fund holdings plotted as the Morningstar Ownership ZoneTM. The Morningstar Style Box is designed to reveal a fund’s investment strategy. The Morningstar Ownership Zone provides detail about a portfolio’s investment style by showing the range of stock sizes and styles. The Ownership Zone is derived by plotting each stock in the portfolio within the proprietary Morningstar Style Box. Over time, the shape and location of a fund’s ownership zone may vary. See page 27 for additional information. |
Value of $10,000Invested on 12/31/96 as of 6/30/15 ($)

Includes reinvestment of distributions.
|
| Top 10 Positions | | |
| % of Net Assets | | |
| | | |
| Buckle (The) | | 3.0 |
| |
| Reinsurance Group of America | | 3.0 |
| |
| PC Connection | | 3.0 |
| |
| MKS Instruments | | 2.9 |
| |
| Vishay Intertechnology | | 2.9 |
| |
| Fabrinet | | 2.9 |
| |
| Genesco | | 2.9 |
| |
| Genworth MI Canada | | 2.8 |
| |
| Cato Corporation (The) Cl. A | | 2.8 |
| |
| Shoe Carnival | | 2.7 |
| |
|
| Portfolio Sector Breakdown | | |
| % of Net Assets | | |
| | | |
| Consumer Discretionary | | 27.7 |
| |
| Information Technology | | 26.1 |
| |
| Financials | | 14.1 |
| |
| Industrials | | 13.1 |
| |
| Energy | | 6.7 |
| |
| Consumer Staples | | 3.7 |
| |
| Health Care | | 2.9 |
| |
| Materials | | 2.5 |
| |
| Miscellaneous | | 0.5 |
| |
| Cash and Cash Equivalents | | 2.7 |
| |
|
| Calendar Year Total Returns (%) | |
| | | |
| YEAR | | RCS |
| |
| 2014 | | 3.2 |
| |
| 2013 | | 34.8 |
| |
| 2012 | | 12.5 |
| |
| 2011 | | -3.3 |
| |
| 2010 | | 20.5 |
| |
| 2009 | | 35.2 |
| |
| 2008 | | -27.2 |
| |
| 2007 | | -2.1 |
| |
| 2006 | | 15.6 |
| |
| 2005 | | 8.6 |
| |
| 2004 | | 25.0 |
| |
| 2003 | | 41.1 |
| |
| 2002 | | -13.8 |
| |
| 2001 | | 21.0 |
| |
| 2000 | | 33.3 |
| |
|
| Upside/Downside Capture Ratios | | | | |
| Periods Ended 6/30/15 (%) | | | | |
| | | UPSIDE | | DOWNSIDE |
| |
| 10-Year | | 90 | | 89 |
| |
From 12/31/96 (Start of Fund’s
First Full Quarter) | | 99 | | 79 |
| |
|
| Portfolio Diagnostics | | |
| | | |
| Fund Net Assets | | $788 million |
| |
| Number of Holdings | | 72 |
| |
| Turnover Rate | | 26% |
| |
| Average Market Capitalization1 | | $1,305 million |
| |
| Weighted Average P/E Ratio2,3 | | 15.4x |
| |
| Weighted Average P/B Ratio2 | | 2.0x |
| |
| Holdings ≥ 75% of Total Investments | | 36 |
| |
| Active Share4 | | 97% |
| |
| U.S. Investments (% of Net Assets) | | 89.8% |
| |
| Non-U.S. Investments (% of Net Assets) | | 7.5% |
| |
| |
| 1 | Geometric Average. This weighted calculation uses each portfolio holding’s market cap in a way designed to not skew the effect of very large or small holdings; instead, it aims to better identify the portfolio’s center, which Royce believes offers a more accurate measure of average market cap than a simple mean or median. |
| 2 | Harmonic Average. This weighted calculation evaluates a portfolio as if it were a single stock and measures it overall. It compares the total market value of the portfolio to the portfolio’s share in the earnings or book value, as the case may be, of its underlying stocks. |
| 3 | The Fund’s P/E ratio calculation excludes companies with zero or negative earnings (0% of portfolio holdings as of 6/30/15). |
| 4 | Active Share is the sum of the absolute values of the different weightings of each holding in the Fund versus each holding in the benchmark, divided by two. |
Important Performance and Expense Information
All performance information in this Report reflects past performance, is presented on a total return basis, reflects the reinvestment of distributions, and does not reflect the deduction of taxes that a shareholder would pay on fund distributions or the redemption of fund shares. Past performance is no guarantee of future results. Investment return and principal value of an investment will fluctuate, so that shares may be worth more or less than their original cost when redeemed. Current performance may be higher or lower than performance quoted. The Fund’s total returns do not reflect any deduction for charges or expenses of the variable contracts investing in the Fund. Returns as of the most recent month-end may be obtained at www.roycefunds.com. All performance and risk information reflects the result of the Investment Class (its oldest class). Shares of RCS’s Service Class bear an annual distribution expense that is not borne by the Investment Class. Operating expenses reflect the Fund’s total annual operating expenses for the Investment Class as of the Fund’s most current prospectus and include management fees and other expenses. Regarding the “Top Contributors” and “Top Detractors” tables shown above, the sum of all contributors to, and all detractors from, performance for all securities in the portfolio would approximate the Fund’s year-to-date performance for 2015. Upside Capture Ratio measures a manager’s performance in up markets relative to the Fund’s benchmark. It is calculated by measuring the Fund’s performance in quarters when the benchmark went up and dividing it by the benchmark’s return in those quarters. Downside Capture Ratio measures a Manager’s performance in down markets relative to the Fund’s benchmark (Russell 2000). It is calculated by measuring the Fund’s performance in quarters when the benchmark goes down and dividing it by the benchmark’s return in those quarters. |
| | | Royce Capital Fund 2015 Semiannual Report to Shareholders | 9 |
Schedules of Investments
Royce Capital Fund - Micro-Cap Portfolio
Common Stocks – 92.2%| | | SHARES | | | | VALUE |
| |
| | | | | | | |
| CONSUMER DISCRETIONARY – 13.2% | | | | | | |
| AUTO COMPONENTS - 0.7% | | | | | | |
Drew Industries | | 35,379 | | | $ | 2,052,689 |
†Superior Industries International | | 81,900 | | | | 1,499,589 |
| | | | | | |
| | | | | | | 3,552,278 |
| | | | | | |
| DISTRIBUTORS - 0.3% | | | | | | |
†Fenix Parts 1 | | 163,800 | | | | 1,641,276 |
| | | | | | |
| DIVERSIFIED CONSUMER SERVICES - 2.4% | | | | | | |
American Public Education 1 | | 130,230 | | | | 3,349,516 |
Capella Education | | 74,872 | | | | 4,018,380 |
Liberty Tax Cl. A | | 89,848 | | | | 2,223,738 |
Lincoln Educational Services 1 | | 894,693 | | | | 1,807,280 |
| | | | | | |
| | | | | | | 11,398,914 |
| | | | | | |
| HOUSEHOLD DURABLES - 0.8% | | | | | | |
Cavco Industries 1 | | 50,504 | | | | 3,810,022 |
| | | | | | |
| INTERNET & CATALOG RETAIL - 0.5% | | | | | | |
FTD Companies 1 | | 30,000 | | | | 845,700 |
Gaiam Cl. A 1 | | 240,500 | | | | 1,572,870 |
| | | | | | |
| | | | | | | 2,418,570 |
| | | | | | |
| LEISURE PRODUCTS - 1.6% | | | | | | |
Malibu Boats Cl. A 1 | | 163,600 | | | | 3,286,724 |
Smith & Wesson Holding Corporation 1,2 | | 246,100 | | | | 4,082,799 |
| | | | | | |
| | | | | | | 7,369,523 |
| | | | | | |
| MEDIA - 0.8% | | | | | | |
†New Media Investment Group | | 107,600 | | | | 1,929,268 |
Rentrak Corporation 1,2 | | 24,300 | | | | 1,696,140 |
| | | | | | |
| | | | | | | 3,625,408 |
| | | | | | |
| SPECIALTY RETAIL - 5.2% | | | | | | |
Boot Barn Holdings 1 | | 32,000 | | | | 1,024,000 |
Buckle (The) | | 68,225 | | | | 3,122,658 |
Build-A-Bear Workshop 1 | | 45,100 | | | | 721,149 |
Cato Corporation (The) Cl. A | | 47,800 | | | | 1,852,728 |
Citi Trends 1 | | 91,186 | | | | 2,206,701 |
†Container Store Group (The) 1,2 | | 41,400 | | | | 698,418 |
Destination Maternity | | 194,900 | | | | 2,272,534 |
Kirkland’s | | 152,380 | | | | 4,246,831 |
Shoe Carnival | | 161,800 | | | | 4,669,548 |
Stein Mart | | 267,078 | | | | 2,796,307 |
Zumiez 1 | | 39,300 | | | | 1,046,559 |
| | | | | | |
| | | | | | | 24,657,433 |
| | | | | | |
| TEXTILES, APPAREL & LUXURY GOODS - 0.9% | | | | | | |
Culp | | 133,849 | | | | 4,149,319 |
| |
| Total (Cost $53,206,161) | | | | | | 62,622,743 |
| |
| | | | | | | |
| CONSUMER STAPLES – 1.4% | | | | | | |
| FOOD PRODUCTS - 1.4% | | | | | | |
Limoneira Company | | 105,300 | | | | 2,340,819 |
Sipef | | 28,400 | | | | 1,513,905 |
†SunOpta 1 | | 209,100 | | | | 2,243,643 |
Waterloo Investment Holdings 1,3 | | 1,303,907 | | | | 495,485 |
| |
| Total (Cost $6,885,205) | | | | | | 6,593,852 |
| |
| | | | | | | |
| ENERGY – 5.5% | | | | | | |
| ENERGY EQUIPMENT & SERVICES - 4.5% | | | | | | |
Canadian Energy Services & Technology | | 142,200 | | | | 819,728 |
Dawson Geophysical 1 | | 437,692 | | | | 2,057,152 |
Geospace Technologies 1,2 | | 113,812 | | | | 2,623,367 |
Gulf Island Fabrication | | 341,134 | | | | 3,810,467 |
Natural Gas Services Group 1 | | 156,500 | | | | 3,571,330 |
Newpark Resources 1 | | 92,200 | | | | 749,586 |
Profire Energy 1,2 | | 467,129 | | | | 523,184 |
Tesco Corporation | | 223,280 | | | | 2,433,752 |
Total Energy Services | | 401,000 | | | | 4,896,117 |
| | | | | | |
| | | | | | | 21,484,683 |
| | | | | | |
| OIL, GAS & CONSUMABLE FUELS - 1.0% | | | | | | |
Ardmore Shipping | | 118,600 | | | | 1,436,246 |
Sprott Resource 1 | | 1,345,600 | | | | 1,012,701 |
Synergy Resources 1 | | 175,600 | | | | 2,007,108 |
| | | | | | |
| | | | | | | 4,456,055 |
| |
| Total (Cost $33,842,269) | | | | | | 25,940,738 |
| |
| | | | | | | |
| FINANCIALS – 9.1% | | | | | | |
| BANKS - 0.8% | | | | | | |
BCB Holdings 1 | | 1,849,707 | | | | 247,040 |
John Marshall Bank 1,4 | | 65,520 | | | | 1,048,975 |
TriState Capital Holdings 1 | | 192,772 | | | | 2,492,542 |
| | | | | | |
| | | | | | | 3,788,557 |
| | | | | | |
| CAPITAL MARKETS - 4.1% | | | | | | |
ASA Gold and Precious Metals | | 52,200 | | | | 506,862 |
FBR & Co. 1 | | 135,575 | | | | 3,137,205 |
Gluskin Sheff + Associates | | 76,000 | | | | 1,527,302 |
GMP Capital | | 362,700 | | | | 1,489,713 |
INTL FCStone 1 | | 105,069 | | | | 3,492,494 |
JMP Group | | 293,751 | | | | 2,291,258 |
Silvercrest Asset Management Group Cl. A | | 234,700 | | | | 3,299,882 |
U.S. Global Investors Cl. A | | 262,700 | | | | 730,306 |
Westwood Holdings Group | | 53,827 | | | | 3,206,474 |
| | | | | | |
| | | | | | | 19,681,496 |
| | | | | | |
| DIVERSIFIED FINANCIAL SERVICES - 0.5% | | | | | | |
GAIN Capital Holdings | | 248,700 | | | | 2,377,572 |
| | | | | | |
| INSURANCE - 0.9% | | | | | | |
Blue Capital Reinsurance Holdings | | 97,500 | | | | 1,752,075 |
eHealth 1 | | 87,100 | | | | 1,105,299 |
Navigators Group 1 | | 16,536 | | | | 1,282,532 |
| | | | | | |
| | | | | | | 4,139,906 |
| | | | | | |
| REAL ESTATE MANAGEMENT & DEVELOPMENT - 2.1% | | | | | | |
AV Homes 1 | | 158,700 | | | | 2,280,519 |
FRP Holdings 1 | | 72,840 | | | | 2,362,201 |
Kennedy-Wilson Holdings | | 137,430 | | | | 3,379,404 |
Midland Holdings 1 | | 4,983,000 | | | | 2,256,366 |
| | | | | | |
| | | | | | | 10,278,490 |
| | | | | | |
| THRIFTS & MORTGAGE FINANCE - 0.7% | | | | | | |
†Beneficial Bancorp 1 | | 117,140 | | | | 1,463,078 |
†Westfield Financial | | 244,954 | | | | 1,790,614 |
| | | | | | |
| | | | | | | 3,253,692 |
| |
| Total (Cost $41,037,986) | | | | | | 43,519,713 |
| |
| | | | | | | |
| HEALTH CARE – 10.8% | | | | | | |
| BIOTECHNOLOGY - 1.4% | | | | | | |
BioSpecifics Technologies 1 | | 26,300 | | | | 1,357,080 |
Dyax Corporation 1 | | 36,716 | | | | 972,974 |
Lexicon Pharmaceuticals 1,2 | | 88,068 | | | | 708,947 |
†Progenics Pharmaceuticals 1 | | 492,700 | | | | 3,675,542 |
| | | | | | |
| | | | | | | 6,714,543 |
| | | | | | |
| HEALTH CARE EQUIPMENT & SUPPLIES - 5.5% | | | | | | |
†Avinger 1 | | 83,100 | | | | 1,072,821 |
Cerus Corporation 1,2 | | 444,357 | | | | 2,306,213 |
CryoLife | | 238,289 | | | | 2,687,900 |
| 10 | Royce Capital Fund 2015 Semiannual Report to Shareholders | THE ACCOMPANYING NOTES ARE AN INTEGRAL PART OF THESE FINANCIAL STATEMENTS |
| June 30, 2015 (unaudited) |
|
| Royce Capital Fund - Micro-Cap Portfolio (continued) |
| | | SHARES | | | | VALUE |
| |
| | | | | | | |
| HEALTH CARE (continued) | | | | | | |
| HEALTH CARE EQUIPMENT & SUPPLIES (continued) | | | | | | |
Cynosure Cl. A 1 | | 55,500 | | | $ | 2,141,190 |
Exactech 1 | | 52,610 | | | | 1,095,866 |
Neovasc 1 | | 159,300 | | | | 1,034,366 |
Novadaq Technologies 1,2 | | 84,979 | | | | 1,029,095 |
Orthofix International 1 | | 52,700 | | | | 1,745,424 |
RTI Surgical 1 | | 353,500 | | | | 2,283,610 |
SurModics 1 | | 131,678 | | | | 3,083,899 |
Synergetics USA 1 | | 404,900 | | | | 1,903,030 |
Syneron Medical 1 | | 196,985 | | | | 2,091,981 |
Trinity Biotech ADR Cl. A | | 89,170 | | | | 1,610,410 |
Vascular Solutions 1 | | 59,600 | | | | 2,069,312 |
| | | | | | |
| | | | | | | 26,155,117 |
| | | | | | |
| HEALTH CARE PROVIDERS & SERVICES - 1.7% | | | | | | |
Bio-Reference Laboratories 1 | | 29,200 | | | | 1,204,500 |
CorVel Corporation 1 | | 85,121 | | | | 2,725,574 |
U.S. Physical Therapy | | 72,560 | | | | 3,973,386 |
| | | | | | |
| | | | | | | 7,903,460 |
| | | | | | |
| HEALTH CARE TECHNOLOGY - 0.7% | | | | | | |
†Castlight Health Cl. B 1,2 | | 187,300 | | | | 1,524,622 |
Computer Programs and Systems | | 2,600 | | | | 138,892 |
Vocera Communications 1 | | 149,300 | | | | 1,709,485 |
| | | | | | |
| | | | | | | 3,372,999 |
| | | | | | |
| LIFE SCIENCES TOOLS & SERVICES - 0.6% | | | | | | |
Harvard Bioscience 1 | | 464,468 | | | | 2,647,468 |
| | | | | | |
| PHARMACEUTICALS - 0.9% | | | | | | |
Agile Therapeutics 1,2 | | 115,000 | | | | 987,850 |
Theravance Biopharma 1,2 | | 177,800 | | | | 2,314,956 |
Vetoquinol | | 28,008 | | | | 1,161,559 |
| | | | | | |
| | | | | | | 4,464,365 |
| |
| Total (Cost $34,083,113) | | | | | | 51,257,952 |
| |
| | | | | | | |
| INDUSTRIALS – 21.6% | | | | | | |
| AEROSPACE & DEFENSE - 1.3% | | | | | | |
AeroVironment 1 | | 66,800 | | | | 1,742,144 |
American Science and Engineering | | 17,800 | | | | 779,818 |
CPI Aerostructures 1 | | 151,344 | | | | 1,514,953 |
†Vectrus 1 | | 88,100 | | | | 2,191,047 |
| | | | | | |
| | | | | | | 6,227,962 |
| | | | | | |
| BUILDING PRODUCTS - 0.6% | | | | | | |
AAON | | 114,262 | | | | 2,573,180 |
| | | | | | |
| COMMERCIAL SERVICES & SUPPLIES - 3.1% | | | | | | |
Black Diamond Group | | 267,300 | | | | 3,747,336 |
Ennis | | 185,049 | | | | 3,440,061 |
Heritage-Crystal Clean 1 | | 111,234 | | | | 1,635,140 |
Horizon North Logistics | | 708,700 | | | | 2,184,544 |
Hudson Technologies 1 | | 398,700 | | | | 1,391,463 |
Performant Financial 1,2 | | 319,600 | | | | 1,035,504 |
US Ecology | | 27,100 | | | | 1,320,312 |
| | | | | | |
| | | | | | | 14,754,360 |
| | | | | | |
| CONSTRUCTION & ENGINEERING - 1.1% | | | | | | |
MYR Group 1 | | 112,238 | | | | 3,474,889 |
†Northwest Pipe 1 | | 80,000 | | | | 1,629,600 |
Severfield 1 | | 244,200 | | | | 262,834 |
| | | | | | |
| | | | | | | 5,367,323 |
| | | | | | |
| ELECTRICAL EQUIPMENT - 2.2% | | | | | | |
Global Power Equipment Group | | 254,288 | | | | 1,973,275 |
Graphite India | | 1,516,809 | | | | 1,980,570 |
LSI Industries | | 424,313 | | | | 3,963,083 |
Powell Industries | | 54,900 | | | | 1,930,833 |
†Power Solutions International 1,2 | | 13,800 | | | | 745,476 |
| | | | | | |
| | | | | | | 10,593,237 |
| | | | | | |
| INDUSTRIAL CONGLOMERATES - 0.2% | | | | | | |
Raven Industries | | 38,000 | | | | 772,540 |
| | | | | | |
| MACHINERY - 6.8% | | | | | | |
CIRCOR International | | 74,000 | | | | 4,035,220 |
FreightCar America | | 87,791 | | | | 1,833,076 |
Gorman-Rupp Company (The) | | 55,837 | | | | 1,567,903 |
Graham Corporation | | 183,320 | | | | 3,756,227 |
Kadant | | 58,631 | | | | 2,767,383 |
Key Technology 1,5 | | 315,129 | | | | 4,159,703 |
†Lindsay Corporation | | 20,800 | | | | 1,828,528 |
†Lydall 1 | | 88,700 | | | | 2,621,972 |
†NN | | 129,700 | | | | 3,309,944 |
RBC Bearings 1 | | 39,522 | | | | 2,836,098 |
Semperit AG Holding | | 70,242 | | | | 2,897,443 |
Sun Hydraulics | | 19,400 | | | | 739,334 |
| | | | | | |
| | | | | | | 32,352,831 |
| | | | | | |
| MARINE - 0.5% | | | | | | |
Clarkson | | 52,200 | | | | 2,244,867 |
| | | | | | |
| PROFESSIONAL SERVICES - 4.2% | | | | | | |
CRA International 1 | | 131,906 | | | | 3,676,220 |
Exponent | | 53,994 | | | | 2,417,851 |
GP Strategies 1 | | 74,508 | | | | 2,476,646 |
Heidrick & Struggles International | | 114,200 | | | | 2,978,336 |
Kforce | | 141,100 | | | | 3,226,957 |
†Marathon Patent Group 1,2 | | 166,330 | | | | 482,357 |
Resources Connection | | 300,254 | | | | 4,831,087 |
| | | | | | |
| | | | | | | 20,089,454 |
| | | | | | |
| ROAD & RAIL - 1.2% | | | | | | |
Marten Transport | | 174,785 | | | | 3,792,834 |
†Patriot Transportation Holding 1,2 | | 80,589 | | | | 1,986,519 |
| | | | | | |
| | | | | | | 5,779,353 |
| | | | | | |
| TRADING COMPANIES & DISTRIBUTORS - 0.4% | | | | | | |
Houston Wire & Cable | | 203,900 | | | | 2,022,688 |
| |
| Total (Cost $83,651,845) | | | | | | 102,777,795 |
| |
| | | | | | | |
| INFORMATION TECHNOLOGY – 18.2% | | | | | | |
| COMMUNICATIONS EQUIPMENT - 3.0% | | | | | | |
CalAmp Corporation 1 | | 135,000 | | | | 2,465,100 |
COM DEV International | | 434,500 | | | | 2,007,258 |
Digi International 1 | | 340,984 | | | | 3,256,397 |
†Harmonic 1 | | 315,700 | | | | 2,156,231 |
KVH Industries 1,2 | | 257,100 | | | | 3,457,995 |
Numerex Corporation Cl. A 1 | | 88,900 | | | | 759,206 |
| | | | | | |
| | | | | | | 14,102,187 |
| | | | | | |
| ELECTRONIC EQUIPMENT, INSTRUMENTS & COMPONENTS - 3.4% | | | | | | |
CUI Global 1,2 | | 312,062 | | | | 1,579,034 |
DTS 1 | | 76,600 | | | | 2,335,534 |
Fabrinet 1 | | 185,369 | | | | 3,471,961 |
GSI Group 1,2 | | 203,300 | | | | 3,055,599 |
Neonode 1,2 | | 493,465 | | | | 1,455,722 |
Newport Corporation 1 | | 55,700 | | | | 1,056,072 |
Pure Technologies | | 88,800 | | | | 515,452 |
Vishay Precision Group 1,2 | | 167,400 | | | | 2,521,044 |
| | | | | | |
| | | | | | | 15,990,418 |
| | | | | | |
| THE ACCOMPANYING NOTES ARE AN INTEGRAL PART OF THESE FINANCIAL STATEMENTS | | Royce Capital Fund 2015 Semiannual Report to Shareholders | 11 |
Schedules of Investments
| |
| Royce Capital Fund - Micro-Cap Portfolio (continued) |
| | | SHARES | | | VALUE |
| |
| | | | | | |
| INFORMATION TECHNOLOGY (continued) | | | | | |
| INTERNET SOFTWARE & SERVICES - 1.0% | | | | | |
Care.com 1,2 | | 166,200 | | $ | 983,904 |
QuinStreet 1,2 | | 370,500 | | | 2,389,725 |
Stamps.com 1 | | 10,300 | | | 757,771 |
United Online 1 | | 34,100 | | | 534,347 |
| | | | | |
| | | | | | 4,665,747 |
| | | | | |
| IT SERVICES - 0.5% | | | | | |
Computer Task Group | | 319,942 | | | 2,469,952 |
| | | | | |
| SEMICONDUCTORS & SEMICONDUCTOR EQUIPMENT - 5.5% | | | | | |
Amtech Systems 1 | | 138,000 | | | 1,433,820 |
Brooks Automation | | 281,600 | | | 3,224,320 |
Cascade Microtech 1 | | 192,900 | | | 2,936,903 |
GSI Technology 1 | | 347,461 | | | 1,810,272 |
PDF Solutions 1 | | 122,400 | | | 1,958,400 |
Photronics 1 | | 430,300 | | | 4,092,153 |
Rudolph Technologies 1 | | 187,093 | | | 2,246,987 |
Ultra Clean Holdings 1 | | 327,000 | | | 2,037,210 |
Ultratech 1 | | 147,900 | | | 2,745,024 |
Xcerra Corporation 1 | | 524,100 | | | 3,967,437 |
| | | | | |
| | | | | | 26,452,526 |
| | | | | |
| SOFTWARE - 3.8% | | | | | |
†Computer Modelling Group | | 142,100 | | | 1,440,341 |
ePlus 1 | | 44,396 | | | 3,402,953 |
Monotype Imaging Holdings | | 116,142 | | | 2,800,184 |
†QAD | | 60,500 | | | 1,599,015 |
Rubicon Project 1 | | 153,400 | | | 2,294,864 |
SeaChange International 1 | | 406,700 | | | 2,850,967 |
TeleNav 1 | | 223,300 | | | 1,797,565 |
Zix Corporation 1 | | 364,600 | | | 1,884,982 |
| | | | | |
| | | | | | 18,070,871 |
| | | | | |
| TECHNOLOGY HARDWARE, STORAGE & PERIPHERALS - 1.0% | | | | | |
Avid Technology 1 | | 157,593 | | | 2,102,291 |
Super Micro Computer 1 | | 99,211 | | | 2,934,661 |
| | | | | |
| | | | | | 5,036,952 |
| |
| Total (Cost $79,936,554) | | | | | 86,788,653 |
| |
| | | | | | |
| MATERIALS – 6.2% | | | | | |
| CHEMICALS - 2.0% | | | | | |
BioAmber 1,2 | | 295,979 | | | 2,545,419 |
FutureFuel Corporation | | 267,500 | | | 3,442,725 |
Quaker Chemical | | 31,488 | | | 2,797,394 |
Societe Internationale de Plantations
d’Heveas 1 | | 21,585 | | | 819,140 |
| | | | | |
| | | | | | 9,604,678 |
| | | | | |
| METALS & MINING - 4.2% | | | | | |
Alamos Gold | | 162,900 | | | 922,100 |
Argonaut Gold 1 | | 361,700 | | | 486,514 |
Endeavour Silver 1 | | 445,300 | | | 886,147 |
Geodrill 1 | | 1,460,700 | | | 877,122 |
Gold Standard Ventures 1 | | 771,600 | | | 365,739 |
Haynes International | | 91,370 | | | 4,506,368 |
Horsehead Holding Corporation 1,2 | | 269,003 | | | 3,152,715 |
Imdex 1 | | 2,184,592 | | | 505,657 |
McEwen Mining 1,2 | | 1,119,096 | | | 1,073,101 |
Olympic Steel | | 180,570 | | | 3,149,141 |
Pilot Gold 1 | | 1,669,325 | | | 828,648 |
Universal Stainless & Alloy Products 1 | | 171,188 | | | 3,363,844 |
| | | | | |
| | | | | | 20,117,096 |
| |
| Total (Cost $37,980,245) | | | | | 29,721,774 |
| |
| | | | | | |
| TELECOMMUNICATION SERVICES – 1.2% | | | | | |
| DIVERSIFIED TELECOMMUNICATION SERVICES - 0.9% | | | | | |
ORBCOMM 1 | | 616,400 | | | 4,160,700 |
| | | | | |
| WIRELESS TELECOMMUNICATION SERVICES - 0.3% | | | | | |
Spok Holdings | | 93,800 | | | 1,579,592 |
| |
| Total (Cost $5,230,445) | | | | | 5,740,292 |
| |
| | | | | | |
| MISCELLANEOUS6 – 5.0% | | | | | |
| |
| Total (Cost $23,323,465) | | | | | 23,733,606 |
| |
| | | | | | |
| TOTAL COMMON STOCKS | | | | | |
| |
| (Cost $399,177,288) | | | | | 438,697,118 |
| |
| | | | | | |
| REPURCHASE AGREEMENT– 8.0% | | | | | |
Fixed Income Clearing Corporation, 0.00% dated 6/30/15, due 7/1/15, maturity value
$38,242,000 (collateralized by obligations of various U.S. Government Agencies, 2.625%
due 8/15/20, valued at $39,008,625) |
| |
| (Cost $38,242,000) | | | | | 38,242,000 |
| |
| | | | | | |
| COLLATERAL RECEIVED FOR SECURITIES LOANED – 2.7% | | | | | |
| Money Market Funds | | | | | |
Federated Government Obligations Fund (7 day yield-0.0099%) | | | | | |
| |
| (Cost $12,718,398) | | | | | 12,718,398 |
| |
| | | | | | |
| | | | | | |
| TOTAL INVESTMENTS – 102.9% | | | | | |
| |
| (Cost $450,137,686) | | | | | 489,657,516 |
| |
| | | | | | |
| LIABILITIES LESS CASH AND OTHER ASSETS – (2.9)% | | | | | (13,966,802) |
| | | | | |
| | | | | | |
| |
| NET ASSETS – 100.0% | | | | $ | 475,690,714 |
| |
| 12 | Royce Capital Fund 2015 Semiannual Report to Shareholders | THE ACCOMPANYING NOTES ARE AN INTEGRAL PART OF THESE FINANCIAL STATEMENTS |
| June 30, 2015 (unaudited) |
| |
| |
Royce Capital Fund - Small-Cap Portfolio
Common Stocks – 97.3% |
| | | SHARES | | | | VALUE |
| |
| | | | | | | |
| CONSUMER DISCRETIONARY – 27.7% | | | | | | |
| AUTO COMPONENTS - 2.0% | | | | | | |
Dorman Products 1 | | 201,669 | | | $ | 9,611,545 |
STRATTEC SECURITY | | 94,219 | | | | 6,472,845 |
| | | | | | |
| | | | | | | 16,084,390 |
| | | | | | |
| AUTOMOBILES - 0.9% | | | | | | |
Thor Industries | | 125,385 | | | | 7,056,668 |
| | | | | | |
| MEDIA - 1.1% | | | | | | |
Saga Communications Cl. A | | 229,782 | | | | 8,697,249 |
| | | | | | |
| SPECIALTY RETAIL - 18.6% | | | | | | |
American Eagle Outfitters | | 752,485 | | | | 12,957,792 |
Ascena Retail Group 1 | | 644,280 | | | | 10,730,483 |
Buckle (The) | | 517,902 | | | | 23,704,374 |
Cato Corporation (The) Cl. A | | 575,191 | | | | 22,294,403 |
DSW Cl. A | | 466,227 | | | | 15,557,995 |
GameStop Corporation Cl. A | | 185,072 | | | | 7,950,693 |
Genesco 1 | | 344,518 | | | | 22,748,524 |
Shoe Carnival | | 749,401 | | | | 21,627,713 |
Stein Mart | | 816,770 | | | | 8,551,582 |
| | | | | | |
| | | | | | | 146,123,559 |
| | | | | | |
| TEXTILES, APPAREL & LUXURY GOODS - 5.1% | | | | | | |
Deckers Outdoor 1 | | 200,986 | | | | 14,464,962 |
G-III Apparel Group 1 | | 53,358 | | | | 3,753,735 |
Movado Group | | 296,629 | | | | 8,056,444 |
Steven Madden 1 | | 280,182 | | | | 11,986,186 |
Vera Bradley 1 | | 147,110 | | | | 1,657,930 |
| | | | | | |
| | | | | | | 39,919,257 |
| |
| Total (Cost $173,603,805) | | | | | | 217,881,123 |
| |
| | | | | | | |
| CONSUMER STAPLES – 3.7% | | | | | | |
| FOOD & STAPLES RETAILING - 1.2% | | | | | | |
Village Super Market Cl. A | | 292,936 | | | | 9,283,142 |
| | | | | | |
| PERSONAL PRODUCTS - 2.5% | | | | | | |
Nu Skin Enterprises Cl. A | | 419,473 | | | | 19,769,762 |
| |
| Total (Cost $26,179,952) | | | | | | 29,052,904 |
| |
| | | | | | | |
| ENERGY – 6.7% | | | | | | |
| ENERGY EQUIPMENT & SERVICES - 5.9% | | | | | | |
Atwood Oceanics | | 470,029 | | | | 12,427,567 |
Helmerich & Payne | | 78,000 | | | | 5,492,760 |
Matrix Service 1 | | 807,450 | | | | 14,760,186 |
Total Energy Services | | 84,750 | | | | 1,034,778 |
Unit Corporation 1 | | 461,640 | | | | 12,519,677 |
| | | | | | |
| | | | | | | 46,234,968 |
| | | | | | |
| OIL, GAS & CONSUMABLE FUELS - 0.8% | | | | | | |
Cimarex Energy | | 61,188 | | | | 6,749,648 |
| |
| Total (Cost $54,829,232) | | | | | | 52,984,616 |
| |
| | | | | | | |
| FINANCIALS – 14.1% | | | | | | |
| BANKS - 4.0% | | | | | | |
Ames National | | 239,150 | | | | 6,002,665 |
Camden National | | 245,948 | | | | 9,518,188 |
City Holding Company | | 320,674 | | | | 15,793,194 |
| | | | | | |
| | | | | | | 31,314,047 |
| | | | | | |
| CAPITAL MARKETS - 0.6% | | | | | | |
Federated Investors Cl. B | | 136,796 | | | | 4,581,298 |
| | | | | | |
| INSURANCE - 4.5% | | | | | | |
Allied World Assurance Company Holdings | | 142,265 | | | | 6,148,693 |
Aspen Insurance Holdings | | 115,666 | | | | 5,540,402 |
Reinsurance Group of America | | 248,100 | | | | 23,537,247 |
| | | | | | |
| | | | | | | 35,226,342 |
| | | | | | |
| THRIFTS & MORTGAGE FINANCE - 5.0% | | | | | | |
Genworth MI Canada | | 853,800 | | | | 22,421,649 |
TrustCo Bank Corp. NY | | 2,449,286 | | | | 17,218,481 |
| | | | | | |
| | | | | | | 39,640,130 |
| |
| Total (Cost $76,268,267) | | | | | | 110,761,817 |
| |
| | | | | | | |
| HEALTH CARE – 2.9% | | | | | | |
| HEALTH CARE PROVIDERS & SERVICES - 2.9% | | | | | | |
Aceto Corporation | | 279,278 | | | | 6,878,617 |
Chemed Corporation | | 27,896 | | | | 3,657,165 |
MEDNAX 1 | | 109,170 | | | | 8,090,589 |
U.S. Physical Therapy | | 82,896 | | | | 4,539,385 |
| |
| Total (Cost $8,698,934) | | | | | | 23,165,756 |
| |
| | | | | | | |
| INDUSTRIALS – 13.1% | | | | | | |
| COMMERCIAL SERVICES & SUPPLIES - 1.9% | | | | | | |
UniFirst Corporation | | 133,450 | | | | 14,926,383 |
| | | | | | |
| CONSTRUCTION & ENGINEERING - 2.0% | | | | | | |
MYR Group 1 | | 522,623 | | | | 16,180,408 |
| | | | | | |
| MACHINERY - 4.9% | | | | | | |
Alamo Group | | 258,452 | | | | 14,121,817 |
Federal Signal | | 576,042 | | | | 8,588,786 |
Kennametal | | 91,195 | | | | 3,111,574 |
Miller Industries 5 | | 663,445 | | | | 13,235,728 |
| | | | | | |
| | | | | | | 39,057,905 |
| | | | | | |
| ROAD & RAIL - 2.4% | | | | | | |
Knight Transportation | | 35,389 | | | | 946,302 |
†Saia 1 | | 269,419 | | | | 10,585,472 |
†Werner Enterprises | | 270,600 | | | | 7,103,250 |
| | | | | | |
| | | | | | | 18,635,024 |
| | | | | | |
| TRADING COMPANIES & DISTRIBUTORS - 1.9% | | | | | | |
Applied Industrial Technologies | | 370,074 | | | | 14,673,434 |
| |
| Total (Cost $91,443,852) | | | | | | 103,473,154 |
| |
| | | | | | | |
| INFORMATION TECHNOLOGY – 26.1% | | | | | | |
| COMMUNICATIONS EQUIPMENT - 5.0% | | | | | | |
†Brocade Communications Systems | | 1,129,400 | | | | 13,417,272 |
NETGEAR 1 | | 450,150 | | | | 13,513,503 |
Plantronics | | 82,534 | | | | 4,647,489 |
TESSCO Technologies 5 | | 417,695 | | | | 8,274,538 |
| | | | | | |
| | | | | | | 39,852,802 |
| | | | | | |
| ELECTRONIC EQUIPMENT, INSTRUMENTS & COMPONENTS - 15.2% | | | | | | |
Benchmark Electronics 1 | | 833,617 | | | | 18,156,178 |
Fabrinet 1 | | 1,220,322 | | | | 22,856,631 |
Key Tronic 1,5 | | 600,081 | | | | 6,522,881 |
PC Connection | | 942,794 | | | | 23,324,724 |
Rofin-Sinar Technologies 1 | | 522,982 | | | | 14,434,303 |
ScanSource 1 | | 297,982 | | | | 11,341,195 |
Vishay Intertechnology | | 1,969,899 | | | | 23,008,420 |
| | | | | | |
| | | | | | | 119,644,332 |
| | | | | | |
| IT SERVICES - 2.7% | | | | | | |
Calian Technologies | | 75,900 | | | | 1,124,219 |
Convergys Corporation | | 434,542 | | | | 11,076,476 |
ManTech International Cl. A | | 304,015 | | | | 8,816,435 |
| | | | | | |
| | | | | | | 21,017,130 |
| | | | | | |
| THE ACCOMPANYING NOTES ARE AN INTEGRAL PART OF THESE FINANCIAL STATEMENTS | Royce Capital Fund 2015 Semiannual Report to Shareholders | 13 |
| June 30, 2015 (unaudited) |
| Schedules of Investments |
| |
| |
| Royce Capital Fund - Small-Cap Portfolio (continued) |
| | | SHARES | | | | VALUE |
| |
| | | | | | | |
| INFORMATION TECHNOLOGY (continued) | | | | | | |
| SEMICONDUCTORS & SEMICONDUCTOR EQUIPMENT - 3.2% | | | | | | |
MKS Instruments | | 609,398 | | | $ | 23,120,560 |
Teradyne | | 117,500 | | | | 2,266,575 |
| | | | | | |
| | | | | | | 25,387,135 |
| |
| Total (Cost $190,732,380) | | | | | | 205,901,399 |
| |
| | | | | | | |
| MATERIALS – 2.5% | | | | | | |
| CHEMICALS - 0.8% | | | | | | |
Innospec | | 138,721 | | | | 6,247,994 |
| | | | | | |
| METALS & MINING - 0.3% | | | | | | |
Reliance Steel & Aluminum | | 36,400 | | | | 2,201,472 |
| | | | | | |
| PAPER & FOREST PRODUCTS - 1.4% | | | | | | |
Schweitzer-Mauduit International | | 284,005 | | | | 11,326,119 |
| |
| Total (Cost $21,268,038) | | | | | | 19,775,585 |
| |
| | | | | | | |
| MISCELLANEOUS6 – 0.5% | | | | | | |
| |
| Total (Cost $3,614,106) | | | | | | 3,590,724 |
| |
| | | | | | | |
| TOTAL COMMON STOCKS | | | | | | |
| |
| (Cost $646,638,566) | | | | | | 766,587,078 |
| |
| | | | | | | |
| REPURCHASE AGREEMENT–2.5% | | | | | | |
Fixed Income Clearing Corporation, 0.00% dated 6/30/15, due 7/1/15, maturity value
$19,731,000 (collateralized by obligations of various U.S. Government Agencies, 2.625%
due 8/15/20, valued at $20,129,400) |
| |
| (Cost $19,731,000) | | | | | | 19,731,000 |
| |
| | | | | | | |
| TOTAL INVESTMENTS – 99.8% | | | | | | |
| |
| (Cost $666,369,566) | | | | | | 786,318,078 |
| |
| | | | | | | |
| | | | | | | |
| CASH AND OTHER ASSETS LESS LIABILITIES – 0.2% | | | | | | 1,613,068 |
| | | | | | |
| | | | | | | |
| |
| NET ASSETS – 100.0% | | | | | $ | 787,931,146 |
| |
| |
| † | New additions in 2015. |
| 1 | Non-income producing. |
| 2 | All or a portion of these securities were on loan at June 30, 2015. |
| 3 | A security for which market quotations are not readily available represents 0.1% of net assets for Royce Micro-Cap Portfolio. This security has been valued at its fair value under procedures approved by the Fund’s Board of Trustees. This security is defined as a Level 3 security due to the use of significant unobservable inputs in the determination of fair value. See Notes to Financial Statements. |
| 4 | These securities are defined as Level 2 securities due to fair value being based on quoted prices for similar securities. See Notes to Financial Statements. |
| 5 | At June 30, 2015, the Fund owned 5% or more of the Company’s outstanding voting securities thereby making the Company an Affiliated Company as that term is defined in the Investment Company Act of 1940. See Notes to Financial Statements. |
| 6 | Includes securities first acquired in 2015 and less than 1% of net assets. |
| | Bold indicates a Fund’s 20 largest equity holdings in terms of June 30, 2015, market value. |
| |
| 14 | Royce Capital Fund 2015 Semiannual Report to Shareholders | THE ACCOMPANYING NOTES ARE AN INTEGRAL PART OF THESE FINANCIAL STATEMENTS |
| June 30, 2015 (unaudited) |
| Statements of Assets and Liabilities |
| | | Micro-Cap | | Small-Cap |
| | | Portfolio | | Portfolio |
| |
| ASSETS: | | | | | | | | |
| Investments at value (including collateral on loaned securities) | | | | | | | | |
| |
Non-Affiliated Companies | | $ | 447,255,813 | | | $ | 738,553,931 | |
| |
Affiliated Companies | | | 4,159,703 | | | | 28,033,147 | |
| |
| Repurchase agreements (at cost and value) | | | 38,242,000 | | | | 19,731,000 | |
| |
| Cash and foreign currency | | | 23,216 | | | | 598 | |
| |
| Receivable for investments sold | | | 3,260,299 | | | | 5,403,475 | |
| |
| Receivable for capital shares sold | | | 142,765 | | | | 6,779,246 | |
| |
| Receivable for dividends and interest | | | 464,244 | | | | 627,507 | |
| |
| Prepaid expenses and other assets | | | 5,085 | | | | 9,771 | |
| |
| Total Assets | | | 493,553,125 | | | | 799,138,675 | |
| |
| LIABILITIES: | | | | | | | | |
| Payable for collateral on loaned securities | | | 12,718,398 | | | | – | |
| |
| Payable for investments purchased | | | 4,202,239 | | | | 9,884,597 | |
| |
| Payable for capital shares redeemed | | | 377,199 | | | | 507,236 | |
| |
| Payable for investment advisory fees | | | 492,542 | | | | 654,673 | |
| |
| Payable for trustees’ fees | | | 14,030 | | | | 23,309 | |
| |
| Accrued expenses | | | 58,003 | | | | 137,714 | |
| |
| Total Liabilities | | | 17,862,411 | | | | 11,207,529 | |
| |
| Net Assets | | $ | 475,690,714 | | | $ | 787,931,146 | |
| |
| ANALYSIS OF NET ASSETS: | | | | | | | | |
| Paid-in capital | | $ | 386,210,578 | | | $ | 502,813,087 | |
| |
| Undistributed net investment income (loss) | | | 1,365,950 | | | | 9,480,090 | |
| |
| Accumulated net realized gain (loss) on investments and foreign currency | | | 48,608,322 | | | | 155,690,070 | |
| |
| Net unrealized appreciation (depreciation) on investments and foreign currency | | | 39,505,864 | | | | 119,947,899 | |
| |
| Net Assets | | $ | 475,690,714 | | | $ | 787,931,146 | |
| |
Investment Class | | $ | 441,682,583 | | | $ | 539,517,016 | |
| |
Service Class | | | 34,008,131 | | | | 248,414,130 | |
| |
| SHARES OUTSTANDING (unlimited number of $.001 par value): | | | | | | | | |
Investment Class | | | 39,273,647 | | | | 42,774,671 | |
| |
Service Class | | | 3,066,127 | | | | 20,044,233 | |
| |
| NET ASSET VALUES (Net Assets ÷ Shares Outstanding): | | | | | | | | |
(offering and redemption price per share) | | | | | | | | |
| |
Investment Class | | $ | 11.25 | | | $ | 12.61 | |
| |
Service Class | | | 11.09 | | | | 12.39 | |
| |
| Investments at identified cost | | $ | 411,895,686 | | | $ | 646,638,566 | |
| |
| Market value of loaned securities | | | 12,250,795 | | | | – | |
| |
| THE ACCOMPANYING NOTES ARE AN INTEGRAL PART OF THESE FINANCIAL STATEMENTS | Royce Capital Fund 2015 Semiannual Report to Shareholders | 15 |
| Statements of Changes in Net Assets |
| | | Micro-Cap Portfolio | Small-Cap Portfolio |
| | | Six Months Ended | | | | | | Six Months Ended | | | | |
| | | 6/30/15 (unaudited) | | Year Ended 12/31/14 | | 6/30/15 (unaudited) | | Year Ended 12/31/14 |
| |
| INVESTMENT OPERATIONS: | | | | | | | | | | | | | | | | |
| Net investment income (loss) | | $ | 1,441,278 | | | $ | (1,834,886 | ) | | $ | 6,048,701 | | | $ | 3,444,089 | |
| |
| Net realized gain (loss) on investments and foreign currency | | | 26,673,004 | | | | 29,875,433 | | | | 41,979,115 | | | | 113,988,714 | |
| |
Net change in unrealized appreciation (depreciation) on investments
and foreign currency | | | (34,056,172 | ) | | | (49,586,578 | ) | | | (52,592,240 | ) | | | (104,002,230 | ) |
| |
| Net increase (decrease) in net assets from investment operations | | | (5,941,890 | ) | | | (21,546,031 | ) | | | (4,564,424 | ) | | | 13,430,573 | |
| |
| DISTRIBUTIONS: | | | | | | | | | | | | | | | | |
| Net investment income | | | | | | | | | | | | | | | | |
Investment Class | | | – | | | | – | | | | – | | | | (741,245 | ) |
| |
Service Class | | | – | | | | – | | | | – | | | | – | |
| |
| Net realized gain on investments and foreign currency | | | | | | | | | | | | | | | | |
Investment Class | | | – | | | | (38,500,129 | ) | | | – | | | | (68,334,587 | ) |
| |
Service Class | | | – | | | | (2,136,259 | ) | | | – | | | | (25,598,591 | ) |
| |
| Total distributions | | | – | | | | (40,636,388 | ) | | | – | | | | (94,674,423 | ) |
| |
| CAPITAL SHARE TRANSACTIONS: | | | | | | | | | | | | | | | | |
| Value of shares sold | | | | | | | | | | | | | | | | |
| |
Investment Class | | | 9,892,665 | | | | 34,040,117 | | | | 30,583,533 | | | | 92,372,709 | |
| |
Service Class | | | 18,876,897 | | | | 10,649,666 | | | | 99,558,124 | | | | 111,830,167 | |
| |
| Distributions reinvested | | | | | | | | | | | | | | | | |
| |
Investment Class | | | – | | | | 38,500,129 | | | | – | | | | 69,075,832 | |
| |
Service Class | | | – | | | | 2,136,259 | | | | – | | | | 25,598,590 | |
| |
| Value of shares redeemed | | | | | | | | | | | | | | | | |
| |
Investment Class | | | (48,397,821 | ) | | | (101,565,924 | ) | | | (67,249,103 | ) | | | (265,398,011 | ) |
| |
Service Class | | | (11,534,664 | ) | | | (22,201,733 | ) | | | (65,794,230 | ) | | | (125,943,712 | ) |
| |
Net increase (decrease) in net assets
from capital share transactions | | | (31,162,923 | ) | | | (38,441,486 | ) | | | (2,901,676 | ) | | | (92,464,425 | ) |
| |
| Net Increase (Decrease) in Net Assets | | | (37,104,813 | ) | | | (100,623,905 | ) | | | (7,466,100 | ) | | | (173,708,275 | ) |
| |
| NET ASSETS: | | | | | | | | | | | | | | | | |
| |
| Beginning of period | | | 512,795,527 | | | | 613,419,432 | | | | 795,397,246 | | | | 969,105,521 | |
| |
| End of period | | $ | 475,690,714 | | | $ | 512,795,527 | | | $ | 787,931,146 | | | $ | 795,397,246 | |
| |
| Undistributed Net Investment Income (Loss) at End of Period | | $ | 1,365,950 | | | $ | (75,328 | ) | | $ | 9,480,090 | | | $ | 3,431,389 | |
| |
| 16 | Royce Capital Fund 2015 Semiannual Report to Shareholders | THE ACCOMPANYING NOTES ARE AN INTEGRAL PART OF THESE FINANCIAL STATEMENTS |
| Six Months Ended June 30, 2015 (unaudited) |
| Statements of Operations |
| | | Micro-Cap | | Small-Cap |
| | | Portfolio | | Portfolio |
| |
| INVESTMENT INCOME: | | | | | | | | |
| INCOME: | | | | | | | | |
| Dividends | | | | | | | | |
| |
Non-Affiliates | | $ | 4,602,102 | | | $ | 10,138,390 | |
| |
Affiliated Companies | | | – | | | | 382,196 | |
| |
| Foreign withholding tax | | | (136,521 | ) | | | (75,625 | ) |
| |
| Securities lending | | | 204,575 | | | | 1,920 | |
| |
| Total income | | | 4,670,156 | | | | 10,446,881 | |
| |
| EXPENSES: | | | | | | | | |
| Investment advisory fees | | | 3,039,613 | | | | 3,905,258 | |
| |
| Distribution fees | | | 37,261 | | | | 283,992 | |
| |
| Custody | | | 40,802 | | | | 41,746 | |
| |
| Administrative and office facilities | | | 36,052 | | | | 57,106 | |
| |
| Trustees’ fees | | | 24,720 | | | | 39,852 | |
| |
| Audit | | | 18,572 | | | | 12,850 | |
| |
| Shareholder reports | | | 13,591 | | | | 31,193 | |
| |
| Shareholder servicing | | | 6,601 | | | | 6,507 | |
| |
| Legal | | | 2,793 | | | | 4,407 | |
| |
| Other expenses | | | 9,934 | | | | 15,270 | |
| |
| Total expenses | | | 3,229,939 | | | | 4,398,181 | |
| |
| Compensating balance credits | | | (25 | ) | | | (1 | ) |
| |
| Expenses reimbursed by investment adviser | | | (1,036 | ) | | | – | |
| |
| Net expenses | | | 3,228,878 | | | | 4,398,180 | |
| |
| Net investment income (loss) | | | 1,441,278 | | | | 6,048,701 | |
| |
| REALIZED AND UNREALIZED GAIN (LOSS) ON INVESTMENTS AND FOREIGN CURRENCY: | | | | | | | | |
| NET REALIZED GAIN (LOSS): | | | | | | | | |
| |
| Investments in Non-Affiliated Companies | | | 26,711,082 | | | | 42,350,162 | |
| |
| Investments in Affiliated Companies | | | (11,700 | ) | | | (351,739 | ) |
| |
| Foreign currency transactions | | | (26,378 | ) | | | (19,308 | ) |
| |
| NET CHANGE IN UNREALIZED APPRECIATION (DEPRECIATION): | | | | | | | | |
| Investments and foreign currency translations | | | (34,052,432 | ) | | | (52,591,614 | ) |
| |
| Other assets and liabilities denominated in foreign currency | | | (3,740 | ) | | | (626 | ) |
| |
| Net realized and unrealized gain (loss) on investments and foreign currency | | | (7,383,168 | ) | | | (10,613,125 | ) |
| |
| NET INCREASE (DECREASE) IN NET ASSETS FROM INVESTMENT OPERATIONS | | $ | (5,941,890 | ) | | $ | (4,564,424 | ) |
| |
| THE ACCOMPANYING NOTES ARE AN INTEGRAL PART OF THESE FINANCIAL STATEMENTS | Royce Capital Fund 2015 Semiannual Report to Shareholders | 17 |
Financial Highlights
| This table is presented to show selected data for a share outstanding throughout each period and to assist shareholders in evaluating a Fund’s performance for the periods presented. Per share amounts have been determined on the basis of the weighted average number of shares outstanding during the period. |
| |
| | | | | | | | | | | | | | | | | | | | | | | | | | | | | | Ratio of Expenses
to Average Net Assets
| | | | | | | | | |
| | | Net Asset Value,
Beginning of Period | | Net Investment
Income (Loss) | | Net Realized and
Unrealized Gain (Loss)
on Investments and
Foreign Currency | | Total from
Investment
Operations | | Distributions
from Net
Investment
Income | | Distributions from Net
Realized Gain on
Investments and
Foreign Currency | | Total
Distributions | | Net Asset Value,
End of Period | | Total Return | | Net Assets,
End of Period
(in thousands) | | Prior to Fee
Waivers and
Balance Credits | | Prior to Fee
Waivers | | Net of Fee
Waivers | | Ratio of Net
Investment Income
(Loss) to Average
Net Assets | | Portfolio
Turnover Rate |
| |
| Micro-Cap Portfolio–Investment Class |
| 2015 | † | | $ | 11.37 | | $ | 0.03 | | | $ | (0.15 | ) | | $ | (0.12 | ) | | $ | – | | | $ | – | | | $ | – | | | $ | 11.25 | | | (1.06 | )%1 | | $ | 441,683 | | | | 1.31 | %2 | | | 1.31 | %2 | | | 1.31 | %2 | | | 0.61 | %2 | | | 26 | % |
| |
| 2014 | | | | 12.83 | | | (0.04 | ) | | | (0.44 | ) | | | (0.48 | ) | | | – | | | | (0.98 | ) | | | (0.98 | ) | | | 11.37 | | | (3.58 | ) | | | 485,434 | | | | 1.30 | | | | 1.30 | | | | 1.30 | | | | (0.32 | ) | | | 25 | |
| |
| 2013 | | | | 10.95 | | | (0.04 | ) | | | 2.32 | | | | 2.28 | | | | (0.06 | ) | | | (0.34 | ) | | | (0.40 | ) | | | 12.83 | | | 20.99 | | | | 572,666 | | | | 1.32 | | | | 1.32 | | | | 1.32 | | | | (0.36 | ) | | | 30 | |
| |
| 2012 | | | | 10.41 | | | 0.04 | | | | 0.74 | | | | 0.78 | | | | – | | | | (0.24 | ) | | | (0.24 | ) | | | 10.95 | | | 7.60 | | | | 543,516 | | | | 1.33 | | | | 1.33 | | | | 1.33 | | | | 0.39 | | | | 21 | |
| |
| 2011 | | | | 12.18 | | | (0.03 | ) | | | (1.45 | ) | | | (1.48 | ) | | | (0.29 | ) | | | – | | | | (0.29 | ) | | | 10.41 | | | (12.10 | ) | | | 569,498 | | | | 1.32 | | | | 1.32 | | | | 1.32 | | | | (0.31 | ) | | | 35 | |
| |
| 2010 | | | | 9.52 | | | (0.01 | ) | | | 2.87 | | | | 2.86 | | | | (0.20 | ) | | | – | | | | (0.20 | ) | | | 12.18 | | | 30.10 | | | | 676,654 | | | | 1.32 | | | | 1.32 | | | | 1.32 | | | | (0.09 | ) | | | 35 | |
| |
| Micro-Cap Portfolio–Service Class |
| 2015 | † | | $ | 11.23 | | $ | 0.02 | | | $ | (0.16 | ) | | $ | (0.14 | ) | | $ | – | | | $ | – | | | $ | – | | | $ | 11.09 | | | (1.25 | )%1 | | $ | 34,008 | | | | 1.59 | %2 | | | 1.59 | %2 | | | 1.58 | %2 | | | 0.31 | %2 | | | 26 | % |
| |
| 2014 | | | | 12.72 | | | (0.07 | ) | | | (0.44 | ) | | | (0.51 | ) | | | – | | | | (0.98 | ) | | | (0.98 | ) | | | 11.23 | | | (3.84 | ) | | | 27,362 | | | | 1.57 | | | | 1.57 | | | | 1.57 | | | | (0.60 | ) | | | 25 | |
| |
| 2013 | | | | 10.87 | | | (0.07 | ) | | | 2.30 | | | | 2.23 | | | | (0.04 | ) | | | (0.34 | ) | | | (0.38 | ) | | | 12.72 | | | 20.65 | | | | 40,753 | | | | 1.60 | | | | 1.60 | | | | 1.58 | | | | (0.62 | ) | | | 30 | |
| |
| 2012 | | | | 10.35 | | | 0.03 | | | | 0.73 | | | | 0.76 | | | | – | | | | (0.24 | ) | | | (0.24 | ) | | | 10.87 | | | 7.45 | | | | 36,764 | | | | 1.59 | | | | 1.59 | | | | 1.55 | | | | 0.27 | | | | 21 | |
| |
| 2011 | | | | 12.13 | | | (0.11 | ) | | | (1.39 | ) | | | (1.50 | ) | | | (0.28 | ) | | | – | | | | (0.28 | ) | | | 10.35 | | | (12.26 | ) | | | 26,096 | | | | 1.60 | | | | 1.60 | | | | 1.49 | | | | (0.46 | ) | | | 35 | |
| |
| 2010 | | | | 9.49 | | | (0.08 | ) | | | 2.91 | | | | 2.83 | | | | (0.19 | ) | | | – | | | | (0.19 | ) | | | 12.13 | | | 29.90 | | | | 17,022 | | | | 1.63 | | | | 1.63 | | | | 1.40 | | | | (0.12 | ) | | | 35 | |
| |
| Small-Cap Portfolio–Investment Class |
| 2015 | † | | $ | 12.65 | | $ | 0.10 | | | $ | (0.14 | ) | | $ | (0.04 | ) | | $ | – | | | $ | – | | | $ | – | | | $ | 12.61 | | | (0.32 | )%1 | | $ | 539,517 | | | | 1.05 | %2 | | | 1.05 | %2 | | | 1.05 | %2 | | | 1.64 | %2 | | | 26 | % |
| |
| 2014 | | | | 13.92 | | | 0.06 | | | | 0.35 | | | | 0.41 | | | | (0.02 | ) | | | (1.66 | ) | | | (1.68 | ) | | | 12.65 | | | 3.24 | | | | 577,222 | | | | 1.05 | | | | 1.05 | | | | 1.05 | | | | 0.44 | | | | 36 | |
| |
| 2013 | | | | 11.03 | | | 0.03 | | | | 3.75 | | | | 3.78 | | | | (0.14 | ) | | | (0.75 | ) | | | (0.89 | ) | | | 13.92 | | | 34.75 | | | | 736,917 | | | | 1.05 | | | | 1.05 | | | | 1.05 | | | | 0.13 | | | | 43 | |
| |
| 2012 | | | | 10.07 | | | 0.15 | | | | 1.10 | | | | 1.25 | | | | (0.01 | ) | | | (0.28 | ) | | | (0.29 | ) | | | 11.03 | | | 12.50 | | | | 623,830 | | | | 1.06 | | | | 1.06 | | | | 1.06 | | | | 1.37 | | | | 62 | |
| |
| 2011 | | | | 10.45 | | | 0.01 | | | | (0.35 | ) | | | (0.34 | ) | | | (0.04 | ) | | | – | | | | (0.04 | ) | | | 10.07 | | | (3.28 | ) | | | 651,243 | | | | 1.05 | | | | 1.05 | | | | 1.05 | | | | 0.11 | | | | 36 | |
| |
| 2010 | | | | 8.68 | | | 0.04 | | | | 1.74 | | | | 1.78 | | | | (0.01 | ) | | | – | | | | (0.01 | ) | | | 10.45 | | | 20.52 | | | | 630,227 | | | | 1.06 | | | | 1.06 | | | | 1.06 | | | | 0.47 | | | | 34 | |
| |
| Small-Cap Portfolio–Service Class |
| 2015 | † | | $ | 12.44 | | $ | 0.08 | | | $ | (0.13 | ) | | $ | (0.05 | ) | | $ | – | | | $ | – | | | $ | – | | | $ | 12.39 | | | (0.40 | )%1 | | $ | 248,414 | | | | 1.30 | %2 | | | 1.30 | %2 | | | 1.30 | %2 | | | 1.33 | %2 | | | 26 | % |
| |
| 2014 | | | | 13.74 | | | 0.03 | | | | 0.33 | | | | 0.36 | | | | – | | | | (1.66 | ) | | | (1.66 | ) | | | 12.44 | | | 2.92 | | | | 218,175 | | | | 1.30 | | | | 1.30 | | | | 1.30 | | | | 0.21 | | | | 36 | |
| |
| 2013 | | | | 10.91 | | | (0.02 | ) | | | 3.73 | | | | 3.71 | | | | (0.13 | ) | | | (0.75 | ) | | | (0.88 | ) | | | 13.74 | | | 34.44 | | | | 232,189 | | | | 1.31 | | | | 1.31 | | | | 1.31 | | | | (0.12 | ) | | | 43 | |
| |
| 2012 | | | | 9.98 | | | 0.15 | | | | 1.06 | | | | 1.21 | | | | (0.00 | ) | | | (0.28 | ) | | | (0.28 | ) | | | 10.91 | | | 12.22 | | | | 148,613 | | | | 1.31 | | | | 1.31 | | | | 1.30 | | | | 1.41 | | | | 62 | |
| |
| 2011 | | | | 10.38 | | | (0.01 | ) | | | (0.36 | ) | | | (0.37 | ) | | | (0.03 | ) | | | – | | | | (0.03 | ) | | | 9.98 | | | (3.55 | ) | | | 79,565 | | | | 1.30 | | | | 1.30 | | | | 1.26 | | | | (0.02 | ) | | | 36 | |
| |
| 2010 | | | | 8.64 | | | 0.03 | | | | 1.72 | | | | 1.75 | | | | (0.01 | ) | | | – | | | | (0.01 | ) | | | 10.38 | | | 20.26 | | | | 41,505 | | | | 1.34 | | | | 1.34 | | | | 1.30 | | | | 0.36 | | | | 34 | |
| |
|
| † Six months ended June 30, 2015 (unaudited). |
| 1 Not annualized |
| 2 Annualized |
| 18 | Royce Capital Fund 2015 Semiannual Report to Shareholders | THE ACCOMPANYING NOTES ARE AN INTEGRAL PART OF THESE FINANCIAL STATEMENTS |
| Notes to Financial Statements (unaudited) |
| Summary of Significant Accounting Policies: |
Royce Micro-Cap Portfolio and Royce Small-Cap Portfolio (the “Fund” or “Funds”) are the two series of Royce Capital Fund (the “Trust”), a diversified open-end management investment company organized as a Delaware statutory trust. Shares of the Funds are offered to life insurance companies for allocation to certain separate accounts established for the purpose of funding qualified and non-qualified variable annuity contracts and variable life insurance contracts. Micro-Cap Portfolio and Small-Cap Portfolio commenced operations on December 27, 1996. |
Classes of shares have equal rights as to earnings and assets, except that each class may bear different fees and expenses for distribution, shareholder servicing, registration and shareholder reports, and receive different compensating balance credits and expense reimbursements. Investment income, realized and unrealized capital gains or losses on investments and foreign currency, and expenses other than those attributable to a specific class are allocated to each class of shares based on its relative net assets. |
The preparation of financial statements in conformity with accounting principles generally accepted in the United States requires management to make estimates and assumptions that affect the reported amounts of assets and liabilities and the disclosure of contingent assets and liabilities at the date of the financial statements and the reported amounts of income and expenses during the reporting period. Actual results could differ from those estimates. |
The Fund is an investment company and accordingly follows the investment company accounting and reporting guidance of the Financial Accounting Standards Board (FASB) Accounting Standard Codification Topic 946 “Financial Services-Investment Companies”. |
| |
| VALUATION OF INVESTMENTS: |
Securities are valued as of the close of trading on the New York Stock Exchange (NYSE) (generally 4:00 p.m. Eastern time) on the valuation date. Securities that trade on an exchange, and securities traded on Nasdaq’s Electronic Bulletin Board, are valued at their last reported sales price or Nasdaq official closing price taken from the primary market in which each security trades or, if no sale is reported for such day, at their highest bid price. Other over-the-counter securities for which market quotations are readily available are valued at their highest bid price, except in the case of some bonds and other fixed income securities which may be valued by reference to other securities with comparable ratings, interest rates and maturities, using established independent pricing services. The Funds value their non-U.S. dollar denominated securities in U.S. dollars daily at the prevailing foreign currency exchange rates as quoted by a major bank. Securities for which market quotations are not readily available are valued at their fair value in accordance with the provisions of the 1940 Act, under procedures approved by the Fund’s Board of Trustees, and are reported as Level 3 securities. As a general principle, the fair value of a security is the amount which the Fund might reasonably expect to receive for the security upon its current sale. However, in light of the judgment involved in fair valuations, there can be no assurance that a fair value assigned to a particular security will be the amount which the Fund might be able to receive upon its current sale. In addition, if, between the time trading ends on a particular security and the close of the customary trading session on the NYSE, events occur that are significant and may make the closing price unreliable, a Fund may fair value the security. The Funds use an independent pricing service to provide fair value estimates for relevant non-U.S. equity securities on days when the U.S. market volatility exceeds a certain threshold. This pricing service uses proprietary correlations it has developed between the movement of prices of non-U.S. equity securities and indices of U.S.-traded securities, futures contracts and other indications to estimate the fair value of relevant non-U.S. securities. When fair value pricing is employed, the prices of securities used by a Fund may differ from quoted or published prices for the same security. Investments in money market funds are valued at net asset value per share. |
Various inputs are used in determining the value of each Fund’s investments, as noted above. These inputs are summarized in the three broad levels below: |
| | | Level 1 | – | quoted prices in active markets for identical securities. |
| | | Level 2 | – | other significant observable inputs (including quoted prices for similar securities, foreign securities that may be fair valued and repurchase agreements). The table below includes all Level 2 securities. Level 2 securities with values based on quoted prices for similar securities are noted in the Schedules of Investments. |
| | | Level 3 | – | significant unobservable inputs (including last trade price before trading was suspended, or at a discount thereto for lack of marketability or otherwise, market price information regarding other securities, information received from the company and/or published documents, including SEC filings and financial statements, or other publicly available information). |
The inputs or methodology used for valuing securities are not necessarily an indication of the risk associated with investing in those securities. |
The following is a summary of the inputs used to value each Fund’s investments as of June 30, 2015. For a detailed breakout of common stocks by sector classification, please refer to the Schedules of Investments. |
| | | LEVEL 1 | | LEVEL 2 | | LEVEL 3 | | TOTAL |
| |
| Micro-Cap Portfolio | | | | | | | | | | | | | | | | |
| Common Stocks | | $ | 437,152,658 | | | $ | 1,048,975 | | | $ | 495,485 | | | $ | 438,697,118 | |
| |
| Cash Equivalents | | | 12,718,398 | | | | 38,242,000 | | | | – | | | | 50,960,398 | |
| |
| Royce Capital Fund 2015 Semiannual Report to Shareholders | 19 |
| Notes to Financial Statements (unaudited) (continued) |
| VALUATION OF INVESTMENTS (continued): | | | | | | | | | | | | | |
| | | | LEVEL 1 | | | LEVEL 2 | | | LEVEL 3 | | | TOTAL | |
| |
| Small-Cap Portfolio | | | | | | | | | | | | | |
| Common Stocks | | | $ 766,587,078 | | | $ – | | | $ – | | | $ 766,587,078 | |
| |
| Cash Equivalents | | | – | | | 19,731,000 | | | – | | | 19,731,000 | |
| |
For the six months ended June 30, 2015, certain securities have transferred in and out of Level 1 and Level 2 measurements. The Funds recognize transfers between levels as of the end of the reporting period. At June 30, 2015, securities valued at $13,642,339 were transferred from Level 2 to Level 1 for Royce Micro-Cap Portfolio within the fair value hierarchy.
Level 3 Reconciliation:
| | | | BALANCE AS OF 12/31/14 | | | UNREALIZED GAIN (LOSS)1 | | | BALANCE AS OF 6/30/15 | |
| |
| Micro-Cap Portfolio | | | | | | | | | | |
| |
| Common Stocks | | | $495,485 | | | $ – | | | $495,485 | |
| |
| 1 | The net change in unrealized appreciation (depreciation) is included in the accompanying Statement of Operations. Change in unrealized appreciation (depreciation) includes net unrealized appreciation (depreciation) resulting from changes in investment values during the reporting period and the reversal of previously recorded unrealized appreciation (depreciation) when gains or losses are realized. |
The following table summarizes the valuation techniques used and unobservable inputs approved by the Valuation Committee to determine the fair value of certain, material Level 3 investments. The table does not include Level 3 investments with values derived utilizing prices from prior transactions or third party pricing information with adjustments (e.g. broker quotes, pricing services, net asset values).
| | | | FAIR VALUE AT | | | | | | | | | IMPACT TO VALUATION FROM |
| | | | 6/30/15 | | VALUATION TECHNIQUE(S) | | UNOBSERVABLE INPUT(S) | | RANGE AVERAGE | | | AN INCREASE IN INPUT1 |
| |
| Micro-Cap Portfolio | | | | | | | | | | | | |
| |
| Common Stocks | | | $495,485 | | Market Approach | | Liquidity Discount | | 30% | | | Decrease |
| |
| 1 | This column represents the directional change in the fair value of the Level 3 investments that would result in an increase from the corresponding unobservable input. A decrease to the unobservable input would have the opposite effect. Significant increases and decreases in these unobservable inputs in isolation could result in significantly higher or lower fair value measurements. |
REPURCHASE AGREEMENTS:
The Funds may enter into repurchase agreements with institutions that the Funds’ investment adviser has determined are creditworthy. Each Fund restricts repurchase agreements to maturities of no more than seven days. Securities pledged as collateral for repurchase agreements, which are held until maturity of the repurchase agreements, are marked-to-market daily and maintained at a value at least equal to the principal amount of the repurchase agreement (including accrued interest). Repurchase agreements could involve certain risks in the event of default or insolvency of the counter-party, including possible delays or restrictions upon the ability of each Fund to dispose of its underlying securities.
FOREIGN CURRENCY:
Net realized foreign exchange gains or losses arise from sales and maturities of short-term securities, sales of foreign currencies, expiration of currency forward contracts, currency gains or losses realized between the trade and settlement dates on securities transactions, and the difference between the amounts of dividends, interest, and foreign withholding taxes recorded on each Fund’s books and the U.S. dollar equivalent of the amounts actually received or paid. Net unrealized foreign exchange gains and losses arise from changes in the value of assets and liabilities, including investments in securities at the end of the reporting period, as a result of changes in foreign currency exchange rates.
SECURITIES LENDING:
The Funds loan securities through a lending agent to qualified institutional investors for the purpose of realizing additional income. Collateral for the Funds on all securities loaned is accepted in cash and cash equivalents and invested temporarily by the custodian. The collateral maintained is at least 100% of the current market value of the loaned securities. The market value of the loaned securities is determined at the close of business of the Funds and any additional required collateral is delivered to the Funds on the next business day. The Funds retain the risk of any loss on the securities on loan as well as incurring the potential loss on investments purchased with cash collateral received for securities lending. The Funds’ securities lending income consists of the income earned on investing cash collateral, plus any premium payments received for lending certain securities, less any rebates paid to borrowers and lending agent fees associated with the loan. The lending agent is not affiliated with Royce.
| 20 | Royce Capital Fund 2015 Semiannual Report to Shareholders |
| SECURITIES LENDING (continued): |
The following table presents by financial instrument, each Fund’s assets and liabilities net of related collateral held by each Fund at June 30, 2015:
| | | | GROSS AMOUNT OF ASSETS AND | | | | | | | |
| | | | LIABILITIES IN THE STATEMENTS OF | | | | | | | |
| | | | ASSETS AND LIABILITIES1 | | | COLLATERAL RECEIVED AND PLEDGED | | | NET AMOUNT | |
| |
| Micro-Cap Portfolio | | | | | | | | | | |
| |
| Securities on Loan/Collateral on Loaned Securities | | | $ 12,718,398 | | | $ (12,718,398) | | | $ – | |
| |
| 1 Absent an event of default, assets and liabilities are presented gross and not offset in the Statements of Assets and Liabilities. |
DISTRIBUTIONS AND TAXES:
As qualified regulated investment companies under Subchapter M of the Internal Revenue Code, the Funds are not subject to income taxes to the extent that each Fund distributes substantially all of its taxable income for its fiscal year.
The Funds pay any dividends and capital gain distributions annually in December. Dividends from net investment income are determined at a class level and distributions from capital gains are determined at a Fund level. Because federal income tax regulations differ from generally accepted accounting principles, income and capital gain distributions determined in accordance with tax regulations may differ from net investment income and realized gains recognized for financial reporting purposes. Accordingly, the character of distributions and composition of net assets for tax purposes differ from those reflected in the accompanying financial statements.
INVESTMENT TRANSACTIONS AND RELATED INVESTMENT INCOME:
Investment transactions are accounted for on the trade date. Dividend income is recorded on the ex-dividend date. Non-cash dividend income is recorded at the fair market value of the securities received. Interest income is recorded on an accrual basis. Realized gains and losses from investment transactions are determined on the basis of identified cost for book and tax purposes.
EXPENSES:
The Funds incur direct and indirect expenses. Expenses directly attributable to a Fund are charged to the Fund’s operations, while expenses applicable to more than one series of the Trust are allocated equitably. Certain personnel, occupancy costs and other administrative expenses related to the Funds are allocated by Royce & Associates, LLC (“Royce”) under an administration agreement and are included in administrative and office facilities and legal expenses. The Trust has adopted a deferred fee agreement that allows the Trustees to defer the receipt of all or a portion of trustees’ fees otherwise payable. The deferred fees are invested in certain Royce Funds until distributed in accordance with the agreement.
COMPENSATING BALANCE CREDITS:
The Funds have arrangements with their custodian bank and transfer agent, whereby a portion of the custodian’s fee and transfer agent’s fee is paid indirectly by credits earned on a Fund’s cash on deposit with the bank and transfer agent. These deposit arrangements are an alternative to purchasing overnight investments. Conversely, a Fund pays interest to the custodian on any cash overdrafts, to the extent they are not offset by credits earned on positive cash balances.
LINE OF CREDIT:
The Funds, along with certain other Royce Funds, participate in a $75 million line of credit (“Credit Agreement”) to be used for temporary or emergency purposes. This revolving Credit Agreement expires on October 16, 2015. Pursuant to the Credit Agreement, each participating Fund is liable only for principal and interest payments related to borrowings made by that Fund. Borrowings under the Credit Agreement bear interest at a rate equal to the higher of the federal funds rate + 1.25% or overnight LIBOR + 1.25%. The Funds did not utilize the line of credit during the six months ended June 30, 2015.
| Capital Share Transactions (in shares): |
| | | SHARES SOLD | | SHARES ISSUED FOR REINVESTMENT OF DISTRIBUTIONS | | SHARES REDEEMED | NET INCREASE (DECREASE) IN SHARES OUTSTANDING |
| | | |
| | | | Six Months Ended | | | | | | | | Six Months Ended | | | | | | | | Six Months Ended | | | | | | | | Six Months Ended | | | | | |
| | | | 6/30/15 | | | | Year Ended | | | | 6/30/15 | | | | Year Ended | | | | 6/30/15 | | | | Year Ended | | | | 6/30/15 | | | | Year Ended | |
| | | | (unaudited) | | | | 12/31/14 | | | | (unaudited) | | | | 12/31/14 | | | | (unaudited) | | | | 12/31/14 | | | | (unaudited) | | | | 12/31/14 | |
| |
| Micro-Cap Portfolio | | | | | | | | | | | | | | | | | | | | | | | | | | | | | | | | |
Investment Class | | | 877,291 | | | | 2,766,262 | | | | – | | | | 3,474,741 | | | | (4,288,203 | ) | | | (8,184,466 | ) | | | (3,410,912 | ) | | | (1,943,463 | ) |
| |
Service Class | | | 1,669,427 | | | | 857,026 | | | | – | | | | 195,270 | | | | (1,039,492 | ) | | | (1,819,692 | ) | | | 629,935 | | | | (767,396 | ) |
| |
| Small-Cap Portfolio | | | | | | | | | | | | | | | | | | | | | | | | | | | | | | | | |
Investment Class | | | 2,414,840 | | | | 6,738,487 | | | | – | | | | 5,602,257 | | | | (5,270,152 | ) | | | (19,656,878 | ) | | | (2,855,312 | ) | | | (7,316,134 | ) |
| |
Service Class | | | 8,020,942 | | | | 8,085,397 | | | | – | | | | 2,110,354 | | | | (5,508,702 | ) | | | (9,568,161 | ) | | | 2,512,240 | | | | 627,590 | |
| |
| Royce Capital Fund 2015 Semiannual Report to Shareholders | 21 |
| Notes to Financial Statements (unaudited) (continued) |
Investment Adviser and Distributor:
INVESTMENT ADVISER:
Under the Trust’s investment advisory agreements with Royce, Royce is entitled to receive Investment Advisory fees that are computed daily and payable monthly, at an annual rate of 1.25% and 1.00% of the average net assets of Micro-Cap Portfolio and Small-Cap Portfolio, respectively. For the six months ended June 30, 2015, Micro-Cap Portfolio recorded advisory fees of $3,039,613 and Small-Cap Portfolio recorded advisory fees of $3,905,258.
DISTRIBUTOR:
Royce Fund Services, Inc. (“RFS”), the distributor of the Trust’s shares, is a wholly owned subsidiary of Royce. RFS is entitled to receive distribution fees from each Fund’s Service Class that are computed daily and payable monthly, at an annual rate of 0.25% of the average net assets of each Class. For the six months ended June 30, 2015, Micro-Cap Portfolio-Service Class recorded net distribution fees of $37,261 and Small-Cap Portfolio-Service Class recorded net distribution fees of $283,992.
Purchases and Sales of Investment Securities:
For the six months ended June 30, 2015, the costs of purchases and the proceeds from sales of investment securities, other than short-term securities and collateral received for securities loaned, were as follows:
| | | PURCHASES | | SALES |
| |
| Micro-Cap Portfolio | | $116,335,464 | | $151,036,389 |
| |
| Small-Cap Portfolio | | 192,218,430 | | 190,780,001 |
| |
Class Specific Expenses:
Class specific expenses were as follows for the six months ended June 30, 2015:
| | | | | | | | | | | | | | | | | | | | | | | CLASS LEVEL |
| | | | | | | | | | | | | | | | | | | | | | | EXPENSES |
| | | | | | | | | | | | | | | | | | | | | | | REIMBURSED BY |
| | | NET DISTRIBUTION | | SHAREHOLDER | | SHAREHOLDER | | TRANSFER AGENT | | | | | | INVESTMENT |
| | | FEES | | SERVICING | | REPORTS | | BALANCE CREDITS | | TOTAL | | ADVISER |
| |
| Micro-Cap Portfolio – Investment Class | | $ | – | | | $ | 3,491 | | | $ | 12,236 | | | $ | (1) | | | $ | 15,726 | | | $ | – |
| |
| Micro-Cap Portfolio – Service Class | | | 37,261 | | | | 3,110 | | | | 1,355 | | | | – | | | | 41,726 | | | | 1,036 |
| |
| | | | 37,261 | | | | 6,601 | | | | 13,591 | | | | (1) | | | | | | | | 1,036 |
| |
| Small-Cap Portfolio – Investment Class | | | – | | | | 3,384 | | | | 23,676 | | | | (1) | | | | 27,059 | | | | – |
| |
| Small-Cap Portfolio – Service Class | | | 283,992 | | | | 3,123 | | | | 7,517 | | | | – | | | | 294,632 | | | | – |
| |
| | | | 283,992 | | | | 6,507 | | | | 31,193 | | | | (1) | | | | | | | | |
| |
TAX INFORMATION:
At June 30, 2015, net unrealized appreciation (depreciation) based on identified cost for tax purposes was as follows:
| | | | | | | | | NET UNREALIZED | | | GROSS UNREALIZED |
| | | | | | | | | | | | | |
| | | | | TAX BASIS COST | | | | APPRECIATION (DEPRECIATION) | | | Appreciation | | | Depreciation |
| |
| Micro-Cap Portfolio | | | | $450,227,338 | | | | $ 39,430,178 | | | | $ 97,812,760 | | | | $ 58,382,582 |
| |
| Small-Cap Portfolio | | | | 666,645,675 | | | | 119,672,403 | | | | 153,976,825 | | | | 34,304,422 |
| |
The primary difference between book and tax basis cost is the timing of the recognition of losses on securities sold.
Transactions in Affiliated Companies:
An “Affiliated Company” as defined in the Investment Company Act of 1940, is a company in which a fund owns 5% or more of the company’s outstanding voting securities at any time during the period. The following transactions were effected in shares of such companies for the six months ended June 30, 2015:
| | | SHARES | | MARKET VALUE | | COST OF | | COST OF | | REALIZED | | DIVIDEND | | | SHARES | | MARKET VALUE |
| AFFILIATED COMPANY | | 12/31/14 | | 12/31/14 | | PURCHASES | | SALES | | GAIN (LOSS) | | INCOME | | | 6/30/15 | | 6/30/15 |
| |
| Micro-Cap Portfolio | | | | | | | | | | | | | | | | | | | | | | | | | | | | | | | | |
| |
| Key Technology | | 313,129 | | | $ | 4,008,051 | | | $ | 150,000 | | | $ | 141,100 | | | $ | (11,700 | ) | | | $ | – | | | | 315,129 | | | $ | 4,159,703 | |
| |
| | | | | | | 4,008,051 | | | | | | | | | | | | (11,700 | ) | | | | – | | | | | | | | 4,159,703 | |
| |
| Small-Cap Portfolio | | | | | | | | | | | | | | | | | | | | | | | | | | | | | | | | |
| |
| Key Tronic | | 607,681 | | | | 4,824,987 | | | | – | | | | 90,125 | | | | (19,349 | ) | | | | – | | | | 600,081 | | | | 6,522,881 | |
| |
| Miller Industries | | 649,645 | | | | 13,506,119 | | | | 430,111 | | | | 146,482 | | | | 331 | | | | | 212,302 | | | | 663,445 | | | | 13,235,728 | |
| |
| TESSCO Technologies | | 428,561 | | | | 12,428,269 | | | | 149,710 | | | | 702,476 | | | | (332,721 | ) | | | | 169,894 | | | | 417,695 | | | | 8,274,538 | |
| |
| | | | | | | 30,759,375 | | | | | | | | | | | | (351,739 | ) | | | | 382,196 | | | | | | | | 28,033,147 | |
| |
| 22 | Royce Capital Fund 2015 Semiannual Report to Shareholders |
| Understanding Your Fund’s Expenses (unaudited) |
As a shareholder of a mutual fund, you pay ongoing expenses, including management fees and other Fund expenses including, for some funds, distribution and/or service (12b-1) fees. Using the information below, you can estimate how these ongoing expenses (in dollars) affect your investment and compare them with the ongoing expenses of other funds. You may also incur one-time transaction expenses which are not shown in this section and would result in higher total costs. The example is based on an investment of $1,000 invested at January 1, 2015, and held for the entire six-month period ended June 30, 2015. Service Class shares are generally available only through certain insurance companies who receive service fees from the Fund for services that they perform.
Actual Expenses
The first part of the table below provides information about actual account values and actual expenses. You may use the information in this section, together with the amount you invested, to estimate the expenses that you paid over the period. Simply divide your account value at June 30, 2015, by $1,000 (for example, an $8,600 account value divided by $1,000 = 8.6), then multiply the result by the number under the heading entitled “Expenses Paid During the Period” to estimate the expenses you paid on your account during this period.
Hypothetical Example for Comparison Purposes
The second part of the table below provides information about hypothetical account values and hypothetical expenses based on the Fund’s actual expense ratio and an assumed rate of return of 5% per year before expenses, which is not the Fund’s actual return. The hypothetical account values and expenses may not be used to estimate the actual ending account balance or expenses you paid for the period. You may use this information to compare the ongoing costs of investing in the Fund and other funds. To do so, compare this 5% hypothetical example with the 5% hypothetical examples that appear in the shareholder reports of the other funds.
Please note that the expenses shown in the table are meant to highlight your ongoing costs only and do not reflect any transactional costs, such as sales charges (loads), redemption fees, or exchange fees. Therefore, this section is useful in comparing ongoing costs only, and will not help you determine the relative total costs of owning different funds. In addition, if these transactional costs were included, your costs would have been higher.
| | | ACTUAL | | | HYPOTHETICAL (5% PER YEAR RETURN BEORE EXPENSES) |
| | |
|
| | | Beginning
Account Value | | Ending
Account Value | | Expenses Paid
During | | | Beginning
Account Value | | | Ending
Account Value | | Expenses Paid
During | | Annualized
Expense | |
| | | 1/1/15 | | 6/30/15 | | the Period1 | | | 1/1/15 | | | 6/30/15 | | the Period1 | | Ratio2 | |
| |
Investment Class
Micro-Cap Portfolio | | $ | 1,000.00 | | $ | 989.45 | | $ | 6.46 | | | $ | 1,000.00 | | | $ | 1,018.30 | | $ | 6.56 | | | 1.31% | |
| |
| Small-Cap Portfolio | | | 1,000.00 | | | 996.84 | | | 5.20 | | | | 1,000.00 | | | | 1,019.59 | | | 5.26 | | | 1.05% | |
| |
Service Class
Micro-Cap Portfolio | | | 1,000.00 | | | 987.53 | | | 7.79 | | | | 1,000.00 | | | | 1,016.96 | | | 7.90 | | | 1.58% | |
| |
| Small-Cap Portfolio | | | 1,000.00 | | | 995.98 | | | 6.43 | | | | 1,000.00 | | | | 1,018.35 | | | 6.51 | | | 1.30% | |
| |
| 1 | Expenses are equal to the Fund’s annualized expense ratio multiplied by the average account value for the period, multiplied by 181 days in the most recent fiscal half-year divided by 365 days (to reflect the half-year period). This information does not include fees or expenses of the variable annuity contracts investing in the Fund. |
| 2 | Annualized expense ratio used to derive figures in the table is based on the most recent fiscal half-year. |
| Royce Capital Fund 2015 Semiannual Report to Shareholders | 23 |
| All Trustees and Officers may be reached c/o The Royce Funds, 745 Fifth Avenue, New York, NY 10151 |
| Charles M. Royce, Trustee1 |
| Age: 75 | Number of Funds Overseen: 27 | Tenure: Since 1982 |
| Non-Royce Directorships: Director of TICC Capital Corp. |
| Principal Occupation(s) During Past Five Years: Chief Executive Officer and a Member of the Board of Managers of Royce & Associates, LLC (“Royce”), the Trust’s investment adviser. |
| |
| Christopher D. Clark, Trustee1, President |
| Age: 50 | Number of Funds Overseen: 27 | Tenure: Since 2014 |
| Principal Occupation(s) During Past Five Years: President (since July 2014), Co-Chief Investment Officer (since January 2014), Managing Director and, since June 2015, a Member of the Board of Managers of Royce having been employed by Royce since May 2007. |
| |
| |
| |
| Patricia W. Chadwick, Trustee |
| Age: 66 | Number of Funds Overseen: 27 | Tenure: Since 2009 |
| Non-Royce Directorships: Trustee of ING Mutual Funds and Director of Wisconsin Energy Corp. |
| Principal Occupation(s) During Past 5 Years: Consultant and President of Ravengate Partners LLC (since 2000). |
| |
| Richard M. Galkin, Trustee |
| Age: 77 | Number of Funds Overseen: 27 | Tenure: Since 1982 |
| Non-Royce Directorships: None |
| Principal Occupation(s) During Past Five Years: Private investor. Mr. Galkin’s prior business experience includes having served as President of Richard M. Galkin Associates, Inc., telecommunications consultants, President of Manhattan Cable Television (a subsidiary of Time, Inc.), President of Haverhills Inc. (another Time, Inc. subsidiary), President of Rhode Island Cable Television, and Senior Vice President of Satellite Television Corp. (a subsidiary of Comsat). |
| |
| Stephen L. Isaacs, Trustee |
| Age: 75 | Number of Funds Overseen: 27 | Tenure: Since 1989 |
| Non-Royce Directorships: None |
| Principal Occupation(s) During Past Five Years: Attorney and President of Health Policy Associates, Inc., consultants. Mr. Isaacs’s prior business experience includes having served as President of the Center for Health and Social Policy (from 1996 to 2012); Director of Columbia University Development Law and Policy Program and Professor at Columbia University (until August 1996). |
| |
| Arthur S. Mehlman, Trustee |
| Age: 73 | Number of Funds Overseen: 45 | Tenure: Since 2004 |
| Non-Royce Directorships: Director/Trustee of registered investment companies constituting the 18 Legg Mason Funds. |
| Principal Occupation(s) During Past Five Years: Director of The League for People with Disabilities, Inc.; Director of University of Maryland Foundation (non-profits). Formerly: Director of Municipal Mortgage & Equity, LLC (from October 2004 to April 1, 2011); Director of University of Maryland College Park Foundation (non-profit) (from 1998 to 2005); Partner, KPMG LLP (international accounting firm) (from 1972 to 2002); Director of Maryland Business Roundtable for Education (from July 1984 to June 2002). |
| |
| David L. Meister, Trustee |
| Age: 75 | Number of Funds Overseen: 27 | Tenure: Since 1982 |
| Non-Royce Directorships: None |
| Principal Occupation(s) During Past Five Years: Consultant. Chairman and Chief Executive Officer of The Tennis Channel (from June 2000 to March 2005). Mr. Meister’s prior business experience includes having served as Chief Executive Officer of Seniorlife.com, a consultant to the communications industry, President of Financial News Network, Senior Vice President of HBO, President of Time-Life Films, and Head of Broadcasting for Major League Baseball. |
| |
| G. Peter O’Brien, Trustee |
| Age: 69 | Number of Funds Overseen: 45 | Tenure: Since 2001 |
| Non-Royce Directorships: Director/Trustee of registered investment companies constituting the 18 Legg Mason Funds; Director of TICC Capital Corp. |
| Principal Occupation(s) During Past Five Years: Trustee Emeritus of Colgate University (since 2005); Board Member of Hill House, Inc. (since 1999); Formerly: Trustee of Colgate University (from 1996 to 2005), President of Hill House, Inc. (from 2001 to 2005) and Managing Director/Equity Capital Markets Group of Merrill Lynch & Co. (from 1971 to 1999). |
| |
| Michael K. Shields, Trustee |
| Age: 57 | Number of Funds Overseen: 27 | Tenure: Since 2015 |
| Principal Occupation(s) During Past Five Years: President and Chief Executive Officer of Piedmont Trust Company, a private North Carolina trust company (since May 2012). Mr. Shields’s prior business experience includes owning Shields Advisors, an investment consulting firm (from April 2010 to June 2012). |
| |
| |
| |
| Francis D. Gannon, Vice President |
| Age: 47 | Tenure: Since 2014 |
| Principal Occupation(s) During Past Five Years: Co-Chief Investment Officer (since January 2014) and Managing Director of Royce, having been employed by Royce since September 2006. |
| |
| Daniel A. O’Byrne, Vice President |
| Age: 53 | Tenure: Since 1994 |
| Principal Occupation(s) During Past Five Years: Principal and Vice President of Royce, having been employed by Royce since October 1986. |
| |
| Peter K. Hoglund, Treasurer |
| Age: 49 | Tenure: Since 2015 |
| Principal Occupation(s) During Past Five Years: Principal, Chief Financial Officer, and Chief Administrative Officer of Royce, having been employed by Royce since December 2014. Prior to joining Royce, Mr. Hoglund spent more than 20 years with Munder Capital Management in Birmingham, MI, serving as Managing Director and Chief Financial Officer and overseeing all financial aspects of the firm. He began his career at Munder as a portfolio manager. |
| |
| John E. Denneen, Secretary and Chief Legal Officer |
| Age: 48 | Tenure: 1996-2001 and Since 2002 |
| Principal Occupation(s) During Past Five Years: General Counsel and, since June 2015, a Member of the Board of Managers of Royce; Chief Legal and Compliance Officer and Secretary of Royce; Secretary and Chief Legal Officer of The Royce Funds. |
| |
| Lisa Curcio, Chief Compliance Officer |
| Age: 55 | Tenure: Since 2004 |
| Principal Occupation(s) During Past Five Years: Chief Compliance Officer of The Royce Funds (since October 2004) and Compliance Officer of Royce (since June 2004). |
| 1 | Interested Trustee. |
| | Trustees will hold office until their successors have been duly elected and qualified or until their earlier resignation or removal. The Statement of Additional Information, which contains additional information about the Trust’s trustees and officers, is available and can be obtained without charge at www.roycefunds.com or by calling (800) 221-4268. |
| 24 | Royce Capital Fund 2015 Semiannual Report to Shareholders |
Board Approval of Investment Advisory Agreements
At meetings held on June 3-4, 2015, the Board of Trustees of Royce Capital Fund (the “Board”), including all of the non-interested trustees, approved the continuance of the Investment Advisory Agreements between Royce & Associates, LLC (“R&A”) and Royce Capital Fund (“RCF”) relating to each of Royce Micro-Cap Portfolio and Royce Small-Cap Portfolio (together, the “Funds”). In reaching these decisions, the Board reviewed the materials provided by R&A, which included, among other things, information prepared internally by R&A and independently by Morningstar Associates, LLC (“Morningstar”) containing detailed expense ratio and investment performance comparisons for each Fund with other mutual funds in its “peer group” and “category”, information regarding the past performance of the Funds and other registered investment companies managed by R&A and a memorandum outlining the legal duties of the Board prepared by independent counsel to the non-interested trustees. R&A also provided the trustees with an analysis of its profitability with respect to providing investment advisory services to each of the Funds. In addition, the Board took into account information furnished throughout the year at regular Board meetings, including reports on investment performance, shareholder services, distribution fees and expenses, regulatory compliance, brokerage commissions and research, and brokerage and execution products and services provided to the Funds. The Board also considered other matters it deemed important to the approval process such as allocation of brokerage commissions, “soft dollar” research services R&A receives, payments made to affiliates of R&A, as well as payments made by R&A, relating to distribution of Fund shares and other direct and indirect benefits to R&A and its affiliates, from their relationship with the Funds. The trustees also met throughout the year with investment advisory personnel from R&A. The Board, in its deliberations, recognized that, for many of the Funds’ shareholders, the decision to purchase Fund shares included a decision to select R&A as the investment adviser and that there was a strong association in the minds of Fund shareholders between R&A and each Fund. In considering factors relating to the approval of the continuance of the Investment Advisory Agreements, the non-interested trustees received with assistance and advice from, and met separately with, their independent legal counsel. While the Investment Advisory Agreements for the Funds were considered at the same Board meeting, the trustees dealt with each agreement separately. Among other factors, the trustees noted that they considered the following:
The nature, extent and quality of services provided by R&A:
The trustees considered the following factors to be of fundamental importance to their consideration of whether to approve the continuance of the Funds’ Investment Advisory Agreements: (i) R&A’s more than 40 years of value investing experience and track record; (ii) the history of long-tenured R&A portfolio managers managing the Funds; (iii) R&A’s focus on mid-cap, small-cap and micro-cap value investing; (iv) the consistency of R&A’s approach to managing open-end mutual funds and closed-end funds over more than 40 years; (v) the integrity and high ethical standards adhered to at R&A; (vi) R&A’s specialized experience in the area of trading small-and micro-cap securities; (vii) R&A’s historical ability to attract and retain portfolio management talent and (viii) R&A’s focus on shareholder interests as exemplified by capping expenses on smaller funds and expansive shareholder reporting and communications. The trustees reviewed the services that R&A provides to the Funds, including, but not limited to, managing each Fund’s investments in accordance with the stated policies of each Fund. The Board considered the fact that R&A provided certain administrative services to the Funds at cost pursuant to the Administration Agreement between RCF and R&A which went into effect on January 1, 2008. The trustees determined that the services to be provided to each Fund by R&A would be the same as those that it previously provided to each Fund. They also took into consideration the histories, reputations and backgrounds of R&A’s portfolio managers for the Funds, finding that these would likely have an impact on the continued success of the Funds. Lastly, the trustees noted R&A’s ability to attract qualified and experienced personnel. The trustees concluded that the investment advisory services provided by R&A to each Fund compared favorably to services provided by R&A to other R&A client accounts, including other funds, in both nature and quality, and that the scope of services provided by R&A would continue to be suitable for each Fund.
Investment performance of the Funds and R&A:
In light of R&A’s risk-averse approach to investing, the trustees believe that risk-adjusted performance continues to be the most appropriate measure of each Fund’s investment performance. One measure of risk-adjusted performance the trustees have historically used in their review of each Fund’s performance is the Sharpe Ratio. The Sharpe Ratio is a risk-adjusted measure of performance developed by Nobel Laureate William Sharpe. It is calculated by dividing a fund’s annualized excess returns by its annualized standard deviation to determine reward per unit of risk. The higher the Sharpe Ratio, the better a fund’s historical risk-adjusted performance. The Board attaches primary importance to risk-adjusted performance over relatively long periods of time, typically 3 to 10 years. The trustees noted that Royce Small-Cap Portfolio’s (“RCS”) Sharpe Ratio placed in the 4th quartile, 3rd quartile, and 2nd quartile within Morningstar’s Small Blend category for the 3-year, 5-year, and 10-year periods, respectively, ended December 31, 2014. The Board also noted that Royce Micro-Cap Portfolio’s (“RCM”) Sharpe Ratio ranked in the 4th quartile within Morningstar’s Small Blend category for each of the 3-year, 5-year, and 10-year periods ended December 31, 2014. It was noted that RCS’s and RCM’s focus on high quality companies (e.g., those with solid balance sheets, low leverage, the ability to generate and effectively allocate free cash flow, and strong returns on invested capital) had hurt their relative performance during the recent market period that has been marked by historically low interest rates and U.S. Federal Reserve market intervention.
In addition to each Fund’s risk–adjusted performance, the Board also reviewed and considered each Fund’s absolute total returns, down market performance, and long-term performance records over periods of 10 years or longer. Each Board also considered it important to look beyond the current snapshot of performance as of December 31, 2014 and therefore examined extended performance histories for each Fund using monthly rolling average return periods through March 31, 2015.
The trustees noted that R&A manages a number of funds that invest in micro-cap, small-cap, and mid-cap issuers, many of which had outperformed their benchmark indices and their competitors during preceding periods. Although the trustees recognized that past performance is not necessarily an indicator of future results, they found that R&A had the necessary qualifications, experience and track record in managing equity mutual funds to manage each Fund. The trustees determined that R&A continued to be an appropriate investment adviser for each Fund and concluded that each Fund’s performance supported the continuation of its Agreement.
Cost of the services provided and profits realized by R&A from its relationship with each Fund:
The trustees considered the cost of the services provided by R&A and the profits realized by R&A from its relationship with each Fund. As part of the analysis, the Board discussed with R&A its methodology in allocating its costs to each Fund and concluded that its allocations were reasonable. The trustees concluded that R&A’s profits were reasonable in relation to the nature and quality of services provided.
The extent to which economies of scale would be realized as the Funds grow and whether fee levels would reflect such economies of scale:
The trustees considered whether there have been economies of scale in respect of the management of each Fund, whether each Fund has appropriately benefited from any economies of scale and whether there is potential for realization of any further economies of
Royce Capital Fund 2015 Semiannual Report to Shareholders | 25
Board Approval of Investment Advisory Agreements (continued)
scale. The trustees noted the time and effort involved in managing portfolios of small- and micro-cap stocks and that they did not involve the same efficiencies as do portfolios of large-cap stocks. The trustees concluded that the current fee structure for each Fund was reasonable, that shareholders sufficiently participated in economies of scale and that no changes were currently necessary.
Comparison of services to be rendered and fees to be paid to those under other investment advisory contracts, such as contracts of the same and other investment advisers or other clients:
The trustees reviewed the investment advisory fee paid by each Fund and compared both the services to be rendered and the fees to be paid under the Investment Advisory Agreements to other contracts of R&A and to contracts of other investment advisers to registered investment companies investing in small- and micro-cap stocks, as provided by Morningstar. The trustees noted the importance of the net expense ratio in measuring a fund’s efficiency, particularly in light of the variations in the mutual fund industry as to which entity is responsible for particular types of expenses. It was noted that RCM’s net expense ratio of 1.30% placed in the middle quintile within its peer group and was two basis points higher than its peer group median. The trustees noted that RCS’s net expense ratio of 1.05% placed in the 4th quartile, 16 basis points higher than its peer group median, due to its higher investment advisory fee compared to its peer group median.
The Board also noted that R&A manages each Fund in an active fashion. The industry accepted metric for measuring how actively an equity portfolio is managed is called “active share.” In particular, active share measures how much the holdings of an equity portfolio differ from the holdings of its appropriate passive benchmark index. At the extremes, a portfolio with no holdings in common with the benchmark would have 100% active share, while a portfolio that is identical to the benchmark would have 0% active share. R&A presented a chart to the Board which demonstrated that mutual funds with high active share scores had higher expense ratios than mutual funds with lower active share scores due to the resources required for the active management of those funds.
The trustees noted that R&A had, from time to time, waived advisory fees in order to maintain expense ratios at competitive levels. The trustees also considered fees charged by R&A to institutional and other clients and noted that, given the greater levels of service that R&A provides to registered investment companies such as the Funds as compared to other accounts, each Fund’s advisory fees compared favorably to these other accounts.
It was noted that no single factor was cited as determinative to the decision of the Board. Rather, after weighing all of the considerations and conclusions discussed above, the entire Board, including all of the non-interested trustees, determined to approve the renewal of the existing Investment Advisory Agreements, concluding that a contract renewal on the existing terms was in the best interest of the shareholders of each Fund and that each investment advisory fee rate was reasonable in relation to the services provided.
26 | Royce Capital Fund 2015 Semiannual Report to Shareholders
Notes to Performance and Other Important Information
The thoughts expressed in this report concerning recent market movements and future prospects for small company stocks are solely the opinion of Royce at June 30, 2015, and, of course, historical market trends are not necessarily indicative of future market movements. Statements regarding the future prospects for particular securities held in the Funds’ portfolios and Royce’s investment intentions with respect to those securities reflect Royce’s opinions as of June 30, 2015 and are subject to change at any time without notice. There can be no assurance that securities mentioned in this report will be included in any Royce-managed portfolio in the future.
Sector weightings are determined using the Global Industry Classification Standard (“GICS”). GICS was developed by, and is the exclusive property of, Standard & Poor’s Financial Services LLC (“S&P”) and MSCI Inc. (“MSCI”). GICS is the trademark of S&P and MSCI. “Global Industry Classification Standard (GICS)” and “GICS Direct” are service marks of S&P and MSCI.
All indexes referenced are unmanaged and capitalization weighted. Each index’s returns include net reinvested dividends and/or interest income. Russell Investment Group is the source and owner of the trademarks, service marks, and copyrights related to the Russell Indexes. Russell® is a trademark of Russell Investment Group. The Russell 2000 is an index of domestic small-cap stocks. It measures the performance of the 2,000 smallest publicly traded U.S. companies in the Russell 3000 Index. The Russell Microcap Index includes 1,000 of the smallest securities in the small-cap Russell 2000 Index along with the next smallest eligible securities as determined by Russell. The Russell Midcap Index measures the performance of the mid-cap segment of the U.S. equity universe. It includes approximately 800 of the smallest securities in the Russell 1000 Index. The Russell 1000 Index is an index of domestic large-cap stocks. It measures the performance of the 1,000 largest publicly traded U.S. companies in the Russell 3000 Index. The Russell Global ex-U.S. Small Cap Index is an index of global small-cap stocks, excluding the United States. The Russell Global ex-U.S. Large-Cap Index is an index of global large-cap stocks, excluding the United States. The S&P 500 is an index of U.S. large-cap stocks selected by Standard & Poor’s based on market size, liquidity, and industry grouping, among other factors. The Nasdaq Composite is an index of the more than 3,000 common equities listed on the Nasdaq stock exchange. The performance of an index does not represent exactly any particular investment, as you cannot invest directly in an index. Returns for the market indexes used in this report were based on information supplied to Royce by Russell Investments. Royce has not independently verified the above described information. The Royce Funds is a service mark of The Royce Funds. Distributor: Royce Fund Services, Inc.
The Price-Earnings, or P/E, Ratio is calculated by dividing a company’s share price by its trailing 12-month earnings-per share (EPS). The Price-to-Book, or P/B, Ratio is calculated by dividing a company’s share price by its book value per share. The Morningstar Style Map uses proprietary scores of a stock’s value and growth characteristics to determine its placement in one of the five categories listed on the horizontal axis. These characteristics are then compared to those of other stocks within the same market capitalization band. Each is scored from zero to 100 for both value and growth attributes. The value score is subtracted from the growth score to determine the overall style score. Standard deviation is a statistical measure within which a fund’s total returns have varied over time. The greater the standard deviation, the greater a fund’s volatility. The value score is subtracted from the growth score to determine the overall style score. For the vertical, market cap axis, Morningstar subdivides into size groups. Giant-cap stocks are defined as those that account for the top 40% of the capitalization of each style zone; large-cap stocks represent the next 30%; mid-cap stocks the next 20%; small-cap stocks the next 7%; micro-cap stocks the smallest 3%. The Royce Funds is a service mark of The Royce Funds. Distributor: Royce Fund Services, Inc.
Royce Capital Fund–Micro-Cap Portfolio invests primarily in securities of micro-cap companies and Royce Capital Fund–Small-Cap Portfolio invests primarily in securities of small-cap companies. Investments in these types of companies may involve considerably more risk than investments in securities of larger-cap companies. (Please see “Primary Risks for Fund Investors” in the prospectus.) Royce Capital Fund–Micro-Cap Portfolio and Royce Capital Fund–Small-Cap Portfolio may each invest up to 25% its assets in foreign securities that may involve political, economic, currency, and other risks not encountered in U.S. investments. (Please see “Investing in Foreign Securities” in the prospectus.) A Fund that invests a significant portion of its assets in a limited number of stocks may be subject to considerably more risk than a more broadly diversified Fund because a decline in the value of any of these stocks would cause that Fund’s overall value to decline to a greater degree. A broadly diversified portfolio does not, however, ensure a profit for a Fund or guarantee against loss. Please read the prospectus carefully before investing or sending money.
Forward-Looking Statements
This material contains forward-looking statements within the meaning of the Securities Exchange Act of 1934, as amended (the “Exchange Act”), that involve risks and uncertainties, including, among others, statements as to:
| • | the Funds’ future operating results, |
| • | the prospects of the Funds’ portfolio companies, |
| • | the impact of investments that the Funds have made or may make, |
| • | the dependence of the Funds’ future success on the general economy and its impact on the companies and industries in which the Funds invest, and |
| • | the ability of the Funds’ portfolio companies to achieve their objectives. |
This review and report use words such as “anticipates,” “believes,” “expects,” “future,” “intends,” and similar expressions to identify forward-looking statements. Actual results may differ materially from those projected in the forward-looking statements for any reason.
The Royce Funds have based the forward-looking statements included in this review and report on information available to us on the date of the report, and we assume no obligation to update any such forward-looking statements. Although The Royce Funds undertake no obligation to revise or update any forward-looking statements, whether as a result of new information, future events, or otherwise, you are advised to consult any additional disclosures that we may make through future shareholder communications or reports.
Proxy Voting
A copy of the policies and procedures that The Royce Funds use to determine how to vote proxies relating to portfolio securities and information regarding how each of The Royce Funds voted proxies relating to portfolio securities during the most recent 12-month period ended June 30 is available, without charge, on The Royce Funds’ website at www.roycefunds.com, by calling (800) 221-4268 (toll-free), and on the website of the Securities and Exchange Commission (“SEC”) at www.sec.gov.
Form N-Q Filing
The Funds file their complete schedules of investments with the SEC for the first and third quarters of each fiscal year on Form N-Q. The Funds’ Forms N-Q are available on The Royce Funds’ website at www.roycefunds.com and on the SEC’s website at www.sec.gov. The Funds’ Forms N-Q may also be reviewed and copied at the SEC’s Public Reference Room in Washington, D.C. To find out more about this public service, call the SEC at (202) 942-8090. The Funds’ complete schedules of investments are updated quarterly and are available at www.roycefunds.com.
Royce Capital Fund 2015 Semiannual Report to Shareholders | 27
| This page is intentionally left blank. |
| | | | | |
| | | | | |
| | | | | |
| | | | | |
| | | | | |
| |
 | |
| |
| | | | | |
| | | | | |
| | | | | |
| | About The Royce Funds | | | |
| | | | | |
| | | | | |
| | Wealth of Experience
With approximately $27 billion in total assets under management, Royce & Associates is committed to the same investment principles that have served us well for more than 40 years. Chuck Royce, our Chief Executive Officer, enjoys one of the longest tenures of any active mutual fund manager. Royce’s investment staff also includes 23 portfolio managers and analysts and eight traders. | | | |
| | | | | |
| | Multiple Funds, Common Focus
Our goal is to offer both individual and institutional investors the best available micro-cap, small-cap, and/or mid-cap portfolios. We have chosen to concentrate on smaller-company investing by providing investors with a range of funds that take full advantage of this large and diverse sector. | | | |
| | | | | |
| | Consistent Discipline
Our approach emphasizes paying close attention to risk and maintaining the same discipline, regardless of market movements and trends. The price we pay for a security must be below our appraisal of its current worth. This requires a thorough analysis of the financial and business dynamics of an enterprise, as though we were purchasing the entire company. | | Contact Us
| |
| |
Co-Ownership of Funds
It is important that our employees and shareholders share a common financial goal. Our officers, employees, and their families currently have more than $127 million invested in The Royce Funds and are often among the largest individual shareholders.
| | GENERAL INFORMATION
Additional Report Copies
and Prospectus Inquiries
(800) 221-4268 | |
| | | | | |
| | | | | |
| | | | | |
| | | | | |
| | | | | |
| |  | | |  |
| | | | | |
| | | | | |
Item 2. Code(s) of Ethics. Not applicable to this semi-annual report.
Item 3. Audit Committee Financial Expert. Not applicable to this semi-annual report.
Item 4. Principal Accountant Fees and Services. Not applicable to this semi-annual report.
Item 5. Audit Committee of Listed Registrants. Not Applicable
Item 6. Investments.
(a) See Item 1.
(b) Not Applicable
Item 7. Disclosure of Proxy Voting Policies and Procedures for Closed-End Management Investment Companies. Not Applicable.
Item 8. Portfolio Managers of Closed-End Management Investment Companies. Not Applicable.
Item 9. Purchases of Equity Securities by Closed-End Management Investment Company and Affiliated Purchasers. Not Applicable
Item 10. Submission of Matters to a Vote of Security Holders. Not Applicable.
Item 11. Controls and Procedures.
(a) Disclosure Controls and Procedures. The Principal Executive and Financial Officers concluded that the Registrant’s Disclosure Controls and Procedures are effective based on their evaluation of the Disclosure Controls and Procedures as of a date within 90 days of the filing date of this report.
(b) Internal Control over Financial Reporting. There were no significant changes in Registrant’s internal control over financial reporting or in other factors that could significantly affect this control subsequent to the date of the evaluation, including any corrective actions with regard to significant deficiencies and material weaknesses during the second fiscal quarter of the period covered by this report.
Item 12. Exhibits. Attached hereto.
(a)(1) Not applicable to this semi-annual report.
(a)(2) Separate certifications by the Registrant’s Principal Executive Officer and Principal Financial Officer as required by Rule 30a-2(a) under the Investment Company Act of 1940.
(a)(3) Not Applicable
(b) Separate certifications by the Registrant’s Principal Executive Officer and Principal Financial Officer, pursuant to Section 906 of the Sarbanes-Oxley Act of 2002 and required by Rule 30a-2(b) under the Investment Company Act of 1940.
Pursuant to the requirements of the Securities Exchange Act of 1934 and the Investment Company Act of 1940, the registrant has duly caused this report to be signed on its behalf by the undersigned, thereunto duly authorized.
ROYCE CAPITAL FUND
| BY: | /s/ Christopher D. Clark | |
| | | | |
| | | Christopher D. Clark | |
| | | President | |
Date: August 28, 2015
Pursuant to the requirements of the Securities Exchange Act of 1934 and the Investment Company Act of 1940, this report has been signed below by the following persons on behalf of the registrant and in the capacities and on the dates indicated.
| ROYCE CAPITAL FUND | | | ROYCE CAPITAL FUND |
| | | | | | | | | | |
| | | | | | | | | | |
| BY: | | /s/ Christopher D. Clark | | | BY: | | /s/ Peter K. Hoglund | | |
| | | | | | | | | | |
| | | Christopher D. Clark | | | | | Peter K. Hoglund | | |
| | | President | | | | | Chief Financial Officer | | |
| | | | | | | | | | |
| Date: August 28, 2015 | | | Date: August 28, 2015 | | |
| | | | | | |
