| UNITED STATES |
| SECURITIES AND EXCHANGE COMMISSION |
| Washington, D.C. 20549 |
| FORM N-CSR |
| CERTIFIED SHAREHOLDER REPORT |
| OF |
| REGISTERED MANAGEMENT INVESTMENT COMPANIES |
| Investment Company Act file number: 811-07537 |
| Name of Registrant: Royce Capital Fund |
| Address of Registrant: 745 Fifth Avenue |
| New York, NY 10151 |
| Name and address of agent for service: | John E. Denneen, Esq. | |||
| 745 Fifth Avenue | ||||
| New York, NY 10151 |
| Registrant’s telephone number, including area code: (212) 508-4500 |
| Date of fiscal year end: December 31, 2013 |
| Date of reporting period: January 1, 2014 – June 30, 2014 |
Item 1. Reports to Shareholders.
|

SEMIANNUAL
REVIEW AND REPORT
TO SHAREHOLDERS
Royce Capital Fund– Micro-Cap Portfolio Royce Capital Fund– Small-Cap Portfolio | |||
www.roycefunds.com |  | ||
| Performance and Expenses | Through June 30, 2014 |
| Average Annual Total Returns | Annual | ||||||||||||||||||||
| Since Inception | Operating | ||||||||||||||||||||
| Fund | Year-to-Date1 | One-Year | Five-Year | 10-Year | 15-Year | (12/27/96) | Expenses | ||||||||||||||
| Royce Capital Fund–Micro-Cap Portfolio | 1.01 | % | 18.32 | % | 14.33 | % | 7.36 | % | 11.30 | % | 11.73 | % | 1.34 | % | |||||||
| Royce Capital Fund–Small-Cap Portfolio | 1.94 | 22.19 | 17.81 | 9.44 | 12.02 | 12.15 | 1.05 | ||||||||||||||
| Russell Microcap Index2 | 1.56 | 24.98 | 20.03 | 6.67 | n.a. | n.a. | n.a. | ||||||||||||||
| Russell 2000 Index | 3.19 | 23.64 | 20.21 | 8.70 | 8.01 | 8.51 | n.a. | ||||||||||||||
Important Performance, Expense, and Risk Information
All performance information in this Review and Report reflects past performance, is presented on a total return basis, reflects the reinvestment of distributions, and does not reflect the deduction of taxes that a shareholder would pay on fund distributions or the redemption of fund shares. Past performance is no guarantee of future results. Investment return and principal value of an investment will fluctuate, so that shares may be worth more or less than their original cost when redeemed. Current performance may be higher or lower than performance quoted and may be obtained at www.roycefunds.com. The Funds’ total returns do not reflect any deduction for charges or expenses of the variable contracts investing in the Funds. All performance and expense information reflects the result for each Fund’s Investment Class Shares. Service Class Shares bear an annual distribution expense that is not borne by the Investment Class; if the expenses were reflected, total returns would have been lower. Operating expenses reflect the Funds’ total annual operating expenses for the Investment Class as of the Funds’ most current prospectus and include management fees, other expenses and, in the case of Royce Capital Fund–Micro-Cap Portfolio, acquired fund fees and expenses. Acquired fund fees and expenses reflect the estimated amount of the fees and expenses incurred indirectly by the Fund through its investments in mutual funds, hedge funds, private equity funds, and other investment companies. Series of Royce Capital Fund invest primarily in securities of micro-cap, small-cap and/or mid-cap companies, which may involve considerably more risk than investments in securities of larger-cap companies. (Please see “Primary Risks for Fund Investors” in the prospectus.) Each series of Royce Capital Fund may invest up to 25% of their respective net assets in foreign securities. Investments in foreign securities may involve political, economic, currency, and other risks not encountered in U.S. investments. (Please see “Investing in Foreign Securities” in the prospectus.) Please read the prospectus carefully before investing or sending money. Russell Investment Group is the source and owner of the trademarks, service marks, and copyrights related to the Russell Indexes. Russell® is a trademark of Russell Investment Group. The Russell Microcap Index includes 1,000 of the smallest securities in the small-cap Russell 2000 Index along with the next smallest eligible securities as determined by Russell. The Russell 2000 Index is an unmanaged, capitalization-weighted index of domestic small-cap stocks. It measures the performance of the 2,000 smallest publicly traded U.S. companies in the Russell 3000 Index. The performance of an index does not represent exactly any particular investment, as you cannot invest directly in an index. Distributor: Royce Fund Services, Inc. |
| This page is not part of the Royce Capital Fund 2014 Semiannual Report to Shareholders |
| Table of Contents | |
| Semiannual Review | |
| Performance and Expenses Table | Inside Cover |
| Letter to Our Shareholders | 2 |
| 2014 In Quotes | 31 |
| Postscript: There’s No Such Thing as a Sure Thing | Inside Back Cover |
| Semiannual Report to Shareholders | 7 |
 | |
| This page is not part of the Royce Capital Fund 2014 Semiannual Report to Shareholders | 1 |
 Charles M. Royce, President The long-running, and probably unresolvable, debate about active versus passive investment strategies has taken on new life in the years since the onset of the Financial Crisis, often to the detriment of active approaches. To take one example, Morningstar compiled data showing that inflows into equity mutual funds have been dwarfed by those into equity ETFs (exchange traded funds) measuring from the momentous year of 2008. For the six calendar years from 2008-2013, traditional equity funds have taken in $5.52 billion while ETFs have attracted $389.08 billion. That’s quite a disparity. It seems to be no secret that many active managers have struggled to keep pace with their respective equity indexes in these often eventful years. These years have also seen a raft of studies purporting to show that most investment managers are unable to consistently beat the market, i.e., regularly outperform a relevant index such as the Russell 2000 or S&P 500 Indexes. Perhaps unsurprisingly, we would offer two caveats before one embraces uncritically the notion that passive Continued on page 4... | Letter to Our Shareholders No Drama Whatever other opinions we may all hold about the stock market’s behavior over the last six years, we think everyone can agree that it has certainly been dramatic. The action began in earnest in the fall of 2008, although it is important to recall that small-cap stock prices had actually been falling for more than a year prior to that—the peak for the Russell 2000 Index having been established on July 13, 2007. Yet the full effects of the bear were unleashed by the events of the Financial Crisis, which keyed the dangerously precipitous nosedive of share prices in the fall of 2008. The tumult lasted until small-caps finally hit a bottom on March 9, 2009. The fear and anxiety the descent created, however, reached into the next several years. The feeling of extraordinary fragility that characterized the early days of the recovery in the spring of 2009 did not magically evaporate when markets began to find their feet again. In fact, one could argue that these emotions dominated the behavior of investors at least until the end of 2012. The three years from 2010 through 2012 were eventful, even if the stress and excitement they generated did not equal that of the first six months of 2009. In fact, much of the market’s most extreme moves in that entire four-year span (2009-2012) took place in the first six months of those years, driven in large part by events both actual and potential. The recession in the U.S., debt issues in Europe, and slow growth in China were all very real, while a double-dip recession here at home, default in Europe, and implosion in China fortunately failed to materialize. By the end of 2012, with the stock market climbing and the economy expanding, investors seemed to recognize that, in spite of high volatility and political uncertainty, equity returns had been solidly positive since the March 2009 bottom. This improved confidence helped to spur a different kind of dramatic arc. The long, slow recovery entered a new phase in 2013—a heady, and virtually correction-free, bull run in which returns for each of the major domestic stock indexes topped 30%. | ||
| 2 | This page is not part of the Royce Capital Fund 2014 Semiannual Report to Shareholders |
The curtain opened on 2014, then, on the heels of one of the better calendar-year performances in the history of domestic equities, which followed four consecutive years of mostly rising stock prices in an uncertain economy. So the question now is, what is the next act for equities? Some argue that the economy is not strong enough to really take flight. They worry about the rich valuations sported by large numbers of stocks. Others see the relative absence of volatility as a sign of complacency and fret that stocks are about to enter a destructive bear phase. There are those who point to increasingly unsettled international situations, such as in Ukraine, Syria, and Iraq, and argue that the market cannot continue to pretend that events in these nations take place far offstage, not in an increasingly intertwined global economy. | Quality companies, particularly those in our chosen small-cap space, have not yet emerged as leaders, but they have inched closer over the last two years. Correlation levels throughout the market are falling. These are excellent conditions, in our view, for disciplined active management approaches, especially those with a long-term investment horizon. | |||
We, however, are in accord with the more widespread consensus that sees the U.S. economy as gradually normalizing. As evidence we would point to the following: The deficit continues to fall, the Fed continues to wind down the rate of its monthly bond purchases, and interest rates, though they remain close to zero, look likely to rise again in the near future as they did last year between May and December. Inflation is tame, commodity prices stable. Volatility, as measured by the VIX, finished the first half of 2014 at low levels not seen since 2007. Add an increasingly robust M&A market, and it seems to us that the recipe for ongoing growth—and bullishness, however mild, at least compared to last year—seems almost complete. And this process of normalization looks likely to accelerate as the Fed’s role recedes further and further into the background, setting the stage for a more dynamic pace of growth. | ||||
So while there remain voices who insist that stocks are overvalued, we think the case for additional gains, which could include a correction along the way, remains persuasive. It seems to us that the relatively lower returns of the first half of 2014 indicate not an end to a bull phase, but a chance for the market to catch its breath and assess its surroundings. It may be that investors need a break from all the drama, a respite from the unrelenting pace of the last six years. So the desire to stand back for a moment and evaluate what is happening seems eminently reasonable. How many investors have enjoyed more than a few moments of true calm since before the recession began back in 2007? Ultimately, we suspect that both the expanding economy and slower pace of returns will result in more fundamentally focused investors. | ||||
| Indeed, the indications that the strength of companies and the businesses they manage are beginning to matter more than indexes and the macro events that move them go back to the spring of 2012, when quality stocks—those with high returns on invested capital—enjoyed a brief run of outperformance. This nascent phenomenon re-started—again, briefly—in May 2013 when the 10-year Treasury rate reached a bottom. Quality companies, particularly those in our chosen small-cap space, have not yet emerged as leaders, but they have inched closer over the last two years. Correlation levels throughout the market are falling. These are excellent conditions, in our view, for disciplined active management approaches, especially those with a long-term investment horizon. | ||||
| This page is not part of the Royce Capital Fund 2014 Semiannual Report to Shareholders | 3 |
investing is always better: First, a number of managers have consistently outperformed the market over long- term periods and especially within the small-cap asset category. In fact, we believe strongly in the idea that it is not necessary for all managers to beat the market in order for active management to be validated as an approach. Our second note of caution relates to time periods. While it would be nice to outperform an index every year, it is just as unrealistic to expect that as it would be to expect an index to outperform active management every year. It is also unrealistic to expect a high degree of outperformance in the long term without experiencing some short-term underperformance periods. A willingness to stick to one’s approach, regardless of market movements and trends, is critical to long-term outperformance in our opinion. This is especially important during market extremes because there are active managers who exhibit style drift or other changes in their discipline when their investment style falls out of favor or is stressed, such as during the tech bubble. Successful active management also entails a willingness to think independently in terms of sector and industry weightings. It is not unusual for the most successful managers to be significantly out of sync relative to a Continued on page 6... | |||
| Letter to Our Shareholders | ||
| No Direction Home U.S. stocks turned in a respectable performance in the first half of 2014. If results were not as lofty as they were in the first half of 2013 (and they were not), they were achieved in a more tranquil domestic environment than in the first halves of 2010, 2011, or 2012. One consequence of the more relaxed atmosphere of the first half was that stocks did not seem to know quite what to do with themselves. While the overvalued/not-quite-overvalued-yet argument goes on, the market has not established a clear direction so far in 2014. The bull has so far remained in place during the current cycle; he simply slowed his run to a brisk walk in the first half. For the year-to-date period ended June 30, 2014, the major domestic indexes remained in the black. The small-cap Russell 2000 Index gained 3.2%, taking a back seat to the more tech-oriented Nasdaq Composite, which advanced 5.5% in the first half, and the large-cap S&P 500 and Russell 1000 Indexes, which scored respective gains of 7.1% and 7.3% for the year-to-date period ended June 30, 2014. The year began on a more moderate note following a red-hot second half of 2013. Nevertheless, 2014’s opening quarter was the seventh consecutive quarter of positive performance for the Russell 2000, which rose 1.1%. Large-caps led for the quarter—the S&P 500 and Russell 1000 gained 1.8% and 2.0%, respectively, while the Nasdaq Composite rose 0.5%. Small-caps reached a first-half high on March 4, and the only correction so far this year was the 9.1% drop for the Russell 2000 from that date through May 15, 2014. April was thus the cruelest month, but a series of mini-rallies from mid-May through the end of June made the second quarter mostly positive. The Russell 2000 posted its eighth consecutive positive quarter, up 2.0%. Once again, large-cap outperformed, with the S&P 500 advancing 5.2% and the Russell 1000 up 5.1% for the second quarter. The Nasdaq bounced back strong as well, climbing 5.0% in the second quarter and leaving only the small-cap index out of the five-percent club. Small-cap held onto leadership outside the U.S. In the first quarter, the Russell Global ex-U.S. Small Cap Index was up 3.2% while the Russell Global ex-U.S. Large Cap Index rose 0.8%. Results were stronger in the second quarter and, as in the first, closer to their domestic counterparts than we have seen in a while. For the second quarter, the Russell Global ex-U.S. Small Cap was up 4.2% versus 5.0% for the Russell Global ex-U.S. Large Cap. Year-to-date, non-U.S. small-caps had the edge, with the Russell Global ex-U.S. Small Cap returning 7.5% versus a gain of 5.8% for the Russell Global ex-U.S. Large Cap. After a challenging first quarter, many Asian equities bounced back in the second and finished closer to the European indexes, most of which had been on a tear prior to cooling off in the second quarter. Moving back to the U.S., mid-caps and micro-caps were equally solid in the first quarter. The Russell Midcap Index was up 3.5% versus a gain of 3.0% for the Russell Microcap Index in 2014’s first three months. This pattern broke down around the time of the March 4 small-cap high and can be seen in the second-quarter results for each index. The Russell Midcap continued its notable 2014 performance, rising 5.0% in the second quarter. This gave mid-caps an impressive 8.7% advance on a year-to-date basis. In contrast, micro-caps |
| 4 | This page is not part of the Royce Capital Fund 2014 Semiannual Report to Shareholders |
| U.S. stocks turned in a respectable performance in the first half of 2014. If results were not as lofty as they were in the first half of 2013 (and they were not), they were achieved in a more tranquil domestic environment than in the first halves of 2010, 2011, or 2012. We are very bullish about the prospects for active small-cap management... we have reached a point at which active management in small-cap stocks simply makes more sense, especially for long-term investors. |
| This page is not part of the Royce Capital Fund 2014 Semiannual Report to Shareholders | 5 |
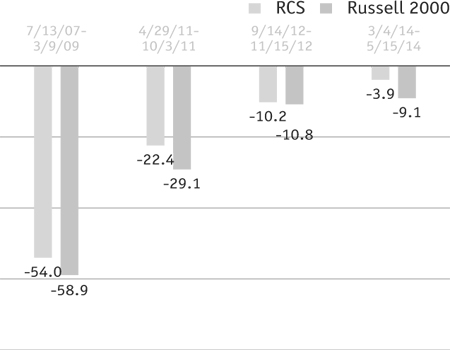
benchmark index with respect to industry and sector weightings (commonly referred to as tracking error). In addition, active managers are not required to invest cash inflows at the time of receipt when market conditions or prices may not be conducive. They may screen for quality and use buy/sell triggers as a means of reducing risk. While a passive manager must own everything, an active manager has the freedom to look for attractive stocks across the targeted universe. All of this helps to explain why we remain so fond of small-caps and so confident in the effectiveness and value of active approaches in the asset class. Active small-cap managers can capture valuation opportunities beyond their respective indexes—an opportunity that would be lost if one were limited to owning only the constituents that make up the index. For example, the Russell 2000, while quite broad, only includes about 2,000 of the more than 4,100 companies1 that make up the domestic small-cap universe (those with market caps up to $2.5 billion). While self-serving, we nevertheless think that the small-cap asset class is ideally suited for active management given its enormous size, lack of institutional focus, and limited research availability. 1 Source: Reuters as of 6/30/14 | Letter to Our Shareholders Know This We feel somewhat fortunate in that we do not need to choose a side in the “overvalued versus ongoing bull market” debate. Rather than trying to make a correct market call, our attention has been focused on those potential opportunities that can materialize even in a widespread bull market. Corrections can arrive at any time, of course, and it has been a while since we have seen one of any significance. The last downturn of more than 10% for the Russell 2000 occurred in the fall of 2012. And share prices recovered so quickly from the 9.1% March-May decline this year that the down phase barely registered. This might lead one to argue that the market is being set up for at least a decent-sized pullback. Our sense, however, is that we are more likely to see smaller ones in the 5-10% range as part of the ongoing bull phase. Against the backdrop of an economy that looks poised for faster growth, a Fed tapering at a healthy clip, and an interest-rate environment in which a steady rate of increase is much more of a “when” than an “if,” less severe downturns look more likely. Small-cap valuations on the whole are above average, though not unreasonably so given near-zero interest rates and low inflation. A number of anomalies remain in the market, and in many cases we see a wide disparity between what look to us like expensive stocks and those that look inexpensive on an absolute basis. The market seems to be in the process of sorting that out—certainly those areas of the market that do not interest us, and that did well in 2012 and 2013, have been more volatile so far in 2014. In addition, we are still seeing companies that look attractively valued to us based on their fundamentals. All in all, it is looking more and more like a stock-picker’s market to us. We could see the second half of the year being pretty similar to the first in terms of the overall returns for stocks. More important, we think there are still enough opportunities out there to keep returns in positive territory through the end of 2014. This could make the market’s next act a very happy one for active small-cap managers. Sincerely, | ||||||
 |  |  | |||||
| Charles M. Royce | Christopher D. Clark | Francis D. Gannon | |||||
| President | Co-Chief Investment Officer, Royce & Associates | Co-Chief Investment Officer, Royce & Associates | |||||
| July 31, 2014 | |||||||
| 6 | Royce Capital Fund 2014 Semiannual Report to Shareholders |
| Table of Contents |
| Semiannual Report to Shareholders | ||||||||||
| Managers’ Discussions of Fund Performance | ||||||||||
| Royce Capital Fund–Micro-Cap Portfolio | 8 | |||||||||
| Royce Capital Fund–Small-Cap Portfolio | 10 | |||||||||
| Schedules of Investments and Financial Statements | 12 | |||||||||
| Notes to Financial Statements | 22 | |||||||||
| Understanding Your Fund’s Expenses | 26 | |||||||||
| Trustees and Officers | 27 | |||||||||
| Board Approval of Investment Advisory Agreements | 28 | |||||||||
| Notes to Performance and Other Important Information | 30 | |||||||||
| Royce Capital Fund 2014 Semiannual Report to Shareholders | 7 |
| Royce Capital Fund–Micro-Cap Portfolio |
AVERAGE ANNUAL TOTAL RETURNS Through 6/30/14 | ||||||||||
| January–June 20141 | 1.01 | % | ||||||||
| One-Year | 18.32 | |||||||||
| Three-Year | 3.99 | |||||||||
| Five-Year | 14.33 | |||||||||
| 10-Year | 7.36 | |||||||||
| 15-Year | 11.30 | |||||||||
| Since Inception (12/27/96) | 11.73 | |||||||||
| ANNUAL EXPENSE RATIO | ||||||||||
| Operating Expenses | 1.34 | % | ||||||||
| 1 Not annualized. | ||||||||||
| CALENDAR YEAR TOTAL RETURNS | ||||||||||
| Year | RCM | Year | RCM | |||||||
| 2013 | 21.0 | % | 2005 | 11.6 | % | |||||
| 2012 | 7.6 | 2004 | 13.8 | |||||||
| 2011 | -12.1 | 2003 | 49.2 | |||||||
| 2010 | 30.1 | 2002 | -12.9 | |||||||
| 2009 | 57.9 | 2001 | 29.7 | |||||||
| 2008 | -43.3 | 2000 | 18.5 | |||||||
| 2007 | 4.0 | 1999 | 28.1 | |||||||
| 2006 | 21.1 | 1998 | 4.1 | |||||||
| TOP 10 POSITIONS % of Net Assets | ||||||||||
| Total Energy Services | 1.4 | % | ||||||||
| Kennedy-Wilson Holdings | 1.3 | |||||||||
| Patriot Transportation Holding | 1.3 | |||||||||
| Foster (L.B.) Company | 1.2 | |||||||||
| Tesco Corporation | 1.2 | |||||||||
| Universal Stainless & Alloy Products | 1.1 | |||||||||
| Resources Connection | 1.1 | |||||||||
| Stein Mart | 1.1 | |||||||||
| Marten Transport | 1.1 | |||||||||
| U.S. Physical Therapy | 1.0 | |||||||||
| PORTFOLIO SECTOR BREAKDOWN % of Net Assets | ||||||||||
| Industrials | 24.4 | % | ||||||||
| Consumer Discretionary | 14.1 | |||||||||
| Information Technology | 13.7 | |||||||||
| Health Care | 9.3 | |||||||||
| Materials | 8.8 | |||||||||
| Energy | 8.5 | |||||||||
| Financials | 8.2 | |||||||||
| Consumer Staples | 0.9 | |||||||||
| Utilities | 0.1 | |||||||||
| Miscellaneous | 4.1 | |||||||||
| Cash and Cash Equivalents | 7.9 | |||||||||
 | |||||||||
Manager’s Discussion Royce Capital Fund–Micro-Cap Portfolio (RCM) finished the year-to-date period ended June 30, 2014 with an advance of 1.0% versus respective gains of 1.6% for its benchmark, the Russell Microcap Index, and 3.2% for the small-cap Russell 2000 Index for the same period. Following a wonderfully bullish 2013, stocks as a group cooled down in the opening months of 2014, though returns for the most part remained solidly in the black. The Fund’s participation was more limited than we would prefer. The year began with many share prices accelerating at a slower pace than they did in the torrid second half of 2013. The Fund, however, fell out of step with the market as a whole—and micro-caps more specifically—during both that highly bullish phase and the more moderate market that ushered in 2014. RCM was down 0.8% in the first quarter versus a gain of 3.0% for the Russell Microcap and 1.1% for the Russell 2000. The Fund’s results improved in the second quarter, which saw the year’s only correction so far. In fact, its performance from the interim small-cap high on March 4 through the end of June was better than both the micro-cap and small-cap indexes, which gave a boost to quarterly results. For the second quarter, RCM advanced 1.8% compared to a decline of 1.4% for the Russell Microcap and an increase of 2.0% for the Russell 2000. A look at longer-term periods showed a healthier advantage. The Fund outpaced the Russell Microcap for the 10-year period ended June 30, 2014. (Data for this index only goes back to June 30, 2000.) RCM also beat the Russell 2000 for the 15-year and since inception (12/27/96) periods ended June 30, 2014. The Fund’s average annual total return since inception was 11.7%. We are very proud of RCM’s long-term performance record. The Fund’s overweight in Energy was a factor as 2014 wore on—the sector’s strong second-quarter results made it the portfolio’s top-performing sector for the year-to-date period ended June 30, 2014. In the micro-cap space we have invested in a large number of E&P (exploration & production) companies and energy services businesses. While the former are often more volatile, we have found a number of conservatively capitalized services companies that we think are well-managed businesses. We also believe that Triangle Petroleum offers an attractive, though high-risk/high-reward opportunity. A Denver-based E&P business, its share price was volatile through much of the first half, though its overall direction was up. | |||||||||
| GOOD IDEAS THAT WORKED Top Contributors to Performance Year-to-Date through 6/30/141 | |||||||||||
| Furiex Pharmaceuticals | 0.42% | ||||||||||
| VASCO Data Security International | 0.41 | ||||||||||
| Super Micro Computer | 0.30 | ||||||||||
| Triangle Petroleum | 0.28 | ||||||||||
| Kennedy-Wilson Holdings | 0.27 | ||||||||||
| 1 Includes dividends. | |||||||||||
Important Performance and Expense Information All performance information in this Report reflects past performance, is presented on a total return basis, reflects the reinvestment of distributions, and does not reflect the deduction of taxes that a shareholder would pay on fund distributions or the redemption of fund shares. Past performance is no guarantee of future results. Investment return and principal value of an investment will fluctuate, so that shares may be worth more or less than their original cost when redeemed. Current performance may be higher or lower than performance quoted. The Fund’s total returns do not reflect any deduction for charges or expenses of the variable contracts investing in the Fund. Returns as of the most recent month-end may be obtained at www.roycefunds.com. All performance and risk information reflects the result of the Investment Class (its oldest class). Shares of RCM’s Service Class bear an annual distribution expense that is not borne by the Investment Class. Operating expenses reflect the Fund’s total annual operating expenses for the Investment Class as of the Fund’s most current prospectus and include management fees, other expenses, and acquired fund fees and expenses. Acquired fund fees and expenses reflect the estimated amount of the fees and expenses incurred indirectly by the Fund through its investments in mutual funds, hedge funds, private equity funds, and other investment companies. Regarding the two “Good Ideas” tables shown above, the sum of all contributors to, and all detractors from, performance for all securities in the portfolio would approximate the Fund’s year-to-date performance for 2014. | |||||||||||
| 8 | Royce Capital Fund 2014 Semiannual Report to Shareholders |
Performance and Portfolio Review Moving quickly, in just two years, from exploration to production helped attract interest in the stock. We liked its prospects going forward, modestly trimming our shares in the first half. The Fund’s top performer was Furiex Pharmaceuticals, which was acquired by Forest Laboratories at a healthy premium. The announcement came in April, when we sold our position. We were drawn first to its royalty & revenues on two approved drugs and to promising results for an IBS (irritable bowel syndrome) drug. VASCO Data Security International specializes in bank security and develops security systems to secure and manage access to user digital assets. Its stock made two significant upticks in the first half. In February, its shares rose on better-than-expected fourth quarter of 2013 earnings and a strong outlook for fiscal 2014. Increased revenues and ongoing earnings strength saw the shares getting another major boost late in April, especially with HSBC, USA, its customer, offering VASCO authentication solutions to its retail customers. A disappointing holiday season and a miserably cold winter spelled tough times for many consumer stocks in both the Discretionary and Staples sectors. Seeing better times ahead, we held onto our shares of Shoe Carnival, a family footwear retailer based in Indiana. The company has a history of strong top-line growth and what we think are reasonable and intelligent plans to both grow and improve its business. It was RCM’s fifteenth-largest holding at the end of June. After a very successful 2013, we were not shocked to see some pullback for transportation and real estate business Patriot Transportation Holding. The stock is thinly traded and tightly held, so transactions tend to have an outsized effect on its shares. Earnings cooled down a bit during the first half, but we think its core strategic business realignment remains on track. Over the past several years, we have been finding some of the most attractive micro-cap valuations in more economically sensitive sectors. The Fund’s largest sector weightings at the end of the period reflected this, with Industrials at 24.4% and Information Technology at 13.7%. The portfolio also remained overweight versus the Russell Microcap in other cyclical sectors, most notably Energy and Materials. Our view is that many portfolio holdings in these (and other) sectors can benefit from a faster-growing economy in which the Fed’s quantitative easing program comes to a close and interest rates are rising. Such an environment is likely to reward disciplined active approaches that focus on fundamentals such as strong balance sheets and high returns on invested capital. So while we remain frustrated by the Fund’s recent performance record, we are confident in its prospects going forward. |
GOOD IDEAS AT THE TIME | |
| Shoe Carnival | -0.38% |
| Patriot Transportation Holding | -0.25 |
| Destination Maternity | -0.24 |
| TGC Industries | -0.22 |
| Global Power Equipment Group | -0.22 |
| 1 Net of dividends. | |
| ROYCE CAPITAL FUND–MICRO-CAP PORTFOLIO VS. RUSSELL MICROCAP AND RUSSELL 2000 Value of $10,000 Invested on 6/30/00 (Russell Microcap Inception) | |||
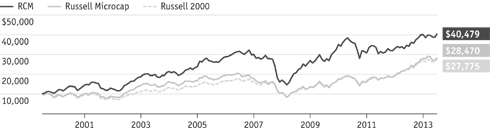 | |||
| Includes reinvestment of distributions. |
| FUND INFORMATION AND PORTFOLIO DIAGNOSTICS | |||
| Fund Net Assets | $579 million | ||
| Number of Holdings | 206 | ||
| Turnover Rate | 12% | ||
| Average Market Capitalization1 | $437 million | ||
| Weighted Average P/E Ratio2,3 | 21.9x | ||
| Weighted Average P/B Ratio2 | 1.7x | ||
| U.S. Investments (% of Net Assets) | 78.2% | ||
| Non-U.S. Investments (% of Net Assets) | 13.9% | ||
| Ticker Symbol | |||
| Investment Class | RCMCX | ||
| Service Class | RCMSX | ||
1Geometric Average. This weighted calculation uses each portfolio holding’s market cap in a way designed to not skew the effect of very large or small holdings; instead, it aims to better identify the portfolio’s center, which Royce believes offers a more accurate measure of average market cap than a simple mean or median. | |||
2Harmonic Average. This weighted calculation evaluates a portfolio as if it were a single stock and measures it overall. It compares the total market value of the portfolio to the portfolio’s share in the earnings of its underlying stocks. | |||
| STATISTICAL MEASURES Five-Year Period Ended 6/30/14 | |||
| Sharpe Ratio | Standard Deviation | ||
| RCM | 0.84 | 17.87 | |
| Russell Microcap | 1.04 | 19.40 | |
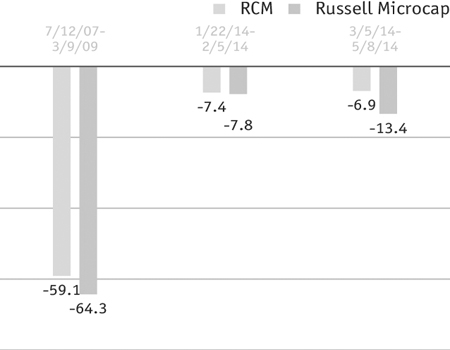
| DOWN MARKET PERFORMANCE COMPARISON All Down Periods of 7.5% or Greater Over the Last 7 Years, in Percentages (%) | |||
 | |||
| Royce Capital Fund 2014 Semiannual Report to Shareholders | 9 |
| Royce Capital Fund–Small-Cap Portfolio |
AVERAGE ANNUAL TOTAL RETURNS Through 6/30/14 | ||||||||||
| January–June 20141 | 1.94 | % | ||||||||
| One-Year | 22.19 | |||||||||
| Three-Year | 12.40 | |||||||||
| Five-Year | 17.81 | |||||||||
| 10-Year | 9.44 | |||||||||
| 15-Year | 12.02 | |||||||||
| Since Inception (12/27/96) | 12.15 | |||||||||
| ANNUAL EXPENSE RATIO | ||||||||||
| Operating Expenses | 1.05 | % | ||||||||
| 1 Not annualized. | ||||||||||
| CALENDAR YEAR TOTAL RETURNS | ||||||||||
| Year | RCS | Year | RCS | |||||||
| 2013 | 34.8 | % | 2005 | 8.6 | % | |||||
| 2012 | 12.5 | 2004 | 25.0 | |||||||
| 2011 | -3.3 | 2003 | 41.1 | |||||||
| 2010 | 20.5 | 2002 | -13.8 | |||||||
| 2009 | 35.2 | 2001 | 21.0 | |||||||
| 2008 | -27.2 | 2000 | 33.3 | |||||||
| 2007 | -2.1 | 1999 | 8.2 | |||||||
| 2006 | 15.6 | 1998 | 8.9 | |||||||
| TOP 10 POSITIONS % of Net Assets | ||||||||||
| Steven Madden | 3.2 | % | ||||||||
| Plantronics | 3.1 | |||||||||
| Unit Corporation | 3.0 | |||||||||
| NETGEAR | 3.0 | |||||||||
| Vishay Intertechnology | 3.0 | |||||||||
| Genesco | 3.0 | |||||||||
| Fabrinet | 3.0 | |||||||||
| Buckle (The) | 2.7 | |||||||||
| Chemed Corporation | 2.6 | |||||||||
| Genworth MI Canada | 2.5 | |||||||||
| PORTFOLIO SECTOR BREAKDOWN % of Net Assets | ||||||||||
| Consumer Discretionary | 25.0 | % | ||||||||
| Information Technology | 24.9 | |||||||||
| Financials | 14.6 | |||||||||
| Industrials | 9.1 | |||||||||
| Energy | 6.4 | |||||||||
| Health Care | 5.5 | |||||||||
| Materials | 4.8 | |||||||||
| Consumer Staples | 1.8 | |||||||||
| Miscellaneous | 1.7 | |||||||||
| Cash and Cash Equivalents | 6.2 | |||||||||
 |
Manager’s Discussion Royce Capital Fund–Small-Cap Portfolio (RCS) was up 1.9% for the year-to-date period ended June 30, 2014 versus a 3.2% gain for its small-cap benchmark, the Russell 2000 Index, for the same period. The first quarter saw a widespread slowdown in the speed of small-cap returns following the dynamic second half of 2013, which was not entirely unexpected considering last year’s blistering pace. RCS rose 0.7% for the first quarter of 2014, trailing its benchmark’s 1.1% advance. A slight downturn that lasted from early March through mid-May made for a rockier second quarter, though June was in general a positive month that did much to bring small-cap results back into the black. For the second quarter, the Fund rose 1.2% compared to 2.0% for the small-cap index. RCS did, however, beat the Russell 2000 from the index’s early March high through the end of June. Although we always like to see the Fund hold a down-market advantage, in light of the last few years of relative underperformance, this edge during a brief bearish phase offered mostly cold comfort. The Fund did outpace the benchmark for much longer-term periods. RCS beat the Russell 2000 for the 10-, 15-year, and since inception (12/27/96) periods ended June 30, 2014. The Fund’s average annual total return since inception was 12.1%. We are very proud of the Fund’s long-term performance record. When selecting stocks for RCS’s portfolio, we focus first on balance sheets, looking for businesses with low debt, which is frequently a sign of financial strength. We next look for high returns on invested capital (ROIC). Like a strong balance sheet, high ROICs are in our view a proxy for quality. We also want the company to be trading for what we believe is an attractively low share price vis-à-vis its worth as a business. In order to evaluate this, we typically use capitalization rates, which we define as operating income divided by enterprise value. We want to understand the return on our investment as if we were buying the whole company. Our challenge through the most recent cycle has been the unfashionable status of this disciplined, value-oriented approach. With a still highly accommodative Federal Reserve pouring money into the economy while keeping interest rates essentially at zero, the cost of debt is historically low and access to cash is extremely easy. This has the effect of reducing the appeal of conservatively capitalized, steadily growing businesses while increasing the demand for both fast growth |
| GOOD IDEAS THAT WORKED Top Contributors to Performance Year-to-Date through 06/30/141 | |||||||||||
| Unit Corporation | 0.91% | ||||||||||
| Matrix Service | 0.68 | ||||||||||
| Synaptics | 0.61 | ||||||||||
| World Wrestling Entertainment Cl. A | 0.59 | ||||||||||
| Vishay Intertechnology | 0.53 | ||||||||||
| 1 Includes dividends. | |||||||||||
Important Performance and Expense Information All performance information in this Report reflects past performance, is presented on a total return basis, reflects the reinvestment of distributions, and does not reflect the deduction of taxes that a shareholder would pay on fund distributions or the redemption of fund shares. Past performance is no guarantee of future results. Investment return and principal value of an investment will fluctuate, so that shares may be worth more or less than their original cost when redeemed. Current performance may be higher or lower than performance quoted. The Fund’s total returns do not reflect any deduction for charges or expenses of the variable contracts investing in the Fund. Returns as of the most recent month-end may be obtained at www.roycefunds.com. All performance and risk information reflects the result of the Investment Class (its oldest class). Shares of RCS’s Service Class bear an annual distribution expense that is not borne by the Investment Class. Operating expenses reflect the Fund’s total annual operating expenses for the Investment Class as of the Fund’s most current prospectus and include management fees and other expenses. Regarding the two “Good Ideas” tables shown above, the sum of all contributors to, and all detractors from, performance for all securities in the portfolio would approximate the Fund’s year-to-date performance for 2014. |
| 10 | Royce Capital Fund 2014 Semiannual Report to Shareholders |
Performance and Portfolio Review |
| (often regardless of profitability) and high yield (often regardless of underlying quality). While there have been some signs that this is changing, a large-scale flight to quality has not yet occurred, certainly not in the small-cap space. We remain, however, squarely focused on both long-term and absolute results and are hopeful for a shift in sentiment in which fundamentals will matter more than momentum and yield. Five of RCS’s eight equity sectors contributed to first-half returns, with Energy holding a considerable edge, followed by notable net gains for Information Technology. The Fund’s two top performers both came from the energy equipment & services industry. Unit Corporation is a long-time position—and the Fund’s third largest at the end of June—that we have owned continuously since 2002. It operates primarily as a contract drilling company, though it also explores for and produces oil and natural gas, and engages in midstream activities. These related businesses make it an outlier in an otherwise rigidly specialized industry. Unit reported double-digit production growth, introduced a new advanced drilling rig, and enjoyed continued strength from its midstream operations. Matrix Service builds natural gas storage tanks and provides construction and maintenance services to the oil, gas, power, petrochemical, industrial, and metals industries. Increased demand for its services, a complementary acquisition, and ongoing strength for natural gas helped both operating results and its stock price. We reduced our position as its price soared. Shoe Carnival is a family footwear retailer that endured the same dismal results that most other retailers did in the first half, including The Buckle and Ascena Retail Group. We held our position in Shoe Carnival and added shares of The Buckle as its stock price declined. In the case of the former, we like its plan to expand the number of stores and raise the quality of the women’s shoes it sells. After a turn as the portfolio’s top contributor in 2013, Nu Skin Enterprises earned a less esteemed status for the semiannual period. The company develops and distributes personal skin care products worldwide. Its share price suffered mightily after an article in a Chinese newspaper accused the firm in January of running a pyramid scheme, and an investigation by the Chinese government followed. The firm paid modest fines in March and began to tighten up its training procedures. We were hopeful that Nu Skin could right itself at the end of June. |
GOOD IDEAS AT THE TIME | |
| Shoe Carnival | -0.68% |
| Nu Skin Enterprises Cl. A | -0.54 |
| Buckle (The) | -0.41 |
| Ascena Retail Group | -0.34 |
| TESSCO Technologies | -0.30 |
| 1 Net of dividends. | |
| ROYCE CAPITAL FUND-SMALL-CAP PORTFOLIO VS. RUSSELL 2000 Value of $10,000 Invested on 12/27/96 | |
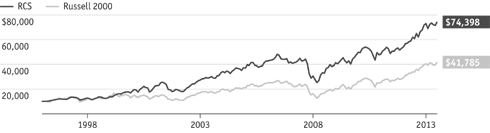 | |
| Includes reinvestment of distributions. | |
| FUND INFORMATION AND PORTFOLIO DIAGNOSTICS | ||||
| Fund Net Assets | $970 million | |||
| Number of Holdings | 76 | |||
| Turnover Rate | 16% | |||
| Average Market Capitalization1 | $1,404 million | |||
| Weighted Average P/E Ratio2,3 | 17.1x | |||
| Weighted Average P/B Ratio2 | 1.9x | |||
| U.S. Investments (% of Net Assets) | 83.8% | |||
| Non-U.S. Investments (% of Net Assets) | 10.0% | |||
| Symbol | ||||
| Investment Class | RCPFX | |||
| Service Class | RCSSX | |||
1Geometric Average. This weighted calculation uses each portfolio holding’s market cap in a way designed to not skew the effect of very large or small holdings; instead, it aims to better identify the portfolio’s center, which Royce believes offers a more accurate measure of average market cap than a simple mean or median. | ||||
2Harmonic Average. This weighted calculation evaluates a portfolio as if it were a single stock and measures it overall. It compares the total market value of the portfolio to the portfolio’s share in the earnings of its underlying stocks. | ||||
3 The Fund’s P/E ratio calculation excludes companies with zero or negative earnings (2% of portfolio holdings as of 6/30/14). | ||||
| STATISTICAL MEASURES Five-Year Period Ended 6/30/14 | ||||
| Sharpe Ratio | Standard Deviation | |||
| RCS | 1.12 | 15.70 | ||
| Russell 2000 | 1.10 | 18.23 | ||
| DOWN MARKET PERFORMANCE COMPARISON All Down Periods of 7.5% or Greater Over the Last 7 Years, in Percentages (%) | ||||
 | ||||
| Royce Capital Fund 2014 Semiannual Report to Shareholders | 11 |
Schedules of Investments
| Royce Capital Fund–Micro-Cap Portfolio |
| SHARES | VALUE | ||||
| COMMON STOCKS – 92.1% | |||||
| Consumer Discretionary – 14.1% | |||||
| Auto Components - 0.9% | |||||
Drew Industries | 100,979 | $ | 5,049,960 | ||
| Diversified Consumer Services - 3.2% | |||||
American Public Education 1 | 150,770 | 5,183,473 | |||
Capella Education | 96,472 | 5,247,112 | |||
JTH Holding Cl. A 1 | 128,500 | 4,280,335 | |||
Lincoln Educational Services | 823,193 | 3,696,136 | |||
| 18,407,056 | |||||
| Household Durables - 0.9% | |||||
Cavco Industries 1 | 62,004 | 5,288,941 | |||
| Internet & Catalog Retail - 0.3% | |||||
Vitacost.com 1 | 258,500 | 1,618,210 | |||
| Leisure Products - 1.2% | |||||
Black Diamond 1 | 62,409 | 700,229 | |||
LeapFrog Enterprises Cl. A 1 | 350,000 | 2,572,500 | |||
| 250,100 | 3,636,454 | ||||
| 6,909,183 | |||||
| Specialty Retail - 6.9% | |||||
Buckle (The) | 76,025 | 3,372,469 | |||
Cato Corporation (The) Cl. A | 152,300 | 4,706,070 | |||
Citi Trends 1 | 145,386 | 3,119,984 | |||
Destination Maternity | 204,500 | 4,656,465 | |||
| 146,143 | 1,486,274 | ||||
Kirkland’s 1 | 290,180 | 5,382,839 | |||
Shoe Carnival | 272,100 | 5,618,865 | |||
Stein Mart | 463,478 | 6,437,710 | |||
Zumiez 1 | 186,700 | 5,151,053 | |||
| 39,931,729 | |||||
| Textiles, Apparel & Luxury Goods - 0.7% | |||||
Culp | 150,149 | 2,614,094 | |||
Perry Ellis International 1 | 98,330 | 1,714,875 | |||
| 4,328,969 | |||||
| Total (Cost $63,097,386) | 81,534,048 | ||||
| Consumer Staples – 0.9% | |||||
| Beverages - 0.1% | |||||
Truett-Hurst Cl. A 1 | 126,100 | 641,849 | |||
| Food Products - 0.6% | |||||
Asian Citrus Holdings | 2,786,100 | 625,492 | |||
Sipef | 28,400 | 2,426,619 | |||
| 1,303,907 | 495,485 | ||||
| 3,547,596 | |||||
| Personal Products - 0.2% | |||||
Medifast 1 | 25,800 | 784,578 | |||
| Total (Cost $4,476,285) | 4,974,023 | ||||
| Energy – 8.5% | |||||
| Energy Equipment & Services - 6.2% | |||||
Canadian Energy Services & Technology | 47,400 | 1,484,568 | |||
Dawson Geophysical | 87,429 | 2,504,841 | |||
Geospace Technologies 1 | 34,912 | 1,922,953 | |||
Gulf Island Fabrication | 273,163 | 5,878,468 | |||
Natural Gas Services Group 1 | 175,400 | 5,798,724 | |||
Tesco Corporation | 313,880 | 6,698,199 | |||
TGC Industries 1 | 672,840 | 3,666,978 | |||
Total Energy Services | 369,200 | 8,037,595 | |||
| 35,992,326 | |||||
| Oil, Gas & Consumable Fuels - 2.3% | |||||
Ardmore Shipping | 53,600 | 741,288 | |||
Contango Oil & Gas 1 | 33,907 | 1,434,605 | |||
| 69,400 | 1,211,030 | ||||
Sprott Resource 1 | 1,087,300 | 3,219,969 | |||
Synergy Resources 1 | 158,100 | 2,094,825 | |||
Triangle Petroleum 1 | 392,504 | 4,611,922 | |||
| 13,313,639 | |||||
| Total (Cost $31,184,127) | 49,305,965 | ||||
| Financials – 8.2% | |||||
| Banks - 1.1% | |||||
BCB Holdings 1 | 1,303,907 | 295,675 | |||
| 44,600 | 813,950 | ||||
Pacific Continental | 238,800 | 3,278,724 | |||
TriState Capital Holdings 1 | 152,972 | 2,161,494 | |||
| 6,549,843 | |||||
| Capital Markets - 3.8% | |||||
FBR & Co. 1 | 152,816 | 4,145,898 | |||
Gluskin Sheff + Associates | 53,200 | 1,587,450 | |||
GMP Capital | 330,700 | 2,640,517 | |||
INTL FCStone 1 | 232,569 | 4,632,774 | |||
JMP Group | 242,751 | 1,837,625 | |||
Silvercrest Asset Management Group Cl. A | 113,200 | 1,948,172 | |||
U.S. Global Investors Cl. A | 198,700 | 699,424 | |||
Westwood Holdings Group | 72,527 | 4,354,521 | |||
| 21,846,381 | |||||
| Consumer Finance - 0.3% | |||||
EZCORP Cl. A 1 | 164,900 | 1,904,595 | |||
| Diversified Financial Services - 0.4% | |||||
PICO Holdings 1 | 96,835 | 2,300,800 | |||
| Insurance - 0.6% | |||||
Blue Capital Reinsurance Holdings | 80,500 | 1,585,850 | |||
Navigators Group 1 | 22,536 | 1,511,039 | |||
| 3,096,889 | |||||
| Real Estate Management & Development - 2.0% | |||||
AV Homes 1 | 107,700 | 1,760,895 | |||
Kennedy-Wilson Holdings | 282,230 | 7,569,408 | |||
Midland Holdings 1 | 4,513,000 | 2,270,941 | |||
| 11,601,244 | |||||
| Total (Cost $40,071,738) | 47,299,752 | ||||
| Health Care – 9.3% | |||||
| Biotechnology - 0.7% | |||||
BioSpecifics Technologies 1 | 39,100 | 1,054,136 | |||
| 12 | Royce Capital Fund 2014 Semiannual Report to Shareholders | THE ACCOMPANYING NOTES ARE AN INTEGRAL PART OF THESE FINANCIAL STATEMENTS. |
June 30, 2014 (unaudited) |
| SHARES | VALUE | ||||
| Health Care (continued) | |||||
| Biotechnology (continued) | |||||
Dyax Corporation 1 | 162,116 | $ | 1,556,314 | ||
Harvard Apparatus Regenerative Technology 1 | 72,367 | 756,235 | |||
Lexicon Pharmaceuticals 1 | 570,379 | 918,310 | |||
| 4,284,995 | |||||
| Health Care Equipment & Supplies - 4.8% | |||||
Cerus Corporation 1 | 538,057 | 2,232,937 | |||
CryoLife | 199,189 | 1,782,742 | |||
Cynosure Cl. A 1 | 102,100 | 2,169,625 | |||
| 454,800 | 709,488 | ||||
Exactech 1 | 91,717 | 2,314,020 | |||
Merit Medical Systems 1 | 164,135 | 2,478,438 | |||
Novadaq Technologies 1 | 25,479 | 419,894 | |||
Orthofix International 1 | 26,400 | 957,000 | |||
RTI Surgical 1 | 318,700 | 1,386,345 | |||
STAAR Surgical 1 | 96,500 | 1,621,200 | |||
SurModics 1 | 164,378 | 3,520,977 | |||
Symmetry Medical 1 | 120,300 | 1,065,858 | |||
Synergetics USA 1 | 438,900 | 1,360,590 | |||
Syneron Medical 1 | 390,385 | 4,028,773 | |||
Trinity Biotech ADR Cl. A | 67,770 | 1,560,743 | |||
| 27,608,630 | |||||
| Health Care Providers & Services - 2.4% | |||||
| 72,500 | 2,190,950 | ||||
CorVel Corporation 1 | 92,321 | 4,171,063 | |||
PDI 1 | 318,120 | 1,393,366 | |||
U.S. Physical Therapy | 175,160 | 5,988,720 | |||
| 13,744,099 | |||||
| Life Sciences Tools & Services - 0.2% | |||||
Harvard Bioscience 1 | 289,468 | 1,317,079 | |||
| Pharmaceuticals - 1.2% | |||||
| 109,500 | 954,840 | ||||
| 41,500 | 1,323,020 | ||||
Unichem Laboratories | 374,164 | 1,404,709 | |||
Vetoquinol | 52,008 | 2,576,543 | |||
| 312,878 | 628,885 | ||||
| 6,887,997 | |||||
| Total (Cost $37,534,429) | 53,842,800 | ||||
| Industrials – 24.4% | |||||
| Aerospace & Defense - 0.9% | |||||
AeroVironment 1 | 67,000 | 2,130,600 | |||
American Science and Engineering | 27,300 | 1,899,807 | |||
CPI Aerostructures 1 | 96,100 | 1,217,587 | |||
| 5,247,994 | |||||
| Building Products - 2.2% | |||||
AAON | 107,308 | 3,596,964 | |||
Quanex Building Products | 232,400 | 4,152,988 | |||
WaterFurnace Renewable Energy | 180,800 | 5,135,699 | |||
| 12,885,651 | |||||
| Commercial Services & Supplies - 2.3% | |||||
Courier Corporation | 175,418 | 2,617,237 | |||
Ennis | 293,449 | 4,478,032 | |||
Heritage-Crystal Clean 1 | 86,734 | 1,702,588 | |||
Hudson Technologies 1 | 319,100 | 922,199 | |||
Team 1 | 39,700 | 1,628,494 | |||
US Ecology | 34,200 | 1,674,090 | |||
| 13,022,640 | |||||
| Construction & Engineering - 2.3% | |||||
Layne Christensen 1 | 213,312 | 2,837,050 | |||
MYR Group 1 | 169,338 | 4,289,331 | |||
Severfield 1 | 3,294,845 | 3,129,532 | |||
Sterling Construction 1 | 306,147 | 2,871,659 | |||
| 13,127,572 | |||||
| Electrical Equipment - 2.9% | |||||
Global Power Equipment Group | 369,588 | 5,972,542 | |||
Graphite India | 1,667,608 | 2,920,982 | |||
LSI Industries | 648,613 | 5,175,932 | |||
Powell Industries | 42,100 | 2,752,498 | |||
| 16,821,954 | |||||
| Machinery - 6.6% | |||||
AIA Engineering | 81,093 | 1,046,274 | |||
CIRCOR International | 20,000 | 1,542,600 | |||
Foster (L.B.) Company | 131,946 | 7,140,917 | |||
FreightCar America | 227,391 | 5,693,871 | |||
Gorman-Rupp Company (The) | 55,837 | 1,974,955 | |||
Graham Corporation | 145,020 | 5,048,146 | |||
Kadant | 129,031 | 4,961,242 | |||
Key Technology 1 | 292,129 | 3,599,029 | |||
RBC Bearings | 44,122 | 2,826,014 | |||
Semperit AG Holding | 75,842 | 4,647,309 | |||
| 38,480,357 | |||||
| Marine - 0.3% | |||||
Clarkson | 47,200 | 1,934,635 | |||
| Professional Services - 4.1% | |||||
CRA International 1 | 217,706 | 5,018,123 | |||
Exponent | 37,297 | 2,764,081 | |||
GP Strategies 1 | 189,108 | 4,894,115 | |||
Kforce | 217,700 | 4,713,205 | |||
Resources Connection | 492,588 | 6,457,829 | |||
| 23,847,353 | |||||
| Road & Rail - 2.4% | |||||
Marten Transport | 277,785 | 6,208,495 | |||
Patriot Transportation Holding 1 | 216,240 | 7,561,913 | |||
| 13,770,408 | |||||
| Trading Companies & Distributors - 0.4% | |||||
Houston Wire & Cable | 186,700 | 2,316,947 | |||
| Total (Cost $109,303,279) | 141,455,511 | ||||
| Information Technology – 13.7% | |||||
| Communications Equipment - 1.4% | |||||
| 255,140 | 648,056 | ||||
COM DEV International | 303,700 | 1,215,312 | |||
Digi International 1 | 297,084 | 2,798,531 | |||
KVH Industries 1 | 255,100 | 3,323,953 | |||
| 7,985,852 | |||||
| THE ACCOMPANYING NOTES ARE AN INTEGRAL PART OF THESE FINANCIAL STATEMENTS. | Royce Capital Fund 2014 Semiannual Report to Shareholders | 13 |
Schedules of Investments
| Royce Capital Fund–Micro-Cap Portfolio (continued) |
| SHARES | VALUE | ||||
| Information Technology (continued) | |||||
| Electronic Equipment, Instruments & Components - 2.9% | |||||
CUI Global 1 | 267,062 | $ | 2,243,321 | ||
Electro Rent | 122,800 | 2,054,444 | |||
Fabrinet 1 | 237,669 | 4,895,981 | |||
GSI Group 1 | 333,300 | 4,242,909 | |||
| 247,465 | 774,566 | ||||
Pure Technologies | 39,000 | 261,328 | |||
Vishay Precision Group 1 | 131,800 | 2,169,428 | |||
| 16,641,977 | |||||
| Internet Software & Services - 0.5% | |||||
QuinStreet 1 | 320,700 | 1,767,057 | |||
Zix Corporation 1 | 411,700 | 1,408,014 | |||
| 3,175,071 | |||||
| IT Services - 0.4% | |||||
EPAM Systems 1 | 41,248 | 1,804,600 | |||
ServiceSource International 1 | 60,275 | 349,595 | |||
| 2,154,195 | |||||
| Semiconductors & Semiconductor Equipment - 4.6% | |||||
Advanced Energy Industries 1 | 179,900 | 3,463,075 | |||
AXT 1 | 829,991 | 1,776,181 | |||
Brooks Automation | 433,400 | 4,667,718 | |||
Cascade Microtech 1 | 61,600 | 841,456 | |||
GSI Technology 1 | 513,861 | 3,062,611 | |||
Integrated Silicon Solution 1 | 360,599 | 5,326,047 | |||
Photronics 1 | 245,300 | 2,109,580 | |||
Rudolph Technologies 1 | 159,293 | 1,573,815 | |||
Ultra Clean Holdings 1 | 103,300 | 934,865 | |||
Xcerra Corporation 1 | 347,600 | 3,163,160 | |||
| 26,918,508 | |||||
| Software - 3.3% | |||||
ePlus 1 | 79,496 | 4,626,667 | |||
| 92,500 | 1,770,450 | ||||
Monotype Imaging Holdings | 151,242 | 4,260,487 | |||
SeaChange International 1 | 215,100 | 1,722,951 | |||
TeleNav 1 | 296,400 | 1,686,516 | |||
VASCO Data Security International 1 | 428,129 | 4,966,297 | |||
| 19,033,368 | |||||
| Technology Hardware, Storage & Peripherals - 0.6% | |||||
| 137,593 | 1,018,188 | ||||
Super Micro Computer 1 | 102,511 | 2,590,453 | |||
| 3,608,641 | |||||
| Total (Cost $67,431,982) | 79,517,612 | ||||
| Materials – 8.8% | |||||
| Chemicals - 2.0% | |||||
BioAmber 1 | 66,979 | 666,441 | |||
Burcon NutraScience 1 | 148,556 | 588,282 | |||
C. Uyemura & Co. | 23,900 | 1,217,354 | |||
FutureFuel Corporation | 196,100 | 3,253,299 | |||
Quaker Chemical | 55,788 | 4,283,960 | |||
Societe Internationale de Plantations d’Heveas | 28,985 | 1,390,708 | |||
| 11,400,044 | |||||
| Metals & Mining - 6.8% | |||||
Alamos Gold | 162,900 | 1,647,243 | |||
Argonaut Gold 1 | 253,100 | 1,048,406 | |||
Endeavour Mining 1 | 750,000 | 583,384 | |||
Endeavour Silver 1 | 466,100 | 2,544,906 | |||
Geodrill 1 | 1,217,200 | 935,387 | |||
Gold Standard Ventures 1 | 700,000 | 553,000 | |||
Goldgroup Mining 1 | 652,000 | 103,875 | |||
Haynes International | 81,170 | 4,593,410 | |||
Horsehead Holding Corporation 1 | 287,803 | 5,255,283 | |||
Imdex 1 | 1,677,092 | 996,291 | |||
| 1,019,096 | 2,934,997 | ||||
Olympic Steel | 203,228 | 5,029,893 | |||
Phoscan Chemical 1 | 2,968,200 | 834,506 | |||
Pilot Gold 1 | 1,669,325 | 2,284,068 | |||
Silvercorp Metals | 486,600 | 1,031,592 | |||
Synalloy Corporation | 126,641 | 2,079,445 | |||
Universal Stainless & Alloy Products 1 | 200,736 | 6,519,905 | |||
Western Copper and Gold 1 | 720,000 | 554,400 | |||
| 39,529,991 | |||||
| Total (Cost $45,534,221) | 50,930,035 | ||||
| Utilities – 0.1% | |||||
| Independent Power & Renewable Electricity Producer - 0.1% | |||||
Alterra Power 1 | 1,844,000 | 604,845 | |||
| Total (Cost $2,120,432) | 604,845 | ||||
| Miscellaneous 5 – 4.1% | |||||
| Total (Cost $22,942,293) | 24,008,391 | ||||
| TOTAL COMMON STOCKS | |||||
(Cost $423,696,172) | 533,472,982 | ||||
| REPURCHASE AGREEMENT – 8.0% | |||||
Fixed Income Clearing Corporation, | 46,310,000 | ||||
| 14 | Royce Capital Fund 2014 Semiannual Report to Shareholders | THE ACCOMPANYING NOTES ARE AN INTEGRAL PART OF THESE FINANCIAL STATEMENTS. |
June 30, 2014 (unaudited) |
| VALUE | ||||||
| COLLATERAL RECEIVED FOR SECURITIES | ||||||
LOANED – 2.9% | ||||||
| Money Market Funds | ||||||
Federated Government Obligations Fund | $ | 16,866,398 | ||||
| TOTAL INVESTMENTS – 103.0% | ||||||
(Cost $486,872,570) | 596,649,380 | |||||
| LIABILITIES LESS CASH | ||||||
AND OTHER ASSETS – (3.0)% | (17,614,643 | ) | ||||
| NET ASSETS – 100.0% | $ | 579,034,737 | ||||
| Royce Capital Fund–Small-Cap Portfolio |
| SHARES | VALUE | ||||
| COMMON STOCKS – 93.8% | |||||
| Consumer Discretionary – 25.0% | |||||
| Automobiles - 0.8% | |||||
Thor Industries | 126,715 | $ | 7,206,282 | ||
| Media - 1.0% | |||||
Saga Communications Cl. A | 228,454 | 9,759,555 | |||
| Specialty Retail - 14.8% | |||||
American Eagle Outfitters | 800,315 | 8,979,534 | |||
Ascena Retail Group 1 | 752,980 | 12,875,958 | |||
Buckle (The) | 586,319 | 26,009,111 | |||
Cato Corporation (The) Cl. A | 493,311 | 15,243,310 | |||
GameStop Corporation Cl. A | 89,272 | 3,612,838 | |||
Genesco 1 | 352,308 | 28,935,056 | |||
Guess? | 387,254 | 10,455,858 | |||
Shoe Carnival | 775,713 | 16,018,474 | |||
Stein Mart | 1,568,778 | 21,790,326 | |||
| 143,920,465 | |||||
| Textiles, Apparel & Luxury Goods - 8.4% | |||||
Barry (R.G.) | 147,573 | 2,796,508 | |||
Crocs 1 | 720,678 | 10,831,790 | |||
Deckers Outdoor 1 | 126,797 | 10,946,385 | |||
G-III Apparel Group 1 | 227,537 | 18,580,672 | |||
Steven Madden 1 | 886,868 | 30,419,572 | |||
| 349,370 | 7,640,722 | ||||
| 81,215,649 | |||||
| Total (Cost $177,569,934) | 242,101,951 | ||||
| Consumer Staples – 1.8% | |||||
| Food & Staples Retailing - 0.6% | |||||
Village Super Market Cl. A | 256,171 | 6,053,321 | |||
| Personal Products - 1.2% | |||||
Inter Parfums | 194,975 | 5,761,511 | |||
Nu Skin Enterprises Cl. A | 75,677 | 5,597,071 | |||
| 11,358,582 | |||||
| Total (Cost $13,223,654) | 17,411,903 | ||||
| Energy – 6.4% | |||||
| Energy Equipment & Services - 5.5% | |||||
Helmerich & Payne | 34,400 | 3,994,184 | |||
Matrix Service 1 | 316,801 | 10,387,905 | |||
Oil States International 1 | 81,386 | 5,216,029 | |||
Total Energy Services | 199,800 | 4,349,706 | |||
Unit Corporation 1 | 422,354 | 29,070,626 | |||
| 53,018,450 | |||||
| Oil, Gas & Consumable Fuels - 0.9% | |||||
Cimarex Energy | 61,518 | 8,825,372 | |||
| Total (Cost $27,296,496) | 61,843,822 | ||||
| Financials – 14.6% | |||||
| Banks - 3.0% | |||||
Ames National | 219,219 | 5,072,728 | |||
Camden National | 248,298 | 9,624,030 | |||
| THE ACCOMPANYING NOTES ARE AN INTEGRAL PART OF THESE FINANCIAL STATEMENTS. | Royce Capital Fund 2014 Semiannual Report to Shareholders | 15 |
Schedules of Investments
| Royce Capital Fund–Small-Cap Portfolio (continued) |
| SHARES | VALUE | ||||
| Financials (continued) | |||||
| Banks (continued) | |||||
City Holding Company | 317,540 | $ | 14,327,405 | ||
| 29,024,163 | |||||
| Capital Markets - 2.0% | |||||
Federated Investors Cl. B | 621,601 | 19,219,903 | |||
| Insurance - 5.3% | |||||
Allied World Assurance Company Holdings | 350,775 | 13,336,465 | |||
Aspen Insurance Holdings | 301,609 | 13,699,081 | |||
Montpelier Re Holdings | 266,121 | 8,502,566 | |||
Reinsurance Group of America | 201,000 | 15,858,900 | |||
| 51,397,012 | |||||
| Thrifts & Mortgage Finance - 4.3% | |||||
Genworth MI Canada | 663,700 | 23,642,038 | |||
TrustCo Bank Corp. NY | 2,776,786 | 18,548,931 | |||
| 42,190,969 | |||||
| Total (Cost $90,917,109) | 141,832,047 | ||||
| Health Care – 5.5% | |||||
| Health Care Providers & Services - 5.5% | |||||
Chemed Corporation | 262,356 | 24,588,004 | |||
Magellan Health 1 | 114,636 | 7,134,945 | |||
MEDNAX 1 | 207,220 | 12,049,843 | |||
U.S. Physical Therapy | 285,169 | 9,749,928 | |||
| Total (Cost $27,429,300) | 53,522,720 | ||||
| Industrials – 9.1% | |||||
| Aerospace & Defense - 0.9% | |||||
Cubic Corporation | 196,000 | 8,723,960 | |||
| Commercial Services & Supplies - 2.0% | |||||
Horizon North Logistics | 452,200 | 3,246,195 | |||
UniFirst Corporation | 155,850 | 16,520,100 | |||
| 19,766,295 | |||||
| Machinery - 3.4% | |||||
Alamo Group | 309,287 | 16,729,334 | |||
Kennametal | 91,195 | 4,220,504 | |||
Miller Industries 6 | 611,445 | 12,583,538 | |||
| 33,533,376 | |||||
| Road & Rail - 1.0% | |||||
Knight Transportation | 395,800 | 9,408,166 | |||
| Trading Companies & Distributors - 1.8% | |||||
Applied Industrial Technologies | 337,453 | 17,118,991 | |||
| Total (Cost $67,279,036) | 88,550,788 | ||||
| Information Technology – 24.9% | |||||
| Communications Equipment - 7.5% | |||||
NETGEAR 1 | 836,019 | 29,068,381 | |||
Plantronics | 616,130 | 29,605,046 | |||
TESSCO Technologies 6 | 438,749 | 13,921,506 | |||
| 72,594,933 | |||||
| Electronic Equipment, Instruments & Components - 9.9% | |||||
Fabrinet 1 | 1,397,388 | 28,786,193 | |||
| 615,397 | 6,449,361 | ||||
Littelfuse | 7,431 | 690,711 | |||
MTS Systems | 11,496 | 778,969 | |||
PC Connection | 914,261 | 18,906,917 | |||
Rofin-Sinar Technologies 1 | 480,502 | 11,551,268 | |||
Vishay Intertechnology | 1,872,153 | 28,999,650 | |||
| 96,163,069 | |||||
| IT Services - 3.9% | |||||
Convergys Corporation | 1,010,692 | 21,669,237 | |||
ManTech International Cl. A | 558,185 | 16,477,621 | |||
| 38,146,858 | |||||
| Semiconductors & Semiconductor Equipment - 3.6% | |||||
Cabot Microelectronics 1 | 19,233 | 858,754 | |||
IXYS Corporation | 491,829 | 6,059,333 | |||
MKS Instruments | 418,800 | 13,083,312 | |||
| 117,500 | 10,650,200 | ||||
Teradyne | 195,700 | 3,835,720 | |||
| 34,487,319 | |||||
| Total (Cost $205,444,344) | 241,392,179 | ||||
| Materials – 4.8% | |||||
| Chemicals - 2.8% | |||||
Innophos Holdings | 136,910 | 7,881,908 | |||
Innospec | 444,599 | 19,193,339 | |||
| 27,075,247 | |||||
| Containers & Packaging - 0.5% | |||||
UFP Technologies 1 | 177,566 | 4,277,565 | |||
| Metals & Mining - 0.1% | |||||
Reliance Steel & Aluminum | 18,300 | 1,348,893 | |||
| Paper & Forest Products - 1.4% | |||||
Schweitzer-Mauduit International | 320,004 | 13,971,375 | |||
| Total (Cost $42,212,568) | 46,673,080 | ||||
| Miscellaneous 5 – 1.7% | |||||
| Total (Cost $16,012,608) | 16,889,252 | ||||
| TOTAL COMMON STOCKS | |||||
(Cost $667,385,049) | 910,217,742 | ||||
| REPURCHASE AGREEMENT – 6.2% | |||||
Fixed Income Clearing Corporation, | 59,813,000 | ||||
| 16 | Royce Capital Fund 2014 Semiannual Report to Shareholders | THE ACCOMPANYING NOTES ARE AN INTEGRAL PART OF THESE FINANCIAL STATEMENTS. |
June 30, 2014 (unaudited) |
| VALUE | ||||||
| COLLATERAL RECEIVED FOR SECURITIES | ||||||
LOANED – 0.5% | ||||||
| Money Market Funds | ||||||
Federated Government Obligations Fund | $ | 5,276,965 | ||||
| TOTAL INVESTMENTS – 100.5% | ||||||
(Cost $732,475,014) | 975,307,707 | |||||
| LIABILITIES LESS CASH | ||||||
AND OTHER ASSETS – (0.5)% | (4,846,467 | ) | ||||
| NET ASSETS – 100.0% | $ | 970,461,240 | ||||
| THE ACCOMPANYING NOTES ARE AN INTEGRAL PART OF THESE FINANCIAL STATEMENTS. | Royce Capital Fund 2014 Semiannual Report to Shareholders | 17 |
| Statements of Assets and Liabilities | June 30, 2014 (unaudited) |
| Micro-Cap | Small-Cap | |||||||
| Portfolio | Portfolio | |||||||
| ASSETS: | ||||||||
| Investments at value (including collateral on loaned securities) | ||||||||
Non-Affiliated Companies | $ | 550,339,380 | $ | 882,540,302 | ||||
Affiliated Companies | – | 32,954,405 | ||||||
| Repurchase agreements (at cost and value) | 46,310,000 | 59,813,000 | ||||||
| Cash and foreign currency | 67,709 | 276 | ||||||
| Receivable for investments sold | 1,400,087 | 1,071,736 | ||||||
| Receivable for capital shares sold | 513,723 | 9,602,851 | ||||||
| Receivable for dividends and interest | 400,892 | 600,180 | ||||||
| Prepaid expenses and other assets | 5,203 | 10,145 | ||||||
Total Assets | 599,036,994 | 986,592,895 | ||||||
| LIABILITIES: | ||||||||
| Payable for collateral on loaned securities | 16,866,398 | 5,276,965 | ||||||
| Payable for investments purchased | 1,727,588 | 8,988,019 | ||||||
| Payable for capital shares redeemed | 755,174 | 956,711 | ||||||
| Payable for investment advisory fees | 580,078 | 777,106 | ||||||
| Accrued expenses | 73,019 | 132,854 | ||||||
Total Liabilities | 20,002,257 | 16,131,655 | ||||||
Net Assets | $ | 579,034,737 | $ | 970,461,240 | ||||
| ANALYSIS OF NET ASSETS: | ||||||||
| Paid-in capital | $ | 416,765,795 | $ | 582,162,071 | ||||
| Undistributed net investment income (loss) | (2,622,729 | ) | 1,796,361 | |||||
| Accumulated net realized gain (loss) on investments and foreign currency | 55,112,550 | 143,670,276 | ||||||
| Net unrealized appreciation (depreciation) on investments and foreign currency | 109,779,121 | 242,832,532 | ||||||
Net Assets | $ | 579,034,737 | $ | 970,461,240 | ||||
Investment Class | $ | 539,262,573 | $ | 735,592,582 | ||||
Service Class | 39,772,164 | 234,868,658 | ||||||
| SHARES OUTSTANDING (unlimited number of $.001 par value): | ||||||||
Investment Class | 41,606,833 | 51,854,001 | ||||||
Service Class | 3,099,531 | 16,797,834 | ||||||
| NET ASSET VALUES (Net Assets ÷ Shares Outstanding): | ||||||||
(offering and redemption price per share) | ||||||||
Investment Class | $12.96 | $14.19 | ||||||
Service Class | 12.83 | 13.98 | ||||||
Investments at identified cost | $ | 440,562,570 | $ | 672,662,014 | ||||
Market value of loaned securities | 16,153,361 | 5,133,683 | ||||||
| 18 | Royce Capital Fund 2014 Semiannual Report to Shareholders | THE ACCOMPANYING NOTES ARE AN INTEGRAL PART OF THESE FINANCIAL STATEMENTS. |
| Statements of Changes in Net Assets |
| Micro-Cap Portfolio | Small-Cap Portfolio | |||||||||||||||
| Six months ended | Six months ended | |||||||||||||||
| 6/30/14 | Year ended | 6/30/14 | Year ended | |||||||||||||
| (unaudited) | 12/31/13 | (unaudited) | 12/31/13 | |||||||||||||
| INVESTMENT OPERATIONS: | ||||||||||||||||
| Net investment income (loss) | $ | (927,677 | ) | $ | (2,172,035 | ) | $ | 1,224,971 | $ | 664,506 | ||||||
Net realized gain (loss) on investments and foreign currency | 18,961,668 | 44,622,348 | 49,857,994 | 94,251,658 | ||||||||||||
Net change in unrealized appreciation (depreciation) on investments and foreign currency | (13,369,494 | ) | 68,959,434 | (33,709,837 | ) | 169,490,816 | ||||||||||
| Net increase (decrease) in net assets from investment operations | 4,664,497 | 111,409,747 | 17,373,128 | 264,406,980 | ||||||||||||
| DISTRIBUTIONS: | ||||||||||||||||
| Net investment income | ||||||||||||||||
Investment Class | – | (2,773,314 | ) | – | (7,334,482 | ) | ||||||||||
Service Class | – | (129,808 | ) | – | (2,049,052 | ) | ||||||||||
Net realized gain on investments and foreign currency | ||||||||||||||||
Investment Class | – | (14,533,900 | ) | – | (38,123,021 | ) | ||||||||||
Service Class | – | (1,029,260 | ) | – | (11,915,684 | ) | ||||||||||
| Total distributions | – | (18,466,282 | ) | – | (59,422,239 | ) | ||||||||||
| CAPITAL SHARE TRANSACTIONS: | ||||||||||||||||
| Value of shares sold | ||||||||||||||||
Investment Class | 17,500,628 | 40,124,309 | 58,015,631 | 94,415,549 | ||||||||||||
Service Class | 6,240,190 | 9,376,424 | 6,863,630 | 36,125,376 | ||||||||||||
| Distributions reinvested | ||||||||||||||||
Investment Class | – | 17,307,214 | – | 45,457,503 | ||||||||||||
Service Class | – | 1,159,068 | – | 13,964,736 | ||||||||||||
| Value of shares redeemed | ||||||||||||||||
Investment Class | (55,468,184 | ) | (115,122,181 | ) | (72,528,389 | ) | (187,804,627 | ) | ||||||||
Service Class | (7,321,826 | ) | (12,649,040 | ) | (8,368,281 | ) | (10,480,881 | ) | ||||||||
| Net increase (decrease) in net assets from capital share transactions | (39,049,192 | ) | (59,804,206 | ) | (16,017,409 | ) | (8,322,344 | ) | ||||||||
NET INCREASE (DECREASE) IN NET ASSETS | (34,384,695 | ) | 33,139,259 | 1,355,719 | 196,662,397 | |||||||||||
| NET ASSETS: | ||||||||||||||||
Beginning of period | 613,419,432 | 580,280,173 | 969,105,521 | 772,443,124 | ||||||||||||
End of period | $ | 579,034,737 | $ | 613,419,432 | $ | 970,461,240 | $ | 969,105,521 | ||||||||
UNDISTRIBUTED NET INVESTMENT INCOME (LOSS) AT END OF PERIOD | $ | (2,622,729 | ) | $ | (1,695,052 | ) | $ | 1,796,361 | $ | 571,390 | ||||||
| THE ACCOMPANYING NOTES ARE AN INTEGRAL PART OF THESE FINANCIAL STATEMENTS. | Royce Capital Fund 2014 Semiannual Report to Shareholders | 19 |
| Statements of Operations | Six Months Ended June 30, 2014 (unaudited) |
| Micro-Cap | Small-Cap | |||||||
| Portfolio | Portfolio | |||||||
| INVESTMENT INCOME: | ||||||||
| Income: | ||||||||
Dividends | $ | 2,868,433 | $ | 6,407,548 | ||||
Foreign withholding tax | (93,230 | ) | (86,946 | ) | ||||
Securities lending | 103,900 | 55,348 | ||||||
| Total income | 2,879,103 | 6,375,950 | ||||||
| Expenses: | ||||||||
Investment advisory fees | 3,596,797 | 4,662,045 | ||||||
Distribution fees | 48,625 | 281,015 | ||||||
Custody | 51,094 | 47,926 | ||||||
Administrative and office facilities | 31,878 | 49,231 | ||||||
Trustees’ fees | 26,694 | 41,814 | ||||||
Audit | 19,627 | 17,800 | ||||||
Shareholder reports | 14,085 | 29,500 | ||||||
Shareholder servicing | 7,655 | 6,726 | ||||||
Legal | 2,444 | 3,784 | ||||||
Other expenses | 7,946 | 11,243 | ||||||
| Total expenses | 3,806,845 | 5,151,084 | ||||||
| Compensating balance credits | (65 | ) | (105 | ) | ||||
| Net expenses | 3,806,780 | 5,150,979 | ||||||
| Net investment income (loss) | (927,677 | ) | 1,224,971 | |||||
| REALIZED AND UNREALIZED GAIN (LOSS) ON INVESTMENTS AND FOREIGN CURRENCY: | ||||||||
| Net realized gain (loss): | ||||||||
Investments | 18,969,302 | 49,859,425 | ||||||
Foreign currency transactions | (7,634 | ) | (1,431 | ) | ||||
| Net change in unrealized appreciation (depreciation): | ||||||||
Investments and foreign currency translations | (13,367,236 | ) | (33,709,609 | ) | ||||
Other assets and liabilities denominated in foreign currency | (2,258 | ) | (228 | ) | ||||
| Net realized and unrealized gain (loss) on investments and foreign currency | 5,592,174 | 16,148,157 | ||||||
| NET INCREASE (DECREASE) IN NET ASSETS FROM INVESTMENT OPERATIONS | $ | 4,664,497 | $ | 17,373,128 | ||||
| 20 | Royce Capital Fund 2014 Semiannual Report to Shareholders | THE ACCOMPANYING NOTES ARE AN INTEGRAL PART OF THESE FINANCIAL STATEMENTS. |
| This table is presented to show selected data for a share outstanding throughout each period and to assist shareholders in evaluating a Fund’s performance for the periods presented. Per share amounts have been determined on the basis of the weighted average number of shares outstanding during the period. | |||||||||||||||||||||||||||||||||||||||||||||||||||||||||||
| Net Realized | Distributions from Net | Ratio of Expenses to Average Net Assets | Ratio of Net | ||||||||||||||||||||||||||||||||||||||||||||||||||||||||
| Net Asset Value, Beginning of Period | Net Investment Income (Loss) | and Unrealized Gain (Loss) on Investments and Foreign Currency | Total from Investment Operations | Distributions from Net Investment Income | Realized Gain on Investments and Foreign Currency | Total Distributions | Net Asset Value, End of Period | Total Return | Net Assets, End of Period (in thousands) | Prior to Fee Waivers and Balance Credits | Prior to Fee Waivers | Net of Fee Waivers | Investment Income (Loss) to Average Net Assets | Portfolio Turnover Rate | |||||||||||||||||||||||||||||||||||||||||||||
| Micro-Cap Portfolio – Investment Class | |||||||||||||||||||||||||||||||||||||||||||||||||||||||||||
| †2014 | $ | 12.83 | $ | (0.02 | ) | $ | 0.15 | $ | 0.13 | $ | – | $ | – | $ | – | $ | 12.96 | 1.01 | %1 | $ | 539,263 | 1.30 | %2 | 1.30 | %2 | 1.30 | %2 | (0.30 | )%2 | 12 | % | ||||||||||||||||||||||||||||
| 2013 | 10.95 | (0.04 | ) | 2.32 | 2.28 | (0.06 | ) | (0.34 | ) | (0.40 | ) | 12.83 | 20.99 | 572,666 | 1.32 | 1.32 | 1.32 | (0.36 | ) | 30 | |||||||||||||||||||||||||||||||||||||||
| 2012 | 10.41 | 0.04 | 0.74 | 0.78 | – | (0.24 | ) | (0.24 | ) | 10.95 | 7.60 | 543,516 | 1.33 | 1.33 | 1.33 | 0.39 | 21 | ||||||||||||||||||||||||||||||||||||||||||
| 2011 | 12.18 | (0.03 | ) | (1.45 | ) | (1.48 | ) | (0.29 | ) | – | (0.29 | ) | 10.41 | (12.10 | ) | 569,498 | 1.32 | 1.32 | 1.32 | (0.31 | ) | 35 | |||||||||||||||||||||||||||||||||||||
| 2010 | 9.52 | (0.01 | ) | 2.87 | 2.86 | (0.20 | ) | – | (0.20 | ) | 12.18 | 30.10 | 676,654 | 1.32 | 1.32 | 1.32 | (0.09 | ) | 35 | ||||||||||||||||||||||||||||||||||||||||
| 2009 | 6.03 | (0.01 | ) | 3.50 | 3.49 | – | – | – | 9.52 | 57.88 | 522,092 | 1.33 | 1.33 | 1.33 | (0.13 | ) | 33 | ||||||||||||||||||||||||||||||||||||||||||
| Micro-Cap Portfolio – Service Class | |||||||||||||||||||||||||||||||||||||||||||||||||||||||||||
| †2014 | $ | 12.72 | $ | (0.04 | ) | $ | 0.15 | $ | 0.11 | $ | – | $ | – | $ | – | $ | 12.83 | 0.86 | %1 | $ | 39,772 | 1.57 | %2 | 1.57 | %2 | 1.57 | %2 | (0.58 | )%2 | 12 | % | ||||||||||||||||||||||||||||
| 2013 | 10.87 | (0.07 | ) | 2.30 | 2.23 | (0.04 | ) | (0.34 | ) | (0.38 | ) | 12.72 | 20.65 | 40,753 | 1.60 | 1.60 | 1.58 | (0.62 | ) | 30 | |||||||||||||||||||||||||||||||||||||||
| 2012 | 10.35 | 0.03 | 0.73 | 0.76 | – | (0.24 | ) | (0.24 | ) | 10.87 | 7.45 | 36,764 | 1.59 | 1.59 | 1.55 | 0.27 | 21 | ||||||||||||||||||||||||||||||||||||||||||
| 2011 | 12.13 | (0.11 | ) | (1.39 | ) | (1.50 | ) | (0.28 | ) | – | (0.28 | ) | 10.35 | (12.26 | ) | 26,096 | 1.60 | 1.60 | 1.49 | (0.46 | ) | 35 | |||||||||||||||||||||||||||||||||||||
| 2010 | 9.49 | (0.08 | ) | 2.91 | 2.83 | (0.19 | ) | – | (0.19 | ) | 12.13 | 29.90 | 17,022 | 1.63 | 1.63 | 1.40 | (0.12 | ) | 35 | ||||||||||||||||||||||||||||||||||||||||
| 2009 | 6.02 | (0.03 | ) | 3.50 | 3.47 | – | – | – | 9.49 | 57.64 | 6,907 | 1.73 | 1.73 | 1.58 | (0.36 | ) | 33 | ||||||||||||||||||||||||||||||||||||||||||
| Small-Cap Portfolio – Investment Class | |||||||||||||||||||||||||||||||||||||||||||||||||||||||||||
| †2014 | $ | 13.92 | $ | 0.02 | $ | 0.25 | $ | 0.27 | $ | – | $ | – | $ | – | $ | 14.19 | 1.94 | %1 | $ | 735,592 | 1.04 | %2 | 1.04 | %2 | 1.04 | %2 | 0.32 | %2 | 16 | % | |||||||||||||||||||||||||||||
| 2013 | 11.03 | 0.03 | 3.75 | 3.78 | (0.14 | ) | (0.75 | ) | (0.89 | ) | 13.92 | 34.75 | 736,917 | 1.05 | 1.05 | 1.05 | 0.13 | 43 | |||||||||||||||||||||||||||||||||||||||||
| 2012 | 10.07 | 0.15 | 1.10 | 1.25 | (0.01 | ) | (0.28 | ) | (0.29 | ) | 11.03 | 12.50 | 623,830 | 1.06 | 1.06 | 1.06 | 1.37 | 62 | |||||||||||||||||||||||||||||||||||||||||
| 2011 | 10.45 | 0.01 | (0.35 | ) | (0.34 | ) | (0.04 | ) | – | (0.04 | ) | 10.07 | (3.28 | ) | 651,243 | 1.05 | 1.05 | 1.05 | 0.11 | 36 | |||||||||||||||||||||||||||||||||||||||
| 2010 | 8.68 | 0.04 | 1.74 | 1.78 | (0.01 | ) | – | (0.01 | ) | 10.45 | 20.52 | 630,227 | 1.06 | 1.06 | 1.06 | 0.47 | 34 | ||||||||||||||||||||||||||||||||||||||||||
| 2009 | 6.42 | 0.01 | 2.25 | 2.26 | – | – | – | 8.68 | 35.20 | 467,401 | 1.07 | 1.07 | 1.07 | 0.20 | 46 | ||||||||||||||||||||||||||||||||||||||||||||
| Small-Cap Portfolio – Service Class | |||||||||||||||||||||||||||||||||||||||||||||||||||||||||||
| †2014 | $ | 13.74 | $ | 0.00 | $ | 0.24 | $ | 0.24 | $ | – | $ | – | $ | – | $ | 13.98 | 1.75 | %1 | $ | 234,869 | 1.30 | %2 | 1.30 | %2 | 1.30 | %2 | 0.07 | %2 | 16 | % | |||||||||||||||||||||||||||||
| 2013 | 10.91 | (0.02 | ) | 3.73 | 3.71 | (0.13 | ) | (0.75 | ) | (0.88 | ) | 13.74 | 34.44 | 232,189 | 1.31 | 1.31 | 1.31 | (0.12 | ) | 43 | |||||||||||||||||||||||||||||||||||||||
| 2012 | 9.98 | 0.15 | 1.06 | 1.21 | (0.00 | ) | (0.28 | ) | (0.28 | ) | 10.91 | 12.22 | 148,613 | 1.31 | 1.31 | 1.30 | 1.41 | 62 | |||||||||||||||||||||||||||||||||||||||||
| 2011 | 10.38 | (0.01 | ) | (0.36 | ) | (0.37 | ) | (0.03 | ) | – | (0.03 | ) | 9.98 | (3.55 | ) | 79,565 | 1.30 | 1.30 | 1.26 | (0.02 | ) | 36 | |||||||||||||||||||||||||||||||||||||
| 2010 | 8.64 | 0.03 | 1.72 | 1.75 | (0.01 | ) | – | (0.01 | ) | 10.38 | 20.26 | 41,505 | 1.34 | 1.34 | 1.30 | 0.36 | 34 | ||||||||||||||||||||||||||||||||||||||||||
| 2009 | 6.40 | (0.00 | ) | 2.24 | 2.24 | – | – | – | 8.64 | 35.00 | 5,160 | 1.62 | 1.62 | 1.36 | (0.04 | ) | 46 | ||||||||||||||||||||||||||||||||||||||||||
| † | Six months ended June 30, 2014 (unaudited). |
| 1 | Not annualized |
| 2 | Annualized |
| THE ACCOMPANYING NOTES ARE AN INTEGRAL PART OF THESE FINANCIAL STATEMENTS. | Royce Capital Fund 2014 Semiannual Report to Shareholders | 21 |
| Notes to Financial Statements (unaudited) | |
| Summary of Significant Accounting Policies: |
Royce Micro-Cap Portfolio and Royce Small-Cap Portfolio (the “Fund” or “Funds”) are the two series of Royce Capital Fund (the “Trust”), a diversified open-end management investment company organized as a Delaware statutory trust. Shares of the Funds are offered to life insurance companies for allocation to certain separate accounts established for the purpose of funding qualified and non-qualified variable annuity contracts and variable life insurance contracts. Micro-Cap Portfolio and Small-Cap Portfolio commenced operations on December 27, 1996. |
Valuation of Investments: |
Securities are valued as of the close of trading on the New York Stock Exchange (NYSE) (generally 4:00 p.m. Eastern time) on the valuation date. Securities that trade on an exchange, and securities traded on Nasdaq’s Electronic Bulletin Board, are valued at their last reported sales price or Nasdaq official closing price taken from the primary market in which each security trades or, if no sale is reported for such day, at their bid price. Other over-the-counter securities for which market quotations are readily available are valued at their highest bid price, except in the case of some bonds and other fixed income securities which may be valued by reference to other securities with comparable ratings, interest rates and maturities, using established independent pricing services. The Funds value their non-U.S. dollar denominated securities in U.S. dollars daily at the prevailing foreign currency exchange rates as quoted by a major bank. Securities for which market quotations are not readily available are valued at their fair value in accordance with the provisions of the 1940 Act, under procedures approved by the Fund’s Board of Trustees, and are reported as Level 3 securities. As a general principle, the fair value of a security is the amount which the Fund might reasonably expect to receive for the security upon its current sale. However, in light of the judgment involved in fair valuations, there can be no assurance that a fair value assigned to a particular security will be the amount which the Fund might be able to receive upon its current sale. In addition, if, between the time trading ends on a particular security and the close of the customary trading session on the NYSE, events occur that are significant and may make the closing price unreliable, a Fund may fair value the security. The Funds use an independent pricing service to provide fair value estimates for relevant non-U.S. equity securities on days when the U.S. market volatility exceeds a certain threshold. This pricing service uses proprietary correlations it has developed between the movement of prices of non-U.S. equity securities and indices of U.S.-traded securities, futures contracts and other indications to estimate the fair value of relevant non-U.S. securities. When fair value pricing is employed, the prices of securities used by a Fund may differ from quoted or published prices for the same security. Investments in money market funds are valued at net asset value per share. |
Various inputs are used in determining the value of each Fund’s investments, as noted above. These inputs are summarized in the three broad levels below: | |||||
Level 1 | – | quoted prices in active markets for identical securities. | |||
Level 2 | – | other significant observable inputs (including quoted prices for similar securities, foreign securities that may be fair valued and repurchase agreements). The table below includes all Level 2 securities. Any Level 2 securities with values based on quoted prices for similar securities are noted in the Schedules of Investments. | |||
Level 3 | – | significant unobservable inputs (including last trade price before trading was suspended, or at a discount thereto for lack of marketability or otherwise, market price information regarding other securities, information received from the company and/or published documents, including SEC filings and financial statements, or other publicly available information). | |||
The inputs or methodology used for valuing securities are not necessarily an indication of the risk associated with investing in those securities. | |||||
The following is a summary of the inputs used to value each Fund’s investments as of June 30, 2014. For a detailed breakout of common stocks by sector classification, please refer to the Schedules of Investments. | |||||
| Level 1 | Level 2 | Level 3 | Total | ||||||||||
| Micro-Cap Portfolio | |||||||||||||
Common Stocks | $ | 531,145,359 | $ | 1,832,138 | $ | 495,485 | $ | 533,472,982 | |||||
Cash Equivalents | 16,866,398 | 46,310,000 | – | 63,176,398 | |||||||||
| Small-Cap Portfolio | |||||||||||||
Common Stocks | 910,217,742 | – | – | 910,217,742 | |||||||||
Cash Equivalents | 5,276,965 | 59,813,000 | – | 65,089,965 | |||||||||
For the six months ended June 30, 2014, certain securities have transferred in and out of Level 1 and Level 2 measurements as a result of the fair value pricing procedures for international equities. The Funds recognize transfers between levels as of the end of the reporting period. At June 30, 2014, securities valued at $1,018,188 were transferred from Level 1 to Level 2 for Royce Micro-Cap Portfolio within the fair value hierarchy. |
| 22 | Royce Capital Fund 2014 Semiannual Report to Shareholders |
| Valuation of Investments (continued): |
| Level 3 Reconciliation: | ||||||||||
| Balance as of 12/31/13 | Unrealized Gain (Loss)1 | Balance as of 6/30/14 | ||||||||
| Micro-Cap Portfolio | ||||||||||
| Common Stocks | $194,282 | $301,203 | $495,485 | |||||||
| 1 | The net change in unrealized appreciation (depreciation) is included in the accompanying Statement of Operations. Change in unrealized appreciation (depreciation) includes net unrealized appreciation (depreciation) resulting from changes in investment values during the reporting period and the reversal of previously recorded unrealized appreciation (depreciation) when gains or losses are realized. | |
| Gross Amount of Assets and | ||||||||||||
| Liabilities in the Statements of | ||||||||||||
| Assets and Liabilities1 | Collateral Received and Pledged | Net Amount | ||||||||||
| Micro-Cap Portfolio | ||||||||||||
| Securities on Loan/Collateral on Loaned Securities | $ | 16,866,398 | $ | (16,866,398 | ) | $ | – | |||||
| Small-Cap Portfolio | ||||||||||||
| Securities on Loan/Collateral on Loaned Securities | 5,276,965 | (5,276,965 | ) | – | ||||||||
| 1 Absent an event of default, assets and liabilities are presented gross and not offset in the Statements of Assets and Liabilities. | ||||||||||||
| Royce Capital Fund 2014 Semiannual Report to Shareholders | 23 |
Capital Share Transactions (in shares):
| Shares issued for | Net increase (decrease) in | |||||||||||||||||||||||||||||||
| Shares sold | reinvestment of distributions | Shares redeemed | shares outstanding | |||||||||||||||||||||||||||||
| Period ended | Period ended | Period ended | Period ended | |||||||||||||||||||||||||||||
| 6/30/14 | Year ended | 6/30/14 | Year ended | 6/30/14 | Year ended | 6/30/14 | Year ended | |||||||||||||||||||||||||
| (unaudited) | 12/31/13 | (unaudited) | 12/31/13 | (unaudited) | 12/31/13 | (unaudited) | 12/31/13 | |||||||||||||||||||||||||
| Micro-Cap Portfolio | ||||||||||||||||||||||||||||||||
| Investment Class | 1,392,823 | 3,459,489 | – | 1,411,681 | (4,414,012 | ) | (9,883,779 | ) | (3,021,189 | ) | (5,012,609 | ) | ||||||||||||||||||||
| Service Class | 496,473 | 819,148 | – | 95,318 | (600,530 | ) | (1,093,944 | ) | (104,057 | ) | (179,478 | ) | ||||||||||||||||||||
| Small-Cap Portfolio | ||||||||||||||||||||||||||||||||
| Investment Class | 4,207,065 | 7,433,565 | – | 3,448,976 | (5,299,181 | ) | (14,508,249 | ) | (1,092,116 | ) | (3,625,708 | ) | ||||||||||||||||||||
| Service Class | 509,029 | 3,003,292 | – | 1,073,385 | (615,598 | ) | (797,085 | ) | (106,569 | ) | 3,279,592 | |||||||||||||||||||||
| Purchases | Sales | |||
| Micro-Cap Portfolio | $ | 63,359,086 | $ | 103,640,256 |
| Small-Cap Portfolio | 148,002,786 | 192,186,680 |
24 | Royce Capital Fund 2014 Semiannual Report to Shareholders
| Net | |||||||||||||||
| Distribution | Shareholder | Shareholder | |||||||||||||
| Fees | Servicing | Reports | Total | ||||||||||||
| Micro-Cap Portfolio – Investment Class | $ | – | $ | 4,530 | $ | 12,836 | $ | 17,366 | |||||||
| Micro-Cap Portfolio – Service Class | 48,625 | 3,125 | 1,249 | 52,999 | |||||||||||
| 48,625 | 7,655 | 14,085 | |||||||||||||
| Small-Cap Portfolio – Investment Class | – | 3,584 | 23,494 | 27,078 | |||||||||||
| Small-Cap Portfolio – Service Class | 281,015 | 3,142 | 6,006 | 290,163 | |||||||||||
| 281,015 | 6,726 | 29,500 | |||||||||||||
| Net Unrealized | ||||||||||||||
| Appreciation | Gross Unrealized | |||||||||||||
| Tax Basis Cost | (Depreciation) | Appreciation | Depreciation | |||||||||||
| Micro-Cap Portfolio | $486,988,586 | $109,660,794 | $147,797,406 | $38,136,612 | ||||||||||
| Small-Cap Portfolio | 732,671,998 | 242,635,709 | 256,014,533 | 13,378,824 | ||||||||||
The primary difference between book and tax basis cost is the timing of the recognition of losses on securities sold.
| Shares | Market Value | Cost of | Cost of | Realized | Dividend | Shares | Market Value | ||||||||||||||||||||||||
| Affiliated Company | 12/31/13 | 12/31/13 | Purchases | Sales | Gain (Loss) | Income | 6/30/14 | 6/30/14 | |||||||||||||||||||||||
| Small-Cap Portfolio | |||||||||||||||||||||||||||||||
| Key Tronic | 614,672 | $ | 6,773,685 | $ | 7,535 | – | – | $ | – | 615,397 | $ | 6,449,361 | |||||||||||||||||||
| Miller Industries | 307,186 | 5,722,875 | 5,859,125 | – | – | 144,488 | 611,445 | 12,583,538 | |||||||||||||||||||||||
| TESSCO Technologies | 266,649 | 10,751,288 | 6,242,339 | – | – | 153,580 | 438,749 | 13,921,506 | |||||||||||||||||||||||
| $ | 23,247,848 | $ | 298,068 | $ | 32,954,405 | ||||||||||||||||||||||||||
Royce Capital Fund 2014 Semiannual Report to Shareholders | 25
As a shareholder of a mutual fund, you pay ongoing expenses, including management fees and other Fund expenses including, for some funds, distribution and/or service (12b-1) fees. Using the information below, you can estimate how these ongoing expenses (in dollars) affect your investment and compare them with the ongoing expenses of other funds. You may also incur one-time transaction expenses which are not shown in this section and would result in higher total costs. The example is based on an investment of $1,000 invested at January 1, 2014, and held for the entire six-month period ended June 30, 2014. Service Class shares are generally available only through certain insurance companies who receive service fees from the Fund for services that they perform.
Please note that the expenses shown in the table are meant to highlight your ongoing costs only and do not reflect any transactional costs, such as sales charges (loads), redemption fees, or exchange fees. Therefore, this section is useful in comparing ongoing costs only, and will not help you determine the relative total costs of owning different funds. In addition, if these transactional costs were included, your costs would have been higher.
| Actual | Hypothetical (5% per year return before expenses) | ||||||||||||||||||||||
| Beginning | Ending | Expenses Paid | Beginning | Ending | Expenses Paid | Annualized | |||||||||||||||||
| Account Value | Account Value | During the | Account Value | Account Value | During the | Expense | |||||||||||||||||
| 1/1/14 | 6/30/14 | Period1 | 1/1/14 | 6/30/14 | Period1 | Ratio2 | |||||||||||||||||
| Investment Class | |||||||||||||||||||||||
| Micro-Cap Portfolio | $ | 1,000.00 | $ | 1,010.13 | $ | 6.48 | $ | 1,000.00 | $ | 1,018.35 | $ | 6.51 | 1.30% | ||||||||||
| Small-Cap Portfolio | 1,000.00 | 1,019.40 | 5.21 | 1,000.00 | 1,019.64 | 5.21 | 1.04% | ||||||||||||||||
| Service Class | |||||||||||||||||||||||
| Micro-Cap Portfolio | 1,000.00 | 1,008.65 | 7.82 | 1,000.00 | 1,017.01 | 7.85 | 1.57% | ||||||||||||||||
| Small-Cap Portfolio | 1,000.00 | 1,017.47 | 6.50 | 1,000.00 | 1,018.35 | 6.51 | 1.30% | ||||||||||||||||
26 | Royce Capital Fund 2014 Semiannual Report to Shareholders
| Trustees and Officers |
| All Trustees and Officers may be reached c/o The Royce Funds, 745 Fifth Avenue, New York, NY 10151 |
Charles M. Royce, Trustee1, President |
| Age: 74 | Number of Funds Overseen: 34 | Tenure: Since 1982 |
| Non-Royce Directorships: Director of TICC Capital Corp. |
| Principal Occupation(s) During Past Five Years: Chief Executive Officer and Chairman of Board of Managers of Royce & Associates, LLC (“Royce”), the Trust’s investment adviser. |
W. Whitney George, Trustee1, Vice President |
| Age: 56 | Number of Funds Overseen: 34 | Tenure: Since September 2013 |
| Non-Royce Directorships: None |
| Principal Occupation(s) During Past 5 Years: Managing Director and Vice President of Royce, having been employed by Royce since October 1991. |
| Patricia W. Chadwick, Trustee |
| Age: 65 | Number of Funds Overseen: 34 | Tenure: Since 2009 |
| Non-Royce Directorships: Trustee of ING Mutual Funds and Director of Wisconsin Energy Corp. |
| Principal Occupation(s) During Past 5 Years: Consultant and President of Ravengate Partners LLC (since 2000). |
| Richard M. Galkin, Trustee |
| Age: 76 | Number of Funds Overseen: 34 | Tenure: Since 1982 |
| Non-Royce Directorships: None |
| Principal Occupation(s) During Past Five Years: Private investor. Mr. Galkin’s prior business experience includes having served as President of Richard M. Galkin Associates, Inc., telecommunications consultants, President of Manhattan Cable Television (a subsidiary of Time, Inc.), President of Haverhills Inc. (another Time, Inc. subsidiary), President of Rhode Island Cable Television, and Senior Vice President of Satellite Television Corp. (a subsidiary of Comsat). |
| Stephen L. Isaacs, Trustee |
| Age: 74 | Number of Funds Overseen: 34 | Tenure: Since 1989 |
| Non-Royce Directorships: None |
| Principal Occupation(s) During Past Five Years: Attorney and President of Health Policy Associates, Inc., consultants. Mr. Isaacs’ prior business experience includes having served as President of The Center for Health and Social Policy (from 1996 to 2012); Director of Columbia University Development Law and Policy Program, and Professor at Columbia University (until August 1996). |
| Arthur S. Mehlman, Trustee |
| Age: 72 | Number of Funds Overseen: 52 | Tenure: Since 2004 |
| Non-Royce Directorships: Director/Trustee of registered investment companies constituting the 18 Legg Mason Funds. |
| Principal Occupation(s) During Past Five Years: Director of The League for People with Disabilities, Inc. and Director of University of Maryland Foundation (non-profits). Formerly: Director of Municipal Mortgage & Equity, LLC (from October 2004 to April 2011); Director of University of Maryland College Park Foundation (non-profit) (from 1998 to 2005); Partner, KPMG LLP (international accounting firm) (from 1972 to 2002) and Director of Maryland Business Roundtable for Education (from July 1984 to June 2002). |
| David L. Meister, Trustee |
| Age: 74 | Number of Funds Overseen: 34 | Tenure: Since 1982 |
| Non-Royce Directorships: None |
| Principal Occupation(s) During Past Five Years: Consultant. Chairman and Chief Executive Officer of The Tennis Channel (from June 2000 to March 2005). Mr. Meister’s prior business experience includes having served as Chief Executive Officer of Seniorlife.com, a consultant to the communications industry, President of Financial News Network, Senior Vice President of HBO, President of Time-Life Films, and Head of Broadcasting for Major League Baseball. |
| G. Peter O’Brien, Trustee |
| Age: 68 | Number of Funds Overseen: 52 | Tenure: Since 2001 |
| Non-Royce Directorships: Director/Trustee of registered investment companies constituting the 18 Legg Mason Funds; Director of TICC Capital Corp. |
| Principal Occupation(s) During Past Five Years: Trustee Emeritus of Colgate University (since 2005) and Board Member of Hill House, Inc. (since 1999); Formerly: Trustee of Colgate University (from 1996 to 2005), President of Hill House, Inc. (from 2001 to 2005) and Managing Director/Equity Capital Markets Group of Merrill Lynch & Co. (from 1971 to 1999). |
| John D. Diederich, Vice President and Treasurer |
| Age: 62 | Tenure: Since 2001 |
| Principal Occupation(s) During Past Five Years: Chief Operating Officer, Managing Director and member of the Board of Managers of Royce; Chief Financial Officer of Royce; Director of Administration of the Trust; and President of RFS, having been employed by Royce since April 1993. |
| Jack E. Fockler, Jr., Vice President |
| Age: 55 | Tenure: Since 1995 |
| Principal Occupation(s) During Past Five Years: Managing Director and Vice President of Royce and Vice President of RFS, having been employed by Royce since October 1989. |
| Daniel A. O’Byrne, Vice President and Assistant Secretary |
| Age: 52 | Tenure: Since 1994 |
| Principal Occupation(s) During Past Five Years: Principal and Vice President of Royce, having been employed by Royce since October 1986. |
| John E. Denneen, Secretary and Chief Legal Officer |
| Age: 47 | Tenure: 1996-2001 and Since April 2002 |
Principal Occupation(s) During Past Five Years: General Counsel, Principal, Chief Legal and Compliance Officer, and Secretary of Royce and Secretary and Chief Legal Officer of The Royce Funds. |
| Lisa Curcio, Chief Compliance Officer |
| Age: 54 | Tenure: Since 2004 |
| Principal Occupation(s) During Past Five Years: Chief Compliance Officer of The Royce Funds (since October 2004) and Compliance Officer of Royce (since June 2004). |
Trustees will hold office until their successors have been duly elected and qualified or until their earlier resignation or removal. The Statement of Additional Information, which contains additional information about the Trust’s trustees and officers, is available and can be obtained without charge at www.roycefunds.com or by calling (800) 221-4268.
| Royce Capital Fund 2014 Semiannual Report to Shareholders | 27 |
| Board Approval of Investment Advisory Agreements |
The trustees noted that R&A manages a number of funds that invest in small-cap and micro-cap issuers, many of which were outperforming their benchmark indices and their competitors. Although the trustees recognized that past performance is not necessarily an indicator of future results, they found that R&A had the necessary qualifications, experience and track record in managing small-cap and micro-cap securities to manage the Funds. The trustees determined that R&A continued to be an appropriate investment adviser for each Fund and concluded that each Fund’s performance supported the renewal of its Investment Advisory Agreement.
| 28 | Royce Capital Fund 2014 Semiannual Report to Shareholders |
| Board Approval of Investment Advisory Agreements (continued) |
The trustees noted that R&A had, from time to time, waived advisory fees in order to maintain expense ratios at competitive levels. The trustees also considered fees charged by R&A to institutional and other clients and noted that, given the greater levels of service that R&A provides to registered investment companies such as the Funds as compared to other accounts, each Fund’s advisory fees compared favorably to these other accounts.
It was noted that no single factor was cited as determinative to the decision of the Board. Rather, after weighing all of the considerations and conclusions discussed above, the entire Board, including all of the non-interested trustees, determined to approve the renewal of the existing Investment Advisory Agreements, concluding that a contract renewal on the existing terms was in the best interest of the shareholders of each Fund and that each investment advisory fee rate was reasonable in relation to the services provided.
| Royce Capital Fund 2014 Semiannual Report to Shareholders | 29 |
| Notes to Performance and Other Important Information |
The thoughts expressed in this report concerning recent market movements and future prospects for small company stocks are solely the opinion of Royce at June 30, 2014, and, of course, historical market trends are not necessarily indicative of future market movements. Statements regarding the future prospects for particular securities held in the Funds’ portfolios and Royce’s investment intentions with respect to those securities reflect Royce’s opinions as of June 30, 2014 and are subject to change at any time without notice. There can be no assurance that securities mentioned in this report will be included in any Royce-managed portfolio in the future. Sector weightings are determined using the Global Industry Classification Standard (“GICS”). GICS was developed by, and is the exclusive property of, Standard & Poor’s Financial Services LLC (“S&P”) and MSCI Inc. (“MSCI”). GICS is the trademark of S&P and MSCI. “Global Industry Classification Standard (GICS)” and “GICS Direct” are service marks of S&P and MSCI. All indexes referenced are unmanaged and capitalization weighted. Each indexes’s returns include net reinvested dividends and/or interest income. Russell Investment Group is the source and owner of the trademarks, service marks, and copyrights related to the Russell Indexes. Russell® is a trademark of Russell Investment Group. The Russell 2000 is an index of domestic small-cap stocks. It measures the performance of the 2,000 smallest publicly traded U.S. companies in the Russell 3000 Index. The Russell Microcap Index includes 1,000 of the smallest securities in the small-cap Russell 2000 Index along with the next smallest eligible securities as determined by Russell. The Russell Midcap Index measures the performance of the mid-cap segment of the U.S. equity universe. It includes approximately 800 of the smallest securities in the Russell 1000 Index. The Russell 1000 Index is an index of domestic large-cap stocks. It measures the performance of the 1,000 largest publicly traded U.S. companies in the Russell 3000 Index. The Russell Global ex-U.S. Small Cap Index is an index of global small-cap stocks, excluding the United States. The Russell Global ex-U.S. Large-Cap Index is an index of global large-cap stocks, excluding the United States. The CBOE Volatility Index (VIX) measures market expectations of near-term volatility conveyed by S&P 500 stock index option prices. The S&P 500 is an index of U.S. large-cap stocks selected by Standard & Poor’s based on market size, liquidity, and industry grouping, among other factors. The Nasdaq Composite is an index of the more than 3,000 common equities listed on the Nasdaq stock exchange. The performance of an index does not represent exactly any particular investment, as you cannot invest directly in an index. Returns for the market indexes used in this report were based on information supplied to Royce by Russell Investments. Royce has not independently verified the above described information. The Royce Funds is a service mark of The Royce Funds. Distributor: Royce Fund Services, Inc. The Price-Earnings, or P/E, Ratio is calculated by dividing a company’s share price by its trailing 12-month earnings-per share (EPS). The Price-to-Book, or P/B, Ratio is calculated by dividing a company’s share price by its book value per share. The Sharpe Ratio is calculated for a specified period by dividing a fund’s annualized excess returns by its annualized standard deviation. The higher the Sharpe Ratio, the better the fund’s historical risk-adjusted performance. Standard deviation is a statistical measure within which a fund’s total returns have varied over time. The greater the standard deviation, the greater a fund’s volatility. The Royce Funds is a service mark of The Royce Funds. Distributor: Royce Fund Services, Inc. Royce Capital Fund–Micro-Cap Portfolio invests primarily in securities of micro-cap companies and Royce Capital Fund–Small-Cap Portfolio invests primarily in securities of small-cap companies that may involve considerably more risk than investments in securities of larger-cap companies. (Please see “Primary Risks for Fund Investors” in the prospectus.) Royce Capital Fund–Micro-Cap Portfolio and Royce Capital Fund–Small-Cap Portfolio may each invest up to 25% its assets in foreign securities that may involve political, economic, currency, and other risks not encountered in U.S. investments. (Please see “Investing in Foreign Securities” in the prospectus.) Please read the prospectus carefully before investing or sending money. |
| Forward-Looking Statements | |
This material contains forward-looking statements within the meaning of the Securities Exchange Act of 1934, as amended (the “Exchange Act”), that involve risks and uncertainties, including, among others, statements as to: | |
| • | the Funds’ future operating results, |
| • | the prospects of the Funds’ portfolio companies, |
| • | the impact of investments that the Funds have made or may make, |
| • | the dependence of the Funds’ future success on the general economy and its impact on the companies and industries in which the Funds of there invest, and |
| • | the ability of the Funds’ portfolio companies to achieve their objectives. |
This review and report use words such as “anticipates,” “believes,” “expects,” “future,” “intends,” and similar expressions to identify forward-looking statements. Actual results may differ materially from those projected in the forward-looking statements for any reason. | |
The Royce Funds have based the forward-looking statements included in this review and report on information available to us on the date of the report, and we assume no obligation to update any such forward-looking statements. Although The Royce Funds undertake no obligation to revise or update any forward-looking statements, whether as a result of new information, future events, or otherwise, you are advised to consult any additional disclosures that we may make through future shareholder communications or reports. | |
| Proxy Voting |
A copy of the policies and procedures that The Royce Funds use to determine how to vote proxies relating to portfolio securities and information regarding how each of The Royce Funds voted proxies relating to portfolio securities during the most recent 12-month period ended June 30 is available, without charge, on The Royce Funds’ website at www.roycefunds.com, by calling (800) 221-4268 (toll-free), and on the website of the Securities and Exchange Commission (“SEC”) at www.sec.gov. |
| Form N-Q Filing |
The Funds file their complete schedules of investments with the SEC for the first and third quarters of each fiscal year on Form N-Q. The Funds’ Forms N-Q are available on The Royce Funds’ website at www.roycefunds.com and on the SEC’s website at www.sec.gov. The Funds’ Forms N-Q may also be reviewed and copied at the SEC’s Public Reference Room in Washington, D.C. To find out more about this public service, call the SEC at (202) 942-8090. The Funds’ complete schedules of investments are updated quarterly and are available at www.roycefunds.com. |
| 30 | Royce Capital Fund 2014 Semiannual Report to Shareholders |
| 2014 In Quotes |
Points to Ponder “It’s not a stock market; it’s a market of stocks,” is accurate and always at work. Even though many investors own index funds, the basis remains the valuation of each stock. —John S. Tobey, Forbes.com, February 4, 2014 New records also bring out old arguments. Market bears point to CAPE—cyclically adjusted P/Es—as a sign of an overheated U.S. market. Briefly, the measure tries to smooth economic cycles by looking at a 10-year earnings path. We think it ignores a low-rate and low-inflation environment, a shift to lower-tax non-U.S. profits and the fact that the last 10 years, as we all know, was hardly a typical economic cycle. It’s a fair debate, however, but it misses the bigger point: There are opportunities at the individual stock level. —Janus Funds, Market Perspectives Series, First Quarter 2014 Investors should diversify emotionally as well as financially. —Terrance Odean, wsj.com, January 27, 2014 During the past 13 months, stock funds have seen nearly 1,000 managers come and more than 1,200 go, 17 have reopened to new investors, and countless others have changed their styles in ways big and small. The difficult part is determining whether these changes are signs of trouble—or just noise to be tuned out. —Ben Levisohn, Barron’s, April 5, 2014 My pension is invested for the next 25 years or more but I have little interest in (or control over) whether my chosen active managers outperform next year or not. I encourage investors to reject the illusion of control, embrace ‘inconsistent persistence’ and accept bad years are all part and parcel of talented fund managers’ long-term value generation. —David Smith, ft.com, May 25, 2014 During every boom there are always some who lose sight of what a stock really is. They talk about “beta,” “growth stories” and “blue sky valuations,” forgetting that a stock is simply a claim on a company’s future cash flows. The less you pay for those cash flows, the better the deal. The more you pay, the worse the deal. Decades of research shows that those who invest by this principle earn superior returns with lower risk. Stocks that are cheap in relation to their net assets, per-share earnings and dividends have proved the best investments over time. —Brett Arends, The Wall Street Journal, June 21, 2014 In Absolute Agreement Far more money has been lost by investors preparing for corrections, or trying to anticipate corrections, than has been lost in corrections themselves. —Peter Lynch, nytimes.com, January 28, 2014 Our job is to find those undervalued companies, understand their business and the industry, and understand what it’s going to take for these headwinds that have caused the stock to be cheap to turn to tailwinds to unlock that value. And that usually takes about a two- to three-year investment horizon. You must be patient. —Brad Evans, morningstar.com, January 31, 2014 Unconventional behavior is the only road to superior investment results, but it isn’t for everyone. In addition to superior skill, successful investing requires the ability to look wrong for a while and survive some mistakes. —Howard Marks, Barron’s, April 9, 2014 We bring a private-equity perspective to public-equity investing. By that, I mean we take the very long-term time horizon that private equity firms typically take, and try to anticipate how investors might view a company differently five years from now. —Bill Nygren, Barron’s, June 3, 2014 Cocktail Conversation The U.S. economy is growing, albeit with bumps in the road. With a confrontation unlikely in Congress over raising the federal debt ceiling, business and consumer psychology should continue to improve. —Mario Gabelli, Barron’s, February 1, 2014 Market efficiency is only a half-truth. You can profit from irrational exuberance. —Robert Shiller One attitudinal difference between Asian investors I talked with and their American counterparts is their fear that a geopolitical event will send equities tumbling everywhere. American investors are more complacent. I certainly hope the Asians are wrong. —Byron Wien, Barron’s, April 29, 2014 Timeless Tidbits Those who want freedom from concern must accept lower returns. —Benjamin Graham Culture eats strategy for breakfast. —Peter Drucker Long ago, Ben Graham taught me that ‘Price is what you pay; value is what you get.’ Whether we’re talking about socks or stocks, I like buying quality merchandise when it is marked down. —Warren Buffett |
| The thoughts expressed above represent solely the opinions of the persons quoted and, of course, there can be no assurance of future market trends or performance. |
| This page is not part of the 2014 Semiannual Report to Shareholders | 31 |
| This page is intentionally left blank. |
| 32 | This page is not part of the 2014 Semiannual Report to Shareholders |
| There’s No Such Thing as a Sure Thing |
There was extraordinary excitement surrounding this year’s Kentucky Derby. This anticipation was well rewarded by a dramatic and electrifying contest. The favorite, California Chrome, took the lead roughly halfway through the race and never looked back, winning by almost two lengths. The same horse’s victory in the Preakness Stakes two weeks later was, if anything, even more decisive. This set up the tantalizing possibility of a Triple Crown winner, the first since Affirmed took the prize more than 35 years ago in 1978. (At the time we managed but a single mutual fund.)
Indeed, as the date of the Belmont Stakes crept closer, more and more people began to talk as if the coveted and rarely won Triple Crown was in the bag. California Chrome’s dominance seemed to increase with each win. His ability to pick up speed as the race progressed was commonly cited as the likely key to victory because the Belmont boasts the longest track of the three legs that constitute the Triple Crown. Then a funny thing happened. California Chrome, the “sure thing,” ran a solid race, but failed to secure victory, finishing fourth. The winning horse, Tonalist, had not run in either the Derby or the Preakness, making him a dark horse in at least the figural sense.
The wake of the upset led us to reexamine the vagaries of performance-based contests. Thinking through the implications of what occurred, we made a rough count of the numerous times when other sure things had failed to achieve the ultimate prize and an upset winner was crowned instead. Interestingly, this happens quite often and occurs in numerous endeavors, including sports, popular culture, the arts, and even asset management.
More important, it gave us an opportunity to reflect on our own experiences investing in small-cap stocks and managing mutual funds. There have been times during our 40-plus years of history when value-rooted small-cap approaches have been the barely acknowledged underdog as well as the prohibitive favorite. There have also been long stretches where our methodology and our asset class were thought of, if we were thought of at all, as being among the middle of the pack.

In this business, every asset manager must live with the reality of the scorecard. Here at Royce we measure our performance against appropriate benchmarks, competitors, and—most crucially—our own absolute standard. We take these measurements over market-cycle and other long-term periods. We make strenuous efforts to learn from our mistakes in several dimensions—at the most critical level individual stocks, of course, but also in terms of sector and industry weightings, country exposure, risk tolerance, and overall portfolio performance. We are also aware that there are influential sources that rate, grade, and rank both fund and portfolio management records.
Indeed, the various methods of evaluating portfolio performance, and the sheer number of people willing to do that for us, make our own internal standards that much more significant. When buying stocks, we attempt to tune out the Wall Street noise and come to our own independent conclusions regarding the companies we are considering for inclusion in our portfolios. We attempt to do the same when it comes to evaluating portfolio performance. That is, we focus on the job that we need to do successfully to help our shareholders (and ourselves, since we are among the largest individual shareholders in the Funds we manage) build wealth over the long run. As Chuck Royce has often said, you can only eat from the table of absolute performance.
Sometimes approaches like ours are considered in vogue, other times out of favor, and still other times somewhere in between. Our task is to run the best race we can, always trying to improve, and focus on what is important. And as we think about it, that’s how we started out, not long before another horse, Secretariat, broke records and won the Triple Crown in 1973.
| The thoughts in this essay concerning the stock market are solely those of Royce & Associates, LLC and, of course, there can be no assurance with regard to future market movements. |
| This page is not part of the 2014 Semiannual Report to Shareholders |
 | |||||||||||||||||||
 | |||||||||||||||||||
About The Royce Funds Wealth of Experience With approximately $38 billion in total assets under management, Royce & Associates is committed to the same investment principles that have served us well for over 40 years. Chuck Royce, our Chief Executive Officer, enjoys one of the longest tenures of any active mutual fund manager. Royce’s investment staff also includes 23 portfolio managers and analysts and nine traders. Multiple Funds, Common Focus Our goal is to offer both individual and institutional investors the best available micro-cap, small-cap, and/or mid-cap portfolios. We have chosen to concentrate on smaller-company investing by providing investors with a range of funds that take full advantage of this large and diverse sector. Consistent Discipline Our approach emphasizes paying close attention to risk and maintaining the same discipline, regardless of market movements and trends. The price we pay for a security must be significantly below our appraisal of its current worth. This requires a thorough analysis of the financial and business dynamics of an enterprise, as though we were purchasing the entire company. Co-Ownership of Funds It is important that our employees and shareholders share a common financial goal. Our officers, employees, and their families currently have more than $215 million invested in The Royce Funds and are often among the largest individual shareholders. | |||||||||||||||||||
| Contact Us General Information Additional Report Copies and Prospectus Inquiries (800) 221-4268 |  | ||||||||||||||||||
Item 2. Code(s) of Ethics. Not applicable to this semi-annual report.
Item 3. Audit Committee Financial Expert. Not applicable to this semi-annual report.
Item 4. Principal Accountant Fees and Services. Not applicable to this semi-annual report.
Item 5. Audit Committee of Listed Registrants. Not Applicable
Item 6. Investments.
(a) See Item 1.
(b) Not Applicable
Item 7. Disclosure of Proxy Voting Policies and Procedures for Closed-End Management Investment Companies. Not Applicable.
Item 8. Portfolio Managers of Closed-End Management Investment Companies. Not Applicable.
Item 9. Purchases of Equity Securities by Closed-End Management Investment Company and Affiliated Purchasers. Not Applicable
Item 10. Submission of Matters to a Vote of Security Holders. Not Applicable.
Item 11. Controls and Procedures.
(a) Disclosure Controls and Procedures. The Principal Executive and Financial Officers concluded that the Registrant’s Disclosure Controls and Procedures are effective based on their evaluation of the Disclosure Controls and Procedures as of a date within 90 days of the filing date of this report.
(b) Internal Control over Financial Reporting. There were no significant changes in Registrant’s internal control over financial reporting or in other factors that could significantly affect this control subsequent to the date of the evaluation, including any corrective actions with regard to significant deficiencies and material weaknesses during the second fiscal quarter of the period covered by this report.
(a)(2) Separate certifications by the Registrant’s Principal Executive Officer and Principal Financial Officer as required by Rule 30a-2(a) under the Investment Company Act of 1940.
(a)(3) Not Applicable
(b) Separate certifications by the Registrant’s Principal Executive Officer and Principal Financial Officer, pursuant to Section 906 of the Sarbanes-Oxley Act of 2002 and required by Rule 30a-2(b) under the Investment Company Act of 1940.
Pursuant to the requirements of the Securities Exchange Act of 1934 and the Investment Company Act of 1940, the registrant has duly caused this report to be signed on its behalf by the undersigned, thereunto duly authorized.
| ROYCE CAPITAL FUND |
| BY: /s/ Charles M. Royce |
Charles M. Royce |
President |
| Date: August 25, 2014 |
Pursuant to the requirements of the Securities Exchange Act of 1934 and the Investment Company Act of 1940, this report has been signed below by the following persons on behalf of the registrant and in the capacities and on the dates indicated.
| ROYCE CAPITAL FUND | ROYCE CAPITAL FUND | |
| BY: /s/ Charles M. Royce | BY: /s/ John D. Diederich | |
Charles M. Royce | John D. Diederich | |
President | Chief Financial Officer | |
| Date: August 25, 2014 | Date: August 25, 2014 | |