| UNITED STATES |
| SECURITIES AND EXCHANGE COMMISSION |
| Washington, D.C. 20549 |
| | FORM N-CSR |
| | CERTIFIED SHAREHOLDER REPORT |
| OF |
| REGISTERED MANAGEMENT INVESTMENT COMPANIES |
| | Investment Company Act file number: 811-07537 |
| | Name of Registrant: Royce Capital Fund |
| | Address of Registrant: 745 Fifth Avenue |
| New York, NY 10151 |
| | Name and address of agent for service: John E. Denneen, Esq. |
| 745 Fifth Avenue |
| New York, NY 10151 |
| | Registrant’s telephone number, including area code: (212) 508-4500 |
| Date of fiscal year end: December 31, 2017 |
| Date of reporting period: January 1, 2017 – June 30, 2017 |
Item 1. Reports to Shareholders.
| | | JUNE 30, 2017 |
| | | |
| | | |
| | | |
| | | 2017 Semiannual |
| | | Review and Report to Shareholders |
| | | |
| | | |
| | | |
| | | |
| | | |
| | | |
| | | |
| | | Royce Capital Fund– |
| | | Micro-Cap Portfolio |
| | | | |
| | | Royce Capital Fund– |
| | | Small-Cap Portfolio |
| | | | |
| | | | |
| | | | |
| | | | |
| | | | |
| | | | |
| | | | |
| | | | |
| | | | |
| | | | |
| | | | |
| | | | |
| | | | |
| | | | |
| | | | |
| | | roycefunds.com |  |
| | | | |
| | | | |
| | | | |
| Table of Contents | | | |
| | | | |
| | | | |
| Semiannual Review | | | |
| | | | |
| Letter to Our Shareholders | | 1 | |
| | | | |
| Performance and Expenses | | 7 | |
| | | | |
| | | | |
| Semiannual Report to Shareholders | | | |
| | | | |
| Managers’ Discussions of Fund Performance and Schedules of Investments | | | |
| | | | |
Royce Capital Fund–Micro-Cap Portfolio | | 8 | |
| | | | |
Royce Capital Fund–Small-Cap Portfolio | | 14 | |
| | | | |
| Financial Statements | | 18 | |
| | | | |
| Notes to Financial Statements | | 22 | |
| | | | |
| Understanding Your Fund’s Expenses | | 26 | |
| | | | |
| Trustees and Officers | | 27 | |
| | | | |
| Board Approval of Investment Advisory Agreement | | 28 | |
| | | | |
| Notes to Performance and Other Important Information | | 30 | |

| This page is not part of the Royce Capital Fund 2017 Semiannual Report to Shareholders |
Letter to Our Shareholders

SMALL-CAP’S LONG AND WINDING ROAD
A good start for small-caps in 2017 masked some key reversals
| In a solid first half for small-cap stocks, the Russell 2000 Index gained 5.0% for the year-to-date period ended June 30, 2017. This followed a terrific 2016, in which the small-cap index advanced 21.3%. From our perspective as small-cap specialists, however, the big news in small-cap last year was the occurrence of three key reversals: leadership for value, improved results for cyclicals, and higher overall returns for small-caps than for large-caps. Perhaps because we had been waiting for so long—and based on history, we endured an inordinately protracted wait for value to resume leadership over growth—we were convinced as we entered 2017 that these reversals would remain in place. Yet the first half saw leadership shifting yet again, as large-caps, growth, and non-cyclicals (especially healthcare) all took the lead after lagging, some significantly, in 2016. (In addition, non-U.S. equities surged, though this came after several years of underperformance). The result was a small-cap market with narrow leadership for growth through most of the first six months. |
| Recent rotations in small-cap style leadership could be seen clearly in the one-year results for the period ended June 30, 2017. The two style indexes finished the 12-month period in remarkably similar places—the Russell 2000 Value Index climbed 24.9% versus a gain of 24.4% for the Russell 2000 Growth Index—though their respective paths were strikingly divergent. |
| |
A Tale of Two Halves
1-Year Return Russell 2000 Value and Russell 2000 Growth |

| In the second half of 2016, the small-cap value index rose 24.2% versus 13.1% for growth, while in the first half of 2017, value rose only 0.5% compared to a 10.0% increase for its growth sibling—A Tale of Two Halves. Our interpretation of these actions is that the first half of 2017 marked a catch-up phase for last year’s laggards and a pause for 2016’s leaders. |
| This page is not part of the Royce Capital Fund 2017 Semiannual Report to Shareholders | 1 |
LETTER TO OUR SHAREHOLDERS
| It’s important to remember that we are still walking the road back to normalization. This is not a straight road—and it was never going to be. If 2017’s first half showed us anything, it was that the path back to normalization (and away from zero interest rates and abundant financial liquidity) will be a winding one with a few sharp twists and turns. |
| Given leadership for growth and non-cyclicals in a period of lackluster economic growth, some market commentators have compared the first half of 2017 to 2015, a year in which growth stocks shined while cyclicals suffered. Growth’s recent leadership notwithstanding, however, 2017 looks nothing like 2015. Today’s environment features rising interest rates, quantitative easing is unwinding in the U.S. (with signs that Europe will soon follow suit), and an increasing amount of data shows a global economy that’s beginning to heat up. In our view, this environment seems significantly different than it did during growth’s last period of extended leadership, which featured anemic global growth and the looming threat of renewed recessions. It’s important to remember that we are still walking the road back to normalization. This is not a straight road—and it was never going to be. If 2017’s first half showed us anything, it was that the path back to normalization (and away from zero interest rates and abundant financial liquidity) will be a winding one with a few sharp twists and turns. We think that we are far from a new regime for growth. In fact, the environment still looks very conducive, at least to us, for value’s leadership to resume and continue—driven by cyclical industries positioned to benefit from global growth. |
CAN THE LOW ROAD LEAD TO OUTPERFORMANCE?
Attractive returns for small-caps in the low-return world we anticipate
Our cautious optimism is tempered by an important caveat—the likelihood of lower returns for small-cap stocks than we experienced over the past five years. We make no secret of our belief in reversion to the mean—and the Russell 2000’s 13.7% average annual total return for the five-year period ended June 30, 2017 was higher |
| |
Rolling 5-Year Returns vs. Latest 5-Year Avg. Annual Total Return
Russell 2000 Average Monthly Rolling Average Annual Total Return for 5-Year Periods Through 6/30/17 |

than its rolling monthly five-year average since the inception of the small-cap index on 12/31/78—a gain of 10.6%.
In addition, the chart above shows that small-cap’s rolling five-year returns over the past 15- and 25-year periods are also lower than the current five-year average for the Russell 2000. This explains why we see a high probability of lower small-cap returns over the next few years—our take is based on reversion to the mean.
That said, we still see positive, and quite likely very competitive, returns for small-caps ahead, with an argument that rests on two primary factors—the reasonable state of current valuations and the prospect for earnings strength and/or improvement. |
|
| Equity Indexes as of June 30, 2017 (%) |
| | | YTD1 | | 1-YR | | 3-YR | | 5-YR | | 10-YR |
| |
| Russell 2000 | | 4.99 | | 24.60 | | 7.36 | | 13.70 | | 6.92 |
| |
| Russell 2000 Value | | 0.54 | | 24.86 | | 7.02 | | 13.39 | | 5.92 |
| |
| Russell 2000 Growth | | 9.97 | | 24.40 | | 7.64 | | 13.98 | | 7.82 |
| |
| S&P 500 | | 9.34 | | 17.90 | | 9.61 | | 14.63 | | 7.18 |
| |
| Russell 1000 | | 9.27 | | 18.03 | | 9.26 | | 14.67 | | 7.29 |
| |
| Nasdaq Composite | | 14.07 | | 26.80 | | 11.68 | | 15.91 | | 8.96 |
| |
| Russell Midcap | | 7.99 | | 16.48 | | 7.69 | | 14.72 | | 7.67 |
| |
| Russell Microcap | | 4.23 | | 27.60 | | 6.69 | | 13.73 | | 5.47 |
| |
|
| |
| 1 Not annualized. |
| For details on Royce Capital Funds’ performance in the period, please turn to the Managers’ Discussions that begin on page 8. |
| Past performance is no guarantee of future results. |
| 2 | This page is not part of the Royce Capital Fund 2017 Semiannual Report to Shareholders |
| While it is true that current small-cap valuations are elevated compared with history, it is also true that within a context of low bond yields, small-caps appear cheap versus bonds. |

Enterprise Value (EV) is calculated by adding a company’s market capitalization, long-term debt, preferred stock, and minority interest, then subtracting cash. EBIT is earnings before interest and tax. EV/EBIT is a harmonic weighted average. Cap Rate is a simple weighted average. Equity Risk Premium is the excess return that an equity investment provides over a risk-free rate, generally defined as the return from U.S. Treasury bonds.
In addition, valuations actually became more attractive for small-cap companies as a whole in the first half of 2017, as earnings advanced at a faster rate than stock prices. At the end of 2016, the average P/E ratio for the Russell 2000 was 22.9x while at the end of June 2017 it had fallen to 21.7x. During this same period, the yield on the 10-year Treasury yield dropped from 2.4% to 2.3%, further increasing small-cap’s attractiveness versus bonds.
Regarding the earnings outlook, our own analyses, our regular discussions with company management teams, and research from our friends at Strategas all reveal a quietly optimistic sales and earnings outlook for many small-cap businesses over the next couple of years, especially if global growth continues to heat up. Small-cap earnings announcements in July 2017 offered some initial, if anecdotal, support for this thesis. |
We contend that if inflation stays below its historical average, then valuations can stay above their historical levels. We believe valuations do not need to increase from this point for small-caps to advance, and if small-caps can track earnings growth, then an expectation of mid- to high single digit returns over the next several years seems reasonable to us. In the low-return world we are anticipating, that could be a very competitive return.
TWO ROADS DIVERGING IN THE SMALL-CAP WORLD
Why mean reversion and history favor small-cap value
Of course, active small-cap managers do not buy the whole market—at least they shouldn’t. If we have sketched a reasonably accurate roadmap for this journey to normalization (of which higher interest rates are a crucial feature), it would have significant implications for investment approaches. Seeing in essence a mirror image of the 2011-2015 period, we think the road to normalization will continue to have divergent paths, with outperformance for value, cyclical, and active management and underperformance for growth, defensive, and passive strategies.
Our favorable view of value is rooted in three observations: value’s long-term historical outperformance record versus growth, mean reversion for growth’s performance, and the interest-rate sensitivity of growth stock valuations. Below is a chart showing the most recent five-year returns for the small-cap value and growth indexes compared with the average five-year returns |
| |
| Latest 5-Year Average Annual Total Returns vs. Average Monthly Rolling Average Annual Total 5-Year Returns Through 6/30/17 |

| We see positive, and quite likely very competitive, returns for small-caps ahead. Our argument rests on two primary factors—the reasonable state of current valuations and the prospect for earnings strength and/or improvement. |
| This page is not part of the Royce Capital Fund 2017 Semiannual Report to Shareholders | 3 |
LETTER TO OUR SHAREHOLDERS
| Our own analyses, our regular discussions with company management teams, and research from our friends at Strategas all reveal a quietly optimistic sales and earnings outlook for many small-cap businesses over the next couple of years, especially if global growth continues to heat up. |
| over all monthly rolling periods since inception (12/31/78). While the most recent five-year period may be seen as highly supportive for financial assets, small-cap value exceeded its historical five-year average return by only about 100 basis points, while its growth equivalent exceeded its historical average by approximately 550 basis points. Reversion to the mean strongly suggests a very challenging road ahead for small-cap growth stocks. |
| In addition, valuations for cyclicals within small-cap look attractive versus defensives. The metric we prefer to use when examining valuations is the median relative enterprise value (“EV”) over earnings before interest and taxes (“EBIT”). We calculated it over the last 12 months ended June 30, 2017, excluding the companies in the Russell 2000 with negative EBIT. We think this gives a clear picture of the relative attractiveness of cyclicals versus defensive stocks. The results can be seen in the chart above, which shows that valuations for cyclical versus defensive sectors were below their long-term average at the end of June. We feel good about small-cap valuations for our preferred companies and see the greatest earnings potential for small-caps in cyclical areas of the market. Indeed, one of the underappreciated aspects of small-cap cyclicals is the degree to which many look poised to participate in global economic expansion. |
| In fact, we would offer a qualified dissent to the idea that small-caps would be in a relatively unfavorable position if international economies outpace the rate of growth in the U.S. To be sure, this notion is sound |

| 1 | Last Twelve Months Enterprise Value/Earnings Before Interest and Taxes
Cyclical Definition: Consumer Discretionary, Energy, Financials, Industrials, Information Technology, Materials.
Defensive Definition: Consumer Staples, Health Care, Real Estate, Telecommunication Services, Utilities
Source: Factset |
| enough when applied to the small-cap universe as a whole—the average company in the Russell 2000 derived only 19.8% of its sales from outside the U.S. at the end of June, compared to about 40% for the S&P 500. However, the level of foreign sales varies considerably by sector and industry in the Russell 2000, with Information Technology (44.1%) and Materials (33.4%) having the highest percentages of revenue derived from non-U.S. sources by sector. |
| |
Information Technology & Materials Had Highest Percentage of Foreign Revenue for the 12 Months Ended 6/30/17
Russell 2000 GICS Sectors |
 |
| Source: Factset |
| 4 | This page is not part of the Royce Capital Fund 2017 Semiannual Report to Shareholders |
LETTER TO OUR SHAREHOLDERS
| There are also certain other cyclical industries, including auto components (47.2%) and machinery (35.9%), that boast significant international exposure and therefore appear well positioned to benefit from global expansion. Additionally, with the dollar weakening, we expect to see heightened demand for U.S. exports. As experienced small-cap specialists, we see a rebounding global economy as being a potential advantage for active managers who, like us, carry more of a cyclical tilt in their portfolios. |
| Granted, our earnings-centric outlook pivots on there being not simply the tailwind of solid earnings and relatively attractive valuations for select cyclicals but also headwinds for growth and defensive companies. Rising interest rates, for example, are more likely to benefit companies with EPS growth and mute multiple expansion. In this Goldilocks, “not too fast, not too slow” economic environment, we expect higher-quality companies (as measured by high returns on invested capital) to have an advantage. Companies that are able to make steady progress and fund their growth from internal cash flow rather than relying on increasingly pricey external sources of capital should be in a superior position to their financially less stable competitors. Moreover, three market environments have historically provided opportunities for many active managers—when value leads, when volatility rises, and when overall market returns are low. All three look more likely than not to us. |
| |
| |
| GO WITH THE FLOW |
| Corrections are historically typical within small-cap |
| | Of course, the road to a lower-return environment likely entails a correction. We do not see this as chilling or discouraging news. Within small-cap, some kind of realignment of stock prices is common. In 18 of the last 20 calendar years, the Russell 2000 had an intra-year decline of at least 10% (and a downturn of 9.6% |
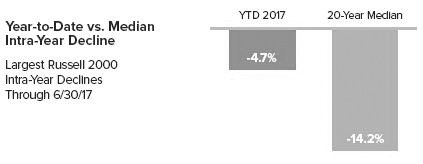
occurred in one of the two years that escaped the 10%-plus fall).
Over the last 20 calendar years, the median intra-year correction was 14.2% while so far in 2017, the Russell 2000’s biggest decline was 4.7%. So we lean toward the likelihood of a pullback in the 8-12% range. We do not see it going much deeper than that because, at least currently, we see none of the signs of a major market top or a recession. |
| Additionally, many market watchers were expecting a correction toward the end of the first quarter, and as of this writing we still have not seen one even in the midst of ample economic and political uncertainty. When this 20-year history is linked with the fact that we have still not experienced anything like a real correction since the February 2016 small-cap trough, then a downturn looks more than probable to us. So while we are confident that many small-cap companies are in fundamentally solid, even strong, shape, we have also seen over the years that markets simply do not keep ascending for this long without a little air being let out of them. |
| | THE ROAD LESS TRAVELED |
| A challenging path worth taking |
| | To be sure, the current environment offers a number of challenges for small-cap investors. Yet we believe it also looks favorable for those who walk the road less traveled —those with disciplined small-cap active management approaches that are geared more globally. Current uncertainty should sooner or later result in higher levels of |
| We feel good about small-cap valuations for our preferred companies and see the greatest earnings potential for small-caps in cyclical areas of the market. Indeed, one of the underappreciated aspects of small-cap cyclicals is the degree to which many look poised to participate in global economic expansion. |
| This page is not part of the Royce Capital Fund 2017 Semiannual Report to Shareholders | 5 |
LETTER TO OUR SHAREHOLDERS
| volatility. (Indeed, perhaps the oddest feature of 2017’s first half was its bullish placidity in the face of so much uncertainty—the 10-year Treasury showed as much, if not more, volatility in the year’s first six months as the stock market.) And we see increased volatility as potentially working to the advantage of the disciplined active manager. |
| There is also the possibility of fiscal or regulatory support from Washington, which could of course help small-caps. Our view, however, is that investors place undue emphasis on this. We take issue with the common assumption that small-caps cannot continue to advance without a cocktail combining corporate tax cuts, deregulation, and infrastructure spending. Our outlook of measured optimism is not grounded on which policies emerge (or do not emerge) from Washington. |
| Ultimately, of course, the success of what we do hinges on the companies in which we invest. On that score, we are encouraged. The ongoing optimism we have been hearing every day from management teams, for example, contradicts the expectation of an economic slowdown. Order books are continuing to fill up, and the majority of the companies we have been meeting with remain confident about their business. That in turn gives us ample confidence in what we do. We are convinced that small-cap active management approaches can remain successful as long as there is a reasonable amount of economic growth, whether here at home or overseas. Simply put, we see modest global economic growth leading to decent earnings growth which should result in moderate advances for small-caps as a group and greater advances for companies in cyclical businesses. Our advice? “Stay active, my friends.” |
 | |  | |  |
| Charles M. Royce | | Christopher D. Clark | | Francis D. Gannon |
| Chairman, | | Chief Executive Officer, and | | Co-Chief Investment Officer, |
| Royce & Associates, LP | | Co-Chief Investment Officer, | | Royce & Associates, LP |
| | | Royce & Associates, LP | | |
| | | | | |
| July 31, 2017 | | | | |
| 6 | This page is not part of the Royce Capital Fund 2017 Semiannual Report to Shareholders |
Performance and Expenses
| |
| Performance and Expenses |
| As of June 30, 2017 |
| | | YTD1 | | 1-YR | | 3-YR | | 5-YR | | 10-YR | | 15-YR | | 20-YR | | SINCE
INCEPTION
(12/27/96) | | ANNUAL OPERATING
EXPENSES (%) |
| |
| Royce Capital Fund–Micro-Cap Portfolio | | 1.71 | | 21.63 | | 0.58 | | 5.49 | | 2.69 | | 6.84 | | 10.07 | | 10.03 | | 1.36 |
| |
| Royce Capital Fund–Small-Cap Portfolio | | -4.16 | | 12.59 | | 1.17 | | 8.76 | | 4.98 | | 8.19 | | 10.13 | | 10.47 | | 1.09 |
| |
INDEX | | | | | | | | | | | | | | | | | | | |
| |
| Russell Microcap Index | | 4.23 | | 27.60 | | 6.69 | | 13.73 | | 5.47 | | 8.44 | | N/A | | N/A | | N/A |
| |
| Russell 2000 Index | | 4.99 | | 24.60 | | 7.36 | | 13.70 | | 6.92 | | 9.19 | | 7.98 | | N/A | | N/A |
| |
| 1 Not annualized | | | | | | | | | | | | | | | | | | |
Important Performance, Expense, and Risk Information
All performance information in this Review and Report reflects past performance, is presented on a total return basis, reflects the reinvestment of distributions, and does not reflect the deduction of taxes that a shareholder would pay on fund distributions or the redemption of fund shares. Past performance is no guarantee of future results. Investment return and principal value of an investment will fluctuate, so that shares may be worth more or less than their original cost when redeemed. Current performance may be higher or lower than performance quoted and may be obtained at www.roycefunds.com. The Funds’ total returns do not reflect any deduction for charges or expenses of the variable contracts investing in the Funds. All performance and expense information reflects the result for each Fund’s Investment Class Shares. Service Class Shares bear an annual distribution expense that is not borne by the Investment Class; if those expenses were reflected, total returns would have been lower. Operating expenses reflect the Funds’ total annual operating expenses for the Investment Class as of the Funds’ most current prospectus and include management fees and other expenses.
Royce Micro-Cap Portfolio invests primarily in micro-cap companies while Royce Small-Cap Portfolio invests primarily in small-cap companies. Investments in micro-cap and small-cap companies may involve considerably more risk than investments in securities of larger-cap companies. (Please see “Primary Risks for Fund Investors” in the prospectus.) Each series of Royce Capital Fund may invest up to 25% of its net assets in foreign securities. Investments in foreign securities may involve political, economic, currency, and other risks not encountered in U.S. investments. (Please see “Investing in Foreign Securities” in the prospectus.) As of 6/30/17, Royce Small-Cap Portfolio invested a significant portion of its assets in a limited number of stocks, which may involve considerably more risk than a more broadly diversified portfolio because a decline in the value of any one of these stocks would cause the Portfolio’s overall value to decline to a greater degree. Royce Micro-Cap Portfolio’s broadly diversified portfolio does not ensure a profit or guarantee against loss. (Please see “Primary Risks for Fund Investors” in the prospectus.) This Review and Report must be preceded or accompanied by a prospectus. Please read the prospectus carefully before investing or sending money. Russell Investment Group is the source and owner of the trademarks, service marks, and copyrights related to the Russell Indexes. Russell® is a trademark of Russell Investment Group. The Russell Microcap Index includes 1,000 of the smallest securities in the small-cap Russell 2000 Index along with the next smallest eligible securities as determined by Russell. The Russell 2000 Index is an unmanaged, capitalization-weighted index of domestic small-cap stocks. It measures the performance of the 2,000 smallest publicly traded U.S. companies in the Russell 3000 Index. The performance of an index does not represent exactly any particular investment, as you cannot invest directly in an index. Distributor: Royce Fund Services, LLC.
| This page is not part of the Royce Capital Fund 2017 Semiannual Report to Shareholders | 7 |
| MANAGERS’ DISCUSSION |
| Royce Capital Fund–Micro-Cap Portfolio (RCM) |
 |
| Jim Stoeffel, Brendan Hartman |
| | FUND PERFORMANCE |
| Royce Capital Fund–Micro-Cap Portfolio gained 1.7% for the year-to-date period ended June 30, 2017, falling short of both its benchmark, the Russell Microcap Index, which was up 4.2%, and the small-cap Russell 2000 Index, which advanced 5.0% for the same period. During the first half of 2017, there was both a reversal in small-cap leadership from value to growth stocks and some inconsistency in relative results for micro-cap companies vis-à-vis their small-cap siblings. |
| The first quarter proved the most challenging period for the Fund on a relative basis. Micro-Cap Portfolio was down 0.8% for the quarter compared to respective gains of 0.4% and 2.5% for the micro-cap and small-cap indexes. The Fund then enjoyed solidly positive results on an absolute basis in the second quarter, up 2.5%, marginally outpacing the Russell 2000 (+2.5%) while trailing the Russell Microcap (+3.8%) in this same period. The Fund’s average annual total return since inception (12/27/96) was 10.0%. |
| | WHAT WORKED... AND WHAT DIDN’T |
| Seven of the Fund’s 10 equity sectors finished the semiannual period in the black, with Health Care and Information Technology leading, followed by Industrials. Consumer Discretionary and Energy, to a lesser degree, made the biggest negative impacts while net losses for Consumer Staples were modest. At the industry level, the top contributor for the first half was health care equipment & supplies (Health Care), with the bulk of its contribution coming in the second quarter from two medical device makers, Novadaq Technologies, which was acquired, and Tactile Systems Technology. Machinery (Industrials) came next, with several companies contributing, including Kornit Digital, Alimak Group, and Kadant. It was followed by semiconductors & semiconductor equipment (Information Technology). Detractors at the industry level included the specialty retail group (Consumer Discretionary), where companies continued to struggle with secular shifts in consumer spending and behavior, and energy equipment & services (Energy), where tumbling oil prices impacted the shares of tech-based energy product maker Tesco Corporation. |
| Capital equipment subsystem provider Ultra Clean Holdings was the Fund’s top contributor at the position level in the first half. The company has been gaining market share with key OEM customers in a vibrant environment for semiconductor capital equipment spending. We held shares at the end of June because the rise in its shares has been driven primarily by earnings growth rather than multiple expansion and because we think Ultra Clean is positioned to grow faster than its underlying industry. Corium International manufactures transdermal patches that range from drug delivery to consumer products. While historically a contract manufacturer, Corium has been developing its own generic drugs over the past several years to leverage its delivery expertise. Constructive results in early clinical trials helped to push its shares higher. |
| Value-priced department store operator Stein Mart detracted most from first-half results. Like many retailers, it suffered from ongoing sales pressure associated with the shift to online shopping. This challenge was exacerbated by a series of internal merchandising miscues. We held a small position at the end of the first half based on our view that correcting the internal miscues should provide a better exit point. CUI Global offers a unique solution for measuring pipeline gas quality that’s quicker, cheaper, and more accurate than other existing technologies. While orders were respectable and the sales pipeline looks solid, the delivery schedule proved longer than expected. This exerted downward pressure on its shares, especially given CUI Global’s relatively small size and resources. Proceeding cautiously, we added shares in the first half because we believe its technology can ultimately be monetized successfully. |
| Relative to the Russell Microcap, the Fund was disadvantaged most in the first half by poor stock selection in Consumer Discretionary, particularly in specialty retail, and Information Technology in the electronic equipment, instruments & components group. Conversely, we benefited from our underweight and better stock picking in Financials while enjoying a smaller advantage from stock selection in the Energy sector. |
| | | | | |
| | Top Contributors to Performance | | | |
| | Year-to-Date Through 6/30/17 (%)1 | | | |
| | | | | |
| | Ultra Clean Holdings | | 0.57 | |
| | | |
| | Corium International | | 0.49 | |
| | | |
| | Novadaq Technologies | | 0.38 | |
| | | |
| | Everspin Technologies | | 0.38 | |
| | | |
| | Novanta | | 0.34 | |
| | | |
| | 1 Includes dividends | | | |
| | | | | |
| | | | | |
| | Top Detractors from Performance | | | |
| | Year-to-Date Through 6/30/17 (%)2 | | | |
| | | | | |
| | Stein Mart | | -0.48 | |
| | | |
| | CUI Global | | -0.34 | |
| | | |
| | Tesco Corporation | | -0.32 | |
| | | |
| | BioAmber | | -0.31 | |
| | | |
| | Neonode | | -0.30 | |
| | | |
| | 2 Net of dividends | | | |
| | | | | |
| CURRENT POSITIONING AND OUTLOOK |
| We did not make significant changes during the first half. We continued to build positions in financial stocks, particularly in banks where we believe micro-cap names can benefit from a more relaxed regulatory environment. Financials remained, however, among our largest sector underweights at the end of June. We also maintained our lower exposure to Health Care, although we have been selectively adding to positions in medical device companies that we believe have created defensible competitive positions. Our largest weightings at the end of June remained Industrials, Information Technology, and Consumer Discretionary, with the first of these also reflecting our largest overweight. We continue to find value in all three of these sectors and view them as areas in which select companies have the potential to benefit from the relative strength of the U.S. economy. |
| 8 | Royce Capital Fund 2017 Semiannual Report to Shareholders |
| PERFORMANCE AND PORTFOLIO REVIEW | | TICKER SYMBOLS RCMCX RCMSX |
| Performance and Expenses |
| Average Annual Total Return (%) Through 6/30/17 |
| | | JAN-JUN 20171 | | 1-YR | | 3-YR | | 5-YR | | 10-YR | | 15-YR | | 20-YR | | SINCE INCEPTION (12/27/96) |
| |
| RCM | | 1.71 | | 21.63 | | 0.58 | | 5.49 | | 2.69 | | 6.84 | | 10.07 | | 10.03 |
| |
| Annual Operating Expenses: 1.36% | | | | | | | | | |
| |
| 1 Not Annualized | | | | | | | | | | | | | | | | |
Relative Returns: Monthly Rolling Average Annual Return PeriodsSince Russell Microcap’s Inception (6/30/00) Through 6/30/17
| On a monthly rolling basis, the Fund outperformed the Russell Microcap in 65% of all 10-year periods; 63% of all 5-year periods; and 51% of all 1-year periods. |
| |
| | | PERIODS BEATING THE INDEX | | | | FUND AVG (%)1 | | INDEX AVG (%)1 |
| |
| 10-year | | 55/85 | | | | | | 65% | | 7.2 | | 6.2 |
| |
| 5-year | | 91/145 | | | | | | 63% | | 7.9 | | 7.9 |
| |
| 1-year | | 99/193 | | | | | | 51% | | 10.4 | | 10.3 |
| |
1Average of monthly rolling average annual total returns over the specified periods.
The Morningstar Style Map is the Morningstar Style BoxTM with the center 75% of fund holdings plotted as the Morningstar Ownership ZoneTM. The Morningstar Style Box is designed to reveal a fund’s investment strategy. The Morningstar Ownership Zone provides detail about a portfolio’s investment style by showing the range of stock sizes and styles. The Ownership Zone is derived by plotting each stock in the portfolio within the proprietary Morningstar Style Box. Over time, the shape and location of a fund's ownership zone may vary. See page 30 for additional information. |
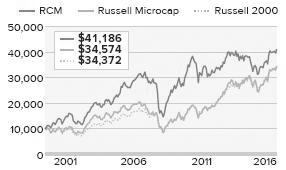
Value of $10,000Invested on 6/30/00 (Russell Microcap Inception)
as of 6/30/17 ($)
Includes reinvestment of distributions.
| |
| Top 10 Positions | | |
| % of Net Assets | | |
| | | |
| Zealand Pharma | | 1.1 |
| |
| CryoLife | | 1.0 |
| |
| AV Homes | | 1.0 |
| |
| Citi Trends | | 0.9 |
| |
| QAD Cl. A | | 0.9 |
| |
| CPI Aerostructures | | 0.9 |
| |
| AtriCure | | 0.9 |
| |
| Ardmore Shipping | | 0.9 |
| |
| Hudson Technologies | | 0.8 |
| |
| Nautilus | | 0.8 |
| |
| |
| Portfolio Sector Breakdown | | |
| % of Net Assets | | |
| | | |
| Industrials | | 20.8 |
| |
| Information Technology | | 19.2 |
| |
| Consumer Discretionary | | 15.0 |
| |
| Financials | | 12.3 |
| |
| Health Care | | 8.5 |
| |
| Energy | | 5.7 |
| |
| Materials | | 5.3 |
| |
| Real Estate | | 1.8 |
| |
| Telecommunication Services | | 0.8 |
| |
| Consumer Staples | | 0.6 |
| |
| Miscellaneous | | 4.9 |
| |
| Cash and Cash Equivalents | | 5.1 |
| |
| |
| Calendar Year Total Returns (%) | | |
| | | |
| YEAR | | RCM |
| |
| 2016 | | 19.7 |
| |
| 2015 | | -12.5 |
| |
| 2014 | | -3.6 |
| |
| 2013 | | 21.0 |
| |
| 2012 | | 7.6 |
| |
| 2011 | | -12.1 |
| |
| 2010 | | 30.1 |
| |
| 2009 | | 57.9 |
| |
| 2008 | | -43.3 |
| |
| 2007 | | 4.0 |
| |
| 2006 | | 21.1 |
| |
| 2005 | | 11.6 |
| |
| 2004 | | 13.8 |
| |
| 2003 | | 49.2 |
| |
| 2002 | | -12.9 |
| |
| |
| Upside/Downside Capture Ratios | | | | |
| Periods Ended 6/30/17 (%) | | | | |
| | | UPSIDE | | DOWNSIDE |
| |
| 10-Year | | 77 | | 88 |
| |
From 6/30/00 (Russell
Microcap Inception) | | 89 | | 77 |
| |
| |
| Portfolio Diagnostics | | |
| | | |
| Fund Net Assets | | $201 million |
| |
| Number of Holdings | | 164 |
| |
| Turnover Rate | | 20% |
| |
| Average Market Capitalization1 | | $448 million |
| |
| Weighted Average P/E Ratio2,3 | | 21.2x |
| |
| Weighted Average P/B Ratio2 | | 1.9x |
| |
| Active Share4 | | 90% |
| |
| U.S. Investments (% of Net Assets) | | 82.1% |
| |
| Non-U.S. Investments (% of Net Assets) | | 12.8% |
| |
| 1 | Geometric Average. This weighted calculation uses each portfolio holding’s market cap in a way designed to not skew the effect of very large or small holdings; instead, it aims to better identify the portfolio’s center, which Royce believes offers a more accurate measure of average market cap than a simple mean or median. |
| 2 | Harmonic Average. This weighted calculation evaluates a portfolio as if it were a single stock and measures it overall. It compares the total market value of the portfolio to the portfolio’s share in the earnings or book value, as the case may be, of its underlying stocks. |
| 3 | The Fund’s P/E ratio calculation excludes companies with zero or negative earnings (24% of portfolio holdings as of 6/30/17). |
| 4 | Active Share is the sum of the absolute values of the different weightings of each holding in the Fund versus each holding in the benchmark, divided by two. |
| Important Performance and Expense Information
All performance information in this Report reflects past performance, is presented on a total return basis, reflects the reinvestment of distributions, and does not reflect the deduction of taxes that a shareholder would pay on fund distributions or the redemption of fund shares. Past performance is no guarantee of future results. Investment return and principal value of an investment will fluctuate, so that shares may be worth more or less than their original cost when redeemed. Current performance may be higher or lower than performance quoted. The Fund’s total returns do not reflect any deduction for charges or expenses of the variable contracts investing in the Fund. Returns as of the most recent month-end may be obtained at www.roycefunds.com. All performance and risk information reflects the result of the Investment Class (its oldest class). Shares of RCM’s Service Class bear an annual distribution expense that is not borne by the Investment Class; if those expenses were reflected, total returns would have been lower. Operating expenses reflect the Fund’s total annual operating expenses for the Investment Class as of the Fund’s most current prospectus and include management fees and other expenses. Regarding the “Top Contributors” and “Top Detractors” tables shown above, the sum of all contributors to, and all detractors from, performance for all securities in the portfolio would approximate the Fund’s year-to-date performance for 2017. Upside Capture Ratio measures a manager’s performance in up markets relative to the Fund’s benchmark. It is calculated by measuring the Fund’s performance in quarters when the benchmark went up and dividing it by the benchmark’s return in those quarters. Downside Capture Ratio measures a manager’s performance in down markets relative to the Fund’s benchmark (Russell Microcap). It is calculated by measuring the Fund’s performance in quarters when the benchmark goes down and dividing it by the benchmark’s return in those quarters.
|
| Royce Capital Fund 2017 Semiannual Report to Shareholders | 9 |
Schedules of Investments
| |
| Royce Capital Fund - Micro-Cap Portfolio | | | | | | |
| Common Stocks – 94.9% | | | | | | |
| | | SHARES | | | | VALUE |
| |
| | | | | | | |
| CONSUMER DISCRETIONARY – 15.0% | | | | | | |
| AUTO COMPONENTS - 2.8% | | | | | | |
Fox Factory Holding 1,2 | | 43,300 | | | $ | 1,541,480 |
Standard Motor Products | | 25,800 | | | | 1,347,276 |
Stoneridge 2 | | 86,100 | | | | 1,326,801 |
Unique Fabricating | | 137,900 | | | | 1,312,808 |
| | | | | | |
| | | | | | | 5,528,365 |
| | | | | | |
| DIVERSIFIED CONSUMER SERVICES - 0.5% | | | | | | |
Capella Education | | 12,272 | | | | 1,050,483 |
| | | | | | |
| HOTELS, RESTAURANTS & LEISURE - 1.1% | | | | | | |
Del Taco Restaurants 2 | | 88,200 | | | | 1,212,750 |
Red Lion Hotels 2 | | 133,700 | | | | 982,695 |
| | | | | | |
| | | | | | | 2,195,445 |
| | | | | | |
| HOUSEHOLD DURABLES - 2.1% | | | | | | |
AV Homes 2 | | 99,300 | | | | 1,990,965 |
Cavco Industries 2 | | 8,904 | | | | 1,154,404 |
ZAGG 2 | | 128,700 | | | | 1,113,255 |
| | | | | | |
| | | | | | | 4,258,624 |
| | | | | | |
| LEISURE PRODUCTS - 2.0% | | | | | | |
American Outdoor Brands 1,2 | | 41,200 | | | | 912,992 |
MCBC Holdings 2 | | 79,017 | | | | 1,544,782 |
†Nautilus 2 | | 85,600 | | | | 1,639,240 |
| | | | | | |
| | | | | | | 4,097,014 |
| | | | | | |
| MEDIA - 0.6% | | | | | | |
New Media Investment Group | | 95,000 | | | | 1,280,600 |
| | | | | | |
| SPECIALTY RETAIL - 4.5% | | | | | | |
Buckle (The) | | 62,425 | | | | 1,111,165 |
Build-A-Bear Workshop 2 | | 124,100 | | | | 1,296,845 |
Cato Corporation (The) Cl. A | | 53,000 | | | | 932,270 |
Citi Trends | | 84,486 | | | | 1,792,793 |
Haverty Furniture | | 57,400 | | | | 1,440,740 |
Kirkland’s 2 | | 66,280 | | | | 681,358 |
Shoe Carnival | | 64,500 | | | | 1,346,760 |
Stein Mart | | 257,478 | | | | 435,138 |
| | | | | | |
| | | | | | | 9,037,069 |
| | | | | | |
| TEXTILES, APPAREL & LUXURY GOODS - 1.4% | | | | | | |
Cherokee 2 | | 116,400 | | | | 808,980 |
Culp | | 30,649 | | | | 996,093 |
Vera Bradley 2 | | 100,900 | | | | 986,802 |
| | | | | | |
| | | | | | | 2,791,875 |
| |
| Total (Cost $24,637,817) | | | | | | 30,239,475 |
| |
| | | | | | | |
| CONSUMER STAPLES – 0.6% | | | | | | |
| FOOD PRODUCTS - 0.6% | | | | | | |
John B. Sanfilippo & Son | | 19,400 | | | | 1,224,334 |
| |
| Total (Cost $935,005) | | | | | | 1,224,334 |
| |
| | | | | | | |
| ENERGY – 5.7% | | | | | | |
| ENERGY EQUIPMENT & SERVICES - 4.2% | | | | | | |
Gulf Island Fabrication | | 92,634 | | | | 1,074,554 |
Independence Contract Drilling 2 | | 284,100 | | | | 1,105,149 |
Natural Gas Services Group 2 | | 55,500 | | | | 1,379,175 |
Newpark Resources 2 | | 203,700 | | | | 1,497,195 |
Profire Energy 2 | | 748,929 | | | | 973,608 |
Tesco Corporation 2 | | 229,380 | | | | 1,020,741 |
Total Energy Services | | 135,700 | | | | 1,391,741 |
| | | | | | |
| | | | | | | 8,442,163 |
| | | | | | |
| OIL, GAS & CONSUMABLE FUELS - 1.5% | | | | | | |
Ardmore Shipping | | 216,500 | | | | 1,764,475 |
Panhandle Oil and Gas Cl. A | | 52,000 | | | | 1,201,200 |
| | | | | | |
| | | | | | | 2,965,675 |
| |
| Total (Cost $11,478,570) | | | | | | 11,407,838 |
| |
| | | | | | | |
| FINANCIALS – 12.3% | | | | | | |
| BANKS - 3.6% | | | | | | |
Blue Hills Bancorp | | 76,400 | | | | 1,367,560 |
Brookline Bancorp | | 64,200 | | | | 937,320 |
Caribbean Investment Holdings 2 | | 1,751,577 | | | | 302,278 |
County Bancorp | | 45,600 | | | | 1,094,400 |
†Franklin Financial Network 2 | | 28,200 | | | | 1,163,250 |
HarborOne Bancorp 2 | | 59,800 | | | | 1,193,608 |
†Midway Investments 2,3 | | 1,751,577 | | | | 0 |
TriState Capital Holdings 2 | | 47,572 | | | | 1,198,814 |
| | | | | | |
| | | | | | | 7,257,230 |
| | | | | | |
| CAPITAL MARKETS - 3.9% | | | | | | |
Canaccord Genuity Group | | 395,500 | | | | 1,625,551 |
GAIN Capital Holdings | | 181,400 | | | | 1,130,122 |
Gluskin Sheff + Associates | | 109,300 | | | | 1,411,763 |
Newtek Business Services | | 57,416 | | | | 935,307 |
Silvercrest Asset Management Group Cl. A | | 106,100 | | | | 1,427,045 |
Westwood Holdings Group | | 24,627 | | | | 1,396,105 |
| | | | | | |
| | | | | | | 7,925,893 |
| | | | | | |
| DIVERSIFIED FINANCIAL SERVICES - 0.2% | | | | | | |
Waterloo Investment Holdings 2,3 | | 1,303,907 | | | | 391,172 |
| | | | | | |
| INSURANCE - 1.2% | | | | | | |
Atlas Financial Holdings 2 | | 98,600 | | | | 1,469,140 |
Blue Capital Reinsurance Holdings | | 52,292 | | | | 956,944 |
| | | | | | |
| | | | | | | 2,426,084 |
| | | | | | |
| THRIFTS & MORTGAGE FINANCE - 3.4% | | | | | | |
Beneficial Bancorp | | 58,240 | | | | 873,600 |
Clifton Bancorp | | 89,800 | | | | 1,484,394 |
Federal Agricultural Mortgage | | 17,900 | | | | 1,158,130 |
Meridian Bancorp | | 65,700 | | | | 1,110,330 |
†PCSB Financial 1,2 | | 50,000 | | | | 853,000 |
Western New England Bancorp | | 124,354 | | | | 1,262,193 |
| | | | | | |
| | | | | | | 6,741,647 |
| |
| Total (Cost $24,398,049) | | | | | | 24,742,026 |
| |
| | | | | | | |
| HEALTH CARE – 8.5% | | | | | | |
| BIOTECHNOLOGY - 2.1% | | | | | | |
BioSpecifics Technologies 2 | | 18,400 | | | | 910,984 |
Progenics Pharmaceuticals 2 | | 159,800 | | | | 1,085,042 |
Zealand Pharma 2 | | 110,358 | | | | 2,212,127 |
| | | | | | |
| | | | | | | 4,208,153 |
| | | | | | |
| HEALTH CARE EQUIPMENT & SUPPLIES - 3.1% | | | | | | |
AtriCure 2 | | 73,000 | | | | 1,770,250 |
CryoLife 2 | | 101,489 | | | | 2,024,705 |
Surmodics 2 | | 38,078 | | | | 1,071,896 |
†Tactile Systems Technology 1,2 | | 48,500 | | | | 1,386,130 |
| | | | | | |
| | | | | | | 6,252,981 |
| | | | | | |
| HEALTH CARE PROVIDERS & SERVICES - 0.5% | | | | | | |
Landauer | | 19,100 | | | | 998,930 |
| | | | | | |
| LIFE SCIENCES TOOLS & SERVICES - 1.1% | | | | | | |
Harvard Bioscience 2 | | 442,268 | | | | 1,127,783 |
†NeoGenomics 2 | | 126,900 | | | | 1,137,024 |
| | | | | | |
| | | | | | | 2,264,807 |
| | | | | | |
| 10 | Royce Capital Fund 2017 Semiannual Report to Shareholders | | THE ACCOMPANYING NOTES ARE AN INTEGRAL PART OF THESE FINANCIAL STATEMENTS |
| June 30, 2017 (unaudited) |
| |
| Royce Capital Fund - Micro-Cap Portfolio (continued) | | | | | | |
| | | | | | | |
| | | SHARES | | | | VALUE |
| |
| | | | | | | |
| HEALTH CARE (continued) | | | | | | |
| PHARMACEUTICALS - 1.7% | | | | | | |
Agile Therapeutics 2 | | 254,500 | | | $ | 954,375 |
Corium International 2 | | 200,600 | | | | 1,496,476 |
Lipocine 2 | | 221,300 | | | | 889,626 |
Synergetics USA (Rights) 2,3 | | 246,900 | | | | 46,911 |
| | | | | | |
| | | | | | | 3,387,388 |
| |
| Total (Cost $13,782,492) | | | | | | 17,112,259 |
| |
| | | | | | | |
| INDUSTRIALS – 20.8% | | | | | | |
| AEROSPACE & DEFENSE - 1.5% | | | | | | |
Astronics Corporation 2 | | 37,800 | | | | 1,151,766 |
Astronics Corporation Cl. B 2,4 | | 4,545 | | | | 137,486 |
CPI Aerostructures 2 | | 189,144 | | | | 1,777,954 |
| | | | | | |
| | | | | | | 3,067,206 |
| | | | | | |
| COMMERCIAL SERVICES & SUPPLIES - 2.5% | | | | | | |
Acme United | | 35,765 | | | | 1,022,879 |
Heritage-Crystal Clean 2 | | 64,834 | | | | 1,030,860 |
Hudson Technologies 2 | | 196,100 | | | | 1,657,045 |
Viad Corporation | | 29,200 | | | | 1,379,700 |
| | | | | | |
| | | | | | | 5,090,484 |
| | | | | | |
| CONSTRUCTION & ENGINEERING - 0.7% | | | | | | |
Northwest Pipe 2 | | 86,000 | | | | 1,398,360 |
| | | | | | |
| ELECTRICAL EQUIPMENT - 2.0% | | | | | | |
Encore Wire | | 30,600 | | | | 1,306,620 |
LSI Industries | | 172,713 | | | | 1,563,053 |
Revolution Lighting Technologies 1,2 | | 167,700 | | | | 1,105,143 |
| | | | | | |
| | | | | | | 3,974,816 |
| | | | | | |
| INDUSTRIAL CONGLOMERATES - 0.6% | | | | | | |
Raven Industries | | 32,900 | | | | 1,095,570 |
| | | | | | |
| MACHINERY - 8.4% | | | | | | |
Alimak Group | | 91,200 | | | | 1,515,544 |
CIRCOR International | | 24,200 | | | | 1,436,996 |
FreightCar America | | 79,391 | | | | 1,380,609 |
Global Brass and Copper Holdings | | 38,900 | | | | 1,188,395 |
Graham Corporation | | 43,420 | | | | 853,637 |
Greenbrier Companies (The) | | 21,600 | | | | 999,000 |
Harsco Corporation 2 | | 79,800 | | | | 1,284,780 |
Kadant | | 19,831 | | | | 1,491,291 |
Kornit Digital 2 | | 72,400 | | | | 1,400,940 |
Lindsay Corporation | | 17,700 | | | | 1,579,725 |
Lydall 2 | | 27,200 | | | | 1,406,240 |
RBC Bearings 2 | | 10,022 | | | | 1,019,839 |
Sun Hydraulics | | 33,700 | | | | 1,437,979 |
| | | | | | |
| | | | | | | 16,994,975 |
| | | | | | |
| MARINE - 0.8% | | | | | | |
Clarkson | | 47,200 | | | | 1,552,874 |
| | | | | | |
| PROFESSIONAL SERVICES - 3.6% | | | | | | |
CRA International | | 27,706 | | | | 1,006,282 |
GP Strategies 2 | | 52,208 | | | | 1,378,291 |
Heidrick & Struggles International | | 64,700 | | | | 1,407,225 |
Kforce | | 62,700 | | | | 1,228,920 |
Navigant Consulting 2 | | 52,400 | | | | 1,035,424 |
Resources Connection | | 91,054 | | | | 1,247,440 |
| | | | | | |
| | | | | | | 7,303,582 |
| | | | | | |
| ROAD & RAIL - 0.7% | | | | | | |
Marten Transport | | 51,685 | | | | 1,416,169 |
| |
| Total (Cost $28,531,830) | | | | | | 41,894,036 |
| |
| | | | | | | |
| INFORMATION TECHNOLOGY – 19.2% | | | | | | |
| COMMUNICATIONS EQUIPMENT - 0.8% | | | | | | |
EMCORE Corporation | | 111,400 | | | | 1,186,410 |
Oclaro 2 | | 54,300 | | | | 507,162 |
| | | | | | |
| | | | | | | 1,693,572 |
| | | | | | |
| ELECTRONIC EQUIPMENT, INSTRUMENTS & COMPONENTS - 7.2% | | | | | | |
Airgain 1,2 | | 78,700 | | | | 1,115,966 |
CUI Global 2 | | 211,062 | | | | 810,478 |
ePlus 2 | | 19,592 | | | | 1,451,767 |
Fabrinet 2 | | 32,069 | | | | 1,368,064 |
Mesa Laboratories | | 8,800 | | | | 1,261,128 |
Neonode 1,2 | | 788,718 | | | | 851,815 |
Netlist 1,2 | | 530,100 | | | | 540,702 |
Novanta 2 | | 35,800 | | | | 1,288,800 |
Orbotech 2 | | 41,200 | | | | 1,343,944 |
PC Connection | | 60,300 | | | | 1,631,718 |
Rogers Corporation 2 | | 12,200 | | | | 1,325,164 |
Vishay Precision Group 2 | | 83,000 | | | | 1,435,900 |
| | | | | | |
| | | | | | | 14,425,446 |
| | | | | | |
| INTERNET SOFTWARE & SERVICES - 0.7% | | | | | | |
QuinStreet 2 | | 336,600 | | | | 1,403,622 |
| | | | | | |
| IT SERVICES - 1.6% | | | | | | |
Cass Information Systems | | 21,400 | | | | 1,404,696 |
Computer Task Group 2 | | 171,142 | | | | 956,684 |
Unisys Corporation 2 | | 72,500 | | | | 928,000 |
| | | | | | |
| | | | | | | 3,289,380 |
| | | | | | |
| SEMICONDUCTORS & SEMICONDUCTOR EQUIPMENT - 5.9% | | | | | | |
Brooks Automation | | 44,200 | | | | 958,698 |
†CyberOptics Corporation 1,2 | | 13,300 | | | | 274,645 |
†Everspin Technologies 2 | | 65,800 | | | | 1,314,684 |
Nanometrics 2 | | 59,200 | | | | 1,497,168 |
NeoPhotonics Corporation 2 | | 162,200 | | | | 1,252,184 |
PDF Solutions 2 | | 52,900 | | | | 870,205 |
Photronics 2 | | 149,000 | | | | 1,400,600 |
Rudolph Technologies 2 | | 65,893 | | | | 1,505,655 |
Silicon Motion Technology ADR | | 32,200 | | | | 1,553,006 |
Ultra Clean Holdings 2 | | 68,100 | | | | 1,276,875 |
| | | | | | |
| | | | | | | 11,903,720 |
| | | | | | |
| SOFTWARE - 2.4% | | | | | | |
Attunity 2 | | 167,400 | | | | 1,203,606 |
Computer Modelling Group | | 133,000 | | | | 1,044,063 |
QAD Cl. A | | 55,500 | | | | 1,778,775 |
SeaChange International 2 | | 293,700 | | | | 781,242 |
| | | | | | |
| | | | | | | 4,807,686 |
| | | | | | |
| TECHNOLOGY HARDWARE, STORAGE & PERIPHERALS - 0.6% | | | | | | |
Super Micro Computer 2 | | 45,511 | | | | 1,121,846 |
| |
| Total (Cost $32,728,296) | | | | | | 38,645,272 |
| |
| | | | | | | |
| MATERIALS – 5.3% | | | | | | |
| CHEMICALS - 2.0% | | | | | | |
BioAmber 1,2 | | 201,479 | | | | 517,801 |
FutureFuel Corporation | | 71,200 | | | | 1,074,408 |
Quaker Chemical | | 7,588 | | | | 1,102,006 |
Trecora Resources 2 | | 115,100 | | | | 1,294,875 |
| | | | | | |
| | | | | | | 3,989,090 |
| | | | | | |
| CONSTRUCTION MATERIALS - 0.7% | | | | | | |
U.S. Concrete 2 | | 19,100 | | | | 1,500,305 |
| | | | | | |
| METALS & MINING - 2.6% | | | | | | |
Haynes International | | 38,570 | | | | 1,400,477 |
Kirkland Lake Gold | | 101,650 | | | | 961,787 |
McEwen Mining | | 221,296 | | | | 582,008 |
| THE ACCOMPANYING NOTES ARE AN INTEGRAL PART OF THESE FINANCIAL STATEMENTS | | Royce Capital Fund 2017 Semiannual Report to Shareholders | 11 |
| Schedules of Investments | | June 30, 2017 (unaudited) |
| |
| Royce Capital Fund - Micro-Cap Portfolio (continued) | | | | | | |
| | | | | | | |
| | | SHARES | | | | VALUE |
| |
| | | | | | | |
| MATERIALS (continued) | | | | | | |
| METALS & MINING (continued) | | | | | | |
Pretium Resources 2 | | 52,500 | | | $ | 504,434 |
Richmont Mines 2 | | 139,200 | | | | 1,085,760 |
Schnitzer Steel Industries Cl. A | | 28,000 | | | | 705,600 |
| | | | | | |
| | | | | | | 5,240,066 |
| |
| Total (Cost $9,046,431) | | | | | | 10,729,461 |
| |
| | | | | | | |
| REAL ESTATE – 1.8% | | | | | | |
| EQUITY REAL ESTATE INVESTMENT TRUSTS (REITS) - 0.7% | | | | | | |
Community Healthcare Trust | | 56,800 | | | | 1,453,512 |
| | | | | | |
| REAL ESTATE MANAGEMENT & DEVELOPMENT - 1.1% | | | | | | |
FRP Holdings 2 | | 18,240 | | | | 841,776 |
Marcus & Millichap 2 | | 51,500 | | | | 1,357,540 |
| | | | | | |
| | | | | | | 2,199,316 |
| |
| Total (Cost $3,059,353) | | | | | | 3,652,828 |
| |
| | | | | | | |
| TELECOMMUNICATION SERVICES – 0.8% | | | | | | |
| DIVERSIFIED TELECOMMUNICATION SERVICES - 0.8% | | | | | | |
ORBCOMM 2 | | 141,500 | | | | 1,598,950 |
| |
| Total (Cost $938,574) | | | | | | 1,598,950 |
| |
| | | | | | | |
| MISCELLANEOUS5 – 4.9% | | | | | | |
| |
| Total (Cost $9,855,454) | | | | | | 9,898,209 |
| |
| | | | | | | |
| TOTAL COMMON STOCKS | | | | | | |
| |
| (Cost $159,391,871) | | | | | | 191,144,688 |
| |
| | | | | | | |
| REPURCHASE AGREEMENT– 5.2% | | | | | | |
| Fixed Income Clearing Corporation, 0.12% dated 6/30/17, due 7/3/17, maturity value $10,382,104 (collateralized by obligations of various U.S. Government Agencies, 2.375% due 8/15/24, valued at $10,590,132) | | | | | | |
| |
| (Cost $10,382,000) | | | | | | 10,382,000 |
| |
| | | | PRINCIPAL | | | | | |
| | | | AMOUNT | | | | | VALUE |
| |
| | | | | | | | | |
| COLLATERAL RECEIVED FOR SECURITIES LOANED – 3.4% | | | | | | | | |
| U.S. Treasury Bills | | | | | | | | |
due 7/20/17-3/1/18 | | $ | 211,973 | | | | $ | 211,965 |
| U.S. Treasury Bonds | | | | | | | | |
2.50%-4.25% | | | | | | | | |
due 8/15/40-2/15/46 | | | 54,150 | | | | | 54,716 |
| U.S. Treasury Notes | | | | | | | | |
0.75%-3.50% | | | | | | | | |
due 10/31/17-2/15/27 | | | 1,157,195 | | | | | 1,162,754 |
| U.S. Treasury Notes - Floating Rate | | | | | | | | |
due 7/31/17-1/31/19 | | | 28,886 | | | | | 28,886 |
| U.S. Treasury TIPS | | | | | | | | |
0.125%-1.875% | | | | | | | | |
due 4/15/18-2/15/46 | | | 164,783 | | | | | 164,934 |
| Money Market Funds | | | | | | | | |
Federated Government Obligations Fund (7 day yield-0.8114%) | | | | | | | | 5,277,539 |
| | | | | | | | | |
| TOTAL COLLATERAL RECEIVED FOR SECURITIES LOANED | | | | | | | | |
| |
| (Cost $6,900,794) | | | | | | | | 6,900,794 |
| |
| | | | | | | | | |
| TOTAL INVESTMENTS – 103.5% | | | | | | | | |
| |
| (Cost $176,674,665) | | | | | | | | 208,427,482 |
| |
| | | | | | | | | |
| LIABILITIES LESS CASH AND OTHER ASSETS – (3.5)% | | | | | | | | (7,090,009) |
| | | | | | | | |
| | | | | | | | | |
| |
| NET ASSETS – 100.0% | | | | | | | $ | 201,337,473 |
| |
| † | New additions in 2017. |
| 1 | All or a portion of these securities were on loan at June 30, 2017. |
| 2 | Non-income producing. |
| 3 | Securities for which market quotations are not readily available represent 0.2% of net assets. These securities have been valued at their fair value under procedures approved by the Fund’s Board of Trustees. These securities are defined as Level 3 securities due to the use of significant unobservable inputs in the determination of fair value. See Notes to Financial Statements. |
| 4 | This security is defined as a Level 2 security due to fair value being based on quoted prices for similar securities. See Notes to Financial Statements. |
| 5 | Includes securities first acquired in 2017 and less than 1% of net assets. |
| | |
| | Bold indicates the Fund’s 20 largest equity holdings in terms of June 30, 2017, market value. |
| 12 | Royce Capital Fund 2017 Semiannual Report to Shareholders | | THE ACCOMPANYING NOTES ARE AN INTEGRAL PART OF THESE FINANCIAL STATEMENTS |
This page is intentionally left blank.
| THE ACCOMPANYING NOTES ARE AN INTEGRAL PART OF THESE FINANCIAL STATEMENTS | | Royce Capital Fund 2017 Semiannual Report to Shareholders | 13 |
| | | MANAGER’S DISCUSSION |
| Royce Capital Fund–Small-Cap Portfolio (RCS) | | |
 |
| Jay Kaplan, CFA |
FUND PERFORMANCE
For the year-to-date period ended June 30, 2017, Royce Capital Fund–Small-Cap Portfolio was down 4.2%, significantly lagging its small-cap benchmark, the Russell 2000 Index, which gained 5.0% for the same period. It was a difficult first half for value stocks and a disappointing one for our contrarian value approach.
The Fund slipped 1.4% in the first quarter versus a 2.5% advance for the small-cap index as value stocks fell behind their growth counterparts early in the year, spurred in large part by surging biotechnology names (which corrected sharply in 2016) and less stellar performance for many of the cyclical areas that did so well in 2016. This pattern held sway in the second quarter, when Small-Cap Portfolio was down 2.8% compared to another 2.5% increase for the Russell 2000. The leadership shift that began early in the year thus remained in place for most of the first half, as healthcare, growth, large-caps, and non-U.S. equities all stayed in the lead after lagging in 2016. Longer-term results were better as the Fund outperformed its benchmark for the 20-year and since inception (12/27/96) periods ended June 30, 2017. Small-Cap Portfolio’s average annual total return since inception was 10.5%. |
| |
| WHAT WORKED...AND WHAT DIDN’T |
| Consumer Discretionary made by far the largest negative impact at the sector level, detracting more than twice as much as Energy, the Fund’s second-biggest detractor for the semiannual period. The specialty retail industry disproportionately drove negative results, with seven of the Fund’s eight biggest first-half detractors coming from the group. Brick and mortar retailers continue to struggle with shifts in consumer spending and shopping habits, along with the ensuing margin contraction, developments keyed to a large degree by the omnipresence of Amazon. We sold our shares of footwear, headwear, and sports apparel retailer Genesco in June and reduced our stake in each of the Fund’s other positions in specialty retail during the first half, including sporting goods company Hibbett Sports, women’s fashion and accessories retailer The Cato Corporation, and footwear specialist Shoe Carnival. The energy equipment & services group also had a substantial negative impact, led by Matrix Service, the Fund’s top detractor at the position level in the first half. The company is a contractor to the energy, power, and industrial markets. Ongoing delays in new project awards and starts, depressed maintenance spending, and increased cost estimates on an electrical infrastructure project all discouraged investors, including us. We sold the last of our shares in the portfolio in May. |
| Industrials, Financials, and Information Technology made the biggest sector-based contributions to 2017’s first-half results, while at the industry level, building products (Industrials), capital markets (Financials), and IT services (Information Technology) made notable positive impacts. Kitchen cabinet and vanity manufacturer American Woodmark led the building products group, and the Fund overall, thanks to impressive sales growth in both its new construction and remodeling products. We trimmed our stake as its share price climbed. We chose to add shares of truck trailer manufacturer (and top-10 holding) Wabash National in the first half. Investors seemed to respond positively to its raised earnings guidance for the rest of 2017 as well the company’s efforts to emphasize its diverse line of transportation products. NCI offers network engineering, information assurance, systems development, and integration for government agencies. Fiscal first-quarter revenues exceeded the midpoint of management’s guidance range given earlier in the year, driven in part by margin improvements resulting from higher contributions from fixed-price contracts. |
| Relative to the Russell 2000, the Fund’s first-half results were affected most by both our overweight and ineffective stock picking in Consumer Discretionary, where the previously mentioned specialty retail group detracted most. Both our lower exposure to Health Care and ineffective stock picks in Information Technology also notably hurt relative results. Bright spots included better stock selection in Financials—most notably in capital markets stocks such as Moelis & Company—and Industrials, where American Woodmark helped the building products group to shine. |
| | Top Contributors to Performance
Year-to-Date Through 6/30/17(%) 1 | | | |
| | | |
| American Woodmark | | 0.54 |
| |
| Wabash National | | 0.50 |
| |
| NCI Cl. A | | 0.50 |
| |
| Moelis & Company Cl. A | | 0.38 |
| |
| Korn/Ferry International | | 0.37 |
| |
| 1 Includes dividends | | |
| | Top Detractors from Performance
Year-to-Date Through 6/30/17(%) 2 | | | |
| | | |
| Matrix Service | | -1.10 |
| |
| Hibbett Sports | | -0.72 |
| |
| Genesco | | -0.61 |
| |
| Cato Corporation (The) Cl. A | | -0.50 |
| |
| Shoe Carnival | | -0.48 |
| |
| 2 Net of dividends | | |
| CURRENT POSITIONING AND OUTLOOK |
| Our outlook has not changed appreciably since the end of 2016. Our valuation-sensitive contrarian approach has made finding new ideas difficult because most of the cheap stocks we have been investigating look priced that way for very good reasons that look likely to persist— classic value traps. Patience, therefore, remains key. We still expect that more interesting opportunities will materialize when some of the current widespread optimism dissipates, and we are prepared to wait. In the event of a correction, we will act opportunistically as we always have when the market trends down. During the first half, in addition to reducing the specialty retail group, we made discrete purchases in both residential and non-residential construction companies, as well as in distribution and networking technology businesses—consistent with our ‘low-tech tech’ ethos and including top-10 holdings Fabrinet and PC Connection. We also purchased shares in a small number of boutique investment banks that look well positioned to benefit from ongoing global uncertainty as well as what we think will be a more robust M&A market in the months to come. |
| 14 | Royce Capital Fund 2017 Semiannual Report to Shareholders | |
| PERFORMANCE AND PORTFOLIO REVIEW | TICKER SYMBOLS RCPFX RCSSX |
| |
| Performance and Expenses | | | | | | | | | | | | | | | | |
| Average Annual Total Return (%) Through 6/30/17 | | | | | | | | | | |
| | | JAN-JUN 2017 1 | | 1-YR | | 3-YR | | 5-YR | | 10-YR | | 15-YR | | 20-YR | | SINCE INCEPTION (12/27/96) |
| |
| RCS | | -4.16 | | 12.59 | | 1.17 | | 8.76 | | 4.98 | | 8.19 | | 10.13 | | 10.47 |
| |
| Annual Operating Expenses: 1.09% | | | | | | | | | | | |
| |
| 1 Not annualized | | | | | | | | | | | | | | | | |
Relative Returns: Monthly Rolling Average Annual Return Periods20 Years Through 6/30/17
| On a monthly rolling basis, the Fund outperformed the Russell 2000 in 79% of all 10-year periods; 71% of all 5-year periods; and 53% of all 1-year periods. |
| |
| | | PERIODS BEATING THE INDEX | | | | | FUND AVG (%) 1 | | INDEX AVG (%) 1 |
| |
| 10-year | | 95/121 | | | | | | 79% | | 9.5 | | 6.7 |
| |
| 5-year | | 128/181 | | | | | | 71% | | 10.6 | | 7.7 |
| |
| 1-year | | 122/229 | | | | | | 53% | | 11.6 | | 9.2 |
| |
1 Average of monthly rolling average annual total returns over the specified periods.
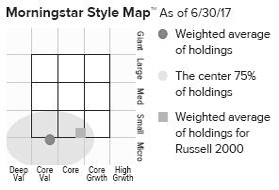
The Morningstar Style Map is the Morningstar Style Box TM with the center 75% of fund holdings plotted as the Morningstar Ownership Zone TM. The Morningstar Style Box is designed to reveal a fund’s investment strategy. The Morningstar Ownership Zone provides detail about a portfolio’s investment style by showing the range of stock sizes and styles. The Ownership Zone is derived by plotting each stock in the portfolio within the proprietary Morningstar Style Box. Over time, the shape and location of a fund’s ownership zone may vary. See page 30 for additional information. |
Value of $10,000Invested on 12/27/96 as of 6/30/17 ($)
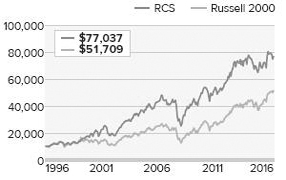
Includes reinvestment of distributions.
| |
| Top 10 Positions | | |
| % of Net Assets | | |
| | | |
| Miller Industries | | 2.2 |
| |
| Genworth MI Canada | | 2.1 |
| |
| Fabrinet | | 2.0 |
| |
| Wabash National | | 2.0 |
| |
| AMN Healthcare Services | | 2.0 |
| |
| Marcus & Millichap | | 2.0 |
| |
| Celestica | | 1.9 |
| |
| PC Connection | | 1.9 |
| |
| Federated Investors Cl. B | | 1.9 |
| |
| Vishay Intertechnology | | 1.9 |
| |
| |
| Portfolio Sector Breakdown | | |
| % of Net Assets | | |
| | | |
| Industrials | | 21.6 |
| |
| Financials | | 18.9 |
| |
| Information Technology | | 18.6 |
| |
| Consumer Discretionary | | 14.5 |
| |
| Health Care | | 2.4 |
| |
| Real Estate | | 2.0 |
| |
| Consumer Staples | | 1.9 |
| |
| Energy | | 1.7 |
| |
| Utilities | | 1.0 |
| |
| Miscellaneous | | 0.9 |
| |
| Cash and Cash Equivalents | | 16.5 |
| |
| |
| Calendar Year Total Returns (%) | |
| | | |
| YEAR | | RCS |
| |
| 2016 | | 21.0 |
| |
| 2015 | | -11.8 |
| |
| 2014 | | 3.2 |
| |
| 2013 | | 34.8 |
| |
| 2012 | | 12.5 |
| |
| 2011 | | -3.3 |
| |
| 2010 | | 20.5 |
| |
| 2009 | | 35.2 |
| |
| 2008 | | -27.2 |
| |
| 2007 | | -2.1 |
| |
| 2006 | | 15.6 |
| |
| 2005 | | 8.6 |
| |
| 2004 | | 25.0 |
| |
| 2003 | | 41.1 |
| |
| 2002 | | -13.8 |
| |
| |
| Upside/Downside Capture Ratios | | | | |
| Periods Ended 6/30/17 (%) | | | | |
| | | UPSIDE | | DOWNSIDE |
| |
| 10-Year | | 76 | | 80 |
| |
From 12/31/96 (Start of
Fund’s First Full Quarter) | | 93 | | 75 |
| |
| |
| Portfolio Diagnostics | | |
| | | |
| Fund Net Assets | | $450 million |
| |
| Number of Holdings | | 76 |
| |
| Turnover Rate | | 39% |
| |
| Average Market Capitalization 1 | | $1,095 million |
| |
| Weighted Average P/E Ratio 2,3 | | 16.5x |
| |
| Weighted Average P/B Ratio 2 | | 1.9x |
| |
| Active Share 4 | | 97% |
| |
| U.S. Investments (% of Net Assets) | | 76.2% |
| |
| Non-U.S. Investments (% of Net Assets) | | 7.3% |
| |
| |
| 1 | Geometric Average. This weighted calculation uses each portfolio holding’s market cap in a way designed to not skew the effect of very large or small holdings; instead, it aims to better identify the portfolio’s center, which Royce believes offers a more accurate measure of average market cap than a simple mean or median. |
| 2 | Harmonic Average. This weighted calculation evaluates a portfolio as if it were a single stock and measures it overall. It compares the total market value of the portfolio to the portfolio’s share in the earnings or book value, as the case may be, of its underlying stocks. |
| 3 | The Fund’s P/E ratio calculation excludes companies with zero or negative earnings (3% of portfolio holdings as of 6/30/17). |
| 4 | Active Share is the sum of the absolute values of the different weightings of each holding in the Fund versus each holding in the benchmark, divided by two. |
Important Performance and Expense Information
All performance information in this Report reflects past performance, is presented on a total return basis, reflects the reinvestment of distributions, and does not reflect the deduction of taxes that a shareholder would pay on fund distributions or the redemption of fund shares. Past performance is no guarantee of future results. Investment return and principal value of an investment will fluctuate, so that shares may be worth more or less than their original cost when redeemed. Current performance may be higher or lower than performance quoted. The Fund’s total returns do not reflect any deduction for charges or expenses of the variable contracts investing in the Fund. Returns as of the most recent month-end may be obtained at www.roycefunds.com. All performance and risk information reflects the result of the Investment Class (its oldest class). Shares of RCS’s Service Class bear an annual distribution expense that is not borne by the Investment Class; if those expenses were reflected, total returns would have been lower. Operating expenses reflect the Fund’s total annual operating expenses for the Investment Class as of the Fund’s most current prospectus and include management fees and other expenses. Regarding the “Top Contributors” and “Top Detractors” tables shown above, the sum of all contributors to, and all detractors from, performance for all securities in the portfolio would approximate the Fund’s year-to-date performance for 2017. Upside Capture Ratio measures a manager’s performance in up markets relative to the Fund’s benchmark. It is calculated by measuring the Fund’s performance in quarters when the benchmark went up and dividing it by the benchmark’s return in those quarters. Downside Capture Ratio measures a manager’s performance in down markets relative to the Fund’s benchmark (Russell 2000). It is calculated by measuring the Fund’s performance in quarters when the benchmark goes down and dividing it by the benchmark’s return in those quarters. |
| | | Royce Capital Fund 2017 Semiannual Report to Shareholders | 15 |
Schedules of Investments
| |
| Royce Capital Fund - Small-Cap Portfolio | | | | | | |
| Common Stocks – 83.5% | | | | | | |
| | | SHARES | | | | VALUE |
| |
| | | | | | | |
| CONSUMER DISCRETIONARY – 14.5% | | | | | | |
| AUTO COMPONENTS - 2.9% | | | | | | |
Gentex Corporation | | 419,616 | | | $ | 7,960,116 |
†Stoneridge 1 | | 303,664 | | | | 4,679,462 |
STRATTEC SECURITY | | 10,655 | | | | 377,187 |
| | | | | | |
| | | | | | | 13,016,765 |
| | | | | | |
| AUTOMOBILES - 0.6% | | | | | | |
Thor Industries | | 26,600 | | | | 2,780,232 |
| | | | | | |
| HOUSEHOLD DURABLES - 0.8% | | | | | | |
Flexsteel Industries | | 67,496 | | | | 3,652,209 |
| | | | | | |
| MEDIA - 1.9% | | | | | | |
Saga Communications Cl. A | | 186,279 | | | | 8,522,264 |
| | | | | | |
| SPECIALTY RETAIL - 6.1% | | | | | | |
American Eagle Outfitters | | 656,065 | | | | 7,905,583 |
Buckle (The) | | 44,930 | | | | 799,754 |
Cato Corporation (The) Cl. A | | 41,881 | | | | 736,687 |
DSW Cl. A | | 347,093 | | | | 6,143,546 |
Hibbett Sports 1 | | 102,164 | | | | 2,119,903 |
Kirkland’s 1 | | 249,247 | | | | 2,562,259 |
Shoe Carnival | | 349,050 | | | | 7,288,164 |
| | | | | | |
| | | | | | | 27,555,896 |
| | | | | | |
| TEXTILES, APPAREL & LUXURY GOODS - 2.2% | | | | | | |
Deckers Outdoor 1 | | 56,366 | | | | 3,847,543 |
Steven Madden 1 | | 146,061 | | | | 5,835,137 |
| | | | | | |
| | | | | | | 9,682,680 |
| |
| Total (Cost $65,573,239) | | | | | | 65,210,046 |
| |
| | | | | | | |
| CONSUMER STAPLES – 1.9% | | | | | | |
| FOOD & STAPLES RETAILING - 1.9% | | | | | | |
Village Super Market Cl. A | | 319,536 | | | | 8,282,373 |
| |
| Total (Cost $9,328,635) | | | | | | 8,282,373 |
| |
| | | | | | | |
| ENERGY – 1.7% | | | | | | |
| ENERGY EQUIPMENT & SERVICES - 1.7% | | | | | | |
Helmerich & Payne | | 38,700 | | | | 2,102,958 |
Unit Corporation 1 | | 304,113 | | | | 5,696,036 |
| |
| Total (Cost $7,856,167) | | | | | | 7,798,994 |
| |
| | | | | | | |
| FINANCIALS – 18.9% | | | | | | |
| BANKS - 7.4% | | | | | | |
Ames National | | 155,004 | | | | 4,743,122 |
Camden National | | 150,343 | | | | 6,451,218 |
City Holding Company | | 61,411 | | | | 4,045,143 |
CNB Financial | | 132,269 | | | | 3,170,488 |
Codorus Valley Bancorp | | 9,674 | | | | 274,742 |
Landmark Bancorp | | 13,095 | | | | 403,326 |
MidWestOne Financial Group | | 172,278 | | | | 5,838,501 |
National Bankshares | | 120,135 | | | | 4,901,508 |
Northrim BanCorp | | 85,000 | | | | 2,584,000 |
Unity Bancorp | | 54,112 | | | | 930,726 |
| | | | | | |
| | | | | | | 33,342,774 |
| | | | | | |
| CAPITAL MARKETS - 5.9% | | | | | | |
Federated Investors Cl. B | | 307,486 | | | | 8,686,479 |
Greenhill & Co. | | 281,015 | | | | 5,648,402 |
Houlihan Lokey Cl. A | | 168,749 | | | | 5,889,340 |
Moelis & Company Cl. A | | 168,620 | | | | 6,550,887 |
| | | | | | |
| | | | | | | 26,775,108 |
| | | | | | |
| INSURANCE - 1.3% | | | | | | |
Reinsurance Group of America | | 45,136 | | | | 5,795,011 |
| | | | | | |
| THRIFTS & MORTGAGE FINANCE - 4.3% | | | | | | |
Genworth MI Canada | | 339,850 | | | | 9,350,592 |
Southern Missouri Bancorp | | 3,991 | | | | 128,750 |
Timberland Bancorp | | 48,100 | | | | 1,215,487 |
TrustCo Bank Corp. NY | | 1,094,933 | | | | 8,485,731 |
| | | | | | |
| | | | | | | 19,180,560 |
| |
| Total (Cost $62,053,013) | | | | | | 85,093,453 |
| |
| | | | | | | |
| HEALTH CARE – 2.4% | | | | | | |
| HEALTH CARE PROVIDERS & SERVICES - 2.4% | | | | | | |
AMN Healthcare Services 1 | | 225,764 | | | | 8,816,084 |
Ensign Group (The) | | 95,420 | | | | 2,077,293 |
| |
| Total (Cost $10,879,438) | | | | | | 10,893,377 |
| |
| | | | | | | |
| INDUSTRIALS – 21.6% | | | | | | |
| AIRLINES - 1.7% | | | | | | |
Spirit Airlines 1 | | 144,053 | | | | 7,440,338 |
| | | | | | |
| BUILDING PRODUCTS - 2.8% | | | | | | |
American Woodmark 1 | | 68,690 | | | | 6,563,329 |
Apogee Enterprises | | 109,071 | | | | 6,199,596 |
| | | | | | |
| | | | | | | 12,762,925 |
| | | | | | |
| COMMERCIAL SERVICES & SUPPLIES - 3.7% | | | | | | |
†Herman Miller | | 176,500 | | | | 5,365,600 |
†HNI Corporation | | 126,800 | | | | 5,055,516 |
Kimball International Cl. B | | 378,793 | | | | 6,322,055 |
| | | | | | |
| | | | | | | 16,743,171 |
| | | | | | |
| CONSTRUCTION & ENGINEERING - 0.9% | | | | | | |
Comfort Systems USA | | 110,569 | | | | 4,102,110 |
| | | | | | |
| MACHINERY - 6.3% | | | | | | |
Alamo Group | | 22,042 | | | | 2,001,634 |
Federal Signal | | 106,145 | | | | 1,842,677 |
Miller Industries | | 390,526 | | | | 9,704,571 |
†Supreme Industries Cl. A | | 367,273 | | | | 6,041,641 |
Wabash National | | 407,298 | | | | 8,952,410 |
| | | | | | |
| | | | | | | 28,542,933 |
| | | | | | |
| PROFESSIONAL SERVICES - 5.4% | | | | | | |
Heidrick & Struggles International | | 296,976 | | | | 6,459,228 |
Korn/Ferry International | | 201,174 | | | | 6,946,538 |
Robert Half International | | 142,400 | | | | 6,825,232 |
TrueBlue 1 | | 145,828 | | | | 3,864,442 |
| | | | | | |
| | | | | | | 24,095,440 |
| | | | | | |
| ROAD & RAIL - 0.8% | | | | | | |
Old Dominion Freight Line | | 4,204 | | | | 400,389 |
Saia 1 | | 39,664 | | | | 2,034,763 |
Werner Enterprises | | 36,061 | | | | 1,058,391 |
| | | | | | |
| | | | | | | 3,493,543 |
| |
| Total (Cost $79,426,814) | | | | | | 97,180,460 |
| |
| | | | | | | |
| INFORMATION TECHNOLOGY – 18.6% | | | | | | |
| COMMUNICATIONS EQUIPMENT - 1.2% | | | | | | |
NETGEAR 1 | | 111,071 | | | | 4,787,160 |
TESSCO Technologies | | 36,940 | | | | 491,302 |
| | | | | | |
| | | | | | | 5,278,462 |
| | | | | | |
| ELECTRONIC EQUIPMENT, INSTRUMENTS & COMPONENTS - 13.3% | | | | | | |
Benchmark Electronics 1 | | 178,530 | | | | 5,766,519 |
†Celestica 1 | | 640,813 | | | | 8,702,241 |
Fabrinet 1 | | 214,496 | | | | 9,150,399 |
Insight Enterprises 1 | | 197,278 | | | | 7,889,147 |
Methode Electronics | | 141,966 | | | | 5,848,999 |
| 16 | Royce Capital Fund 2017 Semiannual Report to Shareholders | | THE ACCOMPANYING NOTES ARE AN INTEGRAL PART OF THESE FINANCIAL STATEMENTS |
| June 30, 2017 (unaudited) |
| |
| Royce Capital Fund - Small-Cap Portfolio (continued) | | | | | | |
| | | | | | | |
| | | SHARES | | | | VALUE |
| |
| | | | | | | |
| INFORMATION TECHNOLOGY (continued) | | | | | | |
| ELECTRONIC EQUIPMENT, INSTRUMENTS & COMPONENTS (continued) | | | | | | |
†Orbotech 1 | | 164,553 | | | $ | 5,367,719 |
PC Connection | | 321,478 | | | | 8,699,195 |
Vishay Intertechnology | | 518,899 | | | | 8,613,723 |
| | | | | | |
| | | | | | | 60,037,942 |
| | | | | | |
| IT SERVICES - 2.3% | | | | | | |
Convergys Corporation | | 163,800 | | | | 3,895,164 |
NCI Cl. A 1 | | 296,526 | | | | 6,256,699 |
| | | | | | |
| | | | | | | 10,151,863 |
| | | | | | |
| SEMICONDUCTORS & SEMICONDUCTOR EQUIPMENT - 0.7% | | | | | | |
MKS Instruments | | 43,691 | | | | 2,940,404 |
| | | | | | |
| TECHNOLOGY HARDWARE, STORAGE & PERIPHERALS - 1.1% | | | | | | |
Super Micro Computer 1 | | 210,336 | | | | 5,184,783 |
| |
| Total (Cost $72,382,724) | | | | | | 83,593,454 |
| |
| REAL ESTATE – 2.0% | | | | | | |
| REAL ESTATE MANAGEMENT & DEVELOPMENT - 2.0% | | | | | | |
†Marcus & Millichap 1 | | 332,594 | | | | 8,767,178 |
| |
| Total (Cost $8,661,367) | | | | | | 8,767,178 |
| |
| UTILITIES – 1.0% | | | | | | |
| GAS UTILITIES - 1.0% | | | | | | |
Star Gas Partners L.P. | | 431,877 | | | | 4,681,547 |
| |
| Total (Cost $4,253,980) | | | | | | 4,681,547 |
| |
| |
| MISCELLANEOUS2 – 0.9% | | | | | | |
| |
| Total (Cost $3,101,769) | | | | | | 3,905,905 |
| |
| | | | | | | |
| TOTAL COMMON STOCKS | | | | | | |
| |
| (Cost $323,517,146) | | | | | | 375,406,787 |
| |
| |
| REPURCHASE AGREEMENT – 16.6% | | | | | | |
| Fixed Income Clearing Corporation, 0.12% dated 6/30/17, due 7/3/17, maturity value $74,951,750 (collateralized by obligations of various U.S. Government Agencies, 2.375% due 8/15/24, valued at $76,451,205) | | | | | | |
| |
| (Cost $74,951,000) | | | | | | 74,951,000 |
| |
| | | | | | | |
| TOTAL INVESTMENTS – 100.1% | | | | | | |
| |
| (Cost $398,468,146) | | | | | | 450,357,787 |
| |
| | | | | | | |
| LIABILITIES LESS CASH AND OTHER ASSETS – (0.1)% | | | | | | (608,143) |
| | | | | | |
| | | | | | | |
| |
| NET ASSETS – 100.0% | | | | | $ | 449,749,644 |
| |
| † | New additions in 2017. |
| 1 | Non-income producing. |
| 2 | Includes securities first acquired in 2017 and less than 1% of net assets. |
| | |
| | Bold indicates the Fund’s 20 largest equity holdings in terms of June 30, 2017, market value. |
| THE ACCOMPANYING NOTES ARE AN INTEGRAL PART OF THESE FINANCIAL STATEMENTS | | Royce Capital Fund 2017 Semiannual Report to Shareholders | 17 |
| Statements of Assets and Liabilities | | June 30, 2017 (unaudited) |
| | | Micro-Cap | | | Small-Cap | |
| | | Portfolio | | | Portfolio | |
| |
| ASSETS: | | | | | | | | |
| Investments at value (including collateral on loaned securities) | | $ | 198,045,482 | | | $ | 375,406,787 | |
| |
| Repurchase agreements (at cost and value) | | | 10,382,000 | | | | 74,951,000 | |
| |
| Cash and foreign currency | | | 6,555 | | | | 519 | |
| |
| Receivable for investments sold | | | 1,267,618 | | | | 442,955 | |
| |
| Receivable for capital shares sold | | | 34,073 | | | | 5,813,889 | |
| |
| Receivable for dividends and interest | | | 194,649 | | | | 389,814 | |
| |
| Prepaid expenses and other assets | | | 1,154 | | | | 7,888 | |
| |
| Total Assets | | | 209,931,531 | | | | 457,012,852 | |
| |
| LIABILITIES: | | | | | | | | |
| Payable for collateral on loaned securities | | | 6,900,794 | | | | – | |
| |
| Payable for investments purchased | | | 1,312,141 | | | | 6,682,996 | |
| |
| Payable for capital shares redeemed | | | 79,885 | | | | 86,003 | |
| |
| Payable for investment advisory fees | | | 206,260 | | | | 339,399 | |
| |
| Payable for trustees’ fees | | | 12,740 | | | | 22,844 | |
| |
| Accrued expenses | | | 82,238 | | | | 131,966 | |
| |
| Total Liabilities | | | 8,594,058 | | | | 7,263,208 | |
| |
| Net Assets | | $ | 201,337,473 | | | $ | 449,749,644 | |
| |
| ANALYSIS OF NET ASSETS: | | | | | | | | |
| Paid-in capital | | $ | 141,760,240 | | | $ | 399,557,970 | |
| |
| Undistributed net investment income (loss) | | | 638,218 | | | | 5,134,486 | |
| |
| Accumulated net realized gain (loss) on investments and foreign currency | | | 27,188,125 | | | | (6,832,453 | ) |
| |
| Net unrealized appreciation (depreciation) on investments and foreign currency | | | 31,750,890 | | | | 51,889,641 | |
| |
| Net Assets | | $ | 201,337,473 | | | $ | 449,749,644 | |
| |
Investment Class | | $ | 168,707,003 | | | $ | 223,049,832 | |
| |
Service Class | | | 32,630,470 | | | | 226,699,812 | |
| |
| SHARES OUTSTANDING (unlimited number of $.001 par value): | | | | | | | | |
Investment Class | | | 14,926,428 | | | | 27,666,585 | |
| |
Service Class | | | 2,936,386 | | | | 28,851,340 | |
| |
| NET ASSET VALUES (Net Assets ÷ Shares Outstanding): | | | | | | | | |
(offering and redemption price per share) | | | | | | | | |
| |
Investment Class | | $ | 11.30 | | | $ | 8.06 | |
| |
Service Class | | | 11.11 | | | | 7.86 | |
| |
| Investments at identified cost | | $ | 166,292,665 | | | $ | 323,517,146 | |
| |
| Market value of loaned securities | | | 6,483,414 | | | | – | |
| |
| 18 | Royce Capital Fund 2017 Semiannual Report to Shareholders | | THE ACCOMPANYING NOTES ARE AN INTEGRAL PART OF THESE FINANCIAL STATEMENTS |
Statements of Changes in Net Assets
| | | Micro-Cap Portfolio | | Small-Cap Portfolio |
| | | Six Months Ended
6/30/17 (unaudited) | | Year Ended 12/31/16 | | Six Months Ended
6/30/17 (unaudited) | | Year Ended 12/31/16 |
| |
| INVESTMENT OPERATIONS: | | | | | | | | | | | | | | | | |
| Net investment income (loss) | | $ | (278,327 | ) | | $ | 15,522 | | | $ | 1,012,885 | | | $ | 4,124,873 | |
| |
| Net realized gain (loss) on investments and foreign currency | | | 6,906,839 | | | | 32,162,000 | | | | (1,426,842 | ) | | | (4,803,979 | ) |
| |
| Net change in unrealized appreciation (depreciation) on investments and foreign | | | | | | | | | | | | | | | | |
currency | | | (3,237,591 | ) | | | 13,570,877 | | | | (22,189,501 | ) | | | 78,278,510 | |
| |
| Net increase (decrease) in net assets from investment operations | | | 3,390,921 | | | | 45,748,399 | | | | (22,603,458 | ) | | | 77,599,404 | |
| |
| DISTRIBUTIONS: | | | | | | | | | | | | | | | | |
| Net investment income | | | | | | | | | | | | | | | | |
Investment Class | | | – | | | | (1,144,126 | ) | | | – | | | | (4,086,843 | ) |
| |
Service Class | | | – | | | | (167,235 | ) | | | – | | | | (4,042,053 | ) |
| |
| Net realized gain on investments and foreign currency | | | | | | | | | | | | | | | | |
Investment Class | | | – | | | | – | | | | – | | | | (40,400,378 | ) |
| |
Service Class | | | – | | | | – | | | | – | | | | (44,252,113 | ) |
| |
| Total distributions | | | – | | | | (1,311,361 | ) | | | – | | | | (92,781,387 | ) |
| |
| CAPITAL SHARE TRANSACTIONS: | | | | | | | | | | | | | | | | |
| Value of shares sold | | | | | | | | | | | | | | | | |
| |
Investment Class | | | 11,375,196 | | | | 18,187,205 | | | | 16,725,595 | | | | 42,916,854 | |
| |
Service Class | | | 664,516 | | | | 18,094,042 | | | | 45,697,858 | | | | 288,890,285 | |
| |
| Distributions reinvested | | | | | | | | | | | | | | | | |
| |
Investment Class | | | – | | | | 1,144,126 | | | | – | | | | 44,487,221 | |
| |
Service Class | | | – | | | | 167,235 | | | | – | | | | 48,294,166 | |
| |
| Value of shares redeemed | | | | | | | | | | | | | | | | |
| |
Investment Class | | | (22,995,695 | ) | | | (251,709,844 | ) | | | (31,971,301 | ) | | | (205,107,623 | ) |
| |
Service Class | | | (3,216,844 | ) | | | (12,119,604 | ) | | | (73,787,911 | ) | | | (173,153,015 | ) |
| |
| Net increase (decrease) in net assets from capital share transactions | | | (14,172,827 | ) | | | (226,236,840 | ) | | | (43,335,759 | ) | | | 46,327,888 | |
| |
| Net Increase (Decrease) in Net Assets | | | (10,781,906 | ) | | | (181,799,802 | ) | | | (65,939,217 | ) | | | 31,145,905 | |
| |
| NET ASSETS: | | | | | | | | | | | | | | | | |
| |
| Beginning of period | | | 212,119,379 | | | | 393,919,181 | | | | 515,688,861 | | | | 484,542,956 | |
| |
| End of period | | $ | 201,337,473 | | | $ | 212,119,379 | | | $ | 449,749,644 | | | $ | 515,688,861 | |
| |
| Undistributed Net Investment Income (Loss) at End of Period | | $ | 638,218 | | | $ | 916,545 | | | $ | 5,134,486 | | | $ | 4,121,602 | |
| |
| THE ACCOMPANYING NOTES ARE AN INTEGRAL PART OF THESE FINANCIAL STATEMENTS | | Royce Capital Fund 2017 Semiannual Report to Shareholders | 19 |
| Statements of Operations | | Six Months Ended June 30, 2017 (unaudited) |
| | | Micro-Cap | | Small-Cap |
| | | Portfolio | | Portfolio |
| |
| INVESTMENT INCOME: | | | | | | | | |
| INCOME: | | | | | | | | |
| Dividends | | $ | 1,046,196 | | | $ | 3,918,460 | |
| |
| Foreign withholding tax | | | (18,995 | ) | | | (44,378 | ) |
| |
| Interest | | | 5,541 | | | | 20,208 | |
| |
| Securities lending | | | 130,174 | | | | 8,058 | |
| |
| Total income | | | 1,162,916 | | | | 3,902,348 | |
| |
| EXPENSES: | | | | | | | | |
| Investment advisory fees | | | 1,255,283 | | | | 2,356,662 | |
| |
| Distribution fees | | | 40,723 | | | | 301,760 | |
| |
| Shareholder reports | | | 39,255 | | | | 50,367 | |
| |
| Administrative and office facilities | | | 35,630 | | | | 66,445 | |
| |
| Audit | | | 28,000 | | | | 15,346 | |
| |
| Trustees’ fees | | | 20,260 | | | | 42,248 | |
| |
| Custody | | | 16,244 | | | | 30,240 | |
| |
| Shareholder servicing | | | 6,760 | | | | 6,643 | |
| |
| Legal | | | 3,070 | | | | 5,871 | |
| |
| Other expenses | | | 7,190 | | | | 13,890 | |
| |
| Total expenses | | | 1,452,415 | | | | 2,889,472 | |
| |
| Compensating balance credits | | | (95 | ) | | | (9 | ) |
| |
| Expenses reimbursed by investment adviser | | | (11,077 | ) | | | – | |
| |
| Net expenses | | | 1,441,243 | | | | 2,889,463 | |
| |
| Net investment income (loss) | | | (278,327 | ) | | | 1,012,885 | |
| |
| REALIZED AND UNREALIZED GAIN (LOSS) ON INVESTMENTS AND FOREIGN CURRENCY: | | | | | | | | |
| NET REALIZED GAIN (LOSS): | | | | | | | | |
| |
| Investments | | | 6,911,386 | | | | (1,434,731 | ) |
| |
| Foreign currency transactions | | | (4,547 | ) | | | 7,889 | |
| |
| NET CHANGE IN UNREALIZED APPRECIATION (DEPRECIATION): | | | | | | | | |
| Investments and foreign currency translations | | | (3,247,631 | ) | | | (22,189,583 | ) |
| |
| Other assets and liabilities denominated in foreign currency | | | 10,040 | | | | 82 | |
| |
| Net realized and unrealized gain (loss) on investments and foreign currency | | | 3,669,248 | | | | (23,616,343 | ) |
| |
| NET INCREASE (DECREASE) IN NET ASSETS FROM INVESTMENT OPERATIONS | | $ | 3,390,921 | | | $ | (22,603,458 | ) |
| |
| 20 | Royce Capital Fund 2017 Semiannual Report to Shareholders | | THE ACCOMPANYING NOTES ARE AN INTEGRAL PART OF THESE FINANCIAL STATEMENTS |
Financial Highlights
This table is presented to show selected data for a share outstanding throughout each year or other indicated period and to assist shareholders in evaluating a Fund’s performance for the periods presented. Per share amounts have been determined on the basis of the weighted average number of shares outstanding during the period.
| | | | | | | | | | | | | | | | | | | | | | | | | | | | | | | | | | | | | | | | | | | Ratio of Expenses to Average Net Assets | | Ratio of Net | | | | |
| | | | | | | | | | | | | | | | | | | | | | | | | | | | | | | | | | | | | | | | | | | | | | | | | | | |
| | | | | | | | | | | Net Realized and | | | | | | Distributions | | Distributions from | | | | | | | | | | | | | | | | | | | | | | | | | | | | | | Investment | | | | |
| | | Net Asset Value, | | | | | | Unrealized Gain (Loss) | | Total from | | from Net | | Net Realized Gain on | | | | | | Net Asset | | | | | | Net Assets, | | Prior to Fee | | | | | | | | | | Income (Loss) to | | | | |
| | | Beginning of | | Net Investment | | on Investments and | | Investment | | Investment | | Investments and | | Total | | Value, End of | | | | | | End of Period | | Waivers and | | Prior to Fee | | Net of Fee | | Average Net | | Portfolio |
| | | Period | | Income (Loss) | | Foreign Currency | | Operations | | Income | | Foreign Currency | | Distributions | | Period | | Total Return | | (in thousands) | | Balance Credits | | Waivers | | Waivers | | Assets | | Turnover Rate |
| |
| Micro-Cap Portfolio–Investment Class |
| 2017 † | | $ | 11.11 | | | $ | (0.01 | ) | | $ | 0.20 | | | $ | 0.19 | | | $ | – | | | $ | – | | | $ | – | | | $ | 11.30 | | | | 1.71 | % 1 | | $ | 168,707 | | | | 1.41 | % 2 | | | 1.41 | % 2 | | | 1.41 | % 2 | | | (0.25 | )% 2 | | | 20 | % |
| |
| 2016 | | | 9.34 | | | | 0.03 | | | | 1.81 | | | | 1.84 | | | | (0.07 | ) | | | – | | | | (0.07 | ) | | | 11.11 | | | | 19.71 | | | | 177,444 | | | | 1.36 | | | | 1.36 | | | | 1.36 | | | | 0.02 | | | | 57 | |
| |
| 2015 | | | 11.37 | | | | 0.03 | | | | (1.45 | ) | | | (1.42 | ) | | | – | | | | (0.61 | ) | | | (0.61 | ) | | | 9.34 | | | | (12.46 | ) | | | 369,991 | | | | 1.32 | | | | 1.32 | | | | 1.32 | | | | 0.27 | | | | 51 | |
| |
| 2014 | | | 12.83 | | | | (0.04 | ) | | | (0.44 | ) | | | (0.48 | ) | | | – | | | | (0.98 | ) | | | (0.98 | ) | | | 11.37 | | | | (3.58 | ) | | | 485,434 | | | | 1.30 | | | | 1.30 | | | | 1.30 | | | | (0.32 | ) | | | 25 | |
| |
| 2013 | | | 10.95 | | | | (0.04 | ) | | | 2.32 | | | | 2.28 | | | | (0.06 | ) | | | (0.34 | ) | | | (0.40 | ) | | | 12.83 | | | | 20.99 | | | | 572,666 | | | | 1.32 | | | | 1.32 | | | | 1.32 | | | | (0.36 | ) | | | 30 | |
| |
| 2012 | | | 10.41 | | | | 0.04 | | | | 0.74 | | | | 0.78 | | | | – | | | | (0.24 | ) | | | (0.24 | ) | | | 10.95 | | | | 7.60 | | | | 543,516 | | | | 1.33 | | | | 1.33 | | | | 1.33 | | | | 0.39 | | | | 21 | |
| |
| Micro-Cap Portfolio–Service Class |
| 2017 † | | $ | 10.93 | | | $ | (0.02 | ) | | $ | 0.20 | | | $ | 0.18 | | | $ | – | | | $ | – | | | $ | – | | | $ | 11.11 | | | | 1.65 | % 1 | | $ | 32,630 | | | | 1.65 | % 2 | | | 1.65 | % 2 | | | 1.58 | % 2 | | | (0.42 | )% 2 | | | 20 | % |
| |
| 2016 | | | 9.20 | | | | (0.02 | ) | | | 1.80 | | | | 1.78 | | | | (0.05 | ) | | | – | | | | (0.05 | ) | | | 10.93 | | | | 19.37 | | | �� | 34,675 | | | | 1.65 | | | | 1.65 | | | | 1.58 | | | | (0.15 | ) | | | 57 | |
| |
| 2015 | | | 11.23 | | | | 0.00 | | | | (1.42 | ) | | | (1.42 | ) | | | – | | | | (0.61 | ) | | | (0.61 | ) | | | 9.20 | | | | (12.61 | ) | | | 23,928 | | | | 1.60 | | | | 1.60 | | | | 1.56 | | | | 0.01 | | | | 51 | |
| |
| 2014 | | | 12.72 | | | | (0.07 | ) | | | (0.44 | ) | | | (0.51 | ) | | | – | | | | (0.98 | ) | | | (0.98 | ) | | | 11.23 | | | | (3.84 | ) | | | 27,362 | | | | 1.57 | | | | 1.57 | | | | 1.57 | | | | (0.60 | ) | | | 25 | |
| |
| 2013 | | | 10.87 | | | | (0.07 | ) | | | 2.30 | | | | 2.23 | | | | (0.04 | ) | | | (0.34 | ) | | | (0.38 | ) | | | 12.72 | | | | 20.65 | | | | 40,753 | | | | 1.60 | | | | 1.60 | | | | 1.58 | | | | (0.62 | ) | | | 30 | |
| |
| 2012 | | | 10.35 | | | | 0.03 | | | | 0.73 | | | | 0.76 | | | | – | | | | (0.24 | ) | | | (0.24 | ) | | | 10.87 | | | | 7.45 | | | | 36,764 | | | | 1.59 | | | | 1.59 | | | | 1.55 | | | | 0.27 | | | | 21 | |
| |
| Small-Cap Portfolio–Investment Class |
| 2017 † | | $ | 8.41 | | | $ | 0.02 | | | $ | (0.37 | ) | | $ | (0.35 | ) | | $ | – | | | $ | – | | | $ | – | | | $ | 8.06 | | | | (4.16 | )% 1 | | $ | 223,050 | | | | 1.11 | % 2 | | | 1.11 | % 2 | | | 1.11 | % 2 | | | 0.55 | % 2 | | | 39 | % |
| |
| 2016 | | | 8.43 | | | | 0.13 | | | | 1.66 | | | | 1.79 | | | | (0.17 | ) | | | (1.64 | ) | | | (1.81 | ) | | | 8.41 | | | | 20.96 | | | | 248,244 | | | | 1.09 | | | | 1.09 | | | | 1.09 | | | | 0.89 | | | | 78 | |
| |
| 2015 | | | 12.65 | | | | 0.17 | | | | (1.66 | ) | | | (1.49 | ) | | | (0.09 | ) | | | (2.64 | ) | | | (2.73 | ) | | | 8.43 | | | | (11.80 | ) | | | 356,258 | | | | 1.06 | | | | 1.06 | | | | 1.06 | | | | 1.26 | | | | 59 | |
| |
| 2014 | | | 13.92 | | | | 0.06 | | | | 0.35 | | | | 0.41 | | | | (0.02 | ) | | | (1.66 | ) | | | (1.68 | ) | | | 12.65 | | | | 3.24 | | | | 577,222 | | | | 1.05 | | | | 1.05 | | | | 1.05 | | | | 0.44 | | | | 36 | |
| |
| 2013 | | | 11.03 | | | | 0.03 | | | | 3.75 | | | | 3.78 | | | | (0.14 | ) | | | (0.75 | ) | | | (0.89 | ) | | | 13.92 | | | | 34.75 | | | | 736,917 | | | | 1.05 | | | | 1.05 | | | | 1.05 | | | | 0.13 | | | | 43 | |
| |
| 2012 | | | 10.07 | | | | 0.15 | | | | 1.10 | | | | 1.25 | | | | (0.01 | ) | | | (0.28 | ) | | | (0.29 | ) | | | 11.03 | | | | 12.50 | | | | 623,830 | | | | 1.06 | | | | 1.06 | | | | 1.06 | | | | 1.37 | | | | 62 | |
| |
| Small-Cap Portfolio–Service Class |
| 2017 † | | $ | 8.20 | | | $ | 0.01 | | | $ | (0.35 | ) | | $ | (0.34 | ) | | $ | – | | | $ | – | | | $ | – | | | $ | 7.86 | | | | (4.15 | )% 1 | | $ | 226,700 | | | | 1.34 | % 2 | | | 1.34 | % 2 | | | 1.34 | % 2 | | | 0.31 | % 2 | | | 39 | % |
| |
| 2016 | | | 8.27 | | | | 0.03 | | | | 1.69 | | | | 1.72 | | | | (0.15 | ) | | | (1.64 | ) | | | (1.79 | ) | | | 8.20 | | | | 20.53 | | | | 267,445 | | | | 1.34 | | | | 1.34 | | | | 1.34 | | | | 0.69 | | | | 78 | |
| |
| 2015 | | | 12.44 | | | | 0.13 | | | | (1.62 | ) | | | (1.49 | ) | | | (0.04 | ) | | | (2.64 | ) | | | (2.68 | ) | | | 8.27 | | | | (11.97 | ) | | | 128,285 | | | | 1.31 | | | | 1.31 | | | | 1.31 | | | | 1.00 | | | | 59 | |
| |
| 2014 | | | 13.74 | | | | 0.03 | | | | 0.33 | | | | 0.36 | | | | – | | | | (1.66 | ) | | | (1.66 | ) | | | 12.44 | | | | 2.92 | | | | 218,175 | | | | 1.30 | | | | 1.30 | | | | 1.30 | | | | 0.21 | | | | 36 | |
| |
| 2013 | | | 10.91 | | | | (0.02 | ) | | | 3.73 | | | | 3.71 | | | | (0.13 | ) | | | (0.75 | ) | | | (0.88 | ) | | | 13.74 | | | | 34.44 | | | | 232,189 | | | | 1.31 | | | | 1.31 | | | | 1.31 | | | | (0.12 | ) | | | 43 | |
| |
| 2012 | | | 9.98 | | | | 0.15 | | | | 1.06 | | | | 1.21 | | | | (0.00 | ) | | | (0.28 | ) | | | (0.28 | ) | | | 10.91 | | | | 12.22 | | | | 148,613 | | | | 1.31 | | | | 1.31 | | | | 1.30 | | | | 1.41 | | | | 62 | |
| |
| † | Six months ended June 30, 2017 (unaudited). |
| 1 | Not annualized |
| 2 | Annualized |
| THE ACCOMPANYING NOTES ARE AN INTEGRAL PART OF THESE FINANCIAL STATEMENTS | | Royce Capital Fund 2017 Semiannual Report to Shareholders | 21 |
Notes to Financial Statements (unaudited)
| Summary of Significant Accounting Policies: |
| Royce Micro-Cap Portfolio and Royce Small-Cap Portfolio (the “Fund” or “Funds”) are the two series of Royce Capital Fund (the “Trust”), a diversified open-end management investment company organized as a Delaware statutory trust. Shares of the Funds are offered to life insurance companies for allocation to certain separate accounts established for the purpose of funding qualified and non-qualified variable annuity contracts and variable life insurance contracts. Micro-Cap Portfolio and Small-Cap Portfolio commenced operations on December 27, 1996. |
| Classes of shares have equal rights as to earnings and assets, except that each class may bear different fees and expenses for distribution, shareholder servicing, registration and shareholder reports, and receive different compensating balance credits and expense reimbursements. Investment income, realized and unrealized capital gains or losses on investments and foreign currency, and expenses other than those attributable to a specific class are allocated to each class of shares based on its relative net assets. |
| The preparation of financial statements in conformity with accounting principles generally accepted in the United States requires management to make estimates and assumptions that affect the reported amounts of assets and liabilities and the disclosure of contingent assets and liabilities at the date of the financial statements and the reported amounts of income and expenses during the reporting period. Actual results could differ from those estimates. |
| Each Fund is an investment company and accordingly follows the investment company accounting and reporting guidance of the Financial Accounting Standards Board (FASB) Accounting Standard Codification Topic 946 “Financial Services-Investment Companies”. |
| | VALUATION OF INVESTMENTS: |
| Securities are valued as of the close of trading on the New York Stock Exchange (NYSE) (generally 4:00 p.m. Eastern time) on the valuation date. Securities that trade on an exchange, and securities traded on Nasdaq’s Electronic Bulletin Board, are valued at their last reported sales price or Nasdaq official closing price taken from the primary market in which each security trades or, if no sale is reported for such day, at their highest bid price. Other over-the-counter securities for which market quotations are readily available are valued at their highest bid price, except in the case of some bonds and other fixed income securities which may be valued by reference to other securities with comparable ratings, interest rates and maturities, using established independent pricing services. The Funds value their non-U.S. dollar denominated securities in U.S. dollars daily at the prevailing foreign currency exchange rates as quoted by a major bank. Securities for which market quotations are not readily available are valued at their fair value in accordance with the provisions of the 1940 Act, under procedures approved by the Trust’s Board of Trustees, and are reported as Level 3 securities. As a general principle, the fair value of a security is the amount which the Fund might reasonably expect to receive for the security upon its current sale. However, in light of the judgment involved in fair valuations, there can be no assurance that a fair value assigned to a particular security will be the amount which the Fund might be able to receive upon its current sale. In addition, if, between the time trading ends on a particular security and the close of the customary trading session on the NYSE, events occur that are significant and may make the closing price unreliable, a Fund may fair value the security. The Funds use an independent pricing service to provide fair value estimates for relevant non-U.S. equity securities on days when the U.S. market volatility exceeds a certain threshold. This pricing service uses proprietary correlations it has developed between the movement of prices of non-U.S. equity securities and indices of U.S.-traded securities, futures contracts and other indications to estimate the fair value of relevant non-U.S. securities. When fair value pricing is employed, the prices of securities used by a Fund may differ from quoted or published prices for the same security. Investments in money market funds are valued at net asset value per share. |
| Various inputs are used in determining the value of each Fund’s investments, as noted above. These inputs are summarized in the three broad levels below: |
| | | Level 1 | – | quoted prices in active markets for identical securities. |
| | | Level 2 | – | other significant observable inputs (including quoted prices for similar securities, foreign securities that may be fair valued and repurchase agreements). The table below includes all Level 2 securities. Level 2 securities with values based on quoted prices for similar securities are noted in the Schedules of Investments. |
| | | Level 3 | – | significant unobservable inputs (including last trade price before trading was suspended, or at a discount thereto for lack of marketability or otherwise, market price information regarding other securities, information received from the company and/or published documents, including SEC filings and financial statements, or other publicly available information). |
| The inputs or methodology used for valuing securities are not necessarily an indication of the risk associated with investing in those securities. |
| The following is a summary of the inputs used to value each Fund’s investments as of June 30, 2017. For a detailed breakout of common stocks by sector classification, please refer to the Schedules of Investments. |
| | | LEVEL 1 | | LEVEL 2 | | LEVEL 3 | | TOTAL |
| |
| Micro-Cap Portfolio | | | | | | | | | | | | | | | |
| Common Stocks | | $ | 190,569,119 | | | $ | 137,486 | | | $ | 438,083 | | | $ | 191,144,688 |
| |
| Cash Equivalents | | | 6,900,794 | | | | 10,382,000 | | | | – | | | | 17,282,794 |
| |
| 22 | Royce Capital Fund 2017 Semiannual Report to Shareholders |
| VALUATION OF INVESTMENTS (continued): | | | | | | | | | | | | | |
| | | LEVEL 1 | | LEVEL 2 | | LEVEL 3 | | TOTAL |
| |
| Small-Cap Portfolio | | | | | | | | | | | | | | | |
| Common Stocks | | $ | 375,406,787 | | | $ | – | | | $ | – | | | $ | 375,406,787 |
| |
| Cash Equivalents | | | – | | | | 74,951,000 | | | | – | | | | 74,951,000 |
| |
Certain securities have transferred in and out of Level 1 and Level 2 measurements during the reporting period. The Funds recognize transfers between levels as of the end of the reporting period. For the six months ended June 30, 2017, securities valued at $5,280,545 were transferred from Level 2 to Level 1 for Royce Micro-Cap Portfolio within the fair value hierarchy. |
| | | | | | | | | | | | | | | |
| Level 3 Reconciliation: | | | | | | | | | | | | | | |
| | | BALANCE AS OF 12/31/16 | | PURCHASES | | UNREALIZED GAIN (LOSS)1 | | BALANCE AS OF 6/30/17 |
| |
| Micro-Cap Portfolio | | | | | | | | | | | | | | | | |
| |
| Common Stocks | | | $438,083 | | | | $ 0 | | | | $– | | | | $438,083 | |
| |
| 1 | The net change in unrealized appreciation (depreciation) is included in the accompanying Statement of Operations. Change in unrealized appreciation (depreciation) includes net unrealized appreciation (depreciation) resulting from changes in investment values during the reporting period and the reversal of previously recorded unrealized appreciation (depreciation) when gains or losses are realized. |
The following table summarizes the valuation techniques used and unobservable inputs approved by the Valuation Committee to determine the fair value of certain, material Level 3 investments. The table does not include Level 3 investments with values derived utilizing prices from prior transactions or third party pricing information with adjustments (e.g. broker quotes, pricing services, net asset values).
| | | | FAIR VALUE AT | | | | | | | | | | | | IMPACT TO VALUATION FROM |
| | | | 6/30/17 | | | VALUATION TECHNIQUE(S) | | | UNOBSERVABLE INPUT(S) | | | RANGE AVERAGE | | | AN INCREASE IN INPUT1 |
| |
| Micro-Cap Portfolio | | | | | | | | | | | | | | | |
| |
| Common Stocks | | | $438,083 | | | Discounted Present Value
Balance Sheet Analysis | | | Liquidity Discount | | | 30%-40% | | | Decrease |
| |
| 1 | This column represents the directional change in the fair value of the Level 3 investments that would result in an increase from the corresponding unobservable input. A decrease to the unobservable input would have the opposite effect. Significant increases and decreases in these unobservable inputs in isolation could result in significantly higher or lower fair value measurements. |
| REPURCHASE AGREEMENTS: |
| The Funds may enter into repurchase agreements with institutions that the Funds’ investment adviser has determined are creditworthy. Each Fund restricts repurchase agreements to maturities of no more than seven days. Securities pledged as collateral for repurchase agreements, which are held until maturity of the repurchase agreements, are marked-to-market daily and maintained at a value at least equal to the principal amount of the repurchase agreement (including accrued interest). Repurchase agreements could involve certain risks in the event of default or insolvency of the counter-party, including possible delays or restrictions upon the ability of each Fund to dispose of its underlying securities. The remaining contractual maturities of repurchase agreements held by the Funds at June 30, 2017 are overnight and continuous. |
| | FOREIGN CURRENCY: |
| Net realized foreign exchange gains or losses arise from sales and maturities of short-term securities, sales of foreign currencies, expiration of currency forward contracts, currency gains or losses realized between the trade and settlement dates on securities transactions, and the difference between the amounts of dividends, interest, and foreign withholding taxes recorded on each Fund’s books and the U.S. dollar equivalent of the amounts actually received or paid. Net unrealized foreign exchange gains and losses arise from changes in the value of assets and liabilities, including investments in securities at the end of the reporting period, as a result of changes in foreign currency exchange rates. |
| | SECURITIES LENDING: |
| The Funds loan securities through a lending agent to qualified institutional investors for the purpose of realizing additional income. Collateral for the Funds on all securities loaned is accepted in cash and cash equivalents and invested temporarily by the custodian. The collateral maintained is at least 100% of the current market value of the loaned securities. The market value of the loaned securities is determined at the close of business of the Funds and any additional required collateral is delivered to the Funds on the next business day. The Funds retain the risk of any loss on the securities on loan as well as incurring the potential loss on investments purchased with cash collateral received for securities lending. Loans of securities generally do not have stated maturity dates, and the Funds may recall a security at any time. The Funds’ securities lending income consists of the income earned on investing cash collateral, plus any premium payments received for lending certain securities, less any rebates paid to borrowers and lending agent fees associated with the loan. The lending agent is not affiliated with Royce. |
| Royce Capital Fund 2017 Semiannual Report to Shareholders | 23 |
Notes to Financial Statements (unaudited) (continued)
| SECURITIES LENDING (continued): |
| | The following table presents by financial instrument, a Fund’s assets and liabilities net of related collateral held by the Fund at June 30, 2017: |
| | | GROSS AMOUNT OF ASSETS AND | | | | | | | | | |
| | | LIABILITIES IN THE STATEMENTS OF | | | | | | | | | |
| | | ASSETS AND LIABILITIES1 | | SECURITIES ON LOAN | | | NET AMOUNT |
| |
| Micro-Cap Portfolio | | | | | | | | | | | | | |
| |
| Collateral on Loaned Securities/Securities on Loan | | $ | 6,900,794 | | | $ | (6,483,414) | | | | $ | 417,380 | |
| |
| 1 Absent an event of default, assets and liabilities are presented gross and not offset in the Statements of Assets and Liabilities. |
| | DISTRIBUTIONS AND TAXES: |
| As qualified regulated investment companies under Subchapter M of the Internal Revenue Code, the Funds are not subject to income taxes to the extent that each Fund distributes substantially all of its taxable income for its fiscal year. |
| The Funds pay any dividends and capital gain distributions annually in December. Dividends from net investment income are determined at a class level and distributions from capital gains are determined at a Fund level. Because federal income tax regulations differ from generally accepted accounting principles, income and capital gain distributions determined in accordance with tax regulations may differ from net investment income and realized gains recognized for financial reporting purposes. Accordingly, the character of distributions and composition of net assets for tax purposes differ from those reflected in the accompanying financial statements. |
| | INVESTMENT TRANSACTIONS AND RELATED INVESTMENT INCOME: |
| Investment transactions are accounted for on the trade date. Dividend income is recorded on the ex-dividend date. Non-cash dividend income is recorded at the fair market value of the securities received. Interest income is recorded on an accrual basis. Realized gains and losses from investment transactions are determined on the basis of identified cost for book and tax purposes. |
| | EXPENSES: |
| The Funds incur direct and indirect expenses. Expenses directly attributable to a Fund are charged to the Fund’s operations, while expenses applicable to more than one series of the Trust are allocated equitably. Certain personnel, occupancy costs and other administrative expenses related to the Funds are allocated by Royce & Associates (“Royce”) under an administration agreement and are included in administrative and office facilities and legal expenses. The Trust has adopted a deferred fee agreement that allows the Trustees to defer the receipt of all or a portion of trustees’ fees otherwise payable. The deferred fees are invested in certain Royce Funds until distributed in accordance with the agreement. |
| | COMPENSATING BALANCE CREDITS: |
| The Funds have arrangements with their custodian bank and transfer agent, whereby a portion of the custodian’s fee and transfer agent’s fee is paid indirectly by credits earned on a Fund’s cash on deposit with the bank and transfer agent. These deposit arrangements are an alternative to purchasing overnight investments. Conversely, a Fund pays interest to the custodian on any cash overdrafts, to the extent they are not offset by credits earned on positive cash balances. |
| | LINE OF CREDIT: |
| The Funds, along with certain other Royce Funds, participate in a $75 million line of credit (“Credit Agreement”) to be used for temporary or emergency purposes. This revolving Credit Agreement expires on October 13, 2017. Pursuant to the Credit Agreement, each participating Fund is liable only for principal and interest payments related to borrowings made by that Fund. Borrowings under the Credit Agreement bear interest at a rate equal to the higher of the federal funds rate or One-Month LIBOR rate. The Funds did not utilize the line of credit during the six months ended June 30, 2017. |
| Capital Share Transactions (in shares): | | | | | | | | | | | | | | | | | | | | | | |
| | | SHARES SOLD | | SHARES ISSUED FOR REINVESTMENT
OF DISTRIBUTIONS | | SHARES REDEEMED | | NET INCREASE (DECREASE) IN
SHARES OUTSTANDING | |
| | | |
| | | Six Months Ended
6/30/17
(unaudited) | | | Year Ended
12/31/16 | | | Six Months Ended
6/30/17
(unaudited) | | Year Ended
12/31/16 | | Six Months Ended
6/30/17
(unaudited) | | | | Year Ended
12/31/16 | | | | Six Months Ended
6/30/17
(unaudited) | | | | Year Ended
12/31/16 | |
| |
| Micro-Cap Portfolio | | | | | | | | | | | | | | | | | | | | | | | | | | | |
Investment Class | | 1,032,569 | | | 1,865,202 | | | – | | | 102,982 | | | (2,084,785 | ) | | | (25,588,782 | ) | | | (1,052,216 | ) | | | (23,620,598 | ) |
| |
Service Class | | 61,464 | | | 1,916,338 | | | – | | | 15,286 | | | (298,330 | ) | | | (1,359,972 | ) | | | (236,866 | ) | | | 571,652 | |
| |
| Small-Cap Portfolio | | | | | | | | | | | | | | | | | | | | | | | | | | | |
Investment Class | | 2,052,042 | | | 4,875,970 | | | – | | | 5,233,791 | | | (3,911,783 | ) | | | (22,853,406 | ) | | | (1,859,741 | ) | | | (12,743,645 | ) |
| |
Service Class | | 5,832,020 | | | 31,834,198 | | | – | | | 5,818,574 | | | (9,580,136 | ) | | | (20,571,720 | ) | | | (3,748,116 | ) | | | 17,081,052 | |
| |
| 24 | Royce Capital Fund 2017 Semiannual Report to Shareholders |
| Investment Adviser and Distributor: | | |
| | | |
| INVESTMENT ADVISER: | | |
| Under the Trust’s investment advisory agreement with Royce, Royce is entitled to receive investment advisory fees that are computed daily and payable monthly, at an annual rate of 1.25% and 1.00% of the average net assets of Micro-Cap Portfolio and Small-Cap Portfolio, respectively. Royce has contractually committed to waive fees and/or reimburse class-specific expenses (excluding acquired fund fees and expenses) to the extent necessary to maintain the net annual operating expense ratio to average net assets at or below 1.58% for the Service Class of Micro-Cap Portfolio through April 30, 2018. For the six months ended June 30, 2017, Micro-Cap Portfolio recorded advisory fees of $1,255,283 and Small-Cap Portfolio recorded advisory fees of $2,356,662. | | |
| | | |
| DISTRIBUTOR: | | |
| Royce Fund Services, LLC (“RFS”), the distributor of the Trust’s shares, is a wholly owned subsidiary of Royce. RFS is entitled to receive distribution fees from each Fund’s Service Class that are computed daily and payable monthly, at an annual rate of 0.25% of the average net assets of each Class. For the six months ended June 30, 2017, Micro-Cap Portfolio-Service Class recorded net distribution fees of $40,723 and Small-Cap Portfolio-Service Class recorded net distribution fees of $301,760. | | |
| | | |
| Purchases and Sales of Investment Securities: | | |
| For the six months ended June 30, 2017, the costs of purchases and the proceeds from sales of investment securities, other than short-term securities and collateral received for securities loaned, were as follows: | | |
| | | | PURCHASES | | | | SALES |
| |
| Micro-Cap Portfolio | | $ | 37,174,704 | | | $ | 38,837,250 |
| |
| Small-Cap Portfolio | | | 161,786,555 | | | | 216,298,236 |
| |
Cross trades were executed by the Funds pursuant to Rule 17a-7 under the 1940 Act. Cross trading is the buying or selling of portfolio securities between funds to which Royce serves as investment adviser. At its regularly scheduled quarterly meetings, the Board reviews such transactions as of the most recent calendar quarter for compliance with the requirements and restrictions set forth by Rule 17a-7. Cross trades for the six months ended June 30, 2017, were as follows:
| | | | COST OF PURCHASES | | PROCEEDS FROM SALES | | REALIZED GAIN (LOSS) |
| |
| Micro-Cap Portfolio | | | $ | – | | | $ | 148,570 | | | $ | (11,346) | |
| |
| Small-Cap Portfolio | | | | – | | | | – | | | | – | |
| |
| Class Specific Expenses: |
| Class specific expenses were as follows for the six months ended June 30, 2017: |
| | | | | | | | | | | | | | | | | | | | | | | | CLASS LEVEL |
| | | | | | | | | | | | | | | | | | | | | | | | EXPENSES |
| | | | | | | | | | | | | | | | | | | | | | | | REIMBURSED BY |
| | | | NET DISTRIBUTION | | SHAREHOLDER | | SHAREHOLDER | | TRANSFER AGENT | | | | | | INVESTMENT |
| | | | FEES | | SERVICING | | REPORTS | | BALANCE CREDITS | | TOTAL | | ADVISER |
| |
| Micro-Cap Portfolio – Investment Class | | | $ | – | | | $ | 3,600 | | | $ | 36,223 | | | $ | (5 | ) | | $ | 39,818 | | | $ | – |
| |
| Micro-Cap Portfolio – Service Class | | | | 40,723 | | | | 3,160 | | | | 3,032 | | | | (2 | ) | | | 46,913 | | | | 11,077 |
| |
| | | | | 40,723 | | | | 6,760 | | | | 39,255 | | | | (7 | ) | | | | | | | 11,077 |
| |
| Small-Cap Portfolio – Investment Class | | | | – | | | | 3,458 | | | | 34,445 | | | | (7 | ) | | | 37,896 | | | | – |
| |
| Small-Cap Portfolio – Service Class | | | | 301,760 | | | | 3,185 | | | | 15,922 | | | | (2 | ) | | | 320,865 | | | | – |
| |
| | | | | 301,760 | | | | 6,643 | | | | 50,367 | | | | (9 | ) | | | | | | | – |
| |
| TAX INFORMATION: |
| At June 30, 2017, net unrealized appreciation (depreciation) based on identified cost for tax purposes was as follows: |
| | | | | | | NET UNREALIZED | | GROSS UNREALIZED |
| | | | | | | | | | | |
| | | TAX BASIS COST | | APPRECIATION (DEPRECIATION) | | Appreciation | | Depreciation |
| |
| Micro-Cap Portfolio | | $ | 176,742,430 | | | $ | 31,685,052 | | | $ | 50,583,558 | | | $ | 18,898,506 |
| |
| Small-Cap Portfolio | | | 399,247,743 | | | | 51,110,044 | | | | 64,702,546 | | | | 13,592,502 |
| |
| The primary cause of the difference between book and tax basis cost is the timing of the recognition of losses on securities sold. |
| Royce Capital Fund 2017 Semiannual Report to Shareholders | 25 |
Understanding Your Fund’s Expenses (unaudited)
As a shareholder of a mutual fund, you pay ongoing expenses, including management fees and other Fund expenses including, for some funds, distribution and/or service (12b-1) fees. Using the information below, you can estimate how these ongoing expenses (in dollars) affect your investment and compare them with the ongoing expenses of other funds. You may also incur one-time transaction expenses which are not shown in this section and would result in higher total costs. The example is based on an investment of $1,000 invested at January 1, 2017, and held for the entire six-month period ended June 30, 2017. Service Class shares are generally available only through certain insurance companies who receive service fees from the Fund for services that they perform.
Actual Expenses
The first part of the table below provides information about actual account values and actual expenses. You may use the information in this section, together with the amount you invested, to estimate the expenses that you paid over the period. Simply divide your account value at June 30, 2017 by $1,000 (for example, an $8,600 account value divided by $1,000 = 8.6), then multiply the result by the number under the heading entitled “Expenses Paid During the Period” to estimate the expenses you paid on your account during this period.
Hypothetical Example for Comparison Purposes
The second part of the table below provides information about hypothetical account values and hypothetical expenses based on the Fund’s actual expense ratio and an assumed rate of return of 5% per year before expenses, which is not the Fund’s actual return. The hypothetical account values and expenses may not be used to estimate the actual ending account balance or expenses you paid for the period. You may use this information to compare the ongoing costs of investing in the Fund and other funds. To do so, compare this 5% hypothetical example with the 5% hypothetical examples that appear in the shareholder reports of the other funds.
Please note that the expenses shown in the table are meant to highlight your ongoing costs only and do not reflect any transactional costs, such as sales charges (loads), redemption fees, or exchange fees. Therefore, this section is useful in comparing ongoing costs only, and will not help you determine the relative total costs of owning different funds. In addition, if these transactional costs were included, your costs would have been higher.
| | | | ACTUAL | | | HYPOTHETICAL (5% PER YEAR RETURN BEFORE EXPENSES) |
| | | |
| | | Beginning Account | | Ending Account Value | | Expenses Paid During | | Beginning Account | | Ending Account Value | | Expenses Paid During | | Annualized Expense |
| | | Value 1/1/17 | | 6/30/17 | | the Period1 | | Value 1/1/17 | | 6/30/17 | | the Period1 | | Ratio2 |
| |
| Investment Class | | | | | | | | | | | | | | | | | | | | | | | | | | |
| Micro-Cap Portfolio | | $ | 1,000.00 | | | $ | 1,017.10 | | | $ | 7.05 | | | $ | 1,000.00 | | | $ | 1,017.80 | | | $ | 7.05 | | | 1.41% |
| |
| Small-Cap Portfolio | | | 1,000.00 | | | | 958.38 | | | | 5.39 | | | | 1,000.00 | | | | 1,019.29 | | | | 5.56 | | | 1.11% |
| |
| Service Class | | | | | | | | | | | | | | | | | | | | | | | | | | |
| Micro-Cap Portfolio | | | 1,000.00 | | | | 1,016.47 | | | | 7.90 | | | | 1,000.00 | | | | 1,016.96 | | | | 7.90 | | | 1.58% |
| |
| Small-Cap Portfolio | | | 1,000.00 | | | | 958.54 | | | | 6.51 | | | | 1,000.00 | | | | 1,018.15 | | | | 6.71 | | | 1.34% |
| |
| 1 | Expenses are equal to the Fund’s annualized expense ratio multiplied by the average account value for the period, multiplied by 181 days in the most recent fiscal half-year divided by 365 days (to reflect the half-year period). This information does not include fees or expenses of the variable annuity contracts investing in the Fund. |
| 2 | Annualized expense ratio used to derive figures in the table is based on the most recent fiscal half-year. |
| 26 | Royce Capital Fund 2017 Semiannual Report to Shareholders |
Trustees and Officers
All Trustees and Officers may be reached c/o The Royce Funds, 745 Fifth Avenue, New York, NY 10151
Charles M. Royce, Trustee1
Age: 77 | Number of Funds Overseen: 22 | Tenure: Since 1982
Non-Royce Directorships: Director of TICC Capital Corp.
Principal Occupation(s) During Past Five Years: Chairman of the Board of Managers of Royce & Associates, LP (“Royce”), the Trust’s investment adviser; Chief Executive Officer (1972-June 2017), President (1972-July 2014) of Royce.
Christopher D. Clark, Trustee1, President
Age: 52 | Number of Funds Overseen: 22 | Tenure: Since 2014
Principal Occupation(s) During Past Five Years: Chief Executive Officer (since July 2017), President (since July 2014), Co-Chief Investment Officer (Since January 2014), Managing Director and, since June 2015, a Member of the Board of Managers of Royce, having been employed by Royce since May 2007.
Patricia W. Chadwick, Trustee
Age: 68 | Number of Funds Overseen: 22 | Tenure: Since 2009
Non-Royce Directorships: Trustee of ING Mutual Funds and Director of Wisconsin Energy Corp.
Principal Occupation(s) During Past 5 Years: Consultant and President of Ravengate Partners LLC (since 2000).
Stephen L. Isaacs, Trustee
Age: 77 | Number of Funds Overseen: 22 | Tenure: Since 1989
Non-Royce Directorships: None
Principal Occupation(s) During Past Five Years: Attorney and President of Health Policy Associates, Inc., consultants. Mr. Isaacs’s prior business experience includes having served as President of the Center for Health and Social Policy (from 1996 to 2012); Director of Columbia University Development Law and Policy Program and Professor at Columbia University (until August 1996).
Arthur S. Mehlman, Trustee
Age: 75 | Number of Funds Overseen: 40 | Tenure: Since 2004
Non-Royce Directorships: Director/Trustee of registered investment companies constituting the 18 Legg Mason Funds.
Principal Occupation(s) During Past Five Years: Director of The League for People with Disabilities, Inc.; Director of University of Maryland Foundation (non-profits). Formerly: Director of Municipal Mortgage & Equity, LLC (from October 2004 to April 1, 2011); Director of University of Maryland College Park Foundation (non-profit) (from 1998 to 2005); Partner, KPMG LLP (international accounting firm) (from 1972 to 2002); Director of Maryland Business Roundtable for Education (from July 1984 to June 2002).
David L. Meister, Trustee
Age: 77 | Number of Funds Overseen: 22 | Tenure: Since 1982
Non-Royce Directorships: None
Principal Occupation(s) During Past Five Years: Consultant. Chairman and Chief Executive Officer of The Tennis Channel (from June 2000 to March 2005). Mr. Meister’s prior business experience includes having served as Chief Executive Officer of Seniorlife.com, a consultant to the communications industry, President of Financial News Network, Senior Vice President of HBO, President of Time-Life Films, and Head of Broadcasting for Major League Baseball.
G. Peter O’Brien, Trustee
Age: 71 | Number of Funds Overseen: 40 | Tenure: Since 2001
Non-Royce Directorships: Director/Trustee of registered investment companies constituting the 18 Legg Mason Funds; Director of TICC Capital Corp.
Principal Occupation(s) During Past Five Years: Trustee Emeritus of Colgate University (since 2005); Board Member of Hill House, Inc. (since 1999); Formerly: Trustee of Colgate University (from 1996 to 2005), President of Hill House, Inc. (from 2001 to 2005) and Managing Director/Equity Capital Markets Group of Merrill Lynch & Co. (from 1971 to 1999).
Michael K. Shields, Trustee
Age: 59 | Number of Funds Overseen: 22 | Tenure: Since 2015
Principal Occupation(s) During Past Five Years: President and Chief Executive Officer of Piedmont Trust Company, a private North Carolina trust company (since May 2012). Mr. Shields’s prior business experience includes owning Shields Advisors, an investment consulting firm (from April 2010 to June 2012).
Francis D. Gannon, Vice President
Age: 49 | Tenure: Since 2014
Principal Occupation(s) During Past Five Years: Co-Chief Investment Officer (since January 2014) and Managing Director of Royce, having been employed by Royce since September 2006.
Daniel A. O’Byrne, Vice President
Age: 55 | Tenure: Since 1994
Principal Occupation(s) During Past Five Years: Principal and Vice President of Royce, having been employed by Royce since October 1986.
Peter K. Hoglund, Treasurer
Age: 51 | Tenure: Since 2015
Principal Occupation(s) During Past Five Years: Chief Financial Officer, Chief Administrative Officer, and Managing Director of Royce, having been employed by Royce since December 2014. Prior to joining Royce, Mr. Hoglund spent more than 20 years with Munder Capital Management in Birmingham, MI, serving as Managing Director and Chief Financial Officer and overseeing all financial aspects of the firm. He began his career at Munder as a portfolio manager.
John E. Denneen, Secretary and Chief Legal Officer
Age: 50 | Tenure: 1996-2001 and Since 2002
Principal Occupation(s) During Past Five Years: General Counsel, Managing Director, and, since June 2015, a Member of the Board of Managers of Royce. Chief Legal and Compliance Officer and Secretary of Royce.
Lisa Curcio, Chief Compliance Officer
Age: 57 | Tenure: Since 2004
Principal Occupation(s) During Past Five Years: Chief Compliance Officer of The Royce Funds (since October 2004) and Compliance Officer of Royce (since June 2004).
| 1 | Interested Trustee. |
| | Trustees will hold office until their successors have been duly elected and qualified or until their earlier resignation or removal. The Statement of Additional Information, which contains additional information about the Trust’s trustees and officers, is available and can be obtained without charge at www.roycefunds.com or by calling (800) 221-4268. |
| Royce Capital Fund 2017 Semiannual Report to Shareholders | 27 |
Board Approval of Investment Advisory Agreement
At meetings held on June 5-6, 2017, the Board of Trustees of Royce Capital Fund (the “Board”), including all of the non-interested trustees, approved the continuation of an investment advisory agreement (the “Investment Advisory Agreement”) between Royce & Associates, LP (“R&A”) and Royce Capital Fund (“RCF”) relating to each of Royce Micro-Cap Portfolio and Royce Small-Cap Portfolio (each, a “Fund” and together, the “Funds”). In reaching these decisions, the Board reviewed the materials provided by R&A, which included, among other things, information prepared internally by R&A and independently by Morningstar Associates, LLC (“Morningstar”) containing detailed investment advisory fee, expense ratio, and investment performance comparisons for each Fund with other mutual funds in its “peer group” and “category”, information regarding the past performance of the Funds and other registered investment companies managed by R&A and a memorandum outlining the legal duties of the Board prepared by independent counsel to the non-interested trustees. R&A also provided the trustees with an analysis of its profitability with respect to providing investment advisory services to each of the Funds. In addition, the Board took into account information furnished throughout the year at regular Board meetings, including reports on investment performance, shareholder services, distribution fees and expenses, regulatory compliance, brokerage commissions and research, brokerage and other execution products and services provided to the Funds. The Board also considered other matters it deemed important to the approval process such as allocation of brokerage commissions, “soft dollar” research services R&A receives, payments made to affiliates of R&A, as well as payments made by R&A, relating to distribution of Fund shares, and other direct and indirect benefits to R&A and its affiliates, from their relationship with the Funds. The trustees also met throughout the year with investment advisory personnel from R&A. The Board, in its deliberations, recognized that, for many of the Funds’ shareholders, the decision to purchase Fund shares included a decision to select R&A as the investment adviser and that there was a strong association in the minds of Fund shareholders between R&A and each Fund. In considering factors relating to the approval of the continuance of the Investment Advisory Agreement, the non-interested trustees received assistance and advice from, and met separately with, their independent legal counsel. While continuation of the investment advisory and administrative arrangements for each Fund was considered at the same Board meeting, the trustees dealt with each Fund separately. Among other factors, the trustees noted that they considered the following:
The nature, extent and quality of services provided by R&A:
The Board considered the following factors to be of fundamental importance to their consideration of whether to approve the continuance of the Investment Advisory Agreement: (i) R&A’s more than 40 years of value investing experience and track record; (ii) the history of long-tenured R&A portfolio managers managing the Funds; (iii) R&A’s focus on mid-cap, small-cap and micro-cap value investing; (iv) the consistency of R&A’s approach to managing the Funds, other open-end mutual funds, and closed-end funds over more than 40 years; (v) the integrity and high ethical standards adhered to at R&A; (vi) R&A’s specialized experience in the area of trading small- and micro-cap securities; (vii) R&A’s historical ability to attract and retain portfolio management talent; and (viii) R&A’s focus on shareholder interests as exemplified by capping expenses on smaller funds and providing expansive shareholder reporting and communications. The Board reviewed the services that R&A provides to the Funds, including, but not limited to, managing each Fund’s investments in accordance with the stated policies of each Fund. The Board considered the fact that R&A provided certain administrative services to the Funds at cost pursuant to the Administration Agreement between RCF and R&A. The Board determined that the services to be provided to each Fund by R&A would be the same as those that it previously provided to each Fund. The trustees also took into consideration the histories, reputations and backgrounds of R&A’s portfolio managers for the Funds, finding that these would likely have an impact on the continued success of the Funds. Lastly, the Board noted R&A’s ability to attract and retain qualified and experienced personnel. The Board concluded that the investment advisory services provided by R&A to each Fund compared favorably to services provided by R&A to other R&A client accounts, including other funds, in both nature and quality, and that the scope of services provided by R&A would continue to be suitable for each Fund.
Investment performance of the Funds and R&A:
In light of R&A’s risk-averse approach to investing, the trustees believe that risk-adjusted performance continues to be the most appropriate measure of each Fund’s investment performance. One measure of risk-adjusted performance the trustees have historically used in their review of each Fund’s performance is the Sharpe Ratio. The Sharpe Ratio is a risk-adjusted measure of performance developed by Nobel Laureate William Sharpe. It is calculated by dividing a fund’s annualized excess returns by its annualized standard deviation to determine reward per unit of risk. The higher the Sharpe Ratio, the better a fund’s historical risk-adjusted performance. The Board attaches primary importance to risk-adjusted performance over relatively long periods of time, typically 3 to 10 years. The trustees noted that Royce Small-Cap Portfolio’s (“RCS”) Sharpe Ratio placed in the 4th quartile, 4th quartile, and 3rd quartile within Morningstar’s Small Blend category for the 3-year, 5-year, and 10-year periods, respectively, ended December 31, 2016. The Board also noted that Royce Micro-Cap Portfolio’s (“RCM”) Sharpe Ratio ranked in the 4th quartile within Morningstar’s Small Blend category for each of the 3-year, 5-year, and 10-year periods ended December 31, 2016.
Although financial markets in 2016 were marked by increased return dispersion, declining correlation, and a steepening yield curve, RCS and RCM underperformed their peers in 2016 as evidenced by their respective Sharpe Ratios. It was further noted that RCS’s and RCM’s focus on high quality companies (e.g., those with solid balance sheets, low leverage, the ability to generate and effectively allocate free cash flow, and strong returns on invested capital) and cyclical companies had hurt their relative performance during the March 2009 to 2015 market period that has been marked by historically low interest rates and significant U.S. Federal Reserve market intervention, as highly leveraged, non-earning companies and yield-oriented securities (e.g., master limited partnerships, real estate investment trusts, and utilities) generally outperformed their higher quality and cyclical counterparts during this period.
In addition to each Fund’s risk–adjusted performance, the Board also reviewed and considered each Fund’s absolute total returns, down market performance, and long-term performance records over periods of 10 years or longer. The Board noted that R&A manages a number of funds that invest in micro-cap, small-cap, and mid-cap issuers, many of which had outperformed their benchmark indices and their competitors during the periods prior to the U.S. Federal Reserve’s near zero interest rate policy and related market interventions as well as in 2016. Although the Board recognized that past performance is not necessarily an indicator of future results, it found that R&A had the necessary qualifications, experience and track record in managing equity mutual funds to manage each Fund. The Board determined that R&A continued to be an appropriate investment adviser for each Fund and concluded that each Fund’s performance supported the approval of the continuance of the Investment Advisory Agreement.
Cost of the services provided and profits realized by R&A from its relationship with each Fund:
The Board considered the cost of the services provided by R&A and the profits realized by R&A from its relationship with each Fund. As part of the analysis, the trustees discussed with R&A its methodology in allocating its costs to each Fund and concluded that its allocations were reasonable. The Board concluded that R&A’s profits were reasonable in relation to the nature and quality of services provided.
| 28 | Royce Capital Fund 2017 Semiannual Report to Shareholders |
Board Approval of Investment Advisory Agreement (continued)
The extent to which economies of scale would be realized as the Funds grow and whether fee levels would reflect such economies of scale:
The Board considered whether there have been economies of scale in respect of the management of each Fund, whether each Fund has appropriately benefited from any economies of scale and whether there is potential for realization of any further economies of scale. The trustees noted the time and effort involved in managing portfolios of small- and micro-cap stocks and that they did not involve the same efficiencies as do portfolios of large-cap stocks. The Board concluded that the current fee structure for each Fund was reasonable, that shareholders sufficiently participated in economies of scale and that no changes were currently necessary.
Comparison of services to be rendered and fees to be paid to those under other investment advisory contracts, such as contracts of the same and other investment advisers or other clients:
The Board reviewed the investment advisory fee paid by each Fund and compared both the services to be rendered and the fees to be paid under the Investment Advisory Agreement to other contracts of R&A and to contracts of other investment advisers to registered investment companies investing in small- and micro-cap stocks, as provided by Morningstar. The trustees noted the importance of the net expense ratio in measuring a fund’s efficiency, particularly in light of the variations in the mutual fund industry as to which entity is responsible for particular types of expenses. It was noted that RCM’s net expense ratio of 1.36% placed in the 4th quartile, 7 basis points higher than its peer group median, primarily due to its higher investment advisory fee as compared to its peer group median. The Board further noted that RCM’s net expense ratio was actually 11 basis points lower than the average expense ratio for the 44 non-institutional, non-ETF domestic funds with weighted average market capitalizations of less than $1 billion within the Morningstar peer group. The Board noted that RCS’s net expense ratio of 1.09% placed in the 4th quartile, 16 basis points higher than its peer group median, primarily due to its higher investment advisory fee as compared to its peer group median. The trustees further noted that RCS’s net expense ratio was actually 32 basis points lower than the average expense ratio for the 110 non-institutional, non-ETF, non-index, small-cap funds within the Morningstar small-cap category.
The Board also noted that R&A manages each Fund in an active fashion. The industry accepted metric for measuring how actively an equity portfolio is managed is called “active share.” In particular, active share measures how much the holdings of an equity portfolio differ from the holdings of its appropriate passive benchmark index. At the extremes, a portfolio with no holdings in common with the benchmark would have 100% active share, while a portfolio that is identical to the benchmark would have 0% active share. R&A presented a chart to the Board which demonstrated that funds with high active share scores had higher expense ratios than funds with lower active share scores due to the resources required for the active management of those funds. The Board noted that the active shares for RCM and RCS were 89% and 97%, respectively, for the calendar year ended December 31, 2016.
The Board further noted that R&A had, from time to time, waived advisory fees in order to maintain expense ratios at competitive levels. The Board also considered fees charged by R&A to institutional and other clients and noted that, given the greater levels of service that R&A provides to registered investment companies such as the Funds as compared to other accounts, each Fund’s advisory fees compared favorably to these other accounts.
No single factor was cited as determinative to the decision of the Board. Rather, after weighing all of the considerations and conclusions discussed above, the entire Board, including all of the non-interested trustees, approved the continuation of the Investment Advisory Agreement, concluding that continuation of such Agreement was in the best interest of the shareholders of each Fund and that each Fund’s investment advisory fee rate was reasonable in relation to the services provided.
| Royce Capital Fund 2017 Semiannual Report to Shareholders | 29 |
Notes to Performance and Other Important Information
The thoughts expressed in this report concerning recent market movements and future prospects for small company stocks are solely the opinion of Royce at June 30, 2017, and, of course, historical market trends are not necessarily indicative of future market movements. Statements regarding the future prospects for particular securities held in the Funds’ portfolios and Royce’s investment intentions with respect to those securities reflect Royce’s opinions as of June 30, 2017 and are subject to change at any time without notice. There can be no assurance that securities mentioned in this report will be included in any Royce-managed portfolio in the future.
Sector weightings are determined using the Global Industry Classification Standard (“GICS”). GICS was developed by, and is the exclusive property of, Standard & Poor’s Financial Services LLC (“S&P”) and MSCI Inc. (“MSCI”). GICS is the trademark of S&P and MSCI. “Global Industry Classification Standard (GICS)” and “GICS Direct” are service marks of S&P and MSCI.
All indexes referenced are unmanaged and capitalization weighted. Each index’s returns include net reinvested dividends and/or interest income. Russell Investment Group is the source and owner of the trademarks, service marks, and copyrights related to the Russell Indexes. Russell® is a trademark of Russell Investment Group. The Russell 2000 is an index of domestic small-cap stocks. It measures the performance of the 2,000 smallest publicly traded U.S. companies in the Russell 3000 Index. The Russell 2000 Value and Growth Indexes consist of the respective value and growth stocks within the Russell 2000 as determined by Russell Investments. The Russell Microcap Index includes 1,000 of the smallest securities in the small-cap Russell 2000 Index along with the next smallest eligible securities as determined by Russell. The Russell Midcap Index measures the performance of the mid-cap segment of the U.S. equity universe. It includes approximately 800 of the smallest securities in the Russell 1000 Index. The Russell 1000 Index is an index of domestic large-cap stocks. It measures the performance of the 1,000 largest publicly traded U.S. companies in the Russell 3000 Index. The S&P 500 is an index of U.S. large-cap stocks selected by Standard & Poor’s based on market size, liquidity, and industry grouping, among other factors. The Nasdaq Composite is an index of the more than 3,000 common equities listed on the Nasdaq stock exchange. The performance of an index does not represent exactly any particular investment, as you cannot invest directly in an index. Returns for the market indexes used in this report were based on information supplied to Royce by Russell Investments. Royce has not independently verified the above described information. The Royce Funds is a service mark of The Royce Funds. Distributor: Royce Fund Services, LLC.
The Price-Earnings, or P/E, Ratio is calculated by dividing a company’s share price by its trailing 12-month earnings-per share (EPS). The Price-to-Book, or P/B, Ratio is calculated by dividing a company’s share price by its book value per share. Standard deviation is a statistical measure within which a fund’s total returns have varied overtime. The greater the standard deviation, the greater a fund’s volatility. The Morningstar Style Map uses proprietary scores of a stock’s value and growth characteristics to determine its placement in one of the five categories listed on the horizontal axis. These characteristics are then compared to those of other stocks within the same market capitalization band. Each is scored from zero to 100 for both value and growth attributes. The value score is subtracted from the growth score to determine the overall style score. For the vertical, market cap axis, Morningstar subdivides into size groups. Giant-cap stocks are defined as those that account for the top 40% of the capitalization of each style zone; large-cap stocks represent the next 30%; mid-cap stocks the next 20%; small-cap stocks the next 7%; micro-cap stocks the smallest 3%. Standard deviation is a statistical measure within which a fund’s total returns have varied over time. The greater the standard deviation, the greater a fund’s volatility. The value score is subtracted from the growth score to determine the overall style score. The Royce Funds is a service mark of The Royce Funds. Distributor: Royce Fund Services, LLC.
Royce Capital Fund—Micro-Cap Portfolio invests primarily in securities of micro-cap companies and Royce Capital Fund—Small-Cap Portfolio invests primarily in securities of small-cap companies. Investments in these types of companies may involve considerably more risk than investments in securities of larger-cap companies. (Please see “Primary Risks for Fund Investors” in the prospectus.) Royce Capital Fund—Micro-Cap Portfolio and Royce Capital Fund—Small-Cap Portfolio may each invest up to 25% its assets in foreign securities that may involve political, economic, currency, and other risks not encountered in U.S. investments. (Please see “Investing in Foreign Securities” in the prospectus.) A Fund that invests a significant portion of its assets in a limited number of stocks may be subject to considerably more risk than a more broadly diversified Fund because a decline in the value of any of these stocks would cause that Fund’s overall value to decline to a greater degree. A broadly diversified portfolio does not, however, ensure a profit for a Fund or guarantee against loss. Please read the prospectus carefully before investing or sending money. A copy of the Funds’ current prospectus and a Statement of Additional Information may be obtained by calling (800) 221-4268 or by visiting www.roycefunds.com. All publicly released material Fund information is disclosed by the Funds on their website at www.roycefunds.com.
Forward-Looking Statements
This material contains forward-looking statements within the meaning of the Securities Exchange Act of 1934, as amended (the “Exchange Act”), that involve risks and uncertainties, including, among others, statements as to:
| • | the Funds’ future operating results, |
| • | the prospects of the Funds’ portfolio companies, |
| • | the impact of investments that the Funds have made or may make, |
| • | the dependence of the Funds’ future success on the general economy and its impact on the companies and industries in which the Funds invest, and |
| • | the ability of the Funds’ portfolio companies to achieve their objectives. |
This review and report use words such as “anticipates,” “believes,” “expects,” “future,” “intends,” and similar expressions to identify forward-looking statements. Actual results may differ materially from those projected in the forward-looking statements for any reason.
The Royce Funds have based the forward-looking statements included in this review and report on information available to us on the date of the report, and we assume no obligation to update any such forward-looking statements. Although The Royce Funds undertake no obligation to revise or update any forward-looking statements, whether as a result of new information, future events, or otherwise, you are advised to consult any additional disclosures that we may make through future shareholder communications or reports.
Proxy Voting
A copy of the policies and procedures that The Royce Funds use to determine how to vote proxies relating to portfolio securities and information regarding how each of The Royce Funds voted proxies relating to portfolio securities during the most recent 12-month period ended June 30 is available, without charge, on The Royce Funds’ website at www.roycefunds.com, by calling (800) 221-4268 (toll-free), and on the website of the Securities and Exchange Commission (“SEC”) at www.sec.gov.
Form N-Q Filing
The Funds file their complete schedules of investments with the SEC for the first and third quarters of each fiscal year on Form N-Q. The Funds’ Forms N-Q are available on The Royce Funds’ website at www.roycefunds.com and on the SEC’s website at www.sec.gov. The Funds’ Forms N-Q may also be reviewed and copied at the SEC’s Public Reference Room in Washington, D.C. To find out more about this public service, call the SEC at (202) 942-8090. The Funds’ complete schedules of investments are updated quarterly and are available at www.roycefunds.com.
| 30 | Royce Capital Fund 2017 Semiannual Report to Shareholders |
| This page is intentionally left blank. |
| This page is intentionally left blank. |
| GET THE LATEST INSIGHTS AND NEWS ON THE ROYCE FUNDS |
| | | | |
| | | | |
| | eDELIVERY SAVES! SIGN UP NOW. | STAY INFORMED | |
| | | | |
| | eDelivery saves paper, time, and fund expenses. Sign up now to view statements, prospectuses, financial reports, and tax forms online. roycefunds.com/edelivery | Connect with us on LinkedIn, follow us on Twitter, watch us on YouTube and subscribe to our RSS feed. Visit roycefunds.com/subscribe to sign up for our monthly eWord newsletter to stay up to date on the latest from Royce. | |
| | | | |
| |  www.twitter.com/roycefunds www.twitter.com/roycefunds | |  www.linkedin.com/roycefunds www.linkedin.com/roycefunds | |  www.youtube.com/roycefunds www.youtube.com/roycefunds | |  www.roycefunds.com/subscribe www.roycefunds.com/subscribe | |
| This page is not part of the Royce Capital Fund 2017 Semiannual Report to Shareholders |
| | | | | |
| | | | | |
| | | | | |
| | | | | |
| | | | | |
| |
 | | | |
 | |
| | | | | |
| | | | | |
| | About The Royce Funds | | | |
| | | | | |
| | | | | |
| | Unparalleled Knowledge + Experience
Pioneers in small-cap investing, with 40+ years
of experience, depth of knowledge, and focus. | | | |
| | | | | |
| | Independent Thinking
The confidence to go against consensus, the insight
to uncover opportunities others might miss, and the
tenacity to stay the course through market cycles. | | | |
| | | | | |
| | Specialized Approaches
Strategies that use value, core, or growth investment
approaches to select micro-cap, small-cap, and
mid-cap companies. | | Contact Us
| |
| |
Unwavering Commitment
Our team of 17 portfolio managers have significant
personal investments in the strategies they manage.
| | GENERAL INFORMATION
Additional Report Copies
and Prospectus Inquiries
(800) 221-4268 | |
| | | | | |
| | | | | |
| | | | | |
| | | | | |
| | | | | |
| |  | |  |  |
| | | | | |
| | | | | |
Item 2. Code(s) of Ethics. Not applicable to this semi-annual report.
Item 3. Audit Committee Financial Expert. Not applicable to this semi-annual report.
Item 4. Principal Accountant Fees and Services. Not applicable to this semi-annual report.
Item 5. Audit Committee of Listed Registrants. Not Applicable
Item 6. Investments.
(a) See Item 1.
(b) Not Applicable
Item 7. Disclosure of Proxy Voting Policies and Procedures for Closed-End Management Investment Companies. Not Applicable.
Item 8. Portfolio Managers of Closed-End Management Investment Companies. Not Applicable.
Item 9. Purchases of Equity Securities by Closed-End Management Investment Company and Affiliated Purchasers. Not Applicable
Item 10. Submission of Matters to a Vote of Security Holders. Not Applicable.
Item 11. Controls and Procedures.
(a) Disclosure Controls and Procedures. The Principal Executive and Financial Officers concluded that the Registrant’s Disclosure Controls and Procedures are effective based on their evaluation of the Disclosure Controls and Procedures as of a date within 90 days of the filing date of this report.
(b) Internal Control over Financial Reporting. There were no significant changes in Registrant’s internal control over financial reporting or in other factors that could significantly affect this control subsequent to the date of the evaluation, including any corrective actions with regard to significant deficiencies and material weaknesses during the second fiscal quarter of the period covered by this report.
Item 12. Exhibits. Attached hereto.
(a)(1) Not applicable to this semi-annual report.
(a)(2) Separate certifications by the Registrant’s Principal Executive Officer and Principal Financial Officer as required by Rule 30a-2(a) under the Investment Company Act of 1940.
(a)(3) Not Applicable
(b) Separate certifications by the Registrant’s Principal Executive Officer and Principal Financial Officer, pursuant to Section 906 of the Sarbanes-Oxley Act of 2002 and required by Rule 30a-2(b) under the Investment Company Act of 1940.
Pursuant to the requirements of the Securities Exchange Act of 1934 and the Investment Company Act of 1940, the registrant has duly caused this report to be signed on its behalf by the undersigned, thereunto duly authorized.
ROYCE CAPITAL FUND
| BY: | /s/ Christopher D. Clark | |
| | | |
| | Christopher D. Clark | |
| | President | |
Date: August 28, 2017
Pursuant to the requirements of the Securities Exchange Act of 1934 and the Investment Company Act of 1940, this report has been signed below by the following persons on behalf of the registrant and in the capacities and on the dates indicated.
| ROYCE CAPITAL FUND | | ROYCE CAPITAL FUND | |
| BY: | /s/ Christopher D. Clark | | BY: | /s/ Peter K. Hoglund | |
| | | | | | |
| | Christopher D. Clark | | | Peter K. Hoglund | |
| | President | | | Chief Financial Officer | |
| | |
| Date: August 28, 2017 | | Date: August 28, 2017 | |