UNITED STATES
SECURITIES AND EXCHANGE COMMISSION
Washington, D.C. 20549
FORM N-CSR
CERTIFIED SHAREHOLDER REPORT
OF
REGISTERED MANAGEMENT INVESTMENT COMPANIES
Investment Company Act File Number: 811-07537
Name of Registrant: Royce Capital Fund
Address of Registrant: 745 Fifth Avenue
New York, NY 10151
Name and address of agent for service:
John E. Denneen, Esq.
745 Fifth Avenue
New York, NY 10151
Registrant's telephone number, including area code: (212) 508-4500
Date of fiscal year end: December 31, 2019
Date of reporting period: January 1, 2019 – June 30, 2019
Item 1. Reports to Shareholders.
 |
| JUNE 30, 2019 | ||
| 2019 Semiannual | ||
| Review and Report to Shareholders | ||
| Royce Capital Fund– | ||||
| Micro-Cap Portfolio | ||||
| Royce Capital Fund– | ||||
| Small-Cap Portfolio | ||||
| Beginning on January 1, 2021, as permitted by regulations adopted by the U.S. Securities and Exchange Commission, paper copies of the Funds’ shareholder reports like this one will no longer be sent by mail, unless you specifically request paper copies of the reports from the Funds or from your financial intermediary (such as a broker-dealer or bank). Instead, the reports will be made available on the Funds’ website (www.roycefunds.com), and you will be notified by mail each time a report is posted and provided with a website link to access the report. If you already elected to receive shareholder reports electronically, you will not be affected by this change and you need not take any action. You may elect to receive shareholder reports and other communications from the Funds electronically anytime by contacting your financial intermediary or, if you are a direct investor with the Funds, by calling 1-800-841-1180. Beginning on January 1, 2019, you may elect to receive all future reports in paper free of charge. If you invest through a financial intermediary, you can contact your financial intermediary to request that you continue to receive paper copies of your shareholder reports. If you invest directly with the Funds, you can call 1-800-841-1180 to let the Funds know you wish to continue receiving paper copies of your shareholder reports. Your election to receive reports in paper will apply to all Funds held in your account if you invest through your financial intermediary or all Funds held with our fund complex if you invest directly with the Funds. | ||||
| roycefunds.com |  | |||
| Table of Contents | |||
| Semiannual Review | |||
| Letter to Our Shareholders | 1 | ||
| Performance and Expenses | 5 | ||
| Semiannual Report to Shareholders | |||
| Managers’ Discussions of Fund Performance and Schedules of Investments | |||
Royce Capital Fund–Micro-Cap Portfolio | 6 | ||
Royce Capital Fund–Small-Cap Portfolio | 12 | ||
| Financial Statements | 16 | ||
| Notes to Financial Statements | 20 | ||
| Understanding Your Fund’s Expenses | 25 | ||
| Trustees and Officers | 26 | ||
| Board Approval of Investment Advisory Agreement | 27 | ||
| Notes to Performance and Other Important Information | 29 |

| This page is not part of the Royce Capital Fund 2019 Semiannual Report to Shareholders |
Letter to Our Shareholders

| The first six months of 2019 offered equity investors almost everything they could have hoped for following the high anxiety of a recession scare and the bearish fourth quarter of 2018, when the small-cap Russell 2000 Index fell 20.2%. Stocks immediately showed great resilience, and then some, by roaring back in the first half of the year. A highly welcome double-digit rebound in the first quarter was followed by a seesawing second quarter that saw more motion than progress. This was an understandable pause that gave the market time to digest the prior advance. The upshot was a solid advance rise in the year’s first six months, a period that saw low trading volumes and little volatility, which was mostly confined to a small decline in May. During the first half, the Russell 2000 advanced 17.0% while its large-cap sibling, the Russell 1000 Index, was even better, up 18.8%. In fact, performance in the first half generally trended higher the further up the market capitalization scale you traveled. |
| Equity Indexes Total Returns Year-to-Date through 6/30/19 | 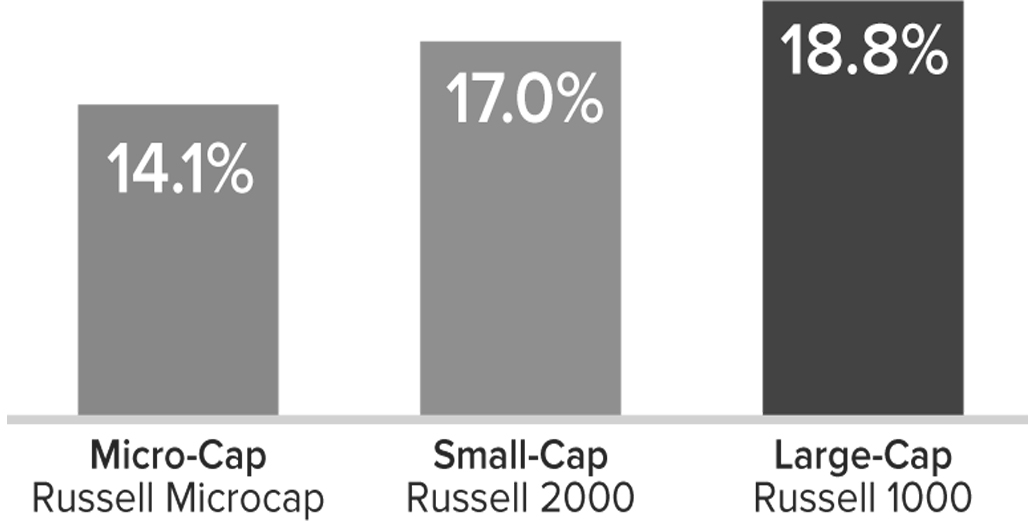 |
| Some questioned the substance of this rally, observing that the same risks that fueled last year’s decline were still with us. The list is long and, by now, familiar. Most of the anxiety continues to circulate around the issue of global growth—or the widely rumored imminent lack of it—and its probable negative impact on corporate profits. There wasn’t much in the way of fresh answers to these concerns at the end of June beyond the admittedly consequential Fed pivot to a more dovish stance (as well as subsequent and similar actions promised from the European Central Bank). Yet, while the Fed’s words and actions went some way to reassuring investors that it was prepared to give the markets a dose of stimulus, the effect on economic growth was pretty much nil. Moreover, the increasing tensions around trade and tariffs remain an issue at this writing. With no resolution forthcoming, many companies were lowering expectations and/or offering a more muted outlook, with predictably negative effects on the stocks of many economically sensitive businesses. It’s not surprising, then, that equity investors showed a marked preference for safety in the form of large-cap stocks, or chose to bet on better times further down the road by vacuuming up shares of growth issues regardless of capitalization size. Some additional context is also important: large-caps, growth stocks, and defensive areas (that is, bond proxies) have historically done better in low or declining interest rate environments, an atmosphere that has characterized much of the decade following the Financial Crisis, with its record-low interest rates (and the |
| For details on The Royce Funds’ performance in the period, please turn to the Managers’ Discussions that begin on page 8. Past performance is no guarantee of future results. |
| This page is not part of the Royce Capital Fund 2019 Semiannual Report to Shareholders | 1 |
LETTER TO OUR SHAREHOLDERS
| ‘easy money’ that came with them). With rates still near historic lows, these same stocks have led the market over the last two-plus years. All of this notwithstanding, we believe that the long-term case for small-cap stocks is strong, as we will explain through the course of this letter. PESSIMISTS, OPTIMISTS—AND US By periodically inverting the otherwise mostly flat yield curve, the bond market maintained its saturnine insistence that the economy was slowing and potentially, perhaps inevitably, moving toward recession. To be sure, many observers point to the inverted yield curve as iron-clad proof that the current slackening momentum in the pace of growth in the U.S., along with the advanced age of the expansion, is a prelude to a recession. More optimistic voices argue that large-cap stocks spent much of the first half making new all-time highs, that the labor market continues to strengthen, and that the economy continues to expand in spite of a raft of dismal headlines. |
| THE CASE FOR SMALL-CAP LEADERSHIP |
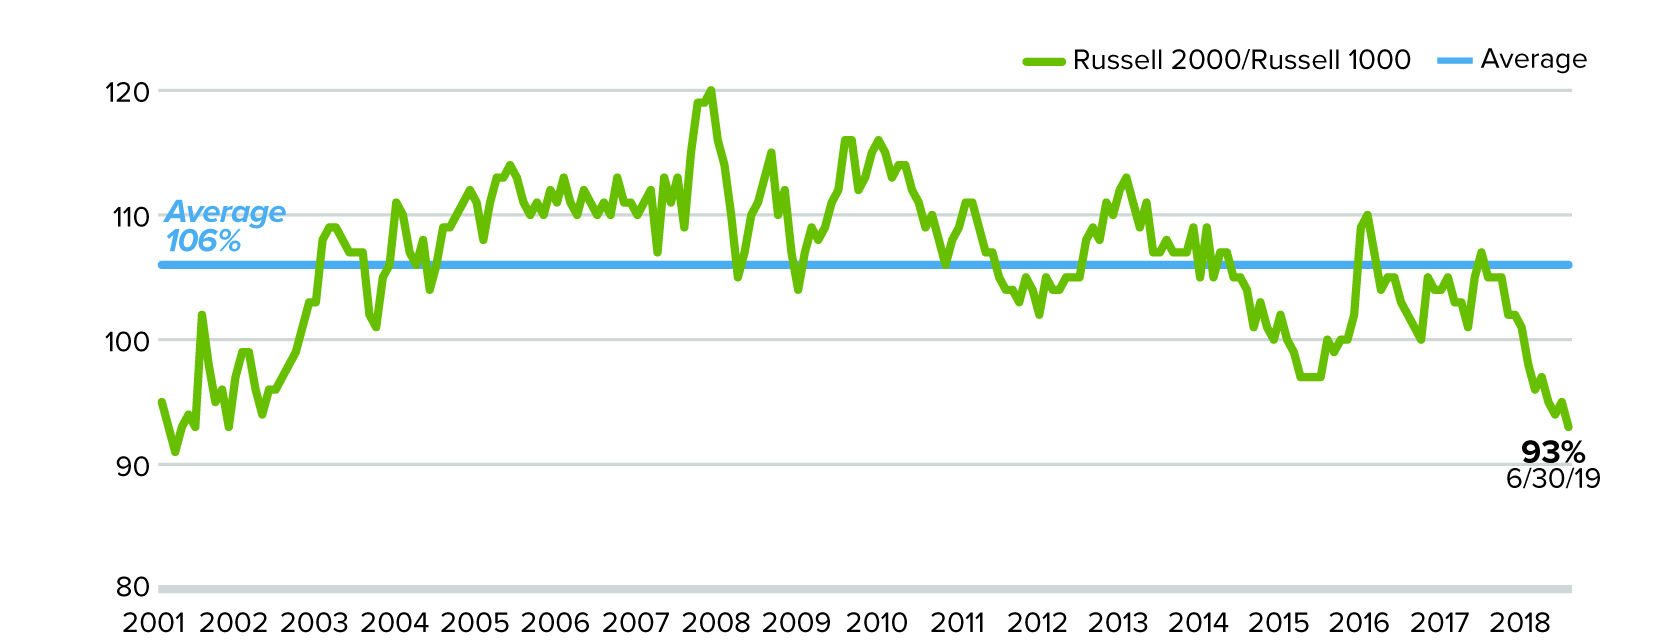
| Our first argument is in favor of small-cap returning to market leadership. We make it on the grounds of reversion to the mean, one of our longest-held investment principles. Looking at first-half performance, the resilience of small-cap stocks seemed both apropos and encouraging to us given that we continue to see solid fundamentals for many companies, attractively joined with historically average, or below average, valuation levels. However, small-caps lagged large-caps not only in the first half but also for the one-year period ended June 30, 2019, when the Russell 2000 fell 3.3% versus a gain of 10.0% for the large-cap index. This performance divergence has created a historical oddity that can be seen in the spread between |
| small- and large-cap returns. It rarely happens over the course of a 12-month period that small-caps are in the red while large-caps are in the black. In fact, it’s happened less than 7% of the time over the past 20 years—in 16 out of 229 monthly rolling 12-month periods. What are the implications of this peculiar divergence in performance? In 93% of the following 12-month periods—only 13 of the 14 currently have subsequent periods to measure—small-caps bounced back to outpace large-caps. It’s true that small-caps have historically tended to lag their large-cap siblings when yields are falling—and have often done the same when economic growth is slowing. The resumption of small-cap leadership, then, is contingent on these conditions changing. When rates rise (or simply normalize) and/or the economy reaccelerates, and history strongly suggests that both should, we would expect small-cap to recapture leadership. |
| What Happened After 12-Month Periods When Large-Caps Rose and Small-Caps Fell? 16 out of 229 Trailing 1-Year Periods from 6/30/99 to 6/30/19 |
| Median Return for Subsequent 12 Months (14/229 Periods) 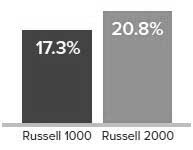 | % of Periods Russell 2000 Outperformed in Subsequent 12 Months (13/14 Periods) 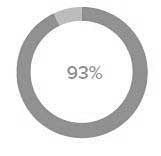 |
| One additional observation on relative performance: From December 31, 1978 through June 30, 2019, the five-year monthly rolling average return was 10.6% for the Russell 2000 and 11.7% for the Russell 1000, while the five-year average annual total returns for the small- and large-cap indexes for the period ended June 30, 2019 were 7.1% and 10.5%, respectively. With small-caps well below their long-term average, we expect performance to improve to a greater degree than for large-caps, which finished June much closer to their long-term average. Our confidence in mean reversion is further grounded in the relative valuation spread between the Russell 2000 and the Russell 1000 at the end of June, which was significantly below its long-term average based on each index’s median last 12-months’ EV/EBIT (enterprise value over earnings before interest and taxes). In fact, small-caps have lagged large-caps for such an extended period of time that they finished June at their cheapest relative to large-caps since 2001. |
| 2 | This page is not part of the Royce Capital Fund 2019 Semiannual Report to Shareholders |
LETTER TO OUR SHAREHOLDERS
| So while no one thinks that stocks are currently bargain priced, it’s also true that the vast and diverse universe of small-cap stocks contains a considerable number of attractive risk/reward opportunities based on the combination of reasonable to attractive valuations (again measured by median EV/EBIT) and profitability. |
| THE VALUATION SITUATION When looking for investment candidates, we typically survey the small-cap market for what looks to us like excess pessimism—which is precisely what we’ve been seeing in certain cyclical areas over the last couple of years. Our practice is to then investigate how much of that negative sentiment is already reflected in the current stock price of a given company. So it was significant that at the end of June, cyclical stocks were selling at a greater discount to the Russell 2000 than they had during the fall of 2008—in the teeth of the Financial Crisis. To us, that is the very definition of excess pessimism. |
| Small-Cap Cyclical Discount Russell 2000 Relative Median EV/EBIT1 (Ex Negative EBIT) Cyclical/Russell 2000 |
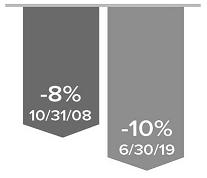
Source: FactSet
| We suspect that these relatively inexpensive valuations are in large part the result of investors placing undue emphasis on daily macro headlines when trying to understand or anticipate small-cap market movements. (The frequently missed distinction between slower economic growth and a recession is an example of the trouble this can lead to.) We think that investors often fail to fully appreciate the “reaction function,” the response of businesses, central banks, and governments to slowdowns. While we are by no means macro forecasters, it would not surprise us if the global economy grew a little faster over the next year. If history is any guide, this reacceleration could boost small-cap stocks, which have done well on both an absolute and relative basis, especially versus large-caps, when the ISM Manufacturing Index (a common proxy for economic conditions) is on the rise. As unlikely as it currently seems, additional growth could come from a U.S.-China |
| Small-Cap’s Relative Valuation Is Significantly Below Its Long-Term Average Russell 2000 vs. Russell 1000 Median LTM EV/EBIT1 (ex. Negative EBIT Companies) from 12/31/01 to 6/30/19 |
Source: FactSet
| trade deal that addresses tariffs and stokes even modest growth in China, which would likely spur increased activity in Europe as well. Moreover, we expect profitable companies in select cyclical areas to do better regardless of which route the global economy takes in the short term. For example, and in spite of reports of revisions, earnings prospects for the second half of 2019 look solid for many of our small-cap cyclical holdings, especially given the relatively weaker third and fourth quarters of 2018 with which 2019’s two second-half quarters will be compared. We often seek to identify opportunities at the intersection of quality and value—that is, companies with average or better profitability and lower-than-average valuations. There were three cyclical sectors that had higher-than-average profitability and lower-than-average valuations at the end of June—Industrials, Consumer Discretionary, and Materials.2 The relative attractiveness of these and other cyclical areas dovetails nicely with our bottom-up approaches, where the search for fundamentally sound, well-managed companies with solid growth potential has more recently led us overwhelmingly to cyclical businesses. SMALL-CAP STOCKS AND THE URGE TO MERGE The appeal of small-cap stocks can also be seen in recent merger & acquisition (M&A) activity. The number of small-cap M&A deals in the U.S. hit a 10-year high in June, with 503 transactions announced for the trailing four quarters through the end of that month, according to Bloomberg data. This is the largest number of deals in the asset class since before the Financial Crisis. |
| 1 Enterprise Value/Earnings before interest and taxes. |
| 2 Based on the relation between each sector’s average return on equity (ROE) for the five years ended 6/30/19 (excluding companies with negative ROE) and median EV/EBIT (excluding companies with negative earnings). Cyclical are defined as follows: Communication Services, Consumer Discretionary, Energy, Financials, Industrials, Information Technology, and Materials. |
| This page is not part of the Royce Capital Fund 2019 Semiannual Report to Shareholders | 3 |
LETTER TO OUR SHAREHOLDERS
| We anticipate that this trend will continue for a variety of reasons. CEO’s are under relentless pressure to grow profits. If they believe organic growth opportunities are limited, then inorganic paths such as acquisitions begin to make sense. Along similar lines, the CEO of a small-cap company might look more favorably on a buyout offer at a significant stock price premium if he or she sees limited opportunities for their own organic growth. However paradoxical, we can see how a further deceleration in economic growth could lead to an acceleration in M&A deals. With their attractive relative valuations, many small-cap companies should continue to be attractive takeover targets. We also think that many better-managed small-cap businesses will continue to be active as acquirers. We meet with many management teams that run companies with strong balance sheets and are eager to find ways to grow. With interest rates so low, many acquisitions are likely to be accretive, which increases their attraction to a potential buyer. THE NEXT LEG OF THE JOURNEY Disagreements about the condition of the market and state of the economy have created opportunities for active managers and other discerning stock pickers because there’s so little consensus about what constitutes value or quality. Somewhat counterintuitively, this has made us generally quite comfortable with what we’re holding in each of our strategies. Of course, our overall cyclical tilt would not immunize any of our portfolios from a recession. However, the market has provided opportunities to build portfolios that we think are not only inexpensive, but that we think should also provide healthy returns going forward in our most valuation-sensitive strategies. We also expect that many of our high-quality holdings (specifically those in Industrials and Information Technology) could outperform cyclicals in general in the event of a recession thanks to their status as market leaders in global niches as opposed to being one of many players in a highly fragmented commodity business. Across all of our strategies, we’ve been adding or holding positions in areas such as technology, industrials, and many other areas that we |
| think should do well under present or improved conditions. Equally important, many of these holdings already have valuations that seem to reflect a high probability of an imminent recession. Any economic news that shows improvement—or simply the absence of worsening conditions—may lift these stocks. In framing this promising picture of the long-term possibilities for small-cap cyclicals, we also recognize that the lengthy list of current risks is creating an even higher level of uncertainty than usual. However, having done this for as long as we have—four decades and counting—we are also highly aware that the markets seldom do what’s most expected. Given today’s widespread concerns about slowing growth, increasing trade tensions, and the extended economic cycle, the most surprising outcome—as we’ve suggested—might be a rally catalyzed by improved growth. When looking forward, we believe it’s appropriate to be humble about our own forecasts and respectful of those that differ from ours. With what seems like ever increasing tariff and trade tensions, there is a plausible negative scenario of slowing Chinese growth that tips languishing European economies into recession and pushes global yields even lower. This would in all likelihood lead to greater instability in global financial markets as well as breeding heightened risk aversion. While we think this outcome is less likely than others, we also believe that investors should remain mindful of the reaction function we mentioned earlier. Additionally, environments that feature increased uncertainty, turbulence, and market volatility often provide opportunities for companies with leading market positions and strong balance sheets to solidify or expand market share. Volatile environments have also been historically favorable for active small-cap managers. We also see four favorable factors in the current market environment—low inflation, modest valuations, moderate growth, and increased access to capital—that we think support solid-to-strong small-cap performance in the intermediate term regardless current anxieties. These four factors paint an attractive picture in our view, one that small-cap investors might be at risk of missing if they pay more attention to the macro picture than to company fundamentals, where we think the real action is. |
| Sincerely, |
 |  |  | ||
| Charles M. Royce | Christopher D. Clark | Francis D. Gannon | ||
| Chairman, | Chief Executive Officer, and | Co-Chief Investment Officer, | ||
| Royce & Associates, LP | Co-Chief Investment Officer, | Royce & Associates, LP | ||
| Royce & Associates, LP | ||||
| July 31, 2019 |
| 4 | This page is not part of the Royce Capital Fund 2019 Semiannual Report to Shareholders |
Performance and Expenses
| Performance and Expenses |
| As of June 30, 2019 |
| YTD1 | 1-YR | 3-YR | 5-YR | 10-YR | 15-YR | 20-YR | SINCE INCEPTION (12/27/96) | ANNUAL OPERATING EXPENSES (%) GROSS/NET | ||||||||||||||
| Royce Capital Fund–Micro-Cap Portfolio | 10.70 | -8.72 | 8.19 | 1.16 | 7.54 | 5.25 | 8.68 | 9.29 | 1.39/1.33 | |||||||||||||
| Royce Capital Fund–Small-Cap Portfolio | 8.51 | -7.10 | 7.18 | 2.52 | 9.90 | 7.08 | 9.56 | 9.93 | 1.11/1.08 | |||||||||||||
INDEX | ||||||||||||||||||||||
| Russell Microcap Index | 14.15 | -10.39 | 11.19 | 5.52 | 12.54 | 6.28 | N/A | N/A | N/A | |||||||||||||
| Russell 2000 Index | 16.98 | -3.31 | 12.30 | 7.06 | 13.45 | 8.15 | 7.77 | N/A | N/A | |||||||||||||
| Russell 2000 Value Index | 13.47 | -6.24 | 9.81 | 5.39 | 12.40 | 7.28 | 8.64 | N/A | N/A | |||||||||||||
| 1 Not annualized. | ||||||||||||||||||||||
Important Performance, Expense, and Risk Information
All performance information in this Review and Report reflects past performance, is presented on a total return basis, reflects the reinvestment of distributions, and does not reflect the deduction of taxes that a shareholder would pay on fund distributions or the redemption of fund shares. Past performance is no guarantee of future results. Investment return and principal value of an investment will fluctuate, so that shares may be worth more or less than their original cost when redeemed. Current performance may be higher or lower than performance quoted and may be obtained at www.roycefunds.com. The Funds’ total returns do not reflect any deduction for charges or expenses of the variable contracts investing in the Funds. All performance and expense information reflects the result for each Fund’s Investment Class Shares. Gross annual operating expenses reflect each Fund’s gross total annual operating expenses and include management fees, operating expenses, and any applicable acquired fund fees and expenses. Net annual operating expenses reflect contractual fee waivers and/or expense reimbursements. All expense information is reported as of each fund’s most current prospectus. Royce & Associates has contractually agreed to waive fees and/or reimburse operating expenses, excluding brokerage commissions, taxes, interest litigation expenses, acquired fund fees and expenses, and other expenses not borne in the ordinary cost of business, to the extent necessary to maintain net operating expenses at or below 1.33% for Royce Capital Fund–Micro-Cap Portfolio, and at or below 1.08% for Royce Capital Fund–Small-Cap Portfolio through April 30, 2020.
Service Class Shares bear an annual distribution expense that is not borne by the Investment Class; if those expenses were reflected, total returns would have been lower. Royce Micro-Cap Portfolio invests primarily in micro-cap companies while Royce Small-Cap Portfolio invests primarily in small-cap companies. Investments in micro-cap and small-cap companies may involve considerably more risk than investments in securities of larger-cap companies. (Please see “Primary Risks for Fund Investors” in the prospectus.) Each series of Royce Capital Fund may invest up to 25% of its net assets in foreign securities. Investments in foreign securities may involve political, economic, currency, and other risks not encountered in U.S. investments. (Please see “Investing in Foreign Securities” in the prospectus.) As of 6/30/19, Royce Small-Cap Portfolio invested a significant portion of its assets in a limited number of stocks, which may involve considerably more risk than a more broadly diversified portfolio because a decline in the value of any one of these stocks would cause the Portfolio’s overall value to decline to a greater degree. Royce Micro-Cap Portfolio’s broadly diversified portfolio does not ensure a profit or guarantee against loss. (Please see “Primary Risks for Fund Investors” in the prospectus.) This Review and Report must be preceded or accompanied by a prospectus. Please read the prospectus carefully before investing or sending money. Russell Investment Group is the source and owner of the trademarks, service marks, and copyrights related to the Russell Indexes. Russell® is a trademark of Russell Investment Group. The Russell Microcap Index includes 1,000 of the smallest securities in the small-cap Russell 2000 Index along with the next smallest eligible securities as determined by Russell. The Russell 2000 Index is an unmanaged, capitalization-weighted index of domestic small-cap stocks. It measures the performance of the 2,000 smallest publicly traded U.S. companies in the Russell 3000 Index. The Russell 2000 Value Index consists of the respective value stocks within the Russell 2000 as determined by Russell Investments. The performance of an index does not represent exactly any particular investment, as you cannot invest directly in an index. Distributor: Royce Fund Services, LLC.
| This page is not part of the Royce Capital Fund 2019 Semiannual Report to Shareholders | 5 |
| MANAGERS’ DISCUSSION |
| Royce Capital Fund–Micro-Cap Portfolio (RCM) |
 |
| Jim Stoeffel Brendan Hartman |
| FUND PERFORMANCE |
| For the year-to-date period ended June 30, 2019, Royce Capital Fund–Micro-Cap Portfolio underperformed both of its benchmarks. The Fund gained 10.7%, while the Russell Microcap and Russell 2000 Indexes returned 14.1% and 17.0%, respectively, for the same period. We were pleased, however, that the Fund outpaced the micro-cap index for the one-year period ended June 30, 2019. |
| WHAT WORKED...AND WHAT DIDN’T |
| Eight of the Fund’s 10 equity sectors generated positive returns in 2019’s first half. Our persistent large weighting in Information Technology worked in our favor as it was the top contributor at the sector level. Industrials and Health Care followed Information Technology while Communication Services and Consumer Staples detracted, but with only minor impacts. At the industry level, the greatest source of positive performance came from semiconductors & semiconductor equipment (Information Technology), which saw strong results from Adesto Technologies, the second-largest contributing position in the overall portfolio. Through a series of acquisitions, the company has transformed itself from a niche memory provider to a more comprehensive systems provider targeting industrial “Internet-of-Things” applications. Recent results have exceeded expectations as management has successfully integrated its acquisitions and is beginning to garner new product wins. We maintained our position in the shares as we believe the transformation is in the very early stages. |
| Machinery (Industrials) and software (Information Technology) followed as the next top-contributing industries. The best-performing position for the year-to-date period was Quanterix Corporation, a medical technology provider that offers ultra-high sensitivity immunoassay platforms used in testing protein biomarkers. Its shares benefited as the company’s leading edge technology drove significant growth in critical life sciences research applications in areas such as neurology, oncology, and cardiology, among others. We also saw a strong contribution from Kornit Digital, a digital printing specialist for the apparel and textile industries thanks to this machinery company’s recent record revenue growth. |
| The top detractors at the industry level were specialty retail and leisure products—both in Consumer Discretionary. After a series of successful new product offerings, health and fitness products company Nautilus suffered through two consecutive failed product launches, with a resulting decision to remove the CEO. While we like a number of the strategic decisions the company has made over the past several years, we sold our position as we expect it will take at least a year to rebuild a new product pipeline, and our confidence in management’s ability to effectively navigate the rapidly changing fitness market was shaken. Independence Contract Drilling operates a fleet of state-of the-art drilling rigs throughout North America. Its shares have been hurt by the ongoing slowdown in drilling activity in the U.S. While the outlook for the industry remains cloudy given volatile oil prices, we held our position as we believe its shares trade well below the underlying asset value of its high-end rigs. |
| Relative to the Russell Microcap, both stock selection and sector allocation hindered performance for the year-to-date period. Health Care hampered relative results most due to both poor stock selection—most notably in biotechnology—and our underexposure, particularly in pharmaceuticals. Consumer Discretionary came next, mostly due to poor stock selection. The specialty retail group hampered results most, as home décor, furniture, and accessories company Kirkland’s suffered a setback in its efforts to redefine itself as an omnichannel retailer capable of competing with the likes of Amazon and Wayfair. While we believe there is an opportunity for well-run retailers to effectively reimagine their business models in the e-commerce age, we moved on from the stock given management’s recent struggles to execute toward their vision. Conversely, Information Technology was the top contributor due to our overweight in the sector, most impactfully in semiconductors & semiconductor equipment. Industrials followed, with construction & engineering the sector’s strongest industry thanks to savvy stock selection. |
| Top Contributors to Performance | ||||
| Year-to-Date Through 6/30/19 (%)1 | ||||
| Quanterix Corporation | 0.62 | |||
| Adesto Technologies | 0.57 | |||
| Kornit Digital | 0.57 | |||
| NeoGenomics | 0.56 | |||
| Zealand Pharma | 0.55 | |||
| 1 Includes dividends | ||||
| Top Detractors from Performance | ||||
| Year-to-Date Through 6/30/19 (%)2 | ||||
| Nautilus | -0.44 | |||
| Kirkland’s | -0.41 | |||
| Independence Contract Drilling | -0.31 | |||
| Harvard Bioscience | -0.26 | |||
| NeoPhotonics Corporation | -0.22 | |||
| 2 Net of dividends | ||||
| CURRENT POSITIONING AND OUTLOOK |
| We remain generally constructive on the U.S. economy despite the increasing uncertainty around trade and late cycle economic concerns. Our constructive stance was further enhanced by the end of the current Fed tightening cycle, which we think should support what we view as attractive fundamentals and valuations for holdings in various technological and industrial areas, as well as in certain pockets of medical technology, where we have been increasingly active. We also continued to incrementally build our exposure to Information Technology. Indeed, we remain optimistic about the overall prospects for micro-cap stocks in the current environment. Anticipating better growth in the U.S. relative to the rest of the globe, we stayed primarily focused on companies that derive most of their revenues from domestic activities. |
| 6 | Royce Capital Fund 2019 Semiannual Report to Shareholders |
| PERFORMANCE AND PORTFOLIO REVIEW | TICKER SYMBOLS RCMCX RCMSX |
| Performance and Expenses | ||||||||||||||||
| Average Annual Total Return (%) Through 6/30/19 | ||||||||||||||||
| JAN-JUN 20191 | 1-YR | 3-YR | 5-YR | 10-YR | 15-YR | 20-YR | SINCE INCEPTION (12/27/96) | |||||||||
| RCM | 10.70 | -8.72 | 8.19 | 1.16 | 7.54 | 5.25 | 8.68 | 9.29 | ||||||||
| Annual Gross Operating Expenses: 1.39% Annual Net Operating Expenses: 1.33% | ||||||||||||||||
| 1 Not annualized | ||||||||||||||||

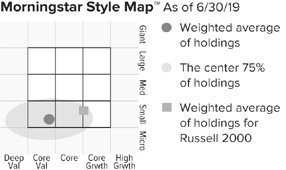
The Morningstar Style Map is the Morningstar Style BoxTM with the center 75% of fund holdings plotted as the Morningstar Ownership ZoneTM. The Morningstar Style Box is designed to reveal a fund’s investment strategy. The Morningstar Ownership Zone provides detail about a portfolio’s investment style by showing the range of stock sizes and styles. The Ownership Zone is derived by plotting each stock in the portfolio within the proprietary Morningstar Style Box. Over time, the shape and location of a fund’s ownership zone may vary. See page 29 for additional information. |
Value of $10,000
as of 6/30/19 ($)
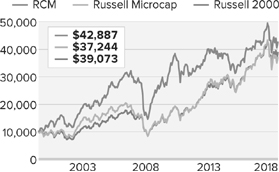
Includes reinvestment of distributions.
| Top 10 Positions | ||
| % of Net Assets | ||
| Stoneridge | 1.4 | |
| NeoGenomics | 1.3 | |
| Adesto Technologies | 1.2 | |
| Northwest Pipe | 1.2 | |
| Quanterix Corporation | 1.1 | |
| Ultra Clean Holdings | 1.1 | |
| Rudolph Technologies | 1.1 | |
| Construction Partners Cl. A | 1.0 | |
| Vishay Precision Group | 1.0 | |
| B. Riley Financial | 1.0 | |
| Portfolio Sector Breakdown | ||
| % of Net Assets | ||
| Industrials | 22.1 | |
| Information Technology | 21.1 | |
| Financials | 13.1 | |
| Health Care | 12.0 | |
| Consumer Discretionary | 9.9 | |
| Energy | 4.1 | |
| Materials | 4.1 | |
| Real Estate | 3.0 | |
| Communication Services | 2.5 | |
| Consumer Staples | 2.0 | |
| Cash and Cash Equivalents | 6.1 | |
| Calendar Year Total Returns (%) | ||
| YEAR | RCM | |
| 2018 | -9.0 | |
| 2017 | 5.2 | |
| 2016 | 19.7 | |
| 2015 | -12.5 | |
| 2014 | -3.6 | |
| 2013 | 21.0 | |
| 2012 | 7.6 | |
| 2011 | -12.1 | |
| 2010 | 30.1 | |
| 2009 | 57.9 | |
| 2008 | -43.3 | |
| 2007 | 4.0 | |
| 2006 | 21.1 | |
| 2005 | 11.6 | |
| 2004 | 13.8 | |
| Upside/Downside Capture Ratios | ||||
| Periods Ended 6/30/19 (%) | ||||
| UPSIDE | DOWNSIDE | |||
| 10-Year | 73 | 88 | ||
| From 6/30/00 (Russell Microcap Inception) | 88 | 79 | ||
| Portfolio Diagnostics | ||
| Fund Net Assets | $148 million | |
| Number of Holdings | 140 | |
| Turnover Rate | 8% | |
| Average Market Capitalization1 | $458 million | |
| Weighted Average P/B Ratio2 | 1.8x | |
| Active Share3 | 90% | |
| U.S. Investments (% of Net Assets) | 81.7% | |
| Non-U.S. Investments (% of Net Assets) | 12.2% | |
| 1 | Geometric Average. This weighted calculation uses each portfolio holding’s market cap in a way designed to not skew the effect of very large or small holdings; instead, it aims to better identify the portfolio’s center, which Royce believes offers a more accurate measure of average market cap than a simple mean or median. |
| 2 | Harmonic Average. This weighted calculation evaluates a portfolio as if it were a single stock and measures it overall. It compares the total market value of the portfolio to the portfolio’s share in the earnings or book value, as the case may be, of its underlying stocks. |
| 3 | Active Share is the sum of the absolute values of the different weightings of each holding in the Fund versus each holding in the benchmark, divided by two. |
| Important Performance and Expense Information All performance information in this Report reflects past performance, is presented on a total return basis, reflects the reinvestment of distributions, and does not reflect the deduction of taxes that a shareholder would pay on fund distributions or the redemption of fund shares. Past performance is no guarantee of future results. Investment return and principal value of an investment will fluctuate, so that shares may be worth more or less than their original cost when redeemed. Current performance may be higher or lower than performance quoted. The Fund’s total returns do not reflect any deduction for charges or expenses of the variable contracts investing in the Fund. Returns as of the most recent month-end may be obtained at www.roycefunds.com. All performance and risk information reflects the result of the Investment Class (its oldest class). Shares of RCM’s Service Class bear an annual distribution expense that is not borne by the Investment Class; if those expenses were reflected, total returns would have been lower. Certain immaterial adjustments were made to the net assets of Royce Capital Fund-Micro-Cap Portfolio at 12/31/17 for financial reporting purposes, and as a result the calendar year total returns based on those net assets values differ from the adjusted net values and calendar year total returns reported in the Financial Highlights. The Fund’s total returns do not reflect any deduction for charges or expenses of the variable contracts investing in the Fund. Gross operating expenses reflect the Fund’s total gross operating expenses for the Investment Class and include management fees and other expenses. Net operating expenses reflect contractual fee waivers and/or expense reimbursements. All expense information is reported as of the Fund’s most current prospectus. Royce & Associates has contractually agreed, without right of termination, to waive fees and/or reimburse expenses to the extent necessary to maintain the Investment Class’s net annual operating expenses (excluding brokerage commissions, taxes, interest, litigation expenses, acquired fund fees and expenses, and other expenses not borne in the ordinary course of business) at or below 1.33% through April 30, 2020. Regarding the “Top Contributors” and “Top Detractors” tables shown above, the sum of all contributors to, and all detractors from, performance for all securities in the portfolio would approximate the Fund’s year-to-date performance for 2019. Upside Capture Ratio measures a manager’s performance in up markets relative to the Fund’s benchmark. It is calculated by measuring the Fund’s performance in quarters when the benchmark went up and dividing it by the benchmark’s return in those quarters. Downside Capture Ratio measures a manager’s performance in down markets relative to the Fund’s benchmark (Russell Microcap). It is calculated by measuring the Fund’s performance in quarters when the benchmark goes down and dividing it by the benchmark’s return in those quarters. |
| Royce Capital Fund 2019 Semiannual Report to Shareholders | 7 |
Schedule of Investments
| Royce Capital Fund - Micro-Cap Portfolio |
| Common Stocks – 93.9% |
| SHARES | VALUE | ||||||
| COMMUNICATION SERVICES – 2.5% | |||||||
| DIVERSIFIED TELECOMMUNICATION SERVICES - 0.6% | |||||||
ORBCOMM 1 | 117,500 | $ | 851,875 | ||||
| ENTERTAINMENT - 0.6% | |||||||
Gaia Cl. A 1 | 113,200 | 858,056 | |||||
| INTERACTIVE MEDIA & SERVICES - 1.0% | |||||||
QuinStreet 1 | 89,900 | 1,424,915 | |||||
| MEDIA - 0.3% | |||||||
Marchex Cl. B 1 | 113,300 | 532,510 | |||||
| Total (Cost $2,920,307) | 3,667,356 | ||||||
| CONSUMER DISCRETIONARY – 9.9% | |||||||
| AUTO COMPONENTS - 2.6% | |||||||
| 16,500 | 1,361,415 | ||||||
Stoneridge 1 | 64,500 | 2,034,975 | |||||
Unique Fabricating 1 | 173,300 | 469,643 | |||||
| 3,866,033 | |||||||
| HOTELS, RESTAURANTS & LEISURE - 2.4% | |||||||
Century Casinos 1 | 131,500 | 1,275,550 | |||||
Lindblad Expeditions Holdings 1 | 62,400 | 1,120,080 | |||||
Red Lion Hotels 1 | 155,000 | 1,102,050 | |||||
| 3,497,680 | |||||||
| HOUSEHOLD DURABLES - 1.4% | |||||||
Cavco Industries 1 | 5,504 | 867,100 | |||||
Lovesac Company (The) 1 | 39,400 | 1,224,158 | |||||
| 2,091,258 | |||||||
| LEISURE PRODUCTS - 0.7% | |||||||
MasterCraft Boat Holdings 1 | 52,917 | 1,036,644 | |||||
| SPECIALTY RETAIL - 1.7% | |||||||
Citi Trends | 47,886 | 700,094 | |||||
Haverty Furniture | 49,100 | 836,173 | |||||
Shoe Carnival | 35,000 | 966,000 | |||||
| 2,502,267 | |||||||
| TEXTILES, APPAREL & LUXURY GOODS - 1.1% | |||||||
Culp | 30,649 | 582,331 | |||||
Vera Bradley 1 | 90,100 | 1,081,200 | |||||
| 1,663,531 | |||||||
| Total (Cost $10,735,015) | 14,657,413 | ||||||
| CONSUMER STAPLES – 2.0% | |||||||
| BEVERAGES - 0.7% | |||||||
| 76,900 | 945,870 | ||||||
| FOOD PRODUCTS - 1.3% | |||||||
Farmer Bros. 1 | 47,800 | 782,486 | |||||
John B. Sanfilippo & Son | 15,000 | 1,195,350 | |||||
| 1,977,836 | |||||||
| Total (Cost $3,105,013) | 2,923,706 | ||||||
| ENERGY – 4.1% | |||||||
| ENERGY EQUIPMENT & SERVICES - 3.3% | |||||||
Gulf Island Fabrication 1 | 92,634 | 657,701 | |||||
Independence Contract Drilling 1 | 301,600 | 476,528 | |||||
Natural Gas Services Group 1 | 61,100 | 1,008,150 | |||||
Newpark Resources 1 | 160,000 | 1,187,200 | |||||
Profire Energy 1 | 486,229 | 734,206 | |||||
Total Energy Services | 139,300 | 878,636 | |||||
| 4,942,421 | |||||||
| OIL, GAS & CONSUMABLE FUELS - 0.8% | |||||||
Ardmore Shipping 1 | 136,000 | 1,108,400 | |||||
| Total (Cost $7,346,954) | 6,050,821 | ||||||
| FINANCIALS – 13.1% | |||||||
| BANKS - 6.0% | |||||||
Allegiance Bancshares 1 | 29,000 | 966,860 | |||||
BayCom Corporation 1 | 45,682 | 1,000,436 | |||||
Caribbean Investment Holdings 1 | 1,751,547 | 355,900 | |||||
County Bancorp | 59,600 | 1,018,564 | |||||
HarborOne Bancorp 1 | 63,100 | 1,181,863 | |||||
HomeTrust Bancshares | 44,700 | 1,123,758 | |||||
Investar Holding | 46,200 | 1,101,870 | |||||
| 1,751,577 | 0 | ||||||
TriState Capital Holdings 1 | 51,072 | 1,089,876 | |||||
Two River Bancorp | 72,400 | 1,039,664 | |||||
| 8,878,791 | |||||||
| CAPITAL MARKETS - 3.6% | |||||||
B. Riley Financial | 73,200 | 1,526,952 | |||||
Canaccord Genuity Group | 257,900 | 1,181,627 | |||||
INTL FCStone 1 | 12,300 | 486,957 | |||||
Silvercrest Asset Management Group Cl. A | 90,300 | 1,266,909 | |||||
Westwood Holdings Group | 23,427 | 824,631 | |||||
| 5,287,076 | |||||||
| DIVERSIFIED FINANCIAL SERVICES - 0.3% | |||||||
| 1,302,000 | 390,600 | ||||||
| INSURANCE - 0.5% | |||||||
| 30,400 | 787,968 | ||||||
| THRIFTS & MORTGAGE FINANCE - 2.7% | |||||||
Meridian Bancorp | 16,300 | 291,607 | |||||
PCSB Financial | 62,600 | 1,267,650 | |||||
Territorial Bancorp | 41,900 | 1,294,710 | |||||
Western New England Bancorp | 130,954 | 1,223,110 | |||||
| 4,077,077 | |||||||
| Total (Cost $22,040,773) | 19,421,512 | ||||||
| HEALTH CARE – 12.0% | |||||||
| BIOTECHNOLOGY - 2.9% | |||||||
BioSpecifics Technologies 1 | 20,300 | 1,212,113 | |||||
Dynavax Technologies 1 | 64,800 | 258,552 | |||||
Progenics Pharmaceuticals 1 | 215,200 | 1,327,784 | |||||
Zealand Pharma 1 | 68,758 | 1,494,751 | |||||
| 4,293,200 | |||||||
| HEALTH CARE EQUIPMENT & SUPPLIES - 5.4% | |||||||
| 19,600 | 131,712 | ||||||
AtriCure 1 | 38,600 | 1,151,824 | |||||
Chembio Diagnostics 1 | 142,400 | 867,216 | |||||
CryoLife 1 | 42,089 | 1,259,724 | |||||
Mesa Laboratories | 4,700 | 1,148,398 | |||||
OrthoPediatrics Corporation 1 | 35,000 | 1,365,000 | |||||
Surmodics 1 | 25,178 | 1,086,934 | |||||
Tactile Systems Technology 1 | 16,200 | 922,104 | |||||
| 7,932,912 | |||||||
| HEALTH CARE TECHNOLOGY - 0.1% | |||||||
| 137,661 | 228,517 | ||||||
| LIFE SCIENCES TOOLS & SERVICES - 2.9% | |||||||
Harvard Bioscience 1 | 357,168 | 714,336 | |||||
NeoGenomics 1 | 87,600 | 1,921,944 | |||||
Quanterix Corporation 1 | 49,400 | 1,669,226 | |||||
| 4,305,506 | |||||||
| PHARMACEUTICALS - 0.7% | |||||||
| 257,200 | 555,552 | ||||||
Paratek Pharmaceuticals 1 | 94,600 | 377,454 | |||||
| 8 | Royce Capital Fund 2019 Semiannual Report to Shareholders | THE ACCOMPANYING NOTES ARE AN INTEGRAL PART OF THESE FINANCIAL STATEMENTS |
| June 30, 2019 (unaudited) |
| Royce Capital Fund - Micro-Cap Portfolio (continued) |
| SHARES | VALUE | ||||||
| HEALTH CARE (continued) | |||||||
| PHARMACEUTICALS (continued) | |||||||
Tetraphase Pharmaceuticals 1 | 253,900 | $ | 121,948 | ||||
| 1,054,954 | |||||||
| Total (Cost $13,285,394) | 17,815,089 | ||||||
| INDUSTRIALS – 22.1% | |||||||
| AEROSPACE & DEFENSE - 1.8% | |||||||
Astronics Corporation 1 | 31,026 | 1,247,866 | |||||
CPI Aerostructures 1 | 174,344 | 1,466,233 | |||||
| 2,714,099 | |||||||
| COMMERCIAL SERVICES & SUPPLIES - 1.5% | |||||||
Acme United | 50,865 | 1,148,532 | |||||
Heritage-Crystal Clean 1 | 41,634 | 1,095,391 | |||||
| 2,243,923 | |||||||
| CONSTRUCTION & ENGINEERING - 2.2% | |||||||
Construction Partners Cl. A 1 | 103,000 | 1,547,060 | |||||
Northwest Pipe 1 | 67,500 | 1,740,150 | |||||
| 3,287,210 | |||||||
| ELECTRICAL EQUIPMENT - 1.7% | |||||||
American Superconductor 1 | 117,400 | 1,089,472 | |||||
Encore Wire | 22,800 | 1,335,624 | |||||
| 2,425,096 | |||||||
| INDUSTRIAL CONGLOMERATES - 0.6% | |||||||
Raven Industries | 25,700 | 922,116 | |||||
| MACHINERY - 8.8% | |||||||
Alimak Group | 80,300 | 1,233,103 | |||||
Exco Technologies | 156,700 | 927,361 | |||||
FreightCar America 1 | 86,091 | 505,354 | |||||
Graham Corporation | 67,020 | 1,354,474 | |||||
Greenbrier Companies (The) | 16,600 | 504,640 | |||||
Helios Technologies | 20,100 | 932,841 | |||||
Kadant | 11,931 | 1,083,454 | |||||
Kornit Digital 1 | 48,200 | 1,526,012 | |||||
Lindsay Corporation | 13,100 | 1,076,951 | |||||
Luxfer Holdings | 46,400 | 1,137,728 | |||||
Lydall 1 | 38,800 | 783,760 | |||||
Spartan Motors | 96,100 | 1,053,256 | |||||
Westport Fuel Systems 1 | 345,300 | 935,763 | |||||
| 13,054,697 | |||||||
| MARINE - 0.8% | |||||||
Clarkson | 38,100 | 1,214,465 | |||||
| PROFESSIONAL SERVICES - 3.8% | |||||||
CRA International | 22,106 | 847,323 | |||||
GP Strategies 1 | 90,608 | 1,366,369 | |||||
Heidrick & Struggles International | 25,600 | 767,232 | |||||
Kforce | 32,600 | 1,143,934 | |||||
Resources Connection | 89,254 | 1,428,956 | |||||
| 5,553,814 | |||||||
| ROAD & RAIL - 0.7% | |||||||
Marten Transport | 55,841 | 1,013,514 | |||||
| TRADING COMPANIES & DISTRIBUTORS - 0.2% | |||||||
| 11,300 | 289,167 | ||||||
| Total (Cost $24,128,601) | 32,718,101 | ||||||
| INFORMATION TECHNOLOGY – 21.1% | |||||||
| COMMUNICATIONS EQUIPMENT - 1.3% | |||||||
Digi International 1 | 97,400 | 1,235,032 | |||||
EMCORE Corporation 1 | 149,300 | 491,197 | |||||
Harmonic 1 | 25,700 | 142,635 | |||||
| 1,868,864 | |||||||
| ELECTRONIC EQUIPMENT, INSTRUMENTS & COMPONENTS - 5.0% | |||||||
ePlus 1 | 13,792 | 950,821 | |||||
Fabrinet 1 | 22,669 | 1,125,969 | |||||
| 232,800 | 211,848 | ||||||
| 30,700 | 138,150 | ||||||
nLIGHT 1 | 47,500 | 912,000 | |||||
Novanta 1 | 13,000 | 1,225,900 | |||||
PC Connection | 36,500 | 1,276,770 | |||||
Vishay Precision Group 1 | 38,000 | 1,543,940 | |||||
| 7,385,398 | |||||||
| IT SERVICES - 0.8% | |||||||
Cass Information Systems | 24,048 | 1,165,847 | |||||
| SEMICONDUCTORS & SEMICONDUCTOR EQUIPMENT - 11.4% | |||||||
Adesto Technologies 1 | 220,400 | 1,796,260 | |||||
Aehr Test Systems 1 | 349,500 | 576,675 | |||||
AXT 1 | 148,600 | 588,456 | |||||
Brooks Automation | 29,500 | 1,143,125 | |||||
†Camtek | 51,800 | 437,710 | |||||
Cohu | 46,800 | 722,124 | |||||
CyberOptics Corporation 1 | 36,300 | 589,149 | |||||
| 92,500 | 603,100 | ||||||
| 33,400 | 789,576 | ||||||
Nanometrics 1 | 8,900 | 308,919 | |||||
NeoPhotonics Corporation 1 | 227,300 | 950,114 | |||||
Nova Measuring Instruments 1 | 57,500 | 1,471,425 | |||||
PDF Solutions 1 | 85,700 | 1,124,384 | |||||
Photronics 1 | 164,600 | 1,349,720 | |||||
Rudolph Technologies 1 | 58,293 | 1,610,635 | |||||
Silicon Motion Technology ADR | 26,900 | 1,193,822 | |||||
Ultra Clean Holdings 1 | 117,100 | 1,630,032 | |||||
| 16,885,226 | |||||||
| SOFTWARE - 1.8% | |||||||
Agilysys 1 | 66,800 | 1,434,196 | |||||
QAD Cl. A | 31,800 | 1,278,678 | |||||
| 2,712,874 | |||||||
| TECHNOLOGY HARDWARE, STORAGE & PERIPHERALS - 0.8% | |||||||
AstroNova | 43,700 | 1,129,208 | |||||
| Total (Cost $23,530,501) | 31,147,417 | ||||||
| MATERIALS – 4.1% | |||||||
| CHEMICALS - 2.0% | |||||||
FutureFuel Corporation | 62,400 | 729,456 | |||||
Quaker Chemical | 5,288 | 1,072,829 | |||||
Trecora Resources 1 | 115,400 | 1,104,378 | |||||
| 2,906,663 | |||||||
| METALS & MINING - 2.1% | |||||||
Haynes International | 39,870 | 1,268,265 | |||||
Major Drilling Group International 1 | 254,700 | 822,711 | |||||
Universal Stainless & Alloy Products 1 | 63,700 | 1,019,200 | |||||
| 3,110,176 | |||||||
| Total (Cost $6,023,402) | 6,016,839 | ||||||
| REAL ESTATE – 3.0% | |||||||
| EQUITY REAL ESTATE INVESTMENT TRUSTS (REITS) - 1.4% | |||||||
Community Healthcare Trust | 32,200 | 1,269,002 | |||||
†Postal Realty Trust Cl. A | 50,400 | 793,800 | |||||
| 2,062,802 | |||||||
| REAL ESTATE MANAGEMENT & DEVELOPMENT - 1.6% | |||||||
FRP Holdings 1 | 23,440 | 1,307,249 | |||||
| THE ACCOMPANYING NOTES ARE AN INTEGRAL PART OF THESE FINANCIAL STATEMENTS | Royce Capital Fund 2019 Semiannual Report to Shareholders | 9 |
| Schedule of Investments | June 30, 2019 (unaudited) |
| Royce Capital Fund - Micro-Cap Portfolio (continued) |
| SHARES | VALUE | ||||||
| REAL ESTATE (continued) | |||||||
| REAL ESTATE MANAGEMENT & DEVELOPMENT (continued) | |||||||
Marcus & Millichap 1 | 33,900 | $ | 1,045,815 | ||||
| 2,353,064 | |||||||
| Total (Cost $3,100,777) | 4,415,866 | ||||||
| TOTAL COMMON STOCKS | |||||||
| (Cost $116,216,737) | 138,834,120 | ||||||
| REPURCHASE AGREEMENT – 6.6% | |||||||
| Fixed Income Clearing Corporation, 0.50% dated 6/28/19, due 7/1/19, maturity value $9,737,406 (collateralized by obligations of various U.S. Government Agencies, 1.75% due 05/31/22, valued at $9,935,991) | |||||||
| (Cost $9,737,000) | 9,737,000 | ||||||
| COLLATERAL RECEIVED FOR SECURITIES LOANED – 0.6% | |||||||
| Money Market Funds | |||||||
Federated Government Obligations Fund (7 day yield-2.2655%) | |||||||
| (Cost $868,441) | 868,441 | ||||||
| TOTAL INVESTMENTS – 101.1% | |||||||
| (Cost $126,822,178) | 149,439,561 | ||||||
| LIABILITIES LESS CASH AND OTHER ASSETS – (1.1)% | (1,640,919 | ) | |||||
| NET ASSETS – 100.0% | $ | 147,798,642 | |||||
ADR – American Depository Receipt
| † | New additions in 2019. |
| 1 | Non-income producing. |
| 2 | All or a portion of these securities were on loan at June 30, 2019. |
| 3 | Securities for which market quotations are not readily available represent 0.3% of net assets. These securities have been valued at their fair value under procedures approved by the Fund’s Board of Trustees. These securities are defined as Level 3 securities due to the use of significant unobservable inputs in the determination of fair value. See Notes to Financial Statements. |
Bold indicates the Fund’s 20 largest equity holdings in terms of June 30, 2019, market value.
| 10 | Royce Capital Fund 2019 Semiannual Report to Shareholders | THE ACCOMPANYING NOTES ARE AN INTEGRAL PART OF THESE FINANCIAL STATEMENTS |
| This page is intentionally left blank. |
| Royce Capital Fund 2019 Semiannual Report to Shareholders | 11 |
| MANAGER’S DISCUSSION |
| Royce Capital Fund–Small-Cap Portfolio (RCS) |
 |
| Jay Kaplan, CFA |
| FUND PERFORMANCE |
| Royce Capital Fund–Small-Cap Portfolio increased 8.5% for the year-to-date period ended June 30, 2019, trailing respective gains of 17.0% and 13.5% for its small-cap benchmarks, the Russell 2000 and Russell 2000 Value Indexes, for the same period. |
| WHAT WORKED... AND WHAT DIDN’T |
| Five of the portfolio’s 11 equity sectors finished the year-to-date period in the black. Industrials, Information Technology, and Financials were the strongest contributors, while Materials and Health Care were more muted. Three sectors finished in the red, with Consumer Discretionary making the biggest detraction, followed by much smaller negative impacts from Energy and Communication Services. (Real Estate, Utilities, and Consumer Staples were essentially flat.) |
| At the industry level, electronic equipment, instruments & components (Information Technology) was the strongest positive contributor in 2019’s first half. The rising shares of Insight Enterprises, which provides information technology hardware and software for large and small enterprises, helped both this industry and the portfolio as a whole. Investors seemed drawn to its improved margins and earnings, along with its solid outlook for the rest of the year. We took some gains as its stock rose. Machinery (Industrials) was the second-biggest industry contributor, boosted by Meritor, which supplies drivetrain, braking, and other aftermarket solutions for commercial and industrial vehicles. Improved revenues and better-than-expected earnings were driven largely by higher North American truck production. It was the portfolio’s second-largest holding at the end of June. |
| Specialty retail (Consumer Discretionary) detracted most at the industry level, due in part to poor performance from Caleres and top-10 holding, Shoe Carnival. Several factors hurt Caleres, such as reduced traffic and same-store sales growth at the firm’s Famous Footwear retailer (which accounts for about half of its profits); near-term margin pressure from having to clear excess inventory at hefty discounts in advance of new, much improved back-to-school styles from Famous Footwear’s largest vendor; and the negative impact that the threatened next round of U.S. tariffs on China-made goods would have on consumer prices and demand. Few retailers were immune from these anxieties, but it seemed to us that the shares of apparel and footwear companies, which also included Shoe Carnival, were among the hardest hit. Ever contrarian and always thinking about the long run, we began to build our stake in Caleres in late June. |
| G-III Apparel Group lost most in the textiles, apparel & luxury goods group, the second-biggest industry detractor. Its stock suffered from the same tariff worries that helped hurt Caleres and Shoe Carnival as well as from poor results from its retail arm. We like that G-III is preparing to move some production out of China. It also maintains a strong wholesale business, powered by popular brands such as DKNY, Donna Karan, and Tommy Hilfiger. ArcBest is a freight and logistics solutions specialist that saw its business stall in the first quarter. Believing in its long-term prospects and thinking that its shares were punished disproportionately by recession fears, we held our position at the end of June. |
| Relative to the Russell 2000, both poor stock picking and sector allocation were sources of first-half underperformance. Stock selection in Consumer Discretionary hurt most, particularly in specialty retail. Stock selection also hurt in Information Technology, primarily in electronic equipment, instruments & components, and in Industrials, where professional services and road & rail detracted most. Materials was the sole source of first-half outperformance, thanks mostly to savvy stock selection in metals & mining—the only industry in this sector where we had exposure. |
| Top Contributors to Performance | ||||
| Year-to-Date Through 6/30/19 (%)1 | ||||
| Insight Enterprises | 0.91 | |||
| Meritor | 0.86 | |||
| Advanced Energy Industries | 0.56 | |||
| Camden National | 0.51 | |||
| Apogee Enterprises | 0.50 | |||
| 1 Includes dividends | ||||
| Top Detractors from Performance | ||||
| Year-to-Date Through 6/30/19 (%)2 | ||||
| G-III Apparel Group | -0.66 | |||
| ArcBest | -0.52 | |||
| Caleres | -0.42 | |||
| Shoe Carnival | -0.35 | |||
| Celestica | -0.33 | |||
| 2 Net of dividends | ||||
| CURRENT POSITIONING AND OUTLOOK |
| There’s been an ongoing slugfest among investors: in one corner, large-cap indexes have been routinely reaching new highs, the labor market is strong, and the economy is growing; on the opposite side of the ring, small-caps have been lagging large-caps—which seldom happens in a vibrant economy—the yield curve was flat or inverted through much of the first half, and economies outside the U.S. are slowing more quickly and appreciably than our own. So optimism, including the more cautious variety, is facing off against a pessimism that sees recession as imminent. Needless to say, only one of these combatants will be able to claim victory. For our part, we are squarely in the guarded optimism camp. We see growth slowing at a marginal pace—and certainly not contracting, which is the key distinction. Many of our holdings finished June at prices that looked to us like a recession had already been priced in. We have therefore been adding to positions in select cyclical areas such as trucking, trucks and automobile components, and footwear manufactures and retailers. We have not found many new opportunities, however, due to the otherwise mostly elevated state of many small-cap valuations. Recent relative performance challenges notwithstanding, we are comfortable with how we’ve positioned the portfolio in the face of ongoing uncertainty. |
| 12 | Royce Capital Fund 2019 Semiannual Report to Shareholders |
| PERFORMANCE AND PORTFOLIO REVIEW | TICKER SYMBOLS RCPFX RCSSX |
| Performance and Expenses | ||||||||||||||||
| Average Annual Total Return (%) Through 6/30/19 | ||||||||||||||||
| JAN-JUN 20191 | 1-YR | 3-YR | 5-YR | 10-YR | 15-YR | 20-YR | SINCE INCEPTION (12/27/96) | |||||||||
| RCS | 8.51 | -7.10 | 7.18 | 2.52 | 9.90 | 7.08 | 9.56 | 9.93 | ||||||||
| Annual Gross Operating Expenses: 1.11% Annual Net Operating Expenses: 1.08% | ||||||||||||||||
| 1 Not annualized | ||||||||||||||||
Relative Returns: Monthly Rolling Average Annual Return Periods
| On a monthly rolling basis, the Fund outperformed the Russell 2000 in 59% of all 10-year periods; 57% of all 5-year periods; and 51% of all 1-year periods. |
| PERIODS BEATING THE INDEX | FUND AVG (%)1 | INDEX AVG (%)1 | ||||||||||
| 10-year | 71/121 | 59% | 8.8 | 7.8 | ||||||||
| 5-year | 104/181 | 57% | 9.7 | 8.8 | ||||||||
| 1-year | 116/229 | 51% | 11.6 | 9.6 | ||||||||
The Morningstar Style Map is the Morningstar Style BoxTM with the center 75% of fund holdings plotted as the Morningstar Ownership ZoneTM. The Morningstar Style Box is designed to reveal a fund’s investment strategy. The Morningstar Ownership Zone provides detail about a portfolio’s investment style by showing the range of stock sizes and styles. The Ownership Zone is derived by plotting each stock in the portfolio within the proprietary Morningstar Style Box. Over time, the shape and location of a fund’s ownership zone may vary. See page 29 for additional information. |
Value of $10,000

Includes reinvestment of distributions.
| Top 10 Positions | ||
| % of Net Assets | ||
| Hilton Grand Vacations | 2.5 | |
| Meritor | 2.5 | |
| Insight Enterprises | 2.4 | |
| Miller Industries | 2.4 | |
| Allegiant Travel | 2.3 | |
| Designer Brands Cl. A | 2.1 | |
| Kulicke & Soffa Industries | 2.1 | |
| Shoe Carnival | 2.0 | |
| Sanmina Corporation | 2.0 | |
| Camden National | 2.0 | |
| Portfolio Sector Breakdown | ||
| % of Net Assets | ||
| Industrials | 29.8 | |
| Financials | 24.7 | |
| Information Technology | 16.1 | |
| Consumer Discretionary | 15.1 | |
| Energy | 2.7 | |
| Consumer Staples | 1.7 | |
| Communication Services | 1.6 | |
| Health Care | 1.0 | |
| Real Estate | 1.0 | |
| Materials | 0.5 | |
| Cash and Cash Equivalents | 5.8 | |
| Calendar Year Total Returns (%) | ||
| YEAR | RCS | |
| 2018 | -8.3 | |
| 2017 | 5.4 | |
| 2016 | 21.0 | |
| 2015 | -11.8 | |
| 2014 | 3.2 | |
| 2013 | 34.8 | |
| 2012 | 12.5 | |
| 2011 | -3.3 | |
| 2010 | 20.5 | |
| 2009 | 35.2 | |
| 2008 | -27.2 | |
| 2007 | -2.1 | |
| 2006 | 15.6 | |
| 2005 | 8.6 | |
| 2004 | 25.0 | |
| Upside/Downside Capture Ratios | ||||
| Periods Ended 6/30/19 (%) | ||||
| UPSIDE | DOWNSIDE | |||
| 10-Year | 72 | 70 | ||
| From 12/31/96 (Start of Fund’s First Full Quarter) | 92 | 75 | ||
| Portfolio Diagnostics | ||
| Fund Net Assets | $276 million | |
| Number of Holdings | 84 | |
| Turnover Rate | 84% | |
| Average Market Capitalization1 | $1,110 million | |
| Weighted Average P/B Ratio2 | 1.7x | |
| Active Share3 | 96% | |
| U.S. Investments (% of Net Assets) | 87.4% | |
| Non-U.S. Investments (% of Net Assets) | 6.8% | |
| 1 | Geometric Average. This weighted calculation uses each portfolio holding’s market cap in a way designed to not skew the effect of very large or small holdings; instead, it aims to better identify the portfolio’s center, which Royce believes offers a more accurate measure of average market cap than a simple mean or median. |
| 2 | Harmonic Average. This weighted calculation evaluates a portfolio as if it were a single stock and measures it overall. It compares the total market value of the portfolio to the portfolio’s share in the earnings or book value, as the case may be, of its underlying stocks. |
| 3 | Active Share is the sum of the absolute values of the different weightings of each holding in the Fund versus each holding in the benchmark, divided by two. |
| Important Performance and Expense Information All performance information in this Report reflects past performance, is presented on a total return basis, reflects the reinvestment of distributions, and does not reflect the deduction of taxes that a shareholder would pay on fund distributions or the redemption of fund shares. Past performance is no guarantee of future results. Investment return and principal value of an investment will fluctuate, so that shares may be worth more or less than their original cost when redeemed. Current performance may be higher or lower than performance quoted. The Fund’s total returns do not reflect any deduction for charges or expenses of the variable contracts investing in the Fund. Returns as of the most recent month-end may be obtained at www.roycefunds.com. All performance and risk information reflects the result of the Investment Class (its oldest class). Shares of RCS’s Service Class bear an annual distribution expense that is not borne by the Investment Class; if those expenses were reflected, total returns would have been lower. Certain immaterial adjustments were made to the net assets of Royce Capital Fund-Small-Cap Portfolio at 12/31/17 for financial reporting purposes, and as a result the calendar year total returns based on those net assets values differ from the adjusted net values and calendar year total returns reported in the Financial Highlights. The Fund’s total returns do not reflect any deduction for charges or expenses of the variable contracts investing in the Fund. Gross operating expenses reflect the Fund’s total gross operating expenses for the Investment Class and include management fees and other expenses. Net operating expenses reflect contractual fee waivers and/or expense reimbursements. All expense information is reported as of the Fund’s most current prospectus. Royce & Associates has contractually agreed, without right of termination, to waive fees and/or reimburse expenses to the extent necessary to maintain the Investment Class’s net annual operating expenses (excluding brokerage commissions, taxes, interest, litigation expenses, acquired fund fees and expenses, and other expenses not borne in the ordinary course of business) at or below 1.08% through April 30, 2020. Regarding the “Top Contributors” and “Top Detractors” tables shown above, the sum of all contributors to, and all detractors from, performance for all securities in the portfolio would approximate the Fund’s year-to-date performance for 2019. Upside Capture Ratio measures a manager’s performance in up markets relative to the Fund’s benchmark. It is calculated by measuring the Fund’s performance in quarters when the benchmark went up and dividing it by the benchmark’s return in those quarters. Downside Capture Ratio measures a manager’s performance in down markets relative to the Fund’s benchmark (Russell 2000). It is calculated by measuring the Fund’s performance in quarters when the benchmark goes down and dividing it by the benchmark’s return in those quarters. |
| Royce Capital Fund 2019 Semiannual Report to Shareholders | 13 |
Schedule of Investments
| Royce Capital Fund - Small-Cap Portfolio | ||||||||
| Common Stocks – 94.2% | ||||||||
| SHARES | VALUE | |||||||
| COMMUNICATION SERVICES – 1.6% | ||||||||
| MEDIA - 1.6% | ||||||||
Saga Communications Cl. A | 141,036 | $ | 4,405,965 | |||||
| Total (Cost $6,074,969) | 4,405,965 | |||||||
| CONSUMER DISCRETIONARY – 15.1% | ||||||||
| AUTO COMPONENTS - 2.7% | ||||||||
Cooper-Standard Holdings 1 | 9,200 | 421,544 | ||||||
Gentex Corporation | 84,116 | 2,070,095 | ||||||
Stoneridge 1 | 41,205 | 1,300,018 | ||||||
†Tower International | 193,551 | 3,774,244 | ||||||
| 7,565,901 | ||||||||
| HOTELS, RESTAURANTS & LEISURE - 2.9% | ||||||||
Cheesecake Factory | 28,315 | 1,237,932 | ||||||
Hilton Grand Vacations 1 | 214,809 | 6,835,222 | ||||||
| 8,073,154 | ||||||||
| HOUSEHOLD DURABLES - 0.9% | ||||||||
La-Z-Boy | 80,986 | 2,483,031 | ||||||
| INTERNET & DIRECT MARKETING RETAIL - 0.1% | ||||||||
| 33,322 | 411,527 | |||||||
| SPECIALTY RETAIL - 6.2% | ||||||||
American Eagle Outfitters | 167,865 | 2,836,918 | ||||||
Caleres | 138,617 | 2,761,251 | ||||||
Designer Brands Cl. A | 300,866 | 5,767,601 | ||||||
Shoe Carnival | 204,736 | 5,650,714 | ||||||
| 17,016,484 | ||||||||
| TEXTILES, APPAREL & LUXURY GOODS - 2.3% | ||||||||
G-III Apparel Group 1 | 167,365 | 4,923,878 | ||||||
Steven Madden | 39,606 | 1,344,624 | ||||||
| 6,268,502 | ||||||||
| Total (Cost $47,474,348) | 41,818,599 | |||||||
| CONSUMER STAPLES – 1.7% | ||||||||
| FOOD & STAPLES RETAILING - 1.7% | ||||||||
Village Super Market Cl. A | 174,078 | 4,614,808 | ||||||
| Total (Cost $4,659,952) | 4,614,808 | |||||||
| ENERGY – 2.7% | ||||||||
| ENERGY EQUIPMENT & SERVICES - 1.3% | ||||||||
Helmerich & Payne | 71,800 | 3,634,516 | ||||||
| OIL, GAS & CONSUMABLE FUELS - 1.4% | ||||||||
†Alliance Resource Partners L.P. | 199,200 | 3,382,416 | ||||||
Unit Corporation 1 | 40,713 | 361,938 | ||||||
| 3,744,354 | ||||||||
| Total (Cost $7,182,133) | 7,378,870 | |||||||
| FINANCIALS – 24.7% | ||||||||
| BANKS - 11.9% | ||||||||
Ames National | 149,942 | 4,063,428 | ||||||
Bar Harbor Bankshares | 64,381 | 1,711,891 | ||||||
Camden National | 120,348 | 5,520,363 | ||||||
City Holding Company | 35,010 | 2,669,863 | ||||||
CNB Financial | 149,719 | 4,228,064 | ||||||
Codorus Valley Bancorp | 53,660 | 1,234,180 | ||||||
Financial Institutions | 70,182 | 2,045,805 | ||||||
Landmark Bancorp | 36,981 | 885,695 | ||||||
MidWestOne Financial Group | 53,069 | 1,483,809 | ||||||
National Bankshares | 99,057 | 3,856,289 | ||||||
Northrim BanCorp | 81,481 | 2,905,612 | ||||||
Unity Bancorp | 109,438 | 2,484,243 | ||||||
| 33,089,242 | ||||||||
| CAPITAL MARKETS - 2.9% | ||||||||
Houlihan Lokey Cl. A | 28,015 | 1,247,508 | ||||||
Moelis & Company Cl. A | 117,271 | 4,098,621 | ||||||
Pzena Investment Management Cl. A | 312,511 | 2,684,470 | ||||||
| 8,030,599 | ||||||||
| INSURANCE - 2.6% | ||||||||
James River Group Holdings | 27,335 | 1,282,011 | ||||||
Kingstone Companies | 204,395 | 1,768,017 | ||||||
Reinsurance Group of America | 26,036 | 4,062,397 | ||||||
| 7,112,425 | ||||||||
| THRIFTS & MORTGAGE FINANCE - 7.3% | ||||||||
Genworth MI Canada | 163,350 | 5,169,122 | ||||||
Southern Missouri Bancorp | 70,381 | 2,451,370 | ||||||
Timberland Bancorp | 77,177 | 2,306,049 | ||||||
TrustCo Bank Corp. NY | 618,682 | 4,899,962 | ||||||
WSFS Financial | 128,900 | 5,323,570 | ||||||
| 20,150,073 | ||||||||
| Total (Cost $60,778,056) | 68,382,339 | |||||||
| HEALTH CARE – 1.0% | ||||||||
| HEALTH CARE PROVIDERS & SERVICES - 1.0% | ||||||||
AMN Healthcare Services 1 | 21,941 | 1,190,299 | ||||||
Ensign Group (The) | 28,314 | 1,611,633 | ||||||
| Total (Cost $1,689,236) | 2,801,932 | |||||||
| INDUSTRIALS – 29.8% | ||||||||
| AEROSPACE & DEFENSE - 0.9% | ||||||||
Magellan Aerospace | 194,200 | 2,417,212 | ||||||
| AIRLINES - 5.3% | ||||||||
Allegiant Travel | 44,393 | 6,370,396 | ||||||
Hawaiian Holdings | 153,055 | 4,198,299 | ||||||
Spirit Airlines 1 | 86,432 | 4,125,399 | ||||||
| 14,694,094 | ||||||||
| BUILDING PRODUCTS - 1.0% | ||||||||
Apogee Enterprises | 67,417 | 2,928,595 | ||||||
| COMMERCIAL SERVICES & SUPPLIES - 2.5% | ||||||||
Herman Miller | 68,403 | 3,057,614 | ||||||
Kimball International Cl. B | 219,982 | 3,834,286 | ||||||
| 6,891,900 | ||||||||
| CONSTRUCTION & ENGINEERING - 0.5% | ||||||||
Comfort Systems USA | 26,269 | 1,339,456 | ||||||
| ELECTRICAL EQUIPMENT - 1.0% | ||||||||
EnerSys | 40,936 | 2,804,116 | ||||||
| MACHINERY - 7.5% | ||||||||
Alamo Group | 13,207 | 1,319,776 | ||||||
| 479,296 | 3,843,954 | |||||||
Federal Signal | 50,022 | 1,338,088 | ||||||
Meritor 1 | 280,329 | 6,797,978 | ||||||
Miller Industries | 218,355 | 6,714,416 | ||||||
Wabash National | 39,854 | 648,425 | ||||||
| 20,662,637 | ||||||||
| PROFESSIONAL SERVICES - 5.6% | ||||||||
Heidrick & Struggles International | 127,108 | 3,809,427 | ||||||
Kforce | 62,446 | 2,191,230 | ||||||
Korn Ferry | 101,271 | 4,057,929 | ||||||
Resources Connection | 162,180 | 2,596,502 | ||||||
Robert Half International | 27,164 | 1,548,619 | ||||||
TrueBlue 1 | 60,648 | 1,337,895 | ||||||
| 15,541,602 | ||||||||
| 14 | Royce Capital Fund 2019 Semiannual Report to Shareholders | THE ACCOMPANYING NOTES ARE AN INTEGRAL PART OF THESE FINANCIAL STATEMENTS |
| June 30, 2019 (unaudited) |
| Royce Capital Fund - Small-Cap Portfolio (continued) | ||||||||
| SHARES | VALUE | |||||||
| INDUSTRIALS (continued) | ||||||||
| ROAD & RAIL - 4.5% | ||||||||
ArcBest | 154,800 | $ | 4,351,428 | |||||
Old Dominion Freight Line | 9,104 | 1,358,863 | ||||||
Saia 1 | 38,918 | 2,516,827 | ||||||
Werner Enterprises | 134,439 | 4,178,364 | ||||||
| 12,405,482 | ||||||||
| TRADING COMPANIES & DISTRIBUTORS - 1.0% | ||||||||
| 127,332 | 2,699,438 | |||||||
| Total (Cost $78,819,293) | 82,384,532 | |||||||
| INFORMATION TECHNOLOGY – 16.1% | ||||||||
| ELECTRONIC EQUIPMENT, INSTRUMENTS & COMPONENTS - 10.6% | ||||||||
Benchmark Electronics | 53,751 | 1,350,225 | ||||||
Fabrinet 1 | 47,186 | 2,343,729 | ||||||
Insight Enterprises 1 | 116,152 | 6,760,046 | ||||||
Methode Electronics | 46,115 | 1,317,506 | ||||||
PC Connection | 127,535 | 4,461,174 | ||||||
Sanmina Corporation 1 | 184,393 | 5,583,420 | ||||||
Vishay Intertechnology | 294,399 | 4,863,472 | ||||||
Vishay Precision Group 1 | 68,300 | 2,775,029 | ||||||
| 29,454,601 | ||||||||
| SEMICONDUCTORS & SEMICONDUCTOR EQUIPMENT - 5.5% | ||||||||
Advanced Energy Industries 1 | 51,152 | 2,878,323 | ||||||
Kulicke & Soffa Industries | 255,126 | 5,753,091 | ||||||
MKS Instruments | 64,691 | 5,038,782 | ||||||
Silicon Motion Technology ADR | 33,900 | 1,504,482 | ||||||
| 15,174,678 | ||||||||
| Total (Cost $39,890,771) | 44,629,279 | |||||||
| MATERIALS – 0.5% | ||||||||
| METALS & MINING - 0.5% | ||||||||
| 95,182 | 1,313,512 | |||||||
| Total (Cost $1,372,799) | 1,313,512 | |||||||
| REAL ESTATE – 1.0% | ||||||||
| REAL ESTATE MANAGEMENT & DEVELOPMENT - 1.0% | ||||||||
Marcus & Millichap 1 | 87,719 | 2,706,131 | ||||||
| Total (Cost $2,627,614) | 2,706,131 | |||||||
| TOTAL COMMON STOCKS | ||||||||
| (Cost $250,569,171) | 260,435,967 | |||||||
| REPURCHASE AGREEMENT – 5.7% | ||||||||
| Fixed Income Clearing Corporation, 0.50% dated 6/28/19, due 7/1/19, maturity value $15,638,652 (collateralized by obligations of various U.S. Government Agencies, 1.75% due 05/31/22, valued at $15,955,679) | ||||||||
| (Cost $15,638,000) | 15,638,000 | |||||||
| TOTAL INVESTMENTS – 99.9% | ||||||||
| (Cost $266,207,171) | 276,073,967 | |||||||
| CASH AND OTHER ASSETS LESS LIABILITIES – 0.1% | 343,862 | |||||||
| NET ASSETS – 100.0% | $ | 276,417,829 | ||||||
| ADR- American Depository Receipt | |
| † | New additions in 2019. |
| 1 | Non-income producing. |
Bold indicates the Fund’s 20 largest equity holdings in terms of June 30, 2019, market value. |
| THE ACCOMPANYING NOTES ARE AN INTEGRAL PART OF THESE FINANCIAL STATEMENTS | Royce Capital Fund 2019 Semiannual Report to Shareholders | 15 |
| Statements of Assets and Liabilities | June 30, 2019 (unaudited) |
| Micro-Cap | Small-Cap | |||||||
| Portfolio | Portfolio | |||||||
| ASSETS: | ||||||||
| Investments at value (including collateral on loaned securities) 1 | $ | 139,702,561 | $ | 260,435,967 | ||||
| Repurchase agreements (at cost and value) | 9,737,000 | 15,638,000 | ||||||
| Cash and foreign currency | 9,282 | 55,401 | ||||||
| Receivable for investments sold | 18,265 | 634,629 | ||||||
| Receivable for capital shares sold | 17,303 | 210,049 | ||||||
| Receivable for dividends and interest | 115,366 | 273,353 | ||||||
| Receivable for securities lending income | 16,157 | 19 | ||||||
| Prepaid expenses and other assets | 414 | 6,301 | ||||||
| Total Assets | 149,616,348 | 277,253,719 | ||||||
| LIABILITIES: | ||||||||
| Payable for collateral on loaned securities | 868,441 | – | ||||||
| Payable for investments purchased | 276,653 | 371,313 | ||||||
| Payable for capital shares redeemed | 465,559 | 143,000 | ||||||
| Payable for investment advisory fees | 141,109 | 205,818 | ||||||
| Payable for trustees’ fees | 12,551 | 27,171 | ||||||
| Accrued expenses | 53,393 | 88,588 | ||||||
| Total Liabilities | 1,817,706 | 835,890 | ||||||
| Net Assets | $ | 147,798,642 | $ | 276,417,829 | ||||
| ANALYSIS OF NET ASSETS: | ||||||||
| Paid-in capital | $ | 108,907,395 | $ | 212,918,918 | ||||
| Total distributable earnings (loss) | 38,891,247 | 63,498,911 | ||||||
| Net Assets | $ | 147,798,642 | $ | 276,417,829 | ||||
Investment Class | $ | 132,560,108 | $ | 167,294,236 | ||||
Service Class | 15,238,534 | 109,123,593 | ||||||
| SHARES OUTSTANDING (unlimited number of $.001 par value): | ||||||||
Investment Class | 13,352,353 | 19,585,969 | ||||||
Service Class | 1,566,761 | 13,085,753 | ||||||
| NET ASSET VALUES (Net Assets ÷ Shares Outstanding): | ||||||||
(offering and redemption price per share) | ||||||||
Investment Class | $9.93 | $8.54 | ||||||
Service Class | 9.73 | 8.34 | ||||||
| Investments at identified cost | $ | 117,085,178 | $ | 250,569,171 | ||||
| Market value of loaned securities2 | 2,797,383 | – | ||||||
| 1 | See Notes to Financial Statements for information on non-cash collateral on loaned securities. |
| 2 | Market value of loaned securities backed by non-cash collateral is as of prior business day. |
| 16 | Royce Capital Fund 2019 Semiannual Report to Shareholders | THE ACCOMPANYING NOTES ARE AN INTEGRAL PART OF THESE FINANCIAL STATEMENTS |
Statements of Changes in Net Assets
| Micro-Cap Portfolio | Small-Cap Portfolio | |||||||||||||||
| Six Months Ended | Six Months Ended | |||||||||||||||
| 6/30/19 (unaudited) | Year Ended 12/31/18 | 6/30/19 (unaudited) | Year Ended 12/31/18 | |||||||||||||
| INVESTMENT OPERATIONS: | ||||||||||||||||
| Net investment income (loss) | $ | (387,357 | ) | $ | (640,551 | ) | $ | 1,616,026 | $ | 2,028,315 | ||||||
| Net realized gain (loss) on investments and foreign currency | 2,459,076 | 14,233,957 | 4,813,490 | 46,496,665 | ||||||||||||
Net change in unrealized appreciation (depreciation) on investments and foreign currency | 12,817,940 | (26,943,361 | ) | 5,380,735 | (72,052,141 | ) | ||||||||||
| Net increase (decrease) in net assets from investment operations | 14,889,659 | (13,349,955 | ) | 11,810,251 | (23,527,161 | ) | ||||||||||
| DISTRIBUTIONS: | ||||||||||||||||
| Total distributable earnings | ||||||||||||||||
Investment Class | – | (6,692,693 | ) | – | (3,942,054 | ) | ||||||||||
Service Class | – | (764,616 | ) | – | (1,828,028 | ) | ||||||||||
| Total distributions | – | (7,457,309 | ) | – | (5,770,082 | ) | ||||||||||
| CAPITAL SHARE TRANSACTIONS: | ||||||||||||||||
| Value of shares sold | ||||||||||||||||
Investment Class | 5,738,470 | 20,188,911 | 8,801,761 | 20,508,660 | ||||||||||||
Service Class | 2,706,178 | 8,396,343 | 180,413,384 | 3,049,574 | ||||||||||||
| Distributions reinvested | ||||||||||||||||
Investment Class | – | 6,692,693 | – | 3,942,054 | ||||||||||||
Service Class | – | 764,616 | – | 1,828,028 | ||||||||||||
| Value of shares redeemed | ||||||||||||||||
Investment Class | (14,134,458 | ) | (45,283,517 | ) | (28,077,509 | ) | (62,882,019 | ) | ||||||||
Service Class | (3,502,047 | ) | (24,574,409 | ) | (172,220,029 | ) | (153,628,193 | ) | ||||||||
| Net increase (decrease) in net assets from capital share transactions | (9,191,857 | ) | (33,815,363 | ) | (11,082,393 | ) | (187,181,896 | ) | ||||||||
| Net Increase (Decrease) in Net Assets | 5,697,802 | (54,622,627 | ) | 727,858 | (216,479,139 | ) | ||||||||||
| NET ASSETS: | ||||||||||||||||
| Beginning of period | 142,100,840 | 196,723,467 | 275,689,971 | 492,169,110 | ||||||||||||
| End of period | $ | 147,798,642 | $ | 142,100,840 | $ | 276,417,829 | $ | 275,689,971 | ||||||||
| THE ACCOMPANYING NOTES ARE AN INTEGRAL PART OF THESE FINANCIAL STATEMENTS | Royce Capital Fund 2019 Semiannual Report to Shareholders | 17 |
| Statements of Operations | Six Months Ended June 30, 2019 (unaudited) |
| Micro-Cap | Small-Cap | |||||||
| Portfolio | Portfolio | |||||||
| INVESTMENT INCOME: | ||||||||
| INCOME: | ||||||||
| Dividends | $ | 574,782 | $ | 3,447,698 | ||||
| Foreign withholding tax | (13,967 | ) | (32,960 | ) | ||||
| Interest | 17,676 | 58,697 | ||||||
| Securities lending | 47,504 | 20 | ||||||
| Total income | 625,995 | 3,473,455 | ||||||
| EXPENSES: | ||||||||
| Investment advisory fees | 934,024 | 1,559,422 | ||||||
| Distribution fees | 19,569 | 173,251 | ||||||
| Administrative and office facilities | 38,688 | 76,674 | ||||||
| Shareholder reports | 28,734 | 35,530 | ||||||
| Trustees’ fees | 22,000 | 46,615 | ||||||
| Audit | 13,404 | 15,564 | ||||||
| Custody | 12,681 | 25,522 | ||||||
| Shareholder servicing | 6,856 | 6,715 | ||||||
| Legal | 3,053 | 6,700 | ||||||
| Other expenses | 6,860 | 15,932 | ||||||
| Total expenses | 1,085,869 | 1,961,925 | ||||||
| Compensating balance credits | (108 | ) | (70 | ) | ||||
| Fees waived by investment adviser | (36,894 | ) | (62,738 | ) | ||||
| Expenses reimbursed by investment adviser | (35,515 | ) | (41,688 | ) | ||||
| Net expenses | 1,013,352 | 1,857,429 | ||||||
| Net investment income (loss) | (387,357 | ) | 1,616,026 | |||||
| REALIZED AND UNREALIZED GAIN (LOSS) ON INVESTMENTS AND FOREIGN CURRENCY: | ||||||||
| NET REALIZED GAIN (LOSS): | ||||||||
| Investments | 2,460,093 | 4,809,598 | ||||||
| Foreign currency transactions | (1,017 | ) | 3,892 | |||||
| NET CHANGE IN UNREALIZED APPRECIATION (DEPRECIATION): | ||||||||
| Investments | 12,818,532 | 5,380,786 | ||||||
| Other assets and liabilities denominated in foreign currency | (592 | ) | (51 | ) | ||||
| Net realized and unrealized gain (loss) on investments and foreign currency | 15,277,016 | 10,194,225 | ||||||
| NET INCREASE (DECREASE) IN NET ASSETS FROM INVESTMENT OPERATIONS | $ | 14,889,659 | $ | 11,810,251 | ||||
| 18 | Royce Capital Fund 2019 Semiannual Report to Shareholders | THE ACCOMPANYING NOTES ARE AN INTEGRAL PART OF THESE FINANCIAL STATEMENTS |
Financial Highlights
This table is presented to show selected data for a share outstanding throughout each year or other indicated period and to assist shareholders in evaluating a Fund’s performance for the periods presented. Per share amounts have been determined on the basis of the weighted average number of shares outstanding during the period.
| Ratio of Expenses to Average Net Assets | |||||||||||||||||||||||||||||||||||||||||||||||||||||||||||
| Net Asset Value, Beginning of Period | Net Investment Income (Loss) | Net Realized and Unrealized Gain (Loss) on Investments and Foreign Currency | Total from Investment Operations | Distributions from Net Investment Income | Distributions from Net Realized Gain on Investments and Foreign Currency | Total Distributions | Net Asset Value, End of Period | Total Return | Net Assets, End of Period (in thousands) | Prior to Fee Waivers, Expense Reimbursements and Balance Credits | Prior to Fee Waivers and Expense Reimbursements | Net of Fee Waivers and Expense Reimbursements | Ratio of Net Investment Income (Loss) to Average Net Assets | Portfolio Turnover Rate | |||||||||||||||||||||||||||||||||||||||||||||
| Micro-Cap Portfolio–Investment Class | |||||||||||||||||||||||||||||||||||||||||||||||||||||||||||
| 2019† | $ | 8.97 | $ | (0.02 | ) | $ | 0.98 | $ | 0.96 | $ | – | $ | – | $ | – | $ | 9.93 | 10.70 | %1 | $ | 132,560 | 1.42 | %2 | 1.42 | %2 | 1.33 | %2 | (0.49 | )%2 | 8 | % | ||||||||||||||||||||||||||||
| 2018 | 10.39 | (0.03 | ) | (0.90 | ) | (0.93 | ) | – | (0.49 | ) | (0.49 | ) | 8.97 | (9.13 | ) | 127,457 | 1.39 | 1.39 | 1.33 | (0.30 | ) | 28 | |||||||||||||||||||||||||||||||||||||
| 2017 | 11.11 | (0.02 | ) | 0.58 | 0.56 | (0.08 | ) | (1.20 | ) | (1.28 | ) | 10.39 | 5.29 | 164,656 | 1.38 | 1.38 | 1.38 | (0.22 | ) | 30 | |||||||||||||||||||||||||||||||||||||||
| 2016 | 9.34 | 0.03 | 1.81 | 1.84 | (0.07 | ) | – | (0.07 | ) | 11.11 | 19.71 | 177,444 | 1.36 | 1.36 | 1.36 | 0.02 | 57 | ||||||||||||||||||||||||||||||||||||||||||
| 2015 | 11.37 | 0.03 | (1.45 | ) | (1.42 | ) | – | (0.61 | ) | (0.61 | ) | 9.34 | (12.46 | ) | 369,991 | 1.32 | 1.32 | 1.32 | 0.27 | 51 | |||||||||||||||||||||||||||||||||||||||
| 2014 | 12.83 | (0.04 | ) | (0.44 | ) | (0.48 | ) | – | (0.98 | ) | (0.98 | ) | 11.37 | (3.58 | ) | 485,434 | 1.30 | 1.30 | 1.30 | (0.32 | ) | 25 | |||||||||||||||||||||||||||||||||||||
| Micro-Cap Portfolio–Service Class | |||||||||||||||||||||||||||||||||||||||||||||||||||||||||||
| 2019† | $ | 8.80 | $ | (0.04 | ) | $ | 0.97 | $ | 0.93 | $ | – | $ | – | $ | – | $ | 9.73 | 10.57 | %1 | $ | 15,239 | 1.72 | %2 | 1.72 | %2 | 1.58 | %2 | (0.74 | )%2 | 8 | % | ||||||||||||||||||||||||||||
| 2018 | 10.21 | (0.06 | ) | (0.87 | ) | (0.93 | ) | – | (0.48 | ) | (0.48 | ) | 8.80 | (9.29 | ) | 14,644 | 1.64 | 1.64 | 1.58 | (0.57 | ) | 28 | |||||||||||||||||||||||||||||||||||||
| 2017 | 10.93 | (0.04 | ) | 0.57 | 0.53 | (0.06 | ) | (1.19 | ) | (1.25 | ) | 10.21 | 5.02 | 32,067 | 1.64 | 1.64 | 1.58 | (0.43 | ) | 30 | |||||||||||||||||||||||||||||||||||||||
| 2016 | 9.20 | (0.02 | ) | 1.80 | 1.78 | (0.05 | ) | – | (0.05 | ) | 10.93 | 19.37 | 34,675 | 1.65 | 1.65 | 1.58 | (0.15 | ) | 57 | ||||||||||||||||||||||||||||||||||||||||
| 2015 | 11.23 | 0.00 | (1.42 | ) | (1.42 | ) | – | (0.61 | ) | (0.61 | ) | 9.20 | (12.61 | ) | 23,928 | 1.60 | 1.60 | 1.56 | 0.01 | 51 | |||||||||||||||||||||||||||||||||||||||
| 2014 | 12.72 | (0.07 | ) | (0.44 | ) | (0.51 | ) | – | (0.98 | ) | (0.98 | ) | 11.23 | (3.84 | ) | 27,362 | 1.57 | 1.57 | 1.57 | (0.60 | ) | 25 | |||||||||||||||||||||||||||||||||||||
| Small-Cap Portfolio–Investment Class | |||||||||||||||||||||||||||||||||||||||||||||||||||||||||||
| 2019† | $ | 7.87 | $ | 0.05 | $ | 0.62 | $ | 0.67 | $ | – | $ | – | $ | – | $ | 8.54 | 8.51 | %1 | $ | 167,294 | 1.15 | %2 | 1.15 | %2 | 1.08 | %2 | 1.12 | %2 | 84 | % | |||||||||||||||||||||||||||||
| 2018 | 8.77 | 0.06 | (0.78 | ) | (0.72 | ) | (0.07 | ) | (0.11 | ) | (0.18 | ) | 7.87 | (8.24 | ) | 171,561 | 1.11 | 1.11 | 1.08 | 0.62 | 56 | ||||||||||||||||||||||||||||||||||||||
| 2017 | 8.41 | 0.05 | 0.39 | 0.44 | (0.08 | ) | – | (0.08 | ) | 8.77 | 5.26 | 228,620 | 1.11 | 1.11 | 1.11 | 0.55 | 91 | ||||||||||||||||||||||||||||||||||||||||||
| 2016 | 8.43 | 0.13 | 1.66 | 1.79 | (0.17 | ) | (1.64 | ) | (1.81 | ) | 8.41 | 20.96 | 248,244 | 1.09 | 1.09 | 1.09 | 0.89 | 78 | |||||||||||||||||||||||||||||||||||||||||
| 2015 | 12.65 | 0.17 | (1.66 | ) | (1.49 | ) | (0.09 | ) | (2.64 | ) | (2.73 | ) | 8.43 | (11.80 | ) | 356,258 | 1.06 | 1.06 | 1.06 | 1.26 | 59 | ||||||||||||||||||||||||||||||||||||||
| 2014 | 13.92 | 0.06 | 0.35 | 0.41 | (0.02 | ) | (1.66 | ) | (1.68 | ) | 12.65 | 3.24 | 577,222 | 1.05 | 1.05 | 1.05 | 0.44 | 36 | |||||||||||||||||||||||||||||||||||||||||
| Small-Cap Portfolio–Service Class | |||||||||||||||||||||||||||||||||||||||||||||||||||||||||||
| 2019† | $ | 7.69 | $ | 0.04 | $ | 0.61 | $ | 0.65 | $ | – | $ | – | $ | – | $ | 8.34 | 8.45 | %1 | $ | 109,124 | 1.39 | %2 | 1.39 | %2 | 1.33 | %2 | 0.93 | %2 | 84 | % | |||||||||||||||||||||||||||||
| 2018 | 8.55 | 0.04 | (0.76 | ) | (0.72 | ) | (0.03 | ) | (0.11 | ) | (0.14 | ) | 7.69 | (8.50 | ) | 104,129 | 1.34 | 1.34 | 1.33 | 0.31 | 56 | ||||||||||||||||||||||||||||||||||||||
| 2017 | 8.20 | 0.02 | 0.40 | 0.42 | (0.07 | ) | – | (0.07 | ) | 8.55 | 5.10 | 263,549 | 1.34 | 1.34 | 1.34 | 0.32 | 91 | ||||||||||||||||||||||||||||||||||||||||||
| 2016 | 8.27 | 0.03 | 1.69 | 1.72 | (0.15 | ) | (1.64 | ) | (1.79 | ) | 8.20 | 20.53 | 267,445 | 1.34 | 1.34 | 1.34 | 0.69 | 78 | |||||||||||||||||||||||||||||||||||||||||
| 2015 | 12.44 | 0.13 | (1.62 | ) | (1.49 | ) | (0.04 | ) | (2.64 | ) | (2.68 | ) | 8.27 | (11.97 | ) | 128,285 | 1.31 | 1.31 | 1.31 | 1.00 | 59 | ||||||||||||||||||||||||||||||||||||||
| 2014 | 13.74 | 0.03 | 0.33 | 0.36 | – | (1.66 | ) | (1.66 | ) | 12.44 | 2.92 | 218,175 | 1.30 | 1.30 | 1.30 | 0.21 | 36 | ||||||||||||||||||||||||||||||||||||||||||
| † | Six months ended June 30, 2019 (unaudited). |
| 1 | Not annualized |
| 2 | Annualized |
| THE ACCOMPANYING NOTES ARE AN INTEGRAL PART OF THESE FINANCIAL STATEMENTS | Royce Capital Fund 2019 Semiannual Report to Shareholders | 19 |
Notes to Financial Statements (unaudited)
| Summary of Significant Accounting Policies: |
| Royce Capital Fund – Micro-Cap Portfolio and Royce Capital Fund – Small-Cap Portfolio (the “Fund” or “Funds”) are the two series of Royce Capital Fund (the “Trust”), an open-end management investment company organized as a Delaware statutory trust. Shares of the Funds are offered to life insurance companies for allocation to certain separate accounts established for the purpose of funding qualified and non-qualified variable annuity contracts and variable life insurance contracts. Micro-Cap Portfolio and Small-Cap Portfolio commenced operations on December 27, 1996. |
| Classes of shares have equal rights as to earnings and assets, except that each class may bear different fees and expenses for distribution, shareholder servicing, registration and shareholder reports, and receive different compensating balance credits and expense reimbursements. Investment income, realized and unrealized capital gains or losses on investments and foreign currency, and expenses other than those attributable to a specific class are allocated to each class of shares based on its relative net assets. |
| The preparation of financial statements in conformity with accounting principles generally accepted in the United States requires management to make estimates and assumptions that affect the reported amounts of assets and liabilities and the disclosure of contingent assets and liabilities at the date of the financial statements and the reported amounts of income and expenses during the reporting period. Actual results could differ from those estimates. |
| Each Fund is an investment company and accordingly follows the investment company accounting and reporting guidance of the Financial Accounting Standards Board (FASB) Accounting Standard Codification Topic 946 “Financial Services-Investment Companies”. |
| VALUATION OF INVESTMENTS: |
| Securities are valued as of the close of trading on the New York Stock Exchange (NYSE) (generally 4:00 p.m. Eastern time) on the valuation date. Securities that trade on an exchange, and securities traded on Nasdaq’s Electronic Bulletin Board, are valued at their last reported sales price or Nasdaq official closing price taken from the primary market in which each security trades or, if no sale is reported for such day, at their highest bid price. Other over-the-counter securities for which market quotations are readily available are valued at their highest bid price, except in the case of some bonds and other fixed income securities which may be valued by reference to other securities with comparable ratings, interest rates and maturities, using established independent pricing services. The Funds value their non-U.S. dollar denominated securities in U.S. dollars daily at the prevailing foreign currency exchange rates as quoted by a major bank. Securities for which market quotations are not readily available are valued at their fair value in accordance with the provisions of the 1940 Act, under procedures approved by the Trust’s Board of Trustees, and are reported as Level 3 securities. As a general principle, the fair value of a security is the amount which the Fund might reasonably expect to receive for the security upon its current sale. However, in light of the judgment involved in fair valuations, there can be no assurance that a fair value assigned to a particular security will be the amount which the Fund might be able to receive upon its current sale. In addition, if, between the time trading ends on a particular security and the close of the customary trading session on the NYSE, events occur that are significant and may make the closing price unreliable, a Fund may fair value the security. The Funds use an independent pricing service to provide fair value estimates for relevant non-U.S. equity securities on days when the U.S. market volatility exceeds a certain threshold. This pricing service uses proprietary correlations it has developed between the movement of prices of non-U.S. equity securities and indices of U.S.-traded securities, futures contracts and other indications to estimate the fair value of relevant non-U.S. securities. When fair value pricing is employed, the prices of securities used by a Fund may differ from quoted or published prices for the same security. Investments in money market funds are valued at net asset value per share. |
| Various inputs are used in determining the value of each Fund’s investments, as noted above. These inputs are summarized in the three broad levels below: |
| Level 1 | – | quoted prices in active markets for identical securities. | ||
| Level 2 | – | other significant observable inputs (including quoted prices for similar securities, foreign securities that may be fair valued and repurchase agreements). The table below includes all Level 2 securities. Any Level 2 securities with values based on quoted prices for similar securities would be noted in the Schedules of Investments. | ||
| Level 3 | – | significant unobservable inputs (including last trade price before trading was suspended, or at a discount thereto for lack of marketability or otherwise, market price information regarding other securities, information received from the company and/or published documents, including SEC filings and financial statements, or other publicly available information). |
| The inputs or methodology used for valuing securities are not necessarily an indication of the risk associated with investing in those securities. |
| The following is a summary of the inputs used to value each Fund’s investments as of June 30, 2019. For a detailed breakout of common stocks by sector classification, please refer to the Schedules of Investments. |
| LEVEL 1 | LEVEL 2 | LEVEL 3 | TOTAL | ||||||||||||
| Micro-Cap Portfolio | |||||||||||||||
| Common Stocks | $ | 138,443,520 | $ | – | $ | 390,600 | $ | 138,834,120 | |||||||
| Repurchase Agreement | – | 9,737,000 | – | 9,737,000 | |||||||||||
| Money Market Fund/Collateral Received for Securities Loaned | 868,441 | – | – | 868,441 | |||||||||||
| 20 | Royce Capital Fund 2019 Semiannual Report to Shareholders |
| VALUATION OF INVESTMENTS (continued): | |||||||||||||||
| LEVEL 1 | LEVEL 2 | LEVEL 3 | TOTAL | ||||||||||||
| Small-Cap Portfolio | |||||||||||||||
| Common Stocks | $ | 260,435,967 | $ | – | $ | – | $ | 260,435,967 | |||||||
| Repurchase Agreement | – | 15,638,000 | – | 15,638,000 | |||||||||||
| Level 3 Reconciliation: | ||||||||||||||||||||||
| BALANCE AS OF 12/31/18 | PURCHASES | SALES | REALIZED GAIN (LOSS) | UNREALIZED GAIN (LOSS)1 | BALANCE AS OF 6/30/19 | |||||||||||||||||
| Micro-Cap Portfolio | ||||||||||||||||||||||
| Common Stocks | $390,600 | $ – | $ – | $ – | $ – | $390,600 | ||||||||||||||||
| 1 | The net change in unrealized appreciation (depreciation) is included in the accompanying Statement of Operations. Change in unrealized appreciation (depreciation) includes net unrealized appreciation (depreciation) resulting from changes in investment values during the reporting period and the reversal of previously recorded unrealized appreciation (depreciation) when gains or losses are realized. Net realized gain (loss) from investments and foreign currency transactions is included in the accompanying Statement of Operations. |
The following table summarizes the valuation techniques used and unobservable inputs approved by the Valuation Committee to determine the fair value of certain Level 3 investments. The table does not include Level 3 investments with values derived utilizing prices from prior transactions or third party pricing information with adjustments (e.g. broker quotes, pricing services, net asset values).
| FAIR VALUE AT | IMPACT TO VALUATION FROM | ||||||||||||||
| 6/30/19 | VALUATION TECHNIQUE(S) | UNOBSERVABLE INPUT(S) | RANGE AVERAGE | AN INCREASE IN INPUT1 | |||||||||||
| Micro-Cap Portfolio | |||||||||||||||
| Common Stocks | $390,600 | Discounted Present Value Balance Sheet Analysis | Liquidity Discount | 30%-40% | Decrease | ||||||||||
| 1 | This column represents the directional change in the fair value of the Level 3 investments that would result in an increase from the corresponding unobservable input. A decrease to the unobservable input would have the opposite effect. Significant increases and decreases in these unobservable inputs in isolation could result in significantly higher or lower fair value measurements. |
| REPURCHASE AGREEMENTS: |
| The Funds may enter into repurchase agreements with institutions that the Funds’ investment adviser has determined are creditworthy. Each Fund restricts repurchase agreements to maturities of no more than seven days. Securities pledged as collateral for repurchase agreements, which are held until maturity of the repurchase agreements, are marked-to-market daily and maintained at a value at least equal to the principal amount of the repurchase agreement (including accrued interest). Repurchase agreements could involve certain risks in the event of default or insolvency of the counter-party, including possible delays or restrictions upon the ability of each Fund to dispose of its underlying securities. The remaining contractual maturities of repurchase agreements held by the Funds at June 30, 2019 are overnight and continuous. |
| FOREIGN CURRENCY: |
| Net realized foreign exchange gains or losses arise from sales and maturities of short-term securities, sales of foreign currencies, expiration of currency forward contracts, currency gains or losses realized between the trade and settlement dates on securities transactions, and the difference between the amounts of dividends, interest, and foreign withholding taxes recorded on each Fund’s books and the U.S. dollar equivalent of the amounts actually received or paid. Net unrealized foreign exchange gains and losses arise from changes in the value of assets and liabilities, other than investments in securities at the end of the reporting period, as a result of changes in foreign currency exchange rates. |
| The Funds do not isolate that portion of the results of operations resulting from fluctuations in foreign exchange rates on investments from the fluctuations arising from changes in market prices of securities held. Such fluctuations are included with the net realized and unrealized gain or loss on investments. |
| SECURITIES LENDING: |
| The Funds loan securities through a lending agent to qualified institutional investors for the purpose of realizing additional income. Collateral for the Funds on all securities loaned is accepted in cash and cash equivalents, which are invested temporarily by the custodian, as well as non-cash collateral, which includes short and long-term U.S. Treasuries. The collateral maintained is at least 100% of the current market value of the loaned securities. The market value of the loaned securities is determined at the close of business of the Funds and any additional required collateral is delivered to the Funds on the next business day. The Funds retain the risk of any loss on the securities on loan as well as incurring the potential loss on investments purchased with cash collateral received for securities lending. In the event of default or bankruptcy by the other party to the agreement, realization and/or retention of the collateral may be subject to legal proceedings. If the borrower fails to return loaned securities, and cash collateral being maintained by the borrower is insufficient to cover |
| Royce Capital Fund 2019 Semiannual Report to Shareholders | 21 |
Notes to Financial Statements (unaudited) (continued)
| SECURITIES LENDING (continued): |
| the value of loaned securities and provided such collateral insufficiency is not the result of investment losses, the lending agent has agreed to pay the amount of the shortfall to the Funds or, at the option of the lending agent, to replace the securities. In the event of the bankruptcy of the borrower, the Funds could experience delay in recovering the loaned securities or only recover cash or a security of equivalent value. Loans of securities generally do not have stated maturity dates, and the Funds may recall a security at any time. The Funds’ securities lending income consists of the income earned on investing cash collateral, plus any premium payments received for lending certain securities, less any rebates paid to borrowers and lending agent fees associated with the loan. The lending agent is not affiliated with Royce. The following table presents cash collateral and the market value of securities on loan collateralized by cash collateral held by the Funds at June 30, 2019: |
| CASH COLLATERAL1 | SECURITIES ON LOAN COLLATERALIZED BY CASH COLLATERAL | NET AMOUNT | |||||||||||
| Micro-Cap Portfolio | $868,441 | $(791,482) | $76,959 | ||||||||||
| 1Absent an event of default, assets and liabilities are presented gross and not offset in the Statements of Assets and Liabilities. The remaining contractual maturity of cash collateral is overnight and continuous. |
The following table presents non-cash collateral and the market value of securities on loan collateralized by non-cash collateral held by the Funds’ custodian at June 30, 2019:
| NON-CASH COLLATERAL | SECURITIES ON LOAN COLLATERALIZED BY NON-CASH COLLATERAL | NET AMOUNT | |||||||||||
| Micro-Cap Portfolio | $2,049,156 | $(2,005,901) | $43,255 | ||||||||||
| DISTRIBUTIONS AND TAXES: |
| As qualified regulated investment companies under Subchapter M of the Internal Revenue Code, the Funds are not subject to income taxes to the extent that each Fund distributes substantially all of its taxable income for its fiscal year. |
| The Funds pay any dividends and capital gain distributions annually in December. Dividends from net investment income and distributions from capital gains are determined at a class level. Because federal income tax regulations differ from generally accepted accounting principles, income and capital gain distributions determined in accordance with tax regulations may differ from net investment income and realized gains recognized for financial reporting purposes. Accordingly, the character of distributions and composition of net assets for tax purposes differ from those reflected in the accompanying financial statements. |
| INVESTMENT TRANSACTIONS AND RELATED INVESTMENT INCOME: |
| Investment transactions are accounted for on the trade date. Dividend income is recorded on the ex-dividend date. Non-cash dividend income is recorded at the fair market value of the securities received. Interest income is recorded on an accrual basis. Realized gains and losses from investment transactions are determined on the basis of identified cost for book and tax purposes. |
| EXPENSES: |
| The Funds incur direct and indirect expenses. Expenses directly attributable to a Fund are charged to the Fund’s operations, while expenses applicable to more than one of the Royce Funds are allocated equitably. Certain personnel, occupancy costs and other administrative expenses related to the Funds are allocated by Royce & Associates (“Royce”) under an administration agreement and are included in administrative and office facilities and legal expenses. The Trust has adopted a deferred fee agreement that allows the Trustees to defer the receipt of all or a portion of trustees’ fees otherwise payable. The deferred fees are invested in certain Royce Funds until distributed in accordance with the agreement. |
| COMPENSATING BALANCE CREDITS: |
| The Funds have arrangements with their custodian bank and transfer agent, whereby a portion of the custodian’s fee and transfer agent’s fee is paid indirectly by credits earned on a Fund’s cash on deposit with the bank and transfer agent. These deposit arrangements are an alternative to purchasing overnight investments. Conversely, a Fund pays interest to the custodian on any cash overdrafts, to the extent they are not offset by credits earned on positive cash balances. |
| LINE OF CREDIT: |
| The Funds, along with certain other Royce Funds, participate in a $65 million line of credit (“Credit Agreement”) with State Street Bank and Trust Company to be used for temporary or emergency purposes. This revolving Credit Agreement expires on October 11, 2019. Pursuant to the Credit Agreement, each participating Fund is liable for a portion of the commitment fee for the credit facility and for principal and interest payments related to borrowings made by that Fund. Borrowings under the Credit Agreement bear interest at a rate equal to the higher of the federal funds rate or One-Month LIBOR rate, plus 1.25%. The Funds did not utilize the line of credit during the six months ended June 30, 2019. |
| 22 | Royce Capital Fund 2019 Semiannual Report to Shareholders |
| Capital Share Transactions (in shares): | |||||||||||||||||||||||||||
| SHARES SOLD | SHARES ISSUED FOR REINVESTMENT OF DISTRIBUTIONS | SHARES REDEEMED | NET INCREASE (DECREASE) IN SHARES OUTSTANDING | ||||||||||||||||||||||||
| Six Months Ended 6/30/19 (unaudited) | Year Ended 12/31/18 | Six Months Ended 6/30/19 (unaudited) | Year Ended 12/31/18 | Six Months Ended 6/30/19 (unaudited) | Year Ended 12/31/18 | Six Months Ended 6/30/19 (unaudited) | Year Ended 12/31/18 | ||||||||||||||||||||
| Micro-Cap Portfolio | |||||||||||||||||||||||||||
| Investment Class | 581,993 | 1,819,499 | – | 714,268 | (1,436,402 | ) | (4,181,042 | ) | (854,409 | ) | (1,647,275 | ) | |||||||||||||||
| Service Class | 271,235 | 801,841 | – | 83,201 | (368,550 | ) | (2,360,627 | ) | (97,315 | ) | (1,475,585 | ) | |||||||||||||||
| Small-Cap Portfolio | |||||||||||||||||||||||||||
| Investment Class | 1,026,612 | 2,267,674 | – | 486,074 | (3,243,615 | ) | (7,004,964 | ) | (2,217,003 | ) | (4,251,216 | ) | |||||||||||||||
| Service Class | 20,289,524 | 351,826 | – | 230,521 | (20,743,818 | ) | (17,851,746 | ) | (454,294 | ) | (17,269,399 | ) | |||||||||||||||
| Investment Adviser and Distributor: |
| INVESTMENT ADVISER: |
| Under the Trust’s investment advisory agreements with Royce, Royce is entitled to receive investment advisory fees in respect of each Fund that are computed daily and payable monthly. Royce has contractually agreed, without right of termination, to waive fees and/or reimburse expenses (excluding brokerage commissions, taxes, interest, litigation expenses, acquired fund fees and expenses, and other expenses not borne in the ordinary course of business) to the extent necessary to maintain the Funds’ net annual operating expense ratios at specified levels through April 30, 2020, and is shown below to the extent that it impacted net expenses for the six months ended June 30, 2019. See the Prospectus for contractual waiver expiration dates. |
| ANNUAL CONTRACTUAL ADVISORY FEE AS A PERCENTAGE OF AVERAGE NET ASSETS | COMMITTED NET ANNUAL OPERATING EXPENSE RATIO CAP1 | SIX MONTHS ENDED JUNE 30, 2019 (UNAUDITED) | ||||||||
| Investment Class1 | Service Class1 | Net advisory fees | Advisory fees waived | |||||||
| Micro-Cap Portfolio | 1.25% | 1.33% | 1.58% | $ 897,130 | $ 36,894 | |||||
| Small-Cap Portfolio | 1.00% | 1.08% | 1.33% | 1,496,684 | 62,738 | |||||
| DISTRIBUTOR: |
| Royce Fund Services, LLC (“RFS”), the distributor of the Trust’s shares, is a wholly owned subsidiary of Royce. RFS is entitled to receive distribution fees from each Fund’s Service Class that are computed daily and payable monthly, at an annual rate of 0.25% of the average net assets of each Class. For the six months ended June 30, 2019, Micro-Cap Portfolio-Service Class recorded net distribution fees of $19,569 and Small-Cap Portfolio-Service Class recorded net distribution fees of $173,251. |
| Purchases and Sales of Investment Securities: |
| For the six months ended June 30, 2019, the costs of purchases and the proceeds from sales of investment securities, other than short-term securities and collateral received for securities loaned, were as follows: |
| PURCHASES | SALES | ||||||
| Micro-Cap Portfolio | $ | 11,095,201 | $ | 23,743,689 | |||
| Small-Cap Portfolio | 237,042,103 | 245,636,805 | |||||
Class Specific Expenses:
Class specific expenses were as follows for the six months ended June 30, 2019:
| CLASS LEVEL | ||||||||||||||||||||||||
| EXPENSES | ||||||||||||||||||||||||
| REIMBURSED BY | ||||||||||||||||||||||||
| NET DISTRIBUTION | SHAREHOLDER | SHAREHOLDER | TRANSFER AGENT | INVESTMENT | ||||||||||||||||||||
| FEES | SERVICING | REPORTS | BALANCE CREDITS | TOTAL | ADVISER | |||||||||||||||||||
| Micro-Cap Portfolio – Investment Class | $ | – | $ | 3,654 | $ | 24,951 | $ | (59 | ) | $ | 28,546 | $ | 28,546 | |||||||||||
| Micro-Cap Portfolio – Service Class | 19,569 | 3,202 | 3,783 | (24 | ) | 26,530 | 6,969 | |||||||||||||||||
| 19,569 | 6,856 | 28,734 | (83 | ) | 35,515 | |||||||||||||||||||
| Small-Cap Portfolio – Investment Class | – | 3,488 | 24,540 | (50 | ) | 27,978 | 27,978 | |||||||||||||||||
| Small-Cap Portfolio – Service Class | 173,251 | 3,227 | 10,990 | (20 | ) | 187,448 | 13,710 | |||||||||||||||||
| 173,251 | 6,715 | 35,530 | (70 | ) | 41,688 | |||||||||||||||||||
| Royce Capital Fund 2019 Semiannual Report to Shareholders | 23 |
Notes to Financial Statements (unaudited) (continued)
| TAX INFORMATION: |
| At June 30, 2019, net unrealized appreciation (depreciation) based on identified cost for tax purposes was as follows: |
| NET UNREALIZED | GROSS UNREALIZED | ||||||||||||||
| TAX BASIS COST | APPRECIATION (DEPRECIATION) | Appreciation | Depreciation | ||||||||||||
| Micro-Cap Portfolio | $126,848,795 | $22,590,766 | $40,749,780 | $18,159,014 | |||||||||||
| Small-Cap Portfolio | 269,617,987 | 6,455,980 | 24,170,398 | 17,714,418 | |||||||||||
The primary cause of the difference between book and tax basis cost is the timing of the recognition of losses on securities sold.
| Subsequent Events: |
| Subsequent events have been evaluated through the date the financial statements were issued. |
| 24 | Royce Capital Fund 2019 Semiannual Report to Shareholders |
Understanding Your Fund’s Expenses (unaudited)
| As a shareholder of a mutual fund, you pay ongoing expenses, including management fees and other Fund expenses including, for some funds, distribution and/or service (12b-1) fees. Using the information below, you can estimate how these ongoing expenses (in dollars) affect your investment and compare them with the ongoing expenses of other funds. You may also incur one-time transaction expenses which are not shown in this section and would result in higher total costs. The example is based on an investment of $1,000 invested at January 1, 2019, and held for the entire six-month period ended June 30, 2019. Service Class shares are generally available only through certain insurance companies who receive service fees from the Fund for services that they perform. |
| Actual Expenses |
| The first part of the table below provides information about actual account values and actual expenses. You may use the information in this section, together with the amount you invested, to estimate the expenses that you paid over the period. Simply divide your account value at June 30, 2019, by $1,000 (for example, an $8,600 account value divided by $1,000 = 8.6), then multiply the result by the number under the heading entitled “Expenses Paid During the Period” to estimate the expenses you paid on your account during this period. |
| Hypothetical Example for Comparison Purposes |
| The second part of the table below provides information about hypothetical account values and hypothetical expenses based on the Fund’s actual expense ratio and an assumed rate of return of 5% per year before expenses, which is not the Fund’s actual return. The hypothetical account values and expenses may not be used to estimate the actual ending account balance or expenses you paid for the period. You may use this information to compare the ongoing costs of investing in the Fund and other funds. To do so, compare this 5% hypothetical example with the 5% hypothetical examples that appear in the shareholder reports of the other funds. |
| Please note that the expenses shown in the table are meant to highlight your ongoing costs only and do not reflect any transactional costs, such as sales charges (loads), redemption fees, or exchange fees. Therefore, this section is useful in comparing ongoing costs only, and will not help you determine the relative total costs of owning different funds. In addition, if these transactional costs were included, your costs would have been higher. |
| ACTUAL | HYPOTHETICAL (5% PER YEAR BEFORE EXPENSES) | |||||||||||||||||||||||||
| Beginning Account | Ending Account Value | Expenses Paid During | Beginning Account | Ending Account Value | Expenses Paid During | Annualized Expense | ||||||||||||||||||||
| Value 1/1/19 | 6/30/19 | the Period1 | Value 1/1/19 | 6/30/19 | the Period1 | Ratio2 | ||||||||||||||||||||
| Investment Class | ||||||||||||||||||||||||||
| Micro-Cap Portfolio | $ | 1,000.00 | $ | 1,107.02 | $ | 6.95 | $ | 1,000.00 | $ | 1,018.20 | $ | 6.66 | 1.33% | |||||||||||||
| Small-Cap Portfolio | 1,000.00 | 1,085.13 | 5.58 | 1,000.00 | 1,019.44 | 5.41 | 1.08% | |||||||||||||||||||
| Service Class | ||||||||||||||||||||||||||
| Micro-Cap Portfolio | 1,000.00 | 1,105.68 | 8.25 | 1,000.00 | 1,016.96 | 7.90 | 1.58% | |||||||||||||||||||
| Small-Cap Portfolio | 1,000.00 | 1,084.53 | 6.87 | 1,000.00 | 1,018.20 | 6.66 | 1.33% | |||||||||||||||||||
| 1 | Expenses are equal to the Fund’s annualized expense ratio multiplied by the average account value for the period, multiplied by 181 days in the most recent fiscal half-year divided by 365 days (to reflect the half-year period). This information does not include fees or expenses of the variable annuity contracts investing in the Fund. |
| Annualized expense ratio used to derive figures in the table is based on the most recent fiscal half-year. |
| Royce Capital Fund 2019 Semiannual Report to Shareholders | 25 |
Trustees and Officers
All Trustees and Officers may be reached c/o The Royce Funds, 745 Fifth Avenue, New York, NY 10151
Charles M. Royce, Trustee1
Age: 79 | Number of Funds Overseen: 16 | Tenure: Since 1982
Non-Royce Directorships: Director of Oxford Square Capital Corp.
Principal Occupation(s) During Past Five Years: A member of the Board of Managers of Royce & Associates, LP (“Royce”), the Trust’s investment adviser; Chief Executive Officer (1972–June 2016), President (1972-June 2014) of Royce.
Christopher D. Clark, Trustee1, President
Age: 54 | Number of Funds Overseen: 16 | Tenure: Since 2014
Principal Occupation(s) During Past Five Years: Chief Executive Officer (since July 2016), President (since July 2014), Co-Chief Investment Officer (Since January 2014), Managing Director of Royce, a Member of the Board of Managers of Royce, having been employed by Royce since May 2007.
Patricia W. Chadwick, Trustee
Age: 70 | Number of Funds Overseen: 16 | Tenure: Since 2009
Non-Royce Directorships: Trustee of Voya Mutual Funds and Director of Wisconsin Energy Corp.
Principal Occupation(s) During Past 5 Years: Consultant and President of Ravengate Partners LLC (since 2000).
Christopher C. Grisanti, Trustee
Age: 57 | Number of Funds Overseen: 16 | Tenure: Since 2017
Non-Royce Directorships: None
Principal Occupation(s) During Past Five Years: Co-Founder and Chief Executive Officer of Grisanti Capital Management LLC, an investment advisory firm (since 1999). Mr. Grisanti’s prior business experience includes serving as Director of Research and Portfolio Manager at Spears Benzak, Salomon & Farrell (from 1994 to 1999) and a senior associate at the law firm of Simpson, Thacher & Bartlett (from 1988 to 1994).
Stephen L. Isaacs, Trustee
Age: 79 | Number of Funds Overseen: 16 | Tenure: Since 1989
Non-Royce Directorships: None
Principal Occupation(s) During Past Five Years: Attorney and President of Health Policy Associates, Inc., consultants. Mr. Isaacs’s prior business experience includes having served as President of the Center for Health and Social Policy (from 1996 to 2012); Director of Columbia University Development Law and Policy Program and Professor at Columbia University (until August 1996).
Arthur S. Mehlman, Trustee
Age: 76 | Number of Funds Overseen: 36 | Tenure: Since 2004
Non-Royce Directorships: Director/Trustee of registered investment companies constituting the 20 Legg Mason Funds.
Principal Occupation(s) During Past Five Years: Director of The League for People with Disabilities, Inc.; Director of University of Maryland Foundation (non-profits). Formerly: Director of Municipal Mortgage & Equity, LLC (from October 2004 to April 1, 2011); Director of University of Maryland College Park Foundation (non-profit) (from 1998 to 2005); Partner, KPMG LLP (international accounting firm) (from 1972 to 2002); Director of Maryland Business Roundtable for Education (from July 1984 to June 2002).
David L. Meister, Trustee
Age: 79 | Number of Funds Overseen: 16 | Tenure: Since 1982
Non-Royce Directorships: None
Principal Occupation(s) During Past Five Years: Consultant. Chairman and Chief Executive Officer of The Tennis Channel (from June 2000 to March 2005). Mr. Meister’s prior business experience includes having served as Chief Executive Officer of Seniorlife.com, a consultant to the communications industry, President of Financial News Network, Senior Vice President of HBO, President of Time-Life Films, and Head of Broadcasting for Major League Baseball.
G. Peter O’Brien, Trustee
Age: 73 | Number of Funds Overseen: 36 | Tenure: Since 2001
Non-Royce Directorships: Director/Trustee of registered investment companies constituting the 20 Legg Mason Funds.
Principal Occupation(s) During Past Five Years: Trustee Emeritus of Colgate University (since 2005); Board Member of Hill House, Inc. (since 1999); Formerly Director of TICC Capital Corp (from 2003-2017): Trustee of Colgate University (from 1996 to 2005), President of Hill House, Inc. (from 2001 to 2005) and Managing Director/Equity Capital Markets Group of Merrill Lynch & Co. (from 1971 to 1999).
Michael K. Shields, Trustee
Age: 61 | Number of Funds Overseen: 16 | Tenure: Since 2015
Principal Occupation(s) During Past Five Years: President and Chief Executive Officer of Piedmont Trust Company, a private North Carolina trust company (since May 2012). Mr. Shields’s prior business experience includes owning Shields Advisors, an investment consulting firm (from April 2010 to June 2012).
Francis D. Gannon, Vice President
Age: 51 | Tenure: Since 2014
Principal Occupation(s) During Past Five Years: Co-Chief Investment Officer (since January 2014) and Managing Director of Royce, having been employed by Royce since September 2006.
Daniel A. O’Byrne, Vice President
Age: 57 | Tenure: Since 1994
Principal Occupation(s) During Past Five Years: Principal and Vice President of Royce, having been employed by Royce since October 1986.
Peter K. Hoglund, Treasurer
Age: 53 | Tenure: Since 2015
Principal Occupation(s) During Past Five Years: Chief Financial Officer, Chief Administrative Officer, and Managing Director of Royce, having been employed by Royce since December 2014. Prior to joining Royce, Mr. Hoglund spent more than 20 years with Munder Capital Management in Birmingham, MI, serving as Managing Director and Chief Financial Officer and overseeing all financial aspects of the firm. He began his career at Munder as a portfolio manager.
John E. Denneen, Secretary and Chief Legal Officer
Age: 52 | Tenure: 1996-2001 and Since 2002
Principal Occupation(s) During Past Five Years: General Counsel, Managing Director, and, since June 2015, a Member of the Board of Managers of Royce. Chief Legal and Compliance Officer and Secretary of Royce.
Lisa Curcio, Chief Compliance Officer
Age: 59 | Tenure: Since 2004
Principal Occupation(s) During Past Five Years: Chief Compliance Officer of The Royce Funds (since October 2004) and Compliance Officer of Royce (since June 2004).
| 1 | Interested Trustee. |
| Trustees will hold office until their successors have been duly elected and qualified or until their earlier resignation or removal. The Statement of Additional Information, which contains additional information about the Trust’s trustees and officers, is available and can be obtained without charge at www.roycefunds.com or by calling (800) 221-4268. |
| 26 | Royce Capital Fund 2019 Semiannual Report to Shareholders |
Board Approval of Investment Advisory Agreement
At meetings held on June 4-5, 2019, the Board of Trustees of Royce Capital Fund (the “Board”), including all of the non-interested trustees, approved the continuation of an investment advisory agreement (the “Investment Advisory Agreement”) between Royce & Associates, LP (“R&A”) and Royce Capital Fund (“RCF”) relating to each of Royce Micro-Cap Portfolio and Royce Small-Cap Portfolio (each, a “Fund” and together, the “Funds”). In reaching these decisions, the Board reviewed the materials provided by R&A, which included, among other things, information prepared internally by R&A and independently by Broadridge Financial Solutions, Inc. (“Broadridge”) using the database and methodology of Morningstar Associates, LLC (“Morningstar”) containing detailed investment advisory fee, expense ratio, and investment performance comparisons for each Fund with other mutual funds in its “peer group” and “category”, information regarding the past performance of the Funds and other registered investment companies managed by R&A and a memorandum outlining the legal duties of the Board prepared by independent counsel to the non-interested trustees. R&A also provided the trustees with an analysis of its profitability with respect to providing investment advisory services to each of the Funds. In addition, the Board took into account information furnished throughout the year at regular Board meetings, including reports on investment performance, shareholder services, distribution fees and expenses, regulatory compliance, brokerage commissions and research, brokerage and other execution products and services provided to the Funds. The Board also considered other matters it deemed important to the approval process such as allocation of brokerage commissions, “soft dollar” research services R&A receives, payments made to affiliates of R&A, as well as payments made by R&A, relating to distribution of Fund shares, and other direct and indirect benefits to R&A and its affiliates, from their relationship with the Funds. The trustees also met throughout the year with investment advisory personnel from R&A. The Board also noted R&A’s efforts to provide enhanced analytical tools to its investment staff along with the ongoing meetings conducted by R&A’s Co-Chief Investment Officers with portfolio managers experiencing performance challenges in an attempt to address such challenges. The Board, in its deliberations, recognized that, for many of the Funds’ shareholders, the decision to purchase Fund shares included a decision to select R&A as the investment adviser and that there was a strong association in the minds of Fund shareholders between R&A and each Fund. In considering factors relating to the approval of the continuance of the Investment Advisory Agreement, the non-interested trustees received assistance and advice from, and met separately with, their independent legal counsel. While continuation of the investment advisory and administrative arrangements for each Fund was considered at the same Board meeting, the trustees dealt with each Fund separately. Among other factors, the trustees noted that they considered the following:
The nature, extent and quality of services provided by R&A:
The Board considered the following factors to be of fundamental importance to their consideration of whether to approve the continuance of the Investment Advisory Agreement: (i) R&A’s more than 40 years of value investing experience and track record; (ii) the history of long-tenured R&A portfolio managers managing the Funds; (iii) R&A’s focus on mid-cap, small-cap and micro-cap value investing; (iv) the consistency of R&A’s approach to managing the Funds, other open-end mutual funds, and closed-end funds over more than 40 years; (v) the integrity and high ethical standards adhered to at R&A; (vi) R&A’s specialized experience in the area of trading small- and micro-cap securities; (vii) R&A’s historical ability to attract and retain portfolio management talent; and (viii) R&A’s focus on shareholder interests as exemplified by capping expenses on smaller funds and providing expansive shareholder reporting and communications. The Board reviewed the services that R&A provides to the Funds, including, but not limited to, managing each Fund’s investments in accordance with the stated policies of each Fund. The Board considered the fact that R&A provided certain administrative services to the Funds at cost pursuant to the Administration Agreement between RCF and R&A. The Board determined that the services to be provided to each Fund by R&A would be the same as those that it previously provided to each Fund. The trustees also took into consideration the histories, reputations and backgrounds of R&A’s portfolio managers for the Funds, finding that these would likely have an impact on the continued success of the Funds. Lastly, the Board noted R&A’s ability to attract and retain qualified and experienced personnel. The Board concluded that the investment advisory services provided by R&A to each Fund compared favorably to services provided by R&A to other R&A client accounts, including other funds, in both nature and quality, and that the scope of services provided by R&A would continue to be suitable for each Fund.
Investment performance of the Funds and R&A:
Although the registered investment companies managed by R&A currently span a wider risk spectrum than they have historically, R&A generally emphasizes a risk-averse approach to investing. In light of that approach, the trustees believe that risk-adjusted performance continues to be the most appropriate measure of each Fund’s investment performance. One measure of risk-adjusted performance the trustees have historically used in their review of each Fund’s performance is the Sharpe Ratio. The Sharpe Ratio is a risk-adjusted measure of performance developed by Nobel Laureate William Sharpe. It is calculated by dividing a fund’s annualized excess returns by its annualized standard deviation to determine reward per unit of risk. The higher the Sharpe Ratio, the better a fund’s historical risk-adjusted performance. The Board attaches primary importance to risk-adjusted performance over relatively long periods of time, typically 3 to 10 years.
The Board noted that 2018 proved to be a turbulent year for financial markets in general and for the small-cap equity market in particular. For much of 2018, the small-cap market experienced positive returns and low volatility, with the Russell 2000 Index reaching an all-time high on August 31, 2018. Small-cap markets then experienced declines along with increased volatility from September through mid-December. Those declines accelerated from mid-December through the end of 2018. Overall, the Russell 2000 Index declined 11.01% in 2018. Within the small-cap market, the Board noted that value stocks beat growth stocks, dividend payers outperformed non-dividend payers, earners held up better than non-earners, and defensive stocks outpaced cyclical stocks in 2018. Notwithstanding the overall decline within the small-cap market in 2018, the Board noted that both Funds ranked within the 1st Sharpe Ratio quartile and the 3rd Sharpe Ratio quartile in their respective Morningstar categories for the 1-year period and the 3-year period, respectively, ended December 31, 2018. The Board noted that the last few years have been marked by increased return dispersion, declining correlation, and a steepening yield curve. While not dispositive, the trustees noted that such improved relative risk-adjusted performance during the more historically customary market environment that has recently prevailed was also not insignificant.
The Board further noted that both Funds ranked within the 4th Sharpe Ratio quartile in their respective Morningstar categories for the 5-year and 10-year periods ended December 31, 2018. This post-2008 market period was marked by historically low interest rates and significant U.S. Federal Reserve market intervention. During this period, highly leveraged, non-earning companies and yield-oriented securities (e.g., master limited partnerships, real estate investment trusts, and utilities) generally outperformed the higher quality companies (e.g., those with solid balance sheets, low leverage, the ability to generate and effectively allocate free cash flow, and strong returns on invested capital) and cyclical companies generally favored by both Funds. The trustees also noted, however, that the relative performance for both Funds during the more historically customary market cycle preceding the 2008 financial crisis was quite strong.
| Royce Capital Fund 2019 Semiannual Report to Shareholders | 27 |
Board Approval of Investment Advisory Agreement
In addition to each Fund’s risk–adjusted performance, the Board also reviewed and considered each Fund’s absolute total returns, down market performance, and long-term performance records over periods of 10 years or longer. The Board noted that R&A manages a number of funds that invest in micro-cap, small-cap, and mid-cap issuers, many of which had outperformed their benchmark indices and their competitors during the periods prior to the U.S. Federal Reserve’s near zero interest rate policy and related market interventions as well as in more recent periods. Although the Board recognized that past performance is not necessarily an indicator of future results, it found that R&A had the necessary qualifications, experience and track record in managing equity mutual funds to manage each Fund. The Board determined that R&A continued to be an appropriate investment adviser for each Fund and concluded that each Fund’s performance supported the approval of the continuance of the Investment Advisory Agreement.
Cost of the services provided and profits realized by R&A from its relationship with each Fund:
The Board considered the cost of the services provided by R&A and the profits realized by R&A from its relationship with each Fund. As part of the analysis, the trustees discussed with R&A its methodology in allocating its costs to each Fund and concluded that R&A’s allocations were reasonable. The Board concluded that R&A’s profits during the year ended December 31, 2018 were reasonable in relation to the nature and quality of services provided.
The extent to which economies of scale would be realized as the Funds grow and whether fee levels would reflect such economies of scale:
The Board considered whether there have been economies of scale in respect of the management of each Fund, whether each Fund has appropriately benefited from any economies of scale and whether there is potential for realization of any further economies of scale. The trustees noted the time and effort involved in managing portfolios of small- and micro-cap stocks and that they did not involve the same efficiencies as do portfolios of large-cap stocks. The Board concluded that the current fee structure for each Fund was reasonable, that shareholders sufficiently participated in economies of scale and that no changes were currently necessary.
Comparison of services to be rendered and fees to be paid to those under other investment advisory contracts, such as contracts of the same and other investment advisers or other clients:
The Board reviewed the investment advisory fee paid by each Fund and compared both the services to be rendered and the fees to be paid under the Investment Advisory Agreement to other contracts of R&A and to contracts of other investment advisers to registered investment companies investing in small- and micro-cap stocks, as provided by Broadridge. The trustees noted that the contractual advisory fee rate for each Fund exceeded the median of its Broadridge-assigned peers. The Board noted the importance of the net expense ratio in measuring a fund’s efficiency, particularly in light of the variations in the mutual fund industry as to which entity is responsible for particular types of expenses. It was noted that Royce Micro-Cap Portfolio’s (“RCM”) net expense ratio of 1.33% placed in the 3rd quartile, 5 basis points higher than the median of the peer group assigned by Broadridge, primarily due to its higher investment advisory fee as compared to such peer group median. The trustees further noted that RCM’s net expense ratio was actually 8 basis points lower than the average expense ratio for the 35 non-institutional, non-ETF domestic funds with weighted average market capitalizations of less than $1 billion within the Morningstar database. The trustees noted that Royce Small-Cap Portfolio’s (“RCS”) net expense ratio of 1.08% placed in the 2nd quartile, 2 basis points lower than the median of the peer group assigned by Broadridge, primarily due to its higher investment advisory fee as compared to such peer group median. The trustees further noted that RCS’s net expense ratio was actually 9 basis points lower than the average expense ratio for the 274 small-cap funds in the Morningstar small-cap category (oldest share class only, non-institutional, non-index, non-ETF funds with Rule 12b-1 fees of 0.25% or less).
The Board also noted that R&A manages each Fund in an active fashion. The industry accepted metric for measuring how actively an equity portfolio is managed is called “active share.” In particular, active share measures how much the holdings of an equity portfolio differ from the holdings of its appropriate passive benchmark index. At the extremes, a portfolio with no holdings in common with the benchmark would have 100% active share, while a portfolio that is identical to the benchmark would have 0% active share. R&A presented several analyses to the Board which demonstrated that mutual funds with high active share scores had higher expense ratios than mutual funds with lower active share scores due to the resources required for the active management of those funds. The trustees noted that the active shares for RCM and RCS were 91% and 97%, respectively, for the calendar year ended December 31, 2018.
The Board further noted that R&A had, from time to time, waived advisory fees in order to maintain expense ratios at competitive levels. The Board also considered fees charged by R&A to institutional and other clients and noted that, given the greater levels of service that R&A provides to registered investment companies such as the Funds as compared to other accounts, each Fund’s advisory fees compared favorably to these other accounts.
No single factor was cited as determinative to the decision of the Board. Rather, after weighing all of the considerations and conclusions discussed above, the entire Board, including all of the non-interested trustees, approved the continuation of the Investment Advisory Agreement, concluding that continuation of such Agreement was in the best interest of the shareholders of each Fund and that each Fund’s investment advisory fee rate was reasonable in relation to the services provided.
| 28 | Royce Capital Fund 2019 Semiannual Report to Shareholders |
Notes to Performance and Other Important Information
The thoughts expressed in this report concerning recent market movements and future prospects for small company stocks are solely the opinion of Royce at June 30, 2019, and, of course, historical market trends are not necessarily indicative of future market movements. Statements regarding the future prospects for particular securities held in the Funds’ portfolios and Royce’s investment intentions with respect to those securities reflect Royce’s opinions as of June 30, 2019 and are subject to change at any time without notice. There can be no assurance that securities mentioned in this report will be included in any Royce-managed portfolio in the future.
Sector weightings are determined using the Global Industry Classification Standard (“GICS”). GICS was developed by, and is the exclusive property of, Standard & Poor’s Financial Services LLC (“S&P”) and MSCI Inc. (“MSCI”). GICS is the trademark of S&P and MSCI. “Global Industry Classification Standard (GICS)” and “GICS Direct” are service marks of S&P and MSCI.
All indexes referenced are unmanaged and capitalization weighted. Each index’s returns include net reinvested dividends and/or interest income. Frank Russell Company (“Russell”) is the source and owner of the trademarks, service marks and copyrights related to the Russell Indexes. Russell® is a trademark of Frank Russell Company. Neither Russell nor its licensors accept any liability for any errors or omissions in the Russell Indexes and / or Russell ratings or underlying data and no party may rely on any Russell Indexes and / or Russell ratings and / or underlying data contained in this communication. No further distribution of Russell Data is permitted without Russell’s express written consent. Russell does not promote, sponsor or endorse the content of this communication. The Russell 2000 is an index of domestic small-cap stocks. It measures the performance of the 2,000 smallest publicly traded U.S. companies in the Russell 3000 Index. The Russell 2000 Value and Growth Indexes consist of the respective value and growth stocks within the Russell 2000 as determined by Russell Investments. The Russell Microcap Index includes 1,000 of the smallest securities in the small-cap Russell 2000 Index along with the next smallest eligible securities as determined by Russell. The Russell 1000 Index is an index of domestic large-cap stocks. It measures the performance of the 1,000 publicly traded U.S. companies in the Russell 3000 Index. The performance of an index does not represent exactly any particular investment, as you cannot invest directly in an index. Returns for the market indexes used in this report were based on information supplied to Royce by Russell Investments. Royce has not independently verified the above described information.
The Price-Earnings, or P/E, Ratio is calculated by dividing a company’s share price by its trailing 12-month earnings-per share (EPS). The Price-to-Book, or P/B, Ratio is calculated by dividing a company’s share price by its book value per share. Standard deviation is a statistical measure within which a fund’s total returns have varied over time. The greater the standard deviation, the greater a fund’s volatility. The Morningstar Style Map uses proprietary scores of a stock’s value and growth characteristics to determine its placement in one of the five categories listed on the horizontal axis. These characteristics are then compared to those of other stocks within the same market capitalization band. Each is scored from zero to 100 for both value and growth attributes. The value score is subtracted from the growth score to determine the overall style score. For the vertical, market cap axis, Morningstar subdivides into size groups. Giant-cap stocks are defined as those that account for the top 40% of the capitalization of each style zone; large-cap stocks represent the next 30%; mid-cap stocks the next 20%; small-cap stocks the next 7%; micro-cap stocks the smallest 3%. Standard deviation is a statistical measure within which a fund’s total returns have varied over time. The greater the standard deviation, the greater a fund’s volatility. The value score is subtracted from the growth score to determine the overall style score. Cyclical and Defensive are defined as follows: Cyclical and Defensive are defined as follows: Cyclical: Communication Services, Consumer Discretionary, Energy, Financials, Industrials, Information Technology, and Materials. Defensive: Consumer Staples, Health Care, Real Estate, Utilities. The Royce Funds is a service mark of The Royce Funds. Distributor: Royce Fund Services, LLC.
Royce Capital Fund–Micro-Cap Portfolio invests primarily in securities of micro-cap companies and Royce Capital Fund–Small-Cap Portfolio invests primarily in securities of small-cap companies. Investments in these types of companies may involve considerably more risk than investments in securities of larger-cap companies. (Please see “Primary Risks for Fund Investors” in the prospectus.) Royce Capital Fund–Micro-Cap Portfolio and Royce Capital Fund–Small-Cap Portfolio may each invest up to 25% its assets in foreign securities that may involve political, economic, currency, and other risks not encountered in U.S. investments. (Please see “Investing in Foreign Securities” in the prospectus.) A Fund that invests a significant portion of its assets in a limited number of stocks may be subject to considerably more risk than a more broadly diversified Fund because a decline in the value of any of these stocks would cause that Fund’s overall value to decline to a greater degree. A broadly diversified portfolio does not, however, ensure a profit for a Fund or guarantee against loss. Please read the prospectus carefully before investing or sending money. A copy of the Funds’ current prospectus and a Statement of Additional Information may be obtained by calling (800) 221-4268 or by visiting www.roycefunds.com. All publicly released material Fund information is disclosed by the Funds on their website at www.roycefunds.com.
This material contains forward-looking statements within the meaning of the Securities Exchange Act of 1934, as amended (the “Exchange Act”), that involve risks and uncertainties, including, among others, statements as to:
| • | the Funds’ future operating results, |
| • | the prospects of the Funds’ portfolio companies, |
| • | the impact of investments that the Funds have made or may make, |
| • | the dependence of the Funds’ future success on the general economy and its impact on the companies and industries in which the Funds invest, and |
| • | the ability of the Funds’ portfolio companies to achieve their objectives. |
This review and report use words such as “anticipates,” “believes,” “expects,” “future,” “intends,” and similar expressions to identify forward-looking statements. Actual results may differ materially from those projected in the forward-looking statements for any reason.
The Royce Funds have based the forward-looking statements included in this review and report on information available to us on the date of the report, and we assume no obligation to update any such forward-looking statements. Although The Royce Funds undertake no obligation to revise or update any forward-looking statements, whether as a result of new information, future events, or otherwise, you are advised to consult any additional disclosures that we may make through future shareholder communications or reports.
Proxy Voting
A copy of the policies and procedures that The Royce Funds use to determine how to vote proxies relating to portfolio securities and information regarding how each of The Royce Funds voted proxies relating to portfolio securities during the most recent 12-month period ended June 30 is available, without charge, on The Royce Funds’ website at www.roycefunds.com, by calling (800) 221-4268 (toll-free), and on the website of the Securities and Exchange Commission (“SEC”) at www.sec.gov.
Disclosure of Portfolio Holdings
The Funds’ complete portfolio holdings are also available on Exhibit F to Form N-PORT, which filings are made with the SEC within 60 days of the end of the first and third fiscal quarters. The Funds’ Form N-PORT filings are available on the SEC’s website at http://www.sec.gov.
| Royce Capital Fund 2019 Semiannual Report to Shareholders | 29 |
 | ||||
| About The Royce Funds | ||||
Unparalleled Knowledge + Experience Pioneers in small-cap investing, with 45+ years of experience, depth of knowledge, and focus. | ||||
Independent Thinking The confidence to go against consensus, the insight to uncover opportunities others might miss, and the tenacity to stay the course through market cycles. | ||||
Specialized Approaches US, international, and global investment strategies that pursue approaches with different risk profiles. | Contact Us | |||
Unwavering Commitment Our team of 18 portfolio managers have significant personal investments in the strategies they manage. | GENERAL INFORMATION Additional Report Copies and Prospectus Inquiries (800) 221-4268 | |||
 | |  | ||
Item 2. Code(s) of Ethics.Not applicable to this semi-annual report.
Item 3. Audit Committee Financial Expert.Not applicable to this semi-annual report.
Item 4. Principal Accountant Fees and Services.Not applicable to this semi-annual report.
Item 5. Audit Committee of Listed Registrants.Not Applicable
Item 6. Investments.
(a) See Item 1.
(b) Not Applicable
Item 7. Disclosure of Proxy Voting Policies and Procedures for Closed-End Management Investment Companies.Not Applicable.
Item 8. Portfolio Managers of Closed-End Management Investment Companies.Not Applicable.
Item 9. Purchases of Equity Securities by Closed-End Management Investment Company and Affiliated Purchasers.Not Applicable
Item 10. Submission of Matters to a Vote of Security Holders.Not Applicable.
Item 11. Controls and Procedures.
(a) Disclosure Controls and Procedures. The Principal Executive and Financial Officers concluded that the Registrant's Disclosure Controls and Procedures are effective based on their evaluation of the Disclosure Controls and Procedures as of a date within 90 days of the filing date of this report.
(b) Internal Control over Financial Reporting. There were no significant changes in Registrant's internal control over financial reporting or in other factors that could significantly affect this control subsequent to the date of the evaluation, including any corrective actions with regard to significant deficiencies and material weaknesses during the period covered by this report.
Item 12. Exhibits.Attached hereto.
(a)(1) Not applicable to this semi-annual report.
(a)(2) Separate certifications by the Registrant’s Principal Executive Officer and Principal Financial Officer as required by Rule 30a-2(a) under the Investment Company Act of 1940.
(a)(3) Not Applicable
(b) Separate certifications by the Registrant’s Principal Executive Officer and Principal Financial Officer, pursuant to Section 906 of the Sarbanes-Oxley Act of 2002 and required by Rule 30a-2(b) under the Investment Company Act of 1940.
Pursuant to the requirements of the Securities Exchange Act of 1934 and the Investment Company Act of 1940, the registrant has duly caused this report to be signed on its behalf by the undersigned, thereunto duly authorized.
ROYCE CAPITAL FUND
BY:/s/ Christopher D. Clark
Christopher D. Clark
President
Date: August 27, 2019
Pursuant to the requirements of the Securities Exchange Act of 1934 and the Investment Company Act of 1940, this report has been signed below by the following persons on behalf of the registrant and in the capacities and on the dates indicated.
| ROYCE CAPITAL FUND | ROYCE CAPITAL FUND |
| BY:/s/ Christopher D. Clark | BY:/s/ Peter K. Hoglund |
| Christopher D. Clark | Peter K. Hoglund |
| President | Chief Financial Officer |
| Date: August 27, 2019 | Date: August 27, 2019 |