UNITED STATES
SECURITIES AND EXCHANGE COMMISSION
Washington, D.C. 20549
FORM N-CSR
CERTIFIED SHAREHOLDER REPORT
OF
REGISTERED MANAGEMENT INVESTMENT COMPANIES
Investment Company Act File Number: 811-07537
Name of Registrant: Royce Capital Fund
Address of Registrant: 745 Fifth Avenue
New York, NY 10151
| Name and address of agent for service: | John E. Denneen, Esq. |
| | 745 Fifth Avenue |
| | New York, NY 10151 |
Registrant's telephone number, including area code: (212) 508-4500
Date of fiscal year end: December 31, 2021
Date of reporting period: January 1, 2021 – June 30, 2021
Item 1. Reports to Shareholders.

Royce Capital Fund 2021 Semiannual
Review and Report to Shareholders
June 30, 2021
Royce Capital Fund–Micro-Cap Portfolio
Royce Capital Fund–Small-Cap Portfolio
Table of Contents

This page is not part of the Royce Capital Fund 2021 Semiannual Report to Shareholders
Letter to Our Shareholders

WHY TWO MAXIMS ARE ESPECIALLY RELEVANT NOW
The first six months of 2021 offered an important reminder that the economy and the equity markets—small cap stocks included—advance at their own speeds. The first quarter of 2021 saw economic acceleration in the form of U.S. real GDP growth of 6.3%, a considerable increase from 4Q20’s also strong 4.3% mark. This growth continued into 2Q21, when real GDP came in at 6.5%, both quarters in line with current consensus estimates of 6-7% annual growth. Over the same period, small cap returns, as measured by the Russell 2000 Index, moved at the opposite pace, from 31.4% in 4Q20 to 12.7% in 1Q21, and finally to 4.3% for 2Q21.
Decelerating Market, Accelerating Economy
Russell 2000 Index Quarterly Returns vs. U.S. Real GDP Growth (annualized, quarter over quarter)
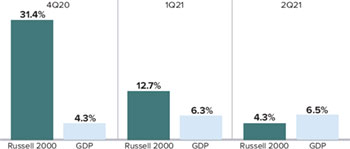
Source: Bloomberg
These seemingly disconnected results are actually more closely connected than they appear. They also provide us with the opportunity to remind investors of an important investment maxim: that it often makes sense to discount the relevance of current economic news when thinking about how to invest. The stock
market has a well-founded reputation as a forward-looking force, often traveling six to 12 months ahead of economic results. This dynamic highlights why the best returns often come when current economic news seems dire or pedestrian. March 2020 provided just the latest example of this long-running phenomenon. And—as the direction of small-cap’s last three quarterly returns makes clear—the other side of this relationship is also frequently accurate: prospective equity returns can be far more subdued when the economy is most robust. (There is a silver lining for active managers to this market-economy dynamic, but more on that later.) Seen from this perspective, the first half’s simultaneous economic acceleration and small-cap deceleration was, in a period that continues to provide plenty of atypical behavior, reassuringly conventional.
The first half of the year also came to a close with nearly every trend established within the equity markets from the March 2020 troughs still firmly in place. To wit: small cap finished ahead of large cap for the year-to-date period ended 6/30/21, as measured by the Russell 2000 (+17.5%) and Russell 1000 (+15.0%) indexes, thus extending the leadership shift that began more than 15 months ago. Similarly, the Russell 2000 Value Index, which advanced 26.7%, solidified its nascent market cycle advantage over the Russell 2000 Growth Index—which rose 9.0%—following nearly a decade of underperformance—an unprecedented length of time for growth to outpace value since the inception of the style indexes. Also within small cap, cyclical sectors maintained a convincing lead over their defensive counterparts.
| Past performance is no guarantee of future results. | This page is not part of the Royce Capital Fund 2021 Semiannual Report to Shareholders | 1 |
LETTER TO OUR SHAREHOLDERS
Will these trends continue? We think they will. What we flesh out in this letter, then, is our case for extended small-cap leadership and, within the asset class, ongoing outperformance for value. Our research delves into equity returns during previous periods of strong nominal GDP growth, current valuation levels, and historical small cap returns patterns, all of which have given us what we admit is an arguably paradoxical point of view: a strong sense of guarded optimism.
BE AWARE OF RECENCY BIAS
Some readers may think we are on shaky ground in arguing that small cap’s first-half leadership looks built to last. And there are reasons that might appear to support the notion that leadership has moved back to large caps. After its historic one-year rally through the end of March 2021—which included three consecutive quarters outperforming large caps—small cap’s advance moderated. The Russell 2000 also fell behind its large-cap sibling during the second quarter of 2021, up 4.3% versus 8.5% for the Russell 1000. And while the Russell 2000 established its latest all-time peak on March 15th, the Russell 1000 reached its latest peak as recently as July 26th, after making previous new highs several times toward the end of the second quarter. In this context, we suspect a certain amount of recency bias may be preventing small-cap skeptics from seeing just how strong first-half performance was—and not just for small cap, but for cyclicals, small-cap value, and micro-cap stocks (which rose 29.0%, as measured by the Russell Microcap Index). For example, the Russell 2000’s 17.5% gain was well above the index’s rolling monthly average six-month return of 6.7% since its inception (12/31/78). History also shows that intra-cycle leadership shifts occur with some regularity during market cycles, as do changes in the tempo of performance. For example, after small caps experienced a very strong absolute and relative recovery in 2009, a digestion period followed in which returns were negative over the next six months before the asset class resumed a positive pace and held on to market leadership.
In addition, it’s worth noting that first-half returns being highest for the smallest capitalization asset classes (as well as being significantly in value’s favor) lines up exactly as we would expect during a period of widespread economic recovery. Equally important, we see little on the horizon in the economy, the market itself, or—and this is always most relevant to us—in our analysis of companies and conversations with management teams—to suggest that small cap’s leadership phase has run its course.
HAS SMALL-CAP’S RUN ONLY JUST BEGUN?
The growing economy underpins an important part of our optimism for small cap’s continued leadership over large cap. Notwithstanding ever-present sources of concern, our bottom-up view of the economy, which we glean from analyzing a wide swath of companies, shows that the U.S. in particular continues to skew heavily toward expansion. The U.S. consumer, whose spending comprises roughly 70% of our economy, is financially flush. With notably strong consumer balance sheets and low mortgage rates, the housing market remains healthy while also boasting favorable long-term demographic trends. Retail and restaurant sales are increasing steadily, passenger air travel remains on the rise, and roads and highways are busy. We would also add lower unemployment, and the potential boost—after the requisite political wrangling—of additional fiscal stimulus, much of it in the form of long needed infrastructure spending, to this list of positives.
And while past performance is no guarantee of future results, history is admirably clear about the pattern of U.S. equity leadership when the economy expanded. During prior periods of robust economic growth, small caps have enjoyed a decided performance edge over their large cap siblings. When nominal U.S. GDP growth exceeded 5% in year-over-year periods, the Russell 2000 beat the Russell 1000 65% of the time with an average annual return of 22.1% versus 17.0%. This is especially relevant to the current environment because consensus projections call for nominal GDP growth in the 8-10% range for 2021 and 5-7% for 2022.
Small Caps Have Tended to Outpace Large Caps in Periods of High Economic Growth
Russell 2000 vs Russell 1000 Regimes from 6/30/01 to 6/30/21

Batting average refers to the percentage of 1-year periods in which the Russell 2000 outperformed the Russell 1000.
The state of valuations between small and large caps is also relevant. With more and more market observers expressing concern about share prices in the U.S. market being unsustainably elevated, we looked at the situation by dividing the market by capitalization. To gauge valuations, we used one of our preferred metrics, enterprise value divided by the
| 2 | This page is not part of the Royce Capital Fund 2021 Semiannual Report to Shareholders | Past performance is no guarantee of future results. |
LETTER TO OUR SHAREHOLDERS
last 12 months’ earnings before interest & taxes (“LTM EV/EBIT”), excluding companies with negative EBIT. Although small cap delivered a significant outperformance over large cap over the past year (+62.0% vs. +43.1%), small-cap stocks are still relatively undervalued versus large caps when compared against their valuation range over the past 20 years.
Relative Valuations for Small Caps Are Near Their Lowest in 20 Years
Russell 2000 vs. Russell 1000 Median LTM EV/EBIT1 (ex. Negative EBIT Companies) from 6/30/01 to 6/30/21
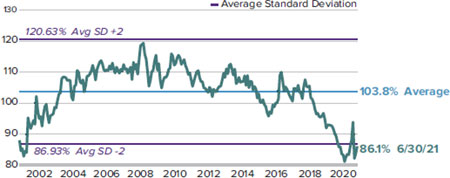
1 Earnings before interest and taxes. Source: FactSet
We think that the combination of the asset class’s strong history in growing economies and its more attractive relative valuations make a powerful case for small cap’s ongoing leadership in the U.S. equity market.
SMALL-CAP VALUE’S ADVANTAGE
In addition to looking for small caps to continue posting attractive relative and solid absolute results, we also expect small-cap value to maintain leadership within small cap—and for the same two reasons as small cap’s relative advantage over large caps: 1) Small-cap value has enjoyed a pronounced tendency to outperform small-cap growth when nominal economic growth has been above average and 2) small-cap value’s relative valuation compared with its historic range also looks attractive. The rationale for small-cap value outperforming in periods of high nominal economic growth is rooted in the idea that small-cap value is both more cyclically sensitive than its growth sibling and a greater beneficiary of inflation for relative earnings growth and valuation.
Our research confirmed this relationship as we looked back over the past 20 years and found that in one-year periods with at least 5% nominal GDP growth, the Russell 2000 Pure Value Index outperformed the Russell 2000 Pure Growth Index 68% of the time by an average of 420 basis points. In contrast, when nominal GDP growth fell between 3-5%, the small-cap value index outperformed only 32% of the time and lagged small-cap growth by an average of 100 basis points. As noted earlier, with consensus projections for nominal
GDP growth for 2021 and 2022 both in excess of 5%, the future environment seems well suited to continued outperformance for value.
Strong Economic Expansion Has Favored Value
Rolling 1-Year Returns for the Russell 2000 Pure Value vs Russell 2000 Pure Growth Indexes from 6/30/01 to 6/30/21
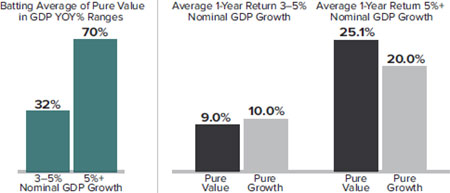
Batting average refers to the percentage of 1-year periods in which the Russell Pure Value outperformed the Russell Pure Growth Index. Source: Russell Investments
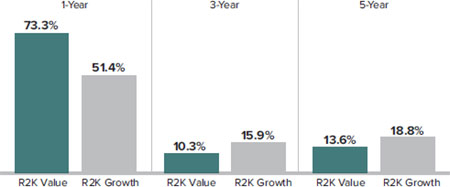
Despite these favorable conditions, some readers, in noting that small cap value has already beaten small-cap growth by a sizable margin over the last year (+73.3% versus +51.4%), may be wondering how much more outperformance value has left. We’d suggest that extending the time periods from the last one year to include the last three and five years reveals a starkly different picture. The Russell 2000 Value lagged its growth counterpart by more than 500 basis points for both the three- and five-year annualized periods ended 6/30/21. Given the depth of value’s underperformance over much of the past five years, then, the idea that value’s run might also be over seems ill founded to us.
Despite Leading from One Year, Value Trails by a Large Margin for Three- and Five-Year Periods
Russell 2000 Value vs Russell 2000 Growth Average Annual Total Returns as of 6/30/21
Current valuations add one final piece of the puzzle: just as small cap valuations finished June looking more attractive than those of large cap, small-cap value wound down 2021’s first half looking far more attractively valued than its growth counterpart—based on the same LTM EV/EBIT metric we used above. Indeed, even after accounting for its recent performance dominance, small-cap value stocks are as inexpensive compared to their small-cap growth cousins than at any time in the last 20 years. At the end of June
| Past performance is no guarantee of future results. | This page is not part of the Royce Capital Fund 2021 Semiannual Report to Shareholders | 3 |
LETTER TO OUR SHAREHOLDERS
2021, the Russell 2000 Value Index had a relative valuation of 22% of the Russell 2000 Growth Index compared to a 20-year average of 85%. This most recent relative valuation shows how much cheaper small-cap value stocks are compared with their historic relationship with valuations for small-cap growth stocks.
THE SECOND MAXIM
With all of the ups and downs the market has experienced since June 30, 2016, many investors may not realize that small caps have more than doubled over that five-year span. A multi-year period of moderately lower returns is to be expected after that high level of performance.
Which brings us to the aforementioned silver lining. The second investment maxim that is especially relevant to the current environment is that, perhaps paradoxically, active small-cap managers have actually added their greatest share of excess return when the Russell 2000 has delivered lower returns—single-digit results over five-year periods to be precise.
Monthly Rolling 5-Year U.S. Small Blend1 Average Excess Returns During Russell 2000 Return Ranges from 12/31/78 through 6/30/21
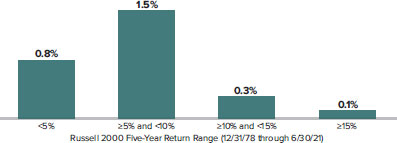
1 There were 514 US Fund Small Blend Funds tracked by Morningstar with at least five years of performance history as of 6/30/21. The excess return for a Morningstar category would be the category’s return for the period minus the Index return. Source: Morningstar
THE AGE OF ALPHA?
For most of the last decade, simply buying the market worked very well. The conditions were close to ideal for a market cap weighted, index-based approach. Large cap beat small cap, and mega caps beat large caps. The economy grew very slowly and with a good
deal of volatility, while 10-year Treasury yields ended the period at less than half of the 3.2% at which they started it. This significant decline in yield fused with the scarcity of economic growth to drive outperformance for duration-sensitive mega-cap growth stocks. The behemoths in turn drove index returns. We would describe this roughly 10-year period as “the era of beta” because overall market returns were so much higher than economic and profit growth, making it difficult for active strategies to stand out. Yet we believe that what we’re calling the “age of alpha” is in front of us—alpha being the term that describes an investment approach’s ability to beat the market.
As we have outlined, there’s good reason to anticipate a period of above-average economic and profit growth that’s accompanied by more subdued market returns. We believe this kind of environment gives disciplined active managers, especially those with a quality bias, an excellent opportunity to excel. A market in which there will be considerable differentiation is apt to reward the very fundamentals we focus on most. So while we anticipate lower overall U.S. equity returns than what the markets have given investors over the last 12-15 months, we also anticipate positive results—for small caps as an asset class and, more specifically, for small-cap value and select cyclicals.
There are always challenges, of course—and surprises, such as the Dow’s 500-point swoon on July 20th. It’s also true that small cap will almost definitely be contending with two countervailing forces over at least the next year or more: their fall through most of June and July notwithstanding, slowly rising rates seem likely to push down on valuations just as many companies are likely to be reporting healthy and growing earnings through at least the end of next year. These forces, however, will not affect all small-cap stocks equally. We believe that we offer our investors the requisite experience, discipline, and expertise to select those companies best positioned to benefit from the more challenging environment we see ahead—one that looks like a promising period for active small-cap management.
| Sincerely, | | |
| | | |
 |  |  |
| | | |
Charles M. Royce Chairman, Royce Investment Partners | Christopher D. Clark Chief Executive Officer, and Co-Chief Investment Officer, Royce Investment Partners | Francis D. Gannon Co-Chief Investment Officer, Royce Investment Partners |
| July 30, 2021 | | |
| 4 | This page is not part of the Royce Capital Fund 2021 Semiannual Report to Shareholders | Past performance is no guarantee of future results. |
Performance and Expenses
Performance and Expenses
As of June 30, 2021
| | YTD1 | 1-YR | 3-YR | 5-YR | 10-YR | 15-YR | 20-YR | SINCE INCEPTION (12/27/96) | ANNUAL OPERATING EXPENSES (%) GROSS/NET |
| Royce Capital Fund–Micro-Cap Portfolio | 25.19 | 74.88 | 15.17 | 16.21 | 7.14 | 6.84 | 8.50 | 10.81 | 1.47/1.33 |
| Royce Capital Fund–Small-Cap Portfolio | 23.48 | 60.24 | 5.22 | 9.07 | 7.26 | 6.90 | 8.12 | 10.10 | 1.19/1.08 |
| INDEX | | | | | | | | | |
| Russell Microcap Index | 29.02 | 75.77 | 14.47 | 18.13 | 13.06 | 8.73 | 9.26 | N/A | N/A |
| Russell 2000 Value Index | 26.69 | 73.28 | 10.27 | 13.62 | 10.85 | 7.90 | 9.17 | N/A | N/A |
| Russell 2000 Index | 17.54 | 62.03 | 13.52 | 16.47 | 12.34 | 9.51 | 9.26 | N/A | N/A |
1 Not annualized.
Important Performance, Expense, and Risk Information
All performance information in this Review and Report reflects past performance, is presented on a total return basis, reflects the reinvestment of distributions, and does not reflect the deduction of taxes that a shareholder would pay on fund distributions or the redemption of fund shares. Past performance is no guarantee of future results. Investment return and principal value of an investment will fluctuate, so that shares may be worth more or less than their original cost when redeemed. Current performance may be higher or lower than performance quoted and may be obtained at www.royceinvest.com. The Funds’ total returns do not reflect any deduction for charges or expenses of the variable contracts investing in the Funds. All performance and expense information reflects the result for each Fund’s Investment Class Shares. Gross annual operating expenses reflect each Fund’s gross total annual operating expenses and include management fees, operating expenses, and any applicable acquired fund fees and expenses. Net annual operating expenses reflect contractual fee waivers and/or expense reimbursements. All expense information is reported as of each fund’s most current prospectus. Royce & Associates has contractually agreed to waive fees and/or reimburse operating expenses, excluding brokerage commissions, taxes, interest litigation expenses, acquired fund fees and expenses, and other expenses not borne in the ordinary cost of business, to the extent necessary to maintain net operating expenses at or below 1.33% for Royce Capital Fund–Micro-Cap Portfolio, and at or below 1.08% for Royce Capital Fund–Small-Cap Portfolio through April 30, 2022.
Service Class Shares bear an annual distribution expense that is not borne by the Investment Class; if those expenses were reflected, total returns would have been lower. Each series of Royce Capital Fund is subject to market risk—the possibility that common stock prices will decline, sometimes sharply and unpredictably, over short or extended periods of time. Such declines may be caused by various factors, including market, financial, and economic conditions, governmental or central bank actions, and other factors, such as the recent COVID-19 pandemic, that may not be directly related to the issuer of a security held by a Fund. This pandemic could adversely affect global market, financial, and economic conditions in ways that cannot necessarily be foreseen. Royce Micro-Cap Portfolio invests primarily in micro-cap companies while Royce Small-Cap Portfolio invests primarily in small-cap companies. Investments in micro-cap and small-cap companies may involve considerably more risk than investments in securities of larger-cap companies. (Please see “Primary Risks for Fund Investors” in the prospectus.) Each series of Royce Capital Fund may invest up to 25% of its net assets in foreign securities. Investments in foreign securities may involve political, economic, currency, and other risks not encountered in U.S. investments. (Please see “Investing in Foreign Securities” in the prospectus.) As of 6/30/21, Royce Small-Cap Portfolio invested a significant portion of its assets in a limited number of stocks, which may involve considerably more risk than a more broadly diversified portfolio because a decline in the value of any one of these stocks would cause the Portfolio’s overall value to decline to a greater degree. Royce Micro-Cap Portfolio’s broadly diversified portfolio does not ensure a profit or guarantee against loss. (Please see “Primary Risks for Fund Investors” in the prospectus.) This Review and Report must be preceded or accompanied by a prospectus. Please read the prospectus carefully before investing or sending money. Russell Investment Group is the source and owner of the trademarks, service marks, and copyrights related to the Russell Indexes. Russell® is a trademark of Russell Investment Group. The Russell Microcap Index includes 1,000 of the smallest securities in the small-cap Russell 2000 Index along with the next smallest eligible securities as determined by Russell. The Russell 2000 Index is an unmanaged, capitalization-weighted index of domestic small-cap stocks. It measures the performance of the 2,000 smallest publicly traded U.S. companies in the Russell 3000 Index. The Russell 2000 Value Index consists of the respective value stocks within the Russell 2000 as determined by Russell Investments. The performance of an index does not represent exactly any particular investment, as you cannot invest directly in an index. Distributor: Royce Fund Services, LLC.
| This page is not part of the Royce Capital Fund 2021 Semiannual Report to Shareholders | 5 |
MANAGERS’ DISCUSSION (UNAUDITED)
Royce Capital Fund–Micro-Cap Portfolio (RCM)

Jim Stoeffel
Brendan Hartman
FUND PERFORMANCE
Royce Capital Fund–Micro-Cap Portfolio advanced 25.2% for the year-to-date period ended 6/30/21, trailing its primary benchmark, the Russell Microcap Index (+29.0%), while outpacing the Russell 2000 Index (+17.5%). The Fund also outperformed the Russell 2000 for the one- and three-year periods and the Russell Microcap for three-year period ended 6/30/21.
WHAT WORKED… AND WHAT DIDN’T
All 10 of the Fund’s equity sectors made positive contributions to performance in 2021’s first half. The most sizable positive impact came from Information Technology, the portfolio’s largest weighting, followed by Industrials and Consumer Discretionary. On the other hand, Consumer Staples, Real Estate, and Energy made the smallest positive contributions for the year-to-date period ended 6/30/21.
The Fund’s top contributing position for the first half was B. Riley Financial. The diversified financial services firm boasts operations that span from investment banking to retailer bankruptcy liquidations. The company’s earnings increased sizably during the pandemic as many of its end markets experienced record activity levels, including its investment banking and capital markets businesses. Citi Trends, a retail clothing chain selling discounted products targeted primarily at urban customers, was also additive to performance during 2021’s first half, benefiting from additional technology, such as merchandise planning software, that allowed the company to effectively target regional taste differences as well as refining its demographic focus. The company’s returns on capital have increased substantially over the last five years to 33%. Harvard Bioscience develops, manufactures, and markets life sciences equipment to support research and drug discovery. The company’s turnaround was sparked by an acquisition that significantly expanded its market. The company then restructured its management team, which proved beneficial as it put in a new operational structure. We maintained our position as we believe the company is relatively early in reaping the benefits of its restructuring.
Motorsport Games, an international media and technology company that develops gaming software, detracted most for the year-to-date period ended 6/30/21, as it was negatively impacted by the disconnect between its recent IPO and the release of its forthcoming key product, NASCAR NXT. We have cautiously added to our position, although we remain cognizant of the inherent risks that a small company faces when it is highly dependent on one software title. We will reevaluate our position as we begin to see gaming influencers provide feedback on NASCAR NXT. LightPath Technologies, which creates optics, photonics, and infrared solutions for the defense, industrial testing and measurement, telecommunications, and medical industries, also detracted from performance. LightPath was hindered by a decline in order backlog caused by a lack of major contract renewals and fewer new orders—its inventory levels are tied to the next phase of the 5G rollout. We maintained our position as we view the price and fundamental volatility as typical of a small company that serves very large markets. Lastly, CIRCOR International—which designs, manufactures, and distributes flow and motion control products—declined as 1Q21 earnings failed to meet expectations, raising concerns about future growth. We were unfazed by the shortfall in the context of a rapidly reopening economy and were heartened by strong bookings growth that provides some visibility into the rest of 2021.
Relative to the micro-cap benchmark in 2021’s first half, performance was hurt most by stock selection—sector allocation was also negative but to a much lesser degree. Ineffective stock picks and sector allocation in Consumer Discretionary and Industrials detracted, with the former caused by our underweight and the latter due to our overweight. The portfolio’s cash position also created a drag on performance. Conversely, Health Care, Financials, and Consumer Staples all benefited from savvy stock selection and our lower weightings.
| | | | | |
| | Top Contributors to Performance | | Top Detractors from Performance | |
| | Year-to-Date Through 6/30/21 (%)1 | | | Year-to-Date Through 6/30/21 (%)2 | |
| | | | | | |
| | B. Riley Financial | 1.02 | | Motorsport Games Cl. A | -0.30 | |
| | Citi Trends | 0.98 | | LightPath Technologies Cl. A | -0.26 | |
| | Harvard Bioscience | 0.83 | | CIRCOR International | -0.20 | |
| | Shoe Carnival | 0.83 | | American Superconductor | -0.16 | |
| | Ultra Clean Holdings | 0.80 | | Unique Fabricating | -0.16 | |
| | 1 Includes dividends | | | 2 Net of dividends | | |
| | | | | | | |
CURRENT POSITIONING AND OUTLOOK
We’ve seen a significant change in market leadership away from growth stocks—which are more heavily weighted in Information Technology and Health Care—to value stocks, which we believe has been caused by the reopening economy. Fears of slower economic growth due to new COVID variants and questions of whether the Fed will maintain its commitment to managing the effects of inflation seem to be the focus of current market dynamics. We remain constructive on the economy and company growth prospects as the world recovers from lockdowns. We also suspect that many recent commodity price spikes will prove short lived—such as we have already seen with lumber prices—as the supply base responds to strong demand. Many services and/or digital business models that are less dependent on oil and commodities to fuel their expansion drive our domestic economy, and many of the transformations caused by the digitalization of the global economy seem to have been accelerated by the pandemic, likely resulting in permanent behavioral changes. Our portfolio positioning reflects this outlook—with a cyclical lean due to our value approach, which we believe is best suited in the current environment.
6 | Royce Capital Fund 2021 Semiannual Report to Shareholders
| PERFORMANCE AND PORTFOLIO REVIEW (UNAUDITED) | | TICKER SYMBOLS RCMCX RCMSX |
Performance and Expenses
Average Annual Total Return (%) Through 6/30/21
| | JAN-JUN 20211 | 1-YR | 3-YR | 5-YR | 10-YR | 15-YR | 20-YR | SINCE INCEPTION (12/27/96) |
| RCM | 25.19 | 74.88 | 15.17 | 16.21 | 7.14 | 6.84 | 8.50 | 10.81 |
| Annual Gross Operating Expenses: 1.47% | Annual Net Operating Expenses: 1.33% |
1 Not annualized
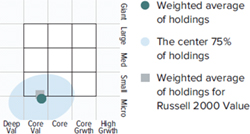
Morningstar Style Map™ As of 6/30/21

The Morningstar Style Map is the Morningstar Style Box™ with the center 75% of fund holdings plotted as the Morningstar Ownership Zone™. The Morningstar Style Box is designed to reveal a fund’s investment strategy. The Morningstar Ownership Zone provides detail about a portfolio’s investment style by showing the range of stock sizes and styles. The Ownership Zone is derived by plotting each stock in the portfolio within the proprietary Morningstar Style Box. Over time, the shape and location of a fund’s ownership zone may vary. See page 28 for additional information.
Value of $10,000
Invested on 6/30/00 (Russell Microcap Inception)
as of 6/30/21 ($)
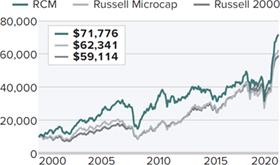
Includes reinvestment of distributions.
Top 10 Positions
% of Net Assets
| | | |
| Harvard Bioscience | | 1.5 |
| Shoe Carnival | | 1.2 |
| Transcat | | 1.2 |
| Agilysys | | 1.2 |
| Century Casinos | | 1.2 |
| Cutera | | 1.2 |
| Aspen Aerogels | | 1.1 |
| Major Drilling Group International | | 1.1 |
| B. Riley Financial | | 1.1 |
| Ultra Clean Holdings | | 1.1 |
Portfolio Sector Breakdown
% of Net Assets
| | | |
| Information Technology | | 23.7 |
| Industrials | | 22.2 |
| Financials | | 13.8 |
| Health Care | | 13.3 |
| Consumer Discretionary | | 11.1 |
| Communication Services | | 4.4 |
| Materials | | 3.5 |
| Energy | | 2.9 |
| Real Estate | | 0.4 |
| Cash and Cash Equivalents | | 4.7 |
Calendar Year Total Returns (%)
| YEAR | | RCM |
| 2020 | | 23.8 |
| 2019 | | 19.6 |
| 2018 | | -9.0 |
| 2017 | | 5.2 |
| 2016 | | 19.7 |
| 2015 | | -12.5 |
| 2014 | | -3.6 |
| 2013 | | 21.0 |
| 2012 | | 7.6 |
| 2011 | | -12.1 |
| 2010 | | 30.1 |
| 2009 | | 57.9 |
| 2008 | | -43.3 |
| 2007 | | 4.0 |
| 2006 | | 21.1 |
Upside/Downside Capture Ratios
Periods Ended 6/30/21 (%)
| | | UPSIDE | | DOWNSIDE |
| 10-Year | | 75 | | 96 |
| From 6/30/00 (Russell Microcap Inception) | | 90 | | 81 |
Portfolio Diagnostics
| Fund Net Assets | | $195 million |
| Number of Holdings | | 128 |
| Turnover Rate | | 13% |
| Average Market Capitalization1 | | $612 million |
| Weighted Average P/B Ratio 2 | | 2.4x |
| Active Share 3 | | 92% |
| U.S. Investments (% of Net Assets) | | 84.1% |
| Non-U.S. Investments (% of Net Assets) | | 11.2% |
| 1 | Geometric Average. This weighted calculation uses each portfolio holding’s market cap in a way designed to not skew the effect of very large or small holdings; instead, it aims to better identify the portfolio’s center, which Royce believes offers a more accurate measure of average market cap than a simple mean or median. |
| 2 | Harmonic Average. This weighted calculation evaluates a portfolio as if it were a single stock and measures it overall. It compares the total market value of the portfolio to the portfolio’s share in the earnings or book value, as the case may be, of its underlying stocks. |
| 3 | Active Share is the sum of the absolute values of the different weightings of each holding in the Fund versus each holding in the benchmark, divided by two. |
Important Performance and Expense Information
All performance information in this Report reflects past performance, is presented on a total return basis, reflects the reinvestment of distributions, and does not reflect the deduction of taxes that a shareholder would pay on fund distributions or the redemption of fund shares. Past performance is no guarantee of future results. Investment return and principal value of an investment will fluctuate, so that shares may be worth more or less than their original cost when redeemed. Current performance may be higher or lower than performance quoted. The Fund’s total returns do not reflect any deduction for charges or expenses of the variable contracts investing in the Fund. Returns as of the most recent month-end may be obtained at www.royceinvest.com. All performance and risk information reflects the result of the Investment Class (its oldest class). Shares of RCM’s Service Class bear an annual distribution expense that is not borne by the Investment Class; if those expenses were reflected, total returns would have been lower. Certain immaterial adjustments were made to the net assets of Royce Capital Fund-Micro-Cap Portfolio at 12/31/17 for financial reporting purposes, and as a result the calendar year total returns based on those net asset values differ from the adjusted net asset values and calendar year total returns reported in the Financial Highlights. Gross operating expenses reflect the Fund’s total gross operating expenses for the Investment Class and include management fees and other expenses. Net operating expenses reflect contractual fee waivers and/or expense reimbursements. All expense information is reported as of the Fund’s most current prospectus. Royce & Associates has contractually agreed, without right of termination, to waive fees and/or reimburse expenses to the extent necessary to maintain the Investment Class’s net annual operating expenses (excluding brokerage commissions, taxes, interest, litigation expenses, acquired fund fees and expenses, and other expenses not borne in the ordinary course of business) at or below 1.33% through April 30, 2022. Regarding the “Top Contributors” and “Top Detractors” tables shown above, the sum of all contributors to, and all detractors from, performance for all securities in the portfolio would approximate the Fund’s year-to-date performance for 2021. Upside Capture Ratio measures a manager’s performance in up markets relative to the Fund’s benchmark (Russell Microcap). It is calculated by measuring the Fund’s performance in quarters when the benchmark went up and dividing it by the benchmark’s return in those quarters. Downside Capture Ratio measures a manager’s performance in down markets relative to the Fund’s benchmark. It is calculated by measuring the Fund’s performance in quarters when the benchmark goes down and dividing it by the benchmark’s return in those quarters.
Royce Capital Fund 2021 Semiannual Report to Shareholders | 7
Schedule of Investments
Royce Capital Fund - Micro-Cap Portfolio
Common Stocks – 95.3%
| | | SHARES | | VALUE |
| | | | | |
| COMMUNICATION SERVICES – 4.4% | | | | | |
| ENTERTAINMENT - 2.9% | | | | | |
| Chicken Soup For The Soul Entertainment Cl. A 1 | | 52,316 | | $ | 2,165,882 |
| Gaia Cl. A 1 | | 123,600 | | | 1,358,364 |
| IMAX Corporation 1 | | 27,400 | | | 589,100 |
| †Motorsport Games Cl. A 1 | | 41,090 | | | 575,260 |
| Score Media and Gaming Cl. A 1 | | 47,450 | | | 951,603 |
| | | | | | 5,640,209 |
| INTERACTIVE MEDIA & SERVICES - 1.0% | | | | | |
| †Enthusiast Gaming Holdings 1 | | 60,200 | | | 357,432 |
| QuinStreet 1 | | 81,300 | | | 1,510,554 |
| | | | | | 1,867,986 |
| MEDIA - 0.5% | | | | | |
| Magnite 1,2 | | 29,800 | | | 1,008,432 |
| Total (Cost $4,619,438) | | | | | 8,516,627 |
| | | | | | |
| CONSUMER DISCRETIONARY – 11.1% | | | | | |
| AUTO COMPONENTS - 2.0% | | | | | |
| Modine Manufacturing 1 | | 93,500 | | | 1,551,165 |
| Stoneridge 1 | | 56,600 | | | 1,669,700 |
| Unique Fabricating 1 | | 177,054 | | | 655,100 |
| | | | | | 3,875,965 |
| DIVERSIFIED CONSUMER SERVICES - 0.3% | | | | | |
| †Select Interior Concepts Cl. A 1 | | 56,100 | | | 527,340 |
| HOTELS, RESTAURANTS & LEISURE - 1.9% | | | | | |
| Century Casinos 1 | | 167,500 | | | 2,249,525 |
| Lindblad Expeditions Holdings 1 | | 87,400 | | | 1,399,274 |
| | | | | | 3,648,799 |
| HOUSEHOLD DURABLES - 0.7% | | | | | |
| Legacy Housing 1 | | 83,900 | | | 1,418,749 |
| LEISURE PRODUCTS - 0.9% | | | | | |
| MasterCraft Boat Holdings 1 | | 66,417 | | | 1,746,103 |
| SPECIALTY RETAIL - 4.3% | | | | | |
| Chico’s FAS 1 | | 79,100 | | | 520,478 |
| Citi Trends 1 | | 24,186 | | | 2,104,182 |
| OneWater Marine Cl. A | | 43,100 | | | 1,811,493 |
| Shoe Carnival | | 33,100 | | | 2,369,629 |
| Zumiez 1 | | 31,400 | | | 1,538,286 |
| | | | | | 8,344,068 |
| TEXTILES, APPAREL & LUXURY GOODS - 1.0% | | | | | |
| †Fossil Group 1 | | 7,000 | | | 99,960 |
| Vera Bradley 1 | | 158,800 | | | 1,967,532 |
| | | | | | 2,067,492 |
| Total (Cost $12,190,302) | | | | | 21,628,516 |
| | | | | | |
| ENERGY – 2.9% | | | | | |
| ENERGY EQUIPMENT & SERVICES - 2.9% | | | | | |
| Aspen Aerogels 1 | | 74,900 | | | 2,241,008 |
| Natural Gas Services Group 1 | | 153,200 | | | 1,574,896 |
| Newpark Resources 1 | | 356,800 | | | 1,234,528 |
| Profire Energy 1 | | 612,129 | | | 691,706 |
| Total (Cost $4,469,672) | | | | | 5,742,138 |
| | | | | | |
| FINANCIALS – 13.8% | | | | | |
| BANKS - 6.7% | | | | | |
| Allegiance Bancshares | | 37,200 | | | 1,429,968 |
| BayCom Corporation 1 | | 75,782 | | | 1,360,287 |
| Caribbean Investment Holdings 1 | | 1,751,547 | | | 787,447 |
| County Bancorp | | 28,878 | | | 980,697 |
| HarborOne Bancorp | | 117,191 | | | 1,680,519 |
| HBT Financial | | 92,200 | | | 1,605,202 |
| HomeTrust Bancshares | | 61,800 | | | 1,724,220 |
| Investar Holding Corporation | | 77,400 | | | 1,771,686 |
| Midway Investments 1,3 | | 1,751,577 | | | 0 |
| TriState Capital Holdings 1 | | 85,772 | | | 1,748,891 |
| | | | | | 13,088,917 |
| CAPITAL MARKETS - 4.6% | | | | | |
| B. Riley Financial | | 29,000 | | | 2,189,500 |
| Canaccord Genuity Group | | 195,600 | | | 2,142,827 |
| Silvercrest Asset Management Group Cl. A | | 90,300 | | | 1,358,112 |
| Sprott | | 50,180 | | | 1,975,058 |
| StoneX Group 1 | | 22,400 | | | 1,359,008 |
| | | | | | 9,024,505 |
| DIVERSIFIED FINANCIAL SERVICES - 0.2% | | | | | |
| Waterloo Investment Holdings 1,3 | | 1,302,000 | | | 325,500 |
| THRIFTS & MORTGAGE FINANCE - 2.3% | | | | | |
| PCSB Financial | | 78,400 | | | 1,424,528 |
| Territorial Bancorp | | 53,100 | | | 1,379,007 |
| Western New England Bancorp | | 205,354 | | | 1,673,635 |
| | | | | | 4,477,170 |
| Total (Cost $23,038,807) | | | | | 26,916,092 |
| | | | | | |
| HEALTH CARE – 13.3% | | | | | |
| BIOTECHNOLOGY - 2.1% | | | | | |
| CareDx 1 | | 15,200 | | | 1,391,104 |
| Dynavax Technologies 1 | | 116,500 | | | 1,147,525 |
| MeiraGTx Holdings 1 | | 99,700 | | | 1,545,350 |
| | | | | | 4,083,979 |
| HEALTH CARE EQUIPMENT & SUPPLIES - 7.2% | | | | | |
| Apyx Medical 1 | | 163,100 | | | 1,681,561 |
| AtriCure 1 | | 21,000 | | | 1,665,930 |
| Chembio Diagnostics 1 | | 107,400 | | | 318,978 |
| CryoLife 1 | | 67,589 | | | 1,919,528 |
| Cutera 1 | | 45,800 | | | 2,245,574 |
| Misonix 1 | | 74,200 | | | 1,645,756 |
| OrthoPediatrics Corp. 1 | | 25,600 | | | 1,617,408 |
| Profound Medical 1 | | 76,900 | | | 1,252,510 |
| Surmodics 1 | | 29,278 | | | 1,588,331 |
| | | | | | 13,935,576 |
| HEALTH CARE PROVIDERS & SERVICES - 0.6% | | | | | |
| Sharps Compliance 1 | | 110,800 | | | 1,141,240 |
| LIFE SCIENCES TOOLS & SERVICES - 3.2% | | | | | |
| Harvard Bioscience 1 | | 340,468 | | | 2,836,098 |
| †Inotiv 1 | | 33,500 | | | 893,780 |
| NeoGenomics 1 | | 23,500 | | | 1,061,495 |
| Quanterix Corporation 1 | | 25,700 | | | 1,507,562 |
| | | | | | 6,298,935 |
| PHARMACEUTICALS - 0.2% | | | | | |
| Axsome Therapeutics 1,2 | | 6,300 | | | 424,998 |
| Total (Cost $12,613,603) | | | | | 25,884,728 |
| | | | | | |
| INDUSTRIALS – 22.2% | | | | | |
| AEROSPACE & DEFENSE - 0.9% | | | | | |
| Astronics Corporation 1 | | 53,600 | | | 938,536 |
| CPI Aerostructures 1 | | 212,231 | | | 753,420 |
| | | | | | 1,691,956 |
| 8 | Royce Capital Fund 2021 Semiannual Report to Shareholders | THE ACCOMPANYING NOTES ARE AN INTEGRAL PART OF THESE FINANCIAL STATEMENTS |
June 30, 2021 (unaudited)
Royce Capital Fund - Micro-Cap Portfolio (continued)
| | | SHARES | | VALUE |
| | | | | |
| INDUSTRIALS (continued) | | | | | |
| BUILDING PRODUCTS - 0.6% | | | | | |
| Quanex Building Products | | 44,800 | | $ | 1,112,832 |
| COMMERCIAL SERVICES & SUPPLIES - 2.3% | | | | | |
| Acme United | | 44,965 | | | 2,003,640 |
| Heritage-Crystal Clean 1 | | 54,934 | | | 1,630,441 |
| †VSE Corporation | | 15,600 | | | 772,356 |
| | | | | | 4,406,437 |
| CONSTRUCTION & ENGINEERING - 4.1% | | | | | |
| Ameresco Cl. A 1 | | 25,800 | | | 1,618,176 |
| Construction Partners Cl. A 1 | | 61,800 | | | 1,940,520 |
| IES Holdings 1 | | 24,000 | | | 1,232,640 |
| Northwest Pipe 1 | | 60,900 | | | 1,720,425 |
| NV5 Global 1 | | 15,900 | | | 1,502,709 |
| | | | | | 8,014,470 |
| ELECTRICAL EQUIPMENT - 0.8% | | | | | |
| American Superconductor 1 | | 92,100 | | | 1,601,619 |
| MACHINERY - 5.6% | | | | | |
| Alimak Group | | 80,300 | | | 1,309,856 |
| CIRCOR International 1 | | 56,400 | | | 1,838,640 |
| Graham Corporation | | 96,020 | | | 1,321,235 |
| Luxfer Holdings | | 31,100 | | | 691,975 |
| Porvair | | 139,600 | | | 1,127,755 |
| Shyft Group (The) | | 56,400 | | | 2,109,924 |
| Wabash National | | 91,900 | | | 1,470,400 |
| Westport Fuel Systems 1 | | 192,500 | | | 1,022,175 |
| | | | | | 10,891,960 |
| MARINE - 0.9% | | | | | |
| Clarkson | | 40,300 | | | 1,778,329 |
| PROFESSIONAL SERVICES - 4.9% | | | | | |
| CRA International | | 23,306 | | | 1,994,994 |
| Forrester Research 1 | | 23,100 | | | 1,057,980 |
| GP Strategies 1 | | 117,608 | | | 1,848,798 |
| Heidrick & Struggles International | | 41,300 | | | 1,839,915 |
| Kforce | | 25,500 | | | 1,604,715 |
| Resources Connection | | 89,254 | | | 1,281,687 |
| | | | | | 9,628,089 |
| TRADING COMPANIES & DISTRIBUTORS - 2.1% | | | | | |
| Lawson Products 1 | | 36,000 | | | 1,926,360 |
| Transcat 1 | | 40,300 | | | 2,277,353 |
| | | | | | 4,203,713 |
| Total (Cost $25,480,739) | | | | | 43,329,405 |
| | | | | | |
| INFORMATION TECHNOLOGY – 23.7% | | | | | |
| COMMUNICATIONS EQUIPMENT - 2.6% | | | | | |
| Digi International 1 | | 96,000 | | | 1,930,560 |
| EMCORE Corporation 1 | | 194,100 | | | 1,789,602 |
| †Genasys 1 | | 122,200 | | | 669,656 |
| Harmonic 1 | | 67,900 | | | 578,508 |
| | | | | | 4,968,326 |
| ELECTRONIC EQUIPMENT, INSTRUMENTS & COMPONENTS - 5.6% | | | | | |
| FARO Technologies 1 | | 21,600 | | | 1,679,832 |
| LightPath Technologies Cl. A 1 | | 354,800 | | | 901,192 |
| Luna Innovations 1 | | 179,100 | | | 1,939,653 |
| nLIGHT 1 | | 40,100 | | | 1,454,828 |
| PAR Technology 1 | | 27,300 | | | 1,909,362 |
| PowerFleet 1 | | 186,000 | | | 1,339,200 |
| Vishay Precision Group 1 | | 51,700 | | | 1,759,868 |
| | | | | | 10,983,935 |
| IT SERVICES - 1.4% | | | | | |
| Cass Information Systems | | 32,848 | | | 1,338,556 |
| Computer Task Group 1 | | 149,000 | | | 1,440,830 |
| | | | | | 2,779,386 |
| SEMICONDUCTORS & SEMICONDUCTOR EQUIPMENT - 11.4% | | | | | |
| Aehr Test Systems 1 | | 322,200 | | | 889,272 |
| Axcelis Technologies 1 | | 42,900 | | | 1,734,018 |
| AXT 1 | | 155,400 | | | 1,706,292 |
| Camtek 1 | | 57,872 | | | 2,182,353 |
| Cohu 1 | | 45,400 | | | 1,670,266 |
| CyberOptics Corporation 1 | | 50,900 | | | 2,084,864 |
| Ichor Holdings 1 | | 37,600 | | | 2,022,880 |
| NeoPhotonics Corporation 1 | | 104,500 | | | 1,066,945 |
| Nova Measuring Instruments 1,2 | | 20,200 | | | 2,078,378 |
| NVE Corporation | | 19,100 | | | 1,414,355 |
| PDF Solutions 1 | | 75,100 | | | 1,365,318 |
| Photronics 1 | | 140,600 | | | 1,857,326 |
| Ultra Clean Holdings 1 | | 40,700 | | | 2,186,404 |
| | | | | | 22,258,671 |
| SOFTWARE - 1.9% | | | | | |
| Agilysys 1 | | 39,700 | | | 2,257,739 |
| †GTY Technology Holdings 1 | | 66,717 | | | 474,358 |
| QAD Cl. A | | 11,200 | | | 974,624 |
| | | | | | 3,706,721 |
| TECHNOLOGY HARDWARE, STORAGE & PERIPHERALS - 0.8% | | | | | |
| AstroNova 1 | | 108,000 | | | 1,503,360 |
| Total (Cost $25,060,710) | | | | | 46,200,399 |
| | | | | | |
| MATERIALS – 3.5% | | | | | |
| METALS & MINING - 3.5% | | | | | |
| Altius Minerals | | 78,900 | | | 1,083,952 |
| Haynes International | | 55,370 | | | 1,958,991 |
| Major Drilling Group International 1 | | 322,600 | | | 2,230,302 |
| Universal Stainless & Alloy Products 1 | | 162,500 | | | 1,636,375 |
| Total (Cost $5,999,195) | | | | | 6,909,620 |
| | | | | | |
| REAL ESTATE – 0.4% | | | | | |
| REAL ESTATE MANAGEMENT & DEVELOPMENT - 0.4% | | | | | |
| FRP Holdings 1 | | 13,840 | | | 770,611 |
| Total (Cost $264,652) | | | | | 770,611 |
| | | | | | |
| TOTAL COMMON STOCKS | | | | | |
| (Cost $113,737,118) | | | | | 185,898,136 |
| THE ACCOMPANYING NOTES ARE AN INTEGRAL PART OF THESE FINANCIAL STATEMENTS | Royce Capital Fund 2021 Semiannual Report to Shareholders | 9 |
June 30, 2021 (unaudited)
Schedule of Investments
Royce Capital Fund - Micro-Cap Portfolio (continued)
| | | VALUE |
| | | |
| REPURCHASE AGREEMENT– 4.5% | | |
| Fixed Income Clearing Corporation, 0.00% dated 6/30/21, due 7/1/21, maturity value $8,727,878 (collateralized by obligations of various U.S. Government Agencies, 1.25% due 6/30/28, valued at $8,902,461) |
| (Cost $8,727,878) | | $ | 8,727,878 |
| | | | |
| TOTAL INVESTMENTS – 99.8% | | | |
| (Cost $122,464,996) | | | 194,626,014 |
| | | | |
| CASH AND OTHER ASSETS LESS LIABILITIES – 0.2% | | | 408,379 |
| | | | |
| NET ASSETS – 100.0% | | $ | 195,034,393 |
| 2 | All or a portion of these securities were on loan at June 30, 2021. |
| 3 | Securities for which market quotations are not readily available represent 0.2% of net assets. These securities have been valued at their fair value under procedures approved by the Fund’s Board of Trustees. These securities are defined as Level 3 securities due to the use of significant unobservable inputs in the determination of fair value. See Notes to Financial Statements. |
Bold indicates the Fund’s 20 largest equity holdings in terms of June 30, 2021, market value.
| 10 | Royce Capital Fund 2021 Semiannual Report to Shareholders | THE ACCOMPANYING NOTES ARE AN INTEGRAL PART OF THESE FINANCIAL STATEMENTS |
This page is intentionally left blank.
Royce Capital Fund 2021 Semiannual Report to Shareholders | 11
MANAGER’S DISCUSSION (UNAUDITED)
Royce Capital Fund–Small-Cap Portfolio (RCS)

Jay Kaplan, CFA
FUND PERFORMANCE
Royce Capital Fund–Small-Cap Portfolio gained 23.5% for the year-to-date period ended 6/30/21, underperforming the Russell 2000 Value Index (+26.7%) while outpacing the Russell 2000 (+17.5%) Index for the same period.
WHAT WORKED… AND WHAT DIDN’T
All nine of the equity sectors in which the portfolio held investments made positive contributions to performance in 2021’s first half. Industrials made the most sizable positive contribution. Consumer Discretionary and Information Technology, our third and fourth largest weightings, respectively, were also additive to results. Real Estate, Consumer Staples, and Energy made the smallest positive contributions to performance for the year-to-date period ended 6/30/21.
Discount footwear retailer Shoe Carnival was the top contributing position, benefiting from substantial sales growth as high demand allowed it to sell shoes at full price rather than resort to discounting, boosting the company’s profits and expanding its margins. Kulicke & Soffa Industries—which designs and manufactures capital equipment and packaging materials used to assemble semiconductor devices—reported strong results for its fiscal second quarter in May, citing increased global reliance on semiconductors and the growing capital intensity within the assembly process as the primary drivers behind its recent success. Kulicke & Soffa’s business also benefited from restoked demand for chips and was added to the Russell 2000 in May, helping to further lift its stock price. Our third best contributor was lease-to-own retailer The Aaron’s Company. Tightening credit for lower income Americans was relieved to a large degree by PPE money, which helped the company’s key rent-to-own furniture and appliance business. Aaron’s also reported first-quarter results in April that included higher revenues, much improved earnings, and raised guidance for the rest of 2021.
Conversely, specialty insurer and reinsurer James River Group Holdings caused the biggest drag on performance for the year-to-date period ended 6/30/21. Its shares were hit hard in May when the company announced a significant reserve charge related to its commercial auto business, specifically Uber, which led James River to stop writing new policies with the ride share company at the end of 2019. A larger-than-expected number of Uber-related legacy claims, however, led the company to meaningfully add to these reserves, which created a consequent negative impact on capital levels that in turn saw James River issue equity, the dilutive effect of which led its shares rapidly downward. Hopeful for an eventual turnaround, we held shares at the end of June. We also held a position in Florida-based Heritage Insurance Holdings at the end of the period. Stormy weather in the Southeast U.S. led to higher-than-anticipated losses that crimped profits. However, its competitors are facing considerable financial pressure, and Florida is implementing price increases for home insurance, both of which should help Heritage to rebound. Like many appliance and furniture companies, furniture manufacturer La-Z-Boy experienced issues with short-term supply chains and attracting labor, which created long lead times and a growing backlog. However, La-Z-Boy hasn’t experienced many order cancellations—demand remains strong. Our expectation, then, is that its stock will rebound once its supply chain challenges are rectified.
Relative to the Russell 2000 Value, sector allocation decisions and ineffective stock selection equally hampered first-half performance. Energy, the sector with the most sizable negative impact, detracted due to our lower weighting. Financials and Communication Services followed as a result of our ineffective stock picks, with sector allocation equally detracting in the latter. On the other hand, Information Technology benefited from savvy stock selection, while our lack of exposure to Utilities and our lower weighting in Real Estate were also additive.
| | | | | | | |
| | Top Contributors to Performance | | | Top Detractors from Performance | | |
| | Year-to-Date Through 6/30/21 (%)1 | | | Year-to-Date Through 6/30/21 (%)2 | | |
| | | | | | | |
| | Shoe Carnival | 1.60 | | James River Group Holdings | -0.31 | |
| | Kulicke & Soffa Industries | 1.53 | | Heritage Insurance Holdings | -0.15 | |
| | Aaron’s Company (The) | 1.16 | | La-Z-Boy | -0.12 | |
| | Rent-A-Center | 1.14 | | PROG Holdings | -0.12 | |
| | ArcBest | 1.13 | | BioDelivery Sciences International | -0.10 | |
| | 1 Includes dividends | | | 2 Net of dividends | | |
| | | | | | | |
CURRENT POSITIONING AND OUTLOOK
Given the backdrop of ample liquidity and a rebounding economy, we believe that inflation is likely to grow, with Fed policy crucial to managing its effects. We think earnings for 2021 should remain strong as they’re being measured off 2020’s recession. However, the earnings picture for 2022 is unclear due to current market uncertainty. We’re populating the portfolio with companies we believe will hold up well in the current murky climate, even if they’re currently out of favor for reasons we see as likely to prove short lived. Our heavy exposures to Industrials, Consumer Discretionary, and Financials best exemplify this. Industries such as construction & engineering in Industrials look attractive to us as they seem best positioned to deal with current supply chain issues and look more than capable of passing on costs in our inflationary environment. Constricted supply and high demand in Consumer Discretionary has attracted us to companies involved in household goods and furniture, because we anticipate that sales should remain robust. While rising rates and a steeper yield curve may bode well for banks, loan growth remains weak. However, a strengthening economy may fix that and, moreover, we believe the market still has an upward, though more modest, trajectory.
12 | Royce Capital Fund 2021 Semiannual Report to Shareholders
| PERFORMANCE AND PORTFOLIO REVIEW (UNAUDITED) | TICKER SYMBOLS RCPFX RCSSX |
Performance and Expenses
Average Annual Total Return (%) Through 6/30/21
| | JAN-JUN 20211 | 1-YR | 3-YR | 5-YR | 10-YR | 15-YR | 20-YR | SINCE INCEPTION (12/27/96) |
| RCS | 23.48 | 60.24 | 5.22 | 9.07 | 7.26 | 6.90 | 8.12 | 10.10 |
| Annual Gross Operating Expenses: 1.19% Annual Net Operating Expenses: 1.08% |
1Not annualized
Morningstar Style Map™ As of 6/30/21
The Morningstar Style Map is the Morningstar Style Box™ with the center 75% of fund holdings plotted as the Morningstar Ownership Zone™. The Morningstar Style Box is designed to reveal a fund’s investment strategy. The Morningstar Ownership Zone provides detail about a portfolio’s investment style by showing the range of stock sizes and styles. The Ownership Zone is derived by plotting each stock in the portfolio within the proprietary Morningstar Style Box. Over time, the shape and location of a fund’s ownership zone may vary. See page 28 for additional information.
Value of $10,000
Invested on 12/27/96 as of 6/30/21 ($)
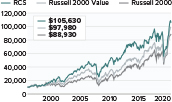
Includes reinvestment of distributions.
| Top 10 Positions | |
| % of Net Assets | |
| | |
| Evercore Cl. A | 2.4 |
| Kulicke & Soffa Industries | 2.4 |
| Shoe Carnival | 2.3 |
| Sanmina Corporation | 2.3 |
| PulteGroup | 2.3 |
| Rent-A-Center | 2.3 |
| Molina Healthcare | 2.1 |
| Vishay Intertechnology | 2.1 |
| Great Lakes Dredge & Dock | 2.0 |
| La-Z-Boy | 2.0 |
| Portfolio Sector Breakdown | |
| % of Net Assets | |
| | |
| Financials | 23.1 |
| Industrials | 23.1 |
| Consumer Discretionary | 22.1 |
| Information Technology | 19.3 |
| Health Care | 7.8 |
| Communication Services | 1.4 |
| Energy | 0.5 |
| Real Estate | 0.5 |
| Consumer Staples | 0.4 |
| Cash and Cash Equivalents | 1.8 |
| Calendar Year Total Returns (%) | |
| YEAR | RCS |
| 2020 | -7.2 |
| 2019 | 18.7 |
| 2018 | -8.3 |
| 2017 | 5.4 |
| 2016 | 21.0 |
| 2015 | -11.8 |
| 2014 | 3.2 |
| 2013 | 34.8 |
| 2012 | 12.5 |
| 2011 | -3.3 |
| 2010 | 20.5 |
| 2009 | 35.2 |
| 2008 | -27.2 |
| 2007 | -2.1 |
| 2006 | 15.6 |
| Upside/Downside Capture Ratios | | |
| Periods Ended 6/30/21 (%) | | |
| | UPSIDE | DOWNSIDE |
| 10-Year | 82 | 96 |
| From 12/31/96 (Start of Fund’s First Full Quarter) | 96 | 91 |
| Portfolio Diagnostics | |
| Fund Net Assets | $385 million |
| Number of Holdings | 95 |
| Turnover Rate | 26% |
| Average Market Capitalization 1 | $1,562 million |
| Weighted Average P/B Ratio 2 | 2.0x |
| Active Share 3 | 96% |
| U.S. Investments (% of Net Assets) | 94.7% |
| Non-U.S. Investments (% of Net Assets) | 3.5% |
| 1 | Geometric Average. This weighted calculation uses each portfolio holding’s market cap in a way designed to not skew the effect of very large or small holdings; instead, it aims to better identify the portfolio’s center, which Royce believes offers a more accurate measure of average market cap than a simple mean or median. |
| 2 | Harmonic Average. This weighted calculation evaluates a portfolio as if it were a single stock and measures it overall. It compares the total market value of the portfolio to the portfolio’s share in the earnings or book value, as the case may be, of its underlying stocks. |
| 3 | Active Share is the sum of the absolute values of the different weightings of each holding in the Fund versus each holding in the benchmark, divided by two. |
Important Performance and Expense Information
All performance information in this Report reflects past performance, is presented on a total return basis, reflects the reinvestment of distributions, and does not reflect the deduction of taxes that a shareholder would pay on fund distributions or the redemption of fund shares. Past performance is no guarantee of future results. Investment return and principal value of an investment will fluctuate, so that shares may be worth more or less than their original cost when redeemed. Current performance may be higher or lower than performance quoted. The Fund’s total returns do not reflect any deduction for charges or expenses of the variable contracts investing in the Fund. Returns as of the most recent month-end may be obtained at www.royceinvest.com. All performance and risk information reflects the result of the Investment Class (its oldest class). Shares of RCS’s Service Class bear an annual distribution expense that is not borne by the Investment Class; if those expenses were reflected, total returns would have been lower. Certain immaterial adjustments were made to the net assets of Royce Capital Fund-Small-Cap Portfolio at 12/31/17 for financial reporting purposes, and as a result the calendar year total returns based on those net asset values differ from the adjusted net asset values and calendar year total returns reported in the Financial Highlights. Gross operating expenses reflect the Fund’s total gross operating expenses for the Investment Class and include management fees and other expenses. Net operating expenses reflect contractual fee waivers and/or expense reimbursements. All expense information is reported as of the Fund’s most current prospectus. Royce & Associates has contractually agreed, without right of termination, to waive fees and/or reimburse expenses to the extent necessary to maintain the Investment Class’s net annual operating expenses (excluding brokerage commissions, taxes, interest, litigation expenses, acquired fund fees and expenses, and other expenses not borne in the ordinary course of business) at or below 1.08% through April 30, 2022. Regarding the “Top Contributors” and “Top Detractors” tables shown above, the sum of all contributors to, and all detractors from, performance for all securities in the portfolio would approximate the Fund’s year-to-date performance for 2021. Upside Capture Ratio measures a manager’s performance in up markets relative to the Fund’s benchmark (Russell 2000 Value). It is calculated by measuring the Fund’s performance in quarters when the benchmark went up and dividing it by the benchmark’s return in those quarters. Downside Capture Ratio measures a manager’s performance in down markets relative to the Fund’s benchmark. It is calculated by measuring the Fund’s performance in quarters when the benchmark goes down and dividing it by the benchmark’s return in those quarters.
Royce Capital Fund 2021 Semiannual Report to Shareholders | 13
Schedule of Investments
| Royce Capital Fund - Small-Cap Portfolio | | | | | | | |
| Common Stocks – 98.2% | | | | | | | |
| | | SHARES | | | VALUE | |
| | | | | | | |
| COMMUNICATION SERVICES – 1.4% | | | | | | |
| ENTERTAINMENT - 0.6% | | | | | | |
| SciPlay Corporation Cl. A 1,2 | | | 121,920 | | | $ | 2,066,544 | |
| MEDIA - 0.8% | | | | | | | | |
| Entravision Communications Cl. A | | | 169,661 | | | | 1,133,335 | |
| Saga Communications Cl. A | | | 93,392 | | | | 2,021,937 | |
| | | | | | | | 3,155,272 | |
| Total (Cost $5,768,908) | | | | | | | 5,221,816 | |
| | | | | | | | | |
| CONSUMER DISCRETIONARY – 22.1% | | | | | | | | |
| AUTO COMPONENTS - 0.5% | | | | | | | | |
| Gentex Corporation | | | 53,516 | | | | 1,770,845 | |
| DIVERSIFIED CONSUMER SERVICES - 1.0% | | | | | | | | |
| †Lincoln Educational Services 2 | | | 491,026 | | | | 3,820,182 | |
| HOUSEHOLD DURABLES - 5.4% | | | | | | | | |
| La-Z-Boy | | | 211,686 | | | | 7,840,849 | |
| †Meritage Homes 2 | | | 43,800 | | | | 4,120,704 | |
| PulteGroup | | | 164,550 | | | | 8,979,494 | |
| | | | | | | | 20,941,047 | |
| LEISURE PRODUCTS - 3.8% | | | | | | | | |
| Malibu Boats Cl. A 2 | | | 60,604 | | | | 4,444,091 | |
| MasterCraft Boat Holdings 2 | | | 241,000 | | | | 6,335,890 | |
| †Nautilus 2 | | | 242,590 | | | | 4,087,642 | |
| | | | | | | | 14,867,623 | |
| SPECIALTY RETAIL - 11.4% | | | | | | | | |
| Aaron's Company (The) | | | 244,385 | | | | 7,817,876 | |
| American Eagle Outfitters | | | 69,865 | | | | 2,622,033 | |
| †Haverty Furniture | | | 113,145 | | | | 4,838,080 | |
| †Lazydays Holdings 2 | | | 171,150 | | | | 3,765,300 | |
| OneWater Marine Cl. A | | | 168,695 | | | | 7,090,251 | |
| Rent-A-Center | | | 164,756 | | | | 8,743,601 | |
| Shoe Carnival | | | 125,508 | | | | 8,985,118 | |
| | | | | | | | 43,862,259 | |
| Total (Cost $60,613,934) | | | | | | | 85,261,956 | |
| | | | | | | | | |
| CONSUMER STAPLES – 0.4% | | | | | | | | |
| FOOD & STAPLES RETAILING - 0.4% | | | | | | | | |
| Village Super Market Cl. A | | | 61,114 | | | | 1,436,790 | |
| Total (Cost $1,364,498) | | | | | | | 1,436,790 | |
| | | | | | | | | |
| ENERGY – 0.5% | | | | | | | | |
| OIL, GAS & CONSUMABLE FUELS - 0.5% | | | | | | | | |
| Dorchester Minerals L.P. | | | 126,450 | | | | 2,130,683 | |
| Total (Cost $1,546,697) | | | | | | | 2,130,683 | |
| | | | | | | | | |
| FINANCIALS – 23.1% | | | | | | | | |
| BANKS - 7.0% | | | | | | | | |
| Ames National | | | 84,737 | | | | 2,076,904 | |
| Camden National | | | 43,594 | | | | 2,082,050 | |
| †Chemung Financial | | | 41,824 | | | | 1,853,222 | |
| City Holding Company | | | 61,064 | | | | 4,594,455 | |
| CNB Financial | | | 93,252 | | | | 2,128,011 | |
| Financial Institutions | | | 63,672 | | | | 1,910,160 | |
| Landmark Bancorp | | | 75,204 | | | | 2,031,260 | |
| MidWestOne Financial Group | | | 109,117 | | | | 3,139,296 | |
| National Bankshares | | | 152,342 | | | | 5,333,493 | |
| Unity Bancorp | | | 92,466 | | | | 2,038,875 | |
| | | | | | | | 27,187,726 | |
| CAPITAL MARKETS - 4.0% | | | | | | | | |
| Evercore Cl. A | | | 66,800 | | | | 9,403,436 | |
| Houlihan Lokey Cl. A | | | 23,315 | | | | 1,906,934 | |
| Moelis & Company Cl. A | | | 74,201 | | | | 4,221,295 | |
| | | | | | | | 15,531,665 | |
| CONSUMER FINANCE - 2.0% | | | | | | | | |
| PROG Holdings 2 | | | 160,570 | | | | 7,728,234 | |
| INSURANCE - 6.9% | | | | | | | | |
| CNO Financial Group | | | 251,700 | | | | 5,945,154 | |
| Donegal Group Cl. A | | | 139,141 | | | | 2,027,284 | |
| †Employers Holdings | | | 156,057 | | | | 6,679,240 | |
| Heritage Insurance Holdings | | | 340,541 | | | | 2,921,842 | |
| James River Group Holdings | | | 61,725 | | | | 2,315,922 | |
| Kemper Corporation | | | 64,327 | | | | 4,753,765 | |
| Selective Insurance Group | | | 23,280 | | | | 1,889,172 | |
| | | | | | | | 26,532,379 | |
| THRIFTS & MORTGAGE FINANCE - 3.2% | | | | | | | | |
| Southern Missouri Bancorp | | | 91,509 | | | | 4,114,245 | |
| Timberland Bancorp | | | 150,070 | | | | 4,219,968 | |
| TrustCo Bank Corp NY | | | 113,577 | | | | 3,904,777 | |
| | | | | | | | 12,238,990 | |
| Total (Cost $72,944,093) | | | | | | | 89,218,994 | |
| | | | | | | | | |
| HEALTH CARE – 7.8% | | | | | | | | |
| BIOTECHNOLOGY - 2.1% | | | | | | | | |
| Catalyst Pharmaceuticals 2 | | | 970,194 | | | | 5,578,615 | |
| Coherus BioSciences 2 | | | 79,312 | | | | 1,096,885 | |
| Vanda Pharmaceuticals 2 | | | 66,600 | | | | 1,432,566 | |
| | | | | | | | 8,108,066 | |
| HEALTH CARE PROVIDERS & SERVICES - 3.1% | | | | | | | | |
| Ensign Group (The) | | | 33,514 | | | | 2,904,659 | |
| Molina Healthcare 2 | | | 32,300 | | | | 8,173,838 | |
| Pennant Group 2 | | | 22,257 | | | | 910,311 | |
| | | | | | | | 11,988,808 | |
| PHARMACEUTICALS - 2.6% | | | | | | | | |
| †BioDelivery Sciences International 2 | | | 769,613 | | | | 2,755,214 | |
| †SIGA Technologies 2 | | | 370,435 | | | | 2,326,332 | |
| Supernus Pharmaceuticals 2 | | | 157,300 | | | | 4,843,267 | |
| | | | | | | | 9,924,813 | |
| Total (Cost $22,239,266) | | | | | | | 30,021,687 | |
| | | | | | | | | |
| INDUSTRIALS – 23.1% | | | | | | | | |
| AEROSPACE & DEFENSE - 1.5% | | | | | | | | |
| Vectrus 2 | | | 119,346 | | | | 5,679,676 | |
| BUILDING PRODUCTS - 1.4% | | | | | | | | |
| †Builders FirstSource 2 | | | 54,130 | | | | 2,309,186 | |
| UFP Industries | | | 44,200 | | | | 3,285,828 | |
| | | | | | | | 5,595,014 | |
| COMMERCIAL SERVICES & SUPPLIES - 1.4% | | | | | | | | |
| Herman Miller | | | 111,303 | | | | 5,246,823 | |
| CONSTRUCTION & ENGINEERING - 5.8% | | | | | | | | |
| Comfort Systems USA | | | 19,671 | | | | 1,549,878 | |
| Great Lakes Dredge & Dock 2 | | | 538,993 | | | | 7,874,688 | |
| MasTec 2 | | | 16,300 | | | | 1,729,430 | |
| MYR Group 2 | | | 21,441 | | | | 1,949,416 | |
| Northwest Pipe 2 | | | 110,550 | | | | 3,123,037 | |
| Primoris Services | | | 205,490 | | | | 6,047,571 | |
| | | | | | | | 22,274,020 | |
| MACHINERY - 2.4% | | | | | | | | |
| Alamo Group | | | 11,207 | | | | 1,711,085 | |
| Federal Signal | | | 44,422 | | | | 1,787,097 | |
| 14 | Royce Capital Fund 2021 Semiannual Report to Shareholders | THE ACCOMPANYING NOTES ARE AN INTEGRAL PART OF THESE FINANCIAL STATEMENTS |
June 30, 2021 (unaudited)
| Royce Capital Fund - Small-Cap Portfolio (continued) |
| | | SHARES | | | VALUE | |
| | | | | | | | | |
| INDUSTRIALS (continued) | | | | | | | | |
| MACHINERY (continued) | | | | | | | | |
| Miller Industries | | | 143,216 | | | $ | 5,648,439 | |
| | | | | | | | 9,146,621 | |
| PROFESSIONAL SERVICES - 5.1% | | | | | | | | |
| Barrett Business Services | | | 35,932 | | | | 2,609,023 | |
| Heidrick & Struggles International | | | 147,966 | | | | 6,591,885 | |
| Kforce | | | 41,423 | | | | 2,606,750 | |
| Korn Ferry | | | 50,335 | | | | 3,651,804 | |
| Resources Connection | | | 170,562 | | | | 2,449,270 | |
| Robert Half International | | | 20,064 | | | | 1,785,094 | |
| | | | | | | | 19,693,826 | |
| ROAD & RAIL - 5.5% | | | | | | | | |
| ArcBest | | | 128,249 | | | | 7,462,809 | |
| Old Dominion Freight Line | | | 6,206 | | | | 1,575,083 | |
| Saia 2 | | | 7,500 | | | | 1,571,175 | |
| Schneider National Cl. B | | | 225,400 | | | | 4,906,958 | |
| Werner Enterprises | | | 132,250 | | | | 5,887,770 | |
| | | | | | | | 21,403,795 | |
| Total (Cost $57,362,126) | | | | | | | 89,039,775 | |
| | | | | | | | | |
| INFORMATION TECHNOLOGY – 19.3% | | | | | | | | |
| COMMUNICATIONS EQUIPMENT - 1.0% | | | | | | | | |
| NETGEAR 2 | | | 104,068 | | | | 3,987,886 | |
| ELECTRONIC EQUIPMENT, INSTRUMENTS & COMPONENTS - 14.0% | | | | | | | | |
| Advanced Energy Industries | | | 17,108 | | | | 1,928,243 | |
| ePlus 2 | | | 65,783 | | | | 5,702,728 | |
| Fabrinet 2 | | | 20,080 | | | | 1,925,070 | |
| Insight Enterprises 2 | | | 59,752 | | | | 5,975,797 | |
| Kimball Electronics 2 | | | 279,995 | | | | 6,087,091 | |
| Methode Electronics | | | 80,022 | | | | 3,937,883 | |
| PC Connection | | | 48,579 | | | | 2,247,750 | |
| Plexus Corporation 2 | | | 20,400 | | | | 1,864,764 | |
| Sanmina Corporation 2 | | | 230,593 | | | | 8,983,903 | |
| SYNNEX Corporation | | | 61,142 | | | | 7,444,650 | |
| Vishay Intertechnology | | | 356,261 | | | | 8,033,686 | |
| | | | | | | | 54,131,565 | |
| IT SERVICES - 1.4% | | | | | | | | |
| Concentrix Corporation 2 | | | 15,300 | | | | 2,460,240 | |
| IBEX 2 | | | 99,406 | | | | 1,940,405 | |
| Sykes Enterprises 2 | | | 14,975 | | | | 804,157 | |
| | | | | | | | 5,204,802 | |
| SEMICONDUCTORS & SEMICONDUCTOR EQUIPMENT - 2.9% | | | | | | | | |
| Kulicke & Soffa Industries | | | 149,826 | | | | 9,169,351 | |
| MKS Instruments | | | 10,791 | | | | 1,920,259 | |
| | | | | | | | 11,089,610 | |
| Total (Cost $45,710,408) | | | | | | | 74,413,863 | |
| | | | | | | | | |
| REAL ESTATE – 0.5% | | | | | | | | |
| REAL ESTATE MANAGEMENT & DEVELOPMENT - 0.5% | | | | | | | | |
| Marcus & Millichap 2 | | | 45,225 | | | | 1,757,896 | |
| Total (Cost $1,177,841) | | | | | | | 1,757,896 | |
| | | | | | | | | |
| TOTAL COMMON STOCKS | | | | | | | | |
| (Cost $268,727,771) | | | | | | | 378,503,460 | |
REPURCHASE AGREEMENT– 1.8% Fixed Income Clearing Corporation, 0.00% dated 6/30/21, due 7/1/21, maturity value $6,766,824 (collateralized by obligations of various U.S. Government Agencies, 1.25% due 6/30/28, valued at $6,902,211) | | | |
| (Cost $6,766,824) | | | 6,766,824 | |
COLLATERAL RECEIVED FOR SECURITIES LOANED – 0.1% Money Market Funds Federated Government Obligations Fund - Institutional Shares (7 day yield-0.01%) | | | |
| (Cost $456,370) | | | 456,370 | |
| | | | | |
| TOTAL INVESTMENTS – 100.1% | | | | |
| (Cost $275,950,965) | | | 385,726,654 | |
| | | | | |
| LIABILITIES LESS CASH AND OTHER ASSETS – (0.1)% | | | (292,457 | ) |
| | | | | |
| NET ASSETS – 100.0% | | $ | 385,434,197 | |
† New additions in 2021.
1 All or a portion of these securities were on loan at June 30, 2021.
2 Non-income producing.
Bold indicates the Fund’s 20 largest equity holdings in terms of June 30, 2021, market value.
| THE ACCOMPANYING NOTES ARE AN INTEGRAL PART OF THESE FINANCIAL STATEMENTS | Royce Capital Fund 2021 Semiannual Report to Shareholders | 15 |
| Statements of Assets and Liabilities | June 30, 2021 (unaudited) |
| | | Micro-Cap Portfolio | | | Small-Cap Portfolio | |
| ASSETS: | | | | | | |
| Investments at value (including collateral on loaned securities)1 | | $ | 185,898,136 | | | $ | 378,959,830 | |
| Repurchase agreements (at cost and value) | | | 8,727,878 | | | | 6,766,824 | |
| Cash | | | 19,389 | | | | – | |
| Foreign currency2 | | | 10,270 | | | | – | |
| Receivable for investments sold | | | 1,251,516 | | | | 1,466,228 | |
| Receivable for capital shares sold | | | 66,749 | | | | 179,780 | |
| Receivable for dividends | | | 84,630 | | | | 569,600 | |
| Receivable for securities lending income | | | 255 | | | | 314 | |
| Prepaid expenses and other assets | | | 3,573 | | | | 6,902 | |
| Total Assets | | | 196,062,396 | | | | 387,949,478 | |
| LIABILITIES: | | | | | | | | |
| Payable for collateral on loaned securities | | | – | | | | 456,370 | |
| Payable for investments purchased | | | 417,598 | | | | 1,382,002 | |
| Payable for capital shares redeemed | | | 332,473 | | | | 221,026 | |
| Payable for investment advisory fees | | | 196,871 | | | | 315,677 | |
| Payable for trustees' fees | | | 9,287 | | | | 19,280 | |
| Accrued expenses | | | 71,774 | | | | 120,926 | |
| Total Liabilities | | | 1,028,003 | | | | 2,515,281 | |
| Net Assets | | $ | 195,034,393 | | | $ | 385,434,197 | |
| ANALYSIS OF NET ASSETS: | | | | | | | | |
| Paid-in capital | | $ | 92,262,898 | | | $ | 295,115,055 | |
| Total distributable earnings (loss) | | | 102,771,495 | | | | 90,319,142 | |
| Net Assets | | $ | 195,034,393 | | | $ | 385,434,197 | |
| Investment Class | | $ | 160,735,414 | | | $ | 172,656,420 | |
| Service Class | | | 34,298,979 | | | | 212,777,777 | |
| SHARES OUTSTANDING (unlimited number of $.001 par value): | | | | | | | | |
| Investment Class | | | 10,779,266 | | | | 18,873,066 | |
| Service Class | | | 2,359,985 | | | | 23,820,075 | |
| NET ASSET VALUES (Net Assets ÷ Shares Outstanding): | | | | | | | | |
| (offering and redemption price per share) | | | | | | | | |
| Investment Class | | | $14.91 | | | | $9.15 | |
| Service Class | | | 14.53 | | | | 8.93 | |
| Investments at identified cost | | $ | 113,737,118 | | | $ | 269,184,141 | |
| Market value of loaned securities3 | | | 2,545,803 | | | | 628,053 | |
1 See Notes to Financial Statements for information on non-cash collateral on loaned securities.
2 The cost of foreign currency is $10,259 for Royce Micro-Cap Portfolio.
3 Market value of loaned securities backed by non-cash collateral is as of prior business day.
| 16 | Royce Capital Fund 2021 Semiannual Report to Shareholders | THE ACCOMPANYING NOTES ARE AN INTEGRAL PART OF THESE FINANCIAL STATEMENTS |
| Statements of Operations | Six Months Ended June 30, 2021 (unaudited) |
| | | | Micro-Cap Portfolio | | | | Small-Cap Portfolio | |
| INVESTMENT INCOME: | | | | | | | | |
| INCOME: | | | | | | | | |
| Dividends | | $ | 837,211 | | | $ | 2,663,031 | |
| Foreign withholding tax | | | (12,408 | ) | | | – | |
| Securities lending | | | 2,333 | | | | 598 | |
| Total income | | | 827,136 | | | | 2,663,629 | |
| EXPENSES: | | | | | | | | |
| Investment advisory fees | | | 1,169,904 | | | | 1,963,002 | |
| Distribution fees | | | 40,630 | | | | 276,469 | |
| Administrative and office facilities | | | 41,782 | | | | 75,959 | |
| Trustees' fees | | | 17,997 | | | | 38,093 | |
| Shareholder reports | | | 17,707 | | | | 22,623 | |
| Audit | | | 15,640 | | | | 15,236 | |
| Custody | | | 11,679 | | | | 22,592 | |
| Shareholder servicing | | | 7,517 | | | | 7,311 | |
| Legal | | | 3,529 | | | | 7,106 | |
| Other expenses | | | 5,872 | | | | 11,032 | |
| Total expenses | | | 1,332,257 | | | | 2,439,423 | |
| Compensating balance credits | | | (2 | ) | | | – | |
| Fees waived by investment adviser | | | (21,594 | ) | | | (13,686 | ) |
| Expenses reimbursed by investment adviser | | | (25,249 | ) | | | (29,170 | ) |
| Net expenses | | | 1,285,412 | | | | 2,396,567 | |
| Net investment income (loss) | | | (458,276 | ) | | | 267,062 | |
| REALIZED AND UNREALIZED GAIN (LOSS) ON INVESTMENTS AND FOREIGN CURRENCY: | | | | | | | | |
| NET REALIZED GAIN (LOSS): | | | | | | | | |
| Investments | | | 22,933,236 | | | | 43,863,307 | |
| Foreign currency transactions | | | 699 | | | | – | |
| NET CHANGE IN UNREALIZED APPRECIATION (DEPRECIATION): | | | | | | | | |
| Investments | | | 18,118,206 | | | | 37,323,686 | |
| Other assets and liabilities denominated in foreign currency | | | (44 | ) | | | – | |
| Net realized and unrealized gain (loss) on investments and foreign currency | | | 41,052,097 | | | | 81,186,993 | |
| NET INCREASE (DECREASE) IN NET ASSETS FROM INVESTMENT OPERATIONS | | $ | 40,593,821 | | | $ | 81,454,055 | |
| THE ACCOMPANYING NOTES ARE AN INTEGRAL PART OF THESE FINANCIAL STATEMENTS | Royce Capital Fund 2021 Semiannual Report to Shareholders | 17 |
Statements of Changes in Net Assets
| | | Micro-Cap Portfolio | | | Small-Cap Portfolio | |
| | | Six Months Ended 6/30/21 (unaudited) | | | Year Ended 12/31/20 | | | Six Months Ended 6/30/21 (unaudited) | | | Year Ended 12/31/20 | |
| INVESTMENT OPERATIONS: | | | | | | | | | | | | | | | | |
| Net investment income (loss) | | $ | (458,276 | ) | | $ | (715,479 | ) | | $ | 267,062 | | | $ | 2,114,816 | |
| Net realized gain (loss) on investments and foreign currency | | | 22,933,935 | | | | 8,169,382 | | | | 43,863,307 | | | | (62,579,226 | ) |
| Net change in unrealized appreciation (depreciation) on investments and foreign currency | | | 18,118,162 | | | | 19,465,169 | | | | 37,323,686 | | | | 34,195,166 | |
| Net increase (decrease) in net assets from investment operations | | | 40,593,821 | | | | 26,919,072 | | | | 81,454,055 | | | | (26,269,244 | ) |
| DISTRIBUTIONS: | | | | | | | | | | | | | | | | |
| Total distributable earnings | | | | | | | | | | | | | | | | |
| Investment Class | | | – | | | | (1,725,374 | ) | | | – | | | | (3,913,734 | ) |
| Service Class | | | – | | | | (371,288 | ) | | | – | | | | (4,765,060 | ) |
| Total distributions | | | – | | | | (2,096,662 | ) | | | – | | | | (8,678,794 | ) |
| CAPITAL SHARE TRANSACTIONS: | | | | | | | | | | | | | | | | |
| Value of shares sold | | | | | | | | | | | | | | | | |
| Investment Class | | | 19,283,703 | | | | 11,192,683 | | | | 12,987,836 | | | | 22,407,979 | |
| Service Class | | | 8,045,591 | | | | 11,856,775 | | | | 1,514,142 | | | | 93,586,484 | |
| Distributions reinvested | | | | | | | | | | | | | | | | |
| Investment Class | | | – | | | | 1,725,374 | | | | – | | | | 3,913,734 | |
| Service Class | | | – | | | | 371,288 | | | | – | | | | 4,765,060 | |
| Value of shares redeemed | | | | | | | | | | | | | | | | |
| Investment Class | | | (26,251,243 | ) | | | (32,465,966 | ) | | | (29,299,557 | ) | | | (30,430,274 | ) |
| Service Class | | | (8,785,462 | ) | | | (14,453,059 | ) | | | (40,675,176 | ) | | | (98,583,746 | ) |
| Net increase (decrease) in net assets from capital share transactions | | | (7,707,411 | ) | | | (21,772,905 | ) | | | (55,472,755 | ) | | | (4,340,763 | ) |
| Net Increase (Decrease) in Net Assets | | | 32,886,410 | | | | 3,049,505 | | | | 25,981,300 | | | | (39,288,801 | ) |
| NET ASSETS: | | | | | | | | | | | | | | | | |
| Beginning of period | | | 162,147,983 | | | | 159,098,478 | | | | 359,452,897 | | | | 398,741,698 | |
| End of period | | $ | 195,034,393 | | | $ | 162,147,983 | | | $ | 385,434,197 | | | $ | 359,452,897 | |
| 18 | Royce Capital Fund 2021 Semiannual Report to Shareholders | THE ACCOMPANYING NOTES ARE AN INTEGRAL PART OF THESE FINANCIAL STATEMENTS |
Financial Highlights
This table is presented to show selected data for a share outstanding throughout each year or other indicated period and to assist shareholders in evaluating a Fund’s performance for the periods presented. Per share amounts have been determined on the basis of the weighted average number of shares outstanding during the period.
| | | | | | | | | | | | | | | | | | | | | | | | | | | | | | | | | | Ratio of Expenses to Average Net Assets | | | | | | | |
| | | | Net Asset Value, Beginning of Period | | | Net Investment Income (Loss) | | | Net Realized and Unrealized Gain (Loss) on Investments and Foreign Currency | | | Total from Investment Operations | | | Distributions from Net Investment Income | | | Distributions from Net Realized Gain on Investments and Foreign Currency | | | Total Distributions | | | Net Asset Value, End of Period | | | Total Return | | | Net Assets, End of Period (in thousands) | | | Prior to Fee Waivers, Expense Reimbursements and Balance Credits | | | Prior to Fee Waivers and Expense Reimbursements | | | Net of Fee Waivers and Expense Reimbursements | | | Ratio of Net Investment Income (Loss) to Average Net Assets | | | Portfolio Turnover Rate | |
| Micro-Cap Portfolio–Investment Class |
| 2021† | | | $ | 11.91 | | | $ | (0.03 | ) | | $ | 3.03 | | | $ | 3.00 | | | $ | — | | | $ | — | | | $ | — | | | $ | 14.91 | | | | 25.19 | %1 | | $ | 160,735 | | | | 1.38 | %2 | | | 1.38 | %2 | | | 1.33 | %2 | | | (0.45 | )%2 | | | 13 | % |
| 2020 | | | | 9.75 | | | | (0.05 | ) | | | 2.36 | | | | 2.31 | | | | — | | | | (0.15 | ) | | | (0.15 | ) | | | 11.91 | | | | 23.79 | | | | 134,109 | | | | 1.47 | | | | 1.47 | | | | 1.33 | | | | (0.51 | ) | | | 25 | |
| 2019 | | | | 8.97 | | | | (0.04 | ) | | | 1.77 | | | | 1.73 | | | | — | | | | (0.95 | ) | | | (0.95 | ) | | | 9.75 | | | | 19.55 | | | | 132,008 | | | | 1.43 | | | | 1.43 | | | | 1.33 | | | | (0.41 | ) | | | 26 | |
| 2018 | | | | 10.39 | | | | (0.03 | ) | | | (0.90 | ) | | | (0.93 | ) | | | — | | | | (0.49 | ) | | | (0.49 | ) | | | 8.97 | | | | (9.13 | ) | | | 127,457 | | | | 1.39 | | | | 1.39 | | | | 1.33 | | | | (0.30 | ) | | | 28 | |
| 2017 | | | | 11.11 | | | | (0.02 | ) | | | 0.58 | | | | 0.56 | | | | (0.08 | ) | | | (1.20 | ) | | | (1.28 | ) | | | 10.39 | | | | 5.29 | | | | 164,656 | | | | 1.38 | | | | 1.38 | | | | 1.38 | | | | (0.22 | ) | | | 30 | |
| 2016 | | | | 9.34 | | | | 0.03 | | | | 1.81 | | | | 1.84 | | | | (0.07 | ) | | | — | | | | (0.07 | ) | | | 11.11 | | | | 19.71 | | | | 177,444 | | | | 1.36 | | | | 1.36 | | | | 1.36 | | | | 0.02 | | | | 57 | |
| Micro-Cap Portfolio–Service Class |
| 2021† | | | $ | 11.63 | | | $ | (0.05 | ) | | $ | 2.95 | | | $ | 2.90 | | | $ | — | | | $ | — | | | $ | — | | | $ | 14.53 | | | | 24.94 | %1 | | $ | 34,299 | | | | 1.64 | %2 | | | 1.64 | %2 | | | 1.58 | %2 | | | (0.70 | )%2 | | | 13 | % |
| 2020 | | | | 9.54 | | | | (0.07 | ) | | | 2.31 | | | | 2.24 | | | | — | | | | (0.15 | ) | | | (0.15 | ) | | | 11.63 | | | | 23.55 | | | | 28,039 | | | | 1.72 | | | | 1.72 | | | | 1.58 | | | | (0.75 | ) | | | 25 | |
| 2019 | | | | 8.80 | | | | (0.06 | ) | | | 1.73 | | | | 1.67 | | | | — | | | | (0.93 | ) | | | (0.93 | ) | | | 9.54 | | | | 19.24 | | | | 27,090 | | | | 1.71 | | | | 1.71 | | | | 1.58 | | | | (0.66 | ) | | | 26 | |
| 2018 | | | | 10.21 | | | | (0.06 | ) | | | (0.87 | ) | | | (0.93 | ) | | | — | | | | (0.48 | ) | | | (0.48 | ) | | | 8.80 | | | | (9.29 | ) | | | 14,644 | | | | 1.64 | | | | 1.64 | | | | 1.58 | | | | (0.57 | ) | | | 28 | |
| 2017 | | | | 10.93 | | | | (0.04 | ) | | | 0.57 | | | | 0.53 | | | | (0.06 | ) | | | (1.19 | ) | | | (1.25 | ) | | | 10.21 | | | | 5.02 | | | | 32,067 | | | | 1.64 | | | | 1.64 | | | | 1.58 | | | | (0.43 | ) | | | 30 | |
| 2016 | | | | 9.20 | | | | (0.02 | ) | | | 1.80 | | | | 1.78 | | | | (0.05 | ) | | | — | | | | (0.05 | ) | | | 10.93 | | | | 19.37 | | | | 34,675 | | | | 1.65 | | | | 1.65 | | | | 1.58 | | | | (0.15 | ) | | | 57 | |
| Small-Cap Portfolio–Investment Class |
| 2021† | | | $ | 7.41 | | | $ | 0.01 | | | $ | 1.73 | | | $ | 1.74 | | | $ | — | | | $ | — | | | $ | — | | | $ | 9.15 | | | | 23.48 | %1 | | $ | 172,656 | | | | 1.11 | %2 | | | 1.11 | %2 | | | 1.08 | %2 | | | 0.28 | %2 | | | 26 | % |
| 2020 | | | | 8.19 | | | | 0.06 | | | | (0.65 | ) | | | (0.59 | ) | | | (0.07 | ) | | | (0.12 | ) | | | (0.19 | ) | | | 7.41 | | | | (7.15 | ) | | | 153,953 | | | | 1.19 | | | | 1.19 | | | | 1.08 | | | | 0.90 | | | | 95 | |
| 2019 | | | | 7.87 | | | | 0.09 | | | | 1.37 | | | | 1.46 | | | | (0.06 | ) | | | (1.08 | ) | | | (1.14 | ) | | | 8.19 | | | | 18.67 | | | | 173,492 | | | | 1.15 | | | | 1.15 | | | | 1.08 | | | | 1.04 | | | | 111 | |
| 2018 | | | | 8.77 | | | | 0.06 | | | | (0.78 | ) | | | (0.72 | ) | | | (0.07 | ) | | | (0.11 | ) | | | (0.18 | ) | | | 7.87 | | | | (8.24 | ) | | | 171,561 | | | | 1.11 | | | | 1.11 | | | | 1.08 | | | | 0.62 | | | | 56 | |
| 2017 | | | | 8.41 | | | | 0.05 | | | | 0.39 | | | | 0.44 | | | | (0.08 | ) | | | — | | | | (0.08 | ) | | | 8.77 | | | | 5.26 | | | | 228,620 | | | | 1.11 | | | | 1.11 | | | | 1.11 | | | | 0.55 | | | | 91 | |
| 2016 | | | | 8.43 | | | | 0.13 | | | | 1.66 | | | | 1.79 | | | | (0.17 | ) | | | (1.64 | ) | | | (1.81 | ) | | | 8.41 | | | | 20.96 | | | | 248,244 | | | | 1.09 | | | | 1.09 | | | | 1.09 | | | | 0.89 | | | | 78 | |
| Small-Cap Portfolio–Service Class |
| 2021† | | | $ | 7.25 | | | $ | 0.00 | | | $ | 1.68 | | | $ | 1.68 | | | $ | — | | | $ | — | | | $ | — | | | $ | 8.93 | | | | 23.17 | %1 | | $ | 212,778 | | | | 1.35 | %2 | | | 1.35 | %2 | | | 1.33 | %2 | | | 0.02 | %2 | | | 26 | % |
| 2020 | | | | 8.01 | | | | 0.05 | | | | (0.64 | ) | | | (0.59 | ) | | | (0.05 | ) | | | (0.12 | ) | | | (0.17 | ) | | | 7.25 | | | | (7.33 | ) | | | 205,500 | | | | 1.43 | | | | 1.43 | | | | 1.33 | | | | 0.73 | | | | 95 | |
| 2019 | | | | 7.69 | | | | 0.06 | | | | 1.35 | | | | 1.41 | | | | (0.04 | ) | | | (1.05 | ) | | | (1.09 | ) | | | 8.01 | | | | 18.44 | | | | 225,250 | | | | 1.39 | | | | 1.39 | | | | 1.33 | | | | 0.86 | | | | 111 | |
| 2018 | | | | 8.55 | | | | 0.04 | | | | (0.76 | ) | | | (0.72 | ) | | | (0.03 | ) | | | (0.11 | ) | | | (0.14 | ) | | | 7.69 | | | | (8.50 | ) | | | 104,129 | | | | 1.34 | | | | 1.34 | | | | 1.33 | | | | 0.31 | | | | 56 | |
| 2017 | | | | 8.20 | | | | 0.02 | | | | 0.40 | | | | 0.42 | | | | (0.07 | ) | | | — | | | | (0.07 | ) | | | 8.55 | | | | 5.10 | | | | 263,549 | | | | 1.34 | | | | 1.34 | | | | 1.34 | | | | 0.32 | | | | 91 | |
| 2016 | | | | 8.27 | | | | 0.03 | | | | 1.69 | | | | 1.72 | | | | (0.15 | ) | | | (1.64 | ) | | | (1.79 | ) | | | 8.20 | | | | 20.53 | | | | 267,445 | | | | 1.34 | | | | 1.34 | | | | 1.34 | | | | 0.69 | | | | 78 | |
† Six months ended June 30, 2021 (unaudited).
1 Not annualized
2 Annualized
| THE ACCOMPANYING NOTES ARE AN INTEGRAL PART OF THESE FINANCIAL STATEMENTS | Royce Capital Fund 2021 Semiannual Report to Shareholders | 19 |
Notes to Financial Statements (unaudited)
Summary of Significant Accounting Policies:
Royce Capital Fund – Micro-Cap Portfolio and Royce Capital Fund – Small-Cap Portfolio (the “Fund” or “Funds”) are the two series of Royce Capital Fund (the “Trust”), an open-end management investment company organized as a Delaware statutory trust. Shares of the Funds are offered to life insurance companies for allocation to certain separate accounts established for the purpose of funding qualified and non-qualified variable annuity contracts and variable life insurance contracts. Micro-Cap Portfolio and Small-Cap Portfolio commenced operations on December 27, 1996.
Classes of shares have equal rights as to earnings and assets, except that each class may bear different fees and expenses for distribution, shareholder servicing, registration and shareholder reports, and receive different compensating balance credits and expense reimbursements. Investment income, realized and unrealized capital gains or losses on investments and foreign currency, and expenses other than those attributable to a specific class are allocated to each class of shares based on its relative net assets.
The preparation of financial statements in conformity with accounting principles generally accepted in the United States requires management to make estimates and assumptions that affect the reported amounts of assets and liabilities and the disclosure of contingent assets and liabilities at the date of the financial statements and the reported amounts of income and expenses during the reporting period. Actual results could differ from those estimates.
Each Fund is an investment company and accordingly follows the investment company accounting and reporting guidance of the Financial Accounting Standards Board (FASB) Accounting Standard Codification Topic 946 “Financial Services-Investment Companies.”
Royce & Associates, LP, the Funds’ investment adviser, is a majority-owned subsidiary of Franklin Resources, Inc. and primarily conducts business using the name Royce Investment Partners (“Royce”).
VALUATION OF INVESTMENTS:
Securities are valued as of the close of trading on the New York Stock Exchange (NYSE) (generally 4:00 p.m. Eastern time) on the valuation date. Securities that trade on an exchange, and securities traded on Nasdaq’s Electronic Bulletin Board, are valued at their last reported sales price or Nasdaq official closing price taken from the primary market in which each security trades or, if no sale is reported for such day, at their highest bid price. Other over-the-counter securities for which market quotations are readily available are valued at their highest bid price, except in the case of some bonds and other fixed income securities which may be valued by reference to other securities with comparable ratings, interest rates and maturities, using established independent pricing services. The Funds value their non-U.S. dollar denominated securities in U.S. dollars daily at the prevailing foreign currency exchange rates as quoted by a major bank. Securities for which market quotations are not readily available are valued at their fair value in accordance with the provisions of the 1940 Act, under procedures approved by the Trust’s Board of Trustees, and are reported as Level 3 securities. As a general principle, the fair value of a security is the amount which the Fund might reasonably expect to receive for the security upon its current sale. However, in light of the judgment involved in fair valuations, there can be no assurance that a fair value assigned to a particular security will be the amount which the Fund might be able to receive upon its current sale. In addition, if, between the time trading ends on a particular security and the close of the customary trading session on the NYSE, events occur that are significant and may make the closing price unreliable, a Fund may fair value the security. The Funds use an independent pricing service to provide fair value estimates for relevant non-U.S. equity securities on days when the U.S. market volatility exceeds a certain threshold. This pricing service uses proprietary correlations it has developed between the movement of prices of non-U.S. equity securities and indices of U.S.-traded securities, futures contracts and other indications to estimate the fair value of relevant non-U.S. securities. When fair value pricing is employed, the prices of securities used by a Fund may differ from quoted or published prices for the same security. Investments in money market funds are valued at net asset value per share.
Various inputs are used in determining the value of each Fund’s investments, as noted above. These inputs are summarized in the three broad levels below:
| Level 1 – | quoted prices in active markets for identical securities. |
| | Level 2 – | other significant observable inputs (including quoted prices for similar securities, foreign securities that may be fair valued and repurchase agreements). The table below includes all Level 2 securities. Any Level 2 securities with values based on quoted prices for similar securities would be noted in the Schedules of Investments. |
| | Level 3 – | significant unobservable inputs (including last trade price before trading was suspended, or at a discount thereto for lack of marketability or otherwise, market price information regarding other securities, information received from the company and/or published documents, including SEC filings and financial statements, or other publicly available information). |
The inputs or methodology used for valuing securities are not necessarily an indication of the risk associated with investing in those securities.
| 20| Royce Capital Fund 2021 Semiannual Report to Shareholders |
VALUATION OF INVESTMENTS (continued):
The following is a summary of the inputs used to value each Fund’s investments as of June 30, 2021. For a detailed breakout of common stocks by sector classification, please refer to the Schedules of Investments.
| | | LEVEL 1 | | | LEVEL 2 | | | LEVEL 3 | | | TOTAL | |
| Micro-Cap Portfolio | | | | | | | | | | | | | | | | |
| Common Stocks | | $ | 185,572,636 | | | $ | – | | | $ | 325,500 | | | $ | 185,898,136 | |
| Repurchase Agreement | | | – | | | | 8,727,878 | | | | – | | | | 8,727,878 | |
| Small-Cap Portfolio | | | | | | | | | | | | | | | | |
| Common Stocks | | | 378,503,460 | | | | – | | | | – | | | | 378,503,460 | |
| Repurchase Agreement | | | – | | | | 6,766,824 | | | | – | | | | 6,766,824 | |
| Money Market Fund/Collateral Received for Securities Loaned | | | 456,370 | | | | – | | | | – | | | | 456,370 | |
Level 3 Reconciliation:
| | | BALANCE AS OF 12/31/20 | | | PURCHASES | | | SALES | | | REALIZED GAIN (LOSS) | | | UNREALIZED GAIN (LOSS)1 | | | BALANCE AS OF 6/30/21 | |
| Micro-Cap Portfolio | | | | | | | | | | | | | | | | | | |
| Common Stocks | | $ | 325,500 | | | $ | – | | | $ | – | | | $ | – | | | $ | – | | | $ | 325,500 | |
| 1 | The net change in unrealized appreciation (depreciation) is included in the accompanying Statement of Operations. Change in unrealized appreciation (depreciation) includes net unrealized appreciation (depreciation) resulting from changes in investment values during the reporting period and the reversal of previously recorded unrealized appreciation (depreciation) when gains or losses are realized. Net realized gain (loss) from investments and foreign currency transactions is included in the accompanying Statement of Operations. |
REPURCHASE AGREEMENTS:
The Funds may enter into repurchase agreements with institutions that the Funds’ investment adviser has determined are creditworthy. Each Fund restricts repurchase agreements to maturities of no more than seven days. Securities pledged as collateral for repurchase agreements, which are held until maturity of the repurchase agreements, are marked-to-market daily and maintained at a value at least equal to the principal amount of the repurchase agreement (including accrued interest). Repurchase agreements could involve certain risks in the event of default or insolvency of the counter-party, including possible delays or restrictions upon the ability of each Fund to dispose of its underlying securities. The remaining contractual maturities of repurchase agreements held by the Funds at June 30, 2021 are overnight and continuous.
FOREIGN CURRENCY:
Net realized foreign exchange gains or losses arise from sales and maturities of short-term securities, sales of foreign currencies, expiration of currency forward contracts, currency gains or losses realized between the trade and settlement dates on securities transactions, and the difference between the amounts of dividends, interest, and foreign withholding taxes recorded on each Fund’s books and the U.S. dollar equivalent of the amounts actually received or paid. Net unrealized foreign exchange gains and losses arise from changes in the value of assets and liabilities, other than investments in securities at the end of the reporting period, as a result of changes in foreign currency exchange rates.
The Funds do not isolate that portion of the results of operations resulting from fluctuations in foreign exchange rates on investments from the fluctuations arising from changes in market prices of securities held. Such fluctuations are included with the net realized and unrealized gain or loss on investments.
SECURITIES LENDING:
The Funds loan securities through a lending agent, State Street Bank and Trust Company, to qualified institutional investors for the purpose of earning additional income. The lending agent receives and holds collateral from such borrowers to secure their obligations to the Funds. Such loans must be secured at all times by collateral in an amount at least equal to the market value of the loaned securities. The market values of the loaned securities and the collateral fluctuate and are determined at the close of each business day by the lending agent. Borrowers are required to post additional collateral to the lending agent on the next succeeding business day in the event of a collateral shortfall. Counterparty risk is further reduced by loaning securities only to parties that participate in a Global Securities Lending Program organized and monitored by the lending agent and that are deemed by it to satisfy its requirements and by having the lending agent enter into securities lending agreements with such borrowers. The lending agent is not affiliated with Royce.
Collateral may be in the form of cash or U.S. Treasuries. Cash collateral is invested in certain money market pooled investment vehicles. The Funds record a liability in their respective Statements of Assets and Liabilities for the return of such cash collateral during periods in which securities are on loan. The Funds bear the risk of loss for any decrease in the market value of the loaned securities or the investments purchased with cash collateral received from the borrowers.
Pursuant to the agreement in place between the Funds and the lending agent, if a borrower fails to return loaned securities, and the cash collateral being maintained by the lending agent on behalf of such borrower is insufficient to cover the value of loaned securities and provided such collateral insufficiency is not the result of investment losses, the lending agent shall, at its option, either replace the loaned securities or pay the amount of the shortfall to the Funds. In the event of the bankruptcy of a borrower, the Funds could experience delay in recovering the loaned securities or only recover cash or a security of equivalent value.
| Royce Capital Fund 2021 Semiannual Report to Shareholders | 21 |
Notes to Financial Statements (unaudited) (continued)
SECURITIES LENDING (continued):
Loans of securities generally do not have stated maturity dates, and the Funds may recall a security at any time. The Funds’ securities lending income consists of the income earned on investing cash collateral, plus any premium payments received for lending certain securities, less any rebates paid to borrowers and lending agent fees associated with the loan. Pursuant to the agreement in place between the Funds and the lending agent, the Funds are responsible for any shortfall in the event the value of the investments purchased with cash collateral is insufficient to pay the rebate fee to the borrower.
The following table presents cash collateral and the market value of securities on loan collateralized by cash collateral held by the Funds at June 30, 2021:
| | CASH COLLATERAL1 | SECURITIES ON LOAN
COLLATERALIZED BY CASH COLLATERAL | NET AMOUNT |
| Small-Cap Portfolio | $456,370 | $(435,801) | $20,569 |
1 Absent an event of default, assets and liabilities are presented gross and not offset in the Statements of Assets and Liabilities. The remaining contractual maturity of cash collateral is overnight and continuous.
The following table presents non-cash collateral and the market value of securities on loan collateralized by non-cash collateral held by the Funds’ custodian at June 30, 2021:
| | | NON-CASH COLLATERAL | | SECURITIES ON LOAN
COLLATERALIZED BY NON-CASH COLLATERAL | | NET AMOUNT |
| Micro-Cap Portfolio | | | $2,603,238 | | | | $(2,545,803 | ) | | | $57,435 | |
| Small-Cap Portfolio | | | 196,115 | | | | (192,252 | ) | | | 3,863 | |
DISTRIBUTIONS AND TAXES:
As qualified regulated investment companies under Subchapter M of the Internal Revenue Code, the Funds are not subject to income taxes to the extent that each Fund distributes substantially all of its taxable income for its fiscal year.
The Funds pay any dividends and capital gain distributions annually in December. Dividends from net investment income and distributions from capital gains are determined at a class level. Because federal income tax regulations differ from generally accepted accounting principles, income and capital gain distributions determined in accordance with tax regulations may differ from net investment income and realized gains recognized for financial reporting purposes. Accordingly, the character of distributions and composition of net assets for tax purposes differ from those reflected in the accompanying financial statements.
INVESTMENT TRANSACTIONS AND RELATED INVESTMENT INCOME:
Investment transactions are accounted for on the trade date. Dividend income is recorded on the ex-dividend date. Non-cash dividend income is recorded at the fair market value of the securities received. Interest income is recorded on an accrual basis. Realized gains and losses from investment transactions are determined on the basis of identified cost for book and tax purposes.
EXPENSES:
The Funds incur direct and indirect expenses. Expenses directly attributable to a Fund are charged to the Fund’s operations, while expenses applicable to more than one of the Royce Funds are allocated equitably. Certain personnel, occupancy costs and other administrative expenses related to the Funds are allocated by Royce under an administration agreement and are included in administrative and office facilities and legal expenses.
COMPENSATING BALANCE CREDITS:
The Funds have arrangements with their custodian bank and transfer agent, whereby a portion of the custodian’s fee and transfer agent’s fee is paid indirectly by credits earned on a Fund’s cash on deposit with the bank and transfer agent. These deposit arrangements are an alternative to purchasing overnight investments. Conversely, a Fund pays interest to the custodian on any cash overdrafts, to the extent they are not offset by credits earned on positive cash balances.
LINE OF CREDIT:
The Funds, along with certain other Royce Funds, participate in a $65 million line of credit (“Credit Agreement”) with State Street Bank and Trust Company to be used for temporary or emergency purposes. This revolving Credit Agreement expires on October 8, 2021. Pursuant to the Credit Agreement, each participating Fund is liable for a portion of the commitment fee for the credit facility and for principal and interest payments related to borrowings made by that Fund. Borrowings under the Credit Agreement bear interest at a variable rate equal to the Applicable Rate plus the Applicable Margin. The term Applicable Rate means, for any day, a rate equal to the sum of (a) 0.10%, plus (b) the higher of (i) the Federal Funds Effective Rate for such day, or (ii) the Overnight Bank Funding Rate for such day. The term Applicable Margin means 1.25%. The Funds did not utilize the line of credit during the six months ended June 30, 2021.
| 22 | Royce Capital Fund 2021 Semiannual Report to Shareholders |
Capital Share Transactions (in shares):
| | | SHARES SOLD | | | SHARES ISSUED FOR REINVESTMENT
OF DISTRIBUTIONS | | | SHARES REDEEMED | | | NET INCREASE (DECREASE) IN
SHARES OUTSTANDING | |
| | | Six Months Ended 6/30/21 (unaudited) | | | Year Ended 12/31/20 | | | Six Months Ended 6/30/21 (unaudited) | | | Year Ended 12/31/20 | | | Six Months Ended 6/30/21 (unaudited) | | | Year Ended 12/31/20 | | | Six Months Ended 6/30/21 (unaudited) | | | Year Ended 12/31/20 | |
| Micro-Cap Portfolio | | | | | | | | | | | | | | | | | | | | | | | | | | | | | |
| Investment Class | | | 1,391,635 | | | | 1,277,467 | | | | – | | | | 150,556 | | | | (1,868,461 | ) | | | (3,709,748 | ) | | | (476,826 | ) | | | (2,281,725 | ) |
| Service Class | | | 589,681 | | | | 1,364,196 | | | | – | | | | 33,180 | | | | (641,314 | ) | | | (1,825,235 | ) | | | (51,633 | ) | | | (427,859 | ) |
| Small-Cap Portfolio | | | | | | | | | | | | | | | | | | | | | | | | | | | | | |
| Investment Class | | | 1,476,977 | | | | 3,859,356 | | | | – | | | | 537,600 | | | | (3,368,776 | ) | | | (4,807,942 | ) | | | (1,891,799 | ) | | | (410,986 | ) |
| Service Class | | | 174,078 | | | | 14,258,227 | | | | – | | | | 669,250 | | | | (4,704,613 | ) | | | (14,694,441 | ) | | | (4,530,535 | ) | | | 233,036 | |
Investment Adviser and Distributor:
INVESTMENT ADVISER:
Under the Trust’s investment advisory agreements with Royce, Royce is entitled to receive investment advisory fees in respect of each Fund that are computed daily and payable monthly. Royce has contractually agreed, without right of termination, to waive fees and/or reimburse expenses (excluding brokerage commissions, taxes, interest, litigation expenses, acquired fund fees and expenses, and other expenses not borne in the ordinary course of business) to the extent necessary to maintain the Funds’ net annual operating expense ratios at specified levels through April 30, 2022, and is shown below to the extent that it impacted net expenses for the six months ended June 30, 2021. See the Prospectus for contractual waivers and expiration dates.
| | ANNUAL CONTRACTUAL
ADVISORY FEE AS A | | COMMITTED NET ANNUAL OPERATING EXPENSE RATIO CAP | | SIX MONTHS ENDED JUNE 30, 2021 (UNAUDITED) | |
| | PERCENTAGE OF AVERAGE
NET ASSETS | Investment Class | Service Class | | Net advisory fees | | | Advisory fees waived | |
| Micro-Cap Portfolio | | 1.25% | | 1.33% | | 1.58% | | $ | 1,148,310 | | | $ | 21,594 | |
| Small-Cap Portfolio | | 1.00% | | 1.08% | | 1.33% | | | 1,949,316 | | | | 13,686 | |
DISTRIBUTOR:
Royce Fund Services, LLC (“RFS”), the distributor of the Trust’s shares, is a wholly owned subsidiary of Royce. RFS is entitled to receive distribution fees from each Fund’s Service Class that are computed daily and payable monthly, at an annual rate of 0.25% of the average net assets of each Class. For the six months ended June 30, 2021, Micro-Cap Portfolio-Service Class recorded distribution fees of $40,630 and Small-Cap Portfolio-Service Class recorded distribution fees of $276,469.
Purchases and Sales of Investment Securities:
For the six months ended June 30, 2021, the costs of purchases and the proceeds from sales of investment securities, other than short-term securities and collateral received for securities loaned, were as follows:
| | | PURCHASES | | | SALES | |
| Micro-Cap Portfolio | | $ | 22,629,297 | | | $ | 37,243,993 | |
| Small-Cap Portfolio | | | 99,485,760 | | | | 149,795,121 | |
Cross trades were executed by the Funds pursuant to Rule 17a-7 under the 1940 Act. Cross trading is the buying or selling of portfolio securities between funds to which Royce serves as investment adviser. The Trust’s Chief Compliance Officer reviews such transactions each quarter for compliance with the requirements and restrictions set forth by Rule 17a-7, and reports the results of her review to the Board of Trustees. Cross trades for the six months ended June 30, 2021, were as follows:
| | COSTS OF PURCHASES | PROCEEDS FROM SALES | REALIZED GAIN (LOSS) |
| Micro-Cap Portfolio | $236,265 | $ – | $ – |
Class Specific Expenses:
Class specific expenses were as follows for the six months ended June 30, 2021:
| | | DISTRIBUTION FEES | | | SHAREHOLDER SERVICING | | | SHAREHOLDER REPORTS | | | TRANSFER AGENT BALANCE CREDITS | | | TOTAL | | | CLASS LEVEL EXPENSES REIMBURSED BY INVESTMENT ADVISER | |
| Micro-Cap Portfolio – Investment Class | | $ | – | | | $ | 4,014 | | | $ | 15,518 | | | $ | – | | | $ | 19,532 | | | $ | 19,532 | |
| Micro-Cap Portfolio – Service Class | | | 40,630 | | | | 3,503 | | | | 2,189 | | | | – | | | | 46,322 | | | | 5,717 | |
| | | | 40,630 | | | | 7,517 | | | | 17,707 | | | | – | | | | | | | | 25,249 | |
| Small-Cap Portfolio – Investment Class | | | – | | | | 3,790 | | | | 13,380 | | | | – | | | | 17,170 | | | | 17,170 | |
| Small-Cap Portfolio – Service Class | | | 276,469 | | | | 3,521 | | | | 9,243 | | | | – | | | | 289,233 | | | | 12,000 | |
| | | | 276,469 | | | | 7,311 | | | | 22,623 | | | | – | | | | | | | | 29,170 | |
| Royce Capital Fund 2021 Semiannual Report to Shareholders | 23 |
Notes to Financial Statements (unaudited) (continued)
Tax Information:
At June 30, 2021, net unrealized appreciation (depreciation) based on identified cost for tax purposes was as follows:
| | | | | | | NET UNREALIZED | | GROSS UNREALIZED |
| | TAX BASIS COST | | APPRECIATION (DEPRECIATION) | | Appreciation | (Depreciation) |
| Micro-Cap Portfolio | | $ | 122,499,266 | | | $ | 72,126,748 | | | $ | 79,345,319 | | | $ | 7,218,571 | |
| Small-Cap Portfolio | | | 276,453,907 | | | | 109,272,747 | | | | 113,425,983 | | | | 4,153,236 | |
The primary cause of the difference between book and tax basis cost is the timing of the recognition of losses on securities sold.
Subsequent Events:
Subsequent events have been evaluated through the date the financial statements were issued.
| 24 | Royce Capital Fund 2021 Semiannual Report to Shareholders |
Understanding Your Fund’s Expenses (unaudited)
As a shareholder of a mutual fund, you pay ongoing expenses, including management fees and other Fund expenses including, for some funds, distribution and/or service (12b-1) fees. Using the information below, you can estimate how these ongoing expenses (in dollars) affect your investment and compare them with the ongoing expenses of other funds. You may also incur one-time transaction expenses which are not shown in this section and would result in higher total costs. The example is based on an investment of $1,000 invested at January 1, 2021, and held for the entire six-month period ended June 30, 2021. Service Class shares are generally available only through certain insurance companies who receive service fees from the Fund for services that they perform.
Actual Expenses
The first part of the table below provides information about actual account values and actual expenses. You may use the information in this section, together with the amount you invested, to estimate the expenses that you paid over the period. Simply divide your account value at June 30, 2021, by $1,000 (for example, an $8,600 account value divided by $1,000 = 8.6), then multiply the result by the number under the heading entitled “Expenses Paid During the Period” to estimate the expenses you paid on your account during this period.
Hypothetical Example for Comparison Purposes
The second part of the table below provides information about hypothetical account values and hypothetical expenses based on the Fund’s actual expense ratio and an assumed rate of return of 5% per year before expenses, which is not the Fund’s actual return. The hypothetical account values and expenses may not be used to estimate the actual ending account balance or expenses you paid for the period. You may use this information to compare the ongoing costs of investing in the Fund and other funds. To do so, compare this 5% hypothetical example with the 5% hypothetical examples that appear in the shareholder reports of the other funds.
Please note that the expenses shown in the table are meant to highlight your ongoing costs only and do not reflect any transactional costs, such as sales charges (loads), redemption fees, or exchange fees. Therefore, this section is useful in comparing ongoing costs only, and will not help you determine the relative total costs of owning different funds. In addition, if these transactional costs were included, your costs would have been higher.
| | | ACTUAL | HYPOTHETICAL (5% PER YEAR BEFORE EXPENSES) |
| | | Beginning
Account Value 1/1/21 | Ending Account Value 6/30/21 | Expenses Paid During the Period1 | Beginning Account Value 1/1/21 | Ending Account Value 6/30/21 | Expenses Paid During the Period1 | Annualized Expense Ratio2 |
Investment Class
Micro-Cap Portfolio | | $ | 1,000.00 | | $ | 1,251.89 | | $ | 7.43 | | $ | 1,000.00 | | $ | 1,018.20 | | $ | 6.66 | | | 1.33 | % |
| Small-Cap Portfolio | | | 1,000.00 | | | 1,234.82 | | | 5.98 | | | 1,000.00 | | | 1,019.44 | | | 5.41 | | | 1.08 | % |
Service Class Micro-Cap Portfolio | | | 1,000.00 | | | 1,249.36 | | | 8.81 | | | 1,000.00 | | | 1,016.96 | | | 7.90 | | | 1.58 | % |
| Small-Cap Portfolio | | | 1,000.00 | | | 1,231.72 | | | 7.36 | | | 1,000.00 | | | 1,018.20 | | | 6.66 | | | 1.33 | % |
| 1 | Expenses are equal to the Fund’s annualized expense ratio multiplied by the average account value for the period, multiplied by 181 days in the most recent fiscal half-year divided by 365 days (to reflect the half-year period). This information does not include fees or expenses of the variable annuity contracts investing in the Fund. |
| 2 | Annualized expense ratio used to derive figures in the table is based on the most recent fiscal half-year. |
Royce Capital Fund 2021 Semiannual Report to Shareholders | 25
Trustees and Officers
All Trustees and Officers may be reached c/o The Royce Funds, 745 Fifth Avenue, New York, NY 10151
Christopher D. Clark, Trustee1, President
Age: 56 | Number of Funds Overseen: 16 | Tenure: Since 2014
Principal Occupation(s) During Past Five Years: Chief Executive Officer (since July 2016), President (since July 2014), Co-Chief Investment Officer (since January 2014), Managing Director of Royce, a Member of the Board of Managers of Royce, having been employed by Royce since May 2007.
Patricia W. Chadwick, Trustee
Age: 72 | Number of Funds Overseen: 16 | Tenure: Since 2009
Non-Royce Directorships: Trustee of Voya Mutual Funds and Director of Wisconsin Energy Corp.
Principal Occupation(s) During Past 5 Years: Consultant and President of Ravengate Partners LLC (since 2000).
Christopher C. Grisanti, Trustee
Age: 59 | Number of Funds Overseen: 16 | Tenure: Since 2017
Non-Royce Directorships: None
Principal Occupation(s) During Past Five Years: Chief Equity Strategist and Senior Portfolio Manager at MAI Capital Management LLC, an investment advisory firm (since May 2020). Previously, Mr. Grisanti was Co-Founder and Chief Executive Officer of Grisanti Capital Management LLC, an investment advisory firm (from 1999 to 2020). Mr. Grisanti’s prior business experience also includes serving as Director of Research and Portfolio Manager at Spears Benzak, Salomon & Farrell (from 1994 to 1999) and a senior associate at the law firm of Simpson, Thacher & Bartlett (from 1988 to 1994).
Cecile B. Harper, Trustee
Age: 58 | Number of Funds Overseen: 16 | Tenure: Since 2020
Non-Royce Directorships: None
Principal Occupation(s) During Past Five Years: Board Member of Pyramid Peak Foundation (since January 2012); and Chief Operating Officer at the College Foundation at the University of Virginia (since October 2019). Ms. Harper’s prior business experience includes serving as Principal of Southeastern Asset Management (from December 1993 to September 2019); and a Board Member of Regional One Health Foundation (from June 2013 to September 2019).
Arthur S. Mehlman, Trustee
Age: 79 | Number of Funds Overseen: 362 | Tenure: Since 2004
Non-Royce Directorships: Director/Trustee of registered investment companies constituting the 20 Legg Mason Funds.
Principal Occupation(s) During Past Five Years: Director of The League for People with Disabilities, Inc.; Director of University of Maryland Foundation (non-profits). Formerly: Director of Municipal Mortgage & Equity, LLC (from October 2004 to April 1, 2011); Director of University of Maryland College Park Foundation (non-profit) (from 1998 to 2005); Partner, KPMG LLP (international accounting firm) (from 1972 to 2002); Director of Maryland Business Roundtable for Education (from July 1984 to June 2002).
G. Peter O’Brien, Trustee
Age: 75 | Number of Funds Overseen: 362 | Tenure: Since 2001
Non-Royce Directorships: Director/Trustee of registered investment companies constituting the 20 Legg Mason Funds.
Principal Occupation(s) During Past Five Years: Trustee Emeritus of Colgate University (since 2005); Board Member of Hill House, Inc. (since 1999); Formerly Director of TICC Capital Corp (from 2003-2017): Trustee of Colgate University (from 1996 to 2005), President of Hill House, Inc. (from 2001 to 2005) and Managing Director/Equity Capital Markets Group of Merrill Lynch & Co. (from 1971 to 1999).
Michael K. Shields, Trustee
Age: 63 | Number of Funds Overseen: 16 | Tenure: Since 2015
Principal Occupation(s) During Past Five Years: President and Chief Executive Officer of Piedmont Trust Company, a privately-owned North Carolina trust company and wealth management firm (since May 2012). Mr. Shields’s prior business experience includes managing institutional and mutual fund equity portfolios in New York at Scudder, Stevens & Clark where he was a Principal in the Global Equity Group (1992 – 1997) and US Trust where he was President & CIO of a wholly-owned investment firm subsidiary (1997 – 2002).
Francis D. Gannon, Vice President
Age: 53 | Tenure: Since 2014
Principal Occupation(s) During Past Five Years: Co-Chief Investment Officer (since January 2014) and Managing Director of Royce, having been employed by Royce since September 2006.
Daniel A. O’Byrne, Vice President
Age: 59 | Tenure: Since 1994
Principal Occupation(s) During Past Five Years: Principal and Vice President of Royce, having been employed by Royce since October 1986.
Peter K. Hoglund, Treasurer
Age: 55 | Tenure: Since 2015
Principal Occupation(s) During Past Five Years: Chief Financial Officer, Chief Administrative Officer, and Managing Director of Royce, having been employed by Royce since December 2014. Prior to joining Royce, Mr. Hoglund spent more than 20 years with Munder Capital Management in Birmingham, MI, serving as Managing Director and Chief Financial Officer and overseeing all financial aspects of the firm. He began his career at Munder as a portfolio manager.
John E. Denneen, Secretary and Chief Legal Officer
Age: 54 | Tenure: 1996-2001 and Since 2002
Principal Occupation(s) During Past Five Years: General Counsel, Managing Director, and, since June 2015, a Member of the Board of Managers of Royce. Chief Legal and Compliance Officer and Secretary of Royce.
Lisa Curcio, Chief Compliance Officer
Age: 61 | Tenure: Since 2004
Principal Occupation(s) During Past Five Years: Chief Compliance Officer of The Royce Funds (since October 2004) and Compliance Officer of Royce (since June 2004).
1 Interested Trustee.
2 As of July 1, 2021, Messrs. Mehlman and O’Brien oversee 75 Funds.
Trustees will hold office until their successors have been duly elected and qualified or until their earlier resignation or removal. The Statement of Additional Information, which contains additional information about the Trust’s trustees and officers, is available and can be obtained without charge at www.royceinvest.com or by calling (800) 221-4268.
26 | Royce Capital Fund 2021 Semiannual Report to Shareholders
Liquidity Risk Management Program
The Securities and Exchange Commission adopted Rule 22e-4 under the Investment Company Act of 1940 (the “Liquidity Rule”) to promote effective liquidity risk management throughout the open-end investment company industry, thereby reducing the risk that funds will be unable to meet their redemption obligations and mitigating dilution of the interests of fund shareholders. As required by the Liquidity Rule, Royce Capital Fund (the “Trust”) adopted and implemented a written Liquidity Risk Management Program (as amended from time to time, the “LRMP”) which took effect on December 1, 2018.
The LRMP is designed to assess and manage the liquidity risk of each of Royce Micro-Cap Portfolio and Royce Small-Cap Portfolio (each, a “Fund” and together, the “Funds”), taking into consideration each Fund’s: (i) investment strategy and the liquidity of its portfolio investments during normal and reasonably foreseeable stressed conditions; (ii) short and long-term cash flow projections; (iii) holdings of cash and cash equivalents; and (iv) access to other funding sources, including custodian overdrafts and the Funds’ line of credit. In this context, liquidity risk refers to the risk that a Fund could not meet requests to redeem its shares without significant dilution of remaining investors’ interests in the Fund.
The Board of Trustees of the Trust (the “Board”) approved the designation of the Chief Risk Officer of Royce Investment Partners (“Royce”) as the administrator of the LRMP (in such capacity, the “Administrator”). The Administrator reports directly to the Board and serves at its pleasure in her capacity as Administrator. Such person also reports directly to Royce’s Chief Executive Officer in her capacity as Royce’s Chief Risk Officer. The members of Royce’s Risk Management Committee and its Legal & Compliance Department serve the Administrator in an advisory capacity. The Administrator may also consult with Royce’s portfolio management, administration, and trading personnel to the extent such person deems it necessary or appropriate to carry out the duties assigned to the Administrator under the LRMP. The Trust has retained a third-party liquidity vendor that performs various functions in connection with the administration of the LRMP, including classifying the liquidity of each Fund investment.
In accordance with the requirements of the Liquidity Rule and the LRMP, each Fund must classify each of its investments into one of four liquidity categories described below based on a determination of a reasonable expectation for how long it would take to convert the investment to cash (or sell or dispose of the investment) without significantly changing its market value.
• Highly liquid investments – cash or convertible to cash within three business days or less.
• Moderately liquid investments – convertible to cash in three to seven calendar days.
• Less liquid investments – can be sold or disposed of, but not settled, within seven calendar days.
• Illiquid investments – cannot not be sold or disposed of within seven calendar days.
In addition, the LRMP prohibits a Fund from acquiring any illiquid investment if, immediately after such acquisition, it would have invested more than 15% of its net assets in illiquid investments. Liquidity classification determinations take into account a variety of factors, including various market, trading and investment-specific considerations, as well as market depth, and generally utilize analysis from the third-party liquidity vendor.
Each Fund has been classified as a “primarily highly liquid fund” under the LRMP. For these purposes, a primarily highly liquid fund must hold more than 50% of its net assets in highly liquid investments. A Fund would cease to be a primarily highly liquid fund if its highly liquid investments fell to 50% or less of its net assets as of the end of any calendar month.
The Administrator presented a report to the Board at its meeting on February 18, 2021 that addressed the adequacy and effectiveness of the LRMP during the period January 1, 2020 to December 31, 2020 (the “covered period”). Among other things, the report provided summary information regarding overall market liquidity and the Funds’ compliance with various liquidity-related requirements along with examples of how the Administrator, Royce’s Risk Management Committee, and the relevant portfolio managers monitored and reacted to changes in liquidity profiles during the covered period. The report also addressed the enhanced liquidity monitoring and stress testing undertaken by the Administrator and Royce’s Risk Management Committee in response to the increased market volatility resulting from the Covid-19 pandemic. The report concluded that:
• each Fund remained a primarily highly liquid fund during the covered period;
• neither Fund breached the 15% limit on illiquid investments during the covered period;
• the LRMP remains reasonably designed and implemented to assess and manage each Fund’s liquidity risk; and
• each Fund was able to meet requests for redemption without significant dilution of remaining investors’ interests in the Fund during the covered period.
No assurance can be given that the LRMP will achieve its objectives in the future. Please refer to the Trust’s statutory prospectus for more information regarding each Fund’s exposure to liquidity risk and other principal risks and a description of how the Funds expect to satisfy redemption requests.
Royce Capital Fund 2021 Semiannual Report to Shareholders | 27
Notes to Performance and Other Important Information
The thoughts expressed in this report concerning recent market movements and future prospects for small company stocks are solely the opinion of Royce at June 30, 2021, and, of course, historical market trends are not necessarily indicative of future market movements. Statements regarding the future prospects for particular securities held in the Funds’ portfolios and Royce’s investment intentions with respect to those securities reflect Royce’s opinions as of June 30, 2021 and are subject to change at any time without notice. There can be no assurance that securities mentioned in this report will be included in any Royce-managed portfolio in the future.
Sector weightings are determined using the Global Industry Classification Standard (“GICS”). GICS was developed by, and is the exclusive property of, Standard & Poor’s Financial Services LLC (“S&P”) and MSCI Inc. (“MSCI”). GICS is the trademark of S&P and MSCI. “Global Industry Classification Standard (GICS)” and “GICS Direct” are service marks of S&P and MSCI.
All indexes referenced are unmanaged and capitalization weighted. Each index’s returns include net reinvested dividends and/or interest income. Frank Russell Company (“Russell”) is the source and owner of the trademarks, service marks and copyrights related to the Russell Indexes. Russell® is a trademark of Frank Russell Company. Neither Russell nor its licensors accept any liability for any errors or omissions in the Russell Indexes and/or Russell ratings or underlying data and no party may rely on any Russell Indexes and/or Russell ratings and/or underlying data contained in this communication. No further distribution of Russell Data is permitted without Russell’s express written consent. Russell does not promote, sponsor or endorse the content of this communication. The Russell 2000 is an index of domestic small-cap stocks. It measures the performance of the 2,000 smallest publicly traded U.S. companies in the Russell 3000 Index. The Russell 2000 Value and Growth Indexes consist of the respective value and growth stocks within the Russell 2000 as determined by Russell Investments. The Russell Microcap Index includes 1,000 of the smallest securities in the small-cap Russell 2000 Index along with the next smallest eligible securities as determined by Russell. The Russell 1000 Index is an index of domestic large-cap stocks. It measures the performance of the 1,000 publicly traded U.S. companies in the Russell 3000 Index. The Russell 2000 Pure Value Index is an unmanaged index composed of securities with strong value characteristics selected from the Russell 2000 Index. Securities are weighted based on their style score. The Russell 2000 Pure Growth Index is an unmanaged index composed of securities with strong growth characteristics selected from the Russell 2000 Index. Securities are weighted based on their style score. The performance of an index does not represent exactly any particular investment, as you cannot invest directly in an index. Returns for the market indexes used in this report were based on information supplied to Royce by Russell Investments. Royce has not independently verified the above described information.
The Price-Earnings, or P/E, Ratio is calculated by dividing a company’s share price by its trailing 12-month earnings-per-share (EPS). The Price-to-Book, or P/B, Ratio is calculated by dividing a company’s share price by its book value per share. Standard deviation is a statistical measure within which a fund’s total returns have varied over time. The greater the standard deviation, the greater a fund’s volatility. Beta is a measure of the volatility or risk of an investment compared to the market as a whole. Alpha describes an investment strategy’s ability to beat the market. The Morningstar Style Map uses proprietary scores of a stock’s value and growth characteristics to determine its placement in one of the five categories listed on the horizontal axis. These characteristics are then compared to those of other stocks within the same market capitalization band. Each is scored from zero to 100 for both value and growth attributes. The value score is subtracted from the growth score to determine the overall style score. For the vertical, market cap axis, Morningstar subdivides into size groups. Giant-cap stocks are defined as those that account for the top 40% of the capitalization of each style zone; large-cap stocks represent the next 30%; mid-cap stocks the next 20%; small-cap stocks the next 7%; micro-cap stocks the smallest 3%. Standard deviation is a statistical measure within which a fund’s total returns have varied over time. The greater the standard deviation, the greater a fund’s volatility. The value score is subtracted from the growth score to determine the overall style score. For the Morningstar Small Blend Category: © 2021 Morningstar. All Rights Reserved. The information regarding the category in this piece is: (1) is proprietary to Morningstar and/or its content providers; (2) may not be copied or distributed; and (3) is not warranted to be accurate, complete or timely. Neither Morningstar nor its content providers are responsible for any damages or losses arising from any use of this information. Cyclical and Defensive are defined as follows: Cyclical: Communication Services, Consumer Discretionary, Energy, Financials, Industrials, Information Technology, and Materials. Defensive: Consumer Staples, Health Care, Real Estate, and Utilities. The Royce Funds is a service mark of The Royce Funds. Distributor: Royce Fund Services, LLC.
Royce Capital Fund–Micro-Cap Portfolio invests primarily in securities of micro-cap companies and Royce Capital Fund–Small-Cap Portfolio invests primarily in securities of small-cap companies. Investments in these types of companies may involve considerably more risk than investments in securities of larger-cap companies. (Please see “Primary Risks for Fund Investors” in the prospectus.) Royce Capital Fund–Micro-Cap Portfolio and Royce Capital Fund–Small-Cap Portfolio may each invest up to 25% its assets in foreign securities that may involve political, economic, currency, and other risks not encountered in U.S. investments. (Please see “Investing in Foreign Securities” in the prospectus.) A Fund that invests a significant portion of its assets in a limited number of stocks may be subject to considerably more risk than a more broadly diversified Fund because a decline in the value of any of these stocks would cause that Fund’s overall value to decline to a greater degree. A broadly diversified portfolio does not, however, ensure a profit for a Fund or guarantee against loss. Please read the prospectus carefully before investing or sending money. A copy of the Funds’ current prospectus and a Statement of Additional Information may be obtained by calling (800) 221-4268 or by visiting www.royceinvest.com. All publicly released material Fund information is disclosed by the Funds on their website at www.royceinvest.com.
Forward-Looking Statements
This material contains forward-looking statements within the meaning of the Securities Exchange Act of 1934, as amended (the “Exchange Act”), that involve risks and uncertainties, including, among others, statements as to:
| • | the Funds’ future operating results, |
| • | the prospects of the Funds’ portfolio companies, |
| • | the impact of investments that the Funds have made or may make, |
| • | the dependence of the Funds’ future success on the general economy and its impact on the companies and industries in which the Funds invest, and |
| • | the ability of the Funds’ portfolio companies to achieve their objectives. |
This review and report use words such as “anticipates,” “believes,” “expects,” “future,” “intends,” and similar expressions to identify forward-looking statements. Actual results may differ materially from those projected in the forward-looking statements for any reason.
28 | Royce Capital Fund 2021 Semiannual Report to Shareholders
Notes to Performance and Other Important Information (continued)
The Royce Funds have based the forward-looking statements included in this review and report on information available to us on the date of the report, and we assume no obligation to update any such forward-looking statements. Although The Royce Funds undertake no obligation to revise or update any forward-looking statements, whether as a result of new information, future events, or otherwise, you are advised to consult any additional disclosures that we may make through future shareholder communications or reports.
Proxy Voting
A copy of the policies and procedures that The Royce Funds use to determine how to vote proxies relating to portfolio securities and information regarding how each of The Royce Funds voted proxies relating to portfolio securities during the most recent 12-month period ended June 30 is available, without charge, on The Royce Funds’ website at www.royceinvest.com, by calling (800) 221-4268 (toll-free), and on the website of the Securities and Exchange Commission (“SEC”) at www.sec.gov.
Disclosure of Portfolio Holdings
The Funds’ complete portfolio holdings are also available on Exhibit F to Form N-PORT, which filings are made with the SEC within 60 days of the end of the first and third fiscal quarters. The Funds’ Form N-PORT filings are available on the SEC’s website at http://www.sec.gov.
Royce Capital Fund 2021 Semiannual Report to Shareholders | 29

About Royce Investment Partners
Unparalleled Knowledge + Experience
Pioneers in small-cap investing, with 45+ years
of experience, depth of knowledge, and focus.
Independent Thinking
The confidence to go against consensus, the insight
to uncover opportunities others might miss, and the
tenacity to stay the course through market cycles.
Specialized Approaches
U.S., international, and global investment strategies
that pursue approaches with different risk profiles.
Unwavering Commitment
Our team of 16 portfolio managers has significant
personal investments in the strategies they manage.
Contact Us
GENERAL INFORMATION
Additional Report Copies and Prospectus Inquiries
(800) 221-4268
RCF-REP-0621
Item 2. Code(s) of Ethics. Not applicable to this semi-annual report.
Item 3. Audit Committee Financial Expert. Not applicable to this semi-annual report.
Item 4. Principal Accountant Fees and Services. Not applicable to this semi-annual report.
Item 5. Audit Committee of Listed Registrants. Not Applicable
Item 6. Investments.
(a) See Item 1.
(b) Not Applicable
Item 7. Disclosure of Proxy Voting Policies and Procedures for Closed-End Management Investment Companies. Not Applicable.
Item 8. Portfolio Managers of Closed-End Management Investment Companies. Not Applicable.
Item 9. Purchases of Equity Securities by Closed-End Management Investment Company and Affiliated Purchasers. Not Applicable
Item 10. Submission of Matters to a Vote of Security Holders. Not Applicable.
Item 11. Controls and Procedures.
(a) Disclosure Controls and Procedures. The Principal Executive and Financial Officers concluded that the Registrant's Disclosure Controls and Procedures are effective based on their evaluation of the Disclosure Controls and Procedures as of a date within 90 days of the filing date of this report.
(b) Internal Control over Financial Reporting. There were no significant changes in Registrant's internal control over financial reporting or in other factors that could significantly affect this control subsequent to the date of the evaluation, including any corrective actions with regard to significant deficiencies and material weaknesses during the period covered by this report.
Item 12. Exhibits. Attached hereto.
(a)(1) Not applicable to this semi-annual report.
(a)(2) Separate certifications by the Registrant’s Principal Executive Officer and Principal Financial Officer as required by Rule 30a-2(a) under the Investment Company Act of 1940.
(a)(3) Not Applicable
(b) Separate certifications by the Registrant’s Principal Executive Officer and Principal Financial Officer, pursuant to Section 906 of the Sarbanes-Oxley Act of 2002 and required by Rule 30a-2(b) under the Investment Company Act of 1940.
Pursuant to the requirements of the Securities Exchange Act of 1934 and the Investment Company Act of 1940, the registrant has duly caused this report to be signed on its behalf by the undersigned, thereunto duly authorized.
ROYCE CAPITAL FUND
BY: /s/ Christopher D. Clark
Christopher D. Clark
President
Date: August 24, 2021
Pursuant to the requirements of the Securities Exchange Act of 1934 and the Investment Company Act of 1940, this report has been signed below by the following persons on behalf of the registrant and in the capacities and on the dates indicated.
| ROYCE CAPITAL FUND | ROYCE CAPITAL FUND |
| | |
| | |
| BY: /s/ Christopher D. Clark | BY: /s/ Peter K. Hoglund |
| Christopher D. Clark | Peter K. Hoglund |
| President | Chief Financial Officer |
| | |
| Date: August 24, 2021 | Date: August 24, 2021 |