UNITED STATES
SECURITIES AND EXCHANGE COMMISSION
Washington, D.C. 20549
FORM N-CSR
CERTIFIED SHAREHOLDER REPORT
OF
REGISTERED MANAGEMENT INVESTMENT COMPANIES
Investment Company Act File Number: 811-07537
Name of Registrant: Royce Capital Fund
Address of Registrant: 745 Fifth Avenue
New York, NY 10151
Name and address of agent for service: John E. Denneen, Esq. 745 Fifth Avenue New York, NY 10151 |
Registrant’s telephone number, including area code: (212) 508-4500
Date of fiscal year end: December 31, 2022
Date of reporting period: January 1, 2022 – June 30, 2022
Item 1. Reports to Shareholders.

Royce Capital Fund 2022 Semiannual
Review and Report to Shareholders
June 30, 2022
Royce Capital Fund–Micro-Cap Portfolio
Royce Capital Fund–Small-Cap Portfolio
Table of Contents
Semiannual Review

This page is not part of the Royce Capital Fund 2022 Semiannual Report to Shareholders | 1
Letter to Our Shareholders

THE FIRST HALF OF 2022: A SEASON OF WORSTS FOR THE CAPITAL MARKETS
The first half of 2022—in particular its more tumultuous second quarter—offered few if any safe havens for investors, regardless of the investment focus. To be sure, the list of negative superlatives is long. As measured by the Russell Indexes, for example, it was the worst calendar first half since the shared 12/31/78 inception dates for the large-cap Russell 1000 Index (-20.9%), the Russell Midcap Index (-21.57%), the small-cap Russell 2000 Index (-23.4%), and the Russell Microcap Index (-25.1% and whose start goes back to 6/30/00). For the large-cap S&P 500 Index, its 20.0% decline marked its worst first half return since 1970 and its most volatile first six months since 2009. Using Center for Research in Securities Prices (CRSP) data that dates back to 1926 shows that the small-cap proxy, the CRSP 6-10 Index, had its fourth-worst first half in nearly 100 years. The three others occurred in 1932 (during the depth of the Great Depression), 1970, and 1973. For the CRSP 1-5—the large-cap cohort—it was the third-worst first half, with only 1932 and 1962 (during the “Kennedy Slide” that followed a decade of rising share prices) faring worse.
Outside the U.S., the results were equally grim. The MSCI ACWI Small Cap (-22.3%) and MSCI ACWI ex USA Small Cap (-22.9%) Indexes each suffered their worst first half since their 1994 inception while the MSCI Emerging Market Index (-17.9%) turned in its second worst. And the damage was not limited to equities. Bonds also posted negative returns in the
first half, declining in both the first and second quarters. This is especially notable because stocks and bonds seldom decline in tandem. They have both had negative returns in just 20 quarters since 1976 (a period that encompasses 186 quarters) and have experienced negative returns for two consecutive quarters only five times—as was the case in 2022—since that same year. In addition, cryptocurrencies are estimated to have lost roughly $2 trillion in value during 2022’s first half, while it is estimated that the amount of wealth in the U.S. has shrunk by as much as $5 trillion so far in 2022. The first half of 2022 saw a significant resetting of asset values on a global scale in a series of deep and broad-based declines that offered, in the words of the Motown classic, “nowhere to run to, nowhere to hide.”
The reasons for this extensive simultaneous swoon have been well rehearsed: Inflation, rising interest rates, an aggressively tightening Fed (with central banks through much of the developed world following suit), lingering supply chain issues, ongoing Covid variants, a sluggish Chinese economy, and the war in Ukraine. Many of these developments are interrelated, with continued Covid outbreaks hampering both a resolution to supply chain delays and growth in China while the war and supply chain delays are exacerbating inflation. The headwinds can be seen in recent economic data, with behemoths such as Walmart, a bellwether for moderate- and low-income U.S. consumers, reporting lower-than-anticipated quarterly earnings and underwhelming near-term prospects while the J.P. Morgan Global Manufacturing PMI™ hit a
2 | This page is not part of the Royce Capital Fund 2022 Semiannual Report to Shareholders
LETTER TO OUR SHAREHOLDERS
22-month low at the end of June. The U.S. manufacturing PMI new orders component ended June at 49.2—and any number below 50 signals a contraction in activity. However, U.S. home and durable good sales rose in June, while as of this writing the U.S. labor market remains strong—and surprisingly resilient in the face of so much dire news. An added positive came from recent bank results, which included reassuring news about the health of consumer credit, as well as the banks’ own balance sheets. The shared health of banks and household balance sheets is important from our perspective as it bolsters the view that any U.S. slowdown seems likely to be both shallow and short-lived. Other dynamics create a different picture outside of the U.S., where a global slowdown looks more worrisome in Europe than in Asia, with the U.S. in between. Regardless of the near-term economic forecast, however, we have examined several small-cap data points that point to potentially better times ahead for investors with the fortitude to remain invested. Much of our case rests on an admittedly counterintuitive and somewhat ironic reason: Improved results for small-cap stocks are rooted in the fact that the environment has been so difficult.
SMALL-CAP IS A DIFFERENT WORLD
Throughout our five decades of investing, we have found that there are two critical features about the overall small-cap market that many investors miss or forget: First, small-cap operates in its own way—frequently diverging from large-cap. This is borne out not only by the differences—often significant—in long-term performance, but also in the varying market cycles,
responses to various economic and monetary regimes and sector and industry concentrations. Second, small-cap is a highly heterogeneous asset class. Its roughly 3,000 publicly traded companies can be found in ample supply in every sector and industry and are involved in almost every imaginable kind of business. Equally important, the depth and breadth of the universe means that there are nearly always potential opportunities for disciplined and discerning investors with the requisite patience for long-term investing.
So, while we can appreciate that investors may feel more comfortable focusing on large-caps in these anxious times, we would counsel resisting that temptation, particularly in the current environment. For example, one of the primary differences between small- and large-cap stocks at the end of June was the radically different valuation picture for each asset class. Despite the dramatic decline in stock prices so far during 2022—which might lead some to believe that valuations throughout the U.S. equity market have been falling to attractively inexpensive levels—large-cap stocks on average remain expensive. And this is true not only in light of their own history, but also versus small-caps. In fact, there has been little change in the extreme valuation gap between the Russell 2000 and Russell 1000 since late 2020. On 6/30/22 the Russell 2000 was at a 20% discount—which marked its lowest relative valuation versus the large-cap index in more than two decades. This stands in stark contrast to the past 20 years, a period in which small-caps have averaged a 3% premium to their larger siblings.
Russell 2000 vs. Russell 1000 Median LTM EV/EBIT1 (ex. Negative EBIT Companies)
From 6/30/02 to 6/30/22
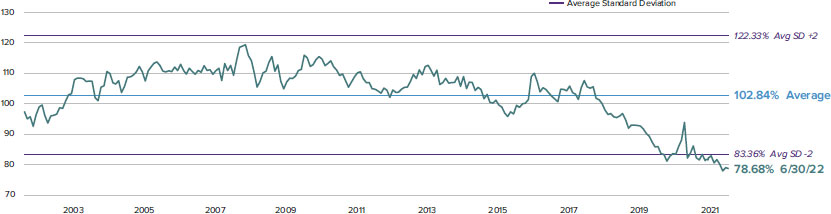
1Earnings before interest and taxes.
The average standard deviation (+/-2) shows how extreme the relative valuation of the indexes is from the average relative valuation over the period shown. Average standard deviation +2 indicates the highest 2.5% of relative valuation observations (i.e., small-caps are relatively expensive), while the average standard deviation -2 indicates the lowest 2.5% of relative valuation observations (i.e., small-caps are relatively inexpensive).
This page is not part of the Royce Capital Fund 2022 Semiannual Report to Shareholders | 3
LETTER TO OUR SHAREHOLDERS
Median EV/EBIT1 (ex-Negative EBIT) Levels for Russell Indexes
As of 6/30/22

1Enterprise value divided by earnings before interest and taxes.
WHEN VALUATION IS A MATTER OF STYLE
Within small-cap, valuations continue to favor value, even as the Russell 2000 Value Index continued to outpace the Russell 2000 Growth Index in small-cap’s miserable first half—in this case by losing less, down 17.3% versus 29.5% for the year-to-date period ended 6/30/22. There were four additional observations from the chart above that we found equally relevant when comparing valuations for the various segments of the U.S. equity market:
| 1. | Small-Cap Value and Small-Cap Core were the cheapest segments of U.S. equities as of 6/30/22. |
| 2. | These segments were the only ones that were below their 25-year average valuation. |
| 3. | While all three value segments (Small-Cap, Mid-Cap, and Large-Cap) had nearly identical 25-year average valuations, their valuations at the end of June were vastly different. |
| 4. | Large-Cap and Mid-Cap Growth valuations remained well above their 25-year average valuations at the end of 2022’s first half. |
These valuation disparities are particularly pertinent now because it seems likely that U.S. equity valuations, at least for some asset classes or styles, may take years to surpass their earlier respective peaks. Our view is that an environment featuring somewhat higher interest rates and inflation, along with a less accommodative Federal Reserve and
increased geopolitical rivalries, will combine for a greater risk environment. (It will also be nearly the reverse of the period from 2009-2021, which saw unprecedented levels of liquidity and near-zero interest rates.) We believe that we will therefore probably see somewhat lower equity valuations in the new climate than we have seen over much of the last 10 years. We think that one important consequence of this shifting and uncertain environment is that investors should consider allocating away from higher valuation assets, which may have stiff headwinds to appreciation, into lower valuation assets, which may receive help from at least a neutral environment or perhaps modest tailwinds. Small-caps in general, and small-cap value specifically, look relatively attractive in this context.
SO BAD IT’S GOOD? REASONS FOR LONG-TERM SMALL-CAP OPTIMISM
Even with a more attractive valuation than large-caps—and a further valuation advantage for small-cap value—we can appreciate that investors may be reticent to put fresh capital to work in the asset class or its value style subset, having just endured the worst first half in the more than 40-year history of the Russell 2000 Index. We also understand their weariness and anxiety as they survey the litany of challenges we have reviewed above. No one, it would seem, needs a reason not to invest these days. Yet that negative perception—substantiated by record lows in both investor and consumer sentiment—is exactly why
4 | This page is not part of the Royce Capital Fund 2022 Semiannual Report to Shareholders
LETTER TO OUR SHAREHOLDERS
we are so emphatic that this looks like a genuinely attractive time to invest in small-caps. We think the case is even stronger, particularly if an investor uses large-cap stocks—with their relatively much higher valuations—as a source of funds.
A little-known dynamic exists between large- and small-cap stock performance as investors’ fears wax and wane. We have found it useful to watch the CBOE S&P 500 Volatility Index (VIX) as a barometer for risk tolerance. (The VIX measures market expectations of near-term volatility conveyed by S&P 500 stock index option prices.) Risk tolerance tends to ebb and flow with events. However, regardless of the specific event (e.g., Long-Term Capital Management’s 1998 meltdown, 9/11, the Great Financial Crisis of 2008-09, the Greek Debt Crisis in 2011, 2020’s Covid shutdown), risk tolerance initially plummets before investors show their resilience and acclimatize to the new development, leading to a normalizing of risk tolerance.
This pattern forms the history of markets. Yet there is another revealing and consistent pattern within U.S. equities: In general, small-cap stocks have absorbed a greater proportion of heightened fear than large-caps as overall stock prices fall—which paradoxically creates an opportunity, as the chart below shows. Using above-average VIX levels as a proxy for markets in the grip of high anxiety shows that these periods have historically supplied two attractive elements for small-cap investors: strong absolute subsequent returns and, equally compelling, often excellent entry points for small-cap outperformance over large-caps. When the VIX has had an average monthly reading of 25 or more, as it did in June 2022, the subsequent three-year annualized returns for the Russell 2000 have been 14.1%, compared with 9.4% for the Russell 1000. Even more striking than the spread of outperformance has been the 83% frequency with which small-caps have beaten large-caps over the subsequent three years from similar starting points of higher-than-average volatility. We think of small-caps as being like a coiled spring in these periods of high investor anxiety, contracting more as fear builds and bouncing robustly back as fear recedes.
Subsequent Average Annualized Three-Year Return for the Russell 2000 Starting in Monthly Rolling VIX Return Ranges
From 12/31/89 to 6/30/22

Past performance is no guarantee of future results. Batting Average refers to the percentage of monthly three-year periods in which the Russell 2000 Index outperformed the Russell 1000 Index. The monthly average VIX from 12/31/89-6/30/22 was 19.6. Higher VIX readings occur when market volatility is higher.
THE VALUE OF STAYING INVESTED
We are certainly in what we would call a “sum of all fears” environment, with war, inflation, slower growth, and rising rates all understandably frightening investors. The anxious realities of our current conditions notwithstanding, we would challenge investors to think about whether our present moment is markedly worse than previous periods—including the Internet Bubble era, the months following the attacks on 9/11, and the Great Financial Crisis. In other words, we would argue against the current sentiment.
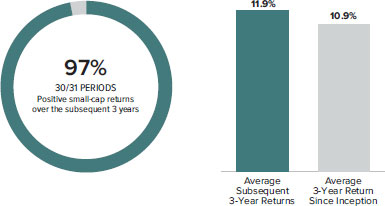
More importantly, we have found that the most opportune times to invest are when fear is high and trailing returns are low. Subsequent returns from these levels have been attractive for those investors with the discipline to stay invested. For instance, the annualized three-year return for the Russell 2000 at the end of June was 4.2% compared to its three-year monthly rolling average since inception of 10.9%. Subsequent annualized three-year returns for small-cap from comparable trailing low-return entry points have been positive 97% of the time since the Russell 2000’s inception, averaging 11.9%. Coming off a record negative first half and enduring what may well be a late stage of the bear market, the current period looks, to us, like a pretty good entry point for long-term small-cap returns going forward. We think all of this makes a very convincing argument for ongoing small-cap investment.
We think of small-caps as being like a coiled spring in these periods of high investor anxiety,
contracting more as fear builds and bouncing robustly back as fear recedes.
This page is not part of the Royce Capital Fund 2022 Semiannual Report to Shareholders | 5
LETTER TO OUR SHAREHOLDERS
Subsequent Average Annualized 3-Year Performance for the Russell 2000 Following 3-Year Annualized Return Ranges of 0-5%
From 12/31/78-6/30/22
Past performance is no guarantee of future results.
We have one final observation—which is that small-cap recoveries have historically happened very quickly, so investors who miss even a few months would have forfeited a sizable share of their return. We looked at the one-year results coming off market bottoms—declines of at least 15% from the previous peak—and then tracked the average returns for investors who missed the first one, two, or three months of each one-year recovery. The results were striking. On average, if an investor were to miss only the first month of the
recovery, their one-year return was on average about one third lower than if they had been investing throughout the trough (+63.8% vs. +41.8%). For an investor who missed the first three months of the recovery, their subsequent one-year return was less than half of what investors experienced by investing at the bottom (+63.8% vs. +31.2%).
Average and Median Returns for the Russell 2000 During the First 12 Months of a Recovery Depending on Entry Point
From 12/31/78-6/30/22
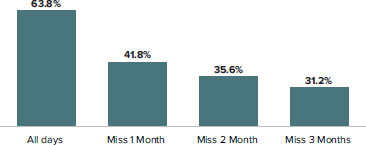
Past performance is no guarantee of future results. Royce defines the starting date of a recovery as the market cycle trough of a decline of 15% or more from the index’s prior historical high.
Our final counsel then, is to follow the wisdom of the investment maxim, “Be fearful when others are greedy and greedy when others are fearful.”
Sincerely,
 |  |  |
Charles M. Royce
Chairman,
Royce Investment Partners | Christopher D. Clark
Chief Executive Officer, and
Co-Chief Investment Officer,
Royce Investment Partners | Francis D. Gannon
Co-Chief Investment Officer,
Royce Investment Partners |
July 29, 2022
| 6 | This page is not part of the Royce Capital Fund 2022 Semiannual Report to Shareholders | Past performance is no guarantee of future results. |
Performance and Expenses
Performance and Expenses
As of June 30, 2022
| | YTD1 | 1-YR | 3-YR | 5-YR | 10-YR | 15-YR | 20-YR | 25-YR | SINCE
INCEPTION
(12/27/96) | ANNUAL OPERATING
EXPENSES (%)
GROSS/NET |
| Royce Capital Fund–Micro-Cap Portfolio | -28.10 | -25.35 | 7.70 | 5.40 | 5.45 | 3.58 | 6.48 | 9.12 | 9.10 | 1.12/1.08 |
| Royce Capital Fund–Small-Cap Portfolio | -19.02 | -15.52 | 1.93 | 2.98 | 5.83 | 4.31 | 6.86 | 8.66 | 8.96 | 1.11/1.08 |
| INDEX | | | | | | | | | | |
| Russell Microcap Index | -25.11 | -30.73 | 5.05 | 4.55 | 9.04 | 5.16 | 7.45 | N/A | N/A | N/A |
| Russell 2000 Value Index | -17.31 | -16.28 | 6.18 | 4.89 | 9.05 | 5.58 | 7.77 | 8.15 | N/A | N/A |
| Russell 2000 Index | -23.43 | -25.20 | 4.21 | 5.17 | 9.35 | 6.33 | 8.17 | 7.41 | N/A | N/A |
1 Not annualized.
Important Performance, Expense, and Risk Information
All performance information in this Review and Report reflects past performance, is presented on a total return basis, reflects the reinvestment of distributions, and does not reflect the deduction of taxes that a shareholder would pay on fund distributions or the redemption of fund shares. Past performance is no guarantee of future results. Investment return and principal value of an investment will fluctuate, so that shares may be worth more or less than their original cost when redeemed. Current performance may be higher or lower than performance quoted and may be obtained at www.royceinvest.com. The Funds’ total returns do not reflect any deduction for charges or expenses of the variable contracts investing in the Funds. All performance and expense information reflects the result for each Fund’s Investment Class Shares. Gross annual operating expenses reflect each Fund’s gross total annual operating expenses and include management fees, operating expenses, and any applicable acquired fund fees and expenses. Net annual operating expenses reflect contractual fee waivers and/or expense reimbursements. All expense information is reported as of each fund’s most current prospectus and, for Royce Micro-Cap Portfolio, reflects the reduction in its investment advisor fee rate from 1.25% to 1.00% of its average daily net assets that will go into effect on July 1, 2022. Royce & Associates has contractually agreed to waive fees and/or reimburse operating expenses, excluding brokerage commissions, taxes, interest litigation expenses, acquired fund fees and expenses, and other expenses not borne in the ordinary cost of business, to the extent necessary to maintain net operating expenses at or below 1.08% for both Royce Capital Fund–Micro-Cap Portfolio and Royce Capital Fund–Small-Cap Portfolio through April 30, 2023.
Service Class Shares bear an annual distribution expense that is not borne by the Investment Class; if those expenses were reflected, total returns would have been lower. Each series of Royce Capital Fund is subject to market risk—the possibility that common stock prices will decline, sometimes sharply and unpredictably, over short or extended periods of time. Such declines may be caused by various factors, including market, financial, and economic conditions, governmental or central bank actions, and other factors, such as the recent Covid-19 pandemic, that may not be directly related to the issuer of a security held by a Fund. This pandemic could adversely affect global market, financial, and economic conditions in ways that cannot necessarily be foreseen. Royce Micro-Cap Portfolio invests primarily in micro-cap companies while Royce Small-Cap Portfolio invests primarily in small-cap companies. Investments in micro-cap and small-cap companies may involve considerably more risk than investments in securities of larger-cap companies. (Please see “Primary Risks for Fund Investors” in the prospectus.) Each series of Royce Capital Fund may invest up to 25% of its net assets in foreign securities. Investments in foreign securities may involve political, economic, currency, and other risks not encountered in U.S. investments. (Please see “Investing in Foreign Securities” in the prospectus.) As of 6/30/22, Royce Small-Cap Portfolio invested a significant portion of its assets in a limited number of stocks, which may involve considerably more risk than a more broadly diversified portfolio because a decline in the value of any one of these stocks would cause the Portfolio’s overall value to decline to a greater degree. Royce Micro-Cap Portfolio’s broadly diversified portfolio does not ensure a profit or guarantee against loss. (Please see “Primary Risks for Fund Investors” in the prospectus.) This Review and Report must be preceded or accompanied by a prospectus. Please read the prospectus carefully before investing or sending money. Russell Investment Group is the source and owner of the trademarks, service marks, and copyrights related to the Russell Indexes. Russell® is a trademark of Russell Investment Group. The Russell Microcap Index includes 1,000 of the smallest securities in the small-cap Russell 2000 Index along with the next smallest eligible securities as determined by Russell. The Russell 2000 Index is an unmanaged, capitalization-weighted index of domestic small-cap stocks. It measures the performance of the 2,000 smallest publicly traded U.S. companies in the Russell 3000 Index. The Russell 2000 Value Index consists of the respective value stocks within the Russell 2000 as determined by Russell Investments. The performance of an index does not represent exactly any particular investment, as you cannot invest directly in an index. Distributor: Royce Fund Services, LLC.
This page is not part of the Royce Capital Fund 2022 Semiannual Report to Shareholders | 7
MANAGERS’ DISCUSSION (UNAUDITED)
Royce Capital Fund–Micro-Cap Portfolio (RCM)

Jim Stoeffel
Brendan Hartman
FUND PERFORMANCE
Royce Capital Fund–Micro-Cap Portfolio was down 28.1% for the year-to-date period ended 06/30/22, versus a loss of 25.1% for its primary benchmark, the Russell Microcap Index, and a 23.4% loss for the small-cap Russell 2000 Index, its secondary benchmark. The portfolio outperformed the Russell Microcap and the Russell 2000 for the one-, three-, and five-year periods ended 6/30/22.
WHAT WORKED... AND WHAT DIDN’T
Seven of the portfolio’s nine sectors made a negative impact on year-to-date performance. Information Technology, Industrials, and Consumer Discretionary detracted most at the sector level, while the only positive impact came from Energy and Real Estate—as well as the Fund’s cash holdings. Semiconductors & semiconductor equipment (Information Technology), specialty retail (Consumer Discretionary), and machinery (Industrials) detracted most for the year-to-date period at the industry level, while software (Information Technology), energy equipment & services (Energy), and real estate management & development (Real Estate) were the largest contributors.
The Fund’s top detractor at the position level was value-priced apparel retailer Citi Trends. The company reduced its second-half outlook given inflationary pressures that are crimping the spending patterns of its core customer base. We think its shares offered attractive value at the end of June in light of the successful turnaround engineered by current management and the long-term outlook for continued growth in its niche markets. Although Aspen Aerogels has enjoyed success winning new customers in the electric vehicle original equipment manufacturer (OEM) space for its unique automotive battery insulation materials, its stock fell when the company announced an equity and debt offering to fund a doubling of capacity. The offering was subsequently pulled while the company explored alternative financing options. MeiraGTx Holdings develops ocular gene therapy and has a partnership with Johnson. The two companies continue to make progress on a drug that treats retinitis pigmentosa, and data from recent clinical studies was positive. Its shares nonetheless sold off along with many in the Health Care sector when valuations compressed.
The Fund’s top contributor was financial services firm StoneX Group, which benefited from the robust operating environment in its global payments business and strong margin growth rooted in the effective management of its cost structure. Rising interest rates have also benefited the company’s asset sensitivity. Resources Connection is a professional services and consulting firm whose turnaround efforts and execution have been solid in a strong demand climate for its mid-level finance and accounting professionals. Investar Holding Corporation owns Investar Bank. The company successfully reduced costs while favorable loan growth and expanding net interest margin have been driving earnings growth.
The portfolio’s disadvantage versus the Russell Microcap came from both stock selection and sector allocation in 2022’s first half. A lower weight in Energy, stock picks in Consumer Discretionary, and much greater exposure to Information Technology had the biggest negative impact versus the primary benchmark. Conversely, our substantially lower weight in Health Care and the Fund’s cash holdings contributed to relative results.
| | | | | |
| | Top Contributors to Performance | | Top Detractors from Performance | |
| | Year-to-Date Through 6/30/22 (%)1 | | Year-to-Date Through 6/30/22 (%)2 | |
| | | | | |
| | StoneX Group | 0.19 | | Citi Trends | -0.83 | |
| | Resources Connection | 0.19 | | Aspen Aerogels | -0.82 | |
| | Investar Holding Corporation | 0.18 | | MeiraGTx Holdings | -0.74 | |
| | Agilysys | 0.14 | | Shyft Group (The) | -0.70 | |
| | Profire Energy | 0.13 | | Bioventus Cl. A | -0.66 | |
| | 1 Includes dividends | | | 2 Net of dividends | | |
| | | | | | | |
CURRENT POSITIONING AND OUTLOOK
The ongoing war, rising interest rates, and inflationary pressures presented challenges in the first half. How much the Fed tightens into a slowing economy and whether we enter a recession appear to be the key determinants as to when stock prices recover. There is a strong possibility inflation peaked in 2Q22, as yields and energy prices reached highs in mid-June. Consumer confidence is at an all-time low—which is remarkable, considering it is lower than during the crash of the dot com bubble, the Financial Crisis, and Covid. Current uncertainties notwithstanding, we remain confident in what we are holding. Many of our micro-cap holdings boast strong balance sheets that should help them weather whatever economic slowdown or recession we ultimately endure, as well as help them gain market share and acquire attractive assets as seller expectations are reset. We have been trimming some inflation beneficiaries, most notably in areas such as basic materials. Infrastructure and construction firms continue to benefit from steady demand for steel and other materials to build roads and bridges, and we expect the federal infrastructure bill to begin positively impacting spend in the next several quarters. We also remain constructive on the aerospace OEM build cycle for narrow-body aircraft, which is seeing strong demand. The global need for communications equipment has not diminished, despite current conditions. The same is generally true for many healthcare companies—so we are adding to existing names and researching potential new ideas. Conversely, we see Consumer Discretionary as likely to remain weak, at least until it is clear that inflation is stabilizing. Given the sharp market selloff, we are also looking for new investment opportunities among small-cap companies that have fallen into the micro-cap universe, particularly hard hit small-cap growth companies. As always, we seek companies that we believe offer the best combination of attractively low valuations with strong long-term growth potential.
8 | Royce Capital Fund 2022 Semiannual Report to Shareholders
| PERFORMANCE AND PORTFOLIO REVIEW (UNAUDITED) | TICKER SYMBOLS RCMCX RCMSX |
Performance and Expenses
Average Annual Total Return (%) Through 6/30/22
| | JAN-JUN 20221 | 1-YR | 3-YR | 5-YR | 10-YR | 15-YR | 20-YR | 25-YR | SINCE INCEPTION (12/27/96) |
| RCM | -28.10 | -25.35 | 7.70 | 5.40 | 5.45 | 3.58 | 6.48 | 9.12 | 9.10 |
| Annual Gross Operating Expenses: 1.12% | Annual Net Operating Expenses: 1.08% |
1 Not annualized
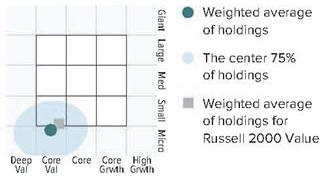
Morningstar Style Map™ As of 6/30/22
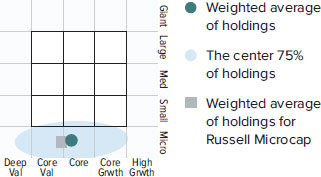
The Morningstar Style Map is the Morningstar Style Box™ with the center 75% of fund holdings plotted as the Morningstar Ownership Zone™. The Morningstar Style Box is designed to reveal a fund’s investment strategy. The Morningstar Ownership Zone provides detail about a portfolio’s investment style by showing the range of stock sizes and styles. The Ownership Zone is derived by plotting each stock in the portfolio within the proprietary Morningstar Style Box. Over time, the shape and location of a fund's ownership zone may vary. See page 32 for additional information.
Value of $10,000
Invested on 6/30/00 (Russell Microcap Inception)
as of 6/30/22 ($)
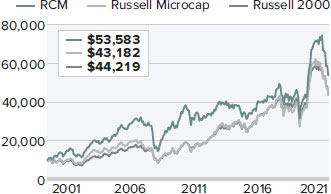
Includes reinvestment of distributions.
Top 10 Positions
% of Net Assets
| Digi International | | 1.5 |
| Photronics | | 1.4 |
| Resources Connection | | 1.4 |
| Northwest Pipe | | 1.4 |
| Investar Holding Corporation | | 1.4 |
| Distribution Solutions Group | | 1.3 |
| HarborOne Bancorp | | 1.2 |
| HBT Financial | | 1.2 |
| BayCom Corporation | | 1.2 |
| Agilysys | | 1.1 |
Portfolio Sector Breakdown
% of Net Assets
| Information Technology | | 25.0 |
| Industrials | | 24.5 |
| Financials | | 14.2 |
| Consumer Discretionary | | 10.1 |
| Health Care | | 9.4 |
| Materials | | 4.4 |
| Communication Services | | 4.3 |
| Energy | | 2.8 |
| Real Estate | | 0.6 |
| Cash and Cash Equivalents | | 4.7 |
Calendar Year Total Returns (%)
| YEAR | | RCM |
| 2021 | | 30.0 |
| 2020 | | 23.8 |
| 2019 | | 19.6 |
| 2018 | | -9.0 |
| 2017 | | 5.2 |
| 2016 | | 19.7 |
| 2015 | | -12.5 |
| 2014 | | -3.6 |
| 2013 | | 21.0 |
| 2012 | | 7.6 |
| 2011 | | -12.1 |
| 2010 | | 30.1 |
| 2009 | | 57.9 |
| 2008 | | -43.3 |
| 2007 | | 4.0 |
Upside/Downside Capture Ratios
Periods Ended 6/30/22 (%)
| | | UPSIDE | | DOWNSIDE |
| 10-Year | | 75 | | 86 |
| From 6/30/00 (Russell Microcap Inception) | | 90 | | 81 |
Portfolio Diagnostics
| Fund Net Assets | | $119 million |
| Number of Holdings | | 129 |
| Turnover Rate | | 6% |
| Average Market Capitalization 1 | | $441 million |
| Weighted Average P/B Ratio 2 | | 1.6x |
| Active Share 3 | | 92% |
| U.S. Investments (% of Net Assets) | | 84.4% |
| Non-U.S. Investments (% of Net Assets) | | 10.9% |
| 1 | Geometric Average. This weighted calculation uses each portfolio holding’s market cap in a way designed to not skew the effect of very large or small holdings; instead, it aims to better identify the portfolio’s center, which Royce believes offers a more accurate measure of average market cap than a simple mean or median. |
| 2 | Harmonic Average. This weighted calculation evaluates a portfolio as if it were a single stock and measures it overall. It compares the total market value of the portfolio to the portfolio’s share in the earnings or book value, as the case may be, of its underlying stocks. |
| 3 | Active Share is the sum of the absolute values of the different weightings of each holding in the Fund versus each holding in the benchmark, divided by two. |
Important Performance and Expense Information
All performance information in this Report reflects past performance, is presented on a total return basis, reflects the reinvestment of distributions, and does not reflect the deduction of taxes that a shareholder would pay on fund distributions or the redemption of fund shares. Past performance is no guarantee of future results. Investment return and principal value of an investment will fluctuate, so that shares may be worth more or less than their original cost when redeemed. Current performance may be higher or lower than performance quoted. The Fund’s total returns do not reflect any deduction for charges or expenses of the variable contracts investing in the Fund. Returns as of the most recent month-end may be obtained at www.royceinvest.com. All performance and risk information reflects the result of the Investment Class (its oldest class). Shares of RCM’s Service Class bear an annual distribution expense that is not borne by the Investment Class; if those expenses were reflected, total returns would have been lower. Gross operating expenses reflect the Fund’s total gross operating expenses for the Investment Class and include management fees and other expenses. Net operating expenses reflect contractual fee waivers and/or expense reimbursements. All expense information is reported as of the Fund’s most current prospectus and reflect the reduction in RCM’s investment advisory fee rate from 1.25% to 1.00% of its average daily net assets that will go into effect on July 1, 2022. Royce & Associates has contractually agreed, without right of termination, to waive fees and/or reimburse expenses to the extent necessary to maintain the Investment Class’s net annual operating expenses (excluding brokerage commissions, taxes, interest, litigation expenses, acquired fund fees and expenses, and other expenses not borne in the ordinary course of business) at or below 1.08% through April 30, 2023. Regarding the “Top Contributors” and “Top Detractors” tables shown above, the sum of all contributors to, and all detractors from, performance for all securities in the portfolio would approximate the Fund’s year-to-date performance for 2022. Upside Capture Ratio measures a manager’s performance in up markets relative to the Fund’s benchmark (Russell Microcap). It is calculated by measuring the Fund’s performance in quarters when the benchmark went up and dividing it by the benchmark’s return in those quarters. Downside Capture Ratio measures a manager’s performance in down markets relative to the Fund’s benchmark. It is calculated by measuring the Fund’s performance in quarters when the benchmark goes down and dividing it by the benchmark’s return in those quarters.
Royce Capital Fund 2022 Semiannual Report to Shareholders | 9
Schedule of Investments
Royce Capital Fund - Micro-Cap Portfolio
Common Stocks – 95.3%
| | | SHARES | | | VALUE |
| | | | | | |
| COMMUNICATION SERVICES – 4.3% | | | | | |
| ENTERTAINMENT - 2.2% | | | | | |
| Chicken Soup for the Soul Entertainment Cl. A 1 | | 92,516 | | $ | 685,544 |
| Gaia Cl. A 1 | | 144,990 | | | 616,207 |
| IMAX Corporation 1 | | 72,000 | | | 1,216,080 |
| | | | | | 2,517,831 |
| INTERACTIVE MEDIA & SERVICES - 1.1% | | | | | |
| Enthusiast Gaming Holdings 1 | | 174,000 | | | 344,702 |
| QuinStreet 1 | | 97,600 | | | 981,856 |
| | | | | | 1,326,558 |
| MEDIA - 1.0% | | | | | |
| Magnite 1 | | 32,500 | | | 288,600 |
| Thryv Holdings 1 | | 41,000 | | | 917,990 |
| | | | | | 1,206,590 |
| Total (Cost $6,933,432) | | | | | 5,050,979 |
| | | | | | |
| CONSUMER DISCRETIONARY – 10.1% | | | | | |
| AUTO COMPONENTS - 2.2% | | | | | |
| Modine Manufacturing 1 | | 122,400 | | | 1,288,872 |
| Stoneridge 1 | | 62,800 | | | 1,077,020 |
| Unique Fabricating 1 | | 148,830 | | | 202,408 |
| | | | | | 2,568,300 |
| HOTELS, RESTAURANTS & LEISURE - 1.4% | | | | | |
| Century Casinos 1 | | 141,300 | | | 1,017,360 |
| Lindblad Expeditions Holdings 1,2 | | 88,100 | | | 713,610 |
| | | | | | 1,730,970 |
| HOUSEHOLD DURABLES - 0.5% | | | | | |
| Legacy Housing 1 | | 50,400 | | | 657,720 |
| LEISURE PRODUCTS - 0.8% | | | | | |
| MasterCraft Boat Holdings 1 | | 45,317 | | | 953,923 |
| SPECIALTY RETAIL - 4.2% | | | | | |
| Barnes & Noble Education 1 | | 119,600 | | | 350,428 |
| Chico’s FAS 1 | | 196,400 | | | 976,108 |
| Citi Trends 1 | | 35,086 | | | 829,784 |
| †JOANN | | 60,000 | | | 465,000 |
| OneWater Marine Cl. A 1 | | 23,900 | | | 789,895 |
| Shoe Carnival | | 45,800 | | | 989,738 |
| Zumiez 1 | | 22,400 | | | 582,400 |
| | | | | | 4,983,353 |
| TEXTILES, APPAREL & LUXURY GOODS - 1.0% | | | | | |
| Fossil Group 1 | | 80,300 | | | 415,151 |
| Vera Bradley 1 | | 172,300 | | | 747,782 |
| | | | | | 1,162,933 |
| Total (Cost $13,674,113) | | | | | 12,057,199 |
| | | | | | |
| ENERGY – 2.8% | | | | | |
| ENERGY EQUIPMENT & SERVICES - 2.8% | | | | | |
| Natural Gas Services Group 1 | | 119,366 | | | 1,313,026 |
| Newpark Resources 1 | | 356,800 | | | 1,102,512 |
| Profire Energy 1 | | 612,129 | | | 881,466 |
| Total (Cost $2,885,696) | | | | | 3,297,004 |
| | | | | | |
| FINANCIALS – 14.2% | | | | | |
| BANKS - 7.3% | | | | | |
| Allegiance Bancshares | | 30,207 | | | 1,140,616 |
| BayCom Corporation | | 68,582 | | | 1,418,276 |
| Caribbean Investment Holdings 1,3 | | 1,751,547 | | | 350,309 |
| HarborOne Bancorp | | 104,791 | | | 1,445,068 |
| HBT Financial | | 80,394 | | | 1,436,641 |
| HomeTrust Bancshares | | 51,400 | | | 1,285,000 |
| Investar Holding Corporation | | 74,410 | | | 1,629,579 |
| Midway Investments 1,3 | | 1,751,577 | | | 0 |
| | | | | | 8,705,489 |
| CAPITAL MARKETS - 4.6% | | | | | |
| B. Riley Financial | | 22,300 | | | 942,175 |
| Canaccord Genuity Group | | 141,982 | | | 929,854 |
| Silvercrest Asset Management Group Cl. A | | 72,484 | | | 1,189,463 |
| Sprott | | 30,380 | | | 1,055,464 |
| StoneX Group 1 | | 17,400 | | | 1,358,418 |
| | | | | | 5,475,374 |
| THRIFTS & MORTGAGE FINANCE - 2.3% | | | | | |
| PCSB Financial | | 15,800 | | | 301,622 |
| Territorial Bancorp | | 50,308 | | | 1,048,922 |
| Western New England Bancorp | | 175,148 | | | 1,306,604 |
| | | | | | 2,657,148 |
| Total (Cost $16,638,663) | | | | | 16,838,011 |
| | | | | | |
| HEALTH CARE – 9.4% | | | | | |
| BIOTECHNOLOGY - 1.7% | | | | | |
| CareDx 1 | | 15,200 | | | 326,496 |
| Dynavax Technologies 1 | | 82,600 | | | 1,039,934 |
| MeiraGTx Holdings 1 | | 81,400 | | | 616,198 |
| | | | | | 1,982,628 |
| HEALTH CARE EQUIPMENT & SUPPLIES - 5.9% | | | | | |
| Apyx Medical 1 | | 123,100 | | | 721,366 |
| Artivion 1 | | 72,089 | | | 1,361,040 |
| AtriCure 1 | | 17,500 | | | 715,050 |
| Bioventus Cl. A 1 | | 122,247 | | | 833,725 |
| Cutera 1,2 | | 22,800 | | | 855,000 |
| OrthoPediatrics Corp. 1 | | 22,100 | | | 953,615 |
| Profound Medical 1 | | 83,400 | | | 609,043 |
| Surmodics 1 | | 25,878 | | | 963,438 |
| | | | | | 7,012,277 |
| HEALTH CARE PROVIDERS & SERVICES - 0.3% | | | | | |
| Sharps Compliance 1 | | 137,843 | | | 402,501 |
| LIFE SCIENCES TOOLS & SERVICES - 1.5% | | | | | |
| Harvard Bioscience 1 | | 271,568 | | | 977,645 |
| Inotiv 1 | | 20,069 | | | 192,662 |
| NeoGenomics 1 | | 19,500 | | | 158,925 |
| Quanterix Corporation 1 | | 30,700 | | | 497,033 |
| | | | | | 1,826,265 |
| Total (Cost $9,879,810) | | | | | 11,223,671 |
| | | | | | |
| INDUSTRIALS – 24.5% | | | | | |
| AEROSPACE & DEFENSE - 2.0% | | | | | |
| Astronics Corporation 1 | | 103,100 | | | 1,048,527 |
| Cadre Holdings | | 51,205 | | | 1,007,202 |
| CPI Aerostructures 1,4 | | 202,231 | | | 323,570 |
| | | | | | 2,379,299 |
| BUILDING PRODUCTS - 1.1% | | | | | |
| Quanex Building Products | | 56,400 | | | 1,283,100 |
| COMMERCIAL SERVICES & SUPPLIES - 2.8% | | | | | |
| Acme United | | 29,379 | | | 930,433 |
| Heritage-Crystal Clean 1 | | 50,334 | | | 1,357,004 |
| VSE Corporation | | 29,000 | | | 1,089,820 |
| | | | | | 3,377,257 |
| CONSTRUCTION & ENGINEERING - 4.7% | | | | | |
| Concrete Pumping Holdings 1 | | 110,400 | | | 669,024 |
| 10 | Royce Capital Fund 2022 Semiannual Report to Shareholders | THE ACCOMPANYING NOTES ARE AN INTEGRAL PART OF THESE FINANCIAL STATEMENTS |
June 30, 2022 (unaudited)
Royce Capital Fund - Micro-Cap Portfolio (continued)
| | | SHARES | | | VALUE |
| | | | | | |
| INDUSTRIALS (continued) | | | | | |
| CONSTRUCTION & ENGINEERING (continued) | | | | | |
| Construction Partners Cl. A 1 | | 60,900 | | $ | 1,275,246 |
| IES Holdings 1 | | 24,400 | | | 736,148 |
| Northwest Pipe 1 | | 55,300 | | | 1,655,682 |
| NV5 Global 1 | | 10,700 | | | 1,249,118 |
| | | | | | 5,585,218 |
| ELECTRICAL EQUIPMENT - 0.5% | | | | | |
| American Superconductor 1 | | 114,400 | | | 592,592 |
| MACHINERY - 5.0% | | | | | |
| Alimak Group | | 80,500 | | | 609,077 |
| CIRCOR International 1 | | 34,100 | | | 558,899 |
| †Commercial Vehicle Group 1 | | 62,990 | | | 367,862 |
| Graham Corporation 1 | | 91,796 | | | 635,228 |
| Luxfer Holdings | | 66,100 | | | 999,432 |
| Porvair | | 130,700 | | | 862,328 |
| Shyft Group (The) | | 38,300 | | | 711,997 |
| Wabash National | | 85,500 | | | 1,161,090 |
| Westport Fuel Systems 1 | | 16,800 | | | 16,968 |
| | | | | | 5,922,881 |
| MARINE - 1.0% | | | | | |
| Clarkson | | 32,000 | | | 1,172,504 |
| PROFESSIONAL SERVICES - 5.2% | | | | | |
| CRA International | | 13,796 | | | 1,232,259 |
| Forrester Research 1 | | 24,200 | | | 1,157,728 |
| Heidrick & Struggles International | | 33,200 | | | 1,074,352 |
| Kforce | | 17,400 | | | 1,067,316 |
| Resources Connection | | 81,454 | | | 1,659,218 |
| | | | | | 6,190,873 |
| TRADING COMPANIES & DISTRIBUTORS - 2.2% | | | | | |
| Distribution Solutions Group 1 | | 29,187 | | | 1,499,920 |
| Transcat 1 | | 19,845 | | | 1,127,394 |
| | | | | | 2,627,314 |
| Total (Cost $24,156,322) | | | | | 29,131,038 |
| | | | | | |
| INFORMATION TECHNOLOGY – 25.0% | | | | | |
| COMMUNICATIONS EQUIPMENT - 4.7% | | | | | |
| Clearfield 1 | | 16,500 | | | 1,022,175 |
| Comtech Telecommunications | | 44,863 | | | 406,907 |
| Digi International 1 | | 71,999 | | | 1,743,816 |
| EMCORE Corporation 1 | | 188,100 | | | 577,467 |
| Genasys 1 | | 218,400 | | | 709,800 |
| Harmonic 1 | | 109,400 | | | 948,498 |
| Sierra Wireless 1 | | 5,400 | | | 126,360 |
| | | | | | 5,535,023 |
| ELECTRONIC EQUIPMENT, INSTRUMENTS & COMPONENTS - 5.3% | | |
| Arlo Technologies 1 | | 83,200 | | | 521,664 |
| FARO Technologies 1 | | 28,900 | | | 890,987 |
| LightPath Technologies Cl. A 1 | | 368,300 | | | 453,009 |
| Luna Innovations 1 | | 192,600 | | | 1,122,858 |
| nLIGHT 1 | | 63,500 | | | 648,970 |
| PAR Technology 1 | | 24,100 | | | 903,509 |
| PowerFleet 1 | | 229,500 | | | 498,015 |
| VIA optronics ADR 1 | | 58,888 | | | 124,842 |
| Vishay Precision Group 1 | | 40,200 | | | 1,171,026 |
| | | | | | 6,334,880 |
| IT SERVICES - 1.7% | | | | | |
| Cass Information Systems | | 26,048 | | | 880,423 |
| Computer Task Group 1 | | 134,920 | | | 1,154,915 |
| | | | | | 2,035,338 |
| SEMICONDUCTORS & SEMICONDUCTOR EQUIPMENT - 10.8% | | | | | |
| Aehr Test Systems 1 | | 79,500 | | | 596,250 |
| Amtech Systems 1 | | 65,487 | | | 478,055 |
| Axcelis Technologies 1 | | 20,000 | | | 1,096,800 |
| AXT 1 | | 189,100 | | | 1,108,126 |
| Camtek 1 | | 39,752 | | | 988,235 |
| Cohu 1 | | 39,400 | | | 1,093,350 |
| CyberOptics Corporation 1 | | 30,037 | | | 1,049,493 |
| Ichor Holdings 1 | | 35,000 | | | 909,300 |
| Nova 1,2 | | 11,300 | | | 1,000,389 |
| NVE Corporation | | 18,100 | | | 843,822 |
| PDF Solutions 1 | | 45,200 | | | 972,252 |
| Photronics 1 | | 86,000 | | | 1,675,280 |
| Ultra Clean Holdings 1 | | 33,600 | | | 1,000,272 |
| | | | | | 12,811,624 |
| SOFTWARE - 1.1% | | | | | |
| Agilysys 1 | | 28,900 | | | 1,366,103 |
| TECHNOLOGY HARDWARE, STORAGE & PERIPHERALS - 1.4% | | | |
| AstroNova 1 | | 90,862 | | | 1,088,527 |
| Intevac 1 | | 110,681 | | | 535,696 |
| | | | | | 1,624,223 |
| Total (Cost $24,805,986) | | | | | 29,707,191 |
| | | | | | |
| MATERIALS – 4.4% | | | | | |
| CHEMICALS - 0.4% | | | | | |
| Aspen Aerogels 1 | | 44,917 | | | 443,780 |
| METALS & MINING - 4.0% | | | | | |
| Altius Minerals | | 52,600 | | | 741,271 |
| Ferroglobe 1 | | 84,300 | | | 500,742 |
| Haynes International | | 35,770 | | | 1,172,183 |
| Major Drilling Group International 1 | | 183,600 | | | 1,287,995 |
| Universal Stainless & Alloy Products 1 | | 140,247 | | | 1,037,828 |
| | | | | | 4,740,019 |
| Total (Cost $4,885,695) | | | | | 5,183,799 |
| | | | | | |
| REAL ESTATE – 0.6% | | | | | |
| REAL ESTATE MANAGEMENT & DEVELOPMENT - 0.6% | | | | | |
| FRP Holdings 1 | | 12,240 | | | 738,684 |
| Total (Cost $202,768) | | | | | 738,684 |
| | | | | | |
| TOTAL COMMON STOCKS | | | | | |
| (Cost $104,062,485) | | | | | 113,227,576 |
| THE ACCOMPANYING NOTES ARE AN INTEGRAL PART OF THESE FINANCIAL STATEMENTS | Royce Capital Fund 2022 Semiannual Report to Shareholders | 11 |
| Schedule of Investments | June 30, 2022 (unaudited) |
Royce Capital Fund - Micro-Cap Portfolio (continued)
| | | VALUE |
| | | |
| REPURCHASE AGREEMENT– 4.6% | | |
| Fixed Income Clearing Corporation, 0.24% dated 6/30/22, due 7/1/22, maturity value $5,519,359 (collateralized by obligations of various U.S. Government Agencies, 3.25% due 6/30/27, valued at $5,629,794) |
| (Cost $5,519,322) | $ | 5,519,322 |
| | | |
| TOTAL INVESTMENTS – 99.9% | | |
| (Cost $109,581,807) | | 118,746,898 |
| | | |
| CASH AND OTHER ASSETS LESS LIABILITIES – 0.1% | | 92,514 |
| | | |
| NET ASSETS – 100.0% | $ | 118,839,412 |
ADR- American Depository Receipt
| 2 | All or a portion of these securities were on loan as of June 30, 2022. |
| 3 | Securities for which market quotations are not readily available represent 0.3% of net assets. These securities have been valued at their fair value under procedures approved by the Fund’s Board of Trustees. These securities are defined as Level 3 securities due to the use of significant unobservable inputs in the determination of fair value. See Notes to Financial Statements. |
| 4 | These securities are defined as Level 2 securities due to fair value being based on quoted prices for similar securities and/or due to the application of fair value factors. See Notes to Financial Statements. |
Bold indicates the Fund’s 20 largest equity holdings in terms of June 30, 2022, market value.
| 12 | Royce Capital Fund 2022 Semiannual Report to Shareholders | THE ACCOMPANYING NOTES ARE AN INTEGRAL PART OF THESE FINANCIAL STATEMENTS |
This page is intentionally left blank.
Royce Capital Fund 2022 Semiannual Report to Shareholders | 13
MANAGER’S DISCUSSION (UNAUDITED)
Royce Capital Fund–Small-Cap Portfolio (RCS)

Jay Kaplan, CFA
FUND PERFORMANCE
Royce Capital Fund–Small-Cap Portfolio fell 19.0% for the year-to-date period ended 6/30/22 versus a 17.3% decline for its primary benchmark, the Russell 2000 Value Index, and a loss of 23.4% for the Russell 2000, its secondary benchmark for the same period. The portfolio outperformed both small-cap indexes for the one-, 25-year, and since inception (12/27/96) periods ended 6/30/22. In addition, its relative performance improved through the first half of 2022. After substantially trailing the Russell 2000 Value in 1Q22—down 9.1% versus a loss of 2.4%—the Fund fell 10.9% versus a decline of 15.3% for its primary benchmark in 2Q22.
What Worked… And What Didn’t
Seven of the portfolio’s nine equity sectors had a negative impact on year-to-date performance. The sectors making the largest detractions were Consumer Discretionary, Information Technology, and Industrials. Health Care and Consumer Staples (along with a contribution from the Fund’s cash holdings) made the only positive impact while Communication Services had the smallest negative effect. At the industry level, specialty retail, household durables (both in Consumer Discretionary), and electronic equipment, instruments & components (Information Technology) detracted most for the year-to-date period, while pharmaceuticals (Health Care), entertainment (Communication Services), and IT services (Information Technology) were the largest contributors.
The portfolio’s top detractor at the position level in the first half of 2022 was family footwear retailer Shoe Carnival. The company continues to execute well, in particular compared to its competitors, by reducing costs, opening new stores, and renovating older sites. Shoe Carnival also released strong 1Q22 earnings in May and maintained its top-line guidance, but saw its shares fall amidst the inhospitable climate for retailers. We held shares at the end of June. Rent-A-Center operates rent-to-own stores. Investors shied away from its stock after the company said that both the end of Covid relief funds and rising inflation would likely hurt its customers’ ability to buy and/or make payments. We were equally concerned about how the company’s 2021 acquisition of lease-to-own solutions provider Acima Holdings put leverage on Rent-A-Center’s balance sheet while also adding credit losses to recent financial results. We sold the last of our shares in March.
The top contributor at the position level was SIGA Technologies, which sells a treatment for smallpox that has also been approved in some countries to treat monkey pox. Its growth has historically been lumpy, driven by government contracts by which purchases of SIGA’s TPOXX smallpox treatment are made in large amounts to stockpile. More recently, however, the monkey pox outbreak has attracted a fresh round of investor interest in its shares. We trimmed our stake in the first half. BioDelivery Sciences International is a specialty pharmaceutical company that makes pain management and neurology products that treat patients living with serious and complex conditions such as chronic pain and acute migraines. In February, Collegium Pharmaceutical, which we also hold and which also specializes in pain management medicines, announced it would acquire BioDelivery at a sizable premium, leading us to begin selling our position.
The portfolio’s disadvantage versus the Russell 2000 Value came entirely from sector allocation in the year-to-date period; stock selection was additive, though not enough to outweigh the effects of sector positioning. Both our substantially larger exposure and stock picks hurt relative results in Consumer Discretionary. Our low weighting in Energy and lack of exposure to Utilities also made an appreciable negative impact versus the benchmark. Conversely, savvy stock selection boosted relative performance in Health Care. Stock picking and our lower weighting in Communication Services also helped results versus the small-cap value index, as did stock selection in Information Technology.
| | | | | | | |
| | Top Contributors to Performance | | | Top Detractors from Performance | | |
| | Year-to-Date Through 6/30/22 (%)1 | | | Year-to-Date Through 6/30/22 (%)2 | | |
| | | | | | | |
| | SIGA Technologies | 0.68 | | Shoe Carnival | -0.95 | |
| | BioDelivery Sciences International | 0.64 | | Rent-A-Center | -0.92 | |
| | Resources Connection | 0.28 | | OneWater Marine Cl. A | -0.91 | |
| | IBEX | 0.16 | | American Eagle Outfitters | -0.83 | |
| | Dorchester Minerals L.P. | 0.14 | | ArcBest | -0.71 | |
| | 1 Includes dividends | | | 2 Net of dividends | | |
| | | | | | | |
CURRENT POSITIONING AND OUTLOOK
We typically adhere to the wisdom in the adage, “Don’t fight the Fed.” However, as the Fed continues to raise rates—and may do so even more aggressively in its attempts to curb inflation—the yield curve has been flipping back and forth from inversion and ended June nearly flat. In addition, credit spreads keep widening, commodity prices have softened, and the bond market is signaling that the economy may be headed for recession—though we may already be there. Needless to say, this has made for a highly challenging investment environment, made even more difficult by the market’s downward moves, which are casting doubt on many earnings estimates. We will be paying especially close attention to any changes in guidance from last quarter once earnings announcements begin in mid-July. With the economic outlook unpromising, several small-cap companies with what seem like transitory issues to us have become attractively inexpensive. We have been focusing primarily on those that combine strong fundamentals—particularly low-debt balance sheets and positive cash flows—with effective operations and execution as well as tangible evidence of efforts to improve their business through the current uncertain period. During the first half, we increased our exposure to certain areas in Information Technology—most notably semiconductor and component makers and contract manufacturers—and Energy while reducing our weightings in big-ticket consumer areas such as boats and housing.
14 | Royce Capital Fund 2022 Semiannual Report to Shareholders
| PERFORMANCE AND PORTFOLIO REVIEW (UNAUDITED) | TICKER SYMBOLS RCPFX RCSSX |
Performance and Expenses
Average Annual Total Return (%) Through 6/30/22
| | JAN-JUN 20221 | 1-YR | 3-YR | 5-YR | 10-YR | 15-YR | 20-YR | 25-YR | SINCE INCEPTION (12/27/96) |
| RCS | -19.02 | -15.52 | 1.93 | 2.98 | 5.83 | 4.31 | 6.86 | 8.66 | 8.96 |
| Annual Gross Operating Expenses: 1.11% Annual Net Operating Expenses: 1.08% |
1 Not annualized
Morningstar Style Map™ As of 6/30/22
The Morningstar Style Map is the Morningstar Style Box™ with the center 75% of fund holdings plotted as the Morningstar Ownership Zone™. The Morningstar Style Box is designed to reveal a fund’s investment strategy. The Morningstar Ownership Zone provides detail about a portfolio’s investment style by showing the range of stock sizes and styles. The Ownership Zone is derived by plotting each stock in the portfolio within the proprietary Morningstar Style Box. Over time, the shape and location of a fund’s ownership zone may vary. See page 32 for additional information.
Value of $10,000
Invested on 12/27/96 as of 6/30/22 ($)
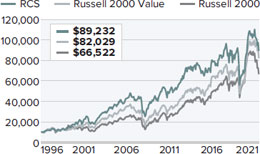
Includes reinvestment of distributions.
Top 10 Positions
% of Net Assets
| Resources Connection | 1.7 |
| Lincoln Educational Services | 1.7 |
| Catalyst Pharmaceuticals | 1.6 |
| Sanmina Corporation | 1.6 |
| Kimball Electronics | 1.6 |
| Schneider National Cl. B | 1.6 |
| ArcBest | 1.5 |
| TD SYNNEX | 1.5 |
| Amkor Technology | 1.5 |
| ePlus | 1.5 |
Portfolio Sector Breakdown
% of Net Assets
| Information Technology | 23.4 |
| Financials | 20.4 |
| Industrials | 18.6 |
| Consumer Discretionary | 13.9 |
| Health Care | 8.3 |
| Energy | 6.3 |
| Communication Services | 2.9 |
| Consumer Staples | 1.8 |
| Real Estate | 1.5 |
| Cash and Cash Equivalents | 2.9 |
Calendar Year Total Returns (%)
| YEAR | RCS |
| 2021 | 28.8 |
| 2020 | -7.2 |
| 2019 | 18.7 |
| 2018 | -8.3 |
| 2017 | 5.4 |
| 2016 | 21.0 |
| 2015 | -11.8 |
| 2014 | 3.2 |
| 2013 | 34.8 |
| 2012 | 12.5 |
| 2011 | -3.3 |
| 2010 | 20.5 |
| 2009 | 35.2 |
| 2008 | -27.2 |
| 2007 | -2.1 |
Upside/Downside Capture Ratios
Periods Ended 6/30/22 (%)
| | UPSIDE | DOWNSIDE |
| 10-Year | 84 | 100 |
| From 12/31/96 (Start of Fund’s First Full Quarter) | 97 | 92 |
Portfolio Diagnostics
| Fund Net Assets | $223 million |
| Number of Holdings | 97 |
| Turnover Rate | 34% |
| Average Market Capitalization1 | $1,069 million |
| Weighted Average P/B Ratio2 | 1.5x |
| Active Share3 | 96% |
| U.S. Investments (% of Net Assets) | 94.6% |
| Non-U.S. Investments (% of Net Assets) | 2.5% |
| 1 | Geometric Average. This weighted calculation uses each portfolio holding’s market cap in a way designed to not skew the effect of very large or small holdings; instead, it aims to better identify the portfolio’s center, which Royce believes offers a more accurate measure of average market cap than a simple mean or median. |
| 2 | Harmonic Average. This weighted calculation evaluates a portfolio as if it were a single stock and measures it overall. It compares the total market value of the portfolio to the portfolio’s share in the earnings or book value, as the case may be, of its underlying stocks. |
| 3 | Active Share is the sum of the absolute values of the different weightings of each holding in the Fund versus each holding in the benchmark, divided by two. |
Important Performance and Expense Information
All performance information in this Report reflects past performance, is presented on a total return basis, reflects the reinvestment of distributions, and does not reflect the deduction of taxes that a shareholder would pay on fund distributions or the redemption of fund shares. Past performance is no guarantee of future results. Investment return and principal value of an investment will fluctuate, so that shares may be worth more or less than their original cost when redeemed. Current performance may be higher or lower than performance quoted. The Fund’s total returns do not reflect any deduction for charges or expenses of the variable contracts investing in the Fund. Returns as of the most recent month-end may be obtained at www.royceinvest.com. All performance and risk information reflects the result of the Investment Class (its oldest class). Shares of RCS’s Service Class bear an annual distribution expense that is not borne by the Investment Class; if those expenses were reflected, total returns would have been lower. Gross operating expenses reflect the Fund’s total gross operating expenses for the Investment Class and include management fees and other expenses. Net operating expenses reflect contractual fee waivers and/or expense reimbursements. All expense information is reported as of the Fund’s most current prospectus. Royce & Associates has contractually agreed, without right of termination, to waive fees and/or reimburse expenses to the extent necessary to maintain the Investment Class’s net annual operating expenses (excluding brokerage commissions, taxes, interest, litigation expenses, acquired fund fees and expenses, and other expenses not borne in the ordinary course of business) at or below 1.08% through April 30, 2023. Regarding the “Top Contributors” and “Top Detractors” tables shown above, the sum of all contributors to, and all detractors from, performance for all securities in the portfolio would approximate the Fund’s year-to-date performance for 2022. Upside Capture Ratio measures a manager’s performance in up markets relative to the Fund’s benchmark (Russell 2000 Value). It is calculated by measuring the Fund’s performance in quarters when the benchmark went up and dividing it by the benchmark’s return in those quarters. Downside Capture Ratio measures a manager’s performance in down markets relative to the Fund’s benchmark. It is calculated by measuring the Fund’s performance in quarters when the benchmark goes down and dividing it by the benchmark’s return in those quarters.
Royce Capital Fund 2022 Semiannual Report to Shareholders | 15
Schedule of Investments
Royce Capital Fund - Small-Cap Portfolio
Common Stocks – 97.1%
| | | SHARES | | | VALUE | |
| | | | | | | | | |
| COMMUNICATION SERVICES – 2.9% | | | | | | | | |
| ENTERTAINMENT - 1.1% | | | | | | | | |
| SciPlay Corporation Cl. A 1 | | | 183,300 | | | $ | 2,560,701 | |
| MEDIA - 1.8% | | | | | | | | |
| Entravision Communications Cl. A | | | 490,242 | | | | 2,235,504 | |
| Saga Communications Cl. A | | | 68,413 | | | | 1,700,063 | |
| | | | | | | | 3,935,567 | |
| Total (Cost $7,611,298) | | | | | | | 6,496,268 | |
| | | | | | | | | |
| CONSUMER DISCRETIONARY – 13.9% | | | | | | | | |
| DIVERSIFIED CONSUMER SERVICES - 1.7% | | | | | | | | |
| Lincoln Educational Services 1 | | | 584,466 | | | | 3,687,980 | |
| HOTELS, RESTAURANTS & LEISURE - 1.1% | | | | | | | | |
| †Bloomin’ Brands | | | 147,200 | | | | 2,446,464 | |
| HOUSEHOLD DURABLES - 3.0% | | | | | | | | |
| La-Z-Boy | | | 59,650 | | | | 1,414,301 | |
| M/I Homes 1 | | | 35,624 | | | | 1,412,848 | |
| Meritage Homes 1 | | | 13,307 | | | | 964,757 | |
| PulteGroup | | | 72,750 | | | | 2,883,083 | |
| | | | | | | | 6,674,989 | |
| LEISURE PRODUCTS - 1.3% | | | | | | | | |
| Malibu Boats Cl. A 1 | | | 25,618 | | | | 1,350,325 | |
| MasterCraft Boat Holdings 1 | | | 74,134 | | | | 1,560,521 | |
| | | | | | | | 2,910,846 | |
| SPECIALTY RETAIL - 5.1% | | | | | | | | |
| Aaron’s Company (The) | | | 45,086 | | | | 656,001 | |
| American Eagle Outfitters | | | 150,753 | | | | 1,685,419 | |
| Container Store Group (The) 1 | | | 243,008 | | | | 1,513,940 | |
| Haverty Furniture | | | 61,500 | | | | 1,425,570 | |
| Lazydays Holdings 1 | | | 164,468 | | | | 1,937,433 | |
| OneWater Marine Cl. A 1 | | | 40,833 | | | | 1,349,531 | |
| Shoe Carnival | | | 127,825 | | | | 2,762,298 | |
| | | | | | | | 11,330,192 | |
| TEXTILES, APPAREL & LUXURY GOODS - 1.7% | | | | | | | | |
| Carter’s | | | 32,566 | | | | 2,295,252 | |
| †Skechers U.S.A. Cl. A 1 | | | 44,700 | | | | 1,590,426 | |
| | | | | | | | 3,885,678 | |
| Total (Cost $35,472,585) | | | | | | | 30,936,149 | |
| | | | | | | | | |
| CONSUMER STAPLES – 1.8% | | | | | | | | |
| FOOD & STAPLES RETAILING - 1.8% | | | | | | | | |
| †Ingles Markets Cl. A | | | 20,600 | | | | 1,787,050 | |
| Village Super Market Cl. A | | | 101,276 | | | | 2,310,106 | |
| Total (Cost $4,092,883) | | | | | | | 4,097,156 | |
| | | | | | | | | |
| ENERGY – 6.3% | | | | | | | | |
| OIL, GAS & CONSUMABLE FUELS - 6.3% | | | | | | | | |
| †Chord Energy | | | 18,695 | | | | 2,274,247 | |
| Civitas Resources | | | 47,300 | | | | 2,473,317 | |
| Dorchester Minerals L.P. | | | 114,805 | | | | 2,738,099 | |
| †Matador Resources | | | 40,000 | | | | 1,863,600 | |
| †SilverBow Resources 1 | | | 79,596 | | | | 2,257,343 | |
| †Whiting Petroleum | | | 34,600 | | | | 2,353,838 | |
| Total (Cost $13,830,231) | | | | | | | 13,960,444 | |
| | | | | | | | | |
| FINANCIALS – 20.4% | | | | | | | | |
| BANKS - 8.2% | | | | | | | | |
| Ames National | | | 18,134 | | | | 402,212 | |
| †Bank of Princeton | | | 60,161 | | | | 1,652,021 | |
| Camden National | | | 8,738 | | | | 384,909 | |
| Chemung Financial | | | 28,286 | | | | 1,329,442 | |
| Citizens Community Bancorp | | | 127,582 | | | | 1,764,459 | |
| CNB Financial | | | 69,552 | | | | 1,682,463 | |
| Financial Institutions | | | 64,263 | | | | 1,672,123 | |
| Landmark Bancorp | | | 45,711 | | | | 1,158,317 | |
| †Mid Penn Bancorp | | | 65,660 | | | | 1,770,850 | |
| MidWestOne Financial Group | | | 40,739 | | | | 1,210,763 | |
| National Bankshares | | | 88,344 | | | | 2,774,002 | |
| Unity Bancorp | | | 94,008 | | | | 2,489,332 | |
| | | | | | | | 18,290,893 | |
| CAPITAL MARKETS - 3.5% | | | | | | | | |
| Evercore Cl. A | | | 35,600 | | | | 3,332,516 | |
| Houlihan Lokey Cl. A | | | 21,142 | | | | 1,668,738 | |
| Moelis & Company Cl. A | | | 69,401 | | | | 2,730,929 | |
| | | | | | | | 7,732,183 | |
| INSURANCE - 4.9% | | | | | | | | |
| CNO Financial Group | | | 118,930 | | | | 2,151,444 | |
| Employers Holdings | | | 80,134 | | | | 3,356,813 | |
| James River Group Holdings | | | 94,084 | | | | 2,331,402 | |
| Tiptree | | | 291,644 | | | | 3,097,259 | |
| | | | | | | | 10,936,918 | |
| THRIFTS & MORTGAGE FINANCE - 3.8% | | | | | | | | |
| Southern Missouri Bancorp | | | 38,384 | | | | 1,737,260 | |
| Timberland Bancorp | | | 111,870 | | | | 2,796,750 | |
| TrustCo Bank Corp NY | | | 75,677 | | | | 2,333,878 | |
| †Western New England Bancorp | | | 211,372 | | | | 1,576,835 | |
| | | | | | | | 8,444,723 | |
| Total (Cost $41,076,613) | | | | | | | 45,404,717 | |
| | | | | | | | | |
| HEALTH CARE – 8.3% | | | | | | | | |
| BIOTECHNOLOGY - 3.3% | | | | | | | | |
| Catalyst Pharmaceuticals 1 | | | 523,338 | | | | 3,668,600 | |
| Ironwood Pharmaceuticals Cl. A 1 | | | 292,411 | | | | 3,371,499 | |
| Vanda Pharmaceuticals 1 | | | 18,577 | | | | 202,489 | |
| | | | | | | | 7,242,588 | |
| HEALTH CARE PROVIDERS & SERVICES - 3.3% | | | | | | | | |
| Cross Country Healthcare 1 | | | 159,275 | | | | 3,317,698 | |
| Ensign Group (The) | | | 13,564 | | | | 996,547 | |
| Molina Healthcare 1 | | | 10,900 | | | | 3,047,749 | |
| | | | | | | | 7,361,994 | |
| PHARMACEUTICALS - 1.7% | | | | | | | | |
| Collegium Pharmaceutical 1 | | | 159,230 | | | | 2,821,556 | |
| SIGA Technologies | | | 84,099 | | | | 973,866 | |
| | | | | | | | 3,795,422 | |
| Total (Cost $15,645,020) | | | | | | | 18,400,004 | |
| | | | | | | | | |
| INDUSTRIALS – 18.6% | | | | | | | | |
| BUILDING PRODUCTS - 2.7% | | | | | | | | |
| Builders FirstSource 1 | | | 19,130 | | | | 1,027,281 | |
| Quanex Building Products | | | 127,223 | | | | 2,894,323 | |
| UFP Industries | | | 31,500 | | | | 2,146,410 | |
| | | | | | | | 6,068,014 | |
| CONSTRUCTION & ENGINEERING - 3.5% | | | | | | | | |
| Northwest Pipe 1 | | | 58,007 | | | | 1,736,730 | |
| Primoris Services | | | 129,890 | | | | 2,826,406 | |
| Sterling Infrastructure 1 | | | 152,049 | | | | 3,332,914 | |
| | | | | | | | 7,896,050 | |
| ELECTRICAL EQUIPMENT - 0.8% | | | | | | | | |
| †Preformed Line Products | | | 27,825 | | | | 1,711,237 | |
| 16 | Royce Capital Fund 2022 Semiannual Report to Shareholders | THE ACCOMPANYING NOTES ARE AN INTEGRAL PART OF THESE FINANCIAL STATEMENTS |
June 30, 2022 (unaudited)
Royce Capital Fund - Small-Cap Portfolio (continued)
| | | SHARES | | | VALUE | |
| | | | | | | | | |
| INDUSTRIALS (continued) | | | | | | | | |
| PROFESSIONAL SERVICES - 6.8% | | | | | | | | |
| Barrett Business Services | | | 33,648 | | | $ | 2,451,930 | |
| Heidrick & Struggles International | | | 98,889 | | | | 3,200,048 | |
| Kforce | | | 37,814 | | | | 2,319,511 | |
| Korn Ferry | | | 42,435 | | | | 2,462,079 | |
| †Mastech Digital 1 | | | 61,182 | | | | 909,164 | |
| Resources Connection | | | 183,602 | | | | 3,739,973 | |
| | | | | | | | 15,082,705 | |
| ROAD & RAIL - 4.8% | | | | | | | | |
| ArcBest | | | 48,949 | | | | 3,444,541 | |
| Heartland Express | | | 123,567 | | | | 1,718,817 | |
| Schneider National Cl. B | | | 155,500 | | | | 3,480,090 | |
| Werner Enterprises | | | 53,750 | | | | 2,071,525 | |
| | | | | | | | 10,714,973 | |
| Total (Cost $34,673,055) | | | | | | | 41,472,979 | |
| | | | | | | | | |
| INFORMATION TECHNOLOGY – 23.4% | | | | | | | | |
| COMMUNICATIONS EQUIPMENT - 1.0% | | | | | | | | |
| †Aviat Networks 1 | | | 93,314 | | | | 2,336,583 | |
| ELECTRONIC EQUIPMENT, INSTRUMENTS & COMPONENTS - 12.8% | | | | | | | | |
| ePlus 1 | | | 63,888 | | | | 3,393,731 | |
| Flex 1 | | | 223,100 | | | | 3,228,257 | |
| Insight Enterprises 1 | | | 26,454 | | | | 2,282,451 | |
| Jabil | | | 64,500 | | | | 3,303,045 | |
| Kimball Electronics 1 | | | 178,216 | | | | 3,582,142 | |
| PC Connection | | | 53,505 | | | | 2,356,895 | |
| Sanmina Corporation 1 | | | 88,143 | | | | 3,590,064 | |
| TD SYNNEX | | | 37,642 | | | | 3,429,186 | |
| Vishay Intertechnology | | | 189,261 | | | | 3,372,631 | |
| | | | | | | | 28,538,402 | |
| IT SERVICES - 1.8% | | | | | | | | |
| †Computer Task Group 1 | | | 188,320 | | | | 1,612,019 | |
| IBEX 1 | | | 141,460 | | | | 2,386,430 | |
| | | | | | | | 3,998,449 | |
| SEMICONDUCTORS & SEMICONDUCTOR EQUIPMENT - 6.7% | | | | | | | | |
| †Alpha & Omega Semiconductor 1 | | | 52,900 | | | | 1,763,686 | |
| Amkor Technology | | | 200,484 | | | | 3,398,204 | |
| Cohu 1 | | | 111,260 | | | | 3,087,465 | |
| Kulicke & Soffa Industries | | | 76,413 | | | | 3,271,241 | |
| MKS Instruments | | | 15,091 | | | | 1,548,789 | |
| Ultra Clean Holdings 1 | | | 62,838 | | | | 1,870,687 | |
| | | | | | | | 14,940,072 | |
| SOFTWARE - 1.1% | | | | | | | | |
| Xperi Holding Corporation | | | 164,000 | | | | 2,366,520 | |
| Total (Cost $47,367,860) | | | | | | | 52,180,026 | |
| REAL ESTATE – 1.5% | | | | | | |
| REAL ESTATE MANAGEMENT & DEVELOPMENT - 1.5% | | | | | | |
| Marcus & Millichap | | | 45,625 | | | | 1,687,669 | |
| †RMR Group (The) Cl. A | | | 59,522 | | | | 1,687,448 | |
| Total (Cost $3,338,975) | | | | | | | 3,375,117 | |
| | | | | | | | | |
| TOTAL COMMON STOCKS | | | | | | | | |
| (Cost $203,108,520) | | | | | | | 216,322,860 | |
| | | | | | | | | |
REPURCHASE AGREEMENT– 3.0%
Fixed Income Clearing Corporation, 0.24% dated 6/30/22, due 7/1/22, maturity value $6,604,774 (collateralized by obligations of various U.S. Government Agencies, 3.25% due 6/30/27, valued at $6,736,887)
| (Cost $6,604,730) | | | 6,604,730 | |
| | | | | |
| TOTAL INVESTMENTS – 100.1% | | | | |
| (Cost $209,713,250) | | | 222,927,590 | |
| LIABILITIES LESS CASH AND OTHER ASSETS – (0.1)% | | | (169,423 | ) |
| | | | | |
| NET ASSETS – 100.0% | | $ | 222,758,167 | |
Bold indicates the Fund’s 20 largest equity holdings in terms of June 30, 2022, market value.
| THE ACCOMPANYING NOTES ARE AN INTEGRAL PART OF THESE FINANCIAL STATEMENTS | Royce Capital Fund 2022 Semiannual Report to Shareholders | 17 |
| Statements of Assets and Liabilities | June 30, 2022 (unaudited) |
| | | Micro-Cap
Portfolio | | | Small-Cap
Portfolio | |
| ASSETS: | | | | | | |
| Investments at value (including collateral on loaned securities)1 | | $ | 113,227,576 | | | $ | 216,322,860 | |
| Repurchase agreements (at cost and value) | | | 5,519,322 | | | | 6,604,730 | |
| Foreign currency2 | | | 10,382 | | | | – | |
| Receivable for investments sold | | | – | | | | 352,081 | |
| Receivable for capital shares sold | | | 386,831 | | | | 12,544 | |
| Receivable for dividends and interest | | | 15,034 | | | | 132,416 | |
| Receivable for securities lending income | | | 226 | | | | 4 | |
| Prepaid expenses and other assets | | | 3,784 | | | | 7,754 | |
| Total Assets | | | 119,163,155 | | | | 223,432,389 | |
| LIABILITIES: | | | | | | | | |
| Payable for investments purchased | | | 61,890 | | | | 160,365 | |
| Payable for capital shares redeemed | | | 55,173 | | | | 178,948 | |
| Payable for investment advisory fees | | | 118,668 | | | | 179,933 | |
| Payable for trustees’ fees | | | 10,620 | | | | 21,751 | |
| Accrued expenses | | | 77,392 | | | | 133,225 | |
| Total Liabilities | | | 323,743 | | | | 674,222 | |
| Net Assets | | $ | 118,839,412 | | | $ | 222,758,167 | |
| ANALYSIS OF NET ASSETS: | | | | | | | | |
| Paid-in capital | | $ | 66,337,779 | | | $ | 182,532,195 | |
| Total distributable earnings (loss) | | | 52,501,633 | | | | 40,225,972 | |
| Net Assets | | $ | 118,839,412 | | | $ | 222,758,167 | |
| Investment Class | | $ | 106,087,250 | | | $ | 132,604,741 | |
| Service Class | | | 12,752,162 | | | | 90,153,426 | |
| SHARES OUTSTANDING (unlimited number of $.001 par value): | | | | | | | | |
| Investment Class | | | 9,990,066 | | | | 17,413,395 | |
| Service Class | | | 1,235,321 | | | | 12,128,536 | |
| NET ASSET VALUES (Net Assets ÷ Shares Outstanding): | | | | | | | | |
| (offering and redemption price per share) | | | | | | | | |
| Investment Class | | | $10.62 | | | | $7.62 | |
| Service Class | | | 10.32 | | | | 7.43 | |
| Investments at identified cost | | $ | 104,062,485 | | | $ | 203,108,520 | |
| Market value of loaned securities3 | | | 2,598,681 | | | | – | |
| 1 | See Notes to Financial Statements for information on non-cash collateral on loaned securities. |
| 2 | The cost of foreign currency is $10,380 for Micro-Cap Portfolio. |
| 3 | Market value of loaned securities backed by non-cash collateral is as of prior business day. |
| 18 | Royce Capital Fund 2022 Semiannual Report to Shareholders | THE ACCOMPANYING NOTES ARE AN INTEGRAL PART OF THESE FINANCIAL STATEMENTS |
| Statements of Operations | Six Months Ended June 30, 2022 (unaudited) |
| | | Micro-Cap
Portfolio | | | Small-Cap
Portfolio | |
| INVESTMENT INCOME: | | | | | | | | |
| INCOME: | | | | | | | | |
| Dividends | | $ | 519,900 | | | $ | 2,224,719 | |
| Foreign withholding tax | | | (10,458 | ) | | | – | |
| Interest | | | 890 | | | | 1,023 | |
| Securities lending | | | 7,485 | | | | 365 | |
| Total income | | | 517,817 | | | | 2,226,107 | |
| EXPENSES: | | | | | | | | |
| Investment advisory fees | | | 888,135 | | | | 1,347,026 | |
| Distribution fees | | | 21,061 | | | | 147,372 | |
| Administrative and office facilities | | | 44,858 | | | | 82,185 | |
| Trustees’ fees | | | 19,895 | | | | 39,466 | |
| Audit | | | 16,891 | | | | 16,304 | |
| Custody | | | 15,998 | | | | 27,665 | |
| Shareholder reports | | | 8,105 | | | | 12,685 | |
| Shareholder servicing | | | 7,867 | | | | 7,570 | |
| Legal | | | 4,171 | | | | 8,625 | |
| Other expenses | | | 6,178 | | | | 11,758 | |
| Total expenses | | | 1,033,159 | | | | 1,700,656 | |
| Compensating balance credits | | | (2 | ) | | | (9 | ) |
| Fees waived by investment adviser | | | (51,704 | ) | | | (83,189 | ) |
| Expenses reimbursed by investment adviser | | | (15,436 | ) | | | (15,323 | ) |
| Net expenses | | | 966,017 | | | | 1,602,135 | |
| Net investment income (loss) | | | (448,200 | ) | | | 623,972 | |
| REALIZED AND UNREALIZED GAIN (LOSS) ON INVESTMENTS AND FOREIGN CURRENCY: | | | | | | | | |
| NET REALIZED GAIN (LOSS): | | | | | | | | |
| Investments | | | 3,874,928 | | | | 20,601,888 | |
| Foreign currency transactions | | | (3,161 | ) | | | – | |
| NET CHANGE IN UNREALIZED APPRECIATION (DEPRECIATION): | | | | | | | | |
| Investments | | | (52,224,790 | ) | | | (82,240,497 | ) |
| Other assets and liabilities denominated in foreign currency | | | (84 | ) | | | – | |
| Net realized and unrealized gain (loss) on investments and foreign currency | | | (48,353,107 | ) | | | (61,638,609 | ) |
| NET INCREASE (DECREASE) IN NET ASSETS FROM INVESTMENT OPERATIONS | | $ | (48,801,307 | ) | | $ | (61,014,637 | ) |
| THE ACCOMPANYING NOTES ARE AN INTEGRAL PART OF THESE FINANCIAL STATEMENTS | Royce Capital Fund 2022 Semiannual Report to Shareholders | 19 |
Statements of Changes in Net Assets
| | | Micro-Cap Portfolio | | | Small-Cap Portfolio | |
| | | Six Months Ended
6/30/22 (unaudited) | | | Year Ended 12/31/21 | | | Six Months Ended
6/30/22 (unaudited) | | | Year Ended 12/31/21 | |
| INVESTMENT OPERATIONS: | | | | | | | | | | | | | | | | |
| Net investment income (loss) | | $ | (448,200 | ) | | $ | (1,126,184 | ) | | $ | 623,972 | | | $ | 851,477 | |
| Net realized gain (loss) on investments and foreign currency | | | 3,871,767 | | | | 41,059,554 | | | | 20,601,888 | | | | 73,334,166 | |
| Net change in unrealized appreciation (depreciation) on investments and foreign currency | | | (52,224,874 | ) | | | 7,347,018 | | | | (82,240,497 | ) | | | 23,002,833 | |
| Net increase (decrease) in net assets from investment operations | | | (48,801,307 | ) | | | 47,280,388 | | | | (61,014,637 | ) | | | 97,188,476 | |
| DISTRIBUTIONS: | | | | | | | | | | | | | | | | |
| Total distributable earnings | | | | | | | | | | | | | | | | |
| Investment Class | | | – | | | | (6,830,287 | ) | | | – | | | | (2,372,831 | ) |
| Service Class | | | – | | | | (1,339,305 | ) | | | – | | | | (2,440,124 | ) |
| Total distributions | | | – | | | | (8,169,592 | ) | | | – | | | | (4,812,955 | ) |
| CAPITAL SHARE TRANSACTIONS: | | | | | | | | | | | | | | | | |
| Value of shares sold | | | | | | | | | | | | | | | | |
| Investment Class | | | 6,714,259 | | | | 26,804,964 | | | | 6,781,175 | | | | 23,770,159 | |
| Service Class | | | 835,811 | | | | 9,163,274 | | | | 1,708,068 | | | | 2,580,610 | |
| Distributions reinvested | | | | | | | | | | | | | | | | |
| Investment Class | | | – | | | | 6,830,287 | | | | – | | | | 2,372,831 | |
| Service Class | | | – | | | | 1,339,305 | | | | – | | | | 2,440,124 | |
| Value of shares redeemed | | | | | | | | | | | | | | | | |
| Investment Class | | | (15,093,000 | ) | | | (43,275,235 | ) | | | (14,123,279 | ) | | | (47,550,848 | ) |
| Service Class | | | (11,089,488 | ) | | | (15,848,237 | ) | | | (92,233,220 | ) | | | (53,801,234 | ) |
| Net increase (decrease) in net assets from capital share transactions | | | (18,632,418 | ) | | | (14,985,642 | ) | | | (97,867,256 | ) | | | (70,188,358 | ) |
| Net Increase (Decrease) in Net Assets | | | (67,433,725 | ) | | | 24,125,154 | | | | (158,881,893 | ) | | | 22,187,163 | |
| NET ASSETS: | | | | | | | | | | | | | | | | |
| Beginning of period | | | 186,273,137 | | | | 162,147,983 | | | | 381,640,060 | | | | 359,452,897 | |
| End of period | | $ | 118,839,412 | | | $ | 186,273,137 | | | $ | 222,758,167 | | | $ | 381,640,060 | |
| 20 | Royce Capital Fund 2022 Semiannual Report to Shareholders | THE ACCOMPANYING NOTES ARE AN INTEGRAL PART OF THESE FINANCIAL STATEMENTS |
Financial Highlights
This table is presented to show selected data for a share outstanding throughout each year or other indicated period and to assist shareholders in evaluating a Fund’s performance for the periods presented. Per share amounts have been determined on the basis of the weighted average number of shares outstanding during the period.
| | | | | | | | | | | | | | | | | | | | | | | | | | | | | | | | | Ratio of Expenses to Average Net Assets | | | | | | | |
| | | Net Asset Value,
Beginning of
Period | | | Net Investment
Income (Loss) | | | Net Realized and
Unrealized Gain (Loss) on
Investments and
Foreign Currency | | | Total from
Investment
Operations | | | Distributions
from Net
Investment
Income | | | Distributions from
Net Realized Gain on
Investments and
Foreign Currency | | | Total
Distributions | | | Net Asset
Value, End of
Period | | | Total Return | | | Net Assets,
End of Period
(in thousands) | | | Prior to Fee
Waivers,
Expense
Reimbursements
and Balance
Credits | | | Prior to Fee
Waivers and
Expense
Reimbursements | | | Net of Fee
Waivers and
Expense
Reimbursements | | | Ratio of Net
Investment
Income (Loss) to
Average Net
Assets | | | Portfolio
Turnover Rate | |
| Micro-Cap Portfolio–Investment Class | | | | | | | | | | | | | | | | | | | | | | | | | | | | | | | | | | | | | | | | | |
| 2022† | | $ | 14.77 | | | $ | (0.04 | ) | | $ | (4.11 | ) | | $ | (4.15 | ) | | $ | – | | | $ | – | | | $ | – | | | $ | 10.62 | | | | (28.10 | )%1 | $ | 106,087 | | | | 1.42 | %2 | | 1.42 | %2 | | 1.33 | %2 | | (0.60 | )%2 | | 6 | % |
| 2021 | | | 11.91 | | | | (0.08 | ) | | | 3.61 | | | | 3.53 | | | | – | | | | (0.67 | ) | | | (0.67 | ) | | | 14.77 | | | | 29.98 | | | | 157,042 | | | | 1.37 | | | | 1.37 | | | | 1.33 | | | | (0.56 | ) | | | 25 | |
| 2020 | | | 9.75 | | | | (0.05 | ) | | | 2.36 | | | | 2.31 | | | | – | | | | (0.15 | ) | | | (0.15 | ) | | | 11.91 | | | | 23.79 | | | | 134,109 | | | | 1.47 | | | | 1.47 | | | | 1.33 | | | | (0.51 | ) | | | 25 | |
| 2019 | | | 8.97 | | | | (0.04 | ) | | | 1.77 | | | | 1.73 | | | | – | | | | (0.95 | ) | | | (0.95 | ) | | | 9.75 | | | | 19.55 | | | | 132,008 | | | | 1.43 | | | | 1.43 | | | | 1.33 | | | | (0.41 | ) | | | 26 | |
| 2018 | | | 10.39 | | | | (0.03 | ) | | | (0.90 | ) | | | (0.93 | ) | | | – | | | | (0.49 | ) | | | (0.49 | ) | | | 8.97 | | | | (9.13 | ) | | | 127,457 | | | | 1.39 | | | | 1.39 | | | | 1.33 | | | | (0.30 | ) | | | 28 | |
| 2017 | | | 11.11 | | | | (0.02 | ) | | | 0.58 | | | | 0.56 | | | | (0.08 | ) | | | (1.20 | ) | | | (1.28 | ) | | | 10.39 | | | | 5.29 | | | | 164,656 | | | | 1.38 | | | | 1.38 | | | | 1.38 | | | | (0.22 | ) | | | 30 | |
| Micro-Cap Portfolio–Service Class | | | | | | | | | | | | | | | | | | | | | | | | | | | | | | | | | | | | | | | | | |
| 2022† | | $ | 14.37 | | | $ | (0.05 | ) | | $ | (4.00 | ) | | $ | (4.05 | ) | | $ | – | | | $ | – | | | $ | – | | | $ | 10.32 | | | | (28.18 | )%1 | $ | 12,752 | | | | 1.71 | %2 | | 1.71 | %2 | | 1.58 | %2 | | (0.87 | )%2 | | 6 | % |
| 2021 | | | 11.63 | | | | (0.11 | ) | | | 3.50 | | | | 3.39 | | | | – | | | | (0.65 | ) | | | (0.65 | ) | | | 14.37 | | | | 29.52 | | | | 29,231 | | | | 1.64 | | | | 1.64 | | | | 1.58 | | | | (0.81 | ) | | | 25 | |
| 2020 | | | 9.54 | | | | (0.07 | ) | | | 2.31 | | | | 2.24 | | | | – | | | | (0.15 | ) | | | (0.15 | ) | | | 11.63 | | | | 23.55 | | | | 28,039 | | | | 1.72 | | | | 1.72 | | | | 1.58 | | | | (0.75 | ) | | | 25 | |
| 2019 | | | 8.80 | | | | (0.06 | ) | | | 1.73 | | | | 1.67 | | | | – | | | | (0.93 | ) | | | (0.93 | ) | | | 9.54 | | | | 19.24 | | | | 27,090 | | | | 1.71 | | | | 1.71 | | | | 1.58 | | | | (0.66 | ) | | | 26 | |
| 2018 | | | 10.21 | | | | (0.06 | ) | | | (0.87 | ) | | | (0.93 | ) | | | – | | | | (0.48 | ) | | | (0.48 | ) | | | 8.80 | | | | (9.29 | ) | | | 14,644 | | | | 1.64 | | | | 1.64 | | | | 1.58 | | | | (0.57 | ) | | | 28 | |
| 2017 | | | 10.93 | | | | (0.04 | ) | | | 0.57 | | | | 0.53 | | | | (0.06 | ) | | | (1.19 | ) | | | (1.25 | ) | | | 10.21 | | | | 5.02 | | | | 32,067 | | | | 1.64 | | | | 1.64 | | | | 1.58 | | | | (0.43 | ) | | | 30 | |
| Small-Cap Portfolio–Investment Class | | | | | | | | | | | | | | | | | | | | | | | | | | | | | | | | | | | | | | | | | |
| 2022† | | $ | 9.41 | | | $ | 0.03 | | | $ | (1.82 | ) | | $ | (1.79 | ) | | $ | – | | | $ | – | | | $ | – | | | $ | 7.62 | | | | (19.02 | )%1 | $ | 132,605 | | | | 1.16 | %2 | | 1.16 | %2 | | 1.08 | %2 | | 0.64 | %2 | | 34 | % |
| 2021 | | | 7.41 | | | | 0.03 | | | | 2.10 | | | | 2.13 | | | | (0.13 | ) | | | – | | | | (0.13 | ) | | | 9.41 | | | | 28.82 | | | | 172,388 | | | | 1.11 | | | | 1.11 | | | | 1.08 | | | | 0.37 | | | | 51 | |
| 2020 | | | 8.19 | | | | 0.06 | | | | (0.65 | ) | | | (0.59 | ) | | | (0.07 | ) | | | (0.12 | ) | | | (0.19 | ) | | | 7.41 | | | | (7.15 | ) | | | 153,953 | | | | 1.19 | | | | 1.19 | | | | 1.08 | | | | 0.90 | | | | 95 | |
| 2019 | | | 7.87 | | | | 0.09 | | | | 1.37 | | | | 1.46 | | | | (0.06 | ) | | | (1.08 | ) | | | (1.14 | ) | | | 8.19 | | | | 18.67 | | | | 173,492 | | | | 1.15 | | | | 1.15 | | | | 1.08 | | | | 1.04 | | | | 111 | |
| 2018 | | | 8.77 | | | | 0.06 | | | | (0.78 | ) | | | (0.72 | ) | | | (0.07 | ) | | | (0.11 | ) | | | (0.18 | ) | | | 7.87 | | | | (8.24 | ) | | | 171,561 | | | | 1.11 | | | | 1.11 | | | | 1.08 | | | | 0.62 | | | | 56 | |
| 2017 | | | 8.41 | | | | 0.05 | | | | 0.39 | | | | 0.44 | | | | (0.08 | ) | | | – | | | | (0.08 | ) | | | 8.77 | | | | 5.26 | | | | 228,620 | | | | 1.11 | | | | 1.11 | | | | 1.11 | | | | 0.55 | | | | 91 | |
| Small-Cap Portfolio–Service Class | | | | | | | | | | | | | | | | | | | | | | | | | | | | | | | | | | | | | | | | | |
| 2022† | | $ | 9.20 | | | $ | 0.01 | | | $ | (1.78 | ) | | $ | (1.77 | ) | | $ | – | | | $ | – | | | $ | – | | | $ | 7.43 | | | | (19.24 | )%1 | $ | 90,153 | | | | 1.40 | %2 | | 1.40 | %2 | | 1.33 | %2 | | 0.23 | %2 | | 34 | % |
| 2021 | | | 7.25 | | | | 0.01 | | | | 2.05 | | | | 2.06 | | | | (0.11 | ) | | | – | | | | (0.11 | ) | | | 9.20 | | | | 28.45 | | | | 209,252 | | | | 1.35 | | | | 1.35 | | | | 1.33 | | | | 0.10 | | | | 51 | |
| 2020 | | | 8.01 | | | | 0.05 | | | | (0.64 | ) | | | (0.59 | ) | | | (0.05 | ) | | | (0.12 | ) | | | (0.17 | ) | | | 7.25 | | | | (7.33 | ) | | | 205,500 | | | | 1.43 | | | | 1.43 | | | | 1.33 | | | | 0.73 | | | | 95 | |
| 2019 | | | 7.69 | | | | 0.06 | | | | 1.35 | | | | 1.41 | | | | (0.04 | ) | | | (1.05 | ) | | | (1.09 | ) | | | 8.01 | | | | 18.44 | | | | 225,250 | | | | 1.39 | | | | 1.39 | | | | 1.33 | | | | 0.86 | | | | 111 | |
| 2018 | | | 8.55 | | | | 0.04 | | | | (0.76 | ) | | | (0.72 | ) | | | (0.03 | ) | | | (0.11 | ) | | | (0.14 | ) | | | 7.69 | | | | (8.50 | ) | | | 104,129 | | | | 1.34 | | | | 1.34 | | | | 1.33 | | | | 0.31 | | | | 56 | |
| 2017 | | | 8.20 | | | | 0.02 | | | | 0.40 | | | | 0.42 | | | | (0.07 | ) | | | – | | | | (0.07 | ) | | | 8.55 | | | | 5.10 | | | | 263,549 | | | | 1.34 | | | | 1.34 | | | | 1.34 | | | | 0.32 | | | | 91 | |
† Six months ended June 30, 2022 (unaudited).
1 Not annualized
2 Annualized
| THE ACCOMPANYING NOTES ARE AN INTEGRAL PART OF THESE FINANCIAL STATEMENTS | Royce Capital Fund 2022 Semiannual Report to Shareholders | 21 |
Notes to Financial Statements (unaudited)
Summary of Significant Accounting Policies:
Royce Capital Fund – Micro-Cap Portfolio and Royce Capital Fund – Small-Cap Portfolio (the “Fund” or “Funds”) are the two series of Royce Capital Fund (the “Trust”), an open-end management investment company organized as a Delaware statutory trust. Shares of the Funds are offered to life insurance companies for allocation to certain separate accounts established for the purpose of funding qualified and non-qualified variable annuity contracts and variable life insurance contracts. Micro-Cap Portfolio and Small-Cap Portfolio commenced operations on December 27, 1996.
Classes of shares have equal rights as to earnings and assets, except that each class may bear different fees and expenses for distribution, shareholder servicing, registration and shareholder reports, and receive different compensating balance credits and expense reimbursements. Investment income, realized and unrealized capital gains or losses on investments and foreign currency, and expenses other than those attributable to a specific class are allocated to each class of shares based on its relative net assets.
The preparation of financial statements in conformity with accounting principles generally accepted in the United States requires management to make estimates and assumptions that affect the reported amounts of assets and liabilities and the disclosure of contingent assets and liabilities at the date of the financial statements and the reported amounts of income and expenses during the reporting period. Actual results could differ from those estimates.
Each Fund is an investment company and accordingly follows the investment company accounting and reporting guidance of the Financial Accounting Standards Board (FASB) Accounting Standard Codification Topic 946 “Financial Services-Investment Companies.”
Royce & Associates, LP, the Funds’ investment adviser, is a majority-owned subsidiary of Franklin Resources, Inc. and primarily conducts business using the name Royce Investment Partners (“Royce”).
VALUATION OF INVESTMENTS:
Securities are valued as of the close of trading on the New York Stock Exchange (“NYSE”) (generally 4:00 p.m. Eastern time) on the valuation date. Securities that trade on an exchange, and securities traded on Nasdaq’s Electronic Bulletin Board, are valued at their last reported sales price or Nasdaq official closing price taken from the primary market in which each security trades or, if no sale is reported for such day, at their highest bid price. Other over-the-counter securities for which market quotations are readily available are valued at their highest bid price, except in the case of some bonds and other fixed income securities which may be valued by reference to other securities with comparable ratings, interest rates and maturities, using established independent pricing services. The Funds value their non-U.S. dollar denominated securities in U.S. dollars daily at the prevailing foreign currency exchange rates as quoted by a major bank. Securities for which market quotations are not readily available are valued at their fair value in accordance with the provisions of the Investment Company Act of 1940 (“1940 Act”), under procedures approved by the Trust’s Board of Trustees, and are reported as Level 3 securities. As a general principle, the fair value of a security is the amount which the Fund might reasonably expect to receive for the security upon its current sale. However, in light of the judgment involved in fair valuations, there can be no assurance that a fair value assigned to a particular security will be the amount which the Fund might be able to receive upon its current sale. In addition, if, between the time trading ends on a particular security and the close of the customary trading session on the NYSE, events occur that are significant and may make the closing price unreliable, a Fund may fair value the security. The Funds use an independent pricing service to provide fair value estimates for relevant non-U.S. equity securities on days when the U.S. market volatility exceeds a certain threshold. This pricing service uses proprietary correlations it has developed between the movement of prices of non-U.S. equity securities and indices of U.S.-traded securities, futures contracts and other indications to estimate the fair value of relevant non-U.S. securities. When fair value pricing is employed, the prices of securities used by a Fund may differ from quoted or published prices for the same security. Investments in money market funds are valued at net asset value per share.
Various inputs are used in determining the value of each Fund’s investments, as noted above. These inputs are summarized in the three broad levels below:
| Level 1 – | quoted prices in active markets for identical securities. |
| | Level 2 – | other significant observable inputs (including quoted prices for similar securities, foreign securities that may be fair valued and repurchase agreements). The table below includes all Level 2 securities. Level 2 securities with values based on quoted prices for similar securities and/or foreign securities that were fair valued are noted in the Schedules of Investments. |
| | Level 3 – | significant unobservable inputs (including last trade price before trading was suspended, or at a discount thereto for lack of marketability or otherwise, market price information regarding other securities, information received from the company and/or published documents, including SEC filings and financial statements, or other publicly available information). |
The inputs or methodology used for valuing securities are not necessarily an indication of the risk associated with investing in those securities.
| 22 | Royce Capital Fund 2022 Semiannual Report to Shareholders |
VALUATION OF INVESTMENTS (continued):
The following is a summary of the inputs used to value each Fund’s investments as of June 30, 2022. For a detailed breakout of common stocks by sector classification, please refer to the Schedules of Investments.
| | | LEVEL 1 | | LEVEL 2 | | LEVEL 3 | | TOTAL |
| Micro-Cap Portfolio | | | | | | | | | | | | | | | | |
| Common Stocks | | $ | 112,553,697 | | | $ | 323,570 | | | $ | 350,309 | | | $ | 113,227,576 | |
| Repurchase Agreement | | | – | | | | 5,519,322 | | | | – | | | | 5,519,322 | |
| Small-Cap Portfolio | | | | | | | | | | | | | | | | |
| Common Stocks | | | 216,322,860 | | | | – | | | | – | | | | 216,322,860 | |
| Repurchase Agreement | | | – | | | | 6,604,730 | | | | – | | | | 6,604,730 | |
Level 3 Reconciliation:
| | | BALANCE AS OF 12/31/21 | | PURCHASES | | SALES | | REALIZED GAIN (LOSS)1 | | UNREALIZED GAIN (LOSS)1 | | BALANCE AS OF
6/30/22 |
| Micro-Cap Portfolio | | | | | | | | | | | | | | | | | | |
| Common Stocks | | $ | 628,264 | | | $ | – | | | $ | 455,700 | | | $ | (421,996 | ) | | $ | 599,741 | | | $ | 350,309 | |
| 1 | The net change in unrealized appreciation (depreciation) is included in the accompanying Statement of Operations. Change in unrealized appreciation (depreciation) includes net unrealized appreciation (depreciation) resulting from changes in investment values during the reporting period and the reversal of previously recorded unrealized appreciation (depreciation) when gains or losses are realized. Net realized gain (loss) from investments and foreign currency transactions is included in the accompanying Statement of Operations. |
REPURCHASE AGREEMENTS:
The Funds may enter into repurchase agreements with institutions that the Funds’ investment adviser has determined are creditworthy. Each Fund restricts repurchase agreements to maturities of no more than seven days. Securities pledged as collateral for repurchase agreements, which are held until maturity of the repurchase agreements, are marked-to-market daily and maintained at a value at least equal to the principal amount of the repurchase agreement (including accrued interest). Repurchase agreements could involve certain risks in the event of default or insolvency of the counter-party, including possible delays or restrictions upon the ability of each Fund to dispose of its underlying securities. The remaining contractual maturities of repurchase agreements held by the Funds at June 30, 2022 are overnight and continuous.
FOREIGN CURRENCY:
Net realized foreign exchange gains or losses arise from sales and maturities of short-term securities, sales of foreign currencies, expiration of currency forward contracts, currency gains or losses realized between the trade and settlement dates on securities transactions, and the difference between the amounts of dividends, interest, and foreign withholding taxes recorded on each Fund’s books and the U.S. dollar equivalent of the amounts actually received or paid. Net unrealized foreign exchange gains and losses arise from changes in the value of assets and liabilities, other than investments in securities at the end of the reporting period, as a result of changes in foreign currency exchange rates.
The Funds do not isolate that portion of the results of operations resulting from fluctuations in foreign exchange rates on investments from the fluctuations arising from changes in market prices of securities held. Such fluctuations are included with the net realized and unrealized gain or loss on investments.
SECURITIES LENDING:
The Funds loan securities through a lending agent, State Street Bank and Trust Company, to qualified institutional investors for the purpose of earning additional income. The lending agent receives and holds collateral from such borrowers to secure their obligations to the Funds. Such loans must be secured at all times by collateral in an amount at least equal to the market value of the loaned securities. The market values of the loaned securities and the collateral fluctuate and are determined at the close of each business day by the lending agent. Borrowers are required to post additional collateral to the lending agent on the next succeeding business day in the event of a collateral shortfall. Counterparty risk is further reduced by loaning securities only to parties that participate in a Global Securities Lending Program organized and monitored by the lending agent and that are deemed by it to satisfy its requirements and by having the lending agent enter into securities lending agreements with such borrowers. The lending agent is not affiliated with Royce.
Collateral may be in the form of cash or U.S. Treasuries. Cash collateral is invested in certain money market pooled investment vehicles. The Funds record a liability in their respective Statements of Assets and Liabilities for the return of such cash collateral during periods in which securities are on loan. The Funds bear the risk of loss for any decrease in the market value of the loaned securities or the investments purchased with cash collateral received from the borrowers.
Pursuant to the agreement in place between the Funds and the lending agent, if a borrower fails to return loaned securities, and the cash collateral being maintained by the lending agent on behalf of such borrower is insufficient to cover the value of loaned securities and provided such collateral insufficiency is not the result of investment losses, the lending agent shall, at its option, either replace the loaned
| Royce Capital Fund 2022 Semiannual Report to Shareholders | 23 |
Notes to Financial Statements (unaudited) (continued)
SECURITIES LENDING (continued):
securities or pay the amount of the shortfall to the Funds. In the event of the bankruptcy of a borrower, the Funds could experience delay in recovering the loaned securities or only recover cash or a security of equivalent value.
Loans of securities generally do not have stated maturity dates, and the Funds may recall a security at any time. The Funds’ securities lending income consists of the income earned on investing cash collateral, plus any premium payments received for lending certain securities, less any rebates paid to borrowers and lending agent fees associated with the loan. Pursuant to the agreement in place between the Funds and the lending agent, the Funds are responsible for any shortfall in the event the value of the investments purchased with cash collateral is insufficient to pay the rebate fee to the borrower.
The following table presents non-cash collateral and the market value of securities on loan collateralized by non-cash collateral held by the Funds’ custodian at June 30, 2022:
| | NON-CASH COLLATERAL | SECURITIES ON LOAN COLLATERALIZED
BY NON-CASH COLLATERAL | NET AMOUNT |
| Micro-Cap Portfolio | $2,654,156 | $(2,598,681) | $55,475 |
DISTRIBUTIONS AND TAXES:
As qualified regulated investment companies under Subchapter M of the Internal Revenue Code, the Funds are not subject to income taxes to the extent that each Fund distributes substantially all of its taxable income for its fiscal year.
The Funds pay any dividends and capital gain distributions annually in December. Dividends from net investment income and distributions from capital gains are determined at a class level. Because federal income tax regulations differ from generally accepted accounting principles, income and capital gain distributions determined in accordance with tax regulations may differ from net investment income and realized gains recognized for financial reporting purposes. Accordingly, the character of distributions and composition of net assets for tax purposes differ from those reflected in the accompanying financial statements.
INVESTMENT TRANSACTIONS AND RELATED INVESTMENT INCOME:
Investment transactions are accounted for on the trade date. Dividend income is recorded on the ex-dividend date. Non-cash dividend income is recorded at the fair market value of the securities received. Interest income is recorded on an accrual basis. Realized gains and losses from investment transactions are determined on the basis of identified cost for book and tax purposes.
EXPENSES:
The Funds incur direct and indirect expenses. Expenses directly attributable to a Fund are charged to the Fund’s operations, while expenses applicable to more than one of the Royce Funds are allocated equitably. Certain personnel, occupancy costs and other administrative expenses related to all of the Royce Funds are allocated by Royce under an administration agreement and are included in administrative and office facilities and legal expenses.
COMPENSATING BALANCE CREDITS:
The Funds have arrangements with their custodian bank and transfer agent, whereby a portion of the custodian’s fee and transfer agent’s fee is paid indirectly by credits earned on a Fund’s cash on deposit with the bank and transfer agent. These deposit arrangements are an alternative to purchasing overnight investments. Conversely, a Fund pays interest to the custodian on any cash overdrafts, to the extent they are not offset by credits earned on positive cash balances.
LINE OF CREDIT:
The Funds, along with certain other Royce Funds, participate in a $65 million line of credit (“Credit Agreement”) with State Street Bank and Trust Company to be used for temporary or emergency purposes. This revolving Credit Agreement expires on October 7, 2022. Pursuant to the Credit Agreement, each participating Fund is liable for a portion of the commitment fee for the credit facility and for principal and interest payments related to borrowings made by that Fund. Borrowings under the Credit Agreement bear interest at a variable rate equal to the Applicable Rate plus the Applicable Margin. The term Applicable Rate means, for any day, a rate equal to the sum of (a) 0.10%, plus (b) the higher of (i) the Federal Funds Effective Rate for such day, or (ii) the Overnight Bank Funding Rate for such day. The term Applicable Margin means 1.25%. The Funds did not utilize the line of credit during the six months ended June 30, 2022.
| 24 | Royce Capital Fund 2022 Semiannual Report to Shareholders |
Capital Share Transactions (in shares):
| | | SHARES SOLD | | | SHARES ISSUED FOR REINVESTMENT
OF DISTRIBUTIONS | | | SHARES REDEEMED | | | NET INCREASE (DECREASE) IN
SHARES OUTSTANDING | |
| | | Six Months Ended
6/30/22
(unaudited) | | | Year Ended
12/31/21 | | | Six Months Ended
6/30/22
(unaudited) | | | Year Ended
12/31/21 | | | Six Months Ended
6/30/22
(unaudited) | | | Year Ended
12/31/21 | | | Six Months Ended
6/30/22
(unaudited) | | | Year Ended
12/31/21 | |
| Micro-Cap Portfolio | | | | | | | | | | | | | | | | | | | | | | | | | | | | |
| Investment Class | | | 545,939 | | | | 1,897,065 | | | – | | | | 489,977 | | | | (1,189,569 | ) | | | (3,009,438 | ) | | | (643,630 | ) | | | (622,396 | ) |
| Service Class | | | 70,614 | | | | 663,833 | | | – | | | | 98,696 | | | | (868,898 | ) | | | (1,140,542 | ) | | | (798,284 | ) | | | (378,013 | ) |
| Small-Cap Portfolio | | | | | | | | | | | | | | | | | | | | | | | | | | | | |
| Investment Class | | | 795,246 | | | | 2,660,185 | | | – | | | | 262,481 | | | | (1,696,430 | ) | | | (5,372,952 | ) | | | (901,184 | ) | | | (2,450,286 | ) |
| Service Class | | | 207,055 | | | | 293,885 | | | – | | | | 276,032 | | | | (10,826,083 | ) | | | (6,172,963 | ) | | | (10,619,028 | ) | | | (5,603,046 | ) |
Investment Adviser and Distributor:
INVESTMENT ADVISER:
Under the Trust’s investment advisory agreements with Royce, Royce is entitled to receive investment advisory fees in respect of each Fund that are computed daily and payable monthly. Royce has contractually agreed, without right of termination, to waive fees and/or reimburse expenses (excluding brokerage commissions, taxes, interest, litigation expenses, acquired fund fees and expenses, and other expenses not borne in the ordinary course of business) to the extent necessary to maintain the Funds’ net annual operating expense ratios at specified levels through April 30, 2023. To the extent that they impacted net expenses for the six months ended June 30, 2022, the effects of those arrangements are shown below. See the Prospectus for contractual waivers and expiration dates.
| | ANNUAL CONTRACTUAL
ADVISORY FEE AS A | | COMMITTED NET ANNUAL
OPERATING EXPENSE RATIO CAP | | SIX MONTHS ENDED
JUNE 30, 2022 (UNAUDITED) | |
| | PERCENTAGE OF AVERAGE
NET ASSETS | Investment Class | Service Class | | Net advisory fees | | | Advisory fees waived | |
| Micro-Cap Portfolio | | 1.25%1 | | 1.33%2 | | 1.58%3 | | $ | 836,431 | | | $ | 51,704 | |
| Small-Cap Portfolio | | 1.00% | | 1.08% | | 1.33% | | | 1,263,837 | | | | 83,189 | |
1 The annual contractual advisory fee for Micro-Cap Portfolio was reduced to 1.00% effective July 1, 2022.
2 Micro-Cap Portfolio’s committed net annual operating expense ratio cap was reduced from 1.33% to 1.08% for Investment Class, effective July 1, 2022.
3 Micro-Cap Portfolio’s committed net annual operating expense ratio cap was reduced from 1.58% to 1.33% for Service Class, effective July 1, 2022.
DISTRIBUTOR:
Royce Fund Services, LLC (“RFS”), the distributor of the Trust’s shares, is a wholly owned subsidiary of Royce. RFS is entitled to receive distribution fees from each Fund’s Service Class that are computed daily and payable monthly, at an annual rate of 0.25% of the average net assets of each Class. For the six months ended June 30, 2022, Micro-Cap Portfolio-Service Class recorded distribution fees of $21,061 and Small-Cap Portfolio-Service Class recorded distribution fees of $147,372.
Purchases and Sales of Investment Securities:
For the six months ended June 30, 2022, the costs of purchases and the proceeds from sales of investment securities, other than short-term securities and collateral received for securities loaned, were as follows:
| | | PURCHASES | | | SALES | |
| Micro-Cap Portfolio | | $ | 8,507,705 | | | $ | 27,050,744 | |
| Small-Cap Portfolio | | | 91,407,858 | | | | 186,563,447 | |
Class Specific Expenses:
Class specific expenses were as follows for the six months ended June 30, 2022:
| | | DISTRIBUTION
FEES | | SHAREHOLDER
SERVICING | | SHAREHOLDER
REPORTS | | TRANSFER AGENT
BALANCE CREDITS | | TOTAL | | CLASS LEVEL
EXPENSES
REIMBURSED BY
INVESTMENT
ADVISER |
| Micro-Cap Portfolio – Investment Class | | $ | – | | | $ | 4,325 | | | $ | 6,566 | | | $ | (2 | ) | | $ | 10,889 | | | $ | 10,889 | |
| Micro-Cap Portfolio – Service Class | | | 21,061 | | | | 3,542 | | | | 1,539 | | | | – | | | | 26,142 | | | | 4,547 | |
| | | | 21,061 | | | | 7,867 | | | | 8,105 | | | | (2 | ) | | | | | | | 15,436 | |
| Small-Cap Portfolio – Investment Class | | | – | | | | 3,979 | | | | 7,572 | | | | (2 | ) | | | 11,549 | | | | 11,549 | |
| Small-Cap Portfolio – Service Class | | | 147,372 | | | | 3,591 | | | | 5,113 | | | | (1 | ) | | | 156,075 | | | | 3,774 | |
| | | | 147,372 | | | | 7,570 | | | | 12,685 | | | | (3 | ) | | | | | | | 15,323 | |
| Royce Capital Fund 2022 Semiannual Report to Shareholders | 25 |
Notes to Financial Statements (unaudited) (continued)
Tax Information:
At June 30, 2022, net unrealized appreciation (depreciation) based on identified cost for tax purposes was as follows:
| | | | | | NET UNREALIZED | | GROSS UNREALIZED |
| | TAX BASIS COST | | APPRECIATION (DEPRECIATION) | | Appreciation | (Depreciation) |
| Micro-Cap Portfolio | | $109,608,775 | | | $ 9,138,123 | | | $30,378,667 | | $21,240,544 | |
| Small-Cap Portfolio | | 210,298,285 | | | 12,629,305 | | | 28,659,319 | | 16,030,014 | |
The primary cause of the difference between book and tax basis cost is the timing of the recognition of losses on securities sold.
Subsequent Events:
Subsequent events have been evaluated through the date the financial statements were issued and it has been determined that no events have occurred that require disclosure.
| 26 | Royce Capital Fund 2022 Semiannual Report to Shareholders |
Understanding Your Fund’s Expenses (unaudited)
As a shareholder of a mutual fund, you pay ongoing expenses, including management fees and other Fund expenses including, for some funds, distribution and/or service (12b-1) fees. Using the information below, you can estimate how these ongoing expenses (in dollars) affect your investment and compare them with the ongoing expenses of other funds. You may also incur one-time transaction expenses which are not shown in this section and would result in higher total costs. The example is based on an investment of $1,000 invested at January 1, 2022, and held for the entire six-month period ended June 30, 2022. Service Class shares are generally available only through certain insurance companies who receive service fees from the Fund for services that they perform.
Actual Expenses
The first part of the table below provides information about actual account values and actual expenses. You may use the information in this section, together with the amount you invested, to estimate the expenses that you paid over the period. Simply divide your account value at June 30, 2022, by $1,000 (for example, an $8,600 account value divided by $1,000 = 8.6), then multiply the result by the number under the heading entitled “Expenses Paid During the Period” to estimate the expenses you paid on your account during this period.
Hypothetical Example for Comparison Purposes
The second part of the table below provides information about hypothetical account values and hypothetical expenses based on the Fund’s actual expense ratio and an assumed rate of return of 5% per year before expenses, which is not the Fund’s actual return. The hypothetical account values and expenses may not be used to estimate the actual ending account balance or expenses you paid for the period. You may use this information to compare the ongoing costs of investing in the Fund and other funds. To do so, compare this 5% hypothetical example with the 5% hypothetical examples that appear in the shareholder reports of the other funds.
Please note that the expenses shown in the table are meant to highlight your ongoing costs only and do not reflect any transactional costs, such as sales charges (loads), redemption fees, or exchange fees. Therefore, this section is useful in comparing ongoing costs only, and will not help you determine the relative total costs of owning different funds. In addition, if these transactional costs were included, your costs would have been higher.
| | | ACTUAL | HYPOTHETICAL (5% PER YEAR BEFORE EXPENSES) |
| | | Beginning Account
Value 1/1/22 | Ending Account Value
6/30/22 | Expenses Paid During
the Period1 | Beginning Account
Value 1/1/22 | Ending Account Value
6/30/22 | Expenses Paid During
the Period1 | Annualized Expense
Ratio2 |
Investment Class
Micro-Cap Portfolio | | $ | 1,000.00 | | $ | 719.03 | | $ | 5.67 | | $ | 1,000.00 | | $ | 1,018.20 | | $ | 6.66 | | | 1.33 | % |
| Small-Cap Portfolio | | | 1,000.00 | | | 809.78 | | | 4.85 | | | 1,000.00 | | | 1,019.44 | | | 5.41 | | | 1.08 | % |
Service Class Micro-Cap Portfolio | | | 1,000.00 | | | 718.16 | | | 6.73 | | | 1,000.00 | | | 1,016.96 | | | 7.90 | | | 1.58 | % |
| Small-Cap Portfolio | | | 1,000.00 | | | 807.61 | | | 5.96 | | | 1,000.00 | | | 1,018.20 | | | 6.66 | | | 1.33 | % |
| 1 | Expenses are equal to the Fund’s annualized expense ratio multiplied by the average account value for the period, multiplied by 181 days in the most recent fiscal half-year divided by 365 days (to reflect the half-year period). This information does not include fees or expenses of the variable annuity contracts investing in the Fund. |
| 2 | Annualized expense ratio used to derive figures in the table is based on the most recent fiscal half-year. |
Royce Capital Fund 2022 Semiannual Report to Shareholders | 27
Trustees and Officers
All Trustees and Officers may be reached c/o The Royce Funds, 745 Fifth Avenue, New York, NY 10151
Christopher D. Clark, Trustee1, President
Age: 57 | Number of Funds Overseen: 16 | Tenure: Since 2014
Principal Occupation(s) During Past Five Years: Chief Executive Officer (since July 2016), President (since July 2014), Co-Chief Investment Officer (since January 2014), Managing Director of Royce, a Member of the Board of Managers of Royce, having been employed by Royce since May 2007.
Patricia W. Chadwick, Trustee
Age: 73 | Number of Funds Overseen: 16 | Tenure: Since 2009
Non-Royce Directorships: Trustee of Voya Mutual Funds
Principal Occupation(s) During Past 5 Years: Consultant and President, Ravengate Partners LLC (since 2000). Formerly Director, Wisconsin Energy Corp. (until 2022).
Christopher C. Grisanti, Trustee
Age: 60 | Number of Funds Overseen: 16 | Tenure: Since 2017
Non-Royce Directorships: None
Principal Occupation(s) During Past Five Years: Chief Equity Strategist and Senior Portfolio Manager, MAI Capital Management LLC (investment advisory firm) (since May 2020). Formerly Co-Founder and Chief Executive Officer, Grisanti Capital Management LLC (investment advisory firm) (from 1999 to 2020); Director of Research and Portfolio Manager, Spears Benzak, Salomon & Farrell (from 1994 to 1999); and Senior Associate, Simpson, Thacher & Bartlett (law firm) (from 1988 to 1994).
Cecile B. Harper, Trustee
Age: 59 | Number of Funds Overseen: 16 | Tenure: Since 2020
Non-Royce Directorships: None
Principal Occupation(s) During Past Five Years: Chief Financial Officer and Chief Operating Officer, College Foundation at the University of Virginia (since October 2019). Formerly Board Member, Pyramid Peak Foundation (January 2012 to 2022); Board Member, Regional One Health Foundation (from June 2013 to September 2019); and Principal, Southeastern Asset Management (from December 1993 to September 2019).
Arthur S. Mehlman, Trustee
Age: 80 | Number of Funds Overseen: 16 | Tenure: Since 2004
Non-Royce Directorships: None
Principal Occupation(s) During Past Five Years: Director, University of Maryland Foundation (non-profits). Formerly Director/Trustee, registered investment companies constituting the Legg Mason Funds (from 2002 to June 2021); Director, The League for People with Disabilities, Inc. (from June 2003 to June 2018); Director, Municipal Mortgage & Equity, LLC (from October 2004 to April 2011); Director, University of Maryland College Park Foundation (non-profit) (from 1998 to 2005); Director, Maryland Business Roundtable for Education (from July 1984 to June 2002); and Partner, KPMG LLP (international accounting firm) (from 1972 to 2002)
G. Peter O’Brien, Trustee
Age: 76 | Number of Funds Overseen: 75 | Tenure: Since 2001
Non-Royce Directorships: Director/Trustee of registered investment companies constituting the 59 Legg Mason Funds.
Principal Occupation(s) During Past Five Years: Trustee Emeritus, Colgate University (since 2005); and Emeritus Board Member, Hill House, Inc. (since 2019). Formerly Director, TICC Capital Corp. (from 2003-2017); Trustee, Colgate University (from 1996 to 2005); President, Hill House, Inc. (from 2001 to 2005); Board Member, Hill House, Inc. (from 1999 to 2019); Director, Bridges School (from 2006 to 2018); and Managing Director/Equity Capital Markets Group, Merrill Lynch & Co. (from 1971 to 1999).
Michael K. Shields, Trustee
Age: 64 | Number of Funds Overseen: 16 | Tenure: Since 2015
Non-Royce Directorships: None
Principal Occupation(s) During Past Five Years: President and Chief Executive Officer, Piedmont Trust Company (privately-owned North Carolina trust company) (since February 2012); Chairman, UNC Charlotte Investment Fund Board (since February 2016); and Chairman, Halftime Carolinas Board (since February 2011). Formerly Owner, Shields Advisors (investment consulting firm) (from April 2010 to June 2012); President and Chief Executive Officer, Eastover Capital Management (2005-2007); President and Chief Executive Officer, Campbell, Cowperthwait (investment subsidiary of U.S. Trust Corporation) (1997-2002); and equity portfolio manager and co-manager of Quality Growth Team, Scudder, Stevens and Clark (1992-1997).
Francis D. Gannon, Vice President
Age: 54 | Tenure: Since 2014
Principal Occupation(s) During Past Five Years: Co-Chief Investment Officer (since January 2014) and Managing Director of Royce, having been employed by Royce since September 2006.
Daniel A. O’Byrne, Vice President
Age: 60 | Tenure: Since 1994
Principal Occupation(s) During Past Five Years: Principal and Vice President of Royce, having been employed by Royce since October 1986.
Peter K. Hoglund, Treasurer
Age: 56 | Tenure: Since 2015
Principal Occupation(s) During Past Five Years: Chief Financial Officer, Chief Administrative Officer, and Managing Director of Royce, having been employed by Royce since December 2014. Prior to joining Royce, Mr. Hoglund spent more than 20 years with Munder Capital Management in Birmingham, MI, serving as Managing Director and Chief Financial Officer and overseeing all financial aspects of the firm. He began his career at Munder as a portfolio manager.
John E. Denneen, Secretary and Chief Legal Officer
Age: 55 | Tenure: 1996-2001 and Since 2002
Principal Occupation(s) During Past Five Years: General Counsel, Managing Director, and, since June 2015, a Member of the Board of Managers of Royce. Chief Legal and Compliance Officer and Secretary of Royce.
John P. Schwartz, Chief Compliance Officer
Age: 51 | Tenure: Since 2022
Principal Occupation(s) During Past Five Years: Chief Compliance Officer of The Royce Funds (since May 2022) and Associate General Counsel and Compliance Officer of Royce (since March 2013).
1 Interested Trustee.
Trustees will hold office until their successors have been duly elected and qualified or until their earlier resignation or removal. The Statement of Additional Information, which contains additional information about the Trust’s trustees and officers, is available and can be obtained without charge at www.royceinvest.com or by calling (800) 221-4268.
28 | Royce Capital Fund 2022 Semiannual Report to Shareholders
Board Approval of Investment Advisory Agreement
At meetings held on June 9-10, 2022, the Board of Trustees of Royce Capital Fund (the “Board”), including all of the non-interested trustees, approved the continuation of the investment advisory agreement in place (the “Agreement”) between Royce & Associates, LP (“Royce”) and Royce Capital Fund (“RCF”) relating to each of Royce Micro-Cap Portfolio and Royce Small-Cap Portfolio (each, a “Fund” and together, the “Funds”). In reaching these decisions, the Board reviewed the materials provided by Royce, which included, among other things, information prepared internally by Royce and independently by Broadridge Financial Solutions, Inc. (“Broadridge”) using the database and methodology of Morningstar Associates, LLC (“Morningstar”) containing detailed investment advisory fee, expense ratio, and investment performance comparisons for each Fund with other mutual funds in its “peer group” and “category”, information regarding the past performance of the Funds and other registered investment companies managed by Royce and a memorandum outlining the legal duties of the Board prepared by independent counsel to the non-interested trustees. Royce also provided the trustees with an analysis of its profitability with respect to providing investment advisory services to each of the Funds. In addition, the Board took into account information furnished throughout the year at regular Board meetings, including reports on investment performance, shareholder services, distribution fees and expenses, regulatory compliance, brokerage commissions and research, brokerage and other execution products and services provided to the Funds. The Board also considered other matters it deemed important to the approval process such as allocation of brokerage commissions, “soft dollar” research services Royce receives, payments made to affiliates of Royce, as well as payments made by Royce, relating to distribution of Fund shares, and other direct and indirect benefits to Royce and its affiliates, from their relationship with the Funds. The trustees also met throughout the year with investment advisory personnel from Royce. The Board also noted Royce’s efforts to provide enhanced analytical tools to its investment staff along with the ongoing meetings conducted by Royce’s Co-Chief Investment Officers with portfolio managers experiencing performance challenges in an attempt to address such challenges. The Board, in its deliberations, recognized that, for many of the Funds’ shareholders, the decision to purchase Fund shares included a decision to select Royce as the investment adviser and that there was a strong association in the minds of Fund shareholders between Royce and each Fund. In considering factors relating to the approval of the continuance of the Agreement, the non-interested trustees received assistance and advice from, and met separately with, their independent legal counsel. While continuation of the investment advisory and administrative arrangements for each Fund was considered at the same Board meeting, the trustees considered the circumstances and interests of each Fund separately. Among other factors, the trustees noted that they considered the following:
The nature, extent and quality of services provided by Royce
The Board considered the following factors to be of fundamental importance to their consideration of whether to approve the continuance of the Agreement: (i) Royce’s more than 45 years of value investing experience and track record; (ii) the history of long-tenured Royce portfolio managers managing the Funds; (iii) Royce’s focus on small-cap and micro-cap value investing; (iv) the consistency of Royce’s approach to managing each Fund, other open-end mutual funds, and closed-end funds over more than 45 years; (v) the integrity and high ethical standards adhered to at Royce; (vi) Royce’s specialized experience in the area of trading small- and micro-cap securities; (vii) Royce’s historical ability to attract and retain portfolio management, research, and analytical talent (and, in this regard, considered the effort and resources Royce had committed to acquiring portfolio management, research, and analytical talent during the preceding few years); and (viii) Royce’s focus on shareholder interests as exemplified by capping expenses on smaller funds and providing expansive shareholder reporting and communications. The Board reviewed the services that Royce provides to the Funds, including, but not limited to, managing each Fund’s investments in accordance with the stated policies of each Fund. The Board considered the fact that Royce provided certain administrative services to the Funds at cost pursuant to the Administration Agreement between Royce and RCF, on behalf of each Fund. The Board determined that the services to be provided to each Fund by Royce would be the same as those that it previously provided to each Fund. The Board also took into consideration the histories, reputations and backgrounds of Royce’s portfolio managers for each Fund, finding that these would likely have an impact on the continued success of such Fund. The Board concluded that the investment advisory services provided by Royce to each Fund compared favorably to services provided by Royce to other Royce client accounts, including other funds, in both nature and quality, and that the scope of services provided by Royce continues to be suitable for each Fund.
Investment performance of the Funds and Royce
Royce generally emphasizes a risk-averse approach in managing such funds. In light of that approach, the trustees believe that risk-adjusted performance continues to be the most appropriate measure of each Fund’s investment performance. One measure of risk-adjusted performance the trustees have historically used in their review of each Fund’s performance is the Sharpe Ratio. The Sharpe Ratio is a risk-adjusted measure of performance developed by Nobel Laureate William Sharpe. It is calculated by dividing a fund’s annualized excess returns by its annualized standard deviation to determine reward per unit of risk. The higher the Sharpe Ratio, the better a fund’s historical risk-adjusted performance. The Board attaches primary importance to risk-adjusted performance over relatively long periods of time, typically 3 to 10 years, because such periods tend to encompass different market environments and cycles, unlike shorter time periods.
Following a 2020 that was fraught with volatility and extremes as a result of the Covid pandemic, the Board noted that 2021 was a year of decelerating optimism for many small-cap investors, as performance momentum slowed as the weeks passed between April and December. After beginning the year with a 12.7% increase in the first quarter, the small-cap Russell 2000 Index gained only 1.9% from the second through the fourth quarter of 2021. When all was said and done, the small-cap index was up 14.8% for the calendar year. Within the small-cap market, the Board noted that small-cap value stocks outperformed small-cap growth stocks (rising 28.3% and 2.8%, respectively) over the period. The trustees further noted that Royce Micro-Cap Portfolio (“RCM”) ranked within the 1st, 2nd, and 2nd Sharpe Ratio quartiles in its Morningstar category for the 1-, 3-, and 5-year periods, respectively, ended December 31, 2021, but that Royce Small-Cap Portfolio (“RCS”) ranked within the 4th Sharpe Ratio quartile in its Morningstar category during such periods.
A large portion of this post-2008 market period was marked by historically low interest rates and significant U.S. Federal Reserve market intervention. During this period, highly leveraged, non-earning companies and yield-oriented securities (e.g., master limited partnerships, real estate investment trusts, and utilities) generally outperformed those companies with more conservative balance sheets, low leverage, the ability to generate and effectively allocate free cash flow, and strong returns on invested capital and cyclical companies, generally favored by the series. The Board noted that each Fund ranked within the 4th Sharpe Ratio quartile in its Morningstar category for the 10-year period ended December 31, 2021.
In addition to the relative risk–adjusted performance of each Fund, the Board also reviewed and considered each Fund’s absolute total returns, down market performance, and long-term performance records over periods of 10 years or longer. The Board noted that Royce manages a number of funds that invest in micro-cap and small-cap
Royce Capital Fund 2022 Semiannual Report to Shareholders | 29
Board Approval of Investment Advisory Agreement (continued)
issuers, many of which had outperformed their benchmark indices and their competitors during the periods prior to the U.S. Federal Reserve’s near zero interest rate policy and related market interventions that followed the 2008 financial crisis as well as in more recent periods. Although the Board recognized that past performance is not necessarily an indicator of future results, it found that Royce had the necessary qualifications, experience and track record in managing equity mutual funds to manage each Fund. The Board determined that Royce continues to be an appropriate investment adviser for each Fund.
Cost of the services provided and profits realized by Royce from its relationship with each Fund
The Board considered the cost of the services provided by Royce and the profits realized by Royce from its relationship with each Fund. As part of the analysis, the Board discussed with Royce its methodology in allocating its costs to each Fund and concluded that Royce’s allocations were reasonable. The Board concluded that Royce’s profits with respect to each Fund during the year ended December 31, 2021, were reasonable in relation to the nature and quality of services provided.
The extent to which economies of scale would be realized as the Funds grow and whether fee levels would reflect such economies of scale
While acknowledging that the presence or absence of economies of scale in fund management businesses can be debated and is in any event difficult to measure and directly assess, the Board considered whether there have been economies of scale in respect of the management of each Fund, whether each Fund has appropriately benefited from any economies of scale and whether there is potential for realization of any further economies of scale. The Board noted the time and effort involved in managing portfolios of small- and micro-cap stocks and that they did not involve the same efficiencies as do portfolios of large-cap stocks. The Board concluded that the current fee structure for each Fund was reasonable, that shareholders sufficiently participated in economies of scale (while again noting the various potential issues with assessing such economies of scale both in general and under the facts at hand) and that no changes were currently necessary.
Comparison of services to be rendered and fees to be paid to those under other investment advisory contracts, such as contracts of the same and other investment advisers or other clients
The Board reviewed the investment advisory fee paid by each Fund and compared both the services to be rendered and the fees to be paid under the Agreement to other contracts of Royce and to contracts of other investment advisers to registered investment companies investing in small- and micro-cap stocks, as provided by Broadridge. The Board noted that the contractual advisory fee rate for each Fund exceeded the median of its Broadridge-assigned peers. The Board noted the importance of the net annual operating expense ratio in measuring a fund’s efficiency, particularly in light of the variations in the mutual fund industry as to which entity is responsible for particular types of expenses. It was noted that RCS’s net annual operating expense ratio of 1.08% placed in the 2nd quartile, 16 basis points lower than the median of the peer group assigned by Broadridge and 3 basis points lower than the average expense ratio for the 222 small-cap funds in the Morningstar small-cap category (oldest share class only, non-institutional, non-index, non-ETF funds with Rule 12b-1 fees of 0.25% or less). The Board further noted that RCM’s net annual operating expense ratio of 1.33% placed in the 3rd quartile, 3 basis points higher than the median of the peer group assigned by Broadridge, primarily due to its higher contractual investment advisory fee rate as compared to such peer group median. The trustees additionally noted: (i) Royce’s proposal to reduce RCM’s contractual investment advisory fee rate from 1.25% to 1.00% of its average daily net assets, which proposal was approved by the Board; (ii) RCM’s net annual operating expense ratio would have been lower than the peer group median had such reduced contractual investment advisory fee rate been in effect for the entire calendar year ended December 31, 2021; and (iii) such reduced contractual investment advisory fee rate, which is scheduled to go into effect as of July 1, 2022, should help to reduce RCM’s net annual operating expense ratio for the calendar year ending December 31, 2022.
The Board also noted that Royce manages each Fund in an active fashion. The industry accepted metric for measuring how actively an equity portfolio is managed is called “active share.” In particular, active share measures how much the holdings of an equity portfolio differ from the holdings of its appropriate passive benchmark index. At the extremes, a portfolio with no holdings in common with the benchmark would have 100% active share, while a portfolio that is identical to the benchmark would have 0% active share. Royce presented several analyses to the Board which demonstrated that mutual funds with high active share scores had higher expense ratios than mutual funds with lower active share scores due to the resources required for the active management of those funds. The Board noted that the active shares for RCM and RCS were 91% and 96%, respectively, for the calendar year ended December 31, 2021.
The Board further noted that Royce had, from time to time, waived advisory fees in order to maintain expense ratios at competitive levels. The Board also considered fees charged by Royce to institutional and other clients and noted that, given the greater level of services that Royce provides to registered investment companies such as the Funds as compared to other accounts, each Fund’s advisory fees compared favorably to these other accounts.
No single factor was cited as determinative to the decision of the Board. Rather, after weighing all of the considerations and conclusions discussed above, the entire Board, including all of the non-interested trustees, determined to approve the continuation of the Agreement, concluding that continuation of the Agreement is in the best interest of the shareholders of each Fund and that each Fund’s investment advisory fee rate is reasonable in relation to the services provided.
30 | Royce Capital Fund 2022 Semiannual Report to Shareholders
Liquidity Risk Management Program
Liquidity Risk Management Program
The Securities and Exchange Commission adopted Rule 22e-4 under the Investment Company Act of 1940 (the “Liquidity Rule”) to promote effective liquidity risk management throughout the open-end investment company industry, thereby reducing the risk that funds will be unable to meet their redemption obligations and mitigating dilution of the interests of fund shareholders. As required by the Liquidity Rule, Royce Capital Fund (the “Trust”) adopted and implemented a written Liquidity Risk Management Program (as amended from time to time, the “LRMP”) which took effect on December 1, 2018.
The LRMP is designed to assess and manage the liquidity risk of each of Royce Micro-Cap Portfolio and Royce Small-Cap Portfolio (each, a “Fund” and together, the “Funds”), taking into consideration each Fund’s: (i) investment strategy and the liquidity of its portfolio investments during normal and reasonably foreseeable stressed conditions; (ii) short and long-term cash flow projections; (iii) holdings of cash and cash equivalents; and (iv) access to other funding sources, including custodian overdrafts and the Funds’ line of credit. In this context, liquidity risk refers to the risk that a Fund could not meet requests to redeem its shares without significant dilution of remaining investors’ interests in the Fund.
The Board of Trustees of the Trust (the “Board”) approved the designation of the Chief Risk Officer of Royce Investment Partners (“Royce”) as the administrator of the LRMP (in such capacity, the “Administrator”). The Administrator reports directly to the Board and serves at its pleasure in her capacity as Administrator. Such person also reports directly to Royce’s Chief Executive Officer in her capacity as Royce’s Chief Risk Officer. The members of Royce’s Risk Management Committee and its Legal & Compliance Department serve the Administrator in an advisory capacity. The Administrator may also consult with Royce’s portfolio management, administration, and trading personnel to the extent such person deems it necessary or appropriate to carry out the duties assigned to the Administrator under the LRMP. The Trust has retained a third-party liquidity vendor that performs various functions in connection with the administration of the LRMP, including classifying the liquidity of each Fund investment.
In accordance with the requirements of the Liquidity Rule and the LRMP, each Fund must classify each of its investments into one of four liquidity categories described below based on a determination of a reasonable expectation for how long it would take to convert the investment to cash (or sell or dispose of the investment) without significantly changing its market value.
| • | Highly liquid investments – cash or convertible to cash within three business days or less. |
| • | Moderately liquid investments – convertible to cash in three to seven calendar days. |
| • | Less liquid investments – can be sold or disposed of, but not settled, within seven calendar days. |
| • | Illiquid investments – cannot not be sold or disposed of within seven calendar days. |
In addition, the LRMP prohibits a Fund from acquiring any illiquid investment if, immediately after such acquisition, it would have invested more than 15% of its net assets in illiquid investments. Liquidity classification determinations take into account a variety of factors, including various market, trading and investment-specific considerations, as well as market depth, and generally utilize analysis from the third-party liquidity vendor.
Each Fund has been classified as a “primarily highly liquid fund” under the LRMP. For these purposes, a primarily highly liquid fund must hold more than 50% of its net assets in highly liquid investments. A Fund would cease to be a primarily highly liquid fund if its highly liquid investments fell to 50% or less of its net assets as of the end of any calendar month.
The Administrator presented a report to the Board at its meeting on February 18, 2022 that addressed the adequacy and effectiveness of the LRMP during the period January 1, 2021 to December 31, 2021 (the “covered period”). Among other things, the report provided summary information regarding overall market liquidity and the Funds’ compliance with various liquidity-related requirements along with examples of how the Administrator, Royce’s Risk Management Committee, and the relevant portfolio managers monitored and reacted to changes in liquidity profiles during the covered period. The report also addressed certain enhancements that were made to the methodology used for calculating each Fund’s reasonable anticipated trade size, an important metric used in evaluating each Fund’s potential liquidity risk. The report concluded that:
| • | each Fund remained a primarily highly liquid fund during the covered period; |
| • | neither Fund breached the 15% limit on illiquid investments during the covered period; |
| • | the LRMP remains reasonably designed and implemented to assess and manage each Fund’s liquidity risk; and |
| • | each Fund was able to meet requests for redemption without significant dilution of remaining investors’ interests in the Fund during the covered period. |
No assurance can be given that the LRMP will achieve its objectives in the future. Please refer to the Trust’s statutory prospectus for more information regarding each Fund’s exposure to liquidity risk and other principal risks and a description of how the Funds expect to satisfy redemption requests.
Royce Capital Fund 2021 Semiannual Report to Shareholders | 31
Notes to Performance and Other Important Information
The thoughts expressed in this report concerning recent market movements and future prospects for small company stocks are solely the opinion of Royce at June 30, 2022, and, of course, historical market trends are not necessarily indicative of future market movements. Statements regarding the future prospects for particular securities held in the Funds’ portfolios and Royce’s investment intentions with respect to those securities reflect Royce’s opinions as of June 30, 2022, and are subject to change at any time without notice. There can be no assurance that securities mentioned in this report will be included in any Royce-managed portfolio in the future.
Sector weightings are determined using the Global Industry Classification Standard (“GICS”). GICS was developed by, and is the exclusive property of, Standard & Poor’s Financial Services LLC (“S&P”) and MSCI Inc. (“MSCI”). GICS is the trademark of S&P and MSCI. “Global Industry Classification Standard (GICS)” and “GICS Direct” are service marks of S&P and MSCI.
All indexes referenced are unmanaged and capitalization weighted. Each index’s returns include net reinvested dividends and/or interest income. Frank Russell Company (“Russell”) is the source and owner of the trademarks, service marks and copyrights related to the Russell Indexes. Russell® is a trademark of Frank Russell Company. Neither Russell nor its licensors accept any liability for any errors or omissions in the Russell Indexes and/or Russell ratings or underlying data and no party may rely on any Russell Indexes and/or Russell ratings and/or underlying data contained in this communication. No further distribution of Russell Data is permitted without Russell’s express written consent. Russell does not promote, sponsor or endorse the content of this communication. The Russell 2000 is an index of domestic small-cap stocks. It measures the performance of the 2,000 smallest publicly traded U.S. companies in the Russell 3000 Index. The Russell 2000 Value and Growth Indexes consist of the respective value and growth stocks within the Russell 2000 as determined by Russell Investments. The Russell Microcap Index includes 1,000 of the smallest securities in the small-cap Russell 2000 Index along with the next smallest eligible securities as determined by Russell. The Russell 1000 Index is an index of domestic large-cap stocks. It measures the performance of the 1,000 publicly traded U.S. companies in the Russell 3000 Index. Securities are weighted based on their style score. Source: MSCI. MSCI makes no express or implied warranties or representations and shall have no liability whatsoever with respect to any MSCI data contained herein. The MSCI data may not be further redistributed or used as a basis for other indexes or any securities or financial products. This material is not approved, endorsed, reviewed or produced by MSCI. None of the MSCI data is intended to constitute investment advice or a recommendation to make (or refrain from making) any kind of investment decision and may not be relied on as such. The MSCI ACWI Small Cap Index is an unmanaged, capitalization-weighted index of global small-cap stocks. The MSCI ACWI ex USA Small Cap Index is an unmanaged, capitalization weighted index of global small-cap stocks, excluding the United States. The MSCI Emerging Markets Index is an unmanaged, capitalization-weighted index of stocks in emerging markets countries. The CBOE S&P 500 Volatility Index (VIX) measures market expectations of near-term volatility conveyed by S&P 500 stock index option prices. It is the square root of the risk-neutral expectation of the S&P 500 variance over the next 30 calendar days and is quoted as an annualized standard deviation. The Center for Research in Securities Prices (CRSP) equally divides the companies listed on the NYSE into 10 deciles based on market capitalization. Deciles 1-5 represent the largest domestic equity companies and Deciles 6-10 represent the smallest. CRSP then sorts all listed domestic equity companies based on these market cap ranges. By way of comparison, the CRSP 1-5 would have similar capitalization parameters to the S&P 500 and the CRSP 6-10 would have similar capitalization parameters to those of the Russell 2000. The performance of an index does not represent exactly any particular investment, as you cannot invest directly in an index. The Purchasing Managers’ Index (PMI) is an index of the prevailing direction of economic trends in the manufacturing and service sectors. The purpose of the PMI is to provide information about current and future business conditions to company decision makers, analysts, and investors. The performance of an index does not represent exactly any particular investment, as you cannot invest directly in an index. Returns for the market indexes used in this report were based on information supplied to Royce by Russell Investments. Royce has not independently verified the above described information.
The Price-Earnings, or P/E, Ratio is calculated by dividing a company’s share price by its trailing 12-month earnings-per-share (EPS). The Price-to-Book, or P/B, Ratio is calculated by dividing a company’s share price by its book value per share. Standard deviation is a statistical measure within which a fund’s total returns have varied over time. The greater the standard deviation, the greater a fund’s volatility. Beta is a measure of the volatility or risk of an investment compared to the market as a whole. Alpha describes an investment strategy’s ability to beat the market. The Morningstar Style Map uses proprietary scores of a stock’s value and growth characteristics to determine its placement in one of the five categories listed on the horizontal axis. These characteristics are then compared to those of other stocks within the same market capitalization band. Each is scored from zero to 100 for both value and growth attributes. The value score is subtracted from the growth score to determine the overall style score. For the vertical, market cap axis, Morningstar subdivides into size groups. Giant-cap stocks are defined as those that account for the top 40% of the capitalization of each style zone; large-cap stocks represent the next 30%; mid-cap stocks the next 20%; small-cap stocks the next 7%; micro-cap stocks the smallest 3%. Standard deviation is a statistical measure within which a fund’s total returns have varied over time. The greater the standard deviation, the greater a fund’s volatility. The value score is subtracted from the growth score to determine the overall style score. For the Morningstar Small Blend Category: © 2022 Morningstar. All Rights Reserved. The information regarding the category in this piece is: (1) is proprietary to Morningstar and/or its content providers; (2) may not be copied or distributed; and (3) is not warranted to be accurate, complete or timely. Neither Morningstar nor its content providers are responsible for any damages or losses arising from any use of this information. Cyclical and Defensive are defined as follows: Cyclical: Communication Services, Consumer Discretionary, Energy, Financials, Industrials, Information Technology, and Materials. Defensive: Consumer Staples, Health Care, Real Estate, and Utilities. The Royce Funds is a service mark of The Royce Funds. Distributor: Royce Fund Services, LLC.
Royce Capital Fund–Micro-Cap Portfolio invests primarily in securities of micro-cap companies and Royce Capital Fund–Small-Cap Portfolio invests primarily in securities of small-cap companies. Investments in these types of companies may involve considerably more risk than investments in securities of larger-cap companies. (Please see “Primary Risks for Fund Investors” in the prospectus.) Royce Capital Fund–Micro-Cap Portfolio and Royce Capital Fund–Small-Cap Portfolio may each invest up to 25% its assets in foreign securities that may involve political, economic, currency, and other risks not encountered in U.S. investments. (Please see “Investing in Foreign Securities” in the prospectus.) A Fund that invests a significant portion of its assets in a limited number of stocks may be subject to considerably more risk than a more broadly diversified Fund because a decline in the value of any of these stocks would cause that Fund’s overall value to decline to a greater degree. A broadly diversified portfolio does not, however, ensure a profit for a Fund or guarantee against loss. Please read the prospectus carefully before investing or sending money. A copy of the Funds’ current prospectus and a Statement of Additional
32 | Royce Capital Fund 2022 Semiannual Report to Shareholders
Notes to Performance and Other Important Information (continued)
Information may be obtained by calling (800) 221-4268 or by visiting www.royceinvest.com. All publicly released material Fund information is disclosed by the Funds on their website at www.royceinvest.com.
Forward-Looking Statements
This material contains forward-looking statements within the meaning of the Securities Exchange Act of 1934, as amended (the “Exchange Act”), that involve risks and uncertainties, including, among others, statements as to:
| • | the Funds’ future operating results, |
| • | the prospects of the Funds’ portfolio companies, |
| • | the impact of investments that the Funds have made or may make, |
| • | the dependence of the Funds’ future success on the general economy and its impact on the companies and industries in which the Funds invest, and |
| • | the ability of the Funds’ portfolio companies to achieve their objectives. |
This review and report use words such as “anticipates,” “believes,” “expects,” “future,” “intends,” and similar expressions to identify forward-looking statements. Actual results may differ materially from those projected in the forward-looking statements for any reason.
The Royce Funds have based the forward-looking statements included in this review and report on information available to us on the date of the report, and we assume no obligation to update any such forward-looking statements. Although The Royce Funds undertake no obligation to revise or update any forward-looking statements, whether as a result of new information, future events, or otherwise, you are advised to consult any additional disclosures that we may make through future shareholder communications or reports.
Proxy Voting
A copy of the policies and procedures that The Royce Funds use to determine how to vote proxies relating to portfolio securities and information regarding how each of The Royce Funds voted proxies relating to portfolio securities during the most recent 12-month period ended June 30 is available, without charge, on The Royce Funds’ website at www.royceinvest.com, by calling (800) 221-4268 (toll-free), and on the website of the Securities and Exchange Commission (“SEC”) at www.sec.gov.
Disclosure of Portfolio Holdings
The Funds’ complete portfolio holdings are also available on Exhibit F to Form N-PORT, which filings are made with the SEC within 60 days of the end of the first and third fiscal quarters. The Funds’ Form N-PORT filings are available on the SEC’s website at http://www.sec.gov.
Royce Capital Fund 2022 Semiannual Report to Shareholders | 33

About Royce Investment Partners
Unparalleled Knowledge + Experience
Pioneers in small-cap investing, with 45+ years
of experience, depth of knowledge, and focus.
Independent Thinking
The confidence to go against consensus, the insight
to uncover opportunities others might miss, and the
tenacity to stay the course through market cycles.
Specialized Approaches
U.S., international, and global investment strategies
that pursue approaches with different risk profiles.
Unwavering Commitment
Our team of 17 portfolio managers has significant
personal investments in the strategies they manage.
Contact Us
GENERAL INFORMATION
Additional Report Copies and Prospectus Inquiries
(800) 221-4268
RCF-REP-0622
Item 2. Code(s) of Ethics. Not applicable to this semi-annual report.
Item 3. Audit Committee Financial Expert. Not applicable to this semi-annual report.
Item 4. Principal Accountant Fees and Services. Not applicable to this semi-annual report.
Item 5. Audit Committee of Listed Registrants. Not Applicable.
Item 6. Investments.
(a) See Item 1.
(b) Not Applicable.
Item 7. Disclosure of Proxy Voting Policies and Procedures for Closed-End Management Investment Companies. Not Applicable.
Item 8. Portfolio Managers of Closed-End Management Investment Companies. Not Applicable.
Item 9. Purchases of Equity Securities by Closed-End Management Investment Company and Affiliated Purchasers. Not Applicable.
Item 10. Submission of Matters to a Vote of Security Holders. Not Applicable.
Item 11. Controls and Procedures.
(a) Disclosure Controls and Procedures. The Principal Executive and Financial Officers concluded that the Registrant’s Disclosure Controls and Procedures are effective based on their evaluation of the Disclosure Controls and Procedures as of a date within 90 days of the filing date of this report.
(b) Internal Control over Financial Reporting. There were no significant changes in Registrant’s internal control over financial reporting or in other factors that could significantly affect this control subsequent to the date of the evaluation, including any corrective actions with regard to significant deficiencies and material weaknesses during the period covered by this report.
Item 12. Exhibits. Attached hereto.
(a)(1) Not applicable to this semi-annual report.
(a)(2) Separate certifications by the Registrant’s Principal Executive Officer and Principal Financial Officer as required by Rule 30a-2(a) under the Investment Company Act of 1940.
(a)(3) Not Applicable.
(b) Separate certifications by the Registrant’s Principal Executive Officer and Principal Financial Officer, pursuant to Section 906 of the Sarbanes-Oxley Act of 2002 and required by Rule 30a-2(b) under the Investment Company Act of 1940.
Pursuant to the requirements of the Securities Exchange Act of 1934 and the Investment Company Act of 1940, the registrant has duly caused this report to be signed on its behalf by the undersigned, thereunto duly authorized.
ROYCE CAPITAL FUND
| BY: | /s/ Christopher D. Clark | |
Christopher D. Clark
President
Date: August 11, 2022
Pursuant to the requirements of the Securities Exchange Act of 1934 and the Investment Company Act of 1940, this report has been signed below by the following persons on behalf of the registrant and in the capacities and on the dates indicated.
| ROYCE CAPITAL FUND | | ROYCE CAPITAL FUND |
| | | | | |
| BY: | /s/ Christopher D. Clark | | BY: | /s/ Peter K. Hoglund |
| Christopher D. Clark | | Peter K. Hoglund |
| President | | Chief Financial Officer |
| | | | | |
| Date: August 11, 2022 | | Date: August 11, 2022 |