UNITED STATES
SECURITIES AND EXCHANGE COMMISSION
Washington, D.C. 20549
FORM N-CSR
CERTIFIED SHAREHOLDER REPORT
OF
REGISTERED MANAGEMENT INVESTMENT COMPANIES
Investment Company Act file number: 811-07537
Name of Registrant: Royce Capital Fund
Address of Registrant: 1414 Avenue of the Americas
New York, NY 10019
| Name and address of agent for service: | John E. Denneen, Esquire 1414 Avenue of the Americas New York, NY 10019 |
Registrant’s telephone number, including area code: (212) 486-1445
Date of fiscal year end: December 31
Date of reporting period: January 1, 2004 - June 30, 2004
Item 1: Reports to Shareholders
| 2004 Semiannual Report | ||
| |
| TheRoyceFundsSM VALUE INVESTING IN SMALL COMPANIES FOR MORE THAN 25 YEARS ROYCE CAPITAL FUND |
MICRO-CAP PORTFOLIO SMALL-CAP PORTFOLIO | ||
SEMIANNUAL REPORT REFERENCE GUIDE
| LETTER TO OUR SHAREHOLDERS: THE IMPERFECT STORM | 2 | ||
| PERFORMANCE AND PORTFOLIO REVIEWS | 4 | ||
| NOTES TO PERFORMANCE AND FORWARD–LOOKING STATEMENTS | 8 | ||
| SCHEDULES OF INVESTMENTS AND OTHER FINANCIAL STATEMENTS | 9 | ||
| TRUSTEES AND OFFICERS | 19 | ||
For more than 25 years, our approach has focused on evaluating a company’s current worth — our assessment of what we believe a knowledgeable buyer might pay to acquire the entire company, or what we think the value of the company should be in the stock market. This analysis takes into consideration a number of relevant factors, including the company’s future prospects. We select these securities using a risk-averse value approach, with the expectation that their market prices should increase toward our estimate of their current worth, resulting in capital appreciation for Fund investors. |
LETTER TO OUR SHAREHOLDERS THE IMPERFECT STORM |
Our view is that the most effective way for us to navigate the potentially treacherous waters between the Scylla of rising interest rates and Charybdis of possible inflation is to continue doing what we have always done – search for what we think are financially strong, attractively priced small companies. |
2 | ROYCE CAPITAL FUND SEMIANNUAL REPORT 2004 |
|
We appreciate your continued support. | ||
Sincerely, | ||
 |  |  |
| Charles M. Royce President | W. Whitney George Vice President | Jack E. Fockler, Jr. Vice President |
July 31, 2004 | ||
ROYCE CAPITAL FUND SEMIANNUAL REPORT 2004 | 3 |
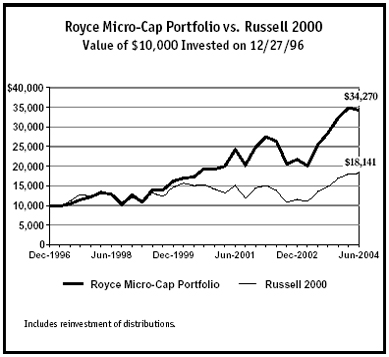
ROYCE CAPITAL FUND — MICRO-CAP PORTFOLIO |
| Average Annual Total Returns Through 6/30/04 | Portfolio Diagnostics | |||
| January — June * | 5.87% | Median Market Capitalization | $261 million | |
| One-Year | 35.01 | Weighted Average P/E Ratio | 19.1x* | |
| Three-Year | 12.32 | Weighted Average P/B Ratio | 1.9x | |
| Five-Year | 19.62 | Weighted Average Yield | 0.3% | |
| Since Inception (12/27/96) | 17.82 | Number of Holdings | 236 | |
| Fund Net Assets | $303 million | |||
| * Not annualized. | * Excludes 28% of portfolio holdings with zero or negative earnings as of 6/30//04. | |||
| MANAGER’S DISCUSSION Royce Capital Fund — Micro-Cap Portfolio (RCM) turned in a respectable performance in the first half. For the year-to-date period ended 6/30/04, the Fund was up 5.9%, trailing its small-cap benchmark, the Russell 2000, which was up 6.8% for the same period. After tearing through the recent market rally at a blistering pace, micro-cap stocks were bound to slow down at some point, and five months of relative underperfomance by a narrow margin versus their small-cap siblings certainly beats a correction. That was the case in 2004’s first half, as micro-cap returns from February through June generally fell behind those of small-cap stocks. Over longer-term and market cycle periods ended 6/30/04, RCM held a performance edge over the small-cap index. From the previous small-cap market peak on 3/9/00, the Fund was up 105.2% versus a gain of 3.3% for the Russell 2000. RCM also outperformed its benchmark for the one-, three-, five-year and since inception (12/27/96) periods ended 6/30/04. The Fund’s average annual total return since inception was 17.8%. 2003 was a year in which investors consistently flocked to more speculative issues and enjoyed double-digit returns. The first half of 2004, on the other hand, generally bestowed favor on higher quality, more liquid companies and produced mostly single-digit positive performances. After leading small-caps (and most other equities) from October 2002 through the end of January 2004, micro-caps ceded leadership to their larger siblings within small-cap in February, though by a small margin through 6/30/04. We expect that this trend will continue at least through the end of the year, as will the choppiness that marked the year’s first six months. However, this should not be construed as dire news for micro-caps or those who invest in them. Small-cap leadership has historically been cyclical, and our own approach to security selection remains firmly rooted in individual company quality. Just as important, our perspective remains focused on the long term. Although gains could be found in many of the Fund’s sectors, holdings in Health and Industrial Products made the largest positive impact on performance in the first half. Substantial gains from energy services companies within the Natural Resources sector were somewhat blunted by losses in the precious metals and mining group. Many metals and mining companies had benefited in 2003 after commodity prices began to recover. The decision of the Chinese government to curb growth, the rally of the US dollar and the anxiety over interest rates all contributed to a correction in commodity prices that in turn hurt stock prices. We see the correction as a temporary phenomenon and still like the longterm prospects for the industry. As for healthcare and energy companies, we still see what we think is solid long-term performance potential in both areas. We increased our positions in those companies that we felt most strongly about, including GulfMark Offshore, Gulf Island Fabrication and Myriad Genetics. All performance information in this Report reflects past performance, is presented on a total return basis and reflects the reinvestment of distributions. Past performance is no guarantee of future results. Investment return and principal value of an investment will fluctuate, so that shares may be worth more or less than their original cost when redeemed. Current performance may be higher or lower than performance quoted. Current month-end performance may be obtained at www.roycefunds.com. |
| 4 | ROYCE CAPITAL FUND SEMIANNUAL REPORT 2004 |
PERFORMANCE AND PORTFOLIO REVIEW |
 | |||
| Top 10 Positions | % of Net Assets | ||
| Exponent | 1.2% | ||
| RC2 Corporation | 1.1 | ||
| Gulf Island Fabrication | 1.1 | ||
| Northern Orion Resources | 1.0 | ||
| Lexicon Genetics | 1.0 | ||
| PLATO Learning | 0.9 | ||
| Trican Well Service | 0.9 | ||
| GulfMark Offshore | 0.9 | ||
| ProAssurance Corporation | 0.9 | ||
| DUSA Pharmaceuticals | 0.8 | ||
| Portfolio Sector Breakdown | % of Net Assets | ||
| Health | 16.7% | ||
| Technology | 16.6 | ||
| Natural Resources | 14.7 | ||
| Industrial Services | 9.5 | ||
| Industrial Products | 7.2 | ||
| Consumer Services | 5.9 | ||
| Financial Intermediaries | 4.8 | ||
| Consumer Products | 4.4 | ||
| Financial Services | 0.6 | ||
| Miscellaneous | 4.7 | ||
| Preferred Stock | 0.2 | ||
| Cash and Cash Equivalents | 14.7 | ||
| GOOD IDEAS THAT WORKED Net Realized and Unrealized Gain Year-to-Date Through 6/30/04 | GOOD IDEAS AT THE TIME Net Realized and Unrealized Loss Year-to-Date Through 6/30/04 | |||
| DUSA Pharmaceuticals | $1,869,585 | Metallica Resources | $1,071,123 | |
| RC2 Corporation | 1,351,148 | Golden Star Resources | 973,707 | |
| Dawson Geophysical | 938,028 | Young Innovations | 677,029 | |
| Input/Output | 934,198 | Curative Health Services | 634,068 | |
| Trican Well Service | 822,890 | White Electronic Designs | 524,129 | |
DUSA Pharmaceuticals — This pharmaceutical company develops drugs and light devices for the treatment and detection of skin diseases. After buying some shares near the firm’s cash value in 2003, we sold shares in April and May as its price climbed. The firm was developing new skin treatments and regained CMS reimbursement. We held a good-sized position at June 30. RC2 Corporation — A series of what we think were intelligent acquisitions expanded the core business of this maker of toys, collectibles and NASCAR vehicle replicas (the firm’s original business). Initially attracted to its low stock price and savvy managers, we like how the firm survived to thrive in a difficult business. | Metallica Resources — The price of this Canadian mineral exploration company not only suffered from the correction in commodity prices but from land-use difficulties through its Mexican subsidiary. Confident in the firm’s long-term prospects, we built our position in the first half. Golden Star Resources — This gold mining company, which bases the bulk of its operations in Ghana, could not avoid the declining prices that tarnished many precious metals businesses. Our view is that the company’s talented management is capable of guiding it through its recent difficulties. We held a significant position at June 30. | |||
| ROYCE CAPITAL FUND SEMIANNUAL REPORT 2004 | 5 |
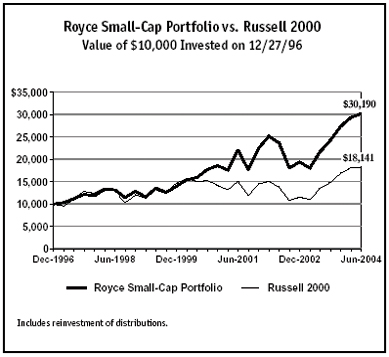
ROYCE CAPITAL FUND — SMALL-CAP PORTFOLIO |
| Average Annual Total Returns Through 6/30/04 | Portfolio Diagnostics | |||
| January – June * | 10.41% | Median Market Capitalization | $844 million | |
| One-Year | 38.99 | Weighted Average P/E Ratio | 17.3x | |
| Three-Year | 10.86 | Weighted Average P/B Ratio | 2.3x | |
| Five-Year | 17.35 | Weighted Average Yield | 0.5% | |
| Since Inception (12/27/96) | 15.84 | Number of Holdings | 81 | |
| * Not annualized. | Fund Net Assets | $79 million | ||
| MANAGER’S DISCUSSION Royce Capital Fund — Small-Cap Portfolio (RCS) enjoyed a strong first half on both a relative and absolute basis. For the year-to-date period ended 6/30/04, the Fund gained 10.4%, ahead of its small-cap benchmark, the Russell 2000, which was up 6.8% for the same period. The effects of better performance from higher quality, more liquid stocks could be seen in RCS’s first-half performance. The recent shift in leadership from micro-cap to small-cap only helped to bolster the Fund’s advantage over its benchmark during market cycle and long-term performance periods. From the previous small-cap market peak on 3/9/00 through 6/30/04, RCS gained 107.5% versus a 3.3% return for the Russell 2000. The Fund also beat the benchmark for the one-, three-, five-year and since inception periods ended 6/30/04. RCS’s average annual total return since inception was 15.8%. During 2004’s first half, quality was king, at least within small-cap and in the context of a low-return environment for equities. But even in a low-return environment, it’s good to be king. The recent move to quality has been of very short duration, lasting only from February through the end of June, but we believe that it marks the beginning of a longer-term trend. During the rally that began on 10/9/02 and that lasted until 1/31/04, not only did small-cap fall behind micro-cap, but companies with earnings trailed those without and businesses that paid dividends posted lower returns than those that did not. However, all three of these trends have reversed since the end of January. After a 16-month period of outperformance, a reversal was not unexpected, and it has so far benefitted several of the Fund’s portfolio holdings, particularly those in Health, the top-performing sector in the first half. Sluggish growth in the vitamin and herbal supplement industry a couple of years ago helped to drop the stock price of nutritional supplement maker Nutraceutical International. Mostly overlooked by Wall Street, its stock looked very inexpensive to us when we first began to buy it late in 2003. Improvement in its business helped its stock price to re-gain its health in 2004’s first half. In spite of solid first-half gains, we held large positions in managed care business Molina Healthcare and staffing services firm Cross Country Healthcare. The expectation of lower energy prices helped to lower the stock prices of oil and natural gas companies in 2003, which prompted us to buy more shares of companies such as Unit Corporation. The firm’s two business units — contract drilling and oil and natural gas exploration — both enjoyed high-octane returns in the first half. We think very highly of its management and were happy to hold a significant position at June 30. We also held significant positions in The Houston Exploration Company and St. Mary Land & Exploration Company. Helped by the recovering economy, companies in the Consumer Services sector made positive contributions to performance, as did many in the Industrial Products sector. We like the long-term prospects in certain businesses in the latter area, so we built our position in steel and construction products maker Gibraltar Steel and held a good-sized position in leading welding and cutting products manufacturer Lincoln Electric Holdings at June 30. All performance information in this Report reflects past performance, is presented on a total return basis and reflects the reinvestment of distributions. Past performance is no guarantee of future results. Investment return and principal value of an investment will fluctuate, so that shares may be worth more or less than their original cost when redeemed. Current performance may be higher or lower than performance quoted. Current month-end performance may be obtained at www.roycefunds.com. |
| 6 | ROYCE CAPITAL FUND SEMIANNUAL REPORT 2004 |
PERFORMANCE AND PORTFOLIO REVIEW |
 | |||
| Top 10 Positions | % of Net Assets | ||
| eFunds Corporation | 2.3% | ||
| Nu Skin Enterprises Cl. A | 2.3 | ||
| Unit Corporation | 2.2 | ||
| West Corporation | 2.0 | ||
| Aspen Insurance Holdings | 1.9 | ||
| Houston Exploration Company (The) | 1.8 | ||
| RC2 Corporation | 1.8 | ||
| Cross Country Healthcare | 1.7 | ||
| Gibraltar Steel | 1.7 | ||
| Ensign Resource Service Group | 1.6 | ||
| Portfolio Sector Breakdown | % of Net Assets | ||
| Health | 16.9% | ||
| Consumer Products | 14.4 | ||
| Natural Resources | 13.6 | ||
| Consumer Services | 9.0 | ||
| Technology | 8.0 | ||
| Industrial Products | 7.1 | ||
| Financial Intermediaries | 5.2 | ||
| Industrial Services | 3.9 | ||
| Financial Services | 2.3 | ||
| Miscellaneous | 1.5 | ||
| Cash and Cash Equivalents | 18.1 | ||
| GOOD IDEAS THAT WORKED Net Realized and Unrealized Gain Year-to-Date Through 6/30/04 | GOOD IDEAS AT THE TIME Net Realized and Unrealized Loss Year-to-Date Through 6/30/04 | |||
| Nu Skin Enterprises Cl. A | $581,790 | Callaway Golf Company | $369,260 | |
| RC2 Corporation | 550,291 | Hecla Mining Company | 300,958 | |
| Nutraceutical International | 509,686 | FTI Consulting | 240,824 | |
| Houston Exploration Company (The) | 509,185 | Aspen Insurance Holdings | 167,673 | |
| Unit Corporation | 428,970 | Goldcorp | 165,210 | |
Nu Skin Enterprises — We like the core business of this direct marketer of cosmetics and diet and nutritional supplements. New products succeeded in North America, its increasingly important Japanese business flourished and the firm made profitable inroads into China. It was RCS’s number two holding at June 30. RC2 Corporation — A series of what we think were intelligent acquisitions expanded the core business of this maker of toys, collectibles and NASCAR vehicle replicas (the firm’s original business). Initially attracted to its low stock price and savvy managers, we like how the firm survived to thrive in a difficult business. We built our position in the first half. | Callaway Golf Company — While on a firm-wide basis we’re still unsure whether we should give a mulligan to this leading golf club and golf ball manufacturer for recently making what looks to us like a questionable acquisition of a struggling competitor, in RCS’s portfolio we decided to take a bogey and move on in July. Hecla Mining Company — This silver, gold, lead and zinc miner suffered from the same King Midas in Reverse condition that afflicted many of its compeers in the precious metals industry. We remain hopeful that this well-managed firm can turn things around, so we were happy to hold a position at June 30. | |||
| ROYCE CAPITAL FUND SEMIANNUAL REPORT 2004 | 7 |
NOTES TO PERFORMANCE AND FORWARD-LOOKING STATEMENTS |
| NOTES TO PERFORMANCE AND STATISTICAL INFORMATION |
| All performance information in this Report reflects past performance, is presented on a total return basis and reflects the reinvestment of distributions. Past performance is no guarantee of future results or volatility. Current performance may be higher or lower than performance quoted. Returns as of the most recent month-end may be obtained at www.roycefunds.com. Investment return and principal value will fluctuate, so that shares may be worth more or less than their original cost when redeemed. The Royce Funds invest primarily in securities of small-cap and/or micro-cap companies that may involve considerably more risk than investments in securities of larger-cap companies (see “Primary Risks for Fund Investors” in the prospectus). The thoughts expressed in this report concerning recent market movements and future prospects for small company stocks are solely the opinion of Royce at June 30, 2004, and, of course, historical market trends are not necessarily indicative of future market movements. Statements regarding the future prospects for particular securities held in the Funds’ portfolios and Royce’s investment intentions with respect to those securities reflect Royce’s opinions as of June 30, 2004 and are subject to change at any time without notice. The Funds’ P/E calculations exclude companies with zero or negative earnings. There can be no assurance that securities mentioned in this report will be included in any Royce-managed portfolio in the future. The Russell 2000, S&P 500 and Nasdaq Composite are unmanaged indices of domestic common stocks. Returns for the market indices used in this Report were based on information supplied to Royce by Frank Russell. Royce has not independently verified the above described information. The Royce Funds is a service mark of The Royce Funds. |
| FORWARD-LOOKING STATEMENTS | ||
This material contains forward-looking statements within the meaning of the Securities Exchange Act of 1934, as amended (the “Exchange Act”), that involve risks and uncertainties, including, among others, statements as to:
| ||
| This report uses words such as “anticipates,” “believes,” “expects,” “future,” “intends,” and similar expressions to identify forward-looking statements. Actual results may differ materially from those projected in the forward-looking statements for any reason. | ||
The Royce Funds have based the forward-looking statements included in this report on information available to us on the date of the report, and we assume no obligation to update any such forward-looking statements. Although The Royce Funds undertake no obligation to revise or update any forward-looking statements, whether as a result of new information, future events or otherwise, you are advised to consult any additional disclosures that we may make through future shareholder communications or reports. |
| 8 | ROYCE CAPITAL FUND SEMIANNUAL REPORT 2004 |
SCHEDULES OF INVESTMENTS | JUNE 30, 2004 (UNAUDITED) |
ROYCE CAPITAL FUND — MICRO-CAP PORTFOLIO | ||||||||||
| COMMON STOCKS – 85.1% | ||||||||||
| SHARES | VALUE | SHARES | VALUE | |||||||
| Consumer Products – 4.4% | Financial Intermediaries – 4.8% | |||||||||
| Apparel and Shoes - 0.3% | Banking - 0.3% | |||||||||
Cutter & Buck | 86,000 | $ | 885,800 | Canadian Western Bank | 35,700 | $ | 1,086,499 | |||
| Collectibles - 0.1% | Insurance - 4.5% | |||||||||
Action Performance Companies | 25,000 | 376,750 | American Safety Insurance Holdings a | 129,100 | 1,937,791 | |||||
Argonaut Group a | 117,000 | 2,156,310 | ||||||||
| Food/Beverage/Tobacco - 1.1% | NYMAGIC | 68,400 | 1,805,760 | |||||||
Boston Beer Company Cl. A a | 41,400 | 833,796 | Navigators Group a | 56,300 | 1,626,507 | |||||
CoolBrands International a | 57,800 | 951,388 | PXRE Group | 67,000 | 1,693,090 | |||||
Green Mountain Coffee Roasters a | 42,000 | 779,940 | ProAssurance Corporation a | 76,500 | 2,609,415 | |||||
Monterey Pasta Company a | 198,100 | 721,084 | United Fire & Casualty Company | 30,000 | 1,732,500 | |||||
| 3,286,208 | 13,561,373 | |||||||||
| Home Furnishing and Appliances - 0.1% | Total (Cost $9,353,044) | 14,647,872 | ||||||||
Bassett Furniture Industries | 12,500 | 272,000 | ||||||||
| Financial Services – 0.6% | ||||||||||
| Sports and Recreation - 0.9% | Insurance Brokers - 0.3% | |||||||||
Arctic Cat | 42,500 | 1,170,025 | CorVel Corporation a | 28,750 | 815,063 | |||||
Thor Industries | 46,200 | 1,545,852 | ||||||||
| Other Financial Services - 0.3% | ||||||||||
| 2,715,877 | Electro Rent | 103,300 | 1,081,551 | |||||||
| Other Consumer Products - 1.9% | Total (Cost $2,032,043) | 1,896,614 | ||||||||
Concord Camera a | 100,600 | 331,980 | ||||||||
| 35,000 | 347,200 | Health – 16.7% | ||||||||
4Kids Entertainment a | 38,000 | 908,960 | Commercial Services - 3.8% | |||||||
Meade Instruments a | 138,500 | 441,815 | Bruker BioSciences a | 251,800 | 1,226,266 | |||||
RC2 Corporation a | 90,000 | 3,195,000 | Discovery Partners International a | 367,700 | 1,875,270 | |||||
Water Pik Technologies a | 35,100 | 581,256 | 274,800 | 1,516,896 | ||||||
Gene Logic a | 205,200 | 831,060 | ||||||||
| 5,806,211 | Hooper Holmes | 300,700 | 1,726,018 | |||||||
PAREXEL International a | 31,000 | 613,800 | ||||||||
| Total (Cost $8,767,082) | 13,342,846 | The TriZetto Group a | 150,600 | 1,009,020 | ||||||
Ventiv Health a | 63,700 | 986,076 | ||||||||
| Consumer Services – 5.9% | Young Innovations | 71,250 | 1,809,750 | |||||||
| Direct Marketing - 0.6% | ||||||||||
†Collegiate Pacific | 101,400 | 1,150,890 | 11,594,156 | |||||||
J. Jill Group a | 25,500 | 601,545 | ||||||||
| Drugs and Biotech - 7.3% | ||||||||||
| 1,752,435 | 60,000 | 1,233,600 | ||||||||
| 91,300 | 781,528 | |||||||||
| Leisure and Entertainment - 1.5% | 50,500 | 275,730 | ||||||||
| 74,200 | 1,990,044 | BioSource International a | 144,100 | 1,017,346 | ||||||
New Frontier Media a | 283,500 | 2,418,255 | 70,500 | 536,505 | ||||||
Cell Genesys a | 76,500 | 794,835 | ||||||||
| 4,408,299 | 335,000 | 804,000 | ||||||||
Compugen a | 162,900 | 765,630 | ||||||||
| Restaurants and Lodgings - 0.9% | 270,500 | 2,569,750 | ||||||||
Benihana Cl. A a | 73,145 | 1,089,860 | 92,600 | 379,660 | ||||||
California Pizza Kitchen a | 63,500 | 1,216,660 | Encysive Pharmaceuticals a | 35,000 | 297,500 | |||||
Chicago Pizza & Brewery a | 31,000 | 471,510 | Lexicon Genetics a | 386,100 | 3,027,024 | |||||
Luminex Corporation a | 75,000 | 754,500 | ||||||||
| 2,778,030 | 101,800 | 982,370 | ||||||||
Maxygen a | 68,000 | 718,760 | ||||||||
| Retail Stores - 2.5% | 159,400 | 2,378,248 | ||||||||
Brookstone a | 50,000 | 1,002,500 | 33,000 | 340,890 | ||||||
Buckle (The) | 52,900 | 1,494,425 | Orchid BioSciences a | 85,300 | 656,810 | |||||
Cache a | 69,000 | 932,190 | Pharmacyclics a | 66,300 | 674,271 | |||||
Cato Corporation Cl. A | 91,000 | 2,042,950 | 22,700 | 582,255 | ||||||
Shoe Carnival a | 35,000 | 525,350 | 212,000 | 771,680 | ||||||
Sport Chalet a | 100,000 | 1,278,000 | Zila a | 363,700 | 1,785,767 | |||||
Trans World Entertainment a | 42,200 | 422,844 | ||||||||
| 22,128,659 | ||||||||||
| 7,698,259 | ||||||||||
| Other Consumer Services - 0.4% | ||||||||||
| 156,000 | 421,200 | |||||||||
First Cash Financial Services a | 33,000 | 702,240 | ||||||||
| 1,123,440 | ||||||||||
| Total (Cost $12,465,502) | 17,760,463 | |||||||||
| THE ACCOMPANYING NOTES ARE AN INTEGRAL PART OF THESE FINANCIAL STATEMENTS. | ROYCE CAPITAL FUND SEMIANNUAL REPORT 2004 | 9 |
SCHEDULES OF INVESTMENTS | |
ROYCE CAPITAL FUND — MICRO-CAP PORTFOLIO (continued) | ||||||||||
| SHARES | VALUE | SHARES | VALUE | |||||||
| Health (continued) | Other Industrial Products - 1.4% | |||||||||
| Health Services - 2.5% | BHA Group Holdings | 15,300 | $ | 579,105 | ||||||
Centene Corporation a | 33,450 | $ | 1,289,497 | Peerless Manufacturing a | 52,200 | 618,570 | ||||
| 79,400 | 1,441,110 | Quixote Corporation | 46,800 | 938,340 | ||||||
Curative Health Services a | 125,300 | 1,085,098 | †Tennant | 25,000 | 1,036,250 | |||||
On Assignment a | 65,500 | 386,450 | Velcro Industries | 81,500 | 938,880 | |||||
Option Care | 40,000 | 610,400 | ||||||||
TLC Vision a | 130,400 | 1,517,856 | 4,111,145 | |||||||
U.S. Physical Therapy a | 76,400 | 1,047,444 | ||||||||
| Total (Cost $17,643,545) | 21,780,517 | |||||||||
| 7,377,855 | ||||||||||
| Industrial Services – 9.5% | ||||||||||
| Medical Products and Devices - 2.1% | Commercial Services - 3.7% | |||||||||
| 117,400 | 684,442 | 166,400 | 2,086,656 | |||||||
Exactech a | 22,800 | 494,760 | Carlisle Holdings a | 339,301 | 2,235,994 | |||||
NMT Medical a | 93,100 | 349,125 | Exponent a | 130,900 | 3,517,283 | |||||
Novoste a | 83,200 | 227,968 | Geo Group (The) a | 43,900 | 895,560 | |||||
OrthoLogic Corporation a | 151,000 | 1,309,170 | New Horizons Worldwide a | 75,700 | 454,200 | |||||
Orthofix International a | 16,000 | 683,680 | RCM Technologies a | 76,300 | 484,429 | |||||
Quinton Cardiology Systems a | 16,000 | 162,080 | RemedyTemp Cl. A a | 54,100 | 654,610 | |||||
| 63,600 | 683,700 | SM&A a | 95,000 | 821,750 | ||||||
Viasys Healthcare a | 32,900 | 687,939 | ||||||||
Zoll Medical a | 32,000 | 1,122,560 | 11,150,482 | |||||||
| 6,405,424 | Engineering and Construction - 0.4% | |||||||||
Insituform Technologies Cl. A a | 57,000 | 927,390 | ||||||||
| Personal Care - 1.0% | Nobility Homes | 18,800 | 385,588 | |||||||
Lifeline Systems a | 70,140 | 1,659,512 | ||||||||
Ocular Sciences a | 36,700 | 1,394,600 | 1,312,978 | |||||||
| 3,054,112 | Food and Tobacco Processors - 1.3% | |||||||||
MGP Ingredients | 28,700 | 1,110,403 | ||||||||
| Total (Cost $41,639,650) | 50,560,206 | Omega Protein a | 160,900 | 1,560,730 | ||||||
Zapata Corporation a | 18,800 | 1,153,380 | ||||||||
| Industrial Products – 7.2% | ||||||||||
| Automotive - 0.7% | 3,824,513 | |||||||||
Spartan Motors | 60,000 | 735,000 | ||||||||
Wescast Industries Cl. A | 62,400 | 1,506,960 | Printing - 1.4% | |||||||
Courier Corporation | 23,800 | 993,412 | ||||||||
| 2,241,960 | Ennis Business Forms | 65,500 | 1,277,250 | |||||||
New England Business Service | 30,400 | 1,337,600 | ||||||||
| Building Systems and Components - 0.8% | Schawk Cl. A | 46,600 | 651,002 | |||||||
LSI Industries | 101,250 | 1,164,375 | ||||||||
Preformed Line Products Company | 52,000 | 1,211,600 | 4,259,264 | |||||||
| 2,375,975 | Transportation and Logistics - 2.2% | |||||||||
AirNet Systems a | 224,500 | 1,005,760 | ||||||||
| Industrial Components - 1.5% | Covenant Transport Cl. A a | 74,400 | 1,271,496 | |||||||
Aaon a | 80,000 | 1,615,200 | Frozen Food Express Industries a | 82,000 | 562,520 | |||||
DuraSwitch Industries a | 388,400 | 970,379 | Marten Transport a | 91,150 | 1,699,947 | |||||
Powell Industries a | 109,400 | 1,868,552 | Vitran Corporation Cl. A a | 138,450 | 2,277,502 | |||||
| 4,454,131 | 6,817,225 | |||||||||
| Machinery - 1.3% | Other Industrial Services - 0.5% | |||||||||
Cascade Corporation | 53,200 | 1,662,500 | Team a | 96,000 | 1,554,240 | |||||
†Pason Systems | 97,000 | 2,243,026 | ||||||||
| Total (Cost $22,421,973) | 28,918,702 | |||||||||
| 3,905,526 | ||||||||||
| Natural Resources – 14.7% | ||||||||||
| Metal Fabrication and Distribution - 0.9% | Energy Services - 7.1% | |||||||||
Gibraltar Steel | 30,100 | 987,882 | Atwood Oceanics a | 11,000 | 459,250 | |||||
Schnitzer Steel Industries Cl. A | 51,000 | 1,731,960 | Carbo Ceramics | 18,000 | 1,228,500 | |||||
| 75,100 | 1,634,927 | |||||||||
| 2,719,842 | Dril-Quip a | 67,000 | 1,252,900 | |||||||
Gulf Island Fabrication | 147,300 | 3,186,099 | ||||||||
| Pumps, Valves and Bearings - 0.3% | GulfMark Offshore a | 170,000 | 2,682,600 | |||||||
Sun Hydraulics | 54,600 | 962,052 | 253,600 | 2,102,344 | ||||||
NATCO Group Cl. A a | 151,300 | 1,166,523 | ||||||||
| Specialty Chemicals and Materials - 0.3% | †RPC | 66,200 | 1,045,298 | |||||||
CFC International a | 76,600 | 590,586 | ||||||||
Hawkins | 35,000 | 419,300 | ||||||||
| 1,009,886 | ||||||||||
| 10 | ROYCE CAPITAL FUND SEMIANNUAL REPORT 2004 | THE ACCOMPANYING NOTES ARE AN INTEGRAL PART OF THESE FINANCIAL STATEMENTS. |
JUNE 30, 2004 (UNAUDITED) | |
| SHARES | VALUE | SHARES | VALUE | |||||||||
Natural Resources (continued) | 45,000 | $ | 536,850 | |||||||||
Energy Services (continued) | Syntel | 29,100 | 481,605 | |||||||||
| 271,600 | $ | 2,197,244 | ||||||||||
TETRA Technologies a | 70,650 | 1,896,952 | 4,640,206 | |||||||||
Trican Well Service a | 85,700 | 2,684,917 | ||||||||||
Semiconductors and Equipment - 2.1% | ||||||||||||
| 21,537,554 | 160,400 | 1,268,764 | ||||||||||
FSI International a | 87,300 | 681,813 | ||||||||||
Oil and Gas - 0.4% | MIPS Technologies a | 191,500 | 1,171,980 | |||||||||
Prima Energy a | 27,000 | 1,068,390 | 20,000 | 227,600 | ||||||||
PDF Solutions a | 69,500 | 588,665 | ||||||||||
Precious Metals and Mining - 7.2% | QuickLogic Corporation a | 117,000 | 408,330 | |||||||||
Apex Silver Mines a | 34,500 | 588,225 | Semitool a | 76,300 | 863,716 | |||||||
Eldorado Gold a | 400,000 | 1,032,000 | 75,000 | 222,000 | ||||||||
| 690,000 | 1,019,096 | White Electronic Designs a | 180,000 | 943,200 | ||||||||
| 217,200 | 1,455,240 | |||||||||||
Glamis Gold a | 52,000 | 911,560 | 6,376,068 | |||||||||
| 417,900 | 1,939,056 | |||||||||||
| 1,563,000 | 1,484,850 | Software - 2.6% | ||||||||||
Minefinders Corporation a | 301,000 | 2,016,700 | Integral Systems | 88,800 | 1,427,904 | |||||||
| 373,000 | 432,680 | 275,658 | 2,731,771 | |||||||||
Northern Orion Resources a | 1,334,600 | 3,056,260 | SPSS a | 60,000 | 1,078,200 | |||||||
| 357,300 | 1,661,445 | Tengtu International a | 737,500 | 597,375 | ||||||||
Royal Gold | 108,000 | 1,530,360 | Transaction Systems Architects Cl. A a | 87,100 | 1,875,263 | |||||||
| 143,800 | 1,773,054 | |||||||||||
Stillwater Mining Company a | 53,872 | 808,619 | 7,710,513 | |||||||||
Twin Mining a | 604,000 | 114,889 | ||||||||||
| 316,500 | 2,136,375 | Telecommunications - 4.0% | ||||||||||
Anaren a | 41,000 | 669,940 | ||||||||||
| 21,960,409 | Atlantic Tele-Network | 35,300 | 1,133,130 | |||||||||
Brooktrout a | 160,750 | 1,737,707 | ||||||||||
Total (Cost $36,694,759) | 44,566,353 | Captaris a | 203,000 | 1,311,380 | ||||||||
Catapult Communications a | 57,100 | 1,313,300 | ||||||||||
Technology – 16.6% | COMARCO a | 60,000 | 423,000 | |||||||||
Aerospace and Defense - 0.7% | Computer Network Technology a | 60,000 | 359,400 | |||||||||
Ducommun a | 93,700 | 2,003,306 | Globecomm Systems a | 76,200 | 398,526 | |||||||
| 119,900 | 1,526,327 | |||||||||||
Components and Systems - 4.1% | Lightbridge a | 75,000 | 420,000 | |||||||||
| 186,500 | 1,049,995 | PC-Tel a | 45,100 | 532,180 | ||||||||
CSP a | 85,700 | 634,180 | 398,700 | 641,907 | ||||||||
Excel Technology a | 55,000 | 1,828,750 | Sunrise Telecom | 94,000 | 244,400 | |||||||
MOCON | 74,400 | 632,400 | ViaSat a | 60,300 | 1,504,485 | |||||||
| 113,200 | 2,256,076 | |||||||||||
Perceptron a | 147,600 | 1,047,960 | 12,215,682 | |||||||||
Performance Technologies a | 132,000 | 1,242,120 | ||||||||||
| 120,200 | 759,664 | Total (Cost $41,384,110) | 50,274,932 | |||||||||
Richardson Electronics | 161,500 | 1,789,420 | ||||||||||
TTM Technologies a | 104,700 | 1,240,695 | Miscellaneous – 4.7% | |||||||||
Total (Cost $14,175,491) | 14,157,783 | |||||||||||
| 12,481,260 | ||||||||||||
TOTAL COMMON STOCKS | ||||||||||||
Distribution - 0.5% | (Cost $206,577,199) | 257,906,288 | ||||||||||
CompuCom Systems a | 104,500 | 474,430 | ||||||||||
Jaco Electronics a | 190,500 | 1,158,240 | PREFERRED STOCK – 0.2% | |||||||||
United Fire & Casualty Company | ||||||||||||
| 1,632,670 | 6.375% Conv. | 15,000 | 549,150 | |||||||||
Internet Software and Services - 1.1% | TOTAL PREFERRED STOCK | |||||||||||
CryptoLogic | 100,700 | 1,813,607 | (Cost $375,000) | 549,150 | ||||||||
CyberSource Corporation a | 60,750 | 507,870 | ||||||||||
Keynote Systems a | 65,000 | 893,750 | ||||||||||
| 3,215,227 | ||||||||||||
IT Services - 1.5% | ||||||||||||
Analysts International a | 209,500 | 645,260 | ||||||||||
answerthink a | 226,200 | 1,296,126 | ||||||||||
Forrester Research a | 90,100 | 1,680,365 | ||||||||||
| THE ACCOMPANYING NOTES ARE AN INTEGRAL PART OF THESE FINANCIAL STATEMENTS. | ROYCE CAPITAL FUND SEMIANNUAL REPORT 2004 | 11 |
SCHEDULES OF INVESTMENTS | |
| ROYCE CAPITAL FUND — MICRO-CAP PORTFOLIO (continued) | ROYCE CAPITAL FUND — SMALL-CAP PORTFOLIO | |||||||||||
| COMMON STOCKS – 81.9% | ||||||||||||
| VALUE | SHARES | VALUE | ||||||||||
REPURCHASE AGREEMENT – 15.7% | Consumer Products – 14.4% | |||||||||||
State Street Bank & Trust Company, | Apparel and Shoes - 4.0% | |||||||||||
0.60% dated 6/30/04, due 7/1/04, | †K-Swiss Cl. A | 37,900 | $ | 765,959 | ||||||||
maturity value $47,504,792 | Steven Madden a | 52,200 | 1,042,434 | |||||||||
(collateralized by U.S. Treasury Bonds, | Polo Ralph Lauren Cl. A | 16,500 | 568,425 | |||||||||
7.25%-10.375% due 11/15/12-5/15/16, | †Stride Rite | 74,000 | 816,220 | |||||||||
valued at $48,462,179) | ||||||||||||
(Cost $47,504,000) | $ | 47,504,000 | 3,193,038 | |||||||||
COLLATERAL RECEIVED FOR SECURITIES LOANED – 6.6% | Collectibles - 0.5% | |||||||||||
U.S. Treasury Bonds | Department 56 a | 26,700 | 411,180 | |||||||||
5.25%-13.25% due 11/15/12-5/15/30 | 764,261 | |||||||||||
U.S. Treasury Notes | Home Furnishing and Appliances - 2.9% | |||||||||||
1.875%-6.50% due 10/15/06-7/15/13 | 997,046 | American Woodmark | 12,300 | 736,155 | ||||||||
U.S. Treasury Strip-Interest | †Hooker Furniture | 37,900 | 764,443 | |||||||||
due 8/15/12-5/15/22 | 264,733 | †Stanley Furniture Company | 19,900 | 837,989 | ||||||||
Money Market Funds | ||||||||||||
State Street Navigator Securities Lending | 2,338,587 | |||||||||||
Prime Portfolio | 18,194,195 | |||||||||||
Sports and Recreation - 2.1% | ||||||||||||
(Cost $20,220,235) | 20,220,235 | Callaway Golf Company | 53,800 | 610,092 | ||||||||
Winnebago Industries | 27,800 | 1,036,384 | ||||||||||
TOTAL INVESTMENTS – 107.6% | ||||||||||||
(Cost $274,676,434) | 326,179,673 | 1,646,476 | ||||||||||
LIABILITIES LESS CASH | ||||||||||||
AND OTHER ASSETS – (7.6)% | (23,131,723 | ) | Other Consumer Products - 4.9% | |||||||||
Blyth | 25,900 | 893,291 | ||||||||||
NET ASSETS – 100% | $ | 303,047,950 | RC2 Corporation a | 40,620 | 1,442,010 | |||||||
Radica Games | 80,400 | 708,324 | ||||||||||
Yankee Candle Company a | 27,900 | 816,075 | ||||||||||
| 3,859,700 | ||||||||||||
Total (Cost $9,658,014) | 11,448,981 | |||||||||||
Consumer Services – 9.0% | ||||||||||||
Direct Marketing - 2.3% | ||||||||||||
Nu Skin Enterprises Cl. A | 71,400 | 1,807,848 | ||||||||||
Leisure and Entertainment - 2.3% | ||||||||||||
Dover Downs Gaming & Entertainment | 57,000 | 641,250 | ||||||||||
Multimedia Games a | 11,100 | 297,702 | ||||||||||
| 41,000 | 902,000 | |||||||||||
| 1,840,952 | ||||||||||||
Restaurants and Lodgings - 0.9% | ||||||||||||
Bob Evans Farms | 25,900 | 709,142 | ||||||||||
Retail Stores - 3.5% | ||||||||||||
Big Lots a | 64,900 | 938,454 | ||||||||||
Electronics Boutique Holdings a | 33,100 | 871,854 | ||||||||||
Pier 1 Imports | 54,100 | 957,029 | ||||||||||
| 2,767,337 | ||||||||||||
Total (Cost $5,603,208) | 7,125,279 | |||||||||||
Financial Intermediaries – 5.2% | ||||||||||||
Insurance - 4.4% | ||||||||||||
Aspen Insurance Holdings | 65,700 | 1,526,211 | ||||||||||
Erie Indemnity Company Cl. A | 6,400 | 299,392 | ||||||||||
ProAssurance Corporation a | 14,100 | 480,951 | ||||||||||
Scottish Re Group | 34,100 | 792,825 | ||||||||||
Universal American Financial a | 33,200 | 364,536 | ||||||||||
| 3,463,915 | ||||||||||||
Other Financial Intermediaries - 0.8% | ||||||||||||
TSX Group | 19,000 | 674,623 | ||||||||||
Total (Cost $3,305,369) | 4,138,538 | |||||||||||
| 12 | ROYCE CAPITAL FUND SEMIANNUAL REPORT 2004 | THE ACCOMPANYING NOTES ARE AN INTEGRAL PART OF THESE FINANCIAL STATEMENTS. |
JUNE 30, 2004 (UNAUDITED) | |
| SHARES | VALUE | SHARES | VALUE | |||||||||||
Financial Services – 2.3% | Engineering and Construction - 0.5% | |||||||||||||
Information and Processing - 2.3% | Dycom Industries a | 13,600 | $ | 380,800 | ||||||||||
eFunds Corporation a | 103,700 | $ | 1,814,750 | |||||||||||
Total (Cost $2,938,498) | 3,071,115 | |||||||||||||
Total (Cost $1,287,643) | 1,814,750 | |||||||||||||
Natural Resources – 13.6% | ||||||||||||||
Health – 16.9% | Energy Services - 4.7% | |||||||||||||
Drugs and Biotech - 4.3% | Ensign Resource Service Group | 81,600 | 1,289,799 | |||||||||||
Antigenics a | 21,700 | 185,752 | Input/Output a | 80,000 | 663,200 | |||||||||
Endo Pharmaceuticals Holdings a | 45,200 | 1,059,940 | Oil States International a | 49,600 | 758,880 | |||||||||
Lexicon Genetics a | 91,300 | 715,792 | Patterson-UTI Energy | 17,700 | 591,357 | |||||||||
| 53,400 | 796,728 | TETRA Technologies a | 15,900 | 426,915 | ||||||||||
Perrigo Company | 32,500 | 616,525 | ||||||||||||
| 3,730,151 | ||||||||||||||
| 3,374,737 | ||||||||||||||
Oil and Gas - 6.2% | ||||||||||||||
Health Services - 10.0% | Cimarex Energy a | 30,218 | 913,490 | |||||||||||
AMN Healthcare Services a | 31,409 | 480,244 | Houston Exploration Company (The) a | 27,900 | 1,446,336 | |||||||||
AMERIGROUP Corporation a | 18,300 | 900,360 | St. Mary Land & Exploration Company | 22,500 | 802,125 | |||||||||
Centene Corporation a | 23,450 | 903,998 | Unit Corporation a | 54,300 | 1,707,735 | |||||||||
Cross Country Healthcare a | 73,800 | 1,339,470 | ||||||||||||
Curative Health Services a | 9,300 | 80,538 | 4,869,686 | |||||||||||
Healthcare Services Group | 35,340 | 540,702 | ||||||||||||
Horizon Health a | 32,048 | 753,128 | Precious Metals and Mining - 2.7% | |||||||||||
Molina Healthcare a | 29,500 | 1,126,310 | Glamis Gold a | 61,400 | 1,076,342 | |||||||||
U.S. Physical Therapy a | 59,900 | 821,229 | Goldcorp | 36,600 | 427,122 | |||||||||
US Oncology a | 65,700 | 967,104 | Hecla Mining Company a | 116,200 | 662,340 | |||||||||
| 7,913,083 | 2,165,804 | |||||||||||||
Medical Products and Devices - 1.4% | Total (Cost $7,815,783) | 10,765,641 | ||||||||||||
Viasys Healthcare a | 54,600 | 1,141,686 | ||||||||||||
Technology – 8.0% | ||||||||||||||
Personal Care - 1.2% | Aerospace and Defense - 0.8% | |||||||||||||
Nutraceutical International a | 44,504 | 948,380 | Curtiss-Wright | 10,800 | 606,852 | |||||||||
Total (Cost $10,037,896) | 13,377,886 | Components and Systems - 1.8% | ||||||||||||
| 94,700 | 783,169 | |||||||||||||
Industrial Products – 7.1% | Rimage Corporation a | 43,954 | 659,750 | |||||||||||
Automotive - 1.0% | ||||||||||||||
Strattec Security a | 12,200 | 834,846 | 1,442,919 | |||||||||||
Building Systems and Components - 1.4% | IT Services - 1.8% | |||||||||||||
Simpson Manufacturing | 19,800 | 1,111,176 | MAXIMUS a | 21,900 | 776,574 | |||||||||
Perot Systems Cl. A a | 47,800 | 634,306 | ||||||||||||
Construction Materials - 0.8% | ||||||||||||||
Florida Rock Industries | 14,400 | 607,248 | 1,410,880 | |||||||||||
Machinery - 2.2% | Semiconductors and Equipment - 1.0% | |||||||||||||
Lincoln Electric Holdings | 18,100 | 617,029 | Entegris a | 71,600 | 828,412 | |||||||||
Thomas Industries | 15,000 | 498,000 | ||||||||||||
Woodward Governor Company | 8,200 | 591,302 | Software - 2.6% | |||||||||||
Intervideo a | 69,100 | 894,154 | ||||||||||||
| 1,706,331 | Sybase a | 62,600 | 1,126,800 | |||||||||||
Metal Fabrication and Distribution - 1.7% | 2,020,954 | |||||||||||||
Gibraltar Steel | 40,700 | 1,335,774 | ||||||||||||
Total (Cost $5,246,156) | 6,310,017 | |||||||||||||
Total (Cost $3,810,735) | 5,595,375 | |||||||||||||
Miscellaneous – 1.5% | ||||||||||||||
Industrial Services – 3.9% | Total (Cost $1,083,565) | 1,205,393 | ||||||||||||
Commercial Services - 3.4% | ||||||||||||||
FTI Consulting a | 67,800 | 1,118,700 | TOTAL COMMON STOCKS | |||||||||||
West Corporation a | 60,100 | 1,571,615 | (Cost $50,786,867) | 64,852,975 | ||||||||||
| 2,690,315 | ||||||||||||||
| THE ACCOMPANYING NOTES ARE AN INTEGRAL PART OF THESE FINANCIAL STATEMENTS. | ROYCE CAPITAL FUND SEMIANNUAL REPORT 2004 | 13 |
SCHEDULES OF INVESTMENTS | JUNE 30, 2004 (UNAUDITED) |
| ROYCE CAPITAL FUND — SMALL-CAP PORTFOLIO (continued) | ||||||||||||
REPURCHASE AGREEMENT – 18.2% | VALUE | ||||
State Street Bank & Trust Company, 0.60% dated 6/30/04, due 7/1/04, maturity value $14,347,239 (collateralized by U.S. Treasury Notes, 1.625% due 1/31/05, valued at $14,637,192) (Cost $14,347,000) | $ | 14,347,000 | |||
TOTAL INVESTMENTS – 100.1% | |||||
(Cost $65,133,867) | 79,199,975 | ||||
LIABILITIES LESS CASH | |||||
AND OTHER ASSETS – (0.1)% | (2,066 | ) | |||
NET ASSETS – 100% | $ | 79,197,909 | |||
| a | Non-income producing. |
| b | A portion of these securities were on loan at June 30, 2004. |
| † | New additions in 2004. |
| Bold indicates the Fund’s largest 20 equity holdings in terms of June 30, 2004 market value. | |
| 14 | ROYCE CAPITAL FUND SEMIANNUAL REPORT 2004 | THE ACCOMPANYING NOTES ARE AN INTEGRAL PART OF THESE FINANCIAL STATEMENTS. | |
STATEMENTS OF ASSETS AND LIABILITIES | JUNE 30, 2004 (UNAUDITED) | |||
| Micro-Cap | Small-Cap | |||||||
| Portfolio | Portfolio | |||||||
| ASSETS: | ||||||||
| Investments at value (including collateral on loaned securities)* | $ | 278,675,673 | $ | 64,852,975 | ||||
| Repurchase agreement (at cost and value) | 47,504,000 | 14,347,000 | ||||||
| Cash | 11,088 | 171 | ||||||
| Receivable for investments sold | 1,299,148 | 148,848 | ||||||
| Receivable for capital shares sold | 379,293 | 79,649 | ||||||
| Receivable for dividends and interest | 54,863 | 23,450 | ||||||
| Prepaid expenses and other assets | 314 | 58 | ||||||
| Total Assets | 327,924,379 | 79,452,151 | ||||||
| LIABILITIES: | ||||||||
| Payable for collateral on loaned securities | 20,220,235 | – | ||||||
| Payable for investments purchased | 4,261,312 | 165,203 | ||||||
| Payable for capital shares redeemed | 36,297 | 1,693 | ||||||
| Payable for investment advisory fees | 302,123 | 62,132 | ||||||
| Accrued expenses | 56,462 | 25,214 | ||||||
| Total Liabilities | 24,876,429 | 254,242 | ||||||
| Net Assets | $ | 303,047,950 | $ | 79,197,909 | ||||
| ANALYSIS OF NET ASSETS: | ||||||||
| Undistributed net investment income (loss) | $ | (1,006,165 | ) | $ | (271,749 | ) | ||
| Accumulated net realized gain (loss) on investments | 20,440,224 | 3,590,182 | ||||||
| Net unrealized appreciation (depreciation) on investments | 51,503,239 | 14,066,108 | ||||||
| Paid-in capital | 232,110,652 | 61,813,368 | ||||||
| Net Assets | $ | 303,047,950 | $ | 79,197,909 | ||||
| SHARES OUTSTANDING: | ||||||||
| (unlimited number of $.001 par value shares authorized for each Fund) | 26,271,508 | 9,452,847 | ||||||
NET ASSET VALUES: | ||||||||
(Net Assets ¸ Shares Outstanding) (offering and redemption price per share) | $11.54 | $8.38 | ||||||
| *Investments at identified cost | $ | 227,172,434 | $ | 50,786,867 | ||||
| Market value of loaned securities | $ | 19,992,473 | ||||||
| THE ACCOMPANYING NOTES ARE AN INTEGRAL PART OF THESE FINANCIAL STATEMENTS. | ROYCE CAPITAL FUND SEMIANNUAL REPORT 2004 | 15 |
STATEMENTS OF CHANGES IN NET ASSETS |
| Micro-Cap Portfolio | Small-Cap Portfolio | |||||||||||||||
| Six months ended June 30, 2004 (unaudited) | Year ended December 31, 2003 | Six months ended June 30, 2004 (unaudited) | Year ended December 31, 2003 | |||||||||||||
| INVESTMENT OPERATIONS: | ||||||||||||||||
| Net investment income (loss) | $ | (1,006,165 | ) | $ | (1,451,273 | ) | $ | (271,749 | ) | $ | (183,664 | ) | ||||
| Net realized gain (loss) on investments | 17,778,212 | 11,810,323 | 3,435,633 | 3,439,484 | ||||||||||||
| Net change in unrealized appreciation (depreciation) on investments | (2,320,894 | ) | 61,883,874 | 3,617,833 | 10,324,465 | |||||||||||
| Net increase (decrease) in net assets from investment operations | 14,451,153 | 72,242,924 | 6,781,717 | 13,580,285 | ||||||||||||
DISTRIBUTIONS: | ||||||||||||||||
| Net realized gain on investments | – | (9,155,398 | ) | – | (3,123,806 | ) | ||||||||||
| Total distributions | – | (9,155,398 | ) | – | (3,123,806 | ) | ||||||||||
CAPITAL SHARE TRANSACTIONS: | ||||||||||||||||
| Value of shares sold | 51,579,748 | 59,995,395 | 24,127,673 | 34,664,544 | ||||||||||||
| Distributions reinvested | – | 9,155,398 | – | 3,123,804 | ||||||||||||
| Value of shares redeemed | (12,635,376 | ) | (16,529,499 | ) | (9,102,194 | ) | (9,044,502 | ) | ||||||||
| Net increase (decrease) in net assets from capital share transactions | 38,944,372 | 52,621,294 | 15,025,479 | 28,743,846 | ||||||||||||
NET INCREASE (DECREASE) IN NET ASSETS | 53,395,525 | 115,708,820 | 21,807,196 | 39,200,325 | ||||||||||||
NET ASSETS: | ||||||||||||||||
| Beginning of period | 249,652,425 | 133,943,605 | 57,390,713 | 18,190,388 | ||||||||||||
| End of period | $ | 303,047,950 | $ | 249,652,425 | $ | 79,197,909 | $ | 57,390,713 | ||||||||
ACCUMULATED NET INVESTMENT INCOME (LOSS) AT END OF PERIOD | $ | (1,006,165 | ) | $ | – | $ | (271,749 | ) | $ | – | ||||||
CAPITAL SHARE TRANSACTIONS (IN SHARES): | ||||||||||||||||
| Shares sold | 4,477,281 | 6,363,768 | 3,019,284 | 5,288,047 | ||||||||||||
| Shares issued for reinvestment of distributions | – | 868,634 | – | 420,998 | ||||||||||||
| Shares redeemed | (1,104,377 | ) | (1,950,586 | ) | (1,123,983 | ) | (1,338,258 | ) | ||||||||
| Net increase (decrease) in shares outstanding | 3,372,904 | 5,281,816 | 1,895,301 | 4,370,787 | ||||||||||||
| 16 | ROYCE CAPITAL FUND SEMIANNUAL REPORT 2004 | THE ACCOMPANYING NOTES ARE AN INTEGRAL PART OF THESE FINANCIAL STATEMENTS. |
STATEMENTS OF OPERATIONS | SIX MONTHS ENDED JUNE 30, 2004 (UNAUDITED) | |||
| Micro-Cap Portfolio | Small-Cap Portfolio | |||||||
| INVESTMENT INCOME: | ||||||||
| Income: | ||||||||
| Dividends | $ | 770,093 | $ | 110,911 | ||||
| Interest | 72,395 | 20,174 | ||||||
| Securities lending | 47,441 | – | ||||||
| Total income | 889,929 | 131,085 | ||||||
| Expenses: | ||||||||
| Investment advisory fees | 1,772,655 | 347,246 | ||||||
| Custody | 47,467 | 25,457 | ||||||
| Shareholder reports | 25,852 | 9,461 | ||||||
| Administrative and office facilities | 12,115 | 2,779 | ||||||
| Trustees’ fees | 11,338 | 2,724 | ||||||
| Shareholder servicing | 7,268 | 5,768 | ||||||
| Audit | 3,750 | 3,750 | ||||||
| Legal | 2,318 | 525 | ||||||
| Other expenses | 13,331 | 5,124 | ||||||
| Total expenses | 1,896,094 | 402,834 | ||||||
| Net investment income (loss) | (1,006,165 | ) | (271,749 | ) | ||||
REALIZED AND UNREALIZED GAIN (LOSS) ON INVESTMENTS: | ||||||||
| Net realized gain (loss) on investments | 17,778,212 | 3,435,633 | ||||||
| Net change in unrealized appreciation (depreciation) on investments | (2,320,894 | ) | 3,617,833 | |||||
| Net realized and unrealized gain (loss) on investments | 15,457,318 | 7,053,466 | ||||||
NET INCREASE (DECREASE) IN NET ASSETS FROM INVESTMENT OPERATIONS | $ | 14,451,153 | $ | 6,781,717 | ||||
FINANCIAL HIGHLIGHTS |
| This table is presented to show selected data for a share outstanding throughout each period and to assist shareholders in evaluating a Fund’s performance for the periods presented. |
| Net Asset Value, Beginning of Period | Net Investment Income (Loss) | Net Realized and Unrealized Gain (Loss) on Investments | Distributions From Net Investment Income | Distributions From Net Realized Gain on Investments | Net Asset Value, End of Period | Total Return | Net Assets, End of Period (in thousands) | Ratio of Expenses to Average Net Assets | Ratio of Net Investment Income (Loss) to Average Net Assets | Portfolio Turnover Rate | ||||||||||||||||||||||||||||||||||
| MICRO-CAP PORTFOLIO (a) | ||||||||||||||||||||||||||||||||||||||||||||
| †2004 (c) | $10.90 | $(0.04) | $ 0.68 | $ | – | $ | – | $11.54 | 5.9 | %** | $ | 303,048 | 1.34 | %* | (0.71 | )%* | 18% | |||||||||||||||||||||||||||
| 2003 (c) | 7.60 | (0.08) | �� | 3.80 | – | (0.42 | ) | 10.90 | 49.2 | % | 249,652 | 1.35 | % | (0.84 | )% | 41% | ||||||||||||||||||||||||||||
| 2002 (c) | 9.00 | (0.08) | (1.08 | ) | – | (0.24 | ) | 7.60 | (12.9 | )% | 133,944 | 1.35 | % | (0.88 | )% | 27% | ||||||||||||||||||||||||||||
| 2001 | 7.05 | (0.03) | 2.12 | – | (0.14 | ) | 9.00 | 29.7 | % | 106,501 | 1.35 | % | (0.61 | )% | 18% | |||||||||||||||||||||||||||||
| 2000 | 6.13 | (0.01) | 1.14 | – | (0.21 | ) | 7.05 | 18.6 | % | 35,437 | 1.35 | % | (0.14 | )% | 31% | |||||||||||||||||||||||||||||
| 1999 | 5.24 | (0.02) | 1.46 | – | (0.55 | ) | 6.13 | 28.1 | % | 7,468 | 1.35 | % | (0.53 | )% | 102% | |||||||||||||||||||||||||||||
| SMALL-CAP PORTFOLIO (b) | ||||||||||||||||||||||||||||||||||||||||||||
| †2004 (c) | $7.59 | $(0.03) | $ 0.82 | $ | – | $ | – | $8.38 | 10.4 | %** | $ | 79,198 | 1.16 | %* | (0.78 | )%* | 25% | |||||||||||||||||||||||||||
| 2003 (c) | 5.71 | (0.04) | 2.38 | – | (0.46 | ) | 7.59 | 41.1 | % | 57,391 | 1.21 | % | (0.55 | )% | 70% | |||||||||||||||||||||||||||||
| 2002 (c) | 6.66 | (0.05) | (0.87 | ) | – | (0.03 | ) | 5.71 | (13.8 | )% | 18,190 | 1.35 | % | (0.80 | )% | 53% | ||||||||||||||||||||||||||||
| 2001 | 6.40 | (0.04) | 1.34 | – | (1.04 | ) | 6.66 | 21.0 | % | 3,324 | 1.35 | % | (0.74 | )% | 188% | |||||||||||||||||||||||||||||
| 2000 | 5.23 | (0.01) | 1.73 | – | (0.55 | ) | 6.40 | 33.3 | % | 1,440 | 1.35 | % | (0.26 | )% | 116% | |||||||||||||||||||||||||||||
| 1999 | 5.47 | – | 0.43 | – | (0.67 | ) | 5.23 | 8.2 | % | 428 | 1.35 | % | (0.06 | )% | 70% | |||||||||||||||||||||||||||||
| THE ACCOMPANYING NOTES ARE AN INTEGRAL PART OF THESE FINANCIAL STATEMENTS. | ROYCE CAPITAL FUND SEMIANNUAL REPORT 2004 | 17 |
NOTES TO FINANCIAL STATEMENTS (UNAUDITED) |
SUMMARY OF SIGNIFICANT ACCOUNTING POLICIES: Royce Micro-Cap Portfolio and Royce Small-Cap Portfolio (the “Fund” or “Funds”) are the two series of Royce Capital Fund (the “Trust”), a diversified open-end management investment company organized as a Delaware business trust. Shares of the Funds are offered to life insurance companies for allocation to certain separate accounts established for the purpose of funding qualified and non-qualified variable annuity contracts and variable life insurance contracts, and may also be offered directly to certain pension plans and retirement plans and accounts permitting accumulation of assets on a tax-deferred basis. Micro-Cap Portfolio and Small-Cap Portfolio commenced operations on December 27, 1996. The preparation of financial statements in conformity with generally accepted accounting principles requires management to make estimates and assumptions that affect the reported amounts of assets and liabilities and the disclosure of contingent assets and liabilities at the date of the financial statements, and the reported amounts of income and expenses during the reporting period. Actual results could differ from those estimates. Valuation of investments: Securities are valued as of the close of trading on the New York Stock Exchange (generally 4:00 p.m. Eastern time) on the valuation date. Securities that trade on an exchange or Nasdaq are valued at their last reported sales price taken from the primary market in which each security trades or, if no sale is reported for such day, at their bid price. Other over-the-counter securities for which market quotations are readily available are valued at their bid price. Securities for which market quotations are not readily available are valued at their fair value under procedures established by the Board of Trustees. Bonds and other fixed income securities may be valued by reference to other securities with comparable ratings, interest rates and maturities, using established independent pricing services. Investment transactions and related investment income: Investment transactions are accounted for on the trade date. Dividend income is recorded on the ex-dividend date and any non-cash dividend income is recorded at the fair market value of the securities received. Interest income is recorded on the accrual basis. Realized gains and losses from investment transactions are determined on the basis of identified cost for book and tax purposes. Expenses: The Funds incur direct and indirect expenses. Expenses directly attributable to a Fund are charged to the Fund’s operations, while expenses applicable to more than one series of the Trust are allocated equitably. Allocated personnel and occupancy costs related to the Royce Funds are included in administrative and office facilities expenses. Distributions and Taxes: As qualified regulated investment companies under Subchapter M of the Internal Revenue Code, the Funds are not subject to income taxes to the extent that each Fund distributes substantially all of its taxable income for its fiscal year. Any dividend and capital gain distributions are recorded on the ex-dividend date and paid annually in December. Because federal income tax regulations differ from generally accepted accounting principles, income and capital gains distributions determined in accordance with tax regulations may differ from net | investment income and realized gains recognized for financial reporting purposes. Accordingly, the character of distributions and composition of net assets for tax purposes differs from those reflected in the accompanying financial statements. Repurchase agreements: The Funds enter into repurchase agreements with respect to portfolio securities solely with State Street Bank and Trust Company (“SSB&T”), the custodian of the Funds’ assets. Each Fund restricts repurchase agreements to maturities of no more than seven days. Securities pledged as collateral for repurchase agreements, which are held by SSB&T until maturity of the repurchase agreements, are marked-to-market daily and maintained at a value at least equal to the principal amount of the repurchase agreement (including accrued interest). Repurchase agreements could involve certain risks in the event of default or insolvency of SSB&T, including possible delays or restrictions upon the ability of each Fund to dispose of its underlying securities. Securities lending: The Funds may loan securities to qualified institutional investors for the purpose of realizing additional income. Collateral on all securities loaned for the Funds is accepted in cash and cash equivalents and invested temporarily by the custodian. The collateral is equal to at least 100% of the current market value of the loaned securities. INVESTMENT ADVISER: Under the Trust’s investment advisory agreements with Royce & Associates, LLC (“Royce”), Royce is entitled to receive management fees that are computed daily and payable monthly, at an annual rate of 1.25% and 1.0% of the average net assets of Micro-Cap Portfolio and Small-Cap Portfolio, respectively. For the six months ended June 30, 2004, Micro-Cap Portfolio recorded advisory fees of $1,772,655 and Small-Cap Portfolio recorded advisory fees of $347,246. PURCHASES AND SALES OF INVESTMENT SECURITIES: For the six months ended June 30, 2004, the cost of purchases and the proceeds from sales of investment securities, other than short-term securities, were as follows: | |||||
| Purchases | Sales | |||||
| Micro-Cap Portfolio | $73,189,218 | $42,017,394 | ||||
| Small-Cap Portfolio | $25,358,983 | $14,352,903 | ||||
| TAX INFORMATION: At June 30, 2004, net unrealized appreciation (depreciation) based on identified cost for tax purposes was as follows: | ||||||
| Tax Basis Cost | Net Unrealized Appreciation (Depreciation) | Gross Unrealized | ||||
| Appreciation | Depreciation | |||||
| Micro-Cap Portfolio | $ 274,744,312 | $ 51,435,361 | $ 64,743,860 | $ 13,308,499 | ||
| Small-Cap Portfolio | 65,136,789 | 14,063,186 | 14,953,569 | 890,383 | ||
| The primary difference between book and tax basis cost is the timing of the recognition of losses on securities sold for book and tax purposes. | ||||||
| 18 | ROYCE CAPITAL FUND SEMIANNUAL REPORT 2004 |
TRUSTEES AND OFFICERS |
All Trustees and Officers may be reached c/o The Royce Funds, 1414 Avenue of the Americas, New York, NY 10019 |
| NAME AND POSITION: | Charles M. Royce, Trustee,* President | NAME AND POSITION: | Arthur S. Mehlman, Trustee | |||
| Age: 64 | No. of Funds Overseen: 21 | Age: 62 | No. of Funds Overseen: 21 | |||
| Tenure: Since 1982 | Non-Royce Directorships: Director of Technology Investment Capital Corp. | Tenure: Since 2004 | Non-Royce Directorships: Director/Trustee of regis tered investment companies constituting the 23 Legg Mason Funds. | |||
Principal Occupation(s) During Past Five Years: President, Chief Investment Officer and Member of Board of Managers of Royce & Associates, LLC (“Royce”) (since October 2001), the Trust’s investment adviser. | Principal Occupation(s) During Past Five Years: Director of the League for People with Disabilities, Inc.; Director of University of Maryland Foundation and University of Maryland College Park Foundation (nonprofits). Formerly: Partner, KPMG LLP (international accounting firm) (1972-2002). | |||||
| NAME AND POSITION: | Mark R. Fetting, Trustee* | |||||
| Age: 49 | No. of Funds Overseen: 21 | NAME AND POSITION: | David L. Meister, Trustee | |||
| Tenure: Since 2001 | Non-Royce Directorships: Director/Trustee of registered investment companies constituting the 23 Legg Mason Funds. | Age: 64 Tenure: Since 1982 | No. of Funds Overseen: 21 Non-Royce Directorships: None | |||
Principal Occupation(s) During Past Five Years: Executive Vice President of Legg Mason, Inc.; Member of Board of Managers of Royce (since October 2001); Division President and Senior Officer, Prudential Financial Group, Inc. and related companies, including Fund Boards and consulting services to subsidiary companies (from 1991 to 2000). Mr. Fetting’s prior business experience includes having served as Partner, Greenwich Associates and Vice President, T. Rowe Price Group, Inc. | Principal Occupation(s) During Past Five Years: Chairman and Chief Executive Officer of The Tennis Channel (since June 2000). Chief Executive Officer of Seniorlife.com (from December 1999 to May 2000). Mr. Meister’s prior business experience includes having served as a consultant to the communications industry, President of Financial News Network, Senior Vice President of HBO, President of Time-Life Films and Head of Broadcasting for Major League Baseball. | |||||
| NAME AND POSITION: | Donald R. Dwight, Trustee | NAME AND POSITION: | G. Peter O’Brien, Trustee | |||
| Age: 73 | No. of Funds Overseen: 21 | Age: 58 | No. of Funds Overseen: 21 | |||
| Tenure: Since 1998 | Non-Royce Directorships: None | Tenure: Since 2001 | Non-Royce Directorships: Director / Trustee of registered investment companies constituting the 23 Legg Mason Funds; Director of Technology Investment Capital Corp. | |||
Principal Occupation(s) During Past Five Years: President of Dwight Partners, Inc., corporate communications consultant; Chairman (from 1982 to March 1998) and Chairman Emeritus (since March 1998) of Newspapers of New England, Inc. Mr. Dwight’s prior experience includes having served as Lieutenant Governor of the Commonwealth of Massachusetts, as President and Publisher of Minneapolis Star and Tribune Company and as a Trustee of the registered investment companies constituting the 94 Eaton Vance Funds. | Principal Occupation(s) During Past Five Years: Trustee of Colgate University; Director of Renaissance Capital Greenwich Funds; Vice President of Hill House, Inc.; Managing Director/Equity Capital Markets Group of Merrill Lynch & Co. (from 1971 to 1999). | |||||
| NAME AND POSITION: John D. Diederich, Vice President and Treasurer | ||||||
| NAME AND POSITION: | Richard M. Galkin, Trustee | Age: 53 | ||||
| Age: 66 | No. of Funds Overseen: 21 | Tenure: Since 2001 | ||||
| Tenure: Since 1982 | Non-Royce Directorships: None | |||||
Principal Occupation(s) During Past Five Years: Managing Director, Chief Operating Officer and Member of Board of Managers of Royce (since October 2001); Director of Administration of the Trust since April 1993. NAME AND POSITION: Jack E. Fockler, Jr., Vice President Age: 45 Tenure: Since 1995 | ||||||
Principal Occupation(s) During Past Five Years: Private investor. Mr. Galkin’s prior business experience includes having served as President of Richard M. Galkin Associates, Inc., telecommunications consultants, President of Manhattan Cable Television (a subsidiary of Time, Inc.), President of Haverhills Inc. (another Time, Inc. subsidiary), President of Rhode Island Cable Television and Senior Vice President of Satellite Television Corp. (a subsidiary of Comsat). | ||||||
| NAME AND POSITION: | Stephen L. Isaacs, Trustee | |||||
| Age: 64 | No. of Funds Overseen: 21 | Principal Occupation(s) During Past Five Years: Managing Director and Vice President of Royce, having been employed by Royce since October 1989. | ||||
| Tenure: Since 1989 | Non-Royce Directorships: None | |||||
Principal Occupation(s) During Past Five Years: President of The Center for Health and Social Policy (since September 1996); Attorney and President of Health Policy Associates, Inc., consultants. Mr. Isaacs’s prior business experience includes having served as Director of Columbia University Development Law and Policy Program and Professor at Columbia University (until August 1996). | NAME AND POSITION: W. Whitney George, Vice President Age: 46 Tenure: Since 1995 | |||||
Principal Occupation(s) During Past Five Years: Managing Director and Vice President of Royce, having been employed by Royce since October 1991. | ||||||
| NAME AND POSITION: | William L. Koke, Trustee | |||||
| Age: 69 | No. of Funds Overseen: 21 | |||||
| Tenure: Since 1996 | Non-Royce Directorships: None | NAME AND POSITION: Daniel A. O’Byrne, Vice President and Assistant Secretary | ||||
| Age: 42 | ||||||
Principal Occupation(s) During Past Five Years: Financial planner with Shoreline Financial Consultants. Mr. Koke’s prior business experience includes having served as Director of Financial Relations of SONAT, Inc., Treasurer of Ward Foods, Inc. and President of CFC, Inc. | Tenure: Since 1994 | |||||
Principal Occupation(s) During Past Five Years: Principal and Vice President of Royce, having been employed by Royce since October 1986. | ||||||
| NAME AND POSITION: John E. Denneen, Secretary Age: 37 Tenure: 1996-2001 and Since April 2002 | ||||||
Principal Occupation(s) During Past Five Years: General Counsel (Deputy General Counsel prior to 2003), Principal, Chief Legal and Compliance Officer and Secretary of Royce (1996-2001 and since April 2002); Principal of Credit Suisse First Boston Private Equity (2001-2002). | ||||||
| ROYCE CAPITAL FUND SEMIANNUAL REPORT 2004 | 19 | |
Item 2: Code(s) of Ethics - Not applicable to this semi-annual report.
Item 3: Audit Committee Financial Expert –
| (a)(1) | The Board of Trustees of the Registrant has determined that it has an audit committee financial expert. | |
| (a)(2) | Arthur S. Mehlman was designated by the Board of Trustees as the Registrant’s Audit Committee Financial Expert, effective April 15, 2004. Mr. Mehlman is “independent” as defined under Item 3 of Form N-CSR. |
Item 4: Principal Accountant Fees and Services – Not applicable to this semi-annual report.
Item 5: Audit Committee of Listed Registrants – Not applicable to this semi-annual report.
Item 6: Schedule of Investments – See Item 1.
Item 7: – Not applicable.
Item 8: – Not applicable.
Item 9: Submission of Matters to a Vote of Security Holders – None.
Item 10: Controls and Procedures.
(a) Disclosure Controls and Procedures. The Principal Executive and Financial Officers concluded that the Registrant’s Disclosure Controls and Procedures are effective based on their evaluation of the Disclosure Controls and Procedures as of a date within 90 days of the filing date of this report.
(b) Internal Controls. There were no significant changes in Registrant’s internal controls or in other factors that could significantly affect these controls subsequent to the date of their evaluation, including any corrective actions with regard to significant deficiencies and material weaknesses.
Item 11: Exhibits attached hereto. (Attach certifications as exhibits)
Pursuant to the requirements of the Securities Exchange Act of 1934 and the Investment Company Act of 1940, the registrant has duly caused this report to be signed on its behalf by the undersigned, thereunto duly authorized.
ROYCE CAPITAL FUND
| BY: | /s/ Charles M. Royce | |
| Charles M. Royce | ||
| President |
Date: August 27, 2004
Pursuant to the requirements of the Securities Exchange Act of 1934 and the Investment Company Act of 1940, this report has been signed below by the following persons on behalf of the registrant and in the capacities and on the dates indicated.
| ROYCE CAPITAL FUND | ROYCE CAPITAL FUND | |
| BY: /s/ Charles M. Royce | BY: /s/ John D. Diederich | |
| Charles M. Royce | John D. Diederich | |
| President | Chief Financial Officer | |
| Date: August 27, 2004 | Date: August 27, 2004 | |