UNITED STATES
SECURITIES AND EXCHANGE COMMISSION
Washington, D.C. 20549
FORM N-CSR
CERTIFIED SHAREHOLDER REPORT OF REGISTERED
MANAGEMENT INVESTMENT COMPANIES
Investment Company Act file number | 811-07527 |
|
Turner Funds |
(Exact name of registrant as specified in charter) |
|
1205 Westlakes Drive, Suite 100 Berwyn, PA | | 19312 |
(Address of principal executive offices) | | (Zip code) |
|
Michael P. Malloy Drinker Biddle & Reath LLP One Logan Square, Suite 2000 Philadelphia, PA 19103 |
(Name and address of agent for service) |
|
Registrant’s telephone number, including area code: | (800) 224-6312 | |
|
Date of fiscal year end: | September 30 | |
|
Date of reporting period: | March 31, 2011 | |
| | | | | | | | |
Item 1. Reports to Stockholders.

Semiannual Report
March 31, 2011 (unaudited)
Long/short equity funds
Turner Market Neutral Fund
Turner Medical Sciences Long/Short Fund
Turner Spectrum Fund
Turner Titan Fund
U.S. growth equity funds
Turner All Cap Growth Fund
(formerly Turner New Enterprise Fund)
Turner Concentrated Growth Fund
Turner Emerging Growth Fund
Turner Large Growth Fund
(formerly Turner Core Growth Fund)
Turner Midcap Growth Fund
Turner Small Cap Growth Fund
Quantitative equity funds
Turner Quantitative Broad Market Equity Fund
Turner Quantitative Large Cap Value Fund
Global and international equity funds
Turner Global Opportunities Fund
Turner International Growth Fund
(formerly Turner International Core Growth Fund)
Core equity fund
Turner Small Cap Equity Fund
Contents
| 2 | | | Letter to shareholders | |
|
| 5 | | | Total returns of Turner Funds | |
|
| 9 | | | Investment review:
Turner Market Neutral Fund | |
|
| 10 | | | Investment review:
Turner Medical Sciences Long/Short Fund | |
|
| 11 | | | Investment review:
Turner Spectrum Fund | |
|
| 12 | | | Investment review:
Turner Titan Fund | |
|
| 13 | | | Investment review:
Turner All Cap Growth Fund
(formerly Turner New Enterprise Fund) | |
|
| 14 | | | Investment review:
Turner Concentrated Growth Fund | |
|
| 15 | | | Investment review:
Turner Emerging Growth Fund | |
|
| 16 | | | Investment review:
Turner Large Growth Fund
(formerly Turner Core Growth Fund) | |
|
| 17 | | | Investment review:
Turner Midcap Growth Fund | |
|
| 18 | | | Investment review:
Turner Small Cap Growth Fund | |
|
| 19 | | | Investment review:
Turner Quantitative Broad Market Equity Fund | |
|
| 20 | | | Investment review:
Turner Quantitative Large Cap Value Fund | |
|
| 21 | | | Investment review:
Turner Global Opportunities Fund | |
|
| 22 | | | Investment review:
Turner International Growth Fund
(formerly Turner International Core Growth
Fund) | |
|
| 23 | | | Investment review:
Turner Small Cap Equity Fund | |
|
| 24 | | | Schedules of investments | |
|
| 64 | | | Financial statements | |
|
| 88 | | | Notes to financial statements | |
|
| 98 | | | Board of Trustees considerations in approving the Advisory Agreements | |
|
| 100 | | | Shareholder voting | |
|
| 101 | | | Disclosure of fund expenses | |
|
Turner Funds
As of March 31, 2011, the Turner Funds offered a series of 15 mutual funds to individual and institutional investors. The minimum initial investment for Institutional Class Shares in a Turner Fund is $250,000 (except for $25,000 for the Turner Quantitative Large Cap Value Fund and $100,000 for the Turner Market Neutral Fund, Turner Medical Sciences Long/Short Fund, Turner Spectrum Fund and Turner Titan Fund) for regular accounts and $100,000 (with the exception of $10,000 for the Turner Quantitative Large Cap Value Fund) for individual retirement accounts. The minimum initial investment for Investor Class Shares, Retirement Class Shares and Class C Shares is $2,500 for regular accounts and $2,000 for individual retirement accounts.
Turner Investments, based in Berwyn, Pennsylvania, serves as the investment adviser for the Funds (other than the Turner Small Cap Equity Fund). Turner Investment Management LLC, a subsidiary of Turner Investments, serves as the investment adviser for the Turner Small Cap Equity Fund. Turner Investments, founded in 1990, manages more than $18 billion in stock investments as of March 31, 2011.
Shareholder services
Turner Funds shareholders receive annual and semiannual reports, quarterly account statements, and a quarterly newsletter. Shareholders who have questions about their accounts may call a toll-free telephone number, 1.800.224.6312, may visit our website, www.turnerinvestments.com, or may write to Turner Funds, P.O. Box 219805, Kansas City, Missouri 64121-9805.
TURNER FUNDS 2011 SEMIANNUAL REPORT 1
LETTER TO SHAREHOLDERS
To our shareholders
Managing a stock mutual fund is not unlike being a golfer who makes a breakthrough on the professional tour. When a rising star distinguishes himself from the pack, golfing pundits say things like, "Well, it's no wonder — look at that upright swing of his." But when he inevitably goes through a rough stretch of performance, the pundits tend to change their tune and observe, "You know, that upright swing of his was just bound to bring him down to earth at some point."
Like a standout professional golfer's swing, the stock-investment processes that we — and other money managers — use aren't perfect. They don't work well all the time. And they often are perceived as only being as good as the most recent performance they have wrought. But the best investment processes, like the best pro golfers, do prove to perform well on balance.
Funds outperform
In managing our own eight U.S. and global/international growth funds and four long/short funds, we employ an investment process that prizes earnings, based on the premise that earnings drive stock prices. Happily, the past six months ended March 31, 2011, happened to be one of those times when our growth-investment process — the investing equivalent of a distinctive and skilled golf swing — worked well. All twelve of our growth and long/short funds in operation throughout the entire six-month period outperformed one or more of their benchmarks. And all three new long/short funds that opened on February 7 — the Turner Market Neutral Fund, the Turner Medical Sciences Long/Short Fund, and the Turner Titan Fund — also got off to good starts, beating one or more of their indexes.
Alas, our swing may not have seemed nearly as good when we most recently reported our funds' results, in the 2010 Turner Funds Annual Report last September. Then, during the 12-month period covered by that report, only four of our funds managed to beat par — their benchmarks.
Even so, we remained confident then that our growth-investment process was sound — that there was nothing fundamentally wrong with our swing. We reasoned that it would eventually lead to better performance.
And that's exactly what happened.
We stick with our processes
When our funds undergo spells of less-than-stellar performance, it's undoubtedly frustrating for shareholders — and for us as well, since our portfolio managers (and other Turner Investments employees) are shareholders in our funds, too.
But if there's anything we believe about stock investing, it's this: if you're convinced that your investment process is logical and well constructed, you shouldn't abandon it when it's generating adverse results. There's a natural tendency in investing to succumb to the temptation to alter an investment process out of desperation to do something — anything — to "cure" a spell of unfavorable performance. But that cure can be worse than the disease. In such a circumstance, we think it's prudent to stick with our investment processes and give them the time needed to pay off.
Of course, the key test for an investment process isn't how it performs in just six months, but its ability to generate outperformance and increase shareholders' wealth over time. And we say with a measure of pride that our funds have generally passed that test: all share classes in eight of the nine growth and long/short funds with records longer than 12 months have beaten one or more of their benchmarks since inception.
As for the investment results in the most recent six-month period, they were certainly helped by a strongly rising stock market. The market, as represented by the S&P 500 Index, gained 17.31%. In the wake of the 2000-2009 decade that we call the Terrible 2000s, the worst decade for stock investing in history, with an annualized 0.95% loss, the S&P 500 has been on a tear, rising almost 100% in the past two years — the second-fastest rise in history.
Bull corrected just once
On balance, this bull market has been uncommonly benign: it has suffered only one correction, i.e., a pullback of 10% or more. (Corrections have occurred about once annually since 1900.) The bull market's resilience has been such that it reminds us of those inflatable punching toys that snap back after being knocked down. With pop-up resilience, the market has kept its equilibrium after absorbing some solid whacks.
Those whacks included three crises late in the period. There was the nuclear crisis in Japan, when the Fukushima Daiichi nuclear station had a partial meltdown following an earthquake-induced tsunami, which resulted in a disruption of component supplies to manufacturers around the world. There was a new phase of the European debt crisis, when Portugal's government collapsed and pushed its credit rating lower, fanning winds of anxiety that a second major financial crisis in three years was in the offing. And there were civil uprisings in the Middle East, most notably in Libya and Egypt, which led to a decline in global oil production. But despite all these geo-economic downers, the market generated positive returns in all six months of the period.
2 TURNER FUNDS 2011 SEMIANNUAL REPORT
March 31, 2011
| Total returns | | | | | |
| Six-month period ended March 31, 2011 | | | | | |
| Long/short equity funds | | | | | |
Turner Market Neutral Fund,
Investor Class (TMNFX) | | | 3.30 | %† | |
| S&P 500 Index | | | 1.48 | † | |
| Barclays Capital U.S. Aggregate Bond Index | | | 1.34 | † | |
| Lipper Equity Market-Neutral Funds Average | | | 0.79 | † | |
Turner Medical Sciences Long/Short Fund,
Investor Class (TMSFX) | | | 2.60 | † | |
| S&P 500 Healthcare Index | | | 2.86 | † | |
| Barclays Capital U.S. Aggregate Bond Index | | | 1.34 | † | |
| Lipper Long/Short Equity Funds Average | | | 0.70 | † | |
Turner Spectrum Fund,
Institutional Class (TSPEX) | | | 9.24 | | |
| S&P 500 Index | | | 17.31 | | |
| Barclays Capital U.S. Aggregate Bond Index | | | -0.88 | | |
| Lipper Long/Short Equity Funds Average | | | 7.88 | | |
Turner Titan Fund,
Investor Class (TTLFX) | | | 1.50 | † | |
| S&P 500 Index | | | 1.48 | † | |
| Barclays Capital U.S. Aggregate Bond Index | | | 1.34 | † | |
| Lipper Long/Short Equity Funds Average | | | 0.70 | † | |
| U.S. growth equity funds | | | | | |
| Turner All Cap Growth Fund (TBTBX) | | | 34.99 | | |
| NASDAQ Composite Index | | | 17.41 | | |
| Russell 3000® Growth Index | | | 19.33 | | |
Turner Concentrated Growth
Fund (TTOPX) | | | 23.08 | | |
| S&P 500 Index | | | 17.31 | | |
| Russell 1000® Growth Index | | | 18.57 | | |
Turner Emerging Growth Fund,
Investor Class (TMCGX) | | | 33.51 | | |
| Russell 2000® Growth Index | | | 27.93 | | |
Turner Large Growth Fund,
Institutional Class (TTMEX) | | | 20.86 | | |
| Russell 1000® Growth Index | | | 18.57 | | |
Turner Midcap Growth Fund,
Investor Class (TMGFX) | | | 30.47 | | |
| Russell Midcap® Growth Index | | | 22.97 | | |
| Turner Small Cap Growth Fund (TSCEX) | | | 30.24 | | |
| Russell 2000® Growth Index | | | 27.93 | | |
| Quantitative equity funds | | | | | |
Turner Quantitative
Broad Market Equity Fund,
Institutional Class (TBMEX) | | | 19.29 | | |
| Russell 3000® Index | | | 18.71 | | |
| S&P 500 Index | | | 17.31 | | |
Turner Quantitative
Large Cap Value Fund,
Institutional Class (TLVFX) | | | 16.21 | % | |
| Russell 1000® Value Index | | | 17.68 | | |
| Global and international equity funds | | | | | |
Turner Global Opportunities Fund,
Institutional Class (TGLBX) | | | 23.26 | | |
| MSCI World Growth Index | | | 14.33 | | |
| MSCI World Index | | | 14.42 | | |
Turner International Growth Fund,
Institutional Class (TICGX) | | | 22.79 | | |
| MSCI World ex-U.S. Growth Index | | | 11.40 | | |
| Core equity fund | | | | | |
Turner Small Cap Equity Fund,
Investor Class (TSEIX) | | | 29.07 | | |
| Russell 2000® Index | | | 25.48 | | |
† Returns are from the fund's inception date: February 7, 2011.
(Please call 1.800.224.6312 or visit our website at www.turnerinvestments.com for the most recent month-end performance. For more details on the performance of each fund during the six-month period, see the Investment review beginning on page 9.)
Stocks look good to us
In our view, stocks have had a lot of things going for them in the past six months — and have a lot of things going for them in the near term that may help sustain this bull market. For example:
• Despite Japan's nuclear crisis, the European debt crisis, and unrest in the Middle East — plus the prospect that a key stock-market catalyst, the Federal Reserve's quantitative easing, may end soon — we estimate the global economy may grow more than 4% this year. That's more than a point higher than the global economy's average in the past two decades.
• Earnings for the S&P 500 Index companies should rise at least 10% this year and in the high single digits next year, in our estimation. And earnings for the first quarter should be the ninth in a series of better-than-expected quarterly results. We agree with this assessment of the state of earnings and the market by Bank of America Merrill Lynch: "Corporate profit growth remains solid, and valuations provide a significant cushion to absorb some worst-than-expected outcomes" for any crisis du jour that may surface.
• Mergers and acquisitions are picking up, with multi-billion-dollar deals announced recently in the telecommunications, semiconductor, e-commerce, and pharmaceutical industries, among others. The resources are certainly available for more M&A activity this year:
TURNER FUNDS 2011 SEMIANNUAL REPORT 3
LETTER TO SHAREHOLDERS (continued)
Lazard, an investment bank, estimates that corporations and private-equity firms hold nearly $2.4 trillion in cash.
• We think corporate capital spending should increase at a double-digit rate in both 2011 and 2012, outpacing economic growth by a factor of three. That should especially help technology and industrial companies, in our analysis.
Allocations shifting
• We believe the stock market should benefit from a continuing shift in investors' asset allocations from low-yielding money markets and bonds to stocks. U.S. and international stock funds took in a net $13 billion of new investment in February (the latest month for which data are available), on the heels of a $19.7 billion inflow in January, Citigroup Global Markets reported. In contrast, stock funds suffered outflows of $37.6 billion in 2010 and $9.1 billion in 2009.
• Finally, we think the market should benefit in 2011 from the third year of the presidential-election cycle, which has invariably been an up year for stocks. Since 1955 the S&P 500 Index has advanced an average of 18% in the third year of the cycle, with no losing years.
And we think the longer term outlook for stocks is encouraging as well. Two years ago, when the Terrible 2000s were at their most terrible, we said in the 2009 Turner Funds Semiannual Report that stocks offered superior return potential to investors with long time horizons. We noted: "We refuse to believe that the next 10 years for stocks will be as painfully disappointing as the last 10 years. That's because we as investors above all believe in probabilities, in making decisions that are the most likely to produce a constructive result. And based on the probabilities, we think this decade of dreadful performance by stocks is likely to be the exception that proves the rule."
Better returns ahead?
We still stand behind that statement today. The five- and 10-year returns on stocks as of March 31 remain below the norm: the S&P 500 Index is up an annualized 2.62% for the past five years and an annualized 3.29% for the past 10 years. So stock investors could continue to profit from the statistical phenomenon known as reversion to the mean — the tendency for worse-than-average performance to be followed by periods of above-average performance, and vice versa.
In our judgment, the lackluster stock-market results of the most recent five- and 10-year periods may be followed by sparkling results over the next five or 10 years. According to WisdomTree Asset Management, after the worst 10-year periods of performance dating back to 1871, stocks generated much better returns in all subsequent 10-year periods, with a level of inflation-adjusted results 2.32 percentage points above that of all other 10-year periods.
In closing, as a result of the strong performance of our stock funds recently and our optimism about the stock market's course, we think our own upright golf swing is in the groove and should deliver more good scores.
If nothing else, the market's exceptional rally over the past two years is a testament to the perils of trying to time the market — the practice of investing in stocks when the market's prospects appear favorable and getting out of stocks when the prospects seem poor. Indeed, because you as a Turner Funds shareholder have in your hands this report, chances are you're not a market timer and thus have benefited from the gains our funds have produced in the past six months or longer.
To our way of thinking, putting time on your side — five years, 10 years, 20 years, whatever — improves the odds that you will reap the wealth-building rewards that stocks can uniquely provide. As we see it, putting time on your side going forward should be rewarded with additional good results in the stock market and our funds.

Bob Turner
Chairman and Chief Investment Officer
Turner Investments
Past performance is no guarantee of future results. The views expressed are those of Turner Investments as of March 31, 2011, and are not intended as a forecast or investment recommendations. The indexes mentioned are not available for investment.

Bob Turner
4 TURNER FUNDS 2011 SEMIANNUAL REPORT
PERFORMANCE
Total returns of the Turner Funds
Through March 31, 2011
Current performance may be lower or higher than the performance data quoted. Please call 1.800.224.6312 or visit our website at www.turnerinvestments.com for the most recent month-end performance information.
The performance data quoted represents past performance and the principal value and investment return will fluctuate so that an investor's shares, when redeemed, may be worth more or less than their original cost. Past performance is no guarantee of future results. Returns shown, unless otherwise indicated, are total returns, with dividends and income reinvested. Returns spanning more than one year are annualized. Fee waivers are in effect; if they had not been in effect, performance would have been lower. The indices mentioned are unmanaged statistical composites of stock-market performance. Investing in an index is not possible.
The holdings and sector weightings of the Funds are subject to change. Forward-earnings projections are not predictors of stock price or investment performance, and do not represent past performance. There is no guarantee that the forward-earnings projections will accurately predict the actual earnings experience of any of the companies involved, and there is no guarantee that owning securities of companies with relatively high price-to-earnings ratios will cause the portfolio to outperform its benchmark or index.
The Turner Funds are distributed by Foreside Fund Services, LLC, Portland, Maine. The investor should consider the investment objectives, risks, charges, and expenses carefully before investing. This and other information can be found in the prospectus. A free prospectus, which contains detailed information, including fees and expenses, and the risks associated with investing in these Funds, can be obtained by calling 1.800.224.6312. Read the prospectus carefully before investing.
| Fund name/Index | | Six
months | | Year
to
date | | One
year | | Three
years | | Five
years | | 10
years | | (Annualized*)
Since
inception | | Total
net assets
($mil) | |
Turner Market Neutral Fund —
Institutional Class Shares | | | n/a | | | | n/a | | | | n/a | | | | n/a | | | | n/a | | | | n/a | | | | 3.40 | % | | $ | 3.35 | | |
| Investor Class Shares | | | n/a | | | | n/a | | | | n/a | | | | n/a | | | | n/a | | | | n/a | | | | 3.30 | | | | 0.07 | | |
| Class C Shares | | | n/a | | | | n/a | | | | n/a | | | | n/a | | | | n/a | | | | n/a | | | | 3.30 | | | | — | | |
| S&P 500 Index | | | n/a | | | | n/a | | | | n/a | | | | n/a | | | | n/a | | | | n/a | | | | 1.48 | | | | |
Barclays Capital U.S. Aggregate
Bond Index | | | n/a | | | | n/a | | | | n/a | | | | n/a | | | | n/a | | | | n/a | | | | 1.34 | | | | |
Lipper Equity Market-Neutral
Funds Average | | | n/a | | | | n/a | | | | n/a | | | | n/a | | | | n/a | | | | n/a | | | | 0.79 | | | | |
| Inception date: 2/7/11 | |
Turner Medical Sciences
Long/Short Fund —
Institutional Class Shares | | | n/a | | | | n/a | | | | n/a | | | | n/a | | | | n/a | | | | n/a | | | | 2.60 | | | | 2.25 | | |
| Investor Class Shares | | | n/a | | | | n/a | | | | n/a | | | | n/a | | | | n/a | | | | n/a | | | | 2.60 | | | | 2.49 | | |
| Class C Shares | | | n/a | | | | n/a | | | | n/a | | | | n/a | | | | n/a | | | | n/a | | | | 2.50 | | | | 0.45 | | |
| S&P 500 Healthcare Index | | | n/a | | | | n/a | | | | n/a | | | | n/a | | | | n/a | | | | n/a | | | | 2.86 | | | | |
Barclays Capital U.S. Aggregate
Bond Index | | | n/a | | | | n/a | | | | n/a | | | | n/a | | | | n/a | | | | n/a | | | | 1.34 | | | | |
| Lipper Long/Short Equity Average | | | n/a | | | | n/a | | | | n/a | | | | n/a | | | | n/a | | | | n/a | | | | 0.70 | | | | |
| Inception date: 2/7/11 | |
Turner Spectrum Fund —
Institutional Class Shares | | | 9.24 | % | | | 2.87 | % | | | 6.87 | % | | | n/a | | | | n/a | | | | n/a | | | | 9.59 | | | | 306.10 | | |
| Investor Class Shares | | | 9.09 | | | | 2.89 | | | | 6.62 | | | | n/a | | | | n/a | | | | n/a | | | | 9.30 | | | | 96.84 | | |
| Class C Shares(1) | | | 8.68 | | | | 2.64 | | | | 5.81 | | | | n/a | | | | n/a | | | | n/a | | | | 9.87 | | | | 8.78 | | |
| S&P 500 Index | | | 17.31 | | | | 5.92 | | | | 15.65 | | | | n/a | | | | n/a | | | | n/a | | | | 24.68 | | | | |
Barclays Capital U.S. Aggregate
Bond Index | | | -0.88 | | | | 0.42 | | | | 5.12 | | | | n/a | | | | n/a | | | | n/a | | | | 6.46 | | | | |
| Lipper Long/Short Equity Average | | | 7.88 | | | | 2.49 | | | | 6.78 | | | | n/a | | | | n/a | | | | n/a | | | | 13.77 | | | | |
| Inception date: 5/7/09 | |
TURNER FUNDS 2011 SEMIANNUAL REPORT 5
PERFORMANCE (continued)
| Fund name/Index | | Six
months | | Year
to
date | | One
year | | Three
years | | Five
years | | 10
years | | (Annualized*)
Since
inception | | Total
net assets
($mil) | |
Turner Titan Fund —
Institutional Class Shares | | | n/a | | | | n/a | | | | n/a | | | | n/a | | | | n/a | | | | n/a | | | | 1.50 | % | | $ | 4.08 | | |
| Investor Class Shares | | | n/a | | | | n/a | | | | n/a | | | | n/a | | | | n/a | | | | n/a | | | | 1.50 | | | | 0.07 | | |
| Class C Shares | | | n/a | | | | n/a | | | | n/a | | | | n/a | | | | n/a | | | | n/a | | | | 1.40 | | | | 0.02 | | |
| S&P 500 Index | | | n/a | | | | n/a | | | | n/a | | | | n/a | | | | n/a | | | | n/a | | | | 1.48 | | | | |
Barclays Capital U.S. Aggregate
Bond Index | | | n/a | | | | n/a | | | | n/a | | | | n/a | | | | n/a | | | | n/a | | | | 1.34 | | | | |
| Lipper Long/Short Equity Average | | | n/a | | | | n/a | | | | n/a | | | | n/a | | | | n/a | | | | n/a | | | | 0.70 | | | | |
| Inception date: 2/7/11 | |
| Turner All Cap Growth Fund(2) | | | 34.99 | % | | | 7.96 | % | | | 38.34 | % | | | 9.88 | % | | | 5.52 | % | | | 8.02 | % | | | -0.48 | | | | 58.97 | | |
| NASDAQ Composite Index | | | 17.41 | | | | 4.83 | | | | 15.98 | | | | 6.86 | | | | 3.52 | | | | 4.22 | | | | -3.25 | | | | |
| Russell 3000® Growth Index | | | 19.33 | | | | 6.30 | | | | 19.24 | | | | 5.58 | | | | 4.32 | | | | 3.26 | | | | -1.86 | | | | |
| Inception date: 6/30/00 | |
Turner Concentrated
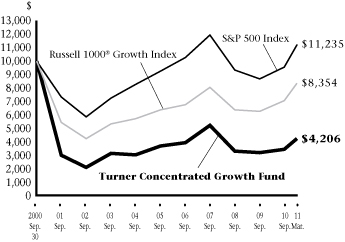
Growth Fund | | | 23.08 | | | | 5.97 | | | | 23.64 | | | | -0.55 | | | | -0.38 | | | | 0.88 | | | | 1.33 | | | | 55.65 | | |
| S&P 500 Index | | | 17.31 | | | | 5.92 | | | | 15.65 | | | | 2.35 | | | | 2.62 | | | | 3.29 | | | | 1.51 | | | | |
| Russell 1000® Growth Index | | | 18.57 | | | | 6.03 | | | | 18.26 | | | | 5.19 | | | | 4.34 | | | | 2.99 | | | | -0.06 | | | | |
| Inception date: 6/30/99 | |
Turner Emerging Growth Fund(2) —
Institutional Class Shares(3) | | | 33.64 | | | | 11.28 | | | | 31.75 | | | | n/a | | | | n/a | | | | n/a | | | | 37.65 | | | | 375.78 | | |
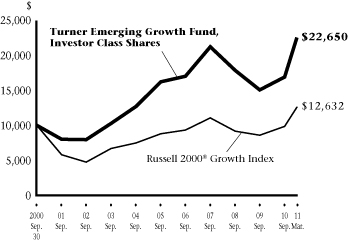
| Investor Class Shares | | | 33.51 | | | | 11.22 | | | | 31.43 | | | | 6.13 | | | | 4.22 | | | | 10.71 | | | | 20.06 | | | | 222.66 | | |
| Russell 2000® Growth Index | | | 27.93 | | | | 9.24 | | | | 31.04 | | | | 10.16 | | | | 4.34 | | | | 6.44 | | | | 3.93 | | | | |
| Inception date: 2/27/98 | |
Turner Large Growth Fund —
Institutional Class Shares | | | 20.86 | | | | 6.97 | | | | 16.77 | | | | 0.87 | | | | 1.72 | | | | 3.67 | | | | 2.64 | | | | 544.16 | | |
| Investor Class Shares(4) | | | 20.78 | | | | 6.92 | | | | 16.56 | | | | 0.61 | | | | 1.48 | | | | n/a | | | | 3.45 | | | | 115.17 | | |
| Russell 1000® Growth Index | | | 18.57 | | | | 6.03 | | | | 18.26 | | | | 5.19 | | | | 4.34 | | | | 2.99 | | | | 1.80 | | | | |
| Inception date: 2/28/01 | |
Turner Midcap Growth Fund(2) —
Institutional Class Shares(5) | | | 30.67 | | | | 10.21 | | | | 30.54 | | | | n/a | | | | n/a | | | | n/a | | | | 4.38 | | | | 258.93 | | |
| Investor Class Shares | | | 30.47 | | | | 10.14 | | | | 30.21 | | | | 7.13 | | | | 4.86 | | | | 6.09 | | | | 11.48 | | | | 955.15 | | |
| Retirement Class Shares(6) | | | 30.30 | | | | 10.06 | | | | 29.90 | | | | 6.86 | | | | 4.56 | | | | n/a | | | | 8.44 | | | | 5.25 | | |
| Russell Midcap® Growth Index | | | 22.97 | | | | 7.85 | | | | 26.60 | | | | 7.63 | | | | 4.93 | | | | 6.94 | | | | 7.68 | | | | |
| Inception date: 10/1/96 | |
Turner Small Cap
Growth Fund(2) | | | 30.24 | | | | 11.36 | | | | 32.29 | | | | 10.35 | | | | 4.90 | | | | 7.62 | | | | 12.16 | | | | 345.17 | | |
| Russell 2000® Growth Index | | | 27.93 | | | | 9.24 | | | | 31.04 | | | | 10.16 | | | | 4.34 | | | | 6.44 | | | | 6.29 | | | | |
| Inception date: 2/7/94 | |
Turner Quantitative Broad
Market Equity Fund —
Institutional Class Shares | | | 19.29 | | | | 6.80 | | | | 14.41 | | | | n/a | | | | n/a | | | | n/a | | | | 2.95 | | | | 12.00 | | |
| Investor Class Shares | | | 19.24 | | | | 6.70 | | | | 14.10 | | | | n/a | | | | n/a | | | | n/a | | | | 2.72 | | | | 0.03 | | |
| Russell 3000® Index | | | 18.71 | | | | 6.38 | | | | 17.41 | | | | n/a | | | | n/a | | | | n/a | | | | 4.38 | | | | |
| S&P 500 Index | | | 17.31 | | | | 5.92 | | | | 15.65 | | | | n/a | | | | n/a | | | | n/a | | | | 3.61 | | | | |
| Inception date: 6/30/08 | |
6 TURNER FUNDS 2011 SEMIANNUAL REPORT
PERFORMANCE (continued)
| Fund name/Index | | Six
months | | Year
to
date | | One
year | | Three
years | | Five
years | | 10
years | | (Annualized*)
Since
inception | | Total
net assets
($mil) | |
Turner Quantitative Large Cap
Value Fund —
Institutional Class Shares | | | 16.21 | % | | | 6.25 | % | | | 12.49 | % | | | -1.80 | % | | | 0.79 | % | | | n/a | | | | 2.56 | % | | $ | 0.81 | | |
| Investor Class Shares(7) | | | 15.99 | | | | 6.13 | | | | 12.13 | | | | n/a | | | | n/a | | | | n/a | | | | 10.14 | | | | 0.01 | | |
| Russell 1000® Value Index | | | 17.68 | | | | 6.46 | | | | 15.15 | | | | 0.60 | | | | 1.38 | | | | n/a | | | | 3.30 | | | | |
| Inception date: 10/10/05 | |
Turner Global Opportunities
Fund —
Institutional Class Shares | | | 23.26 | | | | 5.19 | | | | n/a | | | | n/a | | | | n/a | | | | n/a | | | | 42.00 | | | | 1.34 | | |
| Investor Class Shares | | | 23.13 | | | | 5.12 | | | | n/a | | | | n/a | | | | n/a | | | | n/a | | | | 41.60 | | | | 0.71 | | |
| MSCI World Growth Index | | | 14.33 | | | | 3.79 | | | | n/a | | | | n/a | | | | n/a | | | | n/a | �� | | | 28.66 | | | | |
| MSCI World Index | | | 14.42 | | | | 4.91 | | | | n/a | | | | n/a | | | | n/a | | | | n/a | | | | 27.03 | | | | |
| Inception date: 5/7/10 | |
Turner International
Growth Fund —
Institutional Class Shares | | | 22.79 | | | | 4.47 | | | | 28.24 | | | | 1.76 | | | | n/a | | | | n/a | | | | 4.61 | | | | 6.37 | | |
| Investor Class Shares(7) | | | 22.67 | | | | 4.47 | | | | 27.99 | | | | n/a | | | | n/a | | | | n/a | | | | 30.46 | | | | 0.51 | | |
| MSCI World ex-U.S. Growth Index | | | 11.40 | | | | 2.66 | | | | 14.16 | | | | -1.70 | | | | n/a | | | | n/a | | | | 0.70 | | | | |
| Inception date: 1/31/07 | |
Turner Small Cap
Equity Fund(2) —
Institutional Class Shares(3) | | | 29.26 | | | | 11.34 | | | | 31.63 | | | | n/a | | | | n/a | | | | n/a | | | | 33.02 | | | | — | | |
| Investor Class Shares | | | 29.07 | | | | 11.26 | | | | 31.21 | | | | 4.71 | | | | -0.16 | % | | | n/a | | | | 8.09 | | | | 5.70 | | |
| Russell 2000® Index | | | 25.48 | | | | 7.94 | | | | 25.79 | | | | 8.57 | | | | 3.35 | | | | n/a | | | | 7.61 | | | | |
| Inception date: 3/4/02 | |
(1) Commenced operations on July 14, 2009.
(2) Investing in technology and science companies and small- and mid-capitalization companies may subject the Funds to specific inherent risks, including above-average price fluctuations.
(3) Commenced operations on February 1, 2009.
(4) Commenced operations on August 1, 2005.
(5) Commenced operations on June 16, 2008.
(6) Commenced operations on September 24, 2001.
(7) Commenced operations on October 31, 2008.
* Returns of less than one year are cumulative, and not annualized.
Amounts designated as "—" have been rounded to $0 ($mil)
TURNER FUNDS 2011 SEMIANNUAL REPORT 7
Expense Ratio†
| | | Gross
expense
ratio | | Net
expense
ratio* | |
| Turner Market Neutral Fund | |
| Institutional Class Shares | | | 2.13 | % | | | 1.95 | % | |
| Investor Class Shares | | | 2.38 | % | | | 2.20 | % | |
| Class C Shares | | | 3.13 | % | | | 2.95 | % | |
Turner Medical Sciences
Long/Short Fund | |
| Institutional Class Shares | | | 2.13 | % | | | 1.95 | % | |
| Investor Class Shares | | | 2.38 | % | | | 2.20 | % | |
| Class C Shares | | | 3.13 | % | | | 2.95 | % | |
| Turner Spectrum Fund | |
| Institutional Class Shares | | | 2.88 | % | | | 1.95 | % | |
| Investor Class Shares | | | 3.15 | % | | | 2.20 | % | |
| Class C Shares | | | 3.85 | % | | | 2.95 | % | |
| Turner Titan Fund | |
| Institutional Class Shares | | | 2.13 | % | | | 1.95 | % | |
| Investor Class Shares | | | 2.38 | % | | | 2.20 | % | |
| Class C Shares | | | 3.13 | % | | | 2.95 | % | |
| Turner All Cap Growth Fund | |
| Investor Class Shares | | | 2.15 | % | | | 1.64 | % | |
| Turner Concentrated Growth Fund | |
| Investor Class Shares | | | 1.94 | % | | | 1.51 | % | |
| Turner Emerging Growth Fund | |
| Institutional Class Shares | | | 1.30 | % | | | 1.17 | % | |
| Investor Class Shares | | | 1.55 | % | | | 1.42 | % | |
| Turner Large Growth Fund | |
| Institutional Class Shares | | | 0.87 | % | | | 0.69 | % | |
| Investor Class Shares | | | 1.12 | % | | | 0.94 | % | |
| | | Gross
expense
ratio | | Net
expense
ratio* | |
| Turner Midcap Growth Fund | |
| Institutional Class Shares | | | 1.03 | % | | | 0.93 | % | |
| Investor Class Shares | | | 1.28 | % | | | 1.18 | % | |
| Retirement Class Shares | | | 1.53 | % | | | 1.43 | % | |
| Turner Small Cap Growth Fund | |
| Investor Class Shares | | | 1.52 | % | | | 1.25 | % | |
Turner Quantitative Broad Market
Equity Fund | |
| Institutional Class Shares | | | 2.29 | % | | | 0.65 | % | |
| Investor Class Shares | | | 6.73 | % | | | 0.90 | % | |
Turner Quantitative Large Cap
Value Fund | |
| Institutional Class Shares | | | 12.61 | % | | | 0.69 | % | |
| Investor Class Shares | | | 12.82 | % | | | 0.94 | % | |
| Turner Global Opportunities Fund | |
| Institutional Class Shares | | | 8.34 | % | | | 1.11 | % | |
| Investor Class Shares | | | 8.59 | % | | | 1.36 | % | |
| Turner International Growth Fund | |
| Institutional Class Shares | | | 3.93 | % | | | 1.10 | % | |
| Investor Class Shares | | | 4.18 | % | | | 1.35 | % | |
| Turner Small Cap Equity Fund | |
| Institutional Class Shares | | | 1.79 | % | | | 1.20 | % | |
| Investor Class Shares | | | 2.04 | % | | | 1.45 | % | |
† These expense ratios are based on the most recent prospectus and may differ from those shown in the financial highlights.
* Net expense ratio reflects contractual waivers of certain fees and/or expense reimbursements. Turner may discontinue this arrangement at any time after January 31, 2012.
8 TURNER FUNDS 2011 SEMIANNUAL REPORT
INVESTMENT REVIEW
Turner Market Neutral Fund
Fund profile
March 31, 2011
g Ticker symbol TMNFX
Investor Class Shares
g CUSIP #900297581
Investor Class Shares
g Top five holdings1
(1) Martin Marietta Materials
(2) Arch Capital Group
(3) ACE
(4) Ensco SP ADR
(5) Salesforce.com
g % in five largest holdings 23.4%2
g Number of holdings 711
g Price/earnings ratio 31.9
g Weighted average market capitalization $25.39 billion
g % of holdings with positive earnings surprises 65.7%
g % of holdings with negative earnings surprises 32.9%
g Net assets $0.1 million, Investor Class Shares

Growth of a $10,000 investment in the
Turner Market Neutral Fund,
Investor Class Shares:
February 7, 2011-March 31, 20113,4
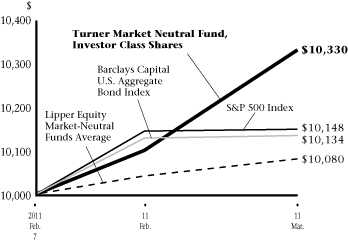
Cumulative total returns (Period ended March 31, 2011)
| | | Since
inception4 | |
| Turner Market Neutral Fund, Institutional Class Shares5 | | | 3.40 | % | |
| Turner Market Neutral Fund, Investor Class Shares5 | | | 3.30 | % | |
| Turner Market Neutral Fund, Class C Shares5 | | | 3.30 | % | |
| S&P 500 Index6 | | | 1.48 | % | |
| Barclays Capital U.S. Aggregate Bond Index7 | | | 1.34 | % | |
| Lipper Equity Market-Neutral Funds Average8 | | | 0.79 | % | |
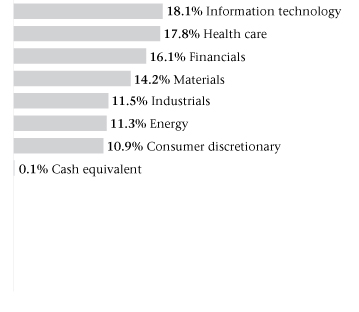
Sector weightings2:
Manager's discussion and analysis
Generally good stock selection helped the Turner Market Neutral Fund, Investor Class Shares (TMNFX) to get off to a good start in its first two months of operation. After opening on February 7, the fund gained 3.30%, beating the S&P 500 Index, the Barclays Capital U.S. Aggregate Bond Index, and the Lipper Equity Market-Neutral Funds Average. The fund seeks to generate returns that have historically been associated with stocks, with relatively low volatility and a correlation unlike that of the broad market.
Six of the seven sectors in which the fund was invested contributed extra return. The information-technology and financials sectors added the most extra return. In those sectors, long and short positions in semiconductor, data-networking, wireless-communications, banking, insurance, and investment-management shares generated favorable relative results. The prime deflator of performance was the energy sector. In that sector, long and short positions in energy-production, natural-gas, and energy-services shares recorded the poorest relative performance.
1 Cash equivalent is not being considered a holding for the top five holdings, but is counted in the number of holdings. The fund composition is subject to change.
2 Percentages based on total investments.
3 These figures represent past performance, which is no guarantee of future results. The investment return and principal value of an investment will fluctuate, so an investor's shares, when redeemed, may be worth more or less than their original cost. The performance in the above graph and table does not reflect the deduction of taxes the shareholder will pay on fund distributions or the redemptions of fund shares. Performance of the Institutional, Investor and Class C Shares will differ due to differences in fees.
4 The inception date of the Turner Market Neutral Fund was February 7, 2011. Cumulative returns, not annualized.
5 Fee waivers are in effect; if they had not been in effect, performance would have been lower.
6 The S&P 500 Index is a widely-recognized, market value-weighted (higher market value stocks have more influence than lower market value stocks) index of 500 stocks designed to mimic the overall equity market's industry weightings.
7 The Barclays Capital U.S. Aggregate Bond Index (prior to November 2008, the Index was known as the "Lehman Brothers U.S. Aggregate Bond Index") represents an unmanaged diversified portfolio of fixed income securities, including U.S. Treasuries, investment-grade corporate bonds, and mortgage-backed and asset-backed securities.
8 The Lipper Equity Market-Neutral Funds Average represents the average annualized total return for all reporting funds in the Lipper Equity Market-Neutral Fund category.
TURNER FUNDS 2011 SEMIANNUAL REPORT 9
INVESTMENT REVIEW
Turner Medical Sciences Long/Short Fund
Fund profile
March 31, 2011
g Ticker symbol TMSFX
Investor Class Shares
g CUSIP #900297557
Investor Class Shares
g Top five holdings1
(1) Allergan
(2) Watson Pharmaceuticals International
(3) Jazz Pharmaceuticals
(4) Pfizer
(5) HCA Holdings
g % in five largest holdings 11.8%2
g Number of holdings 621
g Price/earnings ratio 13.6
g Weighted average market capitalization $34.45 billion
g % of holdings with positive earnings surprises 54.1%
g % of holdings with negative earnings surprises 36.1%
g Net assets $2 million, Investor Class Shares

Growth of a $10,000 investment in the
Turner Medical Sciences Long/Short Fund,
Investor Class Shares:
February 7, 2011-March 31, 20113,4
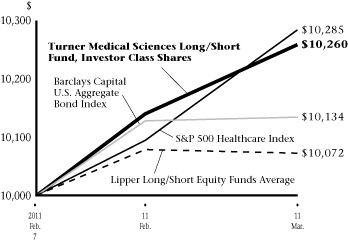
Cumulative total returns (Period ended March 31, 2011)
| | | Since
inception4 | |
| Turner Medical Sciences Long/Short Fund, Institutional Class Shares5 | | | 2.60 | % | |
| Turner Medical Sciences Long/Short Fund, Investor Class Shares5 | | | 2.60 | % | |
| Turner Medical Sciences Long/Short Fund, Class C Shares5 | | | 2.50 | % | |
| S&P 500 Healthcare Index6 | | | 2.86 | % | |
| Barclays Capital U.S. Aggregate Bond Index7 | | | 1.34 | % | |
| Lipper Long/Short Equity Funds Average8 | | | 0.70 | % | |
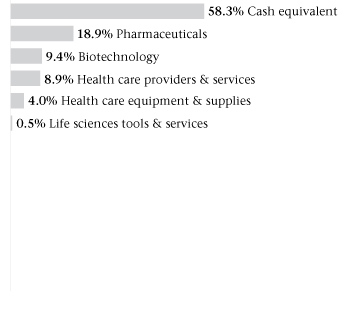
Sector weightings2:
Manager's discussion and analysis
The Turner Medical Sciences Long/Short Fund, Investor Class Shares (TMSFX) got off to a good start in its first two months of operation. Opening on February 7, the fund went on to gain 2.60% through March 31 to outperform the Lipper Long/Short Equity Funds Average and the Barclays Capital U.S. Aggregate Bond Index, but it slightly trailed the S&P 500 Healthcare Index. The fund seeks to capture alpha (the estimated amount of risk-adjusted excess return expected from an investment's fundamentals), reduce volatility, and preserve capital in declining markets.
In the fund's long and short positions, stocks in three health-care industries — biotechnology, specialty pharmaceutical, and health care services — produced the greatest extra return. The main detractors were long and short positions in the stocks of medical-device companies.
1 Cash equivalent is not being considered a holding for the top five holdings, but is counted in the number of holdings. The fund composition is subject to change.
2 Percentages based on total investments.
3 These figures represent past performance, which is no guarantee of future results. The investment return and principal value of an investment will fluctuate, so an investor's shares, when redeemed, may be worth more or less than their original cost. The performance in the above graph and table does not reflect the deduction of taxes the shareholder will pay on fund distributions or the redemptions of fund shares. Performance of the Institutional, Investor and Class C Shares will differ due to differences in fees.
4 The inception date of the Turner Medical Sciences Long/Short Fund was February 7, 2011. Cumulative returns, not annualized.
5 Fee waivers are in effect; if they had not been in effect, performance would have been lower.
6 The S&P 500 Healthcare Index is an unmanaged index which includes the stocks in the health care sector of the S&P 500 Index.
7 The Barclays Capital U.S. Aggregate Bond Index (prior to November 2008, the Index was known as the "Lehman Brothers U.S. Aggregate Bond Index") represents an unmanaged diversified portfolio of fixed income securities, including U.S. Treasuries, investment-grade corporate bonds, and mortgage-backed and asset-backed securities.
8 Lipper Long/Short Equity Funds Average represents the average annualized total return for all reporting funds in the Lipper Long/Short Equity Fund category.
10 TURNER FUNDS 2011 SEMIANNUAL REPORT
INVESTMENT REVIEW
Turner Spectrum Fund
Fund profile
March 31, 2011
g Ticker symbol TSPEX
Institutional Class Shares
g CUSIP #900297664
Institutional Class Shares
g Top five holdings1
(1) HCA Holdings
(2) Google, Cl A
(3) Cubist Pharmaceuticals
(4) Citigroup
(5) CF Industries Holdings
g % in five largest holdings 5.3%2
g Number of holdings 5171
g Price/earnings ratio 17.6
g Weighted average market capitalization $17.16 billion
g % of holdings with positive earnings surprises 54.0%
g % of holdings with negative earnings surprises 24.2%
g Net assets $306 million, Institutional Class Shares

Growth of a $100,000 investment in the
Turner Spectrum Fund, Institutional Class Shares:
May 7, 2009-March 31, 20113,4
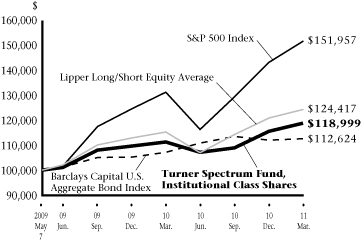
Average annual total returns (Periods ended March 31, 2011)
| | | Six months
(not annualized) | | One
year | | Since
inception | |
| Turner Spectrum Fund, Institutional Class Shares5 | | | 9.24 | % | | | 6.87 | % | | | 9.59 | %4 | |
| Turner Spectrum Fund, Investor Class Shares5 | | | 9.09 | % | | | 6.62 | % | | | 9.30 | %4 | |
| Turner Spectrum Fund, Class C Shares5 | | | 8.68 | % | | | 5.81 | % | | | 9.87 | %6 | |
| S&P 500 Index7 | | | 17.31 | % | | | 15.65 | % | | | 24.68 | %4 | |
| Barclays Capital U.S. Aggregate Bond Index8 | | | -0.88 | % | | | 5.12 | % | | | 6.46 | %4 | |
| Lipper Long/Short Equity Average9 | | | 7.88 | % | | | 6.78 | % | | | 13.77 | %4 | |
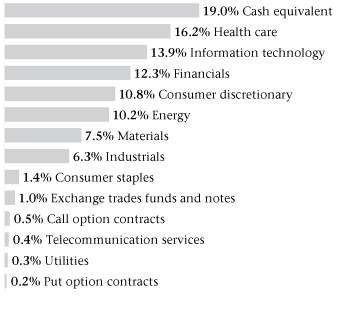
Sector weightings2:
Manager's discussion and analysis
In the six-month period ended March 31, the Turner Spectrum Fund, Institutional Class Shares (TSPEX) produced a 9.24% gain. That return underperformed the S&P 500 Index but outperformed the Barclays Capital U.S. Aggregate Bond Index and the Lipper Long/Short Equity Funds Average. The fund seeks to generate returns that have historically been associated with stocks, with relatively low volatility and a correlation unlike that of the broad market.
Overall, seven of the 10 sectors in which the fund held positions contributed extra return, with the health-care and information-technology sectors making the greatest contributions. In those sectors, long and short positions in drug, medical-device, medical-distribution, data-networking, semiconductor, and wireless-communications shares generated the best relative results. Detracting most from long and short results were holdings in the energy sector. In that sector, energy-production, natural-gas, and energy-services shares performed unsatisfactorily. The fund kept a modest net long exposure, mainly in U.S. stocks.
1 Cash equivalent is not being considered a holding for the top five holdings, but is counted in the number of holdings. The fund composition is subject to change.
2 Percentages based on total investments.
3 These figures represent past performance, which is no guarantee of future results. The investment return and principal value of an investment will fluctuate, so an investor's shares, when redeemed, may be worth more or less than their original cost. The performance in the above graph and table does not reflect the deduction of taxes the shareholder will pay on fund distributions or the redemptions of fund shares. Performance of the Institutional, Investor and Class C Shares will differ due to differences in fees.
4 The inception date of the Turner Spectrum Fund (Institutional Class Shares and Investor Class Shares) was May 7, 2009. Index returns are based on Institutional Class Shares inception date.
5 Fee waivers are in effect; if they had not been in effect, performance would have been lower.
6 The inception date of the Turner Spectrum Fund (Class C Shares) was July 14, 2009.
7 The S&P 500 Index is a widely-recognized, market value-weighted (higher market value stocks have more influence than lower market value stocks) index of 500 stocks designed to mimic the overall equity market's industry weightings.
8 The Barclays Capital U.S. Aggregate Bond Index (prior to November 2008, the Index was known as the "Lehman Brothers U.S. Aggregate Bond Index") represents an unmanaged diversified portfolio of fixed income securities, including U.S. Treasuries, investment-grade corporate bonds, and mortgage-backed and asset-backed securities.
9 Lipper Long/Short Equity Funds Average represents the average annualized total return for all reporting funds in the Lipper Long/Short Equity Fund category.
Cl — Class
TURNER FUNDS 2011 SEMIANNUAL REPORT 11
INVESTMENT REVIEW
Turner Titan Fund
Fund profile
March 31, 2011
g Ticker symbol TTLFX
Investor Class Shares
g CUSIP #900297524
Investor Class Shares
g Top five holdings1
(1) Marathon Oil
(2) Parker Hannifin
(3) Check Point Software Technologies
(4) Las Vegas Sands
(5) Viacom, Cl B
g % in five largest holdings 12.6%2
g Number of holdings 1101
g Price/earnings ratio 15.7
g Weighted average market capitalization $50.33 billion
g % of holdings with positive earnings surprises 79.0%
g % of holdings with negative earnings surprises 24.0%
g Net assets $0.1 million, Investor Class Shares

Growth of a $10,000 investment in the
Turner Titan Fund, Investor Class Shares:
February 7, 2011-March 31, 20113,4
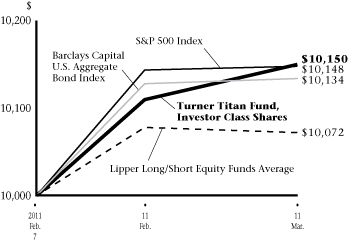
Cumulative total returns (Period ended March 31, 2011)
| | | Since
inception4 | |
| Turner Titan Fund, Institutional Class Shares5 | | | 1.50 | % | |
| Turner Titan Fund, Investor Class Shares5 | | | 1.50 | % | |
| Turner Titan Fund, Class C Shares5 | | | 1.40 | % | |
| S&P 500 Index6 | | | 1.48 | % | |
| Barclays Capital U.S. Aggregate Bond Index7 | | | 1.34 | % | |
| Lipper Long/Short Equity Funds Average8 | | | 0.70 | % | |
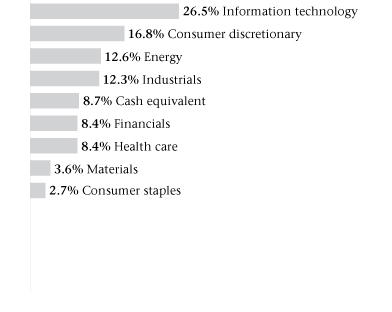
Sector weightings2:
Manager's discussion and analysis
In its first two months of operation, the Turner Titan Fund, Investor Class Shares (TTLFX) produced a 1.50% gain. That return outperformed the S&P 500 Index, the Barclays Capital U.S. Aggregate Bond Index, and the Lipper Long/Short Equity Funds Average. The fund seeks to generate returns that have historically been associated with stocks, with relatively low volatility and a correlation unlike that of the broad market.
Overall, six of the eight sectors in which the fund was invested made positive contributions to performance. Information-technology and financials holdings, in their long and short positions, contributed the most extra return. In those two sectors, semiconductor, data-networking, wireless-communications, insurance, investment-management, and investment-bank shares were among the winners. Detracting most from results were long and short holdings in the consumer-discretionary sector. In that sector, gaming, entertainment, e-commerce, and Internet-search shares performed unsatisfactorily.
1 Cash equivalent is not being considered a holding for the top five holdings, but is counted in the number of holdings. The fund composition is subject to change.
2 Percentages based on total investments.
3 These figures represent past performance, which is no guarantee of future results. The investment return and principal value of an investment will fluctuate, so an investor's shares, when redeemed, may be worth more or less than their original cost. The performance in the above graph and table does not reflect the deduction of taxes the shareholder will pay on fund distributions or the redemptions of fund shares. Performance of the Institutional, Investor and Class C Shares will differ due to differences in fees.
4 The inception date of the Turner Titan Fund was February 7, 2011. Cumulative returns, not annualized.
5 Fee waivers are in effect; if they had not been in effect, performance would have been lower.
6 The S&P 500 Index is a widely-recognized, market value-weighted (higher market value stocks have more influence than lower market value stocks) index of 500 stocks designed to mimic the overall equity market's industry weightings.
7 The Barclays Capital U.S. Aggregate Bond Index (prior to November 2008, the Index was known as the "Lehman Brothers U.S. Aggregate Bond Index") represents an unmanaged diversified portfolio of fixed income securities, including U.S. Treasuries, investment-grade corporate bonds, and mortgage-backed and asset-backed securities.
8 Lipper Long/Short Equity Funds Average represents the average annualized total return for all reporting funds in the Lipper Long/Short Equity Fund category.
Cl — Class
12 TURNER FUNDS 2011 SEMIANNUAL REPORT
INVESTMENT REVIEW
Turner All Cap Growth Fund
(formerly Turner New Enterprise Fund)
Fund profile
March 31, 2011
g Ticker symbol TBTBX
g CUSIP #87252R797
g Top five holdings1
(1) Apple
(2) Las Vegas Sands
(3) TIBCO Software
(4) Concho Resources
(5) Alexion Pharmaceuticals
g % in five largest holdings 17.4%2
g Number of holdings 361
g Price/earnings ratio 19.7
g Weighted average market capitalization $23.09 billion
g % of holdings with positive earnings surprises 82.9%
g % of holdings with negative earnings surprises 17.1%
g Net assets $59 million
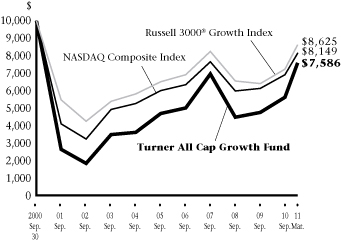
Growth of a $10,000 investment in the
Turner All Cap Growth Fund:
September 30, 2000-March 31, 20113
Average annual total returns (Periods ended March 31, 2011)
| | | Six months
(not annualized) | | One
year | | Three
years | | Five
years | | 10
years | | Since
inception | |
| Turner All Cap Growth Fund4 | | | 34.99 | % | | | 38.34 | % | | | 9.88 | % | | | 5.52 | % | | | 8.02 | % | | | -0.48 | % | |
| NASDAQ Composite Index5 | | | 17.41 | % | | | 15.98 | % | | | 6.86 | % | | | 3.52 | % | | | 4.22 | % | | | -3.25 | % | |
| Russell 3000® Growth Index6 | | | 19.33 | % | | | 19.24 | % | | | 5.58 | % | | | 4.32 | % | | | 3.26 | % | | | -1.86 | % | |
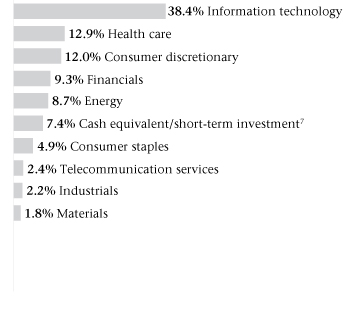
Sector weightings2:
Manager's discussion and analysis
Strong stock selection led to a substantial margin of outperformance for the Turner All Cap Growth Fund (TBTBX), formerly the Turner New Enterprise Fund, in the six months ended March 31. The fund gained 34.99%, beating the NASDAQ Composite Index return of 17.41% by 17.58 percentage points. The fund's gain was the biggest of any of our funds.
Altogether, eight of the fund's nine sector positions produced good relative returns. The information-technology, energy, consumer-staples, and materials sectors, which accounted for 54% of the fund's holdings, performed best. Winners here included data-networking, energy-services, supermarket, and metals shares. The lone sector that impaired performance was financials, a 9% weighting. Stocks in that sector producing unfavorable relative returns included securities-exchange, investment-management, and insurance shares.
1 Cash equivalent and short-term investment are not being considered a holding for the top five holdings, but are counted in the number of holdings. The fund composition is subject to change.
2 Percentages based on total investments.
3 These figures represent past performance, which is no guarantee of future results. The investment return and principal value of an investment will fluctuate, so an investor's shares, when redeemed, may be worth more or less than their original cost. The performance in the above graph and table does not reflect the deduction of taxes the shareholder will pay on fund distributions or the redemptions of fund shares. The inception date of the Turner All Cap Growth Fund, formerly the Turner New Enterprise Fund, was June 30, 2000.
4 Fee waivers are in effect; if they had not been in effect, performance would have been lower.
5 The NASDAQ Composite Index includes the more than 5,000 domestic and non-U.S. based common stocks listed on the NASDAQ stock market. The index is market-value weighted. This means that each company's security affects the index in proportion to its market value. The market value, the last sale price multiplied by total shares outstanding, is calculated throughout the trading day, and is related to the total value of the index. Because it is so broad-based, the Index is one of the most widely followed and quoted major market indices.
6 The Russell 3000® Growth Index measures the performance of the broad growth segment of the U.S. equity universe. It includes those Russell 3000® companies with higher price-to-book ratios and higher forecasted growth values.
7 Cash equivalent includes short-term investment held as collateral for securities lending activity. Please see Note 11 in Notes to Financial Statements for more detailed information.
TURNER FUNDS 2011 SEMIANNUAL REPORT 13
INVESTMENT REVIEW
Turner Concentrated Growth Fund
Fund profile
March 31, 2011
g Ticker symbol TTOPX
g CUSIP #87252R862
g Top five holdings1
(1) Apple
(2) Las Vegas Sands
(3) Salesforce.com
(4) Google, Cl A
(5) Acme Packet
g % in five largest holdings 25.4%2
g Number of holdings 241
g Price/earnings ratio 20.6
g Weighted average market capitalization $50.55 billion
g % of holdings with positive earnings surprises 73.9%
g % of holdings with negative earnings surprises 26.1%
g Net assets $56 million
Growth of a $10,000 investment in the
Turner Concentrated Growth Fund:
September 30, 2000-March 31, 20113
Average annual total returns (Periods ended March 31, 2011)
| | | Six months
(not annualized) | | One
year | | Three
years | | Five
years | | 10
years | | Since
inception | |
| Turner Concentrated Growth Fund4 | | | 23.08 | % | | | 23.64 | % | | | -0.55 | % | | | -0.38 | % | | | 0.88 | % | | | 1.33 | % | |
| S&P 500 Index5 | | | 17.31 | % | | | 15.65 | % | | | 2.35 | % | | | 2.62 | % | | | 3.29 | % | | | 1.51 | % | |
| Russell 1000® Growth Index6 | | | 18.57 | % | | | 18.26 | % | | | 5.19 | % | | | 4.34 | % | | | 2.99 | % | | | -0.06 | % | |
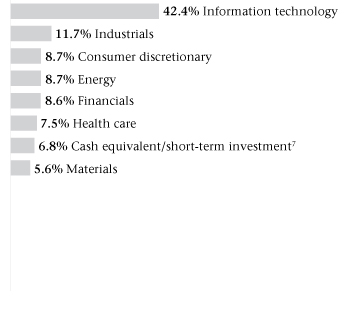
Sector weightings2:
Manager's discussion and analysis
Good results in three major sectors enhanced the performance of the Turner Concentrated Growth Fund (TTOPX) in the six-month period ended March 31. The fund rose 23.08%, outperforming the S&P 500 Index and the Russell 1000® Growth Index returns of 17.31% and 18.57% by 5.77 and 4.51 percentage points, respectively.
About 57% of the fund's holdings were concentrated in three sectors, information technology, consumer discretionary, and materials, whose returns added the most value to performance. In those sectors, semiconductor, data-networking, food-processing, gaming, and metals stocks performed well. Altogether, six of seven sector positions added extra return. The health-care sector, an 8% weighting, was the only detractor from performance, with health-services and medical-equipment shares recording lagging returns.
1 Cash equivalent and short-term investment are not being considered a holding for the top five holdings, but are counted in the number of holdings. The fund composition is subject to change.
2 Percentages based on total investments.
3 These figures represent past performance, which is no guarantee of future results. The investment return and principal value of an investment will fluctuate, so an investor's shares, when redeemed, may be worth more or less than their original cost. The performance in the above graph and table does not reflect the deduction of taxes the shareholder will pay on fund distributions or the redemptions of fund shares. The inception date of the Turner Concentrated Growth Fund was June 30, 1999.
4 Fee waivers are in effect; if they had not been in effect, performance would have been lower.
5 The S&P 500 Index is a widely-recognized, market value-weighted (higher market value stocks have more influence than lower market value stocks) index of 500 stocks designed to mimic the overall equity market's industry weightings.
6 The Russell 1000® Growth Index measures the performance of those Russell 1000 Companies with higher price-to-book ratios and higher forecasted growth values.
7 Cash equivalent includes short-term investment held as collateral for securities lending activity. Please see Note 11 in Notes to Financial Statements for more detailed information.
Cl — Class
14 TURNER FUNDS 2011 SEMIANNUAL REPORT
INVESTMENT REVIEW
Turner Emerging Growth Fund
Fund profile
March 31, 2011
g Ticker symbol TMCGX
Investor Class Shares
g CUSIP #872524301
Investor Class Shares
g Top five holdings1
(1) Deckers Outdoor
(2) Ariba
(3) AMERIGROUP
(4) Huntsman
(5) Hypercom
g % in five largest holdings 10.5%2
g Number of holdings 1211
g Price/earnings ratio 20.1
g Weighted average market capitalization $1.89 billion
g % of holdings with positive earnings surprises 61.7%
g % of holdings with negative earnings surprises 31.7%
g Net assets $223 million, Investor Class Shares
Growth of a $10,000 investment in the
Turner Emerging Growth Fund, Investor Class Shares:
September 30, 2000-March 31, 20113,4
Average annual total returns (Periods ended March 31, 2011)
| | | Six months
(not annualized) | | One
year | | Three
years | | Five
years | | 10
years | | Since
inception | |
Turner Emerging Growth Fund,
Institutional Class Shares5 | | | 33.64 | % | | | 31.75 | % | | | — | | | | — | | | | — | | | | 37.65 | %6 | |
Turner Emerging Growth Fund,
Investor Class Shares5 | | | 33.51 | % | | | 31.43 | % | | | 6.13 | % | | | 4.22 | % | | | 10.71 | % | | | 20.06 | %4 | |
| Russell 2000® Growth Index7 | | | 27.93 | % | | | 31.04 | % | | | 10.16 | % | | | 4.34 | % | | | 6.44 | % | | | 3.93 | %4 | |
Sector weightings2:
Manager's discussion and analysis
Ample outperformance in most sectors helped the Turner Emerging Growth Fund, Investor Class Shares (TMCGX) to produce favorable results in the six-month period ended March 31. The fund rose 33.51%, a return that beat the 27.93% advance by its benchmark, the Russell 2000® Growth Index, by 5.58 percentage points.
Six of the fund's 10 sector positions outperformed their corresponding index sectors. Outperforming the most were health-care, consumer-discretionary, energy, and materials stocks, which represented 47% of all holdings. In those sectors, medical-equipment, health-services, retailing, energy-services, and metals shares did relatively well. The primary detractor from results was the fund's financials position, a 2% weighting. Underperformers here included insurance and diversified financial stocks.
1 Cash equivalent and short-term investment are not being considered a holding for the top five holdings, but are counted in the number of holdings. The fund composition is subject to change.
2 Percentages based on total investments.
3 These figures represent past performance, which is no guarantee of future results. The investment return and principal value of an investment will fluctuate, so an investor's shares, when redeemed, may be worth more or less than their original cost. The performance in the above graph and table does not reflect the deduction of taxes the shareholder will pay on fund distributions or the redemptions of fund shares. Performance of the Institutional and Investor Class Shares will differ due to differences in fees.
4 The inception date of the Turner Emerging Growth Fund (Investor Class Shares) was February 27, 1998. Index returns are based on Investor Class Shares inception date.
5 Fee waivers are in effect; if they had not been in effect, performance would have been lower.
6 The inception date of the Turner Emerging Growth Fund (Institutional Class Shares) was February 1, 2009.
7 The Russell 2000® Growth Index is a widely-recognized, capitalization-weighted (companies with larger market capitalizations have more influence than those with smaller market capitalizations) index of the 2,000 smallest U.S. companies out of the 3,000 largest U.S. companies with higher growth rates and price-to-book ratios.
8 Cash equivalent includes short-term investment held as collateral for securities lending activity. Please see Note 11 in Notes to Financial Statements for more detailed information.
Amounts designated as "—" are not applicable.
TURNER FUNDS 2011 SEMIANNUAL REPORT 15
INVESTMENT REVIEW
Turner Large Growth Fund
(formerly Turner Core Growth Fund)
Fund profile
March 31, 2011
g Ticker symbol TTMEX
Institutional Class Shares
g CUSIP #900297847
Institutional Class Shares
g Top five holdings1
(1) Apple
(2) Google, Cl A
(3) Oracle
(4) Schlumberger
(5) QUALCOMM
g % in five largest holdings 19.6%2
g Number of holdings 761
g Price/earnings ratio 18.2
g Weighted average market capitalization $58.24 billion
g % of holdings with positive earnings surprises 84.0%
g % of holdings with negative earnings surprises 16.0%
g Net assets $544 million, Institutional Class Shares

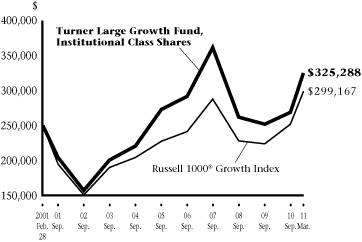
Growth of a $250,000 investment in the
Turner Large Growth Fund, Institutional Class Shares:
February 28, 2001-March 31, 20113,4
Average annual total returns (Periods ended March 31, 2011)
| | | Six months
(not annualized) | | One
year | | Three
years | | Five
years | | 10
years | | Since
inception | |
Turner Large Growth Fund,
Institutional Class Shares5 | | | 20.86 | % | | | 16.77 | % | | | 0.87 | % | | | 1.72 | % | | | 3.67 | % | | | 2.64 | %4 | |
Turner Large Growth Fund,
Investor Class Shares5 | | | 20.78 | % | | | 16.56 | % | | | 0.61 | % | | | 1.48 | % | | | — | | | | 3.45 | %6 | |
| Russell 1000® Growth Index7 | | | 18.57 | % | | | 18.26 | % | | | 5.19 | % | | | 4.34 | % | | | 2.99 | % | | | 1.80 | %4 | |
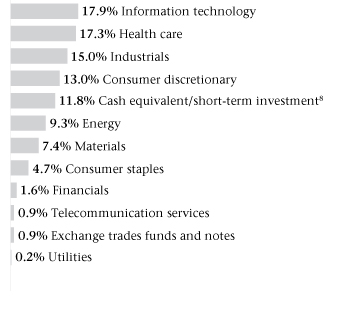
Sector weightings2:
Manager's discussion and analysis
In the six-month period ended March 31, good stock picking fueled the performance of the Turner Large Growth Fund, Institutional Class Shares (TTMEX), formerly the Turner Core Growth Fund. As a result the fund advanced 20.86%, which outpaced the Russell 1000® Growth Index return of 18.57% by 2.29 percentage points.
Six of the fund's nine sector positions beat their corresponding index sectors. Providing the most extra return were information-technology, industrials, and consumer-discretionary shares, which accounted for 62% of holdings. Semiconductor, data-networking, industrial-equipment, automotive, gaming, and e-commerce stocks performed especially well. Financials stocks, a 6% weighting, were the greatest detriment to performance; diversified financial, insurance, and investment-management stocks were notable laggards.
1 Cash equivalent and short-term investment are not being considered a holding for the top five holdings, but are counted in the number of holdings. The fund composition is subject to change.
2 Percentages based on total investments.
3 These figures represent past performance, which is no guarantee of future results. The investment return and principal value of an investment will fluctuate, so an investor's shares, when redeemed, may be worth more or less than their original cost. The performance in the above graph and table does not reflect the deduction of taxes the shareholder will pay on fund distributions or the redemptions of fund shares. On February 25, 2005, the Constellation TIP Core Growth Fund reorganized into the Turner Large Growth Fund, formerly the Turner Core Growth Fund. Performance of the Institutional and Investor Class Shares will differ due to differences in fees.
4 The inception date of the Turner Large Growth Fund (Institutional Class Shares) was February 28, 2001. Index returns are based on Institutional Class Shares inception date.
5 Fee waivers are in effect; if they had not been in effect, performance would have been lower.
6 The inception date of the Turner Large Growth Fund (Investor Class Shares) was August 1, 2005.
7 The Russell 1000® Growth Index measures the performance of those Russell 1000 Companies with higher price-to-book ratios and higher forecasted growth values.
8 Cash equivalent includes short-term investment held as collateral for securities lending activity. Please see Note 11 in Notes to Financial Statements for more detailed information.
Cl — Class
Amounts designated as "—" are not applicable.
16 TURNER FUNDS 2011 SEMIANNUAL REPORT
INVESTMENT REVIEW
Turner Midcap Growth Fund
Fund profile
March 31, 2011
g Ticker symbol TMGFX
Investor Class Shares
g CUSIP #900297409
Investor Class Shares
g Top five holdings1
(1) Salesforce.com
(2) Joy Global
(3) Varian Semiconductor Equipment Associates
(4) Cummins
(5) Green Mountain Coffee Roasters
g % in five largest holdings 9.0%2
g Number of holdings 1001
g Price/earnings ratio 18.7
g Weighted average market capitalization $9.71 billion
g % of holdings with positive earnings surprises 80.8%
g % of holdings with negative earnings surprises 19.2%
g Net assets $955 million, Investor Class Shares

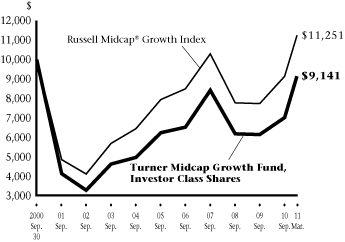
Growth of a $10,000 investment in the
Turner Midcap Growth Fund, Investor Class Shares:
September 30, 2000-March 31, 20113,4
Average annual total returns (Periods ended March 31, 2011)
| | | Six months
(not annualized) | | One
year | | Three
years | | Five
years | | 10
years | | Since
inception | |
Turner Midcap Growth Fund,
Institutional Class Shares5 | | | 30.67 | % | | | 30.54 | % | | | — | | | | — | | | | — | | | | 4.38 | %6 | |
Turner Midcap Growth Fund,
Investor Class Shares5 | | | 30.47 | % | | | 30.21 | % | | | 7.13 | % | | | 4.86 | % | | | 6.09 | % | | | 11.48 | %4 | |
Turner Midcap Growth Fund,
Retirement Class Shares5 | | | 30.30 | % | | | 29.90 | % | | | 6.86 | % | | | 4.56 | % | | | — | | | | 8.44 | %7 | |
| Russell Midcap® Growth Index8 | | | 22.97 | % | | | 26.60 | % | | | 7.63 | % | | | 4.93 | % | | | 6.94 | % | | | 7.68 | %4 | |
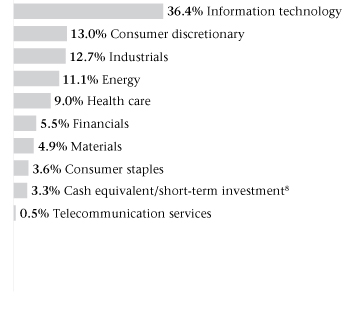
Sector weightings2:
Manager's discussion and analysis
Reflecting the strong performance of smaller stocks, the Turner Midcap Growth Fund, Investor Class Shares (TMGFX) gained 30.47% in the six-month period ended March 31. The fund outperformed the Russell Midcap® Growth Index return of 22.97% by a substantial margin — 7.50 percentage points.
Stock selection was excellent: superior relative returns in nine of 10 sectors added value to the fund's results. Adding the most value were the information-technology, materials, and consumer-staples sectors, a 35% weighting. Semiconductor, data-networking, software, metals, mining, coffee-roasting, and supermarket stocks were notable contributors. A 1% position in utilities stocks, especially in the telecommunications industry, was the sole detractor from performance.
1 Cash equivalent and short-term investment are not being considered a holding for the top five holdings, but are counted in the number of holdings. The fund composition is subject to change.
2 Percentages based on total investments.
3 These figures represent past performance, which is no guarantee of future results. The investment return and principal value of an investment will fluctuate, so an investor's shares, when redeemed, may be worth more or less than their original cost. The performance in the above graph and table does not reflect the deduction of taxes the shareholder will pay on fund distributions or the redemptions of fund shares. Performance of the Institutional, Investor and Retirement Class Shares will differ due to differences in fees.
4 The inception date of the Turner Midcap Growth Fund (Investor Class Shares) was October 1, 1996. Index returns are based on Investor Class Shares inception date.
5 Fee waivers are in effect; if they had not been in effect, performance would have been lower.
6 The inception date of the Turner Midcap Growth Fund (Institutional Class Shares) was June 16, 2008.
7 The inception date of the Turner Midcap Growth Fund (Retirement Class Shares) was September 24, 2001.
8 The Russell Midcap® Growth Index is a capitalization-weighted (companies with larger market capitalizations have more influence than those with smaller market capitalizations) index of the 800 smallest U.S. companies out of the 1,000 largest companies with higher growth rates and price-to-book ratios.
9 Cash equivalent includes short-term investment held as collateral for securities lending activity. Please see Note 11 in Notes to Financial Statements for more detailed information.
Amounts designated as "—" are not applicable.
TURNER FUNDS 2011 SEMIANNUAL REPORT 17
INVESTMENT REVIEW
Turner Small Cap Growth Fund
Fund profile
March 31, 2011
g Ticker symbol TSCEX
g CUSIP #900297300
g Top five holdings1
(1) TIBCO Software
(2) Cooper
(3) Sotheby's
(4) HealthSouth
(5) Genesee & Wyoming, Cl A
g % in five largest holdings 5.5%2
g Number of holdings 1381
g Price/earnings ratio 21.7
g Weighted average market capitalization $2.10 billion
g % of holdings with positive earnings surprises 67.2%
g % of holdings with negative earnings surprises 29.9%
g Net assets $345 million

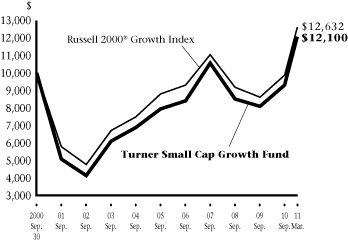
Growth of a $10,000 investment in the
Turner Small Cap Growth Fund:
September 30, 2000-March 31, 20113
Average annual total returns (Periods ended March 31, 2011)
| | | Six months
(not annualized) | | One
year | | Three
years | | Five
years | | 10
years | | Since
inception | |
| Turner Small Cap Growth Fund4 | | | 30.24 | % | | | 32.29 | % | | | 10.35 | % | | | 4.90 | % | | | 7.62 | % | | | 12.16 | % | |
| Russell 2000® Growth Index5 | | | 27.93 | % | | | 31.04 | % | | | 10.16 | % | | | 4.34 | % | | | 6.44 | % | | | 6.29 | % | |
Sector weightings2:
Manager's discussion and analysis
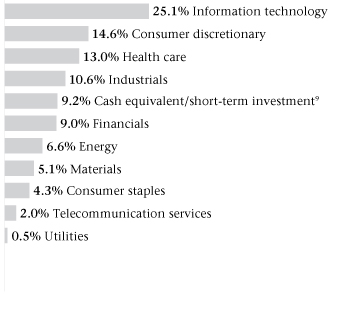
Good stock selection, especially in the larger market sectors, and strong performance by small-cap stocks propelled the Turner Small Cap Growth Fund (TSCEX) to a 30.24% return in the six-month period ended March 31. The fund's results represented a margin of outperformance of 2.31 percentage points over the index, the Russell 2000® Growth Index, which gained 27.93%.
Seven of the fund's nine sector positions beat their index-sector counterparts. The fund's consumer-discretionary, information-technology, and health-care stocks, a 53% weighting, performed best in relative terms. Winners included cosmetics, mattress, electrical-supply, restaurant, photographic-services, digital-networking, wireless-communications, semiconductor, software, information-systems, health-benefits, vision-care, and drug-services stocks. A 5% position in financials stocks, particularly investment-bank, investment-management, and securities-trading services shares, were a drag on performance.
1 Cash equivalent and short-term investment are not being considered a holding for the top five holdings, but are counted in the number of holdings. The fund composition is subject to change.
2 Percentages based on total investments.
3 These figures represent past performance, which is no guarantee of future results. The investment return and principal value of an investment will fluctuate, so an investor's shares, when redeemed, may be worth more or less than their original cost. The performance in the above graph and table does not reflect the deduction of taxes the shareholder will pay on fund distributions or the redemptions of fund shares. The inception date of the Turner Small Cap Growth Fund was February 7, 1994.
4 Fee waivers are in effect; if they had not been in effect, performance would have been lower.
5 The Russell 2000® Growth Index is a widely-recognized, capitalization-weighted (companies with larger market capitalizations have more influence than those with smaller market capitalizations) index of the 2,000 smallest U.S. companies out of the 3,000 largest U.S. companies with higher growth rates and price-to-book ratios.
6 Cash equivalent includes short-term investment held as collateral for securities lending activity. Please see Note 11 in Notes to Financial Statements for more detailed information.
Cl — Class
18 TURNER FUNDS 2011 SEMIANNUAL REPORT
INVESTMENT REVIEW
Turner Quantitative Broad Market Equity Fund
Fund profile
March 31, 2011
g Ticker symbol TBMEX
Institutional Class Shares
g CUSIP #900297730
Institutional Class Shares
g Top five holdings1
(1) Apple
(2) General Electric
(3) International Business Machines
(4) Williams
(5) Caterpillar
g % in five largest holdings 9.5%2
g Number of holdings 1091
g Price/earnings ratio 14.7
g Weighted average market capitalization $69.75 billion
g % of holdings with positive earnings surprises 82.4%
g % of holdings with negative earnings surprises 16.7%
g Net assets $12 million, Institutional Class Shares

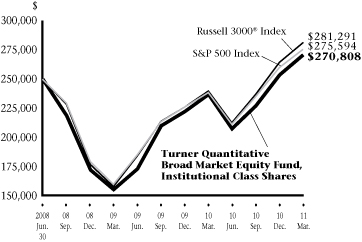
Growth of a $250,000 investment in the
Turner Quantitative Broad Market Equity Fund,
Institutional Class Shares:
June 30, 2008-March 31, 20113
Average annual total returns (Periods ended March 31, 2011)
| | | Six months
(not annualized) | | One
year | | Since
inception | |
| Turner Quantitative Broad Market Equity Fund, Institutional Class Shares4 | | | 19.29 | % | | | 14.41 | % | | | 2.95 | % | |
| Turner Quantitative Broad Market Equity Fund, Investor Class Shares4 | | | 19.24 | % | | | 14.10 | % | | | 2.72 | % | |
| Russell 3000® Index5 | | | 18.71 | % | | | 17.41 | % | | | 4.38 | % | |
| S&P 500 Index6 | | | 17.31 | % | | | 15.65 | % | | | 3.61 | % | |
Sector weightings2:
Manager's discussion and analysis
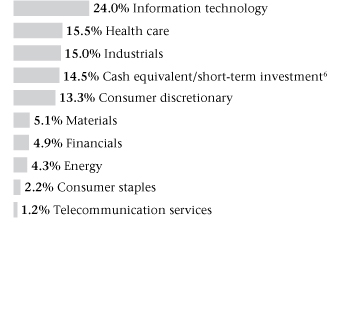
In the six-month period ended March 31, the Turner Quantitative Broad Market Equity Fund, Institutional Class Shares (TBMEX) rose 19.29%. That return was good enough to outdistance the Russell 3000® Index and the S&P 500 Index by 0.58 and 1.98 percentage points, respectively.
The fund's proprietary quantitative model selected stocks that did well in relative terms in seven of the 10 market sectors. Utilities and industrials stocks, a 14% weighting, enhanced performance to the greatest degree. Winners here included telecommunications, electric-utility, industrial-equipment, and heavy-equipment shares. Hurting results the most were energy and consumer-staples stocks, which represented 18% of the portfolio; energy-exploration, energy-services, convenience-store, and food-processing stocks were among the detractors.
1 Cash equivalent is not being considered a holding for the top five holdings, but is counted in the number of holdings. The fund composition is subject to change.
2 Percentages based on total investments.
3 These figures represent past performance, which is no guarantee of future results. The investment return and principal value of an investment will fluctuate, so an investor's shares, when redeemed, may be worth more or less than their original cost. The performance in the above graph and table does not reflect the deduction of taxes the shareholder will pay on fund distributions or the redemptions of fund shares. The inception date of the Turner Quantitative Broad Market Equity Fund was June 30, 2008. Performance of the Institutional and Investor Class Shares will differ due to the difference in fees.
4 Fee waivers are in effect; if they had not been in effect, performance would have been lower.
5 The Russell 3000® Index is a widely-recognized, market value-weighted (higher market value stocks have more influence than lower market value stocks) index of 3000 stocks that reflect the overall equity market's performance.
6 The S&P 500 Index is a widely-recognized, market value-weighted (higher market value stocks have more influence than lower market value stocks) index of 500 stocks designed to mimic the overall equity market's industry weightings.
TURNER FUNDS 2011 SEMIANNUAL REPORT 19
INVESTMENT REVIEW
Turner Quantitative Large Cap Value Fund
Fund profile
March 31, 2011
g Ticker symbol TLVFX
Institutional Class Shares
g CUSIP #900297821
Institutional Class Shares
g Top five holdings1
(1) AT&T
(2) JPMorgan Chase
(3) Berkshire Hathaway, Cl B
(4) Verizon Communications
(5) Chevron
g % in five largest holdings 13.8%2
g Number of holdings 851
g Price/earnings ratio 13.1
g Weighted average market capitalization $62.47 billion
g % of holdings with positive earnings surprises 72.6%
g % of holdings with negative earnings surprises 23.8%
g Net assets $0.8 million, Institutional Class Shares
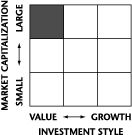
Growth of a $25,000 investment in the
Turner Quantitative Large Cap Value Fund,
Institutional Class Shares:
October 10, 2005-March 31, 20113,4
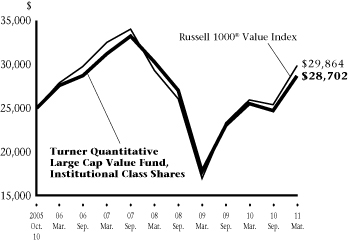
Average annual total returns (Periods ended March 31, 2011)
| | | Six months
(not annualized) | | One
year | | Three
years | | Five
years | | Since
inception | |
Turner Quantitative Large Cap Value Fund,
Institutional Class Shares5 | | | 16.21 | % | | | 12.49 | % | | | -1.80 | % | | | 0.79 | % | | | 2.56 | %4 | |
Turner Quantitative Large Cap Value Fund,
Investor Class Shares5 | | | 15.99 | % | | | 12.13 | % | | | — | | | | — | | | | 10.14 | %6 | |
| Russell 1000® Value Index6 | | | 17.68 | % | | | 15.15 | % | | | 0.60 | % | | | 1.38 | % | | | 3.30 | %4 | |
Sector weightings2:
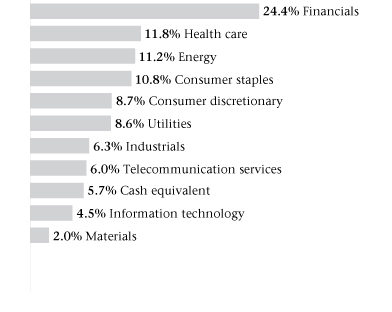
Manager's discussion and analysis
In the six-month period ended March 31, the Turner Quantitative Large Cap Value Fund, Institutional Class Shares (TLVFX) climbed 16.21%. That return trailed the Russell 1000® Value Index's 17.68% gain by 1.47 percentage points.
The fund's proprietary quantitative model selected stocks that did relatively well in three of the 10 market sectors: health care, consumer staples, and industrials, a 29% weighting. The best performers in those sectors included medical-equipment, health-services, beverage, and industrial-equipment shares. Utilities, energy, and consumer-discretionary holdings, representing 29% of the portfolio, impaired results the most; electric-utility, telecommunications, petroleum, natural-gas, energy-services, e-commerce, apparel, and automotive stocks were among the detractors.
1 Cash equivalent is not being considered a holding for the top five holdings, but is counted in the number of holdings. The fund composition is subject to change.
2 Percentages based on total investments.
3 These figures represent past performance, which is no guarantee of future results. The investment return and principal value of an investment will fluctuate, so an investor's shares, when redeemed, may be worth more or less than their original cost. The performance in the above graph and table does not reflect the deduction of taxes the shareholder will pay on fund distributions or the redemptions of fund shares. Performance of the Institutional and Investor Class Shares will differ due to the difference in fees.
4 The inception date of the Turner Quantitative Large Cap Value Fund (Institutional Class Shares) was October 10, 2005. Index returns are based on Institutional Class Shares inception date.
5 Fee waivers are in effect; if they had not been in effect, performance would have been lower.
6 The inception date of the Turner Quantitative Large Cap Value Fund (Investor Class Shares) was October 31, 2008.
6 The Russell 1000® Value Index measures the performance of those Russell 1000® companies with lower price-to-book ratios and lower forecasted growth values.
Cl — Class
Amounts designated as "—" are not applicable.
20 TURNER FUNDS 2011 SEMIANNUAL REPORT
INVESTMENT REVIEW
Turner Global Opportunities Fund
Fund profile
March 31, 2011
g Ticker symbol TGLBX
Institutional Class Shares
g CUSIP #900297623
Institutional Class Shares
g Top five holdings1
(1) Apple
(2) Valeant Pharmaceuticals International
(3) Las Vegas Sands
(4) ASML Holding, NY Shares
(5) Walter Energy
g % in five largest holdings 23.7%2
g Number of holdings 301
g Price/earnings ratio 20.0
g Weighted average market capitalization $47.58 billion
g % of holdings with positive earnings surprises 69.0%
g % of holdings with negative earnings surprises 13.8%
g Net assets $1 million, Institutional Class Shares

Growth of a $250,000 investment in the
Turner Global Opportunities Fund,
Institutional Class Shares:
May 7, 2010-March 31, 20113
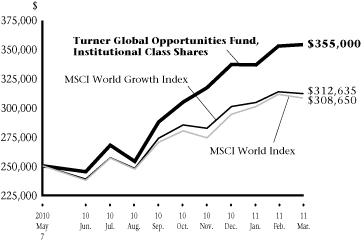
Cumulative total returns (Periods ended March 31, 2011)
| | | Six months
(not annualized) | | Since
inception4 | |
| Turner Global Opportunities Fund, Institutional Class Shares5 | | | 23.26 | % | | | 42.00 | % | |
| Turner Global Opportunities Fund, Investor Class Shares5 | | | 23.13 | % | | | 41.60 | % | |
| MSCI World Growth Index6 | | | 14.33 | % | | | 28.66 | % | |
| MSCI World Index7 | | | 14.42 | % | | | 27.03 | % | |
Sector weightings2:
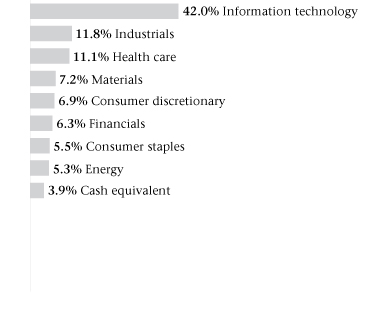
Manager's discussion and analysis
Exceptionally strong performance in two sectors was enough to provide the Turner Global Opportunities Fund, Institutional Class Shares (TGLBX) with the push to outpace its benchmark in the six-month period ended March 31. The fund gained 23.26%, a return that beat the 14.33% and 14.42% returns of its benchmarks, the MSCI World Growth Index and the MSCI World Index by 8.93 and 8.84 percentage points, respectively.
The big sector outperformers, health care and industrials, accounted for 23% of the fund's holdings. Among the winners in those two sectors were pharmaceutical, biotechnology, medical-device, metals, and mining stocks. The primary detractors from results were the fund's information-technology and financials positions, a 48% weighting. Underperformers here included software, semiconductor, insurance, and securities-exchange stocks.
1 Cash equivalent is not being considered a holding for the top five holdings, but is counted in the number of holdings. The fund composition is subject to change.
2 Percentages based on total investments.
3 These figures represent past performance, which is no guarantee of future results. The investment return and principal value of an investment will fluctuate, so an investor's shares, when redeemed, may be worth more or less than their original cost. The performance in the above graph and table does not reflect the deduction of taxes the shareholder will pay on fund distributions or the redemptions of fund shares. The inception date of the Turner Global Opportunities Fund was May 7, 2010. Performance of the Institutional and Investor Class Shares will differ due to differences in fees.
4 Cumulative returns, not annualized.
5 Fee waivers are in effect; if they had not been in effect, performance would have been lower.
6 The MSCI World Growth Index measures the performance of growth stocks in developed countries throughout the world. The index includes reinvestment of dividends, net of foreign withholding taxes.
7 The MSCI World Index is a free float-adjusted market capitalization weighted index that is designed to measure the equity market performance of developed markets. The MSCI World Index consists of the following 24 developed market country indices: Australia, Austria, Belgium, Canada, Denmark, Finland, France, Germany, Greece, Hong Kong, Ireland, Israel, Italy, Japan, Netherlands, New Zealand, Norway, Portugal, Singapore, Spain, Sweden, Switzerland, the United Kingdom, and the United States.
NY — New York
TURNER FUNDS 2011 SEMIANNUAL REPORT 21
INVESTMENT REVIEW
Turner International Growth Fund
(formerly Turner International Core Growth Fund)
Fund profile
March 31, 2011
g Ticker symbol TICGX
Institutional Class Shares
g CUSIP #900297771
Institutional Class Shares
g Top five holdings1
(1) BHP Billiton
(2) Nestle
(3) Rio Tinto
(4) HSBC Holdings
(5) BG Group
g % in five largest holdings 12.3%2
g Number of holdings 741
g Price/earnings ratio 15.2
g Weighted average market capitalization $48.47 billion
g % of holdings with positive earnings surprises 39.7%
g % of holdings with negative earnings surprises 19.2%
g Net assets $6 million, Institutional Class Shares

Growth of a $250,000 investment in the
Turner International Growth Fund,
Institutional Class Shares:
January 31, 2007-March 31, 20113,4
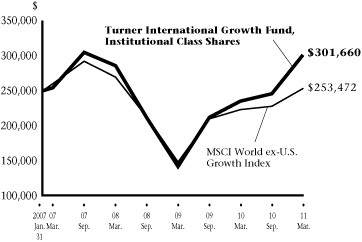
Average annual total returns (Periods ended March 31, 2011)
| | | Six months
(not annualized) | | One
year | | Three
years | | Since
inception | |
| Turner International Growth Fund, Institutional Class Shares5 | | | 22.79 | % | | | 28.24 | % | | | 1.76 | % | | | 4.61 | %4 | |
| Turner International Growth Fund, Investor Class Shares5 | | | 22.67 | % | | | 27.99 | % | | | — | | | | 30.46 | %6 | |
| MSCI World ex-U.S. Growth Index7 | | | 11.40 | % | | | 14.16 | % | | | -1.70 | % | | | 0.70 | %4 | |
Sector weightings2:
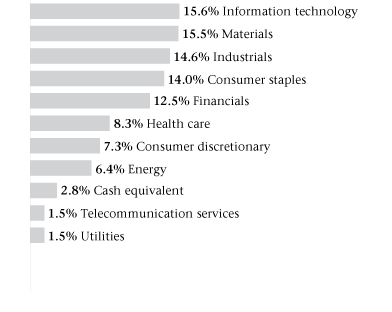
Manager's discussion and analysis
Substantially outdoing the rising international stock market in the six months ended March 31, the Turner International Growth Fund, Institutional Class Shares (TICGX), formerly the Turner International Core Growth Fund, gained 22.79%. The fund outperformed the return for its benchmark, the MSCI World ex-U.S. Growth Index, by 11.39 percentage points.
The key to the fund's outperformance was good stock selection; seven of its 10 sector positions beat their corresponding index sectors. Adding the most value were holdings in the financials, industrials, and consumer-discretionary sectors, which accounted for a 34% weighting. Insurance, investment-management, industrial-equipment, Internet, hotel, and e-commerce stocks performed best. Conversely, energy shares, which constituted 6% of the portfolio, impaired performance the most. Energy-production and energy-services stocks in particular produced subpar returns.
1 Cash equivalent is not being considered a holding for the top five holdings, but is counted in the number of holdings. The fund composition is subject to change.
2 Percentages based on total investments.
3 These figures represent past performance, which is no guarantee of future results. The investment return and principal value of an investment will fluctuate, so an investor's shares, when redeemed, may be worth more or less than their original cost. The performance in the above graph and table does not reflect the deduction of taxes the shareholder will pay on fund distributions or the redemptions of fund shares. Performance of the Institutional and Investor Class Shares will differ due to the difference in fees.
4 The inception date of the Turner International Growth Fund (Institutional Class Shares) was January 31, 2007. Index returns are based on Institutional Class Shares inception date.
5 Fee waivers are in effect; if they had not been in effect, performance would have been lower.
6 The inception date of the Turner International Growth Fund (Investor Class Shares) was October 31, 2008.
7 The MSCI World Growth ex-U.S. Growth Index is a market capitalization weighted index (companies with larger market capitalizations have more influence than those with smaller market capitalizations) designed to measure the combined equity market performance of developed and emerging markets countries, excluding the United States.
Amounts designated as "—" are not applicable.
22 TURNER FUNDS 2011 SEMIANNUAL REPORT
INVESTMENT REVIEW
Turner Small Cap Equity Fund
Fund profile
March 31, 2011
g Ticker symbol TSEIX
Investor Class Shares
g CUSIP #87252R714
Investor Class Shares
g Top five holdings1
(1) Titan International
(2) OmniVision Technologies
(3) HealthSouth
(4) TPC Group
(5) SVB Financial Group
g % in five largest holdings 9.9%2
g Number of holdings 881
g Price/earnings ratio 16.8
g Weighted average market capitalization $1.73 billion
g % of holdings with positive earnings surprises 70.1%
g % of holdings with negative earnings surprises 21.8%
g Net assets $6 million, Investor Class Shares
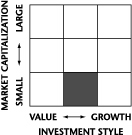
Growth of a $10,000 investment in the
Turner Small Cap Equity Fund,
Investor Class Shares:
March 4, 2002-March 31, 20113,4
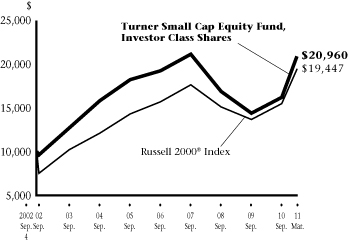
Average annual total returns (Periods ended March 31, 2011)
| | | Six months
(not annualized) | | One
year | | Three
years | | Five
years | | Since
inception | |
Turner Small Cap Equity Fund,
Institutional Class Shares5 | | | 29.26 | % | | | 31.63 | % | | | — | | | | — | | | | 33.02 | %6 | |
Turner Small Cap Equity Fund,
Investor Class Shares5 | | | 29.07 | % | | | 31.21 | % | | | 4.71 | % | | | -0.16 | % | | | 8.09 | %4 | |
| Russell 2000® Index7 | | | 25.48 | % | | | 25.79 | % | | | 8.57 | % | | | 3.35 | % | | | 7.61 | %4 | |
Sector weightings2:
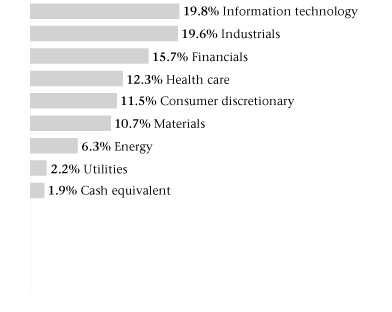
Manager's discussion and analysis
In a robust market for small-cap stocks, the Turner Small Cap Equity Fund, Investor Class Shares (TSEIX) rose 29.07% in the six-month period ended March 31. The fund's return exceeded the Russell 2000® Index's 25.48% gain by 3.59 percentage points.
The fund is invested in both growth and value stocks, and its growth holdings generally outperformed its value holdings. Six of the fund's eight sector positions beat their corresponding index sectors. The greatest degree of outperformance was supplied by information-technology and consumer-discretionary stocks, which represented 31% of the portfolio. Winners included digital-graphics, software, image-sensor, information-systems, laser, retail, and food-processing shares. A 23% position in health-care and materials stocks hurt results the most; specifically, health-care services, diagnostic-test, and metals holdings produced disappointing results.
1 Cash equivalent is not being considered a holding for the top five holdings, but is counted in the number of holdings. The fund composition is subject to change.
2 Percentages based on total investments.
3 These figures represent past performance, which is no guarantee of future results. The investment return and principal value of an investment will fluctuate, so an investor's shares, when redeemed, may be worth more or less than their original cost. The performance in the above graph and table does not reflect the deduction of taxes the shareholder will pay on fund distributions or the redemptions of fund shares. Performance of the Institutional and Investor Class Shares will differ due to the difference in fees.
4 The inception date of the Turner Small Cap Equity Fund (Investor Class Shares) was March 4, 2002. Index returns are based on Investor Class Shares inception date.
5 Fee waivers are in effect; if they had not been in effect, performance would have been lower.
6 The inception date of the Turner Small Cap Equity Fund (Institutional Class Shares) was February 1, 2009.
7 The Russell 2000® Index is a widely-recognized, market value-weighted (higher market value stocks have more influence than lower market value stocks) index of 2000 stocks that reflects the performance of the smallest 2,000 companies in the Russell 3000® Index. The Russell 3000® Index is designed to depict the overall equity market's performance.
Amounts designated as "—" are not applicable.
TURNER FUNDS 2011 SEMIANNUAL REPORT 23
FINANCIAL STATEMENTS
Schedule of investments
Turner Market Neutral Fund
March 31, 2011
| | | Shares | | Value
(000) | |
| Common stock—86.6% | |
| Consumer discretionary—9.4% | |
| CarMax*^ | | | 1,740 | | | $ | 56 | | |
| Home Depot^ | | | 1,700 | | | | 63 | | |
| Interpublic Group of Cos. | | | 5,670 | | | | 71 | | |
| Las Vegas Sands* | | | 1,500 | | | | 63 | | |
| Stanley Black & Decker | | | 900 | | | | 69 | | |
| Total Consumer discretionary | | | | | 322 | | |
| Energy—9.8% | |
| Ensco SP ADR | | | 2,340 | | | | 136 | | |
| James River Coal*^ | | | 2,740 | | | | 66 | | |
| Northern Oil & Gas* | | | 2,590 | | | | 69 | | |
| Swift Energy*^ | | | 1,520 | | | | 65 | | |
| Total Energy | | | | | 336 | | |
| Financials—13.9% | |
| ACE^ | | | 2,160 | | | | 140 | | |
| Arch Capital Group*^ | | | 1,420 | | | | 141 | | |
| Charles Schwab | | | 7,170 | | | | 129 | | |
| Fifth Third Bancorp | | | 4,730 | | | | 66 | | |
| Total Financials | | | | | 476 | | |
| Health care—15.4% | |
| Cubist Pharmaceuticals* | | | 2,750 | | | | 70 | | |
| HCA Holdings* | | | 1,900 | | | | 64 | | |
| Medtronic^ | | | 3,180 | | | | 125 | | |
| Perrigo | | | 920 | | | | 73 | | |
| United Therapeutics*^ | | | 920 | | | | 62 | | |
| Universal Health Services, Cl B^ | | | 1,340 | | | | 66 | | |
| Zimmer Holdings* | | | 1,090 | | | | 66 | | |
| Total Health care | | | | | 526 | | |
| Industrials—10.0% | |
| Caterpillar^ | | | 1,210 | | | | 135 | | |
| Donaldson^ | | | 1,160 | | | | 71 | | |
| Equifax^ | | | 1,710 | | | | 67 | | |
| Flowserve | | | 530 | | | | 68 | | |
| Total Industrials | | | | | 341 | | |
| Information technology—15.8% | |
| Akamai Technologies* | | | 1,760 | | | | 67 | | |
| Google, Cl A*^ | | | 225 | | | | 132 | | |
| Rubicon Technology* | | | 2,540 | | | | 70 | | |
| Salesforce.com* | | | 1,010 | | | | 135 | | |
| | | Shares | | Value
(000) | |
| Synchronoss Technologies* | | | 2,060 | | | $ | 71 | | |
| Tekelec* | | | 7,730 | | | | 63 | | |
| Total Information technology | | | | | 538 | | |
| Materials—12.3% | |
| Air Products & Chemicals^ | | | 760 | | | | 68 | | |
| CF Industries Holdings | | | 520 | | | | 71 | | |
| International Flavors & Fragrances | | | 1,120 | | | | 70 | | |
| Martin Marietta Materials | | | 1,590 | | | | 142 | | |
| Nalco Holding | | | 2,530 | | | | 69 | | |
| Total Materials | | | | | 420 | | |
Total Common stock
(Cost $2,849) | | | | | 2,959 | | |
| Cash equivalent—0.1% | |
BlackRock TempCash Fund,
Institutional Shares,
0.000%**^ | | | 4,020 | | | | 4 | | |
Total Cash equivalent
(Cost $4) | | | | | 4 | | |
Total Investments—86.7%
(Cost $2,853) | | | | $ | 2,963 | | |
As of March 31, 2011, all of the Fund's investments were considered Level 1. Please see Note 2 in Notes to Financial Statements for further information regarding fair value measurements.
Percentages are based on Net Assets of $3,417.***
* Non-income producing security.
** Rate shown is the 7-day effective yield as of March 31, 2011.
*** This number is listed in thousands.
^ All or a portion of the shares have been committed as collateral for open short positions.
ADR — American Depositary Receipt
Cl — Class
The accompanying notes are an integral part of the financial statements.
24 TURNER FUNDS 2011 SEMIANNUAL REPORT
(Unaudited)
Schedule of securities sold short
Turner Market Neutral Fund
March 31, 2011
| | | Shares | | Value
(000) | |
| Common stock—83.6% | |
| Consumer discretionary—11.3% | |
| Advance Auto Parts | | | 890 | | | $ | 58 | | |
| Chipotle Mexican Grill* | | | 500 | | | | 136 | | |
| Lamar Advertising, Cl A* | | | 1,870 | | | | 69 | | |
| Lowe's | | | 2,350 | | | | 62 | | |
| VF | | | 620 | | | | 61 | | |
| Total Consumer discretionary | | | | | 386 | | |
| Consumer staples—2.0% | |
| Kimberly-Clark | | | 1,040 | | | | 68 | | |
| Total Consumer staples | | | | | 68 | | |
| Energy—10.2% | |
| Arch Coal | | | 1,910 | | | | 69 | | |
| Berry Petroleum, Cl A | | | 1,440 | | | | 73 | | |
| Continental Resources* | | | 980 | | | | 70 | | |
| Noble | | | 2,970 | | | | 135 | | |
| Total Energy | | | | | 347 | | |
| Financials—13.4% | |
| Bank of America | | | 4,600 | | | | 61 | | |
| Chubb | | | 2,230 | | | | 137 | | |
| Northern Trust | | | 1,270 | | | | 64 | | |
| Travelers | | | 2,230 | | | | 133 | | |
| Wells Fargo | | | 2,030 | | | | 64 | | |
| Total Financials | | | | | 459 | | |
| Health care—11.1% | |
| AstraZeneca ADR | | | 2,580 | | | | 119 | | |
| Becton Dickinson | | | 840 | | | | 67 | | |
| QIAGEN* | | | 3,130 | | | | 63 | | |
| STERIS | | | 3,730 | | | | 129 | | |
| Total Health care | | | | | 378 | | |
| Industrials—11.8% | |
| ABB SP ADR | | | 5,820 | | | | 141 | | |
| C.R. Bard | | | 700 | | | | 70 | | |
| General Electric | | | 3,260 | | | | 65 | | |
| Masco | | | 4,750 | | | | 66 | | |
| W.W. Grainger | | | 450 | | | | 62 | | |
| Total Industrials | | | | | 404 | | |
| | | Shares | | Value
(000) | |
| Information technology—11.6% | |
| Fiserv* | | | 970 | | | $ | 61 | | |
| Intuit* | | | 1,290 | | | | 68 | | |
| NetApp* | | | 1,350 | | | | 65 | | |
Telefonaktiebolaget LM
Ericsson SP ADR | | | 5,410 | | | | 70 | | |
| VMware, Cl A* | | | 810 | | | | 66 | | |
| Xilinx | | | 2,080 | | | | 68 | | |
| Total Information technology | | | | | 398 | | |
| Materials—10.2% | |
| Mosaic | | | 850 | | | | 67 | | |
| Praxair | | | 680 | | | | 69 | | |
| Sigma-Aldrich | | | 1,070 | | | | 68 | | |
| Vulcan Materials | | | 3,130 | | | | 144 | | |
| Total Materials | | | | | 348 | | |
| Telecommunication services—2.0% | |
| SBA Communications, Cl A* | | | 1,770 | | | | 70 | | |
| Total Telecommunication services | | | | | 70 | | |
Total Common stock
(Proceeds $2,805) | | | | | 2,858 | | |
Total Securities sold short—83.6%
(Proceeds $2,805) | | | | $ | 2,858 | | |
As of March 31, 2011, all of the Fund's investments in securities sold short were considered Level 1. Please see Note 2 in Notes to Financial Statements for further information regarding fair value measurements.
Percentages are based on Net Assets of $3,417.**
* Non-income producing security.
** This number is listed in thousands.
ADR — American Depositary Receipt
Cl — Class
The accompanying notes are an integral part of the financial statements.
TURNER FUNDS 2011 SEMIANNUAL REPORT 25
FINANCIAL STATEMENTS
Schedule of investments
Turner Medical Sciences Long/Short Fund
March 31, 2011
| | | Shares | | Value
(000) | |
| Common stock—37.5% | |
| Biotechnology—8.4% | |
| Achillion Pharmaceuticals* | | | 2,480 | | | $ | 18 | | |
| Amarin ADR* | | | 4,590 | | | | 34 | | |
| Cubist Pharmaceuticals* | | | 2,900 | | | | 73 | | |
| Medivation* | | | 2,220 | | | | 41 | | |
| Momenta Pharmaceuticals* | | | 1,580 | | | | 25 | | |
| Onyx Pharmaceuticals* | | | 660 | | | | 23 | | |
| QLT* | | | 10,060 | | | | 70 | | |
| Regeneron Pharmaceuticals* | | | 870 | | | | 39 | | |
| Savient Pharmaceuticals* | | | 3,770 | | | | 40 | | |
| Targacept* | | | 1,580 | | | | 42 | | |
| United Therapeutics* | | | 510 | | | | 34 | | |
| Total Biotechnology | | | | | 439 | | |
| Health care equipment & supplies—3.6% | |
| Arthrocare* | | | 1,340 | | | | 45 | | |
| Medtronic | | | 1,540 | | | | 60 | | |
| Smith & Nephew | | | 7,150 | | | | 81 | | |
| Total Health care equipment & supplies | | | | | 186 | | |
| Health care providers & services—8.0% | |
| AMERIGROUP* | | | 940 | | | | 60 | | |
| AmerisourceBergen, Cl A | | | 1,830 | | | | 72 | | |
| Chemed | | | 690 | | | | 46 | | |
| HealthSouth* | | | 1,280 | | | | 32 | | |
| Healthspring* | | | 870 | | | | 33 | | |
| MEDNAX* | | | 490 | | | | 33 | | |
| Tenet Healthcare* | | | 9,630 | | | | 72 | | |
| UnitedHealth Group | | | 1,470 | | | | 66 | | |
| Total Health care providers & services | | | | | 414 | | |
| Life sciences tools & services—0.5% | |
| PerkinElmer | | | 940 | | | | 25 | | |
| Total Life sciences tools & services | | | | | 25 | | |
| Pharmaceuticals—17.0% | |
| Allergan | | | 1,920 | | | | 136 | | |
| Bayer | | | 626 | | | | 49 | | |
| HCA Holdings* | | | 2,600 | | | | 88 | | |
| Jazz Pharmaceuticals* | | | 3,080 | | | | 98 | | |
| Perrigo | | | 570 | | | | 45 | | |
| Pfizer | | | 4,600 | | | | 94 | | |
| Questcor Pharmaceuticals* | | | 2,300 | | | | 33 | | |
| Shire ADR | | | 810 | | | | 71 | | |
| | | Shares | | Value
(000) | |
Valeant Pharmaceuticals
International | | | 1,612 | | | $ | 80 | | |
| Watson Pharmaceuticals* | | | 2,410 | | | | 135 | | |
| Zimmer Holdings* | | | 890 | | | | 54 | | |
| Total Pharmaceuticals | | | | | 883 | | |
Total Common stock
(Cost $1,863) | | | | | 1,947 | | |
| Cash equivalent—52.5% | |
BlackRock TempCash Fund,
Institutional Shares,
0.000%**^ | | | 2,722,885 | | | | 2,723 | | |
Total Cash equivalent
(Cost $2,723) | | | | | 2,723 | | |
Total Investments—90.0%
(Cost $4,586) | | | | $ | 4,670 | | |
As of March 31, 2011, all of the Fund's investments were considered Level 1. Please see Note 2 in Notes to Financial Statements for further information regarding fair value measurements.
Percentages are based on Net Assets of $5,190.***
* Non-income producing security.
** Rate shown is the 7-day effective yield as of March 31, 2011.
*** This number is listed in thousands.
^ All or a portion of the shares have been committed as collateral for open short positions.
ADR — American Depositary Receipt
Cl — Class
The accompanying notes are an integral part of the financial statements.
26 TURNER FUNDS 2011 SEMIANNUAL REPORT
(Unaudited)
Schedule of securities sold short
Turner Medical Sciences Long/Short Fund
March 31, 2011
| | | Shares | | Value
(000) | |
| Common stock—22.7% | |
| Biotechnology—8.8% | |
| BioTime* | | | 3,110 | | | $ | 23 | | |
| Curis* | | | 7,950 | | | | 26 | | |
| Cytori Therapeutics* | | | 3,130 | | | | 25 | | |
| Human Genome Sciences* | | | 2,310 | | | | 63 | | |
| ImmunoGen* | | | 6,760 | | | | 61 | | |
| Life Technologies* | | | 1,140 | | | | 59 | | |
| Mesoblast* | | | 5,100 | | | | 38 | | |
| Oncolytics Biotech* | | | 5,120 | | | | 30 | | |
| QIAGEN* | | | 1,430 | | | | 29 | | |
| Sangamo BioSciences* | | | 9,340 | | | | 78 | | |
| Sequenom* | | | 2,200 | | | | 14 | | |
| Synta Pharmaceuticals* | | | 2,440 | | | | 13 | | |
| Total Biotechnology | | | | | 460 | | |
| Commercial services & supplies—1.3% | |
| Stericycle* | | | 770 | | | | 68 | | |
| Total Commercial services & supplies | | | | | 68 | | |
| Health care equipment & supplies—7.0% | |
| Boston Scientific* | | | 4,960 | | | | 36 | | |
| C.R. Bard | | | 1,350 | | | | 134 | | |
| IDEXX Laboratories* | | | 1,030 | | | | 80 | | |
| Patterson | | | 2,180 | | | | 70 | | |
| Thoratec* | | | 1,700 | | | | 44 | | |
| Total Health care equipment & supplies | | | | | 364 | | |
| Life sciences tools & services—1.1% | |
Pharmaceutical Product
Development | | | 1,240 | | | | 34 | | |
| Techne | | | 350 | | | | 25 | | |
| Total Life sciences tools & services | | | | | 59 | | |
| | | Shares | | Value
(000) | |
| Pharmaceuticals—4.4% | |
| AstraZeneca ADR | | | 1,370 | | | $ | 62 | | |
| Auxilium Pharmaceuticals* | | | 640 | | | | 14 | | |
| Genomma Lab Internacional, Cl B* | | | 24,980 | | | | 57 | | |
| Opko Health* | | | 6,060 | | | | 23 | | |
| Salix Pharmaceuticals* | | | 910 | | | | 32 | | |
| ViroPharma* | | | 1,200 | | | | 24 | | |
| VIVUS* | | | 2,920 | | | | 18 | | |
| Total Pharmaceuticals | | | | | 231 | | |
Total Common stock
(Proceeds $1,171) | | | | | 1,180 | | |
Total Securities sold short—22.7%
(Proceeds $1,171) | | | | $ | 1,180 | | |
As of March 31, 2011, all of the Fund's investments in securities sold short were considered Level 1. Please see Note 2 in Notes to Financial Statements for further information regarding fair value measurements.
Percentages are based on Net Assets of $5,190.**
* Non-income producing security.
** This number is listed in thousands.
ADR — American Depositary Receipt
Cl — Class
The accompanying notes are an integral part of the financial statements.
TURNER FUNDS 2011 SEMIANNUAL REPORT 27
FINANCIAL STATEMENTS
Schedule of investments
Turner Spectrum Fund
March 31, 2011
| | | Shares | | Value
(000) | |
| Common stock—66.4% | |
| Consumer discretionary—9.1% | |
| Abercrombie & Fitch, Cl A | | | 15,690 | | | $ | 921 | | |
| Bwin.Party Digital Entertainment* | | | 198,130 | | | | 636 | | |
| CarMax* | | | 25,220 | | | | 810 | | |
| Chico's FAS | | | 27,590 | | | | 411 | | |
| Children's Place Retail Stores* | | | 24,640 | | | | 1,228 | | |
| CROCS* | | | 77,250 | | | | 1,378 | | |
| CyberAgent | | | 230 | | | | 810 | | |
| Daimler* | | | 6,462 | | | | 458 | | |
| Deckers Outdoor* | | | 3,290 | | | | 284 | | |
| Exceed* | | | 79,240 | | | | 589 | | |
| Ford Motor* | | | 32,980 | | | | 492 | | |
| Fossil* | | | 11,300 | | | | 1,058 | | |
| Home Depot | | | 45,360 | | | | 1,681 | | |
| Interpublic Group of Cos. | | | 224,530 | | | | 2,822 | | |
| Kohl's | | | 17,150 | | | | 910 | | |
| Las Vegas Sands* | | | 81,370 | | | | 3,436 | | |
| McDonald's | | | 9,770 | | | | 743 | | |
| Modine Manufacturing* | | | 16,560 | | | | 267 | | |
| Morgans Hotel Group* | | | 25,610 | | | | 251 | | |
| Motorcar Parts of America* | | | 38,800 | | | | 543 | | |
| NagaCorp | | | 1,854,260 | | | | 381 | | |
| Nordstrom | | | 15,450 | | | | 693 | | |
| O'Charley's* | | | 90,090 | | | | 538 | | |
| OfficeMax* | | | 114,080 | | | | 1,476 | | |
| Penn National Gaming* | | | 18,720 | | | | 694 | | |
| RadioShack | | | 32,330 | | | | 485 | | |
| Rakuten | | | 410 | | | | 369 | | |
| Red Robin Gourmet Burgers* | | | 26,920 | | | | 724 | | |
| Scientific Games, Cl A* | | | 118,760 | | | | 1,038 | | |
| Signet Jewelers* | | | 23,910 | | | | 1,100 | | |
| Stanley Black & Decker | | | 21,590 | | | | 1,654 | | |
| Starbucks | | | 27,290 | | | | 1,008 | | |
Starwood Hotels &
Resorts Worldwide | | | 22,150 | | | | 1,287 | | |
| Steven Madden* | | | 13,490 | | | | 633 | | |
| Swatch Group | | | 4,115 | | | | 1,820 | | |
| TRW Automotive Holdings* | | | 11,850 | | | | 653 | | |
| Viacom, Cl B | | | 37,570 | | | | 1,748 | | |
| WMS Industries* | | | 36,530 | | | | 1,291 | | |
| Total Consumer discretionary | | | | | 37,320 | | |
| | | Shares | | Value
(000) | |
| Consumer staples—1.2% | |
Companhia Brasileira de
Distribuicao Grupo Pao
de Acucar ADR | | | 7,570 | | | $ | 318 | | |
| Cosan, Cl A | | | 30,640 | | | | 395 | | |
| Green Mountain Coffee Roasters* | | | 7,800 | | | | 504 | | |
| Hershey | | | 12,150 | | | | 660 | | |
| Mead Johnson Nutrition, Cl A | | | 8,810 | | | | 510 | | |
| Medifast* | | | 35,050 | | | | 692 | | |
| SunOpta* | | | 57,600 | | | | 428 | | |
| Walgreen | | | 34,820 | | | | 1,398 | | |
| Total Consumer staples | | | | | 4,905 | | |
| Energy—8.5% | |
| Anadarko Petroleum | | | 13,650 | | | | 1,118 | | |
| Approach Resources* | | | 20,160 | | | | 677 | | |
| Baker Hughes | | | 14,740 | | | | 1,082 | | |
| BG Group | | | 18,000 | | | | 448 | | |
| BreitBurn Energy Partners LP | | | 32,310 | | | | 702 | | |
| Cabot Oil & Gas | | | 9,800 | | | | 519 | | |
| Cameron International* | | | 27,830 | | | | 1,589 | | |
| Cimarex Energy | | | 12,060 | | | | 1,390 | | |
| Complete Production Services* | | | 16,870 | | | | 537 | | |
| Concho Resources* | | | 18,920 | | | | 2,030 | | |
| CVR Energy* | | | 11,600 | | | | 269 | | |
| Dawson Geophysical* | | | 5,450 | | | | 239 | | |
| Devon Energy | | | 5,460 | | | | 501 | | |
| Dril-Quip* | | | 3,240 | | | | 256 | | |
| El Paso | | | 34,630 | | | | 623 | | |
| Energy XXI (Bermuda)* | | | 16,170 | | | | 551 | | |
| Ensco SP ADR | | | 60,100 | | | | 3,476 | | |
| Gulf Island Fabrication | | | 6,140 | | | | 198 | | |
| Helmerich & Payne | | | 3,640 | | | | 250 | | |
| Hyperdynamics* | | | 24,530 | | | | 113 | | |
| International Coal Group* | | | 134,670 | | | | 1,522 | | |
| James River Coal* | | | 98,270 | | | | 2,375 | | |
| Key Energy Services* | | | 28,970 | | | | 451 | | |
| Kinder Morgan* | | | 35,000 | | | | 1,037 | | |
| Marathon Oil | | | 58,940 | | | | 3,142 | | |
| Nabors Industries* | | | 20,920 | | | | 636 | | |
| Northern Oil & Gas* | | | 125,520 | | | | 3,351 | | |
| Peabody Energy | | | 7,010 | | | | 504 | | |
| Petrohawk Energy* | | | 42,520 | | | | 1,044 | | |
| Petrominerales | | | 15,468 | | | | 586 | | |
| Plains Exploration & Products* | | | 11,230 | | | | 407 | | |
28 TURNER FUNDS 2011 SEMIANNUAL REPORT
(Unaudited)
Schedule of investments
Turner Spectrum Fund
| | | Shares | | Value
(000) | |
| PT Adaro Energy | | | 969,680 | | | $ | 245 | | |
| Schlumberger | | | 5,670 | | | | 529 | | |
| Stone Energy* | | | 12,910 | | | | 431 | | |
| Straits Asia Resources | | | 111,250 | | | | 222 | | |
| Swift Energy* | | | 37,650 | | | | 1,607 | | |
| Tidewater | | | 6,710 | | | | 402 | | |
| Total Energy | | | | | 35,059 | | |
| Financials—10.3% | |
| ACE | | | 47,560 | | | | 3,077 | | |
| Affiliated Managers Group* | | | 7,290 | | | | 797 | | |
| AIA Group* | | | 430,940 | | | | 1,327 | | |
| AON | | | 45,010 | | | | 2,384 | | |
| Arch Capital Group* | | | 20,960 | | | | 2,079 | | |
| Bank of Nova Scotia | | | 8,120 | | | | 499 | | |
| Bank of the Ozarks | | | 7,770 | | | | 340 | | |
Brasil Insurance Participacoes e
Administracao* | | | 775 | | | | 855 | | |
| Capital One Financial | | | 7,320 | | | | 380 | | |
| CB Richard Ellis Group, Cl A* | | | 19,540 | | | | 522 | | |
| Charles Schwab | | | 155,480 | | | | 2,803 | | |
| China Minsheng Banking, Cl H | | | 943,887 | | | | 868 | | |
China Pacific Insurance
Group, Cl H | | | 123,251 | | | | 518 | | |
| CIT Group* | | | 16,500 | | | | 702 | | |
| Citigroup* | | | 796,330 | | | | 3,520 | | |
| Discover Financial Services | | | 95,350 | | | | 2,300 | | |
| DnB NOR ASA | | | 39,754 | | | | 610 | | |
| East West Bancorp | | | 35,040 | | | | 770 | | |
| Fifth Third Bancorp | | | 133,830 | | | | 1,858 | | |
| FPIC Insurance Group* | | | 7,010 | | | | 266 | | |
| Horace Mann Educators | | | 39,760 | | | | 668 | | |
| IntercontinentalExchange* | | | 3,450 | | | | 426 | | |
| Invesco | | | 65,350 | | | | 1,670 | | |
| Jardine Lloyd Thompson Group | | | 53,460 | | | | 593 | | |
| Kilroy Realty | | | 9,070 | | | | 352 | | |
| KKR | | | 41,200 | | | | 676 | | |
| Lazard, Cl A | | | 19,970 | | | | 830 | | |
| M&T Bank | | | 5,620 | | | | 497 | | |
| MarketAxess Holdings | | | 15,240 | | | | 369 | | |
| MF Global Holdings* | | | 163,940 | | | | 1,357 | | |
| Moody's | | | 19,490 | | | | 661 | | |
| NYSE Euronext | | | 69,500 | | | | 2,444 | | |
| Ocwen Financial* | | | 67,220 | | | | 741 | | |
| RenaissanceRe Holdings | | | 31,360 | | | | 2,164 | | |
| | | Shares | | Value
(000) | |
| Standard Chartered | | | 15,393 | | | $ | 399 | | |
| T. Rowe Price Group | | | 7,710 | | | | 512 | | |
| Texas Capital Bancshares* | | | 21,467 | | | | 558 | | |
| Tokio Marine Holdings | | | 6,900 | | | | 185 | | |
| U-Store-It Trust | | | 29,960 | | | | 315 | | |
| Unum Group | | | 13,880 | | | | 364 | | |
| Total Financials | | | | | 42,256 | | |
| Health care—13.6% | |
| Achillion Pharmaceuticals* | | | 77,410 | | | | 553 | | |
| Alexion Pharmaceuticals* | | | 4,390 | | | | 433 | | |
| Allergan | | | 39,300 | | | | 2,791 | | |
| Amarin ADR* | | | 98,984 | | | | 723 | | |
| AMERIGROUP* | | | 10,330 | | | | 664 | | |
| AmerisourceBergen, Cl A | | | 41,130 | | | | 1,627 | | |
| Arthrocare* | | | 30,420 | | | | 1,014 | | |
| Bayer | | | 6,919 | | | | 538 | | |
| Catalyst Health Solutions* | | | 8,450 | | | | 473 | | |
Charles River Laboratories
International* | | | 10,590 | | | | 406 | | |
| Chemed | | | 7,770 | | | | 518 | | |
| Cubist Pharmaceuticals* | | | 145,000 | | | | 3,660 | | |
| DepoMed* | | | 76,440 | | | | 767 | | |
| Express Scripts* | | | 9,360 | | | | 520 | | |
| Gilead Sciences* | | | 13,390 | | | | 568 | | |
| HCA Holdings* | | | 114,010 | | | | 3,861 | | |
| HealthSouth* | | | 39,460 | | | | 986 | | |
| Healthspring* | | | 15,670 | | | | 586 | | |
| Hypermarcas* | | | 56,830 | | | | 749 | | |
| Illumina* | | | 8,800 | | | | 617 | | |
| IPC Hospitalist* | | | 7,200 | | | | 327 | | |
| Jazz Pharmaceuticals* | | | 43,190 | | | | 1,376 | | |
| McKesson | | | 9,470 | | | | 749 | | |
| Medivation* | | | 52,350 | | | | 976 | | |
| MEDNAX* | | | 5,160 | | | | 344 | | |
| Medtronic | | | 63,270 | | | | 2,490 | | |
| Molina Healthcare* | | | 24,490 | | | | 980 | | |
| Momenta Pharmaceuticals* | | | 31,710 | | | | 503 | | |
| Onyx Pharmaceuticals* | | | 7,290 | | | | 256 | | |
| PerkinElmer | | | 9,860 | | | | 259 | | |
| Perrigo | | | 20,020 | | | | 1,592 | | |
| Pfizer | | | 50,910 | | | | 1,034 | | |
| QLT* | | | 235,038 | | | | 1,633 | | |
| Questcor Pharmaceuticals* | | | 25,520 | | | | 368 | | |
| Regeneron Pharmaceuticals* | | | 9,040 | | | | 406 | | |
TURNER FUNDS 2011 SEMIANNUAL REPORT 29
FINANCIAL STATEMENTS
Schedule of investments
Turner Spectrum Fund
| | | Shares | | Value
(000) | |
| Savient Pharmaceuticals* | | | 81,070 | | | $ | 859 | | |
| Shire ADR | | | 22,050 | | | | 1,920 | | |
| Smith & Nephew | | | 185,160 | | | | 2,088 | | |
| Smith & Nephew SP ADR | | | 7,480 | | | | 422 | | |
| Targacept* | | | 36,420 | | | | 968 | | |
| Tenet Healthcare* | | | 260,510 | | | | 1,941 | | |
| United Therapeutics* | | | 19,080 | | | | 1,279 | | |
| UnitedHealth Group | | | 27,260 | | | | 1,232 | | |
| Universal Health Services, Cl B | | | 50,740 | | | | 2,507 | | |
Valeant Pharmaceuticals
International | | | 31,530 | | | | 1,570 | | |
| Vermillion* | | | 17,730 | | | | 82 | | |
| Watson Pharmaceuticals* | | | 49,470 | | | | 2,771 | | |
| Zimmer Holdings* | | | 47,430 | | | | 2,871 | | |
| Total Health care | | | | | 55,857 | | |
| Industrials—5.3% | |
| Caterpillar^ | | | 30,660 | | | | 3,414 | | |
| Chart Industries* | | | 8,080 | | | | 445 | | |
| Commercial Vehicle Group* | | | 7,600 | | | | 136 | | |
| Cummins | | | 4,600 | | | | 504 | | |
| Danaher | | | 14,680 | | | | 762 | | |
| Deere | | | 6,880 | | | | 667 | | |
| Donaldson | | | 16,820 | | | | 1,031 | | |
| Equifax | | | 43,420 | | | | 1,687 | | |
| FedEx | | | 4,230 | | | | 396 | | |
| First Solar* | | | 9,160 | | | | 1,473 | | |
| Flowserve | | | 7,790 | | | | 1,003 | | |
| Greenbrier* | | | 72,706 | | | | 2,063 | | |
| Komatsu SP ADR | | | 18,200 | | | | 619 | | |
| Manpower | | | 8,350 | | | | 525 | | |
| Middleby* | | | 7,623 | | | | 711 | | |
| Owens Corning* | | | 44,820 | | | | 1,613 | | |
| Parker Hannifin | | | 17,090 | | | | 1,618 | | |
| Precision Castparts | | | 3,460 | | | | 509 | | |
| Siemens | | | 4,830 | | | | 662 | | |
| Union Pacific | | | 6,000 | | | | 590 | | |
| United Continental Holdings* | | | 20,780 | | | | 478 | | |
| United Rentals* | | | 18,540 | | | | 617 | | |
| Volvo, B Shares* | | | 10,150 | | | | 178 | | |
| Total Industrials | | | | | 21,701 | | |
| Information technology—11.6% | |
| Acme Packet* | | | 17,120 | | | | 1,215 | | |
| Aeroflex Holding* | | | 30,960 | | | | 564 | | |
| | | Shares | | Value
(000) | |
| Akamai Technologies* | | | 26,580 | | | $ | 1,010 | | |
| Altera | | | 14,310 | | | | 630 | | |
| Anaren* | | | 30,380 | | | | 611 | | |
| Ancestry.com* | | | 14,700 | | | | 521 | | |
| Apple* | | | 5,020 | | | | 1,749 | | |
| Ariba* | | | 24,050 | | | | 821 | | |
| ARM Holdings | | | 39,130 | | | | 361 | | |
| ASML Holding, NY Shares* | | | 34,340 | | | | 1,528 | | |
| Atmel* | | | 37,840 | | | | 516 | | |
| Autodesk* | | | 14,810 | | | | 653 | | |
| Baidu ADR* | | | 3,800 | | | | 524 | | |
Check Point Software
Technologies* | | | 20,510 | | | | 1,047 | | |
| Citrix Systems* | | | 7,310 | | | | 537 | | |
| Comtech Telecommunications | | | 19,930 | | | | 542 | | |
| Cypress Semiconductor* | | | 29,040 | | | | 563 | | |
| Digimarc*^ | | | 46,900 | | | | 1,355 | | |
| EMC* | | | 19,080 | | | | 507 | | |
| Entropic Communications* | | | 27,280 | | | | 230 | | |
| Funtalk China Holdings* | | | 79,070 | | | | 514 | | |
| Google, Cl A* | | | 6,550 | | | | 3,840 | | |
| GSI Group* | | | 116,070 | | | | 1,195 | | |
| HSW International* | | | 86,648 | | | | 275 | | |
| Imagination Technologies Group* | | | 67,050 | | | | 462 | | |
| Informatica* | | | 8,680 | | | | 453 | | |
| InterDigital | | | 16,130 | | | | 770 | | |
| JDS Uniphase* | | | 27,130 | | | | 565 | | |
| Juniper Networks* | | | 30,440 | | | | 1,281 | | |
| Kenexa* | | | 34,240 | | | | 945 | | |
| Lam Research* | | | 8,100 | | | | 459 | | |
| Limelight Networks* | | | 130,320 | | | | 933 | | |
| MasterCard, Cl A | | | 4,140 | | | | 1,042 | | |
| Micron Technology* | | | 55,830 | | | | 640 | | |
| NXP Semiconductors* | | | 20,900 | | | | 627 | | |
| OmniVision Technologies* | | | 18,180 | | | | 646 | | |
| Omron | | | 16,710 | | | | 470 | | |
| OpenTable* | | | 4,750 | | | | 505 | | |
| Oracle | | | 49,220 | | | | 1,642 | | |
| QLIK Technologies* | | | 16,200 | | | | 421 | | |
| QUALCOMM | | | 16,760 | | | | 919 | | |
| Rovi* | | | 7,840 | | | | 421 | | |
| Rubicon Technology* | | | 38,020 | | | | 1,052 | | |
| Salesforce.com* | | | 18,680 | | | | 2,495 | | |
| SAVVIS* | | | 12,780 | | | | 474 | | |
| SINA* | | | 5,690 | | | | 609 | | |
30 TURNER FUNDS 2011 SEMIANNUAL REPORT
(Unaudited)
Schedule of investments
Turner Spectrum Fund
| | | Shares | | Value
(000) | |
| SuccessFactors* | | | 12,860 | | | $ | 503 | | |
| SunPower, Cl A* | | | 14,940 | | | | 256 | | |
| Synchronoss Technologies* | | | 49,950 | | | | 1,736 | | |
| Tekelec* | | | 116,310 | | | | 944 | | |
| Teradyne* | | | 31,380 | | | | 559 | | |
| Texas Instruments | | | 14,740 | | | | 509 | | |
| TIBCO Software* | | | 19,520 | | | | 532 | | |
Varian Semiconductor
Equipment Associates* | | | 30,880 | | | | 1,503 | | |
| VeriFone Systems* | | | 19,514 | | | | 1,072 | | |
| WebMD Health* | | | 11,500 | | | | 614 | | |
| ZTE, Cl H | | | 68,290 | | | | 318 | | |
| Total Information technology | | | | | 47,685 | | |
| Materials—6.2% | |
| African Minerals* | | | 5,215 | | | | 42 | | |
| Air Products & Chemicals | | | 11,450 | | | | 1,033 | | |
| AK Steel Holding | | | 30,610 | | | | 483 | | |
| Arkema | | | 5,220 | | | | 474 | | |
| Atlas Iron* | | | 55,000 | | | | 212 | | |
| CF Industries Holdings | | | 25,510 | | | | 3,490 | | |
| Chemtura* | | | 147,820 | | | | 2,543 | | |
| China Molybdenum, H Shares | | | 220,910 | | | | 193 | | |
| Cliffs Natural Resources | | | 2,670 | | | | 262 | | |
Consolidated Thompson
Iron Mines | | | 125,940 | | | | 2,227 | | |
| Fibria Celulose SP ADR* | | | 33,410 | | | | 549 | | |
| First Quantum Minerals | | | 3,030 | | | | 392 | | |
Freeport-McMoRan
Copper & Gold | | | 9,040 | | | | 502 | | |
| Huntsman | | | 29,150 | | | | 507 | | |
International Flavors &
Fragrances | | | 16,640 | | | | 1,037 | | |
| Lake Shore Gold | | | 94,035 | | | | 397 | | |
LyondellBasell Industries NV,
Cl A* | | | 7,350 | | | | 291 | | |
| Maanshan Iron & Steel, H Shares | | | 348,160 | | | | 188 | | |
| Martin Marietta Materials | | | 23,620 | | | | 2,118 | | |
| Metals USA Holdings* | | | 20,230 | | | | 331 | | |
| Molycorp* | | | 6,220 | | | | 373 | | |
| Nalco Holding | | | 38,260 | | | | 1,045 | | |
| Neo Material Technologies | | | 12,302 | | | | 118 | | |
| North American Palladium* | | | 61,200 | | | | 397 | | |
| OSAKA Titanium technologies | | | 8,000 | | | | 552 | | |
| | | Shares | | Value
(000) | |
| Pan American Silver | | | 10,520 | | | $ | 391 | | |
| Potash Corp. of Saskatchewan | | | 39,270 | | | | 2,314 | | |
| Schnitzer Steel Industries, Cl A | | | 7,480 | | | | 486 | | |
| Senomyx* | | | 52,980 | | | | 320 | | |
Shougang Concord International
Enterprises* | | | 1,983,940 | | | | 273 | | |
| Sims Metal Management | | | 14,200 | | | | 258 | | |
| Temple-Inland | | | 21,640 | | | | 506 | | |
| Titanium Metals* | | | 37,460 | | | | 696 | | |
| United States Steel | | | 8,810 | | | | 475 | | |
| Wacker Chemie | | | 1,100 | | | | 247 | | |
| Total Materials | | | | | 25,722 | | |
| Telecommunication services—0.4% | |
| Brasil Telecom ADR | | | 25,790 | | | | 696 | | |
| Elephant Talk Communications* | | | 58,790 | | | | 153 | | |
| NII Holdings* | | | 12,090 | | | | 504 | | |
| Sprint Nextel* | | | 41,000 | | | | 190 | | |
| Total Telecommunication services | | | | | 1,543 | | |
| Utilities—0.2% | |
| Energen | | | 8,090 | | | | 511 | | |
| Veolia Environnement ADR | | | 17,180 | | | | 535 | | |
| Total Utilities | | | | | 1,046 | | |
Total Common stock
(Cost $255,461) | | | | | 273,094 | | |
| Exchange traded funds—0.4% | |
| ETFS Palladium Trust | | | 1,580 | | | | 120 | | |
iShares Dow Jones U.S. Real
Estate Index Fund^ | | | 16,070 | | | | 955 | | |
PowerShares U.S. Dollar Index
Bullish Fund | | | 29,390 | | | | 640 | | |
Total Exchange traded funds
(Cost $1,559) | | | | | 1,715 | | |
| Exchange traded note—0.4% | |
iPath S&P 500 VIX Short-Term
Futures ETN | | | 54,910 | | | | 1,612 | | |
Total Exchange traded note
(Cost $1,784) | | | | | 1,612 | | |
TURNER FUNDS 2011 SEMIANNUAL REPORT 31
FINANCIAL STATEMENTS
Schedule of investments
Turner Spectrum Fund
| | | Contracts/
Shares | | Value
(000) | |
| Put option contracts—0.2% | |
Chipotle Mexican Grill,
6/11 at $260 | | | 98 | | | $ | 142 | | |
iShares Russell 2000 Index Fund,
4/11 at $81 | | | 975 | | | | 45 | | |
iShares Russell 2000 Index Fund,
5/11 at $80 | | | 1,748 | | | | 231 | | |
Oil Services Holders Trust,
4/11 at $155 | | | 245 | | | | 22 | | |
| Panera Bread, 5/11 at $115 | | | 98 | | | | 25 | | |
| Range Resources, 5/11 at $55 | | | 333 | | | | 65 | | |
SPDR Metals & Mining ETF,
4/11 at $72 | | | 293 | | | | 23 | | |
SPDR S&P 500 ETF Trust,
4/11 at $124 | | | 831 | | | | 17 | | |
SPDR S&P 500 ETF Trust,
6/11 at $120 | | | 352 | | | | 44 | | |
| SPDR S&P Retail ETF, 6/11 at $50 | | | 976 | | | | 178 | | |
| Under Armour, 4/11 at $70 | | | 146 | | | | 45 | | |
Total Put option contracts
(Cost $2,211) | | | | | 837 | | |
| Call option contracts—0.4% | |
| Abercrombie & Fitch, 5/11 at $50 | | | 488 | | | | 483 | | |
| Las Vegas Sands, 6/11 at $40 | | | 1,838 | | | | 910 | | |
| Schlumberger, 5/11 at $85 | | | 205 | | | | 202 | | |
Starwood Hotels & Resorts Worldwide,
5/11 at $58 | | | 239 | | | | 76 | | |
| United States Steel, 4/11 at $53 | | | 479 | | | | 121 | | |
Total Call option contracts
(Cost $1,641) | | | | | 1,792 | | |
| Cash equivalent—15.8% | |
BlackRock TempCash Fund,
Institutional Shares,
0.000%** | | | 65,233,269 | | | | 65,233 | | |
Total Cash equivalent
(Cost $65,233) | | | | | 65,233 | | |
Total Investments—83.6%
(Cost $327,889) | | | | $ | 344,283 | | |
As of March 31, 2011, all of the Fund's investments were considered Level 1. Please see Note 2 in Notes to Financial Statements for further information regarding fair value measurements.
Percentages are based on Net Assets of $411,714.***
^ All or a portion of the shares have been committed as collateral for open short positions.
* Non-income producing security.
** Rate shown is the 7-day effective yield as of March 31, 2011.
*** This number is listed in thousands.
ADR — American Depositary Receipt
Cl — Class
ETF — Exchange Traded Fund
ETN — Exchange Traded Note
LP — Limited Partnership
NV — Naamloze Vennootschap
NY — New York
S&P — Standard & Poor's
SPDR — Standard & Poor's Depositary Receipt
The accompanying notes are an integral part of the financial statements.
32 TURNER FUNDS 2011 SEMIANNUAL REPORT
(Unaudited)
Schedule of securities sold short
Turner Spectrum Fund
March 31, 2011
| | | Shares | | Value
(000) | |
| Common stock—34.7% | |
| Consumer discretionary—5.9% | |
| Adidas | | | 7,729 | | | $ | 487 | | |
| Advance Auto Parts | | | 12,990 | | | | 852 | | |
| Bally Technologies* | | | 24,690 | | | | 935 | | |
| Carter's* | | | 30,850 | | | | 883 | | |
| Chipotle Mexican Grill, Cl A* | | | 17,100 | | | | 4,658 | | |
| DIRECTV, Cl A* | | | 24,380 | | | | 1,141 | | |
| Dollar General* | | | 32,680 | | | | 1,025 | | |
| Gentex | | | 31,210 | | | | 944 | | |
| Lamar Advertising, Cl A* | | | 56,380 | | | | 2,083 | | |
| Life Time Fitness* | | | 7,730 | | | | 288 | | |
| Lowe's | | | 52,590 | | | | 1,390 | | |
| Luxottica Group ADR | | | 9,870 | | | | 324 | | |
| Marks & Spencer | | | 71,981 | | | | 389 | | |
| Marriott International, Cl A | | | 41,820 | | | | 1,488 | | |
| McGraw-Hill | | | 7,980 | | | | 314 | | |
| Netflix* | | | 2,700 | | | | 641 | | |
| P.F. Chang's China Bistro | | | 33,300 | | | | 1,538 | | |
| Ross Stores | | | 9,270 | | | | 659 | | |
| TJX | | | 9,630 | | | | 479 | | |
| Toyota Motor SP ADR | | | 7,070 | | | | 567 | | |
| Under Armour, Cl A* | | | 9,670 | | | | 658 | | |
| VF | | | 14,220 | | | | 1,401 | | |
| Wynn Macau | | | 345,886 | | | | 965 | | |
| Total Consumer discretionary | | | | | 24,109 | | |
| Consumer staples—0.8% | |
| Coca-Cola | | | 9,300 | | | | 254 | | |
| Colgate-Palmolive | | | 6,320 | | | | 510 | | |
| Kimberly-Clark | | | 15,570 | | | | 1,016 | | |
| Nu Skin Enterprises, Cl A | | | 12,820 | | | | 369 | | |
| Wal-Mart Stores | | | 23,140 | | | | 1,205 | | |
| Total Consumer staples | | | | | 3,354 | | |
| Energy—4.2% | |
| Apache | | | 3,160 | | | | 414 | | |
| Arch Coal | | | 28,505 | | | | 1,027 | | |
| Berry Petroleum, Cl A | | | 36,110 | | | | 1,822 | | |
| Bill Barrett* | | | 13,530 | | | | 540 | | |
| Cameco | | | 6,250 | | | | 188 | | |
| CARBO Ceramics | | | 3,700 | | | | 522 | | |
| Comstock Resources* | | | 13,480 | | | | 417 | | |
| Continental Resources* | | | 14,620 | | | | 1,045 | | |
| Denbury Resources* | | | 25,340 | | | | 618 | | |
| | | Shares | | Value
(000) | |
| FMC Technologies* | | | 4,200 | | | $ | 397 | | |
| Halliburton | | | 7,590 | | | | 378 | | |
| Murphy Oil | | | 5,940 | | | | 436 | | |
| Niko Resources | | | 6,160 | | | | 591 | | |
| Noble | | | 69,520 | | | | 3,172 | | |
| Paladin Energy | | | 98,600 | | | | 369 | | |
| Patterson-UTI Energy | | | 14,060 | | | | 413 | | |
| Penn Virginia | | | 20,930 | | | | 355 | | |
| Royal Dutch Shell ADR | | | 8,190 | | | | 597 | | |
| SM Energy | | | 3,370 | | | | 250 | | |
| Southwestern Energy* | | | 7,510 | | | | 323 | | |
| Transocean* | | | 8,860 | | | | 691 | | |
| Ultra Petroleum* | | | 30,890 | | | | 1,521 | | |
| Ur-Energy* | | | 46,290 | | | | 76 | | |
| Weatherford International* | | | 41,800 | | | | 945 | | |
| Total Energy | | | | | 17,107 | | |
| Financials—6.2% | |
| AMB Property | | | 11,460 | | | | 412 | | |
| Associated Banc-Corp | | | 41,040 | | | | 609 | | |
| Banco Santander Chile ADR | | | 7,350 | | | | 638 | | |
| Bank of America | | | 171,250 | | | | 2,283 | | |
| Bank of New York Mellon | | | 34,490 | | | | 1,030 | | |
| China Merchants Bank, H Shares | | | 223,030 | | | | 618 | | |
| Chubb | | | 32,640 | | | | 2,001 | | |
| Compartamos* | | | 238,432 | | | | 430 | | |
| Everest Re Group | | | 6,600 | | | | 582 | | |
| First Niagara Financial Group | | | 33,010 | | | | 448 | | |
| Franklin Resources | | | 5,470 | | | | 684 | | |
| FXCM, Cl A | | | 41,820 | | | | 545 | | |
| Green Dot, Cl A* | | | 13,680 | | | | 587 | | |
| HCP | | | 10,360 | | | | 393 | | |
| Investment Technology Group* | | | 107,730 | | | | 1,960 | | |
| Janus Capital Group | | | 36,840 | | | | 459 | | |
| Legg Mason | | | 38,280 | | | | 1,382 | | |
| Northern Trust | | | 64,440 | | | | 3,270 | | |
Ping An Insurance Group of
China, H Shares | | | 49,397 | | | | 501 | | |
| Piper Jaffray* | | | 9,720 | | | | 403 | | |
| Principal Financial Group | | | 13,670 | | | | 439 | | |
| St. Joe* | | | 21,730 | | | | 545 | | |
| Travelers | | | 58,120 | | | | 3,457 | | |
| Wells Fargo | | | 45,030 | | | | 1,427 | | |
| Weyerhaeuser | | | 20,110 | | | | 495 | | |
| Total Financials | | | | | 25,598 | | |
TURNER FUNDS 2011 SEMIANNUAL REPORT 33
FINANCIAL STATEMENTS
Schedule of securities sold short
Turner Spectrum Fund
| | | Shares | | Value
(000) | |
| Health care—4.3% | |
| AMAG Pharmaceuticals* | | | 600 | | | $ | 10 | | |
| AstraZeneca ADR | | | 67,120 | | | | 3,096 | | |
| Auxilium Pharmaceuticals* | | | 7,090 | | | | 152 | | |
| Becton Dickinson | | | 12,600 | | | | 1,003 | | |
| BioTime* | | | 34,810 | | | | 259 | | |
| Boston Scientific* | | | 54,900 | | | | 395 | | |
| Curis* | | | 88,000 | | | | 286 | | |
| Cytori Therapeutics* | | | 34,700 | | | | 272 | | |
Genomma Lab
Internacional, Cl B* | | | 442,610 | | | | 1,001 | | |
| Human Genome Sciences* | | | 25,630 | | | | 703 | | |
| IDEXX Laboratories* | | | 11,560 | | | | 893 | | |
| ImmunoGen* | | | 74,930 | | | | 680 | | |
| Isis Pharmaceuticals* | | | 20,804 | | | | 188 | | |
| Life Technologies* | | | 12,700 | | | | 666 | | |
| Mesoblast* | | | 53,700 | | | | 403 | | |
| Oncolytics Biotech ADR* | | | 57,300 | | | | 334 | | |
| Opko Health* | | | 64,270 | | | | 240 | | |
| Patterson | | | 24,170 | | | | 778 | | |
Pharmaceutical Product
Development | | | 13,720 | | | | 380 | | |
| QIAGEN* | | | 61,350 | | | | 1,230 | | |
| Salix Pharmaceuticals* | | | 10,090 | | | | 353 | | |
| Sangamo BioSciences* | | | 103,600 | | | | 863 | | |
| Sequenom* | | | 24,450 | | | | 155 | | |
| STERIS | | | 54,270 | | | | 1,874 | | |
| Synta Pharmaceuticals* | | | 25,430 | | | | 134 | | |
| Techne | | | 3,900 | | | | 279 | | |
| Thoratec* | | | 30,448 | | | | 789 | | |
| ViroPharma* | | | 13,170 | | | | 262 | | |
| VIVUS* | | | 32,100 | | | | 199 | | |
| Total Health care | | | | | 17,877 | | |
| Industrials—3.3% | |
| 3M | | | 12,620 | | | | 1,180 | | |
| ABB SP ADR | | | 103,260 | | | | 2,498 | | |
| C.R. Bard | | | 31,070 | | | | 3,086 | | |
| General Electric | | | 72,950 | | | | 1,463 | | |
| Ingersoll-Rand | | | 10,500 | | | | 507 | | |
| Kennametal | | | 15,420 | | | | 601 | | |
| Masco | | | 70,430 | | | | 980 | | |
| Quanta Services* | | | 14,420 | | | | 323 | | |
| Stericycle* | | | 8,630 | | | | 765 | | |
| Textron | | | 28,550 | | | | 782 | | |
| | | Shares | | Value
(000) | |
| W.W. Grainger | | | 9,730 | | | $ | 1,340 | | |
| Total Industrials | | | | | 13,525 | | |
| Information technology—6.1% | |
| Adobe Systems* | | | 15,550 | | | | 516 | | |
| ADTRAN | | | 11,470 | | | | 487 | | |
| Broadridge Financial Solutions | | | 19,980 | | | | 453 | | |
| Cymer* | | | 22,250 | | | | 1,259 | | |
| Dell* | | | 113,120 | | | | 1,641 | | |
| eBay* | | | 19,670 | | | | 611 | | |
| Electronic Arts* | | | 24,510 | | | | 479 | | |
| Fiserv* | | | 26,310 | | | | 1,650 | | |
| FLIR Systems | | | 15,120 | | | | 523 | | |
| Intersil, Cl A | | | 33,940 | | | | 423 | | |
| Intuit* | | | 25,860 | | | | 1,373 | | |
| Lexmark International* | | | 13,850 | | | | 513 | | |
| Linear Technology | | | 22,760 | | | | 765 | | |
| Logitech International* | | | 23,430 | | | | 425 | | |
| Maxim Integrated Products | | | 22,710 | | | | 581 | | |
| NetApp* | | | 38,700 | | | | 1,865 | | |
| Novellus Systems* | | | 18,640 | | | | 692 | | |
| ON Semiconductor* | | | 42,890 | | | | 423 | | |
| Oplink Communications* | | | 14,660 | | | | 286 | | |
| Qlogic* | | | 25,250 | | | | 468 | | |
| RF Micro Devices* | | | 64,490 | | | | 413 | | |
| Silicon Laboratories* | | | 15,980 | | | | 691 | | |
| Skyworks Solutions* | | | 11,360 | | | | 368 | | |
| Sohu.com* | | | 4,320 | | | | 386 | | |
| Sourcefire* | | | 23,770 | | | | 654 | | |
| STMicroelectronics, NY Shares | | | 61,680 | | | | 766 | | |
| Synaptics* | | | 14,330 | | | | 387 | | |
Telefonaktiebolaget LM
Ericsson SP ADR | | | 170,710 | | | | 2,195 | | |
| TriQuint Semiconductor* | | | 23,510 | | | | 304 | | |
| Tyler Technologies* | | | 13,440 | | | | 319 | | |
| VMware, Cl A* | | | 12,170 | | | | 992 | | |
| Xilinx | | | 62,860 | | | | 2,062 | | |
| Total Information technology | | | | | 24,970 | | |
| Materials—3.0% | |
| Acerinox | | | 17,560 | | | | 347 | | |
| Akzo Nobel | | | 7,410 | | | | 509 | | |
| Aluminum Corporation of China* | | | 17,350 | | | | 411 | | |
| ArcelorMittal, NY Shares | | | 21,680 | | | | 784 | | |
| Bemis | | | 9,700 | | | | 318 | | |
34 TURNER FUNDS 2011 SEMIANNUAL REPORT
(Unaudited)
Schedule of securities sold short
Turner Spectrum Fund
| | | Shares | | Value
(000) | |
| Calgon Carbon* | | | 24,580 | | | $ | 390 | | |
| Carpenter Technology | | | 8,640 | | | | 369 | | |
| Coeur d'Alene Mines* | | | 9,920 | | | | 345 | | |
| Inmet Mining | | | 4,100 | | | | 288 | | |
| Kumba Iron Ore | | | 6,350 | | | | 449 | | |
| Mosaic | | | 26,580 | | | | 2,093 | | |
| Newmont Mining | | | 8,380 | | | | 457 | | |
| Nucor | | | 22,680 | | | | 1,044 | | |
| Praxair | | | 10,220 | | | | 1,038 | | |
| Sigma-Aldrich | | | 16,160 | | | | 1,029 | | |
| SSAB AB, A Shares | | | 4,500 | | | | 71 | | |
| Taseko Mines* | | | 54,100 | | | | 321 | | |
| Vulcan Materials | | | 46,370 | | | | 2,115 | | |
| Total Materials | | | | | 12,378 | | |
| Telecommunication services—0.7% | |
| American Tower* | | | 9,790 | | | | 507 | | |
| Crown Castle International* | | | 6,080 | | | | 259 | | |
| SBA Communications, Cl A* | | | 41,960 | | | | 1,665 | | |
| Tele Norte Leste Participacoes ADR | | | 33,680 | | | | 590 | | |
| Total Telecommunication services | | | | | 3,021 | | |
| Utilities—0.2% | |
| Fair Isaac | | | 26,320 | | | | 832 | | |
| Total Utilities | | | | | 832 | | |
Total Common stock
(Proceeds $139,959) | | | | | 142,771 | | |
| Exchange traded funds—7.2% | |
| Financial Select Sector SPDR Fund | | | 34,190 | | | | 561 | | |
| Industrial Select Sector SPDR Fund | | | 68,410 | | | | 2,578 | | |
| iShares MSCI Emerging | | | 23,180 | | | | 1,129 | | |
iShares Russell 2000 Growth
Index Fund | | | 35,140 | | | | 3,350 | | |
iShares Russell 2000 Growth
Index Fund | | | 35,190 | | | | 2,962 | | |
| Materials Select Sector SPDR Trust | | | 103,460 | | | | 4,142 | | |
| Oil Service Holders Trust | | | 1,380 | | | | 227 | | |
| Semiconductor HOLDRs Trust | | | 42,830 | | | | 1,482 | | |
| SPDR Metals & Mining ETF | | | 6,720 | | | | 499 | | |
| SPDR S&P 500 ETF Trust | | | 42,470 | | | | 5,627 | | |
| SPDR S&P Homebuilders ETF | | | 35,260 | | | | 642 | | |
SPDR S&P Oil & Gas
Exploration & Production ETF | | | 39,510 | | | | 2,548 | | |
| | | Shares | | Value
(000) | |
| SPDR S&P Retail ETF | | | 35,660 | | | $ | 1,812 | | |
| Vanguard Small-Cap Growth ETF | | | 23,150 | | | | 1,998 | | |
Total Exchange traded funds
(Proceeds $27,987) | | | | | 29,557 | | |
Total Securities Sold Short—41.9%
(Proceeds $167,946) | | | | $ | 172,328 | | |
As of March 31, 2011, all of the Fund's investments in securities sold short were considered Level 1. Please see Note 2 in Notes to Financial Statements for further information regarding fair value measurements.
Percentages are based on Net Assets of $411,714.**
* Non-income producing security.
** This number is listed in thousands.
ADR — American Depositary Receipt
Cl — Class
ETF — Exchange Traded Fund
NY — New York
S&P — Standard and Poor's
SPDR — Standard and Poor's Depositary Receipt
The accompanying notes are an integral part of the financial statements.
TURNER FUNDS 2011 SEMIANNUAL REPORT 35
FINANCIAL STATEMENTS
Schedule of open options written
Turner Spectrum Fund
March 31, 2011
| | | Contracts | | Value
(000) | |
| Written put options*—0.1% | |
| Abercrombie & Fitch, 5/11 at $47 | | | 486 | | | $ | 24 | | |
Chipotle Mexican Grill,
6/11 at $230 | | | 146 | | | | 83 | | |
iShares Russell 2000 Index Fund,
5/11 at $74 | | | 1,226 | | | | 56 | | |
| Las Vegas Sands, 6/11 at $35 | | | 2,116 | | | | 239 | | |
| Panera Bread, 5/11 at $95 | | | 195 | | | | 12 | | |
| Schlumberger, 5/11 at $75 | | | 306 | | | | 11 | | |
| SPDR S&P Retail ETF, 6/11 at $45 | | | 1,707 | | | | 108 | | |
Starwood Hotels & Resorts Worldwide,
5/11 at $53 | | | 359 | | | | 41 | | |
| Under Armour, 4/11 at $60 | | | 293 | | | | 8 | | |
Total Written put options
(Premiums received $1,124) | | | | | 582 | | |
| Written call options*—0.3% | |
Abercrombie & Fitch,
5/11 at $60 | | | 976 | | | | 288 | | |
Chipotle Mexican Grill,
6/11 at $310 | | | 98 | | | | 63 | | |
iShares Russell 2000 Index Fund,
4/11 at $84 | | | 975 | | | | 141 | | |
| Las Vegas Sands, 6/11 at $50 | | | 3,506 | | | | 431 | | |
| Panera Bread, 7/11 at $130 | | | 195 | | | | 82 | | |
| Schlumberger, 7/11 at $95 | | | 389 | | | | 128 | | |
| SPDR S&P Retail ETF, 6/11 at $52 | | | 976 | | | | 135 | | |
Starwood Hotels & Resorts Worldwide,
5/11 at $65 | | | 248 | | | | 17 | | |
| Under Armour, 4/11 at $75 | | | 219 | | | | 4 | | |
| United States Steel, 4/11 at $58 | | | 489 | | | | 29 | | |
Total Written call options
(Premiums received $1,244) | | | | | 1,318 | | |
Total Written option contracts
(Premiums received $2,368) | | | | $ | 1,900 | | |
As of March 31, 2011 all of the Fund's investments in open options written were considered Level 1. Please see Note 2 in Notes to Financial Statements for further information regarding fair value measurements.
Percentages are based on Net Assets of $411,714.**
* Non-income producing security.
** This number is listed in thousands.
ETF — Exchange Traded Fund
S&P — Standard and Poor's
SPDR — Standard and Poor's Depositary Receipt
The accompanying notes are an integral part of the financial statements.
36 TURNER FUNDS 2011 SEMIANNUAL REPORT
(Unaudited)
Schedule of investments
Turner Titan Fund
March 31, 2011
| | | Shares | | Value
(000) | |
| Common stock—83.5% | |
| Consumer discretionary—15.3% | |
| Fossil* | | | 450 | | | $ | 42 | | |
| Home Depot | | | 1,660 | | | | 62 | | |
| Interpublic Group of Cos. | | | 3,100 | | | | 39 | | |
| Las Vegas Sands*^ | | | 2,050 | | | | 87 | | |
| Scientific Games, Cl A* | | | 4,930 | | | | 43 | | |
| Stanley Black & Decker | | | 710 | | | | 54 | | |
| Starbucks | | | 1,430 | | | | 53 | | |
Starwood Hotels & Resorts
Worldwide | | | 1,080 | | | | 63 | | |
| Swatch Group | | | 132 | | | | 58 | | |
| TRW Automotive Holdings* | | | 960 | | | | 53 | | |
| Viacom, Cl B^ | | | 1,850 | | | | 86 | | |
| Total Consumer discretionary | | | | | 640 | | |
| Consumer staples—2.5% | |
| Mead Johnson Nutrition, Cl A^ | | | 720 | | | | 42 | | |
| Walgreen^ | | | 1,560 | | | | 62 | | |
| Total Consumer staples | | | | | 104 | | |
| Energy—11.5% | |
| Anadarko Petroleum | | | 640 | | | | 53 | | |
| Baker Hughes^ | | | 710 | | | | 52 | | |
| Cabot Oil & Gas^ | | | 800 | | | | 42 | | |
| Cameron International*^ | | | 710 | | | | 41 | | |
| Concho Resources*^ | | | 770 | | | | 83 | | |
| Devon Energy^ | | | 450 | | | | 41 | | |
| Marathon Oil^ | | | 2,390 | | | | 127 | | |
| Peabody Energy | | | 580 | | | | 42 | | |
| Total Energy | | | | | 481 | | |
| Financials—7.7% | |
| AON^ | | | 870 | | | | 46 | | |
| Capital One Financial^ | | | 600 | | | | 31 | | |
| Citigroup*^ | | | 9,340 | | | | 41 | | |
| Discover Financial Services | | | 1,730 | | | | 42 | | |
| IntercontinentalExchange*^ | | | 280 | | | | 35 | | |
| Invesco | | | 2,430 | | | | 62 | | |
| NYSE Euronext | | | 1,760 | | | | 62 | | |
| Total Financials | | | | | 319 | | |
| | | Shares | | Value
(000) | |
| Health care—7.7% | |
| Allergan^ | | | 580 | | | $ | 41 | | |
| Express Scripts* | | | 760 | | | | 42 | | |
| Gilead Sciences* | | | 1,120 | | | | 47 | | |
| HealthSouth* | | | 2,150 | | | | 54 | | |
| McKesson^ | | | 780 | | | | 62 | | |
| Shire ADR | | | 230 | | | | 20 | | |
| Watson Pharmaceuticals*^ | | | 980 | | | | 55 | | |
| Total Health care | | | | | 321 | | |
| Industrials—11.3% | |
| Caterpillar | | | 520 | | | | 58 | | |
| Cummins | | | 410 | | | | 45 | | |
| Deere | | | 570 | | | | 55 | | |
| FedEx | | | 350 | | | | 33 | | |
| Manpower | | | 680 | | | | 43 | | |
| Parker Hannifin^ | | | 990 | | | | 94 | | |
| Precision Castparts | | | 280 | | | | 41 | | |
| Siemens | | | 390 | | | | 53 | | |
| Union Pacific^ | | | 490 | | | | 48 | | |
| Total Industrials | | | | | 470 | | |
| Information technology—24.2% | |
| Acme Packet*^ | | | 720 | | | | 51 | | |
| Apple*^ | | | 180 | | | | 63 | | |
| ASML Holding, NY Shares*^ | | | 1,480 | | | | 66 | | |
| Atmel* | | | 3,070 | | | | 42 | | |
| Autodesk*^ | | | 1,200 | | | | 53 | | |
| Baidu ADR* | | | 310 | | | | 43 | | |
Check Point Software
Technologies*^ | | | 1,710 | | | | 87 | | |
| Citrix Systems* | | | 590 | | | | 43 | | |
| EMC* | | | 1,550 | | | | 41 | | |
| Google, Cl A*^ | | | 145 | | | | 85 | | |
| JDS Uniphase* | | | 2,200 | | | | 46 | | |
| Juniper Networks* | | | 1,570 | | | | 66 | | |
| Limelight Networks* | | | 10,590 | | | | 76 | | |
| Oracle^ | | | 2,290 | | | | 76 | | |
| QUALCOMM^ | | | 1,370 | | | | 75 | | |
| Texas Instruments^ | | | 1,220 | | | | 42 | | |
Varian Semiconductor
Equipment Associates*^ | | | 1,090 | | | | 53 | | |
| Total Information technology | | | | | 1,008 | | |
TURNER FUNDS 2011 SEMIANNUAL REPORT 37
FINANCIAL STATEMENTS
Schedule of investments
Turner Titan Fund
| | | Shares | | Value
(000) | |
| Materials—3.3% | |
| CF Industries Holdings^ | | | 550 | | | $ | 75 | | |
| Cliffs Natural Resources | | | 220 | | | | 22 | | |
| Potash Corp. of Saskatchewan | | | 720 | | | | 42 | | |
| Total Materials | | | | | 139 | | |
Total Common stock
(Cost $3,391) | | | | | 3,482 | | |
| Cash equivalent—8.0% | |
BlackRock TempCash Fund,
Institutional Shares,
0.000%**^ | | | 331,893 | | | | 332 | | |
Total Cash equivalent
(Cost $332) | | | | | 332 | | |
Total Investments—91.5%
(Cost $3,723) | | | | $ | 3,814 | | |
As of March 31, 2011, all of the Fund's investments were considered Level 1. Please see Note 2 in Notes to Financial Statements for further information regarding fair value measurements.
Percentages are based on Net Assets of $4,169.***
* Non-income producing security.
** Rate shown is the 7-day effective yield as of March 31, 2011.
*** This number is listed in thousands.
^ All or a portion of the shares have been committed as collateral for open short positions.
ADR — American Depositary Receipt
Cl — Class
NY — New York
The accompanying notes are an integral part of the financial statements.
38 TURNER FUNDS 2011 SEMIANNUAL REPORT
(Unaudited)
Schedule of securities sold short
Turner Titan Fund
March 31, 2011
| | | Shares | | Value
(000) | |
| Common stock—43.4% | |
| Consumer discretionary—12.5% | |
| Carter's* | | | 1,510 | | | $ | 43 | | |
| Chipotle Mexican Grill* | | | 230 | | | | 63 | | |
| DIRECTV, Cl A* | | | 1,130 | | | | 53 | | |
| Dollar General* | | | 1,340 | | | | 42 | | |
| Gentex | | | 1,500 | | | | 45 | | |
| Lamar Advertising, Cl A* | | | 1,190 | | | | 44 | | |
| Lowe's | | | 1,520 | | | | 40 | | |
| Marriott International, Cl A | | | 1,170 | | | | 42 | | |
| P.F. Chang's China Bistro | | | 680 | | | | 31 | | |
| Toyota Motor SP ADR | | | 570 | | | | 46 | | |
| VF | | | 420 | | | | 41 | | |
| Wynn Macau | | | 11,400 | | | | 32 | | |
| Total Consumer discretionary | | | | | 522 | | |
| Consumer staples—1.0% | |
| Colgate-Palmolive | | | 510 | | | | 41 | | |
| Total Consumer staples | | | | | 41 | | |
| Energy—2.4% | |
| Berry Petroleum, Cl A | | | 430 | | | | 22 | | |
| Ultra Petroleum* | | | 860 | | | | 42 | | |
| Weatherford International* | | | 1,690 | | | | 38 | | |
| Total Energy | | | | | 102 | | |
| Financials—5.0% | |
| Bank of America | | | 4,290 | | | | 57 | | |
| Investment Technology Group* | | | 2,530 | | | | 46 | | |
| Legg Mason | | | 1,220 | | | | 44 | | |
| Northern Trust | | | 1,210 | | | | 61 | | |
| Total Financials | | | | | 208 | | |
| Health care—0.3% | |
| Thoratec* | | | 430 | | | | 11 | | |
| Total Health care | | | | | 11 | | |
| Industrials—4.9% | |
| 3M | | | 450 | | | | 42 | | |
| C.R. Bard | | | 470 | | | | 47 | | |
| General Electric | | | 2,100 | | | | 42 | | |
| Ingersoll-Rand | | | 860 | | | | 42 | | |
| Textron | | | 1,230 | | | | 34 | | |
| Total Industrials | | | | | 207 | | |
| Information technology—14.3% | |
| Adobe Systems* | | | 1,270 | | | | 42 | | |
| Cymer* | | | 940 | | | | 53 | | |
| | | Shares | | Value
(000) | |
| Dell* | | | 2,810 | | | $ | 41 | | |
| FLIR Systems | | | 1,240 | | | | 43 | | |
| Linear Technology | | | 1,860 | | | | 63 | | |
| Logitech International* | | | 1,960 | | | | 36 | | |
| NetApp* | | | 690 | | | | 33 | | |
| Oplink Communications* | | | 1,200 | | | | 23 | | |
| Silicon Laboratories* | | | 1,300 | | | | 56 | | |
| Sourcefire* | | | 1,930 | | | | 53 | | |
| STMicroelectronics, NY Shares | | | 3,000 | | | | 37 | | |
Telefonaktiebolaget LM
Ericsson SP ADR | | | 4,250 | | | | 55 | | |
| TriQuint Semiconductor* | | | 1,910 | | | | 25 | | |
| Xilinx | | | 1,070 | | | | 35 | | |
| Total Information technology | | | | | 595 | | |
| Materials—3.0% | |
| ArcelorMittal, NY Shares | | | 1,760 | | | | 64 | | |
| Mosaic | | | 310 | | | | 24 | | |
| Nucor | | | 800 | | | | 37 | | |
| Total Materials | | | | | 125 | | |
Total Common stock
(Proceeds $1,776) | | | | | 1,811 | | |
| Exchange traded funds—3.8% | |
| SPDR S&P 500 Trust ETF | | | 800 | | | | 106 | | |
| SPDR S&P Homebuilders ETF | | | 2,860 | | | | 52 | | |
Total Exchange traded funds
(Proceeds $156) | | | | | 158 | | |
Total Securities sold short—47.2%
(Proceeds $1,932) | | | | $ | 1,969 | | |
As of March 31, 2011 all of the Fund's investments in securities sold short were considered Level 1. Please see Note 2 in Notes to Financial Statements for further information regarding fair value measurements.
Percentages are based on Net Assets of $4,169.**
* Non-income producing security.
** This number is listed in thousands.
ADR — American Depositary Receipt
Cl — Class
ETF — Exchange Traded Fund
NY — New York
S&P — Standard & Poor's
SPDR — Standard & Poor's Depositary Receipt
The accompanying notes are an integral part of the financial statements.
TURNER FUNDS 2011 SEMIANNUAL REPORT 39
FINANCIAL STATEMENTS
Schedule of investments
Turner All Cap Growth Fund
March 31, 2011
| | | Shares | | Value
(000) | |
| Common stock—98.4%† | |
| Consumer discretionary—12.8% | |
| Abercrombie & Fitch | | | 33,050 | | | $ | 1,940 | | |
| Guess? | | | 39,930 | | | | 1,571 | | |
| Las Vegas Sands* | | | 50,710 | | | | 2,141 | | |
Starwood Hotels & Resorts
Worldwide | | | 32,740 | | | | 1,903 | | |
| Total Consumer discretionary | | | | | 7,555 | | |
| Consumer staples—5.2% | |
Green Mountain Coffee
Roasters* # | | | 28,930 | | | | 1,869 | | |
| Whole Foods Market | | | 18,370 | | | | 1,211 | | |
| Total Consumer staples | | | | | 3,080 | | |
| Energy—9.2% | |
| Cameron International* | | | 23,960 | | | | 1,368 | | |
| Cimarex Energy | | | 16,920 | | | | 1,950 | | |
| Concho Resources* | | | 19,640 | | | | 2,107 | | |
| Total Energy | | | | | 5,425 | | |
| Financials—9.9% | |
| Citigroup* | | | 431,080 | | | | 1,905 | | |
| IntercontinentalExchange* | | | 11,340 | | | | 1,401 | | |
| Invesco | | | 42,130 | | | | 1,077 | | |
| M&T Bank | | | 16,510 | | | | 1,461 | | |
| Total Financials | | | | | 5,844 | | |
| Health care—13.8% | |
| Alexion Pharmaceuticals* | | | 20,610 | | | | 2,034 | | |
| AMERIGROUP* | | | 19,940 | | | | 1,281 | | |
| AmerisourceBergen, Cl A | | | 46,890 | | | | 1,855 | | |
| Illumina* # | | | 24,480 | | | | 1,715 | | |
| United Therapeutics* | | | 18,300 | | | | 1,227 | | |
| Total Health care | | | | | 8,112 | | |
| Industrials—2.4% | |
| Cummins | | | 12,860 | | | | 1,410 | | |
| Total Industrials | | | | | 1,410 | | |
| Information technology—40.7% | |
| Aeroflex Holding* | | | 65,538 | | | | 1,194 | | |
| Apple* | | | 7,180 | | | | 2,502 | | |
| ASML Holding, NY Shares* | | | 43,200 | | | | 1,922 | | |
| Baidu ADR* | | | 11,990 | | | | 1,652 | | |
| | | Shares | | Value
(000) | |
| Broadcom, Cl A | | | 43,490 | | | $ | 1,713 | | |
| Cypress Semiconductor* | | | 89,780 | | | | 1,740 | | |
| Entropic Communications* # | | | 228,210 | | | | 1,928 | | |
| F5 Networks* | | | 17,210 | | | | 1,765 | | |
| Inphi* | | | 56,810 | | | | 1,194 | | |
| Juniper Networks* | | | 27,850 | | | | 1,172 | | |
| Netlogic Microsystems* # | | | 41,250 | | | | 1,733 | | |
| Salesforce.com* | | | 13,930 | | | | 1,861 | | |
| TIBCO Software* | | | 78,400 | | | | 2,136 | | |
Varian Semiconductor
Equipment Associates* | | | 30,550 | | | | 1,487 | | |
| Total Information technology | | | | | 23,999 | | |
| Materials—1.9% | |
| Walter Energy | | | 8,460 | | | | 1,146 | | |
| Total Materials | | | | | 1,146 | | |
| Telecommunication services—2.5% | |
| Aruba Networks* | | | 44,030 | | | | 1,489 | | |
| Total Telecommunication services | | | | | 1,489 | | |
Total Common stock
(Cost $46,202) | | | | | 58,060 | | |
| Cash equivalent—7.9% | |
BlackRock TempCash Fund,
Institutional Shares,
0.000%** (1) | | | 4,650,095 | | | | 4,650 | | |
Total Cash equivalent
(Cost $4,650) | | | | | 4,650 | | |
Total Investments—106.3%
(Cost $50,852) | | | | $ | 62,710 | | |
As of March 31, 2011, all of the Fund's investments were considered Level 1. Please see Note 2 in Notes to Financial Statements for further information regarding fair value measurements.
Percentages are based on Net Assets of $58,968.***
* Non-income producing security.
** Rate shown is the 7-day effective yield as of March 31, 2011.
*** This number is listed in thousands.
† More narrow industries are utilized for compliance purposes, whereas broad sectors are utilized for reporting purposes.
40 TURNER FUNDS 2011 SEMIANNUAL REPORT
(Unaudited)
Schedule of investments
Turner All Cap Growth Fund
# Security fully or partially on loan at March 31, 2011. The total value of securities on loan at March 31, 2011 was $3,843***. Certain of these securities may have been sold prior to period end and are included in receivable for investment securities sold on the Statement of Assets and Liabilities.
(1) The Fund lends securities in its portfolio pursuant to a securities lending agreement ("Lending Agreement") with Morgan Stanley. Unless otherwise agreed, security loans made pursuant to the Lending Agreement are required at all times to be secured by collateral equal to at least 100% of the market value of the securities loaned. Cash collateral received is invested pursuant to the terms of the Lending Agreement in the BlackRock TempCash Fund, Institutional Shares, a money market fund. All such investments are made at the risk of the Fund. As such, the Fund is liable for investment losses. The Fund receives an annual fee for its participation in the Lending Agreement based on projected lending activity. A partial position of this security was purchased with cash collateral received from securities lending. The total value of such security at March 31, 2011 was $3,920.***
ADR — American Depositary Receipt
Cl — Class
NY — New York
The accompanying notes are an integral part of the financial statements.
TURNER FUNDS 2011 SEMIANNUAL REPORT 41
FINANCIAL STATEMENTS
Schedule of investments
Turner Concentrated Growth Fund
March 31, 2011
| | | Shares | | Value
(000) | |
| Common stock—98.6%† | |
| Consumer discretionary—9.1% | |
| Las Vegas Sands* | | | 72,000 | | | $ | 3,040 | | |
| Toll Brothers* | | | 104,450 | | | | 2,065 | | |
| Total Consumer discretionary | | | | | 5,105 | | |
| Energy—9.2% | |
| Anadarko Petroleum | | | 31,250 | | | | 2,560 | | |
| Cimarex Energy | | | 22,220 | | | | 2,561 | | |
| Total Energy | | | | | 5,121 | | |
| Financials—9.1% | |
| Charles Schwab | | | 141,890 | | | | 2,558 | | |
| Citigroup* | | | 570,490 | | | | 2,522 | | |
| Total Financials | | | | | 5,080 | | |
| Health care—8.0% | |
| Allergan | | | 37,960 | | | | 2,696 | | |
| United Therapeutics* | | | 25,850 | | | | 1,732 | | |
| Total Health care | | | | | 4,428 | | |
| Industrials—12.4% | |
| Caterpillar | | | 24,480 | | | | 2,726 | | |
| FedEx | | | 18,150 | | | | 1,698 | | |
| Manpower | | | 39,330 | | | | 2,473 | | |
| Total Industrials | | | | | 6,897 | | |
| Information technology—44.9% | |
| Acme Packet* | | | 40,030 | | | | 2,841 | | |
| Apple* | | | 9,370 | | | | 3,265 | | |
| Broadcom, Cl A | | | 56,040 | | | | 2,207 | | |
| Ciena* # | | | 103,670 | | | | 2,691 | | |
| F5 Networks* | | | 15,090 | | | | 1,548 | | |
| Google, Cl A* | | | 4,850 | | | | 2,843 | | |
| Netlogic Microsystems* | | | 50,880 | | | | 2,138 | | |
| NXP Semiconductors* | | | 70,540 | | | | 2,116 | | |
| Salesforce.com* | | | 22,140 | | | | 2,957 | | |
| SanDisk* | | | 51,100 | | | | 2,355 | | |
| Total Information technology | | | | | 24,961 | | |
| | | Shares | | Value
(000) | |
| Materials—5.9% | |
| CF Industries Holdings | | | 11,900 | | | $ | 1,628 | | |
| Goldcorp | | | 33,080 | | | | 1,647 | | |
| Total Materials | | | | | 3,275 | | |
Total Common stock
(Cost $45,503) | | | | | 54,867 | | |
| Cash equivalent—7.1% | |
BlackRock TempCash Fund,
Institutional Shares,
0.000%** (1) | | | 3,974,438 | | | | 3,974 | | |
Total Cash equivalent
(Cost $3,974) | | | | | 3,974 | | |
Total Investments—105.7%
(Cost $49,477) | | | | $ | 58,841 | | |
As of March 31, 2011, all of the Fund's investments were considered Level 1. Please see Note 2 in Notes to Financial Statements for further information regarding fair value measurements.
Percentages are based on Net Assets of $55,647.***
* Non-income producing security.
** Rate shown is the 7-day effective yield as of March 31, 2011.
*** This number is listed in thousands.
† More narrow industries are utilized for compliance purposes, whereas broad sectors are utilized for reporting purposes.
# Security fully or partially on loan at March 31, 2011. The total value of securities on loan at March 31, 2011 was $2,651***. Certain of these securities may have been sold prior to period end and are included in receivable for investment securities sold on the Statement of Assets and Liabilities.
(1) The Fund lends securities in its portfolio pursuant to a securities lending agreement ("Lending Agreement") with Morgan Stanley. Unless otherwise agreed, security loans made pursuant to the Lending Agreement are required at all times to be secured by collateral equal to at least 100% of the market value of the securities loaned. Cash collateral received is invested pursuant to the terms of the Lending Agreement in the BlackRock TempCash Fund, Institutional Shares, a money market fund. All such investments are made at the risk of the Fund. As such, the Fund is liable for investment losses. The Fund receives an annual fee for its participation in the Lending Agreement based on projected lending activity. A partial position of this security was purchased with cash collateral received from securities lending. The total value of such security at March 31, 2011 was $2,703.***
Cl — Class
The accompanying notes are an integral part of the financial statements.
42 TURNER FUNDS 2011 SEMIANNUAL REPORT
(Unaudited)
Schedule of investments
Turner Emerging Growth Fund
March 31, 2011
| | | Shares | | Value
(000) | |
| Common stock—94.6% | |
| Consumer discretionary—14.1% | |
| 7 Days Group Holdings ADR* # | | | 228,170 | | | $ | 4,627 | | |
| Ann* | | | 171,950 | | | | 5,005 | | |
| Asbury Automotive Group* | | | 192,450 | | | | 3,558 | | |
| Body Central* | | | 155,300 | | | | 3,608 | | |
| Buffalo Wild Wings* | | | 123,710 | | | | 6,734 | | |
| California Pizza Kitchen* | | | 263,770 | | | | 4,452 | | |
| Chico's FAS | | | 79,020 | | | | 1,177 | | |
| Children's Place Retail Stores* | | | 108,150 | | | | 5,389 | | |
| Cooper Tire & Rubber | | | 171,280 | | | | 4,410 | | |
| Cracker Barrel Old Country Store | | | 109,800 | | | | 5,396 | | |
| CROCS* | | | 131,690 | | | | 2,349 | | |
| Deckers Outdoor* | | | 181,410 | | | | 15,630 | | |
| DineEquity* # | | | 59,140 | | | | 3,252 | | |
| Imax* | | | 19,190 | | | | 614 | | |
| JOS. A. Bank Clothiers* # | | | 117,350 | | | | 5,971 | | |
| Maidenform Brands* | | | 52,980 | | | | 1,514 | | |
| Modine Manufacturing* | | | 97,610 | | | | 1,575 | | |
| Stoneridge* | | | 149,180 | | | | 2,181 | | |
Ulta Salon, Cosmetics &
Fragrance* | | | 70,560 | | | | 3,396 | | |
| Vitamin Shoppe* # | | | 106,760 | | | | 3,612 | | |
| Total Consumer discretionary | | | | | 84,450 | | |
| Consumer staples—5.1% | |
| Boston Beer, Cl A* | | | 44,870 | | | | 4,156 | | |
Green Mountain Coffee
Roasters* # | | | 108,165 | | | | 6,988 | | |
| TreeHouse Foods* | | | 163,057 | | | | 9,273 | | |
| United Natural Foods* | | | 226,948 | | | | 10,172 | | |
| Total Consumer staples | | | | | 30,589 | | |
| Energy—10.1% | |
| Approach Resources* | | | 185,890 | | | | 6,246 | | |
| BreitBurn Energy Partners LP | | | 99,440 | | | | 2,161 | | |
| Brigham Exploration* | | | 231,265 | | | | 8,598 | | |
| Carrizo Oil & Gas* | | | 142,448 | | | | 5,261 | | |
| GeoResources* | | | 115,920 | | | | 3,625 | | |
| ION Geophysical* | | | 424,420 | | | | 5,386 | | |
| James River Coal* # | | | 160,620 | | | | 3,882 | | |
| Key Energy Services* | | | 444,390 | | | | 6,910 | | |
| Lufkin Industries | | | 59,520 | | | | 5,563 | | |
| Northern Oil & Gas* | | | 154,580 | | | | 4,127 | | |
| | | Shares | | Value
(000) | |
| Rex Energy* # | | | 219,440 | | | $ | 2,557 | | |
| Swift Energy* | | | 140,890 | | | | 6,013 | | |
| Total Energy | | | | | 60,329 | | |
| Financials—1.7% | |
| Harleysville Group | | | 93,760 | | | | 3,106 | | |
| IBERIABANK | | | 49,766 | | | | 2,993 | | |
| Radian Group | | | 374,170 | | | | 2,548 | | |
| Umpqua Holdings | | | 147,560 | | | | 1,688 | | |
| Total Financials | | | | | 10,335 | | |
| Health care—18.8% | |
| Achillion Pharmaceuticals* | | | 171,370 | | | | 1,225 | | |
| Amarin ADR* | | | 391,330 | | | | 2,857 | | |
| AMERIGROUP* | | | 213,270 | | | | 13,703 | | |
| Ardea Biosciences* # | | | 77,100 | | | | 2,212 | | |
| Arthrocare* | | | 164,180 | | | | 5,474 | | |
| Bio-Reference Laboratories* # | | | 132,770 | | | | 2,979 | | |
| Catalyst Health Solutions* | | | 187,115 | | | | 10,465 | | |
| Computer Programs & Systems | | | 73,980 | | | | 4,755 | | |
| DexCom* | | | 44,350 | | | | 688 | | |
| HeartWare International* # | | | 13,940 | | | | 1,192 | | |
| HMS Holdings* | | | 68,120 | | | | 5,576 | | |
| ICON ADR* | | | 149,360 | | | | 3,225 | | |
| Impax Laboratories* | | | 132,690 | | | | 3,377 | | |
| Medivation* # | | | 131,070 | | | | 2,443 | | |
| Molina Healthcare* | | | 211,573 | | | | 8,463 | | |
| NxStage Medical* | | | 169,290 | | | | 3,721 | | |
| Orthofix International* | | | 150,500 | | | | 4,885 | | |
| Parexel International* | | | 192,484 | | | | 4,793 | | |
| Pharmasset* | | | 72,450 | | | | 5,703 | | |
| PSS World Medical* | | | 123,750 | | | | 3,360 | | |
| QLT* | | | 91,725 | | | | 638 | | |
| Quality Systems # | | | 66,583 | | | | 5,549 | | |
| Questcor Pharmaceuticals* # | | | 272,800 | | | | 3,931 | | |
| Sunrise Senior Living* # | | | 154,415 | | | | 1,842 | | |
| SXC Health Solutions* | | | 126,844 | | | | 6,951 | | |
| Volcano* | | | 90,760 | | | | 2,323 | | |
| Total Health care | | | | | 112,330 | | |
| Industrials—16.3% | |
| American Science & Engineering | | | 28,469 | | | | 2,629 | | |
| Chart Industries* | | | 32,030 | | | | 1,763 | | |
| Clean Harbors* | | | 90,120 | | | | 8,891 | | |
| Consolidated Graphics* | | | 65,417 | | | | 3,574 | | |
TURNER FUNDS 2011 SEMIANNUAL REPORT 43
FINANCIAL STATEMENTS
Schedule of investments
Turner Emerging Growth Fund
| | | Shares | | Value
(000) | |
| Copa Holdings, Cl A | | | 87,851 | | | $ | 4,639 | | |
| EnPro Industries* | | | 146,290 | | | | 5,313 | | |
| ESCO Technologies | | | 72,600 | | | | 2,770 | | |
| Genesee & Wyoming, Cl A* | | | 169,785 | | | | 9,881 | | |
| Greenbrier* | | | 222,776 | | | | 6,322 | | |
| Hub Group, Cl A* | | | 140,098 | | | | 5,070 | | |
| Huron Consulting Group* | | | 191,690 | | | | 5,308 | | |
| Kforce* | | | 413,640 | | | | 7,570 | | |
| Lindsay # | | | 51,171 | | | | 4,043 | | |
| Meritor* | | | 355,070 | | | | 6,026 | | |
| Middleby* | | | 88,163 | | | | 8,219 | | |
| Robbins & Myers | | | 85,734 | | | | 3,943 | | |
| Triumph Group | | | 128,502 | | | | 11,366 | | |
| Total Industrials | | | | | 97,327 | | |
| Information technology—19.3% | |
| Acme Packet* | | | 42,394 | | | | 3,008 | | |
| ANSYS* | | | 121,960 | | | | 6,609 | | |
| Ariba* | | | 435,760 | | | | 14,877 | | |
| Blue Coat Systems* | | | 171,910 | | | | 4,841 | | |
| Bottomline Technologies* | | | 122,402 | | | | 3,077 | | |
Camelot Information
Systems ADR* | | | 230,270 | | | | 3,820 | | |
| Cavium Networks* | | | 72,700 | | | | 3,267 | | |
| Cirrus Logic* | | | 277,570 | | | | 5,837 | | |
| Cogo Group* | | | 213,890 | | | | 1,726 | | |
| Coherent* | | | 45,390 | | | | 2,638 | | |
| Entropic Communications* # | | | 503,480 | | | | 4,254 | | |
| Fabrinet* | | | 140,460 | | | | 2,832 | | |
| Hittite Microwave* | | | 103,860 | | | | 6,623 | | |
| Hypercom* | | | 960,560 | | | | 11,556 | | |
| Ixia* | | | 117,820 | | | | 1,871 | | |
| Kenexa* | | | 198,940 | | | | 5,489 | | |
| Motricity* # | | | 93,689 | | | | 1,408 | | |
| NETGEAR* | | | 114,190 | | | | 3,704 | | |
| Netlogic Microsystems* | | | 119,530 | | | | 5,023 | | |
| NetScout Systems* | | | 136,170 | | | | 3,720 | | |
| Power Integrations | | | 86,280 | | | | 3,307 | | |
| Quantum* | | | 808,750 | | | | 2,038 | | |
| Rofin-Sinar Technologies* | | | 66,960 | | | | 2,645 | | |
| Silicon Image* | | | 205,801 | | | | 1,846 | | |
| Synchronoss Technologies* | | | 95,520 | | | | 3,319 | | |
| Taleo, Cl A* | | | 119,450 | | | | 4,258 | | |
| Terremark Worldwide* | | | 121,450 | | | | 2,308 | | |
| Total Information technology | | | | | 115,901 | | |
| | | Shares | | Value
(000) | |
| Materials—8.1% | |
| Domtar | | | 83,010 | | | $ | 7,619 | | |
| Globe Specialty Metals | | | 309,340 | | | | 7,040 | | |
| Huntsman | | | 708,497 | | | | 12,314 | | |
| KapStone Paper & Packaging* | | | 170,910 | | | | 2,934 | | |
| LSB Industries* | | | 154,740 | | | | 6,134 | | |
| Noranda Aluminum Holding* | | | 205,711 | | | | 3,302 | | |
| Solutia* | | | 349,585 | | | | 8,879 | | |
| Total Materials | | | | | 48,222 | | |
| Telecommunication services—0.9% | |
| Aruba Networks* | | | 163,190 | | | | 5,522 | | |
| Total Telecommunication services | | | | | 5,522 | | |
| Utilities—0.2% | |
| Artesian Resources, Cl A # | | | 66,785 | | | | 1,302 | | |
| Total Utilities | | | | | 1,302 | | |
Total Common stock
(Cost $362,697) | | | | | 566,307 | | |
| Exchange traded fund—1.0% | |
Market Vectors Junior Gold
Miners ETF | | | 145,680 | | | | 5,714 | | |
Total Exchange traded fund
(Cost $5,987) | | | | | 5,714 | | |
| Cash equivalent—12.8% | |
BlackRock TempCash Fund,
Institutional Shares,
0.000%** (1) | | | 76,799,436 | | | | 76,799 | | |
Total Cash equivalent
(Cost $76,799) | | | | | 76,799 | | |
Total Investments—108.4%
(Cost $445,483) | | | | $ | 648,820 | | |
As of March 31, 2011, all of the Fund's investments were considered Level 1. Please see Note 2 in Notes to Financial Statements for further intformation regarding fair value measurements.
Percentages are based on Net Assets of $598,436.***
* Non-income producing security.
** Rate shown is the 7-day effective yield as of March 31, 2011.
*** This number is listed in thousands.
44 TURNER FUNDS 2011 SEMIANNUAL REPORT
(Unaudited)
Schedule of investments
Turner Emerging Growth Fund
# Security fully or partially on loan at March 31, 2011. The total value of securities on loan at March 31, 2011 was $47,085***. Certain of these securities may have been sold prior to period end and are included in receivable for investment securities sold on the Statement of Assets and Liabilities.
(1) The Fund lends securities in its portfolio pursuant to a securities lending agreement ("Lending Agreement") with Morgan Stanley. Unless otherwise agreed, security loans made pursuant to the Lending Agreement are required at all times to be secured by collateral equal to at least 100% of the market value of the securities loaned. Cash collateral received is invested pursuant to the terms of the Lending Agreement in the BlackRock TempCash Fund, Institutional Shares, a money market fund. All such investments are made at the risk of the Fund. As such, the Fund is liable for investment losses. The Fund receives an annual fee for its participation in the Lending Agreement based on projected lending activity. A partial position of this security was purchased with cash collateral received from securities lending. The total value of such security at March 31, 2011 was $48,027.***
ADR — American Depositary Receipt
Cl — Class
ETF — Exchange Traded Fund
LP — Limited Partnership
The accompanying notes are an integral part of the financial statements.
TURNER FUNDS 2011 SEMIANNUAL REPORT 45
FINANCIAL STATEMENTS
Schedule of investments
Turner Large Growth Fund
March 31, 2011
| | | Shares | | Value
(000) | |
| Common stock—97.9%† | |
| Consumer discretionary—13.2% | |
| Amazon.com* | | | 52,570 | | | $ | 9,469 | | |
| Coach | | | 109,350 | | | | 5,691 | | |
| General Motors* | | | 264,030 | | | | 8,193 | | |
| Las Vegas Sands* | | | 276,000 | | | | 11,653 | | |
| Lululemon Athletica* # | | | 54,790 | | | | 4,879 | | |
| Royal Caribbean Cruises* # | | | 119,210 | | | | 4,919 | | |
| Stanley Black & Decker | | | 79,730 | | | | 6,107 | | |
| Starbucks | | | 271,420 | | | | 10,029 | | |
Starwood Hotels & Resorts
Worldwide | | | 127,190 | | | | 7,392 | | |
| Toll Brothers* | | | 343,670 | | | | 6,794 | | |
| TRW Automotive Holdings* | | | 107,340 | | | | 5,912 | | |
| Viacom, Cl B | | | 128,610 | | | | 5,983 | | |
| Total Consumer discretionary | | | | | 87,021 | | |
| Consumer staples—3.6% | |
Companhia Brasileira de
Distribuicao Grupo Pao de
Acucar ADR # | | | 74,810 | | | | 3,137 | | |
| Estee Lauder, Cl A | | | 50,650 | | | | 4,880 | | |
| Mead Johnson Nutrition, Cl A | | | 168,870 | | | | 9,783 | | |
| Whole Foods Market | | | 92,839 | | | | 6,118 | | |
| Total Consumer staples | | | | | 23,918 | | |
| Energy—11.2% | |
| Anadarko Petroleum | | | 139,890 | | | | 11,460 | | |
| Cimarex Energy | | | 99,000 | | | | 11,409 | | |
| Concho Resources* | | | 104,950 | | | | 11,261 | | |
| Devon Energy | | | 151,383 | | | | 13,892 | | |
| National Oilwell Varco | | | 58,920 | | | | 4,670 | | |
| Schlumberger | | | 228,960 | | | | 21,353 | | |
| Total Energy | | | | | 74,045 | | |
| Financials—5.6% | |
| CB Richard Ellis Group, Cl A* | | | 166,800 | | | | 4,453 | | |
| Charles Schwab | | | 547,140 | | | | 9,865 | | |
| Citigroup* | | | 2,103,090 | | | | 9,296 | | |
| IntercontinentalExchange* | | | 36,510 | | | | 4,510 | | |
| Invesco | | | 323,750 | | | | 8,275 | | |
| Western Union | | | 24,010 | | | | 499 | | |
| Total Financials | | | | | 36,898 | | |
| | | Shares | | Value
(000) | |
| Health care—9.1% | |
| Agilent Technologies* | | | 142,720 | | | $ | 6,391 | | |
| Alexion Pharmaceuticals* | | | 40,500 | | | | 3,996 | | |
| Allergan | | | 156,350 | | | | 11,104 | | |
| Covidien | | | 89,490 | | | | 4,648 | | |
| Express Scripts* | | | 110,530 | | | | 6,147 | | |
| Medtronic | | | 153,620 | | | | 6,045 | | |
| Shire ADR | | | 72,650 | | | | 6,328 | | |
| United Therapeutics* | | | 64,870 | | | | 4,348 | | |
| Universal Health Services, Cl B | | | 116,030 | | | | 5,733 | | |
Valeant Pharmaceuticals
International | | | 103,180 | | | | 5,139 | | |
| Total Health care | | | | | 59,879 | | |
| Industrials—12.9% | |
| AGCO* | | | 134,880 | | | | 7,414 | | |
| AMETEK | | | 172,555 | | | | 7,570 | | |
| Caterpillar | | | 145,870 | | | | 16,243 | | |
| Cummins | | | 111,560 | | | | 12,229 | | |
| FedEx | | | 101,420 | | | | 9,488 | | |
| First Solar* | | | 17,100 | | | | 2,750 | | |
| KBR | | | 44,760 | | | | 1,691 | | |
| Manpower | | | 142,410 | | | | 8,955 | | |
| Precision Castparts | | | 48,770 | | | | 7,178 | | |
| Rockwell Automation | | | 121,150 | | | | 11,467 | | |
| Total Industrials | | | | | 84,985 | | |
| Information technology—36.9% | |
| Acme Packet* | | | 98,730 | | | | 7,006 | | |
| Altera | | | 233,400 | | | | 10,274 | | |
| Apple* | | | 107,120 | | | | 37,326 | | |
| ASML Holding, NY Shares* | | | 247,040 | | | | 10,993 | | |
| Broadcom, Cl A | | | 301,770 | | | | 11,884 | | |
| Ciena* # | | | 254,910 | | | | 6,617 | | |
Cognizant Technology
Solutions, Cl A* | | | 113,810 | | | | 9,264 | | |
| EMC* | | | 219,050 | | | | 5,816 | | |
| F5 Networks* | | | 47,740 | | | | 4,897 | | |
| Google, Cl A* | | | 51,950 | | | | 30,454 | | |
| Juniper Networks* | | | 222,710 | | | | 9,372 | | |
| MasterCard, Cl A | | | 23,730 | | | | 5,973 | | |
| Netlogic Microsystems* | | | 145,910 | | | | 6,131 | | |
| NXP Semiconductors* | | | 137,480 | | | | 4,124 | | |
| Oracle | | | 680,040 | | | | 22,693 | | |
| QUALCOMM | | | 353,510 | | | | 19,383 | | |
46 TURNER FUNDS 2011 SEMIANNUAL REPORT
(Unaudited)
Schedule of investments
Turner Large Growth Fund
| | | Shares | | Value
(000) | |
| Rovi* | | | 156,380 | | | $ | 8,390 | | |
| Salesforce.com* | | | 105,480 | | | | 14,090 | | |
| SanDisk* | | | 159,160 | | | | 7,336 | | |
Varian Semiconductor
Equipment Associates* | | | 126,819 | | | | 6,172 | | |
| VeriFone Systems* | | | 93,390 | | | | 5,132 | | |
| Total Information technology | | | | | 243,327 | | |
| Materials—4.9% | |
| Celanese, Ser A | | | 149,170 | | | | 6,618 | | |
| CF Industries Holdings | | | 32,500 | | | | 4,446 | | |
| Cliffs Natural Resources | | | 61,322 | | | | 6,027 | | |
| Goldcorp | | | 147,390 | | | | 7,340 | | |
International Flavors &
Fragrances | | | 130,840 | | | | 8,151 | | |
| Total Materials | | | | | 32,582 | | |
| Telecommunication services—0.5% | |
| Aruba Networks* | | | 91,035 | | | | 3,081 | | |
| Total Telecommunication services | | | | | 3,081 | | |
Total Common stock
(Cost $495,755) | | | | | 645,736 | | |
| Cash equivalent—3.4% | |
BlackRock TempCash Fund,
Institutional Shares,
0.000%** (1) | | | 22,157,621 | | | | 22,158 | | |
Total Cash equivalent
(Cost $22,158) | | | | | 22,158 | | |
Total Investments—101.3%
(Cost $517,913) | | | | $ | 667,894 | | |
As of March 31, 2011, all of the Fund's investments were considered Level 1. Please see Note 2 in Notes to Financial Statements for further information regarding fair value measurements.
Percentages are based on Net Assets of $659,336.***
* Non-income producing security.
** Rate shown is the 7-day effective yield as of March 31, 2011.
*** This number is listed in thousands.
† More narrow industries are utilized for compliance purposes, whereas broad sectors are utilized for reporting purposes.
# Security fully or partially on loan at March 31, 2011. The total value of securities on loan at March 31, 2011 was $15,871***. Certain of these securities may have been sold prior to period end and are included in receivable for investment securities sold on the Statement of Assets and Liabilities.
(1) The Fund lends securities in its portfolio pursuant to a securities lending agreement ("Lending Agreement") with Morgan Stanley. Unless otherwise agreed, security loans made pursuant to the Lending Agreement are required at all times to be secured by collateral equal to at least 100% of the market value of the securities loaned. Cash collateral received is invested pursuant to the terms of the Lending Agreement in the BlackRock TempCash Fund, Institutional Shares, a money market fund. All such investments are made at the risk of the Fund. As such, the Fund is liable for investment losses. The Fund receives an annual fee for its participation in the Lending Agreement based on projected lending activity. A partial position of this security was purchased with cash collateral received from securities lending. The total value of such security at March 31, 2011 was $16,188.***
ADR — American Depositary Receipt
Cl — Class
NY — New York
Ser — Series
The accompanying notes are an integral part of the financial statements.
TURNER FUNDS 2011 SEMIANNUAL REPORT 47
FINANCIAL STATEMENTS
Schedule of investments
Turner Midcap Growth Fund
March 31, 2011
| | | Shares | | Value
(000) | |
| Common stock—98.9%† | |
| Consumer discretionary—16.0% | |
| Abercrombie & Fitch, Cl A | | | 245,530 | | | $ | 14,413 | | |
| BorgWarner* | | | 118,050 | | �� | | 9,407 | | |
| Coach | | | 279,280 | | | | 14,534 | | |
| Dick's Sporting Goods* | | | 260,320 | | | | 10,407 | | |
| Guess? | | | 151,762 | | | | 5,972 | | |
| Interpublic Group of Cos. | | | 1,387,348 | | | | 17,439 | | |
| MGM Resorts International* # | | | 597,200 | | | | 7,853 | | |
| Nordstrom | | | 375,570 | | | | 16,855 | | |
| Priceline.com* | | | 32,260 | | | | 16,338 | | |
| Royal Caribbean Cruises* # | | | 231,530 | | | | 9,553 | | |
| Stanley Black & Decker | | | 131,968 | | | | 10,109 | | |
Starwood Hotels &
Resorts Worldwide | | | 327,910 | | | | 19,058 | | |
| Tempur-Pedic International* | | | 197,440 | | | | 10,002 | | |
| TRW Automotive Holdings* | | | 133,770 | | | | 7,368 | | |
| WMS Industries* | | | 290,655 | | | | 10,275 | | |
| Wynn Resorts | | | 119,425 | | | | 15,197 | | |
| Total Consumer discretionary | | | | | 194,780 | | |
| Consumer staples—4.7% | |
Green Mountain Coffee
Roasters* # | | | 329,400 | | | | 21,283 | | |
| Hansen Natural* | | | 118,502 | | | | 7,137 | | |
| Mead Johnson Nutrition, Cl A | | | 143,820 | | | | 8,332 | | |
| Whole Foods Market | | | 313,450 | | | | 20,656 | | |
| Total Consumer staples | | | | | 57,408 | | |
| Energy—7.1% | |
| Alpha Natural Resources* # | | | 213,840 | | | | 12,696 | | |
| Cameron International* | | | 320,291 | | | | 18,288 | | |
| Cimarex Energy | | | 156,550 | | | | 18,041 | | |
| Concho Resources* | | | 182,640 | | | | 19,597 | | |
| QEP Resources | | | 236,846 | | | | 9,602 | | |
| Whiting Petroleum* | | | 122,680 | | | | 9,011 | | |
| Total Energy | | | | | 87,235 | | |
| Financials—9.8% | |
| AON | | | 314,580 | | | | 16,660 | | |
| CB Richard Ellis Group, Cl A* | | | 642,800 | | | | 17,163 | | |
| Discover Financial Services | | | 415,600 | | | | 10,024 | | |
| IntercontinentalExchange* | | | 76,870 | | | | 9,497 | | |
| Invesco | | | 514,950 | | | | 13,162 | | |
| M&T Bank | | | 116,984 | | | | 10,350 | | |
| | | Shares | | Value
(000) | |
| T. Rowe Price Group | | | 261,629 | | | $ | 17,377 | | |
| Unum Group | | | 405,310 | | | | 10,639 | | |
| Western Union | | | 692,140 | | | | 14,376 | | |
| Total Financials | | | | | 119,248 | | |
| Health care—14.1% | |
| Agilent Technologies* | | | 309,280 | | | | 13,850 | | |
| Alexion Pharmaceuticals* | | | 145,627 | | | | 14,370 | | |
| AMERIGROUP* | | | 160,695 | | | | 10,325 | | |
| AmerisourceBergen, Cl A | | | 359,858 | | | | 14,236 | | |
Charles River Laboratories
International* # | | | 206,240 | | | | 7,915 | | |
| Illumina* # | | | 109,250 | | | | 7,655 | | |
| Intuitive Surgical* | | | 33,292 | | | | 11,102 | | |
Laboratory Corp. of America
Holdings* | | | 102,365 | | | | 9,431 | | |
| Onyx Pharmaceuticals* | | | 141,786 | | | | 4,988 | | |
| Perrigo | | | 123,150 | | | | 9,793 | | |
| United Therapeutics* | | | 149,656 | | | | 10,030 | | |
| Universal Health Services, Cl B | | | 310,340 | | | | 15,334 | | |
Valeant Pharmaceuticals
International | | | 315,800 | | | | 15,730 | | |
| Varian Medical Systems* | | | 155,070 | | | | 10,489 | | |
| Vertex Pharmaceuticals* | | | 101,210 | | | | 4,851 | | |
| Watson Pharmaceuticals* | | | 212,360 | | | | 11,894 | | |
| Total Health care | | | | | 171,993 | | |
| Industrials—11.5% | |
| AGCO* | | | 199,440 | | | | 10,963 | | |
| Cummins | | | 196,780 | | | | 21,571 | | |
| Goodrich | | | 152,278 | | | | 13,024 | | |
| Joy Global | | | 239,942 | | | | 23,709 | | |
| Manpower | | | 159,820 | | | | 10,050 | | |
| Owens Corning* | | | 342,361 | | | | 12,322 | | |
| Parker Hannifin | | | 136,600 | | | | 12,933 | | |
| Rockwell Automation | | | 134,151 | | | | 12,697 | | |
| United Continental Holdings* | | | 582,405 | | | | 13,390 | | |
| WESCO International* | | | 153,953 | | | | 9,622 | | |
| Total Industrials | | | | | 140,281 | | |
| Information technology—27.4% | |
| Acme Packet* | | | 147,690 | | | | 10,480 | | |
| Aeroflex Holding* | | | 377,540 | | | | 6,875 | | |
| Altera | | | 210,440 | | | | 9,264 | | |
| ASML Holding, NY Shares* | | | 419,660 | | | | 18,675 | | |
48 TURNER FUNDS 2011 SEMIANNUAL REPORT
(Unaudited)
Schedule of investments
Turner Midcap Growth Fund
| | | Shares | | Value
(000) | |
| Broadcom, Cl A | | | 310,931 | | | $ | 12,244 | | |
| Ciena* # | | | 328,900 | | | | 8,538 | | |
| Cypress Semiconductor* | | | 904,630 | | | | 17,532 | | |
| F5 Networks* | | | 163,774 | | | | 16,798 | | |
| Fortinet* | | | 133,850 | | | | 5,889 | | |
| Informatica* | | | 173,650 | | | | 9,070 | | |
| Juniper Networks* | | | 289,020 | | | | 12,162 | | |
| Lam Research* | | | 163,335 | | | | 9,255 | | |
| Marvell Technology Group* | | | 779,440 | | | | 12,120 | | |
| MercadoLibre # | | | 77,480 | | | | 6,325 | | |
| Netlogic Microsystems* # | | | 434,820 | | | | 18,271 | | |
| NVIDIA* | | | 385,460 | | | | 7,116 | | |
| NXP Semiconductors* | | | 331,820 | | | | 9,955 | | |
| OpenTable* # | | | 128,460 | | | | 13,662 | | |
| Riverbed Technology* | | | 110,500 | | | | 4,160 | | |
| Rovi* | | | 157,100 | | | | 8,428 | | |
| Salesforce.com* | | | 219,630 | | | | 29,337 | | |
| SanDisk* | | | 319,960 | | | | 14,747 | | |
| SINA* | | | 103,692 | | | | 11,099 | | |
| SuccessFactors* | | | 402,590 | | | | 15,737 | | |
| SunPower, Cl A* # | | | 214,290 | | | | 3,673 | | |
| TIBCO Software* | | | 307,630 | | | | 8,383 | | |
Varian Semiconductor
Equipment Associates* | | | 485,931 | | | | 23,650 | | |
| VeriFone Systems* | | | 190,448 | | | | 10,465 | | |
| Total Information technology | | | | | 333,910 | | |
| Materials—5.6% | |
| CF Industries Holdings | | | 71,050 | | | | 9,719 | | |
| Cliffs Natural Resources | | | 180,495 | | | | 17,739 | | |
LyondellBasell
Industries NV, Cl A* | | | 236,730 | | | | 9,363 | | |
| Silver Wheaton | | | 133,900 | | | | 5,806 | | |
| Temple-Inland | | | 242,480 | | | | 5,674 | | |
| United States Steel # | | | 127,870 | | | | 6,897 | | |
| Walter Energy | | | 93,265 | | | | 12,631 | | |
| Total Materials | | | | | 67,829 | | |
| Telecommunication services—2.2% | |
| Aruba Networks* # | | | 522,860 | | | | 17,694 | | |
| NII Holdings* | | | 208,350 | | | | 8,682 | | |
| Total Telecommunication services | | | | | 26,376 | | |
| | | Shares | | Value
(000) | |
| Utilities—0.5% | |
| Energen | | | 101,590 | | | $ | 6,412 | | |
| Total Utilities | | | | | 6,412 | | |
Total Common stock
(Cost $773,279) | | | | | 1,205,472 | | |
| Cash equivalent—10.0% | |
BlackRock TempCash Fund,
Institutional Shares,
0.000%** (1) | | | 121,940,994 | | | | 121,941 | | |
Total Cash equivalent
(Cost $121,941) | | | | | 121,941 | | |
Total Investments—108.9%
(Cost $895,220) | | | | $ | 1,327,413 | | |
As of March 31, 2011, all of the Fund's investments were considered Level 1. Please see Note 2 in Notes to Financial Statements for further information regarding fair value measurements.
Percentages are based on Net Assets of $1,219,331.***
* Non-income producing security.
** Rate shown is the 7-day effective yield as of March 31, 2011.
*** This number is listed in thousands.
† More narrow industries are utilized for compliance purposes, whereas broad sectors are utilized for reporting purposes.
# Security fully or partially on loan at March 31, 2011. The total value of securities on loan at March 31, 2011 was $109,950***. Certain of these securities may have been sold prior to period end and are included in receivable for investment securities sold on the Statement of Assets and Liabilities.
(1) The Fund lends securities in its portfolio pursuant to a securities lending agreement ("Lending Agreement") with Morgan Stanley. Unless otherwise agreed, security loans made pursuant to the Lending Agreement are required at all times to be secured by collateral equal to at least 100% of the market value of the securities loaned. Cash collateral received is invested pursuant to the terms of the Lending Agreement in the BlackRock TempCash Fund, Institutional Shares, a money market fund. All such investments are made at the risk of the Fund. As such, the Fund is liable for investment losses. The Fund receives an annual fee for its participation in the Lending Agreement based on projected lending activity. A partial position of this security was purchased with cash collateral received from securities lending. The total value of such security at March 31, 2011 was $112,149.***
Cl — Class
NV — Naamloze Vennootschap
NY — New York
The accompanying notes are an integral part of the financial statements.
TURNER FUNDS 2011 SEMIANNUAL REPORT 49
FINANCIAL STATEMENTS
Schedule of investments
Turner Small Cap Growth Fund
March 31, 2011
| | | Shares | | Value
(000) | |
| Common stock—99.1%† | |
| Consumer discretionary—15.5% | |
| 7 Days Group Holdings ADR* # | | | 67,130 | | | $ | 1,361 | | |
| Bravo Brio Restaurant Group* | | | 57,120 | | | | 1,011 | | |
| Brunswick | | | 109,940 | | | | 2,796 | | |
| Children's Place Retail Stores* | | | 41,320 | | | | 2,059 | | |
| CROCS* | | | 136,300 | | | | 2,432 | | |
| DineEquity* # | | | 46,892 | | | | 2,578 | | |
| Finish Line, Cl A | | | 182,640 | | | | 3,625 | | |
| Gaylord Entertainment* # | | | 101,566 | | | | 3,522 | | |
| Meritage Homes* | | | 67,920 | | | | 1,639 | | |
| Modine Manufacturing* | | | 139,850 | | | | 2,257 | | |
| Polaris Industries | | | 33,230 | | | | 2,892 | | |
| Saks* # | | | 232,820 | | | | 2,633 | | |
| Scientific Games, Cl A* | | | 52,260 | | | | 457 | | |
| Sonic Automotive, Cl A # | | | 115,520 | | | | 1,618 | | |
| Sotheby's | | | 83,001 | | | | 4,366 | | |
| Steven Madden* | | | 63,750 | | | | 2,992 | | |
| Tempur-Pedic International* | | | 50,420 | | | | 2,554 | | |
| Tenneco* | | | 52,190 | | | | 2,216 | | |
| Texas Roadhouse, Cl A | | | 148,430 | | | | 2,522 | | |
| True Religion Apparel* # | | | 114,520 | | | | 2,688 | | |
Ulta Salon, Cosmetics &
Fragrance* | | | 58,927 | | | | 2,836 | | |
| Warnaco Group* | | | 40,780 | | | | 2,332 | | |
| Total Consumer discretionary | | | | | 53,386 | | |
| Consumer staples—2.5% | |
| Cott* # | | | 221,960 | | | | 1,864 | | |
| Diamond Foods # | | | 37,840 | | | | 2,112 | | |
| Hain Celestial Group* | | | 56,900 | | | | 1,837 | | |
| United Natural Foods* | | | 65,043 | | | | 2,915 | | |
| Total Consumer staples | | | | | 8,728 | | |
| Energy—5.0% | |
| Dril-Quip* | | | 28,670 | | | | 2,266 | | |
| Energy XXI (Bermuda)* | | | 86,360 | | | | 2,945 | | |
| James River Coal* # | | | 130,400 | | | | 3,152 | | |
| Key Energy Services* | | | 221,737 | | | | 3,448 | | |
| Oasis Petroleum* | | | 84,050 | | | | 2,657 | | |
| Swift Energy* | | | 62,120 | | | | 2,651 | | |
| Total Energy | | | | | 17,119 | | |
| | | Shares | | Value
(000) | |
| Financials—5.7% | |
| Bank of the Ozarks # | | | 56,340 | | | $ | 2,463 | | |
| Calamos Asset Management, Cl A | | | 58,945 | | | | 978 | | |
| Endurance Specialty Holdings | | | 29,750 | | | | 1,453 | | |
| Greenhill # | | | 20,887 | | | | 1,374 | | |
| Kilroy Realty | | | 42,140 | | | | 1,636 | | |
| MarketAxess Holdings | | | 102,370 | | | | 2,477 | | |
| MF Global Holdings* | | | 316,460 | | | | 2,620 | | |
| Portfolio Recovery Associates* | | | 28,570 | | | | 2,432 | | |
| Tanger Factory Outlet Centers | | | 85,940 | | | | 2,255 | | |
| Texas Capital Bancshares* | | | 73,820 | | | | 1,919 | | |
| Total Financials | | | | | 19,607 | | |
| Health care—17.9% | |
| Amarin ADR* | | | 200,620 | | | | 1,464 | | |
| AMERIGROUP* | | | 54,537 | | | | 3,504 | | |
| Catalyst Health Solutions* | | | 55,350 | | | | 3,096 | | |
| Cepheid* | | | 93,890 | | | | 2,631 | | |
| Chemed | | | 37,260 | | | | 2,482 | | |
| Cooper | | | 64,270 | | | | 4,464 | | |
| Exelixis* | | | 85,050 | | | | 961 | | |
| HealthSouth* | | | 174,750 | | | | 4,365 | | |
| Healthspring* | | | 43,240 | | | | 1,616 | | |
| Hill-Rom Holdings | | | 60,190 | | | | 2,286 | | |
| HMS Holdings* | | | 31,570 | | | | 2,584 | | |
| Impax Laboratories* | | | 75,905 | | | | 1,932 | | |
| Incyte* # | | | 115,810 | | | | 1,836 | | |
| Medicis Pharmaceutical, Cl A | | | 55,390 | | | | 1,775 | | |
| Medivation* # | | | 82,630 | | | | 1,540 | | |
| MEDNAX* | | | 39,850 | | | | 2,654 | | |
| Onyx Pharmaceuticals* | | | 65,370 | | | | 2,300 | | |
| Parexel International* | | | 70,220 | | | | 1,748 | | |
| Pharmasset* | | | 33,650 | | | | 2,649 | | |
| PSS World Medical* | | | 106,980 | | | | 2,904 | | |
| Quality Systems # | | | 30,660 | | | | 2,555 | | |
| Regeneron Pharmaceuticals* | | | 41,940 | | | | 1,885 | | |
| Seattle Genetics* # | | | 106,600 | | | | 1,660 | | |
| SXC Health Solutions* | | | 45,240 | | | | 2,479 | | |
| Targacept* | | | 54,830 | | | | 1,458 | | |
| Tenet Healthcare* | | | 322,600 | | | | 2,403 | | |
| Volcano* | | | 28,120 | | | | 720 | | |
| Total Health care | | | | | 61,951 | | |
50 TURNER FUNDS 2011 SEMIANNUAL REPORT
(Unaudited)
Schedule of investments
Turner Small Cap Growth Fund
| | | Shares | | Value
(000) | |
| Industrials—17.4% | |
| A123 Systems* # | | | 157,740 | | | $ | 1,002 | | |
| Actuant, Cl A | | | 97,600 | | | | 2,830 | | |
| Alaska Air Group* | | | 38,770 | | | | 2,459 | | |
| Avis Budget Group* | | | 149,820 | | | | 2,683 | | |
| Belden | | | 48,310 | | | | 1,814 | | |
| Clean Harbors* | | | 33,020 | | | | 3,258 | | |
| Copa Holdings, Cl A | | | 46,250 | | | | 2,442 | | |
| EnPro Industries* | | | 63,670 | | | | 2,313 | | |
| Genesee & Wyoming, Cl A* | | | 72,450 | | | | 4,217 | | |
| GrafTech International* | | | 102,140 | | | | 2,107 | | |
| Greenbrier* | | | 50,290 | | | | 1,427 | | |
| Herman Miller | | | 66,260 | | | | 1,822 | | |
| Hexcel* | | | 144,300 | | | | 2,841 | | |
| Hub Group, Cl A* | | | 87,530 | | | | 3,168 | | |
| Kforce* | | | 164,490 | | | | 3,010 | | |
| Knight Transportation | | | 79,000 | | | | 1,521 | | |
| Lindsay # | | | 26,340 | | | | 2,081 | | |
| Meritor* | | | 76,656 | | | | 1,301 | | |
| Polypore International* | | | 43,217 | | | | 2,489 | | |
| Robbins & Myers | | | 44,015 | | | | 2,024 | | |
| Triumph Group | | | 26,640 | | | | 2,356 | | |
| TrueBlue* | | | 194,842 | | | | 3,271 | | |
| WESCO International* | | | 62,817 | | | | 3,926 | | |
| Woodward Governor | | | 103,131 | | | | 3,564 | | |
| Total Industrials | | | | | 59,926 | | |
| Information technology—27.8% | |
| Acme Packet* | | | 55,980 | | | | 3,972 | | |
| Aeroflex Holding* | | | 97,716 | | | | 1,779 | | |
| Anixter International | | | 33,350 | | | | 2,331 | | |
| Ariba* | | | 115,580 | | | | 3,946 | | |
| BroadSoft* # | | | 18,190 | | | | 867 | | |
| Cavium Networks* | | | 77,460 | | | | 3,480 | | |
| Cirrus Logic* | | | 172,600 | | | | 3,630 | | |
| Concur Technologies* # | | | 72,420 | | | | 4,016 | | |
| Dice Holdings* | | | 127,083 | | | | 1,920 | | |
| Entropic Communications* # | | | 329,800 | | | | 2,787 | | |
| Inphi* # | | | 76,406 | | | | 1,605 | | |
| Intralinks Holdings* | | | 97,700 | | | | 2,612 | | |
| IPG Photonics* | | | 41,930 | | | | 2,418 | | |
| Ixia* | | | 194,370 | | | | 3,087 | | |
| | | Shares | | Value
(000) | |
| Jack Henry & Associates | | | 92,494 | | | $ | 3,135 | | |
| Limelight Networks* | | | 428,860 | | | | 3,071 | | |
| Motricity* # | | | 77,090 | | | | 1,159 | | |
| NETGEAR* | | | 54,890 | | | | 1,781 | | |
| Netlogic Microsystems* # | | | 98,540 | | | | 4,141 | | |
| Oclaro* # | | | 148,480 | | | | 1,709 | | |
| OpenTable* # | | | 17,930 | | | | 1,907 | | |
| Progress Software* | | | 89,190 | | | | 2,594 | | |
| QLIK Technologies* | | | 71,010 | | | | 1,846 | | |
| QuinStreet* # | | | 69,710 | | | | 1,584 | | |
| Riverbed Technology* | | | 106,350 | | | | 4,004 | | |
| Sapient* | | | 290,410 | | | | 3,325 | | |
| SAVVIS* | | | 79,430 | | | | 2,946 | | |
| SuccessFactors* # | | | 76,630 | | | | 2,995 | | |
| Synchronoss Technologies* | | | 107,830 | | | | 3,747 | | |
| Syntel | | | 23,030 | | | | 1,203 | | |
| Taleo, Cl A* | | | 86,750 | | | | 3,093 | | |
| Teradyne* | | | 161,240 | | | | 2,872 | | |
| TIBCO Software* | | | 171,620 | | | | 4,676 | | |
| Ultratech* | | | 86,760 | | | | 2,551 | | |
| VeriFone Systems* | | | 56,685 | | | | 3,115 | | |
| Total Information technology | | | | | 95,904 | | |
| Materials—5.9% | |
| AK Steel Holding | | | 172,570 | | | | 2,723 | | |
| Allied Nevada Gold* | | | 92,229 | | | | 3,272 | | |
| Louisiana-Pacific* | | | 194,550 | | | | 2,043 | | |
| Rock-Tenn, Cl A # | | | 51,941 | | | | 3,602 | | |
| Solutia* | | | 134,180 | | | | 3,408 | | |
| Stillwater Mining* | | | 142,980 | | | | 3,279 | | |
| Thompson Creek Metals* # | | | 174,060 | | | | 2,183 | | |
| Total Materials | | | | | 20,510 | | |
| Telecommunication services—1.4% | |
| Aruba Networks* | | | 86,696 | | | | 2,934 | | |
| Cogent Communications Group* | | | 135,850 | | | | 1,938 | | |
| Total Telecommunication services | | | | | 4,872 | | |
Total Common stock
(Cost $242,643) | | | | | 342,003 | | |
TURNER FUNDS 2011 SEMIANNUAL REPORT 51
FINANCIAL STATEMENTS (Unaudited)
Schedule of investments
Turner Small Cap Growth Fund
| | | Shares | | Value
(000) | |
| Cash equivalent—16.8% | |
BlackRock TempCash Fund,
Institutional Shares,
0.000%** (1) | | | 58,106,678 | | | | 58,107 | | |
Total Cash equivalent
(Cost $58,107) | | | | | 58,107 | | |
Total Investments—115.9%
(Cost $300,750) | | | | $ | 400,110 | | |
As of March 31, 2011, all of the Fund's investments were considered Level 1. Please see Note 2 in Notes to Financial Statements for further information regarding fair value measurements.
Percentages are based on Net Assets of $345,168.***
* Non-income producing security.
** Rate shown is the 7-day effective yield as of March 31, 2011.
*** This number is listed in thousands.
† More narrow industries are utilized for compliance purposes, whereas broad sectors are utilized for reporting purposes.
# Security fully or partially on loan at March 31, 2011. The total value of securities on loan at March 31, 2011 was $53,531***. Certain of these securities may have been sold prior to period end and are included in receivable for investment securities sold on the Statement of Assets and Liabilities.
(1) The Fund lends securities in its portfolio pursuant to a securities lending agreement ("Lending Agreement") with Morgan Stanley. Unless otherwise agreed, security loans made pursuant to the Lending Agreement are required at all times to be secured by collateral equal to at least 100% of the market value of the securities loaned. Cash collateral received is invested pursuant to the terms of the Lending Agreement in the BlackRock TempCash Fund, Institutional Shares, a money market fund. All such investments are made at the risk of the Fund. As such, the Fund is liable for investment losses. The Fund receives an annual fee for its participation in the Lending Agreement based on projected lending activity. A partial position of this security was purchased with cash collateral received from securities lending. The total value of such security at March 31, 2011 was $54,601.***
ADR — American Depositary Receipt
Cl — Class
The accompanying notes are an integral part of the financial statements.
52 TURNER FUNDS 2011 SEMIANNUAL REPORT
(Unaudited)
Schedule of investments
Turner Quantitative Broad Market Equity Fund
March 31, 2011
| | | Shares | | Value
(000) | |
| Common stock—98.9% | |
| Consumer discretionary—12.9% | |
| Amazon.com* | | | 760 | | | $ | 137 | | |
| Automatic Data Processing | | | 2,470 | | | | 127 | | |
| CBS, Cl B | | | 4,000 | | | | 100 | | |
| Comcast, Cl A | | | 4,380 | | | | 108 | | |
| DIRECTV, Cl A* | | | 2,560 | | | | 120 | | |
| Goodyear Tire & Rubber* | | | 6,890 | | | | 103 | | |
| Guess? | | | 2,050 | | | | 81 | | |
| Harley-Davidson | | | 2,560 | | | | 109 | | |
| Interpublic Group of Cos. | | | 7,630 | | | | 96 | | |
| Lowe's | | | 3,630 | | | | 96 | | |
| Starbucks | | | 3,720 | | | | 137 | | |
Starwood Hotels & Resorts
Worldwide | | | 1,540 | | | | 89 | | |
| Tenneco* | | | 1,640 | | | | 70 | | |
| Walt Disney | | | 2,490 | | | | 107 | | |
| WMS Industries* | | | 2,140 | | | | 76 | | |
| Total Consumer discretionary | | | | | 1,556 | | |
| Consumer staples—7.5% | |
| Altria Group | | | 2,850 | | | | 74 | | |
| Brown-Forman, Cl B | | | 1,740 | | | | 119 | | |
| Coca-Cola | | | 1,760 | | | | 117 | | |
| Dr. Pepper Snapple Group | | | 2,380 | | | | 88 | | |
| Mead Johnson Nutrition, Cl A | | | 1,130 | | | | 66 | | |
| PepsiCo | | | 1,536 | | | | 99 | | |
| Philip Morris International | | | 2,040 | | | | 134 | | |
| Procter & Gamble | | | 2,490 | | | | 153 | | |
| Wal-Mart Stores | | | 1,022 | | | | 53 | | |
| Total Consumer staples | | | | | 903 | | |
| Energy—10.7% | |
| Apache | | | 790 | | | | 103 | | |
| Comstock Resources* | | | 3,570 | | | | 110 | | |
| ConocoPhillips | | | 2,150 | | | | 172 | | |
| Devon Energy | | | 1,000 | | | | 92 | | |
| Exxon Mobil | | | 1,860 | | | | 157 | | |
| Occidental Petroleum | | | 1,170 | | | | 122 | | |
| Patterson-UTI Energy | | | 4,180 | | | | 123 | | |
| Spectra Energy | | | 3,980 | | | | 108 | | |
| Whiting Petroleum* | | | 1,540 | | | | 113 | | |
| Williams | | | 6,030 | | | | 188 | | |
| Total Energy | | | | | 1,288 | | |
| | | Shares | | Value
(000) | |
| Financials—17.6% | |
| American Express | | | 2,550 | | | $ | 115 | | |
| Bank of America | | | 7,900 | | | | 105 | | |
| Berkshire Hathaway, Cl B* | | | 1,200 | | | | 100 | | |
| BlackRock, CI A | | | 670 | | | | 135 | | |
| Capital One Financial | | | 1,270 | | | | 66 | | |
| Chubb | | | 1,860 | | | | 114 | | |
| Citigroup* | | | 30,640 | | | | 135 | | |
| Goldman Sachs Group | | | 530 | | | | 84 | | |
| JPMorgan Chase | | | 3,746 | | | | 173 | | |
| M&T Bank | | | 810 | | | | 72 | | |
| MetLife | | | 2,330 | | | | 104 | | |
| MSCI, Cl A* | | | 2,430 | | | | 90 | | |
| NASDAQ OMX Group* | | | 3,600 | | | | 93 | | |
| PNC Financial Services Group | | | 1,580 | | | | 100 | | |
| Progressive | | | 4,980 | | | | 105 | | |
| Raymond James Financial | | | 3,430 | | | | 131 | | |
| SunTrust Banks | | | 3,700 | | | | 107 | | |
| Travelers | | | 2,040 | | | | 121 | | |
| US Bancorp | | | 2,240 | | | | 59 | | |
| Wells Fargo | | | 3,190 | | | | 101 | | |
| Total Financials | | | | | 2,110 | | |
| Health care—11.2% | |
| Alexion Pharmaceuticals* | | | 1,050 | | | | 104 | | |
| Bruker* | | | 4,530 | | | | 94 | | |
| Cerner* | | | 990 | | | | 110 | | |
| CIGNA | | | 2,900 | | | | 128 | | |
| CVS Caremark | | | 3,090 | | | | 106 | | |
| Express Scripts* | | | 1,720 | | | | 96 | | |
| HealthSouth* | | | 3,470 | | | | 87 | | |
| Illumina* | | | 1,170 | | | | 82 | | |
| McKesson | | | 1,700 | | | | 134 | | |
| Medtronic | | | 2,580 | | | | 102 | | |
| Pfizer | | | 9,030 | | | | 183 | | |
| WellPoint | | �� | 1,720 | | | | 120 | | |
| Total Health care | | | | | 1,346 | | |
| Industrials—11.7% | |
| 3M | | | 710 | | | | 66 | | |
| Boeing | | | 990 | | | | 73 | | |
| Caterpillar | | | 1,660 | | | | 185 | | |
| Deere | | | 1,490 | | | | 144 | | |
| First Solar* | | | 420 | | | | 68 | | |
| General Electric | | | 10,977 | | | | 220 | | |
TURNER FUNDS 2011 SEMIANNUAL REPORT 53
FINANCIAL STATEMENTS
Schedule of investments
Turner Quantitative Broad Market Equity Fund
| | | Shares | | Value
(000) | |
| Honeywell International | | | 1,610 | | | $ | 96 | | |
| Manpower | | | 1,080 | | | | 68 | | |
| Norfolk Southern | | | 1,850 | | | | 128 | | |
| Oshkosh* | | | 2,300 | | | | 81 | | |
| Union Pacific | | | 1,460 | | | | 144 | | |
| United Continental Holdings* | | | 2,700 | | | | 62 | | |
| United Parcel Service, Cl B | | | 990 | | | | 74 | | |
| Total Industrials | | | | | 1,409 | | |
| Information technology—14.7% | |
| Adobe Systems* | | | 2,530 | | | | 84 | | |
| Apple* | | | 1,020 | | | | 355 | | |
| ASML Holding, NY Shares* | | | 2,590 | | | | 115 | | |
| Broadcom, Cl A | | | 1,900 | | | | 75 | | |
| Entropic Communications* | | | 8,720 | | | | 74 | | |
| F5 Networks* | | | 360 | | | | 37 | | |
| Google, Cl A* | | | 249 | | | | 146 | | |
| Intel | | | 4,990 | | | | 101 | | |
| International Business Machines | | | 1,210 | | | | 197 | | |
| Micron Technology* | | | 6,450 | | | | 74 | | |
| Oracle | | | 4,880 | | | | 163 | | |
| QUALCOMM | | | 1,080 | | | | 59 | | |
| Salesforce.com* | | | 570 | | | | 76 | | |
| SanDisk* | | | 1,560 | | | | 72 | | |
| Symantec* | | | 3,850 | | | | 71 | | |
| Texas Instruments | | | 2,050 | | | | 71 | | |
| Total Information technology | | | | | 1,770 | | |
| Materials—6.6% | |
| Ball | | | 3,880 | | | | 139 | | |
| Celanese, Ser A | | | 2,180 | | | | 97 | | |
| Eastman Chemical | | | 1,040 | | | | 103 | | |
| Freeport-McMoRan Copper & Gold | | | 2,760 | | | | 153 | | |
| Greif, Cl A | | | 1,230 | | | | 81 | | |
| Monsanto | | | 1,480 | | | | 107 | | |
| Walter Energy | | | 830 | | | | 112 | | |
| Total Materials | | | | | 792 | | |
| Telecommunication services—4.1% | |
| Aruba Networks* | | | 2,720 | | | | 92 | | |
| AT&T | | | 4,790 | | | | 147 | | |
| MetroPCS Communications* | | | 9,020 | | | | 146 | | |
| Verizon Communications | | | 2,660 | | | | 103 | | |
| Total Telecommunication services | | | | | 488 | | |
| | | Shares | | Value
(000) | |
| Utilities—1.9% | |
| AES* | | | 7,570 | | | $ | 99 | | |
| EQT | | | 2,690 | | | | 135 | | |
| Total Utilities | | | | | 234 | | |
Total Common stock
(Cost $9,811) | | | | | 11,896 | | |
| Cash equivalent—1.2% | |
BlackRock TempCash Fund,
Institutional Shares,
0.000%** | | | 148,964 | | | | 149 | | |
Total Cash equivalent
(Cost $149) | | | | | 149 | | |
Total Investments—100.1%
(Cost $9,960) | | | | $ | 12,045 | | |
As of March 31, 2011, all of the Fund's investments were considered Level 1. Please see Note 2 in Notes to Financial Statements for further information regarding fair value measurements.
Percentages are based on Net Assets of $12,033.***
* Non-income producing security.
** Rate shown is the 7-day effective yield as of March 31, 2011.
*** This number is listed in thousands.
Cl — Class
NY — New York
Ser — Series
The accompanying notes are an integral part of the financial statements.
54 TURNER FUNDS 2011 SEMIANNUAL REPORT
(Unaudited)
Schedule of investments
Turner Quantitative Large Cap Value Fund
March 31, 2011
| | | Shares | | Value
(000) | |
| Common stock—97.3%† | |
| Consumer discretionary—9.0% | |
| AutoZone* | | | 50 | | | $ | 14 | | |
| DIRECTV, Cl A* | | | 270 | | | | 13 | | |
| Dollar Tree* | | | 150 | | | | 8 | | |
| Home Depot | | | 170 | | | | 6 | | |
| Johnson Controls | | | 180 | | | | 7 | | |
| Mattel | | | 180 | | | | 4 | | |
| Stanley Black & Decker | | | 90 | | | | 7 | | |
| Time Warner | | | 160 | | | | 6 | | |
| Viacom, Cl B | | | 190 | | | | 9 | | |
| Total Consumer discretionary | | | | | 74 | | |
| Consumer staples—11.1% | |
| Archer-Daniels-Midland | | | 180 | | | | 6 | | |
| Avon Products | | | 300 | | | | 8 | | |
| Clorox | | | 80 | | | | 6 | | |
| Coca-Cola | | | 100 | | | | 7 | | |
| Energizer Holdings* | | | 120 | | | | 9 | | |
| Hansen Natural* | | | 160 | | | | 10 | | |
| Lorillard | | | 120 | | | | 11 | | |
| PepsiCo | | | 140 | | | | 9 | | |
| Philip Morris International | | | 140 | | | | 9 | | |
| Procter & Gamble | | | 150 | | | | 9 | | |
| Wal-Mart Stores | | | 140 | | | | 7 | | |
| Total Consumer staples | | | | | 91 | | |
| Energy—11.6% | |
| Apache | | | 60 | | | | 8 | | |
| Chevron | | | 180 | | | | 19 | | |
| ConocoPhillips | | | 180 | | | | 14 | | |
| Devon Energy | | | 80 | | | | 7 | | |
| Hess | | | 220 | | | | 19 | | |
| Occidental Petroleum | | | 100 | | | | 10 | | |
| Spectra Energy | | | 360 | | | | 10 | | |
| Williams | | | 240 | | | | 8 | | |
| Total Energy | | | | | 95 | | |
| Financials—25.1% | |
| Allstate | | | 310 | | | | 10 | | |
| AMB Property | | | 310 | | | | 11 | | |
| American Express | | | 180 | | | | 8 | | |
| AON | | | 190 | | | | 10 | | |
| Bank of America | | | 400 | | | | 5 | | |
| Berkshire Hathaway, Cl B* | | | 260 | | | | 22 | | |
| | | Shares | | Value
(000) | |
| Citigroup* | | | 1,890 | | | $ | 8 | | |
| CNA Financial | | | 310 | | | | 9 | | |
| Goldman Sachs Group | | | 30 | | | | 5 | | |
| JPMorgan Chase | | | 550 | | | | 25 | | |
| MetLife | | | 210 | | | | 9 | | |
| NASDAQ OMX Group* | | | 370 | | | | 10 | | |
| NYSE Euronext | | | 280 | | | | 10 | | |
| People's United Financial | | | 640 | | | | 8 | | |
| Prinicipal Financial Group | | | 410 | | | | 13 | | |
| Prudential Financial | | | 80 | | | | 5 | | |
| Travelers | | | 100 | | | | 6 | | |
| Unum Group | | | 490 | | | | 13 | | |
| US Bancorp | | | 360 | | | | 10 | | |
| Wells Fargo | | | 290 | | | | 9 | | |
| Total Financials | | | | | 206 | | |
| Health care—12.2% | |
| Boston Scientific* | | | 820 | | | | 6 | | |
| Express Scripts* | | | 220 | | | | 12 | | |
| Henry Schein* | | | 170 | | | | 12 | | |
| Hospira* | | | 100 | | | | 6 | | |
| Johnson & Johnson | | | 230 | | | | 14 | | |
Laboratory Corp. of America
Holdings* | | | 110 | | | | 10 | | |
| Life Technologies* | | | 180 | | | | 9 | | |
| Mylan* | | | 180 | | | | 4 | | |
| PerkinElmer | | | 280 | | | | 7 | | |
| Thermo Fisher Scientific* | | | 160 | | | | 9 | | |
| UnitedHealth Group | | | 240 | | | | 11 | | |
| Total Health care | | | | | 100 | | |
| Industrials—6.5% | |
| Boeing | | | 130 | | | | 9 | | |
| Caterpillar | | | 70 | | | | 8 | | |
| Honeywell International | | | 160 | | | | 9 | | |
| Huntington Ingalls Industries* | | | 23 | | | | 1 | | |
| Norfolk Southern | | | 140 | | | | 10 | | |
| Northrop Grumman | | | 140 | | | | 9 | | |
| Union Pacific | | | 70 | | | | 7 | | |
| Total Industrials | | | | | 53 | | |
| Information technology—4.6% | |
| Fidelity National Information Services | | | 210 | | | | 7 | | |
| Fiserv* | | | 160 | | | | 10 | | |
| Intel | | | 320 | | | | 7 | | |
TURNER FUNDS 2011 SEMIANNUAL REPORT 55
FINANCIAL STATEMENTS
Schedule of investments
Turner Quantitative Large Cap Value Fund
| | | Shares | | Value
(000) | |
| Microsoft | | | 350 | | | $ | 9 | | |
| National Semiconductor | | | 370 | | | | 5 | | |
| Total Information technology | | | | | 38 | | |
| Materials—2.1% | |
| Air Products & Chemicals | | | 60 | | | | 5 | | |
| Dow Chemical | | | 150 | | | | 6 | | |
| EI du Pont de Nemours | | | 110 | | | | 6 | | |
| Total Materials | | | | | 17 | | |
| Telecommunication services—6.2% | |
| AT&T | | | 980 | | | | 30 | | |
| Verizon Communications | | | 550 | | | | 21 | | |
| Total Telecommunication services | | | | | 51 | | |
| Utilities—8.9% | |
| AES* | | | 860 | | | | 11 | | |
| American Electric Power | | | 240 | | | | 9 | | |
| CMS Energy | | | 590 | | | | 12 | | |
| Constellation Energy Group | | | 330 | | | | 10 | | |
| Exelon | | | 120 | | | | 5 | | |
| Pepco Holdings | | | 440 | | | | 8 | | |
| Pinnacle West Capital | | | 220 | | | | 9 | | |
| Sempra Energy | | | 140 | | | | 9 | | |
| Total Utilities | | | | | 73 | | |
Total Common stock
(Cost $635) | | | | | 798 | | |
| Cash equivalent—5.9% | |
BlackRock TempCash Fund,
Institutional Shares,
0.000%** | | | 47,673 | | | | 48 | | |
Total Cash equivalent
(Cost $48) | | | | | 48 | | |
Total Investments—103.2%
(Cost $683) | | | | $ | 846 | | |
As of March 31, 2011, all of the Fund's investments were considered Level 1. Please see Note 2 in Notes to Financial Statements for further information regarding fair value measurements.
Percentages are based on Net Assets of $820.***
* Non-income producing security.
** Rate shown is the 7-day effective yield as of March 31, 2011.
*** This number is listed in thousands.
† More narrow industries are utilized for compliance purposes, whereas broad sectors are utilized for reporting purposes.
Cl — Class
The accompanying notes are an integral part of the financial statements.
56 TURNER FUNDS 2011 SEMIANNUAL REPORT
(Unaudited)
Schedule of investments
Turner Global Opportunities Fund
March 31, 2011
| | | Shares | | Value
(000) | |
| Common stock—98.2%† | |
| Consumer discretionary—7.1% | |
| InterContinental Hotels Group | | | 2,408 | | | $ | 49 | | |
| Las Vegas Sands* | | | 2,270 | | | | 96 | | |
| Total Consumer discretionary | | | | | 145 | | |
| Consumer staples—5.6% | |
| Natura Cosmeticos | | | 1,860 | | | | 52 | | |
| Whole Foods Market | | | 940 | | | | 62 | | |
| Total Consumer staples | | | | | 114 | | |
| Energy—5.4% | |
| Cimarex Energy | | | 600 | | | | 69 | | |
| PT Adaro Energy | | | 166,820 | | | | 42 | | |
| Total Energy | | | | | 111 | | |
| Financials—6.4% | |
| AIA Group* | | | 23,800 | | | | 73 | | |
| Standard Chartered | | | 2,219 | | | | 58 | | |
| Total Financials | | | | | 131 | | |
| Health care—11.4% | |
| Alexion Pharmaceuticals* | | | 780 | | | | 77 | | |
| Shire ADR | | | 1,890 | | | | 55 | | |
Valeant Pharmaceuticals
International | | | 2,020 | | | | 101 | | |
| Total Health care | | | | | 233 | | |
| Industrials—12.0% | |
| Caterpillar | | | 480 | | | | 53 | | |
| CNH Global* | | | 1,190 | | | | 58 | | |
| Danaher | | | 1,630 | | | | 85 | | |
| FANUC | | | 330 | | | | 50 | | |
| Total Industrials | | | | | 246 | | |
| Information technology—42.9% | |
| Apple* | | | 340 | | | | 119 | | |
| ARM Holdings | | | 1,840 | | | | 52 | | |
| ASML Holding, NY Shares* | | | 2,110 | | | | 94 | | |
| Baidu SP ADR* | | | 550 | | | | 76 | | |
| Broadcom, Cl A | | | 1,880 | | | | 74 | | |
| Google, Cl A* | | | 140 | | | | 82 | | |
| Imagination Technologies Group* | | | 7,490 | | | | 51 | | |
| OpenTable* | | | 620 | | | | 66 | | |
| QUALCOMM | | | 1,360 | | | | 75 | | |
| | | Shares | | Value
(000) | |
| Salesforce.com* | | | 580 | | | $ | 77 | | |
| SanDisk* | | | 1,230 | | | | 57 | | |
| ZTE, H Shares | | | 11,600 | | | | 54 | | |
| Total Information technology | | | | | 877 | | |
| Materials—7.4% | |
| Silver Wheaton | | | 1,500 | | | | 65 | | |
| Walter Energy | | | 630 | | | | 86 | | |
| Total Materials | | | | | 151 | | |
Total Common stock
(Cost $1,641) | | | | | 2,008 | | |
| Cash equivalent—4.0% | |
BlackRock TempCash Fund,
Institutional Shares,
0.000%** | | | 82,474 | | | | 82 | | |
Total Cash equivalent
(Cost $82) | | | | | 82 | | |
Total Investments—102.2%
(Cost $1,723) | | | | $ | 2,090 | | |
As of March 31, 2011, all of the Fund's investments were considered Level 1. Please see Note 2 in Notes to Financial Statements for further information regarding fair value measurements.
Percentages are based on Net Assets of $2,045.***
* Non-income producing security.
** Rate shown is the 7-day effective yield as of March 31, 2011.
*** This number is listed in thousands.
† More narrow industries are utilized for compliance purposes, whereas broad sectors are utilized for reporting purposes.
ADR — American Depositary Receipt
Cl — Class
NY — New York
The accompanying notes are an integral part of the financial statements.
TURNER FUNDS 2011 SEMIANNUAL REPORT 57
FINANCIAL STATEMENTS
Schedule of investments
Turner Global Opportunities Fund
| Country Allocation as of 3/31/11† | |
| United States | | | 55.5 | % | |
| United Kingdom | | | 10.1 | | |
| Canada | | | 7.9 | | |
| Netherlands | | | 7.3 | | |
| Cayman Islands | | | 3.6 | | |
| Hong Kong | | | 3.5 | | |
| China | | | 2.6 | | |
| Jersey | | | 2.6 | | |
| Brazil | | | 2.5 | | |
| Japan | | | 2.4 | | |
| Indonesia | | | 2.0 | | |
| Total | | | 100.0 | % | |
† Percentages are based on total investments.
58 TURNER FUNDS 2011 SEMIANNUAL REPORT
(Unaudited)
Schedule of investments
Turner International Growth Fund
March 31, 2011
| | | Shares | | Value
(000) | |
| Common stock—96.1% | |
| Consumer discretionary—7.2% | |
| Hyundai Motor | | | 530 | | | $ | 98 | | |
| InterContinental Hotels Group | | | 3,396 | | | | 70 | | |
| ITV* | | | 46,363 | | | | 57 | | |
| Lululemon Athletica* | | | 1,250 | | | | 111 | | |
| LVMH Moet Hennessy Louis Vuitton | | | 541 | | | | 86 | | |
| Swatch Group | | | 162 | | | | 72 | | |
| Total Consumer discretionary | | | | | 494 | | |
| Consumer staples—13.9% | |
| Adecoagro* | | | 6,770 | | | | 91 | | |
| Anheuser-Busch InBev | | | 1,720 | | | | 98 | | |
| British American Tobacco | | | 2,050 | | | | 82 | | |
| Carlsberg, Cl B | | | 744 | | | | 80 | | |
Companhia Brasileira de Distribuicao
Grupo Pao de Acucar ADR* | | | 1,221 | | | | 50 | | |
| Danone | | | 1,330 | | | | 87 | | |
| Diageo | | | 3,800 | | | | 72 | | |
| FamilyMart | | | 2,300 | | | | 87 | | |
| Nestle | | | 3,724 | | | | 214 | | |
| Remy Cointreau | | | 1,240 | | | | 93 | | |
| Total Consumer staples | | | | | 954 | | |
| Energy—6.4% | |
| BG Group | | | 4,910 | | | | 122 | | |
| Petroleum Geo-Services* | | | 6,270 | | | | 101 | | |
| Petrominerales | | | 2,519 | | | | 96 | | |
| Suncor Energy | | | 2,660 | | | | 119 | | |
| Total Energy | | | | | 438 | | |
| Financials—12.4% | |
| AIA Group* | | | 35,769 | | | | 110 | | |
| Bank of Nova Scotia | | | 1,447 | | | | 89 | | |
| BNP Paribas | | | 1,110 | | | | 81 | | |
| H&R Real Estate Investment Trust | | | 2,940 | | | | 67 | | |
| HSBC Holdings | | | 12,540 | | | | 129 | | |
Industrial & Commerical Bank of
China, H Shares | | | 82,000 | | | | 68 | | |
| Julius Baer Group | | | 2,195 | | | | 95 | | |
| LIG Insurance* | | | 2,840 | | | | 69 | | |
| Standard Chartered | | | 3,183 | | | | 83 | | |
| UBS* | | | 3,440 | | | | 62 | | |
| Total Financials | | | | | 853 | | |
| | | Shares | | Value
(000) | |
| Health care—8.1% | |
| Bayer | | | 849 | | | $ | 66 | | |
| Covidien | | | 1,280 | | | | 66 | | |
| Novo Nordisk, Cl B | | | 660 | | | | 83 | | |
| Roche Holding | | | 620 | | | | 89 | | |
| Shire ADR | | | 3,000 | | | | 87 | | |
| Smith & Nephew | | | 5,690 | | | | 64 | | |
Valeant Pharmaceuticals
International | | | 2,119 | | | | 106 | | |
| Total Health care | | | | | 561 | | |
| Industrials—14.4% | |
| Atlas Copco, A Shares | | | 1,990 | | | | 53 | | |
| Beijing Enterprises Holdings | | | 9,500 | | | | 54 | | |
| CAE | | | 5,040 | | | | 67 | | |
| Canadian National Railway | | | 1,518 | | | | 115 | | |
| CNH Global* | | | 1,490 | | | | 72 | | |
| FANUC | | | 500 | | | | 76 | | |
| Komatsu | | | 2,920 | | | | 99 | | |
| Randstad Holding* | | | 1,800 | | | | 100 | | |
| Sensata Technologies Holding* | | | 2,040 | | | | 71 | | |
| Siemens | | | 840 | | | | 115 | | |
| Volvo, B Shares* | | | 5,320 | | | | 94 | | |
| Wolseley* | | | 2,243 | | | | 75 | | |
| Total Industrials | | | | | 991 | | |
| Information technology—15.4% | |
| ARM Holdings | | | 9,890 | | | | 91 | | |
| ASML Holding | | | 2,580 | | | | 114 | | |
| Baidu ADR* | | | 760 | | | | 105 | | |
| Canon | | | 2,400 | | | | 104 | | |
| Check Point Software Technologies* | | | 1,440 | | | | 74 | | |
| Imagination Technologies Group* | | | 10,610 | | | | 73 | | |
| Infosys Technologies ADR | | | 560 | | | | 40 | | |
| Mail.ru Group GDR Registered* | | | 1,815 | | | | 54 | | |
| Omron | | | 3,400 | | | | 96 | | |
| Qihoo 360 Technology ADR* | | | 2,210 | | | | 65 | | |
| SAP | | | 1,680 | | | | 103 | | |
| SINA* | | | 680 | | | | 73 | | |
| ZTE, Cl H | | | 14,410 | | | | 67 | | |
| Total Information technology | | | | | 1,059 | | |
| Materials—15.4% | |
| Air Liquide | | | 789 | | | | 105 | | |
| Arkema | | | 1,235 | | | | 112 | | |
TURNER FUNDS 2011 SEMIANNUAL REPORT 59
FINANCIAL STATEMENTS
Schedule of investments
Turner International Growth Fund
| | | Shares | | Value
(000) | |
| BHP Billiton | | | 4,970 | | | $ | 239 | | |
| Christian Hansen Holding | | | 3,160 | | | | 72 | | |
| Goldcorp | | | 2,250 | | | | 112 | | |
| LyondellBasell Industries NV, Cl A* | | | 2,350 | | | | 93 | | |
| Potash Corp. of Saskatchewan | | | 1,857 | | | | 110 | | |
| Rexam | | | 14,620 | | | | 85 | | |
| Rio Tinto | | | 1,880 | | | | 132 | | |
| Total Materials | | | | | 1,060 | | |
| Telecommunication services—1.5% | |
| America Movil, Ser L | | | 35,270 | | | | 103 | | |
| Total Telecommunication services | | | | | 103 | | |
| Utilities—1.4% | |
| Veolia Environnement | | | 3,195 | | | | 99 | | |
| Total Utilities | | | | | 99 | | |
Total Common stock
(Cost $5,609) | | | | | 6,612 | | |
| Cash equivalent—2.7% | |
BlackRock TempCash Fund,
Institutional Shares,
0.000%** | | | 188,245 | | | | 188 | | |
Total Cash equivalent
(Cost $188) | | | | | 188 | | |
Total Investments—98.8%
(Cost $5,797) | | | | $ | 6,800 | | |
As of March 31, 2011, all of the Fund's investments were considered Level 1. Please see Note 2 in Notes to Financial Statements for further information regarding fair value measurements.
Percentages are based on Net Assets of $6,882.***
* Non-income producing security.
** Rate shown is the 7-day effective yield as of March 31, 2011.
*** This number is listed in thousands.
ADR — American Depositary Receipt
Cl — Class
GDR — Global Depository Receipt
NV — Naamloze Vennootschap
Ser — Series
The accompanying notes are an integral part of the financial statements.
| Country Allocation as of 3/31/11† | |
| United Kingdom | | | 15.5 | % | |
| Canada | | | 12.9 | | |
| France | | | 9.8 | | |
| Switzerland | | | 7.8 | | |
| Japan | | | 6.8 | | |
| Netherlands | | | 6.6 | | |
| United States | | | 4.4 | | |
| Germany | | | 4.2 | | |
| Cayman Islands | | | 3.6 | | |
| Australia | | | 3.5 | | |
| Denmark | | | 3.5 | | |
| Republic of Korea (South) | | | 2.5 | | |
| Hong Kong | | | 2.4 | | |
| Jersey | | | 2.4 | | |
| Sweden | | | 2.2 | | |
| China | | | 2.0 | | |
| Mexico | | | 1.5 | | |
| Norway | | | 1.5 | | |
| Belgium | | | 1.4 | | |
| Luxembourg | | | 1.3 | | |
| Israel | | | 1.1 | | |
| Ireland (Republic of) | | | 1.0 | | |
| Russian Federation | | | 0.8 | | |
| Brazil | | | 0.7 | | |
| India | | | 0.6 | | |
| Total | | | 100.0 | % | |
† Percentages are based on total investments.
60 TURNER FUNDS 2011 SEMIANNUAL REPORT
(Unaudited)
Schedule of investments
Turner Small Cap Equity Fund
March 31, 2011
| | | Shares | | Value
(000) | |
| Common stock—99.3% | |
| Consumer discretionary—11.7% | |
| American Greetings, Cl A | | | 2,420 | | | $ | 57 | | |
| Cooper Tire & Rubber | | | 2,820 | | | | 73 | | |
| Dillard's, CI A | | | 880 | | | | 35 | | |
| Finish Line, Cl A | | | 3,180 | | | | 63 | | |
| Men's Wearhouse | | | 1,860 | | | | 50 | | |
| Oxford Industries | | | 1,330 | | | | 45 | | |
| Red Robin Gourmet Burgers* | | | 2,460 | | | | 66 | | |
| Sally Beauty Holdings* | | | 5,270 | | | | 74 | | |
| Select Comfort* | | | 4,060 | | | | 49 | | |
| Stage Stores | | | 1,870 | | | | 36 | | |
| Steven Madden* | | | 1,425 | | | | 67 | | |
| Stoneridge* | | | 3,350 | | | | 49 | | |
| Total Consumer discretionary | | | | | 664 | | |
| Energy—6.3% | |
| Berry Petroleum, Cl A | | | 1,820 | | | | 92 | | |
| Complete Production Services* | | | 1,110 | | | | 35 | | |
| Energy XXI (Bermuda)* | | | 2,780 | | | | 95 | | |
| Green Plains Renewable Energy* | | | 2,200 | | | | 26 | | |
| Lufkin Industries | | | 330 | | | | 31 | | |
| Patriot Coal* | | | 3,180 | | | | 82 | | |
| Total Energy | | | | | 361 | | |
| Financials—15.9% | |
| BioMed Realty Trust | | | 2,400 | | | | 46 | | |
| CNO Financial Group* | | | 10,630 | | | | 80 | | |
| EZCORP, CI A* | | | 920 | | | | 29 | | |
| LaSalle Hotel Properties | | | 3,070 | | | | 83 | | |
Mid-America Apartment
Communities | | | 1,390 | | | | 89 | | |
| National Penn Bancshares | | | 10,330 | | | | 80 | | |
| PennantPark Investment | | | 6,960 | | | | 83 | | |
| Platinum Underwriters Holdings | | | 1,310 | | | | 50 | | |
| ProAssurance* | | | 510 | | | | 32 | | |
| Signature Bank* | | | 1,640 | | | | 92 | | |
| Susquehanna Bancshares | | | 5,850 | | | | 55 | | |
| SVB Financial Group* | | | 1,880 | | | | 107 | | |
| Tanger Factory Outlet Centers | | | 1,920 | | | | 50 | | |
| Tower Group | | | 1,210 | | | | 29 | | |
| Total Financials | | | | | 905 | | |
| | | Shares | | Value
(000) | |
| Health care—12.4% | |
| AMERIGROUP* | | | 1,310 | | | $ | 84 | | |
| Centene* | | | 2,050 | | | | 68 | | |
| Emergent BioSolutions* | | | 3,250 | | | | 79 | | |
| Hanger Orthopedic Group* | | | 1,770 | | | | 46 | | |
| HealthSouth* | | | 4,340 | | | | 108 | | |
| Medicis Pharmaceutical, Cl A | | | 2,470 | | | | 79 | | |
| Medidata Solutions* | | | 2,090 | | | | 53 | | |
| Sirona Dental Systems* | | | 1,780 | | | | 89 | | |
| Skilled Healthcare Group, Cl A* | | | 3,060 | | | | 44 | | |
| Zoll Medical* | | | 1,260 | | | | 56 | | |
| Total Health care | | | | | 706 | | |
| Industrials—19.9% | |
| Aircastle | | | 7,260 | | | | 88 | | |
| Alaska Air Group* | | | 1,070 | | | | 68 | | |
| Atlas Air Worldwide Holdings* | | | 1,180 | | | | 82 | | |
| Esterline Technologies* | | | 1,140 | | | | 81 | | |
| Genesee & Wyoming, Cl A* | | | 1,200 | | | | 70 | | |
| Hexcel* | | | 4,990 | | | | 98 | | |
| MasTec* | | | 3,120 | | | | 65 | | |
| Meritor* | | | 2,050 | | | | 35 | | |
| Moog, Cl A* | | | 1,580 | | | | 73 | | |
| Robbins & Myers | | | 1,500 | | | | 69 | | |
| TAL International Group | | | 2,570 | | | | 93 | | |
| Titan International | | | 5,090 | | | | 136 | | |
| Tutor Perini | | | 2,370 | | | | 58 | | |
| WESCO International* | | | 1,480 | | | | 93 | | |
| Woodward Governor | | | 770 | | | | 27 | | |
| Total Industrials | | | | | 1,136 | | |
| Information technology—20.1% | |
| ADTRAN | | | 950 | | | | 40 | | |
| Amkor Technology* | | | 5,410 | | | | 36 | | |
| Coherent* | | | 640 | | | | 37 | | |
| CommVault Systems* | | | 1,710 | | | | 68 | | |
| Compuware* | | | 7,700 | | | | 89 | | |
| Convergys* | | | 3,580 | | | | 51 | | |
| Entegris* | | | 3,600 | | | | 32 | | |
| j2 Global Communications* | | | 2,360 | | | | 70 | | |
| Mentor Graphics* | | | 6,870 | | | | 101 | | |
| OmniVision Technologies* | | | 3,150 | | | | 112 | | |
| QuickLogic* | | | 3,210 | | | | 16 | | |
| ShoreTel* | | | 8,150 | | | | 67 | | |
| Silicon Graphics International* | | | 4,890 | | | | 105 | | |
TURNER FUNDS 2011 SEMIANNUAL REPORT 61
FINANCIAL STATEMENTS (Unaudited)
Schedule of investments
Turner Small Cap Equity Fund
| | | Shares | | Value
(000) | |
| Silicon Image* | | | 6,500 | | | $ | 58 | | |
| SuccessFactors* | | | 1,130 | | | | 44 | | |
| Teradyne* | | | 1,990 | | | | 35 | | |
| TIBCO Software* | | | 2,270 | | | | 62 | | |
| ValueClick* | | | 4,640 | | | | 67 | | |
| VeriFone Systems* | | | 1,000 | | | | 55 | | |
| Total Information technology | | | | | 1,145 | | |
| Materials—10.8% | |
| Ferro* | | | 5,450 | | | | 90 | | |
| Kraton Performance Polymers* | | | 1,540 | | | | 59 | | |
| Louisiana-Pacific* | | | 5,760 | | | | 60 | | |
| Minerals Technologies | | | 810 | | | | 56 | | |
| PolyOne | | | 5,530 | | | | 79 | | |
| Rockwood Holdings* | | | 1,970 | | | | 97 | | |
| Taseko Mines* | | | 4,800 | | | | 28 | | |
| Thompson Creek Metals* | | | 3,280 | | | | 41 | | |
| TPC Group* | | | 3,720 | | | | 108 | | |
| Total Materials | | | | | 618 | | |
| Utilities—2.2% | |
| Avista | | | 2,480 | | | | 57 | | |
| Cleco | | | 2,060 | | | | 71 | | |
| Total Utilities | | | | | 128 | | |
Total Common stock
(Cost $4,079) | | | | | 5,663 | | |
| Cash equivalent—1.9% | |
BlackRock TempCash Fund,
Institutional Shares,
0.000%** | | | 107,538 | | | | 108 | | |
Total Cash equivalent
(Cost $108) | | | | | 108 | | |
Total Investments—101.2%
(Cost $4,187) | | | | $ | 5,771 | | |
As of March 31, 2011, all of the Fund's investments were considered Level 1. Please see Note 2 in Notes to Financial Statements for further information regarding fair value measurements.
Percentages are based on Net Assets of $5,702.***
* Non-income producing security.
** Rate shown is the 7-day effective yield as of March 31, 2011.
*** This number is listed in thousands.
Cl — Class
The accompanying notes are an integral part of the financial statements.
62 TURNER FUNDS 2011 SEMIANNUAL REPORT
THIS PAGE WAS INTENTIONALLY LEFT BLANK
TURNER FUNDS 2011 SEMIANNUAL REPORT 63
FINANCIAL STATEMENTS
Statements of assets and liabilities (000)
March 31, 2011
| | | Turner
Market
Neutral
Fund | | Turner
Medical
Sciences
Long/Short
Fund | | Turner
Spectrum
Fund | | Turner
Titan
Fund | |
| Assets: | |
| Investment securities, at cost | | $ | 2,853 | | | $ | 4,586 | | | $ | 327,889 | | | $ | 3,723 | | |
| Investment securities, at value | | $ | 2,963 | | | $ | 4,670 | | | $ | 344,283 | | | $ | 3,814 | | |
| Deposits with brokers for securities sold short | | | 3,435 | | | | 1,708 | | | | 196,661 | | | | 2,500 | | |
| Deposits with brokers for options | | | — | | | | — | | | | 53,000 | | | | — | | |
| Foreign currency, at value | | | — | | | | — | | | | 1 | | | | — | | |
| Receivable for investment securities sold | | | 550 | | | | 40 | | | | 35,128 | | | | 618 | | |
| Receivable for capital shares sold | | | — | | | | 141 | | | | 5,857 | | | | — | | |
| Prepaid expenses | | | 1 | | | | — | | | | 26 | | | | — | | |
| Receivable for dividend income | | | 3 | | | | — | | | | 132 | | | | 1 | | |
| Reclaim receivable | | | — | | | | — | | | | 2 | | | | — | | |
| Total assets | | | 6,952 | | | | 6,559 | | | | 635,090 | | | | 6,933 | | |
| Liabilities: | |
| Securities sold short, at proceeds | | | 2,805 | | | | 1,171 | | | | 167,946 | | | | 1,932 | | |
| Written options, premiums received | | | — | | | | — | | | | 2,368 | | | | — | | |
| Securities sold short, at value | | | 2,858 | | | | 1,180 | | | | 172,328 | | | | 1,969 | | |
| Written options, at value | | | — | | | | — | | | | 1,900 | | | | — | | |
| Payable for investment securities purchased | | | 674 | | | | 181 | | | | 48,388 | | | | 789 | | |
| Obligation to return securities lending collateral | | | — | | | | — | | | | — | | | | — | | |
| Payable for capital shares redeemed | | | — | | | | — | | | | 163 | | | | — | | |
| Dividends payable on securities sold short (Note 2) | | | — | | | | — | | | | 36 | | | | — | | |
| Broker fees and charges on short sales payable | | | — | | | | — | | | | 65 | | | | — | | |
| Payable due to investment adviser | | | 3 | | | | 6 | | | | 275 | | | | 4 | | |
| Payable due to administrator | | | — | | | | — | | | | 38 | | | | — | | |
| Payable due to shareholder servicing | | | — | | | | — | | | | 33 | | | | — | | |
| Payable due to distributor | | | — | | | | — | | | | 5 | | | | — | | |
| Payable due to fund accounting | | | — | | | | — | | | | 2 | | | | — | | |
| Payable due to transfer agent | | | — | | | | — | | | | 13 | | | | — | | |
| Payable due to custodian | | | — | | | | — | | | | 99 | | | | — | | |
| Payable due to trustees | | | — | | | | — | | | | 2 | | | | — | | |
| Other accrued expenses | | | — | | | | 2 | | | | 29 | | | | 2 | | |
| Total liabilities | | | 3,535 | | | | 1,369 | | | | 223,376 | | | | 2,764 | | |
| Net assets | | $ | 3,417 | | | $ | 5,190 | | | $ | 411,714 | | | $ | 4,169 | | |
| | *Includes market value of securities on loan | | | $ | — | | | $ | — | | | $ | — | | | $ | — | | |
| Net assets: | |
| Portfolio capital | | $ | 3,326 | | | $ | 5,123 | | | $ | 387,115 | | | $ | 4,160 | | |
| Undistributed net investment income (accumulated net investment loss) | | | (1 | ) | | | (9 | ) | | | (2,054 | ) | | | (6 | ) | |
Accumulated net realized gain (loss) on investments, securities sold short,
written options and foreign currency transactions | | | 35 | | | | 1 | | | | 14,185 | | | | (39 | ) | |
Net unrealized appreciation on investments, written options, securities sold short,
foreign currencies and translation of other assets and liabilities denominated in
foreign currencies | | | 57 | | | | 75 | | | | 12,468 | | | | 54 | | |
| Net assets | | $ | 3,417 | | | $ | 5,190 | | | $ | 411,714 | | | $ | 4,169 | | |
| Outstanding shares of beneficial interest Institutional Class Shares (1)(2) | | | 323,634 | | | | 218,956 | | | | 25,897,729 | | | | 401,734 | | |
| Outstanding shares of beneficial interest Investor Class Shares (1)(2) | | | 6,861 | | | | 242,625 | | | | 8,234,167 | | | | 6,937 | | |
| Outstanding shares of beneficial interest Class C Shares (1)(2) | | | 20 | | | | 44,223 | | | | 753,227 | | | | 2,179 | | |
| Net assets — Institutional Class Shares (2) | | $ | 3,345,805 | | | $ | 2,246,619 | | | $ | 306,095,976 | | | $ | 4,076,781 | | |
| Net assets — Investor Class Shares (2) | | $ | 70,889 | | | $ | 2,489,749 | | | $ | 96,840,014 | | | $ | 70,385 | | |
| Net assets — Class C Shares (2) | | $ | 207 | | | $ | 453,444 | | | $ | 8,778,139 | | | $ | 22,088 | | |
| Net asset value, offering and redemption price per share — Institutional Class Shares | | $ | 10.34 | | | $ | 10.26 | | | $ | 11.82 | | | $ | 10.15 | | |
| Net asset value, offering and redemption price per share — Investor Class Shares | | $ | 10.33 | | | $ | 10.26 | | | $ | 11.76 | | | $ | 10.15 | | |
| Net asset value, offering and redemption price per share — Class C Shares | | $ | 10.33 | † | | $ | 10.25 | | | $ | 11.65 | | | $ | 10.14 | | |
64 TURNER FUNDS 2011 SEMIANNUAL REPORT
(Unaudited)
| | | Turner
All Cap
Growth Fund | | Turner
Concentrated
Growth Fund | | Turner
Emerging
Growth Fund | | Turner
Large
Growth Fund | |
| Assets: | |
| Investment securities, at cost | | $ | 50,852 | | | $ | 49,477 | | | $ | 445,483 | | | $ | 517,913 | | |
| Investment securities, at value | | $ | 62,710 | * | | $ | 58,841 | * | | $ | 648,820 | * | | $ | 667,894 | * | |
| Deposits with brokers for securities sold short | | | — | | | | — | | | | — | | | | — | | |
| Deposits with brokers for options | | | 150 | | | | 150 | | | | 150 | | | | 150 | | |
| Foreign currency, at value | | | — | | | | — | | | | — | | | | — | | |
| Receivable for investment securities sold | | | — | | | | 1,473 | | | | 3,053 | | | | 13,591 | | |
| Receivable for capital shares sold | | | 138 | | | | 81 | | | | 698 | | | | 718 | | |
| Prepaid expenses | | | 5 | | | | 7 | | | | 27 | | | | 43 | | |
| Receivable for dividend income | | | 8 | | | | 3 | | | | 98 | | | | 204 | | |
| Reclaim receivable | | | — | | | | — | | | | — | | | | — | | |
| Total assets | | | 63,011 | | | | 60,555 | | | | 652,846 | | | | 682,600 | | |
| Liabilities: | |
| Securities sold short, at proceeds | | | — | | | | — | | | | — | | | | — | | |
| Written options, premiums received | | | — | | | | — | | | | — | | | | — | | |
| Securities sold short, at value | | | — | | | | — | | | | — | | | | — | | |
| Written options, at value | | | — | | | | — | | | | — | | | | — | | |
| Payable for investment securities purchased | | | — | | | | 2,116 | | | | 4,822 | | | | 5,799 | | |
| Obligation to return securities lending collateral | | | 3,920 | | | | 2,703 | | | | 48,027 | | | | 16,188 | | |
| Payable for capital shares redeemed | | | 48 | | | | 14 | | | | 937 | | | | 620 | | |
| Dividends payable on securities sold short (Note 2) | | | — | | | | — | | | | — | | | | — | | |
| Broker fees and charges on short sales payable | | | — | | | | — | | | | — | | | | — | | |
| Payable due to investment adviser | | | 37 | | | | 34 | | | | 432 | | | | 220 | | |
| Payable due to administrator | | | 6 | | | | 6 | | | | 58 | | | | 66 | | |
| Payable due to shareholder servicing | | | 14 | | | | 12 | | | | 45 | | | | 29 | | |
| Payable due to distributor | | | — | | | | — | | | | — | | | | — | | |
| Payable due to fund accounting | | | — | | | | — | | | | — | | | | 2 | | |
| Payable due to transfer agent | | | 4 | | | | 5 | | | | 18 | | | | 84 | | |
| Payable due to custodian | | | 9 | | | | 10 | | | | 29 | | | | 95 | | |
| Payable due to trustees | | | — | | | | — | | | | 2 | | | | 9 | | |
| Other accrued expenses | | | 5 | | | | 8 | | | | 40 | | | | 152 | | |
| Total liabilities | | | 4,043 | | | | 4,908 | | | | 54,410 | | | | 23,264 | | |
| Net assets | | $ | 58,968 | | | $ | 55,647 | | | $ | 598,436 | | | $ | 659,336 | | |
| | *Includes market value of securities on loan | | | $ | 3,843 | | | $ | 2,651 | | | $ | 47,085 | | | $ | 15,871 | | |
| Net assets: | |
| Portfolio capital | | $ | 63,595 | | | $ | 78,676 | | | $ | 431,509 | | | $ | 694,725 | | |
| Undistributed net investment income (accumulated net investment loss) | | | (225 | ) | | | (301 | ) | | | (2,076 | ) | | | (495 | ) | |
Accumulated net realized gain (loss) on investments, securities sold short,
written options and foreign currency transactions | | | (16,260 | ) | | | (32,092 | ) | | | (34,334 | ) | | | (184,875 | ) | |
Net unrealized appreciation on investments, written options, securities sold short,
foreign currencies and translation of other assets and liabilities denominated in
foreign currencies | | | 11,858 | | | | 9,364 | | | | 203,337 | | | | 149,981 | | |
| Net assets | | $ | 58,968 | | | $ | 55,647 | | | $ | 598,436 | | | $ | 659,336 | | |
| Outstanding shares of beneficial interest Institutional Class Shares (1)(2) | | | — | | | | — | | | | 6,614,524 | | | | 42,720,337 | | |
| Outstanding shares of beneficial interest Investor Class Shares (1)(2) | | | 6,212,182 | | | | 6,817,217 | | | | 3,940,603 | | | | 9,093,898 | | |
| Outstanding shares of beneficial interest Class C Shares (1)(2) | | | — | | | | — | | | | — | | | | — | | |
| Net assets — Institutional Class Shares (2) | | $ | — | | | $ | — | | | $ | 375,778,386 | | | $ | 544,161,511 | | |
| Net assets — Investor Class Shares (2) | | $ | 58,968,064 | | | $ | 55,647,184 | | | $ | 222,657,477 | | | $ | 115,174,342 | | |
| Net assets — Class C Shares (2) | | $ | — | | | $ | — | | | $ | — | | | $ | — | | |
| Net asset value, offering and redemption price per share — Institutional Class Shares | | $ | — | | | $ | — | | | $ | 56.81 | | | $ | 12.74 | | |
| Net asset value, offering and redemption price per share — Investor Class Shares | | $ | 9.49 | | | $ | 8.16 | | | $ | 56.50 | | | $ | 12.67 | | |
| Net asset value, offering and redemption price per share — Class C Shares | | $ | — | | | $ | — | | | $ | — | | | $ | — | | |
(1) Unlimited authorization — par value $0.00001.
(2) Shares and Net Assets have not been rounded.
† Difference in net asset value recalculation and net asset value stated is caused by rounding differences.
Amounts designated as "—" are either not applicable, $0 or have been rounded to $0.
The accompanying notes are an integral part of the financial statements.
TURNER FUNDS 2011 SEMIANNUAL REPORT 65
FINANCIAL STATEMENTS
Statements of assets and liabilities (000)
March 31, 2011
| | | Turner
Midcap
Growth Fund | | Turner
Small Cap
Growth Fund | | Turner
Quantitative
Broad Market
Equity Fund | | Turner
Quantitative
Large Cap
Value Fund | |
| Assets: | |
| Investment securities, at cost | | $ | 895,220 | | | $ | 300,750 | | | $ | 9,960 | | | $ | 683 | | |
| Investment securities, at value | | $ | 1,327,413 | * | | $ | 400,110 | * | | $ | 12,045 | | | $ | 846 | | |
| Deposits with brokers for securities sold short | | | — | | | | — | | | | — | | | | — | | |
| Deposits with brokers for options | | | 150 | | | | 150 | | | | — | | | | — | | |
| Foreign currency, at value | | | — | | | | — | | | | — | | | | — | | |
| Receivable for investment securities sold | | | 3,192 | | | | 7,078 | | | | — | | | | — | | |
| Receivable for capital shares sold | | | 2,605 | | | | 1,291 | | | | 15 | | | | — | | |
| Prepaid expenses | | | 41 | | | | 16 | | | | 4 | | | | 5 | | |
| Receivable for dividend income | | | 227 | | | | 96 | | | | 13 | | | | 1 | | |
| Reclaim receivable | | | 16 | | | | — | | | | — | | | | — | | |
| Total assets | | | 1,333,644 | | | | 408,741 | | | | 12,077 | | | | 852 | | |
| Liabilities: | |
| Payable for investment securities purchased | | | — | | | | 5,847 | | | | — | | | | — | | |
| Obligation to return securities lending collateral | | | 112,149 | | | | 54,601 | | | | — | | | | — | | |
| Payable for capital shares redeemed | | | 777 | | | | 2,745 | | | | 13 | | | | — | | |
| Payable due to investment adviser | | | 790 | | | | 200 | | | | 10 | | | | 6 | | |
| Payable due to administrator | | | 139 | | | | 34 | | | | 1 | | | | — | | |
| Payable due to shareholder servicing | | | 211 | | | | 87 | | | | — | | | | — | | |
| Payable due to distributor | | | 1 | | | | — | | | | — | | | | — | | |
| Payable due to fund accounting | | | 1 | | | | — | | | | — | | | | 3 | | |
| Payable due to transfer agent | | | 59 | | | | 11 | | | | 5 | | | | 9 | | |
| Payable due to custodian | | | 50 | | | | 25 | | | | 10 | | | | 12 | | |
| Payable due to trustees | | | 7 | | | | 1 | | | | — | | | | — | | |
| Other accrued expenses | | | 129 | | | | 22 | | | | 5 | | | | 2 | | |
| Total liabilities | | | 114,313 | | | | 63,573 | | | | 44 | | | | 32 | | |
| Net assets | | $ | 1,219,331 | | | $ | 345,168 | | | $ | 12,033 | | | $ | 820 | | |
| | *Includes market value of securities on loan | | | $ | 109,950 | | | $ | 53,531 | | | $ | — | | | $ | — | | |
| Net assets: | |
| Portfolio capital | | $ | 1,041,357 | | | $ | 269,703 | | | $ | 10,488 | | | $ | 909 | | |
| Undistributed net investment income (accumulated net investment loss) | | | (945 | ) | | | (1,301 | ) | | | 26 | | | | 3 | | |
| Accumulated net realized gain (loss) on investments and foreign currency transactions | | | (253,274 | ) | | | (22,594 | ) | | | (566 | ) | | | (255 | ) | |
Net unrealized appreciation on investments, foreign currencies and translation of
other assets and liabilities denominated in foreign currencies | | | 432,193 | | | | 99,360 | | | | 2,085 | | | | 163 | | |
| Net assets | | $ | 1,219,331 | | | $ | 345,168 | | | $ | 12,033 | | | $ | 820 | | |
| Outstanding shares of beneficial interest Institutional Class Shares (1)(2) | | | 6,627,700 | | | | — | | | | 1,139,453 | | | | 90,480 | | |
| Outstanding shares of beneficial interest Investor Class Shares (1)(2) | | | 24,623,167 | | | | 9,147,305 | | | | 2,755 | | | | 586 | | |
| Outstanding shares of beneficial interest Retirement Class Shares (1)(2) | | | 140,448 | | | | — | | | | — | | | | — | | |
| Net assets — Institutional Class Shares (2) | | $ | 258,926,793 | | | $ | — | | | $ | 12,003,958 | | | $ | 814,803 | | |
| Net assets — Investor Class Shares (2) | | $ | 955,149,753 | | | $ | 345,167,747 | | | $ | 28,958 | | | $ | 5,276 | | |
| Net assets — Retirement Class Shares (2) | | $ | 5,254,383 | | | $ | — | | | $ | — | | | $ | — | | |
| Net asset value, offering and redemption price per share — Institutional Class Shares | | $ | 39.07 | | | $ | — | | | $ | 10.53 | | | $ | 9.01 | | |
| Net asset value, offering and redemption price per share — Investor Class Shares | | $ | 38.79 | | | $ | 37.73 | | | $ | 10.51 | | | $ | 9.00 | | |
| Net asset value, offering and redemption price per share — Retirement Class Shares | | $ | 37.41 | | | $ | — | | | $ | — | | | $ | — | | |
66 TURNER FUNDS 2011 SEMIANNUAL REPORT
(Unaudited)
| | | Turner
Global
Opportunities
Fund | | Turner
International
Growth Fund | | Turner
Small Cap
Equity Fund | |
| Assets: | |
| Investment securities, at cost | | $ | 1,723 | | | $ | 5,797 | | | $ | 4,187 | | |
| Investment securities, at value | | $ | 2,090 | | | $ | 6,800 | | | $ | 5,771 | | |
| Deposits with brokers for securities sold short | | | — | | | | — | | | | — | | |
| Deposits with brokers for options | | | — | | | | — | | | | — | | |
| Foreign currency, at value | | | — | | | | 2 | | | | — | | |
| Receivable for investment securities sold | | | — | | | | 143 | | | | 31 | | |
| Receivable for capital shares sold | | | 20 | | | | 52 | | | | 1 | | |
| Prepaid expenses | | | 4 | | | | 18 | | | | 10 | | |
| Receivable for dividend income | | | 3 | | | | 13 | | | | 9 | | |
| Reclaim receivable | | | — | | | | 6 | | | | — | | |
| Total assets | | | 2,117 | | | | 7,034 | | | | 5,822 | | |
| Liabilities: | |
| Payable for investment securities purchased | | | — | | | | 112 | | | | 11 | | |
| Obligation to return securities lending collateral | | | — | | | | — | | | | — | | |
| Payable for capital shares redeemed | | | 50 | | | | — | | | | 77 | | |
| Payable due to investment adviser | | | 4 | | | | 8 | | | | 4 | | |
| Payable due to administrator | | | — | | | | 1 | | | | 1 | | |
| Payable due to shareholder servicing | | | — | | | | — | | | | 1 | | |
| Payable due to distributor | | | — | | | | — | | | | — | | |
| Payable due to fund accounting | | | 4 | | | | 4 | | | | 1 | | |
| Payable due to transfer agent | | | 3 | | | | 3 | | | | 3 | | |
| Payable due to custodian | | | 11 | | | | 21 | | | | 21 | | |
| Payable due to trustees | | | — | | | | — | | | | — | | |
| Other accrued expenses | | | — | | | | 3 | | | | 1 | | |
| Total liabilities | | | 72 | | | | 152 | | | | 120 | | |
| Net assets | | $ | 2,045 | | | $ | 6,882 | | | $ | 5,702 | | |
| | *Includes market value of securities on loan | | | $ | — | | | $ | — | | | $ | — | | |
| Net assets: | |
| Portfolio capital | | $ | 1,586 | | | $ | 6,096 | | | $ | 10,446 | | |
| Undistributed net investment income (accumulated net investment loss) | | | (3 | ) | | | (60 | ) | | | 55 | | |
| Accumulated net realized gain (loss) on investments and foreign currency transactions | | | 95 | | | | (158 | ) | | | (6,383 | ) | |
Net unrealized appreciation on investments, foreign currencies and translation of
other assets and liabilities denominated in foreign currencies | | | 367 | | | | 1,004 | | | | 1,584 | | |
| Net assets | | $ | 2,045 | | | $ | 6,882 | | | $ | 5,702 | | |
| Outstanding shares of beneficial interest Institutional Class Shares (1)(2) | | | 94,172 | | | | 555,514 | | | | 26 | | |
| Outstanding shares of beneficial interest Investor Class Shares (1)(2) | | | 49,982 | | | | 44,989 | | | | 400,532 | | |
| Outstanding shares of beneficial interest Retirement Class Shares (1)(2) | | | — | | | | — | | | | — | | |
| Net assets — Institutional Class Shares (2) | | $ | 1,337,564 | | | $ | 6,367,616 | | | $ | 365 | | |
| Net assets — Investor Class Shares (2) | | $ | 707,880 | | | $ | 514,724 | | | $ | 5,701,191 | | |
| Net assets — Retirement Class Shares (2) | | $ | — | | | $ | — | | | $ | — | | |
| Net asset value, offering and redemption price per share — Institutional Class Shares | | $ | 14.20 | | | $ | 11.46 | | | $ | 14.24 | † | |
| Net asset value, offering and redemption price per share — Investor Class Shares | | $ | 14.16 | | | $ | 11.44 | | | $ | 14.23 | | |
| Net asset value, offering and redemption price per share — Retirement Class Shares | | $ | — | | | $ | — | | | $ | — | | |
(1) Unlimited authorization — par value $0.00001.
(2) Shares and Net Assets have not been rounded.
† Difference in net asset value recalculation and net asset value stated is caused by rounding differences.
Amounts designated as "—" are either not applicable, $0 or have been rounded to $0.
The accompanying notes are an integral part of the financial statements.
TURNER FUNDS 2011 SEMIANNUAL REPORT 67
FINANCIAL STATEMENTS
Statements of operations (000)
| | | Turner
Market
Neutral
Fund | | Turner
Medical
Sciences
Long/Short
Fund | | Turner
Spectrum
Fund | | Turner
Titan
Fund | |
| | | 2/7/11(1) thru
3/31/11 | | 2/7/11(1) thru
3/31/11 | | 10/1/10 thru
3/31/11 | | 2/7/11(1) thru
3/31/11 | |
| Investment income: | |
| Dividend | | $ | 5 | | | $ | 1 | | | $ | 1,193 | | | $ | 2 | | |
| Securities lending | | | — | | | | — | | | | — | | | | — | | |
| Foreign taxes withheld | | | — | | | | — | | | | (20 | ) | | | — | | |
| Total Investment Income | | | 5 | | | | 1 | | | | 1,173 | | | | 2 | | |
| Expenses: | |
| Investment advisory fees | | | 5 | | | | 6 | | | | 2,251 | | | | 5 | | |
| Administrator fees | | | — | | | | 1 | | | | 211 | | | | — | | |
| Shareholder service fees (2) | | | — | | | | 1 | | | | 87 | | | | — | | |
| Shareholder service fees (3) | | | — | | | | — | | | | 10 | | | | — | | |
| Distribution fees (3) | | | — | | | | — | | | | 29 | | | | — | | |
| Chief compliance officer fees | | | — | | | | — | | | | 6 | | | | — | | |
| Accounting agent fees | | | — | | | | — | | | | 10 | | | | — | | |
| Dividend expense | | | 1 | | | | — | | | | 364 | | | | 1 | | |
| Broker fees and charges on short sales | | | — | | | | 1 | | | | 485 | | | | — | | |
| Custodian fees | | | — | | | | — | | | | 159 | | | | — | | |
| Transfer agent fees | | | — | | | | — | | | | 29 | | | | — | | |
| Registration fees | | | 2 | | | | 2 | | | | 67 | | | | 2 | | |
| Professional fees | | | — | | | | — | | | | 28 | | | | — | | |
| Trustees' fees | | | — | | | | — | | | | 8 | | | | — | | |
| Insurance and other fees | | | — | | | | — | | | | 31 | | | | 2 | | |
| Total expenses | | | 8 | | | | 11 | | | | 3,775 | | | | 10 | | |
| Less: | |
| Investment advisory fee waiver | | | (2 | ) | | | (1 | ) | | | (768 | ) | | | (2 | ) | |
| Net expenses | | | 6 | | | | 10 | | | | 3,007 | | | | 8 | | |
| Net investment loss | | | (1 | ) | | | (9 | ) | | | (1,834 | ) | | | (6 | ) | |
| Net realized gain (loss) from securities sold | | | 54 | | | | (22 | ) | | | 42,184 | | | | (31 | ) | |
| Net realized gain (loss) from securities sold short | | | (19 | ) | | | 23 | | | | (20,978 | ) | | | (8 | ) | |
| Net realized gain (loss) on written options contracts | | | — | | | | — | | | | 124 | | | | — | | |
| Net realized gain on foreign currency transactions | | | — | | | | — | | | | 251 | | | | — | | |
| Net change in unrealized appreciation (depreciation) on investments | | | 110 | | | | 84 | | | | 7,813 | | | | 91 | | |
| Net change in unrealized appreciation (depreciation) on securities sold short | | | (53 | ) | | | (9 | ) | | | (2,718 | ) | | | (37 | ) | |
| Net change in unrealized appreciation (depreciation) on written option contracts | | | — | | | | — | | | | 524 | | | | — | | |
Net change in unrealized appreciation (depreciation) on foreign currencies and
translation of other assets and liabilities denominated in foreign currencies | | | — | | | | — | | | | (13 | ) | | | — | | |
| Net realized and unrealized gain (loss) on investments, options and foreign currencies | | | 92 | | | | 76 | | | | 27,187 | | | | 15 | | |
| Net increase (decrease) in net assets resulting from operations | | $ | 91 | | | $ | 67 | | | $ | 25,353 | | | $ | 9 | | |
68 TURNER FUNDS 2011 SEMIANNUAL REPORT
(Unaudited)
| | | Turner
All Cap
Growth Fund | | Turner
Concentrated
Growth Fund | | Turner
Emerging
Growth Fund | | Turner
Large
Growth Fund | |
| | | 10/1/10 thru
3/31/11 | | 10/1/10 thru
3/31/11 | | 10/1/10 thru
3/31/11 | | 10/1/10 thru
3/31/11 | |
| Investment income: | |
| Dividend | | $ | 102 | | | $ | 106 | | | $ | 1,068 | | | $ | 1,760 | | |
| Securities lending | | | 4 | | | | 5 | | | | 141 | | | | 24 | | |
| Foreign taxes withheld | | | — | | | | (4 | ) | | | (22 | ) | | | (29 | ) | |
| Total Investment Income | | | 106 | | | | 107 | | | | 1,187 | | | | 1,755 | | |
| Expenses: | |
| Investment advisory fees | | | 294 | | | | 361 | | | | 2,615 | | | | 1,669 | | |
| Administrator fees | | | 30 | | | | 36 | | | | 368 | | | | 391 | | |
| Shareholder service fees (2) | | | 51 | | | | 63 | | | | 251 | | | | 188 | | |
| Shareholder service fees (3) | | | — | | | | — | | | | — | | | | — | | |
| Distribution fees (3) | | | — | | | | — | | | | — | | | | — | | |
| Chief compliance officer fees | | | 1 | | | | 2 | | | | 12 | | | | 22 | | |
| Accounting agent fees | | | 1 | | | | 1 | | | | 2 | | | | 4 | | |
| Dividend expense | | | — | | | | — | | | | — | | | | — | | |
| Broker fees and charges on short sales | | | — | | | | — | | | | — | | | | — | | |
| Custodian fees | | | 15 | | | | 16 | | | | 68 | | | | 115 | | |
| Transfer agent fees | | | 9 | | | | 12 | | | | 61 | | | | 132 | | |
| Registration fees | | | 8 | | | | 9 | | | | 27 | | | | 26 | | |
| Professional fees | | | 5 | | | | 7 | | | | 59 | | | | 115 | | |
| Trustees' fees | | | 1 | | | | 2 | | | | 16 | | | | 29 | | |
| Insurance and other fees | | | 7 | | | | 10 | �� | | | 58 | | | | 95 | | |
| Total expenses | | | 422 | | | | 519 | | | | 3,537 | | | | 2,786 | | |
| Less: | |
| Investment advisory fee waiver | | | (91 | ) | | | (111 | ) | | | (274 | ) | | | (668 | ) | |
| Net expenses | | | 331 | | | | 408 | | | | 3,263 | | | | 2,118 | | |
| Net investment loss | | | (225 | ) | | | (301 | ) | | | (2,076 | ) | | | (363 | ) | |
| Net realized gain (loss) from securities sold | | | 4,605 | | | | 8,670 | | | | 53,059 | | | | 83,050 | | |
| Net realized gain (loss) from securities sold short | | | — | | | | — | | | | — | | | | — | | |
| Net realized gain (loss) on written options contracts | | | — | | | | — | | | | — | | | | — | | |
| Net realized gain on foreign currency transactions | | | — | | | | — | | | | — | | | | — | | |
| Net change in unrealized appreciation (depreciation) on investments | | | 5,176 | | | | 1,537 | | | | 97,658 | | | | 48,653 | | |
| Net change in unrealized appreciation (depreciation) on securities sold short | | | — | | | | — | | | | — | | | | — | | |
| Net change in unrealized appreciation (depreciation) on written option contracts | | | — | | | | — | | | | — | | | | — | | |
Net change in unrealized appreciation (depreciation) on foreign currencies and
translation of other assets and liabilities denominated in foreign currencies | | | — | | | | — | | | | — | | | | — | | |
| Net realized and unrealized gain (loss) on investments, options and foreign currencies | | | 9,781 | | | | 10,207 | | | | 150,717 | | | | 131,703 | | |
| Net increase (decrease) in net assets resulting from operations | | $ | 9,556 | | | $ | 9,906 | | | $ | 148,641 | | | $ | 131,340 | | |
(1) Commencement of operations.
(2) Attributable to Investor Class Shares only.
(3) Attributable to Class C Shares only.
Amounts designated as "—" are either not applicable, $0 or have been rounded to $0.
The accompanying notes are an integral part of the financial statements.
TURNER FUNDS 2011 SEMIANNUAL REPORT 69
FINANCIAL STATEMENTS
Statements of operations (000)
| | | Turner
Midcap
Growth Fund | | Turner
Small Cap
Growth Fund | | Turner
Quantitative
Broad Market
Equity Fund | | Turner
Quantitative
Large Cap
Value Fund | |
| | | 10/1/10 thru
3/31/11 | | 10/1/10 thru
3/31/11 | | 10/1/10 thru
3/31/11 | | 10/1/10 thru
3/31/11 | |
| Investment income: | |
| Dividend | | $ | 5,142 | | | $ | 409 | | | $ | 104 | | | $ | 9 | | |
| Interest | | | — | | | | — | | | | — | | | | — | | |
| Securities lending | | | 101 | | | | 239 | | | | — | | | | — | | |
| Foreign taxes withheld | | | (59 | ) | | | — | | | | — | | | | — | | |
| Total Investment Income | | | 5,184 | | | | 648 | | | | 104 | | | | 9 | | |
| Expenses: | |
| Investment advisory fees | | | 4,054 | | | | 1,557 | | | | 29 | | | | 2 | | |
| Administrator fees | | | 760 | | | | 219 | | | | 8 | | | | 1 | | |
| Shareholder service fees (1) | | | 1,080 | | | | 389 | | | | — | | | | — | | |
| Shareholder service fees (2) | | | 7 | | | | — | | | | — | | | | — | | |
| Distribution fees (2) | | | 7 | | | | — | | | | — | | | | — | | |
| Chief compliance officer fees | | | 31 | | | | 6 | | | | 1 | | | | — | | |
| Accounting agent fees | | | 4 | | | | 2 | | | | 1 | | | | 4 | | |
| Custodian fees | | | 95 | | | | 54 | | | | 10 | | | | 8 | | |
| Transfer agent fees | | | 163 | | | | 33 | | | | 9 | | | | 10 | | |
| Registration fees | | | 34 | | | | 13 | | | | 12 | | | | 21 | | |
| Professional fees | | | 146 | | | | 31 | | | | 3 | | | | — | | |
| Trustees' fees | | | 39 | | | | 8 | | | | 1 | | | | — | | |
| Insurance and other fees | | | 151 | | | | 29 | | | | 3 | | | | 1 | | |
| Total expenses before fee reductions | | | 6,571 | | | | 2,341 | | | | 77 | | | | 47 | | |
| Less: | |
| Investment advisory fee waiver | | | (442 | ) | | | (392 | ) | | | (29 | ) | | | (2 | ) | |
| Reimbursements of other operating expenses | | | — | | | | — | | | | (12 | ) | | | (42 | ) | |
| Net expenses | | | 6,129 | | | | 1,949 | | | | 36 | | | | 3 | | |
| Net investment income (loss) | | | (945 | ) | | | (1,301 | ) | | | 68 | | | | 6 | | |
| Net realized gain from securities sold | | | 110,241 | | | | 48,313 | | | | 85 | | | | 22 | | |
| Net realized loss on foreign currency transactions | | | — | | | | — | | | | — | | | | — | | |
| Net change in unrealized appreciation (depreciation) on investments | | | 170,889 | | | | 34,360 | | | | 1,874 | | | | 96 | | |
| Net realized and unrealized gain (loss) from investments, options and foreign currencies | | | 281,130 | | | | 82,673 | | | | 1,959 | | | | 118 | | |
| Net increase (decrease) in net assets resulting from operations | | $ | 280,185 | | | $ | 81,372 | | | $ | 2,027 | | | $ | 124 | | |
70 TURNER FUNDS 2011 SEMIANNUAL REPORT
(Unaudited)
| | | Turner
Global
Opportunities
Fund | | Turner
International
Growth Fund | | Turner
Small Cap
Equity Fund | |
| | | 10/1/10 thru
3/31/11 | | 10/1/10 thru
3/31/11 | | 10/1/10 thru
3/31/11 | |
| Investment income: | |
| Dividend | | $ | 7 | | | $ | 40 | | | $ | 49 | | |
| Interest | | | — | | | | — | | | | — | | |
| Securities lending | | | — | | | | — | | | | 53 | | |
| Foreign taxes withheld | | | (1 | ) | | | (4 | ) | | | — | | |
| Total Investment Income | | | 6 | | | | 36 | | | | 102 | | |
| Expenses: | |
| Investment advisory fees | | | 6 | | | | 26 | | | | 30 | | |
| Administrator fees | | | 1 | | | | 4 | | | | 4 | | |
| Shareholder service fees (1) | | | — | | | | — | | | | 7 | | |
| Shareholder service fees (2) | | | — | | | | — | | | | — | | |
| Distribution fees (2) | | | — | | | | — | | | | — | | |
| Chief compliance officer fees | | | — | | | | — | | | | — | | |
| Accounting agent fees | | | 8 | | | | 9 | | | | 2 | | |
| Custodian fees | | | 11 | | | | 22 | | | | 26 | | |
| Transfer agent fees | | | 5 | | | | 5 | | | | 6 | | |
| Registration fees | | | 5 | | | | 16 | | | | 18 | | |
| Professional fees | | | — | | | | 1 | | | | 1 | | |
| Trustees' fees | | | — | | | | — | | | | — | | |
| Insurance and other fees | | | 2 | | | | 3 | | | | 3 | | |
| Total expenses before fee reductions | | | 38 | | | | 86 | | | | 97 | | |
| Less: | |
| Investment advisory fee waiver | | | (6 | ) | | | (26 | ) | | | (30 | ) | |
| Reimbursements of other operating expenses | | | (23 | ) | | | (27 | ) | | | (22 | ) | |
| Net expenses | | | 9 | | | | 33 | | | | 45 | | |
| Net investment income (loss) | | | (3 | ) | | | 3 | | | | 57 | | |
| Net realized gain from securities sold | | | 100 | | | | 1,030 | | | | 1,255 | | |
| Net realized loss on foreign currency transactions | | | (1 | ) | | | (15 | ) | | | — | | |
| Net change in unrealized appreciation (depreciation) on investments | | | 208 | | | | 183 | | | | 352 | | |
| Net realized and unrealized gain (loss) from investments, options and foreign currencies | | | 307 | | | | 1,198 | | | | 1,607 | | |
| Net increase (decrease) in net assets resulting from operations | | $ | 304 | | | $ | 1,201 | | | $ | 1,664 | | |
(1) Attributable to Investor Class Shares only.
(2) Attributable to Retirement Class Shares only.
Amounts designated as "—" are either not applicable, $0 or have been rounded to $0.
The accompanying notes are an integral part of the financial statements.
TURNER FUNDS 2011 SEMIANNUAL REPORT 71
FINANCIAL STATEMENTS
Statements of changes in net assets (000)
| | | Turner
Market Neutral
Fund | | Turner
Medical Sciences
Long/Short
Fund | | Turner
Spectrum
Fund | | Turner
Titan
Fund | | Turner
All Cap Growth
Fund | |
| | | 2/7/11(1) thru
3/31/2011
(unaudited) | | 2/7/11(1) thru
3/31/2011
(unaudited) | | period ended
3/31/2011
(unaudited) | | year ended
9/30/2010 | | 2/7/11(1) thru
3/31/2011
(unaudited) | | period ended
3/31/2011
(unaudited) | | year ended
9/30/2010 | |
| Investment activities: | |
| Net investment loss | | $ | (1 | ) | | $ | (9 | ) | | $ | (1,834 | ) | | $ | (1,410 | ) | | $ | (6 | ) | | $ | (225 | ) | | $ | (344 | ) | |
| Net realized gain (loss) from securities sold and securities sold short | | | 35 | | | | 1 | | | | 21,206 | | | | (6,861 | ) | | | (39 | ) | | | 4,728 | | | | 3,912 | | |
| Net realized gain (loss) on written option contracts | | | — | | | | — | | | | 124 | | | | 247 | | | | — | | | | (123 | ) | | | — | | |
| Net realized gain (loss) on foreign currency transactions | | | — | | | | — | | | | 251 | | | | (138 | ) | | | — | | | | — | | | | — | | |
Net change in unrealized appreciation (depreciation) on investments and
securities sold short | | | 57 | | | | 75 | | | | 5,095 | | | | 6,237 | | | | 54 | | | | 5,176 | | | | 261 | | |
| Net change in unrealized appreciation (depreciation) on written option contracts | | | — | | | | — | | | | 524 | | | | (56 | ) | | | — | | | | — | | | | — | | |
Net change in unrealized appreciation (depreciation) on foreign currencies and translation
of other assets and liabilities denominated in foreign currencies | | | — | | | | — | | | | (13 | ) | | | (2 | ) | | | — | | | | — | | | | — | | |
| Net increase (decrease) in net assets resulting from operations | | | 91 | | | | 67 | | | | 25,353 | | | | (1,983 | ) | | | 9 | | | | 9,556 | | | | 3,829 | | |
| Dividends and distributions to shareholders: | |
| Net investment income | |
| Investor Class Shares | | | — | | | | — | | | | — | | | | — | | | | — | | | | — | | | | (23 | )^ | |
| Realized capital gains | |
| Institutional Class Shares | | | — | | | | — | | | | — | | | | (92 | ) | | | — | | | | — | | | | — | | |
| Investor Class Shares | | | — | | | | — | | | | — | | | | (47 | ) | | | — | | | | — | | | | — | | |
| Class C Shares | | | — | | | | — | | | | — | | | | (3 | ) | | | — | | | | — | | | | — | | |
| Total dividends and distributions | | | — | | | | — | | | | — | | | | (142 | ) | | | — | | | | — | | | | (23 | ) | |
| Capital share transactions: | |
| Institutional Class Shares | |
| Proceeds from shares issued | | | 3,257 | | | | 2,205 | | | | 171,503 | | | | 187,039 | | | | 4,068 | | | | — | | | | — | | |
| Proceeds from shares issued in lieu of cash distributions | | | — | | | | — | | | | — | | | | 84 | | | | — | | | | — | | | | — | | |
| Cost of shares redeemed | | | — | | | | — | | | | (63,927 | ) | | | (14,332 | ) | | | — | | | | — | | | | — | | |
| Net increase in net assets from Institutional Class Shares transactions | | | 3,257 | | | | 2,205 | | | | 107,576 | | | | 172,791 | | | | 4,068 | | | | — | | | | — | | |
| Investor Class Shares | |
| Proceeds from shares issued | | | 69 | | | | 2,489 | | | | 52,605 | | | | 57,936 | | | | 70 | | | | 37,338 | | | | 7,014 | | |
| Proceeds from shares issued in lieu of cash distributions | | | — | | | | — | | | | — | | | | 47 | | | | — | | | | — | | | | 22 | | |
| Cost of shares redeemed | | | — | | | | (22 | ) | | | (13,843 | ) | | | (10,048 | ) | | | — | | | | (11,153 | ) | | | (13,939 | ) | |
| Net increase (decrease) in net assets from Investor Class Shares transactions | | | 69 | | | | 2,467 | | | | 38,762 | | | | 47,935 | | | | 70 | | | | 26,185 | | | | (6,903 | ) | |
| Class C Shares | |
| Proceeds from shares issued | | | — | | | | 451 | | | | 2,013 | | | | 7,401 | | | | 22 | | | | — | | | | — | | |
| Proceeds from shares issued in lieu of cash distributions | | | — | | | | — | | | | — | | | | 3 | | | | — | | | | — | | | | — | | |
| Cost of shares redeemed | | | — | | | | — | | | | (1,046 | ) | | | (197 | ) | | | — | | | | — | | | | — | | |
| Net increase in net assets from Class C Shares transactions | | | — | | | | 451 | | | | 967 | | | | 7,207 | | | | 22 | | | | — | | | | — | | |
| Net increase (decrease) in net assets from capital share transactions | | | 3,326 | | | | 5,123 | | | | 147,305 | | | | 227,933 | | | | 4,160 | | | | 26,185 | | | | (6,903 | ) | |
| Total increase (decrease) in net assets | | | 3,417 | | | | 5,190 | | | | 172,658 | | | | 225,808 | | | | 4,169 | | | | 35,741 | | | | (3,097 | ) | |
| Net Assets: | |
| Beginning of period | | | — | | | | — | | | | 239,056 | | | | 13,248 | | | | — | | | | 23,227 | | | | 26,324 | | |
| End of period | | $ | 3,417 | | | $ | 5,190 | | | $ | 411,714 | | | $ | 239,056 | | | $ | 4,169 | | | $ | 58,968 | | | $ | 23,227 | | |
| Accumulated net investment loss | | $ | (1 | ) | | $ | (9 | ) | | $ | (2,054 | ) | | $ | (220 | ) | | $ | (6 | ) | | $ | (225 | ) | | $ | — | | |
| Share issued and redeemed: | |
| Institutional Class Shares | |
| Issued | | | 324 | | | | 219 | | | | 11,456 | | | | 17,118 | | | | 402 | | | | — | | | | — | | |
| Issued in lieu of cash distributions | | | — | | | | — | | | | — | | | | 8 | | | | — | | | | — | | | | — | | |
| Redeemed | | | — | | | | — | | | | (2,154 | ) | | | (1,333 | ) | | | — | | | | — | | | | — | | |
| Net increase in Institutional Class Shares | | | 324 | | | | 219 | | | | 9,302 | | | | 15,793 | | | | 402 | | | | — | | | | — | | |
| Investor Class Shares | |
| Issued | | | 7 | | | | 245 | | | | 4,603 | | | | 5,370 | | | | 7 | | | | 4,164 | | | | 1,076 | | |
| Issued in lieu of cash distributions | | | — | | | | — | | | | — | | | | 4 | | | | — | | | | — | | | | 4 | | |
| Redeemed | | | — | | | | (2 | ) | | | (1,228 | ) | | | (938 | ) | | | — | | | | (1,255 | ) | | | (2,198 | ) | |
| Net increase (decrease) in Investor Class Shares | | | 7 | | | | 243 | | | | 3,375 | | | | 4,436 | | | | 7 | | | | 2,909 | | | | (1,118 | ) | |
| Class C Shares | |
| Issued | | | — | | | | 44 | | | | 176 | | | | 688 | | | | 2 | | | | — | | | | — | | |
| Redeemed | | | — | | | | — | | | | (92 | ) | | | (19 | ) | | | — | | | | — | | | | — | | |
| Net increase in Class C Shares | | | — | | | | 44 | | | | 84 | | | | 669 | | | | 2 | | | | — | | | | — | | |
| Net increase (decrease) in share transactions | | | 331 | | | | 506 | | | | 12,761 | | | | 20,898 | | | | 411 | | | | 2,909 | | | | (1,118 | ) | |
(1) Commencement of operations.
^ Includes return of capital of $1 (000).
Amounts designated as "—" are either not applicable, $0 or have been rounded to $0.
The accompanying notes are an integral part of the financial statements.
72 TURNER FUNDS 2011 SEMIANNUAL REPORT
(Unaudited)
TURNER FUNDS 2011 SEMIANNUAL REPORT 73
FINANCIAL STATEMENTS
Statements of changes in net assets (000)
| | | Turner
Concentrated Growth
Fund | | Turner
Emerging Growth
Fund | | Turner
Large Growth
Fund | | Turner
Midcap Growth
Fund | | Turner
Small Cap Growth
Fund | |
| | | period ended
3/31/2011
(unaudited) | | year ended
9/30/2010 | | period ended
3/31/2011
(unaudited) | | year ended
9/30/2010 | | period ended
3/31/2011
(unaudited) | | year ended
9/30/2010 | | period ended
3/31/2011
(unaudited) | | year ended
9/30/2010 | | period ended
3/31/2011
(unaudited) | | year ended
9/30/2010 | |
| Investment activities: | |
| Net investment income (loss) | | $ | (301 | ) | | $ | (468 | ) | | $ | (2,076 | ) | | $ | (3,867 | ) | | $ | (363 | ) | | $ | 751 | | | $ | (945 | ) | | $ | (4,906 | ) | | $ | (1,301 | ) | | $ | (1,976 | ) | |
| Net realized gain from securities sold | | | 8,670 | | | | 4,512 | | | | 53,059 | | | | 31,561 | | | | 83,050 | | | | 28,303 | † | | | 110,241 | | | | 107,778 | | | | 48,313 | | | | 25,168 | | |
| Net change in unrealized appreciation (depreciation) on investments | | | 1,537 | | | | (1,040 | ) | | | 97,658 | | | | 22,753 | | | | 48,653 | | | | 6,444 | | | | 170,889 | | | | 24,016 | | | | 34,360 | | | | 14,979 | | |
| Net increase in net assets resulting from operations | | | 9,906 | | | | 3,004 | | | | 148,641 | | | | 50,447 | | | | 131,340 | | | | 35,498 | | | | 280,185 | | | | 126,888 | | | | 81,372 | | | | 38,171 | | |
| Dividends and distributions to shareholders: | |
| Net investment income | |
| Institutional Class Shares | | | — | | | | — | | | | — | | | | — | | | | (671 | ) | | | (1,623 | ) | | | — | | | | — | | | | — | | | | — | | |
| Investor Class Shares | | | — | | | | (121 | )^ | | | — | | | | — | | | | — | | | | (664 | ) | | | — | | | | — | | | | — | | | | — | | |
| Total dividends and distributions | | | — | | | | (121 | ) | | | — | | | | — | | | | (671 | ) | | | (2,287 | ) | | | — | | | | — | | | | — | | | | — | | |
| Capital share transactions: | |
| Institutional Class Shares | |
| Proceeds from shares issued | | | — | | | | — | | | | 37,982 | | | | 44,818 | | | | 20,103 | | | | 279,938 | | | | 71,011 | | | | 61,281 | | | | — | | | | — | | |
| Proceeds from Fund acquisition (Note 14) | | | — | | | | — | | | | — | | | | — | | | | 140,336 | | | | — | | | | — | | | | — | | | | — | | | | — | | |
| Proceeds from shares issued in lieu of cash distributions | | | — | | | | — | | | | — | | | | — | | | | 612 | | | | 1,398 | | | | — | | | | — | | | | — | | | | — | | |
| Cost of shares redeemed | | | — | | | | — | | | | (30,086 | ) | | | (41,796 | ) | | | (95,758 | ) | | | (312,150 | )† | | | (32,121 | ) | | | (48,879 | ) | | | — | | | | — | | |
| Net increase (decrease) in net assets from Institutional Class Shares transactions | | | — | | | | — | | | | 7,896 | | | | 3,022 | | | | 65,293 | | | | (30,814 | ) | | | 38,890 | | | | 12,402 | | | | — | | | | — | | |
| Investor Class Shares | |
| Proceeds from shares issued | | | 9,255 | | | | 12,686 | | | | 13,917 | | | | 16,414 | | | | 10,459 | | | | 158,361 | | | | 124,576 | | | | 189,151 | | | | 61,598 | | | | 56,625 | | |
| Proceeds from Fund acquisition (Note 14) | | | — | | | | — | | | | — | | | | — | | | | 1,518 | | | | — | | | | — | | | | — | | | | — | | | | — | | |
| Proceeds from shares issued in lieu of cash distributions | | | — | | | | 119 | | | | — | | | | — | | | | — | | | | 597 | | | | — | | | | — | | | | — | | | | — | | |
| Cost of shares redeemed | | | (6,438 | ) | | | (12,737 | ) | | | (25,286 | ) | | | (49,217 | ) | | | (90,003 | ) | | | (254,148 | ) | | | (144,360 | ) | | | (407,498 | ) | | | (72,727 | ) | | | (70,731 | ) | |
| Net increase (decrease) in net assets from Investor Class Shares transactions | | | 2,817 | | | | 68 | | | | (11,369 | ) | | | (32,803 | ) | | | (78,026 | ) | | | (95,190 | ) | | | (19,784 | ) | | | (218,347 | ) | | | (11,129 | ) | | | (14,106 | ) | |
| Retirement Class Shares | |
| Proceeds from shares issued | | | — | | | | — | | | | — | | | | — | | | | — | | | | — | | | | 909 | | | | 793 | | | | — | | | | — | | |
| Cost of shares redeemed | | | — | | | | — | | | | — | | | | — | | | | — | | | | — | | | | (1,564 | ) | | | (642 | ) | | | — | | | | — | | |
| Net increase (decrease) in net assets from Retirement Class Shares transactions | | | — | | | | — | | | | — | | | | — | | | | — | | | | — | | | | (655 | ) | | | 151 | | | | — | | | | — | | |
| Net increase (decrease) in net assets from capital share transactions | | | 2,817 | | | | 68 | | | | (3,473 | ) | | | (29,781 | ) | | | (12,733 | ) | | | (126,004 | ) | | | 18,451 | | | | (205,794 | ) | | | (11,129 | ) | | | (14,106 | ) | |
| Total increase (decrease) in net assets | | | 12,723 | | | | 2,951 | | | | 145,168 | | | | 20,666 | | | | 117,936 | | | | (92,793 | ) | | | 298,636 | | | | (78,906 | ) | | | 70,243 | | | | 24,065 | | |
| Net Assets: | |
| Beginning of period | | | 42,924 | | | | 39,973 | | | | 453,268 | | | | 432,602 | | | | 541,400 | | | | 634,193 | | | | 920,695 | | | | 999,601 | | | | 274,925 | | | | 250,860 | | |
| End of period | | $ | 55,647 | | | $ | 42,924 | | | $ | 598,436 | | | $ | 453,268 | | | $ | 659,336 | | | $ | 541,400 | | | $ | 1,219,331 | | | $ | 920,695 | | | $ | 345,168 | | | $ | 274,925 | | |
| Undistributed net investment income (accumulated net investment income) | | $ | (301 | ) | | $ | — | | | $ | (2,076 | ) | | $ | — | | | $ | (495 | ) | | $ | 539 | | | $ | (945 | ) | | $ | — | | | $ | (1,301 | ) | | $ | — | | |
| Share issued and redeemed: | |
| Institutional Class Shares | |
| Issued | | | — | | | | — | | | | 739 | | | | 1,099 | | | | 4,220 | | | | 27,088 | | | | 2,027 | | | | 2,060 | | | | — | | | | — | | |
| Share from Fund acquisition (Note 14) | | | — | | | | — | | | | — | | | | — | | | | 10,966 | | | | — | | | | — | | | | — | | | | — | | | | — | | |
| Issued in lieu of cash distributions | | | — | | | | — | | | | — | | | | — | | | | 51 | | | | 132 | | | | — | | | | — | | | | — | | | | — | | |
| Redeemed | | | — | | | | — | | | | (628 | ) | | | (1,049 | ) | | | (8,295 | ) | | | (29,854 | )† | | | (917 | ) | | | (1,752 | ) | | | — | | | | — | | |
| Net increase (decrease) in Institutional Class Shares | | | — | | | | — | | | | 111 | | | | 50 | | | | 6,942 | | | | (2,634 | ) | | | 1,110 | | | | 308 | | | | — | | | | — | | |
| Investor Class Shares | |
| Issued | | | 1,191 | | | | 2,002 | | | | 271 | | | | 411 | | | | 930 | | | | 15,470 | | | | 3,515 | | | | 6,754 | | | | 1,762 | | | | 2,130 | | |
| Share from Fund acquisition (Note 14) | | | — | | | | — | | | | — | | | | — | | | | 119 | | | | — | | | | — | | | | — | | | | — | | | | — | | |
| Issued in lieu of cash distributions | | | — | | | | 18 | | | | — | | | | — | | | | — | | | | 56 | | | | — | | | | — | | | | — | | | | — | | |
| Redeemed | | | (845 | ) | | | (2,036 | ) | | | (508 | ) | | | (1,240 | ) | | | (7,566 | ) | | | (25,538 | ) | | | (4,157 | ) | | | (14,508 | ) | | | (2,104 | ) | | | (2,609 | ) | |
| Net increase (decrease) in Investor Class Shares | | | 346 | | | | (16 | ) | | | (237 | ) | | | (829 | ) | | | (6,517 | ) | | | (10,012 | ) | | | (642 | ) | | | (7,754 | ) | | | (342 | ) | | | (479 | ) | |
| Retirement Class Shares | |
| Issued | | | — | | | | — | | | | — | | | | — | | | | — | | | | — | | | | 27 | | | | 29 | | | | — | | | | — | | |
| Redeemed | | | — | | | | — | | | | — | | | | — | | | | — | | | | — | | | | (46 | ) | | | (24 | ) | | | — | | | | — | | |
| Net increase (decrease) in Retirement Class Shares | | | — | | | | — | | | | — | | | | — | | | | — | | | | — | | | | (19 | ) | | | 5 | | | | — | | | | — | | |
| Net increase (decrease) in share transactions | | | 346 | | | | (16 | ) | | | (126 | ) | | | (779 | ) | | | 425 | | | | (12,646 | ) | | | 449 | | | | (7,441 | ) | | | (342 | ) | | | (479 | ) | |
† Includes realized gains, losses or redemptions as a result of in-kind transactions (See Note 13 to Financial Statements.)
^ Includes return of capital of $1 (000).
Amounts designated as "—" are either not applicable, $0 or have been rounded to $0.
The accompanying notes are an integral part of the financial statements.
74 TURNER FUNDS 2011 SEMIANNUAL REPORT
(Unaudited)
TURNER FUNDS 2011 SEMIANNUAL REPORT 75
FINANCIAL STATEMENTS
Statements of changes in net assets (000)
| | | Turner
Quantitative
Broad Market
Equity Fund | | Turner
Quantitative
Large Cap
Value Fund | | Turner
Global Opportunities
Fund | | Turner
International Growth
Fund | | Turner
Small Cap Equity
Fund | |
| | | period ended
3/31/2011
(unaudited) | | year ended
9/30/2010 | | period ended
3/31/2011
(unaudited) | | year ended
9/30/2010 | | period ended
3/31/2011
(unaudited) | | 5/7/10(1) thru
9/30/2010 | | period ended
3/31/2011
(unaudited) | | year ended
9/30/2010 | | period ended
3/31/2011
(unaudited) | | year ended
9/30/2010 | |
| Investment activities: | |
| Net investment income (loss) | | $ | 68 | | | $ | 68 | | | $ | 6 | | | $ | 10 | | | $ | (3 | ) | | $ | (1 | ) | | $ | 3 | | | $ | 24 | | | $ | 57 | | | $ | 38 | | |
| Net realized gain (loss) from securities sold | | | 85 | | | | (473 | ) | | | 22 | | | | 104 | | | | 100 | | | | (4 | ) | | | 1,030 | | | | 465 | | | | 1,255 | | | | 4,883 | | |
| Net realized loss on foreign currency transactions | | | — | | | | — | | | | — | | | | — | | | | (1 | ) | | | (1 | ) | | | (15 | ) | | | (12 | ) | | | — | | | | — | | |
| Net change in unrealized appreciation (depreciation) on investments | | | 1,874 | | | | 133 | | | | 96 | | | | (58 | ) | | | 208 | | | | 159 | | | | 183 | | | | 187 | | | | 352 | | | | (3,478 | ) | |
| Net increase (decrease) in net assets resulting from operations | | | 2,027 | | | | (272 | ) | | | 124 | | | | 56 | | | | 304 | | | | 153 | | | | 1,201 | | | | 664 | | | | 1,664 | | | | 1,443 | | |
| Dividends and distributions to shareholders: | |
| Net investment income | |
| Institutional Class Shares | | | (107 | ) | | | (7 | ) | | | (11 | ) | | | (13 | ) | | | — | | | | — | | | | (48 | ) | | | (59 | ) | | | (10 | ) | | | — | | |
| Investor Class Shares | | | — | | | | — | | | | — | | | | — | | | | — | | | | — | | | | (1 | ) | | | — | | | | (12 | ) | | | — | | |
| Total dividends and distributions | | | (107 | ) | | | (7 | ) | | | (11 | ) | | | (13 | ) | | | — | | | | — | | | | (49 | ) | | | (59 | ) | | | (22 | ) | | | — | | |
| Capital share transactions: | |
| Institutional Class Shares | |
| Proceeds from shares issued | | | 998 | | | | 12,228 | | | | 3 | | | | 1 | | | | 417 | | | | 1,000 | | | | 319 | | | | 518 | | | | 1,740 | | | | 723 | | |
| Proceeds from shares issued in lieu of cash distributions | | | 107 | | | | 7 | | | | 11 | | | | 13 | | | | — | | | | — | | | | 48 | | | | 59 | | | | 10 | | | | — | | |
| Cost of shares redeemed | | | (1,969 | ) | | | (1,525 | ) | | | (137 | ) | | | (3 | ) | | | (522 | ) | | | — | | | | (126 | ) | | | — | | | | (2,260 | ) | | | (6,351 | ) | |
| Net increase (decrease) in net assets from Institutional Class Shares transactions | | | (864 | ) | | | 10,710 | | | | (123 | ) | | | 11 | | | | (105 | ) | | | 1,000 | | | | 241 | | | | 577 | | | | (510 | ) | | | (5,628 | ) | |
| Investor Class Shares | |
| Proceeds from shares issued | | | 5 | | | | 15 | | | | — | | | | — | | | | 695 | | | | — | | | | 484 | | | | 135 | | | | 280 | | | | 1,249 | | |
| Proceeds from shares issued in lieu of cash distributions | | | — | | | | — | | | | — | | | | — | | | | — | | | | — | | | | 1 | | | | — | | | | 12 | | | | — | | |
| Cost of shares redeemed | | | — | | | | (5 | ) | | | — | | | | — | | | | (2 | ) | | | — | | | | (125 | ) | | | (36 | ) | | | (2,170 | ) | | | (19,715 | ) | |
| Net increase (decrease) in net assets from Investor Class Shares transactions | | | 5 | | | | 10 | | | | — | | | | — | | | | 693 | | | | — | | | | 360 | | | | 99 | | | | (1,878 | ) | | | (18,466 | ) | |
| Net increase (decrease) in net assets from capital share transactions | | | (859 | ) | | | 10,720 | | | | (123 | ) | | | 11 | | | | 588 | | | | 1,000 | | | | 601 | | | | 676 | | | | (2,388 | ) | | | (24,094 | ) | |
| Total increase (decrease) in net assets | | | 1,061 | | | | 10,441 | | | | (10 | ) | | | 54 | | | | 892 | | | | 1,153 | | | | 1,753 | | | | 1,281 | | | | (746 | ) | | | (22,651 | ) | |
| Net Assets: | |
| Beginning of period | | | 10,972 | | | | 531 | | | | 830 | | | | 776 | | | | 1,153 | | | | — | | | | 5,129 | | | | 3,848 | | | | 6,448 | | | | 29,099 | | |
| End of period | | $ | 12,033 | | | $ | 10,972 | | | $ | 820 | | | $ | 830 | | | $ | 2,045 | | | $ | 1,153 | | | $ | 6,882 | | | $ | 5,129 | | | $ | 5,702 | | | $ | 6,448 | | |
| Undistributed net investment income (accumulated net investment income) | | $ | 26 | | | $ | 65 | | | $ | 3 | | | $ | 8 | | | $ | (3 | ) | | $ | — | | | $ | (60 | ) | | $ | (14 | ) | | $ | 55 | | | $ | 20 | | |
| Share issued and redeemed: | |
| Institutional Class Shares | |
| Issued | | | 102 | | | | 1,338 | | | | — | | | | — | | | | 31 | | | | 100 | | | | 29 | | | | 60 | | | | 147 | | | | 69 | | |
| Issued in lieu of cash distributions | | | 11 | | | | 1 | | | | 1 | | | | 2 | | | | — | | | | — | | | | 4 | | | | 7 | | | | 1 | | | | — | | |
| Redeemed | | | (202 | ) | | | (173 | ) | | | (16 | ) | | | — | | | | (37 | ) | | | — | | | | (11 | ) | | | — | | | | (174 | ) | | | (597 | ) | |
| Net increase (decrease) in Institutional Class Shares | | | (89 | ) | | | 1,166 | | | | (15 | ) | | | 2 | | | | (6 | ) | | | 100 | | | | 22 | | | | 67 | | | | (26 | ) | | | (528 | ) | |
| Investor Class Shares | |
| Issued | | | — | | | | 2 | | | | — | | | | — | | | | 50 | | | | — | | | | 45 | | | | 16 | | | | 22 | | | | 124 | | |
| Issued in lieu of cash distributions | | | — | | | | — | | | | — | | | | — | | | | — | | | | — | | | | — | | | | — | | | | 1 | | | | — | | |
| Redeemed | | | — | | | | (1 | ) | | | — | | | | — | | | | — | | | | — | | | | (12 | ) | | | (4 | ) | | | (180 | ) | | | (1,976 | ) | |
| Net increase (decrease) in Investor Class Shares | | | — | | | | 1 | | | | — | | | | — | | | | 50 | | | | — | | | | 33 | | | | 12 | | | | (157 | ) | | | (1,852 | ) | |
| Net increase (decrease) in share transactions | | | (89 | ) | | | 1,167 | | | | (15 | ) | | | 2 | | | | 44 | | | | 100 | | | | 55 | | | | 79 | | | | (183 | ) | | | (2,380 | ) | |
(1) Commencement of operations.
Amounts designated as "—" are either not applicable, $0 or have been rounded to $0.
The accompanying notes are an integral part of the financial statements.
76 TURNER FUNDS 2011 SEMIANNUAL REPORT
(Unaudited)
TURNER FUNDS 2011 SEMIANNUAL REPORT 77
FINANCIAL STATEMENTS
(Unaudited)
Statements of cash flows (000)
| | | Turner
Market Neutral
Fund | | Turner
Medical Sciences
Long/Short
Fund | |
| | | 2/7/11(1) thru
3/31/11 | | 2/7/11(1) thru
3/31/11 | |
| Cash flows from operating activities: | |
| Net increase(decrease) in net assets resulting from operations | | $ | 91 | | | $ | 67 | | |
Adjustments to reconcile net increase in net assets resulting
from operations to net cash used in operating activities | |
| Purchases of long-term portfolio investments | | | (7,211 | ) | | | (3,241 | ) | |
| Proceeds from sales of long-term portfolio investments | | | 4,415 | | | | 1,356 | | |
| Purchases of short-term portfolio investments | | | (4,136 | ) | | | (5,510 | ) | |
| Proceeds from sales of short-term investments | | | 4,133 | | | | 2,787 | | |
| Payments to cover securities sold short | | | (4,599 | ) | | | (1,232 | ) | |
| Proceeds from securities sold short | | | 7,385 | | | | 2,426 | | |
| Realized gain from securities sold and securities sold short | | | (35 | ) | | | (1 | ) | |
| Change in unrealized appreciation (depreciation) on investments | | | (110 | ) | | | (84 | ) | |
| Change in unrealized appreciation (depreciation) on securities sold short | | | 53 | | | | 9 | | |
| Increase in deposits with brokers for securities sold short and options | | | (3,435 | ) | | | (1,708 | ) | |
| Increase in receivable for investment securities sold | | | (550 | ) | | | (40 | ) | |
| Increase in prepaid expenses | | | (1 | ) | | | — | | |
| Increase in receivable for dividend income | | | (3 | ) | | | — | | |
| Increase in payable for investment securities purchased | | | 674 | | | | 181 | | |
| Increase in payable due to investment adviser | | | 3 | | | | 6 | | |
| Increase in other accrued expenses | | | — | | | | 2 | | |
| Net cash provided by operating activities | | | (3,326 | ) | | | (4,982 | ) | |
| Cash flows from financing activities: | |
| Proceeds from shares issued | | | 3,326 | | | | 5,004 | | |
| Cost of shares reedemed | | | — | | | | (22 | ) | |
| Distributions from capital gains | | | — | | | | — | | |
| Net cash used in financing activities | | | 3,326 | | | | 4,982 | | |
| Net increase in cash | | | — | | | | — | | |
| Cash, beginning of period | | | — | | | | — | | |
| Cash, end of period | | $ | — | | | $ | — | | |
Non-cash
Capital shares sold receivable | | $ | — | | | $ | (141 | ) | |
| Capital shares redeemed payable | | | — | | | | — | | |
| Reinvestments of distributions | | | — | | | | — | | |
(1) Commencement of operations.
Amounts designated as "—" are either not applicable, $0 or have been rounded to $0.
The accompanying notes are an integral part of the financial statements.
78 TURNER FUNDS 2011 SEMIANNUAL REPORT
FINANCIAL STATEMENTS
(Unaudited)
Statements of cash flows (000)
| | | Turner
Spectrum
Fund | | Turner
Titan
Fund | |
| | | period ended
3/31/11 | | 2/7/11(1) thru
3/31/11 | |
| Cash flows from operating activities: | |
| Net increase(decrease) in net assets resulting from operations | | $ | 25,353 | | | $ | 9 | | |
Adjustments to reconcile net increase in net assets resulting
from operations to net cash used in operating activities | |
| Purchases of long-term portfolio investments | | | (1,244,184 | ) | | | (6,233 | ) | |
| Proceeds from sales of long-term portfolio investments | | | 1,189,623 | | | | 2,810 | | |
| Purchases of short-term portfolio investments | | | (552,047 | ) | | | (4,960 | ) | |
| Proceeds from sales of short-term investments | | | 513,934 | | | | 4,629 | | |
| Payments to cover securities sold short | | | (939,893 | ) | | | (3,057 | ) | |
| Proceeds from securities sold short | | | 972,176 | | | | 4,981 | | |
| Realized gain on written option contracts | | | (124 | ) | | | — | | |
| Realized gain/loss from securities sold and securities sold short | | | (21,206 | ) | | | 39 | | |
| Premiums received from written option contracts | | | 13,655 | | | | — | | |
| Premiums paid to closed option contracts | | | (11,403 | ) | | | — | | |
| Change in unrealized appreciation (depreciation) on investments | | | (7,813 | ) | | | (91 | ) | |
| Change in unrealized appreciation (depreciation) on written option contracts | | | (524 | ) | | | — | | |
| Change in unrealized appreciation (depreciation) on securities sold short | | | 2,718 | | | | 37 | | |
| Increase in deposits with brokers for securities sold short and options | | | (88,573 | ) | | | (2,500 | ) | |
| Increase in receivable for investment securities sold | | | (5,371 | ) | | | (618 | ) | |
| Decrease in prepaid expenses | | | 38 | | | | — | | |
| Increase in receivable for dividend income | | | (70 | ) | | | (1 | ) | |
| Increase in reclaim receivable | | | (1 | ) | | | — | | |
| Increase in payable for investment securities purchased | | | 9,985 | | | | 789 | | |
| Decrease in broker fees and charges on short sales payable | | | (5 | ) | | | — | | |
| Increase in payable due to investment adviser | | | 294 | | | | 4 | | |
| Increase in payable due to shareholder servicing | | | 11 | | | | — | | |
| Increase in payable due to distributor | | | 1 | | | | — | | |
| Increase in payable due to administrator | | | 38 | | | | — | | |
| Decrease in dividends payable on securities sold short | | | (22 | ) | | | — | | |
| Increase in other accrued expenses | | | 80 | | | | 2 | | |
| Net cash provided by operating activities | | | (143,330 | ) | | | (4,160 | ) | |
| Cash flows from financing activities: | |
| Proceeds from shares issued | | | 222,076 | | �� | | 4,160 | | |
| Cost of shares reedemed | | | (78,746 | ) | | | — | | |
| Net cash used in financing activities | | | 143,330 | | | | 4,160 | | |
| Net increase in cash | | | — | | | | — | | |
| Cash, beginning of period | | | — | | | | — | | |
| Cash, end of period | | $ | — | | | $ | — | | |
Non-cash
Capital shares sold receivable | | $ | (4,044 | ) | | $ | — | | |
| Capital shares redeemed payable | | | 70 | | | | — | | |
| Reinvestments of distributions | | | 134 | | | | — | | |
(1) Commencement of operations.
Amounts designated as "—" are either not applicable, $0 or have been rounded to $0.
The accompanying notes are an integral part of the financial statements.
TURNER FUNDS 2011 SEMIANNUAL REPORT 79
FINANCIAL STATEMENTS
Financial highlights
For a share outstanding throughout each period
| | | Net asset
value,
beginning
of period | | Net
investment
income
(loss) | | Realized and
unrealized
gains (losses)
on investments | | Total
from
investment
operations | | Dividends
from net
investment
income | | Distributions
from
capital
gains | | Total
dividends and
distributions | | Net asset
value, end
of period | |
| Turner Market Neutral Fund — Institutional Class Shares | | | |
| | 2011 | (1) | | $ | 10.00 | | | | (0.01 | ) (2) | | | 0.35 | | | | 0.34 | | | | — | | | | — | | | | — | | | $ | 10.34 | | |
| Turner Market Neutral Fund — Investor Class Shares | | | |
| | 2011 | (1) | | $ | 10.00 | | | | — | (2)* | | | 0.33 | | | | 0.33 | | | | — | | | | — | | | | — | | | $ | 10.33 | | |
| Turner Market Neutral Fund — Class C Shares | | | |
| | 2011 | (1) | | $ | 10.00 | | | | (0.02 | ) (2) | | | 0.35 | | | | 0.33 | | | | — | | | | — | | | | — | | | $ | 10.33 | | |
| Turner Medical Sciences Long/Short Fund — Institutional Class Shares | | | |
| | 2011 | (1) | | $ | 10.00 | | | | (0.03 | ) (2) | | | 0.29 | | | | 0.26 | | | | — | | | | — | | | | — | | | $ | 10.26 | | |
| Turner Medical Sciences Long/Short Fund — Investor Class Shares | | | |
| | 2011 | (1) | | $ | 10.00 | | | | (0.03 | ) (2) | | | 0.29 | | | | 0.26 | | | | — | | | | — | | | | — | | | $ | 10.26 | | |
| Turner Medical Sciences Long/Short Fund — Class C Shares | | | |
| | 2011 | (1) | | $ | 10.00 | | | | (0.04 | ) (2) | | | 0.29 | | | | 0.25 | | | | — | | | | — | | | | — | | | $ | 10.25 | | |
| Turner Spectrum Fund — Institutional Class Shares | | | |
| | 2011 | ** | | $ | 10.82 | | | | (0.06 | ) (2) | | | 1.06 | | | | 1.00 | | | | — | | | | — | | | | — | | | $ | 11.82 | | |
| | 2010 | | | $ | 10.81 | | | | (0.13 | ) (2) | | | 0.21 | (3) | | | 0.08 | | | | — | | | | (0.07 | ) | | | (0.07 | ) | | $ | 10.82 | | |
| | 2009 | (5) | | $ | 10.00 | | | | (0.07 | ) (2) | | | 0.88 | | | | 0.81 | | | | — | | | | — | | | | — | | | $ | 10.81 | | |
| Turner Spectrum Fund — Investor Class Shares | | | |
| | 2011 | ** | | $ | 10.78 | | | | (0.08 | ) (2) | | | 1.06 | | | | 0.98 | | | | — | | | | — | | | | — | | | $ | 11.76 | | |
| | 2010 | | | $ | 10.80 | | | | (0.16 | ) (2) | | | 0.21 | (3) | | | 0.05 | | | | — | | | | (0.07 | ) | | | (0.07 | ) | | $ | 10.78 | | |
| | 2009 | (5) | | $ | 10.00 | | | | (0.09 | ) (2) | | | 0.89 | | | | 0.80 | | | | — | | | | — | | | | — | | | $ | 10.80 | | |
| Turner Spectrum Fund — Class C Shares | | | |
| | 2011 | ** | | $ | 10.72 | | | | (0.12 | ) (2) | | | 1.05 | | | | 0.93 | | | | — | | | | — | | | | — | | | $ | 11.65 | | |
| | 2010 | | | $ | 10.80 | | | | (0.24 | ) (2) | | | 0.23 | (3) | | | (0.01 | ) | | | — | | | | (0.07 | ) | | | (0.07 | ) | | $ | 10.72 | | |
| | 2009 | (7) | | $ | 9.98 | | | | (0.07 | ) (2) | | | 0.89 | | | | 0.82 | | | | — | | | | — | | | | — | | | $ | 10.80 | | |
| Turner Titan Fund — Institutional Class Shares | | | |
| | 2011 | (1) | | $ | 10.00 | | | | (0.02 | ) (2) | | | 0.17 | | | | 0.15 | | | | — | | | | — | | | | — | | | $ | 10.15 | | |
| Turner Titan Fund — Investor Class Shares | | | |
| | 2011 | (1) | | $ | 10.00 | | | | (0.03 | ) (2) | | | 0.18 | | | | 0.15 | | | | — | | | | — | | | | — | | | $ | 10.15 | | |
| Turner Titan Fund — Class C Shares | | | |
| | 2011 | (1) | | $ | 10.00 | | | | (0.04 | ) (2) | | | 0.18 | | | | 0.14 | | | | — | | | | — | | | | — | | | $ | 10.14 | | |
| Turner All Cap Growth Fund — Investor Class Shares | | | |
| | 2011 | ** | | $ | 7.03 | | | | (0.05 | ) (2) | | | 2.51 | | | | 2.46 | | | | — | | | | — | | | | — | | | $ | 9.49 | | |
| | 2010 | | | $ | 5.95 | | | | (0.09 | ) (2) | | | 1.18 | | | | 1.09 | | | | (0.01 | ) | | | — | | | | (0.01 | ) | | $ | 7.03 | | |
| | 2009 | | | $ | 5.60 | | | | — | * (2) | | | 0.35 | | | | 0.35 | | | | — | | | | — | | | | — | | | $ | 5.95 | | |
| | 2008 | | | $ | 8.72 | | | | (0.07 | ) (2) | | | (3.05 | ) | | | (3.12 | ) | | | — | | | | — | | | | — | | | $ | 5.60 | | |
| | 2007 | | | $ | 6.26 | | | | (0.07 | ) (2) | | | 2.53 | | | | 2.46 | | | | — | | | | — | | | | — | | | $ | 8.72 | | |
| | 2006 | | | $ | 5.86 | | | | (0.07 | ) (2) | | | 0.47 | (3) | | | 0.40 | | | | — | | | | — | | | | — | | | $ | 6.26 | | |
80 TURNER FUNDS 2011 SEMIANNUAL REPORT
| | | Total
return | | Net
assets end
of period
(000) | | Ratio of
net expenses
to average
net assets† | | Ratio of
net expenses
to average
net assets | | Ratio of total
expenses
to average
net assets | | Ratio of net
investment
income (loss)
to average
net assets† | | Portfolio
turnover
rate†† | |
| Turner Market Neutral Fund — Institutional Class Shares | |
| | 2011 | (1) | | | 3.40 | %††† | | $ | 3,346 | | | | 1.95 | % | | | 1.95 | % | | | 2.56 | % | | | (0.36 | )% | | | 231 | % | |
| Turner Market Neutral Fund — Investor Class Shares | |
| | 2011 | (1) | | | 3.30 | %††† | | $ | 71 | | | | 2.17 | % | | | 2.17 | % | | | 2.94 | % | | | (0.28 | )% | | | 231 | % | |
| Turner Market Neutral Fund — Class C Shares | |
| | 2011 | (1) | | | 3.30 | %††† | | $ | — | | | | 2.92 | % | | | 2.92 | % | | | 3.19 | % | | | (1.49 | )% | | | 231 | % | |
| Turner Medical Sciences Long/Short Fund — Institutional Class Shares | |
| | 2011 | (1) | | | 2.60 | %††† | | $ | 2,247 | | | | 1.93 | % | | | 1.93 | % | | | 2.12 | % | | | (1.73 | )% | | | 105 | % | |
| Turner Medical Sciences Long/Short Fund — Investor Class Shares | |
| | 2011 | (1) | | | 2.60 | %††† | | $ | 2,490 | | | | 2.18 | % | | | 2.18 | % | | | 2.49 | % | | | (2.11 | )% | | | 105 | % | |
| Turner Medical Sciences Long/Short Fund — Class C Shares | |
| | 2011 | (1) | | | 2.50 | %††† | | $ | 453 | | | | 2.93 | % | | | 2.93 | % | | | 3.10 | % | | | (2.84 | )% | | | 105 | % | |
| Turner Spectrum Fund — Institutional Class Shares | |
| | 2011 | ** | | | 9.24 | %††† | | $ | 306,096 | | | | 1.91 | % | | | 1.91 | % | | | 2.43 | % | | | (1.13 | )% | | | 556 | % | |
| | 2010 | | | | 0.77 | % | | $ | 179,526 | | | | 1.91 | % (4) | | | 1.91 | % (4) | | | 2.85 | % | | | (1.23 | )% | | | 1,808 | % | |
| | 2009 | (5) | | | 8.10 | %††† | | $ | 8,681 | | | | 2.44 | % (6) | | | 2.44 | % (6) | | | 5.63 | % | | | (1.78 | )% | | | 663 | % | |
| Turner Spectrum Fund — Investor Class Shares | |
| | 2011 | ** | | | 9.09 | %††† | | $ | 96,840 | | | | 2.16 | % | | | 2.16 | % | | | 2.67 | % | | | (1.39 | )% | | | 556 | % | |
| | 2010 | | | | 0.49 | % | | $ | 52,361 | | | | 2.17 | % (4) | | | 2.17 | % (4) | | | 3.12 | % | | | (1.52 | )% | | | 1,808 | % | |
| | 2009 | (5) | | | 8.00 | %††† | | $ | 4,567 | | | | 2.71 | % (6) | | | 2.71 | % (6) | | | 5.84 | % | | | (2.09 | )% | | | 663 | % | |
| Turner Spectrum Fund — Class C Shares | |
| | 2011 | ** | | | 8.68 | %††† | | $ | 8,778 | | | | 2.91 | % | | | 2.91 | % | | | 3.42 | % | | | (2.12 | )% | | | 556 | % | |
| | 2010 | | | | (0.07 | )% | | $ | 7,169 | | | | 2.92 | % (4) | | | 2.92 | % (4) | | | 3.82 | % | | | (2.19 | )% | | | 1,808 | % | |
| | 2009 | (7) | | | 8.22 | %††† | | $ | — | | | | 2.35 | % (6) | | | 2.35 | % (6) | | | 5.28 | % | | | (3.12 | )% | | | 663 | % | |
| Turner Titan Fund — Institutional Class Shares | |
| | 2011 | (1) | | | 1.50 | %††† | | $ | 4,077 | | | | 1.94 | % | | | 1.94 | % | | | 2.45 | % | | | (1.50 | )% | | | 129 | % | |
| Turner Titan Fund — Investor Class Shares | |
| | 2011 | (1) | | | 1.50 | %††† | | $ | 70 | | | | 2.17 | % | | | 2.17 | % | | | 2.69 | % | | | (1.73 | )% | | | 129 | % | |
| Turner Titan Fund — Class C Shares | |
| | 2011 | (1) | | | 1.40 | %††† | | $ | 22 | | | | 2.94 | % | | | 2.94 | % | | | 3.38 | % | | | (2.46 | )% | | | 129 | % | |
| Turner All Cap Growth Fund — Investor Class Shares | |
| | 2011 | ** | | | 34.99 | %††† | | $ | 58,968 | | | | 1.61 | % | | | 1.61 | % | | | 2.06 | % | | | (1.10 | )% | | | 84 | % | |
| | 2010 | | | | 18.25 | % | | $ | 23,227 | | | | 1.64 | % | | | 1.64 | % | | | 2.15 | % | | | (1.38 | )% | | | 115 | % | |
| | 2009 | | | | 6.25 | % | | $ | 26,324 | | | | 0.62 | % | | | 0.63 | % | | | 1.23 | % | | | 0.09 | % | | | 220 | % | |
| | 2008 | | | | (35.78 | )% | | $ | 32,759 | | | | 1.52 | % | | | 1.54 | % | | | 1.90 | % | | | (0.89 | )% | | | 323 | % | |
| | 2007 | | | | 39.30 | % | | $ | 70,145 | | | | 1.27 | % | | | 1.27 | % | | | 1.73 | % | | | (0.98 | )% | | | 173 | % | |
| | 2006 | | | | 6.83 | % | | $ | 24,040 | | | | 1.61 | % | | | 1.61 | % | | | 2.06 | % | | | (1.02 | )% | | | 235 | % | |
* Amount represents less than $0.01 per share.
** For the six-month period ended March 31, 2011, unless otherwise indicated (unaudited). All ratios for the period have been annualized.
† Inclusive of fees paid indirectly, waivers and/or reimbursements.
†† Excludes effect of in-kind transfers and mergers, as applicable. Not annualized for periods less than one year.
††† Total return is for the period indicated and has not been annualized.
(1) Commenced operations on February 7, 2011. All ratios for the period have been annualized (unaudited).
(2) Based on average shares outstanding.
(3) The amount shown for a share outstanding throughout the period does not accord with the aggregate net losses on investments for the period because of the sales and repurchases of fund shares in relation to fluctuating market value of the investments of the Fund.
(4) Dividend expense totaled 0.45% of average net assets for the year ended September 30, 2010, 0.42% of which was waived. Broker fees and charges on short sales totaled 0.38% of average net assets for the year ended September 30, 2010, 0.37% of which was waived beginning on January 13, 2010. If dividend expense and broker fees and charges on short sales had not been contractually waived, the ratios of net expenses to average net assets would have been 2.70%, 2.96% and 3.71% for the Institutional, Investor and Class C Shares, respectively.
(5) Commenced operations on May 7, 2009. All ratios for the period have been annualized.
(6) Dividend expense totaled 0.70% of average net assets for the period ended September 30, 2009. If dividend expense had not been contractually waived, the ratios of net expenses to average net assets would have been 3.14%, 3.41% and 3.05% for the Institutional, Investor and Class C Shares, respectively. If broker fees and charges on short sales had not been included, the ratios of net expenses to average net assets would have been 1.94%, 2.20% and 1.95% for the Institutional, Investor and Class C Shares, respectively.
(7) Commenced operations on July 14, 2009. All ratios for the period have been annualized.
Amounts designated as "—" are either $0, not applicable or have been rounded to $0.
The accompanying notes are an integral part of the financial statements.
TURNER FUNDS 2011 SEMIANNUAL REPORT 81
FINANCIAL STATEMENTS
Financial highlights
For a share outstanding throughout each period
| | | Net asset
value,
beginning
of period | | Net
investment
income
(loss) | | Realized and
unrealized
gains (losses)
on investments | | Total
from
investment
operations | | Dividends
from net
investment
income | | Distributions
from
capital
gains | | Total
dividends and
distributions | | Net asset
value, end
of period | |
| Turner Concentrated Growth Fund — Investor Class Shares | | | |
| | 2011 | * | | $ | 6.63 | | | | (0.05 | ) (1) | | | 1.58 | | | | 1.53 | | | | — | | | | — | | | | — | | | $ | 8.16 | | |
| | 2010 | | | $ | 6.16 | | | | (0.07 | ) (1) | | | 0.56 | | | | 0.49 | | | | (0.02 | ) | | | — | | | | (0.02 | ) | | $ | 6.63 | | |
| | 2009 | | | $ | 6.35 | | | | 0.02 | (1) | | | (0.21 | ) | | | (0.19 | ) | | | — | | | | — | | | | — | | | $ | 6.16 | | |
| | 2008 | | | $ | 10.12 | | | | (0.07 | ) (1) | | | (3.70 | ) | | | (3.77 | ) | | | — | | | | — | | | | — | | | $ | 6.35 | | |
| | 2007 | | | $ | 7.60 | | | | (0.05 | ) (1) | | | 2.57 | | | | 2.52 | | | | — | | | | — | | | | — | | | $ | 10.12 | | |
| | 2006 | | | $ | 7.10 | | | | (0.08 | ) (1) | | | 0.58 | | | | 0.50 | | | | — | | | | — | | | | — | | | $ | 7.60 | | |
| Turner Emerging Growth Fund — Institutional Class Shares | | | |
| | 2011 | * | | $ | 42.51 | | | | (0.17 | ) (1) | | | 14.47 | | | | 14.30 | | | | — | | | | — | | | | — | | | $ | 56.81 | | |
| | 2010 | | | $ | 37.78 | | | | (0.31 | ) (1) | | | 5.04 | | | | 4.73 | | | | — | | | | — | | | | — | | | $ | 42.51 | | |
| | 2009 | (2) | | $ | 28.45 | | | | (0.12 | ) (1) | | | 9.45 | (3) | | | 9.33 | | | | — | | | | — | | | | — | | | $ | 37.78 | | |
| Turner Emerging Growth Fund — Investor Class Shares | | | |
| | 2011 | * | | $ | 42.32 | | | | (0.24 | ) (1) | | | 14.42 | | | | 14.18 | | | | — | | | | — | | | | — | | | $ | 56.50 | | |
| | 2010 | | | $ | 37.71 | | | | (0.41 | ) (1) | | | 5.02 | | | | 4.61 | | | | — | | | | — | | | | — | | | $ | 42.32 | | |
| | 2009 | | | $ | 46.42 | | | | (0.22 | ) (1) | | | (7.31 | ) | | | (7.53 | ) | | | — | | | | (1.18 | ) | | | (1.18 | ) | | $ | 37.71 | | |
| | 2008 | | | $ | 64.06 | | | | (0.35 | ) (1) | | | (8.54 | ) | | | (8.89 | ) | | | (0.25 | ) | | | (8.50 | ) | | | (8.75 | ) | | $ | 46.42 | | |
| | 2007 | | | $ | 55.97 | | | | (0.30 | ) (1) | | | 13.61 | | | | 13.31 | | | | — | | | | (5.22 | ) | | | (5.22 | ) | | $ | 64.06 | | |
| | 2006 | | | $ | 56.46 | | | | (0.32 | ) (1) | | | 3.02 | | | | 2.70 | | | | — | | | | (3.19 | ) | | | (3.19 | ) | | $ | 55.97 | | |
| Turner Large Growth Fund — Institutional Class Shares | | | |
| | 2011 | * | | $ | 10.56 | | | | — | ** (1) | | | 2.20 | | | | 2.20 | | | | (0.02 | ) | | | — | | | | (0.02 | ) | | $ | 12.74 | | |
| | 2010 | | | $ | 9.93 | | | | 0.02 | (1) | | | 0.65 | | | | 0.67 | | | | (0.04 | ) | | | — | | | | (0.04 | ) | | $ | 10.56 | | |
| | 2009 | | | $ | 10.41 | | | | 0.05 | (1) | | | (0.48 | ) | | | (0.43 | ) | | | (0.05 | ) | | | — | | | | (0.05 | ) | | $ | 9.93 | | |
| | 2008 | | | $ | 14.39 | | | | 0.06 | (1) | | | (4.01 | ) | | | (3.95 | ) | | | (0.03 | ) | | | — | | | | (0.03 | ) | | $ | 10.41 | | |
| | 2007 | | | $ | 11.65 | | | | 0.02 | | | | 2.77 | | | | 2.79 | | | | (0.05 | ) | | | — | | | | (0.05 | ) | | $ | 14.39 | | |
| | 2006 | | | $ | 10.93 | | | | 0.06 | | | | 0.69 | | | | 0.75 | | | | (0.03 | ) | | | — | | | | (0.03 | ) | | $ | 11.65 | | |
| Turner Large Growth Fund — Investor Class Shares | | | |
| | 2011 | * | | $ | 10.49 | | | | (0.02 | ) (1) | | | 2.20 | | | | 2.18 | | | | — | | | | — | | | | — | | | $ | 12.67 | | |
| | 2010 | | | $ | 9.87 | | | | — | ** (1) | | | 0.64 | | | | 0.64 | | | | (0.02 | ) | | | — | | | | (0.02 | ) | | $ | 10.49 | | |
| | 2009 | | | $ | 10.34 | | | | 0.03 | (1) | | | (0.47 | ) | | | (0.44 | ) | | | (0.03 | ) | | | — | | | | (0.03 | ) | | $ | 9.87 | | |
| | 2008 | | | $ | 14.33 | | | | 0.02 | (1) | | | (3.99 | ) | | | (3.97 | ) | | | (0.02 | ) | | | — | | | | (0.02 | ) | | $ | 10.34 | | |
| | 2007 | | | $ | 11.61 | | | | 0.02 | | | | 2.73 | | | | 2.75 | | | | (0.03 | ) | | | — | | | | (0.03 | ) | | $ | 14.33 | | |
| | 2006 | | | $ | 10.93 | | | | 0.07 | | | | 0.64 | | | | 0.71 | | | | (0.03 | ) | | | — | | | | (0.03 | ) | | $ | 11.61 | | |
| Turner Midcap Growth Fund — Institutional Class Shares | | | |
| | 2011 | * | | $ | 29.90 | | | | — | ** (1) | | | 9.17 | | | | 9.17 | | | | — | | | | — | | | | — | | | $ | 39.07 | | |
| | 2010 | | | $ | 26.12 | | | | (0.08 | ) (1) | | | 3.86 | | | | 3.78 | | | | — | | | | — | | | | — | | | $ | 29.90 | | |
| | 2009 | | | $ | 26.20 | | | | (0.01 | ) (1) | | | (0.07 | ) | | | (0.08 | ) | | | — | | | | — | | | | — | | | $ | 26.12 | | |
| | 2008 | (4) | | $ | 34.67 | | | | (0.01 | ) (1) | | | (8.46 | ) | | | (8.47 | ) | | | — | | | | — | | | | — | | | $ | 26.20 | | |
| Turner Midcap Growth Fund — Investor Class Shares | | | |
| | 2011 | * | | $ | 29.73 | | | | (0.04 | ) (1) | | | 9.10 | | | | 9.06 | | | | — | | | | — | | | | — | | | $ | 38.79 | | |
| | 2010 | | | $ | 26.03 | | | | (0.15 | ) (1) | | | 3.85 | | | | 3.70 | | | | — | | | | — | | | | — | | | $ | 29.73 | | |
| | 2009 | | | $ | 26.18 | | | | (0.06 | ) (1) | | | (0.09 | ) | | | (0.15 | ) | | | — | | | | — | | | | — | | | $ | 26.03 | | |
| | 2008 | | | $ | 35.71 | | | | (0.14 | ) (1) | | | (9.39 | ) | | | (9.53 | ) | | | — | | | | — | | | | — | | | $ | 26.18 | | |
| | 2007 | | | $ | 27.63 | | | | (0.20 | ) (1) | | | 8.28 | | | | 8.08 | | | | — | | | | — | | | | — | | | $ | 35.71 | | |
| | 2006 | | | $ | 26.39 | | | | (0.08 | ) (1) | | | 1.32 | | | | 1.24 | | | | — | | | | — | | | | — | | | $ | 27.63 | | |
| Turner Midcap Growth Fund — Retirement Class Shares | | | |
| | 2011 | * | | $ | 28.71 | | | | (0.07 | ) (1) | | | 8.77 | | | | 8.70 | | | | — | | | | — | | | | — | | | $ | 37.41 | | |
| | 2010 | | | $ | 25.20 | | | | (0.21 | ) (1) | | | 3.72 | | | | 3.51 | | | | — | | | | — | | | | — | | | $ | 28.71 | | |
| | 2009 | | | $ | 25.40 | | | | (0.11 | ) (1) | | | (0.09 | ) | | | (0.20 | ) | | | — | | | | — | | | | — | | | $ | 25.20 | | |
| | 2008 | | | $ | 34.74 | | | | (0.22 | ) (1) | | | (9.12 | ) | | | (9.34 | ) | | | — | | | | — | | | | — | | | $ | 25.40 | | |
| | 2007 | | | $ | 26.96 | | | | (0.30 | ) (1) | | | 8.08 | | | | 7.78 | | | | — | | | | — | | | | — | | | $ | 34.74 | | |
| | 2006 | | | $ | 25.89 | | | | (0.23 | ) (1) | | | 1.30 | | | | 1.07 | | | | — | | | | — | | | | — | | | $ | 26.96 | | |
82 TURNER FUNDS 2011 SEMIANNUAL REPORT
| | | Total
return | | Net
assets end
of period
(000) | | Ratio of
net expenses
to average
net assets† | | Ratio of
net expenses
to average
net assets | | Ratio of total
expenses
to average
net assets | | Ratio of net
investment
income (loss)
to average
net assets† | | Portfolio
turnover
rate†† | |
| Turner Concentrated Growth Fund — Investor Class Shares | |
| | 2011 | * | | | 23.08 | %††† | | $ | 55,647 | | | | 1.61 | % | | | 1.61 | % | | | 2.05 | % | | | (1.19 | )% | | | 100 | % | |
| | 2010 | | | | 7.94 | % | | $ | 42,924 | | | | 1.51 | % | | | 1.51 | % | | | 1.94 | % | | | (1.14 | )% | | | 215 | % | |
| | 2009 | | | | (2.99 | )% | | $ | 39,973 | | | | 0.82 | % | | | 0.82 | % | | | 1.34 | % | | | 0.38 | % | | | 208 | % | |
| | 2008 | | | | (37.25 | )% | | $ | 42,581 | | | | 1.53 | % | | | 1.54 | % | | | 1.91 | % | | | (0.83 | )% | | | 348 | % | |
| | 2007 | | | | 33.16 | % | | $ | 61,401 | | | | 1.11 | % | | | 1.11 | % | | | 1.46 | % | | | (0.57 | )% | | | 220 | % | |
| | 2006 | | | | 7.04 | % | | $ | 38,180 | | | | 1.59 | % | | | 1.59 | % | | | 1.79 | % | | | (1.01 | )% | | | 251 | % | |
| Turner Emerging Growth Fund — Institutional Class Shares | |
| | 2011 | * | | | 33.64 | %††† | | $ | 375,778 | | | | 1.15 | % | | | 1.15 | % | | | 1.25 | % | | | (0.70 | )% | | | 42 | % | |
| | 2010 | | | | 12.52 | % | | $ | 276,445 | | | | 1.15 | % | | | 1.15 | % | | | 1.28 | % | | | (0.77 | )% | | | 96 | % | |
| | 2009 | (2) | | | 32.79 | %† | | $ | 243,790 | | | | 1.15 | % | | | 1.15 | % | | | 1.33 | % | | | (0.54 | )% | | | 78 | % | |
| Turner Emerging Growth Fund — Investor Class Shares | |
| | 2011 | * | | | 33.51 | %††† | | $ | 222,657 | | | | 1.40 | % | | | 1.40 | % | | | 1.50 | % | | | (0.95 | )% | | | 42 | % | |
| | 2010 | | | | 12.22 | % | | $ | 176,823 | | | | 1.40 | % | | | 1.40 | % | | | 1.53 | % | | | (1.02 | )% | | | 96 | % | |
| | 2009 | | | | (15.58 | )% | | $ | 188,812 | | | | 1.40 | % | | | 1.40 | % | | | 1.56 | % | | | (0.71 | )% | | | 78 | % | |
| | 2008 | | | | (16.08 | )% | | $ | 529,578 | | | | 1.40 | % | | | 1.40 | % | | | 1.49 | % | | | (0.66 | )% | | | 71 | % | |
| | 2007 | | | | 25.08 | % | | $ | 638,037 | | | | 1.40 | % | | | 1.40 | % | | | 1.48 | % | | | (0.50 | )% | | | 88 | % | |
| | 2006 | | | | 4.95 | % | | $ | 565,227 | | | | 1.40 | % | | | 1.40 | % | | | 1.44 | % | | | (0.57 | )% | | | 78 | % | |
| Turner Large Growth Fund — Institutional Class Shares | |
| | 2011 | * | | | 20.86 | %††† | | $ | 544,162 | | | | 0.69 | % | | | 0.69 | % | | | 0.93 | % | | | (0.07 | )% | | | 111 | % | |
| | 2010 | | | | 6.76 | % | | $ | 377,650 | | | | 0.69 | % | | | 0.69 | % | | | 0.87 | % | | | 0.20 | % | | | 178 | % | |
| | 2009 | | | | (3.97 | )% | | $ | 381,277 | | | | 0.69 | % | | | 0.69 | % | | | 0.92 | % | | | 0.65 | % | | | 126 | % | |
| | 2008 | | | | (27.53 | )% | | $ | 360,083 | | | | 0.69 | % | | | 0.69 | % | | | 0.90 | % | | | 0.42 | % | | | 200 | % | |
| | 2007 | | | | 24.00 | % | | $ | 237,778 | | | | 0.68 | % | | | 0.68 | % | | | 1.06 | % | | | 0.42 | % | | | 103 | % | |
| | 2006 | | | | 6.91 | % | | $ | 71,935 | | | | 0.59 | % | | | 0.59 | % | | | 1.20 | % | | | 0.77 | % | | | 124 | % | |
| Turner Large Growth Fund — Investor Class Shares | |
| | 2011 | * | | | 20.78 | %††† | | $ | 115,174 | | | | 0.94 | % | | | 0.94 | % | | | 1.19 | % | | | (0.28 | )% | | | 111 | % | |
| | 2010 | | | | 6.51 | % | | $ | 163,750 | | | | 0.94 | % | | | 0.94 | % | | | 1.12 | % | | | (0.05 | )% | | | 178 | % | |
| | 2009 | | | | (4.21 | )% | | $ | 252,916 | | | | 0.94 | % | | | 0.94 | % | | | 1.17 | % | | | 0.41 | % | | | 126 | % | |
| | 2008 | | | | (27.76 | )% | | $ | 260,692 | | | | 0.94 | % | | | 0.94 | % | | | 1.15 | % | | | 0.15 | % | | | 200 | % | |
| | 2007 | | | | 23.68 | % | | $ | 37,541 | | | | 0.94 | % | | | 0.94 | % | | | 1.31 | % | | | 0.15 | % | | | 103 | % | |
| | 2006 | | | | 6.52 | % | | $ | 23,418 | | | | 0.94 | % | | | 0.94 | % | | | 1.43 | % | | | 0.23 | % | | | 124 | % | |
| Turner Midcap Growth Fund — Institutional Class Shares | |
| | 2011 | * | | | 30.67 | %††† | | $ | 258,927 | | | | 0.93 | % | | | 0.93 | % | | | 1.01 | % | | | 0.02 | % | | | 47 | % | |
| | 2010 | | | | 14.47 | % | | $ | 164,993 | | | | 0.93 | % | | | 0.93 | % | | | 1.03 | % | | | (0.29 | )% | | | 90 | % | |
| | 2009 | | | | (0.31 | )% | | $ | 136,069 | | | | 0.93 | % | | | 0.93 | % | | | 1.08 | % | | | (0.05 | )% | | | 120 | % | |
| | 2008 | (4) | | | (24.43 | )%††† | | $ | 137,451 | | | | 0.93 | % | | | 0.94 | % | | | 1.03 | % | | | (0.09 | )% | | | 157 | % | |
| Turner Midcap Growth Fund — Investor Class Shares | |
| | 2011 | * | | | 30.47 | %††† | | $ | 955,150 | | | | 1.18 | % | | | 1.18 | % | | | 1.26 | % | | | (0.22 | )% | | | 47 | % | |
| | 2010 | | | | 14.21 | % | | $ | 751,124 | | | | 1.18 | % | | | 1.18 | % | | | 1.28 | % | | | (0.54 | )% | | | 90 | % | |
| | 2009 | | | | (0.57 | )% | | $ | 859,640 | | | | 1.18 | % | | | 1.18 | % | | | 1.33 | % | | | (0.29 | )% | | | 120 | % | |
| | 2008 | | | | (26.69 | )% | | $ | 994,545 | | | | 1.18 | % | | | 1.18 | % | | | 1.25 | % | | | (0.44 | )% | | | 157 | % | |
| | 2007 | | | | 29.24 | % | | $ | 1,340,172 | | | | 1.18 | % | | | 1.18 | % | | | 1.24 | % | | | (0.63 | )% | | | 155 | % | |
| | 2006 | | | | 4.70 | % | | $ | 1,113,201 | | | | 1.18 | % | | | 1.18 | % | | | 1.18 | % | | | (0.30 | )% | | | 135 | % | |
| Turner Midcap Growth Fund — Retirement Class Shares | |
| | 2011 | * | | | 30.30 | %††† | | $ | 5,254 | | | | 1.43 | % | | | 1.43 | % | | | 1.51 | % | | | (0.44 | )% | | | 47 | % | |
| | 2010 | | | | 13.93 | % | | $ | 4,578 | | | | 1.43 | % | | | 1.43 | % | | | 1.53 | % | | | (0.79 | )% | | | 90 | % | |
| | 2009 | | | | (0.79 | )% | | $ | 3,892 | | | | 1.43 | % | | | 1.43 | % | | | 1.58 | % | | | (0.55 | )% | | | 120 | % | |
| | 2008 | | | | (26.89 | )% | | $ | 5,784 | | | | 1.43 | % | | | 1.43 | % | | | 1.50 | % | | | (0.69 | )% | | | 157 | % | |
| | 2007 | | | | 28.86 | % | | $ | 6,212 | | | | 1.49 | % | | | 1.49 | % | | | 1.56 | % | | | (0.98 | )% | | | 155 | % | |
| | 2006 | | | | 4.13 | % | | $ | 2,444 | | | | 1.68 | % | | | 1.68 | % | | | 1.68 | % | | | (0.83 | )% | | | 135 | % | |
* For the six-month period ended March 31, 2011, unless otherwise indicated (unaudited). All ratios for the period have been annualized.
** Amount represents less than $0.01 per share.
† Inclusive of fees paid indirectly, waivers and/or reimbursements.
†† Excludes effect of in-kind transfers and mergers, as applicable. Not annualized for periods less than one year.
††† Total return is for the period indicated and has not been annualized.
(1) Based on average shares outstanding.
(2) Commenced operations on February 1, 2009. All ratios for the period have been annualized.
(3) The amount shown for a share outstanding throughout the period does not accord with the aggregate net losses on investments for the period because of the sales and repurchases of fund shares in relation to fluctuating market value of the investments of the Fund.
(4) Commenced operations on June 16, 2008. All ratios for the period have been annualized.
Amounts designated as "—" are either $0, not applicable or have been rounded to $0.
The accompanying notes are an integral part of the financial statements.
TURNER FUNDS 2011 SEMIANNUAL REPORT 83
FINANCIAL STATEMENTS
Financial highlights
For a share outstanding throughout each period
| | | Net asset
value,
beginning
of period | | Net
investment
income
(loss) | | Realized and
unrealized
gains (losses)
on investments | | Total
from
investment
operations | | Dividends
from net
investment
income | | Distributions
from
capital
gains | | Total
dividends and
distributions | | Net asset
value, end
of period | |
| Turner Small Cap Growth Fund — Investor Class Shares | | | |
| | 2011 | * | | $ | 28.97 | | | | (0.14 | ) (1) | | | 8.90 | | | | 8.76 | | | | — | | | | — | | | | — | | | $ | 37.73 | | |
| | 2010 | | | $ | 25.17 | | | | (0.20 | ) (1) | | | 4.00 | | | | 3.80 | | | | — | | | | — | | | | — | | | $ | 28.97 | | |
| | 2009 | | | $ | 26.45 | | | | (0.07 | ) (1) | | | (1.21 | ) | | | (1.28 | ) | | | — | | | | — | | | | — | | | $ | 25.17 | | |
| | 2008 | | | $ | 32.98 | | | | (0.15 | ) (1) | | | (6.38 | ) | | | (6.53 | ) | | | — | | | | — | | | | — | | | $ | 26.45 | | |
| | 2007 | | | $ | 26.17 | | | | (0.20 | ) (1) | | | 7.01 | | | | 6.81 | | | | — | | | | — | | | | — | | | $ | 32.98 | | |
| | 2006 | | | $ | 24.68 | | | | (0.21 | ) (1) | | | 1.70 | | | | 1.49 | | | | — | | | | — | | | | — | | | $ | 26.17 | | |
| Turner Quantitative Broad Market Equity Fund — Institutional Class Shares | | | |
| | 2011 | * | | $ | 8.91 | | | | 0.06 | (1) | | | 1.65 | | | | 1.71 | | | | (0.09 | ) | | | — | | | | (0.09 | ) | | $ | 10.53 | | |
| | 2010 | | | $ | 8.31 | | | | 0.10 | (1) | | | 0.59 | (2) | | | 0.69 | | | | (0.09 | ) | | | — | | | | (0.09 | ) | | $ | 8.91 | | |
| | 2009 | | | $ | 8.73 | | | | 0.11 | (1) | | | (0.47 | ) | | | (0.36 | ) | | | (0.06 | ) | | | — | | | | (0.06 | ) | | $ | 8.31 | | |
| | 2008 | (3) | | $ | 10.00 | | | | 0.04 | (1) | | | (1.31 | ) | | | (1.27 | ) | | | — | | | | — | | | | — | | | $ | 8.73 | | |
| Turner Quantitative Broad Market Equity Fund — Investor Class Shares | | | |
| | 2011 | * | | $ | 8.88 | | | | 0.04 | (1) | | | 1.66 | | | | 1.70 | | | | (0.07 | ) | | | — | | | | (0.07 | ) | | $ | 10.51 | | |
| | 2010 | | | $ | 8.30 | | | | 0.08 | (1) | | | 0.58 | (2) | | | 0.66 | | | | (0.08 | ) | | | — | | | | (0.08 | ) | | $ | 8.88 | | |
| | 2009 | | | $ | 8.72 | | | | 0.08 | (1) | | | (0.45 | ) | | | (0.37 | ) | | | (0.05 | ) | | | — | | | | (0.05 | ) | | $ | 8.30 | | |
| | 2008 | (3) | | $ | 10.00 | | | | 0.03 | (1) | | | (1.31 | ) | | | (1.28 | ) | | | — | | | | — | | | | — | | | $ | 8.72 | | |
| Turner Quantitative Large Cap Value Fund — Institutional Class Shares | | | |
| | 2011 | * | | $ | 7.86 | | | | 0.06 | (1) | | | 1.21 | | | | 1.27 | | | | (0.12 | ) | | | — | | | | (0.12 | ) | | $ | 9.01 | | |
| | 2010 | | | $ | 7.45 | | | | 0.10 | (1) | | | 0.43 | | | | 0.53 | | | | (0.12 | ) | | | — | | | | (0.12 | ) | | $ | 7.86 | | |
| | 2009 | | | $ | 8.97 | | | | 0.14 | (1) | | | (1.49 | ) | | | (1.35 | ) | | | (0.17 | ) | | | — | | | | (0.17 | ) | | $ | 7.45 | | |
| | 2008 | | | $ | 12.86 | | | | 0.16 | (1) | | | (2.23 | ) | | | (2.07 | ) | | | (0.12 | ) | | | (1.70 | ) | | | (1.82 | ) | | $ | 8.97 | | |
| | 2007 | | | $ | 11.44 | | | | 0.14 | (1) | | | 1.65 | | | | 1.79 | | | | (0.15 | ) | | | (0.22 | ) | | | (0.37 | ) | | $ | 12.86 | | |
| | 2006 | (4) | | $ | 10.00 | | | | 0.16 | (1) | | | 1.33 | | | | 1.49 | | | | (0.05 | ) | | | — | | | | (0.05 | ) | | $ | 11.44 | | |
| Turner Quantitative Large Cap Value Fund — Investor Class Shares | | | |
| | 2011 | * | | $ | 7.85 | | | | 0.05 | (1) | | | 1.20 | | | | 1.25 | | | | (0.10 | ) | | | — | | | | (0.10 | ) | | $ | 9.00 | | |
| | 2010 | | | $ | 7.44 | | | | 0.08 | (1) | | | 0.44 | | | | 0.52 | | | | (0.11 | ) | | | — | | | | (0.11 | ) | | $ | 7.85 | | |
| | 2009 | (5) | | $ | 7.50 | | | | 0.07 | (1) | | | 0.04 | (2) | | | 0.11 | | | | (0.17 | ) | | | — | | | | (0.17 | ) | | $ | 7.44 | | |
84 TURNER FUNDS 2011 SEMIANNUAL REPORT
| | | Total
return | | Net
assets end
of period
(000) | | Ratio of
net expenses
to average
net assets† | | Ratio of
net expenses
to average
net assets | | Ratio of total
expenses
to average
net assets | | Ratio of net
investment
income (loss)
to average
net assets† | | Portfolio
turnover
rate†† | |
| Turner Small Cap Growth Fund — Investor Class Shares | |
| | 2011 | * | | | 30.24 | %††† | | $ | 345,168 | | | | 1.25 | % | | | 1.25 | % | | | 1.50 | % | | | (0.83 | )% | | | 55 | % | |
| | 2010 | | | | 15.10 | % | | $ | 274,925 | | | | 1.25 | % | | | 1.25 | % | | | 1.52 | % | | | (0.74 | )% | | | 89 | % | |
| | 2009 | | | | (4.84 | )% | | $ | 250,860 | | | | 1.25 | % | | | 1.25 | % | | | 1.58 | % | | | (0.36 | )% | | | 113 | % | |
| | 2008 | | | | (19.80 | )% | | $ | 249,434 | | | | 1.25 | % | | | 1.26 | % | | | 1.51 | % | | | (0.48 | )% | | | 141 | % | |
| | 2007 | | | | 26.02 | % | | $ | 317,930 | | | | 1.25 | % | | | 1.25 | % | | | 1.48 | % | | | (0.65 | )% | | | 134 | % | |
| | 2006 | | | | 6.04 | % | | $ | 248,271 | | | | 1.25 | % | | | 1.25 | % | | | 1.42 | % | | | (0.79 | )% | | | 154 | % | |
| Turner Quantitative Broad Market Equity Fund — Institutional Class Shares | |
| | 2011 | * | | | 19.29 | %††† | | $ | 12,004 | | | | 0.64 | % | | | 0.64 | % | | | 1.34 | % | | | 1.17 | % | | | 32 | % | |
| | 2010 | | | | 8.30 | % | | $ | 10,952 | | | | 0.64 | % | | | 0.64 | % | | | 2.28 | % | | | 1.13 | % | | | 164 | % | |
| | 2009 | | | | (3.95 | )% | | $ | 521 | | | | 0.64 | % | | | 0.65 | % | | | 20.30 | % | | | 1.56 | % | | | 324 | % | |
| | 2008 | (3) | | | (12.70 | )%††† | | $ | 542 | | | | 0.64 | % | | | 0.66 | % | | | 17.95 | % | | | 1.60 | % | | | 118 | % | |
| Turner Quantitative Broad Market Equity Fund — Investor Class Shares | |
| | 2011 | * | | | 19.24 | %††† | | $ | 29 | | | | 0.89 | % | | | 0.89 | % | | | 1.57 | % | | | 0.90 | % | | | 32 | % | |
| | 2010 | | | | 7.98 | % | | $ | 20 | | | | 0.89 | % | | | 0.89 | % | | | 6.72 | % | | | 0.88 | % | | | 164 | % | |
| | 2009 | | | | (4.09 | )% | | $ | 10 | | | | 0.89 | % | | | 0.90 | % | | | 20.60 | % | | | 1.15 | % | | | 324 | % | |
| | 2008 | (3) | | | (12.80 | )%††† | | $ | 2 | | | | 0.89 | % | | | 0.91 | % | | | 16.99 | % | | | 1.28 | % | | | 118 | % | |
| Turner Quantitative Large Cap Value Fund — Institutional Class Shares | |
| | 2011 | * | | | 16.21 | %††† | | $ | 815 | | | | 0.69 | % | | | 0.69 | % | | | 11.63 | % | | | 1.53 | % | | | 3 | % | |
| | 2010 | | | | 7.24 | % | | $ | 825 | | | | 0.69 | % | | | 0.69 | % | | | 12.61 | % | | | 1.31 | % | | | 201 | % | |
| | 2009 | | | | (14.88 | )% | | $ | 772 | | | | 0.69 | % | | | 0.70 | % | | | 14.51 | % | | | 2.10 | % | | | 241 | % | |
| | 2008 | | | | (18.76 | )% | | $ | 763 | | | | 0.69 | % | | | 0.72 | % | | | 6.13 | % | | | 1.54 | % | | | 181 | % | |
| | 2007 | | | | 15.91 | % | | $ | 835 | | | | 0.65 | % | | | 0.65 | % | | | 5.25 | % | | | 1.15 | % | | | 271 | % | |
| | 2006 | (4) | | | 14.92 | %††† | | $ | 580 | | | | 0.59 | % | | | 0.59 | % | | | 7.71 | % | | | 1.52 | % | | | 252 | % | |
| Turner Quantitative Large Cap Value Fund — Investor Class Shares | |
| | 2011 | * | | | 15.99 | %††† | | $ | 5 | | | | 0.94 | % | | | 0.94 | % | | | 11.77 | % | | | 1.28 | % | | | 3 | % | |
| | 2010 | | | | 7.07 | % | | $ | 5 | | | | 0.90 | % | | | 0.90 | % | | | 12.82 | % | | | 1.10 | % | | | 201 | % | |
| | 2009 | (5) | | | 1.67 | %††† | | $ | 4 | | | | 0.89 | % | | | 0.90 | % | | | 15.93 | % | | | 1.18 | % | | | 241 | % | |
* For the six-month period ended March 31, 2011, unless otherwise indicated (unaudited). All ratios for the period have been annualized.
† Inclusive of fees paid indirectly, waivers and/or reimbursements.
†† Excludes effect of in-kind transfers and mergers, as applicable. Not annualized for periods less than one year.
††† Total return is for the period indicated and has not been annualized.
(1) Based on average shares outstanding.
(2) The amount shown for a share outstanding throughout the period does not accord with the aggregate net losses on investments for the period because of the sales and repurchases of fund shares in relation to fluctuating market value of the investments of the Fund.
(3) Commenced operations on June 30, 2008. All ratios for the period have been annualized.
(4) Commenced operations on October 10, 2005. All ratios for the period have been annualized.
(5) Commenced operations on October 31, 2008. All ratios for the period have been annualized.
Amounts designated as "—" are either $0, not applicable or have been rounded to $0.
The accompanying notes are an integral part of the financial statements.
TURNER FUNDS 2011 SEMIANNUAL REPORT 85
FINANCIAL STATEMENTS
Financial highlights
For a share outstanding throughout each period
| | | Net asset
value,
beginning
of period | | Net
investment
income
(loss) | | Realized and
unrealized
gains (losses)
on investments | | Total
from
investment
operations | | Dividends
from net
investment
income | | Distributions
from
capital
gains | | Total
dividends and
distributions | | Net asset
value, end
of period | |
| Turner Global Opportunities Fund — Institutional Class Shares | | | |
| | 2011 | * | | $ | 11.52 | | | | (0.03 | ) (1) | | | 2.71 | | | | 2.68 | | | | — | | | | — | | | | — | | | $ | 14.20 | | |
| | 2010 | (2) | | $ | 10.00 | | | | (0.01 | ) (1) | | | 1.53 | | | | 1.52 | | | | — | | | | — | | | | — | | | $ | 11.52 | | |
| Turner Global Opportunities Fund — Investor Class Shares | | | |
| | 2011 | * | | $ | 11.50 | | | | (0.01 | ) (1) | | | 2.67 | | | | 2.66 | | | | — | | | | — | | | | — | | | $ | 14.16 | | |
| | 2010 | (2) | | $ | 10.00 | | | | (0.03 | ) (1) | | | 1.53 | | | | 1.50 | | | | — | | | | — | | | | — | | | $ | 11.50 | | |
| Turner International Growth Fund — Institutional Class Shares | | | |
| | 2011 | * | | $ | 9.41 | | | | 0.01 | (1) | | | 2.13 | | | | 2.14 | | | | (0.09 | ) | | | — | | | | (0.09 | ) | | $ | 11.46 | | |
| | 2010 | | | $ | 8.24 | | | | 0.04 | (1) | | | 1.26 | | | | 1.30 | | | | (0.13 | ) | | | — | | | | (0.13 | ) | | $ | 9.41 | | |
| | 2009 | | | $ | 8.34 | | | | 0.08 | (1) | | | (0.07 | ) (3) | | | 0.01 | | | | (0.11 | ) | | | — | | | | (0.11 | ) | | $ | 8.24 | | |
| | 2008 | | | $ | 12.21 | | | | 0.12 | (1) | | | (3.87 | ) | | | (3.75 | ) | | | (0.02 | ) | | | (0.10 | ) | | | (0.12 | ) | | $ | 8.34 | | |
| | 2007 | (4) | | $ | 10.00 | | | | 0.07 | (1) | | | 2.14 | | | | 2.21 | | | | — | | | | — | | | | — | | | $ | 12.21 | | |
| Turner International Growth Fund — Investor Class Shares | | | |
| | 2011 | * | | $ | 9.39 | | | | — | ** (1) | | | 2.12 | | | | 2.12 | | | | (0.07 | ) | | | — | | | | (0.07 | ) | | $ | 11.44 | | |
| | 2010 | | | $ | 8.24 | | | | 0.05 | (1) | | | 1.23 | | | | 1.28 | | | | (0.13 | ) | | | — | | | | (0.13 | ) | | $ | 9.39 | | |
| | 2009 | (5) | | $ | 6.27 | | | | 0.07 | (1) | | | 2.01 | | | | 2.08 | | | | (0.11 | ) | | | — | | | | (0.11 | ) | | $ | 8.24 | | |
| Turner Small Cap Equity Fund — Institutional Class Shares | | | |
| | 2011 | * | | $ | 11.09 | | | | 0.08 | (1) | | | 3.16 | | | | 3.24 | | | | (0.09 | ) | | | — | | | | (0.09 | ) | | $ | 14.24 | | |
| | 2010 | | | $ | 9.83 | | | | 0.05 | (1) | | | 1.21 | | | | 1.26 | | | | — | | | | — | | | | — | | | $ | 11.09 | | |
| | 2009 | (6) | | $ | 7.73 | | | | — | ** (1) | | | 2.10 | (3) | | | 2.10 | | | | — | | | | — | | | | — | | | $ | 9.83 | | |
| Turner Small Cap Equity Fund — Investor Class Shares | | | |
| | 2011 | * | | $ | 11.05 | | | | 0.12 | (1) | | | 3.09 | | | | 3.21 | | | | (0.03 | ) | | | — | | | | (0.03 | ) | | $ | 14.23 | | |
| | 2010 | | | $ | 9.82 | | | | 0.01 | (1) | | | 1.22 | | | | 1.23 | | | | — | | | | — | | | | — | | | $ | 11.05 | | |
| | 2009 | | | $ | 11.53 | | | | — | ** (1) | | | (1.70 | ) | | | (1.70 | ) | | | — | | | | (0.01 | ) | | | (0.01 | ) | | $ | 9.82 | | |
| | 2008 | | | $ | 17.31 | | | | (0.06 | ) (1) | | | (2.95 | ) | | | (3.01 | ) | | | — | | | | (2.77 | ) | | | (2.77 | ) | | $ | 11.53 | | |
| | 2007 | | | $ | 16.94 | | | | (0.12 | ) (1) | | | 1.79 | | | | 1.67 | | | | — | | | | (1.30 | ) | | | (1.30 | ) | | $ | 17.31 | | |
| | 2006 | | | $ | 16.06 | | | | (0.07 | ) (1) | | | 0.95 | | | | 0.88 | | | | — | | | | — | | | | — | | | $ | 16.94 | | |
86 TURNER FUNDS 2011 SEMIANNUAL REPORT
| | | Total
return | | Net
assets end
of period
(000) | | Ratio of
net expenses
to average
net assets† | | Ratio of
net expenses
to average
net assets | | Ratio of total
expenses
to average
net assets | | Ratio of net
investment
income (loss)
to average
net assets† | | Portfolio
turnover
rate†† | |
| Turner Global Opportunities Fund — Institutional Class Shares | |
| | 2011 | * | | | 23.26 | %††† | | $ | 1,338 | | | | 1.10 | % | | | 1.10 | % | | | 4.83 | % | | | (0.38 | )% | | | 65 | % | |
| | 2010 | (2) | | | 15.20 | %††† | | $ | 1,153 | | | | 1.10 | % | | | 1.10 | % | | | 8.33 | % | | | (0.31 | )% | | | 37 | % | |
| Turner Global Opportunities Fund — Investor Class Shares | |
| | 2011 | * | | | 23.13 | %††† | | $ | 708 | | | | 1.35 | % | | | 1.35 | % | | | 3.45 | % | | | (0.19 | )% | | | 65 | % | |
| | 2010 | (2) | | | 15.00 | %††† | | $ | — | | | | 1.56 | % | | | 1.56 | % | | | 8.92 | % | | | (0.77 | )% | | | 37 | % | |
| Turner International Growth Fund — Institutional Class Shares | |
| | 2011 | * | | | 22.79 | %††† | | $ | 6,368 | | | | 1.10 | % | | | 1.10 | % | | | 2.85 | % | | | 0.10 | % | | | 117 | % | |
| | 2010 | | | | 15.88 | % | | $ | 5,019 | | | | 1.10 | % | | | 1.10 | % | | | 3.93 | % | | | 0.51 | % | | | 120 | % | |
| | 2009 | | | | 0.71 | % | | $ | 3,848 | | | | 1.10 | % | | | 1.10 | % | | | 5.24 | % | | | 1.31 | % | | | 139 | % | |
| | 2008 | | | | (31.04 | )% | | $ | 3,335 | | | | 1.10 | % | | | 1.11 | % | | | 3.05 | % | | | 1.10 | % | | | 245 | % | |
| | 2007 | (4) | | | 22.10 | %††† | | $ | 2,409 | | | | 1.10 | % | | | 1.10 | % | | | 4.63 | % | | | 0.99 | % | | | 111 | % | |
| Turner International Growth Fund — Investor Class Shares | |
| | 2011 | * | | | 22.67 | %††† | | $ | 515 | | | | 1.35 | % | | | 1.35 | % | | | 3.05 | % | | | (0.07 | )% | | | 117 | % | |
| | 2010 | | | | 15.61 | % | | $ | 110 | | | | 1.35 | % | | | 1.35 | % | | | 4.15 | % | | | 0.61 | % | | | 120 | % | |
| | 2009 | (5) | | | 33.95 | %††† | | $ | — | | | | 1.29 | % | | | 1.29 | % | | | 5.59 | % | | | 1.14 | % | | | 139 | % | |
| Turner Small Cap Equity Fund — Institutional Class Shares | |
| | 2011 | * | | | 29.26 | %††† | | $ | — | | | | 1.20 | % | | | 1.20 | % | | | 2.60 | % | | | 1.25 | % | | | 86 | % | |
| | 2010 | | | | 12.82 | % | | $ | 291 | | | | 1.20 | % | | | 1.20 | % | | | 1.79 | % | | | 0.52 | % | | | 189 | % | |
| | 2009 | (6) | | | 27.17 | %††† | | $ | 5,439 | | | | 1.20 | % | | | 1.20 | % | | | 1.59 | % | | | 0.05 | % | | | 280 | % | |
| Turner Small Cap Equity Fund — Investor Class Shares | |
| | 2011 | * | | | 29.07 | %††† | | $ | 5,701 | | | | 1.45 | % | | | 1.45 | % | | | 3.12 | % | | | 1.86 | % | | | 86 | % | |
| | 2010 | | | | 12.53 | % | | $ | 6,157 | | | | 1.45 | % | | | 1.45 | % | | | 2.04 | % | | | 0.07 | % | | | 189 | % | |
| | 2009 | | | | (14.78 | )% | | $ | 23,660 | | | | 1.45 | % | | | 1.45 | % | | | 1.89 | % | | | 0.03 | % | | | 280 | % | |
| | 2008 | | | | (20.20 | )% | | $ | 24,208 | | | | 1.45 | % | | | 1.45 | % | | | 1.62 | % | | | (0.48 | )% | | | 168 | % | |
| | 2007 | | | | 10.14 | % | | $ | 65,292 | | | | 1.36 | % | | | 1.36 | % | | | 1.59 | % | | | (0.70 | )% | | | 157 | % | |
| | 2006 | | | | 5.48 | % | | $ | 81,340 | | | | 1.24 | % | | | 1.24 | % | | | 1.70 | % | | | (0.39 | )% | | | 143 | % | |
* For the six-month period ended March 31, 2011, unless otherwise indicated (unaudited). All ratios for the period have been annualized.
** Amount represents less than $0.01 per share.
† Inclusive of fees paid indirectly, waivers and/or reimbursements.
†† Excludes effect of in-kind transfers and mergers, as applicable. Not annualized for periods less than one year.
††† Total return is for the period indicated and has not been annualized.
(1) Based on average shares outstanding.
(2) Commenced operations on May 7, 2010. All ratios for the period have been annualized.
(3) The amount shown for a share outstanding throughout the period does not accord with the aggregate net losses on investments for the period because of the sales and repurchases of fund shares in relation to fluctuating market value of the investments of the Fund.
(4) Commenced operations on January 31, 2007. All ratios for the period have been annualized.
(5) Commenced operations on October 31, 2008. All ratios for the period have been annualized.
(6) Commenced operations on February 1, 2009. All ratios for the period have been annualized.
Amounts designated as "—" are either $0, not applicable or have been rounded to $0.
The accompanying notes are an integral part of the financial statements.
TURNER FUNDS 2011 SEMIANNUAL REPORT 87
NOTES TO FINANCIAL STATEMENTS
(Unaudited)
Notes to financial statements
March 31, 2011
1. Organization:
Turner Funds (the "Trust"), a Massachusetts business trust, is registered under the Investment Company Act of 1940, as amended, as an open-end management investment company with fifteen active portfolios as of March 31, 2011. The financial statements included herein are those of the Turner Market Neutral Fund (the "Market Neutral Fund"), the Turner Medical Sciences Long/Short Fund (the "Medical Sciences Long/Short Fund), the Turner Spectrum Fund (the "Spectrum Fund"), the Turner Titan Fund (the "Titan Fund"), the Turner All Cap Growth Fund (the "All Cap Growth Fund", formerly the Turner New Enterprise Fund), the Turner Concentrated Growth Fund (the "Concentrated Growth Fund"), the Turner Emerging Growth Fund (the "Emerging Growth Fund"), the Turner Large Growth Fund (the "Large Growth Fund", formerly the Turner Core Growth Fund), the Turner Midcap Growth Fund (the "Midcap Growth Fund"), the Turner Small Cap Growth Fund (the "Small Cap Growth Fund"), the Turner Quantitative Broad Market Equity Fund (the "Quantitative Broad Market Equity Fund"), the Turner Quantitative Large Cap Value Fund (the "Quantitative Large Cap Value Fund"), the Turner Global Opportunities Fund (the "Global Opportunities Fund"), the Turner International Growth Fund (the "International Growth Fund", formerly the Turner International Core Growth Fund), and the Turner Small Cap Equity Fund (the "Small Cap Equity Fund"), each a "Fund" and collectively the "Funds." The Market Neutral Fund, Medical Sciences Long/Short Fund and Titan Fund commenced operations on February 7, 2011.
Each Fund is registered as a diversified portfolio of the Trust with the exception of the Concentrated Growth Fund and Global Opportunities Fund, which are non-diversified.
The Funds are registered to offer different classes of shares: Institutional Class Shares, Investor Class Shares, Retirement Class Shares, Class C Shares, or a combination of the four. The assets of each Fund are segregated, and a shareholder's interest is limited to the Fund in which shares are held. The Funds' prospectuses provide a description of each Fund's investment objectives, policies, and strategies along with information on the classes of shares currently being offered.
The Emerging Growth, Small Cap Growth and Small Cap Equity Funds were closed to new investors on March 7, 2000, July 31, 2004 and May 1, 2005, respectively. Effective March 1, 2008 and August 24, 2009, the Small Cap Equity Fund and Small Cap Growth Fund were reopened to new investors and existing shareholders, respectively.
2. Significant accounting policies:
The following is a summary of the significant accounting policies followed by the Funds.
Use of estimates—The preparation of financial statements in conformity with U.S. generally accepted accounting principles ("GAAP") requires management to make estimates and assumptions that affect the reported amounts of assets and liabilities and disclosure of contingent assets and liabilities at the date of the financial statements and the reported amounts of increases and decreases in net assets from operations during the reporting period. Actual results could differ from those estimates.
Security valuation—Securities listed on a securities exchange, market or automated quotation system for which quotations are readily available (except for securities traded on NASDAQ) are valued at the last quoted sale price on the primary exchange or market (foreign or domestic) on which they are traded, or, if there is no such reported sale, at the most recent quoted bid price for long positions and the most recent quoted ask price for short positions. For securities traded on NASDAQ, the NASDAQ official Closing Price will be used. The prices for foreign securities are reported in local currency and converted to U.S. dollars using currency exchange rates. Prices for most securities held in the Funds are provided daily by recognized independent pricing agents. If a security price cannot be obtained from an independent, third-party pricing agent, the Funds seek to obtain bid and ask prices from two broker-dealers who make a market in the security and determine the average of the two.
Securities for which market prices are not "readily available" are valued in accordance with Fair Value Procedures established by the Board of Trustees (the "Board"). The Funds' Fair Value Procedures are implemented through a Fair Value Committee (the "Committee") designated by the Board. Some of the more common reasons that may necessitate that a security be valued using Fair Value Procedures include: the security's trading has been halted or suspended; the security has been delisted from a national exchange; the security's primary trading market is temporarily closed at a time when under normal conditions it would be open; the security has not been traded for an extended period of time; the security's primary pricing source is not able or willing to provide a price; or trading of the security is subject to local government-imposed restrictions. When a security is valued in accordance with the Fair Value Procedures, the Committee will determine the value after taking into consideration relevant information reasonably available to the Committee.
For securities that principally trade on a foreign market or exchange, a significant gap in time can exist between the time of a particular security's last trade and the time at which a Fund calculates its net asset value. The closing prices of such securities may no longer reflect their market value at the time the Fund calculates net asset value if an event that could
88 TURNER FUNDS 2011 SEMIANNUAL REPORT
materially affect the value of those securities (a "Significant Event") has occurred between the time of the security's last close and the time that the Fund calculates net asset value. A Significant Event may relate to a single issuer or to an entire market sector. If the Adviser of a Fund becomes aware of a Significant Event that has occurred with respect to a security or group of securities after the closing of the exchange or market on which the security or securities principally trade, but before the time at which the Fund calculates net asset value, it may request that a Committee meeting be called. In addition, the Fund's Sub-Administrator monitors price movements among certain selected indices, securities and/or baskets of securities that may be an indicator that the closing prices received earlier from foreign exchanges or markets may not reflect market value at the time the Fund calculates net asset value. If price movements in a monitored index or security exceed levels established by the Administrator and approved by the Committee, the Sub-Administrator notifies the Adviser for any Fund holding the relevant securities that such limits have been exceeded. In such event, the Adviser makes the determination whether a Committee meeting should be called based on the information provided.
The Market Neutral Fund, Medical Sciences Long/Short Fund, Spectrum Fund, Titan Fund, Global Opportunities Fund and International Growth Fund use Interactive Data Pricing and Reference Data, Inc. ("Interactive Data") as a third party fair valuation vendor. Interactive Data provides a fair value for foreign securities in the Market Neutral Fund, Medical Sciences Long/Short Fund, Spectrum Fund, Titan Fund, Global Opportunities Fund and International Growth Fund based on certain factors and methodologies (involving, generally, tracking valuation correlations between the U.S. market and each non-U.S. security) applied by Interactive Data in the event that there is a movement in the U.S. market that exceeds a specific threshold established by the Committee. The Committee establishes a "confidence interval" which is used to determine the level of correlation between the value of a foreign security and movements in the U.S. market before a particular security is fair valued when the threshold is exceeded. In the event that the threshold established by the Committee is exceeded on a specific day, the Market Neutral Fund, Medical Sciences Long/Short Fund, Spectrum Fund, Titan Fund, Global Opportunities Fund and International Growth Fund value their non-U.S. securities that exceed the applicable "confidence interval" based upon the fair values provided by Interactive Data. In such event, it is not necessary to hold a Committee meeting. In the event that the Adviser believes that the fair values provided by Interactive Data are not reliable, the Adviser contacts the Funds' Sub-Administrator and may request that a meeting of the Committee be held.
If a local market in which the Funds own securities is closed for one or more days or a portion of a day, the Funds shall value all securities held in that corresponding currency based on the fair value prices provided by Interactive Data using the predetermined confidence interval discussed above.
In accordance with the authoritative guidance on fair value measurements and disclosures under GAAP, fair value is defined as the price that a fund would receive upon selling an investment in a timely transaction to an independent buyer in the principal or most advantageous market. The guidance established a three-tier hierarchy to maximize the use of the observable market data and minimize the use of the unobservable inputs and to establish classification of the fair value measurements for disclosure purposes. Inputs refer broadly to the assumptions that market participants would use in pricing an asset or liability. Inputs may be observable or unobservable. Observable inputs are inputs that reflect the assumptions market participants would use in pricing the asset or liability developed based on market data obtained from sources independent of the reporting entity. Unobservable inputs are inputs that reflect the reporting entity's own assumptions about the assumptions market participants would use in pricing the asset or liability developed based on the best information available in the circumstances.
The three-tier hierarchy of inputs is summarized in the three broad Levels listed below:
Level 1 – quoted prices in active markets for identical investments.
Level 2 – other significant observable inputs (including quoted prices for similar investments, interest rates, prepayment speeds, credit risks, etc.).
Level 3 – significant unobservable inputs (including a fund's own assumptions in determining the fair value of investments).
The valuation techniques used by the Funds to measure fair value in accordance with the guidance, during the six months ended March 31, 2011 maximized the use of observable inputs and minimized the use of unobservable inputs. For the six months ended March 31, 2011, there have been no significant changes to the Funds' fair valuation methodologies. Fair value measurement classifications are summarized in each Fund's Schedule of investments, Schedule of securities sold short or Schedule of open options written. Changes in valuation techniques may result in transfers in or out of an investment's assigned level within the hierarchy during the reporting period. For each Fund there were no significant
TURNER FUNDS 2011 SEMIANNUAL REPORT 89
NOTES TO FINANCIAL STATEMENTS
(Unaudited)
transfers between the levels during the reporting period, based on the input levels assigned under the hierarchy at the beginning and end of the reporting period.
Security transactions and related income—Security transactions are accounted for on the date the security is purchased or sold (trade date). Dividend income is recognized on the ex-dividend date. Costs used in determining realized gains and losses on the sales of investment securities are those of the specific securities sold during the respective holding period.
Securities sold short—As consistent with each Fund's investment objectives, the Funds may engage in short sales. Short sales are transactions under which a Fund sells a security it does not own. To complete such a transaction, the Fund must borrow the security to make delivery to the buyer. The Fund is then obligated to replace the security borrowed by purchasing the security at the market price at the time of the replacement. The price at such time may be more or less than the price at which the security was sold by the Fund. Until the security is replaced, the Fund is required to pay the lender amounts equal to any dividends that accrue during the period of the loan. Dividends are shown as an expense for financial reporting purposes. To borrow the security, the Fund also may be required to pay a fee, which is shown as an expense for financial reporting purposes. The proceeds of the short sale are retained by the broker, to the extent necessary to meet margin requirements, until the short position is closed out. A gain, limited to the price at which the Fund sold the security short, or a loss, unlimited in size, will be recognized upon the close of a short sale.
Until a Fund closes its short position or replaces the borrowed security, the Fund will: (a) maintain a segregated account containing cash or liquid securities at such a level that (i) the amount deposited in the account plus the amount deposited with the brokers as collateral will equal the current value of the security sold short; and (ii) the amount deposited in the segregated account plus the amount deposited with the broker as collateral will not be less than the market value of the security at the time the security was sold short, or (b) otherwise cover the Fund's short positions. The Market Neutral Fund, Medical Sciences Long/Short Fund, Spectrum Fund and Titan Fund engaged in short sales during the six months ended March 31, 2011.
Option transactions—As consistent with each Fund's investment objectives, the Funds may write covered call options as a means of increasing the yield on their portfolios and as a means of providing limited protection against decreases in their market value. The Funds may purchase put and call options to protect against a decline in the market value of the securities in their portfolio or to anticipate an increase in the market value of securities that the Funds may seek to purchase in the future. A put option gives the purchaser of the option the right to sell, and the writer of the option the obligation to buy, the underlying security at any time during the option period. A call option gives the purchaser of the option the right to buy, and the writer of the option the obligation to sell, the underlying security at any time during the option period. The premium paid to the writer is the consideration for undertaking the obligations under the option contract. The initial purchase (sale) of an option contract is an "opening transaction." In order to close out an option position, the Fund may enter into a "closing transaction," which is simply the sale (purchase) of an option contract on the same security with the same exercise price and expiration date as the option contract originally opened. If the Fund is unable to effect a closing purchase transaction with respect to an option it has written, it will not be able to sell the underlying security until the option expires or the Fund delivers the security upon exercise. When the Fund writes (sells) an option, an amount equal to the premium received by the Fund is included in the Statement of Assets and Liabilities as an asset and an equivalent liability. The amount of the liability is subsequently marked-to-market to reflect the current value of the option written. Option contracts are valued at the last quoted sales price. If there is no such reported sale on the valuation date, long positions are valued at the most recent bid price, and short positions are valued at the most recent ask price. When an option expires on its stipulated expiration date or the Fund enters into a closing purchase transaction, the Fund realizes a gain or loss if the cost of the closing purchase transaction differs from the premium received when the option was sold without regard to any unrealized gain or loss on the underlying security, and the liability related to such option is eliminated. When an option is exercised, the premium originally received decreases the cost basis of the security (or increases the proceeds on a sale of the security). Realized and unrealized gains and losses on written option transactions are shown on the Statement of Operations as net realized gain (loss) on written option contracts and net change in unrealized appreciation (depreciation) on written option contracts, respectively. Realized and unrealized gains and (losses) on purchased options in the Spectrum Fund for the six months ended March 31, 2011 were $(1,228,684) and $(1,181,393), respectively. Realized and unrealized gains and (losses) on purchased options in the All Cap Growth Fund for the six months ended March 31, 2011 were $(123,376) and $8,250, respectively. These amounts are shown on the Statement of Operations as net realized gain (loss) from securities
90 TURNER FUNDS 2011 SEMIANNUAL REPORT
sold and net change in unrealized appreciation (depreciation) on investments, respectively.
Foreign currency translation—The books and records of the Market Neutral Fund, Medical Sciences Long/Short Fund, Spectrum Fund, Titan Fund, Global Opportunities Fund and International Growth Fund are maintained in U.S. dollars. Investment securities and other assets and liabilities denominated in a foreign currency are translated into U.S. dollars on the date of valuation. The Market Neutral Fund, Medical Sciences Long/Short Fund, Spectrum Fund, Titan Fund, Global Opportunities Fund and International Growth Fund do not isolate that portion of realized or unrealized gains and losses resulting from changes in the foreign exchange rate from fluctuations arising from changes in the market prices of the securities. These gains and losses are included in net realized and unrealized gains and losses on investments in the Statements of Operations. Net realized and unrealized gains and losses on foreign currency transactions represent net foreign exchange gains or losses from foreign currency exchange contracts, disposition of foreign currencies, currency gains or losses realized between trade and settlement dates on securities transactions and the difference between the amount of the investment income and foreign withholding taxes recorded on the Market Neutral Fund, Medical Sciences Long/Short Fund, Spectrum Fund, Titan Fund, Global Opportunities Fund and International Growth Fund's books and the U.S. dollar equivalent amounts actually received or paid.
Expenses—Expenses that are specifically attributed to one of the Funds are charged to that Fund. Certain other expenses of the Funds are prorated among the Funds on the basis of relative daily net assets. Other common expenses of the Trust are allocated among the Funds on the basis of relative daily net assets.
Classes—Class specific expenses are borne by that class. Income, non-class specific expenses and realized/unrealized gains and losses are allocated to the respective classes on the basis of the relative daily net assets.
Dividends and distributions—The Funds declare and distribute net investment income, if any, annually, as a dividend to shareholders. Any net realized capital gains on sales of securities for all Funds are distributed to shareholders at least annually.
3. Transactions with affiliates:
Certain officers and trustees of the Trust are also officers or employees of Turner Investment Partners, Inc. ("Turner") or Citi Fund Services Ohio, Inc. ("Citi"), the Trust's sub-administrator. With the exception of the Trust's Chief Compliance Officer, such officers are paid no fees by the Trust for serving as officers and trustees of the Trust.
Foreside Fund Services, LLC (the "Distributor") provides distribution services to the Funds under a Distribution Agreement.
4. Administration, shareholder servicing, distribution and transfer agent agreements:
Turner provides administrative services to the Funds under Administration Agreements with the Trust. For its services, Turner receives an annual fee of 0.15% of the aggregate average daily net assets of the Trust up to $2 billion and 0.12% of the aggregate average daily net assets of the Trust over $2 billion. Under a separate Sub-Administration Agreement between Turner and Citi, effective October 1, 2010, Citi provides sub-administrative services to the Trust. For the six months ended March 31, 2011, Citi was paid $412,563 by Turner.
The Funds have adopted a Distribution Plan for Retirement Class Shares and Class C Shares (the "Distribution Plan") under which firms, including the Distributor, that provide distribution services may receive compensation. Under the Distribution Plan, which was adopted pursuant to Rule 12b-1 under the Investment Company Act of 1940, as amended, the Distributor is entitled to receive aggregate fees for distribution services not exceeding seventy-five basis points (0.75%) of the Fund's average daily net assets attributable to Retirement Class or Class C Shares that are subject to the arrangement in return for providing a broad range of distribution services. Currently, the Retirement Class Shares of the Midcap Growth Fund pay the Distributor twenty-five basis points (0.25%) and the Class C Shares of the Market Neutral Fund, Medical Sciences Long/Short Fund, Spectrum Fund and Titan Fund pay the Distributor seventy-five basis points (0.75%) in distribution fees.
The Funds have also adopted Shareholder Services Plans (the "Shareholder Services Plans"). Under the Shareholder Services Plans, service providers are entitled to receive aggregate fees for shareholder services not exceeding twenty-five basis points (0.25%) of each Fund's average daily net assets attributable to Investor Class Shares, Retirement Class Shares and Class C Shares that are subject to the arrangement in return for providing shareholder services. Currently, Investor Class Shares of each Fund, Retirement Class Shares of the Midcap Growth Fund and Class C Shares of the Market Neutral Fund, Medical Sciences Long/Short Fund, Spectrum Fund and Titan Fund pay twenty-five basis points (0.25%) in shareholder servicing fees.
DST Systems, Inc. serves as the transfer agent and dividend disbursing agent for the Fund under a transfer agency agreement with the Trust.
TURNER FUNDS 2011 SEMIANNUAL REPORT 91
NOTES TO FINANCIAL STATEMENTS
(Unaudited)
5. Investment advisory agreement:
The Trust and Turner are parties to an Investment Advisory Agreement dated April 28, 1996 under which Turner receives a fee that is calculated daily and paid monthly, based on the average daily net assets of certain Funds. Pursuant to an Amended and Restated Advisory Agreement dated November 17, 2006, Turner Investment Management LLC, an affiliate of Turner, serves as the investment adviser for the Small Cap Equity Fund.
For their services, Turner and Turner Investment Management LLC receive annual fees, which are calculated daily and paid monthly, based on average daily net assets. Turner and Turner Investment Management LLC have contractually agreed to waive all or a portion of their fees and to reimburse expenses in order to limit total Fund operating expenses (excluding acquired fund fees and expenses and interest expenses relating to short sales, except for the Market Neutral Fund, Medical Sciences Long/Short Fund, Spectrum Fund and Titan Fund, for which Turner includes acquired fund fees and expenses and interest expenses relating to short sales in its contractual waiver) to a specified percentage of the average daily net assets of each Fund, except the Concentrated Growth Fund and All Cap Growth Fund, on an annualized basis through certain dates disclosed in the following table:
| | | Advisory
fee | | Expense
cap | | Date
(through) | |
| Market Neutral Fund | |
| Institutional Class | | | 1.50 | % | | | 1.95 | % | | February 2, 2012 | |
| Investor Class | | | 1.50 | % | | | 2.20 | % | | February 2, 2012 | |
| Class C | | | 1.50 | % | | | 2.95 | % | | February 2, 2012 | |
Medical Sciences Long/Short
Fund | |
| Institutional Class | | | 1.50 | % | | | 1.95 | % | | February 2, 2012 | |
| Investor Class | | | 1.50 | % | | | 2.20 | % | | February 2, 2012 | |
| Class C | | | 1.50 | % | | | 2.95 | % | | February 2, 2012 | |
| Spectrum Fund | |
| Institutional Class | | | 1.50 | % | | | 1.95 | % | | January 31, 2012 | |
| Investor Class | | | 1.50 | % | | | 2.20 | % | | January 31, 2012 | |
| Class C | | | 1.50 | % | | | 2.95 | % | | January 31, 2012 | |
| Titan Fund | |
| Institutional Class | | | 1.50 | % | | | 1.95 | % | | February 2, 2012 | |
| Investor Class | | | 1.50 | % | | | 2.20 | % | | February 2, 2012 | |
| Class C | | | 1.50 | % | | | 2.95 | % | | February 2, 2012 | |
| Emerging Growth Fund | |
| Institutional Class | | | 1.00 | % | | | 1.15 | % | | January 31, 2012 | |
| Investor Class | | | 1.00 | % | | | 1.40 | % | | January 31, 2012 | |
| Large Growth Fund | |
| Institutional Class | | | 0.60 | % | | | 0.69 | % | | January 31, 2012 | |
| Investor Class | | | 0.60 | % | | | 0.94 | % | | January 31, 2012 | |
| Midcap Growth Fund | |
| Institutional Class | | | 0.75 | % | | | 0.93 | % | | January 31, 2012 | |
| Investor Class | | | 0.75 | % | | | 1.18 | % | | January 31, 2012 | |
| Retirement Class | | | 0.75 | % | | | 1.43 | % | | January 31, 2012 | |
| | | Advisory
fee | | Expense
cap | | Date
(through) | |
| Small Cap Growth Fund | |
| Investor Class | | | 1.00 | % | | | 1.25 | % | | January 31, 2012 | |
Quantitative Broad Market
Equity Fund | |
| Institutional Class | | | 0.50 | % | | | 0.64 | % | | January 31, 2012 | |
| Investor Class | | | 0.50 | % | | | 0.89 | % | | January 31, 2012 | |
Quantitative Large Cap
Value Fund | |
| Institutional Class | | | 0.60 | % | | | 0.69 | % | | January 31, 2012 | |
| Investor Class | | | 0.60 | % | | | 0.94 | % | | January 31, 2012 | |
| Global Opportunities Fund | |
| Institutional Class | | | 0.75 | % | | | 1.10 | % | | January 31, 2012 | |
| Investor Class | | | 0.75 | % | | | 1.35 | % | | January 31, 2012 | |
| International Growth Fund | |
| Institutional Class | | | 0.85 | % | | | 1.10 | % | | January 31, 2012 | |
| Investor Class | | | 0.85 | % | | | 1.35 | % | | January 31, 2012 | |
| Small Cap Equity Fund | |
| Institutional Class | | | 0.95 | % | | | 1.20 | % | | January 31, 2012 | |
| Investor Class | | | 0.95 | % | | | 1.45 | % | | January 31, 2012 | |
For the remaining Funds, the Concentrated Growth Fund and the All Cap Growth Fund, the advisory fee is comprised of a base fee and performance adjustment that increases or decreases the total fee depending upon the performance of the Fund relative to the Fund's performance benchmark. The Fund's base fee (1.10% for both the Concentrated Growth Fund and the All Cap Growth Fund) is accrued daily and paid monthly, based on the Fund's average net assets during the current month.
The performance adjustment is calculated and paid monthly by comparing the Fund's performance to that of the Fund's performance benchmark over the current month plus the previous 11 months (the "performance period"). The annual performance adjustment rate is multiplied by the average net assets of the Fund over the entire performance period, which is then multiplied by a fraction, the numerator of which is the number of days in the month and the denominator of which is 365 (366 in leap years). The resulting amount is then added to (in the case of overperformance) or subtracted from (in the case of underperformance) the Fund's base fee.
In cases where the advisory fee is comprised of a base fee and a performance adjustment, Turner has voluntarily agreed to waive all or a portion of their fees and to reimburse expenses in order to keep such Fund's "other expenses" (excluding distribution fees, acquired fund fees and expenses and interest expenses relating to short sales) from exceeding a specified percentage of the average daily net assets of the Fund on an annualized basis. Accordingly, the base advisory fee, annual adjustment
92 TURNER FUNDS 2011 SEMIANNUAL REPORT
rate, over/under performance relative to the benchmark threshold, and other expense cap are as follows:
| | | Base
advisory
fee | | Annual
adjustment
rate | | Benchmark
threshold(1) | | Other
expenses
cap | |
| All Cap Growth Fund | | | 1.10 | % | | | +/-0.40% | | | | +/-2.50% | | | | 0.25 | % | |
| Concentrated Growth Fund | | | 1.10 | % | | | +/-0.40% | | | | +/-2.50% | | | | 0.25 | % | |
(1) See the Funds' Prospectus and Statement of Additional Information for more information regarding each Fund's performance benchmark.
During the six months ended March 31, 2011, the Funds' advisory fees, before waivers, were adjusted in accordance with the policy described above:
| | | Base
adviser
fee | | Performance
adjustment | | Net adviser
fee before
waivers | |
| All Cap Growth Fund | | $ | 224,657 | | | $ | 69,832 | | | $ | 294,489 | | |
| Concentrated Growth Fund | | | 278,800 | | | | 82,690 | | | | 361,490 | | |
6. Redemption fees:
Sales or exchanges out of the All Cap Growth Fund, Large Growth Fund, Quantitative Large Cap Value Fund, and the Small Cap Equity Fund within 90 days of purchase are not currently subject to a redemption fee of 2.00%, but may be in the future. The Funds will provide notice to shareholders before they implement the redemption fee.
7. Contingent deferred sales charges:
A 1.00% contingent deferred sales charge ("CDSC") will be deducted with respect to the Market Neutral Fund, Medical Sciences Long/Short Fund, Spectrum Fund and Titan Fund, Class C Shares, redeemed within 12 months of purchase. The CDSC will be based on the lower of the original purchase price or the value of the Class C Shares redeemed. The CDSC may be waived for certain investors, as described in the Market Neutral Fund, Medical Sciences Long/Short Fund, Spectrum Fund and Titan Fund's Class C statutory prospectus.
8. Investment transactions:
The cost of security purchases and the proceeds from security sales, other than short-term investments, for the six months ended March 31, 2011 were as follows (000):
| | | Purchases | | Sales | |
| Market Neutral Fund | | $ | 7,211 | | | $ | 4,415 | | |
| Medical Sciences Long/Short Fund | | | 3,241 | | | | 1,356 | | |
| Spectrum Fund | | | 1,244,184 | | | | 1,189,623 | | |
| Titan Fund | | | 6,233 | | | | 2,810 | | |
| All Cap Growth Fund | | | 58,878 | | | | 33,340 | | |
| Concentrated Growth Fund | | | 52,179 | | | | 48,202 | | |
| Emerging Growth Fund | | | 211,035 | | | | 218,041 | | |
| Large Growth Fund | | | 607,637 | | | | 637,191 | | |
| Midcap Growth Fund | | | 515,118 | | | | 504,624 | | |
| Small Cap Growth Fund | | | 168,952 | | | | 181,823 | | |
| Quantitative Broad Market Equity Fund | | | 3,589 | | | | 4,451 | | |
| | | Purchases | | Sales | |
| Quantitative Large Cap Value Fund | | $ | 21 | | | $ | 159 | | |
| Global Opportunities Fund | | | 1,566 | | | | 1,024 | | |
| International Growth Fund | | | 7,359 | | | | 6,873 | | |
| Small Cap Equity Fund | | | 5,315 | | | | 7,688 | | |
9. Federal tax policies and information:
Each of the Funds is classified as a separate taxable entity for Federal income tax purposes. Each of the Funds intends to continue to qualify as a separate "regulated investment company" under the Internal Revenue Code and make the requisite distributions to shareholders that will be sufficient to relieve it from Federal income tax and Federal excise tax. Therefore, no Federal tax provision is required.
The amounts of dividends from net investment income and distributions from net realized capital gains, if any, are determined in accordance with Federal income tax regulations, which may differ from those amounts determined under accounting principles generally accepted in the United States of America. These book/tax differences are either temporary or permanent in nature. These differences are primarily due to wash sales, REIT adjustments, expired capital loss carryforwards, foreign currency transactions, net operating losses and investments in partnerships and passive foreign investment companies. The character and timing of dividends from net investment income and distributions from net realized gains distributed during the fiscal year may differ from the year that the income or realized gains (losses) were recorded by the Funds. To the extent these differences are permanent, adjustments are made to the appropriate equity accounts in the period that the differences arise.
The tax character of dividends and distributions declared during the years ended September 30, 2010 and September 30, 2009 were as follows (000):
| | | Ordinary
income | | Long-term
capital gain | | Return of
capital | | Total | |
| Spectrum Fund | | | |
| | 2010 | | | $ | 142 | | | $ | — | | | $ | — | | | $ | 142 | | |
| | 2009 | | | | — | | | | — | | | | — | | | | — | | |
| All Cap Growth Fund | | | |
| | 2010 | | | $ | 22 | | | $ | — | | | $ | 1 | | | $ | 23 | | |
| | 2009 | | | | — | | | | — | | | | — | | | | — | | |
Concentrated Growth
Fund | | | |
| | 2010 | | | $ | 120 | | | $ | — | | | $ | 1 | | | $ | 121 | | |
| | 2009 | | | | — | | | | — | | | | — | | | | — | | |
| Emerging Growth Fund | | | |
| | 2010 | | | $ | — | | | $ | — | | | $ | — | | | $ | — | | |
| | 2009 | | | | — | | | | 12,445 | | | | — | | | | 12,445 | | |
| Large Growth Fund | | | |
| | 2010 | | | $ | 2,287 | | | $ | — | | | $ | — | | | $ | 2,287 | | |
| | 2009 | | | | 2,308 | | | | — | | | | — | | | | 2,308 | | |
TURNER FUNDS 2011 SEMIANNUAL REPORT 93
NOTES TO FINANCIAL STATEMENTS
(Unaudited)
| | | Ordinary
income | | Long-term
capital gain | | Return of
capital | | Total | |
Quantitative Broad
Market Equity Fund | | | |
| | 2010 | | | $ | 7 | | | $ | — | | | $ | — | | | $ | 7 | | |
| | 2009 | | | | 4 | | | | — | | | | — | | | | 4 | | |
Quantitative Large Cap
Value Fund | | | |
| | 2010 | | | $ | 13 | | | $ | — | | | $ | — | | | $ | 13 | | |
| | 2009 | | | | 14 | | | | — | | | | — | | | | 14 | | |
| | | Ordinary
income | | Long-term
capital gain | | Return of
capital | | Total | |
International Growth
Fund | | | |
| | 2010 | | | $ | 59 | | | $ | — | | | $ | — | | | $ | 59 | | |
| | 2009 | | | | 42 | | | | — | | | | — | | | | 42 | | |
| Small Cap Equity Fund | | | |
| | 2010 | | | $ | — | | | $ | — | | | $ | — | | | $ | — | | |
| | 2009 | | | | 17 | | | | — | | | | — | | | | 17 | | |
As of September 30, 2010, the components of distributable earnings (accumulated losses) on a tax basis were as follows (000):
| | | Undistributed
ordinary
income | | Capital
loss
carryforward | | Post-
October
losses | | Post-
October
currency
losses | | Unrealized
appreciation | | Other
temporary
differences | | Total
distributable
earnings
(accumulated
losses) | |
| Spectrum Fund | | $ | — | | | $ | (37 | ) | | $ | (2,435 | ) | | $ | (129 | ) | | $ | 1,847 | | | $ | — | | | $ | (754 | ) | |
| All Cap Growth Fund | | | — | | | | (20,717 | ) | | | — | | | | — | | | | 6,534 | | | | — | | | | (14,183 | ) | |
| Concentrated Growth Fund | | | — | | | | (40,745 | ) | | | — | | | | — | | | | 7,810 | | | | — | | | | (32,935 | ) | |
| Emerging Growth Fund | | | — | | | | (86,022 | ) | | | — | | | | — | | | | 104,308 | | | | — | | | | 18,286 | | |
| Large Growth Fund | | | 540 | | | | (266,157 | ) | | | — | | | | — | | | | 99,559 | | | | — | | | | (166,058 | ) | |
| Midcap Growth Fund | | | — | | | | (361,471 | ) | | | — | | | | — | | | | 259,260 | | | | — | | | | (102,211 | ) | |
| Small Cap Growth Fund | | | — | | | | (70,467 | ) | | | — | | | | — | | | | 64,560 | | | | — | | | | (5,907 | ) | |
| Quantitative Broad Market Equity Fund | | | 67 | | | | (177 | ) | | | (467 | ) | | | — | | | | 202 | | | | — | | | | (375 | ) | |
| Quantitative Large Cap Value Fund | | | 8 | | | | (277 | ) | | | — | | | | — | | | | 67 | | | | — | | | | (202 | ) | |
| Global Opportunities Fund | | | — | | | | — | | | | (4 | ) | | | — | | | | 159 | | | | — | | | | 155 | | |
| International Growth Fund | | | 49 | | | | (1,165 | ) | | | — | | | | (3 | ) | | | 753 | | | | — | | | | (366 | ) | |
| Small Cap Equity Fund | | | 22 | | | | (7,648 | ) | | | — | | | | — | | | | 1,209 | | | | 31 | | | | (6,386 | ) | |
Post-October losses represent losses realized on investment transactions from November1, 2009 through September 30, 2010 that, in accordance with Federal income tax regulations, a Fund may elect to defer and treat as having arisen in the following year. For Federal income tax purposes, capital loss carryforwards may be carried forward and applied against future capital gains.
At September 30, 2010, the Funds had capital loss carry-forwards available to offset future realized capital gains through the indicated expiration dates (000):
| | | Expiring September 30, | |
| | | 2011 | | 2013 | | 2014 | | 2015 | | 2016 | | 2017 | | 2018 | | Total | |
| Spectrum Fund | | $ | — | | | $ | — | | | $ | — | | | $ | — | | | $ | — | | | $ | — | | | $ | 37 | | | $ | 37 | | |
| All Cap Growth Fund | | | 385 | | | | 247 | | | | — | | | | — | | | | — | | | | 17,695 | | | | 2,390 | | | | 20,717 | | |
| Concentrated Growth Fund | | | 12,850 | | | | — | | | | — | | | | — | | | | 172 | | | | — | | | | 27,723 | | | | 40,745 | | |
| Emerging Growth Fund | | | — | | | | — | | | | — | | | | — | | | | — | | | | 41,623 | | | | 44,399 | | | | 86,022 | | |
| Large Growth Fund | | | 318 | | | | — | | | | 200 | | | | 827 | | | | — | | | | 175,370 | | | | 89,442 | | | | 266,157 | | |
| Midcap Growth Fund | | | 129,499 | | | | — | | | | — | | | | — | | | | — | | | | 142,386 | | | | 89,586 | | | | 361,471 | | |
| Small Cap Growth Fund | | | 25,994 | | | | — | | | | — | | | | — | | | | — | | | | 27,970 | | | | 16,503 | | | | 70,467 | | |
| Quantitative Broad Market Equity Fund | | | — | | | | — | | | | — | | | | — | | | | — | | | | 48 | | | | 129 | | | | 177 | | |
| Quantitative Large Cap Value Fund | | | — | | | | — | | | | — | | | | — | | | | — | | | | 155 | | | | 122 | | | | 277 | | |
| International Growth Fund | | | — | | | | — | | | | — | | | | — | | | | — | | | | 1,089 | | | | 76 | | | | 1,165 | | |
| Small Cap Equity Fund | | | — | | | | — | | | | — | | | | — | | | | — | | | | 501 | | | | 7,147 | | | | 7,648 | | |
As of March 7, 2011, the Large Growth Fund credited accumulated net realized loss $12,828 (000) and charged paid-in-capital $123,626 (000) and unrealized appreciation $31,165 (000) due to the Turner Large Cap Growth Fund ("Large Cap Growth Fund") merger with the Large Growth Fund. Internal Revenue Code 382 limits the amount of annual capital loss carryover available for use. It is unlikely that the Fund will need to permanently forfeit any of these amounts.
94 TURNER FUNDS 2011 SEMIANNUAL REPORT
The Regulated Investment Company Modernization Act of 2010, (the "Modernization Act"), was signed into law by President Obama on December 22, 2010. The Modernization Act makes a number of changes to the provisions in the Internal Revenue Code of 1986, as amended relating to regulated investment companies ("RICs") that will generally become effective for taxable years beginning after December 22, 2010. The Modernization Act allows RICs to generally carryover net capital losses indefinitely, effective for losses arising in taxable years beginning after December 22, 2010. Such losses will retain their character as either long-term capital losses or short-term capital losses. Under pre-enactment law, capital losses could be carried forward for eight years and carried forward as short-term losses irrespective of the character of the original loss. Loss carryovers from years beginning prior to December 22, 2010 will still expire subject to the eight-year limitation. The Modernization Act further provides that losses arising in taxable years after December 22, 2010 (which are carried forward indefinitely) would be utilized prior to loss carryovers arising in taxable years beginning prior to December 22, 2010.
At March 31, 2011, the total cost of securities for Federal income tax purposes and the aggregate gross unrealized appreciation and depreciation for the investments held by the Fund, excluding securities sold short and written options, were as follows (000):
| | | Federal
tax cost | | Unrealized
appreciation | | Unrealized
depreciation | | Net
unrealized
appreciation | |
| Market Neutral Fund | | $ | 2,853 | | | $ | 117 | | | $ | (7 | ) | | $ | 110 | | |
| Medical Sciences Long/Short Fund | | | 4,586 | | | | 96 | | | | (12 | ) | | | 84 | | |
| Spectrum Fund | | | 332,246 | | | | 15,471 | | | | (3,434 | ) | | | 12,037 | | |
| Titan Fund | | | 3,723 | | | | 108 | | | | (17 | ) | | | 91 | | |
| All Cap Growth Fund | | | 51,008 | | | | 12,278 | | | | (576 | ) | | | 11,702 | | |
| Concentrated Growth Fund | | | 49,517 | | | | 9,973 | | | | (649 | ) | | | 9,324 | | |
| Emerging Growth Fund | | | 446,814 | | | | 205,504 | | | | (3,498 | ) | | | 202,006 | | |
| Large Growth Fund | | | 519,468 | | | | 151,531 | | | | (3,105 | ) | | | 148,426 | | |
| Midcap Growth Fund | | | 897,042 | | | | 438,176 | | | | (7,805 | ) | | | 430,371 | | |
| Small Cap Growth Fund | | | 301,468 | | | | 101,076 | | | | (2,434 | ) | | | 98,642 | | |
| Quantitative Broad Market Equity Fund | | | 9,964 | | | | 2,150 | | | | (69 | ) | | | 2,081 | | |
| Quantitative Large Cap Value Fund | | | 683 | | | | 165 | | | | (2 | ) | | | 163 | | |
| Global Opportunities Fund | | | 1,723 | | | | 376 | | | | (9 | ) | | | 367 | | |
| International Growth Fund | | | 5,884 | | | | 956 | | | | (40 | ) | | | 916 | | |
| Small Cap Equity Fund | | | 4,214 | | | | 1,579 | | | | (22 | ) | | | 1,557 | | |
Management has analyzed the Funds' tax positions taken on Federal income tax returns for all open tax years and has concluded that as of March 31, 2011, no provision for income tax would be required in the Funds' financial statements. The Funds' Federal and State income and Federal excise tax returns for tax years for which the applicable statutes of limitations have not expired are subject to examination by the Internal Revenue Service and state department of revenue.
10. Concentration/risks:
Certain Funds invest a high percentage of their assets in specific sectors of the market in order to achieve a potentially greater investment return. As a result, the Funds may be more susceptible to economic, political, and regulatory developments in a particular sector of the market, positive or negative, and may experience increased volatility on the Fund's net asset value and magnified effect on the total return.
The Funds enter into contracts that contain a variety of indemnifications. The Funds' maximum exposure under these arrangements is unknown. However, the Funds have not had prior claims or losses pursuant to these contracts and expect the risk of loss to be remote.
11. Loans of portfolio securities:
The Funds may lend securities in their portfolio pursuant to a securities lending agreement ("Lending Agreement") with Morgan Stanley. Unless otherwise agreed, security loans, made pursuant to the Lending Agreement are required at all times to be secured by collateral equal to at least 100% of the market value of the securities loaned. Cash collateral received is invested in the BlackRock TempCash Fund, Institutional Shares, a money market fund. All such investments are made at the risk of the Funds and, as such, the Funds are liable for investment losses. The Funds receive an annual fee for their participation in the Lending Agreement based on projected lending activity.
In the event of bankruptcy of the borrower, realization/retention of the collateral may be subject to legal proceedings.
TURNER FUNDS 2011 SEMIANNUAL REPORT 95
NOTES TO FINANCIAL STATEMENTS
(Unaudited)
12. Derivative contracts:
Written Options—A summary of option contracts written during the six months ended March 31, 2011 for the Spectrum Fund is as follows:
| | | Option
contracts | | Option
premiums
(000) | |
| Options outstanding at beginning of year | | | 2,729 | | | $ | 240 | | |
| Options written | | | 99,643 | | | | 13,655 | | |
Options cancelled in a closing
purchase transaction | | | (83,263 | ) | | | (11,244 | ) | |
| Options exercised | | | (585 | ) | | | (38 | ) | |
| Options expired | | | (3,619 | ) | | | (245 | ) | |
| Options outstanding at end of year | | | 14,905 | | | $ | 2,368 | | |
13. In-kind transactions:
During the year ended September 30, 2010, the Large Growth Fund distributed securities in lieu of cash for shareholder redemptions. The shareholders received a pro-rata portion of the Large Growth Fund's holdings based on shares outstanding. The value of the redemption was as follows:
| Date | | Redemption | | Securities | | Cash | | Realized loss | | Fund shares redeemed | |
| 11/9/09 | | $ | 15,554,214 | | | $ | 15,292,016 | | | $ | 262,198 | | | $ | 1,492,642 | | | | 1,518,966 | | |
During the six months ended March 31, 2011, there were no in-kind transactions.
These transactions were completed pursuant to procedures adopted by the Board. These procedures are designed to minimize or eliminate any adverse tax implications to the Funds and its shareholders.
14. Fund merger:
On March 7, 2011, the Large Growth Fund acquired all of the net assets of the Large Cap Growth Fund, an open-end investment company, pursuant to a plan of reorganization approved by the Large Cap Growth Fund shareholders on February 28, 2011. The purpose of the transaction was to combine the two Funds managed by the Adviser with similar investment objectives and policies. The acquisition was accomplished by a tax-free exchange of 10,966,460 Institutional Class shares and 119,229 Investor Class shares of the Large Growth Fund, valued at $140,366,060 and $1,517,732, respectively, for 23,818,691 Institutional Class shares and 258,725 Investor Class shares of the Large Cap Growth Fund outstanding on March 7, 2011. The exchange ratios (Large Growth Fund shares issued/Large Cap Growth Fund shares outstanding) were 0.46:1 and 0.46:1 for the Institutional Class and Investor Class, respectively.
The investment portfolio of the Large Cap Growth Fund, with a fair value of $141,864,763 and identified cost of $110,699,412 at March 7, 2011, was the principal asset acquired by the Large Growth Fund. For financial reporting purposes, assets received and shares issued by the Fund were recorded at fair value; however, the cost basis of the investments received from the Large Cap Growth Fund was carried forward to align ongoing reporting of the Large Growth Fund's realized and unrealized gains and losses with amounts distributable to shareholders for tax purposes.
Upon the business combination of the Funds on March 7, 2011, the net assets of the Large Cap Growth Fund, which included portfolio capital of $123,626,391, accumulated net investment loss of $39,065, accumulated realized losses of $12,868,885 and unrealized gains of $31,165,351, combined with the Large Growth Fund were $666,939,990. The undistributed net investment income and unrealized gains of the Large Cap Growth Fund may be distributed by the Large Growth Fund in future periods. Immediately prior to the merger, the net assets of the Large Cap Growth Fund and the Large Growth Fund were $141,883,792 and $525,056,198, respectively. All fees and expenses incurred by the Large Cap Growth Fund and the Large Growth Fund directly in connection with the Plan of Reorganization were borne by the Adviser.
Assuming the acquisition had been completed on October 1, 2010, the beginning of the annual reporting period of the Large Growth Fund, the Fund's pro forma results of operations for the six months ended March 31, 2011, are as follows (000):
| Net investment income/(loss): | | $ | (287 | ) | |
| Net realized/unrealized gains/(losses): | | | 146,276 | | |
| Change in net assets resulting from operations: | | $ | 145,989 | | |
96 TURNER FUNDS 2011 SEMIANNUAL REPORT
Because the combined investment portfolios have been managed as a single integrated portfolio since the acquisition was completed, it is not practicable to separate the amounts of revenue and earnings of the Large Cap Growth Fund that have been included in the Large Growth Fund Statement of Operations since March 7, 2011.
15. Subsequent events:
On February 25, 2011, the Board determined to close and liquidate the Quantitative Large Cap Value Fund and the Small Cap Equity Fund, effective on April 29, 2011. This decision was made after careful consideration of the Funds' asset size, strategic importance, current expenses and historical performance. In connection with the liquidation, the Funds discontinued accepting orders for the purchase of the Funds' shares or exchanges into the Funds from other Turner Funds after the close of business on April 1, 2011. On the close of business on April 29, 2011, the Funds distributed pro rata all of its assets in cash to their shareholders, and all outstanding shares were redeemed and cancelled.
Effective April 14, 2011, the Emerging Growth Fund was reopened to new investors and existing shareholders.
On May 27, 2011, the Board determined to close and liquidate the Quantitative Broad Market Equity Fund, effective June 30, 2011.
The Trust has evaluated the need for disclosures and/or adjustments resulting from subsequent events through the date the financial statements were issued. Based on this evaluation, no adjustments were required to the financial statements as of March 31, 2011.
TURNER FUNDS 2011 SEMIANNUAL REPORT 97
BOARD OF TRUSTEES CONSIDERATIONS IN APPROVING THE ADVISORY AGREEMENTS (Unaudited)
Board of Trustees considerations in approving the Advisory Agreements
On November 19, 2010, the Board of Trustees (the "Board" or "Trustees") of the Turner Funds (the "Funds" or the "Trust") held a meeting to decide whether to approve the advisory agreement with Turner Investment Partners, Inc. ("TIP") with respect to each of the Turner Market Neutral Fund, the Turner Titan Fund, and the Turner Medical Sciences Fund (collectively, the "New Funds"). In preparation for the meeting, the Board requested and reviewed a wide variety of information from TIP. The information described, among other things: TIP's business; its organizational structure, personnel and operations; advisory services; the performance of the separate accounts/ strategies that replicated the proposed strategies of the New Funds over past periods; compliance; the proposed advisory fees and expenses to be paid by the New Funds; and information on trading. At the meeting, representatives from TIP presented additional oral information to the Trustees to help them evaluate TIP's fees and other aspects of the advisory agreement. The Trustees discussed the written materials and TIP's oral presentation, and deliberated on the approval of the advisory agreement in light of this information.
The Board, including all of the independent Trustees, considered, among other things: (1) the nature, extent and quality of the proposed services provided by TIP; (2) the performance of the separate accounts/ strategies over the past periods (as available) and versus each New Fund's proposed Morningstar category and peer group; (3) the contractual and actual compensation to be paid under the agreements as compared to the compensation paid to relevant Morningstar peer groups; (4) the proposed expense ratios of the New Funds, with expense waivers, as compared to expense ratios for relevant Morningstar peer groups; (5) the qualifications of TIP's personnel, portfolio management capabilities and investment methodologies; (6) TIP's operations, compliance program and policies; (7) the financial condition of TIP; (8) the cost of services provided by TIP and TIP's potential profitability from managing the New Funds; (9) "fall-out" benefits to TIP and its affiliates from the relationship with the New Funds; (10) the extent to which economies of scale are relevant given the New Funds' proposed asset size and current asset growth potential; and (11) a comparison of the fees charged by TIP with fees charged by TIP to similar clients, to the extent it deemed it relevant.
The independent Trustees, in executive session, reached the following conclusions, among others, regarding TIP and the advisory agreements: the recent performance of the separate account or strategies, as applicable, was generally comparable, and in some cases better, than their respective benchmarks; the proposed advisory fees were generally competitive with the fees of their Morningstar peer groups; and the net total expense ratios of the New Funds were generally competitive. The independent Trustees also concluded that: they were satisfied with the quality of services provided by TIP in advising the existing Turner Funds and believed that the proposed portfolio management teams for the New Funds had the expertise to handle the new products; the fact that TIP did not expect, at least initially, to earn any significant profits from management of the New Funds and in fact would have to subsidize them for an initial period; and that each New Fund was not large enough to attain significant economies of scale.
Based on the factors considered, the independent Trustees had concluded that it was appropriate to approve the advisory agreement with respect to the New Funds.
Based on the Board's deliberations and its evaluation of the information described above, the Trustees, including all of the independent Trustees, unanimously: (a) agreed to approve the advisory agreement and (b) determined that the compensation payable by the New Funds under the advisory agreement is fair and reasonable.
On February 25, 2011, the Board of the Trust held a meeting to decide whether to renew the advisory agreements for each of the Turner Funds (the "Advisory Agreements") with TIP and Turner Investment Management LLC (collectively, the "Adviser") for the upcoming year. In preparation for the meeting, the board requested and reviewed a wide variety of information from the Adviser. The materials described, among other things: the Adviser's business; the Adviser's organizational structure, personnel and operations; advisory services; the Funds' performance; compliance; advisory fees and expenses paid by the Funds for the fiscal year ended September 30, 2010; and information on trading. At the meeting, representatives of the Adviser discussed, and answered Board members' questions about, among other things, a chart of advisory fees received by the Adviser for the various Funds; a schedule of the commissions paid to the Trust's top 10 brokers; a soft dollar commission usage report; the Adviser's Form ADVs; and a profitability report for the Adviser for the fiscal year ended September 30, 2010.
The Board, including all of the independent Trustees, considered, among other things: (1) the nature, extent and quality of the services provided by the Adviser; (2) the performance of the Funds over the past one, three, five and ten years, where applicable, versus each Fund's respective Morningstar category and peer group; (3) the
98 TURNER FUNDS 2011 SEMIANNUAL REPORT
BOARD OF TRUSTEES CONSIDERATIONS IN APPROVING THE ADVISORY AGREEMENTS (Unaudited)
contractual and actual compensation to be paid under the agreements as compared to the compensation paid to relevant Morningstar peer groups; (4) the expense ratios of the Funds, with expense waivers, as compared to expense ratios for relevant Morningstar peer groups; (5) the qualifications of the Adviser's personnel, portfolio management capabilities and investment methodologies; (6) the Adviser's operations, compliance program and policies; (7) the financial condition of the Adviser; (8) the cost of services provided by the Adviser and the Adviser's profitability from each Fund for the year ended September 30, 2010; (9) "fall-out" benefits to the Adviser and its affiliates from the relationship with the Funds; (10) the extent to which economies of scale are relevant given the Funds' current asset size and current asset growth potential; and (11) a comparison of the fees charged by the Adviser with fees charged by the Adviser to similar clients, to the extent the Board deemed it relevant.
The independent Trustees, in executive session, reached the following conclusions, among others, regarding the Adviser and the Advisory Agreements: the recent performance of the Funds was, in most cases, within industry norms. They determined that although performance lagged peer groups in the case of several Funds, the Adviser had helped the performance of the Funds, and the Funds' recent performance, in general, was satisfactory. Moreover, the independent Trustees noted the recent enhancements to the staffing of the portfolio management department and to that department's structure. The independent Trustees also concluded that the Funds' net total expense ratios and advisory fees were generally competitive, and noted that the recently negotiated reductions in transfer agency fees would make them more so. The independent Trustees also concluded that: they were satisfied with the quality of services provided by the Adviser in advising the existing Funds; the profits earned by the Adviser seemed reasonable in light of the nature, extent and quality of the services provided to each existing Fund; and that each Fund, and the Trust, was not large enough to attain significant economies of scale.
Based on the Board's deliberations and its evaluation of the information described above, the Trustees, including all of the independent Trustees, unanimously: (a) agreed to renew the Advisory Agreements for another year and (b) determined that the compensation payable by the Trust's Funds under the Advisory Agreements is fair and reasonable.
TURNER FUNDS 2011 SEMIANNUAL REPORT 99
SHAREHOLDER VOTING (Unaudited)
A special meeting of the shareholders of the Large Cap Growth Fund was held on February 28, 2011 (the "Meeting"). At the Meeting, shareholders of the Large Cap Growth Fund approved a Plan of Reorganization which provides for and contemplates: (1) the transfer of all of the assets and liabilities of the Large Cap Growth Fund to the Large Growth Fund in exchange for Institutional Class shares and Investor Class shares of the Large Growth Fund; and (2) the distribution of the Institutional Class shares of the Large Growth Fund and the distribution of the Investor Class shares of the Large Growth Fund in the liquidation of the Large Cap Growth Fund. There were 23,903,248 shares of Large Cap Growth Fund eligible to vote at the Meeting. The results of the Meeting are presented below:
| Voting Results | | No. of Shares | | % of Outstanding Shares | | % of Shares Voted | |
| Affirmative | | | 18,926,007 | | | | 79.178 | % | | | 99.782 | % | |
| Against | | | 26,197 | | | | 0.109 | % | | | 0.138 | % | |
| Abstain | | | 15,182 | | | | 0.064 | % | | | 0.080 | % | |
| Total | | | 18,967,386 | | | | 79.351 | % | | | 100.000 | % | |
100 TURNER FUNDS 2011 SEMIANNUAL REPORT
DISCLOSURE OF FUND EXPENSES (Unaudited)
All mutual funds have operating expenses. As a shareholder of a mutual fund, your investment is affected by these on-going costs, which include (among others) costs for portfolio management, distribution (12b-1) and/or shareholder services and other expenses. It is important for you to understand the impact of these costs on your investment returns. Operating expenses such as these are deducted from a mutual fund's gross income and directly reduce its final investment return. These expenses are expressed as a percentage of a mutual fund's average net assets; this percentage is known as a mutual fund's expense ratio.
The following examples use the expense ratio and are intended to help you understand the ongoing costs (in dollars) of investing in your Fund and to compare these costs with those other mutual funds. The examples are based on an investment of $1,000 made at the beginning of the period shown and held for the entire period.
The table below and on the next page illustrates your Fund's costs in two ways:
• Actual Fund Return. This section help you estimate the actual expenses after fee waivers that your Fund incurred over the period. The "Expenses Paid During Period" column shows the actual dollar expense cost incurred by a $1,000 investment in the Fund, and the "Ending Account Value" number is derived from deducting that expense cost from the Fund's gross investment return.
You can use this information, together with the actual amount you invested in the Fund, to estimate the expenses you paid over that period. Simply divide your actual account value by $1,000 to arrive at a ratio (for example, an $8,600 account value divided by $1,000 = 8.6), then multiply that ratio by the number shown for your Fund under "Expenses Paid During Period."
• Hypothetical 5% Return. This section helps you compare your Fund's cost with those of other mutual funds. It provides information about hypothetical account values and expenses based on the Fund's actual expense ratio (column 3) and an assumed rate of return of 5% per year before expenses, which is not the Fund's actual return. This section is useful in making comparisons because the Securities and Exchange Commission requires all mutual funds to make this 5% calculation. You can assess your Fund's comparative cost by comparing the hypothetical result for your Fund in the "Expenses Paid During Period" column with those that appear in the same charts in the shareholder reports for other mutual funds.
Note: Because the return is set at 5% for comparison purposes — NOT your Fund's actual return — the hypothetical account values and expenses may not be used to estimate your actual ending account balance or expenses you paid for the period.
| | | Beginning
Account
Value
10/1/10 | | Ending
Account
Value
3/31/11 | | Annualized
Expense
Ratios | | Expenses
Paid
During
Period* | |
| Turner Market Neutral Fund — Institutional Class Shares | |
| Actual Fund Return** | | $ | 1,000.00 | | | $ | 1,034.00 | | | | 1.95 | % | | $ | 2.88 | | |
Hypothetical
5% Return | | | 1,000.00 | | | | 1,015.21 | | | | 1.95 | % | | | 9.80 | | |
| Turner Market Neutral Fund — Investor Class Shares | |
| Actual Fund Return** | | | 1,000.00 | | | | 1,033.00 | | | | 2.17 | % | | | 3.20 | | |
Hypothetical
5% Return | | | 1,000.00 | | | | 1,014.11 | | | | 2.17 | % | | | 10.90 | | |
| Turner Market Neutral Fund — Class C Shares | |
| Actual Fund Return** | | | 1,000.00 | | | | 1,033.00 | | | | 2.92 | % | | | 4.31 | | |
Hypothetical
5% Return | | | 1,000.00 | | | | 1,010.37 | | | | 2.92 | % | | | 14.64 | | |
Turner Medical Sciences Long/Short Fund —
Institutional Class Shares | |
| Actual Fund Return** | | | 1,000.00 | | | | 1,026.00 | | | | 1.93 | % | | | 2.84 | | |
Hypothetical
5% Return | | | 1,000.00 | | | | 1,015.31 | | | | 1.93 | % | | | 9.70 | | |
| Turner Medical Sciences Long/Short Fund — Investor Class Shares | |
| Actual Fund Return** | | | 1,000.00 | | | | 1,026.00 | | | | 2.18 | % | | | 3.21 | | |
Hypothetical
5% Return | | | 1,000.00 | | | | 1,014.06 | | | | 2.18 | % | | | 10.95 | | |
| | | Beginning
Account
Value
10/1/10 | | Ending
Account
Value
3/31/11 | | Annualized
Expense
Ratios | | Expenses
Paid
During
Period* | |
| Turner Medical Sciences Long/Short Fund — Class C Shares | |
| Actual Fund Return** | | $ | 1,000.00 | | | $ | 1,025.00 | | | | 2.93 | % | | $ | 4.31 | | |
Hypothetical
5% Return | | | 1,000.00 | | | | 1,010.32 | | | | 2.93 | % | | | 14.69 | | |
| Turner Spectrum Fund — Institutional Class Shares | |
| Actual Fund Return | | | 1,000.00 | | | | 1,092.40 | | | | 1.91 | % | | | 9.96 | | |
Hypothetical
5% Return | | | 1,000.00 | | | | 1,015.41 | | | | 1.91 | % | | | 9.60 | | |
| Turner Spectrum Fund — Investor Class Shares | |
| Actual Fund Return | | | 1,000.00 | | | | 1,090.90 | | | | 2.16 | % | | | 11.26 | | |
Hypothetical
5% Return | | | 1,000.00 | | | | 1,014.16 | | | | 2.16 | % | | | 10.85 | | |
| Turner Spectrum Fund — Class C Shares | |
| Actual Fund Return | | | 1,000.00 | | | | 1,086.80 | | | | 2.91 | % | | | 15.14 | | |
Hypothetical
5% Return | | | 1,000.00 | | | | 1,010.42 | | | | 2.91 | % | | | 14.59 | | |
| Turner Titan Fund — Institutional Class Shares | |
| Actual Fund Return** | | | 1,000.00 | | | | 1,015.00 | | | | 1.94 | % | | | 2.84 | | |
Hypothetical
5% Return | | | 1,000.00 | | | | 1,015.26 | | | | 1.94 | % | | | 9.75 | | |
TURNER FUNDS 2011 SEMIANNUAL REPORT 101
DISCLOSURE OF FUND EXPENSES (Unaudited)
| | | Beginning
Account
Value
10/1/10 | | Ending
Account
Value
3/31/11 | | Annualized
Expense
Ratios | | Expenses
Paid
During
Period* | |
| Turner Titan Fund — Investor Class Shares | |
| Actual Fund Return** | | $ | 1,000.00 | | | $ | 1,015.00 | | | | 2.17 | % | | $ | 3.17 | | |
Hypothetical
5% Return | | | 1,000.00 | | | | 1,014.11 | | | | 2.17 | % | | | 10.90 | | |
| Turner Titan Fund — Class C Shares | |
| Actual Fund Return** | | | 1,000.00 | | | | 1,014.00 | | | | 2.94 | % | | | 4.30 | | |
Hypothetical
5% Return | | | 1,000.00 | | | | 1,010.27 | | | | 2.94 | % | | | 14.74 | | |
| Turner All Cap Growth Fund — Investor Class Shares | |
| Actual Fund Return | | | 1,000.00 | | | | 1,349.90 | | | | 1.61 | % | | | 9.43 | | |
Hypothetical
5% Return | | | 1,000.00 | | | | 1,016.90 | | | | 1.61 | % | | | 8.10 | | |
| Turner Concentrated Growth Fund — Investor Class Shares | |
| Actual Fund Return | | | 1,000.00 | | | | 1,230.80 | | | | 1.61 | % | | | 8.95 | | |
Hypothetical
5% Return | | | 1,000.00 | | | | 1,016.90 | | | | 1.61 | % | | | 8.10 | | |
| Turner Emerging Growth Fund — Institutional Class Shares | |
| Actual Fund Return | | | 1,000.00 | | | | 1,336.40 | | | | 1.15 | % | | | 6.70 | | |
Hypothetical
5% Return | | | 1,000.00 | | | | 1,019.20 | | | | 1.15 | % | | | 5.79 | | |
| Turner Emerging Growth Fund — Investor Class Shares | |
| Actual Fund Return | | | 1,000.00 | | | | 1,335.10 | | | | 1.40 | % | | | 8.15 | | |
Hypothetical
5% Return | | | 1,000.00 | | | | 1,017.95 | | | | 1.40 | % | | | 7.04 | | |
| Turner Large Growth Fund — Institutional Class Shares | |
| Actual Fund Return | | | 1,000.00 | | | | 1,208.60 | | | | 0.69 | % | | | 3.80 | | |
Hypothetical
5% Return | | | 1,000.00 | | | | 1,021.49 | | | | 0.69 | % | | | 3.48 | | |
| Turner Large Growth Fund — Investor Class Shares | |
| Actual Fund Return | | | 1,000.00 | | | | 1,207.80 | | | | 0.94 | % | | | 5.17 | | |
Hypothetical
5% Return | | | 1,000.00 | | | | 1,020.24 | | | | 0.94 | % | | | 4.73 | | |
| Turner Midcap Growth Fund — Institutional Class Shares | |
| Actual Fund Return | | | 1,000.00 | | | | 1,306.70 | | | | 0.93 | % | | | 5.35 | | |
Hypothetical
5% Return | | | 1,000.00 | | | | 1,020.29 | | | | 0.93 | % | | | 4.68 | | |
| Turner Midcap Growth Fund — Investor Class Shares | |
| Actual Fund Return | | | 1,000.00 | | | | 1,304.70 | | | | 1.18 | % | | | 6.78 | | |
Hypothetical
5% Return | | | 1,000.00 | | | | 1,019.05 | | | | 1.18 | % | | | 5.94 | | |
| Turner Midcap Growth Fund — Retirement Class Shares | |
| Actual Fund Return | | | 1,000.00 | | | | 1,303.00 | | | | 1.43 | % | | | 8.21 | | |
Hypothetical
5% Return | | | 1,000.00 | | | | 1,017.80 | | | | 1.43 | % | | | 7.19 | | |
| | | Beginning
Account
Value
10/1/10 | | Ending
Account
Value
3/31/11 | | Annualized
Expense
Ratios | | Expenses
Paid
During
Period* | |
| Turner Small Cap Growth Fund — Investor Class Shares | |
| Actual Fund Return | | $ | 1,000.00 | | | $ | 1,302.40 | | | | 1.25 | % | | $ | 7.18 | | |
Hypothetical
5% Return | | | 1,000.00 | | | | 1,018.70 | | | | 1.25 | % | | | 6.29 | | |
Turner Quantitative Broad Market Equity Fund —
Institutional Class Shares | |
| Actual Fund Return | | | 1,000.00 | | | | 1,192.90 | | | | 0.64 | % | | | 3.50 | | |
Hypothetical
5% Return | | | 1,000.00 | | | | 1,021.74 | | | | 0.64 | % | | | 3.23 | | |
Turner Quantitative Broad Market Equity Fund —
Investor Class Shares | |
| Actual Fund Return | | | 1,000.00 | | | | 1,192.40 | | | | 0.89 | % | | | 4.86 | | |
Hypothetical
5% Return | | | 1,000.00 | | | | 1,020.49 | | | | 0.89 | % | | | 4.48 | | |
Turner Quantitative Large Cap Value Fund —
Institutional Class Shares | |
| Actual Fund Return | | | 1,000.00 | | | | 1,162.10 | | | | 0.69 | % | | | 3.72 | | |
Hypothetical
5% Return | | | 1,000.00 | | | | 1,021.49 | | | | 0.69 | % | | | 3.48 | | |
| Turner Quantitative Large Cap Value Fund — Investor Class Shares | |
| Actual Fund Return | | | 1,000.00 | | | | 1,159.90 | | | | 0.94 | % | | | 5.06 | | |
Hypothetical
5% Return | | | 1,000.00 | | | | 1,020.24 | | | | 0.94 | % | | | 4.73 | | |
| Turner Global Opportunities Fund — Institutional Class Shares | |
| Actual Fund Return | | | 1,000.00 | | | | 1,232.60 | | | | 1.10 | % | | | 6.12 | | |
Hypothetical
5% Return | | | 1,000.00 | | | | 1,019.45 | | | | 1.10 | % | | | 5.54 | | |
| Turner Global Opportunities Fund — Investor Class Shares | |
| Actual Fund Return | | | 1,000.00 | | | | 1,231.30 | | | | 1.35 | % | | | 7.51 | | |
Hypothetical
5% Return | | | 1,000.00 | | | | 1,018.20 | | | | 1.35 | % | | | 6.79 | | |
| Turner International Growth Fund — Institutional Class Shares | |
| Actual Fund Return | | | 1,000.00 | | | | 1,227.90 | | | | 1.10 | % | | | 6.11 | | |
Hypothetical
5% Return | | | 1,000.00 | | | | 1,019.45 | | | | 1.10 | % | | | 5.54 | | |
| Turner International Growth Fund — Investor Class Shares | |
| Actual Fund Return | | | 1,000.00 | | | | 1,226.70 | | | | 1.35 | % | | | 7.49 | | |
Hypothetical
5% Return | | | 1,000.00 | | | | 1,018.20 | | | | 1.35 | % | | | 6.79 | | |
| Turner Small Cap Equity Fund — Institutional Class Shares | |
| Actual Fund Return | | | 1,000.00 | | | | 1,292.60 | | | | 1.20 | % | | | 6.86 | | |
Hypothetical
5% Return | | | 1,000.00 | | | | 1,018.95 | | | | 1.20 | % | | | 6.04 | | |
| Turner Small Cap Equity Fund — Investor Class Shares | |
| Actual Fund Return | | | 1,000.00 | | | | 1,290.70 | | | | 1.45 | % | | | 8.28 | | |
Hypothetical
5% Return | | | 1,000.00 | | | | 1,017.70 | | | | 1.45 | % | | | 7.29 | | |
* Unless otherwise indicated, expenses are equal to the Fund's annualized expense ratio multiplied by the average account value over the period, multiplied by 182/365 (to reflect the one-half year period from 10/1/10 - 3/31/11).
** Expenses are equal to the Fund's annualized expense ratio multiplied by the average account value over the period, multiplied by 53/365 (to reflect the period from inception to date, 2/7/11 - 3/31/11)
102 TURNER FUNDS 2011 SEMIANNUAL REPORT
Turner Funds
Turner Funds' trustees
Alfred C. Salvato
Chief Investment Officer & Treasurer
Thomas Jefferson University
Janet F. Sansone
Executive Director
JFS Consulting
Thomas R. Trala, Jr.
Executive Managing Director & Chief Operating Officer
Turner Investment Partners, Inc.
Dr. John T. Wholihan
Professor (Retired), Dean Emeritus, College of Business
Loyola Marymount University
Investment advisers
Turner Investment Partners, Inc.
Turner Investment Management LLC
Berwyn, Pennsylvania
Distributor
Foreside Fund Services, LLC
Portland, Maine
Administrator
Turner Investment Partners, Inc.
Berwyn, Pennsylvania
Independent Registered Public Accounting Firm
KPMG LLP
Philadelphia, Pennsylvania
This report was prepared for shareholders of the Turner Funds. It may be distributed to others only if preceded or accompanied by a Turner Funds' Prospectus, which contains detailed information. All Turner Funds are offered by prospectus only.
The Funds file their complete schedules of portfolio holdings with the Securities and Exchange Commission (the "Commission") for the first and third quarters of each fiscal year on Form N-Q within sixty days after the end of the period. The Funds' Forms N-Q are available on the Commission's website at http://www.sec.gov, and may be reviewed and copied at the Commission's Public Reference Room in Washington, DC. Information on the operation of the Public Reference Room may be obtained by calling 1-800-SEC-0330.
The Board of Trustees of the Turner Funds has delegated responsibility for decisions regarding proxy voting for securities held by each Fund to Turner Investment Management LLC ("TIM") (with respect to the Small Cap Equity Fund only) and to Turner Investment Partners, Inc. (with respect to each other Fund). TIM and Turner Investment Partners, Inc., will vote such proxies in accordance with their respective proxy policies and procedures, which are included in Appendix B to the SAI. The Board of Trustees will periodically review each Fund's proxy voting record.
A description of the policies and procedures that the Funds use to determine how to vote proxies relating to portfolio securities, as well as information relating to how the Fund voted proxies relating to portfolio securities during the most recent 12-month period ended June 30, is available (i) via the Funds' website, www.turnerinvestments.com; (ii) on the Commission's website at http://www.sec.gov; and (iii) without charge by calling 1.800.224.6312.
TURNER FUNDS 2011 SEMIANNUAL REPORT 103
THIS PAGE WAS INTENTIONALLY LEFT BLANK
104 TURNER FUNDS 2011 SEMIANNUAL REPORT

Turner Funds
P.O. Box 219805
Kansas City, Missouri 64121-9805
Telephone: 1.800.224.6312
Email: mutualfunds@turnerinvestments.com
Web Site: www.turnerinvestments.com
TUR-SA-002-0505
Item 2. Code of Ethics.
Not applicable for semi-annual report.
Item 3. Audit Committee Financial Expert.
Not applicable for semi-annual report.
Item 4. Principal Accountant Fees and Services.
Not applicable for semi-annual report.
Item 5. Audit Committee of Listed Registrants.
Not applicable to open-end management investment companies.
Item 6. Schedule of Investments.
(a) Schedule of Investments is included as part of report to shareholders filed under Item 1.
Item 7. Disclosure of Proxy Voting Policies and Procedures for Closed-End Management Investment Companies.
Not applicable to open-end management investment companies.
Item 8. Portfolio Managers of Closed-End Management Investment Companies.
Not applicable to open-end management investment companies.
Item 9. Purchases of Equity Securities by Closed-End Management Investment Company and Affiliated Purchasers.
Not applicable to open-end management investment companies.
Item 10. Submission of Matters to a Vote of Security Holders.
There have been no material changes to the procedures by which shareholders may recommend nominees to the registrant’s Board of Trustees since the registrant’s last proxy solicitation.
Item 11. Controls and Procedures.
(a) The registrant’s principal executive officer and principal financial officer concluded that the registrant’s disclosure controls and procedures (as defined in Rule 30a-3(c) under the Investment Company Act of 1940 as amended (the “Act”)) were effective as of a date within 90 days of the filing date of this report, based on their evaluation of the effectiveness of the registrant’s disclosure controls and procedures required by Rule 30a-3(b) under the Act and Rule 13a-15(b) or 15d-15(b) under the Securities and Exchange Act of 1934.
(b) There were no changes in the registrant’s internal control over financial reporting (as defined in Rule 30a-3(d) of the Act) that occurred during the registrant’s last fiscal quarter that have materially affected, or are reasonably likely to materially affect, the registrant’s internal control over financial reporting.
Item 12. Exhibits.
(a)(1) Not applicable for semi-annual report.
(a)(2) A separate certification for the principal executive officer and the principal financial officer of the registrant as required by Rule 30a-2(a) under the Investment Company Act of 1940, as amended (17 CFR 270.30a-2(a)), are filed herewith.
(b) Officer certifications as required by Rule 30a-2(b) under the Investment Company Act of 1940, as amended (17 CFR 270.30a-2(b)), also accompany this filing as an Exhibit.
SIGNATURES
Pursuant to the requirements of the Securities Exchange Act of 1934 and the Investment Company Act of 1940, the registrant has duly caused this report to be signed on its behalf by the undersigned, thereunto duly authorized.
Registrant | Turner Funds | |
| | |
By (Signature and Title) | /s/ Thomas R. Trala, Jr. | |
| Thomas R. Trala, Jr., President | |
Date May 23, 2011
Pursuant to the requirements of the Securities Exchange Act of 1934 and the Investment Company Act of 1940, this report has been signed below by the following persons on behalf of the registrant and in the capacities and on the dates indicated.
By (Signature and Title) | /s/ Thomas R. Trala, Jr. | |
| Thomas R. Trala, Jr., President | |
Date May 23, 2011 | | |
| | |
By (Signature and Title) | /s/ Ty Edwards | |
| Ty Edwards, Treasurer | |
Date May 24, 2011 | | |