UNITED STATES
SECURITIES AND EXCHANGE COMMISSION
Washington, D.C. 20549
FORM N-CSR
CERTIFIED SHAREHOLDER REPORT OF REGISTERED
MANAGEMENT INVESTMENT COMPANIES
Investment Company Act file number | 811-07527 |
|
Turner Funds |
(Exact name of registrant as specified in charter) |
|
1205 Westlakes Drive, Suite 100 Berwyn, PA | | 19312 |
(Address of principal executive offices) | | (Zip code) |
|
Michael P. Malloy Drinker Biddle & Reath LLP One Logan Square, Suite 2000 Philadelphia, PA 19103 |
(Name and address of agent for service) |
|
Registrant’s telephone number, including area code: | 1-800-224-6312 | |
|
Date of fiscal year end: | September 30 | |
|
Date of reporting period: | March 28, 2013 | |
| | | | | | | | |
Item 1. Reports to Stockholders.

March 28, 2013 (unaudited)
Long/short equity funds
Turner Market Neutral Fund
Turner Medical Sciences Long/Short Fund
Turner Spectrum Fund
Turner Titan Fund
U.S. growth equity funds
Turner All Cap Growth Fund
Turner Emerging Growth Fund
Turner Large Growth Fund
Turner Midcap Growth Fund
Turner Small Cap Growth Fund
Global and international equity fund
Turner Global Opportunities Fund
Contents
| | 2 | | | Letter to shareholders | |
| | 5 | | | Total returns of the Turner Funds | |
| 9
| | | Investment review:
Turner Market Neutral Fund | |
| 10
| | | Investment review:
Turner Medical Sciences Long/Short Fund | |
| 11
| | | Investment review:
Turner Spectrum Fund | |
| 12
| | | Investment review:
Turner Titan Fund | |
| 13
| | | Investment review:
Turner All Cap Growth Fund | |
| 14
| | | Investment review:
Turner Emerging Growth Fund | |
| 15
| | | Investment review:
Turner Large Growth Fund | |
| 16
| | | Investment review:
Turner Midcap Growth Fund | |
| 17
| | | Investment review:
Turner Small Cap Growth Fund | |
| 18
| | | Investment review:
Turner Global Opportunities Fund | |
| | 19 | | | Schedules of investments | |
| | 46 | | | Financial statements | |
| | 68 | | | Notes to financial statements | |
| 78
| | | Board of Trustees considerations in approving the
Advisory Agreement | |
| | 79 | | | Disclosure of fund expenses | |
Turner Funds
As of March 28, 2013, the Turner Funds offered a series of 10 mutual funds to individual and institutional investors. The minimum initial investment for Institutional Class Shares in a Turner Fund is $250,000 (except for $100,000 for the Turner Market Neutral Fund, the Turner Medical Sciences Long/Short Fund, the Turner Spectrum Fund, and the Turner Titan Fund) for regular accounts and $100,000 for individual retirement accounts. The minimum initial investment for Investor Class Shares, Retirement Class Shares, and Class C Shares is $2,500 for regular accounts and $2,000 for individual retirement accounts.
Turner Investments, based in Berwyn, Pennsylvania, serves as the investment adviser for the Turner Funds. Turner Investments, founded in 1990, manages more than $10 billion in stock investments as of March 28, 2013.
Shareholder services
Turner Funds shareholders receive annual and semiannual reports, quarterly account statements, and a quarterly newsletter. Shareholders who have questions about their accounts may call a toll-free telephone number, 1.800.224.6312, may visit our website, www.turnerinvestments.com, or may write to Turner Funds, P.O. Box 219805, Kansas City, Missouri 64121-9805.
TURNER FUNDS 2013 SEMIANNUAL REPORT 1
In the six-month period ended March 28, 2013, that's the subject of this report, some feared the world would end because of an ancient Mayan prediction. Indeed, there are plenty of fears in the world: trees (dendrophilia), money (chrometophobia), and even hearing good news (euphobia), to name a few. But if the stock market's performance of the past six months was any indication, investing in stocks seemed anything but fear-inducing.
In fact, fear was generally so absent from the stock market in the period that the CBOE Volatility Index, known as the "fear index," dropped to a multi-year low of 11.30 (on average, it's about 20). The lack of fear helped push the S&P 500 Index in March above its previous all-time high reached in October 2007.
Just two years ago, in the summer of 2011, global stock markets were generally in the grip of record high volatility. So where'd the terror go? For one thing, many global macroeconomic worries have dissipated, if not disappeared entirely. For example, tempered growth in China's pacesetting economy is the new norm, and the European Union's political and financial officials soothed fears by promising to do whatever it takes to prevent further fiscal problems on the Continent. And the United States avoided a much-dreaded and prognosticated double-dip recession. Even one of the biggest downers of the past few years, the housing market, has become a bright spot on the U.S. economic landscape.
In a market environment that's driven less by anxiety about macroeconomic events, the focus can begin, and has begun, to return to our favorite stock-investing criterion: fundamentals. Global correlation among stocks dropped to a seven-year low in early 2013, according to Bank of America Merrill Lynch, which is good news — and not fear-inducing in the least — for stock pickers like us.
Pendulum swings positive
With less apprehension in the air, it seems even the most skeptical investors are embracing stocks. For instance, previously individual investors seemed to have a "wait-and-flee" mindset about stocks, pulling more than $263 billion out of stock mutual funds since the summer of 2011, according to the Investment Company Institute. But starting in the fourth quarter of 2012, their habits abruptly changed; stock funds were the beneficiaries of 19 straight weeks of inflows totaling nearly $100 billion, Bank of America Merrill Lynch reported. While the investment-flow scales are still uneven, you have to start somewhere, and we think this start bodes well for stocks.
Those inflows did come with a dose of restraint, however. ConvergEx Research likened investors' caution to finding a $100 bill on the sidewalk: it looks real, but you want to pick it up casually, just in case it's an embarrassing prank. Because the Federal Reserve has pledged to keep interest rates low for several more quarters, bonds are yielding less than the inflation rate (the yield of the 10-year Treasury note has been hovering
below 2%). In search of income outside of bonds, individual investors who returned to stocks chose to play it safe, investing in lower risk, slower growth, and higher yielding stocks. For instance, the Russell 3000 Value Index beat the Russell 3000 Growth Index by 5.70 percentage points during the period.
In our opinion, whatever type of stocks they like, investors who are in the market now may be rewarded for it. We think that after producing paltry returns in the 2000s, stocks are reverting to the mean, to better results. The historical average for large-cap stocks, as measured by the S&P 500 Index, in the 87 years from 1926 to 2012 is an annualized 9.8% total return. If stock returns are a pendulum, they swung to extreme lows during what we call the Unlucky 13 Era from 2000-2012, when the S&P 500 Index produced a woeful annualized return of just 1.6%. But in a welcome reversal of that trend, the pendulum now appears to moving toward the positive: since January 2010, S&P 500 Index stocks have gained 10.7% annualized. And we think they may have more gains in store in this decade, as more investors return to the market, helping to push stock prices higher in a virtuous cycle.
Moving on up
Stocks certainly were rewarding in the most recent six-month period: they were the best-performing asset class globally in both quarters of the period (the first time that's happened since 2009, according to Bloomberg). In short, the S&P 500 Index moved relentlessly upward for most of the period. With the exception of a modest decline in October in advance of the U.S. presidential election and the so-called fiscal cliff of federal spending cuts and tax increases, the S&P 500 Index proceeded to record gains for five consecutive months and rose 10.19% overall.
But throughout the period stock investors waffled on where to place their money. In the first half of the period, more "risky" cyclical sectors, such as the consumer-discretionary and financial-services sectors, generally performed well. In the second half of the period, though, businesses, in the lead-up to the fiscal cliff, deferred spending, which seemed to hurt the technology sector especially. As a result the technology sector of the broad-based Russell 3000 Index fell about 5% in the first quarter, and more defensive sectors like health care, consumer staples, and utilities flourished.
Out of favor
As for our own growth funds, underperformance in a classic growth sector like technology, in which we invest heavily, hampered returns for the entire six-month period. But one sector alone can't fully explain our largely subpar results; our stock selection in some cases left something to be desired. And despite the positive course of the market, our growth-investing style wasn't rewarded amply. Reflecting investor caution, the type of stocks our growth style favors — stocks with good fundamentals, such as revenue and earnings growth —
2 TURNER FUNDS 2013 SEMIANNUAL REPORT
generally underperformed stocks with less attractive fundamentals and higher dividend yields.
Our funds' ability to outperform has been most pronounced when the market favors stocks with high projected earnings-growth rates, above-average price/earnings ratios, and lower dividend yields — in other words, growth stocks. For better or worse, we weren't the only investment managers challenged recently: in the first quarter of 2013, only 27% of active large-cap managers beat their benchmark, according to Bank of America Merrill Lynch. And to the detriment of our long/short funds, the shares of U.S. companies that were most often sold short rose about 9% in the first quarter, Goldman Sachs noted.
Nonetheless, our family of stock funds generally performed well in absolute terms during the six-month period. Seven of our 10 funds produced positive returns, ranging from 2.17% to 12.80%. However, in relative terms, it was a different story: only the Turner Spectrum Fund and the Turner Medical Sciences Long/Short Fund managed to beat at least one of their benchmarks. As investors in our own funds, we share your disappointment over the funds that did underperform in an up market.
Total returns | | | | | |
Six-month period ended March 28, 2013 | | | | | |
Long/short equity funds | | | | | |
Turner Market Neutral Fund,
Investor Class (TMNFX) | | | -7.31 | % | |
S&P 500 Index | | | 10.19 | | |
Barclays Capital U.S. Aggregate Bond Index | | | 0.09 | | |
Lipper Equity Market-Neutral Funds Average | | | 1.63 | | |
Turner Medical Sciences Long/Short Fund,
Investor Class (TMSFX) | | | 2.17 | | |
S&P 500 Healthcare Index | | | 15.90 | | |
Barclays Capital U.S. Aggregate Bond Index | | | 0.09 | | |
Lipper Long/Short Equity Funds Average | | | 4.96 | | |
Turner Spectrum Fund,
Institutional Class (TSPEX) | | | 2.20 | | |
S&P 500 Index | | | 10.19 | | |
Barclays Capital U.S. Aggregate Bond Index | | | 0.09 | | |
Lipper Long/Short Equity Funds Average | | | 4.96 | | |
Turner Titan Fund, Investor Class (TTLFX) | | | -1.60 | | |
S&P 500 Index | | | 10.19 | | |
Barclays Capital U.S. Aggregate Bond Index | | | 0.09 | | |
Lipper Long/Short Equity Funds Average | | | 4.96 | | |
U.S. growth equity funds | | | | | |
Turner All Cap Growth Fund (TBTBX) | | | -0.66 | | |
Nasdaq Composite Index | | | 4.85 | | |
Russell 3000 Growth Index | | | 8.52 | | |
Turner Emerging Growth Fund,
Investor Class (TMCGX) | | | 8.88 | | |
Russell 2000 Growth Index | | | 13.72 | | |
Turner Large Growth Fund,
Institutional Class (TSGEX) | | | 2.74 | % | |
Russell 1000 Growth Index | | | 8.10 | | |
Turner Midcap Growth Fund,
Investor Class (TMGFX) | | | 8.21 | | |
Russell Midcap Growth Index | | | 13.39 | | |
Turner Small Cap Growth Fund (TSCEX) | | | 12.80 | | |
Russell 2000 Growth Index | | | 13.72 | | |
Global and international equity fund | | | | | |
Turner Global Opportunities Fund,
Institutional Class (TGLBX) | | | 5.96 | | |
MSCI World Growth Index | | | 9.59 | | |
MSCI World Index | | | 10.71 | | |
(Please call 1.800.224.6312 or visit our Web site at www.turnerinvestments.com for the most recent month-end performance. For more details on the performance of each fund during the six-month period, see the Investment review beginning on page 9.)
Smaller-cap funds do best
The highest returns were earned by our funds that invest in stocks with smaller market capitalizations, which often generate the most robust results in a rallying market: the Turner Emerging Growth Fund, the Turner Midcap Growth Fund, and the Turner Small Cap Growth Fund. The weakest absolute returns were, as expected, generated by our long/short funds; it's hard for the short positions of long/short funds to add value when most stocks are advancing, as was the case in the past six months.
However, since we think the true test of a mutual fund's mettle isn't its performance in a short period like six months or even a year, we find our funds' long-term performance more palatable. Since inception, five of our long-only U.S. and international/global funds have beaten at least one of their benchmarks. And since the objective of a long/short fund is less about beating a benchmark than about maintaining a positive return under most market conditions, we're pleased that three of our four long/short funds have produced positive returns since inception.
To us, investing in stocks is not unlike planting a pecan tree, which takes at least a decade to produce nuts. As Bank of America Merrill Lynch pointed out, the stock portfolios of diversified, long-term investors who resisted the impulse to sell during the financial crisis of 2008-2009 probably hit new highs last year — long before the S&P 500 reached a new record in March.
Riding the bull
As for the future, our outlook for the stock market in the near term remains bullish for these reasons, among others:
First, businesses continue to bring home the bacon. The New York Times reported that corporate profits have risen 20.1% annualized since the financial crisis. Some of those profits have been (and in our estimation, should
TURNER FUNDS 2013 SEMIANNUAL REPORT 3
LETTER TO SHAREHOLDERS (continued)
continue to be) returned to shareholders through stock buybacks and increased dividends — or used to finance mergers and acquisitions. In the first quarter U.S. companies were in fact busy buying each other, spending $219 billion in the process, according to Dealogic.
Second, we expect profits to continue growing: we anticipate that S&P 500 earnings may advance by about 8% in 2013. That's nothing to write home about, but 8% growth would exceed the 6.4% rate last year. And since our investment philosophy is based on the market reality that earnings drive stock prices over time (if not always in the short term), continued earnings growth should lead to continued rising stock prices, in our opinion.
Third, although past patterns are no guarantee of future patterns, stocks historically have tended to rise when the economy is either growing or about to grow in the near future. And while the U.S. economy could be described as moving at turtle speed, that speed nevertheless has been steady. The International Monetary Fund estimates that U.S. gross domestic product could grow by 2% this year. We see one catalyst for such growth in the recovering housing market, where prices, sales, and construction all continue to rise off their lows. And despite fiscal cliffs and payroll tax hikes, consumers have remained optimistic and continue to spend; we think consumer spending is being stimulated in part by another economic entity making slow and steady progress: the job market. The forecasting firm IHS Global Insight predicts that all but eight U.S. states will regain peak employment by the end of 2015.
Undoubtedly the market will be subject to some short-term wobbles, since corrections (drops of 10% or more) tend to occur about once a year. At the time of this writing, the S&P 500 Index hasn't suffered a correction in more than a year. Even so, we think this four-year-old bull has more life in it. And from a historical standpoint, a five-year bull run wouldn't at all be unheard of: seven bull markets since 1900 have lasted four years, and five of them have persisted for at least another year after that.
Fine-tuning our process
We can't compel the market to favor our growth-investing style, of course, but we can do something about improving our investment process, a practice that we consider never-ending. To that end, we're striving to hold fewer stocks in our funds. And those stocks that we do hold, we're seeking to hold longer. By holding fewer stocks, we believe we can maximize our funds' results over time. In our judgment, if we identify and hold only a select number of growth stocks, for which we have the highest conviction that their corporate issuers can sustain above-average earnings growth, we think our odds of delivering above-average results improve. In essence, we think this is a case where less (holdings) may be more (return).
In addition, we've also positioned our portfolios in a way we think will take best advantage of a continuing bull market. Our U.S. and international/global growth funds
emphasize three types of stocks: classic growth stocks in industries such as biotechnology and wireless communications that we think have strong fundamentals; stocks of companies gaining market share in their businesses; and growth-cyclical stocks in industries like retail that have tended to do well as the economic cycle progresses. The long positions of our long/short funds contain similar types of stocks, while the short positions consist of shares of companies that we believe have poor earnings potential.
In closing, we trust that you're able to look at stock investing in our mutual funds with little fear; in return, we'll maintain the courage to stick to our convictions — even when it doesn't seem that Mr. Market agrees completely with them at times. As we see it, daring to stick to our convictions ought to provide our best chance of enhancing your — and our own — wealth in a decade that could prove far more rewarding for stocks than the last one did.

Bob Turner
Chairman and Chief Investment Officer
Turner Investments
Past performance is no guarantee of future results. The views expressed are those of Turner Investments as of March 28, 2013, and are not intended as a forecast or investment recommendations. The indexes mentioned are not available for investment.

4 TURNER FUNDS 2013 SEMIANNUAL REPORT
Total returns of the Turner Funds
Through March 28, 2013
Current performance may be lower or higher than the performance data quoted. Please call 1.800.224.6312 or visit our Web site at www.turnerinvestments.com for the most recent month-end performance information.
The performance data quoted represents past performance and the principal value and investment return will fluctuate so that an investor's shares, when redeemed, may be worth more or less than their original cost. Past performance is no guarantee of future results. Returns shown, unless otherwise indicated, are total returns, with dividends and income reinvested. Returns spanning more than one year are annualized. Fee waivers are in effect; if they had not been in effect, performance would have been lower. The indices mentioned are unmanaged statistical composites of stock-market performance. Investing in an index is not possible.
The holdings and sector weightings of the Funds are subject to change. Forward-earnings projections are not predictors of stock price or investment performance, and do not represent past performance. There is no guarantee that the forward-earnings projections will accurately predict the actual earnings experience of any of the companies involved, and there is no guarantee that owning securities of companies with relatively high price-to-earnings ratios will cause the portfolio to outperform its benchmark or index.
The Turner Funds are distributed by Foreside Fund Services, LLC, Portland, Maine. The investor should consider the investment objectives, risks, charges, and expenses carefully before investing. This and other information can be found in the prospectus. A free prospectus, which contains detailed information, including fees and expenses, and the risks associated with investing in these Funds, can be obtained by calling 1.800.224.6312. Read the prospectus carefully before investing.
Fund name/Index | | Six
months* | | Year
to
date* | | One
year | | Three
years | | Five
years | | 10
years | | (Annualized)
Since
inception | | Total
net assets
($mil) | |
Turner Market Neutral Fund —
Institutional Class Shares | | | -7.27 | % | | | -4.26 | % | | | -8.62 | % | | | n/a | | | | n/a | | | | n/a | | | | -1.67 | % | | $ | 13.41 | | |
Investor Class Shares | | | -7.31 | | | | -4.38 | | | | -8.83 | | | | n/a | | | | n/a | | | | n/a | | | | -1.92 | | | | 1.25 | | |
Class C Shares | | | -7.69 | | | | -4.55 | | | | -9.50 | | | | n/a | | | | n/a | | | | n/a | | | | -2.64 | | | | 0.07 | | |
S&P 500 Index | | | 10.19 | | | | 10.61 | | | | 13.96 | | | | n/a | | | | n/a | | | | n/a | | | | 11.17 | | | | | | |
Barclays Capital U.S. Aggregate
Bond Index | | | 0.09 | | | | -0.12 | | | | 3.77 | | | | 5.52 | % | | | n/a | | | | n/a | | | | 5.98 | | | | | | |
Lipper Equity Market-Neutral
Funds Average | | | 1.63 | | | | 1.11 | | | | 2.82 | | | | n/a | | | | n/a | | | | n/a | | | | 2.72 | | | | | | |
Inception date: 2/7/11 | |
Turner Medical Sciences
Long/Short Fund —
Institutional Class Shares | | | 2.26 | | | | 4.41 | | | | 2.06 | | | | n/a | | | | n/a | | | | n/a | | | | 1.94 | | | | 21.42 | | |
Investor Class Shares | | | 2.17 | | | | 4.43 | | | | 1.86 | | | | n/a | | | | n/a | | | | n/a | | | | 1.75 | | | | 3.33 | | |
Class C Shares | | | 1.79 | | | | 4.29 | | | | 1.09 | | | | n/a | | | | n/a | | | | n/a | | | | 1.02 | | | | 1.41 | | |
S&P 500 Healthcare Index | | | 15.90 | | | | 15.81 | | | | 25.19 | | | | n/a | | | | n/a | | | | n/a | | | | 20.75 | | | | | | |
Barclays Capital U.S. Aggregate
Bond Index | | | 0.09 | | | | -0.12 | | | | 3.77 | | | | n/a | | | | n/a | | | | n/a | | | | 5.98 | | | | | | |
Lipper Long/Short Equity
Funds Average | | | 5.12 | | | | 5.26 | | | | 5.17 | | | | n/a | | | | n/a | | | | n/a | | | | 2.98 | | | | | | |
Inception date: 2/7/11 | |
TURNER FUNDS 2013 SEMIANNUAL REPORT 5
Fund name/Index | | Six
months* | | Year
to
date* | | One
year | | Three
years | | Five
years | | 10
years | | (Annualized)
Since
inception | | Total
net assets
($mil) | |
Turner Spectrum Fund —
Institutional Class Shares | | | 2.20 | % | | | 2.20 | % | | | -0.36 | % | | | 1.64 | % | | | n/a | | | | n/a | | | | 4.09 | % | | $ | 763.27 | | |
Investor Class Shares | | | 2.04 | | | | 2.13 | | | | -0.54 | | | | 1.40 | | | | n/a | | | | n/a | | | | 3.83 | | | | 99.80 | | |
Class C Shares(1) | | | 1.70 | | | | 1.99 | | | | -1.29 | | | | 0.65 | | | | n/a | | | | n/a | | | | 3.41 | | | | 6.58 | | |
S&P 500 Index | | | 10.19 | | | | 10.61 | | | | 13.96 | | | | 12.67 | | | | n/a | | | | n/a | | | | 17.57 | | | | | | |
Barclays Capital U.S. Aggregate
Bond Index | | | 0.09 | | | | -0.12 | | | | 3.77 | | | | 5.52 | | | | n/a | | | | n/a | | | | 6.08 | | | | | | |
Lipper Long/Short Equity
Funds Average | | | 5.12 | | | | 5.26 | | | | 5.17 | | | | n/a | | | | n/a | | | | n/a | | | | 2.98 | | | | | | |
Inception date: 5/7/09 | |
Turner Titan Fund —
Institutional Class Shares | | | -1.49 | | | | 2.14 | | | | -3.01 | | | | n/a | | | | n/a | | | | n/a | | | | 2.14 | | | | 44.00 | | |
Investor Class Shares | | | -1.60 | | | | 2.05 | | | | -3.31 | | | | n/a | | | | n/a | | | | n/a | | | | 0.59 | | | | 0.83 | | |
Class C Shares | | | -1.82 | | | | 1.98 | | | | -3.92 | | | | n/a | | | | n/a | | | | n/a | | | | -0.11 | | | | 0.67 | | |
S&P 500 Index | | | 10.19 | | | | 10.61 | | | | 13.96 | | | | n/a | | | | n/a | | | | n/a | | | | 11.17 | | | | | | |
Barclays Capital U.S. Aggregate
Bond Index | | | 0.09 | | | | -0.12 | | | | 3.77 | | | | 5.52 | | | | n/a | | | | n/a | | | | 5.98 | | | | | | |
Lipper Long/Short Equity
Funds Average | | | 5.12 | | | | 5.26 | | | | 5.17 | | | | n/a | | | | n/a | | | | n/a | | | | 2.98 | | | | | | |
Inception date: 2/7/11 | |
Turner All Cap Growth Fund(2) | | | -0.44 | | | | 7.21 | | | | -4.88 | | | | 9.27 | | | | 4.58 | % | | | 12.87 | % | | | -0.86 | | | | 18.31 | | |
Nasdaq Composite Index | | | 4.85 | | | | 8.21 | | | | 5.69 | | | | 10.86 | | | | 7.47 | | | | 9.31 | | | | -1.51 | | | | | | |
Russell 3000® Growth Index | | | 8.52 | | | | 9.82 | | | | 10.42 | | | | 13.19 | | | | 7.44 | | | | 8.84 | | | | -0.05 | | | | | | |
Inception date: 6/30/00 | |
Turner Emerging Growth Fund(2) —
Institutional Class Shares(3) | | | 9.04 | | | | 11.69 | | | | 9.90 | | | | 13.41 | | | | n/a | | | | n/a | | | | 21.03 | | | | 62.07 | | |
Investor Class Shares | | | 8.88 | | | | 11.62 | | | | 9.59 | | | | 13.12 | | | | 5.66 | | | | 12.68 | | | | 17.94 | | | | 163.93 | | |
Russell 2000® Growth Index | | | 15.23 | | | | 11.63 | | | | 18.09 | | | | 12.12 | | | | 7.29 | | | | 11.29 | | | | 4.38 | | | | | | |
Inception date: 2/27/98 | |
Turner Large Growth Fund —
Institutional Class Shares | | | 2.74 | | | | 5.04 | | | | -0.14 | | | | 6.59 | | | | 1.25 | | | | 7.41 | | | | 2.51 | | | | 128.56 | | |
Investor Class Shares(4) | | | 2.62 | | | | 4.99 | | | | -0.35 | | | | 6.35 | | | | 1.00 | | | | n/a | | | | 2.96 | | | | 42.24 | | |
Russell 1000® Growth Index | | | 8.10 | | | | 9.54 | | | | 10.09 | | | | 13.06 | | | | 7.30 | | | | 8.62 | | | | 3.20 | | | | | | |
Inception date: 2/28/01 | |
Turner Midcap Growth Fund(2) —
Institutional Class Shares(5) | | | 8.38 | | | | 10.87 | | | | 2.50 | | | | 8.62 | | | | n/a | | | | n/a | | | | 2.14 | | | | 181.10 | | |
Investor Class Shares | | | 8.21 | | | | 10.81 | | | | 2.23 | | | | 8.36 | | | | 3.74 | | | | 9.81 | | | | 9.87 | | | | 305.40 | | |
Retirement Class Shares(6) | | | 8.19 | | | | 10.77 | | | | 2.15 | | | | -1.35 | | | | 3.49 | | | | 9.44 | | | | 6.68 | | | | 4.03 | | |
Russell Midcap® Growth Index | | | 13.39 | | | | 11.51 | | | | 12.76 | | | | 14.23 | | | | 7.98 | | | | 11.53 | | | | 7.78 | | | | | | |
Inception date: 10/1/96 | |
Turner Small Cap Growth Fund(2) | | | 12.80 | | | | 12.15 | | | | 12.27 | | | | 12.46 | | | | 7.63 | | | | 12.03 | | | | 11.25 | | | | 239.21 | | |
Russell 2000® Growth Index | | | 13.72 | | | | 13.21 | | | | 14.52 | | | | 14.75 | | | | 9.04 | | | | 11.61 | | | | 6.40 | | | | | | |
Inception date: 2/7/94 | |
6 TURNER FUNDS 2013 SEMIANNUAL REPORT
Fund name/Index | | Six
months* | | Year
to
date* | | One
year | | Three
years | | Five
years | | 10
years | | (Annualized)
Since
inception | | Total
net assets
($mil) | |
Turner Global Opportunities Fund —
Institutional Class Shares | | | 5.96 | % | | | 7.50 | % | | | 0.59 | % | | | n/a | | | | n/a | | | | n/a | | | | 13.77 | % | | $ | 1.73 | | |
Investor Class Shares | | | 5.87 | | | | 7.44 | | | | 0.40 | | | | n/a | | | | n/a | | | | n/a | | | | 13.48 | | | | 0.28 | | |
MSCI World Growth Index | | | 9.59 | | | | 7.82 | | | | 11.00 | | | | n/a | | | | n/a | | | | n/a | | | | 13.47 | | | | | | |
MSCI World Index | | | 10.71 | | | | 7.88 | | | | 12.54 | | | | n/a | | | | n/a | | | | n/a | | | | 12.65 | | | | | | |
Inception date: 5/7/10 | |
(1) Commenced operations on July 14, 2009.
(2) Investing in technology and science companies and small- and mid-capitalization companies may subject the Funds to specific inherent risks, including above-average price fluctuations.
(3) Commenced operations on February 1, 2009.
(4) Commenced operations on August 1, 2005.
(5) Commenced operations on June 16, 2008.
(6) Commenced operations on September 24, 2001.
* Returns of less than one year are cumulative, and not annualized.
TURNER FUNDS 2013 SEMIANNUAL REPORT 7
Expense Ratio†
| | | Gross
expense
ratio | | Net
expense
ratio* | |
Turner Market Neutral Fund | |
Institutional Class Shares | | | 2.58 | % | | | 1.95 | % | |
Investor Class Shares | | | 2.83 | % | | | 2.20 | % | |
Class C Shares | | | 3.58 | % | | | 2.95 | % | |
Turner Medical Sciences
Long/Short Fund | |
Institutional Class Shares | | | 2.17 | % | | | 1.95 | % | |
Investor Class Shares | | | 2.42 | % | | | 2.20 | % | |
Class C Shares | | | 3.17 | % | | | 2.95 | % | |
Turner Spectrum Fund | |
Institutional Class Shares | | | 2.40 | % | | | 1.95 | % | |
Investor Class Shares | | | 2.65 | % | | | 2.20 | % | |
Class C Shares | | | 3.40 | % | | | 2.95 | % | |
Turner Titan Fund | |
Institutional Class Shares | | | 2.44 | % | | | 1.95 | % | |
Investor Class Shares | | | 2.69 | % | | | 2.20 | % | |
Class C Shares | | | 3.44 | % | | | 2.95 | % | |
| | | Gross
expense
ratio | | Net
expense
ratio* | |
Turner All Cap Growth Fund | |
Investor Class Shares | | | 1.47 | % | | | 1.24 | % | |
Turner Emerging Growth Fund | |
Institutional Class Shares | | | 1.32 | % | | | 1.17 | % | |
Investor Class Shares | | | 1.57 | % | | | 1.42 | % | |
Turner Large Growth Fund | |
Institutional Class Shares | | | 0.91 | % | | | 0.69 | % | |
Investor Class Shares | | | 1.16 | % | | | 0.94 | % | |
Turner Midcap Growth Fund | |
Institutional Class Shares | | | 1.04 | % | | | 0.93 | % | |
Investor Class Shares | | | 1.29 | % | | | 1.18 | % | |
Retirement Class Shares | | | 1.54 | % | | | 1.43 | % | |
Turner Small Cap Growth Fund | |
Investor Class Shares | | | 1.53 | % | | | 1.25 | % | |
Turner Global Opportunities Fund | |
Institutional Class Shares | | | 4.09 | % | | | 1.10 | % | |
Investor Class Shares | | | 4.34 | % | | | 1.35 | % | |
† These expense ratios are based on the most recent prospectus and may differ from those shown in the financial highlights.
* Net expense ratio reflects contractual waivers of certain fees and/or expense reimbursements. Turner may discontinue this arrangement at any time after January 31, 2014.
8 TURNER FUNDS 2013 SEMIANNUAL REPORT
Turner Market Neutral Fund
Fund profile
March 28, 2013
n Ticker symbol TMNFX
Investor Class Shares
n CUSIP #900297581
Investor Class Shares
n Top five holdings1
(1) TIBCO Software
(2) Cooper
(3) Goldcorp
(4) Concho Resources
(5) Clean Harbors
n % in five largest holdings 25.9%2
n Number of holdings 671
n Weighted average market capitalization $19.49 billion
n Net assets $1.25 million, Investor Class Shares

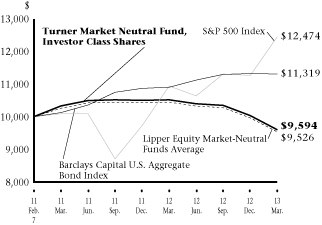
Growth of a $10,000 investment in the
Turner Market Neutral Fund, Investor Class Shares:
February 7, 2011-March 28, 20133,4
Total returns (Six-month period ended March 28, 2013)
Turner Market Neutral Fund, Institutional Class Shares | | | -7.27 | % | |
Turner Market Neutral Fund, Investor Class Shares | | | -7.31 | % | |
Turner Market Neutral Fund, Class C Shares | | | -7.69 | % | |
S&P 500 Index | | | 10.19 | % | |
Barclays Capital U.S. Aggregate Bond Index | | | 0.09 | % | |
Lipper Equity Market-Neutral Funds Average | | | 1.63 | % | |
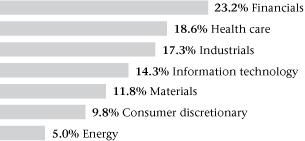
Sector weightings2:
Manager's discussion and analysis
Poor stock selection, particularly in short positions, hampered the Turner Market Neutral Fund, Investor Class Shares (TMNFX), which lost 7.31% in the six-month period ended March 28. The fund's return trailed that of the S&P 500 Index by 17.50 percentage points, the Lipper Equity Market-Neutral Funds Average by 8.94 percentage points, and the Barclays Capital U.S. Aggregate Bond Index by 7.40 percentage points. The Turner Market Neutral Fund seeks capital appreciation using a long/short strategy in attempting to capture alpha, reduce volatility, and preserve capital in declining markets.
The industrials and consumer-discretionary sectors added the most extra return. In those sectors, long and short positions in agricultural-machinery, manufacturing, home-building, automotive, gaming, hotel, retail, and cruise-line companies generated the best performance. The health-care, financials, and information-technology sectors were the biggest detractors from performance. In those sectors, long and short positions in medical-product, pharmacy, real-estate-investment-trust, investment-management, data-storage, Internet, and telecommunication equipment shares produced unsatisfactory results.
1 Cash equivalent is not being considered a holding for the top five holdings, but is counted in the number of holdings. The fund composition is subject to change.
2 Percentages based on total investments.
3 These figures represent past performance, which is no guarantee of future results. The investment return and principal value of an investment will fluctuate, so an investor's shares, when redeemed, may be worth more or less than their original cost. The performance in the above graph and table does not reflect the deduction of taxes the shareholder will pay on fund distributions or the redemptions of fund shares. Performance of the Institutional, Investor and Class C Shares will differ due to differences in fees.
4 The inception date of the Turner Market Neutral Fund was February 7, 2011.
5 Fee waivers are in effect; if they had not been in effect, performance would have been lower.
6 The S&P 500 Index is a widely-recognized, market value-weighted (higher market value stocks have more influence than lower market value stocks) index of 500 stocks designed to mimic the overall equity market's industry weightings.
7 The Barclays Capital U.S. Aggregate Bond Index represents an unmanaged diversified portfolio of fixed income securities, including U.S. Treasuries, investment-grade corporate bonds and mortgage-backed and asset-backed securities.
8 The Lipper Equity Market-Neutral Funds Average represents the average annualized total return for all reporting funds in the Lipper Equity Market-Neutral Fund category.
The Turner Market Neutral Fund is subject to the risks associated with selling securities short. A short sale involves a finite opportunity for appreciation, but a theoretically unlimited risk of loss. The Fund may focus its investments from time to time on one or more economic sectors. To the extent that it does so, developments affecting companies in that sector or sectors will likely have a magnified effect on the Fund's net asset value and total return.
TURNER FUNDS 2013 SEMIANNUAL REPORT 9
Turner Medical Sciences Long/Short Fund
Fund profile
March 28, 2013
n Ticker symbol TMSFX
Investor Class Shares
n CUSIP #900297557
Investor Class Shares
n Top five holdings1
(1) Pfizer
(2) Roche Holding AG ADR
(3) Baxter International
(4) Express Scripts Holding
(5) Sanofi ADR
n % in five largest holdings 19.4%2
n Number of holdings 971
n Weighted average market capitalization $33.60 billion
n Net assets $3.33 million, Investor Class Shares

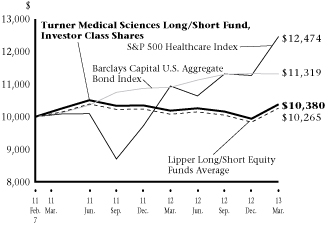
Growth of a $10,000 investment in the
Turner Medical Sciences Long/Short Fund,
Investor Class Shares:
February 7, 2011-March 28, 20133,4
Total returns (Six-month period ended March 28, 2013)
Turner Medical Sciences Long/Short Fund, Institutional Class Shares | | | 2.26 | % | |
Turner Medical Sciences Long/Short Fund, Investor Class Shares | | | 2.17 | % | |
Turner Medical Sciences Long/Short Fund, Class C Shares | | | 1.79 | % | |
S&P 500 Healthcare Index | | | 15.90 | % | |
Barclays Capital U.S. Aggregate Bond Index | | | 0.09 | % | |
Lipper Long/Short Equity Funds Average | | | 4.96 | % | |
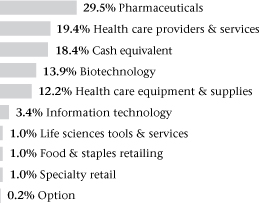
Sector weightings2:
Manager's discussion and analysis
Rewarding long and short positions helped the Turner Medical Sciences Long/Short Fund, Investor Class Shares (TMSFX) produce a 2.17% gain for the six-month period ended March 28. While the fund outperformed the Barclays Capital U.S. Aggregate Bond Index by 2.08 percentage points, it lagged the S&P 500 Healthcare Index by 13.73 percentage points and the Lipper Long/Short Equity Funds Average by 2.79 percentage points. The Turner Medical Sciences Long/Short Fund seeks capital appreciation by investing primarily (at least 80% of its net assets) in stocks of companies in the health-care sector. The fund uses a long/short growth strategy in seeking to capture alpha, reduce volatility, and preserve capital in declining markets.
In the fund's long and short positions, stocks in the pharmaceutical, acute-care, and insurance industries provided the most extra return. Detracting significantly from performance were long and short positions in the stocks of biotechnology, medical-product, and hospital firms.
1 Cash equivalent is not being considered a holding for the top five holdings, but is counted in the number of holdings. The fund composition is subject to change.
2 Percentages based on total investments.
3 These figures represent past performance, which is no guarantee of future results. The investment return and principal value of an investment will fluctuate, so an investor's shares, when redeemed, may be worth more or less than their original cost. The performance in the above graph and table does not reflect the deduction of taxes the shareholder will pay on fund distributions or the redemptions of fund shares. Performance of the Institutional, Investor and Class C Shares will differ due to differences in fees.
4 The inception date of the Turner Medical Sciences Long/Short Fund was February 7, 2011.
5 Fee waivers are in effect; if they had not been in effect, performance would have been lower.
6 The S&P 500 Healthcare Index is an unmanaged index which includes the stocks in the health care sector of the S&P 500 Index.
7 The Barclays Capital U.S. Aggregate Bond Index represents an unmanaged diversified portfolio of fixed income securities, including U.S. Treasuries, investment-grade corporate bonds and mortgage-backed and asset-backed securities.
8 Lipper Long/Short Equity Funds Average represents the average annualized total return for all reporting funds in the Lipper Long/Short Equity Fund category.
ADR — American Depositary Receipt
The Turner Medical Sciences Long/Short Fund is subject to the risks associated with selling securities short. A short sale involves a finite opportunity for appreciation, but a theoretically unlimited risk of loss. The Fund is subject to the risks associated with health care-related companies. Many health care-related companies are smaller and less seasoned than companies in other sectors. Health care-related companies may also be strongly affected by scientific or technological developments and their products may quickly become obsolete. The Fund is subject to risks due to its foreign investments.
10 TURNER FUNDS 2013 SEMIANNUAL REPORT
Fund profile
March 28, 2013
n Ticker symbol TSPEX
Institutional Class Shares
n CUSIP #900297664
Institutional Class Shares
n Top five holdings1
(1) Pfizer
(2) CF Industries Holdings
(3) Visa, Cl A
(4) Concho Resources
(5) eBay
n % in five largest holdings 8.2%2
n Number of holdings 4341
n Weighted average market capitalization $26.32 billion
n Net assets $99.8 million, Institutional Class Shares
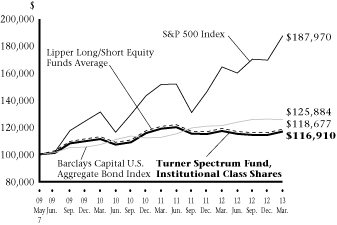
Growth of a $100,000 investment in the
Turner Spectrum Fund, Institutional Class Shares:
May 7, 2009-March 28, 20133,4
Total returns (Six-month period ended March 28, 2013)
Turner Spectrum Fund, Institutional Class Shares | | | 2.20 | % | |
Turner Spectrum Fund, Investor Class Shares | | | 2.04 | % | |
Turner Spectrum Fund, Class C Shares | | | 1.70 | % | |
S&P 500 Index | | | 10.19 | % | |
Barclays Capital U.S. Aggregate Bond Index | | | 0.09 | % | |
Lipper Long/Short Equity Average | | | 4.96 | % | |
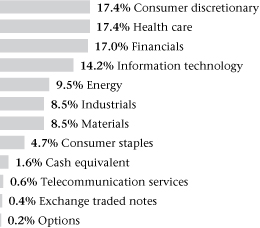
Sector weightings2:
Manager's discussion and analysis
The Turner Spectrum Fund, Institutional Class Shares (TSPEX) gained 2.20% in the six-month period ended March 28. The fund's return beat the Barclays Capital U.S. Aggregate Bond Index by 2.11 percentage points, but trailed the S&P 500 Index by 7.99 percentage points and the Lipper Long/Short Equity Average by 2.76 percentage points. The Turner Spectrum Fund seeks capital appreciation by allocating its assets to seven long/short strategies, each managed by a separate Turner portfolio-management team.
Five of the nine sectors in which the fund was invested provided extra return: information technology, energy, consumer discretionary, telecommunications services, and industrials. In those sectors, long and short positions in computer, social-media, oil-and-gas, gaming, automotive, telecommunication services, water, manufacturing, and home-building shares performed best. The sector that detracted the most from results was financials, with shares of commercial banks, investment banks, credit-card providers, and commercial-services firms underperforming. The fund kept a conservative net exposure (long exposure minus short exposure) of 24%, primarily in U.S. stocks.
1 Cash equivalent is not being considered a holding for the top five holdings, but is counted in the number of holdings. The fund composition is subject to change.
2 Percentages based on total investments.
3 These figures represent past performance, which is no guarantee of future results. The investment return and principal value of an investment will fluctuate, so an investor's shares, when redeemed, may be worth more or less than their original cost. The performance in the above graph and table does not reflect the deduction of taxes the shareholder will pay on fund distributions or the redemptions of fund shares. Performance of the Institutional, Investor and Class C Shares will differ due to differences in fees.
4 The inception date of the Turner Spectrum Fund (Institutional Class Shares and Investor Class Shares) was May 7, 2009. Index returns are based on Institutional Class Shares inception date.
5 Fee waivers are in effect; if they had not been in effect, performance would have been lower.
6 The inception date of the Turner Spectrum Fund (Class C Shares) was July 14, 2009.
7 The S&P 500 Index is a widely-recognized, market value-weighted (higher market value stocks have more influence than lower market value stocks) index of 500 stocks designed to mimic the overall equity market's industry weightings.
8 The Barclays Capital U.S. Aggregate Bond Index represents an unmanaged diversified portfolio of fixed income securities, including U.S. Treasuries, investment-grade corporate bonds and mortgage-backed and asset-backed securities.
9 Lipper Long/Short Equity Funds Average represents the average annualized total return for all reporting funds in the Lipper Long/Short Equity Fund category.
Cl — Class
The Turner Spectrum Fund may focus its investments from time to time on one or more economic sectors. To the extent that it does so, developments affecting companies in that sector or sectors will likely have a magnified effect on the Fund's net asset value and total return. The Fund is subject to the risks associated with selling securities short. A short sale involves a finite opportunity for appreciation, but a theoretically unlimited risk of loss. The smaller capitalization companies the Fund invests in may be more vulnerable to adverse business or economic events than larger, more established companies.
TURNER FUNDS 2013 SEMIANNUAL REPORT 11
Fund profile
March 28, 2013
n Ticker symbol TTLFX
Investor Class Shares
n CUSIP #900297524
Investor Class Shares
n Top five holdings1
(1) Hillshire Brands
(2) Cisco Systems
(3) Citigroup
(4) Time Warner
(5) Michael Kors Holdings
n % in five largest holdings 15.8%2
n Number of holdings 1151
n Weighted average market capitalization $34.96 billion
n Net assets $0.83 million, Investor Class Shares

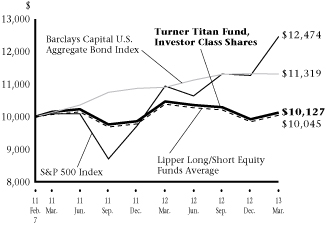
Growth of a $10,000 investment in the
Turner Titan Fund, Investor Class Shares:
February 7, 2011-March 28, 20133,4
Total returns (Six-month period ended March 28, 2013)
Turner Titan Fund, Institutional Class Shares | | | -1.49 | % | |
Turner Titan Fund, Investor Class Shares | | | -1.60 | % | |
Turner Titan Fund, Class C Shares | | | -1.82 | % | |
S&P 500 Index | | | 10.19 | % | |
Barclays Capital U.S. Aggregate Bond Index | | | 0.09 | % | |
Lipper Long/Short Equity Funds Average | | | 4.96 | % | |
Sector weightings2:
Manager's discussion and analysis
The Turner Titan Fund, Investor Class Shares (TTLFX) lost 1.60% in the six-month period ended March 28. The fund's return lagged the S&P 500 Index by 11.79 percentage points, the Lipper Long/Short Equity Funds Average by 6.56 percentage points, and the Barclays Capital U.S. Aggregate Bond Index by 1.69 percentage points. The fund seeks long-term capital appreciation by investing in stocks of companies with mainly large capitalizations in all market sectors; the fund uses long and short positions in seeking to capture alpha, reduce volatility, and preserve capital in declining markets.
Five of the sectors in which the fund was invested generated positive returns: consumer discretionary, industrials, telecommunication services, energy, and consumer staples. Consumer discretionary and industrials added the most to results; in those sectors, shares of gaming, retail, e-commerce, broadcasting, aerospace, electrical-components, and agricultural-machinery shares delivered the best results. The greatest detractor from performance was the health-care sector, with shares in pharmaceutical, medical-instruments, medical-product, and insurance companies producing subpar returns.
1 Cash equivalent is not being considered a holding for the top five holdings, but is counted in the number of holdings. The fund composition is subject to change.
2 Percentages based on total investments.
3 These figures represent past performance, which is no guarantee of future results. The investment return and principal value of an investment will fluctuate, so an investor's shares, when redeemed, may be worth more or less than their original cost. The performance in the above graph and table does not reflect the deduction of taxes the shareholder will pay on fund distributions or the redemptions of fund shares. Performance of the Institutional, Investor and Class C Shares will differ due to differences in fees.
4 The inception date of the Turner Titan Fund was February 7, 2011.
5 Fee waivers are in effect; if they had not been in effect, performance would have been lower.
6 The S&P 500 Index is a widely-recognized, market value-weighted (higher market value stocks have more influence than lower market value stocks) index of 500 stocks designed to mimic the overall equity market's industry weightings.
7 The Barclays Capital U.S. Aggregate Bond Index represents an unmanaged diversified portfolio of fixed income securities, including U.S. Treasuries, investment-grade corporate bonds and mortgage-backed and asset-backed securities.
8 Lipper Long/Short Equity Funds Average represents the average annualized total return for all reporting funds in the Lipper Long/Short Equity Fund category.
The Turner Titan Fund may focus its investments from time to time on one or more economic sectors. To the extent that it does so, developments affecting companies in that sector or sectors will likely have a magnified effect on the Fund's net asset value and total return. The Fund is subject to the risks associated with selling securities short. A short sale involves a finite opportunity for appreciation, but a theoretically unlimited risk of loss. The smaller capitalization companies the Fund invests in may be more vulnerable to adverse business or economic events than larger, more established companies.
12 TURNER FUNDS 2013 SEMIANNUAL REPORT
Turner All Cap Growth Fund
Fund profile
March 28, 2013
n Ticker symbol TBTBX
n CUSIP #87252R797
n Top five holdings1
(1) Apple
(2) NXP Semiconductors
(3) Avago Technologies
(4) Cavium
(5) LinkedIn, Cl A
n % in five largest holdings 25.3%2
n Number of holdings 351
n Price/earnings ratio 15.2
n Weighted average market capitalization $41.97 billion
n Net assets $18.30 million

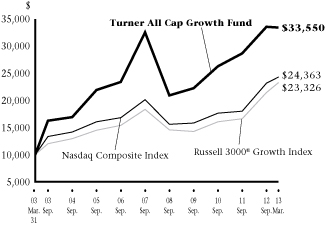
Growth of a $10,000 investment in the
Turner All Cap Growth Fund:
March 31, 2003-March 28, 20133
Total returns (Six-month period ended March 28, 2013)
Turner All Cap Growth Fund | | | -0.66 | % | |
Nasdaq Composite Index | | | 4.85 | % | |
Russell 3000 Growth Index | | | 8.52 | % | |
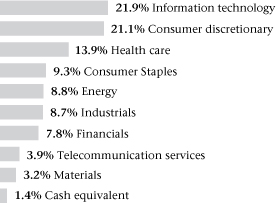
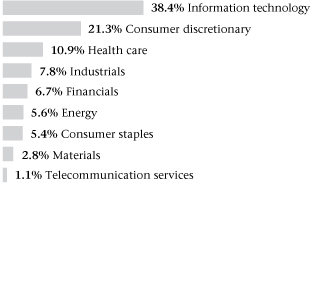
Sector weightings2:
Manager's discussion and analysis
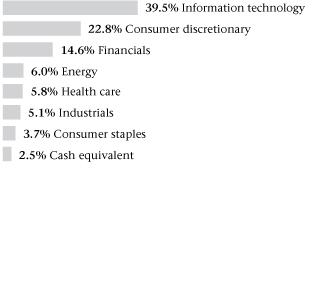
A slowdown in telecommunications spending hurt technology stocks, which impaired performance of the Turner All Cap Growth Fund (TBTBX). The fund lost 0.44% in the six-month period ended March 28. The fund's return lagged that of the Russell 3000 Growth Index by 9.18 percentage points and the Nasdaq Composite Index by 5.51 percentage points.
Two of the fund's eight sector positions outperformed their corresponding index sectors, with a 10% weighting in the financials sector contributing the most return. In that sector, diversified investment-services and investment-exchange shares performed well. The main detractors from performance were the information-technology and health-care sectors, a 60% weighting, with computer, Internet, semiconductor, data-storage, pharmaceutical, and surgical-system shares recording poor relative returns.
1 Cash equivalent and short-term investment are not being considered a holding for the top five holdings, but are counted in the number of holdings. The fund composition is subject to change.
2 Percentages based on total investments.
3 These figures represent past performance, which is no guarantee of future results. The investment return and principal value of an investment will fluctuate, so an investor's shares, when redeemed, may be worth more or less than their original cost. The performance in the above graph and table does not reflect the deduction of taxes the shareholder will pay on fund distributions or the redemptions of fund shares. The inception date of the Turner All Cap Growth Fund was June 30, 2000.
4 Fee waivers are in effect; if they had not been in effect, performance would have been lower.
5 The NASDAQ Composite Index includes more than 5,000 domestic and non-U.S. based common stocks listed on the NASDAQ stock market. The index is market-value weighted. This means that each company's security affects the index in proportion to its market value. The market value, the last sale price multiplied by total shares outstanding, is calculated throughout the trading day, and is related to the total value of the index. Because it is so broad-based, the Index is one of the most widely followed and quoted major market indices.
6 The Russell 3000® Growth Index measures the performance of the broad growth segment of the U.S. equity universe. It includes those Russell 3000® companies with higher price-to-book ratios and higher forecasted growth values.
7 Cash equivalent includes short-term investment held as collateral for securities lending activity. Please see Note 11 in Notes to Financial Statements for more detailed information.
Cl — Class
The Turner All Cap Growth Fund may buy and sell securities frequently as part of its investment strategy. The medium capitalization companies in which the Fund invests may be more vulnerable to adverse business or economic events than larger, more established companies.
TURNER FUNDS 2013 SEMIANNUAL REPORT 13
Turner Emerging Growth Fund
Fund profile
March 28, 2013
n Ticker symbol TMCGX
Investor Class Shares
n CUSIP #872524301
Investor Class Shares
n Top five holdings1
(1) Huron Consulting Group
(2) Cracker Barrel Old Country Store
(3) ArthroCare
(4) Air Methods
(5) Middleby
n % in five largest holdings 13.1%2
n Number of holdings 961
n Price/earnings ratio 17.2
n Weighted average market capitalization $1.65 billion
n Net assets $163.93 million, Investor Class Shares

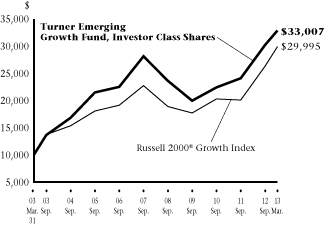
Growth of a $10,000 investment in the
Turner Emerging Growth Fund, Investor Class Shares:
March 31, 2003-March 28, 20133,4
Total returns (Six-month period ended March 28, 2013)
Turner Emerging Growth Fund, Institutional Class Shares | | | 9.04 | % | |
Turner Emerging Growth Fund, Investor Class Shares | | | 8.88 | % | |
Russell 2000 Growth Index | | | 13.72 | % | |
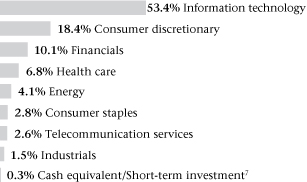
Sector weightings2:
Manager's discussion and analysis
During the six-month period ended March 28, the Turner Emerging Growth Fund, Investor Class Shares (TMCGX) gained 8.88%, underperforming the Russell 2000 Growth Index's 13.72% gain by 4.84 percentage points.
Three of the fund's nine sector positions outperformed their corresponding index sectors. Of those sectors, energy, a 7% weighting, furnished the greatest outperformance by far; shares in oil-and-gas exploration firms did best. The consumer-discretionary sector, an 18% weighting, detracted the most from results. In that sector, mattress, retail, and apparel shares proved disappointing.
1 Cash equivalent and short-term investment are not being considered a holding for the top five holdings, but are counted in the number of holdings. The fund composition is subject to change.
2 Percentages based on total investments.
3 These figures represent past performance, which is no guarantee of future results. The investment return and principal value of an investment will fluctuate, so an investor's shares, when redeemed, may be worth more or less than their original cost. The performance in the above graph and table does not reflect the deduction of taxes the shareholder will pay on fund distributions or the redemptions of fund shares. Performance of the Institutional and Investor Class Shares will differ due to differences in fees.
4 The inception date of the Turner Emerging Growth Fund (Investor Class Shares) was February 27, 1998. Index returns are based on Investor Class Shares inception date.
5 Fee waivers are in effect; if they had not been in effect, performance would have been lower.
6 The inception date of the Turner Emerging Growth Fund (Institutional Class Shares) was February 1, 2009.
7 The Russell 2000® Growth Index is a widely-recognized, capitalization-weighted (companies with larger market capitalizations have more influence than those with smaller market capitalizations) index of the 2,000 smallest U.S. companies out of the 3,000 largest U.S. companies with higher growth rates and price-to-book ratios.
8 Cash equivalent includes short-term investment held as collateral for securities lending activity. Please see Note 11 in Notes to Financial Statements for more detailed information.
Amounts designated as "—" are not applicable.
The Turner Emerging Growth Fund is also subject to taxable income and realized capital gains. Shareholder redemptions may force the Fund to sell securities at an inappropriate time, also resulting in realized gains.
14 TURNER FUNDS 2013 SEMIANNUAL REPORT
Fund profile
March 28, 2013
n Ticker symbol TTMEX
Institutional Class Shares
n CUSIP #900297847
Institutional Class Shares
n Top five holdings1
(1) Apple
(2) Google, Cl A
(3) Colgate-Palamolive
(4) Qualcomm
(5) Amazon.com
n % in five largest holdings 22.6%2
n Number of holdings 611
n Price/earnings ratio 13.5
n Weighted average market capitalization $93.07 billion
n Net assets $42.24 million, Institutional Class Shares
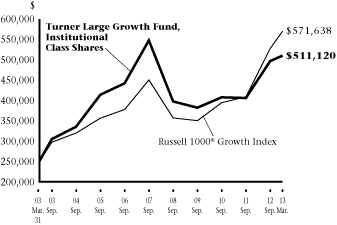
Growth of a $250,000 investment in the
Turner Large Growth Fund, Institutional Class Shares:
March 31, 2003-March 28, 20133,4
Total returns (Six-month period ended March 28, 2013)
Turner Large Growth Fund, Institutional Class Shares | | | 2.74 | % | |
Turner Large Growth Fund, Investor Class Shares | | | 2.62 | % | |
Russell 1000 Growth Index | | | 8.10 | % | |
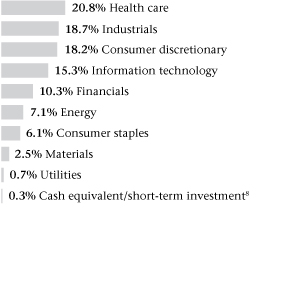
Sector weightings2:
Manager's discussion and analysis
The Turner Large Growth Fund, Institutional Class Shares (TSGEX) gained 2.74% in the six-month period ended March 28. However, the fund underperformed its benchmark, the Russell 1000 Growth Index, by 5.36 percentage points.
Five of the nine sectors the fund was invested in beat their corresponding index sectors. Financials and energy, a 12% weighting, provided the most extra return. In those sectors, real-estate, investment-banking, credit-card, and oil-and-gas-exploration shares boosted performance. Our large exposure to the information-technology sector, a 38% weighting, detracted significantly from performance. Shares of computer, data-storage, cloud-computing, semiconductor, and Internet-infrastructure companies produced unfavorable results in the sector.
1 Cash equivalent and short-term investment are not being considered a holding for the top five holdings, but are counted in the number of holdings. The fund composition is subject to change.
2 Percentages based on total investments.
3 These figures represent past performance, which is no guarantee of future results. The investment return and principal value of an investment will fluctuate, so an investor's shares, when redeemed, may be worth more or less than their original cost. The performance in the above graph and table does not reflect the deduction of taxes the shareholder will pay on fund distributions or the redemptions of fund shares. Performance of the Institutional and Investor Class Shares will differ due to differences in fees.
4 The inception date of the Turner Large Growth Fund (Institutional Class Shares) was February 28, 2001. Index returns are based on Institutional Class Shares inception date.
5 Fee waivers are in effect; if they had not been in effect, performance would have been lower.
6 The inception date of the Turner Large Growth Fund (Investor Class Shares) was August 1, 2005.
7 The Russell 1000® Growth Index measures the performance of the broad growth segment of the U.S. equity universe. It includes those Russell 1000® companies with higher price-to-book ratios and higher forecasted growth values.
8 Cash equivalent includes short-term investment held as collateral for securities lending activity. Please see Note 11 in Notes to Financial Statements for more detailed information.
Amounts designated as "—" are not applicable.
Cl — Class
The Turner Large Growth Fund may buy and sell securities frequently as part of its investment strategy. The Fund is subject to the risk that large capitalization growth stocks may underperform other segments of the equity markets as a whole.
TURNER FUNDS 2013 SEMIANNUAL REPORT 15
Turner Midcap Growth Fund
Fund profile
March 28, 2013
n Ticker symbol TMGFX
Investor Class Shares
n CUSIP #900297409
Investor Class Shares
n Top five holdings1
(1) NXP Semiconductors
(2) Toll Brothers
(3) Kroger
(4) Michael Kors Holdings
(5) HomeAway
n % in five largest holdings 11.3%2
n Number of holdings 741
n Price/earnings ratio 18.4
n Weighted average market capitalization $8.84 billion
n Net assets $305.4 million, Investor Class Shares

Growth of a $10,000 investment in the
Turner Midcap Growth Fund, Investor Class Shares:
March 31, 2003-March 28, 20133,4
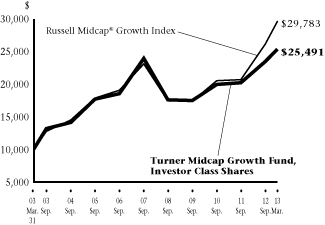
Total returns (Six-month period ended March 28, 2013)
Turner Midcap Growth Fund, Institutional Class Shares | | | 8.38 | % | |
Turner Midcap Growth Fund, Investor Class Shares | | | 8.21 | % | |
Turner Midcap Growth Fund, Retirement Class Shares | | | 9.55 | % | |
Russell Midcap Growth Index | | | 13.39 | % | |
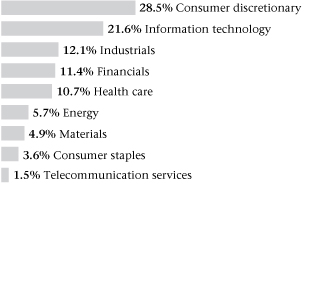
Sector weightings2:
Manager's discussion and analysis
In the six-month period ended March 28, the Turner Midcap Growth Fund, Investor Class Shares (TMGFX) advanced 8.21%, underperforming the Russell Midcap Growth Index by 5.18 percentage points.
Three of the nine sectors the fund was invested in beat their corresponding benchmark sectors; a 16% position in financials and materials provided the greatest contribution to performance. Real-estate-services, investment-manager, insurance, specialty-contractor, specialty-chemical, and coating/chemical shares generated the best results. The major detractors from performance were the information-technology and consumer-discretionary sectors, which represented 50% of the portfolio. Subpar performers in those sectors included bandwidth-management, Internet-infrastructure, storage, Internet-traffic, software, apparel, sporting-goods, broadcast-services, and luxury-apparel shares.
1 Cash equivalent and short-term investment are not being considered a holding for the top five holdings, but are counted in the number of holdings. The fund composition is subject to change.
2 Percentages based on total investments.
3 These figures represent past performance, which is no guarantee of future results. The investment return and principal value of an investment will fluctuate, so an investor's shares, when redeemed, may be worth more or less than their original cost. The performance in the above graph and table does not reflect the deduction of taxes the shareholder will pay on fund distributions or the redemptions of fund shares. Performance of the Institutional, Investor and Retirement Class Shares will differ due to differences in fees.
4 The inception date of the Turner Midcap Growth Fund (Investor Class Shares) was October 1, 1996. Index returns are based on Investor Class Shares inception date.
5 Fee waivers are in effect; if they had not been in effect, performance would have been lower.
6 The inception date of the Turner Midcap Growth Fund (Institutional Class Shares) was June 16, 2008.
7 The inception date of the Turner Midcap Growth Fund (Retirement Class Shares) was September 24, 2001.
8 The Russell Midcap® Growth Index is a capitalization-weighted (companies with larger market capitalizations have more influence than those with smaller market capitalizations) index of the 800 smallest U.S. companies out of the 1,000 largest companies with higher growth rates and price-to-book ratios.
9 Cash equivalent includes short-term investment held as collateral for securities lending activity. Please see Note 11 in Notes to Financial Statements for more detailed information.
Amounts designated as "—" are not applicable.
The Turner Midcap Growth Fund may buy and sell securities frequently as part of its investment strategy. The medium capitalization companies in which the Fund invests may be more vulnerable to adverse business or economic events than larger, more established companies.
16 TURNER FUNDS 2013 SEMIANNUAL REPORT
Turner Small Cap Growth Fund
Fund profile
March 28, 2013
n Ticker symbol TSCEX
n CUSIP #900297300
n Top five holdings1
(1) MAXIMUS
(2) Teleflex
(3) Hexcel
(4) Alaska Air Group
(5) Dril-Quip
n % in five largest holdings 7.3%2
n Number of holdings 1151
n Price/earnings ratio 18.6
n Weighted average market capitalization $2.09 billion
n Net assets $239.21 million
Growth of a $10,000 investment in the
Turner Small Cap Growth Fund:
March 31, 2003-March 28, 20133
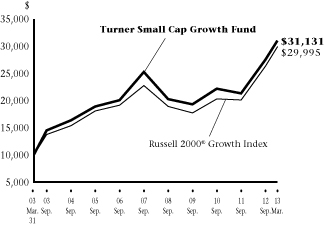
Total returns (Six-month period ended March 28, 2013)
Turner Small Cap Growth Fund | | | 12.80 | % | |
Russell 2000 Growth Index | | | 13.72 | % | |
Sector weightings2:
Manager's discussion and analysis
Decent stock selection in several major market sectors helped the Turner Small Cap Growth Fund (TSCEX) gain 12.80% in the six-month period ended March 28. However, the fund lagged its benchmark, the Russell 2000 Index, by 0.92 percentage point.
Five of the fund's nine sector positions — health care, consumer discretionary, materials, telecommunication services, and industrials, a 60% weighting — beat their index counterparts. Health care contributed the most return, with shares of consulting, medical-instruments, and drug-distribution firms performing the best. But information-technology shares, a 23% weighting, proved the biggest drag on performance; bandwidth-management, data-storage, semiconductor, security, electronic-component, and fiber-optics stocks recorded subpar results.
1 Cash equivalent and short-term investment are not being considered a holding for the top five holdings, but are counted in the number of holdings. The fund composition is subject to change.
2 Percentages based on total investments.
3 These figures represent past performance, which is no guarantee of future results. The investment return and principal value of an investment will fluctuate, so an investor's shares, when redeemed, may be worth more or less than their original cost. The performance in the above graph and table does not reflect the deduction of taxes the shareholder will pay on fund distributions or the redemptions of fund shares. The inception date of the Turner Small Cap Growth Fund was February 7, 1994.
4 Fee waivers are in effect; if they had not been in effect, performance would have been lower.
5 The Russell 2000® Growth Index is a widely-recognized, capitalization-weighted (companies with larger market capitalizations have more influence than those with smaller market capitalizations) index of the 2,000 smallest U.S. companies out of the 3,000 largest U.S. companies with higher growth rates and price-to-book ratios.
6 Cash equivalent includes short-term investment held as collateral for securities lending activity. Please see Note 11 in Notes to Financial Statements for more detailed information.
The Turner Small Cap Growth Fund may buy and sell securities frequently as part of its investment strategy. The smaller capitalization companies the Fund invests in may be more vulnerable to adverse business or economic events than larger, more established companies.
TURNER FUNDS 2013 SEMIANNUAL REPORT 17
Turner Global Opportunities Fund
Fund profile
March 28, 2013
n Ticker symbol TGLBX
Institutional Class Shares
n CUSIP #900297623
Institutional Class Shares
n Top five holdings1
(1) Apple
(2) NXP Semiconductors
(3) Avago Technologies
(4) LinkedIn, Cl A
(5) Starbucks
n % in five largest holdings 23.9%2
n Number of holdings 301
n Price/earnings ratio 14.3
n Weighted average market capitalization $50.97 billion
n Net assets $1.73 million, Institutional Class Shares

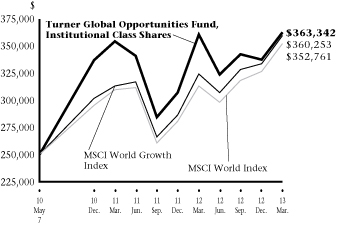
Growth of a $250,000 investment in the
Turner Global Opportunities Fund,
Institutional Class Shares:
May 7, 2010-March 28, 20133
Total returns (Six-month period ended March 28, 2013)
Turner Global Opportunities Fund, Institutional Class Shares | | | 5.96 | % | |
Turner Global Opportunities Fund, Investor Class Shares | | | 5.87 | % | |
MSCI World Growth Index | | | 9.59 | % | |
MSCI World Index | | | 10.71 | % | |
Sector weightings2:
Manager's discussion and analysis
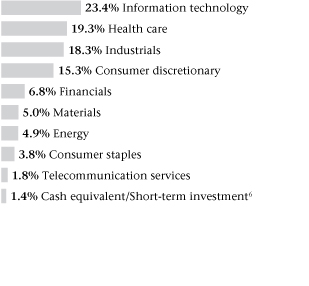
An emphasis on U.S. stocks hurt the Turner Global Opportunities Fund, Institutional Class Shares (TGLBX), which gained 5.96% for the six-month period ended March 28. The fund lagged its benchmarks, the MSCI World Growth Index, by 3.63 percentage points, and the MSCI World Index, by 4.75 percentage points.
A larger weighting in foreign stocks would have benefited the fund's results. Three of the fund's seven sector positions outperformed their corresponding index sectors. The best-performing sectors were financials, consumer discretionary, and energy, which amounted to 43% of holdings. In those sectors, real-estate-services, bank, insurance, social-media, luxury-goods, gaming, e-commerce, and oil-and-gas exploration shares contributed the most extra return. Performance was hurt the most by the information-technology and health-care sectors, with a combined weighting of 45%; computer, data-storage, Internet, security, pharmaceutical, and surgical-systems stocks were the biggest laggards.
1 Cash equivalent is not being considered a holding for the top five holdings, but is counted in the number of holdings. The fund composition is subject to change.
2 Percentages based on total investments.
3 These figures represent past performance, which is no guarantee of future results. The investment return and principal value of an investment will fluctuate, so an investor's shares, when redeemed, may be worth more or less than their original cost. The performance in the above graph and table does not reflect the deduction of taxes the shareholder will pay on fund distributions or the redemptions of fund shares. The inception date of the Turner Global Opportunities Fund was May 7, 2010. Performance of the Institutional and Investor Class Shares will differ due to differences in fees.
4 Fee waivers are in effect; if they had not been in effect, performance would have been lower.
5 The MSCI World Growth Index measures the performance of growth stocks in developed countries throughout the world. The index includes reinvestment of dividends, net of foreign withholding taxes.
6 The MSCI World Index is a free float-adjusted market capitalization-weighted index that is designed to measure the equity market performance of developed markets. The MSCI World Index consists of the following 24 developed market country indices: Australia, Austria, Belgium, Canada, Denmark, Finland, France, Germany, Greece, Hong Kong, Ireland, Israel, Italy, Japan, Netherlands, New Zealand, Norway, Portugal, Singapore, Spain, Sweden, Switzerland, the United Kingdom and the United States.
The Turner Global Opportunities Fund is non-diversified, which means that it may invest in the securities of fewer issuers than a diversified fund. As a result, it may be more susceptible to a single adverse economic or regulatory occurrence affecting one or more of these issuers, and may experience increased volatility. The Fund is subject to risks due to its foreign investments.
18 TURNER FUNDS 2013 SEMIANNUAL REPORT
Turner Market Neutral Fund
March 28, 2013
| | | Shares | | Value
(000) | |
Common stock—85.2% | |
Consumer discretionary—10.1% | |
AutoZone*^ | | | 770 | | | $ | 306 | | |
Dollar General* | | | 11,440 | | | | 578 | | |
Las Vegas Sands | | | 5,670 | | | | 319 | | |
Michael Kors Holdings*^ | | | 4,910 | | | | 279 | | |
Total Consumer discretionary | | | | | 1,482 | | |
Energy—4.2% | |
Concho Resources*^ | | | 6,430 | | | | 626 | | |
Total Energy | | | | | 626 | | |
Financials—15.8% | |
Affiliated Managers Group*^ | | | 3,950 | | | | 607 | | |
American Tower^ | | | 7,960 | | | | 612 | | |
Raymond James Financial^ | | | 11,020 | | | | 508 | | |
Tower Group International | | | 32,860 | | | | 606 | | |
Total Financials | | | | | 2,333 | | |
Health care—14.7% | |
Catamaran*^ | | | 6,060 | | | | 321 | | |
Cooper^ | | | 5,890 | | | | 636 | | |
Laboratory Corp. of America
Holdings* | | | 6,650 | | | | 600 | | |
Pfizer^ | | | 21,250 | | | | 613 | | |
Total Health care | | | | | 2,170 | | |
Industrials—12.2% | |
Clean Harbors* | | | 10,670 | | | | 620 | | |
Nordson^ | | | 9,090 | | | | 599 | | |
Old Dominion Freight Line* | | | 8,210 | | | | 314 | | |
Tata Motors ADR | | | 10,860 | | | | 265 | | |
Total Industrials | | | | | 1,798 | | |
Information technology—19.9% | |
Allot Communications*^ | | | 11,570 | | | | 138 | | |
Fusion-io*^ | | | 18,040 | | | | 295 | | |
Jabil Circuit^ | | | 16,160 | | | | 299 | | |
Juniper Networks* | | | 29,120 | | | | 540 | | |
Skyworks Solutions* | | | 14,040 | | | | 309 | | |
TIBCO Software* | | | 36,510 | | | | 739 | | |
Zynga*^ | | | 177,570 | | | | 597 | | |
Total Information technology | | | | | 2,917 | | |
| | | Shares | | Value
(000) | |
Materials—8.3% | |
CF Industries Holdings^ | | | 1,410 | | | $ | 268 | | |
Goldcorp^ | | | 18,880 | | | | 636 | | |
PetroLogistics^ | | | 23,460 | | | | 323 | | |
Total Materials | | | | | 1,227 | | |
Total Common stock
(Cost $12,425)** | | | | | 12,553 | | |
Total Investments—85.2%
(Cost $12,425)** | | | | | 12,553 | | |
Segregated cash with brokers—147.9% | | | | | 21,785 | | |
Securities sold short—(87.6)%
(Proceeds $(12,534))** | | | | | (12,900 | ) | |
Net Other assets (liabilities)—(45.5)% | | | | | (6,705 | ) | |
Net Assets—100.0% | | | | $ | 14,733 | | |
* Non-income producing security.
** This number is listed in thousands.
^ All or a portion of the shares have been committed as collateral for open short positions.
ADR — American Depositary Receipt
The accompanying notes are an integral part of the financial statements.
TURNER FUNDS 2013 SEMIANNUAL REPORT 19
Schedule of securities sold short
Turner Market Neutral Fund
March 28, 2013
| | | Shares | | Value
(000) | |
Common stock—87.6% | |
Consumer discretionary—15.9% | |
Cabela's | | | 6,090 | | | $ | 370 | | |
DineEquity | | | 4,090 | | | | 281 | | |
Hasbro | | | 7,070 | | | | 311 | | |
Netflix | | | 1,260 | | | | 239 | | |
Omnicom Group | | | 5,470 | | | | 322 | | |
Panera Bread, Cl A | | | 1,860 | | | | 307 | | |
Thomson Reuters | | | 7,500 | | | | 244 | | |
Wolverine World Wide | | | 6,010 | | | | 267 | | |
Total Consumer discretionary | | | | | 2,341 | | |
Consumer staples—2.1% | |
Kimberly-Clark | | | 3,180 | | | | 312 | | |
Total Consumer staples | | | | | 312 | | |
Energy—6.4% | |
ConocoPhillips | | | 4,110 | | | | 247 | | |
Oasis Petroleum | | | 10,100 | | | | 384 | | |
Tenaris SA ADR | | | 7,570 | | | | 309 | | |
Total Energy | | | | | 940 | | |
Financials—14.1% | |
Assurant | | | 3,390 | | | | 153 | | |
Cincinnati Financial | | | 6,480 | | | | 306 | | |
Comerica | | | 7,300 | | | | 262 | | |
Janus Capital Group | | | 15,810 | | | | 149 | | |
Jones Lang LaSalle | | | 4,470 | | | | 444 | | |
Legg Mason | | | 14,300 | | | | 459 | | |
Progressive | | | 12,104 | | | | 306 | | |
Total Financials | | | | | 2,079 | | |
Health care—14.4% | |
C.R. Bard | | | 2,950 | | | | 297 | | |
DENTSPLY International | | | 7,680 | | | | 326 | | |
Johnson & Johnson | | | 3,670 | | | | 299 | | |
Medtronic | | | 6,320 | | | | 297 | | |
Myriad Genetics | | | 6,110 | | | | 155 | | |
Stryker | | | 4,530 | | | | 296 | | |
Varian Medical Systems | | | 6,320 | | | | 455 | | |
Total Health care | | | | | 2,125 | | |
| | | Shares | | Value
(000) | |
Industrials—8.5% | |
Con-Way | | | 8,210 | | | $ | 289 | | |
Costar Group | | | 3,120 | | | | 341 | | |
Dover | | | 4,130 | | | | 301 | | |
Southwest Airlines | | | 23,790 | | | | 321 | | |
Total Industrials | | | | | 1,252 | | |
Information technology—19.5% | |
ARM Holdings ADR | | | 12,260 | | | | 519 | | |
Avnet | | | 8,690 | | | | 315 | | |
FLIR Systems | | | 11,620 | | | | 302 | | |
NVIDIA | | | 23,920 | | | | 307 | | |
Power Integrations | | | 7,150 | | | | 310 | | |
Texas Instruments | | | 10,560 | | | | 375 | | |
VMware, Cl A | | | 9,400 | | | | 741 | | |
Total Information technology | | | | | 2,869 | | |
Materials—6.7% | |
Barrick Gold | | | 11,110 | | | | 327 | | |
Compass Minerals International | | | 4,200 | | | | 331 | | |
Solvay SA | | | 2,390 | | | | 324 | | |
Total Materials | | | | | 982 | | |
Total Common stock
(Proceeds $12,534)* | | | | | 12,900 | | |
Total Securities sold short—87.6%
(Proceeds $12,534)* | | | | $ | 12,900 | | |
Percentages disclosed are based on total net assets of the Fund at March 28, 2013.
* This number is listed in thousands.
ADR — American Depositary Receipt
Cl — Class
The accompanying notes are an integral part of the financial statements.
20 TURNER FUNDS 2013 SEMIANNUAL REPORT
Turner Medical Sciences Long/Short Fund
March 28, 2013
| | | Shares | | Value
(000) | |
Common stock—63.5% | |
Biotechnology—10.8% | |
ARIAD Pharmaceuticals* | | | 11,270 | | | $ | 204 | | |
Biogen Idec* | | | 1,070 | | | | 206 | | |
BioMarin Pharmaceuticals* | | | 2,600 | | | | 162 | | |
Cepheid* | | | 6,840 | | | | 262 | | |
Cubist Pharmaceuticals* | | | 4,880 | | | | 228 | | |
Gilead Sciences* | | | 6,830 | | | | 335 | | |
InterMune* | | | 3,180 | | | | 29 | | |
Momenta Pharmaceuticals* | | | 14,530 | | | | 194 | | |
Neurocrine Biosciences* | | | 16,251 | | | | 197 | | |
NPS Pharmaceuticals* | | | 12,690 | | | | 129 | | |
Onyx Pharmaceuticals* | | | 3,030 | | | | 269 | | |
Prothena* | | | 495 | | | | 3 | | |
QLT* | | | 35,210 | | | | 311 | | |
Sarepta Therapeutics* | | | 1,940 | | | | 72 | | |
Synageva BioPharma* | | | 2,910 | | | | 160 | | |
ThromboGenics* | | | 1,570 | | | | 76 | | |
Total Biotechnology | | | | | 2,837 | | |
Drug stores—1.6% | |
GNC Holdings, Cl A | | | 5,310 | | | | 209 | | |
Walgreen | | | 4,370 | | | | 208 | | |
Total Drug stores | | | | | 417 | | |
Health care equipment & supplies—9.5% | |
Analogic | | | 5,820 | | | | 460 | | |
ArthroCare* | | | 5,630 | | | | 196 | | |
Baxter International | | | 9,520 | | | | 691 | | |
Cooper | | | 4,030 | | | | 435 | | |
Cynosure, Cl A* | | | 6,744 | | | | 176 | | |
Teleflex | | | 6,330 | | | | 535 | | |
Total Health care equipment & supplies | | | | | 2,493 | | |
Health care providers & services—15.1% | |
Air Methods | | | 4,480 | | | | 216 | | |
Catamaran* | | | 7,640 | | | | 405 | | |
Community Health Systems | | | 7,480 | | | | 354 | | |
Emeritus* | | | 6,580 | | | | 183 | | |
Express Scripts Holding* | | | 11,450 | | | | 661 | | |
HCA Holdings | | | 10,340 | | | | 420 | | |
Health Net* | | | 4,550 | | | | 130 | | |
McKesson | | | 4,230 | | | | 457 | | |
Patterson | | | 11,080 | | | | 421 | | |
| | | Contracts/
Shares | | Value
(000) | |
Team Health Holdings* | | | 12,170 | | | $ | 443 | | |
Universal Health Services | | | 4,210 | | | | 269 | | |
Total Health care providers & services | | | | | 3,959 | | |
Life sciences tools & services—3.4% | |
MAXIMUS | | | 4,440 | | | | 355 | | |
OSI Systems* | | | 5,380 | | | | 335 | | |
Thermo Fisher Scientific | | | 2,610 | | | | 200 | | |
Total Life sciences tools & services | | | | | 890 | | |
Pharmaceuticals—23.1% | |
Abbott Laboratories | | | 11,530 | | | | 407 | | |
AbbVie | | | 6,490 | | | | 265 | | |
ACADIA Pharmaceuticals* | | | 33,330 | | | | 265 | | |
Auxilium Pharmaceuticals* | | | 21,090 | | | | 364 | | |
Dr. Reddy's Laboratories ADR | | | 2,410 | | | | 78 | | |
Elan ADR | | | 17,480 | | | | 206 | | |
ONO Pharmaceutical | | | 6,190 | | | | 382 | | |
Pfizer | | | 45,370 | | | | 1,310 | | |
Roche Holding AG ADR | | | 12,460 | | | | 731 | | |
Sanofi ADR | | | 11,160 | | | | 570 | | |
Shire ADR | | | 4,230 | | | | 386 | | |
Takeda Pharmaceutical | | | 2,410 | | | | 132 | | |
ViroPharma* | | | 19,860 | | | | 500 | | |
Warner Chilcott, Cl A | | | 19,100 | | | | 259 | | |
XenoPort* | | | 7,200 | | | | 51 | | |
Zoetis* | | | 3,210 | | | | 107 | | |
Total Pharmaceuticals | | | | | 6,013 | | |
Total Common stock
(Cost $15,109)** | | | | | 16,609 | | |
Call option contracts—0.1% | |
Baxter International, 5/13 at $72.5 | | | 18 | | | | 6 | | |
Baxter International, 4/13 at $72.5 | | | 39 | | | | 6 | | |
Humana, 4/13 at $72.5 | | | 5 | | | | 1 | | |
Humana, 4/13 at $77.5 | | | 13 | | | | — | | |
Humana, 4/13 at $75 | | | 8 | | | | 1 | | |
Humana, 4/13 at $70 | | | 23 | | | | 6 | | |
Quest Diagnostics, 5/13 at $60 | | | 40 | | | | 2 | | |
Total | | | | | 22 | | |
Total Call option contracts
(Cost $20)** | | | | | 22 | | |
TURNER FUNDS 2013 SEMIANNUAL REPORT 21
Schedule of investments
Turner Medical Sciences Long/Short Fund
| | | Contracts/
Shares | | Value
(000) | |
Put option contracts—0.0% | |
Humana, 4/13 at $67.5 | | | 17 | | | $ | 4 | | |
United Therapeutics, 4/13 at $20 | | | 34 | | | | 4 | | |
Total | | | | | 8 | | |
Total Put option contracts
(Cost $12)** | | | | | 8 | | |
Cash equivalent—14.3% | |
BlackRock Liquidity Funds
TempCash Portfolio,
Institutional Shares,
0.010%*** | | | 3,746,942 | | | | 3,747 | | |
Total Cash equivalent
(Cost $3,747)** | | | | | 3,747 | | |
Total Investments—77.9%
(Cost $18,888)** | | | | | 20,386 | | |
Segregated cash with brokers—69.3% | | | | | 18,134 | | |
Securities sold short—(40.7)%
(Proceeds $(9,994))** | | | | | (10,658 | ) | |
Net Other assets (liabilities)—(6.5)% | | | | | (1,699 | ) | |
Net Assets—100.0% | | | | $ | 26,163 | | |
* Non-income producing security.
** This number is listed in thousands.
*** Rate shown is the 7-day effective yield as of March 28, 2013.
ADR — American Depositary Receipt
Cl — Class
Amounts designated as "—" are $0.
The accompanying notes are an integral part of the financial statements.
22 TURNER FUNDS 2013 SEMIANNUAL REPORT
Schedule of securities sold short
Turner Medical Sciences Long/Short Fund
March 28, 2013
| | | Shares | | Value
(000) | |
Common stock—23.1% | |
Biotechnology—3.9% | |
Amgen | | | 3,310 | | | $ | 339 | | |
Arena Pharmaceuticals | | | 23,980 | | | | 197 | | |
ImmunoGen | | | 8,400 | | | | 135 | | |
Myriad Genetics | | | 13,260 | | | | 337 | | |
Total Biotechnology | | | | | 1,008 | | |
Drug stores—0.8% | |
CVS Caremark | | | 2,380 | | | | 131 | | |
Rite AID | | | 35,200 | | | | 67 | | |
Total Drug stores | | | | | 198 | | |
Health care equipment & supplies—6.7% | |
C.R. Bard | | | 3,110 | | | | 313 | | |
DENTSPLY International | | | 7,950 | | | | 337 | | |
Hospira | | | 2,380 | | | | 78 | | |
Medtronic | | | 7,310 | | | | 343 | | |
Neogen | | | 1,880 | | | | 93 | | |
Stryker | | | 5,380 | | | | 351 | | |
Varian Medical Systems | | | 3,610 | | | | 260 | | |
Total Health care equipment & supplies | | | | | 1,775 | | |
Health care providers & services—5.1% | |
AmerisourceBergen, Cl A | | | 3,910 | | | | 201 | | |
Chemed | | | 1,570 | | | | 126 | | |
Fresenius Medical Care ADR | | | 5,420 | | | | 184 | | |
Henry Schein | | | 2,140 | | | | 198 | | |
Kindred Healthcare | | | 9,815 | | | | 103 | | |
Select Medical Holdings | | | 10,640 | | | | 96 | | |
UnitedHealth Group, Cl B | | | 7,260 | | | | 415 | | |
Total Health care providers & services | | | | | 1,323 | | |
Health care technology—0.6% | |
Greenway Medical Technologies | | | 10,020 | | | | 159 | | |
Total Health care technology | | | | | 159 | | |
Life sciences tools & services—1.0% | |
Agilent Technologies | | | 6,190 | | | | 260 | | |
Total Life sciences tools & services | | | | | 260 | | |
Pharmaceuticals—5.0% | |
Amarin PLC ADR | | | 8,440 | | | | 63 | | |
Eisai | | | 7,480 | | | | 334 | | |
Johnson & Johnson | | | 4,350 | | | | 354 | | |
| | | Shares | | Value
(000) | |
Mylan | | | 8,670 | | | $ | 251 | | |
Novartis AG ADR | | | 4,600 | | | | 328 | | |
Total Pharmaceuticals | | | | | 1,330 | | |
Total Common stock
(Proceeds $5,808)* | | | | | 6,053 | | |
Exchange traded funds—17.6% | |
CurrencyShares Euro Trust | | | 4,120 | | | | 524 | | |
CurrencyShares Japanese Yen Trust | | | 1,880 | | | | 196 | | |
Health Care Select Sector SPDR | | | 35,790 | | | | 1,644 | | |
iShares NASDAQ Biotechnology
Index Fund | | | 5,770 | | | | 923 | | |
Market Vectors Biotech ETF | | | 9,340 | | | | 607 | | |
Market Vectors Pharmaceutical ETF | | | 15,780 | | | | 711 | | |
Total Exchange traded funds
(Cost $4,186)* | | | | | 4,605 | | |
Total Securities sold short—40.7%
(Proceeds $9,994)* | | | | $ | 10,658 | | |
Percentages disclosed are based on total net assets of the Fund at March 28, 2013.
* This number is listed in thousands.
ADR — American Depositary Receipt
Cl — Class
ETF — Exchange Traded Fund
The accompanying notes are an integral part of the financial statements.
TURNER FUNDS 2013 SEMIANNUAL REPORT 23
Turner Spectrum Fund
March 28, 2013
| | | Shares | | Value
(000) | |
Common stock—86.5% | |
Consumer discretionary—15.2% | |
Apollo Group, Cl A* | | | 255,540 | | | $ | 4,444 | | |
Arctic Cat* | | | 38,770 | | | | 1,694 | | |
AutoZone*^ | | | 5,980 | | | | 2,373 | | |
Best Buy | | | 195,810 | | | | 4,337 | | |
Coldwater Creek* | | | 300,061 | | | | 948 | | |
Comcast, Cl A | | | 136,890 | | | | 5,751 | | |
Crimson Wine Group* | | | 68,540 | | | | 637 | | |
Dollar General* | | | 89,260 | | | | 4,515 | | |
Dunkin' Brands Group | | | 108,920 | | | | 4,017 | | |
Francesca's Holdings* | | | 81,810 | | | | 2,345 | | |
GNC Holdings, Cl A | | | 155,109 | | | | 6,093 | | |
Hanesbrands* | | | 66,230 | | | | 3,017 | | |
Harley-Davidson | | | 23,100 | | | | 1,231 | | |
Home Depot^ | | | 71,640 | | | | 4,999 | | |
HomeAway* | | | 47,900 | | | | 1,557 | | |
International Game Technology^ | | | 187,670 | | | | 3,097 | | |
Lamar Advertising, Cl A*^ | | | 163,120 | | | | 7,929 | | |
Las Vegas Sands | | | 165,790 | | | | 9,343 | | |
Lennar, Cl A^ | | | 118,090 | | | | 4,898 | | |
M/I Homes* | | | 25,050 | | | | 612 | | |
Michael Kors Holdings* | | | 198,060 | | | | 11,249 | | |
Movado Group | | | 47,320 | | | | 1,586 | | |
O'Reilly Automotive* | | | 42,530 | | | | 4,361 | | |
PulteGroup* | | | 68,040 | | | | 1,377 | | |
SHFL entertainment* | | | 186,540 | | | | 3,091 | | |
Standard Pacific* | | | 362,430 | | | | 3,131 | | |
Starbucks | | | 27,030 | | | | 1,540 | | |
Starwood Hotels & Resorts
Worldwide | | | 75,240 | | | | 4,795 | | |
Tempur-Pedic International* | | | 72,920 | | | | 3,619 | | |
Time Warner | | | 138,790 | | | | 7,997 | | |
Toyota Motor ADR | | | 14,900 | | | | 1,529 | | |
TRI Pointe Homes* | | | 90,200 | | | | 1,818 | | |
Ulta Salon, Cosmetics &
Fragrance* | | | 40,290 | | | | 3,270 | | |
Vera Bradley* | | | 106,700 | | | | 2,521 | | |
VF | | | 14,930 | | | | 2,505 | | |
Walt Disney | | | 82,890 | | | | 4,708 | | |
Total Consumer discretionary | | | | | 132,934 | | |
Consumer staples—4.1% | |
B&G Foods, Cl A | | | 218,470 | | | | 6,661 | | |
Colgate-Palmolive | | | 11,100 | | | | 1,310 | | |
| | | Shares | | Value
(000) | |
Estee Lauder, Cl A | | | 103,230 | | | $ | 6,610 | | |
Fresh Market* | | | 73,090 | | | | 3,126 | | |
Hershey | | | 26,150 | | | | 2,289 | | |
Hillshire Brands | | | 129,820 | | | | 4,563 | | |
JM Smucker | | | 9,530 | | | | 945 | | |
PepsiCo | | | 52,620 | | | | 4,163 | | |
Procter & Gamble | | | 67,930 | | | | 5,235 | | |
Walgreen | | | 21,210 | | | | 1,011 | | |
Total Consumer staples | | | | | 35,913 | | |
Energy—8.3% | |
Anadarko Petroleum | | | 44,320 | | | | 3,876 | | |
Cabot Oil & Gas | | | 45,556 | | | | 3,080 | | |
Cobalt International Energy* | | | 216,140 | | | | 6,095 | | |
Concho Resources*^ | | | 124,690 | | | | 12,148 | | |
Delek US Holdings | | | 183,260 | | | | 7,230 | | |
Energy XXI (Bermuda) | | | 103,740 | | | | 2,824 | | |
Gulfport Energy* | | | 44,940 | | | | 2,060 | | |
Hess | | | 25,790 | | | | 1,847 | | |
Lehigh Gas Partners | | | 247,499 | | | | 5,658 | | |
Marathon Oil | | | 60,350 | | | | 2,035 | | |
Ophir Energy* | | | 1,037,967 | | | | 7,302 | | |
PBF Energy | | | 143,006 | | | | 5,316 | | |
Rosetta Resources* | | | 51,970 | | | | 2,473 | | |
Salamander Energy* | | | 69,500 | | | | 219 | | |
Schlumberger | | | 33,830 | | | | 2,534 | | |
SemGroup, Cl A* | | | 49,010 | | | | 2,535 | | |
Southwestern Energy* | | | 56,590 | | | | 2,109 | | |
SunCoke Energy Partners* | | | 112,180 | | | | 2,345 | | |
TriOil Resources, Cl A* | | | 221,510 | | | | 639 | | |
Total Energy | | | | | 72,325 | | |
Financials—15.0% | |
Affiliated Managers Group*^ | | | 65,810 | | | | 10,107 | | |
AIA Group | | | 843,681 | | | | 3,695 | | |
Allstate | | | 52,210 | | | | 2,562 | | |
Alterra Capital Holdings^ | | | 115,020 | | | | 3,623 | | |
American Tower^ | | | 105,160 | | | | 8,089 | | |
Banco do Brasil SA | | | 264,250 | | | | 3,582 | | |
Bank of the Ozarks^ | | | 69,449 | | | | 3,080 | | |
Brown & Brown | | | 80,810 | | | | 2,589 | | |
Cardtronics* | | | 46,193 | | | | 1,268 | | |
Chubb^ | | | 48,220 | | | | 4,221 | | |
Citigroup^ | | | 170,980 | | | | 7,564 | | |
Countrywide* | | | 315,697 | | | | 1,870 | | |
24 TURNER FUNDS 2013 SEMIANNUAL REPORT
Schedule of investments
Turner Spectrum Fund
| | | Shares | | Value
(000) | |
Credito Real SA de CV* | | | 1,041,686 | | | $ | 1,801 | | |
Donegal Group, Cl A | | | 75,249 | | | | 1,149 | | |
Education Realty Trust^ | | | 293,380 | | | | 3,089 | | |
eHealth* | | | 91,190 | | | | 1,630 | | |
Employers Holdings | | | 63,400 | | | | 1,487 | | |
Fortegra Financial*^ | | | 250,059 | | | | 2,191 | | |
Heritage Oaks Bancorp* | | | 172,261 | | | | 982 | | |
Hersha Hospitality Trust | | | 190,800 | | | | 1,114 | | |
Host Hotels & Resorts | | | 117,230 | | | | 2,050 | | |
IntercontinentalExchange*^ | | | 13,760 | | | | 2,244 | | |
Invesco^ | | | 105,400 | | | | 3,052 | | |
iStar Financial* | | | 168,150 | | | | 1,831 | | |
MetLife | | | 79,810 | | | | 3,034 | | |
Metro Pacific Investments | | | 60,371,348 | | | | 8,258 | | |
MetroCorp Bancshares* | | | 80,709 | | | | 814 | | |
Metropolitan Bank & Trust | | | 581,760 | | | | 1,668 | | |
MGIC Investment* | | | 243,300 | | | | 1,204 | | |
Ocwen Financial*^ | | | 231,825 | | | | 8,792 | | |
OmniAmerican Bancorp* | | | 82,295 | | | | 2,080 | | |
ProAssurance^ | | | 66,210 | | | | 3,134 | | |
Raymond James Financial^ | | | 187,660 | | | | 8,652 | | |
SCBT Financial | | | 39,350 | | | | 1,983 | | |
Shinhan Finnancial Group ADR | | | 28,229 | | | | 1,013 | | |
Signature Bank*^ | | | 36,460 | | | | 2,872 | | |
Tetragon Financial Group | | | 159,120 | | | | 1,739 | | |
Texas Capital Bancshares* | | | 61,280 | | | | 2,479 | | |
The NASDAQ Omx Group | | | 55,360 | | | | 1,788 | | |
Tower Group International | | | 317,425 | | | | 5,856 | | |
Total Financials | | | | | 130,236 | | |
Health care—15.9% | |
Abbott Laboratories | | | 55,136 | | | | 1,947 | | |
AbbVie | | | 31,450 | | | | 1,283 | | |
ACADIA Pharmaceuticals* | | | 155,930 | | | | 1,238 | | |
Air Methods | | | 99,824 | | | | 4,816 | | |
Align Technology* | | | 125,000 | | | | 4,189 | | |
Allscripts Healthcare Solutions* | | | 50,890 | | | | 692 | | |
Analogic | | | 85,660 | | | | 6,769 | | |
ARIAD Pharmaceuticals* | | | 54,570 | | | | 987 | | |
ArthroCare*^ | | | 131,202 | | | | 4,561 | | |
Auxilium Pharmaceuticals* | | | 102,430 | | | | 1,770 | | |
Baxter International | | | 58,960 | | | | 4,283 | | |
Biogen Idec* | | | 10,630 | | | | 2,051 | | |
BioMarin Pharmaceuticals* | | | 12,450 | | | | 775 | | |
Catamaran*^ | | | 84,210 | | | | 4,466 | | |
| | | Shares | | Value
(000) | |
Cepheid* | | | 30,300 | | | $ | 1,163 | | |
Community Health Systems | | | 130,550 | | | | 6,187 | | |
Cooper^ | | | 65,430 | | | | 7,059 | | |
Covance* | | | 13,360 | | | | 993 | | |
Cubist Pharmaceuticals* | | | 21,620 | | | | 1,012 | | |
Cynosure, Cl A* | | | 32,750 | | | | 857 | | |
Dr. Reddy's Laboratories ADR | | | 11,700 | | | | 378 | | |
Elan ADR | | | 83,673 | | | | 987 | | |
Emeritus* | | | 31,390 | | | | 872 | | |
Express Scripts Holding* | | | 98,370 | | | | 5,671 | | |
Gilead Sciences* | | | 91,370 | | | | 4,471 | | |
HCA Holdings | | | 103,020 | | | | 4,186 | | |
Health Net* | | | 22,010 | | | | 630 | | |
InterMune* | | | 11,920 | | | | 108 | | |
Laboratory Corp. of America
Holdings* | | | 51,910 | | | | 4,682 | | |
McKesson | | | 20,500 | | | | 2,213 | | |
Momenta Pharmaceuticals* | | | 62,600 | | | | 835 | | |
Neurocrine Biosciences* | | | 78,709 | | | | 956 | | |
NPS Pharmaceuticals* | | | 61,460 | | | | 626 | | |
ONO Pharmaceutical | | | 29,600 | | | | 1,827 | | |
Onyx Pharmaceuticals* | | | 30,950 | | | | 2,750 | | |
Patterson | | | 53,650 | | | | 2,041 | | |
Pfizer^ | | | 477,620 | | | | 13,783 | | |
Prothena* | | | 1,416 | | | | 9 | | |
QLT* | | | 155,981 | | | | 1,379 | | |
Roche Holding | | | 8,190 | | | | 1,907 | | |
Roche Holding AG ADR | | | 60,320 | | | | 3,535 | | |
Sanofi ADR | | | 52,570 | | | | 2,685 | | |
Sarepta Therapeutics* | | | 51,960 | | | | 1,920 | | |
Shire ADR^ | | | 19,710 | | | | 1,801 | | |
Synageva BioPharma* | | | 12,890 | | | | 708 | | |
Takeda Pharmaceutical | | | 11,730 | | | | 641 | | |
Team Health Holdings* | | | 182,660 | | | | 6,645 | | |
Teleflex^ | | | 80,470 | | | | 6,801 | | |
Thermo Fisher Scientific | | | 12,660 | | | | 968 | | |
ThromboGenics* | | | 7,580 | | | | 365 | | |
Universal Health Services | | | 20,460 | | | | 1,307 | | |
ViroPharma* | | | 90,520 | | | | 2,277 | | |
Warner Chilcott, Cl A | | | 88,920 | | | | 1,205 | | |
XenoPort* | | | 34,830 | | | | 249 | | |
Zoetis* | | | 15,560 | | | | 520 | | |
Total Health care | | | | | 139,036 | | |
TURNER FUNDS 2013 SEMIANNUAL REPORT 25
Schedule of investments
Turner Spectrum Fund
| | | Shares | | Value
(000) | |
Industrials—7.5% | |
Alaska Air Group* | | | 28,320 | | | $ | 1,811 | | |
AMETEK | | | 67,240 | | | | 2,916 | | |
CAI International*^ | | | 95,220 | | | | 2,744 | | |
Clean Harbors* | | | 83,220 | | | | 4,834 | | |
Cummins^ | | | 15,890 | | | | 1,840 | | |
Equifax | | | 71,710 | | | | 4,130 | | |
Fortune Brands Home &
Security* | | | 39,460 | | | | 1,477 | | |
Honeywell International | | | 33,980 | | | | 2,560 | | |
Huron Consulting Group*^ | | | 115,910 | | | | 4,673 | | |
Iron Mountain^ | | | 209,010 | | | | 7,590 | | |
Joy Global | | | 30,720 | | | | 1,828 | | |
Kirby* | | | 42,220 | | | | 3,242 | | |
MSC Industrial Direct, Cl A | | | 15,850 | | | | 1,360 | | |
Nordson | | | 97,670 | | | | 6,442 | | |
OHL Mexico SAB de CV* | | | 885,782 | | | | 2,457 | | |
Old Dominion Freight Line* | | | 120,670 | | | | 4,610 | | |
Parker Hannifin | | | 27,430 | | | | 2,512 | | |
Paul Y. Engineering Group | | | 39,168,286 | | | | 3,784 | | |
TAL International Group | | | 42,360 | | | | 1,919 | | |
Tata Motors ADR | | | 84,720 | | | | 2,068 | | |
Total Industrials | | | | | 64,797 | | |
Information technology—12.5% | |
Allot Communications* | | | 90,250 | | | | 1,078 | | |
Apple | | | 9,590 | | | | 4,245 | | |
Autodesk* | | | 46,990 | | | | 1,938 | | |
Bottomline Technologies* | | | 86,540 | | | | 2,467 | | |
Broadcom, Cl A | | | 53,910 | | | | 1,869 | | |
Ciena* | | | 55,130 | | | | 883 | | |
Cisco Systems | | | 197,670 | | | | 4,133 | | |
Digimarc^ | | | 145,120 | | | | 3,188 | | |
eBay*^ | | | 214,790 | | | | 11,646 | | |
EMC* | | | 74,320 | | | | 1,776 | | |
Facebook, Cl A* | | | 194,380 | | | | 4,972 | | |
Fidelity National Information
Services | | | 68,800 | | | | 2,726 | | |
Fusion-io* | | | 140,790 | | | | 2,305 | | |
Google, Cl A* | | | 6,150 | | | | 4,883 | | |
IPG Photonics | | | 19,230 | | | | 1,277 | | |
Jabil Circuit | | | 126,100 | | | | 2,330 | | |
Juniper Networks* | | | 227,190 | | | | 4,212 | | |
Manhattan Associates* | | | 62,870 | | | | 4,671 | | |
Maxim Integrated Products | | | 48,270 | | | | 1,576 | | |
| | | Shares | | Value
(000) | |
MAXIMUS | | | 20,900 | | | $ | 1,671 | | |
OSI Systems*^ | | | 105,240 | | | | 6,555 | | |
Qualcomm | | | 19,000 | | | | 1,272 | | |
ServiceNow* | | | 29,020 | | | | 1,051 | | |
Skyworks Solutions* | | | 109,580 | | | | 2,414 | | |
Take-Two Interactive Software* | | | 143,570 | | | | 2,319 | | |
TIBCO Software* | | | 217,790 | | | | 4,404 | | |
Tyler Technologies*^ | | | 61,400 | | | | 3,761 | | |
Visa, Cl A^ | | | 74,610 | | | | 12,671 | | |
Xilinx | | | 40,770 | | | | 1,556 | | |
Zynga* | | | 2,520,470 | | | | 8,469 | | |
Total Information technology | | | | | 108,318 | | |
Materials—7.5% | |
Augusta Resource* | | | 257,102 | | | | 659 | | |
Capstone Mining* | | | 376,660 | | | | 838 | | |
CF Industries Holdings^ | | | 69,452 | | | | 13,221 | | |
Eastman Chemical | | | 48,050 | | | | 3,357 | | |
Goldcorp^ | | | 257,020 | | | | 8,644 | | |
Haynes International^ | | | 18,690 | | | | 1,034 | | |
Jiangxi Copper | | | 785,140 | | | | 1,734 | | |
Kinross Gold | | | 284,400 | | | | 2,255 | | |
Methanex | | | 54,720 | | | | 2,223 | | |
Mexichem SA de CV | | | 287,626 | | | | 1,543 | | |
Molycorp* | | | 192,070 | | | | 999 | | |
Monsanto | | | 24,250 | | | | 2,562 | | |
PetroLogistics | | | 557,868 | | | | 7,687 | | |
Rentech Nitrogen Partners^ | | | 68,838 | | | | 2,470 | | |
Rockwood Holdings | | | 90,130 | | | | 5,898 | | |
SilverCrest Mines* | | | 200,434 | | | | 464 | | |
Turquoise Hill Resources* | | | 135,790 | | | | 864 | | |
Westlake Chemical | | | 73,030 | | | | 6,828 | | |
Yamana Gold | | | 100,930 | | | | 1,549 | | |
Total Materials | | | | | 64,829 | | |
Telecommunication services—0.5% | |
Aruba Networks* | | | 60,390 | | | | 1,494 | | |
SBA Communications, Cl A* | | | 43,770 | | | | 3,152 | | |
Total Telecommunication services | | | | | 4,646 | | |
Total Common stock
(Cost $688,488)** | | | | | 753,034 | | |
26 TURNER FUNDS 2013 SEMIANNUAL REPORT
Schedule of investments
Turner Spectrum Fund
| | | Contracts/
Shares | | Value
(000) | |
Exchange traded funds—0.4% | |
SPDR Gold Trust | | | 19,940 | | | $ | 3,080 | | |
Total Exchange traded funds
(Cost $3,085)** | | | | | 3,080 | | |
Call option contracts—0.1% | |
Baxter International, 5/13 at $72.5 | | | 83 | | | | 28 | | |
Baxter International, 4/13 at $72.5 | | | 181 | | | | 31 | | |
Cliffs Natural Resources, 5/13 at $20 | | | 1,203 | | | | 129 | | |
Humana, 4/13 at $72.5 | | | 22 | | | | 3 | | |
Humana, 4/13 at $77.5 | | | 59 | | | | 2 | | |
Humana, 4/13 at $70 | | | 112 | | | | 29 | | |
Humana, 4/13 at $75 | | | 36 | | | | 3 | | |
Market Vectors Gold Miners ETF,
6/13 at $42.5 | | | 2,006 | | | | 102 | | |
Quest Diagnostics, 5/13 at $60 | | | 164 | | | | 8 | | |
SPDR Gold Trust, 5/13 at $158 | | | 1,604 | | | | 208 | | |
Total | | | | | 543 | | |
Total Call option contracts
(Cost $785)** | | | | | 543 | | |
Put option contracts—0.1% | |
Humana, 4/13 at $67.5 | | | 84 | | | | 18 | | |
Market Vectors Oil Services
ETF, 5/13 at $42 | | | 2,209 | | | | 199 | | |
Methanex, 5/13 at $40 | | | 440 | | | | 55 | | |
Ultra Petroleum, 6/13 at $20 | | | 4,809 | | | | 696 | | |
United Therapeutics, 4/13 at $20 | | | 167 | | | | 23 | | |
Total | | | | | 991 | | |
Total Put option contracts
(Cost $982)** | | | | | 991 | | |
| | | Shares | | Value
(000) | |
Cash equivalent—1.4% | |
BlackRock Liquidity Funds
TempCash Portfolio,
Institutional Shares,
0.010%*** | | | 12,421,701 | | | $ | 12,422 | | |
Total Cash equivalent
(Cost $12,422)** | | | | | 12,422 | | |
Total Investments—88.5%
(Cost $705,762)** | | | | | 770,070 | | |
Segregated cash with brokers—75.7% | | | | | 657,977 | | |
Securities sold short—(62.9)%
(Proceeds $(529,300))** | | | | | (547,031 | ) | |
Written option contracts—(0.0)%
(Premiums received $(94))** | | | | | (71 | ) | |
Net Other assets (liabilities)—(1.3)% | | | | | (11,299 | ) | |
Net Assets—100.0% | | | | $ | 869,646 | | |
* Non-income producing security.
** This number is listed in thousands.
*** Rate shown is the 7-day effective yield as of March 28, 2013.
^ All or a portion of the shares have been committed as collateral for open short positions and open written option contracts.
ADR — American Depositary Receipt
Cl — Class
ETF — Exchange Traded Fund
The accompanying notes are an integral part of the financial statements.
TURNER FUNDS 2013 SEMIANNUAL REPORT 27
Schedule of securities sold short
Turner Spectrum Fund
March 28, 2013
| | | Shares | | Value
(000) | |
Common stock—50.5% | |
Consumer discretionary—11.2% | |
Ascena Retail Group | | | 89,210 | | | $ | 1,655 | | |
Autoliv | | | 49,430 | | | | 3,418 | | |
Buckle | | | 37,640 | | | | 1,756 | | |
Cabela's | | | 69,610 | | | | 4,231 | | |
Carnival | | | 35,230 | | | | 1,208 | | |
Columbia Sportswear | | | 40,230 | | | | 2,329 | | |
Daimler AG, Registered Shares | | | 63,135 | | | | 3,435 | | |
Darden Restaurants | | | 24,410 | | | | 1,262 | | |
Dillard's, Cl A | | | 25,000 | | | | 1,964 | | |
DineEquity | | | 45,200 | | | | 3,109 | | |
DIRECTV | | | 51,160 | | | | 2,896 | | |
Discovery Communications, Cl A | | | 20,160 | | | | 1,587 | | |
Foot Locker | | | 34,400 | | | | 1,178 | | |
Galaxy Entertainment Group | | | 299,233 | | | | 1,249 | | |
Genesco | | | 18,080 | | | | 1,086 | | |
G-III Apparel Group | | | 40,660 | | | | 1,631 | | |
Hasbro | | | 55,170 | | | | 2,424 | | |
Hennes & Mauritz AB, B Shares | | | 37,750 | | | | 1,350 | | |
L Brands | | | 34,680 | | | | 1,549 | | |
Lear | | | 15,540 | | | | 853 | | |
Lowe's | | | 129,720 | | | | 4,919 | | |
Lumber Liquidators Holdings | | | 26,740 | | | | 1,878 | | |
M.D.C Holdings | | | 44,070 | | | | 1,615 | | |
Netflix | | | 31,465 | | | | 5,960 | | |
Nordstrom | | | 23,320 | | | | 1,288 | | |
NVR | | | 1,570 | | | | 1,696 | | |
Omnicom Group | | | 106,170 | | | | 6,252 | | |
Panera Bread, Cl A | | | 51,640 | | | | 8,532 | | |
PetSmart | | | 28,190 | | | | 1,751 | | |
Pinnacle Entertainment | | | 71,300 | | | | 1,042 | | |
Priceline.com | | | 1,790 | | | | 1,231 | | |
Ross Stores | | | 30,230 | | | | 1,833 | | |
Thomson Reuters | | | 160,440 | | | | 5,211 | | |
Tim Hortons | | | 50,260 | | | | 2,730 | | |
Time Warner Cable, Cl A | | | 13,705 | | | | 1,317 | | |
Under Armour, Cl A | | | 84,300 | | | | 4,316 | | |
Wolverine World Wide | | | 100,000 | | | | 4,437 | | |
Wynn Macau | | | 472,131 | | | | 1,253 | | |
Total Consumer discretionary | | | | | 97,431 | | |
Consumer staples—1.6% | |
CVS Caremark | | | 11,520 | | | | 633 | | |
Heineken NV | | | 25,575 | | | | 1,927 | | |
Hormel Foods | | | 24,660 | | | | 1,019 | | |
| | | Shares | | Value
(000) | |
Kimberly-Clark | | | 68,220 | | | $ | 6,685 | | |
Rite AID | | | 170,460 | | | | 324 | | |
Sysco | | | 93,960 | | | | 3,305 | | |
Total Consumer staples | | | | | 13,893 | | |
Energy—7.0% | |
Apache | | | 42,550 | | | | 3,283 | | |
Baker Hughes | | | 26,750 | | | | 1,241 | | |
Chesapeake Energy | | | 89,100 | | | | 1,819 | | |
Chevron | | | 24,410 | | | | 2,900 | | |
Cloud Peak Energy | | | 72,180 | | | | 1,356 | | |
ConocoPhillips | | | 136,710 | | | | 8,216 | | |
Continental Resources | | | 41,950 | | | | 3,647 | | |
Ecopetrol SA ADR | | | 78,740 | | | | 4,293 | | |
Encana | | | 185,400 | | | | 3,608 | | |
Halliburton | | | 69,950 | | | | 2,827 | | |
Oasis Petroleum | | | 242,520 | | | | 9,233 | | |
Occidental Petroleum | | | 15,560 | | | | 1,219 | | |
Patterson-UTI Energy | | | 30,870 | | | | 736 | | |
Rpc | | | 97,370 | | | | 1,477 | | |
Tenaris SA ADR | | | 149,390 | | | | 6,092 | | |
Ultra Petroleum | | | 76,140 | | | | 1,530 | | |
Whiting Petroleum | | | 39,870 | | | | 2,027 | | |
Williams Partners | | | 87,100 | | | | 4,512 | | |
Yingde Gases Group | | | 1,110,596 | | | | 1,238 | | |
Total Energy | | | | | 61,254 | | |
Financials—10.5% | |
Ameriprise Financial | | | 32,880 | | | | 2,422 | | |
AON | | | 31,900 | | | | 1,962 | | |
Assurant | | | 135,060 | | | | 6,078 | | |
Banco Bradesco SA ADR | | | 158,818 | | | | 2,703 | | |
Bancolombia SA SP ADR | | | 38,510 | | | | 2,436 | | |
Charles Schwab | | | 179,660 | | | | 3,178 | | |
Cincinnati Financial | | | 98,546 | | | | 4,650 | | |
City National | | | 42,380 | | | | 2,497 | | |
CME Group | | | 57,650 | | | | 3,539 | | |
Comerica | | | 153,400 | | | | 5,515 | | |
Commerzbank AG | | | 688,340 | | | | 1,010 | | |
DuPont Fabros Technology | | | 110,000 | | | | 2,670 | | |
Eaton Vance | | | 39,690 | | | | 1,660 | | |
Equity Residential | | | 42,060 | | | | 2,316 | | |
First Horizon National | | | 142,520 | | | | 1,522 | | |
FXCM, Cl A | | | 101,770 | | | | 1,392 | | |
Green Dot, Cl A | | | 81,090 | | | | 1,355 | | |
28 TURNER FUNDS 2013 SEMIANNUAL REPORT
Schedule of securities sold short
Turner Spectrum Fund
| | | Shares | | Value
(000) | |
Grupo Financiero Banorte
SAB de CV, Cl O | | | 400,503 | | | $ | 3,200 | | |
Janus Capital Group | | | 348,120 | | | | 3,272 | | |
Jones Lang LaSalle | | | 57,720 | | | | 5,738 | | |
LaSalle Hotel Properties | | | 82,390 | | | | 2,091 | | |
Legg Mason | | | 170,270 | | | | 5,474 | | |
MarketAxess Holdings | | | 57,310 | | | | 2,138 | | |
Montpelier Re Holdings | | | 62,100 | | | | 1,618 | | |
MSCI, Cl A | | | 59,730 | | | | 2,027 | | |
Nationstar Mortgage Holdings | | | 120,042 | | | | 4,430 | | |
Progressive | | | 225,195 | | | | 5,691 | | |
Public Storage | | | 14,110 | | | | 2,149 | | |
RLI | | | 31,570 | | | | 2,268 | | |
Stifel Financial | | | 67,100 | | | | 2,326 | | |
Xoom | | | 83,200 | | | | 1,900 | | |
Total Financials | | | | | 91,227 | | |
Health care—5.9% | |
Agilent Technologies | | | 29,630 | | | | 1,244 | | |
Amarin PLC ADR | | | 40,870 | | | | 303 | | |
AmerisourceBergen, Cl A | | | 18,960 | | | | 975 | | |
Amgen | | | 16,020 | | | | 1,642 | | |
Arena Pharmaceuticals | | | 277,940 | | | | 2,282 | | |
Boston Scientific | | | 184,090 | | | | 1,438 | | |
C.R. Bard | | | 53,610 | | | | 5,402 | | |
Chemed | | | 6,900 | | | | 552 | | |
DENTSPLY International | | | 97,170 | | | | 4,122 | | |
Eisai | | | 33,140 | | | | 1,481 | | |
Fresenius Medical Care ADR | | | 26,240 | | | | 888 | | |
Greenway Medical Technologies | | | 88,450 | | | | 1,406 | | |
Henry Schein | | | 10,380 | | | | 961 | | |
Hospira | | | 11,550 | | | | 379 | | |
ImmunoGen | | | 39,340 | | | | 632 | | |
Johnson & Johnson | | | 48,900 | | | | 3,987 | | |
Kindred Healthcare | | | 43,178 | | | | 455 | | |
Medtronic | | | 84,300 | | | | 3,959 | | |
Mylan | | | 41,490 | | | | 1,201 | | |
Myriad Genetics | | | 111,010 | | | | 2,820 | | |
Neogen | | | 9,100 | | | | 451 | | |
Novartis AG ADR | | | 22,280 | | | | 1,587 | | |
Select Medical Holdings | | | 47,140 | | | | 424 | | |
Stryker | | | 74,700 | | | | 4,873 | | |
UnitedHealth Group, Cl B | | | 33,800 | | | | 1,934 | | |
Varian Medical Systems | | | 66,600 | | | | 4,795 | | |
WellPoint | | | 14,130 | | | | 936 | | |
Total Health care | | | | | 51,129 | | |
| | | Shares | | Value
(000) | |
Industrials—3.6% | |
Cintas | | | 20,720 | | | $ | 914 | | |
Con-Way | | | 149,830 | | | | 5,277 | | |
Costar Group | | | 43,480 | | | | 4,759 | | |
Dover | | | 70,520 | | | | 5,140 | | |
Emerson Electric | | | 16,750 | | | | 936 | | |
Fastenal | | | 39,830 | | | | 2,045 | | |
FedEx | | | 11,670 | | | | 1,146 | | |
Harsco | | | 67,420 | | | | 1,670 | | |
Ingersoll-Rand | | | 16,730 | | | | 920 | | |
Northrop Grumman | | | 18,270 | | | | 1,282 | | |
SGL Carbon SE | | | 29,130 | | | | 1,146 | | |
Southwest Airlines | | | 316,500 | | | | 4,266 | | |
Terex | | | 52,730 | | | | 1,815 | | |
Total Industrials | | | | | 31,316 | | |
Information technology—6.6% | |
ADTRAN | | | 47,950 | | | | 942 | | |
ARM Holdings ADR | | | 139,980 | | | | 5,931 | | |
Avnet | | | 67,800 | | | | 2,454 | | |
Check Point Software
Technologies | | | 18,780 | | | | 882 | | |
FactSet Research Systems | | | 21,900 | | | | 2,028 | | |
Fiserv | | | 80,760 | | | | 7,094 | | |
FLIR Systems | | | 213,080 | | | | 5,542 | | |
Freescale Semiconductor | | | 58,530 | | | | 872 | | |
Global Payments | | | 124,840 | | | | 6,200 | | |
International Business Machines | | | 7,230 | | | | 1,542 | | |
MasterCard, Cl A | | | 5,410 | | | | 2,928 | | |
NVIDIA | | | 186,670 | | | | 2,393 | | |
Paychex | | | 35,640 | | | | 1,250 | | |
Power Integrations | | | 55,820 | | | | 2,423 | | |
Rackspace Hosting | | | 16,490 | | | | 832 | | |
Seagate Technology | | | 67,420 | | | | 2,465 | | |
SolarWinds | | | 15,970 | | | | 944 | | |
Tech Data | | | 24,910 | | | | 1,136 | | |
Texas Instruments | | | 82,360 | | | | 2,922 | | |
VeriSign | | | 20,630 | | | | 975 | | |
VMware, Cl A | | | 67,810 | | | | 5,349 | | |
Total Information technology | | | | | 57,104 | | |
Materials—4.1% | |
Airgas | | | 15,700 | | | | 1,557 | | |
Alcoa | | | 283,730 | | | | 2,417 | | |
TURNER FUNDS 2013 SEMIANNUAL REPORT 29
Schedule of securities sold short
Turner Spectrum Fund
| | | Shares | | Value
(000) | |
Aluminum Corp. of China,
H Shares | | | 1,586,040 | | | $ | 611 | | |
AngloGold ADR | | | 51,850 | | | | 1,221 | | |
AptarGroup | | | 30,700 | | | | 1,761 | | |
Aviva | | | 392,640 | | | | 1,767 | | |
Barrick Gold | | | 207,290 | | | | 6,094 | | |
Compass Minerals International | | | 32,800 | | | | 2,588 | | |
E.I. du Pont de Nemours | | | 112,240 | | | | 5,518 | | |
Globe Specialty Metals | | | 80,610 | | | | 1,122 | | |
Mosaic | | | 41,580 | | | | 2,479 | | |
Schnitzer Steel Industries, Cl A | | | 50,410 | | | | 1,344 | | |
Solvay SA | | | 41,660 | | | | 5,641 | | |
Southern Copper | | | 31,260 | | | | 1,174 | | |
Total Materials | | | | | 35,294 | | |
Total Common stock
(Proceeds $425,241)* | | | | | 438,648 | | |
Convertible corporate bond—0.0% | |
Financials—0.0% | |
Credit Suisse Group Capital
(Guernsey) V,
4.00%, 03/29/13**^ | | | 160,000 | | | | 260 | | |
Total Convertible corporate bond
(Proceeds $164)* | | | | | 260 | | |
Exchange traded funds—12.4% | |
CurrencyShares Euro Trust | | | 19,910 | | | | 2,531 | | |
CurrencyShares Japanese Yen
Trust | | | 9,120 | | | | 949 | | |
Health Care Select Sector SPDR | | | 165,690 | | | | 7,613 | | |
iShares NASDAQ Biotechnology
Index Fund | | | 26,851 | | | | 4,294 | | |
iShares Russell 2000 Index Fund | | | 32,920 | | | | 3,103 | | |
Market Vectors Biotech ETF | | | 64,850 | | | | 4,215 | | |
Market Vectors Oil Service ETF | | | 119,140 | | | | 5,116 | | |
Market Vectors
Pharmaceutical ETF | | | 73,430 | | | | 3,309 | | |
PowerShares QQQ Trust | | | 168,770 | | | | 11,640 | | |
SPDR S&P 500 ETF Trust | | | 118,720 | | | | 18,586 | | |
SPDR S&P Retail ETF | | | 44,150 | | | | 3,106 | | |
Vanguard Growth ETF | | | 100,430 | | | | 7,784 | | |
Vanguard S&P 500 ETF | | | 108,410 | | | | 7,766 | | |
Vanguard Small-Cap ETF | | | 127,810 | | | | 11,650 | | |
Vanguard Small-Cap Growth ETF | | | 116,590 | | | | 11,650 | | |
| | | Shares | | Value
(000) | |
VelocityShares Daily Inverse VIX
Short-Term ETN | | | 206,410 | | | $ | 4,811 | | |
Total Exchange traded funds
(Proceeds $103,895)* | | | | | 108,123 | | |
Total Securities sold short—62.9%
(Proceeds $529,300)* | | | | $ | 547,031 | | |
Percentages disclosed are based on total net assets of the Fund at March 28, 2013.
* This number is listed in thousands.
** Represents a restricted security. The security has been deemed illiquid according to the policies and procedures adopted by the Board of Trustees. At March 28, 2013, illiquid securities were 0.0% of the Fund's nets assets.
| | | Acquisition
Date | | Acquisition
Cost* | | Share
Amount* | | Fair
Value* | |
Credit Suisse Group
Capital (Guernsey) V | | 8/13/12 | | $ | 164 | | | | 160,000 | | | $ | 260 | | |
^ Security fair valued using procedures established by the Fair Value Committee. As of March 28, 2013 the total market value of these securities was $260*, representing 0.0% of Net Assets.
ADR — American Depositary Receipt
Cl — Class
ETF — Exchange Traded Fund
ETN — Exchange Traded Note
The accompanying notes are an integral part of the financial statements.
30 TURNER FUNDS 2013 SEMIANNUAL REPORT
Schedule of open written option contracts
Turner Spectrum Fund
March 28, 2013
| | | Contracts | | Value
(000) | |
Written option contracts—0.0% | |
Written call option contracts—0.0% | |
United Petroleum 4/13 at $21 | | | 756 | | | $ | 34 | | |
Total Written call option contracts
(Premiums received $54)* | | | | | 34 | | |
Written put option contracts—0.0% | |
United Petroleum 6/13 at $17 | | | 825 | | | | 37 | | |
Total Written put option contracts
(Premiums received $40)* | | | | | 37 | | |
Total Written option contracts
(Premiums received $94)* | | | | $ | 71 | | |
Percentages are based on Net Assets of $869,646*.
* This number is listed in thousands.
The accompanying notes are an integral part of the financial statements.
TURNER FUNDS 2013 SEMIANNUAL REPORT 31
Turner Titan Fund
March 28, 2013
| | | Shares | | Value
(000) | |
Common stock—97.9% | |
Consumer discretionary—21.0% | |
Best Buy^ | | | 41,610 | | | $ | 922 | | |
Harley-Davidson | | | 9,030 | | | | 481 | | |
HomeAway* | | | 18,720 | | | | 608 | | |
Las Vegas Sands^ | | | 19,230 | | | | 1,084 | | |
Lennar, Cl A | | | 16,740 | | | | 694 | | |
Michael Kors Holdings*^ | | | 22,470 | | | | 1,276 | | |
Movado Group | | | 17,660 | | | | 592 | | |
Starbucks | | | 10,280 | | | | 586 | | |
Starwood Hotels & Resorts
Worldwide | | | 13,270 | | | | 846 | | |
Time Warner^ | | | 22,380 | | | | 1,289 | | |
Toyota Motor ADR | | | 5,600 | | | | 575 | | |
Walt Disney | | | 10,600 | | | | 602 | | |
Total Consumer discretionary | | | | | 9,555 | | |
Consumer staples—9.2% | |
Colgate-Palmolive | | | 4,300 | | | | 508 | | |
Estee Lauder, Cl A | | | 12,410 | | | | 795 | | |
Hershey | | | 9,920 | | | | 868 | | |
Hillshire Brands^ | | | 47,710 | | | | 1,676 | | |
JM Smucker | | | 3,550 | | | | 352 | | |
Total Consumer staples | | | | | 4,199 | | |
Energy—8.7% | |
Cabot Oil & Gas | | | 5,190 | | | | 351 | | |
Cobalt International Energy* | | | 25,610 | | | | 722 | | |
Concho Resources*^ | | | 11,750 | | | | 1,145 | | |
Schlumberger^ | | | 12,580 | | | | 942 | | |
Southwestern Energy* | | | 21,810 | | | | 813 | | |
Total Energy | | | | | 3,973 | | |
Financials—7.7% | |
Affiliated Managers Group* | | | 4,370 | | | | 671 | | |
Allstate | | | 20,500 | | | | 1,006 | | |
Citigroup^ | | | 31,100 | | | | 1,376 | | |
Raymond James Financial | | | 10,240 | | | | 472 | | |
Total Financials | | | | | 3,525 | | |
Health care—13.8% | |
Baxter International | | | 5,380 | | | | 391 | | |
Biogen Idec* | | | 2,030 | | | | 392 | | |
Covance* | | | 5,030 | | | | 374 | | |
Express Scripts Holding* | | | 16,660 | | | | 960 | | |
| | | Shares | | Value
(000) | |
Gilead Sciences* | | | 21,730 | | | $ | 1,063 | | |
HCA Holdings | | | 19,950 | | | | 811 | | |
Onyx Pharmaceuticals* | | | 6,350 | | | | 564 | | |
Pfizer | | | 34,420 | | | | 993 | | |
Roche Holding | | | 3,160 | | | | 736 | | |
Total Health care | | | | | 6,284 | | |
Industrials—8.6% | |
AMETEK | | | 14,080 | | | | 611 | | |
Cummins^ | | | 5,710 | | | | 661 | | |
Equifax | | | 12,800 | | | | 737 | | |
Honeywell International | | | 12,800 | | | | 964 | | |
Parker Hannifin | | | 10,220 | | | | 936 | | |
Total Industrials | | | | | 3,909 | | |
Information technology—21.8% | |
Autodesk* | | | 18,450 | | | | 761 | | |
Broadcom, Cl A | | | 21,060 | | | | 730 | | |
Ciena* | | | 21,530 | | | | 345 | | |
Cisco Systems^ | | | 73,670 | | | | 1,541 | | |
eBay*^ | | | 20,910 | | | | 1,134 | | |
EMC* | | | 28,860 | | | | 689 | | |
Facebook, Cl A*^ | | | 26,560 | | | | 679 | | |
Maxim Integrated Products^ | | | 18,850 | | | | 615 | | |
Qualcomm | | | 7,420 | | | | 497 | | |
ServiceNow* | | | 10,820 | | | | 392 | | |
Take-Two Interactive Software* | | | 55,470 | | | | 896 | | |
Visa, Cl A^ | | | 5,870 | | | | 997 | | |
Xilinx | | | 15,930 | | | | 608 | | |
Total Information technology | | | | | 9,884 | | |
Materials—3.2% | |
Eastman Chemical | | | 7,050 | | | | 493 | | |
Monsanto^ | | | 8,990 | | | | 949 | | |
Total Materials | | | | | 1,442 | | |
Telecommunication services—3.9% | |
Aruba Networks* | | | 23,600 | | | | 584 | | |
SBA Communications, Cl A*^ | | | 16,260 | | | | 1,171 | | |
Total Telecommunication services | | | | | 1,755 | | |
Total Common stock
(Cost $40,865)** | | | | | 44,526 | | |
32 TURNER FUNDS 2013 SEMIANNUAL REPORT
Schedule of investments
Turner Titan Fund
| | | Shares | | Value
(000) | |
Cash equivalent—1.4% | |
BlackRock Liquidity Funds
TempCash Portfolio,
Institutional Shares, 0.010%*** | | | 649,287 | | | $ | 649 | | |
Total Cash equivalent
(Cost $649)** | | | | | 649 | | |
Total Investments—99.3%
(Cost $41,514)** | | | | | 45,175 | | |
Segregated cash with brokers—64.8% | | | | | 29,482 | | |
Securities sold short—(63.9)%
(Proceeds $(28,426))** | | | | | (29,092 | ) | |
Net Other assets (liabilities)—(0.2)% | | | | | (64 | ) | |
Net Assets—100.0% | | | | $ | 45,501 | | |
* Non-income producing security.
** This number is listed in thousands.
*** Rate shown is the 7-day effective yield as of March 28, 2013.
^ All or a portion of the shares have been committed as collateral for open short positions.
ADR — American Depositary Receipt
Cl — Class
The accompanying notes are an integral part of the financial statements.
TURNER FUNDS 2013 SEMIANNUAL REPORT 33
Schedule of securities sold short
Turner Titan Fund
March 28, 2013
| | | Shares | | Value
(000) | |
Common stock—59.6% | |
Consumer discretionary—19.1% | |
Autoliv | | | 4,930 | | | $ | 341 | | |
Carnival | | | 13,660 | | | | 469 | | |
Columbia Sportswear | | | 6,420 | | | | 372 | | |
Daimler AG, Registered Shares | | | 16,230 | | | | 882 | | |
Darden Restaurants | | | 9,100 | | | | 470 | | |
DineEquity | | | 5,205 | | | | 358 | | |
Discovery Communications, Cl A | | | 7,770 | | | | 612 | | |
Lear | | | 6,070 | | | | 333 | | |
Lowe's | | | 12,570 | | | | 477 | | |
Netflix | | | 3,245 | | | | 615 | | |
Nordstrom | | | 8,370 | | | | 462 | | |
Omnicom Group | | | 8,380 | | | | 494 | | |
Panera Bread, Cl A | | | 4,610 | | | | 761 | | |
Thomson Reuters | | | 9,270 | | | | 301 | | |
Time Warner Cable, Cl A | | | 5,315 | | | | 511 | | |
Under Armour, Cl A | | | 18,200 | | | | 931 | | |
Wolverine World Wide | | | 8,130 | | | | 361 | | |
Total Consumer discretionary | | | | | 8,750 | | |
Consumer staples—1.4% | |
Kimberly-Clark | | | 6,370 | | | | 624 | | |
Total Consumer staples | | | | | 624 | | |
Energy—5.5% | |
Baker Hughes | | | 10,310 | | | | 478 | | |
Oasis Petroleum | | | 18,580 | | | | 708 | | |
Occidental Petroleum | | | 6,000 | | | | 470 | | |
Patterson-UTI Energy | | | 11,510 | | | | 274 | | |
Ultra Petroleum | | | 28,380 | | | | 571 | | |
Total Energy | | | | | 2,501 | | |
Financials—6.5% | |
Assurant | | | 16,400 | | | | 739 | | |
Charles Schwab | | | 23,190 | | | | 410 | | |
City National | | | 6,980 | | | | 411 | | |
CME Group | | | 5,950 | | | | 365 | | |
Comerica | | | 9,950 | | | | 358 | | |
Eaton Vance | | | 15,780 | | | | 660 | | |
Total Financials | | | | | 2,943 | | |
| | | Shares | | Value
(000) | |
Health care—4.1% | |
Boston Scientific | | | 71,370 | | | $ | 557 | | |
C.R. Bard | | | 5,990 | | | | 604 | | |
Stryker | | | 5,330 | | | | 348 | | |
WellPoint | | | 5,270 | | | | 349 | | |
Total Health care | | | | | 1,858 | | |
Industrials—4.7% | |
Con-Way | | | 9,990 | | | | 352 | | |
Dover | | | 8,140 | | | | 593 | | |
Emerson Electric | | | 6,240 | | | | 349 | | |
Ingersoll-Rand | | | 6,280 | | | | 345 | | |
Northrop Grumman | | | 7,040 | | | | 494 | | |
Total Industrials | | | | | 2,133 | | |
Information technology—14.5% | |
ADTRAN | | | 18,010 | | | | 354 | | |
ARM Holdings ADR | | | 17,460 | | | | 739 | | |
Check Point Software
Technologies | | | 7,270 | | | | 342 | | |
Fiserv | | | 8,580 | | | | 753 | | |
FLIR Systems | | | 11,210 | | | | 292 | | |
Freescale Semiconductor | | | 22,840 | | | | 340 | | |
Global Payments | | | 8,390 | | | | 417 | | |
International Business Machines | | | 2,830 | | | | 604 | | |
Rackspace Hosting | | | 6,270 | | | | 317 | | |
Seagate Technology | | | 25,130 | | | | 918 | | |
SolarWinds | | | 6,000 | | | | 355 | | |
Tech Data | | | 9,700 | | | | 442 | | |
VeriSign | | | 8,000 | | | | 378 | | |
VMware, Cl A | | | 4,400 | | | | 347 | | |
Total Information technology | | | | | 6,598 | | |
Materials—3.8% | |
Airgas | | | 5,900 | | | | 585 | | |
E.I. du Pont de Nemours | | | 14,890 | | | | 732 | | |
Solvay SA | | | 3,055 | | | | 414 | | |
Total Materials | | | | | 1,731 | | |
Total Common stock
(Proceeds $26,555)* | | | | | 27,138 | | |
34 TURNER FUNDS 2013 SEMIANNUAL REPORT
Schedule of securities sold short
Turner Titan Fund
| | | Shares | | Value
(000) | |
Exchange traded funds—4.3% | |
Market Vectors Biotech ETF | | | 8,750 | | | $ | 569 | | |
SPDR S&P 500 ETF Trust | | | 8,850 | | | | 1,385 | | |
Total Exchange traded funds
(Proceeds $1,871)* | | | | | 1,954 | | |
Total Securities sold short—63.9%
(Proceeds $28,426)* | | | | $ | 29,092 | | |
Percentages disclosed are based on total net assets of the Fund at March 28, 2013.
* This number is listed in thousands.
ADR — American Depositary Receipt
Cl — Class
ETF — Exchange Traded Fund
The accompanying notes are an integral part of the financial statements.
TURNER FUNDS 2013 SEMIANNUAL REPORT 35
Turner All Cap Growth Fund
March 28, 2013
| | | Shares | | Value
(000) | |
Common stock—99.8%† | |
Consumer discretionary—18.3% | |
Fossil* | | | 3,160 | | | $ | 305 | | |
HomeAway* | | | 9,080 | | | | 295 | | |
LinkedIn, Cl A* | | | 4,730 | | | | 833 | | |
Michael Kors Holdings* | | | 10,220 | | | | 580 | | |
Ralph Lauren | | | 3,500 | | | | 593 | | |
Wynn Resorts | | | 6,000 | | | | 751 | | |
Total Consumer discretionary | | | | | 3,357 | | |
Consumer staples—2.8% | |
Beam | | | 8,200 | | | | 521 | | |
Total Consumer staples | | | | | 521 | | |
Energy—4.1% | |
Concho Resources* | | | 7,620 | | | | 742 | | |
Total Energy | | | | | 742 | | |
Financials—10.1% | |
Affiliated Managers Group* | | | 3,390 | | | | 521 | | |
CBRE Group* | | | 24,850 | | | | 627 | | |
IntercontinentalExchange* | | | 4,340 | | | | 708 | | |
Total Financials | | | | | 1,856 | | |
Health care—6.8% | |
Catamaran* | | | 10,490 | | | | 556 | | |
Intuitive Surgical* | | | 810 | | | | 398 | | |
Regeneron Pharmaceuticals* | | | 1,640 | | | | 289 | | |
Total Health care | | | | | 1,243 | | |
Industrials—1.5% | |
Joy Global | | | 4,600 | | | | 274 | | |
Total Industrials | | | | | 274 | | |
Information technology—53.6% | |
Apple | | | 2,770 | | | | 1,226 | | |
Avago Technologies | | | 23,590 | | | | 847 | | |
Cavium # * | | | 21,620 | | | | 839 | | |
Citrix Systems* | | | 10,030 | | | | 724 | | |
eBay* | | | 12,700 | | | | 689 | | |
Fabrinet* | | | 20,390 | | | | 298 | | |
Fusion-io # * | | | 29,560 | | | | 484 | | |
Infinera # * | | | 43,450 | | | | 304 | | |
Invensense # * | | | 40,610 | | | | 434 | | |
Maxim Integrated Products | | | 10,170 | | | | 332 | | |
| | | Shares | | Value
(000) | |
Monolithic Power Systems | | | 14,800 | | | $ | 361 | | |
NXP Semiconductors* | | | 29,370 | | | | 889 | | |
QLIK Technologies* | | | 18,990 | | | | 491 | | |
Qualcomm | | | 9,580 | | | | 641 | | |
RF Micro Devices* | | | 63,680 | | | | 339 | | |
ServiceNow* | | | 7,020 | | | | 254 | | |
Splunk* | | | 7,420 | | | | 297 | | |
Stratasys* | | | 4,610 | | | | 342 | | |
Total Information technology | | | | | 9,791 | | |
Telecommunication services—2.6% | |
SBA Communications, Cl A* | | | 6,610 | | | | 476 | | |
Total Telecommunication services | | | | | 476 | | |
Total Common stock
(Cost $16,819)** | | | | | 18,260 | | |
Cash equivalent—8.3% | |
BlackRock Liquidity Funds
TempCash Portfolio,
Institutional Shares,
0.010%*** (1) | | | 1,528,078 | | | | 1,528 | | |
Total Cash equivalent
(Cost $1,528)** | | | | | 1,528 | | |
Total Investments—108.1%
(Cost $18,347)** | | | | | 19,788 | | |
Net Other assets (liabilities)—(8.1)% | | | | | (1,488 | ) | |
Net Assets—100.0% | | | | $ | 18,300 | | |
* Non-income producing security.
** This number is listed in thousands.
*** Rate shown is the 7-day effective yield as of March 28, 2013.
† More narrow industries are utilized for compliance purposes, whereas broad sectors are utilized for reporting purposes.
# Security fully or partially on loan at March 28, 2013. The total value of securities on loan at March 28, 2013 was $1,434**. Certain of these securities may have been sold prior to period end.
(1) A partial position of this security was purchased with cash collateral received from securities lending. The total value of such security at March 28, 2013 was $1,469**.
Cl — Class
The accompanying notes are an integral part of the financial statements.
36 TURNER FUNDS 2013 SEMIANNUAL REPORT
Turner Emerging Growth Fund
March 28, 2013
| | | Shares | | Value
(000) | |
Common stock—99.8% | |
Consumer discretionary—18.2% | |
Aeropostale* | | | 173,480 | | | $ | 2,359 | | |
Ann* | | | 142,320 | | | | 4,130 | | |
Asbury Automotive Group* | | | 45,749 | | | | 1,679 | | |
Buffalo Wild Wings* | | | 26,470 | | | | 2,317 | | |
Children's Place Retail Stores* | | | 55,400 | | | | 2,483 | | |
Cracker Barrel Old Country Store | | | 71,220 | | | | 5,757 | | |
Dorman Products | | | 12,530 | | | | 466 | | |
Meritage Homes* | | | 41,120 | | | | 1,927 | | |
Movado Group | | | 48,939 | | | | 1,640 | | |
Oxford Industries | | | 59,220 | | | | 3,145 | | |
Red Robin Gourmet Burgers* | | | 37,470 | | | | 1,709 | | |
SHFL entertainment* | | | 168,420 | | | | 2,791 | | |
Shutterfly* | | | 47,590 | | | | 2,102 | | |
Ulta Salon, Cosmetics &
Fragrance* | | | 52,170 | | | | 4,235 | | |
Vitamin Shoppe* | | | 91,629 | | | | 4,476 | | |
Total Consumer discretionary | | | | | 41,216 | | |
Consumer staples—6.1% | |
B&G Foods, Cl A | | | 130,200 | | | | 3,970 | | |
Boston Beer, Cl A # * | | | 11,580 | | | | 1,849 | | |
Susser Holdings* | | | 53,834 | | | | 2,751 | | |
TreeHouse Foods* | | | 29,267 | | | | 1,907 | | |
United Natural Foods* | | | 65,958 | | | | 3,245 | | |
Total Consumer staples | | | | | 13,722 | | |
Energy—7.1% | |
Alon USA Energy | | | 70,947 | | | | 1,352 | | |
Bonanza Creek Energy* | | | 71,610 | | | | 2,769 | | |
Diamondback Energy* | | | 107,400 | | | | 2,883 | | |
Halcon Resources* | | | 87,036 | | | | 678 | | |
Kodiak Oil & Gas* | | | 159,900 | | | | 1,453 | | |
Lufkin Industries | | | 14,790 | | | | 982 | | |
Pdc Energy* | | | 19,500 | | | | 967 | | |
Rex Energy* | | | 238,730 | | | | 3,934 | | |
SunPower # * | | | 93,320 | | | | 1,077 | | |
Total Energy | | | | | 16,095 | | |
Financials—10.3% | |
Campus Crest Communities | | | 153,020 | | | | 2,127 | | |
Cardtronics* | | | 94,869 | | | | 2,605 | | |
Education Realty Trust | | | 249,125 | | | | 2,623 | | |
Home Loan Servicing Solutions | | | 109,150 | | | | 2,546 | | |
| | | Shares | | Value
(000) | |
iStar Financial* | | | 165,380 | | | $ | 1,801 | | |
Oriental Financial Group | | | 78,610 | | | | 1,219 | | |
Sovran Self Storage | | | 46,000 | | | | 2,968 | | |
Stewart Information Services | | | 59,460 | | | | 1,514 | | |
Sun Communities | | | 63,270 | | | | 3,122 | | |
Umpqua Holdings | | | 107,350 | | | | 1,423 | | |
Walter Investment Management* | | | 36,940 | | | | 1,376 | | |
Total Financials | | | | | 23,324 | | |
Health care—21.0% | |
Acadia Healthcare* | | | 90,620 | | | | 2,663 | | |
ACADIA Pharmaceuticals # * | | | 173,306 | | | | 1,376 | | |
Aegerion Pharmaceuticals* | | | 18,800 | | | | 758 | | |
Air Methods | | | 118,070 | | | | 5,695 | | |
Akorn # * | | | 159,210 | | | | 2,202 | | |
Analogic | | | 55,210 | | | | 4,363 | | |
ArthroCare* | | | 163,996 | | | | 5,700 | | |
Cyberonics* | | | 78,314 | | | | 3,666 | | |
Cynosure, Cl A* | | | 59,950 | | | | 1,569 | | |
Emeritus* | | | 67,330 | | | | 1,871 | | |
Enanta Pharmaceuticals* | | | 52,470 | | | | 955 | | |
Endologix* | | | 74,210 | | | | 1,198 | | |
Integra LifeSciences Holdings* | | | 48,370 | | | | 1,887 | | |
Molina Healthcare* | | | 79,590 | | | | 2,457 | | |
Neurocrine Biosciences* | | | 100,972 | | | | 1,226 | | |
PAREXEL International* | | | 51,164 | | | | 2,021 | | |
Proto Labs # * | | | 25,897 | | | | 1,272 | | |
QLT* | | | 31,945 | | | | 282 | | |
Santarus* | | | 117,480 | | | | 2,036 | | |
Sarepta Therapeutics # * | | | 38,070 | | | | 1,407 | | |
Synageva BioPharma* | | | 23,390 | | | | 1,285 | | |
Vanguard Health Systems* | | | 84,284 | | | | 1,253 | | |
Total Health care | | | | | 47,142 | | |
Industrials—18.7% | |
AAR | | | 100,650 | | | | 1,851 | | |
Boise Cascade* | | | 20,520 | | | | 696 | | |
Chart Industries* | | | 29,848 | | | | 2,388 | | |
Copa Holdings, Cl A | | | 41,601 | | | | 4,976 | | |
EnPro Industries* | | | 61,240 | | | | 3,134 | | |
ESCO Technologies | | | 37,190 | | | | 1,520 | | |
Genesee & Wyoming, Cl A* | | | 26,955 | | | | 2,510 | | |
Huron Consulting Group* | | | 172,121 | | | | 6,939 | | |
Middleby* | | | 36,653 | | | | 5,577 | | |
On Assignment* | | | 108,270 | | | | 2,740 | | |
TURNER FUNDS 2013 SEMIANNUAL REPORT 37
Schedule of investments
Turner Emerging Growth Fund
| | | Shares | | Value
(000) | |
Paul Y. Engineering Group | | | 17,323,787 | | | $ | 1,674 | | |
Thermon Group Holdings* | | | 72,630 | | | | 1,613 | | |
Trex* | | | 45,135 | | | | 2,220 | | |
Triumph Group | | | 57,584 | | | | 4,520 | | |
Total Industrials | | | | | 42,358 | | |
Information technology—15.2% | |
ANSYS* | | | 31,700 | | | | 2,581 | | |
Bottomline Technologies* | | | 68,702 | | | | 1,959 | | |
Cavium* | | | 28,000 | | | | 1,087 | | |
Coherent | | | 34,954 | | | | 1,983 | | |
Electronics for Imaging* | | | 135,050 | | | | 3,425 | | |
Heartland Payment Systems | | | 49,730 | | | | 1,640 | | |
Imperva* | | | 68,600 | | | | 2,641 | | |
Manhattan Associates* | | | 49,070 | | | | 3,645 | | |
Monolithic Power Systems | | | 85,950 | | | | 2,095 | | |
NETGEAR* | | | 42,470 | | | | 1,423 | | |
OSI Systems* | | | 57,060 | | | | 3,554 | | |
Synchronoss Technologies* | | | 80,210 | | | | 2,489 | | |
Tyler Technologies* | | | 61,440 | | | | 3,763 | | |
Ultratech* | | | 54,860 | | | | 2,168 | | |
Total Information technology | | | | | 34,453 | | |
Materials—2.5% | |
American Vanguard | | | 27,320 | | | | 834 | | |
KapStone Paper & Packaging | | | 100,880 | | | | 2,805 | | |
Rentech Nitrogen Partners # | | | 57,600 | | | | 2,067 | | |
Total Materials | | | | | 5,706 | | |
Utilities—0.7% | |
Artesian Resources, Cl A | | | 34,815 | | | | 782 | | |
RADWARE* | | | 22,280 | | | | 841 | | |
Total Utilities | | | | | 1,623 | | |
Total Common stock
(Cost $157,671)** | | | | | 225,640 | | |
| | | Shares | | Value
(000) | |
Cash equivalent—3.9% | |
BlackRock Liquidity Funds
TempCash Portfolio,
Institutional Shares,
0.010%*** (1) | | | 8,751,678 | | | $ | 8,752 | | |
Total Cash equivalent
(Cost $8,752)** | | | | | 8,752 | | |
Total Investments—103.7%
(Cost $166,423)** | | | | | 234,392 | | |
Net Other assets (liabilities)—(3.7)% | | | | | (8,399 | ) | |
Net Assets—100.0% | | | | $ | 225,993 | | |
* Non-income producing security.
** This number is listed in thousands.
*** Rate shown is the 7-day effective yield as of March 28, 2013.
# Security fully or partially on loan at March 28, 2013. The total value of securities on loan at March 28, 2013 was $8,054**. Certain of these securities may have been sold prior to period end.
(1) A partial position of this security was purchased with cash collateral received from securities lending. The total value of such security at March 28, 2013 was $8,181**.
Cl — Class
The accompanying notes are an integral part of the financial statements.
38 TURNER FUNDS 2013 SEMIANNUAL REPORT
Turner Large Growth Fund
March 28, 2013
| | | Shares | | Value
(000) | |
Common stock—104.9%† | |
Consumer discretionary—22.2% | |
Amazon.com* | | | 17,630 | | | $ | 4,699 | | |
AutoZone* | | | 3,700 | | | | 1,468 | | |
Comcast, Cl A | | | 86,520 | | | | 3,635 | | |
GNC Holdings, Cl A | | | 70,370 | | | | 2,764 | | |
Home Depot | | | 58,790 | | | | 4,102 | | |
Las Vegas Sands | | | 53,750 | | | | 3,029 | | |
Lennar, Cl A | | | 99,080 | | | | 4,110 | | |
Michael Kors Holdings* | | | 54,780 | | | | 3,111 | | |
Ralph Lauren | | | 12,695 | | | | 2,149 | | |
Starbucks | | | 62,020 | | | | 3,533 | | |
Starwood Hotels & Resorts
Worldwide | | | 44,375 | | | | 2,828 | | |
Walt Disney | | | 43,950 | | | | 2,496 | | |
Total Consumer discretionary | | | | | 37,924 | | |
Consumer staples—5.6% | |
Colgate-Palmolive | | | 42,540 | | | | 5,021 | | |
Estee Lauder, Cl A | | | 48,610 | | | | 3,112 | | |
Whole Foods Market | | | 16,964 | | | | 1,472 | | |
Total Consumer staples | | | | | 9,605 | | |
Energy—5.9% | |
Anadarko Petroleum | | | 26,885 | | | | 2,351 | | |
Cobalt International Energy* | | | 38,730 | | | | 1,092 | | |
Concho Resources* | | | 30,308 | | | | 2,953 | | |
Schlumberger | | | 49,000 | | | | 3,670 | | |
Total Energy | | | | | 10,066 | | |
Financials—7.1% | |
Affiliated Managers Group* | | | 17,080 | | | | 2,623 | | |
American Tower | | | 26,750 | | | | 2,058 | | |
CBRE Group* | | | 103,690 | | | | 2,618 | | |
Citigroup | | | 60,280 | | | | 2,666 | | |
Simon Property Group | | | 13,349 | | | | 2,117 | | |
Total Financials | | | | | 12,082 | | |
Health care—11.5% | |
Abbott Laboratories | | | 94,600 | | | | 3,342 | | |
Allergan | | | 20,580 | | | | 2,297 | | |
Biogen Idec* | | | 16,590 | | | | 3,200 | | |
Catamaran* | | | 40,580 | | | | 2,152 | | |
Cerner* | | | 16,400 | | | | 1,554 | | |
Gilead Sciences* | | | 63,150 | | | | 3,090 | | |
HCA Holdings | | | 68,070 | | | | 2,766 | | |
| | | Shares | | Value
(000) | |
Intuitive Surgical* | | | 2,460 | | | $ | 1,208 | | |
Total Health care | | | | | 19,609 | | |
Industrials—8.2% | |
AMETEK | | | 73,320 | | | | 3,179 | | |
Caterpillar | | | 41,970 | | | | 3,650 | | |
Cummins | | | 32,650 | | | | 3,782 | | |
Pentair | | | 25,200 | | | | 1,329 | | |
Precision Castparts | | | 11,040 | | | | 2,093 | | |
Total Industrials | | | | | 14,033 | | |
Information technology—40.2% | |
Apple | | | 43,890 | | | | 19,428 | | |
ASML Holding, NY Shares # | | | 33,440 | | | | 2,274 | | |
Cavium* | | | 33,480 | | | | 1,299 | | |
eBay* | | | 79,695 | | | | 4,321 | | |
EMC* | | | 80,030 | | | | 1,912 | | |
F5 Networks* | | | 8,950 | | | | 797 | | |
Facebook, Cl A* | | | 148,880 | | | | 3,808 | | |
Fusion-io # * | | | 67,640 | | | | 1,107 | | |
Google, Cl A* | | | 8,135 | | | | 6,460 | | |
Juniper Networks* | | | 116,530 | | | | 2,160 | | |
NXP Semiconductors* | | | 90,670 | | | | 2,744 | | |
Palo Alto Networks # * | | | 24,120 | | | | 1,365 | | |
Qualcomm | | | 72,015 | | | | 4,822 | | |
Salesforce.com* | | | 16,620 | | | | 2,972 | | |
ServiceNow* | | | 22,190 | | | | 803 | | |
Splunk* | | | 32,570 | | | | 1,304 | | |
STMicroelectronics, NY Shares # | | | 282,510 | | | | 2,178 | | |
Stratasys* | | | 39,980 | | | | 2,967 | | |
Visa, Cl A | | | 27,230 | | | | 4,625 | | |
Workday, Cl A # * | | | 22,010 | | | | 1,356 | | |
Total Information technology | | | | | 68,702 | | |
Materials—3.0% | |
Methanex | | | 28,610 | | | | 1,162 | | |
Monsanto | | | 37,135 | | | | 3,923 | | |
Total Materials | | | | | 5,085 | | |
Telecommunication services—1.2% | |
Aruba Networks* | | | 81,130 | | | | 2,007 | | |
Total Telecommunication services | | | | | 2,007 | | |
Total Common stock
(Cost $162,754)** | | | | | 179,113 | | |
TURNER FUNDS 2013 SEMIANNUAL REPORT 39
Schedule of investments
Turner Large Growth Fund
| | | Shares | | Value
(000) | |
Cash equivalent—4.9% | |
BlackRock Liquidity Funds
TempCash Portfolio,
Institutional Shares,
0.010%*** (1) | | | 8,377,021 | | | $ | 8,377 | | |
Total Cash equivalent
(Cost $8,377)** | | | | | 8,377 | | |
Total Investments—109.8%
(Cost $171,131)** | | | | | 187,490 | | |
Net Other assets (liabilities)—(9.8)% | | | | | (16,689 | ) | |
Net Assets—100.0% | | | | $ | 170,801 | | |
* Non-income producing security.
** This number is listed in thousands.
*** Rate shown is the 7-day effective yield as of March 28, 2013.
† More narrow industries are utilized for compliance purposes, whereas broad sectors are utilized for reporting purposes.
# Security fully or partially on loan at March 28, 2013. The total value of securities on loan at March 28, 2013 was $8,264**. Certain of these securities may have been sold prior to period end.
(1) A partial position of this security was purchased with cash collateral received from securities lending. The total value of such security at March 28, 2013 was $8,377**.
Cl — Class
NY — New York
The accompanying notes are an integral part of the financial statements.
40 TURNER FUNDS 2013 SEMIANNUAL REPORT
Turner Midcap Growth Fund
March 28, 2013
| | | Shares | | Value
(000) | |
Common stock—103.0%† | |
Consumer discretionary—29.4% | |
American Eagle Outfitters | | | 309,080 | | | $ | 5,780 | | |
BorgWarner* | | | 124,240 | | | | 9,609 | | |
Dunkin' Brands Group | | | 202,410 | | | | 7,465 | | |
Fossil* | | | 49,540 | | | | 4,786 | | |
GNC Holdings, Cl A | | | 182,470 | | | | 7,167 | | |
Harley-Davidson | | | 142,890 | | | | 7,616 | | |
HomeAway # * | | | 334,620 | | | | 10,875 | | |
LinkedIn, Cl A* | | | 55,010 | | | | 9,685 | | |
Michael Kors Holdings* | | | 192,410 | | | | 10,927 | | |
Polaris Industries | | | 73,970 | | | | 6,841 | | |
Ralph Lauren | | | 52,940 | | | | 8,963 | | |
Starwood Hotels & Resorts
Worldwide | | | 118,380 | | | | 7,544 | | |
Toll Brothers* | | | 333,740 | | | | 11,428 | | |
Tractor Supply | | | 93,420 | | | | 9,728 | | |
TripAdvisor* | | | 65,930 | | | | 3,463 | | |
Urban Outfitters* | | | 124,280 | | | | 4,815 | | |
VF | | | 44,820 | | | | 7,519 | | |
Wynn Resorts | | | 77,575 | | | | 9,709 | | |
Total Consumer discretionary | | | | | 143,920 | | |
Consumer staples—3.7% | |
Beam | | | 109,530 | | | | 6,960 | | |
Kroger | | | 342,110 | | | | 11,337 | | |
Total Consumer staples | | | | | 18,297 | | |
Energy—5.8% | |
Cabot Oil & Gas | | | 123,440 | | | | 8,346 | | |
Cobalt International Energy* | | | 175,020 | | | | 4,936 | | |
Concho Resources* | | | 96,608 | | | | 9,412 | | |
FMC Technologies* | | | 107,730 | | | | 5,859 | | |
Total Energy | | | | | 28,553 | | |
Financials—11.7% | |
Affiliated Managers Group* | | | 53,090 | | | | 8,153 | | |
Brown & Brown | | | 195,288 | | | | 6,257 | | |
Cardtronics* | | | 336,880 | | | | 9,250 | | |
CBRE Group* | | | 331,530 | | | | 8,371 | | |
IntercontinentalExchange # * | | | 55,380 | | | | 9,031 | | |
Markel* | | | 11,760 | | | | 5,921 | | |
Raymond James Financial | | | 131,990 | | | | 6,085 | | |
Signature Bank* | | | 57,130 | | | | 4,500 | | |
Total Financials | | | | | 57,568 | | |
| | | Shares | | Value
(000) | |
Health care—11.0% | |
Alexion Pharmaceuticals* | | | 69,144 | | | $ | 6,371 | | |
ARIAD Pharmaceuticals* | | | 143,630 | | | | 2,598 | | |
Catamaran* | | | 154,070 | | | | 8,170 | | |
Covance* | | | 39,820 | | | | 2,959 | | |
DaVita* | | | 58,310 | | | | 6,915 | | |
HCA Holdings | | | 149,330 | | | | 6,067 | | |
Intuitive Surgical* | | | 10,480 | | | | 5,148 | | |
Onyx Pharmaceuticals* | | | 81,752 | | | | 7,264 | | |
Regeneron Pharmaceuticals* | | | 49,360 | | | | 8,708 | | |
Total Health care | | | | | 54,200 | | |
Industrials—12.5% | |
BE Aerospace* | | | 102,040 | | | | 6,152 | | |
Delta Air Lines* | | | 466,370 | | | | 7,700 | | |
Equifax | | | 126,990 | | | | 7,313 | | |
Genesee & Wyoming, Cl A* | | | 76,070 | | | | 7,083 | | |
Joy Global | | | 122,567 | | | | 7,295 | | |
MasTec* | | | 124,110 | | | | 3,618 | | |
Robert Half International | | | 206,500 | | | | 7,751 | | |
Roper Industries | | | 45,420 | | | | 5,782 | | |
Textron | | | 148,790 | | | | 4,435 | | |
WESCO International* | | | 53,180 | | | | 3,861 | | |
Total Industrials | | | | | 60,990 | | |
Information technology—22.4% | |
Allot Communications # * | | | 236,440 | | | | 2,823 | | |
Autodesk* | | | 168,620 | | | | 6,954 | | |
Avago Technologies | | | 233,190 | | | | 8,376 | | |
Cavium* | | | 270,989 | | | | 10,517 | | |
Ciena* | | | 535,920 | | | | 8,580 | | |
Citrix Systems* | | | 119,650 | | | | 8,634 | | |
F5 Networks* | | | 79,334 | | | | 7,067 | | |
Fusion-io # * | | | 279,920 | | | | 4,582 | | |
Maxim Integrated Products | | | 158,500 | | | | 5,175 | | |
MercadoLibre # | | | 67,166 | | | | 6,486 | | |
NXP Semiconductors* | | | 413,000 | | | | 12,498 | | |
Palo Alto Networks # * | | | 39,160 | | | | 2,216 | | |
ServiceNow* | | | 119,080 | | | | 4,311 | | |
Splunk* | | | 179,530 | | | | 7,187 | | |
Stratasys* | | | 42,930 | | | | 3,186 | | |
TIBCO Software* | | | 177,360 | | | | 3,586 | | |
Ultratech* | | | 181,270 | | | | 7,166 | | |
Total Information technology | | | | | 109,344 | | |
TURNER FUNDS 2013 SEMIANNUAL REPORT 41
Schedule of investments
Turner Midcap Growth Fund
| | | Shares | | Value
(000) | |
Materials—5.0% | |
CF Industries Holdings | | | 22,380 | | | $ | 4,260 | | |
Crown Holdings* | | | 145,890 | | | | 6,070 | | |
Eastman Chemical | | | 108,500 | | | | 7,582 | | |
PPG Industries | | | 51,040 | | | | 6,836 | | |
Total Materials | | | | | 24,748 | | |
Telecommunication services—1.5% | |
SBA Communications, Cl A* | | | 104,570 | | | | 7,531 | | |
Total Telecommunication services | | | | | 7,531 | | |
Total Common stock
(Cost $421,503)** | | | | | 505,151 | | |
Cash equivalent—6.0% | |
BlackRock Liquidity Funds
TempCash Portfolio,
Institutional Shares,
0.010%*** (1) | | | 29,341,398 | | | | 29,341 | | |
Total Cash equivalent
(Cost $29,341)** | | | | | 29,341 | | |
Total Investments—109.0%
(Cost $450,844)** | | | | | 534,492 | | |
Net Other assets (liabilities)—(9.0)% | | | | | (43,962 | ) | |
Net Assets—100.0% | | | | $ | 490,530 | | |
* Non-income producing security.
** This number is listed in thousands.
*** Rate shown is the 7-day effective yield as of March 28, 2013.
# Security fully or partially on loan at March 28, 2013. The total value of securities on loan at March 28, 2013 was $28,789**. Certain of these securities may have been sold prior to period end.
(1) A partial position of this security was purchased with cash collateral received from securities lending. The total value of such security at March 28, 2013 was $29,341**.
† More narrow industries are utilized for compliance purposes, whereas broad sectors are utilized for reporting purposes.
Cl — Class
The accompanying notes are an integral part of the financial statements.
42 TURNER FUNDS 2013 SEMIANNUAL REPORT
Turner Small Cap Growth Fund
March 28, 2013
| | | Shares | | Value
(000) | |
Common stock—99.4% | |
Consumer discretionary—15.5% | |
Ann* | | | 69,518 | | | $ | 2,017 | | |
Arctic Cat* | | | 27,750 | | | | 1,213 | | |
Brunswick | | | 66,450 | | | | 2,274 | | |
Five Below # * | | | 42,210 | | | | 1,599 | | |
Hibbett Sports* | | | 34,820 | | | | 1,959 | | |
HomeAway # * | | | 79,480 | | | | 2,583 | | |
Imax # * | | | 82,590 | | | | 2,208 | | |
Meritage Homes* | | | 44,030 | | | | 2,063 | | |
SHFL entertainment* | | | 134,504 | | | | 2,229 | | |
Shutterfly* | | | 43,320 | | | | 1,913 | | |
Sotheby's | | | 63,194 | | | | 2,364 | | |
Steven Madden* | | | 49,945 | | | | 2,155 | | |
Tenneco* | | | 68,750 | | | | 2,703 | | |
Texas Roadhouse | | | 101,130 | | | | 2,042 | | |
Vail Resorts | | | 38,060 | | | | 2,372 | | |
Vera Bradley # * | | | 80,280 | | | | 1,897 | | |
Vitamin Shoppe* | | | 42,200 | | | | 2,061 | | |
Zumiez # * | | | 66,600 | | | | 1,525 | | |
Total Consumer discretionary | | | | | 37,177 | | |
Consumer staples—3.8% | |
B&G Foods, Cl A | | | 79,650 | | | | 2,428 | | |
Hain Celestial Group # * | | | 33,180 | | | | 2,027 | | |
Susser Holdings* | | | 43,490 | | | | 2,223 | | |
United Natural Foods* | | | 48,733 | | | | 2,398 | | |
Total Consumer staples | | | | | 9,076 | | |
Energy—4.9% | |
Comstock Resources* | | | 47,680 | | | | 775 | | |
Dril-Quip* | | | 35,000 | | | | 3,052 | | |
Energy XXI (Bermuda) | | | 87,410 | | | | 2,379 | | |
Gulfport Energy* | | | 47,990 | | | | 2,199 | | |
Kodiak Oil & Gas* | | | 249,500 | | | | 2,268 | | |
Rosetta Resources* | | | 23,190 | | | | 1,103 | | |
Total Energy | | | | | 11,776 | | |
Financials—6.9% | |
Artisan Partners Asset
Management* | | | 15,950 | | | | 629 | | |
Bank of the Ozarks | | | 56,110 | | | | 2,489 | | |
Cardtronics* | | | 90,470 | | | | 2,484 | | |
Colonial Properties Trust | | | 93,970 | | | | 2,125 | | |
Corporate Office Properties | | | 54,500 | | | | 1,454 | | |
| | | Shares | | Value
(000) | |
Education Realty Trust | | | 215,200 | | | $ | 2,266 | | |
eHealth* | | | 74,460 | | | | 1,331 | | |
ProAssurance | | | 41,290 | | | | 1,954 | | |
Texas Capital Bancshares* | | | 41,980 | | | | 1,698 | | |
Total Financials | | | | | 16,430 | | |
Health care—19.4% | |
Acadia Healthcare* | | | 69,670 | | | | 2,048 | | |
ACADIA Pharmaceuticals # * | | | 209,384 | | | | 1,663 | | |
Aegerion Pharmaceuticals # * | | | 24,530 | | | | 990 | | |
Air Methods | | | 43,420 | | | | 2,095 | | |
Akorn* | | | 146,536 | | | | 2,027 | | |
Align Technology* | | | 79,910 | | | | 2,677 | | |
Auxilium Pharmaceuticals* | | | 56,900 | | | | 983 | | |
Bruker* | | | 100,570 | | | | 1,921 | | |
Cepheid* | | | 63,430 | | | | 2,434 | | |
Cubist Pharmaceuticals* | | | 56,990 | | | | 2,667 | | |
Endologix* | | | 97,870 | | | | 1,581 | | |
Health Management
Associates, Cl A* | | | 127,960 | | | | 1,647 | | |
Integra LifeSciences Holdings* | | | 54,670 | | | | 2,133 | | |
Neurocrine Biosciences* | | | 95,830 | | | | 1,163 | | |
PAREXEL International* | | | 68,230 | | | | 2,695 | | |
Pharmacyclics* | | | 31,240 | | | | 2,512 | | |
Sarepta Therapeutics* | | | 35,440 | | | | 1,310 | | |
Sirona Dental Systems* | | | 23,693 | | | | 1,747 | | |
Synageva BioPharma* | | | 33,664 | | | | 1,849 | | |
Team Health Holdings* | | | 67,500 | | | | 2,456 | | |
Teleflex | | | 47,543 | | | | 4,017 | | |
ViroPharma* | | | 64,870 | | | | 1,632 | | |
West Pharmaceutical Services | | | 33,900 | | | | 2,201 | | |
Total Health care | | | | | 46,448 | | |
Industrials—18.4% | |
Alaska Air Group* | | | 49,410 | | | | 3,160 | | |
Avis Budget Group # * | | | 109,460 | | | | 3,046 | | |
Belden | | | 52,390 | | | | 2,706 | | |
CAI International* | | | 57,560 | | | | 1,659 | | |
Chart Industries* | | | 22,580 | | | | 1,807 | | |
Clean Harbors* | | | 44,040 | | | | 2,558 | | |
Genesee & Wyoming, Cl A* | | | 29,550 | | | | 2,751 | | |
Healthcare Services Group | | | 46,560 | | | | 1,193 | | |
Hexcel* | | | 110,740 | | | | 3,213 | | |
Kforce | | | 88,217 | | | | 1,444 | | |
Old Dominion Freight Line* | | | 71,715 | | | | 2,740 | | |
TURNER FUNDS 2013 SEMIANNUAL REPORT 43
Schedule of investments
Turner Small Cap Growth Fund
| | | Shares | | Value
(000) | |
On Assignment* | | | 76,990 | | | $ | 1,949 | | |
Thermon Group Holdings* | | | 96,295 | | | | 2,139 | | |
Titan International | | | 113,560 | | | | 2,394 | | |
TrueBlue* | | | 111,652 | | | | 2,360 | | |
US Airways Group # * | | | 133,933 | | | | 2,273 | | |
USG # * | | | 94,300 | | | | 2,493 | | |
Watts Water Technologies | | | 27,540 | | | | 1,322 | | |
Woodward | | | 72,191 | | | | 2,870 | | |
Total Industrials | | | | | 44,077 | | |
Information technology—23.6% | |
Aspen Technology* | | | 65,070 | | | | 2,101 | | |
Bottomline Technologies* | | | 78,490 | | | | 2,238 | | |
Cavium* | | | 73,940 | | | | 2,870 | | |
Ciena* | | | 145,910 | | | | 2,336 | | |
Cognex | | | 58,460 | | | | 2,464 | | |
Cornerstone OnDemand* | | | 59,970 | | | | 2,045 | | |
Ellie Mae* | | | 71,810 | | | | 1,727 | | |
Finisar # * | | | 145,600 | | | | 1,920 | | |
Fusion-io # * | | | 80,900 | | | | 1,324 | | |
Guidewire Software* | | | 50,570 | | | | 1,944 | | |
Invensense # * | | | 83,620 | | | | 893 | | |
IPG Photonics # | | | 35,100 | | | | 2,331 | | |
MAXIMUS | | | 52,160 | | | | 4,172 | | |
Monolithic Power Systems | | | 95,200 | | | | 2,320 | | |
NetScout Systems* | | | 90,150 | | | | 2,215 | | |
OSI Systems* | | | 31,610 | | | | 1,969 | | |
QLIK Technologies* | | | 96,101 | | | | 2,482 | | |
RF Micro Devices* | | | 455,110 | | | | 2,421 | | |
Semtech* | | | 82,560 | | | | 2,922 | | |
Stratasys* | | | 26,850 | | | | 1,993 | | |
Synchronoss Technologies* | | | 44,176 | | | | 1,371 | | |
Take-Two Interactive Software* | | | 133,730 | | | | 2,160 | | |
The Ultimate Software Group* | | | 24,810 | | | | 2,584 | | |
Ultratech* | | | 47,470 | | | | 1,876 | | |
Wex* | | | 28,020 | | | | 2,200 | | |
Zillow, Cl A # * | | | 27,360 | | | | 1,496 | | |
Total Information technology | | | | | 56,374 | | |
Materials—5.0% | |
American Vanguard | | | 59,240 | | | | 1,809 | | |
Boise | | | 287,280 | | | | 2,488 | | |
Chemtura* | | | 108,640 | | | | 2,348 | | |
Commercial Metals | | | 118,480 | | | | 1,878 | | |
Kaiser Aluminum | | | 30,740 | | | | 1,987 | | |
| | | Shares | | Value
(000) | |
PolyOne | | | 61,260 | | | $ | 1,495 | | |
Total Materials | | | | | 12,005 | | |
Telecommunication services—1.9% | |
Aruba Networks* | | | 97,590 | | | | 2,414 | | |
Cogent Communications Group | | | 76,880 | | | | 2,030 | | |
Total Telecommunication services | | | | | 4,444 | | |
Total Common stock
(Cost $186,518)** | | | | | 237,807 | | |
Right—0.0% | |
Energy—0.0% | |
CVR Energy*^ | | | 61,770 | | | | — | | |
Total Energy | | | | | — | | |
Total Right
(Cost $—)** | | | | | — | | |
Cash equivalent—12.7% | |
BlackRock Liquidity Funds
TempCash Portfolio,
Institutional Shares,
0.010%*** (1) | | | 30,436,864 | | | | 30,437 | | |
Total Cash equivalent
(Cost $30,437)** | | | | | 30,437 | | |
Total Investments—112.1%
(Cost $216,955)** | | | | | 268,244 | | |
Net Other assets (liabilities)—(12.1)% | | | | | (29,032 | ) | |
Net Assets—100.0% | | | | $ | 239,212 | | |
* Non-income producing security.
** This number is listed in thousands.
*** Rate shown is the 7-day effective yield as of March 28, 2013.
^ Security fair valued using procedures established by the Fair Value Committee. Represents a restricted security. The security has been deemed illiquid according to procedures adopted by the Board of Trustees. As of March 28, 2013 the total market value of this security was $—, representing 0.0% of Net Assets.
# Security fully or partially on loan at March 28, 2013. The total value of securities on loan at March 28, 2013 was $26,306**. Certain of these securities may have been sold prior to period end.
(1) A partial position of this security was purchased with cash collateral received from securities lending. The total value of such security at March 28, 2013 was $26,960**.
Cl — Class
Amounts designated as "—" are $0.
The accompanying notes are an integral part of the financial statements.
44 TURNER FUNDS 2013 SEMIANNUAL REPORT
Turner Global Opportunities Fund
March 28, 2013
| | | Shares | | Value
(000) | |
Common stock—97.1%† | |
Consumer discretionary—22.7% | |
HomeAway* | | | 600 | | | $ | 20 | | |
Lennar, Cl A | | | 1,960 | | | | 81 | | |
LinkedIn, Cl A* | | | 480 | | | | 85 | | |
Michael Kors Holdings* | | | 1,090 | | | | 62 | | |
Ralph Lauren | | | 440 | | | | 74 | | |
Sands China | | | 9,765 | | | | 51 | | |
Starbucks | | | 1,460 | | | | 83 | | |
Total Consumer discretionary | | | | | 456 | | |
Consumer staples—3.7% | |
Companhia de Bebidas das
Americas, Prefered Shares ADR | | | 1,760 | | | | 75 | | |
Total Consumer staples | | | | | 75 | | |
Energy—6.0% | |
Cobalt International Energy* | | | 1,610 | | | | 45 | | |
Concho Resources* | | | 770 | | | | 75 | | |
Total Energy | | | | | 120 | | |
Financials—14.6% | |
AIA Group | | | 17,174 | | | | 75 | | |
Banco do Brasil SA | | | 4,610 | | | | 62 | | |
CBRE Group* | | | 3,000 | | | | 76 | | |
Metropolitan Bank & Trust | | | 27,830 | | | | 80 | | |
Total Financials | | | | | 293 | | |
Health care—5.8% | |
Catamaran* | | | 1,470 | | | | 78 | | |
Intuitive Surgical* | | | 80 | | | | 39 | | |
Total Health care | | | | | 117 | | |
Industrials—5.1% | |
Caterpillar | | | 610 | | | | 53 | | |
PT United Tractors Tbk | | | 26,160 | | | | 49 | | |
Total Industrials | | | | | 102 | | |
Information technology—39.2% | |
Apple | | | 290 | | | | 127 | | |
Avago Technologies | | | 2,390 | | | | 86 | | |
Cavium* | | | 1,440 | | | | 56 | | |
Fusion-io* | | | 2,600 | | | | 43 | | |
Imagination Technologies Group* | | | 9,110 | | | | 68 | | |
Murata Manufacturing | | | 860 | | | | 65 | | |
NXP Semiconductors* | | | 3,210 | | | | 97 | | |
| | | Shares | | Value
(000) | |
Qualcomm | | | 1,190 | | | $ | 80 | | |
Splunk* | | | 1,450 | | | | 58 | | |
STMicroelectronics, NY Shares | | | 6,640 | | | | 51 | | |
Stratasys* | | | 780 | | | | 58 | | |
Total Information technology | | | | | 789 | | |
Total Common stock
(Cost $1,687)** | | | | | 1,952 | | |
Cash equivalent—2.5% | |
BlackRock Liquidity Funds
TempCash Portfolio,
Institutional Shares, 0.010%*** | | | 49,511 | | | | 50 | | |
Total Cash equivalent
(Cost $50)** | | | | | 50 | | |
Total Investments—99.6%
(Cost $1,737)** | | | | | 2,002 | | |
Net Other assets (liabilities)—0.4% | | | | | 8 | | |
Net Assets—100.0% | | | | $ | 2,010 | | |
* Non-income producing security.
** This number is listed in thousands.
*** Rate shown is the 7-day effective yield as of March 28, 2013.
† More narrow industries are utilized for compliance purposes, whereas broad sectors are utilized for reporting purposes.
ADR — American Depositary Receipt
Cl — Class
NY — New York
The accompanying notes are an integral part of the financial statements.
Country Allocation as of 3/28/13†† | |
United States | | | 52.2 | % | |
Netherlands | | | 7.5 | | |
Hong Kong | | | 6.9 | | |
Brazil | | | 6.8 | | |
Singapore | | | 4.3 | | |
Philippines | | | 4.0 | | |
Canada | | | 3.9 | | |
United Kingdom | | | 3.4 | | |
Japan | | | 3.2 | | |
Israel | | | 2.9 | | |
Cayman Islands | | | 2.5 | | |
Indonesia | | | 2.4 | | |
Total | | | 100.0 | % | |
†† Percentages are based on total investments.
TURNER FUNDS 2013 SEMIANNUAL REPORT 45
Statements of assets and liabilities (000)
March 28, 2013
| | | Turner
Market Neutral
Fund | | Turner
Medical Sciences
Long/Short
Fund | | Turner
Spectrum
Fund | |
Assets: | |
Investment securities, at cost | | $ | 12,425 | | | $ | 18,888 | | | $ | 705,762 | | |
Investment securities, at value | | $ | 12,553 | | | $ | 20,386 | | | $ | 770,070 | | |
Deposits with brokers for securities sold short | | | 21,785 | | | | 18,134 | | | | 657,713 | | |
Deposits with broker for written option contracts | | | — | | | | — | | | | 264 | | |
Foreign currency, at value | | | 3 | | | | — | | | | — | | |
Receivable for investment securities sold | | | 5,989 | | | | 469 | | | | 51,710 | | |
Receivable for capital shares sold | | | — | | | | 50 | | | | 3,200 | | |
Prepaid expenses | | | 22 | | | | 25 | | | | 86 | | |
Receivable for dividend income | | | 15 | | | | 36 | | | | 753 | | |
Receivable from investment adviser | | | 1 | | | | — | | | | — | | |
Reclaim receivable | | | — | | | | — | | | | 9 | | |
Total assets | | | 40,368 | | | | 39,100 | | | | 1,483,805 | | |
Liabilities: | |
Securities sold short, at proceeds | | | 12,534 | | | | 9,994 | | | | 529,300 | | |
Written options, premiums received | | | — | | | | — | | | | 94 | | |
Securities sold short, at value | | | 12,900 | | | | 10,658 | | | | 547,031 | | |
Written options, at value | | | — | | | | — | | | | 71 | | |
Cash overdraft | | | 5,673 | | | | — | | | | 416 | | |
Foreign currency overdraft, at value | | | — | | | | — | | | | 2,088 | | |
Payable for investment securities purchased | | | 7,014 | | | | 2,157 | | | | 61,586 | | |
Obligation to return securities lending collateral | | | — | | | | — | | | | — | | |
Payable for capital shares redeemed | | | — | | | | 52 | | | | 1,576 | | |
Dividends payable on securities sold short (Note 2) | | | 15 | | | | 33 | | | | 588 | | |
Broker fees and charges on short securities payable | | | 6 | | | | 7 | | | | — | | |
Payable due to investment adviser | | | — | | | | — | | | | 272 | | |
Payable due to administrator | | | 2 | | | | 2 | | | | 70 | | |
Payable due to shareholder servicing | | | — | | | | 1 | | | | 21 | | |
Payable due to distributor | | | — | | | | 1 | | | | 4 | | |
Payable due to transfer agent | | | 6 | | | | 7 | | | | 115 | | |
Payable due to custodian | | | 7 | | | | 5 | | | | 30 | | |
Other accrued expenses | | | 12 | | | | 14 | | | | 291 | | |
Total liabilities | | | 25,635 | | | | 12,937 | | | | 614,159 | | |
Net assets | | $ | 14,733 | | | $ | 26,163 | | | $ | 869,646 | | |
*Includes market value of securities on loan | | $ | — | | | $ | — | | | $ | — | | |
Net assets: | |
Portfolio capital | | $ | 18,542 | | | $ | 27,276 | | | $ | 887,582 | | |
Distributions in excess of investment income | | | (481 | ) | | | (971 | ) | | | (9,476 | ) | |
Accumulated net realized loss from investments, securities sold short, written options and
foreign currency transactions | | | (3,090 | ) | | | (976 | ) | | | (55,051 | ) | |
Net unrealized appreciation (depreciation) on investments, securities sold short, foreign
currencies and translation of other assets and liabilities denominated in foreign currencies | | | (238 | ) | | | 834 | | | | 46,591 | | |
Net assets | | $ | 14,733 | | | $ | 26,163 | | | $ | 869,646 | | |
Outstanding shares of beneficial interest Institutional Class Shares (1) | | | 1,420 | | | | 2,054 | | | | 68,554 | | |
Outstanding shares of beneficial interest Investor Class Shares (1) | | | 133 | | | | 321 | | | | 9,056 | | |
Outstanding shares of beneficial interest Class C Shares (1) | | | 8 | | | | 139 | | | | 612 | | |
Net assets — Institutional Class Shares | | $ | 13,413 | | | $ | 21,416 | | | $ | 763,265 | | |
Net assets — Investor Class Shares | | $ | 1,246 | | | $ | 3,333 | | | $ | 99,800 | | |
Net assets — Class C Shares | | $ | 74 | | | $ | 1,414 | | | $ | 6,581 | | |
Net asset value, offering and redemption price per share — Institutional Class Shares | | $ | 9.44 | † | | $ | 10.42 | † | | $ | 11.13 | | |
Net asset value, offering and redemption price per share — Investor Class Shares | | $ | 9.39 | † | | $ | 10.38 | | | $ | 11.02 | | |
Net asset value, offering and redemption price per share — Class C Shares | | $ | 9.24 | † | | $ | 10.22 | † | | $ | 10.75 | | |
46 TURNER FUNDS 2013 SEMIANNUAL REPORT
(Unaudited)
| | | Turner
Titan
Fund | | Turner
All Cap
Growth
Fund | |
Assets: | |
Investment securities, at cost | | $ | 41,514 | | | $ | 18,347 | | |
Investment securities, at value | | $ | 45,175 | | | $ | 19,788 | * | |
Deposits with brokers for securities sold short | | | 29,482 | | | | — | | |
Deposits with broker for written option contracts | | | — | | | | — | | |
Foreign currency, at value | | | — | | | | — | | |
Receivable for investment securities sold | | | 4,601 | | | | — | | |
Receivable for capital shares sold | | | 218 | | | | 2 | | |
Prepaid expenses | | | 24 | | | | 6 | | |
Receivable for dividend income | | | 39 | | | | 6 | | |
Receivable from investment adviser | | | — | | | | 1 | | |
Reclaim receivable | | | — | | | | — | | |
Total assets | | | 79,539 | | | | 19,803 | | |
Liabilities: | |
Securities sold short, at proceeds | | | 28,426 | | | | — | | |
Written options, premiums received | | | — | | | | — | | |
Securities sold short, at value | | | 29,092 | | | | — | | |
Written options, at value | | | — | | | | — | | |
Cash overdraft | | | — | | | | — | | |
Foreign currency overdraft, at value | | | — | | | | — | | |
Payable for investment securities purchased | | | 4,086 | | | | — | | |
Obligation to return securities lending collateral | | | — | | | | 1,469 | | |
Payable for capital shares redeemed | | | 801 | | | | 13 | | |
Dividends payable on securities sold short (Note 2) | | | 1 | | | | — | | |
Broker fees and charges on short securities payable | | | — | | | | — | | |
Payable due to investment adviser | | | 42 | | | | — | | |
Payable due to administrator | | | 4 | | | | 1 | | |
Payable due to shareholder servicing | | | — | | | | 4 | | |
Payable due to distributor | | | — | | | | — | | |
Payable due to transfer agent | | | 2 | | | | 5 | | |
Payable due to custodian | | | 2 | | | | 2 | | |
Other accrued expenses | | | 8 | | | | 1 | | |
Total liabilities | | | 34,038 | | | | 1495 | | |
Net assets | | $ | 45,501 | | | $ | 18,308 | | |
*Includes market value of securities on loan | | $ | — | | | $ | 1,434 | | |
Net assets: | |
Portfolio capital | | $ | 46,159 | | | $ | 27,684 | | |
Distributions in excess of investment income | | | (118 | ) | | | (10 | ) | |
Accumulated net realized loss from investments, securities sold short, written options and
foreign currency transactions | | | (3,535 | ) | | | (10,807 | ) | |
Net unrealized appreciation (depreciation) on investments, securities sold short, foreign
currencies and translation of other assets and liabilities denominated in foreign currencies | | | 2,995 | | | | 1,441 | | |
Net assets | | $ | 45,501 | | | $ | 18,308 | | |
Outstanding shares of beneficial interest Institutional Class Shares (1) | | | 4,395 | | | | — | | |
Outstanding shares of beneficial interest Investor Class Shares (1) | | | 83 | | | | 2,052 | | |
Outstanding shares of beneficial interest Class C Shares (1) | | | 68 | | | | — | | |
Net assets — Institutional Class Shares | | $ | 44,004 | | | $ | — | | |
Net assets — Investor Class Shares | | $ | 829 | | | $ | 18,308 | | |
Net assets — Class C Shares | | $ | 668 | | | $ | — | | |
Net asset value, offering and redemption price per share — Institutional Class Shares | | $ | 10.01 | | | $ | — | | |
Net asset value, offering and redemption price per share — Investor Class Shares | | $ | 9.96 | † | | $ | 8.92 | | |
Net asset value, offering and redemption price per share — Class C Shares | | $ | 9.81 | † | | $ | — | | |
(1) Unlimited authorization — par value $0.00001.
† Difference in net asset value recalculation and net asset value stated is caused by rounding differences.
Amounts designated as "—" are either not applicable, $0 or have been rounded to $0.
The accompanying notes are an integral part of the financial statements.
TURNER FUNDS 2013 SEMIANNUAL REPORT 47
Statements of assets and liabilities (000)
March 28, 2013
| | | Turner
Emerging
Growth Fund | | Turner
Large
Growth Fund | | Turner
Midcap
Growth Fund | |
Assets: | |
Investment securities, at cost | | $ | 166,423 | | | $ | 171,131 | | | $ | 450,844 | | |
Investment securities, at value | | $ | 234,392 | * | | $ | 187,490 | * | | $ | 534,492 | * | |
Foreign currency, at value | | | — | | | | — | | | | — | | |
Receivable for investment securities sold | | | — | | | | — | | | | 1,071 | | |
Receivable for capital shares sold | | | 115 | | | | 219 | | | | 560 | | |
Prepaid expenses | | | 23 | | | | 25 | | | | 31 | | |
Receivable for dividend income | | | 149 | | | | 96 | | | | 188 | | |
Receivable from investment adviser | | | — | | | | — | | | | — | | |
Total assets | | | 234,679 | | | | 187,830 | | | | 536,342 | | |
Liabilities: | |
Payable to custodian | | | — | | | | 787 | | | | 7,272 | | |
Payable for investment securities purchased | | | 111 | | | | — | | | | — | | |
Obligation to return securities lending collateral | | | 8,181 | | | | 8,377 | | | | 29,341 | | |
Payable for capital shares redeemed | | | 125 | | | | 7,707 | | | | 8,639 | | |
Payable due to investment adviser | | | 142 | | | | 51 | | | | 225 | | |
Payable due to administrator | | | 18 | | | | 16 | | | | 40 | | |
Payable due to shareholder servicing | | | 32 | | | | 9 | | | | 64 | | |
Payable due to distributor | | | — | | | | — | | | | 1 | | |
Payable due to transfer agent | | | 20 | | | | 18 | | | | 61 | | |
Payable due to custodian | | | 3 | | | | 5 | | | | 7 | | |
Other accrued expenses | | | 54 | | | | 59 | | | | 162 | | |
Total liabilities | | | 8,686 | | | | 17,029 | | | | 45,812 | | |
Net assets | | $ | 225,993 | | | $ | 170,801 | | | $ | 490,530 | | |
*Includes market value of securities on loan | | $ | 8,054 | | | $ | 8,264 | | | $ | 28,789 | | |
Net assets: | |
Portfolio capital | | $ | 143,619 | | | $ | 232,936 | | | $ | 378,234 | | |
Distributions in excess of investment income | | | (1,483 | ) | | | (147 | ) | | | (2,248 | ) | |
Accumulated net realized gain (loss) from investment transactions | | | 15,888 | | | | (78,347 | ) | | | 30,896 | | |
Net unrealized appreciation on investments | | | 67,969 | | | | 16,359 | | | | 83,648 | | |
Net assets | | $ | 225,993 | | | $ | 170,801 | | | $ | 490,530 | | |
Outstanding shares of beneficial interest Institutional Class Shares (1) | | | 1,160 | | | | 9,789 | | | | 4,797 | | |
Outstanding shares of beneficial interest Investor Class Shares (1) | | | 3,102 | | | | 3,241 | | | | 8,188 | | |
Outstanding shares of beneficial interest Retirement Class Shares (1) | | | — | | | | — | | | | 113 | | |
Net assets — Institutional Class Shares | | $ | 62,068 | | | $ | 128,558 | | | $ | 181,096 | | |
Net assets — Investor Class Shares | | $ | 163,925 | | | $ | 42,243 | | | $ | 305,398 | | |
Net assets — Retirement Class Shares | | $ | — | | | $ | — | | | $ | 4,036 | | |
Net asset value, offering and redemption price per share — Institutional Class Shares | | $ | 53.50 | † | | $ | 13.13 | | | $ | 37.75 | | |
Net asset value, offering and redemption price per share — Investor Class Shares | | $ | 52.85 | † | | $ | 13.04 | † | | $ | 37.30 | | |
Net asset value, offering and redemption price per share — Retirement Class Shares | | $ | — | | | $ | — | | | $ | 35.80 | † | |
48 TURNER FUNDS 2013 SEMIANNUAL REPORT
(Unaudited)
| | | Turner
Small Cap
Growth Fund | | Turner Global
Opportunities
Fund | |
Assets: | |
Investment securities, at cost | | $ | 216,955 | | | $ | 1,737 | | |
Investment securities, at value | | $ | 268,244 | * | | $ | 2,002 | | |
Foreign currency, at value | | | — | | | | 1 | | |
Receivable for investment securities sold | | | 107 | | | | — | | |
Receivable for capital shares sold | | | 82 | | | | — | | |
Prepaid expenses | | | 16 | | | | 3 | | |
Receivable for dividend income | | | 90 | | | | 2 | | |
Receivable from investment adviser | | | — | | | | 3 | | |
Total assets | | | 268,539 | | | | 2,011 | | |
Liabilities: | |
Payable to custodian | | | — | | | | — | | |
Payable for investment securities purchased | | | 1,791 | | | | — | | |
Obligation to return securities lending collateral | | | 26,960 | | | | — | | |
Payable for capital shares redeemed | | | 286 | | | | — | | |
Payable due to investment adviser | | | 125 | | | | — | | |
Payable due to administrator | | | 19 | | | | — | | |
Payable due to shareholder servicing | | | 59 | | | | — | | |
Payable due to distributor | | | — | | | | — | | |
Payable due to transfer agent | | | 22 | | | | — | | |
Payable due to custodian | | | 5 | | | | 1 | | |
Other accrued expenses | | | 60 | | | | — | | |
Total liabilities | | | 29,327 | | | | 1 | | |
Net assets | | $ | 239,212 | | | $ | 2,010 | | |
*Includes market value of securities on loan | | $ | 26,306 | | | $ | — | | |
Net assets: | |
Portfolio capital | | $ | 178,125 | | | $ | 1,608 | | |
Distributions in excess of investment income | | | (1,460 | ) | | | (14 | ) | |
Accumulated net realized gain (loss) from investment transactions | | | 11,258 | | | | 151 | | |
Net unrealized appreciation on investments | | | 51,289 | | | | 265 | | |
Net assets | | $ | 239,212 | | | $ | 2,010 | | |
Outstanding shares of beneficial interest Institutional Class Shares (1) | | | — | | | | 124 | | |
Outstanding shares of beneficial interest Investor Class Shares (1) | | | 6,338 | | | | 20 | | |
Outstanding shares of beneficial interest Retirement Class Shares (1) | | | — | | | | — | | |
Net assets — Institutional Class Shares | | $ | — | | | $ | 1,728 | | |
Net assets — Investor Class Shares | | $ | 239,212 | | | $ | 282 | | |
Net assets — Retirement Class Shares | | $ | — | | | $ | — | | |
Net asset value, offering and redemption price per share — Institutional Class Shares | | $ | — | | | $ | 13.91 | † | |
Net asset value, offering and redemption price per share — Investor Class Shares | | $ | 37.74 | | | $ | 13.86 | † | |
Net asset value, offering and redemption price per share — Retirement Class Shares | | $ | — | | | $ | — | | |
(1) Unlimited authorization — par value $0.00001.
† Difference in net asset value recalculation and net asset value stated is caused by rounding differences.
Amounts designated as "—" are either not applicable, $0 or have been rounded to $0.
The accompanying notes are an integral part of the financial statements.
TURNER FUNDS 2013 SEMIANNUAL REPORT 49
Statements of operations (000)
| | | Turner
Market Neutral
Fund | | Turner
Medical Sciences
Long/Short
Fund | | Turner
Spectrum
Fund | |
| | | period ended
3/28/13 | | period ended
3/28/13 | | period ended
3/28/13 | |
Investment income: | |
Dividend | | $ | 200 | | | $ | 148 | | | $ | 7,245 | | |
Securities lending | | | — | | | | — | | | | — | | |
Foreign taxes withheld | | | (1 | ) | | | (1 | ) | | | (54 | ) | |
Total Investment income | | | 199 | | | | 147 | | | | 7,191 | | |
Expenses: | |
Investment advisory fees | | | 262 | | | | 263 | | | | 6,531 | | |
Administrator fees | | | 25 | | | | 25 | | | | 625 | | |
Shareholder service fees (1) | | | 3 | | | | 7 | | | | 136 | | |
Shareholder service fees (2) | | | — | | | | 2 | | | | 10 | | |
Distribution fees (2) | | | — | | | | 7 | | | | 31 | | |
Accounting agent fees | | | 7 | | | | 7 | | | | 12 | | |
Dividend expense | | | 51 | | | | 69 | | | | 1,522 | | |
Broker fees and charges on short sales | | | 52 | | | | 54 | | | | 1,596 | | |
Custodian fees | | | 18 | | | | 12 | | | | 85 | | |
Transfer agent fees | | | 12 | | | | 15 | | | | 288 | | |
Registration fees | | | 22 | | | | 28 | | | | 68 | | |
Professional fees | | | 5 | | | | 6 | | | | 142 | | |
Trustees' fees | | | 3 | | | | 3 | | | | 86 | | |
Insurance and other fees | | | 13 | | | | 15 | | | | 275 | | |
Total expenses | | | 473 | | | | 513 | | | | 11,407 | | |
Less: | |
Investment advisory fee waiver | | | (132 | ) | | | (168 | ) | | | (2,978 | ) | |
Net expenses | | | 341 | | | | 345 | | | | 8,429 | | |
Net investment loss | | | (142 | ) | | | (198 | ) | | | (1,238 | ) | |
Net realized gain from securities sold | | | 1,636 | | | | 3,040 | | | | 60,557 | | |
Net realized (loss) from securities sold short | | | (3,546 | ) | | | (1,491 | ) | | | (54,677 | ) | |
Net realized gain on written options contracts | | | — | | | | — | | | | 46 | | |
Net realized gain loss on foreign currency transactions | | | 1 | | | | (5 | ) | | | (77 | ) | |
Net change in unrealized appreciation (depreciation) on investments | | | (2 | ) | | | (564 | ) | | | 31,404 | | |
Net change in unrealized appreciation (depreciation) on securities sold short | | | (243 | ) | | | (401 | ) | | | (17,759 | ) | |
Net change in unrealized appreciation (depreciation) on written option contracts | | | — | | | | — | | | | 23 | | |
Net change in unrealized appreciation (depreciation) on foreign currencies and translation of
other assets and liabilities denominated in foreign currencies | | | — | | | | 2 | | | | (8 | ) | |
Net realized and unrealized gain (loss) from investments, options and foreign currencies | | | (2,154 | ) | | | 581 | | | | 19,509 | | |
Net increase (decrease) in net assets resulting from operations | | $ | (2,296 | ) | | $ | 383 | | | $ | 18,271 | | |
50 TURNER FUNDS 2013 SEMIANNUAL REPORT
(Unaudited)
| | | Turner
Titan
Fund | | Turner
All Cap
Growth
Fund | |
| | | period ended
3/28/13 | | period ended
3/28/13 | |
Investment income: | |
Dividend | | $ | 321 | | | $ | 147 | | |
Securities lending | | | — | | | | 3 | | |
Foreign taxes withheld | | | — | | | | — | | |
Total Investment income | | | 321 | | | | 150 | | |
Expenses: | |
Investment advisory fees | | | 336 | | | | 60 | | |
Administrator fees | | | 32 | | | | 15 | | |
Shareholder service fees (1) | | | 3 | | | | 26 | | |
Shareholder service fees (2) | | | 1 | | | | — | | |
Distribution fees (2) | | | 3 | | | | — | | |
Accounting agent fees | | | 5 | | | | 2 | | |
Dividend expense | | | 24 | | | | — | | |
Broker fees and charges on short sales | | | 45 | | | | — | | |
Custodian fees | | | 14 | | | | 7 | | |
Transfer agent fees | | | 10 | | | | 16 | | |
Registration fees | | | 20 | | | | 9 | | |
Professional fees | | | 5 | | | | 3 | | |
Trustees' fees | | | 4 | | | | 2 | | |
Insurance and other fees | | | 27 | | | | 6 | | |
Total expenses | | | 529 | | | | 146 | | |
Less: | |
Investment advisory fee waiver | | | (90 | ) | | | (60 | ) | |
Net expenses | | | 439 | | | | 86 | | |
Net investment loss | | | (118 | ) | | | 64 | | |
Net realized gain from securities sold | | | 1,030 | | | | 1,507 | | |
Net realized (loss) from securities sold short | | | (3,434 | ) | | | — | | |
Net realized gain on written options contracts | | | — | | | | — | | |
Net realized gain loss on foreign currency transactions | | | 2 | | | | — | | |
Net change in unrealized appreciation (depreciation) on investments | | | 2,706 | | | | (2,072 | ) | |
Net change in unrealized appreciation (depreciation) on securities sold short | | | (708 | ) | | | — | | |
Net change in unrealized appreciation (depreciation) on written option contracts | | | — | | | | — | | |
Net change in unrealized appreciation (depreciation) on foreign currencies and translation of
other assets and liabilities denominated in foreign currencies | | | — | | | | — | | |
Net realized and unrealized gain (loss) from investments, options and foreign currencies | | | (404 | ) | | | (565 | ) | |
Net increase (decrease) in net assets resulting from operations | | $ | (522 | ) | | $ | (501 | ) | |
(1) Attributable to Investor Class Shares only.
(2) Attributable to Class C Shares only.
Amounts designated as "—" are either not applicable, $0 or have been rounded to $0.
The accompanying notes are an integral part of the financial statements.
TURNER FUNDS 2013 SEMIANNUAL REPORT 51
Statements of operations (000)
| | | Turner
Emerging
Growth Fund | | Turner
Large
Growth Fund | | Turner
Midcap
Growth Fund | |
| | | period ended
3/28/13 | | period ended
3/28/13 | | period ended
3/28/13 | |
Investment income: | |
Dividend | | $ | 1,375 | | | $ | 1,272 | | | $ | 2,528 | | |
Securities lending | | | 134 | | | | 85 | | | | 116 | | |
Foreign taxes withheld | | | — | | | | — | | | | — | | |
Total Investment income | | | 1,509 | | | | 1,357 | | | | 2,644 | | |
Expenses: | |
Investment advisory fees | | | 1,092 | | | | 629 | | | | 1,974 | | |
Administrator fees | | | 157 | | | | 151 | | | | 378 | | |
Shareholder service fees (1) | | | 198 | | | | 49 | | | | 411 | | |
Shareholder service fees (2) | | | — | | | | — | | | | 5 | | |
Distribution fees (2) | | | — | | | | — | | | | 5 | | |
Accounting agent fees | | | 2 | | | | 2 | | | | 2 | | |
Custodian fees | | | 10 | | | | 17 | | | | 32 | | |
Transfer agent fees | | | 49 | | | | 48 | | | | 149 | | |
Registration fees | | | 15 | | | | 21 | | | | 31 | | |
Professional fees | | | 28 | | | | 26 | | | | 73 | | |
Trustees' fees | | | 17 | | | | 14 | | | | 43 | | |
Insurance and other fees | | | 51 | | | | 59 | | | | 149 | | |
Total expenses | | | 1,619 | | | | 1,016 | | | | 3,252 | | |
Less: | |
Investment advisory fee waiver | | | (163 | ) | | | (242 | ) | | | (382 | ) | |
Shareholder services fee waiver | | | — | | | | — | | | | — | | |
Reimbursements of other operating expenses | | | — | | | | — | | | | — | | |
Net expenses | | | 1,456 | | | | 774 | | | | 2,870 | | |
Net investment income (loss) | | | 53 | | | | 583 | | | | (226 | ) | |
Net realized gain from securities sold | | | 17,598 | | | | 19,798 | | | | 39,430 | | |
Net change in unrealized appreciation (depreciation) on investments | | | 756 | | | | (15,542 | ) | | | (3,408 | ) | |
Net realized and unrealized gain (loss) from investments | | | 18,354 | | | | 4,256 | | | | 36,022 | | |
Net increase in net assets resulting from operations | | $ | 18,407 | | | $ | 4,839 | | | $ | 35,796 | | |
52 TURNER FUNDS 2013 SEMIANNUAL REPORT
(Unaudited)
| | | Turner
Small Cap
Growth Fund | | Turner Global
Opportunities
Fund | |
| | | period ended
3/28/13 | | period ended
3/28/13 | |
Investment income: | |
Dividend | | $ | 1,080 | | | $ | 11 | | |
Securities lending | | | 120 | | | | — | | |
Foreign taxes withheld | | | (3 | ) | | | — | | |
Total Investment income | | | 1,197 | | | | 11 | | |
Expenses: | |
Investment advisory fees | | | 1,141 | | | | 7 | | |
Administrator fees | | | 164 | | | | 1 | | |
Shareholder service fees (1) | | | 272 | | | | — | | |
Shareholder service fees (2) | | | — | | | | — | | |
Distribution fees (2) | | | — | | | | — | | |
Accounting agent fees | | | 2 | | | | 6 | | |
Custodian fees | | | 15 | | | | 6 | | |
Transfer agent fees | | | 51 | | | | 1 | | |
Registration fees | | | 15 | | | | 13 | | |
Professional fees | | | 31 | | | | — | | |
Trustees' fees | | | 18 | | | | — | | |
Insurance and other fees | | | 52 | | | | 2 | | |
Total expenses | | | 1,761 | | | | 36 | | |
Less: | |
Investment advisory fee waiver | | | (318 | ) | | | (7 | ) | |
Shareholder services fee waiver | | | (15 | ) | | | — | | |
Reimbursements of other operating expenses | | | — | | | | (18 | ) | |
Net expenses | | | 1,428 | | | | 11 | | |
Net investment income (loss) | | | (231 | ) | | | — | | |
Net realized gain from securities sold | | | 18,127 | | | | 154 | | |
Net change in unrealized appreciation (depreciation) on investments | | | 9,548 | | | | (37 | ) | |
Net realized and unrealized gain (loss) from investments | | | 27,675 | | | | 117 | | |
Net increase in net assets resulting from operations | | $ | 27,444 | | | $ | 117 | | |
(1) Attributable to Investor Class Shares only.
(2) Attributable to Retirement Class Shares only.
Amounts designated as "—" are either not applicable, $0 or have been rounded to $0.
The accompanying notes are an integral part of the financial statements.
TURNER FUNDS 2013 SEMIANNUAL REPORT 53
Statements of changes in net assets (000)
| | | Turner
Market Neutral
Fund | | Turner
Medical Sciences
Long/Short
Fund | |
| | | period ended
3/28/13 (unaudited) | | year ended
9/30/12 | | period ended
3/28/13 (unaudited) | | year ended
9/30/12 | |
Investment Activities: | |
Net investment loss | | $ | (142 | ) | | $ | (417 | ) | | $ | (198 | ) | | $ | (1,097 | ) | |
Net realized gain (loss) from securities sold and securities sold short | | | (1,910 | ) | | | (599 | ) | | | 1,549 | | | | (1,302 | ) | |
Net realized gain on written options contracts | | | — | | | | — | | | | — | | | | — | | |
Net realized gain (loss) on foreign currency transactions | | | 1 | | | | (1 | ) | | | (5 | ) | | | (4 | ) | |
Net change in unrealized appreciation (depreciation) from investments and securities sold short | | | (245 | ) | | | (200 | ) | | | (965 | ) | | | 1,043 | | |
Net change in unrealized appreciation (depreciation) on written options contracts | | | — | | | | — | | | | — | | | | — | | |
Net change in unrealized appreciation (depreciation) on foreign currencies
and translation of other assets and liabilities denominated in foreign currencies | | | — | | | | — | | | | 2 | | | | 2 | | |
Net increase (decrease) in net assets resulting from operations | | | (2,296 | ) | | | (1,217 | ) | | | 383 | | | | (1,358 | ) | |
Dividends and distributions to shareholders: | |
Realized capital gains | |
Institutional Class Shares | | | — | | | | (394 | ) | | | — | | | | — | | |
Investor Class Shares | | | — | | | | (67 | ) | | | — | | | | — | | |
Class C Shares | | | — | | | | — | | | | — | | | | — | | |
Total dividends and distributions | | | — | | | | (461 | ) | | | — | | | | — | | |
Capital share transactions: | |
Institutional Class Shares | |
Proceeds from shares issued | | | 780 | | | | 49,135 | | | | 1,242 | | | | 51,896 | | |
Proceeds from shares issued in lieu of cash distributions | | | — | | | | 385 | | | | — | | | | — | | |
Cost of shares redeemed | | | (33,297 | ) | | | (8,748 | ) | | | (17,348 | ) | | | (59,013 | ) | |
Net increase (decrease) in net assets from Institutional Class Shares transactions | | | (32,517 | ) | | | 40,772 | | | | (16,106 | ) | | | (7,117 | ) | |
Investor Class Shares | |
Proceeds from shares issued | | | 101 | | | | 7,056 | | | | 395 | | | | 18,248 | | |
Proceeds from shares issued in lieu of cash distributions | | | — | | | | 67 | | | | — | | | | — | | |
Cost of shares redeemed | | | (4,374 | ) | | | (4,394 | ) | | | (6,641 | ) | | | (21,057 | ) | |
Net increase (decrease) in net assets from Investor Class Shares transactions | | | (4,273 | ) | | | 2,729 | | | | (6,246 | ) | | | (2,809 | ) | |
Class C Shares | |
Proceeds from shares issued | | | — | | | | 137 | | | | 154 | | | | 2,329 | | |
Proceeds from shares issued in lieu of cash distributions | | | — | | | | — | | | | — | | | | — | | |
Cost of shares redeemed | | | (5 | ) | | | (49 | ) | | | (1,634 | ) | | | (1,522 | ) | |
Net increase (decrease) in net assets from Class C Shares transactions | | | (5 | ) | | | 88 | | | | (1,480 | ) | | | 807 | | |
Net increase (decrease) in net assets from capital share transactions | | | (36,795 | ) | | | 43,589 | | | | (23,832 | ) | | | (9,119 | ) | |
Total increase (decrease) in net assets | | | (39,091 | ) | | | 41,911 | | | | (23,449 | ) | | | (10,477 | ) | |
Net assets: | |
Beginning of period | | | 53,824 | | | | 11,913 | | | | 49,612 | | | | 60,089 | | |
End of period | | $ | 14,733 | | | $ | 53,824 | | | $ | 26,163 | | | $ | 49,612 | | |
Accumulated net investment loss | | $ | (481 | ) | | $ | (339 | ) | | $ | (971 | ) | | $ | (773 | ) | |
Share issued and redeemed: | |
Institutional Class Shares | |
Issued | | | 77 | | | | 4,704 | | | | 122 | | | | 5,070 | | |
Issued in lieu of cash distributions | | | — | | | | 38 | | | | — | | | | — | | |
Redeemed | | | (3,378 | ) | | | (845 | ) | | | (1,709 | ) | | | (5,790 | ) | |
Net increase (decrease) in Institutional Class Shares | | | (3,301 | ) | | | 3,897 | | | | (1,587 | ) | | | (720 | ) | |
Investor Class Shares | |
Issued | | | 10 | | | | 674 | | | | 39 | | | | 1,778 | | |
Issued in lieu of cash distributions | | | — | | | | 7 | | | | — | | | | — | | |
Redeemed | | | (438 | ) | | | (427 | ) | | | (664 | ) | | | (2,068 | ) | |
Net increase (decrease) in Investor Class Shares | | | (428 | ) | | | 254 | | | | (625 | ) | | | (290 | ) | |
Class C Shares | |
Issued | | | — | | | | 14 | | | | 15 | | | | 230 | | |
Issued in lieu of cash distributions | | | — | | | | — | | | | — | | | | — | | |
Redeemed | | | (1 | ) | | | (5 | ) | | | (164 | ) | | | (152 | ) | |
Net increase (decrease) in Class C Shares | | | (1 | ) | | | 9 | | | | (149 | ) | | | 78 | | |
Net increase (decrease) in share transactions | | | (3,730 | ) | | | 4,160 | | | | (2,361 | ) | | | (932 | ) | |
54 TURNER FUNDS 2013 SEMIANNUAL REPORT
| | | Turner
Spectrum
Fund | | Turner
Titan
Fund | |
| | | period ended
3/28/13 (unaudited) | | year ended
9/30/12 | | period ended
3/28/13 (unaudited) | | year ended
9/30/12 | |
Investment Activities: | |
Net investment loss | | $ | (1,238 | ) | | $ | (10,711 | ) | | $ | (118 | ) | | $ | (246 | ) | |
Net realized gain (loss) from securities sold and securities sold short | | | 5,880 | | | | (26,926 | ) | | | (2,404 | ) | | | 298 | | |
Net realized gain on written options contracts | | | 46 | | | | 865 | | | | — | | | | — | | |
Net realized gain (loss) on foreign currency transactions | | | (77 | ) | | | (223 | ) | | | 2 | | | | (1 | ) | |
Net change in unrealized appreciation (depreciation) from investments and securities sold short | | | 13,645 | | | | 25,373 | | | | 1,998 | | | | 863 | | |
Net change in unrealized appreciation (depreciation) on written options contracts | | | 23 | | | | — | | | | — | | | | — | | |
Net change in unrealized appreciation (depreciation) on foreign currencies
and translation of other assets and liabilities denominated in foreign currencies | | | (8 | ) | | | 7 | | | | — | | | | — | | |
Net increase (decrease) in net assets resulting from operations | | | 18,271 | | | | (11,615 | ) | | | (522 | ) | | | 914 | | |
Dividends and distributions to shareholders: | |
Realized capital gains | |
Institutional Class Shares | | | — | | | | (22,293 | ) | | | (341 | ) | | | (110 | ) | |
Investor Class Shares | | | — | | | | (7,313 | ) | | | (20 | ) | | | (40 | ) | |
Class C Shares | | | — | | | | (553 | ) | | | (6 | ) | | | (1 | ) | |
Total dividends and distributions | | | — | | | | (30,159 | ) | | | (367 | ) | | | (151 | ) | |
Capital share transactions: | |
Institutional Class Shares | |
Proceeds from shares issued | | | 192,129 | | | | 786,546 | | | | 38,010 | | | | 18,412 | | |
Proceeds from shares issued in lieu of cash distributions | | | — | | | | 19,084 | | | | 334 | | | | 110 | | |
Cost of shares redeemed | | | (277,727 | ) | | | (388,983 | ) | | | (19,459 | ) | | | (4,663 | ) | |
Net increase (decrease) in net assets from Institutional Class Shares transactions | | | (85,598 | ) | | | 416,647 | | | | 18,885 | | | | 13,859 | | |
Investor Class Shares | |
Proceeds from shares issued | | | 13,990 | | | | 74,782 | | | | 168 | | | | 5,783 | | |
Proceeds from shares issued in lieu of cash distributions | | | — | | | | 7,037 | | | | 20 | | | | 40 | | |
Cost of shares redeemed | | | (42,850 | ) | | | (108,037 | ) | | | (4,218 | ) | | | (3,684 | ) | |
Net increase (decrease) in net assets from Investor Class Shares transactions | | | (28,860 | ) | | | (26,218 | ) | | | (4,030 | ) | | | 2,139 | | |
Class C Shares | |
Proceeds from shares issued | | | 93 | | | | 3,376 | | | | 286 | | | | 503 | | |
Proceeds from shares issued in lieu of cash distributions | | | — | | | | 493 | | | | 6 | | | | 1 | | |
Cost of shares redeemed | | | (4,041 | ) | | | (5,176 | ) | | | (137 | ) | | | — | | |
Net increase (decrease) in net assets from Class C Shares transactions | | | (3,948 | ) | | | (1,307 | ) | | | 155 | | | | 504 | | |
Net increase (decrease) in net assets from capital share transactions | | | (118,406 | ) | | | 389,122 | | | | 15,010 | | | | 16,502 | | |
Total increase (decrease) in net assets | | | (100,135 | ) | | | 347,348 | | | | 14,121 | | | | 17,265 | | |
Net assets: | |
Beginning of period | | | 969,781 | | | | 622,433 | | | | 31,380 | | | | 14,115 | | |
End of period | | $ | 869,646 | | | $ | 969,781 | | | $ | 45,501 | | | $ | 31,380 | | |
Accumulated net investment loss | | $ | (9,476 | ) | | $ | (8,238 | ) | | $ | (118 | ) | | $ | — | | |
Share issued and redeemed: | |
Institutional Class Shares | |
Issued | | | 16,368 | | | | 70,716 | | | | 3,788 | | | | 1,802 | | |
Issued in lieu of cash distributions | | | — | | | | 1,757 | | | | 34 | | | | 11 | | |
Redeemed | | | (24,268 | ) | | | (35,203 | ) | | | (1,949 | ) | | | (455 | ) | |
Net increase (decrease) in Institutional Class Shares | | | (7,900 | ) | | | 37,270 | | | | 1,873 | | | | 1,358 | | |
Investor Class Shares | |
Issued | | | 1,282 | | | | 6,709 | | | | 16 | | | | 579 | | |
Issued in lieu of cash distributions | | | — | | | | 653 | | | | 2 | | | | 4 | | |
Redeemed | | | (3,947 | ) | | | (9,829 | ) | | | (429 | ) | | | (367 | ) | |
Net increase (decrease) in Investor Class Shares | | | (2,665 | ) | | | (2,467 | ) | | | (411 | ) | | | 216 | | |
Class C Shares | |
Issued | | | 9 | | | | 307 | | | | 28 | | | | 50 | | |
Issued in lieu of cash distributions | | | — | | | | 46 | | | | 1 | | | | — | | |
Redeemed | | | (380 | ) | | | (481 | ) | | | (14 | ) | | | — | | |
Net increase (decrease) in Class C Shares | | | (371 | ) | | | (128 | ) | | | 15 | | | | 50 | | |
Net increase (decrease) in share transactions | | | (10,936 | ) | | | 34,675 | | | | 1,477 | | | | 1,624 | | |
Amounts designated as "—" are either not applicable, $0 or have been rounded to $0.
The accompanying notes are an integral part of the financial statements.
TURNER FUNDS 2013 SEMIANNUAL REPORT 55
Statements of changes in net assets (000)
| | | Turner
All Cap Growth
Fund | | Turner
Emerging Growth
Fund | |
| | | period ended
3/28/13 (unaudited) | | year ended
9/30/12 | | period ended
3/28/13 (unaudited) | | year ended
9/30/12 | |
Investment Activities: | |
Net investment income (loss) | | $ | 64 | | | $ | (75 | ) | | $ | 53 | | | $ | (1,966 | ) | |
Net realized gain from securities sold | | | 1,507 | | | | 1,232 | | | | 17,598 | | | | 42,086 | | |
Net realized loss on foreign currency transactions | | | — | | | | — | | | | — | | | | — | | |
Net change in unrealized appreciation (depreciation) from investments and securities sold short | | | (2,072 | ) | | | 3,417 | | | | 756 | | | | 15,892 | | |
Net increase (decrease) in net assets resulting from operations | | | (501 | ) | | | 4,574 | | | | 18,407 | | | | 56,012 | | |
Dividends and distributions to shareholders: | |
Net investment income | |
Institutional Class Shares | | | — | | | | — | | | | — | | | | — | | |
Investor Class Shares | | | (73 | ) | | | — | | | | — | | | | — | | |
Realized capital gains | |
Institutional Class Shares | | | — | | | | — | | | | (8,753 | ) | | | — | | |
Investor Class Shares | | | — | | | | — | | | | (24,111 | ) | | | — | | |
Total dividends and distributions | | | (73 | ) | | | — | | | | (32,864 | ) | | | — | | |
Capital share transactions: | |
Institutional Class Shares | |
Proceeds from shares issued | | | — | | | | — | | | | 5,764 | | | | 12,775 | | |
Proceeds from shares issued in lieu of cash distributions | | | — | | | | — | | | | 8,473 | | | | — | | |
Cost of shares redeemed | | | — | | | | — | | | | (17,496 | ) | | | (27,694 | ) | |
Net increase (decrease) in net assets from Institutional Class Shares transactions | | | — | | | | — | | | | (3,259 | ) | | | (14,919 | ) | |
Investor Class Shares | |
Proceeds from shares issued | | | 1,309 | | | | 7,196 | | | | 9,275 | | | | 27,454 | | |
Proceeds from Fund acquisition (Note 11) | | | — | | | | — | | | | — | | | | — | | |
Proceeds from shares issued in lieu of cash distributions | | | 56 | | | | — | | | | 21,988 | | | | — | | |
Cost of shares redeemed | | | (8,323 | ) | | | (18,983 | ) | | | (25,935 | ) | | | (56,328 | ) | |
Net increase (decrease) in net assets from Investor Class Shares transactions | | | (6,958 | ) | | | (11,787 | ) | | | 5,328 | | | | (28,874 | ) | |
Net increase (decrease) in net assets from capital share transactions | | | (6,958 | ) | | | (11,787 | ) | | | 2,069 | | | | (43,793 | ) | |
Total increase (decrease) in net assets | | | (7,540 | ) | | | (7,213 | ) | | | (12,388 | ) | | | 12,219 | | |
Net assets: | |
Beginning of period | | | 25,840 | | | | 33,053 | | | | 238,381 | | | | 226,162 | | |
End of period | | $ | 18,308 | | | $ | 25,840 | | | $ | 225,993 | | | $ | 238,381 | | |
Undistributed net investment income (accumulated net investment income) | | $ | (10 | ) | | $ | (1 | ) | | $ | (1,483 | ) | | $ | (1,536 | ) | |
Share issued and redeemed: | |
Institutional Class Shares | |
Issued | | | — | | | | — | | | | 109 | | | | 235 | | |
Issued in lieu of cash distributions | | | — | | | | — | | | | 177 | | | | — | | |
Redeemed | | | — | | | | — | | | | (329 | ) | | | (495 | ) | |
Net increase (decrease) in Institutional Class Shares | | | — | | | | — | | | | (43 | ) | | | (260 | ) | |
Investor Class Shares | |
Issued | | | 154 | | | | 815 | | | | 182 | | | | 521 | | |
Shares from Fund acquisition (Note 11) | | | — | | | | — | | | | — | | | | — | | |
Issued in lieu of cash distributions | | | 7 | | | | — | | | | 465 | | | | — | | |
Redeemed | | | (976 | ) | | | (2,255 | ) | | | (502 | ) | | | (1,060 | ) | |
Net increase (decrease) in Investor Class Shares | | | (815 | ) | | | (1,440 | ) | | | 145 | | | | (539 | ) | |
Net increase (decrease) in share transactions | | | (815 | ) | | | (1,440 | ) | | | 102 | | | | (799 | ) | |
56 TURNER FUNDS 2013 SEMIANNUAL REPORT
| | | Turner
Large Growth
Fund | |
| | | period ended
3/28/13 (unaudited) | | year ended
9/30/12 | |
Investment Activities: | |
Net investment income (loss) | | $ | 583 | | | $ | 435 | | |
Net realized gain from securities sold | | | 19,798 | | | | 82,216 | | |
Net realized loss on foreign currency transactions | | | — | | | | (1 | ) | |
Net change in unrealized appreciation (depreciation) from investments and securities sold short | | | (15,542 | ) | | | 4,462 | | |
Net increase (decrease) in net assets resulting from operations | | | 4,839 | | | | 87,112 | | |
Dividends and distributions to shareholders: | |
Net investment income | |
Institutional Class Shares | | | (1,087 | ) | | | — | | |
Investor Class Shares | | | (92 | ) | | | — | | |
Realized capital gains | |
Institutional Class Shares | | | — | | | | — | | |
Investor Class Shares | | | — | | | | — | | |
Total dividends and distributions | | | (1,179 | ) | | | — | | |
Capital share transactions: | |
Institutional Class Shares | |
Proceeds from shares issued | | | 9,943 | | | | 45,450 | | |
Proceeds from shares issued in lieu of cash distributions | | | 1,034 | | | | — | | |
Cost of shares redeemed | | | (86,431 | ) | | | (301,740 | ) | |
Net increase (decrease) in net assets from Institutional Class Shares transactions | | | (75,454 | ) | | | (256,290 | ) | |
Investor Class Shares | |
Proceeds from shares issued | | | 4,220 | | | | 8,694 | | |
Proceeds from Fund acquisition (Note 11) | | | 15,614 | | | | — | | |
Proceeds from shares issued in lieu of cash distributions | | | 90 | | | | — | | |
Cost of shares redeemed | | | (26,241 | ) | | | (29,601 | ) | |
Net increase (decrease) in net assets from Investor Class Shares transactions | | | (6,317 | ) | | | (20,907 | ) | |
Net increase (decrease) in net assets from capital share transactions | | | (81,771 | ) | | | (277,197 | ) | |
Total increase (decrease) in net assets | | | (78,111 | ) | | | (190,085 | ) | |
Net assets: | |
Beginning of period | | | 248,912 | | | | 438,997 | | |
End of period | | $ | 170,801 | | | $ | 248,912 | | |
Undistributed net investment income (accumulated net investment income) | | $ | (147 | ) | | $ | 449 | | |
Share issued and redeemed: | |
Institutional Class Shares | |
Issued | | | 779 | | | | 3,803 | | |
Issued in lieu of cash distributions | | | 83 | | | | — | | |
Redeemed | | | (6,708 | ) | | | (24,590 | ) | |
Net increase (decrease) in Institutional Class Shares | | | (5,846 | ) | | | (20,787 | ) | |
Investor Class Shares | |
Issued | | | 333 | | | | 716 | | |
Shares from Fund acquisition (Note 11) | | | 1,216 | | | | — | | |
Issued in lieu of cash distributions | | | 7 | | | | — | | |
Redeemed | | | (2,073 | ) | | | (2,394 | ) | |
Net increase (decrease) in Investor Class Shares | | | (517 | ) | | | (1,678 | ) | |
Net increase (decrease) in share transactions | | | (6,363 | ) | | | (22,465 | ) | |
Amounts designated as "—" are either not applicable, $0 or have been rounded to $0.
The accompanying notes are an integral part of the financial statements.
TURNER FUNDS 2013 SEMIANNUAL REPORT 57
Statements of changes in net assets (000)
| | | Turner
Midcap Growth
Fund | | Turner
Small Cap Growth
Fund | |
| | | period ended
3/28/13 (unaudited) | | year ended
9/30/12 | | period ended
3/28/13 (unaudited) | | year ended
9/30/12 | |
Investment Activities: | |
Net investment loss | | $ | (226 | ) | | $ | (2,188 | ) | | $ | (231 | ) | | $ | (1,768 | ) | |
Net realized gain from securities sold | | | 39,430 | | | | 93,758 | | | | 18,127 | | | | 19,111 | | |
Net realized loss on foreign currency transactions | | | — | | | | — | | | | — | | | | — | | |
Net change in unrealized appreciation (depreciation) on investment transactions | | | (3,408 | ) | | | 19,856 | | | | 9,548 | | | | 47,225 | | |
Net increase in net assets resulting from operations | | | 35,796 | | | | 111,426 | | | | 27,444 | | | | 64,568 | | |
Dividends and distributions to shareholders: | |
Net investment income | |
Institutional Class Shares | | | — | | | | — | | | | — | | | | — | | |
Investor Class Shares | | | — | | | | — | | | | — | | | | — | | |
Realized capital gains | |
Institutional Class Shares | | | (2,966 | ) | | | — | | | | — | | | | — | | |
Investor Class Shares | | | (5,108 | ) | | | — | | | | (15,983 | ) | | | — | | |
Retirement Class Shares | | | (72 | ) | | | — | | | | — | | | | — | | |
Total dividends and distributions | | | (8,146 | ) | | | — | | | | (15,983 | ) | | | — | | |
Capital share transactions: | |
Institutional Class Shares | |
Proceeds from shares issued | | | 12,814 | | | | 54,971 | | | | — | | | | — | | |
Proceeds from shares issued in lieu of cash distributions | | | 2,364 | | | | — | | | | — | | | | — | | |
Cost of shares redeemed | | | (80,060 | ) | | | (103,598 | ) | | | — | | | | — | | |
Net increase (decrease) in net assets from Institutional Class Shares transactions | | | (64,882 | ) | | | (48,627 | ) | | | — | | | | — | | |
Investor Class Shares | |
Proceeds from shares issued | | | 21,451 | | | | 76,266 | | | | 11,300 | | | | 31,902 | | |
Proceeds from shares issued in lieu of cash distributions | | | 4,948 | | | | — | | | | 15,896 | | | | — | | |
Cost of shares redeemed | | | (143,025 | ) | | | (214,569 | ) | | | (49,544 | ) | | | (76,290 | ) | |
Net increase (decrease) in net assets from Investor Class Shares transactions | | | (116,626 | ) | | | (138,303 | ) | | | (22,348 | ) | | | (44,388 | ) | |
Retirement Class Shares | |
Proceeds from shares issued | | | 351 | | | | 822 | | | | — | | | | — | | |
Proceeds from shares issued in lieu of cash distributions | | | 72 | | | | — | | | | — | | | | — | | |
Cost of shares redeemed | | | (1,420 | ) | | | (671 | ) | | | — | | | | — | | |
Net increase (decrease) in net assets from Retirement Class Shares transactions | | | (997 | ) | | | 151 | | | | — | | | | — | | |
Net increase (decrease) in net assets from capital share transactions | | | (182,505 | ) | | | (186,779 | ) | | | (22,348 | ) | | | (44,388 | ) | |
Total increase (decrease) in net assets | | | (154,855 | ) | | | (75,353 | ) | | | (10,887 | ) | | | 20,180 | | |
Net assets: | |
Beginning of period | | | 645,385 | | | | 720,738 | | | | 250,099 | | | | 229,919 | | |
End of period | | $ | 490,530 | | | $ | 645,385 | | | $ | 239,212 | | | $ | 250,099 | | |
Accumulated net investment income | | $ | (2,248 | ) | | $ | (2,022 | ) | | $ | (1,460 | ) | | $ | (1,229 | ) | |
Share issued and redeemed: | |
Institutional Class Shares | |
Issued | | | 363 | | | | 1,598 | | | | — | | | | — | | |
Issued in lieu of cash distributions | | | 69 | | | | — | | | | — | | | | — | | |
Redeemed | | | (2,306 | ) | | | (2,998 | ) | | | — | | | | — | | |
Net increase (decrease) in Institutional Class Shares | | | (1,874 | ) | | | (1,400 | ) | | | — | | | | — | | |
Investor Class Shares | |
Issued | | | 613 | | | | 2,238 | | | | 319 | | | | 950 | | |
Issued in lieu of cash distributions | | | 147 | | | | — | | | | 473 | | | | — | | |
Redeemed | | | (4,121 | ) | | | (6,311 | ) | | | (1,410 | ) | | | (2,255 | ) | |
Net increase (decrease) in Investor Class Shares | | | (3,363 | ) | | | (4,073 | ) | | | (618 | ) | | | (1,305 | ) | |
Retirement Class Shares | |
Issued | | | 11 | | | | 26 | | | | — | | | | — | | |
Reinvested | | | 2 | | | | — | | | | — | | | | — | | |
Redeemed | | | (43 | ) | | | (20 | ) | | | — | | | | — | | |
Net increase (decrease) in Retirement Class Shares | | | (30 | ) | | | 6 | | | | — | | | | — | | |
Net increase (decrease) in share transactions | | | (5,267 | ) | | | (5,467 | ) | | | (618 | ) | | | (1,305 | ) | |
58 TURNER FUNDS 2013 SEMIANNUAL REPORT
| | | Turner
Global Opportunities
Fund | |
| | | period ended
3/28/13 (unaudited) | | year ended
9/30/12 | |
Investment Activities: | |
Net investment loss | | $ | — | | | $ | (5 | ) | |
Net realized gain from securities sold | | | 154 | | | | 18 | | |
Net realized loss on foreign currency transactions | | | — | | | | (1 | ) | |
Net change in unrealized appreciation (depreciation) on investment transactions | | | (37 | ) | | | 258 | | |
Net increase in net assets resulting from operations | | | 117 | | | | 270 | | |
Dividends and distributions to shareholders: | |
Net investment income | |
Institutional Class Shares | | | (11 | ) | | | — | | |
Investor Class Shares | | | (1 | ) | | | — | | |
Realized capital gains | |
Institutional Class Shares | | | (11 | ) | | | (28 | ) | |
Investor Class Shares | | | (1 | ) | | | (14 | ) | |
Retirement Class Shares | | | — | | | | — | | |
Total dividends and distributions | | | (24 | ) | | | (42 | ) | |
Capital share transactions: | |
Institutional Class Shares | |
Proceeds from shares issued | | | 78 | | | | 561 | | |
Proceeds from shares issued in lieu of cash distributions | | | 22 | | | | 28 | | |
Cost of shares redeemed | | | (106 | ) | | | (15 | ) | |
Net increase (decrease) in net assets from Institutional Class Shares transactions | | | (6 | ) | | | 574 | | |
Investor Class Shares | |
Proceeds from shares issued | | | 51 | | | | 43 | | |
Proceeds from shares issued in lieu of cash distributions | | | 2 | | | | 14 | | |
Cost of shares redeemed | | | (35 | ) | | | (342 | ) | |
Net increase (decrease) in net assets from Investor Class Shares transactions | | | 18 | | | | (285 | ) | |
Retirement Class Shares | |
Proceeds from shares issued | | | — | | | | — | | |
Proceeds from shares issued in lieu of cash distributions | | | — | | | | — | | |
Cost of shares redeemed | | | — | | | | — | | |
Net increase (decrease) in net assets from Retirement Class Shares transactions | | | — | | | | — | | |
Net increase (decrease) in net assets from capital share transactions | | | 12 | | | | 289 | | |
Total increase (decrease) in net assets | | | 105 | | | | 517 | | |
Net assets: | |
Beginning of period | | | 1,905 | | | | 1,388 | | |
End of period | | $ | 2,010 | | | $ | 1,905 | | |
Accumulated net investment income | | $ | (14 | ) | | $ | (2 | ) | |
Share issued and redeemed: | |
Institutional Class Shares | |
Issued | | | 6 | | | | 43 | | |
Issued in lieu of cash distributions | | | 2 | | | | 2 | | |
Redeemed | | | (8 | ) | | | (1 | ) | |
Net increase (decrease) in Institutional Class Shares | | | — | | | | 44 | | |
Investor Class Shares | |
Issued | | | 4 | | | | 3 | | |
Issued in lieu of cash distributions | | | — | | | | 1 | | |
Redeemed | | | (3 | ) | | | (27 | ) | |
Net increase (decrease) in Investor Class Shares | | | 1 | | | | (23 | ) | |
Retirement Class Shares | |
Issued | | | — | | | | — | | |
Reinvested | | | — | | | | — | | |
Redeemed | | | — | | | | — | | |
Net increase (decrease) in Retirement Class Shares | | | — | | | | — | | |
Net increase (decrease) in share transactions | | | 1 | | | | 21 | | |
Amounts designated as "—" are either not applicable, $0 or have been rounded to $0.
The accompanying notes are an integral part of the financial statements.
TURNER FUNDS 2013 SEMIANNUAL REPORT 59
For a share outstanding throughout each period
| | Net asset
value,
beginning
of period | | Net
investment
income
(loss) | | Realized and
unrealized
gains (losses)
on investments | | Total
from
investment
operations | | Dividends
from net
investment
income | | Distributions
from
capital
gains | | Total
dividends and
distributions | |
Turner Market Neutral Fund — Institutional Class Shares | | | |
| | 2013 | ** | | $ | 10.18 | | | | (0.04 | ) (1) | | | (0.70 | ) | | | (0.74 | ) | | | — | | | | — | | | | — | | |
| | 2012 | | | $ | 10.53 | | | | (0.11 | ) (1) | | | (0.02 | ) | | | (0.13 | ) | | | — | | | | (0.22 | ) | | | (0.22 | ) | |
| | 2011 | (3) | | $ | 10.00 | | | | (0.09 | ) (1) | | | 0.62 | | | | 0.53 | | | | — | | | | — | | | | — | | |
Turner Market Neutral Fund — Investor Class Shares | | | |
| | 2013 | ** | | $ | 10.13 | | | | (0.05 | ) (1) | | | (0.69 | ) | | | (0.74 | ) | | | — | | | | — | | | | — | | |
| | 2012 | | | $ | 10.52 | | | | (0.14 | ) (1) | | | (0.03 | ) | | | (0.17 | ) | | | — | | | | (0.22 | ) | | | (0.22 | ) | |
| | 2011 | (3) | | $ | 10.00 | | | | (0.10 | ) (1) | | | 0.62 | | | | 0.52 | | | | — | | | | — | | | | — | | |
Turner Market Neutral Fund — Class C Shares | | | |
| | 2013 | ** | | $ | 10.01 | | | | (0.09 | ) (1) | | | (0.68 | ) | | | (0.77 | ) | | | — | | | | — | | | | — | | |
| | 2012 | | | $ | 10.46 | | | | (0.20 | ) (1) | | | (0.02 | ) | | | (0.23 | ) | | | — | | | | (0.22 | ) | | | (0.22 | ) | |
| | 2011 | (3) | | $ | 10.00 | | | | (0.15 | ) (1) | | | 0.61 | | | | 0.46 | | | | — | | | | — | | | | — | | |
Turner Medical Sciences Long/Short Fund — Institutional Class Shares | | | |
| | 2013 | ** | | $ | 10.19 | | | | (0.05 | ) (1) | | | 0.28 | | | | 0.23 | | | | — | | | | — | | | | — | | |
| | 2012 | | | $ | 10.35 | | | | (0.15 | ) (1) | | | (0.01 | ) | | | (0.16 | ) | | | — | | | | — | | | | — | | |
| | 2011 | (3) | | $ | 10.00 | | | | (0.12 | ) (1) | | | 0.47 | | | | 0.35 | | | | — | | | | — | | | | — | | |
Turner Medical Sciences Long/Short Fund — Investor Class Shares | | | |
| | 2013 | ** | | $ | 10.16 | | | | (0.07 | ) (1) | | | 0.29 | | | | 0.22 | | | | — | | | | — | | | | — | | |
| | 2012 | | | $ | 10.34 | | | | (0.18 | ) (1) | | | — | | | | (0.18 | ) | | | — | | | | — | | | | — | | |
| | 2011 | (3) | | $ | 10.00 | | | | (0.13 | ) (1) | | | 0.47 | | | | 0.34 | | | | — | | | | — | | | | — | | |
Turner Medical Sciences Long/Short Fund — Class C Shares | | | |
| | 2013 | ** | | $ | 10.04 | | | | (0.10 | ) (1) | | | 0.28 | | | | 0.18 | | | | — | | | | — | | | | — | | |
| | 2012 | | | $ | 10.30 | | | | (0.25 | ) (1) | | | (0.01 | ) | | | (0.26 | ) | | | — | | | | — | | | | — | | |
| | 2011 | (3) | | $ | 10.00 | | | | (0.18 | ) (1) | | | 0.48 | | | | 0.30 | | | | — | | | | — | | | | — | | |
60 TURNER FUNDS 2013 SEMIANNUAL REPORT
| | | Net asset
value, end
of period | | Total
return | | Net
assets end
of period
(000) | | Ratio of
net expenses
to average
net assets† | | Ratio of total
expenses
to average
net assets | | Ratio of net
investment
income (loss)
to average
net assets† | | Portfolio
turnover
rate†† | |
Turner Market Neutral Fund — Institutional Class Shares | |
| | 2013 | ** | | $ | 9.44 | | | | (7.27 | )%††† | | $ | 13,413 | | | | 1.94 | %* (2) | | | 2.69 | %* | | | (0.80 | )%* | | | 541 | % | |
| | 2012 | | | $ | 10.18 | | | | (1.23 | )% | | $ | 48,054 | | | | 1.94 | %* (4) | | | 2.57 | %* | | | (1.00 | )%* | | | 1,520 | % | |
| | 2011 | (3) | | $ | 10.53 | | | | 5.30 | %††† | | $ | 8,679 | | | | 1.95 | % (5) | | | 3.92 | % | | | (1.27 | )% | | | 1,184 | % | |
Turner Market Neutral Fund — Investor Class Shares | |
| | 2013 | ** | | $ | 9.39 | | | | (7.31 | )%††† | | $ | 1,246 | | | | 2.19 | %* (2) | | | 2.94 | %* | | | (1.05 | )%* | | | 541 | % | |
| | 2012 | | | $ | 10.13 | | | | (1.62 | )% | | $ | 5,685 | | | | 2.19 | %* (4) | | | 2.82 | %* | | | (1.25 | )%* | | | 1,520 | % | |
| | 2011 | (3) | | $ | 10.52 | | | | 5.20 | %††† | | $ | 3,233 | | | | 2.20 | % (5) | | | 4.18 | % | | | (1.54 | )% | | | 1,184 | % | |
Turner Market Neutral Fund — Class C Shares | |
| | 2013 | ** | | $ | 9.24 | | | | (7.69 | )%††† | | $ | 74 | | | | 2.94 | %* (2) | | | 3.69 | %* | | | (1.80 | )%* | | | 541 | % | |
| | 2012 | | | $ | 10.01 | | | | (2.21 | )% | | $ | 85 | | | | 2.94 | %* (4) | | | 3.57 | %* | | | (2.00 | )%* | | | 1,520 | % | |
| | 2011 | (3) | | $ | 10.46 | | | | 4.60 | %††† | | $ | — | | | | 2.95 | % (5) | | | 4.77 | % | | | (2.26 | )% | | | 1,184 | % | |
Turner Medical Sciences Long/Short Fund — Institutional Class Shares | |
| | 2013 | ** | | $ | 10.42 | | | | 2.26 | %††† | | $ | 21,416 | | | | 1.87 | %* (6) | | | 2.84 | %* | | | (1.03 | )%* | | | 269 | % | |
| | 2012 | | | $ | 10.19 | | | | (1.55 | )% | | $ | 37,117 | | | | 1.87 | %* (7) | | | 2.09 | %* | | | (1.45 | )%* | | | 900 | % | |
| | 2011 | (3) | | $ | 10.35 | | | | 3.50 | %††† | | $ | 45,147 | | | | 1.93 | % (8) | | | 2.74 | % | | | (1.74 | )% | | | 608 | % | |
Turner Medical Sciences Long/Short Fund — Investor Class Shares | |
| | 2013 | ** | | $ | 10.38 | | | | 2.17 | %††† | | $ | 3,333 | | | | 2.12 | %* (6) | | | 3.09 | %* | | | (1.28 | )%* | | | 269 | % | |
| | 2012 | | | $ | 10.16 | | | | (1.74 | )% | | $ | 9,606 | | | | 2.12 | %* (7) | | | 2.34 | %* | | | (1.70 | )%* | | | 900 | % | |
| | 2011 | (3) | | $ | 10.34 | | | | 3.40 | %††† | | $ | 12,777 | | | | 2.14 | % (8) | | | 2.89 | % | | | (1.93 | )% | | | 608 | % | |
Turner Medical Sciences Long/Short Fund — Class C Shares | |
| | 2013 | ** | | $ | 10.22 | | | | 1.79 | %††† | | $ | 1,414 | | | | 2.87 | %* (6) | | | 3.84 | %* | | | (2.03 | )%* | | | 269 | % | |
| | 2012 | | | $ | 10.04 | | | | (2.52 | )% | | $ | 2,889 | | | | 2.87 | %* (7) | | | 3.09 | %* | | | (2.45 | )%* | | | 900 | % | |
| | 2011 | (3) | | $ | 10.30 | | | | 3.00 | %††† | | $ | 2,165 | | | | 2.93 | % (8) | | | 3.63 | % | | | (2.71 | )% | | | 608 | % | |
* Does not include acquired fund fees or expenses
** For the six-month period ended March 28, 2013, unless otherwise indicated (unaudited). All ratios for the period have been annualized.
† Inclusive of fees paid indirectly, waivers and/or reimbursements.
†† Excludes effect of in-kind transfers and mergers, as applicable. Not annualized for periods less than one year.
††† Total return is for the period indicated and has not been annualized.
(1) Based on average shares outstanding.
(2) Dividend expense totaled 0.29% of average net assets for the period ended March 28, 2013, 0.29% of which was waived. Broker fees and charges on short sales totaled 0.15% of average net assets for the period ended March 28, 2013, 0.15% of which was waived. If dividend expense and broker fees and charges on short sales had not been contractually waived, the ratios of net expenses to average net assets would have been 2.38%, 2.63% and 3.38% for the Institutional, Investor and Class C Shares, respectively.
(3) Commenced operations on February 7, 2011. All ratios for the period have been annualized
(4) Dividend expense totaled 0.37% of average net assets for the year ended September 30, 2012, 0.37% of which was waived. Broker fees and charges on short sales totaled 0.22% of average net assets for the year ended September 30, 2012, 0.22% of which was waived. If dividend expense and broker fees and charges on short sales had not been contractually waived, the ratios of net expenses to average net assets would have been 2.53%, 2.78% and 3.53% for the Institutional, Investor and Class C Shares, respectively.
(5) Dividend expense totaled 0.44% of average net assets for the period ended September 30, 2011, 0.34% of which was waived. Broker fees and charges on short sales totaled 0.25% of average net assets for the period ended September 30, 2011, 0.19% of which was waived. If dividend expense and broker fees and charges on short sales had not been contractually waived, the ratios of net expenses to average net assets would have been 2.48%, 2.73% and 3.48% for the Institutional, Investor and Class C Shares, respectively.
(6) Dividend expense totaled 0.19% of average net assets for the period ended March 28, 2013, 0.19% of which was waived. Broker fees and charges on short sales totaled 0.15% of average net assets for the period ended March 28, 2013, 0.15% of which was waived. If dividend expense and broker fees and charges on short sales had not been contractually waived, the ratios of net expenses to average net assets would have been 2.21%, 2.46% and 3.21% for the Institutional, Investor and Class C Shares, respectively.
(7) Dividend expense totaled 0.04% of average net assets for the year ended September 30, 2012, 0.04% of which was waived. Broker fees and charges on short sales totaled 0.15% of average net assets for the year ended September 30, 2012, 0.15% of which was waived. If dividend expense and broker fees and charges on short sales had not been contractually waived, the ratios of net expenses to average net assets would have been 2.06%, 2.31% and 3.06% for the Institutional, Investor and Class C Shares, respectively.
(8) Dividend expense totaled 0.15% of average net assets for the period ended September 30, 2011, 0.12% of which was waived. Broker fees and charges on short sales totaled 0.47% of average net assets for the period ended September 30, 2011, 0.39% of which was waived. If dividend expense and broker fees and charges on short sales had not been contractually waived, the ratios of net expenses to average net assets would have been 2.44%, 2.65% and 3.44% for the Institutional, Investor and Class C Shares, respectively.
Amounts designated as "—" are either $0, not applicable or have been rounded to $0.
The accompanying notes are an integral part of the financial statements.
TURNER FUNDS 2013 SEMIANNUAL REPORT 61
For a share outstanding throughout each period
| | Net asset
value,
beginning
of period | | Net
investment
income
(loss) | | Realized and
unrealized
gains (losses)
on investments | | Total
from
investment
operations | | Dividends
from net
investment
income | | Distributions
from
capital
gains | | Total
dividends and
distributions | |
Turner Spectrum Fund — Institutional Class Shares | | | |
| | 2013 | * | | $ | 10.89 | | | | (0.01 | ) (1) | | | 0.25 | | | | 0.24 | | | | — | | | | — | | | | — | | |
| | 2012 | | | $ | 11.45 | | | | (0.13 | ) (1) | | | 0.04 | (2) | | | (0.09 | ) | | | — | | | | (0.47 | ) | | | (0.47 | ) | |
| | 2011 | | | $ | 10.82 | | | | (0.16 | ) (1) | | | 0.79 | | | | 0.63 | | | | — | | | | — | | | | — | | |
| | 2010 | | | $ | 10.81 | | | | (0.13 | ) (1) | | | 0.21 | | | | 0.08 | | | | — | | | | (0.07 | ) | | | (0.07 | ) | |
| | 2009 | (7) | | $ | 10.00 | | | | (0.07 | ) (1) | | | 0.88 | | | | 0.81 | | | | — | | | | — | | | | — | | |
Turner Spectrum Fund — Investor Class Shares | | | |
| | 2013 | * | | $ | 10.80 | | | | (0.03 | ) (1) | | | 0.25 | | | | 0.22 | | | | — | | | | — | | | | — | | |
| | 2012 | | | $ | 11.38 | | | | (0.16 | ) (1) | | | 0.05 | (2) | | | (0.11 | ) | | | — | | | | (0.47 | ) | | | (0.47 | ) | |
| | 2011 | | | $ | 10.78 | | | | (0.19 | ) (1) | | | 0.79 | | | | 0.60 | | | | — | | | | — | | | | — | | |
| | 2010 | | | $ | 10.80 | | | | (0.16 | ) (1) | | | 0.21 | | | | 0.05 | | | | — | | | | (0.07 | ) | | | (0.07 | ) | |
| | 2009 | (7) | | $ | 10.00 | | | | (0.09 | ) (1) | | | 0.89 | | | | 0.80 | | | | — | | | | — | | | | — | | |
Turner Spectrum Fund — Class C Shares | | | |
| | 2013 | * | | $ | 10.57 | | | | (0.07 | ) (1) | | | 0.25 | | | | 0.18 | | | | — | | | | — | | | | — | | |
| | 2012 | | | $ | 11.23 | | | | (0.24 | ) (1) | | | 0.05 | (2) | | | (0.19 | ) | | | — | | | | (0.47 | ) | | | (0.47 | ) | |
| | 2011 | | | $ | 10.72 | | | | (0.27 | ) (1) | | | 0.78 | | | | 0.51 | | | | — | | | | — | | | | — | | |
| | 2010 | | | $ | 10.80 | | | | (0.24 | ) (1) | | | 0.23 | | | | (0.01 | ) | | | — | | | | (0.07 | ) | | | (0.07 | ) | |
| | 2009 | (9) | | $ | 9.98 | | | | (0.07 | ) (1) | | | 0.89 | | | | 0.82 | | | | — | | | | — | | | | — | | |
Turner Titan Fund — Institutional Class Shares | | | |
| | 2013 | * | | $ | 10.24 | | | | (0.02 | ) (1) | | | (0.13 | ) | | | (0.15 | ) | | | — | | | | (0.08 | ) | | | (0.08 | ) | |
| | 2012 | | | $ | 9.77 | | | | (0.11 | ) (1) | | | 0.67 | | | | 0.56 | | | | — | | | | (0.09 | ) | | | (0.09 | ) | |
| | 2011 | (12) | | $ | 10.00 | | | | (0.10 | ) (1) | | | (0.13 | ) | | | (0.23 | ) | | | — | | | | — | | | | — | | |
Turner Titan Fund — Investor Class Shares | | | |
| | 2013 | * | | $ | 10.20 | | | | (0.04 | ) (1) | | | (0.12 | ) | | | (0.16 | ) | | | — | | | | (0.08 | ) | | | (0.08 | ) | |
| | 2012 | | | $ | 9.76 | | | | (0.13 | ) (1) | | | 0.66 | | | | 0.53 | | | | — | | | | (0.09 | ) | | | (0.09 | ) | |
| | 2011 | (12) | | $ | 10.00 | | | | (0.11 | ) (1) | | | (0.13 | ) | | | (0.24 | ) | | | — | | | | — | | | | — | | |
Turner Titan Fund — Class C Shares | | | |
| | 2013 | * | | $ | 10.07 | | | | (0.07 | ) (1) | | | (0.11 | ) | | | (0.18 | ) | | | — | | | | (0.08 | ) | | | (0.08 | ) | |
| | 2012 | | | $ | 9.72 | | | | (0.21 | ) (1) | | | 0.65 | | | | 0.44 | | | | — | | | | (0.09 | ) | | | (0.09 | ) | |
| | 2011 | (12) | | $ | 10.00 | | | | (0.16 | ) (1) | | | (0.12 | ) | | | (0.28 | ) | | | — | | | | — | | | | — | | |
62 TURNER FUNDS 2013 SEMIANNUAL REPORT
| | | Net asset
value, end
of period | | Total
return | | Net
assets end
of period
(000) | | Ratio of
net expenses
to average
net assets† | | Ratio of total
expenses
to average
net assets | | Ratio of net
investment
income (loss)
to average
net assets† | | Portfolio
turnover
rate†† | |
Turner Spectrum Fund — Institutional Class Shares | |
| | 2013 | * | | $ | 11.13 | | | | 2.20 | %††† | | $ | 763,265 | | | | 1.89 | %** (3) | | | 2.58 | %** | | | (0.24 | )%** | | | 316 | % | |
| | 2012 | | | $ | 10.89 | | | | (0.77 | )% | | $ | 832,857 | | | | 1.89 | %** (4) | | | 2.34 | %** | | | (1.15 | )%** | | | 996 | % | |
| | 2011 | | | $ | 11.45 | | | | 5.82 | % | | $ | 448,554 | | | | 1.93 | % (5) | | | 2.48 | % | | | (1.34 | )% | | | 1,153 | % | |
| | 2010 | | | $ | 10.82 | | | | 0.77 | % | | $ | 179,526 | | | | 1.91 | % (6) | | | 2.85 | % | | | (1.23 | )% | | | 1,808 | % | |
| | 2009 | (7) | | $ | 10.81 | | | | 8.10 | %††† | | $ | 8,681 | | | | 2.44 | % (8) | | | 5.63 | % | | | (1.78 | )% | | | 663 | % | |
Turner Spectrum Fund — Investor Class Shares | |
| | 2013 | * | | $ | 11.02 | | | | 2.04 | %††† | | $ | 99,800 | | | | 2.14 | %** (3) | | | 2.83 | %** | | | (0.49 | )%** | | | 316 | % | |
| | 2012 | | | $ | 10.80 | | | | (0.95 | )% | | $ | 126,533 | | | | 2.14 | %** (4) | | | 2.59 | %** | | | (1.40 | )%** | | | 996 | % | |
| | 2011 | | | $ | 11.38 | | | | 5.57 | % | | $ | 161,401 | | | | 2.18 | % (5) | | | 2.70 | % | | | (1.61 | )% | | | 1,153 | % | |
| | 2010 | | | $ | 10.78 | | | | 0.49 | % | | $ | 52,361 | | | | 2.17 | % (6) | | | 3.12 | % | | | (1.52 | )% | | | 1,808 | % | |
| | 2009 | (7) | | $ | 10.80 | | | | 8.00 | %††† | | $ | 4,567 | | | | 2.71 | % (8) | | | 5.84 | % | | | (2.09 | )% | | | 663 | % | |
Turner Spectrum Fund — Class C Shares | |
| | 2013 | * | | $ | 10.75 | | | | 1.70 | %††† | | $ | 6,581 | | | | 2.89 | %** (3) | | | 3.58 | %** | | | (1.24 | )%** | | | 316 | % | |
| | 2012 | | | $ | 10.57 | | | | (1.71 | )% | | $ | 10,391 | | | | 2.89 | %** (4) | | | 3.34 | %** | | | (2.15 | )%** | | | 996 | % | |
| | 2011 | | | $ | 11.23 | | | | 4.76 | % | | $ | 12,478 | | | | 2.93 | % (5) | | | 3.39 | % | | | (2.33 | )% | | | 1,153 | % | |
| | 2010 | | | $ | 10.72 | | | | (0.07 | )% | | $ | 7,169 | | | | 2.92 | % (6) | | | 3.82 | % | | | (2.19 | )% | | | 1,808 | % | |
| | 2009 | (9) | | $ | 10.80 | | | | 8.22 | %††† | | $ | — | | | | 2.35 | % (8) | | | 5.28 | % | | | (3.12 | )% | | | 663 | % | |
Turner Titan Fund — Institutional Class Shares | |
| | 2013 | * | | $ | 10.01 | | | | (1.49 | )%††† | | $ | 44,004 | | | | 1.92 | %** (10) | | | 2.25 | %** | | | (0.49 | )%** | | | 382 | % | |
| | 2012 | | | $ | 10.24 | | | | 5.75 | % | | $ | 25,811 | | | | 1.92 | %** (11) | | | 2.41 | %** | | | (1.03 | )%** | | | 834 | % | |
| | 2011 | (12) | | $ | 9.77 | | | | (2.30 | )%††† | | $ | 11,374 | | | | 1.92 | % (13) | | | 3.54 | % | | | (1.47 | )% | | | 647 | % | |
Turner Titan Fund — Investor Class Shares | |
| | 2013 | * | | $ | 9.96 | | | | (1.60 | )%††† | | $ | 829 | | | | 2.17 | %** (10) | | | 2.50 | %** | | | (0.74 | )%** | | | 382 | % | |
| | 2012 | | | $ | 10.20 | | | | 5.44 | % | | $ | 5,038 | | | | 2.17 | %** (11) | | | 2.66 | %** | | | (1.28 | )%** | | | 834 | % | |
| | 2011 | (12) | | $ | 9.76 | | | | (2.40 | )%††† | | $ | 2,711 | | | | 2.16 | % (13) | | | 4.66 | % | | | (1.65 | )% | | | 647 | % | |
Turner Titan Fund — Class C Shares | |
| | 2013 | * | | $ | 9.81 | | | | (1.82 | )%††† | | $ | 668 | | | | 2.92 | %** (10) | | | 3.25 | %** | | | (1.49 | )%** | | | 382 | % | |
| | 2012 | | | $ | 10.07 | | | | 4.53 | % | | $ | 531 | | | | 2.92 | %** (11) | | | 3.41 | %** | | | (2.03 | )%** | | | 834 | % | |
| | 2011 | (12) | | $ | 9.72 | | | | (2.80 | )%††† | | $ | 29 | | | | 2.92 | % (13) | | | 2.31 | % | | | (2.44 | )% | | | 647 | % | |
* For the six-month period ended March 28, 2013, unless otherwise indicated (unaudited). All ratios for the period have been annualized.
** Does not include acquired fund fees or expenses.
† Inclusive of fees paid indirectly, waivers and/or reimbursements.
†† Excludes effect of in-kind transfers and mergers, as applicable. Not annualized for periods less than one year.
††† Total return is for the period indicated and has not been annualized.
(1) Based on average shares outstanding.
(2) The amount shown for a share outstanding throughout the period and the aggregate net losses on investments for the period are no in accord, because of the sales and repurchases of fund shares in relation to fluctuating market value of the investments of the Fund.
(3) Dividend expense totaled 0.17% of average net assets for the period ended March 28, 2013, 0.17% of which was waived. Broker fees and charges on short sales totaled 0.18% of average net assets for the period ended March 28, 2013, 0.18% of which was waived. If dividend expense and broker fees and charges on short sales had not been contractually waived, the ratios of net expenses to average net assets would have been 2.24%, 2.49% and 3.24% for the Institutional, Investor and Class C Shares, respectively.
(4) Dividend expense totaled 0.20% of average net assets for the year ended September 30, 2012, 0.20% of which was waived. Broker fees and charges on short sales totaled 0.33% of average net assets for the year ended September 30, 2012, 0.33% of which was waived. If dividend expense and broker fees and charges on short sales had not been contractually waived, the ratios of net expenses to average net assets would have been 2.42%, 2.67% and 3.42% for the Institutional, Investor and Class C Shares, respectively.
(5) Dividend expense totaled 0.28% of average net assets for the year ended September 30, 2011, 0.22% of which was waived. Broker fees and charges on short sales totaled 0.32% of average net assets for the year ended September 30, 2011, 0.25% of which was waived. If dividend expense and broker fees and charges on short sales had not been contractually waived, the ratios of net expenses to average net assets would have been 2.40%, 2.65% and 3.40% for the Institutional, Investor and Class C Shares, respectively.
(6) Dividend expense totaled 0.45% of average net assets for the year ended September 30, 2010, 0.42% of which was waived. Broker fees and charges on short sales totaled 0.38% of average net assets for the year ended September 30, 2010, 0.37% of which was waived beginning on January 13, 2010. If dividend expense and broker fees and charges on short sales had not been contractually waived, the ratios of net expenses to average net assets would have been 2.70%, 2.96% and 3.71% for the Institutional, Investor and Class C Shares, respectively.
(7) Commenced operations on May 7, 2009. All ratios for the period have been annualized.
(8) Dividend expense totaled 0.70% of average net assets for the period ended September 30, 2009. If dividend expense had not been contractually waived, the ratios of net expenses to average net assets would have been 3.14%, 3.41% and 3.05% for the Institutional, Investor and Class C Shares, respectively. If broker fees and charges on short sales had not been included, the ratios of net expenses to average net assets would have been 1.94%, 2.20% and 1.95% for the Institutional, Investor and Class C Shares, respectively.
(9) Commenced operations on July 14, 2009. All ratios for the period have been annualized.
(10) Dividend expense totaled 0.05% of average net assets for the period ended March 28, 2013, 0.05% of which was waived. Broker fees and charges on short sales totaled 0.10% of average net assets for the period ended March 28, 2013, 0.10% of which was waived. If dividend expense and broker fees and charges on short sales had not been contractually waived, the ratios of net expenses to average net assets would have been 2.07%, 2.32% and 3.07% for the Institutional, Investor and Class C Shares, respectively.
(11) Dividend expense totaled 0.08% of average net assets for the period ended September 30, 2012, 0.08% of which was waived. Broker fees and charges on short sales totaled 0.23% of average net assets for the period ended September 30, 2012, 0.23% of which was waived. If dividend expense and broker fees and charges on short sales had not been contractually waived, the ratios of net expenses to average net assets would have been 2.23%, 2.48% and 3.23% for the Institutional, Investor and Class C Shares, respectively.
(12) Commenced operations of February 7, 2011. All ratios for the period have been annualized.
(13) Dividend expense totaled 0.28% of average net assets for the period ended September 30, 2011, 0.22% of which was waived. Broker fees and charges on short sales totaled 0.32% of average net assets for the period ended September 30, 2011, 0.25% of which was waived. If dividend expense and broker fees and charges on short sales had not been contractually waived, the ratios of net expenses to average net assets would have been 2.20%, 2.44% and 3.20% for the Institutional, Investor and Class C Shares, respectively.
Amounts designated as "—" are either $0, not applicable or have been rounded to $0.
The accompanying notes are an integral part of the financial statements.
TURNER FUNDS 2013 SEMIANNUAL REPORT 63
For a share outstanding throughout each period
| | Net asset
value,
beginning
of period | | Net
investment
income
(loss) | | Realized and
unrealized
gains (losses)
on investments | | Total
from
investment
operations | | Dividends
from net
investment
income | | Distributions
from
capital
gains | | Total
dividends and
distributions | |
Turner All Cap Growth Fund — Investor Class Shares | | | |
| | 2013 | * | | $ | 9.01 | | | | 0.03 | (1) | | | (0.09 | ) | | | (0.06 | ) | | | (0.03 | ) | | | — | | | | (0.03 | ) | |
| | 2012 | | | $ | 7.67 | | | | (0.02 | ) (1) | | | 1.36 | | | | 1.34 | | | | — | | | | — | | | | — | | |
| | 2011 | | | $ | 7.03 | | | | (0.11 | ) (1) | | | 0.75 | | | | 0.64 | | | | — | | | | — | | | | — | | |
| | 2010 | | | $ | 5.95 | | | | (0.09 | ) (1) | | | 1.18 | | | | 1.09 | | | | (0.01 | ) | | | — | | | | (0.01 | ) | |
| | 2009 | | | $ | 5.60 | | | | — | (1) | | | 0.35 | | | | 0.35 | | | | — | | | | — | | | | — | | |
| | 2008 | | | $ | 8.72 | | | | (0.07 | ) (1) | | | (3.05 | ) | | | (3.12 | ) | | | — | | | | — | | | | — | | |
Turner Emerging Growth Fund — Institutional Class Shares | | | |
| | 2013 | * | | $ | 57.68 | | | | 0.06 | (1) | | | 4.17 | | | | 4.23 | | | | — | | | | (8.41 | ) | | | (8.41 | ) | |
| | 2012 | | | $ | 45.83 | | | | (0.34 | ) (1) | | | 12.19 | | | | 11.85 | | | | — | | | | — | | | | — | | |
| | 2011 | | | $ | 42.51 | | | | (0.40 | ) (1) | | | 3.72 | | | | 3.32 | | | | — | | | | — | | | | — | | |
| | 2010 | | | $ | 37.78 | | | | (0.31 | ) (1) | | | 5.04 | | | | 4.73 | | | | — | | | | — | | | | — | | |
| | 2009 | (4) | | $ | 28.45 | | | | (0.12 | ) (1) | | | 9.45 | | | | 9.33 | | | | — | | | | — | | | | — | | |
Turner Emerging Growth Fund — Investor Class Shares | | | |
| | 2013 | * | | $ | 57.16 | | | | (0.01 | ) (1) | | | 4.11 | | | | 4.10 | | | | — | | | | (8.41 | ) | | | (8.41 | ) | |
| | 2012 | | | $ | 45.52 | | | | (0.47 | ) (1) | | | 12.11 | | | | 11.64 | | | | — | | | | — | | | | — | | |
| | 2011 | | | $ | 42.32 | | | | (0.52 | ) (1) | | | 3.72 | | | | 3.20 | | | | — | | | | — | | | | — | | |
| | 2010 | | | $ | 37.71 | | | | (0.41 | ) (1) | | | 5.02 | | | | 4.61 | | | | — | | | | — | | | | — | | |
| | 2009 | | | $ | 46.42 | | | | (0.22 | ) (1) | | | (7.31 | ) | | | (7.53 | ) | | | — | | | | (1.18 | ) | | | (1.18 | ) | |
| | 2008 | | | $ | 64.06 | | | | (0.35 | ) (1) | | | (8.54 | ) | | | (8.89 | ) | | | (0.25 | ) | | | (8.50 | ) | | | (8.75 | ) | |
Turner Large Growth Fund — Institutional Class Shares | | | |
| | 2013 | * | | $ | 12.86 | | | | (0.04 | ) (1) | | | 0.31 | | | | 0.35 | | | | (0.08 | ) | | | — | | | | (0.08 | ) | |
| | 2012 | | | $ | 10.50 | | | | 0.02 | (1) | | | 2.34 | | | | 2.36 | | | | — | | | | — | | | | — | | |
| | 2011 | | | $ | 10.56 | | | | — | (1) | | | (0.04 | ) | | | (0.04 | ) | | | (0.02 | ) | | | — | | | | (0.02 | ) | |
| | 2010 | | | $ | 9.93 | | | | 0.02 | (1) | | | 0.65 | | | | 0.67 | | | | (0.04 | ) | | | — | | | | (0.04 | ) | |
| | 2009 | | | $ | 10.41 | | | | 0.05 | (1) | | | (0.48 | ) | | | (0.43 | ) | | | (0.05 | ) | | | — | | | | (0.05 | ) | |
| | 2008 | | | $ | 14.39 | | | | 0.06 | (1) | | | (4.01 | ) | | | (3.95 | ) | | | (0.03 | ) | | | — | | | | (0.03 | ) | |
Turner Large Growth Fund — Investor Class Shares | | | |
| | 2013 | * | | $ | 12.74 | | | | 0.01 | (1) | | | 0.32 | | | | 0.33 | | | | (0.03 | ) | | | — | | | | (0.03 | ) | |
| | 2012 | | | $ | 10.42 | | | | (0.01 | ) (1) | | | 2.33 | | | | 2.32 | | | | — | | | | — | | | | — | | |
| | 2011 | | | $ | 10.49 | | | | (0.03 | ) (1) | | | (0.04 | ) | | | (0.07 | ) | | | — | | | | — | | | | — | | |
| | 2010 | | | $ | 9.87 | | | | — | (1) | | | 0.64 | | | | 0.64 | | | | (0.02 | ) | | | — | | | | (0.02 | ) | |
| | 2009 | | | $ | 10.34 | | | | 0.03 | (1) | | | (0.47 | ) | | | (0.44 | ) | | | (0.03 | ) | | | — | | | | (0.03 | ) | |
| | 2008 | | | $ | 14.33 | | | | 0.02 | (1) | | | (3.99 | ) | | | (3.97 | ) | | | (0.02 | ) | | | — | | | | (0.02 | ) | |
64 TURNER FUNDS 2013 SEMIANNUAL REPORT
| | | Net asset
value, end
of period | | Total
return | | Net
assets end
of period
(000) | | Ratio of
net expenses
to average
net assets† | | Ratio of total
expenses
to average
net assets | | Ratio of net
investment
income (loss)
to average
net assets† | | Portfolio
turnover
rate†† | |
Turner All Cap Growth Fund — Investor Class Shares | |
| | 2013 | * | | $ | 8.92 | | | | (0.66 | )%††† | | $ | 18,300 | | | | 0.83 | % | | | 1.41 | % | | | 0.62 | % | | | 62 | % | |
| | 2012 | | | $ | 9.01 | | | | 17.47 | % | | $ | 25,840 | | | | 0.86 | % | | | 1.34 | % | | | (0.25 | )% | | | 182 | % | |
| | 2011 | | | $ | 7.67 | | | | 9.10 | % | | $ | 33,053 | | | | 1.73 | % | | | 2.12 | % | | | (1.29 | )% | | | 205 | % | |
| | 2010 | | | $ | 7.03 | | | | 18.25 | % | | $ | 23,227 | | | | 1.64 | % | | | 2.15 | % | | | (1.38 | )% | | | 115 | % | |
| | 2009 | | | $ | 5.95 | | | | 6.25 | % | | $ | 26,324 | | | | 0.62 | % (2) | | | 1.23 | % | | | 0.09 | % | | | 220 | % | |
| | 2008 | | | $ | 5.60 | | | | (35.78 | )% | | $ | 32,759 | | | | 1.52 | % (3) | | | 1.90 | % | | | (0.89 | )% | | | 323 | % | |
Turner Emerging Growth Fund — Institutional Class Shares | |
| | 2013 | * | | $ | 53.50 | | | | 9.04 | %††† | | $ | 62,068 | | | | 1.15 | % | | | 1.30 | % | | | 0.23 | % | | | 25 | % | |
| | 2012 | | | $ | 57.68 | | | | 25.86 | % | | $ | 69,391 | | | | 1.15 | % | | | 1.30 | % | | | (0.62 | )% | | | 75 | % | |
| | 2011 | | | $ | 45.83 | | | | 7.81 | % | | $ | 67,035 | | | | 1.15 | % | | | 1.27 | % | | | (0.77 | )% | | | 74 | % | |
| | 2010 | | | $ | 42.51 | | | | 12.52 | % | | $ | 276,445 | | | | 1.15 | % | | | 1.28 | % | | | (0.77 | )% | | | 96 | % | |
| | 2009 | (4) | | $ | 37.78 | | | | 32.79 | %††† | | $ | 243,790 | | | | 1.15 | % | | | 1.33 | % | | | (0.54 | )% | | | 78 | % | |
Turner Emerging Growth Fund — Investor Class Shares | |
| | 2013 | * | | $ | 52.85 | | | | 8.88 | %††† | | $ | 163,925 | | | | 1.40 | % | | | 1.55 | % | | | (0.02 | )% | | | 25 | % | |
| | 2012 | | | $ | 57.16 | | | | 25.57 | % | | $ | 168,990 | | | | 1.40 | % | | | 1.55 | % | | | (0.87 | )% | | | 75 | % | |
| | 2011 | | | $ | 45.52 | | | | 7.56 | % | | $ | 159,127 | | | | 1.40 | % | | | 1.55 | % | | | (1.01 | )% | | | 74 | % | |
| | 2010 | | | $ | 42.32 | | | | 12.22 | % | | $ | 176,823 | | | | 1.40 | % | | | 1.53 | % | | | (1.02 | )% | | | 96 | % | |
| | 2009 | | | $ | 37.71 | | | | (15.58 | )% | | $ | 188,812 | | | | 1.40 | % | | | 1.56 | % | | | (0.71 | )% | | | 78 | % | |
| | 2008 | | | $ | 46.42 | | | | (16.08 | )% | | $ | 529,578 | | | | 1.40 | % | | | 1.49 | % | | | (0.66 | )% | | | 71 | % | |
Turner Large Growth Fund — Institutional Class Shares | |
| | 2013 | * | | $ | 13.13 | | | | 2.74 | %††† | | $ | 128,558 | | | | 0.69 | % | | | 0.92 | % | | | 0.60 | % | | | 34 | % (5) | |
| | 2012 | | | $ | 12.86 | | | | 22.48 | % | | $ | 201,051 | | | | 0.69 | % | | | 0.91 | % | | | 0.15 | % | | | 105 | % | |
| | 2011 | | | $ | 10.50 | | | | (0.39 | )% | | $ | 382,336 | | | | 0.69 | % | | | 0.89 | % | | | (0.03 | )% | | | 182 | % | |
| | 2010 | | | $ | 10.56 | | | | 6.76 | % | | $ | 377,650 | | | | 0.69 | % | | | 0.87 | % | | | 0.20 | % | | | 178 | % | |
| | 2009 | | | $ | 9.93 | | | | (3.97 | )% | | $ | 381,277 | | | | 0.69 | % | | | 0.92 | % | | | 0.65 | % | | | 126 | % | |
| | 2008 | | | $ | 10.41 | | | | (27.53 | )% | | $ | 360,083 | | | | 0.69 | % | | | 0.90 | % | | | 0.42 | % | | | 200 | % | |
Turner Large Growth Fund — Investor Class Shares | |
| | 2013 | * | | $ | 13.04 | | | | 2.62 | %††† | | $ | 42,243 | | | | 0.94 | % | | | 1.17 | % | | | 0.35 | % | | | 34 | % (5) | |
| | 2012 | | | $ | 12.74 | | | | 22.26 | % | | $ | 47,861 | | | | 0.94 | % | | | 1.16 | % | | | (0.10 | )% | | | 105 | % | |
| | 2011 | | | $ | 10.42 | | | | (0.67 | )% | | $ | 56,661 | | | | 0.94 | % | | | 1.13 | % | | | (0.28 | )% | | | 182 | % | |
| | 2010 | | | $ | 10.49 | | | | 6.51 | % | | $ | 163,750 | | | | 0.94 | % | | | 1.12 | % | | | (0.05 | )% | | | 178 | % | |
| | 2009 | | | $ | 9.87 | | | | (4.21 | )% | | $ | 252,916 | | | | 0.94 | % | | | 1.17 | % | | | 0.41 | % | | | 126 | % | |
| | 2008 | | | $ | 10.34 | | | | (27.76 | )% | | $ | 260,692 | | | | 0.94 | % | | | 1.15 | % | | | 0.15 | % | | | 200 | % | |
* For the six-month period ended March 28, 2013, unless otherwise indicated (unaudited). All ratios for the period have been annualized.
† Inclusive of fees paid indirectly, waivers and/or reimbursements.
†† Excludes effect of in-kind transfers and mergers, as applicable. Not annualized for periods less than one year.
††† Total return is for the period indicated and has not been annualized.
(1) Based on average shares outstanding.
(2) Excluding fees paid indirectly, the ratio of net expenses to average net assets would have been 0.63%.
(3) Excluding fees paid indirectly, the ratio of net expenses to average net assets would have been 1.54%.
(4) Commenced operations on February 1, 2009. All ratios for the period have been annualized.
(5) If the purchases of portfolio securities in connection with the reorganization of the Turner Concentrated Growth Fund into the Turner Large Growth Fund had been included, the portfolio turnover rate would have been 41%.
Amounts designated as "—" are either $0, not applicable or have been rounded to $0.
The accompanying notes are an integral part of the financial statements.
TURNER FUNDS 2013 SEMIANNUAL REPORT 65
For a share outstanding throughout each period
| | Net asset
value,
beginning
of period | | Net
investment
income
(loss) | | Realized and
unrealized
gains (losses)
on investments | | Total
from
investment
operations | | Dividends
from net
investment
income | | Distributions
from
capital
gains | | Total
dividends and
distributions | |
Turner Midcap Growth Fund — Institutional Class Shares | | | |
| | 2013 | * | | $ | 35.39 | | | | 0.02 | (1) | | | 2.89 | | | | 2.91 | | | | — | | | | (0.55 | ) | | | (0.55 | ) | |
| | 2012 | | | $ | 30.42 | | | | (0.05 | ) (1) | | | 5.02 | | | | 4.97 | | | | — | | | | — | | | | — | | |
| | 2011 | | | $ | 29.90 | | | | (0.06 | ) (1) | | | 0.58 | | | | 0.52 | | | | — | | | | — | | | | — | | |
| | 2010 | | | $ | 26.12 | | | | (0.08 | ) (1) | | | 3.86 | | | | 3.78 | | | | — | | | | — | | | | — | | |
| | 2009 | | | $ | 26.20 | | | | (0.01 | ) (1) | | | (0.07 | ) | | | (0.08 | ) | | | — | | | | — | | | | — | | |
| | 2008 | (2) | | $ | 34.67 | | | | (0.01 | ) (1) | | | (8.46 | ) | | | (8.47 | ) | | | — | | | | — | | | | — | | |
Turner Midcap Growth Fund — Investor Class Shares | | | |
| | 2013 | * | | $ | 35.03 | | | | (0.03 | ) (1) | | | 2.85 | | | | 2.82 | | | | — | | | | (0.55 | ) | | | (0.55 | ) | |
| | 2012 | | | $ | 30.16 | | | | (0.13 | ) (1) | | | 5.00 | | | | 4.87 | | | | — | | | | — | | | | — | | |
| | 2011 | | | $ | 29.73 | | | | (0.13 | ) (1) | | | 0.56 | | | | 0.43 | | | | — | | | | — | | | | — | | |
| | 2010 | | | $ | 26.03 | | | | (0.15 | ) (1) | | | 3.85 | | | | 3.70 | | | | — | | | | — | | | | — | | |
| | 2009 | | | $ | 26.18 | | | | (0.06 | ) (1) | | | (0.09 | ) | | | (0.15 | ) | | | — | | | | — | | | | — | | |
| | 2008 | | | $ | 35.71 | | | | (0.14 | ) (1) | | | (9.39 | ) | | | (9.53 | ) | | | — | | | | — | | | | — | | |
Turner Midcap Growth Fund — Retirement Class Shares | | | |
| | 2013 | * | | $ | 33.65 | | | | (0.06 | ) (1) | | | 2.76 | | | | 2.70 | | | | — | | | | (0.55 | ) | | | (0.55 | ) | |
| | 2012 | | | $ | 29.05 | | | | (0.20 | ) (1) | | | 4.80 | | | | 4.60 | | | | — | | | | — | | | | — | | |
| | 2011 | | | $ | 28.71 | | | | (0.22 | ) (1) | | | 0.56 | | | | 0.34 | | | | — | | | | — | | | | — | | |
| | 2010 | | | $ | 25.20 | | | | (0.21 | ) (1) | | | 3.72 | | | | 3.51 | | | | — | | | | — | | | | — | | |
| | 2009 | | | $ | 25.40 | | | | (0.11 | ) (1) | | | (0.09 | ) | | | (0.20 | ) | | | — | | | | — | | | | — | | |
| | 2008 | | | $ | 34.74 | | | | (0.22 | ) (1) | | | (9.12 | ) | | | (9.34 | ) | | | — | | | | — | | | | — | | |
Turner Small Cap Growth Fund — Investor Class Shares | | | |
| | 2013 | * | | $ | 35.96 | | | | (0.04 | ) (1) | | | 4.33 | | | | 4.29 | | | | — | | | | (2.51 | ) | | | (2.51 | ) | |
| | 2012 | | | $ | 27.83 | | | | (0.23 | ) (1) | | | 8.36 | | | | 8.13 | | | | — | | | | — | | | | — | | |
| | 2011 | | | $ | 28.97 | | | | (0.26 | ) (1) | | | (0.88 | ) | | | (1.14 | ) | | | — | | | | — | | | | — | | |
| | 2010 | | | $ | 25.17 | | | | (0.20 | ) (1) | | | 4.00 | | | | 3.80 | | | | — | | | | — | | | | — | | |
| | 2009 | | | $ | 26.45 | | | | (0.07 | ) (1) | | | (1.21 | ) | | | (1.28 | ) | | | — | | | | — | | | | — | | |
| | 2008 | | | $ | 32.98 | | | | (0.15 | ) (1) | | | (6.38 | ) | | | (6.53 | ) | | | — | | | | — | | | | — | | |
Turner Global Opportunities Fund — Institutional Class Shares | | | |
| | 2013 | * | | $ | 13.31 | | | | — | (1) | | | 0.78 | | | | 0.78 | | | | (0.09 | ) | | | (0.09 | ) | | | (0.18 | ) | |
| | 2012 | | | $ | 11.38 | | | | (0.03 | ) (1) | | | 2.31 | | | | 2.28 | | | | — | | | | (0.35 | ) | | | (0.35 | ) | |
| | 2011 | | | $ | 11.52 | | | | (0.05 | ) (1) | | | (0.09 | ) | | | (0.14 | ) | | | — | | | | — | | | | — | | |
| | 2010 | (3) | | $ | 10.00 | | | | (0.01 | ) (1) | | | 1.53 | | | | 1.52 | | | | — | | | | — | | | | — | | |
Turner Global Opportunities Fund — Investor Class Shares | | | |
| | 2013 | * | | $ | 13.22 | | | | (0.03 | ) (1) | | | 0.80 | | | | 0.77 | | | | (0.04 | ) | | | (0.09 | ) | | | (0.13 | ) | |
| | 2012 | | | $ | 11.33 | | | | (0.07 | ) (1) | | | 2.31 | | | | 2.24 | | | | — | | | | (0.35 | ) | | | (0.35 | ) | |
| | 2011 | | | $ | 11.50 | | | | (0.06 | ) (1) | | | (0.11 | ) | | | (0.17 | ) | | | — | | | | — | | | | — | | |
| | 2010 | (3) | | $ | 10.00 | | | | (0.03 | ) (1) | | | 1.53 | | | | 1.50 | | | | — | | | | — | | | | — | | |
66 TURNER FUNDS 2013 SEMIANNUAL REPORT
| | | Net asset
value, end
of period | | Total
return | | Net
assets end
of period
(000) | | Ratio of
net expenses
to average
net assets† | | Ratio of total
expenses
to average
net assets | | Ratio of net
investment
income (loss)
to average
net assets† | | Portfolio
turnover
rate†† | |
Turner Midcap Growth Fund — Institutional Class Shares | |
| | 2013 | * | | $ | 37.75 | | | | 8.38 | %††† | | $ | 181,096 | | | | 0.93 | % | | | 1.08 | % | | | 0.07 | % | | | 45 | % | |
| | 2012 | | | $ | 35.39 | | | | 16.34 | % | | $ | 236,147 | | | | 0.93 | % | | | 1.04 | % | | | (0.14 | )% | | | 121 | % | |
| | 2011 | | | $ | 30.42 | | | | 1.74 | % | | $ | 245,480 | | | | 0.93 | % | | | 1.05 | % | | | (0.18 | )% | | | 104 | % | |
| | 2010 | | | $ | 29.90 | | | | 14.47 | % | | $ | 164,993 | | | | 0.93 | % | | | 1.03 | % | | | (0.29 | )% | | | 90 | % | |
| | 2009 | | | $ | 26.12 | | | | (0.31 | )% | | $ | 136,069 | | | | 0.93 | % | | | 1.08 | % | | | (0.05 | )% | | | 120 | % | |
| | 2008 | (2) | | $ | 26.20 | | | | (24.43 | )%††† | | $ | 137,451 | | | | 0.93 | % (4) | | | 1.03 | % | | | (0.09 | )% | | | 157 | % | |
Turner Midcap Growth Fund — Investor Class Shares | |
| | 2013 | * | | $ | 37.30 | | | | 8.21 | %††† | | $ | 305,398 | | | | 1.18 | % | | | 1.33 | % | | | (0.18 | )% | | | 45 | % | |
| | 2012 | | | $ | 35.03 | | | | 16.15 | % | | $ | 404,427 | | | | 1.18 | % | | | 1.29 | % | | | (0.39 | )% | | | 121 | % | |
| | 2011 | | | $ | 30.16 | | | | 1.45 | % | | $ | 471,286 | | | | 1.18 | % | | | 1.28 | % | | | (0.38 | )% | | | 104 | % | |
| | 2010 | | | $ | 29.73 | | | | 14.21 | % | | $ | 751,124 | | | | 1.18 | % | | | 1.28 | % | | | (0.54 | )% | | | 90 | % | |
| | 2009 | | | $ | 26.03 | | | | (0.57 | )% | | $ | 859,640 | | | | 1.18 | % | | | 1.33 | % | | | (0.29 | )% | | | 120 | % | |
| | 2008 | | | $ | 26.18 | | | | (26.69 | )% | | $ | 994,545 | | | | 1.18 | % | | | 1.25 | % | | | (0.44 | )% | | | 157 | % | |
Turner Midcap Growth Fund — Retirement Class Shares | |
| | 2013 | * | | $ | 35.80 | | | | 8.19 | %††† | | $ | 4,036 | | | | 1.43 | % | | | 1.58 | % | | | (0.43 | )% | | | 45 | % | |
| | 2012 | | | $ | 33.65 | | | | 15.83 | % | | $ | 4,811 | | | | 1.43 | % | | | 1.54 | % | | | (0.64 | )% | | | 121 | % | |
| | 2011 | | | $ | 29.05 | | | | 1.18 | % | | $ | 3,972 | | | | 1.43 | % | | | 1.54 | % | | | (0.63 | )% | | | 104 | % | |
| | 2010 | | | $ | 28.71 | | | | 13.93 | % | | $ | 4,578 | | | | 1.43 | % | | | 1.53 | % | | | (0.79 | )% | | | 90 | % | |
| | 2009 | | | $ | 25.20 | | | | (0.79 | )% | | $ | 3,892 | | | | 1.43 | % | | | 1.58 | % | | | (0.55 | )% | | | 120 | % | |
| | 2008 | | | $ | 25.40 | | | | (26.89 | )% | | $ | 5,784 | | | | 1.43 | % | | | 1.50 | % | | | (0.69 | )% | | | 157 | % | |
Turner Small Cap Growth Fund — Investor Class Shares | |
| | 2013 | * | | $ | 37.74 | | | | 12.80 | %††† | | $ | 239,212 | | | | 1.25 | % | | | 1.54 | % | | | (0.19 | )% | | | 40 | % | |
| | 2012 | | | $ | 35.96 | | | | 29.21 | % | | $ | 250,099 | | | | 1.25 | % | | | 1.53 | % | | | (0.68 | )% | | | 100 | % | |
| | 2011 | | | $ | 27.83 | | | | (3.94 | )% | | $ | 229,919 | | | | 1.25 | % | | | 1.53 | % | | | (0.76 | )% | | | 119 | % | |
| | 2010 | | | $ | 28.97 | | | | 15.10 | % | | $ | 274,925 | | | | 1.25 | % | | | 1.52 | % | | | (0.74 | )% | | | 89 | % | |
| | 2009 | | | $ | 25.17 | | | | (4.84 | )% | | $ | 250,860 | | | | 1.25 | % | | | 1.58 | % | | | (0.36 | )% | | | 113 | % | |
| | 2008 | | | $ | 26.45 | | | | (19.80 | )% | | $ | 249,434 | | | | 1.25 | % (5) | | | 1.51 | % | | | (0.48 | )% | | | 141 | % | |
Turner Global Opportunities Fund — Institutional Class Shares | |
| | 2013 | * | | $ | 13.91 | | | | 5.96 | %††† | | $ | 1,728 | | | | 1.10 | % | | | 3.85 | % | | | 0.05 | % | | | 64 | % | |
| | 2012 | | | $ | 13.31 | | | | 20.53 | % | | $ | 1,654 | | | | 1.10 | % | | | 4.09 | % | | | (0.27 | )% | | | 95 | % | |
| | 2011 | | | $ | 11.38 | | | | (1.22 | )% | | $ | 910 | | | | 1.10 | % | | | 3.63 | % | | | (0.31 | )% | | | 178 | % | |
| | 2010 | (3) | | $ | 11.52 | | | | 15.20 | %††† | | $ | 1,153 | | | | 1.10 | % | | | 8.33 | % | | | (0.31 | )% | | | 37 | % | |
Turner Global Opportunities Fund — Investor Class Shares | |
| | 2013 | * | | $ | 13.86 | | | | 5.87 | %††† | | $ | 282 | | | | 1.35 | % | | | 4.10 | % | | | (0.20 | )% | | | 64 | % | |
| | 2012 | | | $ | 13.22 | | | | 20.27 | % | | $ | 251 | | | | 1.35 | % | | | 4.42 | % | | | (0.52 | )% | | | 95 | % | |
| | 2011 | | | $ | 11.33 | | | | (1.48 | )% | | $ | 478 | | | | 1.35 | % | | | 3.16 | % | | | (0.44 | )% | | | 178 | % | |
| | 2010 | (3) | | $ | 11.50 | | | | 15.00 | %††† | | $ | — | | | | 1.56 | % | | | 8.92 | % | | | (0.77 | )% | | | 37 | % | |
* For the six-month period ended March 28, 2013, unless otherwise indicated (unaudited). All ratios for the period have been annualized.
† Inclusive of fees paid indirectly, waivers and/or reimbursements.
†† Excludes effect of in-kind transfers and mergers, as applicable. Not annualized for periods less than one year.
††† Total return is for the period indicated and has not been annualized.
(1) Based on average shares outstanding.
(2) Commenced operations on June 16, 2008. All ratios for the period have been annualized.
(3) Commenced operations on May 7, 2010. All ratios for the period have been annualized.
(4) Excluding fees paid indirectly, the ratio of net expenses to average net assets would have been 0.94%.
(5) Excluding fees paid indirectly, the ratio of net expenses to average net assets would have been 1.26%
Amounts designated as "—" are either $0, not applicable or have been rounded to $0.
The accompanying notes are an integral part of the financial statements.
TURNER FUNDS 2013 SEMIANNUAL REPORT 67
NOTES TO FINANCIAL STATEMENTS (Unaudited)
Notes to financial statements
March 28, 2013
1. Organization:
Turner Funds (the "Trust"), a Massachusetts business trust, is registered under the Investment Company Act of 1940, as amended, as an open-end management investment company. The funds included herein are the Turner Market Neutral Fund ("Market Neutral Fund"), Turner Medical Sciences Long/Short Fund ("Medical Sciences Long/Short Fund"), Turner Spectrum Fund ("Spectrum Fund"), Turner Titan Fund ("Titan Fund"), Turner All Cap Growth Fund ("All Cap Growth Fund"), Turner Emerging Growth Fund ("Emerging Growth Fund"), Turner Large Growth Fund ("Large Growth Fund"), Turner Midcap Growth Fund ("Midcap Growth Fund"), Turner Small Cap Growth Fund ("Small Cap Growth Fund") and Turner Global Opportunities Fund ("Global Opportunities Fund"), each a "Fund" and collectively the "Funds."
Each Fund is registered as a diversified portfolio of the Trust with the exception of the Global Opportunities Fund, which is non-diversified.
The Funds are registered to offer different classes of shares: Institutional Class Shares, Investor Class Shares, Retirement Class Shares, Class C Shares, or a combination of the four. The assets of each Fund are segregated, and a shareholder's interest is limited to the Fund in which shares are held. The Funds' prospectuses provide a description of each Fund's investment objectives, policies and strategies along with information on the classes of shares currently being offered.
2. Significant accounting policies:
The following is a summary of the significant accounting policies followed by the Funds.
Use of estimates—The preparation of financial statements in conformity with U.S. generally accepted accounting principles ("GAAP") requires management to make estimates and assumptions that affect the reported amounts of assets and liabilities and disclosure of contingent assets and liabilities at the date of the financial statements and the reported amounts of increases and decreases in net assets from operations during the reporting period. Actual results could differ from those estimates.
In accordance with the authoritative guidance on fair value measurements and disclosures under GAAP, fair value is defined as the price that a Fund would receive upon selling an investment in a timely transaction to an independent buyer in the principal or most advantageous market.
The Trust has a three-tier fair value hierarchy that is dependent upon the various "inputs" used to determine the value of the Funds' investments. These inputs are summarized in the three broad levels listed below:
Level 1 – quoted prices in active markets for identical investments.
Level 2 – other significant observable inputs (including quoted prices for similar investments, interest rates, prepayment speeds, credit risks, etc.).
Level 3 – significant unobservable inputs (including a Fund's own assumptions in determining the fair value of investments).
Security valuation—Securities listed on a securities exchange, market or automated quotation system for which quotations are readily available (except for securities traded on Nasdaq), including American Depositary Receipts ("ADRs"), are valued at the last quoted sale price on the primary exchange or market (foreign or domestic) on which they are traded, or, if there is no such reported sale, at the most recent quoted bid price for long positions and the most recent quoted ask price for short positions. For securities traded on Nasdaq, the Nasdaq Official Closing Price will be used. The prices for foreign securities are reported in local currency and converted to U.S. dollars using currency exchange rates. Prices for most securities held in the Funds are provided daily by recognized independent pricing agents. To the extent these securities are valued at the last sales price or Nasdaq Official Closing Price, they are categorized as Level 1 in the fair value hierarchy.
Investments in other open-end investment companies are valued at net asset value. These valuations are typically categorized as Level 1 in the fair value hierarchy.
If a security price cannot be obtained from an independent, third-party pricing agent, the Funds seek to obtain bid and ask prices from two broker-dealers who make a market in the security and determine the average of the two. In this situation, valuations are typically categorized as Level 2 in the fair value hierarchy.
Securities for which market prices are not "readily available" are valued in accordance with Fair Value Procedures established by the Board of Trustees (the "Board"). The Funds' Fair Value Procedures are implemented through a Fair Value Committee (the "Committee") designated by the Board. Some of the more common reasons that may necessitate that a security be valued using Fair Value Procedures include: the security's trading has been halted or suspended; the security has been delisted from a national exchange; the security's primary trading market is temporarily closed at a time when under normal conditions it would be open; the security has not been traded for an extended period of time; the security's primary pricing source is not able or willing to provide a price; or trading of the security is subject to local government-imposed restrictions. When a security is valued in accordance with the Fair Value Procedures, the Committee will determine the value after taking
68 TURNER FUNDS 2013 SEMIANNUAL REPORT
into consideration relevant information reasonably available to the Committee. Depending on the source or relative significance of the valuation inputs, these securities may be categorized as Level 2 or Level 3 in the fair value hierarchy.
For securities that principally trade on a foreign market or exchange, a significant gap in time can exist between the time of a particular security's last trade and the time at which a Fund calculates its net asset value. The closing prices of such securities may no longer reflect their market value at the time a Fund calculates net asset value if an event that could materially affect the value of those securities (a "Significant Event") has occurred between the time of the security's last close and the time that a Fund calculates net asset value. A Significant Event may relate to a single issuer or to an entire market sector. In addition, the Funds' Sub-administrator, as defined in Note 3, monitors price movements among certain selected indices, securities and/or baskets of securities that may be an indicator that the closing prices received earlier from foreign exchanges or markets may not reflect market value at the time a Fund calculates its net asset value. If price movements in a monitored index or security exceed levels recommended by the Committee for approval by the Board ("trigger points"), the Sub-administrator will notify the Adviser, as defined in Note 3, that such limits have been exceeded. If such trigger points are exceeded, then the close prices for certain foreign markets are systematically adjusted by fair value factors calculated by an independent pricing service. The circumstances described above use significant observable inputs and therefore these valuations are considered as Level 2 in the fair value hierarchy.
In the event that the Adviser believes that the fair values provided by a third party fair valuation vendor are not reliable, or believes that a foreign security held by a Fund should be fair valued for any other reason, the Adviser shall contact the Sub-administrator and request that a meeting of the Committee be held. Depending on the source or relative significance of the valuation inputs, these securities may be categorized as Level 2 or Level 3 in the fair value hierarchy.
For the six months ended March 28, 2013, there were no Level 3 investments for which significant unobservable events were used to determine fair value.
The following is a summary of inputs used to value the Funds' investments as of March 28, 2013 (000), while the breakdown, by category, of common stock is disclosed on the Schedule of investments and Schedule of securities sold short for each Fund, as applicable:
| | | Level 1 | | Level 2 | | Total | |
Market Neutral Fund | |
Investments in securities | |
Common stock | | $ | 12,553 | | | $ | — | | | $ | 12,553 | | |
Total Investments in securities | | $ | 12,553 | | | $ | — | | | $ | 12,553 | | |
Securities sold short | |
Common stock | | $ | 12,900 | | | $ | — | | | $ | 12,900 | | |
Total Securities sold short | | $ | 12,900 | | | $ | — | | | $ | 12,900 | | |
Medical Sciences Long/Short Fund | |
Investments in securities | |
Common stock | | $ | 16,609 | | | $ | — | | | $ | 16,609 | | |
Call option contracts | | | 22 | | | | — | | | | 22 | | |
Put option contracts | | | 8 | | | | — | | | | 8 | | |
Cash equivalent | | | 3,747 | | | | — | | | | 3,747 | | |
Total Investments in securities | | $ | 20,386 | | | $ | — | | | $ | 20,386 | | |
Securities sold short | |
Common stock | | $ | 6,053 | | | $ | — | | | $ | 6,053 | | |
Exchange traded fund | | | 4,605 | | | | — | | | | 4,605 | | |
Total Securities sold short | | $ | 10,658 | | | $ | — | | | $ | 10,658 | | |
Spectrum Fund | |
Investments in securities | |
Common stock | | $ | 753,034 | | | $ | — | | | $ | 753,034 | | |
Exchange traded fund | | | 3,080 | | | | — | | | | 3,080 | | |
Call option contracts | | | 543 | | | | — | | | | 543 | | |
Put option contracts | | | 991 | | | | — | | | | 991 | | |
Cash equivalent | | | 12,422 | | | | — | | | | 12,422 | | |
Total Investments in securities | | $ | 770,070 | | | $ | — | | | $ | 770,070 | | |
Securities sold short | |
Common stock | | $ | 438,648 | | | $ | — | | | $ | 438,648 | | |
Convertible corporate bond | | | — | | | | 260 | | | | 260 | | |
Exchange traded fund | | | 108,123 | | | | — | | | | 108,123 | | |
Total Securities sold short | | $ | 546,771 | | | $ | 260 | | | $ | 547,031 | | |
Other financial instruments(a) | |
Written call option contracts | | $ | 34 | | | $ | — | | | $ | 34 | | |
Written put option contracts | | | 37 | | | | — | | | | 37 | | |
Total Other financial instruments | | $ | 71 | | | $ | — | | | $ | 71 | | |
Titan Fund | |
Investments in securities | |
Common stock | | $ | 44,526 | | | $ | — | | | $ | 44,526 | | |
Cash equivalent | | | 649 | | | | — | | | | 649 | | |
Total Investments in securities | | $ | 45,175 | | | $ | — | | | $ | 45,175 | | |
Securities sold short | |
Common stock | | $ | 27,138 | | | $ | — | | | $ | 27,138 | | |
Exchange traded fund | | | 1,954 | | | | — | | | | 1,954 | | |
Total Securities sold short | | $ | 29,092 | | | $ | — | | | $ | 29,092 | | |
TURNER FUNDS 2013 SEMIANNUAL REPORT 69
NOTES TO FINANCIAL STATEMENTS (Unaudited)
| | | Level 1 | | Level 2 | | Total | |
All Cap Growth Fund | |
Investments in securities | |
Common stock | | $ | 18,260 | | | $ | — | | | $ | 18,260 | | |
Cash equivalent | | | 1,528 | | | | — | | | | 1,528 | | |
Total Investments in securities | | $ | 19,788 | | | $ | — | | | $ | 19,788 | | |
Emerging Growth Fund | |
Investments in securities | |
Common stock | | $ | 225,640 | | | $ | — | | | $ | 225,640 | | |
Cash equivalent | | | 8,752 | | | | — | | | | 8,752 | | |
Total Investments in securities | | $ | 234,392 | | | $ | — | | | $ | 234,392 | | |
Large Growth Fund | |
Investments in securities | |
Common stock | | $ | 179,113 | | | $ | — | | | $ | 179,113 | | |
Cash equivalent | | | 8,377 | | | | — | | | | 8,377 | | |
Total Investments in securities | | $ | 187,490 | | | $ | — | | | $ | 187,490 | | |
Midcap Growth Fund | |
Investments in securities | |
Common stock | | $ | 505,151 | | | $ | — | | | $ | 505,151 | | |
Cash equivalent | | | 29,341 | | | | — | | | | 29,341 | | |
Total Investments in securities | | $ | 534,492 | | | $ | — | | | $ | 534,492 | | |
Small Cap Growth Fund | |
Investments in securities | |
Common stock | | $ | 237,807 | | | $ | — | | | $ | 237,807 | | |
Right | | | — | | | | — | (b) | | | — | (b) | |
Cash equivalent | | | 30,437 | | | | — | | | | 30,437 | | |
Total Investments in securities | | $ | 268,244 | | | $ | — | (b) | | $ | 268,244 | | |
Global Opportunities Fund | |
Investments in securities | |
Common stock | | $ | 1,952 | | | $ | — | | | $ | 1,952 | | |
Cash equivalent | | | 50 | | | | — | | | | 50 | | |
Total Investments in securities | | $ | 2,002 | | | $ | — | | | $ | 2,002 | | |
(a) Other financial instruments are derivative instruments and are reflected in the Schedule of open written option contracts.
(b) The market value of this security is equal to $0.
For the six months ended March 28, 2013, there have been no significant changes to the Funds' fair valuation methodologies. Changes in valuation techniques may result in transfers in or out of an investment's assigned level within the hierarchy during the reporting period. For each Fund there were no transfers between the levels as of March 28, 2013 based on the input levels assigned at September 30, 2012.
Security transactions and related income—Security transactions are accounted for on the date the security is purchased or sold (trade date). Dividend income is recognized on the ex-dividend date. Costs used in determining realized gains and losses on the sales of investment securities are those of the specific securities lots sold.
Securities sold short—Consistent with each Fund's investment objectives, the Funds may engage in short sales. Short sales are transactions under which a Fund sells a security it does not own. To complete such a transaction, the Fund must borrow the security to make delivery to the buyer. The Fund is then obligated to replace the security borrowed by purchasing the security at the market price at the time of the replacement. The price at such time may be more or less than the price at which the security was sold by the Fund. Until the security is replaced, the Fund is required to pay the lender amounts equal to any dividends that accrue during the period of the loan. Dividends declared on open short positions are recorded on ex-date and shown as an expense for financial reporting purposes. To borrow the security, the Fund also may be required to pay a fee, which is shown as an expense for financial reporting purposes. The proceeds of the short sale are retained by the broker, to the extent necessary to meet margin requirements, until the short position is closed out. A gain, limited to the price at which the Fund sold the security short, or a loss, unlimited in size, will be recognized upon the close of a short sale.
Until a Fund closes its short position or replaces the borrowed security, the Fund will: (a) maintain a segregated account containing cash or liquid securities at such a level that (i) the amount deposited in the account plus the amount deposited with the brokers as collateral will equal the current value of the security sold short; and (ii) the amount deposited in the segregated account plus the amount deposited with the broker as collateral will not be less than the market value of the security at the time the security was sold short, or (b) otherwise cover the short positions. The Market Neutral Fund, Medical Sciences Long/Short Fund, Spectrum Fund and Titan Fund engaged in short sales during the six months ended March 28, 2013.
Option transactions—Consistent with each Fund's investment objectives, the Funds may write covered call options and sell put options as a means of increasing the yield on their portfolios and as a means of providing limited protection against decreases in their market value. The Funds may purchase put and call options to protect against a decline in the market value of the securities in their portfolios or to anticipate an increase in the market value of securities that the Funds may seek to purchase in the future. A put option gives the purchaser of the option the right to sell, and the writer of the option the obligation to buy, the underlying security at any time during the option period. A call option gives the purchaser of the option the right to buy, and the writer of the option the obligation to sell, the underlying security at any time during the option period. The premium paid to the writer is the consideration for undertaking the
70 TURNER FUNDS 2013 SEMIANNUAL REPORT
obligations under the option contract. The initial purchase (sale) of an option contract is an "opening transaction." In order to close out an option position, the Fund may enter into a "closing transaction," which is simply the sale (purchase) of an option contract on the same security with the same exercise price and expiration date as the option contract originally opened. If the Fund is unable to effect a closing purchase transaction with respect to an option it has written, it will not be able to sell the underlying security until the option expires or the Fund delivers the security upon exercise. When the Fund writes (sells) an option, an amount equal to the premium received by the Fund is included in the Statement of Assets and Liabilities as an asset and an equivalent liability. The amount of the liability is subsequently marked-to-market to reflect the current value of the option written.
Option contracts are valued at the last quoted sales price. If there is no such reported sale on the valuation date, long positions are valued at the most recent bid price, and short positions are valued at the most recent ask price. When an option expires on its stipulated expiration date or the Fund enters into a closing purchase transaction, the Fund realizes a gain or loss if the cost of the closing purchase transaction differs from the premium received when the option was sold without regard to any unrealized gain or loss on the underlying security, and the liability related to such option is eliminated. When an option is exercised, the premium originally received decreases the cost basis of the security (or increases the proceeds on a sale of the security). The primary risk exposure from written and purchased options contracts is equity exposure.
Purchased options held by the Funds are included in "Investment securities, at value" on the Statements of assets and liabilities. As of March 28, 2013, these amounts were $28 (000) for the Medical Sciences Long/Short Fund and $1,534 (000) for the Spectrum Fund. Written option contracts are shown on the Statements of assets and liabilities under "Written options, at value" and were $71 (000) for the Spectrum Fund.
Any realized and unrealized gains and losses on purchased option contracts are included in "Net realized gain from securities sold" and "Net change in unrealized appreciation (depreciation) on investments," respectively, on the Statements of operations. Realized and unrealized gains and (losses) on purchased options for the Medical Sciences Long/Short Fund for the six months ended March 28, 2013 were $(48) and $(6), respectively (000). Realized and unrealized gains and (losses) on purchased options for the Spectrum Fund for the six months ended March 28, 2013 were $(1,310) and $(261), respectively (000). Any
realized and unrealized gains and losses on written option contracts are shown on the Statements of operations under "Net realized gain on written options contracts" and "Net change in unrealized appreciation (depreciation) on written option contracts," respectively. Realized and unrealized gains and (losses) on written options for the Spectrum Fund for the six months ended March 28, 2013 were $46 and $(23), respectively (000). The Medical Sciences Long/Short Fund and Spectrum Fund engaged in limited purchased and written option activity during the six months ended March 28, 2013, representing less than 1% of each Fund's average monthly fair value amounts of purchased and written options as compared to net assets.
A summary of option contracts written during the six months ended March 28, 2013 for the Spectrum Fund is as follows:
| | | Option
contracts | | Option
premiums
(000) | |
Options outstanding at beginning
of year | | | — | | | $ | — | | |
Options written | | | 3,230 | | | | 212 | | |
Options cancelled in a closing
purchase transaction | | | (1,649 | ) | | | (118 | ) | |
Options exercised | | | — | | | | — | | |
Options expired | | | — | | | | — | | |
Options outstanding at end of period | | | 1,581 | | | $ | 94 | | |
Foreign currency translation—The books and records of the Market Neutral Fund, Medical Sciences Long/Short Fund, Spectrum Fund, Titan Fund and Global Opportunities Fund are maintained in U.S. dollars. Investment securities and other assets and liabilities denominated in a foreign currency are translated into U.S. dollars on the date of valuation. The Market Neutral Fund, Medical Sciences Long/Short Fund, Spectrum Fund, Titan Fund and Global Opportunities Fund do not isolate that portion of realized or unrealized gains and losses resulting from changes in the foreign exchange rate from fluctuations arising from changes in the market prices of the securities. These gains and losses are included in net realized and unrealized gains and losses on investments in the Statements of Operations. Net realized and unrealized gains and losses on foreign currency transactions represent net foreign exchange gains or losses from foreign currency exchange contracts, disposition of foreign currencies, currency gains or losses realized between trade and settlement dates on securities transactions and the difference between the amount of the investment income and foreign withholding taxes recorded on the Market Neutral Fund, Medical Sciences Long/Short Fund, Spectrum Fund, Titan Fund and
TURNER FUNDS 2013 SEMIANNUAL REPORT 71
NOTES TO FINANCIAL STATEMENTS (Unaudited)
Global Opportunities Fund's books and the U.S. dollar equivalent amounts actually received or paid.
Illiquid Securities—Illiquid securities are securities that cannot be disposed of within seven business days at approximately the price at which they are being carried on a Fund's books. Illiquid securities include demand instruments with demand notice periods exceeding seven days, securities for which there is no active secondary market, and repurchase agreements with maturities of over seven days in length. The Funds may invest in securities that are neither listed on a stock exchange nor traded over the counter, including privately placed securities. Investing in such unlisted emerging country equity securities, including investments in new and early stage companies, may involve a high degree of business and financial risk that can result in substantial losses. As a result of the absence of a public trading market for these securities, they may be less liquid than publicly traded securities. Although these securities may be resold in privately negotiated transactions, the prices realized from these sales could be less than those originally paid by the Fund, or less than what may be considered the fair value of such securities. Further, companies whose securities are not publicly traded may not be subject to the disclosure and other investor protection requirements which might be applicable if their securities were publicly traded. If such securities are required to be registered under the securities laws of one or more jurisdictions before being resold, a Fund may be required to bear the expenses of registration.
Expenses—Expenses that are specifically attributed to one of the Funds are charged to that Fund. Certain other expenses of the Funds are prorated among the Funds on the basis of relative daily net assets.
Classes—Class specific expenses are borne by that class. Income, non-class specific expenses and realized/unrealized gains and losses are allocated to the respective classes on the basis of the relative daily net assets.
Dividends and distributions—The Funds declare and distribute net investment income, if any, annually, as a dividend to shareholders. Any net realized capital gains on sales of securities for all Funds are distributed to shareholders at least annually.
New Accounting Pronouncement—In January 2013, the Financial Accounting Standards Board issued Accounting Standards Update ("ASU") No. 2013-01 "Clarifying the Scope of Disclosures about Offsetting Assets and Liabilities ("ASU 2013-01") which amended Accounting Standards Codification Subtopic 210-20, Balance Sheet Offsetting. ASU 2013-01 clarified the scope of ASU No. 2011-11 "Disclosures about Offsetting Assets and Liabilities ("ASU 2011-11"). ASU 2011-11 requires an entity to disclose information about offsetting
and related arrangements to enable users of that entity's financial statements to understand the effect of those arrangements on its financial position. ASU 2013-01 clarifies the scope of ASU 2011-11 as applying to derivatives accounted for in accordance with Topic 815, Derivatives and Hedging, including bifurcated embedded derivatives, repurchase agreements and reverse repurchase agreements, and securities borrowing and securities lending transactions that are offset either in accordance with other requirements of GAAP or subject to an enforceable master netting arrangement or similar agreement. The guidance in ASU 2013-01 and ASU 2011-11 is effective for interim and annual periods beginning on or after January 1, 2013. Management is evaluating any impact ASU 2013-01 and ASU 2011-11 may have on the Trusts' financial statements.
3. Transactions with affiliates:
Certain officers and trustees of the Trust are also officers or employees of Turner Investments, L.P. ("Turner", the "Adviser", or the "Administrator") or Citi Fund Services Ohio, Inc. ("Citi" or the "Sub-administrator"), the Trust's Sub-administrator. With the exception of the Trust's Chief Compliance Officer, such officers are paid no fees by the Trust for serving as officers and trustees of the Trust.
Foreside Fund Services, LLC (the "Distributor") provides distribution services to the Funds under a Distribution Services Agreement.
4. Administration, shareholder servicing, distribution and transfer agent agreements:
Turner provides administrative services to the Funds under an Administration Agreement with the Trust. For its services, Turner receives an annual fee of 0.15% of the aggregate average daily net assets of the Trust up to $2 billion and 0.12% of the aggregate average daily net assets of the Trust over $2 billion. Under a separate Sub-administration Agreement between Turner and Citi, Citi provides sub-administrative services, including certain fund accounting services, to the Trust. For the six months ended March 28, 2013, Citi was paid $404 (000) by Turner.
The Funds have adopted a Distribution Plan for Retirement Class Shares and Class C Shares (the "Distribution Plan") under which firms, including the Distributor, that provide distribution services may receive compensation. Under the Distribution Plan, which was adopted pursuant to Rule 12b-1 under the Investment Company Act of 1940, as amended, the Distributor is entitled to receive aggregate fees for distribution services not exceeding 0.75% of each Fund's average daily net assets attributable to Retirement Class or Class C Shares that are subject to the arrangement in return for providing a broad range of distribution services. Currently, the Retirement Class Shares of the Midcap Growth Fund pays the
72 TURNER FUNDS 2013 SEMIANNUAL REPORT
Distributor 0.25% and the Class C Shares of the Market Neutral Fund, Medical Sciences Long/Short Fund, Spectrum Fund and Titan Fund pay the Distributor 0.75% in distribution fees.
The Funds have also adopted Shareholder Services Plans (the "Shareholder Services Plans"). Under the Shareholder Services Plans, service providers are entitled to receive aggregate fees for shareholder services not exceeding 0.25% of each Fund's average daily net assets attributable to Investor Class Shares, Retirement Class Shares and Class C Shares that are subject to the arrangement in return for providing shareholder services. Currently, Investor Class Shares of each Fund, Retirement Class Shares of the Midcap Growth Fund and Class C Shares of the Market Neutral Fund, Medical Sciences Long/Short Fund, Spectrum Fund and Titan Fund pay 0.25% in shareholder servicing fees.
DST Systems, Inc. serves as the transfer agent and dividend disbursing agent for the Funds under a Transfer Agency Agreement with the Trust.
5. Investment advisory agreement:
The Trust and Turner are parties to an Investment Advisory Agreement dated April 28, 1996 under which Turner receives a fee that is calculated daily and paid monthly, based on the average daily net assets of the Funds.
For its services, Turner receives annual fees, which are calculated daily and paid monthly, based on average daily net assets of the Funds. Turner has contractually agreed to waive all or a portion of its fees and to reimburse expenses in order to limit total Fund operating expenses (excluding acquired fund fees and expenses and interest expenses relating to short sales, except for the Market Neutral Fund, Medical Sciences Long/Short Fund, Spectrum Fund and Titan Fund, for which Turner includes acquired fund fees and expenses and interest expenses relating to short sales in its contractual waiver) to a specified percentage of the average daily net assets of each Fund, except the All Cap Growth Fund, on an annualized basis through certain dates disclosed in the following table:
| | | Advisory
fee | | Expense
cap | | Date
(through) | |
Market Neutral Fund | |
Institutional Class | | | 1.50 | % | | | 1.95 | % | | January 31, 2014 | |
Investor Class | | | 1.50 | % | | | 2.20 | % | | January 31, 2014 | |
Class C | | | 1.50 | % | | | 2.95 | % | | January 31, 2014 | |
Medical Sciences Long/Short
Fund | |
Institutional Class | | | 1.50 | % | | | 1.95 | % | | January 31, 2014 | |
Investor Class | | | 1.50 | % | | | 2.20 | % | | January 31, 2014 | |
Class C | | | 1.50 | % | | | 2.95 | % | | January 31, 2014 | |
Spectrum Fund | |
Institutional Class | | | 1.50 | % | | | 1.95 | % | | January 31, 2014 | |
Investor Class | | | 1.50 | % | | | 2.20 | % | | January 31, 2014 | |
Class C | | | 1.50 | % | | | 2.95 | % | | January 31, 2014 | |
| | | Advisory
fee | | Expense
cap | | Date
(through) | |
Titan Fund | |
Institutional Class | | | 1.50 | % | | | 1.95 | % | | January 31, 2014 | |
Investor Class | | | 1.50 | % | | | 2.20 | % | | January 31, 2014 | |
Class C | | | 1.50 | % | | | 2.95 | % | | January 31, 2014 | |
Emerging Growth Fund | |
Institutional Class | | | 1.00 | % | | | 1.15 | % | | January 31, 2014 | |
Investor Class | | | 1.00 | % | | | 1.40 | % | | January 31, 2014 | |
Large Growth Fund | |
Institutional Class | | | 0.60 | % | | | 0.69 | % | | January 31, 2014 | |
Investor Class | | | 0.60 | % | | | 0.94 | % | | January 31, 2014 | |
Midcap Growth Fund | |
Institutional Class | | | 0.75 | % | | | 0.93 | % | | January 31, 2014 | |
Investor Class | | | 0.75 | % | | | 1.18 | % | | January 31, 2014 | |
Retirement Class | | | 0.75 | % | | | 1.43 | % | | January 31, 2014 | |
Small Cap Growth Fund | |
Investor Class | | | 1.00 | % | | | 1.25 | % | | January 31, 2014 | |
Global Opportunities Fund | |
Institutional Class | | | 0.75 | % | | | 1.10 | % | | January 31, 2014 | |
Investor Class | | | 0.75 | % | | | 1.35 | % | | January 31, 2014 | |
For the All Cap Growth Fund, the advisory fee is comprised of a base fee and performance adjustment that increases or decreases the total fee depending upon the performance of the Fund relative to its performance benchmark. The Fund's base fee (1.10%) is accrued daily and paid monthly, based on the Fund's average net assets during the current month.
The performance adjustment is calculated and paid monthly by comparing the Fund's performance to that of its performance benchmark over the current month plus the previous 11 months (the "performance period"). The annual performance adjustment rate is multiplied by the average net assets of the Fund over the entire performance period, which is then multiplied by a fraction, the numerator of which is the number of days in the month and the denominator of which is 365 (366 in leap years). The resulting amount is then added to (in the case of overperformance) or subtracted from (in the case of underperformance) the Fund's base advisory fee.
In cases where the advisory fee is comprised of a base fee and a performance adjustment, Turner has voluntarily agreed to waive all or a portion of its fees and to reimburse expenses in order to keep such Fund's "other expenses" (excluding distribution fees, acquired fund fees and expenses and interest expenses relating to short sales) from exceeding a specified percentage of the average daily net assets of the Fund on an annualized basis. Accordingly, the base advisory fee, annual adjustment rate, over/under performance relative to the benchmark threshold, and other expense cap are as follows:
| | | Base
advisory
fee | | Annual
adjustment
rate | | Benchmark
threshold(1) | | Other
expenses
cap | |
All Cap Growth Fund | | | 1.10 | % | | | +/-0.40% | | | | +/-2.50% | | | | 0.25 | % | |
(1) See the Fund's Prospectus and Statement of Additional Information for more information regarding each Fund's performance benchmark.
TURNER FUNDS 2013 SEMIANNUAL REPORT 73
NOTES TO FINANCIAL STATEMENTS (Unaudited)
During the six months ended March 28, 2013, the All Cap Growth Fund's advisory fees, before waivers, were adjusted in accordance with the policy described above (000):
| | | Base
adviser
fee | | Performance
adjustment | | Net adviser
fee before
waivers | |
All Cap Growth Fund | | $ | 114 | | | $ | (54 | ) | | $ | 60 | | |
6. Contingent deferred sales charges (Class C Shares):
A 1.00% contingent deferred sales charge ("CDSC") will be deducted with respect to Class C Shares of the Market Neutral Fund, Medical Sciences Long/Short Fund, Spectrum Fund and Titan Fund redeemed within 12 months of purchase. The CDSC will be based on the lower of the original purchase price or the value of the Class C Shares redeemed. The CDSC may be waived for certain investors, as described in the Class C Shares statutory prospectus for the Market Neutral Fund, Medical Sciences Long/Short Fund, Spectrum Fund and Titan Fund.
7. Investment transactions:
The cost of security purchases and the proceeds from security sales, other than short-term investments and option contracts written, for the six months ended March 28, 2013 were as follows (000):
| | | Purchases | | Sales | |
Market Neutral Fund | | $ | 132,419 | | | $ | 158,074 | | |
Medical Sciences Long/Short Fund | | | 53,245 | | | | 66,208 | | |
Spectrum Fund | | | 2,290,923 | | | | 2,360,207 | | |
Titan Fund | | | 164,289 | | | | 148,271 | | |
All Cap Growth Fund | | | 12,974 | | | | 19,659 | | |
Emerging Growth Fund | | | 55,576 | | | | 81,026 | | |
Large Growth Fund* | | | 88,226 | | | | 161,752 | | |
Midcap Growth Fund | | | 243,221 | | | | 411,307 | | |
Small Cap Growth Fund | | | 93,421 | | | | 129,137 | | |
Global Opportunities Fund | | | 1,174 | | | | 1,189 | | |
* Costs of purchases and proceeds from sales of portfolio securities incurred to realign the Fund's portfolio after the reorganization of the Turner Concentrated Growth Fund into the Turner Large Growth Fund are excluded from these amounts. The cost of purchases excluded are $15,344(000).
8. Federal tax policies and information:
Each of the Funds is classified as a separate taxable entity for Federal income tax purposes. Each of the Funds intends to continue to qualify as a separate "regulated
investment company" under the Internal Revenue Code and make the requisite distributions to shareholders that will be sufficient to relieve it from Federal income tax and Federal excise tax. Therefore, no Federal tax provision is required.
The amounts of dividends from net investment income and distributions from net realized capital gains, if any, are determined in accordance with Federal income tax regulations, which may differ from those amounts determined under GAAP. These book/tax differences are either temporary or permanent in nature. These differences are primarily due to wash sales, REIT adjustments, foreign currency transactions, net operating losses, return of capital distributions, equalization and investments in partnerships and passive foreign investment companies. The character and timing of dividends from net investment income and distributions from net realized gains distributed during the fiscal year may differ from the year that the income or realized gains (losses) were recorded by the Funds. To the extent these differences are permanent, adjustments are made to the appropriate equity accounts in the period that the differences arise. The Funds may utilize equalization accounting for tax purposes and designate earnings and profits, including net realized gains distributed to shareholders on redemption of shares, as part of the dividends paid deduction for income tax purposes.
Withholding taxes on dividends and net realized capital gains as a result of certain investments in ADRs by the Funds have been provided for in accordance with each investment's applicable country's tax rules and rates.
The tax character of dividends and distributions declared during the years ended September 30, 2012 and September 30, 2011 were as follows (000):
| | | Ordinary
income | | Long-term
capital gain | | Total | |
Market Neutral Fund | | | |
| | 2012 | | | $ | 457 | | | $ | 4 | | | $ | 461 | | |
Spectrum Fund | | | |
| | 2012 | | | $ | 30,159 | | | $ | — | | | $ | 30,159 | | |
Titan Fund | | | |
| | 2012 | | | $ | 151 | | | $ | — | | | $ | 151 | | |
Large Growth Fund | | | |
| | 2011 | | | $ | 671 | | | $ | — | | | $ | 671 | | |
Global Opportunities Fund | | | |
| | 2012 | | | $ | 14 | | | $ | 28 | | | $ | 42 | | |
74 TURNER FUNDS 2013 SEMIANNUAL REPORT
As of September 30, 2012, the components of distributable earnings (accumulated losses) on a tax basis were as follows (000):
| | | Undistributed
ordinary
income | | Undistributed
long-term
capital gains | | Capital
loss
carryforward | | Post-
October
losses | | Late
year
ordinary
loss | | Unrealized
appreciation
(depreciation) | | Total
distributable
earnings
(accumulated
losses) | |
Market Neutral Fund | | $ | — | | | $ | — | | | $ | — | | | $ | (129 | ) | | $ | (339 | ) | | $ | (1,045 | ) | | $ | (1,513 | ) | |
Medical Sciences Long/Short Fund | | | — | | | | — | | | | (165 | ) | | | (1,449 | ) | | | (736 | ) | | | 854 | | | | (1,496 | ) | |
Spectrum Fund | | | — | | | | — | | | | (197 | ) | | | (20,357 | ) | | | (7,045 | ) | | | (8,608 | ) | | | (36,207 | ) | |
Titan Fund | | | 367 | | | | — | | | | — | | | | — | | | | — | | | | (136 | ) | | | 231 | | |
All Cap Growth Fund | | | — | | | | — | | | | (9,865 | ) | | | (2,399 | ) | | | — | | | | 3,462 | | | | (8,802 | ) | |
Emerging Growth Fund | | | — | | | | 31,603 | | | | — | | | | — | | | | (1,479 | ) | | | 66,708 | | | | 96,832 | | |
Large Growth Fund | | | 450 | | | | — | | | | (97,399 | ) | | | — | | | | — | | | | 29,779 | | | | (67,170 | ) | |
Midcap Growth Fund | | | — | | | | — | | | | — | | | | (384 | ) | | | (2,022 | ) | | | 87,050 | | | | 84,644 | | |
Small Cap Growth Fund | | | — | | | | 11,606 | | | | — | | | | — | | | | (1,229 | ) | | | 39,250 | | | | 49,627 | | |
Global Opportunities Fund | | | — | | | | 10 | | | | — | | | | — | | | | (2 | ) | | | 302 | | | | 310 | | |
Under current tax law, capital losses and specified ordinary losses realized after October 31st and non-specified ordinary losses incurred after December 31st (ordinary losses collectively known as "late year ordinary loss") may be deferred and treated as having arisen in the following fiscal year.
As of the end of their latest tax year end of September 30, 2012, the Funds in the following tables had capital loss carryforwards ("CLCFs"). CLCFs not subject to expiration must be used prior to using any CLCFs that are subject to expiration. A summary of these CLCFs is detailed in the tables below (000):
CLCFs not subject to expiration:
| | | Short Term | | Long Term | |
Medical Sciences Long/Short Fund | | $ | 165 | | | $ | — | | |
Spectrum Fund | | | 197 | | | | — | | |
CLCFs subject to expiration:
| | | Expiring September 30, | |
| | | 2017 | | 2018 | | Total | |
All Cap Growth Fund | | $ | 7,475 | | | $ | 2,390 | | | $ | 9,865 | | |
Large Growth Fund | | | 7,956 | | | | 89,443 | | | | 97,399 | | |
As of March 7, 2011, the Large Growth Fund credited accumulated net realized loss $12,828 (000) and charged paid-in-capital $123,626 (000) and unrealized appreciation $31,165 (000) due to the Turner Large Cap Growth Fund ("Large Cap Growth Fund") merger with the Large Growth Fund. Internal Revenue Code Section 382 limits the amount of annual CLCFs available for use. However, if the Large Growth Fund recognizes sufficient capital gains before the relevant expiration dates, Section 382 should not preclude the use of these CLCFs.
At March 28, 2013, the total cost of securities for Federal income tax purposes and the aggregate gross unrealized appreciation and depreciation for the investments held by each Fund, excluding securities sold short and written options, were as follows (000):
| | | Federal
tax
cost | | Unrealized
appreciation | | Unrealized
depreciation | | Net
unrealized
appreciation
(depreciation) | |
Market Neutral Fund | | $ | 12,642 | | | $ | 229 | | | $ | (318 | ) | | $ | (89 | ) | |
Medical Sciences Long/Short Fund | | | 18,999 | | | | 1,464 | | | | (77 | ) | | | 1,387 | | |
Spectrum Fund | | | 718,885 | | | | 58,991 | | | | (7,806 | ) | | | 51,185 | | |
Titan Fund | | | 42,275 | | | | 3,021 | | | | (121 | ) | | | 2,900 | | |
All Cap Growth Fund | | | 18,401 | | | | 1,936 | | | | (549 | ) | | | 1,387 | | |
Emerging Growth Fund | | | 166,912 | | | | 68,173 | | | | (693 | ) | | | 67,480 | | |
Large Growth Fund | | | 171,681 | | | | 21,105 | | | | (5,302 | ) | | | 15,803 | | |
Midcap Growth Fund | | | 452,829 | | | | 88,192 | | | | (6,529 | ) | | | 81,663 | | |
Small Cap Growth Fund | | | 218,716 | | | | 52,348 | | | | (2,820 | ) | | | 49,528 | | |
Global Opportunities Fund | | | 1,745 | | | | 286 | | | | (29 | ) | | | 257 | | |
TURNER FUNDS 2013 SEMIANNUAL REPORT 75
NOTES TO FINANCIAL STATEMENTS (Unaudited)
Management has analyzed the Funds' tax positions taken on Federal income tax returns for all open tax years and has concluded that as of March 28, 2013, no provision for income tax would be required in the Funds' financial statements. The Funds' Federal and State income and Federal excise tax returns for tax years for which the applicable statutes of limitations have not expired are subject to examination by the Internal Revenue Service and state taxing authorities.
9. Loans of portfolio securities:
The Funds may lend securities in their portfolios pursuant to a securities lending agreement ("Lending Agreement") with Morgan Stanley. Unless otherwise agreed, security loans made pursuant to the Lending Agreement are required at all times to be secured by collateral equal to at least 100% of the market value of the securities loaned based on the previous day's market value of the securities loaned, marked-to-market daily. Any collateral shortfalls are adjusted the next business day. Cash collateral received is invested in the BlackRock Liquidity Funds TempCash, Dollar Shares, a money market fund. All such investments are made at the risk of the Funds and, as such, the Funds are liable for investment losses. The Funds receive an annual fee for their participation in the Lending Agreement based on the projected lending activity.
In the event of bankruptcy of the borrower, realization/retention of the collateral may be subject to legal proceedings.
At March 28, 2013, the following Funds had securities on loan and the collateral held were as follows (000):
Fund | | Value of Securities
on Loan (000) | | Value of
Collateral (000) | |
All Cap Growth Fund | | $ | 1,434 | | | $ | 1,469 | | |
Emerging Growth Fund | | | 8,054 | | | | 8,181 | | |
Large Growth Fund | | | 8,264 | | | | 8,377 | | |
Midcap Growth Fund | | | 28,789 | | | | 29,341 | | |
Small Cap Growth Fund | | | 26,306 | | | | 26,960 | | |
10. Concentration/risks:
Certain Funds invest a high percentage of their assets in specific sectors of the market in order to achieve a potentially greater investment return. As a result, these Funds may be more susceptible to economic, political, and regulatory developments in a particular sector of the market, positive or negative, and may experience increased volatility on the Fund's net asset value and a magnified effect on the total return.
The Funds enter into contracts that contain a variety of indemnifications. The Funds' maximum exposure under these arrangements is unknown. However, the Funds have not had prior claims or losses pursuant to these contracts and expect the risk of loss to be remote.
11. Fund merger:
On January 18, 2013, the Large Growth Fund acquired all of the net assets of the Turner Concentrated Growth Fund ("Concentrated Growth Fund"), an open-end investment company, pursuant to a Plan of Reorganization approved by the Concentrated Growth Fund shareholders on January 9, 2013. The purpose of the transaction was to combine the two Funds managed by the Adviser with similar investment objectives and policies. The acquisition was accomplished by a tax-free exchange of 1,216,063 Investor Class shares of the Large Growth Fund, valued at $15,614 (000), for 2,025,116 Investor Class shares of the Concentrated Growth Fund outstanding on January 18, 2013. The exchange ratio (Large Growth Fund shares issued/Concentrated Growth Fund shares outstanding) was 0.60:1 for the Investor Class.
The investment portfolio of the Concentrated Growth Fund, with a fair value of $16,717 (000) and identified cost of $15,344 (000) at January 18, 2013, was the principal asset acquired by the Large Growth Fund. For financial reporting purposes, assets received and shares issued by the Large Growth Fund were recorded at fair value; however, the cost basis of the investments received from the Concentrated Growth Fund was carried forward to align ongoing reporting of the Large Growth Fund's realized and unrealized gains and losses with amounts distributable to shareholders for tax purposes.
Upon the business combination of the Funds on January 18, 2013, the net assets of the Concentrated Growth Fund, which included portfolio capital of $35,249 (000), accumulated net investment loss of $87 (000), accumulated realized losses of $20,921 (000) and unrealized gains of $1,373 (000), combined with the Large Growth Fund were $225,958 (000). The undistributed net investment income and unrealized gains of the Concentrated Growth Fund may be distributed by the Large Growth Fund in future periods. Immediately prior to the merger, the net assets (000) of the Concentrated Growth Fund and the Large Growth Fund were $15,614 and $210,344, respectively. All fees and expenses incurred by the Concentrated Growth Fund and the Large Growth Fund directly in connection with the Plan of Reorganization were borne by the Adviser.
Assuming the acquisition had been completed on October 1, 2012, the beginning of the annual reporting period of the Large Growth Fund, the Fund's pro forma results of operations for the six months ended March 28, 2013, are as follows (000):
Net investment income/(loss): | | $ | 846 | | |
Net realized/unrealized gains/(losses): | | | 4,589 | | |
Change in net assets resulting from operations: | | $ | 5,435 | | |
Because the combined investment portfolios have been managed as a single integrated portfolio since the acquisi-
76 TURNER FUNDS 2013 SEMIANNUAL REPORT
tion was completed, it is not practicable to separate the amounts of revenue and earnings of the Concentrated Growth Fund that have been included in the Large Growth Fund's Statement of Operations since January 18, 2013.
12. Subsequent events:
The Trust has evaluated the need for disclosures and/or adjustments resulting from subsequent events through the date the financial statements were issued.
On May 17, 2013, the Board approved the liquidation of the Global Opportunities Fund to occur on or around July 31, 2013.
Based on this evaluation, other than the item noted above, no additional disclosures or adjustments were required to the financial statements as of March 28, 2013.
TURNER FUNDS 2013 SEMIANNUAL REPORT 77
BOARD OF TRUSTEES CONSIDERATIONS IN APPROVING THE ADVISORY AGREEMENT (Unaudited)
Board of Trustees considerations in approving the Advisory Agreement
On March 1, 2013, the Board of Trustees (the "Board" or "Trustees") of the Turner Funds (the "Funds" or the "Trust") held a meeting to decide whether to renew the advisory agreement for each of the Turner Funds (the "Advisory Agreement") with Turner Investments, L.P. ("Turner" or the "Adviser") for the upcoming year. In preparation for the meeting, the Board requested and reviewed a wide variety of information from the Adviser. The materials described, among other things: the Adviser's business; the Adviser's organizational structure, personnel and operations; advisory services; the Funds' performance; compliance; advisory fees and expenses paid by the Funds for the fiscal year ended September 30, 2012; and information on trading. At the meeting, representatives of the Adviser discussed, and answered Board members' questions about, among other things, a chart of advisory fees received by the Adviser for the various Funds; a schedule of the commissions paid to the Trust's top 10 brokers; a soft dollar commission usage report; the Adviser's Form ADVs; and a profitability report for the Adviser for the fiscal year ended September 30, 2012, including its net profitability before and after distribution expenses.
The Board, including all of the independent Trustees, considered, among other things: (1) the nature, extent and quality of the services provided by the Adviser; (2) the performance of the Funds over the past one, three, five and ten years, where applicable, versus each Fund's respective Lipper peer universe; (3) the contractual and actual compensation to be paid under the agreements as compared to the compensation paid to relevant Lipper peer groups; (4) the expense ratios of the Funds, with expense waivers, as compared to expense ratios for relevant Lipper peer groups; (5) the qualifications of the Adviser's personnel, portfolio management capabilities and investment methodologies; (6) the Adviser's operations, compliance program and policies; (7) the financial condition of the Adviser; (8) the cost of services provided by the Adviser and the Adviser's profitability from each
Fund for the year ended September 30, 2012; (9) "fall-out" benefits to the Adviser and its affiliates from the relationship with the Funds; (10) the extent to which economies of scale are relevant given the Funds' current asset size and current asset growth potential; and (11) a comparison of the fees charged by the Adviser with fees charged by the Adviser to similar clients, to the extent the Board deemed it relevant.
After deliberating on all the materials reviewed and reported, the independent Trustees reached the following conclusions, among others, regarding the Adviser and the advisory agreements. They determined that performance lagged peer groups in the case of a number of Funds. The Trustees committed to a continuing close review during the upcoming year of those products where performance lagged. Moreover, the Trustees noted the firm's success in launching a range of alternative investment products to serve shareholders to complement the firm's long-standing growth product line, and discussed and recognized the need for a different fee structure for these alternative products. The independent Trustees also concluded that the Funds' net total expense ratios and advisory fees were generally competitive. The independent Trustees also concluded that: they were satisfied with the quality of services provided by the Adviser in advising the existing Funds; the profits earned by the Adviser seemed reasonable in light of the nature, extent and quality of the services provided to each existing Fund; and that each Fund, and the Trust, was not large enough to attain significant economies of scale, beyond those already incorporated into the fee structures.
Based on the Board's deliberations and its evaluation of the information described above, the Trustees, including all of the independent Trustees, unanimously (a) concluded to renew the Advisory Agreement for another year and (b) determined that the compensation payable by the Trust's Funds under the Advisory Agreement is fair and reasonable.
78 TURNER FUNDS 2013 SEMIANNUAL REPORT
DISCLOSURE OF FUND EXPENSES
All mutual funds have operating expenses. As a shareholder of a mutual fund, your investment is affected by these on-going costs, which include (among others) costs for portfolio management, distribution (12b-1) and/or shareholder services and other expenses. It is important for you to understand the impact of these costs on your investment returns. Operating expenses such as these are deducted from a mutual fund's gross income and directly reduce its final investment return. These expenses are expressed as a percentage of a mutual fund's average net assets; this percentage is known as a mutual fund's expense ratio.
The following examples use the expense ratio and are intended to help you understand the ongoing costs (in dollars) of investing in your Fund and to compare these costs with those other mutual funds. The examples are based on an investment of $1,000 made at the beginning of the period shown and held for the entire period.
The table below and on the next page illustrates your Fund's costs in two ways:
• Actual Fund Return. This section helps you estimate the actual expenses after fee waivers that your Fund incurred over the period. The "Expenses Paid During Period" column shows the actual dollar expense cost incurred by a $1,000 investment in the Fund, and the "Ending Account Value" number is derived from deducting that expense cost from the Fund's gross investment return.
You can use this information, together with the actual amount you invested in the Fund, to estimate the expenses you paid over that period. Simply divide your actual account value by $1,000 to arrive at a ratio (for example, an $8,600 account value divided by $1,000 = 8.6), then multiply that ratio by the number shown for your Fund under "Expenses Paid During Period."
• Hypothetical 5% Return. This section helps you compare your Fund's cost with those of other mutual funds. It provides information about hypothetical account values and expenses based on the Fund's actual expense ratio (column 3) and an assumed rate of return of 5% per year before expenses, which is not the Fund's actual return. This section is useful in making comparisons because the Securities and Exchange Commission requires all mutual funds to make this 5% calculation. You can assess your Fund's comparative cost by comparing the hypothetical result for your Fund in the "Expenses Paid During Period" column with those that appear in the same charts in the shareholder reports for other mutual funds.
Note: Because the return is set at 5% for comparison purposes — NOT your Fund's actual return — the hypothetical account values and expenses may not be used to estimate your actual ending account balance or expenses you paid for the period.
| | Beginning
Account
Value
10/1/12 | | Ending
Account
Value
3/28/13 | | Annualized
Expense
Ratios | | Expenses
Paid
During
Period* | |
Turner Market Neutral Fund — Institutional Class Shares | |
Actual Fund Return | | $ | 1,000.00 | | | $ | 927.30 | | | | 1.94 | % | | $ | 9.17 | | |
Hypothetical
5% Return | | | 1,000.00 | | | | 1,015.01 | | | | 1.94 | | | | 9.59 | | |
Turner Market Neutral Fund — Investor Class Shares | |
Actual Fund Return | | | 1,000.00 | | | | 926.90 | | | | 2.19 | | | | 10.35 | | |
Hypothetical
5% Return | | | 1,000.00 | | | | 1,013.78 | | | | 2.19 | | | | 10.81 | | |
Turner Market Neutral Fund — Class C Shares | |
Actual Fund Return | | | 1,000.00 | | | | 923.10 | | | | 2.94 | | | | 13.86 | | |
Hypothetical
5% Return | | | 1,000.00 | | | | 1,010.10 | | | | 2.94 | | | | 14.49 | | |
Turner Medical Sciences Long/Short Fund — Institutional Class Shares | |
Actual Fund Return | | | 1,000.00 | | | | 1,022.60 | | | | 1.87 | | | | 9.27 | | |
Hypothetical
5% Return | | | 1,000.00 | | | | 1,015.35 | | | | 1.87 | | | | 9.24 | | |
Turner Medical Sciences Long/Short Fund — Investor Class Shares | |
Actual Fund Return | | | 1,000.00 | | | | 1,021.70 | | | | 2.12 | | | | 10.51 | | |
Hypothetical
5% Return | | | 1,000.00 | | | | 1,014.12 | | | | 2.12 | | | | 10.47 | | |
| | Beginning
Account
Value
10/1/12 | | Ending
Account
Value
3/28/13 | | Annualized
Expense
Ratios | | Expenses
Paid
During
Period* | |
Turner Medical Sciences Long/Short Fund — Class C Shares | |
Actual Fund Return | | $ | 1,000.00 | | | $ | 1,017.90 | | | | 2.87 | % | | $ | 14.20 | | |
Hypothetical
5% Return | | | 1,000.00 | | | | 1,010.45 | | | | 2.87 | | | | 14.15 | | |
Turner All Cap Growth Fund — Investor Class Shares | |
Actual Fund Return | | | 1,000.00 | | | | 993.40 | | | | 0.83 | | | | 4.06 | | |
Hypothetical
5% Return | | | 1,000.00 | | | | 1,020.45 | | | | 0.83 | | | | 4.11 | | |
Turner Emerging Growth Fund — Institutional Class Shares | |
Actual Fund Return | | | 1,000.00 | | | | 1,090.40 | | | | 1.15 | | | | 5.89 | | |
Hypothetical
5% Return | | | 1,000.00 | | | | 1,018.88 | | | | 1.15 | | | | 5.69 | | |
Turner Emerging Growth Fund — Investor Class Shares | |
Actual Fund Return | | | 1,000.00 | | | | 1,088.80 | | | | 1.40 | | | | 7.17 | | |
Hypothetical
5% Return | | | 1,000.00 | | | | 1,017.65 | | | | 1.40 | | | | 6.93 | | |
Turner Large Growth Fund — Institutional Class Shares | |
Actual Fund Return | | | 1,000.00 | | | | 1,027.40 | | | | 0.69 | | | | 3.43 | | |
Hypothetical
5% Return | | | 1,000.00 | | | | 1,021.14 | | | | 0.69 | | | | 3.42 | | |
TURNER FUNDS 2013 SEMIANNUAL REPORT 79
DISCLOSURE OF FUND EXPENSES
| | Beginning
Account
Value
10/1/12 | | Ending
Account
Value
3/28/13 | | Annualized
Expense
Ratios | | Expenses
Paid
During
Period* | |
Turner Large Growth Fund — Investor Class Shares | |
Actual Fund Return | | $ | 1,000.00 | | | $ | 1,026.20 | | | | 0.94 | % | | $ | 4.67 | | |
Hypothetical
5% Return | | | 1,000.00 | | | | 1,019.91 | | | | 0.94 | | | | 4.66 | | |
Turner Midcap Growth Fund — Institutional Class Shares | |
Actual Fund Return | | | 1,000.00 | | | | 1,083.80 | | | | 0.93 | | | | 4.75 | | |
Hypothetical
5% Return | | | 1,000.00 | | | | 1,019.96 | | | | 0.93 | | | | 4.61 | | |
Turner Midcap Growth Fund — Investor Class Shares | |
Actual Fund Return | | | 1,000.00 | | | | 1,082.10 | | | | 1.18 | | | | 6.02 | | |
Hypothetical
5% Return | | | 1,000.00 | | | | 1,018.73 | | | | 1.18 | | | | 5.84 | | |
Turner Midcap Growth Fund — Retirement Class Shares | |
Actual Fund Return | | | 1,000.00 | | | | 1,081.90 | | | | 1.43 | | | | 7.30 | | |
Hypothetical
5% Return | | | 1,000.00 | | | | 1,017.51 | | | | 1.43 | | | | 7.07 | | |
Turner Small Cap Growth Fund — Investor Class Shares | |
Actual Fund Return | | | 1,000.00 | | | | 1,128.00 | | | | 1.25 | | | | 6.52 | | |
Hypothetical
5% Return | | | 1,000.00 | | | | 1,018.39 | | | | 1.25 | | | | 6.19 | | |
Turner Spectrum Fund — Institutional Class Shares | |
Actual Fund Return | | | 1,000.00 | | | | 1,022.00 | | | | 1.89 | | | | 9.37 | | |
Hypothetical
5% Return | | | 1,000.00 | | | | 1,015.25 | | | | 1.89 | | | | 9.34 | | |
Turner Spectrum Fund — Investor Class Shares | |
Actual Fund Return | | | 1,000.00 | | | | 1,020.40 | | | | 2.14 | | | | 10.60 | | |
Hypothetical
5% Return | | | 1,000.00 | | | | 1,014.03 | | | | 2.14 | | | | 10.57 | | |
| | Beginning
Account
Value
10/1/12 | | Ending
Account
Value
3/28/13 | | Annualized
Expense
Ratios | | Expenses
Paid
During
Period* | |
Turner Spectrum Fund — Class C Shares | |
Actual Fund Return | | $ | 1,000.00 | | | $ | 1,017.00 | | | | 2.89 | % | | $ | 14.29 | | |
Hypothetical
5% Return | | | 1,000.00 | | | | 1,010.35 | | | | 2.89 | | | | 14.25 | | |
Turner Titan Fund — Institutional Class Shares | |
Actual Fund Return | | | 1,000.00 | | | | 985.10 | | | | 1.92 | | | | 9.35 | | |
Hypothetical
5% Return | | | 1,000.00 | | | | 1,015.10 | | | | 1.92 | | | | 9.49 | | |
Turner Titan Fund — Investor Class Shares | |
Actual Fund Return | | | 1,000.00 | | | | 984.00 | | | | 2.17 | | | | 10.56 | | |
Hypothetical
5% Return | | | 1,000.00 | | | | 1,013.88 | | | | 2.17 | | | | 10.72 | | |
Turner Titan Fund — Class C Shares | |
Actual Fund Return | | | 1,000.00 | | | | 981.80 | | | | 2.92 | | | | 14.19 | | |
Hypothetical
5% Return | | | 1,000.00 | | | | 1,010.20 | | | | 2.92 | | | | 14.39 | | |
Turner Global Opportunities Fund — Institutional Class Shares | |
Actual Fund Return | | | 1,000.00 | | | | 1,059.60 | | | | 1.10 | | | | 5.56 | | |
Hypothetical
5% Return | | | 1,000.00 | | | | 1,019.13 | | | | 1.10 | | | | 5.45 | | |
Turner Global Opportunities Fund — Investor Class Shares | |
Actual Fund Return | | | 1,000.00 | | | | 1,058.70 | | | | 1.35 | | | | 6.81 | | |
Hypothetical
5% Return | | | 1,000.00 | | | | 1,017.90 | | | | 1.35 | | | | 6.68 | | |
* Unless otherwise indicated, expenses are equal to the Fund's annualized expense ratio multiplied by the average account value over the period, multiplied by 179/365 (to reflect the one-half year period from 10/1/12 - 3/28/13).
80 TURNER FUNDS 2013 SEMIANNUAL REPORT

Turner Funds
P.O. Box 219805
Kansas City, Missouri 64121-9805
Telephone: 1.800.224.6312
Email: mutualfunds@turnerinvestments.com
Web Site: www.turnerinvestments.com
Item 2. Code of Ethics.
Not applicable for semiannual report.
Item 3. Audit Committee Financial Expert.
Not applicable for semiannual report.
Item 4. Principal Accountant Fees and Services.
Not applicable for semiannual report.
Item 5. Audit Committee of Listed Registrants.
Not applicable to open-end management investment companies.
Item 6. Schedule of Investments.
Schedule of Investments is included as part of report to shareholders filed under Item 1.
Item 7. Disclosure of Proxy Voting Policies and Procedures for Closed-End Management Investment Companies.
Not applicable to open-end management investment companies.
Item 8. Portfolio Managers of Closed-End Management Investment Companies.
Not applicable to open-end management investment companies.
Item 9. Purchases of Equity Securities by Closed-End Management Investment Company and Affiliated Purchasers.
Not applicable to open-end management investment companies.
Item 10. Submission of Matters to a Vote of Security Holders.
There have been no material changes to the procedures by which shareholders may recommend nominees to the registrant’s Board of Trustees since the registrant’s last proxy solicitation.
Item 11. Controls and Procedures.
(a) The registrant’s Principal Executive Officer and Principal Financial Officer concluded that the registrant’s disclosure controls and procedures (as defined in Rule 30a-3(c) under the Investment Company Act of 1940 as amended (the “Act”)) were effective as of a date within 90 days of the filing date of this report, based on their evaluation of the effectiveness of the registrant’s disclosure controls and procedures required by Rule 30a-3(b) under the Act and Rule 13a-15(b) or 15d-15(b) under the Securities and Exchange Act of 1934.
(b) There were no changes in the registrant’s internal control over financial reporting (as defined in Rule 30a-3(d) of the Act) that occurred during the registrant’s last fiscal quarter that have materially affected, or are reasonably likely to materially affect, the registrant’s internal control over financial reporting.
Item 12. Exhibits.
(a)(1) Not applicable for semiannual report.
(a)(2) A separate certification for the Principal Executive Officer and the Principal Financial Officer of the registrant as required by Rule 30a-2(a) under the Investment Company Act of 1940, as amended (17 CFR 270.30a-2(a)), are filed herewith.
(b) Officer certifications as required by Rule 30a-2(b) under the Investment Company Act of 1940, as amended (17 CFR 270.30a-2(b)), also accompany this filing as an Exhibit.
SIGNATURES
Pursuant to the requirements of the Securities Exchange Act of 1934 and the Investment Company Act of 1940, the registrant has duly caused this report to be signed on its behalf by the undersigned, thereunto duly authorized.
Registrant | Turner Funds | | | |
| | | | |
By (Signature and Title) | /s/ Thomas R. Trala, Jr. | | | |
| Thomas R. Trala, Jr., President (Principal Executive Officer) | |
| | | |
Date | May 29, 2013 | | | |
| | | | | | |
Pursuant to the requirements of the Securities Exchange Act of 1934 and the Investment Company Act of 1940, this report has been signed below by the following persons on behalf of the registrant and in the capacities and on the dates indicated.
By (Signature and Title) | /s/ Thomas R. Trala, Jr. | | | |
| Thomas R. Trala, Jr., President (Principal Executive Officer) | |
| | | |
Date | May 29, 2013 | | | |
| | | | |
By (Signature and Title) | /s/ Ty Edwards | | | |
| Ty Edwards, Controller and Chief Financial Officer (Principal Financial Officer) |
| | | |
Date | May 29, 2013 | | | |
| | | | | |