UNITED STATES
SECURITIES AND EXCHANGE COMMISSION
Washington, D.C. 20549
FORM N-CSR
CERTIFIED SHAREHOLDER REPORT OF REGISTERED
MANAGEMENT INVESTMENT COMPANIES
Investment Company Act file number | 811-07527 |
|
Turner Funds |
(Exact name of registrant as specified in charter) |
|
1205 Westlakes Drive, Suite 100 Berwyn, PA | | 19312 |
(Address of principal executive offices) | | (Zip code) |
|
Michael P. Malloy Drinker Biddle & Reath LLP One Logan Square, Suite 2000 Philadelphia, PA 19103 |
(Name and address of agent for service) |
|
Registrant’s telephone number, including area code: | 1-800-224-6312 | |
|
Date of fiscal year end: | September 30 | |
|
Date of reporting period: | March 31, 2012 | |
| | | | | | | | |
Item 1. Reports to Stockholders.

Semiannual Report
March 31, 2012 (unaudited)
Long/short equity funds
Turner Market Neutral Fund
Turner Medical Sciences Long/Short Fund
Turner Spectrum Fund
Turner Titan Fund
U.S. growth equity funds
Turner All Cap Growth Fund
Turner Concentrated Growth Fund
Turner Emerging Growth Fund
Turner Large Growth Fund
Turner Midcap Growth Fund
Turner Small Cap Growth Fund
Global and international equity funds
Turner Global Opportunities Fund
Turner International Growth Fund
Contents
| 2 | | | Letter to shareholders | |
|
| 5 | | | Total returns of the Turner Funds | |
|
| 9 | | | Investment review:
Turner Market Neutral Fund | |
|
| 10 | | | Investment review:
Turner Medical Sciences Long/Short Fund | |
|
| 11 | | | Investment review:
Turner Spectrum Fund | |
|
| 12 | | | Investment review:
Turner Titan Fund | |
|
| 13 | | | Investment review:
Turner All Cap Growth Fund | |
|
| 14 | | | Investment review:
Turner Concentrated Growth Fund | |
|
| 15 | | | Investment review:
Turner Emerging Growth Fund | |
|
| 16 | | | Investment review:
Turner Large Growth Fund | |
|
| 17 | | | Investment review:
Turner Midcap Growth Fund | |
|
| 18 | | | Investment review:
Turner Small Cap Growth Fund | |
|
| 19 | | | Investment review:
Turner Global Opportunities Fund | |
|
| 20 | | | Investment review:
Turner International Growth Fund | |
|
| 21 | | | Schedules of investments | |
|
| 52 | | | Financial statements | |
|
| 76 | | | Notes to financial statements | |
|
| 86 | | | Board of Trustees considerations in approving the Advisory Agreement | |
|
| 87 | | | Disclosure of fund expenses | |
|
Turner Funds
As of March 31, 2012, the Turner Funds offered a series of 12 mutual funds to individual and institutional investors. The minimum initial investment for Institutional Class Shares in a Turner Fund is $250,000 (except for $100,000 for the Turner Market Neutral Fund, the Turner Medical Sciences Long/Short Fund, the Turner Spectrum Fund, and the Turner Titan Fund) for regular accounts and $100,000 for individual retirement accounts. The minimum initial investment for Investor Class Shares, Retirement Class Shares and Class C Shares is $2,500 for regular accounts and $2,000 for individual retirement accounts.
Turner Investments, L.P., based in Berwyn, Pennsylvania, serves as the investment adviser for the Funds. Turner Investments, L.P., founded in 1990, manages more than $13 billion in stock investments as of March 31, 2012.
Shareholder services
Turner Funds shareholders receive annual and semiannual reports, quarterly account statements, and a quarterly newsletter. Shareholders who have questions about their accounts may call a toll-free telephone number, 1.800.224.6312, may visit our Web site, www.turnerinvestments.com, or may write to Turner Funds, P.O. Box 219805, Kansas City, Missouri 64121-9805.
TURNER FUNDS 2012 SEMIANNUAL REPORT 1
LETTER TO SHAREHOLDERS
To our shareholders
What a difference six months can make. For some people, that's all the time needed to transform one's self from a flabby couch potato to a fit marathon runner. And for stock investors, six months is apparently enough time to complete a 180-degree attitude adjustment.
Last summer three macroeconomic concerns pushed stocks down as the general mood among investors approached panic. One, was the U.S. economy on the brink of a double-dip recession? Two, could Europe enact austerity measures and staunch its sovereign-debt problems to avert another worldwide financial crisis? And three, would the Chinese economy, the global pacesetter since 2008, suffer a hard landing?
But in the six months since September 30, 2011, when we last reported the Turner Funds' performance, investor sentiment has morphed from negative to positive, and stocks in turn posted double-digit gains. The S&P 500 Index soared 25.89%, the small-cap Russell 2000® Growth Index gained 30.26%, and the global MSCI World Index returned 20.34%.
Particularly encouraging to us was that company fundamentals, rather than macroeconomic concerns, were the primary market catalysts. At last, investors seem to be savoring the exceptional springtime blooms that the market has produced. Ah, yes, essentials like earnings — the foundation of our growth-investing process — matter again, to the benefit of the market.
Marathon bull in the 2010s?
Our sense is that investors who have sat out the bull market that began in March 2009 — you might call them investing couch potatoes — may be ready to get up and put money in stocks. And we think that could help keep the bull market going, possibly as part of a marathon bull market that may play out in the 2010s, following atypically weak performance in the 2000s. The 2000s were such a dismal time for stocks, with a 0.95% annualized loss, that pundits refer to it as the Lost Decade — or as we call it, the Terrible 2000s.
To be sure, there are still worrisome macroeconomic concerns out there that could bedevil stocks. For instance, as noted, China caused some worry when its red-hot economic growth slowed to mere single-digit annual rates, and Europe faced a shallow recession. Although Europe has much work yet to do before its sovereign-debt problems are resolved, we think the worst of those problems may be behind it. As we see it, a mild recession and the fallout from sovereign debt in the euro zone are unlikely to derail the U.S. and global economies, and China is likely to navigate a soft economic landing. We concur with the International Monetary Fund's projection that the global economy should grow 3.5% in 2012.
We are especially encouraged by the news on the economic home front. For example, unemployment has been trending lower since the fourth quarter of 2011, job creation appears broad based (although a bit erratic), manufacturing is picking up steam, consumer spending has improved, and consumer confidence is reaching post-financial crisis highs. In short, it seems to us that the pieces of the sustainable-recovery puzzle in the U.S. are fitting together nicely.
Market's direction consistent
As for the six-month period ended March 31, 2012, the subject of this Turner Funds Semiannual Report, stocks, like Sir Edmund Hillary's historic ascent of Mt. Everest, moved determinedly in one direction: up. For instance, the S&P 500 Index generated positive returns in all six months of the period and reached its highest levels since 2008. Although the S&P 500 was still about 10% below its all-time 2007 high as of March 31, it's risen an impressive 109% since its March 2009 low.
And in a striking turnaround, financial services — the repeat offender for the worst-performing sector since 2008 — has become one of the best-performing sectors, alongside technology. Both are considered non-defensive sectors, which makes their performance all the more telling about the current state of investment sentiment, inasmuch as defensive sectors like health care and utilities outperformed last year. Many analysts and economists insisted that any economic recovery that didn't include a rebound in the financial-services sector would have little lasting power. So we think the improved fundamentals and stock-market performance of the sector lend credence to the notion that this recovery is for real.
Also, we think the market's increasing focus on fundamentals bodes well for us as stock pickers going forward. One of the biggest investing difficulties of 2011 was the unprecedented correlation between stocks, which tended to move in unison, like a huge herd of wildebeest. Bank of America Merrill Lynch noted that stock correlations hit an all-time high — above 90% — last September, which posed a tough challenge for stock pickers like us: only 11% of active managers in stocks beat their benchmarks in 2011. Happily, that trend is reversing lately: 77% of large-cap growth managers outperformed in the first quarter of 2012.
Two rallies in one
In effect, the market experienced two distinctly different rallies in the past six months. The initial rally began in the fourth quarter of 2011, when investors who had been leery of stocks decided it was safe to stick their toes in the market waters again. In response to paltry returns in bonds and the money markets, these investors favored stocks offering above-average dividend yields. Then, in
2 TURNER FUNDS 2012 SEMIANNUAL REPORT
March 31, 2012
the first quarter of 2012, as their sense of safety rose, investors tended to gravitate to stocks with high earnings-growth potential that paid smaller or no dividends. Indeed, stocks in the top earnings-growth quartile performed worst in the fourth quarter of 2011, but were the best performers in the first quarter of 2012.
The investment process used to manage our eight U.S. and global/international growth funds and our four long/short funds prizes earnings, and we invest in those companies that can generate superior earnings growth. Investors' preference for dividend-yielding stocks in the fourth quarter of 2011 hurt our funds' performance, but their preference for the shares of corporate earnings leaders in the first quarter of 2012 rewarded our investment process and our funds' results.
All told, our funds performed well in absolute terms for the six-month period: 11 of our 12 funds generated positive returns. However, only four of our funds outperformed one or more of their benchmarks: the Turner Global Opportunities Fund, the Turner International Growth Fund, the Turner Spectrum Fund, and the Turner Titan Fund.
| Total returns | | | | | |
| Six-month period ended March 31, 2012 | | | | | |
| Alternative equity funds | | | | | |
Turner Market Neutral Fund,
Investor Class (TMNFX) | | | 0.03 | % | |
| S&P 500 Index | | | 25.89 | | |
| Barclays Capital U.S. Aggregate Bond Index | | | 1.43 | | |
| Lipper Equity Market-Neutral Funds Average | | | 2.30 | | |
Turner Medical Sciences Long/Short Fund,
Investor Class (TMSFX) | | | -1.45 | | |
| S&P 500 Healthcare Index | | | 19.93 | | |
| Barclays Capital U.S. Aggregate Bond Index | | | 1.43 | | |
| Lipper Long/Short Equity Funds Average | | | 10.93 | | |
Turner Spectrum Fund,
Institutional Class (TSPEX) | | | 1.78 | | |
| S&P 500 Index | | | 25.89 | | |
| Barclays Capital U.S. Aggregate Bond Index | | | 1.43 | | |
| Lipper Long/Short Equity Funds Average | | | 10.93 | | |
| Turner Titan Fund, Investor Class (TTLFX) | | | 7.30 | | |
| S&P 500 Index | | | 25.89 | | |
| Barclays Capital U.S. Aggregate Bond Index | | | 1.43 | | |
| Lipper Long/Short Equity Funds Average | | | 10.93 | | |
| U.S. growth equity funds | | | | | |
| Turner All Cap Growth Fund (TBTBX) | | | 22.69 | | |
| Nasdaq Composite Index | | | 27.99 | | |
| Russell 3000® Growth Index | | | 27.12 | | |
| Turner Concentrated Growth Fund (TTOPX) | | | 26.01 | | |
| S&P 500 Index | | | 25.89 | | |
| Russell 1000® Growth Index | | | 26.85 | | |
Turner Emerging Growth Fund,
Investor Class (TMCGX) | | | 24.76 | % | |
| Russell 2000® Growth Index | | | 30.26 | | |
Turner Large Growth Fund,
Institutional Class (TTMEX) | | | 26.00 | | |
| Russell 1000® Growth Index | | | 26.85 | | |
Turner Midcap Growth Fund,
Investor Class (TMGFX) | | | 22.94 | | |
| Russell Midcap® Growth Index | | | 27.39 | | |
| Turner Small Cap Growth Fund (TSCEX) | | | 29.82 | | |
| Russell 2000® Growth Index | | | 30.26 | | |
| International and global equity funds | | | | | |
Turner Global Opportunities Fund,
Institutional Class (TGLBX) | | | 26.96 | | |
| MSCI World Growth Index | | | 21.96 | | |
| MSCI World Index | | | 20.34 | | |
Turner International Growth Fund,
Institutional Class (TIGCX) | | | 20.96 | | |
| MSCI World ex-U.S. Growth Index | | | 15.72 | | |
(Please call 1.800.224.6312 or visit our Web site at www.turnerinvestments.com for the most recent month-end performance. For more details on the performance of each fund during the six-month period, see the Investment review beginning on page 9.)
True test: the long term
Although we would've liked more of our funds to outperform their benchmarks during the period, their absolute performance was still nothing to sneeze at; our U.S. and international/global funds all recorded returns of more than 20%.
The greatest degree of outperformance was earned by our two international/global funds, the Turner Global Opportunities Fund and the Turner International Growth Fund. The weakest absolute returns were, as expected, produced by our long/short funds.
At the same time we think it's important to keep in mind that the true test of a mutual fund isn't its performance in some six-month period, but its ability to generate outperformance and increase shareholders' wealth in the long run. Focusing too much on a six-month performance period is like admiring only one tiny section of a Vermeer portrait — underwhelming and short-sighted in the extreme.
From a longer-term perspective, here's something admirable about our funds: all eight of our long-only funds have beaten at least one of their benchmarks since inception, a record that we regard with a measure of pride. And all four of our newest funds, the long/short funds, have generated positive returns since inception and volatility below that of the stock market, as intended. But there's certainly always room for improvement — an attitude that's especially relevant to us because we eat our
TURNER FUNDS 2012 SEMIANNUAL REPORT 3
LETTER TO SHAREHOLDERS (continued)
own cooking; most of our portfolio managers and security analysts are invested in our funds. So we as much as anyone want to see our funds generate the best possible results.
Market's prospects promising
In the near term, in the next six months, our outlook for the stock market remains bullish for several reasons.
First, stocks are still cheaply priced. The forward price/earnings ratio for the S&P 500 Index stocks, based on Wall Street's earnings estimates for the next 12 months, is about 14, below the historical average of 16. Earnings growth seems to be slowing: S&P 500 companies' earnings rose 13% in the fourth quarter of 2011, compared with 28% a year earlier. However, we think a time of slowing earnings may be an advantage for growth stocks: as has been the case historically, investors may reward those companies that can sustain above-average earnings growth, and slowing earnings may give rise to higher share valuations if the market's direction remains generally up.
Second, companies have strong balance sheets, with net cash flow of $1.9 trillion annualized in the fourth quarter, a record high. We think companies will continue to return that cash to shareholders in the form of higher dividends and share buybacks or will apply some of that cash to make acquisitions. What's more, companies have continued to improve their productivity by the increased use of automation and mobile and cloud computing. As a result they've been able to increase profits at a remarkable rate: off their 2009 lows, profits are up about 120%, including a 15% rise in 2011. We think profits could come in higher than is generally expected in 2012, up about 10% from last year.
Third, as Barron's notes, "One of the stock market's most significant developments is taking place in the bond market." That is, the multi-decade bull market in bonds may be nearing its end. The yield on the 10-year Treasury is as anemic as the TV ratings for the Brooklyn 11223 reality show on the Oxygen cable channel. But if today's bond yields averaging about 2% begin to rise (and bond prices, which move inversely to yields, begin to fall), we think the appeal of stocks may continue to grow on investors.
More room to run?
Although we're well aware that history is no guarantee of future results, Bank of America Merrill Lynch examined the top 10 bull markets since 1929. The current bull, which has been running loose for about 37 months as of March, ranked ninth best, with a 109% gain. The average length of the 10 bull markets was 55 months, with an average return of 193%. So we think this bull market could still have plenty of room to run. And we think stocks could revert to the mean for this decade as a whole, delivering the traditional annualized return of about 10%.
In anticipation of continued market gains, our U.S. and international/global growth funds emphasize three types of stocks: classic growth stocks in industries such as biotechnology and wireless communications that we think have strong fundamentals; stocks of companies gaining market share in their businesses; and growth-cyclical stocks in industries like retailing and restaurants that have tended to do well as the economic cycle progresses. The long positions of our alternative funds contain similar types of stocks, while the short positions are composed of shares of companies that we believe have poor earnings potential.
In closing, we encourage you to remember the adage that stock investing is more of a marathon than a sprint. And like training for a marathon, stock investing requires courage and discipline. We shall seek to keep the courage of our investment convictions (even if they don't always pan out in the short term) and stick to our investment disciplines. If we do that, we firmly believe our funds stand the best chance of performing well and enriching you — and us — in this decade and beyond.

Bob Turner
Chairman and Chief Investment Officer
Turner Investments, L.P.
Past performance is no guarantee of future results. The views expressed are those of Turner Investments, L.P. as of March 31, 2012, and are not intended as a forecast or investment recommendations. The indexes mentioned are not available for investment.

Bob Turner
4 TURNER FUNDS 2012 SEMIANNUAL REPORT
PERFORMANCE
Total returns of the Turner Funds
Through March 31, 2012
Current performance may be lower or higher than the performance data quoted. Please call 1.800.224.6312 or visit our Web site at www.turnerinvestments.com for the most recent month-end performance information.
The performance data quoted represents past performance and the principal value and investment return will fluctuate so that an investor's shares, when redeemed, may be worth more or less than their original cost. Past performance is no guarantee of future results. Returns shown, unless otherwise indicated, are total returns, with dividends and income reinvested. Returns spanning more than one year are annualized. Fee waivers are in effect; if they had not been in effect, performance would have been lower. The indices mentioned are unmanaged statistical composites of stock-market performance. Investing in an index is not possible.
The holdings and sector weightings of the Funds are subject to change. Forward-earnings projections are not predictors of stock price or investment performance, and do not represent past performance. There is no guarantee that the forward-earnings projections will accurately predict the actual earnings experience of any of the companies involved, and there is no guarantee that owning securities of companies with relatively high price-to-earnings ratios will cause the portfolio to outperform its benchmark or index.
The Turner Funds are distributed by Foreside Fund Services, LLC, Portland, Maine. The investor should consider the investment objectives, risks, charges, and expenses carefully before investing. This and other information can be found in the prospectus. A free prospectus, which contains detailed information, including fees and expenses, and the risks associated with investing in these Funds, can be obtained by calling 1.800.224.6312. Read the prospectus carefully before investing.
| Fund name/Index | | Six
months* | | Year
to
date* | | One
year | | Three
years | | Five
years | | 10
years | | (Annualized)
Since
inception | | Total
net assets
($mil) | |
Turner Market Neutral Fund —
Institutional Class Shares | | | 0.22 | % | | | 0.29 | % | | | 2.06 | % | | | n/a | | | | n/a | | | | n/a | | | | 4.82 | % | | $ | 48.26 | | |
| Investor Class Shares | | | 0.03 | | | | 0.19 | | | | 1.87 | | | | n/a | | | | n/a | | | | n/a | | | | 4.56 | | | | 7.23 | | |
| Class C Shares | | | -0.26 | | | | 0.00 | | | | 0.99 | | | | n/a | | | | n/a | | | | n/a | | | | 3.77 | | | | 0.13 | | |
| S&P 500 Index | | | 25.89 | | | | 12.59 | | | | 8.54 | | | | n/a | | | | n/a | | | | n/a | | | | 8.79 | | | | |
Barclays Capital U.S. Aggregate
Bond Index | | | 1.43 | | | | 0.30 | | | | 7.71 | | | | n/a | | | | n/a | | | | n/a | | | | 7.88 | | | | |
Lipper Equity Market-Neutral
Funds Average | | | 2.30 | | | | 1.35 | | | | 0.44 | | | | n/a | | | | n/a | | | | n/a | | | | 0.84 | | | | |
| Inception date: 2/7/11 | |
Turner Medical Sciences
Long/Short Fund —
Institutional Class Shares | | | -1.35 | | | | -1.45 | | | | -0.49 | | | | n/a | | | | n/a | | | | n/a | | | | 1.83 | | | | 63.18 | | |
| Investor Class Shares | | | -1.45 | | | | -1.55 | | | | -0.68 | | | | n/a | | | | n/a | | | | n/a | | | | 1.66 | | | | 14.00 | | |
| Class C Shares | | | -1.84 | | | | -1.65 | | | | -1.37 | | | | n/a | | | | n/a | | | | n/a | | | | 0.96 | | | | 3.59 | | |
| S&P 500 Healthcare Index | | | 19.93 | | | | 9.06 | | | | 16.41 | | | | n/a | | | | n/a | | | | n/a | | | | 17.00 | | | | |
Barclays Capital U.S. Aggregate
Bond Index | | | 1.43 | | | | 0.30 | | | | 7.71 | | | | n/a | | | | n/a | | | | n/a | | | | 7.88 | | | | |
Lipper Long/Short Equity
Funds Average | | | 10.93 | | | | 5.65 | | | | -0.19 | | | | n/a | | | | n/a | | | | n/a | | | | -1.94 | | | | |
| Inception date: 2/7/11 | |
TURNER FUNDS 2012 SEMIANNUAL REPORT 5
PERFORMANCE (continued)
| Fund name/Index | | Six
months* | | Year
to
date* | | One
year | | Three
years | | Five
years | | 10
years | | (Annualized)
Since
inception | | Total
net assets
($mil) | |
Turner Spectrum Fund —
Institutional Class Shares | | | 1.78 | % | | | 2.01 | % | | | -1.40 | % | | | n/a | | | | n/a | | | | n/a | | | | 5.67 | % | | $ | 762.79 | | |
| Investor Class Shares | | | 1.62 | | | | 1.84 | | | | -1.67 | | | | n/a | | | | n/a | | | | n/a | | | | 5.39 | | | | 168.18 | | |
| Class C Shares(1) | | | 1.27 | | | | 1.68 | | | | -2.38 | | | | n/a | | | | n/a | | | | n/a | | | | 5.19 | | | | 13.47 | | |
| S&P 500 Index | | | 25.89 | | | | 12.59 | | | | 8.54 | | | | n/a | | | | n/a | | | | n/a | | | | 18.84 | | | | |
Barclays Capital U.S. Aggregate
Bond Index | | | 1.43 | | | | 0.30 | | | | 7.71 | | | | n/a | | | | n/a | | | | n/a | | | | 6.89 | | | | |
Lipper Long/Short Equity
Funds Average | | | 10.93 | | | | 5.65 | | | | -0.19 | | | | n/a | | | | n/a | | | | n/a | | | | 10.31 | | | | |
| Inception date: 5/7/09 | |
Turner Titan Fund —
Institutional Class Shares | | | 7.40 | | | | 6.23 | | | | 3.38 | | | | n/a | | | | n/a | | | | n/a | | | | 4.29 | | | | 18.68 | | |
| Investor Class Shares | | | 7.30 | | | | 6.24 | | | | 3.18 | | | | n/a | | | | n/a | | | | n/a | | | | 4.12 | | | | 4.51 | | |
| Class C Shares | | | 6.82 | | | | 5.97 | | | | 2.39 | | | | n/a | | | | n/a | | | | n/a | | | | 3.33 | | | | 0.12 | | |
| S&P 500 Index | | | 25.89 | | | | 12.59 | | | | 8.54 | | | | n/a | | | | n/a | | | | n/a | | | | 8.79 | | | | |
Barclays Capital U.S. Aggregate
Bond Index | | | 1.43 | | | | 0.30 | | | | 7.71 | | | | n/a | | | | n/a | | | | n/a | | | | 7.88 | | | | |
Lipper Long/Short Equity
Funds Average | | | 10.93 | | | | 5.65 | | | | -0.19 | | | | n/a | | | | n/a | | | | n/a | | | | -1.94 | | | | |
| Inception date: 2/7/11 | |
| Turner All Cap Growth Fund(2) | | | 22.69 | | | | 15.46 | | | | -0.84 | | | | 34.74 | % | | | 6.64 | % | | | 8.06 | % | | | -0.51 | | | | 32.60 | | |
| Nasdaq Composite Index | | | 27.99 | | | | 18.67 | | | | 11.16 | | | | 26.46 | | | | 5.01 | | | | 5.30 | | | | -2.10 | | | | |
| Russell 3000® Growth Index | | | 27.12 | | | | 14.58 | | | | 10.14 | | | | 25.50 | | | | 5.02 | | | | 4.42 | | | | -0.89 | | | | |
| Inception date: 6/30/00 | |
| Turner Concentrated Growth Fund | | | 26.01 | | | | 21.11 | | | | -0.86 | | | | 24.25 | | | | 0.06 | | | | 1.33 | | | | 1.16 | | | | 44.02 | | |
| S&P 500 Index | | | 25.89 | | | | 12.59 | | | | 8.54 | | | | 23.42 | | | | 2.01 | | | | 4.12 | | | | 2.05 | | | | |
| Russell 1000® Growth Index | | | 26.85 | | | | 14.69 | | | | 11.02 | | | | 25.28 | | | | 5.10 | | | | 4.28 | | | | 0.77 | | | | |
| Inception date: 6/30/99 | |
Turner Emerging Growth Fund(2) —
Institutional Class Shares(3) | | | 24.87 | | | | 10.95 | | | | 0.74 | | | | 27.12 | | | | n/a | | | | n/a | | | | 24.72 | | | | 79.79 | | |
| Investor Class Shares | | | 24.76 | | | | 10.90 | | | | 0.51 | | | | 26.81 | | | | 3.55 | | | | 8.10 | | | | 18.55 | | | | 180.07 | | |
| Russell 2000® Growth Index | | | 30.26 | | | | 13.28 | | | | 0.68 | | | | 28.36 | | | | 4.15 | | | | 6.00 | | | | 3.70 | | | | |
| Inception date: 2/27/98 | |
Turner Large Growth Fund —
Institutional Class Shares | | | 26.00 | | | | 17.29 | | | | 3.85 | | | | 21.17 | | | | 1.49 | | | | 4.18 | | | | 2.75 | | | | 371.45 | | |
| Investor Class Shares(4) | | | 25.91 | | | | 17.25 | | | | 3.55 | | | | 20.85 | | | | 1.24 | | | | n/a | | | | 3.46 | | | | 55.65 | | |
| Russell 1000® Growth Index | | | 26.85 | | | | 14.69 | | | | 11.02 | | | | 25.28 | | | | 5.10 | | | | 4.28 | | | | 2.60 | | | | |
| Inception date: 2/28/01 | |
Turner Midcap Growth Fund(2) —
Institutional Class Shares(5) | | | 23.01 | | | | 14.89 | | | | -4.22 | | | | 27.86 | | | | n/a | | | | n/a | | | | 2.03 | | | | 301.30 | | |
| Investor Class Shares | | | 22.94 | | | | 14.87 | | | | -4.41 | | | | 27.57 | | | | 4.22 | | | | 5.82 | | | | 10.38 | | | | 505.66 | | |
| Retirement Class Shares(6) | | | 21.27 | | | | 13.39 | | | | -5.83 | | | | 26.73 | | | | 3.71 | | | | 5.30 | | | | 7.00 | | | | 5.06 | | |
| Russell Midcap® Growth Index | | | 27.39 | | | | 14.52 | | | | 4.43 | | | | 29.16 | | | | 4.44 | | | | 6.92 | | | | 7.47 | | | | |
| Inception date: 10/1/96 | |
| Turner Small Cap Growth Fund(2) | | | 29.82 | | | | 12.31 | | | | -4.24 | | | | 27.29 | | | | 3.91 | | | | 6.44 | | | | 11.19 | | | | 276.55 | | |
| Russell 2000® Growth Index | | | 30.26 | | | | 13.28 | | | | 0.68 | | | | 28.36 | | | | 4.15 | | | | 6.00 | | | | 5.97 | | | | |
| Inception date: 2/7/94 | |
6 TURNER FUNDS 2012 SEMIANNUAL REPORT
PERFORMANCE (continued)
| Fund name/Index | | Six
months* | | Year
to
date* | | One
year | | Three
years | | Five
years | | 10
years | | (Annualized)
Since
inception | | Total
net assets
($mil) | |
Turner Global
Opportunities Fund —
Institutional Class Shares | | | 26.96 | % | | | 17.52 | % | | | 1.75 | % | | | n/a | | | | n/a | | | | n/a | | | | 21.39 | % | | $ | 1.15 | | |
| Investor Class Shares | | | 26.82 | | | | 17.44 | | | | 1.47 | | | | n/a | | | | n/a | | | | n/a | | | | 21.03 | | | | 0.54 | | |
| MSCI World Growth Index | | | 21.96 | | | | 13.29 | | | | 3.54 | | | | n/a | | | | n/a | | | | n/a | | | | 14.73 | | | | |
| MSCI World Index | | | 20.34 | | | | 11.72 | | | | 1.14 | | | | n/a | | | | n/a | | | | n/a | | | | 12.64 | | | | |
| Inception date: 5/7/10 | |
Turner International
Growth Fund —
Institutional Class Shares | | | 20.96 | | | | 12.64 | | | | -2.79 | | | | 27.65 | % | | | 2.87 | % | | | n/a | | | | 3.14 | | | | 8.32 | | |
| Investor Class Shares(7) | | | 20.83 | | | | 12.60 | | | | -3.15 | | | | 27.35 | | | | n/a | | | | n/a | | | | 19.56 | | | | 8.45 | | |
| MSCI World ex-U.S. Growth Index | | | 15.72 | | | | 11.24 | | | | -5.09 | | | | 17.93 | | | | -1.26 | | | | n/a | | | | -0.45 | | | | |
| Inception date: 1/31/07 | |
(1) Commenced operations on July 14, 2009.
(2) Investing in technology and science companies and small- and mid-capitalization companies may subject the Funds to specific inherent risks, including above-average price fluctuations.
(3) Commenced operations on February 1, 2009.
(4) Commenced operations on August 1, 2005.
(5) Commenced operations on June 16, 2008.
(6) Commenced operations on September 24, 2001.
(7) Commenced operations on October 31, 2008.
* Returns of less than one year are cumulative, and not annualized.
Amounts designated as "—" have been rounded to $0 ($mil)
TURNER FUNDS 2012 SEMIANNUAL REPORT 7
Expense Ratio†
| | | Gross
expense
ratio | | Net
expense
ratio* | |
| Turner Market Neutral Fund | |
| Institutional Class Shares | | | 3.92 | % | | | 1.95 | % | |
| Investor Class Shares | | | 4.18 | % | | | 2.20 | % | |
| Class C Shares | | | 4.77 | % | | | 2.95 | % | |
Turner Medical Sciences
Long/Short Fund | |
| Institutional Class Shares | | | 2.79 | % | | | 1.95 | % | |
| Investor Class Shares | | | 2.94 | % | | | 2.20 | % | |
| Class C Shares | | | 3.68 | % | | | 2.95 | % | |
| Turner Spectrum Fund | |
| Institutional Class Shares | | | 2.53 | % | | | 1.95 | % | |
| Investor Class Shares | | | 2.75 | % | | | 2.20 | % | |
| Class C Shares | | | 3.44 | % | | | 2.95 | % | |
| Turner Titan Fund | |
| Institutional Class Shares | | | 3.56 | % | | | 1.95 | % | |
| Investor Class Shares | | | 4.68 | % | | | 2.20 | % | |
| Class C Shares | | | 3.82 | % | | | 2.95 | % | |
| Turner All Cap Growth Fund | |
| Investor Class Shares | | | 2.12 | % | | | 1.73 | % | |
| Turner Concentrated Growth Fund | |
| Investor Class Shares | | | 2.08 | % | | | 1.69 | % | |
| | | Gross
expense
ratio | | Net
expense
ratio* | |
| Turner Emerging Growth Fund | |
| Institutional Class Shares | | | 1.29 | % | | | 1.17 | % | |
| Investor Class Shares | | | 1.57 | % | | | 1.42 | % | |
| Turner Large Growth Fund | |
| Institutional Class Shares | | | 0.89 | % | | | 0.69 | % | |
| Investor Class Shares | | | 1.13 | % | | | 0.94 | % | |
| Turner Midcap Growth Fund | |
| Institutional Class Shares | | | 1.05 | % | | | 0.93 | % | |
| Investor Class Shares | | | 1.28 | % | | | 1.18 | % | |
| Retirement Class Shares | | | 1.54 | % | | | 1.43 | % | |
| Turner Small Cap Growth Fund | |
| Investor Class Shares | | | 1.53 | % | | | 1.25 | % | |
| Turner Global Opportunities Fund | |
| Institutional Class Shares | | | 3.64 | % | | | 1.11 | % | |
| Investor Class Shares | | | 3.89 | % | | | 1.36 | % | |
| Turner International Growth Fund | |
| Institutional Class Shares | | | 2.41 | % | | | 1.10 | % | |
| Investor Class Shares | | | 2.46 | % | | | 1.35 | % | |
† These expense ratios are based on the most recent prospectus and may differ from those shown in the financial highlights.
* Net expense ratio reflects contractual waivers of certain fees and/or expense reimbursements. Turner may discontinue this arrangement at any time after January 31, 2013.
8 TURNER FUNDS 2012 SEMIANNUAL REPORT
INVESTMENT REVIEW
Turner Market Neutral Fund
Fund profile
March 31, 2012
g Ticker symbol TMNFX
Investor Class Shares
g CUSIP #900297581
Investor Class Shares
g Top five holdings1
(1) Starwood Hotels & Resorts Worldwide
(2) Monsanto
(3) Western Union
(4) TIBCO Software
(5) Caterpillar
g % in five largest holdings 20.1%2
g Number of holdings 781
g Weighted average market capitalization $17.74 Billion
g Net assets $7 million, Investor Class Shares

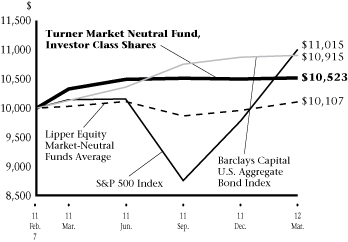
Growth of a $10,000 investment in the
Turner Market Neutral Fund, Investor Class Shares:
February 7, 2011-March 31, 20123,4
Average annual total returns (Periods ended March 31, 2012)
| | | Six months
(not annualized) | | One
year | | Since
inception4 | |
| Turner Market Neutral Fund, Institutional Class Shares5 | | | 0.22 | % | | | 2.06 | % | | | 4.82 | % | |
| Turner Market Neutral Fund, Investor Class Shares5 | | | 0.03 | % | | | 1.87 | % | | | 4.56 | % | |
| Turner Market Neutral Fund, Class C Shares5 | | | -0.26 | % | | | 0.99 | % | | | 3.77 | % | |
| S&P 500 Index6 | | | 25.89 | % | | | 8.54 | % | | | 8.79 | % | |
| Barclays Capital U.S. Aggregate Bond Index7 | | | 1.43 | % | | | 7.71 | % | | | 7.88 | % | |
| Lipper Equity Market-Neutral Funds Average8 | | | 2.30 | % | | | 0.44 | % | | | 0.84 | % | |
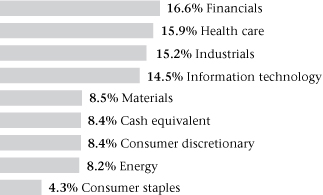
Sector weightings2:
Manager's discussion and analysis
The Turner Market Neutral Fund, Investor Class Shares (TMNFX) generated a flat return of 0.03% in the six-month period ended March 31. The fund's return trailed that of the S&P 500 Index by 25.86 percentage points, the Lipper Equity Market-Neutral Funds Average by 2.27 percentage points, and the Barclays Capital U.S. Aggregate Bond Index by 1.40 percentage points. The fund seeks to generate returns that have historically been associated with stocks, with relatively low volatility and a correlation unlike that of the broad market.
The consumer-discretionary and financials sectors added extra return. In those sectors, long and short positions in e-commerce, retail, search-engine, oil, diversified-financial-services, and regional-bank shares generated the best results. The industrials, information-technology, and materials sectors were the biggest detractors from performance. In those sectors, long and short positions in rental-equipment, machinery, transportation, computers, software, networking, aluminum-mining, steel-production, and building-materials shares produced unsatisfactory results.
1 Cash equivalent is not being considered a holding for the top five holdings, but is counted in the number of holdings. Top five holdings are based on long positions. The fund composition is subject to change.
2 Percentages based on total investments of long positions.
3 These figures represent past performance, which is no guarantee of future results. The investment return and principal value of an investment will fluctuate, so an investor's shares, when redeemed, may be worth more or less than their original cost. The performance in the above graph and table does not reflect the deduction of taxes the shareholder will pay on fund distributions or the redemptions of fund shares. Performance of the Institutional, Investor and Class C Shares will differ due to differences in fees.
4 The inception date of the Turner Market Neutral Fund was February 7, 2011.
5 Fee waivers are in effect; if they had not been in effect, performance would have been lower.
6 The S&P 500 Index is a widely-recognized, market value-weighted (higher market value stocks have more influence than lower market value stocks) index of 500 stocks designed to mimic the overall equity market's industry weightings.
7 The Barclays Capital U.S. Aggregate Bond Index (prior to November 2008, the Index was known as the "Lehman Brothers U.S. Aggregate Bond Index") represents an unmanaged diversified portfolio of fixed income securities, including U.S. Treasuries, investment-grade corporate bonds and mortgage-backed and asset-backed securities.
8 The Lipper Equity Market-Neutral Funds Average represents the average annualized total return for all reporting funds in the Lipper Equity Market-Neutral Fund category.
The Turner Market Neutral Fund is subject to the risks associated with selling securities short. A short sale involves a finite opportunity for appreciation, but a theoretically unlimited risk of loss. The Fund may focus its investments from time to time on one or more economic sectors. To the extent that it does so, developments affecting companies in that sector or sectors will likely have a magnified effect on the Fund's net asset value and total return.
TURNER FUNDS 2012 SEMIANNUAL REPORT 9
INVESTMENT REVIEW
Turner Medical Sciences Long/Short Fund
Fund profile
March 31, 2012
g Ticker symbol TMSFX
Investor Class Shares
g CUSIP #900297557
Investor Class Shares
g Top five holdings1
(1) Pfizer
(2) Zimmer Holdings
(3) Covidien
(4) WellPoint
(5) Merck
g % in five largest holdings 16.5%2
g Number of holdings 871
g Weighted average market capitalization $28.51 Billion
g Net assets $14 million, Investor Class Shares

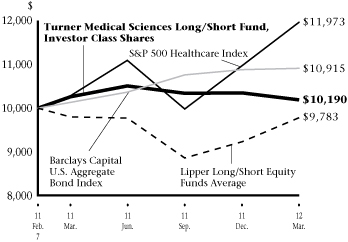
Growth of a $10,000 investment in the
Turner Medical Sciences Long/Short Fund,
Investor Class Shares:
February 7, 2011-March 31, 20123,4
Average annual total returns (Periods ended March 31, 2012)
| | | Six months
(not annualized) | | One
year | | Since
inception4 | |
| Turner Medical Sciences Long/Short Fund, Institutional Class Shares5 | | | -1.35 | % | | | -0.49 | % | | | 1.83 | % | |
| Turner Medical Sciences Long/Short Fund, Investor Class Shares5 | | | -1.45 | % | | | -0.68 | % | | | 1.66 | % | |
| Turner Medical Sciences Long/Short Fund, Class C Shares5 | | | -1.84 | % | | | -1.37 | % | | | 0.96 | % | |
| S&P 500 Healthcare Index6 | | | 19.93 | % | | | 16.41 | % | | | 17.00 | % | |
| Barclays Capital U.S. Aggregate Bond Index7 | | | 1.43 | % | | | 7.71 | % | | | 7.88 | % | |
| Lipper Long/Short Equity Funds Average8 | | | 10.93 | % | | | -0.19 | % | | | -1.94 | % | |
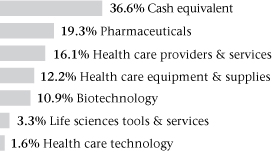
Sector weightings2:
Manager's discussion and analysis
Unrewarding short positions hurt the Turner Medical Sciences Long/Short Fund, Investor Class Shares (TMSFX), which recorded a 1.45% loss for the six-month period ended March 31. The fund's return lagged that of the S&P 500 Healthcare Index by 21.38 percentage points, the Lipper Long/Short Equity Funds Average by 12.38 percentage points, and the Barclays Capital U.S. Aggregate Bond Index by 2.88 percentage points. The fund seeks to capture alpha (the estimated amount of risk-adjusted excess return expected from an investment's fundamentals), reduce volatility, and preserve capital in declining markets.
In the fund's long and short positions, stocks in the pharmaceuticals industry provided the most extra return. Detracting significantly from performance were long and short positions in the stocks of medical-instrument, biotechnology, health-care services, and pharmacy-services firms. Also impeding performance was the fund's position in cash equivalents. Consistent with the fund's investment strategy and given the market's volatility during the period, the fund maintained a significant cash position during the period for defensive purposes. As a result, the fund did not participate in the market advances during the period as much as it would have if it had been more fully invested.
1 Cash equivalent is not being considered a holding for the top five holdings, but is counted in the number of holdings. Top five holdings are based on long positions. The fund composition is subject to change.
2 Percentages based on total investments of long positions.
3 These figures represent past performance, which is no guarantee of future results. The investment return and principal value of an investment will fluctuate, so an investor's shares, when redeemed, may be worth more or less than their original cost. The performance in the above graph and table does not reflect the deduction of taxes the shareholder will pay on fund distributions or the redemptions of fund shares. Performance of the Institutional, Investor and Class C Shares will differ due to differences in fees.
4 The inception date of the Turner Medical Sciences Long/Short Fund was February 7, 2011.
5 Fee waivers are in effect; if they had not been in effect, performance would have been lower.
6 The S&P 500 Healthcare Index is an unmanaged index which includes the stocks in the health-care sector of the S&P 500 Index.
7 The Barclays Capital U.S. Aggregate Bond Index (prior to November 2008, the Index was known as the "Lehman Brothers U.S. Aggregate Bond Index") represents an unmanaged diversified portfolio of fixed income securities, including U.S. Treasuries, investment-grade corporate bonds and mortgage-backed and asset-backed securities.
8 Lipper Long/Short Equity Funds Average represents the average annualized total return for all reporting funds in the Lipper Long/Short Equity Fund category.
The Turner Medical Sciences Long/Short Fund is subject to the risks associated with selling securities short. A short sale involves a finite opportunity for appreciation, but a theoretically unlimited risk of loss. The Fund is subject to the risks associated with health care-related companies. Many health care-related companies are smaller and less seasoned than companies in other sectors. Health care-related companies may also be strongly affected by scientific or technological developments and their products may quickly become obsolete. The Fund is subject to risks due to its foreign investments.
10 TURNER FUNDS 2012 SEMIANNUAL REPORT
INVESTMENT REVIEW
Turner Spectrum Fund
Fund profile
March 31, 2012
g Ticker symbol TSPEX
Institutional Class Shares
g CUSIP #900297664
Institutional Class Shares
g Top five holdings1
(1) Starwood Hotels & Resorts Worldwide
(2) Monsanto
(3) Guess?
(4) WellPoint
(5) American Express
g % in five largest holdings 6.0%2
g Number of holdings 5511
g Weighted average market capitalization $21.14 Billion
g Net assets $763 million, Institutional Class Shares

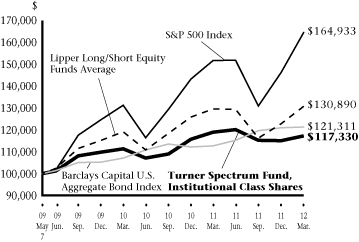
Growth of a $100,000 investment in the
Turner Spectrum Fund, Institutional Class Shares:
May 7, 2009-March 31, 20123,4
Average annual total returns (Periods ended March 31, 2012)
| | | Six months
(not annualized) | | One
year | | Since
inception | |
| Turner Spectrum Fund, Institutional Class Shares5 | | | 1.78 | % | | | -1.40 | % | | | 5.67 | % | |
| Turner Spectrum Fund, Investor Class Shares5 | | | 1.62 | % | | | -1.67 | % | | | 5.39 | % | |
| Turner Spectrum Fund, Class C Shares5 | | | 1.27 | % | | | -2.38 | % | | | 5.19 | % | |
| S&P 500 Index7 | | | 25.89 | % | | | 8.54 | % | | | 18.84 | %4 | |
| Barclays Capital U.S. Aggregate Bond Index8 | | | 1.43 | % | | | 7.71 | % | | | 6.89 | %4 | |
| Lipper Long/Short Equity Funds Average9 | | | 10.93 | % | | | -0.19 | % | | | 10.31 | %4 | |
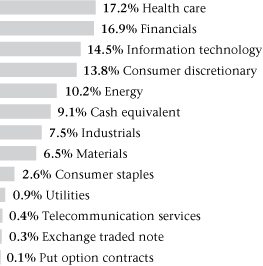
Sector weightings2:
Manager's discussion and analysis
The Turner Spectrum Fund, Institutional Class Shares (TSPEX), gained 1.78% in the six-month period ended March 31. The fund's return beat that of the Barclays Capital U.S. Aggregate Bond Index by 0.35 percentage point, but trailed that of the S&P 500 Index by 24.11 percentage points and the Lipper Long/Short Equity Average by 9.15 percentage points. The fund seeks to generate returns that have historically been associated with stocks, with relatively low volatility and a correlation unlike that of the broad market.
Unproductive short positions were the main drag on the fund's results. Conversely, the utilities and consumer-staples sectors added the most value. In those sectors, long and short positions in telecommunications, electric-utility, energy exploration-and-production, cosmetics, beverage, and food-processing shares performed best. The sectors that detracted the most from results were financials, information technology, materials, and industrials. The fund kept a conservative net long exposure of 88%, primarily in U.S. stocks.
1 Cash equivalent is not being considered a holding for the top five holdings, but is counted in the number of holdings. Top five holdings are based on long positions. The fund composition is subject to change.
2 Percentages based on total investments of long positions.
3 These figures represent past performance, which is no guarantee of future results. The investment return and principal value of an investment will fluctuate, so an investor's shares, when redeemed, may be worth more or less than their original cost. The performance in the above graph and table does not reflect the deduction of taxes the shareholder will pay on fund distributions or the redemptions of fund shares. Performance of the Institutional, Investor and Class C Shares will differ due to differences in fees.
4 The inception date of the Turner Spectrum Fund (Institutional Class Shares and Investor Class Shares) was May 7, 2009. Index returns are based on Institutional Class Shares inception date.
5 Fee waivers are in effect; if they had not been in effect, performance would have been lower.
6 The inception date of the Turner Spectrum Fund (Class C Shares) was July 14, 2009.
7 The S&P 500 Index is a widely-recognized, market value-weighted (higher market value stocks have more influence than lower market value stocks) index of 500 stocks designed to mimic the overall equity market's industry weightings.
8 The Barclays Capital U.S. Aggregate Bond Index (prior to November 2008, the Index was known as the "Lehman Brothers U.S. Aggregate Bond Index") represents an unmanaged diversified portfolio of fixed income securities, including U.S. Treasuries, investment-grade corporate bonds and mortgage-backed and asset-backed securities.
9 Lipper Long/Short Equity Funds Average represents the average annualized total return for all reporting funds in the Lipper Long/Short Equity Fund category.
The Turner Spectrum Fund may focus its investments from time to time on one or more economic sectors. To the extent that it does so, developments affecting companies in that sector or sectors will likely have a magnified effect on the Fund's net asset value and total return. The Fund is subject to the risks associated with selling securities short. A short sale involves a finite opportunity for appreciation, but a theoretically unlimited risk of loss. The smaller capitalization companies the Fund invests in may be more vulnerable to adverse business or economic events than larger, more established companies.
TURNER FUNDS 2012 SEMIANNUAL REPORT 11
INVESTMENT REVIEW
Turner Titan Fund
Fund profile
March 31, 2012
g Ticker symbol TTLFX
Investor Class Shares
g CUSIP #900297524
Investor Class Shares
g Top five holdings1
(1) Broadcom, Cl A
(2) Starwood Hotels & Resorts Worldwide
(3) American Express
(4) Monsanto
(5) Texas Instruments
g % in five largest holdings 14.5%2
g Number of holdings 1181
g Weighted average market capitalization $34.16 Billion
g Net assets $5 million, Investor Class Shares

Growth of a $10,000 investment in the
Turner Titan Fund, Investor Class Shares:
February 7, 2011-March 31, 20123,4

Average annual total returns (Periods ended March 31, 2012)
| | | Six months
(not annualized) | | One
year | | Since
inception4 | |
| Turner Titan Fund, Institutional Class Shares5 | | | 7.40 | % | | | 3.38 | % | | | 4.29 | % | |
| Turner Titan Fund, Investor Class Shares5 | | | 7.30 | % | | | 3.18 | % | | | 4.12 | % | |
| Turner Titan Fund, Class C Shares5 | | | 6.82 | % | | | 2.39 | % | | | 3.33 | % | |
| S&P 500 Index6 | | | 25.89 | % | | | 8.54 | % | | | 8.79 | % | |
| Barclays Capital U.S. Aggregate Bond Index7 | | | 1.43 | % | | | 7.71 | % | | | 7.88 | % | |
| Lipper Long/Short Equity Funds Average8 | | | 10.93 | % | | | -0.19 | % | | | -1.94 | % | |
Sector weightings2:
Manager's discussion and analysis
The Turner Titan Fund, Investor Class Shares (TTLFX) gained 7.30% in the six-month period ended March 31. The fund's return beat the Barclays Capital U.S. Aggregate Bond Index by 5.87 percentage points, but lagged that of the S&P 500 Index by 18.59 percentage points and the Lipper Long/Short Equity Funds average by 3.63 percentage points. The fund seeks to generate returns that have historically been associated with stocks, with relatively low volatility and a correlation unlike that of the broad market.
The fund's short positions generally diminished results. The consumer-discretionary, consumer-staples, and industrials sectors added the most value, with long and short positions in casino, e-commerce, audio/video-equipment, beverages, cosmetics, manufacturing, aerospace, and transportation shares delivering the best results. The greatest detractors from performance were the financials, materials, and energy sectors, with shares in investment-bank, banking, mining, energy exploration-and-production, and oil-field machinery companies producing subpar returns.
1 Cash equivalent is not being considered a holding for the top five holdings, but is counted in the number of holdings. Top five holdings are based on long positions. The fund composition is subject to change.
2 Percentages based on total investments of long positions.
3 These figures represent past performance, which is no guarantee of future results. The investment return and principal value of an investment will fluctuate, so an investor's shares, when redeemed, may be worth more or less than their original cost. The performance in the above graph and table does not reflect the deduction of taxes the shareholder will pay on fund distributions or the redemptions of fund shares. Performance of the Institutional, Investor and Class C Shares will differ due to differences in fees.
4 The inception date of the Turner Titan Fund was February 7, 2011.
5 Fee waivers are in effect; if they had not been in effect, performance would have been lower.
6 The S&P 500 Index is a widely-recognized, market value-weighted (higher market value stocks have more influence than lower market value stocks) index of 500 stocks designed to mimic the overall equity market's industry weightings.
7 The Barclays Capital U.S. Aggregate Bond Index (prior to November 2008, the Index was known as the "Lehman Brothers U.S. Aggregate Bond Index") represents an unmanaged diversified portfolio of fixed income securities, including U.S. Treasuries, investment-grade corporate bonds and mortgage-backed and asset-backed securities.
8 Lipper Long/Short Equity Funds Average represents the average annualized total return for all reporting funds in the Lipper Long/Short Equity Fund category.
Cl — Class
The Turner Titan Fund may focus its investments from time to time on one or more economic sectors. To the extent that it does so, developments affecting companies in that sector or sectors will likely have a magnified effect on the Fund's net asset value and total return. The Fund is subject to the risks associated with selling securities short. A short sale involves a finite opportunity for appreciation, but a theoretically unlimited risk of loss. The smaller capitalization companies the Fund invests in may be more vulnerable to adverse business or economic events than larger, more established companies.
12 TURNER FUNDS 2012 SEMIANNUAL REPORT
INVESTMENT REVIEW
Turner All Cap Growth Fund
Fund profile
March 31, 2012
g Ticker symbol TBTBX
g CUSIP #87252R797
g Top five holdings1
(1) Apple
(2) Qualcomm
(3) Alexion Pharmaceuticals
(4) F5 Networks
(5) Broadcom, Cl A
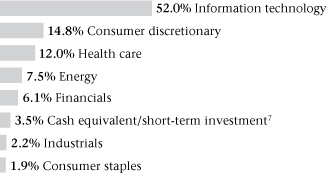
g % in five largest holdings 25.5%2
g Number of holdings 351
g Price/earnings ratio 14.4
g Weighted average market capitalization $62.11 billion
g % of holdings with positive earnings surprises 82.4%
g % of holdings with negative earnings surprises 14.7%
g Net assets $33 million
Growth of a $10,000 investment in the
Turner All Cap Growth Fund:
September 30, 2001-March 31, 20123
Average annual total returns (Periods ended March 31, 2012)
| | | Six months
(not annualized) | | One
year | | Three
years | | Five
years | | 10
years | | Since
inception | |
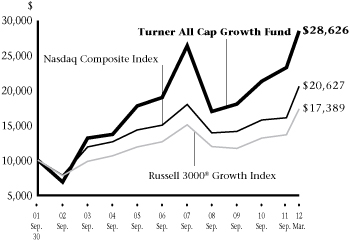
| Turner All Cap Growth Fund4 | | | 22.69 | % | | | -0.84 | % | | | 34.74 | % | | | 6.64 | % | | | 8.06 | % | | | -0.51 | % | |
| Nasdaq Composite Index5 | | | 27.99 | % | | | 11.16 | % | | | 26.46 | % | | | 5.01 | % | | | 5.30 | % | | | -2.10 | % | |
| Russell 3000® Growth Index6 | | | 27.12 | % | | | 10.14 | % | | | 25.50 | % | | | 5.02 | % | | | 4.42 | % | | | -0.89 | % | |
Sector weightings2:
Manager's discussion and analysis
Outperformance in information-technology holdings powered the Turner All Cap Growth Fund (TBTBX) to a 22.69% gain in the six-month period ended March 31. However, the fund's return lagged that of the Nasdaq Composite Index by 5.30 percentage points and the Russell 3000® Growth Index by 4.43 percentage points.
Three of the fund's seven sector positions outperformed their corresponding index sectors, with a 52% weighting in the information-technology sector contributing the most return. In that sector, software, Internet-infrastructure, semiconductor, and computer shares did best. The main detractors from performance were the consumer-discretionary and energy sectors, a 22% weighting, with footwear, apparel, coal-mining, and energy exploration-and-production shares recording poor relative returns.
1 Cash equivalent and short-term investment are not being considered a holding for the top five holdings, but are counted in the number of holdings. The fund composition is subject to change.
2 Percentages based on total investments.
3 These figures represent past performance, which is no guarantee of future results. The investment return and principal value of an investment will fluctuate, so an investor's shares, when redeemed, may be worth more or less than their original cost. The performance in the above graph and table does not reflect the deduction of taxes the shareholder will pay on fund distributions or the redemptions of fund shares. The inception date of the Turner All Cap Growth Fund was June 30, 2000.
4 Fee waivers are in effect; if they had not been in effect, performance would have been lower.
5 The Nasdaq Composite Index includes more than 5,000 domestic and non-U.S. based common stocks listed on the Nasdaq stock market. The index is market-value weighted. This means that each company's security affects the index in proportion to its market value. The market value, the last sale price multiplied by total shares outstanding, is calculated throughout the trading day, and is related to the total value of the index. Because it is so broad-based, the Index is one of the most widely followed and quoted major market indices.
6 The Russell 3000® Growth Index measures the performance of the broad growth segment of the U.S. equity universe. It includes those Russell 3000® companies with higher price-to-book ratios and higher forecasted growth values.
7 Cash equivalent includes short-term investment held as collateral for securities lending activity. Please see Note 11 in Notes to Financial Statements for more detailed information.
Cl — Class
The Turner All Cap Growth Fund may buy and sell securities frequently as part of its investment strategy. The medium capitalization companies in which the Fund invests may be more vulnerable to adverse business or economic events than larger, more established companies.
TURNER FUNDS 2012 SEMIANNUAL REPORT 13
INVESTMENT REVIEW
Turner Concentrated Growth Fund
Fund profile
March 31, 2012
g Ticker symbol TTOPX
g CUSIP #87252R862
g Top five holdings1
(1) Apple
(2) Alexion Pharmaceuticals
(3) CBRE Group
(4) Broadcom, Cl A
(5) Comerica
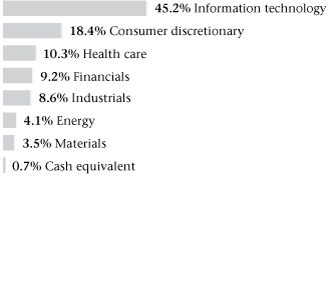
g % in five largest holdings 29.3%2
g Number of holdings 251
g Price/earnings ratio 15.3
g Weighted average market capitalization $87.76 Billion
g % of holdings with positive earnings surprises 87.5%
g % of holdings with negative earnings surprises 12.5%
g Net assets $44 million

Growth of a $10,000 investment in the
Turner Concentrated Growth Fund:
September 30, 2001-March 31, 20123
Average annual total returns (Periods ended March 31, 2012)
| | | Six months
(not annualized) | | One
year | | Three
years | | Five
years | | 10
years | | Since
inception | |
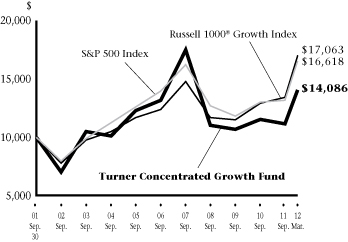
| Turner Concentrated Growth Fund4 | | | 26.01 | % | | | -0.86 | % | | | 24.25 | % | | | 0.06 | % | | | 1.33 | % | | | 1.16 | % | |
| S&P 500 Index5 | | | 25.89 | % | | | 8.54 | % | | | 23.42 | % | | | 2.01 | % | | | 4.12 | % | | | 2.05 | % | |
| Russell 1000® Growth Index6 | | | 26.85 | % | | | 11.02 | % | | | 25.28 | % | | | 5.10 | % | | | 4.28 | % | | | 0.77 | % | |
Sector weightings2:
Manager's discussion and analysis
Generally good stock selection boosted the performance of the Turner Concentrated Growth Fund (TTOPX) in the six-month period ended March 31. As a result, the fund, which contains a select few stocks that we think have the strongest earnings power and return potential, gained 26.01%, outperforming the S&P 500 Index by 0.12 percentage point but lagging the Russell 1000® Growth Index by 0.84 percentage point.
Four of the seven sectors in which the fund is invested beat their corresponding market sectors. The information-technology and industrials sectors, a 54% weighting, provided the most extra return. In those sectors, Internet-infrastructure, computer, semiconductor, machinery, home-builder, and railroad shares performed well. The worst-performing sectors were energy and consumer discretionary, a 23% weighting. Energy exploration-and-production, e-commerce, automotive, and apparel shares underperformed the most.
1 Cash equivalent and short-term investment are not being considered a holding for the top five holdings, but are counted in the number of holdings. The fund composition is subject to change.
2 Percentages based on total investments.
3 These figures represent past performance, which is no guarantee of future results. The investment return and principal value of an investment will fluctuate, so an investor's shares, when redeemed, may be worth more or less than their original cost. The performance in the above graph and table does not reflect the deduction of taxes the shareholder will pay on fund distributions or the redemptions of fund shares. The inception date of the Turner Concentrated Growth Fund was June 30,1999.
4 Fee waivers are in effect; if they had not been in effect, performance would have been lower.
5 The S&P 500 Index is a widely-recognized, market value-weighted (higher market value stocks have more influence than lower market value stocks) index of 500 stocks designed to mimic the overall equity market's industry weightings.
6 The Russell 1000® Growth Index measures the performance of the broad growth segment of the U.S. equity universe. It includes those Russell 1000® companies with higher price-to-book ratios and higher forecasted growth values.
Cl — Class
The Turner Concentrated Growth Fund is non-diversified, which means that it may invest in the securities of fewer issuers than a diversified fund. As a result, it may be more susceptible to a single adverse economic or regulatory occurrence affecting one or more of these issuers, and may experience increased volatility. The Fund may buy and sell securities frequently as part of its investment strategy.
14 TURNER FUNDS 2012 SEMIANNUAL REPORT
INVESTMENT REVIEW
Turner Emerging Growth Fund
Fund profile
March 31, 2012
g Ticker symbol TMCGX
Investor Class Shares
g CUSIP #872524301
Investor Class Shares
g Top five holdings1
(1) Ariba
(2) Clean Harbors
(3) Triumph Group
(4) Cirrus Logic
(5) SXC Health Solutions
g % in five largest holdings 10.2%2
g Number of holdings 1081
g Price/earnings ratio 15.5
g Weighted average market capitalization $1.76 Billion
g % of holdings with positive earnings surprises 66.4%
g % of holdings with negative earnings surprises 30.8%
g Net assets $180 million, Investor Class Shares

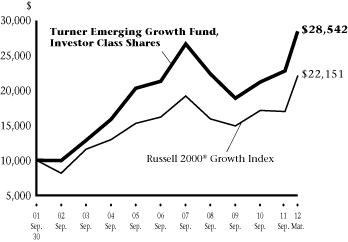
Growth of a $10,000 investment in the
Turner Emerging Growth Fund, Investor Class Shares:
September 30, 2001-March 31, 20123,4
Average annual total returns (Periods ended March 31, 2012)
| | | Six months
(not annualized) | | One
year | | Three
years | | Five
years | | 10
years | | Since
inception | |
| Turner Emerging Growth Fund, Institutional Class Shares5 | | | 24.87 | % | | | 0.74 | % | | | 27.12 | % | | | — | | | | — | | | | 24.72 | %6 | |
| Turner Emerging Growth Fund, Investor Class Shares5 | | | 24.76 | % | | | 0.51 | % | | | 26.81 | % | | | 3.55 | % | | | 8.10 | % | | | 18.55 | %4 | |
| Russell 2000® Growth Index7 | | | 30.26 | % | | | 0.68 | % | | | 28.36 | % | | | 4.15 | % | | | 6.00 | % | | | 3.70 | %4 | |
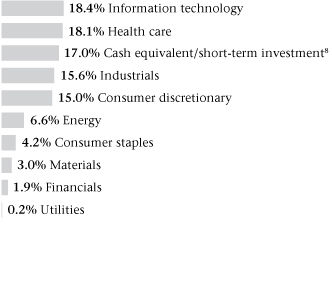
Sector weightings2:
Manager's discussion and analysis
During the six-month period ended March 31, the Turner Emerging Growth Fund, Investor Class Shares (TMCGX) gained 24.76%, underperforming the Russell 2000® Growth Index's 30.26% gain by 5.50 percentage points.
All nine of the fund's sector positions provided positive returns, with three of the positions outperforming their corresponding benchmarks. Of those sectors, financials and materials, a 5% weighting, furnished the greatest outperformance, with shares in commercial banks, software, paper, and diversified manufacturing doing best. The health-care and consumer-discretionary sectors detracted the most from results. In those sectors, which represented a 33% weighting, medical-instrument, pharmacy-services, footwear, apparel, and audio/video-equipment shares proved disappointing.
1 Cash equivalent and short-term investment are not being considered a holding for the top five holdings, but are counted in the number of holdings. The fund composition is subject to change.
2 Percentages based on total investments.
3 These figures represent past performance, which is no guarantee of future results. The investment return and principal value of an investment will fluctuate, so an investor's shares, when redeemed, may be worth more or less than their original cost. The performance in the above graph and table does not reflect the deduction of taxes the shareholder will pay on fund distributions or the redemptions of fund shares. Performance of the Institutional and Investor Class Shares will differ due to differences in fees.
4 The inception date of the Turner Emerging Growth Fund (Investor Class Shares) was February 27, 1998. Index returns are based on Investor Class Shares inception date.
5 Fee waivers are in effect; if they had not been in effect, performance would have been lower.
6 The inception date of the Turner Emerging Growth Fund (Institutional Class Shares) was February 1, 2009.
7 The Russell 2000® Growth Index is a widely-recognized, capitalization-weighted (companies with larger market capitalizations have more influence than those with smaller market capitalizations) index of the 2,000 smallest U.S. companies out of the 3,000 largest U.S. companies with higher growth rates and price-to-book ratios.
8 Cash equivalent includes short-term investment held as collateral for securities lending activity. Please see Note 11 in Notes to Financial Statements for more detailed information.
Amounts designated as "—" are not applicable.
The Turner Emerging Growth Fund is also subject to taxable income and realized capital gains. Shareholder redemptions may force the Fund to sell securities at an inappropriate time, also resulting in realized gains.
TURNER FUNDS 2012 SEMIANNUAL REPORT 15
INVESTMENT REVIEW
Turner Large Growth Fund
Fund profile
March 31, 2012
g Ticker symbol TTMEX
Institutional Class Shares
g CUSIP #900297847
Institutional Class Shares
g Top five holdings1
(1) Apple
(2) Coca-Cola
(3) Qualcomm
(4) Google, Cl A
(5) Schlumberger
g % in five largest holdings 25.0%2
g Number of holdings 731
g Price/earnings ratio 14.1
g Weighted average market capitalization $104.95 Billion
g % of holdings with positive earnings surprises 81.9%
g % of holdings with negative earnings surprises 18.1%
g Net assets $371 million, Institutional Class Shares

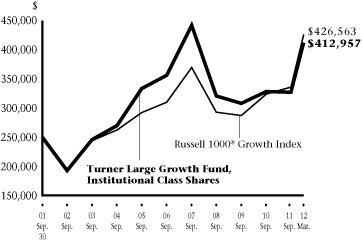
Growth of a $250,000 investment in the
Turner Large Growth Fund, Institutional Class Shares:
September 30, 2001-March 31, 20123,4
Average annual total returns (Periods ended March 31, 2012)
| | | Six months
(not annualized) | | One
year | | Three
years | | Five
years | | 10
years | | Since
inception | |
| Turner Large Growth Fund, Institutional Class Shares5 | | | 26.00 | % | | | 3.85 | % | | | 21.17 | % | | | 1.49 | % | | | 4.18 | % | | | 2.75 | %4 | |
| Turner Large Growth Fund, Investor Class Shares5 | | | 25.91 | % | | | 3.55 | % | | | 20.85 | % | | | 1.24 | % | | | — | | | | 3.46 | %6 | |
| Russell 1000® Growth Index7 | | | 26.85 | % | | | 11.02 | % | | | 25.28 | % | | | 5.10 | % | | | 4.28 | % | | | 2.60 | %4 | |
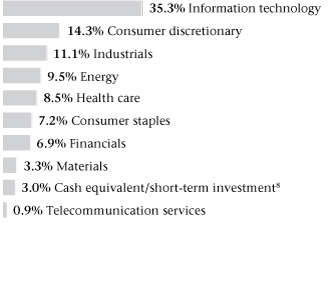
Sector weightings2:
Manager's discussion and analysis
Double-digit gains in every sector enabled the Turner Large Growth Fund, Institutional Class Shares (TTMEX) to return 26.00% in the six-month period ended March 31. However, the fund slightly underperformed its benchmark, the Russell 1000® Growth Index, by 0.85 percentage point.
A 35% position in the information-technology sector provided the greatest contribution to the fund's performance. Five of the nine sectors the fund was invested in beat their corresponding index sectors — especially information technology, in which computer, semiconductor, and Internet-infrastructure shares generated the best results. The major detractors from performance came from the health-care and materials sectors, which represented 12% of the portfolio. The detracting performers in those sectors included pharmaceutical, medical-products, gold-mining, and agricultural-chemical shares.
1 Cash equivalent and short-term investment are not being considered a holding for the top five holdings, but are counted in the number of holdings. The fund composition is subject to change.
2 Percentages based on total investments.
3 These figures represent past performance, which is no guarantee of future results. The investment return and principal value of an investment will fluctuate, so an investor's shares, when redeemed, may be worth more or less than their original cost. The performance in the above graph and table does not reflect the deduction of taxes the shareholder will pay on fund distributions or the redemptions of fund shares. Performance of the Institutional and Investor Class Shares will differ due to differences in fees.
4 The inception date of the Turner Large Growth Fund (Institutional Class Shares) was February 28, 2001. Index returns are based on Institutional Class Shares inception date.
5 Fee waivers are in effect; if they had not been in effect, performance would have been lower.
6 The inception date of the Turner Large Growth Fund (Investor Class Shares) was August 1, 2005.
7 The Russell 1000® Growth Index measures the performance of the broad growth segment of the U.S. equity universe. It includes those Russell 1000® companies with higher price-to-book ratios and higher forecasted growth values.
8 Cash equivalent includes short-term investment held as collateral for securities lending activity. Please see Note 11 in Notes to Financial Statements for more detailed information.
Amounts designated as "—" are not applicable.
Cl — Class
The Turner Large Growth Fund may buy and sell securities frequently as part of its investment strategy. The Fund is subject to the risk that large capitalization growth stocks may underperform other segments of the equity markets as a whole.
16 TURNER FUNDS 2012 SEMIANNUAL REPORT
INVESTMENT REVIEW
Turner Midcap Growth Fund
Fund profile
March 31, 2012
g Ticker symbol TMGFX
Investor Class Shares
g CUSIP #900297409
Investor Class Shares
g Top five holdings1
(1) ON Semiconductor
(2) Starwood Hotels & Resorts Worldwide
(3) Citrix Systems
(4) Broadcom, Cl A
(5) Lam Research
g % in five largest holdings 9.8%2
g Number of holdings 951
g Price/earnings ratio 16.9
g Weighted average market capitalization $9.39 Billion
g % of holdings with positive earnings surprises 77.7%
g % of holdings with negative earnings surprises 21.3%
g Net assets $506 million, Investor Class Shares

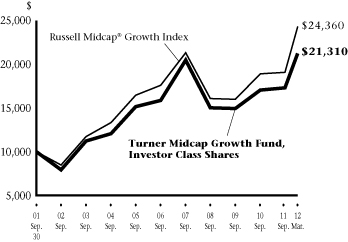
Growth of a $10,000 investment in the
Turner Midcap Growth Fund, Investor Class Shares:
September 30, 2001-March 31, 20123,4
Average annual total returns (Periods ended March 31, 2012)
| | | Six months
(not annualized) | | One
year | | Three
years | | Five
years | | 10
years | | Since
inception | |
| Turner Midcap Growth Fund, Institutional Class Shares5 | | | 23.01 | % | | | -4.22 | % | | | 27.86 | % | | | — | | | | — | | | | 2.03 | %6 | |
| Turner Midcap Growth Fund, Investor Class Shares5 | | | 22.94 | % | | | -4.41 | % | | | 27.57 | % | | | 4.22 | % | | | 5.82 | % | | | 10.38 | %4 | |
| Turner Midcap Growth Fund, Retirement Class Shares5 | | | 21.27 | % | | | -5.83 | % | | | 26.73 | % | | | 3.71 | % | | | 5.30 | % | | | 7.00 | %7 | |
| Russell Midcap® Growth Index8 | | | 27.39 | % | | | 4.43 | % | | | 29.16 | % | | | 4.44 | % | | | 6.92 | % | | | 7.47 | %4 | |
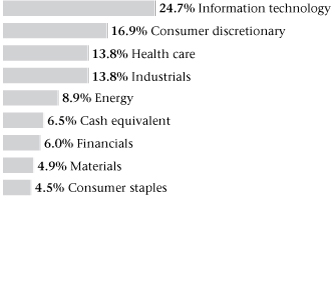
Sector weightings2:
Manager's discussion and analysis
In the six-month period ended March 31, the Turner Midcap Growth Fund, Investor Class Shares (TMGFX) advanced 22.94%, underperforming the Russell Midcap® Growth Index by 4.45 percentage points.
The fund's performance was most aided by favorable relative returns in the information-technology and financials sectors, a 31% weighting. Software, Internet-infrastructure, semiconductor, asset-manager, and real-estate stocks were key contributors in those sectors. The consumer-discretionary sector, a 17% weighting, impaired results the most. Footwear, restaurant, apparel, and entertainment-software stocks accounted for the greatest degree of underperformance.
1 Cash equivalent and short-term investment are not being considered a holding for the top five holdings, but are counted in the number of holdings. The fund composition is subject to change.
2 Percentages based on total investments.
3 These figures represent past performance, which is no guarantee of future results. The investment return and principal value of an investment will fluctuate, so an investor's shares, when redeemed, may be worth more or less than their original cost. The performance in the above graph and table does not reflect the deduction of taxes the shareholder will pay on fund distributions or the redemptions of fund shares. Performance of the Institutional, Investor and Retirement Class Shares will differ due to differences in fees.
4 The inception date of the Turner Midcap Growth Fund (Investor Class Shares) was October 1, 1996. Index returns are based on Investor Class Shares inception date.
5 Fee waivers are in effect; if they had not been in effect, performance would have been lower.
6 The inception date of the Turner Midcap Growth Fund (Institutional Class Shares) was June 16, 2008.
7 The inception date of the Turner Midcap Growth Fund (Retirement Class Shares) was September 24, 2001.
8 The Russell Midcap® Growth Index is a capitalization-weighted (companies with larger market capitalizations have more influence than those with smaller market capitalizations) index of the 800 smallest U.S. companies out of the 1,000 largest companies with higher growth rates and price-to-book ratios.
Cl — Class
Amounts designated as "—" are not applicable.
The Turner Midcap Growth Fund may buy and sell securities frequently as part of its investment strategy. The medium capitalization companies in which the Fund invests may be more vulnerable to adverse business or economic events than larger, more established companies.
TURNER FUNDS 2012 SEMIANNUAL REPORT 17
INVESTMENT REVIEW
Turner Small Cap Growth Fund
Fund profile
March 31, 2012
g Ticker symbol TSCEX
g CUSIP #900297300
g Top five holdings1
(1) Cirrus Logic
(2) Concur Technologies
(3) Quality Systems
(4) Sotheby's
(5) Copa Holdings, Cl A
g % in five largest holdings 5.1%2
g Number of holdings 1261
g Price/earnings ratio 15.6
g Weighted average market capitalization $1.96 Billion
g % of holdings with positive earnings surprises 67.2%
g % of holdings with negative earnings surprises 30.4%
g Net assets $277 million
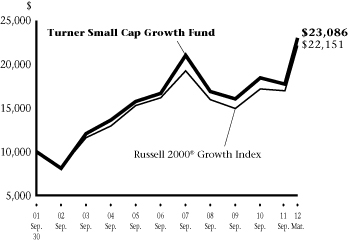
Growth of a $10,000 investment in the
Turner Small Cap Growth Fund:
September 30, 2001-March 31, 20123
Average annual total returns (Periods ended March 31, 2012)
| | | Six months
(not annualized) | | One
year | | Three
years | | Five
years | | 10
years | | Since
inception | |
| Turner Small Cap Growth Fund4 | | | 29.82 | % | | | -4.24 | % | | | 27.29 | % | | | 3.91 | % | | | 6.44 | % | | | 11.19 | % | |
| Russell 2000® Growth Index5 | | | 30.26 | % | | | 0.68 | % | | | 28.36 | % | | | 4.15 | % | | | 6.00 | % | | | 5.97 | % | |
Sector weightings2:
Manager's discussion and analysis
Good stock selection in some major market sectors helped the Turner Small Cap Growth Fund (TSCEX) gain 29.82% in the six-month period ended March 31. However, the fund lagged its benchmark, the Russell 2000® Growth Index, by 0.44 percentage point.
Six of the fund's sector positions — consumer staples, information technology, financials, industrials, consumer discretionary, and telecommunications services, a 57% weighting — beat their index counterparts. Consumer staples contributed the most return, with shares in companies involved in nutritional supplements, food processing, and wholesale foods performing the best. Health-care and materials shares, a 20% weighting, provided the biggest drag on performance. Pharmacy-services, medical-information-systems, diagnostic-equipment, filtration, gold-mining, and electric-product stocks recorded subpar results.
1 Cash equivalent and short-term investment are not being considered a holding for the top five holdings, but are counted in the number of holdings. The fund composition is subject to change.
2 Percentages based on total investments.
3 These figures represent past performance, which is no guarantee of future results. The investment return and principal value of an investment will fluctuate, so an investor's shares, when redeemed, may be worth more or less than their original cost. The performance in the above graph and table does not reflect the deduction of taxes the shareholder will pay on fund distributions or the redemptions of fund shares. The inception date of the Turner Small Cap Growth Fund was February 7, 1994.
4 Fee waivers are in effect; if they had not been in effect, performance would have been lower.
5 The Russell 2000® Growth Index is a widely-recognized, capitalization-weighted (companies with larger market capitalizations have more influence than those with smaller market capitalizations) index of the 2,000 smallest U.S. companies out of the 3,000 largest U.S. companies with higher growth rates and price-to-book ratios.
6 Cash equivalent includes short-term investment held as collateral for securities lending activity. Please see Note 11 in Notes to Financial Statements for more detailed information.
Cl — Class
The Turner Small Cap Growth Fund may buy and sell securities frequently as part of its investment strategy. The smaller capitalization companies the Fund invests in may be more vulnerable to adverse business or economic events than larger, more established companies.
18 TURNER FUNDS 2012 SEMIANNUAL REPORT
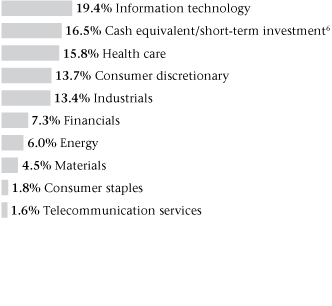
INVESTMENT REVIEW
Turner Global Opportunities Fund
Fund profile
March 31, 2012
g Ticker symbol TGLBX
Institutional Class Shares
g CUSIP #900297623
Institutional Class Shares
g Top five holdings1
(1) Apple
(2) Imagination Technologies Group
(3) AIA Group
(4) Alexion Pharmaceuticals
(5) Remy Cointreau
g % in five largest holdings 27.8%2
g Number of holdings 291
g Price/earnings ratio 15.8
g Weighted average market capitalization $64.66 Billion
g % of holdings with positive earnings surprises 78.6%
g % of holdings with negative earnings surprises 7.1%
g Net assets $1 million, Institutional Class Shares

Growth of a $250,000 investment in the
Turner Global Opportunities Fund,
Institutional Class Shares:
May 7, 2010-March 31, 20123
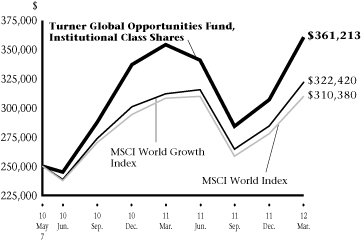
Average annual total returns (Periods ended March 31, 2012)
| | | Six months
(not annualized) | | One
year | | Since
inception | |
| Turner Global Opportunities Fund, Institutional Class Shares4 | | | 26.96 | % | | | 1.75 | % | | | 21.39 | % | |
| Turner Global Opportunities Fund, Investor Class Shares4 | | | 26.82 | % | | | 1.47 | % | | | 21.03 | % | |
| MSCI World Growth Index5 | | | 21.96 | % | | | 3.54 | % | | | 14.73 | % | |
| MSCI World Index6 | | | 20.34 | % | | | 1.14 | % | | | 12.64 | % | |
Sector weightings2:
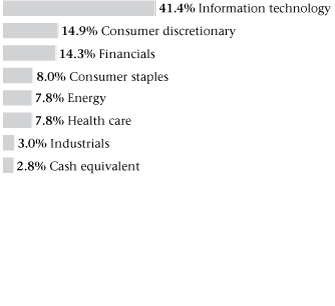
Manager's discussion and analysis
Good stock selection benefited the Turner Global Opportunities Fund, Institutional Class Shares (TGLBX), which gained 26.96% for the six-month period ended March 31. The fund beat its benchmarks, the MSCI World Growth Index and the MSCI World Index, by 5.00 percentage points and 6.62 percentage points, respectively.
Five of the fund's seven sector positions outperformed their corresponding index sectors. The best-performing sector was information technology, which amounted to 41% of holdings. In that sector, Internet-infrastructure, software, and semiconductor shares contributed the most extra return. The fund's performance was hurt the most by the energy and consumer-discretionary sectors, with a combined weighting of 23%. Oil, coal-mining, restaurant, hotel, and e-commerce stocks were the biggest laggards.
1 Cash equivalent is not being considered a holding for the top five holdings, but is counted in the number of holdings. The fund composition is subject to change.
2 Percentages based on total investments.
3 These figures represent past performance, which is no guarantee of future results. The investment return and principal value of an investment will fluctuate, so an investor's shares, when redeemed, may be worth more or less than their original cost. The performance in the above graph and table does not reflect the deduction of taxes the shareholder will pay on fund distributions or the redemptions of fund shares. The inception date of the Turner Global Opportunities Fund was May 7, 2010. Performance of the Institutional and Investor Class Shares will differ due to differences in fees.
4 Fee waivers are in effect; if they had not been in effect, performance would have been lower.
5 The MSCI World Growth Index measures the performance of growth stocks in developed countries throughout the world. The index includes reinvestment of dividends.
6 The MSCI World Index is a free float-adjusted market capitalization-weighted index that is designed to measure the equity market performance of developed markets. The MSCI World Index consists of the following 24 developed market country indices: Australia, Austria, Belgium, Canada, Denmark, Finland, France, Germany, Greece, Hong Kong, Ireland, Israel, Italy, Japan, Netherlands, New Zealand, Norway, Portugal, Singapore, Spain, Sweden, Switzerland, the United Kingdom and the United States.
The Turner Global Opportunities Fund is non-diversified, which means that it may invest in the securities of fewer issuers than a diversified fund. As a result, it may be more susceptible to a single adverse economic or regulatory occurrence affecting one or more of these issuers, and may experience increased volatility. The Fund is subject to risks due to its foreign investments.
TURNER FUNDS 2012 SEMIANNUAL REPORT 19
INVESTMENT REVIEW
Turner International Growth Fund
Fund profile
March 31, 2012
g Ticker symbol TICGX
Institutional Class Shares
g CUSIP #900297771
Institutional Class Shares
g Top five holdings1
(1) Nestle
(2) Roche Holding
(3) Honda Motor
(4) British American Tobacco
(5) Lululemon Athletica
g % in five largest holdings 10.0%2
g Number of holdings 801
g Price/earnings ratio 14.7
g Weighted average market capitalization $45.82 billion
g % of holdings with positive earnings surprises 31.7
g % of holdings with negative earnings surprises 26.6
g Net assets $8 million, Institutional Class Shares
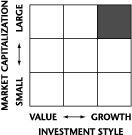
Growth of a $250,000 investment in the
Turner International Growth Fund,
Institutional Class Shares:
January 31, 2007-March 31, 20123,4
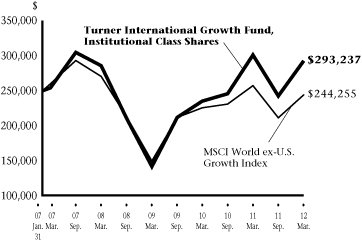
Average annual total returns (Periods ended March 31, 2012)
| | | Six months
(not annualized) | | One
year | | Three
years | | Five
years | | Since
inception | |
| Turner International Growth Fund, Institutional Class Shares5 | | | 20.96 | % | | | -2.79 | % | | | 27.65 | % | | | 2.87 | % | | | 3.14 | %4 | |
| Turner International Growth Fund, Investor Class Shares5 | | | 20.83 | % | | | -3.15 | % | | | 27.35 | % | | | — | | | | 19.56 | %6 | |
| MSCI World ex-U.S. Growth Index7 | | | 15.72 | % | | | -5.09 | % | | | 17.93 | % | | | -1.26 | % | | | -0.45 | %4 | |
Sector weightings2:
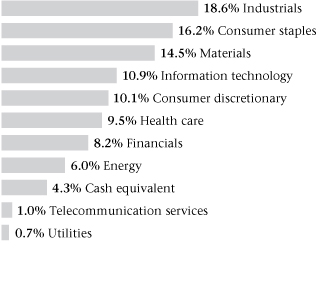
Manager's discussion and analysis
In the six-month period ended March 31, the Turner International Growth Fund, Institutional Class Shares (TICGX) gained 20.96%, a result that outperformed the MSCI World ex-U.S. Growth Index by 5.24 percentage points.
Stock selection was good: nine of the 10 sectors the fund was invested in outperformed their corresponding index sectors, with information technology and financials, a 19% weighting, providing the most extra return. In those sectors, semiconductor, software, commercial-services, and commercial-bank shares performed especially well. A 6% weighting in energy was the fund's only detracting sector, with oil exploration-and-production, oil-field-services, and coal stocks underperforming.
1 Cash equivalent is not being considered a holding for the top five holdings, but is counted in the number of holdings. The fund composition is subject to change.
2 Percentages based on total investments.
3 These figures represent past performance, which is no guarantee of future results. The investment return and principal value of an investment will fluctuate, so an investor's shares, when redeemed, may be worth more or less than their original cost. The performance in the above graph and table does not reflect the deduction of taxes the shareholder will pay on fund distributions or the redemptions of fund shares. Performance of the Institutional and Investor Class Shares will differ due to differences in fees.
4 The inception date of the Turner International Growth Fund (Institutional Class Shares) was January 31, 2007. Index returns are based on Institutional Class Shares inception date.
5 Fee waivers are in effect; if they had not been in effect, performance would have been lower.
6 The inception date of the Turner International Growth Fund (Investor Class Shares) was October 31, 2008.
7 The MSCI World Growth ex-U.S. Growth Index is a market capitalization-weighted index (companies with larger market capitalizations have more influence than those with smaller market capitalizations) designed to measure the combined equity market performance of developed and emerging markets countries, excluding the United States.
Amounts designated as "—" are not applicable.
The Turner International Growth Fund may buy and sell securities frequently as part of its investment strategy. The Fund is subject to risks due to its foreign investments.
20 TURNER FUNDS 2012 SEMIANNUAL REPORT
(Unaudited)
Schedule of investments
Turner Market Neutral Fund
March 31, 2012
| | | Shares | | Value
(000) | |
| Common stock—83.9% | |
| Consumer discretionary—7.7% | |
| Abercrombie & Fitch, Cl A^ | | | 20,920 | | | $ | 1,038 | | |
| Guess?^ | | | 33,030 | | | | 1,032 | | |
Starwood Hotels & Resorts
Worldwide | | | 39,090 | | | | 2,205 | | |
| Total Consumer discretionary | | | | | 4,275 | | |
| Consumer staples—3.9% | |
| Brown-Forman, Cl B^ | | | 13,210 | | | | 1,102 | | |
| Kellogg^ | | | 20,370 | | | | 1,092 | | |
| Total Consumer staples | | | | | 2,194 | | |
| Energy—7.6% | |
| Devon Energy^ | | | 15,420 | | | | 1,097 | | |
| Noble Energy^ | | | 11,010 | | | | 1,077 | | |
| Transocean^ | | | 19,270 | | | | 1,054 | | |
| Weatherford International* | | | 64,420 | | | | 972 | | |
| Total Energy | | | | | 4,200 | | |
| Financials—15.2% | |
| Affiliated Managers Group*^ | | | 9,910 | | | | 1,108 | | |
| AON | | | 22,020 | | | | 1,080 | | |
| Chubb^ | | | 14,310 | | | | 989 | | |
| Compartamos SAB de CV | | | 772,990 | | | | 877 | | |
| Invesco^ | | | 44,050 | | | | 1,175 | | |
| KeyCorp^ | | | 127,730 | | | | 1,085 | | |
| Western Union^ | | | 121,120 | | | | 2,132 | | |
| Total Financials | | | | | 8,446 | | |
| Health care—14.5% | |
| AmerisourceBergen, Cl A | | | 27,530 | | | | 1,092 | | |
| Catalyst Health Solutions*^ | | | 17,070 | | | | 1,088 | | |
| Cerner*^ | �� | | 15,420 | | | | 1,174 | | |
| Covidien^ | | | 21,470 | | | | 1,174 | | |
| Quest Diagnostics | | | 25,430 | | | | 1,555 | | |
| WellPoint | | | 13,760 | | | | 1,016 | | |
| Zimmer Holdings* | | | 15,420 | | | | 991 | | |
| Total Health care | | | | | 8,090 | | |
| Industrials—13.9% | |
| Bombardier, Cl B | | | 269,230 | | | | 1,119 | | |
| Caterpillar^ | | | 15,420 | | | | 1,642 | | |
| Delta Air Lines*^ | | | 115,070 | | | | 1,140 | | |
| Eaton | | | 11,560 | | | | 576 | | |
| | | Shares | | Value
(000) | |
| Esterline Technologies* | | | 14,870 | | | $ | 1,063 | | |
| MSC Industrial Direct, Cl A^ | | | 13,760 | | | | 1,146 | | |
| Titan International | | | 44,050 | | | | 1,042 | | |
| Total Industrials | | | | | 7,728 | | |
| Information technology—13.3% | |
| ADTRAN^ | | | 35,240 | | | | 1,099 | | |
| Cisco Systems^ | | | 53,960 | | | | 1,141 | | |
| Electronic Arts*^ | | | 62,210 | | | | 1,025 | | |
| ON Semiconductor*^ | | | 115,620 | | | | 1,042 | | |
| SanDisk* | | | 20,920 | | | | 1,037 | | |
| TIBCO Software* | | | 67,720 | | | | 2,066 | | |
| Total Information technology | | | | | 7,410 | | |
| Materials—7.8% | |
ArcelorMittal NY, Registered
Shares | | | 53,400 | | | | 1,021 | | |
| Monsanto^ | | | 27,530 | | | | 2,196 | | |
| Silver Wheaton | | | 33,030 | | | | 1,097 | | |
| Total Materials | | | | | 4,314 | | |
Total Common stock
(Cost $46,317)** | | | | | 46,657 | | |
| Cash equivalent—7.7% | |
BlackRock TempCash Fund,
Institutional Shares,
0.010%***^ | | | 4,293,620 | | | | 4,294 | | |
Total Cash equivalent
(Cost $4,294)** | | | | | 4,294 | | |
Total Investments—91.6%
(Cost $50,611)** | | | | $ | 50,951 | | |
Percentages are based on Net Assets of $55,624.**
* Non-income producing security.
** This number is listed in thousands.
*** Rate shown is the 7-day effective yield as of March 31, 2012.
^ All or a portion of the shares have been committed as collateral for open short positions.
Cl — Class
NY — New York
The accompanying notes are an integral part of the financial statements.
TURNER FUNDS 2012 SEMIANNUAL REPORT 21
FINANCIAL STATEMENTS
Schedule of securities sold short
Turner Market Neutral Fund
March 31, 2012
| | | Shares | | Value
(000) | |
| Common stock—83.7% | |
| Consumer discretionary—14.8% | |
| Buckle | | | 20,920 | | | $ | 1,002 | | |
| Hasbro | | | 29,180 | | | | 1,071 | | |
| Limited Brands | | | 23,120 | | | | 1,110 | | |
| Macy's | | | 27,530 | | | | 1,094 | | |
| Marriott International, Cl A | | | 44,600 | | | | 1,688 | | |
| Viacom, Cl B | | | 11,560 | | | | 549 | | |
| Watsco | | | 23,120 | | | | 1,712 | | |
| Total Consumer discretionary | | | | | 8,226 | | |
| Consumer staples—3.7% | |
| CVS Caremark | | | 22,020 | | | | 987 | | |
| Kimberly-Clark | | | 14,310 | | | | 1,057 | | |
| Total Consumer staples | | | | | 2,044 | | |
| Energy—7.5% | |
| Apache | | | 21,470 | | | | 2,157 | | |
| Diamond Offshore Drilling | | | 15,420 | | | | 1,029 | | |
| Helmerich & Payne | | | 18,720 | | | | 1,010 | | |
| Total Energy | | | | | 4,196 | | |
| Financials—11.1% | |
| Cincinnati Financial | | | 30,280 | | | | 1,045 | | |
| Credicorp | | | 6,060 | | | | 799 | | |
| Janus Capital Group | | | 247,750 | | | | 2,207 | | |
| Progressive | | | 42,390 | | | | 983 | | |
| ProLogis | | | 31,380 | | | | 1,130 | | |
| Total Financials | | | | | 6,164 | | |
| Health care—13.4% | |
| Amgen | | | 32,480 | | | | 2,208 | | |
| Becton Dickinson | | | 12,660 | | | | 983 | | |
| Henry Schein | | | 13,760 | | | | 1,041 | | |
| Johnson & Johnson | | | 16,520 | | | | 1,090 | | |
Laboratory Corp. of America
Holdings | | | 23,670 | | | | 2,167 | | |
| Total Health care | | | | | 7,489 | | |
| Industrials—12.6% | |
| Actuant, Cl A | | | 36,890 | | | | 1,069 | | |
| Dover | | | 17,070 | | | | 1,074 | | |
| Fastenal | | | 20,920 | | | | 1,132 | | |
| Northrop Grumman | | | 17,620 | | | | 1,076 | | |
| Parker Hannifin | | | 12,110 | | | | 1,024 | | |
| | | Shares | | Value
(000) | |
| Scotts Miracle-Gro | | | 10,460 | | | $ | 567 | | |
| Southwest Airlines | | | 127,180 | | | | 1,048 | | |
| Total Industrials | | | | | 6,990 | | |
| Information technology—14.8% | |
| Atmel | | | 105,710 | | | | 1,042 | | |
| Jack Henry & Associates | | | 62,760 | | | | 2,141 | | |
| KLA-Tencor | | | 20,370 | | | | 1,109 | | |
| Linear Technology | | | 33,580 | | | | 1,132 | | |
| Red Hat | | | 9,360 | | | | 561 | | |
| Research In Motion | | | 151,960 | | | | 2,235 | | |
| Total Information technology | | | | | 8,220 | | |
| Materials—5.8% | |
| Kinross Gold | | | 105,710 | | | | 1,035 | | |
| Praxair | | | 9,910 | | | | 1,136 | | |
| United States Steel | | | 35,790 | | | | 1,051 | | |
| Total Materials | | | | | 3,222 | | |
Total Common stock
(Proceeds $46,462)* | | | | | 46,551 | | |
Total Securities sold short—83.7%
(Proceeds $46,462)* | | | | $ | 46,551 | | |
Percentages are based on Net Assets of $55,624.*
* This number is listed in thousands.
Cl — Class
The accompanying notes are an integral part of the financial statements.
22 TURNER FUNDS 2012 SEMIANNUAL REPORT
(Unaudited)
Schedule of investments
Turner Medical Sciences Long/Short Fund
March 31, 2012
| | | Shares | | Value
(000) | |
| Common stock—60.0% | |
| Biotechnology—10.4% | |
| Alexion Pharmaceuticals* | | | 8,870 | | | $ | 824 | | |
| Amicus Therapeutics* | | | 95,040 | | | | 502 | | |
| ARIAD Pharmaceuticals* | | | 61,990 | | | | 989 | | |
| ArQule* | | | 23,720 | | | | 166 | | |
| AVI BioPharma* | | | 149,820 | | | | 231 | | |
| BioMarin Pharmaceutical* | | | 30,550 | | | | 1,046 | | |
| Cubist Pharmaceuticals* | | | 11,840 | | | | 512 | | |
| Dynavax Technologies* | | | 33,260 | | | | 168 | | |
| Medivation* | | | 23,460 | | | | 1,753 | | |
| OncoGenex Pharmaceutical* | | | 24,750 | | | | 329 | | |
| Onyx Pharmaceuticals* | | | 24,680 | | | | 930 | | |
| QLT* | | | 47,420 | | | | 332 | | |
| United Therapeutics* | | | 12,310 | | | | 580 | | |
| Total Biotechnology | | | | | 8,362 | | |
| Health care equipment & supplies—11.5% | |
| Alere* | | | 24,670 | | | | 642 | | |
| ArthroCare* | | | 23,400 | | | | 628 | | |
| Covidien | | | 46,350 | | | | 2,534 | | |
| Cyberonics* | | | 10,910 | | | | 416 | | |
| IDEXX Laboratories* | | | 5,940 | | | | 520 | | |
| Intuitive Surgical* | | | 2,360 | | | | 1,279 | | |
| Masimo* | | | 47,570 | | | | 1,112 | | |
| Sirona Dental Systems* | | | 22,570 | | | | 1,163 | | |
| St. Jude Medical | | | 23,310 | | | | 1,033 | | |
| Total Health care equipment & supplies | | | | | 9,327 | | |
| Health care providers & services—15.3% | |
| Acadia Healthcare* | | | 56,330 | | | | 918 | | |
| AmerisourceBergen, Cl A | | | 22,910 | | | | 909 | | |
| Cardinal Health | | | 20,190 | | | | 870 | | |
| Catalyst Health Solutions* | | | 20,520 | | | | 1,308 | | |
| McKesson | | | 10,080 | | | | 885 | | |
| Quest Diagnostics | | | 33,550 | | | | 2,052 | | |
| UnitedHealth Group | | | 14,310 | | | | 843 | | |
| Universal Health Services, Cl B | | | 21,470 | | | | 900 | | |
| Vanguard Health Systems* | | | 27,757 | | | | 274 | | |
| WellCare Health Plans* | | | 11,780 | | | | 847 | | |
| WellPoint | | | 34,340 | | | | 2,534 | | |
| Total Health care providers & services | | | | | 12,340 | | |
| | | Shares | | Value
(000) | |
| Health care technology—1.5% | |
| Cerner* | | | 16,240 | | | $ | 1,237 | | |
| Total Health care technology | | | | | 1,237 | | |
| Life sciences tools & services—3.1% | |
| Illumina* | | | 8,430 | | | | 444 | | |
| Luminex* | | | 48,270 | | | | 1,127 | | |
| Nordion | | | 8,650 | | | | 84 | | |
| Thermo Fisher Scientific | | | 14,760 | | | | 832 | | |
| Total Life sciences tools & services | | | | | 2,487 | | |
| Pharmaceuticals—18.2% | |
| Abbott Laboratories | | | 20,730 | | | | 1,270 | | |
| Akorn* | | | 70,890 | | | | 829 | | |
| Allergan | | | 13,440 | | | | 1,283 | | |
| Astellas Pharma | | | 39,490 | | | | 1,623 | | |
| Jazz Pharmaceuticals* | | | 32,320 | | | | 1,567 | | |
| Merck | | | 61,680 | | | | 2,368 | | |
| Pfizer | | | 114,790 | | | | 2,601 | | |
| Questcor Pharmaceuticals* | | | 17,290 | | | | 650 | | |
| Zimmer Holdings* | | | 39,620 | | | | 2,547 | | |
| Total Pharmaceuticals | | | | | 14,738 | | |
Total Common stock
(Cost $46,551)** | | | | | 48,491 | | |
| Cash equivalent—34.7% | |
BlackRock TempCash Fund,
Institutional Shares,
0.010%***^ | | | 27,995,365 | | | | 27,995 | | |
Total Cash equivalent
(Cost $27,995)** | | | | | 27,995 | | |
Total Investments—94.7%
(Cost $74,546)** | | | | $ | 76,486 | | |
Percentages are based on Net Assets of $80,768.**
* Non-income producing security.
** This number is listed in thousands.
*** Rate shown is the 7-day effective yield as of March 31, 2012.
^ All or a portion of the shares have been committed as collateral for open short positions.
Cl — Class
The accompanying notes are an integral part of the financial statements.
TURNER FUNDS 2012 SEMIANNUAL REPORT 23
FINANCIAL STATEMENTS
Schedule of securities sold short
Turner Medical Sciences Long/Short Fund
March 31, 2012
| | | Shares | | Value
(000) | |
| Common stock—28.2% | |
| Biotechnology—5.0% | |
| Alkermes | | | 33,500 | | | $ | 621 | | |
| Alnylam Pharmaceuticals | | | 13,770 | | | | 153 | | |
| Amgen | | | 15,490 | | | | 1,053 | | |
| Celgene | | | 5,510 | | | | 427 | | |
| Human Genome Sciences | | | 9,830 | | | | 81 | | |
| Ironwood Pharmaceuticals | | | 18,590 | | | | 248 | | |
| Isis Pharmaceuticals | | | 34,660 | | | | 304 | | |
| Lexicon Pharmaceuticals | | | 40,522 | | | | 75 | | |
| Life Technologies | | | 6,550 | | | | 320 | | |
| Seattle Genetics | | | 3,840 | | | | 78 | | |
| Sequenom | | | 46,400 | | | | 189 | | |
| Theravance | | | 8,890 | | | | 173 | | |
| Vertex Pharmaceuticals | | | 8,070 | | | | 331 | | |
| Total Biotechnology | | | | | 4,053 | | |
| Commercial services & supplies—1.3% | |
| Stericycle | | | 12,343 | | | | 1,032 | | |
| Total Commercial services & supplies | | | | | 1,032 | | |
| Food & staples retailing—2.2% | |
| CVS Caremark | | | 40,280 | | | | 1,805 | | |
| Total Food & staples retailing | | | | | 1,805 | | |
| Health care equipment & supplies—7.0% | |
| Becton Dickinson | | | 10,940 | | | | 849 | | |
| C.R. Bard | | | 6,700 | | | | 661 | | |
| DENTSPLY International | | | 16,310 | | | | 655 | | |
| Hologic | | | 40,070 | | | | 864 | | |
| Natus Medical | | | 13,930 | | | | 166 | | |
| Patterson | | | 30,680 | | | | 1,025 | | |
| ResMed | | | 13,400 | | | | 414 | | |
| Varian Medical Systems | | | 9,030 | | | | 623 | | |
| Wright Medical Group | | | 21,440 | | | | 414 | | |
| Total Health care equipment & supplies | | | | | 5,671 | | |
| Health care providers & services—7.5% | |
| Aetna | | | 16,291 | | | | 817 | | |
| Community Health Systems | | | 14,930 | | | | 332 | | |
| HCA Holdings | | | 23,700 | | | | 586 | | |
| Henry Schein | | | 19,210 | | | | 1,454 | | |
| | | Shares | | Value
(000) | |
Laboratory Corp. of America
Holdings | | | 26,700 | | | $ | 2,444 | | |
| LifePoint Hospitals | | | 10,760 | | | | 425 | | |
| Total Health care providers & services | | | | | 6,058 | | |
| Health care technology—0.4% | |
| athenahealth | | | 4,510 | | | | 334 | | |
| Total Health care technology | | | | | 334 | | |
| Life sciences tools & services—1.5% | |
| Covance | | | 13,430 | | | | 639 | | |
| Mettler-Toledo International | | | 3,100 | | | | 573 | | |
| Total Life sciences tools & services | | | | | 1,212 | | |
| Pharmaceuticals—3.3% | |
| Eisai | | | 20,590 | | | | 819 | | |
| Johnson & Johnson | | | 24,700 | | | | 1,629 | | |
| Nektar Therapeutics | | | 21,700 | | | | 172 | | |
| Total Pharmaceuticals | | | | | 2,620 | | |
Total Common stock
(Proceeds $22,464)* | | | | | 22,785 | | |
| Exchange traded funds—7.2% | |
| CurrencyShares Japanese Yen Trust | | | 6,961 | | | | 827 | | |
| Health Care Select Sector SPDR Fund | | | 66,810 | | | | 2,511 | | |
| SPDR S&P 500 ETF Trust | | | 17,700 | | | | 2,491 | | |
Total Exchange traded funds
(Proceeds $5,835)* | | | | | 5,829 | | |
Total Securities sold short—35.4%
(Proceeds $28,299)* | | | | $ | 28,614 | | |
Percentages are based on Net Assets of $80,768.*
* This number is listed in thousands.
The accompanying notes are an integral part of the financial statements.
24 TURNER FUNDS 2012 SEMIANNUAL REPORT
(Unaudited)
Schedule of investments
Turner Spectrum Fund
March 31, 2012
| | | Shares | | Value
(000) | |
| Common stock—73.5% | |
| Consumer discretionary—11.2% | |
| Abercrombie & Fitch, Cl A | | | 145,130 | | | $ | 7,200 | | |
| Aeropostale* | | | 138,410 | | | | 2,992 | | |
| Amazon.com* | | | 11,700 | | | | 2,369 | | |
| American Eagle Outfitters | | | 297,740 | | | | 5,118 | | |
| Ascena Retail Group* | | | 38,440 | | | | 1,704 | | |
| Black Diamond* | | | 92,350 | | | | 855 | | |
| Bravo Brio Restaurant Group* | | | 71,570 | | | | 1,429 | | |
| CBS, Cl B | | | 57,150 | | | | 1,938 | | |
| Coach | | | 15,760 | | | | 1,218 | | |
| Coldwater Creek* | | | 2,226,520 | | | | 2,583 | | |
| Deckers Outdoor* | | | 14,070 | | | | 887 | | |
| Family Dollar Stores | | | 25,660 | | | | 1,624 | | |
| Ford Motor | | | 97,600 | | | | 1,219 | | |
| Gap | | | 88,460 | | | | 2,312 | | |
| Guess? | | | 306,880 | | | | 9,590 | | |
| International Game Technology | | | 152,200 | | | | 2,556 | | |
| Las Vegas Sands | | | 57,420 | | | | 3,306 | | |
| Lear | | | 47,510 | | | | 2,209 | | |
| Penn National Gaming* | | | 21,240 | | | | 913 | | |
| Polaris Industries | | | 22,520 | | | | 1,625 | | |
| PulteGroup* | | | 124,260 | | | | 1,100 | | |
| Ralph Lauren | | | 28,780 | | | | 5,017 | | |
| Scientific Games, Cl A* | | | 268,350 | | | | 3,129 | | |
| Select Comfort* | | | 37,450 | | | | 1,213 | | |
| Shuffle Master* | | | 44,340 | | | | 780 | | |
| Shutterfly* | | | 122,560 | | | | 3,840 | | |
| Sirius XM Radio* | | | 1,506,970 | | | | 3,481 | | |
| Sparkle Roll Group^ | | | 6,611,650 | | | | 596 | | |
| Stanley Black & Decker | | | 25,210 | | | | 1,940 | | |
Starwood Hotels & Resorts
Worldwide | | | 207,960 | | | | 11,731 | | |
| Steven Madden* | | | 54,980 | | | | 2,350 | | |
| Talbots* | | | 191,690 | | | | 581 | | |
| True Religion Apparel* | | | 44,720 | | | | 1,225 | | |
| Urban Outfitters* | | | 56,790 | | | | 1,653 | | |
| Vera Bradley* | | | 92,230 | | | | 2,784 | | |
| Vitamin Shoppe* | | | 26,150 | | | | 1,156 | | |
| Wynn Resorts | | | 42,320 | | | | 5,285 | | |
| Yum! Brands | | | 63,750 | | | | 4,538 | | |
| Total Consumer discretionary | | | | | 106,046 | | |
| | | Shares | | Value
(000) | |
| Consumer staples—2.1% | |
| Brown-Forman, Cl B | | | 27,420 | | | $ | 2,286 | | |
| Coca-Cola | | | 20,540 | | | | 1,520 | | |
| Colgate-Palmolive | | | 18,280 | | | | 1,787 | | |
Companhia de Bebidas das
Americas ADR, Preferred Shares | | | 59,530 | | | | 2,460 | | |
| Crumbs Bake Shop* | | | 156,090 | | | | 573 | | |
| Hain Celestial Group* | | | 32,390 | | | | 1,419 | | |
| Kellogg | | | 42,680 | | | | 2,289 | | |
| Procter & Gamble | | | 35,750 | | | | 2,403 | | |
| Sara Lee | | | 178,670 | | | | 3,847 | | |
| Whole Foods Market | | | 16,840 | | | | 1,401 | | |
| Total Consumer staples | | | | | 19,985 | | |
| Energy—8.3% | |
| Alpha Natural Resources* | | | 49,300 | | | | 750 | | |
| Anadarko Petroleum | | | 55,600 | | | | 4,356 | | |
| Bellatrix Exploration* | | | 130,740 | | | | 690 | | |
| Cabot Oil & Gas | | | 98,866 | | | | 3,082 | | |
| Celtic Exploration* | | | 32,690 | | | | 477 | | |
| CGX Energy* | | | 220,258 | | | | 311 | | |
| Cobalt International Energy* | | | 78,250 | | | | 2,350 | | |
| Comstock Resources* | | | 36,990 | | | | 586 | | |
| Concho Resources* | | | 48,090 | | | | 4,909 | | |
| Dawson Geophysical* | | | 30,130 | | | | 1,035 | | |
| Devon Energy | | | 70,900 | | | | 5,042 | | |
| El Paso | | | 61,950 | | | | 1,831 | | |
| Enbridge | | | 50,510 | | | | 1,962 | | |
| Enterprise Products Partners LP | | | 40,020 | | | | 2,020 | | |
| Epsilon Energy* | | | 195,210 | | | | 509 | | |
| Exxon Mobil | | | 60,080 | | | | 5,211 | | |
| Falkland Oil & Gas* | | | 554,461 | | | | 572 | | |
| FMC Technologies* | | | 20,210 | | | | 1,019 | | |
| Goodrich Petroleum* | | | 33,290 | | | | 633 | | |
| Halcon Resources* | | | 15,886 | | | | 149 | | |
| Hercules Offshore* | | | 92,600 | | | | 438 | | |
| HollyFrontier | | | 27,070 | | | | 870 | | |
| Key Energy Services* | | | 74,830 | | | | 1,156 | | |
| National Oilwell Varco | | | 18,290 | | | | 1,453 | | |
| Niko Resources | | | 18,030 | | | | 634 | | |
| Noble | | | 28,840 | | | | 1,081 | | |
| Noble Energy | | | 46,480 | | | | 4,545 | | |
| Northern Oil & Gas* | | | 55,200 | | | | 1,145 | | |
TURNER FUNDS 2012 SEMIANNUAL REPORT 25
FINANCIAL STATEMENTS
Schedule of investments
Turner Spectrum Fund
| | | Shares | | Value
(000) | |
| Ophir Energy* | | | 195,171 | | | $ | 1,584 | | |
| Pacific Drilling* | | | 94,690 | | | | 958 | | |
| PetroBakken Energy, Cl A | | | 51,520 | | | | 858 | | |
| PetroChina ADR | | | 11,260 | | | | 1,582 | | |
| Poseidon Concepts | | | 27,870 | | | | 392 | | |
| Rockhopper Exploration* | | | 149,715 | | | | 787 | | |
| Rowan* | | | 42,090 | | | | 1,386 | | |
| Schlumberger | | | 38,330 | | | | 2,680 | | |
| Seadrill | | | 45,850 | | | | 1,720 | | |
| SM Energy | | | 20,140 | | | | 1,425 | | |
| Sunoco | | | 18,610 | | | | 710 | | |
| Total SA ADR | | | 48,060 | | | | 2,457 | | |
| Transocean | | | 82,590 | | | | 4,518 | | |
| TriOil Resources* | | | 159,870 | | | | 542 | | |
| Weatherford International* | | | 217,680 | | | | 3,285 | | |
| Whitehaven Coal | | | 147,780 | | | | 863 | | |
| Williams | | | 114,930 | | | | 3,541 | | |
| Total Energy | | | | | 78,104 | | |
| Financials—13.8% | |
| Affiliated Managers Group* | | | 31,310 | | | | 3,501 | | |
| AIA Group | | | 1,423,304 | | | | 5,215 | | |
| American Express | | | 129,820 | | | | 7,511 | | |
American Safety Insurance
Holdings* | | | 7,800 | | | | 147 | | |
| American Tower | | | 36,130 | | | | 2,277 | | |
| AON | | | 85,020 | | | | 4,171 | | |
| Camden Property Trust | | | 19,230 | | | | 1,264 | | |
| Cardinal Financial | | | 18,130 | | | | 205 | | |
| Cardtronics* | | | 87,360 | | | | 2,293 | | |
| CBRE Group* | | | 155,700 | | | | 3,108 | | |
China Construction Bank,
H Shares | | | 2,717,770 | | | | 2,100 | | |
| Chubb | | | 97,020 | | | | 6,705 | | |
| Citigroup | | | 45,370 | | | | 1,658 | | |
| CME Group | | | 8,120 | | | | 2,349 | | |
| CNO Financial Group* | | | 250,440 | | | | 1,948 | | |
| Comerica | | | 208,460 | | | | 6,746 | | |
| Compartamos SAB de CV | | | 5,280,244 | | | | 5,989 | | |
| Discover Financial Services | | | 48,640 | | | | 1,622 | | |
| DnB NOR ASA | | | 140,773 | | | | 1,811 | | |
| Education Realty Trust | | | 143,940 | | | | 1,560 | | |
| First Connecticut Bancorp | | | 61,770 | | | | 815 | | |
| First Republic Bank* | | | 175,630 | | | | 5,785 | | |
| Fortegra Financial* | | | 194,877 | | | | 1,629 | | |
| | | Shares | | Value
(000) | |
| Franklin Resources | | | 18,180 | | | $ | 2,255 | | |
| Invesco | | | 205,210 | | | | 5,473 | | |
| JPMorgan Chase | | | 60,640 | | | | 2,788 | | |
| KeyCorp | | | 263,300 | | | | 2,238 | | |
| Kilroy Realty | | | 33,000 | | | | 1,538 | | |
| Manning & Napier* | | | 79,940 | | | | 1,175 | | |
| MarketAxess Holdings | | | 55,080 | | | | 2,054 | | |
| Metropolitan Bank & Trust | | | 1,007,290 | | | | 2,050 | | |
| Ocwen Financial* | | | 174,730 | | | | 2,731 | | |
| OmniAmerican Bancorp* | | | 57,910 | | | | 1,121 | | |
| ProAssurance | | | 38,270 | | | | 3,372 | | |
| RenaissanceRe Holdings | | | 62,625 | | | | 4,743 | | |
| Signature Bank* | | | 28,580 | | | | 1,802 | | |
| Simon Property Group | | | 15,430 | | | | 2,248 | | |
| Standard Chartered | | | 78,885 | | | | 1,968 | | |
| State Street | | | 86,870 | | | | 3,953 | | |
| Tanger Factory Outlet Centers | | | 48,690 | | | | 1,447 | | |
| TD Ameritrade Holding | | | 133,180 | | | | 2,629 | | |
| Tompkins Financial | | | 73,850 | | | | 2,958 | | |
| Walter Investment Management | | | 50,320 | | | | 1,135 | | |
| Wells Fargo | | | 54,470 | | | | 1,860 | | |
| West Coast Bancorp* | | | 62,890 | | | | 1,190 | | |
| Western Union | | | 387,250 | | | | 6,816 | | |
| Total Financials | | | | | 129,953 | | |
| Health care—14.0% | |
| Abbott Laboratories | | | 27,850 | | | | 1,707 | | |
| Acadia Healthcare* | | | 107,335 | | | | 1,750 | | |
| Achillion Pharmaceuticals* | | | 72,580 | | | | 695 | | |
| Air Methods* | | | 26,870 | | | | 2,345 | | |
| Akorn* | | | 229,979 | | | | 2,691 | | |
| Alere* | | | 69,758 | | | | 1,814 | | |
| Alexion Pharmaceuticals* | | | 12,760 | | | | 1,185 | | |
| Allergan | | | 27,630 | | | | 2,637 | | |
| AmerisourceBergen, Cl A | | | 87,920 | | | | 3,489 | | |
| Amicus Therapeutics* | | | 122,040 | | | | 644 | | |
| Analogic | | | 12,140 | | | | 820 | | |
| ARIAD Pharmaceuticals* | | | 89,180 | | | | 1,423 | | |
| ArQule* | | | 33,410 | | | | 234 | | |
| ArthroCare* | | | 117,360 | | | | 3,151 | | |
| Astellas Pharma | | | 55,860 | | | | 2,295 | | |
| AVI BioPharma* | | | 201,290 | | | | 310 | | |
| BioMarin Pharmaceutical* | | | 39,820 | | | | 1,364 | | |
| Bristol-Myers Squibb | | | 44,510 | | | | 1,502 | | |
| Cardinal Health | | | 27,090 | | | | 1,168 | | |
26 TURNER FUNDS 2012 SEMIANNUAL REPORT
(Unaudited)
Schedule of investments
Turner Spectrum Fund
| | | Shares | | Value
(000) | |
| Catalyst Health Solutions* | | | 83,790 | | | $ | 5,340 | | |
| Cerner* | | | 69,650 | | | | 5,305 | | |
| Covidien | | | 106,350 | | | | 5,815 | | |
| Cubist Pharmaceuticals* | | | 38,910 | | | | 1,683 | | |
| Cyberonics* | | | 14,650 | | | | 559 | | |
| Dynavax Technologies* | | | 212,300 | | | | 1,074 | | |
| Express Scripts* | | | 48,290 | | | | 2,616 | | |
| IDEXX Laboratories* | | | 15,710 | | | | 1,374 | | |
| Illumina* | | | 27,740 | | | | 1,459 | | |
| Intuitive Surgical* | | | 5,960 | | | | 3,229 | | |
| Jazz Pharmaceuticals* | | | 151,820 | | | | 7,359 | | |
| Luminex* | | | 62,970 | | | | 1,470 | | |
| Masimo* | | | 63,650 | | | | 1,488 | | |
| McKesson | | | 13,140 | | | | 1,153 | | |
| Medco Health Solutions* | | | 16,420 | | | | 1,154 | | |
| Medivation* | | | 68,540 | | | | 5,121 | | |
| Merck | | | 88,800 | | | | 3,410 | | |
| Nordion | | | 12,180 | | | | 118 | | |
| OncoGenex Pharmaceutical* | | | 32,843 | | | | 437 | | |
| Onyx Pharmaceuticals* | | | 71,215 | | | | 2,683 | | |
| Pfizer | | | 150,270 | | | | 3,405 | | |
| QLT* | | | 61,761 | | | | 432 | | |
| Quest Diagnostics | | | 117,765 | | | | 7,201 | | |
| Questcor Pharmaceuticals* | | | 22,760 | | | | 856 | | |
| Regeneron Pharmaceuticals* | | | 9,930 | | | | 1,158 | | |
| Santarus* | | | 121,040 | | | | 708 | | |
| Sirona Dental Systems* | | | 30,330 | | | | 1,563 | | |
| St. Jude Medical | | | 99,860 | | | | 4,425 | | |
| Stryker | | | 27,750 | | | | 1,540 | | |
| Thermo Fisher Scientific | | | 19,320 | | | | 1,089 | | |
| United Therapeutics* | | | 17,700 | | | | 834 | | |
| UnitedHealth Group | | | 39,640 | | | | 2,336 | | |
| Universal Health Services, Cl B | | | 30,320 | | | | 1,271 | | |
| Vanguard Health Systems* | | | 91,671 | | | | 904 | | |
| Vivus* | | | 36,740 | | | | 822 | | |
| Waters* | | | 20,300 | | | | 1,881 | | |
| WellCare Health Plans* | | | 69,800 | | | | 5,017 | | |
| WellPoint | | | 102,230 | | | | 7,545 | | |
| Zimmer Holdings* | | | 85,443 | | | | 5,492 | | |
| Total Health care | | | | | 132,550 | | |
| Industrials—6.1% | |
| AMETEK | | | 28,190 | | | | 1,367 | | |
| BE Aerospace* | | | 33,190 | | | | 1,542 | | |
| Bombardier, Cl B | | | 556,770 | | | | 2,314 | | |
| | | Shares | | Value
(000) | |
| Caterpillar | | | 47,750 | | | $ | 5,086 | | |
| Colfax* | | | 43,870 | | | | 1,546 | | |
| Cummins | | | 7,560 | | | | 908 | | |
| Delta Air Lines* | | | 448,720 | | | | 4,447 | | |
Dollar Thrifty Automotive
Group* | | | 42,070 | | | | 3,404 | | |
| Eaton | | | 24,140 | | | | 1,203 | | |
| Emerson Electric | | | 23,060 | | | | 1,203 | | |
| Equifax | | | 36,360 | | | | 1,609 | | |
| Esterline Technologies* | | | 31,790 | | | | 2,272 | | |
Expeditors International of
Washington | | | 30,980 | | | | 1,441 | | |
| Honeywell International | | | 35,530 | | | | 2,169 | | |
| Huron Consulting Group* | | | 48,390 | | | | 1,818 | | |
| Interface, Cl A | | | 46,880 | | | | 654 | | |
| Joy Global | | | 21,020 | | | | 1,545 | | |
| KBR | | | 31,260 | | | | 1,111 | | |
| Manpower | | | 64,730 | | | | 3,066 | | |
| MSC Industrial Direct, Cl A | | | 28,410 | | | | 2,366 | | |
| Owens Corning* | | | 15,940 | | | | 574 | | |
| SeaCube Container Leasing | | | 47,850 | | | | 823 | | |
| SembCorp Marine | | | 93,100 | | | | 391 | | |
| Shaw Group* | | | 30,380 | | | | 963 | | |
| SPX | | | 42,820 | | | | 3,320 | | |
| Timken | | | 11,620 | | | | 590 | | |
| Titan International | | | 136,400 | | | | 3,226 | | |
| Towers Watson, Cl A | | | 55,830 | | | | 3,689 | | |
| US Airways Group* | | | 219,130 | | | | 1,663 | | |
| WESCO International* | | | 18,160 | | | | 1,186 | | |
| Total Industrials | | | | | 57,496 | | |
| Information technology—11.7% | |
| Acme Packet* | | | 50,060 | | | | 1,378 | | |
| ADTRAN | | | 72,650 | | | | 2,266 | | |
| Ancestry.com* | | | 85,190 | | | | 1,937 | | |
| Ariba* | | | 80,310 | | | | 2,627 | | |
| Avago Technologies | | | 61,380 | | | | 2,392 | | |
| Bottomline Technologies* | | | 36,451 | | | | 1,018 | | |
| Broadcom, Cl A | | | 164,070 | | | | 6,448 | | |
| Callidus Software* | | | 41,350 | | | | 323 | | |
| Cirrus Logic* | | | 140,070 | | | | 3,334 | | |
| Cisco Systems | | | 186,900 | | | | 3,953 | | |
| Citrix Systems* | | | 44,620 | | | | 3,521 | | |
Cognizant Technology
Solutions, Cl A* | | | 16,030 | | | | 1,234 | | |
TURNER FUNDS 2012 SEMIANNUAL REPORT 27
FINANCIAL STATEMENTS
Schedule of investments
Turner Spectrum Fund
| | | Shares | | Value
(000) | |
| Coherent* | | | 37,552 | | | $ | 2,190 | | |
| Digimarc* | | | 93,160 | | | | 2,603 | | |
| Diodes* | | | 44,480 | | | | 1,031 | | |
| eBay* | | | 40,340 | | | | 1,488 | | |
| Electronic Arts* | | | 286,470 | | | | 4,721 | | |
| EMC* | | | 31,510 | | | | 942 | | |
| F5 Networks* | | | 20,685 | | | | 2,792 | | |
| Fabrinet* | | | 90,990 | | | | 1,611 | | |
| Fortinet* | | | 51,910 | | | | 1,435 | | |
| Google, Cl A* | | | 2,310 | | | | 1,481 | | |
| GSI Group* | | | 203,380 | | | | 2,453 | | |
| Heartland Payment Systems | | | 66,830 | | | | 1,927 | | |
Imagination Technologies
Group* | | | 79,980 | | | | 876 | | |
| JDS Uniphase* | | | 192,260 | | | | 2,786 | | |
| Kenexa* | | | 27,340 | | | | 854 | | |
| Lam Research* | | | 40,300 | | | | 1,798 | | |
| LinkedIn, Cl A* | | | 20,840 | | | | 2,125 | | |
| LSI* | | | 278,620 | | | | 2,418 | | |
MA-COM Technology Solutions
Holdings* | | | 129,260 | | | | 2,681 | | |
| Manhattan Associates* | | | 9,300 | | | | 442 | | |
| Microsoft | | | 51,220 | | | | 1,652 | | |
| NetApp* | | | 29,990 | | | | 1,343 | | |
| NETGEAR* | | | 35,720 | | | | 1,364 | | |
| OCZ Technology Group* | | | 295,550 | | | | 2,063 | | |
| ON Semiconductor* | | | 600,760 | | | | 5,413 | | |
| Remark Media* | | | 125,350 | | | | 755 | | |
| Salesforce.com* | | | 15,790 | | | | 2,440 | | |
| SanDisk* | | | 83,690 | | | | 4,150 | | |
| Semtech* | | | 78,460 | | | | 2,233 | | |
| Teradyne* | | | 139,960 | | | | 2,364 | | |
| Texas Instruments | | | 167,040 | | | | 5,614 | | |
| TIBCO Software* | | | 235,850 | | | | 7,193 | | |
| Vantiv, Cl A* | | | 174,570 | | | | 3,427 | | |
| Zillow* | | | 53,600 | | | | 1,908 | | |
| Total Information technology | | | | | 111,004 | | |
| Materials—5.3% | |
ArcelorMittal NY, Registered
Shares | | | 214,320 | | | | 4,100 | | |
| Ashland | | | 54,730 | | | | 3,342 | | |
| Atna Resources* | | | 218,704 | | | | 263 | | |
| Augusta Resource* | | | 186,380 | | | | 509 | | |
| AuRico Gold* | | | 139,810 | | | | 1,240 | | |
| B2gold* | | | 108,540 | | | | 466 | | |
| | | Shares | | Value
(000) | |
| Boise | | | 196,760 | | | $ | 1,615 | | |
| Caesar Stone Sdot Yam* | | | 92,710 | | | | 1,083 | | |
| Century Aluminum* | | | 92,850 | | | | 825 | | |
| Cliffs Natural Resources | | | 27,480 | | | | 1,903 | | |
| Commercial Metals | | | 83,480 | | | | 1,237 | | |
| Eastman Chemical | | | 17,600 | | | | 910 | | |
| Huntsman | | | 118,790 | | | | 1,664 | | |
| Labrador Iron Mines Holdings* | | | 101,940 | | | | 469 | | |
| Methanex | | | 22,400 | | | | 726 | | |
| Monsanto | | | 123,580 | | | | 9,857 | | |
| Mosaic | | | 10,130 | | | | 560 | | |
| Noranda Aluminum Holding | | | 128,310 | | | | 1,279 | | |
| Norbord* | | | 58,000 | | | | 669 | | |
| Potash Corp. of Saskatchewan | | | 24,730 | | | | 1,130 | | |
| Rentech Nitrogen Partners LP* | | | 53,300 | | | | 1,479 | | |
| SEMAFO | | | 247,008 | | | | 1,318 | | |
| Senomyx* | | | 49,940 | | | | 137 | | |
| Silver Wheaton | | | 107,390 | | | | 3,565 | | |
| SilverCrest Mines* | | | 200,434 | | | | 500 | | |
| Tronox* | | | 8,360 | | | | 1,457 | | |
| US Silica Holdings* | | | 46,800 | | | | 980 | | |
| Vulcan Materials | | | 31,350 | | | | 1,340 | | |
| W.R. Grace* | | | 41,550 | | | | 2,402 | | |
| Walter Energy | | | 9,140 | | | | 541 | | |
| Worthington Industries | | | 33,680 | | | | 646 | | |
| Yamana Gold | | | 90,360 | | | | 1,411 | | |
| Total Materials | | | | | 49,623 | | |
| Telecommunication services—0.3% | |
| Clearwire, Cl A* | | | 253,270 | | | | 577 | | |
| SBA Communications, Cl A* | | | 21,840 | | | | 1,110 | | |
| Ziggo NV* | | | 37,050 | | | | 1,156 | | |
| Total Telecommunication services | | | | | 2,843 | | |
| Utilities—0.7% | |
| Calpine* | | | 34,690 | | | | 597 | | |
| EQT | | | 20,610 | | | | 994 | | |
| Exelon | | | 48,800 | | | | 1,913 | | |
| ITC Holdings | | | 15,010 | | | | 1,155 | | |
| Questar | | | 59,110 | | | | 1,138 | | |
| Veolia Environnement | | | 74,120 | | | | 1,229 | | |
| Total Utilities | | | | | 7,026 | | |
Total Common stock
(Cost $661,462)** | | | | | 694,630 | | |
28 TURNER FUNDS 2012 SEMIANNUAL REPORT
(Unaudited)
Schedule of investments
Turner Spectrum Fund
| | | Contracts/
Shares | | Value
(000) | |
| Exchange traded note—0.3% | |
iPath S&P 500 VIX Short-Term
Futures ETN | | | 151,300 | | | $ | 2,545 | | |
Total Exchange traded note
(Cost $3,030)** | | | | | 2,545 | | |
| Put option contracts—0.0% | |
SPDR S&P 500 ETF Trust,
5/12 at $138 | | | 1,835 | | | | 356 | | |
United States Steel,
4/12 at $28 | | | 1,100 | | | | 79 | | |
Total Put option contracts
(Cost $566)** | | | | | 435 | | |
| Cash equivalent—7.4% | |
BlackRock TempCash Fund,
Institutional Shares,
0.010%*** | | | 69,681,703 | | | | 69,682 | | |
Total Cash equivalent
(Cost $69,682)** | | | | | 69,682 | | |
Total Investments—81.2%
(Cost $734,740)** | | | | $ | 767,292 | | |
Percentages are based on Net Assets of $944,438.**
* Non-income producing security.
** This number is listed in thousands.
*** Rate shown is the 7-day effective yield as of March 31, 2012.
^ Security fair valued using procedures established by the Fair Value Committee. As of March 31, 2012, the total market value of these securities was $596**, representing 0.1% of Net Assets.
ADR — American Depositary Receipt
Cl — Class
LP — Limited Partnership
NY — New York
The accompanying notes are an integral part of the financial statements.
TURNER FUNDS 2012 SEMIANNUAL REPORT 29
FINANCIAL STATEMENTS
Schedule of securities sold short
Turner Spectrum Fund
March 31, 2012
| | | Shares | | Value
(000) | |
| Common stock—42.3% | |
| Consumer discretionary—8.7% | |
American Axle & Manufacturing
Holdings | | | 74,630 | | | $ | 874 | | |
| Blue Nile | | | 26,830 | | | | 885 | | |
| Buckle | | | 83,190 | | | | 3,985 | | |
| CarMax | | | 40,820 | | | | 1,414 | | |
| Cheesecake Factory | | | 61,660 | | | | 1,812 | | |
| Chipotle Mexican Grill | | | 3,670 | | | | 1,534 | | |
| Choice Hotels International | | | 75,100 | | | | 2,804 | | |
| Coinstar | | | 21,440 | | | | 1,363 | | |
| Columbia Sportswear | | | 41,420 | | | | 1,965 | | |
| Darden Restaurants | | | 20,680 | | | | 1,058 | | |
| DeVry | | | 75,770 | | | | 2,566 | | |
| Dick's Sporting Goods | | | 37,540 | | | | 1,805 | | |
| DineEquity | | | 14,220 | | | | 705 | | |
| Expedia | | | 26,810 | | | | 897 | | |
| Foot Locker | | | 31,870 | | | | 990 | | |
| Fossil | | | 7,160 | | | | 945 | | |
| Groupon | | | 27,800 | | | | 511 | | |
| H&R Block | | | 97,430 | | | | 1,605 | | |
| Hasbro | | | 60,220 | | | | 2,211 | | |
| J.C. Penney | | | 42,890 | | | | 1,520 | | |
| Limited Brands | | | 84,800 | | | | 4,070 | | |
| LKQ | | | 46,630 | | | | 1,453 | | |
| Lumber Liquidators Holdings | | | 72,110 | | | | 1,811 | | |
| Macy's | | | 57,200 | | | | 2,273 | | |
| Magna International | | | 44,860 | | | | 2,142 | | |
| Marriott International, Cl A | | | 170,950 | | | | 6,470 | | |
| Melco Crown Entertainment ADR | | | 135,620 | | | | 1,846 | | |
| Netflix | | | 32,580 | | | | 3,748 | | |
| O'Reilly Automotive | | | 13,010 | | | | 1,188 | | |
| Papa John's International | | | 27,890 | | | | 1,050 | | |
| Pebblebrook Hotel Trust | | | 92,710 | | | | 2,093 | | |
| Pinnacle Entertainment | | | 135,690 | | | | 1,562 | | |
| Priceline.com | | | 1,380 | | | | 990 | | |
| Ross Stores | | | 31,120 | | | | 1,808 | | |
| StoneMor Partners LP | | | 54,080 | | | | 1,317 | | |
| Tempur-Pedic International | | | 16,950 | | | | 1,431 | | |
| Time Warner | | | 24,000 | | | | 906 | | |
| Under Armour, Cl A | | | 43,380 | | | | 4,078 | | |
| Viacom, Cl B | | | 85,370 | | | | 4,052 | | |
| Watsco | | | 47,730 | | | | 3,534 | | |
| Whirlpool | | | 13,920 | | | | 1,070 | | |
| Williams-Sonoma | | | 29,800 | | | | 1,117 | | |
| | | Shares | | Value
(000) | |
| WMS Industries | | | 43,530 | | | $ | 1,033 | | |
| Total Consumer discretionary | | | | | 82,491 | | |
| Consumer staples—1.1% | |
| Bunge | | | 13,720 | | | | 939 | | |
| CVS Caremark | | | 104,880 | | | | 4,699 | | |
| Kimberly-Clark | | | 30,470 | | | | 2,252 | | |
| Reynolds American | | | 28,430 | | | | 1,178 | | |
| Sanderson Farms | | | 14,710 | | | | 780 | | |
| Total Consumer staples | | | | | 9,848 | | |
| Energy—4.7% | |
| Apache | | | 98,990 | | | | 9,943 | | |
| Basic Energy Services | | | 48,550 | | | | 842 | | |
| CARBO Ceramics | | | 10,840 | | | | 1,143 | | |
| China Petroleum & Chemical ADR | | | 15,020 | | | | 1,633 | | |
| Cimarex Energy | | | 11,710 | | | | 884 | | |
| Cloud Peak Energy | | | 51,340 | | | | 818 | | |
| ConocoPhillips | | | 43,140 | | | | 3,279 | | |
| Continental Resources | | | 54,060 | | | | 4,639 | | |
| Crescent Point Energy | | | 20,500 | | | | 883 | | |
| Diamond Offshore Drilling | | | 73,000 | | | | 4,873 | | |
| Encana | | | 89,130 | | | | 1,751 | | |
| EXCO Resources | | | 114,990 | | | | 762 | | |
| Halliburton | | | 40,470 | | | | 1,343 | | |
| Helmerich & Payne | | | 84,320 | | | | 4,549 | | |
| Oasis Petroleum | | | 45,330 | | | | 1,398 | | |
| Patterson-UTI Energy | | | 94,330 | | | | 1,631 | | |
| Sanchez Energy | | | 65,820 | | | | 1,478 | | |
| SandRidge Energy | | | 116,310 | | | | 911 | | |
| Tenaris SA ADR | | | 16,200 | | | | 619 | | |
| Ultra Petroleum | | | 60,170 | | | | 1,362 | | |
| Total Energy | | | | | 44,741 | | |
| Financials—7.1% | |
| Ameriprise Financial | | | 23,480 | | | | 1,341 | | |
| Associated Banc-Corp | | | 133,550 | | | | 1,864 | | |
| Assurant | | | 51,630 | | | | 2,091 | | |
| Cincinnati Financial | | | 125,840 | | | | 4,343 | | |
| Credicorp | | | 41,290 | | | | 5,443 | | |
| Cullen/Frost Bankers | | | 57,430 | | | | 3,342 | | |
| General Growth Properties | | | 137,540 | | | | 2,337 | | |
| Green Dot, Cl A | | | 57,180 | | | | 1,516 | | |
| Janus Capital Group | | | 723,990 | | | | 6,451 | | |
| Jones Lang LaSalle | | | 16,840 | | | | 1,403 | | |
30 TURNER FUNDS 2012 SEMIANNUAL REPORT
(Unaudited)
Schedule of securities sold short
Turner Spectrum Fund
| | | Shares | | Value
(000) | |
| MSCI, Cl A | | | 47,940 | | | $ | 1,765 | | |
Muenchener Rueckversicherungs-
Gesellschaft AG | | | 7,620 | | | | 1,149 | | |
| Nordea Bank AB | | | 187,600 | | | | 1,706 | | |
| Northern Trust | | | 93,200 | | | | 4,422 | | |
| NYSE Euronext | | | 66,810 | | | | 2,005 | | |
| People's United Financial | | | 137,070 | | | | 1,815 | | |
| Progressive | | | 269,050 | | | | 6,237 | | |
| ProLogis | | | 64,610 | | | | 2,327 | | |
| RLI | | | 37,080 | | | | 2,656 | | |
| Royal Bank of Canada | | | 35,260 | | | | 2,047 | | |
| Senior Housing Properties Trust | | | 120,110 | | | | 2,648 | | |
| Societe Generale | | | 37,861 | | | | 1,109 | | |
| Sun Hung Kai Properties | | | 60,850 | | | | 756 | | |
| SunTrust Banks | | | 38,000 | | | | 919 | | |
| Trustmark | | | 88,340 | | | | 2,207 | | |
| Waddell & Reed Financial, Cl A | | | 56,600 | | | | 1,834 | | |
| Weyerhaeuser | | | 66,370 | | | | 1,455 | | |
| Total Financials | | | | | 67,188 | | |
| Health care—5.0% | |
| Aetna | | | 23,069 | | | | 1,157 | | |
| Alkermes | | | 46,901 | | | | 870 | | |
| Alnylam Pharmaceuticals | | | 18,510 | | | | 205 | | |
| Amgen | | | 105,495 | | | | 7,173 | | |
| Athenahealth | | | 6,350 | | | | 471 | | |
| Becton Dickinson | | | 40,710 | | | | 3,161 | | |
| Celgene | | | 7,350 | | | | 570 | | |
| Community Health Systems | | | 20,990 | | | | 467 | | |
| Covance | | | 18,400 | | | | 876 | | |
| DENTSPLY International | | | 21,360 | | | | 857 | | |
| Eisai | | | 29,130 | | | | 1,158 | | |
| HCA Holdings | | | 33,530 | | | | 830 | | |
| Henry Schein | | | 56,590 | | | | 4,283 | | |
| Hologic | | | 51,930 | | | | 1,119 | | |
| Human Genome Sciences | | | 14,140 | | | | 117 | | |
| Ironwood Pharmaceuticals | | | 24,420 | | | | 325 | | |
| Isis Pharmaceuticals | | | 48,310 | | | | 424 | | |
| Johnson & Johnson | | | 90,900 | | | | 5,996 | | |
Laboratory Corp. of America
Holdings | | | 100,310 | | | | 9,182 | | |
| Lexicon Pharmaceuticals | | | 91,870 | | | | 171 | | |
| Life Technologies | | | 9,390 | | | | 458 | | |
| LifePoint Hospitals | | | 14,460 | | | | 570 | | |
| Mettler-Toledo International | | | 4,360 | | | | 805 | | |
| | | Shares | | Value
(000) | |
| Natus Medical | | | 18,720 | | | $ | 223 | | |
| Nektar Therapeutics | | | 29,150 | | | | 231 | | |
| Patterson | | | 43,450 | | | | 1,451 | | |
| ResMed | | | 18,840 | | | | 582 | | |
| Seattle Genetics | | | 5,500 | | | | 112 | | |
| Sequenom | | | 64,270 | | | | 262 | | |
| Theravance | | | 11,890 | | | | 232 | | |
| Tornier NV | | | 28,080 | | | | 722 | | |
| Varian Medical Systems | | | 12,760 | | | | 880 | | |
| Vertex Pharmaceuticals | | | 11,360 | | | | 466 | | |
| Wright Medical Group | | | 30,150 | | | | 582 | | |
| Total Health care | | | | | 46,988 | | |
| Industrials—4.6% | |
| 3M | | | 17,940 | | | | 1,600 | | |
| Actuant, Cl A | | | 78,560 | | | | 2,278 | | |
| AGCO | | | 20,400 | | | | 963 | | |
| C.R. Bard | | | 12,786 | | | | 1,262 | | |
| Dover | | | 35,230 | | | | 2,217 | | |
| Dun & Bradstreet | | | 14,120 | | | | 1,196 | | |
| Fastenal | | | 73,840 | | | | 3,995 | | |
| Gardner Denver | | | 14,380 | | | | 906 | | |
Grupo Aeropotuario del Pacifico
SAB de CV ADR | | | 32,090 | | | | 1,167 | | |
| Jabil Circuit | | | 51,360 | | | | 1,290 | | |
| Kennametal | | | 32,870 | | | | 1,464 | | |
| Masco | | | 90,920 | | | | 1,216 | | |
| Mitsui Engineering & Shipbuilding | | | 251,510 | | | | 438 | | |
| Nabors Industries | | | 104,010 | | | | 1,819 | | |
| Navistar International | | | 18,170 | | | | 735 | | |
| Northrop Grumman | | | 36,110 | | | | 2,206 | | |
| PACCAR | | | 19,640 | | | | 920 | | |
| Parker Hannifin | | | 59,210 | | | | 5,006 | | |
| Ritchie Bros. Auctioneers | | | 70,490 | | | | 1,675 | | |
| Rockwell Automation | | | 13,360 | | | | 1,065 | | |
| Scotts Miracle-Gro | | | 39,140 | | | | 2,120 | | |
| SGL Carbon SE | | | 22,760 | | | | 1,042 | | |
| Southwest Airlines | | | 485,530 | | | | 4,001 | | |
| Stericycle | | | 17,383 | | | | 1,454 | | |
| The Weir Group | | | 31,840 | | | | 898 | | |
| Total Industrials | | | | | 42,933 | | |
| Information technology—7.6% | |
| Amkor Technology | | | 169,660 | | | | 1,043 | | |
| Atmel | | | 293,960 | | | | 2,898 | | |
TURNER FUNDS 2012 SEMIANNUAL REPORT 31
FINANCIAL STATEMENTS
Schedule of securities sold short
Turner Spectrum Fund
| | | Shares | | Value
(000) | |
| ATMI | | | 33,140 | | | $ | 772 | | |
| Baidu ADR | | | 20,320 | | | | 2,962 | | |
| Corning | | | 62,870 | | | | 885 | | |
| Dell | | | 142,520 | | | | 2,366 | | |
| Equinix | | | 7,330 | | | | 1,154 | | |
| FactSet Research Systems | | | 34,230 | | | | 3,390 | | |
| FleetCor Technologies | | | 53,410 | | | | 2,071 | | |
| Global Payments^ | | | 83,520 | | | | 3,965 | | |
| Hewlett-Packard | | | 38,200 | | | | 910 | | |
| Infosys ADR | | | 16,300 | | | | 930 | | |
| Intel | | | 72,230 | | | | 2,030 | | |
| Jack Henry & Associates | | | 253,980 | | | | 8,666 | | |
| KLA-Tencor | | | 69,600 | | | | 3,788 | | |
| Lexmark International, Cl A | | | 21,530 | | | | 716 | | |
| Linear Technology | | | 146,210 | | | | 4,927 | | |
| LogMeIn | | | 18,070 | | | | 637 | | |
| LTX-Credence | | | 228,960 | | | | 1,646 | | |
| Maxim Integrated Products | | | 38,120 | | | | 1,090 | | |
| MercadoLibre | | | 16,580 | | | | 1,621 | | |
| NetSuite | | | 17,880 | | | | 899 | | |
| Paychex | | | 51,660 | | | | 1,601 | | |
| Polycom | | | 46,540 | | | | 888 | | |
| Red Hat | | | 31,790 | | | | 1,904 | | |
| Research In Motion | | | 461,530 | | | | 6,789 | | |
Siliconware Precision Industries
ADR | | | 251,480 | | | | 1,519 | | |
| STMicroelectronics NV, NY Shares | | | 102,360 | | | | 838 | | |
| Tech Data | | | 16,140 | | | | 876 | | |
Telefonaktiebolaget LM Ericsson
ADR | | | 158,170 | | | | 1,631 | | |
| ViaSat | | | 31,160 | | | | 1,502 | | |
| Visa, Cl A | | | 9,900 | | | | 1,168 | | |
| Xilinx | | | 81,840 | | | | 2,981 | | |
| Yelp | | | 24,000 | | | | 645 | | |
| Total Information technology | | | | | 71,708 | | |
| Materials—3.3% | |
| Agnico-Eagle Mines | | | 29,520 | | | | 985 | | |
| Agrium | | | 27,180 | | | | 2,348 | | |
| Alcoa | | | 129,120 | | | | 1,294 | | |
| Aluminum Corp. of China ADR | | | 33,680 | | | | 400 | | |
| Antofagasta | | | 47,030 | | | | 866 | | |
| Bemis | | | 50,310 | | | | 1,625 | | |
| Centerra Gold | | | 37,460 | | | | 583 | | |
| | | Shares | | Value
(000) | |
Companhia Siderurgica Nacional
SA SP ADR | | | 109,190 | | | $ | 1,033 | | |
| Detour Gold | | | 14,710 | | | | 367 | | |
| Dow Chemical | | | 35,160 | | | | 1,218 | | |
| Fortescue Metals Group | | | 150,550 | | | | 906 | | |
| Freeport-McMoRan Copper & Gold | | | 30,310 | | | | 1,153 | | |
| Harmony Gold Mining SP ADR | | | 72,070 | | | | 788 | | |
| Kinross Gold | | | 326,860 | | | | 3,200 | | |
| Martin Marietta Materials | | | 16,130 | | | | 1,381 | | |
| Molycorp | | | 15,650 | | | | 529 | | |
| NewMarket | | | 3,220 | | | | 603 | | |
| Nucor | | | 34,100 | | | | 1,465 | | |
| Praxair | | | 31,280 | | | | 3,586 | | |
| Schnitzer Steel Industries, Cl A | | | 13,920 | | | | 555 | | |
| ThyssenKrupp AG | | | 31,470 | | | | 783 | | |
| Titanium Metals | | | 50,920 | | | | 690 | | |
| United States Steel | | | 136,960 | | | | 4,023 | | |
| Westlake Chemical | | | 8,880 | | | | 575 | | |
| Yara International ASA | | | 11,110 | | | | 530 | | |
| Total Materials | | | | | 31,486 | | |
| Telecommunication services—0.1% | |
America Movil SAB de CV ADR,
Ser L | | | 23,010 | | | | 572 | | |
| Total Telecommunication services | | | | | 572 | | |
| Utilities—0.1% | |
| National Fuel Gas | | | 18,790 | | | | 904 | | |
| Total Utilities | | | | | 904 | | |
Total Common stock
(Proceeds $397,777)* | | | | | 398,859 | | |
| Exchange traded funds—7.6% | |
| CurrencyShares Japanese Yen Trust | | | 9,816 | | | | 1,166 | | |
| Energy Select Sector SPDR Fund | | | 17,230 | | | | 1,236 | | |
Health Care Select Sector
SPDR Fund | | | 94,040 | | | | 3,535 | | |
| Industrial Select Sector SPDR Fund | | | 92,970 | | | | 3,479 | | |
iShares Barclays 20+ Year Treasury
Bond Fund | | | 20,520 | | | | 2,302 | | |
| iShares Russell 2000 Index Fund | | | 24,470 | | | | 2,027 | | |
| Market Vectors Oil Service ETF | | | 110,960 | | | | 4,507 | | |
| Market Vectors Semiconductor | | | 151,620 | | | | 5,428 | | |
| Materials Select Sector SPDR Trust | | | 63,780 | | | | 2,358 | | |
32 TURNER FUNDS 2012 SEMIANNUAL REPORT
(Unaudited)
Schedule of securities sold short
Turner Spectrum Fund
| | | Shares | | Value
(000) | |
| PowerShares QQQ Trust | | | 105,272 | | | $ | 7,111 | | |
| SPDR Metals & Mining ETF | | | 66,580 | | | | 3,309 | | |
| SPDR S&P 500 ETF Trust | | | 143,060 | | | | 20,131 | | |
| SPDR S&P Biotech ETF | | | 18,440 | | | | 1,482 | | |
SPDR S&P Oil & Gas Exploration &
Production ETF | | | 128,340 | | | | 7,304 | | |
| SPDR S&P Retail ETF | | | 38,340 | | | | 2,351 | | |
| United States Natural Gas Fund LP | | | 58,242 | | | | 927 | | |
| Vanguard Small-Cap Growth ETF | | | 41,180 | | | | 3,581 | | |
Total Exchange traded funds
(Proceeds $72,919)* | | | | | 72,234 | | |
Total Securities sold short—49.9%
(Proceeds $470,696)* | | | | $ | 471,093 | | |
Percentages are based on Net Assets of $944,438.*
* This number is listed in thousands.
^ Security fair valued using procedures established by the Fair Value Committee. As of March 31, 2012, the total market value of these securities was $3,965*, representing 0.4% of Net Assets.
ADR — American Depositary Receipt
Cl — Class
LP — Limited Partnership
NY — New York
Ser — Series
The accompanying notes are an integral part of the financial statements.
TURNER FUNDS 2012 SEMIANNUAL REPORT 33
FINANCIAL STATEMENTS
Schedule of open options written
Turner Spectrum Fund
March 31, 2012
| | | Contracts | | Value
(000) | |
| Written put options—0.0% | |
SPDR S&P 500 ETF Trust,
9/12 at $122 | | | 1,377 | | | $ | 325 | | |
Total Written put options
(Premiums received $388)* | | | | | 325 | | |
Total Written option contracts
(Premiums received $388)* | | | | $ | 325 | | |
Percentages are based on Net Assets of $944,438.*
* This number is listed in thousands.
The accompanying notes are an integral part of the financial statements.
34 TURNER FUNDS 2012 SEMIANNUAL REPORT
(Unaudited)
Schedule of investments
Turner Titan Fund
March 31, 2012
| | | Shares | | Value
(000) | |
| Common stock—79.6% | |
| Consumer discretionary—13.3% | |
| CBS, Cl B^ | | | 10,950 | | | $ | 371 | | |
| Coach | | | 3,030 | | | | 234 | | |
| Family Dollar Stores | | | 4,830 | | | | 306 | | |
| Ford Motor | | | 18,250 | | | | 228 | | |
| Las Vegas Sands | | | 3,970 | | | | 229 | | |
| Ralph Lauren | | | 1,625 | | | | 283 | | |
| Shutterfly* | | | 6,840 | | | | 214 | | |
| Stanley Black & Decker | | | 2,170 | | | | 167 | | |
Starwood Hotels & Resorts
Worldwide | | | 10,640 | | | | 600 | | |
| Wynn Resorts | | | 2,230 | | | | 279 | | |
| Yum! Brands | | | 2,680 | | | | 191 | | |
| Total Consumer discretionary | | | | | 3,102 | | |
| Consumer staples—4.0% | |
| Coca-Cola | | | 3,960 | | | | 293 | | |
| Colgate-Palmolive | | | 3,520 | | | | 344 | | |
| Sara Lee | | | 13,210 | | | | 285 | | |
| Total Consumer staples | | | | | 922 | | |
| Energy—9.4% | |
| Anadarko Petroleum^ | | | 4,320 | | | | 338 | | |
| Cabot Oil & Gas | | | 7,890 | | | | 246 | | |
| Concho Resources* | | | 2,710 | | | | 277 | | |
| Devon Energy | | | 4,040 | | | | 287 | | |
| Exxon Mobil | | | 4,000 | | | | 347 | | |
| HollyFrontier | | | 5,090 | | | | 164 | | |
| National Oilwell Varco | | | 3,420 | | | | 272 | | |
| Schlumberger | | | 3,720 | | | | 260 | | |
| Total Energy | | | | | 2,191 | | |
| Financials—11.4% | |
| American Express | | | 9,650 | | | | 558 | | |
| CBRE Group* | | | 14,920 | | | | 298 | | |
| Comerica | | | 10,230 | | | | 331 | | |
| First Republic Bank* | | | 8,000 | | | | 264 | | |
| Invesco | | | 9,990 | | | | 267 | | |
| State Street | | | 8,810 | | | | 401 | | |
| TD Ameritrade Holding | | | 10,150 | | | | 200 | | |
| Wells Fargo | | | 10,230 | | | | 349 | | |
| Total Financials | | | | | 2,668 | | |
| | | Shares | | Value
(000) | |
| Health care—9.0% | |
| Allergan^ | | | 1,860 | | | $ | 177 | | |
| Bristol-Myers Squibb | | | 8,550 | | | | 289 | | |
| Cerner* | | | 2,970 | | | | 226 | | |
| Express Scripts*^ | | | 4,350 | | | | 236 | | |
| Intuitive Surgical* | | | 540 | | | | 293 | | |
| St. Jude Medical | | | 5,270 | | | | 233 | | |
| Stryker | | | 5,350 | | | | 297 | | |
| Waters* | | | 3,770 | | | | 349 | | |
| Total Health care | | | | | 2,100 | | |
| Industrials—9.4% | |
| AMETEK | | | 5,440 | | | | 264 | | |
| BE Aerospace*^ | | | 6,230 | | | | 290 | | |
| Caterpillar | | | 2,730 | | | | 291 | | |
| Cummins | | | 1,480 | | | | 178 | | |
| Honeywell International | | | 6,670 | | | | 407 | | |
| Manpower | | | 5,140 | | | | 243 | | |
| SPX | | | 3,820 | | | | 296 | | |
| WESCO International* | | | 3,450 | | | | 225 | | |
| Total Industrials | | | | | 2,194 | | |
| Information technology—20.8% | |
| Avago Technologies | | | 4,600 | | | | 179 | | |
| Broadcom, Cl A^ | | | 16,350 | | | | 643 | | |
| Cisco Systems | | | 14,050 | | | | 297 | | |
| Citrix Systems* | | | 4,390 | | | | 346 | | |
Cognizant Technology Solutions,
Cl A* | | | 3,000 | | | | 231 | | |
| eBay* | | | 7,690 | | | | 284 | | |
| EMC* | | | 5,890 | | | | 176 | | |
| F5 Networks* | | | 1,445 | | | | 195 | | |
| Fortinet* | | | 9,730 | | | | 269 | | |
| Google, Cl A* | | | 440 | | | | 282 | | |
| JDS Uniphase* | | | 11,240 | | | | 163 | | |
| LinkedIn, Cl A* | | | 1,170 | | | | 119 | | |
| Microsoft | | | 9,820 | | | | 317 | | |
| NetApp* | | | 5,620 | | | | 252 | | |
| Salesforce.com* | | | 1,490 | | | | 230 | | |
| Texas Instruments | | | 14,650 | | | | 492 | | |
| TIBCO Software* | | | 12,140 | | | | 370 | | |
| Total Information technology | | | | | 4,845 | | |
TURNER FUNDS 2012 SEMIANNUAL REPORT 35
FINANCIAL STATEMENTS
Schedule of investments
Turner Titan Fund
| | | Shares | | Value
(000) | |
| Materials—2.3% | |
| Monsanto | | | 6,600 | | | $ | 526 | | |
| Total Materials | | | | | 526 | | |
Total Common stock
(Cost $17,194)** | | | | | 18,548 | | |
| Cash equivalent—3.7% | |
BlackRock TempCash Fund,
Institutional Shares,
0.010%***^ | | | 867,973 | | | | 868 | | |
Total Cash equivalent
(Cost $868)** | | | | | 868 | | |
Total Investments—83.3%
(Cost $18,062)** | | | | $ | 19,416 | | |
Percentages are based on Net Assets of $23,311.**
* Non-income producing security.
** This number is listed in thousands.
*** Rate shown is the 7-day effective yield as of March 31, 2012.
^ All or a portion of the shares have been committed as collateral for open short positions.
Cl — Class
The accompanying notes are an integral part of the financial statements.
36 TURNER FUNDS 2012 SEMIANNUAL REPORT
(Unaudited)
Schedule of securities sold short
Turner Titan Fund
March 31, 2012
| | | Shares | | Value
(000) | |
| Common stock—45.5% | |
| Consumer discretionary—12.1% | |
| Blue Nile | | | 5,120 | | | $ | 169 | | |
| Cheesecake Factory | | | 7,060 | | | | 207 | | |
| Choice Hotels International | | | 4,650 | | | | 174 | | |
| Darden Restaurants | | | 3,900 | | | | 200 | | |
| DeVry | | | 6,750 | | | | 229 | | |
| Expedia | | | 5,110 | | | | 171 | | |
| Magna International | | | 3,850 | | | | 184 | | |
| Marriott International, Cl A | | | 7,690 | | | | 291 | | |
| Melco Crown Entertainment ADR | | | 12,290 | | | | 167 | | |
| Netflix | | | 2,010 | | | | 231 | | |
| O'Reilly Automotive | | | 2,490 | | | | 227 | | |
| Time Warner | | | 4,600 | | | | 174 | | |
| Under Armour, Cl A | | | 1,760 | | | | 165 | | |
| Viacom, Cl B | | | 4,730 | | | | 224 | | |
| Total Consumer discretionary | | | | | 2,813 | | |
| Consumer staples—1.7% | |
| Bunge | | | 2,560 | | | | 175 | | |
| Reynolds American | | | 5,430 | | | | 225 | | |
| Total Consumer staples | | | | | 400 | | |
| Energy—4.0% | |
| Apache | | | 4,100 | | | | 412 | | |
| Cimarex Energy | | | 2,200 | | | | 166 | | |
| Continental Resources | | | 1,960 | | | | 168 | | |
| Diamond Offshore Drilling | | | 2,880 | | | | 192 | | |
| Total Energy | | | | | 938 | | |
| Financials—4.0% | |
| Northern Trust | | | 8,600 | | | | 408 | | |
| SunTrust Banks | | | 7,220 | | | | 175 | | |
| Waddell & Reed Financial, Cl A | | | 10,590 | | | | 343 | | |
| Total Financials | | | | | 926 | | |
| Health care—3.1% | |
| Amgen | | | 3,425 | | | | 233 | | |
| Johnson & Johnson | | | 4,220 | | | | 278 | | |
| Laboratory Corp. of America Holdings | | | 2,440 | | | | 223 | | |
| Total Health care | | | | | 734 | | |
| Industrials—6.7% | |
| 3M | | | 3,360 | | | | 300 | | |
| C.R. Bard | | | 2,391 | | | | 236 | | |
| Navistar International | | | 3,410 | | | | 138 | | |
| | | Shares | | Value
(000) | |
| PACCAR | | | 3,670 | | | $ | 172 | | |
| Parker Hannifin | | | 4,100 | | | | 347 | | |
| Rockwell Automation | | | 2,510 | | | | 200 | | |
| Scotts Miracle-Gro | | | 3,200 | | | | 173 | | |
| Total Industrials | | | | | 1,566 | | |
| Information technology—11.3% | |
| Baidu ADR | | | 1,190 | | | | 173 | | |
| Corning | | | 11,990 | | | | 169 | | |
| Dell | | | 10,800 | | | | 179 | | |
| FactSet Research Systems | | | 2,080 | | | | 206 | | |
| Global Payments^ | | | 2,690 | | | | 128 | | |
| Infosys ADR | | | 3,040 | | | | 173 | | |
| Lexmark International, Cl A | | | 4,000 | | | | 133 | | |
| Linear Technology | | | 6,490 | | | | 219 | | |
| LogMeIn | | | 3,370 | | | | 119 | | |
| NetSuite | | | 3,430 | | | | 173 | | |
| Polycom | | | 8,920 | | | | 170 | | |
| Red Hat | | | 2,260 | | | | 135 | | |
| Research In Motion | | | 16,850 | | | | 248 | | |
| Tech Data | | | 3,090 | | | | 168 | | |
| Xilinx | | | 6,380 | | | | 232 | | |
| Total Information technology | | | | | 2,625 | | |
| Materials—2.6% | |
| Agrium | | | 1,960 | | | | 169 | | |
| Dow Chemical | | | 6,510 | | | | 226 | | |
| Freeport-McMoRan Copper & Gold | | | 5,610 | | | | 213 | | |
| Total Materials | | | | | 608 | | |
Total Common stock
(Proceeds $10,497)* | | | | | 10,610 | | |
| Exchange traded funds—3.1% | |
| Energy Select Sector SPDR Fund | | | 3,200 | | | | 230 | | |
| SPDR S&P 500 ETF Trust | | | 3,460 | | | | 487 | | |
Total Exchange traded funds
(Proceeds $723)* | | | | | 717 | | |
Total Securities sold short—48.6%
(Proceeds $11,220)* | | | | $ | 11,327 | | |
Percentages are based on Net Assets of $23,311.*
* This number is listed in thousands.
^ Security fair valued using procedures established by the Fair Value Committee. As of March 31, 2012, the total market value of these securities was $128*, representing 0.5% of Net Assets.
ADR — American Depositary Receipt
Cl — Class
The accompanying notes are an integral part of the financial statements.
TURNER FUNDS 2012 SEMIANNUAL REPORT 37
FINANCIAL STATEMENTS
Schedule of investments
Turner All Cap Growth Fund
March 31, 2012
| | | Shares | | Value
(000) | |
| Common stock—96.7%† | |
| Consumer discretionary—14.8% | |
| Abercrombie & Fitch, Cl A | | | 12,400 | | | $ | 615 | | |
| Deckers Outdoor* | | | 12,340 | | | | 778 | | |
| Las Vegas Sands | | | 20,180 | | | | 1,162 | | |
| MGM Resorts International* | | | 37,020 | | | | 504 | | |
| Shutterfly* | | | 17,120 | | | | 536 | | |
| Starbucks | | | 10,760 | | | | 601 | | |
Starwood Hotels & Resorts
Worldwide | | | 11,000 | | | | 621 | | |
| Total Consumer discretionary | | | | | 4,817 | | |
| Consumer staples—1.9% | |
| Whole Foods Market | | | 7,390 | | | | 615 | | |
| Total Consumer staples | | | | | 615 | | |
| Energy—7.6% | |
| Cabot Oil & Gas | | | 22,440 | | | | 699 | | |
| Cameron International* | | | 11,500 | | | | 608 | | |
| Concho Resources* | | | 4,430 | | | | 452 | | |
| SM Energy | | | 9,990 | | | | 707 | | |
| Total Energy | | | | | 2,466 | | |
| Financials—6.1% | |
| Affiliated Managers Group* | | | 8,660 | | | | 968 | | |
| CBRE Group* | | | 51,670 | | | | 1,032 | | |
| Total Financials | | | | | 2,000 | | |
| Health care—12.0% | |
| Alexion Pharmaceuticals* | | | 16,400 | | | | 1,523 | | |
| Medivation* | | | 7,860 | | | | 587 | | |
| Regeneron Pharmaceuticals* | | | 8,020 | | | | 935 | | |
| WellCare Health Plans* | | | 12,240 | | | | 880 | | |
| Total Health care | | | | | 3,925 | | |
| Industrials—2.2% | |
Expeditors International of
Washington | | | 15,460 | | | | 719 | | |
| Total Industrials | | | | | 719 | | |
| Information technology—52.1% | |
| Apple* | | | 4,280 | | | | 2,566 | | |
| Avago Technologies | | | 27,930 | | | | 1,088 | | |
| Broadcom, Cl A | | | 34,000 | | | | 1,336 | | |
| eBay* | | | 19,170 | | | | 707 | | |
| | | Shares | | Value
(000) | |
| F5 Networks* | | | 9,970 | | | $ | 1,346 | | |
| JDS Uniphase* | | | 62,390 | | | | 904 | | |
| Lam Research* | | | 15,720 | | | | 701 | | |
| LSI* | | | 129,100 | | | | 1,121 | | |
MA-COM Technology Solutions
Holdings* | | | 22,670 | | | | 470 | | |
| NXP Semiconductors* # | | | 19,540 | | | | 520 | | |
| ON Semiconductor* | | | 144,400 | | | | 1,301 | | |
| Qualcomm | | | 23,130 | | | | 1,573 | | |
| SanDisk* | | | 21,500 | | | | 1,066 | | |
| Teradyne* | | | 75,240 | | | | 1,271 | | |
| Texas Instruments | | | 30,190 | | | | 1,015 | | |
| Total Information technology | | | | | 16,985 | | |
Total Common stock
(Cost $26,199)** | | | | | 31,527 | | |
| Cash equivalent—3.6% | |
BlackRock TempCash Fund,
Institutional Shares,
0.010%*** (1) | | | 1,158,748 | | | | 1,159 | | |
Total Cash equivalent
(Cost $1,159)** | | | | | 1,159 | | |
Total Investments—100.3%
(Cost $27,358)** | | | | $ | 32,686 | | |
Percentages are based on Net Assets of $32,601.**
* Non-income producing security.
** This number is listed in thousands.
*** Rate shown is the 7-day effective yield as of March 31, 2012.
† More narrow industries are utilized for compliance purposes, whereas broad sectors are utilized for reporting purposes.
# Security fully or partially on loan at March 31, 2012. The total value of securities on loan at March 31, 2012 was 75.** Certain of these securities may have been sold prior to period end and are included in receivable for investment securities sold on the Statement of Assets and Liabilities.
(1) A partial position of this security was purchased with cash collateral received from securities lending. The total value of such security at March 31, 2012 was $76.**
Cl — Class
The accompanying notes are an integral part of the financial statements.
38 TURNER FUNDS 2012 SEMIANNUAL REPORT
(Unaudited)
Schedule of investments
Turner Concentrated Growth Fund
March 31, 2012
| | | Shares | | Value
(000) | |
| Common stock—99.4%† | |
| Consumer discretionary—18.4% | |
| Amazon.com* | | | 8,790 | | | $ | 1,780 | | |
| Ford Motor | | | 142,180 | | | | 1,776 | | |
| Guess? | | | 45,960 | | | | 1,436 | | |
| Las Vegas Sands | | | 27,430 | | | | 1,579 | | |
| Lennar, Cl A | | | 56,700 | | | | 1,541 | | |
| Total Consumer discretionary | | | | | 8,112 | | |
| Energy—4.2% | |
| Cabot Oil & Gas | | | 58,560 | | | | 1,825 | | |
| Total Energy | | | | | 1,825 | | |
| Financials—9.2% | |
| CBRE Group* | | | 103,080 | | | | 2,058 | | |
| Comerica | | | 61,990 | | | | 2,006 | | |
| Total Financials | | | | | 4,064 | | |
| Health care—10.3% | |
| Alexion Pharmaceuticals* | | | 22,220 | | | | 2,064 | | |
| Cerner* | | | 15,340 | | | | 1,168 | | |
| Intuitive Surgical* | | | 2,400 | | | | 1,300 | | |
| Total Health care | | | | | 4,532 | | |
| Industrials—8.6% | |
| Boeing | | | 26,000 | | | | 1,934 | | |
| Caterpillar | | | 17,470 | | | | 1,861 | | |
| Total Industrials | | | | | 3,795 | | |
| Information technology—45.2% | |
| Apple* | | | 7,860 | | | | 4,712 | | |
| Broadcom, Cl A | | | 52,160 | | | | 2,050 | | |
| eBay* | | | 47,610 | | | | 1,756 | | |
| Finisar* | | | 76,660 | | | | 1,545 | | |
| Juniper Networks* | | | 80,020 | | | | 1,831 | | |
| Lam Research* | | | 34,190 | | | | 1,526 | | |
| Qualcomm | | | 25,100 | | | | 1,707 | | |
| Salesforce.com* | | | 10,870 | | | | 1,679 | | |
| SanDisk* | | | 30,430 | | | | 1,509 | | |
| Texas Instruments | | | 46,660 | | | | 1,568 | | |
| Total Information technology | | | | | 19,883 | | |
| | | Shares | | Value
(000) | |
| Materials—3.5% | |
| Goldcorp | | | 33,980 | | | $ | 1,531 | | |
| Total Materials | | | | | 1,531 | | |
Total Common stock
(Cost $37,578)** | | | | | 43,742 | | |
| Cash equivalent—0.7% | |
BlackRock TempCash Fund,
Institutional Shares,
0.010%*** | | | 318,741 | | | | 319 | | |
Total Cash equivalent
(Cost $319)** | | | | | 319 | | |
Total Investments—100.1%
(Cost $37,897)** | | | | $ | 44,061 | | |
Percentages are based on Net Assets of $44,022.**
* Non-income producing security.
** This number is listed in thousands.
*** Rate shown is the 7-day effective yield as of March 31, 2012.
† More narrow industries are utilized for compliance purposes, whereas broad sectors are utilized for reporting purposes.
Cl — Class
The accompanying notes are an integral part of the financial statements.
TURNER FUNDS 2012 SEMIANNUAL REPORT 39
FINANCIAL STATEMENTS
Schedule of investments
Turner Emerging Growth Fund
March 31, 2012
| | | Shares | | Value
(000) | |
| Common stock—96.5% | |
| Consumer discretionary—17.4% | |
| Aeropostale* | | | 106,320 | | | $ | 2,299 | | |
| Ann* | | | 89,350 | | | | 2,559 | | |
| Arctic Cat* | | | 35,030 | | | | 1,500 | | |
| Body Central* # | | | 105,740 | | | | 3,069 | | |
| Buffalo Wild Wings* # | | | 18,500 | | | | 1,678 | | |
| Children's Place Retail Stores* # | | | 65,790 | | | | 3,399 | | |
| Cracker Barrel Old Country Store | | | 57,140 | | | | 3,188 | | |
| Crocs* | | | 129,890 | | | | 2,717 | | |
| Deckers Outdoor* | | | 10,884 | | | | 686 | | |
| Jos. A. Bank Clothiers* | | | 41,000 | | | | 2,067 | | |
| Krispy Kreme Doughnuts* | | | 61,170 | | | | 447 | | |
| Oxford Industries | | | 55,990 | | | | 2,845 | | |
| Red Robin Gourmet Burgers* | | | 44,220 | | | | 1,645 | | |
| Scientific Games, Cl A* | | | 59,040 | | | | 688 | | |
| Select Comfort* | | | 112,760 | | | | 3,652 | | |
| Shuffle Master* | | | 89,040 | | | | 1,567 | | |
| Shutterfly* | | | 64,390 | | | | 2,017 | | |
| True Religion Apparel* | | | 36,740 | | | | 1,007 | | |
Ulta Salon, Cosmetics &
Fragrance | | | 36,840 | | | | 3,422 | | |
| Vitamin Shoppe* | | | 106,939 | | | | 4,728 | | |
| Total Consumer discretionary | | | | | 45,180 | | |
| Consumer staples—4.9% | |
| B&G Foods | | | 50,570 | | | | 1,138 | | |
| Boston Beer, Cl A* # | | | 10,120 | | | | 1,081 | | |
| Rite Aid* | | | 863,810 | | | | 1,503 | | |
| TreeHouse Foods* | | | 76,377 | | | | 4,545 | | |
| United Natural Foods* | | | 96,638 | | | | 4,509 | | |
| Total Consumer staples | | | | | 12,776 | | |
| Energy—7.6% | |
| Carrizo Oil & Gas* # | | | 93,448 | | | | 2,641 | | |
| GeoResources* # | | | 60,980 | | | | 1,996 | | |
| GulfMark Offshore, Cl A* | | | 15,150 | | | | 696 | | |
| Key Energy Services* | | | 211,560 | | | | 3,269 | | |
| Kodiak Oil & Gas* | | | 120,590 | | | | 1,201 | | |
| Lufkin Industries | | | 56,360 | | | | 4,545 | | |
| Rex Energy* # | | | 211,500 | | | | 2,259 | | |
| Swift Energy* | | | 111,050 | | | | 3,224 | | |
| Total Energy | | | | | 19,831 | | |
| | | Shares | | Value
(000) | |
| Financials—2.2% | |
| Cardtronics* | | | 45,939 | | | $ | 1,206 | | |
| IBERIABANK | | | 26,156 | | | | 1,398 | | |
| Sovran Self Storage | | | 36,760 | | | | 1,832 | | |
| Umpqua Holdings # | | | 102,000 | | | | 1,383 | | |
| Total Financials | | | | | 5,819 | | |
| Health care—21.0% | |
| ABIOMED* # | | | 86,650 | | | | 1,923 | | |
| Acadia Healthcare* # | | | 207,640 | | | | 3,385 | | |
| Achillion Pharmaceuticals* # | | | 158,870 | | | | 1,522 | | |
| Air Methods* | | | 48,940 | | | | 4,270 | | |
| Akorn* # | | | 204,700 | | | | 2,395 | | |
| AMERIGROUP* | | | 53,020 | | | | 3,567 | | |
| Analogic | | | 18,020 | | | | 1,217 | | |
| ArthroCare* | | | 160,816 | | | | 4,318 | | |
| Catalyst Health Solutions* | | | 36,705 | | | | 2,339 | | |
| Computer Programs & Systems | | | 37,491 | | | | 2,119 | | |
| Cyberonics* | | | 71,738 | | | | 2,735 | | |
| Dynavax Technologies* | | | 156,040 | | | | 790 | | |
| Endologix* | | | 37,060 | | | | 543 | | |
| HMS Holdings* | | | 106,740 | | | | 3,331 | | |
| Luminex* | | | 35,270 | | | | 824 | | |
| Molina Healthcare* | | | 94,120 | | | | 3,165 | | |
| Orthofix International* | | | 49,400 | | | | 1,856 | | |
| PAREXEL International* # | | | 74,304 | | | | 2,004 | | |
| PSS World Medical* # | | | 54,850 | | | | 1,390 | | |
| QLT* | | | 31,325 | | | | 219 | | |
| Quality Systems # | | | 66,906 | | | | 2,926 | | |
| Questcor Pharmaceuticals* | | | 61,960 | | | | 2,331 | | |
| SXC Health Solutions* | | | 72,384 | | | | 5,426 | | |
| Total Health care | | | | | 54,595 | | |
| Industrials—18.1% | |
| Chart Industries* | | | 38,448 | | | | 2,819 | | |
| Clean Harbors* | | | 93,950 | | | | 6,326 | | |
| Copa Holdings, Cl A | | | 49,591 | | | | 3,928 | | |
| EnPro Industries* # | | | 76,700 | | | | 3,152 | | |
| ESCO Technologies | | | 38,080 | | | | 1,400 | | |
| Genesee & Wyoming, Cl A* | | | 29,765 | | | | 1,625 | | |
| Greenbrier* | | | 159,886 | | | | 3,164 | | |
| Hub Group, Cl A* | | | 73,098 | | | | 2,634 | | |
| Huron Consulting Group* | | | 109,430 | | | | 4,110 | | |
| Kforce* # | | | 92,520 | | | | 1,378 | | |
40 TURNER FUNDS 2012 SEMIANNUAL REPORT
(Unaudited)
Schedule of investments
Turner Emerging Growth Fund
| | | Shares | | Value
(000) | |
| Middleby* | | | 37,953 | | | $ | 3,840 | | |
| Proto Labs* | | | 76,380 | | | | 2,604 | | |
| RBC Bearings* | | | 20,666 | | | | 953 | | |
| Robbins & Myers | | | 32,174 | | | | 1,675 | | |
| Titan International | | | 50,860 | | | | 1,203 | | |
| Triumph Group | | | 98,974 | | | | 6,202 | | |
| Total Industrials | | | | | 47,013 | | |
| Information technology—21.5% | |
| ANSYS* | | | 63,480 | | | | 4,128 | | |
| Ariba* | | | 217,690 | | | | 7,121 | | |
| Bottomline Technologies* | | | 102,792 | | | | 2,872 | | |
| BroadSoft* # | | | 66,730 | | | | 2,552 | | |
| Cavium* # | | | 39,470 | | | | 1,221 | | |
| CEVA* # | | | 22,752 | | | | 517 | | |
| Cirrus Logic* # | | | 235,640 | | | | 5,608 | | |
| Coherent* | | | 38,354 | | | | 2,237 | | |
| Diodes* | | | 71,370 | | | | 1,654 | | |
| Electronics for Imaging* | | | 132,430 | | | | 2,201 | | |
| FARO Technologies* | | | 13,690 | | | | 799 | | |
| GSI Group* | | | 177,760 | | | | 2,144 | | |
| Hittite Microwave* | | | 9,650 | | | | 524 | | |
| Imperva* # | | | 50,300 | | | | 1,969 | | |
| Kenexa* # | | | 90,920 | | | | 2,840 | | |
| Liquidity Services* | | | 40,510 | | | | 1,815 | | |
| Manhattan Associates* | | | 39,460 | | | | 1,876 | | |
| NETGEAR* | | | 98,200 | | | | 3,751 | | |
| OCZ Technology Group* # | | | 235,280 | | | | 1,642 | | |
| OPNET Technologies # | | | 23,758 | | | | 689 | | |
| Power Integrations # | | | 50,550 | | | | 1,876 | | |
| Rofin-Sinar Technologies* | | | 65,698 | | | | 1,733 | | |
| Synchronoss Technologies* # | | | 50,200 | | | | 1,602 | | |
| Tangoe* # | | | 38,646 | | | | 727 | | |
| Ultratech* | | | 56,370 | | | | 1,634 | | |
| Total Information technology | | | | | 55,732 | | |
| Materials—3.5% | |
| Century Aluminum* | | | 86,430 | | | | 768 | | |
| Domtar | | | 24,140 | | | | 2,302 | | |
| KapStone Paper & Packaging* | | | 97,350 | | | | 1,918 | | |
| LSB Industries* | | | 68,750 | | | | 2,676 | | |
| Noranda Aluminum Holding | | | 140,941 | | | | 1,405 | | |
| Total Materials | | | | | 9,069 | | |
| | | Shares | | Value
(000) | |
| Utilities—0.3% | |
| Artesian Resources, Cl A # | | | 34,145 | | | $ | 641 | | |
| Total Utilities | | | | | 641 | | |
Total Common stock
(Cost $164,501)** | | | | | 250,656 | | |
| Cash equivalent—19.7% | |
BlackRock TempCash Fund,
Institutional Shares,
0.010%*** (1) | | | 51,171,559 | | | | 51,172 | | |
Total Cash equivalent
(Cost $51,172)** | | | | | 51,172 | | |
Total Investments—116.2%
(Cost $215,673)** | | | | $ | 301,828 | | |
Percentages are based on Net Assets of $259,852.**
* Non-income producing security.
** This number is listed in thousands.
*** Rate shown is the 7-day effective yield as of March 31, 2012.
# Security fully or partially on loan at March 31, 2012. The total value of securities on loan at March 31, 2012 was 39,297.** Certain of these securities may have been sold prior to period end and are included in receivable for investment securities sold on the Statement of Assets and Liabilities.
(1) A partial position of this security was purchased with cash collateral received from securities lending. The total value of such security at March 31, 2012 was $40,208.**
Cl — Class
The accompanying notes are an integral part of the financial statements.
TURNER FUNDS 2012 SEMIANNUAL REPORT 41
FINANCIAL STATEMENTS
Schedule of investments
Turner Large Growth Fund
March 31, 2012
| | | Shares | | Value
(000) | |
| Common stock—101.6%† | |
| Consumer discretionary—15.0% | |
| Amazon.com* | | | 47,670 | | | $ | 9,654 | | |
| Bed Bath & Beyond* | | | 89,926 | | | | 5,914 | | |
| Coach | | | 51,170 | | | | 3,954 | | |
| Comcast, Cl A | | | 218,910 | | | | 6,570 | | |
| Ford Motor | | | 450,660 | | | | 5,629 | | |
| Guess? | | | 130,790 | | | | 4,087 | | |
| Las Vegas Sands | | | 87,440 | | | | 5,034 | | |
| Lennar, Cl A | | | 80,770 | | | | 2,195 | | |
| Lululemon Athletica* # | | | 32,650 | | | | 2,438 | | |
| Ralph Lauren | | | 27,550 | | | | 4,803 | | |
| Stanley Black & Decker | | | 38,760 | | | | 2,983 | | |
| Starbucks | | | 89,780 | | | | 5,018 | | |
Starwood Hotels & Resorts
Worldwide | | | 55,000 | | | | 3,103 | | |
| Yum! Brands | | | 38,090 | | | | 2,711 | | |
| Total Consumer discretionary | | | | | 64,093 | | |
| Consumer staples—7.5% | |
| Coca-Cola | | | 273,190 | | | | 20,219 | | |
| Estee Lauder, Cl A | | | 79,740 | | | | 4,939 | | |
| Mead Johnson Nutrition, Cl A | | | 39,190 | | | | 3,233 | | |
| Whole Foods Market | | | 45,759 | | | | 3,807 | | |
| Total Consumer staples | | | | | 32,198 | | |
| Energy—10.0% | |
| Anadarko Petroleum | | | 102,430 | | | | 8,025 | | |
| Cabot Oil & Gas | | | 156,310 | | | | 4,872 | | |
| Cameron International* | | | 99,450 | | | | 5,254 | | |
| Concho Resources* | | | 86,298 | | | | 8,809 | | |
| Enbridge | | | 81,460 | | | | 3,165 | | |
| Peabody Energy | | | 55,120 | | | | 1,596 | | |
| Schlumberger | | | 154,940 | | | | 10,835 | | |
| Total Energy | | | | | 42,556 | | |
| Financials—7.3% | |
| Affiliated Managers Group* | | | 57,830 | | | | 6,466 | | |
| American Express | | | 136,690 | | | | 7,909 | | |
| CBRE Group* | | | 257,170 | | | | 5,133 | | |
| Comerica | | | 156,700 | | | | 5,071 | | |
| Simon Property Group | | | 21,549 | | | | 3,139 | | |
| TD Ameritrade Holding | | | 167,720 | | | | 3,311 | | |
| Total Financials | | | | | 31,029 | | |
| | | Shares | | Value
(000) | |
| Health care—8.9% | |
| Agilent Technologies* | | | 99,670 | | | $ | 4,436 | | |
| Alexion Pharmaceuticals* | | | 61,750 | | | | 5,734 | | |
| Allergan | | | 51,360 | | | | 4,901 | | |
| Cerner* | | | 55,770 | | | | 4,248 | | |
| Express Scripts* | | | 113,260 | | | | 6,136 | | |
| Gilead Sciences* | | | 59,280 | | | | 2,896 | | |
| Intuitive Surgical* | | | 7,590 | | | | 4,112 | | |
| St. Jude Medical | | | 123,450 | | | | 5,470 | | |
| Total Health care | | | | | 37,933 | | |
| Industrials—11.6% | |
| AMETEK | | | 119,575 | | | | 5,801 | | |
| Boeing | | | 117,040 | | | | 8,704 | | |
| Caterpillar | | | 91,620 | | | | 9,759 | | |
| KBR | | | 91,090 | | | | 3,238 | | |
| Manpower | | | 64,880 | | | | 3,073 | | |
| Pall | | | 62,740 | | | | 3,741 | | |
| Precision Castparts | | | 16,280 | | | | 2,815 | | |
| SPX | | | 51,950 | | | | 4,028 | | |
| Union Pacific | | | 77,480 | | | | 8,328 | | |
| Total Industrials | | | | | 49,487 | | |
| Information technology—36.9% | |
| Acme Packet* # | | | 60,120 | | | | 1,654 | | |
| Altera | | | 215,470 | | | | 8,580 | | |
| Apple* | | | 81,030 | | | | 48,575 | | |
| Broadcom, Cl A | | | 174,900 | | | | 6,874 | | |
| eBay* | | | 223,730 | | | | 8,253 | | |
| F5 Networks* | | | 28,650 | | | | 3,867 | | |
| Finisar* | | | 126,310 | | | | 2,545 | | |
| Fortinet* | | | 89,179 | | | | 2,466 | | |
| Google, Cl A* | | | 23,330 | | | | 14,960 | | |
| Juniper Networks* | | | 153,030 | | | | 3,501 | | |
| Lam Research* | | | 92,280 | | | | 4,118 | | |
| LinkedIn, Cl A* | | | 31,660 | | | | 3,229 | | |
| NXP Semiconductors* # | | | 110,790 | | | | 2,948 | | |
| Qualcomm | | | 250,310 | | | | 17,026 | | |
| Salesforce.com* | | | 40,860 | | | | 6,313 | | |
| SanDisk* | | | 79,720 | | | | 3,953 | | |
| Texas Instruments | | | 278,960 | | | | 9,376 | | |
| Ubiquiti Networks* # | | | 47,930 | | | | 1,516 | | |
| VeriFone Systems* | | | 65,250 | | | | 3,385 | | |
| VMware, Cl A* | | | 41,640 | | | | 4,679 | | |
| Total Information technology | | | | | 157,818 | | |
42 TURNER FUNDS 2012 SEMIANNUAL REPORT
(Unaudited)
Schedule of investments
Turner Large Growth Fund
| | | Shares | | Value
(000) | |
| Materials—3.5% | |
| Goldcorp | | | 114,620 | | | $ | 5,165 | | |
| Monsanto | | | 84,440 | | | | 6,735 | | |
| Owens-Illinois* | | | 124,790 | | | | 2,912 | | |
| Total Materials | | | | | 14,812 | | |
| Telecommunication services—0.9% | |
| Aruba Networks* | | | 176,070 | | | | 3,923 | | |
| Total Telecommunication services | | | | | 3,923 | | |
Total Common stock
(Cost $360,848)** | | | | | 433,849 | | |
| Cash equivalent—3.1% | |
BlackRock TempCash Fund,
Institutional Shares,
0.010%*** (1) | | | 13,371,094 | | | | 13,371 | | |
Total Cash equivalent
(Cost $13,371)** | | | | | 13,371 | | |
Total Investments—104.7%
(Cost $374,219)** | | | | $ | 447,220 | | |
Percentages are based on Net Assets of $427,097.**
* Non-income producing security.
** This number is listed in thousands.
*** Rate shown is the 7-day effective yield as of March 31, 2012.
† More narrow industries are utilized for compliance purposes, whereas broad sectors are utilized for reporting purposes.
# Security fully or partially on loan at March 31, 2012. The total value of securities on loan at March 31, 2012 was 7,937.** Certain of these securities may have been sold prior to period end and are included in receivable for investment securities sold on the Statement of Assets and Liabilities.
(1) A partial position of this security was purchased with cash collateral received from securities lending. The total value of such security at March 31, 2012 was $7,988.**
Cl — Class
The accompanying notes are an integral part of the financial statements.
TURNER FUNDS 2012 SEMIANNUAL REPORT 43
FINANCIAL STATEMENTS
Schedule of investments
Turner Midcap Growth Fund
March 31, 2012
| | | Shares | | Value
(000) | |
| Common stock—100.0%† | |
| Consumer discretionary—18.1% | |
| Arcos Dorados Holdings, Cl A | | | 230,930 | | | $ | 4,178 | | |
| Bed Bath & Beyond* | | | 218,540 | | | | 14,373 | | |
| BorgWarner* # | | | 115,690 | | | | 9,757 | | |
| Coach | | | 130,860 | | | | 10,113 | | |
| Deckers Outdoor* | | | 105,600 | | | | 6,658 | | |
| Family Dollar Stores | | | 139,930 | | | | 8,855 | | |
| Guess? | | | 230,750 | | | | 7,211 | | |
| Harley-Davidson | | | 176,030 | | | | 8,640 | | |
| Lululemon Athletica* # | | | 89,830 | | | | 6,709 | | |
| MGM Resorts International* # | | | 469,360 | | | | 6,393 | | |
| Nordstrom | | | 263,630 | | | | 14,689 | | |
| Ralph Lauren | | | 48,690 | | | | 8,488 | | |
| Shutterfly* | | | 181,160 | | | | 5,676 | | |
| Stanley Black & Decker | | | 94,788 | | | | 7,295 | | |
Starwood Hotels & Resorts
Worldwide | | | 301,320 | | | | 16,997 | | |
| Wynn Resorts | | | 85,605 | | | | 10,690 | | |
| Total Consumer discretionary | | | | | 146,722 | | |
| Consumer staples—4.8% | |
| Hershey | | | 119,880 | | | | 7,352 | | |
| Mead Johnson Nutrition, Cl A | | | 95,710 | | | | 7,894 | | |
| Monster Beverage* | | | 172,304 | | | | 10,698 | | |
| Whole Foods Market # | | | 158,250 | | | | 13,167 | | |
| Total Consumer staples | | | | | 39,111 | | |
| Energy—9.5% | |
| Alpha Natural Resources* | | | 354,550 | | | | 5,393 | | |
| Cabot Oil & Gas | | | 322,760 | | | | 10,061 | | |
| Cameron International* | | | 199,131 | | | | 10,520 | | |
| Concho Resources* | | | 113,608 | | | | 11,597 | | |
| FMC Technologies* | | | 175,540 | | | | 8,851 | | |
| Peabody Energy | | | 184,440 | | | | 5,341 | | |
| Plains Exploration & Production* | | | 127,840 | | | | 5,452 | | |
| Range Resources | | | 45,770 | | | | 2,661 | | |
| Rowan* | | | 152,810 | | | | 5,032 | | |
| SM Energy | | | 179,120 | | | | 12,676 | | |
| Total Energy | | | | | 77,584 | | |
| Financials—6.4% | |
| Affiliated Managers Group* | | | 103,800 | | | | 11,606 | | |
| Camden Property Trust | | | 57,120 | | | | 3,756 | | |
| CBRE Group* | | | 714,890 | | | | 14,269 | | |
| | | Shares | | Value
(000) | |
| East West Bancorp | | | 220,830 | | | $ | 5,099 | | |
| First Republic Bank* | | | 180,560 | | | | 5,948 | | |
| IntercontinentalExchange* | | | 43,760 | | | | 6,013 | | |
| Signature Bank* | | | 80,490 | | | | 5,074 | | |
| Total Financials | | | | | 51,765 | | |
| Health care—14.7% | |
| Agilent Technologies* | | | 244,057 | | | | 10,863 | | |
| Alexion Pharmaceuticals* | | | 157,494 | | | | 14,625 | | |
| AMERIGROUP* | | | 81,480 | | | | 5,482 | | |
| AmerisourceBergen, Cl A | | | 164,258 | | | | 6,518 | | |
| BioMarin Pharmaceutical* | | | 117,500 | | | | 4,024 | | |
| Cepheid* | | | 110,630 | | | | 4,628 | | |
| Cerner* | | | 105,180 | | | | 8,011 | | |
| IDEXX Laboratories* | | | 48,540 | | | | 4,245 | | |
| Illumina* # | | | 56,190 | | | | 2,956 | | |
| Intuitive Surgical* | | | 23,212 | | | | 12,575 | | |
| Perrigo | | | 82,810 | | | | 8,555 | | |
| Regeneron Pharmaceuticals* | | | 69,640 | | | | 8,121 | | |
| SXC Health Solutions* | | | 100,500 | | | | 7,533 | | |
| Universal Health Services, Cl B | | | 130,060 | | | | 5,451 | | |
| Waters* | | | 61,920 | | | | 5,737 | | |
| WellCare Health Plans* | | | 143,262 | | | | 10,298 | | |
| Total Health care | | | | | 119,622 | | |
| Industrials—14.8% | |
| Clean Harbors* | | | 91,060 | | | | 6,131 | | |
| Cooper Industries | | | 151,540 | | | | 9,691 | | |
| Equifax | | | 158,390 | | | | 7,010 | | |
Expeditors International of
Washington | | | 270,229 | | | | 12,568 | | |
| Genesee & Wyoming, Cl A* | | | 125,390 | | | | 6,844 | | |
| Hexcel* | | | 265,600 | | | | 6,377 | | |
| Joy Global | | | 133,587 | | | | 9,819 | | |
| KBR | | | 220,579 | | | | 7,842 | | |
| Kirby* | | | 122,100 | | | | 8,033 | | |
| Manpower | | | 149,820 | | | | 7,097 | | |
| Owens Corning* | | | 155,611 | | | | 5,607 | | |
| Roper Industries | | | 76,630 | | | | 7,599 | | |
| Towers Watson, Cl A | | | 80,329 | | | | 5,307 | | |
| Triumph Group | | | 114,800 | | | | 7,193 | | |
| United Continental Holdings* # | | | 311,875 | | | | 6,705 | | |
| W.W. Grainger | | | 29,380 | | | | 6,311 | | |
| Total Industrials | | | | | 120,134 | | |
44 TURNER FUNDS 2012 SEMIANNUAL REPORT
(Unaudited)
Schedule of investments
Turner Midcap Growth Fund
| | | Shares | | Value
(000) | |
| Information technology—26.4% | |
| Acme Packet* # | | | 82,050 | | | $ | 2,258 | | |
| Altera | | | 198,200 | | | | 7,892 | | |
| Avago Technologies | | | 340,020 | | | | 13,251 | | |
| Broadcom, Cl A | | | 423,491 | | | | 16,643 | | |
| Citrix Systems* | | | 215,380 | | | | 16,996 | | |
| F5 Networks* | | | 89,524 | | | | 12,082 | | |
| Fiserv* | | | 125,020 | | | | 8,675 | | |
| Fortinet* | | | 210,260 | | | | 5,814 | | |
| JDS Uniphase* | | | 494,170 | | | | 7,161 | | |
| Juniper Networks* | | | 427,900 | | | | 9,790 | | |
| Lam Research* | | | 362,965 | | | | 16,196 | | |
| LinkedIn, Cl A* # | | | 93,580 | | | | 9,544 | | |
| LSI* | | | 1,411,540 | | | | 12,252 | | |
| NXP Semiconductors* # | | | 245,170 | | | | 6,524 | | |
| ON Semiconductor* | | | 1,989,950 | | | | 17,929 | | |
| Salesforce.com* | | | 54,020 | | | | 8,347 | | |
| SanDisk* | | | 300,780 | | | | 14,916 | | |
| Teradyne* | | | 839,620 | | | | 14,181 | | |
| TIBCO Software* | | | 229,150 | | | | 6,989 | | |
| VeriFone Systems* | | | 132,328 | | | | 6,864 | | |
| Total Information technology | | | | | 214,304 | | |
| Materials—5.3% | |
| Airgas | | | 70,870 | | | | 6,305 | | |
| CF Industries Holdings | | | 50,900 | | | | 9,297 | | |
| Cliffs Natural Resources | | | 145,345 | | | | 10,067 | | |
| Crown Holdings* | | | 166,080 | | | | 6,117 | | |
| PPG Industries | | | 116,100 | | | | 11,122 | | |
| Total Materials | | | | | 42,908 | | |
Total Common stock
(Cost $645,949)** | | | | | 812,150 | | |
| Cash equivalent—6.9% | |
BlackRock TempCash Fund,
Institutional Shares,
0.010%*** (1) | | | 56,218,292 | | | | 56,218 | | |
Total Cash equivalent
(Cost $56,218)** | | | | | 56,218 | | |
Total Investments—106.9%
(Cost $702,167)** | | | | $ | 868,368 | | |
Percentages are based on Net Assets of $812,021.**
* Non-income producing security.
** This number is listed in thousands.
*** Rate shown is the 7-day effective yield as of March 31, 2012.
† More narrow industries are utilized for compliance purposes, whereas broad sectors are utilized for reporting purposes.
# Security fully or partially on loan at March 31, 2012. The total value of securities on loan at March 31, 2012 was 55,059.** Certain of these securities may have been sold prior to period end and are included in receivable for investment securities sold on the Statement of Assets and Liabilities.
(1) A partial position of this security was purchased with cash collateral received from securities lending. The total value of such security at March 31, 2012 was $56,218.**
Cl — Class
The accompanying notes are an integral part of the financial statements.
TURNER FUNDS 2012 SEMIANNUAL REPORT 45
FINANCIAL STATEMENTS
Schedule of investments
Turner Small Cap Growth Fund
March 31, 2012
| | | Shares | | Value
(000) | |
| Common stock—98.8% | |
| Consumer discretionary—16.2% | |
| Big Lots* | | | 35,550 | | | $ | 1,529 | | |
| BJ's Restaurants* | | | 53,420 | | | | 2,690 | | |
| Bravo Brio Restaurant Group* | | | 102,090 | | | | 2,038 | | |
| Bridgepoint Education* # | | | 72,060 | | | | 1,783 | | |
| Brunswick # | | | 116,040 | | | | 2,988 | | |
| Crocs* | | | 116,080 | | | | 2,428 | | |
| DSW, Cl A | | | 42,880 | | | | 2,349 | | |
| Express* | | | 104,070 | | | | 2,600 | | |
| Gaylord Entertainment* # | | | 71,276 | | | | 2,195 | | |
| GNC Acquisition Holdings, Cl A | | | 85,370 | | | | 2,979 | | |
| Meritage Homes* | | | 53,280 | | | | 1,442 | | |
| Scientific Games, Cl A* | | | 210,125 | | | | 2,450 | | |
| Shutterfly* | | | 36,570 | | | | 1,146 | | |
| Sonic Automotive, Cl A # | | | 155,230 | | | | 2,780 | | |
| Sotheby's | | | 83,381 | | | | 3,280 | | |
| Steven Madden* | | | 71,365 | | | | 3,051 | | |
| Tenneco* | | | 75,670 | | | | 2,811 | | |
| True Religion Apparel* | | | 73,830 | | | | 2,023 | | |
| Vera Bradley* # | | | 74,510 | | | | 2,249 | | |
| Total Consumer discretionary | | | | | 44,811 | | |
| Consumer staples—2.1% | |
| Hain Celestial Group* # | | | 66,780 | | | | 2,926 | | |
| United Natural Foods* | | | 61,643 | | | | 2,876 | | |
| Total Consumer staples | | | | | 5,802 | | |
| Energy—7.1% | |
| Berry Petroleum, Cl A | | | 49,278 | | | | 2,322 | | |
| Carrizo Oil & Gas* # | | | 85,770 | | | | 2,424 | | |
| CVR Energy* | | | 61,770 | | | | 1,652 | | |
| Dril-Quip* | | | 43,780 | | | | 2,846 | | |
| Energy XXI (Bermuda)* | | | 65,180 | | | | 2,354 | | |
| Gulfport Energy* | | | 77,460 | | | | 2,256 | | |
| Key Energy Services* | | | 162,777 | | | | 2,515 | | |
| Northern Oil & Gas* | | | 91,110 | | | | 1,890 | | |
| Swift Energy* | | | 47,050 | | | | 1,366 | | |
| Total Energy | | | | | 19,625 | | |
| Financials—8.6% | |
| Alterra Capital Holdings | | | 87,230 | | | | 2,004 | | |
| Bank of the Ozarks # | | | 48,240 | | | | 1,508 | | |
| Cardtronics* | | | 84,060 | | | | 2,207 | | |
| Colonial Properties Trust | | | 92,640 | | | | 2,013 | | |
| Education Realty Trust | | | 129,310 | | | | 1,402 | | |
| | | Shares | | Value
(000) | |
| Kilroy Realty | | | 63,200 | | | $ | 2,946 | | |
| LaSalle Hotel Properties | | | 82,040 | | | | 2,309 | | |
| MarketAxess Holdings | | | 64,990 | | | | 2,423 | | |
| Signature Bank* | | | 38,230 | | | | 2,410 | | |
| Tanger Factory Outlet Centers # | | | 77,640 | | | | 2,308 | | |
| Texas Capital Bancshares* | | | 68,450 | | | | 2,370 | | |
| Total Financials | | | | | 23,900 | | |
| Health care—18.7% | |
| Air Methods* | | | 18,090 | | | | 1,578 | | |
| Akorn* | | | 183,236 | | | | 2,144 | | |
| Align Technology* | | | 80,510 | | | | 2,218 | | |
| ARIAD Pharmaceuticals* | | | 140,880 | | | | 2,247 | | |
| Bruker* | | | 95,930 | | | | 1,469 | | |
| Catalyst Health Solutions* | | | 29,290 | | | | 1,867 | | |
| Cepheid* | | | 56,360 | | | | 2,358 | | |
| Cubist Pharmaceuticals* | | | 66,240 | | | | 2,865 | | |
| Endologix* | | | 59,480 | | | | 871 | | |
| HMS Holdings* | | | 61,880 | | | | 1,931 | | |
| Idenix Pharmaceuticals* # | | | 67,040 | | | | 656 | | |
| Incyte* # | | | 76,400 | | | | 1,474 | | |
| Integra LifeSciences Holdings* | | | 59,610 | | | | 2,068 | | |
| IPC The Hospitalist* # | | | 39,850 | | | | 1,471 | | |
| Jazz Pharmaceuticals* | | | 26,530 | | | | 1,286 | | |
| Medivation* | | | 29,480 | | | | 2,203 | | |
| MEDNAX* | | | 22,570 | | | | 1,679 | | |
| Molina Healthcare* | | | 43,150 | | | | 1,451 | | |
| Onyx Pharmaceuticals* | | | 62,720 | | | | 2,363 | | |
| PSS World Medical* # | | | 63,000 | | | | 1,596 | | |
| Quality Systems # | | | 75,390 | | | | 3,297 | | |
| Questcor Pharmaceuticals* | | | 71,450 | | | | 2,688 | | |
| Salix Pharmaceuticals* | | | 38,430 | | | | 2,018 | | |
| Sirona Dental Systems* | | | 38,420 | | | | 1,980 | | |
| VCA Antech* | | | 89,360 | | | | 2,074 | | |
| Vivus* | | | 40,750 | | | | 911 | | |
| WellCare Health Plans* | | | 40,350 | | | | 2,900 | | |
| Total Health care | | | | | 51,663 | | |
| Industrials—15.9% | |
| Avis Budget Group* | | | 201,180 | | | | 2,847 | | |
| Belden | | | 53,660 | | | | 2,034 | | |
| Chart Industries* | | | 33,860 | | | | 2,483 | | |
| Clean Harbors* | | | 45,710 | | | | 3,078 | | |
| Colfax* | | | 83,400 | | | | 2,939 | | |
| Copa Holdings, Cl A | | | 39,820 | | | | 3,154 | | |
| Genesee & Wyoming, Cl A* | | | 54,840 | | | | 2,993 | | |
46 TURNER FUNDS 2012 SEMIANNUAL REPORT
(Unaudited)
Schedule of investments
Turner Small Cap Growth Fund
| | | Shares | | Value
(000) | |
| GrafTech International* | | | 183,850 | | | $ | 2,195 | | |
| Healthcare Services Group | | | 89,630 | | | | 1,906 | | |
| Herman Miller | | | 75,710 | | | | 1,738 | | |
| Hexcel* # | | | 113,280 | | | | 2,720 | | |
| Old Dominion Freight Line* | | | 52,930 | | | | 2,523 | | |
| Shaw Group* | | | 64,390 | | | | 2,042 | | |
| Triumph Group | | | 25,860 | | | | 1,620 | | |
| TrueBlue* | | | 167,312 | | | | 2,992 | | |
| US Airways Group* | | | 280,080 | | | | 2,126 | | |
| WESCO International* | | | 36,310 | | | | 2,371 | | |
| Woodward | | | 51,901 | | | | 2,223 | | |
| Total Industrials | | | | | 43,984 | | |
| Information technology—23.0% | |
| Acme Packet* # | | | 44,650 | | | | 1,229 | | |
| ADTRAN | | | 53,810 | | | | 1,678 | | |
| Allot Communications* # | | | 78,620 | | | | 1,828 | | |
| Ancestry.com* # | | | 43,740 | | | | 995 | | |
| Anixter International* | | | 40,430 | | | | 2,932 | | |
| Ariba* | | | 51,140 | | | | 1,673 | | |
| Bankrate* # | | | 77,120 | | | | 1,909 | | |
| BroadSoft* # | | | 59,119 | | | | 2,261 | | |
| Cavium* # | | | 90,270 | | | | 2,793 | | |
| CEVA* # | | | 59,354 | | | | 1,348 | | |
| Cirrus Logic* # | | | 148,190 | | | | 3,527 | | |
| Cognex | | | 56,040 | | | | 2,374 | | |
| Concur Technologies* # | | | 57,750 | | | | 3,314 | | |
| DealerTrack Holdings* # | | | 72,490 | | | | 2,193 | | |
Fairchild Semiconductor
International* | | | 142,670 | | | | 2,097 | | |
| Finisar* | | | 141,300 | | | | 2,847 | | |
| Heartland Payment Systems | | | 46,735 | | | | 1,348 | | |
| Kenexa* | | | 68,940 | | | | 2,154 | | |
| MAXIMUS | | | 40,190 | | | | 1,634 | | |
| NETGEAR* | | | 75,070 | | | | 2,868 | | |
| OSI Systems* | | | 22,042 | | | | 1,351 | | |
| Plexus* | | | 49,330 | | | | 1,726 | | |
| Power Integrations # | | | 60,370 | | | | 2,241 | | |
| QLIK Technologies* # | | | 70,291 | | | | 2,249 | | |
| Sapient | | | 216,670 | | | | 2,697 | | |
| Semtech* | | | 92,120 | | | | 2,622 | | |
| Synchronoss Technologies* # | | | 94,270 | | | | 3,009 | | |
| Teradyne* | | | 138,460 | | | | 2,339 | | |
| Ultratech* | | | 74,490 | | | | 2,159 | | |
| Total Information technology | | | | | 63,395 | | |
| | | Shares | | Value
(000) | |
| Materials—5.3% | |
| Allied Nevada Gold* # | | | 81,569 | | | $ | 2,653 | | |
| Boise | | | 249,630 | | | | 2,050 | | |
| Century Aluminum* | | | 235,950 | | | | 2,095 | | |
| Chemtura* | | | 135,840 | | | | 2,307 | | |
| Kraton Performance Polymers* | | | 51,264 | | | | 1,362 | | |
| Louisiana-Pacific* # | | | 276,882 | | | | 2,589 | | |
| Methanex | | | 46,650 | | | | 1,513 | | |
| Total Materials | | | | | 14,569 | | |
| Telecommunication services—1.9% | |
| AboveNet* | | | 15,070 | | | | 1,248 | | |
| Aruba Networks* # | | | 117,630 | | | | 2,621 | | |
Cogent Communications
Group* # | | | 73,500 | | | | 1,402 | | |
| Total Telecommunication services | | | | | 5,271 | | |
Total Common stock
(Cost $220,927)** | | | | | 273,020 | | |
| Cash equivalent—19.5% | |
BlackRock TempCash Fund,
Institutional Shares,
0.010%*** (1) | | | 54,028,849 | | | | 54,029 | | |
Total Cash equivalent
(Cost $54,029)** | | | | | 54,029 | | |
Total Investments—118.3%
(Cost $274,956)** | | | | $ | 327,049 | | |
Percentages are based on Net Assets of $276,546.**
* Non-income producing security.
** This number is listed in thousands.
*** Rate shown is the 7-day effective yield as of March 31, 2012.
# Security fully or partially on loan at March 31, 2012. The total value of securities on loan at March 31, 2012 was 52,112.** Certain of these securities may have been sold prior to period end and are included in receivable for investment securities sold on the Statement of Assets and Liabilities.
(1) A partial position of this security was purchased with cash collateral received from securities lending. The total value of such security at March 31, 2012 was $53,858.**
Cl — Class
The accompanying notes are an integral part of the financial statements.
TURNER FUNDS 2012 SEMIANNUAL REPORT 47
FINANCIAL STATEMENTS
Schedule of investments
Turner Global Opportunities Fund
March 31, 2012
| | | Shares | | Value
(000) | |
| Common stock—97.0%† | |
| Consumer discretionary—14.8% | |
| InterContinental Hotels Group | | | 1,686 | | | $ | 39 | | |
| Las Vegas Sands | | | 1,200 | | | | 69 | | |
| Lululemon Athletica* | | | 430 | | | | 32 | | |
| LVMH Moet Hennessy Louis Vuitton | | | 339 | | | | 58 | | |
| Rakuten | | | 50 | | | | 53 | | |
| Total Consumer discretionary | | | | | 251 | | |
| Consumer staples—8.0% | |
| Remy Cointreau | | | 820 | | | | 83 | | |
| Whole Foods Market | | | 630 | | | | 53 | | |
| Total Consumer staples | | | | | 136 | | |
| Energy—7.8% | |
| Alpha Natural Resources* | | | 1,160 | | | | 18 | | |
| Anadarko Petroleum | | | 470 | | | | 37 | | |
| BG Group | | | 1,780 | | | | 41 | | |
| Cabot Oil & Gas | | | 1,170 | | | | 36 | | |
| Total Energy | | | | | 132 | | |
| Financials—14.3% | |
| AIA Group | | | 24,772 | | | | 91 | | |
| CBRE Group* | | | 2,810 | | | | 56 | | |
| Compartamos SAB de CV | | | 36,150 | | | | 41 | | |
| DBS Group Holdings | | | 4,810 | | | | 54 | | |
| Total Financials | | | | | 242 | | |
| Health care—7.8% | |
| Alexion Pharmaceuticals* | | | 950 | | | | 88 | | |
| Shire | | | 1,350 | | | | 44 | | |
| Total Health care | | | | | 132 | | |
| Industrials—3.0% | |
| Caterpillar | | | 480 | | | | 51 | | |
| Total Industrials | | | | | 51 | | |
| Information technology—41.3% | |
| Apple* | | | 190 | | | | 114 | | |
| ARM Holdings ADR | | | 1,680 | | | | 48 | | |
| ASML Holding, NY Shares | | | 1,350 | | | | 68 | | |
| Broadcom, Cl A | | | 2,060 | | | | 81 | | |
| F5 Networks* | | | 450 | | | | 61 | | |
| Imagination Technologies Group* | | | 8,610 | | | | 94 | | |
| LG Display* | | | 1,363 | | | | 32 | | |
| | | Shares | | Value
(000) | |
| Qualcomm | | | 1,080 | | | $ | 73 | | |
| Salesforce.com* | | | 370 | | | | 57 | | |
| SanDisk* | | | 1,440 | | | | 71 | | |
| Total Information technology | | | | | 699 | | |
Total Common stock
(Cost $1,254)** | | | | | 1,643 | | |
| Cash equivalent—2.8% | |
BlackRock TempCash Fund,
Institutional Shares,
0.010%*** | | | 48,226 | | | | 48 | | |
Total Cash equivalent
(Cost $48)** | | | | | 48 | | |
Total Investments—99.9%
(Cost $1,302)** | | | | $ | 1,691 | | |
Percentages are based on Net Assets of $1,693.**
* Non-income producing security.
** This number is listed in thousands.
*** Rate shown is the 7-day effective yield as of March 31, 2012.
† More narrow industries are utilized for compliance purposes, whereas broad sectors are utilized for reporting purposes.
ADR — American Depositary Receipt
Cl — Class
NY — New York
The accompanying notes are an integral part of the financial statements.
| Country Allocation as of 3/31/12†† | |
| United States | | | 55.9 | % | |
| United Kingdom | | | 13.1 | | |
| France | | | 8.4 | | |
| Hong Kong | | | 5.4 | | |
| Netherlands | | | 4.0 | | |
| Singapore | | | 3.2 | | |
| Japan | | | 3.1 | | |
| Jersey | | | 2.6 | | |
| Mexico | | | 2.4 | | |
| Republic of Korea (South) | | | 1.9 | | |
| Total | | | 100.0 | % | |
†† Percentages are based on total investments.
48 TURNER FUNDS 2012 SEMIANNUAL REPORT
(Unaudited)
Schedule of investments
Turner International Growth Fund
March 31, 2012
| | | Shares | | Value
(000) | |
| Common stock—95.4% | |
| Consumer discretionary—10.2% | |
| Honda Motor | | | 8,480 | | | $ | 322 | | |
| Hyundai Motor | | | 890 | | | | 183 | | |
| InterContinental Hotels Group | | | 11,762 | | | | 273 | | |
| Lululemon Athletica* | | | 3,840 | | | | 287 | | |
LVMH Moet Hennessy Louis
Vuitton | | | 1,359 | | | | 234 | | |
| Rakuten | | | 250 | | | | 262 | | |
| Sands China | | | 37,544 | | | | 147 | | |
| Total Consumer discretionary | | | | | 1,708 | | |
| Consumer staples—16.1% | |
| Almacenes Exito SA | | | 7,469 | | | | 106 | | |
| British American Tobacco | | | 6,390 | | | | 322 | | |
Companhia de Bebidas das
Americas ADR, Preferred Shares | | | 3,930 | | | | 162 | | |
| Diageo | | | 11,840 | | | | 285 | | |
| FamilyMart | | | 5,850 | | | | 247 | | |
| Golden Eagle Retail Group | | | 40,100 | | | | 103 | | |
| Japan Tobacco | | | 30 | | | | 169 | | |
| Nestle | | | 6,498 | | | | 409 | | |
| Remy Cointreau | | | 2,560 | | | | 260 | | |
| SABMiller | | | 6,431 | | | | 258 | | |
| Shoprite Holdings | | | 6,669 | | | | 120 | | |
| Unilever NV | | | 7,640 | | | | 260 | | |
| Total Consumer staples | | | | | 2,701 | | |
| Energy—6.0% | |
| BG Group | | | 11,620 | | | | 269 | | |
| Enbridge | | | 6,550 | | | | 255 | | |
| Harum Energy | | | 170,660 | | | | 152 | | |
| Petroleum Geo-Services* | | | 10,790 | | | | 158 | | |
| Suncor Energy | | | 5,120 | | | | 167 | | |
| Total Energy | | | | | 1,001 | | |
| Financials—8.2% | |
| AIA Group | | | 59,189 | | | | 217 | | |
China Construction Bank,
H Shares | | | 107,900 | | | | 83 | | |
| Compartamos SAB de CV | | | 77,150 | | | | 88 | | |
| DBS Group Holdings | | | 8,520 | | | | 96 | | |
| Lloyds Banking Group* | | | 218,483 | | | | 118 | | |
| Mitsui Fudosan | | | 5,110 | | | | 98 | | |
| Sberbank of Russia ADR* | | | 8,590 | | | | 110 | | |
| | | Shares | | Value
(000) | |
| Standard Chartered | | | 9,190 | | | $ | 229 | | |
| Tokio Marine Holdings | | | 5,570 | | | | 153 | | |
| UBS* | | | 13,070 | | | | 183 | | |
| Total Financials | | | | | 1,375 | | |
| Health care—9.4% | |
| Astellas Pharma | | | 3,760 | | | | 155 | | |
| Covidien | | | 4,380 | | | | 240 | | |
| GlaxoSmithKline | | | 9,270 | | | | 207 | | |
| ICON SP ADR* | | | 4,920 | | | | 104 | | |
| Novo Nordisk, Cl B | | | 1,400 | | | | 194 | | |
| Roche Holding | | | 1,880 | | | | 327 | | |
| Shire | | | 4,360 | | | | 141 | | |
| SXC Health Solutions* | | | 2,820 | | | | 211 | | |
| Total Health care | | | | | 1,579 | | |
| Industrials—18.5% | |
| Canadian Pacific Railway | | | 2,090 | | | | 159 | | |
| Copa Holdings, Cl A | | | 2,470 | | | | 196 | | |
| Embraer ADR | | | 4,590 | | | | 147 | | |
European Aeronautic Defence &
Space | | | 5,204 | | | | 213 | | |
| Experian | | | 14,701 | | | | 229 | | |
| FANUC | | | 1,320 | | | | 234 | | |
| GEA Group | | | 6,260 | | | | 216 | | |
| Komatsu | | | 9,060 | | | | 258 | | |
| Rolls-Royce Holdings | | | 18,220 | | | | 237 | | |
| Sandvik AB | | | 11,266 | | | | 163 | | |
| Schneider Electric SA | | | 3,740 | | | | 244 | | |
| Siemens | | | 2,720 | | | | 274 | | |
| Tullow Oil | | | 8,620 | | | | 210 | | |
| Wolseley | | | 5,654 | | | | 215 | | |
| Yuexiu Transport Infrastructure | | | 212,890 | | | | 106 | | |
| Total Industrials | | | | | 3,101 | | |
| Information technology—10.9% | |
| Acer | | | 51,673 | | | | 69 | | |
| ARM Holdings | | | 22,700 | | | | 215 | | |
| ASML Holding, NY Shares | | | 5,750 | | | | 287 | | |
| Avago Technologies | | | 6,250 | | | | 244 | | |
| Canon | | | 5,470 | | | | 259 | | |
| Check Point Software Technologies* | | | 3,860 | | | | 246 | | |
| Imagination Technologies Group* | | | 20,470 | | | | 224 | | |
| Samsung Electronics | | | 250 | | | | 281 | | |
| Total Information technology | | | | | 1,825 | | |
TURNER FUNDS 2012 SEMIANNUAL REPORT 49
FINANCIAL STATEMENTS
Schedule of investments
Turner International Growth Fund
| | | Shares | | Value
(000) | |
| Materials—14.5% | |
| BASF SE | | | 3,160 | | | $ | 276 | | |
| BHP Billiton PLC | | | 7,380 | | | | 225 | | |
| BHP Billiton, Ltd. | | | 7,210 | | | | 258 | | |
| Goldcorp | | | 4,230 | | | | 191 | | |
| Linde | | | 1,540 | | | | 276 | | |
| New Gold* | | | 9,360 | | | | 93 | | |
| Potash Corp. of Saskatchewan | | | 5,563 | | | | 254 | | |
| Rexam | | | 39,750 | | | | 272 | | |
| Rio Tinto PLC | | | 3,260 | | | | 180 | | |
| Rio Tinto, Ltd. | | | 2,520 | | | | 171 | | |
| Silver Wheaton | | | 2,780 | | | | 92 | | |
| YAMATO KOGYO | | | 4,740 | | | | 138 | | |
| Total Materials | | | | | 2,426 | | |
| Telecommunication services—0.9% | |
| Tim Participacoes* | | | 25,045 | | | | 159 | | |
| Total Telecommunication services | | | | | 159 | | |
| Utilities—0.7% | |
| Empresa Nacional de Electricidad | | | 67,210 | | | | 121 | | |
| Total Utilities | | | | | 121 | | |
Total Common stock
(Cost $14,404)** | | | | | 15,996 | | |
| Cash equivalent—4.2% | |
BlackRock TempCash Fund,
Institutional Shares,
0.010%*** | | | 710,881 | | | | 711 | | |
Total Cash equivalent
(Cost $711)** | | | | | 711 | | |
Total Investments—99.6%
(Cost $15,115)** | | | | $ | 16,707 | | |
Percentages are based on Net Assets of $16,770.**
* Non-income producing security.
** This number is listed in thousands.
*** Rate shown is the 7-day effective yield as of March 31, 2012.
ADR — American Depositary Receipt
Cl — Class
NY — New York
PLC — Public Liability Co.
The accompanying notes are an integral part of the financial statements.
| Country Allocation as of 3/31/12† | |
| United Kingdom | | | 21.1 | % | |
| Japan | | | 13.7 | | |
| Canada | | | 8.5 | | |
| Germany | | | 6.2 | | |
| United States | | | 6.0 | | |
| Switzerland | | | 5.5 | | |
| Netherlands | | | 4.6 | | |
| France | | | 4.4 | | |
| Jersey | | | 3.5 | | |
| Brazil | | | 2.8 | | |
| Republic of Korea (South) | | | 2.8 | | |
| Australia | | | 2.6 | | |
| Ireland (Republic of) | | | 2.1 | | |
| Singapore | | | 2.0 | | |
| Hong Kong | | | 1.9 | | |
| Cayman Islands | | | 1.5 | | |
| Israel | | | 1.5 | | |
| Panama | | | 1.2 | | |
| Denmark | | | 1.2 | | |
| Sweden | | | 1.0 | | |
| Norway | | | 0.9 | | |
| Indonesia | | | 0.9 | | |
| Chile | | | 0.7 | | |
| South Africa | | | 0.7 | | |
| Russian Federation | | | 0.7 | | |
| Colombia | | | 0.6 | | |
| Mexico | | | 0.5 | | |
| China | | | 0.5 | | |
| Taiwan | | | 0.4 | | |
| Total | | | 100.0 | % | |
† Percentages are based on total investments.
50 TURNER FUNDS 2012 SEMIANNUAL REPORT
THIS PAGE WAS INTENTIONALLY LEFT BLANK
TURNER FUNDS 2012 SEMIANNUAL REPORT 51
FINANCIAL STATEMENTS
Statements of assets and liabilities (000)
March 31, 2012
| | | Turner
Market Neutral
Fund | | Turner
Medical Sciences
Long/Short
Fund | | Turner
Spectrum
Fund | |
| Assets: | |
| Investment securities, at cost | | $ | 50,611 | | | $ | 74,546 | | | $ | 734,740 | | |
| Investment securities, at value | | $ | 50,951 | | | $ | 76,486 | | | $ | 767,292 | | |
| Deposits with brokers for securities sold short | | | 50,221 | | | | 35,417 | | | | 477,785 | | |
| Deposits with brokers for options | | | — | | | | — | | | | 166,600 | | |
| Cash | | | — | | | | — | | | | 34 | | |
| Receivable for investment securities sold | | | 14,069 | | | | 14,115 | | | | 134,807 | | |
| Receivable for capital shares sold | | | 826 | | | | 327 | | | | 14,198 | | |
| Prepaid expenses | | | 22 | | | | 22 | | | | 51 | | |
| Receivable for dividend income | | | 10 | | | | 87 | | | | 451 | | |
| Reclaim receivable | | | — | | | | — | | | | 15 | | |
| Total assets | | | 116,099 | | | | 126,454 | | | | 1,561,233 | | |
| Liabilities: | |
| Securities sold short, at proceeds | | | 46,462 | | | | 28,299 | | | | 470,696 | | |
| Written options, premiums received | | | — | | | | — | | | | 388 | | |
| Securities sold short, at value | | | 46,551 | | | | 28,614 | | | | 471,093 | | |
| Written options, at value | | | — | | | | — | | | | 325 | | |
| Foreign currency overdrafts, at value | | | — | | | | — | | | | 994 | | |
| Payable for investment securities purchased | | | 13,846 | | | | 16,856 | | | | 127,797 | | |
| Obligation to return securities lending collateral | | | — | | | | — | | | | — | | |
| Payable for capital shares redeemed | | | 12 | | | | 76 | | | | 15,084 | | |
| Dividends payable on securities sold short (Note 2) | | | — | | | | 1 | | | | 77 | | |
| Broker fees and charges on short sales payable | | | 6 | | | | 15 | | | | 226 | | |
| Payable due to investment adviser | | | 49 | | | | 80 | | | | 870 | | |
| Payable due to administrator | | | 4 | | | | 8 | | | | 92 | | |
| Payable due to shareholder servicing | | | 1 | | | | 5 | | | | 39 | | |
| Payable due to distributor | | | — | | | | 2 | | | | 9 | | |
| Payable due to transfer agent | | | 1 | | | | 5 | | | | 41 | | |
| Payable due to custodian | | | 2 | | | | 6 | | | | 28 | | |
| Other accrued expenses | | | 3 | | | | 18 | | | | 120 | | |
| Total liabilities | | | 60,475 | | | | 45,686 | | | | 616,795 | | |
| Net assets | | $ | 55,624 | | | $ | 80,768 | | | $ | 944,438 | | |
| *Includes market value of securities on loan | | $ | — | | | $ | — | | | $ | — | | |
| Net assets: | |
| Portfolio capital | | $ | 56,280 | | | $ | 82,350 | | | $ | 959,010 | | |
| Undistributed net investment income (distributions in excess of investment income) | | | (149 | ) | | | (590 | ) | | | (5,594 | ) | |
Accumulated net realized loss from investments, securities sold short, written options
and foreign currency transactions | | | (758 | ) | | | (2,614 | ) | | | (41,185 | ) | |
Net unrealized appreciation on investments, securities sold short, written options, foreign
currencies and translation of other assets and liabilities denominated in foreign currencies | | | 251 | | | | 1,622 | | | | 32,207 | | |
| Net assets | | $ | 55,624 | | | $ | 80,768 | | | $ | 944,438 | | |
| Outstanding shares of beneficial interest Institutional Class Shares (1) | | | 4,672 | | | | 6,188 | | | | 68,296 | | |
| Outstanding shares of beneficial interest Investor Class Shares (1) | | | 703 | | | | 1,374 | | | | 15,175 | | |
| Outstanding shares of beneficial interest Class C Shares (1) | | | 13 | | | | 355 | | | | 1,236 | | |
| Net assets — Institutional Class Shares | | $ | 48,260 | | | $ | 63,178 | | | $ | 762,792 | | |
| Net assets — Investor Class Shares | | $ | 7,233 | | | $ | 14,003 | | | $ | 168,180 | | |
| Net assets — Class C Shares | | $ | 131 | | | $ | 3,587 | | | $ | 13,466 | | |
| Net asset value, offering and redemption price per share — Institutional Class Shares | | $ | 10.33 | | | $ | 10.21 | | | $ | 11.17 | | |
| Net asset value, offering and redemption price per share — Investor Class Shares | | $ | 10.30 | † | | $ | 10.19 | | | $ | 11.08 | | |
| Net asset value, offering and redemption price per share — Class C Shares | | $ | 10.21 | † | | $ | 10.11 | † | | $ | 10.89 | | |
(1) Unlimited authorization — par value $0.00001.
† Differences in net asset value recalculation and net asset value stated are caused by rounding differences.
Amounts designated as "—" are either not applicable, $0 or have been rounded to $0.
The accompanying notes are an integral part of the financial statements.
52 TURNER FUNDS 2012 SEMIANNUAL REPORT
(Unaudited)
| | | Turner
Titan
Fund | | Turner
All Cap
Growth
Fund | | Turner
Concentrated
Growth
Fund | |
| Assets: | |
| Investment securities, at cost | | $ | 18,062 | | | $ | 27,358 | | | $ | 37,897 | | |
| Investment securities, at value | | $ | 19,416 | | | $ | 32,686 | * | | $ | 44,061 | | |
| Deposits with brokers for securities sold short | | | 13,785 | | | | — | | | | — | | |
| Deposits with brokers for options | | | — | | | | — | | | | — | | |
| Cash | | | — | | | | — | | | | — | | |
| Receivable for investment securities sold | | | 2,869 | | | | — | | | | — | | |
| Receivable for capital shares sold | | | 102 | | | | 24 | | | | 24 | | |
| Prepaid expenses | | | 19 | | | | 4 | | | | 5 | | |
| Receivable for dividend income | | | 14 | | | | — | | | | 16 | | |
| Reclaim receivable | | | — | | | | — | | | | — | | |
| Total assets | | | 36,205 | | | | 32,714 | | | | 44,106 | | |
| Liabilities: | |
| Securities sold short, at proceeds | | | 11,220 | | | | — | | | | — | | |
| Written options, premiums received | | | — | | | | — | | | | — | | |
| Securities sold short, at value | | | 11,327 | | | | — | | | | — | | |
| Written options, at value | | | — | | | | — | | | | — | | |
| Foreign currency overdrafts, at value | | | — | | | | — | | | | — | | |
| Payable for investment securities purchased | | | 1,516 | | | | — | | | | — | | |
| Obligation to return securities lending collateral | | | — | | | | 76 | | | | — | | |
| Payable for capital shares redeemed | | | 11 | | | | — | | | | 31 | | |
| Dividends payable on securities sold short (Note 2) | | | 1 | | | | — | | | | — | | |
| Broker fees and charges on short sales payable | | | 2 | | | | — | | | | — | | |
| Payable due to investment adviser | | | 20 | | | | 10 | | | | 17 | | |
| Payable due to administrator | | | 2 | | | | 3 | | | | 4 | | |
| Payable due to shareholder servicing | | | 1 | | | | 4 | | | | 5 | | |
| Payable due to distributor | | | — | | | | — | | | | — | | |
| Payable due to transfer agent | | | 1 | | | | 6 | | | | 6 | | |
| Payable due to custodian | | | 7 | | | | 4 | | | | 5 | | |
| Other accrued expenses | | | 6 | | | | 10 | | | | 16 | | |
| Total liabilities | | | 12,894 | | | | 113 | | | | 84 | | |
| Net assets | | $ | 23,311 | | | $ | 32,601 | | | $ | 44,022 | | |
| *Includes market value of securities on loan | | $ | — | | | $ | 75 | | | $ | — | | |
| Net assets: | |
| Portfolio capital | | $ | 22,713 | | | $ | 39,617 | | | $ | 60,235 | | |
| Undistributed net investment income (distributions in excess of investment income) | | | (115 | ) | | | (140 | ) | | | (70 | ) | |
Accumulated net realized loss from investments, securities sold short, written options
and foreign currency transactions | | | (534 | ) | | | (12,204 | ) | | | (22,307 | ) | |
Net unrealized appreciation on investments, securities sold short, written options, foreign
currencies and translation of other assets and liabilities denominated in foreign currencies | | | 1,247 | | | | 5,328 | | | | 6,164 | | |
| Net assets | | $ | 23,311 | | | $ | 32,601 | | | $ | 44,022 | | |
| Outstanding shares of beneficial interest Institutional Class Shares (1) | | | 1,796 | | | | — | | | | — | | |
| Outstanding shares of beneficial interest Investor Class Shares (1) | | | 435 | | | | 3,465 | | | | 5,443 | | |
| Outstanding shares of beneficial interest Class C Shares (1) | | | 11 | | | | — | | | | — | | |
| Net assets — Institutional Class Shares | | $ | 18,681 | | | $ | — | | | $ | — | | |
| Net assets — Investor Class Shares | | $ | 4,513 | | | $ | 32,601 | | | $ | 44,022 | | |
| Net assets — Class C Shares | | $ | 117 | | | $ | — | | | $ | — | | |
| Net asset value, offering and redemption price per share — Institutional Class Shares | | $ | 10.40 | | | $ | — | | | $ | — | | |
| Net asset value, offering and redemption price per share — Investor Class Shares | | $ | 10.38 | † | | $ | 9.41 | | | $ | 8.09 | | |
| Net asset value, offering and redemption price per share — Class C Shares | | $ | 10.29 | † | | $ | — | | | $ | — | | |
TURNER FUNDS 2012 SEMIANNUAL REPORT 53
FINANCIAL STATEMENTS
Statements of assets and liabilities (000)
March 31, 2012
| | | Turner
Emerging
Growth Fund | | Turner
Large
Growth Fund | | Turner
Midcap
Growth Fund | |
| Assets: | |
| Investment securities, at cost | | $ | 215,673 | | | $ | 374,219 | | | $ | 702,167 | | |
| Investment securities, at value | | $ | 301,828 | * | | $ | 447,220 | * | | $ | 868,368 | * | |
| Foreign currency, at value | | | — | | | | — | | | | — | | |
| Receivable for investment securities sold | | | 430 | | | | 3,078 | | | | 4,773 | | |
| Receivable for capital shares sold | | | 317 | | | | 330 | | | | 609 | | |
| Prepaid expenses | | | 28 | | | | 33 | | | | 36 | | |
| Receivable for dividend income | | | 102 | | | | 379 | | | | 269 | | |
| Receivable from investment adviser | | | — | | | | — | | | | — | | |
| Reclaim receivable | | | — | | | | — | | | | — | | |
| Total assets | | | 302,705 | | | | 451,040 | | | | 874,055 | | |
| Liabilities: | |
| Cash overdraft | | | — | | | | — | | | | 4,138 | | |
| Payable for investment securities purchased | | | 2,058 | | | | 8,383 | | | | — | | |
| Obligation to return securities lending collateral | | | 40,208 | | | | 7,988 | | | | 56,218 | | |
| Payable for capital shares redeemed | | | 163 | | | | 7,168 | | | | 643 | | |
| Payable due to investment adviser | | | 200 | | | | 137 | | | | 502 | | |
| Payable due to administrator | | | 25 | | | | 43 | | | | 80 | | |
| Payable due to shareholder servicing | | | 23 | | | | 13 | | | | 48 | | |
| Payable due to distributor | | | — | | | | — | | | | 1 | | |
| Payable due to transfer agent | | | 31 | | | | 45 | | | | 82 | | |
| Payable due to custodian | | | 12 | | | | 12 | | | | 16 | | |
| Other accrued expenses | | | 133 | | | | 154 | | | | 306 | | |
| Total liabilities | | | 42,853 | | | | 23,943 | | | | 62,034 | | |
| Net assets | | $ | 259,852 | | | $ | 427,097 | | | $ | 812,021 | | |
| *Includes market value of securities on loan | | $ | 39,297 | | | $ | 7,937 | | | $ | 55,059 | | |
| Net assets: | |
| Portfolio capital | | $ | 164,907 | | | $ | 472,705 | | | $ | 679,904 | | |
| Undistributed net investment income (distributions in excess of net investment income) | | | (982 | ) | | | 95 | | | | (1,263 | ) | |
| Accumulated net realized gain (loss) from investments and foreign currency transactions | | | 9,772 | | | | (118,704 | ) | | | (32,821 | ) | |
Net unrealized appreciation on investments, foreign currencies and translation of other assets and
liabilities denominated in foreign currencies | | | 86,155 | | | | 73,001 | | | | 166,201 | | |
| Net assets | | $ | 259,852 | | | $ | 427,097 | | | $ | 812,021 | | |
| Outstanding shares of beneficial interest Institutional Class Shares (1) | | | 1,394 | | | | 28,081 | | | | 8,052 | | |
| Outstanding shares of beneficial interest Investor Class Shares (1) | | | 3,171 | | | | 4,242 | | | | 13,638 | | |
| Outstanding shares of beneficial interest Retirement Class Shares (1) | | | — | | | | — | | | | 144 | | |
| Net assets — Institutional Class Shares | | $ | 79,786 | | | $ | 371,450 | | | $ | 301,301 | | |
| Net assets — Investor Class Shares | | $ | 180,066 | | | $ | 55,647 | | | $ | 505,657 | | |
| Net assets — Retirement Class Shares | | $ | — | | | $ | — | | | $ | 5,063 | | |
| Net asset value, offering and redemption price per share — Institutional Class Shares | | $ | 57.23 | † | | $ | 13.23 | | | $ | 37.42 | | |
| Net asset value, offering and redemption price per share — Investor Class Shares | | $ | 56.79 | | | $ | 13.12 | | | $ | 37.08 | | |
| Net asset value, offering and redemption price per share — Retirement Class Shares | | $ | — | | | $ | — | | | $ | 35.23 | † | |
(1) Unlimited authorization — par value $0.00001.
† Differences in net asset value recalculation and net asset value stated are caused by rounding differences.
Amounts designated as "—" are either not applicable, $0 or have been rounded to $0.
The accompanying notes are an integral part of the financial statements.
54 TURNER FUNDS 2012 SEMIANNUAL REPORT
(Unaudited)
| | | Turner
Small Cap
Growth Fund | | Turner Global
Opportunities
Fund | | Turner
International
Growth Fund | |
| Assets: | |
| Investment securities, at cost | | $ | 274,956 | | | $ | 1,302 | | | $ | 15,115 | | |
| Investment securities, at value | | $ | 327,049 | * | | $ | 1,691 | | | $ | 16,707 | | |
| Foreign currency, at value | | | — | | | | — | | | | 4 | | |
| Receivable for investment securities sold | | | 3,992 | | | | — | | | | — | | |
| Receivable for capital shares sold | | | 158 | | | | — | | | | 20 | | |
| Prepaid expenses | | | 17 | | | | 3 | | | | 15 | | |
| Receivable for dividend income | | | 80 | | | | 1 | | | | 51 | | |
| Receivable from investment adviser | | | — | | | | 3 | | | | — | | |
| Reclaim receivable | | | — | | | | — | | | | 11 | | |
| Total assets | | | 331,296 | | | | 1,698 | | | | 16,808 | | |
| Liabilities: | |
| Cash overdraft | | | — | | | | — | | | | — | | |
| Payable for investment securities purchased | | | 402 | | | | — | | | | — | | |
| Obligation to return securities lending collateral | | | 53,858 | | | | — | | | | — | | |
| Payable for capital shares redeemed | | | 62 | | | | — | | | | — | | |
| Payable due to investment adviser | | | 258 | | | | — | | | | 4 | | |
| Payable due to administrator | | | 27 | | | | — | | | | 2 | | |
| Payable due to shareholder servicing | | | 14 | | | | — | | | | 1 | | |
| Payable due to distributor | | | — | | | | — | | | | — | | |
| Payable due to transfer agent | | | 23 | | | | — | | | | 2 | | |
| Payable due to custodian | | | 15 | | | | 2 | | | | 17 | | |
| Other accrued expenses | | | 91 | | | | 3 | | | | 12 | | |
| Total liabilities | | | 54,750 | | | | 5 | | | | 38 | | |
| Net assets | | $ | 276,546 | | | $ | 1,693 | | | $ | 16,770 | | |
| *Includes market value of securities on loan | | $ | 52,112 | | | $ | — | | | $ | — | | |
| Net assets: | |
| Portfolio capital | | $ | 225,227 | | | $ | 1,298 | | | $ | 16,412 | | |
| Undistributed net investment income (distributions in excess of net investment income) | | | (1,054 | ) | | | (8 | ) | | | 32 | | |
| Accumulated net realized gain (loss) from investments and foreign currency transactions | | | 280 | | | | 14 | | | | (1,266 | ) | |
Net unrealized appreciation on investments, foreign currencies and translation of other assets and
liabilities denominated in foreign currencies | | | 52,093 | | | | 389 | | | | 1,592 | | |
| Net assets | | $ | 276,546 | | | $ | 1,693 | | | $ | 16,770 | | |
| Outstanding shares of beneficial interest Institutional Class Shares (1) | | | — | | | | 82 | | | | 746 | | |
| Outstanding shares of beneficial interest Investor Class Shares (1) | | | 7,656 | | | | 39 | | | | 763 | | |
| Outstanding shares of beneficial interest Retirement Class Shares (1) | | | — | | | | — | | | | — | | |
| Net assets — Institutional Class Shares | | $ | — | | | $ | 1,152 | | | $ | 8,316 | | |
| Net assets — Investor Class Shares | | $ | 276,546 | | | $ | 541 | | | $ | 8,454 | | |
| Net assets — Retirement Class Shares | | $ | — | | | $ | — | | | $ | — | | |
| Net asset value, offering and redemption price per share — Institutional Class Shares | | $ | — | | | $ | 14.02 | † | | $ | 11.14 | † | |
| Net asset value, offering and redemption price per share — Investor Class Shares | | $ | 36.13 | † | | $ | 13.94 | † | | $ | 11.08 | | |
| Net asset value, offering and redemption price per share — Retirement Class Shares | | $ | — | | | $ | — | | | $ | — | | |
TURNER FUNDS 2012 SEMIANNUAL REPORT 55
FINANCIAL STATEMENTS
Statements of operations (000)
| | | Turner
Market Neutral
Fund | | Turner
Medical Sciences
Long/Short
Fund | | Turner
Spectrum
Fund | |
| | | period ended
3/31/12 | | period ended
3/31/12 | | period ended
3/31/12 | |
| Investment income: | |
| Dividend | | $ | 111 | | | $ | 160 | | | $ | 2,318 | | |
| Interest | | | — | | | | 1 | | | | — | | |
| Securities lending | | | — | | | | — | | | | — | | |
| Foreign taxes withheld | | | — | | | | (4 | ) | | | (38 | ) | |
| Total investment income | | | 111 | | | | 157 | | | | 2,280 | | |
| Expenses: | |
| Investment advisory fees | | | 197 | | | | 559 | | | | 5,817 | | |
| Administrator fees | | | 19 | | | | 53 | | | | 556 | | |
| Shareholder service fees (1) | | | 5 | | | | 21 | | | | 213 | | |
| Shareholder service fees (2) | | | — | | | | 4 | | | | 16 | | |
| Distribution fees (2) | | | — | | | | 11 | | | | 49 | | |
| Accounting agent fees | | | 3 | | | | 6 | | | | 8 | | |
| Dividend expense | | | 31 | | | | 4 | | | | 521 | | |
| Broker fees and charges on short sales | | | 29 | | | | 63 | | | | 1,363 | | |
| Custodian fees | | | 8 | | | | 9 | | | | 56 | | |
| Transfer agent fees | | | 5 | | | | 17 | | | | 147 | | |
| Registration fees | | | 27 | | | | 29 | | | | 57 | | |
| Professional fees | | | 2 | | | | 8 | | | | 65 | | |
| Trustees' fees | | | 1 | | | | 5 | | | | 36 | | |
| Other fees | | | 6 | | | | 15 | | | | 130 | | |
| Total expenses | | | 333 | | | | 804 | | | | 9,034 | | |
| Less: | |
| Investment advisory fee waiver | | | (73 | ) | | | (78 | ) | | | (1,540 | ) | |
| Shareholder services fee waiver | | | (1 | ) | | | — | | | | — | | |
| Net expenses | | | 259 | | | | 726 | | | | 7,494 | | |
| Net investment loss | | | (148 | ) | | | (569 | ) | | | (5,214 | ) | |
| Net realized gain (loss) from securities sold | | | 3,598 | | | | 1,738 | | | | 62,170 | | |
| Net realized gain (loss) from securities sold short | | | (3,860 | ) | | | (3,169 | ) | | | (68,736 | ) | |
| Net realized gain (loss) on written options contracts | | | — | | | | — | | | | 307 | | |
| Net realized gain (loss) on foreign currency transactions | | | (5 | ) | | | — | | | | (92 | ) | |
| Net change in unrealized appreciation (depreciation) on investments | | | 673 | | | | 2,139 | | | | 49,711 | | |
| Net change in unrealized appreciation (depreciation) on securities sold short | | | (629 | ) | | | (1,270 | ) | | | (25,115 | ) | |
| Net change in unrealized appreciation (depreciation) on written option contracts | | | — | | | | — | | | | 63 | | |
Net change in unrealized appreciation (depreciation) on foreign currencies and translation of
other assets and liabilities denominated in foreign currencies | | | — | | | | 1 | | | | (3 | ) | |
| Net realized and unrealized gain (loss) from investments, options and foreign currencies | | | (223 | ) | | | (561 | ) | | | 18,305 | | |
| Net increase (decrease) in net assets resulting from operations | | $ | (371 | ) | | $ | (1,130 | ) | | $ | 13,091 | | |
(1) Attributable to Investor Class Shares only.
(2) Attributable to Class C Shares only.
Amounts designated as "—" are either not applicable, $0 or have been rounded to $0.
The accompanying notes are an integral part of the financial statements.
56 TURNER FUNDS 2012 SEMIANNUAL REPORT
(Unaudited)
| | | Turner
Titan
Fund | | Turner
All Cap
Growth
Fund | | Turner
Concentrated
Growth
Fund | |
| | | period ended
3/31/12 | | period ended
3/31/12 | | period ended
3/31/12 | |
| Investment income: | |
| Dividend | | $ | 64 | | | $ | 48 | | | $ | 114 | | |
| Interest | | | — | | | | — | | | | — | | |
| Securities lending | | | — | | | | 3 | | | | 3 | | |
| Foreign taxes withheld | | | — | | | | — | | | | (1 | ) | |
| Total investment income | | | 64 | | | | 51 | | | | 116 | | |
| Expenses: | |
| Investment advisory fees | | | 137 | | | | 156 | | | | 146 | | |
| Administrator fees | | | 13 | | | | 22 | | | | 30 | | |
| Shareholder service fees (1) | | | 6 | | | | 39 | | | | — | | |
| Shareholder service fees (2) | | | — | | | | — | | | | 52 | | |
| Distribution fees (2) | | | — | | | | — | | | | — | | |
| Accounting agent fees | | | 6 | | | | 2 | | | | 2 | | |
| Dividend expense | | | 5 | | | | — | | | | — | | |
| Broker fees and charges on short sales | | | 19 | | | | — | | | | — | | |
| Custodian fees | | | 10 | | | | 6 | | | | 6 | | |
| Transfer agent fees | | | 4 | | | | 18 | | | | 16 | | |
| Registration fees | | | 27 | | | | 9 | | | | 10 | | |
| Professional fees | | | 2 | | | | 5 | | | | 5 | | |
| Trustees' fees | | | 1 | | | | 2 | | | | 3 | | |
| Other fees | | | 3 | | | | 10 | | | | 14 | | |
| Total expenses | | | 233 | | | | 269 | | | | 284 | | |
| Less: | |
| Investment advisory fee waiver | | | (54 | ) | | | (71 | ) | | | (73 | ) | |
| Shareholder services fee waiver | | | — | | | | (4 | ) | | | (11 | ) | |
| Net expenses | | | 179 | | | | 194 | | | | 200 | | |
| Net investment loss | | | (115 | ) | | | (143 | ) | | | (84 | ) | |
| Net realized gain (loss) from securities sold | | | 1,582 | | | | 1,353 | | | | 5,600 | | |
| Net realized gain (loss) from securities sold short | | | (1,299 | ) | | | | | |
| Net realized gain (loss) on written options contracts | | | — | | | | — | | | | — | | |
| Net realized gain (loss) on foreign currency transactions | | | (1 | ) | | | — | | | | — | | |
| Net change in unrealized appreciation (depreciation) on investments | | | 1708 | | | | 5,232 | | | | 4,095 | | |
| Net change in unrealized appreciation (depreciation) on securities sold short | | | (595 | ) | | | — | | | | — | | |
| Net change in unrealized appreciation (depreciation) on written option contracts | | | — | | | | — | | | | — | | |
Net change in unrealized appreciation (depreciation) on foreign currencies and translation of
other assets and liabilities denominated in foreign currencies | | | — | | | | — | | | | — | | |
| Net realized and unrealized gain (loss) from investments, options and foreign currencies | | | 1,395 | | | | 6,585 | | | | 9,695 | | |
| Net increase (decrease) in net assets resulting from operations | | $ | 1,280 | | | $ | 6,442 | | | $ | 9,611 | | |
TURNER FUNDS 2012 SEMIANNUAL REPORT 57
FINANCIAL STATEMENTS
Statements of operations (000)
| | | Turner
Emerging
Growth Fund | | Turner
Large
Growth Fund | | Turner
Midcap
Growth Fund | |
| | | period ended
3/31/12 | | period ended
3/31/12 | | period ended
3/31/12 | |
| Investment income: | |
| Dividend | | $ | 581 | | | $ | 1,724 | | | $ | 2,828 | | |
| Securities lending | | | 130 | | | | 23 | | | | 105 | | |
| Foreign taxes withheld | | | — | | | | (6 | ) | | | (1 | ) | |
| Total investment income | | | 711 | | | | 1,741 | | | | 2,932 | | |
| Expenses: | |
| Investment advisory fees | | | 1,248 | | | | 1,404 | | | | 2,927 | | |
| Administrator fees | | | 179 | | | | 336 | | | | 560 | | |
| Shareholder service fees (1) | | | 218 | | | | 76 | | | | 620 | | |
| Shareholder service fees (2) | | | — | | | | — | | | | 6 | | |
| Distribution fees (2) | | | — | | | | — | | | | 6 | | |
| Accounting agent fees | | | 2 | | | | 2 | | | | 2 | | |
| Custodian fees | | | 11 | | | | 15 | | | | 18 | | |
| Transfer agent fees | | | 63 | | | | 120 | | | | 190 | | |
| Registration fees | | | 21 | | | | 31 | | | | 45 | | |
| Professional fees | | | 46 | | | | 65 | | | | 108 | | |
| Trustees' fees | | | 17 | | | | 31 | | | | 49 | | |
| Insurance and other fees | | | 91 | | | | 126 | | | | 215 | | |
| Total expenses before reductions | | | 1,896 | | | | 2,206 | | | | 4,746 | | |
| Less: | |
| Investment advisory fee waiver | | | (229 | ) | | | (507 | ) | | | (426 | ) | |
| Shareholder services fee waiver | | | (15 | ) | | | (11 | ) | | | (61 | ) | |
| Reimbursements of other operating expenses | | | — | | | | — | | | | — | | |
| Net expenses | | | 1,652 | | | | 1,688 | | | | 4,259 | | |
| Net investment income (loss) | | | (941 | ) | | | 53 | | | | (1,327 | ) | |
| Net realized gain (loss) from securities sold | | | 20,520 | | | | 61,700 | | | | 61,501 | | |
| Net realized gain (loss) on foreign currency transactions | | | — | | | | — | | | | — | | |
| Net change in unrealized appreciation (depreciation) on investments | | | 34,834 | | | | 46,935 | | | | 99,001 | | |
| Net realized and unrealized gain (loss) from investments, options and foreign currencies | | | 55,354 | | | | 108,635 | | | | 160,502 | | |
| Net increase (decrease) in net assets resulting from operations | | $ | 54,413 | | | $ | 108,688 | | | $ | 159,175 | | |
(1) Attributable to Investor Class Shares only.
(2) Attributable to Retirement Class Shares only.
Amounts designated as "—" are either not applicable, $0 or have been rounded to $0.
The accompanying notes are an integral part of the financial statements.
58 TURNER FUNDS 2012 SEMIANNUAL REPORT
(Unaudited)
| | | Turner
Small Cap
Growth Fund | | Turner Global
Opportunities
Fund | | Turner
International
Growth Fund | |
| | | period ended
3/31/12 | | period ended
3/31/12 | | period ended
3/31/12 | |
| Investment income: | |
| Dividend | | $ | 396 | | | $ | 3 | | | $ | 128 | | |
| Securities lending | | | 200 | | | | — | | | | — | | |
| Foreign taxes withheld | | | — | | | | — | | | | (13 | ) | |
| Total investment income | | | 596 | | | | 3 | | | | 115 | | |
| Expenses: | |
| Investment advisory fees | | | 1,319 | | | | 6 | | | | 56 | | |
| Administrator fees | | | 189 | | | | 1 | | | | 9 | | |
| Shareholder service fees (1) | | | 329 | | | | 1 | | | | 8 | | |
| Shareholder service fees (2) | | | — | | | | — | | | | — | | |
| Distribution fees (2) | | | — | | | | — | | | | — | | |
| Accounting agent fees | | | 2 | | | | 8 | | | | 15 | | |
| Custodian fees | | | 17 | | | | 3 | | | | 24 | | |
| Transfer agent fees | | | 54 | | | | 1 | | | | 4 | | |
| Registration fees | | | 13 | | | | 13 | | | | 14 | | |
| Professional fees | | | 34 | | | | — | | | | 2 | | |
| Trustees' fees | | | 16 | | | | — | | | | 1 | | |
| Insurance and other fees | | | 64 | | | | — | | | | 4 | | |
| Total expenses before reductions | | | 2,037 | | | | 33 | | | | 137 | | |
| Less: | |
| Investment advisory fee waiver | | | (313 | ) | | | (6 | ) | | | (55 | ) | |
| Shareholder services fee waiver | | | (74 | ) | | | — | | | | (1 | ) | |
| Reimbursements of other operating expenses | | | — | | | | (18 | ) | | | — | | |
| Net expenses | | | 1,650 | | | | 9 | | | | 81 | | |
| Net investment income (loss) | | | (1,054 | ) | | | (6 | ) | | | 34 | | |
| Net realized gain (loss) from securities sold | | | 10,277 | | | | 23 | | | | (498 | ) | |
| Net realized gain (loss) on foreign currency transactions | | | — | | | | — | | | | (9 | ) | |
| Net change in unrealized appreciation (depreciation) on investments | | | 57,577 | | | | 345 | | | | 2,896 | | |
| Net realized and unrealized gain (loss) from investments, options and foreign currencies | | | 67,854 | | | | 368 | | | | 2,389 | | |
| Net increase (decrease) in net assets resulting from operations | | $ | 66,800 | | | $ | 362 | | | $ | 2,423 | | |
TURNER FUNDS 2012 SEMIANNUAL REPORT 59
FINANCIAL STATEMENTS
Statements of changes in net assets (000)
| | | Turner
Market Neutral
Fund | | Turner
Medical Sciences
Long/Short
Fund | |
| | | period ended
3/31/12 (unaudited) | | 2/7/11(1) thru
9/30/11 | | period ended
3/31/12 (unaudited) | | 2/7/11(1) thru
9/30/11 | |
| Investment activities: | |
| Net investment loss | | $ | (148 | ) | | $ | (50 | ) | | $ | (569 | ) | | $ | (331 | ) | |
| Net realized gain (loss) from securities sold and securities sold short | | | (262 | ) | | | 11 | | | | (1,431 | ) | | | (1,016 | ) | |
| Net realized gain (loss) on written options contracts | | | — | | | | — | | | | — | | | | — | | |
| Net realized gain (loss) on foreign currency transactions | | | (5 | ) | | | — | | | | — | | | | (1 | ) | |
| Net change in unrealized appreciation (depreciation) on investments and securities sold short | | | 44 | | | | 207 | | | | 869 | | | | 756 | | |
| Net change in unrealized appreciation (depreciation) on written options contracts | | | — | | | | — | | | | — | | | | — | | |
| Net change in unrealized appreciation (depreciation) on foreign currencies and translation | | | — | | | | — | | | | 1 | | | | (4 | ) | |
| Net increase (decrease) in net assets resulting from operations | | | (371 | ) | | | 168 | | | | (1,130 | ) | | | (596 | ) | |
| Dividends and distributions to shareholders: | |
| Realized capital gains | |
| Institutional Class Shares | | | (394 | ) | | | — | | | | — | | | | — | | |
| Investor Class Shares | | | (67 | ) | | | — | | | | — | | | | — | | |
| Class C Shares | | | — | | | | — | | | | — | | | | — | | |
| Total dividends and distributions | | | (461 | ) | | | — | | | | — | | | | — | | |
| Capital share transactions: | |
| Institutional Class Shares | |
| Proceeds from shares issued | | | 43,819 | | | | 8,554 | | | | 36,177 | | | | 54,974 | | |
| Proceeds from shares issued in lieu of cash distributions | | | 385 | | | | — | | | | — | | | | — | | |
| Cost of shares redeemed | | | (3,946 | ) | | | (14 | ) | | | (17,389 | ) | | | (9,281 | ) | |
| Net increase in net assets from Institutional Class Shares transactions | | | 40,258 | | | | 8,540 | | | | 18,788 | | | | 45,693 | | |
| Investor Class Shares | |
| Proceeds from shares issued | | | 5,697 | | | | 4,072 | | | | 15,549 | | | | 13,724 | | |
| Proceeds from shares issued in lieu of cash distributions | | | 67 | | | | — | | | | — | | | | — | | |
| Cost of shares redeemed | | | (1,611 | ) | | | (867 | ) | | | (14,008 | ) | | | (911 | ) | |
| Net increase in net assets from Investor Class Shares transactions | | | 4,153 | | | | 3,205 | | | | 1,541 | | | | 12,813 | | |
| Class C Shares | |
| Proceeds from shares issued | | | 132 | | | | — | | | | 1,616 | | | | 2,283 | | |
| Proceeds from shares issued in lieu of cash distributions | | | — | | | | — | | | | — | | | | — | | |
| Cost of shares redeemed | | | — | | | | — | | | | (136 | ) | | | (104 | ) | |
| Net increase in net assets from Class C Shares transactions | | | 132 | | | | — | | | | 1,480 | | | | 2,179 | | |
| Net increase in net assets from capital share transactions | | | 44,543 | | | | 11,745 | | | | 21,809 | | | | 60,685 | | |
| Total increase in net assets | | | 43,711 | | | | 11,913 | | | | 20,679 | | | | 60,089 | | |
| Net assets: | |
| Beginning of period | | | 11,913 | | | | — | | | | 60,089 | | | | — | | |
| End of period | | $ | 55,624 | | | $ | 11,913 | | | $ | 80,768 | | | $ | 60,089 | | |
| Accumulated net investment loss | | $ | (149 | ) | | $ | (1 | ) | | $ | (590 | ) | | $ | (21 | ) | |
| Shares issued and redeemed: | |
| Institutional Class Shares | |
| Issued | | | 4,186 | | | | 825 | | | | 3,526 | | | | 5,247 | | |
| Issued in lieu of cash distributions | | | 38 | | | | — | | | | — | | | | — | | |
| Redeemed | | | (376 | ) | | | (1 | ) | | | (1,699 | ) | | | (886 | ) | |
| Net increase in Institutional Class Shares | | | 3,848 | | | | 824 | | | | 1,827 | | | | 4,361 | | |
| Investor Class Shares | |
| Issued | | | 542 | | | | 390 | | | | 1,512 | | | | 1,322 | | |
| Issued in lieu of cash distributions | | | 7 | | | | — | | | | — | | | | — | | |
| Redeemed | | | (154 | ) | | | (83 | ) | | | (1,373 | ) | | | (87 | ) | |
| Net increase in Investor Class Shares | | | 395 | | | | 307 | | | | 139 | | | | 1,235 | | |
| Class C Shares | |
| Issued | | | 13 | | | | — | | | | 159 | | | | 220 | | |
| Issued in lieu of cash distributions | | | — | | | | — | | | | — | | | | — | | |
| Redeemed | | | — | | | | — | | | | (14 | ) | | | (10 | ) | |
| Net increase in Class C Shares | | | 13 | | | | — | | | | 145 | | | | 210 | | |
| Net increase in share transactions | | | 4,256 | | | | 1,131 | | | | 2,111 | | | | 5,806 | | |
(1) Commencement of operations.
Amounts designated as "—" are either not applicable, $0 or have been rounded to $0.
The accompanying notes are an integral part of the financial statements.
60 TURNER FUNDS 2012 SEMIANNUAL REPORT
| | | Turner
Spectrum
Fund | | Turner
Titan
Fund | |
| | | period ended
3/31/12 (unaudited) | | year ended
9/30/11 | | period ended
3/31/12 (unaudited) | | 2/7/11(1) thru
9/30/11 | |
| Investment activities: | |
| Net investment loss | | $ | (5,214 | ) | | $ | (5,836 | ) | | $ | (115 | ) | | $ | (68 | ) | |
| Net realized gain (loss) from securities sold and securities sold short | | | (6,566 | ) | | | 17,230 | | | | 283 | | | | (607 | ) | |
| Net realized gain (loss) on written options contracts | | | 307 | | | | (6,481 | ) | | | — | | | | — | | |
| Net realized gain (loss) on foreign currency transactions | | | (92 | ) | | | 110 | | | | (1 | ) | | | — | | |
| Net change in unrealized appreciation (depreciation) on investments and securities sold short | | | 24,596 | | | | 642 | | | | 1,113 | | | | 134 | | |
| Net change in unrealized appreciation (depreciation) on written options contracts | | | 63 | | | | 56 | | | | — | | | | — | | |
| Net change in unrealized appreciation (depreciation) on foreign currencies and translation | | | (3 | ) | | | (9 | ) | | | — | | | | — | | |
| Net increase (decrease) in net assets resulting from operations | | | 13,091 | | | | 5,712 | | | | 1,280 | | | | (541 | ) | |
| Dividends and distributions to shareholders: | |
| Realized capital gains | |
| Institutional Class Shares | | | (22,293 | ) | | | — | | | | (110 | ) | | | — | | |
| Investor Class Shares | | | (7,313 | ) | | | — | | | | (39 | ) | | | — | | |
| Class C Shares | | | (553 | ) | | | — | | | | (1 | ) | | | — | | |
| Total dividends and distributions | | | (30,159 | ) | | | — | | | | (150 | ) | | | — | | |
| Capital share transactions: | |
| Institutional Class Shares | |
| Proceeds from shares issued | | | 434,534 | | | | 326,173 | | | | 7,137 | | | | 12,002 | | |
| Proceeds from shares issued in lieu of cash distributions | | | 19,084 | | | | — | | | | 109 | | | | — | | |
| Cost of shares redeemed | | | (127,370 | ) | | | (62,344 | ) | | | (811 | ) | | | (154 | ) | |
| Net increase in net assets from Institutional Class Shares transactions | | | 326,248 | | | | 263,829 | | | | 6,435 | | | | 11,848 | | |
| Investor Class Shares | |
| Proceeds from shares issued | | | 54,137 | | | | 140,625 | | | | 4,648 | | | | 2,777 | | |
| Proceeds from shares issued in lieu of cash distributions | | | 7,036 | | | | — | | | | 40 | | | | — | | |
| Cost of shares redeemed | | | (49,732 | ) | | | (31,909 | ) | | | (3,141 | ) | | | — | | |
| Net increase in net assets from Investor Class Shares transactions | | | 11,441 | | | | 108,716 | | | | 1,547 | | | | 2,777 | | |
| Class C Shares | |
| Proceeds from shares issued | | | 2,540 | | | | 6,802 | | | | 83 | | | | 31 | | |
| Proceeds from shares issued in lieu of cash distributions | | | 493 | | | | — | | | | 1 | | | | — | | |
| Cost of shares redeemed | | | (1,649 | ) | | | (1,682 | ) | | | — | | | | — | | |
| Net increase in net assets from Class C Shares transactions | | | 1,384 | | | | 5,120 | | | | 84 | | | | 31 | | |
| Net increase in net assets from capital share transactions | | | 339,073 | | | | 377,665 | | | | 8,066 | | | | 14,656 | | |
| Total increase in net assets | | | 322,005 | | | | 383,377 | | | | 9,196 | | | | 14,115 | | |
| Net assets: | |
| Beginning of period | | | 622,433 | | | | 239,056 | | | | 14,115 | | | | — | | |
| End of period | | $ | 944,438 | | | $ | 622,433 | | | $ | 23,311 | | | $ | 14,115 | | |
| Accumulated net investment loss | | $ | (5,594 | ) | | $ | (380 | ) | | $ | (115 | ) | | $ | — | | |
| Shares issued and redeemed: | |
| Institutional Class Shares | |
| Issued | | | 38,682 | | | | 27,953 | | | | 702 | | | | 1,179 | | |
| Issued in lieu of cash distributions | | | 1,757 | | | | — | | | | 11 | | | | — | | |
| Redeemed | | | (11,327 | ) | | | (5,366 | ) | | | (81 | ) | | | (15 | ) | |
| Net increase in Institutional Class Shares | | | 29,112 | | | | 22,587 | | | | 632 | | | | 1,164 | | |
| Investor Class Shares | |
| Issued | | | 4,811 | | | | 12,099 | | | | 468 | | | | 278 | | |
| Issued in lieu of cash distributions | | | 652 | | | | — | | | | 4 | | | | — | | |
| Redeemed | | | (4,476 | ) | | | (2,770 | ) | | | (315 | ) | | | — | | |
| Net increase in Investor Class Shares | | | 987 | | | | 9,329 | | | | 157 | | | | 278 | | |
| Class C Shares | |
| Issued | | | 230 | | | | 588 | | | | 8 | | | | 3 | | |
| Issued in lieu of cash distributions | | | 46 | | | | — | | | | — | | | | — | | |
| Redeemed | | | (151 | ) | | | (146 | ) | | | — | | | | — | | |
| Net increase in Class C Shares | | | 125 | | | | 442 | | | | 8 | | | | 3 | | |
| Net increase in share transactions | | | 30,224 | | | | 32,358 | | | | 797 | | | | 1,445 | | |
TURNER FUNDS 2012 SEMIANNUAL REPORT 61
FINANCIAL STATEMENTS
Statements of changes in net assets (000)
| | | Turner
All Cap Growth
Fund | | Turner
Concentrated Growth
Fund | |
| | | period ended
3/31/12 (unaudited) | | year ended
9/30/11 | | period ended
3/31/12 (unaudited) | | year ended
9/30/11 | |
| Investment activities: | |
| Net investment income (loss) | | $ | (143 | ) | | $ | (557 | ) | | $ | (84 | ) | | $ | (645 | ) | |
| Net realized gain from securities sold and securities sold short | | | 1,353 | | | | 7,305 | | | | 5,600 | | | | 5,557 | | |
| Net change in unrealized appreciation (depreciation) from investments and securities sold short | | | 5,232 | | | | (6,586 | ) | | | 4,095 | | | | (5,758 | ) | |
| Net increase (decrease) in net assets resulting from operations | | | 6,442 | | | | 162 | | | | 9,611 | | | | (846 | ) | |
| Dividends and distributions to shareholders: | |
| Net investment income | |
| Institutional Class Shares | | | — | | | | — | | | | — | | | | — | | |
| Total dividends and distributions | | | — | | | | — | | | | — | | | | — | | |
| Capital share transactions: | |
| Institutional Class Shares | |
| Proceeds from shares issued | | | — | | | | — | | | | — | | | | — | | |
| Proceeds from Fund acquisition (Note 14) | | | — | | | | — | | | | — | | | | — | | |
| Proceeds from shares issued in lieu of cash distributions | | | — | | | | — | | | | — | | | | — | | |
| Cost of shares redeemed | | | — | | | | — | | | | — | | | | — | | |
| Net increase (decrease) in net assets from Institutional Class Shares transactions | | | — | | | | — | | | | — | | | | — | | |
| Investor Class Shares | |
| Proceeds from shares issued | | | 4,164 | | | | 46,094 | | | | 4,420 | | | | 15,634 | | |
| Proceeds from Fund acquisition (Note 14) | | | — | | | | — | | | | — | | | | — | | |
| Cost of shares redeemed | | | (11,058 | ) | | | (36,430 | ) | | | (8,948 | ) | | | (18,773 | ) | |
| Net increase (decrease) in net assets from Investor Class Shares transactions | | | (6,894 | ) | | | 9,664 | | | | (4,528 | ) | | | (3,139 | ) | |
| Net increase (decrease) in net assets from capital share transactions | | | (6,894 | ) | | | 9,664 | | | | (4,528 | ) | | | (3,139 | ) | |
| Total increase (decrease) in net assets | | | (452 | ) | | | 9,826 | | | | 5,083 | | | | (3,985 | ) | |
| Net assets: | |
| Beginning of period | | | 33,053 | | | | 23,227 | | | | 38,939 | | | | 42,924 | | |
| End of period | | $ | 32,601 | | | $ | 33,053 | | | $ | 44,022 | | | $ | 38,939 | | |
| Undistributed net investment income (accumulated net investment income) | | $ | (140 | ) | | $ | 3 | | | $ | (70 | ) | | $ | 14 | | |
| Shares issued and redeemed: | |
| Institutional Class Shares | |
| Issued | | | — | | | | — | | | | — | | | | — | | |
| Shares from Fund acquisition (Note 14) | | | — | | | | — | | | | — | | | | — | | |
| Issued in lieu of cash distributions | | | — | | | | — | | | | — | | | | — | | |
| Redeemed | | | — | | | | — | | | | — | | | | — | | |
| Net increase (decrease) in Institutional Class Shares | | | — | | | | — | | | | — | | | | — | | |
| Investor Class Shares | |
| Issued | | | 479 | | | | 5,106 | | | | 616 | | | | 2,038 | | |
| Shares from Fund acquisition (Note 14) | | | — | | | | — | | | | — | | | | — | | |
| Redeemed | | | (1,321 | ) | | | (4,102 | ) | | | (1,237 | ) | | | (2,445 | ) | |
| Net increase (decrease) in Investor Class Shares | | | (842 | ) | | | 1,004 | | | | (621 | ) | | | (407 | ) | |
| Net increase (decrease) in share transactions | | | (842 | ) | | | 1,004 | | | | (621 | ) | | | (407 | ) | |
† Includes realized gains, losses, or redemptions as a result of in-kind transactions (see Note 13 in Notes to Financial Statements).
Amounts designated as "—" are either not applicable, $0 or have been rounded to $0.
The accompanying notes are an integral part of the financial statements.
62 TURNER FUNDS 2012 SEMIANNUAL REPORT
| | | Turner
Emerging Growth
Fund | | Turner
Large Growth
Fund | |
| | | period ended
3/31/12 (unaudited) | | year ended
9/30/11 | | period ended
3/31/12 (unaudited) | | year ended
9/30/11 | |
| Investment activities: | |
| Net investment income (loss) | | $ | (941 | ) | | $ | (4,513 | ) | | $ | 53 | | | $ | (469 | ) | |
| Net realized gain from securities sold and securities sold short | | | 20,520 | | | | 111,565 | † | | | 61,700 | | | | 100,361 | | |
| Net change in unrealized appreciation (depreciation) from investments and securities sold short | | | 34,834 | | | | (54,358 | ) | | | 46,935 | | | | (106,427 | ) | |
| Net increase (decrease) in net assets resulting from operations | | | 54,413 | | | | 52,694 | | | | 108,688 | | | | (6,635 | ) | |
| Dividends and distributions to shareholders: | |
| Net investment income | |
| Institutional Class Shares | | | — | | | | — | | | | — | | | | (671 | ) | |
| Total dividends and distributions | | | — | | | | — | | | | — | | | | (671 | ) | |
| Capital share transactions: | |
| Institutional Class Shares | |
| Proceeds from shares issued | | | 4,915 | | | | 83,629 | | | | 30,844 | | | | 87,009 | | |
| Proceeds from Fund acquisition (Note 14) | | | — | | | | — | | | | — | | | | 140,366 | | |
| Proceeds from shares issued in lieu of cash distributions | | | — | | | | — | | | | — | | | | 612 | | |
| Cost of shares redeemed | | | (8,510 | ) | | | (330,208 | )† | | | (136,525 | ) | | | (209,772 | ) | |
| Net increase (decrease) in net assets from Institutional Class Shares transactions | | | (3,595 | ) | | | (246,579 | ) | | | (105,681 | ) | | | 18,215 | | |
| Investor Class Shares | |
| Proceeds from shares issued | | | 20,747 | | | | 37,791 | | | | 4,948 | | | | 21,626 | | |
| Proceeds from Fund acquisition (Note 14) | | | — | | | | — | | | | — | | | | 1,518 | | |
| Cost of shares redeemed | | | (37,875 | ) | | | (71,012 | ) | | | (19,855 | ) | | | (136,556 | ) | |
| Net increase (decrease) in net assets from Investor Class Shares transactions | | | (17,128 | ) | | | (33,221 | ) | | | (14,907 | ) | | | (113,412 | ) | |
| Net increase (decrease) in net assets from capital share transactions | | | (20,723 | ) | | | (279,800 | ) | | | (120,588 | ) | | | (95,197 | ) | |
| Total increase (decrease) in net assets | | | 33,690 | | | | (227,106 | ) | | | (11,900 | ) | | | (102,403 | ) | |
| Net assets: | |
| Beginning of period | | | 226,162 | | | | 453,268 | | | | 438,997 | | | | 541,400 | | |
| End of period | | $ | 259,852 | | | $ | 226,162 | | | $ | 427,097 | | | $ | 438,997 | | |
| Undistributed net investment income (accumulated net investment income) | | $ | (982 | ) | | $ | (41 | ) | | $ | 95 | | | $ | 42 | | |
| Shares issued and redeemed: | |
| Institutional Class Shares | |
| Issued | | | 92 | | | | 1,614 | | | | 2,635 | | | | 7,643 | | |
| Shares from Fund acquisition (Note 14) | | | — | | | | — | | | | — | | | | 10,966 | | |
| Issued in lieu of cash distributions | | | — | | | | — | | | | — | | | | 51 | | |
| Redeemed | | | (161 | ) | | | (6,655 | )† | | | (10,976 | ) | | | (18,016 | ) | |
| Net increase (decrease) in Institutional Class Shares | | | (69 | ) | | | (5,041 | ) | | | (8,341 | ) | | | 644 | | |
| Investor Class Shares | |
| Issued | | | 398 | | | | 729 | | | | 415 | | | | 1,406 | | |
| Shares from Fund acquisition (Note 14) | | | — | | | | — | | | | — | | | | 119 | | |
| Redeemed | | | (721 | ) | | | (1,411 | ) | | | (1,609 | ) | | | (11,700 | ) | |
| Net increase (decrease) in Investor Class Shares | | | (323 | ) | | | (682 | ) | | | (1,194 | ) | | | (10,175 | ) | |
| Net increase (decrease) in share transactions | | | (392 | ) | | | (5,723 | ) | | | (9,535 | ) | | | (9,531 | ) | |
TURNER FUNDS 2012 SEMIANNUAL REPORT 63
FINANCIAL STATEMENTS
Statements of changes in net assets (000)
| | | Turner
Midcap Growth
Fund | | Turner
Small Cap Growth
Fund | |
| | | period ended
3/31/12 (unaudited) | | year ended
9/30/11 | | period ended
3/31/12 (unaudited) | | year ended
9/30/11 | |
| Investment activities: | |
| Net investment income (loss) | | $ | (1,327 | ) | | $ | (3,356 | ) | | $ | (1,054 | ) | | $ | (2,429 | ) | |
| Net realized gain (loss) from securities sold | | | 61,501 | | | | 268,940 | | | | 10,277 | | | | 60,910 | | |
| Net realized gain (loss) on foreign currency transactions | | | — | | | | 1 | | | | — | | | | — | | |
| Net change in unrealized appreciation (depreciation) on investments | | | 99,001 | | | | (194,104 | ) | | | 57,577 | | | | (70,484 | ) | |
| Net increase (decrease) in net assets resulting from operations | | | 159,175 | | | | 71,481 | | | | 66,800 | | | | (12,003 | ) | |
| Dividends and distributions to shareholders: | |
| Net investment income | |
| Institutional Class Shares | | | — | | | | — | | | | — | | | | — | | |
| Investor Class Shares | | | — | | | | — | | | | — | | | | — | | |
| Realized capital gains | |
| Institutional Class Shares | | | — | | | | — | | | | — | | | | — | | |
| Investor Class Shares | | | — | | | | — | | | | — | | | | — | | |
| Total dividends and distributions | | | — | | | | — | | | | — | | | | — | | |
| Capital share transactions: | |
| Institutional Class Shares | |
| Proceeds from shares issued | | | 35,913 | | | | 172,552 | | | | — | | | | — | | |
| Proceeds from shares issued in lieu of cash distributions | | | — | | | | — | | | | — | | | | — | | |
| Cost of shares redeemed | | | (36,841 | ) | | | (76,894 | ) | | | — | | | | — | | |
| Net increase (decrease) in net assets from Institutional Class Shares transactions | | | (928 | ) | | | 95,658 | | | | — | | | | — | | |
| Investor Class Shares | |
| Proceeds from shares issued | | | 59,020 | | | | 221,546 | | | | 21,185 | | | | 120,040 | | |
| Proceeds from shares issued in lieu of cash distributions | | | — | | | | — | | | | — | | | | — | | |
| Cost of shares redeemed | | | (126,110 | ) | | | (587,846 | ) | | | (41,358 | ) | | | (153,043 | ) | |
| Net increase (decrease) in net assets from Investor Class Shares transactions | | | (67,090 | ) | | | (366,300 | ) | | | (20,173 | ) | | | (33,003 | ) | |
| Retirement Class Shares | |
| Proceeds from shares issued | | | 528 | | | | 1,745 | | | | — | | | | — | | |
| Cost of shares redeemed | | | (402 | ) | | | (2,541 | ) | | | — | | | | — | | |
| Net increase (decrease) in net assets from Retirement Class Shares transactions | | | 126 | | | | (796 | ) | | | — | | | | — | | |
| Net increase (decrease) in net assets from capital share transactions | | | (67,892 | ) | | | (271,438 | ) | | | (20,173 | ) | | | (33,003 | ) | |
| Total increase (decrease) in net assets | | | 91,283 | | | | (199,957 | ) | | | 46,627 | | | | (45,006 | ) | |
| Net assets: | |
| Beginning of period | | | 720,738 | | | | 920,695 | | | | 229,919 | | | | 274,925 | | |
| End of period | | $ | 812,021 | | | $ | 720,738 | | | $ | 276,546 | | | $ | 229,919 | | |
| Undistributed net investment income (accumulated net investment income) | | $ | (1,263 | ) | | $ | 64 | | | $ | (1,054 | ) | | $ | — | | |
| Shares issued and redeemed: | |
| Institutional Class Shares | |
| Issued | | | 1,052 | | | | 4,733 | | | | — | | | | — | | |
| Issued in lieu of cash distributions | | | — | | | | — | | | | — | | | | — | | |
| Redeemed | | | (1,071 | ) | | | (2,179 | ) | | | — | | | | — | | |
| Net increase (decrease) in Institutional Class Shares | | | (19 | ) | | | 2,554 | | | | — | | | | — | | |
| Investor Class Shares | |
| Issued | | | 1,721 | | | | 6,010 | | | | 636 | | | | 3,352 | | |
| Issued in lieu of cash distributions | | | — | | | | — | | | | — | | | | — | | |
| Redeemed | | | (3,707 | ) | | | (15,652 | ) | | | (1,241 | ) | | | (4,580 | ) | |
| Net increase (decrease) in Investor Class Shares | | | (1,986 | ) | | | (9,642 | ) | | | (605 | ) | | | (1,228 | ) | |
| Retirement Class Shares | |
| Issued | | | 17 | | | | 50 | | | | — | | | | — | | |
| Redeemed | | | (10 | ) | | | (72 | ) | | | — | | | | — | | |
| Net increase (decrease) in Retirement Class Shares | | | 7 | | | | (22 | ) | | | — | | | | — | | |
| Net increase (decrease) in share transactions | | | (1,998 | ) | | | (7,110 | ) | | | (605 | ) | | | (1,228 | ) | |
Amounts designated as "—" are either not applicable, $0 or have been rounded to $0.
The accompanying notes are an integral part of the financial statements.
64 TURNER FUNDS 2012 SEMIANNUAL REPORT
| | | Turner
Global Opportunities
Fund | | Turner
International Growth
Fund | |
| | | period ended
3/31/12 (unaudited) | | year ended
9/30/11 | | period ended
3/31/12 (unaudited) | | year ended
9/30/11 | |
| Investment activities: | |
| Net investment income (loss) | | $ | (6 | ) | | $ | (6 | ) | | $ | 34 | | | $ | 52 | | |
| Net realized gain (loss) from securities sold | | | 23 | | | | 82 | | | | (498 | ) | | | 469 | | |
| Net realized gain (loss) on foreign currency transactions | | | — | | | | (3 | ) | | | (9 | ) | | | (46 | ) | |
| Net change in unrealized appreciation (depreciation) on investments | | | 345 | | | | (115 | ) | | | 2,896 | | | | (2,125 | ) | |
| Net increase (decrease) in net assets resulting from operations | | | 362 | | | | (42 | ) | | | 2,423 | | | | (1,650 | ) | |
| Dividends and distributions to shareholders: | |
| Net investment income | |
| Institutional Class Shares | | | — | | | | — | | | | — | | | | (48 | ) | |
| Investor Class Shares | | | — | | | | — | | | | — | | | | (1 | ) | |
| Realized capital gains | |
| Institutional Class Shares | | | (28 | ) | | | — | | | | — | | | | — | | |
| Investor Class Shares | | | (14 | ) | | | — | | | | — | | | | — | | |
| Total dividends and distributions | | | (42 | ) | | | — | | | | — | | | | (49 | ) | |
| Capital share transactions: | |
| Institutional Class Shares | |
| Proceeds from shares issued | | | — | | | | 418 | | | | 1,033 | | | | 1,511 | | |
| Proceeds from shares issued in lieu of cash distributions | | | 28 | | | | — | | | | — | | | | 48 | | |
| Cost of shares redeemed | | | (2 | ) | | | (717 | ) | | | (12 | ) | | | (141 | ) | |
| Net increase (decrease) in net assets from Institutional Class Shares transactions | | | 26 | | | | (299 | ) | | | 1,021 | | | | 1,418 | | |
| Investor Class Shares | |
| Proceeds from shares issued | | | 21 | | | | 973 | | | | 3,381 | | | | 6,586 | | |
| Proceeds from shares issued in lieu of cash distributions | | | 14 | | | | — | | | | — | | | | 1 | | |
| Cost of shares redeemed | | | (76 | ) | | | (397 | ) | | | (979 | ) | | | (511 | ) | |
| Net increase (decrease) in net assets from Investor Class Shares transactions | | | (41 | ) | | | 576 | | | | 2,402 | | | | 6,076 | | |
| Retirement Class Shares | |
| Proceeds from shares issued | | | — | | | | — | | | | — | | | | — | | |
| Cost of shares redeemed | | | — | | | | — | | | | — | | | | — | | |
| Net increase (decrease) in net assets from Retirement Class Shares transactions | | | — | | | | — | | | | — | | | | — | | |
| Net increase (decrease) in net assets from capital share transactions | | | (15 | ) | | | 277 | | | | 3,423 | | | | 7,494 | | |
| Total increase (decrease) in net assets | | | 305 | | | | 235 | | | | 5,846 | | | | 5,795 | | |
| Net assets: | |
| Beginning of period | | | 1,388 | | | | 1,153 | | | | 10,924 | | | | 5,129 | | |
| End of period | | $ | 1,693 | | | $ | 1,388 | | | $ | 16,770 | | | $ | 10,924 | | |
| Undistributed net investment income (accumulated net investment income) | | $ | (8 | ) | | $ | (2 | ) | | $ | 32 | | | $ | (2 | ) | |
| Shares issued and redeemed: | |
| Institutional Class Shares | |
| Issued | | | — | | | | 31 | | | | 94 | | | | 127 | | |
| Issued in lieu of cash distributions | | | 2 | | | | — | | | | — | | | | 6 | | |
| Redeemed | | | — | | | | (51 | ) | | | (1 | ) | | | (13 | ) | |
| Net increase (decrease) in Institutional Class Shares | | | 2 | | | | (20 | ) | | | 93 | | | | 120 | | |
| Investor Class Shares | |
| Issued | | | 2 | | | | 71 | | | | 320 | | | | 572 | | |
| Issued in lieu of cash distributions | | | 1 | | | | — | | | | — | | | | — | | |
| Redeemed | | | (6 | ) | | | (29 | ) | | | (93 | ) | | | (48 | ) | |
| Net increase (decrease) in Investor Class Shares | | | (3 | ) | | | 42 | | | | 227 | | | | 524 | | |
| Retirement Class Shares | |
| Issued | | | — | | | | — | | | | — | | | | — | | |
| Redeemed | | | — | | | | — | | | | — | | | | — | | |
| Net increase (decrease) in Retirement Class Shares | | | — | | | | — | | | | — | | | | — | | |
| Net increase (decrease) in share transactions | | | (1 | ) | | | 22 | | | | 320 | | | | 644 | | |
TURNER FUNDS 2012 SEMIANNUAL REPORT 65
FINANCIAL STATEMENTS
Statements of cash flows (000)
| | | Turner
Market Neutral
Fund | | Turner
Medical Sciences
Long/Short
Fund | |
| | | period ended
3/31/12 | | period ended
3/31/12 | |
| Cash flows from operating activities: | |
| Net decrease in net assets resulting from operations | | $ | (371 | ) | | $ | (1,130 | ) | |
Adjustments to reconcile net increase in net assets resulting
from operations to net cash used in operating activities | |
| Purchases of long-term portfolio investments | | | (195,613 | ) | | | (146,257 | ) | |
| Proceeds from sales of long-term portfolio investments | | | 162,263 | | | | 116,399 | | |
| Purchases of short-term portfolio investments | | | (65,280 | ) | | | (67,853 | ) | |
| Proceeds from sales of short-term investments | | | 61,524 | | | | 72,714 | | |
| Payments to cover securities sold short | | | (177,772 | ) | | | (124,150 | ) | |
| Proceeds from securities sold short | | | 211,074 | | | | 133,214 | | |
| Realized loss from securities sold and securities sold short | | | 262 | | | | 1,431 | | |
| Change in unrealized (appreciation) depreciation on investments | | | (673 | ) | | | (2,139 | ) | |
| Change in unrealized (appreciation) depreciation on securities sold short | | | 629 | | | | 1,270 | | |
| Increase in deposits with brokers for securities sold short and options | | | (38,845 | ) | | | (9,327 | ) | |
| Increase in receivable for investment securities sold | | | (8,911 | ) | | | (7,105 | ) | |
| Decrease in prepaid expenses | | | 24 | | | | 39 | | |
| Increase in receivable for dividend income | | | (3 | ) | | | (76 | ) | |
| Increase in payable for investment securities purchased | | | 8,371 | | | | 10,886 | | |
| Increase (decrease) in broker fees and charges on short sales payable | | | 4 | | | | (10 | ) | |
| Increase in payable due to investment adviser | | | 28 | | | | 26 | | |
| Increase in payable due to shareholder servicing | | | — | | | | 2 | | |
| Increase in payable due to distributor | | | — | | | | 1 | | |
| Increase in payable due to administrator | | | 3 | | | | 3 | | |
| Increase (decrease) in dividends payable on securities sold short | | | (3 | ) | | | 14 | | |
| Increase (decrease) in other accrued expenses | | | (6 | ) | | | 5 | | |
| Net cash used in operating activities | | | (43,295 | ) | | | (22,043 | ) | |
| Cash flows from financing activities: | |
| Proceeds from shares issued | | | 48,850 | | | | 53,530 | | |
| Cost of shares reedemed | | | (5,545 | ) | | | (31,486 | ) | |
| Distributions from capital gains | | | (9 | ) | | | — | | |
| Net cash provided by financing activities | | | 43,296 | | | | 22,044 | | |
| Net increase in cash | | | 1 | | | | 1 | | |
| Cash, beginning of period | | | (1 | ) | | | (1 | ) | |
| Cash, end of period | | $ | — | | | $ | — | | |
Non-cash
Capital shares sold receivable | | $ | (798 | ) | | $ | 188 | | |
| Capital shares redeemed payable | | | 12 | | | | 47 | | |
| Reinvestments of distributions | | | (452 | ) | | | — | | |
Amounts designated as "—" are either not applicable, $0 or have been rounded to $0.
The accompanying notes are an integral part of the financial statements.
66 TURNER FUNDS 2012 SEMIANNUAL REPORT
(Unaudited)
Statements of cash flows (000)
| | | Turner
Spectrum
Fund | | Turner
Titan
Fund | |
| | | period ended
3/31/12 | | period ended
3/31/12 | |
| Cash flows from operating activities: | |
| Net increase in net assets resulting from operations | | $ | 13,091 | | | $ | 1,280 | | |
Adjustments to reconcile net increase in net assets resulting
from operations to net cash used in operating activities | |
| Purchases of long-term portfolio investments | | | (2,734,916 | ) | | | (64,682 | ) | |
| Proceeds from sales of long-term portfolio investments | | | 2,451,600 | | | | 59,183 | | |
| Purchases of short-term portfolio investments | | | (980,121 | ) | | | (23,174 | ) | |
| Proceeds from sales of short-term investments | | | 1,067,536 | | | | 23,067 | | |
| Payments to cover securities sold short | | | (2,420,349 | ) | | | (50,553 | ) | |
| Proceeds from securities sold short | | | 2,514,966 | | | | 52,166 | | |
| Realized gain on written option contracts | | | (307 | ) | | | — | | |
| Realized (gain) loss from securities sold and securities sold short | | | 6,566 | | | | (283 | ) | |
| Premiums received from written option contracts | | | 1,009 | | | | — | | |
| Premiums paid to closed option contracts | | | (314 | ) | | | — | | |
| Change in unrealized (appreciation) depreciation on investments | | | (49,711 | ) | | | (1,708 | ) | |
| Change in unrealized (appreciation) depreciation on written option contracts | | | (63 | ) | | | — | | |
| Change in unrealized (appreciation) depreciation on securities sold short | | | 25,115 | | | | 595 | | |
| Increase in deposits with brokers for securities sold short and options | | | (239,673 | ) | | | (3,756 | ) | |
| Decrease in receivable for investment securities sold | | | 26,107 | | | | 1,018 | | |
| Decrease in prepaid expenses | | | 465 | | | | 50 | | |
| Increase in receivable for dividend income | | | (310 | ) | | | (9 | ) | |
| Increase in reclaim receivable | | | (3 | ) | | | — | | |
| Increase in foreign currency cash overdraft | | | 1,017 | | | | — | | |
| Increase (decrease) in payable for investment securities purchased | | | 7,064 | | | | (1,059 | ) | |
| Increase in broker fees and charges on short sales payable | | | 97 | | | | 1 | | |
| Increase (decrease) in payable due to investment adviser | | | 351 | | | | (22 | ) | |
| Increase in payable due to shareholder servicing | | | 4 | | | | — | | |
| Increase in payable due to distributor | | | 1 | | | | — | | |
| Increase in payable due to administrator | | | 36 | | | | 1 | | |
| Increase (decrease) in dividends payable on securities sold short | | | (2 | ) | | | 1 | | |
| Decrease in other accrued expenses | | | (38 | ) | | | (6 | ) | |
| Net cash used in operating activities | | | (310,782 | ) | | | (7,890 | ) | |
| Cash flows from financing activities: | |
| Proceeds from shares issued | | | 480,718 | | | | 11,836 | | |
| Cost of shares reedemed | | | (166,356 | ) | | | (3,946 | ) | |
| Distributions from capital gains | | | (3,546 | ) | | | — | | |
| Net cash provided by financing activities | | | 310,816 | | | | 7,890 | | |
| Net increase in cash | | | 34 | | | | — | | |
| Cash, beginning of period | | | — | | | | — | | |
| Cash, end of period | | $ | 34 | | | $ | — | | |
Non-cash
Capital shares sold receivable | | $ | (10,493 | ) | | $ | (31 | ) | |
| Capital shares redeemed payable | | | 12,395 | | | | 6 | | |
| Reinvestments of distributions | | | (26,613 | ) | | | (150 | ) | |
Amounts designated as "—" are either not applicable, $0 or have been rounded to $0.
The accompanying notes are an integral part of the financial statements.
TURNER FUNDS 2012 SEMIANNUAL REPORT 67
FINANCIAL STATEMENTS
Financial highlights
For a share outstanding throughout each period
| | | Net asset
value,
beginning
of period | | Net
investment
income
(loss) | | Realized and
unrealized
gains (losses)
on investments | | Total
from
investment
operations | | Dividends
from net
investment
income | | Distributions
from
capital
gains | | Total
dividends and
distributions | |
| Turner Market Neutral Fund — Institutional Class Shares | | | |
| | 2012 | ** | | $ | 10.53 | | | | (0.06 | ) (1) | | | 0.08 | | | | 0.02 | | | | — | | | | (0.22 | ) | | | (0.22 | ) | |
| | 2011 | (3) | | $ | 10.00 | | | | (0.09 | ) (1) | | | 0.62 | | | | 0.53 | | | | — | | | | — | | | | — | | |
| Turner Market Neutral Fund — Investor Class Shares | | | |
| | 2012 | ** | | $ | 10.52 | | | | (0.07 | ) (1) | | | 0.07 | | | | — | | | | — | | | | (0.22 | ) | | | (0.22 | ) | |
| | 2011 | (3) | | $ | 10.00 | | | | (0.10 | ) (1) | | | 0.62 | | | | 0.52 | | | | — | | | | — | | | | — | | |
| Turner Market Neutral Fund — Class C Shares | | | |
| | 2012 | ** | | $ | 10.46 | | | | (0.11 | ) (1) | | | 0.08 | | | | (0.03 | ) | | | — | | | | (0.22 | ) | | | (0.22 | ) | |
| | 2011 | (3) | | $ | 10.00 | | | | (0.15 | ) (1) | | | 0.61 | | | | 0.46 | | | | — | | | | — | | | | — | | |
| Turner Medical Sciences Long/Short Fund — Institutional Class Shares | | | |
| | 2012 | ** | | $ | 10.35 | | | | (0.07 | ) (1) | | | (0.07 | ) | | | (0.14 | ) | | | — | | | | — | | | | — | | |
| | 2011 | (3) | | $ | 10.00 | | | | (0.12 | ) (1) | | | 0.47 | | | | 0.35 | | | | — | | | | — | | | | — | | |
| Turner Medical Sciences Long/Short Fund — Investor Class Shares | | | |
| | 2012 | ** | | $ | 10.34 | | | | (0.09 | ) (1) | | | (0.06 | ) | | | (0.15 | ) | | | — | | | | — | | | | — | | |
| | 2011 | (3) | | $ | 10.00 | | | | (0.13 | ) (1) | | | 0.47 | | | | 0.34 | | | | — | | | | — | | | | — | | |
| Turner Medical Sciences Long/Short Fund — Class C Shares | | | |
| | 2012 | ** | | $ | 10.30 | | | | (0.12 | ) (1) | | | (0.07 | ) | | | (0.19 | ) | | | — | | | | — | | | | — | | |
| | 2011 | (3) | | $ | 10.00 | | | | (0.18 | ) (1) | | | 0.48 | | | | 0.30 | | | | — | | | | — | | | | — | | |
| Turner Spectrum Fund — Institutional Class Shares | | | |
| | 2012 | ** | | $ | 11.45 | | | | (0.07 | ) (1) | | | 0.26 | | | | 0.19 | | | | — | | | | (0.47 | ) | | | (0.47 | ) | |
| | 2011 | | | $ | 10.82 | | | | (0.16 | ) (1) | | | 0.79 | | | | 0.63 | | | | — | | | | — | | | | — | | |
| | 2010 | | | $ | 10.81 | | | | (0.13 | ) (1) | | | 0.21 | (9) | | | 0.08 | | | | — | | | | (0.07 | ) | | | (0.07 | ) | |
| | 2009 | (11) | | $ | 10.00 | | | | (0.07 | ) (1) | | | 0.88 | | | | 0.81 | | | | — | | | | — | | | | — | | |
68 TURNER FUNDS 2012 SEMIANNUAL REPORT
| | | Net asset
value, end
of period | | Total
return | | Net
assets end
of period
(000) | | Ratio of
net expenses
to average
net assets† | | Ratio of total
expenses
to average
net assets | | Ratio of net
investment
income (loss)
to average
net assets† | | Portfolio
turnover
rate†† | |
| Turner Market Neutral Fund — Institutional Class Shares | |
| | 2012 | ** | | $ | 10.33 | | | | 0.22 | %††† | | $ | 48,259 | | | | 1.93 | %* (2) | | | 2.49 | %* | | | (1.08 | )%* | | | 753 | % | |
| | 2011 | (3) | | $ | 10.53 | | | | 5.30 | %††† | | $ | 8,679 | | | | 1.95 | % (4) | | | 3.92 | % | | | (1.27 | )% | | | 1,184 | % | |
| Turner Market Neutral Fund — Investor Class Shares | |
| | 2012 | ** | | $ | 10.30 | | | | 0.03 | %††† | | $ | 7,233 | | | | 2.18 | %* (2) | | | 2.77 | %* | | | (1.37 | )%* | | | 753 | % | |
| | 2011 | (3) | | $ | 10.52 | | | | 5.20 | %††† | | $ | 3,233 | | | | 2.20 | % (4) | | | 4.18 | % | | | (1.54 | )% | | | 1,184 | % | |
| Turner Market Neutral Fund — Class C Shares | |
| | 2012 | ** | | $ | 10.21 | | | | (0.26 | )%††† | | $ | 131 | | | | 2.93 | %* (2) | | | 3.46 | %* | | | (2.24 | )%* | | | 753 | % | |
| | 2011 | (3) | | $ | 10.46 | | | | 4.60 | %††† | | $ | — | | | | 2.95 | % (4) | | | 4.77 | % | | | (2.26 | )% | | | 1,184 | % | |
| Turner Medical Sciences Long/Short Fund — Institutional Class Shares | |
| | 2012 | ** | | $ | 10.21 | | | | (1.35 | )%††† | | $ | 63,178 | | | | 1.85 | %* (5) | | | 2.06 | %* | | | (1.42 | )%* | | | 439 | % | |
| | 2011 | (3) | | $ | 10.35 | | | | 3.50 | %††† | | $ | 45,147 | | | | 1.93 | % (6) | | | 2.74 | % | | | (1.74 | )% | | | 608 | % | |
| Turner Medical Sciences Long/Short Fund — Investor Class Shares | |
| | 2012 | ** | | $ | 10.19 | | | | (1.45 | )%††† | | $ | 14,003 | | | | 2.10 | %* (5) | | | 2.29 | %* | | | (1.71 | )%* | | | 439 | % | |
| | 2011 | (3) | | $ | 10.34 | | | | 3.40 | %††† | | $ | 12,777 | | | | 2.14 | % (6) | | | 2.89 | % | | | (1.93 | )% | | | 608 | % | |
| Turner Medical Sciences Long/Short Fund — Class C Shares | |
| | 2012 | ** | | $ | 10.11 | | | | (1.84 | )%††† | | $ | 3,588 | | | | 2.85 | %* (5) | | | 3.06 | %* | | | (2.41 | )%* | | | 439 | % | |
| | 2011 | (3) | | $ | 10.30 | | | | 3.00 | %††† | | $ | 2,165 | | | | 2.93 | % (6) | | | 3.63 | % | | | (2.71 | )% | | | 608 | % | |
| Turner Spectrum Fund — Institutional Class Shares | |
| | 2012 | ** | | $ | 11.17 | | | | 1.78 | %††† | | $ | 762,792 | | | | 1.86 | %* (7) | | | 2.26 | %* | | | (1.27 | )%* | | | 511 | % | |
| | 2011 | | | $ | 11.45 | | | | 5.82 | % | | $ | 448,554 | | | | 1.93 | % (8) | | | 2.48 | % | | | (1.34 | )% | | | 1,153 | % | |
| | 2010 | | | $ | 10.82 | | | | 0.77 | % | | $ | 179,526 | | | | 1.91 | % (10) | | | 2.85 | % | | | (1.23 | )% | | | 1,808 | % | |
| | 2009 | (11) | | $ | 10.81 | | | | 8.10 | %††† | | $ | 8,681 | | | | 2.44 | % (12) | | | 5.63 | % | | | (1.78 | )% | | | 663 | % | |
* Does not include acquired fund fees or expenses.
** For the six-month period ended March 31, 2012, unless otherwise indicated (unaudited). All ratios for the period have been annualized.
† Inclusive of fees paid indirectly, waivers and/or reimbursements.
†† Excludes effect of in-kind transfers and mergers, as applicable. Not annualized for periods less than one year.
††† Total return is for the period indicated and has not been annualized.
(1) Based on average shares outstanding.
(2) Dividend expense totaled 0.23% of average net assets for the period ended March 31, 2012, 0.23% of which was waived. Broker fees and charges on short sales totaled 0.22% of average net assets for the period ended March 31, 2012, 0.22% of which was waived. If dividend expense and broker fees and charges on short sales had not been contractually waived, the ratios of net expenses to average net assets would have been 2.38%, 2.63% and 3.38% for the Institutional, Investor and Class C Shares, respectively.
(3) Commenced operations on February 7, 2011. All ratios for the period have been annualized (unaudited).
(4) Dividend expense totaled 0.44% of average net assets for the period ended September 30, 2011, 0.34% of which was waived. Broker fees and charges on short sales totaled 0.25% of average net assets for the period ended September 30, 2011, 0.19% of which was waived. If dividend expense and broker fees and charges on short sales had not been contractually waived, the ratios of net expenses to average net assets would have been 2.48%, 2.73% and 3.48% for the Institutional, Investor and Class C Shares, respectively.
(5) Dividend expense totaled 0.01% of average net assets for the period ended March 31, 2012, 0.01% of which was waived. Broker fees and charges on short sales totaled 0.17% of average net assets for the period ended March 31, 2012, 0.17% of which was waived. If dividend expense and broker fees and charges on short sales had not been contractually waived, the ratios of net expenses to average net assets would have been 2.03%, 2.28% and 3.03% for the Institutional, Investor and Class C Shares, respectively.
(6) Dividend expense totaled 0.15% of average net assets for the period ended September 30, 2011, 0.12% of which was waived. Broker fees and charges on short sales totaled 0.47% of average net assets for the period ended September 30, 2011, 0.39% of which was waived. If dividend expense and broker fees and charges on short sales had not been contractually waived, the ratios of net expenses to average net assets would have been 2.44%, 2.65% and 3.44% for the Institutional, Investor and Class C Shares, respectively.
(7) Dividend expense totaled 0.19% of average net assets for the period ended March 31, 2012, 0.19% of which was waived. Broker fees and charges on short sales totaled 0.29% of average net assets for the period ended March 31, 2012, 0.29% of which was waived. If dividend expense and broker fees and charges on short sales had not been contractually waived, the ratios of net expenses to average net assets would have been 2.34%, 2.59% and 3.35% for the Institutional, Investor and Class C Shares, respectively.
(8) Dividend expense totaled 0.28% of average net assets for the year ended September 30, 2011, 0.22% of which was waived. Broker fees and charges on short sales totaled 0.32% of average net assets for the year ended September 30, 2011, 0.25% of which was waived. If dividend expense and broker fees and charges on short sales had not been contractually waived, the ratios of net expenses to average net assets would have been 2.40%, 2.65% and 3.40% for the Institutional, Investor and Class C Shares, respectively.
(9) The amount shown for a share outstanding throughout the period and the aggregate net losses on investments for the period are not in accord because of the sales and repurchases of fund shares in relation to fluctuating market value of the investments of the Fund.
(10) Dividend expense totaled 0.45% of average net assets for the year ended September 30, 2010, 0.42% of which was waived. Broker fees and charges on short sales totaled 0.38% of average net assets for the year ended September 30, 2010, 0.37% of which was waived beginning on January 13, 2010. If dividend expense and broker fees and charges on short sales had not been contractually waived, the ratios of net expenses to average net assets would have been 2.70%, 2.96% and 3.71% for the Institutional, Investor and Class C Shares, respectively.
(11) Commenced operations on May 7, 2009. All ratios for the period have been annualized.
(12) Dividend expense totaled 0.70% of average net assets for the period ended September 30, 2009. If dividend expense had not been contractually waived, the ratios of net expenses to average net assets would have been 3.14%, 3.41% and 3.05% for the Institutional, Investor and Class C Shares, respectively. If broker fees and charges on short sales had not been included, the ratios of net expenses to average net assets would have been 1.94%, 2.20% and 1.95% for the Institutional, Investor and Class C Shares, respectively.
Amounts designated as "—" are either not applicable, $0 or have been rounded to $0.
The accompanying notes are an integral part of the financial statements.
TURNER FUNDS 2012 SEMIANNUAL REPORT 69
FINANCIAL STATEMENTS
Financial highlights
For a share outstanding throughout each period
| | | Net asset
value,
beginning
of period | | Net
investment
income
(loss) | | Realized and
unrealized
gains (losses)
on investments | | Total
from
investment
operations | | Dividends
from net
investment
income | | Distributions
from
capital
gains | | Total
dividends and
distributions | |
| Turner Spectrum Fund — Investor Class Shares | | | |
| | 2012 | ** | | $ | 11.38 | | | | (0.09 | ) (1) | | | 0.26 | | | | 0.17 | | | | — | | | | (0.47 | ) | | | (0.47 | ) | |
| | 2011 | | | $ | 10.78 | | | | (0.19 | ) (1) | | | 0.79 | | | | 0.60 | | | | — | | | | — | | | | — | | |
| | 2010 | | | $ | 10.80 | | | | (0.16 | ) (1) | | | 0.21 | (4) | | | 0.05 | | | | — | | | | (0.07 | ) | | | (0.07 | ) | |
| | 2009 | (6) | | $ | 10.00 | | | | (0.09 | ) (1) | | | 0.89 | | | | 0.80 | | | | — | | | | — | | | | — | | |
| Turner Spectrum Fund — Class C Shares | | | |
| | 2012 | ** | | $ | 11.23 | | | | (0.13 | ) (1) | | | 0.26 | | | | 0.13 | | | | — | | | | (0.47 | ) | | | (0.47 | ) | |
| | 2011 | | | $ | 10.72 | | | | (0.27 | ) (1) | | | 0.78 | | | | 0.51 | | | | — | | | | — | | | | — | | |
| | 2010 | | | $ | 10.80 | | | | (0.24 | ) (1) | | | 0.23 | (4) | | | (0.01 | ) | | | — | | | | (0.07 | ) | | | (0.07 | ) | |
| | 2009 | (8) | | $ | 9.98 | | | | (0.07 | ) (1) | | | 0.89 | | | | 0.82 | | | | — | | | | — | | | | — | | |
| Turner Titan Fund — Institutional Class Shares | | | |
| | 2012 | ** | | $ | 9.77 | | | | (0.06 | ) (1) | | | 0.78 | | | | 0.72 | | | | — | | | | (0.09 | ) | | | (0.09 | ) | |
| | 2011 | (10) | | $ | 10.00 | | | | (0.10 | ) (1) | | | (0.13 | ) | | | (0.23 | ) | | | — | | | | — | | | | — | | |
| Turner Titan Fund — Investor Class Shares | | | |
| | 2012 | ** | | $ | 9.76 | | | | (0.07 | ) (1) | | | 0.78 | | | | 0.71 | | | | — | | | | (0.09 | ) | | | (0.09 | ) | |
| | 2011 | (10) | | $ | 10.00 | | | | (0.11 | ) (1) | | | (0.13 | ) | | | (0.24 | ) | | | — | | | | — | | | | — | | |
| Turner Titan Fund — Class C Shares | | | |
| | 2012 | ** | | $ | 9.72 | | | | (0.11 | ) (1) | | | 0.77 | | | | 0.66 | | | | — | | | | (0.09 | ) | | | (0.09 | ) | |
| | 2011 | (10) | | $ | 10.00 | | | | (0.16 | ) (1) | | | (0.12 | ) | | | (0.28 | ) | | | — | | | | — | | | | — | | |
70 TURNER FUNDS 2012 SEMIANNUAL REPORT
| | | Net asset
value, end
of period | | Total
return | | Net
assets end
of period
(000) | | Ratio of
net expenses
to average
net assets† | | Ratio of total
expenses
to average
net assets | | Ratio of net
investment
income (loss)
to average
net assets† | | Portfolio
turnover
rate†† | |
| Turner Spectrum Fund — Investor Class Shares | |
| | 2012 | ** | | $ | 11.08 | | | | 1.62 | %††† | | $ | 168,180 | | | | 2.11 | %* (2) | | | 2.50 | %* | | | (1.54 | )%* | | | 511 | % | |
| | 2011 | | | $ | 11.38 | | | | 5.57 | % | | $ | 161,401 | | | | 2.18 | % (3) | | | 2.70 | % | | | (1.61 | )% | | | 1,153 | % | |
| | 2010 | | | $ | 10.78 | | | | 0.49 | % | | $ | 52,361 | | | | 2.17 | % (5) | | | 3.12 | % | | | (1.52 | )% | | | 1,808 | % | |
| | 2009 | (6) | | $ | 10.80 | | | | 8.00 | %††† | | $ | 4,567 | | | | 2.71 | % (7) | | | 5.84 | % | | | (2.09 | )% | | | 663 | % | |
| Turner Spectrum Fund — Class C Shares | |
| | 2012 | ** | | $ | 10.89 | | | | 1.27 | %††† | | $ | 13,466 | | | | 2.87 | %* (2) | | | 3.25 | %* | | | (2.29 | )%* | | | 511 | % | |
| | 2011 | | | $ | 11.23 | | | | 4.76 | % | | $ | 12,478 | | | | 2.93 | % (3) | | | 3.39 | % | | | (2.33 | )% | | | 1,153 | % | |
| | 2010 | | | $ | 10.72 | | | | (0.07 | )% | | $ | 7,169 | | | | 2.92 | % (5) | | | 3.82 | % | | | (2.19 | )% | | | 1,808 | % | |
| | 2009 | (8) | | $ | 10.80 | | | | 8.22 | %††† | | $ | — | | | | 2.35 | % (7) | | | 5.28 | % | | | (3.12 | )% | | | 663 | % | |
| Turner Titan Fund — Institutional Class Shares | |
| | 2012 | ** | | $ | 10.40 | | | | 7.40 | %††† | | $ | 18,680 | | | | 1.90 | %* (9) | | | 2.50 | %* | | | (1.20 | )%* | | | 425 | % | |
| | 2011 | (10) | | $ | 9.77 | | | | (2.30 | )%††† | | $ | 11,374 | | | | 1.92 | % (11) | | | 3.54 | % | | | (1.47 | )% | | | 647 | % | |
| Turner Titan Fund — Investor Class Shares | |
| | 2012 | ** | | $ | 10.38 | | | | 7.30 | %††† | | $ | 4,513 | | | | 2.15 | %* (9) | | | 2.76 | %* | | | (1.44 | )%* | | | 425 | % | |
| | 2011 | (10) | | $ | 9.76 | | | | (2.40 | )%††† | | $ | 2,711 | | | | 2.16 | % (11) | | | 4.66 | % | | | (1.65 | )% | | | 647 | % | |
| Turner Titan Fund — Class C Shares | |
| | 2012 | ** | | $ | 10.29 | | | | 6.82 | %††† | | $ | 117 | | | | 2.90 | %* (9) | | | 3.49 | %* | | | (2.16 | )%* | | | 425 | % | |
| | 2011 | (10) | | $ | 9.72 | | | | (2.80 | )%††† | | $ | 29 | | | | 2.92 | % (11) | | | 2.31 | % | | | (2.44 | )% | | | 647 | % | |
* Does not include acquired fund fees or expenses.
** For the six-month period ended March 31, 2012, unless otherwise indicated (unaudited). All ratios for the period have been annualized.
† Inclusive of fees paid indirectly, waivers and/or reimbursements.
†† Excludes effect of in-kind transfers and mergers, as applicable. Not annualized for periods less than one year.
††† Total return is for the period indicated and has not been annualized.
(1) Based on average shares outstanding.
(2) Dividend expense totaled 0.19% of average net assets for the period ended March 31, 2012, 0.19% of which was waived. Broker fees and charges on short sales totaled 0.29% of average net assets for the period ended March 31, 2012, 0.29% of which was waived. If dividend expense and broker fees and charges on short sales had not been contractually waived, the ratios of net expenses to average net assets would have been 2.34%, 2.59% and 3.35% for the Institutional, Investor and Class C Shares, respectively.
(3) Dividend expense totaled 0.28% of average net assets for the year ended September 30, 2011, 0.22% of which was waived. Broker fees and charges on short sales totaled 0.32% of average net assets for the year ended September 30, 2011, 0.25% of which was waived. If dividend expense and broker fees and charges on short sales had not been contractually waived, the ratios of net expenses to average net assets would have been 2.40%, 2.65% and 3.40% for the Institutional, Investor and Class C Shares, respectively.
(4) The amount shown for a share outstanding throughout the period and the aggregate net losses on investments for the period are not in accord because of the sales and repurchases of fund shares in relation to fluctuating market value of the investments of the Fund.
(5) Dividend expense totaled 0.45% of average net assets for the year ended September 30, 2010, 0.42% of which was waived. Broker fees and charges on short sales totaled 0.38% of average net assets for the year ended September 30, 2010, 0.37% of which was waived beginning on January 13, 2010. If dividend expense and broker fees and charges on short sales had not been contractually waived, the ratios of net expenses to average net assets would have been 2.70%, 2.96% and 3.71% for the Institutional, Investor and Class C Shares, respectively.
(6) Commenced operations on May 7, 2009. All ratios for the period have been annualized.
(7) Dividend expense totaled 0.70% of average net assets for the period ended September 30, 2009. If dividend expense had not been contractually waived, the ratios of net expenses to average net assets would have been 3.14%, 3.41% and 3.05% for the Institutional, Investor and Class C Shares, respectively. If broker fees and charges on short sales had not been included, the ratios of net expenses to average net assets would have been 1.94%, 2.20% and 1.95% for the Institutional, Investor and Class C Shares, respectively.
(8) Commenced operations on July 14, 2009. All ratios for the period have been annualized.
(9) Dividend expense totaled 0.06% of average net assets for the period ended March 31, 2012, 0.06% of which was waived. Broker fees and charges on short sales totaled 0.20% of average net assets for the period ended March 31, 2012, 0.20% of which was waived. If dividend expense and broker fees and charges on short sales had not been contractually waived, the ratios of net expenses to average net assets would have been 2.16%, 2.41% and 3.16% for the Institutional, Investor and Class C Shares, respectively.
(10) Commenced operations on February 7, 2011. All ratios for the period have been annualized (unaudited).
(11) Dividend expense totaled 0.28% of average net assets for the period ended September 30, 2011, 0.22% of which was waived. Broker fees and charges on short sales totaled 0.32% of average net assets for the period ended September 30, 2011, 0.25% of which was waived. If dividend expense and broker fees and charges on short sales had not been contractually waived, the ratios of net expenses to average net assets would have been 2.20%, 2.44% and 3.20% for the Institutional, Investor and Class C Shares, respectively.
Amounts designated as "—" are either not applicable, $0 or have been rounded to $0.
The accompanying notes are an integral part of the financial statements.
TURNER FUNDS 2012 SEMIANNUAL REPORT 71
FINANCIAL STATEMENTS
Financial highlights
For a share outstanding throughout each period
| | | Net asset
value,
beginning
of period | | Net
investment
income
(loss) | | Realized and
unrealized
gains (losses)
on investments | | Total
from
investment
operations | | Dividends
from net
investment
income | | Distributions
from
capital
gains | | Total
dividends and
distributions | |
| Turner All Cap Growth Fund — Investor Class Shares | | | |
| | 2012 | * | | $ | 7.67 | | | | (0.04 | ) (1) | | | 1.78 | | | | 1.74 | | | | — | | | | — | | | | — | | |
| | 2011 | | | $ | 7.03 | | | | (0.11 | ) (1) | | | 0.75 | | | | 0.64 | | | | — | | | | — | | | | — | | |
| | 2010 | | | $ | 5.95 | | | | (0.09 | ) (1) | | | 1.18 | | | | 1.09 | | | | (0.01 | ) | | | — | | | | (0.01 | ) | |
| | 2009 | | | $ | 5.60 | | | | — | ** (1) | | | 0.35 | | | | 0.35 | | | | — | | | | — | | | | — | | |
| | 2008 | | | $ | 8.72 | | | | (0.07 | ) (1) | | | (3.05 | ) | | | (3.12 | ) | | | — | | | | — | | | | — | | |
| | 2007 | | | $ | 6.26 | | | | (0.07 | ) (1) | | | 2.53 | | | | 2.46 | | | | — | | | | — | | | | — | | |
| Turner Concentrated Growth Fund — Investor Class Shares | | | |
| | 2012 | * | | $ | 6.42 | | | | (0.01 | ) (1) | | | 1.68 | | | | 1.67 | | | | — | | | | — | | | | — | | |
| | 2011 | | | $ | 6.63 | | | | (0.10 | ) (1) | | | (0.11 | ) | | | (0.21 | ) | | | — | | | | — | | | | — | | |
| | 2010 | | | $ | 6.16 | | | | (0.07 | ) (1) | | | 0.56 | | | | 0.49 | | | | (0.02 | ) | | | — | | | | (0.02 | ) | |
| | 2009 | | | $ | 6.35 | | | | 0.02 | (1) | | | (0.21 | ) | | | (0.19 | ) | | | — | | | | — | | | | — | | |
| | 2008 | | | $ | 10.12 | | | | (0.07 | ) (1) | | | (3.70 | ) | | | (3.77 | ) | | | — | | | | — | | | | — | | |
| | 2007 | | | $ | 7.60 | | | | (0.05 | ) (1) | | | 2.57 | | | | 2.52 | | | | — | | | | — | | | | — | | |
| Turner Emerging Growth Fund — Institutional Class Shares | | | |
| | 2012 | * | | $ | 45.83 | | | | (0.15 | ) (1) | | | 11.55 | | | | 11.40 | | | | — | | | | — | | | | — | | |
| | 2011 | | | $ | 42.51 | | | | (0.40 | ) (1) | | | 3.72 | | | | 3.32 | | | | — | | | | — | | | | — | | |
| | 2010 | | | $ | 37.78 | | | | (0.31 | ) (1) | | | 5.04 | | | | 4.73 | | | | — | | | | — | | | | — | | |
| | 2009 | (4) | | $ | 28.45 | | | | (0.12 | ) (1) | | | 9.45 | (5) | | | 9.33 | | | | — | | | | — | | | | — | | |
| Turner Emerging Growth Fund — Investor Class Shares | | | |
| | 2012 | * | | $ | 45.52 | | | | (0.21 | ) (1) | | | 11.48 | | | | 11.27 | | | | — | | | | — | | | | — | | |
| | 2011 | | | $ | 42.32 | | | | (0.52 | ) (1) | | | 3.72 | | | | 3.20 | | | | — | | | | — | | | | — | | |
| | 2010 | | | $ | 37.71 | | | | (0.41 | ) (1) | | | 5.02 | | | | 4.61 | | | | — | | | | — | | | | — | | |
| | 2009 | | | $ | 46.42 | | | | (0.22 | ) (1) | | | (7.31 | ) | | | (7.53 | ) | | | — | | | | (1.18 | ) | | | (1.18 | ) | |
| | 2008 | | | $ | 64.06 | | | | (0.35 | ) (1) | | | (8.54 | ) | | | (8.89 | ) | | | (0.25 | ) | | | (8.50 | ) | | | (8.75 | ) | |
| | 2007 | | | $ | 55.97 | | | | (0.30 | ) (1) | | | 13.61 | | | | 13.31 | | | | — | | | | (5.22 | ) | | | (5.22 | ) | |
| Turner Large Growth Fund — Institutional Class Shares | | | |
| | 2012 | * | | $ | 10.50 | | | | — | ** (1) | | | 2.73 | | | | 2.73 | | | | — | | | | — | | | | — | | |
| | 2011 | | | $ | 10.56 | | | | — | ** (1) | | | (0.04 | ) | | | (0.04 | ) | | | (0.02 | ) | | | — | | | | (0.02 | ) | |
| | 2010 | | | $ | 9.93 | | | | 0.02 | (1) | | | 0.65 | | | | 0.67 | | | | (0.04 | ) | | | — | | | | (0.04 | ) | |
| | 2009 | | | $ | 10.41 | | | | 0.05 | (1) | | | (0.48 | ) | | | (0.43 | ) | | | (0.05 | ) | | | — | | | | (0.05 | ) | |
| | 2008 | | | $ | 14.39 | | | | 0.06 | (1) | | | (4.01 | ) | | | (3.95 | ) | | | (0.03 | ) | | | — | | | | (0.03 | ) | |
| | 2007 | | | $ | 11.65 | | | | 0.02 | (1) | | | 2.77 | | | | 2.79 | | | | (0.05 | ) | | | — | | | | (0.05 | ) | |
| Turner Large Growth Fund — Investor Class Shares | | | |
| | 2012 | * | | $ | 10.42 | | | | (0.01 | ) (1) | | | 2.71 | | | | 2.70 | | | | — | | | | — | | | | — | | |
| | 2011 | | | $ | 10.49 | | | | (0.03 | ) (1) | | | (0.04 | ) | | | (0.07 | ) | | | — | | | | — | | | | — | | |
| | 2010 | | | $ | 9.87 | | | | — | ** (1) | | | 0.64 | | | | 0.64 | | | | (0.02 | ) | | | — | | | | (0.02 | ) | |
| | 2009 | | | $ | 10.34 | | | | 0.03 | (1) | | | (0.47 | ) | | | (0.44 | ) | | | (0.03 | ) | | | — | | | | (0.03 | ) | |
| | 2008 | | | $ | 14.33 | | | | 0.02 | (1) | | | (3.99 | ) | | | (3.97 | ) | | | (0.02 | ) | | | — | | | | (0.02 | ) | |
| | 2007 | | | $ | 11.61 | | | | 0.02 | (1) | | | 2.73 | | | | 2.75 | | | | (0.03 | ) | | | — | | | | (0.03 | ) | |
| Turner Midcap Growth Fund — Institutional Class Shares | | | |
| | 2012 | * | | $ | 30.42 | | | | (0.03 | ) (1) | | | 7.03 | | | | 7.00 | | | | — | | | | — | | | | — | | |
| | 2011 | | | $ | 29.90 | | | | (0.06 | ) (1) | | | 0.58 | | | | 0.52 | | | | — | | | | — | | | | — | | |
| | 2010 | | | $ | 26.12 | | | | (0.08 | ) (1) | | | 3.86 | | | | 3.78 | | | | — | | | | — | | | | — | | |
| | 2009 | | | $ | 26.20 | | | | (0.01 | ) (1) | | | (0.07 | ) | | | (0.08 | ) | | | — | | | | — | | | | — | | |
| | 2008 | (6) | | $ | 34.67 | | | | (0.01 | ) (1) | | | (8.46 | ) | | | (8.47 | ) | | | — | | | | — | | | | — | | |
72 TURNER FUNDS 2012 SEMIANNUAL REPORT
| | | Net asset
value, end
of period | | Total
return | | Net
assets end
of period
(000) | | Ratio of
net expenses
to average
net assets† | | Ratio of total
expenses
to average
net assets | | Ratio of net
investment
income (loss)
to average
net assets† | | Portfolio
turnover
rate†† | |
| Turner All Cap Growth Fund — Investor Class Shares | |
| | 2012 | * | | $ | 9.41 | | | | 22.69 | %††† | | $ | 32,601 | | | | 1.24 | % | | | 1.72 | % | | | (0.92 | )% | | | 89 | % | |
| | 2011 | | | $ | 7.67 | | | | 9.10 | % | | $ | 33,053 | | | | 1.73 | % | | | 2.12 | % | | | (1.29 | )% | | | 205 | % | |
| | 2010 | | | $ | 7.03 | | | | 18.25 | % | | $ | 23,227 | | | | 1.64 | % | | | 2.15 | % | | | (1.38 | )% | | | 115 | % | |
| | 2009 | | | $ | 5.95 | | | | 6.25 | % | | $ | 26,324 | | | | 0.62 | % (2) | | | 1.23 | % | | | 0.09 | % | | | 220 | % | |
| | 2008 | | | $ | 5.60 | | | | (35.78 | )% | | $ | 32,759 | | | | 1.52 | % (3) | | | 1.90 | % | | | (0.89 | )% | | | 323 | % | |
| | 2007 | | | $ | 8.72 | | | | 39.30 | % | | $ | 70,145 | | | | 1.27 | % | | | 1.73 | % | | | (0.98 | )% | | | 173 | % | |
| Turner Concentrated Growth Fund — Investor Class Shares | |
| | 2012 | * | | $ | 8.09 | | | | 26.01 | %††† | | $ | 44,022 | | | | 0.95 | % | | | 1.36 | % | | | (0.40 | )% | | | 89 | % | |
| | 2011 | | | $ | 6.42 | | | | (3.17 | )% | | $ | 38,939 | | | | 1.69 | % | | | 2.08 | % | | | (1.29 | )% | | | 203 | % | |
| | 2010 | | | $ | 6.63 | | | | 7.94 | % | | $ | 42,924 | | | | 1.51 | % | | | 1.94 | % | | | (1.14 | )% | | | 215 | % | |
| | 2009 | | | $ | 6.16 | | | | (2.99 | )% | | $ | 39,973 | | | | 0.82 | % | | | 1.34 | % | | | 0.38 | % | | | 208 | % | |
| | 2008 | | | $ | 6.35 | | | | (37.25 | )% | | $ | 42,581 | | | | 1.53 | % (3) | | | 1.91 | % | | | (0.83 | )% | | | 348 | % | |
| | 2007 | | | $ | 10.12 | | | | 33.16 | % | | $ | 61,401 | | | | 1.11 | % | | | 1.46 | % | | | (0.57 | )% | | | 220 | % | |
| Turner Emerging Growth Fund — Institutional Class Shares | |
| | 2012 | * | | $ | 57.23 | | | | 24.87 | %††† | | $ | 79,786 | | | | 1.15 | % | | | 1.34 | % | | | (0.58 | )% | | | 37 | % | |
| | 2011 | | | $ | 45.83 | | | | 7.81 | % | | $ | 67,035 | | | | 1.15 | % | | | 1.27 | % | | | (0.77 | )% | | | 74 | % | |
| | 2010 | | | $ | 42.51 | | | | 12.52 | % | | $ | 276,445 | | | | 1.15 | % | | | 1.28 | % | | | (0.77 | )% | | | 96 | % | |
| | 2009 | (4) | | $ | 37.78 | | | | 32.79 | %††† | | $ | 243,790 | | | | 1.15 | % | | | 1.33 | % | | | (0.54 | )% | | | 78 | % | |
| Turner Emerging Growth Fund — Investor Class Shares | |
| | 2012 | * | | $ | 56.79 | | | | 24.76 | %††† | | $ | 180,066 | | | | 1.40 | % | | | 1.60 | % | | | (0.83 | )% | | | 37 | % | |
| | 2011 | | | $ | 45.52 | | | | 7.56 | % | | $ | 159,127 | | | | 1.40 | % | | | 1.55 | % | | | (1.01 | )% | | | 74 | % | |
| | 2010 | | | $ | 42.32 | | | | 12.22 | % | | $ | 176,823 | | | | 1.40 | % | | | 1.53 | % | | | (1.02 | )% | | | 96 | % | |
| | 2009 | | | $ | 37.71 | | | | (15.58 | )% | | $ | 188,812 | | | | 1.40 | % | | | 1.56 | % | | | (0.71 | )% | | | 78 | % | |
| | 2008 | | | $ | 46.42 | | | | (16.08 | )% | | $ | 529,578 | | | | 1.40 | % | | | 1.49 | % | | | (0.66 | )% | | | 71 | % | |
| | 2007 | | | $ | 64.06 | | | | 25.08 | % | | $ | 638,037 | | | | 1.40 | % | | | 1.48 | % | | | (0.50 | )% | | | 88 | % | |
| Turner Large Growth Fund — Institutional Class Shares | |
| | 2012 | * | | $ | 13.23 | | | | 26.00 | %††† | | $ | 371,450 | | | | 0.69 | % | | | 0.91 | % | | | 0.05 | % | | | 60 | % | |
| | 2011 | | | $ | 10.50 | | | | (0.39 | )% | | $ | 382,336 | | | | 0.69 | % | | | 0.89 | % | | | (0.03 | )% | | | 182 | % | |
| | 2010 | | | $ | 10.56 | | | | 6.76 | % | | $ | 377,650 | | | | 0.69 | % | | | 0.87 | % | | | 0.20 | % | | | 178 | % | |
| | 2009 | | | $ | 9.93 | | | | (3.97 | )% | | $ | 381,277 | | | | 0.69 | % | | | 0.92 | % | | | 0.65 | % | | | 126 | % | |
| | 2008 | | | $ | 10.41 | | | | (27.53 | )% | | $ | 360,083 | | | | 0.69 | % | | | 0.90 | % | | | 0.42 | % | | | 200 | % | |
| | 2007 | | | $ | 14.39 | | | | 24.00 | % | | $ | 237,778 | | | | 0.68 | % | | | 1.06 | % | | | 0.42 | % | | | 103 | % | |
| Turner Large Growth Fund — Investor Class Shares | |
| | 2012 | * | | $ | 13.12 | | | | 25.91 | %††† | | $ | 55,647 | | | | 0.94 | % | | | 1.16 | % | | | (0.19 | )% | | | 60 | % | |
| | 2011 | | | $ | 10.42 | | | | (0.67 | )% | | $ | 56,661 | | | | 0.94 | % | | | 1.13 | % | | | (0.28 | )% | | | 182 | % | |
| | 2010 | | | $ | 10.49 | | | | 6.51 | % | | $ | 163,750 | | | | 0.94 | % | | | 1.12 | % | | | (0.05 | )% | | | 178 | % | |
| | 2009 | | | $ | 9.87 | | | | (4.21 | )% | | $ | 252,916 | | | | 0.94 | % | | | 1.17 | % | | | 0.41 | % | | | 126 | % | |
| | 2008 | | | $ | 10.34 | | | | (27.76 | )% | | $ | 260,692 | | | | 0.94 | % | | | 1.15 | % | | | 0.15 | % | | | 200 | % | |
| | 2007 | | | $ | 14.33 | | | | 23.68 | % | | $ | 37,541 | | | | 0.94 | % | | | 1.31 | % | | | 0.15 | % | | | 103 | % | |
| Turner Midcap Growth Fund — Institutional Class Shares | |
| | 2012 | * | | $ | 37.42 | | | | 23.01 | %††† | | $ | 301,301 | | | | 0.93 | % | | | 1.05 | % | | | (0.18 | )% | | | 52 | % | |
| | 2011 | | | $ | 30.42 | | | | 1.74 | % | | $ | 245,480 | | | | 0.93 | % | | | 1.05 | % | | | (0.18 | )% | | | 104 | % | |
| | 2010 | | | $ | 29.90 | | | | 14.47 | % | | $ | 164,993 | | | | 0.93 | % | | | 1.03 | % | | | (0.29 | )% | | | 90 | % | |
| | 2009 | | | $ | 26.12 | | | | (0.31 | )% | | $ | 136,069 | | | | 0.93 | % | | | 1.08 | % | | | (0.05 | )% | | | 120 | % | |
| | 2008 | (6) | | $ | 26.20 | | | | (24.43 | )%††† | | $ | 137,451 | | | | 0.93 | % (7) | | | 1.03 | % | | | (0.09 | )% | | | 157 | % | |
* For the six-month period ended March 31, 2012, unless otherwise indicated (unaudited). All ratios for the period have been annualized.
** Amount represents less than $0.01 per share.
† Inclusive of fees paid indirectly, waivers and/or reimbursements.
†† Excludes effect of in-kind transfers and mergers, as applicable. Not annualized for periods less than one year.
††† Total return is for the period indicated and has not been annualized.
(1) Based on average shares outstanding.
(2) Excluding fees paid indirectly, the ratio of net expenses to average net assets would have been 0.63%.
(3) Excluding fees paid indirectly, the ratio of net expenses to average net assets would have been 1.54%.
(4) Commenced operations on February 1, 2009. All ratios for the period have been annualized.
(5) The amount shown for a share outstanding throughout the period and the aggregate net losses on investments for the period are not in accord because of the sales and repurchases of fund shares in relation to fluctuating market value of the investments of the Fund.
(6) Commenced operations on June 16, 2008. All ratios for the period have been annualized.
(7) Excluding fees paid indirectly, the ratio of net expenses to average net assets would have been 0.94%.
Amounts designated as "—" are either $0, not applicable or have been rounded to $0.
The accompanying notes are an integral part of the financial statements.
TURNER FUNDS 2012 SEMIANNUAL REPORT 73
FINANCIAL STATEMENTS
Financial highlights
For a share outstanding throughout each period
| | | Net asset
value,
beginning
of period | | Net
investment
income
(loss) | | Realized and
unrealized
gains (losses)
on investments | | Total
from
investment
operations | | Dividends
from net
investment
income | | Distributions
from
capital
gains | | Total
dividends and
distributions | |
| Turner Midcap Growth Fund — Investor Class Shares | | | |
| | 2012 | * | | $ | 30.16 | | | | (0.08 | ) (1) | | | 7.00 | | | | 6.92 | | | | — | | | | — | | | | — | | |
| | 2011 | | | $ | 29.73 | | | | (0.13 | ) (1) | | | 0.56 | | | | 0.43 | | | | — | | | | — | | | | — | | |
| | 2010 | | | $ | 26.03 | | | | (0.15 | ) (1) | | | 3.85 | | | | 3.70 | | | | — | | | | — | | | | — | | |
| | 2009 | | | $ | 26.18 | | | | (0.06 | ) (1) | | | (0.09 | ) | | | (0.15 | ) | | | — | | | | — | | | | — | | |
| | 2008 | | | $ | 35.71 | | | | (0.14 | ) (1) | | | (9.39 | ) | | | (9.53 | ) | | | — | | | | — | | | | — | | |
| | 2007 | | | $ | 27.63 | | | | (0.20 | ) (1) | | | 8.28 | | | | 8.08 | | | | — | | | | — | | | | — | | |
| Turner Midcap Growth Fund — Retirement Class Shares | | | |
| | 2012 | * | | $ | 29.05 | | | | (0.11 | ) (1) | | | 6.29 | | | | 6.18 | | | | — | | | | — | | | | — | | |
| | 2011 | | | $ | 28.71 | | | | (0.22 | ) (1) | | | 0.56 | | | | 0.34 | | | | — | | | | — | | | | — | | |
| | 2010 | | | $ | 25.20 | | | | (0.21 | ) (1) | | | 3.72 | | | | 3.51 | | | | — | | | | — | | | | — | | |
| | 2009 | | | $ | 25.40 | | | | (0.11 | ) (1) | | | (0.09 | ) | | | (0.20 | ) | | | — | | | | — | | | | — | | |
| | 2008 | | | $ | 34.74 | | | | (0.22 | ) (1) | | | (9.12 | ) | | | (9.34 | ) | | | — | | | | — | | | | — | | |
| | 2007 | | | $ | 26.96 | | | | (0.30 | ) (1) | | | 8.08 | | | | 7.78 | | | | — | | | | — | | | | — | | |
| Turner Small Cap Growth Fund — Investor Class Shares | | | |
| | 2012 | * | | $ | 27.83 | | | | (0.13 | ) (1) | | | 8.43 | | | | 8.30 | | | | — | | | | — | | | | — | | |
| | 2011 | | | $ | 28.97 | | | | (0.26 | ) (1) | | | (0.88 | ) | | | (1.14 | ) | | | — | | | | — | | | | — | | |
| | 2010 | | | $ | 25.17 | | | | (0.20 | ) (1) | | | 4.00 | | | | 3.80 | | | | — | | | | — | | | | — | | |
| | 2009 | | | $ | 26.45 | | | | (0.07 | ) (1) | | | (1.21 | ) | | | (1.28 | ) | | | — | | | | — | | | | — | | |
| | 2008 | | | $ | 32.98 | | | | (0.15 | ) (1) | | | (6.38 | ) | | | (6.53 | ) | | | — | | | | — | | | | — | | |
| | 2007 | | | $ | 26.17 | | | | (0.20 | ) (1) | | | 7.01 | | | | 6.81 | | | | — | | | | — | | | | — | | |
| Turner Global Opportunities Fund — Institutional Class Shares | | | |
| | 2012 | * | | $ | 11.38 | | | | (0.04 | ) (1) | | | 3.03 | | | | 2.99 | | | | — | | | | (0.35 | ) | | | (0.35 | ) | |
| | 2011 | | | $ | 11.52 | | | | (0.04 | ) (1) | | | (0.10 | ) | | | (0.14 | ) | | | — | | | | — | | | | — | | |
| | 2010 | (3) | | $ | 10.00 | | | | (0.01 | ) (1) | | | 1.53 | | | | 1.52 | | | | — | | | | — | | | | — | | |
| Turner Global Opportunities Fund — Investor Class Shares | | | |
| | 2012 | * | | $ | 11.33 | | | | (0.06 | ) (1) | | | 3.02 | | | | 2.96 | | | | — | | | | (0.35 | ) | | | (0.35 | ) | |
| | 2011 | | | $ | 11.50 | | | | (0.06 | ) (1) | | | (0.11 | ) | | | (0.17 | ) | | | — | | | | — | | | | — | | |
| | 2010 | (3) | | $ | 10.00 | | | | (0.03 | ) (1) | | | 1.53 | | | | 1.50 | | | | — | | | | — | | | | — | | |
| Turner International Growth Fund — Institutional Class Shares | | | |
| | 2012 | * | | $ | 9.21 | | | | 0.03 | (1) | | | 1.90 | | | | 1.93 | | | | — | | | | — | | | | — | | |
| | 2011 | | | $ | 9.41 | | | | 0.08 | (1) | | | (0.19 | ) | | | (0.11 | ) | | | (0.09 | ) | | | — | | | | (0.09 | ) | |
| | 2010 | | | $ | 8.24 | | | | 0.04 | (1) | | | 1.26 | | | | 1.30 | | | | (0.13 | ) | | | — | | | | (0.13 | ) | |
| | 2009 | | | $ | 8.34 | | | | 0.08 | (1) | | | (0.07 | ) (4) | | | 0.01 | | | | (0.11 | ) | | | — | | | | (0.11 | ) | |
| | 2008 | | | $ | 12.21 | | | | 0.12 | (1) | | | (3.87 | ) | | | (3.75 | ) | | | (0.02 | ) | | | (0.10 | ) | | | (0.12 | ) | |
| | 2007 | (6) | | $ | 10.00 | | | | 0.07 | (1) | | | 2.14 | | | | 2.21 | | | | — | | | | — | | | | — | | |
| Turner International Growth Fund — Investor Class Shares | | | |
| | 2012 | * | | $ | 9.17 | | | | 0.02 | (1) | | | 1.89 | | | | 1.91 | | | | — | | | | — | | | | — | | |
| | 2011 | | | $ | 9.39 | | | | 0.05 | (1) | | | (0.20 | ) | | | (0.15 | ) | | | (0.07 | ) | | | — | | | | (0.07 | ) | |
| | 2010 | | | $ | 8.24 | | | | 0.05 | (1) | | | 1.23 | | | | 1.28 | | | | (0.13 | ) | | | — | | | | (0.13 | ) | |
| | 2009 | (7) | | $ | 6.27 | | | | 0.07 | (1) | | | 2.01 | | | | 2.08 | | | | (0.11 | ) | | | — | | | | (0.11 | ) | |
74 TURNER FUNDS 2012 SEMIANNUAL REPORT
| | | Net asset
value, end
of period | | Total
return | | Net
assets end
of period
(000) | | Ratio of
net expenses
to average
net assets† | | Ratio of total
expenses
to average
net assets | | Ratio of net
investment
income (loss)
to average
net assets† | | Portfolio
turnover
rate†† | |
| Turner Midcap Growth Fund — Investor Class Shares | |
| | 2012 | * | | $ | 37.08 | | | | 22.94 | %††† | | $ | 505,657 | | | | 1.18 | % | | | 1.30 | % | | | (0.43 | )% | | | 52 | % | |
| | 2011 | | | $ | 30.16 | | | | 1.45 | % | | $ | 471,286 | | | | 1.18 | % | | | 1.28 | % | | | (0.38 | )% | | | 104 | % | |
| | 2010 | | | $ | 29.73 | | | | 14.21 | % | | $ | 751,124 | | | | 1.18 | % | | | 1.28 | % | | | (0.54 | )% | | | 90 | % | |
| | 2009 | | | $ | 26.03 | | | | (0.57 | )% | | $ | 859,640 | | | | 1.18 | % | | | 1.33 | % | | | (0.29 | )% | | | 120 | % | |
| | 2008 | | | $ | 26.18 | | | | (26.69 | )% | | $ | 994,545 | | | | 1.18 | % | | | 1.25 | % | | | (0.44 | )% | | | 157 | % | |
| | 2007 | | | $ | 35.71 | | | | 29.24 | % | | $ | 1,340,172 | | | | 1.18 | % | | | 1.24 | % | | | (0.63 | )% | | | 155 | % | |
| Turner Midcap Growth Fund — Retirement Class Shares | |
| | 2012 | * | | $ | 35.23 | | | | 21.27 | %††† | | $ | 5,063 | | | | 1.43 | % | | | 1.56 | % | | | (0.68 | )% | | | 52 | % | |
| | 2011 | | | $ | 29.05 | | | | 1.18 | % | | $ | 3,972 | | | | 1.43 | % | | | 1.54 | % | | | (0.63 | )% | | | 104 | % | |
| | 2010 | | | $ | 28.71 | | | | 13.93 | % | | $ | 4,578 | | | | 1.43 | % | | | 1.53 | % | | | (0.79 | )% | | | 90 | % | |
| | 2009 | | | $ | 25.20 | | | | (0.79 | )% | | $ | 3,892 | | | | 1.43 | % | | | 1.58 | % | | | (0.55 | )% | | | 120 | % | |
| | 2008 | | | $ | 25.40 | | | | (26.89 | )% | | $ | 5,784 | | | | 1.43 | % | | | 1.50 | % | | | (0.69 | )% | | | 157 | % | |
| | 2007 | | | $ | 34.74 | | | | 28.86 | % | | $ | 6,212 | | | | 1.49 | % | | | 1.56 | % | | | (0.98 | )% | | | 155 | % | |
| Turner Small Cap Growth Fund — Investor Class Shares | |
| | 2012 | * | | $ | 36.13 | | | | 29.82 | %††† | | $ | 276,546 | | | | 1.25 | % | | | 1.54 | % | | | (0.80 | )% | | | 50 | % | |
| | 2011 | | | $ | 27.83 | | | | (3.94 | )% | | $ | 229,919 | | | | 1.25 | % | | | 1.53 | % | | | (0.76 | )% | | | 119 | % | |
| | 2010 | | | $ | 28.97 | | | | 15.10 | % | | $ | 274,925 | | | | 1.25 | % | | | 1.52 | % | | | (0.74 | )% | | | 89 | % | |
| | 2009 | | | $ | 25.17 | | | | (4.84 | )% | | $ | 250,860 | | | | 1.25 | % | | | 1.58 | % | | | (0.36 | )% | | | 113 | % | |
| | 2008 | | | $ | 26.45 | | | | (19.80 | )% | | $ | 249,434 | | | | 1.25 | % (2) | | | 1.51 | % | | | (0.48 | )% | | | 141 | % | |
| | 2007 | | | $ | 32.98 | | | | 26.02 | % | | $ | 317,930 | | | | 1.25 | % | | | 1.48 | % | | | (0.65 | )% | | | 134 | % | |
| Turner Global Opportunities Fund — Institutional Class Shares | |
| | 2012 | * | | $ | 14.02 | | | | 26.96 | %††† | | $ | 1,152 | | | | 1.10 | % | | | 4.19 | % | | | (0.69 | )% | | | 35 | % | |
| | 2011 | | | $ | 11.38 | | | | (1.22 | )% | | $ | 910 | | | | 1.10 | % | | | 3.63 | % | | | (0.34 | )% | | | 178 | % | |
| | 2010 | (3) | | $ | 11.52 | | | | 15.20 | %††† | | $ | 1,153 | | | | 1.10 | % | | | 8.33 | % | | | (0.31 | )% | | | 37 | % | |
| Turner Global Opportunities Fund — Investor Class Shares | |
| | 2012 | * | | $ | 13.94 | | | | 26.82 | %††† | | $ | 541 | | | | 1.35 | % | | | 4.45 | % | | | (0.94 | )% | | | 35 | % | |
| | 2011 | | | $ | 11.33 | | | | (1.48 | )% | | $ | 478 | | | | 1.35 | % | | | 3.16 | % | | | (0.45 | )% | | | 178 | % | |
| | 2010 | (3) | | $ | 11.50 | | | | 15.00 | %††† | | $ | — | | | | 1.56 | % | | | 8.92 | % | | | (0.77 | )% | | | 37 | % | |
| Turner International Growth Fund — Institutional Class Shares | |
| | 2012 | * | | $ | 11.14 | | | | 20.96 | %††† | | $ | 8,316 | | | | 1.10 | % | | | 1.96 | % | | | 0.60 | % | | | 55 | % | |
| | 2011 | | | $ | 9.21 | | | | (1.32 | )% | | $ | 6,012 | | | | 1.10 | % | | | 2.41 | % | | | 0.70 | % | | | 210 | % | |
| | 2010 | | | $ | 9.41 | | | | 15.88 | % | | $ | 5,019 | | | | 1.10 | % | | | 3.93 | % | | | 0.51 | % | | | 120 | % | |
| | 2009 | | | $ | 8.24 | | | | 0.71 | % | | $ | 3,848 | | | | 1.10 | % | | | 5.24 | % | | | 1.31 | % | | | 139 | % | |
| | 2008 | | | $ | 8.34 | | | | (31.04 | )% | | $ | 3,335 | | | | 1.10 | % (5) | | | 3.05 | % | | | 1.10 | % | | | 245 | % | |
| | 2007 | (6) | | $ | 12.21 | | | | 22.10 | %††† | | $ | 2,409 | | | | 1.10 | % | | | 4.63 | % | | | 0.99 | % | | | 111 | % | |
| Turner International Growth Fund — Investor Class Shares | |
| | 2012 | * | | $ | 11.08 | | | | 20.83 | %††† | | $ | 8,454 | | | | 1.35 | % | | | 2.20 | % | | | 0.45 | % | | | 55 | % | |
| | 2011 | | | $ | 9.17 | | | | (1.67 | )% | | $ | 4,912 | | | | 1.35 | % | | | 2.46 | % | | | 0.44 | % | | | 210 | % | |
| | 2010 | | | $ | 9.39 | | | | 15.61 | % | | $ | 110 | | | | 1.35 | % | | | 4.15 | % | | | 0.61 | % | | | 120 | % | |
| | 2009 | (7) | | $ | 8.24 | | | | 33.95 | %††† | | $ | — | | | | 1.29 | % | | | 5.59 | % | | | 1.14 | % | | | 139 | % | |
* For the six-month period ended March 31, 2012, unless otherwise indicated (unaudited). All ratios for the period have been annualized.
† Inclusive of fees paid indirectly, waivers and/or reimbursements.
†† Excludes effect of in-kind transfers and mergers, as applicable. Not annualized for periods less than one year.
††† Total return is for the period indicated and has not been annualized.
(1) Based on average shares outstanding.
(2) Excluding fees paid indirectly, the ratio of net expenses to average net assets would have been 1.26%.
(3) Commenced operations on May 7, 2010. All ratios for the period have been annualized.
(4) The amount shown for a share outstanding throughout the period and the aggregate net losses on investments for the period are not in accord because of the sales and repurchases of fund shares in relation to fluctuating market value of the investments of the Fund.
(5) Excluding fees paid indirectly, the ratio of net expenses to average net assets would have been 1.11%.
(6) Commenced operations on January 31, 2007. All ratios for the period have been annualized.
(7) Commenced operations on October 31, 2008. All ratios for the period have been annualized.
Amounts designated as "—" are either $0, not applicable or have been rounded to $0.
The accompanying notes are an integral part of the financial statements.
TURNER FUNDS 2012 SEMIANNUAL REPORT 75
NOTES TO FINANCIAL STATEMENTS (Unaudited)
Notes to financial statements
March 31, 2012
1. Organization:
Turner Funds (the "Trust"), a Massachusetts business trust, is registered under the Investment Company Act of 1940, as amended, as an open-end management investment company with twelve active portfolios as of March 31, 2012. The financial statements included herein are those of the Turner Market Neutral Fund (the "Market Neutral Fund"), the Turner Medical Sciences Long/Short Fund (the "Medical Sciences Long/Short Fund"), the Turner Spectrum Fund (the "Spectrum Fund"), the Turner Titan Fund (the "Titan Fund"), the Turner All Cap Growth Fund (the "All Cap Growth Fund"), the Turner Concentrated Growth Fund (the "Concentrated Growth Fund"), the Turner Emerging Growth Fund (the "Emerging Growth Fund"), the Turner Large Growth Fund (the "Large Growth Fund"), the Turner Midcap Growth Fund (the "Midcap Growth Fund"), the Turner Small Cap Growth Fund (the "Small Cap Growth Fund"), the Turner Global Opportunities Fund (the "Global Opportunities Fund"), and the Turner International Growth Fund (the "International Growth Fund"), each a "Fund" and collectively the "Funds."
Each Fund is registered as a diversified portfolio of the Trust with the exception of the Concentrated Growth Fund and the Global Opportunities Fund, which are non-diversified.
The Funds are registered to offer different classes of shares: Institutional Class Shares, Investor Class Shares, Retirement Class Shares, Class C Shares, or a combination of the four. The assets of each Fund are segregated, and a shareholder's interest is limited to the Fund in which shares are held. The Funds' prospectuses provide a description of each Fund's investment objectives, policies, and strategies along with information on the classes of shares currently being offered.
2. Significant accounting policies:
The following is a summary of the significant accounting policies followed by the Funds.
Use of estimates—The preparation of financial statements in conformity with U.S. generally accepted accounting principles ("GAAP") requires management to make estimates and assumptions that affect the reported amounts of assets and liabilities and disclosure of contingent assets and liabilities at the date of the financial statements and the reported amounts of increases and decreases in net assets from operations during the reporting period. Actual results could differ from those estimates.
Security valuation—Securities listed on a securities exchange, market or automated quotation system for which quotations are readily available (except for securities traded on Nasdaq) are valued at the last quoted sale price on the primary exchange or market (foreign or domestic) on which they are traded, or, if there is no such reported sale, at the most recent quoted bid price for long positions and the most recent quoted ask price for short positions. For securities traded on Nasdaq, the Nasdaq Official Closing Price will be used. The prices for foreign securities are reported in local currency and converted to U.S. dollars using currency exchange rates. Prices for most securities held in the Funds are provided daily by recognized independent pricing agents. If a security price cannot be obtained from an independent, third-party pricing agent, the Funds seek to obtain bid and ask prices from two broker-dealers who make a market in the security and determine the average of the two.
Securities for which market prices are not "readily available" are valued in accordance with Fair Value Procedures established by the Board of Trustees (the "Board"). The Funds' Fair Value Procedures are implemented through a Fair Value Committee (the "Committee") designated by the Board. Some of the more common reasons that may necessitate that a security be valued using Fair Value Procedures include: the security's trading has been halted or suspended; the security has been delisted from a national exchange; the security's primary trading market is temporarily closed at a time when under normal conditions it would be open; the security has not been traded for an extended period of time; the security's primary pricing source is not able or willing to provide a price; or trading of the security is subject to local government-imposed restrictions. When a security is valued in accordance with the Fair Value Procedures, the Committee will determine the value after taking into consideration relevant information reasonably available to the Committee.
For securities that principally trade on a foreign market or exchange, a significant gap in time can exist between the time of a particular security's last trade and the time at which a Fund calculates its net asset value. The closing prices of such securities may no longer reflect their market value at the time the Fund calculates net asset value if an event that could materially affect the value of those securities (a "Significant Event") has occurred between the time of the security's last close and the time that the Fund calculates net asset value. A Significant Event may relate to a single issuer or to an entire market sector. If the Adviser , as defined in Note 3, of a Fund becomes aware of a Significant Event that has occurred with respect to a security or group of securities after the closing of the exchange or market on which the security or securities principally trade, but before the time at which the Fund calculates net asset value, it may request that a Committee meeting be called. In addition, the Fund's Sub-administrator, as defined in Note 3, monitors price movements among certain selected indices, securities and/or baskets of securities that may be an indicator that the closing prices received earlier from foreign
76 TURNER FUNDS 2012 SEMIANNUAL REPORT
exchanges or markets may not reflect market value at the time the Fund calculates net asset value. If price movements in a monitored index or security exceed levels established by the Administrator, as defined in Note 3, and approved by the Committee, the Adviser determines whether such securities should be fair valued.
The Funds use Interactive Data Pricing and Reference Data, Inc. ("Interactive Data") as a third party fair valuation vendor for securities principally traded on a foreign market or exchange. Interactive Data provides a fair value for foreign securities in the Funds based on certain factors and methodologies (involving, generally, tracking valuation correlations between the U.S. market and each non-U.S. security) applied by Interactive Data in the event that there is a movement in the U.S. market that exceeds a specific threshold established by the Committee. The Committee establishes a "confidence interval" which is used to determine the level of correlation between the value of a foreign security and movements in the U.S. market before a particular security is fair valued when the threshold is exceeded. In the event that the threshold established by the Committee is exceeded on a specific day, the Funds value their non-U.S. securities that exceed the applicable "confidence interval" based upon the fair values provided by Interactive Data. In such event, it is not necessary to hold a Committee meeting. In the event that the Adviser believes that the fair values provided by Interactive Data are not reliable, or believes that a foreign security held by a Fund should be fair valued for any other reason, the Adviser contacts the Funds' Sub-administrator and may request that a meeting of the Committee be held.
If a local market in which the Funds own securities is closed for one or more days or a portion of a day, the Funds shall value all securities held in that corresponding currency based on the fair value prices provided by Interactive Data using the predetermined confidence interval discussed above.
In accordance with the authoritative guidance on fair value measurements and disclosures under GAAP, fair value is defined as the price that a fund would receive upon selling an investment in a timely transaction to an independent buyer in the principal or most advantageous market.
The Trust has a three-tier fair value hierarchy that is dependent upon the various "inputs" used to determine the value of the Funds' investments. These inputs are summarized in the three broad levels listed below:
Level 1 – quoted prices in active markets for identical investments.
Level 2 – other significant observable inputs (including quoted prices for similar investments, interest rates, prepayment speeds, credit risks, etc.).
Level 3 – significant unobservable inputs (including a Fund's own assumptions in determining the fair value of investments).
The following is a summary of inputs used to value the Funds' investments as of March 31, 2012 (000):
| | | Level 1 | | Level 2 | | Level 3 | | Total | |
| Market Neutral Fund | |
| Investments in securities | |
| Common stock | | $ | 46,657 | | | $ | — | | | $ | — | | | $ | 46,657 | | |
| Cash equivalent | | | 4,294 | | | | — | | | | — | | | | 4,294 | | |
| Total Investments in securities | | $ | 50,951 | | | $ | — | | | $ | — | | | $ | 50,951 | | |
| Securities sold short | |
| Common stock | | $ | 46,551 | | | $ | — | | | $ | — | | | $ | 46,551 | | |
| Total Securities sold short | | $ | 46,551 | | | $ | — | | | $ | — | | | $ | 46,551 | | |
| Medical Sciences Long/Short Fund | |
| Investments in securities | |
| Common stock | | $ | 48,491 | | | $ | — | | | $ | — | | | $ | 48,491 | | |
| Cash equivalent | | | 27,995 | | | | — | | | | — | | | | 27,995 | | |
| Total Investments in securities | | $ | 76,486 | | | $ | — | | | $ | — | | | $ | 76,486 | | |
| Securities sold short | |
| Common stock | | $ | 22,785 | | | $ | — | | | $ | — | | | $ | 22,785 | | |
| Exchange traded fund | | | 5,829 | | | | — | | | | — | | | | 5,829 | | |
| Total Securities sold short | | $ | 28,614 | | | $ | — | | | $ | — | | | $ | 28,614 | | |
| Spectrum Fund | |
| Investments in securities | |
| Common stock | |
| Consumer discretionary | | $ | 105,450 | | | $ | 596 | | | $ | — | | | $ | 106,046 | | |
| Other common stock | | | 588,584 | | | | — | | | | — | | | | 588,584 | | |
| Cash equivalent | | | 69,682 | | | | — | | | | — | | | | 69,682 | | |
| Exchange traded note | | | 2,545 | | | | — | | | | — | | | | 2,545 | | |
| Put option contracts | | | 435 | | | | — | | | | — | | | | 435 | | |
| Total Investments in securities | | $ | 766,696 | | | $ | 596 | | | $ | — | | | $ | 767,292 | | |
| Securities sold short | |
| Common stock | |
| Information technology | | $ | 67,743 | | | $ | 3,965 | | | $ | — | | | $ | 71,708 | | |
| Other common stock | | | 327,151 | | | | — | | | | — | | | | 327,151 | | |
| Exchange traded funds | | | 72,234 | | | | — | | | | — | | | | 72,234 | | |
| Total Securities sold short | | $ | 467,128 | | | $ | 3,965 | | | $ | — | | | $ | 471,093 | | |
| Open options written | |
| Written put option | | $ | 325 | | | $ | — | | | $ | — | | | $ | 325 | | |
| Total Open options written | | $ | 325 | | | $ | — | | | $ | — | | | $ | 325 | | |
| Titan Fund | |
| Investments in securities | |
| Common stock | | $ | 18,548 | | | $ | — | | | $ | — | | | $ | 18,548 | | |
| Cash equivalent | | | 868 | | | | — | | | | — | | | | 868 | | |
| Total Investments in securities | | $ | 19,416 | | | $ | — | | | $ | — | | | $ | 19,416 | | |
| Securities sold short | |
| Common stock | |
| Information technology | | $ | 2,497 | | | $ | 128 | | | $ | — | | | $ | 2,625 | | |
| Other common stock | | | 7,985 | | | | — | | | | — | | | | 7,985 | | |
| Exchange traded fund | | | 717 | | | | — | | | | — | | | | 717 | | |
| Total Securities sold short | | $ | 11,199 | | | $ | 128 | | | $ | — | | | $ | 11,327 | | |
TURNER FUNDS 2012 SEMIANNUAL REPORT 77
NOTES TO FINANCIAL STATEMENTS (Unaudited)
| | | Level 1 | | Level 2 | | Level 3 | | Total | |
| All Cap Growth Fund | |
| Investments in securities | |
| Common stock | | $ | 31,527 | | | $ | — | | | $ | — | | | $ | 31,527 | | |
| Cash equivalent | | | 1,159 | | | | — | | | | — | | | | 1,159 | | |
| Total Investments in securities | | $ | 32,686 | | | $ | — | | | $ | — | | | $ | 32,686 | | |
| Concentrated Growth Fund | |
| Investments in securities | |
| Common stock | | $ | 43,742 | | | $ | — | | | $ | — | | | $ | 43,742 | | |
| Cash equivalent | | | 319 | | | | — | | | | — | | | | 319 | | |
| Total Investments in securities | | $ | 44,061 | | | $ | — | | | $ | — | | | $ | 44,061 | | |
| Emerging Growth Fund | |
| Investments in securities | |
| Common stock | | $ | 250,656 | | | $ | — | | | $ | — | | | $ | 250,656 | | |
| Cash equivalent | | | 51,172 | | | | — | | | | — | | | | 51,172 | | |
| Total Investments in securities | | $ | 301,828 | | | $ | — | | | $ | — | | | $ | 301,828 | | |
| Large Growth Fund | |
| Investments in securities | |
| Common stock | | $ | 433,849 | | | $ | — | | | $ | — | | | $ | 433,849 | | |
| Cash equivalent | | | 13,371 | | | | — | | | | — | | | | 13,371 | | |
| Total Investments in securities | | $ | 447,220 | | | $ | — | | | $ | — | | | $ | 447,220 | | |
| Midcap Growth Fund | |
| Investments in securities | |
| Common stock | | $ | 812,150 | | | $ | — | | | $ | — | | | $ | 812,150 | | |
| Cash equivalent | | | 56,218 | | | | — | | | | — | | | | 56,218 | | |
| Total Investments in securities | | $ | 868,368 | | | $ | — | | | $ | — | | | $ | 868,368 | | |
| Small Cap Growth Fund | |
| Investments in securities | |
| Common stock | | $ | 273,020 | | | $ | — | | | $ | — | | | $ | 273,020 | | |
| Cash equivalent | | | 54,029 | | | | — | | | | — | | | | 54,029 | | |
| Total Investments in securities | | $ | 327,049 | | | $ | — | | | $ | — | | | $ | 327,049 | | |
| Global Opportunities Fund | |
| Investments in securities | |
| Common stock | | $ | 1,643 | | | $ | — | | | $ | — | | | $ | 1,643 | | |
| Cash equivalent | | | 48 | | | | — | | | | — | | | | 48 | | |
| Total Investments in securities | | $ | 1,691 | | | $ | — | | | $ | — | | | $ | 1,691 | | |
| International Growth Fund | |
| Investments in securities | |
| Common stock | | $ | 15,996 | | | $ | — | | | $ | — | | | $ | 15,996 | | |
| Cash equivalent | | | 711 | | | | — | | | | — | | | | 711 | | |
| Total Investments in securities | | $ | 16,707 | | | $ | — | | | $ | — | | | $ | 16,707 | | |
For the six months ended March 31, 2012, there have been no significant changes to the Funds' fair valuation methodologies. Changes in valuation techniques may result in transfers in or out of an investment's assigned level within the hierarchy during the reporting period. For each Fund there were no significant transfers between the levels during the reporting period, based on the input levels assigned under the hierarchy at the beginning and end of the reporting period, except for the Global Opportunities Fund and the International Growth Fund. Significant transfers from Level 2 to Level 1, the result of the established thresholds for foreign securities no longer being exceeded, are as follows (000):
| | | Transfers from
Level 2 to Level 1 | |
| Global Opportunities Fund | |
| Common stock | | $ | 424 | | |
| International Growth Fund | |
| Common stock | | $ | 9,000 | | |
New Accounting Pronouncement—In May 2011, the Financial Accounting Standards Board ("FASB") issued Accounting Standards Update No. 2011-04 "Amendments to Achieve Common Fair Value Measurement and Disclosure Requirements in U.S. GAAP and International Financial Reporting Standards ("IFRS")" ("ASU 2011-04"), which includes common requirements for measurements of and disclosure about fair value between U.S. GAAP and IFRS. ASU 2011-04 will require reporting entities to disclose quantitative information about the unobservable inputs used in the fair value measurements categorized within Level 3 of the fair value hierarchy. In addition, ASU 2011-04 will require reporting entities to make disclosures about amounts and reasons for all transfers in and out of Levels 1 and 2 of the fair value hierarchy. The new and revised disclosures are effective for interim and annual reporting periods beginning after December 15, 2011. Management has determined that this will not have any impact on the Funds' financial statements, other than enhanced disclosures.
Security transactions and related income—Security transactions are accounted for on the date the security is purchased or sold (trade date). Dividend income is recognized on the ex-dividend date. Costs used in determining realized gains and losses on the sales of investment securities are those of the specific securities lots sold.
Securities sold short—Consistent with each Fund's investment objectives, the Funds may engage in short sales. Short sales are transactions under which a Fund sells a security it does not own. To complete such a transaction, the Fund must borrow the security to make delivery to the buyer. The Fund is then obligated to replace the security borrowed by purchasing the security at the market price at the time of the replacement. The price at such time may be more or less than the price at which the security was sold by the Fund. Until the security is replaced, the Fund is required to pay the lender amounts equal to any dividends that accrue during the period of the loan. Dividends are shown as an expense for financial reporting purposes.
78 TURNER FUNDS 2012 SEMIANNUAL REPORT
To borrow the security, the Fund also may be required to pay a fee, which is shown as an expense for financial reporting purposes. The proceeds of the short sale are retained by the broker, to the extent necessary to meet margin requirements, until the short position is closed out. A gain, limited to the price at which the Fund sold the security short, or a loss, unlimited in size, will be recognized upon the close of a short sale.
Until a Fund closes its short position or replaces the borrowed security, the Fund will: (a) maintain a segregated account containing cash or liquid securities at such a level that (i) the amount deposited in the account plus the amount deposited with the brokers as collateral will equal the current value of the security sold short; and (ii) the amount deposited in the segregated account plus the amount deposited with the broker as collateral will not be less than the market value of the security at the time the security was sold short, or (b) otherwise cover the short positions. The Market Neutral Fund, the Medical Sciences Long/Short Fund, the Spectrum Fund and the Titan Fund engaged in short sales during the six months ended March 31, 2012.
Option transactions—Consistent with each Fund's investment objectives, the Funds may write covered call options and sell put options as a means of increasing the yield on their portfolios and as a means of providing limited protection against decreases in their market value. The Funds may purchase put and call options to protect against a decline in the market value of the securities in their portfolio or to anticipate an increase in the market value of securities that the Funds may seek to purchase in the future. A put option gives the purchaser of the option the right to sell, and the writer of the option the obligation to buy, the underlying security at any time during the option period. A call option gives the purchaser of the option the right to buy, and the writer of the option the obligation to sell, the underlying security at any time during the option period. The premium paid to the writer is the consideration for undertaking the obligations under the option contract. The initial purchase (sale) of an option contract is an "opening transaction." In order to close out an option position, the Fund may enter into a "closing transaction," which is simply the sale (purchase) of an option contract on the same security with the same exercise price and expiration date as the option contract originally opened. If the Fund is unable to effect a closing purchase transaction with respect to an option it has written, it will not be able to sell the underlying security until the option expires or the Fund delivers the security upon exercise. When the Fund writes (sells) an option, an amount equal to the premium received by the Fund is included in the Statement of Assets and Liabilities as an asset and an equivalent liability. The amount of the liability is subsequently marked-to-market to reflect the current value of the option written.
Option contracts are valued at the last quoted sales price. If there is no such reported sale on the valuation date, long positions are valued at the most recent bid price, and short positions are valued at the most recent ask price. When an option expires on its stipulated expiration date or the Fund enters into a closing purchase transaction, the Fund realizes a gain or loss if the cost of the closing purchase transaction differs from the premium received when the option was sold without regard to any unrealized gain or loss on the underlying security, and the liability related to such option is eliminated. When an option is exercised, the premium originally received decreases the cost basis of the security (or increases the proceeds on a sale of the security).
Realized and unrealized gains and losses on written option transactions are shown on the Statement of Operations as net realized gain (loss) on written option contracts and net change in unrealized appreciation (depreciation) on written option contracts, respectively. Realized and unrealized gains and (losses) on purchased options in the Spectrum Fund for the six months ended March 31, 2012 were $(2,017) and $168, respectively (000). These amounts are shown on the Statement of Operations as net realized gain (loss) from securities sold and net change in unrealized appreciation (depreciation) on investments, respectively. The primary risk exposure from the written and purchased option contracts is equity exposure. The Spectrum Fund engaged in limited option activity for the six months ended March 31, 2012. This activity represents less than 2% of the Fund's quarterly net assets.
Foreign currency translation—The books and records of the Market Neutral Fund, the Medical Sciences Long/Short Fund, the Spectrum Fund, the Titan Fund, the Global Opportunities Fund and the International Growth Fund are maintained in U.S. dollars. Investment securities and other assets and liabilities denominated in a foreign currency are translated into U.S. dollars on the date of valuation. The Market Neutral Fund, the Medical Sciences Long/Short Fund, the Spectrum Fund, the Titan Fund, the Global Opportunities Fund and the International Growth Fund do not isolate that portion of realized or unrealized gains and losses resulting from changes in the foreign exchange rate from fluctuations arising from changes in the market prices of the securities. These gains and losses are included in net realized and unrealized gains and losses on investments in the Statements of Operations. Net realized and unrealized gains and losses on foreign currency transactions represent net foreign exchange gains or losses from foreign currency exchange contracts, disposition of foreign currencies, currency gains or losses realized between
TURNER FUNDS 2012 SEMIANNUAL REPORT 79
NOTES TO FINANCIAL STATEMENTS (Unaudited)
trade and settlement dates on securities transactions and the difference between the amount of the investment income and foreign withholding taxes recorded on the Market Neutral Fund, the Medical Sciences Long/Short Fund, the Spectrum Fund, the Titan Fund, the Global Opportunities Fund and the International Growth Fund's books and the U.S. dollar equivalent amounts actually received or paid.
Expenses—Expenses that are specifically attributed to one of the Funds are charged to that Fund. Certain other expenses of the Funds are prorated among the Funds on the basis of relative daily net assets.
Classes—Class specific expenses are borne by that class. Income, non-class specific expenses and realized/unrealized gains and losses are allocated to the respective classes on the basis of the relative daily net assets.
Dividends and distributions—The Funds declare and distribute net investment income, if any, annually, as a dividend to shareholders. Any net realized capital gains on sales of securities for all Funds are distributed to shareholders at least annually. The Funds may utilize equalization accounting for tax purposes and designate earnings and profits, including net realized gains distributed to shareholders on redemption of shares, as a part of the dividends paid deduction for income tax purposes.
3. Transactions with affiliates:
Certain officers and trustees of the Trust are also officers or employees of Turner Investments, L.P. ("Turner", the "Adviser", or the "Administrator"), formerly known as Turner Investment Partners, Inc., or Citi Fund Services Ohio, Inc. ("Citi" or the "Sub-administrator"), the Trust's Sub-administrator. With the exception of the Trust's Chief Compliance Officer, such officers are paid no fees by the Trust for serving as officers and trustees of the Trust.
Foreside Fund Services, LLC (the "Distributor") provides distribution services to the Funds under a Distribution Services Agreement.
4. Administration, shareholder servicing, distribution and transfer agent agreements:
Turner provides administrative services to the Funds under an Administration Agreement with the Trust. For its services, Turner receives an annual fee of 0.15% of the aggregate average daily net assets of the Trust up to $2 billion and 0.12% of the aggregate average daily net assets of the Trust over $2 billion. Under a separate Sub-administration Agreement between Turner and Citi, Citi provides sub-administrative services to the Trust. For the six months ended March 31, 2012, Citi was paid $407 (000) by Turner.
The Funds have adopted a Distribution Plan for Retirement Class Shares and Class C Shares (the "Distribution Plan") under which firms, including the Distributor, that provide distribution services may receive compensation. Under the Distribution Plan, which was adopted pursuant to Rule 12b-1 under the Investment Company Act of 1940, as amended, the Distributor is entitled to receive aggregate fees for distribution services not exceeding 0.75% of the Fund's average daily net assets attributable to Retirement Class or Class C Shares that are subject to the arrangement in return for providing a broad range of distribution services. Currently, the Retirement Class Shares of the Midcap Growth Fund pay the Distributor 0.25% and the Class C Shares of the Market Neutral Fund, the Medical Sciences Long/Short Fund, the Spectrum Fund and the Titan Fund pay the Distributor 0.75% in distribution fees.
The Funds have also adopted Shareholder Services Plans (the "Shareholder Services Plans"). Under the Shareholder Services Plans, service providers are entitled to receive aggregate fees for shareholder services not exceeding 0.25% of each Fund's average daily net assets attributable to Investor Class Shares, Retirement Class Shares and Class C Shares that are subject to the arrangement in return for providing shareholder services. Currently, Investor Class Shares of each Fund, Retirement Class Shares of the Midcap Growth Fund and Class C Shares of the Market Neutral Fund, the Medical Sciences Long/Short Fund, the Spectrum Fund and the Titan Fund pay 0.25% in shareholder servicing fees.
DST Systems, Inc. serves as the transfer agent and dividend disbursing agent for the Funds under a Transfer Agency Agreement with the Trust.
5. Investment advisory agreement:
The Trust and Turner are parties to an Investment Advisory Agreement dated April 28, 1996 under which Turner receives a fee that is calculated daily and paid monthly, based on the average daily net assets of the Funds.
For its services, Turner receives annual fees, which are calculated daily and paid monthly, based on average daily net assets of the Funds. Turner has contractually agreed to waive all or a portion of its fees and to reimburse expenses in order to limit total Fund operating expenses (excluding acquired fund fees and expenses and interest expenses relating to short sales, except for the Market Neutral Fund, the Medical Sciences Long/Short Fund, the Spectrum Fund and the Titan Fund, for which Turner includes acquired fund fees and expenses and interest expenses relating to short sales in its contractual waiver) to a specified percentage of the average daily net assets of each Fund, except the All Cap Growth Fund and the
80 TURNER FUNDS 2012 SEMIANNUAL REPORT
Concentrated Growth Fund, on an annualized basis through certain dates disclosed in the following table:
| | | Advisory
fee | | Expense
cap | | Date
(through) | |
| Market Neutral Fund | |
| Institutional Class | | | 1.50 | % | | | 1.95 | % | | January 31, 2013 | |
| Investor Class | | | 1.50 | % | | | 2.20 | % | | January 31, 2013 | |
| Class C | | | 1.50 | % | | | 2.95 | % | | January 31, 2013 | |
Medical Sciences Long/Short
Fund | |
| Institutional Class | | | 1.50 | % | | | 1.95 | % | | January 31, 2013 | |
| Investor Class | | | 1.50 | % | | | 2.20 | % | | January 31, 2013 | |
| Class C | | | 1.50 | % | | | 2.95 | % | | January 31, 2013 | |
| Spectrum Fund | |
| Institutional Class | | | 1.50 | % | | | 1.95 | % | | January 31, 2013 | |
| Investor Class | | | 1.50 | % | | | 2.20 | % | | January 31, 2013 | |
| Class C | | | 1.50 | % | | | 2.95 | % | | January 31, 2013 | |
| Titan Fund | |
| Institutional Class | | | 1.50 | % | | | 1.95 | % | | January 31, 2013 | |
| Investor Class | | | 1.50 | % | | | 2.20 | % | | January 31, 2013 | |
| Class C | | | 1.50 | % | | | 2.95 | % | | January 31, 2013 | |
| Emerging Growth Fund | |
| Institutional Class | | | 1.00 | % | | | 1.15 | % | | January 31, 2013 | |
| Investor Class | | | 1.00 | % | | | 1.40 | % | | January 31, 2013 | |
| Large Growth Fund | |
| Institutional Class | | | 0.60 | % | | | 0.69 | % | | January 31, 2013 | |
| Investor Class | | | 0.60 | % | | | 0.94 | % | | January 31, 2013 | |
| Midcap Growth Fund | |
| Institutional Class | | | 0.75 | % | | | 0.93 | % | | January 31, 2013 | |
| Investor Class | | | 0.75 | % | | | 1.18 | % | | January 31, 2013 | |
| Retirement Class | | | 0.75 | % | | | 1.43 | % | | January 31, 2013 | |
| Small Cap Growth Fund | |
| Investor Class | | | 1.00 | % | | | 1.25 | % | | January 31, 2013 | |
| Global Opportunities Fund | |
| Institutional Class | | | 0.75 | % | | | 1.10 | % | | January 31, 2013 | |
| Investor Class | | | 0.75 | % | | | 1.35 | % | | January 31, 2013 | |
| International Growth Fund | |
| Institutional Class | | | 0.85 | % | | | 1.10 | % | | January 31, 2013 | |
| Investor Class | | | 0.85 | % | | | 1.35 | % | | January 31, 2013 | |
For the remaining Funds, the All Cap Growth Fund and the Concentrated Growth Fund, the advisory fee is comprised of a base fee and performance adjustment that increases or decreases the total fee depending upon the performance of the Fund relative to its performance benchmark. The Fund's base fee (1.10% for both the All Cap Growth Fund and the Concentrated Growth Fund) is accrued daily and paid monthly, based on the Fund's average net assets during the current month.
The performance adjustment is calculated and paid monthly by comparing the Fund's performance to that of its performance benchmark over the current month plus the previous 11 months (the "performance period"). The annual performance adjustment rate is multiplied by the average net assets of the Fund over the entire performance period, which is then multiplied by a fraction, the numerator of which is the number of days in the month and the denominator of which is 365 (366 in leap years). The resulting amount is then added to (in the case of overperformance) or subtracted from (in the case of underperformance) a Fund's base advisory fee.
In cases where the advisory fee is comprised of a base fee and a performance adjustment, Turner has voluntarily agreed to waive all or a portion of its fees and to reimburse expenses in order to keep such Fund's "other expenses" (excluding distribution fees, acquired fund fees and expenses and interest expenses relating to short sales) from exceeding a specified percentage of the average daily net assets of the Fund on an annualized basis. Accordingly, the base advisory fee, annual adjustment rate, over/under performance relative to the benchmark threshold, and other expense cap are as follows:
| | | Base
advisory
fee | | Annual
adjustment
rate | | Benchmark
threshold(1) | | Other
expenses
cap | |
| All Cap Growth Fund | | | 1.10 | % | | | +/-0.40% | | | | +/-2.50% | | | | 0.25 | % | |
| Concentrated Growth Fund | | | 1.10 | % | | | +/-0.40% | | | | +/-2.50% | | | | 0.25 | % | |
(1) See the Funds' Prospectus and Statement of Additional Information for more information regarding each Fund's performance benchmark.
During the six months ended March 31, 2012, the Funds' advisory fees, before waivers, were adjusted in accordance with the policy described above (000):
| | | Base
adviser
fee | | Performance
adjustment | | Net adviser
fee before
waivers | |
| All Cap Growth Fund | | $ | 172 | | | $ | (17 | ) | | $ | 156 | | |
| Concentrated Growth Fund | | | 229 | | | | (83 | ) | | | 146 | | |
6. Redemption fees:
Sales or exchanges out of the All Cap Growth Fund and the Large Growth Fund within 90 days of purchase are not currently subject to a redemption fee of 2.00%, but may be in the future. The Funds will provide notice to shareholders before they implement the redemption fee.
7. Contingent deferred sales charges (Class C Shares):
A 1.00% contingent deferred sales charge ("CDSC") will be deducted with respect to the Market Neutral Fund, the Medical Sciences Long/Short Fund, the Spectrum Fund and the Titan Fund Class C Shares, redeemed within 12 months of purchase. The CDSC will be based on the lower of the original purchase price or the value of the Class C Shares redeemed. The CDSC may be waived for certain investors, as described in the Market Neutral Fund, the Medical Sciences Long/Short Fund, the Spectrum Fund and the Titan Fund Class C statutory prospectus.
TURNER FUNDS 2012 SEMIANNUAL REPORT 81
NOTES TO FINANCIAL STATEMENTS (Unaudited)
8. Investment transactions:
The cost of security purchases and the proceeds from security sales, other than short-term investments, for the six months ended March 31, 2012 were as follows (000):
| | | Purchases | | Sales | |
| Market Neutral Fund | | $ | 195,613 | | | $ | 162,263 | | |
| Medical Sciences Long/Short Fund | | | 146,257 | | | | 116,399 | | |
| Spectrum Fund | | | 2,734,916 | | | | 2,451,600 | | |
| Titan Fund | | | 64,682 | | | | 59,183 | | |
| All Cap Growth Fund | | | 27,785 | | | | 35,628 | | |
| Concentrated Growth Fund | | | 36,270 | | | | 39,503 | | |
| Emerging Growth Fund | | | 86,333 | | | | 87,931 | | |
| Large Growth Fund | | | 273,649 | | | | 377,864 | | |
| Midcap Growth Fund | | | 402,601 | | | | 474,139 | | |
| Small Cap Growth Fund | | | 128,295 | | | | 149,816 | | |
| Global Opportunities Fund | | | 535 | | | | 614 | | |
| International Growth Fund | | | 10,013 | | | | 7,066 | | |
9. Federal tax policies and information:
Each of the Funds is classified as a separate taxable entity for Federal income tax purposes. Each of the Funds intends to continue to qualify as a separate "regulated investment company" under the Internal Revenue Code and make the requisite distributions to shareholders that will be sufficient to relieve it from Federal income tax and Federal excise tax. Therefore, no Federal tax provision is required.
The amounts of dividends from net investment income and distributions from net realized capital gains, if any, are determined in accordance with Federal income tax regulations, which may differ from those amounts determined under GAAP. These book/tax differences are either temporary or permanent in nature. These differences are primarily due to wash sales, REIT adjustments, expired capital loss carryforwards, foreign currency transactions, redemption-in-kind transactions, net operating losses and investments in partnerships and passive foreign investment companies. The character and timing of dividends from net investment income and distributions from net realized gains distributed during the fiscal year may differ from the year that the income or realized gains (losses) were recorded by the Funds. To the extent these differences are permanent, adjustments are made to the appropriate equity accounts in the period that the differences arise.
The tax character of dividends and distributions declared during the years ended September 30, 2011 and September 30, 2010 were as follows (000):
| | | Ordinary
income | | Long-term
capital gain | | Return of
capital | | Total | |
| Market Neutral Fund | | | |
| | 2011 | | | $ | — | | | $ | — | | | $ | — | | | $ | — | | |
| | 2010 | | | | — | | | | — | | | | — | | | | — | | |
Medical Sciences
Long/Short Fund | | | |
| | 2011 | | | $ | — | | | $ | — | | | $ | — | | | $ | — | | |
| | 2010 | | | | — | | | | — | | | | — | | | | — | | |
| Spectrum Fund | | | |
| | 2011 | | | $ | — | | | $ | — | | | $ | — | | | $ | — | | |
| | 2010 | | | | 142 | | | | — | | | | — | | | | 142 | | |
| Titan Fund | | | |
| | 2011 | | | $ | — | | | $ | — | | | $ | — | | | $ | — | | |
| | 2010 | | | | — | | | | — | | | | — | | | | — | | |
| All Cap Growth Fund | | | |
| | 2011 | | | $ | — | | | $ | — | | | $ | — | | | $ | — | | |
| | 2010 | | | | 22 | | | | — | | | | 1 | | | | 23 | | |
Concentrated Growth
Fund | | | |
| | 2011 | | | $ | — | | | $ | — | | | $ | — | | | $ | — | | |
| | 2010 | | | | 120 | | | | — | | | | 1 | | | | 121 | | |
| Emerging Growth Fund | | | |
| | 2011 | | | $ | — | | | $ | — | | | $ | — | | | $ | — | | |
| | 2010 | | | | — | | | | — | | | | — | | | | — | | |
| Large Growth Fund | | | |
| | 2011 | | | $ | 671 | | | $ | — | | | $ | — | | | $ | 671 | | |
| | 2010 | | | | 2,287 | | | | — | | | | — | | | | 2,287 | | |
| Midcap Growth Fund | | | |
| | 2011 | | | $ | — | | | $ | — | | | $ | — | | | $ | — | | |
| | 2010 | | | | — | | | | — | | | | — | | | | — | | |
| Small Cap Growth Fund | | | |
| | 2011 | | | $ | — | | | $ | — | | | $ | — | | | $ | — | | |
| | 2010 | | | | — | | | | — | | | | — | | | | — | | |
Global Opportunities
Fund | | | |
| | 2011 | | | $ | — | | | $ | — | | | $ | — | | | $ | — | | |
| | 2010 | | | | — | | | | — | | | | — | | | | — | | |
International Growth
Fund | | | |
| | 2011 | | | $ | 49 | | | $ | — | | | $ | — | | | $ | 49 | | |
| | 2010 | | | | 59 | | | | — | | | | — | | | | 59 | | |
As of September 30, 2011, the components of distributable earnings (accumulated losses) on a tax basis were as follows (000):
| | | Undistributed
ordinary
income | | Undistributed
long-term
capital gains | | Capital
loss
carryforward | | Post-
October
losses | | Post-
October
currency
losses | | Unrealized
appreciation
(depreciation) | | Other
temporary
differences | | Total
distributable
earnings
(accumulated
losses) | |
| Market Neutral Fund | | $ | 267 | | | $ | — | | | $ | — | | | $ | — | | | $ | — | | | $ | (91 | ) | | $ | — | | | $ | 176 | | |
Medical Sciences
Long/Short Fund | | | — | | | | — | | | | — | | | | — | | | | — | | | | (452 | ) | | | — | | | | (452 | ) | |
| Spectrum Fund | | | 29,763 | | | | — | | | | — | | | | — | | | | (225 | ) | | | (27,042 | ) | | | — | | | | 2,496 | | |
| Titan Fund | | | 151 | | | | — | | | | — | | | | — | | | | — | | | | (683 | ) | | | — | | | | (532 | ) | |
| All Cap Growth Fund | | | — | | | | — | | | | (13,404 | ) | | | — | | | | — | | | | (54 | ) | | | — | | | | (13,458 | ) | |
Concentrated Growth
Fund | | | — | | | | — | | | | (27,895 | ) | | | — | | | | — | | | | 2,071 | | | | — | | | | (25,824 | ) | |
82 TURNER FUNDS 2012 SEMIANNUAL REPORT
| | | Undistributed
ordinary
income | | Undistributed
long-term
capital gains | | Capital
loss
carryforward | | Post-
October
losses | | Post-
October
currency
losses | | Unrealized
appreciation
(depreciation) | | Other
temporary
differences | | Total
distributable
earnings
(accumulated
losses) | |
| Emerging Growth Fund | | $ | — | | | $ | — | | | $ | (10,442 | ) | | $ | — | | | $ | — | | | $ | 50,974 | | | $ | — | | | $ | 40,532 | | |
| Large Growth Fund | | | — | | | | — | | | | (178,397 | ) | | | — | | | | — | | | | 24,101 | | | | — | | | | (154,296 | ) | |
| Midcap Growth Fund | | | — | | | | — | | | | (93,627 | ) | | | — | | | | — | | | | 66,569 | | | | — | | | | (27,058 | ) | |
| Small Cap Growth Fund | | | — | | | | — | | | | (5,854 | ) | | | — | | | | — | | | | (9,627 | ) | | | — | | | | (15,481 | ) | |
| Global Opportunities Fund | | | 14 | | | | 28 | | | | — | | | | — | | | | (3 | ) | | | 36 | | | | — | | | | 75 | | |
| International Growth Fund | | | — | | | | — | | | | (513 | ) | | | — | | | | — | | | | (1,552 | ) | | | — | | | | (2,065 | ) | |
Post-October losses represent losses realized on investment transactions from November 1, 2010 through September 30, 2011 that, in accordance with Federal income tax regulations, a Fund may elect to defer and treat as having arisen in the following fiscal year. For Federal income tax purposes, capital loss carryforwards may be carried forward and applied against future capital gains.
At September 30, 2011, the Funds had capital loss carryforwards available to offset future realized capital gains through the indicated expiration dates (000):
| | | Expiring September 30, | |
| | | 2016 | | 2017 | | 2018 | | Total | |
| Market Neutral Fund | | $ | — | | | $ | — | | | $ | — | | | $ | — | | |
| Medical Sciences Long/Short Fund | | | — | | | | — | | | | — | | | | — | | |
| Spectrum Fund | | | — | | | | — | | | | — | | | | — | | |
| Titan Fund | | | — | | | | — | | | | — | | | | — | | |
| All Cap Growth Fund | | | — | | | | 11,014 | | | | 2,390 | | | | 13,404 | | |
| Concentrated Growth Fund | | | 172 | | | | — | | | | 27,723 | | | | 27,895 | | |
| Emerging Growth Fund | | | — | | | | — | | | | 10,442 | | | | 10,442 | | |
| Large Growth Fund | | | — | | | | 88,955 | | | | 89,442 | | | | 178,397 | | |
| Midcap Growth Fund | | | — | | | | 4,041 | | | | 89,586 | | | | 93,627 | | |
| Small Cap Growth Fund | | | — | | | | — | | | | 5,854 | | | | 5,854 | | |
| Global Opportunities Fund | | | — | | | | — | | | | — | | | | — | | |
| International Growth Fund | | | — | | | | 437 | | | | 77 | | | | 514 | | |
The Regulated Investment Company Modernization Act of 2010 (the "Modernization Act"), was signed into law on December 22, 2010. The Modernization Act makes a number of changes to the provisions in the Internal Revenue Code of 1986, as amended, relating to regulated investment companies ("RICs") that will generally become effective for taxable years beginning after December 22, 2010. The Modernization Act allows RICs to generally carryover net capital losses indefinitely, effective for losses arising in taxable years beginning after December 22, 2010. Such losses will retain their character as either long-term capital losses or short-term capital losses. Under pre-enactment law, capital losses could be carried forward for eight years as short-term losses irrespective of the character of the original loss. Loss carryovers from years beginning prior to December 23, 2010 will still expire subject to the eight-year limitation. The Modernization Act further provides that losses arising in taxable years beginning after December 22, 2010 must utilized prior to loss carryovers arising in taxable years beginning prior to December 23, 2010. As a result of this ordering rule, capital loss carryforwards related to the taxable years beginning prior to the effective date of the Act may have an increased likelihood to expire unused.
At March 31, 2012, the total cost of securities for Federal income tax purposes and the aggregate gross unrealized appreciation and depreciation for the investments held by the Fund, excluding securities sold short and written options, were as follows (000):
| | | Federal
tax
cost | | Unrealized
appreciation | | Unrealized
depreciation | | Net
unrealized
appreciation
(depreciation) | |
| Market Neutral Fund | | $ | 50,700 | | | $ | 788 | | | $ | (537 | ) | | $ | 251 | | |
| Medical Sciences Long/Short Fund | | | 74,840 | | | | 1,905 | | | | (259 | ) | | | 1,646 | | |
| Spectrum Fund | | | 748,743 | | | | 26,470 | | | | (7,921 | ) | | | 18,549 | | |
| Titan Fund | | | 18,370 | | | | 1,129 | | | | (83 | ) | | | 1,046 | | |
| All Cap Growth Fund | | | 27,586 | | | | 5,617 | | | | (517 | ) | | | 5,100 | | |
TURNER FUNDS 2012 SEMIANNUAL REPORT 83
NOTES TO FINANCIAL STATEMENTS (Unaudited)
| | | Federal
tax
cost | | Unrealized
appreciation | | Unrealized
depreciation | | Net
unrealized
appreciation
(depreciation) | |
| Concentrated Growth Fund | | $ | 37,966 | | | $ | 6,852 | | | $ | (757 | ) | | $ | 6,095 | | |
| Emerging Growth Fund | | | 216,228 | | | | 89,565 | | | | (3,965 | ) | | | 85,600 | | |
| Large Growth Fund | | | 375,464 | | | | 77,575 | | | | (5,819 | ) | | | 71,756 | | |
| Midcap Growth Fund | | | 703,296 | | | | 180,757 | | | | (15,685 | ) | | | 165,072 | | |
| Small Cap Growth Fund | | | 278,271 | | | | 53,027 | | | | (4,249 | ) | | | 48,778 | | |
| Global Opportunities Fund | | | 1,310 | | | | 406 | | | | (25 | ) | | | 381 | | |
| International Growth Fund | | | 15,359 | | | | 1,515 | | | | (167 | ) | | | 1,348 | | |
Management has analyzed the Funds' tax positions taken on Federal income tax returns for all open tax years and has concluded that as of March 31, 2012, no provision for income tax would be required in the Funds' financial statements. The Funds' Federal and State income and Federal excise tax returns for tax years for which the applicable statutes of limitations have not expired are subject to examination by the Internal Revenue Service and state taxing authorities.
10. Concentration/risks:
Certain Funds invest a high percentage of their assets in specific sectors of the market in order to achieve a potentially greater investment return. As a result, these Funds may be more susceptible to economic, political, and regulatory developments in a particular sector of the market, positive or negative, and may experience increased volatility on the Fund's net asset value and magnified effect on the total return.
The Funds enter into contracts that contain a variety of indemnifications. The Funds' maximum exposure under these arrangements is unknown. However, the Funds have not had prior claims or losses pursuant to these contracts and expect the risk of loss to be remote.
11. Loans of portfolio securities:
The Funds may lend securities in their portfolio pursuant to a securities lending agreement ("Lending Agreement") with Morgan Stanley. Unless otherwise agreed, security loans, made pursuant to the Lending Agreement are required at all times to be secured by collateral equal to at least 100% of the market value of the securities loaned. Cash collateral received is invested in the BlackRock TempCash Fund, Institutional Shares, a money market fund. All such investments are made at the risk of the Funds and, as such, the Funds are liable for investment losses. The Funds receive an annual fee for their participation in the Lending Agreement based on projected lending activity.
In the event of bankruptcy of the borrower, realization/retention of the collateral may be subject to legal proceedings.
At March 31, 2012, the following Funds had securities on loan (000):
| Fund | | Value of Securities
on Loan (000) | | Value of
Collateral (000) | |
| All Cap Growth Fund | | $ | 75 | | | $ | 76 | | |
| Emerging Growth Fund | | | 39,297 | | | | 40,208 | | |
| Large Growth Fund | | | 7,937 | | | | 7,988 | | |
| Midcap Growth Fund | | | 55,059 | | | | 56,218 | | |
| Small Cap Growth Fund | | | 52,112 | | | | 53,858 | | |
12. Derivative contracts:
Written Options—A summary of option contracts written during the six months ended March 31, 2012 for the Spectrum Fund is as follows:
| | | Option
contracts | | Option
premiums
(000) | |
| Options outstanding at beginning of year | | | — | | | $ | — | | |
| Options written | | | 11,418 | | | | 1,010 | | |
Options cancelled in a closing
purchase transaction | | | (6,604 | ) | | | (490 | ) | |
| Options expired | | | (3,437 | ) | | | (132 | ) | |
| Options outstanding at end of period | | | 1,377 | | | $ | 388 | | |
13. In-kind transactions:
During the year ended September 30, 2011, the Emerging Growth Fund distributed securities in lieu of cash for shareholder redemptions. The shareholders received a pro-rata portion of the Emerging Growth Fund's holdings based on shares outstanding. The value of the redemption was as follows:
| Date | | Redemption
(000) | | Securities
(000) | | Cash
(000) | | Realized gain
(000) | | Fund shares redeemed | |
| 9/1/11 | | $ | 260,853 | | | $ | 238,656 | | | $ | 22,197 | | | $ | 35,229 | | | | 5,266,997 | | |
84 TURNER FUNDS 2012 SEMIANNUAL REPORT
During the six months ended March 31, 2012, there were no in-kind transactions.
These transactions were completed pursuant to procedures adopted by the Board. These procedures are designed to minimize or eliminate any adverse tax implications to the Funds and their shareholders.
14. Fund merger:
On March 7, 2011, the Large Growth Fund acquired all of the net assets of the Large Cap Growth Fund, an open-end investment company, pursuant to a Plan of Reorganization approved by the Large Cap Growth Fund shareholders on February 28, 2011. The purpose of the transaction was to combine the two Funds managed by the Adviser with similar investment objectives and policies. The acquisition was accomplished by a tax-free exchange of 10,966,460 Institutional Class shares and 119,229 Investor Class shares of the Large Growth Fund, valued at $140,366 (000) and $1,518 (000), respectively, for 23,818,691 Institutional Class shares and 258,725 Investor Class shares of the Large Cap Growth Fund outstanding on March 7, 2011. The exchange ratios (Large Growth Fund shares issued/Large Cap Growth Fund shares outstanding) were 0.46:1 and 0.46:1 for the Institutional Class and Investor Class, respectively.
The investment portfolio of the Large Cap Growth Fund, with a fair value of $141,865 (000) and identified cost of $110,699 (000) at March 7, 2011, was the principal asset acquired by the Large Growth Fund. For financial reporting purposes, assets received and shares issued by the Large Growth Fund were recorded at fair value; however, the cost basis of the investments received from the Large Cap Growth Fund was carried forward to align ongoing reporting of the Large Growth Fund's realized and unrealized gains and losses with amounts distributable to shareholders for tax purposes.
Upon the business combination of the Funds on March 7, 2011, the net assets of the Large Cap Growth Fund, which included portfolio capital of $123,626 (000), accumulated net investment loss of $39 (000), accumulated realized losses of $12,869 (000) and unrealized gains of $31,165 (000), combined with the Large Growth Fund were $666,940 (000). The undistributed net investment income and unrealized gains of the Large Cap Growth Fund may be distributed by the Large Growth Fund in future periods. Immediately prior to the merger, the net assets (000) of the Large Cap Growth Fund and the Large Growth Fund were $141,884 and $525,056, respectively. All fees and expenses incurred by the Large Cap Growth Fund and the Large Growth Fund directly in connection with the Plan of Reorganization were borne by the Adviser.
Assuming the acquisition had been completed on October 1, 2010, the beginning of the annual reporting period of the Large Growth Fund, the Fund's pro forma results of operations for the year ended September 30, 2011, are as follows (000):
| Net investment income/(loss): | | $ | (393 | ) | |
| Net realized/unrealized gains/(losses): | | | 39,672 | | |
| Change in net assets resulting from operations: | | $ | 39,279 | | |
Because the combined investment portfolios have been managed as a single integrated portfolio since the acquisition was completed, it is not practicable to separate the amounts of revenue and earnings of the Large Cap Growth Fund that have been included in the Large Growth Fund Statement of Operations since March 7, 2011.
15. Subsequent events:
The Trust has evaluated the need for disclosures and/or adjustments resulting from subsequent events through the date the financial statements were issued. Based on this evaluation, no additional disclosures were required to the financial statements as of March 31, 2012.
TURNER FUNDS 2012 SEMIANNUAL REPORT 85
BOARD OF TRUSTEES CONSIDERATIONS IN APPROVING THE ADVISORY AGREEMENT (Unaudited)
Board of Trustees considerations in approving the Advisory Agreement
On February 17, 2012, the Board of Trustees (the "Board" or "Trustees") of the Turner Funds (the "Funds" or the "Trust") held a meeting to decide whether to renew the advisory agreement for each of the Turner Funds (the "Advisory Agreement") with Turner Investments, L.P. ("Turner" or the "Adviser") for the upcoming year. In preparation for the meeting, the Board requested and reviewed a wide variety of information from the Adviser. The materials described, among other things: the Adviser's business; the Adviser's organizational structure, personnel and operations; advisory services; the Funds' performance; compliance; advisory fees and expenses paid by the Funds for the fiscal year ended September 30, 2011; and information on trading. At the meeting, representatives of the Adviser discussed, and answered Board members' questions about, among other things, a chart of advisory fees received by the Adviser for the various Funds; a schedule of the commissions paid to the Trust's top 10 brokers; a soft dollar commission usage report; the Adviser's Form ADVs; and a profitability report for the Adviser for the fiscal year ended September 30, 2011, including its net profitability before distribution expenses.
The Board, including all of the independent Trustees, considered, among other things: (1) the nature, extent and quality of the services provided by the Adviser; (2) the performance of the Funds over the past one, three, five and ten years, where applicable, versus each Fund's respective Lipper peer universe; (3) the contractual and actual compensation to be paid under the agreements as compared to the compensation paid to relevant Lipper peer groups; (4) the expense ratios of the Funds, with expense waivers, as compared to expense ratios for relevant Lipper peer groups; (5) the qualifications of the Adviser's personnel, portfolio management capabilities and investment methodologies; (6) the Adviser's operations, compliance program and policies; (7) the financial condition of the Adviser; (8) the cost of services provided by the Adviser and the Adviser's profitability from each Fund for the year ended September 30, 2011; (9) "fall-out" benefits to the Adviser and its affiliates from the relationship with the Funds; (10) the extent to which economies of scale are relevant given the Funds' current asset size and current asset growth potential; and (11) a comparison of the fees charged by the Adviser with fees charged by the Adviser to similar clients, to the extent the Board deemed it relevant.
After deliberating on all the materials reviewed and reported, the independent Trustees reached the following conclusions, among others, regarding the Adviser and the advisory agreements; the recent performance of the Funds was, in most cases, within industry norms. They determined that although performance lagged peer groups in the case of several Funds, the Adviser had helped the performance of the Funds, and the Funds' recent performance was, in general satisfactory. Moreover, the Trustees noted the firms' success in launching a range of alternative investment products to serve shareholders to complement the firm's long-standing growth product line, and discussed and recognized the need for a different fee structure for these alternative products. The independent Trustees also concluded that the Funds' net total expense ratios and advisory fees were generally competitive. The independent Trustees also concluded that: they were satisfied with the quality of services provided by the Adviser in advising the existing Funds; the profits earned by the Adviser seemed reasonable in light of the nature, extent and quality of the services provided to each existing Fund; and that each Fund, and the Trust, was not large enough to attain significant economies of scale, beyond those already incorporated into the fee structures.
Based on the Board's deliberations and its evaluation of the information described above, the Trustees, including all of the independent Trustees, unanimously (a) concluded to renew the Advisory Agreement for another year and (b) determined that the compensation payable by the Trust's Funds under the Advisory Agreement is fair and reasonable.
86 TURNER FUNDS 2012 SEMIANNUAL REPORT
DISCLOSURE OF FUND EXPENSES (Unaudited)
All mutual funds have operating expenses. As a shareholder of a mutual fund, your investment is affected by these on-going costs, which include (among others) costs for portfolio management, distribution (12b-1) and/or shareholder services and other expenses. It is important for you to understand the impact of these costs on your investment returns. Operating expenses such as these are deducted from a mutual fund's gross income and directly reduce its final investment return. These expenses are expressed as a percentage of a mutual fund's average net assets; this percentage is known as a mutual fund's expense ratio.
The following examples use the expense ratio and are intended to help you understand the ongoing costs (in dollars) of investing in your Fund and to compare these costs with those other mutual funds. The examples are based on an investment of $1,000 made at the beginning of the period shown and held for the entire period.
The table below and on the next page illustrates your Fund's costs in two ways:
• Actual Fund Return. This section helps you estimate the actual expenses after fee waivers that your Fund incurred over the period. The "Expenses Paid During Period" column shows the actual dollar expense cost incurred by a $1,000 investment in the Fund, and the "Ending Account Value" number is derived from deducting that expense cost from the Fund's gross investment return.
You can use this information, together with the actual amount you invested in the Fund, to estimate the expenses you paid over that period. Simply divide your actual account value by $1,000 to arrive at a ratio (for example, an $8,600 account value divided by $1,000 = 8.6), then multiply that ratio by the number shown for your Fund under "Expenses Paid During Period."
• Hypothetical 5% Return. This section helps you compare your Fund's cost with those of other mutual funds. It provides information about hypothetical account values and expenses based on the Fund's actual expense ratio (column 3) and an assumed rate of return of 5% per year before expenses, which is not the Fund's actual return. This section is useful in making comparisons because the Securities and Exchange Commission requires all mutual funds to make this 5% calculation. You can assess your Fund's comparative cost by comparing the hypothetical result for your Fund in the "Expenses Paid During Period" column with those that appear in the same charts in the shareholder reports for other mutual funds.
Note: Because the return is set at 5% for comparison purposes — NOT your Fund's actual return — the hypothetical account values and expenses may not be used to estimate your actual ending account balance or expenses you paid for the period.
| | | Beginning
Account
Value
10/1/11 | | Ending
Account
Value
3/31/12 | | Annualized
Expense
Ratios | | Expenses
Paid
During
Period* | |
| Turner Market Neutral Fund — Institutional Class Shares | |
| Actual Fund Return | | $ | 1,000.00 | | | $ | 1,002.20 | | | | 1.93 | % | | $ | 9.66 | | |
Hypothetical
5% Return | | | 1,000.00 | | | | 1,015.35 | | | | 1.93 | | | | 9.72 | | |
| Turner Market Neutral Fund — Investor Class Shares | |
| Actual Fund Return | | | 1,000.00 | | | | 1,000.30 | | | | 2.18 | | | | 10.90 | | |
Hypothetical
5% Return | | | 1,000.00 | | | | 1,014.10 | | | | 2.18 | | | | 10.98 | | |
| Turner Market Neutral Fund — Class C Shares | |
| Actual Fund Return | | | 1,000.00 | | | | 997.40 | | | | 2.93 | | | | 14.63 | | |
Hypothetical
5% Return | | | 1,000.00 | | | | 1,010.35 | | | | 2.93 | | | | 14.73 | | |
Turner Medical Sciences Long/Short Fund —
Institutional Class Shares | |
| Actual Fund Return | | | 1,000.00 | | | | 986.50 | | | | 1.85 | | | | 9.19 | | |
Hypothetical
5% Return | | | 1,000.00 | | | | 1,015.75 | | | | 1.85 | | | | 9.32 | | |
| Turner Medical Sciences Long/Short Fund — Investor Class Shares | |
| Actual Fund Return | | | 1,000.00 | | | | 985.50 | | | | 2.10 | | | | 10.42 | | |
Hypothetical
5% Return | | | 1,000.00 | | | | 1,014.50 | | | | 2.10 | | | | 10.58 | | |
| | | Beginning
Account
Value
10/1/11 | | Ending
Account
Value
3/31/12 | | Annualized
Expense
Ratios | | Expenses
Paid
During
Period* | |
| Turner Medical Sciences Long/Short Fund — Class C Shares | |
| Actual Fund Return | | $ | 1,000.00 | | | $ | 981.60 | | | | 2.85 | % | | $ | 14.12 | | |
Hypothetical
5% Return | | | 1,000.00 | | | | 1,010.75 | | | | 2.85 | | | | 14.33 | | |
| Turner Spectrum Fund — Institutional Class Shares | |
| Actual Fund Return | | | 1,000.00 | | | | 1,017.80 | | | | 1.86 | | | | 9.38 | | |
Hypothetical
5% Return | | | 1,000.00 | | | | 1,015.70 | | | | 1.86 | | | | 9.37 | | |
| Turner Spectrum Fund — Investor Class Shares | |
| Actual Fund Return | | | 1,000.00 | | | | 1,016.20 | | | | 2.11 | | | | 10.64 | | |
Hypothetical
5% Return | | | 1,000.00 | | | | 1,014.45 | | | | 2.11 | | | | 10.63 | | |
| Turner Spectrum Fund — Class C Shares | |
| Actual Fund Return | | | 1,000.00 | | | | 1,012.70 | | | | 2.87 | | | | 14.44 | | |
Hypothetical
5% Return | | | 1,000.00 | | | | 1,010.65 | | | | 2.87 | | | | 14.43 | | |
| Turner Titan Fund — Institutional Class Shares | |
| Actual Fund Return | | | 1,000.00 | | | | 1,074.00 | | | | 1.90 | | | | 9.85 | | |
Hypothetical
5% Return | | | 1,000.00 | | | | 1,015.50 | | | | 1.90 | | | | 9.57 | | |
TURNER FUNDS 2012 SEMIANNUAL REPORT 87
DISCLOSURE OF FUND EXPENSES (Unaudited)
| | | Beginning
Account
Value
10/1/11 | | Ending
Account
Value
3/31/12 | | Annualized
Expense
Ratios | | Expenses
Paid
During
Period* | |
| Turner Titan Fund — Investor Class Shares | |
| Actual Fund Return | | $ | 1,000.00 | | | $ | 1,073.00 | | | | 2.15 | % | | $ | 11.14 | | |
Hypothetical
5% Return | | | 1,000.00 | | | | 1,014.25 | | | | 2.15 | | | | 10.83 | | |
| Turner Titan Fund — Class C Shares | |
| Actual Fund Return | | | 1,000.00 | | | | 1,068.20 | | | | 2.90 | | | | 14.99 | | |
Hypothetical
5% Return | | | 1,000.00 | | | | 1,010.50 | | | | 2.90 | | | | 14.58 | | |
| Turner All Cap Growth Fund — Investor Class Shares | |
| Actual Fund Return | | | 1,000.00 | | | | 1,226.90 | | | | 1.24 | | | | 6.90 | | |
Hypothetical
5% Return | | | 1,000.00 | | | | 1,018.80 | | | | 1.24 | | | | 6.26 | | |
| Turner Concentrated Growth Fund — Investor Class Shares | |
| Actual Fund Return | | | 1,000.00 | | | | 1,260.10 | | | | 0.95 | | | | 5.37 | | |
Hypothetical
5% Return | | | 1,000.00 | | | | 1,020.25 | | | | 0.95 | | | | 4.80 | | |
| Turner Emerging Growth Fund — Institutional Class Shares | |
| Actual Fund Return | | | 1,000.00 | | | | 1,248.70 | | | | 1.15 | | | | 6.47 | | |
Hypothetical
5% Return | | | 1,000.00 | | | | 1,019.25 | | | | 1.15 | | | | 5.81 | | |
| Turner Emerging Growth Fund — Investor Class Shares | |
| Actual Fund Return | | | 1,000.00 | | | | 1,247.60 | | | | 1.40 | | | | 7.87 | | |
Hypothetical
5% Return | | | 1,000.00 | | | | 1,018.00 | | | | 1.40 | | | | 7.06 | | |
| Turner Large Growth Fund — Institutional Class Shares | |
| Actual Fund Return | | | 1,000.00 | | | | 1,260.00 | | | | 0.69 | | | | 3.90 | | |
Hypothetical
5% Return | | | 1,000.00 | | | | 1,021.55 | | | | 0.69 | | | | 3.49 | | |
| Turner Large Growth Fund — Investor Class Shares | |
| Actual Fund Return | | | 1,000.00 | | | | 1,259.10 | | | | 0.94 | | | | 5.31 | | |
Hypothetical
5% Return | | | 1,000.00 | | | | 1,020.30 | | | | 0.94 | | | | 4.75 | | |
| | | Beginning
Account
Value
10/1/11 | | Ending
Account
Value
3/31/12 | | Annualized
Expense
Ratios | | Expenses
Paid
During
Period* | |
| Turner Midcap Growth Fund — Institutional Class Shares | |
| Actual Fund Return | | $ | 1,000.00 | | | $ | 1,230.10 | | | | 0.93 | % | | $ | 5.18 | | |
Hypothetical
5% Return | | | 1,000.00 | | | | 1,020.35 | | | | 0.93 | | | | 4.70 | | |
| Turner Midcap Growth Fund — Investor Class Shares | |
| Actual Fund Return | | | 1,000.00 | | | | 1,229.40 | | | | 1.18 | | | | 6.58 | | |
Hypothetical
5% Return | | | 1,000.00 | | | | 1,019.10 | | | | 1.18 | | | | 5.96 | | |
| Turner Midcap Growth Fund — Retirement Class Shares | |
| Actual Fund Return | | | 1,000.00 | | | | 1,212.70 | | | | 1.43 | | | | 7.91 | | |
Hypothetical
5% Return | | | 1,000.00 | | | | 1,017.85 | | | | 1.43 | | | | 7.21 | | |
| Turner Small Cap Growth Fund — Investor Class Shares | |
| Actual Fund Return | | | 1,000.00 | | | | 1,298.20 | | | | 1.25 | | | | 7.18 | | |
Hypothetical
5% Return | | | 1,000.00 | | | | 1,018.75 | | | | 1.25 | | | | 6.31 | | |
| Turner Global Opportunities Fund — Institutional Class Shares | |
| Actual Fund Return | | | 1,000.00 | | | | 1,269.60 | | | | 1.10 | | | | 6.24 | | |
Hypothetical
5% Return | | | 1,000.00 | | | | 1,019.50 | | | | 1.10 | | | | 5.55 | | |
| Turner Global Opportunities Fund — Investor Class Shares | |
| Actual Fund Return | | | 1,000.00 | | | | 1,268.20 | | | | 1.35 | | | | 7.66 | | |
Hypothetical
5% Return | | | 1,000.00 | | | | 1,018.25 | | | | 1.35 | | | | 6.81 | | |
| Turner International Growth Fund — Institutional Class Shares | |
| Actual Fund Return | | | 1,000.00 | | | | 1,209.60 | | | | 1.10 | | | | 6.08 | | |
Hypothetical
5% Return | | | 1,000.00 | | | | 1,019.50 | | | | 1.10 | | | | 5.55 | | |
| Turner International Growth Fund — Investor Class Shares | |
| Actual Fund Return | | | 1,000.00 | | | | 1,208.30 | | | | 1.35 | | | | 7.45 | | |
Hypothetical
5% Return | | | 1,000.00 | | | | 1,018.25 | | | | 1.35 | | | | 6.81 | | |
* Unless otherwise indicated, expenses are equal to the Fund's annualized expense ratio multiplied by the average account value over the period, multiplied by 183/366 (to reflect the one-half year period from 10/1/11—3/31/12).
88 TURNER FUNDS 2012 SEMIANNUAL REPORT
Turner Funds
Turner Funds' trustees
Alfred C. Salvato
Chief Investment Officer & Treasurer
Thomas Jefferson University
Janet F. Sansone
Executive Director
JFS Consulting
Thomas R. Trala, Jr.
Executive Managing Director & Chief Operating Officer
Turner Investments, L.P.
Dr. John T. Wholihan
Professor (Retired), Dean Emeritus, College of Business
Loyola Marymount University
Investment advisers
Turner Investments, L.P.
Berwyn, Pennsylvania
Distributor
Foreside Fund Services, LLC
Portland, Maine
Administrator
Turner Investments, L.P.
Berwyn, Pennsylvania
Independent Registered Public Accounting Firm
KPMG LLP
Philadelphia, Pennsylvania
This report was prepared for shareholders of the Turner Funds. It may be distributed to others only if preceded or accompanied by a Turner Funds' Prospectus, which contains detailed information. All Turner Funds are offered by prospectus only.
The Funds file their complete schedules of portfolio holdings with the Securities and Exchange Commission (the "Commission") for the first and third quarters of each fiscal year on Form N-Q within sixty days after the end of the period. The Funds' Forms N-Q are available on the Commission's Web site at http://www.sec.gov, and may be reviewed and copied at the Commission's Public Reference Room in Washington, DC. Information on the operation of the Public Reference Room may be obtained by calling 1-800-SEC-0330.
The Board of Trustees of the Turner Funds has delegated responsibility for decisions regarding proxy voting for securities held by each Fund to Turner Investments, L.P. Turner Investments, L.P. will vote such proxies in accordance with its proxy policies and procedures, which are included in Appendix B to the SAI. The Board of Trustees will periodically review each Fund's proxy voting record.
A description of the policies and procedures that the Funds use to determine how to vote proxies relating to portfolio securities, as well as information relating to how the Fund voted proxies relating to portfolio securities during the most recent 12-month period ended June 30, is available (i) via the Funds' Web site, www.turnerinvestments.com; (ii) on the Commission's Web site at http://www.sec.gov; and (iii) without charge by calling 1.800.224.6312.
TURNER FUNDS 2012 SEMIANNUAL REPORT 89
THIS PAGE WAS INTENTIONALLY LEFT BLANK
90 TURNER FUNDS 2012 SEMIANNUAL REPORT
THIS PAGE WAS INTENTIONALLY LEFT BLANK
TURNER FUNDS 2012 SEMIANNUAL REPORT 91
THIS PAGE WAS INTENTIONALLY LEFT BLANK
92 TURNER FUNDS 2012 SEMIANNUAL REPORT

Turner Funds
P.O. Box 219805
Kansas City, Missouri 64121-9805
Telephone: 1.800.224.6312
Email: mutualfunds@turnerinvestments.com
Web Site: www.turnerinvestments.com
TUR-SA-002-0506
Item 2. Code of Ethics.
Not applicable for semiannual report.
Item 3. Audit Committee Financial Expert.
Not applicable for semiannual report.
Item 4. Principal Accountant Fees and Services.
Not applicable for semiannual report.
Item 5. Audit Committee of Listed Registrants.
Not applicable to open-end management investment companies.
Item 6. Schedule of Investments.
(a) Schedule of Investments is included as part of report to shareholders filed under Item 1.
Item 7. Disclosure of Proxy Voting Policies and Procedures for Closed-End Management Investment Companies.
Not applicable to open-end management investment companies.
Item 8. Portfolio Managers of Closed-End Management Investment Companies.
Not applicable to open-end management investment companies.
Item 9. Purchases of Equity Securities by Closed-End Management Investment Company and Affiliated Purchasers.
Not applicable to open-end management investment companies.
Item 10. Submission of Matters to a Vote of Security Holders.
There have been no material changes to the procedures by which shareholders may recommend nominees to the registrant’s Board of Trustees since the registrant’s last proxy solicitation.
Item 11. Controls and Procedures.
(a) The registrant’s Principal Executive Officer and Principal Financial Officer concluded that the registrant’s disclosure controls and procedures (as defined in Rule 30a-3(c) under the Investment Company Act of 1940 as amended (the “Act”)) were effective as of a date within 90 days of the filing date of this report, based on their evaluation of the effectiveness of the registrant’s disclosure controls and procedures required by Rule 30a-3(b) under the Act and Rule 13a-15(b) or 15d-15(b) under the Securities and Exchange Act of 1934.
(b) There were no changes in the registrant’s internal control over financial reporting (as defined in Rule 30a-3(d) of the Act) that occurred during the registrant’s last fiscal quarter that have materially affected, or are reasonably likely to materially affect, the registrant’s internal control over financial reporting.
Item 12. Exhibits.
(a)(1) Not applicable for semiannual report.
(a)(2) A separate certification for the Principal Executive Officer and the Principal Financial Officer of the registrant as required by Rule 30a-2(a) under the Investment Company Act of 1940, as amended (17 CFR 270.30a-2(a)), are filed herewith.
(b) Officer certifications as required by Rule 30a-2(b) under the Investment Company Act of 1940, as amended (17 CFR 270.30a-2(b)), also accompany this filing as an Exhibit.
SIGNATURES
Pursuant to the requirements of the Securities Exchange Act of 1934 and the Investment Company Act of 1940, the registrant has duly caused this report to be signed on its behalf by the undersigned, thereunto duly authorized.
Registrant | Turner Funds | | |
| | | |
By (Signature and Title) | /s/ Thomas R. Trala, Jr. | | |
| Thomas R. Trala, Jr., President | | |
Date | May 30, 2012 | | | |
| | | | | | |
Pursuant to the requirements of the Securities Exchange Act of 1934 and the Investment Company Act of 1940, this report has been signed below by the following persons on behalf of the registrant and in the capacities and on the dates indicated.
By (Signature and Title) | /s/ Thomas R. Trala, Jr. | | |
| Thomas R. Trala, Jr., President | | |
Date | May 30, 2012 | | | |
| | | |
By (Signature and Title) | /s/ Ty Edwards | | |
| Ty Edwards, Treasurer | | |
Date | May 30, 2012 | | | |
| | | | | |