UNITED STATES
SECURITIES AND EXCHANGE COMMISSION
Washington, D.C. 20549
FORM N-CSR
CERTIFIED SHAREHOLDER REPORT OF REGISTERED
MANAGEMENT INVESTMENT COMPANIES
Investment Company Act file number | 811-07527 |
|
Turner Funds |
(Exact name of registrant as specified in charter) |
|
1205 Westlakes Drive, Suite 100 Berwyn, PA | | 19312 |
(Address of principal executive offices) | | (Zip code) |
|
Michael P. Malloy Drinker Biddle & Reath LLP One Logan Square, Suite 2000 Philadelphia, PA 19103 |
(Name and address of agent for service) |
|
Registrant’s telephone number, including area code: | 1-800-224-6312 | |
|
Date of fiscal year end: | September 30 | |
|
Date of reporting period: | March 31, 2016 | |
| | | | | | | | |
Item 1. Reports to Stockholders.

March 31, 2016 (unaudited)
Long/short equity funds
Turner Medical Sciences Long/Short Fund
Turner Titan Long/Short Fund (formerly Turner Spectrum Fund, subsequently Turner Titan II Fund)
U.S. growth equity funds
Turner SMID Cap Growth Opportunities Fund (formerly Turner Emerging Growth Fund)
Turner Midcap Growth Fund
Turner Small Cap Growth Fund
Contents
| | 2 | | | Letter to shareholders | |
| | 3 | | | Schedules of investments | |
| | 12 | | | Sector Weightings | |
| | 14 | | | Financial statements | |
| | 26 | | | Notes to financial statements | |
| 33
| | | Board of Trustees considerations in approving the
Advisory Agreement | |
| | 34 | | | Disclosure of fund expenses | |
Turner Funds
As of March 31, 2016, the Turner Funds offered a series of five mutual funds to individual and institutional investors. The minimum initial investment for Institutional Class Shares in a Turner Fund is $250,000 (except for $100,000 for the Turner Medical Sciences Long/Short Fund and the Turner Titan Long/Short Fund) for regular accounts and $100,000 for individual retirement accounts. The minimum initial investment for Investor Class Shares, Retirement Class Shares and Class C Shares is $2,500 for regular accounts and $2,000 for individual retirement accounts.
Turner Investments, L.P., based in Berwyn, Pennsylvania, serves as the investment adviser for the Turner Funds. Turner Investments, L.P., founded in 1990, manages approximately $405 million in equity investments as of March 31, 2016.
Shareholder services
Turner Funds shareholders receive annual and semiannual reports, and quarterly account statements. Shareholders who have questions about their accounts may call a toll-free telephone number, 1.800.224.6312, may visit our website, www.turnerinvestments.com, or may write to Turner Funds, P.O. Box 219805, Kansas City, Missouri 64121-9805.
TURNER FUNDS 2016 SEMIANNUAL REPORT 1
Global GDP for 2015 was just under 3% with inflation about the same. Projections for 2016 are not too dissimilar. Our belief is that there is a strong probability that this pattern of modest global growth and inflation continues for a few years. China's hyper growth has clearly slowed, India's growth is steady but modest, and the rest of the developing countries are mixed with many of them dependent on China for growth. In developed markets, Europe and Japan are showing no growth while the US is the beacon of developed market growth (2.5% in 2015) driven by population growth and increased productivity.
In a way, no one should be chagrined or disappointed by this. There are worse scenarios than modest growth with modest inflation. With this backdrop, it stands to reason that the stock market should be "steady as she goes" with mid-single-digit gains. As we all know, however, there is no such thing as "steady as she goes "with the stock market. While the market (as measured by the S&P 500) has risen over 200% since the bottom in March 2009, there have been six significant corrections during that time.
There were very good and real reasons behind those corrections (European debt crisis, Fed tapering, Ebola scare, etc.) The most recent correction of nearly 15% from late last year to early this year was driven by the first US Federal Reserve rate increase in eight years along with concern over Chinese growth. However, after sharp corrections that are exacerbated by the impact of hedge funds and ETFs, the market seems to remind itself, "Oh yeah, the global economy is growing by 3% and inflation is under control". At that point, the market stabilizes and then moves back to new highs.
For most companies it is hard to grow earnings meaningfully with this backdrop. Through revenue enhancements and cost efficiencies, larger blue chip companies like Boeing, Comcast or MMM are able to grow their earnings above global GDP — say 5%. They then buy back shares at a rate of 3% or so and they have a dividend of about 2%. By doing this, their stock price advances 10% per year, which is very impressive in light of overall modest stock market returns and anemic bond returns (around 2% per annum).
Most companies, however, are not as disciplined as the three aforementioned companies. They tend to be poor stewards of capital and are challenged by a very competitive global backdrop. This is particularly acute among smaller companies.
As a result, outside of a few big companies who are good stewards of capital and can grow earnings above that of global GDP, to have success it is critical to find industries and companies within those industries where growth rates are nicely above global growth rates. Examples of these industries and companies are: 1. Internet and Social Networking — Facebook, Amazon, Google and Tencent; 2. Cloud Computing — Salesforce.com, ServiceNow, Hubspot and Shopify; 3. Cybersecurity — Palo Alto Networks, Fireye and Fortinet; 4. Advanced Semiconductors — Cavium, ASM Lithography and Broadcom; 5. Next Generation Biotech — Horizon Pharmaceutical, Prothena and Achillion Pharmaceutical;
6. Virtual and Augmented Reality — Activision and Electronic Arts; 7. Technology Based Education — 2U and Instructure; and 8. Next Generation and Smart Automotive — Tesla and Mobileye.
At Turner Investments, we strive to identify those fast growing industries and the fastest growing companies within those industries. Unfortunately, there aren't a lot of these. We have, however, found success with portfolios that contain fewer stocks — but holding stocks that offer very high growth rates in revenues and earnings, with the anticipation that the stock price will follow suit.
Moving forward, we believe that we are destined to more of the same, namely modest global economic growth with modest inflation. At some point, a crisis will develop, undoubtedly led by excesses in the credit markets, but in the meantime, corrections are buying opportunities for the high growth companies in the new innovative industries.
We appreciate your investments in the Turner Funds and we look forward to continuing to serve you in the years ahead.
Sincerely,

Bob Turner
Chairman and Chief Investment Officer
Turner Investments
Past performance is no guarantee of future results. The views expressed are those of Turner Investments as of March 31, 2016, and are not intended as a forecast or investment recommendations. The indexes mentioned are not available for investment.

2 TURNER FUNDS 2016 SEMIANNUAL REPORT
FINANCIAL STATEMENTS (Unaudited)
Turner Medical Sciences Long/Short Fund
March 31, 2016
| | | Shares | | Value
(000) | |
Common stock—94.7% | |
Biotechnology—33.4% | |
Achillion Pharmaceuticals* | | | 379,270 | | | $ | 2,928 | | |
Aduro Biotech* | | | 62,900 | | | | 806 | | |
Biogen* | | | 5,850 | | | | 1,523 | | |
Bluebird Bio* | | | 27,980 | | | | 1,189 | | |
Chimerix* | | | 163,730 | | | | 837 | | |
Emergent BioSolutions* | | | 37,620 | | | | 1,367 | | |
Heron Therapeutics* | | | 96,570 | | | | 1,834 | | |
ImmunoGen* | | | 81,020 | | | | 690 | | |
Momenta Pharmaceuticals* | | | 304,600 | | | | 2,815 | | |
Progenics Pharmaceuticals* | | | 236,856 | | | | 1,033 | | |
Prothena* | | | 81,520 | | | | 3,355 | | |
Raptor Pharmaceuticals* | | | 161,100 | | | | 741 | | |
Retrophin* | | | 142,864 | | | | 1,952 | | |
Tesaro* | | | 45,860 | | | | 2,019 | | |
Trevena* | | | 145,420 | | | | 1,203 | | |
Vertex Pharmaceuticals* | | | 7,340 | | | | 583 | | |
Total Biotechnology | | | | | 24,875 | | |
Health care equipment & supplies—13.8% | |
CONMED | | | 64,300 | | | | 2,697 | | |
Edwards Lifesciences* | | | 30,680 | | | | 2,705 | | |
Intuitive Surgical* | | | 4,440 | | | | 2,669 | | |
St. Jude Medical | | | 40,140 | | | | 2,208 | | |
Total Health care equipment &
supplies | | | | | 10,279 | | |
Health care providers & services—2.6% | |
Adeptus Health, Cl A* | | | 13,890 | | | | 771 | | |
BioTelemetry* | | | 97,778 | | | | 1,142 | | |
Total Health care providers &
services | | | | | 1,913 | | |
Life sciences tools & services—6.0% | |
Illumina* | | | 8,280 | | | | 1,342 | | |
Thermo Fisher Scientific | | | 22,060 | | | | 3,124 | | |
Total Life sciences tools & services | | | | | 4,466 | | |
Pharmaceuticals—38.9% | |
Aclaris Therapeutics (a)* | | | 87,004 | | | | 1,649 | | |
Allergan* | | | 5,880 | | | | 1,576 | | |
Aratana Therapeutics* | | | 500,000 | | | | 2,760 | | |
Bristol-Myers Squibb | | | 59,560 | | | | 3,806 | | |
Cardiome Pharma (a)* | | | 505,420 | | | | 2,067 | | |
Corium International* | | | 62,513 | | | | 241 | | |
| | | Shares | | Value
(000) | |
Flamel Technologies ADR* | | | 142,148 | | | $ | 1,569 | | |
GlaxoSmithKline ADR | | | 56,730 | | | | 2,300 | | |
Horizon Pharma* | | | 155,460 | | | | 2,576 | | |
Johnson & Johnson | | | 20,900 | | | | 2,261 | | |
Mallinckrodt* | | | 18,920 | | | | 1,159 | | |
Ocera Therapeutics (a)* | | | 450,000 | | | | 1,323 | | |
Pfizer | | | 127,220 | | | | 3,772 | | |
SteadyMed (a)* | | | 270,000 | | | | 664 | | |
Teligent* | | | 267,776 | | | | 1,312 | | |
Total Pharmaceuticals | | | | | 29,035 | | |
Total Common stock
(Cost $68,168)** | | | | | 70,568 | | |
Warrant—0.0% | |
Biotechnology—0.0% | |
NephroGenex (a)* | | | 65,000 | | | | — | | |
Total Biotechnology | | | | | — | | |
Total Warrant
(Cost $—)** | | | | $ | — | | |
Cash equivalent—1.2% | |
BlackRock Liquidity Funds
TempCash Portfolio,
Dollar Shares, 0.357%‡ | | | 870,721 | | | | 871 | | |
Total Cash equivalent
(Cost $871)** | | | | | 871 | | |
Total Investments—95.9%
(Cost $69,039)** | | | | | 71,439 | | |
Segregated cash with brokers—84.2% | | | | | 62,769 | | |
Securities sold short—(79.9)%
(Proceeds $(65,714))** | | | | | (59,523 | ) | |
Net Other assets (liabilities)—(0.2)% | | | | | (147 | ) | |
Net Assets—100.0% | | | | $ | 74,538 | | |
Amounts designated as "—" have been rounded to $0.
(a) These securities have been deemed illiquid by the Adviser and represent 7.65% of Net Assets.
* Non-income producing security.
** This number is listed in thousands.
‡ Rate shown is the 7-day effective yield as of March 31, 2016.
ADR — American Depositary Receipt
Cl — Class
The accompanying notes are an integral part of the financial statements.
TURNER FUNDS 2016 SEMIANNUAL REPORT 3
FINANCIAL STATEMENTS (Unaudited)
Schedule of securities sold short
Turner Medical Sciences Long/Short Fund
March 31, 2016
| | | Shares | | Value
(000) | |
Common stock—44.3% | |
Biotechnology—7.1% | |
Alexion Pharmaceuticals | | | 12,460 | | | $ | 1,735 | | |
BeiGene ADR | | | 17,550 | | | | 514 | | |
Regeneron Pharmaceuticals | | | 4,030 | | | | 1,453 | | |
Regulus Therapeutics | | | 122,460 | | | | 849 | | |
Seattle Genetics | | | 20,270 | | | | 711 | | |
Total Biotechnology | | | | | 5,262 | | |
Food & staples retailing—1.8% | |
CVS Health | | | 13,180 | | | | 1,367 | | |
Total Food & staples retailing | | | | | 1,367 | | |
Health care equipment & supplies—12.8% | |
Anika Therapeutics | | | 34,650 | | | | 1,550 | | |
C.R. Bard | | | 5,170 | | | | 1,048 | | |
Hologic | | | 38,370 | | | | 1,324 | | |
Medtronic | | | 28,100 | | | | 2,107 | | |
Nevro | | | 14,280 | | | | 803 | | |
Stryker | | | 24,930 | | | | 2,674 | | |
Total Health care equipment &
supplies | | | | | 9,506 | | |
Health care providers & services—8.5% | |
HCA Holdings | | | 19,100 | | | | 1,491 | | |
Henry Schein | | | 10,530 | | | | 1,817 | | |
Laboratory Corp. of America
Holdings | | | 12,360 | | | | 1,448 | | |
UnitedHealth Group, Cl B | | | 12,010 | | | | 1,548 | | |
Total Health care providers &
services | | | | | 6,304 | | |
Health care technology—0.7% | |
athenahealth | | | 3,810 | | | | 529 | | |
Total Health care technology | | | | | 529 | | |
Life sciences tools & services—8.9% | |
ICON | | | 20,070 | | | | 1,507 | | |
Mettler-Toledo International | | | 5,700 | | | | 1,966 | | |
PerkinElmer | | | 30,710 | | | | 1,519 | | |
Waters | | | 12,510 | | | | 1,650 | | |
Total Life sciences tools & services | | | | | 6,642 | | |
| | | Shares | | Value
(000) | |
Pharmaceuticals—4.5% | |
Aerie Pharmaceuticals | | | 69,830 | | | $ | 849 | | |
Dr. Reddy's Laboratories ADR | | | 55,720 | | | | 2,518 | | |
Total Pharmaceuticals | | | | | 3,367 | | |
Total Common stock
(Proceeds $33,642)* | | | | | 32,977 | | |
Exchange traded funds—35.6% | |
Health Care Select Sector SPDR
Fund | | | 111,020 | | | | 7,525 | | |
iShares NASDAQ Biotechnology
ETF | | | 33,320 | | | | 8,691 | | |
iShares Russell 2000 Growth ETF | | | 22,790 | | | | 2,521 | | |
SPDR S&P Biotech ETF | | | 151,170 | | | | 7,809 | | |
Total Exchange traded funds
(Proceeds $32,072)* | | | | | 26,546 | | |
Total Securities sold short—79.9%
(Proceeds $65,714)* | | | | $ | 59,523 | | |
Percentages disclosed are based on total net assets of the Fund at March 31, 2016.
* This number is listed in thousands.
ADR — American Depositary Receipt
Cl — Class
ETF — Exchange Traded Fund
SPDR — Standard & Poor's Depositary Receipt
The accompanying notes are an integral part of the financial statements.
4 TURNER FUNDS 2016 SEMIANNUAL REPORT
Turner Titan Long/Short Fund
March 31, 2016
| | | Shares | | Value
(000) | |
Common stock—91.0%† | |
Consumer discretionary—16.8% | |
CBS, Cl B^ | | | 15,900 | | | $ | 876 | | |
Coach | | | 12,600 | | | | 505 | | |
Dollar General | | | 7,200 | | | | 616 | | |
Hilton Worldwide Holdings^ | | | 32,000 | | | | 721 | | |
Lowe's^ | | | 8,600 | | | | 651 | | |
lululemon athletica*^ | | | 8,800 | | | | 596 | | |
Priceline Group*^ | | | 560 | | | | 722 | | |
Ross Stores | | | 10,300 | | | | 596 | | |
Royal Caribbean Cruises | | | 10,600 | | | | 871 | | |
The Walt Disney | | | 5,850 | | | | 581 | | |
Total Consumer discretionary | | | | | 6,735 | | |
Consumer staples—7.7% | |
Constellation Brands, Cl A^ | | | 11,940 | | | | 1,804 | | |
PepsiCo^ | | | 7,500 | | | | 769 | | |
The Clorox | | | 4,030 | | | | 508 | | |
Total Consumer staples | | | | | 3,081 | | |
Energy—4.8% | |
Anadarko Petroleum^ | | | 18,000 | | | | 838 | | |
Pioneer Natural Resources^ | | | 4,300 | | | | 605 | | |
Weatherford International* | | | 60,000 | | | | 467 | | |
Total Energy | | | | | 1,910 | | |
Financials—8.5% | |
CME Group^ | | | 7,200 | | | | 692 | | |
MetLife | | | 8,200 | | | | 360 | | |
QTS Realty Trust, Cl A | | | 25,600 | | | | 1,213 | | |
T. Rowe Price Group | | | 7,200 | | | | 529 | | |
The Charles Schwab^ | | | 21,700 | | | | 608 | | |
Total Financials | | | | | 3,402 | | |
Health care—9.5% | |
Allergan*^ | | | 3,300 | | | | 885 | | |
Becton Dickinson^ | | | 5,400 | | | | 820 | | |
Boston Scientific*^ | | | 40,600 | | | | 764 | | |
Bristol-Myers Squibb^ | | | 12,590 | | | | 804 | | |
Celgene*^ | | | 5,200 | | | | 520 | | |
Total Health care | | | | | 3,793 | | |
| | | Shares | | Value
(000) | |
Industrials—13.1% | |
C.H. Robinson Worldwide | | | 5,700 | | | $ | 423 | | |
Danaher | | | 7,500 | | | | 711 | | |
Eaton^ | | | 17,790 | | | | 1,113 | | |
Kansas City Southern^ | | | 8,600 | | | | 735 | | |
Raytheon | | | 4,000 | | | | 491 | | |
Southwest Airlines^ | | | 27,550 | | | | 1,234 | | |
Terex | | | 22,000 | | | | 547 | | |
Total Industrials | | | | | 5,254 | | |
Information technology—28.0% | |
Alphabet, Cl A*^ | | | 1,600 | | | | 1,222 | | |
Apple^ | | | 6,500 | | | | 708 | | |
Broadcom | | | 2,600 | | | | 402 | | |
Broadridge Financial Solutions | | | 11,000 | | | | 652 | | |
Cisco Systems | | | 18,200 | | | | 518 | | |
Electronic Arts*^ | | | 10,000 | | | | 661 | | |
Facebook, Cl A*^ | | | 7,710 | | | | 880 | | |
Finisar* | | | 17,400 | | | | 317 | | |
Hewlett Packard Enterprise | | | 17,470 | | | | 310 | | |
Lam Research | | | 10,000 | | | | 826 | | |
NXP Semiconductors*^ | | | 15,000 | | | | 1,216 | | |
Palo Alto Networks* | | | 3,360 | | | | 548 | | |
Salesforce.com*^ | | | 13,600 | | | | 1,004 | | |
ServiceNow* | | | 12,000 | | | | 734 | | |
Vantiv, Cl A*^ | | | 13,000 | | | | 700 | | |
Visa, Cl A^ | | | 7,400 | | | | 566 | | |
Total Information technology | | | | | 11,264 | | |
Materials—2.6% | |
PPG Industries | | | 5,000 | | | | 558 | | |
Summit Materials, Cl A* | | | 25,000 | | | | 486 | | |
Total Materials | | | | | 1,044 | | |
Total Common stock
(Cost $32,476)** | | | | | 36,483 | | |
Exchange traded funds—1.9% | |
SPDR Metals & Mining ETF | | | 36,700 | | | | 752 | | |
Total Exchange traded funds
(Cost $762)** | | | | | 752 | | |
TURNER FUNDS 2016 SEMIANNUAL REPORT 5
FINANCIAL STATEMENTS (Unaudited)
Schedule of investments
Turner Titan Long/Short Fund
| | | Shares | | Value
(000) | |
Warrant—0.1% | |
Financials—0.1% | |
Atlas Mara (a)* | | | 472,160 | | | $ | 47 | | |
Total Financials | | | | | 47 | | |
Total Warrant
(Cost $92)** | | | | | 47 | | |
Total Investments—93.0%
(Cost $33,330)** | | | | | 37,282 | | |
Segregated cash with brokers—60.8% | | | | | 24,386 | | |
Securities sold short—(58.1)%
(Proceeds $(22,804))** | | | | | (23,271 | ) | |
Net Other assets (liabilities)—4.3% | | | | | 1,688 | | |
Net Assets—100.0% | | | | $ | 40,085 | | |
(a) These securities have been deemed illiquid by the Adviser and represent 0.12% of Net Assets.
* Non-income producing security.
** This number is listed in thousands.
^ All or a portion of the shares have been committed as collateral for open short positions.
† More narrow industries are utilized for compliance purposes, whereas broad sectors are utilized for reporting purposes.
Cl — Class
ETF — Exchange Traded Fund
SPDR — Standard & Poor's Depositary Receipt
The accompanying notes are an integral part of the financial statements.
6 TURNER FUNDS 2016 SEMIANNUAL REPORT
Schedule of securities sold short
Turner Titan Long/Short Fund
March 31, 2016
| | | Shares | | Value
(000) | |
Common stock—44.5% | |
Consumer discretionary—13.3% | |
CarMax | | | 6,000 | | | $ | 307 | | |
Dillard's, Cl A | | | 7,000 | | | | 594 | | |
Discovery Communications, Cl A | | | 19,820 | | | | 567 | | |
Expedia | | | 3,780 | | | | 408 | | |
Marriott International, Cl A | | | 11,500 | | | | 819 | | |
McDonald's | | | 2,600 | | | | 327 | | |
Nordstrom | | | 4,900 | | | | 280 | | |
O'Reilly Automotive | | | 820 | | | | 224 | | |
Tesla Motors | | | 2,500 | | | | 574 | | |
Tiffany | | | 5,000 | | | | 367 | | |
TripAdvisor | | | 12,700 | | | | 844 | | |
Total Consumer discretionary | | | | | 5,311 | | |
Consumer staples—3.4% | |
The Coca-Cola | | | 10,000 | | | | 464 | | |
The Kroger | | | 7,900 | | | | 302 | | |
Wal-Mart Stores | | | 9,000 | | | | 616 | | |
Total Consumer staples | | | | | 1,382 | | |
Energy—3.6% | |
Cimarex Energy | | | 4,300 | | | | 418 | | |
Frank's International | | | 13,000 | | | | 214 | | |
Range Resources | | | 25,000 | | | | 810 | | |
Total Energy | | | | | 1,442 | | |
Financials—4.5% | |
Cullen/Frost Bankers | | | 8,300 | | | | 457 | | |
Deutsche Bank | | | 15,000 | | | | 254 | | |
Franklin Resources | | | 10,000 | | | | 391 | | |
Moody's | | | 4,440 | | | | 429 | | |
Morgan Stanley | | | 11,000 | | | | 275 | | |
Total Financials | | | | | 1,806 | | |
Health care—3.6% | |
Abbott Laboratories | | | 10,000 | | | | 418 | | |
Express Scripts Holdings | | | 6,000 | | | | 412 | | |
Varian Medical Systems | | | 7,500 | | | | 601 | | |
Total Health care | | | | | 1,431 | | |
Industrials—6.3% | |
Alaska Air Group | | | 3,900 | | | | 320 | | |
Deere | | | 8,000 | | | | 617 | | |
General Electric | | | 14,000 | | | | 445 | | |
| | | Shares | | Value
(000) | |
Roper Technologies | | | 2,300 | | | $ | 420 | | |
Textron | | | 7,000 | | | | 255 | | |
The Boeing | | | 3,800 | | | | 482 | | |
Total Industrials | | | | | 2,539 | | |
Information technology—8.0% | |
Atlassian, Cl A | | | 11,200 | | | | 282 | | |
Autodesk | | | 7,000 | | | | 408 | | |
Check Point Software Technologies | | | 3,700 | | | | 324 | | |
Fortinet | | | 9,600 | | | | 294 | | |
Grubhub | | | 4,000 | | | | 101 | | |
Intel | | | 10,000 | | | | 324 | | |
Linear Technology | | | 10,000 | | | | 445 | | |
LinkedIn, Cl A | | | 3,800 | | | | 434 | | |
New Relic | | | 10,000 | | | | 261 | | |
Skyworks Solutions | | | 3,700 | | | | 288 | | |
Total Information technology | | | | | 3,161 | | |
Materials—0.7% | |
Compass Minerals International | | | 4,200 | | | | 298 | | |
Total Materials | | | | | 298 | | |
Telecommunication services—1.1% | |
SBA Communications, Cl A | | | 4,500 | | | | 451 | | |
Total Telecommunication services | | | | | 451 | | |
Total Common stock
(Proceeds $17,392)* | | | | | 17,821 | | |
Exchange traded funds—13.6% | |
iShares Russell 1000 Growth ETF | | | 20,000 | | | | 1,996 | | |
SPDR S&P 500 ETF Trust | | | 15,000 | | | | 3,082 | | |
SPDR S&P Biotech ETF | | | 7,200 | | | | 372 | | |
Total Exchange traded funds
(Proceeds $5,412)* | | | | | 5,450 | | |
Total Securities sold short—58.1%
(Proceeds $22,804)* | | | | $ | 23,271 | | |
Percentages disclosed are based on total net assets of the Fund at March 31, 2016.
* This number is listed in thousands.
Cl — Class
ETF — Exchange Traded Fund
SPDR — Standard & Poor's Depositary Receipt
The accompanying notes are an integral part of the financial statements.
TURNER FUNDS 2016 SEMIANNUAL REPORT 7
FINANCIAL STATEMENTS (Unaudited)
Turner SMID Cap Growth Opportunities Fund
March 31, 2016
| | | Shares | | Value
(000) | |
Common stock—92.8%† | |
Consumer discretionary—17.2% | |
Carrols Restaurant Group* | | | 107,000 | | | $ | 1,545 | | |
Chuy's Holdings* | | | 15,000 | | | | 466 | | |
Domino's Pizza | | | 13,000 | | | | 1,714 | | |
Duluth Holdings* | | | 45,000 | | | | 877 | | |
Grand Canyon Education* | | | 23,000 | | | | 983 | | |
Motorcar Parts of America* | | | 47,000 | | | | 1,785 | | |
Ollie's Bargain Outlet Holdings* | | | 72,000 | | | | 1,687 | | |
Sonic | | | 10,000 | | | | 352 | | |
TAL Education Group ADR* | | | 4,000 | | | | 199 | | |
Vista Outdoor* | | | 34,000 | | | | 1,765 | | |
Total Consumer discretionary | | | | | 11,373 | | |
Consumer staples—2.2% | |
Sprouts Farmers Market* | | | 50,000 | | | | 1,452 | | |
Total Consumer staples | | | | | 1,452 | | |
Energy—0.9% | |
Parsley Energy, Cl A* | | | 25,000 | | | | 565 | | |
Total Energy | | | | | 565 | | |
Financials—7.5% | |
CoreSite Realty | | | 33,000 | | | | 2,311 | | |
MSCI, Cl A | | | 16,000 | | | | 1,185 | | |
Physicians Realty Trust | | | 77,500 | | | | 1,440 | | |
Total Financials | | | | | 4,936 | | |
Health care—9.5% | |
Intuitive Surgical* | | | 3,300 | | | | 1,983 | | |
Ligand Pharmaceuticals, Cl B*^ | | | 22,000 | | | | 2,357 | | |
Prestige Brands Holdings* | | | 37,000 | | | | 1,975 | | |
Total Health care | | | | | 6,315 | | |
Industrials—6.0% | |
Controladora Vuela ADR* | | | 45,000 | | | | 948 | | |
Huntington Ingalls Industries | | | 12,000 | | | | 1,643 | | |
Toro | | | 16,000 | | | | 1,378 | | |
Total Industrials | | | | | 3,969 | | |
Information technology—47.2% | |
Alarm.com Holding*^ | | | 40,000 | | | | 948 | | |
Autobytel* | | | 11,000 | | | | 191 | | |
Cray* | | | 28,000 | | | | 1,173 | | |
Cree* | | | 55,000 | | | | 1,601 | | |
| | | Shares | | Value
(000) | |
Ellie Mae* | | | 20,000 | | | $ | 1,813 | | |
Exlservice Holdings* | | | 35,000 | | | | 1,813 | | |
First Solar* | | | 27,000 | | | | 1,849 | | |
Inphi* | | | 41,000 | | | | 1,367 | | |
Littelfuse | | | 17,000 | | | | 2,092 | | |
Lumentum Holdings* | | | 63,000 | | | | 1,699 | | |
MA-Com Technology Solutions
Holdings*^ | | | 40,000 | | | | 1,752 | | |
MaxLinear, Cl A* | | | 110,000 | | | | 2,034 | | |
Mellanox Technologies* | | | 36,000 | | | | 1,955 | | |
Mercury Systems* | | | 66,000 | | | | 1,340 | | |
NVIDIA | | | 40,000 | | | | 1,425 | | |
Shopify, Cl A* | | | 55,000 | | | | 1,552 | | |
SolarEdge Technologies*^ | | | 50,000 | | | | 1,257 | | |
Square, Cl A* | | | 50,000 | | | | 764 | | |
The Rubicon Project* | | | 20,000 | | | | 366 | | |
Ultratech* | | | 44,400 | | | | 970 | | |
Universal Display* | | | 25,000 | | | | 1,353 | | |
Vantive, Cl A* | | | 36,000 | | | | 1,940 | | |
Total Information technology | | | | | 31,254 | | |
Materials—1.0% | |
Agnico Eagle Mines^ | | | 19,000 | | | | 687 | | |
Total Materials | | | | | 687 | | |
Telecommunication services—1.3% | |
ORBCOMM* | | | 83,000 | | | | 841 | | |
Total Telecommunication services | | | | | 841 | | |
Total Common stock
(Cost $55,257)** | | | | | 61,392 | | |
Cash equivalent—14.9% | |
BlackRock Liquidity Funds
TempCash Portfolio,
Dollar Shares, 0.357%‡ (1) | | | 9,875,204 | | | | 9,875 | | |
Total Cash equivalent
(Cost $9,875)** | | | | | 9,875 | | |
Total Investments—107.7%
(Cost $65,132)** | | | | | 71,267 | | |
Net Other assets
(liabilities)—(7.7)% | | | | | (5,089 | ) | |
Net Assets—100.0% | | | | $ | 66,178 | | |
8 TURNER FUNDS 2016 SEMIANNUAL REPORT
Schedule of investments
Turner SMID Cap Growth Opportunities Fund
* Non-income producing security.
** This number is listed in thousands.
(1) A portion of the Fund's position in this security was purchased with cash collateral received from securities lending. The total value of such security at March 31, 2016 was $1,918**.
^ Security fully or partially on loan at March 31, 2016. The total value of securities on loan at March 31, 2016 was $1,868**. Certain of these securities may have been sold prior to period end.
† More narrow industries are utilized for compliance purposes, whereas broad sectors are utilized for reporting purposes.
‡ Rate shown is the 7-day effective yield as of March 31, 2016.
ADR — American Depositary Receipt
Cl — Class
The accompanying notes are an integral part of the financial statements.
TURNER FUNDS 2016 SEMIANNUAL REPORT 9
FINANCIAL STATEMENTS (Unaudited)
Turner Midcap Growth Fund
March 31, 2016
| | | Shares | | Value
(000) | |
Common stock—97.5%† | |
Consumer discretionary—22.2% | |
Aramark | | | 132,030 | | | $ | 4,373 | | |
AutoZone* | | | 1,900 | | | | 1,514 | | |
CBS, Cl B | | | 72,330 | | | | 3,985 | | |
lululemon athletica* | | | 38,110 | | | | 2,580 | | |
Mohawk Industries* | | | 11,490 | | | | 2,193 | | |
Netflix* | | | 18,940 | | | | 1,936 | | |
Newell Rubbermaid | | | 69,880 | | | | 3,095 | | |
The Walt Disney | | | 24,720 | | | | 2,455 | | |
Ulta Salon, Cosmetics & Fragrance* | | | 7,980 | | | | 1,546 | | |
Wynn Resorts^ | | | 42,690 | | | | 3,989 | | |
Total Consumer discretionary | | | | | 27,666 | | |
Consumer staples—6.6% | |
Constellation Brands, Cl A | | | 32,780 | | | | 4,953 | | |
Monster Beverage* | | | 24,410 | | | | 3,256 | | |
Total Consumer staples | | | | | 8,209 | | |
Energy—4.2% | |
Pioneer Natural Resources | | | 19,720 | | | | 2,775 | | |
Weatherford International* | | | 318,880 | | | | 2,481 | | |
Total Energy | | | | | 5,256 | | |
Financials—3.0% | |
Intercontinental Exchange Group | | | 15,660 | | | | 3,682 | | |
Total Financials | | | | | 3,682 | | |
Health care—17.3% | |
Acadia Healthcare* | | | 49,790 | | | | 2,744 | | |
Achillion Pharmaceuticals*^ | | | 329,590 | | | | 2,544 | | |
Boston Scientific* | | | 148,560 | | | | 2,794 | | |
CONMED | | | 61,750 | | | | 2,590 | | |
Edwards Lifesciences* | | | 21,300 | | | | 1,879 | | |
Intuitive Surgical* | | | 7,010 | | | | 4,213 | | |
Ligand Pharmaceuticals, Cl B* | | | 18,140 | | | | 1,943 | | |
Prothena*^ | | | 70,190 | | | | 2,889 | | |
Total Health care | | | | | 21,596 | | |
Industrials—5.2% | |
Fortune Brands Home & Security | | | 49,120 | | | | 2,753 | | |
Southwest Airlines | | | 82,360 | | | | 3,689 | | |
Total Industrials | | | | | 6,442 | | |
| | | Shares | | Value
(000) | |
Information technology—37.4% | |
Alphabet, Cl A* | | | 4,310 | | | $ | 3,288 | | |
Broadcom | | | 30,330 | | | | 4,687 | | |
Cavium* | | | 65,904 | | | | 4,031 | | |
Electronic Arts* | | | 48,760 | | | | 3,224 | | |
Facebook, Cl A* | | | 34,640 | | | | 3,952 | | |
HubSpot*^ | | | 42,140 | | | | 1,838 | | |
Lam Research | | | 30,740 | | | | 2,539 | | |
Monolithic Power Systems | | | 64,730 | | | | 4,119 | | |
NXP Semiconductors* | | | 38,920 | | | | 3,155 | | |
Palo Alto Networks* | | | 25,940 | | | | 4,232 | | |
Proofpoint* | | | 43,010 | | | | 2,313 | | |
Salesforce.com* | | | 53,740 | | | | 3,968 | | |
SolarEdge Technologies* | | | 101,300 | | | | 2,547 | | |
Vantive, Cl A* | | | 52,100 | | | | 2,807 | | |
Total Information technology | | | | | 46,700 | | |
Materials—1.6% | |
PPG Industries | | | 18,040 | | | | 2,011 | | |
Total Materials | | | | | 2,011 | | |
Total Common stock
(Cost $109,180)** | | | | | 121,562 | | |
Cash equivalent—9.1% | |
BlackRock Liquidity Funds
TempCash Portfolio,
Dollar Shares, 0.357%‡ (1) | | | 11,320,336 | | | | 11,320 | | |
Total Cash equivalent
(Cost $11,320)** | | | | | 11,320 | | |
Total Investments—106.6%
(Cost $120,500)** | | | | | 132,882 | | |
Net Other assets (liabilities)—(6.6)% | | | | | (8,182 | ) | |
Net Assets—100.0% | | | | $ | 124,700 | | |
* Non-income producing security.
** This number is listed in thousands.
(1) A portion of the Fund's position in this security was purchased with cash collateral received from securities lending. The total value of such security at March 31, 2016 was $8,128**.
^ Security fully or partially on loan at March 31, 2016. The total value of securities on loan at March 31, 2016 was $8,036**. Certain of these securities may have been sold prior to period end.
† More narrow industries are utilized for compliance purposes, whereas broad sectors are utilized for reporting purposes.
‡ Rate shown is the 7-day effective yield as of March 31, 2016.
Cl — Class
The accompanying notes are an integral part of the financial statements.
10 TURNER FUNDS 2016 SEMIANNUAL REPORT
Turner Small Cap Growth Fund
March 31, 2016
| | | Shares | | Value
(000) | |
Common stock—99.5%† | |
Consumer discretionary—6.3% | |
Fiesta Restaurant Group* | | | 32,000 | | | $ | 1,049 | | |
Kate Spade* | | | 32,000 | | | | 817 | | |
Oxford Industries | | | 7,000 | | | | 471 | | |
Zoe's Kitchen*^ | | | 7,500 | | | | 292 | | |
Total Consumer discretionary | | | | | 2,629 | | |
Consumer staples—2.4% | |
Amplify Snack Brands* | | | 70,000 | | | | 1,002 | | |
Total Consumer staples | | | | | 1,002 | | |
Energy—1.0% | |
Parsley Energy, Cl A* | | | 18,000 | | | | 407 | | |
Total Energy | | | | | 407 | | |
Financials—4.8% | |
CyrusOne | | | 30,000 | | | | 1,370 | | |
Home BancShares | | | 15,000 | | | | 614 | | |
Total Financials | | | | | 1,984 | | |
Health care—24.0% | |
ABIOMED* | | | 18,000 | | | | 1,708 | | |
Achillion Pharmaceuticals*^ | | | 100,000 | | | | 772 | | |
Adeptus Health, Cl A*^ | | | 16,000 | | | | 889 | | |
Cantel Medical Corp. | | | 15,000 | | | | 1,070 | | |
Intrexon Corp.^ | | | 27,500 | | | | 932 | | |
LDR Holding* | | | 58,000 | | | | 1,478 | | |
Ligand Pharmaceuticals, Cl B*^ | | | 14,000 | | | | 1,499 | | |
Prothena*^ | | | 12,000 | | | | 494 | | |
Repligen* | | | 42,000 | | | | 1,126 | | |
Total Health care | | | | | 9,968 | | |
Industrials—12.3% | |
Echo Global Logistics* | | | 30,000 | | | | 815 | | |
HEICO | | | 15,000 | | | | 902 | | |
Insperity | | | 35,000 | | | | 1,810 | | |
John Bean Technologies | | | 11,500 | | | | 649 | | |
Masonite International* | | | 14,000 | | | | 917 | | |
Total Industrials | | | | | 5,093 | | |
Information technology—46.7% | |
Cavium* | | | 16,000 | | | | 979 | | |
CUI Global*^ | | | 185,000 | | | | 1,495 | | |
Digimarc*^ | | | 81,000 | | | | 2,452 | | |
Ellie Mae* | | | 11,000 | | | | 997 | | |
HubSpot* | | | 23,000 | | | | 1,003 | | |
Marchex, Cl B | | | 70,000 | | | | 312 | | |
| | | Shares | | Value
(000) | |
Mellanox Technologies* | | | 18,000 | | | $ | 978 | | |
NeoPhotonics* | | | 62,000 | | | | 870 | | |
Oclaro* | | | 65,000 | | | | 351 | | |
Paycom Software* | | | 27,000 | | | | 961 | | |
Proofpoint* | | | 24,000 | | | | 1,291 | | |
Remark Media (a)* | | | 445,000 | | | | 2,105 | | |
Shopify, Cl A* | | | 54,000 | | | | 1,523 | | |
SolarEdge Technologies*^ | | | 47,000 | | | | 1,182 | | |
Stamps.com* | | | 7,000 | | | | 744 | | |
Ultratech* | | | 40,000 | | | | 874 | | |
Universal Display* | | | 22,000 | | | | 1,190 | | |
Total Information technology | | | | | 19,307 | | |
Materials—2.0% | |
Senomyx (a)*^ | | | 325,000 | | | | 845 | | |
Total Materials | | | | | 845 | | |
Total Common stock
(Cost $36,000)** | | | | | 41,235 | | |
Cash equivalent—24.2% | |
BlackRock Liquidity Funds
TempCash Portfolio,
Dollar Shares, 0.357%‡ (1) | | | 10,040,925 | | | | 10,041 | | |
Total Cash equivalent
(Cost $10,041)** | | | | | 10,041 | | |
Total Investments—123.7%
(Cost $46,041)** | | | | | 51,276 | | |
Net Other assets (liabilities)—(23.7)% | | | | | (9,820 | ) | |
Net Assets—100.0% | | | | $ | 41,456 | | |
(a) These securities have been deemed illiquid by the Adviser and represent 7.12% of Net Assets.
* Non-income producing security.
** This number is listed in thousands.
(1) A portion of the Fund's position in this security was purchased with cash collateral received from securities lending. The total value of such security at March 31, 2016 was $9,442**.
^ Security fully or partially on loan at March 31, 2016. The total value of securities on loan at March 31, 2016 was $9,187**. Certain of these securities may have been sold prior to period end.
† More narrow industries are utilized for compliance purposes, whereas broad sectors are utilized for reporting purposes.
‡ Rate shown is the 7-day effective yield as of March 31, 2016.
Cl — Class
The accompanying notes are an integral part of the financial statements.
TURNER FUNDS 2016 SEMIANNUAL REPORT 11
SECTOR WEIGHTINGS (Unaudited)
The following tables show the fund composition allocated by sector. The fund composition is subject to change, and the percentages are based on total investments.
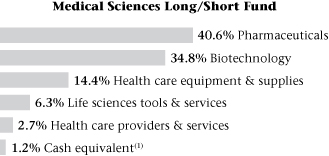
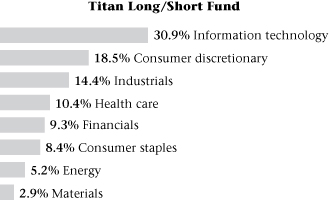
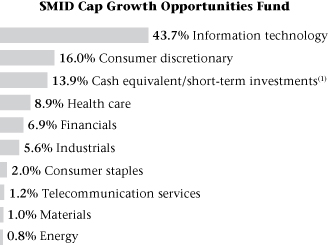
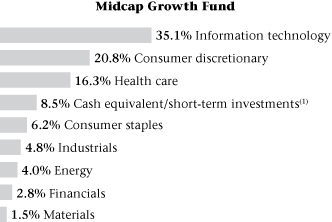
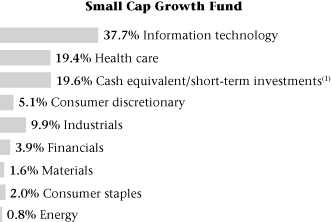
1 Cash equivalent includes short-term investment held as collateral for securities lending activity. Please see Note 8 in the Notes to financial statements for more detailed information.
12 TURNER FUNDS 2016 SEMIANNUAL REPORT
THIS PAGE WAS INTENTIONALLY LEFT BLANK
TURNER FUNDS 2016 SEMIANNUAL REPORT 13
FINANCIAL STATEMENTS (Unaudited)
Statements of assets and liabilities (000)
March 31, 2016
| | | Turner
Medical Sciences
Long/Short
Fund | | Turner
Titan
Long/Short
Fund | | Turner
SMID Cap
Growth
Opportunities
Fund | |
Assets: | |
Investment securities, at cost | | $ | 69,039 | | | $ | 33,330 | | | $ | 65,132 | | |
Investment securities, at value | | $ | 71,439 | | | $ | 37,282 | | | $ | 71,267 | | |
Cash | | | — | | | | 4,054 | | | | — | | |
Deposits with brokers for securities sold short | | | 62,769 | | | | 24,386 | | | | — | | |
Foreign currency, at value | | | — | | | | 3 | | | | — | | |
Receivable for investment securities sold | | | 3,457 | | | | 4,079 | | | | 1,440 | | |
Receivable for capital shares sold | | | 22 | | | | 34 | | | | 4 | | |
Prepaid expenses | | | 44 | | | | 28 | | | | 29 | | |
Receivable for dividend income | | | 183 | | | | 19 | | | | 49 | | |
Total assets | | | 137,914 | | | | 69,885 | | | | 72,789 | | |
Liabilities: | |
Securities sold short, at proceeds | | | 65,714 | | | | 22,804 | | | | — | | |
Securities sold short, at value | | | 59,523 | | | | 23,271 | | | | — | | |
Payable for investment securities purchased | | | 2,218 | | | | 6,324 | | | | 4,589 | | |
Obligation to return securities lending collateral | | | — | | | | — | | | | 1,918 | | |
Payable for capital shares redeemed | | | 1,432 | | | | 95 | | | | 11 | | |
Dividends payable on securities sold short (Note 2) | | | 64 | | | | 24 | | | | — | | |
Payable due to investment adviser | | | 78 | | | | 30 | | | | 25 | | |
Payable due to administrator | | | 4 | | | | 2 | | | | 2 | | |
Payable due to shareholder servicing | | | 13 | | | | 2 | | | | 11 | | |
Payable due to distributor | | | 3 | | | | 1 | | | | — | | |
Payable due to transfer agent | | | 4 | | | | 5 | | | | 5 | | |
Payable due to custodian | | | 2 | | | | 9 | | | | 5 | | |
Payable due to compliance services | | | 16 | | | | 16 | | | | 20 | | |
Other accrued expenses | | | 19 | | | | 21 | | | | 25 | | |
Total liabilities | | | 63,376 | | | | 29,800 | | | | 6,611 | | |
Net assets | | $ | 74,538 | | | $ | 40,085 | | | $ | 66,178 | | |
| | *Includes market value of securities on loan of | | | $ | — | | | $ | — | | | $ | 1,868 | | |
Net assets: | |
Portfolio capital | | $ | 94,006 | | | $ | 41,849 | | | $ | 75,640 | | |
Accumulated net investment loss | | | (3,234 | ) | | | (1,205 | ) | | | (712 | ) | |
Accumulated net realized loss from investments, securities sold short and foreign
currency transactions | | | (24,825 | ) | | | (4,044 | ) | | | (14,885 | ) | |
Net unrealized appreciation on investments, securities sold short, foreign currencies and
translation of other assets and liabilities denominated in foreign currencies | | | 8,591 | | | | 3,485 | | | | 6,135 | | |
Net assets | | $ | 74,538 | | | $ | 40,085 | | | $ | 66,178 | | |
Outstanding shares of beneficial interest — Institutional Class Shares (1) | | | 2,043 | | | | 3,366 | | | | 763 | | |
Outstanding shares of beneficial interest — Investor Class Shares (1) | | | 3,801 | | | | 1,115 | | | | 3,572 | | |
Outstanding shares of beneficial interest — Class C Shares (1) | | | 418 | | | | 177 | | | | — | | |
Outstanding shares of beneficial interest — Retirement Class Shares (1) | | | — | | | | — | | | | — | | |
Net assets — Institutional Class Shares | | $ | 24,595 | | | $ | 29,229 | | | $ | 12,332 | | |
Net assets — Investor Class Shares | | $ | 45,174 | | | $ | 9,444 | | | $ | 53,846 | | |
Net assets — Class C Shares | | $ | 4,769 | | | $ | 1,412 | | | $ | — | | |
Net assets — Retirement Class Shares | | $ | — | | | $ | — | | | $ | — | | |
Net asset value, offering and redemption price per share — Institutional Class Shares | | $ | 12.04 | | | $ | 8.68 | | | $ | 16.16 | | |
Net asset value, offering and redemption price per share — Investor Class Shares | | $ | 11.89 | † | | $ | 8.47 | | | $ | 15.08 | † | |
Net asset value, offering and redemption price per share — Class C Shares | | $ | 11.40 | † | | $ | 7.96 | † | | $ | — | | |
Net asset value, offering and redemption price per share — Retirement Class Shares | | $ | — | | | $ | — | | | $ | — | | |
14 TURNER FUNDS 2016 SEMIANNUAL REPORT
| | | Turner
Midcap
Growth
Fund | | Turner
Small Cap
Growth
Fund | |
Assets: | |
Investment securities, at cost | | $ | 120,500 | | | $ | 46,041 | | |
Investment securities, at value | | $ | 132,882 | | | $ | 51,276 | | |
Cash | | | — | | | | — | | |
Deposits with brokers for securities sold short | | | — | | | | — | | |
Foreign currency, at value | | | — | | | | — | | |
Receivable for investment securities sold | | | — | | | | — | | |
Receivable for capital shares sold | | | 39 | | | | 7 | | |
Prepaid expenses | | | 41 | | | | 21 | | |
Receivable for dividend income | | | 64 | | | | 39 | | |
Total assets | | | 133,026 | | | | 51,343 | | |
Liabilities: | |
Securities sold short, at proceeds | | | — | | | | — | | |
Securities sold short, at value | | | — | | | | — | | |
Payable for investment securities purchased | | | — | | | | — | | |
Obligation to return securities lending collateral | | | 8,128 | | | | 9,442 | | |
Payable for capital shares redeemed | | | 29 | | | | 377 | | |
Dividends payable on securities sold short (Note 2) | | | — | | | | — | | |
Payable due to investment adviser | | | 22 | | | | 10 | | |
Payable due to administrator | | | 15 | | | | — | | |
Payable due to shareholder servicing | | | 22 | | | | 9 | | |
Payable due to distributor | | | 1 | | | | — | | |
Payable due to transfer agent | | | 11 | | | | 4 | | |
Payable due to custodian | | | 3 | | | | 6 | | |
Payable due to compliance services | | | 42 | | | | 17 | | |
Other accrued expenses | | | 53 | | | | 22 | | |
Total liabilities | | | 8,326 | | | | 9,887 | | |
Net assets | | $ | 124,700 | | | $ | 41,456 | | |
| | *Includes market value of securities on loan of | | | $ | 8,036 | | | $ | 9,187 | | |
Net assets: | |
Portfolio capital | | $ | 127,134 | | | $ | 43,616 | | |
Accumulated net investment loss | | | (1,413 | ) | | | (429 | ) | |
Accumulated net realized loss from investments, securities sold short and foreign
currency transactions | | | (13,403 | ) | | | (6,966 | ) | |
Net unrealized appreciation on investments, securities sold short, foreign currencies and
translation of other assets and liabilities denominated in foreign currencies | | | 12,382 | | | | 5,235 | | |
Net assets | | $ | 124,700 | | | $ | 41,456 | | |
Outstanding shares of beneficial interest — Institutional Class Shares (1) | | | 1,014 | | | | — | | |
Outstanding shares of beneficial interest — Investor Class Shares (1) | | | 6,368 | | | | 3,604 | | |
Outstanding shares of beneficial interest — Class C Shares (1) | | | — | | | | — | | |
Outstanding shares of beneficial interest — Retirement Class Shares (1) | | | 168 | | | | — | | |
Net assets — Institutional Class Shares | | $ | 17,441 | | | $ | — | | |
Net assets — Investor Class Shares | | $ | 104,816 | | | $ | 41,456 | | |
Net assets — Class C Shares | | $ | — | | | $ | — | | |
Net assets — Retirement Class Shares | | $ | 2,443 | | | $ | — | | |
Net asset value, offering and redemption price per share — Institutional Class Shares | | $ | 17.21 | † | | $ | — | | |
Net asset value, offering and redemption price per share — Investor Class Shares | | $ | 16.46 | | | $ | 11.50 | | |
Net asset value, offering and redemption price per share — Class C Shares | | $ | — | | | $ | — | | |
Net asset value, offering and redemption price per share — Retirement Class Shares | | $ | 14.57 | † | | $ | — | | |
(1) Unlimited authorization — par value $0.00001.
† Differences in net asset value recalculation and net asset value stated are caused by rounding differences.
Amounts designated as "—" are either not applicable, $0 or have been rounded to $0.
The accompanying notes are an integral part of the financial statements.
TURNER FUNDS 2016 SEMIANNUAL REPORT 15
FINANCIAL STATEMENTS (Unaudited)
Statements of operations (000)
| | | Turner
Medical Sciences
Long/Short
Fund | | Turner
Titan
Long/Short
Fund | | Turner
SMID
Cap Growth
Opportunities
Fund | |
| | period ended
3/31/16 | | period ended
3/31/16 | | period ended
3/31/16 | |
Investment income: | |
Dividend | | $ | 506 | | | $ | 366 | | | $ | 152 | | |
Securities lending | | | — | | | | — | | | | 226 | | |
Total investment income | | | 506 | | | | 366 | | | | 378 | | |
Expenses: | |
Investment advisory fees | | | 940 | | | | 407 | | | | 381 | | |
Administration fees | | | 94 | | | | 41 | | | | 57 | | |
Shareholder service fees (1) | | | 102 | | | | 26 | | | | 78 | | |
Shareholder service fees (2) | | | 7 | | | | 2 | | | | — | | |
Shareholder service fees (3) | | | — | | | | — | | | | — | | |
Distribution fees (2) | | | 20 | | | | 6 | | | | — | | |
Distribution fees (3) | | | — | | | | — | | | | — | | |
Accounting agent fees | | | 1 | | | | 1 | | | | 1 | | |
Dividend expense | | | 232 | | | | 145 | | | | — | | |
Broker fees and charges on short sales | | | 506 | | | | 54 | | | | — | | |
Custodian fees | | | 11 | | | | 18 | | | | 12 | | |
Transfer agent fees | | | 79 | | | | 50 | | | | 50 | | |
Registration fees | | | 36 | | | | 29 | | | | 15 | | |
Professional fees | | | 41 | | | | 20 | | | | 28 | | |
Trustees' fees | | | 43 | | | | 20 | | | | 28 | | |
Compliance service fees | | | 30 | | | | 14 | | | | 20 | | |
Insurance and other fees | | | 43 | | | | 19 | | | | 32 | | |
Total expenses | | | 2,185 | | | | 852 | | | | 702 | | |
Less: | |
Investment advisory fee waiver | | | (133 | ) | | | (106 | ) | | | (189 | ) | |
Net expenses | | | 2,052 | | | | 746 | | | | 513 | | |
Net investment loss | | | (1,546 | ) | | | (380 | ) | | | (135 | ) | |
Net realized loss from securities sold | | | (29,108 | ) | | | (4,365 | ) | | | (10,731 | ) | |
Net realized gain from securities sold short | | | 9,190 | | | | 1,754 | | | | — | | |
Net change in unrealized appreciation (depreciation) on investments | | | 11,889 | | | | 4,153 | | | | 4,488 | | |
Net change in unrealized appreciation (depreciation) on securities sold short | | | (7,781 | ) | | | (2,363 | ) | | | — | | |
Net realized and unrealized gain (loss) from investments and foreign currencies | | | (15,810 | ) | | | (821 | ) | | | (6,243 | ) | |
Net decrease in net assets resulting from operations | | $ | (17,356 | ) | | $ | (1,201 | ) | | $ | (6,378 | ) | |
16 TURNER FUNDS 2016 SEMIANNUAL REPORT
| | | Turner
Midcap
Growth Fund | | Turner
Small Cap
Growth Fund | |
| | period ended
3/31/16 | | period ended
3/31/16 | |
Investment income: | |
Dividend | | $ | 356 | | | $ | 50 | | |
Securities lending | | | 88 | | | | 151 | | |
Total investment income | | | 444 | | | | 201 | | |
Expenses: | |
Investment advisory fees | | | 559 | | | | 247 | | |
Administration fees | | | 112 | | | | 37 | | |
Shareholder service fees (1) | | | 150 | | | | 62 | | |
Shareholder service fees (2) | | | — | | | | — | | |
Shareholder service fees (3) | | | 3 | | | | — | | |
Distribution fees (2) | | | — | | | | — | | |
Distribution fees (3) | | | 3 | | | | — | | |
Accounting agent fees | | | 1 | | | | — | | |
Dividend expense | | | — | | | | — | | |
Broker fees and charges on short sales | | | — | | | | — | | |
Custodian fees | | | 7 | | | | 12 | | |
Transfer agent fees | | | 110 | | | | 36 | | |
Registration fees | | | 30 | | | | 10 | | |
Professional fees | | | 57 | | | | 20 | | |
Trustees' fees | | | 55 | | | | 20 | | |
Compliance service fees | | | 39 | | | | 14 | | |
Insurance and other fees | | | 66 | | | | 25 | | |
Total expenses | | | 1,192 | | | | 483 | | |
Less: | |
Investment advisory fee waiver | | | (345 | ) | | | (176 | ) | |
Net expenses | | | 847 | | | | 307 | | |
Net investment loss | | | (403 | ) | | | (106 | ) | |
Net realized loss from securities sold | | | (8,242 | ) | | | (5,032 | ) | |
Net realized gain from securities sold short | | | — | | | | — | | |
Net change in unrealized appreciation (depreciation) on investments | | | (2,204 | ) | | | 474 | | |
Net change in unrealized appreciation (depreciation) on securities sold short | | | — | | | | — | | |
Net realized and unrealized gain (loss) from investments and foreign currencies | | | (10,446 | ) | | | (4,558 | ) | |
Net decrease in net assets resulting from operations | | $ | (10,849 | ) | | $ | (4,664 | ) | |
(1) Attributable to Investor Class Shares only.
(2) Attributable to Class C Shares only.
(3) Attributable to Retirement Class Shares only.
Amounts designated as "—" are either not applicable, $0 or have been rounded to $0.
The accompanying notes are an integral part of the financial statements.
TURNER FUNDS 2016 SEMIANNUAL REPORT 17
Statements of changes in net assets (000)
| | | Turner
Medical Sciences
Long/Short Fund | | Turner
Titan Long/
Short Fund | |
| | | period ended
3/31/16
(Unaudited) | | year ended
9/30/15 | | period ended
3/31/16
(Unaudited) | | year ended
9/30/15 | |
Investment activities: | |
Net investment loss | | $ | (1,546 | ) | | $ | (1,904 | ) | | $ | (380 | ) | | $ | (1,227 | ) | |
Net realized gain (loss) from securities sold and securities sold short | | | (19,918 | ) | | | (221 | ) | | | (2,611 | ) | | | 7,630 | | |
Net realized gain on foreign currency transactions | | | — | | | | — | | | | — | | | | 2 | | |
Net change in unrealized appreciation (depreciation) on investments and securities sold short | | | 4,108 | | | | 1,534 | | | | 1,790 | | | | (9,128 | ) | |
Net change in unrealized appreciation (depreciation) on foreign currencies and translation of
other assets and liabilities denominated in foreign currencies | | | — | | | | — | | | | — | | | | — | | |
Net increase (decrease) in net assets resulting from operations | | | (17,356 | ) | | | (591 | ) | | | (1,201 | ) | | | (2,723 | ) | |
Dividends and distributions to shareholders: | |
Realized capital gains: | |
Institutional Class Shares | | | (745 | ) | | | (1,619 | ) | | | (1,929 | ) | | | (20,550 | ) | |
Investor Class Shares | | | (1,619 | ) | | | (454 | ) | | | (1,621 | ) | | | (2,460 | ) | |
Class C Shares | | | (104 | ) | | | (176 | ) | | | (92 | ) | | | (595 | ) | |
Total dividends and distributions | | | (2,468 | ) | | | (2,249 | ) | | | (3,642 | ) | | | (23,605 | ) | |
Capital share transactions: | |
Institutional Class Shares | |
Proceeds from shares issued | | | 11,169 | | | | 30,321 | | | | 9,153 | | | | 11,521 | | |
Proceeds from shares issued in lieu of cash distributions | | | 570 | | | | 1,163 | | | | 1,502 | | | | 14,739 | | |
Cost of shares redeemed | | | (21,642 | ) | | | (18,381 | ) | | | (13,215 | ) | | | (89,272 | ) | |
Net increase (decrease) in net assets from Institutional Class Shares transactions | | | (9,903 | ) | | | 13,103 | | | | (2,560 | ) | | | (63,012 | ) | |
Investor Class Shares | |
Proceeds from shares issued | | | 26,180 | | | | 118,863 | | | | 7,249 | | | | 20,650 | | |
Proceeds from shares issued in lieu of cash distributions | | | 1,605 | | | | 400 | | | | 1,595 | | | | 2,346 | | |
Cost of shares redeemed | | | (60,698 | ) | | | (31,830 | ) | | | (22,723 | ) | | | (10,096 | ) | |
Net increase (decrease) in net assets from Investor Class Shares transactions | | | (32,913 | ) | | | 87,433 | | | | (13,879 | ) | | | 12,900 | | |
Class C Shares | |
Proceeds from shares issued | | | 1,147 | | | | 3,409 | | | | 68 | | | | 38 | | |
Proceeds from shares issued in lieu of cash distributions | | | 89 | | | | 142 | | | | 89 | | | | 565 | | |
Cost of shares redeemed | | | (1,068 | ) | | | (1,020 | ) | | | (174 | ) | | | (1,357 | ) | |
Net increase (decrease) in net assets from Class C Shares transactions | | | 168 | | | | 2,531 | | | | (17 | ) | | | (754 | ) | |
Net increase (decrease) in net assets from capital share transactions | | | (42,648 | ) | | | 103,067 | | | | (16,456 | ) | | | (50,866 | ) | |
Total increase (decrease) in net assets | | | (62,472 | ) | | | 100,227 | | | | (21,299 | ) | | | (77,194 | ) | |
Net assets: | |
Beginning of period | | | 137,010 | | | | 36,783 | | | | 61,384 | | | | 138,578 | | |
End of period | | $ | 74,538 | | | $ | 137,010 | | | $ | 40,085 | | | $ | 61,384 | | |
Accumulated net investment loss | | $ | (3,234 | ) | | $ | (1,688 | ) | | $ | (1,205 | ) | | $ | (825 | ) | |
Share issued and redeemed: | |
Institutional Class Shares | |
Issued | | | 833 | | | | 2,117 | | | | 1,032 | | | | 1,216 | | |
Issued in lieu of cash distributions | | | 43 | | | | 103 | | | | 169 | | | | 1,694 | | |
Redeemed | | | (1,726 | ) | | | (1,418 | ) | | | (1,481 | ) | | | (9,308 | ) | |
Net increase (decrease) in Institutional Class Shares | | | (850 | ) | | | 802 | | | | (280 | ) | | | (6,398 | ) | |
Investor Class Shares | |
Issued | | | 1,956 | | | | 8,356 | | | | 817 | | | | 2,209 | | |
Issued in lieu of cash distributions | | | 122 | | | | 36 | | | | 183 | | | | 275 | | |
Redeemed | | | (4,837 | ) | | | (2,284 | ) | | | (2,682 | ) | | | (1,014 | ) | |
Net increase (decrease) in Investor Class Shares | | | (2,759 | ) | | | 6,108 | | | | (1,682 | ) | | | 1,470 | | |
Class C Shares | |
Issued | | | 89 | | | | 245 | | | | 8 | | | | 4 | | |
Issued in lieu of cash distributions | | | 7 | | | | 13 | | | | 11 | | | | 70 | | |
Redeemed | | | (87 | ) | | | (76 | ) | | | (21 | ) | | | (152 | ) | |
Net increase (decrease) in Class C Shares | | | 9 | | | | 182 | | | | (2 | ) | | | (78 | ) | |
Net increase (decrease) in share transactions | | | (3,600 | ) | | | 7,092 | | | | (1,964 | ) | | | (5,006 | ) | |
18 TURNER FUNDS 2016 SEMIANNUAL REPORT
| | | Turner
SMID Cap
Growth Opportunities | |
| | | period ended
3/31/16
(Unaudited) | | year ended
9/30/15 | |
Investment activities: | |
Net investment loss | | $ | (135 | ) | | $ | (585 | ) | |
Net realized gain (loss) from securities sold and securities sold short | | | (10,731 | ) | | | 33,794 | | |
Net realized gain on foreign currency transactions | | | — | | | | — | | |
Net change in unrealized appreciation (depreciation) on investments and securities sold short | | | 4,488 | | | | (24,302 | ) | |
Net change in unrealized appreciation (depreciation) on foreign currencies and translation of
other assets and liabilities denominated in foreign currencies | | | — | | | | — | | |
Net increase (decrease) in net assets resulting from operations | | | (6,378 | ) | | | 8,907 | | |
Dividends and distributions to shareholders: | |
Realized capital gains: | |
Institutional Class Shares | | | (6,644 | ) | | | (8,970 | ) | |
Investor Class Shares | | | (29,725 | ) | | | (49,724 | ) | |
Class C Shares | | | — | | | | — | | |
Total dividends and distributions | | | (36,369 | ) | | | (58,694 | ) | |
Capital share transactions: | |
Institutional Class Shares | |
Proceeds from shares issued | | | 865 | | | | 1,684 | | |
Proceeds from shares issued in lieu of cash distributions | | | 6,630 | | | | 8,776 | | |
Cost of shares redeemed | | | (3,154 | ) | | | (13,071 | ) | |
Net increase (decrease) in net assets from Institutional Class Shares transactions | | | 4,341 | | | | (2,611 | ) | |
Investor Class Shares | |
Proceeds from shares issued | | | 3,766 | | | | 15,293 | | |
Proceeds from shares issued in lieu of cash distributions | | | 27,432 | | | | 46,308 | | |
Cost of shares redeemed | | | (14,116 | ) | | | (64,473 | ) | |
Net increase (decrease) in net assets from Investor Class Shares transactions | | | 17,082 | | | | (2,872 | ) | |
Class C Shares | |
Proceeds from shares issued | | | — | | | | — | | |
Proceeds from shares issued in lieu of cash distributions | | | — | | | | — | | |
Cost of shares redeemed | | | — | | | | — | | |
Net increase (decrease) in net assets from Class C Shares transactions | | | — | | | | — | | |
Net increase (decrease) in net assets from capital share transactions | | | 21,423 | | | | (5,483 | ) | |
Total increase (decrease) in net assets | | | (21,324 | ) | | | (55,270 | ) | |
Net assets: | |
Beginning of period | | | 87,502 | | | | 142,772 | | |
End of period | | $ | 66,178 | | | $ | 87,502 | | |
Accumulated net investment loss | | $ | (712 | ) | | $ | (577 | ) | |
Share issued and redeemed: | |
Institutional Class Shares | |
Issued | | | 40 | | | | 48 | | |
Issued in lieu of cash distributions | | | 376 | | | | 295 | | |
Redeemed | | | (159 | ) | | | (310 | ) | |
Net increase (decrease) in Institutional Class Shares | | | 257 | | | | 33 | | |
Investor Class Shares | |
Issued | | | 226 | | | | 474 | | |
Issued in lieu of cash distributions | | | 1,670 | | | | 1,615 | | |
Redeemed | | | (705 | ) | | | (1,882 | ) | |
Net increase (decrease) in Investor Class Shares | | | 1,191 | | | | 207 | | |
Class C Shares | |
Issued | | | — | | | | — | | |
Issued in lieu of cash distributions | | | — | | | | — | | |
Redeemed | | | — | | | | — | | |
Net increase (decrease) in Class C Shares | | | — | | | | — | | |
Net increase (decrease) in share transactions | | | 1,448 | | | | 240 | | |
Amounts designated as "—" are either not applicable, $0 or have been rounded to $0.
The accompanying notes are an integral part of the financial statements.
TURNER FUNDS 2016 SEMIANNUAL REPORT 19
Statements of changes in net assets (000)
| | | Turner
Midcap Growth
Fund | |
| | | period ended
3/31/16
(Unaudited) | | year ended
9/30/15 | |
Investment activities: | |
Net investment loss | | $ | (403 | ) | | $ | (1,307 | ) | |
Net realized gain (loss) from securities sold | | | (8,242 | ) | | | 31,791 | | |
Net change in unrealized appreciation (depreciation) on investment transactions | | | (2,204 | ) | | | (36,114 | ) | |
Net increase (decrease) in net assets resulting from operations | | | (10,849 | ) | | | (5,630 | ) | |
Dividends and distributions to shareholders: | |
Realized capital gains: | |
Institutional Class Shares | | | (4,537 | ) | | | (15,809 | ) | |
Investor Class Shares | | | (18,204 | ) | | | (76,404 | ) | |
Retirement Class Shares | | | (424 | ) | | | (2,077 | ) | |
Total dividends and distributions | | | (23,165 | ) | | | (94,290 | ) | |
Capital share transactions: | |
Institutional Class Shares | |
Proceeds from shares issued | | | 548 | | | | 9,565 | | |
Proceeds from Fund acquisition (Note 10) | | | — | | | | 14,971 | | |
Proceeds from shares issued in lieu of cash distributions | | | 4,273 | | | | 13,702 | | |
Cost of shares redeemed | | | (16,703 | ) | | | (31,244 | ) | |
Net increase (decrease) in net assets from Institutional Class Shares transactions | | | (11,882 | ) | | | 6,994 | | |
Investor Class Shares | |
Proceeds from shares issued | | | 2,928 | | | | 15,410 | | |
Proceeds from Fund acquisition (Note 10) | | | — | | | | 14,263 | | |
Proceeds from shares issued in lieu of cash distributions | | | 17,080 | | | | 72,044 | | |
Cost of shares redeemed | | | (21,724 | ) | | | (75,850 | ) | |
Net increase (decrease) in net assets from Investor Class Shares transactions | | | (1,716 | ) | | | 25,867 | | |
Retirement Class Shares | |
Proceeds from shares issued | | | 138 | | | | 545 | | |
Proceeds from shares issued in lieu of cash distributions | | | 424 | | | | 2,077 | | |
Cost of shares redeemed | | | (237 | ) | | | (2,477 | ) | |
Net increase in net assets from Retirement Class Shares transactions | | | 325 | | | | 145 | | |
Net increase (decrease) in net assets from capital share transactions | | | (13,273 | ) | | | 33,006 | | |
Total increase (decrease) in net assets | | | (47,287 | ) | | | (66,914 | ) | |
Net assets: | |
Beginning of period | | | 171,987 | | | | 238,901 | | |
End of period | | $ | 124,700 | | | $ | 171,987 | | |
Accumulated net investment loss | | $ | (1,413 | ) | | $ | (1,010 | ) | |
Share issued and redeemed: | |
Institutional Class Shares | |
Issued | | | 30 | | | | 361 | | |
Shares from Fund acquisition (Note 10) | | | — | | | | 646 | | |
Issued in lieu of cash distributions | | | 227 | | | | 603 | | |
Redeemed | | | (904 | ) | | | (1,148 | ) | |
Net increase (decrease) in Institutional Class Shares | | | (647 | ) | | | 462 | | |
Investor Class Shares | |
Issued | | | 164 | | | | 627 | | |
Shares from Fund acquisition (Note 10) | | | — | | | | 638 | | |
Issued in lieu of cash distributions | | | 948 | | | | 3,286 | | |
Redeemed | | | (1,192 | ) | | | (3,077 | ) | |
Net increase (decrease) in Investor Class Shares | | | (80 | ) | | | 1,474 | | |
Retirement Class Shares | |
Issued | | | 8 | | | | 22 | | |
Issued in lieu of cash distributions | | | 27 | | | | 104 | | |
Redeemed | | | (14 | ) | | | (110 | ) | |
Net increase in Retirement Class Shares | | | 21 | | | | 16 | | |
Net increase (decrease) in share transactions | | | (706 | ) | | | 1,952 | | |
20 TURNER FUNDS 2016 SEMIANNUAL REPORT
| | | Turner
Small Cap Growth
Fund | |
| | | period ended
3/31/16
(Unaudited) | | year ended
9/30/15 | |
Investment activities: | |
Net investment loss | | $ | (106 | ) | | $ | (593 | ) | |
Net realized gain (loss) from securities sold | | | (5,032 | ) | | | 18,782 | | |
Net change in unrealized appreciation (depreciation) on investment transactions | | | 474 | | | | (15,758 | ) | |
Net increase (decrease) in net assets resulting from operations | | | (4,664 | ) | | | 2,431 | | |
Dividends and distributions to shareholders: | |
Realized capital gains: | |
Institutional Class Shares | | | — | | | | — | | |
Investor Class Shares | | | (14,893 | ) | | | (46,207 | ) | |
Retirement Class Shares | | | — | | | | — | | |
Total dividends and distributions | | | (14,893 | ) | | | (46,207 | ) | |
Capital share transactions: | |
Institutional Class Shares | |
Proceeds from shares issued | | | — | | | | — | | |
Proceeds from Fund acquisition (Note 10) | | | — | | | | — | | |
Proceeds from shares issued in lieu of cash distributions | | | — | | | | — | | |
Cost of shares redeemed | | | — | | | | — | | |
Net increase (decrease) in net assets from Institutional Class Shares transactions | | | — | | | | — | | |
Investor Class Shares | |
Proceeds from shares issued | | | 3,786 | | | | 41,326 | | |
Proceeds from Fund acquisition (Note 10) | | | — | | | | — | | |
Proceeds from shares issued in lieu of cash distributions | | | 14,328 | | | | 45,588 | | |
Cost of shares redeemed | | | (27,943 | ) | | | (102,381 | ) | |
Net increase (decrease) in net assets from Investor Class Shares transactions | | | (9,829 | ) | | | (15,467 | ) | |
Retirement Class Shares | |
Proceeds from shares issued | | | — | | | | — | | |
Proceeds from shares issued in lieu of cash distributions | | | — | | | | — | | |
Cost of shares redeemed | | | — | | | | — | | |
Net increase in net assets from Retirement Class Shares transactions | | | — | | | | — | | |
Net increase (decrease) in net assets from capital share transactions | | | (9,829 | ) | | | (15,467 | ) | |
Total increase (decrease) in net assets | | | (29,386 | ) | | | (59,243 | ) | |
Net assets: | |
Beginning of period | | | 70,842 | | | | 130,085 | | |
End of period | | $ | 41,456 | | | $ | 70,842 | | |
Accumulated net investment loss | | $ | (429 | ) | | $ | (323 | ) | |
Share issued and redeemed: | |
Institutional Class Shares | |
Issued | | | — | | | | — | | |
Shares from Fund acquisition (Note 10) | | | — | | | | — | | |
Issued in lieu of cash distributions | | | — | | | | — | | |
Redeemed | | | — | | | | — | | |
Net increase (decrease) in Institutional Class Shares | | | — | | | | — | | |
Investor Class Shares | |
Issued | | | 267 | | | | 1,956 | | |
Shares from Fund acquisition (Note 10) | | | — | | | | — | | |
Issued in lieu of cash distributions | | | 1,155 | | | | 2,694 | | |
Redeemed | | | (1,740 | ) | | | (4,222 | ) | |
Net increase (decrease) in Investor Class Shares | | | (318 | ) | | | 428 | | |
Retirement Class Shares | |
Issued | | | — | | | | — | | |
Issued in lieu of cash distributions | | | — | | | | — | | |
Redeemed | | | — | | | | — | | |
Net increase in Retirement Class Shares | | | — | | | | — | | |
Net increase (decrease) in share transactions | | | (318 | ) | | | 428 | | |
Amounts designated as "—" are either not applicable, $0 or have been rounded to $0.
The accompanying notes are an integral part of the financial statements.
TURNER FUNDS 2016 SEMIANNUAL REPORT 21
For a share outstanding throughout each period
| | Net asset
value,
beginning
of period | | Net
investment
income
(loss)(1) | | Realized and
unrealized
gains (losses)
on investments | | Total
from
investment
operations | | Dividends
from net
investment
income | | Distributions
from
capital
gains | | Total
dividends and
distributions | |
Turner Medical Sciences Long/Short Fund — Institutional Class Shares | | | |
| 2016^ | | $ | 14.02 | | | | (0.15 | ) | | | (1.59 | ) | | | (1.74 | ) | | | — | | | | (0.24 | ) | | | (0.24 | ) | |
2015 | | $ | 13.33 | | | | (0.35 | ) | | | 1.83 | | | | 1.48 | | | | — | | | | (0.79 | ) | | | (0.79 | ) | |
2014 | | $ | 11.54 | | | | (0.18 | ) | | | 2.33 | | | | 2.15 | | | | — | | | | (0.36 | ) | | | (0.36 | ) | |
2013 | | $ | 10.19 | | | | (0.13 | ) | | | 1.48 | | | | 1.35 | | | | — | | | | — | | | | — | | |
2012 | | $ | 10.35 | | | | (0.15 | ) | | | (0.01 | ) | | | (0.16 | ) | | | — | | | | — | | | | — | | |
| 2011 (6) | | $ | 10.00 | | | | (0.12 | ) | | | 0.47 | | | | 0.35 | | | | — | | | | — | | | | — | | |
Turner Medical Sciences Long/Short Fund — Investor Class Shares | | | |
| 2016^ | | $ | 13.87 | | | | (0.16 | ) | | | (1.58 | ) | | | (1.74 | ) | | | — | | | | (0.24 | ) | | | (0.24 | ) | |
2015 | | $ | 13.23 | | | | (0.39 | ) | | | 1.82 | | | | 1.43 | | | | — | | | | (0.79 | ) | | | (0.79 | ) | |
2014 | | $ | 11.48 | | | | (0.21 | ) | | | 2.32 | | | | 2.11 | | | | — | | | | (0.36 | ) | | | (0.36 | ) | |
2013 | | $ | 10.16 | | | | (0.16 | ) | | | 1.48 | | | | 1.32 | | | | — | | | | — | | | | — | | |
2012 | | $ | 10.34 | | | | (0.18 | ) | | | — | | | | (0.18 | ) | | | — | | | | — | | | | — | | |
| 2011 (6) | | $ | 10.00 | | | | (0.13 | ) | | | 0.47 | | | | 0.34 | | | | — | | | | — | | | | — | | |
Turner Medical Sciences Long/Short Fund — Class C Shares | | | |
| 2016^ | | $ | 13.36 | | | | (0.20 | ) | | | (1.52 | ) | | | (1.72 | ) | | | — | | | | (0.24 | ) | | | (0.24 | ) | |
2015 | | $ | 12.87 | | | | (0.47 | ) | | | 1.75 | | | | 1.28 | | | | — | | | | (0.79 | ) | | | (0.79 | ) | |
2014 | | $ | 11.26 | | | | (0.29 | ) | | | 2.26 | | | | 1.97 | | | | — | | | | (0.36 | ) | | | (0.36 | ) | |
2013 | | $ | 10.04 | | | | (0.23 | ) | | | 1.45 | | | | 1.22 | | | | — | | | | — | | | | — | | |
2012 | | $ | 10.30 | | | | (0.25 | ) | | | (0.01 | ) | | | (0.26 | ) | | | — | | | | — | | | | — | | |
| 2011 (6) | | $ | 10.00 | | | | (0.18 | ) | | | 0.48 | | | | 0.30 | | | | — | | | | — | | | | — | | |
Turner Titan Long/Short Fund — Institutional Class Shares | | | |
| 2016^ | | $ | 9.37 | | | | (0.06 | ) | | | (0.07 | ) | | | (0.14 | ) | | | — | | | | (0.55 | ) | | | (0.55 | ) | |
2015 | | $ | 11.95 | | | | (0.18 | ) | | | 0.23 | (8) | | | 0.05 | | | | — | | | | (2.63 | ) | | | (2.63 | ) | |
2014 | | $ | 11.43 | | | | (0.14 | ) | | | 0.66 | | | | 0.52 | | | | — | | | | — | | | | — | | |
2013 | | $ | 10.89 | | | | (0.07 | ) | | | 0.61 | | | | 0.54 | | | | — | | | | — | | | | — | | |
2012 | | $ | 11.45 | | | | (0.13 | ) | | | 0.04 | | | | (0.09 | ) | | | — | | | | (0.47 | ) | | | (0.47 | ) | |
2011 | | $ | 10.82 | | | | (0.16 | ) | | | 0.79 | | | | 0.63 | | | | — | | | | — | | | | — | | |
Turner Titan Long/Short Fund — Investor Class Shares | | | |
| 2016^ | | $ | 9.17 | | | | (0.07 | ) | | | (0.08 | ) | | | (0.15 | ) | | | — | | | | (0.55 | ) | | | (0.55 | ) | |
2015 | | $ | 11.78 | | | | (0.20 | ) | | | 0.22 | (8) | | | 0.02 | | | | — | | | | (2.63 | ) | | | (2.63 | ) | |
2014 | | $ | 11.30 | | | | (0.17 | ) | | | 0.65 | | | | 0.48 | | | | — | | | | — | | | | — | | |
2013 | | $ | 10.80 | | | | (0.09 | ) | | | 0.59 | | | | 0.50 | | | | — | | | | — | | | | — | | |
2012 | | $ | 11.38 | | | | (0.16 | ) | | | 0.05 | | | | (0.11 | ) | | | — | | | | (0.47 | ) | | | (0.47 | ) | |
2011 | | $ | 10.78 | | | | (0.19 | ) | | | 0.79 | | | | 0.60 | | | | — | | | | — | | | | — | | |
Turner Titan Long/Short Fund — Class C Shares | | | |
| 2016^ | | $ | 8.68 | | | | (0.09 | ) | | | (0.08 | ) | | | (0.17 | ) | | | — | | | | (0.55 | ) | | | (0.55 | ) | |
2015 | | $ | 11.36 | | | | (0.26 | ) | | | 0.21 | (8) | | | (0.05 | ) | | | — | | | | (2.63 | ) | | | (2.63 | ) | |
2014 | | $ | 10.98 | | | | (0.25 | ) | | | 0.63 | | | | 0.38 | | | | — | | | | — | | | | — | | |
2013 | | $ | 10.57 | | | | (0.17 | ) | | | 0.58 | | | | 0.41 | | | | — | | | | — | | | | — | | |
2012 | | $ | 11.23 | | | | (0.24 | ) | | | 0.05 | | | | (0.19 | ) | | | — | | | | (0.47 | ) | | | (0.47 | ) | |
2011 | | $ | 10.72 | | | | (0.27 | ) | | | 0.78 | | | | 0.51 | | | | — | | | | — | | | | — | | |
22 TURNER FUNDS 2016 SEMIANNUAL REPORT
| | | Net asset
value, end
of period | | Total
return | | Net
assets end
of period
(000) | | Ratio of
net expenses
to average
net assets* | | Ratio of total
expenses
to average
net assets | | Ratio of net
investment
income (loss)
to average
net assets* | | Portfolio
turnover
rate** | |
Turner Medical Sciences Long/Short Fund — Institutional Class Shares | |
| 2016^ | | $ | 12.04 | | | | (12.55 | )%†† | | $ | 24,595 | | | | 3.08 | %† | | | 3.30 | %† | | | (2.27 | )%† | | | 189 | % | |
2015 | | $ | 14.02 | | | | 12.60 | % | | $ | 40,568 | | | | 2.90 | %† (2) | | | 3.39 | %† | | | (2.50 | )%† | | | 206 | % | |
2014 | | $ | 13.33 | | | | 19.08 | % | | $ | 27,884 | | | | 1.93 | %† (3) | | | 3.52 | %† | | | (1.44 | )%† | | | 409 | % | |
2013 | | $ | 11.54 | | | | 13.25 | % | | $ | 16,742 | | | | 1.98 | %† (4) | | | 2.99 | %† | | | (1.26 | )%† | | | 492 | % | |
2012 | | $ | 10.19 | | | | (1.55 | )% | | $ | 37,117 | | | | 1.87 | %† (5) | | | 2.09 | %† | | | (1.45 | )%† | | | 900 | % | |
| 2011 (6) | | $ | 10.35 | | | | 3.50 | %†† | | $ | 45,147 | | | | 1.93 | % (7) | | | 2.74 | % | | | (1.74 | )% | | | 608 | % | |
Turner Medical Sciences Long/Short Fund — Investor Class Shares | |
| 2016^ | | $ | 11.89 | | | | (12.69 | )%†† | | $ | 45,174 | | | | 3.33 | %† | | | 3.55 | %† | | | (2.52 | )%† | | | 189 | % | |
2015 | | $ | 13.87 | | | | 12.30 | % | | $ | 90,976 | | | | 3.15 | %† (2) | | | 3.64 | %† | | | (2.75 | )%† | | | 206 | % | |
2014 | | $ | 13.23 | | | | 18.83 | % | | $ | 5,974 | | | | 2.18 | %† (3) | | | 3.77 | %† | | | (1.69 | )%† | | | 409 | % | |
2013 | | $ | 11.48 | | | | 12.99 | % | | $ | 3,062 | | | | 2.23 | %† (4) | | | 3.24 | %† | | | (1.51 | )%† | | | 492 | % | |
2012 | | $ | 10.16 | | | | (1.74 | )% | | $ | 9,606 | | | | 2.12 | %† (5) | | | 2.34 | %† | | | (1.70 | )%† | | | 900 | % | |
| 2011 (6) | | $ | 10.34 | | | | 3.40 | %†† | | $ | 12,777 | | | | 2.14 | % (7) | | | 2.89 | % | | | (1.93 | )% | | | 608 | % | |
Turner Medical Sciences Long/Short Fund — Class C Shares | |
| 2016^ | | $ | 11.40 | | | | (13.02 | )%†† | | $ | 4,769 | | | | 4.08 | %† | | | 4.30 | %† | | | (3.27 | )%† | | | 189 | % | |
2015 | | $ | 13.36 | | | | 11.43 | % | | $ | 5,466 | | | | 3.90 | %† (2) | | | 4.39 | %† | | | (3.50 | )%† | | | 206 | % | |
2014 | | $ | 12.87 | | | | 17.93 | % | | $ | 2,925 | | | | 2.93 | %† (3) | | | 4.52 | %† | | | (2.44 | )%† | | | 409 | % | |
2013 | | $ | 11.26 | | | | 12.15 | % | | $ | 1,374 | | | | 2.98 | %† (4) | | | 3.99 | %† | | | (2.26 | )%† | | | 492 | % | |
2012 | | $ | 10.04 | | | | (2.52 | )% | | $ | 2,889 | | | | 2.87 | %† (5) | | | 3.09 | %† | | | (2.45 | )%† | | | 900 | % | |
| 2011 (6) | | $ | 10.30 | | | | 3.00 | %†† | | $ | 2,165 | | | | 2.93 | % (7) | | | 3.63 | % | | | (2.71 | )% | | | 608 | % | |
Turner Titan Long/Short Fund — Institutional Class Shares | |
| 2016^ | | $ | 8.68 | | | | (1.69 | )%†† | | $ | 29,229 | | | | 2.64 | %† | | | 3.03 | %† | | | (1.29 | )%† | | | 160 | % | |
2015 | | $ | 9.37 | | | | 2.13 | % | | $ | 34,179 | | | | 2.56 | %† (9) | | | 3.37 | %† | | | (1.83 | )%† | | | 510 | % | |
2014 | | $ | 11.95 | | | | 4.55 | % | | $ | 120,032 | | | | 1.93 | %† (10) | | | 2.82 | %† | | | (1.18 | )%† | | | 443 | % | |
2013 | | $ | 11.43 | | | | 4.96 | % | | $ | 481,845 | | | | 1.93 | %† (11) | | | 2.75 | %† | | | (0.64 | )%† | | | 580 | % | |
2012 | | $ | 10.89 | | | | (0.77 | )% | | $ | 832,857 | | | | 1.89 | %† (12) | | | 2.34 | %† | | | (1.15 | )%† | | | 996 | % | |
2011 | | $ | 11.45 | | | | 5.82 | % | | $ | 448,554 | | | | 1.93 | % (13) | | | 2.48 | % | | | (1.34 | )% | | | 1,153 | % | |
Turner Titan Long/Short Fund — Investor Class Shares | |
| 2016^ | | $ | 8.47 | | | | (1.84 | )%†† | | $ | 9,444 | | | | 2.89 | %† | | | 3.28 | %† | | | (1.54 | )%† | | | 160 | % | |
2015 | | $ | 9.17 | | | | 1.86 | % | | $ | 25,651 | | | | 2.81 | %† (9) | | | 3.62 | %† | | | (2.08 | )%† | | | 510 | % | |
2014 | | $ | 11.78 | | | | 4.25 | % | | $ | 15,630 | | | | 2.18 | %† (10) | | | 3.07 | %† | | | (1.42 | )%† | | | 443 | % | |
2013 | | $ | 11.30 | | | | 4.63 | % | | $ | 44,139 | | | | 2.18 | %† (11) | | | 3.00 | %† | | | (0.89 | )%† | | | 580 | % | |
2012 | | $ | 10.80 | | | | (0.95 | )% | | $ | 126,533 | | | | 2.14 | %† (12) | | | 2.59 | %† | | | (1.40 | )%† | | | 996 | % | |
2011 | | $ | 11.38 | | | | 5.57 | % | | $ | 161,401 | | | | 2.18 | % (13) | | | 2.70 | % | | | (1.61 | )% | | | 1,153 | % | |
Turner Titan Long/Short Fund — Class C Shares | |
| 2016^ | | $ | 7.96 | | | | (2.18 | )%†† | | $ | 1,412 | | | | 3.64 | %† | | | 4.03 | %† | | | (2.29 | )%† | | | 160 | % | |
2015 | | $ | 8.68 | | | | 1.17 | % | | $ | 1,554 | | | | 3.56 | %† (9) | | | 4.37 | %† | | | (2.83 | )%† | | | 510 | % | |
2014 | | $ | 11.36 | | | | 3.46 | % | | $ | 2,916 | | | | 2.93 | %† (10) | | | 3.82 | %† | | | (2.18 | )%† | | | 443 | % | |
2013 | | $ | 10.98 | | | | 3.88 | % | | $ | 5,572 | | | | 2.93 | %† (11) | | | 3.75 | %† | | | (1.64 | )%† | | | 580 | % | |
2012 | | $ | 10.57 | | | | (1.71 | )% | | $ | 10,391 | | | | 2.89 | %† (12) | | | 3.34 | %† | | | (2.15 | )%† | | | 996 | % | |
2011 | | $ | 11.23 | | | | 4.76 | % | | $ | 12,478 | | | | 2.93 | % (13) | | | 3.39 | % | | | (2.33 | )% | | | 1,153 | % | |
* Inclusive of fees paid indirectly, waivers and/or reimbursements.
** Excludes effect of in-kind transfers and mergers, as applicable. Not annualized for periods less than one year.
^ For the six-month period ended March 31, 2016 (unaudited). All ratios for the periods have been annualized unless otherwise noted.
† Does not include acquired fund fees or expenses.
†† Total return is for the period indicated and has not been annualized.
(1) Based on average shares outstanding.
(2) Dividend expense totaled 0.44% of average net assets for the year ended September 30, 2015, 0.02% of which was waived. Broker fees and charges on short sales totaled 0.86% of average net assets for the year ended September 30, 2015, 0.28% of which was waived. If dividend expense and broker fees and charges on short sales had not been contractually waived, the ratios of net expenses to average net assets would have been 3.20%, 3.45% and 4.20% for the Institutional, Investor and Class C Shares, respectively.
(3) Dividend expense totaled 0.16% of average net assets for the year ended September 30, 2014, 0.16% of which was waived. Broker fees and charges on short sales totaled 1.27% of average net assets for the year ended September 30, 2014, 1.27% of which was waived. If dividend expense and broker fees and charges on short sales had not been contractually waived, the ratios of net expenses to average net assets would have been 3.36%, 3.61% and 4.36% for the Institutional, Investor and Class C Shares, respectively.
(4) Dividend expense totaled 0.45% of average net assets for the year ended September 30, 2013, 0.45% of which was waived. Broker fees and charges on short sales totaled 0.41% of average net assets for the year ended September 30, 2013, 0.41% of which was waived. If dividend expense and broker fees and charges on short sales had not been contractually waived, the ratios of net expenses to average net assets would have been 2.79%, 3.04% and 3.79% for the Institutional, Investor and Class C Shares, respectively.
(5) Dividend expense totaled 0.04% of average net assets for the year ended September 30, 2012, 0.04% of which was waived. Broker fees and charges on short sales totaled 0.15% of average net assets for the year ended September 30, 2012, 0.15% of which was waived. If dividend expense and broker fees and charges on short sales had not been contractually waived, the ratios of net expenses to average net assets would have been 2.06%, 2.31% and 3.06% for the Institutional, Investor and Class C Shares, respectively.
(6) Commenced operations on February 7, 2011. All ratios for the period have been annualized.
(7) Dividend expense totaled 0.15% of average net assets for the year ended September 30, 2011, 0.12% of which was waived. Broker fees and charges on short sales totaled 0.47% of average net assets for the year ended September 30, 2011, 0.39% of which was waived. If dividend expense and broker fees and charges on short sales had not been contractually waived, the ratios of net expenses to average net assets would have been 2.44%, 2.65% and 3.44% for the Institutional, Investor and Class C Shares, respectively.
(8) The amount shown for a share outstanding throughout the period does not accord with the change in aggregate gains and losses in the portfolio securities during the period because of the timing of the sales and purchase of fund shares in relation in fluctuating market values during the period.
(9) Dividend expense totaled 0.46% of average net assets for the year ended September 30, 2015, 0.14% of which was waived. Broker fees and charges on short sales totaled 0.68% of average net assets for the year ended September 30, 2015, 0.35% of which was waived. If dividend expense and broker fees and charges on short sales had not been contractually waived, the ratios of net expenses to average net assets would have been 3.05%, 3.30% and 4.05% for the Institutional, Investor and Class C Shares, respectively.
(10)Dividend expense totaled 0.40% of average net assets for the year ended September 30, 2014, 0.40% of which was waived. Broker fees and charges on short sales totaled 0.44% of average net assets for the year ended September 30, 2014, 0.44% of which was waived. If dividend expense and broker fees and charges on short sales had not been contractually waived, the ratios of net expenses to average net assets would have been 2.77%, 3.01% and 3.77% for the Institutional, Investor and Class C Shares, respectively.
(11) Dividend expense totaled 0.45% of average net assets for the year ended September 30, 2013, 0.45% of which was waived. Broker fees and charges on short sales totaled 0.45% of average net assets for the year ended September 30, 2013, 0.45% of which was waived. If dividend expense and broker fees and charges on short sales had not been contractually waived, the ratios of net expenses to average net assets would have been 2.83%, 3.08% and 3.83% for the Institutional, Investor and Class C Shares, respectively.
(12) Dividend expense totaled 0.20% of average net assets for the year ended September 30, 2012, 0.20% of which was waived. Broker fees and charges on short sales totaled 0.33% of average net assets for the year ended September 30, 2012, 0.33% of which was waived. If dividend expense and broker fees and charges on short sales had not been contractually waived, the ratios of net expenses to average net assets would have been 2.42%, 2.67% and 3.42% for the Institutional, Investor and Class C Shares, respectively.
(13) Dividend expense totaled 0.28% of average net assets for the year ended September 30, 2011, 0.22% of which was waived. Broker fees and charges on short sales totaled 0.32% of average net assets for the year ended September 30, 2011, 0.25% of which was waived. If dividend expense and broker fees and charges on short sales had not been contractually waived, the ratios of net expenses to average net assets would have been 2.40%, 2.65% and 3.40% for the Institutional, Investor and Class C Shares, respectively.
Amounts designated as "—" are either not applicable, $0 or have been rounded to $0.
The accompanying notes are and integral part of the financial statements.
TURNER FUNDS 2016 SEMIANNUAL REPORT 23
For a share outstanding throughout each period
| | Net asset
value,
beginning
of period | | Net
investment
income
(loss)(1) | | Realized and
unrealized
gains (losses)
on investments | | Total
from
investment
operations | | Dividends
from net
investment
income | | Distributions
from
capital
gains | | Total
dividends and
distributions | |
Turner SMID Cap Growth Opportunities Fund — Institutional Class Shares | | | |
| 2016^ | | $ | 31.27 | | | | (0.02 | ) | | | (1.48 | ) | | | (1.50 | ) | | | — | | | | (13.61 | ) | | | (13.61 | ) | |
2015 | | $ | 54.75 | | | | (0.12 | ) | | | 2.75 | | | | 2.63 | | | | — | | | | (26.11 | ) | | | (26.11 | ) | |
2014 | | $ | 65.25 | | | | (0.46 | ) | | | 0.32 | | | | (0.14 | ) | | | — | | | | (10.36 | ) | | | (10.36 | ) | |
2013 | | $ | 57.68 | | | | (0.12 | ) | | | 16.10 | | | | 15.98 | | | | — | | | | (8.41 | ) | | | (8.41 | ) | |
2012 | | $ | 45.83 | | | | (0.34 | ) | | | 12.19 | | | | 11.85 | | | | — | | | | — | | | | — | | |
2011 | | $ | 42.51 | | | | (0.40 | ) | | | 3.72 | | | | 3.32 | | | | — | | | | — | | | | — | | |
Turner SMID Cap Growth Opportunities Fund — Investor Class Shares | | | |
| 2016^ | | $ | 30.11 | | | | (0.04 | ) | | | (1.38 | ) | | | (1.42 | ) | | | — | | | | (13.61 | ) | | | (13.61 | ) | |
2015 | | $ | 53.75 | | | | (0.21 | ) | | | 2.68 | | | | 2.47 | | | | — | | | | (26.11 | ) | | | (26.11 | ) | |
2014 | | $ | 64.38 | | | | (0.59 | ) | | | 0.32 | | | | (0.27 | ) | | | — | | | | (10.36 | ) | | | (10.36 | ) | |
2013 | | $ | 57.16 | | | | (0.25 | ) | | | 15.88 | | | | 15.63 | | | | — | | | | (8.41 | ) | | | (8.41 | ) | |
2012 | | $ | 45.52 | | | | (0.47 | ) | | | 12.11 | | | | 11.64 | | | | — | | | | — | | | | — | | |
2011 | | $ | 42.32 | | | | (0.52 | ) | | | 3.72 | | | | 3.20 | | | | — | | | | — | | | | — | | |
Turner Midcap Growth Fund — Institutional Class Shares | | | |
| 2016^ | | $ | 21.49 | | | | (0.03 | ) | | | (1.29 | ) | | | (1.32 | ) | | | — | | | | (2.96 | ) | | | (2.96 | ) | |
2015 | | $ | 38.57 | | | | (0.10 | ) | | | (0.82 | ) | | | (0.92 | ) | | | — | | | | (16.16 | ) | | | (16.16 | ) | |
2014 | | $ | 43.43 | | | | (0.08 | ) | | | 4.58 | | | | 4.50 | | | | — | | | | (9.36 | ) | | | (9.36 | ) | |
2013 | | $ | 35.39 | | | | (0.09 | ) | | | 8.68 | | | | 8.59 | | | | — | | | | (0.55 | ) | | | (0.55 | ) | |
2012 | | $ | 30.42 | | | | (0.05 | ) | | | 5.02 | | | | 4.97 | | | | — | | | | — | | | | — | | |
2011 | | $ | 29.90 | | | | (0.06 | ) | | | 0.58 | | | | 0.52 | | | | — | | | | — | | | | — | | |
Turner Midcap Growth Fund — Investor Class Shares | | | |
| 2016^ | | $ | 20.71 | | | | (0.05 | ) | | | (1.24 | ) | | | (1.29 | ) | | | — | | | | (2.96 | ) | | | (2.96 | ) | |
2015 | | $ | 37.79 | | | | (0.16 | ) | | | (0.76 | ) | | | (0.92 | ) | | | — | | | | (16.16 | ) | | | (16.16 | ) | |
2014 | | $ | 42.85 | | | | (0.17 | ) | | | 4.47 | | | | 4.30 | | | | — | | | | (9.36 | ) | | | (9.36 | ) | |
2013 | | $ | 35.03 | | | | (0.18 | ) | | | 8.55 | | | | 8.37 | | | | — | | | | (0.55 | ) | | | (0.55 | ) | |
2012 | | $ | 30.16 | | | | (0.13 | ) | | | 5.00 | | | | 4.87 | | | | — | | | | — | | | | — | | |
2011 | | $ | 29.73 | | | | (0.13 | ) | | | 0.56 | | | | 0.43 | | | | — | | | | — | | | | — | | |
Turner Midcap Growth Fund — Retirement Class Shares | | | |
| 2016^ | | $ | 18.69 | | | | (0.07 | ) | | | (1.09 | ) | | | (1.16 | ) | | | — | | | | (2.96 | ) | | | (2.96 | ) | |
2015 | | $ | 35.75 | | | | (0.21 | ) | | | (0.69 | ) | | | (0.90 | ) | | | — | | | | (16.16 | ) | | | (16.16 | ) | |
2014 | | $ | 41.07 | | | | (0.25 | ) | | | 4.29 | | | | 4.04 | | | | — | | | | (9.36 | ) | | | (9.36 | ) | |
2013 | | $ | 33.65 | | | | (0.25 | ) | | | 8.22 | | | | 7.97 | | | | — | | | | (0.55 | ) | | | (0.55 | ) | |
2012 | | $ | 29.05 | | | | (0.20 | ) | | | 4.80 | | | | 4.60 | | | | — | | | | — | | | | — | | |
2011 | | $ | 28.71 | | | | (0.22 | ) | | | 0.56 | | | | 0.34 | | | | — | | | | — | | | | — | | |
Turner Small Cap Growth Fund — Investor Class Shares | | | |
| 2016^ | | $ | 18.06 | | | | (0.03 | ) | | | (1.31 | ) | | | (1.34 | ) | | | — | | | | (5.22 | ) | | | (5.22 | ) | |
2015 | | $ | 37.23 | | | | (0.17 | ) | | | 1.25 | | | | 1.08 | | | | — | | | | (20.25 | ) | | | (20.25 | ) | |
2014 | | $ | 44.76 | | | | (0.33 | ) | | | 0.76 | | | | 0.43 | | | | — | | | | (7.96 | ) | | | (7.96 | ) | |
2013 | | $ | 35.96 | | | | (0.16 | ) | | | 11.47 | | | | 11.31 | | | | — | | | | (2.51 | ) | | | (2.51 | ) | |
2012 | | $ | 27.83 | | | | (0.23 | ) | | | 8.36 | | | | 8.13 | | | | — | | | | — | | | | — | | |
2011 | | $ | 28.97 | | | | (0.26 | ) | | | (0.88 | ) | | | (1.14 | ) | | | — | | | | — | | | | — | | |
24 TURNER FUNDS 2016 SEMIANNUAL REPORT
| | | Net asset
value, end
of period | | Total
return | | Net
assets end
of period
(000) | | Ratio of net
expenses
to average
net assets* | | Ratio of total
expenses
to average
net assets | | Ratio of net
investment
income (loss)
to average
net assets* | | Portfolio
turnover
rate** | |
Turner SMID Cap Growth Opportunities Fund — Institutional Class Shares | |
| 2016^ | | $ | 16.16 | | | | (8.37 | )%†† | | $ | 12,331 | | | | 1.15 | % | | | 1.65 | % | | | (0.15 | )% | | | 277 | % | |
2015 | | $ | 31.27 | | | | 7.28 | % | | $ | 15,808 | | | | 1.15 | % | | | 1.58 | % | | | (0.33 | )% | | | 227 | % | |
2014 | | $ | 54.75 | | | | (0.76 | )% | | $ | 25,912 | | | | 1.15 | % | | | 1.42 | % | | | (0.76 | )% | | | 78 | % | |
2013 | | $ | 65.25 | | | | 32.98 | % | | $ | 72,442 | | | | 1.15 | % | | | 1.31 | % | | | (0.21 | )% | | | 62 | % | |
2012 | | $ | 57.68 | | | | 25.86 | % | | $ | 69,391 | | | | 1.15 | % | | | 1.30 | % | | | (0.62 | )% | | | 75 | % | |
2011 | | $ | 45.83 | | | | 7.81 | % | | $ | 67,035 | | | | 1.15 | % | | | 1.27 | % | | | (0.77 | )% | | | 74 | % | |
Turner SMID Cap Growth Opportunities Fund — Investor Class Shares | |
| 2016^ | | $ | 15.08 | | | | (8.44 | )%†† | | $ | 53,846 | | | | 1.40 | % | | | 1.90 | % | | | (0.40 | )% | | | 277 | % | |
2015 | | $ | 30.11 | | | | 7.01 | % | | $ | 71,694 | | | | 1.40 | % | | | 1.83 | % | | | (0.59 | )% | | | 227 | % | |
2014 | | $ | 53.75 | | | | (1.00 | )% | | $ | 116,860 | | | | 1.40 | % | | | 1.67 | % | | | (1.01 | )% | | | 78 | % | |
2013 | | $ | 64.38 | | | | 32.63 | % | | $ | 180,291 | | | | 1.40 | % | | | 1.56 | % | | | (0.46 | )% | | | 62 | % | |
2012 | | $ | 57.16 | | | | 25.57 | % | | $ | 168,990 | | | | 1.40 | % | | | 1.55 | % | | | (0.87 | )% | | | 75 | % | |
2011 | | $ | 45.52 | | | | 7.56 | % | | $ | 159,127 | | | | 1.40 | % | | | 1.55 | % | | | (1.01 | )% | | | 74 | % | |
Turner Midcap Growth Fund — Institutional Class Shares | |
| 2016^ | | $ | 17.21 | | | | (7.32 | )%†† | | $ | 17,441 | | | | 0.93 | % | | | 1.39 | % | | | (0.33 | )% | | | 120 | % | |
2015 | | $ | 21.49 | | | | (4.63 | )% | | $ | 35,704 | | | | 0.93 | % | | | 1.33 | % | | | (0.39 | )% | | | 119 | % (2) | |
2014 | | $ | 38.57 | | | | 12.25 | % | | $ | 46,253 | | | | 0.93 | % | | | 1.17 | % | | | (0.21 | )% | | | 89 | % (3) | |
2013 | | $ | 43.43 | | | | 24.69 | % | | $ | 205,679 | | | | 0.93 | % | | | 1.08 | % | | | (0.24 | )% | | | 84 | % | |
2012 | | $ | 35.39 | | | | 16.34 | % | | $ | 236,147 | | | | 0.93 | % | | | 1.04 | % | | | (0.14 | )% | | | 121 | % | |
2011 | | $ | 30.42 | | | | 1.74 | % | | $ | 245,480 | | | | 0.93 | % | | | 1.05 | % | | | (0.18 | )% | | | 104 | % | |
Turner Midcap Growth Fund — Investor Class Shares | |
| 2016^ | | $ | 16.46 | | | | (7.46 | )%†† | | $ | 104,816 | | | | 1.18 | % | | | 1.64 | % | | | (0.58 | )% | | | 120 | % | |
2015 | | $ | 20.71 | | | | (4.81 | )% | | $ | 133,541 | | | | 1.18 | % | | | 1.58 | % | | | (0.64 | )% | | | 119 | % (2) | |
2014 | | $ | 37.79 | | | | 11.88 | % | | $ | 187,974 | | | | 1.18 | % | | | 1.42 | % | | | (0.44 | )% | | | 89 | % (3) | |
2013 | | $ | 42.85 | | | | 24.31 | % | | $ | 257,240 | | | | 1.18 | % | | | 1.33 | % | | | (0.49 | )% | | | 84 | % | |
2012 | | $ | 35.03 | | | | 16.15 | % | | $ | 404,427 | | | | 1.18 | % | | | 1.29 | % | | | (0.39 | )% | | | 121 | % | |
2011 | | $ | 30.16 | | | | 1.45 | % | | $ | 471,286 | | | | 1.18 | % | | | 1.28 | % | | | (0.38 | )% | | | 104 | % | |
Turner Midcap Growth Fund — Retirement Class Shares | |
| 2016^ | | $ | 14.57 | | | | (7.58 | )%†† | | $ | 2,443 | | | | 1.43 | % | | | 1.89 | % | | | (0.83 | )% | | | 120 | % | |
2015 | | $ | 18.69 | | | | (5.11 | )% | | $ | 2,742 | | | | 1.43 | % | | | 1.83 | % | | | (0.89 | )% | | | 119 | % (2) | |
2014 | | $ | 35.75 | | | | 11.74 | % | | $ | 4,674 | | | | 1.43 | % | | | 1.67 | % | | | (0.68 | )% | | | 89 | % (3) | |
2013 | | $ | 41.07 | | | | 24.11 | % | | $ | 4,235 | | | | 1.43 | % | | | 1.58 | % | | | (0.74 | )% | | | 84 | % | |
2012 | | $ | 33.65 | | | | 15.83 | % | | $ | 4,811 | | | | 1.43 | % | | | 1.54 | % | | | (0.64 | )% | | | 121 | % | |
2011 | | $ | 29.05 | | | | 1.18 | % | | $ | 3,972 | | | | 1.43 | % | | | 1.54 | % | | | (0.63 | )% | | | 104 | % | |
Turner Small Cap Growth Fund — Investor Class Shares | |
| 2016^ | | $ | 11.50 | | | | (9.50 | )%†† | | $ | 41,456 | | | | 1.25 | % | | | 1.97 | % | | | (0.43 | )% | | | 201 | % | |
2015 | | $ | 18.06 | | | | 6.55 | % | | $ | 70,842 | | | | 1.25 | % | | | 1.83 | % | | | (0.77 | )% | | | 280 | % | |
2014 | | $ | 37.23 | | | | 0.99 | % | | $ | 130,085 | | | | 1.25 | % | | | 1.66 | % | | | (0.83 | )% | | | 127 | % | |
2013 | | $ | 44.76 | | | | 33.79 | % | | $ | 233,039 | | | | 1.25 | % | | | 1.56 | % | | | (0.43 | )% | | | 82 | % | |
2012 | | $ | 35.96 | | | | 29.21 | % | | $ | 250,099 | | | | 1.25 | % | | | 1.53 | % | | | (0.68 | )% | | | 100 | % | |
2011 | | $ | 27.83 | | | | (3.94 | )% | | $ | 229,919 | | | | 1.25 | % | | | 1.53 | % | | | (0.76 | )% | | | 119 | % | |
* Inclusive of fees paid indirectly, waivers and/or reimbursements.
** Excludes effect of in-kind transfers and mergers, as applicable. Not annualized for periods less than one year.
^ For the six-month period ended March 31, 2016 (unaudited). All ratios for the periods have been annualized unless otherwise noted.
†† Total return is for the period indicated and has not been annualized.
(1) Based on average shares outstanding.
(2) If purchases of portfolio securities in connection with the reorganization of the Turner Large Growth Fund into the Turner Midcap Growth Fund had been included, the portfolio turnover rate would have been 133%.
(3) If purchases of portfolio securities in connection with the reorganization of the Turner All Cap Growth Fund into the Turner Midcap Growth Fund had been included, the portfolio turnover rate would have been 93%.
Amounts designated as "—" are either not applicable, $0 or have been rounded to $0.
The accompanying notes are and integral part of the financial statements.
TURNER FUNDS 2016 SEMIANNUAL REPORT 25
NOTES TO FINANCIAL STATEMENTS (Unaudited)
Notes to financial statements
March 31, 2016
1. Organization:
Turner Funds (the "Trust"), a Massachusetts business trust, is registered under the Investment Company Act of 1940, as amended, as an open-end management investment company. The Trust meets the definition as an investment company and follows the accounting and reporting guidance under Financial Accounting Standards Board ("FASB") Accounting Standards Codification ("ASC") Topic 946, "Financial Services—Investment Companies." The funds included herein are Turner Medical Sciences Long/Short Fund ("Medical Sciences Long/Short Fund"), Turner Titan Long/Short Fund ("Titan Long/Short Fund," formerly Turner Spectrum Fund and subsequently Turner Titan II Fund), Turner SMID Cap Growth Opportunities Fund ("SMID Cap Growth Opportunities Fund", formerly Turner Emerging Growth Fund), Turner Midcap Growth Fund ("Midcap Growth Fund"), and Turner Small Cap Growth Fund ("Small Cap Growth Fund"), each a "Fund" and collectively the "Funds."
Each Fund is registered as a diversified portfolio of the Trust.
The Funds are registered to offer different classes of shares: Institutional Class Shares, Investor Class Shares, Retirement Class Shares, Class C Shares, or a combination of the four. The assets of each Fund are segregated, and a shareholder's interest is limited to the Fund in which shares are held. The Funds' prospectuses provide a description of each Fund's investment objectives, policies and strategies along with information on the classes of shares currently being offered.
2. Significant accounting policies:
The following is a summary of the significant accounting policies followed by the Funds.
Use of estimates—The preparation of financial statements in conformity with U.S. generally accepted accounting principles ("GAAP") requires management to make estimates and assumptions that affect the reported amounts of assets and liabilities and disclosure of contingent assets and liabilities at the date of the financial statements and the reported amounts of increases and decreases in net assets from operations during the reporting period. Actual results could differ from those estimates.
Securities valuation—In accordance with the authoritative guidance on fair value measurements and disclosures under GAAP, fair value is defined as the price that a Fund would receive upon selling an investment in an orderly transaction to an independent buyer in the principal or most advantageous market.
The Trust has a three-tier fair value hierarchy that is dependent upon the various "inputs" used to determine the value of the Funds' investments. These
inputs are summarized in the three broad levels listed below:
Level 1 – quoted prices in active markets for identical investments
Level 2 – other significant observable inputs (including quoted prices for similar investments, interest rates, prepayment speeds, credit risks, etc.)
Level 3 – significant unobservable inputs (including a Fund's own assumptions in determining the fair value of investments)
Securities listed on a securities exchange, market or automated quotation system for which quotations are readily available (except for securities traded on NASDAQ), including American Depositary Receipts ("ADRs"), are valued at the last quoted sale price on the primary exchange or market (foreign or domestic) on which they are traded, or, if there is no such reported sale, at the most recent quoted bid price for long positions and the most recent quoted ask price for short positions. For securities traded on NASDAQ, the NASDAQ Official Closing Price is used. The prices for foreign securities are reported in local currency and converted to U.S. dollars using currency exchange rates. Prices for most securities held in the Funds are provided daily by recognized independent pricing agents. To the extent these securities are valued at the last sales price or NASDAQ Official Closing Price, they are categorized as Level 1 in the fair value hierarchy.
Investments in other open-end investment companies are valued at net asset value. These valuations are typically categorized as Level 1 in the fair value hierarchy.
If a security price cannot be obtained from an independent, third-party pricing agent, the Funds seek to obtain bid and ask prices from two broker-dealers who make a market in the security and determine the average of the two. In this situation, valuations are typically categorized as Level 2 in the fair value hierarchy.
Securities for which market prices are not "readily available" are valued in accordance with Fair Value Procedures established by the Board of Trustees of the Trust (the "Board"). The Funds' Fair Value Procedures are implemented through a Fair Value Committee (the "Committee") designated by the Board. Some of the more common reasons that may necessitate that a security be valued using Fair Value Procedures include: the security's trading has been halted or suspended; the security has been delisted from a national exchange; the security's primary trading market is temporarily closed at a time when under normal conditions it would be open; the security has not been traded for an extended period of time; the security's primary pricing source is not able or willing to provide
26 TURNER FUNDS 2016 SEMIANNUAL REPORT
a price; or trading of the security is subject to local government-imposed restrictions. When a security is valued in accordance with the Fair Value Procedures, the Committee will determine the value after taking into consideration relevant information reasonably available to the Committee. Depending on the source or relative significance of the valuation inputs, these securities may be categorized as Level 2 or Level 3 in the fair value hierarchy.
For securities that principally trade on a foreign market or exchange, a significant gap in time can exist between the time of a particular security's last trade and the time at which a Fund calculates its net asset value. The closing prices of such securities may no longer reflect their market value at the time a Fund calculates net asset value if an event that could materially affect the value of those securities (a "Significant Event") has occurred between the time of the security's last close and the time that a Fund calculates net asset value. A Significant Event may relate to a single issuer or to an entire market sector.
In the event that Turner Investments, L.P. ("Turner," the "Adviser," or the "Administrator") believes that the fair values provided by a third party fair valuation vendor are not reliable, or believes that a foreign security held by a Fund should be fair valued for any other reason, the Adviser shall contact the sub-administrator, Citi Fund Services, Ohio, Inc. ("Citi" or the "Sub-administrator"), and request that a meeting of the Committee be held. Depending on the source or relative significance of the valuation inputs, these securities may be categorized as Level 2 or Level 3 in the fair value hierarchy.
For the six months ended March 31, 2016, there were no Level 3 investments for which significant unobservable inputs were used to determine fair value.
The following table is a summary of inputs used to value the Funds' investments as of March 31, 2016. The breakdown, by sub-category, of the "common stock" category is disclosed in the Schedule of investments and Schedule of securities sold short for each Fund, as applicable.
| | | Level 1
(000) | | Level 2
(000) | | Total
000) | |
Medical Sciences Long/Short Fund | |
Investments in Securities | |
Common stock | | $ | 70,568 | | | $ | — | | | $ | 70,568 | | |
Cash equivalent | | | 871 | | | | — | | | | 871 | | |
Warrant | | | — | | | | — | * | | | — | * | |
Total Investments in securities | | $ | 71,439 | | | $ | — | | | $ | 71,439 | | |
Securities Sold Short | |
Common stock | | $ | 32,977 | | | $ | — | | | $ | 32,977 | | |
Exchange traded funds | | | 26,546 | | | | — | | | | 26,546 | | |
Total Securities sold short | | $ | 59,523 | | | $ | — | | | $ | 59,523 | | |
| | | Level 1
(000) | | Level 2
(000) | | Total
000) | |
Titan Long/Short Fund | |
Investments in Securities | |
Common stock | | $ | 36,483 | | | $ | — | | | $ | 36,483 | | |
Exchange traded funds | | | 752 | | | | — | | | | 752 | | |
Warrant | | | 47 | | | | — | | | | 47 | | |
Total Investments in securities | | $ | 37,282 | | | $ | — | | | $ | 37,282 | | |
Securities Sold Short | |
Common stock | | $ | 17,821 | | | $ | — | | | $ | 17,821 | | |
Exchange traded funds | | | 5,450 | | | | — | | | | 5,450 | | |
Total Securities sold short | | $ | 23,271 | | | $ | — | | | $ | 23,271 | | |
SMID Cap Growth Opportunities Fund | |
Investments in Securities | |
Common stock | | $ | 61,392 | | | $ | — | | | $ | 61,392 | | |
Cash equivalent | | | 9,875 | | | | — | | | | 9,875 | | |
Total Investments in securities | | $ | 71,267 | | | $ | — | | | $ | 71,267 | | |
Midcap Growth Fund | |
Investments in Securities | |
Common stock | | $ | 121,562 | | | $ | — | | | $ | 121,562 | | |
Cash equivalent | | | 11,320 | | | | — | | | | 11,320 | | |
Total Investments in securities | | $ | 132,882 | | | $ | — | | | $ | 132,882 | | |
Small Cap Growth Fund | |
Investments in Securities | |
Common stock | | $ | 41,235 | | | $ | — | | | $ | 41,235 | | |
Cash equivalent | | | 10,041 | | | | — | | | | 10,041 | | |
Total Investments in securities | | $ | 51,276 | | | $ | — | | | $ | 51,276 | | |
* Represents interest in securities that were determined to have a value of zero at March 31, 2016.
For each Fund, there were no transfers between the levels as of March 31, 2016 based on the input levels assigned at September 30, 2015.
Security transactions and related income—Security transactions are accounted for on the date the security is purchased or sold (trade date). Dividend income is recognized on the ex-dividend date. Costs used in determining realized gains and losses on the sales of investment securities are those of the specific securities lots sold.
Securities sold short—Consistent with each Fund's investment objectives, the Funds may engage in short sales. Short sales are transactions under which a Fund sells a security it does not own. To complete such a transaction, the Fund must borrow the security to make delivery to the buyer. The Fund is then obligated to replace the security borrowed by purchasing the security at the market price at the time of the replacement. The price at such time may be more or less than the price at which the security was sold by the Fund. Until the security is replaced, the Fund is required to pay the lender amounts equal to any dividends that accrue during the period of the loan. Dividends declared on open short positions are recorded on
TURNER FUNDS 2016 SEMIANNUAL REPORT 27
NOTES TO FINANCIAL STATEMENTS (Unaudited)
ex-date and shown as an expense for financial reporting purposes. To borrow the security, the Fund also may be required to pay a fee, which is shown as an expense for financial reporting purposes. The proceeds of the short sale are retained by the broker, to the extent necessary to meet margin requirements, until the short position is closed. A gain, limited to the price at which the Fund sold the security short, or a loss, unlimited in size, will be recognized upon the close of a short sale.
Until a Fund closes its short position or replaces the borrowed security, the Fund will: (a) maintain a segregated account containing cash or liquid securities at such a level that (i) the amount deposited in the account plus the amount deposited with the brokers as collateral will equal the current value of the security sold short; and (ii) the amount deposited in the segregated account plus the amount deposited with the broker as collateral will not be less than the market value of the security at the time the security was sold short, or (b) otherwise cover the short positions. The Medical Sciences Long/Short Fund and Titan Long/Short Fund engaged in short sales during the six months ended March 31, 2016.
Option transactions—Consistent with each Fund's investment objectives, the Funds may write covered call options and sell put options as a means of increasing the yield on their portfolios and as a means of providing limited protection against decreases in their market value. The Funds may purchase put and call options to protect against a decline in the market value of the securities in their portfolios or to anticipate an increase in the market value of securities that the Funds may seek to purchase in the future. A put option gives the purchaser of the option the right to sell, and the writer of the option the obligation to buy, the underlying security at any time during the option period. A call option gives the purchaser of the option the right to buy, and the writer of the option the obligation to sell, the underlying security at any time during the option period. The premium paid to the writer is the consideration for undertaking the obligations under the option contract. The initial purchase (sale) of an option contract is an "opening transaction." In order to close an option position, the Fund may enter into a "closing transaction," which is simply the sale (purchase) of an option contract on the same security with the same exercise price and expiration date as the option contract originally opened. If the Fund is unable to effect a closing purchase transaction with respect to an option it has written, it will not be able to sell the underlying security until the option expires or the Fund delivers the security upon exercise. When the Fund writes (sells) an option, an amount equal to the premium received by the Fund is included in the Statement of assets and liabilities as an asset and
an equivalent liability. The amount of the liability is subsequently marked-to-market to reflect the current value of the option written.
Option contracts are valued at the last quoted sales price. If there is no such reported sale on the valuation date, long positions are valued at the most recent bid price, and short positions are valued at the most recent ask price. When an option expires on its stipulated expiration date or the Fund enters into a closing purchase transaction, the Fund realizes a gain or loss if the cost of the closing purchase transaction differs from the premium received when the option was sold without regard to any unrealized gain or loss on the underlying security, and the liability related to such option is eliminated. When an option is exercised, the premium originally received decreases the cost basis of the security (or increases the proceeds on a sale of the security). The primary risk exposure from written and purchased options contracts is equity exposure.
During the six months ended March 31, 2016, the Funds held no written or purchased options.
Foreign currency translation—The books and records of the Funds are maintained in U.S. dollars. Investment securities and other assets and liabilities denominated in a foreign currency are translated into U.S. dollars on the date of valuation. The Funds do not isolate that portion of realized or unrealized gains and losses resulting from changes in the foreign exchange rate from fluctuations arising from changes in the market prices of the securities. These gains and losses are included in net realized and unrealized gains and losses on investments in the Statements of operations. Net realized and unrealized gains and losses on foreign currency transactions represent net foreign exchange gains or losses from foreign currency exchange contracts, disposition of foreign currencies, currency gains or losses realized between trade and settlement dates on securities transactions and the difference between the amount of the investment income and foreign withholding taxes recorded on the Funds' books and the U.S. dollar equivalent amounts actually received or paid.
Expenses—Expenses that are specifically attributed to one of the Funds are charged to that Fund. Certain other expenses of the Funds are prorated among the Funds on the basis of relative daily net assets.
Classes—Class specific expenses are borne by that class. Income, non-class specific expenses, and realized and unrealized gains and losses are allocated to the respective classes on the basis of relative daily net assets.
Dividends and distributions—The Funds declare and distribute net investment income, if any, annually, as a dividend to shareholders. Any net realized capital
28 TURNER FUNDS 2016 SEMIANNUAL REPORT
gains on sales of securities for all Funds are distributed to shareholders at least annually.
3. Administration, shareholder servicing, distribution and transfer agent agreements:
Turner provides administrative services to the Funds under an Administration Agreement with the Trust. For its services, Turner receives an annual fee of 0.15% of the aggregate average daily net assets of the Trust up to $2 billion and 0.12% of the aggregate average daily net assets of the Trust over $2 billion. Under a separate Sub-administration Agreement between Turner and Citi, Citi provides sub-administrative services, including certain fund accounting services, to the Trust. For the six months ended March 31, 2016, Citi was paid $210 (000) by Turner.
Foreside Fund Services, LLC (the "Distributor") provides distribution services to the Funds under a Distribution Services Agreement.
The Funds have adopted a Distribution Plan for Retirement Class Shares and Class C Shares (the "Distribution Plan") under which firms, including the Distributor, that provide distribution services may receive compensation. Under the Distribution Plan, which was adopted pursuant to Rule 12b-1 under the Investment Company Act of 1940, as amended, the Distributor is entitled to receive aggregate fees for distribution services not to exceed 0.75% of each Fund's average daily net assets attributable to Retirement Class or Class C Shares that are subject to the arrangement in return for providing a broad range of distribution services. Currently, the Retirement Class Shares of the Midcap Growth Fund pay the Distributor 0.25% and the Class C Shares of the Medical Sciences Long/Short Fund and Titan Long/Short Fund pay the Distributor 0.75% in distribution fees.
The Funds have also adopted Shareholder Services Plans (the "Service Plans"). Under the Service Plans, service providers are entitled to receive aggregate fees for shareholder services not to exceed 0.25% of each Fund's average daily net assets attributable to Investor Class Shares, Retirement Class Shares and Class C Shares that are subject to the arrangement in return for providing shareholder services. Currently, Investor Class Shares of each Fund, Retirement Class Shares of the Midcap Growth Fund and Class C Shares of the Medical Sciences Long/Short Fund and Titan Long/Short Fund pay 0.25% in shareholder servicing fees.
DST Systems, Inc. serves as the transfer agent and dividend disbursing agent for the Funds under a Transfer Agency Agreement with the Trust.
Certain officers and trustees of the Trust are also officers or employees of Turner or Citi. With the exception of the Trust's Chief Compliance Officer, such officers are paid
no fees by the Trust for serving as officers and trustees of the Trust.
4. Investment advisory agreement:
The Trust and Turner are parties to an Investment Advisory Agreement dated April 28, 1996 under which Turner receives a fee that is calculated daily and paid monthly, based on the average daily net assets of the Funds.
Turner has contractually agreed to waive all or a portion of its fees and to reimburse expenses in order to limit total Fund operating expenses, excluding interest and borrowing cost on short and long sales and short sale dividend expenses, to a specified percentage of the average daily net assets of each Fund on an annualized basis through certain dates disclosed in the following table:
| | | Advisory
fee | | Expense
cap | | Date
(through) | |
Medical Sciences Long/Short
Fund | |
Institutional Class | | | 1.50 | % | | | 1.90 | % | | January 31, 2017 | |
Investor Class | | | 1.50 | % | | | 2.15 | % | | January 31, 2017 | |
Class C | | | 1.50 | % | | | 2.90 | % | | January 31, 2017 | |
Titan Long/Short Fund | |
Institutional Class | | | 1.50 | % | | | 1.90 | % | | January 31, 2017 | |
Investor Class | | | 1.50 | % | | | 2.15 | % | | January 31, 2017 | |
Class C | | | 1.50 | % | | | 2.90 | % | | January 31, 2017 | |
SMID Cap Growth
Opportunities Fund | |
Institutional Class | | | 1.00 | % | | | 1.15 | % | | January 31, 2017 | |
Investor Class | | | 1.00 | % | | | 1.40 | % | | January 31, 2017 | |
Midcap Growth Fund | |
Institutional Class | | | 0.75 | % | | | 0.93 | % | | January 31, 2017 | |
Investor Class | | | 0.75 | % | | | 1.18 | % | | January 31, 2017 | |
Retirement Class | | | 0.75 | % | | | 1.43 | % | | January 31, 2017 | |
Small Cap Growth Fund | |
Investor Class | | | 1.00 | % | | | 1.25 | % | | January 31, 2017 | |
5. Contingent deferred sales charges (Class C Shares):
A 1.00% contingent deferred sales charge ("CDSC") will be deducted with respect to Class C Shares of the Medical Sciences Long/Short Fund and Titan Long/Short Fund redeemed within 12 months of purchase. The CDSC will be based on the lower of the original purchase price or the value of the Class C Shares redeemed. The CDSC may be waived for certain investors, as described in the Class C Shares statutory prospectus for the Medical Sciences Long/Short Fund and Titan Long/Short Fund.
6. Investment transactions:
The cost of security purchases and the proceeds from security sales, other than short-term investments and
TURNER FUNDS 2016 SEMIANNUAL REPORT 29
NOTES TO FINANCIAL STATEMENTS (Unaudited)
option contracts written, for the six months ended March 31, 2016 were as follows:
| | | Purchases | | Sales | |
Medical Sciences Long/Short Fund | | $ | 66,014 | | | $ | 92,642 | | |
Titan Long/Short Fund | | | 38,199 | | | | 40,682 | | |
SMID Cap Growth Opportunities Fund | | | 183,291 | | | | 174,698 | | |
Midcap Growth Fund | | | 174,358 | | | | 358,365 | | |
Small Cap Growth Fund | | | 100,397 | | | | 124,657 | | |
7. Federal tax policies and information:
Each Fund is classified as a separate taxable entity for Federal income tax purposes. Each Fund intends to continue to qualify as a separate "regulated investment company" under the Internal Revenue Code and make the requisite distributions to shareholders that will be sufficient to relieve it from Federal income tax and Federal excise tax. Therefore, no Federal tax provision is required.
The amounts of dividends from net investment income and distributions from net realized capital gains, if any, are determined in accordance with Federal income tax regulations, which may differ from those amounts determined under GAAP. These book/tax differences are either temporary or permanent in nature. These differences are primarily due to wash sales, REIT adjustments, foreign currency transactions, net operating losses, return of capital distributions, equalization and investments in partnerships and passive foreign investment companies. The character and timing of dividends from net investment income and distributions from net realized gains distributed during the fiscal year may differ from the year that the income or realized gains (losses) were recorded by the Funds. To the extent these differences are perma-
nent, adjustments are made to the appropriate equity accounts in the period that the differences arise. The Funds may utilize equalization accounting for tax purposes and designate earnings and profits, including net realized gains distributed to shareholders on redemption of shares, as part of the dividends paid deduction for income tax purposes. Any available tax equalization will be applied prorata to short-term capital gains and to long-term capital gains, and then to net investment income, as applicable.
Withholding taxes on dividends and net realized capital gains as a result of certain investments in ADRs by the Funds have been provided for in accordance with each investment's applicable country's tax rules and rates.
The tax character of dividends and distributions declared during the years ended September 30, 2015 and September 30, 2014 were as follows:
| | | Ordinary
income
(000) | | Long-term
capital gain
(000) | | Return of
capital
(000) | | Total
(000) | |
Medical Sciences Long/Short Fund | | | |
| | 2015 | | | $ | 1,500 | | | $ | 749 | | | $ | — | | | $ | 2,249 | | |
| | 2014 | | | | 331 | | | | 385 | | | | — | | | | 716 | | |
Titan Long/Short Fund | | | |
| | 2015 | | | $ | — | | | $ | 23,605 | | | $ | — | | | $ | 23,605 | | |
SMID Cap Growth Opportunities Fund | | | |
| | 2015 | | | $ | 396 | | | $ | 58,298 | | | $ | — | | | $ | 58,694 | | |
| | 2014 | | | | — | | | | 38,752 | | | | — | | | | 38,752 | | |
Midcap Growth Fund | | | |
| | 2015 | | | $ | 707 | | | $ | 93,583 | | | $ | — | | | $ | 94,290 | | |
| | 2014 | | | | 17,823 | | | | 67,608 | | | | — | | | | 85,431 | | |
Small Cap Growth Fund | | | |
| | 2015 | | | $ | — | | | $ | 46,207 | | | $ | — | | | $ | 46,207 | | |
| | 2014 | | | | 4,658 | | | | 36,321 | | | | — | | | | 40,979 | | |
As of September 30, 2015, the components of distributable earnings (accumulated losses) on a tax basis were as follows:
| | | Undistributed
ordinary
income
(000) | | Undistributed
long-term
capital gains
(000) | | Capital
loss
carryforward
(000) | | Post-
October
losses
(000) | | Late-year
ordinary
losses
(000) | | Unrealized
appreciation
(depreciation)
(000) | | Total
distributable
earnings
(000) | |
Medical Sciences Long/Short Fund | | $ | — | | | $ | 2,468 | | | $ | — | | | $ | (1,060 | ) | | $ | (1,603 | ) | | $ | 551 | | | $ | 356 | | |
Titan Long/Short Fund | | | — | | | | 3,640 | | | | — | | | | — | | | | (824 | ) | | | 263 | | | | 3,079 | | |
SMID Cap Growth Opportunities Fund | | | — | | | | 36,369 | | | | — | | | | (2,875 | ) | | | (584 | ) | | | 375 | | | | 33,285 | | |
Midcap Growth Fund | | | — | | | | 21,321 | | | | (2,897 | ) | | | — | | | | (1,010 | ) | | | 14,166 | | | | 31,580 | | |
Small Cap Growth Fund | | | — | | | | 14,893 | | | | — | | | | — | | | | (325 | ) | | | 2,828 | | | | 17,397 | | |
Under current tax law, capital losses and specified ordinary losses realized after October 31 and non-specified ordinary losses incurred after December 31 (ordinary losses collectively known as "late year ordinary loss") may be deferred and treated as having arisen in the following fiscal year.
As of the end of their latest tax year end of September 30, 2015, the Funds in the following table had capital loss
carryforwards ("CLCFs"). CLCFs not subject to expiration must be used prior to using any CLCFs that are subject to expiration. A summary of these CLCFs is detailed in the tables below.
The Funds did not have any CLCFs that are not subject to expiration.
30 TURNER FUNDS 2016 SEMIANNUAL REPORT
CLCFs subject to expiration:
| | | Expiring
September 30,
2017
(000) | |
Midcap Growth Fund | | $ | 2,897 | * | |
* CLCFs were acquired as part of the Fund merger described in Note 10. As such, the CLCF is subject to annual limitations.
At March 31, 2016, the total cost of securities for Federal income tax purposes and the aggregate gross unrealized appreciation and depreciation for the investments held by each Fund, excluding securities sold short, were as follows:
| | | Federal
tax
cost
(000) | | Unrealized
appreciation
(000) | | Unrealized
depreciation
(000) | | Net
unrealized
appreciation
(depreciation)
(000) | |
Medical Sciences Long/Short Fund | | $ | 72,747 | | | $ | 6,968 | | | $ | (8,276 | ) | | $ | (1,308 | ) | |
Titan Long/Short Fund | | | 34,876 | | | | 4,078 | | | | (1,672 | ) | | | 2,406 | | |
SMID Cap Growth Opportunities Fund | | | 65,948 | | | | 6,258 | | | | (939 | ) | | | 5,319 | | |
Midcap Growth Fund | | | 122,448 | | | | 13,896 | | | | (3,462 | ) | | | 10,434 | | |
Small Cap Growth Fund | | | 48,454 | | | | 6,071 | | | | (3,249 | ) | | | 2,822 | | |
For the current open tax year and for all major jurisdictions, management has evaluated the tax positions taken or expected to be taken in the course of preparing their tax returns to determine whether the tax positions will "more-likely-than-not" be sustained by the Funds upon challenge by the applicable tax authority. Tax positions taken in previous tax years remain subject to examination by tax authorities (generally three years for federal income tax purposes). Tax positions not deemed to meet the more-likely-than-not threshold and that would result in a tax benefit or expense to the Funds would be recorded as a tax benefit or expense in the current period. For the six months ended March 31, 2016, the Funds did not recognize any amounts for unrecognized tax benefit/expense. A reconciliation of unrecognized tax benefit/expense is not provided herein, as the beginning and ending amounts of unrecognized tax benefit/expenses are zero, with no interim additions, reductions or settlements.
8. Loans of portfolio securities:
The Funds may lend securities in their portfolios pursuant to a securities lending agreement ("Lending Agreement") with Morgan Stanley. Unless otherwise agreed, security loans made pursuant to the Lending Agreement are required at all times to be secured by collateral equal to at least 100% of the market value of the securities loaned based on the previous day's market value of the securities loaned, marked-to-market daily. Any collateral shortfalls are adjusted the next business day. Cash collateral received is invested in the Dollar Shares of the BlackRock Liquidity Funds TempCash, a money market fund. All such investments are made at the risk of the Funds and, as such, the Funds are liable for investment losses. The Funds receive an annual fee for
their participation in the Lending Agreement based on the projected lending activity.
In the event of bankruptcy of the borrower, realization/retention of the collateral may be subject to legal proceedings.
Securities lending transactions are entered into by each Fund under a Master Securities Lending Agreement ("MSLA") which permits the Funds, under certain circumstances including an event of default (such as bankruptcy or insolvency), to offset amounts payable by the Funds to the same counterparty against amounts to be received and create one single net payment due to or from the Funds.
The following Funds had securities on loan and had invested cash collateral, subject to offset under a MSLA, with the following values as of March 31, 2016:
Fund | | Value of
Securities
on Loan (000) | | Value of
Collateral
(000)* | | Net
Amount
(000) | |
SMID Cap Growth
Opportunities Fund | | $ | 1,868 | | | $ | 1,868 | | | | — | | |
Midcap Growth Fund | | | 8,036 | | | | 8,036 | | | | — | | |
Small Cap Growth Fund | | | 9,187 | | | | 9,187 | | | | — | | |
** The actual value of collateral received may be in excess of the amounts shown in the table. The table only reflects collateral amounts up to the amount of the value of securities on loan as disclosed in the Statements of Assets and Liabilities.
9. Concentration/risks:
Certain Funds invest a high percentage of their assets in specific market sectors in order to achieve a potentially greater investment return. As a result, these Funds may
TURNER FUNDS 2016 SEMIANNUAL REPORT 31
NOTES TO FINANCIAL STATEMENTS (Unaudited)
be more susceptible to positive or negative economic, political, and regulatory developments in a particular market sector of the market and may experience the effect of this increased volatility on the Fund's net asset value and a magnified effect on the Fund's total return.
Governments of some developing countries exercise substantial influence over many aspects of the private sector. In some countries, the government owns or controls many companies, including the largest companies in the country. As such, government actions in the future could have a significant effect on economic conditions in developing countries in these regions, which could affect private sector companies, the Fund and the value of its securities. Furthermore, certain developing countries are among the largest debtors to commercial banks and foreign governments. Trading in debt obligations issued or guaranteed by such governments or their agencies and instrumentalities involves a high degree of risk.
The Funds enter into contracts that contain a variety of indemnifications. The Funds' maximum exposure under these arrangements is unknown. However, the Funds have not had prior claims or losses pursuant to these contracts and expect the risk of loss to be remote.
10. Fund Merger:
On January 23, 2015, the Midcap Growth Fund acquired all of the net assets of the Large Growth Fund, an open-end investment company, pursuant to a Plan of Reorganization approved by the Large Growth Fund's shareholders at a meeting held on January 15, 2015. The purpose of the transaction was to combine the two Funds managed by the Adviser with similar objectives and policies. The acquisition was accomplished by a tax-free exchange of 811,506 Investor Class shares of the Large Growth Fund, valued at $14,264 (000), for 637,903 Investor Class shares of the Midcap Growth Fund and 843,931 Institutional Class shares of the Large Growth Fund, valued at $14,971 (000) for 646,409 Institutional Class shares of the Midcap Growth Fund outstanding on January 23, 2015. The exchange ratios (Midcap Growth Fund shares issued/ Large Growth Fund shares outstanding) were 0.79:1 for the Investor Class and 0.77:1 for the Institutional Class.
The investment portfolio of the Large Growth Fund, with a fair value of $29,261 (000) and identified cost of $28,833 (000) at January 23, 2015, was the principal asset acquired by the Midcap Growth Fund. For financial
reporting purposes, assets received and shares issued by the Midcap Growth Fund were recorded at fair value; however, the cost basis of the investments received from the Large Growth Fund was carried forward to align ongoing reporting of the Midcap Growth Fund's realized and unrealized gains and losses with amounts distributable to shareholders for tax purposes.
Upon the business combination of the Funds on January 23, 2015, the net assets of the Large Growth Fund, which included portfolio capital of $72,623 (000), accumulated net investment income of $81 (000), accumulated realized losses of $(43,898) (000) and unrealized gains of $428 (000), combined with the Midcap Growth Fund were $225,779 (000). The undistributed net investment income and unrealized gains of the Large Growth Fund may be distributed by the Midcap Growth Fund in future periods. Immediately prior to the merger, the net assets of the Large Growth Fund and the Midcap Growth Fund were $29,234 (000) and $196,545 (000), respectively. All fees and expenses incurred by the Large Growth Fund and the Midcap Growth Fund directly in connection with the Plan of Reorganization were borne by the Advisor.
Assuming the acquisition had been completed on October 1, 2014, the beginning of the annual reporting period of the Midcap Growth Fund, the Fund's pro forma results of operations for the year ended September 30, 2015, are as follows (000):
Net investment income/(loss): | | $ | (1,321 | ) | |
Net realized/unrealized gains/(losses): | | | (3,362 | ) | |
Change in net assets resulting from operations: | | $ | (4,683 | ) | |
Because the combined investment portfolios have been managed as a single integrated portfolio since the acquisition was completed, it is not practicable to separate the amounts of revenue and earnings of the Large Growth Fund that have been included in the Midcap Growth Fund's Statement of operations since January 23, 2015.
11. Subsequent Events:
The Trust has evaluated the need for disclosures and/or adjustments resulting from subsequent events through the date the financial statements were issued.
Based on this evaluation, no additional disclosures and/or adjustments were required to the financial statements as of March 31, 2016.
32 TURNER FUNDS 2016 SEMIANNUAL REPORT
BOARD OF TRUSTEES CONSIDERATIONS IN APPROVING THE ADVISORY AGREEMENT (Unaudited)
Board of Trustees considerations in approving the Advisory Agreement
On February 26, 2016, the Board of Trustees (the "Board" or the "Trustees") of the Turner Funds (the "Funds" or the "Trust") held an in-person meeting to decide whether to renew the advisory agreement for each of the Turner Funds (the "Advisory Agreement") with Turner Investments, L.P. ("Turner" or the "Adviser") for the upcoming year. In preparation for the meeting, the Board requested and reviewed a wide variety of information from the Adviser. The materials described, among other things: the Adviser's business; the Adviser's organizational structure, personnel and operations; advisory services; the Funds' performance; compliance; advisory fees and expenses paid by the Funds for the fiscal year ended September 30, 2015; and information on trading.
The Trustees discussed all the issues regarding the 15(c) contract renewal, including performance, profitability both before and after 12b-1 fees, and the continuing need to receive in depth reports from portfolio managers and analysts for various funds, as had been the Board's practice over the prior years. The Board, including all of the independent Trustees, considered, among other things: (1) the nature, extent and quality of the services provided by the Adviser; (2) the performance of the Funds over the past one, three, five and ten years, where applicable, versus each Fund's respective Lipper peer universe; (3) the contractual and actual compensation to be paid under the agreements as compared to the compensation paid to relevant Lipper peer groups; (4) the expense ratios of the Funds, with expense waivers, as compared to expense ratios for relevant Lipper peer groups; (5) the qualifications of the Adviser's personnel, portfolio management capabilities and investment methodologies; (6) the Adviser's operations, compliance program and policies; (7) the financial condition of the Adviser; (8) the cost of services provided by the Adviser and the Adviser's profitability from each Fund for the year ended September 30, 2015; (9) "fall-out" benefits to the Adviser and its affiliates from the relationship with
the Funds; (10) the extent to which economies of scale are relevant given the Funds' current asset size and current asset growth potential; and (11) a comparison of the fees charged by the Adviser with fees charged by the Adviser to similar clients, to the extent the Board deemed it relevant.
After deliberating on all the materials reviewed and reported, the independent Trustees reached the following conclusions, among others, regarding the Adviser and the advisory agreements; the recent performance of the Funds was, in most cases, within industry norms. They determined that although performance lagged peer groups in the case of certain Funds, the Funds' performance was, in general satisfactory. The Trustees committed to a continuing close review during the upcoming year of those products where performance lagged. The independent Trustees also concluded that the Funds' net total expense ratios and advisory fees were generally competitive. The independent Trustees also concluded that: they were satisfied with the quality of services provided by the Adviser in advising the Funds; the profits earned by the Adviser seemed reasonable in light of the nature, extent and quality of the services provided to each Fund; and that each Fund, and the Trust, was not large enough to attain significant economies of scale, beyond those already incorporated into the fee structures. The Trustees determined to continue their close oversight of the Adviser and the Funds going forward and, in that light, determined at their February 26, 2016 meeting to renew the Advisory Agreement until the next in-person Board meeting, currently scheduled for May 20, 2016. At the May 20, 2016 in-person Board meeting, the independent Trustees closely reviewed the financial situation of the Adviser and its plans for managing the Funds going forward and determined to renew the Advisory Agreement until the next in-person Board meeting, currently scheduled for August 19, 2016.
TURNER FUNDS 2016 SEMIANNUAL REPORT 33
DISCLOSURE OF FUND EXPENSES (Unaudited)
All mutual funds have operating expenses. As a shareholder of a mutual fund, your investment is affected by these on-going costs, which include (among others) costs for portfolio management, distribution (12b-1) and/or shareholder services and other expenses. It is important for you to understand the impact of these costs on your investment returns. Operating expenses such as these are deducted from a mutual fund's gross income and directly reduce its final investment return. These expenses are expressed as a percentage of a mutual fund's average net assets; this percentage is known as a mutual fund's expense ratio.
The following examples use the expense ratio and are intended to help you understand the ongoing costs (in dollars) of investing in your Fund and to compare these costs with those other mutual funds. The examples are based on an investment of $1,000 made at the beginning of the period shown and held for the entire period.
The table below and on the next page illustrates your Fund's costs in two ways:
• Actual Fund Return. This section helps you estimate the actual expenses after fee waivers that your Fund incurred over the period. The "Expenses Paid During Period" column shows the actual dollar expense cost incurred by a $1,000 investment in the Fund, and the "Ending Account Value" number is derived from deducting that expense cost from the Fund's gross investment return.
You can use this information, together with the actual amount you invested in the Fund, to estimate the expenses you paid over that period. Simply divide your actual account value by $1,000 to arrive at a ratio (for example, an $8,600 account value divided by $1,000 = 8.6), then multiply that ratio by the number shown for your Fund under "Expenses Paid During Period."
• Hypothetical 5% Return. This section helps you compare your Fund's cost with those of other mutual funds. It provides information about hypothetical account values and expenses based on the Fund's actual expense ratio (column 3) and an assumed rate of return of 5% per year before expenses, which is not the Fund's actual return. This section is useful in making comparisons because the Securities and Exchange Commission requires all mutual funds to make this 5% calculation. You can assess your Fund's comparative cost by comparing the hypothetical result for your Fund in the "Expenses Paid During Period" column with those that appear in the same charts in the shareholder reports for other mutual funds.
Note: Because the return is set at 5% for comparison purposes — NOT your Fund's actual return — the hypothetical account values and expenses may not be used to estimate your actual ending account balance or expenses you paid for the period.
| | Beginning
Account
Value
10/1/15 | | Ending
Account
Value
3/31/16 | | Annualized
Expense
Ratios | | Expenses
Paid
During
Period* | |
Turner Medical Sciences Long/Short Fund — Institutional Class Shares | |
Actual Fund Return | | $ | 1,000.00 | | | $ | 874.50 | | | | 3.08 | % | | $ | 14.43 | | |
Hypothetical
5% Return | | | 1,000.00 | | | | 1,009.60 | | | | 3.08 | % | | | 15.47 | | |
Turner Medical Sciences Long/Short Fund — Investor Class Shares | |
Actual Fund Return | | | 1,000.00 | | | | 873.10 | | | | 3.33 | % | | | 15.59 | | |
Hypothetical
5% Return | | | 1,000.00 | | | | 1,008.35 | | | | 3.33 | % | | | 16.72 | | |
Turner Medical Sciences Long/Short Fund — Class C Shares | |
Actual Fund Return | | | 1,000.00 | | | | 869.80 | | | | 4.08 | % | | | 19.07 | | |
Hypothetical
5% Return | | | 1,000.00 | | | | 1,004.60 | | | | 4.08 | % | | | 20.45 | | |
Turner Titan Long/Short Fund — Institutional Class Shares | |
Actual Fund Return | | | 1,000.00 | | | | 983.10 | | | | 2.64 | % | | | 13.09 | | |
Hypothetical
5% Return | | | 1,000.00 | | | | 1,011.80 | | | | 2.64 | % | | | 13.28 | | |
Turner Titan Long/Short Fund — Investor Class Shares | |
Actual Fund Return | | | 1,000.00 | | | | 981.60 | | | | 2.89 | % | | | 14.32 | | |
Hypothetical
5% Return | | | 1,000.00 | | | | 1,010.55 | | | | 2.89 | % | | | 14.53 | | |
Turner Titan Long/Short Fund — Class C Shares | |
Actual Fund Return | | | 1,000.00 | | | | 978.20 | | | | 3.64 | % | | | 18.00 | | |
Hypothetical
5% Return | | | 1,000.00 | | | | 1,006.80 | | | | 3.64 | % | | | 18.26 | | |
| | Beginning
Account
Value
10/1/15 | | Ending
Account
Value
3/31/16 | | Annualized
Expense
Ratios | | Expenses
Paid
During
Period* | |
Turner SMID Cap Growth Opportunities Fund — Institutional Class Shares | |
Actual Fund Return | | $ | 1,000.00 | | | $ | 916.30 | | | | 1.15 | % | | $ | 5.51 | | |
Hypothetical
5% Return | | | 1,000.00 | | | | 1,019.25 | | | | 1.15 | % | | | 5.81 | | |
Turner SMID Cap Growth Opportunities Fund — Investor Class Shares | |
Actual Fund Return | | | 1,000.00 | | | | 915.60 | | | | 1.40 | % | | | 6.70 | | |
Hypothetical
5% Return | | | 1,000.00 | | | | 1,018.00 | | | | 1.40 | % | | | 7.06 | | |
Turner Midcap Growth Fund — Institutional Class Shares | |
Actual Fund Return | | | 1,000.00 | | | | 926.80 | | | | 0.93 | % | | | 4.48 | | |
Hypothetical
5% Return | | | 1,000.00 | | | | 1,020.35 | | | | 0.93 | % | | | 4.70 | | |
Turner Midcap Growth Fund — Investor Class Shares | |
Actual Fund Return | | | 1,000.00 | | | | 925.40 | | | | 1.18 | % | | | 5.68 | | |
Hypothetical
5% Return | | | 1,000.00 | | | | 1,019.10 | | | | 1.18 | % | | | 5.96 | | |
Turner Midcap Growth Fund — Retirement Class Shares | |
Actual Fund Return | | | 1,000.00 | | | | 924.20 | | | | 1.43 | % | | | 6.88 | | |
Hypothetical
5% Return | | | 1,000.00 | | | | 1,017.85 | | | | 1.43 | % | | | 7.21 | | |
Turner Small Cap Growth Fund — Investor Class Shares | |
Actual Fund Return | | | 1,000.00 | | | | 905.00 | | | | 1.25 | % | | | 5.95 | | |
Hypothetical
5% Return | | | 1,000.00 | | | | 1,018.75 | | | | 1.25 | % | | | 6.31 | | |
* Unless otherwise indicated, expenses are equal to the Fund's annualized expense ratio multiplied by the average account value over the period, multiplied by 183/366 (to reflect the one-half year period from 10/1/15 - 3/31/16).
34 TURNER FUNDS 2016 SEMIANNUAL REPORT
This report was prepared for shareholders of the Turner Funds. It may be distributed to others only if preceded or accompanied by a Turner Funds' Prospectus, which contains detailed information. All Turner Funds are offered by prospectus only.
The Funds file their complete schedules of portfolio holdings with the Securities and Exchange Commission (the "Commission") for the first and third quarters of each fiscal year on Form N-Q within sixty days after the end of the period. The Funds' Forms N-Q are available on the Commission's Web site at http://www.sec.gov, and may be reviewed and copied at the Commission's Public Reference Room in Washington, DC. Information on the operation of the Public Reference Room may be obtained by calling 1-800-SEC-0330.
The Board of Trustees of the Turner Funds has delegated responsibility for decisions regarding proxy voting for securities held by each Fund to Turner Investments, L.P. Turner Investments, L.P. will vote such proxies in accordance with its proxy policies and procedures, which are included in Appendix B to the SAI. The Board of Trustees will periodically review each Fund's proxy voting record.
A description of the policies and procedures that the Funds use to determine how to vote proxies relating to portfolio securities, as well as information relating to how the Fund voted proxies relating to portfolio securities during the most recent 12-month period ended June 30, is available (i) via the Funds' Web site, www.turnerinvestments.com; (ii) on the Commission's Web site at http://www.sec.gov; and (iii) without charge by calling 1.800.224.6312.
TURNER FUNDS 2016 SEMIANNUAL REPORT 35
THIS PAGE WAS INTENTIONALLY LEFT BLANK
36 TURNER FUNDS 2016 SEMIANNUAL REPORT

Turner Funds
P.O. Box 219805
Kansas City, Missouri 64121-9805
Telephone: 1.800.224.6312
Email: mutualfunds@turnerinvestments.com
Web Site: www.turnerinvestments.com
Item 2. Code of Ethics.
Not applicable for semiannual report.
Item 3. Audit Committee Financial Expert.
Not applicable for semiannual report.
Item 4. Principal Accountant Fees and Services.
Not applicable for semiannual report.
Item 5. Audit Committee of Listed Registrants.
Not applicable to open-end management investment companies.
Item 6. Schedule of Investments.
Schedule of Investments is included as part of report to shareholders filed under Item 1.
Item 7. Disclosure of Proxy Voting Policies and Procedures for Closed-End Management Investment Companies.
Not applicable to open-end management investment companies.
Item 8. Portfolio Managers of Closed-End Management Investment Companies.
Not applicable to open-end management investment companies.
Item 9. Purchases of Equity Securities by Closed-End Management Investment Company and Affiliated Purchasers.
Not applicable to open-end management investment companies.
Item 10. Submission of Matters to a Vote of Security Holders.
There have been no material changes to the procedures by which shareholders may recommend nominees to the registrant’s Board of Trustees since the registrant’s last proxy solicitation.
Item 11. Controls and Procedures.
(a) The registrant’s Principal Executive Officer and Principal Financial Officer concluded that the registrant’s disclosure controls and procedures (as defined in Rule 30a-3(c) under the Investment Company Act of 1940 as amended (the “Act”)) were effective as of a date within 90 days of the filing date of this report, based on their evaluation of the effectiveness of the registrant’s disclosure controls and procedures required by Rule 30a-3(b) under the Act and Rule 13a-15(b) or 15d-15(b) under the Securities and Exchange Act of 1934.
(b) There were no changes in the registrant’s internal control over financial reporting (as defined in Rule 30a-3(d) of the Act) that occurred during the registrant’s last fiscal quarter that have materially affected, or are reasonably likely to materially affect, the registrant’s internal control over financial reporting.
Item 12. Exhibits.
(a)(1) Not applicable for semiannual report.
(a)(2) A separate certification for the Principal Executive Officer and the Principal Financial Officer of the registrant as required by Rule 30a-2(a) under the Investment Company Act of 1940, as amended (17 CFR 270.30a-2(a)), are filed herewith.
(b) Officer certifications as required by Rule 30a-2(b) under the Investment Company Act of 1940, as amended (17 CFR 270.30a-2(b)), also accompany this filing as an Exhibit.
SIGNATURES
Pursuant to the requirements of the Securities Exchange Act of 1934 and the Investment Company Act of 1940, the registrant has duly caused this report to be signed on its behalf by the undersigned, thereunto duly authorized.
Registrant | Turner Funds | |
|
By (Signature and Title) | /s/ Robert E. Turner | |
| Robert E. Turner, President (Principal Executive Officer) | |
|
Date | 5/27/16 | | |
| | | | | |
Pursuant to the requirements of the Securities Exchange Act of 1934 and the Investment Company Act of 1940, this report has been signed below by the following persons on behalf of the registrant and in the capacities and on the dates indicated.
By (Signature and Title) | /s/ Robert E. Turner | |
| Robert E. Turner, President (Principal Executive Officer) | |
|
Date | 5/27/16 | | |
| | | | | |
By (Signature and Title) | /s/ Joel B. Engle | |
| Joel B. Engle, Controller and Chief Financial Officer (Principal Financial Officer) | |
|
Date | 5/27/16 | | |
| | | | | |