UNITED STATES
SECURITIES AND EXCHANGE COMMISSION
Washington, D.C. 20549
FORM N-CSR
CERTIFIED SHAREHOLDER REPORT OF REGISTERED
MANAGEMENT INVESTMENT COMPANIES
Investment Company Act file number | 811-07527 |
|
Turner Funds |
(Exact name of registrant as specified in charter) |
|
1000 Chesterbrook Boulevard, 1st Floor Berwyn, PA | | 19312 |
(Address of principal executive offices) | | (Zip code) |
|
Jesse Kean Sidley Austin LLP 787 Seventh Avenue New York, NY 10019 |
(Name and address of agent for service) |
|
Registrant’s telephone number, including area code: | 1-800-224-6312 | |
|
Date of fiscal year end: | September 30 | |
|
Date of reporting period: | March 31, 2017 | |
| | | | | | | | |
Item 1. Reports to Stockholders.


March 31, 2017 (unaudited)
Long/short equity funds
Turner Titan Long/Short Fund
U.S. growth equity funds
Turner Midcap Growth Fund
Turner Small Cap Growth Fund
Contents
| | 2 | | | Letter to shareholders | |
| | 4 | | | Schedules of investments | |
| | 11 | | | Sector weightings | |
| | 12 | | | Financial statements | |
| | 20 | | | Notes to financial statements | |
| | 27 | | | Shareholder voting results | |
| | 28 | | | Disclosure of fund expenses | |
Turner Funds
As of March 31, 2017, the Turner Funds offered a series of three mutual funds to individual and institutional investors. The minimum initial investment for Institutional Class Shares in a Turner Fund is $250,000 (except for $100,000 for the Turner Titan Long/Short Fund) for regular accounts and $100,000 for individual retirement accounts. The minimum initial investment for Investor Class Shares, Retirement Class Shares and Class C Shares is $2,500 for regular accounts and $2,000 for individual retirement accounts. The minimum initial investment for Investor Class Shares and Retirement Class Shares, as applicable, for accounts which are established as part of a Systematic Investment Plan, is $1,000.
Turner Investments LLC, based in Berwyn, Pennsylvania, serves as the investment adviser for the Turner Funds. Turner Investments LLC, founded in 1990, manages approximately $170 million in equity investments as of March 31, 2017.
Shareholder services
Turner Funds shareholders receive annual and semiannual reports, and quarterly account statements. Shareholders who have questions about their accounts may call a toll-free telephone number, 1.800.224.6312, may visit our website, www.turnerinvestments.com, or may write to Turner Funds, P.O. Box 219805, Kansas City, Missouri 64121-9805.
TURNER FUNDS 2017 SEMIANNUAL REPORT 1
Elections; the Federal Reserve; Domestic growth; Volatility (or lack thereof); Bitcoin; China growth; Oil; European stability (in the face of great change). You can take your pick as to the markets' focus on any one day, but there has been no shortage of topics to help explain her movements and rotations. And through it all, volatility has been shriveling all-the-while markets have been pressing to all-time highs driving even more debate and analysis. The pattern of slower nominal growth coupled with modest inflation we detailed in our letter last year has played out as we expected and there is a strong probability that it will continue with only modest changes to our assumptions.
Intriguing to many has been the almost pure absence of volatility in the face of all the potential disruptions listed above. New administrations in the United States and France, boisterous advancements from North Korea, collusion among oil producing nations overseas, the continued shaping of Britain's exit from the European Union — any or all should have or could have contributed to market angst and volatility. Instead, the market, as defined by the S&P 500, embarked on a 109 day streak without a 1 percent drop (the record was 112 days set in 1985). The most referenced market volatility index, known as the VIX, found its way into complacency territory not visited since 1993, measured by both depth and duration. It is hard to draw conclusions, and the list of excuses is wide and varied, but complacency is like any metric; it's easy to measure where it is but it's hard to tell how persistent it will be. Time will tell, but active managers like ourselves should be in a superior position to exploit changes in volatility when they unfold.
We are reminded that slower growth and slower inflation makes it difficult for many companies to grow their earnings substantially. Post revenue enhancements, cost efficiencies and stock buybacks, it is critical for active managers to allocate capital to industries and companies within those industries where growth rates are nicely above global growth rates. Here at Turner Investments, we continue to find a feature-rich opportunity set within internet, cloud computing, cybersecurity, next generation biotech, smart-automotive and advanced energy solutions. Our capital allocation process continues to focus on identifying and investing in strong secular growth opportunities that are both innovative and disruptive.
Not all industries are weathering the changes within the economy equally. For example, markets have recently
awarded a higher market capitalization to the 13-year-old, next generation electric car manufacturer Tesla, surpassing the 100-year-old automotive legend, Ford. Henry Ford's company has 20 times the revenue of Elon Musk's; Ford has billions in profits and sells millions of cars per year...Tesla sold 76,000 cars last year. The difference is that investors believe we are truly in the middle of a tectonic shift in transportation, and the ways to profit from such a profound change are limited and hard to find — you see, as complicated as some things may get, the basics of supply and demand still permeate business and investment cycles.
We are also witnessing the beginning of the painful process of rationalization that has begun in "brick-and-mortar" retail. Online retail, dominated by companies like Amazon, is fundamentally changing the way the U.S. consumer shops. The disruption has been building and feels like it has passed its tipping point in the last year. The number of retail closures is accelerating and the rationalization of retail square footage is just beginning. Through April of 2017, there had been nine retail bankruptcies filed (the same number as in all of 2016), and many other chains have listed hundreds of stores slated for closure. There is not much to debate about the "why" of what is happening — Amazon's sales in North America have quintupled from $16 billion in 2010 to $80 billion in 2016; and since 2010, mobile commerce has grown from 2 percent of digital spending to 20 percent. Attitudes and behaviors are changing, causing disruption. At Turner, we have been in front of this trend from an investment standpoint, holding positions in next generation beneficiaries including Shopify, Amazon and Square.
Given the backdrop of modest growth (with an eye for acceleration), low rates (however, anticipating further tightening from the Federal Reserve as the year unfolds) and modest inflation, we would expect the markets to be fairly modest in their return profiles. We are under no false pretenses that the markets won't ever-again contain the joys of volatility or that they will forever be mundane and overly forgiving. We expect, and are ready, for changes in the macro trading environment because we stay true to our active management foundation. Our continued focus will be on a disciplined investment process anchored by an emphasis on momentum, value, quality, profitability, sentiment and management with a goal of creating more predictable outcomes and attractive risk-adjusted returns for our clients.
2 TURNER FUNDS 2017 SEMIANNUAL REPORT
We sincerely appreciate your support and look forward to continuing to serve you in the years ahead.
Sincerely,

Bob Turner
Chairman and Chief Investment Officer
Turner Investments
Past performance is no guarantee of future results. The views expressed are those of Turner Investments as of March 31, 2017, and are not intended as a forecast or investment recommendations. The indexes mentioned are not available for investment.

TURNER FUNDS 2017 SEMIANNUAL REPORT 3
FINANCIAL STATEMENTS (Unaudited)
Turner Titan Long/Short Fund
March 31, 2017
| | | Shares | | Value
(000) | |
Common stock—91.8%† | |
Consumer discretionary—4.3% | |
Amazon.com*^ | | | 470 | | | $ | 417 | | |
American Outdoor Brands Corp.* | | | 6,690 | | | | 133 | | |
CBS, Cl B^ | | | 2,530 | | | | 175 | | |
Total Consumer discretionary | | | | | 725 | | |
Consumer staples—1.3% | |
Monster Beverage* | | | 4,740 | | | | 219 | | |
Total Consumer staples | | | | | 219 | | |
Energy—20.7% | |
Antero Resources*^ | | | 31,540 | | | | 719 | | |
Concho Resources* | | | 1,750 | | | | 225 | | |
Continental Resources* | | | 9,590 | | | | 436 | | |
Diamondback Energy* | | | 2,070 | | | | 215 | | |
Marathon Oil^ | | | 42,750 | | | | 675 | | |
Newfield Exploration*^ | | | 12,290 | | | | 454 | | |
Whiting Petroleum*^ | | | 79,010 | | | | 746 | | |
Total Energy | | | | | 3,470 | | |
Financials—8.6% | |
Bank of America | | | 10,800 | | | | 255 | | |
Bank of the Ozarks | | | 5,140 | | | | 268 | | |
Citigroup | | | 4,300 | | | | 257 | | |
Morgan Stanley | | | 5,880 | | | | 252 | | |
Northern Trust | | | 1,940 | | | | 168 | | |
The Goldman Sachs Group^ | | | 1,090 | | | | 250 | | |
Total Financials | | | | | 1,450 | | |
Health care—14.0% | |
Achillion Pharmaceuticals*^ | | | 65,420 | | | | 275 | | |
Alexion Pharmaceuticals*^ | | | 1,360 | | | | 165 | | |
Boston Scientific*^ | | | 8,710 | | | | 217 | | |
Celgene*^ | | | 2,020 | | | | 251 | | |
Johnson & Johnson | | | 1,890 | | | | 235 | | |
Oncomed Pharmaceuticals*^ | | | 38,083 | | | | 351 | | |
Pfizer | | | 4,970 | | | | 170 | | |
Prothena*^ | | | 4,660 | | | | 260 | | |
Vascular Biogenics*^ | | | 79,611 | | | | 438 | | |
Total Health care | | | | | 2,362 | | |
| | | Shares | | Value
(000) | |
Industrials—5.1% | |
Generac Holdings* | | | 5,060 | | | $ | 189 | | |
Southwest Airlines^ | | | 12,410 | | | | 667 | | |
Total Industrials | | | | | 856 | | |
Information technology—19.7% | |
| 2U*^ | | | 8,640 | | | | 343 | | |
Alphabet, Cl A*^ | | | 290 | | | | 246 | | |
Broadcom^ | | | 1,520 | | | | 333 | | |
Electronic Arts*^ | | | 4,390 | | | | 393 | | |
F5 Networks*^ | | | 1,530 | | | | 218 | | |
Monolithic Power Systems^ | | | 3,550 | | | | 327 | | |
NXP Semiconductors*^ | | | 1,970 | | | | 204 | | |
Salesforce.com*^ | | | 3,950 | | | | 326 | | |
ServiceNow*^ | | | 3,540 | | | | 310 | | |
Shopify, Cl A*^ | | | 6,040 | | | | 410 | | |
Vantiv, Cl A*^ | | | 3,160 | | | | 203 | | |
Total Information technology | | | | | 3,313 | | |
Materials—16.6% | |
Cliffs Natural Resources* | | | 71,610 | | | | 587 | | |
Martin Marietta Materials | | | 1,050 | | | | 229 | | |
Mosaic | | | 5,410 | | | | 158 | | |
Senomyx* | | | 212,661 | | | | 211 | | |
Summit Materials, Cl A*^ | | | 18,318 | | | | 453 | | |
Trinseo SA^ | | | 7,230 | | | | 485 | | |
Vulcan Materials | | | 1,860 | | | | 224 | | |
W.R. Grace & Co. | | | 6,570 | | | | 458 | | |
Total Materials | | | | | 2,805 | | |
Real estate—1.5% | |
QTS Realty Trust, Cl A^ | | | 5,210 | | | | 254 | | |
Total Real estate | | | | | 254 | | |
Total Common stock
(Cost $13,979)** | | | | | 15,454 | | |
Exchange traded funds—2.0% | |
SPDR Metals & Mining ETF | | | 11,240 | | | | 342 | | |
Total Exchange traded funds
(Cost $352)** | | | | | 342 | | |
4 TURNER FUNDS 2017 SEMIANNUAL REPORT
Turner Titan Long/Short Fund
March 31, 2017
| | | Shares | | Value
(000) | |
Warrant—0.0% | |
Financials—0.0% | |
Atlas Mara, 8/21/17 (a)(b) | | | 472,160 | | | $ | — | | |
Total Financials | | | | | — | | |
Total Warrant
(Cost $92) ** | | | | | — | | |
Cash equivalent—1.9% | |
BlackRock Liquidity Funds
Fedfund, 0.593%‡ | | | 322,304 | | | | 322 | | |
Total Cash equivalent
(Cost $322)** | | | | | 322 | | |
Total Investments—95.7%
(Cost $14,653)** | | | | | 16,118 | | |
Segregated cash with
brokers—56.4% | | | | | 9,503 | | |
Securities sold short—(52.0)%
(Proceeds $(7,990))** | | | | | (8,768 | ) | |
Net Other assets
(liabilities)—(0.1)% | | | | | (6 | ) | |
Net Assets—100.0% | | | | $ | 16,847 | | |
(a) These securities have been deemed illiquid by the Adviser and represent 0.00% of Net Assets.
(b) Security was valued in good faith pursuant to procedures approved by the Board of Trustees as of March 31, 2017. The total of all such securities represents less than 0.005% of net assets of the Fund.
Amounts designated as "—" have been rounded to $0.
* Non-income producing security.
** This number is listed in thousands.
^ All or a portion of the shares have been committed as collateral for open short positions.
† More narrow industries are utilized for compliance purposes, whereas broad sectors are utilized for reporting purposes.
‡ Rate shown is the 7-day effective yield as of March 31, 2017.
Cl — Class
ETF — Exchange Traded Fund
SPDR — Standard & Poor's Depositary Receipt
The accompanying notes are an integral part of the financial statements.
TURNER FUNDS 2017 SEMIANNUAL REPORT 5
FINANCIAL STATEMENTS (Unaudited)
Schedule of securities sold short
Turner Titan Long/Short Fund
March 31, 2017
| | | Shares | | Value
(000) | |
Common stock—45.2% | |
Consumer discretionary—10.7% | |
CarMax | | | 7,950 | | | $ | 471 | | |
Carnival, Cl A | | | 8,230 | | | | 485 | | |
Priceline Group | | | 300 | | | | 533 | | |
Tiffany | | | 3,220 | | | | 307 | | |
Total Consumer discretionary | | | | | 1,796 | | |
Energy—1.6% | |
Frank's International | | | 26,106 | | | | 276 | | |
Total Energy | | | | | 276 | | |
Financials-4.0% | |
Deutsche Bank | | | 14,090 | | | | 242 | | |
State Street | | | 5,430 | | | | 432 | | |
Total Financials | | | | | 674 | | |
Health care—1.9% | |
Express Scripts Holdings | | | 4,780 | | | | 315 | | |
Total Health care | | | | | 315 | | |
Industrials—17.6% | |
AGCO | | | 8,060 | | | | 484 | | |
Applied Industrial Technologies | | | 7,090 | | | | 439 | | |
Caterpillar | | | 1,960 | | | | 182 | | |
Deere | | | 4,130 | | | | 450 | | |
Heartland Express | | | 13,140 | | | | 263 | | |
J.B. Hunt Transport Services | | | 2,710 | | | | 249 | | |
MSC Industrial Direct, Cl A | | | 4,689 | | | | 482 | | |
PACCAR | | | 6,160 | | | | 414 | | |
Total Industrials | | | | | 2,963 | | |
Information technology—7.1% | |
Cognizant Technology
Solutions, Cl A | | | 4,000 | | | | 238 | | |
Intel | | | 9,470 | | | | 342 | | |
Oracle | | | 7,460 | | | | 333 | | |
Trimble Navigation | | | 9,030 | | | | 289 | | |
Total Information technology | | | | | 1,202 | | |
| | | Shares | | Value
(000) | |
Materials—2.3% | |
Compass Minerals International | | | 4,420 | | | $ | 300 | | |
Kinross Gold | | | 27,180 | | | | 95 | | |
Total Materials | | | | | 395 | | |
Total Common stock
(Proceeds $6,974)* | | | | | 7,621 | | |
Exchange traded funds—6.4% | |
iShares U.S. Technology ETF | | | 1,350 | | | | 182 | | |
SPDR S&P Biotech ETF | | | 9,690 | | | | 672 | | |
VanEck Vectors Gold ETF | | | 10,160 | | | | 232 | | |
Total Exchange traded funds
(Proceeds $1,016)* | | | | | 1,086 | | |
Right—0.4% | |
Financials—0.4% | |
Deutsche Bank AG, 4/18/17 | | | 25,880 | | | | 61 | | |
Total Financials | | | | | 61 | | |
Total Right
(Proceeds $—)* | | | | | 61 | | |
Total Securities sold short—52.0%
(Proceeds $7,990)* | | | | $ | 8,768 | | |
Percentages disclosed are based on total net assets of the Fund at March 31, 2017.
* This number is listed in thousands.
Cl — Class
ETF — Exchange Traded Fund
SPDR — Standard & Poor's Depositary Receipt
The accompanying notes are an integral part of the financial statements.
6 TURNER FUNDS 2017 SEMIANNUAL REPORT
Turner Midcap Growth Fund
March 31, 2017
| | | Shares | | Value
(000) | |
Common stock—96.5%† | |
Consumer discretionary—23.4% | |
Chipotle Mexican Grill* | | | 3,750 | | | $ | 1,671 | | |
Dollar Tree* | | | 21,000 | | | | 1,648 | | |
Domino's Pizza | | | 7,500 | | | | 1,382 | | |
Expedia | | | 15,000 | | | | 1,893 | | |
Marriott International, Cl A | | | 25,000 | | | | 2,354 | | |
Mohawk Industries* | | | 4,500 | | | | 1,033 | | |
Newell Rubbermaid | | | 25,000 | | | | 1,179 | | |
Omnicom Group | | | 12,000 | | | | 1,035 | | |
O'Reilly Automotive* | | | 8,000 | | | | 2,158 | | |
Panera Bread, Cl A* | | | 3,000 | | | | 786 | | |
Pool | | | 10,000 | | | | 1,193 | | |
PulteGroup | | | 60,000 | | | | 1,413 | | |
Ross Stores | | | 15,000 | | | | 988 | | |
Ulta Salon, Cosmetics & Fragrance* | | | 2,500 | | | | 713 | | |
Visteon Corp.* | | | 12,000 | | | | 1,175 | | |
Wynn Resorts | | | 18,000 | | | | 2,063 | | |
Total Consumer discretionary | | | | | 22,684 | | |
Consumer staples—4.6% | |
ConAgra Foods | | | 45,000 | | | | 1,815 | | |
Hershey | | | 12,500 | | | | 1,366 | | |
The Clorox Company | | | 10,000 | | | | 1,348 | | |
Total Consumer staples | | | | | 4,529 | | |
Energy—1.7% | |
Pioneer Natural Resources | | | 5,000 | | | | 931 | | |
Southwestern Energy* | | | 90,000 | | | | 735 | | |
Total Energy | | | | | 1,666 | | |
Financials—6.7% | |
CBOE Holdings, Inc. | | | 20,000 | | | | 1,621 | | |
Huntington Bancshares, Inc. | | | 95,000 | | | | 1,272 | | |
Intercontinental Exchange Group | | | 18,000 | | | | 1,078 | | |
Raymond James Financial | | | 20,000 | | | | 1,525 | | |
Zions Bancorp | | | 25,000 | | | | 1,050 | | |
Total Financials | | | | | 6,546 | | |
Health care—15.9% | |
ABIOMED* | | | 8,000 | | | | 1,002 | | |
ACADIA Pharmaceuticals*^ | | | 22,000 | | | | 756 | | |
Align Technology* | | | 9,000 | | | | 1,032 | | |
Alkermes* | | | 22,000 | | | | 1,287 | | |
AmerisourceBergen, Cl A | | | 16,000 | | | | 1,416 | | |
| | | Shares | | Value
(000) | |
C.R. Bard | | | 9,000 | | | $ | 2,237 | | |
IDEXX Laboratories* | | | 17,030 | | | | 2,633 | | |
Incyte* | | | 15,000 | | | | 2,005 | | |
Mettler-Toledo International* | | | 4,000 | | | | 1,916 | | |
Veeva Systems, Cl A* | | | 24,000 | | | | 1,231 | | |
Total Health care | | | | | 15,515 | | |
Industrials—14.5% | |
A.O. Smith Corp. | | | 17,000 | | | | 870 | | |
Copart, Inc.* | | | 20,000 | | | | 1,239 | | |
Equifax | | | 9,000 | | | | 1,231 | | |
Fastenal | | | 24,000 | | | | 1,236 | | |
Fortune Brands Home & Security | | | 22,000 | | | | 1,338 | | |
HD Supply Holdings, Inc.* | | | 26,000 | | | | 1,069 | | |
Huntington Ingalls Industries | | | 6,000 | | | | 1,201 | | |
Nordson | | | 9,000 | | | | 1,106 | | |
Rockwell Automation | | | 8,500 | | | | 1,324 | | |
Roper Technologies | | | 4,650 | | | | 960 | | |
The Middleby Corporation* | | | 9,000 | | | | 1,228 | | |
United Rentals* | | | 10,700 | | | | 1,338 | | |
Total Industrials | | | | | 14,140 | | |
Information technology—23.1% | |
Arista Networks* | | | 7,500 | | | | 992 | | |
Cavium* | | | 21,000 | | | | 1,505 | | |
CDK Global, Inc. | | | 25,000 | | | | 1,625 | | |
CDW Corp. of Delaware | | | 20,000 | | | | 1,154 | | |
Commscope Holding, Inc.* | | | 30,000 | | | | 1,251 | | |
Electronic Arts* | | | 16,000 | | | | 1,432 | | |
Fiserv* | | | 22,200 | | | | 2,561 | | |
Fortinet* | | | 15,420 | | | | 591 | | |
Lam Research | | | 12,500 | | | | 1,605 | | |
Maxim Integrated Products | | | 24,000 | | | | 1,079 | | |
Monolithic Power Systems | | | 12,500 | | | | 1,151 | | |
NVIDIA | | | 24,000 | | | | 2,615 | | |
Paychex | | | 15,000 | | | | 884 | | |
Shopify, Cl A* | | | 15,000 | | | | 1,021 | | |
Square, Cl A* | | | 80,000 | | | | 1,382 | | |
Vantiv, Cl A* | | | 26,000 | | | | 1,667 | | |
Total Information technology | | | | | 22,515 | | |
Materials—4.5% | |
Berry Plastics Group* | | | 17,000 | | | | 826 | | |
Celanese | | | 10,000 | | | | 899 | | |
Eagle Materials, Cl A | | | 14,000 | | | | 1,359 | | |
TURNER FUNDS 2017 SEMIANNUAL REPORT 7
FINANCIAL STATEMENTS (Unaudited)
Schedule of investments
Turner Midcap Growth Fund
| | | Shares | | Value
(000) | |
Nucor | | | 22,000 | | | $ | 1,314 | | |
Total Materials | | | | | 4,398 | | |
Real estate—2.1% | |
Equinix | | | 5,000 | | | | 2,002 | | |
Total Real estate | | | | | 2,002 | | |
Total Common stock
(Cost $84,078)** | | | | | 93,995 | | |
Cash equivalent—6.2% | |
BlackRock Liquidity Funds
Fedfund, 0.593%‡ (1) | | | 6,069,005 | | | | 6,069 | | |
Total Cash equivalent
(Cost $6,069)** | | | | | 6,069 | | |
Total Investments—102.7%
(Cost $90,147)** | | | | | 100,064 | | |
Net Other assets (liabilities)—(2.7)% | | | | | (2,660 | ) | |
Net Assets—100.0% | | | | $ | 97,404 | | |
* Non-income producing security.
** This number is listed in thousands.
(1) A portion of the Fund's position in this security was purchased with cash collateral received from securities lending. The total value of such security at March 31, 2017 was $762**
^ Security fully or partially on loan at March 31, 2017. The total value of securities on loan at March 31, 2017 was $753**. Certain of these securities may have been sold prior to period end.
† More narrow industries are utilized for compliance purposes, whereas broad sectors are utilized for reporting purposes.
‡ Rate shown is the 7-day effective yield as of March 31, 2017.
Cl — Class
The accompanying notes are an integral part of the financial statements.
8 TURNER FUNDS 2017 SEMIANNUAL REPORT
Turner Small Cap Growth Fund
March 31, 2017
| | | Shares | | Value
(000) | |
Common stock—96.7%† | |
Consumer discretionary—10.0% | |
Dave & Buster's Entertainment* | | | 7,500 | | | $ | 458 | | |
Grand Canyon Education* | | | 3,500 | | | | 251 | | |
iRobot, Inc.* | | | 3,000 | | | | 198 | | |
KB Home^ | | | 17,000 | | | | 338 | | |
Ollie's Bargain Outlet Holdings* | | | 14,000 | | | | 469 | | |
Penn National Gaming* | | | 16,000 | | | | 295 | | |
Tenneco | | | 4,000 | | | | 250 | | |
The Children's Place | | | 2,000 | | | | 240 | | |
Total Consumer discretionary | | | | | 2,499 | | |
Consumer staples—1.5% | |
National Beverage Corp. | | | 4,500 | | | | 380 | | |
Total Consumer staples | | | | | 380 | | |
Energy—3.5% | |
Callon Petroleum* | | | 37,000 | | | | 487 | | |
US Silica Holdings | | | 8,000 | | | | 384 | | |
Total Energy | | | | | 871 | | |
Financials—5.7% | |
Bank of the Ozarks | | | 7,500 | | | | 390 | | |
Essent Group* | | | 11,500 | | | | 415 | | |
Evercore Partners, Cl A | | | 4,000 | | | | 312 | | |
Financial Engine | | | 7,000 | | | | 305 | | |
Total Financials | | | | | 1,422 | | |
Health care—21.3% | |
ACADIA Pharmaceuticals*^ | | | 5,500 | | | | 189 | | |
Aerie Pharmaceuticals* | | | 5,000 | | | | 227 | | |
AMN Healthcare Services* | | | 5,000 | | | | 203 | | |
Chemed | | | 2,000 | | | | 365 | | |
Corcept Therapeutics, Inc.* | | | 31,810 | | | | 349 | | |
Exelixis, Inc.* | | | 17,000 | | | | 368 | | |
Glaukos Corp.* | | | 7,270 | | | | 373 | | |
Inogen* | | | 5,450 | | | | 423 | | |
Integra LifeSciences Holdings* | | | 3,000 | | | | 126 | | |
Kite Pharma* | | | 3,000 | | | | 235 | | |
Medidata Solutions* | | | 7,500 | | | | 433 | | |
NuVasive* | | | 6,000 | | | | 449 | | |
PRA Health Sciences* | | | 6,000 | | | | 391 | | |
Prothena* | | | 5,000 | | | | 279 | | |
Repligen* | | | 12,000 | | | | 422 | | |
Supernus Pharmaceuticals* | | | 7,000 | | | | 219 | | |
| | | Shares | | Value
(000) | |
Tesaro* | | | 1,800 | | | $ | 277 | | |
Total Health care | | | | | 5,328 | | |
Industrials—11.4% | |
Apogee Enterprises | | | 5,450 | | | | 325 | | |
Builders FirstSource, Inc.* | | | 18,000 | | | | 268 | | |
Insperity | | | 4,540 | | | | 402 | | |
MasTec* | | | 6,000 | | | | 240 | | |
Mercury Systems* | | | 9,500 | | | | 371 | | |
The Brink's Co. | | | 9,090 | | | | 487 | | |
Trex* | | | 4,500 | | | | 312 | | |
WageWorks* | | | 4,500 | | | | 325 | | |
Woodward | | | 2,000 | | | | 136 | | |
Total Industrials | | | | | 2,866 | | |
Information technology—33.7% | |
Advanced Energy Industries* | | | 7,000 | | | | 480 | | |
Advanced Micro Devices, Inc.* | | | 20,000 | | | | 291 | | |
Blackhawk Network Holdings* | | | 5,000 | | | | 203 | | |
Cabot Microelectronics Corp. | | | 5,000 | | | | 383 | | |
Cavium* | | | 4,500 | | | | 322 | | |
Coherent, Inc.* | | | 1,270 | | | | 261 | | |
Digimarc*^ | | | 38,170 | | | | 1,030 | | |
Fair Isaac Corp. | | | 3,640 | | | | 469 | | |
HubSpot* | | | 5,910 | | | | 358 | | |
Integrated Device Technology* | | | 12,750 | | | | 302 | | |
Littelfuse | | | 2,270 | | | | 363 | | |
Lumentum Holdings* | | | 6,000 | | | | 320 | | |
MACOM Technology Solutions
Holdings* | | | 4,000 | | | | 193 | | |
Methode Electronics | | | 8,630 | | | | 394 | | |
Microsemi Corp.* | | | 3,500 | | | | 180 | | |
MKS Instruments, Inc. | | | 7,270 | | | | 500 | | |
Monolithic Power Systems | | | 1,820 | | | | 168 | | |
Novanta, Inc.* | | | 10,000 | | | | 266 | | |
RealPage* | | | 6,360 | | | | 222 | | |
Remark Media, Inc. (a)* | | | 291,750 | | | | 863 | | |
Square, Cl A* | | | 13,630 | | | | 236 | | |
Take-Two Interactive Software* | | | 3,000 | | | | 178 | | |
Universal Display | | | 5,000 | | | | 431 | | |
Total Information technology | | | | | 8,413 | | |
Materials—4.7% | |
Balchem Corp. | | | 2,000 | | | | 165 | | |
Chemours Co. (The) | | | 12,000 | | | | 463 | | |
TURNER FUNDS 2017 SEMIANNUAL REPORT 9
FINANCIAL STATEMENTS (Unaudited)
Schedule of investments
Turner Small Cap Growth Fund
| | | Shares | | Value
(000) | |
Kronos Worldwide, Inc. | | | 15,000 | | | $ | 246 | | |
Louisiana-Pacific* | | | 12,500 | | | | 310 | | |
Total Materials | | | | | 1,184 | | |
Real estate—3.6% | |
CoreSite Realty | | | 5,000 | | | | 451 | | |
DuPont Fabros Technology | | | 9,000 | | | | 446 | | |
Total Real estate | | | | | 897 | | |
Utilities—1.3% | |
Ormat Technologies, Inc. | | | 5,910 | | | | 337 | | |
Total Utilities | | | | | 337 | | |
Total Common stock
(Cost $21,505)** | | | | | 24,197 | | |
Cash equivalent—7.2% | |
BlackRock Liquidity Funds
Fedfund, 0.593%‡ (1) | | | 1,811,642 | | | | 1,812 | | |
Total Cash equivalent
(Cost $1,812)** | | | | | 1,812 | | |
Total Investments—103.9%
(Cost $23,317)** | | | | | 26,009 | | |
Net Other assets (liabilities)—(3.9)% | | | | | (978 | ) | |
Net Assets—100.0% | | | | $ | 25,031 | | |
(a) These securities have been deemed illiquid by the Adviser and represent 3.45% of Net Assets.
* Non-income producing security.
** This number is listed in thousands.
(1) A portion of the Fund's position in this security was purchased with cash collateral received from securities lending. The total value of such security at March 31, 2017 was $1,234**
^ Security fully or partially on loan at March 31, 2017. The total value of securities on loan at March 31, 2017 was $1,228**. Certain of these securities may have been sold prior to period end.
† More narrow industries are utilized for compliance purposes, whereas broad sectors are utilized for reporting purposes.
‡ Rate shown is the 7-day effective yield as of March 31, 2017.
Cl — Class
The accompanying notes are an integral part of the financial statements.
10 TURNER FUNDS 2017 SEMIANNUAL REPORT
SECTOR WEIGHTINGS (Unaudited)
The following tables show the fund composition allocated by sector. The fund composition is subject to change, and the percentages are based on total investments of long positions.
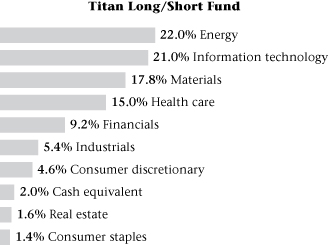
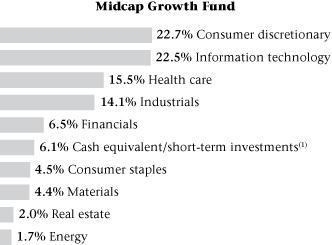
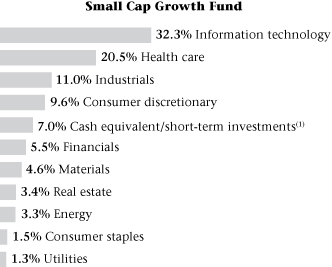
1 Cash equivalent includes short-term investment held as collateral for securities lending activity. Please see Note 8 in the Notes to financial statements for more detailed information.
TURNER FUNDS 2017 SEMIANNUAL REPORT 11
FINANCIAL STATEMENTS (Unaudited)
Statements of assets and liabilities (000)
March 31, 2017
| | | Turner
Titan
Long/Short
Fund | | Turner
Midcap
Growth
Fund | | Turner
Small Cap
Growth
Fund | |
Assets: | |
Investment securities, at cost | | $ | 14,653 | | | $ | 90,147 | | | $ | 23,317 | | |
Investment securities, at value | | $ | 16,118 | | | $ | 100,064 | | | $ | 26,009 | | |
Deposits with brokers for securities sold short | | | 9,503 | | | | — | | | | — | | |
Foreign currency, at value | | | 3 | | | | — | | | | — | | |
Receivable for investment securities sold | | | — | | | | 2,237 | | | | 1,312 | | |
Receivable for capital shares sold | | | — | | | | 1 | | | | 3 | | |
Prepaid expenses | | | 84 | | | | 355 | | | | 115 | | |
Receivable for dividend income | | | 6 | | | | 40 | | | | 18 | | |
Receivable from investment adviser | | | — | | | | 46 | | | | 24 | | |
Total assets | | | 25,714 | | | | 102,743 | | | | 27,481 | | |
Liabilities: | |
Securities sold short, at proceeds | | | 7,990 | | | | — | | | | — | | |
Securities sold short, at value | | | 8,768 | | | | — | | | | — | | |
Payable for investment securities purchased | | | — | | | | 1,602 | | | | 463 | | |
Obligation to return securities lending collateral | | | — | | | | 3,415 | | | | 1,523 | | |
Payable for capital shares redeemed | | | 45 | | | | 191 | | | | 432 | | |
Dividends payable on securities sold short (Note 2) | | | 7 | | | | — | | | | — | | |
Payable due to investment adviser | | | 4 | | | | — | | | | — | | |
Payable due to administrator | | | 3 | | | | 25 | | | | 3 | | |
Payable due to shareholder servicing | | | 1 | | | | 18 | | | | 6 | | |
Payable due to distributor | | | 1 | | | | — | | | | — | | |
Payable due to transfer agent | | | 9 | | | | 20 | | | | 4 | | |
Payable due to custodian | | | 7 | | | | 3 | | | | 3 | | |
Payable due to compliance services | | | 2 | | | | 5 | | | | 1 | | |
Other accrued expenses | | | 20 | | | | 60 | | | | 15 | | |
Total liabilities | | | 8,867 | | | | 5,339 | | | | 2,450 | | |
Net assets | | $ | 16,847 | | | $ | 97,404 | | | $ | 25,031 | | |
* Includes market value of securities on loan | | $ | — | | | $ | 1,228 | | | $ | 753 | | |
Net assets: | |
Portfolio capital | | $ | 19,576 | | | $ | 84,157 | | | $ | 22,201 | | |
Accumulated net investment loss | | | (893 | ) | | | (514 | ) | | | (16 | ) | |
Accumulated net realized gain (loss) from investments,
securities sold short and foreign currency transactions | | | (2,523 | ) | | | 3,844 | | | | 154 | | |
Net unrealized appreciation on investments, securities sold short,
foreign currencies and translation of other assets and liabilities
denominated in foreign currencies | | | 687 | | | | 9,917 | | | | 2,692 | | |
Net assets | | $ | 16,847 | | | $ | 97,404 | | | $ | 25,031 | | |
Outstanding shares of beneficial interest — Institutional Class Shares (1) | | | 1,635 | | | | 704 | | | | — | | |
Outstanding shares of beneficial interest — Investor Class Shares (1) | | | 329 | | | | 4,438 | | | | 1,911 | | |
Outstanding shares of beneficial interest — Class C Shares (1) | | | 124 | | | | — | | | | — | | |
Outstanding shares of beneficial interest — Retirement Class Shares (1) | | | — | | | | 24 | | | | — | | |
Net assets — Institutional Class Shares | | $ | 13,318 | | | $ | 13,820 | | | $ | — | | |
Net assets — Investor Class Shares | | $ | 2,610 | | | $ | 83,181 | | | $ | 25,031 | | |
Net assets — Class C Shares | | $ | 919 | | | $ | — | | | $ | — | | |
Net assets — Retirement Class Shares | | $ | — | | | $ | 403 | | | $ | — | | |
Net asset value, offering and redemption price per share — Institutional Class Shares | | $ | 8.15 | † | | $ | 19.64 | † | | $ | — | | |
Net asset value, offering and redemption price per share — Investor Class Shares | | $ | 7.93 | † | | $ | 18.74 | † | | $ | 13.10 | | |
Net asset value, offering and redemption price per share — Class C Shares | | $ | 7.39 | † | | $ | — | | | $ | — | | |
Net asset value, offering and redemption price per share — Retirement Class Shares | | $ | — | | | $ | 16.54 | † | | $ | — | | |
(1) Unlimited authorization — par value $0.00001.
† Differences in net asset value recalculation and net asset value stated are caused by rounding differences.
Amounts designated as "—" are either not applicable, $0 or have been rounded to $0.
The accompanying notes are an integral part of the financial statements.
12 Turner Funds 2017 SemiAnnual Report
FINANCIAL STATEMENTS (Unaudited)
Statements of operations (000)
| | | Turner
Titan
Long/Short
Fund | | Turner
Midcap
Growth
Fund | | Turner
Small Cap
Growth
Fund | |
| | | period ended
3/31/17 | | period ended
3/31/17 | | period ended
3/31/17 | |
Investment income: | |
Dividend | | $ | 47 | | | $ | 352 | | | $ | 171 | | |
Securities lending | | | — | | | | 102 | | | | 124 | | |
Total investment income | | | 47 | | | | 454 | | | | 295 | | |
Expenses: | |
Investment advisory fees | | | 155 | | | | 382 | | | | 160 | | |
Administration fees | | | 15 | | | | 76 | | | | 24 | | |
Shareholder service fees (1) | | | 5 | | | | 109 | | | | 40 | | |
Shareholder service fees (2) | | | 1 | | | | — | | | | — | | |
Shareholder service fees (3) | | | — | | | | 1 | | | | — | | |
Distribution fees (2) | | | 4 | | | | — | | | | — | | |
Distribution fees (3) | | | — | | | | 1 | | | | — | | |
Accounting agent fees | | | 1 | | | | 1 | | | | 1 | | |
Dividend expense | | | 80 | | | | — | | | | — | | |
Broker fees and charges on short sales | | | 26 | | | | — | | | | — | | |
Custodian fees | | | 8 | | | | 6 | | | | 12 | | |
Transfer agent fees | | | 29 | | | | 108 | | | | 34 | | |
Registration fees | | | 17 | | | | 16 | | | | 10 | | |
Professional fees | | | 20 | | | | 62 | | | | 21 | | |
Trustees' fees | | | 24 | | | | 101 | | | | 32 | | |
Compliance service fees | | | 11 | | | | 47 | | | | 15 | | |
Insurance and other fees | | | 17 | | | | 74 | | | | 25 | | |
Total expenses | | | 413 | | | | 984 | | | | 374 | | |
Less: | |
Investment advisory fee waiver | | | (101 | ) | | | (400 | ) | | | (173 | ) | |
Net expenses | | | 312 | | | | 584 | | | | 201 | | |
Net investment income (loss) | | | (265 | ) | | | (130 | ) | | | 94 | | |
Net realized gain (loss) from securities sold | | | (1,886 | ) | | | 15,074 | | | | 1,788 | | |
Net realized gain from securities sold short | | | 1,059 | | | | — | | | | — | | |
Net change in unrealized appreciation (depreciation)
on investments | | | (270 | ) | | | (10,053 | ) | | | (2,765 | ) | |
Net change in unrealized (depreciation) on investments
sold short | | | (533 | ) | | | — | | | | — | | |
Net realized and unrealized gain (loss) from investments | | | (1,630 | ) | | | 5,021 | | | | (977 | ) | |
Net increase (decrease) in net assets resulting from operations | | $ | (1,895 | ) | | $ | 4,891 | | | $ | (883 | ) | |
(1) Attributable to Investor Class Shares only.
(2) Attributable to Class C Shares only.
(3) Attributable to Retirement Class Shares only.
Amounts designated as "—" are either not applicable, $0 or have been rounded to $0.
The accompanying notes are an integral part of the financial statements.
Turner Funds 2017 SemiAnnual Report 13
Statements of changes in net assets (000)
| | | Turner
Titan Long/Short
Fund | | Turner
Midcap Growth
Fund | |
| | | period ended
3/31/17
(Unaudited) | | year ended
9/30/16 | | period ended
3/31/17
(Unaudited) | | year ended
9/30/16 | |
Investment activities: | |
Net investment income (loss) | | $ | (265 | ) | | $ | (775 | ) | | $ | (130 | ) | | $ | (643 | ) | |
Net realized gain (loss) from securities sold and securities sold short | | | (827 | ) | | | (193 | ) | | | 15,074 | | | | (6,069 | ) | |
Net change in unrealized appreciation (depreciation) on investment and securities sold short | | | (803 | ) | | | (205 | ) | | | (10,053 | ) | | | 5,384 | | |
Net increase (decrease) in net assets resulting from operations | | | (1,895 | ) | | | (1,173 | ) | | | 4,891 | | | | (1,328 | ) | |
Dividends and distributions to shareholders: | |
Net investment income: | |
Investor Class Shares | | | — | | | | — | | | | — | | | | — | | |
Realized capital gains: | |
Institutional Class Shares | | | — | | | | (1,929 | ) | | | — | | | | (4,537 | ) | |
Investor Class Shares | | | — | | | | (1,621 | ) | | | — | | | | (18,204 | ) | |
Class C Shares | | | — | | | | (92 | ) | | | — | | | | — | | |
Retirement Class Shares | | | — | | | | — | | | | — | | | | (424 | ) | |
Total dividends and distributions | | | — | | | | (3,642 | ) | | | — | | | | (23,165 | ) | |
Capital share transactions: | |
Institutional Class Shares | |
Proceeds from shares issued | | | 84 | | | | 9,532 | | | | 311 | | | | 760 | | |
Proceeds from shares issued in lieu of cash distributions | | | — | | | | 1,502 | | | | — | | | | 4,273 | | |
Cost of shares redeemed | | | (6,568 | ) | | | (21,651 | ) | | | (3,353 | ) | | | (19,487 | ) | |
Net decrease in net assets from Institutional Class Shares transactions | | | (6,484 | ) | | | (10,617 | ) | | | (3,042 | ) | | | (14,454 | ) | |
Investor Class Shares | |
Proceeds from shares issued | | | 79 | | | | 8,469 | | | | 1,014 | | | | 4,704 | | |
Proceeds from shares issued in lieu of cash distributions | | | — | | | | 1,595 | | | | — | | | | 17,080 | | |
Cost of shares redeemed | | | (3,570 | ) | | | (26,876 | ) | | | (18,176 | ) | | | (40,199 | ) | |
Net decrease in net assets from Investor Class Shares transactions | | | (3,491 | ) | | | (16,812 | ) | | | (17,162 | ) | | | (18,415 | ) | |
Class C Shares | |
Proceeds from shares issued | | | — | | | | 71 | | | | — | | | | — | | |
Proceeds from shares issued in lieu of cash distributions | | | — | | | | 89 | | | | — | | | | — | | |
Cost of shares redeemed | | | (211 | ) | | | (372 | ) | | | — | | | | — | | |
Net decrease in net assets from Class C Shares transactions | | | (211 | ) | | | (212 | ) | | | — | | | | — | | |
Retirement Class Shares | |
Proceeds from shares issued | | | — | | | | — | | | | 3 | | | | 186 | | |
Proceeds from shares issued in lieu of cash distributions | | | — | | | | — | | | | — | | | | 424 | | |
Cost of shares redeemed | | | — | | | | — | | | | (16 | ) | | | (2,505 | ) | |
Net decrease in net assets from Retirement Class Shares transactions | | | — | | | | — | | | | (13 | ) | | | (1,895 | ) | |
Net decrease in net assets from capital share transactions | | | (10,186 | ) | | | (27,641 | ) | | | (20,217 | ) | | | (34,764 | ) | |
Total increase (decrease) in net assets | | | (12,081 | ) | | | (32,456 | ) | | | (15,326 | ) | | | (59,257 | ) | |
Net assets: | |
Beginning of period | | | 28,928 | | | | 61,384 | | | | 112,730 | | | | 171,987 | | |
End of period | | $ | 16,847 | | | $ | 28,928 | | | $ | 97,404 | | | $ | 112,730 | | |
Accumulated net investment loss | | $ | (893 | ) | | $ | (628 | ) | | $ | (514 | ) | | $ | (384 | ) | |
Institutional Class Shares | |
Issued | | | 10 | | | | 1,074 | | | | 16 | | | | 42 | | |
Issued in lieu of cash distributions | | | — | | | | 169 | | | | — | | | | 227 | | |
Redeemed | | | (813 | ) | | | (2,451 | ) | | | (183 | ) | | | (1,059 | ) | |
Net decrease in Institutional Class Shares | | | (803 | ) | | | (1,208 | ) | | | (167 | ) | | | (790 | ) | |
Investor Class Shares | |
Issued | | | 10 | | | | 961 | | | | 58 | | | | 268 | | |
Issued in lieu of cash distributions | | | — | | | | 183 | | | | — | | | | 948 | | |
Redeemed | | | (450 | ) | | | (3,172 | ) | | | (1,028 | ) | | | (2,256 | ) | |
Net decrease in Investor Class Shares | | | (440 | ) | | | (2,028 | ) | | | (970 | ) | | | (1,040 | ) | |
Class C Shares | |
Issued | | | — | | | | 8 | | | | — | | | | — | | |
Issued in lieu of cash distributions | | | — | | | | 11 | | | | — | | | | — | | |
Redeemed | | | (29 | ) | | | (45 | ) | | | — | | | | — | | |
Net decrease in Class C Shares | | | (29 | ) | | | (26 | ) | | | — | | | | — | | |
Retirement Class Shares | |
Issued | | | — | | | | — | | | | — | | | | 12 | | |
Issued in lieu of cash distributions | | | — | | | | — | | | | — | | | | 26 | | |
Redeemed | | | — | | | | — | | | | (1 | ) | | | (160 | ) | |
Net decrease in Retirement Class Shares | | | — | | | | — | | | | (1 | ) | | | (122 | ) | |
Net decrease in share transactions | | | (1,272 | ) | | | (3,262 | ) | | | (1,138 | ) | | | (1,952 | ) | |
14 Turner Funds 2017 SemiAnnual Report
| | | Turner
Small Cap Growth
Fund | |
| | | period ended
3/31/17
(Unaudited) | | year ended
9/30/16 | |
Investment activities: | |
Net investment income (loss) | | $ | 94 | | | $ | (156 | ) | |
Net realized gain (loss) from securities sold and securities sold short | | | 1,788 | | | | 1,087 | | |
Net change in unrealized appreciation (depreciation) on investment and securities sold short | | | (2,765 | ) | | | 696 | | |
Net increase (decrease) in net assets resulting from operations | | | (883 | ) | | | 1,627 | | |
Dividends and distributions to shareholders: | |
Net investment income: | |
Investor Class Shares | | | (36 | ) | | | — | | |
Realized capital gains: | |
Institutional Class Shares | | | — | | | | — | | |
Investor Class Shares | | | (787 | ) | | | (14,893 | ) | |
Class C Shares | | | — | | | | — | | |
Retirement Class Shares | | | — | | | | — | | |
Total dividends and distributions | | | (823 | ) | | | (14,893 | ) | |
Capital share transactions: | |
Institutional Class Shares | |
Proceeds from shares issued | | | — | | | | — | | |
Proceeds from shares issued in lieu of cash distributions | | | — | | | | — | | |
Cost of shares redeemed | | | — | | | | — | | |
Net decrease in net assets from Institutional Class Shares transactions | | | — | | | | — | | |
Investor Class Shares | |
Proceeds from shares issued | | | 5,399 | | | | 5,054 | | |
Proceeds from shares issued in lieu of cash distributions | | | 792 | | | | 14,328 | | |
Cost of shares redeemed | | | (15,785 | ) | | | (40,627 | ) | |
Net decrease in net assets from Investor Class Shares transactions | | | (9,594 | ) | | | (21,245 | ) | |
Class C Shares | |
Proceeds from shares issued | | | — | | | | — | | |
Proceeds from shares issued in lieu of cash distributions | | | — | | | | — | | |
Cost of shares redeemed | | | — | | | | — | | |
Net decrease in net assets from Class C Shares transactions | | | — | | | | — | | |
Retirement Class Shares | |
Proceeds from shares issued | | | — | | | | — | | |
Proceeds from shares issued in lieu of cash distributions | | | — | | | | — | | |
Cost of shares redeemed | | | — | | | | — | | |
Net decrease in net assets from Retirement Class Shares transactions | | | — | | | | — | | |
Net decrease in net assets from capital share transactions | | | (9,594 | ) | | | (21,245 | ) | |
Total increase (decrease) in net assets | | | (11,300 | ) | | | (34,511 | ) | |
Net assets: | |
Beginning of period | | | 36,331 | | | | 70,842 | | |
End of period | | $ | 25,031 | | | $ | 36,331 | | |
Accumulated net investment loss | | $ | (16 | ) | | $ | (74 | ) | |
Institutional Class Shares | |
Issued | | | — | | | | — | | |
Issued in lieu of cash distributions | | | — | | | | — | | |
Redeemed | | | — | | | | — | | |
Net decrease in Institutional Class Shares | | | — | | | | — | | |
Investor Class Shares | |
Issued | | | 408 | | | | 373 | | |
Issued in lieu of cash distributions | | | 64 | | | | 1,155 | | |
Redeemed | | | (1,246 | ) | | | (2,765 | ) | |
Net decrease in Investor Class Shares | | | (774 | ) | | | (1,237 | ) | |
Class C Shares | |
Issued | | | — | | | | — | | |
Issued in lieu of cash distributions | | | — | | | | — | | |
Redeemed | | | — | | | | — | | |
Net decrease in Class C Shares | | | — | | | | — | | |
Retirement Class Shares | |
Issued | | | — | | | | — | | |
Issued in lieu of cash distributions | | | — | | | | — | | |
Redeemed | | | — | | | | — | | |
Net decrease in Retirement Class Shares | | | — | | | | — | | |
Net decrease in share transactions | | | (774 | ) | | | (1,237 | ) | |
Amounts designated as "—" are either not applicable, $0 or have been rounded to $0.
The accompanying notes are an integral part of the financial statements.
Turner Funds 2017 SemiAnnual Report 15
For a share outstanding throughout each period
| | | Net asset
value,
beginning
of period | | Net
investment
income
(loss)(1) | | Realized and
unrealized
gains (losses)
on investments | | Total
from
investment
operations | | Dividends
from net
investment
income | | Distributions
from
capital
gains | | Total
dividends and
distributions | |
Turner Titan Long/Short Fund — Institutional Class Shares | | | |
| 2017^ | | $ | 8.69 | | | | (0.10 | ) | | | (0.44 | ) | | | (0.54 | ) | | | — | | | | — | | | | — | | |
2016 | | $ | 9.37 | | | | (0.15 | ) | | | 0.02 | (2) | | | (0.13 | ) | | | — | | | | (0.55 | ) | | | (0.55 | ) | |
2015 | | $ | 11.95 | | | | (0.18 | ) | | | 0.23 | | | | 0.05 | | | | — | | | | (2.63 | ) | | | (2.63 | ) | |
2014 | | $ | 11.43 | | | | (0.14 | ) | | | 0.66 | | | | 0.52 | | | | — | | | | — | | | | — | | |
2013 | | $ | 10.89 | | | | (0.07 | ) | | | 0.61 | | | | 0.54 | | | | — | | | | — | | | | — | | |
2012 | | $ | 11.45 | | | | (0.13 | ) | | | 0.04 | | | | (0.09 | ) | | | — | | | | (0.47 | ) | | | (0.47 | ) | |
Turner Titan Long/Short Fund — Investor Class Shares | | | |
| 2017^ | | $ | 8.47 | | | | (0.11 | ) | | | (0.43 | ) | | | (0.54 | ) | | | — | | | | — | | | | — | | |
2016 | | $ | 9.17 | | | | (0.17 | ) | | | 0.02 | (2) | | | (0.15 | ) | | | — | | | | (0.55 | ) | | | (0.55 | ) | |
2015 | | $ | 11.78 | | | | (0.20 | ) | | | 0.22 | | | | 0.02 | | | | — | | | | (2.63 | ) | | | (2.63 | ) | |
2014 | | $ | 11.30 | | | | (0.17 | ) | | | 0.65 | | | | 0.48 | | | | — | | | | — | | | | — | | |
2013 | | $ | 10.80 | | | | (0.09 | ) | | | 0.59 | | | | 0.50 | | | | — | | | | — | | | | — | | |
2012 | | $ | 11.38 | | | | (0.16 | ) | | | 0.05 | | | | (0.11 | ) | | | — | | | | (0.47 | ) | | | (0.47 | ) | |
Turner Titan Long/Short Fund — Class C Shares | | | |
| 2017^ | | $ | 7.93 | | | | (0.13 | ) | | | (0.41 | ) | | | (0.54 | ) | | | — | | | | — | | | | — | | |
2016 | | $ | 8.68 | | | | (0.22 | ) | | | 0.02 | (2) | | | (0.20 | ) | | | — | | | | (0.55 | ) | | | (0.55 | ) | |
2015 | | $ | 11.36 | | | | (0.26 | ) | | | 0.21 | | | | (0.05 | ) | | | — | | | | (2.63 | ) | | | (2.63 | ) | |
2014 | | $ | 10.98 | | | | (0.25 | ) | | | 0.63 | | | | 0.38 | | | | — | | | | — | | | | — | | |
2013 | | $ | 10.57 | | | | (0.17 | ) | | | 0.58 | | | | 0.41 | | | | — | | | | — | | | | — | | |
2012 | | $ | 11.23 | | | | (0.24 | ) | | | 0.05 | | | | (0.19 | ) | | | — | | | | (0.47 | ) | | | (0.47 | ) | |
16 TURNER FUNDS 2017 SEMIANNUAL REPORT
| | | Net asset
value, end
of period | | Total
return | | Net
assets end
of period
(000) | | Ratio of
net expenses
to average
net assets*† | | Ratio of total
expenses
to average
net assets† | | Ratio of net
investment
income (loss)
to average
net assets*† | | Portfolio
turnover
rate** | |
Turner Titan Long/Short Fund — Institutional Class Shares | |
| 2017^ | | $ | 8.15 | | | | (6.21 | )%†† | | $ | 13,318 | | | | 2.93 | % | | | 3.91 | % | | | (2.48 | )% | | | 229 | % | |
2016 | | $ | 8.69 | | | | (1.58 | )% | | $ | 21,204 | | | | 2.82 | % | | | 3.35 | % | | | (1.66 | )% | | | 572 | % | |
2015 | | $ | 9.37 | | | | 2.13 | % | | $ | 34,179 | | | | 2.56 | % (3) | | | 3.37 | % | | | (1.83 | )% | | | 510 | % | |
2014 | | $ | 11.95 | | | | 4.55 | % | | $ | 120,032 | | | | 1.93 | % (4) | | | 2.82 | % | | | (1.18 | )% | | | 443 | % | |
2013 | | $ | 11.43 | | | | 4.96 | % | | $ | 481,845 | | | | 1.93 | % (5) | | | 2.75 | % | | | (0.64 | )% | | | 580 | % | |
2012 | | $ | 10.89 | | | | (0.77 | )% | | $ | 832,857 | | | | 1.89 | % (6) | | | 2.34 | % | | | (1.15 | )% | | | 996 | % | |
Turner Titan Long/Short Fund — Investor Class Shares | |
| 2017^ | | $ | 7.93 | | | | (6.38 | )%†† | | $ | 2,610 | | | | 3.18 | % | | | 4.16 | % | | | (2.73 | )% | | | 229 | % | |
2016 | | $ | 8.47 | | | | (1.84 | )% | | $ | 6,511 | | | | 3.07 | % | | | 3.60 | % | | | (1.91 | )% | | | 572 | % | |
2015 | | $ | 9.17 | | | | 1.86 | % | | $ | 25,651 | | | | 2.81 | % (3) | | | 3.62 | % | | | (2.08 | )% | | | 510 | % | |
2014 | | $ | 11.78 | | | | 4.25 | % | | $ | 15,630 | | | | 2.18 | % (4) | | | 3.07 | % | | | (1.42 | )% | | | 443 | % | |
2013 | | $ | 11.30 | | | | 4.63 | % | | $ | 44,139 | | | | 2.18 | % (5) | | | 3.00 | % | | | (0.89 | )% | | | 580 | % | |
2012 | | $ | 10.80 | | | | (0.95 | )% | | $ | 126,533 | | | | 2.14 | % (6) | | | 2.59 | % | | | (1.40 | )% | | | 996 | % | |
Turner Titan Long/Short Fund — Class C Shares | |
| 2017^ | | $ | 7.39 | | | | (6.81 | )%†† | | $ | 919 | | | | 3.93 | % | | | 4.91 | % | | | (3.48 | )% | | | 229 | % | |
2016 | | $ | 7.93 | | | | (2.55 | )% | | $ | 1,213 | | | | 3.82 | % | | | 4.35 | % | | | (2.66 | )% | | | 572 | % | |
2015 | | $ | 8.68 | | | | 1.17 | % | | $ | 1,554 | | | | 3.56 | % (3) | | | 4.37 | % | | | (2.83 | )% | | | 510 | % | |
2014 | | $ | 11.36 | | | | 3.46 | % | | $ | 2,916 | | | | 2.93 | % (4) | | | 3.82 | % | | | (2.18 | )% | | | 443 | % | |
2013 | | $ | 10.98 | | | | 3.88 | % | | $ | 5,572 | | | | 2.93 | % (5) | | | 3.75 | % | | | (1.64 | )% | | | 580 | % | |
2012 | | $ | 10.57 | | | | (1.71 | )% | | $ | 10,391 | | | | 2.89 | % (6) | | | 3.34 | % | | | (2.15 | )% | | | 996 | % | |
* Inclusive of fees paid indirectly, waivers and/or reimbursements.
** Excludes effect of in-kind transfers and mergers, as applicable. Not annualized for periods less than one year.
^ For the six-month period ended March 31, 2017 (unaudited). All ratios for the periods have been annualized unless otherwise noted.
† Does not include acquired fund fees or expenses.
†† Total return is for the period indicated and has not been annualized.
(1) Based on average shares outstanding.
(2) The amount shown for a share outstanding throughout the period does not accord with the change in aggregate gains and losses in the portfolio of securities during the period because of the timing of the sales and purchases of fund shares in relation to fluctuating market values during the period.
(3) Dividend expense totaled 0.46% of average net assets for the year ended September 30, 2015, 0.14% of which was waived. Broker fees and charges on short sales totaled 0.68% of average net assets for the year ended September 30, 2015, 0.35% of which was waived. If dividend expense and broker fees and charges on short sales had not been contractually waived, the ratios of net expenses to average net assets would have been 3.05%, 3.30% and 4.05% for the Institutional, Investor and Class C Shares, respectively.
(4) Dividend expense totaled 0.40% of average net assets for the year ended September 30, 2014, 0.40% of which was waived. Broker fees and charges on short sales totaled 0.44% of average net assets for the year ended September 30, 2014, 0.44% of which was waived. If dividend expense and broker fees and charges on short sales had not been contractually waived, the ratios of net expenses to average net assets would have been 2.77%, 3.01% and 3.77% for the Institutional, Investor and Class C Shares, respectively.
(5) Dividend expense totaled 0.45% of average net assets for the year ended September 30, 2013, 0.45% of which was waived. Broker fees and charges on short sales totaled 0.45% of average net assets for the year ended September 30, 2013, 0.45% of which was waived. If dividend expense and broker fees and charges on short sales had not been contractually waived, the ratios of net expenses to average net assets would have been 2.83%, 3.08% and 3.83% for the Institutional, Investor and Class C Shares, respectively.
(6) Dividend expense totaled 0.20% of average net assets for the year ended September 30, 2012, 0.20% of which was waived. Broker fees and charges on short sales totaled 0.33% of average net assets for the year ended September 30, 2012, 0.33% of which was waived. If dividend expense and broker fees and charges on short sales had not been contractually waived, the ratios of net expenses to average net assets would have been 2.42%, 2.67% and 3.42% for the Institutional, Investor and Class C Shares, respectively.
Amounts designated as "—" are either not applicable, $0 or have been rounded to $0.
The accompanying notes are an integral part of the financial statements.
TURNER FUNDS 2017 SEMIANNUAL REPORT 17
For a share outstanding throughout each period
| | Net asset
value,
beginning
of period | | Net
investment
income
(loss)(1) | | Realized and
unrealized
gains (losses)
on investments | | Total
from
investment
operations | | Dividends
from net
investment
income | | Distributions
from
capital
gains | | Total
dividends and
distributions | |
Turner Midcap Growth Fund — Institutional Class Shares | | | |
| 2017^ | | $ | 18.61 | | | | — | | | | 1.03 | | | | 1.03 | | | | — | | | | — | | | | — | | |
2016 | | $ | 21.49 | | | | (0.05 | ) | | | 0.13 | (2) | | | 0.08 | | | | — | | | | (2.96 | ) | | | (2.96 | ) | |
2015 | | $ | 38.57 | | | | (0.10 | ) | | | (0.82 | ) | | | (0.92 | ) | | | — | | | | (16.16 | ) | | | (16.16 | ) | |
2014 | | $ | 43.43 | | | | (0.08 | ) | | | 4.58 | | | | 4.50 | | | | — | | | | (9.36 | ) | | | (9.36 | ) | |
2013 | | $ | 35.39 | | | | (0.09 | ) | | | 8.68 | | | | 8.59 | | | | — | | | | (0.55 | ) | | | (0.55 | ) | |
2012 | | $ | 30.42 | | | | (0.05 | ) | | | 5.02 | | | | 4.97 | | | | — | | | | — | | | | — | | |
Turner Midcap Growth Fund — Investor Class Shares | | | |
| 2017^ | | $ | 17.78 | | | | (0.03 | ) | | | 0.99 | | | | 0.96 | | | | — | | | | — | | | | — | | |
2016 | | $ | 20.71 | | | | (0.09 | ) | | | 0.12 | (2) | | | 0.03 | | | | — | | | | (2.96 | ) | | | (2.96 | ) | |
2015 | | $ | 37.79 | | | | (0.16 | ) | | | (0.76 | ) | | | (0.92 | ) | | | — | | | | (16.16 | ) | | | (16.16 | ) | |
2014 | | $ | 42.85 | | | | (0.17 | ) | | | 4.47 | | | | 4.30 | | | | — | | | | (9.36 | ) | | | (9.36 | ) | |
2013 | | $ | 35.03 | | | | (0.18 | ) | | | 8.55 | | | | 8.37 | | | | — | | | | (0.55 | ) | | | (0.55 | ) | |
2012 | | $ | 30.16 | | | | (0.13 | ) | | | 5.00 | | | | 4.87 | | | | — | | | | — | | | | — | | |
Turner Midcap Growth Fund — Retirement Class Shares | | | |
| 2017^ | | $ | 15.71 | | | | (0.04 | ) | | | 0.87 | | | | 0.83 | | | | — | | | | — | | | | — | | |
2016 | | $ | 18.69 | | | | (0.12 | ) | | | 0.10 | (2) | | | (0.02 | ) | | | — | | | | (2.96 | ) | | | (2.96 | ) | |
2015 | | $ | 35.75 | | | | (0.21 | ) | | | (0.69 | ) | | | (0.90 | ) | | | — | | | | (16.16 | ) | | | (16.16 | ) | |
2014 | | $ | 41.07 | | | | (0.25 | ) | | | 4.29 | | | | 4.04 | | | | — | | | | (9.36 | ) | | | (9.36 | ) | |
2013 | | $ | 33.65 | | | | (0.25 | ) | | | 8.22 | | | | 7.97 | | | | — | | | | (0.55 | ) | | | (0.55 | ) | |
2012 | | $ | 29.05 | | | | (0.20 | ) | | | 4.80 | | | | 4.60 | | | | — | | | | — | | | | — | | |
Turner Small Cap Growth Fund — Investor Class Shares | | | |
| 2017^ | | $ | 13.53 | | | | 0.04 | | | | (0.15 | ) | | | (0.11 | ) | | | (0.01 | ) | | | (0.31 | ) | | | (0.32 | ) | |
2016 | | $ | 18.06 | | | | (0.05 | ) | | | 0.74 | | | | 0.69 | | | | — | | | | (5.22 | ) | | | (5.22 | ) | |
2015 | | $ | 37.23 | | | | (0.17 | ) | | | 1.25 | | | | 1.08 | | | | — | | | | (20.25 | ) | | | (20.25 | ) | |
2014 | | $ | 44.76 | | | | (0.33 | ) | | | 0.76 | | | | 0.43 | | | | — | | | | (7.96 | ) | | | (7.96 | ) | |
2013 | | $ | 35.96 | | | | (0.16 | ) | | | 11.47 | | | | 11.31 | | | | — | | | | (2.51 | ) | | | (2.51 | ) | |
2012 | | $ | 27.83 | | | | (0.23 | ) | | | 8.36 | | | | 8.13 | | | | — | | | | — | | | | — | | |
18 TURNER FUNDS 2017 SEMIANNUAL REPORT
| | | Net asset
value, end
of period | | Total
return | | Net
assets end
of period
(000) | | Ratio of
net expenses
to average
net assets*† | | Ratio of total
expenses
to average
net assets† | | Ratio of net
investment
income (loss)
to average
net assets*† | | Portfolio
turnover
rate** | |
Turner Midcap Growth Fund — Institutional Class Shares | |
| 2017^ | | $ | 19.64 | | | | 5.53 | %†† | | $ | 13,820 | | | | 0.93 | % | | | 1.71 | % | | | (0.04 | )% | | | 113 | % | |
2016 | | $ | 18.61 | | | | 0.22 | % | | $ | 16,205 | | | | 0.93 | % | | | 1.50 | % | | | (0.26 | )% | | | 165 | % | |
2015 | | $ | 21.49 | | | | (4.63 | )% | | $ | 35,704 | | | | 0.93 | % | | | 1.33 | % | | | (0.39 | )% | | | 119 | % (3) | |
2014 | | $ | 38.57 | | | | 12.25 | % | | $ | 46,253 | | | | 0.93 | % | | | 1.17 | % | | | (0.21 | )% | | | 89 | % (4) | |
2013 | | $ | 43.43 | | | | 24.69 | % | | $ | 205,679 | | | | 0.93 | % | | | 1.08 | % | | | (0.24 | )% | | | 84 | % | |
2012 | | $ | 35.39 | | | | 16.34 | % | | $ | 236,147 | | | | 0.93 | % | | | 1.04 | % | | | (0.14 | )% | | | 121 | % | |
Turner Midcap Growth Fund — Investor Class Shares | |
| 2017^ | | $ | 18.74 | | | | 5.40 | %†† | | $ | 83,181 | | | | 1.18 | % | | | 1.96 | % | | | (0.29 | )% | | | 113 | % | |
2016 | | $ | 17.78 | | | | (0.04 | )% | | $ | 96,130 | | | | 1.18 | % | | | 1.75 | % | | | (0.51 | )% | | | 165 | % | |
2015 | | $ | 20.71 | | | | (4.81 | )% | | $ | 133,541 | | | | 1.18 | % | | | 1.58 | % | | | (0.64 | )% | | | 119 | % (3) | |
2014 | | $ | 37.79 | | | | 11.88 | % | | $ | 187,974 | | | | 1.18 | % | | | 1.42 | % | | | (0.44 | )% | | | 89 | % (4) | |
2013 | | $ | 42.85 | | | | 24.31 | % | | $ | 257,240 | | | | 1.18 | % | | | 1.33 | % | | | (0.49 | )% | | | 84 | % | |
2012 | | $ | 35.03 | | | | 16.15 | % | | $ | 404,427 | | | | 1.18 | % | | | 1.29 | % | | | (0.39 | )% | | | 121 | % | |
Turner Midcap Growth Fund — Retirement Class Shares | |
| 2017^ | | $ | 16.54 | | | | 5.28 | %†† | | $ | 403 | | | | 1.43 | % | | | 2.21 | % | | | (0.54 | )% | | | 113 | % | |
2016 | | $ | 15.71 | | | | (0.35 | )% | | $ | 395 | | | | 1.43 | % | | | 2.00 | % | | | (0.76 | )% | | | 165 | % | |
2015 | | $ | 18.69 | | | | (5.11 | )% | | $ | 2,742 | | | | 1.43 | % | | | 1.83 | % | | | (0.89 | )% | | | 119 | % (3) | |
2014 | | $ | 35.75 | | | | 11.74 | % | | $ | 4,674 | | | | 1.43 | % | | | 1.67 | % | | | (0.68 | )% | | | 89 | % (4) | |
2013 | | $ | 41.07 | | | | 24.11 | % | | $ | 4,235 | | | | 1.43 | % | | | 1.58 | % | | | (0.74 | )% | | | 84 | % | |
2012 | | $ | 33.65 | | | | 15.83 | % | | $ | 4,811 | | | | 1.43 | % | | | 1.54 | % | | | (0.64 | )% | | | 121 | % | |
Turner Small Cap Growth Fund — Investor Class Shares | |
| 2017^ | | $ | 13.10 | | | | (0.69 | )%†† | | $ | 25,031 | | | | 1.25 | % | | | 2.33 | % | | | (0.59 | )% | | | 242 | % | |
2016 | | $ | 13.53 | | | | 6.47 | % | | $ | 36,331 | | | | 1.25 | % | | | 2.04 | % | | | (0.35 | )% | | | 372 | % | |
2015 | | $ | 18.06 | | | | 6.55 | % | | $ | 70,842 | | | | 1.25 | % | | | 1.83 | % | | | (0.77 | )% | | | 280 | % | |
2014 | | $ | 37.23 | | | | 0.99 | % | | $ | 130,085 | | | | 1.25 | % | | | 1.66 | % | | | (0.83 | )% | | | 127 | % | |
2013 | | $ | 44.76 | | | | 33.79 | % | | $ | 233,039 | | | | 1.25 | % | | | 1.56 | % | | | (0.43 | )% | | | 82 | % | |
2012 | | $ | 35.96 | | | | 29.21 | % | | $ | 250,099 | | | | 1.25 | % | | | 1.53 | % | | | (0.68 | )% | | | 100 | % | |
* Inclusive of fees paid indirectly, waivers and/or reimbursements.
** Excludes effect of in-kind transfers and mergers, as applicable. Not annualized for periods less than one year.
^ For the six-month period ended March 31, 2017 (unaudited). All ratios for the periods have been annualized unless otherwise noted.
† Does not include acquired fund fees or expenses.
†† Total return is for the period indicated and has not been annualized.
(1) Based on average shares outstanding.
(2) The amount shown for a share outstanding throughout the period does not accord with the change in aggregate gains and losses in the portfolio of securities during the period because of the timing of the sales and purchases of fund shares in relation to fluctuating market values during the
(3) If purchases of portfolio securities in connection with the reorganization of the Turner Large Growth Fund into the Turner Midcap Growth Fund had been included, the portfolio turnover rate would have been 133%.
(4) If purchases of portfolio securities in connection with the reorganization of the Turner All Cap Growth Fund into the Turner Midcap Growth Fund had been included, the portfolio turnover rate would have been 93%.
Amounts designated as "—" are either not applicable, $0 or have been rounded to $0.
The accompanying notes are an integral part of the financial statements.
TURNER FUNDS 2017 SEMIANNUAL REPORT 19
NOTES TO FINANCIAL STATEMENTS (Unaudited)
Notes to financial statements
March 31, 2017
1. Organization:
Turner Funds (the "Trust"), a Massachusetts business trust, is registered under the Investment Company Act of 1940, as amended, as an open-end management investment company. The Trust meets the definition as an investment company and follows the accounting and reporting guidance under Financial Accounting Standards Board ("FASB") Accounting Standards Codification ("ASC") Topic 946, "Financial Services—Investment Companies." The funds included herein are Turner Titan Long/Short Fund ("Titan Long/Short Fund"), Turner Midcap Growth Fund ("Midcap Growth Fund") and Turner Small Cap Growth Fund ("Small Cap Growth Fund"), each a "Fund" and collectively the "Funds."
Each Fund is registered as a diversified portfolio of the Trust.
The Funds are registered to offer different classes of shares: Institutional Class Shares, Investor Class Shares, Retirement Class Shares, Class C Shares, or a combination of the four. The assets of each Fund are segregated, and a shareholder's interest is limited to the Fund in which shares are held. The Funds' prospectuses provide a description of each Fund's investment objectives, policies and strategies along with information on the classes of shares currently being offered.
2. Significant accounting policies:
The following is a summary of the significant accounting policies followed by the Funds.
Use of estimates—The preparation of financial statements in conformity with U.S. generally accepted accounting principles ("GAAP") requires management to make estimates and assumptions that affect the reported amounts of assets and liabilities and disclosure of contingent assets and liabilities at the date of the financial statements and the reported amounts of increases and decreases in net assets from operations during the reporting period. Actual results could differ from those estimates.
Securities valuation—In accordance with the authoritative guidance on fair value measurements and disclosures under GAAP, fair value is defined as the price that a Fund would receive upon selling an investment in an orderly transaction to an independent buyer in the principal or most advantageous market.
The Trust has a three-tier fair value hierarchy that is dependent upon the various "inputs" used to determine the value of the Funds' investments. These inputs are summarized in the three broad levels listed below:
Level 1 – quoted prices in active markets for identical investments
Level 2 – other significant observable inputs (including quoted prices for similar investments, interest rates, prepayment speeds, credit risks, etc.)
Level 3 – significant unobservable inputs (including a Fund's own assumptions in determining the fair value of investments)
Securities listed on a securities exchange, market or automated quotation system for which quotations are readily available (except for securities traded on NASDAQ), including American Depositary Receipts ("ADRs"), are valued at the last quoted sale price on the primary exchange or market (foreign or domestic) on which they are traded, or, if there is no such reported sale, at the most recent quoted bid price for long positions and the most recent quoted ask price for short positions. For securities traded on NASDAQ, the NASDAQ Official Closing Price is used. The prices for foreign securities are reported in local currency and converted to U.S. dollars using currency exchange rates. Prices for most securities held in the Funds are provided daily by recognized independent pricing agents. To the extent these securities are valued at the last sales price or NASDAQ Official Closing Price, they are categorized as Level 1 in the fair value hierarchy.
Investments in other open-end investment companies are valued at net asset value. These valuations are typically categorized as Level 1 in the fair value hierarchy.
If a security price cannot be obtained from an independent, third-party pricing agent, the Funds seek to obtain bid and ask prices from two broker-dealers who make a market in the security and determine the average of the two. In this situation, valuations are typically categorized as Level 2 in the fair value hierarchy.
Securities for which market prices are not "readily available" are valued in accordance with Fair Value Procedures established by the Board of Trustees of the Trust (the "Board"). The Funds' Fair Value Procedures are implemented through a Fair Value Committee (the "Committee") designated by the Board. Some of the more common reasons that may necessitate that a security be valued using Fair Value Procedures include: the security's trading has been halted or suspended; the security has been delisted from a national exchange; the security's primary trading market is temporarily closed at a time when under normal conditions it would be open; the security has not been traded for an extended period of time; the security's primary pricing source is not able or willing to provide a price; or trading of the security is subject to local government-imposed restrictions. When a security is valued in accordance with the Fair Value Procedures, the Committee will determine the value after taking
20 TURNER FUNDS 2017 SEMIANNUAL REPORT
into consideration relevant information reasonably available to the Committee. Depending on the source or relative significance of the valuation inputs, these securities may be categorized as Level 2 or Level 3 in the fair value hierarchy.
For securities that principally trade on a foreign market or exchange, a significant gap in time can exist between the time of a particular security's last trade and the time at which a Fund calculates its net asset value. The closing prices of such securities may no longer reflect their market value at the time a Fund calculates net asset value if an event that could materially affect the value of those securities (a "Significant Event") has occurred between the time of the security's last close and the time that a Fund calculates net asset value. A Significant Event may relate to a single issuer or to an entire market sector.
In the event that Turner Investments LLC ("Turner" or the "Adviser") believes that the fair values provided by a third party fair valuation vendor are not reliable, or believes that a foreign security held by a Fund should be fair valued for any other reason, the Adviser shall contact the sub-administrator, Citi Fund Services Ohio, Inc. ("Citi" or the "Sub-administrator"), and request that a meeting of the Committee be held. Depending on the source or relative significance of the valuation inputs, these securities may be categorized as Level 2 or Level 3 in the fair value hierarchy.
For the six months ended March 31, 2017, there were no Level 3 investments for which significant unobservable inputs were used to determine fair value.
The following table is a summary of inputs used to value the Funds' investments as of March 31, 2017. The breakdown, by sub-category, of the "common stock" category is disclosed in the Schedule of investments and Schedule of securities sold short for each Fund, as applicable.
| | | Level 1
(000) | | Level 2
(000) | | Total
(000) | |
Titan Long/Short Fund | |
Investments in Securities | |
Common stock | | $ | 15,454 | | | $ | — | | | $ | 15,454 | | |
Cash equivalent | | | 322 | | | | — | | | | 322 | | |
Exchange traded funds | | | 342 | | | | — | | | | 342 | | |
Warrant | | | — | * | | | — | | | | — | * | |
Total Investments in securities | | $ | 16,118 | | | $ | — | | | $ | 16,118 | | |
Securities Sold Short | |
Common stock | | $ | 7,621 | | | $ | — | | | $ | 7,621 | | |
Right | | | 61 | | | | — | | | | 61 | | |
Exchange traded funds | | | 1,086 | | | | — | | | | 1,086 | | |
Total Securities sold short | | $ | 8,768 | | | $ | — | | | $ | 8,768 | | |
| | | Level 1
(000) | | Level 2
(000) | | Total
(000) | |
Midcap Growth Fund | |
Investments in Securities | |
Common stock | | $ | 93,995 | | | $ | — | | | $ | 93,995 | | |
Cash equivalent | | | 6,069 | | | | — | | | | 6,069 | | |
Total Investments in securities | | $ | 100,064 | | | $ | — | | | $ | 100,064 | | |
Small Cap Growth Fund | |
Investments in Securities | |
Common stock | | $ | 24,197 | | | $ | — | | | $ | 24,197 | | |
Cash equivalent | | | 1,812 | | | | — | | | | 1,812 | | |
Total Investments in securities | | $ | 26,009 | | | $ | — | | | $ | 26,009 | | |
* Represents interest in securities that were determined to have a value of zero at March 31, 2017.
For each Fund, there were no transfers between the levels as of March 31, 2017 based on the input levels assigned at September 30, 2016.
Security transactions and related income—Security transactions are accounted for on the date the security is purchased or sold (trade date). Dividend income is recognized on the ex-dividend date. Costs used in determining realized gains and losses on the sales of investment securities are those of the specific securities lots sold.
Securities sold short—Consistent with each Fund's investment objectives, the Funds may engage in short sales. Short sales are transactions under which a Fund sells a security it does not own. To complete such a transaction, the Fund must borrow the security to make delivery to the buyer. The Fund is then obligated to replace the security borrowed by purchasing the security at the market price at the time of the replacement. The price at such time may be more or less than the price at which the security was sold by the Fund. Until the security is replaced, the Fund is required to pay the lender amounts equal to any dividends that accrue during the period of the loan. Dividends declared on open short positions are recorded on the ex-date and shown as an expense for financial reporting purposes. To borrow the security, the Fund also may be required to pay a fee, which is shown as an expense for financial reporting purposes. The proceeds of the short sale are retained by the broker, to the extent necessary to meet margin requirements, until the short position is closed. A gain, limited to the price at which the Fund sold the security short, or a loss, unlimited in size, will be recognized upon the close of a short sale.
Until a Fund closes its short position or replaces the borrowed security, the Fund will: (a) maintain a segregated account containing cash or liquid securities at such a level that (i) the amount deposited in the account plus the amount deposited with the brokers as
TURNER FUNDS 2017 SEMIANNUAL REPORT 21
NOTES TO FINANCIAL STATEMENTS (Unaudited)
collateral will equal the current value of the security sold short; and (ii) the amount deposited in the segregated account plus the amount deposited with the broker as collateral will not be less than the market value of the security at the time the security was sold short, or (b) otherwise cover the short positions. The Titan Long/Short Fund engaged in short sales during the six months ended March 31, 2017.
Option transactions—Consistent with each Fund's investment objectives, the Funds may write covered call options and sell put options as a means of increasing the yield on their portfolios and as a means of providing limited protection against decreases in their market value. The Funds may purchase put and call options to protect against a decline in the market value of the securities in their portfolios or to anticipate an increase in the market value of securities that the Funds may seek to purchase in the future. A put option gives the purchaser of the option the right to sell, and the writer of the option the obligation to buy, the underlying security at any time during the option period. A call option gives the purchaser of the option the right to buy, and the writer of the option the obligation to sell, the underlying security at any time during the option period. The premium paid to the writer is the consideration for undertaking the obligations under the option contract. The initial purchase (sale) of an option contract is an "opening transaction." In order to close an option position, the Fund may enter into a "closing transaction," which is simply the sale (purchase) of an option contract on the same security with the same exercise price and expiration date as the option contract originally opened. If the Fund is unable to effect a closing purchase transaction with respect to an option it has written, it will not be able to sell the underlying security until the option expires or the Fund delivers the security upon exercise. When the Fund writes (sells) an option, an amount equal to the premium received by the Fund is included in the Statement of assets and liabilities as an asset and an equivalent liability. The amount of the liability is subsequently marked-to-market to reflect the current value of the option written.
Option contracts are valued at the last quoted sales price. If there is no such reported sale on the valuation date, long positions are valued at the most recent bid price, and short positions are valued at the most recent ask price. When an option expires on its stipulated expiration date or the Fund enters into a closing purchase transaction, the Fund realizes a gain or loss if the cost of the closing purchase transaction differs from the premium received when the option was sold without regard to any unrealized gain or loss on the underlying security, and the liability related to such option is eliminated. When an option is exercised, the
premium originally received decreases the cost basis of the security (or increases the proceeds on a sale of the security). The primary risk exposure from written and purchased options contracts is equity exposure.
During the six months ended March 31, 2017, the Funds held no written or purchased options.
Foreign currency translation—The books and records of the Funds are maintained in U.S. dollars. Investment securities and other assets and liabilities denominated in a foreign currency are translated into U.S. dollars on the date of valuation. The Funds do not isolate that portion of realized or unrealized gains and losses resulting from changes in the foreign exchange rate from fluctuations arising from changes in the market prices of the securities. These gains and losses are included in net realized and unrealized gains and losses on investments in the Statements of operations. Net realized and unrealized gains and losses on foreign currency transactions represent net foreign exchange gains or losses from foreign currency exchange contracts, disposition of foreign currencies, currency gains or losses realized between trade and settlement dates on securities transactions and the difference between the amount of the investment income and foreign withholding taxes recorded on the Funds' books and the U.S. dollar equivalent amounts actually received or paid.
Expenses—Expenses that are specifically attributed to one of the Funds are charged to that Fund. Certain other expenses of the Funds are prorated among the Funds on the basis of relative daily net assets.
Classes—Class specific expenses are borne by that class. Income, non-class specific expenses, and realized and unrealized gains and losses are allocated to the respective classes on the basis of relative daily net assets.
Dividends and distributions—The Funds declare and distribute net investment income, if any, annually, as a dividend to shareholders. Any net realized capital gains on sales of securities for all Funds are distributed to shareholders at least annually.
3. Administration, shareholder servicing, distribution and transfer agent agreements:
Turner provides administrative services to the Funds under an Administration Agreement with the Trust. For its services, Turner receives an annual fee of 0.15% of the aggregate average daily net assets of the Trust up to $2 billion and 0.12% of the aggregate average daily net assets of the Trust over $2 billion. As of August 19, 2016, the services provided by Turner Investments, L.P. (the "Prior Adviser") under the Administration Agreement were assigned to Turner. See Note 4 below for additional information. Under a separate Sub-administration Agreement between Turner and Citi, Citi provides
22 TURNER FUNDS 2017 SEMIANNUAL REPORT
subadministrative services, including certain fund accounting services, to the Trust. For the six months ended March 31, 2017, Citi was paid $142 (000) by Turner.
Foreside Fund Services, LLC (the "Distributor") provides distribution services to the Funds under a Distribution Services Agreement.
The Funds have adopted a Distribution Plan for Retirement Class Shares and Class C Shares (the "Distribution Plan") under which firms, including the Distributor, that provide distribution services may receive compensation. Under the Distribution Plan, which was adopted pursuant to Rule 12b-1 under the Investment Company Act of 1940, as amended, the Distributor is entitled to receive aggregate fees for distribution services not to exceed 0.75% of each Fund's average daily net assets attributable to Retirement Class or Class C Shares that are subject to the arrangement in return for providing a broad range of distribution services. Currently, the Retirement Class Shares of the Midcap Growth Fund pay the Distributor 0.25% and the Class C Shares of the Titan Long/Short Fund pay the Distributor 0.75% in distribution fees.
The Funds have also adopted Shareholder Services Plans (the "Service Plans"). Under the Service Plans, service providers are entitled to receive aggregate fees for shareholder services not to exceed 0.25% of each Fund's average daily net assets attributable to Investor Class Shares, Retirement Class Shares and Class C Shares that are subject to the arrangement in return for providing shareholder services. Currently, Investor Class Shares of each Fund, Retirement Class Shares of the Midcap Growth Fund and Class C Shares of the Titan Long/Short Fund pay 0.25% in shareholder servicing fees.
DST Systems, Inc. serves as the transfer agent and dividend disbursing agent for the Funds under a Transfer Agency Agreement with the Trust.
Certain officers and trustees of the Trust are also officers or employees of Turner or Citi. With the exception of the Trust's Chief Compliance Officer, such officers are paid no fees by the Trust for serving as officers and trustees of the Trust.
4. Investment advisory agreement:
The Prior Adviser merged with Turner Investment Holdings L.P. ("TIH") effective August 19, 2016 (the "Closing Date"), by which TIH agreed to acquire, directly and indirectly, all of the outstanding equity interests of the Prior Adviser through a merger transaction (the "Acquisition") which resulted in a change of control of the Prior Adviser effective as of the Closing Date. Following the Acquisition, Turner succeeded to the investment adviser registration of the Prior Adviser and succeeded the Prior Adviser as the Adviser to the Funds.
The Trust and Turner are parties to an Investment Advisory Agreement under which Turner receives a fee that is calculated daily and paid monthly, based on the average daily net assets of the Funds.
Turner has contractually agreed to waive all or a portion of its fees and to reimburse expenses in order to limit total Fund operating expenses, excluding interest and borrowing cost on short and long sales and short sale dividend expenses, to a specified percentage of the average daily net assets of each Fund on an annualized basis through certain dates disclosed in the following table:
| | | Advisory
fee(a) | | Expense
cap | | Date
(through) | |
Titan Long/Short Fund | |
Institutional Class | | | 1.50 | % | | | 1.90 | % | | January 31, 2018 | |
Investor Class | | | 1.50 | % | | | 2.15 | % | | January 31, 2018 | |
Class C | | | 1.50 | % | | | 2.90 | % | | January 31, 2018 | |
Midcap Growth Fund | |
Institutional Class | | | 0.75 | % | | | 0.93 | % | | January 31, 2018 | |
Investor Class | | | 0.75 | % | | | 1.18 | % | | January 31, 2018 | |
Retirement Class | | | 0.75 | % | | | 1.43 | % | | January 31, 2018 | |
Small Cap Growth Fund | |
Investor Class | | | 1.00 | % | | | 1.25 | % | | January 31, 2018 | |
(a) Effective December 23, 2016, Turner agreed to waive a portion of the Advisory fee to keep such fees from exceeding 0.75% through January 31, 2017 for the Titan Long/Short Fund. Effective January 12, 2017, Turner agreed to waive a portion of the Advisory fee to keep such fees from exceeding 0.40% and 0.50% for the Midcap Growth Fund and the Small Cap Growth Fund, respectively. Effective January 27, 2017, Turner agreed to waive a portion of the Advisory fee to keep such fees from exceeding 0.75%, 0.40% and 0.50% for the Titan Long/Short Fund, the Midcap Growth Fund and the Small Cap Growth Fund, respectively, through January 31, 2018.
5. Contingent deferred sales charges (Class C Shares):
A 1.00% contingent deferred sales charge ("CDSC") will be deducted with respect to Class C Shares of the Titan Long/Short Fund redeemed within 12 months of purchase. The CDSC will be based on the lower of the original purchase price or the value of the Class C Shares redeemed. The CDSC may be waived for certain investors, as described in the Class C Shares statutory prospectus for the Titan Long/Short Fund.
6. Investment transactions:
The cost of security purchases and the proceeds from security sales, other than short-term investments, for the six months ended March 31, 2017 were as follows:
| | | Purchases | | Sales | |
Titan Long/Short Fund | | $ | 16,539 | | | $ | 28,380 | | |
Midcap Growth Fund | | | 112,566 | | | | 133,404 | | |
Small Cap Growth Fund | | | 73,925 | | | | 84,376 | | |
TURNER FUNDS 2017 SEMIANNUAL REPORT 23
NOTES TO FINANCIAL STATEMENTS (Unaudited)
7. Federal tax policies and information:
Each Fund is classified as a separate taxable entity for Federal income tax purposes. Each Fund intends to continue to qualify as a separate "regulated investment company" under the Internal Revenue Code and make the requisite distributions to shareholders that will be sufficient to relieve it from Federal income tax and Federal excise tax. Therefore, no Federal tax provision is required.
The amounts of dividends from net investment income and distributions from net realized capital gains, if any, are determined in accordance with Federal income tax regulations, which may differ from those amounts determined under GAAP. These book/tax differences are either temporary or permanent in nature. These differences are primarily due to wash sales, REIT adjustments, foreign currency transactions, net operating losses, return of capital distributions, equalization and investments in partnerships and passive foreign investment companies. The character and timing of dividends from net investment income and distributions from net realized gains distributed during the fiscal year may differ from the year that the income or realized gains (losses) were recorded by the Funds. To the extent these differences are permanent, adjustments are made to the appropriate equity accounts in the period that the differences arise. The Funds may utilize equalization accounting for tax
purposes and designate earnings and profits, including net realized gains distributed to shareholders on redemption of shares, as part of the dividends paid deduction for income tax purposes. Any available tax equalization will be applied prorata to short-term capital gains and to long-term capital gains, and then to net investment income, as applicable.
Withholding taxes on dividends and net realized capital gains as a result of certain investments in ADRs by the Funds have been provided for in accordance with each investment's applicable country's tax rules and rates.
The tax character of dividends and distributions declared during the years ended September 30, 2016 and September 30, 2015 were as follows:
| | | Ordinary
income
(000) | | Long-term
capital gain
(000) | | Return of
capital
(000) | | Total
(000) | |
Titan Long/Short Fund | | | |
| | 2016 | | | $ | — | | | $ | 3,642 | | | $ | — | | | $ | 3,642 | | |
| | 2015 | | | | — | | | | 23,605 | | | | — | | | | 23,605 | | |
Midcap Growth Fund | | | |
| | 2016 | | | $ | — | | | $ | 23,165 | | | $ | — | | | $ | 23,165 | | |
| | 2015 | | | | 707 | | | | 93,583 | | | | — | | | | 94,290 | | |
Small Cap Growth Fund | | | |
| | 2016 | | | $ | — | | | $ | 14,893 | | | $ | — | | | $ | 14,893 | | |
| | 2015 | | | | — | | | | 46,207 | | | | — | | | | 46,207 | | |
As of September 30, 2016, the components of distributable earnings (accumulated losses) on a tax basis were as follows:
| | | Undistributed
ordinary
income
(000) | | Undistributed
long-term
capital gains
(000) | | Capital
loss
carryforward
(000) | | Post-
October
losses
(000) | | Late-year
ordinary
losses
(000) | | Unrealized
appreciation
(depreciation)
(000) | | Total
distributable
earnings
(000) | |
Titan Long/Short Fund | | $ | — | | | $ | — | | | $ | — | | | $ | (595 | ) | | $ | (506 | ) | | $ | 267 | | | $ | (834 | ) | |
Midcap Growth Fund | | | — | | | | — | | | | (1,345 | ) | | | (8,764 | ) | | | (384 | ) | | | 18,849 | | | | 8,356 | | |
Small Cap Growth Fund | | | — | | | | 413 | | | | — | | | | — | | | | (76 | ) | | | 4,199 | | | | 4,536 | | |
Under current tax law, capital losses and specified ordinary losses realized after October 31 and non-specified ordinary losses incurred after December 31 (ordinary losses collectively known as "late year ordinary loss") may be deferred and treated as having arisen in the following fiscal year.
As of the end of their latest tax year end of September 30, 2016, the Funds in the following table had capital loss carryforwards ("CLCFs"). CLCFs not subject to expiration must be used prior to using any CLCFs that are subject to expiration. A summary of these CLCFs is detailed in the tables below.
The Funds did not have any CLCFs that are not subject to expiration.
CLCFs subject to expiration:
| | | Expiring
September 30,
2017
(000) | |
Midcap Growth Fund* | | $ | 1,345 | | |
* CLCFs were acquired as part of a Fund merger which occurred January 23, 2015. As such, the CLCFs are subject to annual limitations.
At March 31, 2017, the total cost of securities for Federal income tax purposes and the aggregate gross unrealized appreciation and depreciation for the investments held
24 TURNER FUNDS 2017 SEMIANNUAL REPORT
by each Fund, excluding securities sold short, were as follows:
| | | Federal
tax
cost
(000) | | Unrealized
appreciation
(000) | | Unrealized
depreciation
(000) | | Net
unrealized
appreciation
(depreciation)
(000) | |
Titan Long/Short Fund | | $ | 15,411 | | | $ | 2,525 | | | $ | (1,818 | ) | | $ | 707 | | |
Midcap Growth Fund | | | 90,984 | | | | 10,364 | | | | (1,284 | ) | | | 9,080 | | |
Small Cap Growth Fund | | | 23,541 | | | | 3,010 | | | | (542 | ) | | | 2,468 | | |
For the current open tax year and for all major jurisdictions, management has evaluated the tax positions taken or expected to be taken in the course of preparing their tax returns to determine whether the tax positions will "more-likely-than-not" be sustained by the Funds upon challenge by the applicable tax authority. Tax positions taken in previous tax years remain subject to examination by tax authorities (generally three years for federal income tax purposes). Tax positions not deemed to meet the more-likely-than-not threshold and that would result in a tax benefit or expense to the Funds would be recorded as a tax benefit or expense in the current period. For the six months ended March 31, 2017, the Funds did not recognize any amounts for unrecognized tax benefit/expense. A reconciliation of unrecognized tax benefit/expense is not provided herein, as the beginning and ending amounts of unrecognized tax benefit/expenses are zero, with no interim additions, reductions or settlements.
8. Loans of portfolio securities:
The Funds may lend securities in their portfolios pursuant to a securities lending agreement ("Lending Agreement") with Morgan Stanley. Unless otherwise agreed, security loans made pursuant to the Lending Agreement are required at all times to be secured by collateral equal to at least 100% of the market value of the securities loaned based on the previous day's market value of the securities loaned, marked-to-market daily. Any collateral shortfalls are adjusted the next business day. Cash collateral received is invested in the Dollar Shares of the BlackRock Liquidity Funds TempCash, a money market fund. All such investments are made at the risk of the Funds and, as such, the Funds are liable for investment losses. The Funds receive an annual fee for their participation in the Lending Agreement based on the projected lending activity.
In the event of bankruptcy of the borrower, realization/retention of the collateral may be subject to legal proceedings.
Securities lending transactions are entered into by each Fund under a Master Securities Lending Agreement ("MSLA") which permits the Funds, under certain circumstances including an event of default (such as bankruptcy or insolvency), to offset amounts payable by the Funds to the same counterparty against amounts to be received
and create one single net payment due to or from the Funds.
The following Funds had securities on loan and had invested cash collateral, subject to offset under a MSLA, with the following values as of March 31, 2017:
Fund | | Value of
Securities
on Loan (000) | | Value of
Collateral
(000)* | | Net
Amount
(000) | |
Midcap Growth Fund | | $ | 753 | | | $ | 753 | | | | — | | |
Small Cap Growth Fund | | | 1,228 | | | | 1,228 | | | | — | | |
* The actual value of collateral received may be in excess of the amounts shown in the table. The table only reflects collateral amounts up to the amount of the value of securities on loan as disclosed in the Statements of assets and liabilities.
9. Concentration/risks:
Certain Funds invest a high percentage of their assets in specific market sectors in order to achieve a potentially greater investment return. As a result, these Funds may be more susceptible to positive or negative economic, political, and regulatory developments in a particular market sector of the market and may experience the effect of this increased volatility on the Fund's net asset value and a magnified effect on the Fund's total return.
Governments of some developing countries exercise substantial influence over many aspects of the private sector. In some countries, the government owns or controls many companies, including the largest companies in the country. As such, government actions in the future could have a significant effect on economic conditions in developing countries in these regions, which could affect private sector companies, the Fund and the value of its securities. Furthermore, certain developing countries are among the largest debtors to commercial banks and foreign governments. Trading in debt obligations issued or guaranteed by such governments or their agencies and instrumentalities involves a high degree of risk.
The Funds enter into contracts that contain a variety of indemnifications. The Funds' maximum exposure under these arrangements is unknown. However, the Funds have not had prior claims or losses pursuant to these contracts and expect the risk of loss to be remote.
TURNER FUNDS 2017 SEMIANNUAL REPORT 25
NOTES TO FINANCIAL STATEMENTS (Unaudited)
10. Investment Company Reporting Modernization
In October 2016, the Securities and Exchange Commission (the "SEC") released its Final Rules on Investment Company Reporting Modernization (the "Rules"). The Rules, which introduce two new regulatory reporting forms for investment companies — Form N-PORT and Form N-CEN — also contain amendments to Regulation S-X which require standardized, enhanced disclosures about derivatives in investment company financial statements, as well as other amendments. The amendments are effective for filings made with the SEC after August 1, 2017. Management is currently evaluating the impact of the amendments on the Funds' financial statements. The adoption will have no effect on the Funds' net assets or results of operations.
11. Subsequent Events:
The Trust has evaluated the need for disclosures and/or adjustments resulting from subsequent events through the date the financial statements were issued.
Based on this evaluation, no additional disclosures and/or adjustments were required to the financial statements as of March 31, 2017.
26 TURNER FUNDS 2017 SEMIANNUAL REPORT
SHAREHOLDER VOTING RESULTS (Unaudited)
Results of Shareholder Votes:
A special meeting of shareholders was held for shareholders of record on September 12, 2016 to approve a new advisory agreement between the Trust, on behalf of the Funds, and Turner.
The new advisory agreement was approved as follows:
| | | For Approval | | Against Approval | | Abstain | |
Titan Long/Short Fund* | | | 1,802,121 | | | | 15,877 | | | | 19,014 | | |
Midcap Growth Fund** | | | 2,330,811 | | | | 100,700 | | | | 66,852 | | |
Small Cap Growth Fund** | | | 1,071,316 | | | | 51,152 | | | | 58,634 | | |
* The special meeting of shareholders was held on December 2, 2016 and adjourned until December 23, 2016, with respect to Titan Long/Short Fund.
** The special meeting of shareholders was held on December 2, 2016 and adjourned until December 23, 2016 and further adjourned until January 12, 2017, with respect to Midcap Growth Fund and Small Cap Growth Fund.
TURNER FUNDS 2017 SEMIANNUAL REPORT 27
DISCLOSURE OF FUND EXPENSES (Unaudited)
All mutual funds have operating expenses. As a shareholder of a mutual fund, your investment is affected by these on-going costs, which include (among others) costs for portfolio management, distribution (12b-1) and/or shareholder services and other expenses. It is important for you to understand the impact of these costs on your investment returns. Operating expenses such as these are deducted from a mutual fund's gross income and directly reduce its final investment return. These expenses are expressed as a percentage of a mutual fund's average net assets; this percentage is known as a mutual fund's expense ratio.
The following examples use the expense ratio and are intended to help you understand the ongoing costs (in dollars) of investing in your Fund and to compare these costs with those other mutual funds. The examples are based on an investment of $1,000 made at the beginning of the period shown and held for the entire period.
The table below and on the next page illustrates your Fund's costs in two ways:
• Actual Fund Return. This section helps you estimate the actual expenses after fee waivers that your Fund incurred over the period. The "Expenses Paid During Period" column shows the actual dollar expense cost incurred by a $1,000 investment in the Fund, and the "Ending Account Value" number is derived from deducting that expense cost from the Fund's gross investment return.
You can use this information, together with the actual amount you invested in the Fund, to estimate the expenses you paid over that period. Simply divide your actual account value by $1,000 to arrive at a ratio (for example, an $8,600 account value divided by $1,000 = 8.6), then multiply that ratio by the number shown for your Fund under "Expenses Paid During Period."
• Hypothetical 5% Return. This section helps you compare your Fund's cost with those of other mutual funds. It provides information about hypothetical account values and expenses based on the Fund's actual expense ratio (column 3) and an assumed rate of return of 5% per year before expenses, which is not the Fund's actual return. This section is useful in making comparisons because the Securities and Exchange Commission requires all mutual funds to make this 5% calculation. You can assess your Fund's comparative cost by comparing the hypothetical result for your Fund in the "Expenses Paid During Period" column with those that appear in the same charts in the shareholder reports for other mutual funds.
Note: Because the return is set at 5% for comparison purposes — NOT your Fund's actual return — the hypothetical account values and expenses may not be used to estimate your actual ending account balance or expenses you paid for the period.
| | | Beginning
Account
Value
10/1/16 | | Ending
Account
Value
3/31/17 | | Annualized
Expense
Ratios | | Expenses
Paid
During
Period* | |
Turner Titan Long/Short Fund — Institutional Class Shares | |
Actual Fund Return | | $ | 1,000.00 | | | $ | 937.90 | | | | 2.93 | % | | $ | 14.16 | | |
Hypothetical
5% Return | | | 1,000.00 | | | | 1,010.32 | | | | 2.93 | | | | 14.69 | | |
Turner Titan Long/Short Fund — Investor Class Shares | |
Actual Fund Return | | | 1,000.00 | | | | 936.20 | | | | 3.18 | | | | 15.35 | | |
Hypothetical
5% Return | | | 1,000.00 | | | | 1,009.08 | | | | 3.18 | | | | 15.93 | | |
Turner Titan Long/Short Fund — Class C Shares | |
Actual Fund Return | | | 1,000.00 | | | | 931.90 | | | | 3.93 | | | | 18.93 | | |
Hypothetical
5% Return | | | 1,000.00 | | | | 1,005.34 | | | | 3.93 | | | | 19.65 | | |
Turner Midcap Growth Fund — Institutional Class Shares | |
Actual Fund Return | | | 1,000.00 | | | | 1,055.30 | | | | 0.93 | | | | 4.77 | | |
Hypothetical
5% Return | | | 1,000.00 | | | | 1,020.29 | | | | 0.93 | | | | 4.68 | | |
| | | Beginning
Account
Value
10/1/16 | | Ending
Account
Value
3/31/17 | | Annualized
Expense
Ratios | | Expenses
Paid
During
Period* | |
Turner Midcap Growth Fund — Investor Class Shares | |
Actual Fund Return | | | 1,000.00 | | | | 1,054.00 | | | | 1.18 | % | | $ | 6.04 | | |
Hypothetical
5% Return | | | 1,000.00 | | | | 1,019.05 | | | | 1.18 | | | | 5.94 | | |
Turner Midcap Growth Fund — Retirement Class Shares | |
Actual Fund Return | | | 1,000.00 | | | | 1,052.80 | | | | 1.43 | | | | 7.32 | | |
Hypothetical
5% Return | | | 1,000.00 | | | | 1,017.80 | | | | 1.43 | | | | 7.19 | | |
Turner Small Cap Growth Fund — Investor Class Shares | |
Actual Fund Return | | | 1,000.00 | | | | 993.10 | | | | 1.25 | | | | 6.21 | | |
Hypothetical
5% Return | | | 1,000.00 | | | | 1,018.70 | | | | 1.25 | | | | 6.29 | | |
* Unless otherwise indicated, expenses are equal to the Fund's annualized expense ratio multiplied by the average account value over the period, multiplied by 182/365 (to reflect the one-half year period from 10/1/16 - 3/31/17).
28 TURNER FUNDS 2017 SEMIANNUAL REPORT
This report was prepared for shareholders of the Turner Funds. It may be distributed to others only if preceded or accompanied by a Turner Funds' Prospectus, which contains detailed information. All Turner Funds are offered by prospectus only.
The Funds file their complete schedules of portfolio holdings with the Securities and Exchange Commission (the "Commission") for the first and third quarters of each fiscal year on Form N-Q within sixty days after the end of the period. The Funds' Forms N-Q are available on the Commission's Web site at http://www.sec.gov, and may be reviewed and copied at the Commission's Public Reference Room in Washington, DC. Information on the operation of the Public Reference Room may be obtained by calling 1-800-SEC-0330.
The Board of Trustees of the Turner Funds has delegated responsibility for decisions regarding proxy voting for securities held by each Fund to Turner Investments LLC. Turner Investments LLC will vote such proxies in accordance with its proxy policies and procedures, which are included in Appendix B to the SAI. The Board of Trustees will periodically review each Fund's proxy voting record.
A description of the policies and procedures that the Funds use to determine how to vote proxies relating to portfolio securities, as well as information relating to how each Fund voted proxies relating to portfolio securities during the most recent 12-month period ended June 30, is available (i) via the Funds' Web site, www.turnerinvestments.com; (ii) on the Commission's Web site at http://www.sec.gov; and (iii) without charge by calling 1.800.224.6312.
TURNER FUNDS 2017 SEMIANNUAL REPORT 29

Turner Funds
P.O. Box 219805
Kansas City, Missouri 64121-9805
Telephone: 1.800.224.6312
Web Site: www.turnerinvestments.com
Item 2. Code of Ethics.
Not applicable for semiannual report.
Item 3. Audit Committee Financial Expert.
Not applicable for semiannual report.
Item 4. Principal Accountant Fees and Services.
Not applicable for semiannual report.
Item 5. Audit Committee of Listed Registrants.
Not applicable to open-end management investment companies.
Item 6. Schedule of Investments.
Schedule of Investments is included as part of report to shareholders filed under Item 1.
Item 7. Disclosure of Proxy Voting Policies and Procedures for Closed-End Management Investment Companies.
Not applicable to open-end management investment companies.
Item 8. Portfolio Managers of Closed-End Management Investment Companies.
Not applicable to open-end management investment companies.
Item 9. Purchases of Equity Securities by Closed-End Management Investment Company and Affiliated Purchasers.
Not applicable to open-end management investment companies.
Item 10. Submission of Matters to a Vote of Security Holders.
There have been no material changes to the procedures by which shareholders may recommend nominees to the registrant’s Board of Trustees since the registrant’s last proxy solicitation.
Item 11. Controls and Procedures.
(a) The registrant’s Principal Executive Officer and Principal Financial Officer concluded that the registrant’s disclosure controls and procedures (as defined in Rule 30a-3(c) under the Investment Company Act of 1940 as amended (the “Act”)) were effective as of a date within 90 days of the filing date of this report, based on their evaluation of the effectiveness of the registrant’s disclosure controls and procedures required by Rule 30a-3(b) under the Act and Rule 13a-15(b) or 15d-15(b) under the Securities and Exchange Act of 1934.
(b) There were no changes in the registrant’s internal control over financial reporting (as defined in Rule 30a-3(d) of the Act) that occurred during the registrant’s last fiscal quarter that have materially affected, or are reasonably likely to materially affect, the registrant’s internal control over financial reporting.
Item 12. Exhibits.
(a)(1) Not applicable for semiannual report.
(a)(2) A separate certification for the Principal Executive Officer and the Principal Financial Officer of the registrant as required by Rule 30a-2(a) under the Investment Company Act of 1940, as amended (17 CFR 270.30a-2(a)), are filed herewith.
(b) Officer certifications as required by Rule 30a-2(b) under the Investment Company Act of 1940, as amended (17 CFR 270.30a-2(b)), also accompany this filing as an Exhibit.
SIGNATURES
Pursuant to the requirements of the Securities Exchange Act of 1934 and the Investment Company Act of 1940, the registrant has duly caused this report to be signed on its behalf by the undersigned, thereunto duly authorized.
Registrant | Turner Funds | |
| | |
By (Signature and Title) | /s/ Robert E. Turner | |
| Robert E. Turner, President (Principal Executive Officer) | |
Date | 5/31/17 | | |
| | | | | |
Pursuant to the requirements of the Securities Exchange Act of 1934 and the Investment Company Act of 1940, this report has been signed below by the following persons on behalf of the registrant and in the capacities and on the dates indicated.
By (Signature and Title) | /s/ Robert E. Turner | |
| Robert E. Turner, President (Principal Executive Officer) | |
Date | 5/31/17 | | |
| | |
 By (Signature and Title) By (Signature and Title)
| /s/ Joel B. Engle | |
| Joel B. Engle, Controller and Chief Financial Officer (Principal Financial Officer) | |
Date | 5/31/17 | | |
| | | | |