UNITED STATES
SECURITIES AND EXCHANGE COMMISSION
Washington, D.C. 20549
FORM N-CSR
CERTIFIED SHAREHOLDER REPORT OF REGISTERED
MANAGEMENT INVESTMENT COMPANIES
Investment Company Act file number | 811-07527 |
|
Turner Funds |
(Exact name of registrant as specified in charter) |
|
1205 Westlakes Drive, Suite 100
Berwyn, PA | | 19312 |
(Address of principal executive offices) | | (Zip code) |
|
Michael P. Malloy
Drinker Biddle & Reath LLP
One Logan Square, Suite 2000
Philadelphia, PA 19103 |
(Name and address of agent for service) |
|
Registrant’s telephone number, including area code: | 1-800-224-6312 | |
|
Date of fiscal year end: | September 30 | |
|
Date of reporting period: | September 30, 2012 | |
| | | | | | | | |
Item 1. Reports to Stockholders.

Long/short equity funds
Turner Market Neutral Fund
Turner Medical Sciences Long/Short Fund
Turner Spectrum Fund
Turner Titan Fund
U.S. growth equity funds
Turner All Cap Growth Fund
Turner Concentrated Growth Fund
Turner Emerging Growth Fund
Turner Large Growth Fund
Turner Midcap Growth Fund
Turner Small Cap Growth Fund
Global and international equity funds
Turner Global Opportunities Fund
Turner International Growth Fund
Contents
| | 2 | | | Letter to shareholders | |
| | 5 | | | Total returns of the Turner Funds | |
| 9
| | | Investment review:
Turner Market Neutral Fund | |
| 10
| | | Investment review:
Turner Medical Sciences Long/Short Fund | |
| 11
| | | Investment review:
Turner Spectrum Fund | |
| 12
| | | Investment review:
Turner Titan Fund | |
| 13
| | | Investment review:
Turner All Cap Growth Fund | |
| 14
| | | Investment review:
Turner Concentrated Growth Fund | |
| 15
| | | Investment review:
Turner Emerging Growth Fund | |
| 16
| | | Investment review:
Turner Large Growth Fund | |
| 17
| | | Investment review:
Turner Midcap Growth Fund | |
| 18
| | | Investment review:
Turner Small Cap Growth Fund | |
| 19
| | | Investment review:
Turner Global Opportunities Fund | |
| 20
| | | Investment review:
Turner International Growth Fund | |
| | 21 | | | Schedules of investments | |
| | 50 | | | Financial statements | |
| | 72 | | | Notes to financial statements | |
| 82
| | | Report of independent registered public
accounting firm | |
| | 83 | | | Notice to shareholders | |
| | 84 | | | Disclosure of fund expenses | |
| | 86 | | | Trustees and officers of the Trust | |
Turner Funds
As of September 30, 2012, the Turner Funds offered a series of 12 mutual funds to individual and institutional investors. The minimum initial investment for Institutional Class Shares in a Turner Fund is $250,000 (except for $100,000 for the Turner Market Neutral Fund, Turner Medical Sciences Long/Short Fund, Turner Spectrum Fund, and Turner Titan Fund) for regular accounts and $100,000 for individual retirement accounts. The minimum initial investment for Investor Class Shares, Retirement Class Shares, and Class C Shares is $2,500 for regular accounts and $2,000 for individual retirement accounts.
Turner Investments, L.P., based in Berwyn, Pennsylvania, serves as the investment adviser for the Turner Funds. Turner Investments, L.P., founded in 1990, manages more than $11.6 billion in stock investments as of September 30, 2012.
Shareholder services
Turner Funds shareholders receive annual and semiannual reports, quarterly account statements, and a quarterly newsletter. Shareholders who have questions about their accounts may call a toll-free telephone number, 1.800.224.6312, may visit our Web site, www.turnerinvestments.com, or may write to Turner Funds, P.O. Box 219805, Kansas City, Missouri 64121-9805.
TURNER FUNDS 2012 ANNUAL REPORT 1
If you've ever driven to work without recalling traveling from Point A to Point B, you can chalk it up to your basal ganglia. It's your basal ganglia that are the part of your brain responsible for procedural learning — in essence, for creating habits.
It typically takes three or four weeks of repetition to make a new habit automatic. But for stock investors, it's taken years to adjust to the stock market after the infamous financial crisis of 2008 — that is, a market ruled more by macroeconomic events like European sovereign-debt problems than by underlying company fundamentals like expanding profit margins.
Here's how the macroeconomic picture looks now. Europe is mired in a recession, but its banking and political leaders have made enough progress and enough commitments that the prospect of a debt contagion seems much less likely than before. China, the world's second-largest economy, is no longer registering blazing economic growth, but it is still growing (at a 7.7% annual rate, according to the World Bank) and thus averting the widely feared hard landing. And the United States has faced quarter after quarter of tepid (below 3%) economic growth, but at the same time no economists of any repute are forecasting even a single quarter of negative growth through 2014.
In short, after years of fretting about a dizzying array of macroeconomic issues, investors seem to have accepted that eventually, somehow, those issues will muddle through to resolution. Instead, investors now seem increasingly focused on how to cope with — and capitalize on — this new reality of slow global economic growth.
Living the new reality
In coming to terms with this new reality, long-term stock investors have notably done well; those who had the tolerance for risk to endure the few rough market patches of the last few years have generally been rewarded amply. In the 12-month period ended September 30, 2012, that's the subject of this report, the S&P 500 Index rose 30.20%. That extraordinary gain in turn helped lift the S&P 500 Index 116% from its bottom in March 2009 (and within spitting distance — within 8% — of its all-time high of 1565.15 reached in October 2007).
We believe a bull market may prevail in the 2010s. The current bull market is the eighth-strongest and ninth-longest since 1928, according to Bespoke Investment Group. We think this bull has more room to run, especially since some investors aren't convinced it's had legs to stand on. Reuters called this "the most uncelebrated bull market in history," and we agree. But we think there are a number of reasons why investors may appreciate this market more as time passes.
Green shoots in sight
First, stocks remain cheaply priced. Selling for 13 times next year's earnings, stocks are still priced below their long-term average of 16. The Federal Reserve has vowed to keep interest rates low through 2015, which has driven 10-year Treasury yields below 2%. As measly as a $1 tip on a seven-course dinner, Treasuries in particular and investment-grade bonds in general seem unlikely to even cover the rate of inflation going forward. We think stocks offer a distinctly more attractive risk/reward profile in comparison.
Then there's the reviving housing market. We believe we're seeing a true, sustainable recovery after several false starts. Demand for homes is rising along with prices, while renting is becoming prohibitively expensive and competitive for many consumers. When you factor in record-low mortgage rates, it seems like an attractive time to buy a home, which remains the essence of the American dream.
A true housing recovery could provide an additional leg up for consumer spending, which accounts for roughly 70% of U.S. gross domestic product. Rising home values enhance the so-called "wealth effect" for homeowners, based on the premise that as personal wealth increases, so, proportionately, does consumer spending and investment. Bank of America Merrill Lynch calculates that this wealth effect could raise gross domestic product each quarter in the back half of 2013 by 0.1 percentage point. As a result consumers may feel comfortable investing in stocks rather than keeping their money stashed under bedroom floorboards or — a marginally better alternative — in a five-year certificate of deposit that paid 1.38% on average nationally, as of September 30.
Up, up and away?
Third, stocks may have boosted their appeal just by continuing to rise over the past 12 months. With the exception of a brief stumble in the spring, which prompted some pundits to (incorrectly) predict a third consecutive summer slump, the market performed impressively for much of the past 12 months. All told, nine of the 12 months produced positive returns and a steady upward climb for the S&P 500 Index.
Finally, central banks around the world have been busy providing stimulus to keep the global economy chugging along. All told, more than 250 stimulus measures have been carried out in the past 12 months, according to ISI Group. We think all this activity clearly shows that governments are determined to keep the global economy's head above recessionary waters. We think such activity should soothe investors' pangs of uncertainty and in the process help keep the market investor friendly.
Even though the market has on balance been investor friendly over the past 12 months, cautionary "risk on/risk off" investing was much in evidence. Investors tended to
2 TURNER FUNDS 2012 ANNUAL REPORT
adjust their appetite for risk based on the levels of danger they perceived in the macroeconomic environment, preferring "safe" investments such as bonds when risk seemed high and flocking to "riskier" assets like stocks when conditions appeared less threatening.
Growth investing not rewarded fully
During the period, as always, the investment process used to manage our eight U.S. and global/international growth funds and our four long/short funds prized earnings, and we invested in the stocks of those companies that we believed could generate superior earnings growth. To our consternation, though, in many cases the stocks with the best earnings growth — which also tend to be more richly valued and more volatile — weren't rewarded lavishly by investors when they were in a risk-on frame of mind.
With bond yields leaving much to be desired, many investors evidently sought income from stocks with lower volatility and higher dividends — the mirror image of the growth stocks we prefer. That, alas, moderated the total returns of our funds. Ours wasn't a singular investing experience by any means; less than 40% of actively managed stock funds beat their benchmarks during the period, according to Bank of America Merrill Lynch.
Net-net, we think our family of stock funds generally performed well in absolute terms for the 12-month period. Eight of our 12 funds generated double-digit gains, but only two of them outperformed at least one of their benchmarks: the Turner International Growth Fund and the Turner Titan Fund. Our four long/short funds delivered relatively low volatility, as they are designed to do, but their short positions impaired their ability to produce positive returns in a market whose direction was decidedly up.
Total returns | | | | | |
12-month period ended September 30, 2012 | | | | | |
Long/short equity funds | | | | | |
Turner Market Neutral Fund,
Investor Class (TMNFX) | | | -1.62 | % | |
S&P 500 Index | | | 30.20 | | |
Barclays Capital U.S. Aggregate Bond Index | | | 5.16 | | |
Lipper Equity Market-Neutral Funds Average | | | 2.06 | | |
Turner Medical Sciences Long/Short Fund,
Investor Class (TMSFX) | | | -1.74 | | |
S&P 500 Healthcare Index | | | 29.54 | | |
Barclays Capital U.S. Aggregate Bond Index | | | 5.16 | | |
Lipper Long/Short Equity Funds Average | | | 10.61 | | |
Turner Spectrum Fund, Institutional
Class (TSPEX) | | | -0.77 | | |
S&P 500 Index | | | 30.20 | | |
Barclays Capital U.S. Aggregate Bond Index | | | 5.16 | | |
Lipper Long/Short Equity Funds Average | | | 10.61 | | |
Turner Titan Fund, Investor Class (TTLFX) | | | 5.44 | % | |
S&P 500 Index | | | 30.20 | | |
Barclays Capital U.S. Aggregate Bond Index | | | 5.16 | | |
Lipper Long/Short Equity Funds Average | | | 10.61 | | |
U.S. growth equity funds | | | | | |
Turner All Cap Growth Fund (TBTBX) | | | 17.47 | | |
Nasdaq Composite Index | | | 29.02 | | |
Russell 3000® Growth Index | | | 29.35 | | |
Turner Concentrated Growth Fund (TTOPX) | | | 16.04 | | |
S&P 500 Index | | | 30.20 | | |
Russell 1000® Growth Index | | | 29.19 | | |
Turner Emerging Growth Fund, Investor
Class (TMCGX) | | | 25.57 | | |
Russell 2000® Growth Index | | | 31.18 | | |
Turner Large Growth Fund,
Institutional Class (TTMEX) | | | 22.48 | | |
Russell 1000® Growth Index | | | 29.19 | | |
Turner Midcap Growth Fund, Investor
Class (TMGFX) | | | 16.15 | | |
Russell Midcap® Growth Index | | | 26.69 | | |
Turner Small Cap Growth Fund (TSCEX) | | | 29.21 | | |
Russell 2000® Growth Index | | | 31.18 | | |
International and global equity funds | | | | | |
Turner Global Opportunities Fund,
Institutional Class (TGLBX) | | | 20.53 | | |
MSCI World Growth Index | | | 23.52 | | |
MSCI World Index | | | 22.32 | | |
Turner International Growth Fund,
Institutional Class (TICGX) | | | 17.92 | | |
MSCI World ex-U.S. Growth Index | | | 14.91 | | |
(Please call 1.800.224.6312 or visit our Web site at www.turnerinvestments.com for the most recent month-end performance. For more details on the performance of each fund during the 12-month period, see the Investment review beginning on page 9.)
Long term matters more
Delivering double-digit returns over 12 months, as our growth funds did in this period, certainly has its merits. But to pat ourselves on the back for such performance would be disingenuous and myopic in the extreme, since our goal is to outperform generally and since the ultimate purpose of investing is to multiply your, and our, wealth over the long term. We say "our wealth" because our employees are invested in our funds. So, although our growth funds posted strong gains in the past 12 months, our employee shareholders, like you, would have much preferred that a majority of our funds had bested the indexes.
We are far more pleased with our funds' long-term track records, which in our opinion is the true test of any
TURNER FUNDS 2012 ANNUAL REPORT 3
LETTER TO SHAREHOLDERS (continued)
investment's mettle. Since inception, seven of our eight growth funds have beaten one or more of their benchmarks. And our long/short funds have all achieved positive returns since inception, with lower volatility than that of the broad market.
While no one can always accurately predict the future, when we look forward, we believe stocks may continue rising — even if their ascent isn't quite as rapid as the number of views of a new viral video on the Internet. Even so, we think it's entirely possible that the S&P 500 Index could reach, and perhaps even surpass, its all-time high of 2007 over the next 12 months. As we see it, there's plenty to be optimistic about in 2013 and beyond. We think that stocks, after their paltry returns in the 2000s, appear to be reverting to their long-term average of 10% annualized returns in this decade.
Uncertainties remain
Don't get us wrong — there are still legitimate uncertainties out there that could thwart stocks and discourage the investors now sitting on the sidelines from getting into the market scrum. For instance, one unknown of Mount Everest stature looms in the short term: the outcome of the so-called "fiscal cliff," a combination of prospective federal tax increases and spending cuts at the end of the year. Some Wall Street analysts expect a potential drag of 1-1.5% on the economy early next year if the nation falls off the fiscal cliff. However, we don't think either political party, even in this age of fierce and dismaying partisanship, would be reckless enough to slam the brakes on the economy. Although each party's approach to solving America's fiscal problems figures to differ like the candidates' favorite red and blue ties, we think an acceptable compromise on the fiscal cliff should be reached, even though voters in the November election basically maintained the political status quo in Washington; they reelected President Obama and kept the House in Republican hands and the Senate in Democratic hands.
In the nearly four years of this economic recovery, earnings growth has been the stock market's engine. As the recovery ages, it's a stretch to expect continued blowout earnings each quarter. That's not to imply that earnings will collapse; we simply believe earnings-growth rates are likely to slow — and price/earnings multiples may rise. That could be a boon for both growth stocks and the market as a whole: investors' willingness to buy quality stocks for their sustained earnings growth could reinforce the market's upward tendencies.
In anticipation of the market's further ascent, we've positioned our U.S. and international/global growth funds to emphasize three types of stocks: classic growth stocks such as biotechnology and wireless-communications shares that we think have strong fundamentals; stocks of companies gaining market share; and growth-cyclical
stocks in industries like retailing, manufacturing, and housing that have tended to do well as the economic cycle progresses. As for our long/short funds, their long positions contain similar types of bona fide growth stocks, while their short positions consist of shares of companies that we believe have poor earnings potential.
We don't believe in timing the market; we generally remain fully invested in stocks. (That's one habit our own basal ganglia has made automatic in us.) We believe as the housing market, employment, and consumer sentiment improve in the U.S. and the global economy continues to expand, the positive catalysts will likely outweigh the negative catalysts and elevate stocks into 2013. And we pledge to continue doing our best for you and us in what we think could be a rewarding time for stocks not only in 2013 but in this decade.

Bob Turner
Chairman and Chief Investment Officer
Turner Investments
Past performance is no guarantee of future results. The views expressed are those of Turner Investments as of September 30, 2012, and are not intended as a forecast or investment recommendations. The indexes mentioned are not available for investment.

4 TURNER FUNDS 2012 ANNUAL REPORT
Total returns of the Turner Funds
Through September 30, 2012
Current performance may be lower or higher than the performance data quoted. Please call 1.800.224.6312 or visit our Web site at www.turnerinvestments.com for the most recent month-end performance information.
The performance data quoted represents past performance and the principal value and investment return will fluctuate so that an investor's shares, when redeemed, may be worth more or less than their original cost. Past performance is no guarantee of future results. Returns shown, unless otherwise indicated, are total returns, with dividends and income reinvested. Returns spanning more than one year are annualized. Fee waivers are in effect; if they had not been in effect, performance would have been lower. The indices mentioned are unmanaged statistical composites of stock-market performance. Investing in an index is not possible.
The holdings and sector weightings of the Funds are subject to change. Forward-earnings projections are not predictors of stock price or investment performance, and do not represent past performance. There is no guarantee that the forward-earnings projections will accurately predict the actual earnings experience of any of the companies involved, and there is no guarantee that owning securities of companies with relatively high price-to-earnings ratios will cause the portfolio to outperform its benchmark or index.
The Turner Funds are distributed by Foreside Fund Services, LLC, Portland, Maine. The investor should consider the investment objectives, risks, charges, and expenses carefully before investing. This and other information can be found in the prospectus. A free prospectus, which contains detailed information, including fees and expenses, and the risks associated with investing in these Funds, can be obtained by calling 1.800.224.6312. Read the prospectus carefully before investing.
Fund name/Index | | Six
months* | | Year
to
date* | | One
year | | Three
years | | Five
years | | 10
years | | (Annualized)
Since
inception | | Total
net assets
($mil) | |
Turner Market Neutral Fund —
Institutional Class Shares | | | -1.45 | % | | | -1.17 | % | | | -1.23 | % | | | n/a | | | | n/a | | | | n/a | | | | 2.41 | % | | $ | 48.05 | | |
Investor Class Shares | | | -1.65 | | | | -1.46 | | | | -1.62 | | | | n/a | | | | n/a | | | | n/a | | | | 2.11 | | | | 5.69 | | |
Class C Shares | | | -1.96 | | | | -1.96 | | | | -2.21 | | | | n/a | | | | n/a | | | | n/a | | | | 1.38 | | | | 0.09 | | |
S&P 500 Index | | | 3.43 | | | | 16.44 | | | | 30.20 | | | | n/a | | | | n/a | | | | n/a | | | | 8.23 | | | | | | |
Barclays Capital U.S. Aggregate
Bond Index | | | 3.68 | | | | 3.99 | | | | 5.16 | | | | n/a | | | | n/a | | | | n/a | | | | 7.76 | | | | | | |
Lipper Equity Market-Neutral
Funds Average | | | 0.00 | | | | 1.15 | | | | 2.06 | | | | n/a | | | | n/a | | | | n/a | | | | 1.14 | | | | | | |
Inception date: 2/7/11 | |
Turner Medical Sciences
Long/Short Fund —
Institutional Class Shares | | | -0.20 | | | | -1.64 | | | | -1.55 | | | | n/a | | | | n/a | | | | n/a | | | | 1.15 | | | | 37.12 | | |
Investor Class Shares | | | -0.29 | | | | -1.84 | | | | -1.74 | | | | n/a | | | | n/a | | | | n/a | | | | 0.97 | | | | 9.61 | | |
Class C Shares | | | -0.69 | | | | -2.33 | | | | -2.52 | | | | n/a | | | | n/a | | | | n/a | | | | 0.24 | | | | 2.89 | | |
S&P 500 Healthcare Index | | | 8.01 | | | | 17.80 | | | | 29.54 | | | | n/a | | | | n/a | | | | n/a | | | | 16.89 | | | | | | |
Barclays Capital U.S. Aggregate
Bond Index | | | 3.68 | | | | 3.99 | | | | 5.16 | | | | n/a | | | | n/a | | | | n/a | | | | 7.76 | | | | | | |
Lipper Long/Short Equity Funds
Average | | | -0.03 | | | | 5.54 | | | | 10.61 | | | | n/a | | | | n/a | | | | n/a | | | | -0.69 | | | | | | |
Inception date: 2/7/11 | |
TURNER FUNDS 2012 ANNUAL REPORT 5
LETTER TO SHAREHOLDERS (continued)
Fund name/Index | | Six
months* | | Year
to
date* | | One
year | | Three
years | | Five
years | | 10
years | | (Annualized)
Since
inception | | Total
net assets
($mil) | |
Turner Spectrum Fund —
Institutional Class Shares | | | -2.51 | % | | | -0.55 | % | | | -0.77 | % | | | 1.90 | % | | | n/a | | | | n/a | | | | 4.03 | % | | $ | 832.86 | | |
Investor Class Shares | | | -2.53 | | | | -0.74 | | | | -0.95 | | | | 1.66 | | | | n/a | | | | n/a | | | | 3.79 | | | | 126.53 | | |
Class C Shares(1) | | | -2.94 | | | | -1.31 | | | | -1.71 | | | | 0.96 | | | | n/a | | | | n/a | | | | 3.40 | | | | 10.39 | | |
S&P 500 Index | | | 3.43 | | | | 16.44 | | | | 30.20 | | | | 13.20 | | | | n/a | | | | n/a | | | | 17.01 | | | | | | |
Barclays Capital U.S.
Aggregate Bond Index | | | 3.68 | | | | 3.99 | | | | 5.16 | | | | 6.19 | | | | n/a | | | | n/a | | | | 6.98 | | | | | | |
Lipper Long/Short Equity
Funds Average | | | -0.03 | | | | 5.54 | | | | 10.61 | | | | 4.73 | | | | n/a | | | | n/a | | | | 7.73 | | | | | | |
Inception date: 5/7/09 | |
Turner Titan Fund —
Institutional Class Shares | | | -1.54 | | | | 4.60 | | | | 5.75 | | | | n/a | | | | n/a | | | | n/a | | | | 2.00 | | | | 25.81 | | |
Investor Class Shares | | | -1.73 | | | | 4.40 | | | | 5.44 | | | | n/a | | | | n/a | | | | n/a | | | | 1.76 | | | | 5.04 | | |
Class C Shares | | | -2.14 | | | | 3.71 | | | | 4.53 | | | | n/a | | | | n/a | | | | n/a | | | | 0.97 | | | | 0.53 | | |
S&P 500 Index | | | 3.43 | | | | 16.44 | | | | 30.20 | | | | n/a | | | | n/a | | | | n/a | | | | 8.23 | | | | | | |
Barclays Capital U.S.
Aggregate Bond Index | | | 3.68 | | | | 3.99 | | | | 5.16 | | | | n/a | | | | n/a | | | | n/a | | | | 7.76 | | | | | | |
Lipper Long/Short Equity
Funds Average | | | -0.03 | | | | 5.54 | | | | 10.61 | | | | n/a | | | | n/a | | | | n/a | | | | -0.69 | | | | | | |
Inception date: 2/7/11 | |
Turner All Cap
Growth Fund(2) | | | -4.35 | | | | 10.55 | | | | 17.47 | | | | 14.87 | | | | 0.67 | % | | | 14.79 | % | | | -0.84 | | | | 25.84 | | |
Nasdaq Composite Index | | | 0.80 | | | | 19.62 | | | | 29.02 | | | | 13.66 | | | | 2.90 | | | | 10.27 | | | | -1.95 | | | | | | |
Russell 3000® Growth Index | | | 1.75 | | | | 16.59 | | | | 29.35 | | | | 14.69 | | | | 3.22 | | | | 8.57 | | | | -0.72 | | | | | | |
Inception date: 6/30/00 | |
Turner Concentrated
Growth Fund | | | -7.91 | | | | 11.53 | | | | 16.04 | | | | 6.65 | | | | -5.89 | | | | 6.37 | | | | 0.49 | | | | 34.93 | | |
S&P 500 Index | | | 3.43 | | | | 16.44 | | | | 30.20 | | | | 13.20 | | | | 1.05 | | | | 8.01 | | | | 2.23 | | | | | | |
Russell 1000® Growth Index | | | 1.84 | | | | 16.80 | | | | 29.19 | | | | 14.73 | | | | 3.24 | | | | 8.41 | | | | 0.88 | | | | | | |
Inception date: 6/30/99 | |
Turner Emerging Growth Fund(2) —
Institutional Class Shares(3) | | | 0.79 | | | | 11.83 | | | | 25.86 | | | | 15.15 | | | | n/a | | | | n/a | | | | 21.26 | | | | 69.39 | | |
Investor Class Shares | | | 0.65 | | | | 11.62 | | | | 25.57 | | | | 14.87 | | | | 1.43 | | | | 11.14 | | | | 17.91 | | | | 168.99 | | |
Russell 2000® Growth Index | | | 0.71 | | | | 14.08 | | | | 31.18 | | | | 14.19 | | | | 2.96 | | | | 10.55 | | | | 3.62 | | | | | | |
Inception date: 2/27/98 | |
Turner Large Growth Fund —
Institutional Class Shares | | | -2.80 | | | | 14.01 | | | | 22.48 | | | | 9.21 | | | | -1.95 | | | | 7.64 | | | | 2.38 | | | | 201.05 | | |
Investor Class Shares(4) | | | -2.90 | | | | 13.85 | | | | 22.26 | | | | 8.96 | | | | -2.19 | | | | n/a | | | | 2.79 | | | | 47.86 | | |
Russell 1000® Growth Index | | | 1.84 | | | | 16.80 | | | | 29.19 | | | | 14.73 | | | | 3.24 | | | | 8.41 | | | | 2.64 | | | | | | |
Inception date: 2/28/01 | |
Turner Midcap Growth Fund(2) —
Institutional Class Shares(5) | | | -5.42 | | | | 8.66 | | | | 16.34 | | | | 10.65 | | | | n/a | | | | n/a | | | | 0.48 | | | | 236.15 | | |
Investor Class Shares | | | -5.53 | | | | 8.52 | | | | 16.15 | | | | 10.40 | | | | -0.38 | | | | 9.78 | | | | 9.65 | | | | 404.43 | | |
Retirement Class Shares(6) | | | -5.58 | | | | 8.30 | | | | 15.83 | | | | 10.12 | | | | -0.64 | | | | 9.39 | | | | 9.37 | | | | 4.81 | | |
Russell Midcap® Growth Index | | | -0.56 | | | | 13.88 | | | | 26.69 | | | | 14.73 | | | | 2.54 | | | | 11.11 | | | | 7.19 | | | | | | |
Inception date: 10/1/96 | |
6 TURNER FUNDS 2012 ANNUAL REPORT
Fund name/Index | | Six
months* | | Year
to
date* | | One
year | | Three
years | | Five
years | | 10
years | | (Annualized)
Since
inception | | Total
net assets
($mil) | |
Turner Small Cap
Growth Fund(2) | | | -0.47 | % | | | 11.78 | % | | | 29.21 | % | | | 12.63 | % | | | 1.75 | % | | | 11.04 | % | | | 10.85 | % | | $ | 250.10 | | |
Russell 2000® Growth Index | | | 0.71 | | | | 14.08 | | | | 31.18 | | | | 14.19 | | | | 2.96 | | | | 10.55 | | | | 5.84 | | | | | | |
Inception date: 2/7/94 | |
Turner Global
Opportunities Fund —
Institutional Class Shares | | | -5.06 | | | | 11.57 | | | | 20.53 | | | | n/a | | | | n/a | | | | n/a | | | | 14.07 | | | | 1.65 | | |
Investor Class Shares | | | -5.17 | | | | 11.37 | | | | 20.27 | | | | n/a | | | | n/a | | | | n/a | | | | 13.76 | | | | 0.25 | | |
MSCI World Growth Index | | | 1.28 | | | | 14.74 | | | | 23.52 | | | | n/a | | | | n/a | | | | n/a | | | | 12.08 | | | | | | |
MSCI World Index | | | 1.65 | | | | 13.56 | | | | 22.32 | | | | n/a | | | | n/a | | | | n/a | | | | 10.63 | | | | | | |
Inception date: 5/7/10 | |
Turner International
Growth Fund —
Institutional Class Shares | | | -2.51 | | | | 9.81 | | | | 17.92 | | | | 10.48 | | | | -1.30 | | | | n/a | | | | 2.39 | | | | 23.41 | | |
Investor Class Shares(7) | | | -2.62 | | | | 9.65 | | | | 17.67 | | | | 10.18 | | | | n/a | | | | n/a | | | | 16.06 | | | | 6.17 | | |
MSCI World ex-U.S. Growth Index | | | -0.70 | | | | 10.47 | | | | 14.91 | | | | 4.62 | | | | -3.74 | | | | n/a | | | | -0.53 | | | | | | |
Inception date: 1/31/07 | |
(1) Commenced operations on July 14, 2009.
(2) Investing in technology and science companies and small- and mid-capitalization companies may subject the Funds to specific inherent risks, including above-average price fluctuations.
(3) Commenced operations on February 1, 2009.
(4) Commenced operations on August 1, 2005.
(5) Commenced operations on June 16, 2008.
(6) Commenced operations on September 24, 2001.
(7) Commenced operations on October 31, 2008.
* Returns of less than one year are cumulative, and not annualized.
TURNER FUNDS 2012 ANNUAL REPORT 7
Expense Ratio†
| | | Gross
expense
ratio | | Net
expense
ratio* | |
Turner Market Neutral Fund | |
Institutional Class Shares | | | 3.92 | % | | | 1.95 | % | |
Investor Class Shares | | | 4.18 | % | | | 2.20 | % | |
Class C Shares | | | 4.77 | % | | | 2.95 | % | |
Turner Medical Sciences
Long/Short Fund | |
Institutional Class Shares | | | 2.79 | % | | | 1.95 | % | |
Investor Class Shares | | | 2.94 | % | | | 2.20 | % | |
Class C Shares | | | 3.68 | % | | | 2.95 | % | |
Turner Spectrum Fund | |
Institutional Class Shares | | | 2.53 | % | | | 1.95 | % | |
Investor Class Shares | | | 2.75 | % | | | 2.20 | % | |
Class C Shares | | | 3.44 | % | | | 2.95 | % | |
Turner Titan Fund | |
Institutional Class Shares | | | 3.56 | % | | | 1.95 | % | |
Investor Class Shares | | | 4.68 | % | | | 2.20 | % | |
Class C Shares | | | 3.82 | % | | | 2.95 | % | |
Turner All Cap Growth Fund | |
Investor Class Shares | | | 2.12 | % | | | 1.73 | % | |
Turner Concentrated Growth Fund | |
Investor Class Shares | | | 2.08 | % | | | 1.69 | % | |
| | | Gross
expense
ratio | | Net
expense
ratio* | |
Turner Emerging Growth Fund | |
Institutional Class Shares | | | 1.29 | % | | | 1.17 | % | |
Investor Class Shares | | | 1.57 | % | | | 1.42 | % | |
Turner Large Growth Fund | |
Institutional Class Shares | | | 0.89 | % | | | 0.69 | % | |
Investor Class Shares | | | 1.13 | % | | | 0.94 | % | |
Turner Midcap Growth Fund | |
Institutional Class Shares | | | 1.05 | % | | | 0.93 | % | |
Investor Class Shares | | | 1.28 | % | | | 1.18 | % | |
Retirement Class Shares | | | 1.54 | % | | | 1.43 | % | |
Turner Small Cap Growth Fund | |
Investor Class Shares | | | 1.53 | % | | | 1.25 | % | |
Turner Global Opportunities Fund | |
Institutional Class Shares | | | 3.64 | % | | | 1.11 | % | |
Investor Class Shares | | | 3.89 | % | | | 1.36 | % | |
Turner International Growth Fund | |
Institutional Class Shares | | | 2.41 | % | | | 1.10 | % | |
Investor Class Shares | | | 2.46 | % | | | 1.35 | % | |
† These expense ratios are based on the most recent prospectus and may differ from those shown in the financial highlights.
* Net expense ratio reflects contractual waivers of certain fees and/or expense reimbursements. Turner may discontinue this arrangement at any time after January 31, 2013.
8 TURNER FUNDS 2012 ANNUAL REPORT
Turner Market Neutral Fund
Fund profile
September 30, 2012
n Ticker symbol TMNFX
Investor Class Shares
n CUSIP #900297581
Investor Class Shares
n Top five holdings1
(1) Freeport-McMoRan Copper & Gold
(2) Embraer SA SP ADR
(3) Deere
(4) SPX
(5) Invesco
n % in five largest holdings 22%2
n Number of holdings 721
n Weighted average market capitalization $40.29 billion
n Net assets $6 million, Investor Class Shares
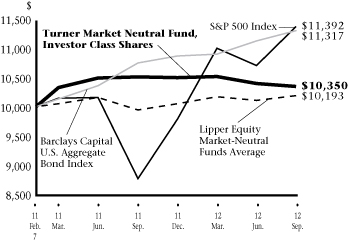
Growth of a $10,000 investment in the
Turner Market Neutral Fund, Investor Class Shares:
February 7, 2011-September 30, 20123,4
Average annual total returns (Periods ended September 30, 2012)
| | | One
year | | Since
inception4 | |
Turner Market Neutral Fund, Institutional Class Shares5 | | | -1.23 | % | | | 2.41 | % | |
Turner Market Neutral Fund, Investor Class Shares5 | | | -1.62 | % | | | 2.11 | % | |
Turner Market Neutral Fund, Class C Shares5 | | | -2.21 | % | | | 1.38 | % | |
S&P 500 Index6 | | | 30.20 | % | | | 8.23 | % | |
Barclays Capital U.S. Aggregate Bond Index7 | | | 5.16 | % | | | 7.76 | % | |
Lipper Equity Market-Neutral Funds Average8 | | | 2.06 | % | | | 1.14 | % | |
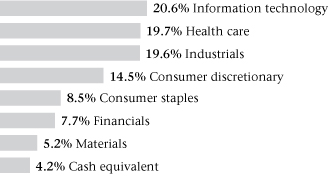
Sector weightings2:
Manager's discussion and analysis
Poor short positions hampered the Turner Market Neutral Fund, Investor Class Shares (TMNFX), which generated a loss of 1.62% in the 12-month period ended September 30. The fund's return trailed that of the S&P 500 Index by 31.82 percentage points, the Barclays Capital U.S. Aggregate Bond Index by 6.78 percentage points, and the Lipper Equity Market-Neutral Funds Average by 3.68 percentage points. The Turner Market Neutral Fund seeks capital appreciation using a long/short strategy in seeking to capture alpha, reduce volatility, and preserve capital in declining markets.
The consumer-discretionary, consumer-staples, financials, and industrials sectors added the most extra return. In those sectors, long and short positions in gaming, automotive, beverage, investment-management, regional-bank, oil-exploration, and pipeline shares generated the best performance. The materials sector was the biggest detractor from performance. In that sector, long and short positions in steel, building-products, and diversified-chemical shares produced unsatisfactory results.
1 Cash equivalent is not being considered a holding for the top five holdings, but is counted in the number of holdings. Top five holdings are based on long positions. The fund composition is subject to change.
2 Percentages based on total investments of long positions.
3 These figures represent past performance, which is no guarantee of future results. The investment return and principal value of an investment will fluctuate, so an investor's shares, when redeemed, may be worth more or less than their original cost. The performance in the above graph and table does not reflect the deduction of taxes the shareholder will pay on fund distributions or the redemptions of fund shares. Performance of the Institutional, Investor and Class C Shares will differ due to differences in fees.
4 The inception date of the Turner Market Neutral Fund was February 7, 2011.
5 Fee waivers are in effect; if they had not been in effect, performance would have been lower.
6 The S&P 500 Index is a widely-recognized, market value-weighted (higher market value stocks have more influence than lower market value stocks) index of 500 stocks designed to mimic the overall equity market's industry weightings.
7 The Barclays Capital U.S. Aggregate Bond Index (prior to November 2008, the Index was known as the "Lehman Brothers U.S. Aggregate Bond Index") represents an unmanaged diversified portfolio of fixed income securities, including U.S. Treasuries, investment-grade corporate bonds and mortgage-backed and asset-backed securities.
8 The Lipper Equity Market-Neutral Funds Average represents the average annualized total return for all reporting funds in the Lipper Equity Market-Neutral Fund category.
The Turner Market Neutral Fund is subject to the risks associated with selling securities short. A short sale involves a finite opportunity for appreciation, but a theoretically unlimited risk of loss. The Fund may focus its investments from time to time on one or more economic sectors. To the extent that it does so, developments affecting companies in that sector or sectors will likely have a magnified effect on the Fund's net asset value and total return.
TURNER FUNDS 2012 ANNUAL REPORT 9
Turner Medical Sciences Long/Short Fund
Fund profile
September 30, 2012
n Ticker symbol TMSFX
Investor Class Shares
n CUSIP #900297557
Investor Class Shares
n Top five holdings1
(1) Covidien
(2) Alexion Pharmaceuticals
(3) Allergan
(4) Abbott Laboratories
(5) Cooper
n % in five largest holdings 18.6%2
n Number of holdings 681
n Weighted average market capitalization $37.92 billion
n Net assets $10 million, Investor Class Shares
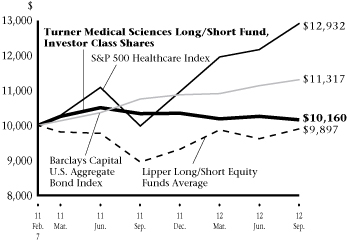
Growth of a $10,000 investment in the
Turner Medical Sciences Long/Short Fund,
Investor Class Shares:
February 7, 2011-September 30, 20123,4
Average annual total returns (Periods ended September 30, 2012)
| | | One
year | | Since
inception4 | |
Turner Medical Sciences Long/Short Fund, Institutional Class Shares5 | | | -1.55 | % | | | 1.15 | % | |
Turner Medical Sciences Long/Short Fund, Investor Class Shares5 | | | -1.74 | % | | | 0.97 | % | |
Turner Medical Sciences Long/Short Fund, Class C Shares5 | | | -2.52 | % | | | 0.24 | % | |
S&P 500 Healthcare Index6 | | | 29.54 | % | | | 16.89 | % | |
Barclays Capital U.S. Aggregate Bond Index7 | | | 5.16 | % | | | 7.76 | % | |
Lipper Long/Short Equity Funds Average8 | | | 10.61 | % | | | -0.69 | % | |
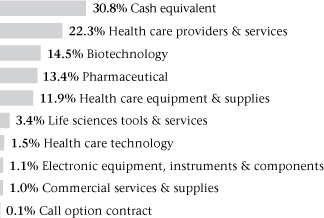
Sector weightings2:
Manager's discussion and analysis
Unrewarding short positions hurt the Turner Medical Sciences Long/Short Fund, Investor Class Shares (TMSFX), which recorded a 1.74% loss for the 12-month period ended September 30. The fund's return lagged that of the S&P 500 Healthcare Index by 31.28 percentage points, the Lipper Long/Short Equity Funds Average by 12.35 percentage points, and the Barclays Capital U.S. Aggregate Bond Index by 6.90 percentage points. The Turner Medical Sciences Long/Short Fund seeks capital appreciation by investing primarily (at least 80% of its net assets) in stocks of companies in the health-care sector; the fund uses a long/short growth strategy in seeking to capture alpha, reduce volatility, and preserve capital in declining markets.
In the fund's long and short positions, stocks in the therapeutic-pharmaceutical and biotechnology industries provided the most extra return. Detracting significantly from performance were long and short positions in the stocks of pharmaceutical, biomedical, medical-instrument, and health-care services firms. Also impeding performance was the fund's position in cash equivalents. Consistent with the fund's investment strategy and given the market's volatility during the period, the fund maintained a significant cash position during the period for defensive purposes. As a result, the fund did not participate in the market advances during the period as much as it would have if it had been more fully invested.
1 Cash equivalent is not being considered a holding for the top five holdings, but is counted in the number of holdings. Top five holdings are based on long positions. The fund composition is subject to change.
2 Percentages based on total investments of long positions.
3 These figures represent past performance, which is no guarantee of future results. The investment return and principal value of an investment will fluctuate, so an investor's shares, when redeemed, may be worth more or less than their original cost. The performance in the above graph and table does not reflect the deduction of taxes the shareholder will pay on fund distributions or the redemptions of fund shares. Performance of the Institutional, Investor and Class C Shares will differ due to differences in fees.
4 The inception date of the Turner Medical Sciences Long/Short Fund was February 7, 2011.
5 Fee waivers are in effect; if they had not been in effect, performance would have been lower.
6 The S&P 500 Healthcare Index is an unmanaged index which includes the stocks in the health-care sector of the S&P 500 Index.
7 The Barclays Capital U.S. Aggregate Bond Index (prior to November 2008, the Index was known as the "Lehman Brothers U.S. Aggregate Bond Index") represents an unmanaged diversified portfolio of fixed income securities, including U.S. Treasuries, investment-grade corporate bonds and mortgage-backed and asset-backed securities.
8 Lipper Long/Short Equity Funds Average represents the average annualized total return for all reporting funds in the Lipper Long/Short Equity Fund category.
The Turner Medical Sciences Long/Short Fund is subject to the risks associated with selling securities short. A short sale involves a finite opportunity for appreciation, but a theoretically unlimited risk of loss. The Fund is subject to the risks associated with health care-related companies. Many health care-related companies are smaller and less seasoned than companies in other sectors. Health care-related companies may also be strongly affected by scientific or technological developments and their products may quickly become obsolete. The Fund is subject to risks due to its foreign investments.
10 TURNER FUNDS 2012 ANNUAL REPORT
Fund profile
September 30, 2012
n Ticker symbol TSPEX
Institutional Class Shares
n CUSIP #900297664
Institutional Class Shares
n Top five holdings1
(1) Coca-Cola
(2) Home Depot
(3) Allergan
(4) Air Methods
(5) ProAssurance
n % in five largest holdings 6.0%2
n Number of holdings 4381
n Weighted average market capitalization $26.67 billion
n Net assets $833 million, Institutional Class Shares
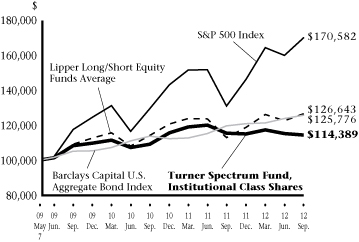
Growth of a $100,000 investment in the
Turner Spectrum Fund, Institutional Class Shares:
May 7, 2009-September 30, 20123,4
Average annual total returns (Periods ended September 30, 2012)
| | | One
year | | Three
years | | Since
inception | |
Turner Spectrum Fund, Institutional Class Shares5 | | | -0.77 | % | | | 1.90 | % | | | 4.03 | % | |
Turner Spectrum Fund, Investor Class Shares5 | | | -0.95 | % | | | 1.66 | % | | | 3.79 | % | |
Turner Spectrum Fund, Class C Shares5 | | | -1.71 | % | | | 0.96 | % | | | 3.40 | % | |
S&P 500 Index7 | | | 30.20 | % | | | 13.20 | % | | | 17.01 | %4 | |
Barclays Capital U.S. Aggregate Bond Index8 | | | 5.16 | % | | | 6.19 | % | | | 6.98 | %4 | |
Lipper Long/Short Equity Funds Average9 | | | 10.61 | % | | | 4.73 | % | | | 7.73 | %4 | |
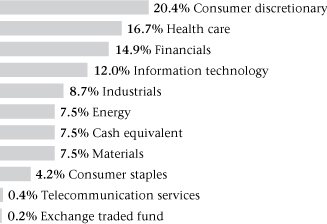
Sector weightings2:
Manager's discussion and analysis
The Turner Spectrum Fund, Institutional Class Shares (TSPEX), lost 0.77% in the 12-month period ended September 30. The fund's return trailed the S&P 500 Index by 30.97 percentage points, the Lipper Long/Short Equity Average by 11.38 percentage points, and the Barclays Capital U.S. Aggregate Bond Index by 5.93 percentage points. The Turner Spectrum Fund seeks capital appreciation through allocating its assets to various investment strategies, each managed by a separate portfolio management team at Turner.
Unproductive short positions were the main drag on the fund's results. Conversely, the consumer-staples sector added the most value. In that sector, long and short positions in cosmetics, beverage, diversified-food, and dairy shares performed best. The sector that detracted the most from results was consumer discretionary, with shares of shoe, multimedia, and home-improvement companies providing the worst returns. The fund kept a conservative net long exposure of 27%, primarily in U.S. stocks.
1 Cash equivalent is not being considered a holding for the top five holdings, but is counted in the number of holdings. Top five holdings are based on long positions. The fund composition is subject to change.
2 Percentages based on total investments of long positions.
3 These figures represent past performance, which is no guarantee of future results. The investment return and principal value of an investment will fluctuate, so an investor's shares, when redeemed, may be worth more or less than their original cost. The performance in the above graph and table does not reflect the deduction of taxes the shareholder will pay on fund distributions or the redemptions of fund shares. Performance of the Institutional, Investor and Class C Shares will differ due to differences in fees.
4 The inception date of the Turner Spectrum Fund (Institutional Class Shares and Investor Class Shares) was May 7, 2009. Index returns are based on Institutional Class Shares inception date.
5 Fee waivers are in effect; if they had not been in effect, performance would have been lower.
6 The inception date of the Turner Spectrum Fund (Class C Shares) was July 14, 2009.
7 The S&P 500 Index is a widely-recognized, market value-weighted (higher market value stocks have more influence than lower market value stocks) index of 500 stocks designed to mimic the overall equity market's industry weightings.
8 The Barclays Capital U.S. Aggregate Bond Index (prior to November 2008, the Index was known as the "Lehman Brothers U.S. Aggregate Bond Index") represents an unmanaged diversified portfolio of fixed income securities, including U.S. Treasuries, investment-grade corporate bonds and mortgage-backed and asset-backed securities.
9 Lipper Long/Short Equity Funds Average represents the average annualized total return for all reporting funds in the Lipper Long/Short Equity Fund category.
The Turner Spectrum Fund may focus its investments from time to time on one or more economic sectors. To the extent that it does so, developments affecting companies in that sector or sectors will likely have a magnified effect on the Fund's net asset value and total return. The Fund is subject to the risks associated with selling securities short. A short sale involves a finite opportunity for appreciation, but a theoretically unlimited risk of loss. The smaller capitalization companies the Fund invests in may be more vulnerable to adverse business or economic events than larger, more established companies.
TURNER FUNDS 2012 ANNUAL REPORT 11
Fund profile
September 30, 2012
n Ticker symbol TTLFX
Investor Class Shares
n CUSIP #900297524
Investor Class Shares
n Top five holdings1
(1) Concho Resources
(2) Broadcom, Cl A
(3) Coca-Cola
(4) Allergan
(5) F5 Networks
n % in five largest holdings 14.1%2
n Number of holdings 1101
n Weighted average market capitalization $27.32 billion
n Net assets $5 million, Investor Class Shares
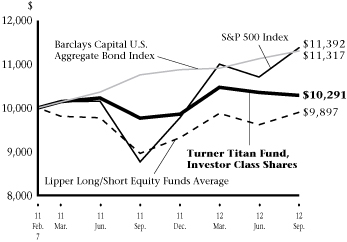
Growth of a $10,000 investment in the
Turner Titan Fund, Investor Class Shares:
February 7, 2011-September 30, 20123,4
Average annual total returns (Periods ended September 30, 2012)
| | | One
year | | Since
inception4 | |
Turner Titan Fund, Institutional Class Shares5 | | | 5.75 | % | | | 2.00 | % | |
Turner Titan Fund, Investor Class Shares5 | | | 5.44 | % | | | 1.76 | % | |
Turner Titan Fund, Class C Shares5 | | | 4.53 | % | | | 0.97 | % | |
S&P 500 Index6 | | | 30.20 | % | | | 8.23 | % | |
Barclays Capital U.S. Aggregate Bond Index7 | | | 5.16 | % | | | 7.76 | % | |
Lipper Long/Short Equity Funds Average8 | | | 10.61 | % | | | -0.69 | % | |
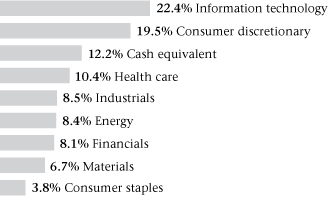
Sector weightings2:
Manager's discussion and analysis
The Turner Titan Fund, Investor Class Shares (TTLFX) gained 5.44% in the 12-month period ended September 30. The fund's return beat the Barclays Capital U.S. Aggregate Bond Index by 0.28 percentage point, but underperformed the S&P 500 Index by 24.76 percentage points and the Lipper Long/Short Equity Funds Average by 5.17 percentage points. The Turner Titan Fund seeks long-term capital appreciation by investing in stocks of companies with primarily large-capitalization ranges across all major industry sectors; the fund uses a long/short strategy in seeking to capture alpha, reduce volatility, and preserve capital in declining markets.
The industrials and consumer-staples sectors added the most value, with long and short positions in electrical-products, diversified-foods, automotive-manufacturing, diversified-machinery, beverage, and cosmetics shares delivering the best results. The greatest detractor from performance was the consumer-discretionary sector, with shares in apparel, advertising, and social-media companies producing subpar returns.
1 Cash equivalent is not being considered a holding for the top five holdings, but is counted in the number of holdings. Top five holdings are based on long positions. The fund composition is subject to change.
2 Percentages based on total investments of long positions.
3 These figures represent past performance, which is no guarantee of future results. The investment return and principal value of an investment will fluctuate, so an investor's shares, when redeemed, may be worth more or less than their original cost. The performance in the above graph and table does not reflect the deduction of taxes the shareholder will pay on fund distributions or the redemptions of fund shares. Performance of the Institutional, Investor and Class C Shares will differ due to differences in fees.
4 The inception date of the Turner Titan Fund was February 7, 2011.
5 Fee waivers are in effect; if they had not been in effect, performance would have been lower.
6 The S&P 500 Index is a widely-recognized, market value-weighted (higher market value stocks have more influence than lower market value stocks) index of 500 stocks designed to mimic the overall equity market's industry weightings.
7 The Barclays Capital U.S. Aggregate Bond Index (prior to November 2008, the Index was known as the "Lehman Brothers U.S. Aggregate Bond Index") represents an unmanaged diversified portfolio of fixed income securities, including U.S. Treasuries, investment-grade corporate bonds and mortgage-backed and asset-backed securities.
8 Lipper Long/Short Equity Funds Average represents the average annualized total return for all reporting funds in the Lipper Long/Short Equity Fund category.
Cl — Class
The Turner Titan Fund may focus its investments from time to time on one or more economic sectors. To the extent that it does so, developments affecting companies in that sector or sectors will likely have a magnified effect on the Fund's net asset value and total return. The Fund is subject to the risks associated with selling securities short. A short sale involves a finite opportunity for appreciation, but a theoretically unlimited risk of loss. The smaller capitalization companies the Fund invests in may be more vulnerable to adverse business or economic events than larger, more established companies.
12 TURNER FUNDS 2012 ANNUAL REPORT
Turner All Cap Growth Fund
Fund profile
September 30, 2012
n Ticker symbol TBTBX
n CUSIP #87252R797
n Top five holdings1
(1) Apple
(2) NXP Semiconductors
(3) Broadcom, Cl A
(4) ASML Holding, NY Shares
(5) Cavium
n % in five largest holdings 23.6%2
n Number of holdings 381
n Price/earnings ratio 17.0
n Weighted average market capitalization $70.55 billion
n Net assets $26 million
Growth of a $10,000 investment in the
Turner All Cap Growth Fund:
September 30, 2002-September 30, 20123
Average annual total returns (Periods ended September 30, 2012)
| | | One
year | | Three
years | | Five
years | | 10
years | | Since
inception | |
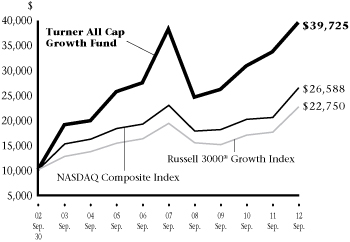
Turner All Cap Growth Fund4 | | | 17.47 | % | | | 14.87 | % | | | 0.67 | % | | | 14.79 | % | | | -0.84 | % | |
Nasdaq Composite Index5 | | | 29.02 | % | | | 13.66 | % | | | 2.90 | % | | | 10.27 | % | | | -1.95 | % | |
Russell 3000® Growth Index6 | | | 29.35 | % | | | 14.69 | % | | | 3.22 | % | | | 8.57 | % | | | -0.72 | % | |
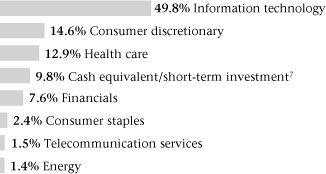
Sector weightings2:
Manager's discussion and analysis
Outperformance in drug holdings helped the Turner All Cap Growth Fund (TBTBX) to gain 17.47% in the 12-month period ended September 30. However, the fund's return lagged that of the Russell 3000® Growth Index by 11.88 percentage points and the Nasdaq Composite Index by 11.55 percentage points.
Three of the fund's seven sector positions outperformed their corresponding index sectors, with a 13% weighting in the health-care sector contributing the most return. The main detractors from performance were the consumer-discretionary, energy, and consumer-staples sectors, an 18% weighting, with shoe, apparel, social-media, coal-mining, oil-exploration, and coffee-roasting shares recording poor relative returns.
1 Cash equivalent and short-term investment are not being considered a holding for the top five holdings, but are counted in the number of holdings. The fund composition is subject to change.
2 Percentages based on total investments.
3 These figures represent past performance, which is no guarantee of future results. The investment return and principal value of an investment will fluctuate, so an investor's shares, when redeemed, may be worth more or less than their original cost. The performance in the above graph and table does not reflect the deduction of taxes the shareholder will pay on fund distributions or the redemptions of fund shares. The inception date of the Turner All Cap Growth Fund was June 30, 2000.
4 Fee waivers are in effect; if they had not been in effect, performance would have been lower.
5 The Nasdaq Composite Index includes more than 5,000 domestic and non-U.S. based common stocks listed on the Nasdaq stock market. The index is market-value weighted. This means that each company's security affects the index in proportion to its market value. The market value, the last sale price multiplied by total shares outstanding, is calculated throughout the trading day, and is related to the total value of the index. Because it is so broad-based, the Index is one of the most widely followed and quoted major market indices.
6 The Russell 3000® Growth Index measures the performance of the broad growth segment of the U.S. equity universe. It includes those Russell 3000® companies with higher price-to-book ratios and higher forecasted growth values.
7 Cash equivalent includes short-term investment held as collateral for securities lending activity. Please see Note 10 in Notes to Financial Statements for more detailed information.
Cl — Class
NY — New York
The Turner All Cap Growth Fund may buy and sell securities frequently as part of its investment strategy. The medium capitalization companies in which the Fund invests may be more vulnerable to adverse business or economic events than larger, more established companies.
TURNER FUNDS 2012 ANNUAL REPORT 13
Turner Concentrated Growth Fund
Fund profile
September 30, 2012
n Ticker symbol TTOPX
n CUSIP #87252R862
n Top five holdings1
(1) Apple
(2) Lennar, Cl A
(3) Alexion Pharmaceuticals
(4) CBRE Group
(5) Qualcomm
n % in five largest holdings 28.8%2
n Number of holdings 231
n Price/earnings ratio 15.0
n Weighted average market capitalization $111.37 billion
n Net assets $35 million
Growth of a $10,000 investment in the
Turner Concentrated Growth Fund:
September 30, 2002-September 30, 20123

Average annual total returns (Periods ended September 30, 2012)
| | | One
year | | Three
years | | Five
years | | 10
years | | Since
inception | |
Turner Concentrated Growth Fund4 | | | 16.04 | % | | | 6.65 | % | | | -5.89 | % | | | 6.37 | % | | | 0.49 | % | |
S&P 500 Index5 | | | 30.20 | % | | | 13.20 | % | | | 1.05 | % | | | 8.01 | % | | | 2.23 | % | |
Russell 1000® Growth Index6 | | | 29.19 | % | | | 14.73 | % | | | 3.24 | % | | | 8.41 | % | | | 0.88 | % | |
Sector weightings2:
Manager's discussion and analysis
Sub-par stock selection impaired the performance of the Turner Concentrated Growth Fund (TTOPX) in the 12-month period ended September 30. As a result the fund, which contains a select few stocks that we think have the strongest earnings power and return potential, gained 16.04%. The fund underperformed the S&P 500 Index by 14.16 percentage points and the Russell 1000® Growth Index by 13.15 percentage points.
One of the seven sectors in which the fund was invested beat its corresponding market sector. The health-care sector, a 9% weighting, provided the most extra return. In that sector, pharmaceutical, medical-instrument, and medical-information-system shares performed well. The worst-performing sectors were consumer discretionary and energy, a 16% weighting. Social-media, e-commerce, apparel, automotive, and oil-exploration shares underperformed the most.
On September 7, 2012, the Board of Trustees of the Turner Funds approved the reorganization of Turner Concentrated Growth Fund (the "Concentrated Growth Fund") into Turner Large Growth Fund. In anticipation of the reorganization, the Board has determined to close the Concentrated Growth Fund to new investors effective December 28, 2012.
1 Cash equivalent and short-term investment are not being considered a holding for the top five holdings, but are counted in the number of holdings. The fund composition is subject to change.
2 Percentages based on total investments.
3 These figures represent past performance, which is no guarantee of future results. The investment return and principal value of an investment will fluctuate, so an investor's shares, when redeemed, may be worth more or less than their original cost. The performance in the above graph and table does not reflect the deduction of taxes the shareholder will pay on fund distributions or the redemptions of fund shares. The inception date of the Turner Concentrated Growth Fund was June 30,1999.
4 Fee waivers are in effect; if they had not been in effect, performance would have been lower.
5 The S&P 500 Index is a widely-recognized, market value-weighted (higher market value stocks have more influence than lower market value stocks) index of 500 stocks designed to mimic the overall equity market's industry weightings.
6 The Russell 1000® Growth Index measures the performance of the broad growth segment of the U.S. equity universe. It includes those Russell 1000® companies with higher price-to-book ratios and higher forecasted growth values.
7 Cash equivalent includes short-term investment held as collateral for securities lending activity. Please see Note 10 in Notes to Financial Statements for more detailed information.
Cl — Class
The Turner Concentrated Growth Fund is non-diversified, which means that it may invest in the securities of fewer issuers than a diversified fund. As a result, it may be more susceptible to a single adverse economic or regulatory occurrence affecting one or more of these issuers, and may experience increased volatility. The Fund may buy and sell securities frequently as part of its investment strategy.
14 TURNER FUNDS 2012 ANNUAL REPORT
Turner Emerging Growth Fund
Fund profile
September 30, 2012
n Ticker symbol TMCGX
Investor Class Shares
n CUSIP #872524301
Investor Class Shares
n Top five holdings1
(1) Catamaran
(2) Vitamin Shoppe
(3) United Natural Foods
(4) Huron Consulting Group
(5) Air Methods
n % in five largest holdings 12.0%2
n Number of holdings 921
n Price/earnings ratio 16.7
n Weighted average market capitalization $1.71 billion
n Net assets $169 million, Investor Class Shares
Growth of a $10,000 investment in the
Turner Emerging Growth Fund, Investor Class Shares:
September 30, 2002-September 30, 20123,4
Average annual total returns (Periods ended September 30, 2012)
| | | One
year | | Three
years | | Five
years | | 10
years | | Since
inception | |
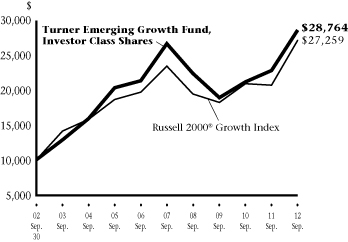
Turner Emerging Growth Fund, Institutional Class Shares5 | | | 25.86 | % | | | 15.15 | % | | | — | | | | — | | | | 21.26 | %6 | |
Turner Emerging Growth Fund, Investor Class Shares5 | | | 25.57 | % | | | 14.87 | % | | | 1.43 | % | | | 11.14 | % | | | 17.91 | %4 | |
Russell 2000® Growth Index7 | | | 31.18 | % | | | 14.19 | % | | | 2.96 | % | | | 10.55 | % | | | 3.62 | %4 | |
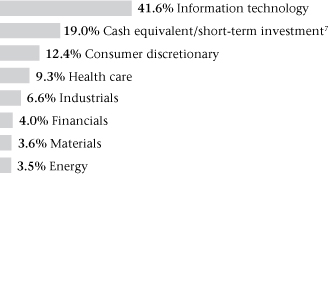
Sector weightings2:
Manager's discussion and analysis
During the 12-month period ended September 30, the Turner Emerging Growth Fund, Investor Class Shares (TMCGX) gained 25.57%, underperforming the Russell 2000® Growth Index's 31.18% gain by 5.61 percentage points.
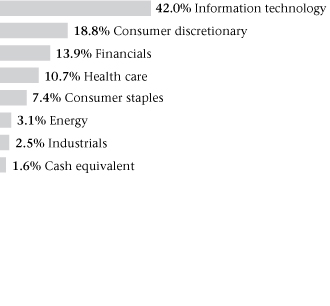
All 10 of the fund's sector positions provided positive returns, with four of the positions outperforming their corresponding index sectors. Of those sectors, information technology, an 18% weighting, furnished the greatest outperformance by far; shares in software, semiconductor, and information-services firms did best. The health-care and consumer-discretionary sectors detracted the most from results. In those sectors, which represented a 37% weighting, medical-information-systems, software, biotechnology, footwear, apparel, and hazardous-waste-disposal shares proved disappointing.
1 Cash equivalent and short-term investment are not being considered a holding for the top five holdings, but are counted in the number of holdings. The fund composition is subject to change.
2 Percentages based on total investments.
3 These figures represent past performance, which is no guarantee of future results. The investment return and principal value of an investment will fluctuate, so an investor's shares, when redeemed, may be worth more or less than their original cost. The performance in the above graph and table does not reflect the deduction of taxes the shareholder will pay on fund distributions or the redemptions of fund shares. Performance of the Institutional and Investor Class Shares will differ due to differences in fees.
4 The inception date of the Turner Emerging Growth Fund (Investor Class Shares) was February 27, 1998. Index returns are based on Investor Class Shares inception date.
5 Fee waivers are in effect; if they had not been in effect, performance would have been lower.
6 The inception date of the Turner Emerging Growth Fund (Institutional Class Shares) was February 1, 2009.
7 The Russell 2000® Growth Index is a widely-recognized, capitalization-weighted (companies with larger market capitalizations have more influence than those with smaller market capitalizations) index of the 2,000 smallest U.S. companies out of the 3,000 largest U.S. companies with higher growth rates and price-to-book ratios.
8 Cash equivalent includes short-term investment held as collateral for securities lending activity. Please see Note 10 in Notes to Financial Statements for more detailed information.
Amounts designated as "—" are not applicable.
The Turner Emerging Growth Fund is also subject to taxable income and realized capital gains. Shareholder redemptions may force the Fund to sell securities at an inappropriate time, also resulting in realized gains.
TURNER FUNDS 2012 ANNUAL REPORT 15
Fund profile
September 30, 2012
n Ticker symbol TTMEX
Institutional Class Shares
n CUSIP #900297847
Institutional Class Shares
n Top five holdings1
(1) Apple
(2) Coca-Cola
(3) Google, Cl A
(4) Qualcomm
(5) EMC
n % in five largest holdings 23.7%2
n Number of holdings 671
n Price/earnings ratio 15.0
n Weighted average market capitalization $123.78 billion
n Net assets $201 million, Institutional Class Shares
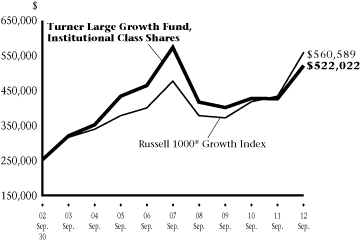
Growth of a $250,000 investment in the
Turner Large Growth Fund, Institutional Class Shares:
September 30, 2002-September 30, 20123,4
Average annual total returns (Periods ended September 30, 2012)
| | | One
year | | Three
years | | Five
years | | 10
years | | Since
inception | |
Turner Large Growth Fund, Institutional Class Shares5 | | | 22.48 | % | | | 9.21 | % | | | -1.95 | % | | | 7.64 | % | | | 2.38 | %4 | |
Turner Large Growth Fund, Investor Class Shares5 | | | 22.26 | % | | | 8.96 | % | | | -2.19 | % | | | — | | | | 2.79 | %6 | |
Russell 1000® Growth Index7 | | | 29.19 | % | | | 14.73 | % | | | 3.24 | % | | | 8.41 | % | | | 2.64 | %4 | |
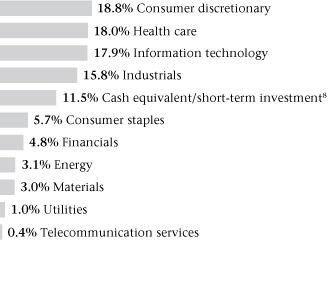
Sector weightings2:
Manager's discussion and analysis
The Turner Large Growth Fund, Institutional Class Shares (TTMEX) gained 22.48% in the 12-month period ended September 30. However, the fund underperformed its benchmark, the Russell 1000® Growth Index, by 6.71 percentage points.
Four of the eight sectors the fund was invested in beat their corresponding index sectors. Industrials, information technology, and financials, a 52% weighting, provided the most extra return. In those sectors, telecommunication, computer, semiconductor, Internet-application-software, computer-services, investment-management, and transactional-software shares boosted performance. The health-care, consumer-discretionary, and materials sectors, a 29% weighting, detracted the most from performance; shares of generic-pharmaceutical, biomedical, electronic-measurement, social-media, e-commerce, automotive, apparel, gold-mining, packaging, and fertilizer companies provided unfavorable results.
1 Cash equivalent and short-term investment are not being considered a holding for the top five holdings, but are counted in the number of holdings. The fund composition is subject to change.
2 Percentages based on total investments.
3 These figures represent past performance, which is no guarantee of future results. The investment return and principal value of an investment will fluctuate, so an investor's shares, when redeemed, may be worth more or less than their original cost. The performance in the above graph and table does not reflect the deduction of taxes the shareholder will pay on fund distributions or the redemptions of fund shares. Performance of the Institutional and Investor Class Shares will differ due to differences in fees.
4 The inception date of the Turner Large Growth Fund (Institutional Class Shares) was February 28, 2001. Index returns are based on Institutional Class Shares inception date.
5 Fee waivers are in effect; if they had not been in effect, performance would have been lower.
6 The inception date of the Turner Large Growth Fund (Investor Class Shares) was August 1, 2005.
7 The Russell 1000® Growth Index measures the performance of the broad growth segment of the U.S. equity universe. It includes those Russell 1000® companies with higher price-to-book ratios and higher forecasted growth values.
8 Cash equivalent includes short-term investment held as collateral for securities lending activity. Please see Note 10 in Notes to Financial Statements for more detailed information.
Amounts designated as "—" are not applicable.
Cl — Class
The Turner Large Growth Fund may buy and sell securities frequently as part of its investment strategy. The Fund is subject to the risk that large capitalization growth stocks may underperform other segments of the equity markets as a whole.
16 TURNER FUNDS 2012 ANNUAL REPORT
Turner Midcap Growth Fund
Fund profile
September 30, 2012
n Ticker symbol TMGFX
Investor Class Shares
n CUSIP #900297409
Investor Class Shares
n Top five holdings1
(1) Broadcom, Cl A
(2) NXP Semiconductors
(3) Citrix Systems
(4) Concho Resources
(5) F5 Networks
n % in five largest holdings 10.2%2
n Number of holdings 781
n Price/earnings ratio 19.0
n Weighted average market capitalization $9.33 billion
n Net assets $405 million, Investor Class Shares
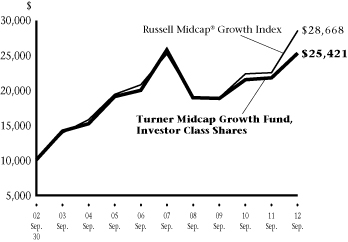
Growth of a $10,000 investment in the
Turner Midcap Growth Fund, Investor Class Shares:
September 30, 2002-September 30, 20123,4
Average annual total returns (Periods ended September 30, 2012)
| | | One
year | | Three
years | | Five
years | | 10
years | | Since
inception | |
Turner Midcap Growth Fund, Institutional Class Shares5 | | | 16.34 | % | | | 10.65 | % | | | — | | | | — | | | | 0.48 | %6 | |
Turner Midcap Growth Fund, Investor Class Shares5 | | | 16.15 | % | | | 10.40 | % | | | -0.38 | % | | | 9.78 | % | | | 9.65 | %4 | |
Turner Midcap Growth Fund, Retirement Class Shares5 | | | 15.83 | % | | | 10.12 | % | | | -0.64 | % | | | 9.39 | % | | | 9.37 | %7 | |
Russell Midcap® Growth Index8 | | | 26.69 | % | | | 14.73 | % | | | 2.54 | % | | | 11.11 | % | | | 7.19 | %4 | |
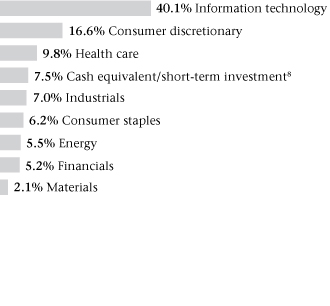
Sector weightings2:
Manager's discussion and analysis
In the 12-month period ended September 30, the Turner Midcap Growth Fund, Investor Class Shares (TMGFX) advanced 16.15%, underperforming the Russell Midcap® Growth Index by 10.54 percentage points.
A 14% position in financials and consumer staples provided the greatest contribution to the fund's performance. Those two sectors, out of the eight the fund was invested in, beat their corresponding index sectors. Investment-management, transactional-software, commercial-bank, diversified-food, grocery-store, beverage, and vitamin shares generated the best results. The major detractors from performance were the health-care, energy, and consumer-discretionary sectors, which represented 41% of the portfolio. Subpar performers in those sectors included footwear, restaurant, apparel, coal-mining, oil-exploration, generic-pharmaceutical, medical-product, medical-instrument, and diagnostic-equipment shares.
1 Cash equivalent and short-term investment are not being considered a holding for the top five holdings, but are counted in the number of holdings. The fund composition is subject to change.
2 Percentages based on total investments.
3 These figures represent past performance, which is no guarantee of future results. The investment return and principal value of an investment will fluctuate, so an investor's shares, when redeemed, may be worth more or less than their original cost. The performance in the above graph and table does not reflect the deduction of taxes the shareholder will pay on fund distributions or the redemptions of fund shares. Performance of the Institutional, Investor and Retirement Class Shares will differ due to differences in fees.
4 The inception date of the Turner Midcap Growth Fund (Investor Class Shares) was October 1, 1996. Index returns are based on Investor Class Shares inception date.
5 Fee waivers are in effect; if they had not been in effect, performance would have been lower.
6 The inception date of the Turner Midcap Growth Fund (Institutional Class Shares) was June 16, 2008.
7 The inception date of the Turner Midcap Growth Fund (Retirement Class Shares) was September 24, 2001.
8 The Russell Midcap® Growth Index is a capitalization-weighted (companies with larger market capitalizations have more influence than those with smaller market capitalizations) index of the 800 smallest U.S. companies out of the 1,000 largest companies with higher growth rates and price-to-book ratios.
9 Cash equivalent includes short-term investment held as collateral for securities lending activity. Please see Note 10 in Notes to Financial Statements for more detailed information.
Cl — Class
Amounts designated as "—" are not applicable.
The Turner Midcap Growth Fund may buy and sell securities frequently as part of its investment strategy. The medium capitalization companies in which the Fund invests may be more vulnerable to adverse business or economic events than larger, more established companies.
TURNER FUNDS 2012 ANNUAL REPORT 17
Turner Small Cap Growth Fund
Fund profile
September 30, 2012
n Ticker symbol TSCEX
n CUSIP #900297300
n Top five holdings1
(1) MAXIMUS
(2) Cubist Pharmaceuticals
(3) Boise
(4) Dril-Quip
(5) United Natural Foods
n % in five largest holdings 5.0%2
n Number of holdings 1261
n Price/earnings ratio 17.7
n Weighted average market capitalization $1.88 billion
n Net assets $250 million
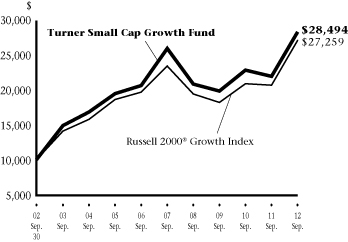
Growth of a $10,000 investment in the
Turner Small Cap Growth Fund:
September 30, 2002-September 30, 20123
Average annual total returns (Periods ended September 30, 2012)
| | | One
year | | Three
years | | Five
years | | 10
years | | Since
inception | |
Turner Small Cap Growth Fund4 | | | 29.21 | % | | | 12.63 | % | | | 1.75 | % | | | 11.04 | % | | | 10.85 | % | |
Russell 2000® Growth Index5 | | | 31.18 | % | | | 14.19 | % | | | 2.96 | % | | | 10.55 | % | | | 5.84 | % | |
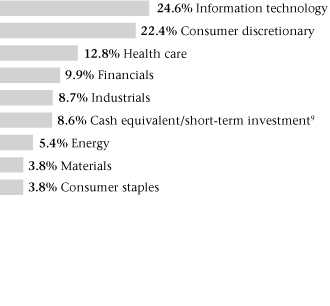
Sector weightings2:
Manager's discussion and analysis
Decent stock selection in several major market sectors helped the Turner Small Cap Growth Fund (TSCEX) gain 29.21% in the 12-month period ended September 30. However, the fund lagged its benchmark, the Russell 2000® Index, by 1.97 percentage points.
Six of the fund's sector positions — consumer staples, information technology, industrials, financials, energy, and utilities, a 51% weighting — beat their index counterparts. Consumer staples contributed the most return, with shares in companies involved in diversified food and wholesale food distribution performing the best. But consumer-discretionary and materials shares, an 18% weighting, proved the biggest drag on performance. Apparel, educational-services, footwear, hazardous-waste-disposal, restaurant, filtration, gold-mining, electrical-products, and aluminum stocks recorded subpar results.
1 Cash equivalent and short-term investment are not being considered a holding for the top five holdings, but are counted in the number of holdings. The fund composition is subject to change.
2 Percentages based on total investments.
3 These figures represent past performance, which is no guarantee of future results. The investment return and principal value of an investment will fluctuate, so an investor's shares, when redeemed, may be worth more or less than their original cost. The performance in the above graph and table does not reflect the deduction of taxes the shareholder will pay on fund distributions or the redemptions of fund shares. The inception date of the Turner Small Cap Growth Fund was February 7, 1994.
4 Fee waivers are in effect; if they had not been in effect, performance would have been lower.
5 The Russell 2000® Growth Index is a widely-recognized, capitalization-weighted (companies with larger market capitalizations have more influence than those with smaller market capitalizations) index of the 2,000 smallest U.S. companies out of the 3,000 largest U.S. companies with higher growth rates and price-to-book ratios.
6 Cash equivalent includes short-term investment held as collateral for securities lending activity. Please see Note 10 in Notes to Financial Statements for more detailed information.
The Turner Small Cap Growth Fund may buy and sell securities frequently as part of its investment strategy. The smaller capitalization companies the Fund invests in may be more vulnerable to adverse business or economic events than larger, more established companies.
18 TURNER FUNDS 2012 ANNUAL REPORT
Turner Global Opportunities Fund
Fund profile
September 30, 2012
n Ticker symbol TGLBX
Institutional Class Shares
n CUSIP #900297623
Institutional Class Shares
n Top five holdings1
(1) Apple
(2) ASML Holding, NY Shares
(3) Alexion Pharmaceuticals
(4) NXP Semiconductors
(5) Broadcom, Cl A
n % in five largest holdings 29.3%2
n Number of holdings 281
n Price/earnings ratio 15.5
n Weighted average market capitalization $83.45 billion
n Net assets $2 million, Institutional Class Shares
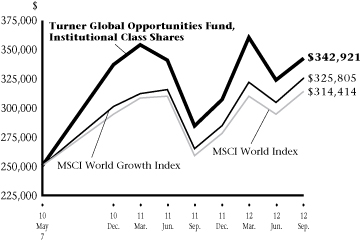
Growth of a $250,000 investment in the
Turner Global Opportunities Fund,
Institutional Class Shares:
May 7, 2010-September 30, 20123
Average annual total returns (Periods ended September 30, 2012)
| | | One
Year | | Since
inception | |
Turner Global Opportunities Fund, Institutional Class Shares4 | | | 20.53 | % | | | 14.07 | % | |
Turner Global Opportunities Fund, Investor Class Shares4 | | | 20.27 | % | | | 13.76 | % | |
MSCI World Growth Index5 | | | 23.52 | % | | | 12.08 | % | |
MSCI World Index6 | | | 22.32 | % | | | 10.63 | % | |
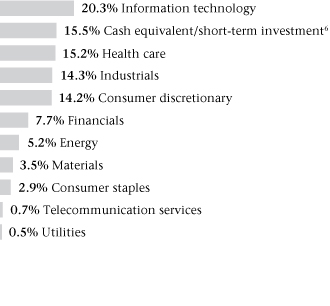
Sector weightings2:
Manager's discussion and analysis
An emphasis on U.S. stocks hurt the Turner Global Opportunities Fund, Institutional Class Shares (TGLBX), which gained 20.53% for the 12-month period ended September 30. The fund lagged its benchmark, the MSCI World Growth Index, by 2.99 percentage points, and the MSCI World Index by 1.79 percentage points.
A larger weighting in foreign stocks would have benefited the fund's results. Four of the fund's seven sector positions outperformed their corresponding index sectors. The best-performing sectors were industrials and health care, which amounted to 13% of holdings. In those sectors, semiconductor, diversified-machinery, biotechnology, and medical-product shares contributed the most extra return. The fund's performance was hurt the most by the energy and consumer-discretionary sectors, with a combined weighting of 22%. Oil, coal-mining, e-commerce, restaurant, and social-media stocks were the biggest laggards.
1 Cash equivalent is not being considered a holding for the top five holdings, but is counted in the number of holdings. The fund composition is subject to change.
2 Percentages based on total investments.
3 These figures represent past performance, which is no guarantee of future results. The investment return and principal value of an investment will fluctuate, so an investor's shares, when redeemed, may be worth more or less than their original cost. The performance in the above graph and table does not reflect the deduction of taxes the shareholder will pay on fund distributions or the redemptions of fund shares. The inception date of the Turner Global Opportunities Fund was May 7, 2010. Performance of the Institutional and Investor Class Shares will differ due to differences in fees.
4 Fee waivers are in effect; if they had not been in effect, performance would have been lower.
5 The MSCI World Growth Index measures the performance of growth stocks in developed countries throughout the world. The index includes reinvestment of dividends.
6 The MSCI World Index is a free float-adjusted market capitalization-weighted index that is designed to measure the equity market performance of developed markets. The MSCI World Index consists of the following 24 developed market country indices: Australia, Austria, Belgium, Canada, Denmark, Finland, France, Germany, Greece, Hong Kong, Ireland, Israel, Italy, Japan, Netherlands, New Zealand, Norway, Portugal, Singapore, Spain, Sweden, Switzerland, the United Kingdom and the United States.
Cl — Class
NY — New York
The Turner Global Opportunities Fund is non-diversified, which means that it may invest in the securities of fewer issuers than a diversified fund. As a result, it may be more susceptible to a single adverse economic or regulatory occurrence affecting one or more of these issuers, and may experience increased volatility. The Fund is subject to risks due to its foreign investments.
TURNER FUNDS 2012 ANNUAL REPORT 19
Turner International Growth Fund
Fund profile
September 30, 2012
n Ticker symbol TICGX
Institutional Class Shares
n CUSIP #900297771
Institutional Class Shares
n Top five holdings1
(1) Roche Holding
(2) Nestle
(3) BHP Billiton, Ltd.
(4) BT Group
(5) Goldcorp
n % in five largest holdings 11.9%2
n Number of holdings 801
n Price/earnings ratio 11.5
n Weighted average market capitalization $46.53 billion
n Net assets $23 million, Institutional Class Shares
Growth of a $250,000 investment in the
Turner International Growth Fund,
Institutional Class Shares:
January 31, 2007-September 30, 20123,4
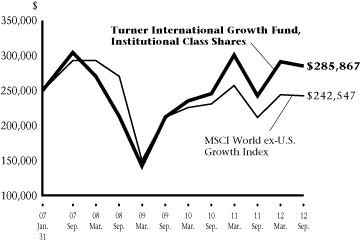
Average annual total returns (Periods ended September 30, 2012)
| | | One
year | | Three
years | | Five
years | | Since
inception | |
Turner International Growth Fund, Institutional Class Shares5 | | | 17.92 | % | | | 10.48 | % | | | -1.30 | % | | | 2.39 | %4 | |
Turner International Growth Fund, Investor Class Shares5 | | | 17.67 | % | | | 10.18 | % | | | — | | | | 16.06 | %6 | |
MSCI World ex-U.S. Growth Index7 | | | 14.91 | % | | | 4.62 | % | | | -3.74 | % | | | -0.53 | %4 | |
Sector weightings2:
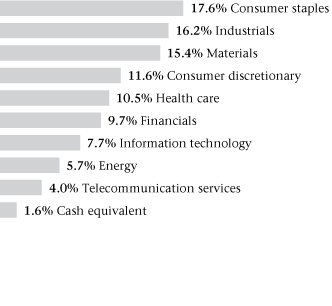
Manager's discussion and analysis
In the 12-month period ended September 30, double-digit gains in nearly every sector powered the Turner International Growth Fund, Institutional Class Shares (TICGX) to a 17.92% gain, a result that outperformed the MSCI World Growth ex-U.S. Index by 3.01 percentage points.
Stock selection was excellent: all nine of the market sectors the fund was invested in outperformed their corresponding index sectors. The consumer-discretionary sector, a 12% weighting, provided the most extra return. In that sector, hotel, wholesale-food-distribution, and apparel shares performed especially well. A 6% weighting in the energy sector contributed the least, with oil exploration-and-production, oil-field-services, and coal-mining stocks underperforming.
On September 7, 2012, the Board of Trustees of the Turner Funds approved the reorganization of Turner International Growth Fund into the John Hancock International Growth Equity Fund, a series of John Hancock Funds II with the same investment objectives and policies. In anticipation of the reorganization, the Board has determined to close the International Growth Fund to new investors effective October 12, 2012.
1 Cash equivalent is not being considered a holding for the top five holdings, but is counted in the number of holdings. The fund composition is subject to change.
2 Percentages based on total investments.
3 These figures represent past performance, which is no guarantee of future results. The investment return and principal value of an investment will fluctuate, so an investor's shares, when redeemed, may be worth more or less than their original cost. The performance in the above graph and table does not reflect the deduction of taxes the shareholder will pay on fund distributions or the redemptions of fund shares. Performance of the Institutional and Investor Class Shares will differ due to differences in fees.
4 The inception date of the Turner International Growth Fund (Institutional Class Shares) was January 31, 2007. Index returns are based on Institutional Class Shares inception date.
5 Fee waivers are in effect; if they had not been in effect, performance would have been lower.
6 The inception date of the Turner International Growth Fund (Investor Class Shares) was October 31, 2008.
7 The MSCI World Growth ex-U.S. Growth Index is a market capitalization-weighted index (companies with larger market capitalizations have more influence than those with smaller market capitalizations) designed to measure the combined equity market performance of developed and emerging markets countries, excluding the United States.
Amounts designated as "—" are not applicable.
The Turner International Growth Fund may buy and sell securities frequently as part of its investment strategy. The Fund is subject to risks due to its foreign investments.
20 TURNER FUNDS 2012 ANNUAL REPORT
Turner Market Neutral Fund
September 30, 2012
| | | Shares | | Value
(000) | |
Common stock—68.0% | |
Consumer discretionary—10.3% | |
Adidas AG | | | 11,978 | | | $ | 983 | | |
Harley-Davidson | | | 23,410 | | | | 992 | | |
Home Depot | | | 18,510 | | | | 1,117 | | |
Lennar, Cl A | | | 11,110 | | | | 386 | | |
Royal Caribbean Cruises | | | 33,680 | | | | 1,018 | | |
Starbucks | | | 20,690 | | | | 1,050 | | |
Total Consumer discretionary | | | | | 5,546 | | |
Consumer staples—6.0% | |
Coca-Cola | | | 28,310 | | | | 1,074 | | |
Kellogg | | | 20,330 | | | | 1,050 | | |
Procter & Gamble | | | 16,330 | | | | 1,133 | | |
Total Consumer staples | | | | | 3,257 | | |
Financials—5.5% | |
Credicorp | | | 5,707 | | | | 715 | | |
Invesco | | | 45,730 | | | | 1,143 | | |
ProAssurance | | | 11,980 | | | | 1,083 | | |
Total Financials | | | | | 2,941 | | |
Health care—14.0% | |
Abbott Laboratories | | | 14,700 | | | | 1,008 | | |
Alexion Pharmaceuticals* | | | 9,260 | | | | 1,059 | | |
Allergan | | | 11,430 | | | | 1,047 | | |
ARIAD Pharmaceuticals* | | | 45,560 | | | | 1,104 | | |
Express Scripts Holding* | | | 17,050 | | | | 1,068 | | |
MEDNAX* | | | 13,610 | | | | 1,013 | | |
St. Jude Medical | | | 24,870 | | | | 1,048 | | |
Team Health Holdings* | | | 6,530 | | | | 177 | | |
Total Health care | | | | | 7,524 | | |
Industrials—13.9% | |
Cummins | | | 5,440 | | | | 502 | | |
Deere | | | 21,780 | | | | 1,797 | | |
Embraer SA SP ADR | | | 69,690 | | | | 1,855 | | |
Equifax | | | 8,170 | | | | 380 | | |
SPX | | | 24,860 | | | | 1,626 | | |
Titan International | | | 25,590 | | | | 452 | | |
Verisk Analytics, Cl A* | | | 18,590 | | | | 885 | | |
Total Industrials | | | | | 7,497 | | |
| | | Shares | | Value
(000) | |
Information technology—14.6% | |
Apple | | | 1,630 | | | $ | 1,088 | | |
Broadcom, Cl A | | | 27,780 | | | | 961 | | |
EMC* | | | 37,570 | | | | 1,025 | | |
Fidelity National Information
Services | | | 20,306 | | | | 634 | | |
Global Payments | | | 25,040 | | | | 1,047 | | |
NXP Semiconductors* | | | 43,010 | | | | 1,076 | | |
Riverbed Technology* | | | 46,380 | | | | 1,079 | | |
Sourcefire* | | | 19,060 | | | | 934 | | |
Total Information technology | | | | | 7,844 | | |
Materials—3.7% | |
Freeport-McMoRan
Copper & Gold | | | 50,090 | | | | 1,982 | | |
Total Materials | | | | | 1,982 | | |
Total Common stock
(Cost $36,461)** | | | | | 36,591 | | |
Cash equivalent—3.0% | |
BlackRock TempCash Fund,
Institutional Shares,
0.010%***^ | | | 1,606,102 | | | | 1,606 | | |
Total Cash equivalent
(Cost $1,606)** | | | | | 1,606 | | |
Total Investments—71.0%
(Cost $38,067)** | | | | | 38,197 | | |
Segregated cash with brokers—96.4% | | | | | 51,858 | | |
Securities sold short—(67.6)%
(Proceeds $(36,271))** | | | | | (36,394 | ) | |
Net Other assets (liabilities)—0.2% | | | | | 163 | | |
Net Assets—100.0% | | | | $ | 53,824 | | |
* Non-income producing security.
** This number is listed in thousands.
*** Rate shown is the 7-day effective yield as of September 30, 2012.
^ All or a portion of the shares have been committed as collateral for open short positions.
ADR — American Depositary Receipt
Cl — Class
The accompanying notes are an integral part of the financial statements.
TURNER FUNDS 2012 ANNUAL REPORT 21
Schedule of securities sold short
Turner Market Neutral Fund
September 30, 2012
| | | Shares | | Value
(000) | |
Common stock—67.6% | |
Consumer discretionary—7.7% | |
AutoNation | | | 25,040 | | | $ | 1,094 | | |
Lowe's | | | 37,570 | | | | 1,136 | | |
Marriott International, Cl A | | | 49,600 | | | | 1,939 | | |
Total Consumer discretionary | | | | | 4,169 | | |
Consumer staples—7.8% | |
H.J. Heinz | | | 18,660 | | | | 1,044 | | |
Kroger | | | 44,100 | | | | 1,038 | | |
McDonald's | | | 11,430 | | | | 1,049 | | |
Sysco | | | 34,840 | | | | 1,089 | | |
Total Consumer staples | | | | | 4,220 | | |
Financials—6.7% | |
Banco Santander Chile SP ADR | | | 9,558 | | | | 700 | | |
HCC Insurance Holdings | | | 30,700 | | | | 1,040 | | |
MSCI, Cl A | | | 10,340 | | | | 370 | | |
T. Rowe Price Group | | | 16,880 | | | | 1,069 | | |
Vornado Realty Trust | | | 4,970 | | | | 403 | | |
Total Financials | | | | | 3,582 | | |
Health care—14.1% | |
Aetna | | | 4,900 | | | | 194 | | |
Becton Dickinson | | | 27,280 | | | | 2,143 | | |
Bristol-Myers Squibb | | | 31,030 | | | | 1,047 | | |
Johnson & Johnson | | | 29,940 | | | | 2,063 | | |
Medtronic | | | 24,500 | | | | 1,057 | | |
Novartis AG SP ADR | | | 17,420 | | | | 1,067 | | |
Total Health care | | | | | 7,571 | | |
Industrials—9.6% | |
Dover | | | 13,610 | | | | 809 | | |
Emerson Electric | | | 33,430 | | | | 1,614 | | |
PACCAR | | | 13,610 | | | | 545 | | |
Rockwell Collins | | | 19,850 | | | | 1,065 | | |
Scotts Miracle-Gro | | | 26,130 | | | | 1,136 | | |
Total Industrials | | | | | 5,169 | | |
Information technology—16.1% | |
Check Point Software
Technologies | | | 21,780 | | | | 1,049 | | |
Fiserv | | | 15,240 | | | | 1,128 | | |
Jack Henry & Associates | | | 19,705 | | | | 747 | | |
Linear Technology | | | 31,580 | | | | 1,006 | | |
| | | Shares | | Value
(000) | |
NetApp | | | 29,400 | | | $ | 967 | | |
Nokia SP ADR | | | 361,520 | | | | 929 | | |
Paychex | | | 26,770 | | | | 891 | | |
Polycom | | | 97,990 | | | | 967 | | |
Tech Data | | | 21,140 | | | | 958 | | |
Total Information technology | | | | | 8,642 | | |
Materials—5.6% | |
Alcoa | | | 103,450 | | | | 915 | | |
Compass Minerals International | | | 14,100 | | | | 1,052 | | |
Praxair | | | 10,340 | | | | 1,074 | | |
Total Materials | | | | | 3,041 | | |
Total Common stock
(Proceeds $36,271)* | | | | | 36,394 | | |
Total Securities sold short—67.6%
(Proceeds $36,271)* | | | | | 36,394 | | |
Percentages disclosed are based on total net assets of the Fund at September 30, 2012.
* This number is listed in thousands.
ADR — American Depositary Receipt
Cl — Class
The accompanying notes are an integral part of the financial statements.
22 TURNER FUNDS 2012 ANNUAL REPORT
Turner Medical Sciences Long/Short Fund
September 30, 2012
| | | Shares | | Value
(000) | |
Common stock—54.5% | |
Biotechnology—11.4% | |
Achillion Pharmaceuticals* | | | 27,160 | | | $ | 283 | | |
Alexion Pharmaceuticals* | | | 12,380 | | | | 1,416 | | |
ARIAD Pharmaceuticals* | | | 31,540 | | | | 764 | | |
Cubist Pharmaceuticals* | | | 7,810 | | | | 372 | | |
Incyte* | | | 14,440 | | | | 261 | | |
Medivation* | | | 5,060 | | | | 285 | | |
OncoGenex Pharmaceutical* | | | 12,590 | | | | 178 | | |
Onyx Pharmaceuticals* | | | 13,320 | | | | 1,126 | | |
QLT* | | | 36,530 | | | | 285 | | |
Spectrum Pharmaceuticals* | | | 7,890 | | | | 92 | | |
Synageva BioPharma* | | | 9,490 | | | | 507 | | |
YM Biosciences* | | | 57,905 | | | | 107 | | |
Total Biotechnology | | | | | 5,676 | | |
Commercial services & supplies—0.7% | |
Stericycle* | | | 4,130 | | | | 374 | | |
Total Commercial services & supplies | | | | | 374 | | |
Electronic Equipment, Instruments & Components—0.9% | |
OSI Systems* | | | 5,550 | | | | 432 | | |
Total Electronic Equipment,
Instruments & Components | | | | | 432 | | |
Health care equipment & supplies—9.4% | |
ArthroCare* | | | 16,340 | | | | 529 | | |
Cooper | | | 12,810 | | | | 1,210 | | |
Covidien | | | 34,210 | | | | 2,033 | | |
IDEXX Laboratories* | | | 3,790 | | | | 377 | | |
Teleflex | | | 7,280 | | | | 501 | | |
Total Health care
equipment & supplies | | | | | 4,650 | | |
Health care providers & services—17.6% | |
Acadia Healthcare* | | | 13,281 | | | | 317 | | |
Air Methods* | | | 8,750 | | | | 1,044 | | |
Catamaran* | | | 9,010 | | | | 883 | | |
Centene* | | | 4,660 | | | | 174 | | |
Elan SP ADR* | | | 29,960 | | | | 321 | | |
Express Scripts Holding* | | | 16,070 | | | | 1,007 | | |
Health Net* | | | 17,050 | | | | 384 | | |
Humana | | | 3,570 | | | | 250 | | |
McKesson | | | 10,620 | | | | 914 | | |
| | | Contracts/
Shares | | Value
(000) | |
MEDNAX* | | | 3,350 | | | $ | 249 | | |
Metropolitan Health Networks* | | | 51,880 | | | | 485 | | |
Patterson | | | 11,010 | | | | 377 | | |
PSS World Medical* | | | 28,150 | | | | 641 | | |
Team Health Holdings* | | | 44,500 | | | | 1,207 | | |
WellCare Health Plans* | | | 8,410 | | | | 476 | | |
Total Health care providers & services | | | | | 8,729 | | |
Health care technology—1.2% | |
Biogen Idec* | | | 4,030 | | | | 601 | | |
Total Health care technology | | | | | 601 | | |
Life sciences tools & services—2.7% | |
Agilent Technologies | | | 21,130 | | | | 813 | | |
Charles River Laboratories
International* | | | 9,820 | | | | 389 | | |
Fluidigm* | | | 6,960 | | | | 118 | | |
Total Life sciences tools & services | | | | | 1,320 | | |
Pharmaceuticals—10.6% | |
Abbott Laboratories | | | 18,180 | | | | 1,246 | | |
Allergan | | | 15,250 | | | | 1,397 | | |
Optimer Pharmaceuticals* | | | 8,923 | | | | 126 | | |
Perrigo | | | 3,210 | | | | 373 | | |
Pfizer | | | 40,030 | | | | 995 | | |
Roche Holding AG SP ADR | | | 10,610 | | | | 499 | | |
Shire SP ADR | | | 3,320 | | | | 294 | | |
ViroPharma* | | | 10,900 | | | | 329 | | |
Total Pharmaceuticals | | | | | 5,259 | | |
Total Common stock
(Cost $24,983)** | | | | | 27,041 | | |
Call option contract—0.1% | |
Humana, 11/12 at $75 | | | 255 | | | | 41 | | |
Total Call option contract
(Cost $37)** | | | | | 41 | | |
TURNER FUNDS 2012 ANNUAL REPORT 23
Schedule of investments
Turner Medical Sciences Long/Short Fund
| | | Shares | | Value
(000) | |
Cash equivalent—24.4% | |
BlackRock TempCash Fund,
Institutional Shares,
0.010%*** | | | 12,102,906 | | | $ | 12,103 | | |
Total Cash equivalent
(Cost $12,103)** | | | | | 12,103 | | |
Total Investments—79.0%
(Cost $37,123)** | | | | | 39,185 | | |
Segregated cash with brokers—52.9% | | | | | 26,225 | | |
Securities sold short—(27.8)%
(Proceeds $(13,533))** | | | | | (13,796 | ) | |
Net Other assets (liabilities)**—(4.1)% | | | | | (2,002 | ) | |
Net Assets**—100.0% | | | | $ | 49,612 | | |
* Non-income producing security.
** This number is listed in thousands.
*** Rate shown is the 7-day effective yield as of September 30, 2012.
ADR — American Depositary Receipt
The accompanying notes are an integral part of the financial statements.
24 TURNER FUNDS 2012 ANNUAL REPORT
Schedule of securities sold short
Turner Medical Sciences Long/Short Fund
September 30, 2012
| | | Shares | | Value
(000) | |
Common stock—20.0% | |
Biotechnology—1.0% | |
Myriad Genetics | | | 12,370 | | | $ | 334 | | |
Seattle Genetics | | | 5,500 | | | | 148 | | |
Total Biotechnology | | | | | 482 | | |
Health care equipment & supplies—4.4% | |
Baxter International | | | 12,520 | | | | 755 | | |
DENTSPLY International | | | 10,050 | | | | 383 | | |
Medtronic | | | 14,660 | | | | 632 | | |
Mindray Medical
International SP ADR | | | 12,000 | | | | 403 | | |
Total Health care
equipment & supplies | | | | | 2,173 | | |
Health care providers & services—5.1% | |
Aetna | | | 14,110 | | | | 559 | | |
AmerisourceBergen, Cl A | | | 16,000 | | | | 619 | | |
Bristol-Myers Squibb | | | 18,980 | | | | 641 | | |
Kindred Healthcare | | | 21,870 | | | | 249 | | |
Takeda Pharmaceutical | | | 10,450 | | | | 481 | | |
Total Health care
providers & services | | | | | 2,549 | | |
Life sciences tools & services—0.7% | |
Thermo Fisher Scientific | | | 6,250 | | | | 368 | | |
Total Life sciences tools & services | | | | | 368 | | |
Pharmaceuticals—8.8% | |
AstraZeneca SP ADR | | | 21,500 | | | | 1,029 | | |
Johnson & Johnson | | | 22,120 | | | | 1,525 | | |
Novartis AG SP ADR | | | 12,650 | | | | 775 | | |
Sanofi SP ADR | | | 17,510 | | | | 754 | | |
Valeant Pharmaceuticals
International | | | 5,320 | | | | 294 | | |
Total Pharmaceuticals | | | | | 4,377 | | |
Total Common stock
(Proceeds $9,787)* | | | | | 9,949 | | |
| | | Shares | | Value
(000) | |
Exchange traded funds—7.8% | |
Health Care Select Sector SPDR
Fund | | | 30,990 | | | $ | 1,243 | | |
iShares NASDAQ Biotechnology
Index Fund | | | 3,940 | | | | 561 | | |
Market Vectors Pharmaceutical ETF | | | 49,830 | | | | 2,043 | | |
Total Exchange traded funds
(Proceeds $3,746)* | | | | | 3,847 | | |
Total Securities sold short—27.8%
(Proceeds $13,533)* | | | | | 13,796 | | |
Percentages disclosed are based on total net assets of the Fund at September 30, 2012.
* This number is listed in thousands.
ADR — American Depositary Receipt
Cl — Class
ETF — Exchange Traded Fund
The accompanying notes are an integral part of the financial statements.
TURNER FUNDS 2012 ANNUAL REPORT 25
Turner Spectrum Fund
September 30, 2012
| | | Shares | | Value
(000) | |
Common stock—75.3% | |
Consumer discretionary—16.6% | |
Adidas AG | | | 54,208 | | | $ | 4,447 | | |
Aeropostale* | | | 591,790 | | | | 8,007 | | |
American Eagle Outfitters | | | 349,560 | | | | 7,369 | | |
Arctic Cat* | | | 40,860 | | | | 1,694 | | |
| ASOS* | | | 57,980 | | | | 2,057 | | |
Buffalo Wild Wings* | | | 24,350 | | | | 2,088 | | |
CBS, Cl B | | | 124,750 | | | | 4,532 | | |
Coach | | | 33,240 | | | | 1,862 | | |
Coldwater Creek* | | | 1,099,430 | | | | 913 | | |
Ctrip.com
International SP ADR* | | | 109,040 | | | | 1,841 | | |
Dick's Sporting Goods | | | 39,370 | | | | 2,041 | | |
Dollar Tree* | | | 29,670 | | | | 1,432 | | |
Ford Motor | | | 334,990 | | | | 3,303 | | |
Gap | | | 92,650 | | | | 3,315 | | |
GNC Holdings, Cl A | | | 98,180 | | | | 3,826 | | |
Harley-Davidson | | | 60,210 | | | | 2,551 | | |
Harman International
Industries | | | 48,200 | | | | 2,225 | | |
Home Depot | | | 168,730 | | | | 10,186 | | |
HomeAway* | | | 180,480 | | | | 4,232 | | |
Industria de Diseno Textil SA | | | 28,320 | | | | 3,516 | | |
International Game Technology | | | 259,540 | | | | 3,397 | | |
Lamar Advertising, Cl A* | | | 109,670 | | | | 4,064 | | |
Las Vegas Sands | | | 113,410 | | | | 5,259 | | |
Lennar, Cl A | | | 115,750 | | | | 4,025 | | |
M/I Homes* | | | 33,290 | | | | 644 | | |
Melco Crown
Entertainment SP ADR* | | | 184,590 | | | | 2,488 | | |
Meritage Homes* | | | 34,410 | | | | 1,309 | | |
Michael Kors Holdings* | | | 107,150 | | | | 5,698 | | |
New Oriental Education &
Technology Group SP ADR | | | 121,450 | | | | 2,025 | | |
Parkson Retail Group | | | 1,490,851 | | | | 1,250 | | |
PulteGroup* | | | 81,190 | | | | 1,258 | | |
Ralph Lauren | | | 17,490 | | | | 2,645 | | |
Royal Caribbean Cruises | | | 200,460 | | | | 6,056 | | |
rue21* | | | 124,890 | | | | 3,890 | | |
Sands China | | | 638,976 | | | | 2,386 | | |
Shutterfly* | | | 151,310 | | | | 4,709 | | |
SodaStream International* | | | 26,360 | | | | 1,032 | | |
Standard Pacific* | | | 135,530 | | | | 916 | | |
Starbucks | | | 135,520 | | | | 6,878 | | |
| | | Shares | | Value
(000) | |
Starwood Hotels & Resorts
Worldwide | | | 89,309 | | | $ | 5,176 | | |
Target | | | 42,030 | | | | 2,668 | | |
Tempur-Pedic International* | | | 40,130 | | | | 1,199 | | |
Under Armour, Cl A* | | | 23,320 | | | | 1,302 | | |
Urban Outfitters* | | | 55,110 | | | | 2,070 | | |
Vera Bradley* | | | 174,070 | | | | 4,152 | | |
VF | | | 29,930 | | | | 4,770 | | |
Vitamin Shoppe* | | | 44,480 | | | | 2,594 | | |
Yum! Brands | | | 86,170 | | | | 5,716 | | |
Total Consumer discretionary | | | | | 161,013 | | |
Consumer staples—3.4% | |
Coca-Cola | | | 311,530 | | | | 11,817 | | |
Costco Wholesale | | | 26,560 | | | | 2,659 | | |
Golden Eagle Retail Group | | | 344,940 | | | | 677 | | |
Kellogg | | | 131,940 | | | | 6,816 | | |
Mead Johnson Nutrition, Cl A | | | 18,800 | | | | 1,378 | | |
Procter & Gamble | | | 42,010 | | | | 2,914 | | |
Susser Holdings* | | | 34,810 | | | | 1,259 | | |
Unilever PLC SP ADR | | | 147,240 | | | | 5,377 | | |
Total Consumer staples | | | | | 32,897 | | |
Energy—6.1% | |
Anadarko Petroleum | | | 105,070 | | | | 7,347 | | |
Bellatrix Exploration* | | | 153,250 | | | | 622 | | |
Cabot Oil & Gas | | | 92,256 | | | | 4,142 | | |
Cameron International* | | | 40,940 | | | | 2,296 | | |
China Petroleum & Chemical,
H Shares | | | 1,503,340 | | | | 1,404 | | |
Cobalt International Energy* | | | 158,010 | | | | 3,519 | | |
Comstock Resources* | | | 68,455 | | | | 1,258 | | |
Concho Resources* | | | 78,740 | | | | 7,461 | | |
Enbridge | | | 73,030 | | | | 2,850 | | |
Epsilon Energy* | | | 290,280 | | | | 620 | | |
Gulfport Energy* | | | 41,690 | | | | 1,303 | | |
Halliburton | | | 76,620 | | | | 2,581 | | |
Hess | | | 82,770 | | | | 4,446 | | |
Kinder Morgan | | | 75,069 | | | | 2,667 | | |
Marathon Oil | | | 139,020 | | | | 4,111 | | |
Ophir Energy* | | | 323,607 | | | | 3,177 | | |
Pioneer Natural Resources | | | 18,220 | | | | 1,902 | | |
Rex Energy* | | | 55,380 | | | | 739 | | |
Schlumberger | | | 65,420 | | | | 4,732 | | |
Susser Petroleum Partners LP* | | | 66,960 | | | | 1,606 | | |
26 TURNER FUNDS 2012 ANNUAL REPORT
Schedule of investments
Turner Spectrum Fund
| | | Shares | | Value
(000) | |
TriOil Resources* | | | 269,210 | | | $ | 685 | | |
Total Energy | | | | | 59,468 | | |
Financials—12.2% | |
Affiliated Managers Group* | | | 20,010 | | | | 2,461 | | |
AIA Group | | | 471,821 | | | | 1,759 | | |
Alterra Capital Holdings | | | 59,180 | | | | 1,417 | | |
American Safety Insurance
Holdings* | | | 124,410 | | | | 2,325 | | |
American Tower | | | 37,200 | | | | 2,656 | | |
Bank of Nova Scotia | | | 62,600 | | | | 3,432 | | |
Bank of the Ozarks | | | 83,409 | | | | 2,875 | | |
Brown & Brown | | | 156,280 | | | | 4,074 | | |
Camden Property Trust | | | 30,330 | | | | 1,956 | | |
Cardinal Financial | | | 77,040 | | | | 1,102 | | |
Cardtronics* | | | 97,073 | | | | 2,891 | | |
Citigroup | | | 56,490 | | | | 1,848 | | |
Compartamos SAB de CV | | | 1,096,531 | | | | 1,284 | | |
Credicorp | | | 14,630 | | | | 1,833 | | |
Discover Financial Services | | | 84,030 | | | | 3,338 | | |
Education Realty Trust | | | 286,470 | | | | 3,122 | | |
Fidelity National Financial, Cl A | | | 207,690 | | | | 4,442 | | |
Fortegra Financial* | | | 280,097 | | | | 2,221 | | |
Franklin Resources | | | 11,240 | | | | 1,406 | | |
General Growth Properties | | | 102,660 | | | | 2,000 | | |
Grupo Financiero Santander
Mexico SAB de CV SP
ADR, Cl B* | | | 117,640 | | | | 1,612 | | |
Hanover Insurance Group | | | 18,940 | | | | 706 | | |
Hersha Hospitality Trust | | | 205,470 | | | | 1,007 | | |
ICICI Bank SP ADR | | | 38,210 | | | | 1,534 | | |
IntercontinentalExchange* | | | 11,770 | | | | 1,570 | | |
Inversiones La Construccion SA* | | | 84,613 | | | | 1,368 | | |
Invesco | | | 242,720 | | | | 6,066 | | |
Lazard, Cl A | | | 85,450 | | | | 2,498 | | |
MarketAxess Holdings | | | 45,020 | | | | 1,423 | | |
MetroCorp Bancshares* | | | 186,359 | | | | 1,973 | | |
Metropolitan Bank & Trust | | | 1,419,410 | | | | 3,148 | | |
National Bank Holdings, Cl A* | | | 111,000 | | | | 2,160 | | |
Ocwen Financial* | | | 228,385 | | | | 6,260 | | |
OmniAmerican Bancorp* | | | 64,134 | | | | 1,458 | | |
ProAssurance | | | 90,580 | | | | 8,192 | | |
Signature Bank* | | | 21,330 | | | | 1,431 | | |
Simon Property Group | | | 47,080 | | | | 7,147 | | |
Summit Hotel Properties | | | 256,150 | | | | 2,187 | | |
| | | Shares | | Value
(000) | |
Sun Communities | | | 60,150 | | | $ | 2,654 | | |
Tetragon Financial Group | | | 75,429 | | | | 644 | | |
Texas Capital Bancshares* | | | 62,210 | | | | 3,092 | | |
Walter Investment Management* | | | 112,721 | | | | 4,172 | | |
Wells Fargo | | | 210,000 | | | | 7,251 | | |
Total Financials | | | | | 117,995 | | |
Health care—13.7% | |
Abbott Laboratories | | | 87,510 | | | | 6,000 | | |
Acadia Healthcare* | | | 34,225 | | | | 816 | | |
Achillion Pharmaceuticals* | | | 155,440 | | | | 1,618 | | |
Agilent Technologies | | | 114,140 | | | | 4,389 | | |
Air Methods* | | | 70,518 | | | | 8,418 | | |
Akorn* | | | 76,989 | | | | 1,018 | | |
Alexion Pharmaceuticals* | | | 56,960 | | | | 6,516 | | |
Allergan | | | 106,930 | | | | 9,793 | | |
Analogic | | | 16,820 | | | | 1,315 | | |
ARIAD Pharmaceuticals* | | | 203,820 | | | | 4,937 | | |
ArthroCare* | | | 168,812 | | | | 5,469 | | |
Biogen Idec* | | | 25,200 | | | | 3,761 | | |
Catamaran* | | | 24,740 | | | | 2,424 | | |
Centene* | | | 12,350 | | | | 462 | | |
Charles River Laboratories
International* | | | 26,740 | | | | 1,059 | | |
Cooper | | | 34,690 | | | | 3,277 | | |
Covidien | | | 123,860 | | | | 7,360 | | |
Cubist Pharmaceuticals* | | | 21,520 | | | | 1,026 | | |
Elan SP ADR* | | | 199,203 | | | | 2,135 | | |
Express Scripts Holding* | | | 122,080 | | | | 7,651 | | |
Fluidigm* | | | 17,921 | | | | 305 | | |
Health Net* | | | 92,900 | | | | 2,091 | | |
Humana | | | 9,810 | | | | 688 | | |
IDEXX Laboratories* | | | 10,310 | | | | 1,024 | | |
Incyte* | | | 39,040 | | | | 705 | | |
Intuitive Surgical* | | | 4,410 | | | | 2,186 | | |
McKesson | | | 28,710 | | | | 2,470 | | |
Medivation* | | | 13,140 | | | | 741 | | |
MEDNAX* | | | 57,740 | | | | 4,299 | | |
Metropolitan Health Networks* | | | 448,719 | | | | 4,191 | | |
OncoGenex Pharmaceutical* | | | 32,553 | | | | 461 | | |
Onyx Pharmaceuticals* | | | 35,170 | | | | 2,972 | | |
Optimer Pharmaceuticals* | | | 24,490 | | | | 346 | | |
Patterson | | | 29,970 | | | | 1,026 | | |
Perrigo | | | 8,810 | | | | 1,023 | | |
Pfizer | | | 109,860 | | | | 2,730 | | |
TURNER FUNDS 2012 ANNUAL REPORT 27
Schedule of investments
Turner Spectrum Fund
| | | Shares | | Value
(000) | |
PSS World Medical* | | | 134,415 | | | $ | 3,062 | | |
QLT* | | | 100,131 | | | | 780 | | |
Roche Holding AG SP ADR | | | 28,940 | | | | 1,360 | | |
Shire SP ADR | | | 9,160 | | | | 812 | | |
Spectrum Pharmaceuticals* | | | 166,668 | | | | 1,950 | | |
St. Jude Medical | | | 64,760 | | | | 2,728 | | |
Synageva BioPharma* | | | 25,840 | | | | 1,381 | | |
Team Health Holdings* | | | 188,811 | | | | 5,122 | | |
Teleflex | | | 48,970 | | | | 3,371 | | |
ViroPharma* | | | 28,730 | | | | 868 | | |
WellCare Health Plans* | | | 72,670 | | | | 4,109 | | |
YM Biosciences* | | | 152,702 | | | | 281 | | |
Total Health care | | | | | 132,526 | | |
Industrials—7.1% | |
Alaska Air Group* | | | 65,680 | | | | 2,303 | | |
AMETEK | | | 50,160 | | | | 1,778 | | |
BE Aerospace* | | | 42,490 | | | | 1,789 | | |
Caterpillar | | | 17,510 | | | | 1,507 | | |
Corporate Executive Board | | | 36,750 | | | | 1,971 | | |
Corrections Corp. of America | | | 62,250 | | | | 2,082 | | |
Cummins | | | 53,440 | | | | 4,928 | | |
Deere | | | 73,462 | | | | 6,060 | | |
Eaton | | | 49,410 | | | | 2,335 | | |
Embraer SA SP ADR | | | 270,093 | | | | 7,190 | | |
Equifax | | | 118,080 | | | | 5,500 | | |
Fortune Brands Home &
Security* | | | 119,420 | | | | 3,225 | | |
Hertz Global Holdings* | | | 89,160 | | | | 1,224 | | |
Honeywell International | | | 24,240 | | | | 1,448 | | |
Huron Consulting Group* | | | 115,910 | | | | 4,036 | | |
Middleby* | | | 10,420 | | | | 1,205 | | |
Silvercrest Mines* | | | 200,434 | | | | 567 | | |
SPX | | | 63,710 | | | | 4,167 | | |
Stericycle* | | | 11,300 | | | | 1,023 | | |
Thermon Group Holdings* | | | 87,570 | | | | 2,188 | | |
Titan International | | | 65,819 | | | | 1,162 | | |
Union Pacific | | | 14,850 | | | | 1,763 | | |
US Airways Group* | | | 255,520 | | | | 2,673 | | |
Verisk Analytics, Cl A* | | | 140,911 | | | | 6,709 | | |
Total Industrials | | | | | 68,833 | | |
Information technology—9.8% | |
Akamai Technologies* | | | 47,490 | | | | 1,817 | | |
Altera | | | 62,620 | | | | 2,128 | | |
| | | Shares | | Value
(000) | |
Apple | | | 8,230 | | | $ | 5,492 | | |
Broadcom, Cl A | | | 177,830 | | | | 6,149 | | |
Cirrus Logic* | | | 67,192 | | | | 2,579 | | |
Citrix Systems* | | | 21,490 | | | | 1,645 | | |
Cognizant Technology
Solutions, Cl A* | | | 10,600 | | | | 741 | | |
Digimarc | | | 118,071 | | | | 2,627 | | |
eBay* | | | 37,780 | | | | 1,829 | | |
Electronic Arts* | | | 153,180 | | | | 1,944 | | |
EMC* | | | 180,040 | | | | 4,910 | | |
F5 Networks* | | | 30,850 | | | | 3,230 | | |
Fidelity National Information
Services | | | 52,235 | | | | 1,631 | | |
Fortinet* | | | 118,030 | | | | 2,849 | | |
Fusion-io* | | | 36,750 | | | | 1,112 | | |
Global Payments | | | 118,060 | | | | 4,938 | | |
GSI Group* | | | 59,160 | | | | 527 | | |
Heartland Payment Systems | | | 106,740 | | | | 3,382 | | |
Manhattan Associates* | | | 43,060 | | | | 2,466 | | |
MercadoLibre | | | 15,080 | | | | 1,245 | | |
Monolithic Power Systems* | | | 49,180 | | | | 971 | | |
NXP Semiconductors* | | | 110,630 | | | | 2,767 | | |
OSI Systems* | | | 55,621 | | | | 4,330 | | |
Power Integrations | | | 29,810 | | | | 907 | | |
Remark Media* | | | 128,960 | | | | 217 | | |
Riverbed Technology* | | | 118,880 | | | | 2,766 | | |
Samsung Electronics | | | 1,480 | | | | 1,793 | | |
SINA* | | | 30,560 | | | | 1,977 | | |
Sourcefire* | | | 49,010 | | | | 2,403 | | |
Stamps.com* | | | 175,650 | | | | 4,065 | | |
Synchronoss Technologies* | | | 32,000 | | | | 733 | | |
Take-Two Interactive Software* | | | 262,450 | | | | 2,737 | | |
Tencent Holdings | | | 107,400 | | | | 3,659 | | |
TIBCO Software* | | | 69,220 | | | | 2,093 | | |
Trimble Navigation* | | | 55,660 | | | | 2,653 | | |
Tyler Technologies* | | | 37,480 | | | | 1,650 | | |
Ultratech* | | | 21,580 | | | | 677 | | |
Visa, Cl A | | | 38,750 | | | | 5,203 | | |
Total Information technology | | | | | 94,842 | | |
Materials—6.1% | |
Celanese, Ser A | | | 37,210 | | | | 1,411 | | |
Cemex SAB de CV SP ADR* | | | 184,270 | | | | 1,535 | | |
CF Industries Holdings | | | 25,332 | | | | 5,630 | | |
Cliffs Natural Resources | | | 105,080 | | | | 4,112 | | |
28 TURNER FUNDS 2012 ANNUAL REPORT
Schedule of investments
Turner Spectrum Fund
| | | Contracts/
Shares | | Value
(000) | |
Crown Holdings* | | | 64,660 | | | $ | 2,376 | | |
Eldorado Gold | | | 395,580 | | | | 6,029 | | |
Freeport-McMoRan
Copper & Gold | | | 203,060 | | | | 8,037 | | |
Goldcorp | | | 47,020 | | | | 2,156 | | |
HudBay Minerals | | | 86,660 | | | | 853 | | |
Metals USA Holdings* | | | 98,520 | | | | 1,317 | | |
Monsanto | | | 46,440 | | | | 4,227 | | |
Mosaic | | | 59,880 | | | | 3,450 | | |
Nucor | | | 40,530 | | | | 1,551 | | |
PPG Industries | | | 33,130 | | | | 3,805 | | |
Rentech Nitrogen Partners LP | | | 142,220 | | | | 5,512 | | |
Rock-Tenn, Cl A | | | 29,000 | | | | 2,093 | | |
Silver Wheaton | | | 48,230 | | | | 1,915 | | |
Yamana Gold | | | 173,740 | | | | 3,320 | | |
Total Materials | | | | | 59,329 | | |
Telecommunication services—0.3% | |
Cincinnati Bell* | | | 491,040 | | | | 2,799 | | |
Total Telecommunication services | | | | | 2,799 | | |
Total Common stock
(Cost $697,192)** | | | | | 729,702 | | |
Exchange traded fund—0.1% | |
ETFS Platinum Trust | | | 8,330 | | | | 1,361 | | |
Total Exchange traded fund
(Cost $1,381)** | | | | | 1,361 | | |
Call option contract—0.0% | |
Humana, 11/12 at $75 | | | 701 | | | | 112 | | |
Total Call option contract
(Cost $103)** | | | | | 112 | | |
Put option contract—0.0% | |
United States Oil Fund LP,
10/12 at $35 | | | 1,153 | | | | 167 | | |
Total Put option contract
(Cost $148)** | | | | | 167 | | |
| | | Shares | | Value
(000) | |
Warrant—0.1% | |
Consumer discretionary—0.1% | |
Kinder Morgan* | | | 110,604 | | | $ | 386 | | |
Total Consumer discretionary | | | | | 386 | | |
Total Warrant
(Cost $—)** | | | | | 386 | | |
Cash equivalent—6.1% | |
BlackRock TempCash Fund,
Institutional Shares,
0.010%*** | | | 59,200,945 | | | | 59,201 | | |
Total Cash equivalent
(Cost $59,201)** | | | | | 59,201 | | |
Total Investments—81.6%
(Cost $758,025)** | | | | | 790,929 | | |
Segregated cash with brokers—69.3% | | | | | 672,327 | | |
Securities sold short—(48.9)%
(Proceeds $(474,712))** | | | | | (474,684 | ) | |
Net Other assets (liabilities)—(2.0)% | | | | | (18,791 | ) | |
Net Assets—100.0% | | | | $ | 969,781 | | |
* Non-income producing security.
** This number is listed in thousands.
*** Rate shown is the 7-day effective yield as of September 30, 2012.
ADR — American Depositary Receipt
Cl — Class
LP — Limited Partnership
Ser — Series
The accompanying notes are an integral part of the financial statements.
TURNER FUNDS 2012 ANNUAL REPORT 29
Schedule of securities sold short
Turner Spectrum Fund
September 30, 2012
| | | Shares | | Value
(000) | |
Common stock—41.8% | |
Consumer discretionary—9.7% | |
AutoNation | | | 64,410 | | | $ | 2,813 | | |
Bally Technologies | | | 36,060 | | | | 1,781 | | |
BYD, H Shares | | | 393,380 | | | | 686 | | |
Compagnie Financiere
Richemont SA, Cl A | | | 30,470 | | | | 1,828 | | |
Daimler AG, Registered Shares | | | 64,543 | | | | 3,124 | | |
Deckers Outdoor | | | 38,110 | | | | 1,396 | | |
Dunkin' Brands Group | | | 134,680 | | | | 3,932 | | |
Expedia | | | 46,230 | | | | 2,674 | | |
Fossil | | | 12,790 | | | | 1,083 | | |
Genesco | | | 26,550 | | | | 1,772 | | |
Goodyear Tire & Rubber | | | 52,450 | | | | 639 | | |
Hennes & Mauritz AB, B Shares | | | 57,790 | | | | 2,008 | | |
Jos. A. Bank Clothiers | | | 20,320 | | | | 985 | | |
Life Time Fitness | | | 35,970 | | | | 1,645 | | |
Lowe's | | | 263,740 | | | | 7,976 | | |
Lumber Liquidators Holdings | | | 34,760 | | | | 1,762 | | |
Macy's | | | 87,880 | | | | 3,306 | | |
Magna International | | | 27,610 | | | | 1,195 | | |
Manchester United, Cl A | | | 39,455 | | | | 502 | | |
Marriott International, Cl A | | | 283,970 | | | | 11,103 | | |
Mattel | | | 72,160 | | | | 2,560 | | |
Men's Wearhouse | | | 23,090 | | | | 795 | | |
Netflix | | | 13,100 | | | | 713 | | |
Next | | | 36,355 | | | | 2,025 | | |
Nike, Cl B | | | 21,860 | | | | 2,075 | | |
Nordstrom | | | 22,310 | | | | 1,231 | | |
O'Reilly Automotive | | | 40,600 | | | | 3,395 | | |
PetSmart | | | 26,040 | | | | 1,796 | | |
PPR | | | 12,096 | | | | 1,856 | | |
Sherwin-Williams | | | 13,130 | | | | 1,955 | | |
Skechers U.S.A., Cl A | | | 52,760 | | | | 1,076 | | |
Stanely Black & Decker | | | 17,380 | | | | 1,325 | | |
Swatch Group AG, Bearer Shares | | | 12,652 | | | | 5,049 | | |
Tiffany | | | 76,450 | | | | 4,731 | | |
Tim Hortons | | | 51,170 | | | | 2,662 | | |
TJX | | | 42,870 | | | | 1,920 | | |
Viacom, Cl B | | | 30,910 | | | | 1,657 | | |
VistaPrint NV | | | 49,440 | | | | 1,688 | | |
Whirlpool | | | 17,480 | | | | 1,449 | | |
Wolverine World Wide | | | 20,250 | | | | 899 | | |
Wynn Macau | | | 357,416 | | | | 966 | | |
Total Consumer discretionary | | | | | 94,033 | | |
| | | Shares | | Value
(000) | |
Consumer staples—2.8% | |
Dr Pepper Snapple Group | | | 61,680 | | | $ | 2,747 | | |
Green Mountain Coffee Roasters | | | 126,920 | | | | 3,014 | | |
H.J. Heinz | | | 47,830 | | | | 2,676 | | |
Kraft Foods Group | | | 36,760 | | | | 1,641 | | |
Kroger | | | 113,890 | | | | 2,681 | | |
McDonald's | | | 58,240 | | | | 5,344 | | |
Sysco | | | 180,050 | | | | 5,630 | | |
Wal-Mart Stores | | | 49,780 | | | | 3,674 | | |
Total Consumer staples | | | | | 27,407 | | |
Energy—4.2% | |
Apache | | | 62,230 | | | | 5,381 | | |
Berry Petroleum, Cl A | | | 50,730 | | | | 2,061 | | |
CARBO Ceramics | | | 15,260 | | | | 960 | | |
Chesapeake Energy | | | 90,890 | | | | 1,715 | | |
Chevron | | | 20,930 | | | | 2,440 | | |
ConocoPhillips | | | 122,840 | | | | 7,024 | | |
CONSOL Energy | | | 49,430 | | | | 1,485 | | |
Diamond Offshore Drilling | | | 41,410 | | | | 2,725 | | |
Ecopetrol SA SP ADR | | | 29,430 | | | | 1,734 | | |
Encana | | | 110,780 | | | | 2,428 | | |
Green Plains Renewable Energy | | | 89,712 | | | | 526 | | |
Helmerich & Payne | | | 60,120 | | | | 2,862 | | |
Oasis Petroleum | | | 71,850 | | | | 2,118 | | |
Patterson-UTI Energy | | | 122,640 | | | | 1,943 | | |
PetroChina | | | 1,077,270 | | | | 1,412 | | |
Southwestern Energy | | | 19,720 | | | | 686 | | |
Ultra Petroleum | | | 145,150 | | | | 3,190 | | |
Total Energy | | | | | 40,690 | | |
Financials—6.5% | |
Ameriprise Financial | | | 43,740 | | | | 2,480 | | |
Apartment Investment &
Management, Cl A | | | 94,940 | | | | 2,467 | | |
Banco Santander Chile SP ADR | | | 39,009 | | | | 2,857 | | |
Bancolombia SA SP ADR | | | 36,020 | | | | 2,151 | | |
BancorpSouth | | | 136,270 | | | | 2,009 | | |
Bank of Montreal | | | 41,510 | | | | 2,451 | | |
Boston Private Financial
Holdings | | | 205,320 | | | | 1,969 | | |
Cincinnati Financial | | | 62,510 | | | | 2,368 | | |
City National | | | 39,030 | | | | 2,010 | | |
Grupo Financiero Banorte
SAB de CV | | | 260,713 | | | | 1,474 | | |
30 TURNER FUNDS 2012 ANNUAL REPORT
Schedule of securities sold short
Turner Spectrum Fund
| | | Shares | | Value
(000) | |
HCC Insurance Holdings | | | 150,420 | | | $ | 5,098 | | |
HDFC Bank SP ADR | | | 44,810 | | | | 1,684 | | |
Legg Mason | | | 55,670 | | | | 1,374 | | |
Montpelier Re Holdings | | | 128,210 | | | | 2,837 | | |
MSCI, Cl A | | | 150,890 | | | | 5,400 | | |
Northern Trust | | | 23,320 | | | | 1,082 | | |
Progressive | | | 123,440 | | | | 2,560 | | |
State Street | | | 62,960 | | | | 2,642 | | |
T. Rowe Price Group | | | 99,440 | | | | 6,294 | | |
Tanger Factory Outlet Centers | | | 66,380 | | | | 2,146 | | |
TD Ameritrade Holding | | | 116,640 | | | | 1,793 | | |
Valley National Bancorp | | | 243,570 | | | | 2,441 | | |
Vornado Realty Trust | | | 45,930 | | | | 3,723 | | |
W.R. Berkley | | | 57,960 | | | | 2,173 | | |
Total Financials | | | | | 63,483 | | |
Health care—5.4% | |
Aetna | | | 51,380 | | | | 2,035 | | |
AmerisourceBergen, Cl A | | | 43,930 | | | | 1,701 | | |
AstraZeneca SP ADR | | | 58,530 | | | | 2,801 | | |
Baxter International | | | 34,080 | | | | 2,054 | | |
Becton Dickinson | | | 69,910 | | | | 5,492 | | |
Bristol-Myers Squibb | | | 131,500 | | | | 4,438 | | |
DENTSPLY International | | | 27,370 | | | | 1,044 | | |
Johnson & Johnson | | | 136,890 | | | | 9,433 | | |
Kindred Healthcare | | | 60,000 | | | | 683 | | |
Medtronic | | | 103,590 | | | | 4,467 | | |
Mettler-Toledo International | | | 12,480 | | | | 2,131 | | |
Mindray Medical
International SP ADR | | | 62,920 | | | | 2,115 | | |
Myriad Genetics | | | 31,890 | | | | 861 | | |
Novartis AG SP ADR | | | 79,250 | | | | 4,855 | | |
Sanofi SP ADR | | | 48,060 | | | | 2,069 | | |
Seattle Genetics | | | 15,040 | | | | 405 | | |
Takeda Pharmaceutical | | | 28,590 | | | | 1,317 | | |
Thermo Fisher Scientific | | | 17,040 | | | | 1,002 | | |
Valeant Pharmaceuticals
International | | | 14,680 | | | | 811 | | |
Varian Medical Systems | | | 47,840 | | | | 2,886 | | |
Total Health care | | | | | 52,600 | | |
Industrials—3.7% | |
Ball | | | 56,580 | | | | 2,394 | | |
C.R. Bard | | | 10,560 | | | | 1,105 | | |
Dover | | | 35,010 | | | | 2,083 | | |
| | | Shares | | Value
(000) | |
Emerson Electric | | | 85,650 | | | $ | 4,134 | | |
Fastenal | | | 43,510 | | | | 1,870 | | |
FedEx | | | 19,470 | | | | 1,648 | | |
GrafTech International | | | 80,730 | | | | 726 | | |
Kennametal | | | 18,200 | | | | 675 | | |
Lindsay | | | 14,587 | | | | 1,050 | | |
PACCAR | | | 149,650 | | | | 5,990 | | |
Parker Hannifin | | | 21,600 | | | | 1,805 | | |
Rockwell Automation | | | 10,160 | | | | 707 | | |
Rockwell Collins | | | 85,500 | | | | 4,586 | | |
Scotts Miracle-Gro | | | 67,220 | | | | 2,922 | | |
SGL Carbon SE | | | 29,130 | | | | 1,167 | | |
Southwest Airlines | | | 298,700 | | | | 2,620 | | |
Total Industrials | | | | | 35,482 | | |
Information technology—6.6% | |
Activision Blizzard | | | 138,790 | | | | 1,566 | | |
ADTRAN | | | 35,850 | | | | 619 | | |
Alliance Data Systems | | | 17,730 | | | | 2,517 | | |
Applied Materials | | | 161,880 | | | | 1,807 | | |
Autodesk | | | 21,760 | | | | 726 | | |
CEVA | | | 16,100 | | | | 232 | | |
Check Point Software
Technologies | | | 56,010 | | | | 2,697 | | |
Fiserv | | | 71,530 | | | | 5,295 | | |
Infosys SP ADR | | | 19,740 | | | | 958 | | |
Jack Henry & Associates | | | 124,394 | | | | 4,715 | | |
Lender Processing Services | | | 81,330 | | | | 2,268 | | |
Linear Technology | | | 114,720 | | | | 3,654 | | |
MasterCard, Cl A | | | 12,105 | | | | 5,465 | | |
MicroStrategy, Cl A | | | 13,530 | | | | 1,814 | | |
NetApp | | | 95,260 | | | | 3,132 | | |
Nokia SP ADR | | | 929,810 | | | | 2,390 | | |
Oracle | | | 69,560 | | | | 2,190 | | |
Parametric Technology | | | 49,370 | | | | 1,076 | | |
Paychex | | | 150,527 | | | | 5,011 | | |
Plantronics | | | 25,800 | | | | 912 | | |
Polycom | | | 251,160 | | | | 2,479 | | |
Research In Motion | | | 94,450 | | | | 708 | | |
Seagate Technology | | | 92,090 | | | | 2,855 | | |
Syntel | | | 11,706 | | | | 731 | | |
Tech Data | | | 81,560 | | | | 3,695 | | |
Teradata | | | 11,750 | | | | 886 | | |
VeriFone Systems | | | 25,570 | | | | 712 | | |
Western Union | | | 173,380 | | | | 3,159 | | |
Total Information technology | | | | | 64,269 | | |
TURNER FUNDS 2012 ANNUAL REPORT 31
Schedule of securities sold short
Turner Spectrum Fund
| | | Shares | | Value
(000) | |
Materials—2.9% | |
Alcoa | | | 642,710 | | | $ | 5,688 | | |
Allegheny Technologies | | | 35,260 | | | | 1,125 | | |
Allied Nevada Gold | | | 36,570 | | | | 1,428 | | |
Aluminum Corp. of China,
H Shares | | | 1,586,040 | | | | 657 | | |
Compass Minerals International | | | 64,720 | | | | 4,828 | | |
Detour Gold | | | 26,270 | | | | 733 | | |
Gold Fields SP ADR | | | 72,250 | | | | 928 | | |
Intrepid Potash | | | 34,010 | | | | 731 | | |
Molycorp | | | 38,500 | | | | 443 | | |
Newmont Mining | | | 12,160 | | | | 681 | | |
Praxair | | | 26,610 | | | | 2,764 | | |
Schnitzer Steel Industries, Cl A | | | 55,990 | | | | 1,576 | | |
Sigma-Aldrich | | | 28,860 | | | | 2,077 | | |
Steel Dynamics | | | 112,770 | | | | 1,266 | | |
Teck Resources, Cl B | | | 48,640 | | | | 1,433 | | |
United States Steel | | | 79,150 | | | | 1,509 | | |
Total Materials | | | | | 27,867 | | |
Total Common stock
(Proceeds $406,114)* | | | | | 405,831 | | |
Convertible corporate bond—0.0% | |
Financials—0.0% | |
Credit Suisse Group Capital
(Guernsey) V, 4.00%, 3/29/13† | | | 160 | | | | 211 | | |
Total Convertible corporate bond
(Proceeds $164) | | | | | 211 | | |
Exchange traded funds—7.1% | |
Health Care Select Sector
SPDR Fund | | | 85,090 | | | | 3,413 | | |
iShares NASDAQ Biotechnology
Index Fund | | | 10,170 | | | | 1,449 | | |
iShares Russell 2000 Index Fund | | | 35,860 | | | | 2,993 | | |
Market Vectors Oil Service ETF | | | 132,090 | | | | 5,310 | | |
Market Vectors
Pharmaceutical ETF | | | 135,660 | | | | 5,562 | | |
Market Vectors Semiconductor | | | 308,800 | | | | 9,767 | | |
SPDR S&P 500 ETF Trust | | | 61,700 | | | | 8,880 | | |
SPDR S&P Oil & Gas
Exploration & Production ETF | | | 94,620 | | | | 5,269 | | |
SPDR S&P Retail ETF | | | 43,740 | | | | 2,743 | | |
| | | Shares | | Value
(000) | |
Technology Select
Sector SPDR Fund | | | 30,790 | | | $ | 949 | | |
United States Natural Gas Fund LP | | | 84,862 | | | | 1,811 | | |
Vanguard Small-Cap Growth ETF | | | 131,650 | | | | 10,550 | | |
Vanguard Small-Cap Growth ETF | | | 112,720 | | | | 9,946 | | |
Total Exchange traded funds
(Proceeds $68,434)* | | | | | 68,642 | | |
Total Securities sold short—48.9%
(Proceeds $474,712)* | | | | | 474,684 | | |
Percentages disclosed are based on total net assets of the Fund at September 30, 2012.
* This number is listed in thousands.
† Represents a restricted security. The security has been deemed illiquid according to the policies and procedures adopted by the Board of Trustees. At September 30, 2012, illiquid securities were 0.0% of the Fund's net assets.
| | Acquisition
Date | | Acquisition
Cost* | | Share
Amount | | Fair
Value* | |
Credit Suisse Group
Capital (Guernsey) V | | 8/13/12 | | $ | 164 | | | | 160 | | | $ | 211 | | |
ADR — American Depositary Receipt
Cl — Class
ETF — Exchange Traded Fund
LP — Limited Partnership
The accompanying notes are an integral part of the financial statements.
32 TURNER FUNDS 2012 ANNUAL REPORT
Turner Titan Fund
September 30, 2012
| | | Shares | | Value
(000) | |
Common stock—78.9% | |
Consumer discretionary—17.5% | |
American Eagle Outfitters | | | 13,490 | | | $ | 284 | | |
CBS, Cl B^ | | | 7,260 | | | | 264 | | |
Coach | | | 7,150 | | | | 401 | | |
Dollar Tree* | | | 6,370 | | | | 307 | | |
GNC Holdings, Cl A^ | | | 13,940 | | | | 543 | | |
Home Depot | | | 6,560 | | | | 396 | | |
HomeAway* | | | 17,170 | | | | 403 | | |
Las Vegas Sands | | | 6,690 | | | | 310 | | |
Michael Kors Holdings* | | | 7,040 | | | | 374 | | |
Royal Caribbean Cruises | | | 8,270 | | | | 250 | | |
Sands China | | | 75,960 | | | | 284 | | |
Shutterfly* | | | 10,570 | | | | 329 | | |
Starbucks | | | 6,190 | | | | 314 | | |
Starwood Hotels & Resorts
Worldwide | | | 6,580 | | | | 381 | | |
Under Armour, Cl A* | | | 5,020 | | | | 280 | | |
Yum! Brands | | | 5,540 | | | | 368 | | |
Total Consumer discretionary | | | | | 5,488 | | |
Consumer staples—3.4% | |
Coca-Cola | | | 20,460 | | | | 776 | | |
Mead Johnson Nutrition, Cl A | | | 4,060 | | | | 297 | | |
Total Consumer staples | | | | | 1,073 | | |
Energy—7.5% | |
Anadarko Petroleum^ | | | 6,770 | | | | 473 | | |
Cabot Oil & Gas | | | 9,130 | | | | 410 | | |
Concho Resources* | | | 10,780 | | | | 1,022 | | |
Schlumberger^ | | | 6,390 | | | | 462 | | |
Total Energy | | | | | 2,367 | | |
Financials—7.3% | |
Citigroup | | | 12,100 | | | | 396 | | |
Franklin Resources | | | 2,430 | | | | 304 | | |
IntercontinentalExchange*^ | | | 2,530 | | | | 337 | | |
Simon Property Group | | | 4,050 | | | | 615 | | |
Wells Fargo | | | 18,030 | | | | 623 | | |
Total Financials | | | | | 2,275 | | |
Health care—9.4% | |
Agilent Technologies | | | 12,080 | | | | 464 | | |
Allergan | | | 7,640 | | | | 700 | | |
Biogen Idec* | | | 3,040 | | | | 454 | | |
| | | Shares | | Value
(000) | |
Covidien^ | | | 6,640 | | | $ | 394 | | |
Express Scripts Holding* | | | 7,420 | | | | 465 | | |
Intuitive Surgical*^ | | | 930 | | | | 461 | | |
Total Health care | | | | | 2,938 | | |
Industrials—7.6% | |
AMETEK | | | 10,730 | | | | 380 | | |
BE Aerospace* | | | 9,020 | | | | 380 | | |
Cummins | | | 3,930 | | | | 362 | | |
Eaton | | | 10,490 | | | | 496 | | |
Equifax | | | 10,050 | | | | 468 | | |
Honeywell International | | | 5,220 | | | | 312 | | |
Total Industrials | | | | | 2,398 | | |
Information technology—20.2% | |
Akamai Technologies* | | | 10,220 | | | | 391 | | |
Altera | | | 13,460 | | | | 457 | | |
Broadcom, Cl A | | | 22,860 | | | | 791 | | |
Citrix Systems* | | | 4,620 | | | | 354 | | |
Cognizant Technology
Solutions, Cl A* | | | 2,280 | | | | 159 | | |
eBay* | | | 8,170 | | | | 396 | | |
EMC* | | | 17,980 | | | | 490 | | |
F5 Networks* | | | 6,640 | | | | 695 | | |
Fortinet* | | | 25,400 | | | | 613 | | |
Fusion-io* | | | 7,890 | | | | 239 | | |
MercadoLibre | | | 3,170 | | | | 262 | | |
Tencent Holdings | | | 9,480 | | | | 323 | | |
TIBCO Software* | | | 14,650 | | | | 443 | | |
Trimble Navigation* | | | 6,680 | | | | 318 | | |
Visa, Cl A | | | 2,940 | | | | 395 | | |
Total Information technology | | | | | 6,326 | | |
Materials—6.0% | |
Eldorado Gold | | | 36,050 | | | | 549 | | |
Monsanto | | | 6,990 | | | | 636 | | |
PPG Industries | | | 3,470 | | | | 399 | | |
Yamana Gold | | | 16,350 | | | | 313 | | |
Total Materials | | | | | 1,897 | | |
Total Common stock
(Cost $23,806)** | | | | | 24,762 | | |
TURNER FUNDS 2012 ANNUAL REPORT 33
Schedule of investments
Turner Titan Fund
| | | Shares | | Value
(000) | |
Cash equivalent—11.0% | |
BlackRock TempCash Fund,
Institutional Shares,
0.010%***^ | | | 3,441,805 | | | $ | 3,442 | | |
Total Cash equivalent
(Cost $3,442)** | | | | | 3,442 | | |
Total Investments—89.9%
(Cost $27,248)** | | | | | 28,204 | | |
Segregated cash with brokers—56.1% | | | | | 17,596 | | |
Securities sold short—(46.2)%
(Proceeds $(14,535))** | | | | | (14,494 | ) | |
Net Other assets (liabilities)—0.2% | | | | | 74 | | |
Net Assets—100.0% | | | | $ | 31,380 | | |
* Non-income producing security.
** This number is listed in thousands.
*** Rate shown is the 7-day effective yield as of September 30, 2012.
^ All or a portion of the shares have been committed as collateral for open short positions.
Cl — Class
The accompanying notes are an integral part of the financial statements.
34 TURNER FUNDS 2012 ANNUAL REPORT
Schedule of securities sold short
Turner Titan Fund
September 30, 2012
| | | Shares | | Value
(000) | |
Common stock—42.7% | |
Consumer discretionary—14.5% | |
Daimler AG, Registered Shares | | | 5,770 | | | $ | 279 | | |
Dunkin' Brands Group | | | 9,470 | | | | 276 | | |
Expedia | | | 4,780 | | | | 276 | | |
Lowe's | | | 11,480 | | | | 347 | | |
Macy's | | | 8,150 | | | | 307 | | |
Manchester United, Cl A | | | 8,380 | | | | 107 | | |
Marriott International, Cl A | | | 11,900 | | | | 465 | | |
Netflix | | | 2,830 | | | | 154 | | |
Nike, Cl B | | | 2,440 | | | | 232 | | |
Nordstrom | | | 4,800 | | | | 265 | | |
O'Reilly Automotive | | | 4,070 | | | | 340 | | |
Swatch Group AG, Bearer Shares | | | 1,450 | | | | 579 | | |
Tiffany | | | 5,070 | | | | 314 | | |
Tim Hortons | | | 5,430 | | | | 283 | | |
VistaPrint NV | | | 3,460 | | | | 118 | | |
Wolverine World Wide | | | 4,300 | | | | 191 | | |
Total Consumer discretionary | | | | | 4,533 | | |
Consumer staples—1.1% | |
Green Mountain Coffee Roasters | | | 6,200 | | | | 148 | | |
Sysco | | | 6,690 | | | | 209 | | |
Total Consumer staples | | | | | 357 | | |
Energy—4.6% | |
Apache | | | 4,480 | | | | 387 | | |
ConocoPhillips | | | 5,460 | | | | 312 | | |
CONSOL Energy | | | 10,620 | | | | 319 | | |
Encana | | | 10,120 | | | | 222 | | |
Helmerich & Payne | | | 4,420 | | | | 211 | | |
Total Energy | | | | | 1,451 | | |
Financials—2.8% | |
MSCI, Cl A | | | 9,460 | | | | 339 | | |
Northern Trust | | | 5,030 | | | | 233 | | |
T. Rowe Price Group | | | 4,820 | | | | 305 | | |
Total Financials | | | | | 877 | | |
Health care—3.4% | |
Mettler-Toledo International | | | 2,670 | | | | 456 | | |
Varian Medical Systems | | | 10,070 | | | | 607 | | |
Total Health care | | | | | 1,063 | | |
| | | Shares | | Value
(000) | |
Industrials—5.6% | |
C.R. Bard | | | 2,240 | | | $ | 234 | | |
Kennametal | | | 3,930 | | | | 146 | | |
PACCAR | | | 11,470 | | | | 459 | | |
Parker Hannifin | | | 4,620 | | | | 386 | | |
Rockwell Automation | | | 2,180 | | | | 152 | | |
Rockwell Collins | | | 7,310 | | | | 392 | | |
Total Industrials | | | | | 1,769 | | |
Information technology—8.7% | |
ADTRAN | | | 7,670 | | | | 133 | | |
Applied Materials | | | 34,770 | | | | 388 | | |
Autodesk | | | 4,630 | | | | 154 | | |
Infosys SP ADR | | | 4,260 | | | | 207 | | |
Linear Technology | | | 7,180 | | | | 229 | | |
NetApp | | | 4,510 | | | | 148 | | |
Oracle | | | 14,990 | | | | 472 | | |
Plantronics | | | 5,520 | | | | 195 | | |
Seagate Technology | | | 5,900 | | | | 183 | | |
Tech Data | | | 6,090 | | | | 276 | | |
Teradata | | | 2,470 | | | | 186 | | |
VeriFone Systems | | | 5,500 | | | | 153 | | |
Total Information technology | | | | | 2,724 | | |
Materials—2.0% | |
Alcoa | | | 26,170 | | | | 232 | | |
Allegheny Technologies | | | 7,550 | | | | 241 | | |
Intrepid Potash | | | 7,320 | | | | 157 | | |
Total Materials | | | | | 630 | | |
Total Common stock
(Proceeds $13,441)* | | | | | 13,404 | | |
Exchange traded funds—3.5% | |
Market Vectors Semiconductor | | | 19,830 | | | | 627 | | |
SPDR S&P 500 ETF Trust | | | 3,220 | | | | 463 | | |
Total Exchange traded funds
(Proceeds $1,094)* | | | | | 1,090 | | |
Total Securities sold short—46.2%
(Proceeds $14,535)* | | | | | 14,494 | | |
Percentages disclosed are based on total net assets of the Fund at September 30, 2012.
* This number is listed in thousands.
ADR — American Depositary Receipt
Cl — Class
ETF — Exchange Traded Fund
The accompanying notes are an integral part of the financial statements.
TURNER FUNDS 2012 ANNUAL REPORT 35
Turner All Cap Growth Fund
September 30, 2012
| | | Shares | | Value
(000) | |
Common stock—99.2%† | |
Consumer discretionary—16.0% | |
Amazon.com* | | | 2,100 | | | $ | 534 | | |
American Eagle Outfitters | | | 32,320 | | | | 681 | | |
Michael Kors Holdings* | | | 7,310 | | | | 389 | | |
Starbucks | | | 17,100 | | | | 868 | | |
Starwood Hotels & Resorts
Worldwide | | | 10,020 | | | | 581 | | |
Under Armour, Cl A* # | | | 6,940 | | | | 387 | | |
Wynn Resorts | | | 6,000 | | | | 693 | | |
Total Consumer discretionary | | | | | 4,133 | | |
Consumer staples—2.6% | |
Whole Foods Market | | | 7,000 | | | | 682 | | |
Total Consumer staples | | | | | 682 | | |
Energy—1.6% | |
Concho Resources* | | | 4,350 | | | | 412 | | |
Total Energy | | | | | 412 | | |
Financials—8.4% | |
Affiliated Managers Group* | �� | | 6,270 | | | | 771 | | |
CBRE Group* | | | 41,400 | | | | 762 | | |
IntercontinentalExchange* | | | 4,760 | | | | 635 | | |
Total Financials | | | | | 2,168 | | |
Health care—14.2% | |
Alexion Pharmaceuticals* | | | 7,490 | | | | 857 | | |
ARIAD Pharmaceuticals* | | | 36,030 | | | | 873 | | |
Catamaran* | | | 8,220 | | | | 805 | | |
Intuitive Surgical* | | | 1,220 | | | | 605 | | |
Medivation* | | | 9,400 | | | | 530 | | |
Total Health care | | | | | 3,670 | | |
Information technology—54.8% | |
Apple | | | 3,470 | | | | 2,315 | | |
ASML Holding, NY Shares | | | 19,290 | | | | 1,036 | | |
Avago Technologies | | | 26,000 | | | | 907 | | |
Broadcom, Cl A | | | 35,030 | | | | 1,211 | | |
Cavium* # | | | 27,250 | | | | 908 | | |
Citrix Systems* | | | 6,910 | | | | 529 | | |
Cornerstone OnDemand* | | | 15,250 | | | | 468 | | |
eBay* | | | 9,100 | | | | 441 | | |
EMC* | | | 15,270 | | | | 416 | | |
F5 Networks* | | | 5,500 | | | | 576 | | |
| | | Shares | | Value
(000) | |
Fusion-io* | | | 14,280 | | | $ | 432 | | |
LinkedIn, Cl A* # | | | 6,570 | | | | 791 | | |
Monolithic Power Systems* | | | 14,460 | | | | 286 | | |
NXP Semiconductors* | | | 49,990 | | | | 1,250 | | |
Peregrine Semiconductor* | | | 41,080 | | | | 696 | | |
Procera Networks* | | | 15,940 | | | | 375 | | |
Salesforce.com* | | | 2,620 | | | | 400 | | |
TIBCO Software* | | | 24,460 | | | | 739 | | |
VMware, Cl A* | | | 3,860 | | | | 373 | | |
Total Information technology | | | | | 14,149 | | |
Telecommunication services—1.6% | |
Aruba Networks* # | | | 18,600 | | | | 418 | | |
Total Telecommunication services | | | | | 418 | | |
Total Common stock
(Cost $22,119)** | | | | | 25,632 | | |
Cash equivalent—10.8% | |
BlackRock TempCash Fund,
Institutional Shares,
0.010%*** (1) | | | 2,792,271 | | | | 2,792 | | |
Total Cash equivalent
(Cost $2,792)** | | | | | 2,792 | | |
Total Investments—110.0%
(Cost $24,911)** | | | | | 28,424 | | |
Net Other assets (liabilities)—(10.0)% | | | | | (2,584 | ) | |
Net Assets—100.0% | | | | $ | 25,840 | | |
* Non-income producing security.
** This number is listed in thousands.
*** Rate shown is the 7-day effective yield as of September 30, 2012.
† More narrow industries are utilized for compliance purposes, whereas broad sectors are utilized for reporting purposes.
# Security fully or partially on loan at September 30, 2012. The total value of securities on loan at September 30, 2012 was $2,493**. Certain of these securities may have been sold prior to period end and are included in receivable for investment securities sold on the Statement of Assets and Liabilities.
(1) A partial position of this security was purchased with cash collateral received from securities lending. The total value of such security at September 30, 2012 was $2,552**.
Cl — Class
NY — New York
The accompanying notes are an integral part of the financial statements.
36 TURNER FUNDS 2012 ANNUAL REPORT
Turner Concentrated Growth Fund
September 30, 2012
| | | Shares | | Value
(000) | |
Common stock—96.6%† | |
Consumer discretionary—14.7% | |
Las Vegas Sands | | | 34,170 | | | $ | 1,584 | | |
Lennar, Cl A # | | | 65,020 | | | | 2,261 | | |
Starbucks | | | 25,810 | | | | 1,310 | | |
Total Consumer discretionary | | | | | 5,155 | | |
Energy—4.2% | |
Concho Resources* | | | 15,510 | | | | 1,470 | | |
Total Energy | | | | | 1,470 | | |
Financials—4.8% | |
CBRE Group* | | | 91,490 | | | | 1,684 | | |
Total Financials | | | | | 1,684 | | |
Health care—11.1% | |
Alexion Pharmaceuticals* | | | 15,390 | | | | 1,761 | | |
Cerner* | | | 13,610 | | | | 1,053 | | |
Intuitive Surgical* | | | 2,130 | | | | 1,056 | | |
Total Health care | | | | | 3,870 | | |
Industrials—7.9% | |
AMETEK | | | 35,255 | | | | 1,250 | | |
Caterpillar | | | 17,360 | | | | 1,493 | | |
Total Industrials | | | | | 2,743 | | |
Information technology—49.6% | |
Apple | | | 6,980 | | | | 4,657 | | |
ASML Holding, NY Shares | | | 18,960 | | | | 1,018 | | |
Broadcom, Cl A | | | 46,300 | | | | 1,601 | | |
eBay* | | | 29,270 | | | | 1,417 | | |
Facebook, Cl A* # | | | 60,970 | | | | 1,320 | | |
Juniper Networks* | | | 69,410 | | | | 1,188 | | |
Palo Alto Networks* # | | | 18,230 | | | | 1,122 | | |
Qualcomm | | | 26,100 | | | | 1,631 | | |
Splunk* # | | | 28,420 | | | | 1,044 | | |
Stratasys* | | | 17,220 | | | | 937 | | |
VMware, Cl A* # | | | 14,350 | | | | 1,388 | | |
Total Information technology | | | | | 17,323 | | |
| | | Shares | | Value
(000) | |
Materials—4.3% | |
Monsanto | | | 16,460 | | | | 1,498 | | |
Total Materials | | | | | 1,498 | | |
Total Common stock
(Cost $29,688)** | | | | | 33,743 | | |
Cash equivalent—22.7% | |
BlackRock TempCash Fund,
Institutional Shares,
0.010%*** (1) | | | 7,917,985 | | | | 7,918 | | |
Total Cash equivalent
(Cost $7,918)** | | | | | 7,918 | | |
Total Investments—119.3%
(Cost $37,606)** | | | | | 41,661 | | |
Net Other assets (liabilities)—(19.3)% | | | | | (6,734 | ) | |
Net Assets—100.0% | | | | $ | 34,927 | | |
* Non-income producing security.
** This number is listed in thousands.
*** Rate shown is the 7-day effective yield as of September 30, 2012.
† More narrow industries are utilized for compliance purposes, whereas broad sectors are utilized for reporting purposes.
# Security fully or partially on loan at September 30, 2012. The total value of securities on loan at September 30, 2012 was $6,584**. Certain of these securities may have been sold prior to period end and are included in receivable for investment securities sold on the Statement of Assets and Liabilities.
(1) A partial position of this security was purchased with cash collateral received from securities lending. The total value of such security at September 30, 2012 was $6,758**.
Cl — Class
NY — New York
The accompanying notes are an integral part of the financial statements.
TURNER FUNDS 2012 ANNUAL REPORT 37
Turner Emerging Growth Fund
September 30, 2012
| | | Shares | | Value
(000) | |
Common stock—97.8% | |
Consumer discretionary—20.7% | |
Aeropostale* | | | 235,160 | | | $ | 3,182 | | |
Ann* | | | 90,060 | | | | 3,398 | | |
Arctic Cat* | | | 70,640 | | | | 2,929 | | |
Buffalo Wild Wings* # | | | 34,170 | | | | 2,930 | | |
Children's Place Retail Stores* # | | | 53,360 | | | | 3,202 | | |
Cracker Barrel Old Country Store | | | 79,600 | | | | 5,342 | | |
Meritage Homes* | | | 64,260 | | | | 2,444 | | |
Oxford Industries | | | 56,440 | | | | 3,186 | | |
Red Robin Gourmet Burgers* | | | 55,050 | | | | 1,792 | | |
rue21* | | | 52,558 | | | | 1,637 | | |
Select Comfort* | | | 120,170 | | | | 3,791 | | |
Shuffle Master* | | | 198,690 | | | | 3,141 | | |
Shutterfly* | | | 80,780 | | | | 2,514 | | |
Ulta Salon, Cosmetics & Fragrance | | | 37,130 | | | | 3,576 | | |
Vitamin Shoppe* | | | 107,789 | | | | 6,286 | | |
Total Consumer discretionary | | | | | 49,350 | | |
Consumer staples—6.4% | |
B&G Foods | | | 75,840 | | | | 2,299 | | |
Boston Beer, Cl A* # | | | 10,200 | | | | 1,142 | | |
Susser Holdings* | | | 93,812 | | | | 3,393 | | |
TreeHouse Foods* | | | 49,647 | | | | 2,606 | | |
United Natural Foods* | | | 97,408 | | | | 5,694 | | |
Total Consumer staples | | | | | 15,134 | | |
Energy—3.4% | |
Bonanza Creek Energy* | | | 54,780 | | | | 1,291 | | |
Halcon Resources* # | | | 78,786 | | | | 577 | | |
Kodiak Oil & Gas* # | | | 151,150 | | | | 1,415 | | |
Lufkin Industries | | | 32,940 | | | | 1,773 | | |
Rex Energy* | | | 235,970 | | | | 3,150 | | |
Total Energy | | | | | 8,206 | | |
Financials—5.3% | |
Cardtronics* | | | 63,899 | | | | 1,903 | | |
Education Realty Trust | | | 291,945 | | | | 3,182 | | |
Sovran Self Storage | | | 58,360 | | | | 3,376 | | |
Sun Communities | | | 57,770 | | | | 2,549 | | |
Umpqua Holdings # | | | 102,810 | | | | 1,325 | | |
Walter Investment Management* | | | 10,646 | | | | 394 | | |
Total Financials | | | | | 12,729 | | |
| | | Shares | | Value
(000) | |
Health care—19.9% | |
ABIOMED* # | | | 22,630 | | | $ | 475 | | |
Acadia Healthcare* # | | | 106,300 | | | | 2,535 | | |
Air Methods* | | | 45,450 | | | | 5,425 | | |
Akorn* # | | | 261,180 | | | | 3,453 | | |
Analogic | | | 46,370 | | | | 3,625 | | |
ArthroCare* | | | 162,096 | | | | 5,252 | | |
Catamaran* | | | 86,391 | | | | 8,464 | | |
Computer Programs & Systems | | | 43,431 | | | | 2,413 | | |
Cyberonics* | | | 72,308 | | | | 3,790 | | |
Endologix* | | | 62,760 | | | | 867 | | |
Molina Healthcare* | | | 110,520 | | | | 2,780 | | |
Orthofix International* | | | 49,790 | | | | 2,228 | | |
PAREXEL International* # | | | 74,894 | | | | 2,304 | | |
PSS World Medical* # | | | 55,290 | | | | 1,259 | | |
QLT* | | | 31,575 | | | | 246 | | |
Spectrum Pharmaceuticals* # | | | 144,590 | | | | 1,692 | | |
Synageva BioPharma* | | | 10,170 | | | | 543 | | |
Total Health care | | | | | 47,351 | | |
Industrials—17.4% | |
Chart Industries* | | | 63,248 | | | | 4,671 | | |
Clean Harbors* | | | 15,280 | | | | 746 | | |
Copa Holdings, Cl A | | | 49,991 | | | | 4,063 | | |
EnPro Industries* # | | | 77,310 | | | | 2,784 | | |
ESCO Technologies | | | 48,840 | | | | 1,898 | | |
Genesee & Wyoming, Cl A* | | | 30,005 | | | | 2,006 | | |
Hub Group, Cl A* | | | 86,128 | | | | 2,556 | | |
Huron Consulting Group* | | | 161,100 | | | | 5,610 | | |
Kforce* | | | 57,580 | | | | 679 | | |
Middleby* | | | 46,763 | | | | 5,408 | | |
On Assignment* | | | 115,470 | | | | 2,300 | | |
RBC Bearings* | | | 20,836 | | | | 1,002 | | |
Thermon Group Holdings* | | | 60,120 | | | | 1,502 | | |
Titan International # | | | 51,270 | | | | 905 | | |
Triumph Group | | | 86,434 | | | | 5,405 | | |
Total Industrials | | | | | 41,535 | | |
Information technology—19.8% | |
ANSYS* | | | 41,610 | | | | 3,054 | | |
Bottomline Technologies* | | | 65,732 | | | | 1,623 | | |
BroadSoft* # | | | 32,370 | | | | 1,328 | | |
Cavium* # | | | 27,680 | | | | 923 | | |
Cirrus Logic* | | | 121,450 | | | | 4,663 | | |
Coherent* | | | 38,664 | | | | 1,773 | | |
38 TURNER FUNDS 2012 ANNUAL REPORT
Schedule of investments
Turner Emerging Growth Fund
| | | Shares | | Value
(000) | |
Electronics for Imaging* | | | 133,490 | | | $ | 2,217 | | |
Ellie Mae* | | | 54,950 | | | | 1,496 | | |
GSI Group* | | | 190,970 | | | | 1,702 | | |
Heartland Payment Systems | | | 84,980 | | | | 2,692 | | |
Imperva* # | | | 67,810 | | | | 2,508 | | |
Infoblox* # | | | 13,040 | | | | 303 | | |
Manhattan Associates* | | | 48,500 | | | | 2,778 | | |
Monolithic Power Systems* | | | 84,950 | | | | 1,678 | | |
NETGEAR* | | | 36,060 | | | | 1,375 | | |
OSI Systems* | | | 50,450 | | | | 3,927 | | |
Power Integrations # | | | 50,950 | | | | 1,550 | | |
Procera Networks* | | | 60,170 | | | | 1,414 | | |
Stamps.com* # | | | 157,171 | | | | 3,637 | | |
Synchronoss Technologies* # | | | 77,410 | | | | 1,773 | | |
Tyler Technologies* | | | 60,730 | | | | 2,673 | | |
Ultratech* | | | 63,450 | | | | 1,991 | | |
Total Information technology | | | | | 47,078 | | |
Materials—3.3% | |
KapStone Paper & Packaging* | | | 98,130 | | | | 2,197 | | |
LSB Industries* | | | 79,650 | | | | 3,494 | | |
Rentech Nitrogen Partners LP # | | | 54,540 | | | | 2,114 | | |
Total Materials | | | | | 7,805 | | |
Telecommunication services—0.4% | |
| 8x8* | | | 161,370 | | | | 1,059 | | |
Total Telecommunication services | | | | | 1,059 | | |
Utilities—1.2% | |
Artesian Resources, Cl A # | | | 34,415 | | | | 799 | | |
RADWARE* | | | 53,580 | | | | 1,930 | | |
Total Utilities | | | | | 2,729 | | |
Total Common stock
(Cost $165,763)** | | | | | 232,976 | | |
| | | Shares | | Value
(000) | |
Cash equivalent—12.7% | |
BlackRock TempCash Fund,
Institutional Shares,
0.010%*** (1) | | | 30,373,615 | | | | 30,374 | | |
Total Cash equivalent
(Cost $30,374)** | | | | | 30,374 | | |
Total Investments—110.5%
(Cost $196,137)** | | | | | 263,350 | | |
Net Other assets (liabilities)—(10.5)% | | | | | (24,969 | ) | |
Net Assets—100.0% | | | | $ | 238,381 | | |
* Non-income producing security.
** This number is listed in thousands.
*** Rate shown is the 7-day effective yield as of September 30, 2012.
# Security fully or partially on loan at September 30, 2012. The total value of securities on loan at September 30, 2012 was $23,850**. Certain of these securities may have been sold prior to period end and are included in receivable for investment securities sold on the Statement of Assets and Liabilities.
(1) A partial position of this security was purchased with cash collateral received from securities lending. The total value of such security at September 30, 2012 was $24,427**.
Cl — Class
LP — Limited Partnership
The accompanying notes are an integral part of the financial statements.
TURNER FUNDS 2012 ANNUAL REPORT 39
Turner Large Growth Fund
September 30, 2012
| | | Shares | | Value
(000) | |
Common stock—99.5%† | |
Consumer discretionary—17.8% | |
Amazon.com* | | | 19,590 | | | $ | 4,982 | | |
AutoZone* | | | 4,870 | | | | 1,800 | | |
Chipotle Mexican Grill* | | | 3,960 | | | | 1,258 | | |
Comcast, Cl A | | | 103,500 | | | | 3,702 | | |
GNC Holdings, Cl A | | | 67,010 | | | | 2,611 | | |
Home Depot | | | 86,900 | | | | 5,246 | | |
Las Vegas Sands | | | 80,930 | | | | 3,753 | | |
Lennar, Cl A # | | | 71,110 | | | | 2,473 | | |
Lululemon Athletica* # | | | 27,325 | | | | 2,020 | | |
Michael Kors Holdings* | | | 33,410 | | | | 1,777 | | |
Ralph Lauren | | | 18,835 | | | | 2,849 | | |
Starbucks | | | 88,370 | | | | 4,485 | | |
Starwood Hotels & Resorts
Worldwide | | | 67,155 | | | | 3,892 | | |
Under Armour, Cl A* # | | | 31,650 | | | | 1,767 | | |
Yum! Brands | | | 26,110 | | | | 1,732 | | |
Total Consumer discretionary | | | | | 44,347 | | |
Consumer staples—6.7% | |
Coca-Cola | | | 242,470 | | | | 9,197 | | |
Estee Lauder, Cl A | | | 36,120 | | | | 2,224 | | |
Mead Johnson Nutrition, Cl A | | | 30,440 | | | | 2,231 | | |
Whole Foods Market | | | 31,594 | | | | 3,077 | | |
Total Consumer staples | | | | | 16,729 | | |
Energy—5.9% | |
Anadarko Petroleum | | | 27,675 | | | | 1,935 | | |
Cabot Oil & Gas | | | 41,930 | | | | 1,883 | | |
Concho Resources* | | | 32,658 | | | | 3,094 | | |
Enbridge | | | 61,270 | | | | 2,392 | | |
Schlumberger | | | 76,070 | | | | 5,502 | | |
Total Energy | | | | | 14,806 | | |
Financials—5.6% | |
Affiliated Managers Group* | | | 34,250 | | | | 4,213 | | |
American Express | | | 61,840 | | | | 3,516 | | |
CBRE Group* | | | 172,280 | | | | 3,172 | | |
Simon Property Group | | | 19,829 | | | | 3,010 | | |
Total Financials | | | | | 13,911 | | |
| | | Shares | | Value
(000) | |
Health care—10.6% | |
Agilent Technologies | | | 88,317 | | | $ | 3,396 | | |
Alexion Pharmaceuticals* | | | 32,235 | | | | 3,688 | | |
Allergan | | | 38,910 | | | | 3,563 | | |
ARIAD Pharmaceuticals* | | | 55,010 | | | | 1,332 | | |
Biogen Idec* | | | 30,820 | | | | 4,599 | | |
Cerner* | | | 50,160 | | | | 3,883 | | |
Intuitive Surgical* | | | 7,330 | | | | 3,633 | | |
Perrigo | | | 19,470 | | | | 2,262 | | |
Total Health care | | | | | 26,356 | | |
Industrials—7.6% | |
AMETEK | | | 106,655 | | | | 3,781 | | |
Caterpillar | | | 53,130 | | | | 4,571 | | |
Cummins | | | 27,240 | | | | 2,512 | | |
Deere | | | 28,590 | | | | 2,358 | | |
Precision Castparts | | | 17,130 | | | | 2,798 | | |
SPX | | | 42,560 | | | | 2,784 | | |
Total Industrials | | | | | 18,804 | | |
Information technology—43.1% | |
Altera | | | 128,795 | | | | 4,377 | | |
Apple | | | 47,380 | | | | 31,615 | | |
ASML Holding, NY Shares | | | 53,710 | | | | 2,883 | | |
Broadcom, Cl A | | | 112,040 | | | | 3,874 | | |
eBay* | | | 87,825 | | | | 4,252 | | |
EMC* | | | 227,390 | | | | 6,201 | | |
F5 Networks* | | | 22,890 | | | | 2,397 | | |
Facebook, Cl A* # | | | 140,390 | | | | 3,039 | | |
Fidelity National Information
Services | | | 95,485 | | | | 2,981 | | |
Fortinet* | | | 70,199 | | | | 1,695 | | |
Fusion-io* # | | | 45,290 | | | | 1,371 | | |
Google, Cl A* | | | 11,665 | | | | 8,801 | | |
Juniper Networks* | | | 125,730 | | | | 2,151 | | |
LinkedIn, Cl A* # | | | 14,930 | | | | 1,798 | | |
NXP Semiconductors* | | | 95,610 | | | | 2,391 | | |
Palo Alto Networks* # | | | 24,520 | | | | 1,510 | | |
Qualcomm | | | 120,915 | | | | 7,556 | | |
Salesforce.com* | | | 15,660 | | | | 2,391 | | |
Splunk* # | | | 43,880 | | | | 1,611 | | |
Stratasys* | | | 30,930 | | | | 1,683 | | |
TIBCO Software* | | | 96,540 | | | | 2,918 | | |
Visa, Cl A | | | 39,750 | | | | 5,338 | | |
40 TURNER FUNDS 2012 ANNUAL REPORT
Schedule of investments
Turner Large Growth Fund
| | | Shares | | Value
(000) | |
VMware, Cl A* # | | | 44,700 | | | $ | 4,324 | | |
Total Information technology | | | | | 107,157 | | |
Materials—2.2% | |
Monsanto | | | 60,385 | | | | 5,496 | | |
Total Materials | | | | | 5,496 | | |
Total Common stock
(Cost $217,078)** | | | | | 247,606 | | |
Cash equivalent—8.1% | |
BlackRock TempCash Fund,
Institutional Shares,
0.010%*** (1) | | | 20,157,059 | | | | 20,157 | | |
Total Cash equivalent
(Cost $20,157)** | | | | | 20,157 | | |
Total Investments—107.6%
(Cost $237,235)** | | | | | 267,763 | | |
Net Other assets (liabilities)—(7.6)% | | | | | (18,851 | ) | |
Net Assets—100.0% | | | | $ | 248,912 | | |
* Non-income producing security.
** This number is listed in thousands.
*** Rate shown is the 7-day effective yield as of September 30, 2012.
† More narrow industries are utilized for compliance purposes, whereas broad sectors are utilized for reporting purposes.
# Security fully or partially on loan at September 30, 2012. The total value of securities on loan at September 30, 2012 was $17,310**. Certain of these securities may have been sold prior to period end and are included in receivable for investment securities sold on the Statement of Assets and Liabilities.
(1) A partial position of this security was purchased with cash collateral received from securities lending. The total value of such security at September 30, 2012 was $17,591**.
Cl — Class
NY — New York
The accompanying notes are an integral part of the financial statements.
TURNER FUNDS 2012 ANNUAL REPORT 41
Turner Midcap Growth Fund
September 30, 2012
| | | Shares | | Value
(000) | |
Common stock—99.2%† | |
Consumer discretionary—24.3% | |
American Eagle Outfitters | | | 493,060 | | | $ | 10,394 | | |
BorgWarner* | | | 133,350 | | | | 9,216 | | |
CBS, Cl B | | | 273,660 | | | | 9,942 | | |
Coach | | | 50,700 | | | | 2,840 | | |
Dick's Sporting Goods | | | 169,180 | | | | 8,772 | | |
Discovery Communications,
Cl A* | | | 158,190 | | | | 9,433 | | |
GNC Holdings, Cl A | | | 163,190 | | | | 6,360 | | |
Harley-Davidson | | | 199,930 | | | | 8,471 | | |
HomeAway* | | | 138,950 | | | | 3,258 | | |
Lululemon Athletica* # | | | 74,530 | | | | 5,511 | | |
Michael Kors Holdings* | | | 156,910 | | | | 8,344 | | |
Ralph Lauren | | | 68,240 | | | | 10,320 | | |
Sally Beauty Holdings* | | | 252,800 | | | | 6,343 | | |
Starwood Hotels & Resorts
Worldwide | | | 173,090 | | | | 10,032 | | |
Toll Brothers* | | | 201,480 | | | | 6,695 | | |
Tractor Supply | | | 81,150 | | | | 8,025 | | |
Under Armour, Cl A* # | | | 135,120 | | | | 7,544 | | |
Urban Outfitters* | | | 119,730 | | | | 4,497 | | |
VF | | | 61,630 | | | | 9,821 | | |
Wynn Resorts | | | 97,105 | | | | 11,210 | | |
Total Consumer discretionary | | | | | 157,028 | | |
Consumer staples—4.1% | |
Hain Celestial Group* | | | 139,830 | | | | 8,809 | | |
Mead Johnson Nutrition, Cl A | | | 75,690 | | | | 5,547 | | |
Whole Foods Market | | | 124,630 | | | | 12,139 | | |
Total Consumer staples | | | | | 26,495 | | |
Energy—5.9% | |
Cabot Oil & Gas | | | 201,710 | | | | 9,057 | | |
Concho Resources* | | | 141,808 | | | | 13,436 | | |
FMC Technologies* | | | 226,450 | | | | 10,484 | | |
Oil States International* | | | 60,380 | | | | 4,798 | | |
Total Energy | | | | | 37,775 | | |
Financials—10.8% | |
Affiliated Managers Group* | | | 90,460 | | | | 11,127 | | |
AvalonBay Communities | | | 64,240 | | | | 8,736 | | |
Brown & Brown | | | 359,208 | | | | 9,364 | | |
Cardtronics* | | | 164,690 | | | | 4,904 | | |
CBRE Group* | | | 603,430 | | | | 11,109 | | |
| | | Shares | | Value
(000) | |
First Republic Bank # | | | 176,050 | | | $ | 6,067 | | |
IntercontinentalExchange* | | | 87,140 | | | | 11,625 | | |
Signature Bank* | | | 99,920 | | | | 6,703 | | |
Total Financials | | | | | 69,635 | | |
Health care—13.9% | |
Alexion Pharmaceuticals* | | | 100,234 | | | | 11,467 | | |
ARIAD Pharmaceuticals* | | | 193,290 | | | | 4,682 | | |
Catamaran* | | | 129,150 | | | | 12,653 | | |
Cerner* | | | 68,340 | | | | 5,290 | | |
DaVita* | | | 102,190 | | | | 10,588 | | |
IDEXX Laboratories* # | | | 48,540 | | | | 4,822 | | |
Intuitive Surgical* | | | 10,300 | | | | 5,105 | | |
Medivation* # | | | 140,616 | | | | 7,925 | | |
Onyx Pharmaceuticals* | | | 47,852 | | | | 4,044 | | |
Perrigo | | | 84,220 | | | | 9,784 | | |
Regeneron Pharmaceuticals* | | | 60,000 | | | | 9,160 | | |
WellCare Health Plans* | | | 78,780 | | | | 4,455 | | |
Total Health care | | | | | 89,975 | | |
Industrials—9.5% | |
BE Aerospace* | | | 107,540 | | | | 4,527 | | |
Chart Industries* | | | 69,030 | | | | 5,098 | | |
Equifax | | | 172,110 | | | | 8,017 | | |
Genesee & Wyoming, Cl A* | | | 139,440 | | | | 9,323 | | |
Joy Global | | | 171,327 | | | | 9,605 | | |
Roper Industries | | | 88,360 | | | | 9,710 | | |
SPX | | | 80,980 | | | | 5,297 | | |
W.W. Grainger | | | 45,300 | | | | 9,439 | | |
Total Industrials | | | | | 61,016 | | |
Information technology—26.6% | |
Allot Communications* | | | 199,580 | | | | 5,293 | | |
Altera | | | 262,450 | | | | 8,919 | | |
ASML Holding, NY Shares | | | 199,420 | | | | 10,705 | | |
Avago Technologies | | | 343,310 | | | | 11,969 | | |
Broadcom, Cl A | | | 456,391 | | | | 15,782 | | |
Cavium* # | | | 296,509 | | | | 9,883 | | |
Ciena* # | | | 264,890 | | | | 3,602 | | |
Citrix Systems* | | | 185,800 | | | | 14,227 | | |
F5 Networks* | | | 126,094 | | | | 13,202 | | |
Fusion-io* | | | 227,740 | | | | 6,894 | | |
LinkedIn, Cl A* # | | | 69,390 | | | | 8,355 | | |
MercadoLibre | | | 80,386 | | | | 6,636 | | |
NXP Semiconductors* # | | | 597,740 | | | | 14,949 | | |
42 TURNER FUNDS 2012 ANNUAL REPORT
Schedule of investments
Turner Midcap Growth Fund
| | | Shares | | Value
(000) | |
Palo Alto Networks* # | | | 69,960 | | | $ | 4,307 | | |
SINA* | | | 107,300 | | | | 6,940 | | |
Splunk* # | | | 107,740 | | | | 3,956 | | |
TIBCO Software* | | | 412,790 | | | | 12,479 | | |
Trimble Navigation* | | | 183,250 | | | | 8,734 | | |
Ultratech* | | | 154,300 | | | | 4,842 | | |
Total Information technology | | | | | 171,674 | | |
Materials—4.1% | |
Crown Holdings* | | | 209,390 | | | | 7,695 | | |
Eastman Chemical | | | 159,780 | | | | 9,109 | | |
PPG Industries | | | 84,440 | | | | 9,697 | | |
Total Materials | | | | | 26,501 | | |
Total Common stock
(Cost $553,043)** | | | | | 640,099 | | |
Cash equivalent—9.3% | |
BlackRock TempCash Fund,
Institutional Shares,
0.010%*** (1) | | | 60,253,677 | | | | 60,254 | | |
Total Cash equivalent
(Cost $60,254)** | | | | | 60,254 | | |
Total Investments—108.5%
(Cost $613,297)** | | | | | 700,353 | | |
Net Other assets (liabilities)—(8.5)% | | | | | (54,968 | ) | |
Net Assets—100.0% | | | | $ | 645,385 | | |
* Non-income producing security.
** This number is listed in thousands.
*** Rate shown is the 7-day effective yield as of September 30, 2012.
† More narrow industries are utilized for compliance purposes, whereas broad sectors are utilized for reporting purposes.
# Security fully or partially on loan at September 30, 2012. The total value of securities on loan at September 30, 2012 was $58,468**. Certain of these securities may have been sold prior to period end and are included in receivable for investment securities sold on the Statement of Assets and Liabilities.
(1) A partial position of this security was purchased with cash collateral received from securities lending. The total value of such security at September 30, 2012 was $60,254**.
Cl — Class
NY — New York
The accompanying notes are an integral part of the financial statements.
TURNER FUNDS 2012 ANNUAL REPORT 43
Turner Small Cap Growth Fund
September 30, 2012
| | | Shares | | Value
(000) | |
Common stock—98.7% | |
Consumer discretionary—16.6% | |
Aeropostale* | | | 106,550 | | | $ | 1,442 | | |
BJ's Restaurants* # | | | 52,020 | | | | 2,359 | | |
Bravo Brio Restaurant Group* | | | 80,090 | | | | 1,165 | | |
Brunswick | | | 104,940 | | | | 2,375 | | |
Crocs* | | | 121,610 | | | | 1,971 | | |
DSW, Cl A | | | 31,710 | | | | 2,116 | | |
Five Below* # | | | 40,480 | | | | 1,582 | | |
Gaylord Entertainment* | | | 44,686 | | | | 1,766 | | |
Hibbett Sports* | | | 37,140 | | | | 2,208 | | |
HomeAway* # | | | 91,340 | | | | 2,142 | | |
Imax* # | | | 68,390 | | | | 1,362 | | |
Meritage Homes* | | | 64,100 | | | | 2,438 | | |
Scientific Games, Cl A* | | | 65,865 | | | | 545 | | |
Shuffle Master* | | | 154,564 | | | | 2,444 | | |
Shutterfly* | | | 61,640 | | | | 1,918 | | |
Sonic Automotive, Cl A | | | 112,940 | | | | 2,144 | | |
Sotheby's | | | 67,964 | | | | 2,141 | | |
Steven Madden* | | | 53,305 | | | | 2,330 | | |
Tenneco* | | | 79,010 | | | | 2,212 | | |
Texas Roadhouse | | | 116,230 | | | | 1,987 | | |
True Religion Apparel | | | 39,500 | | | | 842 | | |
Vitamin Shoppe* | | | 35,390 | | | | 2,064 | | |
Total Consumer discretionary | | | | | 41,553 | | |
Consumer staples—3.4% | |
B&G Foods | | | 66,890 | | | | 2,027 | | |
Hain Celestial Group* # | | | 29,500 | | | | 1,859 | | |
Susser Holdings* | | | 48,150 | | | | 1,742 | | |
United Natural Foods* | | | 48,733 | | | | 2,848 | | |
Total Consumer staples | | | | | 8,476 | | |
Energy—6.1% | |
Carrizo Oil & Gas* # | | | 78,820 | | | | 1,971 | | |
Comstock Resources* # | | | 110,770 | | | | 2,036 | | |
Dril-Quip* | | | 40,230 | | | | 2,892 | | |
Energy XXI (Bermuda) | | | 59,910 | | | | 2,094 | | |
Gulfport Energy* | | | 71,190 | | | | 2,225 | | |
Kodiak Oil & Gas* | | | 198,170 | | | | 1,855 | | |
Stone Energy* | | | 82,040 | | | | 2,061 | | |
Total Energy | | | | | 15,134 | | |
| | | Shares | | Value
(000) | |
Financials—9.0% | |
Alterra Capital Holdings | | | 80,170 | | | $ | 1,919 | | |
Bank of the Ozarks # | | | 64,470 | | | | 2,222 | | |
Cardtronics* | | | 94,120 | | | | 2,803 | | |
Colonial Properties Trust | | | 108,000 | | | | 2,274 | | |
Education Realty Trust | | | 217,240 | | | | 2,368 | | |
Equity One | | | 111,870 | | | | 2,356 | | |
Highwoods Properties | | | 65,180 | | | | 2,126 | | |
MarketAxess Holdings | | | 65,480 | | | | 2,069 | | |
ProAssurance | | | 19,330 | | | | 1,748 | | |
Texas Capital Bancshares* | | | 53,540 | | | | 2,662 | | |
Total Financials | | | | | 22,547 | | |
Health care—17.8% | |
Acadia Healthcare* | | | 67,440 | | | | 1,608 | | |
Air Methods* | | | 16,630 | | | | 1,985 | | |
Akorn* # | | | 168,396 | | | | 2,226 | | |
Align Technology* | | | 73,990 | | | | 2,735 | | |
ARIAD Pharmaceuticals* | | | 56,220 | | | | 1,362 | | |
Bruker* | | | 98,920 | | | | 1,295 | | |
Cepheid* # | | | 38,560 | | | | 1,331 | | |
Cubist Pharmaceuticals* # | | | 60,880 | | | | 2,903 | | |
Endologix* | | | 82,630 | | | | 1,142 | | |
Health Management
Associates, Cl A* | | | 228,100 | | | | 1,914 | | |
Incyte* # | | | 102,453 | | | | 1,849 | | |
Integra LifeSciences Holdings* | | | 62,240 | | | | 2,558 | | |
IPC The Hospitalist* # | | | 21,520 | | | | 984 | | |
Onyx Pharmaceuticals* | | | 25,070 | | | | 2,118 | | |
PAREXEL International* | | | 59,810 | | | | 1,840 | | |
Pharmacyclics* # | | | 33,750 | | | | 2,177 | | |
PSS World Medical* # | | | 88,840 | | | | 2,024 | | |
Salix Pharmaceuticals* | | | 35,330 | | | | 1,496 | | |
Sirona Dental Systems* | | | 41,013 | | | | 2,336 | | |
Synageva BioPharma* # | | | 21,574 | | | | 1,153 | | |
Team Health Holdings* | | | 61,880 | | | | 1,679 | | |
Teleflex | | | 35,663 | | | | 2,455 | | |
WellCare Health Plans* | | | 29,810 | | | | 1,686 | | |
West Pharmaceutical Services | | | 28,650 | | | | 1,520 | | |
Total Health care | | | | | 44,376 | | |
44 TURNER FUNDS 2012 ANNUAL REPORT
Schedule of investments
Turner Small Cap Growth Fund
| | | Shares | | Value
(000) | |
Industrials—16.7% | |
Alaska Air Group* | | | 38,130 | | | $ | 1,337 | | |
Avis Budget Group* | | | 184,890 | | | | 2,844 | | |
Beacon Roofing Supply* | | | 48,220 | | | | 1,374 | | |
Belden | | | 71,510 | | | | 2,637 | | |
Carpenter Technology | | | 41,690 | | | | 2,181 | | |
Chart Industries* | | | 31,120 | | | | 2,298 | | |
Clean Harbors* | | | 45,470 | | | | 2,221 | | |
Colfax* # | | | 68,720 | | | | 2,520 | | |
Copa Holdings, Cl A | | | 24,040 | | | | 1,954 | | |
Genesee & Wyoming, Cl A* | | | 33,950 | | | | 2,270 | | |
Healthcare Services Group | | | 69,000 | | | | 1,578 | | |
Hexcel* # | | | 110,510 | | | | 2,655 | | |
Old Dominion Freight Line* | | | 85,755 | | | | 2,586 | | |
Thermon Group Holdings* | | | 45,940 | | | | 1,148 | | |
Titan International | | | 110,750 | | | | 1,956 | | |
TrueBlue* | | | 153,762 | | | | 2,417 | | |
US Airways Group* # | | | 183,033 | | | | 1,915 | | |
USG* # | | | 70,040 | | | | 1,537 | | |
WESCO International* | | | 34,850 | | | | 1,993 | | |
Woodward | | | 70,911 | | | | 2,410 | | |
Total Industrials | | | | | 41,831 | | |
Information technology—23.7% | |
Allot Communications* # | | | 77,700 | | | | 2,061 | | |
Aspen Technology* | | | 40,010 | | | | 1,034 | | |
BroadSoft* | | | 61,289 | | | | 2,514 | | |
Cavium* # | | | 82,960 | | | | 2,765 | | |
Ciena* # | | | 138,420 | | | | 1,883 | | |
Cirrus Logic* | | | 51,130 | | | | 1,963 | | |
Cognex | | | 60,570 | | | | 2,095 | | |
CommVault Systems* | | | 46,230 | | | | 2,714 | | |
Cornerstone OnDemand* # | | | 53,490 | | | | 1,640 | | |
Fairchild Semiconductor
International* | | | 142,200 | | | | 1,866 | | |
Finisar* # | | | 136,320 | | | | 1,949 | | |
Fusion-io* | | | 59,100 | | | | 1,789 | | |
Guidewire Software* | | | 62,590 | | | | 1,943 | | |
Heartland Payment Systems | | | 62,965 | | | | 1,995 | | |
IPG Photonics* | | | 31,510 | | | | 1,806 | | |
Manhattan Associates* | | | 20,060 | | | | 1,149 | | |
MAXIMUS | | | 49,710 | | | | 2,969 | | |
Monolithic Power Systems* | | | 66,520 | | | | 1,314 | | |
NetScout Systems* | | | 67,160 | | | | 1,713 | | |
| | Shares | | Value
(000) | |
OSI Systems* | | | 34,520 | | | $ | 2,687 | | |
Plexus* | | | 68,320 | | | | 2,069 | | |
Power Integrations # | | | 55,480 | | | | 1,688 | | |
QLIK Technologies* | | | 97,681 | | | | 2,189 | | |
Semtech* | | | 94,880 | | | | 2,386 | | |
Sourcefire* # | | | 48,180 | | | | 2,362 | | |
Stratasys* | | | 20,640 | | | | 1,123 | | |
Teradyne* | | | 127,250 | | | | 1,809 | | |
The Ultimate Software Group* | | | 22,620 | | | | 2,309 | | |
Ultratech* | | | 68,460 | | | | 2,148 | | |
Zillow, Cl A* | | | 33,210 | | | | 1,401 | | |
Total Information technology | | | | | 59,333 | | |
Materials—4.1% | |
Boise | | | 330,160 | | | | 2,892 | | |
Chemtura* | | | 124,850 | | | | 2,150 | | |
Commercial Metals | | | 106,450 | | | | 1,405 | | |
Louisiana-Pacific* # | | | 181,352 | | | | 2,267 | | |
Methanex | | | 50,210 | | | | 1,433 | | |
Total Materials | | | | | 10,147 | | |
Telecommunication services—0.8% | |
Cogent Communications Group # | | | 88,360 | | | | 2,031 | | |
Total Telecommunication services | | | | | 2,031 | | |
Utilities—0.5% | |
RADWARE* | | | 36,520 | | | | 1,315 | | |
Total Utilities | | | | | 1,315 | | |
Total Common stock
(Cost $205,002)** | | | | | 246,743 | | |
Right—0.0% | |
Energy—0.0% | |
CVR Energy* | | | 61,770 | | | | — | | |
Total Right
(Cost $—)** | | | | | — | | |
TURNER FUNDS 2012 ANNUAL REPORT 45
Schedule of investments
Turner Small Cap Growth Fund
| | | Shares | | Value
(000) | |
Cash equivalent—18.1% | |
BlackRock TempCash Fund,
Institutional Shares,
0.010%*** (1) | | | 45,333,765 | | | $ | 45,334 | | |
Total Cash equivalent
(Cost $45,334)** | | | | | 45,334 | | |
Total Investments—116.8%
(Cost $250,336)** | | | | | 292,077 | | |
Net Other assets (liabilities)—(16.8)% | | | | | (41,978 | ) | |
Net Assets—100.0% | | | | $ | 250,099 | | |
* Non-income producing security.
** This number is listed in thousands.
*** Rate shown is the 7-day effective yield as of September 30, 2012.
# Security fully or partially on loan at September 30, 2012. The total value of securities on loan at September 30, 2012 was $41,952**. Certain of these securities may have been sold prior to period end and are included in receivable for investment securities sold on the Statement of Assets and Liabilities.
(1) A partial position of this security was purchased with cash collateral received from securities lending. The total value of such security at September 30, 2012 was $43,018**.
Cl — Class
The accompanying notes are an integral part of the financial statements.
46 TURNER FUNDS 2012 ANNUAL REPORT
Turner Global Opportunities Fund
September 30, 2012
| | | Shares | | Value
(000) | |
Common stock—97.9%† | |
Consumer discretionary—18.7% | |
Las Vegas Sands | | | 1,770 | | | $ | 82 | | |
Lennar, Cl A | | | 1,400 | | | | 49 | | |
Lululemon Athletica* | | | 620 | | | | 46 | | |
LVMH Moet Hennessy Louis Vuitton | | | 419 | | | | 63 | | |
Ralph Lauren | | | 340 | | | | 51 | | |
Starbucks | | | 1,290 | | | | 65 | | |
Total Consumer discretionary | | | | | 356 | | |
Consumer staples—7.4% | |
Remy Cointreau | | | 700 | | | | 81 | | |
Whole Foods Market | | | 620 | | | | 60 | | |
Total Consumer staples | | | | | 141 | | |
Energy—3.0% | |
Schlumberger | | | 800 | | | | 58 | | |
Total Energy | | | | | 58 | | |
Financials—13.8% | |
AIA Group | | | 22,576 | | | | 84 | | |
CBRE Group* | | | 3,630 | | | | 67 | | |
Compartamos SAB de CV | | | 46,740 | | | | 55 | | |
Metropolitan Bank & Trust | | | 25,810 | | | | 57 | | |
Total Financials | | | | | 263 | | |
Health care—10.7% | |
Alexion Pharmaceuticals* | | | 830 | | | | 95 | | |
Catamaran* | | | 700 | | | | 68 | | |
Intuitive Surgical* | | | 80 | | | | 40 | | |
Total Health care | | | | | 203 | | |
Industrials—2.5% | |
Caterpillar | | | 550 | | | | 47 | | |
Total Industrials | | | | | 47 | | |
Information technology—41.8% | |
Apple | | | 270 | | | | 180 | | |
ASML Holding, NY Shares | | | 1,870 | | | | 100 | | |
Broadcom, Cl A | | | 2,500 | | | | 86 | | |
F5 Networks* | | | 600 | | | | 63 | | |
Imagination Technologies Group* | | | 9,110 | | | | 70 | | |
LinkedIn, Cl A* | | | 480 | | | | 58 | | |
NXP Semiconductors* | | | 3,780 | | | | 95 | | |
Palo Alto Networks* | | | 490 | | | | 30 | | |
| | | Shares | | Value
(000) | |
Qualcomm | | | 1,090 | | | $ | 68 | | |
TIBCO Software* | | | 1,540 | | | | 47 | | |
Total Information technology | | | | | 797 | | |
Total Common stock
(Cost $1,563)** | | | | | 1,865 | | |
Cash equivalent—1.6% | |
BlackRock TempCash Fund,
Institutional Shares,
0.010%*** | | | 29,520 | | | | 30 | | |
Total Cash equivalent
(Cost $30)** | | | | | 30 | | |
Total Investments—99.5%
(Cost $1,593)** | | | | | 1,895 | | |
Net Other assets (liabilities)—0.5% | | | | | 10 | | |
Net Assets—100.0% | | | | $ | 1,905 | | |
* Non-income producing security.
** This number is listed in thousands.
*** Rate shown is the 7-day effective yield as of September 30, 2012.
† More narrow industries are utilized for compliance purposes, whereas broad sectors are utilized for reporting purposes.
Cl — Class
NY — New York
The accompanying notes are an integral part of the financial statements.
Country Allocation as of 9/30/12†† | |
United States | | | 59.0 | % | |
Netherlands | | | 10.3 | | |
France | | | 7.6 | | |
Canada | | | 6.0 | | |
Hong Kong | | | 4.4 | | |
United Kingdom | | | 3.7 | | |
Netherlands Antilles | | | 3.1 | | |
Philippines | | | 3.0 | | |
Mexico | | | 2.9 | | |
Total | | | 100.0 | % | |
†† Percentages are based on total investments.
TURNER FUNDS 2012 ANNUAL REPORT 47
Turner International Growth Fund
September 30, 2012
| | | Shares | | Value
(000) | |
Common stock—98.7% | |
Consumer discretionary—11.7% | |
Adidas AG | | | 4,497 | | | $ | 369 | | |
Honda Motor | | | 8,910 | | | | 274 | | |
Hyundai Motor | | | 1,350 | | | | 306 | | |
Industria de Diseno Textil SA | | | 1,644 | | | | 204 | | |
InterContinental Hotels Group | | | 13,357 | | | | 350 | | |
Lululemon Athletica* | | | 5,680 | | | | 420 | | |
LVMH Moet Hennessy Louis Vuitton | | | 1,918 | | | | 288 | | |
Publicis Groupe | | | 8,670 | | | | 485 | | |
Sands China | | | 87,801 | | | | 328 | | |
Toyota Motor | | | 11,420 | | | | 445 | | |
Total Consumer discretionary | | | | | 3,469 | | |
Consumer staples—17.6% | |
British American Tobacco | | | 10,270 | | | | 527 | | |
Companhia de Bebidas das
Americas SP ADR,
Preferred Shares | | | 6,280 | | | | 240 | | |
Diageo | | | 18,010 | | | | 506 | | |
FamilyMart | | | 10,230 | | | | 503 | | |
Japan Tobacco | | | 9,700 | | | | 291 | | |
Kimberly-Clark de Mexico SAB
de CV, Ser A | | | 86,226 | | | | 206 | | |
L'Oreal SA | | | 2,903 | | | | 359 | | |
Nestle | | | 12,030 | | | | 759 | | |
Remy Cointreau | | | 3,040 | | | | 350 | | |
SABMiller | | | 9,621 | | | | 423 | | |
Shoprite Holdings | | | 10,654 | | | | 216 | | |
Unilever | | | 10,230 | | | | 372 | | |
Unilever NV | | | 12,870 | | | | 455 | | |
Total Consumer staples | | | | | 5,207 | | |
Energy—5.7% | |
BG Group | | | 28,090 | | | | 567 | | |
Enbridge | | | 7,180 | | | | 281 | | |
Petroleum Geo-Services | | | 24,440 | | | | 404 | | |
Suncor Energy | | | 13,600 | | | | 447 | | |
Total Energy | | | | | 1,699 | | |
Financials—9.7% | |
AIA Group | | | 79,014 | | | | 294 | | |
Bank of Nova Scotia | | | 4,916 | | | | 270 | | |
Grupo Financiero Santander Mexico
SAB de CV SP ADR, Cl B* | | | 11,560 | | | | 158 | | |
| | | Shares | | Value
(000) | |
ICICI Bank SP ADR | | | 3,960 | | | $ | 159 | | |
Japan Retail Fund Investment | | | 175 | | | | 313 | | |
Metropolitan Bank & Trust | | | 126,930 | | | | 282 | | |
Sberbank of Russia ADR | | | 24,310 | | | | 285 | | |
Standard Chartered | | | 19,049 | | | | 431 | | |
Swedbank AB, A Shares | | | 20,658 | | | | 388 | | |
Tokio Marine Holdings | | | 11,520 | | | | 294 | | |
Total Financials | | | | | 2,874 | | |
Health care—10.5% | |
Catamaran* | | | 4,380 | | | | 429 | | |
Covidien | | | 8,100 | | | | 481 | | |
GlaxoSmithKline | | | 19,560 | | | | 451 | | |
Life Healthcare Group
Holdings Pte | | | 45,446 | | | | 174 | | |
Novo Nordisk, Cl B | | | 2,070 | | | | 327 | | |
PT Kalbe Farma Tbk | | | 459,440 | | | | 226 | | |
Roche Holding | | | 4,370 | | | | 817 | | |
Teva Pharmaceutical Industries
SP ADR | | | 4,770 | | | | 197 | | |
Total Health care | | | | | 3,102 | | |
Industrials—16.3% | |
Canadian Pacific Railway | | | 5,770 | | | | 479 | | |
Copa Holdings, Cl A | | | 4,400 | | | | 358 | | |
Embraer SA | | | 43,198 | | | | 288 | | |
Experian | | | 17,250 | | | | 287 | | |
FANUC | | | 1,580 | | | | 255 | | |
GEA Group | | | 14,160 | | | | 428 | | |
Hitachi | | | 58,640 | | | | 326 | | |
Komatsu | | | 11,540 | | | | 227 | | |
Rolls-Royce Holdings | | | 32,900 | | | | 448 | | |
Sandvik AB | | | 29,289 | | | | 398 | | |
Schneider Electric SA | | | 6,750 | | | | 399 | | |
Tullow Oil | | | 20,700 | | | | 458 | | |
Wolseley | | | 10,664 | | | | 455 | | |
Total Industrials | | | | | 4,806 | | |
Information technology—7.8% | |
ASML Holding, NY Shares | | | 6,400 | | | | 342 | | |
Avago Technologies | | | 8,650 | | | | 302 | | |
Imagination Technologies Group* | | | 32,880 | | | | 252 | | |
LG Display* | | | 8,814 | | | | 225 | | |
MercadoLibre | | | 3,480 | | | | 287 | | |
NXP Semiconductors* | | | 12,320 | | | | 308 | | |
48 TURNER FUNDS 2012 ANNUAL REPORT
Schedule of investments
Turner International Growth Fund
| | | Shares | | Value
(000) | |
Samsung Electronics | | | 220 | | | $ | 266 | | |
Tencent Holdings | | | 9,270 | | | | 316 | | |
Total Information technology | | | | | 2,298 | | |
Materials—15.4% | |
BASF SE | | | 6,930 | | | | 584 | | |
BHP Billiton, Ltd. | | | 22,000 | | | | 754 | | |
Goldcorp | | | 13,040 | | | | 599 | | |
Linde | | | 2,640 | | | | 454 | | |
Potash Corp. of Saskatchewan | | | 6,835 | | | | 297 | | |
Rexam | | | 63,530 | | | | 446 | | |
Rio Tinto PLC | | | 10,520 | | | | 490 | | |
Rio Tinto, Ltd. | | | 4,910 | | | | 272 | | |
Silver Wheaton Corp. | | | 9,420 | | | | 375 | | |
YAMATO KOGYO | | | 9,610 | | | | 284 | | |
Total Materials | | | | | 4,555 | | |
Telecommunication services—4.0% | |
BT Group | | | 163,230 | | | | 608 | | |
Philippine Long Distance
Telephone | | | 2,840 | | | | 190 | | |
SoftBank | | | 9,610 | | | | 389 | | |
Total Telecommunication services | | | | | 1,187 | | |
Total Common stock
(Cost $26,641)** | | | | | 29,197 | | |
Cash equivalent—1.6% | |
BlackRock TempCash Fund,
Institutional Shares,
0.010%*** | | | 463,219 | | | | 463 | | |
Total Cash equivalent
(Cost $463)** | | | | | 463 | | |
Total Investments—100.3%
(Cost $27,104)** | | | | | 29,660 | | |
Net other assets (liabilities)—(0.3)% | | | | | (83 | ) | |
Net Assets—100.0% | | | | $ | 29,577 | | |
* Non-income producing security.
** This number is listed in thousands.
*** Rate shown is the 7-day effective yield as of September 30, 2012.
ADR — American Depositary Receipt
Cl — Class
NY — New York
PLC — Public Liability Co.
Ser — Series
The accompanying notes are an integral part of the financial statements.
Country Allocation as of 9/30/12† | |
United Kingdom | | | 18.4 | % | |
Canada | | | 12.2 | | |
Japan | | | 12.1 | | |
France | | | 6.3 | | |
Germany | | | 6.2 | | |
United States | | | 5.4 | | |
Switzerland | | | 5.3 | | |
Netherlands | | | 3.7 | | |
Australia | | | 3.5 | | |
Republic of Korea (South) | | | 2.7 | | |
Sweden | | | 2.6 | | |
Jersey | | | 2.5 | | |
Cayman Islands | | | 2.2 | | |
Brazil | | | 1.8 | | |
Ireland (Republic of) | | | 1.6 | | |
Philippines | | | 1.6 | | |
Norway | | | 1.4 | | |
South Africa | | | 1.3 | | |
Mexico | | | 1.2 | | |
Panama | | | 1.2 | | |
Denmark | | | 1.1 | | |
Singapore | | | 1.0 | | |
Hong Kong | | | 1.0 | | |
Russian Federation | | | 1.0 | | |
Indonesia | | | 0.8 | | |
Spain | | | 0.7 | | |
Israel | | | 0.7 | | |
India | | | 0.5 | | |
Total | | | 100.0 | % | |
† Percentages are based on total investments.
TURNER FUNDS 2012 ANNUAL REPORT 49
Statements of assets and liabilities (000)
September 30, 2012
| | | Turner
Market Neutral
Fund | | Turner
Medical Sciences
Long/Short
Fund | | Turner
Spectrum
Fund | |
Assets: | |
Investment securities, at cost | | $ | 38,067 | | | $ | 37,123 | | | $ | 758,025 | | |
Investment securities, at value | | $ | 38,197 | | | $ | 39,185 | | | $ | 790,929 | | |
Deposits with brokers for securities sold short | | | 51,858 | | | | 26,225 | | | | 672,327 | | |
Foreign currency, at value | | | — | | | | — | | | | 216 | | |
Receivable for investment securities sold | | | 7,363 | | | | 2,272 | | | | 92,698 | | |
Receivable for capital shares sold | | | 25 | | | | 59 | | | | 2,254 | | |
Prepaid expenses | | | 10 | | | | 18 | | | | 91 | | |
Receivable for dividend income | | | 31 | | | | 17 | | | | 1,054 | | |
Receivable from investment adviser | | | — | | | | — | | | | — | | |
Receivable from sub-administrator | | | — | | | | — | | | | — | | |
Reclaim receivable | | | — | | | | — | | | | 14 | | |
Total assets | | | 97,484 | | | | 67,776 | | | | 1,559,583 | | |
Liabilities: | |
Securities sold short, at proceeds | | | 36,271 | | | | 13,533 | | | | 474,712 | | |
Securities sold short, at value | | | 36,394 | | | | 13,796 | | | | 474,684 | | |
Cash overdraft | | | — | | | | — | | | | 5,410 | | |
Payable for investment securities purchased | | | 7,205 | | | | 3,981 | | | | 105,468 | | |
Obligation to return securities lending collateral | | | — | | | | — | | | | — | | |
Payable for capital shares redeemed | | | 15 | | | | 295 | | | | 2,696 | | |
Dividends payable on securities sold short (Note 2) | | | 5 | | | | 5 | | | | 175 | | |
Broker fees and charges on short securities payable | | | 11 | | | | 3 | | | | 196 | | |
Payable due to investment adviser | | | 4 | | | | 50 | | | | 726 | | |
Payable due to administrator | | | 5 | | | | 5 | | | | 97 | | |
Payable due to shareholder servicing | | | 1 | | | | 3 | | | | 29 | | |
Payable due to distributor | | | — | | | | 2 | | | | 7 | | |
Payable due to transfer agent | | | 3 | | | | 4 | | | | 53 | | |
Payable due to custodian | | | 4 | | | | 3 | | | | 23 | | |
Other accrued expenses | | | 13 | | | | 17 | | | | 238 | | |
Total liabilities | | | 43,660 | | | | 18,164 | | | | 589,802 | | |
Net assets | | $ | 53,824 | | | $ | 49,612 | | | $ | 969,781 | | |
*Includes market value of securities on loan | | $ | — | | | $ | — | | | $ | — | | |
Net assets: | |
Portfolio capital | | $ | 55,337 | | | $ | 51,108 | | | $ | 1,005,988 | | |
Distributions in excess of investment income | | | (339 | ) | | | (773 | ) | | | (8,238 | ) | |
Accumulated net realized loss from investments, securities sold short, written options
and foreign currency transactions | | | (1,181 | ) | | | (2,520 | ) | | | (60,900 | ) | |
Net unrealized appreciation on investments, securities sold short, foreign
currencies and translation of other assets and liabilities denominated in foreign currencies | | | 7 | | | | 1,797 | | | | 32,931 | | |
Net assets | | $ | 53,824 | | | $ | 49,612 | | | $ | 969,781 | | |
Outstanding shares of beneficial interest Institutional Class Shares (1) | | | 4,721 | | | | 3,641 | | | | 76,454 | | |
Outstanding shares of beneficial interest Investor Class Shares (1) | | | 561 | | | | 946 | | | | 11,721 | | |
Outstanding shares of beneficial interest Class C Shares (1) | | | 9 | | | | 288 | | | | 983 | | |
Net assets — Institutional Class Shares | | $ | 48,054 | | | $ | 37,117 | | | $ | 832,857 | | |
Net assets — Investor Class Shares | | $ | 5,685 | | | $ | 9,606 | | | $ | 126,533 | | |
Net assets — Class C Shares | | $ | 85 | | | $ | 2,889 | | | $ | 10,391 | | |
Net asset value, offering and redemption price per share — Institutional Class Shares | | $ | 10.18 | | | $ | 10.19 | | | $ | 10.89 | | |
Net asset value, offering and redemption price per share — Investor Class Shares | | $ | 10.13 | | | $ | 10.16 | † | | $ | 10.80 | | |
Net asset value, offering and redemption price per share — Class C Shares | | $ | 10.01 | † | | $ | 10.04 | † | | $ | 10.57 | | |
50 TURNER FUNDS 2012 ANNUAL REPORT
| | | Turner
Titan
Fund | | Turner
All Cap
Growth
Fund | | Turner
Concentrated
Growth
Fund | |
Assets: | |
Investment securities, at cost | | $ | 27,248 | | | $ | 24,911 | | | $ | 37,606 | | |
Investment securities, at value | | $ | 28,204 | | | $ | 28,424 | * | | $ | 41,661 | * | |
Deposits with brokers for securities sold short | | | 17,596 | | | | — | | | | — | | |
Foreign currency, at value | | | — | | | | — | | | | — | | |
Receivable for investment securities sold | | | 3,507 | | | | 398 | | | | — | | |
Receivable for capital shares sold | | | 79 | | | | 9 | | | | 26 | | |
Prepaid expenses | | | 7 | | | | 9 | | | | 8 | | |
Receivable for dividend income | | | 47 | | | | 59 | | | | — | | |
Receivable from investment adviser | | | — | | | | 57 | | | | 36 | | |
Receivable from sub-administrator | | | — | | | | 6 | | | | 8 | | |
Reclaim receivable | | | — | | | | — | | | | — | | |
Total assets | | | 49,440 | | | | 28,962 | | | | 41,739 | | |
Liabilities: | |
Securities sold short, at proceeds | | | 14,535 | | | | — | | | | — | | |
Securities sold short, at value | | | 14,494 | | | | — | | | | — | | |
Cash overdraft | | | — | | | | — | | | | — | | |
Payable for investment securities purchased | | | 3,513 | | | | 546 | | | | — | | |
Obligation to return securities lending collateral | | | — | | | | 2,552 | | | | 6,758 | | |
Payable for capital shares redeemed | | | 4 | | | | 6 | | | | 31 | | |
Dividends payable on securities sold short (Note 2) | | | 1 | | | | — | | | | — | | |
Broker fees and charges on short securities payable | | | 4 | | | | — | | | | — | | |
Payable due to investment adviser | | | 30 | | | | — | | | | — | | |
Payable due to administrator | | | 3 | | | | — | | | | — | | |
Payable due to shareholder servicing | | | 1 | | | | 5 | | | | 7 | | |
Payable due to distributor | | | — | | | | — | | | | — | | |
Payable due to transfer agent | | | 1 | | | | 3 | | | | 3 | | |
Payable due to custodian | | | 3 | | | | 2 | | | | 2 | | |
Other accrued expenses | | | 6 | | | | 8 | | | | 11 | | |
Total liabilities | | | 18,060 | | | | 3,122 | | | | 6,812 | | |
Net assets | | $ | 31,380 | | | $ | 25,840 | | | $ | 34,927 | | |
*Includes market value of securities on loan | | $ | — | | | $ | 2,493 | | | $ | 6,584 | | |
Net assets: | |
Portfolio capital | | $ | 31,149 | | | $ | 34,642 | | | $ | 54,822 | | |
Distributions in excess of investment income | | | — | | | | (1 | ) | | | (19 | ) | |
Accumulated net realized loss from investments, securities sold short, written options
and foreign currency transactions | | | (766 | ) | | | (12,314 | ) | | | (23,931 | ) | |
Net unrealized appreciation on investments, securities sold short, foreign
currencies and translation of other assets and liabilities denominated in foreign currencies | | | 997 | | | | 3,513 | | | | 4,055 | | |
Net assets | | $ | 31,380 | | | $ | 25,840 | | | $ | 34,927 | | |
Outstanding shares of beneficial interest Institutional Class Shares (1) | | | 2,522 | | | | — | | | | — | | |
Outstanding shares of beneficial interest Investor Class Shares (1) | | | 494 | | | | 2,867 | | | | 4,689 | | |
Outstanding shares of beneficial interest Class C Shares (1) | | | 53 | | | | — | | | | — | | |
Net assets — Institutional Class Shares | | $ | 25,811 | | | $ | — | | | $ | — | | |
Net assets — Investor Class Shares | | $ | 5,038 | | | $ | 25,840 | | | $ | 34,927 | | |
Net assets — Class C Shares | | $ | 531 | | | $ | — | | | $ | — | | |
Net asset value, offering and redemption price per share — Institutional Class Shares | | $ | 10.24 | † | | $ | — | | | $ | — | | |
Net asset value, offering and redemption price per share — Investor Class Shares | | $ | 10.20 | | | $ | 9.01 | | | $ | 7.45 | | |
Net asset value, offering and redemption price per share — Class C Shares | | $ | 10.07 | † | | $ | — | | | $ | — | | |
(1) Unlimited authorization — par value $0.00001.
† Differences in net asset value recalculation and net asset value stated are caused by rounding differences.
Amounts designated as "—" are either not applicable, $0 or have been rounded to $0.
The accompanying notes are an integral part of the financial statements.
TURNER FUNDS 2012 ANNUAL REPORT 51
Statements of assets and liabilities (000)
September 30, 2012
| | | Turner
Emerging
Growth Fund | | Turner
Large
Growth Fund | | Turner
Midcap
Growth Fund | |
Assets: | |
Investment securities, at cost | | $ | 196,137 | | | $ | 237,235 | | | $ | 613,297 | | |
Investment securities, at value | | $ | 263,350 | * | | $ | 267,763 | * | | $ | 700,353 | * | |
Foreign currency, at value | | | — | | | | — | | | | — | | |
Receivable for investment securities sold | | | — | | | | 1,433 | | | | 16,702 | | |
Receivable for capital shares sold | | | 147 | | | | 191 | | | | 215 | | |
Prepaid expenses | | | 17 | | | | 22 | | | | 56 | | |
Receivable for dividend income | | | 47 | | | | 144 | | | | 1,159 | | |
Receivable from investment adviser | | | — | | | | — | | | | — | | |
Reclaim receivable | | | — | | | | — | | | | — | | |
Total assets | | | 263,561 | | | | 269,553 | | | | 718,485 | | |
Liabilities: | |
Payable to custodian | | | — | | | | — | | | | 7,839 | | |
Payable for investment securities purchased | | | — | | | | 2,527 | | | | 2,739 | | |
Obligation to return securities lending collateral | | | 24,427 | | | | 17,591 | | | | 60,254 | | |
Payable for capital shares redeemed | | | 400 | | | | 283 | | | | 1,496 | | |
Payable due to investment adviser | | | 205 | | | | 97 | | | | 362 | | |
Payable due to administrator | | | 24 | | | | 25 | | | | 65 | | |
Payable due to shareholder servicing | | | 35 | | | | 10 | | | | 85 | | |
Payable due to distributor | | | — | | | | — | | | | 1 | | |
Payable due to transfer agent | | | 12 | | | | 14 | | | | 39 | | |
Payable due to custodian | | | 4 | | | | 6 | | | | 7 | | |
Other accrued expenses | | | 73 | | | | 88 | | | | 213 | | |
Total liabilities | | | 25,180 | | | | 20,641 | | | | 73,100 | | |
Net assets | | $ | 238,381 | | | $ | 248,912 | | | $ | 645,385 | | |
*Includes market value of securities on loan | | $ | 23,850 | | | $ | 17,310 | | | $ | 58,468 | | |
Net assets: | |
Portfolio capital | | $ | 141,550 | | | $ | 316,080 | | | $ | 560,739 | | |
Undistributed net investment income (distributions in excess of investment income) | | | (1,536 | ) | | | 449 | | | | (2,022 | ) | |
Accumulated net realized gain (loss) from investment transactions | | | 31,154 | | | | (98,145 | ) | | | (388 | ) | |
Net unrealized appreciation on investments | | | 67,213 | | | | 30,528 | | | | 87,056 | | |
Net assets | | $ | 238,381 | | | $ | 248,912 | | | $ | 645,385 | | |
Outstanding shares of beneficial interest Institutional Class Shares (1) | | | 1,203 | | | | 15,635 | | | | 6,671 | | |
Outstanding shares of beneficial interest Investor Class Shares (1) | | | 2,957 | | | | 3,758 | | | | 11,551 | | |
Outstanding shares of beneficial interest Retirement Class Shares (1) | | | — | | | | — | | | | 143 | | |
Net assets — Institutional Class Shares | | $ | 69,391 | | | $ | 201,051 | | | $ | 236,147 | | |
Net assets — Investor Class Shares | | $ | 168,990 | | | $ | 47,861 | | | $ | 404,427 | | |
Net assets — Retirement Class Shares | | $ | — | | | $ | — | | | $ | 4,811 | | |
Net asset value, offering and redemption price per share — Institutional Class Shares | | $ | 57.68 | | | $ | 12.86 | | | $ | 35.39 | † | |
Net asset value, offering and redemption price per share — Investor Class Shares | | $ | 57.16 | † | | $ | 12.74 | | | $ | 35.03 | † | |
Net asset value, offering and redemption price per share — Retirement Class Shares | | $ | — | | | $ | — | | | $ | 33.65 | † | |
52 TURNER FUNDS 2012 ANNUAL REPORT
| | | Turner
Small Cap
Growth Fund | | Turner Global
Opportunities
Fund | | Turner
International
Growth Fund | |
Assets: | |
Investment securities, at cost | | $ | 250,336 | | | $ | 1,593 | | | $ | 27,104 | | |
Investment securities, at value | | $ | 292,077 | * | | $ | 1,895 | | | $ | 29,660 | | |
Foreign currency, at value | | | — | | | | — | | | | 3 | | |
Receivable for investment securities sold | | | 4,384 | | | | — | | | | 1,404 | | |
Receivable for capital shares sold | | | 176 | | | | — | | | | 3 | | |
Prepaid expenses | | | 20 | | | | 8 | | | | 11 | | |
Receivable for dividend income | | | 98 | | | | 2 | | | | 62 | | |
Receivable from investment adviser | | | — | | | | 2 | | | | 6 | | |
Reclaim receivable | | | — | | | | — | | | | 18 | | |
Total assets | | | 296,755 | | | | 1,907 | | | | 31,167 | | |
Liabilities: | |
Payable to custodian | | | — | | | | — | | | | — | | |
Payable for investment securities purchased | | | 3,221 | | | | — | | | | 1,558 | | |
Obligation to return securities lending collateral | | | 43,018 | | | | — | | | | — | | |
Payable for capital shares redeemed | | | 81 | | | | — | | | | 7 | | |
Payable due to investment adviser | | | 169 | | | | — | | | | — | | |
Payable due to administrator | | | 25 | | | | — | | | | 3 | | |
Payable due to shareholder servicing | | | 53 | | | | — | | | | 1 | | |
Payable due to distributor | | | — | | | | — | | | | — | | |
Payable due to transfer agent | | | 12 | | | | — | | | | 1 | | |
Payable due to custodian | | | 6 | | | | 1 | | | | 16 | | |
Other accrued expenses | | | 71 | | | | 1 | | | | 4 | | |
Total liabilities | | | 46,656 | | | | 2 | | | | 1,590 | | |
Net assets | | $ | 250,099 | | | $ | 1,905 | | | $ | 29,577 | | |
*Includes market value of securities on loan | | $ | 41,952 | | | $ | — | | | $ | — | | |
Net assets: | |
Portfolio capital | | $ | 200,473 | | | $ | 1,596 | | | $ | 29,074 | | |
Undistributed net investment income (distributions in excess of investment income) | | | (1,229 | ) | | | (2 | ) | | | 124 | | |
Accumulated net realized gain (loss) from investment transactions | | | 9,114 | | | | 9 | | | | (2,176 | ) | |
Net unrealized appreciation on investments | | | 41,741 | | | | 302 | | | | 2,555 | | |
Net assets | | $ | 250,099 | | | $ | 1,905 | | | $ | 29,577 | | |
Outstanding shares of beneficial interest Institutional Class Shares (1) | | | — | | | | 124 | | | | 2,154 | | |
Outstanding shares of beneficial interest Investor Class Shares (1) | | | 6,956 | | | | 19 | | | | 572 | | |
Outstanding shares of beneficial interest Retirement Class Shares (1) | | | — | | | | — | | | | — | | |
Net assets — Institutional Class Shares | | $ | — | | | $ | 1,654 | | | $ | 23,406 | | |
Net assets — Investor Class Shares | | $ | 250,099 | | | $ | 251 | | | $ | 6,171 | | |
Net assets — Retirement Class Shares | | $ | — | | | $ | — | | | $ | — | | |
Net asset value, offering and redemption price per share — Institutional Class Shares | | $ | — | | | $ | 13.31 | † | | $ | 10.86 | † | |
Net asset value, offering and redemption price per share — Investor Class Shares | | $ | 35.96 | † | | $ | 13.22 | † | | $ | 10.79 | | |
Net asset value, offering and redemption price per share — Retirement Class Shares | | $ | — | | | $ | — | | | $ | — | | |
(1) Unlimited authorization — par value $0.00001.
† Differences in net asset value recalculation and net asset value stated are caused by rounding differences.
Amounts designated as "—" are either not applicable, $0 or have been rounded to $0.
The accompanying notes are an integral part of the financial statements.
TURNER FUNDS 2012 ANNUAL REPORT 53
Statements of operations (000)
| | Turner
Market Neutral
Fund | | Turner
Medical Sciences
Long/Short
Fund | | Turner
Spectrum
Fund | |
| | | year ended
9/30/12 | | year ended
9/30/12 | | year ended
9/30/12 | |
Investment Income: | |
Dividend | | $ | 381 | | | $ | 296 | | | $ | 6,607 | | |
Interest | | | 1 | | | | 2 | | | | 1 | | |
Securities lending | | | — | | | | — | | | | — | | |
Foreign taxes withheld | | | (5 | ) | | | (4 | ) | | | (85 | ) | |
Total investment income | | | 377 | | | | 294 | | | | 6,523 | | |
Expenses: | |
Investment advisory fees | | | 602 | | | | 1,066 | | | | 13,244 | | |
Administrator fees | | | 57 | | | | 101 | | | | 1,256 | | |
Shareholder service fees (1) | | | 13 | | | | 36 | | | | 397 | | |
Shareholder service fees (2) | | | — | | | | 8 | | | | 32 | | |
Distribution fees (2) | | | 1 | | | | 23 | | | | 96 | | |
Accounting agent fees | | | 11 | | | | 12 | | | | 21 | | |
Dividend expense | | | 150 | | | | 25 | | | | 1,741 | | |
Broker fees and charges on short sales | | | 88 | | | | 110 | | | | 2,949 | | |
Custodian fees | | | 25 | | | | 18 | | | | 151 | | |
Transfer agent fees | | | 21 | | | | 35 | | | | 475 | | |
Registration fees | | | 47 | | | | 54 | | | | 119 | | |
Professional fees | | | 12 | | | | 17 | | | | 218 | | |
Trustees' fees | | | 6 | | | | 10 | | | | 121 | | |
Insurance and other fees | | | 15 | | | | 32 | | | | 392 | | |
Total expenses | | | 1,048 | | | | 1,547 | | | | 21,212 | | |
Less: | |
Investment advisory fee waiver | | | (253 | ) | | | (151 | ) | | | (3,978 | ) | |
Shareholder services waiver | | | (1 | ) | | | (5 | ) | | | — | | |
Net expenses | | | 794 | | | | 1,391 | | | | 17,234 | | |
Net investment loss | | | (417 | ) | | | (1,097 | ) | | | (10,711 | ) | |
Net realized gain (loss) from securities sold | | | 2,027 | | | | 3,345 | | | | 41,348 | | |
Net realized gain (loss) from securities sold short | | | (2,626 | ) | | | (4,647 | ) | | | (68,274 | ) | |
Net realized gain (loss) on written options contracts | | | — | | | | — | | | | 865 | | |
Net realized gain (loss) on foreign currency transactions | | | (1 | ) | | | (4 | ) | | | (223 | ) | |
Net change in unrealized appreciation (depreciation) on investments | | | 463 | | | | 2,261 | | | | 50,063 | | |
Net change in unrealized appreciation (depreciation) on securities sold short | | | (663 | ) | | | (1,218 | ) | | | (24,690 | ) | |
Net change in unrealized appreciation (depreciation) on foreign currencies and translation of
other assets and liabilities denominated in foreign currencies | | | — | | | | 2 | | | | 7 | | |
Net realized and unrealized gain (loss) from investments, options and foreign currencies | | | (800 | ) | | | (261 | ) | | | (904 | ) | |
Net increase (decrease) in net assets resulting from operations | | $ | (1,217 | ) | | $ | (1,358 | ) | | $ | (11,615 | ) | |
54 TURNER FUNDS 2012 ANNUAL REPORT
| | | Turner
Titan
Fund | | Turner
All Cap
Growth
Fund | | Turner
Concentrated
Growth
Fund | |
| | | year ended
9/30/12 | | year ended
9/30/12 | | year ended
9/30/12 | |
Investment Income: | |
Dividend | | $ | 202 | | | $ | 177 | | | $ | 239 | | |
Interest | | | — | | | | 1 | | | | — | | |
Securities lending | | | — | | | | 5 | | | | 5 | | |
Foreign taxes withheld | | | (1 | ) | | | — | | | | (1 | ) | |
Total investment income | | | 201 | | | | 183 | | | | 243 | | |
Expenses: | |
Investment advisory fees | | | 338 | | | | 183 | | | | 217 | | |
Administrator fees | | | 32 | | | | 43 | | | | 56 | | |
Shareholder service fees (1) | | | 12 | | | | 75 | | | | 98 | | |
Shareholder service fees (2) | | | — | | | | — | | | | — | | |
Distribution fees (2) | | | 1 | | | | — | | | | — | | |
Accounting agent fees | | | 11 | | | | 3 | | | | 3 | | |
Dividend expense | | | 17 | | | | — | | | | — | | |
Broker fees and charges on short sales | | | 51 | | | | — | | | | — | | |
Custodian fees | | | 21 | | | | 13 | | | | 11 | | |
Transfer agent fees | | | 11 | | | | 35 | | | | 31 | | |
Registration fees | | | 44 | | | | 18 | | | | 19 | | |
Professional fees | | | 5 | | | | 7 | | | | 9 | | |
Trustees' fees | | | 3 | | | | 4 | | | | 5 | | |
Insurance and other fees | | | 11 | | | | 21 | | | | 30 | | |
Total expenses | | | 557 | | | | 402 | | | | 479 | | |
Less: | |
Investment advisory fee waiver | | | (110 | ) | | | (138 | ) | | | (151 | ) | |
Shareholder services waiver | | | — | | | | (6 | ) | | | (13 | ) | |
Net expenses | | | 447 | | | | 258 | | | | 315 | | |
Net investment loss | | | (246 | ) | | | (75 | ) | | | (72 | ) | |
Net realized gain (loss) from securities sold | | | 1,275 | | | | 1,232 | | | | 3,970 | | |
Net realized gain (loss) from securities sold short | | | (977 | ) | | | — | | | | — | | |
Net realized gain (loss) on written options contracts | | | — | | | | — | | | | — | | |
Net realized gain (loss) on foreign currency transactions | | | (1 | ) | | | — | | | | — | | |
Net change in unrealized appreciation (depreciation) on investments | | | 1,310 | | | | 3,417 | | | | 1,986 | | |
Net change in unrealized appreciation (depreciation) on securities sold short | | | (447 | ) | | | — | | | | — | | |
Net change in unrealized appreciation (depreciation) on foreign currencies and translation of
other assets and liabilities denominated in foreign currencies | | | — | | | | — | | | | — | | |
Net realized and unrealized gain (loss) from investments, options and foreign currencies | | | 1,160 | | | | 4,649 | | | | 5,956 | | |
Net increase (decrease) in net assets resulting from operations | | $ | 914 | | | $ | 4,574 | | | $ | 5,884 | | |
(1) Attributable to Investor Class Shares only.
(2) Attributable to Class C Shares only.
Amounts designated as "—" are either not applicable, $0 or have been rounded to $0.
The accompanying notes are an integral part of the financial statements.
TURNER FUNDS 2012 ANNUAL REPORT 55
Statements of operations (000)
| | | Turner
Emerging
Growth Fund | | Turner
Large
Growth Fund | | Turner
Midcap
Growth Fund | |
| | | year ended
9/30/12 | | year ended
9/30/12 | | year ended
9/30/12 | |
Investment Income: | |
Dividend | | $ | 1,075 | | | $ | 3,119 | | | $ | 5,691 | | |
Interest | | | — | | | | — | | | | 1 | | |
Securities lending | | | 227 | | | | 169 | | | | 201 | | |
Foreign taxes withheld | | | — | | | | (13 | ) | | | (1 | ) | |
Total investment income | | | 1,302 | | | | 3,275 | | | | 5,892 | | |
Expenses: | |
Investment advisory fees | | | 2,472 | | | | 2,353 | | | | 5,563 | | |
Administrator fees | | | 352 | | | | 559 | | | | 1,056 | | |
Shareholder service fees (1) | | | 427 | | | | 139 | | | | 1,166 | | |
Shareholder service fees (2) | | | — | | | | — | | | | 12 | | |
Distribution fees (2) | | | — | | | | — | | | | 12 | | |
Accounting agent fees | | | 4 | | | | 4 | | | | 4 | | |
Custodian fees | | | 18 | | | | 58 | | | | 48 | | |
Transfer agent fees | | | 103 | | | | 183 | | | | 348 | | |
Registration fees | | | 41 | | | | 60 | | | | 80 | | |
Professional fees | | | 54 | | | | 85 | | | | 165 | | |
Trustees' fees | | | 32 | | | | 55 | | | | 99 | | |
Insurance and other fees | | | 126 | | | | 212 | | | | 378 | | |
Total expenses | | | 3,629 | | | | 3,708 | | | | 8,931 | | |
Less: | |
Investment advisory fee waiver | | | (346 | ) | | | (857 | ) | | | (787 | ) | |
Shareholder services fee waiver | | | (15 | ) | | | (11 | ) | | | (64 | ) | |
Reimbursements of other operating expenses | | | — | | | | — | | | | — | | |
Net expenses | | | 3,268 | | | | 2,840 | | | | 8,080 | | |
Net investment income (loss) | | | (1,966 | ) | | | 435 | | | | (2,188 | ) | |
Net realized gain (loss) from securities sold | | | 42,086 | | | | 82,216 | | | | 93,758 | | |
Net realized gain (loss) on foreign currency transactions | | | — | | | | (1 | ) | | | — | | |
Net change in unrealized appreciation (depreciation) on investments | | | 15,892 | | | | 4,462 | | | | 19,856 | | |
Net change in unrealized appreciation (depreciation) on foreign currencies and translation
of other assets and liabilities denominated in foreign currencies | | | — | | | | — | | | | — | | |
Net realized and unrealized gain (loss) from investments, options and foreign currencies | | | 57,978 | | | | 86,677 | | | | 113,614 | | |
Net increase in net assets resulting from operations | | $ | 56,012 | | | $ | 87,112 | | | $ | 111,426 | | |
56 TURNER FUNDS 2012 ANNUAL REPORT
| | | Turner
Small Cap
Growth Fund | | Turner Global
Opportunities
Fund | | Turner
International
Growth Fund | |
| | | year ended
9/30/12 | | year ended
9/30/12 | | year ended
9/30/12 | |
Investment Income: | |
Dividend | | $ | 1,148 | | | $ | 14 | | | $ | 411 | | |
Interest | | | — | | | | — | | | | — | | |
Securities lending | | | 313 | | | | — | | | | — | | |
Foreign taxes withheld | | | (2 | ) | | | (1 | ) | | | (41 | ) | |
Total investment income | | | 1,459 | | | | 13 | | | | 370 | | |
Expenses: | |
Investment advisory fees | | | 2,582 | | | | 12 | | | | 147 | | |
Administrator fees | | | 368 | | | | 2 | | | | 25 | | |
Shareholder service fees (1) | | | 645 | | | | 1 | | | | 17 | | |
Shareholder service fees (2) | | | — | | | | — | | | | — | | |
Distribution fees (2) | | | — | | | | — | | | | — | | |
Accounting agent fees | | | 4 | | | | 14 | | | | 25 | | |
Custodian fees | | | 30 | | | | 5 | | | | 82 | | |
Transfer agent fees | | | 103 | | | | 2 | | | | 8 | | |
Registration fees | | | 29 | | | | 26 | | | | 27 | | |
Professional fees | | | 57 | | | | — | | | | 5 | | |
Trustees' fees | | | 34 | | | | — | | | | 2 | | |
Insurance and other fees | | | 109 | | | | 3 | | | | 6 | | |
Total expenses | | | 3,961 | | | | 65 | | | | 344 | | |
Less: | |
Investment advisory fee waiver | | | (678 | ) | | | (12 | ) | | | (136 | ) | |
Shareholder services fee waiver | | | (56 | ) | | | — | | | | (1 | ) | |
Reimbursements of other operating expenses | | | — | | | | (35 | ) | | | — | | |
Net expenses | | | 3,227 | | | | 18 | | | | 207 | | |
Net investment income (loss) | | | (1,768 | ) | | | (5 | ) | | | 163 | | |
Net realized gain (loss) from securities sold | | | 19,111 | | | | 18 | | | | (1,417 | ) | |
Net realized gain (loss) on foreign currency transactions | | | — | | | | (1 | ) | | | (36 | ) | |
Net change in unrealized appreciation (depreciation) on investments | | | 47,225 | | | | 258 | | | | 3,860 | | |
Net change in unrealized appreciation (depreciation) on foreign currencies and translation
of other assets and liabilities denominated in foreign currencies | | | — | | | | — | | | | (1 | ) | |
Net realized and unrealized gain (loss) from investments, options and foreign currencies | | | 66,336 | | | | 275 | | | | 2,406 | | |
Net increase in net assets resulting from operations | | $ | 64,568 | | | $ | 270 | | | $ | 2,569 | | |
(1) Attributable to Investor Class Shares only.
(2) Attributable to Retirement Class Shares only.
Amounts designated as "—" are either not applicable, $0 or have been rounded to $0.
The accompanying notes are an integral part of the financial statements.
TURNER FUNDS 2012 ANNUAL REPORT 57
Statements of changes in net assets (000)
| | | Turner
Market Neutral
Fund | | Turner
Medical Sciences
Long/Short
Fund | |
| | | year ended
9/30/12 | | 2/7/11(1) thru
9/30/11 | | year ended
9/30/12 | | 2/7/11(1) thru
9/30/11 | |
Investment Activities: | |
Net investment loss | | $ | (417 | ) | | $ | (50 | ) | | $ | (1,097 | ) | | $ | (331 | ) | |
Net realized gain (loss) from securities sold and securities sold short | | | (599 | ) | | | 11 | | | | (1,302 | ) | | | (1,016 | ) | |
Net realized gain (loss) on written options contracts | | | — | | | | — | | | | — | | | | — | | |
Net realized gain (loss) on foreign currency transactions | | | (1 | ) | | | — | | | | (4 | ) | | | (1 | ) | |
Net change in unrealized appreciation (depreciation) from investments and securities sold short | | | (200 | ) | | | 207 | | | | 1,043 | | | | 756 | | |
Net change in unrealized appreciation (depreciation) on written options contracts | | | — | | | | — | | | | — | | | | — | | |
Net change in unrealized appreciation (depreciation) on foreign currencies and translation | | | — | | | | — | | | | 2 | | | | (4 | ) | |
Net increase (decrease) in net assets resulting from operations | | | (1,217 | ) | | | 168 | | | | (1,358 | ) | | | (596 | ) | |
Dividends and distributions to shareholders: | |
Realized capital gains | |
Institutional Class Shares | | | (394 | ) | | | — | | | | — | | | | — | | |
Investor Class Shares | | | (67 | ) | | | — | | | | — | | | | — | | |
Class C Shares | | | — | | | | — | | | | — | | | | — | | |
Total dividends and distributions | | | (461 | ) | | | — | | | | — | | | | — | | |
Capital share transactions: | |
Institutional Class Shares | |
Proceeds from shares issued | | | 49,135 | | | | 8,554 | | | | 51,896 | | | | 54,974 | | |
Proceeds from shares issued in lieu of cash distributions | | | 385 | | | | — | | | | — | | | | — | | |
Cost of shares redeemed | | | (8,748 | ) | | | (14 | ) | | | (59,013 | ) | | | (9,281 | ) | |
Net increase (decrease) in net assets from Institutional Class Shares transactions | | | 40,772 | | | | 8,540 | | | | (7,117 | ) | | | 45,693 | | |
Investor Class Shares | |
Proceeds from shares issued | | | 7,056 | | | | 4,072 | | | | 18,248 | | | | 13,724 | | |
Proceeds from shares issued in lieu of cash distributions | | | 67 | | | | — | | | | — | | | | — | | |
Cost of shares redeemed | | | (4,394 | ) | | | (867 | ) | | | (21,057 | ) | | | (911 | ) | |
Net increase (decrease) in net assets from Investor Class Shares transactions | | | 2,729 | | | | 3,205 | | | | (2,809 | ) | | | 12,813 | | |
Class C Shares | |
Proceeds from shares issued | | | 137 | | | | — | | | | 2,329 | | | | 2,283 | | |
Proceeds from shares issued in lieu of cash distributions | | | — | | | | — | | | | — | | | | — | | |
Cost of shares redeemed | | | (49 | ) | | | — | | | | (1,522 | ) | | | (104 | ) | |
Net increase (decrease) in net assets from Class C Shares transactions | | | 88 | | | | — | | | | 807 | | | | 2,179 | | |
Net increase (decrease) in net assets from capital share transactions | | | 43,589 | | | | 11,745 | | | | (9,119 | ) | | | 60,685 | | |
Total increase (decrease) in net assets | | | 41,911 | | | | 11,913 | | | | (10,477 | ) | | | 60,089 | | |
Net Assets: | |
Beginning of period | | | 11,913 | | | | — | | | | 60,089 | | | | — | | |
End of period | | $ | 53,824 | | | $ | 11,913 | | | $ | 49,612 | | | $ | 60,089 | | |
Accumulated net investment loss | | $ | (339 | ) | | $ | (1 | ) | | $ | (773 | ) | | $ | (21 | ) | |
Share issued and redeemed: | |
Institutional Class Shares | |
Issued | | | 4,704 | | | | 825 | | | | 5,070 | | | | 5,247 | | |
Issued in lieu of cash distributions | | | 38 | | | | — | | | | — | | | | — | | |
Redeemed | | | (845 | ) | | | (1 | ) | | | (5,790 | ) | | | (886 | ) | |
Net increase (decrease) in Institutional Class Shares | | | 3,897 | | | | 824 | | | | (720 | ) | | | 4,361 | | |
Investor Class Shares | |
Issued | | | 674 | | | | 390 | | | | 1,778 | | | | 1,322 | | |
Issued in lieu of cash distributions | | | 7 | | | | — | | | | — | | | | — | | |
Redeemed | | | (427 | ) | | | (83 | ) | | | (2,068 | ) | | | (87 | ) | |
Net increase (decrease) in Investor Class Shares | | | 254 | | | | 307 | | | | (290 | ) | | | 1,235 | | |
Class C Shares | |
Issued | | | 14 | | | | — | | | | 230 | | | | 220 | | |
Issued in lieu of cash distributions | | | — | | | | — | | | | — | | | | — | | |
Redeemed | | | (5 | ) | | | — | | | | (152 | ) | | | (10 | ) | |
Net increase (decrease) in Class C Shares | | | 9 | | | | — | | | | 78 | | | | 210 | | |
Net increase (decrease) in share transactions | | | 4,160 | | | | 1,131 | | | | (932 | ) | | | 5,806 | | |
58 TURNER FUNDS 2012 ANNUAL REPORT
| | | Turner
Spectrum
Fund | | Turner
Titan
Fund | |
| | | year ended
9/30/12 | | year ended
9/30/11 | | year ended
9/30/12 | | 2/7/11(1) thru
9/30/11 | |
Investment Activities: | |
Net investment loss | | $ | (10,711 | ) | | $ | (5,836 | ) | | $ | (246 | ) | | $ | (68 | ) | |
Net realized gain (loss) from securities sold and securities sold short | | | (26,926 | ) | | | 17,230 | | | | 298 | | | | (607 | ) | |
Net realized gain (loss) on written options contracts | | | 865 | | | | (6,481 | ) | | | — | | | | — | | |
Net realized gain (loss) on foreign currency transactions | | | (223 | ) | | | 110 | | | | (1 | ) | | | — | | |
Net change in unrealized appreciation (depreciation) from investments and securities sold short | | | 25,373 | | | | 642 | | | | 863 | | | | 134 | | |
Net change in unrealized appreciation (depreciation) on written options contracts | | | — | | | | 56 | | | | — | | | | — | | |
Net change in unrealized appreciation (depreciation) on foreign currencies and translation | | | 7 | | | | (9 | ) | | | — | | | | — | | |
Net increase (decrease) in net assets resulting from operations | | | (11,615 | ) | | | 5,712 | | | | 914 | | | | (541 | ) | |
Dividends and distributions to shareholders: | |
Realized capital gains | |
Institutional Class Shares | | | (22,293 | ) | | | — | | | | (110 | ) | | | — | | |
Investor Class Shares | | | (7,313 | ) | | | — | | | | (40 | ) | | | — | | |
Class C Shares | | | (553 | ) | | | — | | | | (1 | ) | | | — | | |
Total dividends and distributions | | | (30,159 | ) | | | — | | | | (151 | ) | | | — | | |
Capital share transactions: | |
Institutional Class Shares | |
Proceeds from shares issued | | | 786,546 | | | | 326,173 | | | | 18,412 | | | | 12,002 | | |
Proceeds from shares issued in lieu of cash distributions | | | 19,084 | | | | — | | | | 110 | | | | — | | |
Cost of shares redeemed | | | (388,983 | ) | | | (62,344 | ) | | | (4,663 | ) | | | (154 | ) | |
Net increase (decrease) in net assets from Institutional Class Shares transactions | | | 416,647 | | | | 263,829 | | | | 13,859 | | | | 11,848 | | |
Investor Class Shares | |
Proceeds from shares issued | | | 74,782 | | | | 140,625 | | | | 5,783 | | | | 2,777 | | |
Proceeds from shares issued in lieu of cash distributions | | | 7,037 | | | | — | | | | 40 | | | | — | | |
Cost of shares redeemed | | | (108,037 | ) | | | (31,909 | ) | | | (3,684 | ) | | | — | | |
Net increase (decrease) in net assets from Investor Class Shares transactions | | | (26,218 | ) | | | 108,716 | | | | 2,139 | | | | 2,777 | | |
Class C Shares | |
Proceeds from shares issued | | | 3,376 | | | | 6,802 | | | | 503 | | | | 31 | | |
Proceeds from shares issued in lieu of cash distributions | | | 493 | | | | — | | | | 1 | | | | — | | |
Cost of shares redeemed | | | (5,176 | ) | | | (1,682 | ) | | | — | | | | — | | |
Net increase (decrease) in net assets from Class C Shares transactions | | | (1,307 | ) | | | 5,120 | | | | 504 | | | | 31 | | |
Net increase (decrease) in net assets from capital share transactions | | | 389,122 | | | | 377,665 | | | | 16,502 | | | | 14,656 | | |
Total increase (decrease) in net assets | | | 347,348 | | | | 383,377 | | | | 17,265 | | | | 14,115 | | |
Net Assets: | |
Beginning of period | | | 622,433 | | | | 239,056 | | | | 14,115 | | | | — | | |
End of period | | $ | 969,781 | | | $ | 622,433 | | | $ | 31,380 | | | $ | 14,115 | | |
Accumulated net investment loss | | $ | (8,238 | ) | | $ | (380 | ) | | $ | — | | | $ | — | | |
Share issued and redeemed: | |
Institutional Class Shares | |
Issued | | | 70,716 | | | | 27,953 | | | | 1,802 | | | | 1,179 | | |
Issued in lieu of cash distributions | | | 1,757 | | | | — | | | | 11 | | | | — | | |
Redeemed | | | (35,203 | ) | | | (5,366 | ) | | | (455 | ) | | | (15 | ) | |
Net increase (decrease) in Institutional Class Shares | | | 37,270 | | | | 22,587 | | | | 1,358 | | | | 1,164 | | |
Investor Class Shares | |
Issued | | | 6,709 | | | | 12,099 | | | | 579 | | | | 278 | | |
Issued in lieu of cash distributions | | | 653 | | | | — | | | | 4 | | | | — | | |
Redeemed | | | (9,829 | ) | | | (2,770 | ) | | | (367 | ) | | | — | | |
Net increase (decrease) in Investor Class Shares | | | (2,467 | ) | | | 9,329 | | | | 216 | | | | 278 | | |
Class C Shares | |
Issued | | | 307 | | | | 588 | | | | 50 | | | | 3 | | |
Issued in lieu of cash distributions | | | 46 | | | | — | | | | — | | | | — | | |
Redeemed | | | (481 | ) | | | (146 | ) | | | — | | | | — | | |
Net increase (decrease) in Class C Shares | | | (128 | ) | | | 442 | | | | 50 | | | | 3 | | |
Net increase (decrease) in share transactions | | | 34,675 | | | | 32,358 | | | | 1,624 | | | | 1,445 | | |
(1) Commencement of operations.
Amounts designated as "—" are either not applicable, $0 or have been rounded to $0.
The accompanying notes are an integral part of the financial statements.
TURNER FUNDS 2012 ANNUAL REPORT 59
Statements of changes in net assets (000)
| | | Turner
All Cap Growth
Fund | | Turner
Concentrated Growth
Fund | |
| | | year ended
9/30/12 | | year ended
9/30/11 | | year ended
9/30/12 | | year ended
9/30/11 | |
Investment Activities: | |
Net investment income (loss) | | $ | (75 | ) | | $ | (557 | ) | | $ | (72 | ) | | $ | (645 | ) | |
Net realized gain (loss) from securities sold and securities sold short | | | 1,232 | | | | 7,305 | | | | 3,970 | | | | 5,557 | | |
Net realized gain (loss) on foreign currency transactions | | | — | | | | — | | | | — | | | | — | | |
Net change in unrealized appreciation (depreciation) from investments and securities sold short | | | 3,417 | | | | (6,586 | ) | | | 1,986 | | | | (5,758 | ) | |
Net increase (decrease) in net assets resulting from operations | | | 4,574 | | | | 162 | | | | 5,884 | | | | (846 | ) | |
Dividends and distributions to shareholders: | |
Net investment income | |
Institutional Class Shares | | | — | | | | — | | | | — | | | | — | | |
Total dividends and distributions | | | — | | | | — | | | | — | | | | — | | |
Capital share transactions: | |
Institutional Class Shares | |
Proceeds from shares issued | | | — | | | | — | | | | — | | | | — | | |
Proceeds from Fund acquisition (Note 12) | | | — | | | | — | | | | — | | | | — | | |
Proceeds from shares issued in lieu of cash distributions | | | — | | | | — | | | | — | | | | — | | |
Cost of shares redeemed | | | — | | | | — | | | | — | | | | — | | |
Net increase (decrease) in net assets from Institutional Class Shares transactions | | | — | | | | — | | | | — | | | | — | | |
Investor Class Shares | |
Proceeds from shares issued | | | 7,196 | | | | 46,094 | | | | 8,906 | | | | 15,634 | | |
Proceeds from Fund acquisition (Note 12) | | | — | | | | — | | | | — | | | | — | | |
Cost of shares redeemed | | | (18,983 | ) | | | (36,430 | ) | | | (18,802 | ) | | | (18,773 | ) | |
Net increase (decrease) in net assets from Investor Class Shares transactions | | | (11,787 | ) | | | 9,664 | | | | (9,896 | ) | | | (3,139 | ) | |
Net increase (decrease) in net assets from capital share transactions | | | (11,787 | ) | | | 9,664 | | | | (9,896 | ) | | | (3,139 | ) | |
Total increase (decrease) in net assets | | | (7,213 | ) | | | 9,826 | | | | (4,012 | ) | | | (3,985 | ) | |
Net Assets: | |
Beginning of period | | | 33,053 | | | | 23,227 | | | | 38,939 | | | | 42,924 | | |
End of period | | $ | 25,840 | | | $ | 33,053 | | | $ | 34,927 | | | $ | 38,939 | | |
Undistributed net investment income (accumulated net investment income) | | $ | (1 | ) | | $ | 3 | | | $ | (19 | ) | | $ | 14 | | |
Share issued and redeemed: | |
Institutional Class Shares | |
Issued | | | — | | | | — | | | | — | | | | — | | |
Shares from Fund acquisition (Note 12) | | | — | | | | — | | | | — | | | | — | | |
Issued in lieu of cash distributions | | | — | | | | — | | | | — | | | | — | | |
Redeemed | | | — | | | | — | | | | — | | | | — | | |
Net increase (decrease) in Institutional Class Shares | | | — | | | | — | | | | — | | | | — | | |
Investor Class Shares | |
Issued | | | 815 | | | | 5,106 | | | | 1,224 | | | | 2,038 | | |
Shares from Fund acquisition (Note 12) | | | — | | | | — | | | | — | | | | — | | |
Redeemed | | | (2,255 | ) | | | (4,102 | ) | | | (2,599 | ) | | | (2,445 | ) | |
Net increase (decrease) in Investor Class Shares | | | (1,440 | ) | | | 1,004 | | | | (1,375 | ) | | | (407 | ) | |
Net increase (decrease) in share transactions | | | (1,440 | ) | | | 1,004 | | | | (1,375 | ) | | | (407 | ) | |
60 TURNER FUNDS 2012 ANNUAL REPORT
| | | Turner
Emerging Growth
Fund | | Turner
Large Growth
Fund | |
| | | year ended
9/30/12 | | year ended
9/30/11 | | year ended
9/30/12 | | year ended
9/30/11 | |
Investment Activities: | |
Net investment income (loss) | | $ | (1,966 | ) | | $ | (4,513 | ) | | $ | 435 | | | $ | (469 | ) | |
Net realized gain (loss) from securities sold and securities sold short | | | 42,086 | | | | 111,565 | † | | | 82,216 | | | | 100,361 | | |
Net realized gain (loss) on foreign currency transactions | | | — | | | | — | | | | (1 | ) | | | — | | |
Net change in unrealized appreciation (depreciation) from investments and securities sold short | | | 15,892 | | | | (54,358 | ) | | | 4,462 | | | | (106,427 | ) | |
Net increase (decrease) in net assets resulting from operations | | | 56,012 | | | | 52,694 | | | | 87,112 | | | | (6,535 | ) | |
Dividends and distributions to shareholders: | |
Net investment income | |
Institutional Class Shares | | | — | | | | — | | | | — | | | | (671 | ) | |
Total dividends and distributions | | | — | | | | — | | | | — | | | | (671 | ) | |
Capital share transactions: | |
Institutional Class Shares | |
Proceeds from shares issued | | | 12,775 | | | | 83,629 | | | | 45,450 | | | | 87,009 | | |
Proceeds from Fund acquisition (Note 12) | | | — | | | | — | | | | — | | | | 140,366 | | |
Proceeds from shares issued in lieu of cash distributions | | | — | | | | — | | | | — | | | | 612 | | |
Cost of shares redeemed | | | (27,694 | ) | | | (330,208 | )† | | | (301,740 | ) | | | (209,772 | ) | |
Net increase (decrease) in net assets from Institutional Class Shares transactions | | | (14,919 | ) | | | (246,579 | ) | | | (256,290 | ) | | | 18,215 | | |
Investor Class Shares | |
Proceeds from shares issued | | | 27,454 | | | | 37,791 | | | | 8,694 | | | | 21,626 | | |
Proceeds from Fund acquisition (Note 12) | | | — | | | | — | | | | — | | | | 1,518 | | |
Cost of shares redeemed | | | (56,328 | ) | | | (71,012 | ) | | | (29,601 | ) | | | (136,556 | ) | |
Net increase (decrease) in net assets from Investor Class Shares transactions | | | (28,874 | ) | | | (33,221 | ) | | | (20,907 | ) | | | (113,412 | ) | |
Net increase (decrease) in net assets from capital share transactions | | | (43,793 | ) | | | (279,800 | ) | | | (277,197 | ) | | | (95,197 | ) | |
Total increase (decrease) in net assets | | | 12,219 | | | | (227,106 | ) | | | (190,085 | ) | | | (102,403 | ) | |
Net Assets: | |
Beginning of period | | | 226,162 | | | | 453,268 | | | | 438,997 | | | | 541,400 | | |
End of period | | $ | 238,381 | | | $ | 226,162 | | | $ | 248,912 | | | $ | 438,997 | | |
Undistributed net investment income (accumulated net investment income) | | $ | (1,536 | ) | | $ | (41 | ) | | $ | 449 | | | $ | 42 | | |
Share issued and redeemed: | |
Institutional Class Shares | |
Issued | | | 235 | | | | 1,614 | | | | 3,803 | | | | 7,643 | | |
Shares from Fund acquisition (Note 12) | | | — | | | | — | | | | — | | | | 10,966 | | |
Issued in lieu of cash distributions | | | — | | | | — | | | | — | | | | 51 | | |
Redeemed | | | (495 | ) | | | (6,655 | )† | | | (24,590 | ) | | | (18,016 | ) | |
Net increase (decrease) in Institutional Class Shares | | | (260 | ) | | | (5,041 | ) | | | (20,787 | ) | | | 644 | | |
Investor Class Shares | |
Issued | | | 521 | | | | 729 | | | | 716 | | | | 1,406 | | |
Shares from Fund acquisition (Note 12) | | | — | | | | — | | | | — | | | | 119 | | |
Redeemed | | | (1,060 | ) | | | (1,411 | ) | | | (2,394 | ) | | | (11,700 | ) | |
Net increase (decrease) in Investor Class Shares | | | (539 | ) | | | (682 | ) | | | (1,678 | ) | | | (10,175 | ) | |
Net increase (decrease) in share transactions | | | (799 | ) | | | (5,723 | ) | | | (22,465 | ) | | | (9,531 | ) | |
† Includes realized gains, losses, or redemptions as a result of in-kind transactions (see Note 11 in Notes to Financial Statements).
Amounts designated as "—" are either not applicable, $0 or have been rounded to $0.
The accompanying notes are an integral part of the financial statements.
TURNER FUNDS 2012 ANNUAL REPORT 61
Statements of changes in net assets (000)
| | | Turner
Midcap Growth
Fund | | Turner
Small Cap Growth
Fund | |
| | | year ended
9/30/12 | | year ended
9/30/11 | | year ended
9/30/12 | | year ended
9/30/11 | |
Investment Activities: | |
Net investment income (loss) | | $ | (2,188 | ) | | $ | (3,356 | ) | | $ | (1,768 | ) | | $ | (2,429 | ) | |
Net realized gain (loss) from securities sold | | | 93,758 | | | | 268,940 | | | | 19,111 | | | | 60,910 | | |
Net realized gain (loss) on foreign currency transactions | | | — | | | | 1 | | | | — | | | | — | | |
Net change in unrealized appreciation (depreciation) on investments | | | 19,856 | | | | (194,104 | ) | | | 47,225 | | | | (70,484 | ) | |
Net change in unrealized appreciation (depreciation) on foreign currencies
and translation of other assets and liabilities denominated in foreign currencies | | | — | | | | — | | | | — | | | | — | | |
Net increase (decrease) in net assets resulting from operations | | | 111,426 | | | | 71,481 | | | | 64,568 | | | | (12,003 | ) | |
Dividends and distributions to shareholders: | |
Net investment income | |
Institutional Class Shares | | | — | | | | — | | | | — | | | | — | | |
Investor Class Shares | | | — | | | | — | | | | — | | | | — | | |
Realized capital gains | |
Institutional Class Shares | | | — | | | | — | | | | — | | | | — | | |
Investor Class Shares | | | — | | | | — | | | | — | | | | — | | |
Total dividends and distributions | | | — | | | | — | | | | — | | | | — | | |
Capital share transactions: | |
Institutional Class Shares | |
Proceeds from shares issued | | | 54,971 | | | | 172,552 | | | | — | | | | — | | |
Proceeds from shares issued in lieu of cash distributions | | | — | | | | — | | | | — | | | | — | | |
Cost of shares redeemed | | | (103,598 | ) | | | (76,894 | ) | | | — | | | | — | | |
Net increase (decrease) in net assets from Institutional Class Shares transactions | | | (48,627 | ) | | | 95,658 | | | | — | | | | — | | |
Investor Class Shares | |
Proceeds from shares issued | | | 76,266 | | | | 221,546 | | | | 31,902 | | | | 120,040 | | |
Proceeds from shares issued in lieu of cash distributions | | | — | | | | — | | | | — | | | | — | | |
Cost of shares redeemed | | | (214,569 | ) | | | (587,846 | ) | | | (76,290 | ) | | | (153,043 | ) | |
Net increase (decrease) in net assets from Investor Class Shares transactions | | | (138,303 | ) | | | (366,300 | ) | | | (44,388 | ) | | | (33,003 | ) | |
Retirement Class Shares | |
Proceeds from shares issued | | | 822 | | | | 1,745 | | | | — | | | | — | | |
Cost of shares redeemed | | | (671 | ) | | | (2,541 | ) | | | — | | | | — | | |
Net increase (decrease) in net assets from Retirement Class Shares transactions | | | 151 | | | | (796 | ) | | | — | | | | — | | |
Net increase (decrease) in net assets from capital share transactions | | | (186,779 | ) | | | (271,438 | ) | | | (44,388 | ) | | | (33,003 | ) | |
Total increase (decrease) in net assets | | | (75,353 | ) | | | (199,957 | ) | | | 20,180 | | | | (45,006 | ) | |
Net Assets: | |
Beginning of period | | | 720,738 | | | | 920,695 | | | | 229,919 | | | | 274,925 | | |
End of period | | $ | 645,385 | | | $ | 720,738 | | | $ | 250,099 | | | $ | 229,919 | | |
Undistributed net investment income (accumulated net investment income) | | $ | (2,022 | ) | | $ | 64 | | | $ | (1,229 | ) | | $ | — | | |
Share issued and redeemed: | |
Institutional Class Shares | |
Issued | | | 1,598 | | | | 4,733 | | | | — | | | | — | | |
Issued in lieu of cash distributions | | | — | | | | — | | | | — | | | | — | | |
Redeemed | | | (2,998 | ) | | | (2,179 | ) | | | — | | | | — | | |
Net increase (decrease) in Institutional Class Shares | | | (1,400 | ) | | | 2,554 | | | | — | | | | — | | |
Investor Class Shares | |
Issued | | | 2,238 | | | | 6,010 | | | | 950 | | | | 3,352 | | |
Issued in lieu of cash distributions | | | — | | | | — | | | | — | | | | — | | |
Redeemed | | | (6,311 | ) | | | (15,652 | ) | | | (2,255 | ) | | | (4,580 | ) | |
Net increase (decrease) in Investor Class Shares | | | (4,073 | ) | | | (9,642 | ) | | | (1,305 | ) | | | (1,228 | ) | |
Retirement Class Shares | |
Issued | | | 26 | | | | 50 | | | | — | | | | — | | |
Redeemed | | | (20 | ) | | | (72 | ) | | | — | | | | — | | |
Net increase (decrease) in Retirement Class Shares | | | 6 | | | | (22 | ) | | | — | | | | — | | |
Net increase (decrease) in share transactions | | | (5,467 | ) | | | (7,110 | ) | | | (1,305 | ) | | | (1,228 | ) | |
62 TURNER FUNDS 2012 ANNUAL REPORT
| | | Turner
Global Opportunities
Fund | | Turner
International Growth
Fund | |
| | | year ended
9/30/12 | | year ended
9/30/11 | | year ended
9/30/12 | | year ended
9/30/11 | |
Investment Activities: | |
Net investment income (loss) | | $ | (5 | ) | | $ | (6 | ) | | $ | 163 | | | $ | 52 | | |
Net realized gain (loss) from securities sold | | | 18 | | | | 82 | | | | (1,417 | ) | | | 469 | | |
Net realized gain (loss) on foreign currency transactions | | | (1 | ) | | | (3 | ) | | | (36 | ) | | | (46 | ) | |
Net change in unrealized appreciation (depreciation) on investments | | | 258 | | | | (115 | ) | | | 3,860 | | | | (2,125 | ) | |
Net change in unrealized appreciation (depreciation) on foreign currencies
and translation of other assets and liabilities denominated in foreign currencies | | | — | | | | — | | | | (1 | ) | | | — | | |
Net increase (decrease) in net assets resulting from operations | | | 270 | | | | (42 | ) | | | 2,569 | | | | (1,650 | ) | |
Dividends and distributions to shareholders: | |
Net investment income | |
Institutional Class Shares | | | — | | | | — | | | | — | | | | (48 | ) | |
Investor Class Shares | | | — | | | | — | | | | — | | | | (1 | ) | |
Realized capital gains | |
Institutional Class Shares | | | (28 | ) | | | — | | | | — | | | | — | | |
Investor Class Shares | | | (14 | ) | | | — | | | | — | | | | — | | |
Total dividends and distributions | | | (42 | ) | | | — | | | | — | | | | (49 | ) | |
Capital share transactions: | |
Institutional Class Shares | |
Proceeds from shares issued | | | 561 | | | | 418 | | | | 15,611 | | | | 1,511 | | |
Proceeds from shares issued in lieu of cash distributions | | | 28 | | | | — | | | | — | | | | 48 | | |
Cost of shares redeemed | | | (15 | ) | | | (717 | ) | | | (81 | ) | | | (141 | ) | |
Net increase (decrease) in net assets from Institutional Class Shares transactions | | | 574 | | | | (299 | ) | | | 15,530 | | | | 1,418 | | |
Investor Class Shares | |
Proceeds from shares issued | | | 43 | | | | 973 | | | | 6,900 | | | | 6,586 | | |
Proceeds from shares issued in lieu of cash distributions | | | 14 | | | | — | | | | — | | | | 1 | | |
Cost of shares redeemed | | | (342 | ) | | | (397 | ) | | | (6,346 | ) | | | (511 | ) | |
Net increase (decrease) in net assets from Investor Class Shares transactions | | | (285 | ) | | | 576 | | | | 554 | | | | 6,076 | | |
Retirement Class Shares | |
Proceeds from shares issued | | | — | | | | — | | | | — | | | | — | | |
Cost of shares redeemed | | | — | | | | — | | | | — | | | | — | | |
Net increase (decrease) in net assets from Retirement Class Shares transactions | | | — | | | | — | | | | — | | | | — | | |
Net increase (decrease) in net assets from capital share transactions | | | 289 | | | | 277 | | | | 16,084 | | | | 7,494 | | |
Total increase (decrease) in net assets | | | 517 | | | | 235 | | | | 18,653 | | | | 5,795 | | |
Net Assets: | |
Beginning of period | | | 1,388 | | | | 1,153 | | | | 10,924 | | | | 5,129 | | |
End of period | | $ | 1,905 | | | $ | 1,388 | | | $ | 29,577 | | | $ | 10,924 | | |
Undistributed net investment income (accumulated net investment income) | | $ | (2 | ) | | $ | (2 | ) | | $ | 124 | | | $ | (2 | ) | |
Share issued and redeemed: | |
Institutional Class Shares | |
Issued | | | 43 | | | | 31 | | | | 1,509 | | | | 127 | | |
Issued in lieu of cash distributions | | | 2 | | | | — | | | | — | | | | 6 | | |
Redeemed | | | (1 | ) | | | (51 | ) | | | (8 | ) | | | (13 | ) | |
Net increase (decrease) in Institutional Class Shares | | | 44 | | | | (20 | ) | | | 1,501 | | | | 120 | | |
Investor Class Shares | |
Issued | | | 3 | | | | 71 | | | | 649 | | | | 572 | | |
Issued in lieu of cash distributions | | | 1 | | | | — | | | | — | | | | — | | |
Redeemed | | | (27 | ) | | | (29 | ) | | | (613 | ) | | | (48 | ) | |
Net increase (decrease) in Investor Class Shares | | | (23 | ) | | | 42 | | | | 36 | | | | 524 | | |
Retirement Class Shares | |
Issued | | | — | | | | — | | | | — | | | | — | | |
Redeemed | | | — | | | | — | | | | — | | | | — | | |
Net increase (decrease) in Retirement Class Shares | | | — | | | | — | | | | — | | | | — | | |
Net increase (decrease) in share transactions | | | 21 | | | | 22 | | | | 1,537 | | | | 644 | | |
Amounts designated as "—" are either not applicable, $0 or have been rounded to $0.
The accompanying notes are an integral part of the financial statements.
TURNER FUNDS 2012 ANNUAL REPORT 63
For a share outstanding throughout each period
| | | Net asset
value,
beginning
of period | | Net
investment
income
(loss) | | Realized and
unrealized
gains (losses)
on investments | | Total
from
investment
operations | | Dividends
from net
investment
income | | Distributions
from
capital
gains | | Total
dividends and
distributions | |
Turner Market Neutral Fund — Institutional Class Shares | | | |
2012 | | $ | 10.53 | | | | (0.11 | ) (1) | | | (0.02 | ) | | | (0.13 | ) | | | — | | | | (0.22 | ) | | | (0.22 | ) | |
| 2011 (3) | | $ | 10.00 | | | | (0.09 | ) (1) | | | 0.62 | | | | 0.53 | | | | — | | | | — | | | | — | | |
Turner Market Neutral Fund — Investor Class Shares | | | |
2012 | | $ | 10.52 | | | | (0.14 | ) (1) | | | (0.03 | ) | | | (0.17 | ) | | | — | | | | (0.22 | ) | | | (0.22 | ) | |
| 2011 (3) | | $ | 10.00 | | | | (0.10 | ) (1) | | | 0.62 | | | | 0.52 | | | | — | | | | — | | | | — | | |
Turner Market Neutral Fund — Class C Shares | | | |
2012 | | $ | 10.46 | | | | (0.20 | ) (1) | | | (0.03 | ) | | | (0.23 | ) | | | — | | | | (0.22 | ) | | | (0.22 | ) | |
| 2011 (3) | | $ | 10.00 | | | | (0.15 | ) (1) | | | 0.61 | | | | 0.46 | | | | — | | | | — | | | | — | | |
Turner Medical Sciences Long/Short Fund — Institutional Class Shares | | | |
2012 | | $ | 10.35 | | | | (0.15 | ) (1) | | | (0.01 | ) | | | (0.16 | ) | | | — | | | | — | | | | — | | |
| 2011 (3) | | $ | 10.00 | | | | (0.12 | ) (1) | | | 0.47 | | | | 0.35 | | | | — | | | | — | | | | — | | |
Turner Medical Sciences Long/Short Fund — Investor Class Shares | | | |
2012 | | $ | 10.34 | | | | (0.18 | ) (1) | | | — | | | | (0.18 | ) | | | — | | | | — | | | | — | | |
| 2011 (3) | | $ | 10.00 | | | | (0.13 | ) (1) | | | 0.47 | | | | 0.34 | | | | — | | | | — | | | | — | | |
Turner Medical Sciences Long/Short Fund — Class C Shares | | | |
2012 | | $ | 10.30 | | | | (0.25 | ) (1) | | | (0.01 | ) | | | (0.26 | ) | | | — | | | | — | | | | — | | |
| 2011 (3) | | $ | 10.00 | | | | (0.18 | ) (1) | | | 0.48 | | | | 0.30 | | | | — | | | | — | | | | — | | |
64 TURNER FUNDS 2012 ANNUAL REPORT
| | | Net asset
value, end
of period | | Total
return | | Net
assets end
of period
(000) | | Ratio of
net expenses
to average
net assets† | | Ratio of total
expenses
to average
net assets | | Ratio of net
investment
income (loss)
to average
net assets† | | Portfolio
turnover
rate†† | |
Turner Market Neutral Fund — Institutional Class Shares | |
2012 | | $ | 10.18 | | | | (1.23 | )% | | $ | 48,054 | | | | 1.94 | %* (2) | | | 2.57 | %* | | | (1.00 | )%* | | | 1,520 | % | |
| 2011 (3) | | $ | 10.53 | | | | 5.30 | %††† | | $ | 8,679 | | | | 1.95 | % (4) | | | 3.92 | % | | | (1.27 | )% | | | 1,184 | % | |
Turner Market Neutral Fund — Investor Class Shares | |
2012 | | $ | 10.13 | | | | (1.62 | )% | | $ | 5,685 | | | | 2.19 | %* (2) | | | 2.82 | %* | | | (1.25 | )%* | | | 1,520 | % | |
| 2011 (3) | | $ | 10.52 | | | | 5.20 | %††† | | $ | 3,233 | | | | 2.20 | % (4) | | | 4.18 | % | | | (1.54 | )% | | | 1,184 | % | |
Turner Market Neutral Fund — Class C Shares | |
2012 | | $ | 10.01 | | | | (2.21 | )% | | $ | 85 | | | | 2.94 | %* (2) | | | 3.57 | %* | | | (2.00 | )%* | | | 1,520 | % | |
| 2011 (3) | | $ | 10.46 | | | | 4.60 | %††† | | $ | — | | | | 2.95 | % (4) | | | 4.77 | % | | | (2.26 | )% | | | 1,184 | % | |
Turner Medical Sciences Long/Short Fund — Institutional Class Shares | |
2012 | | $ | 10.19 | | | | (1.55 | )% | | $ | 37,117 | | | | 1.87 | %* (5) | | | 2.09 | %* | | | (1.45 | )%* | | | 900 | % | |
| 2011 (3) | | $ | 10.35 | | | | 3.50 | %††† | | $ | 45,147 | | | | 1.93 | % (6) | | | 2.74 | % | | | (1.74 | )% | | | 608 | % | |
Turner Medical Sciences Long/Short Fund — Investor Class Shares | |
2012 | | $ | 10.16 | | | | (1.74 | )% | | $ | 9,606 | | | | 2.12 | %* (5) | | | 2.34 | %* | | | (1.70 | )%* | | | 900 | % | |
| 2011 (3) | | $ | 10.34 | | | | 3.40 | %††† | | $ | 12,777 | | | | 2.14 | % (6) | | | 2.89 | % | | | (1.93 | )% | | | 608 | % | |
Turner Medical Sciences Long/Short Fund — Class C Shares | |
2012 | | $ | 10.04 | | | | (2.52 | )% | | $ | 2,889 | | | | 2.87 | %* (5) | | | 3.09 | %* | | | (2.45 | )%* | | | 900 | % | |
| 2011 (3) | | $ | 10.30 | | | | 3.00 | %††† | | $ | 2,165 | | | | 2.93 | % (6) | | | 3.63 | % | | | (2.71 | )% | | | 608 | % | |
* Does not include acquired fund fees or expenses.
† Inclusive of fees paid indirectly, waivers and/or reimbursements.
†† Excludes effect of in-kind transfers and mergers, as applicable. Not annualized for periods less than one year.
††† Total return is for the period indicated and has not been annualized.
(1) Based on average shares outstanding.
(2) Dividend expense totaled 0.37% of average net assets for the year ended September 30, 2012, 0.37% of which was waived. Broker fees and charges on short sales totaled 0.22% of average net assets for the year ended September 30, 2012, 0.22% of which was waived. If dividend expense and broker fees and charges on short sales had not been contractually waived, the ratios of net expenses to average net assets would have been 2.53%, 2.78% and 3.53% for the Institutional, Investor and Class C Shares, respectively.
(3) Commenced operations on February 7, 2011. All ratios for the period have been annualized.
(4) Dividend expense totaled 0.44% of average net assets for the period ended September 30, 2011, 0.34% of which was waived. Broker fees and charges on short sales totaled 0.25% of average net assets for the period ended September 30, 2011, 0.19% of which was waived. If dividend expense and broker fees and charges on short sales had not been contractually waived, the ratios of net expenses to average net assets would have been 2.48%, 2.73% and 3.48% for the Institutional, Investor and Class C Shares, respectively.
(5) Dividend expense totaled 0.04% of average net assets for the year ended September 30, 2012, 0.04% of which was waived. Broker fees and charges on short sales totaled 0.15% of average net assets for the year ended September 30, 2012, 0.15% of which was waived. If dividend expense and broker fees and charges on short sales had not been contractually waived, the ratios of net expenses to average net assets would have been 2.06%, 2.31% and 3.06% for the Institutional, Investor and Class C Shares, respectively.
(6) Dividend expense totaled 0.15% of average net assets for the period ended September 30, 2011, 0.12% of which was waived. Broker fees and charges on short sales totaled 0.47% of average net assets for the period ended September 30, 2011, 0.39% of which was waived. If dividend expense and broker fees and charges on short sales had not been contractually waived, the ratios of net expenses to average net assets would have been 2.44%, 2.65% and 3.44% for the Institutional, Investor and Class C Shares, respectively.
Amounts designated as "—" are either $0, not applicable or have been rounded to $0.
The accompanying notes are an integral part of the financial statements.
TURNER FUNDS 2012 ANNUAL REPORT 65
For a share outstanding throughout each period
| | | Net asset
value,
beginning
of period | | Net
investment
income
(loss) | | Realized and
unrealized
gains (losses)
on investments | | Total
from
investment
operations | | Dividends
from net
investment
income | | Distributions
from
capital
gains | | Total
dividends and
distributions | |
Turner Spectrum Fund — Institutional Class Shares | | | |
2012 | | $ | 11.45 | | | | (0.13 | ) (1) | | | 0.04 | (2) | | | (0.09 | ) | | | — | | | | (0.47 | ) | | | (0.47 | ) | |
2011 | | $ | 10.82 | | | | (0.16 | ) (1) | | | 0.79 | | | | 0.63 | | | | — | | | | — | | | | — | | |
2010 | | $ | 10.81 | | | | (0.13 | ) (1) | | | 0.21 | | | | 0.08 | | | | — | | | | (0.07 | ) | | | (0.07 | ) | |
| 2009 (6) | | $ | 10.00 | | | | (0.07 | ) (1) | | | 0.88 | | | | 0.81 | | | | — | | | | — | | | | — | | |
Turner Spectrum Fund — Investor Class Shares | | | |
2012 | | $ | 11.38 | | | | (0.16 | ) (1) | | | 0.05 | (2) | | | (0.11 | ) | | | — | | | | (0.47 | ) | | | (0.47 | ) | |
2011 | | $ | 10.78 | | | | (0.19 | ) (1) | | | 0.79 | | | | 0.60 | | | | — | | | | — | | | | — | | |
2010 | | $ | 10.80 | | | | (0.16 | ) (1) | | | 0.21 | | | | 0.05 | | | | — | | | | (0.07 | ) | | | (0.07 | ) | |
| 2009 (6) | | $ | 10.00 | | | | (0.09 | ) (1) | | | 0.89 | | | | 0.80 | | | | — | | | | — | | | | — | | |
Turner Spectrum Fund — Class C Shares | | | |
2012 | | $ | 11.23 | | | | (0.24 | ) (1) | | | 0.05 | (2) | | | (0.19 | ) | | | — | | | | (0.47 | ) | | | (0.47 | ) | |
2011 | | $ | 10.72 | | | | (0.27 | ) (1) | | | 0.78 | | | | 0.51 | | | | — | | | | — | | | | — | | |
2010 | | $ | 10.80 | | | | (0.24 | ) (1) | | | 0.23 | | | | (0.01 | ) | | | — | | | | (0.07 | ) | | | (0.07 | ) | |
| 2009 (8) | | $ | 9.98 | | | | (0.07 | ) (1) | | | 0.89 | | | | 0.82 | | | | — | | | | — | | | | — | | |
Turner Titan Fund — Institutional Class Shares | | | |
2012 | | $ | 9.77 | | | | (0.11 | ) (1) | | | 0.67 | | | | 0.56 | | | | — | | | | (0.09 | ) | | | (0.09 | ) | |
| 2011 (10) | | $ | 10.00 | | | | (0.10 | ) (1) | | | (0.13 | ) | | | (0.23 | ) | | | — | | | | — | | | | — | | |
Turner Titan Fund — Investor Class Shares | | | |
2012 | | $ | 9.76 | | | | (0.13 | ) (1) | | | 0.66 | | | | 0.53 | | | | — | | | | (0.09 | ) | | | (0.09 | ) | |
| 2011 (10) | | $ | 10.00 | | | | (0.11 | ) (1) | | | (0.13 | ) | | | (0.24 | ) | | | — | | | | — | | | | — | | |
Turner Titan Fund — Class C Shares | | | |
2012 | | $ | 9.72 | | | | (0.21 | ) (1) | | | 0.65 | | | | 0.44 | | | | — | | | | (0.09 | ) | | | (0.09 | ) | |
| 2011 (10) | | $ | 10.00 | | | | (0.16 | ) (1) | | | (0.12 | ) | | | (0.28 | ) | | | — | | | | — | | | | — | | |
66 TURNER FUNDS 2012 ANNUAL REPORT
| | Net asset
value, end
of period | | Total
return | | Net
assets end
of period
(000) | | Ratio of
net expenses
to average
net assets† | | Ratio of total
expenses
to average
net assets | | Ratio of net
investment
income (loss)
to average
net assets† | | Portfolio
turnover
rate†† | |
Turner Spectrum Fund — Institutional Class Shares | |
2012 | | $ | 10.89 | | | | (0.77 | )% | | $ | 832,857 | | | | 1.89 | %* (3) | | | 2.34 | %* | | | (1.15 | )%* | | | 996 | % | |
2011 | | $ | 11.45 | | | | 5.82 | % | | $ | 448,554 | | | | 1.93 | % (4) | | | 2.48 | % | | | (1.34 | )% | | | 1,153 | % | |
2010 | | $ | 10.82 | | | | 0.77 | % | | $ | 179,526 | | | | 1.91 | % (5) | | | 2.85 | % | | | (1.23 | )% | | | 1,808 | % | |
| 2009 (6) | | $ | 10.81 | | | | 8.10 | %††† | | $ | 8,681 | | | | 2.44 | % (7) | | | 5.63 | % | | | (1.78 | )% | | | 663 | % | |
Turner Spectrum Fund — Investor Class Shares | |
2012 | | $ | 10.80 | | | | (0.95 | )% | | $ | 126,533 | | | | 2.14 | %* (3) | | | 2.59 | %* | | | (1.40 | )%* | | | 996 | % | |
2011 | | $ | 11.38 | | | | 5.57 | % | | $ | 161,401 | | | | 2.18 | % (4) | | | 2.70 | % | | | (1.61 | )% | | | 1,153 | % | |
2010 | | $ | 10.78 | | | | 0.49 | % | | $ | 52,361 | | | | 2.17 | % (5) | | | 3.12 | % | | | (1.52 | )% | | | 1,808 | % | |
| 2009 (6) | | $ | 10.80 | | | | 8.00 | %††† | | $ | 4,567 | | | | 2.71 | % (7) | | | 5.84 | % | | | (2.09 | )% | | | 663 | % | |
Turner Spectrum Fund — Class C Shares | |
2012 | | $ | 10.57 | | | | (1.71 | )% | | $ | 10,391 | | | | 2.89 | %* (3) | | | 3.34 | %* | | | (2.15 | )%* | | | 996 | % | |
2011 | | $ | 11.23 | | | | 4.76 | % | | $ | 12,478 | | | | 2.93 | % (4) | | | 3.39 | % | | | (2.33 | )% | | | 1,153 | % | |
2010 | | $ | 10.72 | | | | (0.07 | )% | | $ | 7,169 | | | | 2.92 | % (5) | | | 3.82 | % | | | (2.19 | )% | | | 1,808 | % | |
| 2009 (8) | | $ | 10.80 | | | | 8.22 | %††† | | $ | — | | | | 2.35 | % (7) | | | 5.28 | % | | | (3.12 | )% | | | 663 | % | |
Turner Titan Fund — Institutional Class Shares | |
2012 | | $ | 10.24 | | | | 5.75 | % | | $ | 25,811 | | | | 1.92 | %* (9) | | | 2.41 | %* | | | (1.03 | )%* | | | 834 | % | |
| 2011 (10) | | $ | 9.77 | | | | (2.30 | )%††† | | $ | 11,374 | | | | 1.92 | % (11) | | | 3.54 | % | | | (1.47 | )% | | | 647 | % | |
Turner Titan Fund — Investor Class Shares | |
2012 | | $ | 10.20 | | | | 5.44 | % | | $ | 5,038 | | | | 2.17 | %* (9) | | | 2.66 | %* | | | (1.28 | )%* | | | 834 | % | |
| 2011 (10) | | $ | 9.76 | | | | (2.40 | )%††† | | $ | 2,711 | | | | 2.16 | % (11) | | | 4.66 | % | | | (1.65 | )% | | | 647 | % | |
Turner Titan Fund — Class C Shares | |
2012 | | $ | 10.07 | | | | 4.53 | % | | $ | 531 | | | | 2.92 | %* (9) | | | 3.41 | %* | | | (2.03 | )%* | | | 834 | % | |
| 2011 (10) | | $ | 9.72 | | | | (2.80 | )%††† | | $ | 29 | | | | 2.92 | % (11) | | | 2.31 | % | | | (2.44 | )% | | | 647 | % | |
* Does not include acquired fund fees or expenses.
† Inclusive of fees paid indirectly, waivers and/or reimbursements.
†† Excludes effect of in-kind transfers and mergers, as applicable. Not annualized for periods less than one year.
††† Total return is for the period indicated and has not been annualized.
(1) Based on average shares outstanding.
(2) The amount shown for a share outstanding throughout the period and the aggregate net losses on investments for the period are not in accord, because of the sales and repurchases of fund shares in relation to fluctuating market value of the investments of the Fund.
(3) Dividend expense totaled 0.20% of average net assets for the year ended September 30, 2012, 0.20% of which was waived. Broker fees and charges on short sales totaled 0.33% of average net assets for the year ended September 30, 2012, 0.33% of which was waived. If dividend expense and broker fees and charges on short sales had not been contractually waived, the ratios of net expenses to average net assets would have been 2.42%, 2.67% and 3.42% for the Institutional, Investor and Class C Shares, respectively.
(4) Dividend expense totaled 0.28% of average net assets for the year ended September 30, 2011, 0.22% of which was waived. Broker fees and charges on short sales totaled 0.32% of average net assets for the year ended September 30, 2011, 0.25% of which was waived. If dividend expense and broker fees and charges on short sales had not been contractually waived, the ratios of net expenses to average net assets would have been 2.40%, 2.65% and 3.40% for the Institutional, Investor and Class C Shares, respectively.
(5) Dividend expense totaled 0.45% of average net assets for the year ended September 30, 2010, 0.42% of which was waived. Broker fees and charges on short sales totaled 0.38% of average net assets for the year ended September 30, 2010, 0.37% of which was waived beginning on January 13, 2010. If dividend expense and broker fees and charges on short sales had not been contractually waived, the ratios of net expenses to average net assets would have been 2.70%, 2.96% and 3.71% for the Institutional, Investor and Class C Shares, respectively.
(6) Commenced operations on May 7, 2009. All ratios for the period have been annualized.
(7) Dividend expense totaled 0.70% of average net assets for the period ended September 30, 2009. If dividend expense had not been contractually waived, the ratios of net expenses to average net assets would have been 3.14%, 3.41% and 3.05% for the Institutional, Investor and Class C Shares, respectively. If broker fees and charges on short sales had not been included, the ratios of net expenses to average net assets would have been 1.94%, 2.20% and 1.95% for the Institutional, Investor and Class C Shares, respectively.
(8) Commenced operations on July 14, 2009. All ratios for the period have been annualized.
(9) Dividend expense totaled 0.08% of average net assets for the period ended September 30, 2012, 0.08% of which was waived. Broker fees and charges on short sales totaled 0.23% of average net assets for the period ended September 30, 2012, 0.23% of which was waived. If dividend expense and broker fees and charges on short sales had not been contractually waived, the ratios of net expenses to average net assets would have been 2.23%, 2.48% and 3.23% for the Institutional, Investor and Class C Shares, respectively.
(10) Commenced operations of February 7, 2011. All ratios for the period have been annualized.
(11) Dividend expense totaled 0.28% of average net assets for the period ended September 30, 2011, 0.22% of which was waived. Broker fees and charges on short sales totaled 0.32% of average net assets for the period ended September 30, 2011, 0.25% of which was waived. If dividend expense and broker fees and charges on short sales had not been contractually waived, the ratios of net expenses to average net assets would have been 2.20%, 2.44% and 3.20% for the Institutional, Investor and Class C Shares, respectively.
Amounts designated as "—" are either $0, not applicable or have been rounded to $0.
The accompanying notes are an integral part of the financial statements.
TURNER FUNDS 2012 ANNUAL REPORT 67
For a share outstanding throughout each period
| | | Net asset
value,
beginning
of period | | Net
investment
income
(loss) | | Realized and
unrealized
gains (losses)
on investments | | Total
from
investment
operations | | Dividends
from net
investment
income | | Distributions
from
capital
gains | | Total
dividends and
distributions | |
Turner All Cap Growth Fund — Investor Class Shares | | | |
2012 | | $ | 7.67 | | | | (0.02 | ) (1) | | | 1.36 | | | | 1.34 | | | | — | | | | — | | | | — | | |
2011 | | $ | 7.03 | | | | (0.11 | ) (1) | | | 0.75 | | | | 0.64 | | | | — | | | | — | | | | — | | |
2010 | | $ | 5.95 | | | | (0.09 | ) (1) | | | 1.18 | | | | 1.09 | | | | (0.01 | ) | | | — | | | | (0.01 | ) | |
2009 | | $ | 5.60 | | | | — | (1) | | | 0.35 | | | | 0.35 | | | | — | | | | — | | | | — | | |
2008 | | $ | 8.72 | | | | (0.07 | ) (1) | | | (3.05 | ) | | | (3.12 | ) | | | — | | | | — | | | | — | | |
Turner Concentrated Growth Fund — Investor Class Shares | | | |
2012 | | $ | 6.42 | | | | (0.01 | ) (1) | | | 1.04 | | | | 1.03 | | | | — | | | | — | | | | — | | |
2011 | | $ | 6.63 | | | | (0.10 | ) (1) | | | (0.11 | ) | | | (0.21 | ) | | | — | | | | — | | | | — | | |
2010 | | $ | 6.16 | | | | (0.07 | ) (1) | | | 0.56 | | | | 0.49 | | | | (0.02 | ) | | | — | | | | (0.02 | ) | |
2009 | | $ | 6.35 | | | | 0.02 | (1) | | | (0.21 | ) | | | (0.19 | ) | | | — | | | | — | | | | — | | |
2008 | | $ | 10.12 | | | | (0.07 | ) (1) | | | (3.70 | ) | | | (3.77 | ) | | | — | | | | — | | | | — | | |
Turner Emerging Growth Fund — Institutional Class Shares | | | |
2012 | | $ | 45.83 | | | | (0.34 | ) (1) | | | 12.19 | | | | 11.85 | | | | — | | | | — | | | | — | | |
2011 | | $ | 42.51 | | | | (0.40 | ) (1) | | | 3.72 | | | | 3.32 | | | | — | | | | — | | | | — | | |
2010 | | $ | 37.78 | | | | (0.31 | ) (1) | | | 5.04 | | | | 4.73 | | | | — | | | | — | | | | — | | |
| 2009 (4) | | $ | 28.45 | | | | (0.12 | ) (1) | | | 9.45 | | | | 9.33 | | | | — | | | | — | | | | — | | |
Turner Emerging Growth Fund — Investor Class Shares | | | |
2012 | | $ | 45.52 | | | | (0.47 | ) (1) | | | 12.11 | | | | 11.64 | | | | — | | | | — | | | | — | | |
2011 | | $ | 42.32 | | | | (0.52 | ) (1) | | | 3.72 | | | | 3.20 | | | | — | | | | — | | | | — | | |
2010 | | $ | 37.71 | | | | (0.41 | ) (1) | | | 5.02 | | | | 4.61 | | | | — | | | | — | | | | — | | |
2009 | | $ | 46.42 | | | | (0.22 | ) (1) | | | (7.31 | ) | | | (7.53 | ) | | | — | | | | (1.18 | ) | | | (1.18 | ) | |
2008 | | $ | 64.06 | | | | (0.35 | ) (1) | | | (8.54 | ) | | | (8.89 | ) | | | (0.25 | ) | | | (8.50 | ) | | | (8.75 | ) | |
Turner Large Growth Fund — Institutional Class Shares | | | |
2012 | | $ | 10.50 | | | | 0.02 | (1) | | | 2.34 | | | | 2.36 | | | | — | | | | — | | | | — | | |
2011 | | $ | 10.56 | | | | — | (1) | | | (0.04 | ) | | | (0.04 | ) | | | (0.02 | ) | | | — | | | | (0.02 | ) | |
2010 | | $ | 9.93 | | | | 0.02 | (1) | | | 0.65 | | | | 0.67 | | | | (0.04 | ) | | | — | | | | (0.04 | ) | |
2009 | | $ | 10.41 | | | | 0.05 | (1) | | | (0.48 | ) | | | (0.43 | ) | | | (0.05 | ) | | | — | | | | (0.05 | ) | |
2008 | | $ | 14.39 | | | | 0.06 | (1) | | | (4.01 | ) | | | (3.95 | ) | | | (0.03 | ) | | | — | | | | (0.03 | ) | |
Turner Large Growth Fund — Investor Class Shares | | | |
2012 | | $ | 10.42 | | | | (0.01 | ) (1) | | | 2.33 | | | | 2.32 | | | | — | | | | — | | | | — | | |
2011 | | $ | 10.49 | | | | (0.03 | ) (1) | | | (0.04 | ) | | | (0.07 | ) | | | — | | | | — | | | | — | | |
2010 | | $ | 9.87 | | | | — | (1) | | | 0.64 | | | | 0.64 | | | | (0.02 | ) | | | — | | | | (0.02 | ) | |
2009 | | $ | 10.34 | | | | 0.03 | (1) | | | (0.47 | ) | | | (0.44 | ) | | | (0.03 | ) | | | — | | | | (0.03 | ) | |
2008 | | $ | 14.33 | | | | 0.02 | (1) | | | (3.99 | ) | | | (3.97 | ) | | | (0.02 | ) | | | — | | | | (0.02 | ) | |
Turner Midcap Growth Fund — Institutional Class Shares | | | |
2012 | | $ | 30.42 | | | | (0.05 | ) (1) | | | 5.02 | | | | 4.97 | | | | — | | | | — | | | | — | | |
2011 | | $ | 29.90 | | | | (0.06 | ) (1) | | | 0.58 | | | | 0.52 | | | | — | | | | — | | | | — | | |
2010 | | $ | 26.12 | | | | (0.08 | ) (1) | | | 3.86 | | | | 3.78 | | | | — | | | | — | | | | — | | |
2009 | | $ | 26.20 | | | | (0.01 | ) (1) | | | (0.07 | ) | | | (0.08 | ) | | | — | | | | — | | | | — | | |
| 2008 (5) | | $ | 34.67 | | | | (0.01 | ) (1) | | | (8.46 | ) | | | (8.47 | ) | | | — | | | | — | | | | — | | |
68 TURNER FUNDS 2012 ANNUAL REPORT
| | | Net asset
value, end
of period | | Total
return | | Net
assets end
of period
(000) | | Ratio of
net expenses
to average
net assets† | | Ratio of total
expenses
to average
net assets | | Ratio of net
investment
income (loss)
to average
net assets† | | Portfolio
turnover
rate†† | |
Turner All Cap Growth Fund — Investor Class Shares | |
2012 | | $ | 9.01 | | | | 17.47 | % | | $ | 25,840 | | | | 0.86 | % | | | 1.34 | % | | | (0.25 | )% | | | 182 | % | |
2011 | | $ | 7.67 | | | | 9.10 | % | | $ | 33,053 | | | | 1.73 | % | | | 2.12 | % | | | (1.29 | )% | | | 205 | % | |
2010 | | $ | 7.03 | | | | 18.25 | % | | $ | 23,227 | | | | 1.64 | % | | | 2.15 | % | | | (1.38 | )% | | | 115 | % | |
2009 | | $ | 5.95 | | | | 6.25 | % | | $ | 26,324 | | | | 0.62 | % (2) | | | 1.23 | % | | | 0.09 | % | | | 220 | % | |
2008 | | $ | 5.60 | | | | (35.78 | )% | | $ | 32,759 | | | | 1.52 | % (3) | | | 1.90 | % | | | (0.89 | )% | | | 323 | % | |
Turner Concentrated Growth Fund — Investor Class Shares | |
2012 | | $ | 7.45 | | | | 16.04 | % | | $ | 34,927 | | | | 0.80 | % | | | 1.22 | % | | | (0.18 | )% | | | 150 | % | |
2011 | | $ | 6.42 | | | | (3.17 | )% | | $ | 38,939 | | | | 1.69 | % | | | 2.08 | % | | | (1.29 | )% | | | 203 | % | |
2010 | | $ | 6.63 | | | | 7.94 | % | | $ | 42,924 | | | | 1.51 | % | | | 1.94 | % | | | (1.14 | )% | | | 215 | % | |
2009 | | $ | 6.16 | | | | (2.99 | )% | | $ | 39,973 | | | | 0.82 | % | | | 1.34 | % | | | 0.38 | % | | | 208 | % | |
2008 | | $ | 6.35 | | | | (37.25 | )% | | $ | 42,581 | | | | 1.53 | % (3) | | | 1.91 | % | | | (0.83 | )% | | | 348 | % | |
Turner Emerging Growth Fund — Institutional Class Shares | |
2012 | | $ | 57.68 | | | | 25.86 | % | | $ | 69,391 | | | | 1.15 | % | | | 1.30 | % | | | (0.62 | )% | | | 75 | % | |
2011 | | $ | 45.83 | | | | 7.81 | % | | $ | 67,035 | | | | 1.15 | % | | | 1.27 | % | | | (0.77 | )% | | | 74 | % | |
2010 | | $ | 42.51 | | | | 12.52 | % | | $ | 276,445 | | | | 1.15 | % | | | 1.28 | % | | | (0.77 | )% | | | 96 | % | |
| 2009 (4) | | $ | 37.78 | | | | 32.79 | %††† | | $ | 243,790 | | | | 1.15 | % | | | 1.33 | % | | | (0.54 | )% | | | 78 | % | |
Turner Emerging Growth Fund — Investor Class Shares | |
2012 | | $ | 57.16 | | | | 25.57 | % | | $ | 168,990 | | | | 1.40 | % | | | 1.55 | % | | | (0.87 | )% | | | 75 | % | |
2011 | | $ | 45.52 | | | | 7.56 | % | | $ | 159,127 | | | | 1.40 | % | | | 1.55 | % | | | (1.01 | )% | | | 74 | % | |
2010 | | $ | 42.32 | | | | 12.22 | % | | $ | 176,823 | | | | 1.40 | % | | | 1.53 | % | | | (1.02 | )% | | | 96 | % | |
2009 | | $ | 37.71 | | | | (15.58 | )% | | $ | 188,812 | | | | 1.40 | % | | | 1.56 | % | | | (0.71 | )% | | | 78 | % | |
2008 | | $ | 46.42 | | | | (16.08 | )% | | $ | 529,578 | | | | 1.40 | % | | | 1.49 | % | | | (0.66 | )% | | | 71 | % | |
Turner Large Growth Fund — Institutional Class Shares | |
2012 | | $ | 12.86 | | | | 22.48 | % | | $ | 201,051 | | | | 0.69 | % | | | 0.91 | % | | | 0.15 | % | | | 105 | % | |
2011 | | $ | 10.50 | | | | (0.39 | )% | | $ | 382,336 | | | | 0.69 | % | | | 0.89 | % | | | (0.03 | )% | | | 182 | % | |
2010 | | $ | 10.56 | | | | 6.76 | % | | $ | 377,650 | | | | 0.69 | % | | | 0.87 | % | | | 0.20 | % | | | 178 | % | |
2009 | | $ | 9.93 | | | | (3.97 | )% | | $ | 381,277 | | | | 0.69 | % | | | 0.92 | % | | | 0.65 | % | | | 126 | % | |
2008 | | $ | 10.41 | | | | (27.53 | )% | | $ | 360,083 | | | | 0.69 | % | | | 0.90 | % | | | 0.42 | % | | | 200 | % | |
Turner Large Growth Fund — Investor Class Shares | |
2012 | | $ | 12.74 | | | | 22.26 | % | | $ | 47,861 | | | | 0.94 | % | | | 1.16 | % | | | (0.10 | )% | | | 105 | % | |
2011 | | $ | 10.42 | | | | (0.67 | )% | | $ | 56,661 | | | | 0.94 | % | | | 1.13 | % | | | (0.28 | )% | | | 182 | % | |
2010 | | $ | 10.49 | | | | 6.51 | % | | $ | 163,750 | | | | 0.94 | % | | | 1.12 | % | | | (0.050 | % | | | 178 | % | |
2009 | | $ | 9.87 | | | | (4.21 | )% | | $ | 252,916 | | | | 0.94 | % | | | 1.17 | % | | | 0.41 | % | | | 126 | % | |
2008 | | $ | 10.34 | | | | (27.76 | )% | | $ | 260,692 | | | | 0.94 | % | | | 1.15 | % | | | 0.15 | % | | | 200 | % | |
Turner Midcap Growth Fund — Institutional Class Shares | |
2012 | | $ | 35.39 | | | | 16.34 | % | | $ | 236,147 | | | | 0.93 | % | | | 1.04 | % | | | (0.14 | )% | | | 121 | % | |
2011 | | $ | 30.42 | | | | 1.74 | % | | $ | 245,480 | | | | 0.93 | % | | | 1.05 | % | | | (0.18 | )% | | | 104 | % | |
2010 | | $ | 29.90 | | | | 14.47 | % | | $ | 164,993 | | | | 0.93 | % | | | 1.03 | % | | | (0.29 | )% | | | 90 | % | |
2009 | | $ | 26.12 | | | | (0.31 | )% | | $ | 136,069 | | | | 0.93 | % | | | 1.08 | % | | | (0.05 | )% | | | 120 | % | |
| 2008 (5) | | $ | 26.20 | | | | (24.43 | )%††† | | $ | 137,451 | | | | 0.93 | % (6) | | | 1.03 | % | | | (0.09 | )% | | | 157 | % | |
† Inclusive of fees paid indirectly, waivers and/or reimbursements.
†† Excludes effect of in-kind transfers and mergers, as applicable. Not annualized for periods less than one year.
††† Total return is for the period indicated and has not been annualized.
(1) Based on average shares outstanding.
(2) Excluding fees paid indirectly, the ratio of net expenses to average net assets would have been 0.63%.
(3) Excluding fees paid indirectly, the ratio of net expenses to average net assets would have been 1.54%.
(4) Commenced operations on February 1, 2009. All ratios for the period have been annualized.
(5) Commenced operations on June 16, 2008. All ratios for the period have been annualized.
(6) Excluding fees paid indirectly, the ratio of net expenses to average net assets would have been 0.94%.
Amounts designated as "—" are either $0, not applicable or have been rounded to $0.
The accompanying notes are an integral part of the financial statements.
TURNER FUNDS 2012 ANNUAL REPORT 69
For a share outstanding throughout each period
| | | Net asset
value,
beginning
of period | | Net
investment
income
(loss) | | Realized and
unrealized
gains (losses)
on investments | | Total
from
investment
operations | | Dividends
from net
investment
income | | Distributions
from
capital
gains | | Total
dividends and
distributions | |
Turner Midcap Growth Fund — Investor Class Shares | | | |
2012 | | $ | 30.16 | | | | (0.13 | ) (1) | | | 5.00 | | | | 4.87 | | | | — | | | | — | | | | — | | |
2011 | | $ | 29.73 | | | | (0.13 | ) (1) | | | 0.56 | | | | 0.43 | | | | — | | | | — | | | | — | | |
2010 | | $ | 26.03 | | | | (0.15 | ) (1) | | | 3.85 | | | | 3.70 | | | | — | | | | — | | | | — | | |
2009 | | $ | 26.18 | | | | (0.06 | ) (1) | | | (0.09 | ) | | | (0.15 | ) | | | — | | | | — | | | | — | | |
2008 | | $ | 35.71 | | | | (0.14 | ) (1) | | | (9.39 | ) | | | (9.53 | ) | | | — | | | | — | | | | — | | |
Turner Midcap Growth Fund — Retirement Class Shares | | | |
2012 | | $ | 29.05 | | | | (0.20 | ) (1) | | | 4.80 | | | | 4.60 | | | | — | | | | — | | | | — | | |
2011 | | $ | 28.71 | | | | (0.22 | ) (1) | | | 0.56 | | | | 0.34 | | | | — | | | | — | | | | — | | |
2010 | | $ | 25.20 | | | | (0.21 | ) (1) | | | 3.72 | | | | 3.51 | | | | — | | | | — | | | | — | | |
2009 | | $ | 25.40 | | | | (0.11 | ) (1) | | | (0.09 | ) | | | (0.20 | ) | | | — | | | | — | | | | — | | |
2008 | | $ | 34.74 | | | | (0.22 | ) (1) | | | (9.12 | ) | | | (9.34 | ) | | | — | | | | — | | | | — | | |
Turner Small Cap Growth Fund — Investor Class Shares | | | |
2012 | | $ | 27.83 | | | | (0.23 | ) (1) | | | 8.36 | | | | 8.13 | | | | — | | | | — | | | | — | | |
2011 | | $ | 28.97 | | | | (0.26 | ) (1) | | | (0.88 | ) | | | (1.14 | ) | | | — | | | | — | | | | — | | |
2010 | | $ | 25.17 | | | | (0.20 | ) (1) | | | 4.00 | | | | 3.80 | | | | — | | | | — | | | | — | | |
2009 | | $ | 26.45 | | | | (0.07 | ) (1) | | | (1.21 | ) | | | (1.28 | ) | | | — | | | | — | | | | — | | |
2008 | | $ | 32.98 | | | | (0.15 | ) (1) | | | (6.38 | ) | | | (6.53 | ) | | | — | | | | — | | | | — | | |
Turner Global Opportunities Fund — Institutional Class Shares | | | |
2012 | | $ | 11.38 | | | | (0.03 | ) (1) | | | 2.31 | | | | 2.28 | | | | — | | | | (0.35 | ) | | | (0.35 | ) | |
2011 | | $ | 11.52 | | | | (0.04 | ) (1) | | | (0.10 | ) | | | (0.14 | ) | | | — | | | | — | | | | — | | |
| 2010 (3) | | $ | 10.00 | | | | (0.01 | ) (1) | | | 1.53 | | | | 1.52 | | | | — | | | | — | | | | — | | |
Turner Global Opportunities Fund — Investor Class Shares | | | |
2012 | | $ | 11.33 | | | | (0.07 | ) (1) | | | 2.31 | | | | 2.24 | | | | — | | | | (0.35 | ) | | | (0.35 | ) | |
2011 | | $ | 11.50 | | | | (0.06 | ) (1) | | | (0.11 | ) | | | (0.17 | ) | | | — | | | | — | | | | — | | |
| 2010 (3) | | $ | 10.00 | | | | (0.03 | ) (1) | | | 1.53 | | | | 1.50 | | | | — | | | | — | | | | — | | |
Turner International Growth Fund — Institutional Class Shares | | | |
2012 | | $ | 9.21 | | | | 0.11 | (1) | | | 1.54 | | | | 1.65 | | | | — | | | | — | | | | — | | |
2011 | | $ | 9.41 | | | | 0.08 | (1) | | | (0.19 | ) | | | (0.11 | ) | | | (0.09 | ) | | | — | | | | (0.09 | ) | |
2010 | | $ | 8.24 | | | | 0.04 | (1) | | | 1.26 | | | | 1.30 | | | | (0.13 | ) | | | — | | | | (0.13 | ) | |
2009 | | $ | 8.34 | | | | 0.08 | (1) | | | (0.07 | ) | | | 0.01 | | | | (0.11 | ) | | | — | | | | (0.11 | ) | |
2008 | | $ | 12.21 | | | | 0.12 | (1) | | | (3.87 | ) | | | (3.75 | ) | | | (0.02 | ) | | | (0.10 | ) | | | (0.12 | ) | |
Turner International Growth Fund — Investor Class Shares | | | |
2012 | | $ | 9.17 | | | | 0.08 | (1) | | | 1.54 | | | | 1.62 | | | | — | | | | — | | | | — | | |
2011 | | $ | 9.39 | | | | 0.05 | (1) | | | (0.20 | ) | | | (0.15 | ) | | | (0.07 | ) | | | — | | | | (0.07 | ) | |
2010 | | $ | 8.24 | | | | 0.05 | (1) | | | 1.23 | | | | 1.28 | | | | (0.13 | ) | | | — | | | | (0.13 | ) | |
| 2009 (5) | | $ | 6.27 | | | | 0.07 | (1) | | | 2.01 | | | | 2.08 | | | | (0.11 | ) | | | — | | | | (0.11 | ) | |
70 TURNER FUNDS 2012 ANNUAL REPORT
| | | Net asset
value, end
of period | | Total
return | | Net
assets end
of period
(000) | | Ratio of
net expenses
to average
net assets† | | Ratio of total
expenses
to average
net assets | | Ratio of net
investment
income (loss)
to average
net assets† | | Portfolio
turnover
rate†† | |
Turner Midcap Growth Fund — Investor Class Shares | |
2012 | | $ | 35.03 | | | | 16.15 | % | | $ | 404,427 | | | | 1.18 | % | | | 1.29 | % | | | (0.39 | )% | | | 121 | % | |
2011 | | $ | 30.16 | | | | 1.45 | % | | $ | 471,286 | | | | 1.18 | % | | | 1.28 | % | | | (0.38 | )% | | | 104 | % | |
2010 | | $ | 29.73 | | | | 14.21 | % | | $ | 751,124 | | | | 1.18 | % | | | 1.28 | % | | | (0.54 | )% | | | 90 | % | |
2009 | | $ | 26.03 | | | | (0.57 | )% | | $ | 859,640 | | | | 1.18 | % | | | 1.33 | % | | | (0.29 | )% | | | 120 | % | |
2008 | | $ | 26.18 | | | | (26.69 | )% | | $ | 994,545 | | | | 1.18 | % | | | 1.25 | % | | | (0.44 | )% | | | 157 | % | |
Turner Midcap Growth Fund — Retirement Class Shares | |
2012 | | $ | 33.65 | | | | 15.83 | % | | $ | 4,811 | | | | 1.43 | % | | | 1.54 | % | | | (0.64 | )% | | | 121 | % | |
2011 | | $ | 29.05 | | | | 1.18 | % | | $ | 3,972 | | | | 1.43 | % | | | 1.54 | % | | | (0.63 | )% | | | 104 | % | |
2010 | | $ | 28.71 | | | | 13.93 | % | | $ | 4,578 | | | | 1.43 | % | | | 1.53 | % | | | (0.79 | )% | | | 90 | % | |
2009 | | $ | 25.20 | | | | (0.79 | )% | | $ | 3,892 | | | | 1.43 | % | | | 1.58 | % | | | (0.55 | )% | | | 120 | % | |
2008 | | $ | 25.40 | | | | (26.89 | )% | | $ | 5,784 | | | | 1.43 | % | | | 1.50 | % | | | (0.69 | )% | | | 157 | % | |
Turner Small Cap Growth Fund — Investor Class Shares | |
2012 | | $ | 35.96 | | | | 29.21 | % | | $ | 250,099 | | | | 1.25 | % | | | 1.53 | % | | | (0.68 | )% | | | 100 | % | |
2011 | | $ | 27.83 | | | | (3.94 | )% | | $ | 229,919 | | | | 1.25 | % | | | 1.53 | % | | | (0.76 | )% | | | 119 | % | |
2010 | | $ | 28.97 | | | | 15.10 | % | | $ | 274,925 | | | | 1.25 | % | | | 1.52 | % | | | (0.74 | )% | | | 89 | % | |
2009 | | $ | 25.17 | | | | (4.84 | )% | | $ | 250,860 | | | | 1.25 | % | | | 1.58 | % | | | (0.36 | )% | | | 113 | % | |
2008 | | $ | 26.45 | | | | (19.80 | )% | | $ | 249,434 | | | | 1.25 | % (2) | | | 1.51 | % | | | (0.48 | )% | | | 141 | % | |
Turner Global Opportunities Fund — Institutional Class Shares | |
2012 | | $ | 13.31 | | | | 20.53 | % | | $ | 1,654 | | | | 1.10 | % | | | 4.09 | % | | | (0.27 | )% | | | 95 | % | |
2011 | | $ | 11.38 | | | | (1.22 | )% | | $ | 910 | | | | 1.10 | % | | | 3.63 | % | | | (0.31 | )% | | | 178 | % | |
| 2010 (3) | | $ | 11.52 | | | | 15.20 | %††† | | $ | 1,153 | | | | 1.10 | % | | | 8.33 | % | | | (0.31 | )% | | | 37 | % | |
Turner Global Opportunities Fund — Investor Class Shares | |
2012 | | $ | 13.22 | | | | 20.27 | % | | $ | 251 | | | | 1.35 | % | | | 4.42 | % | | | (0.52 | )% | | | 95 | % | |
2011 | | $ | 11.33 | | | | (1.48 | )% | | $ | 478 | | | | 1.35 | % | | | 3.16 | % | | | (0.44 | )% | | | 178 | % | |
| 2010 (3) | | $ | 11.50 | | | | 15.00 | %††† | | $ | — | | | | 1.56 | % | | | 8.92 | % | | | (0.77 | )% | | | 37 | % | |
Turner International Growth Fund — Institutional Class Shares | |
2012 | | $ | 10.86 | | | | 17.92 | % | | $ | 23,406 | | | | 1.10 | % | | | 1.90 | % | | | 1.03 | % | | | 138 | % | |
2011 | | $ | 9.21 | | | | (1.32 | )% | | $ | 6,012 | | | | 1.10 | % | | | 2.41 | % | | | 0.70 | % | | | 210 | % | |
2010 | | $ | 9.41 | | | | 15.88 | % | | $ | 5,019 | | | | 1.10 | % | | | 3.93 | % | | | 0.51 | % | | | 120 | % | |
2009 | | $ | 8.24 | | | | 0.71 | % | | $ | 3,848 | | | | 1.10 | % | | | 5.24 | % | | | 1.31 | % | | | 139 | % | |
2008 | | $ | 8.34 | | | | (31.04 | )% | | $ | 3,335 | | | | 1.10 | % (4) | | | 3.05 | % | | | 1.10 | % | | | 245 | % | |
Turner International Growth Fund — Investor Class Shares | |
2012 | | $ | 10.79 | | | | 17.67 | % | | $ | 6,171 | | | | 1.35 | % | | | 2.15 | % | | | 0.78 | % | | | 138 | % | |
2011 | | $ | 9.17 | | | | (1.67 | )% | | $ | 4,912 | | | | 1.35 | % | | | 2.46 | % | | | 0.44 | % | | | 210 | % | |
2010 | | $ | 9.39 | | | | 15.61 | % | | $ | 110 | | | | 1.35 | % | | | 4.15 | % | | | 0.61 | % | | | 120 | % | |
| 2009 (5) | | $ | 8.24 | | | | 33.95 | %††† | | $ | — | | | | 1.29 | % | | | 5.59 | % | | | 1.14 | % | | | 139 | % | |
† Inclusive of fees paid indirectly, waivers and/or reimbursements.
†† Excludes effect of in-kind transfers and mergers, as applicable. Not annualized for periods less than one year.
††† Total return is for the period indicated and has not been annualized.
(1) Based on average shares outstanding.
(2) Excluding fees paid indirectly, the ratio of net expenses to average net assets would have been 1.26%.
(3) Commencement of operations on May 7, 2010. All ratios for the period have been annualized.
(4) Excluding fees paid indirectly, the ratio of net expenses to average net assets would have been 1.11%.
(5) Commenced operations on October 31, 2008. All ratios for the period have been annualized.
Amounts designated as "—" are either $0, not applicable or have been rounded to $0.
The accompanying notes are an integral part of the financial statements.
TURNER FUNDS 2012 ANNUAL REPORT 71
NOTES TO FINANCIAL STATEMENTS
Notes to financial statements
September 30, 2012
1. Organization:
Turner Funds (the "Trust"), a Massachusetts business trust, is registered under the Investment Company Act of 1940, as amended (the "1940 Act"), as an open-end management investment company. The funds included herein are the Turner Market Neutral Fund ("Market Neutral Fund"), Turner Medical Sciences Long/Short Fund ("Medical Sciences Long/Short Fund"), Turner Spectrum Fund ("Spectrum Fund"), Turner Titan Fund ("Titan Fund"), Turner All Cap Growth Fund ("All Cap Growth Fund"), Turner Concentrated Growth Fund ("Concentrated Growth Fund"), Turner Emerging Growth Fund ("Emerging Growth Fund"), Turner Large Growth Fund ("Large Growth Fund"), Turner Midcap Growth Fund ("Midcap Growth Fund"), Turner Small Cap Growth Fund ("Small Cap Growth Fund"), Turner Global Opportunities Fund ("Global Opportunities Fund") and Turner International Growth Fund ("International Growth Fund"), each a "Fund" and collectively the "Funds."
Each Fund is registered as a diversified portfolio of the Trust with the exception of the Concentrated Growth Fund and the Global Opportunities Fund, which are non-diversified.
The Funds are registered to offer different classes of shares: Institutional Class Shares, Investor Class Shares, Retirement Class Shares, Class C Shares, or a combination of the four. The assets of each Fund are segregated, and a shareholder's interest is limited to the Fund in which shares are held. The Funds' prospectuses provide a description of each Fund's investment objectives, policies and strategies along with information on the classes of shares currently being offered.
2. Significant accounting policies:
The following is a summary of the significant accounting policies followed by the Funds.
Use of estimates—The preparation of financial statements in conformity with U.S. generally accepted accounting principles ("GAAP") requires management to make estimates and assumptions that affect the reported amounts of assets and liabilities and disclosure of contingent assets and liabilities at the date of the financial statements and the reported amounts of increases and decreases in net assets from operations during the reporting period. Actual results could differ from those estimates.
In accordance with the authoritative guidance on fair value measurements and disclosures under GAAP, fair value is defined as the price that a fund would receive upon selling an investment in a timely transaction to an independent buyer in the principal or most advantageous market.
The Trust has a three-tier fair value hierarchy that is dependent upon the various "inputs" used to
determine the value of the Funds' investments. These inputs are summarized in the three broad levels listed below:
Level 1 – quoted prices in active markets for identical investments.
Level 2 – other significant observable inputs (including quoted prices for similar investments, interest rates, prepayment speeds, credit risks, etc.).
Level 3 – significant unobservable inputs (including a Fund's own assumptions in determining the fair value of investments).
Security valuation—Securities listed on a securities exchange, market or automated quotation system for which quotations are readily available (except for securities traded on Nasdaq), including American Depository Receipts ("ADRs"), are valued at the last quoted sale price on the primary exchange or market (foreign or domestic) on which they are traded, or, if there is no such reported sale, at the most recent quoted bid price for long positions and the most recent quoted ask price for short positions. For securities traded on Nasdaq, the Nasdaq Official Closing Price will be used. The prices for foreign securities are reported in local currency and converted to U.S. dollars using currency exchange rates. Prices for most securities held in the Funds are provided daily by recognized independent pricing agents. To the extent these securities are valued at the last sales price or Nasdaq Official Closing Price, they are categorized as Level 1 in the fair value hierarchy.
Investments in other open-end investment companies are valued at net asset value. These valuations are typically categorized as Level 1 in the fair value hierarchy.
If a security price cannot be obtained from an independent, third-party pricing agent, the Funds seek to obtain bid and ask prices from two broker-dealers who make a market in the security and determine the average of the two. In this situation, valuations are typically categorized as a Level 2 in the fair value hierarchy.
Securities for which market prices are not "readily available" are valued in accordance with Fair Value Procedures established by the Board of Trustees (the "Board"). The Funds' Fair Value Procedures are implemented through a Fair Value Committee (the "Committee") designated by the Board. Some of the more common reasons that may necessitate that a security be valued using Fair Value Procedures include: the security's trading has been halted or suspended; the security has been delisted from a national exchange; the security's primary trading market is temporarily closed at a time when under normal
72 TURNER FUNDS 2012 ANNUAL REPORT
conditions it would be open; the security has not been traded for an extended period of time; the security's primary pricing source is not able or willing to provide a price; or trading of the security is subject to local government-imposed restrictions. When a security is valued in accordance with the Fair Value Procedures, the Committee will determine the value after taking into consideration relevant information reasonably available to the Committee. Depending on the source or relative significance of the valuation inputs, these securities may be categorized as a Level 2 or Level 3 in the fair value hierarchy.
For securities that principally trade on a foreign market or exchange, a significant gap in time can exist between the time of a particular security's last trade and the time at which a Fund calculates its net asset value. The closing prices of such securities may no longer reflect their market value at the time a Fund calculates net asset value if an event that could materially affect the value of those securities (a "Significant Event") has occurred between the time of the security's last close and the time that a Fund calculates net asset value. A Significant Event may relate to a single issuer or to an entire market sector. In addition, the Funds' Sub-administrator, as defined in Note 3, monitors price movements among certain selected indices, securities and/or baskets of securities that may be an indicator that the closing prices received earlier from foreign exchanges or markets may not reflect market value at the time a Fund calculates its net asset value. If price movements in a monitored index or security exceed levels recommended by the Committee for approval by the Board ("trigger points"), the Sub-administrator will notify the Adviser, as defined in Note 3, that such limits have been exceeded. If such trigger points are exceeded, then the close prices for certain foreign markets are systematically adjusted by fair value factors calculated by an independent pricing service. The circumstances described above use significant observable inputs and therefore these valuations are considered as Level 2 in the fair value hierarchy.
In the event that the Adviser believes that the fair values provided by a third party fair valuation vendor are not reliable, or believes that a foreign security held by a Fund should be fair valued for any other reason, the Adviser shall contact the Sub-administrator and request that a meeting of the Committee be held. Depending on the source or relative significance of the valuation inputs, these securities may be categorized as a Level 2 or Level 3 in the fair value hierarchy.
For the year ended September 30, 2012, there were no Level 3 investments for which significant unobservable inputs were used to determine fair value.
The following is a summary of inputs used to value the Funds' investments as of September 30, 2012 (000):
| | | Level 1 | | Level 2 | | Total | |
Market Neutral Fund | |
Investments in securities | |
Common stock | | $ | 36,591 | | | $ | — | | | $ | 36,591 | | |
Cash equivalent | | | 1,606 | | | | — | | | | 1,606 | | |
Total Investments in securities | | $ | 38,197 | | | $ | — | | | $ | 38,197 | | |
Securities sold short | |
Common stock | | $ | 36,394 | | | $ | — | | | $ | 36,394 | | |
Total Securities sold short | | $ | 36,394 | | | $ | — | | | $ | 36,394 | | |
Medical Sciences Long/Short Fund | |
Investments in securities | |
Common stock | | $ | 27,041 | | | $ | — | | | $ | 27,041 | | |
Call option contract | | | 41 | | | | — | | | | 41 | | |
Cash equivalent | | | 12,103 | | | | — | | | | 12,103 | | |
Total Investments in securities | | $ | 39,185 | | | $ | — | | | $ | 39,185 | | |
Securities sold short | |
Common stock | | $ | 9,949 | | | $ | — | | | $ | 9,949 | | |
Exchange traded funds | | | 3,847 | | | | — | | | | 3,847 | | |
Total Securities sold short | | $ | 13,796 | | | $ | — | | | $ | 13,796 | | |
Spectrum Fund | |
Investments in securities | |
Common stock | | $ | 729,702 | | | $ | — | | | $ | 729,702 | | |
Exchange traded fund | | | 1,361 | | | | — | | | | 1,361 | | |
Call option contract | | | 112 | | | | — | | | | 112 | | |
Put option contract | | | 167 | | | | — | | | | 167 | | |
Warrant | | | 386 | | | | — | | | | 386 | | |
Cash equivalent | | | 59,201 | | | | — | | | | 59,201 | | |
Total Investments in securities | | $ | 790,929 | | | $ | — | | | $ | 790,929 | | |
Securities sold short | |
Common stock | | $ | 405,831 | | | $ | — | | | $ | 405,831 | | |
Convertible corporate bond | | | — | | | | 211 | | | | 211 | | |
Exchange traded funds | | | 68,642 | | | | — | | | | 68,642 | | |
Total Securities sold short | | $ | 474,473 | | | $ | 211 | | | $ | 474,684 | | |
Titan Fund | |
Investments in securities | |
Common stock | | $ | 24,762 | | | $ | — | | | $ | 24,762 | | |
Cash equivalent | | | 3,442 | | | | — | | | | 3,442 | | |
Total Investments in securities | | $ | 28,204 | | | $ | — | | | $ | 28,204 | | |
Securities sold short | |
Common stock | | $ | 13,404 | | | $ | — | | | $ | 13,404 | | |
Exchange traded funds | | | 1,090 | | | | — | | | | 1,090 | | |
Total Securities sold short | | $ | 14,494 | | | $ | — | | | $ | 14,494 | | |
All Cap Growth Fund | |
Investments in securities | |
Common stock | | $ | 25,632 | | | $ | — | | | $ | 25,632 | | |
Cash equivalent | | | 2,792 | | | | — | | | | 2,792 | | |
Total Investments in securities | | $ | 28,424 | | | $ | — | | | $ | 28,424 | | |
TURNER FUNDS 2012 ANNUAL REPORT 73
NOTES TO FINANCIAL STATEMENTS
| | | Level 1 | | Level 2 | | Total | |
Concentrated Growth Fund | |
Investments in securities | |
Common stock | | $ | 33,743 | | | $ | — | | | $ | 33,743 | | |
Cash equivalent | | | 7,918 | | | | — | | | | 7,918 | | |
Total Investments in securities | | $ | 41,661 | | | $ | — | | | $ | 41,661 | | |
Emerging Growth Fund | |
Investments in securities | |
Common stock | | $ | 232,976 | | | $ | — | | | $ | 232,976 | | |
Cash equivalent | | | 30,374 | | | | — | | | | 30,374 | | |
Total Investments in securities | | $ | 263,350 | | | $ | — | | | $ | 263,350 | | |
Large Growth Fund | |
Investments in securities | |
Common stock | | $ | 247,606 | | | $ | — | | | $ | 247,606 | | |
Cash equivalent | | | 20,157 | | | | — | | | | 20,157 | | |
Total Investments in securities | | $ | 267,763 | | | $ | — | | | $ | 267,763 | | |
Midcap Growth Fund | |
Investments in securities | |
Common stock | | $ | 640,099 | | | $ | — | | | $ | 640,099 | | |
Cash equivalent | | | 60,254 | | | | — | | | | 60,254 | | |
Total Investments in securities | | $ | 700,353 | | | $ | — | | | $ | 700,353 | | |
Small Cap Growth Fund | |
Investments in securities | |
Common stock | | $ | 246,743 | | | $ | — | | | $ | 246,743 | | |
Right | | | — | | | | — | (a) | | | — | (a) | |
Cash equivalent | | | 45,334 | | | | — | | | | 45,334 | | |
Total Investments in securities | | $ | 292,077 | | | $ | — | (a) | | $ | 292,077 | | |
Global Opportunities Fund | |
Investments in securities | |
Common stock | | $ | 1,865 | | | $ | — | | | $ | 1,865 | | |
Cash equivalent | | | 30 | | | | — | | | | 30 | | |
Total Investments in securities | | $ | 1,895 | | | $ | — | | | $ | 1,895 | | |
International Growth Fund | |
Investments in securities | |
Common stock | | $ | 29,197 | | | $ | — | | | $ | 29,197 | | |
Cash equivalent | | | 463 | | | | — | | | | 463 | | |
Total Investments in securities | | $ | 29,660 | | | $ | — | | | $ | 29,660 | | |
(a) The market value of this security is equal to $0.
For the year ended September 30, 2012, there have been no significant changes to the Funds' fair valuation methodologies. Changes in valuation techniques may result in transfers in or out of an investment's assigned level within the hierarchy during the reporting period. For each Fund there were no transfers between the levels as of September 30, 2012 based on the input levels assigned at September 30, 2011, except for Funds listed in the table below. Transfers from Level 2 to Level 1, the
result of the established thresholds for foreign securities no longer being exceeded, are as follows (000):
| | | Transfers from
Level 2 to Level 1 | |
Spectrum Fund | |
Common stock | | $ | 1,759 | | |
Common stock sold short | | $ | (5,285 | ) | |
Global Opportunities Fund | |
Common stock | | $ | 298 | | |
International Growth Fund | |
Common stock | | $ | 11,861 | | |
Security transactions and related income—Security transactions are accounted for on the date the security is purchased or sold (trade date). Dividend income is recognized on the ex-dividend date. Costs used in determining realized gains and losses on the sales of investment securities are those of the specific securities lots sold.
Securities sold short—Consistent with each Fund's investment objectives, the Funds may engage in short sales. Short sales are transactions under which a Fund sells a security it does not own. To complete such a transaction, the Fund must borrow the security to make delivery to the buyer. The Fund is then obligated to replace the security borrowed by purchasing the security at the market price at the time of the replacement. The price at such time may be more or less than the price at which the security was sold by the Fund. Until the security is replaced, the Fund is required to pay the lender amounts equal to any dividends that accrue during the period of the loan. Dividends declared on open short positions are recorded on ex-date and shown as an expense for financial reporting purposes. To borrow the security, the Fund also may be required to pay a fee, which is shown as an expense for financial reporting purposes. The proceeds of the short sale are retained by the broker, to the extent necessary to meet margin requirements, until the short position is closed out. A gain, limited to the price at which the Fund sold the security short, or a loss, unlimited in size, will be recognized upon the close of a short sale.
Until a Fund closes its short position or replaces the borrowed security, the Fund will: (a) maintain a segregated account containing cash or liquid securities at such a level that (i) the amount deposited in the account plus the amount deposited with the brokers as collateral will equal the current value of the security sold short; and (ii) the amount deposited in the segregated account plus the amount deposited with the broker as collateral will not be less than the market value of the security at the time the security was sold short, or (b) otherwise cover the short positions. The Market Neutral Fund, Medical Sciences Long/Short
74 TURNER FUNDS 2012 ANNUAL REPORT
Fund, Spectrum Fund and Titan Fund engaged in short sales during the year ended September 30, 2012.
Option Transactions—Consistent with each Fund's investment objectives, the Funds may write covered call options and sell put options as a means of increasing the yield on their portfolios and as a means of providing limited protection against decreases in their market value. The Funds may purchase put and call options to protect against a decline in the market value of the securities in their portfolio or to anticipate an increase in the market value of securities that the Funds may seek to purchase in the future. A put option gives the purchaser of the option the right to sell, and the writer of the option the obligation to buy, the underlying security at any time during the option period. A call option gives the purchaser of the option the right to buy, and the writer of the option the obligation to sell, the underlying security at any time during the option period. The premium paid to the writer is the consideration for undertaking the obligations under the option contract. The initial purchase (sale) of an option contract is an "opening transaction." In order to close out an option position, the Fund may enter into a "closing transaction," which is simply the sale (purchase) of an option contract on the same security with the same exercise price and expiration date as the option contract originally opened. If the Fund is unable to effect a closing purchase transaction with respect to an option it has written, it will not be able to sell the underlying security until the option expires or the Fund delivers the security upon exercise. When the Fund writes (sells) an option, an amount equal to the premium received by the Fund is included in the Statement of Assets and Liabilities as an asset and an equivalent liability. The amount of the liability is subsequently marked-to-market to reflect the current value of the option written.
Option contracts are valued at the last quoted sales price. If there is no such reported sale on the valuation date, long positions are valued at the most recent bid price, and short positions are valued at the most recent ask price. When an option expires on its stipulated expiration date or the Fund enters into a closing purchase transaction, the Fund realizes a gain or loss if the cost of the closing purchase transaction differs from the premium received when the option was sold without regard to any unrealized gain or loss on the underlying security, and the liability related to such option is eliminated. When an option is exercised, the premium originally received decreases the cost basis of the security (or increases the proceeds on a sale of the security).
Realized and unrealized gains and losses on written option transactions are shown on the Statement of Operations as net realized gain (loss) on written option
contracts and net change in unrealized appreciation (depreciation) on written option contracts, respectively. Realized and unrealized gains and (losses) on purchased options in the Medical Sciences Long/Short Fund for the year ended September 30, 2012 were $0 and $3, respectively (000). Realized and unrealized gains and (losses) on purchased options in the Spectrum Fund for the year ended September 30, 2012 were $(3,801) and $327, respectively (000). These amounts are shown on the Statement of Operations as net realized gain (loss) from securities sold and net change in unrealized appreciation (depreciation) on investments, respectively. The primary risk exposure from the written and purchased option contracts is equity exposure. The Medical Sciences Long/Short Fund and Spectrum Fund engaged in limited option activity representing less than 2% of each Fund's net assets during the year ended September 30, 2012.
A summary of option contracts written during the year ended September 30, 2012 for the Spectrum Fund is as follows:
| | | Option
contracts | | Option
premiums
(000) | |
Options outstanding at beginning
of year | | | — | | | $ | — | | |
Options written | | | 20,181 | | | | 1,800 | | |
Options cancelled in a closing
purchase transaction | | | (15,452 | ) | | | (1,580 | ) | |
Options expired | | | (4,729 | ) | | | (220 | ) | |
Options outstanding at end of period | | | — | | | $ | — | | |
Foreign currency translation—The books and records of the Market Neutral Fund, Medical Sciences Long/Short Fund, Spectrum Fund, Titan Fund, Global Opportunities Fund and International Growth Fund are maintained in U.S. dollars. Investment securities and other assets and liabilities denominated in a foreign currency are translated into U.S. dollars on the date of valuation. The Market Neutral Fund, Medical Sciences Long/Short Fund, Spectrum Fund, Titan Fund, Global Opportunities Fund and International Growth Fund do not isolate that portion of realized or unrealized gains and losses resulting from changes in the foreign exchange rate from fluctuations arising from changes in the market prices of the securities. These gains and losses are included in net realized and unrealized gains and losses on investments in the Statements of Operations. Net realized and unrealized gains and losses on foreign currency transactions represent net foreign exchange gains or losses from foreign currency exchange contracts, disposition of foreign currencies, currency gains or losses realized between trade and settlement dates on securities transactions and the difference between the amount of the investment income and foreign withholding taxes recorded on the
TURNER FUNDS 2012 ANNUAL REPORT 75
NOTES TO FINANCIAL STATEMENTS
Market Neutral Fund, Medical Sciences Long/Short Fund, Spectrum Fund, Titan Fund, Global Opportunities Fund and International Growth Fund's books and the U.S. dollar equivalent amounts actually received or paid.
Illiquid Securities—Illiquid securities are securities that cannot be disposed of within seven business days at approximately the price at which they are being carried on a Fund's books. Illiquid securities include demand instruments with demand notice periods exceeding seven days, securities for which there is no active secondary market, and repurchase agreements with maturities of over seven days in length. The Funds may invest in securities that are neither listed on a stock exchange nor traded over the counter, including privately placed securities. Investing in such unlisted emerging country equity securities, including investments in new and early stage companies, may involve a high degree of business and financial risk that can result in substantial losses. As a result of the absence of a public trading market for these securities, they may be less liquid than publicly traded securities. Although these securities may be resold in privately negotiated transactions, the prices realized from these sales could be less than those originally paid by the Fund, or less than what may be considered the fair value of such securities. Further, companies whose securities are not publicly traded may not be subject to the disclosure and other investor protection requirements which might be applicable if their securities were publicly traded. If such securities are required to be registered under the securities laws of one or more jurisdictions before being resold, a Fund may be required to bear the expenses of registration.
Expenses—Expenses that are specifically attributed to one of the Funds are charged to that Fund. Certain other expenses of the Funds are prorated among the Funds on the basis of relative daily net assets.
Classes—Class specific expenses are borne by that class. Income, non-class specific expenses and realized/unrealized gains and losses are allocated to the respective classes on the basis of the relative daily net assets.
Dividends and distributions—The Funds declare and distribute net investment income, if any, annually, as a dividend to shareholders. Any net realized capital gains on sales of securities for all Funds are distributed to shareholders at least annually. The Funds may utilize equalization accounting for tax purposes and designate earnings and profits, including net realized gains distributed to shareholders on redemption of shares, as a part of the dividends paid deduction for income tax purposes.
New Accounting Pronouncement—In December 2011, the Financial Accounting Standards Board issued Accounting Standards Update No. 2011-11 "Disclosures about Offsetting Assets and Liabilities" ("ASU No. 2011-11") requiring disclosure of both gross and net information related to offsetting and related arrangements enabling users of its financial statements to understand the effect of those arrangements on the entity's financial position. The objective of this disclosure is to facilitate comparison between those entities that prepare their financial statements on the basis of U.S. GAAP and those entities that prepare their financial statements on the basis of International Financial Reporting Standards. ASU No. 2011-11 is effective for interim and annual periods beginning on or after January 1, 2013. Management is currently evaluating any impact ASU No. 2011-11 may have on the Funds' financial statements.
3. Transactions with affiliates:
Certain officers and trustees of the Trust are also officers or employees of Turner Investments, L.P. ("Turner", the "Adviser", or the "Administrator") or Citi Fund Services Ohio, Inc. ("Citi" or the "Sub-administrator"), the Trust's Sub-administrator. With the exception of the Trust's Chief Compliance Officer, such officers are paid no fees by the Trust for serving as officers and trustees of the Trust.
Foreside Fund Services, LLC (the "Distributor") provides distribution services to the Funds under a Distribution Services Agreement.
4. Administration, shareholder servicing, distribution and transfer agent agreements:
Turner provides administrative services to the Funds under an Administration Agreement with the Trust. For its services, Turner receives an annual fee of 0.15% of the aggregate average daily net assets of the Trust up to $2 billion and 0.12% of the aggregate average daily net assets of the Trust over $2 billion. Under a separate Sub-administration Agreement between Turner and Citi, Citi provides sub-administrative services, including certain fund accounting services, to the Trust. For the year ended September 30, 2012, Citi was paid $956 (000) by Turner.
The Funds have adopted a Distribution Plan for Retirement Class Shares and Class C Shares (the "Distribution Plan") under which firms, including the Distributor, that provide distribution services may receive compensation. Under the Distribution Plan, which was adopted pursuant to Rule 12b-1 under the 1940 Act, as amended, the Distributor is entitled to receive aggregate fees for distribution services not exceeding 0.75% of each Fund's average daily net assets attributable to Retirement Class Shares or Class C Shares that are subject to the arrangement in return for providing a broad range of distribution services. Currently, the Retirement Class Shares of
76 TURNER FUNDS 2012 ANNUAL REPORT
the Midcap Growth Fund pay the Distributor 0.25% and the Class C Shares of the Market Neutral Fund, Medical Sciences Long/Short Fund, Spectrum Fund and Titan Fund pay the Distributor 0.75% in distribution fees.
The Funds have also adopted Shareholder Services Plans (the "Shareholder Services Plans"). Under the Shareholder Services Plans, service providers are entitled to receive aggregate fees for shareholder services not exceeding 0.25% of each Fund's average daily net assets attributable to Investor Class Shares, Retirement Class Shares and Class C Shares that are subject to the arrangement in return for providing shareholder services. Currently, Investor Class Shares of each Fund, Retirement Class Shares of the Midcap Growth Fund and Class C Shares of the Market Neutral Fund, Medical Sciences Long/Short Fund, Spectrum Fund and Titan Fund pay 0.25% in shareholder servicing fees.
DST Systems, Inc. serves as the transfer agent and dividend disbursing agent for the Funds under a Transfer Agency Agreement with the Trust.
5. Investment advisory agreement:
The Trust and Turner are parties to an Investment Advisory Agreement dated April 28, 1996 under which Turner receives a fee that is calculated daily and paid monthly, based on the average daily net assets of the Funds.
For its services, Turner receives annual fees, which are calculated daily and paid monthly, based on average daily net assets of the Funds. Turner has contractually agreed to waive all or a portion of its fees and to reimburse expenses in order to limit total Fund operating expenses (excluding acquired fund fees and expenses and interest expenses relating to short sales, except for the Market Neutral Fund, Medical Sciences Long/Short Fund, Spectrum Fund and Titan Fund, for which Turner includes acquired fund fees and expenses and interest expenses relating to short sales in its contractual waiver) to a specified percentage of the average daily net assets of each Fund, except the All Cap Growth Fund and Concentrated Growth Fund, on an annualized basis through certain dates disclosed in the following table:
| | | Advisory
fee | | Expense
cap | | Date
(through) | |
Market Neutral Fund | |
Institutional Class | | | 1.50 | % | | | 1.95 | % | | January 31, 2013 | |
Investor Class | | | 1.50 | % | | | 2.20 | % | | January 31, 2013 | |
Class C | | | 1.50 | % | | | 2.95 | % | | January 31, 2013 | |
Medical Sciences Long/Short
Fund | |
Institutional Class | | | 1.50 | % | | | 1.95 | % | | January 31, 2013 | |
Investor Class | | | 1.50 | % | | | 2.20 | % | | January 31, 2013 | |
Class C | | | 1.50 | % | | | 2.95 | % | | January 31, 2013 | |
| | | Advisory
fee | | Expense
cap | | Date
(through) | |
Spectrum Fund | |
Institutional Class | | | 1.50 | % | | | 1.95 | % | | January 31, 2013 | |
Investor Class | | | 1.50 | % | | | 2.20 | % | | January 31, 2013 | |
Class C | | | 1.50 | % | | | 2.95 | % | | January 31, 2013 | |
Titan Fund | |
Institutional Class | | | 1.50 | % | | | 1.95 | % | | January 31, 2013 | |
Investor Class | | | 1.50 | % | | | 2.20 | % | | January 31, 2013 | |
Class C | | | 1.50 | % | | | 2.95 | % | | January 31, 2013 | |
Emerging Growth Fund | |
Institutional Class | | | 1.00 | % | | | 1.15 | % | | January 31, 2013 | |
Investor Class | | | 1.00 | % | | | 1.40 | % | | January 31, 2013 | |
Large Growth Fund | |
Institutional Class | | | 0.60 | % | | | 0.69 | % | | January 31, 2013 | |
Investor Class | | | 0.60 | % | | | 0.94 | % | | January 31, 2013 | |
Midcap Growth Fund | |
Institutional Class | | | 0.75 | % | | | 0.93 | % | | January 31, 2013 | |
Investor Class | | | 0.75 | % | | | 1.18 | % | | January 31, 2013 | |
Retirement Class | | | 0.75 | % | | | 1.43 | % | | January 31, 2013 | |
Small Cap Growth Fund | |
Investor Class | | | 1.00 | % | | | 1.25 | % | | January 31, 2013 | |
Global Opportunities Fund | |
Institutional Class | | | 0.75 | % | | | 1.10 | % | | January 31, 2013 | |
Investor Class | | | 0.75 | % | | | 1.35 | % | | January 31, 2013 | |
International Growth Fund | |
Institutional Class | | | 0.85 | % | | | 1.10 | % | | January 31, 2013 | |
Investor Class | | | 0.85 | % | | | 1.35 | % | | January 31, 2013 | |
For the remaining Funds, the All Cap Growth Fund and Concentrated Growth Fund, the advisory fee is comprised of a base fee and performance adjustment that increases or decreases the total fee depending upon the performance of the Fund relative to its performance benchmark. The Fund's base fee (1.10% for both the All Cap Growth Fund and Concentrated Growth Fund) is accrued daily and paid monthly, based on the Fund's average net assets during the current month.
The performance adjustment is calculated and paid monthly by comparing the Fund's performance to that of its performance benchmark over the current month plus the previous 11 months (the "performance period"). The annual performance adjustment rate is multiplied by the average net assets of the Fund over the entire performance period, which is then multiplied by a fraction, the numerator of which is the number of days in the month and the denominator of which is 365 (366 in leap years). The resulting amount is then added to (in the case of overperformance) or subtracted from (in the case of underperformance) a Fund's base advisory fee.
In cases where the advisory fee is comprised of a base fee and a performance adjustment, Turner has voluntarily agreed to waive all or a portion of its fees and to reimburse expenses in order to keep such Fund's "other expenses" (excluding distribution fees, acquired fund fees and expenses and interest expenses relating to short sales) from exceeding a specified percentage of the
TURNER FUNDS 2012 ANNUAL REPORT 77
NOTES TO FINANCIAL STATEMENTS
average daily net assets of the Fund on an annualized basis. Accordingly, the base advisory fee, annual adjustment rate, over/under performance relative to the benchmark threshold, and other expense cap are as follows:
| | | Base
advisory
fee | | Annual
adjustment
rate | | Benchmark
threshold(1) | | Other
expenses
cap | |
All Cap Growth Fund | | | 1.10 | % | | | +/-0.40% | | | | +/-2.50% | | | | 0.25 | % | |
Concentrated Growth Fund | | | 1.10 | % | | | +/-0.40% | | | | +/-2.50% | | | | 0.25 | % | |
(1) See the Funds' Prospectus and Statement of Additional Information for more information regarding each Fund's performance benchmark.
During the year ended September 30, 2012, the Funds' advisory fees, before waivers, were adjusted in accordance with the policy described above (000):
| | Base
advisory
fee | | Performance
adjustment | | Net advisory
fee before
waivers | |
All Cap Growth Fund | | $ | 329 | | | $ | (146 | ) | | $ | 183 | | |
Concentrated Growth Fund | | | 431 | | | | (214 | ) | | | 217 | | |
6. Contingent deferred sales charges
(Class C Shares):
A 1.00% contingent deferred sales charge ("CDSC") will be deducted with respect to Class C Shares of the Market Neutral Fund, Medical Sciences Long/Short Fund, Spectrum Fund and Titan Fund redeemed within 12 months of purchase. The CDSC will be based on the lower of the original purchase price or the value of the Class C Shares redeemed. The CDSC may be waived for certain investors, as described in the Class C Shares statutory prospectus for the Market Neutral Fund, Medical Sciences Long/Short Fund, Spectrum Fund and Titan Fund.
7. Investment transactions:
The cost of security purchases and the proceeds from security sales, other than short-term investments, for the year ended September 30, 2012 were as follows (000):
| | | Purchases | | Sales | |
Market Neutral Fund | | $ | 458,494 | | | $ | 433,430 | | |
Medical Sciences Long/Short Fund | | | 261,322 | | | | 254,637 | | |
Spectrum Fund | | | 5,902,780 | | | | 5,567,031 | | |
Titan Fund | | | 156,059 | | | | 143,640 | | |
All Cap Growth Fund | | | 53,925 | | | | 65,726 | | |
Concentrated Growth Fund | | | 57,051 | | | | 66,541 | | |
Emerging Growth Fund | | | 175,306 | | | | 197,206 | | |
Large Growth Fund | | | 401,640 | | | | 670,139 | | |
Midcap Growth Fund | | | 886,570 | | | | 1,083,218 | | |
Small Cap Growth Fund | | | 253,447 | | | | 299,724 | | |
Global Opportunities Fund | | | 1,663 | | | | 1,426 | | |
International Growth Fund | | | 40,040 | | | | 23,938 | | |
8. Federal tax policies and information:
Each of the Funds is classified as a separate taxable entity for Federal income tax purposes. Each of the Funds intends to continue to qualify as a separate "regulated investment company" under the Internal Revenue Code and make the requisite distributions to shareholders that will be sufficient to relieve it from Federal income tax and Federal excise tax. Therefore, no Federal tax provision is required.
The amounts of dividends from net investment income and distributions from net realized capital gains, if any, are determined in accordance with Federal income tax regulations, which may differ from those amounts determined under GAAP. These book/tax differences are either temporary or permanent in nature. These differences are primarily due to wash sales, REIT adjustments, foreign currency transactions, net operating losses, return of capital distributions, equalization and investments in partnerships and passive foreign investment companies. The character and timing of dividends from net investment income and distributions from net realized gains distributed during the fiscal year may differ from the year that the income or realized gains (losses) were recorded by the Funds. To the extent these differences are permanent, adjustments are made to the appropriate equity accounts in the period that the differences arise. The Funds may utilize equalization accounting for tax purposes and designate earnings and profits, including net realized gains distributed to shareholders on redemption of shares, as a part of the dividends paid deduction for income tax purposes.
Withholding taxes on dividends and net realized capital gains as a result of certain investments in ADRs by the Funds have been provided for in accordance with each investment's applicable country's tax rules and rates.
Accordingly, the following permanent differences have been reclassified to/from the following accounts during the fiscal year ended September 30, 2012 (000):
| Fund | | Undistributed
net investment
income | | Accumulated
net realized
gain (loss) | | Portfolio
Capital | |
Market Neutral Fund | | $ | 79 | | | $ | (90 | ) | | $ | 11 | | |
Medical Sciences
Long/Short Fund | | | 346 | | | | (31 | ) | | | (315 | ) | |
Spectrum Fund | | | 2,852 | | | | 219 | | | | (3,071 | ) | |
Titan Fund | | | 246 | | | | (246 | ) | | | — | | |
All Cap Growth Fund | | | 71 | | | | 11 | | | | (82 | ) | |
Concentrated Growth Fund | | | 39 | | | | 6 | | | | (45 | ) | |
Emerging Growth Fund | | | 471 | | | | (184 | ) | | | (287 | ) | |
Large Growth Fund | | | (28 | ) | | | 44 | | | | (16 | ) | |
Midcap Growth Fund | | | 102 | | | | 176 | | | | (278 | ) | |
Small Cap Growth Fund | | | 539 | | | | — | | | | (539 | ) | |
Global Opportunities Fund | | | 5 | | | | 1 | | | | (6 | ) | |
International Growth Fund | | | (36 | ) | | | 36 | | | | — | | |
78 TURNER FUNDS 2012 ANNUAL REPORT
The tax character of dividends and distributions declared during the years ended September 30, 2012 and September 30, 2011 were as follows (000):
| | | Ordinary
income | | Long-term
capital gain | | Total | |
Market Neutral Fund | | | |
| | 2012 | | | $ | 457 | | | $ | 4 | | | $ | 461 | | |
| | 2011 | | | | — | | | | — | | | | — | | |
Spectrum Fund | | | |
| | 2012 | | | $ | 30,159 | | | $ | — | | | $ | 30,159 | | |
| | 2011 | | | | — | | | | — | | | | — | | |
Titan Fund | | | |
| | 2012 | | | $ | 151 | | | $ | — | | | $ | 151 | | |
| | 2011 | | | | — | | | | — | | | | — | | |
| | Ordinary
income | | Long-term
capital gain | | Total | |
Large Growth Fund | | | |
| | 2012 | | | $ | — | | | $ | — | | | $ | — | | |
| | 2011 | | | | 671 | | | | — | | | | 671 | | |
Global Opportunities
Fund | | | |
| | 2012 | | | $ | 14 | | | $ | 28 | | | $ | 42 | | |
| | 2011 | | | | — | | | | — | | | | — | | |
International Growth
Fund | | | |
| | 2012 | | | $ | — | | | $ | — | | | $ | — | | |
| | 2011 | | | | 49 | | | | — | | | | 49 | | |
As of September 30, 2012, the components of distributable earnings (accumulated losses) on a tax basis were as follows (000):
| | Undistributed
ordinary
income | | Undistributed
long term
capital gains | | Capital
loss
carryforward | | Post-
October
losses | | Late
year
ordinary
loss | | Unrealized
appreciation
(depreciaton) | | Total
distributable
earnings
(accumulated
losses) | |
Market Neutral Fund | | $ | — | | | $ | — | | | $ | — | | | $ | (129 | ) | | $ | (339 | ) | | $ | (1,045 | ) | | $ | (1,513 | ) | |
Medical Sciences Long/
Short Fund | | | — | | | | — | | | | (165 | ) | | | (1,449 | ) | | | (736 | ) | | | 854 | | | | (1,496 | ) | |
Spectrum Fund | | | — | | | | — | | | | (197 | ) | | | (20,357 | ) | | | (7,045 | ) | | | (8,608 | ) | | | (36,207 | ) | |
Titan Fund | | | 367 | | | | — | | | | — | | | | — | | | | — | | | | (136 | ) | | | 231 | | |
All Cap Growth Fund | | | — | | | | — | | | | (9,865 | ) | | | (2,399 | ) | | | — | | | | 3,462 | | | | (8,802 | ) | |
Concentrated Growth Fund | | | — | | | | — | | | | (23,401 | ) | | | (531 | ) | | | (26 | ) | | | 4,063 | | | | (19,895 | ) | |
Emerging Growth Fund | | | — | | | | 31,603 | | | | — | | | | — | | | | (1,479 | ) | | | 66,708 | | | | 96,832 | | |
Large Growth Fund | | | 450 | | | | — | | | | (97,399 | ) | | | — | | | | — | | | | 29,779 | | | | (67,170 | ) | |
Midcap Growth Fund | | | — | | | | — | | | | — | | | | (384 | ) | | | (2,022 | ) | | | 87,050 | | | | 84,644 | | |
Small Cap Growth Fund | | | — | | | | 11,606 | | | | — | | | | — | | | | (1,229 | ) | | | 39,250 | | | | 49,627 | | |
Global Opportunities Fund | | | — | | | | 10 | | | | — | | | | — | | | | (2 | ) | | | 302 | | | | 310 | | |
International Growth Fund | | | 137 | | | | — | | | | (581 | ) | | | (889 | ) | | | — | | | | 1,836 | | | | 503 | | |
Under current tax law, capital losses and specified ordinary losses realized after October 31st and non-specified ordinary losses incurred after December 31st (ordinary losses collectively known as "late year ordinary loss") may be deferred and treated as having arisen in the following fiscal year.
As of the end of their latest tax year end of September 30, 2012, the following Funds have capital loss carryforwards ("CLCFs"). CLCFs not subject to expiration must be used prior to using any CLCFs that are subject to expiration. A summary of these CLCFs is detailed in the tables below (000):
CLCFs not subject to expiration (000):
| | Short Term | | Long Term | |
Medical Sciences Long/Short Fund | | $ | 165 | | | $ | — | | |
Spectrum Fund 197 —
International Growth Fund 67 —
CLCFs subject to expiration (000):
| | | Expiring September 30, | |
| | | 2017 | | 2018 | | Total | |
All Cap Growth Fund | | $ | 7,475 | | | $ | 2,390 | | | $ | 9,865 | | |
Concentrated Growth Fund | | | — | | | | 23,401 | | | | 23,401 | | |
Large Growth Fund | | | 7,956 | | | | 89,443 | | | | 97,399 | | |
International Growth Fund | | | 437 | | | | 77 | | | | 514 | | |
As of March 7, 2011, the Large Growth Fund credited accumulated net realized loss $12,828 (000) and charged paid-in-capital $123,626 (000) and unrealized appreciation $31,165 (000) due to the Turner Large Cap Growth Fund ("Large Cap Growth Fund") merger with the Large Growth Fund. Internal Revenue Code Section 382 limits the amount of annual CLCFs available for use. However, if the Large Growth Fund recognizes sufficient capital gains before the relevant expiration dates, Section 382 should not preclude the use of these CLCFs.
TURNER FUNDS 2012 ANNUAL REPORT 79
NOTES TO FINANCIAL STATEMENTS
At September 30, 2012, the total cost of securities for Federal income tax purposes and the aggregate gross unrealized appreciation and depreciation for the investments held by each Fund, excluding securities sold short and written options, were as follows (000):
| | Federal
tax
cost | | Unrealized
appreciation | | Unrealized
depreciation | | Net
unrealized
appreciation/
(depreciation) | |
Market Neutral Fund | | $ | 38,312 | | | $ | 696 | | | $ | (811 | ) | | $ | (115 | ) | |
Medical Sciences Long/Short Fund | | | 37,540 | | | | 2,281 | | | | (636 | ) | | | 1,645 | | |
Spectrum Fund | | | 777,555 | | | | 41,501 | | | | (28,127 | ) | | | 13,374 | | |
Titan Fund | | | 27,869 | | | | 1,136 | | | | (801 | ) | | | 335 | | |
All Cap Growth Fund | | | 24,962 | | | | 3,949 | | | | (487 | ) | | | 3,462 | | |
Concentrated Growth Fund | | | 37,598 | | | | 5,960 | | | | (1,897 | ) | | | 4,063 | | |
Emerging Growth Fund | | | 196,642 | | | | 69,721 | | | | (3,013 | ) | | | 66,708 | | |
Large Growth Fund | | | 237,984 | | | | 37,461 | | | | (7,682 | ) | | | 29,779 | | |
Midcap Growth Fund | | | 613,303 | | | | 91,317 | | | | (4,267 | ) | | | 87,050 | | |
Small Cap Growth Fund | | | 252,827 | | | | 46,334 | | | | (7,084 | ) | | | 39,250 | | |
Global Opportunities Fund | | | 1,593 | | | | 319 | | | | (17 | ) | | | 302 | | |
International Growth Fund | | | 27,824 | | | | 2,705 | | | | (869 | ) | | | 1,836 | | |
Management has analyzed the Funds' tax positions taken on Federal income tax returns for all open tax years and has concluded that as of September 30, 2012, no provision for income tax would be required in the Funds' financial statements. The Funds' Federal and State income and Federal excise tax returns for tax years for which the applicable statutes of limitations have not expired are subject to examination by the Internal Revenue Service and state taxing authorities.
9. Concentration/risks:
Certain Funds invest a high percentage of their assets in specific sectors of the market in order to achieve a potentially greater investment return. As a result, these Funds may be more susceptible to economic, political, and regulatory developments in a particular sector of the market, positive or negative, and may experience increased volatility on the Fund's net asset value and magnified effect on the total return.
The Funds enter into contracts that contain a variety of indemnifications. The Funds' maximum exposure under these arrangements is unknown. However, the Funds have not had prior claims or losses pursuant to these contracts and expect the risk of loss to be remote.
10. Loans of portfolio securities:
The Funds may lend securities in their portfolio pursuant to a securities lending agreement ("Lending Agreement")
with Morgan Stanley. Unless otherwise agreed, security loans made pursuant to the Lending Agreement are required at all times to be secured by collateral equal to at least 100% of the market value of the securities loaned based on the previous day's market value of the securities loaned, marked-to-market daily. Any collateral shortfalls are adjusted the next business day. Cash collateral received is invested in the BlackRock TempCash Fund, Institutional Shares, a money market fund. All such investments are made at the risk of the Funds and, as such, the Funds are liable for investment losses. The Funds receive an annual fee for their participation in the Lending Agreement based on the projected lending activity.
In the event of bankruptcy of the borrower, realization/retention of the collateral may be subject to legal proceedings.
At September 30, 2012, the following Funds had securities on loan and the collateral held were as follows (000):
Fund | | Value of Securities
on Loan (000) | | Value of
Collateral (000) | |
All Cap Growth Fund | | $ | 2,493 | | | $ | 2,552 | | |
Concentrated Growth Fund | | | 6,584 | | | | 6,758 | | |
Emerging Growth Fund | | | 23,850 | | | | 24,427 | | |
Large Growth Fund | | | 17,310 | | | | 17,591 | | |
Midcap Growth Fund | | | 58,468 | | | | 60,254 | | |
Small Cap Growth Fund | | | 41,952 | | | | 43,018 | | |
11. In-kind transactions:
During the year ended September 30, 2011, the Emerging Growth Fund distributed securities in lieu of cash for shareholder redemptions. The shareholders received a pro-rata portion of the Emerging Growth Fund's holdings based on shares outstanding. The value of the redemption was as follows:
Date | | Redemption
(000) | | Securities
(000) | | Cash
(000) | | Realized gain
(000) | | Fund shares redeemed | |
9/1/11 | | $ | 260,853 | | | $ | 238,656 | | | $ | 22,197 | | | $ | 35,229 | | | | 5,266,997 | | |
During the year ended September 30, 2012, there were no in-kind transactions.
80 TURNER FUNDS 2012 ANNUAL REPORT
These transactions were completed pursuant to procedures adopted by the Board. These procedures are designed to minimize or eliminate any adverse tax implications to the Funds and their shareholders.
12. Fund Merger:
On March 7, 2011, the Large Growth Fund acquired all of the net assets of the Large Cap Growth Fund, an open-end investment company, pursuant to a Plan of Reorganization approved by the Large Cap Growth Fund shareholders on February 28, 2011. The purpose of the transaction was to combine the two Funds managed by the Adviser with similar investment objectives and policies. The acquisition was accomplished by a tax-free exchange of 10,966,460 Institutional Class shares and 119,229 Investor Class shares of the Large Growth Fund, valued at $140,366 (000) and $1,518 (000), respectively, for 23,818,691 Institutional Class shares and 258,725 Investor Class shares of the Large Cap Growth Fund outstanding on March 7, 2011. The exchange ratios (Large Growth Fund shares issued/Large Cap Growth Fund shares outstanding) were 0.46:1 and 0.46:1 for the Institutional Class and Investor Class, respectively.
The investment portfolio of the Large Cap Growth Fund, with a fair value of $141,865 (000) and identified cost of $110,700 (000) at March 7, 2011, was the principal asset acquired by the Large Growth Fund. For financial reporting purposes, assets received and shares issued by the Large Growth Fund were recorded at fair value; however, the cost basis of the investments received from the Large Cap Growth Fund was carried forward to align ongoing reporting of the Large Growth Fund's realized and unrealized gains and losses with amounts distributable to shareholders for tax purposes.
Upon the business combination of the Funds on March 7, 2011, the net assets of the Large Cap Growth Fund, which included portfolio capital of $123,626 (000), accumulated net investment loss of $39 (000), accumulated realized losses of $12,869 (000) and unrealized gains of $31,165 (000), combined with the Large Growth Fund were $666,940 (000). The undistributed net investment income and unrealized gains of the Large Cap Growth Fund may be distributed by the Large Growth Fund in future periods. Immediately prior to the merger, the net assets (000) of the Large Cap Growth Fund and the Large Growth Fund were $141,884 and $525,056, respectively. All fees and expenses incurred by the Large Cap Growth Fund and the Large Growth Fund directly in connection with the Plan of Reorganization were borne by the Adviser.
Assuming the acquisition had been completed on October 1, 2010, the beginning of the annual reporting period of the Large Growth Fund, the Fund's pro forma
results of operations for the year ended September 30, 2011, are as follows (000):
Net investment income/(loss): | | $ | (393 | ) | |
Net realized/unrealized gains/(losses): | | | 39,672 | | |
Change in net assets resulting from operations: | | $ | 39,279 | | |
Because the combined investment portfolios have been managed as a single integrated portfolio since the acquisition was completed, it is not practicable to separate the amounts of revenue and earnings of the Large Cap Growth Fund that have been included in the Large Growth Fund Statement of Operations since March 7, 2011.
13. Subsequent Events:
The Trust has evaluated the need for disclosures and/or adjustments resulting from subsequent events through the date the financial statements were issued and two events are reported below.
On September 7, 2012, the Board approved the reorganization of the Concentrated Growth Fund into the Large Growth Fund. The decision is subject to shareholder approval at a Special Meeting expected to take place during the first quarter of 2013. In anticipation of the reorganization, the Concentrated Growth Fund will close to new investors effective December 28, 2012.
On September 7, 2012, the Board also approved the reorganization of the International Growth Fund into the John Hancock International Growth Equity Fund. The decision is subject to shareholder approval at a Special Meeting expected to take place during the first quarter of 2013. In anticipation of the reorganization, the International Growth Fund will close to new investors effective October 12, 2012.
Based on this evaluation, other than the items noted above, no additional disclosures were required, and no adjustments were required as of September 30, 2012.
TURNER FUNDS 2012 ANNUAL REPORT 81
REPORT OF INDEPENDENT REGISTERED PUBLIC ACCOUNTING FIRM
The Board of Trustees and Shareholders
Turner Funds:
We have audited the accompanying statements of assets and liabilities, including the schedules of investments, of the Turner Funds, comprising the Turner Market Neutral Fund, Turner Medical Sciences Long/Short Fund, Turner Spectrum Fund, Turner Titan Fund, Turner All Cap Growth Fund, Turner Concentrated Growth Fund, Turner Emerging Growth Fund, Turner Large Growth Fund, Turner Midcap Growth Fund, Turner Small Cap Growth Fund, Turner Global Opportunities Fund, and Turner International Growth Fund, (collectively, the Funds), as of September 30, 2012, and the related statements of operations for the year then ended, the statements of changes in net assets for each of the years or periods in the two-year period then ended and the financial highlights for each of the years or periods in the five-year period then ended. These financial statements and financial highlights are the responsibility of the Funds' management. Our responsibility is to express an opinion on these financial statements and financial highlights based on our audits.
We conducted our audits in accordance with the standards of the Public Company Accounting Oversight Board (United States). Those standards require that we plan and perform the audit to obtain reasonable assurance about whether the financial statements and financial highlights are free of material misstatement. An audit includes examining, on a test basis, evidence supporting the amounts and disclosures in the financial statements. Our procedures included confirmation of securities owned as of September 30, 2012, by correspondence with the custodian and brokers or other appropriate auditing procedures. An audit also includes assessing the accounting principles used and significant estimates made by management, as well as evaluating the overall financial statement presentation. We believe that our audits provide a reasonable basis for our opinion.
In our opinion, the financial statements and financial highlights referred to above present fairly, in all material respects, the financial position of each of the Funds comprising Turner Funds as of September 30, 2012, the results of their operations for the year then ended, the changes in their net assets for each of the years or periods in the two-year period then ended, and the financial highlights for each of the years or periods in the five-year period then ended, in conformity with U.S. generally accepted accounting principles.
Philadelphia, Pennsylvania
November 29, 2012
82 TURNER FUNDS 2012 ANNUAL REPORT
NOTICE TO SHAREHOLDERS (Unaudited)
For shareholders that do not have a September 30, 2012 tax year end, this notice is for informational purposes only. For shareholders with a September 30, 2012 year end, please consult your tax advisor as to the pertinence of this notice. For the fiscal period ended September 30, 2012, each portfolio is designating the following items with regard to distributions paid during the year.
| | Long-term
capital
gain
distribution | | Ordinary
income
distributions | | Total
distributions | | Dividends
qualifying for
corporate
dividends
receivable
deduction(1) | | Qualifying
dividend
income(2) | | Qualifying
interest
income(3) | | Qualifying
short-term
capital
gain(4) | |
Market Neutral Fund | | | 0.94 | % | | | 99.06 | % | | | 100.00 | % | | | 16.90 | % | | | 19.64 | % | | | 0.00 | % | | | 100.00 | % | |
Medical Sciences
Long/Short Fund | | | 0.00 | % | | | 0.00 | % | | | 0.00 | % | | | 0.00 | % | | | 0.00 | % | | | 0.00 | % | | | 0.00 | % | |
Spectrum Fund | | | 0.00 | % | | | 100.00 | % | | | 100.00 | % | | | 0.00 | % | | | 0.00 | % | | | 0.00 | % | | | 100.00 | % | |
Titan Fund | | | 0.00 | % | | | 100.00 | % | | | 100.00 | % | | | 0.00 | % | | | 0.00 | % | | | 0.00 | % | | | 100.00 | % | |
All Cap Growth Fund | | | 0.00 | % | | | 0.00 | % | | | 0.00 | % | | | 0.00 | % | | | 0.00 | % | | | 0.00 | % | | | 0.00 | % | |
Concentrated
Growth Fund | | | 0.00 | % | | | 0.00 | % | | | 0.00 | % | | | 0.00 | % | | | 0.00 | % | | | 0.00 | % | | | 0.00 | % | |
Emerging Growth Fund | | | 0.00 | % | | | 0.00 | % | | | 0.00 | % | | | 0.00 | % | | | 0.00 | % | | | 0.00 | % | | | 0.00 | % | |
Large Growth Fund | | | 0.00 | % | | | 0.00 | % | | | 0.00 | % | | | 0.00 | % | | | 0.00 | % | | | 0.00 | % | | | 0.00 | % | |
Midcap Growth Fund | | | 0.00 | % | | | 0.00 | % | | | 0.00 | % | | | 0.00 | % | | | 0.00 | % | | | 0.00 | % | | | 0.00 | % | |
Small Cap Growth Fund | | | 0.00 | % | | | 0.00 | % | | | 0.00 | % | | | 0.00 | % | | | 0.00 | % | | | 0.00 | % | | | 0.00 | % | |
Global
Opportunities Fund | | | 66.93 | % | | | 33.07 | % | | | 100.00 | % | | | 17.08 | % | | | 29.66 | % | | | 0.00 | % | | | 100.00 | % | |
International
Growth Fund* | | | 0.00 | % | | | 0.00 | % | | | 0.00 | % | | | 0.20 | % | | | 100.00 | % | | | 0.00 | % | | | 0.00 | % | |
(1) Qualifying dividends represent dividends which qualify for the corporate dividends received deduction and are reflected as a percentage of "Ordinary Income Distributions".
(2) The percentage in this column represents the amount of "Qualifying Dividend Income" as created by the Jobs and Growth Tax Relief Reconciliation Act of 2003 and is reflected as a percentage of "Ordinary Income Distributions". It is the intention of each of the aforementioned funds to designate the maximum amount permitted by law.
(3) The percentage of this column represents the amount of "Qualifying Interest Income" as created by the American Jobs Creation Act of 2004 and is reflected as a percentage of net investment income distributions that is exempt from U.S. withholding tax when paid to foreign investors. This provision of the Internal Revenue Code will be expiring for tax years beginning after December 31, 2011.
(4) The percentage in this column represents the amount of "Qualifying Short-Term Capital Gain" as created by the American Jobs Creation Act of 2004 and is reflected as a percentage of short-term capital gain distributions that is exempt from U.S. withholding tax when paid to foreign investors. This provision of the Internal Revenue Code will be expiring for tax years beginning after December 31, 2011.
* The Turner International Growth Fund intends to pass through a foreign tax credit to shareholders. For the fiscal year ended 2012, the total amount of foreign source income is $370,203. The total amount of foreign tax paid is $41,228. Your allocable share of the foreign tax credit will be reported on the Form 1099-DIV.
The information reported herein may differ from the information and distributions taxable to the Shareholders for the calendar year ending December 31, 2012. Complete information will be computed and reported in conjunction with your 2012 Form 1099-DIV.
TURNER FUNDS 2012 ANNUAL REPORT 83
DISCLOSURE OF FUND EXPENSES (Unaudited)
All mutual funds have operating expenses. As a shareholder of a mutual fund, your investment is affected by these on-going costs, which include (among others) costs for portfolio management, distribution (12b-1) and/or shareholder services and other expenses. It is important for you to understand the impact of these costs on your investment returns. Operating expenses such as these are deducted from a mutual fund's gross income and directly reduce its final investment return. These expenses are expressed as a percentage of a mutual fund's average net assets; this percentage is known as a mutual fund's expense ratio.
The following examples use the expense ratio and are intended to help you understand the ongoing costs (in dollars) of investing in your Fund and to compare these costs with those other mutual funds. The examples are based on an investment of $1,000 made at the beginning of the period shown and held for the entire period.
The table below and on the next page illustrates your Fund's costs in two ways:
• Actual Fund Return. This section helps you estimate the actual expenses after fee waivers that your Fund incurred over the period. The "Expenses Paid During Period" column shows the actual dollar expense cost incurred by a $1,000 investment in the Fund, and the "Ending Account Value" number is derived from deducting that expense cost from the Fund's gross investment return.
You can use this information, together with the actual amount you invested in the Fund, to estimate the expenses you paid over that period. Simply divide your actual account value by $1,000 to arrive at a ratio (for example, an $8,600 account value divided by $1,000 = 8.6), then multiply that ratio by the number shown for your Fund under "Expenses Paid During Period."
• Hypothetical 5% Return. This section helps you compare your Fund's cost with those of other mutual funds. It provides information about hypothetical account values and expenses based on the Fund's actual expense ratio (column 3) and an assumed rate of return of 5% per year before expenses, which is not the Fund's actual return. This section is useful in making comparisons because the Securities and Exchange Commission requires all mutual funds to make this 5% calculation. You can assess your Fund's comparative cost by comparing the hypothetical result for your Fund in the "Expenses Paid During Period" column with those that appear in the same charts in the shareholder reports for other mutual funds.
Note: Because the return is set at 5% for comparison purposes — NOT your Fund's actual return — the hypothetical account values and expenses may not be used to estimate your actual ending account balance or expenses you paid for the period.
| | Beginning
Account
Value
4/1/12 | | Ending
Account
Value
9/30/12 | | Annualized
Expense
Ratios | | Expenses
Paid
During
Period* | |
Turner Market Neutral Fund — Institutional Class Shares | |
Actual Fund Return | | $ | 1,000.00 | | | $ | 985.50 | | | | 1.95 | % | | $ | 9.68 | | |
Hypothetical
5% Return | | | 1,000.00 | | | | 1,015.25 | | | | 1.95 | | | | 9.82 | | |
Turner Market Neutral Fund — Investor Class Shares | |
Actual Fund Return | | | 1,000.00 | | | | 983.50 | | | | 2.20 | | | | 10.91 | | |
Hypothetical
5% Return | | | 1,000.00 | | | | 1,014.00 | | | | 2.20 | | | | 11.08 | | |
Turner Market Neutral Fund — Class C Shares | |
Actual Fund Return | | | 1,000.00 | | | | 980.40 | | | | 2.95 | | | | 14.61 | | |
Hypothetical
5% Return | | | 1,000.00 | | | | 1,010.25 | | | | 2.95 | | | | 14.83 | | |
Turner Medical Sciences Long/Short Fund —
Institutional Class Shares | |
Actual Fund Return | | | 1,000.00 | | | | 998.00 | | | | 1.88 | | | | 9.39 | | |
Hypothetical
5% Return | | | 1,000.00 | | | | 1,015.60 | | | | 1.88 | | | | 9.47 | | |
Turner Medical Sciences Long/Short Fund — Investor Class Shares | |
Actual Fund Return | | | 1,000.00 | | | | 997.10 | | | | 2.13 | | | | 10.63 | | |
Hypothetical
5% Return | | | 1,000.00 | | | | 1,014.35 | | | | 2.13 | | | | 10.73 | | |
| | Beginning
Account
Value
4/1/12 | | Ending
Account
Value
9/30/12 | | Annualized
Expense
Ratios | | Expenses
Paid
During
Period* | |
Turner Medical Sciences Long/Short Fund — Class C Shares | |
Actual Fund Return | | $ | 1,000.00 | | | $ | 993.10 | | | | 2.88 | % | | $ | 14.35 | | |
Hypothetical
5% Return | | | 1,000.00 | | | | 1,010.60 | | | | 2.88 | | | | 14.48 | | |
Turner Spectrum Fund — Institutional Class Shares | |
Actual Fund Return | | | 1,000.00 | | | | 974.90 | | | | 1.91 | | | | 9.43 | | |
Hypothetical
5% Return | | | 1,000.00 | | | | 1,015.45 | | | | 1.91 | | | | 9.62 | | |
Turner Spectrum Fund — Investor Class Shares | |
Actual Fund Return | | | 1,000.00 | | | | 974.70 | | | | 2.16 | | | | 10.66 | | |
Hypothetical
5% Return | | | 1,000.00 | | | | 1,014.20 | | | | 2.16 | | | | 10.88 | | |
Turner Spectrum Fund — Class C Shares | |
Actual Fund Return | | | 1,000.00 | | | | 970.60 | | | | 2.91 | | | | 14.34 | | |
Hypothetical
5% Return | | | 1,000.00 | | | | 1,010.45 | | | | 2.91 | | | | 14.63 | | |
Turner Titan Fund — Institutional Class Shares | |
Actual Fund Return | | | 1,000.00 | | | | 984.60 | | | | 1.94 | | | | 9.63 | | |
Hypothetical
5% Return | | | 1,000.00 | | | | 1,015.30 | | | | 1.94 | | | | 9.77 | | |
84 TURNER FUNDS 2012 ANNUAL REPORT
| | Beginning
Account
Value
4/1/12 | | Ending
Account
Value
9/30/12 | | Annualized
Expense
Ratios | | Expenses
Paid
During
Period* | |
Turner Titan Fund — Investor Class Shares | |
Actual Fund Return | | $ | 1,000.00 | | | $ | 982.70 | | | | 2.19 | % | | $ | 10.86 | | |
Hypothetical
5% Return | | | 1,000.00 | | | | 1,014.05 | | | | 2.19 | | | | 11.03 | | |
Turner Titan Fund — Class C Shares | |
Actual Fund Return | | | 1,000.00 | | | | 978.60 | | | | 2.94 | | | | 14.54 | | |
Hypothetical
5% Return | | | 1,000.00 | | | | 1,010.30 | | | | 2.94 | | | | 14.78 | | |
Turner All Cap Growth Fund — Investor Class Shares | |
Actual Fund Return | | | 1,000.00 | | | | 956.50 | | | | 0.89 | | | | 4.35 | | |
Hypothetical
5% Return | | | 1,000.00 | | | | 1,020.55 | | | | 0.89 | | | | 4.50 | | |
Turner Concentrated Growth Fund — Investor Class Shares | |
Actual Fund Return | | | 1,000.00 | | | | 920.90 | | | | 0.90 | | | | 4.32 | | |
Hypothetical
5% Return | | | 1,000.00 | | | | 1,020.50 | | | | 0.90 | | | | 4.55 | | |
Turner Emerging Growth Fund — Institutional Class Shares | |
Actual Fund Return | | | 1,000.00 | | | | 1,007.90 | | | | 1.15 | | | | 5.77 | | |
Hypothetical
5% Return | | | 1,000.00 | | | | 1,019.25 | | | | 1.15 | | | | 5.81 | | |
Turner Emerging Growth Fund — Investor Class Shares | |
Actual Fund Return | | | 1,000.00 | | | | 1,006.50 | | | | 1.40 | | | | 7.02 | | |
Hypothetical
5% Return | | | 1,000.00 | | | | 1,018.00 | | | | 1.40 | | | | 7.06 | | |
Turner Large Growth Fund — Institutional Class Shares | |
Actual Fund Return | | | 1,000.00 | | | | 972.00 | | | | 0.69 | | | | 3.40 | | |
Hypothetical
5% Return | | | 1,000.00 | | | | 1,021.55 | | | | 0.69 | | | | 3.49 | | |
Turner Large Growth Fund — Investor Class Shares | |
Actual Fund Return | | | 1,000.00 | | | | 971.00 | | | | 0.94 | | | | 4.63 | | |
Hypothetical
5% Return | | | 1,000.00 | | | | 1,020.30 | | | | 0.94 | | | | 4.75 | | |
| | Beginning
Account
Value
4/1/12 | | Ending
Account
Value
9/30/12 | | Annualized
Expense
Ratios | | Expenses
Paid
During
Period* | |
Turner Midcap Growth Fund — Institutional Class Shares | |
Actual Fund Return | | $ | 1,000.00 | | | $ | 945.80 | | | | 0.93 | % | | $ | 4.52 | | |
Hypothetical
5% Return | | | 1,000.00 | | | | 1,020.35 | | | | 0.93 | | | | 4.70 | | |
Turner Midcap Growth Fund — Investor Class Shares | |
Actual Fund Return | | | 1,000.00 | | | | 944.70 | | | | 1.18 | | | | 5.74 | | |
Hypothetical
5% Return | | | 1,000.00 | | | | 1,019.10 | | | | 1.18 | | | | 5.96 | | |
Turner Midcap Growth Fund — Retirement Class Shares | |
Actual Fund Return | | | 1,000.00 | | | | 944.20 | | | | 1.43 | | | | 6.95 | | |
Hypothetical
5% Return | | | 1,000.00 | | | | 1,017.85 | | | | 1.43 | | | | 7.21 | | |
Turner Small Cap Growth Fund — Investor Class Shares | |
Actual Fund Return | | | 1,000.00 | | | | 995.30 | | | | 1.25 | | | | 6.24 | | |
Hypothetical
5% Return | | | 1,000.00 | | | | 1,018.75 | | | | 1.25 | | | | 6.31 | | |
Turner Global Opportunities Fund — Institutional Class Shares | |
Actual Fund Return | | | 1,000.00 | | | | 949.40 | | | | 1.10 | | | | 5.36 | | |
Hypothetical
5% Return | | | 1,000.00 | | | | 1,019.50 | | | | 1.10 | | | | 5.55 | | |
Turner Global Opportunities Fund — Investor Class Shares | |
Actual Fund Return | | | 1,000.00 | | | | 948.30 | | | | 1.35 | | | | 6.58 | | |
Hypothetical
5% Return | | | 1,000.00 | | | | 1,018.25 | | | | 1.35 | | | | 6.81 | | |
Turner International Growth Fund — Institutional Class Shares | |
Actual Fund Return | | | 1,000.00 | | | | 974.90 | | | | 1.10 | | | | 5.43 | | |
Hypothetical
5% Return | | | 1,000.00 | | | | 1,019.50 | | | | 1.10 | | | | 5.55 | | |
Turner International Growth Fund — Investor Class Shares | |
Actual Fund Return | | | 1,000.00 | | | | 973.80 | | | | 1.35 | | | | 6.66 | | |
Hypothetical
5% Return | | | 1,000.00 | | | | 1,018.25 | | | | 1.35 | | | | 6.81 | | |
* Unless otherwise indicated, expenses are equal to the Fund's annualized expense ratio multiplied by the average account value over the period, multiplied by 183/366 (to reflect the one-half year period from 4/1/12 - 9/30/12).
TURNER FUNDS 2012 ANNUAL REPORT 85
TRUSTEE AND OFFICERS OF THE TRUST
Name, address and age(1) | | Position held with
Trust and length
of service(2) | | Principal occupation(s)
during past 5 years | | Number of
portfolios in
complex
overseen
by trustee | | Other
directorships
held | |
Interested Trustee* | |
Thomas R. Trala, Jr.
(45) | | Trustee (since 2010); President (since 2004) | | Executive Managing Director (since 2010) and Chief Operating Officer (since 2004), Turner. | | | 12 | | | Turner Global Financial Services Offshore, Ltd. (since 2012); Turner Global Financial Services Master, Ltd. (since 2012); Turner Navigator Offshore, Ltd. (since 2012); Turner Navigator Master, Ltd. (since 2012); Turner International, Ltd. (since 2007). | |
* Mr. Trala is deemed to be an "Interested Trustee" by virtue of his relationship with Turner.
Non-Interested Trustees | |
Alfred C. Salvato
(54) | | Chairman of the Board (since 2004); Trustee (since 1996) | | Chief Investment Officer (since 2003) and Treasurer (since 1995), Thomas Jefferson University. | | | 12 | | | None | |
Janet F. Sansone
(67) | | Trustee (since 1996) | | Chief Management Officer, United States Government Printing Office (2008-2010); Self-employed Consultant (since 1999). | | | 12 | | | None | |
John T. Wholihan
(74) | | Trustee (since 1996) | | Dean Emeritus (since 2007), Professor (since 1984) and Dean (1984-2007), College of Business Administration, Loyola Marymount University. | | | 12 | | | None | |
Executive Officers | |
Ty S. Edwards
3435 Stelzer Road, Columbus,
OH 43219
(46) | | Controller and Chief Financial Officer (since 2010) | | Senior Vice President, Financial Services, Citi Fund Services (since 2010); Director, Product Management, Columbia Management (2007-2009); Deputy Treasurer, Columbia Funds, (2006-2007); Director, Fund Administration, Columbia Management (2004-2007). | | | N/A | | | N/A | |
Brian F. McNally
(54) | | Vice-President (since 2002), Secretary and Chief Compliance Officer (since 2004) | | General Counsel and Chief Compliance Officer (since 2004), Deputy General Counsel (2002-2004), Turner. | | | N/A | | | Turner Investment Partners (Australia) Pty Ltd. (since 2012); Turner Funds plc (since 2008). | |
86 TURNER FUNDS 2012 ANNUAL REPORT
TRUSTEE AND OFFICERS OF THE TRUST
Name, address and age(1) | | Position held with
Trust and length
of service(2) | | Principal occupation(s)
during past 5 years | | Number of
portfolios in
complex
overseen
by trustee | | Other
directorships
held | |
Executive Officers | |
Jennifer L. Page
(46) | | Vice-President and Assistant Secretary (since 2011) | | Director – Fund Administration and Compliance (since 2011), Director – Fund Administration – Offshore & Alternatives (2011), Turner; Senior Project Manager, AC Lordi Consulting (2010-2011); Senior Manager – Internal Audit (2006-2010), Senior Compliance Manager (2004-2006), Senior Risk Manager (2001-2006), Senior Fund Accounting Manager (1996-2001), Vanguard. | | | N/A | | | N/A | |
(1) Each Trustee and executive officer, unless noted otherwise, may be contacted by writing to such Trustee or Officer c/o Turner Funds, 1205 Westlakes Drive, Suite 100, Berwyn, PA 19312, Attn: Turner Chief Legal Officer.
(2) Each Officer serves a one-year term. All Trustees elected to office on or after February 19, 2010, are subject to a 12-year term of office ending on December 31st of the 12-year anniversary of the year in which he or she was first elected to the position of Trustee, subject to a one-time renewal for a second 12-year term by vote of a majority of the Trustees, including a majority of the "non-interested" Trustees. Additionally, each Trustee who had not reached the age of 70 as of December 31, 2009, is subject to a retirement age of 75, so that any Trustee who reaches such age shall resign as of the December 31st immediately following his or her 75th birthday. All other Trustees serve until his or her respective successor has been duly elected and qualified.
The Trust's Statement of Additional Information ("SAI") includes additional information about the Trustees and Officers. The SAI may be obtained without charge by calling 1.800.224.6312.
TURNER FUNDS 2012 ANNUAL REPORT 87
Turner Funds' trustees
Alfred C. Salvato
Chief Investment Officer & Treasurer
Thomas Jefferson University
Janet F. Sansone
Executive Director
JFS Consulting
Thomas R. Trala, Jr.
Executive Managing Director & Chief Operating Officer
Turner Investments, L.P.
Dr. John T. Wholihan
Professor (Retired), Dean Emeritus, College of Business
Loyola Marymount University
Investment adviser
Turner Investments, L.P.
Berwyn, Pennsylvania
Distributor
Foreside Fund Services, LLC
Portland, Maine
Administrator
Turner Investments, L.P.
Berwyn, Pennsylvania
Independent Registered Public Accounting Firm
KPMG LLP
Philadelphia, Pennsylvania
This report was prepared for shareholders of the Turner Funds. It may be distributed to others only if preceded or accompanied by a Turner Funds' Prospectus, which contains detailed information. All Turner Funds are offered by prospectus only.
The Funds file their complete schedules of portfolio holdings with the Securities and Exchange Commission (the "Commission") for the first and third quarters of each fiscal year on Form N-Q within sixty days after the end of the period. The Funds' Forms N-Q are available on the Commission's Web site at http://www.sec.gov, and may be reviewed and copied at the Commission's Public Reference Room in Washington, DC. Information on the operation of the Public Reference Room may be obtained by calling 1-800-SEC-0330.
The Board of Trustees of the Turner Funds has delegated responsibility for decisions regarding proxy voting for securities held by each Fund to Turner Investments, L.P. Turner Investments, L.P. will vote such proxies in accordance with its proxy policies and procedures, which are included in Appendix B to the SAI. The Board of Trustees will periodically review each Fund's proxy voting record.
A description of the policies and procedures that the Funds use to determine how to vote proxies relating to portfolio securities, as well as information relating to how the Fund voted proxies relating to portfolio securities during the most recent 12-month period ended June 30, is available (i) via the Funds' Web site, www.turnerinvestments.com; (ii) on the Commission's Web site at http://www.sec.gov; and (iii) without charge by calling 1.800.224.6312.
88 TURNER FUNDS 2012 ANNUAL REPORT

Turner Funds
P.O. Box 219805
Kansas City, Missouri 64121-9805
Telephone: 1.800.224.6312
Email: mutualfunds@turnerinvestments.com
Web Site: www.turnerinvestments.com
Item 2. Code of Ethics.
The registrant has adopted a code of ethics that applies to the registrant’s Principal Executive Officer, Principal Financial Officer, and Principal Accounting Officer.
Item 3. Audit Committee Financial Expert.
The Board of Trustees of the Turner Funds has determined that the Board’s Audit Committee does not have an “audit committee financial expert,” as the Securities and Exchange Commission has defined that term. After carefully considering all of the factors involved in the definition of “audit committee financial expert,” the Board determined that none of the members of the Audit Committee possessed all five attributes in the definition, although some members of the Audit Committee possessed some of the attributes. The Board also determined that the Audit Committee members have general financial expertise, and given the size and types of the Turner Funds and in light of the nature of the accounting and valuation issues presented over the past several years, it did not appear that the Audit Committee members lacked any necessary skill to serve on the Audit Committee.
Item 4. Principal Accountant Fees and Services.
Fees billed by KPMG LLP (“KPMG”) Related to the Trust
KPMG billed the Trust the aggregate fees for services rendered to the Trust for the last two fiscal years as follows:
| | 2012 | | 2011 | |
| | All fees and
services to the
Trust that were
pre-approved | | All fees and
services to service
affiliates that
were pre-approved | | All other fees
and services to
service
affiliates that
did not require
pre-approval | | All fees and
services to the
Trust that were
pre-approved | | All fees and
services to service
affiliates that
were pre-approved | | All other fees
and services to
service
affiliates that
did not require
pre-approval | |
(a) Audit Fees (1) | | $ | 255,000 | | N/A | | N/A | | $ | 261,000 | | N/A | | N/A | |
(b) Audit-Related Fees | | N/A | | N/A | | N/A | | N/A | | N/A | | N/A | |
(c) Tax Fees (2) | | $ | 101,844 | | N/A | | N/A | | $ | 120,328 | | N/A | | N/A | |
(d) All Other Fees | | N/A | | N/A | | N/A | | N/A | | N/A | | N/A | |
Notes:
(1) Audit Fees include fees related to the audit of the registrant’s annual financial statements and services normally provided by the accountant in connection with statutory and regulatory filings.
(2) Tax Fees consist of tax compliance services for the Trust. These services primarily included review of federal income tax returns and excise tax returns, as well as services relating to excise tax distribution requirements.
(e)(1) The Audit Committee has delegated pre-approval of non-audit services to the Chairman of the Audit Committee, subject to ratification by the Audit Committee.
(e)(2) Percentage of fees billed applicable to non-audit services pursuant to waiver of pre-approval requirement were as follows:
| | 2012 | | 2011 | |
Audit-Related Fees | | 0.00 | % | 0.00 | % |
Tax Fees | | 0.00 | % | 0.00 | % |
All Other Fees | | 0.00 | % | 0.00 | % |
(f) Not applicable.
(g) The aggregate non-audit fees and services billed by KPMG for the last two fiscal years were $101,844 and $120,328 for 2012 and 2011, respectively, as described above.
(h) The registrant’s Audit Committee has considered whether the provision of non-audit services that were rendered to the registrant’s Investment Adviser and any entity controlling, controlled by, or under common control with the Investment Adviser that provides on-going services to the registrant that were not pre-approved pursuant to paragraph (c)(7)(ii) of Rule 2-01 of Regulation S-X is compatible with maintaining the principal accountant’s independence.
Item 5. Audit Committee of Listed Registrants.
Not applicable to open-end management investment companies.
Item 6. Schedule of Investments.
Schedule of Investments is included as part of report to shareholders filed under Item 1.
Item 7. Disclosure of Proxy Voting Policies and Procedures for Closed-End Management Investment Companies.
Not applicable to open-end management investment companies.
Item 8. Portfolio Managers of Closed-End Management Investment Companies.
Not applicable to open-end management investment companies.
Item 9. Purchases of Equity Securities by Closed-End Management Investment Company and Affiliated Purchasers.
Not applicable to open-end management investment companies.
Item 10. Submission of Matters to a Vote of Security Holders.
There have been no material changes to the procedures by which shareholders may recommend nominees to the registrant’s Board of Trustees since the registrant’s last proxy solicitation.
Item 11. Controls and Procedures.
(a) The registrant’s Principal Executive Officer and Principal Financial Officer concluded that the registrant’s disclosure controls and procedures (as defined in Rule 30a-3(c) under the Investment Company Act of 1940 as amended (the “Act”)) were effective as of a date within 90 days of the filing date of this report, based on their evaluation of the effectiveness of the registrant’s disclosure controls and procedures required by Rule 30a-3(b) under the Act and Rule 13a-15(b) or 15d-15(b) under the Securities and Exchange Act of 1934.
(b) There were no changes in the registrant’s internal control over financial reporting (as defined in Rule 30a-3(d) of the Act) that occurred during the registrant’s last fiscal quarter that have materially affected, or are reasonably likely to materially affect, the registrant’s internal control over financial reporting.
Item 12. Exhibits.
(a)(1) Code of Ethics is attached hereto.
(a)(2) A separate certification for the Principal Executive Officer and the Principal Financial Officer of the registrant as required by Rule 30a-2(a) under the Investment Company Act of 1940, as amended (17 CFR 270.30a-2(a)), are filed herewith.
(b) Officer certifications as required by Rule 30a-2(b) under the Investment Company Act of 1940, as amended (17 CFR 270.30a-2(b)), also accompany this filing as an Exhibit.
SIGNATURES
Pursuant to the requirements of the Securities Exchange Act of 1934 and the Investment Company Act of 1940, the registrant has duly caused this report to be signed on its behalf by the undersigned, thereunto duly authorized.
Registrant | Turner Funds | | | |
| | | | |
By (Signature and Title) | /s/ Thomas R. Trala, Jr. | | | |
| Thomas R. Trala, Jr., President (Principal Executive Officer) | |
| | | |
Date | December 6, 2012 | | | |
| | | | | | |
Pursuant to the requirements of the Securities Exchange Act of 1934 and the Investment Company Act of 1940, this report has been signed below by the following persons on behalf of the registrant and in the capacities and on the dates indicated.
By (Signature and Title) | /s/ Thomas R. Trala, Jr. | | | |
| Thomas R. Trala, Jr., President (Principal Executive Officer) | |
| | | |
Date | December 6, 2012 | | | |
| | | | | |
By (Signature and Title) | /s/ Ty Edwards | | | |
| Ty Edwards, Controller and Chief Financial Officer (Principal Financial Officer) |
| | | |
Date | December 6, 2012 | | | |
| | | | | |