UNITED STATES
SECURITIES AND EXCHANGE COMMISSION
Washington, D.C. 20549
FORM N-CSR
CERTIFIED SHAREHOLDER REPORT OF REGISTERED
MANAGEMENT INVESTMENT COMPANIES
Investment Company Act file number | 811-07527 |
|
Turner Funds |
(Exact name of registrant as specified in charter) |
|
1205 Westlakes Drive, Suite 100 Berwyn, PA | | 19312 |
(Address of principal executive offices) | | (Zip code) |
|
Michael P. Malloy Drinker Biddle & Reath LLP One Logan Square, Suite 2000 Philadelphia, PA 19103 |
(Name and address of agent for service) |
|
Registrant’s telephone number, including area code: | 1-800-224-6312 | |
|
Date of fiscal year end: | September 30 | |
|
Date of reporting period: | September 30, 2014 | |
| | | | | | | | |
Item 1. Reports to Stockholders.

Long/short equity funds
Turner Medical Sciences Long/Short Fund
Turner Spectrum Fund
Turner Titan Fund
U.S. growth equity funds
Turner Emerging Growth Fund
Turner Large Growth Fund
Turner Midcap Growth Fund
Turner Small Cap Growth Fund
Contents
| | 2 | | | Letter to shareholders | |
| | 4 | | | Total returns of the Turner Funds | |
| 6
| | | Investment review:
Turner Medical Sciences Long/Short Fund | |
| 7
| | | Investment review:
Turner Spectrum Fund | |
| 8
| | | Investment review:
Turner Titan Fund | |
| 9
| | | Investment review:
Turner Emerging Growth Fund | |
| 10
| | | Investment review:
Turner Large Growth Fund | |
| 11
| | | Investment review:
Turner Midcap Growth Fund | |
| 12
| | | Investment review:
Turner Small Cap Growth Fund | |
| | 13 | | | Schedules of investments | |
| | 32 | | | Financial statements | |
| | 46 | | | Notes to financial statements | |
| 55
| | | Report of independent registered public
accounting firm | |
| | 56 | | | Notice to shareholders | |
| | 57 | | | Disclosure of fund expenses | |
| | 59 | | | Trustees and officers of the Trust | |
Turner Funds
As of September 30, 2014, the Turner Funds offered a series of seven mutual funds to individual and institutional investors. The minimum initial investment for Institutional Class Shares in a Turner Fund is $250,000 (except for $100,000 for the Turner Medical Sciences Long/Short Fund, the Turner Spectrum Fund, and the Turner Titan Fund) for regular accounts and $100,000 for individual retirement accounts. The minimum initial investment for Investor Class Shares, Retirement Class Shares and Class C Shares is $2,500 for regular accounts and $2,000 for individual retirement accounts.
Turner Investments, L.P., based in Berwyn, Pennsylvania, serves as the investment adviser for the Turner Funds. Turner Investments, L.P., founded in 1990, manages more than $1.9 billion in stock investments as of September 30, 2014.
Shareholder services
Turner Funds shareholders receive annual and semiannual reports, quarterly account statements, and a quarterly newsletter. Shareholders who have questions about their accounts may call a toll-free telephone number, 1.800.224.6312, may visit our website, www.turnerinvestments.com, or may write to Turner Funds, P.O. Box 219805, Kansas City, Missouri 64121-9805.
TURNER FUNDS 2014 ANNUAL REPORT 1
LETTER TO SHAREHOLDERS (Unaudited)
The stock market concluded a robust 2013 with all global equity indices posting absolute gains for the fourth quarter. Highlighting the quarter was the 10.5% return of the S&P 500 Index, which vaulted that bellwether to a 30% gain for the full year, its best result since 1997. In turn, all global indices — save emerging markets — posted strong gains for the year. For all of the noise in 2013 — the U.S. government shutdown, tapering fears, the threat of military action in Syria, and Cyprus seeking a bailout — markets showed tremendous resiliency. In the face of such macroeconomic concerns investors chose to focus on the prospects of a growing global economy led by the U.S. In fact, U.S. corporate earnings rose for a fourth consecutive year to a record $109 a share for S&P 500 companies (source: S&P Capital IQ). All along the capitalization and style spectra stocks were up dramatically. Large-cap stocks reversed the dominance that small-cap stocks had displayed through the second and third quarters. The Russell 1000 Index posted a return of 10.2%, outpacing the 8.7% return of the Small-Cap Russell 2000 Index, though, for the year, small cap stocks were the clear winners with the Russell 2000 Index up over 38%. From a style perspective, performance was capitalization dependent. Broadly, the Russell 3000 Growth Index outperformed the Russell 3000 Value Index but only on the relative strength of large caps. Both the Russell Midcap Value Index and Russell 2000 Value Index outperformed their growth counterparts. For 2013, growth stocks outpaced value stocks across the market cap spectrum with the largest discrepancy coming from small cap stocks. Here, the Russell 2000 Growth Index gained 43.3% versus the Russell 2000 Value Index gain of 34.5%. All nine sectors of the Russell 3000 Index produced positive returns in the quarter. The best-performing sectors were producer durables and materials/processing while defensive sectors utilities and consumer staples lagged. For the year, the consumer discretionary (+45.9%) and health care (+41.8%) sectors led the way aided by a more confident consumer and the explosive growth in biotech stocks. Utility (+19.6%) stocks were the worst performing sector in this upward moving market as is typically the case in such an environment.
After a heady 2013, equity markets stumbled out of the gate in January and by the first trading day of February, global and US equity markets had plummeted over 5%, as measured by the MSCI World Index and Russell 3000 Index, respectively. Weaker than expected US manufacturing, disappointing data from China that adversely affected emerging markets and worries over deflation in the euro zone all combined to drive investors to safer assets. From that low, however, markets retraced their steps steadily through the rest of February and into March, as the Ukrainian crisis eased and China hinted at stimulus for its slowing economy. Ultimately, global
equity markets generally ended the quarter with positive returns. US markets fared better than non-US markets: the Russell 3000 Index posted a 1.97% return, while the MSCI World ex-USA Index eked out a 0.09% return. Along the capitalization spectrum of US stocks, mid-cap stocks posted the highest returns (Russell Midcap Index up 3.53%), followed by large caps while small caps brought up the rear with a 1.12% gain for the Russell 2000 Index. The flight to perceived safety, mentioned above, seems to have manifested itself across styles in Q1. While growth stocks jumped out well ahead of value stocks early in the quarter, a search for yield and lower volatility in the wake of the late-January swoon benefited value stocks in March, pushing them ahead of growth stocks in all capitalization ranges for the quarter. The 2.92% quarterly return of the Russell 3000 Value Index outstripped that of its growth counterpart by 185 basis points. In March alone, that gap was 343 basis points. Similar style performance patterns played out across all capitalization ranges. Within the mid-cap growth area, the healthcare sector was the strongest performer within the benchmark, while the financial sector posted negative returns.
The second quarter of 2014 began in much the same sluggish fashion as the first quarter. Equity markets continued to show weakness resulting from a 2.9% decline in first quarter GDP results in the U.S. linked to the severe winter weather, continuing weak sentiment towards Japan and escalating unrest in the Ukraine. In May, global equity markets moved higher and volatility across many asset classes declined. Investor fears eased as economic activity improved relative to the previous quarter, some geopolitical risks faded and interest rates remained low. In addition, monetary policy looked to be more accommodative, particularly in Europe with the European Central Bank lowering the main refinancing rate and announcing targeted long-term refinancing operations. With the U.S. manufacturing and labor reports indicating continued recovery and growth, U.S. markets continued the upward trend in June with all U.S. indices positive for the quarter. Along the capitalization spectrum of U.S. stocks, large cap stocks posted the highest returns (Russell 1000 Index up 5.12%) with large cap growth pushing out a few basis points ahead of value. Mid caps closely followed with a 4.97% gain for the Russell Midcap Index while small caps brought up the rear with a 2.05% gain for the Russell 2000 Index. Growth stocks reversed their downward trend at the end of April, making steady gains in May and June and the growth indices ending the quarter in positive territory. Despite these gains, investors still favored value stocks in the small cap to mid cap space as lower quality outperformed. Within mid cap growth the utilities sector was the strongest performer up over 15% with the energy
2 TURNER FUNDS 2014 ANNUAL REPORT
sector a close second up over 12%. All other sectors had modest single digit returns.
U.S. equity markets reached some new highs with the S&P 500 reaching 2000 for the first time in the third quarter of 2014. However, it was not without corrections, some of which were quite sharp. In July, equity markets declined globally due to multiple concerns: the deterioration in the Ukraine-Russia border, the escalation between Israel and Hamas, Argentina's partial bond default, and the uncertainty regarding the U.S. Fed monetary policy. While these concerns continued to depress markets in August, they were offset, at least partially, by positive news out of the U.S. Second quarter GDP was revised upward and housing and manufacturing data indicated improving conditions, which compelled markets to end on a positive note. Fear returned in September with the equity markets declining sharply as long-term interest rates in the U.S. and the U.S. dollar spiked higher, causing concerns over the impact to the European and emerging markets economies and U.S. exports. The results of these seesawing markets for the quarter were relatively flat. U.S. equity markets outperformed their international counterparts with developed markets down -5.88% and emerging markets decreasing -3.49%, as measured by MSCI EAFE and MSCI Emerging Markets, respectively. Along the capitalization spectrum of U.S. stocks, large cap stocks posted the highest returns (Russell 1000 Index up 0.65%) with large cap growth handily beating value by 1.68%. Mid caps ended the quarter in negative territory with a loss of -1.66% with small caps trailing much further behind at -7.36% for the Russell 2000 Index. Growth stocks outperformed value across all market caps. Within the Russell Midcap Growth Index, the energy sector was the weakest performer at -11% giving up all the positive territory gained in the prior quarter.
The uncertainty over the direction and velocity of long-term interest rates in the U.S. is likely to increase volatility in global equity markets over the next few months, as it impacts currency moves and inflation expectations across the globe. Following the typical seasonal correction during September and October, we expect U.S. Equities to resume their moderate appreciation into year-end. Our research has shown that during periods of improving economic activity and moderately rising interest rates, companies in the health care, technology and financial sectors with above average revenue growth and improving margins typically outperform. We believe that equities should continue to be an appealing investment and our active management strategy of focusing on companies with stronger earnings growth than peers may outperform in this lower growth environment.
Sincerely,

Bob Turner
Chairman and Chief Investment Officer
Turner Investments
Past performance is no guarantee of future results. The views expressed are those of Turner Investments as of September 30, 2014, and are not intended as a forecast or investment recommendations. The indexes mentioned are not available for investment.

TURNER FUNDS 2014 ANNUAL REPORT 3
Total returns of the Turner Funds
Through September 30, 2014
Current performance may be lower or higher than the performance data quoted. Please call 1.800.224.6312 or visit our Web site at www.turnerinvestments.com for the most recent month-end performance information.
The performance data quoted represents past performance and the principal value and investment return will fluctuate so that an investor's shares, when redeemed, may be worth more or less than their original cost. Past performance is no guarantee of future results. Returns shown, unless otherwise indicated, are total returns, with dividends and income reinvested. Returns spanning more than one year are annualized. Fee waivers are in effect; if they had not been in effect, performance would have been lower. The indices mentioned are unmanaged statistical composites of stock-market performance. Investing in an index is not possible.
The holdings and sector weightings of the Turner Funds are subject to change. Forward-earnings projections are not predictors of stock price or investment performance, and do not represent past performance. There is no guarantee that the forward-earnings projections will accurately predict the actual earnings experience of any of the companies involved, and there is no guarantee that owning securities of companies with relatively high price-to-earnings ratios will cause the portfolio to outperform its benchmark or index.
The Turner Funds are distributed by Foreside Fund Services, LLC, Portland, Maine. The investor should consider the investment objectives, risks, charges, and expenses carefully before investing. This and other information can be found in the prospectus. A free prospectus, which contains detailed information, including fees and expenses, and the risks associated with investing in these Funds, can be obtained by calling 1.800.224.6312. Read the prospectus carefully before investing.
Fund name/Index | | Six
months* | | Year
to
date* | | One
year | | Three
years | | Five
years | | 10
years | | (Annualized)
Since
inception | | Total
net assets
($mil) | |
Turner Medical Sciences
Long/Short Fund(1) —
Institutional Class Shares | | | 5.13 | % | | | 13.35 | % | | | 19.08 | % | | | 9.91 | % | | | n/a | | | | n/a | | | | 9.11 | % | | $ | 27.88 | | |
Investor Class Shares | | | 5.08 | | | | 13.27 | | | | 18.83 | | | | 9.68 | | | | n/a | | | | n/a | | | | 8.89 | | | | 5.97 | | |
Class C Shares | | | 4.63 | | | | 12.60 | | | | 17.93 | | | | 8.84 | | | | n/a | | | | n/a | | | | 8.09 | | | | 2.93 | | |
S&P 500 Health Care Index | | | 10.21 | | | | 16.62 | | | | 28.43 | | | | 28.84 | | | | n/a | | | | n/a | | | | 23.19 | | | | | | |
Barclays Capital U.S. Aggregate
Bond Index | | | 2.21 | | | | 4.10 | | | | 3.96 | | | | 2.43 | | | | n/a | | | | n/a | | | | 4.05 | | | | | | |
Lipper Long/Short Equity Funds
Average | | | 0.74 | | | | 1.39 | | | | 5.74 | | | | 8.18 | | | | n/a | | | | n/a | | | | 4.25 | | | | | | |
Inception date: 2/7/11 | |
Turner Spectrum Fund(1) —
Institutional Class Shares | | | 0.08 | | | | 2.22 | | | | 4.55 | | | | 2.88 | | | | 3.03 | % | | | n/a | | | | 4.30 | | | | 120.03 | | |
Investor Class Shares | | | -0.08 | | | | 1.99 | | | | 4.25 | | | | 2.61 | | | | 2.76 | | | | n/a | | | | 4.03 | | | | 15.63 | | |
Class C Shares(2) | | | -0.44 | | | | 1.34 | | | | 3.46 | | | | 1.85 | | | | 2.03 | | | | n/a | | | | 3.50 | | | | 2.92 | | |
S&P 500 Index | | | 6.42 | | | | 8.34 | | | | 19.73 | | | | 22.99 | | | | 15.70 | | | | n/a | | | | 17.94 | | | | | | |
Barclays Capital U.S. Aggregate
Bond Index | | | 2.21 | | | | 4.10 | | | | 3.96 | | | | 2.43 | | | | 4.12 | | | | n/a | | | | 4.76 | | | | | | |
Lipper Long/Short Equity Funds
Average | | | 0.74 | | | | 1.39 | | | | 5.74 | | | | 8.18 | | | | 5.44 | | | | n/a | | | | 7.46 | | | | | | |
Inception date: 5/7/09 | |
Turner Titan Fund(1) —
Institutional Class Shares | | | 2.70 | | | | 4.96 | | | | 10.00 | | | | 6.36 | | | | n/a | | | | n/a | | | | 4.53 | | | | 9.63 | | |
Investor Class Shares | | | 2.44 | | | | 4.72 | | | | 9.68 | | | | 6.05 | | | | n/a | | | | n/a | | | | 4.26 | | | | 0.55 | | |
Class C Shares | | | 2.14 | | | | 4.17 | | | | 8.90 | | | | 5.20 | | | | n/a | | | | n/a | | | | 3.45 | | | | 0.26 | | |
S&P 500 Index | | | 6.42 | | | | 8.34 | | | | 19.73 | | | | 22.99 | | | | n/a | | | | n/a | | | | 14.11 | | | | | | |
Barclays Capital U.S. Aggregate
Bond Index | | | 2.21 | | | | 4.10 | | | | 3.96 | | | | 2.43 | | | | n/a | | | | n/a | | | | 4.05 | | | | | | |
Lipper Long/Short Equity Funds
Average | | | 0.74 | | | | 1.39 | | | | 5.74 | | | | 8.18 | | | | n/a | | | | n/a | | | | 4.25 | | | | | | |
Inception date: 2/7/11 | |
4 TURNER FUNDS 2014 ANNUAL REPORT
PERFORMANCE (continued) (Unaudited)
Fund name/Index | | Six
months* | | Year
to
date* | | One
year | | Three
years | | Five
years | | 10
years | | (Annualized)
Since
inception | | Total
net assets
($mil) | |
Turner Emerging
Growth Fund(1) —
Institutional Class Shares(3) | | | -7.80 | % | | | -7.86 | % | | | -0.76 | % | | | 18.43 | % | | | 15.04 | % | | | n/a | | | | 18.97 | % | | $ | 25.91 | | |
Investor Class Shares | | | -7.91 | | | | -8.03 | | | | -1.00 | | | | 18.14 | | | | 14.76 | | | | 9.00 | % | | | 17.51 | | | | 116.86 | | |
Russell 2000® Growth Index | | | -4.51 | | | | -4.05 | | | | 3.79 | | | | 21.91 | | | | 15.51 | | | | 9.03 | | | | 5.20 | | | | | | |
Inception date: 2/27/98 | |
Turner Large Growth Fund —
Institutional Class Shares | | | 4.31 | | | | 3.74 | | | | 17.03 | | | | 18.08 | | | | 11.85 | | | | 7.16 | | | | 4.27 | | | | 17.43 | | |
Investor Class Shares(4) | | | 4.17 | | | | 3.53 | | | | 16.77 | | | | 17.80 | | | | 11.58 | | | | n/a | | | | 5.47 | | | | 20.52 | | |
Russell 1000® Growth Index | | | 6.69 | | | | 7.89 | | | | 19.15 | | | | 22.45 | | | | 16.50 | | | | 8.94 | | | | 4.93 | | | | | | |
Inception date: 2/28/01 | |
Turner Midcap Growth Fund(1) —
Institutional Class Shares(5) | | | -0.34 | | | | 4.16 | | | | 12.25 | | | | 17.64 | | | | 13.65 | | | | n/a | | | | 5.83 | | | | 46.25 | | |
Investor Class Shares | | | -0.53 | | | | 3.90 | | | | 11.88 | | | | 17.33 | | | | 13.36 | | | | 8.78 | | | | 10.54 | | | | 187.97 | | |
Retirement Class Shares(6) | | | -0.53 | | | | 3.83 | | | | 11.74 | | | | 17.12 | | | | 13.11 | | | | 8.47 | | | | 7.92 | | | | 4.67 | | |
Russell Midcap® Growth Index | | | 3.61 | | | | 5.73 | | | | 14.43 | | | | 22.74 | | | | 17.12 | | | | 10.24 | | | | 8.62 | | | | | | |
Inception date: 10/1/96 | |
Turner Small Cap Growth Fund(1) | | | -2.95 | | | | -4.69 | | | | 0.99 | | | | 20.41 | | | | 14.06 | | | | 8.58 | | | | 11.36 | | | | 130.09 | | |
Russell 2000® Growth Index | | | -4.51 | | | | -4.05 | | | | 3.79 | | | | 21.91 | | | | 15.51 | | | | 9.03 | | | | 6.92 | | | | |
Inception date: 2/7/94 | |
(1) Investing in technology and science companies and small- and mid-capitalization companies may subject the Funds to specific inherent risks, including above-average price fluctuations.
(2) Commenced operations on July 14, 2009.
(3) Commenced operations on February 1, 2009.
(4) Commenced operations on August 1, 2005.
(5) Commenced operations on June 16, 2008.
(6) Commenced operations on September 24, 2001.
* Returns of less than one year are cumulative, and not annualized.
Expense Ratio†
| | | Gross
expense
ratio | | Net
expense
ratio* | |
Turner Medical Sciences
Long/Short Fund | |
Institutional Class Shares | | | 3.01 | % | | | 1.95 | % | |
Investor Class Shares | | | 3.26 | % | | | 2.20 | % | |
Class C Shares | | | 4.01 | % | | | 2.95 | % | |
Turner Spectrum Fund | |
Institutional Class Shares | | | 2.77 | % | | | 1.95 | % | |
Investor Class Shares | | | 3.02 | % | | | 2.20 | % | |
Class C Shares | | | 3.77 | % | | | 2.95 | % | |
Turner Titan Fund | |
Institutional Class Shares | | | 2.42 | % | | | 1.95 | % | |
Investor Class Shares | | | 2.67 | % | | | 2.20 | % | |
Class C Shares | | | 3.42 | % | | | 2.95 | % | |
| | | Gross
expense
ratio | | Net
expense
ratio* | |
Turner Emerging Growth Fund | |
Institutional Class Shares | | | 1.31 | % | | | 1.15 | % | |
Investor Class Shares | | | 1.56 | % | | | 1.40 | % | |
Turner Large Growth Fund | |
Institutional Class Shares | | | 0.96 | % | | | 0.69 | % | |
Investor Class Shares | | | 1.21 | % | | | 0.94 | % | |
Turner Midcap Growth Fund | |
Institutional Class Shares | | | 1.08 | % | | | 0.93 | % | |
Investor Class Shares | | | 1.33 | % | | | 1.18 | % | |
Retirement Class Shares | | | 1.58 | % | | | 1.43 | % | |
Turner Small Cap Growth Fund | |
Investor Class Shares | | | 1.56 | % | | | 1.25 | % | |
† These expense ratios are based on the most recent prospectus and may differ from those shown in the financial highlights.
* Net expense ratio reflects contractual waivers of certain fees and/or expense reimbursements. Turner may discontinue this arrangement at any time after January 31, 2015.
TURNER FUNDS 2014 ANNUAL REPORT 5
INVESTMENT REVIEW (Unaudited)
Turner Medical Sciences Long/Short Fund
Fund profile
September 30, 2014
n Ticker symbol TMSFX
Investor Class Shares
n CUSIP #900297557
Investor Class Shares
n Top five holdings1
(1) Horizon Pharma
(2) AMAG Pharmaceuticals
(3) Flamel Technologies SA ADR
(4) IGI Laboratories
(5) Chimerix
n % in five largest holdings 36.6%1,2
n Number of holdings 611
n Net assets $5.97 million, Investor Class Shares
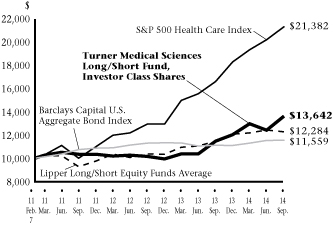
Growth of a $10,000 investment in the
Turner Medical Sciences Long/Short Fund,
Investor Class Shares:
February 7, 2011-September 30, 20143,4
Average annual total returns (Periods ended September 30, 2014)3
| | | One
year | | Three
years | | Since
inception4 | |
Turner Medical Sciences Long/Short Fund, Institutional Class Shares5 | | | 19.08 | % | | | 9.91 | % | | | 9.11 | % | |
Turner Medical Sciences Long/Short Fund, Investor Class Shares5 | | | 18.83 | % | | | 9.68 | % | | | 8.89 | % | |
Turner Medical Sciences Long/Short Fund, Class C Shares5 | | | 17.93 | % | | | 8.84 | % | | | 8.09 | % | |
S&P 500 Health Care Index6 | | | 28.43 | % | | | 28.84 | % | | | 23.19 | % | |
Barclays Capital U.S. Aggregate Bond Index7 | | | 3.96 | % | | | 2.43 | % | | | 4.05 | % | |
Lipper Long/Short Equity Funds Average8 | | | 5.74 | % | | | 8.18 | % | | | 4.25 | % | |
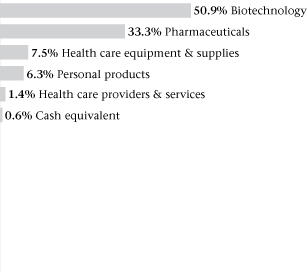
Sector weightings1:
Manager's discussion and analysis
The Turner Medical Sciences Long/Short Fund generated a positive absolute return for the 12-month period ended September 30, 2014. During the reporting period, the Fund outperformed the Barclays Capital U.S. Aggregate Bond Index and the Lipper Long/Short Equity Funds Average but underperformed the S&P 500 Health Care Index. The Fund invests primarily (at least 80% of its net assets) in stocks of companies engaged in the healthcare sector using a long/short growth strategy in seeking to capture alpha, reduce volatility, and preserve capital in declining markets.
During the reporting period, top contributors to performance were long and short positions in the pharmaceutical, household personal care and biotechnology industries. Over the same period, detractors to performance were long and short positions in medical specialty, biotechnology and pharmaceutical companies.
1 Cash equivalent is not being considered a holding for the top five holdings, but is counted in the number of holdings. Top five holdings are based on long positions. The fund composition is subject to change.
2 Percentages based on total investments of long positions.
3 These figures represent past performance, which is no guarantee of future results. The investment return and principal value of an investment will fluctuate, so an investor's shares, when redeemed, may be worth more or less than their original cost. The performance in the above graph and table does not reflect the deduction of taxes the shareholder will pay on fund distributions or the redemptions of fund shares. Performance of the Institutional, Investor and Class C Shares will differ due to differences in fees.
4 The inception date of the Turner Medical Sciences Long/Short Fund was February 7, 2011.
5 Fee waivers are in effect; if they had not been in effect, performance would have been lower.
6 The S&P 500 Health Care Index is an unmanaged index which includes the stocks in the health-care sector of the S&P 500 Index.
7 The Barclays Capital U.S. Aggregate Bond Index represents an unmanaged diversified portfolio of fixed income securities, including U.S. Treasuries, investment-grade corporate bonds and mortgage-backed and asset-backed securities.
8 Lipper Long/Short Equity Funds Average represents the average annualized total return for all reporting funds in the Lipper Long/Short Equity Fund category.
ADR — American Depositary Receipt
The Turner Medical Sciences Long/Short Fund is subject to the risks associated with selling securities short. A short sale involves a finite opportunity for appreciation, but a theoretically unlimited risk of loss. The fund is subject to the risks associated with health care-related companies. Many health care-related companies are smaller and less seasoned than companies in other sectors. Health care-related companies may also be strongly affected by scientific or technological developments and their products may quickly become obsolete. The fund is subject to risks due to its foreign investments. The fund is also subject to taxable income and realized capital gains. Shareholder redemptions may force the fund to sell securities at an inappropriate time, also resulting in realized gains. The fund may purchase and write options to hedge against market movements.
6 TURNER FUNDS 2014 ANNUAL REPORT
INVESTMENT REVIEW (Unaudited)
Fund profile
September 30, 2014
n Ticker symbol TSPEX
Institutional Class Shares
n CUSIP #900297664
Institutional Class Shares
n Top five holdings1
(1) Horizon Pharma
(2) AMAG Pharmaceuticals
(3) Flamel Technologies SA ADR
(4) Atlas Mara CO-Nvest
(5) IGI Laboratories
n % in five largest holdings 10.9%1,2
n Number of holdings 2931
n Net assets $120.03 million, Institutional Class Shares
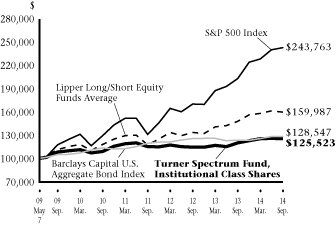
Growth of a $100,000 investment in the
Turner Spectrum Fund, Institutional Class Shares:
May 7, 2009-September 30, 20143,4
Average annual total returns (Periods ended September 30, 2014)3
| | | One
year | | Three
years | | Five
years | | Since
inception | |
Turner Spectrum Fund, Institutional Class Shares5 | | | 4.55 | % | | | 2.88 | % | | | 3.03 | % | | | 4.30 | %4 | |
Turner Spectrum Fund, Investor Class Shares5 | | | 4.25 | % | | | 2.61 | % | | | 2.76 | % | | | 4.03 | %4 | |
Turner Spectrum Fund, Class C Shares5 | | | 3.46 | % | | | 1.85 | % | | | 2.03 | % | | | 3.50 | %6 | |
S&P 500 Index7 | | | 19.73 | % | | | 22.99 | % | | | 15.70 | % | | | 17.94 | % | |
Barclays Capital U.S. Aggregate Bond Index8 | | | 3.96 | % | | | 2.43 | % | | | 4.12 | % | | | 4.76 | % | |
Lipper Long/Short Equity Funds Average9 | | | 5.74 | % | | | 8.18 | % | | | 5.44 | % | | | 7.46 | % | |
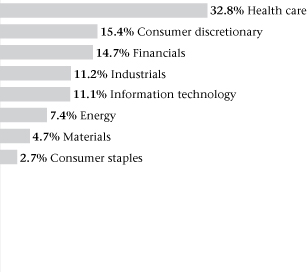
Sector weightings1:
Manager's discussion and analysis
The Turner Spectrum Fund generated a positive absolute return for the 12-month period ended September 30, 2014. During the reporting period, the Fund outperformed the Barclays Capital U.S. Aggregate Bond Index but underperformed both the S&P 500 Index and the Lipper Long/Short Equity Funds Average. The Turner Spectrum Fund is a multi-manager mutual fund that seeks long-term capital appreciation through investments in a number of long/short equity strategies offered by Turner Investments.
During the reporting period, top contributors to performance were in the energy, health care and producer durable sectors. The strongest returns came from biotechnology, oil & gas production and pharmaceutical companies. Financial, technology and consumer discretionary sectors all detracted from returns on a relative basis versus the S&P 500 benchmark.
1 Cash equivalent is not being considered a holding for the top five holdings, but is counted in the number of holdings. Top five holdings are based on long positions. The fund composition is subject to change.
2 Percentages based on total investments of long positions.
3 These figures represent past performance, which is no guarantee of future results. The investment return and principal value of an investment will fluctuate, so an investor's shares, when redeemed, may be worth more or less than their original cost. The performance in the above graph and table does not reflect the deduction of taxes the shareholder will pay on fund distributions or the redemptions of fund shares. Performance of the Institutional, Investor and Class C Shares will differ due to differences in fees.
4 The inception date of the Turner Spectrum Fund (Institutional Class Shares and Investor Class Shares) was May 7, 2009. Index returns are based on Institutional Class Shares inception date.
5 Fee waivers are in effect; if they had not been in effect, performance would have been lower.
6 The inception date of the Turner Spectrum Fund (Class C Shares) was July 14, 2009.
7 The S&P 500 Index is a widely-recognized, market value-weighted (higher market value stocks have more influence than lower market value stocks) index of 500 stocks designed to mimic the overall equity market's industry weightings.
8 The Barclays Capital U.S. Aggregate Bond Index represents an unmanaged diversified portfolio of fixed income securities, including U.S. Treasuries, investment-grade corporate bonds and mortgage-backed and asset-backed securities.
9 Lipper Long/Short Equity Funds Average represents the average annualized total return for all reporting funds in the Lipper Long/Short Equity Fund category.
ADR — American Depositary Receipt
The Turner Spectrum Fund may focus its investments from time to time on one or more economic sectors. To the extent that it does so, developments affecting companies in that sector or sectors will likely have a magnified effect on the fund's net asset value and total return. The fund is subject to the risks associated with selling securities short. A short sale involves a finite opportunity for appreciation, but a theoretically unlimited risk of loss. The fund is subject to risks due to its foreign investments. The fund is also subject to taxable income and realized capital gains. Shareholder redemptions may force the fund to sell securities at an inappropriate time, also resulting in realized gains. The fund may purchase and write options to hedge against market movements.
TURNER FUNDS 2014 ANNUAL REPORT 7
INVESTMENT REVIEW (Unaudited)
Fund profile
September 30, 2014
n Ticker symbol TTLFX
Investor Class Shares
n CUSIP #900297524
Investor Class Shares
n Top five holdings1
(1) Union Pacific
(2) Biogen Idec
(3) McKesson
(4) Facebook, Cl A
(5) Johnson & Johnson
n % in five largest holdings 17.2%1,2
n Number of holdings 1021
n Net assets $0.05 million, Investor Class Shares
Growth of a $10,000 investment in the
Turner Titan Fund, Investor Class Shares:
February 7, 2011-September 30, 20143,4
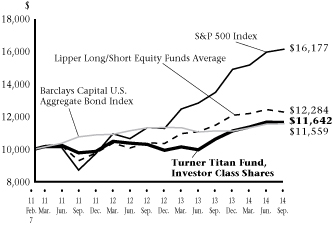
Average annual total returns (Periods ended September 30, 2014)3
| | | One
year | | Three
years | | Since
inception4 | |
Turner Titan Fund, Institutional Class Shares5 | | | 10.00 | % | | | 6.36 | % | | | 4.53 | % | |
Turner Titan Fund, Investor Class Shares5 | | | 9.68 | % | | | 6.05 | % | | | 4.26 | % | |
Turner Titan Fund, Class C Shares5 | | | 8.90 | % | | | 5.20 | % | | | 3.45 | % | |
S&P 500 Index6 | | | 19.73 | % | | | 22.99 | % | | | 14.11 | % | |
Barclays Capital U.S. Aggregate Bond Index7 | | | 3.96 | % | | | 2.43 | % | | | 4.05 | % | |
Lipper Long/Short Equity Funds Average8 | | | 5.74 | % | | | 8.18 | % | | | 4.25 | % | |
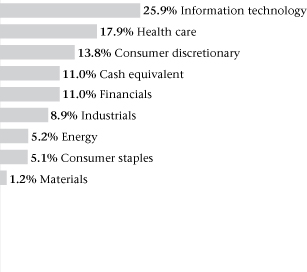
Sector weightings1:
Manager's discussion and analysis
The Turner Titan Fund generated a positive absolute return for the 12-month period ended September 30, 2014. During the reporting period, the Fund outperformed two of its performance benchmarks, the Barclays Capital U.S. Aggregate Bond Index and the Lipper Long/Short Equity Funds Average but trailed the return of the S&P 500 Index. The Turner Titan Fund invests in stocks of companies with primarily large capitalization ranges across all major industry sectors using a long/short strategy in seeking to capture alpha, reduce volatility, and preserve capital in declining markets.
During the reporting period, top contributors to performance were long and short positions in technology, energy and consumer discretionary sectors. The financial and materials sectors were relative drags on performance versus the S&P 500 benchmark for the 12-month period ended September 30, 2014.
1 Cash equivalent is not being considered a holding for the top five holdings, but is counted in the number of holdings. Top five holdings are based on long positions. The fund composition is subject to change.
2 Percentages based on total investments of long positions.
3 These figures represent past performance, which is no guarantee of future results. The investment return and principal value of an investment will fluctuate, so an investor's shares, when redeemed, may be worth more or less than their original cost. The performance in the above graph and table does not reflect the deduction of taxes the shareholder will pay on fund distributions or the redemptions of fund shares. Performance of the Institutional, Investor and Class C Shares will differ due to differences in fees.
4 The inception date of the Turner Titan Fund was February 7, 2011.
5 Fee waivers are in effect; if they had not been in effect, performance would have been lower.
6 The S&P 500 Index is a widely-recognized, market value-weighted (higher market value stocks have more influence than lower market value stocks) index of 500 stocks designed to mimic the overall equity market's industry weightings.
7 The Barclays Capital U.S. Aggregate Bond Index represents an unmanaged diversified portfolio of fixed income securities, including U.S. Treasuries, investment-grade corporate bonds and mortgage-backed and asset-backed securities.
8 Lipper Long/Short Equity Funds Average represents the average annualized total return for all reporting funds in the Lipper Long/Short Equity Fund category.
Cl — Class
The Turner Titan Fund may focus its investments from time to time on one or more economic sectors. To the extent that it does so, developments affecting companies in that sector or sectors will likely have a magnified effect on the fund's net asset value and total return. The fund is subject to the risks associated with selling securities short. A short sale involves a finite opportunity for appreciation, but a theoretically unlimited risk of loss. The fund is subject to risks due to its foreign investments. The fund is also subject to taxable income and realized capital gains. Shareholder redemptions may force the fund to sell securities at an inappropriate time, also resulting in realized gains.
8 TURNER FUNDS 2014 ANNUAL REPORT
INVESTMENT REVIEW (Unaudited)
Turner Emerging Growth Fund
Fund profile
September 30, 2014
n Ticker symbol TMCGX
Investor Class Shares
n CUSIP #872524301
Investor Class Shares
n Top five holdings1
(1) Proofpoint
(2) Ambarella
(3) Monolithic Power Systems
(4) Huron Consulting Group
(5) Electronics for Imaging
n % in five largest holdings 12.9%1,2
n Number of holdings 841
n Net assets $116.86 million, Investor Class Shares
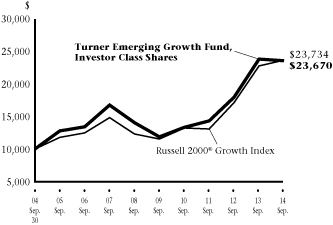
Growth of a $10,000 investment in the
Turner Emerging Growth Fund, Investor Class Shares:
September 30, 2004-September 30, 20143,4
Average annual total returns (Periods ended September 30, 2014)3
| | | One
year | | Three
years | | Five
years | | Ten
years | | Since
inception | |
Turner Emerging Growth Fund, Institutional Class Shares5 | | | -0.76 | % | | | 18.43 | % | | | 15.04 | % | | | — | | | | 18.97 | %6 | |
Turner Emerging Growth Fund, Investor Class Shares5 | | | -1.00 | % | | | 18.14 | % | | | 14.76 | % | | | 9.00 | % | | | 17.51 | %4 | |
Russell 2000® Growth Index7 | | | 3.79 | % | | | 21.91 | % | | | 15.51 | % | | | 9.03 | % | | | 5.20 | % | |
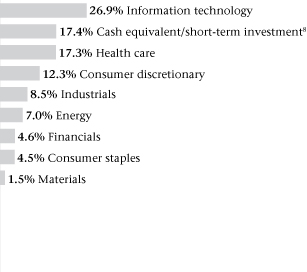
Sector weightings1:
Manager's discussion and analysis
During the 12-month period ended September 30, 2014, the Turner Emerging Growth Fund trailed the returns of the benchmark Russell 2000® Growth Index.
The two strongest returning sectors were health care and materials with those sectors outperforming their corresponding index sectors. Within those sectors, shares in the biotech, pharmaceuticals and pulp & paper industries performed the best. Consumer discretionary and consumer staple stocks detracted the most from relative returns. In those sectors, internet software, retail apparel and food distributors posted the worst returns for the year.
1 Cash equivalent and short-term investment are not being considered a holding for the top five holdings, but are counted in the number of holdings. The fund composition is subject to change.
2 Percentages based on total investments.
3 These figures represent past performance, which is no guarantee of future results. The investment return and principal value of an investment will fluctuate, so an investor's shares, when redeemed, may be worth more or less than their original cost. The performance in the above graph and table does not reflect the deduction of taxes the shareholder will pay on fund distributions or the redemptions of fund shares. Performance of the Institutional and Investor Class Shares will differ due to differences in fees.
4 The inception date of the Turner Emerging Growth Fund (Investor Class Shares) was February 27, 1998. Index returns are based on Investor Class Shares inception date.
5 Fee waivers are in effect; if they had not been in effect, performance would have been lower.
6 The inception date of the Turner Emerging Growth Fund (Institutional Class Shares) was February 1, 2009.
7 The Russell 2000® Growth Index is a widely-recognized, capitalization-weighted (companies with larger market capitalizations have more influence than those with smaller market capitalizations) index of the 2,000 smallest U.S. companies out of the 3,000 largest U.S. companies with higher growth rates and price-to-book ratios.
8 Cash equivalent includes short-term investment held as collateral for securities lending activity. Please see Note 8 in Notes to Financial Statements for more detailed information.
Amounts designated as " — " are not applicable.
The Turner Emerging Growth Fund may buy and sell securities frequently as part of its investment strategy. The smaller capitalization companies
the fund invests in may be more vulnerable to adverse business or economic events than larger, more established companies. The fund is subject to risks due to its foreign investments. The fund is also subject to taxable income and realized capital gains. Shareholder redemptions may force the fund to sell securities at an inappropriate time, also resulting in realized gains.
TURNER FUNDS 2014 ANNUAL REPORT 9
INVESTMENT REVIEW (Unaudited)
Fund profile
September 30, 2014
n Ticker symbol TTMEX
Institutional Class Shares
n CUSIP #900297847
Institutional Class Shares
n Top five holdings1
(1) Apple
(2) Google, Cl A
(3) Facebook, Cl A
(4) McKesson
(5) Comcast, Cl A
n % in five largest holdings 20.1%1,2
n Number of holdings 641
n Net assets $17.43 million, Institutional Class Shares
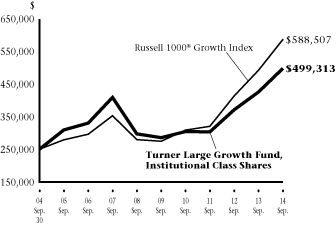
Growth of a $250,000 investment in the
Turner Large Growth Fund, Institutional Class Shares:
September 30, 2004-September 30, 20143,4
Average annual total returns (Periods ended September 30, 2014)3
| | | One
year | | Three
years | | Five
years | | Ten
years | | Since
inception | |
Turner Large Growth Fund, Institutional Class Shares5 | | | 17.03 | % | | | 18.08 | % | | | 11.85 | % | | | 7.16 | % | | | 4.27 | %4 | |
Turner Large Growth Fund, Investor Class Shares5 | | | 16.77 | % | | | 17.80 | % | | | 11.58 | % | | | — | | | | 5.47 | %6 | |
Russell 1000® Growth Index7 | | | 19.15 | % | | | 22.45 | % | | | 16.50 | % | | | 8.94 | % | | | 4.93 | %4 | |
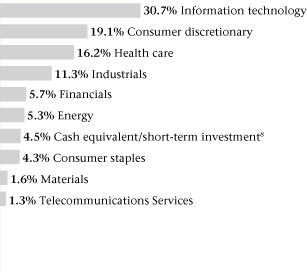
Sector weightings1:
Manager's discussion and analysis
During the 12-month period ended September 30, 2014, the Turner Large Growth Fund trailed the returns of the benchmark Russell 1000® Growth Index.
Regarding sector attribution, the consumer discretionary and producer durables contributed the most versus the corresponding index sectors. Within those sectors, internet software services, restaurants and railroads performed the best. An underweight position in the health care sector hurt relative returns versus the benchmark due to high returns in the biotech and pharmaceutical industries. The financial and consumer staple sectors also detracted from relative returns.
1 Cash equivalent and short-term investment are not being considered a holding for the top five holdings, but are counted in the number of holdings. The fund composition is subject to change.
2 Percentages based on total investments.
3 These figures represent past performance, which is no guarantee of future results. The investment return and principal value of an investment will fluctuate, so an investor's shares, when redeemed, may be worth more or less than their original cost. The performance in the above graph and table does not reflect the deduction of taxes the shareholder will pay on fund distributions or the redemptions of fund shares. Performance of the Institutional and Investor Class Shares will differ due to differences in fees.
4 The inception date of the Turner Large Growth Fund (Institutional Class Shares) was February 28, 2001. Index returns are based on Institutional Class Shares inception date.
5 Fee waivers are in effect; if they had not been in effect, performance would have been lower.
6 The inception date of the Turner Large Growth Fund (Investor Class Shares) was August 1, 2005.
7 The Russell 1000® Growth Index measures the performance of the broad growth segment of the U.S. equity universe. It includes those Russell 1000® companies with higher price-to-book ratios and higher forecasted growth values.
8 Cash equivalent includes short-term investment held as collateral for securities lending activity. Please see Note 8 in Notes to Financial Statements for more detailed information.
Amounts designated as "—" are not applicable.
Cl — Class
The Turner Large Growth Fund may buy and sell securities frequently as part of its investment strategy. The fund is subject to the risk that large capitalization growth stocks may underperform other segments of the equity markets as a whole. The fund is subject to risks due to its foreign investments. The fund is also subject to taxable income and realized capital gains. Shareholder redemptions may force the fund to sell securities at an inappropriate time, also resulting in realized gains.
10 TURNER FUNDS 2014 ANNUAL REPORT
INVESTMENT REVIEW (Unaudited)
Turner Midcap Growth Fund
Fund profile
September 30, 2014
n Ticker symbol TMGFX
Investor Class Shares
n CUSIP #900297409
Investor Class Shares
n Top five holdings1
(1) NXP Semiconductors
(2) Alexion Pharmaceuticals
(3) Cavium
(4) Avago Technologies
(5) WhiteWave Foods, Cl A
n % in five largest holdings 16.2%1,2
n Number of holdings 571
n Net assets $187.97 million, Investor Class Shares
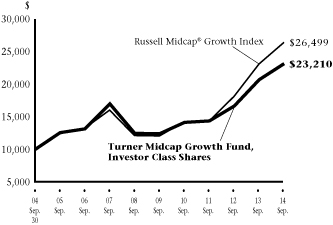
Growth of a $10,000 investment in the
Turner Midcap Growth Fund, Investor Class Shares:
September 30, 2004-September 30, 20143,4
Average annual total returns (Periods ended September 30, 2014)3
| | | One
year | | Three
years | | Five
years | | Ten
years | | Since
inception | |
Turner Midcap Growth Fund, Institutional Class Shares5 | | | 12.25 | % | | | 17.64 | % | | | 13.65 | % | | | — | | | | 5.83 | %6 | |
Turner Midcap Growth Fund, Investor Class Shares5 | | | 11.88 | % | | | 17.33 | % | | | 13.36 | % | | | 8.78 | % | | | 10.54 | %4 | |
Turner Midcap Growth Fund, Retirement Class Shares5 | | | 11.74 | % | | | 17.12 | % | | | 13.11 | % | | | 8.47 | % | | | 7.92 | %7 | |
Russell Midcap® Growth Index8 | | | 14.43 | % | | | 22.74 | % | | | 17.12 | % | | | 10.24 | % | | | 8.62 | %4 | |
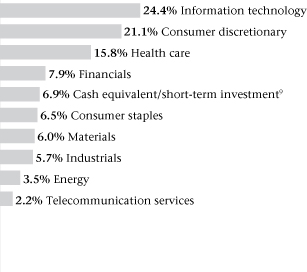
Sector weightings1:
Manager's discussion and analysis
In the 12-month period ended September 30, 2014, the Turner Midcap Growth Fund trailed the returns of the benchmark Russell Midcap® Growth Index.
The technology and consumer discretionary sectors provided the greatest contribution to the fund's performance. Semiconductor, information technology, food and beverage holdings generated the best returns within these sectors. The main detractors from performance were in the energy and utility sectors. Within these sectors, oil & gas producers and cable/satellite TV holdings were the worst performers.
1 Cash equivalent and short-term investment are not being considered a holding for the top five holdings, but are counted in the number of holdings. The fund composition is subject to change.
2 Percentages based on total investments.
3 These figures represent past performance, which is no guarantee of future results. The investment return and principal value of an investment will fluctuate, so an investor's shares, when redeemed, may be worth more or less than their original cost. The performance in the above graph and table does not reflect the deduction of taxes the shareholder will pay on fund distributions or the redemptions of fund shares. Performance of the Institutional, Investor and Retirement Class Shares will differ due to differences in fees.
4 The inception date of the Turner Midcap Growth Fund (Investor Class Shares) was October 1, 1996. Index returns are based on Investor Class Shares inception date.
5 Fee waivers are in effect; if they had not been in effect, performance would have been lower.
6 The inception date of the Turner Midcap Growth Fund (Institutional Class Shares) was June 16, 2008.
7 The inception date of the Turner Midcap Growth Fund (Retirement Class Shares) was September 24, 2001.
8 The Russell Midcap® Growth Index is a capitalization-weighted (companies with larger market capitalizations have more influence than those with smaller market capitalizations) index of the 800 smallest U.S. companies out of the 1,000 largest companies with higher growth rates and price-to-book ratios.
9 Cash equivalent includes short-term investment held as collateral for securities lending activity. Please see Note 8 in Notes to Financial Statements for more detailed information.
Amounts designated as "—" are not applicable.
Cl — Class
The Turner Midcap Growth Fund may buy and sell securities frequently as part of its investment strategy. The medium capitalization companies in which the fund invests may be more vulnerable to adverse business or economic events than larger, more established companies. The fund is subject to risks due to its foreign investments. The fund is also subject to taxable income and realized capital gains. Shareholder redemptions may force the fund to sell securities at an inappropriate time, also resulting in realized gains.
TURNER FUNDS 2014 ANNUAL REPORT 11
INVESTMENT REVIEW (Unaudited)
Turner Small Cap Growth Fund
Fund profile
September 30, 2014
n Ticker symbol TSCEX
n CUSIP #900297300
n Top five holdings1
(1) Proofpoint
(2) Cavium
(3) RF Micro Devices
(4) Team Health Holdings
(5) Penn-Virginia
n % in five largest holdings 8.8%1,2
n Number of holdings 821
n Net assets $130.09 million
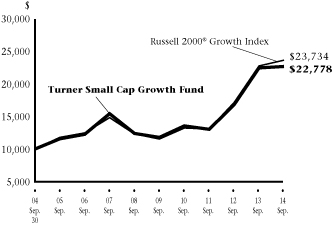
Growth of a $10,000 investment in the
Turner Small Cap Growth Fund:
September 30, 2004-September 30, 20143
Average annual total returns (Periods ended September 30, 2014)
| | | One
year | | Three
years | | Five
years | | Ten
years | | Since
inception | |
Turner Small Cap Growth Fund4 | | | 0.99 | % | | | 20.41 | % | | | 14.06 | % | | | 8.58 | % | | | 11.36 | % | |
Russell 2000® Growth Index5 | | | 3.79 | % | | | 21.91 | % | | | 15.51 | % | | | 9.03 | % | | | 6.92 | % | |
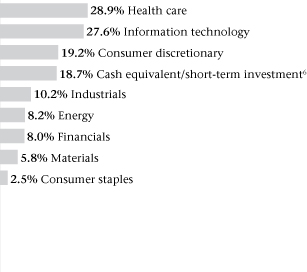
Sector weightings1:
Manager's discussion and analysis
During the 12-month period ended September 30, 2014, the Turner Small Cap Growth Fund trailed the returns of the benchmark Russell 2000® Growth Index.
The strongest returning sectors were health care, utility and producer durables with those sectors outperforming their corresponding index sectors. Within those sectors, shares in the biotech, trucking, oil & gas pipeline industries performed the best. The technology, financial and energy sectors were all drags on relative and absolute returns.
1 Cash equivalent and short-term investment are not being considered a holding for the top five holdings, but are counted in the number of holdings. The fund composition is subject to change.
2 Percentages based on total investments.
3 These figures represent past performance, which is no guarantee of future results. The investment return and principal value of an investment will fluctuate, so an investor's shares, when redeemed, may be worth more or less than their original cost. The performance in the above graph and table does not reflect the deduction of taxes the shareholder will pay on fund distributions or the redemptions of fund shares. The inception date of the Turner Small Cap Growth Fund was February 7, 1994.
4 Fee waivers are in effect; if they had not been in effect, performance would have been lower.
5 The Russell 2000® Growth Index is a widely-recognized, capitalization-weighted (companies with larger market capitalizations have more influence than those with smaller market capitalizations) index of the 2,000 smallest U.S. companies out of the 3,000 largest U.S. companies with higher growth rates and price-to-book ratios.
6 Cash equivalent includes short-term investment held as collateral for securities lending activity. Please see Note 8 in Notes to Financial Statements for more detailed information.
The Turner Small Cap Growth Fund may buy and sell securities frequently as part of its investment strategy. The smaller capitalization companies the fund invests in may be more vulnerable to adverse business or economic events than larger, more established companies. The fund is subject to risks due to its foreign investments. The fund is also subject to taxable income and realized capital gains. Shareholder redemptions may force the fund to sell securities at an inappropriate time, also resulting in realized gains.
12 TURNER FUNDS 2014 ANNUAL REPORT
Turner Medical Sciences Long/Short Fund
September 30, 2014
| | | Shares | | Value
(000) | |
Common stock—126.4%† | |
Biotechnology—64.7% | |
AMAG Pharmaceuticals* | | | 109,830 | | | $ | 3,506 | | |
Amarin ADR* | | | 309,470 | | | | 337 | | |
Anacor Pharmaceuticals* | | | 16,300 | | | | 399 | | |
ANI Pharmaceuticals* | | | 37,120 | | | | 1,050 | | |
Chimerix* | | | 101,780 | | | | 2,812 | | |
Concert Pharmaceuticals* | | | 85,070 | | | | 1,073 | | |
Cubist Pharmaceuticals* | | | 21,140 | | | | 1,402 | | |
Discovery Laboratories* | | | 1,425,423 | | | | 2,623 | | |
Dynavax Technologies* | | | 235,740 | | | | 337 | | |
Emergent Biosolutions* | | | 16,870 | | | | 359 | | |
Heron Therapeutics* | | | 57,740 | | | | 481 | | |
Infinity Pharmaceuticals* | | | 61,130 | | | | 820 | | |
Intercept Pharmaceuticals* | | | 8,290 | | | | 1,962 | | |
Keryx Biopharmaceuticals* | | | 25,170 | | | | 346 | | |
NPS Pharmaceuticals* | | | 63,040 | | | | 1,639 | | |
Otonomy* | | | 26,860 | | | | 645 | | |
Progenics Pharmaceuticals* | | | 89,200 | | | | 463 | | |
Prothena* | | | 58,740 | | | | 1,302 | | |
Puma Biotechnology* | | | 3,175 | | | | 757 | | |
Retrophin* | | | 165,530 | | | | 1,493 | | |
Total Biotechnology | | | | | 23,806 | | |
Health care equipment & supplies—9.5% | |
Baxter International | | | 2,240 | | | | 161 | | |
LDR Holding* | | | 63,700 | | | | 1,983 | | |
Unilife* | | | 595,810 | | | | 1,367 | | |
Total Health care equipment & supplies | | | | | 3,511 | | |
Health care providers & services—1.8% | |
Envision Healthcare Holdings* | | | 9,860 | | | | 342 | | |
Team Health Holdings* | | | 5,690 | | | | 330 | | |
Total Health care providers & services | | | | | 672 | | |
Personal products—8.0% | |
IGI Laboratories* | | | 313,842 | | | | 2,925 | | |
Total Personal products | | | | | 2,925 | | |
Pharmaceuticals—42.4% | |
Amphastar Pharmaceuticals* | | | 28,920 | | | | 337 | | |
Cardiome Pharma* | | | 65,813 | | | | 588 | | |
DepoMed* | | | 117,860 | | | | 1,790 | | |
Flamel Technologies SA ADR* | | | 221,545 | | | | 3,170 | | |
Horizon Pharma* | | | 384,060 | | | | 4,716 | | |
| | | Shares | | Value
(000) | |
Jazz Pharmaceuticals* | | | 12,860 | | | $ | 2,065 | | |
Lannett* | | | 47,680 | | | | 2,178 | | |
Ocera Therapeutics* | | | 87,590 | | | | 429 | | |
The Medicines* | | | 13,660 | | | | 305 | | |
Total Pharmaceuticals | | | | | 15,578 | | |
Total Common stock
(Cost $43,311)** | | | | | 46,492 | | |
Cash equivalent—0.8% | |
BlackRock Liquidity Funds
TempCash Portfolio,
Dollar Shares, 0.078%‡ | | | 278,466 | | | | 278 | | |
Total Cash equivalent
(Cost $278)** | | | | | 278 | | |
Total Investments—127.2%
(Cost $43,589)** | | | | | 46,770 | | |
Segregated cash with brokers—36.5% | | | | | 13,442 | | |
Securities sold short—(62.5)%
(Proceeds $(22,747))** | | | | | (22,979 | ) | |
Net Other assets (liabilities)—(1.2)% | | | | | (450 | ) | |
Net Assets—100.0% | | | | $ | 36,783 | | |
* Non-income producing security.
** This number is listed in thousands.
† More narrow industries are utilized for compliance purposes, whereas broad sectors are utilized for reporting purposes.
‡ Rate shown is the 7-day effective yield as of September 30, 2014.
ADR — American Depositary Receipt
The accompanying notes are an integral part of the financial statements.
TURNER FUNDS 2014 ANNUAL REPORT 13
Schedule of securities sold short
Turner Medical Sciences Long/Short Fund
September 30, 2014
| | | Shares | | Value
(000) | |
Common stock—62.5% | |
Biotechnology—36.6% | |
Achillion Pharmaceuticals | | | 50,940 | | | $ | 508 | | |
Acorda Therapeutics | | | 37,310 | | | | 1,264 | | |
Agios Pharmaceuticals | | | 30,450 | | | | 1,869 | | |
Amgen | | | 3,780 | | | | 531 | | |
Avalanche Biotechnologies | | | 20,190 | | | | 690 | | |
BioMarin Pharmaceuticals | | | 9,070 | | | | 654 | | |
Bluebird Bio | | | 33,770 | | | | 1,212 | | |
Isis Pharmaceuticals | | | 14,870 | | | | 577 | | |
Karyopharm Therapeutics | | | 32,097 | | | | 1,121 | | |
Ligand Pharmaceuticals, Cl B | | | 12,840 | | | | 603 | | |
Newlink Genetics | | | 54,070 | | | | 1,158 | | |
Ophthotech | | | 27,740 | | | | 1,080 | | |
Ovascience | | | 40,229 | | | | 668 | | |
Tekmira Pharmaceuticals | | | 72,310 | | | | 1,530 | | |
Total Biotechnology | | | | | 13,465 | | |
Health care equipment & supplies—10.2% | |
ABIOMED | | | 25,210 | | | | 626 | | |
Hologic | | | 15,230 | | | | 371 | | |
Hospira | | | 18,690 | | | | 972 | | |
ReWalk Robotics | | | 51,840 | | | | 1,770 | | |
Total Health care equipment & supplies | | | | | 3,739 | | |
Health care providers & services—4.7% | |
Anika Therapeutics | | | 32,480 | | | | 1,191 | | |
UnitedHealth Group, Cl B | | | 6,180 | | | | 533 | | |
Total Health care providers & services | | | | | 1,724 | | |
Life sciences tools & services—3.8% | |
Charles River Laboratories
International | | | 14,620 | | | | 873 | | |
Illumina | | | 3,270 | | | | 536 | | |
Total Life sciences tools & services | | | | | 1,409 | | |
| | | Shares | | Value
(000) | |
Pharmaceuticals—7.2% | |
ACADIA Pharmaceuticals | | | 38,290 | | | $ | 948 | | |
Nektar Therapeutics | | | 45,640 | | | | 551 | | |
Perrigo | | | 7,610 | | | | 1,143 | | |
Total Pharmaceuticals | | | | | 2,642 | | |
Total Common stock
(Proceeds $22,747)* | | | | | 22,979 | | |
Total Securities sold short—62.5%
(Proceeds $22,747)* | | | | $ | 22,979 | | |
Percentages disclosed are based on total net assets of the Fund at September 30, 2014.
* This number is listed in thousands.
Cl — Class
The accompanying notes are an integral part of the financial statements.
14 TURNER FUNDS 2014 ANNUAL REPORT
Turner Spectrum Fund
September 30, 2014
| | | Shares | | Value
(000) | |
Common stock—96.7%† | |
Consumer discretionary—15.0% | |
Advance Auto Parts | | | 10,920 | | | $ | 1,423 | | |
American Eagle Outfitters | | | 35,550 | | | | 516 | | |
Asbury Automotive Group* | | | 7,600 | | | | 490 | | |
Best Buy | | | 21,330 | | | | 716 | | |
Big Lots^ | | | 22,830 | | | | 983 | | |
Brunswick | | | 13,180 | | | | 555 | | |
Burlington Stores*^ | | | 7,840 | | | | 313 | | |
Criteo SA ADR* | | | 11,830 | | | | 398 | | |
Deckers Outdoor*^ | | | 14,610 | | | | 1,420 | | |
Delphi Automotive | | | 4,500 | | | | 276 | | |
Expedia | | | 3,370 | | | | 295 | | |
Genesco* | | | 8,700 | | | | 650 | | |
G-III Apparel Group* | | | 7,390 | | | | 612 | | |
Home Depot | | | 15,460 | | | | 1,418 | | |
HomeAway* | | | 6,600 | | | | 234 | | |
J.C. Penney* | | | 37,540 | | | | 377 | | |
Kohl's | | | 11,220 | | | | 685 | | |
Las Vegas Sands | | | 5,690 | | | | 354 | | |
Lumber Liquidators Holdings* | | | 11,780 | | | | 676 | | |
MGM Resorts International* | | | 15,450 | | | | 352 | | |
Nike, Cl B | | | 6,590 | | | | 588 | | |
SFX Entertainment*^ | | | 22,490 | | | | 113 | | |
Shutterfly* | | | 13,460 | | | | 656 | | |
Skechers U.S.A., Cl A*^ | | | 8,150 | | | | 434 | | |
Starwood Hotels & Resorts
Worldwide^ | | | 17,040 | | | | 1,418 | | |
Tenneco* | | | 11,590 | | | | 606 | | |
Time Warner | | | 7,740 | | | | 582 | | |
Urban Outfitters*^ | | | 38,970 | | | | 1,431 | | |
VF | | | 11,950 | | | | 789 | | |
Vince Holding* | | | 10,830 | | | | 328 | | |
Zalando SE # * § | | | 1,820 | | | | 49 | | |
Zoe's Kitchen* | | | 31,910 | | | | 982 | | |
Total Consumer discretionary | | | | | 20,719 | | |
Consumer staples—2.6% | |
Mead Johnson Nutrition, Cl A^ | | | 3,980 | | | | 383 | | |
Monster Beverage* | | | 13,990 | | | | 1,283 | | |
PepsiCo^ | | | 6,200 | | | | 577 | | |
WhiteWave Foods, Cl A*^ | | | 26,140 | | | | 950 | | |
Whole Foods Market | | | 10,530 | | | | 401 | | |
Total Consumer staples | | | | | 3,594 | | |
| | | Shares | | Value
(000) | |
Energy—7.2% | |
EOG Resources^ | | | 4,160 | | | $ | 412 | | |
Green Plains Renewable Energy | | | 51,060 | | | | 1,909 | | |
Halliburton^ | | | 8,810 | | | | 568 | | |
Independence Contract
Drilling*^ | | | 160,000 | | | | 1,880 | | |
Kinder Morgan | | | 28,380 | | | | 1,088 | | |
Lehigh Gas Partners^ | | | 37,382 | | | | 1,270 | | |
Memorial Resource
Development*^ | | | 29,750 | | | | 807 | | |
Sanchez Energy Corp.* | | | 10,860 | | | | 285 | | |
Schlumberger^ | | | 7,030 | | | | 715 | | |
Vaalco Energy* | | | 63,960 | | | | 544 | | |
Whiting Petroleum* | | | 5,790 | | | | 449 | | |
Total Energy | | | | | 9,927 | | |
Financials—13.9% | |
Ameris Bancorp | | | 15,520 | | | | 341 | | |
Aon^ | | | 13,070 | | | | 1,146 | | |
Atlas Mara Co-Nvest* | | | 270,290 | | | | 2,648 | | |
Bank of the Ozarks^ | | | 18,898 | | | | 596 | | |
Bryn Mawr Bank | | | 17,181 | | | | 487 | | |
Discover Financial Services^ | | | 31,022 | | | | 1,998 | | |
East West Bancorp^ | | | 14,760 | | | | 502 | | |
Essent Group*^ | | | 61,120 | | | | 1,309 | | |
FS Investment^ | | | 75,160 | | | | 809 | | |
Goldman Sachs Group | | | 2,720 | | | | 499 | | |
Hanmi Financial^ | | | 32,540 | | | | 656 | | |
Invesco^ | | | 32,980 | | | | 1,302 | | |
Janus Capital Group | | | 23,210 | | | | 337 | | |
Kennedy-Wilson Holdings^ | | | 46,410 | | | | 1,112 | | |
MetLife^ | | | 16,160 | | | | 868 | | |
Moelis | | | 12,870 | | | | 440 | | |
Moody's^ | | | 21,390 | | | | 2,021 | | |
Morgan Stanley^ | | | 18,610 | | | | 643 | | |
Signature Bank*^ | | | 7,270 | | | | 815 | | |
Square 1 Financial, Cl A* | | | 19,870 | | | | 382 | | |
Wells Fargo | | | 7,860 | | | | 408 | | |
Total Financials | | | | | 19,319 | | |
Health care—31.8% | |
Actavis* | | | 2,950 | | | | 712 | | |
AMAG Pharmaceuticals*^ | | | 90,320 | | | | 2,883 | | |
Amarin ADR* | | | 275,550 | | | | 300 | | |
Amphastar Pharmaceuticals* | | | 24,120 | | | | 281 | | |
TURNER FUNDS 2014 ANNUAL REPORT 15
Schedule of investments
Turner Spectrum Fund
| | | Shares | | Value
(000) | |
Anacor Pharmaceuticals* | | | 14,520 | | | $ | 355 | | |
ANI Pharmaceuticals* | | | 30,670 | | | | 867 | | |
Baxter International | | | 1,960 | | | | 141 | | |
Biogen Idec*^ | | | 3,030 | | | | 1,002 | | |
Cardiome Pharma* | | | 58,600 | | | | 523 | | |
Celgene* | | | 3,120 | | | | 296 | | |
Chimerix* | | | 74,190 | | | | 2,049 | | |
Cigna | | | 3,080 | | | | 279 | | |
Concert Pharmaceuticals* | | | 70,970 | | | | 895 | | |
Cubist Pharmaceuticals*^ | | | 18,825 | | | | 1,249 | | |
DepoMed*^ | | | 102,717 | | | | 1,560 | | |
Discovery Laboratories*^ | | | 1,046,097 | | | | 1,925 | | |
Dynavax Technologies* | | | 209,900 | | | | 300 | | |
Emergent Biosolutions* | | | 15,020 | | | | 320 | | |
Envision Healthcare Holdings* | | | 8,360 | | | | 290 | | |
Flamel Technologies SA ADR*^ | | | 186,929 | | | | 2,675 | | |
Gilead Sciences* | | | 3,340 | | | | 356 | | |
Heron Therapeutics* | | | 51,410 | | | | 428 | | |
Horizon Pharma*^ | | | 318,120 | | | | 3,908 | | |
IGI Laboratories*^ | | | 279,450 | | | | 2,604 | | |
Infinity Pharmaceuticals* | | | 53,520 | | | | 718 | | |
Intercept Pharmaceuticals*^ | | | 6,870 | | | | 1,626 | | |
Jazz Pharmaceuticals*^ | | | 10,910 | | | | 1,752 | | |
Johnson & Johnson^ | | | 8,170 | | | | 871 | | |
Keryx Biopharmaceuticals* | | | 22,410 | | | | 308 | | |
Lannett*^ | | | 41,550 | | | | 1,898 | | |
LDR Holding*^ | | | 55,510 | | | | 1,728 | | |
McKesson^ | | | 4,970 | | | | 968 | | |
Merck | | | 7,390 | | | | 438 | | |
NPS Pharmaceuticals* | | | 52,660 | | | | 1,369 | | |
Ocera Therapeutics* | | | 77,990 | | | | 382 | | |
Otonomy* | | | 22,090 | | | | 530 | | |
Progenics Pharmaceuticals* | | | 79,420 | | | | 412 | | |
Prothena* | | | 52,300 | | | | 1,159 | | |
Puma Biotechnology* | | | 2,830 | | | | 675 | | |
Retrophin* | | | 138,270 | | | | 1,247 | | |
Team Health Holdings* | | | 5,070 | | | | 294 | | |
The Medicines* | | | 12,160 | | | | 271 | | |
Unilife* | | | 530,496 | | | | 1,217 | | |
Total Health care | | | | | 44,061 | | |
Industrials—10.9% | |
Aercap Holdings*^ | | | 11,050 | | | | 452 | | |
American Airlines Group | | | 31,650 | | | | 1,123 | | |
AMETEK^ | | | 7,600 | | | | 382 | | |
| | | Shares | | Value
(000) | |
C.H. Robinson Worldwide | | | 8,950 | | | $ | 594 | | |
Canadian Pacific Railway^ | | | 3,614 | | | | 750 | | |
Chicago Bridge & Iron | | | 10,950 | | | | 633 | | |
FedEx | | | 2,770 | | | | 447 | | |
Honeywell International | | | 4,590 | | | | 427 | | |
Hub Group, Cl A*^ | | | 15,790 | | | | 640 | | |
Kansas City Southern | | | 6,020 | | | | 730 | | |
Kirby* | | | 4,170 | | | | 491 | | |
Landstar System^ | | | 15,490 | | | | 1,118 | | |
Louis XIII Holdings* | | | 607,566 | | | | 306 | | |
Old Dominion Freight Line*^ | | | 10,650 | | | | 752 | | |
Precision Castparts^ | | | 5,970 | | | | 1,414 | | |
Rockwell Automation | | | 1,930 | | | | 212 | | |
Saia*^ | | | 16,345 | | | | 810 | | |
Scorpio Bulkers* | | | 41,360 | | | | 241 | | |
Spirit Airlines* | | | 2,700 | | | | 187 | | |
Swift Transportation*^ | | | 38,070 | | | | 799 | | |
Tutor Perini* | | | 12,520 | | | | 331 | | |
Union Pacific | | | 15,940 | | | | 1,728 | | |
United Rentals*^ | | | 4,950 | | | | 550 | | |
Total Industrials | | | | | 15,117 | | |
Information technology—10.8% | |
Activision Blizzard | | | 21,310 | | | | 443 | | |
Alliance Data Systems*^ | | | 2,130 | | | | 529 | | |
Apple | | | 4,290 | | | | 432 | | |
Avago Technologies | | | 4,180 | | | | 364 | | |
Digimarc^ | | | 50,000 | | | | 1,036 | | |
Envestnet* | | | 18,350 | | | | 826 | | |
F5 Networks* | | | 3,570 | | | | 424 | | |
Facebook, Cl A*^ | | | 18,910 | | | | 1,494 | | |
FireEye* | | | 27,670 | | | | 846 | | |
Google, Cl A*^ | | | 3,760 | | | | 2,211 | | |
IZEA* | | | 125,930 | | | | 47 | | |
Materialise ADR* | | | 33,970 | | | | 381 | | |
NXP Semiconductors* | | | 6,240 | | | | 427 | | |
Pandora Media* | | | 18,680 | | | | 451 | | |
Remark Media*^ | | | 140,950 | | | | 887 | | |
Salesforce.com*^ | | | 15,070 | | | | 867 | | |
SanDisk | | | 3,650 | | | | 358 | | |
Twitter* | | | 16,180 | | | | 835 | | |
Visa, Cl A | | | 5,780 | | | | 1,233 | | |
Western Digital | | | 8,980 | | | | 874 | | |
Total Information technology | | | | | 14,965 | | |
16 TURNER FUNDS 2014 ANNUAL REPORT
Schedule of investments
Turner Spectrum Fund
| | | Shares | | Value
(000) | |
Materials—4.5% | |
Compass Minerals
International^ | | | 17,770 | | | $ | 1,497 | | |
Huntsman | | | 38,380 | | | | 997 | | |
KapStone Paper & Packaging* | | | 15,990 | | | | 447 | | |
Lyondellbasell Industries, Cl A | | | 7,240 | | | | 787 | | |
Methanex | | | 11,700 | | | | 782 | | |
Packaging Corp. of America | | | 7,310 | | | | 467 | | |
PolyOne | | | 21,380 | | | | 761 | | |
Senomyx* | | | 63,100 | | | | 517 | | |
Total Materials | | | | | 6,255 | | |
Total Common stock
(Cost $125,585)** | | | | | 133,957 | | |
Warrant—0.3% | |
Financials—0.3% | |
Atlas Mara Co-Nvest* | | | 472,160 | | | | 472 | | |
Total Financials | | | | | 472 | | |
Total Warrant
(Cost $92)** | | | | | 472 | | |
Total Investments—97.0%
(Cost $125,677)** | | | | | 134,429 | | |
Segregated cash with brokers—48.5% | | | | | 67,228 | | |
Securities sold short—(53.9)%
(Proceeds $(76,749))** | | | | | (74,677 | ) | |
Net Other assets (liabilities)—8.4% | | | | | 11,598 | | |
Net Assets—100.0% | | | | $ | 138,578 | | |
# Represents a restricted security. The security has been deemed illiquid according to the policies and procedures adopted by the Board of Trustees. Trading of this security did not begin publicly until October 1, 2014. As of September 30, 2014, illiquid securities were 0.0% of the Fund's net assets.
| | | Acquisition
Date | | Acquisition
Cost** | | Share
Amount | | Fair
Value** | |
Zalando SE | | 9/30/14 | | $ | 49 | | | | 1,820 | | | $ | 49 | | |
* Non-income producing security.
** This number is listed in thousands.
^ All or a portion of the shares have been committed as collateral for open short positions.
§ Security fair valued using procedures established by the Fair Value Committee. As of September 30, 2014, the total market value of these securities was $49**, representing 0.0% of Net Assets.
† More narrow industries are utilized for compliance purposes, whereas broad sectors are utilized for reporting purposes.
ADR — American Depositary Receipt
Cl — Class
The accompanying notes are an integral part of the financial statements.
TURNER FUNDS 2014 ANNUAL REPORT 17
Schedule of securities sold short
Turner Spectrum Fund
September 30, 2014
| | | Shares | | Value
(000) | |
Common stock—47.9% | |
Consumer discretionary—8.9% | |
Amazon.com | | | 3,220 | | | $ | 1,038 | | |
Autoliv | | | 11,300 | | | | 1,039 | | |
AutoZone | | | 2,630 | | | | 1,341 | | |
Bed Bath & Beyond | | | 11,960 | | | | 787 | | |
CBS Outdoor Americas | | | 14,290 | | | | 428 | | |
Dillard's, Cl A | | | 6,110 | | | | 666 | | |
Discovery Communications, Cl A | | | 7,220 | | | | 273 | | |
Ford Motor | | | 14,300 | | | | 211 | | |
Fossil | | | 2,960 | | | | 278 | | |
Garmin | | | 2,820 | | | | 147 | | |
Hyatt Hotels, Cl A | | | 9,110 | | | | 551 | | |
Johnson Controls | | | 14,530 | | | | 639 | | |
L Brands | | | 5,990 | | | | 401 | | |
Nexstar Broadcasting Group | | | 3,540 | | | | 143 | | |
Nordstrom | | | 4,020 | | | | 275 | | |
ReWalk Robotics | | | 22,560 | | | | 770 | | |
Ross Stores | | | 6,390 | | | | 483 | | |
Sonic Automotive, Cl A | | | 15,000 | | | | 368 | | |
Steven Madden | | | 6,140 | | | | 198 | | |
Tiffany | | | 2,700 | | | | 260 | | |
Tumi Holdings | | | 19,000 | | | | 387 | | |
Twenty-First Century Fox | | | 6,330 | | | | 217 | | |
Ulta Salon, Cosmetics & Fragrance | | | 3,860 | | | | 456 | | |
Under Armour, Cl A | | | 2,420 | | | | 167 | | |
Wolverine World Wide | | | 15,420 | | | | 386 | | |
Yum! Brands | | | 6,860 | | | | 494 | | |
Total Consumer discretionary | | | | | 12,403 | | |
Consumer staples—2.2% | |
Campbell Soup | | | 5,140 | | | | 220 | | |
General Mills | | | 15,170 | | | | 765 | | |
Kraft Foods Group | | | 3,840 | | | | 217 | | |
McDonald's | | | 7,650 | | | | 725 | | |
Wal-Mart Stores | | | 14,100 | | | | 1,078 | | |
Total Consumer staples | | | | | 3,005 | | |
Energy—0.6% | |
Apache | | | 3,940 | | | | 369 | | |
Rosetta Resources | | | 5,020 | | | | 224 | | |
Tidewater | | | 4,420 | | | | 173 | | |
Total Energy | | | | | 766 | | |
| | | Shares | | Value
(000) | |
Financials—7.0% | |
AFLAC, Inc. | | | 11,990 | | | $ | 698 | | |
Ally Financial | | | 24,610 | | | | 569 | | |
BancorpSouth | | | 31,140 | | | | 627 | | |
Bank of America | | | 17,400 | | | | 297 | | |
Bank Pekao SA | | | 8,380 | | | | 492 | | |
CBRE Group | | | 26,180 | | | | 779 | | |
First Republic Bank | | | 9,830 | | | | 485 | | |
Franklin Resources | | | 5,450 | | | | 298 | | |
Genworth Financial, Cl A | | | 44,870 | | | | 588 | | |
Greenhill | | | 5,530 | | | | 257 | | |
IntercontinentalExchange Group | | | 5,860 | | | | 1,144 | | |
Northern Trust | | | 8,540 | | | | 581 | | |
Ocwen Financial | | | 3,530 | | | | 92 | | |
Realogy Holdings | | | 28,200 | | | | 1,049 | | |
Stifel Financial | | | 5,390 | | | | 253 | | |
Synchrony Financial | | | 30,360 | | | | 745 | | |
T. Rowe Price Group | | | 9,210 | | | | 722 | | |
Total Financials | | | | | 9,676 | | |
Health care—13.1% | |
ABIOMED | | | 22,450 | | | | 557 | | |
ACADIA Pharmaceuticals | | | 32,810 | | | | 812 | | |
Achillion Pharmaceuticals | | | 43,220 | | | | 431 | | |
Acorda Therapeutics | | | 30,910 | | | | 1,047 | | |
Agios Pharmaceuticals | | | 25,440 | | | | 1,562 | | |
Amgen | | | 3,310 | | | | 465 | | |
Anika Therapeutics | | | 28,920 | | | | 1,060 | | |
Avalanche Biotechnologies | | | 17,590 | | | | 601 | | |
BioMarin Pharmaceuticals | | | 7,900 | | | | 570 | | |
Bluebird Bio | | | 28,930 | | | | 1,038 | | |
Charles River Laboratories
International | | | 12,740 | | | | 761 | | |
Express Scripts Holding | | | 6,140 | | | | 434 | | |
Hologic | | | 13,560 | | | | 330 | | |
Hospira | | | 16,320 | | | | 849 | | |
Illumina | | | 2,910 | | | | 477 | | |
Isis Pharmaceuticals | | | 13,240 | | | | 514 | | |
Karyopharm Therapeutics | | | 28,580 | | | | 999 | | |
Ligand Pharmaceuticals, Cl B | | | 11,190 | | | | 526 | | |
Nektar Therapeutics | | | 38,680 | | | | 467 | | |
Newlink Genetics | | | 44,850 | | | | 961 | | |
Ophthotech | | | 24,700 | | | | 962 | | |
Ovascience | | | 33,177 | | | | 551 | | |
Perrigo | | | 6,780 | | | | 1,018 | | |
18 TURNER FUNDS 2014 ANNUAL REPORT
Schedule of securities sold short
Turner Spectrum Fund
| | | Shares | | Value
(000) | |
Sirona Dental Systems | | | 2,250 | | | $ | 173 | | |
Tekmira Pharmaceuticals | | | 10,000 | | | | 211 | | |
UnitedHealth Group, Cl B | | | 5,500 | | | | 474 | | |
Varian Medical Systems | | | 2,580 | | | | 207 | | |
Waters | | | 2,040 | | | | 202 | | |
Total Health care | | | | | 18,259 | | |
Industrials—9.1% | |
| 3M | | | 2,010 | | | | 285 | | |
AGCO | | | 20,770 | | | | 944 | | |
Atlas Air Worldwide Holdings | | | 15,150 | | | | 500 | | |
Boeing | | | 10,250 | | | | 1,306 | | |
Cummins | | | 2,130 | | | | 281 | | |
Deere | | | 17,920 | | | | 1,469 | | |
Dover | | | 2,640 | | | | 212 | | |
Emerson Electric | | | 14,770 | | | | 924 | | |
Expeditors International of
Washington | | | 15,690 | | | | 637 | | |
Granite Construction | | | 19,950 | | | | 635 | | |
Hunt (JB) Transportation Services | | | 6,500 | | | | 481 | | |
KBR | | | 29,030 | | | | 547 | | |
Matson | | | 22,980 | | | | 575 | | |
Team | | | 8,030 | | | | 304 | | |
Terex | | | 4,230 | | | | 134 | | |
Titan Machinery | | | 39,400 | | | | 512 | | |
United Technologies | | | 2,060 | | | | 218 | | |
Valmont Industries | | | 17,270 | | | | 2,330 | | |
Werner Enterprises | | | 15,462 | | | | 390 | | |
Total Industrials | | | | | 12,684 | | |
Information technology—4.1% | |
Accenture PLC | | | 8,260 | | | | 672 | | |
Altera | | | 6,050 | | | | 216 | | |
ARM Holdings ADR | | | 3,210 | | | | 140 | | |
Cardtronics | | | 24,210 | | | | 852 | | |
Ciena | | | 8,210 | | | | 137 | | |
Cree | | | 8,340 | | | | 342 | | |
eBay | | | 2,740 | | | | 155 | | |
Fairchild Semiconductor
International | | | 13,320 | | | | 207 | | |
LG Display ADR | | | 8,800 | | | | 139 | | |
Linear Technology | | | 6,370 | | | | 283 | | |
Oracle | | | 5,540 | | | | 212 | | |
Semtech | | | 6,340 | | | | 172 | | |
Symantec | | | 8,910 | | | | 209 | | |
| | | Shares | | Value
(000) | |
VeriSign | | | 4,890 | | | $ | 270 | | |
Western Union | | | 74,190 | | | | 1,190 | | |
Yelp | | | 6,820 | | | | 465 | | |
Total Information technology | | | | | 5,661 | | |
Materials—2.9% | |
Agrium | | | 12,840 | | | | 1,143 | | |
American Vanguard | | | 62,990 | | | | 705 | | |
Monsanto | | | 10,310 | | | | 1,160 | | |
Rock-Tenn, Cl A | | | 19,900 | | | | 947 | | |
Total Materials | | | | | 3,955 | | |
Total Common stock
(Proceeds $68,205)* | | | | | 66,409 | | |
Exchange traded funds—6.0% | |
Consumer Staples Select Sector
SPDR Fund ETF | | | 14,790 | | | | 667 | | |
iShares China Large-Capital ETF | | | 12,820 | | | | 491 | | |
iShares Russell 2000 Growth ETF | | | 11,560 | | | | 1,499 | | |
iShares Transportation Average ETF | | | 6,800 | | | | 1,026 | | |
SPDR S&P 500 ETF Trust | | | 5,350 | | | | 1,054 | | |
SPDR S&P Biotech ETF | | | 1,390 | | | | 217 | | |
SPDR S&P Retail ETF | | | 6,040 | | | | 517 | | |
Teucrium Corn Fund | | | 39,100 | | | | 891 | | |
Vanguard S&P 500 ETF | | | 7,910 | | | | 1,428 | | |
VelocityShares Daily Inverse VIX
Short-Term ETN | | | 12,500 | | | | 478 | | |
Total Exchange traded funds
(Proceeds $8,544)* | | | | | 8,268 | | |
Total Securities sold short—53.9%
(Proceeds $76,749)* | | | | $ | 74,677 | | |
Percentages disclosed are based on total net assets of the Fund at September 30, 2014.
* This number is listed in thousands.
ADR — American Depositary Receipt
Cl — Class
ETF — Exchange Traded Fund
ETN — Exchange Traded Note
SPDR — Standard & Poor's Depositary Receipt
The accompanying notes are an integral part of the financial statements.
TURNER FUNDS 2014 ANNUAL REPORT 19
Turner Titan Fund
September 30, 2014
| | | Shares | | Value
(000) | |
Common stock—85.7% | |
Consumer discretionary—13.3% | |
Deckers Outdoor* | | | 2,150 | | | $ | 209 | | |
Delphi Automotive | | | 1,630 | | | | 100 | | |
Expedia | | | 1,230 | | | | 108 | | |
Home Depot | | | 3,400 | | | | 312 | | |
HomeAway* | | | 2,400 | | | | 85 | | |
Starwood Hotels & Resorts
Worldwide^ | | | 1,690 | | | | 141 | | |
Time Warner | | | 2,810 | | | | 211 | | |
Urban Outfitters* | | | 5,650 | | | | 207 | | |
Zalando SE # * § | | | 660 | | | | 18 | | |
Total Consumer discretionary | | | | | 1,391 | | |
Consumer staples—5.0% | |
Monster Beverage* | | | 1,830 | | | | 168 | | |
PepsiCo^ | | | 2,340 | | | | 217 | | |
WhiteWave Foods, Cl A* | | | 3,620 | | | | 132 | | |
Total Consumer staples | | | | | 517 | | |
Energy—5.0% | |
EOG Resources^ | | | 1,525 | | | | 151 | | |
Halliburton^ | | | 3,230 | | | | 208 | | |
Whiting Petroleum* | | | 2,110 | | | | 164 | | |
Total Energy | | | | | 523 | | |
Financials—10.6% | |
Aon^ | | | 1,530 | | | | 134 | | |
Discover Financial Services^ | | | 3,390 | | | | 218 | | |
Goldman Sachs Group | | | 990 | | | | 182 | | |
Invesco | | | 3,240 | | | | 128 | | |
Moody's | | | 3,110 | | | | 294 | | |
Wells Fargo | | | 2,860 | | | | 148 | | |
Total Financials | | | | | 1,104 | | |
Health care—17.2% | |
Actavis* | | | 1,080 | | | | 261 | | |
Biogen Idec*^ | | | 1,105 | | | | 364 | | |
Celgene* | | | 1,140 | | | | 108 | | |
Cigna | | | 1,120 | | | | 102 | | |
Gilead Sciences* | | | 1,210 | | | | 129 | | |
Johnson & Johnson^ | | | 2,990 | | | | 319 | | |
| | | Shares | | Value
(000) | |
McKesson^ | | | 1,820 | | | $ | 354 | | |
Merck | | | 2,690 | | | | 159 | | |
Total Health care | | | | | 1,796 | | |
Industrials—8.6% | |
FedEx | | | 1,010 | | | | 163 | | |
Honeywell International | | | 1,680 | | | | 156 | | |
Precision Castparts | | | 550 | | | | 130 | | |
Rockwell Automation | | | 700 | | | | 77 | | |
Union Pacific^ | | | 3,410 | | | | 371 | | |
Total Industrials | | | | | 897 | | |
Information technology—24.8% | |
Apple | | | 1,550 | | | | 156 | | |
Avago Technologies | | | 1,520 | | | | 132 | | |
F5 Networks* | | | 1,290 | | | | 153 | | |
Facebook, Cl A*^ | | | 4,110 | | | | 326 | | |
FireEye* | | | 10,000 | | | | 306 | | |
Google, Cl A* | | | 440 | | | | 259 | | |
NXP Semiconductors* | | | 2,280 | | | | 156 | | |
Pandora Media* | | | 3,160 | | | | 76 | | |
Salesforce.com*^ | | | 5,480 | | | | 315 | | |
SanDisk^ | | | 1,330 | | | | 130 | | |
Twitter* | | | 2,170 | | | | 112 | | |
Visa, Cl A | | | 740 | | | | 158 | | |
Western Digital | | | 3,270 | | | | 319 | | |
Total Information technology | | | | | 2,598 | | |
Materials—1.2% | |
Huntsman | | | 4,820 | | | | 125 | | |
Total Materials | | | | | 125 | | |
Total Common stock
(Cost $8,353)** | | | | | 8,951 | | |
20 TURNER FUNDS 2014 ANNUAL REPORT
Schedule of investments
Turner Titan Fund
| | | Shares | | Value
(000) | |
Cash equivalent—10.6% | |
BlackRock Liquidity Funds
TempCash Portfolio,
Dollar Shares, 0.078%‡ | | | 1,104,289 | | | $ | 1,104 | | |
Total Cash equivalent
(Cost $1,104)** | | | | | 1,104 | | |
Total Investments—96.3%
(Cost $9,457)** | | | | | 10,055 | | |
Segregated cash with brokers—55.2% | | | | | 5,759 | | |
Securities sold short—(51.5)%
(Proceeds $(5,549))** | | | | | (5,380 | ) | |
Net Other assets (liabilities)—0.0% | | | | | 6 | | |
Net Assets—100.0% | | | | $ | 10,440 | | |
# Represents a restricted security. The security has been deemed illiquid according to the policies and procedures adopted by the Board of Trustees. Trading of this security did not begin publicly until October 1, 2014. As of September 30, 2014, illiquid securities were 0.2% of the Fund's net assets.
| | | Acquisition
Date | | Acquisition
Cost** | | Share
Amount | | Fair
Value** | |
Zalando SE | | 9/30/14 | | $ | 18 | | | | 660 | | | $ | 18 | | |
* Non-income producing security.
** This number is listed in thousands.
^ All or a portion of the shares have been committed as collateral for open short positions.
§ Security fair valued using procedures established by the Fair Value Committee. As of September 30, 2014, the total market value of these securities was $18**, representing 0.2% of Net Assets.
‡ Rate shown is the 7-day effective yield as of September 30, 2014.
Cl — Class
The accompanying notes are an integral part of the financial statements.
TURNER FUNDS 2014 ANNUAL REPORT 21
Schedule of securities sold short
Turner Titan Fund
September 30, 2014
| | | Shares | | Value
(000) | |
Common stock—43.3% | |
Consumer discretionary—8.4% | |
Amazon.com | | | 405 | | | $ | 131 | | |
Autoliv | | | 1,680 | | | | 154 | | |
Bed Bath & Beyond | | | 1,510 | | | | 99 | | |
CBS Outdoor Americas | | | 1,760 | | | | 53 | | |
Discovery Communications, Cl A | | | 2,630 | | | | 99 | | |
Ford Motor | | | 5,210 | | | | 77 | | |
Garmin | | | 1,030 | | | | 54 | | |
Nexstar Broadcasting Group | | | 1,280 | | | | 52 | | |
Twenty-First Century Fox | | | 2,260 | | | | 77 | | |
Yum! Brands | | | 1,110 | | | | 80 | | |
Total Consumer discretionary | | | | | 876 | | |
Consumer staples—5.1% | |
Campbell Soup | | | 1,860 | | | | 79 | | |
General Mills | | | 2,020 | | | | 102 | | |
Kraft Foods Group | | | 1,390 | | | | 78 | | |
McDonald's | | | 1,710 | | | | 162 | | |
Wal-Mart Stores | | | 1,420 | | | | 109 | | |
Total Consumer staples | | | | | 530 | | |
Energy—2.7% | |
Apache | | | 1,430 | | | | 135 | | |
Rosetta Resources | | | 1,820 | | | | 81 | | |
Tidewater | | | 1,600 | | | | 62 | | |
Total Energy | | | | | 278 | | |
Financials—4.1% | |
Bank of America | | | 6,380 | | | | 109 | | |
Franklin Resources | | | 1,930 | | | | 105 | | |
IntercontinentalExchange Group | | | 540 | | | | 105 | | |
Ocwen Financial | | | 1,280 | | | | 34 | | |
Realogy Holdings | | | 1,980 | | | | 74 | | |
Total Financials | | | | | 427 | | |
Health care—3.6% | |
Express Scripts Holding | | | 2,210 | | | | 157 | | |
Sirona Dental Systems | | | 820 | | | | 63 | | |
Varian Medical Systems | | | 940 | | | | 75 | | |
Waters | | | 770 | | | | 76 | | |
Total Health care | | | | | 371 | | |
| | | Shares | | Value
(000) | |
Industrials—8.7% | |
| 3M | | | 730 | | | $ | 103 | | |
Boeing | | | 840 | | | | 107 | | |
Cummins | | | 780 | | | | 103 | | |
Deere | | | 940 | | | | 77 | | |
Dover | | | 960 | | | | 77 | | |
Emerson Electric | | | 2,240 | | | | 140 | | |
Terex | | | 1,540 | | | | 49 | | |
United Technologies | | | 740 | | | | 78 | | |
Valmont Industries | | | 1,360 | | | | 184 | | |
Total Industrials | | | | | 918 | | |
Information technology—8.2% | |
Altera | | | 2,210 | | | | 79 | | |
ARM Holdings ADR | | | 1,170 | | | | 51 | | |
Ciena | | | 2,990 | | | | 50 | | |
Cree | | | 3,050 | | | | 126 | | |
eBay | | | 990 | | | | 56 | | |
Fairchild Semiconductor
International | | | 4,860 | | | | 75 | | |
LG Display ADR | | | 3,200 | | | | 50 | | |
Linear Technology | | | 2,340 | | | | 104 | | |
Oracle | | | 2,000 | | | | 77 | | |
Semtech | | | 2,300 | | | | 62 | | |
Symantec | | | 3,270 | | | | 77 | | |
Yelp | | | 760 | | | | 52 | | |
Total Information technology | | | | | 859 | | |
Materials—2.5% | |
Agrium | | | 870 | | | | 77 | | |
Monsanto | | | 1,640 | | | | 185 | | |
Total Materials | | | | | 262 | | |
Total Common stock
(Proceeds $4,676)* | | | | | 4,521 | | |
Exchange traded funds—8.2% | |
iShares Russell 2000 Growth ETF | | | 2,000 | | | | 259 | | |
SPDR S&P Biotech ETF | | | 510 | | | | 80 | | |
Vanguard S&P 500 ETF | | | 2,880 | | | | 520 | | |
Total Exchange traded funds
(Proceeds $873)* | | | | | 859 | | |
Total Securities sold short—51.5%
(Proceeds $5,549)* | | | | $ | 5,380 | | |
22 TURNER FUNDS 2014 ANNUAL REPORT
Schedule of securities sold short
Turner Titan Fund
Percentages disclosed are based on total net assets of the Fund at September 30, 2014.
* This number is listed in thousands.
ADR — American Depositary Receipt
Cl — Class
ETF — Exchange Traded Fund
SPDR — Standard & Poor's Depositary Receipt
The accompanying notes are an integral part of the financial statements.
TURNER FUNDS 2014 ANNUAL REPORT 23
Turner Emerging Growth Fund
September 30, 2014
| | | Shares | | Value
(000) | |
Common stock—98.7%† | |
Consumer discretionary—14.6% | |
Chuy's Holdings*^ | | | 84,280 | | | $ | 2,646 | | |
del Frisco's Restaurant Group*^ | | | 67,080 | | | | 1,284 | | |
Fox Factory Holding* | | | 114,140 | | | | 1,769 | | |
Kona Grill* | | | 140,110 | | | | 2,764 | | |
Lithia Motors, Cl A | | | 16,241 | | | | 1,229 | | |
Oxford Industries | | | 27,273 | | | | 1,663 | | |
Pacific Sunwear of California* | | | 772,260 | | | | 1,390 | | |
Rentrak*^ | | | 39,650 | | | | 2,416 | | |
Shutterfly* | | | 56,144 | | | | 2,736 | | |
Zoe's Kitchen*^ | | | 98,100 | | | | 3,019 | | |
Total Consumer discretionary | | | | | 20,916 | | |
Consumer staples—5.4% | |
B&G Foods, Cl A | | | 25,883 | | | | 713 | | |
Boston Beer, Cl A* | | | 7,470 | | | | 1,657 | | |
Boulder Brands* | | | 152,660 | | | | 2,080 | | |
Inventure Foods* | | | 84,490 | | | | 1,095 | | |
Smart & Final Stores* | | | 29,650 | | | | 428 | | |
SunOpta* | | | 143,550 | | | | 1,733 | | |
Total Consumer staples | | | | | 7,706 | | |
Energy—8.4% | |
Bonanza Creek Energy* | | | 26,460 | | | | 1,506 | | |
Callon Petroleum* | | | 116,140 | | | | 1,023 | | |
Diamondback Energy* | | | 19,825 | | | | 1,483 | | |
Emerald Oil* | | | 134,020 | | | | 824 | | |
Independence Contract
Drilling* | | | 135,940 | | | | 1,597 | | |
Knightsbridge Tankers | | | 148,890 | | | | 1,318 | | |
Panhandle Oil & Gas, Cl A | | | 29,620 | | | | 1,768 | | |
PDC Energy* | | | 23,370 | | | | 1,175 | | |
Rex Energy* | | | 46,800 | | | | 593 | | |
TCP International Holdings*^ | | | 86,200 | | | | 657 | | |
Total Energy | | | | | 11,944 | | |
Financials—5.5% | |
Banc of California | | | 154,170 | | | | 1,793 | | |
Bryn Mawr Bank | | | 63,011 | | | | 1,785 | | |
Hanmi Financial | | | 65,070 | | | | 1,312 | | |
Square 1 Financial, Cl A* | | | 153,850 | | | | 2,958 | | |
Total Financials | | | | | 7,848 | | |
| | | Shares | | Value
(000) | |
Health care—20.7% | |
Acadia Healthcare*^ | | | 40,990 | | | $ | 1,988 | | |
Air Methods*^ | | | 26,680 | | | | 1,482 | | |
Akorn*^ | | | 88,860 | | | | 3,223 | | |
ANI Pharmaceuticals* | | | 18,900 | | | | 534 | | |
Arrowhead Research*^ | | | 82,640 | | | | 1,221 | | |
Atricure* | | | 41,910 | | | | 617 | | |
Biodelivery Sciences
International* | | | 182,600 | | | | 3,121 | | |
Cardiovascular Systems* | | | 56,830 | | | | 1,343 | | |
DepoMed* | | | 122,560 | | | | 1,862 | | |
Enanta Pharmaceuticals*^ | | | 44,220 | | | | 1,750 | | |
HealthEquity* | | | 81,010 | | | | 1,483 | | |
Horizon Pharma* | | | 85,130 | | | | 1,045 | | |
Keryx Biopharmaceuticals*^ | | | 99,930 | | | | 1,374 | | |
NanoString Technologies* | | | 121,440 | | | | 1,329 | | |
Natus Medical* | | | 71,442 | | | | 2,108 | | |
NPS Pharmaceuticals* | | | 42,370 | | | | 1,102 | | |
OraSure Technologies* | | | 155,530 | | | | 1,123 | | |
Receptos* | | | 46,070 | | | | 2,861 | | |
Total Health care | | | | | 29,566 | | |
Industrials—10.2% | |
American Railcar Industries^ | | | 17,600 | | | | 1,301 | | |
Chart Industries*^ | | | 16,288 | | | | 996 | | |
CIRCOR International | | | 13,545 | | | | 912 | | |
EnPro Industries*^ | | | 21,460 | | | | 1,299 | | |
Huron Consulting Group* | | | 56,151 | | | | 3,423 | | |
Middleby* | | | 9,080 | | | | 800 | | |
PGT* | | | 184,250 | | | | 1,717 | | |
Primoris Services | | | 52,280 | | | | 1,403 | | |
Star Bulk Carriers*^ | | | 140,280 | | | | 1,546 | | |
WageWorks* | | | 26,170 | | | | 1,192 | | |
Total Industrials | | | | | 14,589 | | |
Information technology—32.2% | |
Actua* | | | 105,154 | | | | 1,685 | | |
Aerohive Networks*^ | | | 202,380 | | | | 1,623 | | |
Ambarella* | | | 87,131 | | | | 3,805 | | |
Applied Optoelectronics* | | | 130,340 | | | | 2,098 | | |
Callidus Software* | | | 198,310 | | | | 2,384 | | |
Canadian Solar* | | | 43,710 | | | | 1,564 | | |
Channeladvisor*^ | | | 68,720 | | | | 1,127 | | |
24 TURNER FUNDS 2014 ANNUAL REPORT
Schedule of investments
Turner Emerging Growth Fund
| | | Shares | | Value
(000) | |
Coherent* | | | 26,924 | | | $ | 1,652 | | |
Digimarc | | | 51,357 | | | | 1,064 | | |
Diodes* | | | 53,270 | | | | 1,274 | | |
Electronics for Imaging* | | | 77,230 | | | | 3,411 | | |
FARO Technologies* | | | 27,560 | | | | 1,399 | | |
Immersion* | | | 152,570 | | | | 1,309 | | |
Inphi* | | | 110,000 | | | | 1,582 | | |
Manhattan Associates* | | | 37,890 | | | | 1,266 | | |
Maxlinear* | | | 272,160 | | | | 1,872 | | |
Methode Electronics | | | 53,840 | | | | 1,985 | | |
Monolithic Power Systems | | | 77,960 | | | | 3,434 | | |
Proofpoint*^ | | | 112,270 | | | | 4,170 | | |
QIWI ADR | | | 49,330 | | | | 1,558 | | |
SPS Commerce* | | | 31,660 | | | | 1,683 | | |
Textura*^ | | | 63,710 | | | | 1,682 | | |
The Rubicon Project* | | | 194,590 | | | | 2,283 | | |
Total Information technology | | | | | 45,910 | | |
Materials—1.7% | |
KapStone Paper & Packaging* | | | 52,842 | | | | 1,478 | | |
Senomyx*^ | | | 122,250 | | | | 1,002 | | |
Total Materials | | | | | 2,480 | | |
Total Common stock
(Cost $115,010)** | | | | | 140,959 | | |
Cash equivalent—20.9% | |
BlackRock Liquidity Funds
TempCash Portfolio,
Dollar Shares, 0.078%‡ (1) | | | 29,757,892 | | | | 29,758 | | |
Total Cash equivalent
(Cost $29,758)** | | | | | 29,758 | | |
Total Investments—119.6%
(Cost $144,768)** | | | | | 170,717 | | |
Net Other assets (liabilities)—(19.6)% | | | | | (27,945 | ) | |
Net Assets—100.0% | | | | $ | 142,772 | | |
* Non-income producing security.
** This number is listed in thousands.
(1) A portion of the Fund's position in this security was purchased with cash collateral received from securities lending. The total value of such security at September 30, 2014 was $27,771**.
^ Security fully or partially on loan at September 30, 2014. The total value of securities on loan at September 30, 2014 was $27,002**. Certain of these securities may have been sold prior to period end.
† More narrow industries are utilized for compliance purposes, whereas broad sectors are utilized for reporting purposes.
‡ Rate shown is the 7-day effective yield as of September 30, 2014.
ADR — American Depositary Receipt
Cl — Class
The accompanying notes are an integral part of the financial statements.
TURNER FUNDS 2014 ANNUAL REPORT 25
Turner Large Growth Fund
September 30, 2014
| | | Shares | | Value
(000) | |
Common stock—98.1%† | |
Consumer discretionary—19.6% | |
BorgWarner | | | 6,680 | | | $ | 351 | | |
Chipotle Mexican Grill* | | | 980 | | | | 653 | | |
Comcast, Cl A^ | | | 19,610 | | | | 1,055 | | |
Home Depot | | | 7,910 | | | | 726 | | |
Kate Spade* | | | 6,880 | | | | 180 | | |
Las Vegas Sands | | | 6,750 | | | | 420 | | |
Michael Kors Holdings* | | | 5,260 | | | | 376 | | |
Netflix* | | | 1,060 | | | | 478 | | |
Nike, Cl B | | | 6,330 | | | | 565 | | |
Priceline.com* | | | 450 | | | | 521 | | |
Starbucks | | | 8,320 | | | | 628 | | |
Starwood Hotels & Resorts
Worldwide | | | 6,250 | | | | 520 | | |
TripAdvisor* | | | 3,140 | | | | 287 | | |
Walt Disney | | | 7,650 | | | | 681 | | |
Total Consumer discretionary | | | | | 7,441 | | |
Consumer staples—4.5% | |
Colgate-Palmolive | | | 8,130 | | | | 530 | | |
Constellation Brands* | | | 5,480 | | | | 478 | | |
Estee Lauder, Cl A | | | 5,310 | | | | 397 | | |
WhiteWave Foods, Cl A* | | | 7,910 | | | | 287 | | |
Total Consumer staples | | | | | 1,692 | | |
Energy—5.5% | |
EOG Resources | | | 4,710 | | | | 466 | | |
Halliburton | | | 11,840 | | | | 764 | | |
Range Resources | | | 3,740 | | | | 254 | | |
Schlumberger | | | 5,850 | | | | 595 | | |
Total Energy | | | | | 2,079 | | |
Financials—5.8% | |
Affiliated Managers Group* | | | 2,020 | | | | 405 | | |
Aon | | | 4,600 | | | | 403 | | |
Discover Financial Services | | | 7,130 | | | | 459 | | |
Moody's | | | 5,230 | | | | 494 | | |
Morgan Stanley | | | 13,070 | | | | 452 | | |
Total Financials | | | | | 2,213 | | |
Health care—16.6% | |
Actavis* | | | 2,430 | | | | 586 | | |
Alexion Pharmaceuticals* | | | 2,490 | | | | 413 | | |
| | | Shares | | Value
(000) | |
Biogen Idec* | | | 3,100 | | | $ | 1,026 | | |
Celgene* | | | 4,080 | | | | 387 | | |
Cigna | | | 5,710 | | | | 518 | | |
Gilead Sciences* | | | 8,280 | | | | 881 | | |
Johnson & Johnson | | | 6,940 | | | | 740 | | |
McKesson | | | 6,290 | | | | 1,224 | | |
Roche Holding AG ADR | | | 14,170 | | | | 524 | | |
Total Health care | | | | | 6,299 | | |
Industrials—11.6% | |
AMETEK | | | 12,120 | | | | 609 | | |
Canadian Pacific Railway | | | 4,250 | | | | 882 | | |
FedEx | | | 2,440 | | | | 394 | | |
Honeywell International | | | 8,820 | | | | 821 | | |
Kirby* | | | 3,890 | | | | 458 | | |
Nielsen Holdings NV | | | 6,420 | | | | 285 | | |
Precision Castparts | | | 2,340 | | | | 554 | | |
Rockwell Automation | | | 3,650 | | | | 401 | | |
Total Industrials | | | | | 4,404 | | |
Information technology—31.5% | |
Adobe Systems* | | | 5,090 | | | | 352 | | |
Alliance Data Systems* | | | 1,940 | | | | 482 | | |
Apple | | | 22,586 | | | | 2,275 | | |
Avago Technologies | | | 5,350 | | | | 465 | | |
F5 Networks* | | | 3,480 | | | | 413 | | |
Facebook, Cl A* | | | 17,400 | | | | 1,375 | | |
Google, Cl A* | | | 3,275 | | | | 1,927 | | |
Microsoft | | | 13,200 | | | | 612 | | |
NXP Semiconductors* | | | 9,450 | | | | 647 | | |
Palo Alto Networks* | | | 2,320 | | | | 228 | | |
Red Hat* | | | 6,670 | | | | 375 | | |
Salesforce.com* | | | 15,900 | | | | 915 | | |
ServiceNow* | | | 7,700 | | | | 453 | | |
Tableau Software, Cl A*^ | | | 5,340 | | | | 388 | | |
Visa, Cl A | | | 3,730 | | | | 796 | | |
Western Digital | | | 2,630 | | | | 256 | | |
Total Information technology | | | | | 11,959 | | |
Materials—1.6% | |
International Flavors &
Fragrances | | | 3,890 | | | | 372 | | |
Methanex | | | 3,780 | | | | 253 | | |
Total Materials | | | | | 625 | | |
26 TURNER FUNDS 2014 ANNUAL REPORT
Schedule of investments
Turner Large Growth Fund
| | | Shares | | Value
(000) | |
Telecommunication services—1.4% | |
SBA Communications, Cl A* | | | 4,690 | | | $ | 520 | | |
Total Telecommunication services | | | | | 520 | | |
Total Common stock
(Cost $30,974)** | | | | | 37,232 | | |
Cash equivalent—4.7% | |
BlackRock Liquidity Funds
TempCash Portfolio,
Dollar Shares, 0.078%‡ (1) | | | 1,764,947 | | | | 1,765 | | |
Total Cash equivalent
(Cost $1,765)** | | | | | 1,765 | | |
Total Investments—102.8%
(Cost $32,739)** | | | | | 38,997 | | |
Net Other assets (liabilities)—(2.8)% | | | | | (1,048 | ) | |
Net Assets—100.0% | | | | $ | 37,949 | | |
* Non-income producing security.
** This number is listed in thousands.
(1) A portion of the Fund's position in this security was purchased with cash collateral received from securities lending. The total value of such security at September 30, 2014 was $1,463**.
^ Security fully or partially on loan at September 30, 2014. The total value of securities on loan at September 30, 2014 was $1,425**.
† More narrow industries are utilized for compliance purposes, whereas broad sectors are utilized for reporting purposes.
‡ Rate shown is the 7-day effective yield as of September 30, 2014.
ADR — American Depositary Receipt
Cl — Class
The accompanying notes are an integral part of the financial statements.
TURNER FUNDS 2014 ANNUAL REPORT 27
Turner Midcap Growth Fund
September 30, 2014
| | | Shares | | Value
(000) | |
Common stock—98.2%† | |
Consumer discretionary—22.2% | |
Advance Auto Parts | | | 37,390 | | | $ | 4,872 | | |
BorgWarner | | | 75,810 | | | | 3,988 | | |
Chipotle Mexican Grill* | | | 6,600 | | | | 4,399 | | |
Dunkin' Brands Group | | | 74,550 | | | | 3,341 | | |
HomeAway* | | | 145,240 | | | | 5,156 | | |
Kate Spade* | | | 129,170 | | | | 3,388 | | |
Netflix* | | | 11,900 | | | | 5,370 | | |
Polaris Industries | | | 35,940 | | | | 5,384 | | |
PVH | | | 29,000 | | | | 3,513 | | |
Starwood Hotels & Resorts
Worldwide | | | 55,610 | | | | 4,627 | | |
TripAdvisor* | | | 57,300 | | | | 5,239 | | |
Wynn Resorts | | | 20,525 | | | | 3,840 | | |
Total Consumer discretionary | | | | | 53,117 | | |
Consumer staples—6.9% | |
Hershey | | | 19,440 | | | | 1,855 | | |
Kroger | | | 60,340 | | | | 3,138 | | |
Mead Johnson Nutrition, Cl A | | | 46,480 | | | | 4,472 | | |
WhiteWave Foods, Cl A* | | | 191,700 | | | | 6,965 | | |
Total Consumer staples | | | | | 16,430 | | |
Energy—3.7% | |
Cabot Oil & Gas | | | 72,420 | | | | 2,367 | | |
Concho Resources* | | | 30,118 | | | | 3,777 | | |
Memorial Resource
Development* | | | 97,460 | | | | 2,642 | | |
Total Energy | | | | | 8,786 | | |
Financials—8.3% | |
Affiliated Managers Group* | | | 29,600 | | | | 5,930 | | |
Aon | | | 47,600 | | | | 4,173 | | |
Atlas Mara Co-Nvest* | | | 4,040 | | | | 40 | | |
Moody's | | | 60,030 | | | | 5,673 | | |
Signature Bank* | | | 36,650 | | | | 4,107 | | |
Total Financials | | | | | 19,923 | | |
Health care—16.7% | |
Actavis* | | | 8,240 | | | | 1,988 | | |
Alexion Pharmaceuticals* | | | 46,414 | | | | 7,697 | | |
AmerisourceBergen, Cl A | | | 51,740 | | | | 4,000 | | |
Cooper | | | 23,370 | | | | 3,640 | | |
Cubist Pharmaceuticals* | | | 64,700 | | | | 4,292 | | |
HCA Holdings* | | | 47,950 | | | | 3,381 | | |
| | | Shares | | Value
(000) | |
Intercept Pharmaceuticals* | | | 15,740 | | | $ | 3,726 | | |
Jazz Pharmaceuticals* | | | 31,360 | | | | 5,035 | | |
Mylan* | | | 52,210 | | | | 2,375 | | |
NPS Pharmaceuticals* | | | 14,130 | | | | 367 | | |
Regeneron Pharmaceuticals* | | | 9,260 | | | | 3,338 | | |
Total Health care | | | | | 39,839 | | |
Industrials—6.0% | |
AMETEK | | | 38,450 | | | | 1,931 | | |
Delta Air Lines | | | 108,820 | | | | 3,934 | | |
Roper Industries | | | 34,380 | | | | 5,029 | | |
United Rentals* | | | 31,360 | | | | 3,484 | | |
Total Industrials | | | | | 14,378 | | |
Information technology—25.8% | |
Alliance Data Systems* | | | 27,880 | | | | 6,922 | | |
Applied Materials | | | 166,810 | | | | 3,605 | | |
Avago Technologies | | | 87,130 | | | | 7,580 | | |
Cavium*^ | | | 153,339 | | | | 7,626 | | |
KLA-Tencor | | | 45,760 | | | | 3,605 | | |
LinkedIn, Cl A* | | | 23,080 | | | | 4,796 | | |
Monolithic Power Systems | | | 11,720 | | | | 516 | | |
NXP Semiconductors* | | | 161,000 | | | | 11,017 | | |
Proofpoint* | | | 18,830 | | | | 699 | | |
RF Micro Devices* | | | 306,930 | | | | 3,542 | | |
ServiceNow* | | | 87,410 | | | | 5,138 | | |
Sunedison* | | | 114,430 | | | | 2,160 | | |
Workday, Cl A* | | | 52,932 | | | | 4,367 | | |
Total Information technology | | | | | 61,573 | | |
Materials—6.3% | |
International Flavors &
Fragrances | | | 29,640 | | | | 2,842 | | |
Methanex^ | | | 86,940 | | | | 5,807 | | |
PolyOne | | | 82,970 | | | | 2,952 | | |
PPG Industries | | | 17,830 | | | | 3,508 | | |
Total Materials | | | | | 15,109 | | |
Telecommunication services—2.3% | |
SBA Communications, Cl A* | | | 49,830 | | | | 5,526 | | |
Total Telecommunication
services | | | | | 5,526 | | |
Total Common stock
(Cost $184,462)** | | | | | 234,681 | | |
28 TURNER FUNDS 2014 ANNUAL REPORT
Schedule of investments
Turner Midcap Growth Fund
| | | Shares | | Value
(000) | |
Warrant—0.0% | |
Financials—0.0% | |
Atlas Mara Co-Nvest* | | | 65,000 | | | $ | 65 | | |
Total Financials | | | | | 65 | | |
Total Warrant
(Cost $12)** | | | | | 65 | | |
Cash equivalent—7.3% | |
BlackRock Liquidity Funds
TempCash Portfolio,
Dollar Shares, 0.078%‡ (1) | | | 17,321,087 | | | | 17,321 | | |
Total Cash equivalent
(Cost $17,321)** | | | | | 17,321 | | |
Total Investments—105.5%
(Cost $201,795)** | | | | | 252,067 | | |
Net Other assets (liabilities)—(5.5)% | | | | | (13,166 | ) | |
Net Assets—100.0% | | | | $ | 238,901 | | |
* Non-income producing security.
** This number is listed in thousands.
(1) A portion of the Fund's position in this security was purchased with cash collateral received from securities lending. The total value of such security at September 30, 2014 was $13,092**.
^ Security fully or partially on loan at September 30, 2014. The total value of securities on loan at September 30, 2014 was $12,535**.
† More narrow industries are utilized for compliance purposes, whereas broad sectors are utilized for reporting purposes.
‡ Rate shown is the 7-day effective yield as of September 30, 2014.
Cl — Class
The accompanying notes are an integral part of the financial statements.
TURNER FUNDS 2014 ANNUAL REPORT 29
Turner Small Cap Growth Fund
September 30, 2014
| | | Shares | | Value
(000) | |
Common stock—100.7%† | |
Consumer discretionary—17.5% | |
Brunswick | | | 25,290 | | | $ | 1,066 | | |
Burlington Stores* | | | 44,271 | | | | 1,765 | | |
Chuy's Holdings*^ | | | 57,720 | | | | 1,812 | | |
Core-Mark Holding | | | 41,840 | | | | 2,219 | | |
del Frisco's Restaurant Group* | | | 15,370 | | | | 294 | | |
Five Below*^ | | | 32,700 | | | | 1,295 | | |
Gentherm* | | | 32,280 | | | | 1,363 | | |
G-III Apparel Group* | | | 27,190 | | | | 2,253 | | |
HomeAway* | | | 31,160 | | | | 1,106 | | |
Kate Spade* | | | 9,950 | | | | 261 | | |
Lumber Liquidators Holdings* | | | 22,700 | | | | 1,303 | | |
Restoration Hardware Holdings* | | | 18,750 | | | | 1,492 | | |
Skechers U.S.A., Cl A* | | | 36,670 | | | | 1,955 | | |
Tenneco* | | | 11,670 | | | | 610 | | |
Vince Holding* | | | 48,690 | | | | 1,473 | | |
Zoe's Kitchen*^ | | | 82,390 | | | | 2,534 | | |
Total Consumer discretionary | | | | | 22,801 | | |
Consumer staples—2.3% | |
Boston Beer, Cl A* | | | 5,780 | | | | 1,282 | | |
Boulder Brands* | | | 60,900 | | | | 830 | | |
Inventure Foods* | | | 65,100 | | | | 844 | | |
Total Consumer staples | | | | | 2,956 | | |
Energy—7.5% | |
Chesapeake Lodging Trust | | | 25,620 | | | | 747 | | |
Diamondback Energy* | | | 31,750 | | | | 2,374 | | |
Forum Energy Technologies* | | | 56,110 | | | | 1,718 | | |
Green Plains Renewable Energy | | | 39,690 | | | | 1,484 | | |
Penn-Virginia*^ | | | 201,551 | | | | 2,561 | | |
SemGroup, Cl A | | | 10,010 | | | | 834 | | |
Total Energy | | | | | 9,718 | | |
Financials—7.3% | |
Bank of the Ozarks^ | | | 72,210 | | | | 2,275 | | |
Essent Group* | | | 105,070 | | | | 2,250 | | |
Evercore Partners | | | 6,350 | | | | 298 | | |
FXCM, Cl A | | | 83,950 | | | | 1,331 | | |
Janus Capital Group | | | 77,620 | | | | 1,129 | | |
Kennedy-Wilson Holdings | | | 92,780 | | | | 2,223 | | |
Total Financials | | | | | 9,506 | | |
| | | Shares | | Value
(000) | |
Health care—26.4% | |
Acadia Healthcare* | | | 38,430 | | | $ | 1,864 | | |
Aegerion Pharmaceuticals* | | | 44,890 | | | | 1,498 | | |
Akorn* | | | 55,830 | | | | 2,025 | | |
Biodelivery Sciences
International* | | | 125,340 | | | | 2,142 | | |
Cepheid*^ | | | 45,460 | | | | 2,002 | | |
DepoMed* | | | 147,240 | | | | 2,237 | | |
Dexcom* | | | 47,970 | | | | 1,918 | | |
Dyax* | | | 52,260 | | | | 529 | | |
Exact Sciences* | | | 80,500 | | | | 1,560 | | |
ExamWorks Group* | | | 56,480 | | | | 1,850 | | |
Horizon Pharma* | | | 172,250 | | | | 2,115 | | |
Keryx Biopharmaceuticals*^ | | | 67,800 | | | | 932 | | |
LDR Holding* | | | 71,300 | | | | 2,220 | | |
LifePoint Hospitals* | | | 18,700 | | | | 1,294 | | |
NPS Pharmaceuticals* | | | 18,730 | | | | 487 | | |
Pacira Pharmaceuticals*^ | | | 19,630 | | | | 1,903 | | |
Puma Biotechnology*^ | | | 8,330 | | | | 1,987 | | |
Receptos* | | | 16,740 | | | | 1,040 | | |
Team Health Holdings* | | | 44,220 | | | | 2,563 | | |
The Medicines* | | | 21,520 | | | | 480 | | |
Veeva Systems, Cl A* | | | 61,620 | | | | 1,736 | | |
Total Health care | | | | | 34,382 | | |
Industrials—9.3% | |
Greenbrier | | | 29,210 | | | | 2,143 | | |
H&E Equipment Services | | | 47,742 | | | | 1,923 | | |
Proto Labs*^ | | | 25,940 | | | | 1,790 | | |
Rexnord* | | | 63,660 | | | | 1,811 | | |
Saia* | | | 42,050 | | | | 2,084 | | |
Spirit Airlines* | | | 23,140 | | | | 1,600 | | |
Tutor Perini* | | | 29,340 | | | | 775 | | |
Total Industrials | | | | | 12,126 | | |
Information technology—25.1% | |
Cavium* | | | 55,130 | | | | 2,742 | | |
Cognex*^ | | | 46,040 | | | | 1,854 | | |
Constant Contact* | | | 45,420 | | | | 1,233 | | |
Cornerstone OnDemand*^ | | | 28,340 | | | | 975 | | |
Demandware*^ | | | 39,670 | | | | 2,020 | | |
Digimarc^ | | | 98,010 | | | | 2,030 | | |
Envestnet* | | | 36,650 | | | | 1,649 | | |
Guidewire Software*^ | | | 45,220 | | | | 2,005 | | |
Integrated Device Technology* | | | 127,990 | | | | 2,041 | | |
30 TURNER FUNDS 2014 ANNUAL REPORT
Schedule of investments
Turner Small Cap Growth Fund
| | | Shares | | Value
(000) | |
Monolithic Power Systems | | | 50,460 | | | $ | 2,223 | | |
Proofpoint*^ | | | 80,870 | | | | 3,005 | | |
RF Micro Devices* | | | 228,630 | | | | 2,638 | | |
Sunedison* | | | 50,390 | | | | 951 | | |
Synaptics* | | | 32,920 | | | | 2,410 | | |
The Ultimate Software Group*^ | | | 16,010 | | | | 2,266 | | |
Trulia* | | | 15,180 | | | | 742 | | |
Wex* | | | 16,980 | | | | 1,873 | | |
Total Information technology | | | | | 32,657 | | |
Materials—5.3% | |
Graphic Packaging Holding* | | | 109,170 | | | | 1,357 | | |
Platform Specialty Products* | | | 74,880 | | | | 1,874 | | |
PolyOne | | | 37,350 | | | | 1,329 | | |
Senomyx*^ | | | 161,930 | | | | 1,328 | | |
US Silica Holdings | | | 15,620 | | | | 976 | | |
Total Materials | | | | | 6,864 | | |
Total Common stock
(Cost $110,491)** | | | | | 131,010 | | |
Cash equivalent—17.1% | |
BlackRock Liquidity Funds
TempCash Portfolio,
Dollar Shares, 0.078%‡ (1) | | | 22,224,348 | | | | 22,224 | | |
Total Cash equivalent
(Cost $22,224)** | | | | | 22,224 | | |
Total Investments—117.8%
(Cost $132,715)** | | | | | 153,234 | | |
Net Other assets (liabilities)—(17.8)% | | | | | (23,149 | ) | |
Net Assets—100.0% | | | | $ | 130,085 | | |
* Non-income producing security.
** This number is listed in thousands.
(1) A portion of the Fund's position in this security was purchased with cash collateral received from securities lending. The total value of such security at September 30, 2014 was $21,438**.
^ Security fully or partially on loan at September 30, 2014. The total value of securities on loan at September 30, 2014 was $20,720**.
† More narrow industries are utilized for compliance purposes, whereas broad sectors are utilized for reporting purposes.
‡ Rate shown is the 7-day effective yield as of September 30, 2014.
Cl — Class
The accompanying notes are an integral part of the financial statements.
TURNER FUNDS 2014 ANNUAL REPORT 31
Statements of assets and liabilities (000)
September 30, 2014
| | | Turner
Medical Sciences
Long/Short
Fund | | Turner
Spectrum
Fund | | Turner
Titan
Fund | | Turner
Emerging
Growth Fund | |
Assets: | |
Investment securities, at cost | | $ | 43,589 | | | $ | 125,677 | | | $ | 9,457 | | | $ | 144,768 | | |
Investment securities, at value | | $ | 46,770 | | | $ | 134,429 | | | $ | 10,055 | | | $ | 170,717 | * | |
Cash | | | — | | | | 12,855 | | | | — | | | | — | | |
Deposits with brokers for securities sold short | | | 13,442 | | | | 67,228 | | | | 5,759 | | | | — | | |
Foreign currency, at value | | | — | | | | 3 | | | | — | | | | — | | |
Receivable for investment securities sold | | | 1,454 | | | | 9,494 | | | | 766 | | | | 150 | | |
Receivable for capital shares sold | | | 207 | | | | 18 | | | | — | | | | 39 | | |
Prepaid expenses | | | 19 | | | | 41 | | | | 12 | | | | 40 | | |
Receivable for dividend income | | | 4 | | | | 47 | | | | 4 | | | | 75 | | |
Receivable from investment adviser | | | 79 | | | | — | | | | — | | | | — | | |
Reclaim receivable | | | 3 | | | | 3 | | | | 1 | | | | — | | |
Total assets | | | 61,978 | | | | 224,118 | | | | 16,597 | | | | 171,021 | | |
Liabilities: | |
Securities sold short, at proceeds | | | 22,747 | | | | 76,749 | | | | 5,549 | | | | — | | |
Securities sold short, at value | | | 22,979 | | | | 74,677 | | | | 5,380 | | | | — | | |
Foreign currency overdraft, at value | | | 3 | | | | — | | | | — | | | | — | | |
Payable for investment securities purchased | | | 2,075 | | | | 10,388 | | | | 752 | | | | — | | |
Obligation to return securities lending collateral | | | — | | | | — | | | | — | | | | 27,771 | | |
Payable for capital shares redeemed | | | 18 | | | | 166 | | | | — | | | | 279 | | |
Dividends payable on securities sold short (Note 2) | | | 89 | | | | 66 | | | | 5 | | | | — | | |
Payable due to investment adviser | | | — | | | | 79 | | | | 5 | | | | 49 | | |
Payable due to administrator | | | 3 | | | | 13 | | | | 1 | | | | 12 | | |
Payable due to shareholder servicing | | | 2 | | | | 4 | | | | — | | | | 25 | | |
Payable due to distributor | | | 2 | | | | 2 | | | | — | | | | — | | |
Payable due to transfer agent | | | 3 | | | | 20 | | | | 1 | | | | 17 | | |
Payable due to custodian | | | 7 | | | | 32 | | | | 7 | | | | 5 | | |
Other accrued expenses | | | 14 | | | | 93 | | | | 6 | | | | 91 | | |
Total liabilities | | | 25,195 | | | | 85,540 | | | | 6,157 | | | | 28,249 | | |
Net assets | | $ | 36,783 | | | $ | 138,578 | | | $ | 10,440 | | | $ | 142,772 | | |
*Includes market value of securities on loan | | $ | — | | | $ | — | | | $ | — | | | $ | 27,002 | | |
Net assets: | |
Portfolio capital | | $ | 33,575 | | | $ | 116,054 | | | $ | 8,465 | | | $ | 59,452 | | |
Distributions in excess of investment income | | | — | | | | (6,550 | ) | | | — | | | | 24 | | |
Accumulated net realized gain (loss) from investments, securities sold short, written options
and foreign currency transactions | | | 259 | | | | 18,251 | | | | 1,208 | | | | 57,347 | | |
Net unrealized appreciation on investments, securities sold short, foreign
currencies and translation of other assets and liabilities denominated in foreign currencies | | | 2,949 | | | | 10,823 | | | | 767 | | | | 25,949 | | |
Net assets | | $ | 36,783 | | | $ | 138,578 | | | $ | 10,440 | | | $ | 142,772 | | |
Outstanding shares of beneficial interest — Institutional Class Shares (1) | | | 2,091 | | | | 10,044 | | | | 843 | | | | 473 | | |
Outstanding shares of beneficial interest — Investor Class Shares (1) | | | 452 | | | | 1,327 | | | | 49 | | | | 2,174 | | |
Outstanding shares of beneficial interest — Class C Shares (1) | | | 227 | | | | 257 | | | | 23 | | | | — | | |
Outstanding shares of beneficial interest — Retirement Class Shares (1) | | | — | | | | — | | | | — | | | | — | | |
Net assets — Institutional Class Shares | | $ | 27,884 | | | $ | 120,032 | | | $ | 9,633 | | | $ | 25,912 | | |
Net assets — Investor Class Shares | | $ | 5,974 | | | $ | 15,630 | | | $ | 551 | | | $ | 116,860 | | |
Net assets — Class C Shares | | $ | 2,925 | | | $ | 2,916 | | | $ | 256 | | | $ | — | | |
Net assets — Retirement Class Shares | | $ | — | | | $ | — | | | $ | — | | | $ | — | | |
Net asset value, offering and redemption price per share — Institutional Class Shares | | $ | 13.33 | † | | $ | 11.95 | | | $ | 11.43 | | | $ | 54.75 | † | |
Net asset value, offering and redemption price per share — Investor Class Shares | | $ | 13.23 | † | | $ | 11.78 | | | $ | 11.32 | † | | $ | 53.75 | | |
Net asset value, offering and redemption price per share — Class C Shares | | $ | 12.87 | † | | $ | 11.36 | † | | $ | 11.00 | † | | $ | — | | |
Net asset value, offering and redemption price per share — Retirement Class Shares | | $ | — | | | $ | — | | | $ | — | | | $ | — | | |
32 TURNER FUNDS 2014 ANNUAL REPORT
| | | Turner
Large
Growth Fund | | Turner
Midcap
Growth Fund | | Turner
Small Cap
Growth Fund | |
Assets: | |
Investment securities, at cost | | $ | 32,739 | | | $ | 201,795 | | | $ | 132,715 | | |
Investment securities, at value | | $ | 38,997 | * | | $ | 252,067 | * | | $ | 153,234 | * | |
Cash | | | — | | | | — | | | | — | | |
Deposits with brokers for securities sold short | | | — | | | | — | | | | — | | |
Foreign currency, at value | | | — | | | | — | | | | — | | |
Receivable for investment securities sold | | | 388 | | | | 97 | | | | 1,476 | | |
Receivable for capital shares sold | | | 45 | | | | 111 | | | | 48 | | |
Prepaid expenses | | | 15 | | | | 65 | | | | 27 | | |
Receivable for dividend income | | | 17 | | | | 37 | | | | 34 | | |
Receivable from investment adviser | | | — | | | | — | | | | — | | |
Reclaim receivable | | | — | | | | — | | | | — | | |
Total assets | | | 39,462 | | | | 252,377 | | | | 154,819 | | |
Liabilities: | |
Securities sold short, at proceeds | | | — | | | | — | | | | — | | |
Securities sold short, at value | | | — | | | | — | | | | — | | |
Foreign currency overdraft, at value | | | — | | | | — | | | | — | | |
Payable for investment securities purchased | | | — | | | | — | | | | 1,818 | | |
Obligation to return securities lending collateral | | | 1,463 | | | | 13,092 | | | | 21,438 | | |
Payable for capital shares redeemed | | | 7 | | | | 69 | | | | 1,305 | | |
Dividends payable on securities sold short (Note 2) | | | — | | | | — | | | | — | | |
Payable due to investment adviser | | | 7 | | | | 71 | | | | 41 | | |
Payable due to administrator | | | 2 | | | | 33 | | | | 11 | | |
Payable due to shareholder servicing | | | 4 | | | | 41 | | | | 29 | | |
Payable due to distributor | | | — | | | | 1 | | | | — | | |
Payable due to transfer agent | | | 5 | | | | 27 | | | | 12 | | |
Payable due to custodian | | | 3 | | | | 6 | | | | 8 | | |
Other accrued expenses | | | 22 | | | | 136 | | | | 72 | | |
Total liabilities | | | 1,513 | | | | 13,476 | | | | 24,734 | | |
Net assets | | $ | 37,949 | | | $ | 238,901 | | | $ | 130,085 | | |
*Includes market value of securities on loan | | $ | 1,425 | | | $ | 12,535 | | | $ | 20,720 | | |
Net assets: | |
Portfolio capital | | $ | 82,223 | | | $ | 106,091 | | | $ | 69,331 | | |
Distributions in excess of investment income | | | 76 | | | | — | | | | (1,087 | ) | |
Accumulated net realized gain (loss) from investments, securities sold short, written options
and foreign currency transactions | | | (50,608 | ) | | | 82,538 | | | | 41,322 | | |
Net unrealized appreciation on investments, securities sold short, foreign
currencies and translation of other assets and liabilities denominated in foreign currencies | | | 6,258 | | | | 50,272 | | | | 20,519 | | |
Net assets | | $ | 37,949 | | | $ | 238,901 | | | $ | 130,085 | | |
Outstanding shares of beneficial interest — Institutional Class Shares (1) | | | 1,015 | | | | 1,199 | | | | — | | |
Outstanding shares of beneficial interest — Investor Class Shares (1) | | | 1,208 | | | | 4,974 | | | | 3,494 | | |
Outstanding shares of beneficial interest — Class C Shares (1) | | | — | | | | — | | | | — | | |
Outstanding shares of beneficial interest — Retirement Class Shares (1) | | | — | | | | 131 | | | | — | | |
Net assets — Institutional Class Shares | | $ | 17,433 | | | $ | 46,253 | | | $ | — | | |
Net assets — Investor Class Shares | | $ | 20,516 | | | $ | 187,974 | | | $ | 130,085 | | |
Net assets — Class C Shares | | $ | — | | | $ | — | | | $ | — | | |
Net assets — Retirement Class Shares | | $ | — | | | $ | 4,674 | | | $ | — | | |
Net asset value, offering and redemption price per share — Institutional Class Shares | | $ | 17.18 | | | $ | 38.57 | † | | $ | — | | |
Net asset value, offering and redemption price per share — Investor Class Shares | | $ | 16.99 | † | | $ | 37.79 | | | $ | 37.23 | | |
Net asset value, offering and redemption price per share — Class C Shares | | $ | — | | | $ | — | | | $ | — | | |
Net asset value, offering and redemption price per share — Retirement Class Shares | | $ | — | | | $ | 35.75 | † | | $ | — | | |
(1) Unlimited authorization — par value $0.00001.
† Differences in net asset value recalculation and net asset value stated are caused by rounding differences.
Amounts designated as "—" are either not applicable, $0, or have been rounded to $0.
The accompanying notes are an integral part of the financial statements.
TURNER FUNDS 2014 ANNUAL REPORT 33
Statements of operations (000)
| | | Turner
Medical Sciences
Long/Short
Fund | | Turner
Spectrum
Fund | | Turner
Titan
Fund | | Turner
Emerging
Growth Fund | |
| | | year ended
9/30/14 | | year ended
9/30/14 | | year ended
9/30/14 | | year ended
9/30/14 | |
Investment income: | |
Dividend | | $ | 185 | | | $ | 2,331 | | | $ | 197 | | | $ | 620 | | |
Securities lending | | | — | | | | — | | | | — | | | | 294 | | |
Foreign taxes withheld | | | (5 | ) | | | (30 | ) | | | — | | | | (1 | ) | |
Total investment income | | | 180 | | | | 2,301 | | | | 197 | | | | 913 | | |
Expenses: | |
Investment advisory fees | | | 552 | | | | 4,649 | | | | 316 | | | | 2,319 | | |
Administration fees | | | 55 | | | | 462 | | | | 31 | | | | 345 | | |
Shareholder service fees (1) | | | 31 | | | | 76 | | | | 1 | | | | 410 | | |
Shareholder service fees (2) | | | 6 | | | | 10 | | | | — | | | | — | | |
Shareholder service fees (3) | | | — | | | | — | | | | — | | | | — | | |
Distribution fees (2) | | | 18 | | | | 31 | | | | 1 | | | | — | | |
Distribution fees (3) | | | — | | | | — | | | | — | | | | — | | |
Accounting agent fees | | | 8 | | | | 15 | | | | 4 | | | | 2 | | |
Dividend expense | | | 60 | | | | 1,241 | | | | 42 | | | | — | | |
Broker fees and charges on short sales | | | 467 | | | | 1,350 | | | | 96 | | | | — | | |
Custodian fees | | | 27 | | | | 160 | | | | 20 | | | | 17 | | |
Transfer agent fees | | | 30 | | | | 270 | | | | 17 | | | | 163 | | |
Registration fees | | | 37 | | | | 66 | | | | 36 | | | | 50 | | |
Professional fees | | | 24 | | | | 154 | | | | 11 | | | | 143 | | |
Trustees' fees | | | 14 | | | | 107 | | | | 8 | | | | 97 | | |
Insurance and other fees | | | 24 | | | | 239 | | | | 17 | | | | 152 | | |
Total expenses | | | 1,353 | | | | 8,830 | | | | 600 | | | | 3,698 | | |
Less: | |
Investment advisory fee waiver | | | (586 | ) | | | (2,769 | ) | | | (192 | ) | | | (631 | ) | |
Net expenses | | | 767 | | | | 6,061 | | | | 408 | | | | 3,067 | | |
Net investment income (loss) | | | (587 | ) | | | (3,760 | ) | | | (211 | ) | | | (2,154 | ) | |
Net realized gain from securities sold | | | 6,364 | | | | 104,679 | | | | 4,875 | | | | 74,679 | | |
Net realized loss from securities sold short | | | (3,959 | ) | | | (42,941 | ) | | | (1,582 | ) | | | — | | |
Net realized gain on written options contracts | | | — | | | | 207 | | | | — | | | | — | | |
Net realized loss on foreign currency transactions | | | (2 | ) | | | (58 | ) | | | (2 | ) | | | — | | |
Net change in unrealized appreciation (depreciation) on investments | | | 1,239 | | | | (50,334 | ) | | | (1,275 | ) | | | (70,983 | ) | |
Net change in unrealized appreciation (depreciation) on securities sold short | | | 308 | | | | 11,950 | | | | 231 | | | | — | | |
Net change in unrealized appreciation (depreciation) on written options contracts | | | — | | | | (31 | ) | | | — | | | | — | | |
Net change in unrealized appreciation (depreciation) on foreign currencies and translation of
other assets and liabilities denominated in foreign currencies | | | — | | | | 2 | | | | — | | | | — | | |
Net realized and unrealized gain from investments, options and foreign currencies | | | 3,950 | | | | 23,474 | | | | 2,247 | | | | 3,696 | | |
Net increase in net assets resulting from operations | | $ | 3,363 | | | $ | 19,714 | | | $ | 2,036 | | | $ | 1,542 | | |
34 TURNER FUNDS 2014 ANNUAL REPORT
| | | Turner
Large
Growth Fund | | Turner
Midcap
Growth Fund | | Turner
Small Cap
Growth Fund | |
| | | year ended
9/30/14 | | year ended
9/30/14 | | year ended
9/30/14 | |
Investment income: | |
Dividend | | $ | 425 | | | $ | 2,546 | | | $ | 731 | | |
Securities lending | | | 48 | | | | 79 | | | | 100 | | |
Foreign taxes withheld | | | (2 | ) | | | (8 | ) | | | — | | |
Total investment income | | | 471 | | | | 2,617 | | | | 831 | | |
Expenses: | |
Investment advisory fees | | | 297 | | | | 2,702 | | | | 1,980 | | |
Administration fees | | | 74 | | | | 536 | | | | 294 | | |
Shareholder service fees (1) | | | 56 | | | | 577 | | | | 495 | | |
Shareholder service fees (2) | | | — | | | | — | | | | — | | |
Shareholder service fees (3) | | | — | | | | 12 | | | | — | | |
Distribution fees (2) | | | — | | | | — | | | | — | | |
Distribution fees (3) | | | — | | | | 12 | | | | — | | |
Accounting agent fees | | | 1 | | | | 1 | | | | 1 | | |
Dividend expense | | | — | | | | — | | | | — | | |
Broker fees and charges on short sales | | | — | | | | — | | | | — | | |
Custodian fees | | | 9 | | | | 58 | | | | 42 | | |
Transfer agent fees | | | 36 | | | | 272 | | | | 126 | | |
Registration fees | | | 28 | | | | 55 | | | | 23 | | |
Professional fees | | | 22 | | | | 210 | | | | 117 | | |
Trustees' fees | | | 13 | | | | 139 | | | | 76 | | |
Insurance and other fees | | | 29 | | | | 235 | | | | 128 | | |
Total expenses | | | 565 | | | | 4,809 | | | | 3,282 | | |
Less: | |
Investment advisory fee waiver | | | (168 | ) | | | (864 | ) | | | (811 | ) | |
Net expenses | | | 397 | | | | 3,945 | | | | 2,471 | | |
Net investment income (loss) | | | 74 | | | | (1,328 | ) | | | (1,640 | ) | |
Net realized gain from securities sold | | | 15,713 | | | | 104,546 | | | | 48,313 | | |
Net realized loss from securities sold short | | | — | | | | — | | | | — | | |
Net realized gain on written options contracts | | | — | | | | — | | | | — | | |
Net realized loss on foreign currency transactions | | | — | | | | — | | | | — | | |
Net change in unrealized appreciation (depreciation) on investments | | | (5,664 | ) | | | (59,603 | ) | | | (44,329 | ) | |
Net change in unrealized appreciation (depreciation) on securities sold short | | | — | | | | — | | | | — | | |
Net change in unrealized appreciation (depreciation) on written options contracts | | | — | | | | — | | | | — | | |
Net change in unrealized appreciation (depreciation) on foreign currencies and translation of
other assets and liabilities denominated in foreign currencies | | | — | | | | — | | | | — | | |
Net realized and unrealized gain from investments, options and foreign currencies | | | 10,049 | | | | 44,943 | | | | 3,984 | | |
Net increase in net assets resulting from operations | | $ | 10,123 | | | $ | 43,615 | | | $ | 2,344 | | |
(1) Attributable to Investor Class Shares only.
(2) Attributable to Class C Shares only.
(3) Attributable to Retirement Class Shares only.
Amounts designated as "—" are either not applicable, $0, or have been rounded to $0.
The accompanying notes are an integral part of the financial statements.
TURNER FUNDS 2014 ANNUAL REPORT 35
Statements of changes in net assets (000)
| | | Turner
Medical Sciences
Long/Short
Fund | | Turner
Spectrum
Fund | |
| | | year ended
9/30/14 | | year ended
9/30/13 | | year ended
9/30/14 | | year ended
9/30/13 | |
Investment activities: | |
Net investment loss | | $ | (587 | ) | | $ | (393 | ) | | $ | (3,760 | ) | | $ | (5,419 | ) | |
Net realized gain from securities sold and securities sold short | | | 2,405 | | | | 3,301 | | | | 61,738 | | | | 22,449 | | |
Net realized gain on written options contracts | | | — | | | | — | | | | 207 | | | | 65 | | |
Net realized loss on foreign currency transactions | | | (2 | ) | | | (6 | ) | | | (58 | ) | | | (284 | ) | |
Net change in unrealized appreciation (depreciation) on investments and securities sold short | | | 1,547 | | | | (397 | ) | | | (38,384 | ) | | | 16,276 | | |
Net change in unrealized appreciation (depreciation) on written options contracts | | | — | | | | — | | | | (31 | ) | | | 31 | | |
Net change in unrealized appreciation (depreciation) on foreign currencies and translation of
other assets and liabilities denominated in foreign currencies | | | — | | | | 2 | | | | 2 | | | | (2 | ) | |
Net increase in net assets resulting from operations | | | 3,363 | | | | 2,507 | | | | 19,714 | | | | 33,116 | | |
Dividends and distributions to shareholders: | |
Realized capital gains: | |
Institutional Class Shares | | | (524 | ) | | | — | | | | — | | | | — | | |
Investor Class Shares | | | (145 | ) | | | — | | | | — | | | | — | | |
Class C Shares | | | (47 | ) | | | — | | | | — | | | | — | | |
Total dividends and distributions | | | (716 | ) | | | — | | | | — | | | | — | | |
Capital share transactions: | |
Institutional Class Shares | |
Proceeds from shares issued | | | 33,366 | | | | 2,380 | | | | 82,515 | | | | 295,417 | | |
Proceeds from shares issued in lieu of cash distributions | | | 472 | | | | — | | | | — | | | | — | | |
Cost of shares redeemed | | | (25,607 | ) | | | (24,867 | ) | | | (462,399 | ) | | | (676,075 | ) | |
Net increase (decrease) in net assets from Institutional Class Shares transactions | | | 8,231 | | | | (22,487 | ) | | | (379,884 | ) | | | (380,658 | ) | |
Investor Class Shares | |
Proceeds from shares issued | | | 31,610 | | | | 548 | | | | 4,871 | | | | 23,320 | | |
Proceeds from shares issued in lieu of cash distributions | | | 141 | | | | — | | | | — | | | | — | | |
Cost of shares redeemed | | | (28,345 | ) | | | (7,356 | ) | | | (34,856 | ) | | | (108,927 | ) | |
Net increase (decrease) in net assets from Investor Class Shares transactions | | | 3,406 | | | | (6,808 | ) | | | (29,985 | ) | | | (85,607 | ) | |
Class C Shares | |
Proceeds from shares issued | | | 1,987 | | | | 361 | | | | 42 | | | | 351 | | |
Proceeds from shares issued in lieu of cash distributions | | | 42 | | | | — | | | | — | | | | — | | |
Cost of shares redeemed | | | (708 | ) | | | (2,007 | ) | | | (2,865 | ) | | | (5,427 | ) | |
Net increase (decrease) in net assets from Class C Shares transactions | | | 1,321 | | | | (1,646 | ) | | | (2,823 | ) | | | (5,076 | ) | |
Net increase (decrease) in net assets from capital share transactions | | | 12,958 | | | | (30,941 | ) | | | (412,692 | ) | | | (471,341 | ) | |
Total increase (decrease) in net assets | | | 15,605 | | | | (28,434 | ) | | | (392,978 | ) | | | (438,225 | ) | |
Net assets: | |
Beginning of year | | | 21,178 | | | | 49,612 | | | | 531,556 | | | | 969,781 | | |
End of year | | $ | 36,783 | | | $ | 21,178 | | | $ | 138,578 | | | $ | 531,556 | | |
Distributions in excess of net investment income | | $ | — | | | $ | (153 | ) | | $ | (6,550 | ) | | $ | (5,895 | ) | |
Share issued and redeemed: | |
Institutional Class Shares | |
Issued | | | 2,739 | | | | 228 | | | | 7,042 | | | | 26,718 | | |
Issued in lieu of cash distributions | | | 41 | | | | — | | | | — | | | | — | | |
Redeemed | | | (2,139 | ) | | | (2,419 | ) | | | (39,139 | ) | | | (61,031 | ) | |
Net increase (decrease) in Institutional Class Shares | | | 641 | | | | (2,191 | ) | | | (32,097 | ) | | | (34,313 | ) | |
Investor Class Shares | |
Issued | | | 2,555 | | | | 53 | | | | 419 | | | | 2,130 | | |
Issued in lieu of cash distributions | | | 12 | | | | — | | | | — | | | | — | | |
Redeemed | | | (2,382 | ) | | | (732 | ) | | | (2,998 | ) | | | (9,945 | ) | |
Net increase (decrease) in Investor Class Shares | | | 185 | | | | (679 | ) | | | (2,579 | ) | | | (7,815 | ) | |
Class C Shares | |
Issued | | | 163 | | | | 35 | | | | 4 | | | | 33 | | |
Issued in lieu of cash distributions | | | 4 | | | | — | | | | — | | | | — | | |
Redeemed | | | (62 | ) | | | (201 | ) | | | (254 | ) | | | (509 | ) | |
Net increase (decrease) in Class C Shares | | | 105 | | | | (166 | ) | | | (250 | ) | | | (476 | ) | |
Net increase (decrease) in share transactions | | | 931 | | | | (3,036 | ) | | | (34,926 | ) | | | (42,604 | ) | |
36 TURNER FUNDS 2014 ANNUAL REPORT
| | | Turner
Titan
Fund | | Turner
Emerging Growth
Fund | |
| | | year ended
9/30/14 | | year ended
9/30/13 | | year ended
9/30/14 | | year ended
9/30/13 | |
Investment activities: | |
Net investment loss | | $ | (211 | ) | | $ | (329 | ) | | $ | (2,154 | ) | | $ | (894 | ) | |
Net realized gain from securities sold and securities sold short | | | 3,293 | | | | 242 | | | | 74,679 | | | | 36,788 | | |
Net realized gain on written options contracts | | | — | | | | — | | | | — | | | | — | | |
Net realized loss on foreign currency transactions | | | (2 | ) | | | (6 | ) | | | — | | | | — | | |
Net change in unrealized appreciation (depreciation) on investments and securities sold short | | | (1,044 | ) | | | 814 | | | | (70,983 | ) | | | 29,719 | | |
Net change in unrealized appreciation (depreciation) on written options contracts | | | — | | | | — | | | | — | | | | — | | |
Net change in unrealized appreciation (depreciation) on foreign currencies and translation of
other assets and liabilities denominated in foreign currencies | | | — | | | | — | | | | — | | | | — | | |
Net increase in net assets resulting from operations | | | 2,036 | | | | 721 | | | | 1,542 | | | | 65,613 | | |
Dividends and distributions to shareholders: | |
Realized capital gains: | |
Institutional Class Shares | | | (275 | ) | | | (341 | ) | | | (11,300 | ) | | | (8,753 | ) | |
Investor Class Shares | | | (3 | ) | | | (20 | ) | | | (27,452 | ) | | | (24,111 | ) | |
Class C Shares | | | — | | | | (6 | ) | | | — | | | | — | | |
Total dividends and distributions | | | (278 | ) | | | (367 | ) | | | (38,752 | ) | | | (32,864 | ) | |
Capital share transactions: | |
Institutional Class Shares | |
Proceeds from shares issued | | | 9,298 | | | | 48,123 | | | | 12,449 | | | | 9,023 | | |
Proceeds from shares issued in lieu of cash distributions | | | 268 | | | | 334 | | | | 10,821 | | | | 8,473 | | |
Cost of shares redeemed | | | (22,824 | ) | | | (53,640 | ) | | | (59,692 | ) | | | (23,483 | ) | |
Net increase (decrease) in net assets from Institutional Class Shares transactions | | | (13,258 | ) | | | (5,183 | ) | | | (36,422 | ) | | | (5,987 | ) | |
Investor Class Shares | |
Proceeds from shares issued | | | 374 | | | | 202 | | | | 50,804 | | | | 24,834 | | |
Proceeds from shares issued in lieu of cash distributions | | | 3 | | | | 20 | | | | 26,301 | | | | 21,988 | | |
Cost of shares redeemed | | | (245 | ) | | | (4,711 | ) | | | (113,434 | ) | | | (59,232 | ) | |
Net increase (decrease) in net assets from Investor Class Shares transactions | | | 132 | | | | (4,489 | ) | | | (36,329 | ) | | | (12,410 | ) | |
Class C Shares | |
Proceeds from shares issued | | | 251 | | | | 286 | | | | — | | | | — | | |
Proceeds from shares issued in lieu of cash distributions | | | — | | | | 6 | | | | — | | | | — | | |
Cost of shares redeemed | | | (22 | ) | | | (775 | ) | | | — | | | | — | | |
Net increase (decrease) in net assets from Class C Shares transactions | | | 229 | | | | (483 | ) | | | — | | | | — | | |
Net increase (decrease) in net assets from capital share transactions | | | (12,897 | ) | | | (10,155 | ) | | | (72,751 | ) | | | (18,397 | ) | |
Total increase (decrease) in net assets | | | (11,139 | ) | | | (9,801 | ) | | | (109,961 | ) | | | 14,352 | | |
Net assets: | |
Beginning of year | | | 21,579 | | | | 31,380 | | | | 252,733 | | | | 238,381 | | |
End of year | | $ | 10,440 | | | $ | 21,579 | | | $ | 142,772 | | | $ | 252,733 | | |
Distributions in excess of net investment income | | $ | — | | | $ | (260 | ) | | $ | 24 | | | $ | (1,286 | ) | |
Share issued and redeemed: | |
Institutional Class Shares | |
Issued | | | 851 | | | | 4,796 | | | | 207 | | | | 166 | | |
Issued in lieu of cash distributions | | | 25 | | | | 34 | | | | 191 | | | | 177 | | |
Redeemed | | | (2,047 | ) | | | (5,338 | ) | | | (1,035 | ) | | | (436 | ) | |
Net increase (decrease) in Institutional Class Shares | | | (1,171 | ) | | | (508 | ) | | | (637 | ) | | | (93 | ) | |
Investor Class Shares | |
Issued | | | 34 | | | | 20 | | | | 855 | | | | 451 | | |
Issued in lieu of cash distributions | | | — | | | | 2 | | | | 471 | | | | 464 | | |
Redeemed | | | (22 | ) | | | (479 | ) | | | (1,952 | ) | | | (1,072 | ) | |
Net increase (decrease) in Investor Class Shares | | | 12 | | | | (457 | ) | | | (626 | ) | | | (157 | ) | |
Class C Shares | |
Issued | | | 22 | | | | 29 | | | | — | | | | — | | |
Issued in lieu of cash distributions | | | — | | | | 1 | | | | — | | | | — | | |
Redeemed | | | (2 | ) | | | (80 | ) | | | — | | | | — | | |
Net increase (decrease) in Class C Shares | | | 20 | | | | (50 | ) | | | — | | | | — | | |
Net increase (decrease) in share transactions | | | (1,139 | ) | | | (1,015 | ) | | | (1,263 | ) | | | (250 | ) | |
Amounts designated as "—" are either not applicable, $0, or have been rounded to $0.
The accompanying notes are an integral part of the financial statements.
TURNER FUNDS 2014 ANNUAL REPORT 37
Statements of changes in net assets (000)
| | | Turner
Large Growth
Fund | | Turner
Midcap Growth
Fund | |
| | | year ended
9/30/14 | | year ended
9/30/13 | | year ended
9/30/14 | | year ended
9/30/13 | |
Investment activities: | |
Net investment income (loss) | | $ | 74 | | | $ | 740 | | | $ | (1,328 | ) | | $ | (1,982 | ) | |
Net realized gain from securities sold | | | 15,713 | | | | 33,884 | | | | 104,546 | | | | 82,710 | | |
Net change in unrealized appreciation (depreciation) on investment transactions | | | (5,664 | ) | | | (19,979 | ) | | | (59,603 | ) | | | 19,404 | | |
Net increase in net assets resulting from operations | | | 10,123 | | | | 14,645 | | | | 43,615 | | | | 100,132 | | |
Dividends and distributions to shareholders: | |
Net investment income: | |
Institutional Class Shares | | | — | | | | (1,087 | ) | | | — | | | | — | | |
Investor Class Shares | | | — | | | | (92 | ) | | | — | | | | — | | |
Realized capital gains: | |
Institutional Class Shares | | | — | | | | — | | | | (33,824 | ) | | | (2,966 | ) | |
Investor Class Shares | | | — | | | | — | | | | (50,614 | ) | | | (5,108 | ) | |
Retirement Class Shares | | | — | | | | — | | | | (993 | ) | | | (72 | ) | |
Total dividends and distributions | | | — | | | | (1,179 | ) | | | (85,431 | ) | | | (8,146 | ) | |
Capital share transactions: | |
Institutional Class Shares | |
Proceeds from shares issued | | | 2,255 | | | | 14,890 | | | | 34,748 | | | | 59,903 | | |
Proceeds from shares issued in lieu of cash distributions | | | — | | | | 1,034 | | | | 27,598 | | | | 2,364 | | |
Cost of shares redeemed | | | (44,924 | ) | | | (172,365 | ) | | | (206,567 | ) | | | (131,596 | ) | |
Net decrease in net assets from Institutional Class Shares transactions | | | (42,669 | ) | | | (156,441 | ) | | | (144,221 | ) | | | (69,329 | ) | |
Investor Class Shares | |
Proceeds from shares issued | | | 4,946 | | | | 7,080 | | | | 66,808 | | | | 40,974 | | |
Proceeds from Fund acquisition (Notes 10 and 11) | | | — | | | | 15,614 | | | | 16,748 | | | | — | | |
Proceeds from shares issued in lieu of cash distributions | | | — | | | | 91 | | | | 48,868 | | | | 4,946 | | |
Cost of shares redeemed | | | (19,039 | ) | | | (44,134 | ) | | | (175,570 | ) | | | (245,432 | ) | |
Net decrease in net assets from Investor Class Shares transactions | | | (14,093 | ) | | | (21,349 | ) | | | (43,146 | ) | | | (199,512 | ) | |
Retirement Class Shares | |
Proceeds from shares issued | | | — | | | | — | | | | 513 | | | | 576 | | |
Proceeds from shares issued in lieu of cash distributions | | | — | | | | — | | | | 993 | | | | 72 | | |
Cost of shares redeemed | | | — | | | | — | | | | (576 | ) | | | (2,024 | ) | |
Net increase (decrease) in net assets from Retirement Class Shares transactions | | | — | | | | — | | | | 930 | | | | (1,376 | ) | |
Net decrease in net assets from capital share transactions | | | (56,762 | ) | | | (177,790 | ) | | | (186,437 | ) | | | (270,217 | ) | |
Total decrease in net assets | | | (46,639 | ) | | | (164,324 | ) | | | (228,253 | ) | | | (178,231 | ) | |
Net assets: | |
Beginning of year | | | 84,588 | | | | 248,912 | | | | 467,154 | | | | 645,385 | | |
End of year | | $ | 37,949 | | | $ | 84,588 | | | $ | 238,901 | | | $ | 467,154 | | |
Undistributed net investment income (accumulated net investment income) | | $ | 76 | | | $ | 10 | | | $ | — | | | $ | 1 | | |
Share issued and redeemed: | |
Institutional Class Shares | |
Issued | | | 139 | | | | 1,153 | | | | 882 | | | | 1,600 | | |
Issued in lieu of cash distributions | | | — | | | | 83 | | | | 778 | | | | 69 | | |
Redeemed | | | (2,801 | ) | | | (13,194 | ) | | | (5,197 | ) | | | (3,604 | ) | |
Net decrease in Institutional Class Shares | | | (2,662 | ) | | | (11,958 | ) | | | (3,537 | ) | | | (1,935 | ) | |
Investor Class Shares | |
Issued | | | 306 | | | | 546 | | | | 1,719 | | | | 1,098 | | |
Shares from Fund acquisition (Notes 10 and 11) | | | — | | | | 1,216 | | | | 427 | | | | — | | |
Issued in lieu of cash distributions | | | — | | | | 7 | | | | 1,403 | | | | 147 | | |
Redeemed | | | (1,202 | ) | | | (3,423 | ) | | | (4,578 | ) | | | (6,793 | ) | |
Net decrease in Investor Class Shares | | | (896 | ) | | | (1,654 | ) | | | (1,029 | ) | | | (5,548 | ) | |
Retirement Class Shares | |
Issued | | | — | | | | — | | | | 14 | | | | 17 | | |
Issued in lieu of cash distributions | | | — | | | | — | | | | 30 | | | | 2 | | |
Redeemed | | | — | | | | — | | | | (16 | ) | | | (59 | ) | |
Net increase (decrease) in Retirement Class Shares | | | — | | | | — | | | | 28 | | | | (40 | ) | |
Net decrease in share transactions | | | (3,558 | ) | | | (13,612 | ) | | | (4,538 | ) | | | (7,523 | ) | |
38 TURNER FUNDS 2014 ANNUAL REPORT
| | | Turner
Small Cap Growth
Fund | |
| | | year ended
9/30/14 | | year ended
9/30/13 | |
Investment activities: | |
Net investment income (loss) | | $ | (1,640 | ) | | $ | (986 | ) | |
Net realized gain from securities sold | | | 48,313 | | | | 43,625 | | |
Net change in unrealized appreciation (depreciation) on investment transactions | | | (44,329 | ) | | | 23,107 | | |
Net increase in net assets resulting from operations | | | 2,344 | | | | 65,746 | | |
Dividends and distributions to shareholders: | |
Net investment income: | |
Institutional Class Shares | | | — | | | | — | | |
Investor Class Shares | | | — | | | | — | | |
Realized capital gains: | |
Institutional Class Shares | | | — | | | | — | | |
Investor Class Shares | | | (40,979 | ) | | | (15,983 | ) | |
Retirement Class Shares | | | — | | | | — | | |
Total dividends and distributions | | | (40,979 | ) | | | (15,983 | ) | |
Capital share transactions: | |
Institutional Class Shares | |
Proceeds from shares issued | | | — | | | | — | | |
Proceeds from shares issued in lieu of cash distributions | | | — | | | | — | | |
Cost of shares redeemed | | | — | | | | — | | |
Net decrease in net assets from Institutional Class Shares transactions | | | — | | | | — | | |
Investor Class Shares | |
Proceeds from shares issued | | | 25,152 | | | | 20,912 | | |
Proceeds from Fund acquisition (Notes 10 and 11) | | | — | | | | — | | |
Proceeds from shares issued in lieu of cash distributions | | | 40,735 | | | | 15,896 | | |
Cost of shares redeemed | | | (130,206 | ) | | | (103,631 | ) | |
Net decrease in net assets from Investor Class Shares transactions | | | (64,319 | ) | | | (66,823 | ) | |
Retirement Class Shares | |
Proceeds from shares issued | | | — | | | | — | | |
Proceeds from shares issued in lieu of cash distributions | | | — | | | | — | | |
Cost of shares redeemed | | | — | | | | — | | |
Net increase (decrease) in net assets from Retirement Class Shares transactions | | | — | | | | — | | |
Net decrease in net assets from capital share transactions | | | (64,319 | ) | | | (66,823 | ) | |
Total decrease in net assets | | | (102,954 | ) | | | (17,060 | ) | |
Net assets: | |
Beginning of year | | | 233,039 | | | | 250,099 | | |
End of year | | $ | 130,085 | | | $ | 233,039 | | |
Undistributed net investment income (accumulated net investment income) | | $ | (1,087 | ) | | $ | — | | |
Share issued and redeemed: | |
Institutional Class Shares | |
Issued | | | — | | | | — | | |
Issued in lieu of cash distributions | | | — | | | | — | | |
Redeemed | | | — | | | | — | | |
Net decrease in Institutional Class Shares | | | — | | | | — | | |
Investor Class Shares | |
Issued | | | 616 | | | | 558 | | |
Shares from Fund acquisition (Notes 10 and 11) | | | — | | | | — | | |
Issued in lieu of cash distributions | | | 1,096 | | | | 473 | | |
Redeemed | | | (3,424 | ) | | | (2,781 | ) | |
Net decrease in Investor Class Shares | | | (1,712 | ) | | | (1,750 | ) | |
Retirement Class Shares | |
Issued | | | — | | | | — | | |
Issued in lieu of cash distributions | | | — | | | | — | | |
Redeemed | | | — | | | | — | | |
Net increase (decrease) in Retirement Class Shares | | | — | | | | — | | |
Net decrease in share transactions | | | (1,712 | ) | | | (1,750 | ) | |
Amounts designated as "—" are either not applicable, $0, or have been rounded to $0.
The accompanying notes are an integral part of the financial statements.
TURNER FUNDS 2014 ANNUAL REPORT 39
For a share outstanding throughout each period
| | Net asset
value,
beginning
of period | | Net
investment
income
(loss)(1) | | Realized and
unrealized
gains (losses)
on investments | | Total
from
investment
operations | | Dividends
from net
investment
income | | Distributions
from
capital
gains | | Total
dividends and
distributions | |
Turner Medical Sciences Long/Short Fund — Institutional Class Shares | | | |
2014 | | $ | 11.54 | | | | (0.18 | ) | | | 2.33 | | | | 2.15 | | | | — | | | | (0.36 | ) | | | (0.36 | ) | |
2013 | | $ | 10.19 | | | | (0.13 | ) | | | 1.48 | | | | 1.35 | | | | — | | | | — | | | | — | | |
2012 | | $ | 10.35 | �� | | | (0.15 | ) | | | (0.01 | ) | | | (0.16 | ) | | | — | | | | — | | | | — | | |
| 2011 (5) | | $ | 10.00 | | | | (0.12 | ) | | | 0.47 | | | | 0.35 | | | | — | | | | — | | | | — | | |
Turner Medical Sciences Long/Short Fund — Investor Class Shares | | | |
2014 | | $ | 11.48 | | | | (0.21 | ) | | | 2.32 | | | | 2.11 | | | | — | | | | (0.36 | ) | | | (0.36 | ) | |
2013 | | $ | 10.16 | | | | (0.16 | ) | | | 1.48 | | | | 1.32 | | | | — | | | | — | | | | — | | |
2012 | | $ | 10.34 | | | | (0.18 | ) | | | — | | | | (0.18 | ) | | | — | | | | — | | | | — | | |
| 2011 (5) | | $ | 10.00 | | | | (0.13 | ) | | | 0.47 | | | | 0.34 | | | | — | | | | — | | | | — | | |
Turner Medical Sciences Long/Short Fund — Class C Shares | | | |
2014 | | $ | 11.26 | | | | (0.29 | ) | | | 2.26 | | | | 1.97 | | | | — | | | | (0.36 | ) | | | (0.36 | ) | |
2013 | | $ | 10.04 | | | | (0.23 | ) | | | 1.45 | | | | 1.22 | | | | — | | | | — | | | | — | | |
2012 | | $ | 10.30 | | | | (0.25 | ) | | | (0.01 | ) | | | (0.26 | ) | | | — | | | | — | | | | — | | |
| 2011 (5) | | $ | 10.00 | | | | (0.18 | ) | | | 0.48 | | | | 0.30 | | | | — | | | | — | | | | — | | |
Turner Spectrum Fund — Institutional Class Shares | | | |
2014 | | $ | 11.43 | | | | (0.14 | ) | | | 0.66 | | | | 0.52 | | | | — | | | | — | | | | — | | |
2013 | | $ | 10.89 | | | | (0.07 | ) | | | 0.61 | | | | 0.54 | | | | — | | | | — | | | | — | | |
2012 | | $ | 11.45 | | | | (0.13 | ) | | | 0.04 | | | | (0.09 | ) | | | — | | | | (0.47 | ) | | | (0.47 | ) | |
2011 | | $ | 10.82 | | | | (0.16 | ) | | | 0.79 | | | | 0.63 | | | | — | | | | — | | | | — | | |
2010 | | $ | 10.81 | | | | (0.13 | ) | | | 0.21 | | | | 0.08 | | | | — | | | | (0.07 | ) | | | (0.07 | ) | |
Turner Spectrum Fund — Investor Class Shares | | | |
2014 | | $ | 11.30 | | | | (0.17 | ) | | | 0.65 | | | | 0.48 | | | | — | | | | — | | | | — | | |
2013 | | $ | 10.80 | | | | (0.09 | ) | | | 0.59 | | | | 0.50 | | | | — | | | | — | | | | — | | |
2012 | | $ | 11.38 | | | | (0.16 | ) | | | 0.05 | | | | (0.11 | ) | | | — | | | | (0.47 | ) | | | (0.47 | ) | |
2011 | | $ | 10.78 | | | | (0.19 | ) | | | 0.79 | | | | 0.60 | | | | — | | | | — | | | | — | | |
2010 | | $ | 10.80 | | | | (0.16 | ) | | | 0.21 | | | | 0.05 | | | | — | | | | (0.07 | ) | | | (0.07 | ) | |
Turner Spectrum Fund — Class C Shares | | | |
2014 | | $ | 10.98 | | | | (0.25 | ) | | | 0.63 | | | | 0.38 | | | | — | | | | — | | | | — | | |
2013 | | $ | 10.57 | | | | (0.17 | ) | | | 0.58 | | | | 0.41 | | | | — | | | | — | | | | — | | |
2012 | | $ | 11.23 | | | | (0.24 | ) | | | 0.05 | | | | (0.19 | ) | | | — | | | | (0.47 | ) | | | (0.47 | ) | |
2011 | | $ | 10.72 | | | | (0.27 | ) | | | 0.78 | | | | 0.51 | | | | — | | | | — | | | | — | | |
2010 | | $ | 10.80 | | | | (0.24 | ) | | | 0.23 | | | | (0.01 | ) | | | — | | | | (0.07 | ) | | | (0.07 | ) | |
40 TURNER FUNDS 2014 ANNUAL REPORT
| | | Net asset
value, end
of period | | Total
return | | Net
assets end
of period
(000) | | Ratio of
net expenses
to average
net assets* | | Ratio of total
expenses
to average
net assets | | Ratio of net
investment
income (loss)
to average
net assets* | | Portfolio
turnover
rate** | |
Turner Medical Sciences Long/Short Fund — Institutional Class Shares | |
2014 | | $ | 13.33 | | | | 19.08 | % | | $ | 27,884 | | | | 1.93 | % (2)+ | | | 3.52 | %+ | | | (1.44 | )%+ | | | 409 | % | |
2013 | | $ | 11.54 | | | | 13.25 | % | | $ | 16,742 | | | | 1.98 | % (3)+ | | | 2.99 | %+ | | | (1.26 | )%+ | | | 492 | % | |
2012 | | $ | 10.19 | | | | (1.55 | )% | | $ | 37,117 | | | | 1.87 | % (4)+ | | | 2.09 | %+ | | | (1.45 | )%+ | | | 900 | % | |
| 2011 (5) | | $ | 10.35 | | | | 3.50 | %++ | | $ | 45,147 | | | | 1.93 | % (6) | | | 2.74 | % | | | (1.74 | )% | | | 608 | % | |
Turner Medical Sciences Long/Short Fund — Investor Class Shares | |
2014 | | $ | 13.23 | | | | 18.83 | % | | $ | 5,974 | | | | 2.18 | % (2)+ | | | 3.77 | %+ | | | (1.69 | )%+ | | | 409 | % | |
2013 | | $ | 11.48 | | | | 12.99 | % | | $ | 3,062 | | | | 2.23 | % (3)+ | | | 3.24 | %+ | | | (1.51 | )%+ | | | 492 | % | |
2012 | | $ | 10.16 | | | | (1.74 | )% | | $ | 9,606 | | | | 2.12 | % (4)+ | | | 2.34 | %+ | | | (1.70 | )%+ | | | 900 | % | |
| 2011 (5) | | $ | 10.34 | | | | 3.40 | %++ | | $ | 12,777 | | | | 2.14 | % (6) | | | 2.89 | % | | | (1.93 | )% | | | 608 | % | |
Turner Medical Sciences Long/Short Fund — Class C Shares | |
2014 | | $ | 12.87 | | | | 17.93 | % | | $ | 2,925 | | | | 2.93 | % (2)+ | | | 4.52 | %+ | | | (2.44 | )%+ | | | 409 | % | |
2013 | | $ | 11.26 | | | | 12.15 | % | | $ | 1,374 | | | | 2.98 | % (3)+ | | | 3.99 | %+ | | | (2.26 | )%+ | | | 492 | % | |
2012 | | $ | 10.04 | | | | (2.52 | )% | | $ | 2,889 | | | | 2.87 | % (4)+ | | | 3.09 | %+ | | | (2.45 | )%+ | | | 900 | % | |
| 2011 (5) | | $ | 10.30 | | | | 3.00 | %++ | | $ | 2,165 | | | | 2.93 | % (6) | | | 3.63 | % | | | (2.71 | )% | | | 608 | % | |
Turner Spectrum Fund — Institutional Class Shares | |
2014 | | $ | 11.95 | | | | 4.55 | % | | $ | 120,032 | | | | 1.93 | % (7)+ | | | 2.82 | %+ | | | (1.18 | )%+ | | | 443 | % | |
2013 | | $ | 11.43 | | | | 4.96 | % | | $ | 481,845 | | | | 1.93 | % (8)+ | | | 2.75 | %+ | | | (0.64 | )%+ | | | 580 | % | |
2012 | | $ | 10.89 | | | | (0.77 | )% | | $ | 832,857 | | | | 1.89 | % (9)+ | | | 2.34 | %+ | | | (1.15 | )%+ | | | 996 | % | |
2011 | | $ | 11.45 | | | | 5.82 | % | | $ | 448,554 | | | | 1.93 | % (10) | | | 2.48 | % | | | (1.34 | )% | | | 1,153 | % | |
2010 | | $ | 10.82 | | | | 0.77 | % | | $ | 179,526 | | | | 1.91 | % (11) | | | 2.85 | % | | | (1.23 | )% | | | 1,808 | % | |
Turner Spectrum Fund — Investor Class Shares | |
2014 | | $ | 11.78 | | | | 4.25 | % | | $ | 15,630 | | | | 2.18 | % (7)+ | | | 3.07 | %+ | | | (1.42 | )%+ | | | 443 | % | |
2013 | | $ | 11.30 | | | | 4.63 | % | | $ | 44,139 | | | | 2.18 | % (8)+ | | | 3.00 | %+ | | | (0.89 | )%+ | | | 580 | % | |
2012 | | $ | 10.80 | | | | (0.95 | )% | | $ | 126,533 | | | | 2.14 | % (9)+ | | | 2.59 | %+ | | | (1.40 | )%+ | | | 996 | % | |
2011 | | $ | 11.38 | | | | 5.57 | % | | $ | 161,401 | | | | 2.18 | % (10) | | | 2.70 | % | | | (1.61 | )% | | | 1,153 | % | |
2010 | | $ | 10.78 | | | | 0.49 | % | | $ | 52,361 | | | | 2.17 | % (11) | | | 3.12 | % | | | (1.52 | )% | | | 1,808 | % | |
Turner Spectrum Fund — Class C Shares | |
2014 | | $ | 11.36 | | | | 3.46 | % | | $ | 2,916 | | | | 2.93 | % (7)+ | | | 3.82 | %+ | | | (2.18 | )%+ | | | 443 | % | |
2013 | | $ | 10.98 | | | | 3.88 | % | | $ | 5,572 | | | | 2.93 | % (8)+ | | | 3.75 | %+ | | | (1.64 | )%+ | | | 580 | % | |
2012 | | $ | 10.57 | | | | (1.71 | )% | | $ | 10,391 | | | | 2.89 | % (9)+ | | | 3.34 | %+ | | | (2.15 | )%+ | | | 996 | % | |
2011 | | $ | 11.23 | | | | 4.76 | % | | $ | 12,478 | | | | 2.93 | % (10) | | | 3.39 | % | | | (2.33 | )% | | | 1,153 | % | |
2010 | | $ | 10.72 | | | | (0.07 | )% | | $ | 7,169 | | | | 2.92 | % (11) | | | 3.82 | % | | | (2.19 | )% | | | 1,808 | % | |
* Inclusive of fees paid indirectly, waivers and/or reimbursements.
** Excludes effect of in-kind transfers and mergers, as applicable. Not annualized for periods less than one year.
+ Does not include acquired fund fees or expenses.
++ Total return is for the period indicated and has not been annualized.
(1) Based on average shares outstanding.
(2) Dividend expense totaled 0.16% of average net assets for the year ended September 30, 2014, 0.16% of which was waived. Broker fees and charges on short sales totaled 1.27% of average net assets for the year ended September 30, 2014, 1.27% of which was waived. If dividend expense and broker fees and charges on short sales had not been contractually waived, the ratios of net expenses to average net assets would have been 3.36%, 3.61% and 4.36% for the Institutional, Investor and Class C Shares, respectively.
(3) Dividend expense totaled 0.45% of average net assets for the year ended September 30, 2013, 0.45% of which was waived. Broker fees and charges on short sales totaled 0.41% of average net assets for the year ended September 30, 2013, 0.41% of which was waived. If dividend expense and broker fees and charges on short sales had not been contractually waived, the ratios of net expenses to average net assets would have been 2.79%, 3.04% and 3.79% for the Institutional, Investor and Class C Shares, respectively.
(4) Dividend expense totaled 0.04% of average net assets for the year ended September 30, 2012, 0.04% of which was waived. Broker fees and charges on short sales totaled 0.15% of average net assets for the year ended September 30, 2012, 0.15% of which was waived. If dividend expense and broker fees and charges on short sales had not been contractually waived, the ratios of net expenses to average net assets would have been 2.06%, 2.31% and 3.06% for the Institutional, Investor and Class C Shares, respectively.
(5) Commenced operations on February 7, 2011. All ratios for the period have been annualized unless otherwise indicated.
(6) Dividend expense totaled 0.15% of average net assets for the year ended September 30, 2011, 0.12% of which was waived. Broker fees and charges on short sales totaled 0.47% of average net assets for the year ended September 30, 2011, 0.39% of which was waived. If dividend expense and broker fees and charges on short sales had not been contractually waived, the ratios of net expenses to average net assets would have been 2.44%, 2.65% and 3.44% for the Institutional, Investor and Class C Shares, respectively.
(7) Dividend expense totaled 0.40% of average net assets for the year ended September 30, 2014, 0.40% of which was waived. Broker fees and charges on short sales totaled 0.44% of average net assets for the year ended September 30, 2014, 0.44% of which was waived. If dividend expense and broker fees and charges on short sales had not been contractually waived, the ratios of net expenses to average net assets would have been 2.77%, 3.01% and 3.77% for the Institutional, Investor and Class C Shares, respectively.
(8) Dividend expense totaled 0.45% of average net assets for the year ended September 30, 2013, 0.45% of which was waived. Broker fees and charges on short sales totaled 0.45% of average net assets for the year ended September 30, 2013, 0.45% of which was waived. If dividend expense and broker fees and charges on short sales had not been contractually waived, the ratios of net expenses to average net assets would have been 2.83%, 3.08% and 3.83% for the Institutional, Investor and Class C Shares, respectively.
(9) Dividend expense totaled 0.20% of average net assets for the year ended September 30, 2012, 0.20% of which was waived. Broker fees and charges on short sales totaled 0.33% of average net assets for the year ended September 30, 2012, 0.33% of which was waived. If dividend expense and broker fees and charges on short sales had not been contractually waived, the ratios of net expenses to average net assets would have been 2.42%, 2.67% and 3.42% for the Institutional, Investor and Class C Shares, respectively.
(10) Dividend expense totaled 0.28% of average net assets for the year ended September 30, 2011, 0.22% of which was waived. Broker fees and charges on short sales totaled 0.32% of average net assets for the year ended September 30, 2011, 0.25% of which was waived. If dividend expense and broker fees and charges on short sales had not been contractually waived, the ratios of net expenses to average net assets would have been 2.40%, 2.65% and 3.40% for the Institutional, Investor and Class C Shares, respectively.
(11) Dividend expense totaled 0.45% of average net assets for the year ended September 30, 2010, 0.42% of which was waived. Broker fees and charges on short sales totaled 0.38% of average net assets for the year ended September 30, 2010, 0.37% of which was waived beginning on January 13, 2010. If dividend expense and broker fees and charges on short sales had not been contractually waived, the ratios of net expenses to average net assets would have been 2.70%, 2.96% and 3.71% for the Institutional, Investor and Class C Shares, respectively.
Amounts designated as "—" are either not applicable, $0 or have been rounded to $0.
The accompanying notes are an integral part of the financial statements.
TURNER FUNDS 2014 ANNUAL REPORT 41
For a share outstanding throughout each period
| | | Net asset
value,
beginning
of period | | Net
investment
income
(loss)(1) | | Realized and
unrealized
gains (losses)
on investments | | Total
from
investment
operations | | Dividends
from net
investment
income | | Distributions
from
capital
gains | | Total
dividends and
distributions | |
Turner Titan Fund — Institutional Class Shares | | | |
2014 | | $ | 10.51 | | | | (0.11 | ) | | | 1.15 | | | | 1.04 | | | | — | | | | (0.12 | ) | | | (0.12 | ) | |
2013 | | $ | 10.24 | | | | (0.08 | ) | | | 0.43 | | | | 0.35 | | | | — | | | | (0.08 | ) | | | (0.08 | ) | |
2012 | | $ | 9.77 | | | | (0.11 | ) | | | 0.67 | | | | 0.56 | | | | — | | | | (0.09 | ) | | | (0.09 | ) | |
| 2011 (5) | | $ | 10.00 | | | | (0.10 | ) | | | (0.13 | ) | | | (0.23 | ) | | | — | | | | — | | | | — | | |
Turner Titan Fund — Investor Class Shares | | | |
2014 | | $ | 10.44 | | | | (0.14 | ) | | | 1.14 | | | | 1.00 | | | | — | | | | (0.12 | ) | | | (0.12 | ) | |
2013 | | $ | 10.20 | | | | (0.10 | ) | | | 0.42 | | | | 0.32 | | | | — | | | | (0.08 | ) | | | (0.08 | ) | |
2012 | | $ | 9.76 | | | | (0.13 | ) | | | 0.66 | | | | 0.53 | | | | — | | | | (0.09 | ) | | | (0.09 | ) | |
| 2011 (5) | | $ | 10.00 | | | | (0.11 | ) | | | (0.13 | ) | | | (0.24 | ) | | | — | | | | — | | | | — | | |
Turner Titan Fund — Class C Shares | | | |
2014 | | $ | 10.22 | | | | (0.22 | ) | | | 1.12 | | | | 0.90 | | | | — | | | | (0.12 | ) | | | (0.12 | ) | |
2013 | | $ | 10.07 | | | | (0.16 | ) | | | 0.39 | | | | 0.23 | | | | — | | | | (0.08 | ) | | | (0.08 | ) | |
2012 | | $ | 9.72 | | | | (0.21 | ) | | | 0.65 | | | | 0.44 | | | | — | | | | (0.09 | ) | | | (0.09 | ) | |
| 2011 (5) | | $ | 10.00 | | | | (0.16 | ) | | | (0.12 | ) | | | (0.28 | ) | | | — | | | | — | | | | — | | |
Turner Emerging Growth Fund — Institutional Class Shares | | | |
2014 | | $ | 65.25 | | | | (0.46 | ) | | | 0.32 | | | | (0.14 | ) | | | — | | | | (10.36 | ) | | | (10.36 | ) | |
2013 | | $ | 57.68 | | | | (0.12 | ) | | | 16.10 | | | | 15.98 | | | | — | | | | (8.41 | ) | | | (8.41 | ) | |
2012 | | $ | 45.83 | | | | (0.34 | ) | | | 12.19 | | | | 11.85 | | | | — | | | | — | | | | — | | |
2011 | | $ | 42.51 | | | | (0.40 | ) | | | 3.72 | | | | 3.32 | | | | — | | | | — | | | | — | | |
2010 | | $ | 37.78 | | | | (0.31 | ) | | | 5.04 | | | | 4.73 | | | | — | | | | — | | | | — | | |
Turner Emerging Growth Fund — Investor Class Shares | | | |
2014 | | $ | 64.38 | | | | (0.59 | ) | | | 0.32 | | | | (0.27 | ) | | | — | | | | (10.36 | ) | | | (10.36 | ) | |
2013 | | $ | 57.16 | | | | (0.25 | ) | | | 15.88 | | | | 15.63 | | | | — | | | | (8.41 | ) | | | (8.41 | ) | |
2012 | | $ | 45.52 | | | | (0.47 | ) | | | 12.11 | | | | 11.64 | | | | — | | | | — | | | | — | | |
2011 | | $ | 42.32 | | | | (0.52 | ) | | | 3.72 | | | | 3.20 | | | | — | | | | — | | | | — | | |
2010 | | $ | 37.71 | | | | (0.41 | ) | | | 5.02 | | | | 4.61 | | | | — | | | | — | | | | — | | |
42 TURNER FUNDS 2014 ANNUAL REPORT
| | | Net asset
value, end
of period | | Total
return | | Net
assets end
of period
(000) | | Ratio of
net expenses
to average
net assets* | | Ratio of total
expenses
to average
net assets | | Ratio of net
investment
income (loss)
to average
net assets* | | Portfolio
turnover
rate** | |
Turner Titan Fund — Institutional Class Shares | |
2014 | | $ | 11.43 | | | | 10.00 | % | | $ | 9,633 | | | | 1.93 | % (2)+ | | | 2.85 | %+ | | | (0.99 | )%+ | | | 777 | % | |
2013 | | $ | 10.51 | | | | 3.43 | % | | $ | 21,166 | | | | 1.94 | % (3)+ | | | 2.42 | %+ | | | (0.76 | )%+ | | | 788 | % | |
2012 | | $ | 10.24 | | | | 5.75 | % | | $ | 25,811 | | | | 1.92 | % (4)+ | | | 2.41 | %+ | | | (1.03 | )%+ | | | 834 | % | |
| 2011 (5) | | $ | 9.77 | | | | (2.30 | )%++ | | $ | 11,374 | | | | 1.92 | % (6) | | | 3.54 | % | | | (1.47 | )% | | | 647 | % | |
Turner Titan Fund — Investor Class Shares | |
2014 | | $ | 11.32 | | | | 9.68 | % | | $ | 551 | | | | 2.18 | % (2)+ | | | 3.10 | %+ | | | (1.24 | )%+ | | | 777 | % | |
2013 | | $ | 10.44 | | | | 3.14 | % | | $ | 387 | | | | 2.19 | % (3)+ | | | 2.67 | %+ | | | (1.01 | )%+ | | | 788 | % | |
2012 | | $ | 10.20 | | | | 5.44 | % | | $ | 5,038 | | | | 2.17 | % (4)+ | | | 2.66 | %+ | | | (1.28 | )%+ | | | 834 | % | |
| 2011 (5) | | $ | 9.76 | | | | (2.40 | )%++ | | $ | 2,711 | | | | 2.16 | % (6) | | | 4.66 | % | | | (1.65 | )% | | | 647 | % | |
Turner Titan Fund — Class C Shares | |
2014 | | $ | 11.00 | | | | 8.90 | % | | $ | 256 | | | | 2.93 | % (2)+ | | | 3.85 | %+ | | | (1.99 | )%+ | | | 777 | % | |
2013 | | $ | 10.22 | | | | 2.28 | % | | $ | 26 | | | | 2.94 | % (3)+ | | | 3.42 | %+ | | | (1.76 | )%+ | | | 788 | % | |
2012 | | $ | 10.07 | | | | 4.53 | % | | $ | 531 | | | | 2.92 | % (4)+ | | | 3.41 | %+ | | | (2.03 | )% + | | | 834 | % | |
| 2011 (5) | | $ | 9.72 | | | | (2.80 | )%++ | | $ | 29 | | | | 2.92 | % (6) | | | 2.31 | % | | | (2.44 | )% | | | 647 | % | |
Turner Emerging Growth Fund — Institutional Class Shares | |
2014 | | $ | 54.75 | | | | (0.76 | )% | | $ | 25,912 | | | | 1.15 | % | | | 1.42 | % | | | (0.76 | )% | | | 78 | % | |
2013 | | $ | 65.25 | | | | 32.98 | % | | $ | 72,442 | | | | 1.15 | % | | | 1.31 | % | | | (0.21 | )% | | | 62 | % | |
2012 | | $ | 57.68 | | | | 25.86 | % | | $ | 69,391 | | | | 1.15 | % | | | 1.30 | % | | | (0.62 | )% | | | 75 | % | |
2011 | | $ | 45.83 | | | | 7.81 | % | | $ | 67,035 | | | | 1.15 | % | | | 1.27 | % | | | (0.77 | )% | | | 74 | % | |
2010 | | $ | 42.51 | | | | 12.52 | % | | $ | 276,445 | | | | 1.15 | % | | | 1.28 | % | | | (0.77 | )% | | | 96 | % | |
Turner Emerging Growth Fund — Investor Class Shares | |
2014 | | $ | 53.75 | | | | (1.00 | )% | | $ | 116,860 | | | | 1.40 | % | | | 1.67 | % | | | (1.01 | )% | | | 78 | % | |
2013 | | $ | 64.38 | | | | 32.63 | % | | $ | 180,291 | | | | 1.40 | % | | | 1.56 | % | | | (0.46 | )% | | | 62 | % | |
2012 | | $ | 57.16 | | | | 25.57 | % | | $ | 168,990 | | | | 1.40 | % | | | 1.55 | % | | | (0.87 | )% | | | 75 | % | |
2011 | | $ | 45.52 | | | | 7.56 | % | | $ | 159,127 | | | | 1.40 | % | | | 1.55 | % | | | (1.01 | )% | | | 74 | % | |
2010 | | $ | 42.32 | | | | 12.22 | % | | $ | 176,823 | | | | 1.40 | % | | | 1.53 | % | | | (1.02 | )% | | | 96 | % | |
* Inclusive of fees paid indirectly, waivers and/or reimbursements.
** Excludes effect of in-kind transfers and mergers, as applicable. Not annualized for periods less than one year.
+ Does not include acquired fund fees or expenses.
++ Total return is for the period indicated and has not been annualized.
(1) Based on average shares outstanding.
(2) Dividend expense totaled 0.20% of average net assets for the year ended September 30, 2014, 0.20% of which was waived. Broker fees and charges on short sales totaled 0.46% of average net assets for the year ended September 30, 2014, 0.46% of which was waived. If dividend expense and broker fees and charges on short sales had not been contractually waived, the ratios of net expenses to average net assets would have been 2.58%, 2.83% and 3.58% for the Institutional, Investor and Class C Shares, respectively.
(3) Dividend expense totaled 0.14% of average net assets for the year ended September 30, 2013, 0.14% of which was waived. Broker fees and charges on short sales totaled 0.27% of average net assets for the year ended September 30, 2013, 0.27% of which was waived. If dividend expense and broker fees and charges on short sales had not been contractually waived, the ratios of net expenses to average net assets would have been 2.35%, 2.60% and 3.35% for the Institutional, Investor and Class C Shares, respectively.
(4) Dividend expense totaled 0.08% of average net assets for the year ended September 30, 2012, 0.08% of which was waived. Broker fees and charges on short sales totaled 0.23% of average net assets for the year ended September 30, 2012, 0.23% of which was waived. If dividend expense and broker fees and charges on short sales had not been contractually waived, the ratios of net expenses to average net assets would have been 2.23%, 2.48% and 3.23% for the Institutional, Investor and Class C Shares, respectively.
(5) Commenced operations on February 7, 2011. All ratios for the period have been annualized unless otherwise indicated.
(6) Dividend expense totaled 0.28% of average net assets for the year ended September 30, 2011, 0.22% of which was waived. Broker fees and charges on short sales totaled 0.32% of average net assets for the year ended September 30, 2011, 0.25% of which was waived. If dividend expense and broker fees and charges on short sales had not been contractually waived, the ratios of net expenses to average net assets would have been 2.20%, 2.44% and 3.20% for the Institutional, Investor and Class C Shares, respectively.
Amounts designated as "—" are either not applicable, $0 or have been rounded to $0.
The accompanying notes are an integral part of the financial statements.
TURNER FUNDS 2014 ANNUAL REPORT 43
For a share outstanding throughout each period
| | | Net asset
value,
beginning
of period | | Net
investment
income
(loss)(1) | | Realized and
unrealized
gains (losses)
on investments | | Total
from
investment
operations | | Dividends
from net
investment
income | | Distributions
from
capital
gains | | Total
dividends and
distributions | |
Turner Large Growth Fund — Institutional Class Shares | | | |
2014 | | $ | 14.68 | | | | 0.04 | | | | 2.46 | | | | 2.50 | | | | — | | | | — | | | | — | | |
2013 | | $ | 12.86 | | | | 0.07 | | | | 1.83 | | | | 1.90 | | | | (0.08 | ) | | | — | | | | (0.08 | ) | |
2012 | | $ | 10.50 | | | | 0.02 | | | | 2.34 | | | | 2.36 | | | | — | | | | — | | | | — | | |
2011 | | $ | 10.56 | | | | — | | | | (0.04 | ) | | | (0.04 | ) | | | (0.02 | ) | | | — | | | | (0.02 | ) | |
2010 | | $ | 9.93 | | | | 0.02 | | | | 0.65 | | | | 0.67 | | | | (0.04 | ) | | | — | | | | (0.04 | ) | |
Turner Large Growth Fund — Investor Class Shares | | | |
2014 | | $ | 14.55 | | | | — | | | | 2.44 | | | | 2.44 | | | | — | | | | — | | | | — | | |
2013 | | $ | 12.74 | | | | 0.02 | | | | 1.82 | | | | 1.84 | | | | (0.03 | ) | | | — | | | | (0.03 | ) | |
2012 | | $ | 10.42 | | | | (0.01 | ) | | | 2.33 | | | | 2.32 | | | | — | | | | — | | | | — | | |
2011 | | $ | 10.49 | | | | (0.03 | ) | | | (0.04 | ) | | | (0.07 | ) | | | — | | | | — | | | | — | | |
2010 | | $ | 9.87 | | | | — | | | | 0.64 | | | | 0.64 | | | | (0.02 | ) | | | — | | | | (0.02 | ) | |
Turner Midcap Growth Fund — Institutional Class Shares | | | |
2014 | | $ | 43.43 | | | | (0.08 | ) | | | 4.58 | | | | 4.50 | | | | — | | | | (9.36 | ) | | | (9.36 | ) | |
2013 | | $ | 35.39 | | | | (0.09 | ) | | | 8.68 | | | | 8.59 | | | | — | | | | (0.55 | ) | | | (0.55 | ) | |
2012 | | $ | 30.42 | | | | (0.05 | ) | | | 5.02 | | | | 4.97 | | | | — | | | | — | | | | — | | |
2011 | | $ | 29.90 | | | | (0.06 | ) | | | 0.58 | | | | 0.52 | | | | — | | | | — | | | | — | | |
2010 | | $ | 26.12 | | | | (0.08 | ) | | | 3.86 | | | | 3.78 | | | | — | | | | — | | | | — | | |
Turner Midcap Growth Fund — Investor Class Shares | | | |
2014 | | $ | 42.85 | | | | (0.17 | ) | | | 4.47 | | | | 4.30 | | | | — | | | | (9.36 | ) | | | (9.36 | ) | |
2013 | | $ | 35.03 | | | | (0.18 | ) | | | 8.55 | | | | 8.37 | | | | — | | | | (0.55 | ) | | | (0.55 | ) | |
2012 | | $ | 30.16 | | | | (0.13 | ) | | | 5.00 | | | | 4.87 | | | | — | | | | — | | | | — | | |
2011 | | $ | 29.73 | | | | (0.13 | ) | | | 0.56 | | | | 0.43 | | | | — | | | | — | | | | — | | |
2010 | | $ | 26.03 | | | | (0.15 | ) | | | 3.85 | | | | 3.70 | | | | — | | | | — | | | | — | | |
Turner Midcap Growth Fund — Retirement Class Shares | | | |
2014 | | $ | 41.07 | | | | (0.25 | ) | | | 4.29 | | | | 4.04 | | | | — | | | | (9.36 | ) | | | (9.36 | ) | |
2013 | | $ | 33.65 | | | | (0.25 | ) | | | 8.22 | | | | 7.97 | | | | — | | | | (0.55 | ) | | | (0.55 | ) | |
2012 | | $ | 29.05 | | | | (0.20 | ) | | | 4.80 | | | | 4.60 | | | | — | | | | — | | | | — | | |
2011 | | $ | 28.71 | | | | (0.22 | ) | | | 0.56 | | | | 0.34 | | | | — | | | | — | | | | — | | |
2010 | | $ | 25.20 | | | | (0.21 | ) | | | 3.72 | | | | 3.51 | | | | — | | | | — | | | | — | | |
Turner Small Cap Growth Fund — Investor Class Shares | | | |
2014 | | $ | 44.76 | | | | (0.33 | ) | | | 0.76 | | | | 0.43 | | | | — | | | | (7.96 | ) | | | (7.96 | ) | |
2013 | | $ | 35.96 | | | | (0.16 | ) | | | 11.47 | | | | 11.31 | | | | — | | | | (2.51 | ) | | | (2.51 | ) | |
2012 | | $ | 27.83 | | | | (0.23 | ) | | | 8.36 | | | | 8.13 | | | | — | | | | — | | | | — | | |
2011 | | $ | 28.97 | | | | (0.26 | ) | | | (0.88 | ) | | | (1.14 | ) | | | — | | | | — | | | | — | | |
2010 | | $ | 25.17 | | | | (0.20 | ) | | | 4.00 | | | | 3.80 | | | | — | | | | — | | | | — | | |
44 TURNER FUNDS 2014 ANNUAL REPORT
| | | Net asset
value, end
of period | | Total
return | | Net
assets end
of period
(000) | | Ratio of
net expenses
to average
net assets* | | Ratio of total
expenses
to average
net assets | | Ratio of net
investment
income (loss)
to average
net assets* | | Portfolio
turnover
rate** | |
Turner Large Growth Fund — Institutional Class Shares | |
2014 | | $ | 17.18 | | | | 17.03 | % | | $ | 17,433 | | | | 0.69 | % | | | 1.03 | % | | | 0.26 | % | | | 61 | % | |
2013 | | $ | 14.68 | | | | 14.87 | % | | $ | 53,965 | | | | 0.69 | % | | | 0.96 | % | | | 0.52 | % | | | 71 | % (2) | |
2012 | | $ | 12.86 | | | | 22.48 | % | | $ | 201,051 | | | | 0.69 | % | | | 0.91 | % | | | 0.15 | % | | | 105 | % | |
2011 | | $ | 10.50 | | | | (0.39 | )% | | $ | 382,336 | | | | 0.69 | % | | | 0.89 | % | | | (0.03 | )% | | | 182 | % | |
2010 | | $ | 10.56 | | | | 6.76 | % | | $ | 377,650 | | | | 0.69 | % | | | 0.87 | % | | | 0.20 | % | | | 178 | % | |
Turner Large Growth Fund — Investor Class Shares | |
2014 | | $ | 16.99 | | | | 16.77 | % | | $ | 20,516 | | | | 0.94 | % | | | 1.28 | % | | | 0.01 | % | | | 61 | % | |
2013 | | $ | 14.55 | | | | 14.50 | % | | $ | 30,623 | | | | 0.94 | % | | | 1.21 | % | | | 0.27 | % | | | 71 | % (2) | |
2012 | | $ | 12.74 | | | | 22.26 | % | | $ | 47,861 | | | | 0.94 | % | | | 1.16 | % | | | (0.10 | )% | | | 105 | % | |
2011 | | $ | 10.42 | | | | (0.67 | )% | | $ | 56,661 | | | | 0.94 | % | | | 1.13 | % | | | (0.28 | )% | | | 182 | % | |
2010 | | $ | 10.49 | | | | 6.51 | % | | $ | 163,750 | | | | 0.94 | % | | | 1.12 | % | | | (0.05 | )% | | | 178 | % | |
Turner Midcap Growth Fund — Institutional Class Shares | |
2014 | | $ | 38.57 | | | | 12.25 | % | | $ | 46,253 | | | | 0.93 | % | | | 1.17 | % | | | (0.21 | )% | | | 89 | % (3) | |
2013 | | $ | 43.43 | | | | 24.69 | % | | $ | 205,679 | | | | 0.93 | % | | | 1.08 | % | | | (0.24 | )% | | | 84 | % | |
2012 | | $ | 35.39 | | | | 16.34 | % | | $ | 236,147 | | | | 0.93 | % | | | 1.04 | % | | | (0.14 | )% | | | 121 | % | |
2011 | | $ | 30.42 | | | | 1.74 | % | | $ | 245,480 | | | | 0.93 | % | | | 1.05 | % | | | (0.18 | )% | | | 104 | % | |
2010 | | $ | 29.90 | | | | 14.47 | % | | $ | 164,993 | | | | 0.93 | % | | | 1.03 | % | | | (0.29 | )% | | | 90 | % | |
Turner Midcap Growth Fund — Investor Class Shares | |
2014 | | $ | 37.79 | | | | 11.88 | % | | $ | 187,974 | | | | 1.18 | % | | | 1.42 | % | | | (0.44 | )% | | | 89 | % (3) | |
2013 | | $ | 42.85 | | | | 24.31 | % | | $ | 257,240 | | | | 1.18 | % | | | 1.33 | % | | | (0.49 | )% | | | 84 | % | |
2012 | | $ | 35.03 | | | | 16.15 | % | | $ | 404,427 | | | | 1.18 | % | | | 1.29 | % | | | (0.39 | )% | | | 121 | % | |
2011 | | $ | 30.16 | | | | 1.45 | % | | $ | 471,286 | | | | 1.18 | % | | | 1.28 | % | | | (0.38 | )% | | | 104 | % | |
2010 | | $ | 29.73 | | | | 14.21 | % | | $ | 751,124 | | | | 1.18 | % | | | 1.28 | % | | | (0.54 | )% | | | 90 | % | |
Turner Midcap Growth Fund — Retirement Class Shares | |
2014 | | $ | 35.75 | | | | 11.74 | % | | $ | 4,674 | | | | 1.43 | % | | | 1.67 | % | | | (0.68 | )% | | | 89 | % (3) | |
2013 | | $ | 41.07 | | | | 24.11 | % | | $ | 4,235 | | | | 1.43 | % | | | 1.58 | % | | | (0.74 | )% | | | 84 | % | |
2012 | | $ | 33.65 | | | | 15.83 | % | | $ | 4,811 | | | | 1.43 | % | | | 1.54 | % | | | (0.64 | )% | | | 121 | % | |
2011 | | $ | 29.05 | | | | 1.18 | % | | $ | 3,972 | | | | 1.43 | % | | | 1.54 | % | | | (0.63 | )% | | | 104 | % | |
2010 | | $ | 28.71 | | | | 13.93 | % | | $ | 4,578 | | | | 1.43 | % | | | 1.53 | % | | | (0.79 | )% | | | 90 | % | |
Turner Small Cap Growth Fund — Investor Class Shares | |
2014 | | $ | 37.23 | | | | 0.99 | % | | $ | 130,085 | | | | 1.25 | % | | | 1.66 | % | | | (0.83 | )% | | | 127 | % | |
2013 | | $ | 44.76 | | | | 33.79 | % | | $ | 233,039 | | | | 1.25 | % | | | 1.56 | % | | | (0.43 | )% | | | 82 | % | |
2012 | | $ | 35.96 | | | | 29.21 | % | | $ | 250,099 | | | | 1.25 | % | | | 1.53 | % | | | (0.68 | )% | | | 100 | % | |
2011 | | $ | 27.83 | | | | (3.94 | )% | | $ | 229,919 | | | | 1.25 | % | | | 1.53 | % | | | (0.76 | )% | | | 119 | % | |
2010 | | $ | 28.97 | | | | 15.10 | % | | $ | 274,925 | | | | 1.25 | % | | | 1.52 | % | | | (0.74 | )% | | | 89 | % | |
* Inclusive of fees paid indirectly, waivers and/or reimbursements.
** Excludes effect of in-kind transfers and mergers, as applicable. Not annualized for periods less than one year.
(1) Based on average shares outstanding.
(2) If purchases of portfolio securities in connection with the reorganization of the Turner Concentrated Growth Fund into the Turner Large Growth Fund had been included, the portfolio turnover rate would have been 81%.
(3) If purchases of portfolio securities in connection with the reorganization of the Turner All Cap Growth Fund into the Turner Midcap Growth Fund had been included, the portfolio turnover rate would have been 93%.
Amounts designated as "—" are either not applicable, $0 or have been rounded to $0.
The accompanying notes are an integral part of the financial statements.
TURNER FUNDS 2014 ANNUAL REPORT 45
NOTES TO FINANCIAL STATEMENTS
Notes to financial statements
September 30, 2014
1. Organization:
Turner Funds (the "Trust"), a Massachusetts business trust, is registered under the Investment Company Act of 1940, as amended, as an open-end management investment company. The funds included herein are Turner Medical Sciences Long/Short Fund ("Medical Sciences Long/Short Fund"), Turner Spectrum Fund ("Spectrum Fund"), Turner Titan Fund ("Titan Fund"), Turner Emerging Growth Fund ("Emerging Growth Fund"), Turner Large Growth Fund ("Large Growth Fund"), Turner Midcap Growth Fund ("Midcap Growth Fund"), and Turner Small Cap Growth Fund ("Small Cap Growth Fund"), each a "Fund" and collectively the "Funds."
Each Fund is registered as a diversified portfolio of the Trust.
The Funds are registered to offer different classes of shares: Institutional Class Shares, Investor Class Shares, Retirement Class Shares, Class C Shares, or a combination of the four. The assets of each Fund are segregated, and a shareholder's interest is limited to the Fund in which shares are held. The Funds' prospectuses provide a description of each Fund's investment objectives, policies and strategies along with information on the classes of shares currently being offered.
At a meeting of the Board of Trustees (the "Board") held September 12, 2014, the Board approved the reorganization of the Large Growth Fund into the Midcap Growth Fund. The decision is subject to shareholder approval at a Special Meeting of Shareholders expected to take place on or about January 15, 2015. In anticipation of the reorganization, the Large Growth Fund closed to new investors on September 30, 2014.
2. Significant accounting policies:
The following is a summary of the significant accounting policies followed by the Funds.
Use of estimates—The preparation of financial statements in conformity with U.S. generally accepted accounting principles ("GAAP") requires management to make estimates and assumptions that affect the reported amounts of assets and liabilities and disclosure of contingent assets and liabilities at the date of the financial statements and the reported amounts of increases and decreases in net assets from operations during the reporting period. Actual results could differ from those estimates.
Securities valuation—In accordance with the authoritative guidance on fair value measurements and disclosures under GAAP, fair value is defined as the price that a Fund would receive upon selling an investment in an orderly transaction to an independent buyer in the principal or most advantageous market.
The Trust has a three-tier fair value hierarchy that is dependent upon the various "inputs" used to
determine the value of the Funds' investments. These inputs are summarized in the three broad levels listed below:
Level 1 – quoted prices in active markets for identical investments
Level 2 – other significant observable inputs (including quoted prices for similar investments, interest rates, prepayment speeds, credit risks, etc.)
Level 3 – significant unobservable inputs (including a Fund's own assumptions in determining the fair value of investments)
Securities listed on a securities exchange, market or automated quotation system for which quotations are readily available (except for securities traded on NASDAQ), including American Depositary Receipts ("ADRs"), are valued at the last quoted sale price on the primary exchange or market (foreign or domestic) on which they are traded, or, if there is no such reported sale, at the most recent quoted bid price for long positions and the most recent quoted ask price for short positions. For securities traded on NASDAQ, the NASDAQ Official Closing Price is used. The prices for foreign securities are reported in local currency and converted to U.S. dollars using currency exchange rates. Prices for most securities held in the Funds are provided daily by recognized independent pricing agents. To the extent these securities are valued at the last sales price or NASDAQ Official Closing Price, they are categorized as Level 1 in the fair value hierarchy.
Investments in other open-end investment companies are valued at net asset value. These valuations are typically categorized as Level 1 in the fair value hierarchy.
If a security price cannot be obtained from an independent, third-party pricing agent, the Funds seek to obtain bid and ask prices from two broker-dealers who make a market in the security and determine the average of the two. In this situation, valuations are typically categorized as Level 2 in the fair value hierarchy.
Securities for which market prices are not "readily available" are valued in accordance with Fair Value Procedures established by the Board. The Funds' Fair Value Procedures are implemented through a Fair Value Committee (the "Committee") designated by the Board. Some of the more common reasons that may necessitate that a security be valued using Fair Value Procedures include: the security's trading has been halted or suspended; the security has been delisted from a national exchange; the security's primary trading market is temporarily closed at a time when under normal conditions it would be open; the security has not been traded for an extended period of time; the security's primary pricing source is not able
46 TURNER FUNDS 2014 ANNUAL REPORT
or willing to provide a price; or trading of the security is subject to local government-imposed restrictions. When a security is valued in accordance with the Fair Value Procedures, the Committee will determine the value after taking into consideration relevant information reasonably available to the Committee. Depending on the source or relative significance of the valuation inputs, these securities may be categorized as Level 2 or Level 3 in the fair value hierarchy.
For securities that principally trade on a foreign market or exchange, a significant gap in time can exist between the time of a particular security's last trade and the time at which a Fund calculates its net asset value. The closing prices of such securities may no longer reflect their market value at the time a Fund calculates net asset value if an event that could materially affect the value of those securities (a "Significant Event") has occurred between the time of the security's last close and the time that a Fund calculates net asset value. A Significant Event may relate to a single issuer or to an entire market sector.
Prior to September 16, 2014, the Funds' Subadministrator, as defined in Note 3, monitored price movements among certain selected indices, securities and/or baskets of securities that may be an indicator that the closing prices received earlier from foreign exchanges or markets may not reflect market value at the time a Fund calculated its net asset value. If price movements in a monitored index or security exceeded levels recommended by the Committee for approval by the Board ("trigger points"), the Sub-administrator notified the Adviser, as defined in Note 3, that such limits had been exceeded. If such trigger points were exceeded, then the close prices for certain foreign markets were systematically adjusted by fair value factors calculated by an independent pricing service. The Board approved to discontinue fair valuation services for international securities, including the use of trigger points, at a meeting in May 2014. The Board determined that the limited number of international securities held by the Funds and the limited number of days in which fair value was utilized did not warrant further use of fair valuation services or the use of trigger points by the Funds. These circumstances described above used significant observable inputs and therefore these valuations were considered as Level 2 in the fair value hierarchy.
In the event that the Adviser believes that the fair values provided by a third party fair valuation vendor are not reliable, or believes that a foreign security held by a Fund should be fair valued for any other reason, the Adviser shall contact the Sub-administrator and request that a meeting of the Committee be held. Depending on the source or relative significance of the valuation inputs, these securities may be categorized as Level 2 or Level 3 in the fair value hierarchy.
Other than the above change to no longer monitor trigger points, for the year ended September 30, 2014, there were no significant changes to the Funds' fair valuation methodologies.
For the year ended September 30, 2014, there were no Level 3 investments for which significant unobservable inputs were used to determine fair value.
The following table is a summary of inputs used to value the Funds' investments as of September 30, 2014. The breakdown, by sub-category, of the "common stock" category is disclosed in the Schedule of investments and Schedule of securities sold short for each Fund, as applicable.
| | Level 1
(000) | | Level 2
(000) | | Total
(000) | |
Medical Sciences Long/Short Fund | |
Investments in securities | |
Common stock | | $ | 46,492 | | | $ | — | | | $ | 46,492 | | |
Cash equivalent | | | 278 | | | | — | | | | 278 | | |
Total Investments in securities | | $ | 46,770 | | | $ | — | | | $ | 46,770 | | |
Securities sold short | |
Common stock | | $ | 22,979 | | | $ | — | | | $ | 22,979 | | |
Total Securities sold short | | $ | 22,979 | | | $ | — | | | $ | 22,979 | | |
Spectrum Fund | |
Investments in securities | |
Common stock | | $ | 133,908 | | | $ | 49 | | | $ | 133,957 | | |
Warrant | | | 472 | | | | — | | | | 472 | | |
Total Investments in securities | | $ | 134,380 | | | $ | 49 | | | $ | 134,429 | | |
Securities sold short | |
Common stock | | $ | 66,409 | | | $ | — | | | $ | 66,409 | | |
Exchange traded funds | | | 8,268 | | | | — | | | | 8,268 | | |
Total Securities sold short | | $ | 74,677 | | | $ | — | | | $ | 74,677 | | |
Titan Fund | |
Investments in securities | |
Common stock | | $ | 8,933 | | | $ | 18 | | | $ | 8,951 | | |
Cash equivalent | | | 1,104 | | | | — | | | | 1,104 | | |
Total Investments in securities | | $ | 10,037 | | | $ | 18 | | | $ | 10,055 | | |
Securities sold short | |
Common stock | | $ | 4,521 | | | $ | — | | | $ | 4,521 | | |
Exchange traded funds | | | 859 | | | | — | | | | 859 | | |
Total Securities sold short | | $ | 5,380 | | | $ | — | | | $ | 5,380 | | |
Emerging Growth Fund | |
Investments in securities | |
Common stock | | $ | 140,959 | | | $ | — | | | $ | 140,959 | | |
Cash equivalent | | | 29,758 | | | | — | | | | 29,758 | | |
Total Investments in securities | | $ | 170,717 | | | $ | — | | | $ | 170,717 | | |
Large Growth Fund | |
Investments in securities | |
Common stock | | $ | 37,232 | | | $ | — | | | $ | 37,232 | | |
Cash equivalent | | | 1,765 | | | | — | | | | 1,765 | | |
Total Investments in securities | | $ | 38,997 | | | $ | — | | | $ | 38,997 | | |
TURNER FUNDS 2014 ANNUAL REPORT 47
NOTES TO FINANCIAL STATEMENTS
| | | Level 1
(000) | | Level 2
(000) | | Total
(000) | |
Midcap Growth Fund | |
Investments in securities | |
Common stock | | $ | 234,681 | | | $ | — | | | $ | 234,681 | | |
Warrant | | | 65 | | | | — | | | | 65 | | |
Cash equivalent | | | 17,321 | | | | — | | | | 17,321 | | |
Total Investments in securities | | $ | 252,067 | | | $ | — | | | $ | 252,067 | | |
Small Cap Growth Fund | |
Investments in securities | |
Common stock | | $ | 131,010 | | | $ | — | | | $ | 131,010 | | |
Cash equivalent | | | 22,224 | | | | — | | | | 22,224 | | |
Total Investments in securities | | $ | 153,234 | | | $ | — | | | $ | 153,234 | | |
For each Fund, there were no transfers between the levels as of September 30, 2014 based on the input levels assigned at September 30, 2013.
Security transactions and related income—Security transactions are accounted for on the date the security is purchased or sold (trade date). Dividend income is recognized on the ex-dividend date. Costs used in determining realized gains and losses on the sales of investment securities are those of the specific securities lots sold.
Securities sold short—Consistent with each Fund's investment objectives, the Funds may engage in short sales. Short sales are transactions under which a Fund sells a security it does not own. To complete such a transaction, the Fund must borrow the security to make delivery to the buyer. The Fund is then obligated to replace the security borrowed by purchasing the security at the market price at the time of the replacement. The price at such time may be more or less than the price at which the security was sold by the Fund. Until the security is replaced, the Fund is required to pay the lender amounts equal to any dividends that accrue during the period of the loan. Dividends declared on open short positions are recorded on ex-date and shown as an expense for financial reporting purposes. To borrow the security, the Fund also may be required to pay a fee, which is shown as an expense for financial reporting purposes. The proceeds of the short sale are retained by the broker, to the extent necessary to meet margin requirements, until the short position is closed. A gain, limited to the price at which the Fund sold the security short, or a loss, unlimited in size, will be recognized upon the close of a short sale.
Until a Fund closes its short position or replaces the borrowed security, the Fund will: (a) maintain a segregated account containing cash or liquid securities at such a level that (i) the amount deposited in the account plus the amount deposited with the brokers as collateral will equal the current value of the security sold short; and (ii) the amount deposited in the segregated account plus the amount deposited with the
broker as collateral will not be less than the market value of the security at the time the security was sold short, or (b) otherwise cover the short positions. The Medical Sciences Long/Short Fund, Spectrum Fund and Titan Fund engaged in short sales during the year ended September 30, 2014.
Option transactions—Consistent with each Fund's investment objectives, the Funds may write covered call options and sell put options as a means of increasing the yield on their portfolios and as a means of providing limited protection against decreases in their market value. The Funds may purchase put and call options to protect against a decline in the market value of the securities in their portfolios or to anticipate an increase in the market value of securities that the Funds may seek to purchase in the future. A put option gives the purchaser of the option the right to sell, and the writer of the option the obligation to buy, the underlying security at any time during the option period. A call option gives the purchaser of the option the right to buy, and the writer of the option the obligation to sell, the underlying security at any time during the option period. The premium paid to the writer is the consideration for undertaking the obligations under the option contract. The initial purchase (sale) of an option contract is an "opening transaction." In order to close an option position, the Fund may enter into a "closing transaction," which is simply the sale (purchase) of an option contract on the same security with the same exercise price and expiration date as the option contract originally opened. If the Fund is unable to effect a closing purchase transaction with respect to an option it has written, it will not be able to sell the underlying security until the option expires or the Fund delivers the security upon exercise. When the Fund writes (sells) an option, an amount equal to the premium received by the Fund is included in the Statement of assets and liabilities as an asset and an equivalent liability. The amount of the liability is subsequently marked-to-market to reflect the current value of the option written.
Option contracts are valued at the last quoted sales price. If there is no such reported sale on the valuation date, long positions are valued at the most recent bid price, and short positions are valued at the most recent ask price. When an option expires on its stipulated expiration date or the Fund enters into a closing purchase transaction, the Fund realizes a gain or loss if the cost of the closing purchase transaction differs from the premium received when the option was sold without regard to any unrealized gain or loss on the underlying security, and the liability related to such option is eliminated. When an option is exercised, the premium originally received decreases the cost basis of the security (or increases the proceeds on a sale of the
48 TURNER FUNDS 2014 ANNUAL REPORT
security). The primary risk exposure from written and purchased options contracts is equity exposure.
As of September 30, 2014, the Funds held no written or purchased options.
Any realized and unrealized gains and losses on purchase option contracts are included in "Net realized gain from securities sold" and "Net change in unrealized appreciation (depreciation) on investments," respectively, in the Statements of operations. Realized and unrealized gains and (losses) on purchased options for the Medical Sciences Long/Short Fund for the year ended September 30, 2014 were $(159) and $1, respectively (000). Realized and unrealized gains and (losses) on purchased options for the Spectrum Fund for the year ended September 30, 2014 were $(2,076) and $66, respectively (000). Any realized and unrealized gains and losses on written option contracts are shown in the Statements of operations under "Net realized gain from written options contracts" and "Net change in unrealized appreciation (depreciation) on written option contracts," respectively. Realized and unrealized gains and (losses) on written options for the Spectrum Fund for the year ended September 30, 2014 were $207 and $(31), respectively (000). The Medical Sciences Long/Short Fund and Spectrum Fund engaged in limited purchased and written option activity during the year ended September 30, 2014, representing less than 1% of each Fund's average monthly fair value amounts of purchased and written options as compared to net assets.
A summary of option contracts written during the year ended September 30, 2014 for Medical Sciences Long/Short Fund and Spectrum Fund is as follows:
Medical Sciences Long/Short Fund | | Option
contracts | | Option
premiums
(000) | |
Options outstanding at beginning of year | | | — | | | $ | — | | |
Options written | | | 288 | | | | 53 | | |
Options cancelled in a closing
purchase transaction | | | (64 | ) | | | (12 | ) | |
Options exercised | | | — | | | | — | | |
Options expired | | | (224 | ) | | | (41 | ) | |
Options outstanding at end of year | | | — | | | $ | — | | |
Spectrum Fund | | Option
contracts | | Option
premiums
(000) | |
Options outstanding at beginning of year | | | 1,448 | | | $ | 89 | | |
Options written | | | 5,420 | | | | 179 | | |
Options cancelled in a closing
purchase transaction | | | (3,159 | ) | | | (61 | ) | |
Options exercised | | | — | | | | — | | |
Options expired | | | (3,709 | ) | | | (207 | ) | |
Options outstanding at end of year | | | — | | | $ | — | | |
Foreign currency translation—The books and records of the Funds are maintained in U.S. dollars. Investment securities and other assets and liabilities denominated in a foreign currency are translated into U.S. dollars on the date of valuation. The Funds do not isolate that portion of realized or unrealized gains and losses resulting from changes in the foreign exchange rate from fluctuations arising from changes in the market prices of the securities. These gains and losses are included in net realized and unrealized gains and losses on investments in the Statements of operations. Net realized and unrealized gains and losses on foreign currency transactions represent net foreign exchange gains or losses from foreign currency exchange contracts, disposition of foreign currencies, currency gains or losses realized between trade and settlement dates on securities transactions and the difference between the amount of the investment income and foreign withholding taxes recorded on the Funds' books and the U.S. dollar equivalent amounts actually received or paid.
Expenses—Expenses that are specifically attributed to one of the Funds are charged to that Fund. Certain other expenses of the Funds are prorated among the Funds on the basis of relative daily net assets.
Classes—Class specific expenses are borne by that class. Income, non-class specific expenses, and realized and unrealized gains and losses are allocated to the respective classes on the basis of relative daily net assets.
Dividends and distributions—The Funds declare and distribute net investment income, if any, annually, as a dividend to shareholders. Any net realized capital gains on sales of securities for all Funds are distributed to shareholders at least annually.
3. Administration, shareholder servicing, distribution and transfer agent agreements:
Turner Investments, L.P. ("Turner," the "Adviser," or the "Administrator") provides administrative services to the Funds under an Administration Agreement with the Trust. For its services, Turner receives an annual fee of 0.15% of the aggregate average daily net assets of the Trust up to $2 billion and 0.12% of the aggregate average daily net assets of the Trust over $2 billion. Under a separate Sub-administration Agreement between Turner and Citi Fund Services Ohio, Inc. ("Citi" or the "Sub-administrator"), Citi provides sub-administrative services, including certain fund accounting services, to the Trust. For the year ended September 30, 2014, Citi was paid $599 (000) by Turner.
Foreside Fund Services, LLC (the "Distributor") provides distribution services to the Funds under a Distribution Services Agreement.
TURNER FUNDS 2014 ANNUAL REPORT 49
NOTES TO FINANCIAL STATEMENTS
The Funds have adopted a Distribution Plan for Retirement Class Shares and Class C Shares (the "Distribution Plan") under which firms, including the Distributor, that provide distribution services may receive compensation. Under the Distribution Plan, which was adopted pursuant to Rule 12b-1 under the Investment Company Act of 1940, as amended, the Distributor is entitled to receive aggregate fees for distribution services not to exceed 0.75% of each Fund's average daily net assets attributable to Retirement Class or Class C Shares that are subject to the arrangement in return for providing a broad range of distribution services. Currently, the Retirement Class Shares of the Midcap Growth Fund pay the Distributor 0.25% and the Class C Shares of the Medical Sciences Long/Short Fund, Spectrum Fund and Titan Fund pay the Distributor 0.75% in distribution fees.
The Funds have also adopted Shareholder Services Plans (the "Shareholder Services Plans"). Under the Shareholder Services Plans, service providers are entitled to receive aggregate fees for shareholder services not to exceed 0.25% of each Fund's average daily net assets attributable to Investor Class Shares, Retirement Class Shares and Class C Shares that are subject to the arrangement in return for providing shareholder services. Currently, Investor Class Shares of each Fund, Retirement Class Shares of the Midcap Growth Fund and Class C Shares of the Medical Sciences Long/Short Fund, Spectrum Fund and Titan Fund pay 0.25% in shareholder servicing fees.
DST Systems, Inc. serves as the transfer agent and dividend disbursing agent for the Funds under a Transfer Agency Agreement with the Trust.
Certain officers and trustees of the Trust are also officers or employees of Turner or Citi. With the exception of the Trust's Chief Compliance Officer, such officers are paid no fees by the Trust for serving as officers and trustees of the Trust.
4. Investment advisory agreement:
The Trust and Turner are parties to an Investment Advisory Agreement dated April 28, 1996 under which Turner receives a fee that is calculated daily and paid monthly, based on the average daily net assets of the Funds.
Turner has contractually agreed to waive all or a portion of its fees and to reimburse expenses in order to limit total Fund operating expenses (excluding acquired fund fees and expenses and interest expense relating to short sales, except for the Medical Sciences Long/Short Fund, Spectrum Fund and Titan Fund, for which Turner
includes acquired fund fees and expenses and interest expense relating to short sales in its contractual waiver) to a specified percentage of the average daily net assets of each Fund on an annualized basis through certain dates disclosed in the following table:
| | | Advisory
fee | | Expense
cap | | Date
(through) | |
Medical Sciences Long/Short
Fund | |
Institutional Class | | | 1.50 | % | | | 1.95 | % | | January 31, 2015 | |
Investor Class | | | 1.50 | % | | | 2.20 | % | | January 31, 2015 | |
Class C | | | 1.50 | % | | | 2.95 | % | | January 31, 2015 | |
Spectrum Fund | |
Institutional Class | | | 1.50 | % | | | 1.95 | % | | January 31, 2015 | |
Investor Class | | | 1.50 | % | | | 2.20 | % | | January 31, 2015 | |
Class C | | | 1.50 | % | | | 2.95 | % | | January 31, 2015 | |
Titan Fund | |
Institutional Class | | | 1.50 | % | | | 1.95 | % | | January 31, 2015 | |
Investor Class | | | 1.50 | % | | | 2.20 | % | | January 31, 2015 | |
Class C | | | 1.50 | % | | | 2.95 | % | | January 31, 2015 | |
Emerging Growth Fund | |
Institutional Class | | | 1.00 | % | | | 1.15 | % | | January 31, 2015 | |
Investor Class | | | 1.00 | % | | | 1.40 | % | | January 31, 2015 | |
Large Growth Fund | |
Institutional Class | | | 0.60 | % | | | 0.69 | % | | January 31, 2015 | |
Investor Class | | | 0.60 | % | | | 0.94 | % | | January 31, 2015 | |
Midcap Growth Fund | |
Institutional Class | | | 0.75 | % | | | 0.93 | % | | January 31, 2015 | |
Investor Class | | | 0.75 | % | | | 1.18 | % | | January 31, 2015 | |
Retirement Class | | | 0.75 | % | | | 1.43 | % | | January 31, 2015 | |
Small Cap Growth Fund | |
Investor Class | | | 1.00 | % | | | 1.25 | % | | January 31, 2015 | |
5. Contingent deferred sales charges (Class C Shares):
A 1.00% contingent deferred sales charge ("CDSC") will be deducted with respect to Class C Shares of the Medical Sciences Long/Short Fund, Spectrum Fund and Titan Fund redeemed within 12 months of purchase. The CDSC will be based on the lower of the original purchase price or the value of the Class C Shares redeemed. The CDSC may be waived for certain investors, as described in the Class C Shares statutory prospectus for the Medical Sciences Long/Short Fund, Spectrum Fund and Titan Fund.
50 TURNER FUNDS 2014 ANNUAL REPORT
6. Investment transactions:
The cost of security purchases and the proceeds from security sales, other than short-term investments and option contracts written, for the year ended September 30, 2014 were as follows:
| | | Purchases (000) | | Sales (000) | |
Medical Sciences Long/Short Fund | | $ | 151,444 | | | $ | 126,680 | | |
Spectrum Fund | | | 1,211,284 | | | | 1,654,093 | | |
Titan Fund | | | 144,518 | | | | 157,867 | | |
Emerging Growth Fund | | | 171,346 | | | | 285,748 | | |
Large Growth Fund | | | 31,086 | | | | 88,428 | | |
Midcap Growth Fund* | | | 316,841 | | | | 590,508 | | |
Small Cap Growth Fund | | | 249,860 | | | | 353,678 | | |
* Costs of purchases and proceeds from sales of portfolio securities incurred to realign the Fund's portfolio after the reorganization of the Turner All Cap Growth Fund into the Midcap Growth Fund are excluded from these amounts. The cost of purchases excluded were $13,336 (000).
7. Federal tax policies and information:
Each of the Funds is classified as a separate taxable entity for Federal income tax purposes. Each of the Funds intends to continue to qualify as a separate "regulated investment company" under the Internal Revenue Code and make the requisite distributions to shareholders that will be sufficient to relieve it from Federal income tax and Federal excise tax. Therefore, no Federal tax provision is required.
The amounts of dividends from net investment income and distributions from net realized capital gains, if any, are determined in accordance with Federal income tax regulations, which may differ from those amounts determined under GAAP. These book/tax differences are either temporary or permanent in nature. These differences are primarily due to wash sales, foreign currency transactions, net operating losses, return of capital distributions, equalization and investments in partnerships and passive foreign investment companies. The character and timing of dividends from net investment income and distributions from net realized gains distributed during the fiscal year may differ from the year that the income or realized gains (losses) were recorded by the Funds. To the extent these differences are permanent, adjustments are made to the appropriate equity accounts in the period that the differences arise. The Funds may utilize equalization accounting for tax purposes and designate earnings and profits, including net realized gains distributed to shareholders on redemption of shares, as part of the dividends
paid deduction for income tax purposes. Any available tax equalization will be applied prorata to short-term capital gains and to long-term capital gains, and then to net investment income, as applicable.
Withholding taxes on dividends and net realized capital gains as a result of certain investments in ADRs by the Funds have been provided for in accordance with each investment's applicable country's tax rules and rates.
Accordingly, the following permanent differences have been reclassified to/from the following accounts during the fiscal year ended September 30, 2014:
| | Undistributed
net investment
income
(000) | | Accumulated
net realized
gain (loss)
(000) | | Portfolio
capital
(000) | |
Medical Sciences
Long/Short Fund | | $ | 740 | | | $ | (1,235 | ) | | $ | 495 | | |
Spectrum Fund | | | 3,105 | | | | (5,010 | ) | | | 1,905 | | |
Titan Fund | | | 471 | | | | (903 | ) | | | 432 | | |
Emerging Growth Fund | | | 3,464 | | | | (13,555 | ) | | | 10,091 | | |
Large Growth Fund | | | (8 | ) | | | 22 | | | | (14 | ) | |
Midcap Growth Fund | | | 1,327 | | | | 1,167 | | | | (2,494 | ) | |
Small Cap Growth Fund | | | 553 | | | | (553 | ) | | | — | | |
The tax character of dividends and distributions declared during the years ended September 30, 2014 and September 30, 2013 were as follows:
| | | Ordinary
income
(000) | | Long-term
capital gain
(000) | | Return of
capital
(000) | | Total
(000) | |
Medical Sciences Long/Short Fund | | | |
2014 | | $ | 331 | | | $ | 385 | | | $ | — | | | $ | 716 | | |
Titan Fund | | | |
2014 | | $ | — | | | $ | 278 | | | $ | — | | | $ | 278 | | |
2013 | | | 367 | | | | — | | | | — | | | | 367 | | |
Emerging Growth Fund | | | |
2014 | | $ | — | | | $ | 38,752 | | | $ | — | | | $ | 38,752 | | |
2013 | | | — | | | | 32,864 | | | | — | | | | 32,864 | | |
Large Growth Fund | | | |
2014 | | $ | — | | | $ | — | | | $ | — | | | $ | — | | |
2013 | | | 1,179 | | | | — | | | | — | | | | 1,179 | | |
Midcap Growth Fund | | | |
2014 | | $ | 17,823 | | | $ | 67,608 | | | $ | — | | | $ | 85,431 | | |
2013 | | | 739 | | | | 7,407 | | | | — | | | | 8,146 | | |
Small Cap Growth Fund | | | |
2014 | | $ | 4,658 | | | $ | 36,321 | | | $ | — | | | $ | 40,979 | | |
2013 | | | — | | | | 15,983 | | | | — | | | | 15,983 | | |
TURNER FUNDS 2014 ANNUAL REPORT 51
NOTES TO FINANCIAL STATEMENTS
As of September 30, 2014, the components of distributable earnings (accumulated losses) on a tax basis were as follows:
| | Undistributed
ordinary
income
(000) | | Undistributed
long-term
capital gains
(000) | | Capital
loss
carryforward
(000) | | Post-
October
losses
(000) | | Late-year
ordinary
losses
(000) | | Unrealized
appreciation
(depreciation)
(000) | | Total
distributable
earnings
(accumulated
losses)
(000) | |
Medical Sciences Long/Short Fund | | $ | 1,263 | | | $ | 749 | | | $ | — | | | $ | — | | | $ | — | | | $ | 1,196 | | | $ | 3,208 | | |
Spectrum Fund | | | — | | | | 23,520 | | | | — | | | | — | | | | (6,549 | ) | | | 5,553 | | | | 22,524 | | |
Titan Fund | | | 673 | | | | 704 | | | | — | | | | — | | | | — | | | | 598 | | | | 1,975 | | |
Emerging Growth Fund | | | 420 | | | | 58,274 | | | | — | | | | — | | | | — | | | | 24,626 | | | | 83,320 | | |
Large Growth Fund | | | 72 | | | | — | | | | (50,589 | ) | | | — | | | | — | | | | 6,243 | | | | (44,274 | ) | |
Midcap Growth Fund | | | 706 | | | | 87,661 | | | | (4,831 | ) | | | — | | | | — | | | | 49,275 | | | | 132,811 | | |
Small Cap Growth Fund | | | — | | | | 44,059 | | | | — | | | | (1,088 | ) | | | (323 | ) | | | 18,106 | | | | 60,754 | | |
Under current tax law, capital losses and specified ordinary losses realized after October 31 and non-specified ordinary losses incurred after December 31 (ordinary losses collectively known as "late year ordinary loss") may be deferred and treated as having arisen in the following fiscal year.
As of the end of their latest tax year end of September 30, 2014, the Funds in the following tables had capital loss carryforwards ("CLCFs"). CLCFs not subject to expiration must be used prior to using any CLCFs that are subject to expiration. A summary of these CLCFs is detailed in the tables below:
The Funds did not have any CLCFs that are not subject to expiration.
CLCFs subject to expiration:
| | | Expiring September 30, | |
| | | 2016
(000) | | 2017
(000) | | 2018
(000) | | Total
(000) | |
Large Growth Fund | | $ | — | | | $ | 1,330 | | | $ | 49,259 | | | $ | 50,589 | | |
Midcap Growth Fund | | | 2,441 | | | | 2,390 | | | | — | | | | 4,831 | | |
As of August 29, 2014, the Midcap Growth Fund credited accumulated net realized loss $95 (000) and charged paid-in-capital $21,343 (000) and unrealized appreciation $3,415 (000) due to the Turner All Cap Growth Fund merger with Midcap Growth Fund.
As of January 18, 2013, the Large Growth Fund credited accumulated net realized loss $20,921 (000) and charged paid-in-capital $35,249 (000) and unrealized appreciation $1,373 (000) due to the Turner Concentrated Growth Fund merger with Large Growth Fund. As of March 7, 2011, the Large Growth Fund credited accumulated net realized loss $12,828 (000) and charged paid-in-capital $123,626 (000) and unrealized appreciation $31,165 (000) due to the Turner Large Cap Growth Fund's merger with Large Growth Fund. Internal Revenue Code Section 382 limits the amount of annual CLCFs available for use.
During the year ended September 30, 2014, Spectrum Fund, Large Growth Fund and Midcap Growth Fund utilized $13,866, $15,659 and $578, respectively (000), of CLCFs.
At September 30, 2014, the total cost of securities for Federal income tax purposes and the aggregate gross unrealized appreciation and depreciation for the investments held by each Fund, excluding securities sold short and written options, were as follows:
| | Federal
tax
cost
(000) | | Unrealized
appreciation
(000) | | Unrealized
depreciation
(000) | | Net
unrealized
appreciation
(000) | |
Medical Sciences Long/Short Fund | | $ | 45,057 | | | $ | 7,224 | | | $ | (5,511 | ) | | $ | 1,713 | | |
Spectrum Fund | | | 128,983 | | | | 12,933 | | | | (7,487 | ) | | | 5,446 | | |
Titan Fund | | | 9,549 | | | | 860 | | | | (354 | ) | | | 506 | | |
Emerging Growth Fund | | | 146,090 | | | | 34,511 | | | | (9,884 | ) | | | 24,627 | | |
Large Growth Fund | | | 32,756 | | | | 6,608 | | | | (367 | ) | | | 6,241 | | |
Midcap Growth Fund | | | 202,795 | | | | 51,473 | | | | (2,201 | ) | | | 49,272 | | |
Small Cap Growth Fund | | | 135,127 | | | | 24,371 | | | | (6,264 | ) | | | 18,107 | | |
52 TURNER FUNDS 2014 ANNUAL REPORT
For the current open tax year and for all major jurisdictions, management has evaluated the tax positions taken or expected to be taken in the course of preparing their tax returns to determine whether the tax positions will "more-likely-than-not" be sustained by the Funds upon challenge by the applicable tax authority. Tax positions not deemed to meet the more-likely-than-not threshold and that would result in a tax benefit or expense to the Funds would be recorded as a tax benefit or expense in the current period. For the year ended September 30, 2014, the Funds did not recognize any amounts for unrecognized tax benefit/expense. A reconciliation of unrecognized tax benefit/expense is not provided herein, as the beginning and ending amounts of unrecognized tax benefit/expenses are zero, with no interim additions, reductions or settlements.
8. Loans of portfolio securities:
The Funds may lend securities in their portfolios pursuant to a securities lending agreement ("Lending Agreement") with Morgan Stanley. Unless otherwise agreed, security loans made pursuant to the Lending Agreement are required at all times to be secured by collateral equal to at least 100% of the market value of the securities loaned based on the previous day's market value of the securities loaned, marked-to-market daily. Any collateral shortfalls are adjusted the next business day. Cash collateral received is invested in the Dollar Shares of the BlackRock Liquidity Funds TempCash, a money market fund. All such investments are made at the risk of the Funds and, as such, the Funds are liable for investment losses. The Funds receive an annual fee for their participation in the Lending Agreement based on the projected lending activity.
In the event of bankruptcy of the borrower, realization/retention of the collateral may be subject to legal proceedings.
Securities lending transactions are entered into by each Fund under a Master Securities Lending Agreement ("MSLA") which permits the Funds, under certain circumstances including an event of default (such as bankruptcy or insolvency), to offset amounts payable by the Funds to the same counterparty against amounts to be received and create one single net payment due to or from the Funds.
The following Funds had securities on loan and had invested cash collateral, subject to offset under a MSLA, with the following values as of September 30, 2014:
Fund | | Value of Securities
on Loan (000) | | Value of
Collateral
Received
(000)* | | Net
Amount
(000) | |
Emerging Growth Fund | | $ | 27,002 | | | $ | 27,002 | | | $ | — | | |
Large Growth Fund | | | 1,425 | | | | 1,425 | | | | — | | |
Midcap Growth Fund | | | 12,535 | | | | 12,535 | | | | — | | |
Small Cap Growth Fund | | | 20,720 | | | | 20,720 | | | | — | | |
* The actual value of collateral received may be in excess of the amounts shown in the table. The table only reflects collateral amounts up to the amount of the value of securities on loan as disclosed in the Statements of assets and liabilities.
9. Concentration/risks:
Certain Funds invest a high percentage of their assets in specific market sectors in order to achieve a potentially greater investment return. As a result, these Funds may be more susceptible to positive or negative economic, political, and regulatory developments in a particular market sector of the market and may experience the effect of this increased volatility on the Fund's net asset value and a magnified effect on the Fund's total return.
Governments of some developing countries exercise substantial influence over many aspects of the private sector. In some countries, the government owns or controls many companies, including the largest companies in the country. As such, government actions in the future could have a significant effect on economic conditions in developing countries in these regions, which could affect private sector companies, the Fund and the value of its securities. Furthermore, certain developing countries are among the largest debtors to commercial banks and foreign governments. Trading in debt obligations issued or guaranteed by such governments or their agencies and instrumentalities involves a high degree of risk.
The Funds enter into contracts that contain a variety of indemnifications. The Funds' maximum exposure under these arrangements is unknown. However, the Funds have not had prior claims or losses pursuant to these contracts and expect the risk of loss to be remote.
10. Fund Merger — Midcap Growth Fund:
On August 29, 2014, the Midcap Growth Fund acquired all of the net assets of the Turner All Cap Growth Fund ("All Cap Growth Fund"), an open-end investment company, pursuant to a Plan of Reorganization approved by the All Cap Growth Fund's shareholders at a meeting held on August 22, 2014. The purpose of the transaction was to combine the two Funds managed by the Adviser with similar investment objectives and policies. The acquisition was accomplished by a tax-free exchange of 426,504 Investor Class shares of the Midcap Growth Fund, valued at $16,748 (000), for 1,425,928 Investor Class shares of the All Cap Growth Fund outstanding on August 29, 2014. The exchange ratio (Midcap Growth Fund shares issued/All Cap Growth Fund shares outstanding) was 0.299:1 for the Investor Class.
The investment portfolio of the All Cap Growth Fund, with a fair value of $16,742 (000) and identified cost of $13,327 (000) at August 29, 2014, was the principal asset acquired by the Midcap Growth Fund. For financial reporting purposes, assets received and shares issued by the Midcap Growth Fund were recorded at fair value;
TURNER FUNDS 2014 ANNUAL REPORT 53
NOTES TO FINANCIAL STATEMENTS
however, the cost basis of the investments received from the All Cap Growth Fund was carried forward to align ongoing reporting of the Midcap Growth Fund's realized and unrealized gains and losses with amounts distributable to shareholders for tax purposes.
Upon the business combination of the Funds on August 29, 2014, the net assets of the All Cap Growth Fund, which included portfolio capital of $21,343 (000), accumulated net investment loss of $95 (000), accumulated realized losses of $7,915 (000) and unrealized gains of $3,415 (000), combined with the Midcap Growth Fund were $254,640 (000). The undistributed net investment income and unrealized gains of the All Cap Growth Fund may be distributed by the Midcap Growth Fund in future periods. Immediately prior to the merger, the net assets (000) of the All Cap Growth Fund and the Midcap Growth Fund were $16,748 (000) and $237,892 (000), respectively. All fees and expenses incurred by the All Cap Growth Fund and the Midcap Growth Fund directly in connection with the Plan of Reorganization were borne by the Adviser.
Assuming the acquisition had been completed on October 1, 2013, the beginning of the annual reporting period of the Midcap Growth Fund, the Fund's pro forma results of operations for the year ended September 30, 2014, are as follows (000):
Net investment income/(loss): | | $ | (1,355 | ) | |
Net realized/unrealized gains/(losses): | | | 47,180 | | |
Change in net assets resulting from operations: | | $ | 45,825 | | |
Because the combined investment portfolios have been managed as a single integrated portfolio since the acquisition was completed, it is not practicable to separate the amounts of revenue and earnings of the All Cap Growth Fund that have been included in the Midcap Growth Fund's Statement of operations since August 29, 2014.
11. Fund Merger — Large Growth Fund:
On January 18, 2013, the Large Growth Fund acquired all of the net assets of the Turner Concentrated Growth Fund ("Concentrated Growth Fund"), an open-end investment company, pursuant to a Plan of Reorganization approved by the Concentrated Growth Fund shareholders on January 9, 2013. The purpose of the transaction was to combine the two Funds managed by the Adviser with similar investment objectives and policies. The acquisition was accomplished by a tax-free exchange of 1,216,063 Investor Class shares of the Large Growth Fund, valued at $15,614 (000), for 2,025,116 Investor Class shares of the Concentrated Growth Fund outstanding on January 18, 2013. The exchange ratio (Large Growth Fund shares issued/Concentrated Growth Fund shares outstanding) was 0.60:1 for the Investor Class.
The investment portfolio of the Concentrated Growth Fund, with a fair value of $16,717 (000) and identified cost of $15,344 (000) at January 18, 2013, was the principal asset acquired by the Large Growth Fund. For financial reporting purposes, assets received and shares issued by the Large Growth Fund were recorded at fair value; however, the cost basis of the investments received from the Concentrated Growth Fund was carried forward to align ongoing reporting of the Large Growth Fund's realized and unrealized gains and losses with amounts distributable to shareholders for tax purposes.
Upon the business combination of the Funds on January 18, 2013, the net assets of the Concentrated Growth Fund, which included portfolio capital of $35,249 (000), accumulated net investment loss of $87 (000), accumulated realized losses of $20,921 (000) and unrealized gains of $1,373 (000), combined with the Large Growth Fund were $225,958 (000). The undistributed net investment income and unrealized gains of the Concentrated Growth Fund may be distributed by the Large Growth Fund in future periods. Immediately prior to the merger, the net assets (000) of the Concentrated Growth Fund and the Large Growth Fund were $15,614 (000) and $210,344 (000), respectively. All fees and expenses incurred by the Concentrated Growth Fund and the Large Growth Fund directly in connection with the Plan of Reorganization were borne by the Adviser.
Assuming the acquisition had been completed on October 1, 2012, the beginning of the annual reporting period of the Large Growth Fund, the Fund's pro forma results of operations for the year ended Returns the end of the date range, are as follows (000):
Net investment income/(loss): | | $ | 1,012 | | |
Net realized/unrealized gains/(losses): | | | 14,238 | | |
Change in net assets resulting from operations: | | $ | 15,250 | | |
Because the combined investment portfolios have been managed as a single integrated portfolio since the acquisition was completed, it is not practicable to separate the amounts of revenue and earnings of the Concentrated Growth Fund that have been included in the Large Growth Fund's Statement of operations since January 18, 2013.
12. Subsequent Events:
The Trust has evaluated the need for disclosures and/or adjustments resulting from subsequent events through the date the financial statements were issued. Based on this evaluation, no additional disclosures and/or adjustments were required to the financial statements as of September 30, 2014.
54 TURNER FUNDS 2014 ANNUAL REPORT
REPORT OF INDEPENDENT REGISTERED PUBLIC ACCOUNTING FIRM
The Board of Trustees and Shareholders
Turner Funds:
We have audited the accompanying statements of assets and liabilities, including the schedules of investments, of the Turner Funds, comprising the Turner Medical Sciences Long/Short Fund, Turner Spectrum Fund, Turner Titan Fund, Turner Emerging Growth Fund, Turner Large Growth Fund, Turner Midcap Growth Fund, and Turner Small Cap Growth Fund (collectively, the Funds), as of September 30, 2014, and the related statements of operations for the year then ended, the statements of changes in net assets for each of the years in the two-year period then ended and the financial highlights for each of the years or periods in the five-year period then ended. These financial statements and financial highlights are the responsibility of the Funds' management. Our responsibility is to express an opinion on these financial statements and financial highlights based on our audits.
We conducted our audits in accordance with the standards of the Public Company Accounting Oversight Board (United States). Those standards require that we plan and perform the audit to obtain reasonable assurance about whether the financial statements and financial highlights are free of material misstatement. An audit includes examining, on a test basis, evidence supporting the amounts and disclosures in the financial statements. Our procedures included confirmation of securities owned as of September 30, 2014, by correspondence with the custodian and brokers or other appropriate auditing procedures. An audit also includes assessing the accounting principles used and significant estimates made by management, as well as evaluating the overall financial statement presentation. We believe that our audits provide a reasonable basis for our opinion.
In our opinion, the financial statements and financial highlights referred to above present fairly, in all material respects, the financial position of each of the Funds comprising the Turner Funds referred to above as of September 30, 2014, the results of their operations for the year then ended, the changes in their net assets for each of the years in the two-year period then ended, and the financial highlights for each of the years or periods in the five-year period then ended, in conformity with U.S. generally accepted accounting principles.
Philadelphia, Pennsylvania
November 24, 2014
TURNER FUNDS 2014 ANNUAL REPORT 55
NOTICE TO SHAREHOLDERS (Unaudited)
For shareholders that do not have a September 30, 2014 tax year end, this notice is for informational purposes only. For shareholders with a September 30, 2014 year end, please consult your tax advisor as to the pertinence of this notice. For the fiscal period ended September 30, 2014, each portfolio is designating the following items with regard to distributions paid during the year.
| | Dividends qualifying
for corporate
dividends receivable
deduction(1) | | Qualifying dividend
income(2) | | Short-term
capital gain(3)
(000) | | Long-term
capital gain(4)
(000) | |
Medical Sciences Long/Short Fund | | | 4.41 | % | | | 7.83 | % | | $ | 641 | (5) | | $ | 570 | (5) | |
Spectrum Fund | | | 0.00 | % | | | 0.00 | % | | | — | | | | 1,905 | (6) | |
Titan Fund | | | 12.94 | % | | | 12.66 | % | | | 211 | (7) | | | 499 | (7) | |
Emerging Growth Fund | | | 0.00 | % | | | 0.00 | % | | | 71 | (8) | | | 48,615 | (8) | |
Large Growth Fund | | | 0.00 | % | | | 0.00 | % | | | — | | | | — | | |
Midcap Growth Fund | | | 26.44 | % | | | 27.63 | % | | | 17,823 | | | | 67,608 | | |
Small Cap Growth Fund | | | 41.87 | % | | | 42.20 | % | | | 4,658 | | | | 36,321 | | |
(1) Qualifying dividends represent dividends which qualify for the corporate dividends received deduction and are reflected as a percentage of "Ordinary Income Distributions."
(2) The percentage in this column represents the amount of "Qualifying Dividend Income" and is reflected as a percentage of "Ordinary Income Distributions" which may be subject to a maximum tax rate of 23.8% for individual taxpayers.
(3) The amount in this column represents the amount of "Short-Term Capital Gain" as designated in accordance with Section 871(k)(2) and 881(e) of the Internal Revenue Code. This designation is not applicable to U.S. citizens or U.S. resident shareholders.
(4) The amount in this column represents the amount of "Long-Term Capital Gain" as designated by each applicable fund.
(5) Pursuant to Section 852 of the Internal Revenue Code, $311 (000) of the amount designated as short-term capital gains distributions and $184 (000) of the amount designated as long-term capital gains distributions was distributed in connection with share redemptions.
(6) Pursuant to Section 852 of the Internal Revenue Code, $1,905 (000) of the amount designated as long-term capital gains distributions was distributed in connection with share redemptions.
(7) Pursuant to Section 852 of the Internal Revenue Code, $211 (000) of the amount designated as short-term capital gains distributions and $221 (000) of the amount designated as long-term capital gains distributions was distributed in connection with share redemptions.
(8) Pursuant to Section 852 of the Internal Revenue Code, $71 (000) of the amount designated as short-term capital gains distributions and 9,863 (000) of the amount designated as long-term capital gains distributions was distributed in connection with share redemptions.
The information reported herein may differ from the information and distributions taxable to the Shareholders for the calendar year ended December 31, 2014. Complete information will be computed and reported in conjunction with your 2014 Form 1099-DIV.
56 TURNER FUNDS 2014 ANNUAL REPORT
DISCLOSURE OF FUND EXPENSES (Unaudited)
All mutual funds have operating expenses. As a shareholder of a mutual fund, your investment is affected by these on-going costs, which include (among others) costs for portfolio management, distribution (12b-1) and/or shareholder services and other expenses. It is important for you to understand the impact of these costs on your investment returns. Operating expenses such as these are deducted from a mutual fund's gross income and directly reduce its final investment return. These expenses are expressed as a percentage of a mutual fund's average net assets; this percentage is known as a mutual fund's expense ratio.
The following examples use the expense ratio and are intended to help you understand the ongoing costs (in dollars) of investing in your Fund and to compare these costs with those other mutual funds. The examples are based on an investment of $1,000 made at the beginning of the period shown and held for the entire period.
The table below and on the next page illustrates your Fund's costs in two ways:
• Actual Fund Return. This section helps you estimate the actual expenses after fee waivers that your Fund incurred over the period. The "Expenses Paid During Period" column shows the actual dollar expense cost incurred by a $1,000 investment in the Fund, and the "Ending Account Value" number is derived from deducting that expense cost from the Fund's gross investment return.
You can use this information, together with the actual amount you invested in the Fund, to estimate the expenses you paid over that period. Simply divide your actual account value by $1,000 to arrive at a ratio (for example, an $8,600 account value divided by $1,000 = 8.6), then multiply that ratio by the number shown for your Fund under "Expenses Paid During Period."
• Hypothetical 5% Return. This section helps you compare your Fund's cost with those of other mutual funds. It provides information about hypothetical account values and expenses based on the Fund's actual expense ratio (column 3) and an assumed rate of return of 5% per year before expenses, which is not the Fund's actual return. This section is useful in making comparisons because the Securities and Exchange Commission requires all mutual funds to make this 5% calculation. You can assess your Fund's comparative cost by comparing the hypothetical result for your Fund in the "Expenses Paid During Period" column with those that appear in the same charts in the shareholder reports for other mutual funds.
Note: Because the return is set at 5% for comparison purposes — NOT your Fund's actual return — the hypothetical account values and expenses may not be used to estimate your actual ending account balance or expenses you paid for the period.
| | | Beginning
Account
Value
4/1/14 | | Ending
Account
Value
9/30/14 | | Annualized
Expense
Ratios | | Expenses
Paid
During
Period* | |
Turner Medical Sciences Long/Short Fund —
Institutional Class Shares | |
Actual Fund Return | | $ | 1,000.00 | | | $ | 1,051.30 | | | | 1.95 | % | | $ | 10.03 | | |
Hypothetical
5% Return | | | 1,000.00 | | | | 1,015.29 | | | | 1.95 | | | | 9.85 | | |
Turner Medical Sciences Long/Short Fund — Investor Class Shares | |
Actual Fund Return | | | 1,000.00 | | | | 1,050.80 | | | | 2.20 | | | | 11.31 | | |
Hypothetical
5% Return | | | 1,000.00 | | | | 1,014.04 | | | | 2.20 | | | | 11.11 | | |
Turner Medical Sciences Long/Short Fund — Class C Shares | |
Actual Fund Return | | | 1,000.00 | | | | 1,046.30 | | | | 2.95 | | | | 15.13 | | |
Hypothetical
5% Return | | | 1,000.00 | | | | 1,010.28 | | | | 2.95 | | | | 14.87 | | |
Turner Spectrum Fund — Institutional Class Shares | |
Actual Fund Return | | | 1,000.00 | | | | 1,000.80 | | | | 1.95 | | | | 9.78 | | |
Hypothetical
5% Return | | | 1,000.00 | | | | 1,015.29 | | | | 1.95 | | | | 9.85 | | |
Turner Spectrum Fund — Investor Class Shares | |
Actual Fund Return | | | 1,000.00 | | | | 999.20 | | | | 2.20 | | | | 11.03 | | |
Hypothetical
5% Return | | | 1,000.00 | | | | 1,014.04 | | | | 2.20 | | | | 11.11 | | |
| | | Beginning
Account
Value
4/1/14 | | Ending
Account
Value
9/30/14 | | Annualized
Expense
Ratios | | Expenses
Paid
During
Period* | |
Turner Spectrum Fund — Class C Shares | |
Actual Fund Return | | $ | 1,000.00 | | | $ | 995.60 | | | | 2.95 | % | | $ | 14.76 | | |
Hypothetical
5% Return | | | 1,000.00 | | | | 1,010.28 | | | | 2.95 | | | | 14.87 | | |
Turner Titan Fund — Institutional Class Shares | |
Actual Fund Return | | | 1,000.00 | | | | 1,027.00 | | | | 1.95 | | | | 9.91 | | |
Hypothetical
5% Return | | | 1,000.00 | | | | 1,015.29 | | | | 1.95 | | | | 9.85 | | |
Turner Titan Fund — Investor Class Shares | |
Actual Fund Return | | | 1,000.00 | | | | 1,024.40 | | | | 2.20 | | | | 11.16 | | |
Hypothetical
5% Return | | | 1,000.00 | | | | 1,014.04 | | | | 2.20 | | | | 11.11 | | |
Turner Titan Fund — Class C Shares | |
Actual Fund Return | | | 1,000.00 | | | | 1,021.40 | | | | 2.95 | | | | 14.95 | | |
Hypothetical
5% Return | | | 1,000.00 | | | | 1,010.28 | | | | 2.95 | | | | 14.87 | | |
Turner Emerging Growth Fund — Institutional Class Shares | |
Actual Fund Return | | | 1,000.00 | | | | 922.00 | | | | 1.15 | | | | 5.54 | | |
Hypothetical
5% Return | | | 1,000.00 | | | | 1,019.30 | | | | 1.15 | | | | 5.82 | | |
TURNER FUNDS 2014 ANNUAL REPORT 57
| | | Beginning
Account
Value
4/1/14 | | Ending
Account
Value
9/30/14 | | Annualized
Expense
Ratios | | Expenses
Paid
During
Period* | |
Turner Emerging Growth Fund — Investor Class Shares | |
Actual Fund Return | | $ | 1,000.00 | | | $ | 920.90 | | | | 1.40 | % | | $ | 6.74 | | |
Hypothetical
5% Return | | | 1,000.00 | | | | 1,018.05 | | | | 1.40 | | | | 7.08 | | |
Turner Large Growth Fund — Institutional Class Shares | |
Actual Fund Return | | | 1,000.00 | | | | 1,043.10 | | | | 0.69 | | | | 3.53 | | |
Hypothetical
5% Return | | | 1,000.00 | | | | 1,021.61 | | | | 0.69 | | | | 3.50 | | |
Turner Large Growth Fund — Investor Class Shares | |
Actual Fund Return | | | 1,000.00 | | | | 1,041.70 | | | | 0.94 | | | | 4.81 | | |
Hypothetical
5% Return | | | 1,000.00 | | | | 1,020.36 | | | | 0.94 | | | | 4.76 | | |
Turner Midcap Growth Fund — Institutional Class Shares | |
Actual Fund Return | | | 1,000.00 | | | | 996.60 | | | | 0.93 | | | | 4.65 | | |
Hypothetical
5% Return | | | 1,000.00 | | | | 1,020.41 | | | | 0.93 | | | | 4.71 | | |
| | | Beginning
Account
Value
4/1/14 | | Ending
Account
Value
9/30/14 | | Annualized
Expense
Ratios | | Expenses
Paid
During
Period* | |
Turner Midcap Growth Fund — Investor Class Shares | |
Actual Fund Return | | $ | 1,000.00 | | | $ | 994.70 | | | | 1.18 | % | | $ | 5.90 | | |
Hypothetical
5% Return | | | 1,000.00 | | | | 1,019.15 | | | | 1.18 | | | | 5.97 | | |
Turner Midcap Growth Fund — Retirement Class Shares | |
Actual Fund Return | | | 1,000.00 | | | | 994.70 | | | | 1.43 | | | | 7.15 | | |
Hypothetical
5% Return | | | 1,000.00 | | | | 1,017.90 | | | | 1.43 | | | | 7.23 | | |
Turner Small Cap Growth Fund — Investor Class Shares | |
Actual Fund Return | | | 1,000.00 | | | | 970.50 | | | | 1.25 | | | | 6.17 | | |
Hypothetical
5% Return | | | 1,000.00 | | | | 1,018.80 | | | | 1.25 | | | | 6.33 | | |
* Unless otherwise indicated, expenses are equal to the Fund's annualized expense ratio multiplied by the average account value over the period, multiplied by 183/365 (to reflect the one-half year period from 4/1/14 - 9/30/14).
58 TURNER FUNDS 2014 ANNUAL REPORT
TRUSTEE AND OFFICERS OF THE TRUST (Unaudited)
Name, address and age(1) | | Position held with
Trust and length
of service(2) | | Principal occupation(s)
during past 5 years | | Number of
portfolios in
complex
overseen
by trustee | | Other
directorships
held | |
Interested Trustee* | | | | | | | | | |
Stephen J. Negrotti
(63) | | Trustee (since 2014); President (since 2014) | | President and Chief Executive Officer (since 2014), Turner; Partner (1986-2011), Ernst & Young LLP. | | | 7 | | | | None | | |
* Mr. Negrotti is deemed to be an "Interested Trustee" by virtue of his relationship with Turner.
Non-Interested Trustees | | | | | | | | | |
Alfred C. Salvato
(56) | | Chairman of the Board (since 2004); Trustee (since 1996) | | Senior Vice President of Finance and Chief Investment Officer (since 2003) and Treasurer (since 1995), Thomas Jefferson University. | | | 7 | | | | None | | |
Janet F. Sansone
(69) | | Trustee (since 1996) | | Chief Management Officer, United States Government Printing Office (2008-2010); Self-employed Consultant (since 1999). | | | 7 | | | | None | | |
John T. Wholihan
(76) | | Trustee (since 1996) | | Dean Emeritus (since 2007), Professor (since 1984) and Dean (1984-2007), College of Business Administration, Loyola Marymount University. | | | 7 | | | | None | | |
Executive Officers | | | | | | | | | |
Bashir C. Asad
3435 Stelzer Road, Columbus, OH 43219
(51) | | Controller and Chief Financial Officer (since 2014) | | Senior Vice President and Head of Fund Adminstration Department (since 2013), Senior Vice President (since 2010) and Vice President (since 2007), Citi Fund Services. | | | N/A | | | | N/A | | |
Brian F. McNally
(56) | | Vice-President (since 2002), Secretary and Chief Compliance Officer (since 2004) | | General Counsel and Chief Compliance Officer (since 2004), Deputy General Counsel (2002-2004), Turner. | | | N/A | | | Turner Funds plc (since 2008). | |
William Speacht
(44) | | Vice-President (since 2013) | | Director of Fund Administration (since 2013), Deputy Chief Compliance Officer and Anti-Money Laundering Officer (since 2006), Turner; Compliance Officer (1997-2006), Delaware Investments. | | | N/A | | | | N/A | | |
(1) Each Trustee and executive officer, unless noted otherwise, may be contacted by writing to such Trustee or Officer c/o Turner Funds, 1205 Westlakes Drive, Suite 100, Berwyn, PA 19312, Attn: Turner Chief Legal Officer.
(2) Each Officer serves a one-year term. All Trustees elected to office on or after February 19, 2010, are subject to a 12-year term of office ending on December 31st of the 12 year anniversary of the year in which he or she was first elected to the position of Trustee, subject to a one-time renewal for a second 12-year term by vote of a majority of the Trustees, including a majority of the "non-interested" Trustees. Additionally, each Trustee who had not reached the age of 70 as of December 31, 2009, is subject to a retirement age of 75, so that any Trustee who reaches such age shall resign as of the December 31st immediately following his or her 75th birthday. All other Trustees serve until his or her respective successor has been duly elected and qualified.
Trustee and Officer information is as of September 30, 2014.
The Trust's Statement of Additional Information ("SAI") includes additional information about the Trustees and Officers. The SAI may be obtained without charge by calling 1.800.224.6312.
TURNER FUNDS 2014 ANNUAL REPORT 59
Turner Funds' trustees
Alfred C. Salvato
Chief Investment Officer & Treasurer
Thomas Jefferson University
Janet F. Sansone
Executive Director
JFS Consulting
Stephen J. Negrotti
President and Chief Executive Officer
Turner Investments, L.P.
Dr. John T. Wholihan
Professor (Retired), Dean Emeritus, College of Business
Loyola Marymount University
Investment adviser
Turner Investments, L.P.
Berwyn, Pennsylvania
Distributor
Foreside Fund Services, LLC
Portland, Maine
Administrator
Turner Investments, L.P.
Berwyn, Pennsylvania
Independent Registered Public Accounting Firm
KPMG LLP
Philadelphia, Pennsylvania
This report was prepared for shareholders of the Turner Funds. It may be distributed to others only if preceded or accompanied by a Turner Funds' Prospectus, which contains detailed information. All Turner Funds are offered by prospectus only.
The Funds file their complete schedules of portfolio holdings with the Securities and Exchange Commission (the "Commission") for the first and third quarters of each fiscal year on Form N-Q within sixty days after the end of the period. The Funds' Forms N-Q are available on the Commission's Web site at http://www.sec.gov, and may be reviewed and copied at the Commission's Public Reference Room in Washington, DC. Information on the operation of the Public Reference Room may be obtained by calling 1-800-SEC-0330.
The Board of Trustees of the Turner Funds has delegated responsibility for decisions regarding proxy voting for securities held by each Fund to Turner Investments, L.P. Turner Investments, L.P. will vote such proxies in accordance with its proxy policies and procedures, which are included in Appendix B to the SAI. The Board of Trustees will periodically review each Fund's proxy voting record.
A description of the policies and procedures that the Funds use to determine how to vote proxies relating to portfolio securities, as well as information relating to how the Fund voted proxies relating to portfolio securities during the most recent 12-month period ended June 30, is available (i) via the Funds' Web site, www.turnerinvestments.com; (ii) on the Commission's Web site at http://www.sec.gov; and (iii) without charge by calling 1.800.224.6312.
60 TURNER FUNDS 2014 ANNUAL REPORT

Turner Funds
P.O. Box 219805
Kansas City, Missouri 64121-9805
Telephone: 1.800.224.6312
Email: mutualfunds@turnerinvestments.com
Web Site: www.turnerinvestments.com
Item 2. Code of Ethics.
The registrant has adopted a code of ethics that applies to the registrant’s Principal Executive Officer, Principal Financial Officer, and Principal Accounting Officer.
Item 3. Audit Committee Financial Expert.
The Board of Trustees of the Turner Funds has determined that the Board’s Audit Committee does not have an “audit committee financial expert,” as the Securities and Exchange Commission has defined that term. After carefully considering all of the factors involved in the definition of “audit committee financial expert,” the Board determined that none of the members of the Audit Committee possessed all five attributes in the definition, although some members of the Audit Committee possessed some of the attributes. The Board also determined that the Audit Committee members have general financial expertise, and given the size and types of the Turner Funds and in light of the nature of the accounting and valuation issues presented over the past several years, it did not appear that the Audit Committee members lacked any necessary skill to serve on the Audit Committee.
Item 4. Principal Accountant Fees and Services.
Fees billed by KPMG LLP (“KPMG”) related to the Trust
KPMG billed the Trust the aggregate fees for services rendered to the Trust for the last two fiscal years as follows:
| | 2014 | | 2013 | |
| | All fees and
services to the
Trust that were
pre-approved | | All fees and
services to
service
affiliates that
were pre-
approved | | All other fees
and services to
service
affiliates that
did not require
pre-approval | | All fees and
services to the
Trust that were
pre-approved | | All fees and
services to
service
affiliates that
were pre-
approved | | All other fees
and services to
service
affiliates that
did not require
pre-approval | |
(a) Audit Fees (1) | | $ | 230,150 | | N/A | | N/A | | $ | 240,000 | | N/A | | N/A | |
(b) Audit-Related Fees (2) | | $ | 15,000 | | N/A | | N/A | | $ | 12,500 | | N/A | | N/A | |
(c) Tax Fees (3) | | $ | 96,964 | | N/A | | N/A | | $ | 113,704 | | N/A | | N/A | |
(d) All Other Fees | | N/A | | N/A | | N/A | | N/A | | N/A | | N/A | |
Notes:
(1) Audit Fees include fees related to the audit of the registrant’s annual financial statements and services normally provided by the accountant in connection with statutory and regulatory filings.
(2) Audit-Related Fees relate to consents issued in connection with review of registration statements.
(3) Tax Fees consist of tax compliance services for the Trust. These services primarily included preparation of federal and state income tax returns and federal excise tax returns, as well as review of annual excise distribution requirements.
(e)(1) The Audit Committee has delegated pre-approval of non-audit services to the Chairman of the Audit Committee, subject to ratification by the Audit Committee.
(e)(2) Percentage of fees billed applicable to non-audit services pursuant to waiver of pre-approval requirement were as follows:
| | 2014 | | 2013 | |
Audit-Related Fees | | 0.00 | % | 0.00 | % |
Tax Fees | | 0.00 | % | 0.00 | % |
All Other Fees | | 0.00 | % | 0.00 | % |
(f) Not applicable.
(g) The aggregate non-audit fees and services billed by KPMG for the last two fiscal years were $96,964 and $113,704 for 2014 and 2013, respectively, as described above.
(h) The registrant’s Audit Committee has considered whether the provision of non-audit services that were rendered to the registrant’s Investment Adviser and any entity controlling, controlled by, or under common control with the Investment Adviser that provides on-going services to the registrant that were not pre-approved pursuant to paragraph (c)(7)(ii) of Rule 2-01 of Regulation S-X is compatible with maintaining the principal accountant’s independence.
Item 5. Audit Committee of Listed Registrants.
Not applicable to open-end management investment companies.
Item 6. Schedule of Investments.
Schedule of Investments is included as part of report to shareholders filed under Item 1.
Item 7. Disclosure of Proxy Voting Policies and Procedures for Closed-End Management Investment Companies.
Not applicable to open-end management investment companies.
Item 8. Portfolio Managers of Closed-End Management Investment Companies.
Not applicable to open-end management investment companies.
Item 9. Purchases of Equity Securities by Closed-End Management Investment Company and Affiliated Purchasers.
Not applicable to open-end management investment companies.
Item 10. Submission of Matters to a Vote of Security Holders.
There have been no material changes to the procedures by which shareholders may recommend nominees to the registrant’s Board of Trustees since the registrant’s last proxy solicitation.
Item 11. Controls and Procedures.
(a) The registrant’s Principal Executive Officer and Principal Financial Officer concluded that the registrant’s disclosure controls and procedures (as defined in Rule 30a-3(c) under the Investment Company Act of 1940 as amended (the “Act”)) were effective as of a date within 90 days of the filing date of this report, based on their evaluation of the effectiveness of the registrant’s disclosure controls and procedures required by Rule 30a-3(b) under the Act and Rule 13a-15(b) or 15d-15(b) under the Securities and Exchange Act of 1934.
(b) There were no changes in the registrant’s internal control over financial reporting (as defined in Rule 30a-3(d) of the Act) that occurred during the registrant’s last fiscal quarter that have materially affected, or are reasonably likely to materially affect, the registrant’s internal control over financial reporting.
Item 12. Exhibits.
(a)(1) Registrant’s Code of Ethics for Principal Executive and Senior Financial Officer is incorporated herein by reference to Exhibit 12(a)(1) if the registrant’s Form N-CSR filed on December 7, 2012, which is the most current document.
(a)(2) A separate certification for the Principal Executive Officer and the Principal Financial Officer of the registrant as required by Rule 30a-2(a) under the Investment Company Act of 1940, as amended (17 CFR 270.30a-2(a)), are filed herewith.
(b) Officer certifications as required by Rule 30a-2(b) under the Investment Company Act of 1940, as amended (17 CFR 270.30a-2(b)), also accompany this filing as an Exhibit.
SIGNATURES
Pursuant to the requirements of the Securities Exchange Act of 1934 and the Investment Company Act of 1940, the registrant has duly caused this report to be signed on its behalf by the undersigned, thereunto duly authorized.
Registrant | Turner Funds | |
| |
By (Signature and Title) | /s/ Stephen J. Negrotti | |
| Stephen J. Negrotti, President (Principal Executive Officer) | |
| |
Date | December 8, 2014 | |
| | | | |
Pursuant to the requirements of the Securities Exchange Act of 1934 and the Investment Company Act of 1940, this report has been signed below by the following persons on behalf of the registrant and in the capacities and on the dates indicated.
By (Signature and Title) | /s/ Stephen J. Negrotti | |
| Stephen J. Negrotti, President (Principal Executive Officer) | |
| |
Date | December 8, 2014 | |
| |
By (Signature and Title) | /s/ Bashir Asad | |
| Bashir Asad, Controller and Chief Financial Officer (Principal Financial Officer) | |
| |
Date | December 8, 2014 | |
| | | |