Exhibit 99.5

F RWARD FOCUS
Cameco
2012 Annual Report

Focused on the
FUTURE
Around the world, demand for energy continues to expand and nuclear remains an important part of the energy mix. Cameco continues to move forward on the path towards increasing annual uranium supply to 36 M lbs by 2018 in order to meet future uranium demand.
Message from the Chair
Dear Shareholder,
Your board of directors is responsible for overseeing management to ensure the company stays on track to achieve its strategy and deliver value to you, the shareholder. We were once again very busy with these tasks in 2012 amidst the continued near-term challenges of the nuclear industry. This involved adjustment to our strategy to meet the needs of our market, both in the near term and long term. We were an active part of that decision and, as part of the process, also decided to expand the responsibilities of the audit committee to include recommendations on all matters of a financial and financing nature. Going forward, we believe the adjustment to Cameco‘s growth plans is the right decision in order to deliver the best value to shareholders over the near and long term.
Governance continues to be an important consideration for the board, and we further enhanced enterprise risk management governance by incorporating strategic risks into our formal risk management system. We also adopted new independence rules for human resources committee members – the same as those adopted by the New York Stock Exchange.
We know that compensation is a primary focus for shareholders, and this year upon our regular compensation review, we made changes to enhance the integrity of our performance-driven executive compensation program. We are pleased with management‘s performance in 2012, delivering strong results for the company, despite the current challenges in the market.
As we move into 2013, we remain confident in a bright future for Cameco and our industry, based upon strong long-term fundamentals of supply and demand. The board continues to work with management to plan for the future and ensure Cameco remains a leader in our field.
| | |
An important part of planning for the future is board renewal and strong board leadership. On that subject, over the last several years, we have added two board members with significant financial expertise to bring additional focus to financial performance for our strategic growth. In 2013, however, we are losing Oyvind Hushovd, who is retiring from the board after serving for 10 years. He has been a tremendous resource, bringing valuable operational, financial and general business experience as a mining executive at a time when Cameco saw significant growth and change. | | 
|
I will also be stepping down from the position of board chair after this year‘s AGM, but will continue to serve as a director. I am pleased that Neil McMillan will stand as your incoming chair. Mr. McMillan was nominated by the board as a result of their confidence in him, which I share, having witnessed his knowledge and abilities first-hand over the years we‘ve worked together on Cameco‘s board. | |
It has been a pleasure to have served as Cameco‘s chair of the board for 10 years, and to have worked in that capacity with Jerry Grandey, Tim Gitzel, and my current and past directors. During this time, we have seen considerable growth at Cameco and successfully faced industry challenges. I look forward to continuing to contribute to the board, and remain confident in our vision and strategy and what the future holds for Cameco. | |
| Victor J. Zaleschuk | |
| Chair of the board | |
| March 15, 2013 | |
Message from the CEO
Dear Shareholder,
2012 was an eventful year for our business and our industry – and another strong year for Cameco. We demonstrated resilience in 2012, exceeding our production target, delivering on our sales guidance, and achieving $2.3 billion in revenue, despite a challenging environment.
The economic malaise felt around the world, and the lingering effects of the events in Japan, overshadowed our industry, exerting significant downward pressure on uranium prices throughout the year. This resulted in many producers, including us, delaying or cancelling projects that had become uneconomic.
We also decided to slow our growth plans and focus primarily on projects with the most certainty, while pursuing our other projects at a more measured pace. As a result, we plan to provide 36 million pounds of annual supply by 2018, while at the same time maintaining optionality in our project portfolio – what we call our ‘bullpen’ – to allow us to be the first to respond when the market signals new production is needed. This will let us spread out our capital spend over a longer period of time to improve near-term results, and also prepare for the longer term picture.
We were, however, able to find opportunity in the current market environment, acquiring the NUKEM trading group, as well as the Yeelirrie project in Australia and an increased portion of the Millennium project in Saskatchewan. These are world-class assets, and our decision to acquire them reflects our confidence in the nuclear industry and our commitment to be ready to supply new production when it is needed.
| | |
Ours is still a growth plan, to prepare for the strong long-term demand we see for uranium. There is strong reactor growth around the world at a time when uranium supply is diminishing: the Russian Highly Enriched Uranium commercial agreement ends this year and, as I already mentioned, new uranium mining projects are being delayed and cancelled. Each day these projects don’t move forward, the larger the future supply-demand gap becomes. | |  |
| |
At Cameco, we are maintaining a forward focus – continuing to move forward toward that increased long-term demand, but, as always, with an emphasis on achieving our growth plans safely, efficiently and profitably – and in line with our adjusted strategy to enhance our shorter term profitability. We have excellent people at Cameco who are accomplishing these goals every day and who achieved strong results again this year. | |
Despite the macro challenges of 2012, I’m pleased with the work accomplished at Cameco this year, with the opportunities that we acted upon and the progress we made towards our goals. I look forward to continuing that trend in 2013. | |
| |
| Tim Gitzel | |
| President and CEO | |
| March 15, 2013 | |

Management’s discussion
and analysis
February 11, 2013
This management‘s discussion and analysis (MD&A) includes information that will help you understand management‘s perspective of our audited consolidated financial statements (financial statements) and notes for the year ended December 31, 2012. This information is based on what we knew on February 8, 2013.
We encourage you to read our financial statements and notes as you review this MD&A. You can find more information about Cameco, including our financial statements and our most recent annual information form, on our website at cameco.com, on SEDAR at sedar.com or on EDGAR at sec.gov. You should also read our annual information form before making an investment decision about our securities.
WHAT’S INSIDE
Throughout this document, the termswe, us, ourandCamecomean Cameco Corporation and its subsidiaries; however it does not include NUKEM Gmbh (NUKEM), unless otherwise indicated.
The financial information in this MD&A and in our financial statements and notes are prepared according to International Financial Reporting Standards (IFRS).
Unless we have specified otherwise, all dollar amounts are in Canadian dollars.
Caution about forward-looking information
Our MD&A includes statements and information about our expectations for the future. When we discuss our strategy, plans, future financial and operating performance, or other things that have not yet taken place, we are making statements considered to beforward-looking information orforward-looking statements under Canadian and United States securities laws. We refer to them in this MD&A asforward-looking information.
Key things to understand about the forward-looking information in this MD&A:
| • | It typically includes words and phrases about the future, such as: believe, estimate, anticipate, expect, plan, intend, predict, goal, target, project, potential, strategy and outlook (see examples below). |
| • | It represents our current views, and can change significantly. |
| • | It is based on a number ofmaterial assumptions,including those we have listed on page 4, which may prove to be incorrect. |
| • | Actual results and events may be significantly different from what we currently expect, due to the risks associated with our business. We list a number of thesematerial riskson page 3. We recommend you also review our annual information form, which includes a discussion of other material risks that could cause actual results to differ significantly from our current expectations. |
| • | Forward-looking information is designed to help you understand management’s current views of our near and longer term prospects, and may not be appropriate for other purposes. We will not necessarily update this information unless we are required to by securities laws. |
Examples of forward-looking information in this MD&A
| • | our expectations about 2013 and future global uranium supply, consumption, demand, long-term contracting volumes, number of operable reactors and nuclear generating capacity, including the discussion on the expected impact resulting from the March 2011 nuclear incident in Japan |
| • | our expectations for spot prices in 2013 |
| • | our strategy for increasing annual supply to 36 million pounds by 2018, including the expected sources of such supply and development projects in connection therewith |
| • | our expectation that existing cash balances and operating cash flows will meet anticipated 2013 capital requirements without the need for any significant additional funding |
| • | our expectations regarding uranium demand in the near term |
| • | the outlook for each of our operating segments for 2013, and our consolidated outlook for the year |
| • | our outlook for the first quarter of 2013 |
| • | our expectation that we will continue to invest in expanding our production capacity at our existing mines and advancing projects as we pursue our growth strategy |
| • | our expectation that cash balances will decline as we use the funds in our business and pursue our growth plans |
| • | our expectations for 2013, 2014 and 2015 capital expenditures |
| • | our expectation that our operating and investment activities in 2013 will not be constrained by the financial covenants in our unsecured revolving credit facility |
| • | our uranium price sensitivity analysis |
| • | forecast production at our uranium operations from 2013 to 2017 |
| • | the likely terms and volumes to be covered by long-term delivery contracts that we enter into in 2013 and in future years |
| • | our expectations about the purchase volumes and prices to be realized under the Russian HEU commercial agreement in 2013, as well as our expectations and strategy regarding maintaining sales volumes when the Russian HEU commercial agreement ends |
2CAMECO CORPORATION
| • | our expectations about 2013 global consumption of conversion services and production at our fuel services operations |
| • | future royalty and tax payments and rates |
| • | our future plans for each of our uranium operating properties, development projects and projects under evaluation, and fuel services operating sites |
| • | our expectations regarding Cigar Lake |
| • | our mineral reserve and resource estimates |
| • | our expectations regarding the cash flows, profit margins, uranium deliveries, sales, revenues, costs, tax rates and profitability recognized by NUKEM in 2013 and in the future |
Material risks
| • | actual sales volumes or market prices for any of our products or services are lower than we expect for any reason, including changes in market prices or loss of market share to a competitor |
| • | we are adversely affected by changes in foreign currency exchange rates, interest rates or tax rates, or we are unsuccessful in our dispute with tax authorities |
| • | our production costs are higher than planned, or necessary supplies are not available, or not available on commercially reasonable terms |
| • | our estimates of production, purchases, costs, decommissioning or reclamation expenses, or our tax expense estimates, prove to be inaccurate |
| • | we are unable to enforce our legal rights under our existing agreements, permits or licences, or are subject to litigation or arbitration that has an adverse outcome |
| • | there are defects in, or challenges to, title to our properties |
| • | our mineral reserve and resource estimates are not reliable, or we face unexpected or challenging geological, hydrological or mining conditions |
| • | we are affected by environmental, safety and regulatory risks, including increased regulatory burdens or delays |
| • | we cannot obtain or maintain necessary permits or approvals from government authorities |
| • | we are affected by political risks in a developing country where we operate |
| • | we are affected by terrorism, sabotage, blockades, civil unrest, social or political activism, accident or a deterioration in political support for, or demand for, nuclear energy |
| • | we are impacted by changes in the regulation or public perception of the safety of nuclear power plants, which adversely affect the construction of new plants, the relicensing of existing plants and the demand for uranium |
| • | there are changes to government regulations or policies that adversely affect us, including tax and trade laws and policies |
| • | our uranium and conversion suppliers fail to fulfill delivery commitments |
| • | our Cigar Lake development, mining or production plans are delayed or do not succeed, including as a result of any difficulties encountered with the jet boring mining method or our inability to acquire any of the required jet boring equipment |
| • | we are affected by natural phenomena, including inclement weather, fire, flood and earthquakes |
| • | our operations are disrupted due to problems with our own or our customers’ facilities, the unavailability of reagents, equipment, operating parts and supplies critical to production, equipment failure, lack of tailings capacity, labour shortages, labour relations issues (including an inability to renew agreements with unionized employees at McArthur River, Key Lake or the Port Hope Conversion facility), strikes or lockouts, underground floods, cave ins, ground movements, tailings dam failures, transportation disruptions or accidents, or other development and operating risks |
2012 ANNUAL REPORT3
| • | NUKEM’s actual uranium sales volume, cash flows and earnings in 2013 and in the future are lower than expected due to losses in connection with spot market purchases, counterparty default on payment or other obligations, counterparty insolvency or other risks |
| • | departure of key personnel at NUKEM could have an adverse effect on continuing operations |
Material assumptions
| • | our expectations regarding sales and purchase volumes and prices for uranium, fuel services and electricity |
| • | our expectations regarding the demand for uranium, the construction of new nuclear power plants and the relicensing of existing nuclear power plants not being adversely affected by changes in regulation or in the public perception of the safety of nuclear power plants |
| • | our expected production level and production costs |
| • | the assumptions regarding market conditions upon which we have based our capital expenditure expectations |
| • | our expectations regarding spot prices and realized prices for uranium, and other factors discussed on pages 48 and 49,Price sensitivity analysis: uranium |
| • | our expectations regarding tax rates and payments, the outcome of the dispute with tax authorities, foreign currency exchange rates and interest rates |
| • | our decommissioning and reclamation expenses |
| • | our mineral reserve and resource estimates, and the assumptions upon which they are based, are reliable |
| • | the geological, hydrological and other conditions at our mines |
| • | our Cigar Lake development, mining and production plans succeed, including the success of the jet boring mining method at Cigar Lake and that we will be able to obtain the additional jet boring system units we require on schedule |
| • | our ability to continue to supply our products and services in the expected quantities and at the expected times |
| • | our ability to comply with current and future environmental, safety and other regulatory requirements, and to obtain and maintain required regulatory approvals |
| • | our operations are not significantly disrupted as a result of political instability, nationalization, terrorism, sabotage, blockades, civil unrest, social or political activism, equipment breakdown, natural disasters, governmental or political actions, litigation or arbitration proceedings, the unavailability of reagents, equipment, operating parts and supplies critical to production, labour shortages, labour relations issues (including an inability to renew agreements with unionized employees at McArthur River, Key Lake or the Port Hope Conversion facility), strikes or lockouts, underground floods, cave ins, ground movements, tailings dam failure, lack of tailings capacity, transportation disruptions or accidents or other development or operating risks |
| • | NUKEM’s actual uranium sales volume, cash flows and earnings in 2013 and in the future will be consistent with our expectations |
| • | key personnel will remain with NUKEM |
4CAMECO CORPORATION
2012 highlights
The long-term outlook for growth in the nuclear industry remains very strong, with 64 reactors under construction at the beginning of 2013, and an average annual increase in uranium demand expected to be around 3% over the next decade. However, the near-term challenges have persisted for longer than anticipated due to the lingering effects of the events in Japan, as well as global economic slowdown. As a result, in 2012, we re-examined our growth plans and adjusted them to better match current market conditions. We decided to focus primarily on advancing those projects with the most near-term certainty, while pursuing our other projects at a measured pace in order to maintain the ability to respond should market conditions improve. We expect this approach will result in our achieving 36 million pounds of annual supply by 2018, and allow us to spread our capital spend over a longer period of time, improving our near-term financial performance.
In spite of the challenging market environment, we demonstrated our strengths again in 2012, exceeding our production target and delivering on our financial guidance.
Strong financial performance
Our financial results remained strong in 2012:
| • | annual revenue of $2.3 billion |
| • | annual gross profit of $723 million from our nuclear business |
| • | annual revenue of $1.5 billion from our uranium segment |
| • | annual average realized price of $47.61 per pound ($47.62 US per pound) in our uranium segment |
Net earnings attributable to our equity holders (net earnings) in 2012 were $266 million compared to $450 million in 2011. This $184 million decline in net earnings was the result of:
| • | a $168 million write-down of our investment in the Kintyre deposit, required due to the weakening of the uranium market since the asset was purchased in 2008, no increase in mineral resources in 2012 and the decision not to proceed with the feasibility study in 2012 |
| • | lower earnings in our uranium business |
| • | stronger results in our electricity segment. |
| | | | | | | | | | | | | | | | |
HIGHLIGHTS DECEMBER 31 ($ MILLIONS EXCEPT WHERE INDICATED) | | 2012 | | | 2011 | | | CHANGE | |
Revenue | | | 2,321 | | | | 2,384 | | | | (3 | )% |
Gross Profit | | | 723 | | | | 776 | | | | (7 | )% |
Net earnings attributable to equity holders | | | 266 | | | | 450 | | | | (41 | )% |
$ per common share (diluted) | | | 0.67 | | | | 1.14 | | | | (41 | )% |
Adjusted net earnings (non-IFRS, see page 34) | | | 447 | | | | 509 | | | | (12 | )% |
$ per common share (adjusted and diluted) | | | 1.13 | | | | 1.29 | | | | (12 | )% |
Cash provided by operations (after working capital changes) | | | 644 | | | | 745 | | | | (14 | )% |
Average realized prices | | Uranium | | $US/lb | | | 47.62 | | | | 49.17 | | | | (3 | )% |
| | | | $Cdn/lb | | | 47.61 | | | | 49.18 | | | | (3 | )% |
| | Fuel services | | $Cdn/kgU | | | 17.24 | | | | 16.71 | | | | 3 | % |
| | Electricity | | $Cdn/MWh | | | 55 | | | | 54 | | | | 2 | % |
2012 ANNUAL REPORT5
Solid progress in our uranium segment this year
In our uranium segment this year, production was 1% higher than the guidance we provided in our 2012 third quarter MD&A. We had a number of successes at our mining operations, development projects and projects under evaluation. Key highlights:
| • | realized benefits of production flexibility provisions in our McArthur River/Key Lake licences, exceeding our production target by 1% |
| • | completed a technical report for McArthur River which included a 19% increase in mineral reserves |
| • | completed remediation of the underground mine and sinking of shaft 2 at Cigar Lake |
| • | assembled the first jet boring system unit underground at Cigar Lake and began preliminary commissioning and testing |
| • | purchased AREVA Resources Canada Inc.’s 27.94% interest in the Millennium project to acquire majority ownership interest of 69.9% |
| • | the Finnish government granted Talvivaara, a company from which we have the right to buy uranium produced as a by-product, a licence to extract uranium as a by-product from the Sotkamo nickel mine |
| • | acquired the Yeelirrie uranium project in Western Australia from BHP Billiton Yeelirrie Development Company Pty Ltd. |
| • | signed a mine development agreement with the Martu concerning our Kintyre project |
| • | entered into a binding memorandum of agreement with our joint venture partner Kazatomprom, setting out the framework to increase annual production at Inkai to 10.4 million pounds (100% basis), to extend the term of Inkai’s resource use contract through 2045, and to co-operate on the development of uranium conversion capacity, with the primary focus on uranium refining rather than uranium conversion |
We also continued to advance our exploration activities, spending $10 million on four brownfield exploration projects, and $24 million for project evaluation at Kintyre and Cigar Lake. We spent about $45 million on regional exploration programs, mostly in Saskatchewan, followed by Australia, northern Canada, Asia and South America.
Updates on our other segments
In our fuel services segment, we decreased production due to unfavourable market conditions for UF6. We signed a new three-year collective agreement with about 120 unionized employees at our fuel manufacturing operations in Port Hope and Cobourg, Ontario.
In our electricity segment, Bruce Power Limited Partnership (BPLP) generated 26.8 terawatt hours (TWh) of electricity, at a capacity factor of 94%. Our share of earnings before taxes was $175 million, a 90% increase compared to 2011.
We entered into an agreement with Advent International to purchase NUKEM Energy GmbH, one of the world’s leading traders and brokers of nuclear fuel products and services, which was completed in January, 2013.
Our investment in Global Laser Enrichment (GLE) continues to progress. GLE is continuing its testing activities and engineering design work for a commercial facility. The US Nuclear Regulatory Commission approved GLE’s application for a commercial facility construction and operating licence.
6CAMECO CORPORATION
| | | | | | | | | | | | | | |
HIGHLIGHTS | | 2012 | | | 2011 | | | CHANGE | |
Uranium | | Production volume (million lbs) | | | 21.9 | | | | 22.4 | | | | (2 | )% |
| | Sales volume (million lbs) | | | 32.5 | | | | 32.9 | | | | (1 | )% |
| | Revenue ($ millions) | | | 1,546 | | | | 1,616 | | | | (4 | )% |
| | Gross profit ($ millions) | | | 504 | | | | 632 | | | | (20 | )% |
Fuel services | | Production volume (million kgU) | | | 14.2 | | | | 14.7 | | | | (3 | )% |
| | Sales volume (million kgU) | | | 16.1 | | | | 18.3 | | | | (12 | )% |
| | Revenue ($ millions) | | | 277 | | | | 305 | | | | (9 | )% |
| | Gross profit ($ millions) | | | 42 | | | | 54 | | | | (22 | )% |
Electricity | | Output (100%) (TWh) | | | 26.8 | | | | 24.9 | | | | 8 | % |
| | Revenue (100%) | | | 1,487 | | | | 1,354 | | | | 10 | % |
| | Our share of earnings before taxes ($ millions) | | | 175 | | | | 92 | | | | 90 | % |
SHARES AND STOCK OPTIONS OUTSTANDING
At February 7, 2013, we had:
| • | 395,351,354 common shares and one Class B share outstanding |
| • | 9,505,753 stock options outstanding, with exercise prices ranging from $15.79 to $54.38 |
DIVIDEND POLICY
Our board of directors has established a policy of paying a quarterly dividend of $0.10 ($0.40 per year) per common share. This policy will be reviewed from time to time based on our cash flow, earnings, financial position, strategy and other relevant factors.
2012 ANNUAL REPORT7
The nuclear fuel cycle
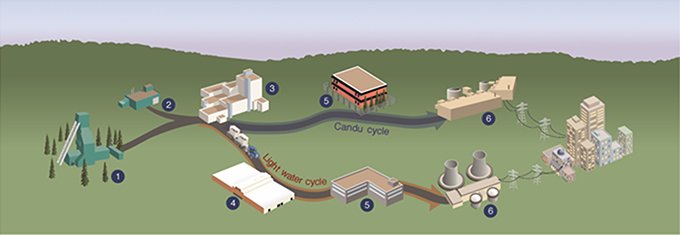
Once an orebody is discovered and defined by exploration, there are three common ways to mine uranium, depending on the depth of the orebody and the deposit’s geological characteristics:
| | • | Open pit mining is used if the ore is near the surface. The ore is usually mined using drilling and blasting. |
| | • | Underground mining is used if the ore is too deep to make open pit mining economical. Tunnels and shafts provide access to the ore. |
| | • | In situ recovery (ISR) does not require large scale excavation. Instead, holes are drilled into the ore and a solution is used to dissolve the uranium. The solution is pumped to the surface where the uranium is recovered. |
Ore from open pit and underground mines is processed to extract the uranium and package it as a powder typically referred to asuranium concentrates (U3O8) oryellowcake. The leftover processed rock and other solid waste (tailings) is placed in an engineered tailings facility.
Refining removes the impurities from the uranium concentrate and changes its chemical form touranium trioxide (UO3).
For light water reactors, the UO3 is converted touranium hexafluoride (UF6) gas to prepare it for enrichment. For heavy water reactors like the Candu reactor, the UO3 is converted into powdereduranium dioxide (UO2).
Uranium is made up of two main isotopes: U-238 and U-235. Only U-235 atoms, which make up 0.7% of natural uranium, are involved in the nuclear reaction (fission). Most of the world’s commercial nuclear reactors require uranium that has an enriched level of U-235 atoms.
The enrichment process increases the concentration of U-235 to between 3% and 5% by separating U-235 atoms from the U-238. Enriched UF6 gas is then converted to powdered UO2.
Natural or enriched UO2 is pressed into pellets, which are baked at a high temperature. These are packed into zircaloy or stainless steel tubes, sealed and then assembled into fuel bundles.
Nuclear reactors are used to generate electricity.
U-235 atoms in the reactor fuel fission, creating heat that generates steam to drive turbines. The fuel bundles in the reactor need to be replaced as the U-235 atoms are depleted, typically after one or two years depending upon the reactor type. The used–orspent–fuel is stored or reprocessed.
Spent fuel management
The majority of spent fuel is safely stored at the reactor site. A small amount of spent fuel is reprocessed. The reprocessed fuel is used in some European and Japanese reactors.
8CAMECO CORPORATION
About Cameco
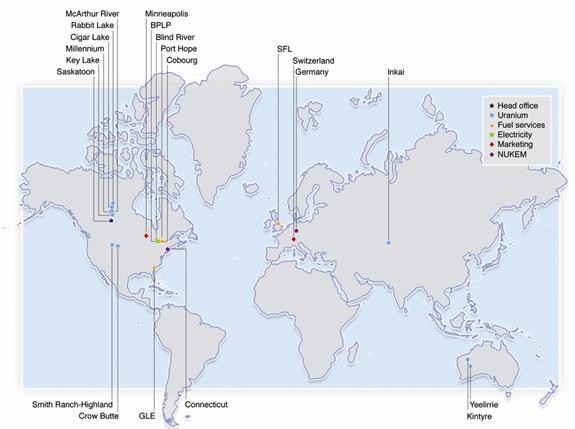
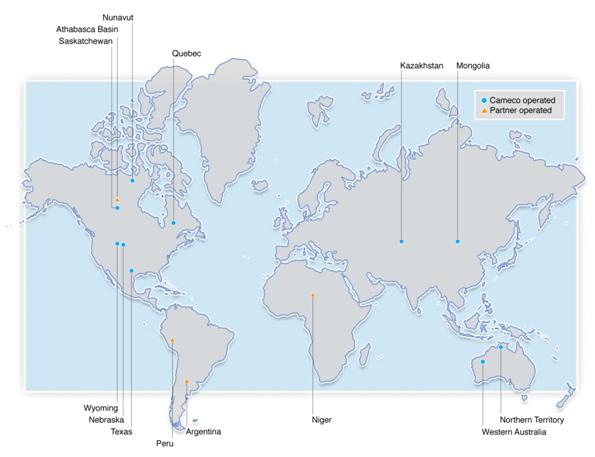
Our head office is in Saskatoon, Saskatchewan. We are one of the world’s largest uranium producers, with uranium assets on three continents. Nuclear energy plants around the world use our uranium products to generate one of the cleanest sources of electricity available today. Our operations and investments span the nuclear fuel cycle, from exploration to electricity generation.
Strengths
We are a pure-play nuclear investment with a proven track record and the strengths to take advantage of the world’s rising demand for safe, clean and reliable energy.
With our extraordinary assets, contract portfolio, employee expertise, comprehensive industry knowledge and financial strength, we are confident in our ability to continue to grow and increase shareholder value.
Business segments
| | |
| URANIUM | | |
| |
We are one of the world’s largest uranium producers, and in 2012 accounted for about 14% of the world’s production. We have controlling ownership of the world’s largest high-grade reserves, with ore grades up to 100 times the world average, and low-cost operations. Product • uranium concentrates (U3O8) Mineral reserves and resources Mineral reserves • approximately 465 million pounds proven and probable Mineral resources • approximately 244 million pounds measured and indicated and 287 million pounds inferred Global exploration • focused on four continents • approximately 3.7 million hectares of land | | Operating properties • McArthur River and Key Lake, Saskatchewan • Rabbit Lake, Saskatchewan • Smith Ranch-Highland, Wyoming • Crow Butte, Nebraska • Inkai, Kazakhstan Development project • Cigar Lake, Saskatchewan Projects under evaluation • Inkai blocks 1 and 2 production increase, Kazakhstan • Inkai block 3, Kazakhstan • Millennium, Saskatchewan • Yeelirrie, Australia • Kintyre, Australia |
| |
FUEL SERVICES | | |
| |
We are an integrated uranium fuel supplier, offering refining, conversion and fuel manufacturing services. Products • uranium trioxide (UO3) • uranium hexafluoride (UF6) (control about 25% of world conversion capacity) • uranium dioxide (UO2) (the world’s only commercial supplier of natural UO2) • fuel bundles, reactor components and monitoring equipment used by Candu reactors | | Operations • Blind River refinery, Ontario (refines uranium concentrates to UO3) • Port Hope conversion facility, Ontario (converts UO3 to UF6 or UO2) • Cameco Fuel Manufacturing Inc., Ontario (manufactures fuel bundles and reactor components) • a toll conversion agreement with Springfields Fuels Ltd. (SFL), Lancashire, United Kingdom (UK) (to convert UO3 to UF6 – expires in 2016) We also have a 24% interest in Global Laser Enrichment (GLE) in North Carolina, with General Electric (51%) and Hitachi Ltd. (25%). GLE is testing a third-generation technology that, if successful, will use lasers to commercially enrich uranium. |
| |
NUKEM | | |
| |
| Our ownership of NUKEM GmbH (NUKEM) provides us with access to one of the world’s key traders of uranium and uranium-related products. We acquired NUKEM in January, 2013. | | Activity • physical trading of uranium concentrates, conversion and enrichment services through back to back purchase and sales transactions • recovery of natural and enriched non-standard uranium from western facilities and other sources |
2012 ANNUAL REPORT9
We generate clean electricity through our 31.6% interest in the Bruce Power Limited Partnership (BPLP), which operates four nuclear reactors at the Bruce B generating station in southern Ontario.
Capacity
| • | 3,260 megawatts (MW) (100% basis) |
| | (about 15% of Ontario’s electricity) |
We also have agreements to manage the procurement of fuel and fuel services for BPLP, including:
| • | fuel fabrication services |
KEY MARKET FACTS
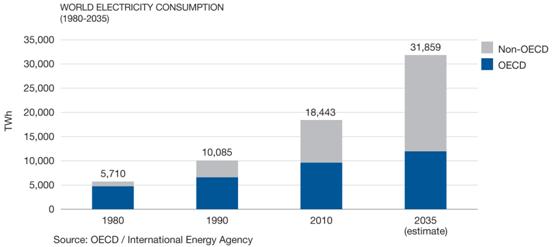
The 2012 World Energy Outlook predicts that by 2035 electricity consumption will have grown by about 70% from current levels, driven mainly by growth in the developing world as it seeks to diversify sources of energy and provide security of supply.
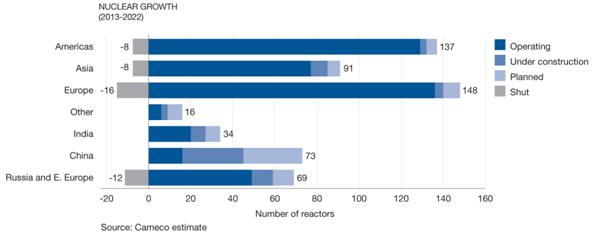
| | • | | At the start of 2013, there were 433 operable commercial nuclear power reactors in 31 countries, and by 2022, we expect that to grow to 524 reactors. |
| | • | | At the start of 2013, there were 64 reactors under construction in 14 countries, and dozens more planned to begin operation by 2022. |
| | • | | Most of this new build is being driven by rapidly developing countries like China and India, which have severe energy deficits and want clean sources of electricity to improve their environment and sustain economic growth. |
| | • | | Over the next decade, we expect demand for uranium to grow by an average of 3% per year and to meet global demand, we expect about two-thirds of uranium supply will come from mines that are currently in operation, about 15% from finite sources of secondary supply (mainly Russian highly enriched uranium (HEU), government inventories and limited recycling), and about 20% will have to come from new sources of supply. |
| | • | | With uranium assets on three continents, including high-grade reserves and low-cost mining operations in Canada, and investments that cover the nuclear fuel cycle—we are ideally positioned to benefit from the world’s growing need for clean, reliable energy. |
10CAMECO CORPORATION
2012 ANNUAL REPORT11
The nuclear energy industry today
In last year’s annual review of the uranium market, we indicated that the near-term environment for the industry was challenging, but that the long-term outlook remained very positive. We believe this continues to be the case today.
There was little improvement in 2012 over 2011 due to the lingering effects of the events in Japan, as well as global economic slowdown. However, we started to see some clarity on issues that have been overhanging the market. The most significant of these was the establishment in Japan of the Nuclear Regulatory Authority (NRA), which is currently drafting new safety standards for the nuclear industry in that country, against which reactor restarts will be evaluated. The NRA indicated that this process would likely take until mid-2013. While this means that reactor restarts will take longer than we had previously thought, we believe that the NRA brings important stability to the nuclear regulatory environment in Japan, and welcome the clarity it has already brought to the issue of reactor restarts.
We believe the election of the Liberal Democratic Party (LDP) in Japan will be similarly positive for the nuclear industry. Though it remains to be seen what kind of energy policy will emerge from the newly elected government, the LDP has been positively disposed towards nuclear in the past, and has been clear that rebuilding Japan’s economy is its main priority, in which the nuclear industry plays a large role.
Later in 2012, China lifted a temporary moratorium on new reactor construction and has since started construction on four reactors. The resumption of reactor construction in China is clearly a positive signal for the market.
Beyond Japan and China, some other countries made changes to their nuclear programs, including announcements of older reactor retirements from Canada, France and Belgium. India also revised its 2020 nuclear target down from 20 to 14.6 gigawatts. These changes, combined with slower than expected restarts in Japan, the temporary pause in China new-build approvals, and slower economic growth worldwide, caused us to re-examine our reactor forecast at the end of 2012. While the market continues to evolve, our current estimates project nuclear generating capacity to reach about 510 gigawatts by 2022 from today’s 392 gigawatts, which represents average annual growth of 3%. Of this expected growth, approximately 64 new reactors with 64 gigawatts of generating capacity are under construction today.
Reactor retirements and delays in both restarts and new construction have had an effect on demand and the uranium price in 2012. There has been concern that excess inventories resulting from reduced requirements, deferrals and/or cancellations of deliveries under sales contracts could be introduced to the market. In 2012, any excess inventories have been responsibly managed between suppliers and customers, but the situation has caused market participants to be discretionary in their purchases and the uranium price to remain depressed. This remains the case at the beginning of 2013, but we believe the clearing of excess inventories, resumption of restarts in Japan and new-build around the world, in addition to promising supply-demand fundamentals, will lead to improved market conditions. We also anticipate utilities will be ramping up contracting activities well in advance of their requirements becoming uncovered around 2016.
The other side of the equation is supply, which saw a great deal of destruction and deferral in 2012 as the uranium spot price remained at a level well below where new projects are economic. A number of uranium producers decreased their production growth plans, ourselves included when we announced the adjustment to our growth plans from 40 million pounds annual production down to 36 million pounds of annual supply by 2018. Details on our strategy are available on page 18.
12CAMECO CORPORATION
These challenges to primary supply occur while secondary supply is decreasing as a result of the end of the Russian Highly Enriched Uranium (HEU) commercial agreement in 2013, and while steady demand growth continues – with an expectation that it will reach about 3% per year.
So, although the supply-demand outlook continues to evolve, nuclear remains an important part of the global energy mix and it is clear that new uranium supply will be needed. Though some of the future supply gap could be filled by additions to secondary supplies, the majority will need to come from new mines and expansions to existing mines, which we expect will bring the economics of new production to bear on the market. You can read more about our outlook on future supply and demand inThe long-term view on page15.
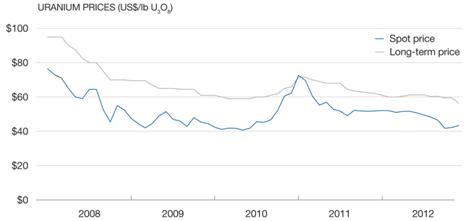
Industry prices
In 2012, the spot price declined from $52 (US) per pound to the low $42 (US) per pound range. Utilities continue to be well covered under existing contracts. Given the current uncertainties in the market, we expect utilities and other market participants will continue to be opportunistic in their buying. We expect uranium demand in the near- to medium-term to remain somewhat discretionary, and prices to be relatively stable in 2013.
| | | | | | | | | | | | |
| | | 2012 | | | 2011 | | | CHANGE | |
Uranium ($US/lb U3O8) 1 | | | | | | | | | | | | |
Average spot market price | | | 48.40 | | | | 56.36 | | | | (14 | )% |
Average long-term price | | | 60.13 | | | | 66.79 | | | | (10 | )% |
Fuel services ($US/kgU as UF6)1 | | | | | | | | | | | | |
Average spot market price | | | | | | | | | | | | |
• North America | | | | | | | | | | | | |
• Europe | | | | | | | | | | | | |
Average long-term price | | | 7.99 | | | | 10.61 | | | | (25 | )% |
• North America | | | 8.56 | | | | 10.61 | | | | (19 | )% |
• Europe | | | 16.75 | | | | 16.09 | | | | 4 | % |
Note: the industry does not publish UO2prices. | | | 17.25 | | | | 16.42 | | | | 5 | % |
Electricity ($/MWh) | | | | | | | | | | | | |
Average Ontario electricity spot price | | | 23 | | | | 30 | | | | (23 | )% |
| 1 | Average of prices reported by TradeTech and Ux Consulting (Ux) |
2012 ANNUAL REPORT13
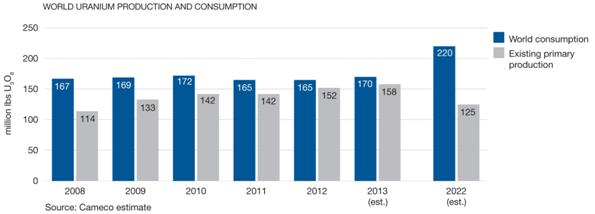
World consumption and production
We estimate global uranium consumption in 2012 was about 165 million pounds and production was 152 million pounds.
We expect global uranium consumption to increase to about 170 million pounds in 2013, and global production to be approximately 158 million pounds. Secondary supplies should continue to bridge the gap.
By 2022, we expect world uranium consumption to be about 220 million pounds per year, representing average annual growth of about 3%. These consumption estimates exclude strategic inventory building that we expect will occur in growth regions.
We expect existing primary production to decrease over the next decade reaching 125 million pounds by 2022 which highlights the need for new primary supply.
We expect world consumption for UF6 and natural UO2 conversion services to increase by about 3% in 2013.
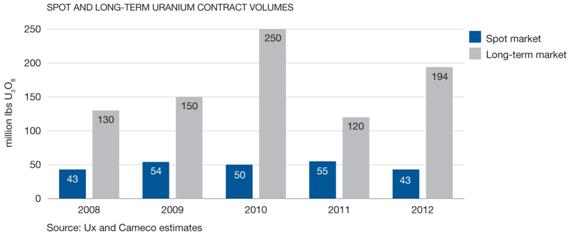
Contract volumes
The Ux estimate for global spot market sales in 2012 is about 43 million pounds, significantly lower than in previous years. Utilities were responsible for over 45% of the purchases. Traders and financial players were also participants, taking advantage of the lower spot prices to make opportunistic purchases.
At the start of 2012, we estimated long-term contracting volumes for the year to be between 80 million and 100 million pounds, though they ended the year at about 194 million pounds. The higher than expected contracting can be attributed to a small number of large volume deals. We estimate long-term contracting volumes in 2013 will be between 75 million and 100 million pounds, depending on supply, market expectations and market prices.
14CAMECO CORPORATION
The long-term view
We remain confident in the long-term fundamentals of the nuclear industry, despite the near- to medium-term challenges. Our industry is driven by demand for energy, which continues to grow as a result of continued increases in world population and industrial development. The 2012 World Energy Outlook predicts that by 2035 electricity consumption will have grown by about 70% from current levels. Most of this energy will be used by developing (non-OECD) countries as their populations and standards of living increase.
New reactor outlook
Within this context, most countries are pursuing a diversified approach to energy growth, with an emphasis on energy security and clean energy. Nuclear power can generate baseload electricity with no toxic air pollutants, carbon dioxide (CO2) or other greenhouse gas emissions. It has the capacity to produce enough electricity on a global scale to meet the world’s growing needs, and while it is not the only solution, it is an affordable and sustainable source of safe, clean and reliable energy. As a result, we expect nuclear energy to remain an important part of the energy mix.
This is evident in the growth in reactor construction we expect over the next 10 years. There are 433 reactors operable today with a total generating capacity of 392 gigawatts. We expect nuclear generating capacity to reach about 510 gigawatts (524 reactors) by 2022, which represents average annual growth of 3%. Of this growth, approximately 64 reactors with 64 gigawatts of generating capacity are under construction today. This is a significant rate of growth in new reactor construction.
2012 ANNUAL REPORT15
India, Russia and South Korea are expanding their nuclear generating capacity, and China continues to lead the growth, with 29 reactors under construction. Near the end of 2012, China resumed approvals of new reactor construction.
In the UK, government commitment to nuclear energy is strong, driven by concerns about energy security and the need to limit CO2 emissions. In 2012, the first site licence in 25 years was granted at the Hinkley Point nuclear power plant, where two new units are planned. The US also continues to make progress toward new nuclear development with one unit under construction and preparatory work ongoing at four units.
Other previously non-nuclear countries are either moving ahead with their reactor construction programs or considering adding nuclear to their energy programs in the future. The United Arab Emirates (UAE) recently became the first non-nuclear country in 27 years to start building its first nuclear power plant. The UAE is proceeding with its plans to have 5.6 gigawatts of nuclear capacity in place by 2020, and in 2012 secured long-term fuel supply contracts for those reactors. In Saudi Arabia, where power demand has been increasing by 7% to 8% annually, plans to build 16 reactors by 2030 have been announced. Vietnam, Bangladesh, Poland, Turkey, and Belarus are also moving forward with plans to proceed with nuclear power development.
DEMAND FOR URANIUM IS GROWING
Not surprisingly, as the number of reactors grows, so too does the demand for uranium.
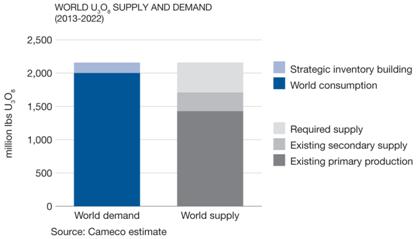
We expect world demand of approximately 2.2 billion pounds over the next 10 years, which includes both world consumption and strategic inventory building. By 2022, we expect world uranium demand to be about 240 million pounds per year, representing average annual growth of about 3%.
SUPPLY IS TIGHTENING
While demand is expected to increase over the next decade, 2012 saw a great deal of supply destruction as many producers announced delays and cancellations to their projects. We were counted among this group with the adjustment to our uranium growth strategy in response to market conditions. The resulting impact on the long-term outlook for uranium supply could be significant if these delays continue.
We estimate roughly two-thirds of global uranium supply over the next 10 years to come from existingprimary production—mines that are currently in commercial operation—and about 15% to come from existingsecondary supply sources. However, most secondary sources are finite and will not meet long-term needs. Currently, one of the largest sources of secondary supply is uranium derived from the Russian HEU commercial agreement, which is scheduled to end in 2013 and leave a gap of about 24 million pounds per year. This volume is more than our current total annual production.
16CAMECO CORPORATION
The result is that we estimate about 20% of supply will need to come fromnew sources at a time when new projects are being delayed or cancelled because of current market conditions.The situation is exacerbated by barriers to entry and lead times for new uranium production being as long as 10 years or more, depending on the deposit type and location. As conditions continue to evolve, it is important to keep an eye on supply.
WE ARE WELL POSITIONED
Despite the current challenging industry environment, we are well positioned to continue to succeed and meet the growing demand for uranium. We have advantages like extensive mineral reserves and resources, low cost operations, a strong contract portfolio, experienced employees and a growth strategy that will allow us to remain competitive in challenging environments and respond quickly when the market signals more production is needed.
2012 ANNUAL REPORT17
Our strategy
Our strategy is to increase annual uranium supply to 36 million pounds by 2018, subject to market conditions, and to invest in opportunities across the nuclear fuel cycle that we expect will complement and enhance our business.
Uranium: growing production
The focus of our growth strategy is our uranium segment. Over the next 10 years, we expect annual consumption to increase by 50 million pounds as new reactors come on line. Deliveries under the Russian HEU commercial agreement will end in 2013, and the industry will need new uranium production. Lead-times in our industry are long, so we are preparing our assets today to make sure we can be among the first to respond when the market signals new production is needed. However, our production decisions will always be made with a focus on profitability.
Given the current challenging market environment, we are pursuing our growth with an increased focus on execution. The projects we are pursuing to contribute to our target of 36 million pounds of annual supply by 2018 are those that provide the most certainty in the near-term, and are primarily brownfield development. Our growth will come from operating properties, expansions at operating properties and our development projects.
We plan to achieve our growth with a focus on enhancing our nearer term financial picture by spreading our capital spending over a longer period and decreasing project related expenses. Of course, all of our project decisions will depend upon market conditions and profitability. We continue to monitor the market closely, and will adjust our plans in response to market signals.
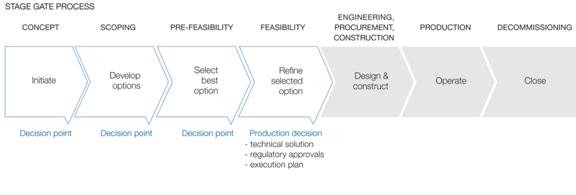
We advance each project through a stage gate process that includes several defined decision points in the assessment and development stages. At each point, we re-evaluate the project based on current economic, competitive, social, legal, political and environmental considerations. If it continues to meet our criteria, we proceed to the next stage. This process allows us to build a pipeline of projects ready for a production decision and minimize expenditures on projects whose feasibility has not yet been determined.
18CAMECO CORPORATION
OPERATING PROPERTIES
Our current sources of production are McArthur River/Key Lake, Rabbit Lake, Smith Ranch-Highland, Crow Butte and Inkai. We expect about 60% of our total 2018 annual supply will come from mines that are already operating.
BROWNFIELD EXPANSIONS AND DEVELOPMENT PROJECTS
We expect the rest of the 36 million pounds to come primarily from brownfield expansions and development projects, which provide the benefit of existing infrastructure, workforce and positive relationships with communities, governments and regulators. These include:
| • | bringing Cigar Lake into production |
| • | expanding production at McArthur River and our US operations |
| • | refurbishing and expanding the Key Lake mill |
| • | working to extend the life of the Rabbit Lake mine |
| • | advancing the process for extracting uranium from the Talvivaara mine in Finland |
We previously estimated capital costs on development projects and projects under evaluation to be between $200 and $400 million per year for the next three years. However, we adjusted our strategy down from 40 million pounds to 36 million pounds of annual supply by 2018, and we now estimate capital costs for our brownfield expansions and development projects to be about $310 million in 2013, and between $140 and $190 million per year in growth capital for 2014 and 2015. SeeCapital Spending on page 42.
MAINTAINING OPTIONALITY
We will also continue to advance our other projects at a pace measured to market opportunities in order to respond should the market reflect the need for more uranium. These projects are:
| • | increasing production at Inkai |
We previously expected to spend between $20 and $25 million per year on average for the next three years to assess the feasibility of projects under evaluation. We expect to spend about $24 million in 2013 to preserve optionality for these projects. Based on market conditions, we currently expect to spend less than $5 million per year in 2014 and 2015.
2012 ANNUAL REPORT19
Exploration: sustaining long-term production
Our exploration program is directed at replacing mineral reserves as they are depleted by our production, and ensuring our growth beyond 2018. We have maintained an active program even during periods of weak uranium prices, which has helped us secure land with exploration and development prospects that are among the best in the world, mainly in Canada, Australia, Kazakhstan and the US. Globally, our land holdings total 3.7 million hectares (9.3 million acres). In northern Saskatchewan alone, we have direct interests in 584,000 hectares (1.4 million acres) of land covering many of the most prospective exploration areas of the Athabasca Basin. Many of our prospects are located close to our existing operations where we have established infrastructure and capacity to expand.
For properties that meet our investment criteria, we will partner with other companies through strategic alliances, equity holdings and traditional joint venture arrangements. Our leadership position and industry expertise in both exploration and corporate social responsibility make us a partner of choice.
20CAMECO CORPORATION
Fuel services: capturing synergies
UF6 AND UO2
We control about 25% of world UF6 conversion capacity and are the only commercial supplier of natural UO2. Our focus is on cost-competitiveness and operational efficiency.
Our fuel services segment is strategically important because it helps support the growth of the uranium segment. Offering a range of products and services to customers helps us broaden our business relationships and expand our uranium market share.
ENRICHMENT
We also continue to explore innovative areas like laser enrichment technology to broaden our fuel cycle participation and help us serve our customers more effectively.
Today, uranium enrichment is the second largest value component, after uranium, in a typical light water reactor fuel bundle. The enrichment market has the same customer base as the uranium market, and most of the world’s commercial nuclear reactors need enriched uranium.
Uranium and enrichment can be substituted for each other to some extent to produce a given amount of enriched uranium product. For example, when uranium is relatively more expensive than enrichment, it is more cost-effective to reduce the amount of uranium feedstock and use more enrichment capacity. When enrichment is relatively more expensive, it makes sense to use more uranium and less enrichment to produce the same amount of enriched uranium product.
Enrichment has the potential to be a significant growth area for us, and offers operational synergies that could significantly enhance profit margins for both our uranium business and future enrichment operations.
NUKEM: strengthening our position
Our January 2013 acquisition of NUKEM complements our uranium segment by strengthening our position in nuclear fuel markets and improving our access to unconventional and secondary sources of supply. We expect it to deliver solid cash flow and sustainable profitability.
Electricity: capturing added value
Our investment in BPLP has been an excellent source of cash flow. Our focus is on maintaining steady cash flow and building synergies with our other segments. Ontario’s Long Term Energy Plan has earmarked 6,300 MW of long-term capacity needed from the Bruce Power site. This means that all of the units at Bruce B will need to be refurbished and we will have an opportunity to invest if BPLP decides to proceed. We would base this investment decision on the underlying value proposition and the strategic fit with our other growth objectives. The timing of this opportunity is still unclear, as Bruce Power is working with the Ontario Power Authority (OPA) on a possible refurbishment schedule recognizing the significant role the nuclear units play in maintaining system reliability and the importance of sequencing these activities over a multi-year period.
Acquisition program
We have a dedicated team looking for acquisition opportunities that could further add to our supply, support our sales activities and complement and enhance our business in the nuclear industry. We will invest when an opportunity is available at the right time and the right price. We strive to pursue corporate development initiatives that will leave us and our shareholders in a fundamentally stronger position.
2012 ANNUAL REPORT21
Capital Allocation
We remain on a cautious growth path, taking a balanced approach to capital allocation and subjecting all investment decisions to a rigorous and disciplined review process. This review involves an assessment of our overall liquidity, the overall level of investment needed, and the prioritization of our investment choices based on the merits of each opportunity. Our assessment also takes expected levels of future operating cash flow and the cost and availability of new financing into account. In the context of our uranium growth strategy, we are focused on opportunities to leverage existing infrastructure (brownfield expansion), and on projects with greater near-term certainty. The review may result in good opportunities being held back in favour of higher return projects, and should allow us to generate the best return on investment decisions when we are faced with multiple prospects. Future changes in the market could impact the timing and amount of cash available for future investment in capital projects, acquisitions, dividends, debt repayments and other uses of capital.
This discussion of our strategy and our process to increase our annual uranium supply by 2018 is all forward-looking information. It is based on the assumptions and subject to the material risks discussed on pages 3 and 4, and specifically on the assumptions and risks listed here.
ASSUMPTIONS
Our statements about increasing annual supply by 2018 to 36 million pounds reflect our current supply target for 2018. Although we are confident in our efforts to reach that target, we cannot guarantee that we will. We have made assumptions about 2018 production levels at each of our existing operating mines. We have also made assumptions about the development of mines that are not operating yet and their 2018 production levels, and about uranium by-product supply from the Talvivaara mine. We believe these assumptions are reasonable, individually and together, but if an assumption about one or more mines proves to be incorrect, we will not reach our 2018 target supply level unless the shortfall can be made up in other ways.
Material risks that could prevent us from reaching our target
| • | | we cannot locate additional mineral reserves to extend Rabbit Lake’s mine life to maintain production |
| • | | our partner or the Kazakh government does not support an increase in production to the expected level at Inkai, blocks 1 and 2, or we do not reach the full production level as quickly as we expect |
| • | | development at Cigar Lake is not completed on schedule, or we do not reach the full production level as quickly as we expect |
| • | | the Key Lake mill does not have enough capacity to handle anticipated production increases, and we are not able to expand its capacity or to identify alternative milling arrangements |
| • | | we are unable to obtain the expected level of uranium by-product supply from the Talvivaara mine |
| • | | our mine expansion and development projects do not proceed or, if they do, are not completed on schedule or do not reach full production levels as quickly as we expect |
| • | | uranium prices and development and operating costs make it uneconomical to proceed with our mine expansion and development projects |
| • | | we cannot obtain or maintain necessary permits or approvals from government authorities |
| • | | disruption in production or development due to natural phenomena, labour disputes (including an inability to renew agreements with unionized employees at McArthur River and Key Lake), political risks, blockades or other acts of social or political activism, lack of tailings capacity, or other development and operation risks. |
22CAMECO CORPORATION
Building on our strengths
WORLD-CLASS ASSETS
We have extensive mineral reserves and resources, a large portfolio of low-cost mining operations, and geographically diverse uranium assets with controlling interests in the world’s largest high-grade uranium reserves.
EMPLOYEE EXPERTISE
Our company is filled with talented and creative people who are committed to achieving our strategy in a manner consistent with our corporate values of protecting people and the environment, excellence and integrity.
STRONG CUSTOMER RELATIONSHIPS
We have large, creditworthy customers that continue to need uranium, even during weak economic conditions, and we expect the uranium contract portfolio we have built to provide a solid revenue stream for years to come.
URANIUM PRICE LEVERAGE
Our plans to increase our supply of uranium, combined with our contracting strategy, are designed to give us leverage when uranium prices go up, and to protect us when prices decline.
FINANCIAL STRENGTH
We are in a strong financial position to proceed with our growth plans. We are working to ensure our capital structure is appropriate and adds value for our shareholders.
DISCIPLINED PORTFOLIO MANAGEMENT
We have a disciplined portfolio management process that incorporates all capital projects into a single capital plan and uses a stage gate decision process (see page 18). This ensures our capital projects are aligned with our strategic objectives, and that business benefits are measurable and attainable.
FOCUSED RISK MANAGEMENT
We have a formal enterprise-wide risk management process that we apply consistently and systematically across our organization. Risk management is a core element of our strategy and our objectives, and we use it to continuously improve our organization. It will underpin decisions we make as we move ahead with our growth strategy.
INNOVATION
We are always looking for ways to improve processes, to increase safety and environmental performance, and reduce costs. We are currently working on innovative projects in all aspects of operations, including upgrading the Key Lake and Rabbit Lake mills.
REPUTATION
We believe strongly in our values and apply them consistently in our operations and business dealings. We are recognized as a reliable supplier and business partner, strong community supporter and employer of choice.
2012 ANNUAL REPORT23
Managing our growth
Our ability to grow is a function of our people, processes, assets and reputation, and the ability to enhance and leverage these strengths to add value and build competitive advantage.
We use four categories to define what we are committed to deliver, and how we will measure our results:
| • | | outstanding financial performance |
| • | | a safe, healthy and rewarding workplace |
We introduced these measures of success to proactively address the financial, social and environmental aspects of our business. We believe that each is integral to our overall success and that, together, they will ensure our long-term sustainability.
FOCUS ON LONG-TERM SUSTAINABILITY
Companies are under growing scrutiny for the way they conduct their business, and there has been a significant increase in stakeholder expectations for environmentally and socially responsible business practices.
Rather than viewing sustainable development as an ‘add-on’ to traditional business activity, we see it as integral to the way we do business, and have made it a strategic priority, integrating it into our objectives and compensation policies.
You can find out more in our 2012 sustainable development report, which is on our website (cameco.com).
OUTSTANDING FINANCIAL PERFORMANCE
Our financial results depend heavily on our sales and production volumes, on the cost of supply, and on the prices we realize in our uranium and fuel services segments.
Managing our supply and costs
Uranium and Fuel Services
We sell more uranium than we produce every year. To meet our delivery commitments, we use uranium obtained:
| • | | from our own production |
| • | | through long-term purchase agreements and on the spot market |
| • | | from our existing inventory (we target inventories of about six months of forward sales of uranium concentrates and UF6) |
Like all mining companies, our uranium segment is affected by the rising cost of inputs like labour and fuel. In 2012, labour, production supplies and contracted services made up 91% of the production costs at our uranium mines. Labour (37%) was the largest component. Production supplies (28%) included fuels, reagents and other items. Contracted services (26%) included mining and maintenance contractors, air charters, security and ground freight.
Starting in early 2014, we expect to begin to recognize the profits or losses related to Cigar Lake’s operating activities. All expenditures incurred before that time are expected to be capitalized as development costs. Depending on the actual timing of the rampup to the full production rate, we expect that the cost of material produced from Cigar Lake will initially be higher than our other sources of production, which is likely to temporarily increase our unit cost of sales.
Operating costs in our fuel services segment are mainly fixed. In 2012, labour accounted for about 54% of the total. The largest variable operating cost is for energy (natural gas and electricity), followed by zirconium and anhydrous hydrogen fluoride.
To help us operate efficiently and cost-effectively as we grow, we manage operating costs and improve plant reliability by prudently investing in production infrastructure, new technology and business process improvements. In addition, in the third quarter of 2012, we adjusted our growth strategy to allow us to spread our capital expenditures over a longer period of time and decrease our administration and project related costs.
24CAMECO CORPORATION
SeeOur strategy on page 18 for more information.
Our costs are also affected by the purchases of uranium and conversion services we make under long-term contracts and on the spot market.
Prices under our long-term purchase contracts are lower than the current published spot and long-term prices. Our most significant long-term purchase contract is the Russian HEU commercial agreement, which ends this year. Our final purchase is expected to be about 10 million pounds under this agreement. The purchase price escalates with inflation and was agreed to in 2001 when uranium prices were much lower than today. In 2008, pricing on a portion of the volumes available to us in 2011 through to 2013, was renegotiated. This will affect about 3 million of the 10 million pounds we expect to purchase under the agreement in 2013 and using a $50 (US) per pound uranium spot price, the average price for those pounds is expected to increase by about $11 (US) per pound (including an adjustment for inflation).
After the Russian HEU commercial agreement ends this year, we expect to maintain our sales volumes using a combination of sources including:
| • | | increased production from various supply sources (including the rampup of Cigar Lake) |
| • | | normal-course purchases of uranium under existing and/or new arrangements |
| • | | discretionary use of inventories |
We expect our purchases will result in profitable sales; however, the cost of purchased material is likely to be higher than our other sources of supply.
In addition, we will make spot purchases to take advantage of opportunities to place material into higher priced contracts. We make spot purchases prudently, looking at the spot price and other factors relating to our business to decide whether a spot purchase is appropriate. This activity gives us insight into the underlying market fundamentals and is a source of profit.
Managing contracts
Uranium and Fuel Services
We sell uranium and fuel services directly to nuclear utilities around the world, as uranium concentrates, UO2, UF6, conversion services or fuel fabrication.
Uranium is not traded in meaningful quantities on a commodity exchange. Utilities buy the majority of their uranium and fuel services products under long-term contracts with suppliers, and meet the rest of their needs on the spot market.
Our extensive portfolio of long-term sales contracts—and the long-term, trusting relationships we have with our customers—are core strengths for us. We currently have commitments to supply approximately 270 million pounds of U3O8 under long-term contracts with 52 customers worldwide. Our five largest customers account for 47% of these commitments, and 38% of our committed sales volume is attributed to purchasers in the Americas (US, Canada and Latin America), 39% in Asia and 23% in Europe.
Because we deliver large volumes of uranium every year, our net earnings and operating cash flows are affected by changes in the uranium price. Our contracting strategy is to secure a solid base of earnings and cash flow by maintaining a balanced contract portfolio that maximizes our realized price. Market prices are influenced by the fundamentals of supply and demand, geopolitical events, disruptions in planned supply and other market factors. Contract terms usually reflect market conditions at the time the contract is accepted, with deliveries beginning several years in the future.
2012 ANNUAL REPORT25
Our current uranium contracting strategy is to sign contracts with terms between 5 and 10 years (on average) that include mechanisms to protect us when market prices decline, and allow us to benefit when market prices go up. Our portfolio includes a mix of fixed-price and market-related contracts, which we target at a 40:60 ratio.
| • | | Fixed-price contracts are typically based on the industry long-term price indicator at the time the contract is accepted, adjusted for inflation to the time of delivery. |
| • | | Market-related contracts may be based on either the spot price or the long-term price as quoted at the time of delivery, and often include floor and ceiling prices adjusted for inflation. |
This is a balanced approach that reduces the volatility of our future earnings and cash flow, and that we believe delivers the best value to shareholders over the long term. It is also consistent with the contracting strategy of our customers. This strategy has allowed us to add increasingly favourable contracts to our portfolio that will enable us to benefit from any increases in market prices in the future.
The majority of our existing contracts include a supply interruption clause that gives us the right to reduce, on a pro rata basis, defer or cancel deliveries if there is a shortfall in planned production or in deliveries under the Russian HEU commercial agreement.
We are heavily committed under long-term uranium contracts through 2016, so we are being selective when considering new commitments.
Since March 2011, the nuclear industry has been addressing challenges related to the events in Japan. We have been working with our customers who were directly impacted by those events to help them manage their contractual obligations and excess inventories. As clarity is slowly gained around the situation in Japan, we are receiving fewer requests for assistance. In the limited instances where customers have requested help to manage their inventories, we have agreed to consider arrangements that are financially beneficial to us. We realized benefits from these contract improvement opportunities in 2011 and 2012. We expect that these requests will continue to decline as Japan gets closer to restarting its nuclear fleet.
The majority of our fuel services contracts are at a fixed price per kgU, adjusted for inflation, and reflect the market at the time the contract is accepted.
We have a similar marketing strategy for UF6 conversion services. We sell our conversion services to utilities in the Americas, Europe and Asia and primarily through long-term contracts. We currently have UF6 conversion services commitments of approximately 80 million kilograms of uranium under long-term contracts with 43 customers worldwide. Our five largest customers account for 41% of these commitments, and of our committed UF6 conversion services volume, 51% is attributed to purchasers in the Americas, 33% in Asia and 16% in Europe.
NUKEM Gmbh
NUKEM Gmbh (NUKEM), which we acquired in January 2013, has access to contracted volumes and inventories in diverse geographic locations as well as scope for opportunistic trading of uranium and uranium-related products. This enables NUKEM to provide a wide range of solutions to its customers that may fall outside the scope of typical uranium sourcing and selling arrangements. Its trading strategy is non-speculative and seeks to match quantities and pricing structures of its long-term supply and delivery contracts, minimizing exposure to commodity price fluctuations and locking in profit margins.
NUKEM’s main customers are commercial nuclear power plants using enriched uranium fuel, typically large utilities that are either government-owned, or large-scale utilities with multi-billion market capitalizations and strong credit ratings. NUKEM also trades with converters, enrichers, other traders and investors. It has uranium and uranium-related products under contract until 2022. NUKEM is party to the Russian HEU commercial agreement and will receive its final delivery of approximately 2 million pounds in 2013.
26CAMECO CORPORATION
A SAFE, HEALTHY AND REWARDING WORKPLACE
We strive to foster a safe, healthy and rewarding workplace at all of our facilities, and measure progress against key indicators, such as conventional and radiation safety statistics, employee sentiment toward the company and employment creation.
To achieve our growth objectives, we continue to build an engaged, qualified and diverse organization capable of leading and implementing our strategies. Our challenge is to retain our current workforce and compete for the limited number of qualified people available, both to replace retiring employees and to support our growth. Our long-term people strategy includes identifying critical workforce segments and planning our workforce to meet this challenge.
Our approach is working. We were recognized in a number of ways for our employee programs in 2012: the Financial Post named us as one of the Top 10 Best Companies to Work for in Canada for the third year in a row; Mediacorp named us one of Canada’s Top 100 Employers and also one of Canada’s Best Diversity Employers, both for the third year in a row; and we were named one of Canada’s Top Employers for Young People by Mediacorp. You can find out more about our awards on cameco.com.
A CLEAN ENVIRONMENT
We are committed to operating our business with respect and care for the local and global environment. We strive to be a leader in environmental practices by complying with and moving beyond legal and other requirements, and by integrating environmental leadership into everything we do.
We continually refine our objectives for environmental leadership and revisit the indicators we use to measure our progress in protecting the air, water and land near our operations, and in reducing the amount of waste we generate.
Reducing our impact
We work to reduce our impact on the environment by monitoring and implementing measures to reduce our effect on air, water and land, optimizing the amount of energy we consume, and managing waste.
| • | | Water: We have employed water treatment technologies that have improved the quality of the water released from our Saskatchewan uranium mining and milling operations. |
| • | | Waste: We continue to work on projects to reduce waste, improve the reclamation process and manage waste rock more effectively at all of our operations. In 2012, Blind River successfully removed a large inventory of waste materials stored at the facility. To ensure effective on-going waste management, the fuel services division has initiated plans to process these materials on an on-going basis to ensure accumulation does not occur in the future. |
| • | | Air: We are maximizing the lifespan of our operating sites to limit the areas impacted by our operations, including revitalizing the Key Lake mill (in operation for 30 years) and Rabbit Lake mill (in operation for 38 years). In doing so, we have improved air emissions by replacing some existing facilities. |
Like other large industrial organizations, we use chemicals in our operations that could be hazardous to our health and the environment if they are not handled correctly. We train our employees in the proper use of hazardous substances and in emergency response techniques.
AWARDED FOR SOCIAL RESPONSIBILITY
We are the 2013 recipient of the Prospectors and Developers Association of Canada’s Environmental and Social Responsibility award.
The award recognizes our outstanding accomplishments in establishing good community relations to support our exploration and mining operations.
2012 ANNUAL REPORT27
We are always investing in management systems and safety initiatives to achieve operational excellence and reliability, which also continues to improve our safety and environmental performance. We have incorporated life cycle value assessment into our project management and engineering processes to ensure social, environmental and financial risks have been more fully considered when designing new facilities.
SUPPORTIVE COMMUNITIES
To maintain public support for our operations (our social licence to operate) and our global reputation, we need the respect and support of communities, indigenous people, governments and regulators affected by our operations.
We work with communities who are affected by our activities to tell them what we are doing and to receive feedback and further input to build and sustain their trust. For example, in Saskatchewan, we participate in the Athabasca Working Group and Northern Saskatchewan Environmental Quality Committee. In Ontario, we liaise with our communities by regularly holding educational and environment-focused activities. Public opinion research shows that we have strong local support in these communities.
We build and sustain the trust of local communities by being a leader in corporate social responsibility (CSR). Through our CSR initiatives, we educate, engage, employ and invest in the people in the regions where we operate.
For example, in northern Saskatchewan in 2012:
| • | | just under 50% of the employees at our northern mines were local residents (756) and were paid over $73 million in wages |
| • | | over $460 million was paid to northern businesses, which provided 73% of services to our northern minesites. This is the most that we have ever procured from northern vendors in one year. |
| • | | we made over 85 community visits in northern Saskatchewan to discuss potential projects at our northern operations and to provide career information to high school students and community members |
| • | | we donated over $1.7 million to northern and aboriginal initiatives for youth, health and wellness, education and literacy, and culture and recreation |
| • | | we provided $100,000 in scholarships to post-secondary students |
In an effort to formalize our relationship with local communities and guide future cooperation and the sharing of benefits from our operations, we negotiated the first of several collaboration agreements with northern Saskatchewan communities in 2012. In a joint effort with AREVA Resource Canada Inc., we signed a collaboration agreement with the Northern Village of Pinehouse and the Kineepik Metis Local Inc. The agreement sets out specific commitments by the mining companies with respect to workforce development, business development, community engagement, environmental stewardship and community investment. The agreement confirms the support of the village and local for our existing projects and operations subject to our continued work to protect the health and safety of people and the environment.
Our operations are closely regulated to give the public comfort that we are operating in a safe and environmentally responsible way. Regulators approve the construction, startup, continued operation and any significant changes to our operations. Our operations are also subject to laws and regulations related to safety and the environment, including the management of hazardous wastes and materials.
Our objectives are consistent with those of our regulators—to keep people safe and to protect the environment. We pursue these goals through transparent and respectful efforts with all of our regulators. We work to earn their trust and that of stakeholders by continually striving to protect people and the environment.
28CAMECO CORPORATION
Measuring our results
| | |
2012 OBJECTIVES | | RESULTS |
Outstanding financial performance |
Production • Achieve budgeted production from our uranium and fuel services segments. | | Achieved • Our share of U3O8 production was 21.9 million pounds, or 99% of plan, and we produced 14.2 million kgU at fuel services, or 99% of plan. |
McArthur River • Implement productivity improvements to maintain planned production during mining zone transitions. | | Achieved • Made productivity improvements on cycle times, and changed the sequencing of the raises in zone 2, panel 5. Mitigated the risk to production in 2013 associated with the transition to the upper mining area of zone 4. |
Financial measures Corporate performance • Achieve budgeted net earnings and cash flow from operations (before working capital changes). | | Exceeded • Adjusted net earnings1 were $447 million, 20% higher than budget. Cash flow from operations (before working capital changes)1 was $717 million, 22% higher than budget. |
Costs • Achieve budgeted unit operating costs and corporate support costs. | | Achieved • Actual consolidated unit operating costs were in line with budget. Unit operating costs for uranium were $20.46 or 3% higher than budget and unit operating costs for fuel services were 2% lower than our budget of $17.11 per kgU. For the purposes of calculating performance on this objective, unit costs are weighted 70% for uranium and 30% for fuel services. Direct administrative expenses (corporate support costs) at year-end were 3% better than budgeted costs of $168 million. Our minimum target was to achieve budgeted unit costs on a consolidated basis. |
Growth • Meet regulatory project milestones and stage gate assessments on projects that support our Double U growth strategy. | | Achieved • Licence renewal applications were submitted for McArthur River, Key Lake and Rabbit Lake sites. Draft Environmental Impact Statements were submitted for the Millennium project, Key Lake extension project, and Eagle Point water management. Licence renewals were received for Blind River refinery, Port Hope conversion facility and Cameco Fuel Manufacturing. Engineering, procurement and construction management (EPCM) approach rolled out for McArthur River expansion, Millennium and the Port Hope Vision in Motion projects, and EPCM negotiations completed and firms retained. In Q4, we adjusted our growth strategy down from 40 million to 36 million pounds U3O8 by 2018. |
Cigar Lake • Advance the project towards startup in 2013 by successfully completing critical activities planned for 2012. | | Achieved • Completed the sinking of shaft 2 to its final depth of 500 metres and began installing shaft infrastructure. Assembled the first jet boring system unit underground, moved it to a production tunnel and began preliminary commissioning and system testing. Cigar Lake is a challenging deposit to mine. Completion of these critical milestones requires careful planning and deliberate execution. |
Inkai • Advance block 3 mineral resource delineation drilling and complete the test leach facility. • Receive approval to increase annual production from blocks 1 and 2 to design capacity of 5.2 million pounds per annum (100% basis). Continue to advance our longer-term objective of receiving approval to double annual production from blocks 1 and 2, extend the lease terms and secure block 3 mining rights. | | Partially achieved • Received regulatory approval for the detailed block 3 delineation and test leach work programs. Continued to advance block 3 mineral resource delineation, started technological drilling of test wellfields, continued infrastructure development and started construction of a test leach facility. Partially achieved • We continue to await government approval of an amendment to the resource use contract to increase annual production from blocks 1 and 2 to 5.2 million pounds per year (100% basis). • We signed a binding memorandum of agreement with our partner setting out the framework to increase annual production to 10.4 million pounds (100% basis), to extend the term of Inkai’s resource use contract, and to co-operate on the development of uranium conversion capacity, with the primary focus on uranium refining. Implementation of the MOA in this complex and developing regulatory environment is subject to further agreements and receipt of all necessary Canadian and Kazakhstan government approvals. |
| 1 | We use adjusted net earnings and cash flow from operations (before working capital changes) as a more meaningful way to compare our financial performance from period to period. These are not standard measures and not a substitute for financial information prepared in accordance with IFRS. Other companies may calculate these measures differently. Cash flow from operations (before working capital changes) is derived by adding amounts included in “Other operating items” to the line item “Net cash provided by operations” presented in the consolidated statements of cash flows in our 2012 audited financial statements. See Non-IFRS measures-Adjusted net earnings on page 34 and note 26 to our audited financial statements for more information. |
2012 ANNUAL REPORT29
| | |
2012 OBJECTIVES | | RESULTS |
Outstanding financial performance (continued) |
Growth (continued) Kintyre • Continue to advance project evaluation in 2012 and decide if we will proceed to feasibility. | | Achieved • We drill tested ten additional prospective areas on the property in 2012 and no additional resources were identified. We completed the prefeasibility study and decided not to proceed with the feasibility study at this time due to challenging project economics. |
Exploration and innovation • Replace mineral reserves and resources at the rate of annual U3O8 production based on a three-year rolling average. | | Achieved • Over the last three years, mineral reserves decreased by 13.5 million pounds compared to production of 67.2 million pounds, measured and indicated resources increased by 104.4 million pounds and inferred resources decreased by 67 million pounds. On average, production was replaced and exceeded by nearly 8 million pounds per year in each of the last three years (2010 to 2012). Replacing our reserves and resources is fundamental to our long-term success. |
Capital project management • Deliver capital projects planned for completion in 2012 within budget and on schedule. | | Partially achieved • The 165 capital projects that closed in 2012 were on schedule but 11.9% over our budget of $300 million. |
| | |
2012 OBJECTIVES | | RESULTS |
Safe, healthy and rewarding workplace |
• Strive for no lost-time injuries at all Cameco-operated sites and, at a minimum, maintain a long-term downward trend in combined employee and contractor injury frequency and severity, and radiation doses. | | Achieved • Safety performance was strong in 2012 with a downward trend in lost-time frequency and severity with the best lost-time frequency performance in the company’s history at 0.13 versus a target of 0.29. Average radiation doses were low and stable. |
• Attract, retain, engage and develop employees in support of current and future operations and establish succession pools for key positions. | | Partially achieved • Turnover rate of 7.5% was lower than the targeted performance range of 8.1% to 9.9%; but there was a higher than expected turnover rate for new hires within the first year of employment at 12.4%. Cameco was listed as both a Top 100 Employer and on the Financial Post’s 10 Best Companies to Work For, in addition to receiving awards for being among Saskatchewan’s top Employers, Canada’s Best Diversity Employers, and a Top Employer of Canadians over 40. |
| | |
2012 OBJECTIVES | | RESULTS |
Clean environment | | |
• Strive for zero reportable environmental incidents, reduce the frequency of incidents and have no significant incidents at Cameco-operated sites. | | Achieved • We incurred a total of 28 reportable environmental incidents in 2012, less than our long-term average of 40 reportable environmental incidents per year. There were no significant environmental incidents. |
| | |
2012 OBJECTIVES | | RESULTS |
Supportive communities | | |
• Develop long-term relationships by engaging with regulators and other stakeholders important to our sustainability. Secure continued support from our employees, impacted communities, investors, governments and the general public through communications, community investment and business development. | | Achieved • Maintained positive relationships with groups affected by our operating activities. Received a higher management credibility rating of 79% in our investor perception study compared to 74% in 2011. Maintained strong corporate trust ratings in Saskatchewan (7.52/10 compared to 7.24 in 2011) and Port Hope (8.03/10 compared to 7.98 in 2011); polling was not conducted in the US this year. |
• Implement Cameco’s corporate social responsibility policy to advance Cameco projects in all locations and secure support from indigenous communities affected by our operations. | | Achieved • A revised corporate social responsibility policy was developed and approved, and roll-out to operations commenced as planned. Meetings in local communities in northern Saskatchewan, Nunavut, James Bay and Australia, took place throughout the year. Successfully concluded the negotiation and signing of the Martu/Cameco Mining Development Agreement in Australia. Signed a collaboration agreement with the Northern Village of Pinehouse and Kineepik Metis Local Inc. in northern Saskatchewan. Negotiations are in progress with other communities in northern Saskatchewan. |
30CAMECO CORPORATION
2013 objectives
We set corporate, business unit and departmental objectives every year under our four measures of success, and these become the foundation for a portion of annual employee compensation.
2013 OBJECTIVES
Outstanding financial performance
| • | | Achieve targeted adjusted net earnings and cash flow from operations. |
| • | | Execute capital projects within scope, on time and on budget. |
| • | | Achieve production at Cigar Lake in 2013, and advance other activities needed to achieve medium and long-term growth objectives. |
Safe, healthy and rewarding workplace
| • | | Improve workplace safety performance at all sites. |
| • | | Attract and retain the employees needed to support operations and growth. |
Clean environment
| • | | Improve environmental performance at all sites. |
Supportive communities
| • | | Build and sustain strong stakeholder support for our activities. |
2012 ANNUAL REPORT31
Financial results
This section of our MD&A discusses our performance, financial condition and outlook for the future.
| | |
| |
| 33 | | 2012 consolidated financial results |
| |
| 40 | | Outlook for 2013 |
| |
| 41 | | Liquidity and capital resources |
| |
| 47 | | 2012 financial results by segment |
| |
| 47 | | Uranium |
| |
| 51 | | Fuel services |
| |
| 52 | | NUKEM |
| |
| 53 | | Electricity |
| |
| 55 | | Fourth quarter results |
| |
| 55 | | Fourth quarter consolidated results |
| |
| 56 | | Quarterly trends |
| |
| 57 | | Fourth quarter results by segment |
32CAMECO CORPORATION
2012 consolidated financial results
Starting in the first quarter of 2013,IFRS 11 – Joint Arrangements requires that we account for our interest in Bruce Power Limited Partnership (BPLP) using equity accounting. We will recast our quarterly results for 2012 for comparative purposes.
For the purposes of this report our interest in BPLP is presented in accordance with the proportionate consolidation method.
| | | | | | | | | | | | | | | | |
HIGHLIGHTS DECEMBER 31 ($ MILLIONS EXCEPT WHERE INDICATED) | | 2012 | | | 2011 | | | 2010 | | | CHANGE FROM
2011 TO 2012 | |
Revenue | | | 2,321 | | | | 2,384 | | | | 2,124 | | | | (3 | )% |
Gross profit | | | 723 | | | | 776 | | | | 772 | | | | (7 | )% |
Net earnings attributable to equity holders | | | 266 | | | | 450 | | | | 516 | | | | (41 | )% |
$ per common share (basic) | | | 0.67 | | | | 1.14 | | | | 1.31 | | | | (41 | )% |
$ per common share (diluted) | | | 0.67 | | | | 1.14 | | | | 1.31 | | | | (41 | )% |
Adjusted net earnings (non-IFRS, see below) | | | 447 | | | | 509 | | | | 497 | | | | (12 | )% |
$ per common share (adjusted and diluted) | | | 1.13 | | | | 1.29 | | | | 1.26 | | | | (12 | )% |
Cash provided by operations (after working capital changes) | | | 644 | | | | 745 | | | | 530 | | | | (14 | )% |
Net earnings
Our net earnings attributable to equity holders (net earnings) were $266 million ($0.67 per share diluted) compared to $450 million ($1.14 per share diluted) in 2011 mainly due to:
| • | | a $168 million write-down of our investment in the Kintyre project |
| • | | lower earnings from our uranium business as a result of lower realized prices and an increase in the cost of product sold |
| • | | lower earnings from our fuel services business as a result of a decrease in sales volumes |
| • | | higher earnings from our electricity business due to higher generation and lower costs |
| • | | lower taxes due mainly to lower pre-tax earnings and a decrease in the expense recorded in 2012 related to our transfer pricing dispute with the Canadian Revenue Agency (CRA). SeeIncome Taxes on page 37 for details. |
Our net earnings normally trend with revenue, but in recent years have been significantly influenced by unusual items.
In 2011, our net earnings were $66 million lower than in 2010 primarily due to recording losses on foreign exchange derivatives compared to gains in 2010. We recorded an after tax loss of $3 million on foreign exchange derivatives in 2011 compared to an after tax profit of $55 million in 2010.
Impairment charge on non-producing property
During the fourth quarter of 2012, we recorded a $168 million write-down of the carrying value of our interest in Kintyre, our advanced uranium exploration project in Australia. Due to the weakening of the uranium market since the asset was purchased in 2008, no increase in mineral resources in 2012 and the decision not to proceed with the feasibility study, we concluded it was appropriate to recognize an impairment charge for this asset. Kintyre remains an important asset in our portfolio. However, given the current state of the market, it was necessary to reduce its carrying value at this time. The amount of the write-down was determined as the excess of the carrying value over the fair value less cost to sell based on the implied fair value of the resources in place using comparable market transaction metrics.
2012 ANNUAL REPORT33
Non-IFRS measures
ADJUSTED NET EARNINGS
Adjusted net earnings is a measure that does not have a standardized meaning or a consistent basis of calculation under IFRS (non-IFRS measure). We use this measure as a more meaningful way to compare our financial performance from period to period. We believe that, in addition to conventional measures prepared in accordance with IFRS, certain investors use this information to evaluate our performance. Adjusted net earnings is our net earnings attributable to equity holders, adjusted to better reflect the underlying financial performance for the reporting period. The adjusted earnings measure reflects the matching of the net benefits of our hedging program with the inflows of foreign currencies in the applicable reporting period, and adjusted for impairment charges on non-producing properties.
Adjusted net earnings is non-standard supplemental information and should not be considered in isolation or as a substitute for financial information prepared according to accounting standards. Other companies may calculate this measure differently so you may not be able to make a direct comparison to similar measures presented by other companies.
To facilitate a better understanding of these measures, the table below reconciles adjusted net earnings with our net earnings for the years ended 2012, 2011 and 2010, as reported in our financial statements.
| | | | | | | | | | | | |
($ MILLIONS) | | 2012 | | | 2011 | | | 2010 | |
Net earnings attributable to equity holders | | | 266 | | | | 450 | | | | 516 | |
Adjustments | | | | | | | | | | | | |
Adjustments on derivatives1(pre-tax) | | | 17 | | | | 80 | | | | (26 | ) |
Income taxes on adjustments to derivatives | | | (4 | ) | | | (21 | ) | | | 7 | |
Impairment charge on non-producing property | | | 168 | | | | — | | | | — | |
| | | | | | | | | | | | |
Adjusted net earnings | | | 447 | | | | 509 | | | | 497 | |
| | | | | | | | | | | | |
| 1 | In 2008, we opted to discontinue hedge accounting for our portfolio of foreign currency forward sales contracts. Since then, we have adjusted our gains or losses on derivatives to reflect what our earnings would have been had hedge accounting been applied. |
The table below shows what contributed to the change in adjusted net earnings for 2012.
| | | | | | |
($ MILLIONS) | |
Adjusted net earnings – 2011 | | | 509 | |
| | | | | | |
Change in gross profit by segment (we calculate gross profit by deducting from revenue the cost of products and services sold, and depreciation and amortization (D&A), net of hedging benefits) | | | | |
| | |
Uranium | | Lower sales volume | | | (7 | ) |
| | Lower realized prices ($US) | | | (50 | ) |
| | Foreign exchange impact on realized prices | | | (1 | ) |
| | Higher costs | | | (70 | ) |
| | Hedging benefits | | | (14 | ) |
| | | | | | |
| | change – uranium | | | (142 | ) |
| | | | | | |
Fuel services | | Lower sales volume | | | (7 | ) |
| | Higher realized prices ($Cdn) | | | 9 | |
| | Higher costs | | | (14 | ) |
| | Hedging benefits | | | (2 | ) |
| | | | | | |
| | change – fuel services | | | (14 | ) |
| | | | | | |
Electricity | | Higher sales volume | | | 9 | |
| | Higher realized prices ($Cdn) | | | 9 | |
| | Lower costs | | | 66 | |
| | | | | | |
| | change – electricity | | | 84 | |
| | | | | | |
Other changes | | | | |
Contract termination charge | | | (30 | ) |
Higher administration expenditures | | | (24 | ) |
Higher exploration expenditures | | | (12 | ) |
Lower income taxes | | | 75 | |
Other | | | 1 | |
| | | | | | |
Adjusted net earnings – 2012 | | | 447 | |
| | | | | | |
34CAMECO CORPORATION
THREE-YEAR TREND
Our adjusted net earnings were relatively stable from 2010 to 2011 but declined in 2012.
The 2% increase from 2010 to 2011 resulted from:
| • | | higher earnings from our uranium business due to higher realized prices, and an increase in sales volumes |
partially offset by:
| • | | an increase in the cost of product sold |
| • | | lower earnings from our electricity business mainly due to higher costs, lower realized prices and lower sales volumes |
| • | | lower earnings from our fuel services business resulting from higher costs, partially offset by higher sales volumes |
The 12% decrease from 2011 to 2012 resulted from:
| • | | lower earnings from our uranium business due to lower realized prices and an increase in our unit costs |
| • | | higher charges for administration and exploration |
partially offset by:
| • | | higher earnings from our electricity business mainly due to lower costs and higher sales volumes |
Revenue
The table below shows what contributed to the change in revenue this year.
| | | | |
($ MILLIONS) | | | |
Revenue – 2011 | | | 2,384 | |
Uranium | | | | |
Lower sales volume | | | (19 | ) |
Lower realized prices ($Cdn) | | | (51 | ) |
Fuel services | | | | |
Lower sales volume | | | (37 | ) |
Higher realized prices ($Cdn) | | | 8 | |
Electricity | | | | |
Higher output | | | 33 | |
Higher realized prices ($Cdn) | | | 9 | |
Other | | | (6 | ) |
| | | | |
Revenue – 2012 | | | 2,321 | |
| | | | |
See2012 Financial results by segment on page 47 for more detailed discussion.
THREE-YEAR TREND
In 2011, revenue increased by 12% to a record $2.4 billion, due to higher sales volumes and record realized prices in our uranium business.
In 2012, revenue declined by 3% mainly due to a lower realized price for uranium, which was $1.57 per pound lower than the record price of $49.18 per pound in 2011.
2012 ANNUAL REPORT35
Average realized prices
| | | | | | | | | | | | | | | | | | | | |
| | | | 2012 | | | 2011 | | | 2010 | | | CHANGE FROM
2011 TO 2012 | |
Uranium1 | | $ | US/lb | | | | 47.62 | | | | 49.17 | | | | 43.63 | | | | (3 | )% |
| | $ | Cdn/lb | | | | 47.61 | | | | 49.18 | | | | 45.81 | | | | (3 | )% |
Fuel services | | $ | Cdn/kgU | | | | 17.24 | | | | 16.71 | | | | 16.86 | | | | 3 | % |
Electricity | | $ | Cdn/MWh | | | | 55 | | | | 54 | | | | 58 | | | | 2 | % |
| 1 | Average realized foreign exchange rate ($US/$Cdn): 2012—$1.00, 2011 – $1.00 and 2010 – $1.05. |
OUTLOOK FOR 2013
Effective January 1, 2013, with the adoption of IFRS 11 – Joint Arrangements, we will apply the equity method of accounting for our interest in BPLP and will no longer consolidate our share of their revenues. Our revenue outlook for 2013 does not include BPLP. For comparative purposes, our revenue for 2012 was $1,851,000 excluding BPLP. Furthermore, our outlook for 2013 presented below does not include any revenues expected to be recognized through NUKEM (seeNUKEM on page 52).
We expect consolidated revenue to be up to 5% higher in 2013 due to:
| • | | an increase in realized prices in the uranium business |
| • | | higher sales volumes in the fuel services business |
| • | | an increase in realized prices in the fuel services business |
In our uranium and fuel services segments, our customers choose when in the year to receive deliveries, so our quarterly delivery patterns, and therefore our sales volumes and revenue, can vary significantly. In 2013, we expect that deliveries will be lower in the first quarter with only about 15% of the year’s deliveries scheduled for the first three months. We expect uranium sales for the balance of 2013 to be more heavily weighted (~60%) to the second half of the year. However, not all delivery notices have been received to date, which could alter the delivery pattern. Typically, we receive notices six months in advance of the requested delivery date.
Corporate expenses
ADMINISTRATION
| | | | | | | | | | | | |
($ MILLIONS) | | 2012 | | | 2011 | | | CHANGE | |
Direct administration | | | 163 | | | | 147 | | | | 11 | % |
Stock-based compensation | | | 18 | | | | 10 | | | | 80 | % |
| | | | | | | | | | | | |
Total administration | | | 181 | | | | 157 | | | | 15 | % |
| | | | | | | | | | | | |
Direct administration costs in 2012 were $16 million higher than in 2011. The increase in the year reflects the following:
| • | | studies and analyses of various business opportunities |
| • | | enhancements to information systems |
We recorded $18 million in stock-based compensation expenses this year under our stock option, deferred share unit, performance share unit and phantom stock option plans, an increase of $8 million compared to 2011. Our share price increased by 6.4% in 2012, whereas it declined markedly in 2011 following the Fukushima disaster. See note 27 to the financial statements.
Outlook for 2013
We expect administration costs (not including stock-based compensation) to be up to 5% lower than in 2012 due to expected reductions in business development and corporate administrative activities related to our adjusted growth plans.
36CAMECO CORPORATION
EXPLORATION
In 2012, uranium exploration expenses were $97 million, an increase of $12 million compared to 2011 due largely to greater exploration activity in Saskatchewan. Our exploration efforts in 2012 focused on Canada, Australia, Kazakhstan and the United States.
Outlook for 2013
We expect exploration expenses to be about 5% to 10% lower than they were in 2012 due to:
| • | | decreased evaluation activities at Kintyre |
| • | | a general reorganization of our global exploration portfolio that has allowed us to focus on our core projects in Saskatchewan, the US, Kazakhstan and Australia |
FINANCE COSTS
Finance costs were $80 million compared to $74 million in 2011. The increase from last year largely reflects higher foreign exchange expenses and interest charges related to the debentures issued in the fourth quarter of 2012. See note 22 to the financial statements.
FINANCE INCOME
Finance income was $21 million compared to $25 million in 2011 due to lower levels of short-term investments in 2012.
GAINS AND LOSSES ON DERIVATIVES
In 2012, we recorded $39 million in gains on our derivatives compared to losses of $4 million in 2011. The gains reflect the strengthening of the Canadian dollar compared to the US dollar in 2012. See note 29 to the financial statements.
INCOME TAXES
We recorded an income tax recovery of $46 million in 2012 compared to an expense of $12 million in 2011. The change in the net expense was in part due to a decline in pre-tax earnings in 2012. The distribution of earnings between jurisdictions was also different compared to 2011. In 2012, we recorded losses of $320 million in Canada compared to $377 million in 2011, whereas earnings in foreign jurisdictions declined to $538 million from $839 million. The tax rate in Canada is higher than the average of the rates in the foreign jurisdictions in which we operate. The decline was also in part due to:
| • | | a decrease in the expense recorded in 2012 related to the CRA transfer pricing dispute. In 2012, we increased our provision by $9 million whereas the amount recognized in 2011 was $27 million. |
| • | | additional certainty we received on particular tax provisions that allowed us to recognize a $9 million recovery in our income tax expense. |
See note 24 to the financial statements.
On an adjusted earnings basis, we recognized a tax recovery of $42 million in 2012 compared to an expense of $33 million in 2011. The increase was related to the items noted above. Our effective tax rate was a recovery of 10% in 2012 compared to an expense of 6% in 2011. The table below presents our adjusted earnings and adjusted income tax expenses attributable to Canadian and foreign jurisdictions.
2012 ANNUAL REPORT37
| | | | | | | | |
($ MILLIONS) | | 2012 | | | 2011 | |
Pre-tax Adjusted Earnings1 | | | | | | | | |
Canada2 | | | (303 | ) | | | (298 | ) |
Foreign2 | | | 706 | | | | 839 | |
| | | | | | | | |
Total pre-tax adjusted earnings | | | 403 | | | | 541 | |
| | | | | | | | |
Adjusted Income Taxes1 | | | | | | | | |
Canada2 | | | (70 | ) | | | (34 | ) |
Foreign | | | 28 | | | | 67 | |
| | | | | | | | |
Adjusted income tax expense (recovery) | | | (42 | ) | | | 33 | |
| | | | | | | | |
Effective tax rate | | | (10 | )% | | | 6 | % |
| 1 | Pre-tax adjusted earnings and adjusted income taxes are non-IFRS measures. |
| 2 | Our IFRS-based measures have been adjusted by the amounts reflected in the table in adjusted net earnings (non-IFRS measure on page 34). |
Since 2008, CRA has disputed the offshore marketing company structure and related transfer pricing methodology we used for certain uranium sale and purchase agreements and issued notices of reassessment for our 2003 through 2007 tax returns. We believe it is likely that CRA will reassess our tax returns for 2008 through 2012 on a similar basis. Our view is that CRA is incorrect, and we are contesting its position. As a result we are pursuing our appeal rights under theIncome Tax Act. However, to reflect the uncertainties of CRA’s appeals process and litigation, we have provided a total of $63 million for uncertain tax positions for the years 2003 through 2012. We believe that the ultimate resolution of this matter will not be material to our financial position, results of operations or liquidity in the year(s) of resolution. However, substantial success for the CRA would be material, and other unfavourable outcomes for the years 2003 to 2012 could be material, to our financial position, results of operations and cash flows in the year(s) of resolution. Due to the availability of elective deductions and tax loss carrybacks, we were not required to make any significant payment of cash taxes through 2012. However, upon receipt of the reassessment for 2007, an amount of about $27 million became payable and was remitted in January 2013. See note 24 to the financial statements.
Outlook for 2013
We have contractual arrangements to sell uranium produced at our Canadian mining operations to a trading and marketing company located in a foreign jurisdiction. These arrangements reflect the uranium markets at the time they were signed, with the risk and benefit of subsequent movements in uranium prices accruing to the foreign trading and marketing company.
On an adjusted net earnings basis, we expect a recovery of 15% to 20% in 2013 from our uranium, fuel services and electricity segments, as taxable income in Canada is expected to decline. Subject to our success in the litigation with CRA, we expect our tax rate to continue in accordance with the 2013 outlook until the contractual arrangements noted above expire in 2016. As these arrangements expire and are replaced by new contracts that reflect the uranium market at the time of signing, our tax expense is expected to rise over time.
FOREIGN EXCHANGE
The exchange rate between the Canadian dollar and US dollar affects the financial results of our uranium and fuel services segments.
Sales of uranium and fuel services are routinely denominated in US dollars, while production costs are largely denominated in Canadian dollars. We use planned hedging to try to protect net inflows (total uranium and fuel services sales less US dollar cash expenses and product purchases) from the uranium and fuel services segments against declines in the US dollar in the shorter term. Our strategy is to hedge net inflows over a rolling 60-month period. Our policy is to hedge 35% to 100% of net inflows in the first 12 months. The range declines every year until it reaches 0% to 10% of our net inflows (from 48 and 60 months).
38CAMECO CORPORATION
We also have a natural hedge against US currency fluctuations as a portion of our annual cash outlays, including purchases of uranium and fuel services, are denominated in US dollars. The earnings impact of this natural hedge is more difficult to identify because inventory includes material added over more than one fiscal period.
At December 31, 2012:
| • | | The value of the US dollar relative to the Canadian dollar was $1.00 (US) for $0.99(Cdn), down from $1.00 (US) for $1.02 (Cdn) at December 31, 2011. The exchange rate averaged $1.00 (US) for $1.00 (Cdn) over the year. |
| • | | Our effective exchange rate for the year was about $1.00 (US) for $1.00 (Cdn), the same as in 2011. |
| • | | We had foreign currency forward contracts of $1.4 billion (US),EUR 110 million, AUD 20 million and an option to buy EUR 105 million at December 31, 2012. The US currency contracts had an average exchange rate of $1.00 (US) for $1.01 (Cdn). |
| • | | The mark-to-market gain on all foreign exchange contracts was $15 million compared to an $18 million loss at December 31, 2011. |
We manage counterparty risk associated with hedging by dealing with highly rated counterparties and limiting our exposure. At December 31, 2012, all counterparties to foreign exchange hedging contracts had a Standard & Poor’s (S&P) credit rating of A or better.
Sensitivity analysis
At December 31, 2012, every one-cent change in the value of the Canadian dollar versus the US dollar would change our 2013 net earnings by about $10 million (Cdn). This sensitivity is based on an exchange rate of $1.00 (US) for $1.00 (Cdn).
2012 ANNUAL REPORT39
Outlook for 2013
Over the next several years, we expect to invest significantly in expanding production at existing mines and advancing projects, subject to market conditions, as we pursue our growth strategy. The projects are at various stages of development, from exploration and evaluation to construction.
We expect our existing cash balances and operating cash flows will meet our anticipated 2013 capital requirements without the need for significant additional funding. Cash balances will decline as we use the funds in our business and pursue our growth plans.
Our outlook for 2013 reflects the growth expenditures necessary to help us achieve our strategy. We do not provide an outlook for the items in the table that are marked with a dash.
See2012 Financial results by segment on page 47 for details.
2013 FINANCIAL OUTLOOK
BPLP is not included in consolidated amounts due to a change in accounting (see page 36). NUKEM is also excluded (see page 52 for more information).
| | | | | | | | |
| | | CONSOLIDATED | | URANIUM | | FUEL SERVICES | | ELECTRICITY |
Production | | — | | 23.3 million lbs | | 15 to 16 million kgU5 | | — |
| | | | |
Sales volume | | — | | 31 to 33 million lbs | | Increase
0% to 5% | | — |
| | | | |
Capacity factor | �� | — | | — | | — | | 88% |
| | | | |
Revenue compared to 2012 | | Increase 0% to 5% | | Increase
0% to 5%1 | | Increase
5% to 10% | | Decrease
5% to 10% |
| | | | |
Average unit cost of sales (including D&A) | | — | | Increase
0% to 5%2 | | Decrease
0% to 5% | | Increase
25% to 30% |
| | | | |
Direct administration costs compared to 20123 | | Decrease 0% to 5% | | — | | — | | — |
| | | | |
Exploration costs compared to 2012 | | — | | Decrease
5% to 10% | | — | | — |
| | | | |
Tax rate | | Recovery of 15% to 20% | | — | | — | | — |
| | | | |
Capital expenditures | | $655 million4 | | — | | — | | $93 million
(our share) |
| 1 | Based on a uranium spot price of $43.65(US) per pound (the Ux spot price as of February 4, 2013), a long-term price indicator of $56.00 (US) per pound (the Ux long-term indicator on January 28, 2013) and an exchange rate of $1.00 (US) for $1.00 (Cdn). |
| 2 | This increase is based on the unit cost of sale for produced material and committed long-term purchases. If we decide to make discretionary purchases in 2013 then we expect the overall unit cost of product sold to increase further. |
| 3 | Direct administration costs do not include stock-based compensation expenses. See page 36 for more information. |
| 4 | Does not include our share of capital expenditures at BPLP. |
| 5 | Outlook corrected from 14 to 15 million kgU on February 19, 2013 to match the Port Hope production target included on page 95. |
FIRST QUARTER 2013
It is not our practice to provide earnings outlook. However, due to a combination of factors expected to occur in the first quarter, we have determined it appropriate to provide some outlook for investors regarding our current expectations for our first quarter earnings.
In our uranium and fuel services segments, our customers choose when in the year to receive deliveries, so our quarterly delivery patterns, sales volumes and revenue, can vary significantly. We expect our uranium deliveries for the first quarter will be in the range of 5 million to 6 million pounds, down considerably from the 8 million reported in the first three months of 2012. Uranium sales for the balance of 2013 are expected to be more heavily weighted (~60%) to the second half of the year. However, not all delivery notices have been received to date, which could alter the delivery pattern. Typically, we receive notices six months in advance of the requested delivery date.
40CAMECO CORPORATION
In addition, BPLP has outages scheduled for three of its four units in the first three months of 2013. Accordingly, we expect electricity generation to be significantly lower in the first quarter of 2013 than it was in the first quarter of 2012. The capacity factor is likely to be in the range of 75% to 80% and it is probable BPLP will report an operating loss for the quarter.
As a result, we expect our adjusted net earnings for the first quarter of 2013 will be significantly lower than the $124 million ($0.31 per share) in the first quarter of 2012. We do not believe that these factors will continue to have an impact on our adjusted net earnings for subsequent quarters of 2013. The guidance we have provided in the outlook table reflects our current expectations for the full year. We also expect our net earnings attributable to equity holders will be similarly impacted.
SENSITIVITY ANALYSIS
For 2013:
| | • | | a change of $5 (US) per pound in each of the Ux spot price ($43.65 (US) per pound on February 4, 2013) and the Ux long-term price indicator ($56.00 (US) per pound on January 28, 2013) would change revenue by $77 million and net earnings by $44 million |
| | • | | a change of $5/MWh in the electricity spot price would change our 2013 net earnings by $2 million based on the assumption that the spot price will remain below the floor price of $51.62/MWh provided for under BPLP’s agreement with the Ontario Power Authority (OPA) |
Liquidity and capital resources
At the end of 2012, we had cash and short-term investments of $799 million in a mix of short-term deposits and treasury bills, while our total debt amounted to $1.5 billion.
We have large, creditworthy customers that continue to need uranium even during weak economic conditions, and we expect the uranium contract portfolio we have built to provide a solid revenue stream for years to come.
We expect to continue investing in expanding our production capacity over the next several years. We have a number of alternatives to fund this continued growth including using our current cash balances, drawing on our existing credit facilities, entering new credit facilities, using our operating cash flow, and raising additional capital through debt or equity financings. We are always considering our financing options so that we can take advantage of favourable market conditions when they arise.
FINANCIAL CONDITION
| | | | | | | | |
| | | 2012 | | | 2011 | |
Cash position ($ millions) | | | 799 | | | | 1,202 | |
(cash, cash equivalents, short-term investments) | | | | | | | | |
Cash provided by operations ($ millions) | | | 644 | | | | 745 | |
(net cash flow generated by our operating activities after changes in working capital) | | | | | | | | |
Cash provided by operations/net debt | | | 88 | % | | | n/a | 1 |
(net debt is total consolidated debt, less cash position) | | | | | | | | |
Net debt/total capitalization | | | 12 | % | | | n/a | 1 |
(total capitalization is total long-term debt and equity) | | | | | | | | |
| 1 | Cash and cash equivalents exceeded debt. |
2012 ANNUAL REPORT41
CREDIT RATINGS
The credit ratings assigned to our securities by external ratings agencies are important to our ability to raise capital at competitive pricing to support our business operations. Our investment grade credit ratings reflect the current financial strength of our company.
Third-party ratings for our commercial paper and senior debt as of December 31, 2012:
| | | | | | | | |
SECURITY | | DBRS | | | S&P | |
Commercial paper | | | R-1 (low) | | | | A-1 (low) | 1 |
Senior unsecured debentures | | | A (low) | | | | BBB+ | |
| 1 | Canadian National Scale Rating. The Global Scale Rating is A-2. |
The rating agencies may revise or withdraw these ratings if they believe circumstances warrant. A change in our credit ratings could affect our cost of funding and our access to capital through the capital markets.
Liquidity
| | | | | | | | |
($ MILLIONS) | | 2012 | | | 2011 | |
Cash, cash equivalents and short term investments at beginning of year | | | 1202 | | | | 1,258 | |
Cash from operations | | | 644 | | | | 745 | |
Investment activities | | | | | | | | |
Additions to property, plant and equipment and acquisitions | | | (1,310 | ) | | | (647 | ) |
Other investing activities | | | (23 | ) | | | 40 | |
Financing activities | | | | | | | | |
Change in debt | | | 492 | | | | (3 | ) |
Interest paid | | | (54 | ) | | | (61 | ) |
Issue of shares | | | 7 | | | | 7 | |
Dividends | | | (158 | ) | | | (146 | ) |
Exchange rate on changes on foreign currency cash balances | | | (1 | ) | | | 9 | |
Cash, cash equivalents and short term investments at end of year | | | 799 | | | | 1,202 | |
Cash from operations
Cash from operations was 14% lower than in 2011 mainly due to lower profits in the uranium business and higher working capital requirements relating to increased inventory levels. Not including working capital requirements, our operating cash flows in the year were down $143 million. See note 26 to the financial statements.
Investing activities
Cash used in investing includes acquisitions and capital spending.
ACQUISITIONS AND DIVESTITURES
In 2012, we concluded the acquisition of the Yeelirrie deposit in Western Australia for a total cost of $454 million (US) (including $1.5 million in acquisition costs). In the second quarter, we acquired an additional interest in the Millennium project at a cost of $150 million. On January 9, 2013 we completed the acquisition of NUKEM by paying a total of $140 million (US) and assuming its net debt of $111 million (US). In 2011, we concluded no significant acquisitions or divestitures.
CAPITAL SPENDING
Starting in 2013, we are classifying capital spending as sustaining, capacity replacement or growth. As a mining company, sustaining capital is the money we spend to keep our facilities running in their present state, which would follow a gradually decreasing production curve, while capacity replacement capital is spent to maintain current production levels at those operations. Growth capital is money we invest to generate incremental production, and for business development. Previously, we categorized our capital spending as either sustaining (which included capacity replacement projects) or growth.
42CAMECO CORPORATION
| | | | | | | | |
(CAMECO’S SHARE IN $ MILLIONS) | | 2012 PLAN | | | 2012 ACTUAL | |
Growth capital | | | | | | | | |
Cigar Lake | | | 215 | | | | 231 | |
Inkai | | | 10 | | | | 9 | |
McArthur River | | | 35 | | | | 32 | |
Millennium | | | 5 | | | | 9 | |
US ISR | | | 30 | | | | 48 | |
| | | | | | | | |
Total growth capital | | | 295 | | | | 329 | |
| | | | | | | | |
Sustaining capital | | | | | | | | |
McArthur River/Key Lake | | | 145 | | | | 154 | |
US ISR | | | 50 | | | | 26 | |
Rabbit Lake | | | 75 | | | | 77 | |
Inkai | | | 30 | | | | 15 | |
Fuel services | | | 20 | | | | 15 | |
Other | | | 5 | | | | 15 | |
| | | | | | | | |
Total sustaining capital | | | 325 | | | | 302 | |
| | | | | | | | |
Talvivaara | | | — | | | | 41 | |
| | | | | | | | |
Total uranium & fuel services | | | 620 | 1 | | | 672 | |
| | | | | | | | |
Electricity (our 31.6% share of BPLP) | | | 80 | | | | 62 | |
| 1 | We updated our 2012 capital cost estimate in the Q2 MD&A to $680 million and in the Q3 MD&A to $730 million. |
Capital expenditures were 5% above our 2012 plan, mainly due to variances at Cigar Lake caused by a change in the timing of expenditures and increased costs.
OUTLOOK FOR INVESTING ACTIVITIES
| | | | | | | | | | | | |
(CAMECO’S SHARE IN $ MILLIONS) | | 2013 PLAN | | | 2014 PLAN | | | 2015 PLAN | |
Total uranium & fuel services | | | 650 | | | | 600-650 | | | | 550-600 | |
| | | | | | | | | | | | |
Sustaining capital | | | 200 | | | | 300-320 | | | | 290-310 | |
Growth capital | | | 310 | | | | 175-190 | | | | 140-155 | |
Capacity replacement capital | | | 140 | | | | 125-140 | | | | 120-135 | |
Talvivaara | | | 5 | | | | | | | | | |
| | | | | | | | | | | | |
Total uranium & fuel services | | | 655 | | | | | | | | | |
| | | | | | | | | | | | |
Electricity (our 31.6% share of BPLP) | | | 93 | | | | | | | | | |
We expect total capital expenditures for uranium and fuel services to decrease by about 1% in 2013.
Major sustaining, capacity replacement and growth expenditures in 2013 include:
| | • | | McArthur River/Key Lake – At McArthur River, the largest component is mine development at about $50 million. Other projects include upgrade of electrical infrastructure at about $40 million, as well as other site facility expansion and equipment purchases. At Key Lake, various projects to revitalize the mill will be undertaken at about $30 million, as well as upgrades to site electrical services and work on the tailings facilities. |
| | • | | US in situ recovery (ISR) – Wellfield construction and well installation is the largest project at approximately $40 million. We also plan to continue work on the development of the North Butte project and revitalization of the processing plant. |
| | • | | Rabbit Lake – At Eagle Point, the largest project includes mine development at about $15 million. Other projects include work on electrical systems, various mill equipment replacements and continued work on mine dewatering systems and tailings facilities. |
2012 ANNUAL REPORT43
| | • | | Cigar Lake – In order to bring Cigar Lake into production in 2013, we estimate our share of capital expenditures will be about $182 million, including $27 million on modifications to the McClean Lake mill. |
Our growth capital expenditures are related to our strategy to increase annual supply to 36 million pounds by 2018 and maintain the ability to respond quickly to changing market signals. The mix of projects and their underlying capital estimates could change significantly.
This information regarding currently expected capital expenditures for future periods is forward-looking information, and is based upon the assumptions and subject to the material risks discussed on pages 3 and 4. Our actual capital expenditures for future periods may be significantly different.
Financing activities
Cash from financing includes borrowing and repaying debt, and other financial transactions including paying dividends and providing financial assurance.
LONG-TERM CONTRACTUAL OBLIGATIONS
| | | | | | | | | | | | | | | | | | | | |
DECEMBER 31, 2012 ($ MILLIONS) | | 2013 | | | 2014 AND
2015 | | | 2016 AND
2017 | | | 2018 AND
BEYOND | | | TOTAL | |
Long-term debt | | | 16 | | | | 339 | | | | 48 | | | | 1,028 | | | | 1,431 | |
Interest on long-term debt | | | 71 | | | | 140 | | | | 105 | | | | 260 | | | | 576 | |
Provision for reclamation | | | 16 | | | | 32 | | | | 54 | | | | 596 | | | | 698 | |
Provision for waste disposal | | | 3 | | | | 6 | | | | 8 | | | | — | | | | 17 | |
Other liabilities | | | — | | | | — | | | | — | | | | 586 | | | | 586 | |
| | | | | | | | | | | | | | | | | | | | |
Total | | | 106 | | | | 517 | | | | 215 | | | | 2,470 | | | | 3,308 | |
| | | | | | | | | | | | | | | | | | | | |
We have unsecured lines of credit of about $1.9 billion, which include the following:
| | • | | A $1.25 billion unsecured revolving credit facility that matures November 1, 2017. Each year on the anniversary date, and upon mutual agreement, the facility can be extended for an additional year. In addition to borrowing directly from this facility, we can use up to $100 million of it to issue letters of credit and we may use it to provide liquidity for our commercial paper program, as necessary. We may increase the revolving credit facility above $1.25 billion, by increments of no less than $50 million, up to a total of $1.75 billion. The facility ranks equally with all of our other senior debt. At December 31, 2012, there was nothing outstanding under this facility. |
| | • | | Approximately $700 million in short-term borrowing and letters of credit provided by various financial institutions. We use these facilities mainly to provide financial assurance for future decommissioning and reclamation of our operating sites, and as overdraft protection. At December 31, 2012, we had approximately $672 million outstanding in letters of credit. |
In the fourth quarter, we issued $400 million in Series E Debentures bearing interest at 3.75% per year, maturing on November 14, 2022 as well as $100 million in Series F Debentures bearing interest at 5.09% per year, maturing on November 14, 2042.
In total, we have $1.3 billion in senior unsecured debentures outstanding:
| | • | | $300 million bearing interest at 4.7% per year, maturing on September 16, 2015 |
| | • | | $500 million bearing interest at 5.67% per year, maturing on September 2, 2019 |
| | • | | $400 million bearing interest at 3.75% per year, maturing on November 14, 2022 |
| | • | | $100 million bearing interest at 5.09% per year, maturing on November 14, 2042 |
We have issued a $73 million (US) promissory note to GLE to support future development of its business. As of December 31, 2012, GLE requested drawings of $31 million (US) in principal and $7.7 million (US) in interest. The balance remaining on the note is $42 million (US).
44CAMECO CORPORATION
DEBT COVENANTS
Our revolving credit facility includes the following financial covenants:
| | • | | our funded debt to tangible net worth ratio must be 1:1 or less |
| | • | | other customary covenants and events of default |
Funded debt is total consolidated debt less the following: non-recourse debt, $100 million in letters of credit, cash and short-term investments.
Not complying with any of these covenants could result in accelerated payment and termination of our revolving credit facility. At December 31, 2012, we complied with all covenants, and we expect to continue to comply in 2013.
Off-balance sheet arrangements
We had two kinds of off-balance sheet arrangements at the end of 2012:
PURCHASE COMMITMENTS
| | | | | | | | | | | | | | | | | | | | |
DECEMBER 31, 2012 ($ MILLIONS) | | 2013 | | | 2014 AND
2015 | | | 2016 AND
2017 | | | 2018 AND
BEYOND | | | TOTAL | |
Purchase commitments1 | | | 436 | | | | 216 | | | | 92 | | | | 476 | | | | 1,220 | |
| 1 | Denominated in US dollars, converted to Canadian dollars as of December 31, 2012 at the rate of $1.00. |
Most of these are commitments to buy uranium and fuel services products under long-term, fixed-price arrangements.
At the end of 2012, we had committed to $1.2 billion (Cdn) for the following:
| | • | | Approximately 25 million pounds of U3O8 equivalent from 2013 to 2027. Of these, about 10 million pounds are from our agreement with Techsnabexport Joint Stock Company (Tenex) to buy uranium from dismantled Russian weapons (the Russian HEU commercial agreement) through 2013. |
| | • | | Approximately 23 million kgU as UF6 in conversion services from 2013 to 2016 primarily under our agreements with Springfields Fuels Ltd. (SFL) and Tenex. |
| | • | | Over 0.7 million Separative Work Units (SWU) of enrichment services to meet existing forward sales commitments under agreements with a non-western supplier. |
Non-delivery by Tenex or SFL under their agreements could have a material adverse effect on our financial condition, liquidity and results of operations.
Tenex, SFL and the SWU supplier do not have the right to terminate their agreements other than pursuant to customary event of default provisions.
2012 ANNUAL REPORT45
FINANCIAL ASSURANCES
| | | | | | | | | | | | |
DECEMBER 31 ($ MILLIONS) | | 2012 | | | 2011 | | | CHANGE | |
Standby letters of credit | | | 672 | | | | 665 | | | | 1 | % |
BPLP guarantees | | | 59 | | | | 69 | | | | (14 | )% |
| | | | | | | | | | | | |
Total | | | 731 | | | | 734 | | | | — | |
| | | | | | | | | | | | |
Standby letters of credit mainly provide financial assurance for the decommissioning and reclamation of our mining and conversion facilities. We are required to provide letters of credit to various regulatory agencies until decommissioning and reclamation activities are complete. Letters of credit are issued by financial institutions for a one-year term.
Our total commitment for financial guarantees on behalf of BPLP was an estimated $63 million at the end of the year. See note 31 to the financial statements.
Balance sheet
| | | | | | | | | | | | | | | | |
DECEMBER 31 ($ MILLIONS EXCEPT PER SHARE AMOUNTS) | | 2012 | | | 2011 | | | 2010 | | | CHANGE FROM
2011 TO 2012 | |
Inventory | | | 564 | | | | 494 | | | | 533 | | | | 14 | % |
Total assets | | | 8,215 | | | | 7,616 | | | | 7,021 | | | | 8 | % |
Long-term financial liabilities | | | 2,249 | | | | 1,736 | | | | 1,524 | | | | 30 | % |
Dividends per common share | | | 0.40 | | | | 0.40 | | | | 0.28 | | | | — | |
Total product inventories increased by 14% to $564 million this year due to higher levels of inventory for uranium and fuel services, where the quantities sold were lower than the quantities produced and purchased for the year. The average cost of uranium was higher as a result of the increasing costs of produced and purchased material. At December 31, 2012, our average cost for uranium was $27.35 per pound, up from $25.11 per pound at December 31, 2011. In 2011, total product inventories decreased by 7% due to lower levels of uranium, where the quantities sold exceeded quantities produced and purchased for the year.
At the end of 2012, our total assets amounted to $8.2 billion, an increase of $0.6 billion compared to 2011 due primarily to acquisitions of uranium properties in the year. In 2011, the total asset balance increased by $0.6 billion due primarily to a higher rate of investment in property, plant and equipment.
The major components of long-term financial liabilities are long-term debt, finance lease obligations, the provision for reclamation and financial derivatives. In 2012, our balance increased by $0.5 billion. In 2011, our balance increased by $0.2 billion.
46CAMECO CORPORATION
2012 financial results by segment
Uranium
| | | | | | | | | | | | |
HIGHLIGHTS | | 2012 | | | 2011 | | | CHANGE | |
Production volume (million lbs) | | | 21.9 | | | | 22.4 | | | | (2 | )% |
Sales volume (million lbs) | | | 32.5 | | | | 32.9 | | | | (1 | )% |
Average spot price ($US/lb) | | | 48.40 | | | | 56.36 | | | | (14 | )% |
Average long-term price ($US/lb) | | | 60.13 | | | | 66.79 | | | | (10 | )% |
Average realized price | | | | | | | | | | | | |
($US/lb) | | | 47.62 | | | | 49.17 | | | | (3 | )% |
($Cdn/lb) | | | 47.61 | | | | 49.18 | | | | (3 | )% |
Average unit cost of sales ($Cdn/lb) (including D&A) | | | 32.09 | | | | 29.94 | | | | 7 | % |
Revenue ($ millions) | | | 1,546 | | | | 1,616 | | | | (4 | )% |
Gross profit ($ millions) | | | 504 | | | | 632 | | | | (20 | )% |
Gross profit (%) | | | 33 | | | | 39 | | | | (15 | )% |
Production volumes in 2012 were 2% lower than 2011 due to lower production from Smith Ranch-Highland and McArthur River/Key Lake, which had record production in 2011. SeeUranium – production overviewon page 64 for more information.
Uranium revenues this year were down 4% compared to 2011, due to a slight decrease in sales volumes and a decrease of 3% in the Canadian dollar average realized price. Our realized prices this year in US dollars were 3% lower than 2011 mainly due to lower US dollar prices under market-related contracts. The spot price for uranium averaged $48.40 in 2012, a decline of 14% compared to the 2011 average price of $56.36. Total cost of sales (including D&A) increased by 6% this year ($1.0 billion compared to $984 million in 2011). This was mainly the result of the following:
| | • | | average unit costs for produced uranium were 13% higher and average unit costs for purchased uranium were 9% higher due to an increase in spot purchases |
| | • | | lower royalty charges in 2012 due mainly to the decline in the realized price. In 2012, total royalties were $116 million compared to $124 million in 2011. |
The net effect was a $128 million decrease in gross profit for the year.
The following table shows the costs of produced and purchased uranium incurred in the reporting periods (non-IFRS measures see below). These costs do not include selling costs such as royalties, transportation and commissions, nor do they reflect the impact of opening inventories on our reported cost of sales.
| | | | | | | | | | | | |
($CDN/lb) | | 2012 | | | 2011 | | | CHANGE | |
Produced | | | | | | | | | | | | |
Cash cost | | | 19.95 | | | | 18.45 | | | | 8 | % |
Non-cash cost | | | 8.13 | | | | 6.50 | | | | 25 | % |
| | | | | | | | | | | | |
Total production cost | | | 28.08 | | | | 24.95 | | | | 13 | % |
| | | | | | | | | | | | |
Quantity produced (million lbs) | | | 21.9 | | | | 22.4 | | | | (2 | )% |
Purchased | | | | | | | | | | | | |
Cash cost | | | 28.50 | | | | 26.08 | | | | 9 | % |
Quantity purchased (million lbs) | | | 11.2 | | | | 9.6 | | | | 17 | % |
Totals | | | | | | | | | | | | |
Produced and purchased costs | | | 28.22 | | | | 25.29 | | | | 12 | % |
Quantities produced and purchased (million lbs) | | | 33.1 | | | | 32.0 | | | | 3 | % |
2012 ANNUAL REPORT47
Cash cost per pound, non-cash cost per pound and total cost per pound for produced and purchased uranium presented in the above table are non-IFRS measures. These measures do not have a standardized meaning or a consistent basis of calculation under IFRS. We use these measures in our assessment of the performance of our uranium business. We believe that, in addition to conventional measures prepared in accordance with IFRS, certain investors use this information to evaluate our performance and ability to generate cash flow.
These measures are non-standard supplemental information and should not be considered in isolation or as a substitute for measures of performance prepared according to accounting standards. These measures are not necessarily indicative of operating profit or cash flow from operations as determined under IFRS. Other companies may calculate these measures differently so you may not be able to make a direct comparison to similar measures presented by other companies.
To facilitate a better understanding of these measures, the table below presents a reconciliation of these measures to our unit cost of sales for the years ended 2012 and 2011 as reported in our financial statements.
CASH AND TOTAL COST PER POUND RECONCILIATION
| | | | | | | | |
($ MILLIONS) | | 2012 | | | 2011 | |
Cost of product sold | | | 871.3 | | | | 824.3 | |
Add / (subtract) | | | | | | | | |
Royalties | | | (116.0 | ) | | | (123.6 | ) |
Standby charges | | | (28.6 | ) | | | (22.0 | ) |
Other selling costs | | | (6.2 | ) | | | (9.4 | ) |
Change in inventories | | | 35.6 | | | | (5.7 | ) |
| | | | | | | | |
Cash operating costs (a) | | | 756.1 | | | | 663.6 | |
Add / (subtract) | | | | | | | | |
Depreciation and amortization | | | 170.9 | | | | 159.2 | |
Change in inventories | | | 7.2 | | | | (13.6 | ) |
| | | | | | | | |
Total operating costs (b) | | | 934.2 | | | | 809.2 | |
| | | | | | | | |
Uranium produced and purchased (millions lbs) (c) | | | 33.1 | | | | 32.0 | |
Cash costs per pound (a ÷ c) | | | 22.84 | | | | 20.74 | |
| | | | | | | | |
Total costs per pound (b ÷ c) | | | 28.22 | | | | 25.29 | |
| | | | | | | | |
OUTLOOK FOR 2013
We expect to produce 23.3 million pounds in 2013 and have commitments under long-term contracts to purchase 12 million pounds.
Based on the contracts we have in place, we expect to sell between 31 million and 33 million pounds of U3O8 in 2013. We expect the unit cost of sales to be up to 5% higher than in 2012. The increase is due primarily to higher costs for produced material. If we decide to make additional discretionary purchases in 2013, then we expect the overall unit cost of sales to increase further.
Based on current spot prices, revenue should be up to 5% higher than it was in 2012 as a result of an expected increase in the realized price.
PRICE SENSITIVITY ANALYSIS: URANIUM
The table and graph below are not forecasts of prices we expect to receive. The prices we actually realize will be different from the prices shown in the table and graph. They are designed to indicate how the portfolio of long-term contracts we had in place on December 31, 2012 would respond to different spot prices. In other words, we would realize these prices only if the contract portfolio remained the same as it was on December 31, 2012, and none of the assumptions we list below change.
48CAMECO CORPORATION
We intend to update this table and graph each quarter in our MD&A to reflect deliveries made and changes to our contract portfolio each quarter. As a result, we expect the table and graph to change from quarter to quarter.
Expected realized uranium price sensitivity under various spot price assumptions
(rounded to the nearest $1.00)
| | | | | | | | | | | | | | | | | | | | | | | | | | | | |
SPOT PRICES ($US/lb U3O8) | | $20 | | | $40 | | | $60 | | | $80 | | | $100 | | | $120 | | | $140 | |
2013 | | | 43 | | | | 46 | | | | 53 | | | | 61 | | | | 69 | | | | 77 | | | | 83 | |
2014 | | | 45 | | | | 48 | | | | 56 | | | | 64 | | | | 73 | | | | 82 | | | | 89 | |
2015 | | | 41 | | | | 46 | | | | 56 | | | | 66 | | | | 76 | | | | 86 | | | | 95 | |
2016 | | | 43 | | | | 48 | | | | 58 | | | | 69 | | | | 80 | | | | 90 | | | | 98 | |
2017 | | | 42 | | | | 47 | | | | 57 | | | | 67 | | | | 78 | | | | 87 | | | | 95 | |
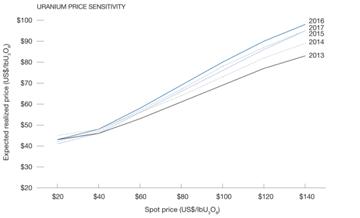
The table and graph illustrate the mix of long-term contracts in our December 31, 2012 portfolio, and are consistent with our contracting strategy. Both have been updated to December 31, 2012 to reflect:
| | • | | deliveries made and contracts entered into up to December 31, 2012 |
| | • | | our best estimate of future deliveries |
Our portfolio includes a mix of fixed-price and market-related contracts, which we target at a 40:60 ratio. Those that are fixed at lower prices or have low ceiling prices will yield prices that are lower than current market prices. In 2012, a number of older contracts expired and we are starting to deliver into more favourably priced contracts.
Our portfolio is affected by more than just the spot price. We made the following assumptions (which are not forecasts) to create the table:
Sales
| | • | | sales volumes on average of 32 million pounds per year |
Deliveries
| | • | | customers take the maximum quantity allowed under each contract (unless they have already provided a delivery notice indicating they will take less) |
| | • | | we defer a portion of deliveries under existing contracts for 2013 |
Inflation
Prices
| | • | | the average long-term price indicator is the same as the average spot price for the entire year (a simplified approach for this purpose only). Since 1996, the long-term price indicator has averaged 15% higher than the spot price. This differential has varied significantly. Assuming the long-term price is at a premium to spot, the prices in the table and graph will be higher. |
2012 ANNUAL REPORT49
TIERED ROYALTIES
As sales of material we produce at our Saskatchewan properties increase, so do the tiered royalties we pay. The table below indicates what we would pay in tiered royalties at various realized prices. We record tiered royalties as a cost of sales.
This table assumes that we sell 100,000 pounds U3O8 and that there is no capital allowance available to reduce royalties, and is based on 2012 government prescribed rates. The index value to calculate rates for 2013 is not available until April 2013.
| | | | | | | | | | | | | | | | |
REALIZED PRICE ($Cdn) | | TIER 1 ROYALTY
6% X
(SALES PRICE—$18.66) | | | TIER 2 ROYALTY
4% X
(SALES PRICE—$28.00) | | | TIER 3 ROYALTY
5% X
(SALES PRICE—$37.33) | | | TOTAL ROYALTIES | |
25 | | | 38,040 | | | | — | | | | — | | | | 38,040 | |
35 | | | 98,040 | | | | 28,000 | | | | — | | | | 126,040 | |
45 | | | 158,040 | | | | 68,000 | | | | 38,350 | | | | 264,390 | |
55 | | | 218,040 | | | | 108,000 | | | | 88,350 | | | | 414,390 | |
65 | | | 278,040 | | | | 148,000 | | | | 138,350 | | | | 564,390 | |
75 | | | 338,040 | | | | 188,000 | | | | 188,350 | | | | 714,390 | |
85 | | | 398,040 | | | | 228,000 | | | | 238,350 | | | | 864,390 | |
50CAMECO CORPORATION
Fuel services
(Includes results for UF6, UO2 and fuel fabrication)
| | | | | | | | | | | | |
HIGHLIGHTS | | 2012 | | | 2011 | | | CHANGE | |
Production volume (million kgU) | | | 14.2 | | | | 14.7 | | | | (3 | )% |
Sales volume (million kgU) | | | 16.1 | | | | 18.3 | | | | (12 | )% |
Realized price ($Cdn/kgU) | | | 17.24 | | | | 16.71 | | | | 3 | % |
Average unit cost of sales ($Cdn/kgU) (including D&A) | | | 14.63 | | | | 13.75 | | | | 6 | % |
Revenue ($ millions) | | | 277 | | | | 305 | | | | (9 | )% |
Gross profit ($ millions) | | | 42 | | | | 54 | | | | (22 | )% |
Gross profit (%) | | | 15 | | | | 18 | | | | (17 | )% |
Total revenue decreased by 9% due to a 12% decrease in sales volumes. We set lower sales target in 2012 due to weak market conditions at the beginning of the year.
The total cost of products and services sold (including D&A) decreased by 6% ($235 million compared to $251 million in 2011) due to the decrease in sales volumes. The average unit cost of sales was 6% higher due to higher unit costs for UF6 relating to lower production.
The net effect was a $12 million decrease in gross profit.
OUTLOOK FOR 2013
In 2013, we plan to produce 14 million to 15 million kgU, and we expect sales volumes to be up to 5% higher than in 2012. Overall revenue is expected to increase by 5% to 10%, as a result of the higher volumes and an expected increase in the average realized price. We expect the unit cost of product sold (including D&A) to decrease by 0% to 5%, therefore overall gross profit will increase as a result.
2012 ANNUAL REPORT51
NUKEM
On January 9, 2013, we completed the acquisition of NUKEM GmbH (NUKEM) from Advent International (Advent) and other shareholders. NUKEM is one of the world’s leading traders and brokers of nuclear fuel products and services.
NUKEM was acquired for cash consideration of €107 million ($140 million (US)), plus closing adjustments. We also assumed NUKEM’s net debt which amounted to about €84 million ($111 million (US)) on January 9, 2013. Acquisition related costs of $4 million have been expensed and included in administration expense in the consolidated statement of earnings. We received the economic benefits of owning NUKEM as of January 1, 2012, however, in accordance with accounting requirements, our financial reporting will reflect results from January 9, 2013 forward.
The purchase agreement also includes an earn-out provision that could provide Advent with a share of NUKEM’s earnings under certain conditions for the years 2012 through 2014. The earn-out is based on NUKEM exceeding certain minimum threshold levels of EBITDA, as specified and defined in the purchase agreement. The EBITDA is derived from NUKEM’s audited financial statements and the earn-out payment to Advent is paid in the following year. For 2012, we estimate the earn-out amount will be about $5 million (US).
For accounting purposes, the purchase price is allocated to the assets and liabilities acquired based on their fair values as of the acquisition date (January 9, 2013). As the acquisition has closed very recently, we have not yet finalized the allocation of the purchase price. However, we expect that the majority of the purchase price will be allocated to the purchase and sales contracts acquired, nuclear fuel inventories, and goodwill.
OUTLOOK FOR 2013
The requirement to assign fair values to the sales and purchase contracts as of the acquisition date will impact the future operating results reported for NUKEM. For example, NUKEM is a party to the Russian HEU commercial agreement, which provides for the purchase of uranium at a price well below the current market. We will assign a portion of the purchase price to this contract. Our future cost of sales will reflect the amortization of the value assigned to the contract in the periods in which this HEU material is delivered. This accounting will be applied to all contracts in the portfolio as of the acquisition date. As a result, we expect the profit margins we report for NUKEM will be in the range of 3% to 5% in 2013. We plan to report NUKEM as a separate business segment.
For 2013, NUKEM expects to deliver approximately 9 million to 11 million pounds of uranium and about 500,000 SWU, resulting in total revenues in the range of $500 million to $600 million. NUKEM expects to incur costs for administration in the range of $10 million to $12 million. The effective income tax rate is expected to be in the range of 30% to 35%. Operating cash flows are expected to be in the range of $100 million to $125 million.
52CAMECO CORPORATION
Electricity
BPLP
(100% – not prorated to reflect our 31.6% interest)
| | | | | | | | | | | | |
HIGHLIGHTS ($ MILLIONS EXCEPT WHERE INDICATED) | | 2012 | | | 2011 | | | CHANGE | |
Output—terawatt hours (TWh) | | | 26.8 | | | | 24.9 | | | | 8 | % |
Capacity factor (the amount of electricity the plants actually produced for sale as a percentage of the amount they were capable of producing) | | | 94 | % | | | 87 | % | | | 8 | % |
Realized price ($/MWh) | | | 55 | 1 | | | 54 | 2 | | | 2 | % |
Average Ontario electricity spot price ($/MWh) | | | 23 | | | | 30 | | | | (23 | )% |
Revenue | | | 1,487 | | | | 1,354 | | | | 10 | % |
Operating costs (net of cost recoveries) | | | 889 | | | | 1,006 | | | | (12 | )% |
Cash costs | | | 669 | | | | 812 | | | | (18 | )% |
Non-cash costs | | | 220 | | | | 194 | | | | 13 | % |
Income before interest and finance charges | | | 598 | | | | 348 | | | | 72 | % |
Interest and finance charges | | | 26 | | | | 37 | | | | (30 | )% |
Cash from operations | | | 543 | | | | 490 | | | | 11 | % |
Capital expenditures | | | 194 | | | | 243 | | | | (20 | )% |
Distributions | | | 425 | | | | 270 | | | | 57 | % |
Capital calls | | | 63 | | | | 21 | | | | 200 | % |
Operating costs ($/MWh) | | | 33 | 1 | | | 40 | 2 | | | (18 | )% |
| 1 | Based on actual generation of 26.8 TWh plus deemed generation of 0.4 TWh |
| 2 | Based on actual generation of 24.9 TWh plus deemed generation of 0.4 TWh |
OUR EARNINGS FROM BPLP
| | | | | | | | | | | | |
HIGHLIGHTS ($ MILLIONS EXCEPT WHERE INDICATED) | | 2012 | | | 2011 | | | CHANGE | |
BPLP’s earnings before taxes (100%) | | | 572 | | | | 311 | | | | 84 | % |
Cameco’s share of pretax earnings before adjustments (31.6%) | | | 181 | | | | 98 | | | | 85 | % |
Proprietary adjustments | | | (6 | ) | | | (6 | ) | | | — | |
Earnings before taxes from BPLP | | | 175 | | | | 92 | | | | 90 | % |
BPLP’s increased results in 2012 when compared to 2011 are partially the result of revenues being 10% higher than in 2011 due to a 2% increase in realized electricity prices. BPLP’s average realized price reflects spot sales, revenue recognized under BPLP’s agreement with the Ontario Power Authority (OPA) and revenue from financial contracts.
BPLP has an agreement with the OPA under which output from each B reactor is supported by a floor price (currently $51.62/MWh) that is adjusted annually for inflation. The floor price mechanism and any associated payments to BPLP for the output from each individual B reactor will expire on a date specified in the agreement. The expiry dates are December 31, 2015 for unit B6, December 31, 2016 for unit B5, December 31, 2017 for unit B7 and December 31, 2019 for unit B8. Revenue is recognized monthly, based on the positive difference between the floor price and the spot price. BPLP does not have to repay the revenue from the agreement with the OPA to the extent that the floor price for the particular year exceeds the average spot price for that year.
The agreement also provides for payment if the Independent Electricity System Operator (IESO) reduces BPLP’s generation because Ontario’s baseload generation supply is higher than required. The amount of the reduction is considered ‘deemed generation’, for which BPLP is paid either the spot price or the floor price—whichever is higher. The deemed generation approach has provided the IESO with significant flexibility in dealing with changes to the Ontario electricity market in recent years. Deemed generation was 0.4 TWh in 2012, the same as in 2011.
2012 ANNUAL REPORT53
During 2012, BPLP recognized revenue of $773 million under the agreement with the OPA, compared to $498 million in 2011.
BPLP also has financial contracts in place that reflect market conditions at the time they were signed. BPLP receives or pays the difference between the contract price and the spot price. BPLP sold the equivalent of about 64% of its output under financial contracts in 2012, compared to 54% in 2011. From time to time, BPLP enters the market to lock in gains under these contracts. Gains on BPLP’s contracting activity were slightly higher than in 2011.
In addition, BPLP’s increased results in 2012 when compared to 2011 were also partially the result of lower operating costs. BPLP’s operating costs were $889 million this year compared to $1.0 billion in 2011 due to lower supplemental lease payments and lower maintenance costs incurred during outage periods.
The net effect was an increase in our share of earnings before taxes of 90%.
BPLP distributed $425 million to the partners in 2012. Our share was $134 million. BPLP capital calls to the partners in 2012 were $63 million. Our share was $20 million. The partners have agreed that BPLP will distribute excess cash monthly, and will make separate cash calls for major capital projects.
BPLP’s capacity factor was 94% in 2012, up from 87% in 2011 due to a lower volume of outage days during the year’s planned outages compared to last year’s planned outages.
OUTLOOK FOR 2013
Bruce Power estimates the average capacity factor for the four Bruce B reactors to be 88% in 2013, and actual output to be about 5% to 10% lower than it was in 2012 due to more planned outage days in 2013. The 2013 realized price for electricity is projected to be slightly lower than 2012. As a result we expect that revenue will decrease by about 5% to 10%.
We expect the average unit cost (net of cost recoveries) to be 25% to 30% higher in 2013 and total operating costs to increase by about 15% to 20%, mainly due to more planned outages resulting in higher costs.
In 2013, we will account for our interest in BPLP using equity accounting.
54CAMECO CORPORATION
Fourth quarter results
Fourth quarter consolidated results
| | | | | | | | | | | | |
HIGHLIGHTS ($ MILLIONS EXCEPT WHERE INDICATED) | | THREE MONTHS ENDED
DECEMBER 31 | | | CHANGE | |
| | 2012 | | | 2011 | | |
Revenue | | | 958 | | | | 971 | | | | (1 | )% |
Gross profit | | | 307 | | | | 353 | | | | (13 | )% |
Net earnings attributable to equity holders | | | 45 | | | | 265 | | | | (83 | )% |
$ per common share (basic) | | | 0.11 | | | | 0.67 | | | | (84 | )% |
$ per common share (diluted) | | | 0.11 | | | | 0.67 | | | | (84 | )% |
Adjusted net earnings (non-IFRS, see page 34) | | | 237 | | | | 249 | | | | (5 | )% |
$ per common share (adjusted and diluted) | | | 0.60 | | | | 0.63 | | | | (5 | )% |
Cash provided by operations (after working capital changes) | | | 283 | | | | 258 | | | | 10 | % |
In the fourth quarter of 2012, our net earnings attributable to equity holders (net earnings) were $45 million ($0.11 per share diluted), a decrease of $220 million compared to $265 million ($0.67 per share diluted) in 2011. This decline was largely the result of the $168 million write-down of our interest in the Kintyre project and lower earnings from our uranium business, partially offset by stronger results in the electricity business. Uranium profits were impacted by a 7% decline in the average realized selling price due mainly to a lower spot price compared to the fourth quarter of 2011. Earnings in the electricity business improved as a result of higher generation and lower operating costs.
The 5% decrease in adjusted net earnings in the quarter followed the same trend as our net earnings, due to lower results in our uranium business, partially offset by the results in our electricity business.
We use adjusted net earnings, a non-IFRS measure, as a more meaningful way to compare our financial performance from period to period. See page 34 for more information. The table below reconciles adjusted net earnings with our net earnings.
| | | | | | | | |
($ MILLIONS) | | THREE MONTHS ENDED
DECEMBER 31 | |
| | 2012 | | | 2011 | |
Net earnings attributable to equity holders | | | 45 | | | | 265 | |
Adjustments | | | | | | | | |
Adjustments on derivatives1(pre-tax) | | | 33 | | | | (22 | ) |
Income taxes on adjustments to derivatives | | | (9 | ) | | | 6 | |
Impairment charge on non-producing property | | | 168 | | | | — | |
| | | | | | | | |
Adjusted net earnings | | | 237 | | | | 249 | |
| | | | | | | | |
| 1 | In 2008, we opted to discontinue hedge accounting for our portfolio of foreign currency forward sales contracts. Since then, we have adjusted our gains or losses on derivatives to reflect what our earnings would have been had hedge accounting been applied. |
We recorded an income tax recovery of $5 million this quarter, based on adjusted net earnings, compared to a $25 million expense in 2011.
Direct administration costs were $53 million in the quarter, $7 million higher than the same period last year. Stock-based compensation expenses were $1 million lower than the fourth quarter of 2011. See note 27 to the financial statements.
2012 ANNUAL REPORT55
| | | | | | | | | | | | |
($ MILLIONS) | | THREE MONTHS ENDED
DECEMBER 31 | | | CHANGE | |
| | 2012 | | | 2011 | | |
Direct administration | | | 53 | | | | 46 | | | | 15 | % |
Stock-based compensation | | | 4 | | | | 5 | | | | (20 | )% |
| | | | | | | | | | | | |
Total administration | | | 57 | | | | 51 | | | | 12 | % |
| | | | | | | | | | | | |
Quarterly trends
| | | | | | | | | | | | | | | | | | | | | | | | | | | | | | | | |
HIGHLIGHTS ($ MILLIONS EXCEPT PER SHARE AMOUNTS) | | 2012 | | | 2011 | |
| | Q4 | | | Q3 | | | Q2 | | | Q1 | | | Q4 | | | Q3 | | | Q2 | | | Q1 | |
Revenue | | | 958 | | | | 408 | | | | 391 | | | | 564 | | | | 971 | | | | 527 | | | | 425 | | | | 461 | |
Net earnings attributable to equity holders | | | 45 | | | | 82 | | | | 8 | | | | 131 | | | | 265 | | | | 39 | | | | 55 | | | | 91 | |
$ per common share (basic) | | | 0.11 | | | | 0.21 | | | | 0.02 | | | | 0.33 | | | | 0.67 | | | | 0.10 | | | | 0.14 | | | | 0.23 | |
$ per common share (diluted) | | | 0.11 | | | | 0.21 | | | | 0.02 | | | | 0.33 | | | | 0.67 | | | | 0.10 | | | | 0.14 | | | | 0.23 | |
Adjusted net earnings (non-IFRS, see page 34) | | | 237 | | | | 52 | | | | 34 | | | | 124 | | | | 249 | | | | 104 | | | | 72 | | | | 84 | |
$ per common share (adjusted and diluted) | | | 0.60 | | | | 0.13 | | | | 0.09 | | | | 0.31 | | | | 0.63 | | | | 0.26 | | | | 0.18 | | | | 0.22 | |
Cash provided by operations (after working capital changes) | | | 283 | | | | 44 | | | | (94 | ) | | | 411 | | | | 258 | | | | 192 | | | | 23 | | | | 272 | |
Key things to note:
| | • | | Our financial results are strongly influenced by the performance of our uranium segment, which accounted for 74% of consolidated revenues in the fourth quarter of 2012. |
| | • | | The timing of customer requirements, which tend to vary from quarter to quarter, drives revenue in the uranium and fuel services segments. More than 40% of our uranium deliveries for 2012 occurred in the fourth quarter. |
| | • | | Net earnings do not trend directly with revenue due to unusual items and transactions that occur from time to time. We use adjusted net earnings, a non-IFRS measure, as a more meaningful way to compare our results from period to period (see page 34 for more information). |
| | • | | Cash from operations tends to fluctuate as a result of the timing of deliveries and product purchases in our uranium and fuel services segments. |
| | • | | Quarterly results are not necessarily a good indication of annual results due to the variability in customer requirements noted above. |
56CAMECO CORPORATION
Fourth quarter results by segment
Uranium
| | | | | | | | | | | | |
HIGHLIGHTS | | THREE MONTHS ENDED
DECEMBER 31 | | | CHANGE | |
| | 2012 | | | 2011 | | |
Production volume (million lbs) | | | 6.5 | | | | 6.6 | | | | (2 | )% |
Sales volume (million lbs) | | | 14.4 | | | | 13.8 | | | | 4 | % |
Average spot price ($US/lb) | | | 42.46 | | | | 51.79 | | | | (18 | )% |
Average long-term price ($US/lb) | | | 58.50 | | | | 62.50 | | | | (6 | )% |
Average realized price | | | | | | | | | | | | |
($US/lb) | | | 49.97 | | | | 52.09 | | | | (4 | )% |
($Cdn/lb) | | | 49.37 | | | | 53.08 | | | | (7 | )% |
Average unit cost of sales ($Cdn/lb) (including D&A) | | | 32.88 | | | | 30.29 | | | | 9 | % |
Revenue ($ millions) | | | 709 | | | | 731 | | | | (3 | )% |
Gross profit ($ millions) | | | 237 | | | | 314 | | | | (25 | )% |
Gross profit (%) | | | 33 | | | | 43 | | | | (23 | )% |
Production volumes for the quarter decreased by 2% year over year. SeeUranium – production overviewon page 64 for more information.
Uranium revenues were down 3% due to a 7% decrease in the Canadian dollar average realized price, partially offset by a 4% increase in sales volumes.
Our realized prices this quarter were lower than the fourth quarter of 2011 mainly due to lower US dollar prices under market related contracts. In the fourth quarter of 2012, the uranium spot price averaged $42.46 (US), 18% lower than the $51.79 (US) in the fourth quarter of 2011.
Total cost of sales (including D&A) increased by 13% ($472 million compared to $417 million in 2011). This was mainly the result of the following:
| | • | | the 4% increase in sales volumes |
| | • | | the 11% increase in average unit costs for produced uranium due to an increase in non-cash costs |
| | • | | a 75% increase in the average unit costs for purchased uranium due to increased purchases at spot prices. In the fourth quarter of 2011, most of our purchases were under long-term contracts at more favourable fixed prices. |
| | • | | lower royalty charges due to the lower realized price and reduced deliveries of Saskatchewan-produced material. In 2012, total royalty charges were $52 million compared to $61 million in 2011. |
The net effect was a $77 million decrease in gross profit for the quarter.
The following table shows the costs of produced and purchased uranium incurred in the reporting periods (non-IFRS measures see below). These costs do not include selling costs such as royalties, transportation and commissions, nor do they reflect the impact of opening inventories on our reported cost of sales.
2012 ANNUAL REPORT57
| | | | | | | | | | | | |
($Cdn/lb) | | THREE MONTHS ENDED
DECEMBER 31 | | | CHANGE | |
| | 2012 | | | 2011 | | |
Produced | | | | | | | | | | | | |
Cash cost | | | 17.01 | | | | 17.44 | | | | (2 | )% |
Non-cash cost | | | 8.41 | | | | 5.52 | | | | 52 | % |
| | | | | | | | | | | | |
Total production cost | | | 25.42 | | | | 22.96 | | | | 11 | % |
| | | | | | | | | | | | |
Quantity produced (million lbs) | | | 6.5 | | | | 6.6 | | | | (2 | )% |
| | | | | | | | | | | | |
Purchased | | | | | | | | | | | | |
Cash cost | | | 32.94 | | | | 18.86 | | | | 75 | % |
| | | | | | | | | | | | |
Quantity purchased (million lbs) | | | 2.8 | | | | 2.3 | | | | 22 | % |
| | | | | | | | | | | | |
Totals | | | | | | | | | | | | |
Produced and purchased costs | | | 27.69 | | | | 21.90 | | | | 26 | % |
| | | | | | | | | | | | |
Quantities produced and purchased (million lbs) | | | 9.3 | | | | 8.9 | | | | 4 | % |
| | | | | | | | | | | | |
Cash cost per pound, non-cash cost per pound and total cost per pound for produced and purchased uranium presented in the above table are non-IFRS measures. These measures do not have a standardized meaning or a consistent basis of calculation under IFRS. We use these measures in our assessment of the performance of our uranium business. We believe that, in addition to conventional measures prepared in accordance with IFRS, certain investors use this information to evaluate our performance and ability to generate cash flow.
These measures are non-standard supplemental information and should not be considered in isolation or as a substitute for measures of performance prepared according to accounting standards. These measures are not necessarily indicative of operating profit or cash flow from operations as determined under IFRS. Other companies may calculate these measures differently so you may not be able to make a direct comparison to similar measures presented by other companies.
To facilitate a better understanding of these measures, the following table presents a reconciliation of these measures to our unit cost of sales for the fourth quarters of 2012 and 2011.
CASH AND TOTAL COST PER POUND RECONCILIATION
| | | | | | | | |
($ MILLIONS) | | THREE MONTHS ENDED
DECEMBER 31 | |
| | 2012 | | | 2011 | |
Cost of product sold | | | 390.7 | | | | 336.8 | |
Add / (subtract) | | | | | | | | |
Royalties | | | (51.7 | ) | | | (61.3 | ) |
Standby charges | | | (7.7 | ) | | | (6.0 | ) |
Other selling costs | | | (3.3 | ) | | | (2.8 | ) |
Change in inventories | | | (125.2 | ) | | | (108.2 | ) |
| | | | | | | | |
Cash operating costs(a) | | | 202.8 | | | | 158.5 | |
Add / (subtract) | | | | | | | | |
Depreciation and amortization | | | 81.3 | | | | 80.1 | |
Change in inventories | | | (26.6 | ) | | | (43.7 | ) |
| | | | | | | | |
Total operating costs(b) | | | 257.5 | | | | 194.9 | |
| | | | | | | | |
Uranium produced & purchased (millions lbs) (c) | | | 9.3 | | | | 8.9 | |
| | | | | | | | |
Cash costs per pound (a ÷ c) | | | 21.81 | | | | 17.81 | |
Total costs per pound (b ÷ c) | | | 27.69 | | | | 21.90 | |
| | | | | | | | |
58CAMECO CORPORATION
Fuel services
(includes results for UF6, UO2 and fuel fabrication)
| | | | | | | | | | | | |
HIGHLIGHTS | | THREE MONTHS ENDED
DECEMBER 31 | | | CHANGE | |
| | 2012 | | | 2011 | | |
Production volume (million kgU) | | | 3.3 | | | | 3.1 | | | | 6 | % |
Sales volume (million kgU) | | | 5.9 | | | | 7.2 | | | | (18 | )% |
Realized price ($Cdn/kgU) | | | 16.70 | | | | 14.67 | | | | 14 | % |
Average unit cost of sales ($Cdn/kgU) (including D&A) | | | 13.44 | | | | 11.18 | | | | 20 | % |
Revenue ($ millions) | | | 99 | | | | 106 | | | | (7 | )% |
Gross profit ($ millions) | | | 19 | | | | 25 | | | | (24 | )% |
Gross profit (%) | | | 19 | | | | 24 | | | | (21 | )% |
Total revenue decreased by 7% due to an 18% decrease in sales volumes, offset by a 14% increase in realized price.
The total cost of products and services sold (including D&A) decreased by 2% ($79 million compared to $81 million in the fourth quarter of 2011) due to the decrease in sales volumes, offset by an increase in the average unit cost of sales. When compared to 2011, the average unit cost of sales was 20% higher due to the mix of fuel services products sold and to higher cost recoveries being recorded in 2011.
The net effect was a $6 million decrease in gross profit.
2012 ANNUAL REPORT59
Electricity
BPLP (100% – not prorated to reflect our 31.6% interest)
| | | | | | | | | | | | |
HIGHLIGHTS ($ MILLIONS EXCEPT WHERE INDICATED) | | THREE MONTHS ENDED
DECEMBER 31 | | | CHANGE | |
| | 2012 | | | 2011 | | |
Output—terawatt hours (TWh) | | | 7.2 | | | | 6.2 | | | | 16 | % |
Capacity factor (the amount of electricity the plants actually produced for sale as a percentage of the amount they were capable of producing) | | | 100 | % | | | 86 | % | | | 16 | % |
Realized price ($/MWh) | | | 54 | | | | 53 | 1 | | | 2 | % |
Average Ontario electricity spot price ($/MWh) | | | 24 | | | | 27 | | | | (11 | )% |
Revenue | | | 392 | | | | 338 | | | | 16 | % |
Operating costs (net of cost recoveries) | | | 221 | | | | 271 | | | | (18 | )% |
Cash costs | | | 165 | | | | 220 | | | | (25 | )% |
Non-cash costs | | | 56 | | | | 51 | | | | 10 | % |
Income before interest and finance charges | | | 171 | | | | 67 | | | | 155 | % |
Interest and finance charges | | | 6 | | | | 7 | | | | (13 | )% |
Cash from operations | | | 101 | | | | 114 | | | | (11 | )% |
Capital expenditures | | | 54 | | | | 84 | | | | (36 | )% |
Distributions | | | 140 | | | | 65 | | | | 115 | % |
Capital calls | | | 14 | | | | 10 | | | | 40 | % |
Operating costs ($/MWh) | | | 31 | | | | 42 | 1 | | | (26 | )% |
| 1 | Based on actual generation of 6.2 TWh plus deemed generation of 0.2 TWh in the fourth quarter. |
OUR EARNINGS FROM BPLP
| | | | | | | | | | | | |
HIGHLIGHTS ($ MILLIONS EXCEPT WHERE INDICATED) | | THREE MONTHS ENDED
DECEMBER 31 | | | CHANGE | |
| | 2012 | | | 2011 | | |
BPLP’s earnings before taxes (100%) | | | 165 | | | | 60 | | | | 175 | % |
Cameco’s share of pretax earnings before adjustments (31.6%) | | | 52 | | | | 19 | | | | 174 | % |
Proprietary adjustments | | | (2 | ) | | | (2 | ) | | | — | |
Earnings before taxes from BPLP | | | 50 | | | | 17 | | | | 194 | % |
Total electricity revenue increased 16% due to higher output and slightly higher realized price. Realized prices reflect spot sales, revenue recognized under BPLP’s agreement with the OPA, and financial contract revenue. BPLP recognized revenue of $198 million this quarter under its agreement with the OPA, compared to $147 million in the fourth quarter of 2011. The equivalent of about 58% of BPLP’s output was sold under financial contracts this quarter, compared to 66% in the fourth quarter of 2011. From time to time BPLP enters the market to lock in gains under these contracts. Gains on BPLP’s contracting activity in the fourth quarter 2012 were similar to 2011.
The capacity factor was 100% this quarter, up from 86% in the fourth quarter of 2011. There were no outage days in the fourth quarter this year compared to a planned outage in 2011.
Operating costs were $221 million compared to $271 million in 2011 due to lower supplemental lease payments and lower maintenance costs incurred as a result of no outages in the fourth quarter.
The result was a 194% increase in our share of earnings before taxes.
BPLP distributed $140 million to the partners in the fourth quarter. Our share was $44 million. BPLP capital calls to the partners in the fourth quarter were $14 million. Our share was $4 million. The partners have agreed that BPLP will distribute excess cash monthly, and will make separate cash calls for major capital projects.
60CAMECO CORPORATION
Our operations and development projects
This section of our MD&A is an overview of each of our operations, what we accomplished this year, our plans for the future and how we manage risk.
| | |
| | | URANIUM |
| |
| | | Operating properties |
| 66 | | McArthur River / Key Lake |
| 72 | | Rabbit Lake |
| 74 | | Smith Ranch-Highland |
| 76 | | Crow Butte |
| 77 | | Inkai |
| |
| | Development project |
| 81 | | Cigar Lake |
| |
| | Projects under evaluation |
| 86 | | Kintyre |
| 88 | | Millennium |
| 90 | | Yeelirrie |
| |
| 92 | | EXPLORATION |
| |
| | FUEL SERVICES |
| |
| | Refining |
| 93 | | Blind River refinery |
| |
| | Conversion and fuel manufacturing |
| 94 | | Port Hope conversion services |
| 94 | | Cameco fuel manufacturing |
| 94 | | Springfields fuels |
| |
| 96 | | NUKEM Gmbh |
| |
| | ELECTRICITY |
| 97 | | Bruce Power Limited Partnership |
2012 ANNUAL REPORT61
Managing the risks
The nature of our operations means we face many potential risks and hazards that could have a significant impact on our business. We have comprehensive systems and procedures in place to manage them, but there is no assurance we will be successful in preventing the harm any of these risks and hazards could cause.
Below we list the regulatory, environmental and operational risks that generally apply to all of our operations, development projects and projects under evaluation. We also talk about how we manage specific risks in each operation or project update. These risks could have a material impact on our business in the near term.
We recommend you also review our annual information form, which includes a discussion of other material risks that could have an impact on our business.
Regulatory risks
A significant part of our economic value depends on our ability to:
| • | obtain and renew the licences and other approvals we need to operate, to increase production at our mines and to develop new mines. If we do not receive the regulatory approvals we need, or do not receive them at the right time, then we may have to delay, modify or cancel a project, which could increase our costs and delay or prevent us from generating revenue from the project. Regulatory review, including the review of environmental matters, is a long and complex process. |
| • | comply with the conditions in these licences and approvals. In a number of instances, our right to continue operating facilities, increase production at our mines and develop new mines depends on our compliance with these conditions. |
| • | comply with the extensive and complex laws and regulations that govern our activities, including our growth plans. Environmental legislation imposes strict standards and controls on almost every aspect of our operations and the mines we plan to develop, and is not only introducing new requirements, but also becoming more stringent. For example: |
| • | we must complete the environmental assessment process before we can begin developing a new mine or make any significant change to our operations |
| • | we may need regulatory approval to make changes to our operational processes, which can take a significant amount of time because it may require an extensive review of supporting technical information. The complexity of this process can be further compounded when regulatory approvals are required from multiple agencies. |
We use significant management and financial resources to manage our regulatory risks.
Environmental risks
We have the safety, health and environmental risks associated with any mining and chemical processing company. Our uranium, fuel services and electricity segments also face unique risks associated with radiation.
Laws to protect the environment are becoming more stringent for members of the nuclear energy industry and have inter-jurisdictional aspects (both federal and provincial/state regimes are applicable). Once we have permanently stopped mining and processing activities at an operating site, we are required to decommission the site to the satisfaction of the regulators. We have developed conceptual decommissioning plans for our operating sites and use them to estimate our decommissioning costs. Regulators review our detailed decommissioning plan on a regular basis and, as the site approaches or goes into decommissioning, carry out the required regulatory approval process. This can result in further regulatory process, as well as additional requirements, costs and financial assurances.
62CAMECO CORPORATION
At the end of 2012, our estimate of total decommissioning and reclamation costs was $698 million. This is the undiscounted value of the obligation and is based on our current operations. We had accounting provisions of $553 million at the end of 2012 (the present value of the $698 million). Since we expect to incur most of these expenditures at the end of the useful lives of the operations they relate to, our expected costs for decommissioning and reclamation for the next five years are not material. We are in the process of updating the preliminary decommissioning plans and cost estimates for Cigar Lake, McArthur River, Key Lake and Rabbit Lake, which will be reviewed by all of the regulatory authorities in 2013. As part of that process, we expect that the preliminary decommissioning cost estimates for these facilities will increase.
We provide financial assurances for decommissioning and reclamation such as letters of credit to regulatory authorities, as required. We had a total of $672 million in letters of credit supporting our reclamation liabilities at the end of 2012. All of our North American operations have letters of credit in place that provide financial assurance in connection with our preliminary plans for decommissioning for the sites.
Some of the sites we own or operate have been under ongoing investigation and/or remediation and planning as a result of historic soil and groundwater conditions. For example, we are addressing issues related to historic soil and groundwater contamination at Port Hope.
We use significant management and financial resources to manage our environmental risks.
We manage environmental risks through our safety, health, environment and quality (SHEQ) management system. Our chief executive officer is responsible for ensuring that our SHEQ management system is implemented. Our board’s safety, health and environment committee also oversees how we manage our environmental risks.
In 2012, we invested:
| • | $117 million in environmental protection, monitoring and assessment programs, or 19% more than 2011 |
| • | $30 million in health and safety programs, or about the same as 2011 |
Spending for health and safety programs in 2013 is expected to be similar to 2012, while spending for environmental programs is expected to decrease slightly.
Operational risks
Other operational risks and hazards include:
| • | industrial and transportation accidents |
| • | labour shortages, disputes or strikes |
| • | cost increases for labour, contracted or purchased materials, supplies and services |
| • | shortages of required materials, supplies and equipment |
| • | transportation disruptions |
| • | electrical power interruptions |
| • | non-compliance with laws and licences |
| • | blockades or other acts of social or political activism |
| • | natural phenomena, such as inclement weather conditions, floods and earthquakes |
| • | unusual, unexpected or adverse mining or geological conditions |
| • | ground movement or cave ins |
| • | tailings pipeline or dam failures |
| • | technological failure of mining methods. |
We have insurance to cover some of these risks and hazards, but not all of them, and not to the full amount of losses or liabilities that could potentially arise.
2012 ANNUAL REPORT63
Uranium – production overview
URANIUM PRODUCTION
| | | | | | | | | | | | | | | | | | | | |
| CAMECO’S SHARE | | THREE MONTHS ENDED
DECEMBER 31 | | | YEAR ENDED
DECEMBER 31 | | | | |
(MILLION lbs) | | 2012 | | | 2011 | | | 2012 | | | 2011 | | | 2012 PLAN | |
McArthur River/Key Lake | | | 3.5 | | | | 3.9 | | | | 13.6 | | | | 13.9 | | | | 13.5 | 1 |
Rabbit Lake | | | 1.7 | | | | 1.6 | | | | 3.8 | | | | 3.8 | | | | 3.7 | |
Smith Ranch-Highland | | | 0.3 | | | | 0.2 | | | | 1.1 | | | | 1.4 | | | | 1.3 | 1 |
Crow Butte | | | 0.2 | | | | 0.2 | | | | 0.8 | | | | 0.8 | | | | 0.7 | |
Inkai | | | 0.8 | | | | 0.7 | | | | 2.6 | | | | 2.5 | | | | 2.5 | |
| | | | | | | | | | | | | | | | | | | | |
Total | | | 6.5 | | | | 6.6 | | | | 21.9 | | | | 22.4 | | | | 21.7 | 1 |
| | | | | | | | | | | | | | | | | | | | |
| 1 | We updated our initial 2012 plan for McArthur River/Key Lake (to 13.5 million pounds from 13.1 million pounds) and Smith Ranch-Highland (to 1.3 million pounds from 1.6 million pounds) in our Q3 MD&A. |
OUTLOOK
We have geographically diverse sources of production. Subject to market conditions, our plan is to focus primarily on advancing our brownfield projects and the process to extract uranium from the Talvivaara mine to achieve annual supply of 36 million pounds by 2018. We expect to purchase about 900,000 pounds of supply under our agreement with Talvivaara when all regulatory approvals are received, work on the extraction process is complete, and once they ramp up to full production. We expect production to start in the first half of 2014.
Cameco’s share of production – annual forecast to 2017
| | | | | | | | | | | | | | | | | | | | |
CURRENT FORECAST (MILLION lbs) | | 2013 | | | 2014 | | | 2015 | | | 2016 | | | 2017 | |
McArthur River/Key Lake | | | 13.2 | | | | 13.1 | | | | 13.1 | | | | 13.1 | | | | 13.1 | |
Rabbit Lake | | | 4.2 | | | | 4.2 | | | | 4.2 | | | | 4.2 | | | | 4.2 | |
US ISR | | | 2.6 | | | | 2.9 | | | | 2.9 | | | | 3.0 | | | | 3.0 | |
Inkai1 | | | 2.9 | | | | 2.9 | | | | 2.9 | | | | 2.9 | | | | 2.9 | |
Cigar Lake | | | 0.3 | | | | 1.8 | | | | 5.5 | | | | 7.9 | | | | 8.2 | |
Total share of production | | | 23.2 | | | | 24.9 | | | | 28.6 | | | | 31.1 | | | | 31.4 | |
Cameco’s share of Inkai’s production on which profits are generated2 | | | | | | | | | | | | | | | | | | | | |
Inkai1 | | | 3.0 | | | | 3.0 | | | | 3.0 | | | | 3.0 | | | | 3.0 | |
| | | | | | | | | | | | | | | | | | | | |
Total2 | | | 23.3 | | | | 25.0 | | | | 28.7 | | | | 31.2 | | | | 31.5 | |
| | | | | | | | | | | | | | | | | | | | |
| 1 | In 2011, we signed a memorandum of agreement (2011 MOA) with Kazatomprom to increase annual production to 5.2 million pounds (100% basis). Under the 2011 MOA, we will have the right to purchase 2.9 million pounds of Inkai’s annual production and receive profits on 3.0 million pounds. |
| 2 | We have adjusted the production table to reflect the share of Inkai’s production we will use to calculate our profits under the 2011 MOA, as described in the note above. |
Our 2013 and future annual production targets for Inkai assume, and we expect, that Inkai will obtain the necessary government permits and approvals to produce at an annual rate of 5.2 million pounds (100% basis), including an amendment to the resource use contract.
There is no certainty Inkai will receive these permits or approvals. If Inkai does not, or if the permits and approvals are delayed, Inkai may be unable to achieve its 2013 and future annual production targets and we may have to re-categorize some of Inkai’s mineral reserves as resources.
This forecast is forward-looking information. It is based on the assumptions and subject to the material risks discussed on pages 3 and 4, and specifically on the assumptions and risks noted above and listed here. Actual production may be significantly different from this forecast.
64CAMECO CORPORATION
Assumptions
| • | we achieve our forecast production for each operation, which requires, among other things, that our mining plans succeed, processing plants and equipment are available and function as designed, we have sufficient tailings capacity and our mineral reserve estimates are reliable |
| • | we obtain or maintain the necessary permits and approvals from government authorities |
| • | our production is not disrupted or reduced as a result of natural phenomena, labour disputes, political risks, blockades or other acts of social or political activism, shortage or lack of supplies critical to production, equipment failures or other development and operation risks |
Material risks that could cause actual results to differ materially
| • | we do not achieve forecast production levels for each operation because of a change in our mining plans, processing plants or equipment are not available or do not function as designed, lack of tailings capacity or for other reasons |
| • | we cannot obtain or maintain necessary permits or approvals from government authorities |
| • | natural phenomena, labour disputes (including an inability to renew agreements with unionized employees at McArthur River and Key Lake), political risks, blockades or other acts of social or political activism, shortage or lack of supplies critical to production, equipment failures or other development and operation risks disrupt or reduce our production |
2012 ANNUAL REPORT65
Uranium – operating properties
| | |
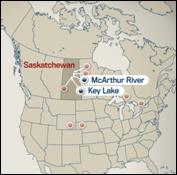 | | McArthur River/Key Lake McArthur River is the world’s largest, high-grade uranium mine, and Key Lake is the largest uranium mill in the world. Ore grades at the McArthur River mine are 100 times the world average, which means it can produce more than 18 million pounds per year by mining only 150 to 200 tonnes of ore per day. We are the operator. McArthur River is one of our three material uranium properties. |
| |
| Location | | Saskatchewan, Canada |
| |
| Ownership | | 69.805% – McArthur River 83.33% – Key Lake |
| |
| End product | | Uranium concentrates |
| |
| ISO certification | | ISO 14001 certified |
| |
| Mine type | | Underground |
| |
| Estimated reserves (our share) | | 264.5 million pounds (proven and probable), average grade U3O8: 16.36% |
| |
| Estimated resources(our share) | | 8.5 million pounds (measured and indicated), average grade U3O8: 5.65% 39.5 million pounds (inferred), average grade U3O8: 7.78% |
| |
| Mining methods | | Currently: raiseboring; Secondary (under development): blasthole stoping, Boxhole boring |
| |
| Licenced capacity | | Mine and mill: 18.7 million pounds per year (can be exceeded – seeProduction flexibility) |
| |
Total production:2000 to 2012 (100% basis)1983 to 2002 | | 230.5 million pounds (McArthur River/Key Lake) 209.8 million pounds (Key Lake) |
| |
| 2012 production (our share) | | 13.6 million pounds |
| |
| 2013 forecast production (our share) | | 13.2 million pounds |
| |
Estimated decommissioning cost (100% basis) | | $48 million – McArthur River (pending regulatory review) $225 million – Key Lake (pending regulatory review) |
BACKGROUND
Production Flexibility
Our operating licences for the Key Lake mill and McArthur River mine were amended in 2009 and 2010, giving us flexibility in our annual licensed production limit. As long as average annual production does not exceed 18.7 million pounds per year, these amendments allow:
| • | the Key Lake mill to produce up to 20.4 million pounds (100% basis) per year |
| • | the McArthur River mine to produce up to 21 million pounds (100% basis) per year |
If production is lower than 18.7 million pounds in any year, we can produce more in future years until we recover the shortfall.
Mining methods and techniques
We use a number of innovative methods to mine the McArthur River deposit:
Ground freezing
The sandstone that overlays the deposit and basement rocks is water-bearing, with large volumes of water under significant pressure. We use ground freezing to form an impermeable wall around the area being mined. This prevents water from entering the mine, and helps stabilize weak rock formations. To date, we have installed five freezewalls and are currently preparing a sixth.
66CAMECO CORPORATION
Raisebore mining
Raisebore mining is an innovative non-entry approach that we adapted to meet the unique challenges at McArthur River. It involves:
| • | drilling a series of overlapping holes through the ore zone from a raisebore chamber in waste rock above the mineralization |
| • | collecting the broken ore at the bottom of the raises using line-of-sight remote-controlled scoop trams, and transporting it to a grinding circuit |
| • | once mining is complete, filling each raisebore hole with concrete |
| • | when all the rows of raises in a chamber are complete, removing the equipment and filling the entire chamber with concrete |
| • | starting the process again with the next raisebore chamber |
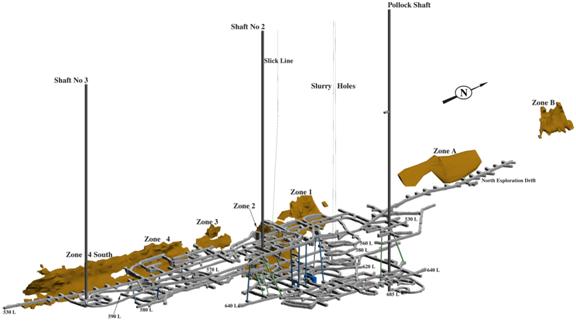
We have used the raisebore mining method to successfully extract about 230 million pounds (100% basis) since we began mining in 1999.
McArthur River currently has six areas with delineated mineral reserves (zones 1 to 4, zone 4 south and zone B) and eight areas with delineated mineral resources. We are currently mining zone 2 and the lower area of zone 4.
Zone 2 has been actively mined since production began. It is divided into four panels (panels 1, 2, 3 and 5) based on the configuration of the freeze wall around the ore. As the freeze wall is expanded, the inner connecting freeze walls are decommissioned in order to recover the uranium that was inaccessible around the active freeze pipes. Panel 5 represents the upper portion of zone 2, overlying part of the other panels. Mining is nearing completion in panels 1, 2 and 3, and the majority of the remaining zone 2 proven mineral reserves are in panel 5.
Zone 4 is divided into three mining areas: central, north and south. We are actively mining the central area. A new mining area is also under development – zone 4 north – and is forecasted to be in production in 2014.
2012 ANNUAL REPORT67
Raisebore mining is scheduled to remain the primary extraction method over the life of mine. We are testing two other mining methods, blasthole stoping and boxhole boring. Upon successful completion of the test programs in 2013, an application will be made to the CNSC to approve these mining methods as secondary extraction methods for McArthur River.
Boxhole boring
Boxhole boring is similar to the raisebore method, but the drilling machine is located below the mineralization, so development is not required above the mineralization. This method is currently being used at a few mines around the world, but had not been used for uranium mining prior to testing at McArthur River.
We expect boxhole boring will only be used as a secondary method, in areas where we determine raiseboring is not feasible or practical. Test mining to date has identified this as a viable mining option; however, only a minor amount of ore is scheduled to be extracted using this method.
Blasthole stoping
Blasthole stoping involves establishing drill access above the mineralization and extraction access below the mineralization. The area between the upper and lower access levels (the stope) is then drilled off and blasted. The broken rock is collected on the lower level and removed by line-of-sight remote-controlled scoop trams, then transported to a grinding circuit. Once a stope is mined out, it is backfilled with concrete to maintain ground stability and allow the next stope in sequence to be mined. This mining method has been used extensively in the mining industry, including uranium mining.
Blasthole stoping is planned in areas where blast holes can be accurately drilled and small stable stopes excavated without jeopardizing the freezewall integrity. We expect this method to complement the raiseboring method and to allow for more economic recovery of ore on the periphery of the orebody, as well as smaller, lower grade areas.
2012 UPDATE
Production
Our share of production in 2012 was 1% higher than our forecast for the year and 2% lower than total production in 2011.
At McArthur River and Key Lake we realized benefits under the production flexibility amendments to the McArthur River and Key Lake operating licences (seeProduction flexibility) for the fourth consecutive year. Ongoing efforts to improve the efficiency and reliability of the Key Lake mill resulted in record mill performance.
We have mitigated the risk to production in 2013 associated with the transition to the upper mining area of zone 4. We have made productivity improvements on cycle times, which include the use of blasthole stoping in smaller, lower-grade areas of the mine located away from the freezewalls. In addition, we have changed the sequencing of the raises in zone 2, panel 5, which will improve productivity.
New mining areas
We continued drilling to install the freezewall in the upper mining area of zone 4 north. We expect to finish installing brine circulation lines and start freezing upper zone 4 north in 2013, and begin production from this area in 2014.
In addition to the underground work, we have started to upgrade our electrical infrastructure on surface to address the future need for increased ventilation and freeze capacity associated with mining new zones and increasing mine production.
68CAMECO CORPORATION
McArthur River production expansion
In 2012, we completed the feasibility study on the McArthur River extension project, and based on the positive results, revised our mine plan to incorporate a mine expansion. This includes an increase in our annual production rate to 22 million pounds U3O8 (100% basis) by 2018, subject to receipt of regulatory approval.
We were notified by the CNSC that the environmental assessment for the planned increase in production would be transitioned to the CNSC licensing and compliance processes rather than the federal environmental assessment process. We are developing plans to complete this regulatory process.
In addition, we must continue to successfully transition into new mine areas through mine development and investment in support infrastructure. As part of this multi-year project, we plan to:
| • | | expand the freeze plant and electrical distribution systems |
| • | | increase ventilation by sinking a fourth shaft at the northern end of the mine |
| • | | improve our dewatering system and expand our water treatment capacity. |
McArthur River technical report
In 2012, we updated the McArthur River technical report. Highlights included:
| • | | a 19% increase in our share of the mineral reserves due to a 22% addition in tonnage and a slight decrease in the estimated average grade. For more information, seeMineral reserves and resources on page 98. |
| • | | a decrease in the estimated average cash operating cost to about $19.23 per pound over the life of the mine from about $19.69 per pound estimated in 2009, despite the escalating costs in the industry |
| • | | a production rate increase to 22 million pounds per year scheduled for 2018, subject to regulatory approval |
| • | | a mine life of at least 22 years, based on the planned production schedule |
Key Lake extension project and mill revitalization
The Key Lake mill began operating in 1983. Mill production at Key Lake is expected to closely follow McArthur River production, subject to receipt of regulatory approval. As part of our Key Lake extension environmental assessment, we are seeking approval to increase Key Lake’s nominal annual production rate to 25 million pounds U3O8and to increase our tailings capacity.
The mill revitalization plan includes upgrading circuits with new technology to simplify operations and improve environmental performance. As part of this plan, we replaced the acid, steam and oxygen plants.
Tailings capacity
This year we:
| • | | advanced the environmental assessment for the Key Lake extension project by submitting the draft environmental impact statement to the regulators, receiving their comments and providing responses |
| • | | began flattening the slope of the Deilmann tailings management facility pitwalls, relocating about 80% of the sand |
Exploration
In 2012, our surface exploration programs drill tested targets north and south of the current mining areas.
PLANNING FOR THE FUTURE
Production
Forecast: 18.7 million pounds of U3O8 per year until 2017 (our share will be 13.1 million pounds), with a planned production increase in 2018.
New mining zones
Zone 4 north is the next area to be mined. It is currently under development and we forecast production to begin in 2014. We expect to start freezing the lower mining area of zone 4 north in 2013.
2012 ANNUAL REPORT69
We expect to use raisebore mining in this area, applying the ground freezing experience we gained in zone 2, panel 5. This should significantly improve production efficiencies compared to boxhole boring.
In 2013, we also expect to complete the expansion of the existing freeze plant to support our production plans at McArthur River.
Mill revitalization
In 2013, we expect to:
| • | | complete installation and commissioning of a new electrical substation |
| • | | complete the structural steel work and equipment installation for a new calciner, to be commissioned in 2014 |
Tailings capacity
In 2013, we expect to:
| • | | complete flattening of the Deilmann tailings management facility pitwalls and begin constructing a buttress to prevent sand sloughing when the water level is raised |
| • | | advance the environmental assessment for the Key Lake extension project, by submitting the final environmental impact statement for review by the provincial and federal regulators and pursue the required regulatory approvals |
SeeKey Lake tailings capacity riskon page 71 for additional information.
Licensing
We will be applying for a renewal of our McArthur River and Key Lake operating licences in 2013. The Canadian Nuclear Safety Commission has scheduled a one-day hearing in the third quarter as part of the application process.
Exploration
In 2013, we plan to continue advancing the underground exploration drifts to the southwest and northeast directions. Additional drilling is planned underground to delineate zone A, and from surface to identify additional mineral resources in the deposit.
MANAGING OUR RISKS
Production at McArthur River/Key Lake poses many challenges: control of groundwater, weak rock formations, radiation protection, water inflow, mine area transitioning, regulatory approvals and tailings capacity. Operational experience gained since the start of production has resulted in a significant reduction in risk.
Water inflow risk
The greatest risk is production interruption from water inflows. A 2003 water inflow resulted in a three-month suspension of production. We also had a small water inflow in 2008 that did not impact production.
The consequences of another water inflow at McArthur River would depend on its magnitude, location and timing, but could include a significant interruption or reduction in production, a material increase in costs or a loss of mineral reserves.
70CAMECO CORPORATION
We take the following steps to reduce the risk of inflows, but there is no guarantee that these will be successful:
| • | | Ground freezing: Before mining, we drill freezeholes and freeze the ground to form an impermeable freezewall around the area being mined. Ground freezing reduces but does not eliminate the risk of water inflows. |
| • | | Mine development: We plan for our mine development to take place away from known groundwater sources whenever possible. In addition, we assess all planned mine development for relative risk, and apply extensive additional technical and operating controls for all higher risk development. |
| • | | Pumping capacity and treatment limits: Our standard for this project is to secure pumping capacity of at least one and a half times the estimated maximum sustained inflow. We review our dewatering system and requirements at least once a year and before beginning work on any new zone. |
We believe we have sufficient pumping, water treatment and surface storage capacity to handle the estimated maximum sustained inflow.
Transition to new mining areas
In order to successfully achieve the planned production schedule, we must continue to successfully transition into new mining areas, which includes mine development and investment in critical support infrastructure.
The zone 4 north transition planned in late 2014 carries a slightly higher transition risk than other mining area transitions due to the site’s limited flexibility to offset a shortfall in production due to schedule delays.
Labour relations
The current collective agreement with unionized employees at the McArthur River and Key Lake operations expires on December 31, 2013. There is risk to production in 2014 if we are unable to reach an agreement and employees go on strike.
Key Lake tailings capacity risk
Tailings from processing McArthur River ore are deposited in the Deilmann tailings management facility. At current production rates, the facility will reach licensed capacity by 2018. A significant delay in obtaining or a failure to receive, the necessary regulatory approval for the expansion of the facility could interrupt or prevent the operation of McArthur River and Key Lake as planned.
In the past, sloughing of material from the pitwalls has resulted in loss of capacity. Technical studies show that stabilizing and reducing water levels in the pit enhances the stability of the pitwalls and reduces the risk of sloughing. In 2009, regulators approved our plan for the long-term stabilization of the Deilmann tailings management facility pitwalls. We are implementing the plan, and expect it will be complete in 2014. We are proceeding with the environmental assessment to support an application for regulatory approval to deposit tailings to a much higher level. This would provide enough tailings capacity to mill all the known McArthur River mineral reserves and resources, should they be converted to reserves, with additional capacity to toll mill ore from other regional deposits.
We also manage the risks listed on pages 62 to 63.
2012 ANNUAL REPORT71
Uranium – operating properties
| | |
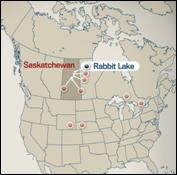
| | Rabbit Lake The Rabbit Lake operation, which opened in 1975, is the longest operating uranium production facility in North America, and the second largest uranium mill in the world. |
| |
Location | | Saskatchewan, Canada |
| |
| Ownership | | 100% |
| |
| End product | | Uranium concentrates |
| |
| ISO certification | | ISO 14001 certified |
| |
| Mine type | | Underground |
| |
| Estimated reserves | | 22.8 million pounds (proven and probable), average grade U3O8: 0.70% |
| |
| Estimated resources | | 6.4 million pounds (indicated), average grade U3O8: 0.60% 10.3 million pounds (inferred), average grade U3O8: 1.24% |
| |
| Mining methods | | Vertical blasthole stoping |
| |
| Licenced capacity | | Mill: maximum 16.9 million pounds per year; currently 11 million |
| |
| Total production: 1975 to 2012 | | 190.1 million pounds1 |
| |
| 2012 production | | 3.8 million pounds |
| |
| 2013 forecast production | | 4.2 million pounds |
| |
| Estimated decommissioning cost | | $105 million (2008 estimate – currently under review) |
| 1 | Updated on February 21, 2013 from 186.3 million pounds. |
2012 UPDATE
Production
Production this year was about 3% higher than our forecast for the year and similar to 2011 production.
Development and production continued at Eagle Point mine. At the mill we were able to achieve improved performance by replacing key pieces of mill infrastructure and improving the efficiency of the mill operation schedule.
In 2011, we received regulatory approval to begin exploration–related development and drilling on a new ore zone located about 650 metres northeast of the existing mine workings. In 2012, we completed a portion of the development work and in 2013, plan to complete the development and continue drilling to further evaluate this zone.
Exploration
We continued our underground drilling reserve replacement program.
Exploration work was completed directly to the east and northeast of the current mine workings and returned promising results.
72CAMECO CORPORATION
PLANNING FOR THE FUTURE
Production
We expect to produce 4.2 million pounds in 2013.
Tailings capacity
We continued to enhance our milling processes and as a result of improved settling of solid material in the tailings management facility, we expect to have sufficient tailings capacity to support milling of Eagle Point ore until about the end of 2017 (based upon expected ore grades and milling rates).
We are planning to expand the existing tailings management facility by the end of 2017 to support the extension of Rabbit Lake’s mine life and provide additional tailings capacity to process ore from other potential sources. We need an environmental assessment and regulatory approval to proceed with any increase in capacity.
Exploration
We will continue our underground drilling reserve replacement program in 2013. We plan to continue surface drilling in areas of interest east and northeast of the mine.
Reclamation
As part of our multi-year site-wide reclamation plan, we spent over $7.5 million in 2012 to reclaim facilities that are no longer in use and plan to spend over $2.7 million in 2013.
MANAGING OUR RISKS
We manage the risks listed on pages 62 and 63.
2012 ANNUAL REPORT73
Uranium – operating properties
| | |
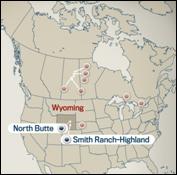
| | Smith Ranch-Highland We operate Smith Ranch and Highland as a combined operation. Each has its own processing facility, but the Smith Ranch central plant currently processes all the uranium and the Highland plant is currently idle. Together, they form the largest uranium production facility in the United States. In 2013 we expect to start production from the North Butte satellite operation with final uranium processing also at the Smith Ranch-Highland processing facilities. |
| |
Location | | Wyoming, US |
| |
| Ownership | | 100% |
| |
| End product | | Uranium concentrates |
| |
| ISO certification | | ISO 14001 certified |
| |
| Estimated reserves | | Smith Ranch-Highland: 6.3 million pounds (proven and probable), average grade U3O8: 0.09% North Butte-Brown Ranch: 3.3 million pounds (proven and probable), average grade U3O8: 0.08% |
| |
| Estimated resources | | Smith Ranch-Highland: 23.0 million pounds (measured and indicated), average grade U3O8: 0.06% 6.6 million pounds (inferred), average grade U3O8: 0.05% North Butte-Brown Ranch 12.3 million pounds (measured and indicated), average grade U3O8: 0.08% 0.8 million pounds (inferred), average grade U3O8: 0.06% |
| |
| Mining methods | | In situ recovery (ISR) |
| |
| Licenced capacity | | Wellfields: 3 million pounds per year including North Butte Processing plants: 5 million pounds per year including Highland mill |
| |
| Total production: 2002 to 2012 | | 15.9 million pounds |
| |
| 2012 production | | 1.1 million pounds |
| |
| 2013 forecast production | | 1.8 million pounds |
| |
| Estimated decommissioning cost | | $182 million (US) (including North Butte satellite operation) |
2012 UPDATE
Production
Production this year was slightly lower than our third quarter guidance and lower than 2011 production. The lengthened review process to obtain regulatory approvals for new mine units (wellfields) at Smith Ranch-Highland continued to impact production this year. One significant new mine unit was in full production by August, following the receipt of all necessary approvals. Approval for a portion of another important mine unit was received at the end of the year, enabling us to bring it into production in early 2013. We continue to seek regulatory approvals to proceed with the rest of our expansion plans.
We have made good progress on construction of the satellite plant and development of the first wellfield at North Butte in Wyoming in line with our growth plans.
Licensing
The regulators continue to review our licence renewal application. We are allowed to continue with all previously approved activities during the licence renewal process.
74CAMECO CORPORATION
PLANNING FOR THE FUTURE
Production
In 2013, we expect to produce 1.9 million pounds, including 0.3 million pounds from our North Butte satellite operation.
We continue to seek regulatory approvals to proceed with expansions at our various satellite operations in Wyoming. The regulators are constrained by a shortage of resources as they try to work through a large volume of permit and licence amendment requests from resource companies. However, we are beginning to receive some approvals. We continue to communicate with them to ensure we understand and meet their information needs in a timely manner.
New Mining Areas
We will continue construction of the satellite plant and the first wellfields at North Butte. Once commissioned, we expect to produce approximately 300,000 pounds in 2013 and ramp up to a target annual production rate of more than 700,000 pounds per year by 2015.
Exploration
We are continuing our exploration activity with the objective of extending the mine life at Smith Ranch-Highland and satellite properties.
MANAGING OUR RISKS
The operating environment is becoming more complex as public interest and regulatory oversight increase. This may affect our plans to increase production. We also manage the risks listed on pages 62 and 63.
2012 ANNUAL REPORT75
Uranium – operating properties
| | |
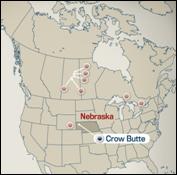
| | Crow Butte Crow Butte was discovered in 1980 and began production in 1991. It is the first uranium mine in Nebraska, and is a significant contributor to the economy of northwest Nebraska. |
| |
| Location | | Nebraska, US |
| |
| Ownership | | 100% |
| |
| End product | | Uranium concentrates |
| |
| ISO certification | | ISO 14001 certified |
| |
| Estimated reserves | | 3.0 million pounds (proven), average grade U3O8: 0.12% |
| |
| Estimated resources | | 12.2 million pounds (indicated), average grade U3O8: 0.21% 5.4 million pounds (inferred), average grade U3O8: 0.12% |
| |
| Mining methods | | In situ recovery (ISR) |
| |
Licenced capacity (processing plants and wellfields) | | 1 million pounds per year |
| |
| Total production: 2002 to 2012 | | 8.3 million pounds |
| |
| 2012 production | | 0.8 million pounds |
| |
| 2013 forecast production | | 0.7 million pounds |
| |
| Estimated decommissioning cost | | $40 million (US) |
2012 UPDATE
Production
Production this year was slightly higher than our forecast and similar to 2011 production.
Licensing
The regulators continued to review our applications to expand and re-license Crow Butte. We are allowed to continue with all previously approved activities during the licence renewal process.
PLANNING FOR THE FUTURE
Production
In 2013, we expect to produce 0.7 million pounds.
We continue to seek regulatory approvals to proceed with expansions at our various satellite operations in Nebraska. The regulators are constrained by a shortage of resources as they try to work through a large volume of permit and licence amendment requests from resource companies; however, we are beginning to receive some approvals. We continue to communicate with them to ensure we understand and meet their information needs in a timely manner.
Managing our risks
The operating environment is becoming more complex as public interest and regulatory oversight increase. This may affect our plans to increase production. We also manage the risks listed on pages 62 and 63.
76CAMECO CORPORATION
Uranium – operating properties
| | |
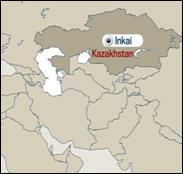
| | Inkai Inkai is a very significant uranium deposit, located in Kazakhstan. There are two production areas (blocks 1 and 2) and an exploration area (block 3). The operator is joint venture Inkai limited liability partnership, which we jointly own (60%) with Kazatomprom (40%). Inkai is one of our three material uranium properties. |
| |
| Location | | South Kazakhstan |
| |
| Ownership | | 60% |
| |
| End product | | Uranium concentrates |
| |
| Certifications | | BSI OHSAS 18001 ISO 14001 certified |
| |
| Estimated reserves (our share) | | 53.9 million pounds (proven and probable), average grade U3O8: 0.07% |
| |
| Estimated resources (our share) | | 28.0 million pounds (indicated), average grade U3O8: 0.08% 146.6 million pounds (inferred), average grade U3O8: 0.05% |
| |
| Mining methods | | In situ recovery (ISR) |
| |
| Licenced capacity (wellfields) | | approved: 3.9 million pounds per year, (our share 2.3 million pounds per year) application: 5.2 million pounds per year, (our share 3.0 million pounds per year – seeLicensing) |
| |
| Total production: 2008 to 2012 (our share) | | 9.0 million pounds |
| |
| 2012 production (our share) | | 2.6 million pounds |
| |
| 2013 forecast production(100% basis) | | 5.2 million pounds (our share of production 3.0 million pounds – seeLicensing) |
| |
Estimated decommissioning cost (100% basis ) | | $14 million (US) |
2012 UPDATE
Production
Production this year was 4% higher than our forecast for the year and 4% higher than production in 2011.
We continued to bring on additional wellfields to maintain some new, typically higher grade, wellfields in the production mix. The processing plant has the capacity to produce at an annual rate of 5.2 million pounds (100% basis) depending on the grade of the production solution. Production at Inkai steadily improved over the course of the year and the facility is now operating at design capacity. However, regulatory approval is required to carry out production at the annual rate of 5.2 million pounds (100% basis).
Licensing
An amendment to Inkai’s resource use contract was signed early in 2011, and Inkai received government approval to:
| • | | increase annual production from blocks 1 and 2 to 3.9 million pounds (100% basis) |
| • | | carry out a five-year assessment program at block 3 that includes delineation drilling, uranium resource estimation, construction and operation of a test leach facility, and completion of a feasibility study |
2012 ANNUAL REPORT77
In 2011, we also signed an MOA (2011 MOA) with our partner, Kazatomprom, to increase production from blocks 1 and 2 to 5.2 million pounds (100% basis). Under the 2011 MOA, our share of Inkai’s annual production will be 2.9 million pounds with the processing plant at full capacity. We will also be entitled to receive profits on 3.0 million pounds.
To implement the increase, we continue to await government approval of an amendment to the resource use contract.
Project funding
We have a loan agreement with Inkai whereby we funded Inkai’s project development costs. As of December 31, 2012, there was $133 million (US) of principal outstanding on the loan. In 2012, Inkai paid $4.3 million (US) in interest on the loan and repaid $59 million (US) of principal.
Under the loan agreement, Inkai first uses cash available every year to pay accrued interest. Inkai then uses 80% of the remaining cash available for distribution to repay principal outstanding on the loan. The remaining 20% is distributed as dividends to the owners.
We have also agreed to advance funds for Inkai’s work on block 3 until the feasibility study is complete. As of December 31, 2012 the block 3 loan principal amounted to $85 million (US).
Uranium conversion project and doubling production
In 2012, we entered into a binding memorandum of agreement (2012 MOA) with our joint venture partner, Kazatomprom, setting out a framework to:
| • | | increase Inkai’s annual production from blocks 1 and 2 to 10.4 million pounds (our share 5.2 million pounds) and sustain it at that level |
| • | | extend the term of Inkai’s resource use contract through 2045 |
Kazatomprom is pursuing a strategic objective to develop uranium processing capacity in Kazakhstan to complement its leading uranium mining operations. The 2012 MOA builds on the non-binding memorandum of understanding signed in 2007, which sought to align the annual production increase with the development of uranium conversion capacity. Kazatomprom’s primary focus is now on uranium refining rather than uranium conversion.
The 2012 MOA strengthens our partnership with Kazatomprom and includes a number of connected provisions relating to the increase of Inkai’s annual production and extension to the term of Inkai’s resource use contract. Under the terms of the 2012 MOA, we agree to:
| • | | adjust our ownership interests in Inkai to 50% on an overall basis after achieving the production increase |
| • | | make two milestone payments of $34 million (US) each – the first after Inkai receives all necessary government approvals to increase uranium production to 10.4 million pounds (100%) annually through 2045, and the second after the increased production target is achieved |
| • | | pay to Kazatomprom a royalty of $5 (US) per pound of uranium concentrate on our share of production above 2.6 million pounds annually from Inkai once Inkai obtains all approvals required for the production increase to 10.4 million pounds (100% basis) |
| • | | participate in the construction and operation of a uranium refinery in Kazakhstan with capacity to produce 6,000 tonnes of uranium (tU) as UO3 annually, where we will own one third of the refinery and the remaining two thirds will be owned by Kazatomprom, with construction to begin by 2018 |
| • | | provide Kazatomprom with a five-year option to license our proprietary uranium conversion technology for purposes of constructing and operating a UF6 conversion facility in Kazakhstan |
| • | | negotiate with Kazatomprom toward a conversion services agreement for up to 4,000 tU of conversion services annually and/or, for a three-year period, provide an opportunity for Kazatomprom to acquire a one-third interest in our conversion facility in Canada |
78CAMECO CORPORATION
Under the 2012 MOA, the first steps will be to complete a feasibility study for the production increase, and a prefeasibility study for the uranium refinery. We agree to work with Kazatomprom to pace investments for increasing uranium production to match progress on the transfer of our uranium refining technology and construction of the uranium refinery in Kazakhstan, subject to market conditions.
Implementation of the 2012 MOA is subject to:
| • | | further agreements on a number of issues including agreements governing the ownership, construction and operation of the uranium refinery in Kazakhstan |
| • | | the receipt of all necessary Canadian and Kazakhstan governmental approvals including all licences and permits required to allow the transfer and licensing of our uranium refining technology |
Block 3 exploration
In April 2012, Inkai received regulatory approval for the detailed block 3 delineation and test leach work programs. Inkai continued delineation drilling, started technological drilling of test wellfields, continued with infrastructure development and started construction of a test leach facility for the block 3 assessment program.
Based on earlier agreements, profits from future block 3 production are to be shared on a 50:50 basis with our partner, instead of based on our ownership interests.
PLANNING FOR THE FUTURE
Production
We expect our share of production to be 3.0 million pounds in 2013 from blocks 1 and 2.
Block 3 exploration
In 2013, Inkai expects to:
| • | | complete delineation drilling |
| • | | complete construction of the test leach facility and test wellfields |
| • | | extend power line to block 3 facilities |
| • | | start operation of the test wellfields |
MANAGING OUR RISKS
Regulatory approvals
Our 2013 and future annual production targets for Inkai assume, and we expect, that Inkai will obtain the necessary government permits and approvals to produce at an annual rate of 5.2 million pounds (100% basis), including an amendment to the resource use contract.
There is no certainty Inkai will receive these permits or approvals. If Inkai does not, or if the permits and approvals are delayed, Inkai may be unable to achieve its 2013 and future annual production targets and we may have to re-categorize some of Inkai’s mineral reserves as resources.
Supply of sulphuric acid
There were no interruptions to sulphuric acid supply during 2012. Given the importance of sulphuric acid to Inkai’s mining operations and shortages in previous years, we continue to closely monitor its availability. Our production may be less than forecast if there is a shortage.
Political risk
Kazakhstan declared itself independent in 1991 after the dissolution of the Soviet Union. Our Inkai investment, and our plans to increase production, are subject to the risks associated with doing business in developing countries, which have significant potential for social, economic, political, legal, and fiscal instability. Kazakh laws and regulations are complex and still developing and their application can be difficult to predict. To maintain and increase Inkai production, we need ongoing support, agreement and co-operation from our partner and the government.
2012 ANNUAL REPORT79
The principal legislation governing subsoil exploration and mining activity in Kazakhstan is the Subsoil Use Law dated June 24, 2010. It replaces the Law on the Subsoil and Subsoil Use, dated January 27, 1996.
In general, Inkai’s licences are governed by the version of the subsoil law that was in effect when the licences were issued in April 1999, and new legislation applies to Inkai only if it does not worsen Inkai’s position. Changes to legislation related to national security, among other criteria, however, are exempt from the stabilization clause in the resource use contract. The Kazakh government interprets the national security exemption broadly.
With the new subsoil law, the government continues to weaken its stabilization guarantee. The government is broadly applying the national security exception to encompass security over strategic national resources.
The resource use contract contains significantly broader stabilization provisions than the new subsoil law, and these contract provisions currently apply to us.
To date, the new subsoil law has not had a significant impact on Inkai. We continue to assess the impact. See our annual information form for an overview of this change in law.
We also manage the risks listed on pages 62 and 63.
80CAMECO CORPORATION
Uranium – development project
| | |
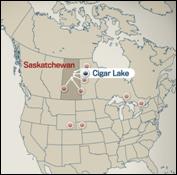
| | Cigar Lake Cigar Lake is the world’s second largest high-grade uranium deposit, with grades that are 100 times the world average. We are a 50% owner and the mine operator. Cigar Lake, which is being developed and scheduled to begin production this year, is one of our three material uranium properties. |
| |
| Location | | Saskatchewan, Canada |
| |
| Ownership | | 50.025% |
| |
| End product | | Uranium concentrates |
| |
| Mine type | | Underground |
| |
| Estimated reserves (our share) | | 108.4 million pounds (proven and probable), average grade U3O8: 18.30% |
| |
| Estimated resources (our share) | | 1.1 million pounds (measured and indicated), average grade U3O8: 2.27% 49.5 million pounds (inferred), average grade U3O8: 12.01% |
| |
| Mining methods | | Jet boring |
| |
| Target production date | | Begin commissioning in ore mid-2013 First packaged pounds in the fourth quarter of 2013 |
| |
| Target annual production(our share) | | 9 million pounds at full production |
| |
| 2013 forecast production (our share) | | 0.3 million pounds |
| |
Estimated decommissioning cost (100% basis ) | | $49 million (pending regulatory review) |
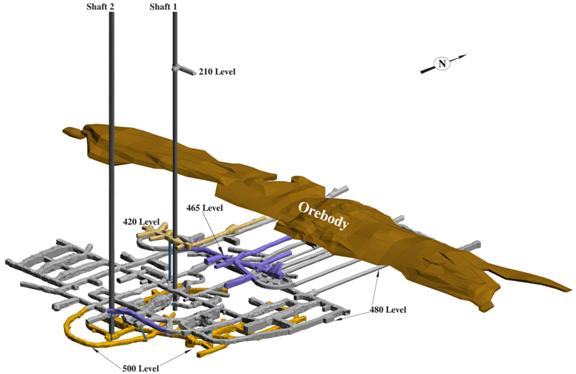
2012 ANNUAL REPORT81
BACKGROUND
Development
We began developing the Cigar Lake underground mine in 2005, but development was delayed due to water inflows (two in 2006 and one in 2008). The first inflow flooded shaft 2 while it was under construction. The second inflow flooded the underground development and we began remediation late in 2006. In 2008, another inflow interrupted the dewatering of the underground development. We sealed the inflows and completed dewatering of shafts 1 and 2. In 2011, we completed remediation of the underground.
Mining method
We will use a number of innovative methods and techniques to mine the Cigar Lake deposit:
Bulk freezing
The sandstone that overlays the deposit and basement rocks is water-bearing, with large volumes of water under significant pressure. We will freeze the ore zone and surrounding ground in the area to be mined to prevent water from entering the mine and to help stabilize weak rock formations.
Our plan is to use a hybrid freezing approach. We will use surface freezing to support the rampup period and underground freezing for the longer term development of the mine. Through 2012, we continued to drill freezeholes from surface, expand the surface freezing infrastructure and put the new freezeholes in operation. To meet our production schedule, the ground has to be fully frozen in the area being mined before we begin jet boring.
Jet boring
After many years of test mining, we selected jet boring, a non-entry mining method, which we have developed and adapted specifically for this deposit. Overall, our initial test program was a success and met all initial objectives. This method involves:
| • | | drilling a pilot hole into the frozen orebody, inserting a high pressure water jet and cutting a cavity out of the frozen ore |
| • | | collecting the ore and water mixture (slurry) from the cavity and pumping it to storage (sump storage) allowing it to settle |
| • | | using a clamshell, transporting the ore from the sump storage to a grinding and processing circuit, eventually loading a tanker truck with ore slurry for transport to the mill |
| • | | once mining is complete, filling each cavity in the orebody with concrete |
| • | | starting the process again with the next cavity |
Jet boring system process
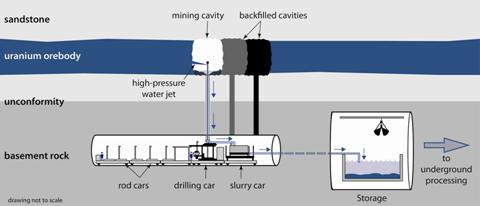
82CAMECO CORPORATION
We have divided the orebody into production panels, and will have one jet boring mining unit operating in a panel. At least four production panels need to be frozen at one time to achieve the full production rate of 18 million pounds per year. At full production, two jet boring machines will be working at a time, while the other two are being moved, set up, in the backfill cycle or on maintenance.
Milling
We have signed agreements with the owners of the Cigar Lake project and McClean Lake mill to process all Cigar Lake’s ore slurry at the McClean Lake mill. To process Cigar Lake ore slurry, a number of mill modifications have been completed. The McClean Lake joint venture is required to further modify and expand the mill to process and package all of Cigar Lake’s current mineral reserves. The Cigar Lake joint venture has agreed to pay for the capital costs for such modification and expansion.
2012 UPDATE
During the year, we:
| • | | completed the sinking of shaft 2 to its final depth of 500 metres |
| • | | began installing shaft 2 infrastructure, including construction of a concrete ventilation partition, installation of electrical cable, water services, ore slurry pipes and hoist systems |
| • | | began commissioning of the surface ore loadout facility |
| • | | remediated a portion of an existing mine development tunnel and continue to explore ways to optimize our methods of ground support |
| • | | resumed underground development in the north end of the mine |
| • | | completed mine development on the 500 metre level |
| • | | replaced temporary contingency pumps with permanent infrastructure |
| • | | completed the Seru Bay pipeline |
| • | | completed all engineering designs and drawings for the project |
| • | | constructed the primary clarifier infrastructure |
We also assembled the first jet boring system unit underground and moved it to a production tunnel where we:
| • | | began preliminary commissioning and system testing |
| • | | established temporary infrastructure to support testing in waste rock |
Costs
As of December 31, 2012, we had:
| • | | invested about $911 million for our share of the construction costs to develop Cigar Lake |
| • | | expensed about $86 million in remediation expenses |
| • | | expensed about $63 million in standby costs |
Our total share of the capital cost for this project is about $1.1 billion since we began development in 2005. In order to bring Cigar Lake into production in 2013, we estimate our share of capital expenditures will be about $182 million, including $27 million on modifications to the McClean Lake mill. Our share of standby charges until production is achieved this year are estimated to be about $52 million.
Licensing
The Canadian Nuclear Safety Commission (CNSC) approved AREVA’s amendment to the operating licence for the McClean Lake mill to process Cigar Lake ore.
2012 ANNUAL REPORT83
PLANNING FOR THE FUTURE
Production
In 2013, we expect to:
| • | | test the jet boring unit in waste and begin commissioning of the system |
| • | | complete the installation of all infrastructure required to begin production |
| • | | bring the mine into production in mid-2013 |
| • | | produce the first packaged pounds from AREVA’s McClean Lake mill in the fourth quarter |
We expect our share of production to be 0.3 million pounds in 2013.
Given the scale of this project and the challenging nature of the geology and mining method, we have made significant progress. We will continue to develop this asset in a safe and deliberate manner to ensure we realize the economic benefits of this project.
Licensing
We have submitted an operating licence application to the CNSC. The CNSC will be holding a public hearing in the second quarter of 2013 as part of the process to obtain our operating licence. Our construction licence is currently set to expire on December 31, 2013. We anticipate that Cigar Lake will be in a position to start mining in ore following the safe commissioning of the ore processing circuits in mid-2013.
Caution regarding forward-looking information
Our expectations and plans regarding Cigar Lake, including our expected share of 2013 production and capital costs, are forward-looking information. They are based on the assumptions and subject to the material risks discussed on pages 3 and 4, and specifically on these assumptions and risks:
Assumptions
| • | | there is no material delay or disruption in our plans as a result of ground movements, cave ins, additional water inflows, a failure of seals or plugs used for previous water inflows, natural phenomena, delay in acquiring critical equipment, equipment failure or other causes |
| • | | there are no labour disputes or shortages |
| • | | our expectation that the jet boring mining method will be successful and that we will be able to obtain the additional jet boring system units we require on schedule |
| • | | we obtain contractors, equipment, operating parts, supplies, regulatory permits and approvals when we need them |
| • | | processing plants are available and function as designed and sufficient tailings facility capacity is available |
| • | | our mineral reserves estimate and the assumptions it is based on are reliable |
| • | | our Cigar Lake development, mining and production plans succeed |
Material risks
| • | | an unexpected geological, hydrological or underground condition or an additional water inflow, further delays our progress |
| • | | ground movements or cave ins |
| • | | we cannot obtain or maintain the necessary regulatory permits or approvals |
| • | | natural phenomena, labour disputes, equipment failure, delay in obtaining the required contractors, equipment, operating parts and supplies or other reasons cause a material delay or disruption in our plans |
| • | | processing plants are not available or do not function as designed and sufficient tailings facility capacity is not available |
| • | | our mineral reserves estimate is not reliable |
| • | | our development, mining or production plans for Cigar Lake are delayed or do not succeed for any reason, including technical difficulties with the jet boring mining method or our inability to acquire any of the required jet boring equipment |
84CAMECO CORPORATION
MANAGING OUR RISKS
Cigar Lake is a challenging deposit to develop and mine. These challenges include control of groundwater, weak rock formations, radiation protection, water inflow, mining method uncertainty, regulatory approvals, tailings capacity, surface and underground fires and other mining-related challenges. To reduce this risk, we are applying our operational experience and the lessons we have learned about water inflows at McArthur River and Cigar Lake.
Water inflow risk
A significant risk to development and production is from water inflows. The 2006 and 2008 water inflows were significant setbacks.
The consequences of another water inflow at Cigar Lake would depend on its magnitude, location and timing, but could include a significant delay in Cigar Lake’s development or production, a material increase in costs or a loss of mineral reserves.
We take the following steps to reduce the risk of inflows, but there is no guarantee that these will be successful:
| • | | Bulk freezing: Two of the primary challenges in mining the deposit are control of groundwater and ground support. Bulk freezing reduces but does not eliminate the risk of water inflows. |
| • | | Mine development: We plan for our mine development to take place away from known groundwater sources whenever possible. In addition, we assess all planned mine development for relative risk, and apply extensive additional technical and operating controls for all higher risk development. |
| • | | Pumping capacity and treatment limits: We have pumping capacity to meet our standard for this project of at least one and a half times the estimated maximum inflow. |
We believe we have sufficient pumping, water treatment and surface storage capacity to handle the estimated maximum inflow.
Jet boring mining method and units
We have successfully demonstrated the jet boring mining method in trials. This method, however, has not been proven at full production. We have developed and adapted this method specifically for this deposit. As we ramp up production, there may be some technical challenges, which could affect our production plans. There is a risk the rampup to full production may take longer than planned and that the full production rate may not be achieved on a sustained and consistent basis. A comprehensive testing, pre-commissioning, commissioning and startup plan has been implemented to assure successful startup and on-going operations. We are confident we will be able to solve challenges that may arise, but failure to do so would have a significant impact on our business.
Our mining plan requires four jet boring system units. We currently have one unit and in 2011 agreed to purchase an additional three units. There is a risk that rampup to full production at Cigar Lake may take longer than planned if the manufacture or delivery of these three units does not take place as scheduled. As part of our startup plan noted above, we are working with our supplier to assure timely delivery of these units. The second unit is scheduled to arrive in Canada in early 2013 and work has begun on the third unit at the supplier’s facilities.
We also manage the risks listed on pages 62 and 63.
2012 ANNUAL REPORT85
Uranium – projects under evaluation
| | |
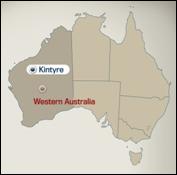
| | Kintyre Kintyre is a uranium deposit that is amenable to open pit mining techniques. We own 70% and are the operator. |
| |
| Location | | Western Australia |
| |
| Ownership | | 70% |
| |
| End product | | Uranium concentrates |
| |
| Mine type | | Open pit |
| |
| Estimated resources(our share) | | 38.7 million pounds (indicated), average grade U3O8: 0.58% 6.7 million pounds (inferred), average grade U3O8: 0.46% |
BACKGROUND
In August 2008, we paid $346 million (US) to acquire a 70% interest in Kintyre.
2012 UPDATE
This year we:
| • | | carried out further exploration drilling to test for other potential satellite deposits |
| • | | completed the prefeasibility study |
| • | | prepared a draft Environmental Review and Management Program |
| • | | signed the Kintyre Mining Development Indigenous Land Use Agreement with the Martu |
Prefeasibility
We completed the prefeasibility study, and found that given the measured and indicated mineral resource estimate of about 55 million pounds (100% basis) at an average grade of 0.58%, current uranium prices and continued cost escalation in Western Australia, the economics of the project are challenging. The study was based on an open pit mine with an estimated mine life of about seven years, estimated total production of about 40 million pounds of packaged uranium at an average production rate of about 6 million pounds per year. To break even, the prefeasibility study indicates the project would require an average realized price of about $67 (US) or greater total production at uranium prices similar to today’s spot price.
Based on our review of the current market environment, we will complete the value engineering study currently in progress and the environmental permitting in order to maintain the ability to proceed with the project should the market factors improve the economics. However, we have decided not to proceed with the detailed feasibility study at this time.
86CAMECO CORPORATION
Impairment charge
During the fourth quarter of 2012, we recorded a $168 million write-down of the carrying value of our interest in Kintyre. Due to the recent weakening of the uranium market, no increase in mineral resources in 2012 and the decision not to proceed to a feasibility study, we concluded it was appropriate to recognize an impairment charge for this asset. Kintyre remains an important asset in our portfolio. However, given the current state of the market, it was necessary to reduce its carrying value at this time.
Exploration
Ten additional prospective areas on the property were drill tested in 2012 and to date, no additional resources have been identified.
PLANNING FOR THE FUTURE
Kintyre provides a potential opportunity for us to diversify our portfolio in mining method and geography. Any decision to further advance the Kintyre project through our stage gate process will ultimately be based on positive project economics—seeStage gate process on page 18 for additional details.
Our plan for 2013 is to:
| • | | complete the value engineering study |
| • | | complete registration of the Kintyre Mining Development Indigenous Land Use Agreement with the relevant government authority |
| • | | submit an Environmental Review and Management Program |
| • | | carry out further exploration to test for potential satellite deposits at Kintyre and at other regional exploration projects close to Kintyre. |
Exploration
In order to fully analyze the existing deposit data and prepare to effectively drill test any remaining targets, we will not undertake any additional delineation drilling at Kintyre in 2013. Exploration will be focused on potential satellite deposit targets.
MANAGING THE RISKS
We manage the risks listed on pages 62 and 63.
2012 ANNUAL REPORT87
Uranium – projects under evaluation
| | |
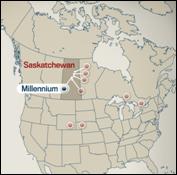
| | Millennium Millennium is a uranium deposit in northern Saskatchewan that we expect will use our excess milling capacity. We are the operator. |
| |
| Location | | Saskatchewan, Canada |
| |
| Ownership | | 69.9% |
| |
| End product | | Uranium concentrates |
| |
| Mine type | | Underground |
| |
| Estimated resources(our share) | | 47.7 million pounds (indicated), average grade U3O8: 4.16% 15.6 million pounds (inferred), average grade U3O8: 5.29% |
BACKGROUND
The Millennium deposit was discovered in 2000, and was delineated through geophysical survey and drilling work between 2000 and 2007.
2012 UPDATE
This year we:
| • | | continued work on the environmental assessment |
| • | | completed a summer drill program, which increased our indicated and inferred mineral resource estimate |
| • | | carried out additional studies and design work to advance the project |
In June, we closed an agreement with AREVA Resources Canada Inc. to purchase AREVA’s 27.94% interest in the Millennium project for $150 million. With the closing, our interest in the Millennium project increased to 69.9%. The remaining 30.1% is owned by JCU (Canada) Exploration Co.
The purchase agreement provides AREVA with a 4% royalty on revenue from 27.94% of any production that exceeds 63 million pounds U3O8 from the project.
We have received comments from the regulators on our draft environmental impact statement and are working to address the questions and issues they have raised.
Highway 905 to 914 connector
In cooperation with several uranium industry partners in Saskatchewan, we have been working with the provincial government on a plan to connect our McArthur River and Cigar Lake mine sites by completing Highway 914 in the Athabasca Basin. This crucial connection will expand access to milling infrastructure across the northern part of the province and provide additional options for the milling of Millennium and other regional sources of ore. It will also enhance transportation efficiency and offer an alternate route in and out of northern Saskatchewan. The Government of Saskatchewan has agreed to fund half of the cost of the final road subject to the decision to develop the Millennium deposit. The industry partners will share the remaining cost.
88CAMECO CORPORATION
PLANNING FOR THE FUTURE
Our plan for 2013 is to:
| • | | submit the final environmental impact statement to regulators |
| • | | complete an exploration drill program to test targets near the deposit |
| • | | continue to advance the project toward a development decision at a pace aligned with market opportunities, using our stage gate process |
MANAGING OUR RISKS
The English River First Nation (ERFN) has selected surface lands covering the Millennium deposit in a claim for Treaty Land Entitlement (TLE). The Saskatchewan government has rejected the selection, but the ERFN has challenged the government’s decision in the courts and this litigation continues. The TLE process does not affect our mineral rights, but it could have an impact on the surface rights and benefits we ultimately negotiate as part of the development of this deposit.
Environment Canada has brought forward a national recovery plan for woodland caribou that has the potential to impact economic and social development in northern Saskatchewan. Additional research work is being conducted so that a determination can be made on the sustainability of the species within the region. The research could result in measures being taken to further limit habitat disturbance in order to improve the health of the woodland caribou population in northern Saskatchewan and it could have an impact on our ability to develop this deposit.
We also manage the risks listed on pages 62 and 63.
2012 ANNUAL REPORT89
Uranium – projects under evaluation
| | |

| | Yeelirrie Yeelirrie is a near-surface calcrete-style deposit that is amenable to open pit mining techniques. It is one of Australia’s largest undeveloped uranium deposits. |
| |
| Location | | Western Australia |
| |
| Ownership | | 100% |
| |
| End product | | Uranium concentrates |
| |
| Mine type | | Open pit |
BACKGROUND
The Yeelirrie deposit was discovered in 1972 and is one of Australia’s largest undeveloped uranium deposits.
In December 2012, we completed the purchase of Yeelirrie from BHP Billiton Yeelirrie Development Company Pty Ltd for $430 million (US) and then paid $22 million (US) in stamp duty to the government of Western Australia. Yeelirrie represents an attractive deposit that fits well with our long-term strategy.
A historic estimate of the mineral content of Yeelirrie was prepared for BHP Billiton in June 2012 by an international mining consulting firm. The historic estimate indicates that Yeelirrie hosts measured and indicated mineral resources of approximately 139 million pounds of U3O8, with an average grade of approximately 0.13% U3O8 and inferred resource of approximately 5 million pounds at 0.10% U3O8. This historic estimate uses resource categories from the Australasian Code for Reporting of Identified Mineral Resources and Ore Reserves (the JORC Code). The acquisition closed at the end of the year and we have not had sufficient time for a qualified person to classify the historic estimate as current mineral resources for purposes of National Instrument 43-101 – Standards of Disclosure for Mineral Projects (NI 43-101). We are not treating the historic estimate as current mineral resources.
Summary of historic estimate for the Yeelirrie project
(Non-compliant with NI 43-101)
(tonnes in thousands; pounds in millions)
| | | | | | | | | | | | | | | | | | | | | | | | | | | | | | | | | | |
| MEASURED RESOURCE | | | INDICATED RESOURCE | | | INFERRED RESOURCE | |
| TONNES | | | GRADE
% U3O8 | | | CONTENT
(lbs U3O8) | | | TONNES | | | GRADE
% U3O8 | | | CONTENT
(lbs U3O8) | | | TONNES | | | GRADE
% U3O8 | | | CONTENT
(lbs U3O8) | |
| | 16.61 | | | | 0.16 | | | | 60.3 | | | | 31.03 | | | | 0.12 | | | | 78.9 | | | | 2.41 | | | | 0.10 | | | | 5.3 | |
The above historic estimate was based on 10,250 surface holes, of which nearly 4,000 diamond drill holes had assay values and the rest had uranium grade measured by downhole radiometric probing. The interpretation of the mineralization envelopes at a cut-off of 0.05% U3O8 focused less on strict application of a grade cut-off, and more on the assumption of significant continuity of the mineralized zones. The uranium grade was estimated for blocks of 25m by 25m by 0.5m.
90CAMECO CORPORATION
We consider the historic estimate relevant as an indication of the potential of the Yeelirrie property and believe that the total uranium content of the historic estimate may be overstated by approximately 10%. The historic estimate should not be relied upon as a quantification of mineral resources, given that, in our opinion approximately 50 million pounds of U3O8 reported as indicated resources would have to be re-categorized because they are not supported by sufficient drilling density and geochemical assays characterizing the uranium grade and other mineral components of the mineralized material.
PLANNING FOR THE FUTURE
In 2013, we expect to:
| • | | conduct a full document review of Yeelirrie |
| • | | complete a mineral resource estimate in accordance with NI 43-101 |
Yeelirrie is an important asset in our portfolio and is part of our plan to sustain our production beyond 2018. Based on our assessment of the deposit and the benefits we expect to derive, we believe we paid a fair price. We will advance the development of this project at a pace aligned with market opportunities, using our stage gate process.
MANAGING OUR RISKS
We manage the risks listed on pages 62 and 63.
2012 ANNUAL REPORT91
Uranium – exploration
In 2012, we adjusted our exploration strategy to focus on the most prospective North American and Australian projects in our portfolio. Exploration is key to ensuring our long-term growth, and since 2008 we have continued to make a significant investment in exploring the land that we hold.
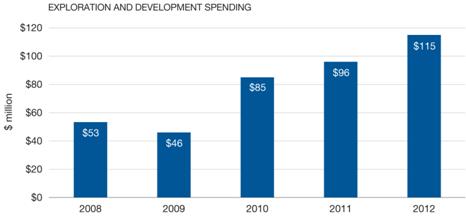
2012 UPDATE
Brownfield exploration
Brownfield exploration is uranium exploration near our existing operations, and includes expenses for advanced exploration projects where uranium mineralization is being defined.
This year we spent $10 million on four brownfield exploration projects, and $24 million for resource definition at Kintyre and Cigar Lake.
Regional exploration
We spent about $45 million on regional exploration programs (including support costs). Saskatchewan was the largest region, followed by Australia, northern Canada, Asia and South America.
PLANS FOR 2013
We plan to spend approximately 5% to 10% less on uranium exploration in 2013 as part of our long-term strategy.
Brownfield exploration
We plan to spend approximately $14 million on eight brownfield exploration projects in the Athabasca Basin and Australia. Our expenditures on projects under evaluation are expected to total $24 million, with the largest amount spent on Inkai block 3.
Regional exploration
We plan to spend about $34 million on 32 projects worldwide, the majority of which are at drill target stage. Among the larger expenditures planned are $9 million to test targets near our US operations and on our US satellite properties, $8 million on the Read Lake project which is adjacent to McArthur River in Saskatchewan, and about $6 million on our Northern Territory projects in Australia.
92CAMECO CORPORATION
Fuel services – refining
| | |
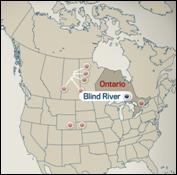
| | Blind River refinery Blind River is the world’s largest commercial uranium refinery, refining uranium concentrates from mines around the world into UO3. |
| |
| Location | | Ontario, Canada |
| |
| Ownership | | 100% |
| |
| End product | | UO3 |
| |
| ISO certification | | ISO 14001 certified |
| |
| Licensed capacity | | 24 million kgU as UO3 per year (subject to the completion of certain equipment upgrades) |
| |
| Estimated decommissioning cost | | $39 million |
2012 UPDATE
Production
Our Blind River refinery produced 13.1 million kgU of UO3 this year, enabling our conversion business to achieve its production targets.
Licensing
In February, the Canadian Nuclear Safety Commission granted a 10-year operating licence for the Blind River refinery. In addition to the new operating licence, the annual licensed production capacity was increased from 18 million kgU as UO3 to 24 million kgU as UO3 subject to the completion of certain equipment upgrades.
MANAGING OUR RISKS
We manage the risks listed on pages 62 and 63.
2012 ANNUAL REPORT93
Fuel services – conversion and fuel manufacturing
| | |
| | Port Hope conversion services Port Hope is the only uranium conversion facility in Canada and the only commercial supplier of UO2 for Canadian-made Candu reactors. We control about 25% of world UF6 conversion capacity. |
| |
| Location | | Ontario, Canada |
| |
| Ownership | | 100% |
| |
| End product | | UF6, UO2 |
| |
| ISO certification | | ISO 14001 certified |
| |
| Licensed capacity | | 12.5 million kgU as UF6 per year 2.8 million kgU as UO2 per year |
| |
| Estimated decommissioning cost | | $102 million |
Cameco Fuel Manufacturing Inc. (CFM)
CFM produces fuel bundles and reactor components for Candu reactors.
| | |
| Location | | Ontario, Canada |
| |
| Ownership | | 100% |
| |
| End product | | Candu fuel bundles and components |
| |
| ISO certification | | ISO 9001 certified, ISO 14001 certified |
| |
| Licensed capacity | | 1.2 million kgU as UO2as finished bundles |
| |
| Estimated decommissioning cost | | $20 million |
Springfields Fuels Ltd. (SFL)
SFL is the newest conversion facility in the world. We contract almost all of its capacity through a toll-processing agreement to 2016.
| | |
| Location | | Lancashire, UK |
| |
| Toll-processing agreement | | Annual conversion of 5 million kgU as UO3 to UF6 |
| |
| Licensed capacity | | 6.0 million kgU as UF6 per year |
2012 UPDATE
Production
Fuel services produced 14.2 million kgU, slightly higher than our plan at the beginning of the year and 3% lower than 2011.
Licensing
In February, the Canadian Nuclear Safety Commission approved a five-year operating licence for the Port Hope conversion facility and a ten-year licence for CFM.
94CAMECO CORPORATION
Labour relations
In July, unionized employees at our fuel manufacturing operations in Port Hope and Cobourg, Ontario voted to accept a new three-year collective agreement. The agreement includes a 5.25% wage increase over the term of the agreement.
Port Hope conversion facility cleanup and modernization (Vision in Motion, formerly Vision 2010)
In December, we received a positive decision from Canada’s Environment Minister to allow us to proceed with the licence amendment from the Canadian Nuclear Safety Commission, an amendment that is required to advance the project.
Springfields toll milling agreement
Based on the current market for UF6 conversion, we do not anticipate an extension of our toll conversion contract with SFL beyond 2016. We remain fully committed to the current contract. If market conditions improve over the next few years, we would consider resuming our discussions to extend the contract.
PLANNING FOR THE FUTURE
Production
We have increased our production target for 2013 to between 15 million and 16 million kgU.
Port Hope conversion facility cleanup and modernization (Vision in Motion)
In 2013, we expect to commence the licence amendment process required for the project.
MANAGING OUR RISKS
Labour relations
The current collective agreements with unionized employees at the Port Hope Conversion facility will expire on June 30, 2013. Bargaining will begin in April 2013. There is risk to production if we are unable to reach an agreement and employees go on strike.
We also manage the risks listed on pages 62 and 63.
2012 ANNUAL REPORT95
NUKEM Gmbh
NUKEM Gmbh is one of the world’s key traders of uranium and uranium-related products.
| | |
| Offices | | Alzenau, Germany (Headquarters, NUKEM Gmbh) Connecticut, US (subsidiary, NUKEM Inc.) |
| |
| Ownership | | 100% |
| |
| Activity | | trading of uranium and uranium-related products |
| |
| 2013 forecast sales | | 9 to 11 million lbs U3O8 and about 500,000 SWU |
BACKGROUND
In January 2013, we completed the acquisition of NUKEM. On closing, we paid €107 million ($140 million (US)) to Advent International and other shareholders and assumed its net debt of about €84 million ($111 million (US)).
Under the earn-out provisions in the agreement, we expect to pay Advent a share of NUKEM’s 2012 earnings. An additional payment may be required in 2015 depending on results achieved in 2013 and 2014.
NUKEM’s business model
NUKEM’s purchase contracts are with longstanding supply partners and its sales contracts are with blue-chip utilities which have strong credit ratings.
PLANNING FOR THE FUTURE
In 2013, we expect NUKEM to deliver approximately 9 to 11 million pounds of uranium and about 500,000 SWU.
MANAGING OUR RISKS
NUKEM manages the risks associated with trading and brokering nuclear fuels and services. It participates in the uranium spot market making purchases to place material in higher price contracts. There are risks associated with these spot market purchases including the risk of losses. NUKEM is also subject to counterparty risk of suppliers not meeting their delivery commitments and purchasers not paying for the product delivered. If a counterparty defaults on a payment or other obligation or becomes insolvent, this could significantly affect NUKEM’s contribution to our earnings, cash flows, financial condition or results of operations.
96CAMECO CORPORATION
Electricity
| | |
 | | Bruce Power Limited Partnership (BPLP) BPLP leases and operates four Candu nuclear reactors that have the capacity to provide about 15% of Ontario’s electricity. |
| |
| Location | | Ontario, Canada |
| |
| Ownership | | 31.6% |
| |
| ISO certification | | ISO 14001 certified |
| |
| Expected reactor life | | 2018 to 2021 |
| |
| Term of lease | | 2018 – right to extend for up to 25 years |
| |
| Generation capacity | | 3,260 MW |
BACKGROUND
We are the fuel procurement manager for BPLP’s four nuclear reactors and for Bruce A Limited Partnership’s (BALP) four reactors.
We provide 100% of BPLP’s uranium concentrates and have agreed to supply BALP with the majority of its future uranium concentrates. We also provide 100% of BPLP and BALP’s fuel manufacturing and UO2 conversion requirements.
2012 UPDATE
Output
BPLP’s produced 26.8 terawatt hours of clean electricity in 2012, 8% higher than in 2011. The capacity factor was 94% compared to 87% in 2011.
PLANNING FOR THE FUTURE
Output
We expect the capacity factor to be 88% in 2013 and actual output to be about 5% to 10% lower than 2012.
MANAGING OUR RISKS
BPLP manages the unique risks associated with operating Candu reactors. The amount of electricity generated, and the cost of that generation, could vary materially from forecast if planned outages are significantly longer than planned, or there are many unplanned outages, either for maintenance, regulatory requirements, equipment malfunction or due to other causes.
BPLP also manages the risks listed on pages 62 and 63.
2012 ANNUAL REPORT97
Mineral reserves and resources
Our mineral reserves and resources are the foundation of our company and fundamental to our success.
We have interests in a number of uranium properties. The tables in this section show our estimates of the proven and probable reserves, measured and indicated resources and inferred resources at those properties. However, only three of the properties listed in those tables are material uranium properties for us: McArthur River and Inkai, which are being mined, and Cigar Lake, which is being developed.
We estimate and disclose mineral reserves and resources in five categories, using the definitions adopted by the Canadian Institute of Mining, Metallurgy and Petroleum, and in accordance with CanadianNational Instrument 43-101 – Standards of Disclosure for Mineral Projects (NI 43-101), developed by the Canadian Securities Administrators. You can find out more about these categories at www.cim.org.
About mineral resources
Mineral resources do not have demonstrated economic viability, but have reasonable prospects for economic extraction. They fall into three categories: measured, indicated and inferred. Our reported mineral resources are exclusive of mineral reserves.
| • | Measured and indicated mineral resources can be estimated with a level of confidence sufficient to allow the appropriate application of technical and economic parameters to support evaluation of the economic viability of the deposit. |
| • | measured resources: we can confirm geological and grade continuity to support production planning. |
| • | indicated resources: we can reasonably assume geological and grade continuity to support mine planning. |
| • | inferred mineral resources are estimated using limited information. We do not have enough confidence to evaluate their economic viability in a meaningful way. You should not assume that all or any part of an inferred mineral resource will be upgraded to an indicated or measured mineral resource as a result of continued exploration. |
Our share of uranium in the mineral resource tables below is based on our respective ownership interests, except for Inkai which is based on our interest in potential production (57.5%), which differs from our ownership interest (60%). Mineral resources that are not mineral reserves have no demonstrated economic viability.
About mineral reserves
Mineral reserves are the economically mineable part of measured and indicated mineral resources demonstrated by at least a preliminary feasibility study. They fall into two categories:
| • | proven reserves: the economically mineable part of a measured resource for which a preliminary feasibility study demonstrates that economic extraction is justified |
| • | probable reserves: the economically mineable part of a measured and/or indicated resource for which a preliminary feasibility study demonstrates that economic extraction is justified |
We use current geological models, an average uranium price of $61 (US) per pound U3O8, and current or projected operating costs and mine plans to estimate our mineral reserves, allowing for dilution and mining losses. We apply our standard data verification process for every estimate.
The price assumption is based on independent industry and analyst estimates of spot prices and the corresponding long-term prices and reflects our committed and uncommitted sales volumes. For committed sales volumes, the spot and term price assumptions were applied in accordance with the terms of the agreements. For uncommitted sales volumes the same price assumptions were applied using a spot-to-term price ratio of 60:40.
98CAMECO CORPORATION
We report mineral reserves as the quantity of contained ore supporting our mining plans, and include an estimate of the metallurgical recovery for each uranium property. The estimate of the amount of valuable product that can be physically recovered by the metallurgical extraction process is obtained by multiplying the quantity of contained metal by the planned metallurgical recovery percentage. Our share of uranium in the mineral reserves table below is before accounting for estimated metallurgical recovery and is based on our respective ownership interests, except for Inkai which is based on our interest in planned production (57.5%) assuming an annual production rate of 5.2 million pounds, which differs from our ownership interest (60%).
Changes this year
Our share of proven and probable mineral reserves went from 435 million pounds U3O8 at the end of 2011 to 465 million pounds at the end of 2012. The change in reserves was mostly the result of:
| • | the mining and milling activities, which removed 22.9 million pounds from our mineral inventory |
| • | the conversion of mineral resources to probable mineral reserves from an updated resource model and mine plan at McArthur River |
| • | our decision to report our Inkai mineral reserves based on our interest in planned production (57.5%) rather than as previously reported based on our ownership interest (60%), which resulted in a decrease in our share of mineral reserves of 2.7 million pounds. This is in addition to the decrease due to the 2012 production. |
| • | the addition to mineral reserves at Smith Ranch-Highland from production drilling and production results. |
Measured and indicated mineral resources decreased from 254 million pounds U3O8 at the end of 2011 to 244 million pounds at the end of 2012. Our share of inferred mineral resources was 287 million pounds U3O8.
The variance in resources was mostly the result of:
| • | the conversion of mineral resources to probable mineral reserves at McArthur River |
| • | a share ownership increase and additional surface drilling results at Millennium |
| • | a decrease of inferred mineral resources at Cigar Lake Phase 2 from additional surface drilling indicating a narrower width of the mineralization |
| • | our decision to report our Inkai mineral resources based on our interest in potential production (57.5%) rather than as previously reported based on our ownership interest (60%), which resulted in a decrease in our share of mineral resources of 7.3 million pounds |
| • | an updated mineral resource estimate following additional surface drilling at the Phoenix deposit |
| • | the underground drilling results at Rabbit Lake. |
Qualified persons
The technical and scientific information discussed in this MD&A, including mineral reserve and resource estimates, for our material properties (McArthur River/Key Lake, Inkai and Cigar Lake) were approved by the following individuals who are qualified persons for the purposes of NI 43-101:
MCARTHUR RIVER/KEY LAKE
| • | Alain G. Mainville, director, mineral resources management, Cameco |
| • | David Bronkhorst, vice-president, Saskatchewan mining south, Cameco |
| • | Greg Murdock, technical superintendent, McArthur River, Cameco |
| • | Les Yesnik, general manager, Key Lake, Cameco |
CIGAR LAKE
| • | Alain G. Mainville, director, mineral resources management, Cameco |
| • | Eric Paulsen, chief metallurgist, technology & innovation, Cameco |
| • | Grant Goddard, vice-president, Saskatchewan mining north, Cameco |
| • | Scott Bishop, principal mine engineer, technology & innovation, Cameco |
2012 ANNUAL REPORT99
INKAI
| • | Alain G. Mainville, director, mineral resources management, Cameco |
| • | Dave Neuburger, vice-president, international mining, Cameco |
| • | Lawrence Reimann, manager, technical services, Cameco Resources |
Important information about mineral reserve and resource estimates
Although we have carefully prepared and verified the mineral reserve and resource figures in this document, the figures are estimates, based in part on forward-looking information.
Estimates are based on our knowledge, mining experience, analysis of drilling results, the quality of available data and management’s best judgment. They are, however, imprecise by nature, may change over time, and include many variables and assumptions, including:
| • | geological interpretation |
| • | commodity prices and currency exchange rates |
| • | operating and capital costs |
There is no assurance that the indicated levels of uranium will be produced, and we may have to re-estimate our mineral reserves based on actual production experience. Changes in the price of uranium, production costs or recovery rates could make it unprofitable for us to operate or develop a particular site or sites for a period of time. See page 2 for information about forward-looking information.
Please see our mineral reserves and resources section of our annual information form for the specific assumptions, parameters and methods used for McArthur River, Inkai and Cigar Lake mineral reserve and resource estimates.
Important information for US investors
While the terms measured, indicated and inferred mineral resources are recognized and required by Canadian securities regulatory authorities, the US Securities and Exchange Commission (SEC) does not recognize them. Under US standards, mineralization may not be classified as a ‘reserve’ unless it has been determined at the time of reporting that the mineralization could be economically and legally produced or extracted. US investors should not assume that:
| • | any or all of a measured or indicated mineral resource will ever be converted into proven or probable mineral reserves |
| • | any or all of an inferred mineral resource exists or is economically or legally mineable, or will ever be upgraded to a higher category. Under Canadian securities regulations, estimates of inferred resources may not form the basis of feasibility or prefeasibility studies. Inferred resources have a great amount of uncertainty as to their existence and economic and legal feasibility. |
The requirements of Canadian securities regulators for identification of ‘reserves’ are also not the same as those of the SEC, and mineral reserves reported by us in accordance with Canadian requirements may not qualify as reserves under SEC standards.
Other information concerning descriptions of mineralization, mineral reserves and resources may not be comparable to information made public by companies that comply with the SEC’s reporting and disclosure requirements for US domestic mining companies, including Industry Guide 7.
100CAMECO CORPORATION
Mineral reserves
As at December 31, 2012 (100% basis – only the second last column shows our share)
Proven and probable
(tonnes in thousands; pounds in millions)
| | | | | | | | | | | | | | | | | | | | | | | | | | | | | | | | | | | | | | | | | | | | | | |
| | | | | PROVEN | | | PROBABLE | | | TOTAL MINERAL RESERVES | |
PROPERTY | | MINING
METHOD | | TONNES | | | GRADE
% U3O8 | | | CONTENT
(lbs U3O8) | | | TONNES | | | GRADE
% U3O8 | | | CONTENT
(lbs U3O8) | | | TONNES | | | GRADE
% U3O8 | | | CONTENT
(lbs U3O8) | | | CAMECO’S
SHARE OF
CONTENT
(lbs U3O8) | | | METALLUR-
GICAL
RECOVERY
(%) | |
McArthur River | | underground | | | 365.8 | | | | 24.18 | | | | 195.0 | | | | 684.8 | | | | 12.18 | | | | 183.9 | | | | 1,050.6 | | | | 16.36 | | | | 378.9 | | | | 264.5 | | | | 98.7 | |
Cigar Lake | | underground | | | 233.6 | | | | 22.31 | | | | 114.9 | | | | 303.5 | | | | 15.22 | | | | 101.8 | | | | 537.1 | | | | 18.30 | | | | 216.7 | | | | 108.4 | | | | 98.5 | |
Rabbit Lake | | underground | | | 87.2 | | | | 0.62 | | | | 1.2 | | | | 1,380.7 | | | | 0.71 | | | | 21.6 | | | | 1,467.9 | | | | 0.70 | | | | 22.8 | | | | 22.8 | | | | 96.7 | |
Key Lake | | open pit | | | 61.9 | | | | 0.52 | | | | 0.7 | | | | | | | | | | | | | | | | 61.9 | | | | 0.52 | | | | 0.7 | | | | 0.6 | | | | 98.7 | |
Inkai | | ISR | | | 2,774.3 | | | | 0.08 | | | | 5.1 | | | | 61,031.1 | | | | 0.07 | | | | 88.7 | | | | 63,805.4 | | | | 0.07 | | | | 93.8 | | | | 53.9 | | | | 85.0 | |
Gas Hills-Peach | | ISR | | | | | | | | | | | | | | | 999.2 | | | | 0.11 | | | | 2.4 | | | | 999.2 | | | | 0.11 | | | | 2.4 | | | | 2.4 | | | | 72.0 | |
North Butte-Brown Ranch | | ISR | | | | | | | | | | | | | | | 1,839.3 | | | | 0.08 | | | | 3.3 | | | | 1,839.3 | | | | 0.08 | | | | 3.3 | | | | 3.3 | | | | 80.0 | |
Smith Ranch-Highland | | ISR | | | 1,373.2 | | | | 0.10 | | | | 3.0 | | | | 1,781.5 | | | | 0.08 | | | | 3.2 | | | | 3,154.7 | | | | 0.09 | | | | 6.2 | | | | 6.2 | | | | 80.0 | |
Crow Butte | | ISR | | | 1,117.6 | | | | 0.12 | | | | 2.9 | | | | 17.3 | | | | 0.18 | | | | 0.1 | | | | 1,134.9 | | | | 0.12 | | | | 3.0 | | | | 3.0 | | | | 85.0 | |
| | | | | | | | | | | | | | | | | | | | | | | | | | | | | | | | | | | | | | | | | | | | | | |
Total | | | | | 6,013.6 | | | | — | | | | 322.8 | | | | 68,037.4 | | | | — | | | | 405.0 | | | | 74,051.0 | | | | — | | | | 727.8 | | | | 465.1 | | | | | |
| | | | | | | | | | | | | | | | | | | | | | | | | | | | | | | | | | | | | | | | | | | | | | |
Notes
Estimates in the above table:
| • | use an average uranium price of $61 (US)/lb U3O8 |
| • | are based on an average exchange rate of $1 US=$1.00 Cdn, except Cigar Lake, which is based on an average exchange rate of $1.00 US=$1.10 Cdn |
Totals may not add up due to rounding.
Except for the possible Inkai permitting issue referred to below, we do not expect these mineral reserve estimates to be materially affected by metallurgical, environmental, permitting, legal, taxation, socio-economic, political, marketing or other relevant issues.
METALLURGICAL RECOVERY
We report mineral reserves as the quantity of contained ore supporting our mining plans, and include an estimate of the metallurgical recovery for each uranium property. The estimate of the amount of valuable product that can be physically recovered by the metallurgical extraction process is obtained by multiplying quantity of contained metal (content) by the planned metallurgical recovery percentage. Our share of uranium in the table above is before accounting for estimated metallurgical recovery.
ESTIMATES FOR INKAI
Our 2013 and future annual production targets for Inkai assume, and we expect, that Inkai will obtain the necessary government permits and approvals to produce at an annual rate of 5.2 million pounds (100% basis), including an amendment to the resource use contract
There is no certainty Inkai will receive these permits or approvals. If Inkai does not, or if the permits and approvals are delayed, Inkai may be unable to achieve its 2013 and future annual production targets and we may have to re-categorize some of Inkai’s mineral reserves as resources.
2012 ANNUAL REPORT101
Mineral resources
As at December 31, 2012 (100% – only the last column shows our share)
Measured and indicated
(tonnes in thousands; pounds in millions)
| | | | | | | | | | | | | | | | | | | | | | | | | | | | | | | | | | | | | | | | | | |
| | | | | MEASURED | | | INDICATED | | | TOTAL MEASURED AND INDICATED | |
PROPERTY | | MINING
METHOD | | TONNES | | | GRADE
% U3O8 | | | CONTENT
(lbs U3O8) | | | TONNES | | | GRADE
% U3O8 | | | CONTENT
(lbs U3O8) | | | TONNES | | | GRADE
% U3O8 | | | CONTENT
(lbs U3O8) | | | CAMECO’S
SHARE (lbs
U3O8) | |
McArthur River | | underground | | | 81.7 | | | | 4.83 | | | | 8.7 | | | | 15.5 | | | | 9.97 | | | | 3.4 | | | | 97.2 | | | | 5.65 | | | | 12.1 | | | | 8.5 | |
Cigar Lake | | underground | | | 18.9 | | | | 1.68 | | | | 0.7 | | | | 25.5 | | | | 2.71 | | | | 1.5 | | | | 44.4 | | | | 2.27 | | | | 2.2 | | | | 1.1 | |
Kintyre | | open pit | | | | | | | | | | | | | | | 4,315.4 | | | | 0.58 | | | | 55.2 | | | | 4,315.4 | | | | 0.58 | | | | 55.2 | | | | 38.7 | |
Rabbit Lake | | underground | | | | | | | | | | | | | | | 485.6 | | | | 0.60 | | | | 6.4 | | | | 485.6 | | | | 0.60 | | | | 6.4 | | | | 6.4 | |
Dawn Lake | | open pit, underground | | | | | | | | | | | | | | | 347.0 | | | | 1.69 | | | | 12.9 | | | | 347.0 | | | | 1.69 | | | | 12.9 | | | | 7.4 | |
Millennium | | underground | | | | | | | | | | | | | | | 742.7 | | | | 4.16 | | | | 68.2 | | | | 742.7 | | | | 4.16 | | | | 68.2 | | | | 47.7 | |
Phoenix | | underground | | | | | | | | | | | | | | | 152.4 | | | | 15.60 | | | | 52.3 | | | | 152.4 | | | | 15.60 | | | | 52.3 | | | | 15.7 | |
Tamarack | | underground | | | | | | | | | | | | | | | 183.8 | | | | 4.42 | | | | 17.9 | | | | 183.8 | | | | 4.42 | | | | 17.9 | | | | 10.3 | |
Inkai | | ISR | | | | | | | | | | | | | | | 28,992.7 | | | | 0.08 | | | | 48.6 | | | | 28,992.7 | | | | 0.08 | | | | 48.6 | | | | 28.0 | |
Gas Hills-Peach | | ISR | | | 1,964.2 | | | | 0.08 | | | | 3.4 | | | | 6,857.9 | | | | 0.12 | | | | 18.8 | | | | 8,822.1 | | | | 0.11 | | | | 22.2 | | | | 22.2 | |
North Butte-Brown Ranch | | ISR | | | | | | | | | | | | | | | 7,248.9 | | | | 0.08 | | | | 12.3 | | | | 7,248.9 | | | | 0.08 | | | | 12.3 | | | | 12.3 | |
Smith Ranch-Highland | | ISR | | | 2,324.5 | | | | 0.10 | | | | 5.2 | | | | 14,618.1 | | | | 0.06 | | | | 17.8 | | | | 16,942.6 | | | | 0.06 | | | | 23.0 | | | | 23.0 | |
Crow Butte | | ISR | | | | | | | | | | | | | | | 2,595.1 | | | | 0.21 | | | | 12.2 | | | | 2,595.1 | | | | 0.21 | | | | 12.2 | | | | 12.2 | |
Ruby Ranch | | ISR | | | | | | | | | | | | | | | 2,215.3 | | | | 0.08 | | | | 4.1 | | | | 2,215.3 | | | | 0.08 | | | | 4.1 | | | | 4.1 | |
Ruth | | ISR | | | | | | | | | | | | | | | 1,080.5 | | | | 0.09 | | | | 2.1 | | | | 1,080.5 | | | | 0.09 | | | | 2.1 | | | | 2.1 | |
Shirley Basin | | ISR | | | 89.2 | | | | 0.16 | | | | 0.3 | | | | 1,638.2 | | | | 0.11 | | | | 4.1 | | | | 1,727.4 | | | | 0.12 | | | | 4.4 | | | | 4.4 | |
| | | | | | | | | | | | | | | | | | | | | | | | | | | | | | | | | | | | | | | | | | |
Total | | | | | 4,478.5 | | | | — | | | | 18.3 | | | | 71,514.6 | | | | — | | | | 337.8 | | | | 75,993.1 | | | | — | | | | 356.1 | | | | 244.1 | |
| | | | | | | | | | | | | | | | | | | | | | | | | | | | | | | | | | | | | | | | | | |
102CAMECO CORPORATION
Inferred
(tonnes in thousands; pounds in millions)
| | | | | | | | | | | | | | | | | | |
PROPERTY | | MINING
METHOD | | TONNES | | | GRADE
% U3O8 | | | CONTENT
(lbs U3O8) | | | CAMECO’S SHARE
(lbs U3O8) | |
McArthur River | | underground | | | 329.4 | | | | 7.78 | | | | 56.5 | | | | 39.5 | |
Cigar Lake | | underground | | | 373.4 | | | | 12.01 | | | | 98.9 | | | | 49.5 | |
Kintyre | | open pit | | | 950.2 | | | | 0.46 | | | | 9.6 | | | | 6.7 | |
Rabbit Lake | | underground | | | 375.0 | | | | 1.24 | | | | 10.3 | | | | 10.3 | |
Millennium | | underground | | | 191.5 | | | | 5.29 | | | | 22.3 | | | | 15.6 | |
Phoenix | | underground | | | 11.6 | | | | 29.80 | | | | 7.6 | | | | 2.3 | |
Tamarack | | underground | | | 45.6 | | | | 1.02 | | | | 1.0 | | | | 0.6 | |
Inkai | | ISR | | | 254,606.1 | | | | 0.05 | | | | 255.0 | | | | 146.6 | |
Gas Hills-Peach | | ISR | | | 861.5 | | | | 0.07 | | | | 1.3 | | | | 1.3 | |
North Butte-Brown Ranch | | ISR | | | 594.3 | | | | 0.06 | | | | 0.8 | | | | 0.8 | |
Smith Ranch-Highland | | ISR | | | 6,404.0 | | | | 0.05 | | | | 6.6 | | | | 6.6 | |
Crow Butte | | ISR | | | 2,114.6 | | | | 0.12 | | | | 5.4 | | | | 5.4 | |
Ruby Ranch | | ISR | | | 56.2 | | | | 0.14 | | | | 0.2 | | | | 0.2 | |
Ruth | | ISR | | | 210.9 | | | | 0.08 | | | | 0.4 | | | | 0.4 | |
Shirley Basin | | ISR | | | 508.0 | | | | 0.10 | | | | 1.1 | | | | 1.1 | |
| | | | | | | | | | | | | | | | | | |
Total | | | | | 267,632.3 | | | | — | | | | 477.0 | | | | 286.9 | |
| | | | | | | | | | | | | | | | | | |
Notes
ISR – in situ recovery
Mineral resources do not include amounts that have been identified as mineral reserves.
Mineral resources do not have demonstrated economic viability. Totals may not add up due to rounding.
2012 ANNUAL REPORT103
Additional information
Related party transactions
We buy significant amounts of goods and services for our Saskatchewan mining operations from northern Saskatchewan suppliers to support economic development in the region. One of these suppliers is Points Athabasca Contracting Ltd. (PACL). In 2012, we paid PACL $57 million for construction and contracting services (2011 – $63 million). These transactions were carried out in the normal course of business. A member of Cameco’s board of directors is the president of PACL.
Critical accounting estimates
Because of the nature of our business, we are required to make estimates that affect the amount of assets and liabilities, revenues and expenses, commitments and contingencies we report.
We base our estimates on our experience, our best judgment, guidelines established by the Canadian Institute of Mining, Metallurgy and Petroleum and on assumptions we believe are reasonable. We believe the following critical accounting estimates reflect the more significant judgments used in the preparation of our financial statements.
DECOMMISSIONING AND RECLAMATION
We are required to estimate the cost of decommissioning and reclamation for each operation, but we normally do not incur these costs until an asset is nearing the end of its useful life. Regulatory requirements and decommissioning methods could change during that time, making our actual costs different from our estimates. A significant change in these costs or in our mineral reserves could have a material impact on our net earnings and financial position.
PROPERTY, PLANT AND EQUIPMENT
We depreciate property, plant and equipment primarily using the unit of production method, where the carrying value is reduced as resources are depleted. A change in our mineral reserves would change our depreciation expenses, and such a change could have a material impact on amounts charged to earnings.
We assess the carrying values of property, plant and equipment and goodwill every year, or more often if necessary. If we determine that we cannot recover the carrying value of an asset or goodwill, we write off the unrecoverable amount against current earnings. We base our assessment of recoverability on assumptions and judgments we make about future prices, production costs, our requirements for sustaining capital and our ability to economically recover mineral reserves. A material change in any of these assumptions could have a significant impact on the potential impairment of these assets.
TAXES
When we are preparing our financial statements, we estimate taxes in each jurisdiction we operate in, taking into consideration different tax rates, non-deductible expenses, valuation of deferred tax assets, changes in tax laws and our expectations for future results.
We base our estimates of deferred income taxes on temporary differences between the assets and liabilities we report in our financial statements, and the assets and liabilities determined by the tax laws in the various countries we operate in. We record deferred income taxes in our financial statements based on our estimated future cash flows, which includes estimates of non-deductible expenses. If these estimates are not accurate, there could be a material impact on our net earnings and financial position.
104CAMECO CORPORATION
Controls and procedures
We have evaluated the effectiveness of our disclosure controls and procedures and internal control over financial reporting as of December 31, 2012, as required by the rules of the US Securities and Exchange Commission and the Canadian Securities Administrators.
Management, including our CEO and our CFO, supervised and participated in the evaluation, and concluded that our disclosure controls and procedures are effective to provide a reasonable level of assurance that the information we are required to disclose in reports we file or submit under securities laws is recorded, processed, summarized and reported accurately, and within the time periods specified. It should be noted that, while the CEO and CFO believe that our disclosure controls and procedures provide a reasonable level of assurance that they are effective, they do not expect the disclosure controls and procedures or internal control over financial reporting to be capable of preventing all errors and fraud. A control system, no matter how well conceived or operated, can provide only reasonable, not absolute, assurance that the objectives of the control system are met.
Management, including our CEO and our CFO, is responsible for establishing and maintaining internal control over financial reporting and conducted an evaluation of the effectiveness of our internal control over financial reporting based on the Internal Control — Integrated Framework issued by the Committee of Sponsoring Organizations of the Treadway Commission. Based on this evaluation, management concluded that our internal control over financial reporting was effective as of December 31, 2012. We have not made any change to our internal control over financial reporting during the 2012 fiscal year that has materially affected, or is reasonably likely to materially affect, our internal control over financial reporting.
New standards and interpretations not yet adopted
A number of new standards, interpretations and amendments to existing standards are not yet effective for the year ended December 31, 2012, and have not been applied in preparing these consolidated financial statements. The following standards, amendments to and interpretations of existing standards have been published and are mandatory for our accounting periods beginning on or after January 1, 2013, unless otherwise noted.
FINANCIAL INSTRUMENTS
In October 2010, the International Accounting Standards Board (IASB) issued IFRS 9, Financial Instruments (IFRS 9). This standard is part of a wider project to replace IAS 39,Financial Instruments: Recognition and Measurement(IAS 39). IFRS 9 replaces the current multiple classification and measurement models for financial assets and liabilities with a single model that has only two classification categories: amortized cost and fair value. The basis of classification depends on the entity’s business model and the contractual cash flow characteristics of the financial asset or liability. The guidance in IAS 39 on impairment of financial assets and hedge accounting continues to apply. IFRS 9 is effective for annual periods beginning on or after January 1, 2015, with early adoption permitted. We do not intend to early adopt IFRS 9. The extent of the impact of adoption of IFRS 9 has not yet been determined.
CONSOLIDATED FINANCIAL STATEMENTS
In May 2011, the IASB issued IFRS 10, Consolidated Financial Statements (IFRS 10). This standard establishes principles for the presentation and preparation of consolidated financial statements when an entity controls one or more other entities. IFRS 10 defines the principle of control and establishes control as the basis for determining which entities are consolidated in the consolidated financial statements. We performed a review of our investees and determined that adoption of this standard will not have a material impact on our financial statements.
2012 ANNUAL REPORT105
JOINT ARRANGEMENTS
In May 2011, the IASB issued IFRS 11,Joint Arrangements (IFRS 11). This standard establishes principles for financial reporting by parties to a joint arrangement. IFRS 11 requires a party to assess the rights and obligations arising from an arrangement in determining whether an arrangement is either a joint venture or a joint operation. Joint ventures are to be accounted for using the equity method while joint operations will continue to be accounted for using proportionate consolidation. We performed a review of all arrangements and determined that our interest in BPLP constitutes a joint venture. As a result we will no longer recognize our proportionate share of the revenue, expenses, assets, liabilities and cash flows of BPLP. Instead, we will recognize our share of net assets and earnings on a single line in the consolidated statements of financial position and consolidated statements of earnings, with partner distributions being recognized in the consolidated statements of cash flows.
DISCLOSURE OF INTERESTS IN OTHER ENTITIES
In May 2011, the IASB issued IFRS 12,Disclosure of Interests in Other Entities (IFRS 12). This standard applies to entities that have an interest in a subsidiary, a joint arrangement, an associate or an unconsolidated structured entity. IFRS 12 integrates and makes consistent the disclosure requirements for a reporting entity’s interest in other entities and presents those requirements in a single standard. The adoption of IFRS 12 is expected to increase the current level of disclosure of interests in other entities.
FAIR VALUE MEASUREMENT
In May 2011, the IASB issued IFRS 13,Fair Value Measurement (IFRS 13). This standard provides additional guidance where IFRS requires fair value to be used. IFRS 13 defines fair value, sets out in a single standard a framework for measuring fair value and establishes the required disclosures about fair value measurements. We do not expect the adoption of IFRS 13 to have a material impact on the financial statements.
EMPLOYEE BENEFITS
In June 2011, the IASB issued an amended version of IAS 19,Employee Benefits (IAS 19). This amendment eliminates the ‘corridor method’ of accounting for defined benefit plans. Revised IAS 19 also accelerates the recognition of past service costs and requires a net interest approach. In addition, it streamlines the presentation of changes in assets and liabilities arising from defined benefit plans, and enhances the disclosure requirements. We intend to retrospectively adopt the amendments in our financial statements. It is expected that the use of the net interest approach, which is the use of the discount rate as opposed to the expected long-term rate of return on plan assets, will have the greatest impact on the financial results. While this change will not materially impact our plans, it is expected to increase our share of the BPLP employee benefit costs for 2013 by approximately $24 million (2012 – $17 million). The difference between the actual return on plan assets and the discount rate will be recognized in other comprehensive income.
PRESENTATION OF OTHER COMPREHENSIVE INCOME (OCI)
In June 2011, the IASB issued an amended version of IAS 1,Presentation of Financial Statements (IAS 1). This amendment is effective for annual periods beginning on or after July 1, 2012 and requires companies preparing financial statements in accordance with IFRS to group together items within OCI that may be reclassified to earnings. Revised IAS 1 also reaffirms existing requirements that items in OCI and earnings should be presented as either a single statement or two consecutive statements. The adoption of these amendments to IAS 1 will not have a material impact on the financial statements.
106CAMECO CORPORATION
FINANCIAL ASSETS AND FINANCIAL LIABILITIES
In December 2011, the IASB issued amendments to IAS 32,Financial Instruments: Presentation (IAS 32) and IFRS 7,Financial Instruments: Disclosures (IFRS 7). The amendments are effective for periods beginning on or after January 1, 2013 for IFRS 7 and January 1, 2014 for IAS 32 and are to be applied retrospectively. These amendments clarify matters regarding offsetting financial assets and financial liabilities as well as related disclosure requirements. We intend to adopt the amendments to IFRS 7 in our financial statements for the annual period beginning on January 1, 2013, and the amendments to IAS 32 in our financial statements for the annual period beginning January 1, 2014 and do not expect the amendments to have a material impact on the financial statements.
2012 ANNUAL REPORT107
Report of management’s accountability
The accompanying consolidated financial statements have been prepared by management in accordance with International Financial Reporting Standards as issued by the International Accounting Standards Board. Management is responsible for ensuring that these statements, which include amounts based upon estimates and judgments, are consistent with other information and operating data contained in the annual financial review and reflect the corporation’s business transactions and financial position.
Management is also responsible for the information disclosed in the management’s discussion and analysis including responsibility for the existence of appropriate information systems, procedures and controls to ensure that the information used internally by management and disclosed externally is complete and reliable in all material respects.
In addition, management is responsible for establishing and maintaining an adequate system of internal control over financial reporting. The internal control system includes an internal audit function and a code of conduct and ethics, which is communicated to all levels in the organization and requires all employees to maintain high standards in their conduct of the corporation’s affairs. Such systems are designed to provide reasonable assurance that the financial information is relevant, reliable and accurate and that the Company’s assets are appropriately accounted for and adequately safeguarded. Management conducted an evaluation of the effectiveness of the system of internal control over financial reporting based on the criteria established in “Internal Control – Integrated Framework” issued by the Committee of Sponsoring Organizations of the Treadway Commission. Based on this evaluation, management concluded that the Company’s system of internal control over financial reporting was effective as at December 31, 2012.
KPMG LLP has audited the consolidated financial statements in accordance with Canadian generally accepted auditing standards and the standards of the Public Company Accounting Oversight Board (United States).
The board of directors annually appoints an audit committee comprised of directors who are not employees of the corporation. This committee meets regularly with management, the internal auditor and the shareholders’ auditors to review significant accounting, reporting and internal control matters. Both the internal and shareholders’ auditors have unrestricted access to the audit committee. The audit committee reviews the financial statements, the report of the shareholders’ auditors, and the management’s discussion and analysis and submits its report to the board of directors for formal approval.
| | |
| Original signed by Tim S. Gitzel | | Original signed by Grant E. Isaac |
| President and Chief Executive Officer | | Senior Vice-President and Chief Financial Officer |
| February 8, 2013 | | February 8, 2013 |
108CAMECO CORPORATION
Independent auditors’ report of registered public accounting firm
To the Shareholders of Cameco Corporation:
We have audited the accompanying consolidated financial statements of Cameco Corporation, which comprise the consolidated statements of financial position as at December 31, 2012 and December 31, 2011, the consolidated statements of earnings, comprehensive income, changes in equity and cash flows for the years then ended, and notes, comprising a summary of significant accounting policies and other explanatory information.
Management’s responsibility for the consolidated financial statements
Management is responsible for the preparation and fair presentation of these consolidated financial statements in accordance with International Financial Reporting Standards as issued by the International Accounting Standards Board, and for such internal control as management determines is necessary to enable the preparation of consolidated financial statements that are free from material misstatement, whether due to fraud or error.
Auditors’ responsibility
Our responsibility is to express an opinion on these consolidated financial statements based on our audits. We conducted our audits in accordance with Canadian generally accepted auditing standards and the standards of the Public Company Accounting Oversight Board (United States). Those standards require that we comply with ethical requirements and plan and perform the audit to obtain reasonable assurance about whether the consolidated financial statements are free from material misstatement.
An audit involves performing procedures to obtain audit evidence about the amounts and disclosures in the consolidated financial statements. The procedures selected depend on our judgment, including the assessment of the risks of material misstatement of the consolidated financial statements, whether due to fraud or error. In making those risk assessments, we consider internal control relevant to the entity’s preparation and fair presentation of the consolidated financial statements in order to design audit procedures that are appropriate in the circumstances. An audit also includes evaluating the appropriateness of accounting policies used and the reasonableness of accounting estimates made by management, as well as evaluating the overall presentation of the consolidated financial statements.
We believe that the audit evidence we have obtained in our audits is sufficient and appropriate to provide a basis for our audit opinion.
Opinion
In our opinion, the consolidated financial statements present fairly, in all material respects, the consolidated financial position of Cameco Corporation as at December 31, 2012 and December 31, 2011, and its consolidated financial performance and its consolidated cash flows for the years then ended in accordance with International Financial Reporting Standards as issued by the International Accounting Standards Board.
Original signed by KPMG LLP
Chartered Accountants
Saskatoon, Canada
February 8, 2013
2012 ANNUAL REPORT109
Consolidated statements of earnings
(Recast—note 6)
| | | | | | | | | | | | |
| For the years ended December 31 | | Note | | | 2012 | | | 2011 | |
| ($Cdn thousands, except per share amounts) | | | | | | | | | |
Revenue from products and services | | | | | | $ | 2,321,471 | | | $ | 2,384,404 | |
| | | |
Cost of products and services sold | | | | | | | 1,304,778 | | | | 1,333,449 | |
Depreciation and amortization | | | | | | | 293,429 | | | | 274,663 | |
| | | | | | | | | | | | |
Cost of sales | | | | | | | 1,598,207 | | | | 1,608,112 | |
| | | | | | | | | | | | |
Gross profit | | | | | | | 723,264 | | | | 776,292 | |
| | | |
Administration | | | | | | | 181,248 | | | | 157,487 | |
Impairment charge on non-producing property | | | 10 | | | | 168,000 | | | | — | |
Exploration | | | | | | | 97,169 | | | | 84,875 | |
Research and development | | | | | | | 9,301 | | | | 4,514 | |
Loss (gain) on sale of assets | | | | | | | (1,660 | ) | | | 7,602 | |
| | | | | | | | | | | | |
Earnings from operations | | | | | | | 269,206 | | | | 521,814 | |
Finance costs | | | 22 | | | | (80,349 | ) | | | (73,668 | ) |
Gains (losses) on derivatives | | | 29 | | | | 39,356 | | | | (4,417 | ) |
Finance income | | | | | | | 20,745 | | | | 24,547 | |
Share of loss from equity-accounted investees | | | 13 | | | | (6,005 | ) | | | (7,233 | ) |
Other income (expense) | | | 23 | | | | (24,746 | ) | | | 556 | |
| | | | | | | | | | | | |
Earnings before income taxes | | | | | | | 218,207 | | | | 461,599 | |
Income tax expense (recovery) | | | 24 | | | | (46,376 | ) | | | 11,755 | |
| | | | | | | | | | | | |
Net earnings | | | | | | $ | 264,583 | | | $ | 449,844 | |
| | | | | | | | | | | | |
Net earnings (loss) attributable to: | | | | | | | | | | | | |
Equity holders | | | | | | $ | 266,136 | | | $ | 450,404 | |
Non-controlling interest | | | | | | | (1,553 | ) | | | (560 | ) |
| | | | | | | | | | | | |
Net earnings | | | | | | $ | 264,583 | | | $ | 449,844 | |
| | | | | | | | | | | | |
Earnings per common share attributable to equity holders | | | | | | | | | | | | |
Basic | | | 25 | | | $ | 0.67 | | | $ | 1.14 | |
| | | | | | | | | | | | |
Diluted | | | 25 | | | $ | 0.67 | | | $ | 1.14 | |
| | | | | | | | | | | | |
See accompanying notes to consolidated financial statements.
110CAMECO CORPORATION
Consolidated statements of comprehensive income
(Recast—note 6)
| | | | | | | | | | | | |
| For the years ended December 31 | | Note | | | 2012 | | | 2011 | |
| ($Cdn thousands) | | | | | | | | | |
Net earnings | | | | | | $ | 264,583 | | | $ | 449,844 | |
| | | |
Other comprehensive income (loss), net of taxes | | | 24 | | | | | | | | | |
Exchange differences on translation of foreign operations | | | | | | | (23,287 | ) | | | 34,361 | |
Gains on derivatives designated as cash flow hedges | | | | | | | 3,982 | | | | 7,954 | |
Gains on derivatives designated as cash flow hedges transferred to net earnings | | | | | | | (19,450 | ) | | | (18,700 | ) |
Unrealized gains (losses) on available-for-sale assets | | | | | | | (19 | ) | | | 272 | |
Gains on available-for-sale assets transferred to net earnings | | | | | | | (129 | ) | | | (1,917 | ) |
Defined benefit plan actuarial losses | | | | | | | (67,545 | ) | | | (104,037 | ) |
| | | | | | | | | | | | |
Other comprehensive loss, net of taxes | | | | | | | (106,448 | ) | | | (82,067 | ) |
| | | | | | | | | | | | |
Total comprehensive income | | | | | | $ | 158,135 | | | $ | 367,777 | |
| | | | | | | | | | | | |
Other comprehensive income (loss) attributable to: | | | | | | | | | | | | |
| | | |
Equity holders | | | | | | $ | (106,328 | ) | | $ | (82,286 | ) |
Non-controlling interest | | | | | | | (120 | ) | | | 219 | |
| | | | | | | | | | | | |
Other comprehensive loss for the period | | | | | | $ | (106,448 | ) | | $ | (82,067 | ) |
| | | | | | | | | | | | |
Total comprehensive income (loss) attributable to: | | | | | | | | | | | | |
Equity holders | | | | | | $ | 159,808 | | | $ | 368,118 | |
Non-controlling interest | | | | | | | (1,673 | ) | | | (341 | ) |
| | | | | | | | | | | | |
Total comprehensive income for the period | | | | | | $ | 158,135 | | | $ | 367,777 | |
| | | | | | | | | | | | |
See accompanying notes to consolidated financial statements.
2012 ANNUAL REPORT111
Consolidated statements of financial position
(Recast—note 6)
| | | | | | | | | | | | |
| As at December 31 | | Note | | | 2012 | | | 2011 | |
| ($Cdn thousands) | | | | | | | | | |
Assets | | | | | | | | | | | | |
Current assets | | | | | | | | | | | | |
Cash and cash equivalents | | | | | | $ | 749,824 | | | $ | 398,084 | |
Short-term investments | | | 7 | | | | 49,535 | | | | 804,141 | |
Accounts receivable | | | 8 | | | | 546,500 | | | | 611,815 | |
Current tax assets | | | | | | | 22,804 | | | | 31,388 | |
Inventories | | | 9 | | | | 563,578 | | | | 493,875 | |
Supplies and prepaid expenses | | | | | | | 189,421 | | | | 182,037 | |
Current portion of long-term receivables, investments and other | | | 12 | | | | 46,259 | | | | 62,433 | |
| | | | | | | | | | | | |
Total current assets | | | | | | | 2,167,921 | | | | 2,583,773 | |
| | | | | | | | | | | | |
Property, plant and equipment | | | 10 | | | | 5,249,099 | | | | 4,349,492 | |
Intangible assets | | | 11 | | | | 94,327 | | | | 98,954 | |
Long-term receivables, investments and other | | | 12 | | | | 298,038 | | | | 282,513 | |
Investments in equity-accounted investees | | | 13 | | | | 212,522 | | | | 220,226 | |
Deferred tax assets | | | 24 | | | | 193,113 | | | | 81,392 | |
| | | | | | | | | | | | |
Total non-current assets | | | | | | | 6,047,099 | | | | 5,032,577 | |
| | | | | | | | | | | | |
Total assets | | | | | | $ | 8,215,020 | | | $ | 7,616,350 | |
| | | | | | | | | | | | |
Liabilities and Shareholders’ Equity | | | | | | | | | | | | |
Current liabilities | | | | | | | | | | | | |
Accounts payable and accrued liabilities | | | 14 | | | $ | 468,776 | | | $ | 455,499 | |
Current tax liabilities | | | | | | | 36,600 | | | | 39,330 | |
Short-term debt | | | 15 | | | | 106,590 | | | | 97,830 | |
Dividends payable | | | | | | | 39,535 | | | | 39,475 | |
Current portion of finance lease obligation | | | 17 | | | | 16,337 | | | | 14,852 | |
Current portion of other liabilities | | | 18 | | | | 21,144 | | | | 50,495 | |
Current portion of provisions | | | 19 | | | | 18,830 | | | | 14,857 | |
| | | | | | | | | | | | |
Total current liabilities | | | | | | | 707,812 | | | | 712,338 | |
| | | | | | | | | | | | |
Long-term debt | | | 16 | | | | 1,292,440 | | | | 795,145 | |
Finance lease obligation | | | 17 | | | | 114,676 | | | | 130,982 | |
Other liabilities | | | 18 | | | | 599,428 | | | | 526,959 | |
Provisions | | | 19 | | | | 550,624 | | | | 519,625 | |
Deferred tax liabilities | | | 24 | | | | 5,773 | | | | 8,165 | |
| | | | | | | | | | | | |
Total non-current liabilities | | | | | | | 2,562,941 | | | | 1,980,876 | |
| | | | | | | | | | | | |
Shareholders’ equity | | | | | | | | | | | | |
Share capital | | | | | | | 1,851,507 | | | | 1,842,289 | |
Contributed surplus | | | | | | | 168,952 | | | | 155,757 | |
Retained earnings | | | | | | | 2,915,437 | | | | 2,874,973 | |
Other components of equity | | | | | | | 7,791 | | | | 46,574 | |
| | | | | | | | | | | | |
Total shareholders’ equity attributable to equity holders | | | | | | | 4,943,687 | | | | 4,919,593 | |
Non-controlling interest | | | | | | | 580 | | | | 3,543 | |
| | | | | | | | | | | | |
Total shareholders’ equity | | | | | | | 4,944,267 | | | | 4,923,136 | |
| | | | | | | | | | | | |
Total liabilities and shareholders’ equity | | | | | | $ | 8,215,020 | | | $ | 7,616,350 | |
| | | | | | | | | | | | |
Commitments and contingencies [notes 19,24,31]
See accompanying notes to consolidated financial statements.
Approved by the board of directors
Original signed by Tim S. Gitzel and John H. Clappison
112CAMECO CORPORATION
Consolidated statements of changes in equity
($Cdn Thousands)
(Recast—note 6)
| | | | | | | | | | | | | | | | | | | | | | | | | | | | | | | | | | | | |
| | | Attributable to equity holders | | | | | | | |
| | | Share
Capital | | | Contributed
Surplus | | | Retained
Earnings | | | Foreign
Currency
Translation | | | Cash
Flow
Hedges | | | Available-
For-Sale
Assets | | | Total | | | Non-
Controlling
Interest | | | Total
Equity | |
Balance at January 1, 2012 | | $ | 1,842,289 | | | $ | 155,757 | | | $ | 2,874,973 | | | $ | 26,866 | | | $ | 19,560 | | | $ | 148 | | | $ | 4,919,593 | | | $ | 3,543 | | | $ | 4,923,136 | |
Net earnings | | | — | | | | — | | | | 266,136 | | | | — | | | | — | | | | — | | | | 266,136 | | | | (1,553 | ) | | | 264,583 | |
Other comprehensive loss | | | — | | | | — | | | | (67,545 | ) | | | (23,167 | ) | | | (15,468 | ) | | | (148 | ) | | | (106,328 | ) | | | (120 | ) | | | (106,448 | ) |
| | | | | | | | | | | | | | | | | | | | | | | | | | | | | | | | | | | | |
Total comprehensive income for the year | | | — | | | | — | | | | 198,591 | | | | (23,167 | ) | | | (15,468 | ) | | | (148 | ) | | | 159,808 | | | | (1,673 | ) | | | 158,135 | |
| | | | | | | | | | | | | | | | | | | | | | | | | | | | | | | | | | | | |
Share-based compensation | | | — | | | | 17,550 | | | | — | | | | — | | | | — | | | | — | | | | 17,550 | | | | — | | | | 17,550 | |
Share options exercised | | | 9,218 | | | | (4,355 | ) | | | — | | | | — | | | | — | | | | — | | | | 4,863 | | | | — | | | | 4,863 | |
Dividends | | | — | | | | — | | | | (158,127 | ) | | | — | | | | — | | | | — | | | | (158,127 | ) | | | — | | | | (158,127 | ) |
Change in ownership interests in subsidiary | | | — | | | | — | | | | — | | | | — | | | | — | | | | — | | | | — | | | | (1,290 | ) | | | (1,290 | ) |
| | | | | | | | | | | | | | | | | | | | | | | | | | | | | | | | | | | | |
Balance at December 31, 2012 | | $ | 1,851,507 | | | $ | 168,952 | | | $ | 2,915,437 | | | $ | 3,699 | | | $ | 4,092 | | | $ | — | | | $ | 4,943,687 | | | $ | 580 | | | $ | 4,944,267 | |
| | | | | | | | | | | | | | | | | | | | | | | | | | | | | | | | | | | | |
Balance at January 1, 2011 | | | 1,833,257 | | | | 142,376 | | | | 2,690,184 | | | | (7,276 | ) | | | 30,306 | | | | 1,793 | | | | 4,690,640 | | | | — | | | | 4,690,640 | |
Net earnings | | | — | | | | — | | | | 450,404 | | | | — | | | | — | | | | — | | | | 450,404 | | | | (560 | ) | | | 449,844 | |
Other comprehensive income (loss) | | | �� | | | | — | | | | (104,037 | ) | | | 34,142 | | | | (10,746 | ) | | | (1,645 | ) | | | (82,286 | ) | | | 219 | | | | (82,067 | ) |
| | | | | | | | | | | | | | | | | | | | | | | | | | | | | | | | | | | | |
Total comprehensive income for the year | | | — | | | | — | | | | 346,367 | | | | 34,142 | | | | (10,746 | ) | | | (1,645 | ) | | | 368,118 | | | | (341 | ) | | | 367,777 | |
| | | | | | | | | | | | | | | | | | | | | | | | | | | | | | | | | | | | |
Share-based compensation | | | — | | | | 19,492 | | | | — | | | | — | | | | — | | | | — | | | | 19,492 | | | | — | | | | 19,492 | |
Share options exercised | | | 9,032 | | | | (6,111 | ) | | | — | | | | — | | | | — | | | | — | | | | 2,921 | | | | — | | | | 2,921 | |
Dividends | | | — | | | | — | | | | (157,887 | ) | | | — | | | | — | | | | — | | | | (157,887 | ) | | | — | | | | (157,887 | ) |
Change in ownership interests in subsidiary | | | — | | | | — | | | | (3,691 | ) | | | — | | | | — | | | | — | | | | (3,691 | ) | | | 3,884 | | | | 193 | |
| | | | | | | | | | | | | | | | | | | | | | | | | | | | | | | | | | | | |
Balance at December 31, 2011 | | $ | 1,842,289 | | | $ | 155,757 | | | $ | 2,874,973 | | | $ | 26,866 | | | $ | 19,560 | | | $ | 148 | | | $ | 4,919,593 | | | $ | 3,543 | | | $ | 4,923,136 | |
| | | | | | | | | | | | | | | | | | | | | | | | | | | | | | | | | | | | |
See accompanying notes to consolidated financial statements.
2012 ANNUAL REPORT113
Consolidated statements of cash flows
(Recast—note 6)
| | | | | | | | | | | | |
| For the years ended December 31 | | Note | | | 2012 | | | 2011 | |
| ($Cdn thousands) | | | | | | | | | |
Operating activities | | | | | | | | | | | | |
Net earnings | | | | | | $ | 264,583 | | | $ | 449,844 | |
Adjustments for: | | | | | | | | | | | | |
Depreciation and amortization | | | | | | | 293,429 | | | | 274,663 | |
Deferred charges | | | | | | | (2,910 | ) | | | (7,869 | ) |
Unrealized losses (gains) on derivatives | | | | | | | (22,057 | ) | | | 60,558 | |
Share-based compensation | | | 27 | | | | 17,550 | | | | 19,492 | |
Loss (gain) on sale of assets | | | | | | | (1,660 | ) | | | 7,602 | |
Finance costs | | | 22 | | | | 80,349 | | | | 73,668 | |
Finance income | | | | | | | (20,745 | ) | | | (24,547 | ) |
Share of loss from equity-accounted investees | | | 13 | | | | 6,005 | | | | 7,233 | |
Impairment charge on non-producing property | | | 10 | | | | 168,000 | | | | — | |
Other income | | | 23 | | | | (4,796 | ) | | | (4,920 | ) |
Income tax expense (recovery) | | | 24 | | | | (46,376 | ) | | | 11,755 | |
Interest received | | | | | | | 21,964 | | | | 23,718 | |
Income taxes paid | | | | | | | (54,475 | ) | | | (60,744 | ) |
Income taxes refunded | | | | | | | 18,569 | | | | 30,128 | |
Other operating items | | | 26 | | | | (73,518 | ) | | | (115,719 | ) |
| | | | | | | | | | | | |
Net cash provided by operations | | | | | | | 643,912 | | | | 744,862 | |
| | | | | | | | | | | | |
Investing activities | | | | | | | | | | | | |
Additions to property, plant and equipment | | | 10 | | | | (733,648 | ) | | | (647,137 | ) |
Acquisitions | | | 37 | | | | (576,408 | ) | | | — | |
Decrease in short-term investments | | | | | | | 754,434 | | | | 79,228 | |
Decrease (increase) in long-term receivables, investments and other | | | | | | | (26,294 | ) | | | 39,890 | |
Proceeds from sale of property, plant and equipment | | | | | | | 3,315 | | | | 62 | |
| | | | | | | | | | | | |
Net cash used in investing | | | | | | | (578,601 | ) | | | (527,957 | ) |
| | | | | | | | | | | | |
Financing activities | | | | | | | | | | | | |
Increase in debt | | | | | | | 527,606 | | | | 12,105 | |
Decrease in debt | | | | | | | (35,629 | ) | | | (14,713 | ) |
Interest paid | | | | | | | (53,956 | ) | | | (60,533 | ) |
Proceeds from issuance of shares, stock option plan | | | | | | | 7,033 | | | | 7,339 | |
Dividends paid | | | | | | | (158,066 | ) | | | (146,017 | ) |
| | | | | | | | | | | | |
Net cash provided by (used in) financing | | | | | | | 286,988 | | | | (201,819 | ) |
| | | | | | | | | | | | |
Increase in cash during the period | | | | | | | 352,299 | | | | 15,086 | |
Exchange rate changes on foreign currency cash balances | | | | | | | (559 | ) | | | 7,618 | |
Cash and cash equivalents at beginning of period | | | | | | | 398,084 | | | | 375,380 | |
| | | | | | | | | | | | |
Cash and cash equivalents at end of period | | | | | | $ | 749,824 | | | $ | 398,084 | |
| | | | | | | | | | | | |
Cash and cash equivalents is comprised of: | | | | | | | | | | | | |
Cash | | | | | | $ | 204,694 | | | $ | 48,353 | |
Cash equivalents | | | | | | | 545,130 | | | | 349,731 | |
| | | | | | | | | | | | |
| | | | | | $ | 749,824 | | | $ | 398,084 | |
| | | | | | | | | | | | |
See accompanying notes to consolidated financial statements.
114CAMECO CORPORATION
Notes to consolidated financial statements
For the years ended December 31, 2012 and 2011
($Cdn thousands, except per share amounts as noted)
1. Cameco Corporation
Cameco Corporation is incorporated under the Canada Business Corporations Act. The address of its registered office is 2121 11th Street West, Saskatoon, Saskatchewan, S7M 1J3. The consolidated financial statements as at and for the year ended December 31, 2012 comprise Cameco Corporation and its subsidiaries (collectively, the Company or Cameco) and the Company’s interest in associates and joint ventures. The Company is primarily engaged in the exploration for and the development, mining, refining, conversion and fabrication of uranium for sale as fuel for generating electricity in nuclear power reactors in Canada and other countries. Cameco has a 31.6% interest in Bruce Power L.P. (BPLP), which operates the four Bruce B nuclear reactors in Ontario.
2. Significant accounting policies
A. Statement of compliance
These consolidated financial statements have been prepared in accordance with International Financial Reporting Standards (IFRS) as issued by the International Accounting Standards Board (IASB).
These consolidated financial statements were authorized for issuance by the Company’s board of directors on February 8, 2013.
B. Basis of presentation
These consolidated financial statements are presented in Canadian dollars, which is the Company’s functional currency. All financial information presented in Canadian dollars in tabular format has been rounded to the nearest thousand except where otherwise noted.
The consolidated financial statements have been prepared on the historical cost basis except for the following material items in the statements of financial position: derivative financial instruments are measured at fair value, available-for-sale financial assets are measured at fair value, liabilities for cash-settled share-based payment arrangements are measured at fair value and the defined benefit asset is recognized as plan assets, plus unrecognized past service cost, less the present value of the defined benefit obligation.
The preparation of the consolidated financial statements in conformity with IFRS requires management to make judgments, estimates and assumptions that affect the application of accounting policies and the reported amounts of assets, liabilities, revenue and expenses. Actual results may vary from these estimates.
Estimates and underlying assumptions are reviewed on an ongoing basis. Revisions to accounting estimates are recognized in the period in which the estimates are revised and in any future periods affected. The areas involving a higher degree of judgment or complexity, or areas where assumptions and estimates are significant to the consolidated financial statements are disclosed in note 5.
This summary of significant accounting policies is a description of the accounting methods and practices that have been used in the preparation of these consolidated financial statements and is presented to assist the reader in interpreting the statements contained herein. These accounting policies have been applied consistently to all entities within the consolidated group and to all periods presented in these consolidated financial statements.
2012 ANNUAL REPORT115
C. Consolidation principles
i. Business combinations
The acquisition method of accounting is used to account for the acquisition of subsidiaries by the Company. The Company measures goodwill at the acquisition date as the fair value of the consideration transferred, including the recognized amount of any non-controlling interests in the aquiree, less the net recognized amount (generally fair value) of the identifiable assets acquired and liabilities assumed, all measured as of the acquisition date. When the excess is negative, a bargain purchase gain is recognized immediately in earnings. In a business combination achieved in stages, the acquisition date fair value of the Company’s previously held equity interest in the acquiree is also considered in computing goodwill.
Consideration transferred includes the fair values of the assets transferred, liabilities incurred and equity interests issued by the Company. Consideration also includes the fair value of any contingent consideration and share-based compensation awards that are replaced mandatorily in a business combination.
The Company elects on a transaction-by-transaction basis whether to measure any non-controlling interest at fair value, or at their proportionate share of the recognized amount of the identifiable net assets of the acquiree, at the acquisition date.
Acquisition-related costs are expensed as incurred, except for those costs related to the issue of debt or equity instruments. Transaction costs arising on the issue of equity instruments are recognized directly in equity. Transaction costs that are directly related to the probable issuance of a security that is classified as a financial liability is deducted from the amount of the financial liability when it is initially recognized, or recognized in earnings when the issuance is no longer probable.
ii. Subsidiaries
The consolidated financial statements include the accounts of Cameco and its subsidiaries. Subsidiaries are entities over which the Company has control. Subsidiaries are fully consolidated from the date on which control is transferred to the Company and are deconsolidated from the date that control ceases.
iii. Investments in associates
Associates are those entities over which the Company has significant influence, but not control, over the financial and operating policies. Significant influence is presumed to exist when the Company holds between 20% and 50% of the voting power of another entity, but can also arise where the Company holds less than 20% if it has the power to be actively involved and influential in policy decisions affecting the entity.
Investments in associates are accounted for using the equity method. The equity method involves the recording of the initial investment at cost and the subsequent adjusting of the carrying value of the investment for Cameco’s proportionate share of the earnings or loss and any other changes in the associates’ net assets, such as dividends. The cost of the investment includes transaction costs.
Adjustments are made to align the accounting policies of the associate with those of the Company before applying the equity method. When the Company’s share of losses exceeds its interest in an equity-accounted investee, the carrying amount of that interest is reduced to zero, and the recognition of further losses is discontinued except to the extent that the Company has incurred legal or constructive obligations or made payments on behalf of the associate. If the associate subsequently reports profits, Cameco resumes recognizing its share of those profits only after its share of the profits equals the share of losses not recognized.
iv. Interests in joint ventures
A joint venture can take the form of a jointly controlled entity, jointly controlled operation or jointly controlled asset. All joint ventures involve a contractual arrangement that establishes joint control. Cameco’s joint ventures consist of jointly controlled entities and jointly controlled assets.
116CAMECO CORPORATION
A jointly controlled entity is an entity in which Cameco shares joint control over the strategic financial and operating decisions with one or more venturers through the establishment of a corporation, partnership or other entity. A jointly controlled entity operates in the same way as other entities, controlling the assets of the joint venture, earning its own revenue and incurring its own liabilities and expenses. Interests in jointly controlled entities are accounted for using the proportionate consolidation method, whereby the Company’s proportionate interest in the assets, liabilities, revenues and expenses of jointly controlled entities are recognized within each applicable line item of the consolidated financial statements. The share of jointly controlled entities’ results is recognized in the Company’s consolidated financial statements from the date that joint control commences until the date at which it ceases.
A jointly controlled asset involves contractual arrangements with other participants to engage in joint activities that do not give rise to a jointly controlled entity. These arrangements involve joint control of one or more of the assets acquired or contributed for the purpose of the joint venture. Each venturer receives a share of the output from the assets and bears an agreed upon share of the expenses rather than deriving returns from an interest in a separate entity. The consolidated financial statements of the Company include its share of the assets in such joint ventures, together with its share of the liabilities, revenues and expenses arising jointly or otherwise from those operations. All such amounts are measured in accordance with the terms of each arrangement, which are usually in proportion to the Company’s interest in the jointly controlled assets.
v. Transactions eliminated on consolidation
Intra-group balances and transactions, and any unrealized income and expenses arising from intra-group transactions, are eliminated in preparing consolidated financial statements. Unrealized gains arising from transactions with equity-accounted investees and joint ventures are eliminated against the investment to the extent of the Company’s interest in the associate or the joint venture. Unrealized losses are eliminated in the same manner as unrealized gains, but only to the extent that there is no evidence of impairment.
D. Foreign currency translation
Items included in the financial statements of each of Cameco’s subsidiaries, associates and jointly controlled entities are measured using their functional currency, which is the currency of the primary economic environment in which the entity operates. The consolidated financial statements are presented in Canadian dollars, which is Cameco’s functional and presentation currency.
i. Foreign currency transactions
Foreign currency transactions are translated into the respective functional currency of the Company and its entities using the exchange rates prevailing at the dates of the transactions. At the reporting date, monetary assets and liabilities denominated in foreign currencies are translated to the functional currency at the exchange rate at that date. Non-monetary items that are measured in terms of historical cost in a foreign currency are translated using the exchange rate at the date of the transaction. The applicable exchange gains and losses arising on these transactions are reflected in earnings with the exception of foreign exchange gains or losses on provisions for decommissioning and reclamation activities that are in a foreign currency, which are capitalized in property, plant and equipment.
ii. Foreign operations
The assets and liabilities of foreign operations, including goodwill and fair value adjustments arising on acquisition, are translated to Canadian dollars at exchange rates at the reporting date. The revenues and expenses of foreign operations are translated to Canadian dollars at exchange rates at the dates of the transactions.
Foreign currency differences are recognized in other comprehensive income. When a foreign operation is disposed of, in whole or in part, the relevant amount in the foreign currency translation account is transferred to earnings as part of the gain or loss on disposal.
2012 ANNUAL REPORT117
When the settlement of a monetary item receivable from or payable to a foreign operation is neither planned nor likely in the foreseeable future, foreign exchange gains and losses arising from such a monetary item are considered to form part of the net investment in a foreign operation, and are recognized in other comprehensive income and presented within equity in the foreign currency translation account.
E. Cash and cash equivalents
Cash and cash equivalents consists of balances with financial institutions and investments in money market instruments, which have a term to maturity of three months or less at the time of purchase.
F. Inventories
Inventories of broken ore, uranium concentrates, and refined and converted products are measured at the lower of cost and net realizable value.
Cost includes direct materials, direct labour, operational overhead expenses and depreciation. Net realizable value is the estimated selling price in the ordinary course of business, less the estimated costs of completion and selling expenses.
Consumable supplies and spares are valued at the lower of cost or replacement value.
G. Property, plant and equipment
i. Buildings, plant and equipment and other
Items of property, plant and equipment are measured at cost less accumulated depreciation and impairment charges. The cost of self-constructed assets includes the cost of materials and direct labour, borrowing costs and any other costs directly attributable to bringing the assets to the location and condition necessary for them to be capable of operating in the manner intended by management, including the initial estimate of the cost of dismantling and removing the items and restoring the site on which they are located.
When components of an item of property, plant and equipment have different useful lives, they are accounted for as separate items of property, plant and equipment and depreciated separately.
Gains and losses on disposal of an item of property, plant and equipment are determined by comparing the proceeds from disposal with the carrying amount of property, plant and equipment, and are recognized in earnings.
ii. Mineral properties and mine development costs
The decision to develop a mine property within a project area is based on an assessment of the commercial viability of the property, the availability of financing and the existence of markets for the product. Once the decision to proceed to development is made, development and other expenditures relating to the project area are deferred as part of assets under construction and disclosed as a component of property, plant and equipment with the intention that these will be depreciated by charges against earnings from future mining operations. No depreciation is charged against the property until commercial production commences. After a mine property has been brought into commercial production, costs of any additional work on that property are expensed as incurred, except for large development programs, which will be deferred and depreciated over the remaining life of the related assets.
118CAMECO CORPORATION
iii. Depreciation
Depreciation is calculated over the depreciable amount, which is the cost of the asset less its residual value. Assets, which are unrelated to production, are depreciated according to the straight-line method based on estimated useful lives as follows:
| | | | |
Land | | | Not depreciated | |
Buildings | | | 15 - 25 years | |
Plant and equipment | | | 4 - 15 years | |
Furniture and fixtures | | | 3 - 10 years | |
Other | | | 3 - 5 years | |
Mining properties and certain mining and conversion assets for which the economic benefits from the asset are consumed in a pattern which is linked to the production level are depreciated according to the unit-of-production method. For conversion assets, the amount of depreciation is measured by the portion of the facilities’ total estimated lifetime production that is produced in that period. For mining assets and properties, the amount of depreciation or depletion is measured by the portion of the mines’ proven and probable mineral reserves recovered during the period.
Depreciation methods, useful lives and residual values are reviewed at each reporting period and are adjusted if appropriate.
iv. Borrowing costs
Borrowing costs on funds directly attributable to finance the acquisition, production or construction of a qualifying asset are capitalized until such time as substantially all the activities necessary to prepare the qualifying asset for its intended use are complete. A qualifying asset is one that takes a substantial period of time to prepare for its intended use. Capitalization is discontinued when the asset enters commercial production or development ceases. Where the funds used to finance a project form part of general borrowings, interest is capitalized based on the weighted average interest rate applicable to the general borrowings outstanding during the period of construction.
v. Repairs and maintenance
The cost of replacing a component of property, plant and equipment is capitalized if it is probable that future economic benefits embodied within the component will flow to the Company. The carrying amount of the replaced component is derecognized. Costs of routine maintenance and repair are charged to products and services sold.
vi. Leased assets
Nuclear generating plants which are leased assets are depreciated according to the straight-line method based on the shorter of useful life and remaining lease term.
H. Intangible assets
Intangible assets acquired individually or as part of a group of assets are initially recognized at cost and measured subsequently at cost less accumulated amortization and impairment losses. Subsequent expenditure is capitalized only when it increases the future economic benefits embodied in the specific asset to which it relates. The cost of a group of intangible assets acquired in a transaction, including those acquired in a business combination that meet the specified criteria for recognition apart from goodwill, is allocated to the individual assets acquired based on their relative fair values.
Finite-lived intangible assets are amortized over the estimated production profile of the business unit to which they relate, since this most closely reflects the expected pattern of realization of the future economic benefits embodied in the asset. Amortization methods and useful lives are reviewed at each reporting period and are adjusted if appropriate.
2012 ANNUAL REPORT119
I. Leased assets
Leases which result in the Company receiving substantially all the risks and rewards of ownership are classified as finance leases. Upon initial recognition, the leased asset is measured at an amount equal to the lower of its fair value and the present value of the minimum lease payments. Subsequent to initial recognition, the asset is accounted for in accordance with the accounting policy applicable to that asset.
Lease agreements that do not meet the recognition criteria of a finance lease are classified and recognized as operating leases and are not recognized in the Company’s statements of financial position. Payments made under operating leases are charged to income on a straight-line basis over the lease term. Minimum lease payments made under finance leases are apportioned between finance cost and the reduction of the outstanding liability. The finance cost is allocated to each period of the lease term to produce a constant periodic rate of interest on the remaining balance of the liability.
J. Finance income and finance costs
Finance income comprises interest income on funds invested, gains on the disposal of available-for-sale financial assets, and changes in the fair value of financial assets. Interest income is recognized in earnings as it accrues, using the effective interest method. Finance costs comprise interest and fees on borrowings, unwinding of the discount on provisions and changes in the fair value of financial assets.
Borrowing costs that are not directly attributable to the acquisition, construction or production of a qualifying asset are expensed in the period incurred.
Foreign currency gains and losses are reported on a net basis as part of finance costs.
K. Impairment
i. Financial assets
A financial asset not carried at fair value through profit and loss is assessed at each reporting date to determine whether there is objective evidence that it is impaired. A financial asset is impaired if objective evidence indicates that a loss event has occurred after the initial recognition of the asset, and that the loss event had a negative effect on the estimated future cash flows of that asset.
Objective evidence that financial assets (including equity securities) are impaired can include default or delinquency by a debtor, restructuring of an amount due to the Company on terms that the Company would not consider otherwise, indications that a debtor or issuer will enter bankruptcy, or the disappearance of an active market for a security. In addition, for an investment in an equity security, a significant or prolonged decline in its fair value below its cost is objective evidence of impairment.
Impairment losses on available-for-sale debt and equity securities are recognized by transferring the cumulative loss that has been recognized in other comprehensive income, and presented in equity, to earnings. The cumulative loss that is removed from other comprehensive income and recognized in earnings is the difference between the acquisition cost, net of any principal payment and amortization, and the current fair value, less any impairment loss previously recognized in earnings. Changes in impairment provisions attributable to time value are reflected as a component of finance costs.
If, in a subsequent period, the fair value of an impaired available-for-sale debt security increases and the increase can be related objectively to an event occurring after the impairment loss was recognized in earnings, then the impairment loss is reversed, with the amount of the reversal recognized in earnings. Impairment losses on available-for-sale equity securities that are recognized in earnings are never reversed through earnings.
120CAMECO CORPORATION
ii. Non-financial assets
The carrying amounts of Cameco’s non-financial assets, other than inventories and deferred tax assets, are reviewed at each reporting date to determine whether there is any indication of impairment. If any such indication exists, then the asset’s recoverable amount is estimated.
The recoverable amount of an asset or cash-generating unit (CGU) is the greater of its value in use and its fair value less costs to sell.
Fair value is determined as the amount that would be obtained from the sale of the asset in an arm’s-length transaction between knowledgeable and willing parties. Fair value for mineral assets is generally determined as the present value of the estimated future cash flows expected to arise from the continued use of the asset, including any expansion prospects, and its eventual disposal, using assumptions that an independent market participant may take into account. These cash flows are discounted by an appropriate discount rate to arrive at a net present value of the asset.
Value in use is determined as the present value of the estimated future cash flows expected to arise from the continued use of the asset in its present form and its eventual disposal. Value in use is determined by applying assumptions specific to the Company’s continued use and cannot take into account future development. These assumptions are different than those used in calculating fair value and, consequently, the value in use calculation is likely to give a different result than a fair value calculation. The estimated future cash flows are discounted to their present value using a pre-tax discount rate that reflects current market assessments of the time value of money and the risks specific to the asset. For the purpose of impairment testing, assets that cannot be tested individually are grouped together into the smallest group of assets that generates cash inflows from continuing use that are largely independent of the cash inflows of other assets or groups of assets.
The Company’s corporate assets do not generate separate cash inflows. If there is an indication that a corporate asset may be impaired, then the recoverable amount is determined for the CGU to which the corporate asset belongs.
An impairment loss is recognized if the carrying amount of an asset or its CGU exceeds its recoverable amount. Impairment losses are recognized in earnings. Impairment losses recognized in respect of CGUs are allocated first to reduce the carrying amount of any goodwill allocated to the units, and then to reduce the carrying amounts of the other assets in the unit (group of units) on a pro rata basis.
Impairment losses recognized in prior periods are assessed at each reporting date whenever events or changes in circumstances indicate that the impairment may have reversed. If the impairment has reversed, the carrying amount of the asset is increased to its recoverable amount. An impairment loss is reversed only to the extent that the asset’s carrying amount does not exceed the carrying amount that would have been determined, net of depreciation or amortization, if no impairment loss had been recognized. A reversal of an impairment loss is recognized immediately in earnings.
L. Exploration and evaluation expenditures
Exploration and evaluation expenditures are those expenditures incurred by the Company in connection with the exploration for and evaluation of mineral resources before the technical feasibility and commercial viability of extracting a mineral resource are demonstrable. These expenditures include researching and analyzing existing exploration data, conducting geological studies, exploratory drilling and sampling, and compiling prefeasibility and feasibility studies. Exploration and evaluation expenditures are charged against earnings as incurred, except when there is a high degree of confidence in the viability of the project and it is probable that these costs will be recovered through future development and exploitation.
The technical feasibility and commercial viability of extracting a resource is considered to be determinable based on several factors, including the existence of proven and probable reserves and the demonstration that future economic benefits are probable. When an area is determined to be technically feasible and commercially viable, the exploration and evaluation assets attributable to that area are first tested for impairment and then transferred to property, plant and equipment.
2012 ANNUAL REPORT121
Exploration and evaluation costs that have been acquired in a business combination or asset acquisition are capitalized under the scope of IFRS 6,Exploration for and Evaluation of Mineral Resources, and are reported as part of property, plant, and equipment.
M. Provisions
A provision is recognized if, as a result of a past event, the Company has a present legal or constructive obligation that can be estimated reliably, and it is probable that an outflow of economic benefits will be required to settle the obligation. Provisions are determined by discounting the risk-adjusted expected future cash flows at a pre-tax risk-free rate that reflects current market assessments of the time value of money. The unwinding of the discount is recognized as a finance cost.
i. Environmental restoration
The mining, extraction and processing activities of the Company normally give rise to obligations for site closure and environmental restoration. Closure and restoration can include facility decommissioning and dismantling, removal or treatment of waste materials, as well as site and land restoration. The Company provides for the closure, reclamation and decommissioning of its operating sites in the financial period when the related environmental disturbance occurs, based on the estimated future costs using information available at the reporting date. Costs included in the provision comprise all closure and restoration activity expected to occur gradually over the life of the operation and at the time of closure. Routine operating costs that may impact the ultimate closure and restoration activities, such as waste material handling conducted as a normal part of a mining or production process, are not included in the provision.
The timing of the actual closure and restoration expenditure is dependent upon a number of factors such as the life and nature of the asset, the operating licence conditions and the environment in which the mine operates. Closure and restoration provisions are measured at the expected value of future cash flows, discounted to their present value using a current pre-tax risk-free rate. Significant judgments and estimates are involved in deriving the expectations of future activities and the amount and timing of the associated cash flows.
At the time a provision is initially recognized, to the extent that it is probable that future economic benefits associated with the reclamation, decommissioning and restoration expenditure will flow to the Company, the corresponding cost is capitalized as an asset. The capitalized cost of closure and restoration activities is recognized in property, plant and equipment and depreciated on a units-of-production basis. The value of the provision is gradually increased over time as the effect of discounting unwinds. The unwinding of the discount is an expense recognized in finance costs.
Closure and rehabilitation provisions are also adjusted for changes in estimates. The provision is reviewed on an annual basis for changes to obligations or legislation or discount rates that effect change in cost estimates or life of operations. The cost of the related asset is adjusted for changes in the provision resulting from changes in estimated cash flows or discount rates, and the adjusted cost of the asset is depreciated prospectively.
ii. Waste disposal
The refining, conversion and manufacturing processes generate certain uranium-contaminated waste. The Company has established strict procedures to ensure this waste is disposed of safely. A provision for waste disposal costs in respect of these materials is recognized when they are generated. Costs associated with the disposal, the timing of cash flows and discount rates are estimated both at initial recognition and subsequent measurement.
122CAMECO CORPORATION
N. Employee future benefits
i. Pension obligations
The Company accrues its obligations under employee benefit plans. The Company has both defined benefit and defined contribution plans. A defined contribution plan is a pension plan under which the Company pays fixed contributions into a separate entity. The Company has no legal or constructive obligations to pay further contributions if the fund does not hold sufficient assets to pay all employees the benefits relating to employee service in the current and prior periods. A defined benefit plan is a pension plan other than a defined contribution plan. Typically, defined benefit plans define an amount of pension benefit that an employee will receive on retirement, usually dependent on one or more factors such as age, years of service and compensation.
The liability recognized in the statements of financial position in respect of defined benefit pension plans is the present value of the defined benefit obligation at the reporting date less the fair value of plan assets, together with adjustments for unrecognized past service costs. The defined benefit obligation is calculated annually, by qualified independent actuaries using the projected unit credit method prorated on service and management’s best estimate of expected plan investment performance, salary escalation, retirement ages of employees and expected health care costs. The present value of the defined benefit obligation is determined by discounting the estimated future cash outflows using interest rates of high-quality corporate bonds that are denominated in the currency in which the benefits will be paid, and that have terms to maturity approximating the terms of the related pension liability.
The Company recognizes all actuarial gains and losses arising from defined benefit plans in other comprehensive income, and reports them in retained earnings. When the benefits of a plan are improved, the portion of the increased benefit relating to past service by employees is recognized in earnings on a straight-line basis over the average period until the benefits become vested. To the extent that the benefits vest immediately, the expense is recognized immediately in earnings.
For defined contribution plans, the contributions are recognized as employee benefit expense in earnings in the periods during which services are rendered by employees. Prepaid contributions are recognized as an asset to the extent that a cash refund or a reduction in future payments is available.
ii. Other post-retirement benefit plans
The Company provides certain post-retirement health care benefits to its retirees. The entitlement to these benefits is usually conditional on the employee remaining in service up to retirement age and the completion of a minimum service period. The expected costs of these benefits are accrued over the period of employment using the same accounting methodology as used for defined benefit pension plans. Actuarial gains and losses are recognized in other comprehensive income in the period in which they arise. These obligations are valued annually by independent qualified actuaries.
iii. Short-term employee benefits
Short-term employee benefit obligations are measured on an undiscounted basis and are expensed as the related service is provided. A liability is recognized for the amount expected to be paid under short-term cash bonus plans if the Company has a present legal or constructive obligation to pay this amount as a result of past service provided by the employee, and the obligation can be measured reliably.
2012 ANNUAL REPORT123
iv. Termination benefits
Termination benefits are payable when employment is terminated by the Company before the normal retirement date, or whenever an employee accepts voluntary redundancy in exchange for these benefits. Cameco recognizes termination benefits as an expense when the Company is demonstrably committed, without realistic possibility of withdrawal, to a formal detailed plan to either terminate employment before the normal retirement date, or to provide termination benefits as a result of an offer made to encourage voluntary redundancy. Termination benefits for voluntary redundancies are recognized as an expense if the Company has made an offer, it is probable that the offer will be accepted and the number of acceptances can be estimated reliably. If benefits are payable more than 12 months after the reporting period, they are discounted to their present value.
v. Share-based compensation
For equity-settled plans, the grant date fair value of share-based compensation awards granted to employees is recognized as an employee benefit expense, with a corresponding increase in equity, over the period that the employees unconditionally become entitled to the awards. The amount recognized as an expense is adjusted to reflect the number of awards for which the related service and vesting conditions are expected to be met, such that the amount ultimately recognized as an expense is based on the number of awards that meet the related service and non-market performance conditions at the vesting date.
For cash-settled plans, the fair value of the amount payable to employees is recognized as an expense, with a corresponding increase in liabilities, over the period that the employees unconditionally become entitled to payment. The liability is re-measured at each reporting date and at settlement date. Any changes in the fair value of the liability are recognized as employee benefit expense in earnings.
Cameco’s contributions under the employee share ownership plan are expensed during the year of contribution. Shares purchased with Company contributions and with dividends paid on such shares become unrestricted on January 1 of the second plan year following the date on which such shares were purchased.
O. Revenue recognition
Cameco supplies uranium concentrates and uranium conversion services to utility customers.
Cameco recognizes revenue on the sale of its nuclear products when the risks and rewards of ownership pass to the customer and collection is reasonably assured. Cameco’s sales are pursuant to an enforceable contract that indicates the type of sales arrangement, pricing and delivery terms, as well as details related to the transfer of title.
Cameco has three types of sales arrangements with its customers in its uranium and fuel services businesses. These arrangements include uranium supply, toll conversion services and conversion supply (converted uranium), which is a combination of uranium supply and toll conversion services.
Uranium supply
In a uranium supply arrangement, Cameco is contractually obligated to provide uranium concentrates to its customers. Cameco-owned uranium is physically delivered to conversion facilities (Converters) where the Converter will credit Cameco’s account for the volume of accepted uranium. Based on delivery terms in a sales contract with its customer, Cameco instructs the Converter to transfer title of a contractually-specified quantity of uranium to the customer’s account at the Converter’s facility. At this point, the risks and rewards of ownership have been transferred and Cameco invoices the customer and recognizes revenue for the uranium supply.
124CAMECO CORPORATION
Toll conversion services
In a toll conversion arrangement, Cameco is contractually obligated to convert customer-owned uranium to a chemical state suitable for enrichment. Based on delivery terms in a sales contract with its customer, Cameco either (i) physically delivers converted uranium to enrichment facilities (Enrichers) where it instructs the Enricher to transfer title of a contractually-specified quantity of converted uranium to the customer’s account at the Enricher’s facility, or (ii) transfers title of a contractually-specified quantity of converted uranium to either an Enricher’s account or the customer’s account. At this point, the risks and rewards of ownership have been transferred and Cameco invoices the customer and recognizes revenue for the toll conversion services.
Conversion supply
In a conversion supply arrangement, Cameco is contractually obligated to provide converted uranium of acceptable origins to its customers. Based on delivery terms in a sales contract with its customer, Cameco either (i) physically delivers converted uranium to the Enricher where it instructs the Enricher to transfer title of a contractually-specified quantity of converted uranium to the customer’s account at the Enricher’s facility, or (ii) transfers title of a contractually-specified quantity of converted uranium to either an Enricher’s account or a customer’s account at Cameco’s Port Hope conversion facility. At this point, the risks and rewards of ownership have been transferred and Cameco invoices the customer and recognizes revenue for both the uranium supplied and the conversion service provided.
Electricity sales are recognized at the time of generation, and delivery to the purchasing utility is metered at the point of interconnection with the transmission system. Revenues are recognized on an accrual basis, which includes an estimate of the value of electricity produced during the period but not yet billed.
P. Financial instruments
i. Financial assets and financial liabilities
Financial assets include cash and cash equivalents, short-term investments, trade receivables, other receivables, loans, other investments and derivative financial instruments. The Company determines the classification of its financial assets at initial recognition and records the assets at the fair value of consideration paid. Subsequently, financial assets are carried at fair value or amortized cost less impairment charges. Where non-derivative financial assets are carried at fair value, gains and losses on remeasurement are recognized directly in equity unless the financial assets have been designated as being held at fair value through profit or loss, in which case the gains and losses are recognized directly in earnings.
Financial liabilities include trade and other payables, debt and derivative financial instruments. The Company determines the classification of its financial liabilities at initial recognition. All financial liabilities are initially recognized at the fair value of consideration received net of transaction costs and subsequently carried at amortized cost.
The Company has the following non-derivative financial assets: loans and receivables and available-for-sale financial assets.
Loans and receivables
Loans and receivables are financial assets with fixed or determinable payments that are not quoted in an active market. Such assets are carried at amortized cost using the effective interest method if the time value of money is significant. This category of financial assets includes trade and other receivables.
Cash and cash equivalents consist of balances with financial institutions and investments in money market instruments, which have a term to maturity of three months or less at time of purchase.
2012 ANNUAL REPORT125
Available-for-sale financial assets
Available-for-sale financial assets are non-derivative financial assets that are not classified as loans and receivables. The Company’s investments in equity securities and certain debt securities are classified as available-for-sale financial assets. Subsequent to initial recognition, they are measured at fair value, with gains or losses recognized within other comprehensive income. Accumulated changes in fair value are recorded as a separate component of equity until the investment is derecognized or impaired, then the cumulative gain or loss in other comprehensive income is transferred to earnings.
The Company has the following non-derivative financial liabilities: loans and accounts payable. Such liabilities are carried at amortized cost using the effective interest method if the time value of money is significant.
ii. Derivative financial instruments
The Company holds derivative financial and commodity instruments to reduce exposure to fluctuations in foreign currency exchange rates, interest rates and commodity prices. Except for those designated as hedging instruments, all derivative instruments are recorded at fair value in the consolidated statements of financial position, with attributable transaction costs recognized in earnings as incurred. Subsequent to initial recognition, changes in fair value are recognized in earnings.
The purpose of hedging transactions is to modify the Company’s exposure to one or more risks by creating an offset between changes in the fair value of, or the cash inflows attributable to, the hedged item and the hedging item. When hedge accounting is appropriate, the hedging relationship is designated as a fair value hedge, a cash flow hedge, or a foreign currency risk hedge related to a net investment in a foreign operation.
At the inception of a hedging relationship, the Company formally documents all relationships between hedging instruments and hedged items, as well as its risk management objective and strategy for undertaking various hedge transactions. The process includes linking all derivatives to specific assets and liabilities on the consolidated statement of financial position or to specific firm commitments or forecasted transactions. The Company also formally assesses, both at the inception and on an ongoing basis, whether the derivatives that are used in hedging transactions are highly effective in offsetting changes in fair values or cash flows of hedged items.
For fair value hedges, changes in the fair value of the derivatives and corresponding changes in fair value of the hedged items attributed to the risk being hedged are recognized in earnings. For cash flow hedges, the effective portion of the changes in the fair values of the derivative instruments are recorded in other comprehensive income until the hedged items are recognized in earnings. Derivative instruments that do not qualify for hedge accounting, or are not designated as hedging instruments, are marked-to-market and the resulting net gains or losses are recognized in earnings.
Separable embedded derivatives
Derivatives may be embedded in other financial instruments (the “host instrument”). Embedded derivatives are treated as separate derivatives when their economic characteristics and risks are not clearly and closely related to those of the host instrument, the terms of the embedded derivative are the same as those of a stand-alone derivative, and the combined contract is not designated at fair value. These embedded derivatives are measured at fair value with subsequent changes recognized in gains or losses on derivatives.
Q. Income tax
Income tax expense is comprised of current and deferred taxes. Current tax and deferred tax are recognized in earnings except to the extent that it relates to a business combination, or items recognized directly in equity or in other comprehensive income.
Current tax is the expected tax payable or receivable on the taxable income or loss for the year, using tax rates enacted or substantially enacted at the reporting date, and any adjustments to tax payable in respect of previous years.
126CAMECO CORPORATION
Deferred tax is recognized in respect of temporary differences between the carrying amounts of assets and liabilities for financial reporting purposes and the amounts used for taxation purposes. In addition, deferred tax is not recognized for taxable temporary differences arising on the initial recognition of goodwill. Deferred tax is measured at the tax rates that are expected to be applied to temporary differences when they reverse, based on the laws that have been enacted or substantively enacted by the reporting date. Deferred tax assets and liabilities are offset if there is a legally enforceable right to offset current tax liabilities and assets, and they relate to income taxes levied by the same tax authority on the same taxable entity, or on different tax entities, but they intend to settle current tax liabilities and assets on a net basis or their tax assets and liabilities will be realized simultaneously.
A deferred tax asset is recognized for unused tax losses, tax credits and deductible temporary differences, to the extent that it is probable that future taxable profits will be available against which they can be utilized. Deferred tax assets are reviewed at each reporting date and are reduced to the extent that it is no longer probable that the related tax benefit will be realized.
The Company’s exposure to uncertain tax positions is evaluated and a provision is made where it is probable that this exposure will materialize. Accrued interest and penalties for uncertain tax positions are recognized in the period in which uncertainties are identified.
R. Share capital
Common shares are classified as equity. Incremental costs directly attributable to the issue of common shares are recognized as a reduction of equity, net of any tax effects.
S. Earnings per share
The Company presents basic and diluted earnings per share data for its common shares. Earnings per share is calculated by dividing the net earnings attributable to equity holders of the Company by the weighted average number of common shares outstanding.
Diluted earnings per share is determined by adjusting the net earnings attributable to equity holders of the Company and the weighted average number of common shares outstanding, for the effects of all dilutive potential common shares. The calculation of diluted earnings per share assumes that outstanding options which are dilutive to earnings per share are exercised and the proceeds are used to repurchase shares of the Company at the average market price of the shares for the period. The effect is to increase the number of shares used to calculate diluted earnings per share.
T. Segment reporting
An operating segment is a component of the Company that engages in business activities from which it may earn revenues and incur expenses, including revenues and expenses that relate to transactions with any of the Company’s other segments. To be classified as a segment, discrete financial information must be available and operating results must be regularly reviewed by the Company’s Chief Executive Officer.
Segment capital expenditure is the total cost incurred during the period to acquire property, plant and equipment, and intangible assets other than goodwill.
3. Accounting standards
A. New standards and interpretations not yet adopted
A number of new standards, interpretations and amendments to existing standards are not yet effective for the year ended December 31, 2012, and have not been applied in preparing these consolidated financial statements. The following standards, amendments to and interpretations of existing standards have been published and are mandatory for Cameco’s accounting periods beginning on or after January 1, 2013, unless otherwise noted.
2012 ANNUAL REPORT127
i. Financial instruments
In October 2010, the International Accounting Standards Board (IASB) issued IFRS 9, Financial Instruments (IFRS 9). This standard is part of a wider project to replace IAS 39,Financial Instruments: Recognition and Measurement(IAS 39). IFRS 9 replaces the current multiple classification and measurement models for financial assets and liabilities with a single model that has only two classification categories: amortized cost and fair value. The basis of classification depends on the entity’s business model and the contractual cash flow characteristics of the financial asset or liability. The guidance in IAS 39 on impairment of financial assets and hedge accounting continues to apply. IFRS 9 is effective for annual periods beginning on or after January 1, 2015, with early adoption permitted. Cameco does not intend to early adopt IFRS 9. The extent of the impact of adoption of IFRS 9 has not yet been determined.
ii. Consolidated financial statements
In May 2011, the IASB issued IFRS 10, Consolidated Financial Statements (IFRS 10). This standard establishes principles for the presentation and preparation of consolidated financial statements when an entity controls one or more other entities. IFRS 10 defines the principle of control and establishes control as the basis for determining which entities are consolidated in the consolidated financial statements. Cameco performed a review of its investees and determined that adoption of this standard will not have a material impact on its financial statements.
iii. Joint arrangements
In May 2011, the IASB issued IFRS 11,Joint Arrangements (IFRS 11). This standard establishes principles for financial reporting by parties to a joint arrangement. IFRS 11 requires a party to assess the rights and obligations arising from an arrangement in determining whether an arrangement is either a joint venture or a joint operation. Joint ventures are to be accounted for using the equity method while joint operations will continue to be accounted for using proportionate consolidation. Cameco performed a review of all arrangements and determined that Cameco’s interest in BPLP constitutes a joint venture. As a result, Cameco will no longer recognize its proportionate share of the revenue, expenses, assets, liabilities and cash flows of BPLP. Instead, Cameco will recognize its share of net assets and earnings on a single line in the consolidated statements of financial position and consolidated statements of earnings, with partner distributions being recognized in the consolidated statements of cash flows.
iv. Disclosure of interests in other entities
In May 2011, the IASB issued IFRS 12,Disclosure of Interests in Other Entities (IFRS 12). This standard applies to entities that have an interest in a subsidiary, a joint arrangement, an associate or an unconsolidated structured entity. IFRS 12 integrates and makes consistent the disclosure requirements for a reporting entity’s interest in other entities and presents those requirements in a single standard. The adoption of IFRS12 is expected to increase the current level of disclosure of interests in other entities.
v. Fair value measurement
In May 2011, the IASB issued IFRS 13,Fair Value Measurement (IFRS 13). This standard provides additional guidance where IFRS requires fair value to be used. IFRS 13 defines fair value, sets out in a single standard a framework for measuring fair value and establishes the required disclosures about fair value measurements. Cameco does not expect the adoption of IFRS 13 to have a material impact on its financial statements.
128CAMECO CORPORATION
vi. Employee benefits
In June 2011, the IASB issued an amended version of IAS 19,Employee Benefits (IAS 19). This amendment eliminates the ‘corridor method’ of accounting for defined benefit plans. Revised IAS 19 also accelerates the recognition of past service costs and requires a net interest approach. In addition, it streamlines the presentation of changes in assets and liabilities arising from defined benefit plans, and enhances the disclosure requirements. Cameco will retrospectively adopt the amendments in its financial statements. It is expected that the use of the net interest approach, which is the use of the discount rate as opposed to the expected long-term rate of return on plan assets, will have the greatest impact on the financial results. While this change will not materially impact Cameco’s plans, it is expected to increase Cameco’s share of the BPLP employee benefit costs for 2013 by approximately $24 million (2012—$17 million). The difference between the actual return on plan assets and the discount rate will be recognized in other comprehensive income.
vii. Presentation of other comprehensive income
In June 2011, the IASB issued an amended version of IAS 1,Presentation of Financial Statements (IAS 1). This amendment is effective for annual periods beginning on or after July 1, 2012 and requires companies preparing financial statements in accordance with IFRS to group together items within other comprehensive income (OCI) that may be reclassified to earnings. Revised IAS 1 also reaffirms existing requirements that items in OCI and earnings should be presented as either a single statement or two consecutive statements. The adoption of these amendments to IAS 1 will not have a material impact on the financial statements.
viii. Financial assets and financial liabilities
In December 2011, the IASB issued amendments to IAS 32,Financial Instruments: Presentation (IAS 32) and IFRS 7,Financial Instruments: Disclosures (IFRS 7). The amendments are effective for periods beginning on or after January 1, 2013 for IFRS 7 and January 1, 2014 for IAS 32 and are to be applied retrospectively. These amendments clarify matters regarding offsetting financial assets and financial liabilities as well as related disclosure requirements. Cameco intends to adopt the amendments to IFRS 7 in its financial statements for the annual period beginning on January 1, 2013, and the amendments to IAS 32 in its financial statements for the annual period beginning January 1, 2014 and does not expect the amendments to have a material impact on the financial statements.
4. Determination of fair values
A number of the Company’s accounting policies and disclosures require the determination of fair value, for both financial and non-financial assets and liabilities. Fair values have been determined for measurement and/or disclosure purposes based on the following methods. When applicable, further information about the assumptions made in determining fair values is disclosed in the notes to the specific asset or liability.
A. Investments in equity and debt securities
The fair value of available-for-sale financial assets is determined by reference to their quoted closing bid price at the reporting date.
B. Derivatives
The fair value of forward exchange contracts is based on the current quoted foreign exchange rates. The fair value of interest rate swaps is determined by discounting estimated future cash flows based on the terms and maturity of each contract and using market interest rates for a similar instrument at the measurement date. The fair value of interest rate caps is based on broker quotes.
Fair values reflect the credit risk of the instrument and include adjustments to take into account the credit risk of the Company and counterparty when appropriate.
2012 ANNUAL REPORT129
C. Share-based compensation
The fair values of the stock option, phantom stock option, deferred share unit and restricted share unit plans are measured using the Black-Scholes option-pricing model. The fair value of the performance share unit plan is measured using Monte Carlo simulation. Measurement inputs include share price on measurement date, exercise price of the instrument, expected volatility (based on weighted average historic volatility), weighted average expected life of the instruments (based on historical experience and general option holder behaviour), expected dividends and the risk-free interest rate (based on government bonds). Service and non-market performance conditions attached to the transactions are taken into account in determining fair value for valuations performed using Monte Carlo simulation.
5. Use of estimates and judgments
The preparation of the consolidated financial statements in conformity with IFRS requires management to make judgments, estimates and assumptions that affect the application of accounting policies and the reported amounts of assets, liabilities, revenues and expenses. Actual results may differ from these estimates.
Estimates and underlying assumptions are reviewed on an ongoing basis. Revisions to accounting estimates are recognized in the period in which the estimates are revised and in any future period affected.
Information about critical judgments in applying the accounting policies that have the most significant effect on the amounts recognized in the consolidated financial statements is discussed below. Further details of the nature of these judgments, estimates and assumptions may be found in the relevant notes to the financial statements.
A. Recoverability of long-lived and intangible assets
Cameco assesses the carrying values of property, plant and equipment, and intangible assets annually or more frequently if warranted by a change in circumstances. If it is determined that carrying values of assets or goodwill cannot be recovered, the unrecoverable amounts are charged against current earnings. Recoverability is dependent upon assumptions and judgments regarding future prices, costs of production, sustaining capital requirements and mineral reserves. A material change in assumptions may significantly impact the potential impairment of these assets. In addition, assumptions used in the calculation of recoverable amounts are discount rates, future cash flows and profit margins.
B. Cash generating units
In performing impairment assessments of long-lived assets, assets that cannot be assessed individually are grouped together into the smallest group of assets that generates cash inflows that are largely independent of the cash inflows from other assets or groups of assets. Management is required to exercise judgment in identifying these cash generating units.
C. Provisions for decommissioning and reclamation of assets
Significant decommissioning and reclamation activities are often not undertaken until near the end of the useful lives of the productive assets. Regulatory requirements and alternatives with respect to these activities are subject to change over time. A significant change to either the estimated costs or mineral reserves may result in a material change in the amount charged to earnings.
130CAMECO CORPORATION
D. Deferred income taxes
Cameco operates in a number of tax jurisdictions and is, therefore, required to estimate its income taxes in each of these tax jurisdictions in preparing its financial statements. In calculating income taxes, consideration is given to factors such as tax rates in the different jurisdictions, non-deductible expenses, valuation allowances, changes in tax law and management’s expectations of future operating results. Cameco estimates deferred income taxes based on temporary differences between the income and losses reported in its financial statements and its taxable income and losses as determined under the applicable tax laws. The tax effect of these temporary differences is recorded as deferred tax assets or liabilities in the financial statements. The calculation of income taxes requires the use of judgment and estimates. If these judgments and estimates prove to be inaccurate, future earnings may be materially impacted.
E. Mineral reserves
Depreciation on property, plant and equipment is primarily calculated using the unit-of-production method. This method allocates the cost of an asset to each period based on current period production as a portion of total lifetime production or a portion of estimated mineral reserves. Estimates of life-of-mine and amounts of mineral reserves are updated annually and are subject to judgment and significant change over time. If actual mineral reserves prove to be significantly different than the estimates, there could be a material impact on the amounts of depreciation charged to earnings.
F. Pension, other post-retirement and other post-employment benefits
The carrying value of pensions, other post-retirement and other post-employment benefit obligations is based on actuarial valuations that are sensitive to assumptions concerning discount rates, wage increase rates, and other actuarial assumptions used. Changes in these assumptions could result in a material impact to the financial statements.
G. Purchase price allocations
Purchase prices related to business combinations and asset acquisitions are allocated to the underlying acquired assets and liabilities based on their estimated fair value at the time of acquisition. The determination of fair value requires Cameco to make assumptions, estimates and judgments regarding future events. The allocation process is inherently subjective and impacts the amounts assigned to individually identifiable assets and liabilities. As a result, the purchase price allocation impacts Cameco’s reported assets and liabilities, future net earnings due to the impact on future depreciation and amortization expense and impairment tests.
H. Derivative financial instruments
Cameco is exposed to risks related to changes in commodity prices, foreign exchange rates and interest rates. Cameco utilizes specific derivative financial instruments to manage these risks. These derivatives are recorded at their fair value. In the determination of the fair value of these instruments, Cameco utilizes independent prices and, when independent prices are not available, internal financial models which are based primarily on observable market data. Management’s judgment is required in the development of these models.
6. Accounting for Kintyre
In August 2008, Cameco acquired a 70% interest in the Kintyre exploration project in Australia. The Company previously consolidated its investment in Kintyre on the basis that it was able to exercise control over the asset. In the second quarter of 2012, the Company reconsidered the accounting treatment applied to Kintyre and concluded that consolidation of the investment was not appropriate and only Cameco’s interest in the assets and liabilities of Kintyre should be recognized. Accordingly, the non-controlling interest in the assets, liabilities and expenses has been removed from the financial statements. The change in accounting has been applied retrospectively and the comparative statements for 2011 have been recast. There was no impact on retained earnings or net earnings attributable to equity holders for any of the recast periods. The most significant changes relate to a reduction of property, plant and equipment of $182,615,000 and a reduction of the non-controlling interest on the statement of changes in financial position of $182,395,000.
2012 ANNUAL REPORT131
7. Short-term investments
Short-term investments are denominated in Canadian dollars and are comprised of money market instruments with terms to maturity between three and 12 months. Short-term investments are classified as available-for-sale.
8. Accounts receivable
| | | | | | | | |
| | | 2012 | | | 2011 | |
Trade receivables | | $ | 500,274 | | | $ | 564,629 | |
Receivables due from related parties [note 36] | | | 23,210 | | | | 19,557 | |
HST/VAT receivables | | | 13,746 | | | | 16,675 | |
Other receivables | | | 9,270 | | | | 10,954 | |
| | | | | | | | |
Total | | $ | 546,500 | | | $ | 611,815 | |
| | | | | | | | |
The Company’s exposure to credit and currency risks as well as impairment loss related to trade and other receivables, excluding HST/VAT receivables is disclosed in note 29.
9. Inventories
| | | | | | | | |
| | | 2012 | | | 2011 | |
Uranium | | | | | | | | |
Concentrate | | $ | 407,067 | | | $ | 361,481 | |
Broken Ore | | | 22,537 | | | | 14,310 | |
| | | | | | | | |
| | | 429,604 | | | | 375,791 | |
| | |
Fuel Services | | | 133,974 | | | | 118,084 | |
| | | | | | | | |
Total | | $ | 563,578 | | | $ | 493,875 | |
| | | | | | | | |
Cameco expensed $1,159,500,000 of inventory as cost of sales during 2012 (2011—$1,124,500,000).
132CAMECO CORPORATION
10. Property, plant and equipment
| | | | | | | | | | | | | | | | | | | | | | | | |
| | | Land
and
buildings | | | Plant and
equipment(a) | | | Furniture
and
fixtures | | | Under
construction | | | Exploration
and
evaluation | | | Total | |
Cost | | | | | | | | | | | | | | | | | | | | | | | | |
Beginning of year | | $ | 2,460,549 | | | $ | 2,346,052 | | | $ | 92,471 | | | $ | 1,553,236 | | | $ | 421,953 | | | $ | 6,874,261 | |
Acquisitions [note 37] | | | — | | | | — | | | | — | | | | — | | | | 598,407 | | | | 598,407 | |
Additions | | | 97,481 | | | | 25,556 | | | | 2,099 | | | | 644,848 | | | | 9,260 | | | | 779,244 | |
Transfers | | | 129,688 | | | | 193,867 | | | | 9,800 | | | | (333,355 | ) | | | — | | | | — | |
Disposals | | | (2,281 | ) | | | (13,180 | ) | | | (3 | ) | | | — | | | | — | | | | (15,464 | ) |
Effect of movements in exchange rates | | | (9,707 | ) | | | (3,110 | ) | | | (181 | ) | | | (3,083 | ) | | | (5,233 | ) | | | (21,314 | ) |
| | | | | | | | | | | | | | | | | | | | | | | | |
End of year | | | 2,675,730 | | | | 2,549,185 | | | | 104,186 | | | | 1,861,646 | | | | 1,024,387 | | | | 8,215,134 | |
| | | | | | | | | | | | | | | | | | | | | | | | |
Accumulated depreciation | | | | | | | | | | | | | | | | | | | | | | | | |
Beginning of year | | | 1,190,263 | | | | 1,258,911 | | | | 75,595 | | | | — | | | | — | | | | 2,524,769 | |
Depreciation charge | | | 137,811 | | | | 144,312 | | | | 9,982 | | | | — | | | | — | | | | 292,105 | |
Disposals | | | (1,251 | ) | | | (12,554 | ) | | | (4 | ) | | | — | | | | — | | | | (13,809 | ) |
Impairment charge on non-producing property(b) | | | — | | | | — | | | | — | | | | — | | | | 168,000 | | | | 168,000 | |
Effect of movements in exchange rates | | | (3,969 | ) | | | (941 | ) | | | (120 | ) | | | — | | | | — | | | | (5,030 | ) |
| | | | | | | | | | | | | | | | | | | | | | | | |
End of year | | | 1,322,854 | | | | 1,389,728 | | | | 85,453 | | | | — | | | | 168,000 | | | | 2,966,035 | |
| | | | | | | | | | | | | | | | | | | | | | | | |
Net book value at December 31, 2012 | | $ | 1,352,876 | | | $ | 1,159,457 | | | $ | 18,733 | | | $ | 1,861,646 | | | $ | 856,387 | | | $ | 5,249,099 | |
| | | | | | | | | | | | | | | | | | | | | | | | |
| | | | | | |
| | | Land
and
buildings | | | Plant and
equipment(a) | | | Furniture
and
fixtures | | | Under
construction | | | Exploration
and
evaluation | | | (Recast -
note 6)
Total | |
Cost | | | | | | | | | | | | | | | | | | | | | | | | |
Beginning of year | | $ | 2,183,854 | | | $ | 2,212,015 | | | $ | 85,248 | | | $ | 1,189,854 | | | $ | 408,333 | | | $ | 6,079,304 | |
Additions | | | 196,567 | | | | 33,328 | | | | 3,263 | | | | 575,185 | | | | 3,833 | | | | 812,176 | |
Transfers | | | 75,976 | | | | 131,306 | | | | 3,762 | | | | (211,044 | ) | | | — | | | | — | |
Disposals | | | (4,226 | ) | | | (33,949 | ) | | | (12 | ) | | | (3,083 | ) | | | — | | | | (41,270 | ) |
Effect of movements in exchange rates | | | 8,378 | | | | 3,352 | | | | 210 | | | | 2,324 | | | | 9,787 | | | | 24,051 | |
| | | | | | | | | | | | | | | | | | | | | | | | |
End of year | | | 2,460,549 | | | | 2,346,052 | | | | 92,471 | | | | 1,553,236 | | | | 421,953 | | | | 6,874,261 | |
| | | | | | | | | | | | | | | | | | | | | | | | |
Accumulated depreciation | | | | | | | | | | | | | | | | | | | | | | | | |
Beginning of year | | | 1,083,584 | | | | 1,156,032 | | | | 63,478 | | | | — | | | | — | | | | 2,303,094 | |
Depreciation charge | | | 106,164 | | | | 131,898 | | | | 11,998 | | | | — | | | | — | | | | 250,060 | |
Disposals | | | (3,597 | ) | | | (29,998 | ) | | | (11 | ) | | | — | | | | — | | | | (33,606 | ) |
Effect of movements in exchange rates | | | 4,112 | | | | 979 | | | | 130 | | | | — | | | | — | | | | 5,221 | |
| | | | | | | | | | | | | | | | | | | | | | | | |
End of year | | | 1,190,263 | | | | 1,258,911 | | | | 75,595 | | | | — | | | | — | | | | 2,524,769 | |
| | | | | | | | | | | | | | | | | | | | | | | | |
Net book value at December 31, 2011 | | $ | 1,270,286 | | | $ | 1,087,141 | | | $ | 16,876 | | | $ | 1,553,236 | | | $ | 421,953 | | | $ | 4,349,492 | |
| | | | | | | | | | | | | | | | | | | | | | | | |
| (a) | At December 31, 2012, the net amount included in the statement of financial position for plant and equipment includes Cameco’s share of BPLP’s nuclear generating plant under finance lease of $79,316,000 (2011—$93,220,000). |
2012 ANNUAL REPORT133
| (b) | During 2012, Cameco recognized a $168,000,000 impairment charge relating to Kintyre, its advanced uranium exploration project in Australia. Due to the weakening of the uranium market since the asset was purchased in 2008, no increase to the mineral resource estimate in 2012 and the decision not to proceed with the detailed feasibility study, the Company concluded it was appropriate to recognize an impairment charge. The amount of the charge was determined as the excess of the carrying value over the fair value less costs to sell based on the implied fair value of the resources in place using comparable market transaction metrics. |
11. Intangible assets
| | | | | | | | | | | | |
| | | Intellectual
Property | | | Patents | | | Total | |
Cost | | | | | | | | | | | | |
Beginning of year | | $ | 118,819 | | | $ | 8,890 | | | $ | 127,709 | |
Effect of movements in exchange rates | | | — | | | | (193 | ) | | | (193 | ) |
| | | | | | | | | | | | |
End of year | | | 118,819 | | | | 8,697 | | | | 127,516 | |
| | | | | | | | | | | | |
Accumulated depreciation | | | | | | | | | | | | |
Beginning of year | | | 28,509 | | | | 246 | | | | 28,755 | |
Amortization charge | | | 3,959 | | | | 484 | | | | 4,443 | |
Effect of movements in exchange rates | | | — | | | | (9 | ) | | | (9 | ) |
| | | | | | | | | | | | |
End of year | | | 32,468 | | | | 721 | | | | 33,189 | |
| | | | | | | | | | | | |
Net book value at December 31, 2012 | | $ | 86,351 | | | $ | 7,976 | | | $ | 94,327 | |
| | | | | | | | | | | | |
| | | | | | | | | | | | |
| | | Intellectual
Property | | | Patents | | | Total | |
Cost | | | | | | | | | | | | |
Beginning of year | | $ | 118,819 | | | $ | — | | | $ | 118,819 | |
Additions | | | — | | | | 8,462 | | | | 8,462 | |
Effect of movements in exchange rates | | | — | | | | 428 | | | | 428 | |
| | | | | | | | | | | | |
End of year | | | 118,819 | | | | 8,890 | | | | 127,709 | |
| | | | | | | | | | | | |
Accumulated depreciation | | | | | | | | | | | | |
Beginning of year | | | 24,549 | | | | — | | | | 24,549 | |
Amortization charge | | | 3,960 | | | | 239 | | | | 4,199 | |
Effect of movements in exchange rates | | | — | | | | 7 | | | | 7 | |
| | | | | | | | | | | | |
End of year | | | 28,509 | | | | 246 | | | | 28,755 | |
| | | | | | | | | | | | |
Net book value at December 31, 2011 | | $ | 90,310 | | | $ | 8,644 | | | $ | 98,954 | |
| | | | | | | | | | | | |
The intangible asset values relate to intellectual property acquired with Cameco Fuel Manufacturing (CFM) and patents acquired with UFP Investments LLC (UFP). The CFM intellectual property is being amortized on a unit-of-production basis over its remaining life which expires in 2030. Amortization is allocated to the cost of inventory and is recognized in cost of products and services sold as inventory is sold. The patents acquired with UFP are being amortized to cost of products and services sold on a straight-line basis over their remaining life which expires in July 2029.
134CAMECO CORPORATION
12. Long-term receivables, investments and other
| | | | | | | | |
| | | 2012 | | | 2011 | |
BPLP | | | | | | | | |
Finance lease receivable from Bruce A Limited Partnership (BALP)(a) | | $ | 81,528 | | | $ | 87,785 | |
Derivatives [note 29] | | | 20,180 | | | | 54,010 | |
Available-for-sale securities | | | | | | | | |
GoviEx Uranium (privately held) | | | 20,599 | | | | 21,057 | |
Derivatives [note 29] | | | 22,453 | | | | 17,569 | |
Advances receivable from JV Inkai LLP [note 36] | | | 87,264 | | | | 78,058 | |
Investment tax credits | | | 69,690 | | | | 54,038 | |
Other | | | 42,583 | | | | 32,429 | |
| | | | | | | | |
| | | 344,297 | | | | 344,946 | |
Less current portion | | | (46,259 | ) | | | (62,433 | ) |
| | | | | | | | |
Net | | $ | 298,038 | | | $ | 282,513 | |
| | | | | | | | |
| (a) | BPLP leases the Bruce A nuclear generating plants and other property, plant and equipment to BALP, a related party, under a sublease agreement. Future minimum base rent sublease payments under the capital lease receivable are imputed using a 7.5% discount rate. The future minimum lease payments are as follows: |
At December 31, 2012
| | | | | | | | | | | | |
| | | Future minimum
lease payments | | | Interest | | | Present value of
minimum lease
payments | |
Less than one year | | $ | 12,798 | | | $ | 5,880 | | | $ | 6,918 | |
Between one and five years | | | 69,754 | | | | 16,093 | | | | 53,661 | |
More than five years | | | 21,810 | | | | 861 | | | | 20,949 | |
| | | | | | | | | | | | |
Total | | $ | 104,362 | | | $ | 22,834 | | | $ | 81,528 | |
| | | | | | | | | | | | |
At December 31, 2011
| | | | | | | | | | | | |
| | | Future minimum
lease payments | | | Interest | | | Present value of
minimum lease
payments | |
Less than one year | | $ | 12,640 | | | $ | 6,372 | | | $ | 6,268 | |
Between one and five years | | | 59,800 | | | | 19,566 | | | | 40,234 | |
More than five years | | | 44,550 | | | | 3,267 | | | | 41,283 | |
| | | | | | | | | | | | |
Total | | $ | 116,990 | | | $ | 29,205 | | | $ | 87,785 | |
| | | | | | | | | | | | |
Included in finance income is $6,383,000 related to the finance lease receivable for the year ended December 31, 2012 (2011—$6,731,000).
The lease agreement includes supplemental lease payments which are classified as contingent rents. Annual supplemental rents of $31,000,000 (subject to CPI) per operating reactor are payable by BPLP to Ontario Power Generation Inc. (OPG). Should the hourly annual average price of electricity in Ontario fall below $30 per megawatt hour for any calendar year, the supplemental rent reduces to $12,000,000 per operating reactor.
In accordance with the sublease agreement, BALP will participate in its share of supplemental rent and any subsequent adjustments. There were $35,866,000 in supplemental lease payments to OPG recognized in 2012 (2011—$58,302,000). Of
2012 ANNUAL REPORT135
this amount, $20,698,000 was reimbursed to BPLP from BALP during 2012 (2011—$19,434,000). The net amounts have been recognized in cost of products and services sold.
In addition, the base rent payments during the renewal periods have been classified as contingent rents. The calculation of the renewal base rent payments is based on the proportion of operational BALP units versus BPLP units, contingent on the extent of use of the respective stations. These base rents will commence in 2019.
13. Equity-accounted investees
| | | | | | | | |
| | | 2012 | | | 2011 | |
Beginning of year | | $ | 220,226 | | | $ | 220,430 | |
Investment cost addition | | | 3,366 | | | | 10,026 | |
Share of loss | | | (6,005 | ) | | | (7,233 | ) |
Control of associate acquired | | | — | | | | (6,846 | ) |
Exchange differences and other | | | (5,065 | ) | | | 3,849 | |
| | | | | | | | |
End of year | | $ | 212,522 | | | $ | 220,226 | |
| | | | | | | | |
Summary financial information for Cameco’s equity-accounted investees, adjusted for the percentage of ownership held, is as follows:
| | | | | | | | |
| | | 2012 | | | 2011 | |
Current assets | | $ | 7,428 | | | $ | 22,402 | |
Non-current assets | | | 60,835 | | | | 51,129 | |
Current liabilities | | | (2,145 | ) | | | (3,669 | ) |
Non-current liabilities | | | (2,873 | ) | | | (3,114 | ) |
| | | | | | | | |
Net assets | | $ | 63,245 | | | $ | 66,748 | |
| | | | | | | | |
Revenue | | $ | 1,667 | | | $ | 1,608 | |
Expenses | | | (7,672 | ) | | | (8,841 | ) |
| | | | | | | | |
Net loss | | $ | (6,005 | ) | | $ | (7,233 | ) |
| | | | | | | | |
At December 31, 2012, the quoted value of the Company’s share in associates having shares listed on recognized stock exchanges was $29,512,000 (December 31, 2011—$30,268,000). The carrying value of these investments was $7,745,000 at December 31, 2012 (December 31, 2011—$6,699,000).
14. Accounts payable and accrued liabilities
| | | | | | | | |
| | | 2012 | | | 2011 | |
Trade payables | | $ | 320,991 | | | $ | 310,944 | |
Non-trade payables | | | 136,426 | | | | 134,613 | |
Payables due to related parties | | | 11,359 | | | | 9,942 | |
| | | | | | | | |
Total | | $ | 468,776 | | | $ | 455,499 | |
| | | | | | | | |
The Company’s exposure to currency and liquidity risk related to trade and other payables is disclosed in note 29.
136CAMECO CORPORATION
15. Short-term debt
| | | | | | | | |
| | | 2012 | | | 2011 | |
Promissory note payable | | $ | 42,106 | | | $ | 73,059 | |
BPLP | | | 39,500 | | | | 18,644 | |
Commercial paper | | | 24,984 | | | | — | |
JV Inkai LLP | | | — | | | | 6,127 | |
| | | | | | | | |
Total | | $ | 106,590 | | | $ | 97,830 | |
| | | | | | | | |
In 2008, a promissory note in the amount of $73,344,000 (US) was issued to finance the acquisition of GE-Hitachi Global Laser Enrichment LLC (GLE). The promissory note is payable on demand and bears interest at a market rate of 1.07%. At December 31, 2012, $42,322,000 (US) was outstanding under this promissory note (2011—$71,838,000 (US)).
BPLP has a $150,000,000 working capital and operational letter of credit facility that is available until July 30, 2015, as well as $489,000,000 in letter of credit facilities. Cameco’s share of the available facilities is $47,400,000 under the working capital and operational letter of credit facility and $154,524,000 in letter of credit facilities.
As at December 31, 2012, BPLP had $145,000,000 (2011—$75,000,000) outstanding under the working capital ($125,000,000) and operational letter of credit facility ($20,000,000) and $489,000,000 outstanding under the letter of credit facilities (2011—$362,000,000). As at December 31, 2012, Cameco’s share outstanding under the working capital ($39,500,000) and operational letter of credit facility ($6,320,000) was $45,820,000 (2011—$23,700,000) and $154,524,000 under the letter of credit facilities (2011—$114,390,000).
Cameco also borrows directly in the commercial paper market. As of December 31, 2012, there was $24,984,000 outstanding, bearing interest at an average rate of 1.14%.
Inkai has a $20,000,000 (US) revolving credit facility that is available until August 11, 2014. Cameco’s share of this facility is $12,000,000 (US). While no balance was outstanding under this facility at December 31, 2012, $10,040,000 (US) was outstanding at the end of 2011 (Cameco’s share $6,024,000 (US)).
16. Long-term debt
| | | | | | | | |
| | | 2012 | | | 2011 | |
Debentures—Series C | | $ | 299,265 | | | $ | 298,993 | |
Debentures—Series D | | | 496,566 | | | | 496,152 | |
Debentures—Series E | | | 397,403 | | | | — | |
Debentures—Series F | | | 99,206 | | | | — | |
| | | | | | | | |
Total | | $ | 1,292,440 | | | $ | 795,145 | |
| | | | | | | | |
On November 14, 2012, Cameco issued additional debentures (Series E and Series F) in the amounts of $400,000,000 and $100,000,000 respectively. The Series E debentures bear interest at a rate of 3.75% per annum (effective interest rate of 3.83%) and mature on November 14, 2022. The proceeds of the issue after deducting expenses were $397,400,000. The Series F debentures bear interest at a rate of 5.09% per annum (effective interest rate of 5.14%) and mature on November 14, 2042. The proceeds of the issue after deducting expenses were $99,200,000.
Cameco has $299,000,000 outstanding in senior unsecured debentures (Series C). These debentures bear interest at a rate of 4.70% per annum (effective interest rate of 4.79%) and mature on September 16, 2015.
Cameco has $497,000,000 outstanding in senior unsecured debentures (Series D). These debentures bear interest at a rate of 5.67% per annum (effective interest rate of 5.80%) and mature on September 2, 2019.
2012 ANNUAL REPORT137
Cameco has a $1,250,000,000 unsecured revolving credit facility that is available until November 1, 2017. Upon mutual agreement, the facility can be extended for an additional year on the anniversary date. In addition to direct borrowings under the facility, up to $100,000,000 can be used for the issuance of letters of credit and, to the extent necessary, it may be used to provide liquidity support for the Company’s commercial paper program. The agreement also provides the ability to increase the revolving credit facility above $1,250,000,000 by no less than increments of $50,000,000, up to a total of $1,750,000,000. The facility ranks equally with all of Cameco’s other senior debt. As of December 31, 2012 there were no amounts outstanding under this facility.
Cameco has $698,814,000 ($410,917,000 and $289,374,000 (US)) in letter of credit facilities. Outstanding letters of credit at December 31, 2012 amounted to $672,224,000 ($405,421,000 and $267,879,000 (US)) (2011—$664,575,000 ($395,606,000 and $264,186,000 (US))), the majority of which relate to future decommissioning and reclamation liabilities [note 19].
Cameco is bound by a covenant in its revolving credit facility. The covenant requires a funded debt to tangible net worth ratio equal to or less than 1:1. Non-compliance with this covenant could result in accelerated payment and termination of the revolving credit facility. At December 31, 2012, Cameco was in compliance with the covenant and does not expect its operating and investing activities in 2013 to be constrained by it.
The table below represents currently scheduled maturities of long-term debt.
| | | | | | | | | | | | | | | | | | | | | | | | |
2013 | | 2014 | | | 2015 | | | 2016 | | | 2017 | | | Thereafter | | | Total | |
| $— | | $ | — | | | $ | 299,266 | | | $ | — | | | $ | — | | | $ | 993,174 | | | $ | 1,292,440 | |
17. Finance lease obligation
BPLP holds a long-term lease with OPG to operate the Bruce nuclear power facility. The initial term of the lease expires in 2018, with options to extend the lease for up to an additional 25 years. The interest rate associated with the lease is 7.5%. The future minimum lease payments are as follows:
At December 31, 2012
| | | | | | | | | | | | |
| | | Future minimum
lease payments | | | Interest | | | Present value of
minimum lease
payments | |
Less than one year | | $ | 25,596 | | | $ | 9,259 | | | $ | 16,337 | |
Between one and five years | | | 109,336 | | | | 22,594 | | | | 86,742 | |
More than five years | | | 29,072 | | | | 1,138 | | | | 27,934 | |
| | | | | | | | | | | | |
Total | | $ | 164,004 | | | $ | 32,991 | | | $ | 131,013 | |
| | | | | | | | | | | | |
At December 31, 2011
| | | | | | | | | | | | |
| | | Future minimum
lease payments | | | Interest | | | Present value of
minimum lease
payments | |
Less than one year | | $ | 25,280 | | | $ | 10,428 | | | $ | 14,852 | |
Between one and five years | | | 106,492 | | | | 28,728 | | | | 77,764 | |
More than five years | | | 57,512 | | | | 4,294 | | | | 53,218 | |
| | | | | | | | | | | | |
Total | | $ | 189,284 | | | $ | 43,450 | | | $ | 145,834 | |
| | | | | | | | | | | | |
Included in finance costs is $10,428,000 related to the finance lease obligation for the year ended December 31, 2012 (2011—$11,376,000).
138CAMECO CORPORATION
The lease agreement includes supplemental payments which are classified as contingent rents. Annual supplemental rents of $31,000,000 (subject to CPI) per operating reactor are payable by BPLP to OPG. Should the hourly annual average price of electricity in Ontario fall below $30 per megawatt hour for any calendar year, the supplemental rent reduces to $12,000,000 per operating reactor.
BPLP leases the Bruce A nuclear generating plants and other property, plant and equipment to BALP under a sublease agreement. In accordance with the sublease agreement, BALP will participate in its share of supplemental rent and any subsequent adjustments. There were $35,866,000 in supplemental lease payments to OPG recognized in 2012 (2011—$58,302,000). Of this amount, $20,698,000 was reimbursed to BPLP from BALP during 2012 (2011—$19,434,000). The net amounts have been recognized in cost of products and services sold.
In addition, the base rent payments during the renewal periods have been classified as contingent rents. The calculation of the renewal base rent payments is based on the proportion of operational BALP units versus BPLP units, contingent on the extent of use of the respective stations. These base rents will commence in 2019.
18. Other liabilities
| | | | | | | | |
| | | 2012 | | | 2011 | |
BPLP | | | | | | | | |
Accrued pension and post-retirement benefit liability [note 28] | | $ | 554,532 | | | $ | 468,363 | |
Derivatives [note 29] | | | 8,294 | | | | 19,439 | |
Other | | | 7,584 | | | | 4,045 | |
Deferred sales | | | 9,820 | | | | 13,739 | |
Derivatives [note 29] | | | 1,954 | | | | 27,194 | |
Accrued pension and post-retirement benefit liability [note 28] | | | 30,648 | | | | 38,050 | |
Other | | | 7,740 | | | | 6,624 | |
| | | | | | | | |
| | | 620,572 | | | | 577,454 | |
Less current portion | | | (21,144 | ) | | | (50,495 | ) |
| | | | | | | | |
Net | | $ | 599,428 | | | $ | 526,959 | |
| | | | | | | | |
19. Provisions
| | | | | | | | | | | | |
| | | Reclamation | | | Waste Disposal | | | Total | |
Beginning of year | | $ | 508,766 | | | $ | 25,716 | | | $ | 534,482 | |
Changes in estimates and discount rates | | | 55,990 | | | | (3,289 | ) | | | 52,701 | |
Provisions used during the period | | | (21,263 | ) | | | (5,938 | ) | | | (27,201 | ) |
Unwinding of discount | | | 13,208 | | | | 329 | | | | 13,537 | |
Impact of foreign exchange | | | (4,065 | ) | | | — | | | | (4,065 | ) |
| | | | | | | | | | | | |
End of year | | $ | 552,636 | | | $ | 16,818 | | | $ | 569,454 | |
| | | | | | | | | | | | |
Current | | $ | 15,819 | | | $ | 3,011 | | | $ | 18,830 | |
Non-current | | | 536,817 | | | | 13,807 | | | | 550,624 | |
| | | | | | | | | | | | |
| | $ | 552,636 | | | $ | 16,818 | | | $ | 569,454 | |
| | | | | | | | | | | | |
A. Reclamation provision
Cameco’s estimates of future decommissioning obligations are based on reclamation standards that satisfy regulatory requirements. Elements of uncertainty in estimating these amounts include potential changes in regulatory requirements, decommissioning and reclamation alternatives and amounts to be recovered from other parties.
2012 ANNUAL REPORT139
Cameco estimates total future decommissioning and reclamation costs for its existing operating assets to be $697,740,000. The expected timing of these outflows is based on life-of-mine plans with the majority of expenditures expected to occur after 2018. These estimates are reviewed by Cameco technical personnel as required by regulatory agencies or more frequently as circumstances warrant. In connection with future decommissioning and reclamation costs, Cameco has provided financial assurances of $671,880,000 in the form of letters of credit to satisfy current regulatory requirements.
The reclamation provision relates to the following segments:
| | | | | | | | |
| | | 2012 | | | 2011 | |
Uranium | | $ | 435,842 | | | $ | 381,967 | |
Fuel Services | | | 116,794 | | | | 126,799 | |
| | | | | | | | |
Total | | $ | 552,636 | | | $ | 508,766 | |
| | | | | | | | |
B. Waste disposal
The Fuel Services division consists of the Blind River Refinery, Port Hope Conversion Facility and Cameco Fuel Manufacturing. The refining, conversion and manufacturing processes generate certain uranium contaminated waste. These include contaminated combustible material (paper, rags, gloves, etc.), and contaminated non-combustible material (metal parts, soil from excavations, building and roofing materials, spent uranium concentrate drums, etc.). These materials can in some instances be recycled or reprocessed. A provision for waste disposal costs in respect of these materials is recognized when they are generated.
Cameco estimates total future costs related to existing waste disposal to be $17,110,000. These outflows are expected to occur within the next five years.
20. Share capital
Authorized share capital:
| | • | | Unlimited number of first preferred shares |
| | • | | Unlimited number of second preferred shares |
| | • | | Unlimited number of voting common shares, no stated par value, and |
A. Common shares
| | | | | | | | |
Number Issued(Number of shares) | | 2012 | | | 2011 | |
Beginning of year | | | 394,745,423 | | | | 394,351,043 | |
Issued: | | | | | | | | |
Stock option plan [note 27] | | | 604,971 | | | | 394,380 | |
| | | | | | | | |
Total | | | 395,350,394 | | | | 394,745,423 | |
| | | | | | | | |
All issued shares are fully paid.
B. Class B share
One Class B share issued during 1988 and assigned $1 of share capital entitles the shareholder to vote separately as a class in respect of any proposal to locate the head office of Cameco to a place not in the province of Saskatchewan.
C. Dividends
Dividends on Cameco Corporation common shares are declared in Canadian dollars. For the year ended December 31, 2012, the dividend declared per share was $0.40 (December 31, 2011—$0.40).
140CAMECO CORPORATION
21. Employee benefit expense
The following employee benefit expenses are included in cost of products and services sold, administration, exploration, research and development, other income and property, plant and equipment.
| | | | | | | | |
| | | 2012 | | | 2011 | |
Wages and salaries | | $ | 535,159 | | | $ | 513,824 | |
Statutory and company benefits | | | 69,423 | | | | 62,765 | |
Equity-settled share-based compensation | | | 22,780 | | | | 24,139 | |
Expenses related to defined benefit plans | | | 55,366 | | | | 46,524 | |
Contributions to defined contribution plans | | | 16,114 | | | | 16,663 | |
Cash-settled share-based compensation | | | 677 | | | | (10,333 | ) |
| | | | | | | | |
Total | | $ | 699,519 | | | $ | 653,582 | |
| | | | | | | | |
22. Finance costs
| | | | | | | | |
| | | 2012 | | | 2011 | |
Interest on long-term debt | | $ | 57,077 | | | $ | 56,618 | |
Unwinding of discount on provisions | | | 13,537 | | | | 13,427 | |
Other charges | | | 7,576 | | | | 3,179 | |
Foreign exchange (gains) losses | | | 415 | | | | (1,678 | ) |
Interest on short-term debt | | | 1,744 | | | | 2,122 | |
| | | | | | | | |
Total | | $ | 80,349 | | | $ | 73,668 | |
| | | | | | | | |
23. Other income (expense)
| | | | | | | | |
| | | 2012 | | | 2011 | |
Contract termination fee | | $ | (30,294 | ) | | $ | — | |
Claim settlement | | | 11,000 | | | | — | |
Sale of investments | | | — | | | | 4,623 | |
Other | | | (5,452 | ) | | | (4,067 | ) |
| | | | | | | | |
Total | | $ | (24,746 | ) | | $ | 556 | |
| | | | | | | | |
2012 ANNUAL REPORT141
24. Income taxes
A. Significant components of deferred tax assets and liabilities
| | | | | | | | | | | | | | | | |
| | | Recognized in earnings | | | As at December 31 | |
| | | 2012 | | | 2011 | | | 2012 | | | 2011 | |
Assets | | | | | | | | | | | | | | | | |
Inventories | | $ | 3,250 | | | $ | — | | | $ | 3,250 | | | $ | — | |
Provision for reclamation | | | 7,152 | | | | 47,645 | | | | 166,588 | | | | 159,455 | |
Foreign exploration and development | | | (62 | ) | | | 432 | | | | 9,621 | | | | 9,683 | |
Income tax losses | | | 59,174 | | | | 55,702 | | | | 126,241 | | | | 67,072 | |
Defined benefit plan actuarial losses | | | — | | | | — | | | | 93,831 | | | | 71,304 | |
Other | | | 11,542 | | | | 7,150 | | | | 42,552 | | | | 26,503 | |
| | | | | | | | | | | | | | | | |
Deferred tax assets | | | 81,056 | | | | 110,929 | | | | 442,083 | | | | 334,017 | |
| | | | | | | | | | | | | | | | |
Liabilities | | | | | | | | | | | | | | | | |
Property, plant and equipment | | | (16,646 | ) | | | 110,616 | | | | 226,723 | | | | 243,345 | |
Inventories | | | (4,629 | ) | | | (3,301 | ) | | | — | | | | 4,629 | |
Long-term investments and other | | | 15,204 | | | | (27,857 | ) | | | 28,020 | | | | 12,816 | |
| | | | | | | | | | | | | | | | |
Deferred tax liabilities | | | (6,071 | ) | | | 79,458 | | | | 254,743 | | | | 260,790 | |
| | | | | | | | | | | | | | | | |
Net deferred tax asset | | $ | 87,127 | | | $ | 31,471 | | | $ | 187,340 | | | $ | 73,227 | |
| | | | | | | | | | | | | | | | |
| | | | | | | | |
Deferred tax allocated as | | 2012 | | | 2011 | |
Deferred tax assets | | $ | 193,113 | | | $ | 81,392 | |
Deferred tax liabilities | | | (5,773 | ) | | | (8,165 | ) |
| | | | | | | | |
Net deferred tax asset | | $ | 187,340 | | | $ | 73,227 | |
| | | | | | | | |
Based on projections of future income, realization of these deferred tax assets is probable and consequently a deferred tax asset has been recorded.
B. Movement in net deferred tax assets and liabilities
| | | | | | | | |
| | | 2012 | | | 2011 | |
Deferred tax asset (liability) at beginning of year | | $ | 73,227 | | | $ | (676 | ) |
Recovery for the year in net earnings | | | 87,127 | | | | 31,471 | |
Recovery for the year in other comprehensive income | | | 27,631 | | | | 38,951 | |
Foreign exchange adjustments | | | (645 | ) | | | 3,481 | |
| | | | | | | | |
End of year | | $ | 187,340 | | | $ | 73,227 | |
| | | | | | | | |
C. Significant components of unrecognized deferred tax assets
| | | | | | | | |
| | | 2012 | | | 2011 | |
Income tax losses | | $ | 73,019 | | | $ | 45,847 | |
Property, plant and equipment | | | 58,249 | | | | 27,328 | |
Long-term investments and other | | | 7,750 | | | | 2,893 | |
| | | | | | | | |
Total | | $ | 139,018 | | | $ | 76,068 | |
| | | | | | | | |
142CAMECO CORPORATION
D. Tax rate reconciliation
The provision for income taxes differs from the amount computed by applying the combined expected federal and provincial income tax rate to earnings before income taxes. The reasons for these differences are as follows:
| | | | | | | | |
| | | 2012 | | | 2011 | |
Earnings before income taxes and non-controlling interest | | $ | 218,207 | | | $ | 461,599 | |
Combined federal and provincial tax rate | | | 26.9 | % | | | 28.4 | % |
| | | | | | | | |
Computed income tax expense | | | 58,697 | | | | 131,094 | |
Increase (decrease) in taxes resulting from: | | | | | | | | |
Difference between Canadian rates and rates applicable to subsidiaries in other countries | | | (173,829 | ) | | | (188,084 | ) |
Change in unrecorded deferred tax assets | | | 52,742 | | | | 15,961 | |
Other provincial taxes | | | 3,524 | | | | 2,935 | |
Share-based compensation plans | | | 3,828 | | | | 4,295 | |
Change in tax provision related to transfer pricing | | | 9,000 | | | | 27,000 | |
Change in income tax rates | | | 114 | | | | 7,582 | |
Other permanent differences | | | (452 | ) | | | 10,972 | |
| | | | | | | | |
Income tax expense (recovery) | | $ | (46,376 | ) | | $ | 11,755 | |
| | | | | | | | |
E. Reassessments
In 2008, as part of the ongoing annual audits of Cameco’s Canadian tax returns, Canada Revenue Agency (CRA) disputed the transfer pricing structure and methodology used by Cameco and its wholly owned Swiss subsidiary, Cameco Europe Ltd. (CEL), in respect of sale and purchase agreements for uranium products. From December 2008 to date, CRA issued notices of reassessment for the taxation years 2003 through 2007, which have increased Cameco’s income for Canadian income tax purposes by approximately $43,000,000, $108,000,000, $197,000,000, $243,000,000 and $708,000,000 respectively. The 2007 reassessment has resulted in Cameco being required to make a cash payment of approximately $27,000,000 subsequent to year-end. Cameco believes it is likely that CRA will reassess Cameco’s tax returns for subsequent years on a similar basis and that these will result in future cash payments on receipt of the reassessments.
CRA’s Transfer Pricing Review Committee has not imposed a transfer pricing penalty for any year reassessed to date.
Having regard to advice from its external advisors, Cameco’s opinion is that CRA’s position is incorrect, and Cameco is contesting CRA’s position and expects to recover any cash paid as a result of the reassessments. However, to reflect the uncertainties of CRA’s appeals process and litigation, Cameco has recorded a cumulative tax provision related to this matter for the years 2003 through 2012 in the amount of $63,000,000. No provisions for penalties or interest have been recorded. While the resolution of this matter may result in liabilities that are higher or lower than the reserve, management believes that the ultimate resolution will not be material to Cameco’s financial position, results of operations or liquidity in the year(s) of resolution. Resolution of this matter as stipulated by CRA would be material to Cameco’s financial position, results of operations or liquidity in the year(s) of resolution, and other unfavourable outcomes for the years 2003 through 2012 could be material, to Cameco’s financial position, results of operations and cash flows in the year(s) of resolution.
Further to Cameco’s decision to contest CRA’s reassessments, Cameco is pursuing its appeal rights under the Income Tax Act.
2012 ANNUAL REPORT143
F. Earnings and income taxes by jurisdiction
| | | | | | | | |
| | | 2012 | | | 2011 | |
Earnings (loss) before income taxes | | | | | | | | |
Canada | | $ | (319,865 | ) | | $ | (376,952 | ) |
Foreign | | | 538,072 | | | | 838,551 | |
| | | | | | | | |
| | $ | 218,207 | | | $ | 461,599 | |
| | | | | | | | |
Current income taxes (recovery) | | | | | | | | |
Canada | | $ | 504 | | | $ | (7,856 | ) |
Foreign | | | 40,247 | | | | 51,082 | |
| | | | | | | | |
| | $ | 40,751 | | | $ | 43,226 | |
Deferred income taxes (recovery) | | | | | | | | |
Canada | | $ | (75,051 | ) | | $ | (47,427 | ) |
Foreign | | | (12,076 | ) | | | 15,956 | |
| | | | | | | | |
| | $ | (87,127 | ) | | $ | (31,471 | ) |
| | | | | | | | |
Income tax expense (recovery) | | $ | (46,376 | ) | | $ | 11,755 | |
| | | | | | | | |
G. Income tax losses
At December 31, 2012, income tax losses carried forward of $702,654,000 (2011—$402,041,000) are available to reduce taxable income. These losses expire as follows:
| | | | | | | | | | | | | | | | |
Date of expiry | | Canada | | | US | | | Other | | | Total | |
2018 | | $ | — | | | $ | 1,880 | | | $ | — | | | $ | 1,880 | |
2029 | | | — | | | | 8,099 | | | | — | | | | 8,099 | |
2030 | | | 410 | | | | 10,549 | | | | — | | | | 10,959 | |
2031 | | | 143,747 | | | | 17,437 | | | | — | | | | 161,184 | |
2032 | | | 268,343 | | | | 11,951 | | | | — | | | | 280,294 | |
No expiry | | | — | | | | — | | | | 240,238 | | | | 240,238 | |
| | | | | | | | | | | | | | | | |
| | $ | 412,500 | | | $ | 49,916 | | | $ | 240,238 | | | $ | 702,654 | |
| | | | | | | | | | | | | | | | |
Included in the table above is $243,080,000 (2011—$152,848,000) of temporary differences related to loss carry forwards where no future benefit is realized.
H. Other comprehensive loss
Other comprehensive loss included on the consolidated statements of comprehensive income and the consolidated statements of changes in equity is presented net of income taxes. The following income tax amounts are included in each component of other comprehensive loss:
144CAMECO CORPORATION
For the year ended December 31, 2012
| | | | | | | | | | | | |
| | | Before tax | | | Income tax
recovery
(expense) | | | Net of tax | |
Exchange differences on translation of foreign operations | | $ | (23,287 | ) | | $ | — | | | $ | (23,287 | ) |
Gains on derivatives designated as cash flow hedges | | | 5,309 | | | | (1,327 | ) | | | 3,982 | |
Gains on derivatives designated as cash flow hedges transferred to net earnings | | | (25,934 | ) | | | 6,484 | | | | (19,450 | ) |
Unrealized losses on available-for-sale assets | | | (24 | ) | | | 5 | | | | (19 | ) |
Gains on available-for-sale assets transferred to net earnings | | | (149 | ) | | | 20 | | | | (129 | ) |
Defined benefit plan actuarial losses | | | (89,994 | ) | | | 22,449 | | | | (67,545 | ) |
| | | | | | | | | | | | |
| | $ | (134,079 | ) | | $ | 27,631 | | | $ | (106,448 | ) |
| | | | | | | | | | | | |
For the year ended December 31, 2011
| | | | | | | | | | | | |
| | | Before tax | | | Income tax
recovery
(expense) | | | Net of tax | |
Exchange differences on translation of foreign operations | | $ | 34,361 | | | $ | — | | | $ | 34,361 | |
Gains on derivatives designated as cash flow hedges | | | 10,717 | | | | (2,763 | ) | | | 7,954 | |
Gains on derivatives designated as cash flow hedges transferred to net earnings | | | (25,506 | ) | | | 6,806 | | | | (18,700 | ) |
Unrealized gains on available-for-sale assets | | | 311 | | | | (39 | ) | | | 272 | |
Gains on available-for-sale assets transferred to net earnings | | | (2,209 | ) | | | 292 | | | | (1,917 | ) |
Defined benefit plan actuarial losses | | | (138,692 | ) | | | 34,655 | | | | (104,037 | ) |
| | | | | | | | | | | | |
| | $ | (121,018 | ) | | $ | 38,951 | | | $ | (82,067 | ) |
| | | | | | | | | | | | |
25. Per share amounts
Per share amounts have been calculated based on the weighted average number of common shares outstanding during the period. The weighted average number of paid shares outstanding in 2012 was 395,234,091 (2011—394,661,591).
| | | | | | | | |
| | | 2012 | | | 2011 | |
Basic earnings per share computation | | | | | | | | |
Net earnings attributable to equity holders | | $ | 266,136 | | | $ | 450,404 | |
Weighted average common shares outstanding | | | 395,234 | | | | 394,662 | |
| | | | | | | | |
Basic earnings per common share | | $ | 0.67 | | | $ | 1.14 | |
| | |
Diluted earnings per share computation | | | | | | | | |
Net earnings attributable to equity holders | | $ | 266,136 | | | $ | 450,404 | |
Weighted average common shares outstanding | | | 395,234 | | | | 394,662 | |
Dilutive effect of stock options | | | 605 | | | | 817 | |
| | | | | | | | |
Weighted average common shares outstanding, assuming dilution | | | 395,839 | | | | 395,479 | |
| | | | | | | | |
Diluted earnings per common share | | $ | 0.67 | | | $ | 1.14 | |
| | | | | | | | |
2012 ANNUAL REPORT145
26. Statements of cash flows
| | | | | | | | |
| | | 2012 | | | 2011 | |
Changes in non-cash working capital: | | | | | | | | |
Accounts receivable | | $ | 66,252 | | | $ | (159,317 | ) |
Inventories | | | (56,707 | ) | | | 29,105 | |
Supplies and prepaid expenses | | | (7,696 | ) | | | 8,084 | |
Accounts payable and accrued liabilities | | | (20,169 | ) | | | 69,342 | |
Reclamation payments | | | (27,201 | ) | | | (22,883 | ) |
Other | | | (27,997 | ) | | | (40,050 | ) |
| | | | | | | | |
Other operating items | | $ | (73,518 | ) | | $ | (115,719 | ) |
| | | | | | | | |
27. Share-based compensation plans
The Company has the following equity-settled plans:
A. Stock option plan
The Company has established a stock option plan under which options to purchase common shares may be granted to employees of Cameco. Options granted under the stock option plan have an exercise price of not less than the closing price quoted on the TSX for the common shares of Cameco on the trading day prior to the date on which the option is granted. The options vest over three years and expire eight years from the date granted.
The aggregate number of common shares that may be issued pursuant to the Cameco stock option plan shall not exceed 43,017,198, of which 27,427,951 shares have been issued.
Stock option transactions for the respective years were as follows:
| | | | | | | | |
(Number of options) | | 2012 | | | 2011 | |
Beginning of year | | | 8,526,090 | | | | 7,552,379 | |
Options granted | | | 2,097,573 | | | | 1,630,069 | |
Options forfeited | | | (500,852 | ) | | | (261,978 | ) |
Options exercised [note 20] | | | (604,971 | ) | | | (394,380 | ) |
| | | | | | | | |
End of year | | | 9,517,840 | | | | 8,526,090 | |
| | | | | | | | |
Exercisable | | | 5,964,201 | | | | 5,556,417 | |
| | | | | | | | |
Weighted average exercise prices were as follows:
| | | | | | | | |
| | | 2012 | | | 2011 | |
Beginning of year | | $ | 32.47 | | | $ | 30.26 | |
Options granted | | | 21.14 | | | | 39.10 | |
Options forfeited | | | 34.22 | | | | 36.88 | |
Options exercised | | | 11.61 | | | | 14.68 | |
| | | | | | | | |
End of year | | $ | 31.20 | | | $ | 32.47 | |
| | | | | | | | |
Exercisable | | $ | 33.53 | | | $ | 32.16 | |
| | | | | | | | |
146CAMECO CORPORATION
Total options outstanding and exercisable at December 31, 2012 were as follows:
| | | | | | | | | | | | | | | | | | | | |
| | | | | | Options Outstanding | | | Options Exercisable | |
Option Price Per Share | | Number | | | Weighted
Average
Remaining
Life | | | Weighted
Average
Exercisable
Price | | | Number | | | Weighted
Average
Exercisable
Price | |
$15.50—28.99 | | | 5,388,149 | | | | 5.1 | | | $ | 23.73 | | | | 2,820,020 | | | $ | 24.76 | |
$29.00—54.50 | | | 4,129,691 | | | | 3.6 | | | | 40.95 | | | | 3,144,181 | | | | 41.39 | |
| | | | | | | | | | | | | | | | | | | | |
| | | 9,517,840 | | | | | | | | | | | | 5,964,201 | | | | | |
| | | | | | | | | | | | | | | | | | | | |
The foregoing options have expiry dates ranging from August 16, 2013 to May 14, 2020.
Non-vested stock option transactions for the respective years were as follows:
| | | | | | | | |
(Number of options) | | 2012 | | | 2011 | |
Beginning of year | | | 2,969,673 | | | | 2,737,618 | |
Options granted | | | 2,097,573 | | | | 1,630,069 | |
Options forfeited | | | (88,868 | ) | | | (96,055 | ) |
Options vested | | | (1,424,739 | ) | | | (1,301,959 | ) |
| | | | | | | | |
End of year | | | 3,553,639 | | | | 2,969,673 | |
| | | | | | | | |
For the year ended December 31, 2012, Cameco has recorded an expense of $14,247,000 (2011—$14,803,000) related to options that vested during the year.
B. Executive performance share unit (PSU)
The Company has established a PSU plan whereby it provides each plan participant an annual grant of PSUs in an amount determined by the board. Each PSU represents one phantom common share that entitles the participant to a payment of one Cameco common share purchased on the open market, or cash at the board’s discretion, at the end of each three-year period if certain performance and vesting criteria have been met. The final value of the PSUs will be based on the value of Cameco common shares at the end of the three-year period and the number of PSUs that ultimately vest. Vesting of PSUs at the end of the three-year period will be based on total shareholder return over the three years, Cameco’s ability to meet its annual cash flow from operations targets and whether the participating executive remains employed by Cameco at the end of the three-year vesting period.
Cameco records compensation expense with an offsetting credit to contributed surplus to reflect the estimated fair value of PSUs granted to employees. For the year ended December 31, 2012, the amount recorded was $2,709,000 (2011—$4,392,000). As of December 31, 2012, the total number of PSUs held by the participants after adjusting for forfeitures on retirement was 350,240 (2011—310,413).
C. Executive restricted share unit (RSU)
In 2011, the Company established an RSU plan whereby it provides each plan participant an annual grant of RSUs in an amount determined by the board. Each RSU represents one phantom common share that entitles the participant to a payment of one Cameco common share purchased on the open market, or cash at the board’s discretion. The final value of the RSUs will be based on the value of Cameco common shares at the end of the three-year vesting period.
2012 ANNUAL REPORT147
Cameco records compensation expense with an offsetting credit to contributed surplus to reflect the estimated fair value of RSUs granted to employees. For the year ended December 31, 2012, the amount recorded was $594,000 (2011—$297,000). As of December 31, 2012, the total number of RSUs held by the participants was 70,000 (2011—70,000). There were no grants of RSUs in 2012.
The fair value of the units granted through the PSU plan was determined based on Monte Carlo simulation and the fair value of all other equity settled payment plans was measured based on the Black-Scholes option pricing model. Expected volatility is estimated by considering historic average share price volatility.
The inputs used in the measurement of the fair values at grant date of the equity-settled share-based payment plans were as follows:
| | | | | | | | |
| | | Stock
Option Plan | | | PSUs | |
Number of options granted | | | 2,097,573 | | | | 178,640 | |
Average strike price | | $ | 21.14 | | | | — | |
Expected dividend | | $ | 0.40 | | | | — | |
Expected volatility | | | 47 | % | | | 36 | % |
Risk-free interest rate | | | 1.4 | % | | | 1.4 | % |
Expected life of option | | | 4.3 years | | | | 3 years | |
Expected forfeitures | | | 10 | % | | | 0 | % |
Weighted average grant date fair values | | $ | 7.21 | | | $ | 20.05 | |
| | | | | | | | |
In addition to these inputs, other features of the PSU grant were incorporated into the measurement of fair value. The market condition based on total shareholder return was incorporated by utilizing a Monte Carlo simulation. The non-market criteria relating to realized selling prices, production targets and cost control have been incorporated into the valuation at grant date by reviewing prior history and corporate budgets.
The Company has the following cash-settled plans:
A. Deferred share unit (DSU)
Cameco offers a DSU plan to non-employee directors. A DSU is a notional unit that reflects the market value of a single common share of Cameco. 60% of each director’s annual retainer is paid in DSUs. In addition, on an annual basis, directors can elect to receive 25%, 50%, 75% or 100% of the remaining 40% of their annual retainer and any additional fees in the form of DSUs. If a director meets their ownership requirements, the director may elect to take 25%, 50%, 75% or 100% of their annual retainer and any fees in cash, with the balance, if any, to be paid in DSUs. Each DSU fully vests upon award. The DSUs will be redeemed for cash upon a director leaving the board. The redemption amount will be based upon the weighted average of the closing prices of the common shares of Cameco on the TSX for the last 20 trading days prior to the redemption date multiplied by the number of DSUs held by the director. As of December 31, 2012, the total number of DSUs held by participating directors was 457,277 (2011—380,851).
148CAMECO CORPORATION
B. Phantom stock option
Cameco makes annual grants of bonuses to eligible non-North American employees in the form of phantom stock options. Employees receive the equivalent value of shares in cash when exercised. Options granted under the phantom stock option plan have an award value equal to the closing price quoted on the TSX for the common shares of Cameco on the trading day prior to the date on which the option is granted. The options vest over three years and expire eight years from the date granted. As of December 31, 2012, the number of options held by participating employees was 248,440 (2011—249,227) with exercise prices ranging from $19.37 to $46.88 per share (2011—$10.51 to $46.88) and a weighted average exercise price of $32.13 (2011—$31.48).
The fair value of all cash-settled payment plans was measured based on the Black-Scholes option-pricing model. Expected volatility is estimated by considering historic average share price volatility. The inputs used in the measurement of the fair values at measurement date of the cash-settled share-based payment plans were as follows:
| | | | |
| | | Phantom Option
Plan | |
Number of units outstanding | | | 248,440 | |
Average strike price | | $ | 32.13 | |
Expected dividend | | $ | 0.40 | |
Expected volatility | | | 40 | % |
Risk-free interest rate | | | 1.3 | % |
Expected life of option | | | 3.4 years | |
Expected forfeitures | | | 0 | % |
Weighted average measurement date fair values | | $ | 2.83 | |
| | | | |
Cameco also has an employee share ownership plan which commenced in 2007, whereby both employee and Company contributions are used to purchase shares on the open market for employees. The Company’s contributions are expensed during the year of contribution. Under the plan, employees have the opportunity to participate in the program to a maximum of 6% of eligible earnings each year with Cameco matching the first 3% of employee-paid shares by 50%. Cameco contributes $1,000 of shares annually to each employee that is enrolled in the plan. Shares purchased with Company contributions and with dividends paid on such shares become unrestricted on January 1 of the second plan year following the date on which such shares were purchased. At December 31, 2012, there were 3,913 participants in the plan (2011—3,695). The total number of shares purchased in 2012 with Company contributions was 265,921 shares (2011—257,747). In 2012, the Company’s contributions totaled $5,230,000 (2011—$4,647,000).
Cameco has recognized the following expenses (recoveries) under these plans:
| | | | | | | | |
| | | 2012 | | | 2011 | |
Deferred share units | | $ | 352 | | | $ | (7,725 | ) |
Phantom stock options | | | 325 | | | | (2,608 | ) |
Employee share ownership plan | | | 5,230 | | | | 4,647 | |
| | | | | | | | |
At December 31, 2012, a liability of $9,665,000 (2011—$7,479,000) was included in the statements of financial position to recognize accrued but unpaid expenses for these plans.
2012 ANNUAL REPORT149
28. Pension and other post-retirement benefits
Cameco maintains both defined benefit and defined contribution plans providing pension and post-retirement benefits to substantially all of its employees.
Under the defined pension benefit plans, Cameco provides benefits to retirees based on their length of service and final average earnings. The non-pension post-retirement plan covers such benefits as group life and supplemental health insurance to eligible employees and their dependants. The costs related to the non-pension post-retirement plans are charged to earnings in the period during which the employment services are rendered. However, these future obligations are not funded.
The effective date for the most recent valuations for funding purposes on the pension benefit plans is January 1, 2012. The next planned effective date for valuation for funding purposes of the pension benefit plans is set to be January 1, 2013.
A reconciliation of the funded status of the benefit plans to the financial statements is as follows:
| | | | | | | | | | | | | | | | |
| | | Pension Benefit Plans | | | Other Benefit Plans | |
| | | 2012 | | | 2011 | | | 2012 | | | 2011 | |
Fair value of plan assets, beginning of year | | $ | 21,766 | | | $ | 27,135 | | | $ | — | | | $ | — | |
Expected return on assets | | | 713 | | | | 880 | | | | — | | | | — | |
Actuarial gain (loss) | | | 166 | | | | (562 | ) | | | — | | | | — | |
Employer contributions | | | 10,015 | | | | 1,875 | | | | — | | | | — | |
Benefits paid | | | (10,949 | ) | | | (7,562 | ) | | | — | | | | — | |
| | | | | | | | | | | | | | | | |
Fair value of plan assets, end of year | | $ | 21,711 | | | $ | 21,766 | | | $ | — | | | $ | — | |
| | | | | | | | | | | | | | | | |
Defined benefit obligation, beginning of year | | $ | 44,111 | | | $ | 35,518 | | | $ | 16,276 | | | $ | 13,355 | |
Current service cost | | | 1,717 | | | | 1,283 | | | | 834 | | | | 727 | |
Interest cost | | | 1,819 | | | | 1,948 | | | | 737 | | | | 747 | |
Actuarial loss (gain) | | | 797 | | | | 12,934 | | | | (1,550 | ) | | | 1,803 | |
Past service cost | | | — | | | | — | | | | — | | | | 688 | |
Benefits paid | | | (10,949 | ) | | | (7,562 | ) | | | (980 | ) | | | (1,044 | ) |
Foreign exchange | | | 2 | | | | (10 | ) | | | — | | | | — | |
| | | | | | | | | | | | | | | | |
Defined benefit obligation, end of year | | $ | 37,497 | | | $ | 44,111 | | | $ | 15,317 | | | $ | 16,276 | |
| | | | | | | | | | | | | | | | |
Funded status of plans—deficit | | $ | (15,786 | ) | | $ | (22,345 | ) | | $ | (15,317 | ) | | $ | (16,276 | ) |
Unrecognized past service cost | | | — | | | | — | | | | 455 | | | | 571 | |
| | | | | | | | | | | | | | | | |
Defined benefit liability[note 18] | | $ | (15,786 | ) | | $ | (22,345 | ) | | $ | (14,862 | ) | | $ | (15,705 | ) |
| | | | | | | | | | | | | | | | |
The actual return on plan assets for the pension benefit plans for the year ended December 31, 2012 was $878,800 (2011—$318,400).
150CAMECO CORPORATION
The percentages of the total fair value of assets in the pension plans for each asset category at December 31 were as follows:
| | | | | | | | |
| | | Pension Benefit Plans | |
| | | 2012 | | | 2011 | |
Asset Category (i) | | | | | | | | |
Equity securities | | | 28 | % | | | 22 | % |
Fixed income | | | 24 | % | | | 20 | % |
Other (ii) | | | 48 | % | | | 58 | % |
| | | | | | | | |
Total | | | 100 | % | | | 100 | % |
| | | | | | | | |
| (i) | The defined benefit plan assets contain no material amounts of related party assets at December 31, 2012 and 2011 respectively. |
| (ii) | Relates to the value of the refundable tax account held by the Canada Revenue Agency. The refundable total is approximately equal to half of the sum of the realized investment income plus employer contributions less half of the benefits paid by the plan. |
The following represents the components of net pension and other benefit expense included primarily as part of administration expense:
| | | | | | | | | | | | | | | | |
| | | Pension Benefit Plans | | | Other Benefit Plans | |
| | | 2012 | | | 2011 | | | 2012 | | | 2011 | |
Current service cost | | $ | 1,717 | | | $ | 1,283 | | | $ | 834 | | | $ | 727 | |
Interest cost | | | 1,819 | | | | 1,948 | | | | 737 | | | | 747 | |
Expected return on plan assets | | | (713 | ) | | | (880 | ) | | | — | | | | — | |
Past service cost | | | — | | | | — | | | | 116 | | | | 117 | |
| | | | | | | | | | | | | | | | |
Defined benefit expense | | | 2,823 | | | | 2,351 | | | | 1,687 | | | | 1,591 | |
Defined contribution pension expense | | | 16,114 | | | | 16,663 | | | | — | | | | — | |
| | | | | | | | | | | | | | | | |
Net pension and other benefit expense | | $ | 18,937 | | | $ | 19,014 | | | $ | 1,687 | | | $ | 1,591 | |
| | | | | | | | | | | | | | | | |
The assumptions used to determine the Company’s defined benefit obligation and net pension and other benefit expense were as follows at December 31:
| | | | | | | | | | | | | | | | |
| | | Pension Benefit Plans | | | Other Benefit Plans | |
| | | 2012 | | | 2011 | | | 2012 | | | 2011 | |
Discount rate | | | 4.0 | % | | | 4.5 | % | | | 4.0 | % | | | 4.5 | % |
Rate of compensation increase | | | 3.0 | % | | | 4.0 | % | | | — | | | | — | |
Long-term rate of return on assets | | | 5.9 | % | | | 5.9 | % | | | — | | | | — | |
Initial health care cost trend rate | | | — | | | | — | | | | 7.0 | % | | | 9.0 | % |
Cost trend rate declines to | | | — | | | | — | | | | 5.0 | % | | | — | |
Year the rate reaches its final level | | | — | | | | — | | | | 2018 | | | | — | |
| | | | | | | | | | | | | | | | |
The long-term rate of return on assets has been determined using an asset model that takes into account the allocation of assets among various asset classes, the expected rate of return on each asset class, the variability of returns and the correlation of returns among asset classes.
2012 ANNUAL REPORT151
An increase of 1% in the assumed health care cost trend rate would increase the aggregate of the current service cost and interest cost components of other benefit expense by $30,400 and increase the defined benefit obligation for these plans by $292,300. A decrease of 1% in the assumed health care cost trend rate would decrease the aggregate of the current service cost and interest cost components of other benefit expense by $41,800 and decrease the defined benefit obligation for these plans by $366,500.
The total amount of actuarial losses (gains) recognized in other comprehensive income is:
| | | | | | | | | | | | | | | | |
| | | Pension Benefit Plans | | | Other Benefit Plans | |
| | | 2012 | | | 2011 | | | 2012 | | | 2011 | |
Balance at beginning of year | | $ | 14,070 | | | $ | 574 | | | $ | 1,803 | | | $ | — | |
Recognized during the year | | | 631 | | | | 13,496 | | | | (1,550 | ) | | | 1,803 | |
| | | | | | | | | | | | | | | | |
| | $ | 14,701 | | | $ | 14,070 | | | $ | 253 | | | $ | 1,803 | |
| | | | | | | | | | | | | | | | |
The following table presents historical information on both the pension and other benefit plans:
| | | | | | | | | | | | | | | | |
| | | Pension Benefit Plans | | | Other Benefit Plans | |
| | | 2012 | | | 2011 | | | 2012 | | | 2011 | |
Fair value of plan assets | | $ | 21,711 | | | $ | 21,766 | | | $ | — | | | $ | — | |
Defined benefit obligation | | | 37,497 | | | | 44,111 | | | | 15,317 | | | | 16,276 | |
| | | | | | | | | | | | | | | | |
Deficit in the plan | | $ | (15,786 | ) | | $ | (22,345 | ) | | $ | (15,317 | ) | | $ | (16,276 | ) |
| | | | | | | | | | | | | | | | |
Experience adjustments arising on plan assets | | | 0.8 | % | | | (2.6 | )% | | | — | | | | — | |
Experience adjustments arising on plan liabilities | | | 2.1 | % | | | 29.3 | % | | | (10.1 | )% | | | 11.1 | % |
| | | | | | | | | | | | | | | | |
The following are the contributions expected to be paid to the plans during the annual period beginning after the end of the current reporting period:
| | | | |
| | | 2013 | |
Employer contribution to funded pension plans | | $ | 281 | |
Benefits paid for unfunded benefit plans | | | 788 | |
Cash contributions to defined contribution plans | | | 16,598 | |
| | | | |
BPLP
BPLP has a funded registered pension plan and an unfunded supplemental pension plan. The funded plan is a contributory, defined benefit plan covering all employees up to the limits imposed by the Income Tax Act. The supplemental pension plan is a non-contributory, defined benefit plan covering all employees with respect to benefits that exceed the limits under the Income Tax Act. These plans are based on years of service and final average salary.
BPLP also has other post-retirement benefit and other post-employment benefit plans that provide for group life insurance, health care and long-term disability benefits. These plans are non-contributory.
The effective date for the most recent valuations for funding purposes on the pension benefit plans is January 1, 2012. The next planned effective date for valuation for funding purposes of the pension benefit plans is set to be January 1, 2013. The status of Cameco’s proportionate share (31.6%) of the benefit plans is shown below.
152CAMECO CORPORATION
A reconciliation of the funded status of the benefit plans to the financial statements is as follows:
| | | | | | | | | | | | | | | | |
| | | Pension Benefit Plans | | | Other Benefit Plans | |
| | | 2012 | | | 2011 | | | 2012 | | | 2011 | |
Fair value of plan assets, beginning of year | | $ | 758,652 | | | $ | 717,320 | | | $ | — | | | $ | — | |
Expected return on assets | | | 54,036 | | | | 50,484 | | | | — | | | | — | |
Actuarial gain (loss) | | | 18,644 | | | | (26,300 | ) | | | — | | | | — | |
Employer contributions | | | 48,980 | | | | 41,294 | | | | — | | | | — | |
Plan participants’ contributions | | | 7,584 | | | | 7,900 | | | | — | | | | | |
Benefits paid | | | (44,240 | ) | | | (32,046 | ) | | | — | | | | — | |
| | | | | | | | | | | | | | | | |
Fair value of plan assets, end of year | | $ | 843,656 | | | $ | 758,652 | | | $ | — | | | $ | — | |
| | | | | | | | | | | | | | | | |
Defined benefit obligation, beginning of year | | $ | 1,017,453 | | | $ | 887,419 | | | $ | 211,093 | | | $ | 181,011 | |
Current service cost | | | 35,430 | | | | 26,752 | | | | 9,936 | | | | 9,312 | |
Interest cost | | | 49,427 | | | | 47,122 | | | | 9,665 | | | | 9,424 | |
Actuarial loss (gain) | | | 122,495 | | | | 81,064 | | | | (12,938 | ) | | | 16,029 | |
Plan participants’ contributions | | | 7,584 | | | | 7,900 | | | | — | | | | — | |
Benefits paid | | | (45,692 | ) | | | (32,804 | ) | | | (5,184 | ) | | | (4,683 | ) |
| | | | | | | | | | | | | | | | |
Defined benefit obligation, end of year | | $ | 1,186,697 | | | $ | 1,017,453 | | | $ | 212,572 | | | $ | 211,093 | |
| | | | | | | | | | | | | | | | |
Funded status of plans—deficit | | $ | (343,041 | ) | | $ | (258,801 | ) | | $ | (212,572 | ) | | $ | (211,093 | ) |
Unrecognized past service cost | | | — | | | | — | | | | 1,081 | | | | 1,531 | |
| | | | | | | | | | | | | | | | |
Defined benefit liability[note 18] | | $ | (343,041 | ) | | $ | (258,801 | ) | | $ | (211,491 | ) | | $ | (209,562 | ) |
| | | | | | | | | | | | | | | | |
The actual return on plan assets for the pension benefit plans for the year ended December 31, 2012 was $72,680,000 (2011—$24,184,000).
The percentages of the total fair value of assets in the pension plans for each asset category at December 31 were as follows:
| | | | | | | | | | | | | | | | |
| | | Asset Allocation | | | Target Allocation | |
| | | 2012 | | | 2011 | | | 2012 | | | 2011 | |
Asset Category (i) | | | | | | | | | | | | | | | | |
Equity securities | | | 58 | % | | | 55 | % | | | 60 | % | | | 60 | % |
Fixed income | | | 39 | % | | | 43 | % | | | 40 | % | | | 40 | % |
Cash | | | 3 | % | | | 2 | % | | | — | | | | — | |
| | | | | | | | | | | | | | | | |
Total | | | 100 | % | | | 100 | % | | | 100 | % | | | 100 | % |
| | | | | | | | | | | | | | | | |
| (i) | The defined benefit plan assets contain no material amounts of related party assets at December 31, 2012. |
The assets of the pension plan are managed on a going concern basis subject to legislative restrictions. The plan’s investment policy is to maximize returns within an acceptable risk tolerance. Pension assets are invested in a diversified manner with consideration given to the demographics of the plan participants.
The following represents the components of net pension and other benefit expense included primarily as part of cost of products and services sold:
2012 ANNUAL REPORT153
| | | | | | | | | | | | | | | | |
| | | Pension Benefit Plans | | | Other Benefit Plans | |
| | | 2012 | | | 2011 | | | 2012 | | | 2011 | |
Current service cost | | $ | 35,430 | | | $ | 26,752 | | | $ | 9,936 | | | $ | 9,312 | |
Interest cost | | | 49,427 | | | | 47,122 | | | | 9,665 | | | | 9,424 | |
Expected return on plan assets | | | (54,036 | ) | | | (50,484 | ) | | | — | | | | — | |
Past service cost | | | — | | | | — | | | | 450 | | | | 450 | |
| | | | | | | | | | | | | | | | |
Net pension and other benefit expense | | $ | 30,821 | | | $ | 23,390 | | | $ | 20,051 | | | $ | 19,186 | |
| | | | | | | | | | | | | | | | |
The assumptions used to determine BPLP’s defined benefit obligation and net pension and other benefit expense related to the pension benefit and other benefit plans were as follows:
| | | | | | | | | | | | | | | | |
| | | Pension Benefit Plans | | | Other Benefit Plans | |
| | | 2012 | | | 2011 | | | 2012 | | | 2011 | |
Discount rate | | | 4.3 | % | | | 4.8 | % | | | 4.1 | % | | | 4.6 | % |
Rate of compensation increase | | | 3.5 | % | | | 3.5 | % | | | 3.5 | % | | | 3.5 | % |
Long-term rate of return on assets | | | 7.0 | % | | | 7.0 | % | | | — | | | | — | |
Initial health care cost trend rate | | | — | | | | — | | | | 8.5 | % | | | 9.0 | % |
Cost trend rate declines to | | | — | | | | — | | | | 5.0 | % | | | 5.0 | % |
Year the rate reaches its final level | | | — | | | | — | | | | 2019 | | | | 2019 | |
| | | | | | | | | | | | | | | | |
The overall expected rate of return is a weighted average of the expected returns of the various categories of plan assets held. The assessment of the expected returns is based on historical return trends with reference to market interest rates at the measurement date on high-quality debt instruments with cash flows that match the timing and amount of expected future benefit payments.
An increase of 1% in the assumed health care cost trend rate would increase the aggregate of the current service cost and interest cost components of other benefit expense by $4,188,000 and increase the defined benefit obligation for these plans by $37,521,000. A decrease of 1% in the assumed health care cost trend rate would decrease the aggregate of the current service cost and interest cost components of other benefit expense by $3,119,000 and decrease the defined benefit obligation for these plans by $28,780,000.
The total amount of actuarial losses (gains) recognized in other comprehensive income is:
| | | | | | | | | | | | | | | | |
| | | Pension Benefit Plans | | | Other Benefit Plans | |
| | | 2012 | | | 2011 | | | 2012 | | | 2011 | |
Balance at beginning of year | | $ | 234,815 | | | $ | 127,451 | | | $ | 33,320 | | | $ | 17,291 | |
Recognized during the year | | | 103,851 | | | | 107,364 | | | | (12,938 | ) | | | 16,029 | |
| | | | | | | | | | | | | | | | |
| | $ | 338,666 | | | $ | 234,815 | | | $ | 20,382 | | | $ | 33,320 | |
| | | | | | | | | | | | | | | | |
154CAMECO CORPORATION
The following table presents historical information on both the pension and other benefit plans:
| | | | | | | | | | | | | | | | |
| | | Pension Benefit Plans | | | Other Benefit Plans | |
| | | 2012 | | | 2011 | | | 2012 | | | 2011 | |
Fair value of plan assets | | $ | 843,656 | | | $ | 758,652 | | | $ | — | | | $ | — | |
Defined benefit obligation | | | 1,186,697 | | | | 1,017,453 | | | | 212,572 | | | | 211,093 | |
| | | | | | | | | | | | | | | | |
Deficit in the plan | | $ | (343,041 | ) | | $ | (258,801 | ) | | $ | (212,572 | ) | | $ | (211,093 | ) |
| | | | | | | | | | | | | | | | |
Experience adjustments arising on plan assets | | | 2.2 | % | | | (3.5 | )% | | | — | | | | — | |
Experience adjustments arising on plan liabilities | | | 10.3 | % | | | 8.0 | % | | | (6.1 | )% | | | 7.6 | % |
| | | | | | | | | | | | | | | | |
The following are the contributions expected to be paid to the plans during the annual period beginning after the end of the current reporting period:
| | | | |
| | | 2013 | |
Employer contribution to funded pension plans | | $ | 87,532 | |
Benefits paid for unfunded benefit plans | | | 6,259 | |
| | | | |
29. Financial instruments and related risk management
Cameco is exposed in varying degrees to a variety of risks from its use of financial instruments. Management and the board of directors, both separately and together, discuss the principal risks of our businesses. The board sets policies for the implementation of systems to manage, monitor and mitigate identifiable risks. Cameco’s risk management objective in relation to these instruments is to protect and minimize volatility in cash flow. The types of risks Cameco is exposed to, the source of risk exposure and how each is managed, is outlined below.
Market risk
Market risk is the risk that changes in market prices, such as commodity prices, foreign currency exchange rates and interest rates, will affect the Company’s earnings or the fair value of its financial instruments. Cameco engages in various business activities which expose the Company to market risk. As part of its overall risk management strategy, Cameco uses derivatives to manage some of its exposures to market risk that result from these activities.
Derivative instruments may include financial and physical forward contracts. Such contracts may be used to establish a fixed price for a commodity, an interest-bearing obligation or a cash flow denominated in a foreign currency. Market risks are monitored regularly against defined risk limits and tolerances.
Cameco’s actual exposure to these market risks is constantly changing as the Company’s portfolios of foreign currency and commodity contracts change. Changes in fair value or cash flows based on market variable fluctuations cannot be extrapolated as the relationship between the change in the market variable and the change in fair value or cash flow may not be linear.
The types of market risk exposure and the way in which such exposure is managed are as follows:
A. Commodity price risk
As a significant producer and supplier of uranium, nuclear fuel processing and electricity, Cameco bears significant exposure to changes in prices for these products. A substantial change in prices will affect the Company’s net earnings and operating cash flows. Prices for Cameco’s products are volatile and are influenced by numerous factors beyond the Company’s control, such as supply and demand fundamentals, geopolitical events and, in the case of electricity prices, weather.
2012 ANNUAL REPORT155
Cameco’s sales contracting strategy focuses on reducing the volatility in future earnings and cash flow, while providing both protection against decreases in market price and retention of exposure to future market price increases. To mitigate the risks associated with the fluctuations in the market price for uranium products, Cameco seeks to maintain a portfolio of uranium product sales contracts with a variety of delivery dates and pricing mechanisms that provide a degree of protection from pricing volatility.
To mitigate risks associated with fluctuations in the market price for electricity, BPLP enters into various fixed price energy sales contracts that qualify as cash flow hedges. These instruments have terms ranging from 2013 to 2017. The periods in which the cash flows associated with these cash flow hedges are expected to occur and when they are expected to impact earnings are as follows:
| | | | | | | | |
| | | Cash flows | | | Earnings impact | |
2013 | | $ | 6,101 | | | $ | 4,074 | |
2014 | | | 556 | | | | — | |
2015 | | | 94 | | | | — | |
2016 | | | 4 | | | | — | |
2017 | | | — | | | | — | |
| | | | | | | | |
Total | | $ | 6,755 | | | $ | 4,074 | |
| | | | | | | | |
The maximum length of time BPLP is hedging its exposure to the variability in future cash flows related to electricity prices on anticipated transactions is six years. For the year ended December 31, 2012, a net unrealized loss of $2,058,000 (2011—$3,141,000) was recognized for the ineffective portion of cash flow hedges.
At December 31, 2012, the effect of a $1/MWh increase in the market price for electricity would be a decrease of $149,000 in net earnings and a decrease in other comprehensive income of $154,000 for 2012.
B. Foreign Exchange Risk
The relationship between the Canadian and US dollar affects financial results of the uranium business as well as the fuel services business. Sales of uranium product, conversion and fuel manufacturing services are routinely denominated in US dollars while production costs are largely denominated in Canadian dollars.
Cameco attempts to provide some protection against exchange rate fluctuations by planned hedging activity designed to smooth volatility. To mitigate risks associated with foreign currency, Cameco enters into forward sales contracts to establish a price for future delivery of the foreign currency. These forward sales contracts are not designated as hedges and are recorded at fair value with changes in fair value recognized in earnings. Cameco also has a natural hedge against US currency fluctuations because a portion of its annual cash outlays, including purchases of uranium and conversion services, is denominated in US dollars.
At December 31, 2012, the effect of a $0.01 increase in the US to Canadian dollar exchange rate on our portfolio of currency hedges and other US denominated exposures would have been a decrease of $10,200,000 in net earnings for 2012.
156CAMECO CORPORATION
C. Interest Rate Risk
Cameco is exposed to interest rate risk through its interest rate swap contracts whereby fixed rate payments on a notional amount of $155,000,000 of the Series C senior unsecured debentures were swapped for variable rate payments. The swaps terminate on March 16, 2015. Under the terms of the swaps, Cameco makes interest payments based on the three-month Canada Dealer Offered Rate plus an average margin of 1.83% and receives fixed interest payments of 4.7%. To mitigate this risk, Cameco entered into interest rate cap arrangements, effective March 18, 2013, whereby the three-month Canada Dealer Offered Rate was capped at 5.0% such that total variable payments will not exceed, on average, 6.83%. At December 31, 2012, the fair value of Cameco’s interest rate swaps and caps was $5,453,000 (2011—$8,647,000).
At December 31, 2012, the effect of a 1% increase in the three-month bankers’ acceptance rate would be a decrease in net earnings of $2,770,000.
Counterparty credit risk
Counterparty credit risk is associated with the ability of counterparties to satisfy their contractual obligations to Cameco, including both payment and performance. Cameco’s sales of uranium product, conversion and fuel manufacturing services expose the Company to the risk of non-payment.
Cameco manages the risk of non-payment by monitoring the credit worthiness of our customers and seeking pre-payment or other forms of payment security from customers with an unacceptable level of credit risk. To mitigate risks associated with certain financial assets, Cameco will hold positions with a variety of large creditworthy institutions.
Cameco is exposed to credit risk on its cash and cash equivalents, short-term investments, accounts receivable and derivative assets. The maximum exposure to credit risk, as represented by the carrying amount of the financial assets at December 31 was:
| | | | | | | | |
| | | 2012 | | | 2011 | |
Cash and cash equivalents | | $ | 749,824 | | | $ | 398,084 | |
Short-term investments | | | 49,535 | | | | 804,141 | |
Accounts receivable | | | 532,754 | | | | 595,140 | |
Derivative assets | | | 42,633 | | | | 71,579 | |
| | | | | | | | |
At December 31, 2012, there were no significant concentrations of credit risk and no amounts were held as collateral. Historically, Cameco has experienced minimal customer defaults and, as a result, considers the credit quality of its accounts receivable to be high. All accounts receivable at the reporting date are neither past due nor impaired.
Liquidity risk
Financial liquidity represents Cameco’s ability to fund future operating activities and investments. Cameco ensures that there is sufficient capital in order to meet short-term business requirements, after taking into account cash flows from operations and the Company’s holdings of cash and cash equivalents. The Company believes that these sources will be sufficient to cover the likely short-term and long-term cash requirements.
2012 ANNUAL REPORT157
The table below outlines the Company’s available debt facilities at December 31, 2012:
| | | | | | | | | | | | |
| | | Total Amount | | | Outstanding and
Committed | | | Amount Available | |
Unsecured revolving credit facility | | $ | 1,250,000 | | | $ | — | | | $ | 1,250,000 | |
Letter of credit facility | | | 698,814 | | | | 698,814 | | | | — | |
Inkai revolving credit facility (Cameco’s share) | | | 11,939 | | | | — | | | | 11,939 | |
BPLP working capital and operational letter of credit facility (Cameco’s share)(a) | | | 47,400 | | | | 45,820 | | | | 1,580 | |
BPLP letter of credit facilities (Cameco’s share) | | | 154,524 | | | | 154,524 | | | | — | |
| | | | | | | | | | | | |
| (a) | The amount outstanding and committed includes $39,500,000 relating to working capital and $6,320,000 of operational letters of credit. |
The tables below present a maturity analysis of Cameco’s financial liabilities, including principal and interest, based on the expected cash flows from the reporting date to the contractual maturity date.
| | | | | | | | | | | | | | | | | | | | | | | | |
| | | Carrying
Amount | | | Contractual
Cash Flows | | | Due in less
than 1
year | | | Due in 1-3
years | | | Due in 3-5
years | | | Due after 5
years | |
Accounts payable and accrued liabilities | | $ | 468,776 | | | $ | 468,776 | | | $ | 468,776 | | | $ | — | | | $ | — | | | $ | — | |
Short-term debt | | | 106,590 | | | | 106,606 | | | | 106,606 | | | | — | | | | — | | | | — | |
Long-term debt | | | 1,292,440 | | | | 1,300,000 | | | | — | | | | 300,000 | | | | — | | | | 1,000,000 | |
BPLP lease | | | 131,013 | | | | 131,013 | | | | 16,337 | | | | 38,552 | | | | 48,190 | | | | 27,934 | |
Energy and sales contracts | | | 8,294 | | | | 8,294 | | | | 6,957 | | | | 1,106 | | | | 231 | | | | — | |
Foreign currency contracts | | | 1,954 | | | | 1,954 | | | | 1,954 | | | | — | | | | — | | | | — | |
| | | | | | | | | | | | | | | | | | | | | | | | |
Total contractual repayments | | $ | 2,009,067 | | | $ | 2,016,643 | | | $ | 600,630 | | | $ | 339,658 | | | $ | 48,421 | | | $ | 1,027,934 | |
| | | | | | | | | | | | | | | | | | | | | | | | |
| | | | | | | | | | | | | | | | | | | | |
| | | Total | | | Due in less
than 1
year | | | Due in 1-3
years | | | Due in 3-5
years | | | Due after 5
years | |
Interest on short-term debt | | $ | 1,567 | | | $ | 1,567 | | | $ | — | | | $ | — | | | $ | — | |
Interest on long-term debt | | | 543,450 | | | | 62,540 | | | | 125,080 | | | | 96,880 | | | | 258,950 | |
Interest on BPLP lease | | | 32,991 | | | | 9,259 | | | | 14,536 | | | | 8,058 | | | | 1,138 | |
| | | | | | | | | | | | | | | | | | | | |
Total interest payments | | $ | 578,008 | | | $ | 73,366 | | | $ | 139,616 | | | $ | 104,938 | | | $ | 260,088 | |
| | | | | | | | | | | | | | | | | | | | |
158CAMECO CORPORATION
Fair value
All financial instruments measured at fair value are categorized into one of three hierarchy levels, described below, for disclosure purposes. Each level is based on the transparency of the inputs used to measure the fair values of assets and liabilities:
| | • | Level 1 – Values based on unadjusted quoted prices in active markets that are accessible at the measurement date for identical assets or liabilities. |
| | • | Level 2 – Values based on quoted prices in markets that are not active or model inputs that are observable either directly or indirectly for substantially the full term of the asset or liability. |
| | • | Level 3 – Values based on prices or valuation techniques that require inputs that are both unobservable and significant to the overall fair value measurement. |
When the inputs used to measure fair value fall within more than one level of the hierarchy, the level within which the fair value measurement is categorized is based on the lowest level input that is significant to the fair value measure in its entirety.
Except as otherwise disclosed, the fair market value of Cameco’s financial assets and liabilities approximates the carrying amount as a result of the short-term nature of the instruments, or the variable interest rate associated with the instruments, or the fixed interest rate of the instruments being similar to market rates.
The fair value of Cameco’s privately held available-for-sale securities, as described in note 12, has not been disclosed because of the unavailability of a quoted market price in an active market. Cameco does not currently have plans to dispose of this investment.
The following tables present Cameco’s fair value hierarchy for those assets and liabilities measured at fair value on a recurring basis.
As at December 31, 2012
| | | | | | | | | | | | | | | | |
| | | Level 1 | | | Level 2 | | | Level 3 | | | Total | |
Derivative instrument assets | | $ | — | | | $ | 42,317 | | | $ | 316 | | | $ | 42,633 | |
Available-for-sale securities [note 7] | | | 49,535 | | | | — | | | | — | | | | 49,535 | |
Derivative instrument liabilities | | | — | | | | (10,248 | ) | | | — | | | | (10,248 | ) |
| | | | | | | | | | | | | | | | |
Net | | $ | 49,535 | | | $ | 32,069 | | | $ | 316 | | | $ | 81,920 | |
| | | | | | | | | | | | | | | | |
As at December 31, 2011
| | | | | | | | | | | | | | | | |
| | | Level 1 | | | Level 2 | | | Level 3 | | | Total | |
Derivative instrument assets | | $ | — | | | $ | 69,367 | | | $ | 2,212 | | | $ | 71,579 | |
Available-for-sale securities [note 7] | | | 804,141 | | | | — | | | | — | | | | 804,141 | |
Derivative instrument liabilities | | | — | | | | (46,317 | ) | | | (316 | ) | | | (46,633 | ) |
| | | �� | | | | | | | | | | | | | |
Net | | $ | 804,141 | | | $ | 23,050 | | | $ | 1,896 | | | $ | 829,087 | |
| | | | | | | | | | | | | | | | |
The fair value of a financial instrument is the amount at which the financial instrument could be exchanged in an arm’s-length transaction between knowledgeable and willing parties under no compulsion to act. Fair values of identical instruments traded in active markets are determined by reference to the last quoted prices, in the most advantageous active market for that instrument. In the absence of an active market, we determine fair values based on quoted prices for instruments with similar characteristics and risk profiles. Fair values of financial instruments determined using valuation models require the use of inputs. In determining those inputs, we look primarily to external, readily observable market inputs, when available, including factors such as interest rate yield curves, currency rates, and price and rate volatilities, as applicable. In some circumstances, we use input parameters that are not based on observable market data. In these cases, we may adjust model values to reflect the valuation uncertainty in order to determine what the fair value would be based on the assumptions that market participants
2012 ANNUAL REPORT159
would use in pricing the financial instrument. These adjustments are made in order to determine the fair value of the instruments.
We make valuation adjustments for the credit risk of our derivative portfolios in order to arrive at their fair values. These adjustments take into account the creditworthiness of our counterparties.
Financial instruments classified as available-for-sale comprise actively traded debt and equity securities and are carried at fair value based on available quoted prices.
There were no significant transfers between level 1 and level 2 of the fair value hierarchy. The following table presents a reconciliation of the beginning and ending balances of those financial instruments in level 3 of the fair value hierarchy:
| | | | | | | | |
| | | 2012 | | | 2011 | |
Beginning of year | | $ | 1,896 | | | $ | 5,056 | |
Losses recognized in earnings | | | 1,580 | | | | 632 | |
Unrecognized losses previously recognized in other components of equity | | | — | | | | 632 | |
Transfers out of level 3 | | | (3,160 | ) | | | (4,424 | ) |
| | | | | | | | |
End of year | | $ | 316 | | | $ | 1,896 | |
| | | | | | | | |
Transfers into level 3 are comprised of BPLP derivative financial instruments with contract terms extending beyond 36 months.
Derivatives
The following tables summarize the fair value of derivatives and classification on the statements of financial position:
As at December 31, 2012
| | | | | | | | | | | | |
| | | Cameco | | | BPLP | | | Total | |
Non-hedge derivatives: | | | | | | | | | | | | |
Embedded derivatives—sales contracts | | $ | — | | | $ | 5,126 | | | $ | 5,126 | |
Foreign currency contracts | | | 15,046 | | | | — | | | | 15,046 | |
Interest rate contracts | | | 5,453 | | | | — | | | | 5,453 | |
Cash flow hedges: | | | | | | | | | | | | |
Energy sales contracts | | | — | | | | 6,760 | | | | 6,760 | |
| | | | | | | | | | | | |
Net | | $ | 20,499 | | | $ | 11,886 | | | $ | 32,385 | |
| | | | | | | | | | | | |
Classification: | | | | | | | | | | | | |
Current portion of long-term receivables, investments and other [note 12] | | $ | 17,000 | | | $ | 16,532 | | | $ | 33,532 | |
Long-term receivables, investments and other [note 12] | | | 5,453 | | | | 3,648 | | | | 9,101 | |
Current portion of other liabilities [note 18] | | | (1,954 | ) | | | (6,947 | ) | | | (8,901 | ) |
Other liabilities [note 18] | | | — | | | | (1,347 | ) | | | (1,347 | ) |
| | | | | | | | | | | | |
Net | | $ | 20,499 | | | $ | 11,886 | | | $ | 32,385 | |
| | | | | | | | | | | | |
160CAMECO CORPORATION
At December 31, 2011
| | | | | | | | | | | | |
| | | Cameco | | | BPLP | | | Total | |
Non-hedge derivatives: | | | | | | | | | | | | |
Embedded derivatives—sales contracts | | $ | (639 | ) | | $ | 8,033 | | | $ | 7,394 | |
Foreign currency contracts | | | (17,633 | ) | | | — | | | | (17,633 | ) |
Interest rate contracts | | | 8,647 | | | | — | | | | 8,647 | |
Cash flow hedges: | | | | | | | | | | | | |
Energy sales contracts | | | — | | | | 26,538 | | | | 26,538 | |
| | | | | | | | | | | | |
Net | | $ | (9,625 | ) | | $ | 34,571 | | | $ | 24,946 | |
| | | | | | | | | | | | |
Classification: | | | | | | | | | | | | |
Current portion of long-term receivables, investments and other [note 12] | | $ | 8,922 | | | $ | 42,088 | | | $ | 51,010 | |
Long-term receivables, investments and other [note 12] | | | 8,647 | | | | 11,922 | | | | 20,569 | |
Current portion of other liabilities [note 18] | | | (26,555 | ) | | | (16,913 | ) | | | (43,468 | ) |
Other liabilities [note 18] | | | (639 | ) | | | (2,526 | ) | | | (3,165 | ) |
| | | | | | | | | | | | |
Net | | $ | (9,625 | ) | | $ | 34,571 | | | $ | 24,946 | |
| | | | | | | | | | | | |
The following tables summarize different components of the gains (losses) on derivatives:
For the year ended December 31, 2012
| | | | | | | | | | | | |
| | | Cameco | | | BPLP | | | Total | |
Non-hedge derivatives: | | | | | | | | | | | | |
Embedded derivatives—sales contracts | | $ | 138 | | | $ | (2 | ) | | $ | 136 | |
Foreign currency contracts | | | 42,063 | | | | — | | | | 42,063 | |
Interest rate contracts | | | (785 | ) | | | — | | | | (785 | ) |
Cash flow hedges: | | | | | | | | | | | | |
Energy sales contracts | | | — | | | | (2,058 | ) | | | (2,058 | ) |
| | | | | | | | | | | | |
Net | | $ | 41,416 | | | $ | (2,060 | ) | | $ | 39,356 | |
| | | | | | | | | | | | |
For the year ended December 31, 2011
| | | | | | | | | | | | |
| | | Cameco | | | BPLP | | | Total | |
Non-hedge derivatives: | | | | | | | | | | | | |
Embedded derivatives—sales contracts | | $ | 3,264 | | | $ | (952 | ) | | $ | 2,312 | |
Foreign currency contracts | | | (11,586 | ) | | | — | | | | (11,586 | ) |
Interest rate contracts | | | 7,998 | | | | — | | | | 7,998 | |
Cash flow hedges: | | | | | | | | | | | | |
Energy sales contracts | | | — | | | | (3,141 | ) | | | (3,141 | ) |
| | | | | | | | | | | | |
Net | | $ | (324 | ) | | $ | (4,093 | ) | | $ | (4,417 | ) |
| | | | | | | | | | | | |
2012 ANNUAL REPORT161
30. Capital management
Cameco’s capital structure reflects our vision and the environment in which we operate. We seek growth through development and expansion of existing assets and by acquisition. Our capital resources are managed to support achievement of our goals. The overall objectives for managing capital remained unchanged in 2012 from the prior comparative period.
Cameco’s management considers its capital structure to consist of long-term debt, finance lease obligation, short-term debt (net of cash and cash equivalents and short-term investments), non-controlling interest and shareholders’ equity.
The capital structure at December 31 was as follows:
| | | | | | | | |
| | | 2012 | | | 2011 | |
Long-term debt | | $ | 1,292,440 | | | $ | 795,145 | |
Finance lease obligation | | | 131,013 | | | | 145,834 | |
Short-term debt | | | 106,590 | | | | 97,830 | |
Cash and cash equivalents | | | (749,824 | ) | | | (398,084 | ) |
Short-term investments | | | (49,535 | ) | | | (804,141 | ) |
| | | | | | | | |
Net debt | | | 730,684 | | | | (163,416 | ) |
| | | | | | | | |
Non-controlling interest | | | 580 | | | | 3,543 | |
Shareholders’ equity | | | 4,943,687 | | | | 4,919,593 | |
| | | | | | | | |
Total equity | | | 4,944,267 | | | | 4,923,136 | |
| | | | | | | | |
Total capital | | $ | 5,674,951 | | | $ | 4,759,720 | |
| | | | | | | | |
Cameco is bound by certain covenants in its general credit facilities. These covenants place restrictions on total debt, including guarantees, and set minimum levels for net worth. As of December 31, 2012, Cameco met these requirements.
31. Commitments and contingencies
(a) On May 16, 2012, Cameco, Cameco Bruce Holdings II Inc., BPC Generation Infrastructure Trust (BPC) and TransCanada Pipelines Limited (TransCanada) (collectively, the Consortium) received an arbitration award against British Energy Limited and British Energy International Holdings Limited (collectively, BE) ruling in favour of the Consortium on the issues of repair costs and lost revenue for breach of a representation and warranty contained in the February 14, 2003 Amended and Restated Master Purchase Agreement under which the Consortium acquired BE’s interest in BPLP. The Consortium and BE are in discussions over the quantification of the damages under the arbitrators award. If these issues are not resolved, they will be referred back to the arbitrator for a final decision. The Company recorded an estimate of the expected net proceeds.
In connection with this arbitration, BE issued on February 10, 2006, and then served on OPG and BPLP a Statement of Claim. This Statement of Claim seeks damages for any amounts that BE is found liable to pay to the Consortium in connection with the Unit 8 steam generator arbitration described above, additional damages in the amount of $500,000,000, costs and pre and post judgment interest amongst other things. Further proceedings in this action are on hold pending final disposition of the arbitration award.
(b) Annual supplemental rents of $31,000,000 (subject to CPI) per operating reactor are payable by BPLP to OPG. Should the hourly annual average price of electricity in Ontario fall below $30 per megawatt hour for any calendar year, the supplemental rent reduces to $12,000,000 per operating reactor. During 2012, BPLP recognized an amount receivable of $78,000,000 and a related reduction to lease expense, with Cameco’s share being $24,600,000.
162CAMECO CORPORATION
(c) Cameco, TransCanada and BPC have assumed the obligations to provide financial guarantees on behalf of BPLP. Cameco has provided the following financial assurances, with varying terms that range from 2012 to 2018:
| | i) | Guarantees to customers under power sales agreements of up to $4,300,000. At December 31, 2012, Cameco’s actual exposure under these agreements was $300,000. |
| | ii) | Termination payments to OPG pursuant to the lease agreement of $58,300,000. The fair value of these guarantees is nominal. |
(d) Under a supply contract with the Ontario Power Authority (OPA), BPLP is entitled to receive payments from the OPA during periods when the market price for electricity in Ontario is lower than the floor price defined under the agreement during a calendar year. On July 6, 2009, BPLP and the OPA amended the supply contract such that beginning in 2009, the annual payments received will not be subject to repayment in future years. Previously, the payments received under the agreement were subject to repayment during the entire term of the contract, dependent on the spot price in future periods. BPLP’s entitlement to receive these payments remains in effect until December 31, 2019 but the generation that is subject to these payments starts to decrease in 2016, reflecting the original estimated lives for the Bruce B units. During 2012, BPLP recorded $773,300,000 under this agreement which was recognized as revenue with Cameco’s share being $244,400,000.
32. Segmented information
Cameco has three reportable segments: uranium, fuel services and electricity. The uranium segment involves the exploration for, mining, milling, purchase and sale of uranium concentrate. The fuel services segment involves the refining, conversion and fabrication of uranium concentrate and the purchase and sale of conversion services. The electricity segment involves the generation and sale of electricity.
Cameco’s reportable segments are strategic business units with different products, processes and marketing strategies.
Accounting policies used in each segment are consistent with the policies outlined in the summary of significant accounting policies. Segment revenues, expenses and results include transactions between segments incurred in the ordinary course of business. These transactions are priced on an arm’s length basis and are eliminated on consolidation.
2012 ANNUAL REPORT163
A. Business segments
For the year ended December 31, 2012
| | | | | | | | | | | | | | | | | | | | |
| | | Uranium | | | Fuel
Services | | | Electricity | | | Other | | | Total | |
Revenue | | $ | 1,546,200 | | | $ | 276,740 | | | $ | 470,018 | | | $ | 28,513 | | | $ | 2,321,471 | |
| | | | | |
Expenses | | | | | | | | | | | | | | | | | | | | |
Cost of products and services sold | | | 871,282 | | | | 209,697 | | | | 197,299 | | | | 26,500 | | | | 1,304,778 | |
Depreciation and amortization | | | 170,864 | | | | 25,166 | | | | 79,834 | | | | 17,565 | | | | 293,429 | |
| | | | | | | | | | | | | | | | | | | | |
Cost of sales | | | 1,042,146 | | | | 234,863 | | | | 277,133 | | | | 44,065 | | | | 1,598,207 | |
| | | | | | | | | | | | | | | | | | | | |
Gross profit (loss) | | | 504,054 | | | | 41,877 | | | | 192,885 | | | | (15,552 | ) | | | 723,264 | |
Impairment charge on non-producing property | | | 168,000 | | | | — | | | | — | | | | — | | | | 168,000 | |
Exploration | | | 97,169 | | | | — | | | | — | | | | — | | | | 97,169 | |
Gain on sale of assets | | | (1,660 | ) | | | — | | | | — | | | | — | | | | (1,660 | ) |
Share of loss from equity-accounted investees | | | 2,951 | | | | 3,054 | | | | — | | | | — | | | | 6,005 | |
Other expense | | | 24,746 | | | | — | | | | — | | | | — | | | | 24,746 | |
Non-segmented expenses | | | | | | | | | | | | | | | | | | | 210,797 | |
| | | | | | | | | | | | | | | | | | | | |
Earnings (loss) before income taxes | | | 212,848 | | | | 38,823 | | | | 192,885 | | | | (15,552 | ) | | | 218,207 | |
Income tax recovery | | | | | | | | | | | | | | | | | | | (46,376 | ) |
| | | | | | | | | | | | | | | | | | | | |
Net earnings | | | | | | | | | | | | | | | | | | $ | 264,583 | |
| | | | | | | | | | | | | | | | | | | | |
Assets | | $ | 6,667,588 | | | $ | 733,346 | | | $ | 814,086 | | | $ | — | | | $ | 8,215,020 | |
Capital expenditures for the year | | $ | 1,232,526 | | | $ | 15,284 | | | $ | 62,246 | | | $ | — | | | $ | 1,310,056 | |
| | | | | | | | | | | | | | | | | | | | |
For the year ended December 31, 2011
| | | | | | | | | | | | | | | | | | | | |
| | | Uranium | | | Fuel
Services | | | Electricity | | | Other | | | Total | |
Revenue | | $ | 1,615,697 | | | $ | 305,280 | | | $ | 427,927 | | | $ | 35,500 | | | $ | 2,384,404 | |
| | | | | |
Expenses | | | | | | | | | | | | | | | | | | | | |
Cost of products and services sold | | | 824,324 | | | | 224,548 | | | | 247,665 | | | | 36,912 | | | | 1,333,449 | |
Depreciation and amortization | | | 159,168 | | | | 26,579 | | | | 71,247 | | | | 17,669 | | | | 274,663 | |
| | | | | | | | | | | | | | | | | | | | |
Cost of sales | | | 983,492 | | | | 251,127 | | | | 318,912 | | | | 54,581 | | | | 1,608,112 | |
| | | | | | | | | | | | | | | | | | | | |
Gross profit (loss) | | | 632,205 | | | | 54,153 | | | | 109,015 | | | | (19,081 | ) | | | 776,292 | |
Exploration | | | 84,875 | | | | — | | | | — | | | | — | | | | 84,875 | |
Loss on sale of assets | | | 7,602 | | | | — | | | | — | | | | — | | | | 7,602 | |
Share of loss from equity-accounted investees | | | 4,533 | | | | 2,700 | | | | — | | | | — | | | | 7,233 | |
Other income | | | 1,826 | | | | (2,382 | ) | | | — | | | | — | | | | (556 | ) |
Non-segmented expenses | | | | | | | | | | | | | | | | | | | 215,539 | |
| | | | | | | | | | | | | | | | | | | | |
Earnings (loss) before income taxes | | | 533,369 | | | | 53,835 | | | | 109,015 | | | | (19,081 | ) | | | 461,599 | |
Income tax expense | | | | | | | | | | | | | | | | | | | 11,755 | |
| | | | | | | | | | | | | | | | | | | | |
Net earnings | | | | | | | | | | | | | | | | | | $ | 449,844 | |
| | | | | | | | | | | | | | | | | | | | |
Assets | | $ | 6,046,000 | | | $ | 773,277 | | | $ | 797,073 | | | $ | — | | | $ | 7,616,350 | |
Capital expenditures for the year | | $ | 552,557 | | | $ | 17,918 | | | $ | 76,662 | | | $ | — | | | $ | 647,137 | |
| | | | | | | | | | | | | | | | | | | | |
164CAMECO CORPORATION
B. Geographic segments
Revenue is attributed to the geographic location based on the location of the entity providing the services. The Company’s revenue from external customers is as follows:
| | | | | | | | |
| | | 2012 | | | 2011 | |
Canada | | $ | 701,645 | | | $ | 719,454 | |
United States | | | 1,619,826 | | | | 1,664,950 | |
| | | | | | | | |
| | $ | 2,321,471 | | | $ | 2,384,404 | |
| | | | | | | | |
The Company’s non-current assets, excluding deferred tax assets and financial instruments, by geographic location are as follows:
| | | | | | | | |
| | | 2012 | | | 2011 | |
Canada | | $ | 4,091,790 | | | $ | 3,516,368 | |
United States | | | 336,534 | | | | 305,976 | |
Australia | | | 702,585 | | | | 429,823 | |
Other | | | 212,517 | | | | 196,279 | |
| | | | | | | | |
| | $ | 5,343,426 | | | $ | 4,448,446 | |
| | | | | | | | |
33. Group entities
The following are the principal subsidiaries, associates and jointly controlled entities of the Company:
| | | | | | | | | | | | |
| | | Country of | | | Ownership Interest | |
| | | Incorporation | | | 2012 | | | 2011 | |
Subsidiaries: | | | Canada | | | | 100 | % | | | 100 | % |
Cameco Bruce Holdings Inc. | | | Canada | | | | 100 | % | | | 100 | % |
Cameco Bruce Holdings II Inc. | | | Canada | | | | 100 | % | | | 100 | % |
Cameco Global Exploration Ltd. | | | Canada | | | | 100 | % | | | 100 | % |
Cameco Fuel Manufacturing Inc. | | | Canada | | | | 100 | % | | | 100 | % |
Cameco Inc. | | | U.S. | | | | 100 | % | | | 100 | % |
Power Resources, Inc. | | | U.S. | | | | 100 | % | | | 100 | % |
Crow Butte Resources, Inc. | | | U.S. | | | | 100 | % | | | 100 | % |
Cameco Enrichment Holdings LLC | | | U.S. | | | | 100 | % | | | 100 | % |
UFP Investments LLC | | | U.S. | | | | 53 | % | | | 53 | % |
Cameco Australia Pty. Ltd. | | | Australia | | | | 100 | % | | | 100 | % |
Cameco Europe Ltd. | | | Switzerland | | | | 100 | % | | | 100 | % |
Cameco Europe (Central Asia) Ltd. | | | Switzerland | | | | 100 | % | | | 100 | % |
Cameco Services Inc. | | | Barbados | | | | 100 | % | | | 100 | % |
Associates | | | | | | | | | | | | |
GE-Hitachi Global Laser Enrichment LLC | | | U.S. | | | | 24.00 | % | | | 24.00 | % |
UEX Corporation | | | Canada | | | | 22.58 | % | | | 22.58 | % |
34. Jointly controlled assets
Cameco conducts a portion of its exploration, development, mining and milling activities through joint ventures. Cameco’s significant uranium joint venture interests are McArthur River, Key Lake and Cigar Lake. Uranium joint ventures allocate
2012 ANNUAL REPORT165
uranium production to each joint venture participant and the joint venture participant derives revenue directly from the sale of such product. Mining and milling expenses incurred by the joint venture are included in the cost of inventory.
Cameco reflects its proportionate interest in these assets and liabilities as follows:
| | | | | | | | | | | | |
| | | Ownership | | | 2012 | | | 2011 | |
Total Assets | | | | | | | | | | | | |
McArthur River | | | 69.81 | % | | $ | 1,018,089 | | | $ | 972,184 | |
Key Lake | | | 83.33 | % | | | 618,821 | | | | 523,690 | |
Cigar Lake | | | 50.03 | % | | | 1,086,565 | | | | 889,140 | |
| | | | | | | | | | | | |
| | | | | | $ | 2,723,475 | | | $ | 2,385,014 | |
| | | | | | | | | | | | |
Total Liabilities | | | | | | | | | | | | |
McArthur River | | | 69.81 | % | | $ | 55,517 | | | $ | 45,753 | |
Key Lake | | | 83.33 | % | | | 156,400 | | | | 105,033 | |
Cigar Lake | | | 50.03 | % | | | 55,673 | | | | 45,270 | |
| | | | | | | | | | | | |
| | | | | | $ | 267,590 | | | $ | 196,056 | |
| | | | | | | | | | | | |
35. Jointly controlled entities
Cameco holds a 31.6% interest in the BPLP partnership, which is governed by an agreement that provides for joint control of the strategic operating, investing and financing activities among the three major partners. Cameco uses the proportionate consolidation method to account for its 31.6% interest in BPLP. Cameco also holds a 60% interest in the Inkai joint venture. The participants in the joint venture have joint control of the strategic operating, investing and financing activities. Cameco uses the proportionate consolidation method to account for its 60% interest in Inkai.
The following schedules reflect Cameco’s proportionate interest in the assets, liabilities, revenue and expenses of the BPLP partnership:
| | | | | | | | |
| | | 2012 | | | 2011 | |
Current assets | | $ | 260,131 | | | $ | 225,719 | |
Non-current assets | | | 492,233 | | | | 502,250 | |
Current liabilities | | | (155,788 | ) | | | (155,504 | ) |
Non-current liabilities | | | (675,450 | ) | | | (605,993 | ) |
| | | | | | | | |
Net liabilities | | $ | (78,874 | ) | | $ | (33,528 | ) |
| | | | | | | | |
| | | | | | | | |
| | | 2012 | | | 2011 | |
Revenue | | $ | 470,018 | | | $ | 427,927 | |
Expenses | | | (289,405 | ) | | | (329,605 | ) |
| | | | | | | | |
Net earnings | | $ | 180,613 | | | $ | 98,322 | |
| | | | | | | | |
166CAMECO CORPORATION
The following schedule reflects Cameco’s proportionate interest in the assets and liabilities of the Inkai joint venture:
| | | | | | | | |
| | | 2012 | | | 2011 | |
Current assets | | $ | 66,424 | | | $ | 54,968 | |
Non-current assets | | | 221,664 | | | | 198,831 | |
Current liabilities | | | (12,779 | ) | | | (17,085 | ) |
Non-current liabilities | | | (146,895 | ) | | | (130,782 | ) |
| | | | | | | | |
Net assets | | $ | 128,414 | | | $ | 105,932 | |
| | | | | | | | |
Through unsecured shareholder loans, Cameco has agreed to fund the development of the Inkai project. On proportionate consolidation of Inkai, Cameco eliminates the loan balances recorded by Inkai and records advances receivable (notes 12 & 36) representing its 40% ownership interest.
The following schedule reflects Cameco’s proportionate interest in the revenue and expenses of the Inkai joint venture:
| | | | | | | | |
| | | 2012 | | | 2011 | |
Revenue | | $ | 116,144 | | | $ | 132,845 | |
Expenses | | | (80,102 | ) | | | (78,517 | ) |
| | | | | | | | |
Net earnings | | $ | 36,042 | | | $ | 54,328 | |
| | | | | | | | |
The participants in the Inkai joint venture purchase uranium from Inkai, and, in turn, derive revenue directly from the sale of such product to third party customers. On proportionate consolidation of Inkai, Cameco eliminates revenues and cost of sales recorded by Inkai related to sales by Inkai to Cameco.
36. Related parties
The shares of Cameco are widely held and no shareholder, resident in Canada, is allowed to own more than 25% of the Company’s outstanding common shares, either individually or together with associates. A non-resident of Canada is not allowed to own more than 15%.
Transactions with key management personnel
Key management personnel are those persons that have the authority and responsibility for planning, directing and controlling the activities of the Company, directly or indirectly. Key management personnel of the Company include executive officers, vice-presidents, other senior managers and members of the board of directors.
In addition to their salaries, Cameco also provides non-cash benefits to executive officers and vice-presidents, and contributes to pension plans on their behalf (note 28). Senior management and directors also participate in the Company’s share-based compensation plans (note 27).
Executive officers are subject to terms of notice ranging from three to six months. Upon resignation at the Company’s request, they are entitled to termination benefits up to the lesser of 24 months or the period remaining until age 65. The termination benefits include gross salary plus the target short-term incentive bonus for the year in which termination occurs.
Compensation for key management personnel was comprised of:
| | | | | | | | |
| | | 2012 | | | 2011 | |
Short-term employee benefits | | $ | 23,789 | | | $ | 24,887 | |
Post-employment benefits | | | 6,728 | | | | 5,949 | |
Share-based compensation(a) | | | 8,622 | | | | 10,808 | |
| | | | | | | | |
| | $ | 39,139 | | | $ | 41,644 | |
| | | | | | | | |
2012 ANNUAL REPORT167
| (a) | Excludes deferred share units held by directors (see note 27). |
Certain key management personnel, or their related parties, hold positions in other entities that result in them having control or significant influence over the financial or operating policies of those entities. As noted below, one of these entities transacted with the Company in the reporting period. The terms and conditions of the transactions were on an arm’s length basis.
Cameco purchases a significant amount of goods and services for its Saskatchewan mining operations from northern Saskatchewan suppliers to support economic development in the region. One such supplier is Points Athabasca Contracting Ltd. and the president of the company became a member of the board of directors of Cameco during 2009. In 2012, Cameco paid Points Athabasca Contracting Ltd. $57,000,000 (2011—$63,000,000) for construction and contracting services. The transactions were conducted in the normal course of business and were accounted for at the exchange amount. Accounts payable include a balance of $1,780,000 (2011—$1,540,000).
Other related party transactions
| | | | | | | | | | | | | | | | |
| | | Transaction Value | | | Balance Outstanding | |
| | | Year ended | | | As at | | | | |
| | | 2012 | | | 2011 | | | 2012 | | | 2011 | |
Sale of goods and services | | | | | | | | | | | | | | | | |
Jointly Controlled Entities | | | | | | | | | | | | | | | | |
BPLP(a) | | $ | 84,859 | | | $ | 49,914 | | | $ | 23,210 | | | $ | 19,557 | |
Other | | | | | | | | | | | | | | | | |
Jointly Controlled Entities | | | | | | | | | | | | | | | | |
Interest income (Inkai)(a) | | | 2,334 | | | | 2,208 | | | | 87,264 | | | | 78,058 | |
Associates | | | | | | | | | | | | | | | | |
Interest expense | | | (919 | ) | | | (1,597 | ) | | | (42,220 | ) | | | (73,468 | ) |
| (a) | Disclosures in respect of transactions with jointly controlled entities represent the amount of such transactions which do not eliminate on proportionate consolidation. |
Cameco has entered into fuel supply agreements with BPLP for the procurement of fabricated fuel. Under these agreements, Cameco will supply uranium, conversion services and fabrication services. Contract terms are at market rates and on normal trade terms.
Through unsecured shareholder loans, Cameco has agreed to fund Inkai’s project development costs as well as further evaluation on block 3. The limit of the loan facilities are $322,150,000 (US) and advances under these facilities bear interest at a rate of LIBOR plus 2%. At December 31, 2012, $219,277,000 (US) of principal and interest was outstanding (December 31, 2011—$191,882,000 (US)).
In 2008, a promissory note in the amount of $73,344,000 (US) was issued to finance the acquisition of GE-Hitachi Global Laser Enrichment LLC (GLE) The promissory note is payable on demand and bears interest at market rates. At December 31, 2012, $42,436,000 (US) of principal and interest was outstanding (December 31, 2011—$72,240,000 (US)).
37. Acquisitions
(a) On June 11, 2012, Cameco acquired a 27.94% interest in the Millennium project from AREVA Resources Canada Inc. (AREVA) for $150,840,000, increasing its ownership to 69.9%. The remaining 30.1% is owned by JCU (Canada) Exploration Co. The Millennium project is a proposed uranium mine located in the Athabasca Basin of northern Saskatchewan. The terms of the purchase agreement provide AREVA with a 4% royalty on revenue from 27.94% of any production that exceeds 63,000,000 pounds U3O8from this project. The acquisition was financed by existing cash balances and was assigned to exploration and evaluation assets included in property, plant and equipment.
168CAMECO CORPORATION
(b) On December 18, 2012, a wholly owned Cameco subsidiary acquired a 100% interest in the Yeelirrie uranium project in Western Australia from BHP Billiton for a total cost of $453,900,000 (US). Included in the purchase price is $1,500,000 (US) in transaction costs and a $22,000,000 (US) stamp duty payable to the government of Western Australia. Yeelirrie is one of Australia’s largest undeveloped uranium deposits and is located about 650 kilometres northeast of Perth and about 750 kilometres south of Cameco’s Kintyre exploration project. The acquisition was financed by existing cash balances and was assigned to exploration and evaluation assets included in property, plant and equipment.
(c) On January 9, 2013, subsequent to year-end, Cameco completed the acquisition of NUKEM Energy GmbH (NUKEM) from Advent International (Advent) and other shareholders, through the purchase of all the outstanding shares for cash consideration of €107 million ($140 million (USD)), plus closing adjustments. Cameco receives the economic benefit of owning NUKEM as of January 1, 2012. In addition to the initial purchase price, Cameco will pay Advent and the other shareholders a share of NUKEM’s 2012 earnings under the terms of the agreement. An additional payment may be required in 2015 depending on results achieved in 2013 and 2014. These earn-out payments are based on NUKEM exceeding certain minimum threshold levels of EBITDA, as specified and defined in the purchase agreement. The acquisition complements Cameco’s business by strengthening our position in nuclear fuel markets and improving our access to unconventional and secondary sources of supply.
The initial accounting for the business combination is incomplete as the Company is in the process of evaluating the fair value of the net assets acquired. It is our expectation that the majority of the purchase price will be allocated to purchase and sale contracts, nuclear fuel inventories and goodwill.
Acquisition related costs of $3,800,000 have been expensed and included in administration expense in the consolidated statements of earnings.
2012 ANNUAL REPORT169
INVESTOR INFORMATION
Common Shares
Toronto (CCO) | New York (CCJ)
Transfer Agents and Registrars
The registrar and transfer agent for Cameco’s common shares is CIBC Mellon Trust Company1. For information on common shareholdings, dividend cheques, lost share certificates and address changes, contact:
In Canada:
CIBC Mellon Trust Company c/o Canadian Stock Transfer Company Inc.
P.O. Box 700, Station B Montreal, Quebec H3B 3K3
In the United States:
American Stock Transfer
& Trust Company, LLC
Attention: General Counsel 6201 15th Avenue Brooklyn, NY
11219
Telephone:
1-800-387-0825 OR
1-416-682-3860 outside of North America www.canstockta.com
1 Canadian Stock Transfer Company Inc. acts as the Administrative Agent for CIBC Mellon Trust Company.
Annual Meeting
The annual meeting of shareholders of Cameco Corporation is scheduled to be held on Tuesday, May 14, 2013 at 1:30 p.m. at Cameco’s head office in Saskatoon, Saskatchewan.
Dividend Policy
The board of directors has established a policy of paying a quarterly dividend of $0.10 ($0.40 per year) per common share. This policy will be reviewed from time to time in light of the company’s cash flow, earnings, financial position and other relevant factors.
Inquiries
Cameco Corporation 2121 – 11th Street West
Saskatoon, Saskatchewan S7M 1J3 Phone: 306-956-6200 Fax: 306-956-6201
Caution about forward-looking information
We are making statements and providing information about our expectations for the future which are considered to be forward-looking information or forward-looking statements under Canadian and U.S. securities laws. These include statements about our goal of increasing annual uranium supply to 36 million pounds by 2018, our aim to be able to respond quickly to market demand for new production, our expectations about the strong long-term demand for uranium and diminishing supply, and our ability to achieve our growth plans. We are presenting this information to help you understand management’s current views of our future prospects, and it may not be appropriate for other purposes. We will not necessarily update this information unless required to do so by securities laws. This information is based upon a number of material assumptions and is subject to a number of material risks, which are discussed in our annual MD&A contained in this document, including under the heading “Caution about forward-looking information”.
For comprehensive financial information visit:
CAMECO.COM

Cameco
cameco.com