Item 1: Report to Shareholders| Mid-Cap Value Fund | December 31, 2007 |
The views and opinions in this report were current as of December 31, 2007. They are not guarantees of performance or investment results and should not be taken as investment advice. Investment decisions reflect a variety of factors, and the managers reserve the right to change their views about individual stocks, sectors, and the markets at any time. As a result, the views expressed should not be relied upon as a forecast of the fund’s future investment intent. The report is certified under the Sarbanes-Oxley Act, which requires mutual funds and other public companies to affirm that, to the best of their knowledge, the information in their financial reports is fairly and accurately stated in all material respects.
REPORTS ON THE WEB
Sign up for our E-mail Program, and you can begin to receive updated fund reports and prospectuses online rather than through the mail. Log in to your account at troweprice.com for more information.
Manager’s Letter
Fellow Shareholders
Charles Dickens’ famous observation about Paris in the 18th century might be adjusted a bit for the U.S. stock market in 2007: “It was the best of times, but the worst of times was just around the corner.” Equity markets enjoyed a strong first half of the year in 2007, buoyed by robust economic growth, a favorable interest rate environment, and record profits in the corporate sector. A key feature of the investment landscape was the proliferation of merger and acquisition activity. Low interest rates and easy borrowing terms as well as a surge in funds available for buyouts combined to create a dramatic wave of transactions that crested in the first half of 2007. The takeover boom helped the fund’s strong results in the first half of the year, as 12 of our holdings were acquired.
HIGHLIGHTS
• The second half of 2007 proved much more challenging than the first, and value-oriented stocks bore the brunt of the market’s slump.
• The fund lagged the Lipper Mid-Cap Core Funds Index due largely to its value focus, but it outperformed the Russell Midcap Value Index.
• Financials holdings were particularly weak as they felt the effects of the subprime debacle, while oil and gas holdings were among the portfolio’s best performers.
• While we share many current concerns, we make a point of not trying to read the economic tea leaves; rather, our focus will remain on searching for attractive investment opportunities that allow us to balance risk and return.
All was not well in the markets, however, as the second half would soon show. The financials sector began to suffer the ill effects of declining collateral values as the domestic housing market weakened, capital market liquidity dried up, and weakness in the credit sector began to spread elsewhere in the economy. Though the Federal Reserve and other central banks attempted to restore liquidity to the global financial system, the damage was done, and the stock market ended 2007 on a sour note. These were particularly tough times for value investors, and our fund’s loss over the past six months largely exhausted its gain earlier in the year.
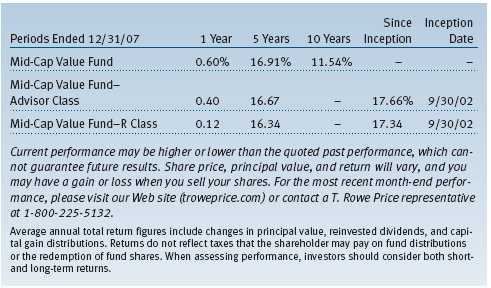
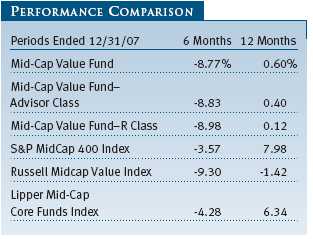
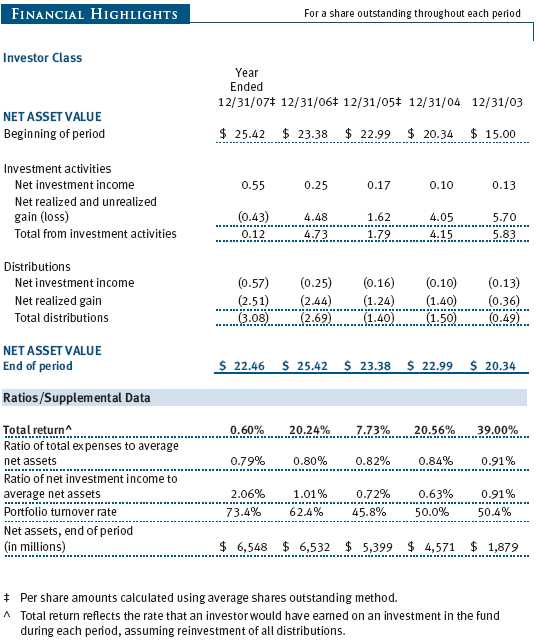
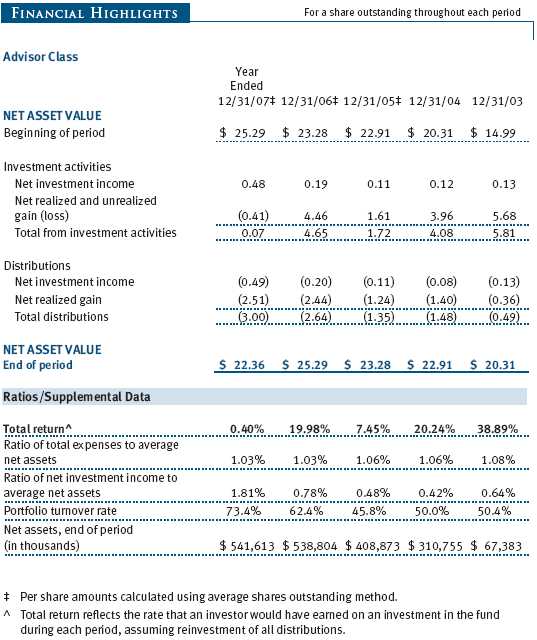
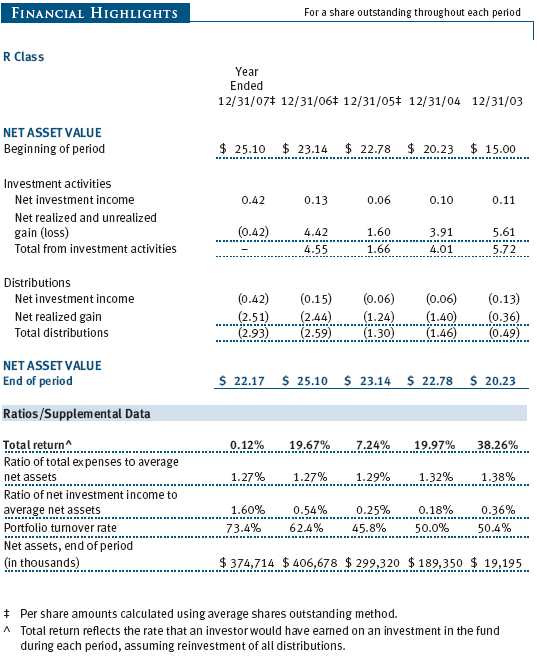
Your fund returned -8.77% for the six months ended December 31, 2007, and 0.60% for the one-year period. As shown in the table on page 1, the portfolio lagged the Lipper Mid-Cap Core Funds Index, due largely to the fund’s value-oriented focus in a period that favored a growth approach. The fund outperformed the Russell Midcap Value Index over both periods, however. Returns for the fund’s Advisor and R Class shares were slightly lower due to their different cost structures.
Despite a challenging year, the fund’s long-term performance remains favorable, as recognized by Morningstar’s overall four-star rating, as well as its rank among competitive funds as tracked by Lipper over longer time periods. (The Mid-Cap Value Fund received an Overall Morningstar Rating™ of four stars for its risk-adjusted performance. This rating is derived from a weighted average of the performance figures associated with a fund’s 3-, 5-, and 10-year (if applicable) Morningstar Rating™ metrics. The fund was rated among 274, 274, 220, and 64 mid-cap value funds for the overall rating and the 3-, 5-, and 10-year periods ended December 31, 2007. Based on cumulative total return, Lipper ranked the Mid-Cap Value Fund 285 out of 346, 155 out of 285, 63 out of 233, and 26 out of 85 mid-cap core funds for the 1-, 3-, 5-, and 10-year periods ended December 31, 2007, respectively. Results will vary for other periods. Past performance cannot guarantee future results.)
IMPORTANT INFORMATION ABOUT MORNINGSTAR RATINGS
For funds with at least a 3-year history, a Morningstar Rating™ is based on a risk-adjusted return measure (including the effects of sales charges, loads, and redemption fees) with emphasis on downward variations and consistent performance. The top 10% of funds in each category receive 5 stars, the next 22.5% 4 stars, the next 35% 3 stars, the next 22.5% 2 stars, and the bottom 10% 1 star. Each share class is counted as a fraction of one fund within this scale and rated separately. Morningstar Rating™ is for the retail share class only; other classes may have different performance characteristics. The fund received 3, 4, and 5 stars for the 3-, 5-, and 10-year periods ended December 31, 2007, respectively.
©2008 Morningstar, Inc. All Rights Reserved. The information contained herein: (1) is proprietary to Morningstar and/or its content providers; (2) may not be copied or distributed; and (3) is not warranted to be accurate, complete, or timely. Neither Morningstar nor its content providers are responsible for any damages or losses arising from any use of this information.
MARKET ENVIRONMENT
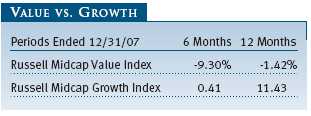
The past year may be notable as a period in which the pendulum of market leadership swung away from small-caps and value-oriented shares and toward larger-caps and growth issues. For the year, the large-cap Russell 1000 Index returned 5.77%, while the smaller companies represented in the small-cap Russell 2000 Index returned -1.57%, with virtually all the differential occurring over the past six months. (The Russell Midcap Index represents the 800 smallest companies within the Russell 1000.) The difference between growth and value shares was even more striking. As shown in the adjacent chart, mid-cap growth shares outpaced value stocks in 2007 by a whopping 1,285 basis points (12.85%) after having lagged the value camp in six of the seven preceding years.
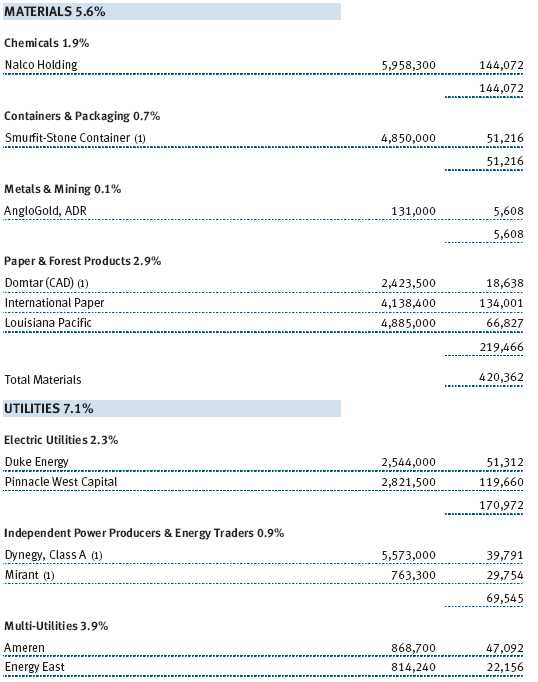
As is often the case, results within the markets varied widely among industries and sectors. Energy shares were the big winners within the Russell Midcap Value Index as the price of oil crept near $100 per barrel at the end of the year. Materials stocks also generated excellent returns, helped by seemingly insatiable demand for commodities from emerging markets such as China. Utilities, which often act like bonds because of their relatively high dividend payouts, also performed well as interest rates declined. On the downside, financials fell sharply as banks tightened their lending standards, the housing market continued to weaken, and capital markets companies with exposure to subprime mortgages reported substantial losses. Consumer discretionary shares also declined amid concerns that a weaker economy and high energy costs would discourage consumer spending.
PORTFOLIO AND STRATEGY REVIEW
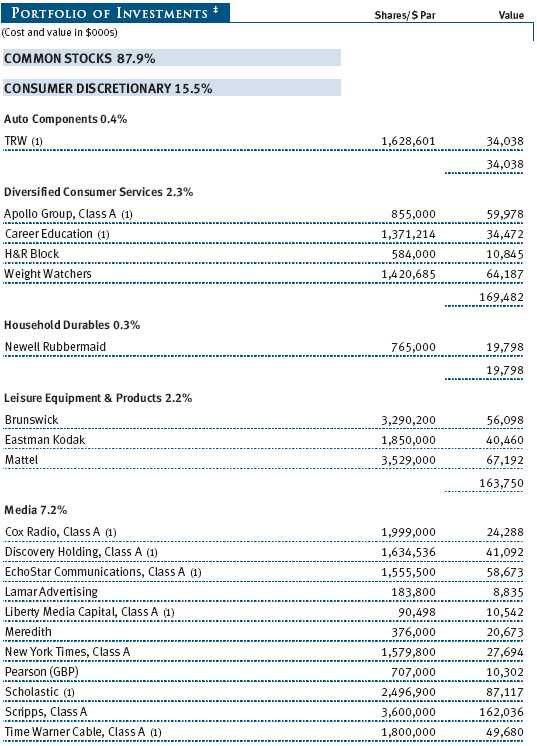
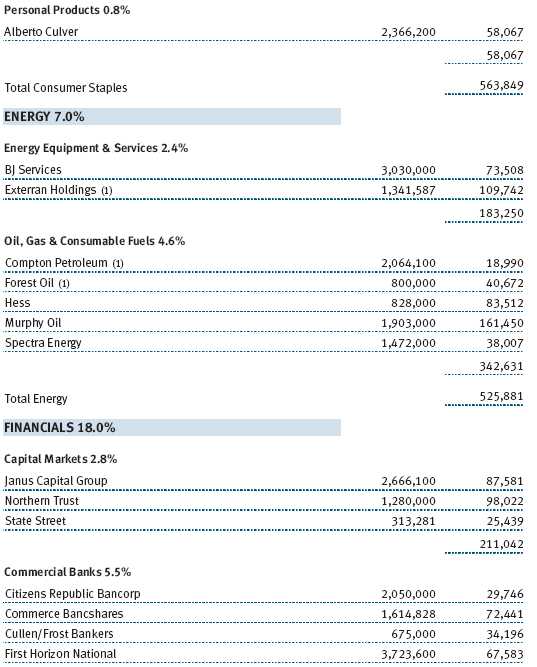
The best contributors to the fund’s performance in 2007 were in the oil and gas industry. We first bought shares of Murphy Oil, a U.S.-based energy producer and refiner, in 2004, and we added to the position after a string of disappointing exploration results. Litigation fears associated with its hurricane-damaged New Orleans refinery also weighed on the stock. We have known the management of Murphy for over a decade, have been impressed by their historical record of exploration success and capital allocation, and have believed that its legal liabilities were manageable. Our patience was rewarded last year as higher oil and gas prices and production growth boosted its profits, and discoveries in Asia and the U.S. highlighted its future potential. Higher energy prices as well as drilling success in the Gulf of Mexico and potential exposure to a large discovery off the coast of Brazil also boosted holding Hess, another domestic oil and gas producer. Finally, exploration and production company Pogo Producing rose as management succumbed to shareholder pressure to sell its Canadian assets and eventually auction the rest of the company. (Please refer to our portfolio of investments for a complete listing of holdings and the amount each represents in the portfolio.)
Elsewhere in the materials sector, the long-suffering paper industry failed to deliver good results despite a dramatic reduction in industry capacity, a series of mergers that concentrated production in the hands of fewer players, the divestiture of forestland and timber (which forced managements to operate their equipment with greater efficiency), and good economic growth in most corners of the globe. Over the years, in other cyclical areas such as steel, base metals, energy, and power generation, we have produced good returns by investing during the kind of difficult times that have beset the paper producers. What we failed to anticipate was the rate at which technological change was altering the outlook for the paper industry, particularly in newsprint and related products. As electronic communications have substituted for the printed word in business and everyday life, the need for most grades of paper has diminished. The effect has been subtle and gradual, but nonetheless real, and thu s the demand stabilization that we anticipated has yet to materialize. We still expect that certain paper producers, such as International Paper, are better positioned due to their substantial restructuring and cost reduction programs, but we have eliminated our position in shares such as newsprint producer AbitibiBowater in acknowledgment of the economic realities.
Among consumer companies, the fund had some notable winners over the past year, even as consumer discretionary holdings were particularly weak for the past six months. As discussed in greater detail in our first-half report, Dow Jones, publisher of The Wall Street Journal, was acquired by News Corporation over the summer for a 65% premium, and online retailer Amazon.com’s stock rose significantly as it harvested the fruits of many years of technology investment. For-profit education company Apollo Group benefited from a turnaround in admissions growth and improved operating margins. Among other media companies, cable network operator Discovery Holdings saw its profits expand as it divested non-core businesses and focused on improving programming quality and international distribution. Scripps announced plans to split itself into two new companies—one containing its newspaper and traditional television assets and the other its home and garden and food cable networks—highlighting the value in each business.
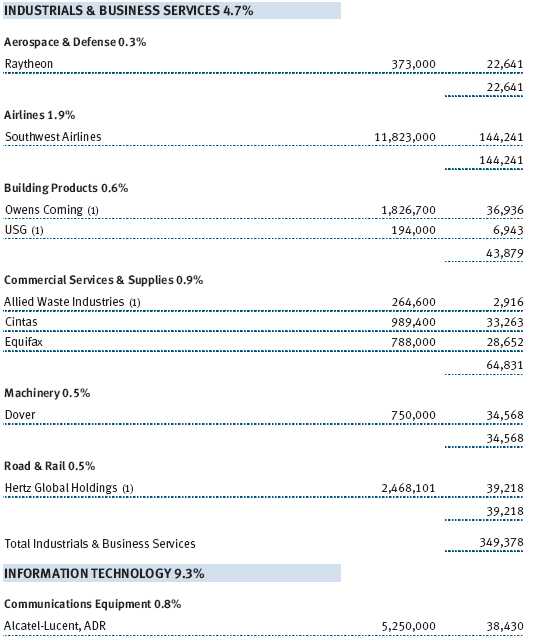
Among industrials and business services companies, the biggest detractor from the portfolio was Southwest Airlines. For many years, we have been impressed by Southwest’s unique business proposition, as it has delivered a low-cost, convenient, and unique alternative to air travelers. The airline’s financial results have dramatically outperformed its peers over time. As Southwest begins to focus on improved returns after a long period of market expansion, its earnings potential should be enhanced. Nonetheless, the lack of strength of the overall economy can, over any short-term horizon, overwhelm the efforts of management in many industries, and weakness in the consumer sector as well as high fuel prices diminished the outlook for Southwest late in the year.
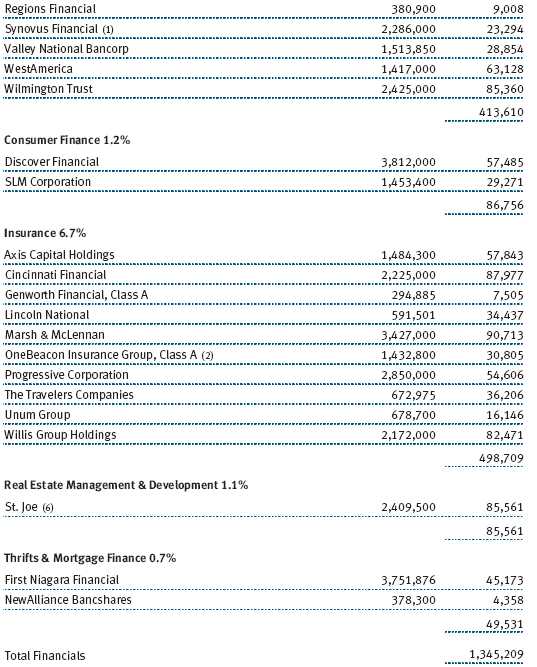
Financial stocks were a challenge to most investors in 2007, as the banking sector felt the ill effects of the housing debacle. Portfolio holdings First Horizon and Indymac fell into this category, as both suffered from their exposure to the mortgage industry and concerns they would require additions to capital and reserves for bad loans. However, several financial companies in the fund whose income is mainly fee based contributed significantly to overall fund results. Investors Financial Services, a Boston-based trust and custody company, was acquired by State Street for a 38% premium to its market price in the first quarter. Northern Trust, a well-established Chicago-based advisor, investment manager, and custodian that the fund has owned for a decade, saw its earnings rise as assets under management and fee income climbed. Finally Janus Capital, the Denver-based mutual fund company, whose shares the fund began accumulating in 2002, benefited from many hard years of restructuring, good performance by its investment professionals, and healthy markets for the traditional growth stocks that are its domain of expertise.
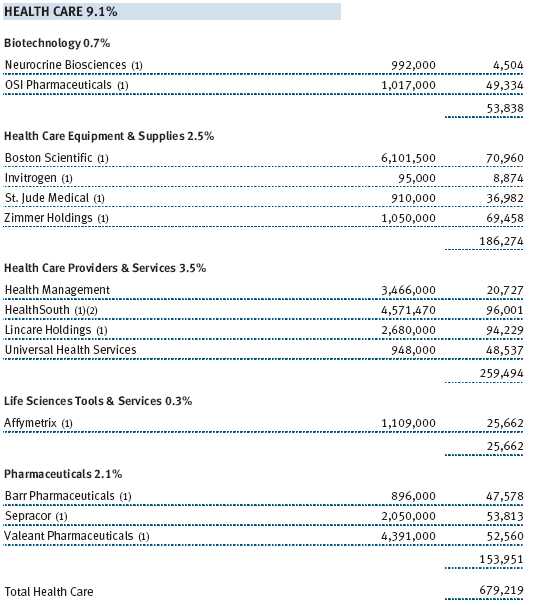
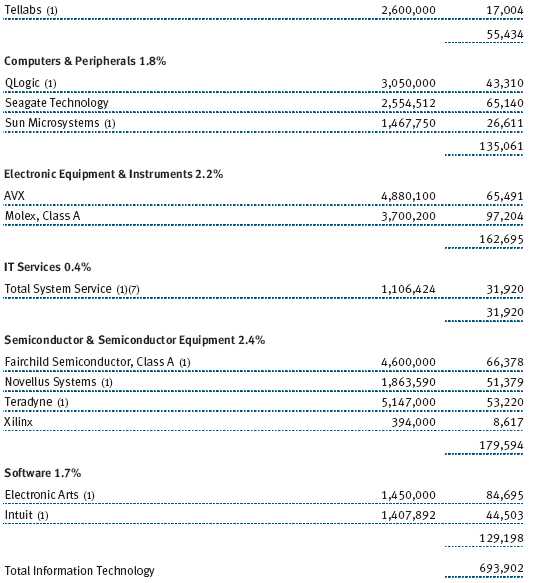
Finally, the fund’s information technology and health care holdings detracted from returns over the past six months and year. In technology, some of the primary laggards were our semiconductor equipment holdings, such as Novellus Systems and Teradyne, as the stocks suffered from concerns over a downturn in end markets. Nortel Networks, which we eliminated from the portfolio, declined due to weak product demand and an increasingly intense competitive environment. Acute care hospital company Health Management weighed heavily on our results in the health care sector. Increased bad debt expense impaired hospital earnings, particularly within Florida. One very bright spot in the sector was MedImmune. The biotechnology company was a leading contributor in the first half as a result of its purchase, at a significant premium, by British pharmaceuticals manufacturer AstraZeneca.
OUTLOOK
As our longtime investors know, we have never made it a practice to make forecasts about the near-term direction of the economy or markets. Of course, we see reasons for concern, many of which have already been enumerated elsewhere: Oil prices are high, the housing sector is in a recession, consumers are under pressure, and the financial system has performed unevenly in recent months. The risks of an economic slowdown are always present and probably more real today than they have been in some time. However, we are mindful of the positive factors at work as well: Interest rates are low, the world’s central banks are responsive to economic problems, and corporate balance sheets in most sectors are healthy.
Instead of trying to read the economic tea leaves, our focus has always been on analyzing individual companies based on their own merits, valuing their businesses based on potential financial performance over several years, and comparing that underlying value to the stock market price. When the gap between the two is large, we are inclined to buy. We closed the Mid-Cap Value Fund to new investors in 2005 as it became clear, after five years of excellent stock market performance by medium-sized companies, that fewer equities were meeting this buy criterion. Since then, our perspective on risk and reward among mid-cap stocks has not changed much, as, on average, their value is still somewhat limited relative to large companies. Not surprisingly, however, the recent downturn in the markets has exposed more bargains than we have seen in some time, and we are exploiting opportunities in the media, consumer products, financial services, and power generation sectors, among others.
Thankfully, the history of the markets is that they rise over time. Human ingenuity, hard work, and political freedom have always led to economic progress and been rewarded by higher values for businesses. We see no reason for that to change. We will continue looking for good investment ideas, managing risk and return, and doing our best to steward your investment.
Respectfully submitted,

David J. Wallack
Chairman of the fund’s Investment Advisory Committee
January 18, 2008
The committee chairman has day-to-day responsibility for managing the portfolio and works with committee members in developing and executing the fund’s investment program.
RISKS OF INVESTING
The fund’s share price can fall because of weakness in the stock or bond markets, a particular industry, or specific holdings. Stock markets can decline for many reasons, including adverse political or economic developments, changes in investor psychology, or heavy institutional selling. The prospects for an industry or company may deteriorate because of a variety of factors, including disappointing earnings or changes in the competitive environment. In addition, the investment manager’s assessment of companies held in a fund may prove incorrect, resulting in losses or poor performance even in rising markets.
Mid-caps typically offer greater return potential than larger, established firms and involve less risk than small-caps. Value investors seek to invest in companies whose stock prices are low in relation to their real worth or future prospects. By identifying companies whose stocks are currently out of favor or misunderstood, value investors hope to realize significant appreciation as other investors recognize the stock’s intrinsic value and the price rises accordingly. The value approach carries the risk that the market will not recognize a security’s intrinsic value for a long time or that a stock judged to be undervalued may actually be appropriately priced.
GLOSSARY
Lipper indexes: Fund benchmarks that consist of a small number of the largest mutual funds in a particular category as tracked by Lipper Inc.
Russell 1000 Index: Measures the performance of the 1,000 largest companies in the Russell 3000 Index.
Russell 2000 Index: An unmanaged index that tracks the stocks of 2,000 small U.S. companies.
Russell Midcap Growth Index: An unmanaged index that measures the performance of those Russell Midcap companies with higher price-to-book ratios and higher forecasted growth values.
Russell Midcap Value Index: An unmanaged index that measures the performance of those Russell Midcap companies with lower price-to-book ratios and lower forecasted growth values.
S&P 400 MidCap Index: An unmanaged index that tracks the stocks of 400 mid-size U.S. companies.

Performance and Expenses
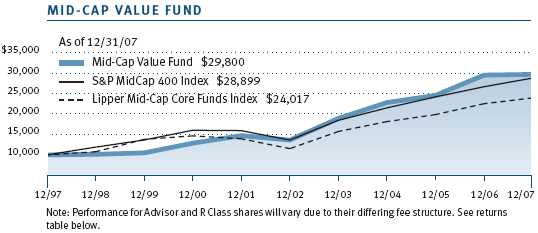
This chart shows the value of a hypothetical $10,000 investment in the fund over the past 10 fiscal year periods or since inception (for funds lacking 10-year records). The result is compared with benchmarks, which may include a broad-based market index and a peer group average or index. Market indexes do not include expenses, which are deducted from fund returns as well as mutual fund averages and indexes.
| AVERAGE ANNUAL COMPOUND TOTAL RETURN |
This table shows how the fund would have performed each year if its actual (or cumulative) returns had been earned at a constant rate.
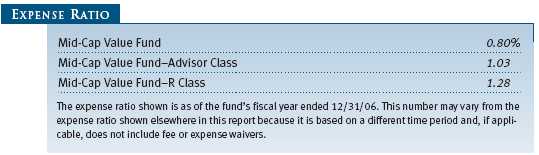
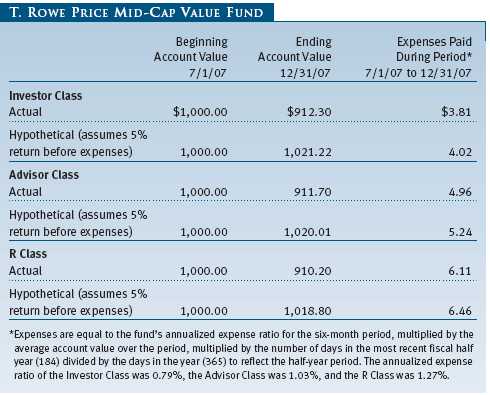
As a mutual fund shareholder, you may incur two types of costs: (1) transaction costs, such as redemption fees or sales loads, and (2) ongoing costs, including management fees, distribution and service (12b-1) fees, and other fund expenses. The following example is intended to help you understand your ongoing costs (in dollars) of investing in the fund and to compare these costs with the ongoing costs of investing in other mutual funds. The example is based on an investment of $1,000 invested at the beginning of the most recent six-month period and held for the entire period.
Please note that the fund has three share classes: The original share class (“investor class”) charges no distribution and service (12b-1) fee; Advisor Class shares are offered only through unaffiliated brokers and other financial intermediaries and charge a 0.25% 12b-1 fee; R Class shares are available to retirement plans serviced by intermediaries and charge a 0.50% 12b-1 fee. Each share class is presented separately in the table.
Actual Expenses
The first line of the following table (“Actual”) provides information about actual account values and expenses based on the fund’s actual returns. You may use the information in this line, together with your account balance, to estimate the expenses that you paid over the period. Simply divide your account value by $1,000 (for example, an $8,600 account value divided by $1,000 = 8.6), then multiply the result by the number in the first line under the heading “Expenses Paid During Period” to estimate the expenses you paid on your account during this period.
Hypothetical Example for Comparison Purposes
The information on the second line of the table (“Hypothetical”) is based on hypothetical account values and expenses derived from the fund’s actual expense ratio and an assumed 5% per year rate of return before expenses (not the fund’s actual return). You may compare the ongoing costs of investing in the fund with other funds by contrasting this 5% hypothetical example and the 5% hypothetical examples that appear in the shareholder reports of the other funds. The hypothetical account values and expenses may not be used to estimate the actual ending account balance or expenses you paid for the period.
Note: T. Rowe Price charges an annual small-account maintenance fee of $10, generally for accounts with less than $2,000 ($500 for UGMA/UTMA). The fee is waived for any investor whose T. Rowe Price mutual fund accounts total $25,000 or more, accounts employing automatic investing, and IRAs and other retirement plan accounts that utilize a prototype plan sponsored by T. Rowe Price (although a separate custodial or administrative fee may apply to such accounts). This fee is not included in the accompanying table. If you are subject to the fee, keep it in mind when you are estimating the ongoing expenses of investing in the fund and when comparing the expenses of this fund with other funds.
You should also be aware that the expenses shown in the table highlight only your ongoing costs and do not reflect any transaction costs, such as redemption fees or sales loads. Therefore, the second line of the table is useful in comparing ongoing costs only and will not help you determine the relative total costs of owning different funds. To the extent a fund charges transaction costs, however, the total cost of owning that fund is higher.
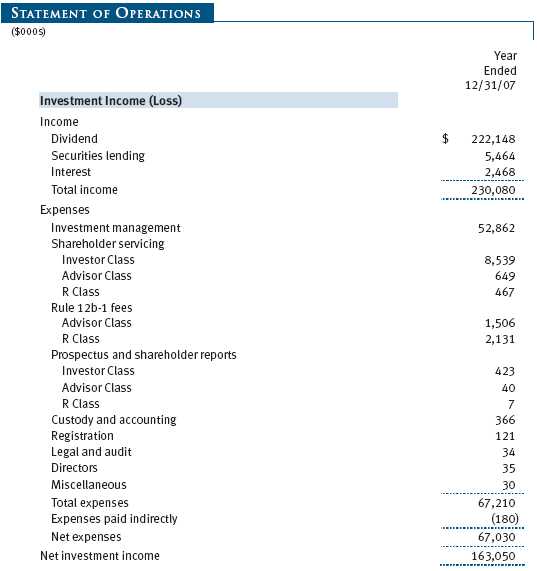
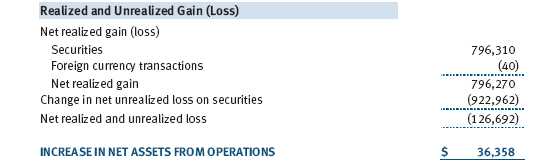
The accompanying notes are an integral part of these financial statements.
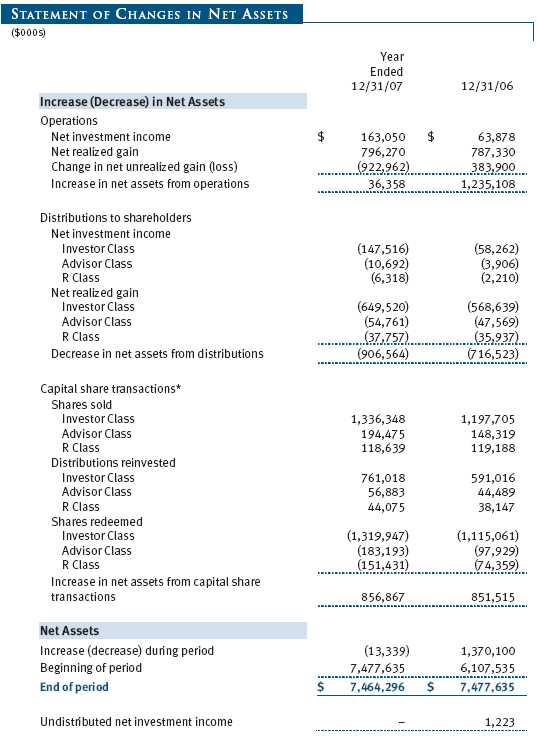
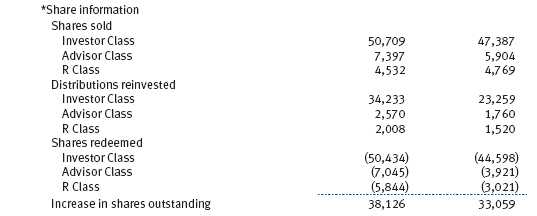
The accompanying notes are an integral part of these financial statements.
The accompanying notes are an integral part of these financial statements.

The accompanying notes are an integral part of these financial statements.
The accompanying notes are an integral part of these financial statements.
The accompanying notes are an integral part of these financial statements.
The accompanying notes are an integral part of these financial statements.
| NOTES TO FINANCIAL STATEMENTS |
NOTE 1 - SIGNIFICANT ACCOUNTING POLICIES
T. Rowe Price Mid-Cap Value Fund, Inc. (the fund), is registered under the Investment Company Act of 1940 (the 1940 Act) as a diversified, open-end management investment company. The fund seeks to provide long-term capital appreciation by investing primarily in mid-sized companies that appear to be undervalued. The fund has three classes of shares: the Mid-Cap Value Fund original share class, referred to in this report as the Investor Class, offered since June 28, 1996; the Mid-Cap Value Fund—Advisor Class (Advisor Class), offered since September 30, 2002; and the Mid-Cap Value Fund—R Class (R Class), offered since September 30, 2002. Advisor Class shares are sold only through unaffiliated brokers and other unaffiliated financial intermediaries, and R Class shares are available to retirement plans serviced by intermediaries. The Advisor Class and R Class each operate under separate Board-approved Rule 12b-1 plans, pursuant to which each class compensates financial intermediaries for distribution, shareholder servicing, and/or certain administrative services. Each class has exclusive voting rights on matters related solely to that class, separate voting rights on matters that relate to all classes, and, in all other respects, the same rights and obligations as the other classes.
The accompanying financial statements were prepared in accordance with accounting principles generally accepted in the United States of America, which require the use of estimates made by fund management. Fund management believes that estimates and security valuations are appropriate; however, actual results may differ from those estimates, and the security valuations reflected in the financial statements may differ from the value the fund ultimately realizes upon sale of the securities.
Valuation The fund values its investments and computes its net asset value per share at the close of the New York Stock Exchange (NYSE), normally 4 p.m. ET, each day that the NYSE is open for business. Equity securities listed or regularly traded on a securities exchange or in the over-the-counter (OTC) market are valued at the last quoted sale price or, for certain markets, the official closing price at the time the valuations are made, except for OTC Bulletin Board securities, which are valued at the mean of the latest bid and asked prices. A security that is listed or traded on more than one exchange is valued at the quotation on the exchange determined to be the primary market for such security. Listed securities not traded on a particular day are valued at the mean of the latest bid and asked prices for domestic securities and the last quoted sale price for international securities.
Debt securities are generally traded in the over-the-counter market. Securities with original maturities of one year or more are valued at prices furnished by dealers who make markets in such securities or by an independent pricing service, which considers yield or price of bonds of comparable quality, coupon, maturity, and type, as well as prices quoted by dealers who make markets in such securities. Securities with original maturities of less than one year are valued at amortized cost in local currency, which approximates fair value when combined with accrued interest.
Investments in mutual funds are valued at the mutual fund’s closing net asset value per share on the day of valuation.
Other investments, including restricted securities, and those for which the above valuation procedures are inappropriate or are deemed not to reflect fair value are stated at fair value as determined in good faith by the T. Rowe Price Valuation Committee, established by the fund’s Board of Directors.
Most foreign markets close before the close of trading on the NYSE. If the fund determines that developments between the close of a foreign market and the close of the NYSE will, in its judgment, materially affect the value of some or all of its portfolio securities, which in turn will affect the fund’s share price, the fund will adjust the previous closing prices to reflect the fair value of the securities as of the close of the NYSE, as determined in good faith by the T. Rowe Price Valuation Committee, established by the fund’s Board of Directors. A fund may also fair value securities in other situations, such as when a particular foreign market is closed but the fund is open. In deciding whether to make fair value adjustments, the fund reviews a variety of factors, including developments in foreign markets, the performance of U.S. securities markets, and the performance of instruments trading in U.S. markets that represent foreign securities and baskets of foreign securities. The fund uses outside pricing services to provide it with closing market prices and information used for adjusting those prices. The fund cannot predict when and how often it will use closing prices and when it will adjust those prices to reflect fair value. As a means of evaluating its fair value process, the fund routinely compares closing market prices, the next day’s opening prices in the same markets, and adjusted prices.
Currency Translation Assets, including investments, and liabilities denominated in foreign currencies are translated into U.S. dollar values each day at the prevailing exchange rate, using the mean of the bid and asked prices of such currencies against U.S. dollars as quoted by a major bank. Purchases and sales of securities, income, and expenses are translated into U.S. dollars at the prevailing exchange rate on the date of the transaction. The effect of changes in foreign currency exchange rates on realized and unrealized security gains and losses is reflected as a component of security gains and losses.
Class Accounting The Advisor Class and R Class each pay distribution, shareholder servicing, and/or certain administrative expenses in the form of Rule 12b-1 fees, in an amount not exceeding 0.25% and 0.50%, respectively, of the class’s average daily net assets. Shareholder servicing, prospectus, and shareholder report expenses incurred by each class are charged directly to the class to which they relate. Expenses common to all classes, investment income, and realized and unrealized gains and losses are allocated to the classes based upon the relative daily net assets of each class.
Rebates and Credits Subject to best execution, the fund may direct certain security trades to brokers who have agreed to rebate a portion of the related brokerage commission to the fund in cash. Commission rebates are reflected as realized gain on securities in the accompanying financial statements and totaled $446,000 for the year ended December 31, 2007. Additionally, the fund earns credits on temporarily uninvested cash balances at the custodian that reduce the fund’s custody charges. Custody expense in the accompanying financial statements is presented before reduction for credits, which are reflected as expenses paid indirectly.
Investment Transactions, Investment Income, and Distributions Income and expenses are recorded on the accrual basis. Premiums and discounts on debt securities are amortized for financial reporting purposes. Dividends received from mutual fund investments are reflected as dividend income; capital gain distributions are reflected as realized gain/loss. Dividend income and capital gain distributions are recorded on the ex-dividend date. Income tax-related interest and penalties, if incurred, would be recorded as income tax expense. Investment transactions are accounted for on the trade date. Realized gains and losses are reported on the identified cost basis. Distributions to shareholders are recorded on the ex-dividend date. Income distributions are declared and paid by each class on an annual basis. Capital gain distributions, if any, are declared and paid by the fund, typically on an annual basis.
New Accounting Pronouncements Effective June 29, 2007, the fund adopted Financial Accounting Standards Board (FASB) Interpretation No. 48 (FIN 48), Accounting for Uncertainty in Income Taxes, a clarification of FASB Statement No. 109, Accounting for Income Taxes. FIN 48 establishes financial accounting and disclosure requirements for recognition and measurement of tax positions taken or expected to be taken on an income tax return. The adoption of FIN 48 had no impact on the fund’s net assets or results of operations.
In September 2006, the FASB released the Statement of Financial Accounting Standard No. 157 (FAS 157), Fair Value Measurements. FAS 157 clarifies the definition of fair value and establishes the framework for measuring fair value, as well as proper disclosure of this methodology in the financial statements. It will be effective for the fund’s fiscal year beginning January 1, 2008. Management is evaluating the effects of FAS 157; however, it is not expected to have a material impact on the fund’s net assets or results of operations.
NOTE 2 - INVESTMENT TRANSACTIONS
Consistent with its investment objective, the fund engages in the following practices to manage exposure to certain risks or to enhance performance. The investment objective, policies, program, and risk factors of the fund are described more fully in the fund’s prospectus and Statement of Additional Information.
Restricted Securities The fund may invest in securities that are subject to legal or contractual restrictions on resale. Prompt sale of such securities at an acceptable price may be difficult due to substantial delays and additional costs related to their restrictions.
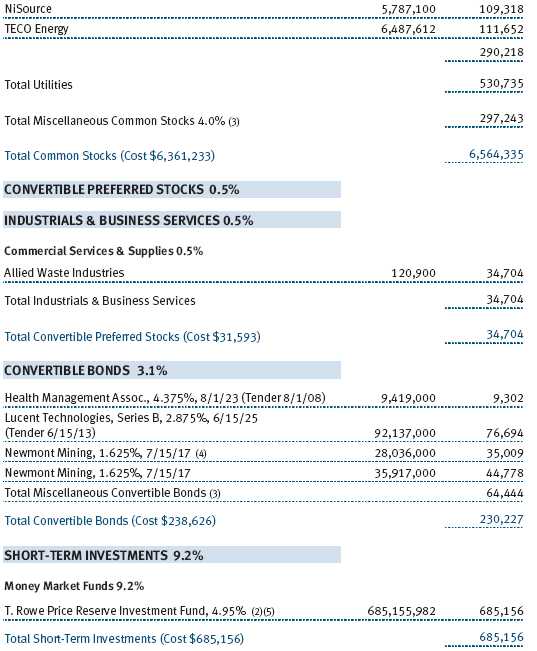
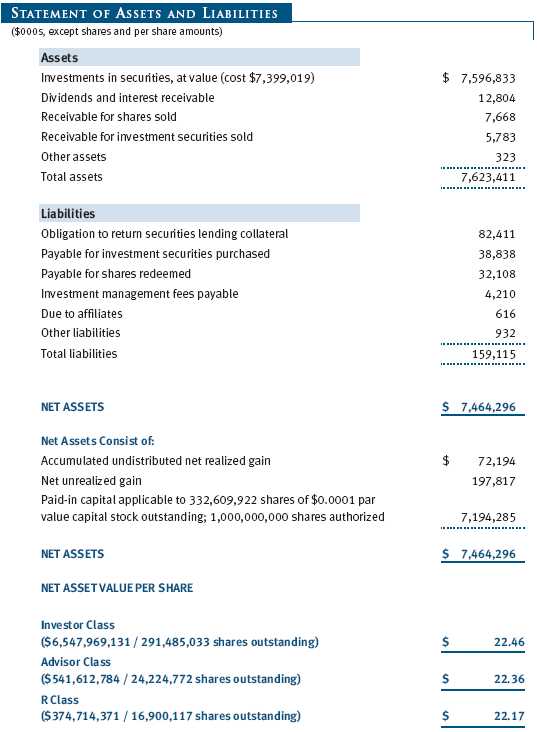
Securities Lending The fund lends its securities to approved brokers to earn additional income. It receives as collateral cash and U.S. government securities valued at 102% to 105% of the value of the securities on loan. Cash collateral is invested in a money market pooled trust managed by the fund’s lending agent in accordance with investment guidelines approved by fund management. Collateral is maintained over the life of the loan in an amount not less than the value of loaned securities, as determined at the close of fund business each day; any additional collateral required due to changes in security values is delivered to the fund the next business day. Although risk is mitigated by the collateral, the fund could experience a delay in recovering its securities and a possible loss of income or value if the borrower fails to return the securities. Securities lending revenue recognized by the fund consists of earnings on invested collateral and borrowing fees, net of any rebates to the borrower and compensation to the lending agent. At December 31, 2007, the value of loaned securities was $82,434,000; aggregate collateral consisted of $82,411,000 in the money market pooled trust.
Other Purchases and sales of portfolio securities, other than short-term securities, aggregated $5,497,031,000 and $5,480,649,000, respectively, for the year ended December 31, 2007.
NOTE 3 - FEDERAL INCOME TAXES
No provision for federal income taxes is required since the fund intends to continue to qualify as a regulated investment company under Subchapter M of the Internal Revenue Code and distribute to shareholders all of its taxable income and gains. Federal income tax regulations differ from generally accepted accounting principles; therefore, distributions determined in accordance with tax regulations may differ significantly in amount or character from net investment income and realized gains for financial reporting purposes. Financial reporting records are adjusted for permanent book/tax differences to reflect tax character. Financial records are not adjusted for temporary differences.
Distributions during the year ended December 31, 2007, were characterized as follows for tax purposes:
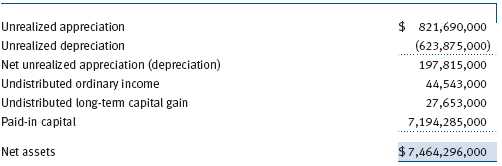
At December 31, 2007, the tax-basis components of net assets were as follows:
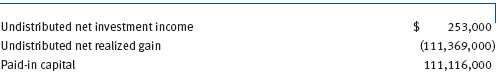
For the year ended December 31, 2007, the fund recorded the following permanent reclassifications to reflect tax character. Reclassifications to paid-in capital relate primarily to a tax practice that treats a portion of the proceeds from each redemption of capital shares as a distribution of taxable net investment income and/or realized capital gain. Results of operations and net assets were not affected by these reclassifications.
At December 31, 2007, the cost of investments for federal income tax purposes was $7,399,021,000.
NOTE 4 - RELATED PARTY TRANSACTIONS
The fund is managed by T. Rowe Price Associates, Inc. (the manager or Price Associates), a wholly owned subsidiary of T. Rowe Price Group, Inc. The investment management agreement between the fund and the manager provides for an annual investment management fee, which is computed daily and paid monthly. The fee consists of an individual fund fee, equal to 0.35% of the fund’s average daily net assets, and a group fee. The group fee rate is calculated based on the combined net assets of certain mutual funds sponsored by Price Associates (the group) applied to a graduated fee schedule, with rates ranging from 0.48% for the first $1 billion of assets to 0.285% for assets in excess of $220 billion. The fund’s group fee is determined by applying the group fee rate to the fund’s average daily net assets. At December 31, 2007, the effective annual group fee rate was 0.30%.
In addition, the fund has entered into service agreements with Price Associates and two wholly owned subsidiaries of Price Associates (collectively, Price). Price Associates computes the daily share prices and provides certain other administrative services to the fund. T. Rowe Price Services, Inc., provides shareholder and administrative services in its capacity as the fund’s transfer and dividend disbursing agent. T. Rowe Price Retirement Plan Services, Inc., provides subaccounting and recordkeeping services for certain retirement accounts invested in the Investor Class and R Class. For the year ended December 31, 2007, expenses incurred pursuant to these service agreements were $131,000 for Price Associates, $2,357,000 for T. Rowe Price Services, Inc., and $1,458,000 for T. Rowe Price Retirement Plan Services, Inc. The total amount payable at period-end pursuant to these service agreements is reflected as Due to Affiliates in the accompanying financial statements.
Additionally, the fund is one of several mutual funds in which certain college savings plans managed by Price Associates may invest. As approved by the fund’s Board of Directors, shareholder servicing costs associated with each college savings plan are borne by the fund in proportion to the average daily value of its shares owned by the college savings plan. For the year ended December 31, 2007, the fund was charged $409,000 for shareholder servicing costs related to the college savings plans, of which $324,000 was for services provided by Price. The amount payable at period-end pursuant to this agreement is reflected as Due to Affiliates in the accompanying financial statements. At December 31, 2007, approximately 3% of the outstanding shares of the Investor Class were held by college savings plans.
The fund is also one of several mutual funds sponsored by Price Associates (underlying Price funds) in which the T. Rowe Price Spectrum Funds (Spectrum Funds) and T. Rowe Price Retirement Funds (Retirement Funds) may invest. Neither the Spectrum Funds nor the Retirement Funds invest in the underlying Price funds for the purpose of exercising management or control. Pursuant to separate special servicing agreements, expenses associated with the operation of the Spectrum and Retirement Funds are borne by each underlying Price fund to the extent of estimated savings to it and in proportion to the average daily value of its shares owned by the Spectrum and Retirement Funds, respectively. Expenses allocated under these agreements are reflected as shareholder servicing expenses in the accompanying financial statements. For the year ended December 31, 2007, the fund was allocated $277,000 of Spectrum Funds’ expenses and $1,706,000 of Retirement Funds’ expenses. Of these amounts, $1,500, 000 related to services provided by Price. The amount payable at period-end pursuant to this agreement is reflected as Due to Affiliates in the accompanying financial statements. At December 31, 2007, approximately 3% of the outstanding shares of the Investor Class were held by the Spectrum Funds and 14% were held by the Retirement Funds.
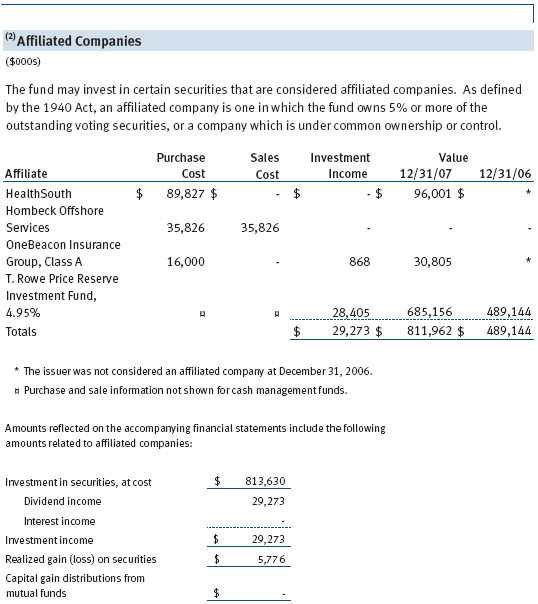
The fund may invest in the T. Rowe Price Reserve Investment Fund and the T. Rowe Price Government Reserve Investment Fund (collectively, the T. Rowe Price Reserve Investment Funds), open-end management investment companies managed by Price Associates and affiliates of the fund. The T. Rowe Price Reserve Investment Funds are offered as cash management options to mutual funds, trusts, and other accounts managed by Price Associates and/or its affiliates, and are not available for direct purchase by members of the public. The T. Rowe Price Reserve Investment Funds pay no investment management fees.
As of December 31, 2007, T. Rowe Price Group, Inc., and/or its wholly owned subsidiaries owned 169,796 shares of the Investor Class, representing less than 1% of the fund’s net assets.
| REPORT OF INDEPENDENT REGISTERED PUBLIC ACCOUNTING FIRM |
To the Board of Directors and Shareholders of T. Rowe Price Mid-Cap Value Fund, Inc.
In our opinion, the accompanying statement of assets and liabilities, including the portfolio of investments, and the related statements of operations and of changes in net assets and the financial highlights present fairly, in all material respects, the financial position of T. Rowe Price Mid-Cap Value Fund, Inc. (the “Fund”) at December 31, 2007, the results of its operations for the year then ended, the changes in its net assets for each of the two years in the period then ended and the financial highlights for each of the five years in the period then ended, in conformity with accounting principles generally accepted in the United States of America. These financial statements and financial highlights (hereafter referred to as “financial statements”) are the responsibility of the Fund’s management; our responsibility is to express an opinion on these financial statements based on our audits. We conducted our audits of these financial statements in accordance with the auditing standards of the Public Company Accounting Oversight Board (United States). Those standards require that we plan and perform the audit to obtain reasonable assurance about whether the financial statements are free of material misstatement. An audit includes examining, on a test basis, evidence supporting the amounts and disclosures in the financial statements, assessing the accounting principles used and significant estimates made by management, and evaluating the overall financial statement presentation. We believe that our audits, which included confirmation of securities at December 31, 2007, by correspondence with the custodian, brokers and by agreement to the underlying ownership records for T. Rowe Price Reserve Investment Fund, provide a reasonable basis for our opinion.
PricewaterhouseCoopers LLP
Baltimore, Maryland
February 12, 2008
| TAX INFORMATION (UNAUDITED) FOR THE TAX YEAR ENDED 12/31/07 |
We are providing this information as required by the Internal Revenue Code. The amounts shown may differ from those elsewhere in this report because of differences between tax and financial reporting requirements.
The fund’s distributions to shareholders included:
• $316,679,000 from short-term capital gains
• $536,475,000 from long-term capital gains, of which $535,792,000 was subject to the 15% rate gains category, and $683,000 to the 25% rate gains category.
For taxable non-corporate shareholders, $191,457,000 of the fund’s income represents qualified dividend income subject to the 15% rate category.
For corporate shareholders, $182,151,000 of the fund’s income qualifies for the dividends-received deduction.
| INFORMATION ON PROXY VOTING POLICIES, PROCEDURES, AND RECORDS |
A description of the policies and procedures used by T. Rowe Price funds and portfolios to determine how to vote proxies relating to portfolio securities is available in each fund’s Statement of Additional Information, which you may request by calling 1-800-225-5132 or by accessing the SEC’s Web site, www.sec.gov. The description of our proxy voting policies and procedures is also available on our Web site, www.troweprice.com. To access it, click on the words “Company Info” at the top of our homepage for individual investors. Then, in the window that appears, click on the “Proxy Voting Policy” navigation button in the top left corner.
Each fund’s most recent annual proxy voting record is available on our Web site and through the SEC’s Web site. To access it through our Web site, follow the directions above, then click on the words “Proxy Voting Record” at the bottom of the Proxy Voting Policy page.
| HOW TO OBTAIN QUARTERLY PORTFOLIO HOLDINGS |
The fund files a complete schedule of portfolio holdings with the Securities and Exchange Commission for the first and third quarters of each fiscal year on Form N-Q. The fund’s Form N-Q is available electronically on the SEC’s Web site (www.sec.gov); hard copies may be reviewed and copied at the SEC’s Public Reference Room, 450 Fifth St. N.W., Washington, DC 20549. For more information on the Public Reference Room, call 1-800-SEC-0330.
| ABOUT THE FUND’S DIRECTORS AND OFFICERS |
Your fund is governed by a Board of Directors (Board) that meets regularly to review a wide variety of matters affecting the fund, including performance, investment programs, compliance matters, advisory fees and expenses, service providers, and other business affairs. The Board elects the fund’s officers, who are listed in the final table. At least 75% of Board members are independent of T. Rowe Price Associates, Inc. (T. Rowe Price), and T. Rowe Price International, Inc. (T. Rowe Price International); “inside” or “interested” directors are employees or officers of T. Rowe Price. The business address of each director and officer is 100 East Pratt Street, Baltimore, Maryland 21202. The Statement of Additional Information includes additional information about the directors and is available without charge by calling a T. Rowe Price representative at 1-800-225-5132.
| Independent Directors | |
| |
| Name | |
| (Year of Birth) | Principal Occupation(s) During Past 5 Years and Directorships of |
| Year Elected* | Other Public Companies |
| |
| Jeremiah E. Casey | Director, National Life Insurance (2001 to 2005); Director, The Rouse |
| (1940) | Company, real estate developers (1990 to 2004); Director, Allfirst |
| 2005 | Financial Inc. (previously First Maryland Bancorp) (1983 to 2002) |
| |
| Anthony W. Deering | Chairman, Exeter Capital, LLC, a private investment firm (2004 to pres- |
| (1945) | ent); Director, Vornado Real Estate Investment Trust (3/04 to present); |
| 2001 | Member, Advisory Board, Deutsche Bank North America (2004 to pres- |
| | ent); Director, Chairman of the Board, and Chief Executive Officer, The |
| | Rouse Company, real estate developers (1997 to 2004) |
| |
| Donald W. Dick, Jr. | Principal, EuroCapital Advisors, LLC, an acquisition and management |
| (1943) | advisory firm; Chairman, The Haven Group, a custom manufacturer of |
| 1996 | modular homes (1/04 to present) |
| |
| David K. Fagin | Chairman and President, Nye Corporation (6/88 to present); Chairman, |
| (1938) | Canyon Resources Corp. (8/07 to present); Director, Golden Star |
| 1996 | Resources Ltd. (5/92 to present); Director, Pacific Rim Mining Corp. |
| | (2/02 to present) |
| |
| Karen N. Horn | Director, Federal National Mortgage Association (9/06 to present); |
| (1943) | Managing Director and President, Global Private Client Services, |
| 2003 | Marsh Inc. (1999 to 2003); Director, Georgia Pacific (5/04 to 12/05), |
| | Eli Lilly and Company, and Simon Property Group |
| |
| Theo C. Rodgers | President, A&R Development Corporation (1977 to present) |
| (1941) | |
| 2005 | |
| John G. Schreiber | Owner/President, Centaur Capital Partners, Inc., a real estate invest- |
| (1946) | ment company; Partner, Blackstone Real Estate Advisors, L.P. |
| 2001 | |
| |
| *Each independent director oversees 121 T. Rowe Price portfolios and serves until retirement, resignation, or |
| election of a successor. | |
| Inside Directors | |
| |
| Name | |
| (Year of Birth) | |
| Year Elected* | |
| [Number of T. Rowe Price | Principal Occupation(s) During Past 5 Years and Directorships of |
| Portfolios Overseen] | Other Public Companies |
| |
| Edward C. Bernard | Director and Vice President, T. Rowe Price; Vice Chairman of the Board, |
| (1956) | Director, and Vice President, T. Rowe Price Group, Inc.; Chairman of the |
| 2006 | Board, Director, and President, T. Rowe Price Investment Services, |
| [121] | Inc.; Chairman of the Board and Director, T. Rowe Price Global Asset |
| | Management Limited, T. Rowe Price Global Investment Services |
| | Limited, T. Rowe Price Retirement Plan Services, Inc., T. Rowe Price |
| | Savings Bank, and T. Rowe Price Services, Inc.; Director, T. Rowe Price |
| | International, Inc.; Chief Executive Officer, Chairman of the Board, |
| | Director, and President, T. Rowe Price Trust Company; Chairman of the |
| | Board, all funds |
| |
| Brian C. Rogers, CFA, CIC | Chief Investment Officer, Director, and Vice President, T. Rowe Price; |
| (1955) | Chairman of the Board, Chief Investment Officer, Director, and Vice |
| 2006 | President, T. Rowe Price Group, Inc.; Vice President, T. Rowe Price |
| [68] | Trust Company |
| |
| *Each inside director serves until retirement, resignation, or election of a successor. |
| Officers | |
| |
| Name (Year of Birth) | |
| Title and Fund(s) Served | Principal Occupation(s) |
| |
| Peter J. Bates, CFA (1974) | Vice President, T. Rowe Price and T. Rowe Price |
| Vice President, Mid-Cap Value Fund | Group, Inc.; formerly intern, T. Rowe Price (to |
| | 2004); Vice President of Finance, Rent-A-Center, |
| | Inc. (to 2003) |
| |
| Laurie M. Bertner (1977) | Vice President, T. Rowe Price and T. Rowe Price |
| Vice President, Mid-Cap Value Fund | Group, Inc. |
| |
| Christopher W. Carlson (1967) | Vice President, T. Rowe Price and T. Rowe Price |
| Vice President, Mid-Cap Value Fund | Group, Inc. |
| |
| Joseph A. Carrier, CPA (1960) | Vice President, T. Rowe Price, T. Rowe Price |
| Treasurer, Mid-Cap Value Fund | Group, Inc., T. Rowe Price Investment Services, |
| | Inc., and T. Rowe Price Trust Company |
| |
| Kara Cheseby, CFA (1963) | Vice President, T. Rowe Price and T. Rowe Price |
| Vice President, Mid-Cap Value Fund | Group, Inc. |
| |
| Henry M. Ellenbogen (1971) | Vice President, T. Rowe Price and T. Rowe Price |
| Vice President, Mid-Cap Value Fund | Group, Inc. |
| |
| Roger L. Fiery III, CPA (1959) | Vice President, T. Rowe Price, T. Rowe Price |
| Vice President, Mid-Cap Value Fund | Group, Inc., T. Rowe Price International, Inc., |
| | and T. Rowe Price Trust Company |
| |
| John R. Gilner (1961) | Chief Compliance Officer and Vice President, |
| Chief Compliance Officer, Mid-Cap Value Fund | T. Rowe Price; Vice President, T. Rowe Price |
| | Group, Inc., and T. Rowe Price Investment |
| | Services, Inc. |
| |
| Gregory S. Golczewski (1966) | Vice President, T. Rowe Price and T. Rowe Price |
| Vice President, Mid-Cap Value Fund | Trust Company |
| |
| Henry H. Hopkins (1942) | Director and Vice President, T. Rowe Price |
| Vice President, Mid-Cap Value Fund | Investment Services, Inc., T. Rowe Price Services, |
| | Inc., and T. Rowe Price Trust Company; Vice |
| | President, T. Rowe Price, T. Rowe Price Group, |
| | Inc., T. Rowe Price International, Inc., and |
| | T. Rowe Price Retirement Plan Services, Inc. |
| |
| Patricia B. Lippert (1953) | Assistant Vice President, T. Rowe Price and |
| Secretary, Mid-Cap Value Fund | T. Rowe Price Investment Services, Inc. |
| Gregory A. McCrickard, CFA (1958) | Vice President, T. Rowe Price, T. Rowe Price |
| Vice President, Mid-Cap Value Fund | Group, Inc., and T. Rowe Price Trust Company |
| |
| Heather K. McPherson, CPA (1967) | Vice President, T. Rowe Price and T. Rowe Price |
| Vice President, Mid-Cap Value Fund | Group, Inc. |
| |
| Joseph M. Milano, CFA (1972) | Vice President, T. Rowe Price and T. Rowe Price |
| Vice President, Mid-Cap Value Fund | Group, Inc. |
| |
| J. David Wagner, CFA (1974) | Vice President, T. Rowe Price and T. Rowe Price |
| Vice President, Mid-Cap Value Fund | Group, Inc. |
| |
| David J. Wallack (1960) | Vice President, T. Rowe Price and T. Rowe Price |
| President, Mid-Cap Value Fund | Group, Inc. |
| |
| Julie L. Waples (1970) | Vice President, T. Rowe Price |
| Vice President, Mid-Cap Value Fund | |
| |
| Unless otherwise noted, officers have been employees of T. Rowe Price or T. Rowe Price International for at least |
| five years. | |
Item 2. Code of Ethics.
The registrant has adopted a code of ethics, as defined in Item 2 of Form N-CSR, applicable to its principal executive officer, principal financial officer, principal accounting officer or controller, or persons performing similar functions. A copy of this code of ethics is filed as an exhibit to this Form N-CSR. No substantive amendments were approved or waivers were granted to this code of ethics during the period covered by this report.
Item 3. Audit Committee Financial Expert.
The registrant’s Board of Directors/Trustees has determined that Ms. Karen N. Horn qualifies as an audit committee financial expert, as defined in Item 3 of Form N-CSR. Ms. Horn is considered independent for purposes of Item 3 of Form N-CSR.
Item 4. Principal Accountant Fees and Services.
(a) – (d) Aggregate fees billed to the registrant for the last two fiscal years for professional services rendered by the registrant’s principal accountant were as follows:
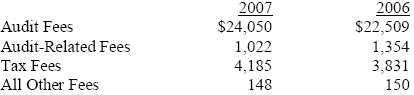
Audit fees include amounts related to the audit of the registrant’s annual financial statements and services normally provided by the accountant in connection with statutory and regulatory filings. Audit-related fees include amounts reasonably related to the performance of the audit of the registrant’s financial statements and specifically include the issuance of a report on internal controls and, if applicable, agreed-upon procedures related to fund acquisitions. Tax fees include amounts related to services for tax compliance, tax planning, and tax advice. The nature of these services specifically includes the review of distribution calculations and the preparation of Federal, state, and excise tax returns. All other fees include the registrant’s pro-rata share of amounts for agreed-upon procedures in conjunction with service contract approvals by the registrant’s Board of Directors/Trustees.
(e)(1) The registrant’s audit committee has adopted a policy whereby audit and non-audit services performed by the registrant’s principal accountant for the registrant, its investment adviser, and any entity controlling, controlled by, or under common control with the investment adviser that provides ongoing services to the registrant require pre-approval in advance at regularly scheduled audit committee meetings. If such a service is required between regularly scheduled audit committee meetings, pre-approval may be authorized by one audit committee member with ratification at the next scheduled audit committee meeting. Waiver of pre-approval for audit or non-audit services requiring fees of a de minimis amount is not permitted.
(2) No services included in (b) – (d) above were approved pursuant to paragraph (c)(7)(i)(C) of Rule 2-01 of Regulation S-X.
(f) Less than 50 percent of the hours expended on the principal accountant’s engagement to audit the registrant’s financial statements for the most recent fiscal year were attributed to work performed by persons other than the principal accountant’s full-time, permanent employees.
(g) The aggregate fees billed for the most recent fiscal year and the preceding fiscal year by the registrant’s principal accountant for non-audit services rendered to the registrant, its investment adviser, and any entity controlling, controlled by, or under common control with the investment adviser that provides ongoing services to the registrant were $1,486,000 and $1,401,000, respectively, and were less than the aggregate fees billed for those same periods by the registrant’s principal accountant for audit services rendered to the T. Rowe Price Funds.
(h) All non-audit services rendered in (g) above were pre-approved by the registrant’s audit committee. Accordingly, these services were considered by the registrant’s audit committee in maintaining the principal accountant’s independence.
Item 5. Audit Committee of Listed Registrants.
Not applicable.
Item 6. Schedule of Investments.
Not applicable. The complete schedule of investments is included in Item 1 of this Form N-CSR.
Item 7. Disclosure of Proxy Voting Policies and Procedures for Closed-End Management Investment Companies.
Not applicable.
Item 8. Portfolio Managers of Closed-End Management Investment Companies.
Not applicable.
Item 9. Purchases of Equity Securities by Closed-End Management Investment Company and Affiliated Purchasers.
Not applicable.
Item 10. Submission of Matters to a Vote of Security Holders.
Not applicable.
Item 11. Controls and Procedures.
(a) The registrant’s principal executive officer and principal financial officer have evaluated the registrant’s disclosure controls and procedures within 90 days of this filing and have concluded that the registrant’s disclosure controls and procedures were effective, as of that date, in ensuring that information required to be disclosed by the registrant in this Form N-CSR was recorded, processed, summarized, and reported timely.
(b) The registrant’s principal executive officer and principal financial officer are aware of no change in the registrant’s internal control over financial reporting that occurred during the registrant’s second fiscal quarter covered by this report that has materially affected, or is reasonably likely to materially affect, the registrant’s internal control over financial reporting.
Item 12. Exhibits.
(a)(1) The registrant’s code of ethics pursuant to Item 2 of Form N-CSR is attached.
(2) Separate certifications by the registrant's principal executive officer and principal financial officer, pursuant to Section 302 of the Sarbanes-Oxley Act of 2002 and required by Rule 30a-2(a) under the Investment Company Act of 1940, are attached.
(3) Written solicitation to repurchase securities issued by closed-end companies: not applicable.
(b) A certification by the registrant's principal executive officer and principal financial officer, pursuant to Section 906 of the Sarbanes-Oxley Act of 2002 and required by Rule 30a-2(b) under the Investment Company Act of 1940, is attached.
| | |
SIGNATURES |
| |
| | Pursuant to the requirements of the Securities Exchange Act of 1934 and the Investment |
| Company Act of 1940, the registrant has duly caused this report to be signed on its behalf by the |
| undersigned, thereunto duly authorized. |
| |
| T. Rowe Price Mid-Cap Value Fund, Inc. |
| |
| |
| By | /s/ Edward C. Bernard |
| | Edward C. Bernard |
| | Principal Executive Officer |
| |
| Date | February 19, 2008 |
| |
| |
| |
| | Pursuant to the requirements of the Securities Exchange Act of 1934 and the Investment |
| Company Act of 1940, this report has been signed below by the following persons on behalf of |
| the registrant and in the capacities and on the dates indicated. |
| |
| |
| By | /s/ Edward C. Bernard |
| | Edward C. Bernard |
| | Principal Executive Officer |
| |
| Date | February 19, 2008 |
| |
| |
| |
| By | /s/ Joseph A. Carrier |
| | Joseph A. Carrier |
| | Principal Financial Officer |
| |
| Date | February 19, 2008 |