| UNITED STATES |
| SECURITIES AND EXCHANGE COMMISSION |
| Washington, D.C. 20549 |
| |
FORM N-CSR |
| |
CERTIFIED SHAREHOLDER REPORT OF REGISTERED |
MANAGEMENT INVESTMENT COMPANIES |
| |
| |
| |
| Investment Company Act File Number: 811-07605 |
|
| |
| T. Rowe Price Mid-Cap Value Fund, Inc. |
|
| (Exact name of registrant as specified in charter) |
| |
| 100 East Pratt Street, Baltimore, MD 21202 |
|
| (Address of principal executive offices) |
| |
| David Oestreicher |
| 100 East Pratt Street, Baltimore, MD 21202 |
|
| (Name and address of agent for service) |
| |
| |
| Registrant’s telephone number, including area code: (410) 345-2000 |
| |
| |
| Date of fiscal year end: December 31 |
| |
| |
| Date of reporting period: December 31, 2010 |
Item 1: Report to Shareholders| Mid-Cap Value Fund | December 31, 2010 |
The views and opinions in this report were current as of December 31, 2010. They are not guarantees of performance or investment results and should not be taken as investment advice. Investment decisions reflect a variety of factors, and the managers reserve the right to change their views about individual stocks, sectors, and the markets at any time. As a result, the views expressed should not be relied upon as a forecast of the fund’s future investment intent. The report is certified under the Sarbanes-Oxley Act, which requires mutual funds and other public companies to affirm that, to the best of their knowledge, the information in their financial reports is fairly and accurately stated in all material respects.
REPORTS ON THE WEB
Sign up for our E-mail Program, and you can begin to receive updated fund reports and prospectuses online rather than through the mail. Log in to your account at troweprice.com for more information.
Manager’s Letter
Fellow Shareholders
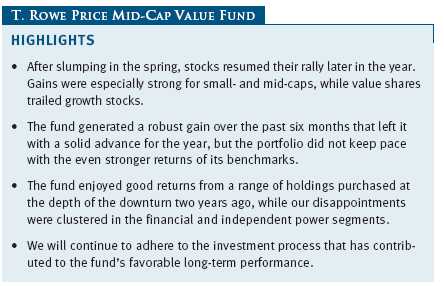
Despite suffering a setback in the spring, stocks continued their rebound over the past year as investors welcomed healthy corporate profits and signs of continued economic growth in the U.S. and abroad. Further monetary and fiscal stimulus also helped boost sentiment. Mid- and small-cap shares enjoyed especially strong returns in this environment, helping bring the S&P MidCap 400 Index within a few percentage points of its all-time high by year-end. Your fund recorded a robust gain over the past six months, resulting in a solid advance for the year. We trailed the even stronger returns of our benchmarks, however, due in part to a cluster of disappointments in the financial and independent power segments.
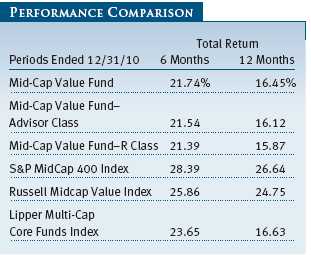
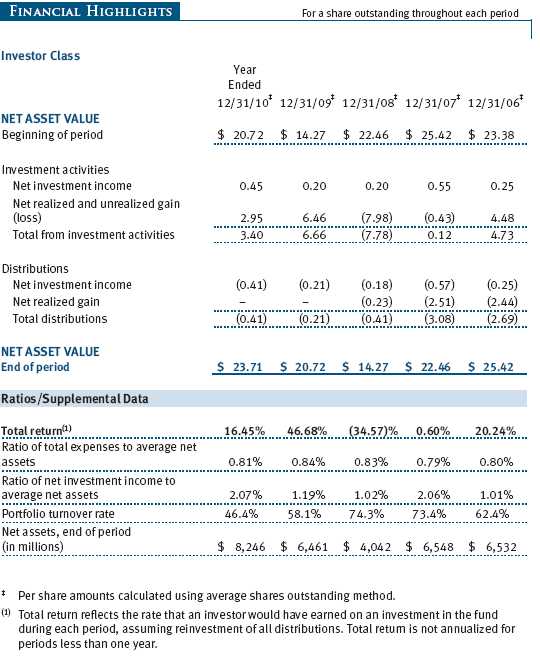
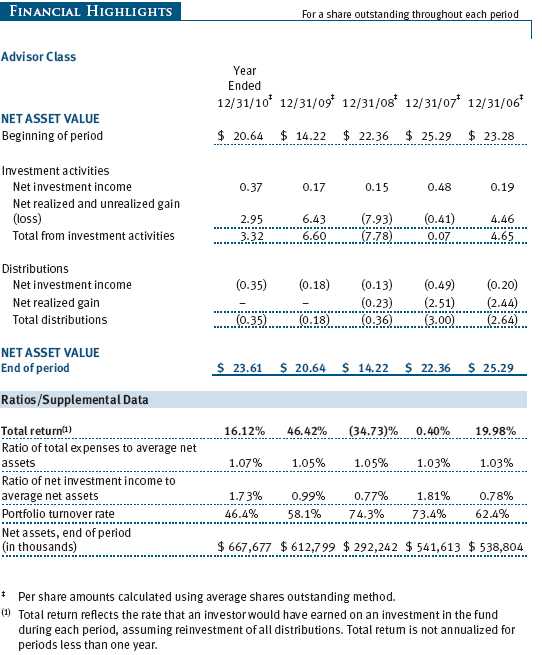
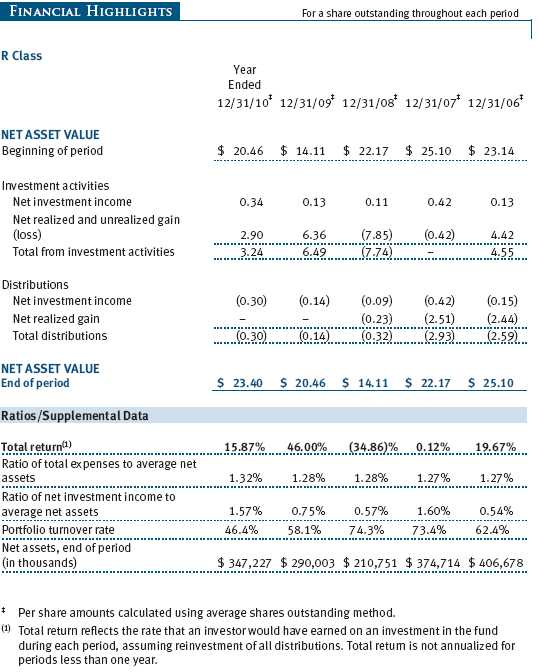
The Mid-Cap Value Fund returned 21.74% for the six months ended December 31, 2010, and 16.45% for the year. As shown in the Performance Comparison table, the fund lagged its benchmarks in both periods. (Please note that Lipper classifies the fund as “multi-cap core” rather than “mid-cap value.” Lipper’s fund classification has alternated in the past.) Returns for the fund’s Advisor and R Class shares were slightly lower due to their different cost structures.
Despite lagging its benchmarks recently, the fund’s long-term performance remains favorable, in relative terms, as recognized by Morningstar’s overall five-star rating, as well as its rank among competitive funds as tracked by Lipper over longer time periods. The Mid-Cap Value Fund received an Overall Morningstar Rating™ of five stars for its risk-adjusted performance. This rating is derived from a weighted average of the performance figures associated with a fund’s 3-, 5-, and 10-year (if applicable) Morningstar Rating™ metrics. The fund was rated among 360, 360, 286, and 98 mid-cap value funds for the overall rating and the 3-, 5-, and 10-year periods ended December 31, 2010, respectively. (Please refer to page 8 for additional information about Morningstar ratings.) Based on cumulative total return, Lipper ranked the Mid-Cap Value Fund 334 of 816, 22 of 712, 25 of 594, and 6 of 277 multi-cap core funds for the 1-, 3-, 5-, and 10-year periods ended December 31, 2010, respectively. Results will vary for other periods. Past performance cannot guarantee future results.
MARKET ENVIRONMENT
After continuing to rally early in the year, stocks fell sharply in late spring as investor sentiment plummeted amid indications that the economic recovery was losing steam. A number of culprits may have been to blame for the slowdown, including reverberations from a sovereign debt crisis in Europe, the end of the homebuyer tax credit, and the waning impact of government stimulus measures. With nerves already frayed, investors had to endure a sharp downturn in stock prices in the spring, punctuated by the “flash crash” of May 6, which saw the major indexes plunge nearly 10% in minutes before recovering most of their losses just as quickly. The flash crash itself was eventually attributed to a glitch in electronic trading, but stock prices continued to slump through early July.
While many began to worry that the economy might experience a “double dip” recession, signs of renewed economic strength later in the year suggested the recovery remained on track. Both the service and manufacturing sectors continued to expand, and consumers proved willing to spend income gains. Exports remained a bright spot for corporate profits and the economy as a whole, as emerging markets in particular continued to benefit from growing domestic consumption fed by burgeoning middle classes. Two dark clouds remained on the U.S. economic horizon, however. First, the housing sector continued to languish, with sales and construction stuck at low levels while home prices ended the year falling again across the country, according to the latest available data. Second, rising corporate profits failed to boost the weak labor market. Private employers added jobs throughout most of the year but at a meager pace that kept the unemployment rate near 10%.
Continued weakness in the job market encouraged further government stimulus, both monetary and fiscal. After trading sideways through much of the summer, stocks began climbing in late August amid hopes for new stimulus measures from the Federal Reserve. Optimism grew as many U.S. and global companies continued to report record profitability and earnings. On November 3, the Fed announced a plan to buy $600 billion of longer-term Treasuries by mid-2011 in an effort to lower borrowing costs and add liquidity to the financial system. In December, stocks marched still higher when the White House and Congressional Republicans announced a deal to extend existing tax rates and unemployment benefits while introducing a one-year payroll tax cut.
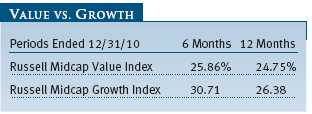
Mid-cap value stocks trailed their growth counterparts during the sharp rally over the past six months, resulting in modest underperformance for the year as a whole. Mid- and small-caps handily outperformed large-caps, however—a pattern that was especially evident over the year as a whole.
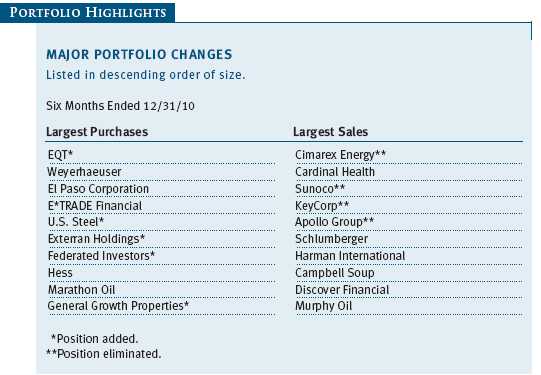
PORTFOLIO AND STRATEGY REVIEW
The dark days of late 2008 and early 2009 may seem a dim memory to some equity investors, but we remember them well. Fear was abundant, uncertainty reigned, and the stock market declined violently. Few—ourselves included—predicted that stocks would soon recover and that many market indexes would double from their lows over the ensuing two years. We shared many of the concerns of other investors in the bear market but did our best to keep our heads down and continue to adhere to the tried and true principles of seeking good businesses at attractive prices, managing risk and reward, and investing with a longer-term horizon.
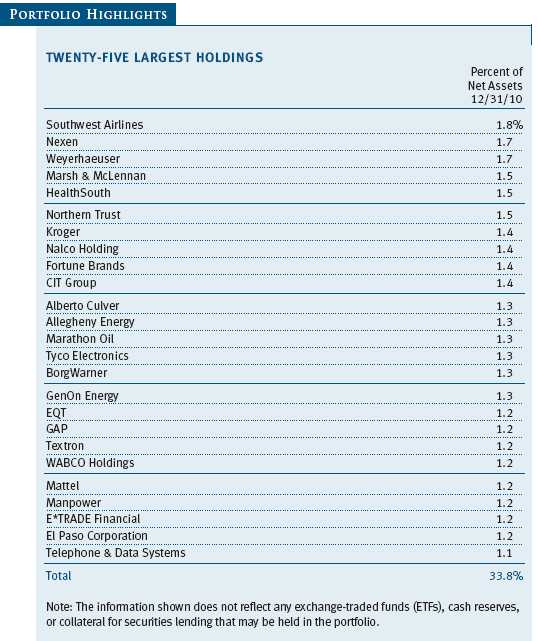
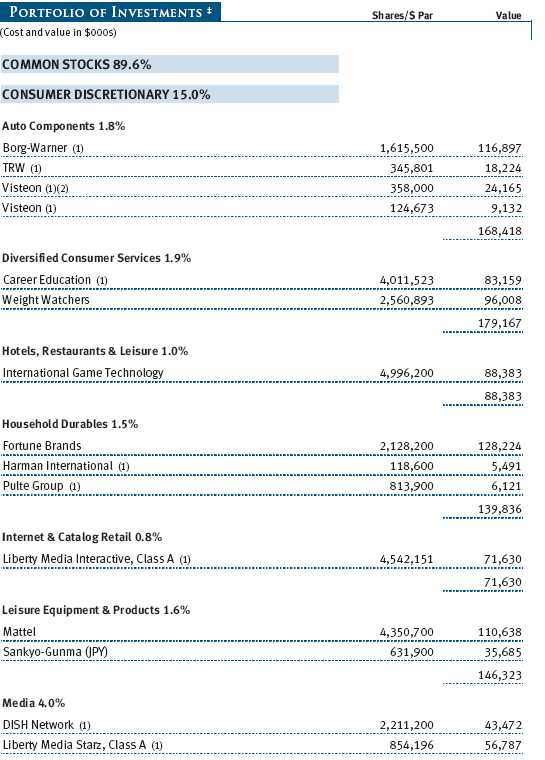
As it has in the past, this approach produced many of the best stocks in the fund last year. BorgWarner, a maker of dual clutch transmissions and emission control systems for automobiles, and the fund’s best performer, is an example. At the time of our original purchases in early 2009, we did not anticipate a powerful economic upswing in the world’s emerging markets, nor did we necessarily expect the next Great Depression. Rather, our focus was on Borg’s market leadership, management track record, financial health, and the likelihood of an eventual improvement in the auto parts industry due to consolidation. Finally, we reasoned that given its then-current price, the upside potential in its shares if business improved was disproportional to the downside risk if business stayed poor. As it happened, Borg proved to be a major beneficiary of improving global auto demand and a growing focus by consumers on engine efficiency and cleaner air emissions in rapidly growing, developing markets in Asia, Latin America, and elsewhere. (Please refer to the fund’s portfolio of investments for a complete list of holdings and the amount each represents in the portfolio.)
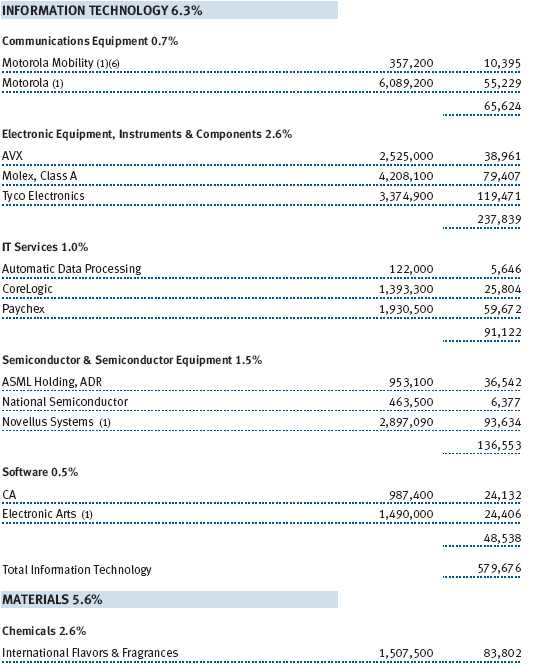
The rapid growth in the world’s developing markets also buoyed WABCO Holdings, one of two large global manufacturers of truck braking systems. Here again, when we first bought WABCO’s shares, expectations about a revival of truck demand in emerging markets were low, but its stock was priced for a continuation of poor business conditions. When the recovery came, WABCO’s shares were poised to do well, and they rose significantly. We added to the fund’s position in Tyco Electronics, one of the world’s largest electronic connector makers, during the downturn. It was another good performer last year as demand for its products surged with global consumption of autos, smartphones, and electronics of all kinds rising around the world. Finally, our purchases of Novellus Systems when times for the technology industry were difficult proved fruitful as this supplier of semiconductor capital equipment benefited from its aggressive cost-reduction campaign and rising capital spending as its customers geared up for growth.
Results in the fund’s financial stocks were more mixed, and this group produced some of its best and worst performers. The shares of Kimco Realty, a real estate investment trust and the country’s largest operator of neighborhood shopping centers, rose as consumer spending rebounded and occupancy levels and rents subsequently stabilized. The company was also able to refinance debt on favorable terms. An improving outlook for its corporate clients drove the shares of Marsh & McLennan higher, as investors in the world’s largest insurance brokerage firm anticipated better premium volumes and an increase in consulting assignments. CIT Group, a century-old commercial lender, emerged from Chapter 11 bankruptcy with a stronger balance sheet and new management. CIT’s franchise remains intact despite its brief, 38-day stay in bankruptcy court, and its stock performed well as management refinanced high-cost debt, reduced operating costs, tackled regulatory challenges, and repositioned the company for an improvement in commercial leasing.
Wilmington Trust’s shares did not fare so well, and it was one of the fund’s biggest losers last year. We have long been attracted to unique banking institutions that possess a strong and conservative credit culture, have a distinctive brand name, and have survived through many cycles. Northern Trust, Commerce Bancshares, and Westamerica Bank are examples of such banks, and these have been held in the portfolio for many years. Wilmington Trust appeared to be in the same category and appeared to have many of the attributes we have found in past successful investments: a recognized brand name, leadership in its markets, and what appeared to be good upside potential relative to downside risk. Originally founded by the famed Du Pont family to oversee its fortune, Wilmington had managed its business conservatively over the decades, with great scrutiny given to prospective loans, but the growth in residential and commercial lending that occurred in the past 15 years proved to be the undoing of this storied institution. With perfect hindsight, there were warning signs that belied a divergence from the bank’s traditionally conservative practices: rapid lending growth, unusually good loan performance given the worsening environment, an unexpected equity financing, and an abrupt management change. Our faith in the company was misplaced, however, and we sold the position at a loss.
Fidelity National Financial, the country’s largest title insurance company, was another detractor for the year, as sentiment soured further on the outlook for the housing industry. The Mid-Cap Value Fund owns shares in two title insurers—First American Financial and Fidelity—and their combined share is over 60% of the market following a protracted, four-year downturn that greatly diminished the ranks of competitors. The industry’s distress presented Fidelity with the opportunity to acquire the assets of its third-largest player, Landamerica, out of bankruptcy court two years ago. Almost all residential and commercial real estate transactions require title insurance, and with these markets already depressed, we believe both companies are well positioned for improved financial results when real estate activity returns to more normal levels.
We have spent time in previous letters discussing our investments in the independent power sector and a number of our investments here, especially Mirant and NRG Energy, underperformed last year as the industry’s woes continued. The causes of the decline in power prices over the past few years will be recognizable to readers of these letters and investors familiar with the boom-to-bust cycles in cyclical industries. In the middle of the past decade, high electricity prices and excessive optimism on the part of the industry regarding future profitability led to the construction of a large number of new power plants, many of which were eventually completed just as the economy sank into recession. High power prices eventually encouraged conservation by consumers, and the economic downturn led to an unprecedented decline in power demand—even greater than that seen during the Great Depression—resulting in a steep drop in the price of electricity. Another unexpected development in recent years that has exacerbated the down cycle was the technological breakthrough known as horizontal drilling, which permits the exploitation of previously uneconomic domestic natural gas reserves. The subsequent oversupply and collapse of natural gas prices has had an especially negative impact on many higher-cost, coal-burning independent power producers, including some that are owned by the fund.
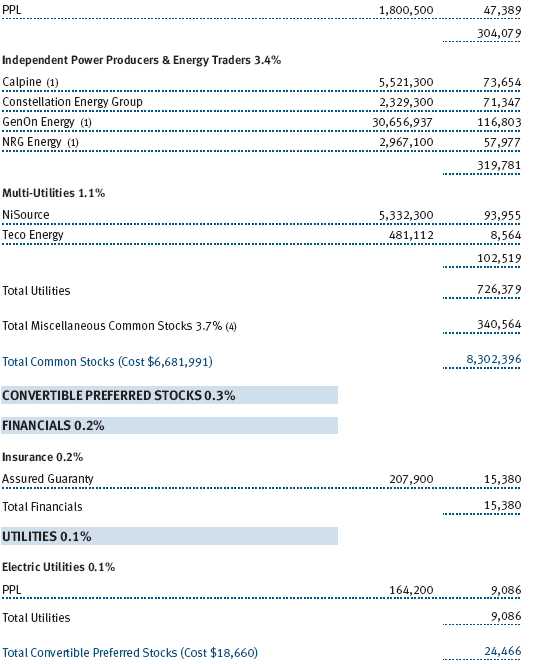
Business is tough for the independent power producers, but the signs of a cyclical bottom are apparent. Profit margins in the industry have been squeezed to levels that have caused producers such as American Electric Power, Duke Energy, Dominion Power, Progress Energy, and Exelon (the latter three not held in the fund) to curtail output and shutter old, uneconomic power plants, reducing industry capacity. The threat of new, punitive environmental regulations regarding air emissions is causing consternation among utility executives, and more plant closures are probable. Naturally, with low electricity prices prevailing, there are very few additions of new generating capacity planned over the next few years. Industry consolidation—the Darwinian process by which the strong become stronger and the weak fall away—has accelerated. The managements of the fund’s portfolio companies are not wasting the opportunity to acquire assets cheaply, and they have been active participants in consolidating the power industry. Last year witnessed the proposed merger of FirstEnergy and Allegheny Energy, the creation of GenOn Energy from the combination of Mirant and Reliant Energy, and purchases of assets by Constellation Energy, Calpine, and NRG Energy. All of these companies are held by the fund. Undoubtedly, conditions remain difficult in the power generating sector, but the signs of a cyclical bottom are many, and we remain optimistic about the industry outlook.
Indeed, we have written at length about industry consolidation in previous letters, and this remained a favorable theme for the fund, across many industries, in 2010. Some of the better performers for the year included OSI Pharmaceuticals, a biotechnology firm and a longstanding fund position, which was acquired by Japanese pharmaceuticals company Astellas at a significant premium; Smith International, a manufacturer and distributor of drilling equipment bought by industry giant Schlumberger; and beauty products niche player Alberto Culver, which agreed to a takeover bid by consumer products conglomerate Unilever. Finally, longtime fund holding Fortune Brands announced that it had agreed to separate its three consumer businesses: its world-class spirits franchise, which produces such labels as Jim Beam, Cruzan, and Sauza; its large building products division; and its well-regarded golf unit, which produces such well-known brands as Titleist and Footjoy. Though the outcome of Fortune’s internal study is still pending, and there are numerous options for the company, we believe there is still value in its shares after its recent move upward, and it remains a top holding.
IN CLOSING
Relative to its benchmarks, 2010 was not the best year for the Mid-Cap Value Fund, but it produced a solid absolute return. From time to time, our long-term orientation will cause the portfolio to be out of step with its peer group, and the past 12 months was one of those periods. Further, we make our share of mistakes, and Wilmington Trust stands out in this regard. The Mid-Cap Value Fund’s long-term record remains favorable, however, and we will adhere to the same investment process and focus on risk and reward that has generated these results over the years. In the meantime, volatility in individual stocks of late has produced some good candidates for purchase. We are finding opportunities in the consumer staples, health care, and property and casualty insurance businesses and look forward to reporting to you on our progress at midyear.

David J. Wallack
President of the fund and chairman of its Investment Advisory Committee

Heather M. McPherson
Executive vice president of the fund
January 25, 2011
The committee chairman has day-to-day responsibility for managing the portfolio and works with committee members in developing and executing the fund’s investment program.
IMPORTANT INFORMATION ABOUT MORNINGSTAR RATINGS
For funds with at least a 3-year history, a Morningstar Rating™ is based on a risk-adjusted return measure (including the effects of sales charges, loads, and redemption fees) with emphasis on downward variations and consistent performance. The top 10% of funds in each category receive 5 stars, the next 22.5% 4 stars, the next 35% 3 stars, the next 22.5% 2 stars, and the bottom 10% 1 star. Each share class is counted as a fraction of 1 fund within this scale and rated separately. Morningstar Rating™ is for the retail share class only; other classes may have different performance characteristics. The fund received 4 stars for the 3-year period, 4 stars for the 5-year period, and 5 stars for the 10-year period as of December 31, 2010.
©2011 Morningstar, Inc. All Rights Reserved. The information contained herein: (1) is proprietary to Morningstar and/or its content providers; (2) may not be copied or distributed; and (3) is not warranted to be accurate, complete, or timely. Neither Morningstar nor its content providers are responsible for any damages or losses arising from any use of this information.
RISKS OF INVESTING
The fund’s share price can fall because of weakness in the stock or bond markets, a particular industry, or specific holdings. Stock markets can decline for many reasons, including adverse political or economic developments, changes in investor psychology, or heavy institutional selling. The prospects for an industry or company may deteriorate because of a variety of factors, including disappointing earnings or changes in the competitive environment. In addition, the investment manager’s assessment of companies held in a fund may prove incorrect, resulting in losses or poor performance even in rising markets.
Mid-caps typically offer greater return potential than larger established firms and involve less risk than small-caps. Value investors seek to invest in companies whose stock prices are low in relation to their real worth or future prospects. By identifying companies whose stocks are currently out of favor or misunderstood, value investors hope to realize significant appreciation as other investors recognize the stock’s intrinsic value and the price rises accordingly. The value approach carries the risk that the market will not recognize a security’s intrinsic value for a long time or that a stock judged to be undervalued may actually be appropriately priced.
GLOSSARY
Lipper indexes: Fund benchmarks that consist of a small number of the largest mutual funds in a particular category as tracked by Lipper Inc.
Russell Midcap Growth Index: An unmanaged index that measures the performance of those Russell Midcap companies with higher price-to-book ratios and higher forecasted growth values.
Russell Midcap Value Index: An unmanaged index that measures the performance of those Russell Midcap companies with lower price-to-book ratios and lower forecasted growth values.
S&P MidCap 400 Index: An unmanaged index that tracks the stocks of 400 mid-size U.S. companies.
Performance and Expenses
This chart shows the value of a hypothetical $10,000 investment in the fund over the past 10 fiscal year periods or since inception (for funds lacking 10-year records). The result is compared with benchmarks, which may include a broad-based market index and a peer group average or index. Market indexes do not include expenses, which are deducted from fund returns as well as mutual fund averages and indexes.


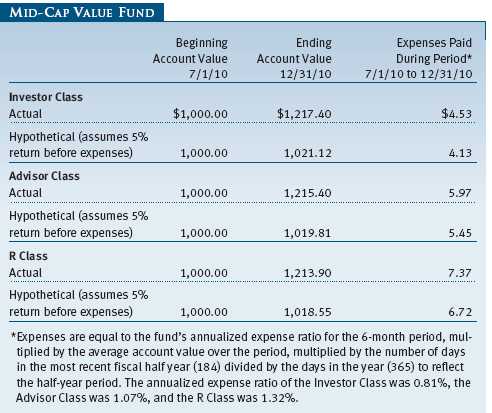
As a mutual fund shareholder, you may incur two types of costs: (1) transaction costs, such as redemption fees or sales loads, and (2) ongoing costs, including management fees, distribution and service (12b-1) fees, and other fund expenses. The following example is intended to help you understand your ongoing costs (in dollars) of investing in the fund and to compare these costs with the ongoing costs of investing in other mutual funds. The example is based on an investment of $1,000 invested at the beginning of the most recent six-month period and held for the entire period.
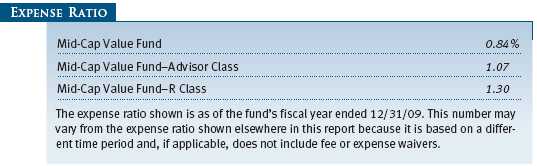
Please note that the fund has three share classes: The original share class (“investor class”) charges no distribution and service (12b-1) fee, Advisor Class shares are offered only through unaffiliated brokers and other financial intermediaries and charge a 0.25% 12b-1 fee, and R Class shares are available to retirement plans serviced by intermediaries and charge a 0.50% 12b-1 fee. Each share class is presented separately in the table.
Actual Expenses
The first line of the following table (“Actual”) provides information about actual account values and expenses based on the fund’s actual returns. You may use the information in this line, together with your account balance, to estimate the expenses that you paid over the period. Simply divide your account value by $1,000 (for example, an $8,600 account value divided by $1,000 = 8.6), then multiply the result by the number in the first line under the heading “Expenses Paid During Period” to estimate the expenses you paid on your account during this period.
Hypothetical Example for Comparison Purposes
The information on the second line of the table (“Hypothetical”) is based on hypothetical account values and expenses derived from the fund’s actual expense ratio and an assumed 5% per year rate of return before expenses (not the fund’s actual return). You may compare the ongoing costs of investing in the fund with other funds by contrasting this 5% hypothetical example and the 5% hypothetical examples that appear in the shareholder reports of the other funds. The hypothetical account values and expenses may not be used to estimate the actual ending account balance or expenses you paid for the period.
Note: T. Rowe Price charges an annual small-account maintenance fee of $10, generally for accounts with less than $2,000 ($500 for UGMA/UTMA). The fee is waived for any investor whose T. Rowe Price mutual fund accounts total $25,000 or more, accounts employing automatic investing, and IRAs and other retirement plan accounts that utilize a prototype plan sponsored by T. Rowe Price (although a separate custodial or administrative fee may apply to such accounts). This fee is not included in the accompanying table. If you are subject to the fee, keep it in mind when you are estimating the ongoing expenses of investing in the fund and when comparing the expenses of this fund with other funds.
You should also be aware that the expenses shown in the table highlight only your ongoing costs and do not reflect any transaction costs, such as redemption fees or sales loads. Therefore, the second line of the table is useful in comparing ongoing costs only and will not help you determine the relative total costs of owning different funds. To the extent a fund charges transaction costs, however, the total cost of owning that fund is higher.
The accompanying notes are an integral part of these financial statements.
The accompanying notes are an integral part of these financial statements.
The accompanying notes are an integral part of these financial statements.

The accompanying notes are an integral part of these financial statements.
The accompanying notes are an integral part of these financial statements.
The accompanying notes are an integral part of these financial statements.
The accompanying notes are an integral part of these financial statements.
| NOTES TO FINANCIAL STATEMENTS |
T. Rowe Price Mid-Cap Value Fund, Inc. (the fund), is registered under the Investment Company Act of 1940 (the 1940 Act) as a diversified, open-end management investment company. The fund seeks to provide long-term capital appreciation by investing primarily in mid-sized companies that appear to be undervalued. The fund has three classes of shares: the Mid-Cap Value Fund original share class, referred to in this report as the Investor Class, offered since June 28, 1996; the Mid-Cap Value Fund—Advisor Class (Advisor Class), offered since September 30, 2002; and the Mid-Cap Value Fund—R Class (R Class), offered since September 30, 2002. Advisor Class shares are sold only through unaffiliated brokers and other unaffiliated financial intermediaries, and R Class shares are available to retirement plans serviced by intermediaries. The Advisor Class and R Class each operate under separate Board-approved Rule 12b-1 plans, pursuant to which each class compensates financial intermediaries for distribution, shareholder servicing, and/or certain administrative services. Each class has exclusive voting rights on matters related solely to that class; separate voting rights on matters that relate to all classes; and, in all other respects, the same rights and obligations as the other classes.
NOTE 1 - SIGNIFICANT ACCOUNTING POLICIES
Basis of Preparation The accompanying financial statements were prepared in accordance with accounting principles generally accepted in the United States of America (GAAP), which require the use of estimates made by fund management. Fund management believes that estimates and valuations are appropriate; however, actual results may differ from those estimates, and the valuations reflected in the accompanying financial statements may differ from the value ultimately realized upon sale or maturity.
Investment Transactions, Investment Income, and Distributions Income and expenses are recorded on the accrual basis. Premiums and discounts on debt securities are amortized for financial reporting purposes. Dividends received from mutual fund investments are reflected as dividend income; capital gain distributions are reflected as realized gain/loss. Dividend income and capital gain distributions are recorded on the ex-dividend date. Income tax-related interest and penalties, if incurred, would be recorded as income tax expense. Investment transactions are accounted for on the trade date.
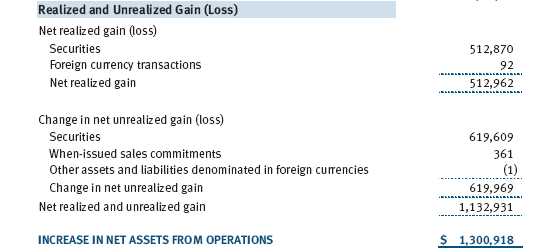
Realized gains and losses are reported on the identified cost basis. Distributions to shareholders are recorded on the ex-dividend date. Income distributions are declared and paid by each class annually. Capital gain distributions, if any, are generally declared and paid by the fund annually.
Currency Translation Assets, including investments, and liabilities denominated in foreign currencies are translated into U.S. dollar values each day at the prevailing exchange rate, using the mean of the bid and asked prices of such currencies against U.S. dollars as quoted by a major bank. Purchases and sales of securities, income, and expenses are translated into U.S. dollars at the prevailing exchange rate on the date of the transaction. The effect of changes in foreign currency exchange rates on realized and unrealized security gains and losses is reflected as a component of security gains and losses.
Class Accounting The Advisor Class and R Class each pay distribution, shareholder servicing, and/or certain administrative expenses in the form of Rule 12b-1 fees, in an amount not exceeding 0.25% and 0.50%, respectively, of the class’s average daily net assets. Shareholder servicing, prospectus, and shareholder report expenses incurred by each class are charged directly to the class to which they relate. Expenses common to all classes, investment income, and realized and unrealized gains and losses are allocated to the classes based upon the relative daily net assets of each class.
Rebates and Credits Subject to best execution, the fund may direct certain security trades to brokers who have agreed to rebate a portion of the related brokerage commission to the fund in cash. Commission rebates are reflected as realized gain on securities in the accompanying financial statements and totaled $344,000 for the year ended December 31, 2010. Additionally, the fund earns credits on temporarily uninvested cash balances held at the custodian, which reduce the fund’s custody charges. Custody expense in the accompanying financial statements is presented before reduction for credits, which are reflected as expenses paid indirectly.
In-Kind Redemptions In accordance with guidelines described in the fund’s prospectus, the fund may distribute portfolio securities rather than cash as payment for a redemption of fund shares (in-kind redemption). For financial reporting purposes, the fund recognizes a gain on in-kind redemptions to the extent the value of the distributed securities on the date of redemption exceeds the cost of those securities. Gains and losses realized on in-kind redemptions are not recognized for tax purposes and are reclassified from undistributed realized gain (loss) to paid-in capital. During the year ended December 31, 2010, the fund realized $57,553,000 of net gain on $163,057,000 of in-kind redemptions.
New Accounting Pronouncement On January 1, 2010, the fund adopted new accounting guidance that requires enhanced disclosures about fair value measurements in the financial statements. Adoption of this guidance had no impact on the fund’s net assets or results of operations.
NOTE 2 - VALUATION
The fund’s financial instruments are reported at fair value as defined by GAAP. The fund determines the values of each class’s assets and liabilities and computes each class’s net asset value per share at the close of the New York Stock Exchange (NYSE), normally 4 p.m. ET, each day that the NYSE is open for business.
Valuation Methods Equity securities listed or regularly traded on a securities exchange or in the over-the-counter (OTC) market are valued at the last quoted sale price or, for certain markets, the official closing price at the time the valuations are made, except for OTC Bulletin Board securities, which are valued at the mean of the latest bid and asked prices. A security that is listed or traded on more than one exchange is valued at the quotation on the exchange determined to be the primary market for such security. Listed securities not traded on a particular day are valued at the mean of the latest bid and asked prices for domestic securities and the last quoted sale price for international securities.
Debt securities are generally traded in the OTC market. Securities with remaining maturities of one year or more at the time of acquisition are valued at prices furnished by dealers who make markets in such securities or by an independent pricing service, which considers the yield or price of bonds of comparable quality, coupon, maturity, and type, as well as prices quoted by dealers who make markets in such securities. Securities with remaining maturities of less than one year at the time of acquisition generally use amortized cost in local currency to approximate fair value. However, if amortized cost is deemed not to reflect fair value or the fund holds a significant amount of such securities with remaining maturities of more than 60 days, the securities are valued at prices furnished by dealers who make markets in such securities or by an independent pricing service.
Investments in mutual funds are valued at the mutual fund’s closing net asset value per share on the day of valuation.
Other investments, including restricted securities, and those financial instruments for which the above valuation procedures are inappropriate or are deemed not to reflect fair value are stated at fair value as determined in good faith by the T. Rowe Price Valuation Committee, established by the fund’s Board of Directors.
For valuation purposes, the last quoted prices of non-U.S. equity securities may be adjusted under the circumstances described below. If the fund determines that developments between the close of a foreign market and the close of the NYSE will, in its judgment, materially affect the value of some or all of its portfolio securities, the fund will adjust the previous closing prices to reflect what it believes to be the fair value of the securities as of the close of the NYSE. In deciding whether it is necessary to adjust closing prices to reflect fair value, the fund reviews a variety of factors, including developments in foreign markets, the performance of U.S. securities markets, and the performance of instruments trading in U.S. markets that represent foreign securities and baskets of foreign securities. A fund may also fair value securities in other situations, such as when a particular foreign market is closed but the fund is open. The fund uses outside pricing services to provide it with closing prices and information to evaluate and/or adjust those prices. The fund cannot predict how often it will use closing prices and how often it will determine it necessary to adjust those prices to reflect fair value. As a means of evaluating its security valuation process, the fund routinely compares closing prices, the next day’s opening prices in the same markets, and adjusted prices.
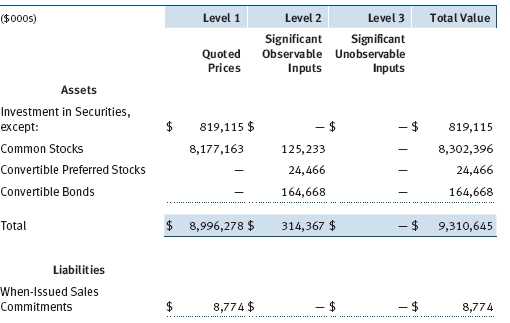
Valuation Inputs Various inputs are used to determine the value of the fund’s financial instruments. These inputs are summarized in the three broad levels listed below:
Level 1 – quoted prices in active markets for identical financial instruments
Level 2 – observable inputs other than Level 1 quoted prices (including, but not limited to, quoted prices for similar financial instruments, interest rates, prepayment speeds, and credit risk)
Level 3 – unobservable inputs
Observable inputs are those based on market data obtained from sources independent of the fund, and unobservable inputs reflect the fund’s own assumptions based on the best information available. The input levels are not necessarily an indication of the risk or liquidity associated with financial instruments at that level. For example, non-U.S. equity securities actively traded in foreign markets generally are reflected in Level 2 despite the availability of closing prices because the fund evaluates and determines whether those closing prices reflect fair value at the close of the NYSE or require adjustment, as described above. The following table summarizes the fund’s financial instruments, based on the inputs used to determine their values on December 31, 2010:
NOTE 3 - OTHER INVESTMENT TRANSACTIONS
Consistent with its investment objective, the fund engages in the following practices to manage exposure to certain risks and/or to enhance performance. The investment objective, policies, program, and risk factors of the fund are described more fully in the fund’s prospectus and Statement of Additional Information.
Restricted Securities The fund may invest in securities that are subject to legal or contractual restrictions on resale. Prompt sale of such securities at an acceptable price may be difficult and may involve substantial delays and additional costs.
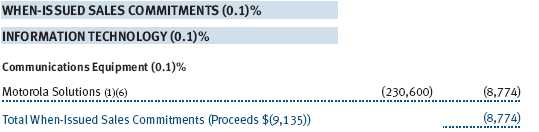
When-Issued Securities The fund may enter into when-issued purchases and/or sales commitments, pursuant to which it agrees to purchase or sell, respectively, the underlying security for a fixed unit price, with payment and delivery at a scheduled future date generally beyond the customary settlement period for such securities. When-issued refers to securities that have not yet been issued but will be issued in the future and may include new securities or securities obtained through corporate actions on current holdings. The fund normally purchases when-issued securities with the intention of taking possession, but may enter into a separate agreement to sell the securities before the settlement date. Until settlement, the fund maintains cash reserves and liquid assets sufficient to settle its when-issued commitments.
Other Purchases and sales of portfolio securities other than short-term securities aggregated $3,843,703,000 and $3,522,978,000, respectively, for the year ended December 31, 2010.
NOTE 4 - FEDERAL INCOME TAXES
No provision for federal income taxes is required since the fund intends to continue to qualify as a regulated investment company under Subchapter M of the Internal Revenue Code and distribute to shareholders all of its taxable income and gains. Distributions determined in accordance with federal income tax regulations may differ in amount or character from net investment income and realized gains for financial reporting purposes. Financial reporting records are adjusted for permanent book/tax differences to reflect tax character but are not adjusted for temporary differences.
The fund files U.S. federal, state, and local tax returns as required. The fund’s tax returns are subject to examination by the relevant tax authorities until expiration of the applicable statute of limitations, which is generally three years after the filing of the tax return but which can be extended to six years in certain circumstances. Tax returns for open years have incorporated no uncertain tax positions that require a provision for income taxes.
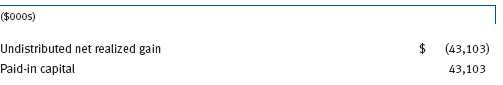
Reclassifications to paid-in capital relate primarily to redemptions in kind. For the year ended December 31, 2010, the following reclassifications were recorded to reflect tax character; there was no impact on results of operations or net assets:
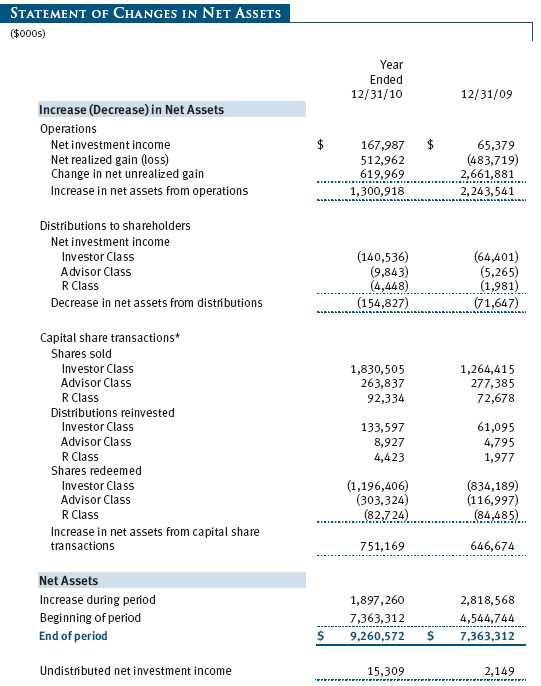
Distributions during the years ended December 31, 2010 and December 31, 2009, totaled $154,827,000 and $71,647,000, respectively, and were characterized as ordinary income for tax purposes. At December 31, 2010, the tax-basis cost of investments and components of net assets were as follows:

The difference between book-basis and tax-basis net unrealized appreciation (depreciation) is attributable to the deferral of losses from wash sales and the realization of unrealized gains/losses on passive foreign investment companies for tax purposes. The fund intends to retain realized gains to the extent of available capital loss carryforwards. During the year ended December 31, 2010, the fund utilized $437,095,000 of capital loss carryforwards. The fund’s unused capital loss carryforwards as of December 31, 2010, all expire in fiscal 2017. In accordance with federal income tax regulations applicable to investment companies, recognition of capital and/or currency losses on certain transactions realized between November 1 and the fund’s fiscal year-end is deferred for tax purposes until the subsequent year (post-October loss deferrals); however, such losses are recognized for financial reporting purposes in the year realized.
NOTE 5 - RELATED PARTY TRANSACTIONS
The fund is managed by T. Rowe Price Associates, Inc. (the manager or Price Associates), a wholly owned subsidiary of T. Rowe Price Group, Inc. The investment management agreement between the fund and the manager provides for an annual investment management fee, which is computed daily and paid monthly.
The fee consists of an individual fund fee, equal to 0.35% of the fund’s average daily net assets, and a group fee. The group fee rate is calculated based on the combined net assets of certain mutual funds sponsored by Price Associates (the group) applied to a graduated fee schedule, with rates ranging from 0.48% for the first $1 billion of assets to 0.285% for assets in excess of $220 billion. The fund’s group fee is determined by applying the group fee rate to the fund’s average daily net assets. At December 31, 2010, the effective annual group fee rate was 0.30%.
In addition, the fund has entered into service agreements with Price Associates and two wholly owned subsidiaries of Price Associates (collectively, Price). Price Associates computes the daily share prices and provides certain other administrative services to the fund. T. Rowe Price Services, Inc., provides shareholder and administrative services in its capacity as the fund’s transfer and dividend disbursing agent. T. Rowe Price Retirement Plan Services, Inc., provides subaccounting and recordkeeping services for certain retirement accounts invested in the Investor Class and R Class. For the year ended December 31, 2010, expenses incurred pursuant to these service agreements were $111,000 for Price Associates; $1,932,000 for T. Rowe Price Services, Inc.; and $1,474,000 for T. Rowe Price Retirement Plan Services, Inc. The total amount payable at period-end pursuant to these service agreements is reflected as Due to Affiliates in the accompanying financial statements.
Additionally, the fund is one of several mutual funds in which certain college savings plans managed by Price Associates may invest. As approved by the fund’s Board of Directors, shareholder servicing costs associated with each college savings plan are borne by the fund in proportion to the average daily value of its shares owned by the college savings plan. For the year ended December 31, 2010, the fund was charged $418,000 for shareholder servicing costs related to the college savings plans, of which $314,000 was for services provided by Price. The amount payable at period-end pursuant to this agreement is reflected as Due to Affiliates in the accompanying financial statements. At December 31, 2010, approximately 3% of the outstanding shares of the Investor Class were held by college savings plans.
The fund is also one of several mutual funds sponsored by Price Associates (underlying Price funds) in which the T. Rowe Price Spectrum Funds (Spectrum Funds) and T. Rowe Price Retirement Funds (Retirement Funds) may invest. Neither the Spectrum Funds nor the Retirement Funds invest in the underlying Price funds for the purpose of exercising management or control. Pursuant to separate special servicing agreements, expenses associated with the operation of the Spectrum and Retirement Funds are borne by each underlying Price fund to the extent of estimated savings to it and in proportion to the average daily value of its shares owned by the Spectrum and Retirement Funds, respectively. Expenses allocated under these agreements are reflected as shareholder servicing expenses in the accompanying financial statements. For the year ended December 31, 2010, the fund was allocated $168,000 of Spectrum Funds’ expenses and $3,428,000 of Retirement Funds’ expenses. Of these amounts, $2,213,000 related to services provided by Price. The amount payable at period-end pursuant to this agreement is reflected as Due to Affiliates in the accompanying financial statements. At December 31, 2010, approximately 2% of the outstanding shares of the Investor Class were held by the Spectrum Funds and 24% were held by the Retirement Funds.
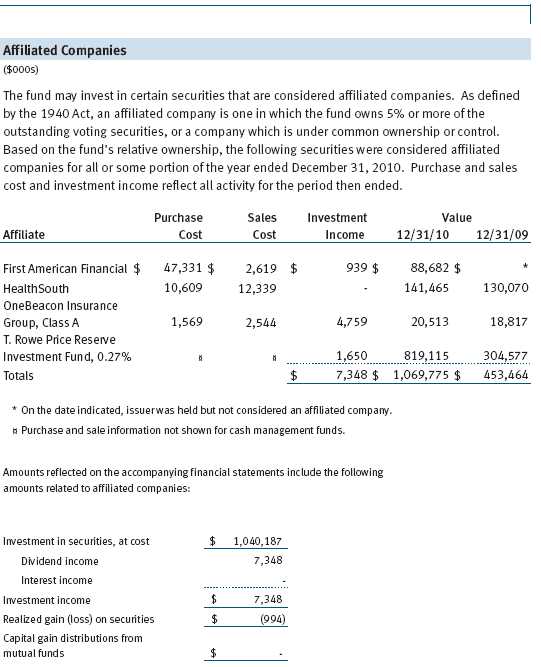
The fund may invest in the T. Rowe Price Reserve Investment Fund and the T. Rowe Price Government Reserve Investment Fund (collectively, the T. Rowe Price Reserve Investment Funds), open-end management investment companies managed by Price Associates and considered affiliates of the fund. The T. Rowe Price Reserve Investment Funds are offered as cash management options to mutual funds, trusts, and other accounts managed by Price Associates and/or its affiliates and are not available for direct purchase by members of the public. The T. Rowe Price Reserve Investment Funds pay no investment management fees.
NOTE 6 - LITIGATION
The fund has received notice that it may be named in a class of defendants in a lawsuit that the Unsecured Creditors Committee (the Committee) of the Tribune Company has filed in Delaware bankruptcy court. The Committee is seeking to recover all payments made to beneficial owners of common stock in connection with a leveraged buyout of Tribune, including those made in connection with a 2007 tender offer in which the fund participated. The complaint alleges no misconduct by the fund and management intends to vigorously defend any lawsuit. The value of the proceeds received by the fund is $70,070,000 (0.76% of net assets) and the fund could incur legal expenses. Management is currently assessing the case and has not yet determined the effect, if any, on the fund’s net assets and results of operations.
| REPORT OF INDEPENDENT REGISTERED PUBLIC ACCOUNTING FIRM |
To the Board of Directors and Shareholders of
T. Rowe Price Mid-Cap Value Fund, Inc.
In our opinion, the accompanying statement of assets and liabilities, including the portfolio of investments, and the related statements of operations and of changes in net assets and the financial highlights present fairly, in all material respects, the financial position of T. Rowe Price Mid-Cap Value Fund, Inc. (the “Fund”) at December 31, 2010, the results of its operations for the year then ended, the changes in its net assets for each of the two years in the period then ended and the financial highlights for each of the five years in the period then ended, in conformity with accounting principles generally accepted in the United States of America. These financial statements and financial highlights (hereafter referred to as “financial statements”) are the responsibility of the Fund’s management; our responsibility is to express an opinion on these financial statements based on our audits. We conducted our audits of these financial statements in accordance with the standards of the Public Company Accounting Oversight Board (United States). Those standards require that we plan and perform the audit to obtain reasonable assurance about whether the financial statements are free of material misstatement. An audit includes examining, on a test basis, evidence supporting the amounts and disclosures in the financial statements, assessing the accounting principles used and significant estimates made by management, and evaluating the overall financial statement presentation. We believe that our audits, which included confirmation of securities at December 31, 2010 by correspondence with the custodian and brokers, and confirmation of the underlying funds by correspondence with the transfer agent, provide a reasonable basis for our opinion.
PricewaterhouseCoopers LLP
Baltimore, Maryland
February 17, 2011
| TAX INFORMATION (UNAUDITED) FOR THE TAX YEAR ENDED 12/31/10 |
We are providing this information as required by the Internal Revenue Code. The amounts shown may differ from those elsewhere in this report because of differences between tax and financial reporting requirements.
For taxable non-corporate shareholders, $181,405,000 of the fund’s income represents qualified dividend income subject to the 15% rate category.
For corporate shareholders, $181,405,000 of the fund’s income qualifies for the dividends-received deduction.
| INFORMATION ON PROXY VOTING POLICIES, PROCEDURES, AND RECORDS |
A description of the policies and procedures used by T. Rowe Price funds and portfolios to determine how to vote proxies relating to portfolio securities is available in each fund’s Statement of Additional Information, which you may request by calling 1-800-225-5132 or by accessing the SEC’s website, sec.gov. The description of our proxy voting policies and procedures is also available on our website, troweprice.com. To access it, click on the words “Our Company” at the top of our corporate homepage. Then, when the next page appears, click on the words “Proxy Voting Policies” on the left side of the page.
Each fund’s most recent annual proxy voting record is available on our website and through the SEC’s website. To access it through our website, follow the directions above, then click on the words “Proxy Voting Records” on the right side of the Proxy Voting Policies page.
| HOW TO OBTAIN QUARTERLY PORTFOLIO HOLDINGS |
The fund files a complete schedule of portfolio holdings with the Securities and Exchange Commission for the first and third quarters of each fiscal year on Form N-Q. The fund’s Form N-Q is available electronically on the SEC’s website (sec.gov); hard copies may be reviewed and copied at the SEC’s Public Reference Room, 450 Fifth St. N.W., Washington, DC 20549. For more information on the Public Reference Room, call 1-800-SEC-0330.
| ABOUT THE FUND’S DIRECTORS AND OFFICERS |
Your fund is overseen by a Board of Directors (Board) that meets regularly to review a wide variety of matters affecting the fund, including performance, investment programs, compliance matters, advisory fees and expenses, service providers, and other business affairs. The Board elects the fund’s officers, who are listed in the final table. At least 75% of the Board’s members are independent of T. Rowe Price Associates, Inc. (T. Rowe Price), and T. Rowe Price International Ltd (T. Rowe Price International); “inside” or “interested” directors are employees or officers of T. Rowe Price. The business address of each director and officer is 100 East Pratt Street, Baltimore, Maryland 21202. The Statement of Additional Information includes additional information about the fund directors and is available without charge by calling a T. Rowe Price representative at 1-800-225-5132.
| Independent Directors | |
| |
| Name | |
| (Year of Birth) | Principal Occupation(s) and Directorships of Public Companies and |
| Year Elected* | Other Investment Companies During the Past Five Years |
| | |
| William R. Brody, M.D., Ph.D. | President and Trustee, Salk Institute for Biological Studies (2009 |
| (1944) | to present); Director, Novartis, Inc. (2009 to present); Director, IBM |
| 2009 | (2007 to present); President and Trustee, Johns Hopkins University |
| | (1996 to 2009); Chairman of Executive Committee and Trustee, |
| | Johns Hopkins Health System (1996 to 2009); Director, Medtronic, |
| | Inc. (1998 to 2007); Director, Mercantile Bankshares (1997 to 2007) |
| | |
| Jeremiah E. Casey | Director, National Life Insurance (2001 to 2005); Director, NLV |
| (1940) | Financial Corporation (2004 to 2005) |
| 2005 | |
| | |
| Anthony W. Deering | Chairman, Exeter Capital, LLC, a private investment firm (2004 to |
| (1945) | present); Director, Under Armour (2008 to present); Director, Vornado |
| 2001 | Real Estate Investment Trust (2004 to present); Director, Mercantile |
| | Bankshares (2002 to 2007); Member, Advisory Board, Deutsche Bank |
| | North America (2004 to present) |
| | |
| Donald W. Dick, Jr. | Principal, EuroCapital Partners, LLC, an acquisition and management |
| (1943) | advisory firm (1995 to present) |
| 1996 | |
| | |
| Karen N. Horn | Senior Managing Director, Brock Capital Group, an advisory and |
| (1943) | investment banking firm (2004 to present); Director, Eli Lilly and |
| 2003 | Company (1987 to present); Director, Simon Property Group (2004 |
| | to present); Director, Norfolk Southern (2008 to present); Director, |
| | Fannie Mae (2006 to 2008); Director, Georgia Pacific (2004 to 2005) |
| | |
| Theo C. Rodgers | President, A&R Development Corporation (1977 to present) |
| (1941) | |
| 2005 | |
| John G. Schreiber | Owner/President, Centaur Capital Partners, Inc., a real estate invest- |
| (1946) | ment company (1991 to present); Cofounder and Partner, Blackstone |
| 2001 | Real Estate Advisors, L.P. (1992 to present) |
| | |
| Mark R. Tercek | President and Chief Executive Officer, The Nature Conservancy (2008 |
| (1957) | to present); Managing Director, The Goldman Sachs Group, Inc. (1984 |
| 2009 | to 2008) |
| |
| *Each independent director oversees 128 T. Rowe Price portfolios and serves until retirement, |
| resignation, or election of a successor. |
| Inside Directors | |
| |
| Name | |
| (Year of Birth) | |
| Year Elected* | |
| [Number of T. Rowe Price | Principal Occupation(s) and Directorships of Public Companies and |
| Portfolios Overseen] | Other Investment Companies During the Past Five Years |
| | |
| Edward C. Bernard | Director and Vice President, T. Rowe Price; Vice Chairman of the Board, |
| (1956) | Director, and Vice President, T. Rowe Price Group, Inc.; Chairman of |
| 2006 | the Board, Director, and President, T. Rowe Price Investment Services, |
| [128] | Inc.; Chairman of the Board and Director, T. Rowe Price Retirement |
| | Plan Services, Inc., T. Rowe Price Savings Bank, and T. Rowe Price |
| | Services, Inc.; Director and Chief Executive Officer, T. Rowe Price |
| | International; Chief Executive Officer, Chairman of the Board, Director, |
| | and President, T. Rowe Price Trust Company; Chairman of the Board, |
| | all funds |
| | |
| Brian C. Rogers, CFA, CIC | Chief Investment Officer, Director, and Vice President, T. Rowe Price; |
| (1955) | Chairman of the Board, Chief Investment Officer, Director, and Vice |
| 2006 | President, T. Rowe Price Group, Inc.; Vice President, T. Rowe Price |
| [73] | Trust Company |
| |
| *Each inside director serves until retirement, resignation, or election of a successor. |
| Officers | |
| |
| Name (Year of Birth) | |
| Position Held With Mid-Cap Value Fund | Principal Occupation(s) |
| | |
| Peter J. Bates, CFA (1974) | Vice President, T. Rowe Price and T. Rowe Price |
| Vice President | Group, Inc. |
| | |
| Christopher W. Carlson (1967) | Vice President, T. Rowe Price and T. Rowe Price |
| Vice President | Group, Inc. |
| | |
| Jonathan Chou (1980) | Vice President, T. Rowe Price; student, Darden |
| Vice President | Graduate School of Business Administration, |
| | University of Virginia (to 2008); Principal, |
| | Gladstone Management Corporation (to 2006) |
| | |
| Henry M. Ellenbogen (1973) | Vice President, T. Rowe Price, T. Rowe Price |
| Vice President | Group, Inc., and T. Rowe Price Trust Company |
| | |
| Roger L. Fiery III, CPA (1959) | Vice President, Price Hong Kong, Price |
| Vice President | Singapore, T. Rowe Price, T. Rowe Price Group, |
| | Inc., T. Rowe Price International, and T. Rowe |
| | Price Trust Company |
| | |
| Mark S. Finn, CFA, CPA (1963) | Vice President, T. Rowe Price and T. Rowe Price |
| Vice President | Group, Inc. |
| | |
| John R. Gilner (1961) | Chief Compliance Officer and Vice President, |
| Chief Compliance Officer | T. Rowe Price; Vice President, T. Rowe Price |
| | Group, Inc., and T. Rowe Price Investment |
| | Services, Inc. |
| | |
| Gregory S. Golczewski (1966) | Vice President, T. Rowe Price and T. Rowe Price |
| Vice President | Trust Company |
| | |
| Gregory K. Hinkle, CPA (1958) | Vice President, T. Rowe Price, T. Rowe Price |
| Treasurer | Group, Inc., and T. Rowe Price Trust Company; |
| | formerly Partner, PricewaterhouseCoopers LLP |
| | (to 2007) |
| | |
| Patricia B. Lippert (1953) | Assistant Vice President, T. Rowe Price and |
| Secretary | T. Rowe Price Investment Services, Inc. |
| | |
| Gregory A. McCrickard, CFA (1958) | Vice President, T. Rowe Price, T. Rowe Price |
| Vice President | Group, Inc., and T. Rowe Price Trust Company |
| | |
| Heather K. McPherson, CPA (1967) | Vice President, T. Rowe Price and T. Rowe Price |
| Executive Vice President | Group, Inc. |
| | |
| Joseph M. Milano, CFA (1972) | Vice President, T. Rowe Price and T. Rowe Price |
| Vice President | Group, Inc. |
| | |
| David Oestreicher (1967) | Director and Vice President, T. Rowe Price |
| Vice President | Investment Services, Inc., T. Rowe Price Trust |
| | Company, and T. Rowe Price Services, Inc.; Vice |
| | President, Price Hong Kong, Price Singapore, |
| | T. Rowe Price, T. Rowe Price Group, Inc., T. Rowe |
| | Price International, and T. Rowe Price Retirement |
| | Plan Services, Inc. |
| | |
| Deborah D. Seidel (1962) | Vice President, T. Rowe Price, T. Rowe Price |
| Vice President | Group, Inc., and T. Rowe Price Investment |
| | Services, Inc.; Vice President and Assistant |
| | Treasurer, T. Rowe Price Services, Inc. |
| | |
| J. David Wagner, CFA (1974) | Vice President, T. Rowe Price and T. Rowe Price |
| Vice President | Group, Inc. |
| | |
| David J. Wallack (1960) | Vice President, T. Rowe Price, T. Rowe Price |
| President | Group, Inc., and T. Rowe Price Trust Company |
| | |
| Julie L. Waples (1970) | Vice President, T. Rowe Price |
| Vice President | |
| |
| Unless otherwise noted, officers have been employees of T. Rowe Price or T. Rowe Price International |
| for at least 5 years. | |
Item 2. Code of Ethics.
The registrant has adopted a code of ethics, as defined in Item 2 of Form N-CSR, applicable to its principal executive officer, principal financial officer, principal accounting officer or controller, or persons performing similar functions. A copy of this code of ethics is filed as an exhibit to this Form N-CSR. No substantive amendments were approved or waivers were granted to this code of ethics during the period covered by this report.
Item 3. Audit Committee Financial Expert.
The registrant’s Board of Directors/Trustees has determined that Mr. Anthony W. Deering qualifies as an audit committee financial expert, as defined in Item 3 of Form N-CSR. Mr. Deering is considered independent for purposes of Item 3 of Form N-CSR.
Item 4. Principal Accountant Fees and Services.
(a) – (d) Aggregate fees billed to the registrant for the last two fiscal years for professional services rendered by the registrant’s principal accountant were as follows:

Audit fees include amounts related to the audit of the registrant’s annual financial statements and services normally provided by the accountant in connection with statutory and regulatory filings. Audit-related fees include amounts reasonably related to the performance of the audit of the registrant’s financial statements and specifically include the issuance of a report on internal controls and, if applicable, agreed-upon procedures related to fund acquisitions. Tax fees include amounts related to services for tax compliance, tax planning, and tax advice. The nature of these services specifically includes the review of distribution calculations and the preparation of Federal, state, and excise tax returns. All other fees include the registrant’s pro-rata share of amounts for agreed-upon procedures in conjunction with service contract approvals by the registrant’s Board of Directors/Trustees.
(e)(1) The registrant’s audit committee has adopted a policy whereby audit and non-audit services performed by the registrant’s principal accountant for the registrant, its investment adviser, and any entity controlling, controlled by, or under common control with the investment adviser that provides ongoing services to the registrant require pre-approval in advance at regularly scheduled audit committee meetings. If such a service is required between regularly scheduled audit committee meetings, pre-approval may be authorized by one audit committee member with ratification at the next scheduled audit committee meeting. Waiver of pre-approval for audit or non-audit services requiring fees of a de minimis amount is not permitted.
(2) No services included in (b) – (d) above were approved pursuant to paragraph (c)(7)(i)(C) of Rule 2-01 of Regulation S-X.
(f) Less than 50 percent of the hours expended on the principal accountant’s engagement to audit the registrant’s financial statements for the most recent fiscal year were attributed to work performed by persons other than the principal accountant’s full-time, permanent employees.
(g) The aggregate fees billed for the most recent fiscal year and the preceding fiscal year by the registrant’s principal accountant for non-audit services rendered to the registrant, its investment adviser, and any entity controlling, controlled by, or under common control with the investment adviser that provides ongoing services to the registrant were $1,417,000 and $1,879,000, respectively.
(h) All non-audit services rendered in (g) above were pre-approved by the registrant’s audit committee. Accordingly, these services were considered by the registrant’s audit committee in maintaining the principal accountant’s independence.
Item 5. Audit Committee of Listed Registrants.
Not applicable.
Item 6. Investments.
(a) Not applicable. The complete schedule of investments is included in Item 1 of this Form N-CSR.
(b) Not applicable.
Item 7. Disclosure of Proxy Voting Policies and Procedures for Closed-End Management Investment Companies.
Not applicable.
Item 8. Portfolio Managers of Closed-End Management Investment Companies.
Not applicable.
Item 9. Purchases of Equity Securities by Closed-End Management Investment Company and Affiliated Purchasers.
Not applicable.
Item 10. Submission of Matters to a Vote of Security Holders.
Not applicable.
Item 11. Controls and Procedures.
(a) The registrant’s principal executive officer and principal financial officer have evaluated the registrant’s disclosure controls and procedures within 90 days of this filing and have concluded that the registrant’s disclosure controls and procedures were effective, as of that date, in ensuring that information required to be disclosed by the registrant in this Form N-CSR was recorded, processed, summarized, and reported timely.
(b) The registrant’s principal executive officer and principal financial officer are aware of no change in the registrant’s internal control over financial reporting that occurred during the registrant’s second fiscal quarter covered by this report that has materially affected, or is reasonably likely to materially affect, the registrant’s internal control over financial reporting.
Item 12. Exhibits.
(a)(1) The registrant’s code of ethics pursuant to Item 2 of Form N-CSR is attached.
(2) Separate certifications by the registrant's principal executive officer and principal financial officer, pursuant to Section 302 of the Sarbanes-Oxley Act of 2002 and required by Rule 30a-2(a) under the Investment Company Act of 1940, are attached.
(3) Written solicitation to repurchase securities issued by closed-end companies: not applicable.
(b) A certification by the registrant's principal executive officer and principal financial officer, pursuant to Section 906 of the Sarbanes-Oxley Act of 2002 and required by Rule 30a-2(b) under the Investment Company Act of 1940, is attached.
| | |
SIGNATURES |
| |
| | Pursuant to the requirements of the Securities Exchange Act of 1934 and the Investment |
| Company Act of 1940, the registrant has duly caused this report to be signed on its behalf by the |
| undersigned, thereunto duly authorized. |
| |
| T. Rowe Price Mid-Cap Value Fund, Inc. |
| |
| |
| |
| By | /s/ Edward C. Bernard |
| | Edward C. Bernard |
| | Principal Executive Officer |
| |
| Date | February 17, 2011 |
| |
| |
| |
| | Pursuant to the requirements of the Securities Exchange Act of 1934 and the Investment |
| Company Act of 1940, this report has been signed below by the following persons on behalf of |
| the registrant and in the capacities and on the dates indicated. |
| |
| |
| By | /s/ Edward C. Bernard |
| | Edward C. Bernard |
| | Principal Executive Officer |
| |
| Date | February 17, 2011 |
| |
| |
| |
| By | /s/ Gregory K. Hinkle |
| | Gregory K. Hinkle |
| | Principal Financial Officer |
| |
| Date | February 17, 2011 |