Exhibit (c)(2)
Discussion Materials FBL Financial Special Committee October 7, 2020
Table of Contents 1. Overview 2 2. Selected Insurance Credentials 4 3. Initial Observations on Valuation 6 4. Special Committee Process 14 5. Timeline and Next Steps 15 6. Conclusion 17 ________________________________________________________________________________________ Appendix A. Team Bios 18 B. FBL Financial Trading Comps 20

The Barclays Team Broad platform allows core team to draw from depth of experience across advisory and capital markets capabilitie s Core FBL Advisory Team Tom Vandever Managing Director Head of FIG Americas M&A Maria DeMuro Director FIG M&A Conor Eckert Analyst FIG Greg Hunt Vice President FIG M&A M&A Leadership Capital Markets Team Senior Insurance Team Gary Antenberg Managing Director Co - Head of FIG Americas Larry Hamdan Managing Director Head of Americas M&A Gautam Chawla Managing Director Vice Chairman, FIG Amrit David Managing Director Taylor Wright Managing Director Co - Head of ECM Radhika Gupte Managing Director Co - Head of FIG DCM Jaime Cohen Managing Director FIG ECM Jeremy Hazan Managing Director Leveraged Finance 1

Overview

Our Understanding of the Situation On September 4, 2020 FBL Financial (the “Company”) received a non - binding proposal (the “Proposal”) to purchase the remaining public minority stake from Farm Bureau Property & Casualty Insurance Company The Proposal offered shareholders $47.00 for each Class A and B common share (which represents a ~26% premium to the Company’s closing stock price on September 3 rd – the day prior to the announcement) The Iowa Farm Bureau Federation owns ~60% and ~67% of the Company’s Class A and Class B common stock, respectively The Special Committee must assess whether accepting the Proposal is fair to and in the best interest of the Company’s shareholders The Company’s stock price, like other life and annuity peers, has been under significant pressure from a number of macro and com pany - specific drivers: Historically low interest rates have squeezed spread margins for interest - sensitive life and annuity products which make up a significant portion of the Company’s business Slowing sales given low crediting rates offered to clients, particularly in the annuity segment While the Company’ stock price has been under pressure over the past couple years, the business has a number of key strengths th at differentiate from its broader peers: Distribution platform and cross - sell capabilities with Farm Bureau P&C policies Brand affiliation with strong relationships to target markets Growing fee income stream from investment advisory services For comparison purposes we’ve used a comp set of other public life and annuity providers. The chart below summarizes the Comp any ’s unaffected valuation and valuation of the proposal: The Proposal represents a premium to the Company’s unaffected stock price and the associated valuation is in - line with the tradi ng value of other Protection peers Situation Overview ___________________________ Source: Factset , SNL Financial. Market data as of 10/6/2020. Financial data as of 10/6/2020. 1. Unaffected based on FBL’s share price at 9/3/2020. The proposal valued at $47.00 per share. 2. Annuity peers include AT H a nd AEL. Life peers include CNO, GL and PRI. We understand that FBL Financial Group (“FBL” or “FFG”) has formed a Special Committee to evaluate a potential “buy - in” transaction for the remaining public minority stake Valuation FBL Financial (1) Peer Set (2) Unaffected The Proposal Annuity Protection Price / Earnings 2020E 9.0x 11.3x 5.4x 11.7x 2021E 7.5x 9.4x 4.5x 10.8x Price / Book Value incl. AOCI 0.58x 0.73x 0.50x 1.10x ex. AOCI 0.84x 1.06x 0.76x 1.54x 2
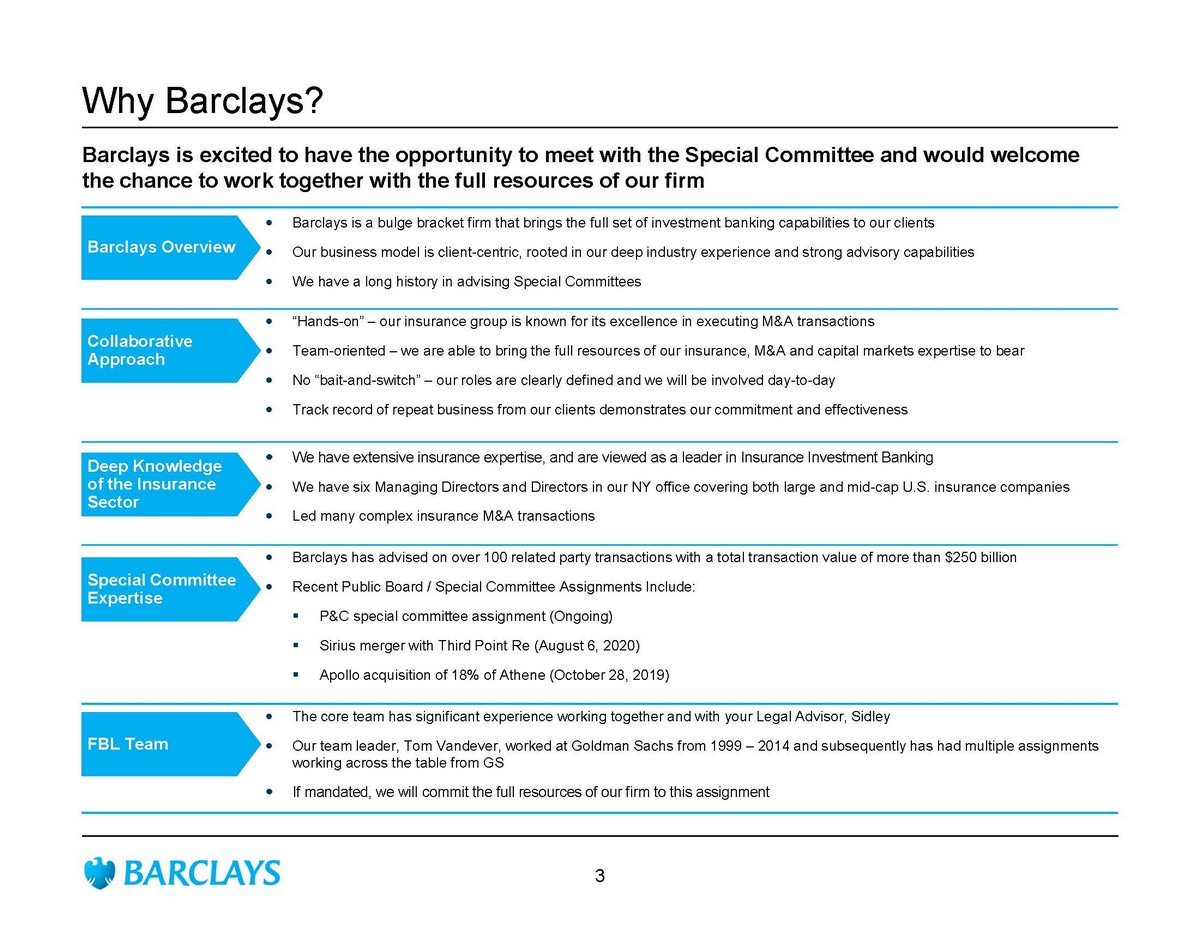
Why Barclays? Barclays is a bulge bracket firm that brings the full set of investment banking capabilities to our clients Our business model is client - centric, rooted in our deep industry experience and strong advisory capabilities We have a long history in advising Special Committees “Hands - on” – our insurance group is known for its excellence in executing M&A transactions Team - oriented – we are able to bring the full resources of our insurance, M&A and capital markets expertise to bear No “bait - and - switch” – our roles are clearly defined and we will be involved day - to - day Track record of repeat business from our clients demonstrates our commitment and effectiveness We have extensive insurance expertise, and are viewed as a leader in Insurance Investment Banking We have six Managing Directors and Directors in our NY office covering both large and mid - cap U.S. insurance companies Led many complex insurance M&A transactions Barclays has advised on over 100 related party transactions with a total transaction value of more than $250 billion Recent Public Board / Special Committee Assignments Include: ▪ P&C special committee assignment (Ongoing) ▪ Sirius merger with Third Point Re (August 6, 2020) ▪ Apollo acquisition of 18% of Athene (October 28, 2019) The core team has significant experience working together and with your Legal Advisor, Sidley Our team leader, Tom Vandever, worked at Goldman Sachs from 1999 – 2014 and subsequently has had multiple assignments working across the table from GS If mandated, we will commit the full resources of our firm to this assignment Deep Knowledge of the Insurance Sector Special Committee Expertise Collaborative Approach Barclays Overview Barclays is excited to have the opportunity to meet with the Special Committee and would welcome the chance to work together with the full resources of our firm FBL Team 3

Selected Insurance Credentials
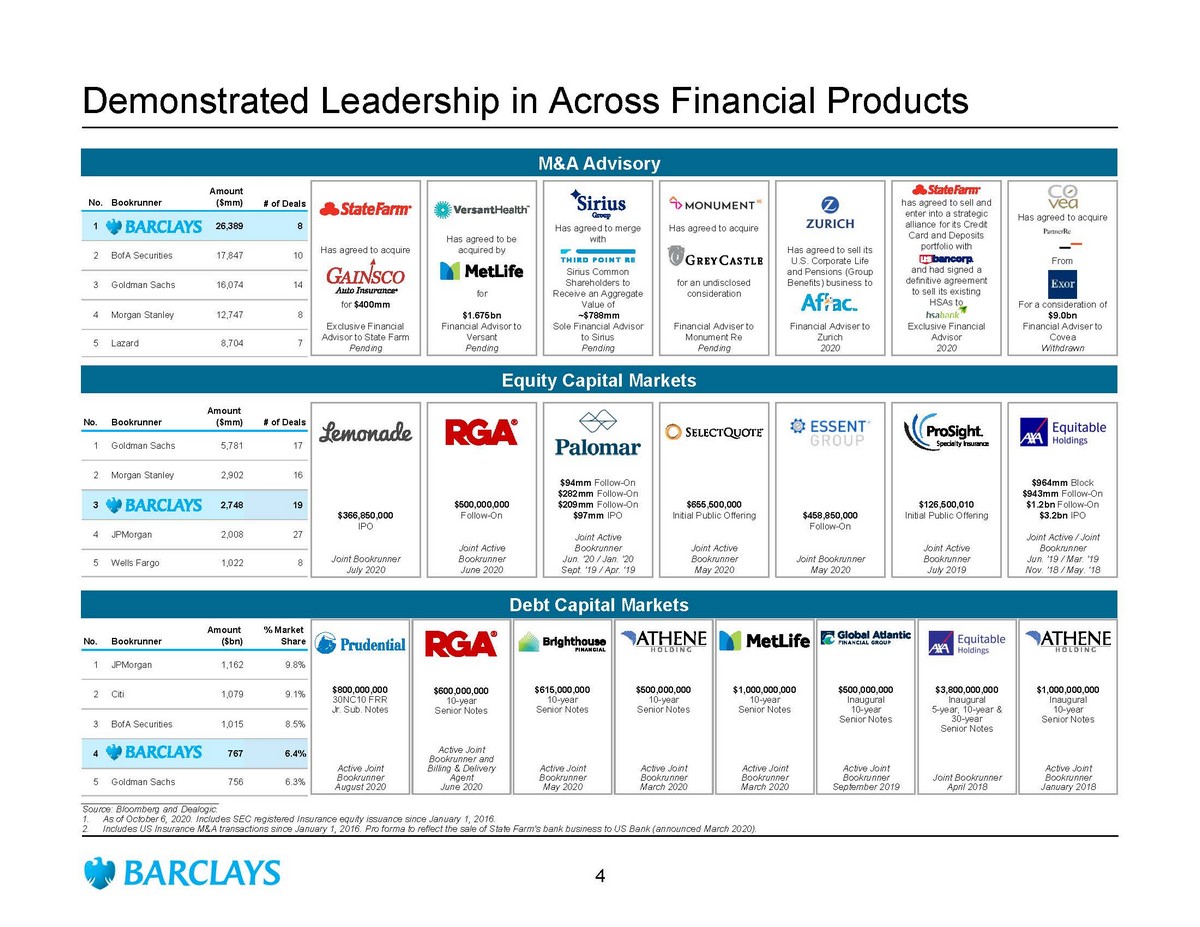
No. Bookrunner Amount ($bn) % Market Share 1 JPMorgan 1,162 9.8% 2 Citi 1,079 9.1% 3 BofA Securities 1,015 8.5% 4 767 6.4% 5 Goldman Sachs 756 6.3% Demonstrated Leadership in Across Financial Products M&A Advisory Equity Capital Markets Debt Capital Markets No. Bookrunner Amount ($mm) # of Deals 1 26,389 8 2 BofA Securities 17,847 10 3 Goldman Sachs 16,074 14 4 Morgan Stanley 12,747 8 5 Lazard 8,704 7 No. Bookrunner Amount ($mm) # of Deals 1 Goldman Sachs 5,781 17 2 Morgan Stanley 2,902 16 3 2,748 19 4 JPMorgan 2,008 27 5 Wells Fargo 1,022 8 $ 500,000,000 Follow - On Joint Active Bookrunner June 2020 $ 655,500,000 Initial Public Offering Joint Active Bookrunner May 2020 $ 458,850,000 Follow - On Joint Bookrunner May 2020 $ 126,500,010 Initial Public Offering Joint Active Bookrunner July 2019 $ 964mm Block $943mm Follow - On $1.2bn Follow - On $3.2bn IPO Joint Active / Joint Bookrunner Jun. ’19 / Mar. ’19 Nov. ’18 / May. ‘ 18 $94mm Follow - On $282mm Follow - On $209mm Follow - On $ 97mm IPO Joint Active Bookrunner Jun. ’20 / Jan. ’20 Sept. ’19 / Apr. ‘19 $ 366,850,000 IPO Joint Bookrunner July 2020 Has agreed to acquire for $400mm Exclusive Financial Advisor to State Farm Pending Has agreed to be acquired by for $1.675bn Financial Advisor to Versant Pending Has agreed to merge with Sirius Common Shareholders to Receive an Aggregate Value of ~$788mm Sole Financial Advisor to Sirius Pending ___________________________ Source: Bloomberg and Dealogic . 1. A s of October 6, 2020. Includes SEC registered Insurance equity issuance since January 1, 2016. 2. Includes US Insurance M&A transactions since January 1, 2016. Pro forma to reflect the sale of State Farm’s bank business to US Bank ( ann ounced March 2020). Has agreed to sell its U.S. Corporate Life and Pensions (Group Benefits) business to Financial Adviser to Zurich 2020 has agreed to sell and enter into a strategic alliance for its Credit Card and Deposits portfolio with and had signed a definitive agreement to sell its existing HSAs to Exclusive Financial Advisor 2020 Has agreed to acquire From For a consideration of $9.0bn Financial Adviser to Covea Withdrawn Has agreed to acquire for an undisclosed consideration Financial Adviser to Monument Re Pending $800,000,000 30NC10 FRR Jr. Sub. Notes Active Joint Bookrunner August 2020 $3,800,000,000 Inaugural 5 - year, 10 - year & 30 - year Senior Notes Joint Bookrunner April 2018 $1,000,000,000 Inaugural 10 - year Senior Notes Active Joint Bookrunner January 2018 $1,000,000,000 10 - year Senior Notes Active Joint Bookrunner March 2020 $615,000,000 10 - year Senior Notes Active Joint Bookrunner May 2020 $500,000,000 Inaugural 10 - year Senior Notes Active Joint Bookrunner September 2019 $500,000,000 10 - year Senior Notes Active Joint Bookrunner March 2020 $600,000,000 10 - year Senior Notes Active Joint Bookrunner and Billing & Delivery Agent June 2020 4

Barclays is a Leader in Complicated Insurance M&A The Barclays team has a long track record of advising clients and public company Board of Directors in complicated M&A situations Recent M&A Advisory Has agreed to merge with Sirius Common Shareholders to Receive an Aggregate Value of ~$ 788mm Sole Financial Advisor Pending Special Committee / Board Advisory Advisor to the Independent Committee of Public Insurance Company Board (Ongoing) A Consortium of Investors, led by has agreed to acquire the CBVA segment Financial Advisor to Investor Group June 2018 Has agreed to be acquired by For $531mm Exclusive Financial Advisor to the Special Committee of CastlePoint August 2008 Has agreed to sell Liberty Life Assurance Company to Will acquire Employee Benefits business and legal entity Will reinsure life and annuity business $3.3 billion Exclusive Financial Advisor January 2018 has agreed to reinsure $19 billion of Fixed and Fixed Indexed Annuities from Financial Advisor to Athene December 2017 has agreed to sell its U.S Corporate Life and Pensions (Group Benefits) Business to Exclusive Financial Advisor March 2020 Has agreed to acquire an incremental ~18% stake in For $1.55 billion Financial Advisor to the Conflicts Committee of Apollo’s Board October 2019 has agreed to reinsure $2.7bn of Legacy LTC Reserves f rom Financial Advisor March 2020 5

Initial Observations on Valuation

Valuation Considerations for FBL There are multiple considerations to be weighed in assessing the offer from FBPCIC Macro Environment – judgment as to whether now is the right time to sell Company Projections / Future Business Prospects Balance Sheet Strength Segment Analysis Shareholder Perspectives Additional Considerations – synergies, tax implications, FBPCIC’s ability - to - pay and public market perceptions of negotiations (including potential M&A buyer interest) 1 5 2 3 4 6 6

Macro Environment Historically Low Interest Rates… …and Concerns About the Recession… …Have Driven Significant Downward Pressure on Life and Annuity Stock Prices 1 ___________________________ Source: Factset , Federal Reserve, Barclays Research, Bloomberg. Market data as of 10/6/20. 1. Life & Annuity Index calculated using a market weighting methodology (average of the comp set’s market caps). Index includes: ME T, AFL, PRU, AIG, AMP, PFG, GL, EQH, ATH, RGA, LNC, VOYA, PRI, UNM, AEL, BHF and CNO. (1) 0.25% 0.67% 1.41% 0.0% 0.5% 1.0% 1.5% 2.0% 2.5% 3.0% 3.5% Sep-15 Sep-16 Sep-17 Sep-18 Sep-19 Sep-20 5Y UST Yield 10Y UST Yield 30Y UST Yield %q/q SAAR Mean Unemployment Rate Mean Q1 Actual (5.0) Q1 Actual 3.8% Q2 Actual (32.9) Q2 Actual 13.0% Q3 Est. 22.9 Q3 Actual 8.8% Q4 Est. 5.1 Q4 Est. 7.5% 2020 (%y/y) (4.5) Bulge Bracket 2020 Real GDP Growth Est. Bloomberg Composite Est. (60%) (45%) (30%) (15%) - 15% Dec-19 Jan-20 Feb-20 Mar-20 Apr-20 May-20 Jun-20 Jul-20 Aug-20 Sep-20 (YTD Indexed Performance) Life & Annuity Index S&P 500 4.0% ( 28 .8%) 7
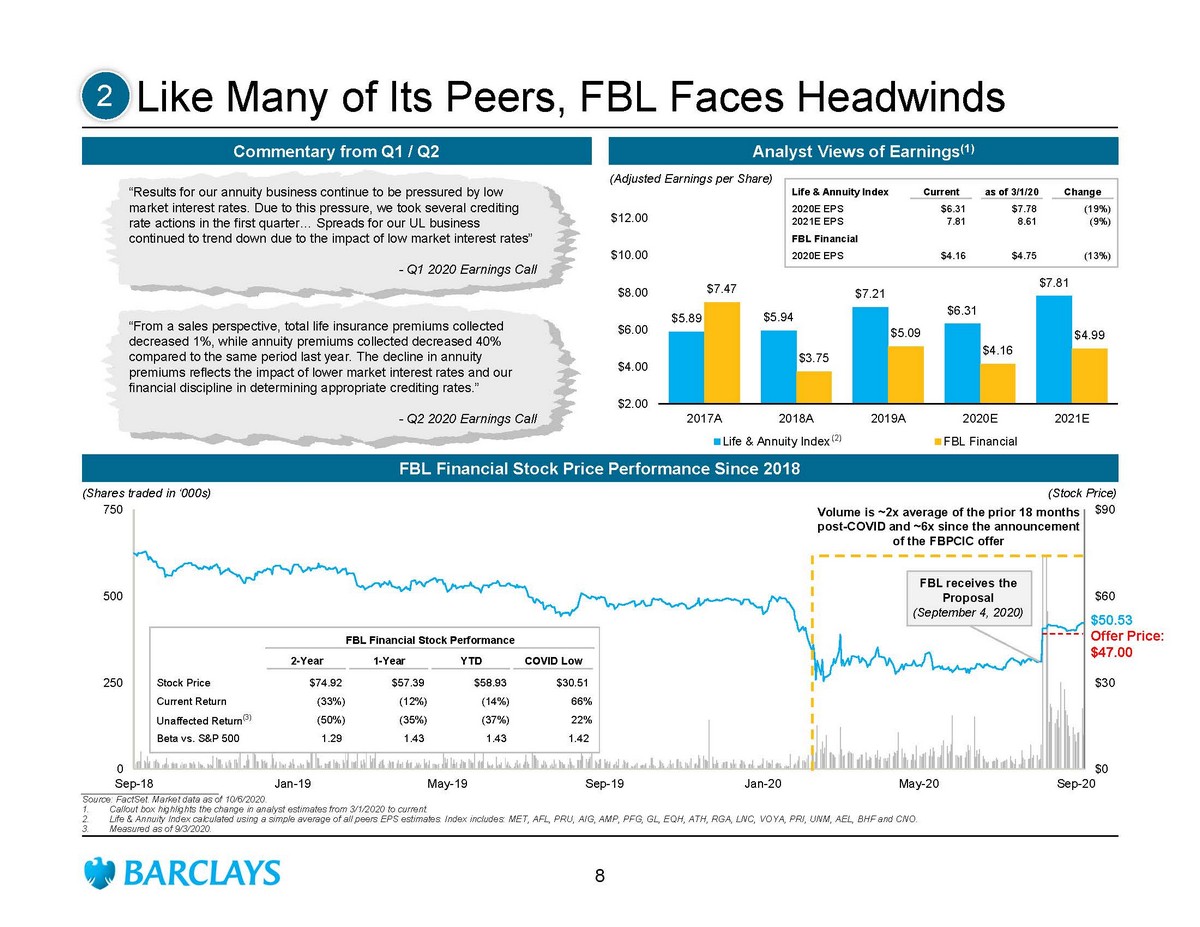
$5.89 $5.94 $7.21 $6.31 $7.81 $7.47 $3.75 $5.09 $4.16 $4.99 $2.00 $4.00 $6.00 $8.00 $10.00 $12.00 2017A 2018A 2019A 2020E 2021E Life & Annuity Index FBL Financial Like Many of Its Peers, FBL Faces Headwinds Commentary from Q1 / Q2 Analyst Views of Earnings (1) FBL Financial Stock Price Performance Since 2018 $0 $30 $60 $90 0 250 500 750 Sep-18 Jan-19 May-19 Sep-19 Jan-20 May-20 Sep-20 $50.53 FBL Financial Stock Performance 2-Year 1-Year YTD COVID Low Stock Price $74.92 $57.39 $58.93 $30.51 Current Return (33%) (12%) (14%) 66% Unaffected Return (3) (50%) (35%) (37%) 22% Beta vs. S&P 500 1.29 1.43 1.43 1.42 ___________________________ Source: FactSet . Market data as of 10/6/2020. 1. Callout box highlights the change in analyst estimates from 3/1/2020 to current. 2. Life & Annuity Index calculated using a simple average of all peers EPS estimates. Index includes: MET, AFL, PRU, AIG, AMP, PFG, GL, EQH, ATH, RGA, LNC, VOYA, PRI, UNM, AEL, BHF and CNO . 3. Measured as of 9/3/2020. (Shares traded in ‘000s) (Stock Price) (Adjusted Earnings per Share) 2 (2) “Results for our annuity business continue to be pressured by low market interest rates. Due to this pressure, we took several crediting rate actions in the first quarter… Spreads for our UL business continued to trend down due to the impact of low market interest rates ” - Q1 2020 Earnings Call “From a sales perspective, total life insurance premiums collected decreased 1%, while annuity premiums collected decreased 40% compared to the same period last year. The decline in annuity premiums reflects the impact of lower market interest rates and our financial discipline in determining appropriate crediting rates.” - Q2 2020 Earnings Call Volume is ~2x average of the prior 18 months post - COVID and ~6x since the announcement of the FBPCIC offer Life & Annuity Index Current as of 3/1/20 Change 2020E EPS $6.31 $7.78 (19%) 2021E EPS 7.81 8.61 (9%) FBL Financial 2020E EPS $4.16 $4.75 (13%) Offer Price: $47.00 FBL receives the Proposal (September 4, 2020) 8

Balance Sheet / Segment Analysis FBL’s Business Mix is Balanced… …But the Company Has Significant Investment Leverage Both Life and Annuity Peers Have Lost Value In the Current Environment (2) ___________________________ Source: FactSet , Company Filings, SNL. Market data as of 10/ 6 /2020. Financial data as of 6/30/2020. Note: Life Peers include CNO, PRI and GL. Annuity Peers include ATH and AEL . 1. Based on unaffected price before the bid from Athene and Mass Mutual. 2. Based on the Athene and Mass Mutual bid of $36.00 per share. 4 3 Annuity 41% Life 50% Corporate & Other 9% Total LTM Pre - tax Operating Income: $112.1 million Price / NTM Earnings P/BV (ex. AOCI) 11.0x 9.3x 6.0x 5.5x 2.7x 2.5x AEL ATH FBL CNO GL PRI (Investments / Equity) 0.76x (1) 0.66x 1.14x 0.75x 1.54x 2.72x P/BV ex. AOCI 16.0x 13.3x 10.6x 16.1x 11.3x 11.1x 10.1x 6.4x 4.7x 14.2x 7.4x 8.3x 7.8x 12/31/2017 12/31/2018 10/6/2020 1.59x 1.49x 1.14x 2.16x 1.62x 1.54x 1.31x 0.96x 0.71x 1.34x 1.03x 0.76x 1.25x 12/31/2017 12/31/2018 10/6/2020 Protection Peers (Median) Annuity Peers (Median) (1) FBL Financial All Peers (Median) (1) AEL (Bid Price) (2) FFG 9

Shareholder Perspectives %TSO Owned Account AUM ($bn) Type FFG CNO PRI GL ATH AEL Avg. Dimensional Fund Advisors LP 383.9 Quant 8.2% 7.8% 1.9% 0.8% 1.9% 8.3% 4.1% The Vanguard Group, Inc. 3,582.7 Index 3.8% 10.3% 11.1% 10.6% 8.1% 11.2% 10.3% BlackRock Fund Advisors 2,253.2 Index 2.7% 10.8% 8.4% 4.7% 2.6% 13.3% 8.0% Victory Capital Management, Inc. (Investment Management) 85.8 Active 1.7% 0.2% 0.8% 0.2% 0.1% 0.9% 0.4% SSgA Funds Management, Inc. 1,536.8 Index 1.0% 4.0% 2.7% 4.6% 1.7% 3.7% 3.3% Columbia Management Investment Advisers LLC 234.9 Active 0.9% 0.7% 0.2% 0.1% * 1.2% 0.4% Northern Trust Investments, Inc.(Investment Management) 476.6 Index 0.8% 2.8% 0.9% 1.2% 0.4% 2.6% 1.6% Royce & Associates LP 11.4 Active 0.8% 0.3% - - - * 0.1% Dalton, Greiner, Hartman, Maher & Co. LLC 1.1 Active 0.8% - - * - - 0.0% Norges Bank Investment Management 800.6 Active 0.7% 1.9% 1.1% 1.1% 0.8% 1.5% 1.3% Geode Capital Management LLC 580.8 Index 0.6% 1.4% 1.7% 1.5% 0.7% 1.4% 1.4% Bridgeway Capital Management, Inc. 5.2 Active 0.5% - - - - - - Wells Capital Management, Inc. 96.0 Active 0.4% 2.3% * 0.1% * 0.3% 0.6% Mellon Investments Corp. 194.0 Index 0.4% 0.7% 0.6% 0.4% 0.1% 0.6% 0.5% PhiloSmith Capital Corp. 0.2 Active 0.4% - 0.3% - - 0.4% 0.3% Goldman Sachs Asset Management LP 164.8 Active 0.3% 0.6% 1.5% 0.3% 1.6% 1.2% 1.0% Renaissance Technologies LLC 123.3 Quant 0.3% - 0.1% 0.2% - - 0.1% Millennium Management LLC 49.2 Active 0.3% 0.1% 0.1% 0.2% 0.3% 0.1% 0.1% Charles Schwab Investment Management, Inc. 267.0 Broker/Dealer 0.3% 0.8% 0.8% 0.6% 0.3% 1.2% 0.7% QMA LLC 54.9 Quant 0.2% 0.3% * 0.1% 0.1% 0.8% 0.3% Citadel Advisors LLC 77.6 Active 0.2% 0.1% * 1.1% 1.0% - 0.6% Thrivent Investment Management, Inc. 37.7 Active 0.2% * 0.8% * - 0.1% 0.2% BlackRock Investment Management LLC 148.8 Active 0.2% 0.6% 0.3% 0.3% 0.1% 0.5% 0.4% Parametric Portfolio Associates LLC 143.8 Index 0.1% 1.1% 0.2% 0.4% 0.1% 1.1% 0.6% Keeley-Teton Advisors LLC 0.7 Active 0.1% - - - - - - Brandywine Global Investment Management LLC 10.3 Active 0.1% 0.2% 0.1% 0.2% * 0.3% 0.2% CornerCap Investment Counsel, Inc. 0.6 Active 0.1% * * - - - 0.0% LSV Asset Management 61.8 Quant 0.1% 3.9% - - * 0.9% 1.6% The Bank of New York Mellon Corp. (Investment Management) 153.1 Broker/Dealer 0.1% 0.5% 0.5% 0.4% 0.1% 0.3% 0.4% Thrivent Financial for Lutherans (Investment Portfolio) 9.6 Active 0.1% - 0.4% - - 0.1% 0.2% Top 30 Holders of FBL and Peers ___________________________ Note: Holdings data per 13 - F filings dated 6/30/20. Active managers in bold. An asterisk indicates less than 0.05% in holdings. Source: FactSet . FBL’s public shareholders include a number of prominent active investors, many of whom own stock in FBL’s peers 5 10

Additional Considerations 6 Affiliate Relationships Assess current related party relationships and impact of any go - forward changes Synergies Impact of savings from no longer having public company obligation Assess whether there are additional cost or revenue synergies Growth Profile Ability of FBL to organically originate new business across its existing life and annuity business, and its new wealth management offering Tax Implications Assess corporate and shareholder level tax impact FBPCIC Ability - to - Pay Assess FBPCIC’s sources of capital, impact to capital and ability - to - pay a higher price for the public stock Public Market Perspective Ability (or lack thereof) to solicit outside interest in the company As evidence of a strong negotiating posture, the Special Committee should seek a “bump” to the initial offer 11

Recent Affiliate Transactions (Insurance Only) ___________________________ Source: Dealogic data as of 10/6/2020. 1. The following Dealogic screens were used: includes deals that were (i) announced since January 1, 2006, (ii) have been comple ted or are pending, (iii) U.S. public company targets, (iv) deal sizes >$50mm, (v) cash consideration only, (vi) acquiror’s position in the target pre - announcement was >50% and was >90% post - close and (vii) the targe t is categorized as an insurance company. 2. The following Dealogic screens were used: includes deals that were (i) announced since January 1, 2006, (ii) have been comple ted or are pending, (iii) U.S. and Bermuda public company targets, (iv) deal sizes >$50mm, (v) acquiror’s position in the target pre - announcement was >5% and was >90% post - close, and (vi) the target is categoriz ed as an insurance company. 3. For pending deals, premium calculated using the most recent offer price per share. 4. Purchase of non - voting preferred stock. Precedent Insurance Minority Buy - Ins (1) Precedent Insurance Majority Buy - Ins (2) (4) ($ in millions) % Change from Announce Close % # of Price Initial Offer Price to Premium to Pre-Announce Price (3) Date Date Target Name Acquiror Name Deal Value Acquired Changes Final Offer Price 1 Day Prior 1 Month Prior 4/14/2015 3/18/2016 PartnerRe Ltd Exor SpA $6,410 91% 2 8.1% 17.9% 24.2% 2/18/2010 5/20/2010 Zenith National Insurance Corp Fairfax Financial Holdings Ltd 1,301 92% 0 0.0% 31.4% 26.2% 8/5/2008 2/5/2009 Castlepoint Holdings Ltd Tower Group Inc 531 89% 0 0.0% 42.7% 31.0% 11/1/2006 3/14/2007 Clark Inc AEGON NV 268 87% 1 4.0% 37.6% 57.9% Median $916 90.2% 0.5 2.0% 34.5% 28.6% Average 2,128 89.8% 0.8 3.0% 32.4% 34.8% ($ in millions) % Change from Announce Close % # of Price Initial Offer Price to Premium to Pre-Announce Price (3) Date Date Target Name Acquiror Name Deal Value Acquired Changes Final Offer Price 1 Day Prior 1 Month Prior 9/4/2020 Pending FBL Financial Farm Bureau P&C Insurance Co $455 40% NA NA 26.2% 32.4% 11/16/2018 9/19/2019 EMC Insurance Group Employers Mutual Casualty 356 46% 1 20.0% 50.1% 49.0% 1/9/2018 11/29/2018 Amtrust Financial Services Stone Point Capital 1,539 49% 2 20.4% 45.5% 46.3% 3/7/2016 11/10/2016 National Interstate Corp American Financial Group Inc 315 49% 2 6.7% 41.5% 37.4% 11/1/2010 6/9/2011 CNA Surety Corp CNA 475 39% 1 20.7% 37.9% 46.9% 9/8/2009 10/21/2009 Odyssey Re Holdings Corp Fairfax Financial Holdings Ltd 1,098 28% 1 8.3% 29.8% 39.7% 10/27/2008 11/7/2008 CNA Financial Corp Loews 1,250 NA NA NA NA NA 3/10/2008 1/2/2009 Nationwide Financial Services Inc Nationwide Mutual Insurance Co 2,440 34% 1 10.7% 37.8% 24.3% 7/17/2007 4/16/2008 Alfa Corp Alfa Mutual Insurance Co 811 45% 1 25.0% 44.7% 29.8% 2/23/2007 9/28/2007 Great American Financial Resources Inc American Financial Group Inc 223 19% 1 4.3% 13.0% 11.4% 1/24/2007 9/27/2007 21st Century Insurance Group American International Group Inc - AIG 758 39% 1 11.4% 34.6% 24.9% Median $758 39.5% 1.0 11.4% 37.8% 34.9% Average 884 38.8% 1.2 14.2% 36.1% 34.2% 12

Pre-Ann. Offer FBL Price Price Potential Upside Metric $37.25 $47.00 $50.00 $52.50 $55.00 $57.50 $60.00 Premium / (Discount) to: Current Trading Price (10/6/20 Close) $50.53 (26.3) % (7.0) (1.0) % 3.9 % 8.8 % 13.8 % 18.7 % Unaffected 37.25 0.0 26.2 34.2 40.9 47.7 54.4 61.1 Bid price 47.00 (20.7) 0.0 6.4 11.7 17.0 22.3 27.7 30-Day Average Share Price (1) 37.59 (0.9) 25.0 33.0 39.7 46.3 53.0 59.6 90-Day Average Share Price (1) 35.98 3.5 30.6 39.0 45.9 52.9 59.8 66.8 52 Week High 60.03 (37.9) (21.7) (16.7) (12.5) (8.4) (4.2) (0.0) 52 Week Low 30.51 22.1 54.0 63.9 72.1 80.3 88.5 96.7 Trading Comps Implied Price to 6/30/20 BVPS Multiples Annuity Protection All Comps Stated (incl. AOCI) (2) $64.30 0.58 x 0.73 x 0.78 x 0.82 x 0.86 x 0.89 x 0.93 x 0.50 x 1.10 x 0.55 x Ex. AOCI (2) 44.54 0.84 1.06 1.12 1.18 1.23 1.29 1.35 0.76 1.54 0.71 Implied Price / EPS Multiples 2020E EPS $4.16 9.0 x 11.3 x 12.0 x 12.6 x 13.2 x 13.8 x 14.4 x 5.6 x 11.7 x 8.3 x 2021E EPS 4.99 7.5 9.4 10.0 10.5 11.0 11.5 12.0 4.7 10.8 8.3 Analysis at Various Prices ___________________________ Note: Market Data as of 10/6/20. Source: FactSet, SNL, Wall Street Research. 1. Volume - weighted average unaffected price per FactSet . 2. Based on FBL’s most recent 10 - Q filing. Illustrative, for discussion purposes only; based on publicly available information. Median of precedents at 38% Median of precedents at 35% Median of precedents at 11% 13

Special Committee Process

Barclays’ Role We would envision a role for Barclays that would entail broad representation of the company as it considers alternatives or a more well - defined evaluation of a single proposal In either case, Barclays will support the Special Committee process in a number of ways Process Work hand - in - hand with the Special Committee and counsel to ensure a thorough, complete and transparent process and to arrive at the best recommendation for the minority shareholders Strategic Assessment Assess the company’s strategic, financial and market situation to assist in evaluation and proper response to the Proposal. Evaluate alternatives to the proposed transaction. Due Diligence / Documentation Conduct due diligence and document the process thoroughly to create a body of work to supporting decision - making and upon which the Special Committee can rely in fulfilling its duty of care. Valuation Analysis Assess prospects and valuation under several alternatives scenarios Negotiations Negotiate structure and terms of the proposed transaction with the counterparty Shareholder Communication Frame recommendations and help develop proper communication strategy Fairness Opinion If requested, deliver opinion supported by Barclays’ internal Valuation and Fairness Opinion Committee review process 14

Timeline and Next Steps

1 – 2 Months Initial engagement with financial advisor Evaluate FBL business plan and projections Consider engaging outside actuary to perform “intrinsic” analysis of in - force and new business Prepare initial financial analysis Up to 4 Weeks Engage in detailed transaction negotiation and finalize key terms, if appropriate Document transaction Fairness opinion is delivered by Barclays, if requested Q1 2021 (3 – 4 Months) Prepare proxy Shareholder meeting Seek regulatory approval (including Form A filing, as necessary) Draft Timeline Sign - to - Close (if Applicable) Engagement / Negotiation Evaluation The Special Committee and its advisors should balance the desire for an expedited response with the need to conduct a thorough evaluation 15
Next Steps Engage Barclays Kickoff meeting – level - set on background to the situation, timing expectations, cadence between Special Committee and Advisors Set up standing weekly meeting Initial due diligence with FBL m anagement Begin detailed modeling and valuation work 16

Conclusion
Conclusions The Barclays team will work hand - in - hand with the Special Committee and counsel to ensure a thorough, thoughtful and transparent approach and to arrive at the best recommendation for shareholders The senior members of the Barclays team will be involved day - to - day We believe Barclays is the right firm to advise the Special Committee We are prepared to begin our work immediately 17

Appendix

Team Bios
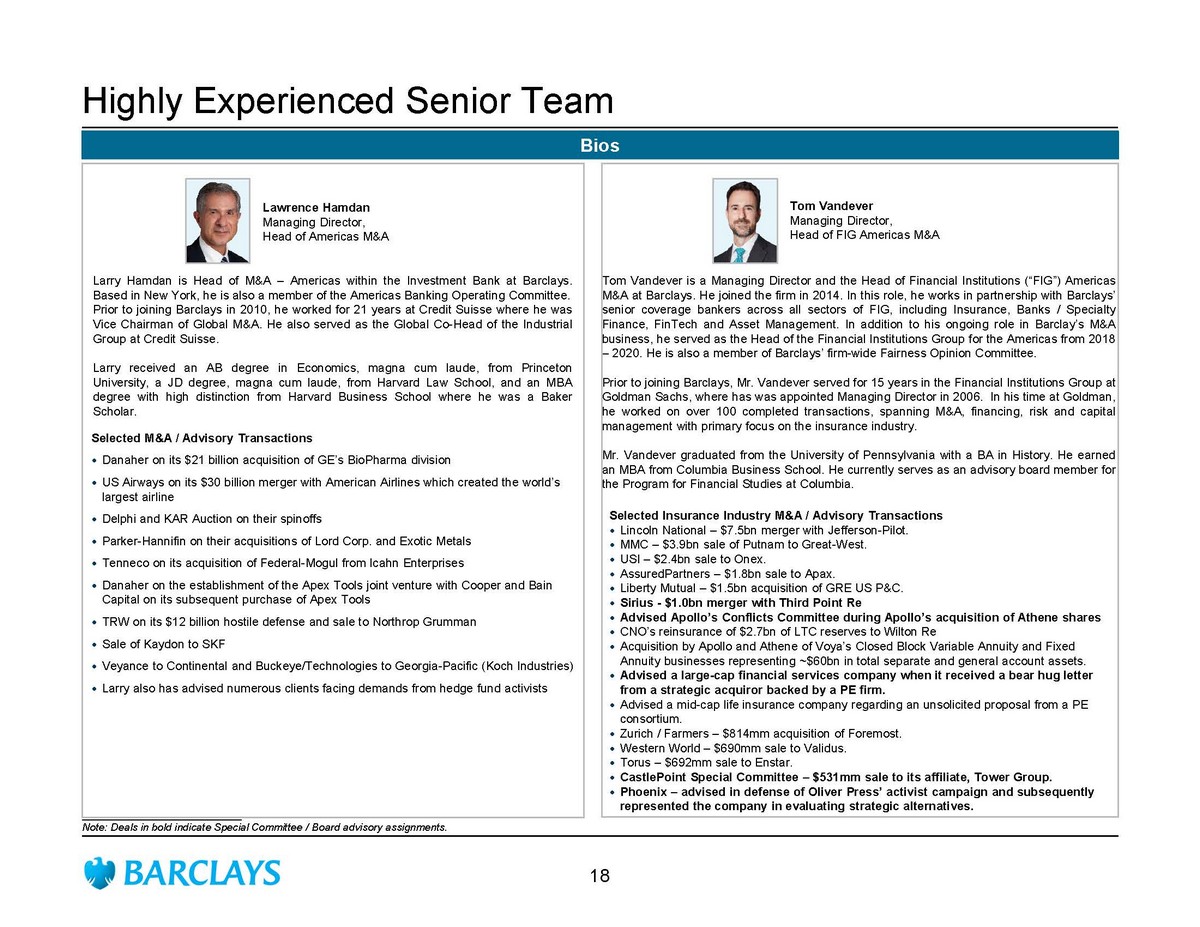
Tom Vandever is a Managing Director and the Head of Financial Institutions (“FIG”) Americas M&A at Barclays . He joined the firm in 2014 . In this role, he works in partnership with Barclays’ senior coverage bankers across all sectors of FIG, including Insurance, Banks / Specialty Finance, FinTech and Asset Management . In addition to his ongoing role in Barclay’s M&A business, he served as the Head of the Financial Institutions Group for the Americas from 2018 – 2020 . He is also a member of Barclays’ firm - wide Fairness Opinion Committee . Prior to joining Barclays, Mr . Vandever served for 15 years in the Financial Institutions Group at Goldman Sachs, where has was appointed Managing Director in 2006 . In his time at Goldman, he worked on over 100 completed transactions, spanning M&A, financing, risk and capital management with primary focus on the insurance industry . Mr . Vandever graduated from the University of Pennsylvania with a BA in History . He earned an MBA from Columbia Business School . He currently serves as an advisory board member for the Program for Financial Studies at Columbia . Highly Experienced Senior Team Selected Insurance Industry M&A / Advisory Transactions Lincoln National – $7.5bn merger with Jefferson - Pilot. MMC – $3.9bn sale of Putnam to Great - West. USI – $2.4bn sale to Onex. AssuredPartners – $1.8bn sale to Apax . Liberty Mutual – $1.5bn acquisition of GRE US P&C. Sirius - $1.0bn merger with Third Point Re Advised Apollo’s Conflicts Committee during Apollo’s acquisition of Athene shares CNO’s reinsurance of $2.7bn of LTC reserves to Wilton Re Acquisition by Apollo and Athene of Voya’s Closed Block Variable Annuity and Fixed Annuity businesses representing ~$60bn in total separate and general account assets. Advised a large - cap financial services company when it received a bear hug letter from a strategic acquiror backed by a PE firm. Advised a mid - cap life insurance company regarding an unsolicited proposal from a PE consortium. Zurich / Farmers – $814mm acquisition of Foremost. Western World – $690mm sale to Validus . Torus – $692mm sale to Enstar . CastlePoint Special Committee – $531mm sale to its affiliate, Tower Group. Phoenix – advised in defense of Oliver Press’ activist campaign and subsequently represented the company in evaluating strategic alternatives . Bios ___________________________ Note: Deals in bold indicate Special Committee / Board advisory assignments. Tom Vandever Managing Director, Head of FIG Americas M&A Larry Hamdan is Head of M&A – Americas within the Investment Bank at Barclays . Based in New York, he is also a member of the Americas Banking Operating Committee . Prior to joining Barclays in 2010 , he worked for 21 years at Credit Suisse where he was Vice Chairman of Global M&A . He also served as the Global Co - Head of the Industrial Group at Credit Suisse . Larry received an AB degree in Economics, magna cum laude, from Princeton University, a JD degree, magna cum laude, from Harvard Law School, and an MBA degree with high distinction from Harvard Business School where he was a Baker Scholar . Lawrence Hamdan Managing Director, Head of Americas M&A Selected M&A / Advisory Transactions Danaher on its $21 billion acquisition of GE’s BioPharma division US Airways on its $30 billion merger with American Airlines which created the world’s largest airline Delphi and KAR Auction on their spinoffs Parker - Hannifin on their acquisitions of Lord Corp. and Exotic Metals Tenneco on its acquisition of Federal - Mogul from Icahn Enterprises Danaher on the establishment of the Apex Tools joint venture with Cooper and Bain Capital on its subsequent purchase of Apex Tools TRW on its $12 billion hostile defense and sale to Northrop Grumman Sale of Kaydon to SKF Veyance to Continental and Buckeye/Technologies to Georgia - Pacific (Koch Industries ) Larry also has advised numerous clients facing demands from hedge fund activists 18
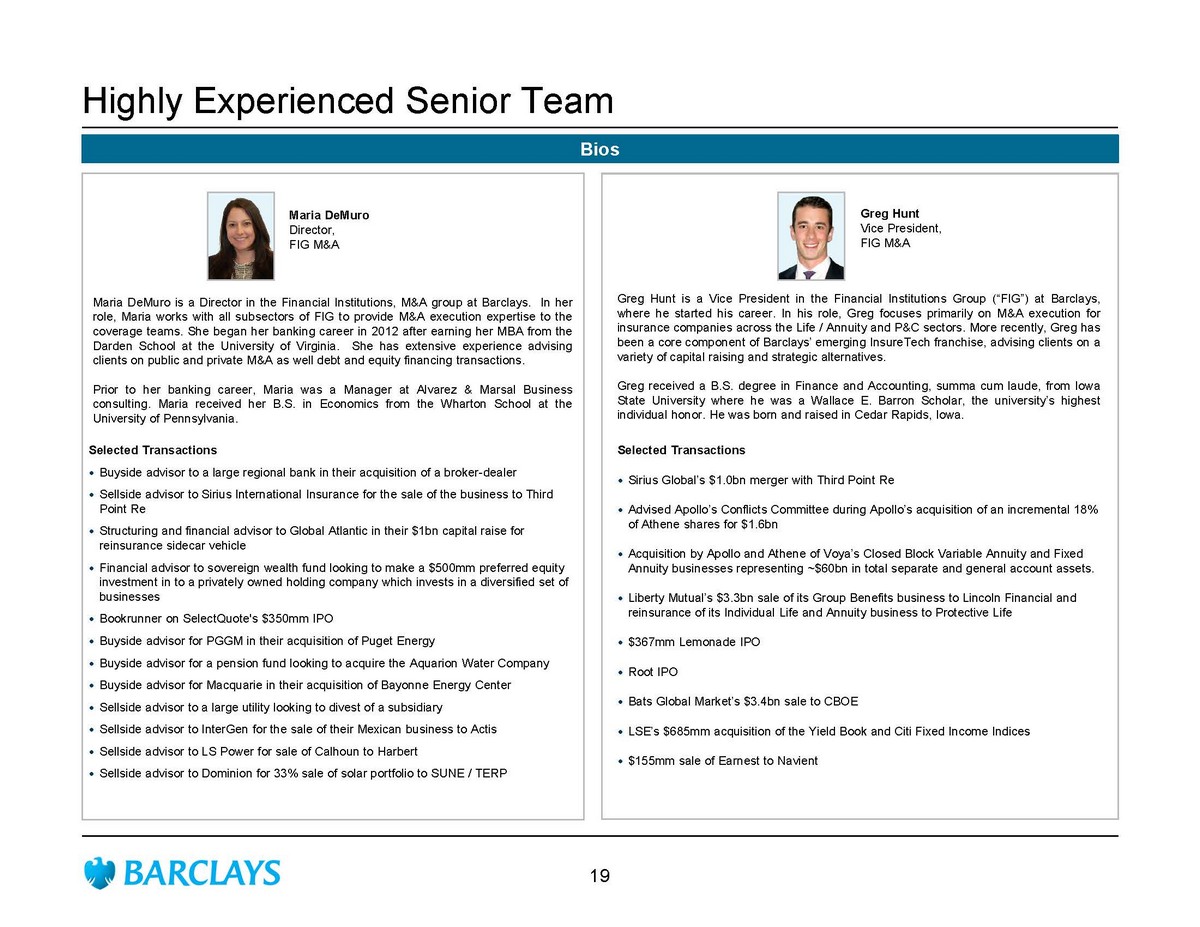
Greg Hunt is a Vice President in the Financial Institutions Group (“FIG”) at Barclays, where he started his career . In his role, Greg focuses primarily on M&A execution for insurance companies across the Life / Annuity and P&C sectors . More recently, Greg has been a core component of Barclays’ emerging InsureTech franchise, advising clients on a variety of capital raising and strategic alternatives . Greg received a B . S . degree in Finance and Accounting, summa cum laude, from Iowa State University where he was a Wallace E . Barron Scholar, the university’s highest individual honor . He was born and raised in Cedar Rapids, Iowa . Highly Experienced Senior Team Selected Transactions Sirius Global’s $1.0bn merger with Third Point Re Advised Apollo’s Conflicts Committee during Apollo’s acquisition of an incremental 18% of Athene shares for $1.6bn Acquisition by Apollo and Athene of Voya’s Closed Block Variable Annuity and Fixed Annuity businesses representing ~$60bn in total separate and general account assets. Liberty Mutual’s $3.3bn sale of its Group Benefits business to Lincoln Financial and reinsurance of its Individual Life and Annuity business to Protective Life $367mm Lemonade IPO Root IPO Bats Global Market’s $3.4bn sale to CBOE LSE’s $685mm acquisition of the Yield Book and Citi Fixed Income Indices $155mm sale of Earnest to Navient Bios Greg Hunt Vice President, FIG M&A Maria DeMuro is a Director in the Financial Institutions, M&A group at Barclays . In her role, Maria works with all subsectors of FIG to provide M&A execution expertise to the coverage teams . She began her banking career in 2012 after earning her MBA from the Darden School at the University of Virginia . She has extensive experience advising clients on public and private M&A as well debt and equity financing transactions . Prior to her banking career, Maria was a Manager at Alvarez & Marsal Business consulting . Maria received her B . S . in Economics from the Wharton School at the University of Pennsylvania . Maria DeMuro Director, FIG M&A Selected Transactions Buyside advisor to a large regional bank in their acquisition of a broker - dealer Sellside advisor to Sirius International Insurance for the sale of the business to Third Point Re Structuring and financial advisor to Global Atlantic in their $1bn capital raise for reinsurance sidecar vehicle Financial advisor to sovereign wealth fund looking to make a $500mm preferred equity investment in to a privately owned holding company which invests in a diversified set of businesses Bookrunner on SelectQuote's $350mm IPO Buyside advisor for PGGM in their acquisition of Puget Energy Buyside advisor for a pension fund looking to acquire the Aquarion Water Company Buyside advisor for Macquarie in their acquisition of Bayonne Energy Center Sellside advisor to a large utility looking to divest of a subsidiary Sellside advisor to InterGen for the sale of their Mexican business to Actis Sellside advisor to LS Power for sale of Calhoun to Harbert Sellside advisor to Dominion for 33% sale of solar portfolio to SUNE / TERP 19

FBL Financial Trading Comps
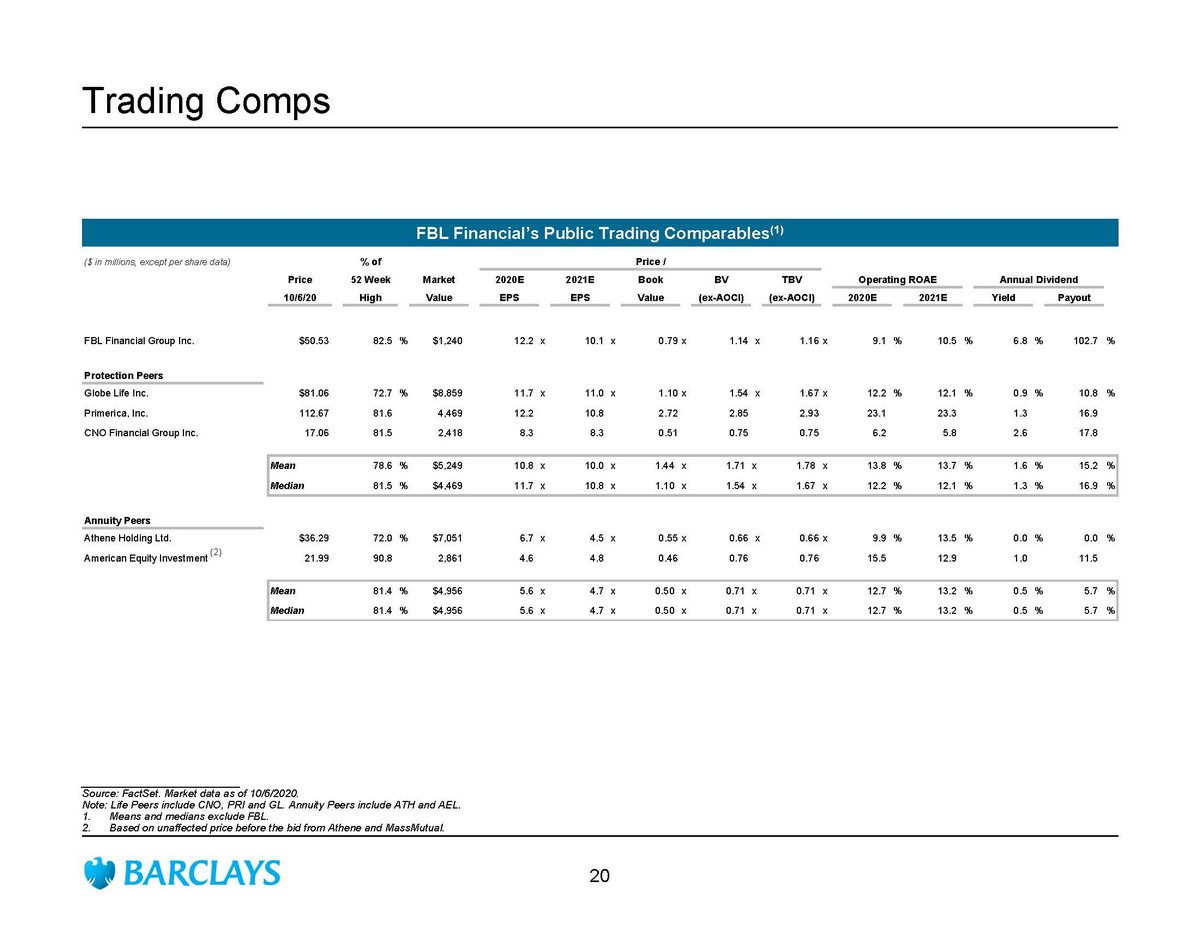
Trading Comps ___________________________ Source: FactSet . Market data as of 10/6/2020. Note: Life Peers include CNO, PRI and GL. Annuity Peers include ATH and AEL. 1. Means and medians exclude FBL. 2. Based on unaffected price before the bid from Athene and MassMutual. FBL Financial’s Public Trading Comparables (1) ($ in millions, except per share data) % of Price / Price 52 Week Market 2020E 2021E Book BV TBV Operating ROAE Annual Dividend 10/6/20 High Value EPS EPS Value (ex-AOCI) (ex-AOCI) 2020E 2021E Yield Payout Sort By Market Value FBL Financial Group Inc. $50.53 82.5 % $1,240 12.2 x 10.1 x 0.79x 1.14 x 1.16x 9.1 % 10.5 % 6.8 % 102.7 % Protection Peers Globe Life Inc. $81.06 72.7 % $8,859 11.7 x 11.0 x 1.10x 1.54 x 1.67x 12.2 % 12.1 % 0.9 % 10.8 % Primerica, Inc. 112.67 81.6 4,469 12.2 10.8 2.72 2.85 2.93 23.1 23.3 1.3 16.9 CNO Financial Group Inc. 17.06 81.5 2,418 8.3 8.3 0.51 0.75 0.75 6.2 5.8 2.6 17.8 Mean 78.6 % $5,249 10.8 x 10.0 x 1.44 x 1.71 x 1.78 x 13.8 % 13.7 % 1.6 % 15.2 % Median 81.5 % $4,469 11.7 x 10.8 x 1.10 x 1.54 x 1.67 x 12.2 % 12.1 % 1.3 % 16.9 % Annuity Peers Athene Holding Ltd. $36.29 72.0 % $7,051 6.7 x 4.5 x 0.55x 0.66 x 0.66x 9.9 % 13.5 % 0.0 % 0.0 % American Equity Investment 21.99 90.8 2,861 4.6 4.8 0.46 0.76 0.76 15.5 12.9 1.0 11.5 Mean 81.4 % $4,956 5.6 x 4.7 x 0.50 x 0.71 x 0.71 x 12.7 % 13.2 % 0.5 % 5.7 % Median 81.4 % $4,956 5.6 x 4.7 x 0.50 x 0.71 x 0.71 x 12.7 % 13.2 % 0.5 % 5.7 % (2) 20

Disclaimer The following pages contain material that was provided to the Board of Directors (the “Board”) of FBL Financial, Inc . (the “Company”) by Barclays Capital Inc . (“Barclays”) . The accompanying material was compiled or prepared on a confidential basis solely for consideration by the Board and no part of it may be reproduced, distributed or transmitted without the prior written consent of Barclays . The information contained in this material was obtained from the Company and/or publicly available sources, and Barclays has relied upon such information without independent verification thereof . These materials are being provided in connection with an actual engagement and may not be used or relied upon for any purpose other than as specifically contemplated by a written agreement with Barclays . Any estimates and projections contained herein have been prepared by management of the Company or were obtained from publicly available sources or are based upon such estimates and projections . With respect to such estimates and projections, Barclays has assumed that they have been reasonably prepared on a basis reflecting the best currently available estimates, projections and judgment of the management of the Company . The projections contained herein may or may not be achieved and differences between projected results and those actually achieved may be material . No representation or warranty, expressed or implied, is made as to the accuracy or completeness of such information and nothing contained herein is, or shall be relied upon as, a promise or representation, whether as to the past or the future . The analysis contained herein is based on current market conditions which are subject to change and Barclays assumes no obligation to update or otherwise revise these materials . Because these materials were prepared for use in the context of a presentation to the Board, these materials are incomplete without reference to, and should be assessed solely in conjunction with, the oral briefing provided by Barclays . These materials were not prepared to comply with the disclosure standards under state and federal securities laws and, to the extent the material may be considered by readers not as familiar with the business and affairs of the Company as the Board, none of the Company, Barclays, their respective affiliates or any of their respective legal or financial advisors or accountants takes any responsibility for the accuracy or completeness of any of the material if used by persons other than the Board . These materials are not intended to provide the sole basis for evaluation of the proposed transaction and do not purport to contain all information that may be required and should not be considered a recommendation with respect to the proposed transaction . Barclays, its subsidiaries and affiliates engage in a wide range of businesses from investment and commercial banking, lending, asset management and other financial and non - financial services . In the ordinary course of its business, Barclays and its affiliates may actively trade and effect transactions in the equity, debt and/or other securities (and any derivatives thereof) and financial instruments (including loans and other obligations) of the Company for its own account and for the accounts of its customers and, accordingly, may at any time hold long or short positions and investments in such securities and financial instruments . These materials do not constitute nor do they form part of an offer to sell or purchase, or the solicitation of an offer to sell or purchase, any securities or any of the businesses or assets described herein or an offer of financing or an offer or recommendation to enter into any transaction described herein . Barclays Capital Inc . is the United States investment bank of Barclays Bank PLC . Barclays Bank PLC is authorised by the Prudential Regulation Authority and regulated by the Financial Conduct Authority and the Prudential Regulation Authority (Financial Services Register No . 122702 ) . Registered in England . Registered No . 1026167 . Registered office : 1 Churchill Place, London E 14 5 HP . Copyright Barclays Bank PLC, 2016 (all rights reserved) . 21