Exhibit (c)(8)
CONFIDENTIAL – Draft for Discussion Purposes Only Working Draft as of Dec 3, 2020 Project Kinnick Special Committee Valuation Materials December 3, 2020 Note that this is a working draft subject to further revision in its entirety from ongoing discussion / negotiation / refinement

Project Kinnick Confidential CONFIDENTIAL – Draft for Discussion Purposes Only Working Draft as of Dec 3, 2020 Finalized / FBL management approved GAAP plan Updated valuation analysis as of December 1, 2020 Agenda Update on Milliman’s v aluation / appraisal 1 2 3 1
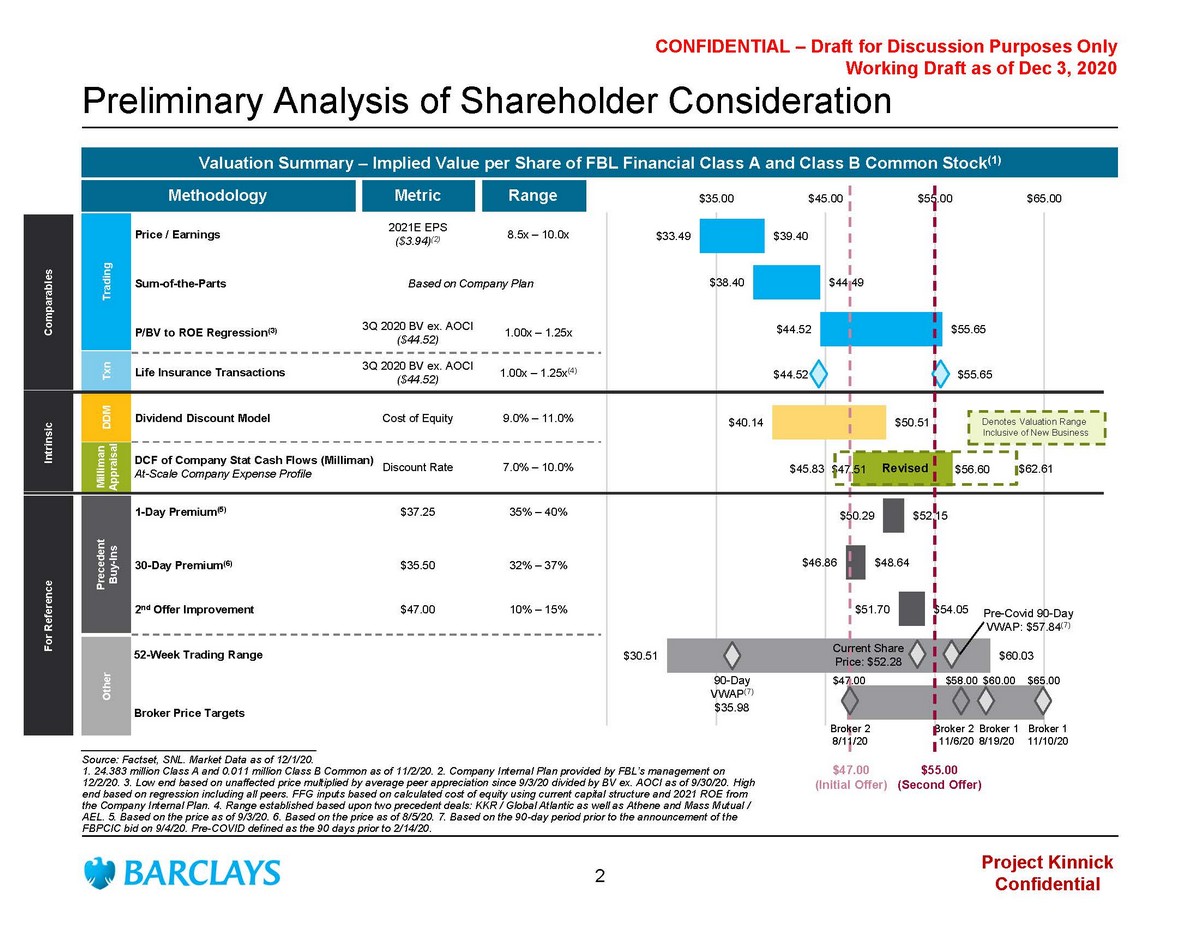
Project Kinnick Confidential CONFIDENTIAL – Draft for Discussion Purposes Only Working Draft as of Dec 3, 2020 Broker 2 11/6/20 $33.49 $38.40 $44.52 $44.52 $40.14 $47.51 $50.29 $46.86 $51.70 $30.51 $39.40 $44.49 $55.65 $55.65 $50.51 $56.60 $52.15 $48.64 $54.05 $60.03 $25.00 $35.00 $45.00 $55.00 $65.00 Preliminary Analysis of Shareholder Consideration ________________________________________ Source: Factset , SNL. Market Data as of 12/1/20. 1. 24.383 million Class A and 0.011 million Class B Common as of 11/2/20. 2. Company Internal Plan provided by FBL’s management on 12/2/20. 3. Low end based on unaffected price multiplied by average peer appreciation since 9/3/20 divided by BV ex. AOCI as of 9/30/20. High end based on regression including all peers. FFG inputs based on calculated cost of equity using current capital structure and 2021 ROE fr om the Company Internal Plan. 4. Range established based upon two precedent deals: KKR / Global Atlantic as well as Athene and Mass Mutual / AEL. 5. Based on the price as of 9/3/20. 6. Based on the price as of 8/5/20. 7. Based on the 90 - day period prior to the announcement of the FBPCIC bid on 9/4/20. Pre - COVID defined as the 90 days prior to 2/14/20 . Valuation Summary – Implied Value per Share of FBL Financial Class A and Class B Common Stock (1) 7.0% – 10.0% DDM Methodology Metric Range Discount Rate Dividend Discount Model 9.0% – 11.0% Cost of Equity Trading Price / Earnings 8.5x – 10.0x 2021E EPS ($3.94) (2) Precedent Buy - Ins 1 - Day Premium (5) 35% – 40 % 2 nd Offer Improvement 10% – 1 5% 30 - Day Premium (6) 32% – 37% Other 52 - Week Trading Range Broker Price Targets Txn Life Insurance Transactions 1.00x – 1.25x (4) $37.25 Broker 2 8/11/20 Broker 1 8/19/20 Broker 1 11/10/20 $35.50 $47.00 $47.00 $60.00 $65.00 3 Q 2020 BV ex. AOCI ($44.52) Milliman Appraisal For Reference P/BV to ROE Regression (3) 1 .00x – 1.25x Sum - of - the - Parts Based on Company Plan 3 Q 2020 BV ex. AOCI ($44.52) Intrinsic Comparables $58.00 90 - Day VWAP (7) $35.98 Pre - Covid 90 - Day VWAP: $57.84 (7) Revised DCF of Company Stat Cash Flows ( Milliman ) At - Scale Company Expense Profile $47.00 (Initial Offer) Current Share Price: $52.28 $55.00 (Second Offer) Denotes Valuation Range Inclusive of New Business $62.61 $45.83 2
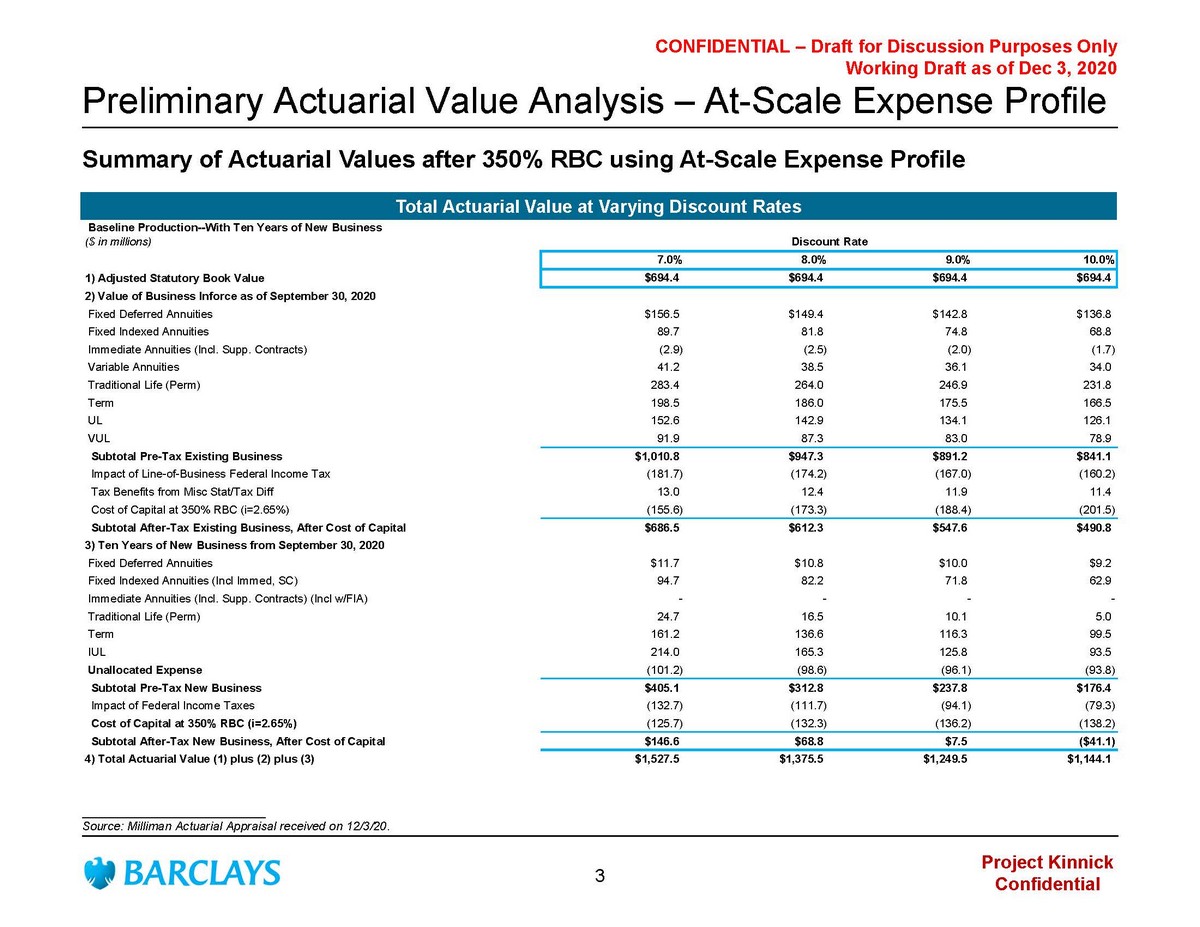
Project Kinnick Confidential CONFIDENTIAL – Draft for Discussion Purposes Only Working Draft as of Dec 3, 2020 Preliminary Actuarial Value Analysis – At - Scale Expense Profile Summary of Actuarial Values after 350% RBC using At - Scale Expense Profile Total Actuarial Value at Varying Discount Rates ___________________________ Source: Milliman Actuarial Appraisal received on 12/3/20. Baseline Production--With Ten Years of New Business ($ in millions) Discount Rate 7.0% 8.0% 9.0% 10.0% 1) Adjusted Statutory Book Value $694.4 $694.4 $694.4 $694.4 2) Value of Business Inforce as of September 30, 2020 Fixed Deferred Annuities $156.5 $149.4 $142.8 $136.8 Fixed Indexed Annuities 89.7 81.8 74.8 68.8 Immediate Annuities (Incl. Supp. Contracts) (2.9) (2.5) (2.0) (1.7) Variable Annuities 41.2 38.5 36.1 34.0 Traditional Life (Perm) 283.4 264.0 246.9 231.8 Term 198.5 186.0 175.5 166.5 UL 152.6 142.9 134.1 126.1 VUL 91.9 87.3 83.0 78.9 Subtotal Pre-Tax Existing Business $1,010.8 $947.3 $891.2 $841.1 Impact of Line-of-Business Federal Income Tax (181.7) (174.2) (167.0) (160.2) Tax Benefits from Misc Stat/Tax Diff 13.0 12.4 11.9 11.4 Cost of Capital at 350% RBC (i=2.65%) (155.6) (173.3) (188.4) (201.5) Subtotal After-Tax Existing Business, After Cost of Capital $686.5 $612.3 $547.6 $490.8 3) Ten Years of New Business from September 30, 2020 Fixed Deferred Annuities $11.7 $10.8 $10.0 $9.2 Fixed Indexed Annuities (Incl Immed, SC) 94.7 82.2 71.8 62.9 Immediate Annuities (Incl. Supp. Contracts) (Incl w/FIA) - - - - Traditional Life (Perm) 24.7 16.5 10.1 5.0 Term 161.2 136.6 116.3 99.5 IUL 214.0 165.3 125.8 93.5 Unallocated Expense (101.2) (98.6) (96.1) (93.8) Subtotal Pre-Tax New Business $405.1 $312.8 $237.8 $176.4 Impact of Federal Income Taxes (132.7) (111.7) (94.1) (79.3) Cost of Capital at 350% RBC (i=2.65%) (125.7) (132.3) (136.2) (138.2) Subtotal After-Tax New Business, After Cost of Capital $146.6 $68.8 $7.5 ($41.1) 4) Total Actuarial Value (1) plus (2) plus (3) $1,527.5 $1,375.5 $1,249.5 $1,144.1 3

Project Kinnick Confidential CONFIDENTIAL – Draft for Discussion Purposes Only Working Draft as of Dec 3, 2020 Appraisal Valuation Bridge Milliman’s appraisal derives a consolidated value for FBL’s insurance operations in Farm Bureau Life Insurance Company and Greensfields Life Insurance Company Milliman’s valuation does not include value attributable to FBL businesses that do not reside in its two insurance operating entities The bridge below provides a walk to the total valuation for FBL Financial Group from Milliman’s appraisal Discount Rate ($ in millions, except per share values) 7% 8% 9% 10% Total Actuarial Value (incl. New Business) (1) $1,528 $1,376 $1,250 $1,144 Topside Adjustments: (+) Holding Company Net Income / (Loss) (2) 10 8 7 6 (-) Wealth Management Value (3) -- -- -- -- (+) Leasing Business (4) 10 8 7 6 (+) Investment Management Business (5) 2 2 1 1 (+) Financial Services Business (6) 47 40 34 30 (+) Holding Compnay Net Assets (7) 28 28 28 28 (-) Trust Preferreds (97) (97) (97) (97) Total Value of FBL Financial Group $1,527 $1,364 $1,229 $1,118 Shares Outstanding (8) 24.4 24.4 24.4 24.4 Total Value per Share $62.61 $55.90 $50.40 $45.83 ___________________________ Source: Company filings. 1. Values per Milliman’s appraisal shared on December 3, 2020. 2. Holding company net income assumes FBL Life pays a $6.0mm management fee and the FBPCIC pays a $2.0mm management fee to the p are nt company. These offset $7.5mm of general and administrative expenses for the parent company. We assume no tax is paid by the parent company given its tax position and is valued assuming a 2% growth on earnings. 3. No value attributed to wealth management segment, consistent with other valuation analysis . 4. Value of leasing business assumes $0.6mm of pre - tax earnings in 2021, tax effected at 21% and valued using a growth methodology using a 2% growth rate. 5. Value of 3 rd party investment management business assumes $ 0.1mm of pre - tax earnings in 2021, tax effected at 21% and valued using a growth methodology using a 2% growth rate . 6. Represents value of investment management fees paid by FBPCIC subsidiaries to FBL Financial Services. Assumes $3.0mm of pre - tax income, tax effected at 21% and valued using a growth methodology using a 2% growth rate. 7. Net assets calculated as non - consolidated assets and liabilities from FBL Financial Group, Inc.’s balance sheet as of September 30, 2020 (latest values reported). 8. 24.383 million Class A and 0.011 million Class B Common as of 11/2/20. 4

Project Kinnick Confidential CONFIDENTIAL – Draft for Discussion Purposes Only Working Draft as of Dec 3, 2020 Expense Scenario Comparison Annual Expense Breakdown ___________________________ Source: Milliman Actuarial Appraisal received on 12/3/20. Unit Expense Allowable Unabsorbed Total Acquisition Maintenance Sub-Total Expense Expense 2021 30.6 55.5 86.1 7.0 93.1 2022 36.9 58.3 95.2 0.4 95.6 2023 39.1 61.2 100.3 - 100.3 2024 41.4 64.4 105.8 - 105.8 2025 43.9 67.9 111.8 - 111.8 2026 46.8 71.8 118.6 - 118.6 2027 49.6 75.9 125.5 - 125.5 2028 52.1 80.2 132.3 - 132.3 2029 54.7 84.7 139.4 - 139.4 2030 57.5 89.4 147.0 - 147.0 Unit Expense Allowable Unabsorbed Total Acquisition Maintenance Sub-Total Expense Expense 2021 30.6 21.1 51.7 41.4 93.1 2022 36.9 22.2 59.1 36.5 95.6 2023 39.1 23.3 62.4 35.4 97.8 2024 41.4 24.5 66.0 34.0 100.0 2025 43.9 25.9 69.8 32.5 102.3 2026 46.8 27.3 74.1 30.5 104.6 2027 49.6 28.8 78.4 28.6 107.0 2028 52.1 30.4 82.5 26.9 109.4 2029 54.7 32.1 86.8 25.1 111.9 2030 57.5 33.8 91.3 23.0 114.4 Unit Expense Allowable Unabsorbed Total Acquisition Maintenance Sub-Total Expense Expense 2021 30.6 36.1 66.7 26.5 93.1 2022 36.9 37.9 74.8 20.8 95.6 2023 39.1 39.8 78.9 18.9 97.8 2024 41.4 41.8 83.3 16.7 100.0 2025 43.9 44.1 88.0 14.2 102.3 2026 46.8 46.7 93.5 11.1 104.6 2027 49.6 49.3 98.9 8.1 107.0 2028 52.1 52.1 104.2 5.2 109.4 2029 54.7 55.1 109.8 2.1 111.9 2030 57.5 58.1 115.7 - 115.7 At-Scale Expense Profile Industry Expense Profile Current Fully-Allocated Company Expense Profile Commentary Expense base modeled using FBL’s budgeted 2021 expenses, assuming no benefit from operating leverage in the subsequent years In the out years, expense base is inflated vs. FBL’s plan, driven by unit expense growth Total expenses based on Company budget Unit expenses modeled based on industry best - in - class profile Unabsorbed expenses are created to match FBL’s plan, which are credited against new business value $23.0mm of unallocated expenses in year 10 Similar approach to industry expense methodology, (i.e., total expenses based on Company budget) but unabsorbed expenses are fed back into unit expenses over time to better match FBL’s plan while also capturing operating leverage No remaining unabsorbed expense by year 10 Consistent with typical appraisal approach 5
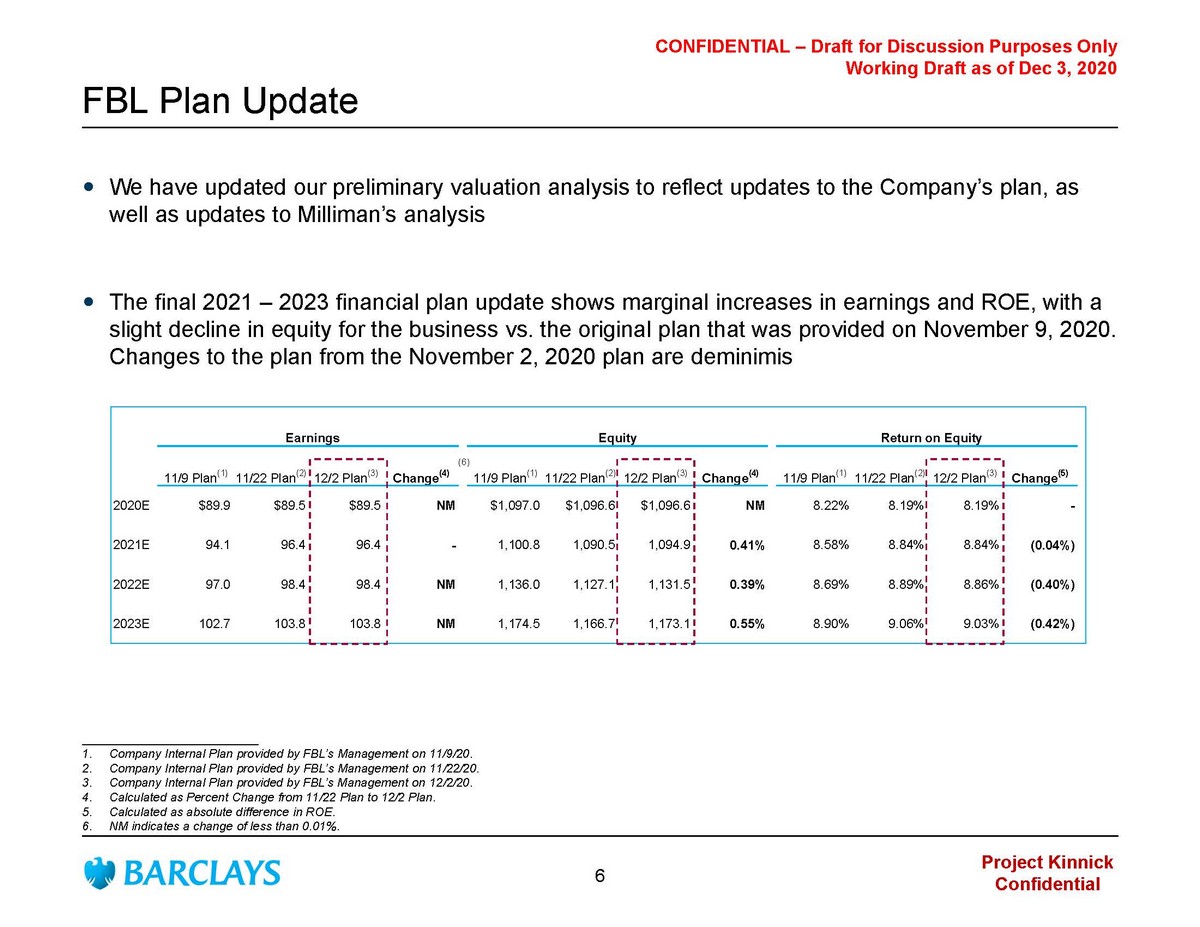
Project Kinnick Confidential CONFIDENTIAL – Draft for Discussion Purposes Only Working Draft as of Dec 3, 2020 We have updated our preliminary valuation analysis to reflect updates to the Company’s plan, as well as updates to Milliman’s analysis The final 2021 – 2023 financial plan update shows marginal increases in earnings and ROE, with a slight decline in equity for the business vs. the original plan that was provided on November 9, 2020. Changes to the plan from the November 2, 2020 plan are deminimis FBL Plan Update __________________________ 1. Company Internal Plan provided by FBL’s Management on 11/9/20. 2. Company Internal Plan provided by FBL’s Management on 11/22/20. 3. Company Internal Plan provided by FBL’s Management on 12/2/20. 4. Calculated as Percent Change from 11/22 Plan to 12/2 Plan. 5. Calculated as absolute difference in ROE. 6. NM indicates a change of less than 0.01%. Earnings Equity Return on Equity 11/9 Plan (1) 11/22 Plan (2) 12/2 Plan (3) Change (4) 11/9 Plan (1) 11/22 Plan (2) 12/2 Plan (3) Change (4) 11/9 Plan (1) 11/22 Plan (2) 12/2 Plan (3) Change (5) 2020E $89.9 $89.5 $89.5 NM $1,097.0 $1,096.6 $1,096.6 NM 8.22% 8.19% 8.19% - 2021E 94.1 96.4 96.4 - 1,100.8 1,090.5 1,094.9 0.41% 8.58% 8.84% 8.84% (0.04%) 2022E 97.0 98.4 98.4 NM 1,136.0 1,127.1 1,131.5 0.39% 8.69% 8.89% 8.86% (0.40%) 2023E 102.7 103.8 103.8 NM 1,174.5 1,166.7 1,173.1 0.55% 8.90% 9.06% 9.03% (0.42%) (6) 6

Project Kinnick Confidential CONFIDENTIAL – Draft for Discussion Purposes Only Working Draft as of Dec 3, 2020 Disclaimer The prior pages contain material that was provided to the Special Committee of the Board of Directors (the “Special Committee ”) of FBL Financial Group, Inc. (the “Company”) by Barclays Capital Inc. (“Barclays”). The accompanying material and any Barclays presentation related to the material was compiled or pr epa red on a confidential basis solely for consideration by the Special Committee and no part of it may be reproduced, distributed or transmitted without the prior written consent of Barcla ys. The information contained in this material was obtained from the Company, and/or publicly available sources, and Barclays has relied upon such information without independent verification th ere of and does not assume any liability for any such information. These materials are being provided in connection with an actual corporate engagement and may not be used or relied upon for a ny purpose other than as specifically contemplated by a written agreement with Barclays. Moreover, any information provided herein was not prepared for or intended for use by any individual fo r personal, family or household purposes. Any estimates, historical financial information, projections and other information contained herein have been prepared by man age ment of the Company and Milliman , Inc. or were obtained from publicly available sources (approved for Barclays’ use by the Company) or are based upon such estimates and projections. Wi th respect to such estimates and projections, Barclays has assumed that they have been reasonably prepared on a basis reflecting the best currently available estimates, projections and ju dgment of the management of the Company or Milliman , Inc. The projections contained herein may or may not be achieved and differences between projected results and those actually achi eve d may be material. No representation or warranty, expressed or implied, is made as to the accuracy or completeness of such information and nothing contained herein is, or shal l b e relied upon as, a promise or representation, whether as to the past or the future. The analysis contained herein is based on current market conditions which are subject to change and B arc lays assumes no obligation to update or otherwise revise these materials. Nothing in these materials shall be deemed to constitute a recommendation or investment, legal, tax, financi al, accounting or other advice. Because these materials were prepared for use in the context of a presentation to the Special Committee, these materials are inc omplete without reference to, and should be assessed solely in conjunction with, the oral briefing provided by Barclays to the Special Committee (in their capacity as directors and not in any individual capacity and is not for the benefit of any individual, including any individual officer, director, shareholder or any other person). These materials were not prepared for or intend ed for use by any individual for personal, family or household purposes nor were they prepared to comply with the disclosure standards under state and federal securities laws or any other app licable laws and, to the extent the material may be considered by readers not as familiar with the business and affairs of the Company as the Special Committee, none of the Company, Barcla ys, their respective affiliates or any of their respective legal or financial advisors or accountants takes any responsibility for the accuracy or completeness of any of the material if used by pe rsons other than the Special Committee. These materials are not intended to provide the sole basis for evaluation of the proposed corporate transaction and do not purport to contain all inf orm ation that may be required and should not be considered a recommendation with respect to the proposed corporate transaction. Barclays has not made or obtained any evaluations or appraisals of the assets or liabilities of the Company or any other part y t o any corporate transaction or any of their respective affiliates and has no obligation to evaluate the solvency of the Company or any other party to any transaction under any state or federa l l aws relating to bankruptcy, insolvency or similar matters. The analyses contained herein do not purport to be appraisals nor do they necessarily reflect the prices at which businesses or s ecu rities actually may be sold or purchased. Barclays’ role in any due diligence review is limited solely to performing such a review as it shall deem necessary to support its own advice and a nal ysis and shall not be on behalf of the Company, the Special Committee or any individual officer, director, shareholder or any other person. Barclays, its subsidiaries and affiliates engage in a wide range of businesses from investment and commercial banking, lendin g, asset management and other financial and non - financial services. In the ordinary course of its business, Barclays and its affiliates may actively trade and effect transactions in t he equity, debt and/or other securities (and any derivatives thereof) and financial instruments (including loans and other obligations) of the Company for its own account and for the accounts of its cus tomers and, accordingly, may at any time hold long or short positions and investments in such securities and financial instruments or in other financial products and instruments. Unless ot herwise expressly agreed or provided for in other applicable Barclays disclosures governing such corporate transactions or required by law or regulation, Barclays conducts these activiti es as principal and executes its principal transactions as an arm’s length counterparty. Barclays does not act as a fiduciary in relation to these corporate transactions. These materials do not constitute investment advice nor do they form part of an offer to sell or purchase, or the solicitatio n o f an offer to sell or purchase, any securities or any of the businesses or assets described herein or an offer of financing or an offer or recommendation to enter into any corporate tran sac tion described herein. Barclays Capital Inc. is the United States investment bank of Barclays Bank PLC. Barclays Bank PLC is authorised by the Prudential Regulation Authority and regulated by the Financial Conduct Authority and the Prudential Regulation Authority (Financial Services Register No. 122702). Registered in England. Re gis tered No. 1026167. Registered office: 1 Churchill Place, London E14 5HP. Copyright Barclays Bank PLC, 2020 (all rights reserved). 7