Exhibit (c)(5)
CONFIDENTIAL – Draft for Discussion Purposes Only Working Draft as of Nov 13, 2020 Project Kinnick Special Committee Valuation Materials November 15, 2020 Note that this is a working draft subject to further revision in its entirety from ongoing discussion / negotiation / refinement

Project Kinnick Confidential CONFIDENTIAL – Draft for Discussion Purposes Only Working Draft as of Nov 13, 2020 Table of Contents 1. Overview 1 2. Plan / Street Expectations 8 3. Valuation Analysis 10 4. Next Steps 12 5. Valuation Reference Materials A. Selected Public Trading Comparables 13 B. Selected Precedent Transaction Comparables 15 C. Gordon Growth Model for Financial Institutions 16 ________________________________________________________________________________________ Appendices A. Supplemental Valuation Support 18 B. Historical Operating Results 20 C. Shareholder Analysis 21

Overview
Project Kinnick Confidential CONFIDENTIAL – Draft for Discussion Purposes Only Working Draft as of Nov 13, 2020 Overview On September 4, 2020, the Board of Directors of FBL Financial Group (“FBL” or the “Company”) received a letter (the “Proposal”) from Farm Bureau Property & Casualty Insurance Company (“FBPCIC”) offering $47.00 per share in cash for all Class A common stock and Class B common stock not owned by FBPCIC or the Iowa Farm Bureau Federation (“IFBF”) Together FBPCIC and IFBF own ~60% of the outstanding shares of Class A common stock and ~67% of the outstanding shares of Class B common stock Since being engaged by the Special Committee, Barclays has been conducting due diligence on FBL and preparing a preliminary valuation analysis of the Company to facilitate a response by the Special Committee to the Proposal Milliman was formally engaged to perform an actuarial appraisal on November 2, 2020, and began work in mid - to - late October Barclays’ initial valuation work includes input from Milliman’s actuarial analysis and management’s updated business plan, which was provided by management on November 9, 2020 The objectives of today’s discussion are to: Present preliminary valuation methodologies and key takeaways Discuss potential responses to FBPCIC’s offer ___________________________ Source : Offer letter received by FBL Financial’s Board of Directors on September 4, 2020. 1

Project Kinnick Confidential CONFIDENTIAL – Draft for Discussion Purposes Only Working Draft as of Nov 13, 2020 FBL Financial Group Corporate Structure Farm Bureau Mutual Holding Company Farm Bureau Multi - State Services, Inc. Farm Bureau Property and Casualty Insurance Company FBL Insurance Brokerage, LLC Western Agricultural Insurance Company Farm Bureau Life Insurance Company Greenfields Life Insurance Company FBL Assigned Benefit Company FBL Investment Management Services, Inc. FBL Leasing Services, Inc. FBL Financial Group Capital Trust FBL Marketing Services, LLC FBL Financial Services, Inc. FBL Wealth Management, LLC FBL FINANCIAL GROUP, INC. NYSE: FFG Ownership Management Agreement ___________________________ Source: Company Filings. Public Investors (~40% Class A Ownership) (~33% Class B Ownership) Iowa Farm Bureau Federation (~60% Clas s A Ownership) (~67% Class B Ownership ) 2
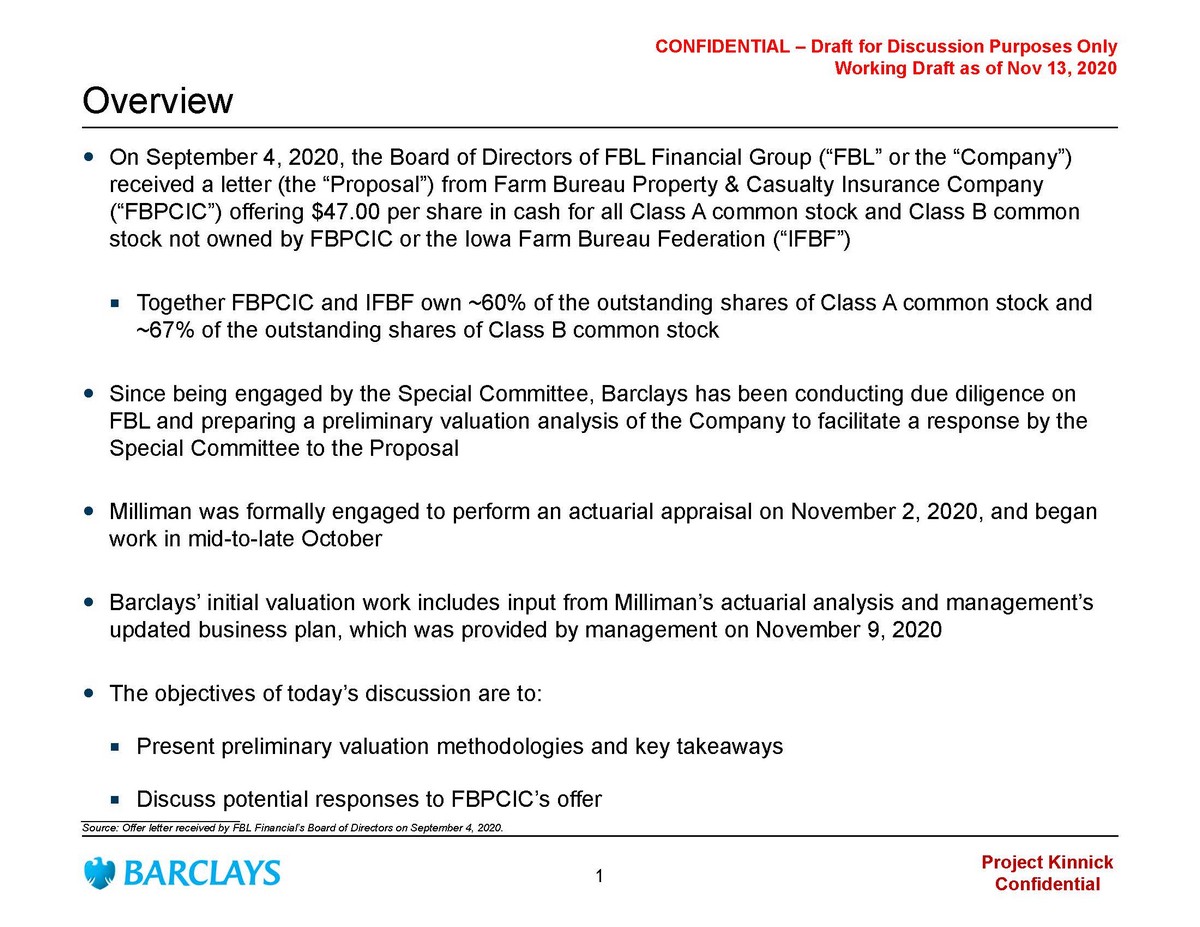
Project Kinnick Confidential CONFIDENTIAL – Draft for Discussion Purposes Only Working Draft as of Nov 13, 2020 Annuity 39% Universal Life 6% Permanent Life 25% Term Life 18% Corporate and Other 12% Overview of FBL and FBPCIC FBL is a holding company for Farm Bureau Life Insurance Company (FBL), which underwrites and markets life and annuities products to individuals and small business FBL utilizes a core distribution force of exclusive Farm Bureau agents in 15 Midwestern and Western states, and targets customers that are members of the American Farm Bureau FBL launched FBL Wealth Management in Q1 2019. The division provides wealth management services and investment solutions across 14 Midwestern and Western States Founded: 1939 Headquarters: Des Moines, Iowa FBL Company Overview FBLIC Business Mix Total 2019 Operating Income: $117.5m ___________________________ Source: A.M. Best, Company Filings. Farm Bureau Property and Casualty (FBPCIC) is an indirect subsidiary of the Farm Bureau Mutual Holding Company FBPCIC engages in the sale of property - casualty insurance products to Farm Bureau members across 8 Western and Midwestern states FBPCIC utilizes a network of more than 11,000 exclusive multi - line agents and agency managers Key products include Personal Auto, Personal Property, Farm, Commercial, Crop and Commercial Ag insurance Founded: 1939 Headquarters: Des Moines, Iowa FBPCIC Company Overview Personal Property and Auto 35% Farmowners 21% Homeowners 21% Commercial 9% Crop 8% Commercial Ag 3% Other Personal 3% Total 2019 Direct Written Premiums: $1,551m FBPCIC Business Mix Note: Interest - sensitive reserves represent ~1/3 of total life reserves 3

Project Kinnick Confidential CONFIDENTIAL – Draft for Discussion Purposes Only Working Draft as of Nov 13, 2020 8.4% 10.2% 13.9% 14.4% 18.0% 22.0% CNO FFG GL ATH AEL PRI 2.2x 2.6x 5.3x 5.9x 8.5x 9.3x PRI GL CNO FFG ATH AEL (0.7%) 0.9% 4.6% 11.2% 12.1% 17.9% CNO FFG GL AEL PRI ATH Historical Operating Benchmarking Asset Leverage (2 ) 5 - Year Revenue Growth (1) 3 - Year Avg. Operating ROE (3) _____________________________________________________________________ Source: SNL Financial, FactSet , Company Filings. Financial data as of year - end 2019. 1. Includes revenue from annuity related product charges. 2. Calculated as Total Investments / Total Equity as of 9/30/20. 3. 3 - Year Average Operating ROE based on reported adjusted operating ROE and book value ex. AOCI. Protection Peers FBL Financial Peer Median: 11.2% Annuity Peers Peer Median: 5.3x Peer Median: 14.4% FBL Financial’s operating performance faces headwinds from lower rates, spread pressure, and slowing organic top - line growth 4
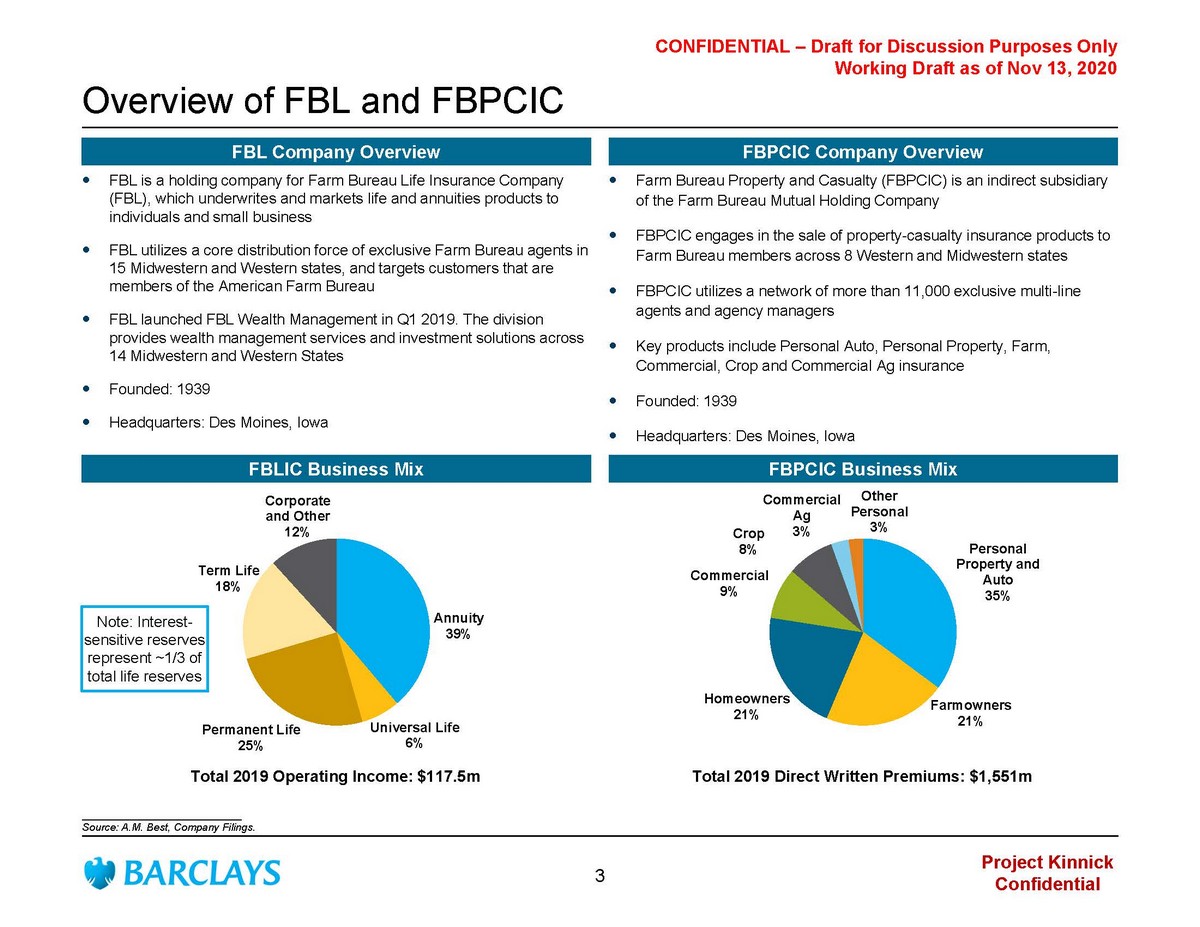
Project Kinnick Confidential CONFIDENTIAL – Draft for Discussion Purposes Only Working Draft as of Nov 13, 2020 219.7 218.8 205.9 155.8 158.3 158.0 158.2 117.0 1.94% 1.90% 1.75% 1.65% 1.38% 1.24% 1.04% 0.93% 0.0% 0.5% 1.0% 1.5% 2.0% $0 $100 $200 $300 $400 2017 2018 2019 2020 YTD (Spread) (Spread Income, $mm) Annuity Life Annuity Spread Life Spread Low Rate Environment Driving Spread Compression FBL has Experienced Spread Compression in Recent Years… (1) …Driven by the Drop in Interest Rates (2) 0.85% 0.93% 1.01% 1.10% 1.20% 1.29% 1.39% 1.47% 1.53% 0.0% 0.5% 1.0% 1.5% 2.0% 2.5% 3.0% Q4 20 Q1 21 Q2 21 Q3 21 Q4 21 Q1 22 Q2 22 Q3 22 Q4 22 Yield (%) Bloomberg Weighted Average 10-Yr Yield Projections Low Rates are Expected to Persist (3) 0.10% 0.09% 0.10% 0.12% 0.17% 0.23% 0.41% 0.65% 0.89% 1.43% 1.65% 1.56% 1.57% 1.59% 1.57% 1.63% 1.65% 1.69% 1.79% 1.88% 2.20% 2.36% 1.07% 1.24% 1.37% 1.55% 1.70% 1.82% 2.08% 2.27% 2.40% 2.67% 2.87% 0.0% 0.5% 1.0% 1.5% 2.0% 2.5% 3.0% 1 Mo 3 Mo 6 Mo 1 Yr 2 Yr 3 Yr 5 Yr 7 Yr 10 Yr 20 Yr 30 Yr Yield (%) Current 1-Yr Ago 3-Yrs Ago ___________________________ Source: Company Filings, US Department of Treasury, and Bloomberg. 1. Data per Financial S upplement and Company Internal Plan provided by FBL’s m anagement on 11/9/20. 2. Data per US Department Treasury as of 11/13/20. 3. Bloomberg Median Forecasts as of 11/13/20. 5
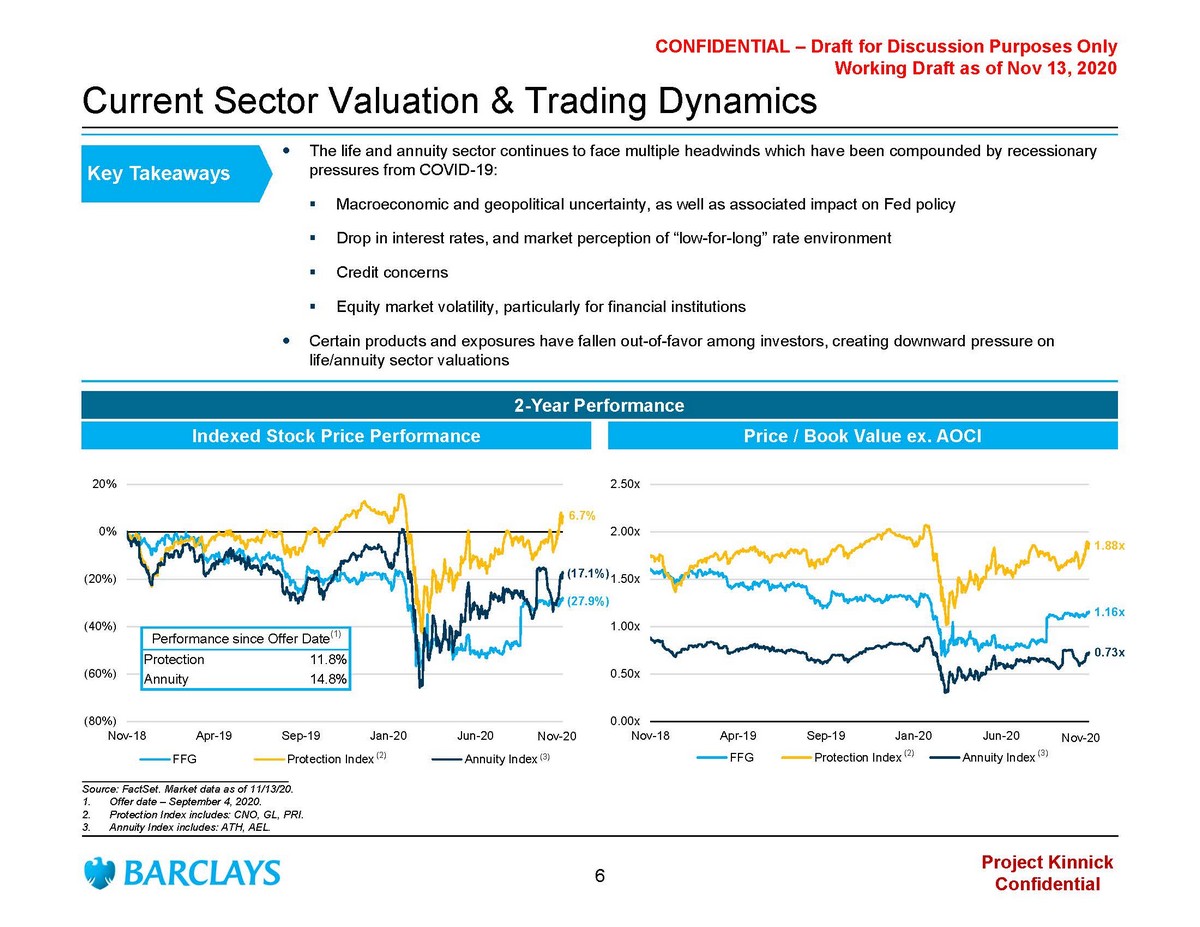
Project Kinnick Confidential CONFIDENTIAL – Draft for Discussion Purposes Only Working Draft as of Nov 13, 2020 0.00x 0.50x 1.00x 1.50x 2.00x 2.50x Nov-18 Apr-19 Sep-19 Jan-20 Jun-20 Nov-20 FFG Protection Index Annuity Index (80%) (60%) (40%) (20%) 0% 20% Nov-18 Apr-19 Sep-19 Jan-20 Jun-20 Nov-20 FFG Protection Index Annuity Index The life and annuity sector continues to face multiple headwinds which have been compounded by recessionary pressures from COVID - 19: ▪ Macroeconomic and geopolitical uncertainty, as well as associated impact on Fed policy ▪ Drop in interest rates, and market perception of “low - for - long” rate environment ▪ Credit concerns ▪ Equity market volatility, particularly for financial institutions Certain products and exposures have fallen out - of - favor among investors, creating downward pressure on life/annuity sector valuations Current Sector Valuation & Trading Dynamics Key Takeaways Indexed Stock Price Performance 2 - Year Performance Price / Book Value ex. AOCI (3) ___________________________________ Source: FactSet . Market data as of 11/13/20. 1. Offer date – September 4, 2020 . 2. Protection Index includes: CNO, GL, PRI. 3. Annuity Index includes: ATH, AEL. (2) (2) ( 3 ) 6.7% (17.1%) (27.9%) 1.88x 0.73x 1.16x Nov - 20 Nov - 20 Performance since Offer Date (1) Protection 11.8% Annuity 14.8% 6
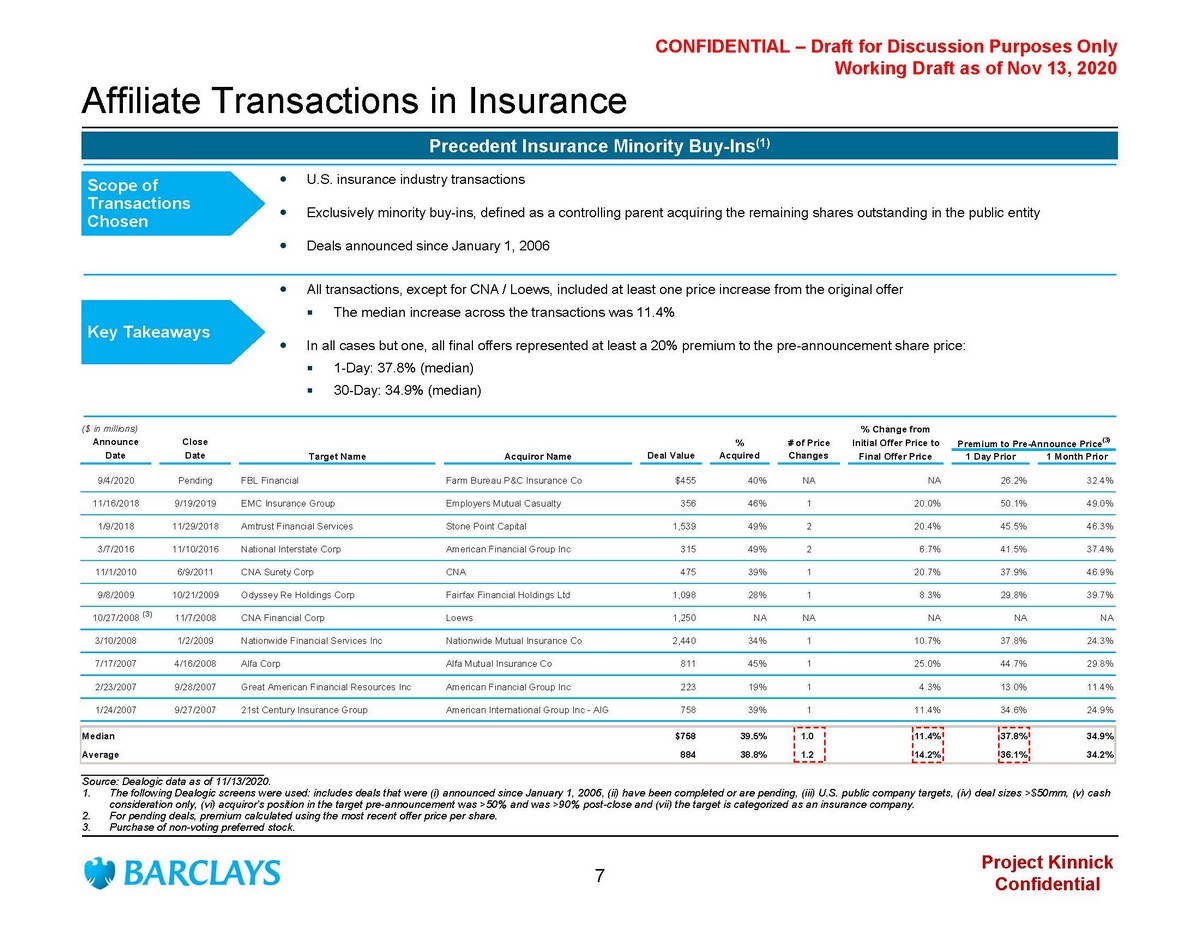
Project Kinnick Confidential CONFIDENTIAL – Draft for Discussion Purposes Only Working Draft as of Nov 13, 2020 ($ in millions) % Change from Announce Close % # of Price Initial Offer Price to Premium to Pre-Announce Price (3) Date Date Target Name Acquiror Name Deal Value Acquired Changes Final Offer Price 1 Day Prior 1 Month Prior 9/4/2020 Pending FBL Financial Farm Bureau P&C Insurance Co $455 40% NA NA 26.2% 32.4% 11/16/2018 9/19/2019 EMC Insurance Group Employers Mutual Casualty 356 46% 1 20.0% 50.1% 49.0% 1/9/2018 11/29/2018 Amtrust Financial Services Stone Point Capital 1,539 49% 2 20.4% 45.5% 46.3% 3/7/2016 11/10/2016 National Interstate Corp American Financial Group Inc 315 49% 2 6.7% 41.5% 37.4% 11/1/2010 6/9/2011 CNA Surety Corp CNA 475 39% 1 20.7% 37.9% 46.9% 9/8/2009 10/21/2009 Odyssey Re Holdings Corp Fairfax Financial Holdings Ltd 1,098 28% 1 8.3% 29.8% 39.7% 10/27/2008 11/7/2008 CNA Financial Corp Loews 1,250 NA NA NA NA NA 3/10/2008 1/2/2009 Nationwide Financial Services Inc Nationwide Mutual Insurance Co 2,440 34% 1 10.7% 37.8% 24.3% 7/17/2007 4/16/2008 Alfa Corp Alfa Mutual Insurance Co 811 45% 1 25.0% 44.7% 29.8% 2/23/2007 9/28/2007 Great American Financial Resources Inc American Financial Group Inc 223 19% 1 4.3% 13.0% 11.4% 1/24/2007 9/27/2007 21st Century Insurance Group American International Group Inc - AIG 758 39% 1 11.4% 34.6% 24.9% Median $758 39.5% 1.0 11.4% 37.8% 34.9% Average 884 38.8% 1.2 14.2% 36.1% 34.2% Affiliate Transactions in Insurance _______________________________ Source: Dealogic data as of 11/13/2020. 1. The following Dealogic screens were used: includes deals that were (i) announced since January 1, 2006, (ii) have been comple ted or are pending, (iii) U.S. public company targets, (iv) deal sizes >$50mm, (v) cash consideration only, (vi) acquiror’s position in the target pre - announcement was >50% and was >90% post - close and (vii) the targe t is categorized as an insurance company. 2. For pending deals, premium calculated using the most recent offer price per share. 3. Purchase of non - voting preferred stock. Precedent Insurance Minority Buy - Ins (1) (3) U.S. insurance industry transactions Exclusively minority buy - ins, defined as a controlling parent acquiring the remaining shares outstanding in the public entity Deals announced since January 1, 2006 All transactions, except for CNA / Loews, included at least one price increase from the original offer The median increase across the transactions was 11.4% In all cases but one, all final offers represented at least a 20% premium to the pre - announcement share price: 1 - Day: 37.8% (median) 30 - Day: 34.9% (median) Scope of Transactions Chosen Key Takeaways 7
Plan / Street Expectations
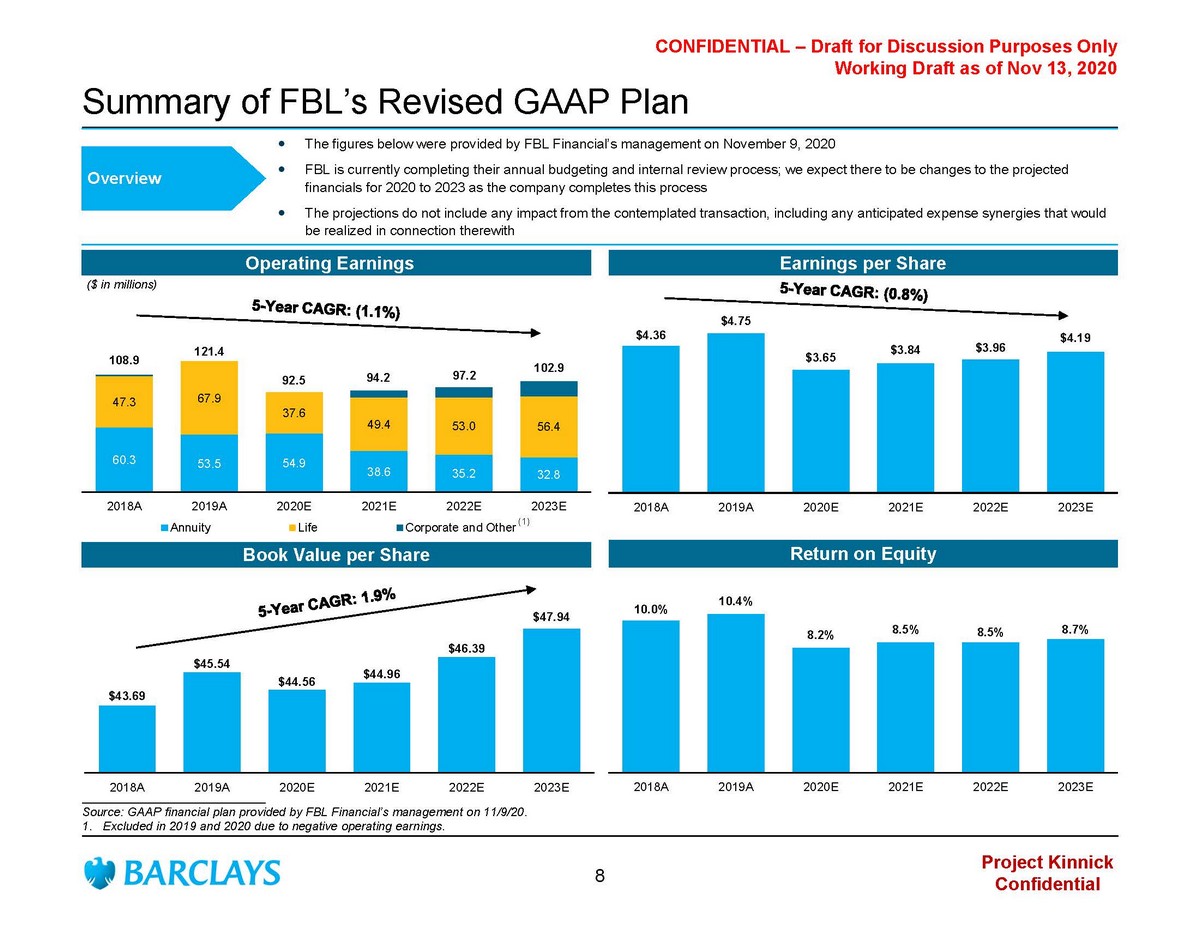
Project Kinnick Confidential CONFIDENTIAL – Draft for Discussion Purposes Only Working Draft as of Nov 13, 2020 Summary of FBL’s Revised GAAP Plan The figures below were provided by FBL Financial’s management on November 9, 2020 FBL is currently completing their annual budgeting and internal review process; we expect there to be changes to the projecte d financials for 2020 to 2023 as the company completes this process The projections do not include any impact from the contemplated transaction, including any anticipated expense synergies that wo uld be realized in connection therewith Overview Operating Earnings Earnings per Share Book Value per Share Return on Equity 60.3 53.5 54.9 38.6 35.2 32.8 47.3 67.9 37.6 49.4 53.0 56.4 2018A 2019A 2020E 2021E 2022E 2023E ($ in millions) Annuity Life Corporate and Other $4.36 $4.75 $3.65 $3.84 $3.96 $4.19 2018A 2019A 2020E 2021E 2022E 2023E 108.9 121.4 92.5 94.2 97.2 102.9 $43.69 $45.54 $44.56 $44.96 $46.39 $47.94 2018A 2019A 2020E 2021E 2022E 2023E 10.0% 10.4% 8.2% 8.5% 8.5% 8.7% 2018A 2019A 2020E 2021E 2022E 2023E ___________________________ Source: GAAP financial plan provided by FBL Financial’s management on 11/9/20. 1. Excluded in 2019 and 2020 due to negative operating earnings. (1) 8

Project Kinnick Confidential CONFIDENTIAL – Draft for Discussion Purposes Only Working Draft as of Nov 13, 2020 Research Analyst Perspectives of FBL ___________________________ Source: Broker research provided by FBL Finanical’s management. Broker 1 Broker 2 Date of Last Report 11/10/20 11/6/20 Current Price Target $65.00 $58.00 Current Recommendation Overweight Hold Price Target Evolution 2021 EPS Evolution Selected Commentary “ While we favor cash deals, we firmly believe FFG at a minimum is worth the last reported book value of $63.76… we view FFG as a best - in - class asset in the life insurance industry reflecting the company’s conservative asset leverage and investment portfolio, superb dividend record, competitive advantages in an attractive niche market, and high - quality management team” – Sept. 2020 “While our outlook for continued spread compression and an increasingly competitive annuity sales environment hasn’t changed, we believe FFG represents a more compelling risk/reward opportunity relative to other spread - based businesses in our coverage universe over the next several quarters. Over the past five years, FFG has paid $7.50 per share in special dividends including $1.50 paid on 3/31/20. The company’s current dividend yield is 5.4% (above the peer average of 3.9%), which we believe FFG should be able to sustain…” – Aug. 2020 “Despite the low interest rate environment, FFG reported 3Q:20 revenue of $197.8mm compared to $184.7mm reported in 3Q:19. (We modeled $191.5mm). FFG achieved this growth even though annuity premiums collected fell 19% year - over - year, primarily reflecting lower indexed annuity sales…FFG implemented cost containment efforts to improve operating performance and also tightened requirements for agents on productivity and profitability” – Nov. 2020 “FFG’s wealth management initiative is advancing, which we think could be a catalyst for the stock. Wealth Management adds a new fee - based revenue stream and diversifies revenue away from interest sensitive annuities and other interest sensitive products.” – Aug. 2020 NM NM $60.00 $65.00 $65.00 2/10/2020 5/11/2020 8/19/2020 09/08/20 11/10/20 $47.00 $47.00 $47.00 $47.00 $58.00 03/16/20 05/08/20 06/18/20 08/11/20 11/06/20 $4.75 $4.45 $4.60 $4.60 $4.60 2/10/2020 5/11/2020 8/19/2020 09/08/20 11/10/20 $4.87 $5.37 $5.37 $5.37 $5.37 03/16/20 05/08/20 06/18/20 08/11/20 11/06/20 9
Valuation Analysis
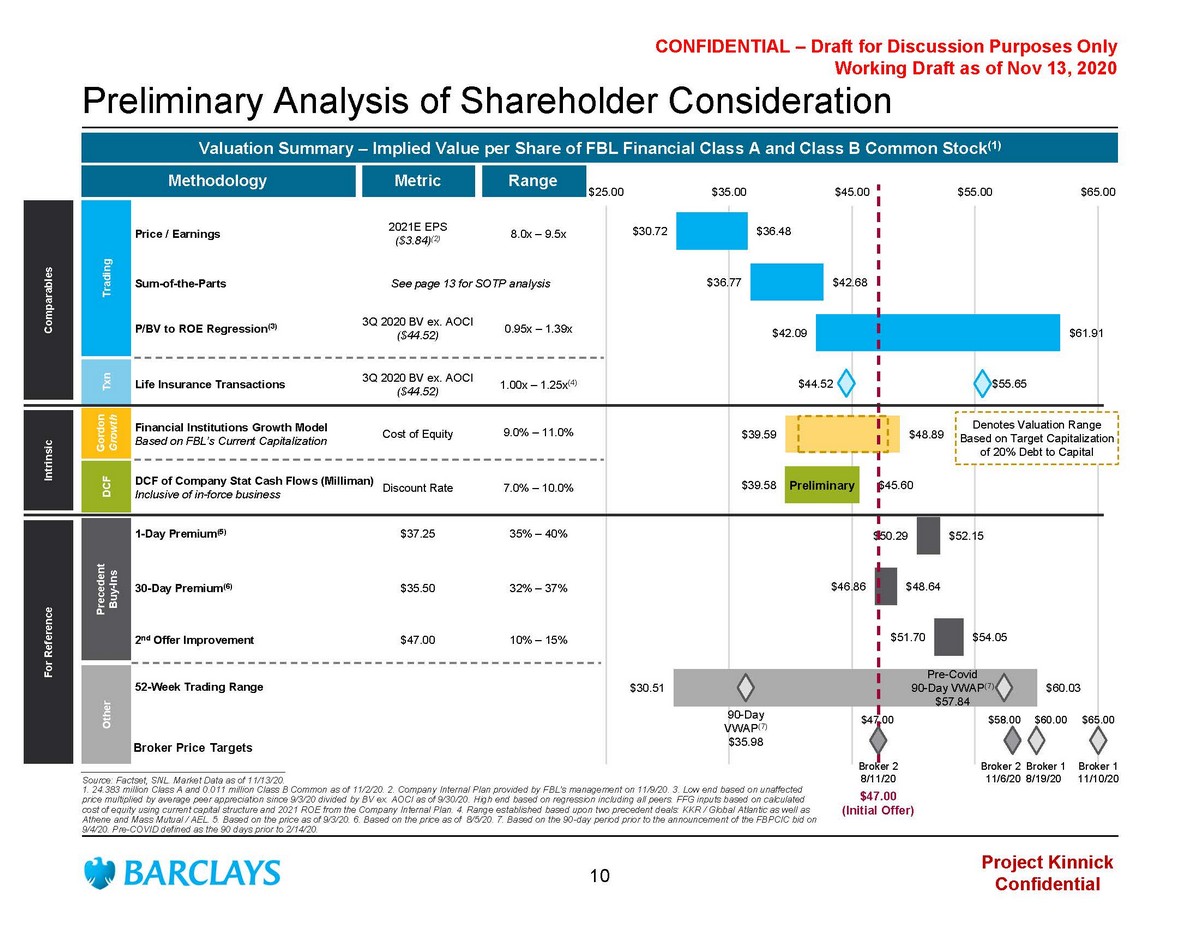
Project Kinnick Confidential CONFIDENTIAL – Draft for Discussion Purposes Only Working Draft as of Nov 13, 2020 $30.72 $36.77 $42.09 $44.52 $39.59 $39.58 $50.29 $46.86 $51.70 $30.51 $36.48 $42.68 $61.91 $55.65 $48.89 $45.60 $52.15 $48.64 $54.05 $60.03 $25.00 $35.00 $45.00 $55.00 $65.00 Preliminary Analysis of Shareholder Consideration ________________________________________ Source: Factset , SNL. Market Data as of 11/13/20. 1. 24.383 million Class A and 0.011 million Class B Common as of 11/2/20. 2. Company Internal Plan provided by FBL’s management on 11/9/20 . 3. Low end based on unaffected price multiplied by average peer appreciation since 9/3/20 divided by BV ex. AOCI as of 9/30/20. High end based on regression including all peers. FFG inputs based on calculated cost of equity using current capital structure and 2021 ROE from the Company Internal Plan. 4. Range established based upon t wo precedent deals: KKR / Global Atlantic as well as Athene and Mass Mutual / AEL. 5. Based on the price as of 9/3/20. 6. Based on the price as of 8/5/20. 7. Based on the 90 - day period prior to the announcement of the FBPCIC bid on 9/4/20. Pre - COVID defined as the 90 days prior to 2/14/20 . Valuation Summary – Implied Value per Share of FBL Financial Class A and Class B Common Stock (1) DCF of Company Stat Cash Flows ( Milliman ) Inclusive of in - force business 7.0% – 10.0% Gordon Growth Methodology Metric Range Discount Rate Financial Institutions Growth Model Based on FBL’s Current Capitalization 9.0% – 11.0% Cost of Equity Trading Price / Earnings 8.0x – 9.5x 2021E EPS ($3.84) (2) Precedent Buy - Ins 1 - Day Premium (5) 35% – 40 % 2 nd Offer Improvement 10% – 1 5% 30 - Day Premium (6) 32% – 37% Other 52 - Week Trading Range Broker Price Targets Txn Life Insurance Transactions 1.00x – 1.25x (4) $37.25 Broker 2 8/11/20 Broker 1 8/19/20 Broker 1 11/10/20 $47.00 (Initial Offer) $35.50 $47.00 $47.00 $60.00 $65.00 3 Q 2020 BV ex. AOCI ($44.52) DCF For Reference Denotes Valuation Range Based on Target Capitalization of 20% Debt to Capital P/BV to ROE Regression (3) 0.95x – 1.39x Sum - of - the - Parts See page 13 for SOTP analysis 3 Q 2020 BV ex. AOCI ($44.52) Intrinsic Comparables $58.00 Broker 2 11/6/20 90 - Day VWAP (7) $35.98 Pre - Covid 90 - Day VWAP (7) $57.84 Preliminary 10
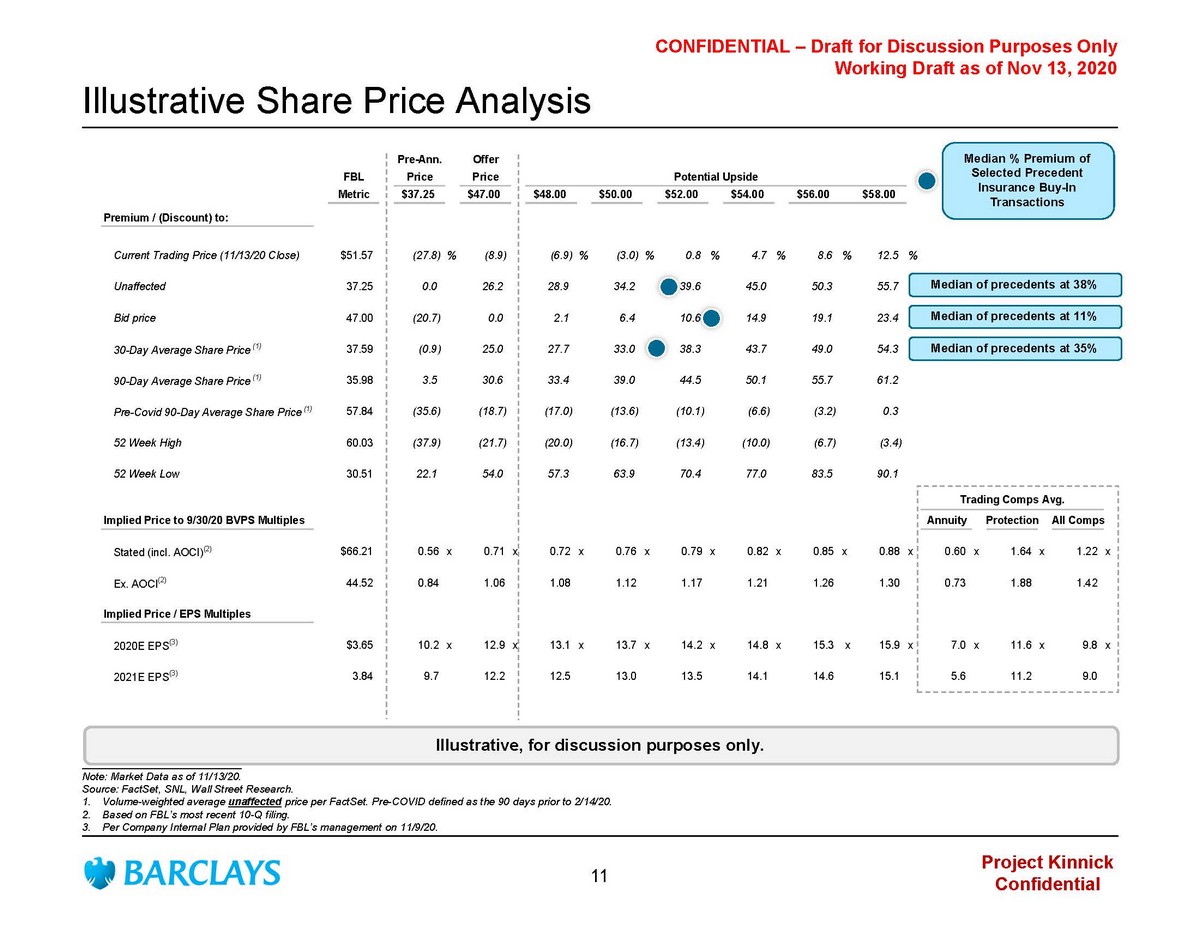
Project Kinnick Confidential CONFIDENTIAL – Draft for Discussion Purposes Only Working Draft as of Nov 13, 2020 Pre-Ann. Offer FBL Price Price Potential Upside Metric $37.25 $47.00 $48.00 $50.00 $52.00 $54.00 $56.00 $58.00 Premium / (Discount) to: Current Trading Price (11/13/20 Close) $51.57 (27.8) % (8.9) (6.9) % (3.0) % 0.8 % 4.7 % 8.6 % 12.5 % Unaffected 37.25 0.0 26.2 28.9 34.2 39.6 45.0 50.3 55.7 Bid price 47.00 (20.7) 0.0 2.1 6.4 10.6 14.9 19.1 23.4 30-Day Average Share Price (1) 37.59 (0.9) 25.0 27.7 33.0 38.3 43.7 49.0 54.3 90-Day Average Share Price (1) 35.98 3.5 30.6 33.4 39.0 44.5 50.1 55.7 61.2 Pre-Covid 90-Day Average Share Price (1) 57.84 (35.6) (18.7) (17.0) (13.6) (10.1) (6.6) (3.2) 0.3 52 Week High 60.03 (37.9) (21.7) (20.0) (16.7) (13.4) (10.0) (6.7) (3.4) 52 Week Low 30.51 22.1 54.0 57.3 63.9 70.4 77.0 83.5 90.1 Trading Comps Avg. Implied Price to 9/30/20 BVPS Multiples Annuity Protection All Comps Stated (incl. AOCI) (2) $66.21 0.56 x 0.71 x 0.72 x 0.76 x 0.79 x 0.82 x 0.85 x 0.88 x 0.60 x 1.64 x 1.22 x Ex. AOCI (2) 44.52 0.84 1.06 1.08 1.12 1.17 1.21 1.26 1.30 0.73 1.88 1.42 Implied Price / EPS Multiples 2020E EPS (3) $3.65 10.2 x 12.9 x 13.1 x 13.7 x 14.2 x 14.8 x 15.3 x 15.9 x 7.0 x 11.6 x 9.8 x 2021E EPS (3) 3.84 9.7 12.2 12.5 13.0 13.5 14.1 14.6 15.1 5.6 11.2 9.0 Illustrative Share Price Analysis ___________________________ Note: Market Data as of 11/13/20. Source: FactSet, SNL, Wall Street Research. 1. Volume - weighted average unaffected price per FactSet . Pre - COVID defined as the 90 days prior to 2/14/20. 2. Based on FBL’s most recent 10 - Q filing. 3. Per Company Internal Plan provided by FBL’s management on 11/9/20. Illustrative, for discussion purposes only. Median % Premium of Selected P recedent I nsurance B uy - In T ransactions Median of precedents at 38% Median of precedents at 35% Median of precedents at 11% 11

Next Steps

Project Kinnick Confidential CONFIDENTIAL – Draft for Discussion Purposes Only Working Draft as of Nov 13, 2020 Response Alternatives Description Strategic Considerations Accept Offer SC accepts the offer without further negotiation The SC will have established that now is right time to sell at $47 Mitigates risk of FBPCIC walking away Potential valuation upside won’t be known Provide a Response to FBPCIC with: A Specific Price Target SC declines the offer but provides a specific price target at which it would support a sale Portrays a constructive posture to FBPCIC and a willingness to negotiate Specific marker gives FBPCIC something to measure an offer bump against A high price target could halt negotiations if the valuation gap is too wide Setting too low of a price target could result in a lower offer price bump Very challenging to increase counter - offer at a later date Depending on timing, may not have a final plan/appraisal report No Specific Valuation Feedback SC declines the offer but indicates that a sale may be possible if FBPCIC is willing to increase its price Creates valuation upside potential for FBL Financial (e.g., no top - end is established) If an offer bump is received, likely indicative of how aggressive FBPCIC is willing to be on valuation / pricing expectations Could be viewed as unconstructive by FBPCIC No counter SC declines to support the offer and indicates that a sale does not make sense at this time The SC will have established that now is not the right time to sell No further offers from FBPCIC are likely to be received – potential valuation upside won’t be known 12

Valuation Reference Materials

Selected Public Trading Comparables

Project Kinnick Confidential CONFIDENTIAL – Draft for Discussion Purposes Only Working Draft as of Nov 13, 2020 22% $241.8 41% $38.6 48% $520.2 53% $49.4 30% $324.2 6% $6.1 Q3 2020 Allocated Equity 2021 Earnings Annuity Life Corporate Q3 2020 Allocated Equity Illustrative Public Comparables Valuation Analysis FBL Peer Comparable (P / ’21 EPS) (1) ___________________________ Source: Factset and SNL. Market data as of 11/13/20. 1. Represents a 60 / 40 Life / Annuity weighting method between business segments. Relevant ranges: Life (10.0x – 12.0x) and Annuit y (5.0x – 6.0x). 2021 EPS estimates per FactSet consensus. 2. Figures based on Company Internal Plan provided by FBL’s management on 11/9/20. 3. Adjustments to Annuity and Life for the removal of excess capital above 425% RBC at 3.0% pre - tax cost of capital. Excess capital allocated to Annuity and Life based on current allocation of GAAP equity. 4. Wealth management currently reported in Corporate & Other. $2.9mm post - tax net loss assumes 21% tax rate and no allocated expens es are able to be separated to the segment. FGL Segment Contribution (2) Sum - of - the - Parts Valuation (2) Selected Blended Valuation Range 8.0x – 9.5x (1) 2021E Earnings Selected Multiple Range Implied Valuation Standalone Adj. (3) Pro Forma Low High Low High Low High Annuity $38.6 ($1.3) $37.3 5.0x 6.0x $186.4 $223.7 $7.64 $9.17 Life 49.4 (2.8) 46.6 10.0x 12.0x 466.4 559.7 19.12 22.94 Corp 6.1 2.9 9.0 8.0x 9.5x 72.2 85.7 2.96 3.51 Wealth Management (4) - (2.9) (2.9) -- -- -- -- -- -- Total Segment Value $94.1 ($4.1) $90.0 8.1x 9.7x $725.0 $869.1 $29.72 $35.63 (+) Excess Capital -- -- -- -- -- 172.1 172.1 7.05 7.05 Total Valuation $94.1 ($4.1) $90.0 10.0x 11.6x $897.1 $1,041.2 $36.77 $42.68 ($ in millions, except per share amounts) $ in Millions 12.1x 11.9x 9.6x GL PRI CNO Annuity Average: 11.2x Average: 5.6x Protection 6.0x 5.2x ATH AEL 2021 Earnings 13

Project Kinnick Confidential CONFIDENTIAL – Draft for Discussion Purposes Only Working Draft as of Nov 13, 2020 ATH AEL CNO GL PRI FFG R² = 86.5% R² = 55.5% 0.00x 0.50x 1.00x 1.50x 2.00x 2.50x 3.00x 3.50x (10.00%) (8.00%) (6.00%) (4.00%) (2.00%) - 2.00% 4.00% 6.00% 8.00% 10.00% ___________________________ Source: Company filings, FactSet, Duff & Phelps, Bloomberg. Market data as of 11/13/20. 1. Long - term historical equity risk - premium per Duff and Phelps. 2. 20 - year US Treasury. 3. Based on Market Cap and Duff & Phelp s Size Premium Calculator. 4. Based on FactSet Consensus. FBL ROE based on Company Internal Plan provided by FBL’s management on 11/9/20. 5. Based on unaffected price multiplied by average peer appreciation since 9/3/20 divided by BV ex. AOCI as of 9/30/20. Regression Analysis Regression Analysis Price / Book Value ex. AOCI 2021 ROE Less Cost of Equity Adjusted ROE Build ATH AEL CNO GL PRI FFG Cost of Equity Build-Up: Levered Beta 1.917 1.919 1.502 1.200 1.593 0.971 * Market Risk Premium (1) 7.15% 7.15% 7.15% 7.15% 7.15% 7.15% Investment Risk Premium 13.71% 13.72% 10.74% 8.58% 11.39% 6.94% + Risk free rate (2) 1.43% 1.43% 1.43% 1.43% 1.43% 1.43% + Size Premium (3) 0.79% 1.34% 1.34% 0.73% 0.79% 1.47% Cost of Equity 15.93% 16.49% 13.51% 10.74% 13.61% 9.84% 2021E ROE (4) 12.19% 10.20% 5.40% 11.84% 22.43% 8.64% 2021E ROE - Cost of Equity (3.74%) (6.29%) (8.11%) 1.10% 8.82% (1.20%) (5) 0.95x – 1.39x Implied Price / Book Multiple 14
Selected Precedent Transaction Comparables
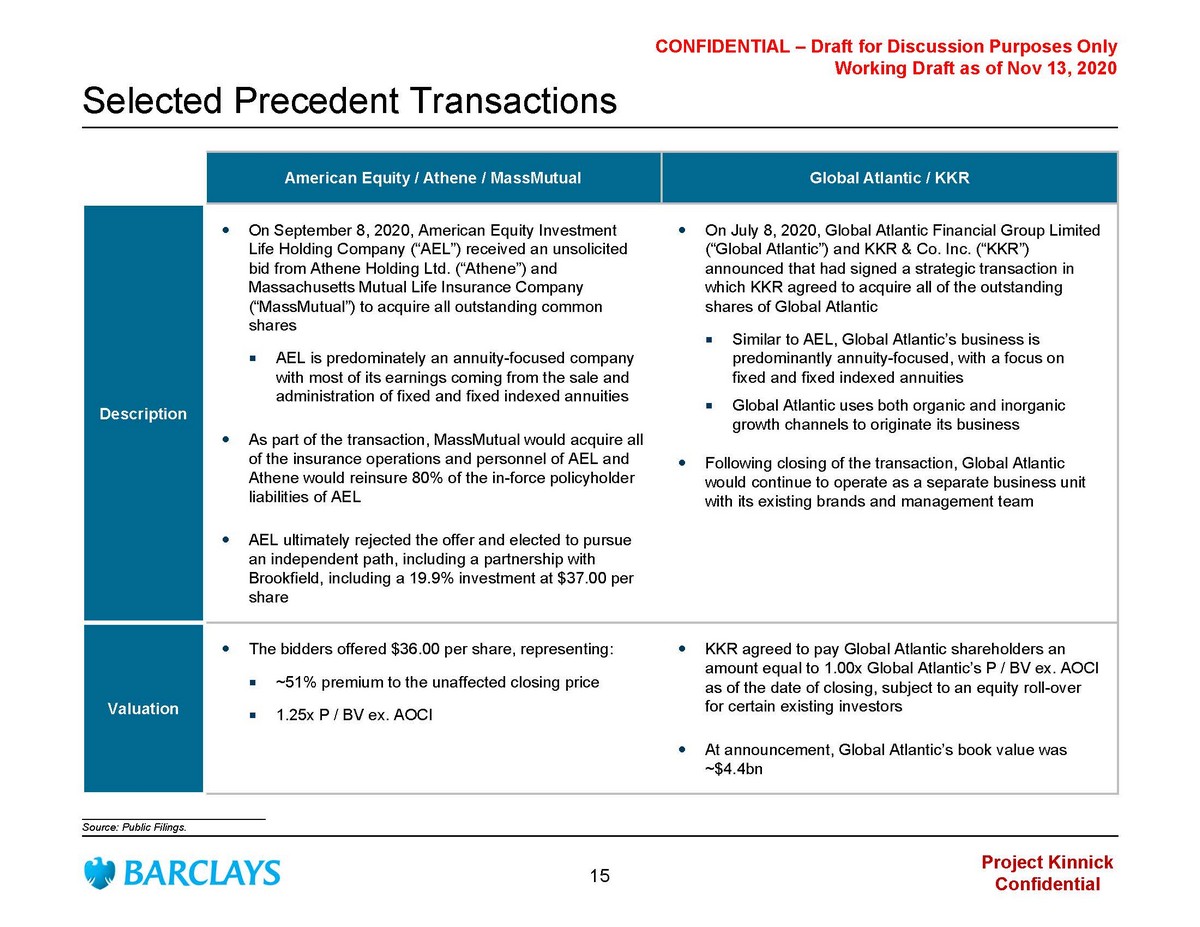
Project Kinnick Confidential CONFIDENTIAL – Draft for Discussion Purposes Only Working Draft as of Nov 13, 2020 Selected Precedent Transactions American Equity / Athene / MassMutual Global Atlantic / KKR Description On September 8, 2020 , American Equity Investment Life Holding Company (“AEL”) received an unsolicited bid from Athene Holding Ltd. (“Athene”) and Massachusetts Mutual Life Insurance Company (“MassMutual”) to acquire all outstanding common shares AEL is predominately an annuity - focused company with most of its earnings coming from the sale and administration of fixed and fixed indexed annuities As part of the transaction, MassMutual would acquire all of the insurance operations and personnel of AEL and Athene would reinsure 80% of the in - force policyholder liabilities of AEL AEL ultimately rejected the offer and elected to pursue an independent path, including a partnership with Brookfield, including a 19.9% investment at $37.00 per share On July 8, 2020 , Global Atlantic Financial Group Limited (“Global Atlantic”) and KKR & Co. Inc. (“KKR”) announced that had signed a strategic transaction in which KKR agreed to acquire all of the outstanding shares of Global Atlantic Similar to AEL, Global Atlantic’s business is predominantly annuity - focused, with a focus on fixed and fixed indexed annuities Global Atlantic uses both organic and inorganic growth channels to originate its business Following closing of the transaction, Global Atlantic would continue to operate as a separate business unit with its existing brands and management team Valuation The bidders offered $36.00 per share, representing: ~51% premium to the unaffected closing price 1.25x P / BV ex. AOCI KKR agreed to pay Global Atlantic shareholders an amount equal to 1.00x Global Atlantic’s P / BV ex. AOCI as of the date of closing, subject to an equity roll - over for certain existing investors At announcement, Global Atlantic’s book value was ~$4.4bn ___________________________ Source: Public Filings. 15
Gordon Growth Model for Financial Institutions
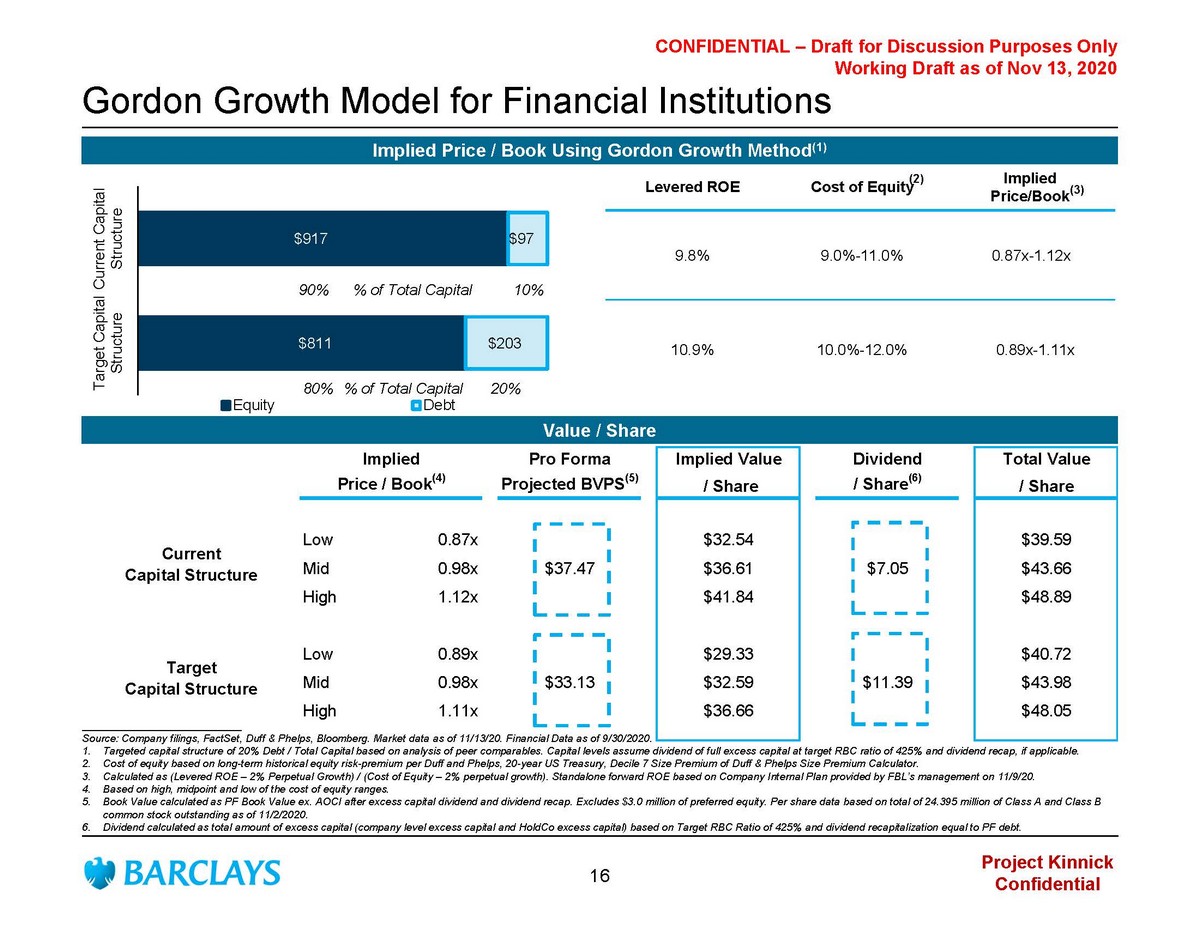
Project Kinnick Confidential CONFIDENTIAL – Draft for Discussion Purposes Only Working Draft as of Nov 13, 2020 $811 $917 $203 $97 Target Capital Structure Current Capital Structure Equity Debt Levered ROE Cost of Equity Implied Price/Book 9.8% 9.0% - 11.0% 0.87 x - 1.12x 10.9% 10.0% - 12.0% 0.89x - 1.11x Gordon Growth Model for Financial Institutions Implied Price / Book Using Gordon Growth Method (1) Value / Share (2) ___________________________ Source: Company filings, FactSet , Duff & Phelps, Bloomberg. Market data as of 11/13/20. Financial Data as of 9/30/2020. 1. Targeted capital structure of 20% Debt / Total Capital based on analysis of peer comparables . Capital levels assume dividend of full excess capital at target RBC ratio of 425% and dividend recap, if applicable. 2. Cost of equity based on long - term historical equity risk - premium per Duff and Phelps, 20 - year US Treasury, Decile 7 Size Premium of D uff & Phelps Size Premium Calculator. 3. Calculated as (Levered ROE – 2% Perpetual Growth) / (Cost of Equity – 2% perpetual growth). Standalone f orward ROE based on Company Internal Plan provided by FBL’s management on 11/9/20. 4. Based on high, midpoint and low of the cost of equity ranges. 5. Book Value calculated as PF Book Value ex. AOCI after excess capital dividend and dividend recap. Excludes $3.0 million of preferred equity. Per share data b ased on total of 24.395 million of Class A and Class B common stock outstanding as of 11/2/2020. 6. Dividend calculated as total amount of excess capital (company level excess capital and HoldCo excess capital) based on Target RBC Ratio of 425% and dividend recapitalization equal to PF debt. 90% 10% % of Total Capital 80% 20% % of Total Capital (3) Implied Pro Forma Implied Value Dividend Total Value Price / Book (4) Projected BVPS (5) / Share / Share (6) / Share Low 0.87x $32.54 $39.59 Mid 0.98x $37.47 $36.61 $7.05 $43.66 High 1.12x $41.84 $48.89 Low 0.89x $29.33 $40.72 Mid 0.98x $33.13 $32.59 $11.39 $43.98 High 1.11x $36.66 $48.05 Current Capital Structure Target Capital Structure 16

Project Kinnick Confidential CONFIDENTIAL – Draft for Discussion Purposes Only Working Draft as of Nov 13, 2020 Gordon Growth Model Sensitivity Analysis: Current Capital Str. Cost of Equity x Growth Rate Perpetuity Growth Rate $43.66 0.5% 1.0% 1.5% 2.0% 2.5% 3.0% 8.0% $53.59 $54.24 $54.99 $55.86 $56.89 $58.13 9.0% $48.12 $48.34 $48.60 $48.89 $49.23 $49.62 10.0% $43.80 $43.76 $43.71 $43.66 $43.60 $43.54 11.0% $40.30 $40.09 $39.85 $39.59 $39.30 $38.98 12.0% $37.41 $37.08 $36.73 $36.34 $35.91 $35.43 Cost of Equity Growth Rate x Standalone ROE Standalone ROE $43.66 7.5% 8.0% 8.6% 9.0% 9.5% 10.0% 0.5% $38.46 $40.80 $43.80 $45.48 $47.83 $50.17 1.0% $38.12 $40.59 $43.76 $45.54 $48.01 $50.48 1.5% $37.74 $40.36 $43.71 $45.60 $48.21 $50.83 2.0% $37.32 $40.10 $43.66 $45.66 $48.44 $51.23 2.5% $36.84 $39.81 $43.60 $45.74 $48.71 $51.67 Perpetuity Growth Rate Cost of Equity x Standalone ROE Standalone ROE $43.66 7.5% 8.0% 8.6% 9.0% 9.5% 10.0% 8.0% $47.41 $51.12 $55.86 $58.53 $62.24 $65.95 9.0% $41.64 $44.82 $48.89 $51.18 $54.36 $57.54 10.0% $37.32 $40.10 $43.66 $45.66 $48.44 $51.23 11.0% $33.96 $36.43 $39.59 $41.37 $43.85 $46.32 12.0% $31.27 $33.49 $36.34 $37.94 $40.17 $42.39 Cost of Equity Cost of Equity x RBC Ratio RBC Ratio $43.66 350% 375% 400% 425% 450% 475% 8.0% $59.67 $58.40 $57.13 $55.86 $54.59 $53.32 9.0% $52.74 $51.45 $50.17 $48.89 $47.61 $46.32 10.0% $47.53 $46.24 $44.95 $43.66 $42.37 $41.08 11.0% $43.49 $42.19 $40.89 $39.59 $38.29 $36.99 12.0% $40.25 $38.95 $37.64 $36.34 $35.03 $33.73 Cost of Equity ___________________________ Source: Company filings, FactSet , Duff & Phelps, Bloomberg. Market data as of 11/13/20 . Financial Data as of 9/30/2020 and Company Internal Plan provided by FBL’s management on 11/9/20 . 17

Appendices

Supplemental Valuation Support
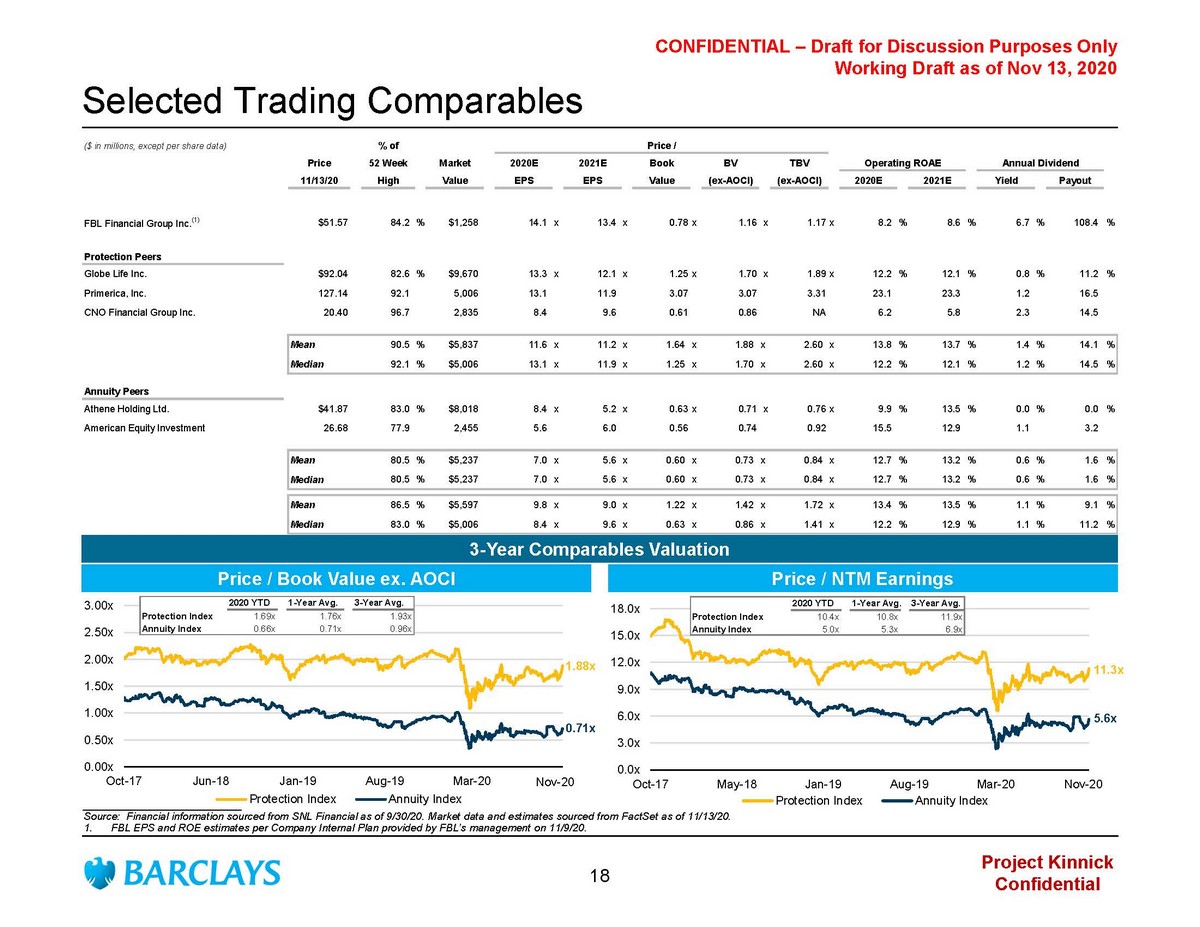
Project Kinnick Confidential CONFIDENTIAL – Draft for Discussion Purposes Only Working Draft as of Nov 13, 2020 Selected Trading Comparables ___________________________ Source: Financial information sourced from SNL Financial as of 9/30/20. Market data and estimates sourced from FactSet as of 11/13/20 . 1. FBL EPS and ROE estimates per Company Internal Plan provided by FBL’s management on 11/9/20. Price / Book Value ex. AOCI 3 - Year Comparables Valuation 0.0x 3.0x 6.0x 9.0x 12.0x 15.0x 18.0x Oct-17 May-18 Jan-19 Aug-19 Mar-20 Oct-20 Protection Index Annuity Index Price / NTM Earnings 0.00x 0.50x 1.00x 1.50x 2.00x 2.50x 3.00x Oct-17 Jun-18 Jan-19 Aug-19 Mar-20 Oct-20 Protection Index Annuity Index ($ in millions, except per share data) % of Price / Price 52 Week Market 2020E 2021E Book BV TBV Operating ROAE Annual Dividend 11/13/20 High Value EPS EPS Value (ex-AOCI) (ex-AOCI) 2020E 2021E Yield Payout Sort By Market Value FBL Financial Group Inc. (1) $51.57 84.2 % $1,258 14.1 x 13.4 x 0.78x 1.16 x 1.17x 8.2 % 8.6 % 6.7 % 108.4 % Protection Peers Globe Life Inc. $92.04 82.6 % $9,670 13.3 x 12.1 x 1.25x 1.70 x 1.89x 12.2 % 12.1 % 0.8 % 11.2 % Primerica, Inc. 127.14 92.1 5,006 13.1 11.9 3.07 3.07 3.31 23.1 23.3 1.2 16.5 CNO Financial Group Inc. 20.40 96.7 2,835 8.4 9.6 0.61 0.86 NA 6.2 5.8 2.3 14.5 Mean 90.5 % $5,837 11.6 x 11.2 x 1.64 x 1.88 x 2.60 x 13.8 % 13.7 % 1.4 % 14.1 % Median 92.1 % $5,006 13.1 x 11.9 x 1.25 x 1.70 x 2.60 x 12.2 % 12.1 % 1.2 % 14.5 % Annuity Peers Athene Holding Ltd. $41.87 83.0 % $8,018 8.4 x 5.2 x 0.63x 0.71 x 0.76x 9.9 % 13.5 % 0.0 % 0.0 % American Equity Investment 26.68 77.9 2,455 5.6 6.0 0.56 0.74 0.92 15.5 12.9 1.1 3.2 Mean 80.5 % $5,237 7.0 x 5.6 x 0.60 x 0.73 x 0.84 x 12.7 % 13.2 % 0.6 % 1.6 % Median 80.5 % $5,237 7.0 x 5.6 x 0.60 x 0.73 x 0.84 x 12.7 % 13.2 % 0.6 % 1.6 % Mean 86.5 % $5,597 9.8 x 9.0 x 1.22 x 1.42 x 1.72 x 13.4 % 13.5 % 1.1 % 9.1 % Median 83.0 % $5,006 8.4 x 9.6 x 0.63 x 0.86 x 1.41 x 12.2 % 12.9 % 1.1 % 11.2 % 2020 YTD 1-Year Avg. 3-Year Avg. Protection Index 1.69x 1.76x 1.93x Annuity Index 0.66x 0.71x 0.96x 2020 YTD 1-Year Avg. 3-Year Avg. Protection Index 10.4x 10.8x 11.9x Annuity Index 5.0x 5.3x 6.9x 1.88x 11.3x 0.71x 5.6x Nov - 20 Nov - 20 18
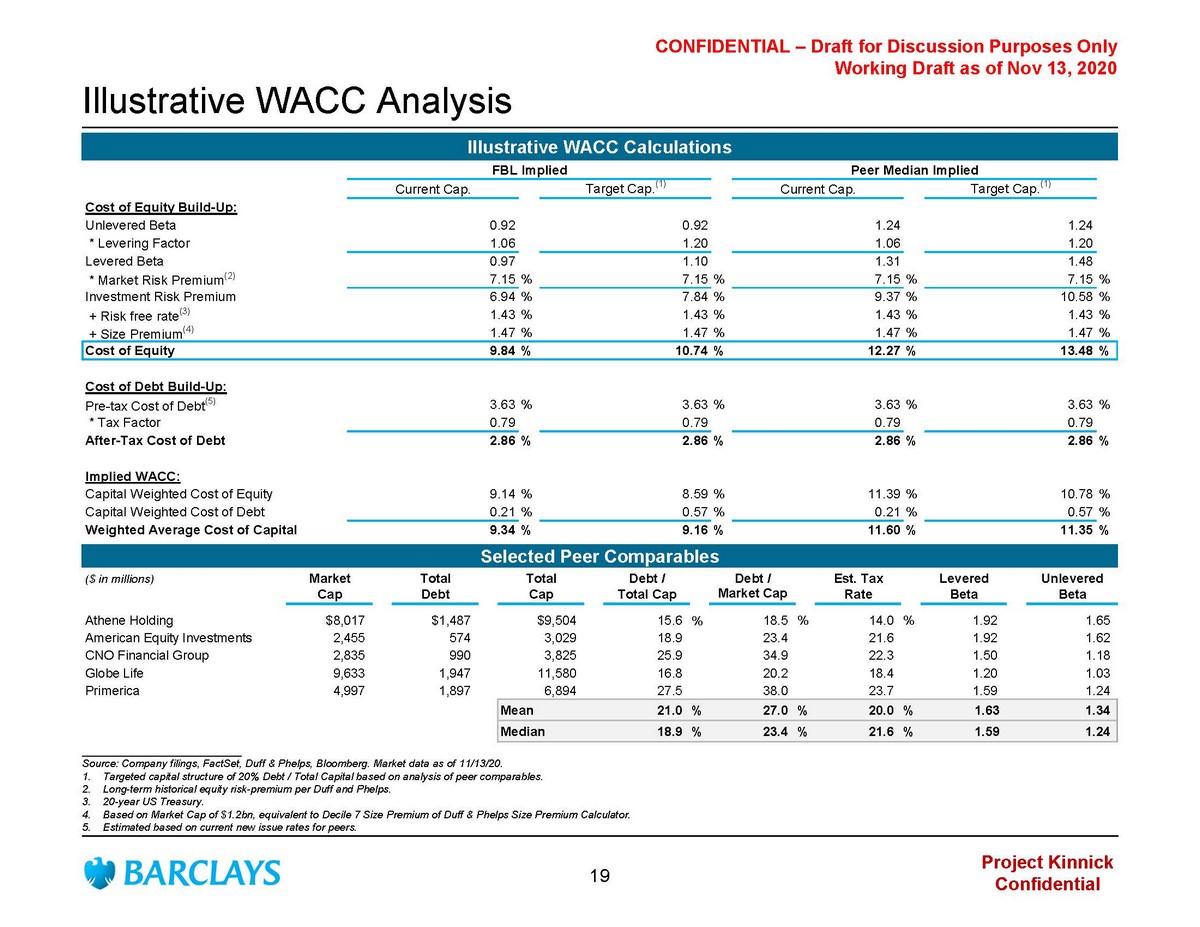
Project Kinnick Confidential CONFIDENTIAL – Draft for Discussion Purposes Only Working Draft as of Nov 13, 2020 Illustrative WACC Analysis Illustrative WACC Calculations FBL Implied Peer Median Implied Peer Avg. Implied Current Cap. Target Cap. (1) Current Cap. Target Cap. (1) Cost of Equity Build-Up: Unlevered Beta 0.92 0.92 1.24 1.24 * Levering Factor 1.06 1.20 1.06 1.20 Levered Beta 0.97 1.10 1.31 1.48 * Market Risk Premium (2) 7.15% 7.15% 7.15% 7.15% Investment Risk Premium 6.94% 7.84% 9.37% 10.58% + Risk free rate (3) 1.43% 1.43% 1.43% 1.43% + Size Premium (4) 1.47% 1.47% 1.47% 1.47% Cost of Equity 9.84% 10.74% 12.27% 13.48% Cost of Debt Build-Up: Pre-tax Cost of Debt (5) 3.63% 3.63% 3.63% 3.63% * Tax Factor 0.79 0.79 0.79 0.79 After-Tax Cost of Debt 2.86% 2.86% 2.86% 2.86% Implied WACC: Capital Weighted Cost of Equity 9.14% 8.59% 11.39% 10.78% Capital Weighted Cost of Debt 0.21% 0.57% 0.21% 0.57% Weighted Average Cost of Capital 9.34% 9.16% 11.60% 11.35% Selected Peer Comparables ($ in millions) Market Total Total Debt / Debt / Est. Tax Levered Unlevered Cap Debt Cap Total Cap Market Cap Rate Beta Beta Athene Holding $8,017 $1,487 $9,504 15.6 % 18.5 % 14.0 % 1.92 1.65 American Equity Investments 2,455 574 3,029 18.9 23.4 21.6 1.92 1.62 CNO Financial Group 2,835 990 3,825 25.9 34.9 22.3 1.50 1.18 Globe Life 9,633 1,947 11,580 16.8 20.2 18.4 1.20 1.03 Primerica 4,997 1,897 6,894 27.5 38.0 23.7 1.59 1.24 Mean 21.0 % 27.0 % 20.0 % 1.63 1.34 Median 18.9 % 23.4 % 21.6 % 1.59 1.24 ___________________________ Source: Company filings, FactSet, Duff & Phelps, Bloomberg. Market data as of 11/13/20. 1. Targeted capital structure of 20% Debt / Total Capital based on analysis of peer comparables. 2. Long - term historical equity risk - premium per Duff and Phelps. 3. 20 - year US Treasury. 4. Based on Market Cap of $1.2bn, equivalent to Decile 7 Size Premium of Duff & Phelps Size Premium Calculator. 5. Estimated based on current new issue rates for peers. 19
Historical Operating Results

Project Kinnick Confidential CONFIDENTIAL – Draft for Discussion Purposes Only Working Draft as of Nov 13, 2020 FBL Historical Operating Results Detailed ROE Build by Segment ($ in millions) 2018 2019 2020 2021 2022 2023 Actual Actual Plan Plan Plan Plan Operating Income Annuity $54.6 $45.6 $49.9 $38.6 $35.2 $32.8 Permanent life 24.4 29.3 21.5 19.4 19.8 18.8 Term life 15.3 21.0 17.3 22.5 25.2 29.7 Universal life 1.6 7.9 (4.9) 7.5 8.0 7.8 Life insurance 41.4 58.1 34.0 49.4 53.0 56.4 Corporate and other 12.8 13.8 6.0 6.1 8.8 13.6 Total $108.8 $117.5 $89.9 $94.1 $97.0 $102.7 Common Equity Annuity $266.9 $253.1 $245.3 $245.2 $245.2 $245.3 Permanent life 189.0 199.5 213.4 213.3 213.3 213.4 Term life 133.3 142.4 154.3 154.2 154.2 154.3 Universal life 130.0 138.5 149.4 149.3 149.4 149.4 Life insurance 452.3 480.5 517.1 516.8 516.9 517.2 Corporate and other 370.7 394.4 334.6 338.8 373.9 411.9 Total $1,089.8 $1,128.0 $1,097.0 $1,100.8 $1,136.0 $1,174.5 ROE - Rolling 12 Months Annuity 20.2 % 18.0 % 20.4 % 15.8 % 14.4 % 13.4 Permanent life 13.0 14.9 10.3 9.1 9.3 8.8 Term life 11.7 15.1 11.4 14.7 16.3 19.3 Universal life 1.3 5.9 (3.3) 5.1 5.3 5.2 Life insurance 9.3 12.4 6.7 9.6 10.3 10.9 Corporate and other 3.4 3.7 1.8 1.8 2.5 3.5 Total 10.0 % 10.7 % 8.2 % 8.6 % 8.7 % 8.9 ___________________________ Source: Historical and Projected data from Company Internal Plan provided by FBL’s management on 11/9/20. 20

Shareholder Analysis
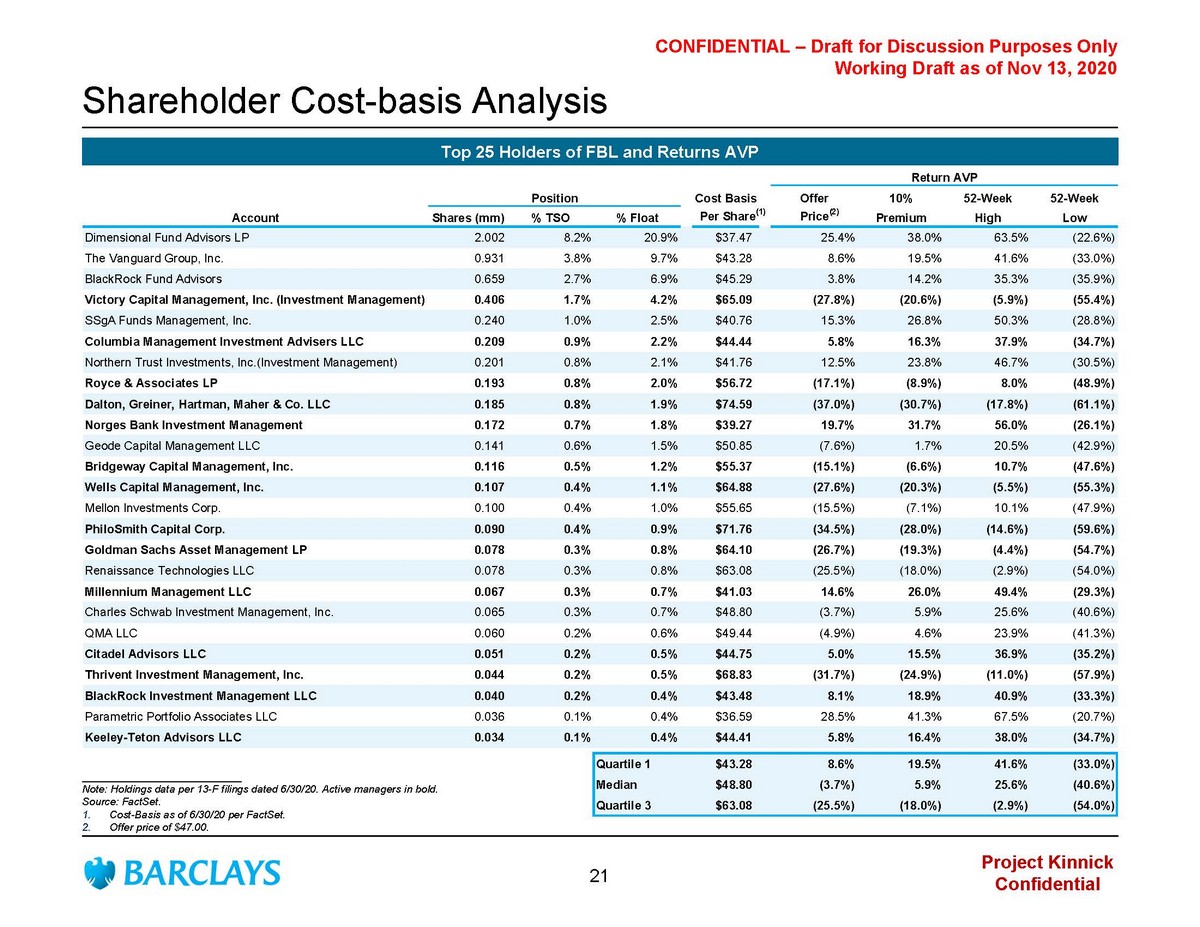
Project Kinnick Confidential CONFIDENTIAL – Draft for Discussion Purposes Only Working Draft as of Nov 13, 2020 Shareholder Cost - basis Analysis ___________________________ Note: Holdings data per 13 - F filings dated 6/30/20. Active managers in bold. Source: FactSet . 1. Cost - Basis as of 6/30/20 per FactSet . 2. Offer price of $47.00. Return AVP Position Cost Basis Offer 10% 52-Week 52-Week Account Shares (mm) % TSO % Float Per Share (1) Price (2) Premium High Low Dimensional Fund Advisors LP 2.002 8.2% 20.9% $37.47 25.4% 38.0% 63.5% (22.6%) The Vanguard Group, Inc. 0.931 3.8% 9.7% $43.28 8.6% 19.5% 41.6% (33.0%) BlackRock Fund Advisors 0.659 2.7% 6.9% $45.29 3.8% 14.2% 35.3% (35.9%) Victory Capital Management, Inc. (Investment Management) 0.406 1.7% 4.2% $65.09 (27.8%) (20.6%) (5.9%) (55.4%) SSgA Funds Management, Inc. 0.240 1.0% 2.5% $40.76 15.3% 26.8% 50.3% (28.8%) Columbia Management Investment Advisers LLC 0.209 0.9% 2.2% $44.44 5.8% 16.3% 37.9% (34.7%) Northern Trust Investments, Inc.(Investment Management) 0.201 0.8% 2.1% $41.76 12.5% 23.8% 46.7% (30.5%) Royce & Associates LP 0.193 0.8% 2.0% $56.72 (17.1%) (8.9%) 8.0% (48.9%) Dalton, Greiner, Hartman, Maher & Co. LLC 0.185 0.8% 1.9% $74.59 (37.0%) (30.7%) (17.8%) (61.1%) Norges Bank Investment Management 0.172 0.7% 1.8% $39.27 19.7% 31.7% 56.0% (26.1%) Geode Capital Management LLC 0.141 0.6% 1.5% $50.85 (7.6%) 1.7% 20.5% (42.9%) Bridgeway Capital Management, Inc. 0.116 0.5% 1.2% $55.37 (15.1%) (6.6%) 10.7% (47.6%) Wells Capital Management, Inc. 0.107 0.4% 1.1% $64.88 (27.6%) (20.3%) (5.5%) (55.3%) Mellon Investments Corp. 0.100 0.4% 1.0% $55.65 (15.5%) (7.1%) 10.1% (47.9%) PhiloSmith Capital Corp. 0.090 0.4% 0.9% $71.76 (34.5%) (28.0%) (14.6%) (59.6%) Goldman Sachs Asset Management LP 0.078 0.3% 0.8% $64.10 (26.7%) (19.3%) (4.4%) (54.7%) Renaissance Technologies LLC 0.078 0.3% 0.8% $63.08 (25.5%) (18.0%) (2.9%) (54.0%) Millennium Management LLC 0.067 0.3% 0.7% $41.03 14.6% 26.0% 49.4% (29.3%) Charles Schwab Investment Management, Inc. 0.065 0.3% 0.7% $48.80 (3.7%) 5.9% 25.6% (40.6%) QMA LLC 0.060 0.2% 0.6% $49.44 (4.9%) 4.6% 23.9% (41.3%) Citadel Advisors LLC 0.051 0.2% 0.5% $44.75 5.0% 15.5% 36.9% (35.2%) Thrivent Investment Management, Inc. 0.044 0.2% 0.5% $68.83 (31.7%) (24.9%) (11.0%) (57.9%) BlackRock Investment Management LLC 0.040 0.2% 0.4% $43.48 8.1% 18.9% 40.9% (33.3%) Parametric Portfolio Associates LLC 0.036 0.1% 0.4% $36.59 28.5% 41.3% 67.5% (20.7%) Keeley-Teton Advisors LLC 0.034 0.1% 0.4% $44.41 5.8% 16.4% 38.0% (34.7%) Quartile 1 $43.28 8.6% 19.5% 41.6% (33.0%) Median $48.80 (3.7%) 5.9% 25.6% (40.6%) Quartile 3 $63.08 (25.5%) (18.0%) (2.9%) (54.0%) Top 25 Holders of FBL and Returns AVP 21

Project Kinnick Confidential CONFIDENTIAL – Draft for Discussion Purposes Only Working Draft as of Nov 13, 2020 Disclaimer The following pages contain material that was provided to the Special Committee of the Board of Directors (the “Special Commi tte e”) of FBL Financial Group, Inc. (the “Company”) by Barclays Capital Inc. (“Barclays”). The accompanying material and any Barclays presentation related to the material was compiled or pr epa red on a confidential basis solely for consideration by the Board and no part of it may be reproduced, distributed or transmitted without the prior written consent of Barclays. The info rma tion contained in this material was obtained from the Company, and/or publicly available sources, and Barclays has relied upon such information without independent verification thereof and do es not assume any liability for any such information. These materials are being provided in connection with an actual corporate engagement and may not be used or relied upon for any pur pos e other than as specifically contemplated by a written agreement with Barclays. Moreover, any information provided herein was not prepared for or intended for use by any individual fo r personal, family or household purposes. Any estimates, historical financial information, projections and other information contained herein have been prepared by man age ment of the Company and Milliman , Inc. or were obtained from publicly available sources (approved for Barclays’ use by the Company) or are based upon such estimates and projections. Wi th respect to such estimates and projections, Barclays has assumed that they have been reasonably prepared on a basis reflecting the best currently available estimates, projections and ju dgment of the management of the Company or Milliman , Inc. The projections contained herein may or may not be achieved and differences between projected results and those actually achi eve d may be material. No representation or warranty, expressed or implied, is made as to the accuracy or completeness of such information and nothing contained herein is, or shal l b e relied upon as, a promise or representation, whether as to the past or the future. The analysis contained herein is based on current market conditions which are subject to change and B arc lays assumes no obligation to update or otherwise revise these materials. Nothing in these materials shall be deemed to constitute a recommendation or investment, legal, tax, financ ial , accounting or other advice. Because these materials were prepared for use in the context of a presentation to the Board, these materials are incomplete w ith out reference to, and should be assessed solely in conjunction with, the oral briefing provided by Barclays to the Board (in their capacity as directors and not in any individual capacity and is not for the benefit of any individual, including any individual officer, director, shareholder or any other person). These materials were not prepared for or intended for use by any indivi dua l for personal, family or household purposes nor were they prepared to comply with the disclosure standards under state and federal securities laws or any other applicable laws and, to th e extent the material may be considered by readers not as familiar with the business and affairs of the Company as the Board, none of the Company, Barclays, their respective affiliate s o r any of their respective legal or financial advisors or accountants takes any responsibility for the accuracy or completeness of any of the material if used by persons other than the Board. The se materials are not intended to provide the sole basis for evaluation of the proposed corporate transaction and do not purport to contain all information that may be required and shoul d n ot be considered a recommendation with respect to the proposed corporate transaction. Barclays has not made or obtained any evaluations or appraisals of the assets or liabilities of the Company or any other part y t o any corporate transaction or any of their respective affiliates and has no obligation to evaluate the solvency of the Company or any other party to any transaction under any state or federa l l aws relating to bankruptcy, insolvency or similar matters. The analyses contained herein do not purport to be appraisals nor do they necessarily reflect the prices at which businesses or s ecu rities actually may be sold or purchased. Barclays’ role in any due diligence review is limited solely to performing such a review as it shall deem necessary to support its own advice and a nal ysis and shall not be on behalf of the Company, the Board or any individual officer, director, shareholder or any other person. Barclays, its subsidiaries and affiliates engage in a wide range of businesses from investment and commercial banking, lendin g, asset management and other financial and non - financial services. In the ordinary course of its business, Barclays and its affiliates may actively trade and effect transactions in t he equity, debt and/or other securities (and any derivatives thereof) and financial instruments (including loans and other obligations) of the Company for its own account and for the accounts of its cus tomers and, accordingly, may at any time hold long or short positions and investments in such securities and financial instruments or in other financial products and instruments. Unless ot herwise expressly agreed or provided for in other applicable Barclays disclosures governing such corporate transactions or required by law or regulation, Barclays conducts these activiti es as principal and executes its principal transactions as an arm’s length counterparty. Barclays does not act as a fiduciary in relation to these corporate transactions. These materials do not constitute investment advice nor do they form part of an offer to sell or purchase, or the solicitatio n o f an offer to sell or purchase, any securities or any of the businesses or assets described herein or an offer of financing or an offer or recommendation to enter into any corporate tran sac tion described herein. Barclays Capital Inc. is the United States investment bank of Barclays Bank PLC. Barclays Bank PLC is authorised by the Prudential Regulation Authority and regulated by the Financial Conduct Authority and the Prudential Regulation Authority (Financial Services Register No. 122702). Registered in England. Re gis tered No. 1026167. Registered office: 1 Churchill Place, London E14 5HP. Copyright Barclays Bank PLC, 2020 (all rights reserved). 22