Exhibit 99.1 

Earnings
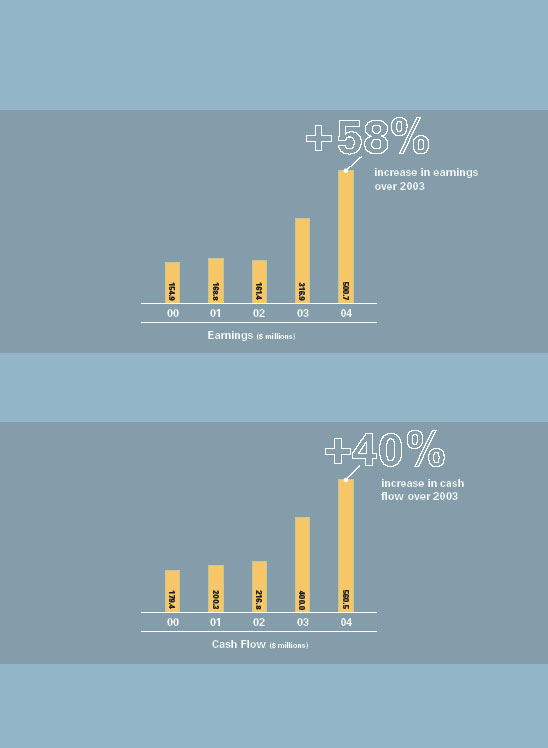
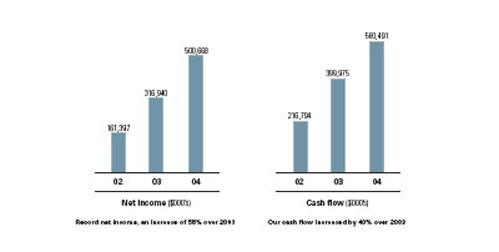
PetroKazakhstan generated record earnings of over $0.5 billion in 2004, an increase of 58% versus 2003.
Cash flow
PetroKazakhstan generated record cash flow of $0.56 billion in 2004, an increase of 40% versus 2003.
4 PetroKazakhstan Inc. |
| 5 |
2004 Highlights and Achievements |
Achievements
| 4 | Record financial results |
| 4 | Significant increase in oil reserves |
| 4 | Reserve recognition of substantial Natural Gas Liquids and natural gas |
| 4 | Exploration success in Kyzylkiya, Aryskum and Akshabulak |
| 4 | Introduction of a regular quarterly dividend policy |
| 4 | KAM pipeline and Dzhusaly rail loading terminal operating effectively |
| 4 | Completed construction and commissioned the Gas Utilization Project |
| 4 | Acquired additional exploration acreage |
| 4 | Increased shipments of crude oil to China |
| 4 | PetroKazakhstan’s common shares listed on the Kazakhstan Stock Exchange |
FINANCIAL AND OPERATING HIGHLIGHTS
EXPRESSED IN MILLIONS OF UNITED STATES DOLLARS (EXCEPT PER SHARE AMOUNTS)
| Years ended December 31 | 2004 | 2003 | 2002 | |||||||
FINANCIAL | ||||||||||
| Net Income | 500.7 | 316.9 | 161.4 | |||||||
Per share (basic) ($) | 6.40 | 4.06 | 2.00 | |||||||
| Cash Flow | 560.5 | 400.0 | 216.8 | |||||||
Per share (basic) ($) | 7.16 | 5.12 | 2.68 | |||||||
| EBITDA | 931.6 | 590.5 | 343.6 | |||||||
| Capital Expenditures | 166.0 | 203.2 | 140.1 | |||||||
| Total Assets | 1,269.1 | 1,041.5 | 709.7 | |||||||
| Shareholders’ Equity | 890.1 | 571.7 | 266.9 | |||||||
| Shares Outstanding at December 31 | 76,223,130 | 77,920,226 | 78,956,875 | |||||||
| Number of Employees at December 31 | 3,001 | 2,610 | 3,306 | |||||||
OPERATING | ||||||||||
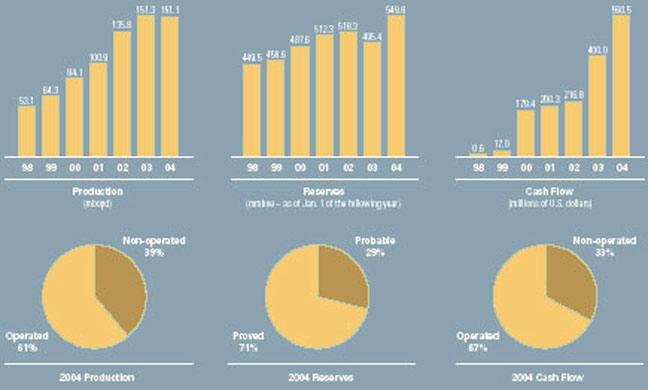
Production (bopd) | 151,102 | 151,349 | 135,842 | |||||||
Reserves (proved plus probable) (mmboes)* | 549.8 | 495.4 | 518.3 | |||||||
*As of January 1 of the following year
6 PetroKazakhstan Inc. |
Operating Achievements
| 4 | Replaced 180% of 2004 crude oil production |
| 4 | Five-year finding and development costs of $1.53/bbl based on proved reserves |
| 4 | Continuous operations of the 55 MW gas utilization plant |
| 4 | Exploration success in three fields |
| 4 | Yearly differential reduced by $1.49/bbl versus 2003 |
2005 Objectives
| 4 | Increase production by 12.5% |
| 4 | Reduce export differential |
| 4 | Develop asset base through further exploration and appraisal work |
| 4 | Continue to improve the yield of the Shymkent refinery |
| 4 | Commission a Liquified Petroleum Gas facility |
| 4 | Implement an Enhanced Oil Recovery project |
| 7 |
A Message from Mr. Bernard Isautier - President and Chief Executive Officer |
Our Company has continued to generate record financial results for 2004. This was achieved through strong commodity prices, a reduction in our differential and enhanced refinery contributions.
Going beyond boundaries summarizes what the Company has achieved in 2004 and the path it will continue to follow in the future. In 2004, PetroKazakhstan focused on proving exploration concepts resulting in new oil discoveries, further exploiting its asset base through new technologies, creating new refined products such as Vacuum Gas Oil (VGO), implementing new activities in the form of electrical power generation, identifying new markets for crude oil and refined products, developing new transportation routes, investing in logistics and adding new talents and professional disciplines to our organization. These initiatives contributed to the generation of record financial results. ASSET AND RESERVE GROWTH In 2004, the Company was successful in significantly increasing its exploration land position from the prior year. Due to these land acquisitions the Company initiated and completed a basin study. This study has led to the identification of an exploration inventory that includes 94 independent structures which will give us many years of drilling prospects. This increased focus on exploration led to the discovery of a new reservoir within the Aryskum field license and new channel sands on the Akshabulak license. It also proved the presence of a significant northern extension to the Kyzylkiya field and identified other highly prospective opportunities on new exploration land blocks. We plan to continue to aggressively prove up and identify other new structures and plays in 2005. As of January 1, 2005 PetroKazakhstan’s reserves were independently determined by the Canadian company McDaniel & Associates Consultants Ltd., to be 549.8 million barrels of | oil equivalent (mmboe) comprised of 502.9 million barrels (mmbbls) of crude oil, 31.2 mmboe of Natural Gas Liquids (NGLs) and 88.4 billion cubic feet (bcf) of gas on a proved plus probable basis. This represents a 197% replacement of 2004 production on a boe basis even though he more stringent Canadian standard of reserves definition and recognition as set out in National Instrument 51-101 (Standards of Disclosure for Oil and Natural Gas activities) was used. QUARTERLY DIVIDEND POLICY AND SHARE BUY-BACKS PetroKazakhstan introduced a regular quarterly dividend in early 2004. On December 13, 2004, the Company’s Board of Directors approved a 33% increase in its quarterly dividend from C$0.15 per share to C$0.20 per share. As an additional means of adding shareholder value, the Company has implemented, for a third year in a row, a share repurchase program approved by the Toronto Stock Exchange. This share repurchase program, called a Normal Course Issuer Bid (NCIB), allows the Company to repurchase up to 10% of its public float or 7,091,429 shares, for our most recent program, over a one year time period beginning August 13, 2004 and terminating no later than August 12, 2005. As of the end of 2004, the Company had repurchased and cancelled 1,257,500 shares. Subsequent to year end 2004, the Company has continued to repurchase and cancel shares. In 2004 PetroKazakhstan also implemented a Dutch auction substantial issuer bid share tender. This share tender ended on July 19, 2004 and resulted in the repurchase and cancellation of 3,999,975 shares at C$40.00 per share. |
8 PetroKazakhstan Inc. |

RECORD RESULTS Our Company has continued to generate record financial results for 2004. This was achieved through strong commodity prices, a reduction in our differential and enhanced refinery contributions. Some of the key financial results were: 4 Cash flow reached $560.5 million, an increase of 40% over 2003 4 Net income was $500.7 million, an increase of 58% over 2003 BROADER MARKET RECOGNITION PetroKazakhstan was successful in becoming the first foreign company to have its shares listed on the Kazakhstan Exchange as of December 27, 2004. This listing will allow all Kazakhstan institutions and citizens, including our own employees, to become PetroKazakhstan shareholders, to become more involved in the market activities of our Company and to more generally participate in the development of the market economy in Kazakhstan. TRANSPORTATION COSTS Transportation costs continued to be the Company’s largest operating expense and hence our largest opportunity for cost reduction throughout 2004. Effective use of our newly constructed 177 kilometer (km) Kyzylkiya, Aryskum and Maibulak (KAM) pipeline which became operational in June 2003 was key. The savings in rail transportation costs for crude oil exports, sent west to the Black Sea, has been approximately $2.00/barrel (bbl). Shipments of crude oil and refined products to China continued to increase in 2004. After many years of planning, the governments of Kazakhstan and China broke ground and began the | construction of a 1,000 km pipeline from Kazakhstan to the Chinese border. This pipeline, which is currently planned for construction completion by the end of 2005, with start-up in early 2006, will structurally change the movement and flow of oil within Kazakhstan. With an initial capacity of 200,000 bopd, expandable to 400,000 bopd and beyond, via additional construction phases, this pipeline will draw on Kazakhstan oil to feed the voracious Chinese appetite for oil. PetroKazakhstan believes it is well positioned to supply significant amounts of crude oil into this pipeline, given appropriate terms. In 2004, crude oil produced by Turgai Petroleum (Turgai), our joint venture with Lukoil, exported via the Caspian Pipeline Consortium (CPC) pipeline, was increased. Shipments in 2004 represented 92% of our CPC contractual maximum of 31,800 bopd gross (1.5 million tonnes per year). Shipments in 2005 are expected to be greater than that achieved in 2004. The construction of a 1,000,000 bopd pipeline originating in Azerbaijan, terminating at the Mediterranean Sea via Turkey, the Baku-Tbilisi-Ceyhan (BTC) pipeline will further lead to enhanced competition for crude oil and potential tariff cost reductions. This $4 billion pipeline, scheduled for start-up in mid 2005, will significantly increase the current take-away capacity for crude produced in the region. The Company has approached consortium partners and expressed its desire to ship crude through BTC, given the appropriate terms. Oil exports via China, Iran, CPC, BTC and Atyrau are expected to result in further transportation cost savings. To efficiently handle increased rail movement of exported crude, the Company expanded its fleet of controlled railcars from just over 2,000 cars at the end of 2003 to approximately 5,000 cars by year end 2004. |
| 9 |
UPSTREAM OPERATIONS The Company’s 2005 annual production plan is to produce 170,000 bopd. Achievement of this technical potential remains subject to timely receipt of various regulatory approvals and the absence of unforeseen marketing constraints. This projection represents a 12.5% increase in production versus 2004 and will be accomplished through further development of a number of our existing fields. Phase I of the Kumkol South Enhanced Oil Recovery (EOR) project will begin in 2005 as will the development of the East Kumkol field and the commissioning of the Akshabulak gas plant for Liquefied Petroleum Gas (LPG). These projects will increase our production and reserve base. From an exploration and production perspective, PetroKazakhstan now has land interests of approximately 3.4 million acres (13,760 km2) in the South Turgai basin, where we operate, with 3.2 million acres being exploratory in nature. The South Turgai basin has long been identified as having reserve potential in the billions of barrels. To date the Company has been successful in proving up additional new exploration concepts which have led to new field discoveries. In 2005 we will continue to aggressively drill exploration wells on our exploration acreage to find and prove up additional reserves. DOWNSTREAM OPERATIONS The downstream sector continues to be a very important aspect of our integrated business, not only from an opportunity driven basis, but also from a revenue generation perspective. Our focus has and continues to be, enhancing the product slate of the refinery and the implementation of ongoing process improvements. The startup of the Vacuum Distillation Unit (VDU) in 2004 has led to a lower yield of heavy fuel oil (mazut). Over the course of 2004, the mazut yield has been reduced by 29%, from an average of 32.5% in 2003 of crude feedstock to an average of 23.1% for 2004. With the startup of a newly constructed boiler which generates steam required in the operations of our refinery, we have been able to achieve energy efficiencies and therefore, cost savings. HEALTH, SAFETY AND ENVIRONMENT 2004 was the first year of continuous operations of the Company’s newly built 55-megawatt (MW) power plant located at the Kumkol field. This plant has reduced gas emissions by converting associated gas produced from the Kumkol fields into electricity. In 2005, a second natural gas project at the Company’s joint venture field at Akshabulak will be commissioned. | This project will further reduce gas emissions and will also provide natural gas to the Kyzylorda region. Improving safety is one of our primary focuses. In 2004, in our Upstream operations, we had one lost time accident and reported 10 accidents/incidents. We had no lost time accidents at our refinery for a second consecutive year, a record we are very proud of. In 2005, we will continue in our efforts to make our workplace as safe as possible. LOOKING FORWARD PetroKazakhstan’s key objectives for 2005 and beyond will be to focused on: 4Increasing production and reserves through development, exploration and acquisitions. 4Reducing the export differential. 4Continuing to improve the product yield of the Shymkent refinery. 4Increasing the value obtained for our refined products. 4Commissioning a new Liquefied Petroleum Gas facility. 4Implementing an Enhanced Oil Recovery project. PEOPLE GOING BEYOND BOUNDARIES As we continue to expand our businesses, we add new professional disciplines to deal with the new challenges which require much energy and commitment to resolve. I’m proud of the quality of our staff and the dedication shown by our staff in continuing to achieve excellent results for our Company. On behalf of the Board of Directors, thank-you to all of our employees. Respectfully submitted on behalf of the Board of Directors, (signed) BERNARD F. ISAUTIER President and Chief Executive Officer |
10 PetroKazakhstan Inc. |

President’s Questions and Answers |
Q & A
Q4 | Production for year 2004 was flat versus 2003 even though you projected production increases, why? |
A4 | Three unforeseen key operational factors arose in 2004 leading to this situation. Early in 2004, 19 Kumkol South wells were shut in while a mutually acceptable resolution on the operating conditions of wells located at the border between Kumkol South and Kumkol North was sought with the neighboring license holder, Turgai Petroleum. In June, all wells were back on production, although at a reduced rate from their potential. The net impact on the Company’s average annual rate of production was a decrease of 8,500 bopd. Unexpected failures of electrical submersible pumps in two prolific South Kumkol producers had a further impact of 4,500 bopd on the Company’s annual rate of production. During the fourth quarter of 2004, pumps were optimized and field production resumed at normal rates. The Company has increased the pump stock inventory to minimize individual well downtime when equipment failures occur. Lastly, a significant delay in the arrival of a drilling rig reduced the number of Aryskum development wells resulting in an additional impact of 2,300 bopd on the Company’s average annual production rate. Therefore, these three factors resulted in a total reduction of 15,300 bopd. |
Q4 | With these unforeseen operational factors, can you continue to increase production and grow your assets in 2005? |
A4 | Yes, we can. We own or operate 11 oilfields. Of these fields, a number of them are just in the initial phases of development. We have plans in place to increase production from these fields. With regard to reserves, two methods to increase them are through ongoing appraisal and extensions of existing fields and via EOR. |
| We estimate that the additional possible reserve potential from EOR is anywhere from 55 to 180 million barrels. We are also looking at recovering significant LPG reserves from our fields. As of January 1, 2005, our current reserves, on a proven and probable basis, are 549.8 million barrels of oil equivalent. Independent consultants have determined we have in excess of 250 million barrels of possible oil reserves that we intend to prove up in the future through additional drilling. With regard to exploration, the basin in which we operate is still at a very early phase of maturity. There has been limited exploration in this region over the last 10 years. Independent experts, the US Geological Survey, have estimated that the remaining undiscovered oil potential of the basin is 2.7 billion barrels. Our own portfolio of exploration prospects and leads has identified over 1.0 billion barrels of potential unrisked reserves. So in the years to come, we intend to carry out a very aggressive exploration program to find additional reserves. | |
Q4 | Are you still looking at acquisitions as another means of growth? |
A4 | Yes. Our philosophy is that acquisitions should add value for our shareholders. We are not driven by size for the sake of size. To this point we have been quite successful in acquiring exploration acreage. We have not yet made a large reserve acquisition because in the current high oil price environment, there is a gap between seller and buyer expectations. We are reviewing opportunities in Kazakhstan and in countries that are close to Kazakhstan, where the current operating environment may have some similarities. We are ready to move if the right opportunity materializes. Even without acquisitions, we are confident we can continue to deliver substantial internal growth to our shareholders. |
| 12 PetroKazakhstan Inc. |
Q4 | How important is Kazakhstan as an oil producer and where are the markets for its products at this point? What are your strategies and opportunities? |
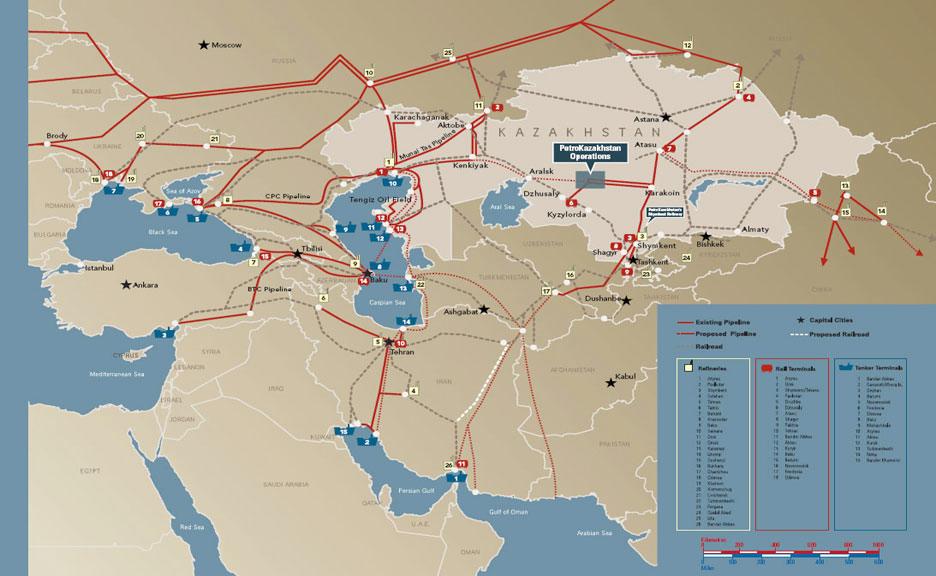
A4 | Kazakhstan is a very important country supplying oil into the international market. Three years ago, a discovery was made in the Caspian Sea, the Kashagan discovery, which could have up to 40 billion barrels of oil in place. This is the largest oil discovery made in the world over the last 35 years. So Kazakhstan is the Kuwait of Central Asia, and all international companies are interested in investing in Kazakhstan. The Kashagan discovery is not unique; there are quite a large number of prospects still to be explored with a high likelihood of success. So the question is how do you bring these resources to the international markets? Kazakhstan is a landlocked country. However, the distances from the fields in Kazakhstan to export points are similar to other producing countries in the world. Kazakhstan has a number of options for the export of its oil, and intends to capitalize on all of them - selling crude oil through pipeline via Russia to the European markets; selling through pipeline via the Black Sea, the Bosphorus and then the Mediterranean Sea; shipping across the Caspian Sea then through pipeline, directly to the Mediterranean market; possibly shipping through Iran to the Persian Gulf; and also selling to China via pipeline, the construction of which started in the fall of 2004. As a company, we as well, are pursuing all these export options. |
Q4 | What is your priority regarding transportation costs and continuing to reduce your export differential in 2005? |
A4 | One of our priorities is to continue to lower transportation costs. Transportation is the single largest operating cost we have. Our main export markets are China, the Persian Gulf, the Mediterranean and Black Seas. Even though we have significantly reduced our transportation costs to these markets over the last few years, we continue to seek further cost reduction opportunities. This implies diversification, negotiation of better tariffs and enhanced competition between various routes. We are in an environment that is moving more and more to a free competitive international market. This will benefit us and will enhance the value of our assets. |
Q4 | Why was PetroKazakhstan’s common stock listed on the Kazakhstan Stock Exchange in 2004 given that you are already listed on four other major exchanges, namely Canada, the United States, the United Kingdom and Germany? |
A4 | Over the last few years we have worked hard to raise the profile of our Company in North America, with success. By listing on the Kazakhstan Stock Exchange we hope to be able to attract new shareholders and local investment. By doing so we will become more ingrained in the daily lives of the Kazakh investor, leading to increased confidence and support. |
Q4 | What will you do with the build up of cash that you are experiencing? |
A4 | We will continue to return excess cash to our shareholders through various means. We are buying back shares and paying out dividends on a quarterly basis and we continue to review the possibility of further increasing the amount we will pay out to investors. We have made special dividend distributions in the past and don’t rule out the possibility of doing it again. We will also look at other means of effectively and efficiently enhancing shareholder value. While doing so, we are careful to maintain the flexibility to finance an acquisition or unusual capital project. |
Q4 | How has the dismantling of Yukos in Russia and the current Russian political situation impacted PetroKazakhstan or Kazakhstan? |
A4 | The dismantling of Yukos has not impacted PetroKazakhstan’s operations. Needless to say, Kazakhstan is not Russia in any respect. However, the average investor has become more sensitive to the state of affairs in Russia and as a result, additional downward pressure has been exerted on the stock prices of companies who operate near Russia, including ourselves. By continuing to effectively communicate our opportunities and challenges to investors, we believe we can help alleviate that pressure. |
| 13 |
Q4 | Have the challenges or problems which you faced in 2004 changed and if so, how? |
A4 | No, not to any appreciable degree. The challenge of operating in Kazakhstan is that there are still many opportunities which are not being realized. Significant amounts of time are being spent in negotiations with officials at various levels to obtain the approvals and support needed to realize these opportunities. We are focused on this and are rising to the challenge. |
Q4 | What misperceptions do you still continue to face in the investment community today? |
A4 | The main communication challenge that we still face is the lack of familiarity with Kazakhstan. Not all investors are experts in geopolitics. Their lack of familiarity with Kazakhstan means that they attribute more “political risk” to Kazakhstan than we believe is appropriate. We feel that the risks are manageable. Kazakhstan is a country that is pro foreign investment, pro market economy and is growing rapidly. It is working on accession to the WTO. While we continue to make progress with familiarizing the investment community with Kazakhstan, we still have a long way to go. |
Q4 | Can you comment on your staff? |
A4 | We have built an outstanding team. An area where we have significantly invested in talents is marketing and transportation. We have assembled an outstanding team of traders, engineers, transportation specialists, market analysts and regulatory specialists to deal with the unique transportation issues. We also have something that many companies don’t have, a government relations and regulatory affairs group that monitors very closely the regulatory and energy policy developments in the region, not only in Kazakhstan, but in the countries where we sell our crude oil and products. These groups are supported by a team of analysts. We have the right talents to prepare professional submissions to government authorities, always advocating liberalization of the economy and for policies that promote economic development in the interest of all parties. Our Upstream team continues to deliver excellent results as new reserves have been found and developed. Our investor relations group has worked hard over the last five years to significantly increase our worldwide shareholder base. We have broadened our U.S. investor base, both institutional and retail. We have also expanded our European, Russian and emerging market shareholder base. It is most gratifying to see the skills and motivation of our executives and staff. |
Q4 | What are your goals with respect to being independent in an industry where there is consolidation and growth through merger and acquisition? |
A4 | We’d like to remain an independent company as we believe we can deliver superior value to our shareholders. The Board would not however, oppose or resist a takeover attempt if this was made on the basis of a fair assessment of our net asset value. But until this happens, we will continue to focus our work and efforts on the profitable growth of the Company. |
Q4 | Has your vision for PetroKazakhstan changed over the last year? |
A4 | No. PetroKazakhstan’s vision is to continue to be recognized as a leader in the international oil and gas industry within the Former Soviet Union; to be a leader recognized by its ability to create shareholder value, to operate in a professional manner and to be recognized in Kazakhstan as a model corporate citizen. |
Q4 | What changes should we expect to see in PetroKazakhstan over the next three years? |
A4 | We expect to be focused on further increases in production and reserves and cost reductions, especially transportation costs. We will continue to develop our Downstream operations and hope to have established another area of operation in or around Kazakhstan to support our further growth. |
Q4 | Why should someone invest in PetroKazakhstan today? |
A4 | We have an exceptional and proven track record of delivering growth. We offer a management team operating under western governance and reporting criteria. Our finding and development costs and operating costs are extremely low by world standards. We have been effective in reducing transportation costs and are delivering solid netbacks and returns to our investors. We continue to focus on value creation by buying back our shares and by paying a regular quarterly dividend. We have a history of growth in production, reserves and share price. For all these reasons, we believe PetroKazakhstan remains an outstanding investment opportunity. |
| 14 PetroKazakhstan Inc. |

Operations Overview |
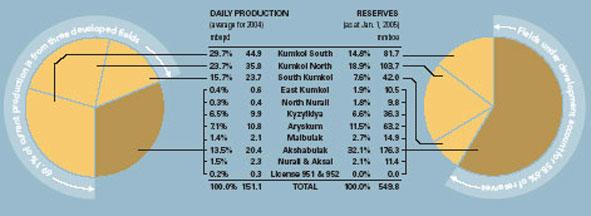
All of PetroKazakhstan’s exploration and production operations are located in the 80,000 km2 South Turgai basin in south central Kazakhstan. PetroKazakhstan holds working interests in four exploration licenses covering a total of over 3.4 million acres. This acreage is 10 times larger than our holdings two years ago. PetroKazakhstan has interests in eleven fields. Within the Kumkol Area there are three developed fields, Kumkol South, Kumkol North and South Kumkol. In close proximity are two new fields in the early stages of development, East Kumkol and North Nurali. To the west of the Kumkol area are the three KAM fields which are in development. Finally, to the south of Kumkol we have interests in three fields, Akshabulak, which is under development and Nurali and Aksai, on test production for appraisal. As of January 1, 2005, proved reserves were estimated at 392.0 mmboe. Proved plus probable reserves were 549.8 mmboe. During PetroKazakhstan’s tenure in Kazakhstan our reserve portfolio has grown by 204 mmbbls of oil in the proved plus probable category net of production of 302 mmbbls. This net production is twice the volume of proved reserves that were attributed to the Company at its inception. Average daily oil production in 2004 was 151,102 bopd. Our fields generally have productive zones at relatively shallow depths ranging from 760 m to 1,830 m with some of our newly drilled wells ranging from 2,300 m to 3,550 m. Most of our reservoirs have high porosity and permeability. Our reservoirs produce light, sweet crude at 37° to 44° American Petroleum Institute (API) gravity with a sulphur content of less than 0.4%. These favourable field and crude oil characteristics enable us to develop our fields and produce and refine our crude oil at a low cost. There are three main processing facilities. A Central Processing Facility (CPF) located in South Kumkol services all production from Kumkol South, South Kumkol and Kumkol North fields and has the capacity to handle 300,000 barrels of fluid per day (bfpd). Gas is gathered from these fields and used to feed a 55 MW power plant in Kumkol. Under construction at the Kyzylkiya and Aryskum fields are facilities that will be capable of processing all fluids from these two fields and that of the Maibulak field to the northwest. In addition, all gas produced from the KAM fields will be injected back into the Aryskum gas cap. | Akshabulak crude is treated at the field facilities, which are being expanded to handle 70,000 bopd. An LPG plant is under construction and a 124 km gas line has been laid from the field, and runs south to the city of Kyzylorda. Substantial unutilized capacity in the government controlled oil pipeline, which runs from our fields to our refinery at Shymkent, still exists. This combination of facilities and pipelines allows for continued production growth and the development of additional reserves without the need for new transportation infrastructure. In addition, the KAM pipeline, commissioned in June 2003, provides an alternative export transportation route directly to our Dzhusaly rail-loading terminal. Beginning in early 2002, our exploration program was primarily focused on accessing stratigraphic prospects, which had not been explored to any great extent in the basin. We have been successful in proving up these concepts in discovering the North Nurali field. The exploration program has also been successful in finding reserves within current production licenses at Kyzylkiya and Aryskum. One of our recent successes has been the discovery of previously unexplored channel sands below the Aryskum gas cap. The 3-year exploration and appraisal success ratio is 73%. The Company has increased its exploration acreage by a factor of ten over the past 2 years providing excellent opportunities for further discoveries from the estimated 94 leads and prospects held therein. As of January 1, 2005, our proved reserves are 392.0 mmboe. Proved and Probable reserves are now 549.8 mmboe which includes 15 mmboe or 88.4 bcf of gas, and 32.1 mmbbls of NGLs. As of January 1, 2005, our proved, probable and possible reserves as determined by our independent reservoir engineering consultants totaled in excess of 800 mmboe. We intend to focus on the complete reserve base and continue to develop and bring more reserves into the proved category. |
| 21 |
Upstream - Property Review |
14 | Kumkol South |
Working interest % | 100 | |||
Operator | PKKR | |||
Acreage (acres) | 18,604 | |||
2004 oil production (mbopd) | 44.9 | |||
2004 gas production (mboepd) | 0.6 | |||
Production wells | 158 | |||
Wells drilled in 2004 | 0 | |||
2005 target oil production (mbopd) | 39 .2 |
The Kumkol field was discovered in 1984 and has been producing since 1990. We are producing from six horizons, in the Cretaceous and Jurassic formations, located at depths less than 1,400 m. The crude oil is sweet and light, 42º API. The field is divided into two operating areas, Kumkol South and Kumkol North.
As the field has matured and water production has increased, significant modifications have been made to the process facilities and the water injection system. Production facilities now handle over 300,000 barrels fluid per day (bfpd) and some 200,000 barrels water per day (bwpd) are re-injected back into the reservoirs to provide pressure support.
PetroKazakhstan is evaluating the potential for EOR in all of its producing fields. A hydrocarbon miscible flood scheme utilizing excess produced gas has been developed for Kumkol South. Phase one of this EOR project is underway with injection expected to commence in the third quarter of 2005 into one of the Kumkol South reservoirs. Our independent reserve engineers have made a nominal addition of probable reserves associated with this project.
24 | South Kumkol |
Working interest % | 100 | |||
Operator | PKKR | |||
Acreage (acres) | 2,826 | |||
2004 oil production (mbopd) | 23.7 | |||
2004 gas production (mboepd) | 0.1 | |||
Production wells | 23 | |||
Wells drilled in 2004 | 0 | |||
2005 target oil production (mbopd) | 22.8 |
The South Kumkol field was discovered in 1992 and has been producing since 1997 from the Cretaceous and Jurassic sands from an average depth of 1200 m. South Kumkol crude is processed at the Kumkol CPF. Water injection is undertaken to maintain reservoir pressure and all wells make use of downhole pumps to maximize production and reserves exploitation. EOR is being evaluated for South Kumkol.
34 | Kyzylkiya |
Working interest % | 100 | |||
Operator | PKKR | |||
Acreage (acres) | 95,657 | |||
2004 oil production (mbopd) | 9.9 | |||
Production wells | 34 | |||
Wells drilled in 2004 | 15 | |||
2005 target oil production (mbopd) | 13.5 |
The Kyzylkiya field was discovered in 1988. Production, which commenced in August 2000, is from the Cretaceous and Jurassic formations at depths less than 1,600 m.
3D seismic has been acquired over the entire field. Development drilling continued in 2004 within the main field structure and to the north into our Kolzhan license area. 4 wells drilled in this area have confirmed the extension of the main Kyzylkiya field to the north. The Company was successful in acquiring additional acreage to the south of the field in which seismic and exploration drilling are planned in 2005.
An integrated oil and gas gathering system is being constructed to deliver produced fluids to Aryskum for crude shipment to our KAM pipeline with gas being re-injected into the Aryskum gas cap.
| 22 PetroKazakhstan Inc. |
44 | Aryskum |
Working interest % | 100 | |||
Operator | PKKR | |||
Acreage (acres) | 41,634 | |||
2004 oil production (mbopd) | 10.8 | |||
Production wells | 34 | |||
Wells drilled in 2004 | 19 | |||
2005 target oil production (mbopd) | 21.5 |
The Aryskum field was discovered in 1988 and was on test production for three years from Cretaceous horizons at 1,200 m. 3D seismic was acquired over the entire field in 2002. Full development is on-going as 34 production wells and 1 gas injection well have been drilled. Oil processing facilities are in place along with water injection and gas injection facilities. Gas injection commenced in 2004 as part of a field pressure maintenance and gas conservation program. Ultimately, gas from all the KAM fields and excess gas from the Kumkol fields will be injected into the Aryskum gas cap. The Company was successful in discovering oil in Jurassic channel sands below this gas cap. The sands, which are of excellent quality and exhibited well flowrates of up to 1,600 bopd, were not anticipated in the initial development plan and add to the reserve base for this field. The Company intends to continue its appraisal of further channel sands in the area.
54 | Maibulak |
Working interest % | 100 | |||
Operator | PKKR | |||
Acreage (acres) | 10,263 | |||
2004 oil production (mbopd) | 2.1 | |||
Production wells | 9 | |||
Wells drilled in 2004 | 0 | |||
2005 target oil production (mbopd) | 3.9 |
The Maibulak field was discovered in 1988 with four productive zones in the Jurassic formation identified at depths of less than 1,400 m. 3D seismic surveys have been conducted over the entire field. Test production crude has been trucked to Aryskum, some 40 km to the south east. Full development is underway where all produced fluids including gas will be piped to the Aryskum facilities. Water injection facilities are in place and operational.
64 | East Kumkol |
Working interest % ** | 80 | |||
Operator | PKKR | |||
Acreage (acres)* | 8,151 | |||
2004 oil production (mbopd) * | 0.6 | |||
Production wells * | 5 | |||
Wells drilled in 2004 * | 0 | |||
2005 target oil production (mbopd)* | 0.9 |
East Kumkol has been in an appraisal testing phase. 3D seismic survey acquired over the entire field confirmed that the field extends into the Kumkol North (Turgai) license area. PetroKazakhstan and Turgai have developed joint venture agreements, a joint development plan and production agreements for approval by the authorities. The field is currently not producing pending finalization of the development and production plan and necessary regulatory approvals.
74 | North Nurali |
Working interest % | 100 | |||
Operator | PKKR | |||
2004 oil production (mbopd) | 0.4 | |||
Production wells | 8 | |||
Wells drilled in 2004 | 3 | |||
2005 target oil production (mbopd) | 2.5 |
Just 5 kms west of the Kumkol field, North Nurali has proved to be a success in the Company’s exploration of new concept leads in the South Turgai Basin. A total of ten wells have been drilled by PetroKazakhstan in this field to depths ranging from 2,300 m to 3,550 m. Application is being made for an extended test production program with produced fluids being tied into the Kumkol facilities.
| 23 |
84 | Kumkol North |
Working interest % | 50 | |||
Operator | Turgai | |||
Acreage (acres)* | 40,655 | |||
2004 oil production (mbopd) * | 71.5 | |||
2004 gas production (mboepd) * | 2.9 | |||
Production wells * | 228 | |||
Wells drilled in 2004 * | 18 | |||
2005 target oil production (mbopd)* | 71.6 |
Turgai operates Kumkol North, which is owned equally between PetroKazakhstan and Lukoil Overseas Ltd. Production and ancillary support facilities are provided by PetroKazakhstan as the operator of Kumkol South on a fee basis. The crude is commingled after a metering station at the field’s border, and then processed at the CPF. Eighteen development wells were drilled in 2004.
94 | Akshabulak |
Working interest % | 50 | |||
Operator | Kazgermunai | |||
Acreage (acres) * | 64,118 | |||
2004 oil production (mbopd) * | 40.8 | |||
Production wells * | 20 | |||
Wells drilled in 2004 * | 4 | |||
2005 target oil production (mbopd)* | 55.0 |
Kazgermunai operates Akshabulak which is owned 50% by PetroKazakhstan, 25% by RWE, 17.5% by EEG and 7.5% by International Finance Corporation (IFC). The Akshabulak field was discovered in 1988 and production began in 1997. Production is currently being transported by pipeline to the Kumkol field where it ties into the Kumkol - - Karakoin pipeline. This in turn connects to the central pipeline that delivers oil to the Shymkent refinery. Kazgermunai sells all of its crude into the export market.
Full development of the field is still to be accomplished. It has been delayed by the German joint venture partners, pending assurances from the Government of Kazakhstan on marketing and transportation issues. However, full field development has progressed with the acquisition of 3D seismic and development drilling of eleven wells over the past two years. Facility expansion is ongoing which should enable production of up to 70,000 bopd by the end of 2005. An LPG plant will be commissioned in the third quarter of 2005 and dry gas will be exported to the city of Kyzylorda via a 10” pipeline.
104 | Nurali and Aksai |
Working interest % | 50 | |||
Operator | Kazgermunai | |||
Acreage (acres)* | 164,795 | |||
2004 oil production (mbopd) * | 4.6 | |||
Production wells * | 15 | |||
Wells drilled in 2004 * | 4 | |||
2005 target oil production (mbopd)* | 5.0 |
Nurali and Aksai have the same ownership structure as Akshabulak. The complex geology of the Nurali and Aksai fields has led to a new assessment of the appraisal and development plan. 3D seismic has been acquired and interpreted.
Four wells were drilled and selective wells were put on test production in 2004. The development will continue in 2005 with the drilling of up to five more wells during the year based on the interim production plan approved by the authorities.
* Items are at 100% or gross working interest. ** Subject to variation on settelment
| 24 PetroKazakhstan Inc. |
Exploration - - 260 D1 License
This 333,841 acre license surrounds the Kumkol field and continues to be one of our focus areas for our exploration efforts. The term of this license has been extended to June 2007. Leads that were originally identified in this license area from a comprehensive basin study resulted in the discovery of the North Nurali field.
The wells identified deeper target sands in stratigraphic traps, unexplored in the basin. Well depths for all the leads range from 2,300 m to 4,000 m. The North Nurali wells have validated the concept of producible hydrocarbons from deep stratigraphic traps. Extensive exploration and appraisal work has been conducted with the acquisition of 3D seismic over the North Nurali field itself and to the north where there exists the potential for a field extension in which a well will be drilled in 2005.
The exploration program will continue in 2005 with the acquisition of 3D seismic over the Karavanchy structure (east of the Kyzylkiya field) and over an area to the north of the Kumkol main reservoir in which an exploration well is planned.
Exploration - - License 952 (Kolzhan)
The acquisition of the 122,811 acre Kolzhan license, directly north of the Kyzylkiya field, was completed in the 4th quarter of 2003 and the license term has been extended to June 2007. Well KK34, drilled to 1,500 m produced light, sweet, oil at a rate of 1,000 bopd. Well evaluation results confirm that this accumulation is an extension of the main Kyzylkiya field. 3D seismic was acquired over the western half of the block enabling mapping of the main Kyzylkiya field extension. To date, 5 wells have been drilled with at least a further 4 wells planned in 2005 and the reprocessing of 2D seismic over the eastern half of the block. We had test production of 0.3 mbopd in 2004.
Exploration - - License 951-D
PetroKazakhstan has farmed-in to acquire operatorship and a 75% equity position in two separate blocks totaling over one million acres (4,290 km2) in a joint venture with Orient Petroleum. Two exploration wells on this license previously tested oil. The license is split into two blocks, Doshan to the north and Zhamansu to the south. Following the acquisition and interpretation of 714 kms of 2D seismic over the license, some 32 leads were identified in the Zhamansu block. Four wells were drilled in this block late in 2004, 2 wells encountered hydrocarbon sands but commercial production rates could not be attained. Two wells were dry.
Interpretation of data in the Doshan has identified a number of prospects and two exploration wells are planned for 2005.
Exploration - - Karaganda License
This large (1,876,508 acre) license, lies to the north of the 260 D1 and 952 Kolzhan licenses, and has been awarded to PetroKazakhstan. We are currently awaiting confirmation of the contract terms. The combination of large structural leads and evidence of oil migration into this area (the Company has drilled a well directly to the south of this license) elevates the prospectivity. The staged worked program will start with reprocessing of 400 km of 2D seismic and the acquisition of new 2D seismic in 2005.
| 25 |
GAS RESOURCE CONSERVATION AND EXPLOITATION
The Company has addressed the issue of utilizing associated produced gas in a number of ways.
| 4 | PetroKazakhstan has built a 55 MW power plant in the Kumkol field. This facility uses associated produced gas from the Kumkol South, South Kumkol and Kumkol North fields to produce electricity for field use and to minimize gas flaring. |
| 4 | As a joint venture partner in the Akshabulak fields, PetroKazakhstan is participating in a project to provide natural gas to the Kyzylorda region and to extract LPG. This plant will be operational in the third quarter of 2005. The gas pipeline has been built. |
| 4 | The Kumkol field’s EOR project with LPG injection will commence in the third quarter of 2005 and will use excess produced gas. |
| 4 | Aryskum gas is now re-injected back into the reservoir for gas conservation and pressure maintenance. Kyzylkiya and Maibulak produced gas will also be re-injected as part of the KAM field development program. |
| 4 | The Company has embarked on a complete gas gathering program through all its fields. NGLs will be extracted for sale, and dry gas will be re-injected back into reservoir gas caps for conservation and reservoir pressure maintenance. |
McDaniel and Associates Consultants Ltd., the Company’s independent reserve engineers, have acknowledged these programs through the recognition of reserves.
HEALTH, SAFETY AND ENVIRONMENT
PetroKazakhstan is committed to the continuous improvement of its Health, Safety and the Environment (HS&E) performance. During 2004, Upstream operations experienced only one lost time accident and reported 10 accidents/incidents. The Company has paid particular attention to its contractors’ performance through routine and operations specific safety meetings, the addition of contractual HS&E obligations and implementation of a contractor safety reporting program. Training is an integral part of our HS&E program and we employ experienced HS&E staff to assist all levels of the workforce in addressing issues. We routinely test and certify staff for work in critical and hazardous operations to ensure a high level of safe working practices.
We are conducting a program of upgrading all emergency response plans that will be complete in the second quarter of 2005.
We have reduced emissions through the continued use of our 55 MW power generation plant at Kumkol which uses, previously flared, produced associated gas. In addition, the Company has commissioned the Aryskum gas re-injection facility which reduces flared emissions in the Aryskum oilfield. PetroKazakhstan implemented several other capital projects such as bio-remediation, waste water treatment and improved handling of oilfield and domestic waste programs.
The Company continues to maintain a close working relationship with local authorities to ensure continuing compliance with the Republic of Kazakhstan’s laws and regulations.
| 26 PetroKazakhstan Inc. |
Reserves |
RESERVES RECONCILIATION BY FIELD
Proved plus probable (mmboe)
| Kumkol | Kumkol | South | East | North | |||||||||||||||||||||||||||||||||
| South | North | Kumkol | Kumkol | Nurali | Kyzylkiya | Aryskum | Maibulak | Akshabulak | Nurali | Aksai | Total | ||||||||||||||||||||||||||
| Reserves as of Jan 1, 2004 | 71.9 | 100.3 | 47.1 | 11.7 | 12.8 | 35.3 | 47.7 | 14.0 | 143.5 | 9.9 | 1.3 | 495.5 | |||||||||||||||||||||||||
| Revisions | 26.4 | 17.0 | 3.6 | (1.0 | ) | (2.9 | ) | 4.7 | 19.5 | 1.7 | 40.6 | 0.9 | (0.2 | ) | 110.3 | ||||||||||||||||||||||
| Production | (16.6 | ) | (13.6 | ) | (8.7 | ) | (0.2 | ) | (0.1 | ) | (3.7 | ) | (4.0 | ) | (0.8 | ) | (7.8 | ) | (0.5 | ) | (0.0 | ) | (56.0 | ) | |||||||||||||
Reserves as of Jan 1, 2005 | 81.7 | 103.7 | 42.0 | 10.5 | 9.8 | 36.3 | 63.2 | 14.9 | 176.3 | 10.3 | 1.1 | 549.8 | |||||||||||||||||||||||||
Total PetroKazakhstan interest by field. As at January 1, 2005. McDaniel & Associates Consultants Ltd.
| Proved + | |||||||||||||
Reserves (mmboe) | Proved | % | Probable | % | |||||||||
| Kumkol South | 60.4 | 15.4 | % | 81.7 | 14.9 | % | |||||||
| Kumkol North | 83.7 | 21.3 | % | 103.7 | 18.9 | % | |||||||
| South Kumkol | 34.6 | 8.8 | % | 42.0 | 7.6 | % | |||||||
| East Kumkol | 7.1 | 1.8 | % | 10.5 | 1.9 | % | |||||||
| North Nurali | 1.8 | 0.5 | % | 9.8 | 1.8 | % | |||||||
| Kyzylkiya | 21.9 | 5.6 | % | 36.3 | 6.6 | % | |||||||
| Aryskum | 47.4 | 12.1 | % | 63.2 | 11.5 | % | |||||||
| Maibulak | 7.2 | 1.8 | % | 14.9 | 2.7 | % | |||||||
| Akshabulak | 123.0 | 31.4 | % | 176.3 | 32.0 | % | |||||||
| Nurali | 4.9 | 1.3 | % | 10.3 | 1.9 | % | |||||||
| Aksai | 0.0 | 0.0 | % | 1.1 | 0.2 | % | |||||||
| Total | 392.0 | 100.0 | % | 549.8 | 100.0 | % | |||||||
RESERVE EVALUATION
Summary of remaining reserves.As at January 1, 2005. McDaniel & Associates Consultants Ltd.
| Crude Oil | Natural Gas | Natural Gas Liquids | Total Reserves | ||||||||||||||||||||||
(mmbbls) | (bcf) | (mmbbls) | (mmboe) | ||||||||||||||||||||||
| Property | Company | Property | Company | Property | Company | Property | Company | ||||||||||||||||||
| Gross | Gross* | Gross | Gross* | Gross | Gross* | Gross | Gross* | ||||||||||||||||||
| Proved developed producing | 342.8 | 224.4 | 49.3 | 31.6 | 0.0 | 0.0 | 351.0 | 229.7 | |||||||||||||||||
| Proved developed non-producing | 73.5 | 48.7 | 0.0 | 0.0 | 0.0 | 0.0 | 73.5 | 48.7 | |||||||||||||||||
| Proved undeveloped | 135.7 | 84.2 | 54.8 | 27.0 | 36.9 | 24.9 | 181.8 | 113.6 | |||||||||||||||||
| Total proved | 552.0 | 357.3 | 104.1 | 58.6 | 36.9 | 24.9 | 606.3 | 392.0 | |||||||||||||||||
| Probable | 219.2 | 145.6 | 53.2 | 29.8 | 10.7 | 7.2 | 238.7 | 157.8 | |||||||||||||||||
| Proved plus probable | 771.2 | 502.9 | 157.3 | 88.4 | 47.6 | 32.1 | 845.0 | 549.8 | |||||||||||||||||
| Possible | 389.1 | 254.8 | 389.1 | 254.8 | |||||||||||||||||||||
| Proved plus probable plus possible | 1,160.3 | 757.7 | 1,234.1 | 804.6 | |||||||||||||||||||||
* | Company gross reserves are before royalties. |
| 28 PetroKazakhstan Inc. |
Summary of remaining reserves and present values. As at January 1, 2005. McDaniel & Associates Consultants Ltd.
Escalating Price Assumptions
| Total Reserves | Net Present Worth Value Before Income Taxes - Unrisked | ||||||||||||||||||
(mmboe) | (thousands of U.S. dollars) | ||||||||||||||||||
| Company | |||||||||||||||||||
| Gross* | 0% | 5% | 10% | 15% | 20% | ||||||||||||||
| Proved developed producing | 229.7 | 3,793,089 | 3,310,873 | 2,951,983 | 2,674,373 | 2,452,976 | |||||||||||||
| Proved developed non-producing | 48.7 | 849,166 | 650,887 | 520,695 | 429,922 | 363,558 | |||||||||||||
| Proved undeveloped | 113.6 | 1,409,587 | 1,042,773 | 806,970 | 646,100 | 530,957 | |||||||||||||
| Total proved | 392.0 | 6,051,842 | 5,004,533 | 4,279,648 | 3,750,395 | 3,347,491 | |||||||||||||
| Probable | 157.8 | 2,591,473 | 1,837,721 | 1,376,159 | 1,075,414 | 869,004 | |||||||||||||
| Proved plus probable | 549.8 | 8,643,315 | 6,842,254 | 5,655,807 | 4,825,809 | 4,216,495 | |||||||||||||
| Possible | 254.8 | ||||||||||||||||||
| Proved plus probable plus possible | 804.6 | ||||||||||||||||||
* | Company gross reserves are before royalties. |
Summary of remaining reserves and present values. As at January 1, 2005. McDaniel & Associates Consultants Ltd.
Constant Price Assumptions
| Total Reserves | Net Present Worth Value Before Income Taxes - Unrisked | ||||||||||||||||||
(mmboe) | (thousands of U.S. dollars) | ||||||||||||||||||
| Company | |||||||||||||||||||
| Gross* | 0% | 5% | 10% | 15% | 20% | ||||||||||||||
| Proved developed producing | 229.7 | 4,727,816 | 4,044,562 | 3,545,453 | 3,166,130 | 2,868,555 | |||||||||||||
| Proved developed non-producing | 48.7 | 1,091,466 | 836,676 | 667,538 | 548,911 | 461,993 | |||||||||||||
| Proved undeveloped | 113.6 | 1,854,692 | 1,378,832 | 1,069,072 | 856,048 | 702,891 | |||||||||||||
| Total proved | 392.0 | 7,673,974 | 6,260,070 | 5,282,063 | 4,571,089 | 4,033,439 | |||||||||||||
| Probable | 157.8 | 3,281,302 | 2,344,077 | 1,760,493 | 1,375,554 | 1,109,133 | |||||||||||||
| Proved plus probable | 549.8 | 10,955,276 | 8,604,147 | 7,042,556 | 5,946,643 | 5,142,572 | |||||||||||||
| Possible | 254.8 | ||||||||||||||||||
| Proved plus probable plus possible | 804.6 | ||||||||||||||||||
* | Company gross reserves are before royalties. |
| 29 |
Downstream Review |
Our refinery at Shymkent continues to be the best performing refinery in Kazakhstan and further improvements are being made through process improvements.
BACKGROUND PetroKazakhstan exports crude oil from a variety of loading points through a number of pipeline systems, and rail and sea routes to different markets and customers. The flexibility provided through these alternative routes continues to allow us to improve our export and domestic sales netbacks and provides security in the event that one route is closed for some unforeseen operational reason. Our refinery at Shymkent continues to be the best performing refinery in Kazakhstan and further improvements are being made through process improvements. Our refinery is well located and designed to serve both the domestic and export markets. PetroKazakhstan refined products continue to be recognised in both the domestic and export markets as being of exceptional quality and offering excellent value. CRUDE OIL LOGISTICS PetroKazakhstan’s and Turgai Petroleum’s crude oil export shipments increased from 3.5 million tonnes (27.1 mmbbls) in 2003 to 3.9 million tonnes (30.2 mmbbls) in 2004, an increase in average daily shipments from 9,800 tonnes per day to 10,800 tonnes per day from 2003 to 2004. Seventy two percent of these shipments were loaded through our KAM pipeline and Dzhusaly Terminal which continues to generate the $2.00/bbl savings forecasted at the time the project was conceived. Shipments through the CPC pipeline accounted for around 36% of all shipments as volumes approached their maximum contractual limit. Deliveries to China accounted for 19% of the overall shipments. Eighty eight percent of all shipments to China were made via the state owned pipeline to Atasu, eliminating a significant rail journey and the associated costs. | Shipments to the Tehran refinery under the swap agreement with the National Iranian Oil Company grew steadily until June 2004, after which the Ministry of Energy and Mineral Resources (MEMR) of the Republic of Kazakhstan imposed export limits and finally blocked all exports on this route. The dialogue between PetroKazakhstan and MEMR is continuing and we are hopeful of a positive outcome. PetroKazakhstan’s position is that the imposition of quota restrictions on this route is unjustified as we provide all the necessary logistics, there are no physical constraints on this route and such restrictions are not in the best interest of the Republic of Kazakhstan or the neighbouring transit republics of Uzbekistan and Turkmenistan and is contrary to the policy wishes of the governments of Kazakhstan and Iran. As part of our on-going strategy to take control of and improve our logistics costs, crude oil exports on an FCA (Free Carrier) basis were completely eliminated during 2004. In support of this initiative the number of rail cars in the fleet dedicated to PetroKazakhstan grew to approximately 5,000 at the end of 2004 up significantly from 2,000 at the end of 2003. The enlarged fleet comprises a mix of owned and long and short-term leased rail cars to provide operational and financial flexibility. CRUDE OIL TRADING Throughout 2004, the international crude oil markets remained nervous about the lead up to the elections in Iraq, production interruptions, and the level of US inventories. At the same time strong demand from China and transportation capacity limits in Russia added further upward pressure to an already rising market. As a consequence, and due to an element of speculation by traders, international crude oil prices remained at extremely high levels with an enormous level of volatility. The highest recorded daily mean for Brent dated in 2004 was $52.03/bbl with a low of $29.12/bbl producing a price spread over the year of $22.90/bbl. |
| 31 |
In response to supply concerns OPEC increased their output of heavier sour crudes. While this addressed the overall supply demand balance it caused a distortion of the heavy sour/light sweet differentials. Crude grades such as Urals saw their discount against Brent rise from around $1.60/bbl at the beginning of 2004 to a high of $7.50/bbl by October 2004. This generated a strong incentive for European refineries to buy the cheaper heavier grades and consequently the Mediterranean market became long on sweet crude and prices for sweet crudes began to slide against Brent in November 2004. Grades like CPC Blend and Siberian Light fared the worst, recording a discount to Brent of up to $4.50/bbl. While Kumkol performed better, the premium against Brent which is typically between $0.50 to $0.80/bbl slipped to a discount of between $0.10 and $2.00/bbl during the last 6 weeks of 2004. Kumkol closed the year at a discount to Brent of $0.12/bbl. The improvement in our differentials to Brent recorded for the first three quarters of 2004 were as a result of the elimination of FCA contracts, the higher utilisation of better routes and the utilization of our KAM pipeline and Dzhusaly terminal. The fourth quarter of 2004 saw a deterioration of differentials reflecting the changes in the crude oil markets as mentioned above and the seasonal impact of night-time shipping restrictions in the Bosphorus Straits and some intermittent weather problems at Aktau. This situation is expected to continue for the first quarter of 2005. Nevertheless, the average differential for 2004 was a substantial improvement over 2003. REFINERY OPERATIONS AND REFINED PRODUCT SALES The ongoing continuous improvement program at our Shymkent refinery continues to yield significant value benefits. We measure the change in product yield value on a fixed crude and product price basis thus eliminating the variations of market prices. This measure indicates a steady trend of improvements over the last two years which has generated an improvement in refining margins in excess of $2.00/bbl. By the second quarter of 2004 the VDU was operating at maximum capacity and regular sales were being made through the Baltic port of Tallinn. During 2005 we expect to be able to increase the yield of VGO and to develop additional outlets for this product. Refinery per unit costs showed an increase from $0.58/bbl in 2003 to $0.80/bbl which is line with the equivalent figures for 2002. The reasons for the increase were lower throughput, the maintenance turnaround in 2004 and the additional operating costs associated with the start up of the VDU. | The average price of refined products improved by $7.84/bbl compared to 2003. These improvements were as a result of firmer market prices, the improved yield of higher value products, a greater proportion of refined product exports and improved pricing management keeping a balance between Kazakh prices and Russian competitor prices. Exports of refined products were on average around 75,000 tonnes per month (approximately 19,100 bpd) destined primarily for the neighbouring republics although some products such as VGO and fuel oil were sold on the international market in the Baltic and the Mediterranean. HEALTH, SAFETY AND ENVIRONMENT Preservation of the environment and the health and safety of our refinery employees and contractors continues to be a top management priority. Environmental and safety indicators demonstrate a continuing improvement. In 2003 and 2004, a zero Lost Time Incident rate amongst refinery employees was achieved versus five incidents in 2002. This performance is attributed to a focused effort in passing on responsibility for safety to the supervisory level. Emphasis is placed on meeting or improving on regulatory environmental limits and education of employees and contractors regarding occupational health issues. The oil and gas industry is a focal point for environmental performance and scrutiny by government authorities. The Republic of Kazakhstan is no exception. Our refinery faces increasingly stringent limits imposed by the Kazakh ministries. In 2004, with the exception of a minor spill from a waste water line which posed no environmental hazard, the refinery performance continued to improve. Waste water from the refinery to off-site treatment works has declined by 43% in the last two years. Since 2002, refinery emissions have consistently been at least 10% under license limits. We are well placed to meet future challenges. Areas of environmental focus in 2005 include projects to: 4 Reduce emissions from our refined fuels. 4 Further reduce Sulphur Dioxide and Nitrous Oxide emissions. 4 Improve water conservation and waste water quality. 4 Improve the oily waste processing facilities. 4 Rehabilitate soils. |
| 32 PetroKazakhstan Inc. |
Management’s Discussion and Analysis |
The following Management’s Discussion and Analysis (“MD&A”) of the financial condition and results of our operations should be read in conjunction with our consolidated financial statements and notes relating thereto that are included elsewhere in this report. Our financial statements have been prepared in accordance with Canadian generally accepted accounting principles (“GAAP”). This discussion and analysis contains forward-looking statements, which involve risks and uncertainties. Our actual results could differ materially from those anticipated in the forward-looking statements.
These forward-looking statements can generally be identified by the use of statements that include phrases such as “believe”, “expect”, “anticipate”, “intend”, “plan”, “likely”, “will” or similar words or phrases. Similarly, statements that describe our objectives, plans or goals are or may be forward-looking statements. These forward-looking statements are based on our current expectations and projections about future events. However, whether actual results and developments will conform with our expectations and projections is subject to a number of risks and uncertainties, including, among other things, the risks and uncertainties described under section “Risk Analysis” and the risk factors described in our Annual Information Form for the year ended December 31, 2004 under the heading “Risk Factors”. These are not necessarily all of the important factors that could cause actual results to differ materially from those expressed in any of our forward-looking statements. Other known or unpredictable factors could also harm our results. Consequently, there can be no assurance that the actual results or developments anticipated by us will be realized or, even if substantially realized, that they will have the expected consequences to, or affects on, us. Unless otherwise required by applicable securities law, we disclaim any intention or obligation to publicly update or revise any forward-looking statements, whether as a result of new information, future events or otherwise.
In our MD&A we use certain terms, which are specific to the oil and gas industry, including “net return” and “cash flow”. These are non-GAAP terms defined within our MD&A.
Except as otherwise required by the context, reference in this MD&A to “our”, “we” or “us” refer to the combined business of PetroKazakhstan Inc. and all of its subsidiaries and joint ventures.
Additional information filed with Canadian securities commissions and the United States Securities and Exchange Commission, including our quarterly and annual reports and our Annual Information Form (AIF/40-F), are available on line at www.sedar.com and www.sec.gov.
All numbers are in U.S. Dollars unless otherwise indicated.
| 33 |
OVERVIEW AND STRATEGY
PetroKazakhstan Inc. is an integrated oil company that owns and operates oil and gas production and a refinery in Kazakhstan. We use the term “Upstream” to refer to the exploration for and production of oil and gas from our licenses in the South Turgai Basin, Kazakhstan. We use the term “Downstream” to refer to the operations of our refinery located in Shymkent, Kazakhstan and the marketing and transportation of refined products and the management of the marketing and transportation of crude oil for Upstream.
BUSINESS STRATEGY
PetroKazakhstan strives to be the leading integrated oil and gas company in the Former Soviet Union and an exemplary corporate citizen. Our goal is to create superior value for our shareholders and the Republic of Kazakhstan while protecting the health and safety of our people and the environment.
The primary elements of our strategy are to:
| 4 | Explore our undeveloped properties.We have approximately 3,400,000 acres of land that we intend to explore and develop. |
| 4 | Capitalize on development opportunities.We intend to bring our proved undeveloped reserves into production in a timely, efficient and profitable manner. |
| 4 | Fully exploit our reserves.We intend to focus on the complete reserve base and continue to develop and bring more reserves into the proved category. |
| 4 | Seek selective acquisition opportunities. As part of our strategy to increase reserves and production, we are pursuing opportunities to acquire additional reserves from third parties. Our acquisition strategy has focused on acreage and assets, both producing and of exploration potential, within the vicinity of our current oil fields and throughout Kazakhstan. |
| 4 | Open new transportation routes to international markets and reduce our transportation costs.In 2004, approximately 55% of crude oil sales went to export markets. Though we have been successful in reducing our transportation costs to these markets, they still remain our single largest cost of operations. |
| 4 | Improve the operational performance of our refinery. Since the acquisition of the refinery in 2000, we have been implementing projects designed to increase product quality and production yields and to improve the refinery’s product mix. |
| 4 | Control and reduce our overhead and operating costs.Overlaps in the operations of our principal operating subsidiaries, PKKR and PKOP, have been essentially eliminated by establishing a joint marketing and transportation team. We have divested non-core activities and continue to aim at reduction of our operating costs. |
| 4 | Manage our environmental and social responsibilities to ensure that we earn support from all stakeholders for PetroKazakhstan’s growth and operating plans.In late 2003 we commissioned our gas utilization project designed to reduce the flaring of gas produced from our Kumkol fields and the consequential release of pollutants into the environment. We also plan to complete the construction of a gas processing plant in our Akshabulak field in 2005, which will further reduce gas flaring. |
| 34 PetroKazakhstan Inc. |
HIGHLIGHTS
| Years ended December 31 | ||||||||||||||||
2004 | 2003 | |||||||||||||||
2004 | 2003 | 2002 | vs 2003 | vs 2002 | ||||||||||||
Net income ($000’s) | 500,668 | 316,940 | 161,397 | 58 | % | 96 | % | |||||||||
Cash flow($000’s)1 | 560,491 | 399,975 | 216,794 | 40 | % | 84 | % | |||||||||
| Basic net income per share | 6.40 | 4.06 | 2.00 | 58 | % | 103 | % | |||||||||
| Basic cash flow per share | 7.16 | 5.12 | 2.68 | 40 | % | 91 | % | |||||||||
Production, bopd2 | 151,102 | 151,349 | 135,842 | - | 11 | % | ||||||||||
| Capital expenditures | 165,952 | 203,213 | 140,102 | (18 | %) | 45 | % | |||||||||
| Total assets | 1,269,081 | 1,041,451 | 709,723 | 22 | % | 47 | % | |||||||||
| Long-term debt | 134,862 | 246,655 | 281,797 | (45 | %) | (12 | %) | |||||||||
| Cash dividends declared | 39,253 | - | - | 100 | % | - | ||||||||||
| Common shares outstanding | 76,223,130 | 77,920,226 | 78,956,875 | (2 | %) | (1 | %) | |||||||||
1 | Cash flow: We evaluate our operations based upon our net income and cash flow. Cash flow is a non-GAAP measure that represents cash generated from operating activities before changes in non-cash working capital. We consider this to be a key measure as we use this measure to evaluate our ability to generate cash to fund our growth through capital expenditures and our ability to repay debt. The comparable GAAP measure is cash flow from operating activities. The following table reconciles our non-GAAP measure cash flow to the comparable GAAP measure “Cash flow from operating activities”. Cash flow does not have any standardized meaning prescribed by Canadian GAAP and is, therefore, unlikely to be comparable to similar measures presented by other issuers. |
| Years ended December 31 | ||||||||||
($000’s) | 2004 | 2003 | 2002 | |||||||
| Cash flow | 560,491 | 399,975 | 216,794 | |||||||
| Changes in non-cash operating working capital items | (24,899 | ) | (60,625 | ) | (37,816 | ) | ||||
| Cash flow from operating activities | 535,592 | 339,350 | 178,978 | |||||||
2 | We report production before royalties as we measure our Upstream operations on this basis, which is consistent with industry practice in Canada. |
| 35 |
NET INCOME VARIANCES
| $ millions | ||||
| Net income for the year ended December 31, 2002: | 161 | |||
| Increase in the price of crude oil | 76 | |||
| Increase in net return at Kumkol for refined products | 72 | |||
| Increase in refined products sales volumes | 23 | |||
| Increase in crude oil export sales volumes | 16 | |||
| Increase in depletion and depreciation | (16 | ) | ||
| Other variances | (15 | ) | ||
| Net income for the year ended December 31, 2003: | 317 | |||
| Increase in the price of crude oil | 200 | |||
| Increase in net return at Kumkol for refined products | 92 | |||
| Improvement in differential | 32 | |||
| Increase in crude oil export sales volumes | 24 | |||
| Increase in prices for crude oil purchases | (38 | ) | ||
| Excess profit tax | (35 | ) | ||
| Hedging | (26 | ) | ||
| Decrease in refined products sales volumes | (22 | ) | ||
| Increase in depletion and depreciation | (16 | ) | ||
| Higher income tax rate for Kazgermunai | (12 | ) | ||
| Other variances | (15 | ) | ||
Net income for the year ended December 31, 2004: | 501 | |||
Higher prices for crude oil and refined products in 2003 and 2004 were the major reason for our record results. Our efforts to improve our differential in 2004 added an additional $32.0 million to our net income. These gains were partially offset by the foregone revenue from our hedging program and the increased prices paid for crude oil purchased from third parties. Lower throughput volumes and the refinery turnaround led to lower sales of refined products in 2004.
KEY PERFORMANCE INDICATORS
We measure the performance of our Upstream and Downstream operations using the following key performance indicators:
| Years ended December 31 | ||||||||||
2004 | 2003 | 2002 | ||||||||
| Production, bopd | 151,102 | 151,349 | 135,842 | |||||||
Differential ($/bbl) | 12.62 | 14.11 | 13.97 | |||||||
Average refined products price($/bbl) | 25.02 | 17.18 | 13.59 | |||||||
Production expense($/bbl) | 1.62 | 1.19 | 1.22 | |||||||
Refining cost($/bbl) | 0.80 | 0.58 | 0.80 | |||||||
General and administrative($/bbl) | 1.16 | 1.12 | 1.39 | |||||||
Effective income tax rate(%) | 37.5 | 32.8 | 38.0 | |||||||
Production. SeeVolumetrics for a discussion of our production.
| 36 PetroKazakhstan Inc. |
Strategy: Open new transportation routes to international markets and reduce our transportation costs
Differentials. The graph below shows the evolution of our differential.

* | Our differential is calculated as the difference between the average Brent price for crude oil export sales received by PKKR and Turgai, and our net return at Kumkol. Differential is a non-GAAP measure that is the sum of the costs and discounts incurred in order to transport and sell our crude oil to international markets. The sales revenue used in this measure differs from sales revenue in the statement of net income and the net return table for the following reasons: | |
4 | The differential does not include Kazgermunai sales over which we have limited control. Kazgermunai is excluded because the differential is used to measure the performance of our internal marketing group. | |
4 | The differential is calculated using finalized sales transactions. Our financial statements include estimates that may or may not reflect the finalized transactions. | |
The term “differential” does not have a standardized meaning prescribed by Canadian GAAP and is, therefore, unlikely to be comparable to similar measures presented by other companies. | ||
Our differential constitutes our single largest expenditure and the management of this cost is one of our primary objectives. To achieve this, we have a dedicated crude oil marketing and logistics team whose objective is to sell our crude oil to end users and to obtain a greater understanding and control over our export routes. To accomplish this, we have acquired a fleet of approximately 5,000 purchased and leased rail cars, obtained access to loading facilities and ports and we have opened new transportation routes.
We export crude oil in all geographical directions, north to Atyrau through our Dzhusaly terminal and then onward through the CPC pipeline, east to China via the Atasu terminal, south to Uzbekistan and Iran and west through Aktau to the port of Batumi and some onward shipments to ports in the Mediterranean.
| 37 |
We have made greater use of pipelines thereby reducing our rail costs. Specifically, our KAM pipeline and the KTO pipeline to Atasu with onward rail to China.
In the third quarter of 2004, the combination of different routes, increased utilisation of pipelines, having railcars under our control, and reduced discounts negotiated with buyers led to our overall crude differential reaching its lowest level in four years at $11.66/bbl.
In the fourth quarter of 2004 our differential increased by $0.79/bbl over the fourth quarter of 2003 and increased by $2.17/bbl over the third quarter of 2004.
Increased demand for sour crudes in the Mediterranean as a result of increases in the differential between sweet and sour crudes, changed the average premium of Kumkol over Brent of $0.68/bbl in the third quarter of 2004 to a discount of $0.38/bbl by the fourth quarter of 2004, an impact of $1.06/bbl.
Increased shipping rates and demurrage costs for vessels, a seasonal factor, were exacerbated by the hurricanes in the United States during the fall of 2004, which led to worldwide increased shipping rates charged by crude oil purchasers during the fourth quarter of 2004. For cargoes of approximately 80,000 metric tonnes average freight and demurrage rates increased from $1.06/bbl in the third quarter of 2004 to $3.37/bbl in the fourth quarter of 2004. Approximately 68% of completed sales during the fourth quarter of 2004 were affected by these rate increases.
To address this issue, we have chartered our own vessels on better terms than those obtained through our crude oil purchasers, and our cargoes are being delivered by us directly into the Mediterranean. We have also concentrated our efforts on selling into markets that are not affected by this increase in shipping rates, including Central Asia and China.
The Kumkol premium to Brent during the fourth quarter of 2003 was $0.37/bbl. The improved discounts we have negotiated on our sales and the impact of increased volumes on routes with better differentials were offset by the year over year $0.75/bbl change in the premium/discount of Kumkol crude oil to Brent, and our increased shipping and demurrage costs when comparing the fourth quarter of 2004 with 2003.
Outlook: Expectations going forward are that the differential will remain between $13.50/bbl and $14.00/bbl until the end of the first quarter of 2005, with a return to the $12.00/bbl mark for the second and third quarters of 2005. The seasonal factors discussed above will likely increase our fourth quarter differential in 2005, though it is difficult to predict by how much and we will take all possible steps to mitigate these factors.
| 38 PetroKazakhstan Inc. |
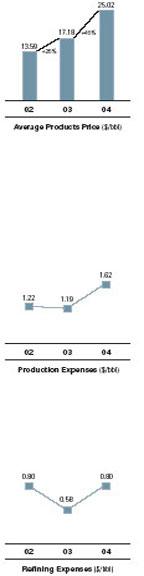 | Average refined products price Our average refined product price received in 2004 was $7.84 higher than the average price we received in 2003. This was due to improvements in our yield such that we obtain greater volumes of higher value products per each barrel of crude oil refined. In addition, international crude oil prices influence refined product prices, as does economic growth within Kazakhstan. The price of refined products in Russia has a significant impact on the market price in Kazakhstan as products from Russia move across the border with relative ease and if refined product prices rise above Russian prices the Kazakhstan market is oversupplied with refined products from Russia. Outlook: Refined product prices will be determined by market prices, including refined product prices in Russia and world oil prices. Strategy: Control and reduce our overhead and operation costs Production expenses Production expenses were higher in 2004 compared to 2003 due to a number of factors. We continued to use temporary power generators to operate single well batteries in the KAM fields pending construction of infrastructure. The water cut in a number of our fields including our joint venture Turgai continued to increase resulting in higher production expenses. The number of wells and facilities commissioned in 2004 was higher compared to 2003. During 2004, we drilled 54 new production wells, including 25 wells that were drilled by our joint ventures. Outlook: During 2005 we will be installing flowlines to tie in the single wells at the KAM fields to our main facilities and we are also planning to increase the capacity of existing facilities to handle the increasing water production. Our Upstream operations have embarked on a program focused on reducing production expenses. A number of initiatives have been identified and we are in the process of implementation. Refining cost Refining costs in 2004 reflected the impact of the first major turnaround since 2002. Major repairs were performed on the main crude processing units, visbreaker and storage facilities. Annual purchased energy costs were also marginally higher due to the operation of the Vacuum Distillation Unit (VDU) brought online in January 2004. Outlook: We do not plan to have a major turnaround in 2005. Refining costs should therefore be lower. |
| 39 |
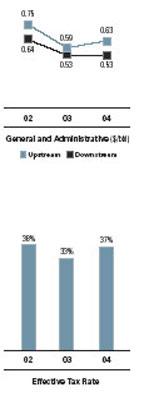 | General and administrative expenses Our general and administrative expenses are virtually unchanged in 2004, as most of our expenses are fixed in nature. The per barrel decrease in 2003 compared to 2002 was mainly due to increased production levels. Our Upstream field office is in Kyzylorda, the majority of our Upstream staff is located there, and all related costs are classified as general and administrative as opposed to production expenses. Outlook: We do not expect a significant change in our general and administrative expenses in 2005. Effective income tax rate The statutory tax rate in Kazakhstan, where all of our operations are located, is 30%. Our effective tax rate differs due to certain expenses, which cannot be deducted for statutory tax purposes. Our tax rate as a percentage of net income before tax of 37.5% in 2004 increased from 32.8% in 2003, mainly due to excess profit tax provided for in Turgai and the higher marginal tax rate in Kazgermunai. Our tax rate as a percentage of net income before tax of 32.8% in 2003 decreased from 38.0% in 2002, mainly because we refinanced our debt, increasing the deductibility of our interest expense. Outlook: It remains our goal to minimize our non-deductible expenses and manage our excess profit tax exposure. Our goal is to maximize deductions, consistent with the applicable tax legislation for each of our hydrocarbon production contracts. SensitivitiesThe following table sets forth our estimate of the impact on net income and cash flow to changes in the following. |
| Net income and | |||||||
| Change | cash flow after tax | ||||||
($ millions) | |||||||
| Crude oil | $ | 1/bbl in Brent | 28.5 | ||||
| Differential | $ | 1/bbl change | 24.5 | ||||
| Refined products price | $ | 1/bbl in overall average | 15.7 | ||||
| Production volume | 5,000 bopd | 14.0 | |||||
| Production cost | 10 | % | 6.1 | ||||
| General and administrative expenses | 10 | % | 4.0 | ||||
| Refining cost | 10 | % | 1.9 | ||||
| 4 | The variable with the most significant impact on our business is the international price for crude oil. This directly impacts the value of our exports, and has a significant influence on refined product prices. |
| 4 | The differential has an equivalent per barrel impact as Brent on our exports of crude oil, while average refined product prices impact the value obtained for refined products sales. |
| 4 | Production volumes impact our results as we have more or less crude oil to sell or refine. |
| 4 | Changes in our production, general and administrative and refining costs are less significant because these costs represent a relatively low percentage of our total costs. |
| 40 PetroKazakhstan Inc. |
VOLUMETRICS UPSTREAM Production The following table sets forth our barrels of oil produced per day by field: |
Field (bopd) | 2004 | 2003 | 2002 | |||||||
| Kumkol South | 44,851 | 58,718 | 66,726 | |||||||
| Kumkol North | 35,752 | 29,746 | 22,810 | |||||||
| South Kumkol | 23,682 | 29,846 | 22,728 | |||||||
| Kyzylkiya | 9,895 | 7,925 | 6,941 | |||||||
| Aryskum | 10,835 | 7,000 | 4,330 | |||||||
| Maibulak | 2,130 | 1,051 | 824 | |||||||
| North Nurali | 398 | 464 | - | |||||||
| East Kumkol | 589 | - | 634 | |||||||
| License #952 | 270 | - | - | |||||||
| License #951 | 7 | - | - | |||||||
| Kazgermunai Fields | 22,693 | 16,599 | 10,849 | |||||||
| Total | 151,102 | 151,349 | 135,842 | |||||||
 | Strategy: Fully and effectively exploit our reserves 2004 versus 2003 Kumkol South - decrease of 13,867 bopd. The decrease in Kumkol South production in 2004 was mainly due to 19 wells that border the Kumkol North field that were shut-in for the first four months of 2004 and are now on a reduced production scheme designed to equalize the reservoir pressure between the fields. The net impact of the reduced production scheme on our average annual rate of production was a decrease of 8,500 bopd. Additionally, during the fourth quarter of 2004 water injection capacity was a limiting factor in optimizing our production due to increased water production from our Kumkol South, South Kumkol and Kumkol North fields. Outlook: We expect to produce 39,200 bopd per day from Kumkol South in 2005 and plan to improve our surface water handling facilities by looping lines, adding further injection pumping capacity and debottlenecking existing facilities. Kumkol North- increase of 6,006 bopd. Increases in production from our Kumkol North field were due to an increase in the number of production wells and installation of artificial lift. Outlook: We do not plan to increase the level of production in 2005, and our expectation for the next year is 35,800 bopd. |
| 41 |
 | South Kumkol- decrease of 6,164 bopd. South Kumkol production decreased due to declining reservoir pressure which necessitated the conversion of three of our producing wells to water injection wells. Unexpected failures of electrical pumps had an impact of 4,500 bopd on our rate of production. During the fourth quarter of 2004, pumps were optimized and field production resumed at normal rates. Outlook: We plan to maintain our production levels at 22,800 bopd in 2005 by constructing a new water injection facility to maintain reservoir pressure. KAM fields - increase of 6,884 bopd. The increase in production from our KAM fields (Kyzylkiya, Aryskum, Maibulak) was due to the increased number of wells put on production and implementation of our artificial lift program. A significant delay in the arrival of a drilling rig reduced the number of Aryskum development wells resulting in a negative impact of 2,300 bopd on our average annual forecasted production rate. Outlook: We expect to further increase production to 38,900 bopd in 2005 through continued investment in these fields including new development drilling and infrastructure investment. East Kumkol - increase of 589 bopd. East Kumkol volume was produced on an extended production test, pending completion of a hydrocarbon production contract. Outlook: Our expectation is to start commercial production in the second quarter of 2005 with our share of production from this field to average 900 bopd over the year. Kazgermunai fields - increase of 6,094 bopd. Kazgermunai completed surface facility debottlenecking measures in late 2003, leading to the increase in 2004 production. Outlook: We expect the production level in our Kazgermunai fields to be at 30,000 bopd in 2005, which will be achieved due to the installation of parallel production facilities. 2003 versus 2002: Production levels in 2003 were affected by a number of factors unrelated to the technical performance of our fields. These included weather related issues in the Caspian and Black Seas, which reduced producers’ ability to export crude oil, restrictions in the transportation system and the temporary suspension of production at the Aryskum field in mid-year. The fourth quarter also saw a temporary reduction of production in order to harmonize the operation of certain wells at the border of Kumkol South and Kumkol North fields. |
| 42 PetroKazakhstan Inc. |
Crude oil volumetrics
The following table sets forth the movements in inventory for our Upstream operations for the years ended December 31:
(mmbbls) | 2004 | 2003 | 2002 | |||||||
| Opening inventory of crude oil | 2.87 | 2.72 | 0.70 | |||||||
| Production | 55.31 | 55.24 | 49.58 | |||||||
| Crude oil purchased from third parties | 1.09 | 0.03 | 0.68 | |||||||
Crude oil purchased from joint ventures(50%) | 0.11 | 0.25 | 2.92 | |||||||
| Sales or transfers | (55.15 | ) | (54.53 | ) | (51.08 | ) | ||||
| Field and transportation losses | (0.28 | ) | (0.19 | ) | (0.08 | ) | ||||
| Return of purchased crude | - | (0.65 | ) | - | ||||||
| Closing inventory of crude oil | 3.95 | 2.87 | 2.72 | |||||||
In 2002, our Upstream operations purchased 2.9 mmbbls of crude oil from Turgai. In 2004 and 2003 almost all crude oil acquired from Turgai was purchased by our Downstream operations.
Under the terms of an agreement with the company assigned by the government to market royalty-in-kind volumes for 2002 we purchased 0.65 mmbbls of crude oil, which was in our inventory at December 31, 2002. This oil was returned in the first quarter of 2003.
The following table sets out our total crude oil sales and transfers from Upstream operations for the years ended December 31:
2004 | 2003 | 2002 | |||||||||||||||||
| mmbbls | % | mmbbls | % | mmbbls | % | ||||||||||||||
| Crude oil exports | 30.30 | 54.9 | 27.99 | 51.3 | 25.89 | 50.7 | |||||||||||||
Crude oil transferred to Downstream | 14.93 | 27.1 | 18.85 | 34.6 | 16.82 | 32.9 | |||||||||||||
Crude oil transferred to Downstream by joint ventures(50%) | 5.82 | 10.6 | 5.31 | 9.7 | 4.39 | 8.6 | |||||||||||||
Crude oil tolled by joint ventures (50%) | - | - | 0.35 | 0.7 | - | - | |||||||||||||
| Royalty payments | 4.10 | 7.4 | 2.03 | 3.7 | 3.48 | 6.8 | |||||||||||||
Crude oil domestic sales | - | - | - | - | 0.50 | 1.0 | |||||||||||||
Total crude oil sales or transfers | 55.15 | 100.0 | 54.53 | 100.0 | 51.08 | 100.0 | |||||||||||||
DOWNSTREAM
Refining
The refinery at Shymkent has a total operating capacity of 6.6 million tonnes per year or about 51.1 million barrels per year. Crude oil feedstock for our refinery is primarily acquired from our Upstream operations, but purchases are also made from third parties. Feedstock is refined into a number of products, which are generally sold domestically. The refinery also refines crude oil on behalf of third parties for a processing fee. Due to the size of the available market for refined products in Kazakhstan, the refinery operated at 53% of capacity or 27.2 million barrels in 2004, 60% capacity or 30.6 million barrels in 2003 and 53% capacity or 27.1 million barrels in 2002.
Our total processed volumes were as follows:
(mmbbls) | 2004 | 2003 | 2002 | |||||||
| Feedstock refined into product | 26.70 | 30.01 | 25.77 | |||||||
| Tolled volumes | 0.53 | 0.59 | 1.33 | |||||||
| Total processed volumes * | 27.23 | 30.60 | 27.10 | |||||||
* | The total processed volumes are used for our per barrel calculations |
| 43 |
Strategy: Improve the operational performance of our refinery
The refinery continued to focus on the improvement of yields while minimizing the production of heavier end and lower value products. The production of mazut (heavy fuel oil), a low value product, has been further reduced year-over-year. Mazut yield in 2004 averaged 23.1% versus 32.5% in 2003 (35.9% in 2002). Our Vacuum Distillation Unit was brought on stream in January 2004, resulting in a significant decline in mazut production.
Outlook: We continue working on the improvement of our refinery yields and quality of products. In 2005 we expect to increase the quality of our high-grade gasoline by using high-value additives.
Sources of feedstock supplies for our refinery were as follows:
(mmbbls) | 2004 | 2003 | 2002 | |||||||
| Acquired from PKKR | 14.93 | 18.85 | 16.82 | |||||||
Purchased from joint ventures(100%) | 11.65 | 10.62 | 8.78 | |||||||
Tolled by joint ventures(50%)* | - | 0.35 | - | |||||||
| Purchased from third parties | 0.02 | 0.08 | - | |||||||
| Total feedstock acquired | 26.60 | 29.90 | 25.60 | |||||||
* | 50% of volumes tolled by our joint ventures are attributable to our joint venture partners and are not included in our inventory movements and ending inventory. |
Feedstock and refined products volumetrics
The movements in our feedstock inventory at our refinery were as follows:
(mmbbls) | 2004 | 2003 | 2002 | |||||||
| Opening inventory of crude oil feedstock | 0.03 | 0.20 | 0.34 | |||||||
| Purchase and acquisition of feedstock | 26.60 | 29.90 | 25.60 | |||||||
| Recoverable feedstock from traps * | 0.10 | (0.06 | ) | 0.03 | ||||||
| Feedstock refined into product | (26.70 | ) | (30.01 | ) | (25.77 | ) | ||||
| Closing inventory of feedstock | 0.03 | 0.03 | 0.20 | |||||||
* | This represents trapped oil processed, net of trapped oil recovered. During 2003 the trapped oil tank was emptied for repairs. |
The movement in inventory of refined products was as follows:
(mmtonnes)* | 2004 | 2003 | 2002 | |||||||
| Opening inventory of refined product | 0.26 | 0.22 | 0.20 | |||||||
| Refined product from feedstock** | 3.23 | 3.64 | 3.09 | |||||||
| Refined product purchased | 0.05 | 0.02 | 0.09 | |||||||
| Refined product sold | (3.30 | ) | (3.62 | ) | (3.16 | ) | ||||
| Refined product internal use and yield losses | (0.03 | ) | - | - | ||||||
| Closing inventory of refined product | 0.21 | 0.26 | 0.22 | |||||||
* | The inventory of products represents a mix of products for which no unique conversion from barrels to tonnes exists. The standard conversion used by us for crude oil is 7.746 barrels to the tonne. |
** | Refined products from feedstock are presented as actual output from refined volumes of crude oil. |
| 44 PetroKazakhstan Inc. |
RESULTS OF OPERATIONS
NET RETURN PER BARREL
Set forth below are the details of the average net return achieved for crude oil export sales and sales derived from the refining of our own crude. Net return per barrel is a non-GAAP measure that shows averages across all types of sales contracts and illustrates the relationship between exports of crude oil versus refining our own crude oil and marketing refined crude oil products. Net return per barrel does not have a standardized meaning prescribed by Canadian GAAP and is therefore unlikely to be comparable to similar measures presented by other companies.
| Crude oil | Own crude oil | ||||||
($/bbl) | exports | refined and sold | |||||
Year ended December 31, 2004 | |||||||
| Net realized price | 30.12 | 25.02 | |||||
| Transportation costs | (6.94 | ) | (2.66 | ) | |||
| Selling costs | (0.60 | ) | (0.78 | ) | |||
| Crude utilized in refining ** | - | (1.36 | ) | ||||
| Refining cost | - | (0.80 | ) | ||||
| Royalties and taxes - Downstream | - | (0.71 | ) | ||||
General and administrative costs - Downstream | - | (0.53 | ) | ||||
| Net return at Kumkol *** | 22.58 | 18.18 | |||||
| Production cost | (1.62 | ) | (1.62 | ) | |||
| Royalties and taxes - Upstream | (1.94 | ) | (1.94 | ) | |||
| General and administrative costs - Upstream | (0.63 | ) | (0.63 | ) | |||
| Net return per barrel | 18.39 | 13.99 | |||||
Year ended December 31, 2003 | |||||||
| Net realized price | 21.32 | 17.20* | |||||
| Transportation costs | (7.21 | ) | (1.09 | ) | |||
| Selling costs | (0.38 | ) | (0.64 | ) | |||
| Crude utilized in refining ** | - | (0.94 | ) | ||||
| Refining cost | - | (0.58 | ) | ||||
| Royalties and taxes - Downstream | - | (0.40 | ) | ||||
| General and administrative costs - Downstream | - | (0.53 | ) | ||||
| Net return at Kumkol *** | 13.73 | 13.02 | |||||
| Production cost | (1.19 | ) | (1.19 | ) | |||
| Royalties and taxes - Upstream | (1.27 | ) | (1.27 | ) | |||
| General and administrative costs - Upstream | (0.59 | ) | (0.59 | ) | |||
| Net return per barrel | 10.68 | 9.97 | |||||
See notes on page 46
| 45 |
| Crude oil | Own crude oil | ||||||
($/bbl) | exports | refined and sold | |||||
Year ended December 31, 2002 | |||||||
| Net realized price | 17.20 | 13.81* | |||||
| Transportation costs | (5.04 | ) | (0.94 | ) | |||
| Selling costs | (0.23 | ) | (0.67 | ) | |||
| Crude utilized in refining ** | - | (0.98 | ) | ||||
| Refining cost | - | (0.80 | ) | ||||
| Royalties and taxes - Downstream | - | (0.41 | ) | ||||
| General and administrative costs - Downstream | - | (0.64 | ) | ||||
| Net return at Kumkol *** | 11.93 | 9.37 | |||||
| Production cost | (1.22 | ) | (1.22 | ) | |||
| Royalties and taxes - Upstream | (1.16 | ) | (1.16 | ) | |||
| General and administrative costs - Upstream | (0.75 | ) | (0.75 | ) | |||
| Net return per barrel | 8.80 | 6.24 | |||||
* | Net realized price shown in these tables does not include the price received for purchased refined products resold. |
** | Crude utilized in refining is our fuel consumption and yield loss percentage from refining our crude oil applied to the overall sales price received for our products. |
*** | Average Brent or a similar index for each respective period does not reflect our average realized Brent price because of the timing of recognition of sales for financial statement purposes and the terms of the sales. Financial statement sales revenue is the basis used to determine the net sales price achieved in these tables. Therefore, a comparison of average Brent or similar index to our net return at Kumkol cannot be used to determine our differential. |
2004 versus 2003:
Net return for crude oil exports increased by $7.71/bbl in 2004 primarily due to:
| 4 | Significant increase in market prices, with average Brent in 2004 of $38.27/bbl compared to $28.83/bbl in 2003. This was partially offset by: | |
| 4 | Foregone revenue due to our hedging program, which had a negative impact of $1.39 per barrel sold in 2004 compared to $0.16/bbl for 2003. See Note 15 to our consolidated financial statements. | |
| 4 | Royalties and taxes, which increased by $0.67/bbl due to the increase in royalties as a result of higher crude oil prices. | |
Net return for own crude oil refined and sold increased by $4.02/bbl in 2004 primarily due to:
| 4 | Higher sales prices on all products and an improved yield, whereby more higher value products were produced. |
| 4 | The sale of VGO, a new high value product, accounted for 8% of total sales volumes in 2004. |
| 4 | Transportation costs increased by $1.57/bbl with a corresponding increase in our sales price due to refined products export sales on non-FCA terms. |
2003 versus 2002:
During 2003, our net return for crude oil exports increased by $1.88/bbl compared to 2002 due to an increase in market prices (average Brent was $28.83/bbl compared to $25.02/bbl in 2002) and transportation cost reductions after the start up of the KAM pipeline. These were partially offset by an increase in pipeline and railway tariffs. The increase in non-FCA sales of 19.40 million barrels or 90% in 2003 versus 2002, increased both the net sales price achieved and our transportation costs, as our sales point for crude oil, where title is transferred, was closer to the final destination. Our net return for own crude oil refined and sold increased by $3.73/bbl compared to 2002 due to an improvement in yields and higher sales prices.
| 46 PetroKazakhstan Inc. |
REVENUE
| 2004 | |||||||||||||
Year ended December 31 ($000’s) | 2004 | 2003 | vs 2003 | % | |||||||||
| Crude oil | 992,880 | 621,126 | 371,754 | 59.9 | |||||||||
| Refined products | 639,405 | 481,326 | 158,079 | 32.8 | |||||||||
| Service fees | 6,484 | 11,532 | (5,048 | ) | (43.8 | ) | |||||||
| Interest income | 3,658 | 3,340 | 318 | 9.5 | |||||||||
| Total revenue | 1,642,427 | 1,117,324 | 525,103 | 47.0 | |||||||||
| 2003 | |||||||||||||
Year ended December 31 ($000’s) | 2003 | 2002 | vs 2002 | % | |||||||||
| Crude oil | 621,126 | 481,114 | 140,012 | 29.1 | |||||||||
| Refined products | 481,326 | 332,639 | 148,687 | 44.7 | |||||||||
| Service fees | 11,532 | 9,646 | 1,886 | 19.6 | |||||||||
| Interest income | 3,340 | 1,951 | 1,389 | 71.2 | |||||||||
| Total revenue | 1,117,324 | 825,350 | 291,974 | 35.4 | |||||||||
We derive our revenues principally from the sale of crude oil and refined products. To a much lesser extent, we also derive revenue from refining crude oil on behalf of third parties for which we receive processing fees, and production and ancillary support services provided to our joint venture Turgai Petroleum on a fee basis. Our results are dependent on the levels of our oil production and on prevailing world prices for crude oil and Kazakhstani prices for refined products. Prices for crude oil and refined products are subject to large fluctuations in response to a variety of factors beyond our control.
Crude oil
We market and sell our crude oil for export under a variety of contracts. Crude production can be sold to third parties within Kazakhstan, normally at rail terminals in Kazakhstan. Under these contracts, called Free Carrier Agreements (“FCA”) sales title to the crude oil passes to the buyer at the point of loading the crude into rail cars. The price achieved for these export sales is shown net of a differential to the prevailing Brent price at the time of the sale. The differential reflects a number of factors, the most significant of which relates to rail transportation costs. In the following tables included in our MD&A, these sales are shown as “Crude sales sold FCA”.
Alternatively, we can sell crude at points closer to a final delivery point. Under this type of sale, whereby contracts are concluded on various alternative bases, including delivery at frontier (“DAF”), delivered duty unpaid (“DDU”), cost, insurance and freight (“CIF”), cost and freight (“CFR”), delivered ex ship (“DES”), carriage paid to (“CPT”) and free on board (“FOB”), we arrange and assume all of the costs and obligations of transportation. The sales price reflects the Brent price less a differential. As with FCA sales, this differential reflects a number of factors, the most significant being remaining transportation costs to the final delivery point. With this type of sale, title to the crude oil does not pass to the buyer until the crude is loaded into an oil tanker at a port or the rail cars pass the borders of Kazakhstan or reach a specific destination point. We do not record the associated revenue until title to the crude oil passes to the buyer. This leads to significant volumes in transit, recorded as inventory. These sales are shown in the tables as “Crude sales sold non-FCA”.
For 2004 there were large fluctuations in world crude oil prices due to increased demand for crude oil and various political instabilities. The benchmark price that we use on all of our crude sales contracts, regardless of destination and the sales or Incoterms used, is Brent. Brent closed the year over the $40.00/bbl mark, with an average for the year of $38.27/bbl. For 2003 the average was $28.83/bbl. There was a lot of volatility, with the spread between high and low daily Platts quotes of some $22.96/bbl in 2004 with a much lower spread in 2003 of $11.90/bbl.
| 47 |
The average quarterly quotes for Brent were as follows:
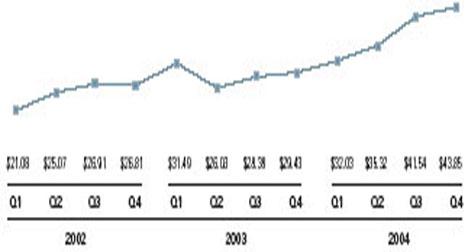
The table below sets out the crude oil revenue, volumes sold and net realized prices:
| Quantity | Net realized | |||||||||
| sold | price | Revenue | ||||||||
(mmbbls) | ($/bbl) | ($000's) | ||||||||
2004 | ||||||||||
| Crude sales sold FCA | - | - | - | |||||||
| Crude sales sold non-FCA | 23.32 | 31.18 | 727,221 | |||||||
| Kazgermunai export sales | 6.98 | 26.59 | 185,632 | |||||||
| Royalty payments | 4.10 | 19.52 | 80,027 | |||||||
| Total | 34.40 | 28.86 | 992,880 | |||||||
| 2003 | ||||||||||
| Crude sales sold FCA | 2.89 | 15.50 | 44,781 | |||||||
| Crude sales sold non-FCA | 19.40 | 23.22 | 450,542 | |||||||
| Kazgermunai export sales | 5.70 | 17.78 | 101,350 | |||||||
| Royalty payments | 2.03 | 12.05 | 24,453 | |||||||
| Total | 30.02 | 20.69 | 621,126 | |||||||
| 2002 | ||||||||||
| Crude sales sold FCA | 12.74 | 13.48 | 171,711 | |||||||
| Crude sales sold non-FCA | 10.21 | 22.70 | 231,766 | |||||||
| Kazgermunai export sales | 2.94 | 14.22 | 41,813 | |||||||
| Royalty payments | 3.48 | 9.27 | 32,247 | |||||||
| Crude oil domestic sales | 0.50 | 7.15 | 3,577 | |||||||
| Total | 29.87 | 16.11 | 481,114 | |||||||
As in our net return discussion, net realized prices are dependent on the world price for crude oil, the export route used and the point of sale or terms of sales, all of which may vary significantly from period to period. Our differential from Brent is our key performance indicator.
| 48 PetroKazakhstan Inc. |
2004 versus 2003:
| 4 | Our increase of $371.8 million in crude oil sales for 2004 compared to 2003 was due to the increased market price for crude oil (average Brent for 2004 increased by $9.44/bbl) and higher sales volumes realized on non-FCA terms. |
| 4 | The positive effect from the increase in market prices was partially offset by higher hedging expenses that decreased our revenue by $42.1 million. |
| 4 | Royalty payment volumes are physical deliveries made quarterly in arrears for all fields with the exception of our North Kumkol and Kazgermunai fields. There were no royalty in-kind volumes in first half of 2003, because we settled our royalty obligations with cash payments. |
2003 versus 2002:
| 4 | Our increase of $140.0 million in crude oil revenue for 2003 compared to 2002 was due to the increase in the average price we receive for our exported crude oil. Our total volumes of crude oil sold were virtually unchanged as our increase in production was processed through our refinery. |
| 4 | We increased our net realized price by $4.58/bbl. We achieved this increase mainly because average Brent for the year was $3.81/bbl higher when compared to 2002. Additionally, we increased our non-FCA volumes, which obtain a higher price, as the sale is made closer to the final destination. |
| 4 | Kazgermunai also contributed to the increase because they increased crude oil revenue by $59.5 million due to an almost doubling of export volumes and a $3.56 increase in the price received per barrel. |
| 4 | We have dramatically increased the percentage of our oil export sales sold through non-FCA contracts in 2003, which were 64.6% in 2003 (34.2% in 2002). By the end of 2003 there were no crude oil sales sold on an FCA basis. |
Refined products
The tables below set forth the related tonnes of refined products sold, the average prices obtained and revenues received for 2004, 2003 and 2002:
| Tonnes | Average | |||||||||
Year ended December 31 | sold | price | Revenue | |||||||
($/tonne) | ($000's) | |||||||||
2004 | 3,298,956 | 193.82 | 639,405 | |||||||
| 2003 | 3,617,085 | 133.07 | 481,326 | |||||||
| 2002 | 3,160,062 | 105.26 | 332,639 | |||||||
2004 versus 2003:
Refined product revenues of $639.4 million in 2004 showed an increase of $158.1 million as compared to 2003. The main contributing factors were as follows:
| 4 | Strong world crude oil prices during the period, which resulted in higher average product prices in Kazakhstan and its neighboring countries. This increased revenues by $160.1 million in 2004. |
| 4 | The shift from FCA to non-FCA export terms during the period. A portion of the non-FCA sales price includes the recovery of transportation costs to the delivery point where title transfers to the customer, usually at the Kazakhstan border. This transfer to non-FCA terms added approximately $40.3 million to refined products revenues. |
| 4 | The sale of our new product VGO, a product not produced or sold in 2003. The commissioning of the Vacuum Distillation Unit at our Shymkent refinery in January 2004 allowed us to further refine Mazut, a low-grade product, into VGO, which realizes a considerably higher price on the export market. VGO sales generated $66.6 million of revenues in 2004. |
| 4 | The foregoing factors were partially offset by $42.3 million due to the decrease in sales of refined products. |
| 49 |
2003 versus 2002:
The revenue increase in 2003 of $148.7 million was due to our higher average realized price of $133.07/tonne (compared to $105.26/tonne in 2002) and our higher sales volumes of 3.6 million tonnes (compared to 3.2 million tonnes in 2002).We were able to obtain higher prices and volumes for 2003 as compared to 2002, as demand in Kazakhstan increased.
We increased our refinery throughput in 2003, as we were experiencing interruptions in our ability to export crude oil at the beginning of the year. This led to a 457,023 tonne, or 14.5%, increase in refined product sales. Our average price increase of $27.81/tonne was mainly due to increases in prices received for gasoline and diesel.
PRODUCTION EXPENSES
Production expenses relate to the cost of producing crude oil in our Upstream operations. Based on the number of barrels of oil produced, these costs were as follows:
| Production | Per barrel of | ||||||
Year ended December 31 | expenses | oil produced | |||||
($000’s) | ($/bbl) | ||||||
2004 | 89,339 | 1.62 | |||||
| 2003 | 65,516 | 1.19 | |||||
| 2002 | 60,596 | 1.22 | |||||
2004 versus 2003:
Production expenses increased by $23.8 million, or $0.43/bbl, for the year ended December 31, 2004. The main contributing factors were as follows:
| 4 | The continued increase in water cut at our Kumkol South, South Kumkol and Kumkol North fields and additional wells placed on artificial lift resulted in increased expenditures of $5.9 million, or $0.11/bbl. Additional investments will be made during 2005 on water handling facilities which we expect to reduce our production expenses |
| 4 | In our KAM fields, we are operating single well batteries pending completion of infrastructure. We also commissioned a number of new facilities: Aryskum central processing facility, Aryskum gas compressor for gas re-injection, Maibulak water injection, Aryskum pumping station on our KAM pipeline, and we commenced installation of artificial lift, all of which led to higher costs of approximately $6.8 million, or $0.12/bbl. |
| 4 | Direct production expenses in our joint ventures did not significantly change in 2004 compared to 2003. However, our production expenses in 2003 included adjustments in our Turgai joint venture related to 2002 and the reversal of over accrued insurance costs, which reduced 2003 expenses by $2.3 million. There were also significant changes in the levels of inventory in Turgai that impacted our production expenses. These factors had an impact of $0.13/bbl on our consolidated production costs. |
2003 versus 2002:
Production expenses increased by $4.9 million in 2003. The main reason was the 11.4% increase in production volumes, which led to an increase of $3.8 million. The remaining $1.1 million was due to increased costs because of the increasing production of formation water.
| 50 PetroKazakhstan Inc. |
ROYALTIES AND TAXES
The following table sets forth the components of royalties and taxes:
($000’s) | 2004 | 2003 | 2002 | |||||||
| Royalties and production bonus | 81,185 | 56,016 | 47,892 | |||||||
| Tax assessments | 14,452 | 5,401 | 5,121 | |||||||
| ARNM assessment | 5,045 | - | - | |||||||
| Other taxes | 25,762 | 20,878 | 15,701 | |||||||
| Royalties and taxes | 126,444 | 82,295 | 68,714 | |||||||
Royalties and production bonus
Royalties are levied at differing rates for each of our oil fields. The table below sets forth the parameters for each production field. Royalty terms remain the same throughout the term of the license.
| Annual production | ||||||||||||||||
| at which | Effective | Effective | Effective | |||||||||||||
| maximum royalty | average royalty | average royalty | average royalty | |||||||||||||
| Field | Range | rate is charged | rate for 2004 | rate for 2003 | rate for 2002 | |||||||||||
| Kumkol South | 3.0 - 15.0 | % | 11.62 mmbbls | 8.9 | % | 10.3 | % | 10.9 | % | |||||||
| Kumkol North | 9 | % | Flat | 9.0 | % | 9.0 | % | 9.0 | % | |||||||
| South Kumkol | 10 | % | Flat | 10.0 | % | 10.0 | % | 10.0 | % | |||||||
| Kyzylkiya | 1.5 - 2.5 | % | 24.8 mmbbls* | 1.5 | % | 1.5 | % | 1.5 | % | |||||||
| Aryskum | 1.5 - 2.5 | % | 52.7 mmbbls* | 1.5 | % | 1.5 | % | 1.5 | % | |||||||
| Maibulak | 3.0 - 6.0 | % | 3.9 mmbbls | 3.0 | % | 3.0 | % | 3.0 | % | |||||||
| Kazgermunai Fields | 3.0 - 15.0 | % | 11.62 mmbbls | 8.94 | % | 6.12 | % | 4.5 | % | |||||||
* | Royalty rate is based upon cumulative life of field production. |
Royalties and production bonus for the year ended December 31, 2004 were $81.2 million, which represented an effective overall royalty rate of 7.9% excluding production bonuses of $0.7 million for our Kumkol North field. Royalties and production bonus for 2003 were $56.0 million, which represented an effective overall royalty rate of 8.6% excluding production bonuses of $1.4 million for Kumkol North, Kumkol South and South Kumkol fields. The main reason for the lower overall royalty rate was that a higher proportion of production came from fields with lower royalty rates. Despite the decrease in the average rate, royalties and taxes increased due to the increase in crude oil prices.
Royalties and production bonus for 2002 were $47.9 million, an overall royalty rate of 9.0%, after excluding the production bonuses of $4.0 million. The reason for the lower overall royalty rate in 2003 was that a higher proportion of production came from fields with lower royalty rates.
Our production bonus expense was $0.7 million in 2004, $1.4 million in 2003 and $4.0 million in 2002. In 2004 production bonus expenses related only to our North Kumkol field. In 2003 and 2002 our production bonuses were related to our Kumkol South, South Kumkol and North Kumkol fields. The bonus decreased by $2.6 million in 2003, because we paid the final amount for our Kumkol South field in February of 2003 and on our South Kumkol field in October of 2003. We have to pay a further $1.0 million (our 50% share) for North Kumkol when the cumulative production reaches 15,000,000 tonnes (116.2 million barrels), which we expect to occur in 2005.
| 51 |
Tax assessments
Our tax assessments of $14.5 million in 2004 included the following amounts:
| 4 | $8.0 million in fines and penalties on road fund taxes related to assessments for 1998-1999 and $2.1 million for royalties on associated gas related to tax assessments for 2000-2001. See Note 18 to our consolidated financial statements for the year ended December 31, 2004. |
| 4 | Additional $2.9 million provided for 2002 and 2003, because we lost the tax cases on royalties on associated gas for 2000-2001. An additional provision of $1.6 million for penalties was recorded relating to interest charges on this tax assessment. |
Tax assessments of $5.4 million in 2003 included the following amounts related to the tax assessments for 2000 and 2001:
| 4 | $2.1 million of the assessments related to the revaluation of assets for tax purposes. |
| 4 | $1.7 million of social and employment fund taxes. |
| 4 | $0.2 million on royalties on associated gas. |
| 4 | $0.8 million of the assessments related to transfer pricing and $0.6 million of other taxes. |
Tax assessments of $5.1 million in 2002 include $2.9 million related to assessments for 1998 and 1999 and $2.2 million related to assessments for 2000 and 2001.
See Note 18 to our consolidated financial statements for the year ended December 31, 2004.
ARNM assessment
The Agency for Regulation of Natural Monopolies and Protection of Competition (“ARNM”) alleged that PetroKazakhstan Oil Products (“PKOP”), our subsidiary that operates our refinery, charged prices for refined oil products that in total were $6.3 million in excess of ARNM authorized maximum prices. In April 2004, following a Supreme Court decision, we paid $3.6 million to satisfy the assessment. PKOP provided an additional $1.4 million in December 2004. See Note 18 to our consolidated financial statements for the year ended December 31, 2004.
Other taxes
Other taxes of $25.8 million in 2004 included:
| 4 | Excise tax on refined products ($12.9 million in 2004 compared to $12.4 million in 2003). |
| 4 | Payment to satisfy an environmental claim ($2.0 million in 2004, nil in 2003). |
| 4 | Non-recoverable value added tax on crude oil ($4.3 million in 2004 compared to $4.1 million in 2003). |
| 4 | Various taxes, including property taxes, road fund and other ($6.6 million in 2004 compared to $4.4 million in 2003). |
The increase in other taxes for 2003 compared to 2002 of $5.2 million was mainly due to $4.1 million of expensed VAT and various other taxes. Tax legislation amendments introduced at the beginning of 2003 required the expensing of a portion of VAT for crude oil purchases made by the refinery.
| 52 PetroKazakhstan Inc. |
TRANSPORTATION
Transportation costs are the costs of shipping crude oil from our central processing facility located at South Kumkol (“CPF”) to our Shymkent refinery, our rail terminals at Tekesu (adjacent to our refinery), Dzhusaly and the terminal at Atasu for oil destined for China. It also includes the costs of trucking crude oil from our KAM fields to the CPF, railway transportation, vessels chartering and pipeline costs under non-FCA crude sales contracts and for the export of refined products. Transportation costs also include transportation of crude produced by our Kazgermunai joint venture to its export customers.
As noted in our net return discussion, the changes in our transportation and selling costs are largely dependent on our choice of export routes and the terms of sales, which vary from period to period. Our differential from Brent is the key performance indicator, which can be used to assess the results of our exports. Please see the discussion of our differential inOverview and Strategy, Key Performance Indicators.
The table below sets out the components of transportation costs:
($000’s) | 2004 | 2003 | 2002 | |||||||
| Pipeline | 33,207 | 58,004 | 56,230 | |||||||
| Kazgermunai transportation | 31,990 | 18,675 | 8,462 | |||||||
| Crude oil export | 157,529 | 137,251 | 93,305 | |||||||
| Refined products export | 40,320 | 2,011 | - | |||||||
| Other | 8,763 | 9,046 | 5,804 | |||||||
| Total | 271,809 | 224,987 | 163,801 | |||||||
Pipeline
Pipeline costs decreased by $24.8 million during 2004 compared to 2003 primarily reflecting the following:
| 4 | Decrease of $19.8 million, as a result of a decrease in volumes sold for export through the Kumkol - Shymkent pipeline (2.5 mmbbls in 2004 compared to 15.7 mmbbls in 2003), partially offset by higher tariffs for the Kumkol - Shymkent pipeline in 2004 ($1.66/bbl in 2004 compared to $1.52/bbl in 2003) due to the strengthening of the Tenge to the U.S. dollar. |
| 4 | Decrease of $10.5 million in non-FCA pipeline costs (nil for 2004 compared to $10.5 million in 2003) because we did not use the Atyrau - Samara pipeline. |
| 4 | Decrease of $1.2 million, as a result of a decrease of 4.2 mmbbls in crude oil volumes sent to the refinery through the Kumkol - Shymkent pipeline. |
| 4 | A partial offset attributable to an increase of $6.7 million on volumes shipped through our KAM pipeline and through the Atasu terminal for China. Our KAM pipeline became operational in the third quarter of 2003; hence our expenses related to the KAM pipeline are higher by $4.0 million for 2004 compared to 2003, as there were no expenses for the first half of 2003. Our transportation expenses through Atasu terminal were higher by $2.0 million as we shipped 5.0 mmbbls in 2004 compared to 2.8 mmbbls in 2003. |
Pipeline costs slightly increased by $1.8 million during 2003 compared to 2002 primarily reflecting the following:
| 4 | $2.7 million increase attributable to higher volumes supplied to Downstream for processing (24.51 mmbbls in 2003 compared to 21.21 mmbbls in 2002). |
| 4 | $2.5 million due to the increased export tariff to Shymkent ($1.52/bbl in 2003 versus $1.41/bbl in 2002). |
| 4 | $1.6 million increase in non-FCA pipeline costs ($10.5 million for 2003 compared to $8.9 million for 2002) because of our use of the Atyrau-Samara pipeline for the first six months of 2003. |
| 4 | These increases were partially offset by $5.0 million in savings from using our KAM pipeline, when compared to exports of crude oil through our Tekesu rail terminal located in Shymkent. |
| 53 |
Kazgermunai transportation
Kazgermunai transportation increased by $13.3 million in 2004 compared to 2003 due to a 22% increase in sales volumes and increases in railway tariffs.
Crude oil export
Export transportation of crude oil increased by $20.3 million in 2004, as we moved our sales points closer to end-users. This included $8.2 million for sea freight and demurrage fees, as we chartered our own vessels for crude deliveries into the Mediterranean, and $3.6 million of additional railcar lease expenses in line with our strategy of securing control over our transportation. The remaining increase was the combination of higher crude export sales volumes and a different mix of routes.
Export transportation of crude oil increased by $44.0 million or 47.1% for 2003 compared to 2002 due to our increase in non-FCA sales. Non-FCA sales increased by 90.0% in 2003 compared to 2002 (19.40 mmbbls versus 10.21 mmbbls). Additionally, the ARNM approved a 6% increase in rail tariffs effective January 1, 2003.
Refined products export
In 2004 export transportation of refined products increased by $38.3 million, as we exported 435,800 tonnes of various products on a non-FCA basis as compared to only 22,000 tonnes during 2003.
Other
Other transportation costs are mainly trucking costs incurred to transport crude oil from the KAM fields to the CPF located at Kumkol.
REFINING
Refining costs represent the direct costs related to processing all crude oil including tollers’ volumes at the refinery.
Refining costs for 2004 were $21.6 million ($0.80/bbl) compared to $17.8 million ($0.58/bbl) in 2003. The main reasons for the $3.8 million increase in refining costs were higher repair costs incurred during the turnaround and to a lesser extent, additional purchased steam and electric power related to the start-up and operation of the Vacuum Distillation Unit during 2004. Major repairs of the main crude processing units, visbreaker and storage facilities were also completed throughout the year.
Refining costs for 2003 were $17.8 million ($0.58/bbl) compared to $21.7 million ($0.80/bbl) in 2002. The main reason for the $3.9 million decrease in refining costs was that purchased steam costs were lower as a result of process improvements and equipment upgrades combined with a lower price per unit. With no major turnaround in 2003, the refinery’s repairs, maintenance and other expenses were also $1.0 million lower.
CRUDE OIL AND REFINED PRODUCT PURCHASES
Crude oil and refined product purchases represent the expensed portion of crude oil purchased for the refinery from third parties, as well as refined products purchased for resale. Purchases and sales between our Upstream and Downstream business units are eliminated on consolidation.
| 54 PetroKazakhstan Inc. |
Our purchases of crude oil and refined products were as follows:
($000’s) | 2004 | 2003 | 2002 | |||||||
| Crude oil | 104,575 | 55,886 | 69,410 | |||||||
| Refined products | 6,764 | 574 | 3,917 | |||||||
| Total | 111,339 | 56,460 | 73,327 | |||||||
Crude oil purchases are higher by $48.7 million in 2004 as compared to 2003. During the first quarter of 2004 we repurchased royalty-in-kind volumes for $17.1 million and subsequently resold them. The remaining purchases of crude oil were made from our joint ventures for further refining. The volumes purchased from the joint ventures during 2004 and 2003 are approximately the same, however, the increase in world crude oil prices led to higher purchase costs.
SELLING
Selling expenses for crude oil are comprised of customs, quality inspection and costs related to the export of crude oil. Selling expenses for refined products are comprised of the costs of operating the regional distribution centres and other administrative costs related to our Downstream operations.
($000’s) | 2004 | 2003 | 2002 | |||||||
| Crude oil | 18,084 | 10,495 | 3,471 | |||||||
| Refined products | 19,850 | 18,034 | 19,782 | |||||||
| Total | 37,934 | 28,529 | 23,253 | |||||||
2004 versus 2003:
The increase in crude oil selling expenses in 2004 was mainly due to marketing management fees of $3.8 million charged by our partner in Turgai related to Turgai’s export sales through the CPC pipeline.
In addition, Turgai selling expenses includes unloading fees, for crude oil sold at the CPC pipeline inlet at Atyrau. These loading fees were $1.4 million for 2004. The remaining increases in crude oil selling expenses are attributable to the administrative costs of our marketing and transportation business unit due to the increased level of activity.
Selling expenses related to refined products increased in 2004 due to increases in storage fees, transportation security fees and personnel costs. We did, however, take measures in the fourth quarter of 2004 to rationalize the domestic wholesale business resulting in the closure of two low volume distribution outlets and other cost reduction measures.
2003 versus 2002:
The increase in crude oil selling expenses during 2003 compared to 2002 was the direct result of increased export sales volumes related to non-FCA routes, for which all selling costs are borne by us, as well as the increase in Kazgermunai sales and a reclassification of certain crude oil marketing costs to selling from general and administrative expenses.
The decrease in selling expenses on refined products during 2003 was due to the fact that in 2002 Downstream refunded $1.1 million of transportation discounts it had received, as it had not met the throughput obligations under a transportation contract. This contract is no longer in effect.
| 55 |
GENERAL AND ADMINISTRATIVE
The table below analyzes total general and administrative costs for Upstream, Downstream and Corporate. In the case of Upstream and Downstream the general and administrative costs are also reflected on a per barrel basis.
| General and | Per barrel of oil | ||||||
| administrative | produced or processed* | ||||||
($000’s) | ($/bbl) | ||||||
2004 | |||||||
| Upstream | 34,955 | 0.63 | |||||
| Downstream | 14,493 | 0.53 | |||||
| Corporate | 11,467 | ||||||
| Total | 60,915 | ||||||
| 2003 | |||||||
| Upstream | 32,721 | 0.59 | |||||
| Downstream | 16,075 | 0.53 | |||||
| Corporate | 5,483 | ||||||
| Total | 54,279 | ||||||
| 2002 | |||||||
| Upstream | 37,093 | 0.75 | |||||
| Downstream | 17,216 | 0.64 | |||||
| Corporate | 4,570 | ||||||
| Total | 58,879 | ||||||
* Including tollers’ volumes
2004 versus 2003:
| 4 | Downstream general and administrative expenses were lower in 2004, because in 2003 we recorded severance payments to the employees of the non-core business units divested in 2003 and related divestiture expenditures. |
| 4 | The increase in corporate expenses was mainly due to $4.0 million of compensation cost being recognized for stock options pursuant to a new accounting standard. See Note 2 to our consolidated financial statements. The remaining increase in corporate and Upstream expenses is attributable to increased activity levels. |
2003 versus 2002:
| 4 | Upstream expenses decreased by $4.4 million in 2003 due to the reclassification of certain costs relating to crude oil marketing to selling expenses. |
| 56 PetroKazakhstan Inc. |
INTEREST AND FINANCING
The following table sets forth our interest and financing costs and any related amortization of debt issue costs or discounts upon issuance of the debt instrument:
($000’s) | 2004 | 2003 | 2002 | |||||||
| 9.625% Notes | 14,539 | 11,860 | - | |||||||
| Term facility | 6,082 | 9,858 | 4,106 | |||||||
| Commitment fees and amortization of deferred charges on $100 million committed credit facility | 629 | - | - | |||||||
| Short-term debt | 790 | 754 | 1,470 | |||||||
| 12% Notes | - | 8,718 | 24,936 | |||||||
| Kazgermunai debt | 1,331 | 1,657 | 3,447 | |||||||
| Term loans | 503 | 594 | 332 | |||||||
| PKOP bonds | 469 | 2,576 | 1,514 | |||||||
| Less portion capitalized | (13 | ) | (438 | ) | (332 | ) | ||||
| Total | 24,330 | 35,579 | 35,473 | |||||||
2004 versus 2003:
| 4 | Our 9.625% Notes interest expense increased in 2004 by $2.7 million, as the Notes were issued in February 2003. |
| 4 | Our term facility interest expense decreased by $3.8 million in 2004 due to the full repayment of the facility. |
| 4 | PKOP bonds were fully redeemed on February 26, 2004. |
| 4 | Our 12% Notes interest expense in 2003 was $8.7 million including $6.6 million of issue costs that were expensed when we redeemed these notes on February 2, 2003. |
2003 versus 2002:
| 4 | Our 9.625% Notes interest expense arose only in 2003 as these notes were issued in February 2003. |
| 4 | Our term facility interest expense increased by $5.8 million due to the repayment of the previous $60.0 million facility and entering a new $225.0 million facility. |
| 4 | Our 12% Notes interest expense in 2003 is $8.7 million including $6.6 million of issue costs that were expensed when we redeemed these notes, whereas 2002 includes interest for the entire year. |
| 4 | Interest on our Kazgermunai debt decreased by $1.8 million due to an $18.3 million (our 50% share) repayment of the debt. |
| 4 | Interest on our PKOP bonds increased by $1.1 million due to the issuance of the remaining 115,200 bonds in February 2003. |
DEPRECIATION AND DEPLETION
| Depreciation and | Depreciation and | ||||||
| depletion | depletion | ||||||
($000’s) | ($/bbl*) | ||||||
2004 | |||||||
| Upstream | 83,927 | 1.52 | |||||
| Downstream | 20,338 | 0.89 | |||||
| Corporate | 1,255 | ||||||
| Total | 105,520 | ||||||
* | Downstream includes tollers’ volumes |
| 57 |
| Depreciation and | Depreciation and | ||||||
| depletion | depletion | ||||||
($000’s) | ($/bbl*) | ||||||
| 2003 | |||||||
| Upstream | 63,321 | 1.15 | |||||
| Downstream | 18,849 | 0.62 | |||||
| Corporate | 182 | ||||||
| Total | 82,352 | ||||||
| 2002 | |||||||
| Upstream | 32,970 | 0.66 | |||||
| Downstream | 13,347 | 0.49 | |||||
| Corporate | 94 | ||||||
| Total | 46,411 | ||||||
* | Downstream includes tollers’ volumes |
The increase in Upstream depreciation and depletion expense of $20.6 million was mainly due to the increase in our depletable assets and future development costs. Our Upstream depletion expense for 2004 includes accretion expense relating to our asset retirement obligations of $2.4 million ($2.1 million in 2003 and $1.8 million in 2002).
Upstream depreciation and depletion increased by $30.4 million during 2003 compared to 2002. This increase was mainly due to an increase in the amounts subject to depletion or depreciation as a result of capital expenditures. Our 11.4% increase in production and 10.4% decline in proved producing reserves also increased our depletion charge. Downstream depreciation increased by $5.5 million in 2003 compared to 2002 mainly due to additional depreciation for assets, which were under construction in 2002.
UNUSUAL ITEMS
There were no unusual items in 2004 and 2003.
We were named as defendants in a claim filed by a company alleging it was retained under a consulting contract. The arbitration decision was received in 2002 and we accrued and paid $7.1 million for full settlement of the claim.
INCOME TAXES
2004 | 2003 | 2002 | ||||||||
| Upstream | 218,214 | 78,893 | 71,807 | |||||||
| Downstream | 75,253 | 72,370 | 18,691 | |||||||
| Corporate | 7,616 | 4,359 | 9,845 | |||||||
| Total | 301,083 | 155,622 | 100,343 | |||||||
Income taxes increased by $145.5 million in 2004 compared to 2003 mainly due to the following:
| 4 | $98.5 million was due to an increase in income before taxes. |
| 4 | We provided for $35.0 million of excess profit tax in Turgai for 2004. See Note 18 to our consolidated financial statements. |
| 4 | $10.1 million of tax assessments settled in 2004 are not deductible for tax. |
| 4 | In Kazgermunai we incurred an additional $12.2 million of income tax because the marginal tax rate exceeded the statutory tax rate resulting in the effective tax rate becoming 38.6% for 2004. See Kazgermunai discussion in the following paragraphs. |
The increase in income taxes of $55.3 million in 2003 was mainly the result of the increase in sales volumes and in the price of crude oil and refined products, which led to an increase in income before income taxes of $211.1 million.
| 58 PetroKazakhstan Inc. |
Kazakhstani income taxes are based upon stabilized tax regimes under the terms of our hydrocarbon contracts. The majority of the differences are temporary differences where an expense item is recorded for Canadian GAAP purposes in a different period than allowed under the terms of our hydrocarbon contracts. The income tax rate is 30%.
The foundation agreement for Kazgermunai provides for a tax on the profits of Kazgermunai with respect to its operations in the Akshabulak, Nurali and Aksai fields. The foundation agreement provides for taxes of:
Range ($ millions) | Income tax rate | |||
| Up $20.0 | 25 | % | ||
| $20.0 - $30.0 | 30 | % | ||
| $30.0 - $40.0 | 35 | % | ||
| Over $40.0 | 40 | % | ||
Income taxes in our corporate segment are the withholding taxes on the dividends paid from subsidiaries in Kazakhstan to Canada.
Excess profit tax has been negotiated with the Kazakhstani government in each hydrocarbon contract with the exception of the Kazgermunai licenses. With respect to the Kumkol South, South Kumkol and KAM fields, we are subject to excess profit tax at rates that vary from 0% to 30% based on the cumulative internal rate of return. With respect to North Kumkol, we are subject to excess profit tax at rates that vary from 0% to 50% based on the cumulative internal rate of return.
We have provided $70.0 million (our 50% share) for excess profit tax for North Kumkol in 2004. This amount is included in our current income taxes. Because excess profit tax is deductible in the following year, we have recorded a future income tax asset of $35.0 million, which represents 50% of our provision for excess profit tax.
We did not incur excess profit taxes in 2004 for any of our other fields.
Strategy: Capitalize on development opportunities and explore our undeveloped properties
CAPITAL EXPENDITURES AND COMMITMENTS
The table below sets forth a breakdown of our capital expenditures in 2004, 2003 and 2002:
2004 | 2003 | 2002 | ||||||||
| Upstream | ||||||||||
Development wells | 30,898 | 56,767 | 40,489 | |||||||
Facilities and equipment | 90,945 | 92,002 | 67,884 | |||||||
Exploration | 27,150 | 34,365 | 23,502 | |||||||
| Downstream | ||||||||||
Refinery HS&E | 2,242 | 704 | 773 | |||||||
Refinery sustaining | 5,802 | 2,571 | 4,019 | |||||||
Refinery return projects | 3,661 | 15,024 | 3,364 | |||||||
Marketing and other | 3,982 | 771 | 71 | |||||||
| Corporate | 1,272 | 1,009 | - | |||||||
| Total capital expenditure | 165,952 | 203,213 | 140,102 | |||||||
| Less accrued amounts | (2,722 | ) | (6,743 | ) | (3,250 | ) | ||||
| Total cash capital expenditure | 163,230 | 196,470 | 136,852 | |||||||
Capital expenditures amounted to $166.0 million for the year 2004, compared to our budget of $176.0 million.
| 59 |
Development wells. In 2004 we continued developing our KAM fields and invested approximately $12.3 million in drilling 23 wells. At North Nurali, we have completed stimulation, testing and evaluation work at 3 wells and drilled an additional 2 wells, all of which amounted to $2.7 million. Turgai invested approximately $8.0 million (our 50% share) in drilling new wells. We have also spent $7.2 million (our 50% share) in Kazgermunai on further development of the Akshabulak, Aksai and Nurali fields.
Facilities and equipment. We spent approximately $24.6 million for facilities under our KAM fields development program, which included construction of flowlines and road facilities, installation of gas re-injection facilities in the Aryskum field as well as installation of artificial lift on certain wells. We have invested $10.0 million in upgrades, tanks, storage facilities and equipment for our crude loading facilities at Dzhusaly and continued to expand our railcar fleet by investing $30.0 million for an additional 800 railcars. Kazgermunai spent $5.9 million (our 50% share) on the first phase of our gas utilization plant in our Akshabulak field and we plan to spend $5.6 million in 2005 to complete the facility.
Exploration.Our 2004 exploration program focused on our Aryskum, Kolzhan, Zhamansu and Doshan licences. We acquired and analyzed seismic data and drilled exploration wells, investing $27.2 million in 2004. We have drilled 5 wells in Aryskum in 2004 and discovered a new reservoir, which will be further appraised in 2005. We have also carried out two seismic programs and drilled 5 wells on our Kolzhan license, all of which encountered hydrocarbons. This program proved that we have a northern extension to our Kyzylkiya field. An appraisal program is planned over this area in 2005. In 2004 we became the operator of two blocks, Zhamansu and Doshan in license 951 with a 75% interest. We spent $6.0 million on drilling exploration wells in these blocks, which remain highly prospective and will be further explored in 2005.
Our 2005 capital expenditure program is currently allocated as follows:
| Business Unit | ($ millions) | |||
Upstream (including joint ventures) | 211.0 | |||
| Downstream | 14.0 | |||
| Marketing and transportation | 2.0 | |||
| Corporate | 16.0 | |||
| Total | 243.0 | |||
The key items included within the capital budget are:
Upstream
| 4 | Continued full field development of the KAM fields. |
| 4 | An exploration and appraisal program, including the drilling of 17 wells. |
| 4 | Significant seismic programs, both 3D and 2D. |
| 4 | Development of the East Kumkol field. |
| 4 | Pilot test production phase of the North Nurali field. |
| 4 | Kumkol South infill drilling and production facilities enhancements. |
| 4 | Phase 1 of the Kumkol South enhanced oil recovery (“EOR”) project. |
| 4 | Commissioning of the Akshabulak gas plant for LPG production. |
| 4 | Commissioning of additional Akshabulak facilities for increased production. |
| 4 | Completion of Kumkol North development drilling and facilities enhancements. |
The firm exploration and appraisal budget has been set at a base level of $20.0 million with additional funds available for potential appraisal wells and new opportunities.
Downstream
| 4 | Additional refinery equipment installation and process optimizations. |
| 4 | Expansion of retail stations. |
| 4 | Upgrading of equipment at distribution centers. |
| 60 PetroKazakhstan Inc. |
Corporate
| 4 | First phase of construction of a head office in Astana, subject to obtaining a building permit. |
We have a commitment for construction of a gas plant at Kazgermunai; our 50% share is $11.5 million. These commitments are included in our capital budget for 2005. The remainder of our capital budget can be modified, if necessary, to meet changing circumstances.
Capital investments are judged against our internal investment criteria that require that:
| 4 | Investments generate a real internal rate of return of 15%. |
| 4 | That the present value discounted at 10% of the return from the investment is sufficient to repay the investment plus a 50% premium. |
| 4 | The long term real Brent oil price is $25.00/bbl. |
Contractual commitments
In addition to the above, we have the following contractual obligations as at December 31, 2004:
| Total commitments by period | ||||||||||||||||
($ millions) | Total | Within 1 year | 1-3 years | 4-5 years | After 5 years | |||||||||||
| Long-term debt | 134.9 | 15.5 | 3.7 | 1.9 | 113.8 | |||||||||||
| Estimated interest payments | 92.8 | 17.9 | 36.9 | 37.6 | 0.4 | |||||||||||
| Operating leases | 104.0 | 43.0 | 59.8 | 1.2 | - | |||||||||||
| Capital leases | - | - | - | - | - | |||||||||||
| Future site restoration costs | 32.5 | - | - | - | 32.5 | |||||||||||
| Work commitments | 6.1 | 3.5 | 2.6 | - | - | |||||||||||
| Purchase obligations | 12.2 | 12.2 | - | - | - | |||||||||||
| Total | 382.5 | 92.1 | 103.0 | 40.7 | 146.7 | |||||||||||
Long-term debt - please refer to Note 11 in our consolidated financial statements for the year ended December 31, 2004.
Estimated interest payments relate to our outstanding debt balances as at December 31, 2004.
Operating leases are mainly for rail cars that we use to transport our crude oil and refined products and certain equipment used in our Upstream operations. Although we are committed to lease rail cars, our contracts allow the termination with a 30-day notice. We have no capital leases.
We have an obligation of $32.5 million for future site restoration costs as at December 31, 2004, which are the estimated future cash outflows discounted at 8.5%. The total undiscounted estimated cash flows required to settle the obligations are $77.4 million with the expenditures being incurred over ten years commencing in 2014.
Work commitments are non-discretionary expenditures for seismic and drilling that we have contractually committed to under the terms of our Hydrocarbons Licenses.
Purchase obligations represent contractual obligations for goods and services for which the services have yet to be provided or for which we have not yet taken title to the goods. All other purchase commitments are discretionary.
Sales commitments
We have sales commitments under contracts with two customers to supply an agreed volume of crude oil within the first four months of 2005. The estimated value of these commitments is approximately $43.1 million.
| 61 |
LIQUIDITY
The levels of cash, current assets and current liabilities as at December 31, 2004 and December 31, 2003 are set out below:
As at December 31 ($000’s) | 2004 | 2003 | |||||
| Cash and cash equivalents | 199,105 | 184,660 | |||||
| Cash flow | 560,491 | 399,975 | |||||
| Working capital * | 215,681 | 151,737 | |||||
| Net debt ** | (48,702 | ) | 135,220 | ||||
| Ratio of cash flow to net debt | - | 3.0 | |||||
| Ratio of cash flow to fixed charges*** | 20.9 | 10.6 | |||||
| Ratio of earnings to fixed charges **** | 30.9 | 13.6 | |||||
* | Working capital is net of cash and short-term debt |
** | Net debt includes short-term and long-term debt less cash |
*** | Fixed charges include interest expense and preferred dividends before tax |
**** | Earnings is income before income taxes plus fixed charges |
Our net working capital has increased mainly due to increases in our accounts receivable, inventory and prepaid expenses, partly offset by an increase in accounts payable. Our accounts receivable increased mainly because we sold 1.5 mmbbls of crude oil close to year end with payment due 30 days after the sale. Build up of unsold volumes of crude oil increased our inventory and prepaid expenses. The main components of the increase in accounts payable are income and excess profit tax, accrued dividends payable and amounts owed for crude oil purchased from one of our joint ventures.
Our restricted cash is $47.7 million as at December 31, 2004 ($35.5 million at December 31, 2003). Restricted cash includes $8.7 million of cash dedicated to a debt service reserve account for our term facility and $39.0 million of cash dedicated to a margin account for our hedging program. Though our term facility was fully repaid as at December 31, 2004, we still have a balance in our debt service reserve account because our hedging liability has not been discharged in full (see Note 8 to our consolidated financial statements).
The restricted cash balance related to our hedging program increased by $14.0 million compared to December 31, 2003 due to the change in the market value of our hedging contracts. Cash dedicated to our hedging margin account fluctuates on a weekly basis with fluctuations in the future Brent price for crude oil. As the year progresses we will settle our hedges, and the cash dedicated to our hedging margin account will likely reduce and is expected to be nil by December 31, 2005. See discussion of our hedging contracts in Note 15 to our consolidated financial statements for the year ended December 31, 2004.
Our long-term debt decreased substantially from $246.7 million at December 31, 2003 to $134.9 million at December 31, 2004, as we fully repaid our term facility at the end of September.
During the year ended December 31, 2004 Kazgermunai repaid $25.6 million of its long-term debt. Turgai repaid its shareholder loans of $22.0 million to us and $22.0 million to our partner. Turgai also paid each partner dividends of $25.5 million in the fourth quarter of 2004.
Our 9.625% Notes have a credit rating of B+ from Standard and Poors and Ba3 from Moody’s. We are in compliance with our debt covenants as of December 31, 2004.
| 62 PetroKazakhstan Inc. |
On May 25, 2004 we entered into a five and one half year $100.0 million committed credit facility. This facility is unsecured, bears interest at LIBOR plus 2.65% and is subject to annual review. $30.0 million of this facility has been dedicated to cover margin calls under our hedging program. In the event our credit rating decreases by 2 or more notches, we may be required to secure this facility with crude oil export contracts.
We also have available working capital facilities of $67.0 million. We believe we have sufficient funding and liquidity to meet our needs in 2005 through our cash flow and available credit facilities.
We have $93.9 million in future income tax assets, the recoverability of which is dependent on generating sufficient taxable income in our operating subsidiaries to realize our future income tax assets. Seventy percent of our future income tax assets are current and, accordingly, we expect to realize them within the next year.
RISK ANALYSIS
BUSINESS RISKS
Reserves and production
The addition of oil and gas reserves and our ability to develop these reserves is one of the key factors to our success. New exploration acreage must be acquired through acquisitions or obtaining additional licenses. We are actively pursuing acquisitions while adhering to our investment criteria. We have successfully acquired new exploration acreage in 2003 and 2004, including the Kolzhan, Zhamansu, Doshan and Karaganda blocks. We believe we are well positioned to continue to succeed as we have a demonstrated track record in discovering and developing reserves, continual involvement with the industry in Kazakhstan and with the Government of Kazakhstan and we have the financial capacity to execute transactions. This is a highly competitive process.
Our ability to discover new reserves and develop our reserves is another key to our success. We have introduced and continue to utilize Western technology in exploring for and developing reserves. We have the financial capacity to acquire and implement this technology but we compete for the staff and intellectual capacity necessary to fully utilize this technology. We have successfully addressed this through offering competitive compensation and recruiting on a worldwide basis. The recruitment of staff is a highly competitive process.
Evaluation of oil and gas reserves
The process of estimating our oil and gas reserves is complex and requires significant assumptions and decisions in the evaluation of engineering, geological, geophysical and financial information. On an annual basis McDaniel & Associates Consultants Ltd. of Calgary, Alberta, perform an independent evaluation of our reserves. This reserve evaluation may change substantively from year to year as a result of numerous factors, including but not limited to the development and economic conditions, under which we operate our business. As a result, despite all reasonable efforts involved in the process of evaluation, the estimation of our reserves may materially change from period to period.
Key performance indicators
Please refer to the section entitledKey Performance Indicators of our MD&A for a discussion of these indicators and their impact on our business.
Taxes
We have been engaged in litigation and disputes related to tax assessments. Future tax assessments could be significant as we experience inconsistent application and interpretation of the tax legislation applicable to each of our hydrocarbon contracts. The tax legislation applicable to each of our hydrocarbon contracts is stabilized at the legislation in effect on the date of signing the contract, all of which were signed from 1996 through 1998. As the legislation applicable to our contracts is from five to eight years old, the expertise pertaining to this legislation is diminishing within the tax inspectorate.
| 63 |
Kazakhstan environment and legislation
We have received assessments from the ARNM relating to the sale of refined products in Kazakhstan. The impact of these assessments will be significant, if we do not prevail in our view with respect to these assessments.
We believe we are currently in compliance with all existing environmental laws and regulations. However, as new environmental laws are enacted and the old laws are repealed, interpretation, application and enforcement of the laws may become inconsistent. Compliance in the future could require significant expenditures, which may adversely effect our operations.
MARKETING RISKS
Commodity prices
Commodity price risk related to conventional crude oil prices is our most significant market risk exposure. Crude oil prices are influenced by such worldwide factors as Organization of Petroleum Exporting Countries actions, political events and supply and demand fundamentals.
FINANCIAL RISKS
See Note 15 to our consolidated financial statements.
CRITICAL ACCOUNTING ESTIMATES
PROPERTY, PLANT AND EQUIPMENT
We follow the full cost method of accounting for oil and gas operations whereby all acquisition, exploration and development expenditures are capitalized. This may lead to the capitalization of costs for which no direct future benefit will be obtained.
We perform an impairment test on a quarterly basis to assess whether the carrying amount of our assets is recoverable from our undiscounted cash flow. This test is based on a number of estimates. We use our independent reservoir engineer’s estimate of our production from our proved reserves, forecasts of crude oil prices and estimated costs to produce our reserves and run our operations. All of these estimates are subject to uncertainty.
We use the unit of production method for calculating depletion of our oil and gas assets. Our reserve estimates, production volumes and estimated future development costs have a significant impact on our depletion expense.
ASSET RETIREMENT OBLIGATIONS
As described in Note 2 to our consolidated financial statements, effective January 1, 2004, we adopted the new recommendation of the Canadian Institute of Chartered Accountants (“CICA”) regarding asset retirement obligations. This new standard changes the method of estimating and accounting for future site restoration costs, and requires recording the fair value of asset retirement obligations when the related asset is brought into service rather than accruing the obligation over the useful life of the asset.
We have estimated the fair value of our asset retirement obligations based on existing laws, current costs and industry practices. Our estimate can be affected by changes in laws, costs and industry practice.
| 64 PetroKazakhstan Inc. |
CONTROL ENVIRONMENT
PetroKazakhstan maintains disclosure controls and procedures and internal control over financial reporting designed to ensure that information required to be disclosed in the reports filed under the United States Securities Exchange Act (“Exchange Act”) of 1934, as amended, and Multilateral Instrument 52-109 - Certificate of Discloser in Issuers’ Annual and Interim Filings (“MI 52-109”) is recorded, processed, summarized and reported within the time periods specified in the Securities and Exchange Commission’s rules and forms. PetroKazakhstan’s Chief Executive Officer and Chief Financial Officer, after evaluating the effectiveness of PetroKazakhstan’s disclosure controls and procedures (as defined in Exchange Act Rule 13a-15 (e) and in MI 52-109) as of December 31, 2004, concluded that as of such date PetroKazakhstan’s disclosure controls and procedures were effective for the purpose for which they were designed.
During the fiscal year ended December 31, 2004, there were no changes in PetroKazakhstan’s internal control over financial reporting that have materially affected, or are reasonably likely to materially affect, PetroKazakhstan’s internal control over financial reporting.
We are in the process of implementing a number of major modifications to our ERP system. We are also in the process of undertaking a comprehensive review of our existing controls over financial reporting to facilitate compliance with Section 404 of the United States Sarbanes-Oxley Act of 2002. We expect that these initiatives will lead to significant business process redesign, some of which will relate to controls over financial reporting.
QUARTERLY INFORMATION
The table below sets out selected quarterly information for 2004, 2003 and 2002:
Net Income Per Share | |||||||||||||
($000’s) | Total revenue | Net income | Basic | Diluted | |||||||||
2004, Quarter ended | |||||||||||||
| March 31 | 320,193 | 87,485 | 1.11 | 1.08 | |||||||||
June 30 | 398,501 | 122,028 | 1.54 | 1.51 | |||||||||
| September 30 | 518,602 | 176,218 | 2.30 | 2.27 | |||||||||
| December 31 | 405,131 | 114,937 | 1.51 | 1.49 | |||||||||
| 2003, Quarter ended | |||||||||||||
| March 31 | 248,923 | 68,552 | 0.87 | 0.83 | |||||||||
| June 30 | 254,601 | 68,430 | 0.88 | 0.84 | |||||||||
| September 30 | 303,152 | 91,150 | 1.17 | 1.12 | |||||||||
| December 31 | 310,648 | 88,808 | 1.14 | 1.09 | |||||||||
| 2002, Quarter ended | |||||||||||||
| March 31 | 143,331 | 22,860 | 0.28 | 0.27 | |||||||||
| June 30 | 177,398 | 33,456 | 0.41 | 0.40 | |||||||||
| September 30 | 247,962 | 60,230 | 0.74 | 0.71 | |||||||||
| December 31 | 256,659 | 44,851 | 0.56 | 0.54 | |||||||||
The historical quarterly information presented in these tables was restated due to the adoption of new accounting standards as described in Note 2 to our consolidated financial statements.
| 65 |
Quarterly highlights:
In the first quarter of 2004, our production decreased to 142,919 bopd from 164,559 in the previous quarter, a 13% decline. Throughout the quarter 19 Kumkol South wells were shut-in due to the border well issue with Turgai. There were also weather related restrictions, which led to reduced export shipments. The increased average Brent price of $32.03/bbl offset these decreases.
Our production levels in the last three quarters of 2004 remained at a lower level than our historical high at the end of 2003 due to increased water cut and the reduced production scheme for our Kumkol South field resulting from our border well dispute with Turgai. Our revenues and net income continued to grow in the second quarter and the third quarter of 2004 due to the increases in world crude oil prices, improvement of our differential and the production of VGO, our new product which decreased the production of low-value mazut. Average Brent was $35.32/bbl in the second quarter, $41.54/bbl in the third quarter and $43.85/bbl in the fourth quarter of 2004.
The last quarter of 2004 had lower revenues and net income than expected, because of deterioration in our differential and our inventory build up.
Increased world prices for crude oil in the first quarter of 2003 ($31.49/bbl) and improved prices for our refined products resulted in a 53% increase in our net income for the first quarter of 2003. However, because of transportation difficulties due to seasonal factors our crude oil exports were restricted, and we had to curtail our production to 140,765 bopd, a 10% decrease over the previous quarter.
During the last three quarters of 2003, we were continuously increasing our production in all fields (145,066 bopd in the second quarter, 154,712 bopd in the third quarter and 164,559 bopd in the fourth quarter of 2003). Together with the stable Brent price for crude oil (average $26.03/bbl in the second quarter, $28.38/bbl in the third quarter and $29.43/bbl in the fourth quarter of 2003) and improving prices for our refined products, we had steadily growing revenues and net income. Our refinery was fully operational throughout the year, as there was no major turnaround in 2003.
Our second quarter of 2002 results improved slightly compared to the first quarter of 2002 due to the increased average Brent crude oil price of $25.07/bbl as compared to $21.08/bbl in the previous quarter. This was offset in part by a 30-day shutdown of our refinery for a turnaround in the second quarter of 2002. Our production in the second quarter of 2002 was 117,844 bopd versus 123,372 bopd in the first quarter of 2002, mainly because of the major refinery turnaround.
We had a substantial increase in our sales and net income in the third quarter of 2002. Though the world crude oil prices did not increase materially ($26.91/bbl versus $25.07/bbl), our production reached 143,175 bopd and we also achieved record export sales. These achievements were partially offset by the continuing disappointing prices for refined products throughout 2002.
The transfer to non-FCA terms and a build up of inventory of crude oil in transit by the end of 2002 caused approximately $13.0 million of net income deferred from the fourth quarter of 2002 to the first quarter of 2003. This was the main reason for the decline in net income in the quarter. The Brent price was almost the same as in the third quarter of 2002 ($26.81/bbl), and our production reached 157,268 bopd.
| 66 PetroKazakhstan Inc. |
| Statement of Corporate Governance Practices |
The Board of Directors and senior management of the Corporation consider good corporate governance to be central to the effective and efficient operation of the Corporation and its business. The Board of Directors and management are committed not only to satisfying legal and regulatory requirements, but also to developing and maintaining corporate governance practices that reflect evolving best practices standards as appropriate to the Corporation and its business.
The Board of Directors and management have been following developments in corporate governance requirements and best practices standards in both Canada and the United States closely. The Corporation is listed on the New York Stock Exchange (the “NYSE”). Although it is not required to comply with many of the corporate governance listing requirements imposed by the NYSE for domestic listed issuers, the Corporation has aligned its governance practices with those requirements. The Board of Directors and management have reviewed the corporate governance policy (Multilateral Instrument 58-201) released by certain of the Canadian securities regulators for comment in January 2004. To the extent necessary, the Corporation intends to adapt its governance practices to the best practices set out in the final form of that policy.
TSX CORPORATE GOVERNANCE POLICY GUIDELINES
The 14 corporate governance guidelines set out in the TSX Corporate Governance Policy and a brief discussion of the Corporation’s corporate governance practices with reference to each guideline is set out below.
1. | The Board of Directors should explicitly assume responsibility for the stewardship of the Corporation, and specifically for: (a) adoption of a strategic planning process, (b) identification of principal risks and ensuring the implementation of appropriate systems to manage these risks, (c) succession planning, including appointing, training and monitoring senior management, (d) communications policy for the Corporation, and (e) integrity of the Corporation’s internal control and management information systems. | |
| The mandate of the Board of Directors is to manage the business and affairs of the Corporation. Pursuant to this mandate, it has explicitly assumed responsibility for the stewardship of the Corporation and, as part of the overall stewardship responsibility, has assumed the responsibilities described below. | ||
| a) | The Board of Directors provides input to management in the development of the Corporation’s strategic plan, approves that plan and monitors management’s execution of that plan. As part of the Board of Directors’ responsibility for the strategic planning process, the Board of Directors establishes the goals of the business of the Corporation with the input of management and strategies and policies within which the Corporation is managed. Management is required to seek approval of the Board of Directors for material deviations, financial or otherwise, from the approved business goals, strategies and policies. | |
| b) | It is management’s responsibility to identify the principal risks to the Corporation’s business and to develop strategies to manage those risks. The Board of Directors receives regular reports from management on those risks, the systems in place to manage those risks and the effectiveness of those systems. | |
| 67 |
| c) | The Board of Directors is responsible for the appointment, appraisal and monitoring of the Corporation’s senior management. The Corporation’s policy is to attract management personnel whose prior experience results in them having been well trained for their responsibilities with the Corporation. The Board of Directors discusses succession issues with the CEO on a regular basis and becomes acquainted with other members of senior management, their experience and skill sets. The Board of Directors encourages senior management to participate in appropriate professional and personal development activities, courses and programs, and supports management’s commitment to the training and development of all permanent employees. | |
| d) | The Board of Directors oversees the policy of communications by the Corporation with its shareholders and, in conjunction with management, continues to review the Corporation’s approach to communications with its shareholders, regulatory bodies, governments, media and the public. | |
| e) | The Board of Directors oversees the integrity of the Corporation’s internal control and management information systems, including through reports from management, from the external auditors and from the Audit Committee. In addition, a Disclosure Committee, composed of non-director members including financial officers of the Corporation, has been established to assist and advise the Chief Executive Officer and Chief Financial Officer with respect to the Corporation’s internal controls and disclosure of financial information. | |
2. | Majority of directors should be “unrelated” (free from conflicting interest). | |
| The TSX Guidelines provide that the term “unrelated director” means a director who is independent of management and is free from any interest and any business or other relationship which could, or could reasonably be perceived to, materially interfere with the director’s ability to act with a view to the best interests of the Corporation, other than interests and relationships arising from shareholdings. The Board of Directors consists of six members, five of whom are unrelated directors and one who is a related director. | ||
3. | Disclose for each director whether he or she is related, and how that conclusion was reached. | |
| The current Board of Directors is comprised of six directors, five of whom are unrelated to management. As the Corporation’s Chief Executive Officer, Bernard F. Isautier is a related director. The remaining directors, Louis W. MacEachern, James B.C. Doak, Jacques Lefèvre, Nurlan J. Kapparov and Jan Bonde Nielsen have no relationship with the Corporation other than as a director or a security holder and accordingly are all unrelated directors. The Corporation does not have a significant shareholder. | ||
4. | Appointment of a committee responsible for appointment/assessment of directors and that is comprised exclusively of outside (i.e. non-management) directors, a majority of whom are unrelated directors. | |
| The Corporate Governance Committee of the Board of Directors, which is comprised entirely of outside and unrelated directors, has been given the responsibility of assessing the effectiveness of the Board of Directors and its individual members as well as the committees of the Board of Directors. In addition, the Corporate Governance Committee has responsibility for identifying prospective nominees for the Board of Directors and recommending them to the Board of Directors and for establishing criteria for Board of Directors membership and retirement therefrom. | ||
| 68 PetroKazakhstan Inc. |
5. | Implement a process for assessing the effectiveness of the Board of Directors as a whole and its committees and individual directors. |
| The Corporate Governance Committee of the Board of Directors assesses, at least annually, the effectiveness of the Board of Directors and the committees of the Board of Directors. The assessments are carried out through one-on-one discussions between the Chair of the Corporate Governance Committee and each individual director. This process does not focus specifically on assessing the effectiveness of individual directors, but it provides an opportunity for each director to provide feedback on the effectiveness of the other directors. The Chair of the Corporate Governance Committee reports on the results of this process to the full Board of Directors. | |
6. | Provide orientation and education programs for new directors. |
| The directors who joined the Board of Directors most recently were provided with an orientation to the Corporation and education about the Corporation’s business and the environment in which it operates through discussions with the CEO and other members of management and a review of certain corporate records. As new directors join the Board of Directors in the future, they will receive similar orientation and education. | |
7. | Consider the size of the Board of Directors and the impact of the number on the Board of Directors’ effectiveness. |
| The Corporation’s articles require that the Board of Directors be comprised of three to nine directors. The number of directors is currently set at six. The Board of Directors is satisfied that this number allows for the balance of skill sets and experience appropriate to the effective discharge of the Board of Directors’ oversight responsibilities. | |
8. | The Board of Directors should review the adequacy and form of the compensation of directors to ensure compensation realistically reflects responsibilities and risks involved. |
| The Compensation Committee, which is comprised entirely of outside and unrelated directors, regularly reviews the adequacy and form of compensation of directors of the Corporation. Based on a review of the compensation paid to directors of Canadian companies of comparable size and on discussions among the directors, the Board of Directors is satisfied that it realistically reflects the responsibilities and risks involved. | |
9. | Committees of the Board of Directors should generally be composed of outside directors, a majority of whom are unrelated, although some committees, such as the executive committee, may include one or more inside directors. |
| The Board of Directors has established three committees: the Audit Committee, the Compensation Committee and the Corporate Governance Committee. All committees are comprised of outside directors, all of whom are also unrelated directors. |
| 69 |
10. | The Board of Directors should expressly assume responsibility for, or assign to a committee of directors, the general responsibility for developing the Corporation’s approach to governance issues. |
| The Corporate Governance Committee has the responsibility of developing the Corporation’s approach to governance issues, and administering the Board of Directors’ relationship with management. This includes responsibility for: (i) assessing, at least annually, the effectiveness of the Board of Directors as a whole and the committees of the Board of Directors, (ii) reviewing annually the mandates of the Board of Directors and its committees and making recommendations for change, (iii) recommending procedures to permit the Board of Directors to function independently from management, (iv) reviewing and, if appropriate, approving requests from directors for the engagement of outside advisors, (v) preparing and maintaining corporate governance policies for the Corporation, and (vi) identifying prospective nominees for the Board of Directors and recommending them to the Board of Directors and establishing criteria for the Board of Directors’ membership and retirement therefrom. | |
11. | The Board of Directors should define limits to management’s responsibilities by developing (a) mandates for the Board of Directors and the Chief Executive Officer of the Corporation and (b) the corporate objectives for which the Chief Executive Officer is responsible. |
| The Board of Directors is responsible for the overall stewardship of the Corporation and in furtherance thereof supervises the officers of the Corporation in their management of the business and affairs of the Corporation and manages the Corporation’s strategic planning process. The Board of Directors has developed mandates and corporate objectives for which the Chief Executive Officer is responsible. The Board of Directors requires the Chief Executive Officer and other management of the Corporation to keep the Board of Directors informed in a timely and candid manner of the progress towards the achievement of the established goals and of any material deviation from such goals and from the Corporation’s strategies and policies as approved by the Board of Directors. | |
12. | Establish procedures to enable the Board of Directors to function independently of management. |
| The importance of the independence of the Board of Directors from management is fully endorsed by the Corporation and its management. The Board of Directors considers it important to the ability of the CEO to function most effectively in Kazakhstan, that the CEO also be the Chairman of the Board of Directors. The Board of Directors discharges the responsibilities which are central to its oversight function through the Audit, Compensation and Corporate Governance Committees, each of which is comprised entirely of unrelated directors. Well-developed mandates for these committees, position descriptions for the Board of Directors and the CEO, Board of Directors assessment processes and ongoing discussions about effective governance and evolving best practices also support the independence of the Board of Directors from management. In addition to the CEO, each of the other directors are established businesspersons who are each satisfied that they discharge their responsibilities to the Corporation in an independent-minded way and do not believe that other, more formal procedures are necessary. |
| 70 PetroKazakhstan Inc. |
13. | Establish an audit committee with a specifically defined mandate and direct communication channels with internal and external auditors, with all members being outside directors. The audit committee’s duties should include oversight responsibility for management reporting on internal control and should ensure that management has designed and implemented an effective system of internal control. |
| The Board of Directors has an Audit Committee, all the members of which are outside directors. The roles and responsibilities of the Audit Committee include responsibility for reviewing and making recommendations to the Board of Directors on (i) financial statements and the related reports of management and external auditors, (ii) accounting and financial reporting procedures and methods, (iii) internal audit procedures and reports, and (iv) matters relating to external auditors, including the appointment and terms of engagement of external auditors and their reports relating to accounting, financial and internal audit matters. The Audit Committee has direct communication channels with the external auditors. The Corporation has an internal audit function and the Audit Committee has a direct communication channel with the internal audit. | |
| The U.S. Securities and Exchange Commission (the “SEC”) requires that a company filing under the U.S. Securities Exchange Act of 1934 (the “Act”) disclose whether its board of directors has determined that there is at least one “audit committee financial expert” as defined by the SEC, on its audit committee. The Board of Directors of the Company has determined that Jacques Lefèvre is such an “audit committee financial expert” fulfilling this requirement. The SEC further requires, pursuant to Rule 10A-3 of the Act, that each member of the audit committee be “independent” as that term is defined by the SEC. All of the members of the audit committee are “independent” as required by the SEC. | |
14. | Implement a system to enable an individual director to engage outside advisors at the Corporation’s expense. The engagement of the outside advisor should be subject to the approval of an appropriate committee of the Board of Directors. |
| Any member of the Board of Directors may engage an outside advisor at the expense of the Corporation in appropriate circumstances, subject to the approval of the Corporate Governance Committee. |
| 71 |
DIFFERENCES IN CORPORATE GOVERNANCE PRACTICES OF THE CORPORATION COMPARED TO NYSE STANDARDS APPLICABLE TO U.S. DOMESTIC ISSUERS
As a Canadian company, the Corporation is not required to comply with many of the corporate governance listing requirements imposed by the NYSE for U.S. domestic issuers. The Corporation must however, provide a brief description of any significant difference between its corporate governance practices and those followed by U.S. companies under the NYSE listing standards. The following provides a summary of the significant differences between the Corporation’s domestic practice and the NYSE rules.
| 4 | Section 303A.01 of the NYSE corporate governance rules requires a majority of directors of a U.S. domestic issuer to be “independent” and Section 303A.02 sets forth the independence standards for such directors. The TSX guidelines provide that the board of directors of a company should have a majority of “unrelated” directors. The principles for determining whether a director is “unrelated” differ significantly from the NYSE’s “independence” standards. The Corporation follows the TSX guidelines |
| 4 | Section 303A.03 of the NYSE corporate governance rules requires non-management directors of a U.S. domestic issuer to meet at regularly scheduled executive sessions without management. Although non-management directors of the Corporation meet without management, such meetings do not currently follow a regular schedule. |
| 4 | Section 303A.05 of the NYSE corporate governance rules requires the compensation committee of a U.S. domestic issuer to review and approve corporate goals and objectives relevant to the Chief Executive Officer’s compensation, evaluate the Chief Executive Officer’s performance in light of these goals and, either as a committee or together with the other independent directors, determine and approve the Chief Executive Officer’s compensation level based on this evaluation. The TSX guidelines provide that the board of directors should approve or develop the corporate objectives which the Chief Executive Officer is responsible for meeting. The Corporation follows the TSX guidelines relating to corporate objectives for which the Chief Executive Officer is responsible. |
| 4 | Section 303A.09 of the NYSE corporate governance rules requires a U.S. domestic issuer to adopt and disclose a set of corporate governance guidelines and to post such guidelines on the company’s website. The Corporation has aligned its corporate governance practices with TSX guidelines as well as the policies released by certain Canadian securities regulators for comment in January 2004. The Corporate Governance Committee has not however, codified its corporate governance principles into formal guidelines in order to post them on its website. |
| 4 | Section 303A.12(a) of the NYSE corporate governance rules requires the Chief Executive Officer of a U.S. domestic issuer to annually certify that he or she is not aware of any violation by the company of NYSE corporate governance standards. As a Canadian company, the Corporation (and its Chief Executive Officer) is not subject to this requirement. However, in accordance with NYSE rules applicable to both U.S. domestic and foreign private issuers, the Chief Executive Officer is required to promptly notify the NYSE in writing after any executive officer becomes aware of any material non-compliance with the NYSE corporate governance standards applicable to the Corporation. |
| 72 PetroKazakhstan Inc. |
Corporate Structure |
The following diagram shows the principal operating subsidiaries of PetroKazakhstan Inc., their respective jurisdictions of incorporation and the percentage ownership PetroKazakhstan has, directly or indirectly, The Company conducts virtually all of its operations through, and virtually all its assets are held, directly or indirectly, by PKKR, Turgai, Kazgermunai, PKOP and PetroKazakhstan Marketing Ltd.
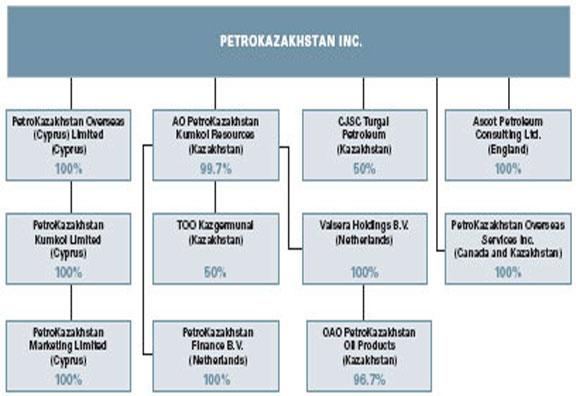
PetroKazakhstan Inc.(Canada) is our registered head office that directly or indirectly owns all of the other companies within the PetroKazakhstan group. PetroKazakhstan Overseas (Cyprus) Limited (Cyprus) is an intermediate holding company. PetroKazakhstan Kumkol Limited (Cyprus) is an intermediate holding company. PetroKazakhstan Marketing Limited (Cyprus) is a crude oil marketing subsidiary of the PetroKazakhstan group. AO PetroKazakhstan Kumkol Resources (Kazakhstan) is engaged in developing the Kumkol South, South Kumkol, KAM, East Kumkol, North Nurali fields and our exploration blocks. TOO Kazgermunai (Kazakhstan) is a 50% joint venture with RWE-DEA AG (RWE) (25%), Erdol-Erdgas Gommern GmbH (EEG) (17.5%), and International Finance Corporation (IFC) (7.5%) engaged in developing the Akshabulak, Nurali and Aksai fields. | PetroKazakhstan Finance B.V.(Netherlands), a special purpose entity, is a wholly owned subsidiary of PKKR. CJSC Turgai Petroleum (Kazakhstan) is a 50% joint venture with Lukoil Overseas Ltd., engaged in developing the North Kumkol field. Valsera Holdings B.V. (Netherlands) is an intermediate holding company for our refining activities. OAO PetroKazakhstan Oil Products (Kazakhstan) is the company in which our refining activities take place. Ascot Petroleum Consulting Ltd. (England) provides management services to companies in the PetroKazakhstan group. PetroKazakhstan Overseas Services Inc.(Canada and Kazakhstan) supplies international goods and services for PetroKazakhstan’s Kazakhstani operations and provides personnel services to the group. |
| 73 |

2004 Consolidated Financial Statements and Notes to the Consolidated Financial Statements | |||
Management Report | FS2 | ||
Comments by Independent Registered Public Accounting Firm to U.S. Readers on Canada - U.S. Reporting Differences | FS3 | ||
Consolidated Financial Statements for the Years Ended December 31, 2004 and 2003: | |||
4 | Consolidated Statements of Income and Retained Earnings (Deficit) | FS4 | |
4 | Consolidated Balance Sheets | FS5 | |
4 | Consolidated Statements of Cash Flow | FS6 | |
Notes to the Consolidated Financial Statements | FS7 | ||
| FS1 |
Management Report |
The accompanying consolidated financial statements and all information in the annual report are the responsibility of management.
The consolidated financial statements have been prepared by management in accordance with Canadian generally accepted accounting principles. When alternative accounting methods exist, management has chosen those it deems most appropriate in the circumstances. The consolidated financial statements are not precise since they include certain amounts based on estimates and judgments. Management has determined such amounts on a reasonable basis in order to ensure that the consolidated financial statements are presented fairly, in all material respects. Financial information presented elsewhere in this annual report has been prepared on a basis consistent with that in the consolidated financial statements.
PetroKazakhstan Inc. maintains systems of internal accounting and administrative controls. These systems are designed to provide reasonable assurance that financial information is relevant, reliable and accurate and that the Corporation’s assets are properly accounted for and adequately safeguarded.
The Audit Committee of the Board of Directors, composed of non-management Directors, meets regularly with management, as well as the external auditors, to discuss auditing (external and internal), internal controls, accounting policy and financial reporting matters. The Audit Committee reviews the consolidated financial statements with both management and the independent auditors and reports its finding to the Board of Directors before such statements are approved by the Board.
The consolidated financial statements have been audited by TOO Deloitte & Touche, the independent auditors, in accordance with the generally accepted auditing standards on behalf of the shareholders. TOO Deloitte & Touche have full and free access to the Audit Committee.
| (signed) | (signed) |
| Bernard F. Isautier | Clayton Clift |
| President and Chief Executive Officer | Senior Vice President Finance and Chief Financial Officer |
| March 1, 2005 | March 1, 2005 |
| FS2 PetroKazakhstan Inc. |
Report of Independent Registered Public Accounting Firm |
To the Shareholders of PetroKazakhstan Inc.
We have audited the consolidated balance sheets of PetroKazakhstan Inc. (“the Corporation”) as at December 31, 2004 and 2003 and the consolidated statements of income and retained earnings, and cash flows for each of the years in the three-year period ended December 31, 2004. These consolidated financial statements are the responsibility of the Corporation’s management. Our responsibility is to express an opinion on these financial statements based on our audits.
We conducted our audits in accordance with Canadian generally accepted auditing standards and the standards of the Public Company Accounting Oversight Board (United States). Those standards require that we plan and perform an audit to obtain reasonable assurance whether the consolidated financial statements are free of material misstatements. An audit includes examining, on a test basis, evidence supporting the amounts and disclosures in the consolidated financial statements. An audit also includes assessing the accounting principles used and significant estimates made by management, as well as evaluating the overall financial statement presentation.
In our opinion, these consolidated financial statements present fairly, in all material respects, the financial position of the Corporation as at December 31, 2004 and 2003 and the results of its operations and cash flows for each of the years in the three-year period ended December 31, 2004, in accordance with Canadian generally accepted accounting principles.
The Corporation is not required to have, nor were we engaged to perform, an audit of its internal control over financial reporting. Our audit included consideration of internal control over financial reporting as a basis for designing audit procedures that are appropriate in the circumstances, but not for the purpose of expressing an opinion on the effectiveness of the Corporation’s internal control over financial reporting. Accordingly, we express no such opinion.
(signed)
TOO Deloitte & Touche
Almaty, Kazakhstan
March 1, 2005
Comments by Independent Registered Public Accounting Firm
to U.S. Readers on Canada - U.S. Reporting Differences
The standards of the Public Company Accounting Oversight Board (United States) require the addition of an explanatory paragraph (following the opinion paragraph) when there are changes in accounting principles that have a material effect on the comparability of the Corporation’s consolidated financial statements and changes that have been implemented in the financial statements, such as the changes described in Note 2 to the consolidated financial statements. Our report to the shareholders dated March 1, 2005 is expressed in accordance with Canadian reporting standards, which do not require a reference to such a change in accounting principles in the report of the independent registered public accounting firm when the change is properly accounted for and adequately disclosed in the consolidated financial statements.
(signed)
TOO Deloitte & Touche
Almaty, Kazakhstan
March 1, 2005
| FS3 |
Consolidated Statements of Income and Retained Earnings (Deficit) |
Years ended December 31 - EXPRESSED IN THOUSANDS OF UNITED STATES DOLLARS (EXCEPT PER SHARE AMOUNTS)
2004 | 2003 | 2002 | ||||||||
(Restated - | (Restated - | |||||||||
see Note 2) | see Note 2) | |||||||||
REVENUE | ||||||||||
| Crude oil | 992,880 | 621,126 | 481,114 | |||||||
| Refined products | 639,405 | 481,326 | 332,639 | |||||||
| Service fee | 6,484 | 11,532 | 9,646 | |||||||
| Interest income | 3,658 | 3,340 | 1,951 | |||||||
1,642,427 | 1,117,324 | 825,350 | ||||||||
EXPENSES | ||||||||||
| Production | 89,339 | 65,516 | 60,596 | |||||||
| Royalties and taxes | 126,444 | 82,295 | 68,714 | |||||||
| Transportation | 271,809 | 224,987 | 163,801 | |||||||
| Refining | 21,646 | 17,760 | 21,721 | |||||||
| Crude oil and refined product purchases | 111,339 | 56,460 | 73,327 | |||||||
| Selling | 37,934 | 28,529 | 23,253 | |||||||
| General and administrative | 60,915 | 54,279 | 58,879 | |||||||
| Interest and financing costs | 24,330 | 35,579 | 35,473 | |||||||
| Depletion, depreciation and accretion | 105,520 | 82,352 | 46,411 | |||||||
| Foreign exchange (gain) loss | (9,919 | ) | (5,333 | ) | 2,233 | |||||
839,357 | 642,424 | 554,408 | ||||||||
| INCOME BEFORE UNUSUAL ITEMS | 803,070 | 474,900 | 270,942 | |||||||
| UNUSUAL ITEMS | ||||||||||
Arbitration settlement(Note 18) | - | - | 7,134 | |||||||
| INCOME BEFORE INCOME TAXES | 803,070 | 474,900 | 263,808 | |||||||
INCOME TAXES(Note 13) | ||||||||||
| Current provision | 356,249 | 165,379 | 100,808 | |||||||
| Future income tax recovery | (55,166 | ) | (9,757 | ) | (465 | ) | ||||
301,083 | 155,622 | 100,343 | ||||||||
NET INCOME BEFORE NON-CONTROLLING INTEREST | 501,987 | 319,278 | 163,465 | |||||||
| NON-CONTROLLING INTEREST | 1,319 | 2,338 | 2,068 | |||||||
NET INCOME | 500,668 | 316,940 | 161,397 | |||||||
RETAINED EARNINGS (DEFICIT), BEGINNING OF YEAR | 378,819 | 73,143 | (70,873 | ) | ||||||
Substantial issuer bid(Note 12) | (111,335 | ) | - | - | ||||||
Normal course issuer bid (Note 12) | (35,528 | ) | (11,232 | ) | (17,350 | ) | ||||
| Common share dividends | (39,253 | ) | - | - | ||||||
| Preferred share dividends | (35 | ) | (32 | ) | (31 | ) | ||||
RETAINED EARNINGS, END OF YEAR | 693,336 | 378,819 | 73,143 | |||||||
BASIC NET INCOME PER SHARE(Note 14) | 6.40 | 4.06 | 2.00 | |||||||
DILUTED NET INCOME PER SHARE (Note 14) | 6.28 | 3.90 | 1.92 | |||||||
See accompanying notes to the consolidated financial statements.
| FS4 PetroKazakhstan Inc. |
Consolidated Balance Sheet |
As at December 31 - EXPRESSED IN THOUSANDS OF UNITED STATES DOLLARS
2004 | 2003 | ||||||
(Restated - | |||||||
see Note 2) | |||||||
ASSETS | |||||||
| CURRENT | |||||||
| Cash | 199,105 | 184,660 | |||||
Accounts receivable(Note 5) | 198,504 | 150,293 | |||||
Inventory(Note 6) | 61,242 | 36,920 | |||||
Prepaid expenses(Note 7) | 62,179 | 44,901 | |||||
Current portion of future income tax asset(Note 13) | 65,431 | 14,697 | |||||
586,461 | 431,471 | ||||||
Deferred charges(Note 11) | 4,662 | 6,729 | |||||
Restricted cash(Note 8) | 47,741 | 35,468 | |||||
Future income tax asset(Note 13) | 28,470 | 25,466 | |||||
Property, plant and equipment(Note 9) | 601,747 | 542,317 | |||||
TOTAL ASSETS | 1,269,081 | 1,041,451 | |||||
LIABILITIES | |||||||
| CURRENT | |||||||
Accounts payable and accrued liabilities(Note 10) | 161,759 | 88,422 | |||||
Short-term debt(Note 11) | 15,541 | 73,225 | |||||
| Prepayments for crude oil and refined products | 9,916 | 6,652 | |||||
187,216 | 168,299 | ||||||
Long-term debt(Note 11) | 134,862 | 246,655 | |||||
Asset retirement obligations(Note 2) | 32,499 | 28,625 | |||||
Future income tax liability(Note 13) | 9,936 | 13,012 | |||||
364,513 | 456,591 | ||||||
| Non-controlling interest | 14,411 | 13,091 | |||||
| Preferred shares of subsidiary | 80 | 80 | |||||
COMMITMENTS AND CONTINGENCIES (Note 18) | |||||||
SHAREHOLDERS’ EQUITY | |||||||
Share capital(Note 12) | 191,529 | 191,695 | |||||
Contributed surplus (Note 2) | 5,212 | 1,175 | |||||
| Retained earnings | 693,336 | 378,819 | |||||
890,077 | 571,689 | ||||||
TOTAL LIABILITIES AND SHAREHOLDERS’ EQUITY | 1,269,081 | 1,041,451 | |||||
See accompanying notes to the consolidated financial statements.
Approved by the Board of Directors:
| (signed) | (signed) |
| Bernard Isautier | Jacques Lefèvre |
| Director | Director |
| FS5 |
Consolidated Statements of Cash Flow |
Years ended December 31 - EXPRESSED IN THOUSANDS OF UNITED STATES DOLLAR
2004 | 2003 | 2002 | ||||||||
(Restated - | (Restated - | |||||||||
see Note 2) | see Note 2) | |||||||||
OPERATING ACTIVITIES | ||||||||||
| Net income | 500,668 | 316,940 | 161,397 | |||||||
| Items not affecting cash: | ||||||||||
Depletion, depreciation and accretion | 105,520 | 82,352 | 46,411 | |||||||
Future income tax recovery | (55,166 | ) | (9,757 | ) | (465 | ) | ||||
Non-controlling interest | 1,319 | 2,338 | 2,068 | |||||||
Compensation expense(Note 2) | 4,037 | 1,175 | - | |||||||
Amortization of deferred charges | 3,572 | 3,936 | 1,402 | |||||||
Other non-cash charges | 541 | 2,991 | 5,981 | |||||||
| Cash flow | 560,491 | 399,975 | 216,794 | |||||||
Changes in non-cash operating working capital items(Note 17) | (24,899 | ) | (60,625 | ) | (37,816 | ) | ||||
| Cash flow from operating activities | 535,592 | 339,350 | 178,978 | |||||||
FINANCING ACTIVITIES | ||||||||||
Short-term debt proceeds(Note 17) | 98,006 | 77,411 | 109,954 | |||||||
Short-term debt repayment(Note 17) | (171,231 | ) | (154,528 | ) | (136,564 | ) | ||||
Long-term debt proceeds(Note 17) | - | 312,986 | 17,195 | |||||||
Long-term debt repayment(Note 17) | (97,016 | ) | (217,699 | ) | (34,853 | ) | ||||
| Deferred charges paid | (1,674 | ) | (3,642 | ) | (2,850 | ) | ||||
| Common share dividends | (26,665 | ) | - | - | ||||||
| Preferred share dividends | (35 | ) | (32 | ) | (31 | ) | ||||
Purchase of common shares under a normal course issuer bid(Note 12) | (38,648 | ) | (14,848 | ) | (23,549 | ) | ||||
Purchase of common shares under a substantial issuer bid(Note 12) | (121,117 | ) | - | - | ||||||
| Proceeds from issue of share capital, net of share issuance costs | 12,736 | 1,588 | 1,417 | |||||||
| Cash flow (used in) from financing activities | (345,644 | ) | 1,236 | (69,281 | ) | |||||
INVESTING ACTIVITIES | ||||||||||
| Restricted cash | (12,273 | ) | (35,468 | ) | - | |||||
| Capital expenditures | (163,230 | ) | (196,470 | ) | (136,852 | ) | ||||
| Proceeds from sale of property, plant and equipment | - | 1,258 | - | |||||||
| Long-term investment | - | - | 40,000 | |||||||
| Acquisition of subsidiary, net of cash acquired | - | (38 | ) | (2,853 | ) | |||||
Purchase of preferred shares of subsidiary | - | (4 | ) | (8 | ) | |||||
| Cash flow used in investing activities | (175,503 | ) | (230,722 | ) | (99,713 | ) | ||||
INCREASE IN CASH | 14,445 | 109,864 | 9,984 | |||||||
CASH, BEGINNING OF YEAR | 184,660 | 74,796 | 64,812 | |||||||
CASH, END OF YEAR | 199,105 | 184,660 | 74,796 | |||||||
See accompanying notes to the consolidated financial statements.
| FS6 PetroKazakhstan Inc. |
Notes to Consolidated Financial Statements |
Years ended December 31 - EXPRESSED IN THOUSANDS OF UNITED STATES DOLLARS, TABULAR AMOUNTS IN THOUSANDS OF DOLLARS (UNLESS OTHERWISE INDICATED)
NOTE 1 | 4 | SIGNIFICANT ACCOUNTING POLICIES |
Principles of Consolidation PetroKazakhstan Inc. (“PetroKazakhstan” or the “Corporation”), formerly known as Hurricane Hydrocarbons Ltd., is an independent integrated oil and gas corporation, operating in the Republic of Kazakhstan, engaged in the acquisition, exploration, development and production of oil and gas, refining of oil, and the sale of oil and oil products. The consolidated financial statements of PetroKazakhstan have been prepared in accordance with Canadian Generally Accepted Accounting Principles and include the accounts of the Corporation, which is incorporated under the laws of Alberta, together with the accounts of its subsidiaries which are incorporated under the laws of Canada, Cyprus, England, the Netherlands, British Virgin Islands and Kazakhstan. Intercompany transactions are eliminated upon consolidation. On August 28, 1996, the Corporation entered into a Share Sale-Purchase Agreement with the Republic of Kazakhstan for the purchase of 100% of the issued common shares of Yuzhneftegas, a state owned joint stock company, later renamed to OJSC Hurricane Kumkol Munai and then to PetroKazakhstan Kumkol Resources (“PKKR”), operating in the South Turgai Basin, located in South Central Kazakhstan. On March 31, 2000, the Corporation acquired 88.4% of the common shares of OJSC Shymkentnefteorgsyntez, later renamed to OJSC Hurricane Oil Products and then to PetroKazakhstan Oil Products (“PKOP”). The Corporation has acquired an additional 8.3% interest in PKOP and had a 96.7% interest in PKOP as at December 31, 2004. PKOP owns and operates an oil refinery located in Shymkent, a city in South Central Kazakhstan. These consolidated financial statements are prepared in accordance with Canadian Generally Accepted Accounting Principles (“GAAP”) and have been reconciled to U.S. Generally Accepted Accounting Principles in Note 20. Use of estimates The preparation of financial statements in accordance with generally accepted accounting principles requires management to make estimates and assumptions that affect the reported amounts of assets and liabilities at the date of the consolidated financial statements and the reported amounts of revenues and expenses during the reporting period. These estimates are subject to measurement uncertainty. Actual results could differ from and affect the results reported in these consolidated financial statements. With respect to accounting for oil and gas properties, amounts recorded for depletion, asset retirement obligations and amounts used for impairment test calculations, are based on estimates of oil and natural gas reserves and future development costs. By their nature, these estimates of reserves and the related future cash flows are subject to measurement uncertainty, and the impact on the consolidated financial statements of future periods could be material. The Corporation is involved in litigation and claims as described in Notes 18 and 19. The determination of contingent liabilities relating to litigation and claims is a complex process that involves judgements as to the outcomes and interpretation of laws and regulations. Changes in these judgements and interpretations may result in an increase or decrease in the Corporation’s contingent liabilities in the future. The determination of the provision for income taxes is an inherently complex process requiring management to interpret continually changing regulations and to make certain judgements. While income tax filings are subject to audits and reassessments, management believes adequate provision has been made for all income tax obligations. However, changes in the interpretations or judgements made may result in an increase or decrease in the Corporation’s income tax provision in the future. Joint ventures As more fully explained in Note 4, certain of PetroKazakhstan’s activities are conducted jointly with others through incorporated joint ventures. Accordingly, these consolidated financial statements reflect PetroKazakhstan’s proportionate interest in such activities. |
| FS7 |
Foreign currency translation
Foreign currency amounts, including those of foreign subsidiaries, are translated into United States dollars using the temporal method as follows:
| (a) | Monetary assets and liabilities - at the rate of exchange in effect at year end. |
| (b) | Non-monetary assets and liabilities - at historical rates. |
| (c) | Revenues and expenses - at the average exchange rates during the period, except for provisions for depletion and depreciation, which are translated on the same basis as the related assets. |
Gains or losses resulting from such translations are charged to operations.
Cash
Cash may include term deposits with original maturity terms not exceeding 90 days.
Inventories
Crude oil and oil products are recorded at the lower of average cost and net realizable value. Materials and supplies are recorded at the lower of average cost and replacement cost. Cost comprises direct materials and, where applicable, direct labour costs and those overheads and costs, which have been incurred in bringing the inventories to their present location and condition. Net realizable value represents the estimated selling price less all estimated costs to completion and costs to be incurred in marketing, selling and distribution.
Deferred charges
Costs related to the issuance of long-term debt are deferred and amortized over the term of the respective debt instrument on a straight-line basis.
Property, plant and equipment
a) | Petroleum and natural gas properties |
PetroKazakhstan follows the full cost method of accounting for oil and gas operations whereby all acquisition, exploration and development expenditures are capitalized. Capitalized expenditures include land acquisition costs, geological and geophysical expenses, costs of drilling both productive and non-productive wells, gathering and production facilities and equipment and overhead expenses related to exploration and development activities. Interest is capitalized during the development phase of capital projects until operations or production commences. Proceeds from sales of oil and gas properties are recorded as reductions of capitalized costs, unless the cost centre’s depreciation and depletion rate would change by a factor of 20% or more, whereupon gains or losses are recognized as income. Maintenance and repair costs are expensed as incurred, while improvements and major renovations to assets are capitalized.
Accumulated oil and gas costs and the estimated future development costs are depleted using the unit-of-production method based upon estimated proved reserves before royalties. Significant development projects and expenditures on exploration properties are excluded from the depletion calculation prior to assessment of the existence of proved reserves. Other plant and equipment costs are depreciated using the straight-line method based on the estimated useful lives of the assets which range from 8 to 20 years.
b) | Refining |
Maintenance and repairs, including minor renewals and improvements are charged to income as incurred. The cost of major renovations and improvements, which increase useful lives, are capitalized. Direct costs incurred in the construction of fixed assets, including labour, materials and supplies are capitalized.
Depreciation is calculated using the straight-line method based upon the following estimated useful lives:
| Buildings, warehouses and storage facilities | 10 - 20 years |
| Process machinery and equipment | 5 - 20 years |
| Transport equipment | 5 - 30 years |
| Other tangible fixed assets | 3 - 15 years |
| FS8 PetroKazakhstan Inc. |
c) | Impairment of property, plant and equipment |
Impairment of petroleum and natural gas properties
On a quarterly basis, petroleum and natural gas properties are reviewed for impairment. An impairment loss is recognized when the carrying amount of a cost centre is not recoverable and exceeds its fair value. The carrying amount is not recoverable if the carrying amount exceeds the sum of the undiscounted cash flows expected to result from its use and eventual disposition.
For estimating the future cash flows, the Corporation uses quoted Brent benchmark prices in the futures market and estimates made by its independent reserve engineers for crude oil prices, less transportation and selling expenses, royalties, production costs, general and administrative expenses, income tax and future asset retirement obligations.
Impairment of other assets
Other assets are periodically reviewed for impairment. If the carrying value exceeds the sum of the undiscounted future cash flows, the property’s value is impaired. The property’s fair value is determined using its estimated total future cash flows, discounted for the time value of money. Any excess carrying value is charged to depletion and depreciation.
Estimates of future cash flows for other assets includes the future cash flows (cash inflows less associated cash outflows) that are directly associated with, and that are expected to arise as a direct result of, the use of the assets. Estimate of future cash flows incorporate the Corporation’s own assumptions about its use, considering all available evidence, including internal budgets.
Asset Retirement Obligations
Asset retirement obligations are the estimated fair value of legal obligations associated with dismantlement and site restoration due to the retirement of tangible long-lived assets. Asset retirement obligations are not recorded for assets which have an indeterminable life. Estimated future asset retirement obligations are discounted to estimate the fair value of the obligation and recorded as a liability when the related assets are constructed and commissioned. The fair value of the obligation is also added to the value of property, plant and equipment and depleted using the unit-of-production method based upon estimated proved reserves before royalties. Accretion expense resulting from the increase in the present value of the liability due to the passage of time is recorded as depletion, depreciation and accretion expense.
Revenue recognition
Sales of petroleum and refined products are recorded in the period in which title to the petroleum or refined product transfers to the customer. Produced but unsold petroleum and refined products are recorded as inventory until sold. In the case of FCA sales (Free Carrier), title to the crude oil passes at the point of loading. The Corporation records revenue based on a provisional Brent price at the time of delivery, then marks to market at month end to reflect increases or decreases in prevailing Brent prices and adjusts the final price, if necessary, at the bill of lading date according to the contract terms.
Derivative commodity instruments
The Corporation utilizes derivative instruments to manage the Corporation’s exposure to fluctuations in the price of crude oil as described in Note 15. These derivative financial instruments are not used for speculative purposes and a system of controls is maintained that includes a policy covering the authorization, reporting and monitoring of derivative activity.
The Corporation formally documents all derivative instruments designated as hedges, the risk management objective and the strategy for undertaking the hedge.
Hedge accounting is used when there is a high degree of correlation between movements in the fair value of the derivative instrument and the item designated as being hedged. Gains and losses on derivatives that are designated as and determined to be effective hedges are deferred and recognized in the same period as the hedged item, and are recorded in the same manner as the hedged item in the Consolidated Statement of Income.
The Corporation assesses both at inception and over the term of the hedging relationship, whether the derivative instruments used in the hedging transactions are effective in offsetting changes in the fair value of cash flows of the hedged item. If correlation ceases, hedge accounting is terminated and changes in the market value of the derivative instruments are recognized in the period of change.
| FS9 |
Derivative instruments that are not designated as hedges for accounting purposes are recorded on the Consolidated Balance Sheet at fair value with any resulting gain or loss recognized in the Consolidated Statement of Income and Retained Earnings in the current period. Stock-based compensation The Corporation has a stock option plan as described in Note 12. Compensation expense is recognized in the Consolidated Statements of Income for all common share options granted to employees and non-executive directors on or after January 1, 2003, with a corresponding increase in contributed surplus recorded in the Consolidated Balance Sheet. Compensation expense for options granted on or after January 1, 2003 is determined based on the fair values at the time of grant, the cost of which is recognized in the Consolidated Statement of Income over the vesting periods of the respective options. For common share stock options granted prior to January 1, 2003, compensation expense is not recognized and the Corporation discloses the pro-forma earnings impact. Income taxes Income taxes are calculated using the liability method of tax accounting. Under this method, future income tax assets and liabilities are computed based on temporary differences between the tax basis and carrying amount on the balance sheet for assets and liabilities. Future income tax assets and liabilities are calculated using tax rates anticipated to apply in the periods that the temporary differences are expected to reverse. Comparative figures The presentation of certain amounts for previous years has been changed to conform with the presentation adopted for the current year. | ||
NOTE 2 | 4 | CHANGES IN ACCOUNTING STANDARDS |
Stock-Based Compensation Effective January 1, 2002 the Corporation adopted the recommendations of the Canadian Institute of Chartered Accountants regarding stock based compensation. The Canadian Institute of Chartered Accountants revised their recommendations and effective January 1, 2004 recognition of compensation expense using the fair value of the equity instrument granted was required. The Corporation adopted this recommendation on a prospective basis, effective January 1, 2003 as provided under the transitional provisions. Accordingly, the Corporation recognized compensation expense for all common stock options granted to employees and non-executive directors on or after January 1, 2003 using the estimated fair value. The Corporation has recorded compensation expense of $4.0 and $1.2 million in general and administrative expenses within the consolidated statements of income and retained earnings for the years ended December 31, 2004 and 2003, respectively, with a corresponding increase in contributed surplus within shareholder’s equity. Compensation expense for options granted on or after January 1, 2003 is recognized as compensation expense over the vesting period of the respective options. For common share options granted prior to January 1, 2003 the Corporation discloses the pro forma impact on net income and net income per share as if the estimated fair value of common stock options granted had been recognized as an expense. Asset Retirement Obligations Effective January 1, 2004, the Corporation adopted the new recommendation of the Canadian Institute of Chartered Accountants (“CICA”) regarding asset retirement obligations. This new standard changes the method of estimating and accounting for future site restoration costs. Total estimated asset retirement obligations are discounted to estimate the fair value of the obligation and recorded as a liability when the related assets are constructed and commissioned. The fair value of the obligation increases the value of property, plant and equipment and is depleted using the unit-of-production method based upon estimated proved reserves before royalties. Accretion expense, resulting from the increase in the present value of the liability due to the passage of time is recorded as part of depletion, depreciation and accretion expense. Estimated cash flows are discounted at 8.5%. The total undiscounted estimated cash flows required to settle the obligations are $77.4 million with the expenditures being incurred over ten years commencing in 2014. The new standard has been applied retroactively, and the financial statements of prior periods have been restated. |
| FS10 PetroKazakhstan Inc. |
Adoption of the new standard of accounting for asset retirement obligations resulted in the following changes in the consolidated balance sheet and statement of income and retained earnings.
Changes in consolidated balance sheets:
As at December 31 | 2004 | 2003 | |||||
Increase / (decrease) | |||||||
| Future income tax asset | 377 | 651 | |||||
| Property, plant and equipment | 14,457 | 15,181 | |||||
| Total assets | 14,834 | 15,832 | |||||
| Asset retirement obligations | 21,527 | 22,058 | |||||
| Retained earnings | (6,693 | ) | (6,226 | ) | |||
| Total liabilities and shareholders’ equity | 14,834 | 15,832 | |||||
Changes in consolidated statements of income and retained earnings for the years ended December 31, 2004 and 2003:
| Years ended December | ||||||||||
As at December 31 | 2004 | 2003 | 2002 | |||||||
Increase / (decrease) | ||||||||||
| Accretion expense | 2,433 | 2,124 | 1,789 | |||||||
| Depletion and depreciation | (2,240 | ) | (1,757 | ) | (466 | ) | ||||
| Income before income taxes | (193 | ) | (367 | ) | (1,323 | ) | ||||
| Income taxes | 274 | 181 | (152 | ) | ||||||
| Net income | (467 | ) | (548 | ) | (1,171 | ) | ||||
| Basic net income per share | - | (0.01 | ) | (0.01 | ) | |||||
| Diluted net income per share | - | (0.01 | ) | (0.01 | ) | |||||
The change in asset retirement obligations is as follows:
2004 | 2003 | ||||||
Asset retirement obligations liability, beginning of year | 28,625 | 22,831 | |||||
| Revisions | 1,578 | 3,670 | |||||
| Accretion expense | 2,433 | 2,124 | |||||
| Settlements | (137 | ) | - | ||||
Asset retirement obligations liability, end of year | 32,499 | 28,625 | |||||
Full Cost Accounting
In September 2003 the CICA issued Accounting Guideline 16 “Oil and Gas Accounting - Full Cost” (“AcG 16”), which replaced Accounting Guideline 5 “Full Cost Accounting in the Oil and Gas Industry” (“AcG 5”). The most significant change between AcG 16 and AcG 5 is that under AcG 16 the carrying value of oil and gas properties should not exceed their fair value. The fair value is equal to estimated future cash flows from proved reserves, unproved properties and major development projects using future price forecasts and costs discounted at a risk-free rate. This differs from the cost recovery ceiling test under AcG 5 that used undiscounted cash flows, and constant prices, less general and administrative, financing costs and taxes. The Corporation adopted AcG 16 effective January 1, 2004 and as at December 31, 2004 there were no indications of impairment.
Impairment of Long-Lived Assets
Effective January 1, 2004, the Corporation adopted the new recommendation of the CICA issued in December 2002 on impairment of long-lived assets. This recommendation provides guidance on the recognition, measurement and disclosure of impairment of long-lived assets. There is a requirement to recognize an impairment loss for a long-lived asset when its carrying amount exceeds the sum of the undiscounted cash flows expected from its use and eventual disposition. The impairment loss is measured as the amount by which carrying amount of the asset exceeds its fair value. As at December 31, 2004 there were no indications of impairment of long-lived assets.
| FS11 |
Hedge Accounting | |
| Effective January 1, 2004, the Corporation adopted Accounting Guideline 13 “Hedging Relationships” (AcG 13”). AcG 13 provides guidance regarding the identification, designation, documentation and effectiveness of hedging relationships for the purposes of applying hedge accounting. This guideline establishes certain conditions for when hedge accounting may be applied. The Corporation has applied hedge accounting for the financial instruments disclosed in Note 15. | |
New Canadian GAAP pronouncements | |
| In June 2003 the CICA issued Accounting Guideline 15 “Consolidation of Variable Interest Entities” (“AcG15”). AcG15 provides guidance for determining when an enterprise consolidates the assets, liabilities and results of activities of a variable interest entity (“VIEs”) in its consolidated financial statements. In general, VIEs are entities that either do not have equity investors with voting rights or have equity investors that do not provide sufficient financial resources for the entity to support its activities. AcG15 is effective for the Corporation for the interim and annual financial statements beginning on January 1, 2005. The Corporation does not expect any impact on its consolidated financial statements. | |
| In January 2005, the CICA issued the following new pronouncements: | |
4 | Section 1530 “Comprehensive Income”. |
4 | Section 3251 “Equity” (replacing Section 3050 “Surplus”. |
4 | Section 3855 “Financial Instruments - Recognition and Measurement”. |
4 | Section 3865 “Hedges” |
| These are the highlights of the new standards: | |
4 | All financial instruments, including derivatives, are to be included on the balance sheet and measured, either at their fair values or, in limited circumstances when fair value may not be considered most relevant, at cost or amortized cost. The standards also specify when gains and losses as a result of changes in fair values are to be recognized in the statement of income. |
4 | Existing requirements for hedge accounting are extended. Currently, the CICA has requirements that specify the circumstances under which hedge accounting is permissible, but do not comprehensively specify the accounting entries. |
4 | A new location for recognizing certain gains and losses, “Other comprehensive income”, has been introduced. This provides an ability for certain gains and losses arising from changes in fair value to be temporarily recorded outside of the statement of income, but in a transparent manner. |
| These new pronouncements are effective for interim and annual financial statements for fiscal years beginning on or after October 1, 2006. Earlier adoption is permitted only as of the beginning of a fiscal year ending on or after December 31, 2004. The Corporation has yet to evaluate the impact of these new pronouncements on its consolidated financial statements. | |
NOTE 3 | 4 | SEGMENTED INFORMATION |
| Following the acquisition of PKOP in 2000, the Corporation became an integrated oil and gas company. All of the commercial activity of the Corporation is concentrated in the Republic of Kazakhstan in Central Asia. | |
| On a primary basis, the business segments are: | |
4 | Upstream comprising the exploration, development and production of crude oil and natural gas. |
4 | Downstream comprising the refining and marketing of refined products and the management of the marketing of crude oil. |
| The accounting policies of the operating segments are the same as those described in Note 1. Identifiable assets are those used in the operation of the segment. | |
| Corporate income tax for the year ended December 31, 2004 includes withholding tax on dividends paid to Canada. The consolidated income tax impact of non-deductible interest expense of $2.6 million for the year ended December 31, 2003 ($7.5 million - 2002) has been allocated to Corporate. | |
| The Corporation does not disclose export revenue attributable to individual foreign countries as it is impractical to obtain the information. | |
| FS12 PetroKazakhstan Inc. |
Year ended December 31, 2004 | Upstream | Downstream | Corporate | Eliminations | Consolidated | |||||||||||
| REVENUE | ||||||||||||||||
| Crude oil | 1,090,815 | - | - | (97,935 | ) | 992,880 | ||||||||||
| Reined products | 219,348 | 480,318 | - | (60,261 | ) | 639,405 | ||||||||||
| Service fees | 3,018 | 3,040 | 426 | - | 6,484 | |||||||||||
| Interest income | 1,765 | 638 | 1,255 | - | 3,658 | |||||||||||
1,314,946 | 483,996 | 1,681 | (158,196 | ) | 1,642,427 | |||||||||||
| EXPENSES | ||||||||||||||||
| Production | 89,339 | - | - | - | 89,339 | |||||||||||
| Royalties and taxes | 120,042 | 6,402 | - | - | 126,444 | |||||||||||
| Transportation | 271,809 | - | - | - | 271,809 | |||||||||||
| Refining | - | 21,646 | - | - | 21,646 | |||||||||||
| Crude oil and refined product purchases | 86,943 | 182,592 | - | (158,196 | ) | 111,339 | ||||||||||
| Selling | 18,083 | 19,851 | - | - | 37,934 | |||||||||||
| General and administrative | 34,955 | 14,493 | 11,467 | - | 60,915 | |||||||||||
| Interest and financing costs | 23,848 | 473 | 9 | - | 24,330 | |||||||||||
| Depletion, depreciation and accretion | 83,927 | 20,338 | 1,255 | - | 105,520 | |||||||||||
| Foreign exchange loss (gain) | 3,963 | (13,767 | ) | (115 | ) | - | (9,919 | ) | ||||||||
732,909 | 252,028 | 12,616 | (158,196 | ) | 839,357 | |||||||||||
| INCOME (LOSS) BEFORE INCOME TAXES | 582,037 | 231,968 | (10,935 | ) | - | 803,070 | ||||||||||
| INCOME TAXES | ||||||||||||||||
| Current provision | 272,863 | 75,770 | 7,616 | - | 356,249 | |||||||||||
| Future income tax | (54,649 | ) | (517 | ) | - | - | (55,166 | ) | ||||||||
218,214 | 75,253 | 7,616 | - | 301,083 | ||||||||||||
| NON-CONTOLLING INTEREST | - | 1,139 | - | - | 1,319 | |||||||||||
| NET INCOME (LOSS) | 363,823 | 155,396 | (18,551 | ) | - | 500,668 | ||||||||||
Included in Upstream crude revenue are sales to one customer in the amount of $167.4 million.
Eliminations are intersegment revenue.
As at December 31, 2004 | Upstream | Downstream | Corporate | Consolidated | |||||||||
| Total assets | 1,038,727 | 180,081 | 50,273 | 1,269,081 | |||||||||
| Total liabilities | 335,591 | 29,431 | 15,982 | 379,004 | |||||||||
| Capital expenditures for the year | 148,993 | 15,687 | 1,272 | 165,952 | |||||||||
Year Ended December 31, 2004 | Export | Domestic | Consolidated | |||||||
| Crude oil | 912,854 | 80,026 | 992,880 | |||||||
| Refined products | 219,508 | 419,897 | 639,405 | |||||||
| FS13 |
| Year ended December 31, 2003 | Upstream | Downstream | Corporate | Eliminations | Consolidated | |||||||||||
| Revenue | ||||||||||||||||
| Crude oil | 719,009 | - | - | (97,883 | ) | 621,126 | ||||||||||
| Refined products | 76,885 | 441,200 | - | (36,759 | ) | 481,326 | ||||||||||
| Service fee | 9,086 | 2,191 | 255 | - | 11,532 | |||||||||||
| Interest income | 936 | 416 | 1,988 | - | 3,340 | |||||||||||
| 805,916 | 443,807 | 2,243 | (134,642 | ) | 1,117,324 | |||||||||||
| EXPENSES | ||||||||||||||||
| Production | 65,516 | - | - | - | 65,516 | |||||||||||
| Royalties and taxes | 80,046 | 2,249 | - | - | 82,295 | |||||||||||
| Transportation | 223,000 | 1,987 | - | - | 224,987 | |||||||||||
| Refining | - | 17,760 | - | - | 17,760 | |||||||||||
| Crude oil and refined product purchases | 55,161 | 135,941 | - | (134,842 | ) | 56,460 | ||||||||||
| Selling | 10,508 | 18,021 | - | - | 28,529 | |||||||||||
| General and administrative | 32,721 | 16,075 | 5.483 | - | 54,279 | |||||||||||
| Interest and financing costs | 24,226 | 2,576 | 8,777 | - | 35,579 | |||||||||||
| Depletion, depreciation and accretion | 63,321 | 18,849 | 182 | - | 82,352 | |||||||||||
| Foreign exchange loss (gain) | 2,632 | (9,863 | ) | 1,898 | - | (5,333 | ) | |||||||||
| 557,131 | 203,595 | 16,340 | (134,842 | ) | 642,424 | |||||||||||
| INCOME (LOSS) BEFORE INCOME TAXES | 248,785 | 240,212 | (14,097 | ) | - | 474,900 | ||||||||||
| INCOME TAXES | ||||||||||||||||
| Current provision | 86,803 | 74,217 | 4,359 | - | 165,379 | |||||||||||
| Future income tax | (7,910 | ) | (1,847 | ) | - | (9,757 | ) | |||||||||
| 78,893 | 72,370 | 4,359 | - | 155,622 | ||||||||||||
| NON-CONTROLLING INTEREST | - | 2,338 | - | - | 2,338 | |||||||||||
| NET INCOME (LOSS) | 169,892 | 165,504 | (18,456 | ) | - | 316,940 | ||||||||||
There were no sales to an individual customer in excess of 10% of consolidated revenue.
Eliminations are intersegment revenue.
| As at December 31, 2003 | Upstream | Downstream | Corporate | Consolidated | |||||||||
| Total assets | 737,691 | 157,474 | 146,286 | 1,041,451 | |||||||||
| Total liabilities | 409,145 | 58,554 | 2,063 | 469,762 | |||||||||
| Capital expenditures for the year | 183,134 | 19,070 | 1,009 | 203,213 | |||||||||
| Year Ended December 31, 2003 | Export | Domestic | Consolidated | |||||||
| Crude oil | 596,673 | 24,453 | 621,126 | |||||||
| Refined products | 112,316 | 369,010 | 481,326 | |||||||
| FS14 PetroKazakhstan Inc. |
| Year ended December 31, 2002 | Upstream | Downstream | Corporate | Eliminations | Consolidated | |||||||||||
| REVENUE | ||||||||||||||||
| Crude oil | 566,033 | - | - | (84,919 | ) | 481,114 | ||||||||||
| Refined products | 97,761 | 266,420 | - | (31,542 | ) | 332,639 | ||||||||||
| Service fee | 5,610 | 3,423 | 613 | - | 9,646 | |||||||||||
| Interest income | 282 | 217 | 1,452 | - | 1,951 | |||||||||||
| 669,686 | 270,060 | 2,065 | (116,461 | ) | 825,350 | |||||||||||
| EXPENSES | ||||||||||||||||
| Production | 60,596 | - | - | - | 60,596 | |||||||||||
| Royalties and taxes | 61,400 | 7,314 | - | - | 68,714 | |||||||||||
| Transportation | 163,791 | 10 | - | - | 163,801 | |||||||||||
| Refining | - | 21,721 | - | - | 21,721 | |||||||||||
| Crude oil and reined product purchases | 68,758 | 121,030 | - | (116,461 | ) | 73,327 | ||||||||||
| Selling | 6,815 | 16,438 | - | - | 23,253 | |||||||||||
| General and administrative | 37,093 | 17,216 | 4,570 | - | 58,879 | |||||||||||
| Interest and financing costs | 9,023 | 1,514 | 24,936 | - | 35,473 | |||||||||||
| Depletion. depreciation and accretion | 32,970 | 13,347 | 94 | - | 46,411 | |||||||||||
| Foreign exchange loss | 1,024 | 995 | 214 | - | 2,233 | |||||||||||
| 441,470 | 199,585 | 29,814 | (116,461 | ) | 554,408 | |||||||||||
| INCOME BEFORE UNUSUAL ITEMS | 228,216 | 70,475 | (27,749 | ) | - | 270,942 | ||||||||||
| Arbitration settlement | 7,134 | - | - | - | 7,134 | |||||||||||
| INCOME (LOSS) BEFORE INCOME TAXES | 221,082 | 70,475 | (27,749 | ) | - | 263,808 | ||||||||||
| INCOME TAXES | ||||||||||||||||
| Current provision | 64,500 | 26,463 | 9,845 | - | 100,808 | |||||||||||
| Future income tax | 7,307 | (7,772 | ) | - | - | (465 | ) | |||||||||
| 71,807 | 18,691 | 9,845 | - | 100,343 | ||||||||||||
| NON-CONTROLLING INTEREST | - | 2,068 | - | - | 2,068 | |||||||||||
| NET INCOME (LOSS) | 149,275 | 49,716 | (37,594 | ) | - | 161,397 | ||||||||||
Included in Upstream crude oil revenue are sales to one customer in the amount of $103.0 million.
| As at December 31, 2002 | Upstream | Downstream | Corporate | Consolidated | |||||||||
| Total assets | 506,915 | 169,071 | 33,737 | 709,723 | |||||||||
| Total liabilities | 172,474 | 42,141 | 228,242 | 442,857 | |||||||||
| Capital expenditures for the year | 131,875 | 8,227 | - | 140,102 | |||||||||
| Year Ended December 31, 2002 | Export | Domestic | Consolidated | |||||||
| Crude oil | 445,290 | 35,824 | 481,114 | |||||||
| Refined products | 53,111 | 279,528 | 332,639 | |||||||
| FS15 |
NOTE 4 | 4 | JOINT VENTURES |
| The Corporation has the following interests in two joint ventures: | |
| a) | a 50% equity shareholding with equivalent voting power in Turgai Petroleum CJSC (“Turgai”), which operates the northern part of the Kumkol field in Kazakhstan. |
| b) | a 50% equity shareholding with equivalent voting power in LLP Kazgermunai (“Kazgermunai”), which operates three oil fields in Kazakhstan: Akshabulak, Nurali and Aksai. |
| The Corporation’s interests in these joint ventures have been accounted for using the proportionate consolidation method. Under this method, the Corporation’s balance sheets, statements of income, retained earnings and deficit and cash flow include the Corporation’s share of income, expenses, assets, liabilities and cash flows of these joint ventures. | |
| The following amounts are included in the Corporation’s consolidated financial statements as a result of the proportionate consolidation of its joint ventures and before consolidation eliminations: | |
Year ended December 31, 2004 | Turgai | Kazgermunai | Total | |||||||
| Cash | 34,678 | 50,800 | 85,478 | |||||||
| Current assets, excluding cash | 103,183 | 57,495 | 160,678 | |||||||
| Property, plant and equipment | 86,791 | 62,555 | 149,346 | |||||||
| Current liabilities | 77,849 | 24,343 | 102,192 | |||||||
| Long-term debt | - | - | - | |||||||
| Revenue | 310,221 | 225,882 | 536,103 | |||||||
| Expenses | 206,869 | 140,312 | 347,181 | |||||||
| Net income | 103,352 | 85,570 | 188,922 | |||||||
| Cash flow from operating activities | 66,634 | 77,968 | 144,602 | |||||||
| Cash flow used in financing activities | (46,204 | ) | (25,632 | ) | (71,836 | ) | ||||
| Cash flow used in investing activities | (18,328 | ) | (11,967 | ) | (30,295 | ) | ||||
| Revenue for the year ended December 31, 2004 for Turgai includes $72.9 million of crude oil sales made to Downstream and $29.9 million of crude oil sales made by Turgai to Upstream. These amounts were eliminated on consolidation. | ||
| Revenue for the year ended December 31, 2004 for Kazgermunai includes $8.1 million of crude oil sales made to Upstream and $4.6 million crude oil sales to Downstream. These amounts were eliminated on consolidation. |
| Year ended December 31, 2003 | Turgai | Kazgermunai | Total | |||||||
| Cash | 8,370 | 10,432 | 18,802 | |||||||
| Current assets, excluding cash | 26,890 | 32,875 | 59,765 | |||||||
| Property, plant and equipment | 82,682 | 66,397 | 149,079 | |||||||
| Current liabilities | 76,533 | 11,260 | 87,793 | |||||||
| Long-term debt | - | 37,743 | 37,743 | |||||||
| Revenue | 118,167 | 111,860 | 230,027 | |||||||
| Expenses | 81,623 | 76,675 | 158,298 | |||||||
| Net income | 36,544 | 35,185 | 71,729 | |||||||
| Cash flow from operating activities | 58,566 | 39,089 | 97,655 | |||||||
| Cash flow used in financing activities | - | (9,317 | ) | (9,317 | ) | |||||
| Cash flow used in investing activities | (50,503 | ) | (22,193 | ) | (72,696 | ) | ||||
| FS16 PetroKazakhstan Inc. |
Revenue for the year ended December 31, 2003 for Turgai includes $35.9 million of crude oil sales made to Downstream and $2.5 million of crude oil sales made to Upstream. These amounts were eliminated on consolidation. Revenue for the year ended December 31, 2003 for Kazgermunai includes $0.5 million of crude oil sales made to Upstream and no crude oil sales to Downstream. This amount was eliminated on consolidation. |
| Year ended December 31, 2002 | Turgai | Kazgermunai | Total | |||||||
| Cash | 307 | 2,854 | 3,161 | |||||||
| Current assets, excluding cash | 14,248 | 14,743 | 28,991 | |||||||
| Property, plant and equipment | 41,602 | 58,853 | 100,455 | |||||||
| Current liabilities | 24,909 | 4,798 | 29,707 | |||||||
| Long-term debt | - | 45,231 | 45,231 | |||||||
| Revenue | 72,938 | 48,284 | 121,222 | |||||||
| Expenses | 47,241 | 37,431 | 84,672 | |||||||
| Net income | 25,697 | 10,853 | 36,550 | |||||||
| Cash flow from operating activities | 25,420 | 19,264 | 44,684 | |||||||
| Cash flow used in financing activities | - | (15,837 | ) | (15,837 | ) | |||||
| Cash flow used in investing activities | (26,613 | ) | (12,089 | ) | (38,702 | ) | ||||
| Revenue for the year ended December 31, 2002 includes $55.0 million of crude oil sales made by Turgai and $6.3 million of crude oil sales made by Kazgermunai to Downstream. These amounts were eliminated on consolidation. | ||
NOTE 5 | 4 | ACCOUNTS RECEIVABLE |
| Accounts receivable consist of the following: |
2004 | 2003 | ||||||
| Trade | 150,462 | 70,282 | |||||
| Value added tax recoverable | 29,316 | 22,864 | |||||
| Due from Turgai | 6,942 | 37,231 | |||||
| Other | 11,784 | 19,916 | |||||
198,504 | 150,293 | ||||||
NOTE 6 | 4 | INVENTORY |
| Inventory consists of the following: |
2004 | 2003 | ||||||
| Refined products | 16,682 | 6,626 | |||||
| Crude oil produced | 25,275 | 12,502 | |||||
| Materials and supplies | 19,285 | 17,792 | |||||
61,242 | 36,920 | ||||||
| FS17 |
NOTE 7 | 4 | PREPAID EXPENSES |
| Prepaid expenses consist of the following: |
2004 | 2003 | ||||||
| Advances for services and equipment | 16,825 | 10,930 | |||||
| Prepayment of transportation for crude oil sales | 40,911 | 30,422 | |||||
| Prepayment for pipeline tariff | 4,443 | 3,549 | |||||
62,179 | 44,901 | ||||||
NOTE 8 | 4 | RESTRICTED CASH |
| Restricted cash comprises: |
| a) | Cash dedicated to a debt service reserve account for the Corporation’s term facility of $8.7 million at December 31, 2004 ($10.5 million as at December 31, 2003). On September 30, 2004 the term facility was repaid in full. The Corporation discharged all hedging liabilities related to this facility as at December 31, 2004. The debt service reserve account was repaid in January 2005. |
| b) | Cash dedicated to a margin account for the Corporation’s hedging program being $39.0 million at December 31, 2004 ($25.0 million as at December 31, 2003). |
| Restricted cash is not available for current purposes. | |
NOTE 9 | 4 | PROPERTY, PLANT AND EQUIPMENT |
| Accumulated | ||||||||||
| Depletion and | Net Book | |||||||||
As at December 31 | Cost | Depreciation | Value | |||||||
2004 | ||||||||||
| Oil and gas | 830,977 | 443,369 | 387,608 | |||||||
| Refining | 168,674 | 63,902 | 104,772 | |||||||
| Transportation | 118,098 | 14,639 | 103,459 | |||||||
1,117,749 | 521,910 | 595,839 | ||||||||
| Other | 10,813 | 4,905 | 5,908 | |||||||
1,128,562 | 526,815 | 601,747 | ||||||||
| 2003 | ||||||||||
| Oil and gas | 722,015 | 365,349 | 356,666 | |||||||
| Refining | 154,402 | 44,483 | 109,919 | |||||||
| Transportation | 73,666 | 4,087 | 69,579 | |||||||
| 950,083 | 413,919 | 536,164 | ||||||||
| Other | 9,365 | 3,212 | 6,153 | |||||||
| 959,448 | 417,131 | 542,317 | ||||||||
| Excluded from the depletable base of oil and gas properties are undeveloped properties of $24.5 million (December 31, 2003 - $17.0 million). No work in progress is excluded from the depletable base of oil and gas properties as at December 31, 2004 ($29.1 million as at December 31, 2003). During the year ended December 31, 2004 no interest was capitalized ($0.4 million in 2003). |
| FS18 PetroKazakhstan Inc. |
| The Corporation used future Brent prices for the years 2005-2009 ($40.19 per barrel in 2005, $38.26 per barrel in 2006, $36.62 per barrel for 2007, $35.04 per barrel for 2008 and $33.53 per barrel for 2009) and estimates made by its independent reserve engineers for periods thereafter for its impairment test calculation. The average annual percentage change in the prices after 2009 was 2%. |
NOTE 10 | 4 | ACCOUNTS PAYABLE AND ACCRUED LIABILITIES |
| Accounts payable and accrued liabilities consist of the following: |
2004 | 2003 | ||||||
| Trade | 70,160 | 66,115 | |||||
| Due to Turgai | 19,668 | - | |||||
| Royalties | 18,259 | 16,133 | |||||
| Income taxes | 30,175 | - | |||||
| Common share dividends | 12,588 | - | |||||
| Other | 10,909 | 6,174 | |||||
161,759 | 88,422 | ||||||
NOTE 11 | 4 | INDEBTEDNESS |
Short-term debt |
2004 | 2003 | ||||||
| Current portion of term facility | - | 35,692 | |||||
| Current portion of term loans | 2,039 | 2,039 | |||||
| Joint venture loan payable | - | 11,000 | |||||
| PKOP bonds | - | 24,494 | |||||
| Kazgermunai debt | 13,502 | - | |||||
15,541 | 73,225 | ||||||
Long-term debt |
2004 | 2003 | ||||||
| Long-term portion of term facility | - | 71,384 | |||||
| Long-term portion of term loans | 9,862 | 12,528 | |||||
| 9.625% bonds | 125,000 | 125,000 | |||||
| Kazgermunai debt | - | 37,743 | |||||
134,862 | 246,655 | ||||||
Committed credit facility | ||
| On May 25, 2004 the Corporation entered into a five and one half year $100.0 million committed credit facility. This facility is unsecured, bears interest at LIBOR plus 2.65% and is subject to annual review. $30.0 million of this facility has been dedicated to cover margin calls under the Corporation’s hedging program. This amount is not available for general corporate purposes. Costs related to this facility amounting to $1.5 million are recorded as deferred charges and amortized over the life of the facility. | ||
Term facility | ||
| On January 2, 2003, PetroKazakhstan Kumkol Resources (“PKKR”) entered into a $225.0 million term facility secured by crude oil export contracts. This facility was repayable in 42 equal monthly installments commencing July 2003. The facility bore interest at a rate of LIBOR plus 3.25% per annum. PKKR drew $190.0 million under this facility and chose not to utilize the remainder. On September 30, 2004 the Corporation had fully repaid the term facility. Unamortized issue costs of $2.1 million related to the term facility have been expensed. |
| FS19 |
Joint venture loan
The joint venture loan was fully repaid on October 7, 2004.
PKOP bonds
On February 16, 2001 PetroKazakhstan Oil Products (“PKOP”) registered 250,000 unsecured bonds (par value $100) in the amount of $25.0 million with the National Securities Commission of the Republic of Kazakhstan (the “PKOP bonds”). The PKOP bonds had a three-year maturity and bore a coupon rate of 10% per annum. The PKOP bonds were listed on the Kazakh Stock Exchange.
The PKOP bonds were fully redeemed on February 26, 2004.
Term loans
PKKR has obtained secured term loans guaranteed by Export Credit Agencies for certain equipment related to the KAM pipeline and the Gas Utilization Facility. The loans are secured by the equipment purchased, bear interest at LIBOR plus 4% per annum, are repayable in equal semi-annual installments and have final maturity dates ranging from five to seven years.
9.625% Notes
On February 12, 2003, PetroKazakhstan Finance B.V., a wholly owned subsidiary of PKKR issued U.S. $125.0 million 9.625% Notes due February 12, 2010. The Notes are unsecured, unconditionally guaranteed by the Corporation, PKKR and PKOP, and were issued at a price of 98.389% of par value. Each of the guarantors has agreed to certain covenants, including limitations on indebtedness, restrictions on payments of dividends, repurchase all or any part of the notes at the holders’ discretion in the case of a change of control. On March 15, 2004 the Corporation’s Notes were approved for listing on the Kazakhstan Stock Exchange.
As at December 31, 2004 issue costs and the discount on the sale of the Notes of $3.2 million are recorded as deferred charges and are amortized over the term of the Notes.
Kazgermunai debt
The Kazgermunai debt is non-recourse to the Corporation. The amounts set out below represent the 50% of Kazgermunai’s total debt, which has been included in the consolidated financial statements on a proportionate consolidation basis (see Note 4).
2004 | 2003 | ||||||
| Subordinated debt | - | 25,057 | |||||
| Loan from Government of Kazakhstan | 13,502 | 12,686 | |||||
13,502 | 37,743 | ||||||
Subordinated Debt
The subordinated debt bore interest at LIBOR plus 3% and was unsecured. Accrued interest was added to the principal on a semi-annual basis. On June 24, Kazgermunai repaid $24.3 million of its outstanding subordinated debt and as at December 31, 2004 the subordinated debt was repaid in full.
Amounts Repaid | 2004 | 2003 | |||||
| Principal repaid | 13,655 | 5,224 | |||||
| Interest repaid | 11,977 | 3,848 | |||||
25,632 | 9,072 | ||||||
Loan from Government of Kazakhstan
The loan from the Government of Kazakhstan relates to exploration and development work performed on the Akshabulak, Nurali and Aksai fields prior to the formation of Kazgermunai. The loan bears interest at LIBOR plus 3% and is unsecured. Accrued interest is added to the principal on a semi-annual basis. Kazgermunai expects to repay the government loan in 2005.
| FS20 PetroKazakhstan Inc. |
| Kazgermunai is restricted from paying dividends until all outstanding loans have been repaid in full. | ||
Repayment | ||
| Principal repayments due for each of the next five years and in total are as follows: |
| Less amounts | |||||||||||||||||||||||||
| included in | Total | ||||||||||||||||||||||||
| short-term | long-term | ||||||||||||||||||||||||
| 2005 | 2006 | 2007 | 2008 | 2009 | There-after | debt | debt | ||||||||||||||||||
| Term loans | 2,039 | 2,039 | 1,645 | 1,252 | 626 | 4,300 | (2,039 | ) | 9,862 | ||||||||||||||||
| 9.625% Notes | - | - | - | - | - | 125,000 | - | 125,000 | |||||||||||||||||
| Kazgermunai | 13,502 | - | - | - | - | - | (13,502 | ) | - | ||||||||||||||||
| 15,541 | 2,039 | 1,645 | 1,252 | 626 | 129,300 | (15,541 | ) | 134,862 | |||||||||||||||||
Interest Expense |
2004 | 2003 | 2002 | ||||||||
| Interest on long-term debt | 22,539 | 23,375 | 29,897 | |||||||
| Interest on short-term debt | 1,791 | 12,204 | 5,576 | |||||||
24,330 | 35,579 | 35,473 | ||||||||
NOTE 12 | 4 | SHARE CAPITAL |
| The Corporation’s common shares are listed on the New York, Toronto, London and Frankfurt Stock Exchanges. On October 21, 2004 PetroKazakhstan shares were listed on the Kazakhstan Stock Exchange. | ||
| Authorized share capital consists of an unlimited number of Class A common shares, and an unlimited number of Class B redeemable preferred shares, issuable in series. |
2004 | 2003 | ||||||||||||
December 31 | Number | Amount | Number | Amount | |||||||||
| Balance, beginning of year | 77,920,226 | 191,695 | 78,956,875 | 193,723 | |||||||||
Shares repurchased and cancelled pursuant to Normal Course Issuer Bid (a) | (1,257,500 | ) | (3,120 | ) | (1,477,400 | ) | (3,616 | ) | |||||
Shares repurchased and cancelled pursuant to Substantial Issuer Bid (b) | (3,999,975 | ) | (9,782 | ) | - | - | |||||||
Stock options exercised for cash | 3,531,821 | 12,726 | 411,275 | 1,608 | |||||||||
| Corresponding convertible securities, converted (c) | 28,558 | 10 | 29,476 | (20 | ) | ||||||||
| Balance, end of year | 76,223,130 | 191,529 | 77,920,226 | 191,695 | |||||||||
| (a) | The Corporation’s Normal Course Issuer Bid program was renewed on August 5, 2003. Under the program up to 5,775,028 common shares may be repurchased for cancellation, during the period from August 7, 2003 to August 6, 2004. In August 2004 the Corporation again renewed this program which enabled the Corporation to repurchase 7,091,429 Class A common shares during the period from August 13, 2004 to August 12, 2005. The Corporation purchased and cancelled 1,477,400 shares at an average price of C$14.69 per share during the year ended December 31, 2003 and 1,257,500 shares at an average price of C$40.00 per share during the year ended December 31, 2004. The excess of cost over the book value for the shares purchased was applied to retained earnings. |
| (b) | In June 2004 the Corporation commenced a Substantial Issuer Bid to repurchase, for cancellation, up to C$160 million of its Class A common shares. As at December 31, 2004, the Corporation had purchased and cancelled 3,999,975 shares at an average price of C$40.00 per share. The excess of cost over the book value for the shares purchased was applied to retained earnings. |
| FS21 |
| (c) | On March 31, 2000, in connection with the acquisition of PKOP, the Corporation issued corresponding convertible securities as follows: |
| Options to purchase 1,105,753 Common Shares of the Corporation at prices and terms which were identical to those options outstanding at March 31, 2000, but in each case the number of options equalled 40.80% of the outstanding options. As at December 31, 2004 there were 8,159 outstanding corresponding convertible securities (36,717 - as at December 31, 2003). | |
| (d) | The Corporation maintains an incentive stock option plan (“plan”) under which directors, officers and key personnel may be granted options to purchase class A common shares of the Corporation. The Corporation has reserved 8,076,050 class A common shares for issuance upon the exercise of options granted under the terms of the plan (2003 - 8,076,050). The Board of Directors determines the exercise price of each option, provided that no option shall be granted with an exercise price at a discount to market. The vesting periods established under the Corporation’s stock option plan and the term of the options are set by the board of directors, subject to a maximum term for any option of 10 years. Granted options have a vesting period of 3-5 years, except for options granted to non-executive directors, which vest immediately. |
| A summary of the status of the Corporation’s stock option plan as of December 31, 2004 and the changes during the year ended December 31, 2004 and year ended December 31, 2003 is presented below (expressed in Canadian dollars): | |
| Weighted Average | |||||||
| Options | Exercise Price | ||||||
| Outstanding at December 31, 2001 | 5,736,880 | 3.07 | |||||
| Granted | 605,000 | 14.65 | |||||
| Exercised | (1,393,281 | ) | 1.09 | ||||
| Forfeited | (98,463 | ) | 6.73 | ||||
| Outstanding at December 31, 2002 | 4,850,136 | 5.01 | |||||
| Granted | 791,000 | 25.82 | |||||
| Exercised | (440,751 | ) | 3.76 | ||||
| Forfeited | (84,925 | ) | 9.27 | ||||
| Outstanding at December 31, 2003 | 5,115,460 | 8.17 | |||||
| Granted | 724,100 | 42.50 | |||||
| Exercised | (3,560,379 | ) | 4.77 | ||||
| Forfeited | (192,525 | ) | 15.94 | ||||
Outstanding at December 31, 2004 | 2,086,656 | 25.17 | |||||
| Options exercisable as at: | |||||||
| December 31, 2003 | 2,816,683 | 5.14 | |||||
| December 31, 2004 | 866,903 | 16.29 | |||||
| The weighted average fair value of the 724,100 options granted during the year ended December 31, 2004 was $8.7 million. |
| FS22 PetroKazakhstan Inc. |
All stock options outstanding as of August 3, 2001 were re-priced in connection with the special dividend that was issued by the Corporation. The exercise price was reduced by C$3.78 per share. Certain options had exercise prices less than C$3.78.
As at December 31, 2004 | Outstanding Options | Exercisable Options | ||||||||||||||
| Weighted | ||||||||||||||||
| Average | Weighted | Weighted | ||||||||||||||
| Number of | Remaining | Average | Number of | Average | ||||||||||||
| Range of Exercise Price | Options | Contractual Life | Exercise Price | Options | Exercise Price | |||||||||||
(C$) | (C$) | (C$) | ||||||||||||||
| 0 to 2.50 | 128,159 | 0.22 | 0.61 | 128,159 | 0.61 | |||||||||||
| 2.50 to 7.50 | 101,000 | 1.25 | 6.13 | 68,500 | 5.88 | |||||||||||
| 7.50 to 12.50 | 290,656 | 1.77 | 9.39 | 214,253 | 9.52 | |||||||||||
| 12.50 to 17.50 | 295,500 | 2.95 | 14.72 | 116,750 | 14.65 | |||||||||||
| 17.50 to 31.62 | 607,241 | 3.96 | 26.14 | 289,241 | 26.68 | |||||||||||
| 31.62 to 44.50 | 664,100 | 4.93 | 43.48 | 50,000 | 43.50 | |||||||||||
| 2,086,656 | 3.46 | 25.17 | 866,903 | 16.29 | ||||||||||||
The pro forma net income per share had we recognized compensation expense using the fair value of common stock options granted for all stock options outstanding prior to January 1, 2003 follows:
2004 | 2003 | 2002 | ||||||||
| Net income | ||||||||||
As reported | 500,668 | 316,940 | 161,397 | |||||||
Pro forma | 499,532 | 314,752 | 158,867 | |||||||
| Basic net income per share | ||||||||||
As reported | 6.40 | 4.06 | 2.00 | |||||||
Pro forma | 6.38 | 4.03 | 1.96 | |||||||
| Diluted net income per share | ||||||||||
As reported | 6.28 | 3.90 | 1.92 | |||||||
Pro forma | 6.27 | 3.87 | 1.89 | |||||||
The estimated fair value of the stock options issued were determined using the Black-Scholes option pricing model with the following assumptions:
2004 | 2003 | 2002 | ||||||||
| Risk-free interest rate | 3.66 | % | 3.91 | % | 3.96 | % | ||||
| Expected option life | 5 years | 5 years | 5 years | |||||||
| Expected volatility in the price of the Corporation's common shares | 32 | % | 38 | % | 68 | % | ||||
| Expected dividends | 2 | % | - | - | ||||||
| Weighted average fair value of options granted during the year | $ | 9.88 | $ | 7.82 | $ | 5.73 | ||||
| FS23 |
NOTE 13 | 4 | INCOME TAXES |
| The Corporation and its subsidiaries are required to file tax returns in the jurisdictions in which they operate. The primary operating jurisdiction is Kazakhstan with substantially all income earned in Kazakhstan. | ||
| The provision for income taxes differs from the results, which would have been obtained by applying the statutory tax rate of 30% to PetroKazakhstan’s income before income taxes. This difference results from the following items: |
2004 | 2003 | 2002 | ||||||||
| Income before income taxes | 803,070 | 474,900 | 263,808 | |||||||
| Statutory Kazakhstan income tax rate | 30 | % | 30 | % | 30 | % | ||||
| Expected tax expense | 240,921 | 142,470 | 79,142 | |||||||
| Excess profit tax provision | 35,000 | - | - | |||||||
| Higher tax rate for Kazgermunai | 12,165 | 2,444 | - | |||||||
| Non-deductible amounts, net | 6,148 | 9,324 | 16,475 | |||||||
| Withholding tax on dividends | 6,849 | 1,384 | - | |||||||
Reversal of lower tax rate for South Kumkol field | - | - | 4,726 | |||||||
| Income tax expense | 301,083 | 155,622 | 100,343 | |||||||
| The following are the major future income tax assets and liabilities arising from temporary differences between the carrying values and tax basis of the following assets and liabilities: |
2004 | 2003 | ||||||
| Future income tax assets: | |||||||
Fixed assets | 34,487 | 23,126 | |||||
Excess profit tax | 36,647 | - | |||||
Provision for inter-company profit eliminations | 15,516 | 9,087 | |||||
Provision for royalties | 5,448 | 4,831 | |||||
Provision for obsolete inventories | 1,310 | 1,180 | |||||
Provision for doubtful debts | 6 | 1,515 | |||||
Other | 487 | 424 | |||||
| Total future income tax assets | 93,901 | 40,163 | |||||
Less: current portion of future income tax assets | (65,431 | ) | (14,697 | ) | |||
Long-term future income tax assets | 28,470 | 25,466 | |||||
| Future income tax liabilities: | |||||||
Fixed assets | 9,936 | 13,012 | |||||
| The Corporation’s principal subsidiaries, PKKR and PKOP, and the Corporation’s other subsidiaries and joint ventures operating in Kazakhstan are separate taxpayers under Kazakhstani tax legislation. |
| FS24 PetroKazakhstan Inc. |
| Taxes are payable in Kazakhstan based on financial statements prepared in accordance with the laws of Kazakhstan rather than financial statements prepared in accordance with generally accepted accounting principles in Canada. The majority of the differences between the two sets of financial statements are temporary differences where an expense or revenue item is recorded for Canadian GAAP purposes in a different period than allowed under Kazakhstani law. The provision for Kazakhstani income taxes has been calculated by applying the Kazakhstani statutory tax rate of 30% to the income of PetroKazakhstan’s Kazakhstan subsidiaries. | ||
| Excess profit tax is in addition to statutory income taxes. Excess profit tax takes effect after the field has achieved a cumulative internal rate of return higher than 20% for the specific field. The excess profit tax ranges from 0% to 30% of taxable income for the year for PKKR and from 0% to 50% for Turgai. | ||
| A provision has been made for expected excess profit tax for the 2004 tax year for Turgai. Excess profit tax paid in one year is deductible in the computation of the excess profit tax liability in the following year. |
NOTE 14 | 4 | NET INCOME PER SHARE |
| The income per share calculations are based on the weighted average and diluted numbers of Class A common shares outstanding during the period as follows: |
2004 | 2003 | 2002 | ||||||||
Weighted average number of common shares outstanding | 78,285,025 | 78,149,904 | 80,853,597 | |||||||
Dilution from options (including convertible securities) | 1,423,880 | 3,142,302 | 3,346,939 | |||||||
| Diluted number of shares outstanding | 79,708,905 | 81,292,206 | 84,200,536 | |||||||
| 649,100 options were excluded from the calculation of diluted number of shares outstanding for the year ended December 31, 2004 as the exercise price was in excess of the average market price for the year. 774,000 options were excluded from the calculation of diluted number of shares outstanding for the year ended December 31, 2003. No options were excluded from the calculation of diluted number of shares outstanding for the year ended December 31, 2002. |
NOTE 15 | 4 | FINANCIAL INSTRUMENTS |
| The nature of the Corporation’s operations and issuance of long-term debt exposes the Corporation to fluctuations in commodity prices, foreign currency exchange rates, interest rates and credit risk. The Corporation recognizes these risks and manages operations in a manner such that exposure to these risks is minimized to the extent practical. | ||
| The Corporation’s financial instruments include cash, accounts receivable, all current liabilities and long-term debt. The fair value of cash, accounts receivable and current liabilities approximates their carrying amounts due to the short-term maturity of these instruments. The fair value of Kazgermunai debt and the term loans approximates their carrying value as they bear interest at market rates. The fair value of the 9.625% Notes is $139.5 million versus the carrying value of $125.0 million as at December 31, 2004 as determined through reference to market price. |
a) | Commodity price risk |
| The Corporation has entered into a commodity-hedging program where it is utilizing derivative instruments to manage the Corporation’s exposure to fluctuations in the price of crude oil. The Corporation has entered into the following contracts with a major financial institution. |
| FS25 |
| Contract | Price Ceiling or | ||||||||||||
| Amount | Contract Period | Contract Type | Contracted Price | Price Floor | |||||||||
(bbls per month) | |||||||||||||
| 362,000 | January 2004 to March 2004 | Dated Brent | 29.80-29.82 | - | |||||||||
| 75,000 | January 2004 to December 2004 | Zero cost collar | 28.00 | 17.00 | |||||||||
| 75,000 | January 2004 to December 2004 | Zero cost collar | 29.00 | 17.00 | |||||||||
| 75,000 | January 2004 to December 2004 | Zero cost collar | 29.25 | 17.00 | |||||||||
| 37,500 | January 2004 to December 2004 | Zero cost collar | 29.60 | 17.00 | |||||||||
| 110,000 | January 2004 to December 2004 | Zero cost collar | 30.20 | 18.00 | |||||||||
| 120,000 | January 2005 to March 2005 | IPE Future | 26.30-26.52 | - | |||||||||
| 40,000 | April 2005 to June 2005 | IPE Future | 25.92 | - | |||||||||
| 458,333 | January 2005 to December 2005 | IPE Future | 25.65-25.90 | - | |||||||||
During the year ended December 31, 2004, the Corporation has foregone revenue of $42.1 million through these contracts ($5.0 million during the year ended December 31, 2003).
The unrealized loss on these hedges as at December 31, 2004 is $60.9 million. This amount is deferred and recognized in the consolidated statement of income when the related contract is settled. The fair value of these hedges was determined based on forward prices as at December 31, 2004.
b) | Foreign currency exchange rate risk |
Export revenues are denominated in U.S. dollars and domestic sales of refined products and crude oil are made in the Tenge equivalent to U.S. dollars at the time of sale. Substantial portions of the Corporation’s operating costs are denominated in Tenge. The Corporation manages this exposure by operating in a manner that minimizes the need to convert between these currencies.
The Corporation, through its Downstream operations, has foreign currency exposure as the tax basis of its assets are denominated in Tenge. For Upstream, the Corporation has the possibility to revalue the tax basis of its assets using the industrial price index through the tax stability provisions of its Hydrocarbon Contracts. There is no significant forward market for the Tenge, therefore, the Corporation does not hedge this exposure.
c) | Interest rate risk |
The Corporation manages its interest rate risk through utilizing fixed and floating rate debt to finance its operations. The floating rate debt exposes the Corporation to fluctuations in interest payments due to changes in interest rates.
d) | Credit risk |
A substantial portion of the Corporation’s accounts receivable are with customers in the energy industry and are subject to normal industry risk. The Corporation’s crude oil sales are sold on credit to purchasers with A rating and all other sales are supported by letters of credit issued by major financial institutions. The Corporation’s sales of refined products are either made on a prepayment basis or supported by letters of credit issued by major financial institutions.
| FS26 PetroKazakhstan Inc. |
NOTE 16 | 4 | RELATED PARTY TRANSACTIONS |
| The Corporation had the following transactions with its joint ventures. |
($ millions) | 2004 | 2003 | 2002 | |||||||
| Crude oil purchased from Turgai | 205.5 | 76.8 | 110.0 | |||||||
| Crude oil purchased from Kazgermunai | 25.5 | 1.1 | 12.6 | |||||||
| Services provided to Turgai | 5.0 | 21.0 | 16.4 | |||||||
| The amounts in the table above represent 100% of transactions with the joint ventures. 50% of these amounts are eliminated on consolidation of the Corporation’s 50% interest in joint ventures. The remaining 50% remains in results of operations. | ||
| As at December 31, 2004 the Corporation has an account payable to the shareholder of the Turgai joint venture amounting to $24.8 million ($16.6 million as at December 31, 2003). |
NOTE 17 | 4 | CASH FLOW INFORMATION |
| Interest and income taxes paid: |
2004 | 2003 | 2002 | ||||||||
| Interest paid | 22,111 | 33,988 | 30,622 | |||||||
| Income taxes paid | 322,907 | 173,275 | 97,903 | |||||||
| Changes in non-cash operating working capital items: |
2004 | 2003 | 2002 | ||||||||
| Increase in accounts receivable | (48,211 | ) | (57,525 | ) | (40,144 | ) | ||||
| (Increase)/decrease in inventory | (20,136 | ) | 3,565 | (10,583 | ) | |||||
| Increase in prepaid expenses | (17,278 | ) | (306 | ) | (27,275 | ) | ||||
| Increase/(decrease) in accounts payable and accrued liabilities | 57,462 | (9,470 | ) | 44,068 | ||||||
Increase/(decrease) in prepayments for crude oil and refined products | 3,264 | 3,111 | (3,882 | ) | ||||||
(24,899 | ) | (60,625 | ) | (37,816 | ) | |||||
| Changes in short-tem debt: |
2004 | 2003 | 2002 | ||||||||
| Cash movements: | ||||||||||
Proceeds from working capital facilities | 98,006 | 66,079 | 64,954 | |||||||
Proceeds from term facility | - | - | 40,000 | |||||||
Proceeds from PKOP bonds | - | 11,332 | - | |||||||
Proceeds from joint venture loan | - | - | 5,000 | |||||||
Total proceeds | 98,006 | 77,411 | 109,954 | |||||||
Repayment of working capital facilities | (98,006 | ) | (69,566 | ) | (92,564 | ) | ||||
Pepayment of term facility | (35,692 | ) | (82,923 | ) | (44,000 | ) | ||||
Repayment of PKOP bonds | (24,494 | ) | - | - | ||||||
Repayment of term loans | (2,039 | ) | (2,039 | ) | - | |||||
Repayment of joint venture loan | (11,000 | ) | - | - | ||||||
Total repayment | (171,231 | ) | (154,528 | ) | (136,564 | ) | ||||
| Non-cash movements: | 15,541 | 134,035 | (9,640 | ) | ||||||
| Net change | (57,684 | ) | 56,918 | (36,250 | ) | |||||
| FS27 |
| Changes in long-term debt: |
2004 | 2003 | 2002 | ||||||||
| Cash movement: | ||||||||||
Proceeds from term facility | - | 190,000 | - | |||||||
Proceeds for sale of 9.625% notes | - | 122,986 | - | |||||||
12% Notes sold, net of discount | - | - | 17,195 | |||||||
Total proceeds | - | 312,986 | 17,195 | |||||||
Repayment of term facility | (71,384 | ) | - | (16,000 | ) | |||||
Redemption of 12% Notes | - | (208,210 | ) | - | ||||||
Repayment of Kazgermunai debt | (25,632 | ) | (9,489 | ) | (18,853 | ) | ||||
Total repayment | (97,016 | ) | (217,699 | ) | (34,853 | ) | ||||
| Non-cash movement | (14,777 | ) | (130,429 | ) | 18,280 | |||||
| Net change | (111,793 | ) | (35.142 | ) | 622 | |||||
| Non-cash movement includes reclassifications of current portion of long-term debt to short-term debt and current liabilities. |
NOTE 18 | 4 | COMMITMENTS AND CONTINGENCIES |
Agency for Regulation of Natural Monopolies and Protection of Competition (“ARNM”) | ||
PKOP | ||
| The ARNM alleged that PKOP charged prices for refined oil products that in total were $6.3 million in excess of ARNM authorized maximum prices. PKOP initiated legal proceedings to annul the ARNM claim and the court of first instance reduced the ARNM claim to approximately $1.1 million. PKOP and the ARNM appealed this decision to the Supreme Court. The Supreme Court recognized approximately $3.6 million of the ARNM’s original assessment. This amount has been paid and recorded in the financial statements. The Corporation has no plans to appeal. | ||
| PKOP received an additional assessment from ARNM in the amount of $8.8 million for allegedly charging prices for refined products in excess of ARNM authorized maximum prices. PKOP appealed this assessment. The ARNM revoked approximately $5.2 million of the assessment and the court of the first instance recognized approximately $1.4 million of the remaining $3.6 million. PKOP appealed this decision and was unsuccessful. $1.4 million has been recorded in the financial statements as a final settlement. | ||
| PKOP’s position remains that the ARNM does not have the right to establish prices for the refinery, and the Corporation, as the party in interest under the Privatization Agreement for the Shymkent Refinery, has notified the Government of Kazakhstan that it is in breach of provisions of the Privatization Agreement. The Corporation has the right to proceed to international arbitration under the terms of the Privatization Agreement. | ||
Group companies | ||
| The ARNM claimed $34.1 million ($31.0 million at December 31, 2003) from a group company for allegedly violating Kazakhstan’s competition law. The group company initiated legal proceedings and the court of first instance dismissed the ARNM claim. The ARNM appealed this decision; the appellate court upheld the decision of the lower court. The ARNM has filed a motion to re-open the court case on the basis of new information. | ||
| The ARNM claimed approximately $96.4 million ($91.4 million at December 31, 2003) from group companies for allegedly violating Kazakhstan’s competition law. The group companies initiated legal action, and at the Astana City Court were unsuccessful in their challenge of allegations by the ARNM that these companies had violated Kazakhstan competition laws. The initial trial court judgment upheld the ARNM determination that these group companies had received unjustified revenues totaling approximately $96.4 million. |
| FS28 PetroKazakhstan Inc. |
The group companies appealed this judgment to the Supreme Court. The initial Supreme Court hearing on the matter was held in the second quarter of 2004 and the Court suspended the case and instructed the parties to seek an agreed settlement. During the period from April to May 13, 2004 the parties did engage in discussions aimed at a settlement, but were unable to resolve the matter through negotiations.
On May 13, 2004, after a hearing on the merits, the Supreme Court overturned the lower court decision which was in favour of the ARNM and sent the case back to the Astana City Court for a new trial. During the third quarter of 2004, the General Prosecutor’s office filed a protest regarding the May 13 decision of the Supreme Court with the Supreme Court Supervisory Panel. On August 25, 2004, the Supervisory Panel issued an opinion upholding the May 13 decision and returned the case to the Astana City Court. In September 2004, the Astana City Court issued a ruling suspending further consideration of the merits of the case pending the completion of parallel investigations being conducted by the “Agency of the Republic of Kazakhstan for Fight Against Economic and Corruption Criminality”. This suspension was removed in late 2004 and the case is currently being reviewed by economic and financial experts under order of the Court. It is currently expected that the economic and financial expertise will be concluded during the spring of 2005 and that the case will, at that point, be subject to further review and decision by the Astana City Court. No provision has been made in the consolidated financial statements for these assessments.
It remains the Corporation’s view that the allegations leveled against the group companies are without justification. A highly competitive market exists for oil products within Kazakhstan and the current level of prices reflects current world crude oil prices. Also, the prices charged by the group companies are competitive with Russian imports and with those charged by distributors of the other two refineries in Kazakhstan.
The Corporation is considering its recourse rights under the terms of the Shymkent refinery Privatization Agreement, which clearly stipulates the right to sell any and all its products in Kazakhstan and abroad at free market prices.
The Corporation will continue to seek a dialogue with the appropriate authorities to address the concerns related to the pricing of refined products and possible measures to be taken to further promote transparency and effective monitoring of the dynamics of competition, consistent with market economy principles.
Tax matters
The local and national tax environment in the Republic of Kazakhstan is subject to change and inconsistent application, interpretation and enforcement. Non-compliance with Kazakhstan laws and regulations, as interpreted by the Kazakh authorities, can lead to the imposition of fines, penalties and interest.
In response to the Corporation’s submission, the Minister of Finance initiated the creation of a high-level Working Group between its officials and the Corporation’s representatives to address and seek resolution of all outstanding tax issues through dialogue and negotiations. On January 22, 2004, the Working Group signed a memorandum that sets out the agreed resolution of several important tax issues which were pending. Certain actions, such as the approval of the amendments to hydrocarbon contracts and issuance of an instruction letter, were required to fully implement the terms of the memorandum. The hydrocarbon contract amendments were approved on July 21, 2004, but the instruction letter has not been issued. The terms of this memorandum are reflected in the following discussion of the Corporation’s tax matters.
Tax assessments for 1998 and 1999
PKKR received tax assessments for 1998 and 1999. The assessments were for a total of approximately $10.5 million including taxes, fines, interest and penalties. PKKR was successful in challenging the assessments at the first level of the court system and was unsuccessful on the majority of the issues at the Supreme Court level. Specifically, PKKR was unsuccessful in obtaining agreement of the Supervisory Panel of the Supreme Court to hear its appeal on the assessed taxes. Accordingly, the Corporation provided for $2.9 million of the $10.5 million total assessment in the consolidated financial statements for the year ended December 31, 2002.
PKKR has been disputing the remaining $7.6 million (currently $8.0 million due to strengthening of the tenge), which relates to fines and penalties assessed, because PKKR believes there was an incorrect application of the provisions of tax legislation. However, PKKR paid this amount to stop the further accumulation of fines and penalties and recorded this payment as an account receivable pending resolution of the issue. The Working Group agreed with PKKR’s position and determined that there was an incorrect application of the provisions of the tax legislation. This matter was
| FS29 |
simultaneously appealed to the Supervisory Panel of the Supreme Court (“Supervisory Panel”) due to time limitations. The Supervisory Panel remanded the case back to the lower court for a retrial. The lower court rejected the Supervisory Panel’s instruction, a retrial was not held, and the lower court let the original decision stand. The lower court’s refusal to comply with the Supervisory Panel’s instruction was appealed to the Supervisory Panel. The Supervisory Panel refused to hear the appeal.
The Ministry of Finance has requested that the Working Group memorandum be revised to reflect the Court’s decision. The Corporation does not agree and intends to pursue this matter with the Ministry of Finance. The Corporation believes, and the Ministry of Finance has previously agreed, that there was an incorrect application of the provisions of the tax legislation. Due to the uncertainty of the outcome, the Corporation has recorded, as an expense, the remaining amount of approximately $8.0 million in the consolidated financial statements for the year ended December 31, 2004.
Tax assessments for 2000 and 2001
PKKR also received assessments for 2000 and 2001. Challenges to the assessments were divided into two court cases. The first case was for amounts totaling approximately $13.0 million and at the first level of the court system PKKR was successful on $6.8 million of the $13.0 million and was unsuccessful on the remainder. The major issue on which PKKR was unsuccessful was the assessment of royalties on flared associated gas. PKKR believes the claim for royalties on flared associated gas, which has no commercial value, contravenes the provisions of its hydrocarbon contracts. PKKR appealed to the Supreme Court and the Supervisory Panel of the Supreme Court and was unsuccessful. Royalties on flared gas were recorded in the consolidated financial statements as follows: $2.2 million in 2002, $0.2 million in 2003 and $2.1 million in 2004. As a result of the lost cases, the Corporation recorded additional $2.9 million related to royalties on gas for 2002 and 2003 in its consolidated financial statements for the year ended December 31, 2004. Additionally, the Corporation has provided for $1.6 million relating to interest charges on this tax assessment. A further provision of $1.7 million was made regarding other issues, which was recorded in 2003.
The second case was for $13.5 million, with $6.9 million related to transfer pricing sent back by the court for re-negotiation. The final assessment resulting from the court hearing held in September 2003 totalled $783,000 including the transfer pricing issue. The Ministry of Finance appealed to the Supreme Court, approximately $2.1 million of the assessment relating to the methodology used to revalue tax pools for currency fluctuations ($1.7 million) and the accelerated write-off of certain assets ($0.4 million). PKKR was unsuccessful at the Supreme Court. The Corporation had provided for these amounts in its consolidated financial statements for the year ended December 31, 2003.
Excess profit tax
The Corporation, through its subsidiary PKKR and joint venture Turgai, is subject to excess profit tax under the terms of the Hydrocarbon Exploration and Production contracts they have for oil and gas production. The contracts are specific to each field.
Excess profit tax is in addition to statutory income taxes, which are at a rate of 30%, and excess profit tax takes effect after the field has achieved a cumulative internal rate of return higher than 20% for the specific field. The excess profit tax ranges from 0% to 30% of taxable income for the year for PKKR and from 0% to 50% for Turgai. As at December 31, 2004 the Corporation through Turgai provided for excess profit tax of $35.0 million for 2004. PetroKazakhstan did not incur excess profit tax in any of its other fields in 2004. It may, however be subject to excess profit tax for the year ended December 31, 2005 and subsequent years in certain of its fields.
Turgai tax assessments
During 2004, Turgai was subject to a tax audit for the years 2002-2003 and received a tax assessment for approximately $148.0 million including penalties and interest (the Corporation’s 50% share is $74.0 million). The major issue was an assessment for excess profit taxes of approximately $100.0 million including fines (the Corporation’s 50% share is $50.0 million). The Ministry of Finance had adopted the position that expenditures relating to construction in progress are not allowed as a cash outflow when computing the internal rate of return. The Corporation believes this position is contrary to the concept of an internal rate of return calculation and counter to the legislation of the Republic of Kazakhstan. The Corporation, fellow shareholder Lukoil and Turgai entered into discussions regarding this assessment with the Ministry of Finance. As a result, the assessment was re-issued for $27.0 million (the Corporation’s 50% share is $13.5 million) and discussions will be held to determine the correct method of calculating excess profit tax and to clarify the interpretation of current legislation. A further revised assessment may be issued depending on the outcome of the discussions. The Corporation will continue to work with government authorities, Turgai, and Lukoil to resolve the dispute. No provision has been made in the financial statements for this assessment.
| FS30 PetroKazakhstan Inc. |
Capital expenditures commitment Pursuant to the Share Sale-Purchase Agreement with the Republic of Kazakhstan, a commitment was made to invest, in Kazakhstan, an aggregate of $280.0 million in capital expenditures, investments or other items that may be treated as capital assets of PKKR on or before December 31, 2002. The Government of Kazakhstan audited compliance with the investment commitment and has agreed that PKKR has more than met its commitments. The Corporation has assumed the rights and obligations under the PKOP privatization agreement, whereby the Government of Kazakhstan privatized PKOP. Under this agreement, the Corporation was required to invest, or cause PKOP to invest, the Tenge equivalent of $150.0 million in capital expenditures or investments by December 31, 2001. As of December 31, 2004, the Corporation believes it has met this commitment. The Government of Kazakhstan agrees with the Corporation’s assertion regarding $116.0 million of this commitment and is claiming the remaining obligation has not been met. If it is established that the Corporation has not met the remaining obligation, the Corporation may be required, under the terms of the agreement, to pay a penalty of 15% of the unfulfilled obligation or $5.1 million. No provision has been made in the financial statements for this matter. Commitments The Corporation has entered into a number of operating leases for rail cars, certain oil field equipment and office space. As at December 31, 2004 such commitments totaled $104.0 million. The obligations for each of the next five years and in total are as follows: |
($ millions) | 2005 | 2006 | 2007 | 2008 | 2009 | Thereafter | Total | |||||||||||||||
| Operating leases | 43.0 | 38.8 | 21.0 | 1.0 | 0.2 | - | 104.0 | |||||||||||||||
| Work commitments | 3.5 | 2.1 | 0.5 | - | - | - | 6.1 | |||||||||||||||
| Total | 46.5 | 40.9 | 21.5 | 1.0 | 0.2 | - | 110.1 | |||||||||||||||
Legal proceedings The Corporation was named as defendant in a claim filed by a company alleging it was retained under a consulting contract from January 17, 1997 until services were suspended in May 1999. The liquidated principal amount claimed was, in aggregate, $6.6 million and an additional unspecified amount was claimed as an alleged penalty provision, with the total claim not to exceed $35.0 million. The arbitration decision was received and the Corporation paid $7.1 million for full settlement of the claim. This amount was recorded in the consolidated financial statements for the year ended December 31, 2002. The Corporation is involved in certain other litigation and claims associated with the normal course of operations. Management believes that settlements, if any, would not have a material impact on the Corporation’s financial statements. | ||
NOTE 19 | 4 | SUBSEQUENT EVENTS |
In February 2005 the Corporation, through one of its operating subsidiaries in Kazakhstan received a court claim filed by Turgai for $17.0 million in damages. This claim relates to the temporary production curtailment of Turgai in late December 2004. The Corporation believes the claim is without merit and, accordingly, no provision has been made in the financial statements. In February 2005 the Corporation, through its joint venture Kazgermunai, received a court claim filed by the Kyzylorda Akimat for failure to fulfill infrastructure obligations. The claim is for approximately $102.0 million (the Corporation’s 50% share is $51.0 million), $28.1 million relating to infrastructure obligations with the remainder being interest charges. The Corporation believes the claim is without merit as a substantial portion of the obligation has been met and the agreement does not impose deadlines. Accordingly, no provision has been made for this claim in the financial statements |
| FS31 |
NOTE 20 | 4 | RECONCILIATION OF RESULTS FROM CANADIAN GAAP TO U.S. GAAP |
These consolidated financial statements have been prepared in accordance with accounting principles generally accepted in Canada (“Canadian GAAP”) which conform in all material respects with those applicable in the United States (“U.S. GAAP”), except as set forth below: Income taxes Recommendations of the CICA with respect to accounting for future income taxes differ from U.S. GAAP due to accounting for certain tax incentives. Under the tax legislation in the Republic of Kazakhstan, the Corporation may revalue the tax pool of its upstream assets using the prescribed inflation rate. A future income tax asset is recognized to reflect such revaluation in the consolidated financial statements, which is reversed for U.S. GAAP. Foreign currency translation PetroKazakhstan’s principal operating subsidiaries are PKKR and PKOP and for Canadian GAAP are classified as integrated which leads to the use of the temporal method of translation (Note 1). Under U.S. GAAP, the Corporation, on a consolidated basis, is required to translate the accounts of its principal operating subsidiaries using the current rate method. The significant changes which result from this difference are a reduction in the carrying value of capital assets and the creation of a cumulative translation account within the equity section of the balance sheet, which reduces total equity. Accounting for commodity hedges The Corporation has entered into a commodity-hedging program where it is utilizing derivative instruments as described in Note 17. The Corporation has designated these as cash flow hedges under SFAS 133 and recognizes in earnings, changes in fair value of these derivatives in the same period as the hedged item. Any change in the fair value of these cash flow hedges before that period are recognized in other comprehensive income. For Canadian GAAP the fair value is deferred and recognized as part of sales revenue when the hedges are settled. Comprehensive income for the year ended December 31, 2004 was reduced by $58.3 million (2003 - $1.6 million). The amount recorded as accounts payable as at December 31, 2004 was $60.9 million (2003 - $2.8 million). Accounting for oil and gas properties The Corporation has completed an impairment test calculation under U.S. GAAP at December 31, September 30, June 30 and March 31, in 2004, 2003 and 2002. According to Staff Accounting Bulletin 106 (“SAB 106”) released by the U.S. Securities and Exchange Commission in September 2004, the future cash outflows associated with settling asset retirement obligations should be excluded from the computation of the present value of estimated future net revenues for the purposes of the full cost impairment calculations. As at December 31, 2004 there was no impairment of full cost assets. There are certain differences between the full cost method of accounting for oil and gas assets as applied in Canada and as applied in the United States. The Corporation has reviewed such differences and determined that no variances in financial statement balances would have resulted from the application of full cost accounting in accordance with U.S. GAAP. Canadian GAAP requires that under full cost accounting, depletion for oil and gas properties, including future development costs, should be determined using proved reserves based on estimated future prices and costs. U.S. GAAP requires that future development costs should be based on current costs. As at December 31, 2004, the difference between Canadian GAAP and U.S. GAAP requirements for depletion was immaterial. Comprehensive income U.S. GAAP utilizes the concept of comprehensive income, which includes net income and other comprehensive income. As at December 31, 2004 there was no similar concept under Canadian GAAP. Other comprehensive income represents the change in equity during the period from transactions and other events from non-owner sources and includes items such as changes in the fair value of cash flow hedges. |
| FS32 PetroKazakhstan Inc. |
Change in accounting principles
Accounting for Asset Retirement Obligations
Effective January 1, 2003, the Corporation adopted SFAS 143, Accounting for Asset Retirement Obligations. The Corporation recognized the estimated fair value of the liability for its assets retirement obligation. As at December 31, 2003 the fair value of the obligation was estimated to be $11.0 million (including accretion expense of $0.9 million for the year ended December 31, 2003). These estimated costs were recorded as an increase in the gross book value of property, plant and equipment with a corresponding increase in the asset retirement obligation. The asset retirement obligation is depleted on a unit-of-production basis over the useful life of the related assets. Accretion expense, resulting from the increase in the present value of the liability due to the passage of time, is recorded as part of depletion, depreciation and accretion expense.
During the year ended December 31, 2004, the Corporation revised the estimated fair value of its asset retirement obligations to $32.5 million (including accretion expense of $2.4 million for the year ended December 31, 2004). The increase in the estimate was recorded as an increase in property, plant and equipment with a corresponding increase in asset retirement obligations. This change in estimate had an impact of a $2.0 million decrease in net income for the year ended December 31, 2004.
The change in asset retirement obligations is as follows:
2004 | 2003 | ||||||
| Asset retirement obligations liability, beginning of year | 11,041 | 4,167 | |||||
| Beginning balance reversed for adoption of SFAS 143 | - | (4,167 | ) | ||||
| Estimate following the adoption of SFAS 143 | - | 10,129 | |||||
| Revisions | 19,162 | - | |||||
| Accretion expense | 2,433 | 912 | |||||
| Settlements | (137 | ) | - | ||||
| Asset retirement obligations liability, end of year | 32,499 | 11,041 | |||||
Under U.S. GAAP the new accounting standard pertaining to accounting for asset retirement obligations was effective January 1, 2003. Changes to the equivalent Canadian accounting standards were effective January 1, 2004 (see Note 2), which eliminated asset retirement obligations as a GAAP difference in 2004 and for future years. Under U.S. GAAP, the cumulative effect of initial application is required to be charged to net income in the year the standard became effective. Canadian GAAP requires this change in accounting policy to be applied retroactively and prior periods presented for comparative purposes restated.
The cumulative effect from the date the liability would have been recognized at the date of adoption of SFAS 143 was $2.1 million and is included in net income for the year ended December 31, 2003.
The asset retirement obligation liability, had we applied SFAS 143 for all years presented in these financial statements, would be $10.1 million as at January 1, 2003.
The pro forma information, had we applied SFAS 143 for comparative years presented in these consolidated financial statements, would be as follows:
| 2002 | ||||
| Net income | ||||
As reported | 162,539 | |||
Pro forma | 162,498 | |||
| Basic net income per share: | ||||
As reported | 2.01 | |||
Pro forma | 2.01 | |||
| Diluted net income per share: | ||||
As reported | 1.93 | |||
Pro forma | 1.93 | |||
| FS33 |
Consolidation of variable interest entities
In January 2003, FASB issued Interpretation No. 46 (“FIN 46”), “Consolidation of Variable Interest Entities.” FIN 46 clarifies the application of Accounting Research Bulletin No. 51, “Consolidated Financial Statements,” for certain entities in which equity investors do not have the characteristics of a controlling financial interest or do not have sufficient equity at risk for the entity to finance its activities without additional subordinated support from other parties. This Interpretation requires variable interest entities (“VIE”) to be consolidated by the primary beneficiary, which represents the enterprise that will absorb the majority of the VIE’s expected losses if they occur, receive a majority of the VIE’s residual returns if they occur, or both. FIN 46 was effective for VIE’s created after January 31, 2003 and for VIE’s in which an enterprise obtains an interest after that date. In December 2003, the FASB issued Interpretation No. 46R (“FIN 46R”), “Consolidation of Variable Interest Entities — an interpretation of Accounting Research Bulletin No. 51 (revised December 2003),” which replaces FIN 46. FIN 46R was primarily issued to clarify the required accounting for interests in VIE’s. The Corporation has determined that the adoption of FIN 46 and FIN 46R did not have a material impact on its financial position or results of operations.
Consolidated Statements of Income
The application of U.S. GAPP would have the following effects on net income as reported:
Years ended December 31 | 2004 | 2003 | 2002 | |||||||
| Net income as reported in accordance with Canadian GAAP | 500,668 | 316,940 | 161,397 | |||||||
| Accounting for income taxes | - | 629 | - | |||||||
| Amortization of debt issue costs | - | - | (29 | ) | ||||||
| Depletion, depreciation and accretion expense | (6,018 | ) | 1,614 | 1,171 | ||||||
| Future income tax | 1,026 | (193 | ) | - | ||||||
Net income under U.S. GAAP before cumulative effect of initial application of SFAS 143 | 495,676 | 318,990 | 162,539 | |||||||
| Cumulative effect of initial application of SFAS 143 | - | (2,107 | ) | - | ||||||
Net income under U.S. GAAP | 495,676 | 316,883 | 162,539 | |||||||
Basic income pershareunder U.S. GAAP: | ||||||||||
| Net income under U.S. GAAP before cumulative effect of initial application of SFAS 143 | 6.33 | 4.08 | 2.01 | |||||||
| Cumulative effect of initial application of SFAS 143 | - | (0.03 | ) | - | ||||||
| Net income under U.S. GAAP | 6.33 | 4.05 | 2.01 | |||||||
Diluted income per share under U.S GAAP: | ||||||||||
| Net income under U.S. GAAP before cumulative effect of initial application of SFAS 143 | 6.22 | 3.92 | 1.93 | |||||||
| Cumulative effect of initial application of SFAS 143 | - | (0.02 | ) | - | ||||||
| Net income under U.S. GAAP | 6.22 | 3.90 | 1.93 | |||||||
Comprehensive income | ||||||||||
| Foreign exchange translation adjustment | 57,138 | 35,199 | (2,235 | ) | ||||||
| Fair value adjustment cash flow hedges | (58,102 | ) | 1,594 | (4,392 | ) | |||||
Total comprehensive income | 494,712 | 353,676 | 155,912 | |||||||
| FS34 PetroKazakhstan Inc. |
Stock based compensation
The Corporation has a stock-based compensation plan as described in Note 12. During the year ended December 2003, the Corporation adopted SFAS 123 and 148, which require recognition of compensation expense using the fair value of the equity instrument granted. The Corporation has adopted this recommendation on a prospective basis, effective January 1, 2003. Accordingly, the Corporation has recognized compensation expense for all common stock options granted to employees and non-executive directors on or after January 1, 2003 using the estimated fair value. The Corporation has recorded compensation expense of $4.0 and $1.2 million in general and administrative expenses within the consolidated statements of income and retained earnings for the years ended December 31, 2004 and 2003 with a corresponding increase in contributed surplus within shareholder’s equity. Compensation expense for options granted on or after January 1, 2003 is recognized as compensation expense over the vesting period of the respective options. For common share options granted prior to January 1, 2003 the pro forma impact on net income and net income per share are as follows:
Years ended December 31 | 2004 | 2003 | 2002 | |||||||
| Net income under U.S. GAAP: | ||||||||||
| As reported | 495,676 | 316,883 | 162,539 | |||||||
| Add stock-based employee compensation expense included in reported net income | 4,034 | 1,175 | - | |||||||
| Deduct total stock-based employee compensation expense for all awards | (5,170 | ) | (3,363 | ) | (2,530 | ) | ||||
| Pro forma | 494,540 | 314,695 | 160,009 | |||||||
| Basic net income per share: | ||||||||||
As reported | 6.33 | 4.05 | 2.01 | |||||||
Pro forma | 6.32 | 4.03 | 1.98 | |||||||
| Diluted net income per share: | ||||||||||
As reported | 6.22 | 3.90 | 1.93 | |||||||
Pro forma | 6.21 | 3.87 | 1.90 | |||||||
| Stock options vested during period (thousands) | 371 | 381 | 513 | |||||||
| Weighted average exercise price | 3.06 | 6.59 | 6.02 | |||||||
| Weighted average fair value of options vested during the period | 6.73 | 5.74 | 4.93 | |||||||
| Weighted average fair value of options granted during the period | 9.88 | 7.82 | 5.73 | |||||||
The foregoing information is calculated in accordance with the Black-Scholes option pricing model, using the following data and assumptions: volatility, as of the date of grant, computed using the prior one to three-year weekly average prices of the Corporation’s common shares, which ranged from 32% to 68%; expected dividend yield - 2%; option terms to expiry - 5 years as defined by the option contracts; risk-free rate of return as of the date of grant - 3.60% to 3.96%, based on five year Government of Canada Bond yields.
| FS35 |
CONSOLIDATED BALANCE SHEETS
The application of U.S. GAAP would have the following effects on balance sheet items as reported:
| Foreign | Fair value | �� | |||||||||||||||||
| exchange | adjustment | Accounting | Asset | ||||||||||||||||
| As | translation | cash flow | for income | retirement | U.S. | ||||||||||||||
| reported | adjustment | hedges | taxes | obligation | GAAP | ||||||||||||||
December 31, 2004 | |||||||||||||||||||
| Current assets | 586,461 | 586,461 | |||||||||||||||||
| Deferred charges | 4,662 | 4,662 | |||||||||||||||||
| Property, plant and equipment | 601,747 | 43,692 | 645,439 | ||||||||||||||||
| Restricted cash | 47,741 | 47,741 | |||||||||||||||||
| Future income tax assets | 28,470 | (5,528 | ) | 22,942 | |||||||||||||||
| Current liabilities | 187,216 | 60,900 | 248,116 | ||||||||||||||||
| Long-term debt | 134,862 | 134,862 | |||||||||||||||||
| Future income tax liability | 9,936 | 9,936 | |||||||||||||||||
| Provision for future site restoration | 32,499 | 32,499 | |||||||||||||||||
| Non-controlling interest | 14,411 | 14,411 | |||||||||||||||||
| Preferred shares of subsidiary | 80 | 80 | |||||||||||||||||
| Shareholders' equity | 890,077 | 43,692 | (60,900 | ) | (5,528 | ) | 867,341 | ||||||||||||
| December 31, 2003 | |||||||||||||||||||
| Current assets | 431,471 | 431,471 | |||||||||||||||||
| Deferred charges | 6,729 | 6,729 | |||||||||||||||||
| Property, plant and equipment | 542,317 | (13,446 | ) | (11,567 | ) | 517,304 | |||||||||||||
| Restricted cash | 35,468 | 35,468 | |||||||||||||||||
| Future income tax assets | 25,466 | (5,528 | ) | (1,025 | ) | 18,913 | |||||||||||||
| Current liabilities | 168,299 | 2,798 | 171,097 | ||||||||||||||||
| Long-term debt | 246,655 | 246,655 | |||||||||||||||||
| Future income tax liability | 13,012 | 13,012 | |||||||||||||||||
| Provision for future site restoration | 28,625 | (17,584 | ) | 11,041 | |||||||||||||||
| Non-controlling interest | 13,091 | 13,091 | |||||||||||||||||
| Preferred shares of subsidiary | 80 | 80 | |||||||||||||||||
| Shareholders' equity | 571,689 | (13,446 | ) | (2,798 | ) | (5,528 | ) | 4,992 | 554,909 | ||||||||||
Consolidated Statements of Income and Retained Earnings (Deficit) Reclassifications
Interest and other income is presented within revenue under Canadian GAAP, under the U.S. GAAP this would be presented as a separate line item after operating income. Interest and financing costs is presented within expenses under Canadian GAAP, under U.S. GAAP this would be presented as a separate line item after operating income. Unusual items as presented under Canadian GAAP would be included within expenses under U.S. GAAP. The “Cash flow” subtotal line would not be presented in a cash flow statement prepared under U.S. GAAP.
New U.S. GAAP pronouncements
In December 2004, the FASB issued Statement of Financial Accounting Standards No. 123R (“SFAS 123R”) “Share Based Payment”, which is a revision of Statement of Financial Accounting Standards No. 123 “Accounting for Stock-Based Compensation”. SFAS 123R establishes standards for the accounting for transactions in which an entity exchanges its equity instruments for goods or services. It also addresses transactions in which an entity incurs liabilities in exchange for goods or services that are based on the fair value of the entity’s equity instruments or that may be settled by the issuance of those equity instruments. SFAS 123R focuses primarily on accounting for transactions in which an entity obtains employee services in share-based payment transactions. SFAS 123R is effective for the Corporation as of June 30, 2005. The Corporation is in the process of evaluating the impact of SFAS 123R on its consolidated financial statements.
The following new U.S. GAAP pronouncements are not expected to have any impact on the Corporation’s consolidated financial statements.
| 4 | Statement of Financial Accounting Standards No. 151 (“SFAS 151”) - Inventory Costs, an Amendment of ARB No. 43, Chapter 4. |
| 4 | Statement of Financial Accounting Standards No. 152 (“SFAS 152”) - Accounting for Real Estate Time-Sharing Transactions—an amendment of FASB Statements No. 66 and 67. |
| 4 | Statement of Financial Accounting Standards No. 153 (“SFAS 153”) - Exchanges of Nonmonetary Assets—an amendment of APB Opinion No. 29. |
| FS36 PetroKazakhstan Inc. |
Historical Financial Data |
Years ended December 31 - UNAUDITED - EXPRESSED IN MILLIONS OF UNITED STATES DOLLARS (EXCEPT PER SHARE AMOUNTS)
2004 | 2003 | 2002 | 2001 | 2000 | 1999 | 1998 | 1997 | ||||||||||||||||||
INCOME | |||||||||||||||||||||||||
| Revenue | 1,642.4 | 1,117.3 | 825.4 | 603.1 | 523.2 | 155.2 | 175.9 | 94.8 | |||||||||||||||||
| Expenses | (733.8 | ) | (560.1 | ) | (508.1 | ) | (323.7 | ) | (223.5 | ) | (136.8 | ) | (153.9 | ) | (56.0 | ) | |||||||||
| Depletion and depreciation | (105.5 | ) | (82.4 | ) | (46.4 | ) | (34.8 | ) | (14.7 | ) | (2.9 | ) | (55.3 | ) | (15.9 | ) | |||||||||
| Ceiling test write-downs | - | - | - | - | - | (2.1 | ) | (173.4 | ) | - | |||||||||||||||
| Income taxes | (301.1 | ) | (155.6 | ) | (100.3 | ) | (68.4 | ) | (99.7 | ) | (17.7 | ) | (22.6 | ) | (7.1 | ) | |||||||||
| Unusual items | - | - | (7.1 | ) | (5.5 | ) | (20.4 | ) | 12.8 | - | - | ||||||||||||||
| Non-controlling interest | (1.3 | ) | (2.3 | ) | (2.1 | ) | (1.9 | ) | (10.0 | ) | - | - | - | ||||||||||||
| Net Income (Loss) | 500.7 | 316.9 | 161.4 | 168.8 | 154.9 | 8.5 | (229.3 | ) | 15.8 | ||||||||||||||||
CASH FLOW | |||||||||||||||||||||||||
| Cash flow | 560.5 | 400.0 | 216.8 | 200.3 | 179.4 | 17.0 | 0.6 | 32.0 | |||||||||||||||||
| Proceeds from shares issued | 13.1 | 1.6 | 1.4 | 0.7 | 26.7 | - | 2.3 | 0.3 | |||||||||||||||||
| Share repurchased and cancelled | 38.6 | 14.8 | 23.5 | - | - | - | - | - | |||||||||||||||||
| Capital expenditures | 166.0 | 203.2 | 140.1 | 110.2 | 17.0 | 15.2 | 113.0 | 47.3 | |||||||||||||||||
BALANCE SHEET | |||||||||||||||||||||||||
| Property, plant and equipment | 601.7 | 542.3 | 417.6 | 342.9 | 264.5 | 87.6 | 76.8 | 178.8 | |||||||||||||||||
| Long-term debt | 134.9 | 246.7 | 281.8 | 281.2 | 82.0 | - | - | 180.5 | |||||||||||||||||
| Net debt | (48.7 | ) | 135.2 | 223.3 | 268.9 | 47.8 | 167.8 | 178.1 | 154.9 | ||||||||||||||||
| Shareholders' Equity | 890.1 | 571.7 | 266.9 | 127.6 | 185.0 | (87.6 | ) | (96.0 | ) | 130.9 | |||||||||||||||
Production(mbopd) | 151.1 | 151.3 | 135.8 | 100.9 | 84.1 | 64.3 | 53.1 | 45.0 | |||||||||||||||||
Reserves(mmboes)(as of January 1 of the following year) (proved plus probable) | 549.8 | 495.4 | 518.3 | 512.3 | 487.6 | 458.6 | 449.5 | 429.9 | |||||||||||||||||
STATISTICS | |||||||||||||||||||||||||
Weighted average common shares outstanding(millions) | 78.29 | 78.15 | 80.85 | 79.81 | 70.59 | 44.51 | 44.24 | 42.83 | |||||||||||||||||
| Per Share (basic) | |||||||||||||||||||||||||
Net income (loss) | $ | 6.40 | $ | 4.06 | $ | 2.00 | $ | 2.12 | $ | 2.19 | $ | 0.19 | $ | (5.18 | ) | $ | 0.37 | ||||||||
Cash flow | $ | 7.16 | $ | 5.12 | $ | 2.68 | $ | 2.51 | $ | 2.54 | $ | 0.38 | $ | 0.01 | $ | 0.75 | |||||||||
| Market Price for shares | |||||||||||||||||||||||||
Toronto(C$) | |||||||||||||||||||||||||
High | 50.58 | 30.93 | 25.70 | 14.30 | 11.25 | 3.65 | 12.00 | 14.40 | |||||||||||||||||
Low | 29.00 | 13.87 | 8.27 | 7.10 | 2.70 | 0.25 | 1.40 | 5.05 | |||||||||||||||||
Close | 44.53 | 29.27 | 16.48 | 10.80 | 7.65 | 3.30 | 1.76 | 11.10 | |||||||||||||||||
United States(U.S.$) | |||||||||||||||||||||||||
High | 42.62 | 23.25 | 16.05 | 9.05 | 7.50 | 2.50 | 8.66 | 10.62 | |||||||||||||||||
Low | 21.67 | 9.51 | 5.23 | 4.41 | 1.06 | 0.06 | 0.84 | 3.67 | |||||||||||||||||
Close | 37.10 | 22.51 | 10.42 | 6.82 | 5.08 | 2.23 | 1.16 | 7.80 | |||||||||||||||||
| FS37 |
Share Price Performance |
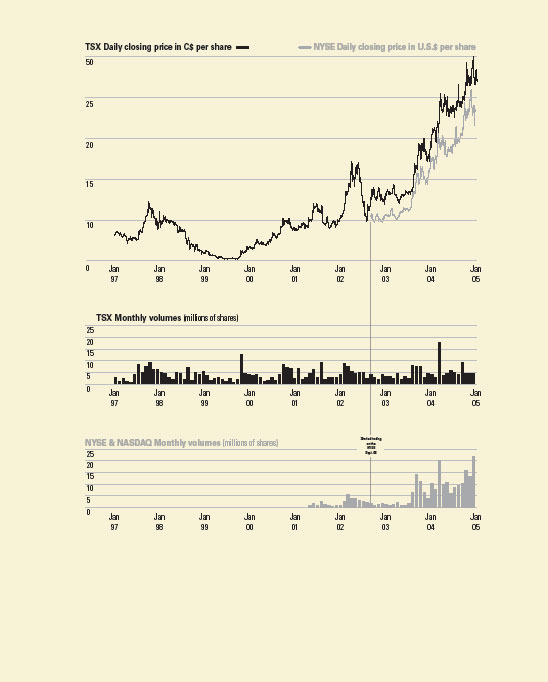
| FS38 PetroKazakhstan Inc. |
Officers of PetroKazakhstan Inc. |

| FS39 |
Corporate Information |
DIRECTORS Bernard F. Isautier President and Chief Executive Officer Windsor, United Kingdom James B.C. Doak(1) (3) President and Managing Partner, Megantic Asset Management Inc. Toronto, Ontario Nurlan J. Kapparov(2) (3) Chairman, KazInvest Bank Almaty, Kazakhstan Jacques Lefèvre(1) (2) Vice Chairman, Lafarge S.A. Paris, France Louis W. MacEachern(2) (3) President, Fortune Industries Ltd. Calgary, Alberta Jan Bonde-Nielsen(1) Chairman, Greenoak Holdings London, England (1) Audit Committee Member (2) Compensation Committee Member (3) Corporate Governance CommitteeMember OFFICERS Bernard F. Isautier President and Chief Executive Officer Mike Azancot Senior Vice President, Exploration and Development Clayton J. Clift Senior Vice President, Finance and Chief Financial Officer Anthony R. Peart Senior Vice President, General Counsel and Corporate Secretary Dermot A. Hassett Vice President, Marketing and Transportation Ihor P. Wasylkiw Vice President, Investor Relations | SHARE TRANSFER AGENT Computershare Trust Company of Canada Calgary, Alberta Toronto, Ontario AUDITORS TOO Deloitte & Touche Almaty, Kazakhstan BANKERS ABN Amro Bank Kazakhstan Almaty, Kazakhstan Bank Turan Alem Almaty, Kazakhstan Citibank Almaty, Kazakhstan London, England National Bank of Canada Calgary, Alberta Barclays Bank Plc Nicosia, Cyprus LEGAL COUNSEL Davies Ward Phillips & Vineberg LLP Toronto, Ontario Gowling Lafleur and Henderson LLP Calgary, Alberta Paul, Weiss, Rifkind, Wharton & Garrison New York, New York Denton Wilde Sapte Almaty, Kazakhstan Salans Almaty, Kazakhstan INDEPENDENT RESERVOIR CONSULTANTS McDaniel & Associates Consultants Ltd. Calgary, Alberta | OFFICE ADDRESSES Registered Office PetroKazakhstan Inc. Suite 1460 Sun Life Plaza, North Tower, 140 - 4th Avenue S.W. Calgary, Alberta Canada T2P 3N3 Tel: (403) 221-8435 Fax: (403) 221-8425 Website: www.petrokazakhstan.com Email: ir@petrokazakhstan.com Contact: Ihor P. Wasylkiw Vice President, Investor Relations UK Representative Office Ascot Petroleum Consulting Ltd. Hogarth House, 31 Sheet Street Windsor, Berkshire United Kingdom SL4 1BY Tel: 44 (1753) 410 020 Fax: 44 (1753) 410 030 Contact: Jeffrey D. Auld Vice President, Treasurer Kazakhstan Offices PetroKazakhstan Kumkol Resources PetroKazakhstan Oil Products 204 Karasai Batyr Street Almaty, Republic of Kazakhstan, 480009 Tel: 7 (3272) 58-18-48 Fax: 7 (3272) 58-18-60 Contact: Thomas Dvorak President SHARE LISTINGS The Toronto Stock Exchange S&P/TSX 4 100 Composite Index 4Energy Index 4Canadian Midcap Index New York Stock Exchange 4NYSE Composite Index 4NYSE Energy Index The London Stock Exchange Frankfurt Stock Exchange Trading Symbol - PKZ Kazakhstan Stock Exchange Trading Symbol - CA_PKZ |
| FS40 PetroKazakhstan Inc. |
CONVERSION AND EQUIVALENCY TABLES
Multiply by | |||
| Kilometres to Miles | 0.621 | C$ 1.5973 to the U.S.$1.00 as at December 31, 2001 | |
| Metric Tonnes to U.S. barrels for 40° API crude | 7.746 | C$ 1.5781 to the U.S.$1.00 as at December 31, 2002 | |
| Hectares to Acres | 2.471 | C$ 1.2854 to the U.S.$1.00 as at December 31, 2003 | |
| Metres to Feet | 3.281 | C$ 1.2052 to the U.S.$1.00 as at December 31, 2004 |
| 1 square km = .386 square miles | Tenge 150.76 to the U.S.$1.00 as at December 31, 2001 | |
| 1 square km = 247 acres | Tenge 154.96 to the U.S.$1.00 as at December 31, 2002 | |
| 1 square mile = 640 acres | Tenge 143.19 to the U.S.$1.00 as at December 31, 2003 | |
| Tenge 130.00 to the U.S. $1.00 as at December 31, 2004 |
ABBREVIATIONS AND DEFINITIONS
AIF | Annual Information Form | KAM | Kyzylkiya, Aryskum and Maibulak | |
API | American Petroleum Institute | km | kilometre(s) | |
ARNM | Agency for Regulation of Natural Monopolies and Protection of Competition | km2 | square kilometre(s) | |
bbl | barrel | LIBOR | London Inter Bank Offering Rate | |
bbls | barrels | LPG | Liquified Petroleum Gas | |
bcf | billion cubic feet | mazut | heavy fuel oil | |
bfpd | barrels of fluid per day | mboe | thousand barrels of oil equivalent | |
bopd | barrels of oil per day | mboepd | thousand barrels of oil equivalent per day | |
bpd | barrels per day | mbopd | thousand barrels of oil per day | |
Brent | Brent dated oil reference price | MEMR | Ministry of Energy and Mineral Resources | |
BTC | Baku, Tbilisi, Ceyhan Pipeline | mm | million | |
bwpd | barrels of water per day | mmbbls | million barrels | |
C$ | Canadian dollars | mmboe | million barrels of oil equivalent | |
CFR | cost and freight | mmtonnes | million metric tonnes | |
CICA | Canadian Institute of Chartered Accountants | MW | megawatt | |
CIF | cost insurance and freight | NCIB | Normal course Issuer Bid | |
CPC | Caspian Pipeline Consortium | NGLs | Natural Gas Liquids | |
CPF | Central Processing Facility | NYSE | New York Stock Exchange | |
CPT | carriage paid to | OPEC | Organization of Petroleum Exporting Countries | |
DAF | delivered at frontier | PKOP | PetroKazakhstan Oil Products | |
DDU | delivered duty unpaid | PKKR | PetroKazakhstan Kumkol Resources | |
DES | delivered ex ship | RWE | RWE-DEA AG | |
EBITDA | Earnings before interest, income taxes, depreciation, depletion and amortization | SFAS | Statement of Financial Accounting Standards | |
EEG | Erdol Erdgas Gommern GmbH | tones | metric tonnes | |
EOR | enhanced oil recovery | Turgai | Turgai Petroleum | |
ERP | Enterprise Resource Planning | TSX | Toronto Stock Exchange | |
FCA | Free Carrier | U.S.$ | United States dollars | |
FOB | Free On Board | VAT | Value Added Tax | |
GAAP | Generally accepted accounting principles | VDU | Vacuum Distillation Unit | |
GDP | Gross Domestic Product | VGO | Vacuum Gas Oil | |
GUP | Gas Utilization Project | VIEs | Variable Interest Entities | |
HS&E | Health, safety and environment | WTO | World Trade Organization | |
IFC | International Finance Corporation | $/bbl U.S. | dollars per barrel | |
2D | two dimensional | |||
3D | three dimensional |
FORWARD-LOOKING STATEMENTS
This document contains forward-looking statements that involve risks and uncertainties. These statements relate to the Corporation’s future plans, objectives, expectations and intentions. These statements are identified by the use of words such as “may”, “will”, “expect”, “anticipate”, “intend”, “plan”, “estimate”, “believe”, “continue” or other similar expressions. These forward-looking statements reflect management’s current expectations and assumptions as to future events that may not prove to be accurate. Actual results are subject to a number of risks and uncertainties and could differ materially from those discussed in these statements. In light of the many risks and uncertainties surrounding our business and operations, you should keep in mind that the forward-looking statements described in this document may not transpire. The Corporation undertakes no obligation, and does not intend, to update or revise any forward-looking statements, whether as a result of new information, future events or otherwise.