Exhibit 99.3
2004 Consolidated Financial Statements and Notes to the Consolidated Financial Statements | |||
Management Report | FS2 | ||
Comments by Independent Registered Public Accounting Firm to U.S. Readers on Canada - U.S. Reporting Differences | FS3 | ||
Consolidated Financial Statements for the Years Ended December 31, 2004 and 2003: | |||
4 | Consolidated Statements of Income and Retained Earnings (Deficit) | FS4 | |
4 | Consolidated Balance Sheets | FS5 | |
4 | Consolidated Statements of Cash Flow | FS6 | |
Notes to the Consolidated Financial Statements | FS7 | ||
| FS1 |
Management Report |
The accompanying consolidated financial statements and all information in the annual report are the responsibility of management.
The consolidated financial statements have been prepared by management in accordance with Canadian generally accepted accounting principles. When alternative accounting methods exist, management has chosen those it deems most appropriate in the circumstances. The consolidated financial statements are not precise since they include certain amounts based on estimates and judgments. Management has determined such amounts on a reasonable basis in order to ensure that the consolidated financial statements are presented fairly, in all material respects. Financial information presented elsewhere in this annual report has been prepared on a basis consistent with that in the consolidated financial statements.
PetroKazakhstan Inc. maintains systems of internal accounting and administrative controls. These systems are designed to provide reasonable assurance that financial information is relevant, reliable and accurate and that the Corporation’s assets are properly accounted for and adequately safeguarded.
The Audit Committee of the Board of Directors, composed of non-management Directors, meets regularly with management, as well as the external auditors, to discuss auditing (external and internal), internal controls, accounting policy and financial reporting matters. The Audit Committee reviews the consolidated financial statements with both management and the independent auditors and reports its finding to the Board of Directors before such statements are approved by the Board.
The consolidated financial statements have been audited by TOO Deloitte & Touche, the independent auditors, in accordance with the generally accepted auditing standards on behalf of the shareholders. TOO Deloitte & Touche have full and free access to the Audit Committee.
| (signed) | (signed) |
| Bernard F. Isautier | Clayton Clift |
| President and Chief Executive Officer | Senior Vice President Finance and Chief Financial Officer |
| March 1, 2005 | March 1, 2005 |
| FS2 PetroKazakhstan Inc. |
Report of Independent Registered Public Accounting Firm |
To the Shareholders of PetroKazakhstan Inc.
We have audited the consolidated balance sheets of PetroKazakhstan Inc. (“the Corporation”) as at December 31, 2004 and 2003 and the consolidated statements of income and retained earnings, and cash flows for each of the years in the three-year period ended December 31, 2004. These consolidated financial statements are the responsibility of the Corporation’s management. Our responsibility is to express an opinion on these financial statements based on our audits.
We conducted our audits in accordance with Canadian generally accepted auditing standards and the standards of the Public Company Accounting Oversight Board (United States). Those standards require that we plan and perform an audit to obtain reasonable assurance whether the consolidated financial statements are free of material misstatements. An audit includes examining, on a test basis, evidence supporting the amounts and disclosures in the consolidated financial statements. An audit also includes assessing the accounting principles used and significant estimates made by management, as well as evaluating the overall financial statement presentation.
In our opinion, these consolidated financial statements present fairly, in all material respects, the financial position of the Corporation as at December 31, 2004 and 2003 and the results of its operations and cash flows for each of the years in the three-year period ended December 31, 2004, in accordance with Canadian generally accepted accounting principles.
The Corporation is not required to have, nor were we engaged to perform, an audit of its internal control over financial reporting. Our audit included consideration of internal control over financial reporting as a basis for designing audit procedures that are appropriate in the circumstances, but not for the purpose of expressing an opinion on the effectiveness of the Corporation’s internal control over financial reporting. Accordingly, we express no such opinion.
(signed)
TOO Deloitte & Touche
Almaty, Kazakhstan
March 1, 2005
Comments by Independent Registered Public Accounting Firm
to U.S. Readers on Canada - U.S. Reporting Differences
The standards of the Public Company Accounting Oversight Board (United States) require the addition of an explanatory paragraph (following the opinion paragraph) when there are changes in accounting principles that have a material effect on the comparability of the Corporation’s consolidated financial statements and changes that have been implemented in the financial statements, such as the changes described in Note 2 to the consolidated financial statements. Our report to the shareholders dated March 1, 2005 is expressed in accordance with Canadian reporting standards, which do not require a reference to such a change in accounting principles in the report of the independent registered public accounting firm when the change is properly accounted for and adequately disclosed in the consolidated financial statements.
(signed)
TOO Deloitte & Touche
Almaty, Kazakhstan
March 1, 2005
| FS3 |
Consolidated Statements of Income and Retained Earnings (Deficit) |
Years ended December 31 - EXPRESSED IN THOUSANDS OF UNITED STATES DOLLARS (EXCEPT PER SHARE AMOUNTS)
2004 | 2003 | 2002 | ||||||||
(Restated - | (Restated - | |||||||||
see Note 2) | see Note 2) | |||||||||
REVENUE | ||||||||||
| Crude oil | 992,880 | 621,126 | 481,114 | |||||||
| Refined products | 639,405 | 481,326 | 332,639 | |||||||
| Service fee | 6,484 | 11,532 | 9,646 | |||||||
| Interest income | 3,658 | 3,340 | 1,951 | |||||||
1,642,427 | 1,117,324 | 825,350 | ||||||||
EXPENSES | ||||||||||
| Production | 89,339 | 65,516 | 60,596 | |||||||
| Royalties and taxes | 126,444 | 82,295 | 68,714 | |||||||
| Transportation | 271,809 | 224,987 | 163,801 | |||||||
| Refining | 21,646 | 17,760 | 21,721 | |||||||
| Crude oil and refined product purchases | 111,339 | 56,460 | 73,327 | |||||||
| Selling | 37,934 | 28,529 | 23,253 | |||||||
| General and administrative | 60,915 | 54,279 | 58,879 | |||||||
| Interest and financing costs | 24,330 | 35,579 | 35,473 | |||||||
| Depletion, depreciation and accretion | 105,520 | 82,352 | 46,411 | |||||||
| Foreign exchange (gain) loss | (9,919 | ) | (5,333 | ) | 2,233 | |||||
839,357 | 642,424 | 554,408 | ||||||||
| INCOME BEFORE UNUSUAL ITEMS | 803,070 | 474,900 | 270,942 | |||||||
| UNUSUAL ITEMS | ||||||||||
Arbitration settlement(Note 18) | - | - | 7,134 | |||||||
| INCOME BEFORE INCOME TAXES | 803,070 | 474,900 | 263,808 | |||||||
INCOME TAXES(Note 13) | ||||||||||
| Current provision | 356,249 | 165,379 | 100,808 | |||||||
| Future income tax recovery | (55,166 | ) | (9,757 | ) | (465 | ) | ||||
301,083 | 155,622 | 100,343 | ||||||||
NET INCOME BEFORE NON-CONTROLLING INTEREST | 501,987 | 319,278 | 163,465 | |||||||
| NON-CONTROLLING INTEREST | 1,319 | 2,338 | 2,068 | |||||||
NET INCOME | 500,668 | 316,940 | 161,397 | |||||||
RETAINED EARNINGS (DEFICIT), BEGINNING OF YEAR | 378,819 | 73,143 | (70,873 | ) | ||||||
Substantial issuer bid(Note 12) | (111,335 | ) | - | - | ||||||
Normal course issuer bid (Note 12) | (35,528 | ) | (11,232 | ) | (17,350 | ) | ||||
| Common share dividends | (39,253 | ) | - | - | ||||||
| Preferred share dividends | (35 | ) | (32 | ) | (31 | ) | ||||
RETAINED EARNINGS, END OF YEAR | 693,336 | 378,819 | 73,143 | |||||||
BASIC NET INCOME PER SHARE(Note 14) | 6.40 | 4.06 | 2.00 | |||||||
DILUTED NET INCOME PER SHARE (Note 14) | 6.28 | 3.90 | 1.92 | |||||||
See accompanying notes to the consolidated financial statements.
| FS4 PetroKazakhstan Inc. |
Consolidated Balance Sheet |
As at December 31 - EXPRESSED IN THOUSANDS OF UNITED STATES DOLLARS
2004 | 2003 | ||||||
(Restated - | |||||||
see Note 2) | |||||||
ASSETS | |||||||
| CURRENT | |||||||
| Cash | 199,105 | 184,660 | |||||
Accounts receivable(Note 5) | 198,504 | 150,293 | |||||
Inventory(Note 6) | 61,242 | 36,920 | |||||
Prepaid expenses(Note 7) | 62,179 | 44,901 | |||||
Current portion of future income tax asset(Note 13) | 65,431 | 14,697 | |||||
586,461 | 431,471 | ||||||
Deferred charges(Note 11) | 4,662 | 6,729 | |||||
Restricted cash(Note 8) | 47,741 | 35,468 | |||||
Future income tax asset(Note 13) | 28,470 | 25,466 | |||||
Property, plant and equipment(Note 9) | 601,747 | 542,317 | |||||
TOTAL ASSETS | 1,269,081 | 1,041,451 | |||||
LIABILITIES | |||||||
| CURRENT | |||||||
Accounts payable and accrued liabilities(Note 10) | 161,759 | 88,422 | |||||
Short-term debt(Note 11) | 15,541 | 73,225 | |||||
| Prepayments for crude oil and refined products | 9,916 | 6,652 | |||||
187,216 | 168,299 | ||||||
Long-term debt(Note 11) | 134,862 | 246,655 | |||||
Asset retirement obligations(Note 2) | 32,499 | 28,625 | |||||
Future income tax liability(Note 13) | 9,936 | 13,012 | |||||
364,513 | 456,591 | ||||||
| Non-controlling interest | 14,411 | 13,091 | |||||
| Preferred shares of subsidiary | 80 | 80 | |||||
COMMITMENTS AND CONTINGENCIES (Note 18) | |||||||
SHAREHOLDERS’ EQUITY | |||||||
Share capital(Note 12) | 191,529 | 191,695 | |||||
Contributed surplus (Note 2) | 5,212 | 1,175 | |||||
| Retained earnings | 693,336 | 378,819 | |||||
890,077 | 571,689 | ||||||
TOTAL LIABILITIES AND SHAREHOLDERS’ EQUITY | 1,269,081 | 1,041,451 | |||||
See accompanying notes to the consolidated financial statements.
Approved by the Board of Directors:
| (signed) | (signed) |
| Bernard Isautier | Jacques Lefèvre |
| Director | Director |
| FS5 |
Consolidated Statements of Cash Flow |
Years ended December 31 - EXPRESSED IN THOUSANDS OF UNITED STATES DOLLAR
2004 | 2003 | 2002 | ||||||||
(Restated - | (Restated - | |||||||||
see Note 2) | see Note 2) | |||||||||
OPERATING ACTIVITIES | ||||||||||
| Net income | 500,668 | 316,940 | 161,397 | |||||||
| Items not affecting cash: | ||||||||||
Depletion, depreciation and accretion | 105,520 | 82,352 | 46,411 | |||||||
Future income tax recovery | (55,166 | ) | (9,757 | ) | (465 | ) | ||||
Non-controlling interest | 1,319 | 2,338 | 2,068 | |||||||
Compensation expense(Note 2) | 4,037 | 1,175 | - | |||||||
Amortization of deferred charges | 3,572 | 3,936 | 1,402 | |||||||
Other non-cash charges | 541 | 2,991 | 5,981 | |||||||
| Cash flow | 560,491 | 399,975 | 216,794 | |||||||
Changes in non-cash operating working capital items(Note 17) | (24,899 | ) | (60,625 | ) | (37,816 | ) | ||||
| Cash flow from operating activities | 535,592 | 339,350 | 178,978 | |||||||
FINANCING ACTIVITIES | ||||||||||
Short-term debt proceeds(Note 17) | 98,006 | 77,411 | 109,954 | |||||||
Short-term debt repayment(Note 17) | (171,231 | ) | (154,528 | ) | (136,564 | ) | ||||
Long-term debt proceeds(Note 17) | - | 312,986 | 17,195 | |||||||
Long-term debt repayment(Note 17) | (97,016 | ) | (217,699 | ) | (34,853 | ) | ||||
| Deferred charges paid | (1,674 | ) | (3,642 | ) | (2,850 | ) | ||||
| Common share dividends | (26,665 | ) | - | - | ||||||
| Preferred share dividends | (35 | ) | (32 | ) | (31 | ) | ||||
Purchase of common shares under a normal course issuer bid(Note 12) | (38,648 | ) | (14,848 | ) | (23,549 | ) | ||||
Purchase of common shares under a substantial issuer bid(Note 12) | (121,117 | ) | - | - | ||||||
| Proceeds from issue of share capital, net of share issuance costs | 12,736 | 1,588 | 1,417 | |||||||
| Cash flow (used in) from financing activities | (345,644 | ) | 1,236 | (69,281 | ) | |||||
INVESTING ACTIVITIES | ||||||||||
| Restricted cash | (12,273 | ) | (35,468 | ) | - | |||||
| Capital expenditures | (163,230 | ) | (196,470 | ) | (136,852 | ) | ||||
| Proceeds from sale of property, plant and equipment | - | 1,258 | - | |||||||
| Long-term investment | - | - | 40,000 | |||||||
| Acquisition of subsidiary, net of cash acquired | - | (38 | ) | (2,853 | ) | |||||
Purchase of preferred shares of subsidiary | - | (4 | ) | (8 | ) | |||||
| Cash flow used in investing activities | (175,503 | ) | (230,722 | ) | (99,713 | ) | ||||
INCREASE IN CASH | 14,445 | 109,864 | 9,984 | |||||||
CASH, BEGINNING OF YEAR | 184,660 | 74,796 | 64,812 | |||||||
CASH, END OF YEAR | 199,105 | 184,660 | 74,796 | |||||||
See accompanying notes to the consolidated financial statements.
| FS6 PetroKazakhstan Inc. |
Notes to Consolidated Financial Statements |
Years ended December 31 - EXPRESSED IN THOUSANDS OF UNITED STATES DOLLARS, TABULAR AMOUNTS IN THOUSANDS OF DOLLARS (UNLESS OTHERWISE INDICATED)
NOTE 1 | 4 | SIGNIFICANT ACCOUNTING POLICIES |
Principles of Consolidation PetroKazakhstan Inc. (“PetroKazakhstan” or the “Corporation”), formerly known as Hurricane Hydrocarbons Ltd., is an independent integrated oil and gas corporation, operating in the Republic of Kazakhstan, engaged in the acquisition, exploration, development and production of oil and gas, refining of oil, and the sale of oil and oil products. The consolidated financial statements of PetroKazakhstan have been prepared in accordance with Canadian Generally Accepted Accounting Principles and include the accounts of the Corporation, which is incorporated under the laws of Alberta, together with the accounts of its subsidiaries which are incorporated under the laws of Canada, Cyprus, England, the Netherlands, British Virgin Islands and Kazakhstan. Intercompany transactions are eliminated upon consolidation. On August 28, 1996, the Corporation entered into a Share Sale-Purchase Agreement with the Republic of Kazakhstan for the purchase of 100% of the issued common shares of Yuzhneftegas, a state owned joint stock company, later renamed to OJSC Hurricane Kumkol Munai and then to PetroKazakhstan Kumkol Resources (“PKKR”), operating in the South Turgai Basin, located in South Central Kazakhstan. On March 31, 2000, the Corporation acquired 88.4% of the common shares of OJSC Shymkentnefteorgsyntez, later renamed to OJSC Hurricane Oil Products and then to PetroKazakhstan Oil Products (“PKOP”). The Corporation has acquired an additional 8.3% interest in PKOP and had a 96.7% interest in PKOP as at December 31, 2004. PKOP owns and operates an oil refinery located in Shymkent, a city in South Central Kazakhstan. These consolidated financial statements are prepared in accordance with Canadian Generally Accepted Accounting Principles (“GAAP”) and have been reconciled to U.S. Generally Accepted Accounting Principles in Note 20. Use of estimates The preparation of financial statements in accordance with generally accepted accounting principles requires management to make estimates and assumptions that affect the reported amounts of assets and liabilities at the date of the consolidated financial statements and the reported amounts of revenues and expenses during the reporting period. These estimates are subject to measurement uncertainty. Actual results could differ from and affect the results reported in these consolidated financial statements. With respect to accounting for oil and gas properties, amounts recorded for depletion, asset retirement obligations and amounts used for impairment test calculations, are based on estimates of oil and natural gas reserves and future development costs. By their nature, these estimates of reserves and the related future cash flows are subject to measurement uncertainty, and the impact on the consolidated financial statements of future periods could be material. The Corporation is involved in litigation and claims as described in Notes 18 and 19. The determination of contingent liabilities relating to litigation and claims is a complex process that involves judgements as to the outcomes and interpretation of laws and regulations. Changes in these judgements and interpretations may result in an increase or decrease in the Corporation’s contingent liabilities in the future. The determination of the provision for income taxes is an inherently complex process requiring management to interpret continually changing regulations and to make certain judgements. While income tax filings are subject to audits and reassessments, management believes adequate provision has been made for all income tax obligations. However, changes in the interpretations or judgements made may result in an increase or decrease in the Corporation’s income tax provision in the future. Joint ventures As more fully explained in Note 4, certain of PetroKazakhstan’s activities are conducted jointly with others through incorporated joint ventures. Accordingly, these consolidated financial statements reflect PetroKazakhstan’s proportionate interest in such activities. |
| FS7 |
Foreign currency translation
Foreign currency amounts, including those of foreign subsidiaries, are translated into United States dollars using the temporal method as follows:
| (a) | Monetary assets and liabilities - at the rate of exchange in effect at year end. |
| (b) | Non-monetary assets and liabilities - at historical rates. |
| (c) | Revenues and expenses - at the average exchange rates during the period, except for provisions for depletion and depreciation, which are translated on the same basis as the related assets. |
Gains or losses resulting from such translations are charged to operations.
Cash
Cash may include term deposits with original maturity terms not exceeding 90 days.
Inventories
Crude oil and oil products are recorded at the lower of average cost and net realizable value. Materials and supplies are recorded at the lower of average cost and replacement cost. Cost comprises direct materials and, where applicable, direct labour costs and those overheads and costs, which have been incurred in bringing the inventories to their present location and condition. Net realizable value represents the estimated selling price less all estimated costs to completion and costs to be incurred in marketing, selling and distribution.
Deferred charges
Costs related to the issuance of long-term debt are deferred and amortized over the term of the respective debt instrument on a straight-line basis.
Property, plant and equipment
a) | Petroleum and natural gas properties |
PetroKazakhstan follows the full cost method of accounting for oil and gas operations whereby all acquisition, exploration and development expenditures are capitalized. Capitalized expenditures include land acquisition costs, geological and geophysical expenses, costs of drilling both productive and non-productive wells, gathering and production facilities and equipment and overhead expenses related to exploration and development activities. Interest is capitalized during the development phase of capital projects until operations or production commences. Proceeds from sales of oil and gas properties are recorded as reductions of capitalized costs, unless the cost centre’s depreciation and depletion rate would change by a factor of 20% or more, whereupon gains or losses are recognized as income. Maintenance and repair costs are expensed as incurred, while improvements and major renovations to assets are capitalized.
Accumulated oil and gas costs and the estimated future development costs are depleted using the unit-of-production method based upon estimated proved reserves before royalties. Significant development projects and expenditures on exploration properties are excluded from the depletion calculation prior to assessment of the existence of proved reserves. Other plant and equipment costs are depreciated using the straight-line method based on the estimated useful lives of the assets which range from 8 to 20 years.
b) | Refining |
Maintenance and repairs, including minor renewals and improvements are charged to income as incurred. The cost of major renovations and improvements, which increase useful lives, are capitalized. Direct costs incurred in the construction of fixed assets, including labour, materials and supplies are capitalized.
Depreciation is calculated using the straight-line method based upon the following estimated useful lives:
| Buildings, warehouses and storage facilities | 10 - 20 years |
| Process machinery and equipment | 5 - 20 years |
| Transport equipment | 5 - 30 years |
| Other tangible fixed assets | 3 - 15 years |
| FS8 PetroKazakhstan Inc. |
c) | Impairment of property, plant and equipment |
Impairment of petroleum and natural gas properties
On a quarterly basis, petroleum and natural gas properties are reviewed for impairment. An impairment loss is recognized when the carrying amount of a cost centre is not recoverable and exceeds its fair value. The carrying amount is not recoverable if the carrying amount exceeds the sum of the undiscounted cash flows expected to result from its use and eventual disposition.
For estimating the future cash flows, the Corporation uses quoted Brent benchmark prices in the futures market and estimates made by its independent reserve engineers for crude oil prices, less transportation and selling expenses, royalties, production costs, general and administrative expenses, income tax and future asset retirement obligations.
Impairment of other assets
Other assets are periodically reviewed for impairment. If the carrying value exceeds the sum of the undiscounted future cash flows, the property’s value is impaired. The property’s fair value is determined using its estimated total future cash flows, discounted for the time value of money. Any excess carrying value is charged to depletion and depreciation.
Estimates of future cash flows for other assets includes the future cash flows (cash inflows less associated cash outflows) that are directly associated with, and that are expected to arise as a direct result of, the use of the assets. Estimate of future cash flows incorporate the Corporation’s own assumptions about its use, considering all available evidence, including internal budgets.
Asset Retirement Obligations
Asset retirement obligations are the estimated fair value of legal obligations associated with dismantlement and site restoration due to the retirement of tangible long-lived assets. Asset retirement obligations are not recorded for assets which have an indeterminable life. Estimated future asset retirement obligations are discounted to estimate the fair value of the obligation and recorded as a liability when the related assets are constructed and commissioned. The fair value of the obligation is also added to the value of property, plant and equipment and depleted using the unit-of-production method based upon estimated proved reserves before royalties. Accretion expense resulting from the increase in the present value of the liability due to the passage of time is recorded as depletion, depreciation and accretion expense.
Revenue recognition
Sales of petroleum and refined products are recorded in the period in which title to the petroleum or refined product transfers to the customer. Produced but unsold petroleum and refined products are recorded as inventory until sold. In the case of FCA sales (Free Carrier), title to the crude oil passes at the point of loading. The Corporation records revenue based on a provisional Brent price at the time of delivery, then marks to market at month end to reflect increases or decreases in prevailing Brent prices and adjusts the final price, if necessary, at the bill of lading date according to the contract terms.
Derivative commodity instruments
The Corporation utilizes derivative instruments to manage the Corporation’s exposure to fluctuations in the price of crude oil as described in Note 15. These derivative financial instruments are not used for speculative purposes and a system of controls is maintained that includes a policy covering the authorization, reporting and monitoring of derivative activity.
The Corporation formally documents all derivative instruments designated as hedges, the risk management objective and the strategy for undertaking the hedge.
Hedge accounting is used when there is a high degree of correlation between movements in the fair value of the derivative instrument and the item designated as being hedged. Gains and losses on derivatives that are designated as and determined to be effective hedges are deferred and recognized in the same period as the hedged item, and are recorded in the same manner as the hedged item in the Consolidated Statement of Income.
The Corporation assesses both at inception and over the term of the hedging relationship, whether the derivative instruments used in the hedging transactions are effective in offsetting changes in the fair value of cash flows of the hedged item. If correlation ceases, hedge accounting is terminated and changes in the market value of the derivative instruments are recognized in the period of change.
| FS9 |
Derivative instruments that are not designated as hedges for accounting purposes are recorded on the Consolidated Balance Sheet at fair value with any resulting gain or loss recognized in the Consolidated Statement of Income and Retained Earnings in the current period. Stock-based compensation The Corporation has a stock option plan as described in Note 12. Compensation expense is recognized in the Consolidated Statements of Income for all common share options granted to employees and non-executive directors on or after January 1, 2003, with a corresponding increase in contributed surplus recorded in the Consolidated Balance Sheet. Compensation expense for options granted on or after January 1, 2003 is determined based on the fair values at the time of grant, the cost of which is recognized in the Consolidated Statement of Income over the vesting periods of the respective options. For common share stock options granted prior to January 1, 2003, compensation expense is not recognized and the Corporation discloses the pro-forma earnings impact. Income taxes Income taxes are calculated using the liability method of tax accounting. Under this method, future income tax assets and liabilities are computed based on temporary differences between the tax basis and carrying amount on the balance sheet for assets and liabilities. Future income tax assets and liabilities are calculated using tax rates anticipated to apply in the periods that the temporary differences are expected to reverse. Comparative figures The presentation of certain amounts for previous years has been changed to conform with the presentation adopted for the current year. | ||
NOTE 2 | 4 | CHANGES IN ACCOUNTING STANDARDS |
Stock-Based Compensation Effective January 1, 2002 the Corporation adopted the recommendations of the Canadian Institute of Chartered Accountants regarding stock based compensation. The Canadian Institute of Chartered Accountants revised their recommendations and effective January 1, 2004 recognition of compensation expense using the fair value of the equity instrument granted was required. The Corporation adopted this recommendation on a prospective basis, effective January 1, 2003 as provided under the transitional provisions. Accordingly, the Corporation recognized compensation expense for all common stock options granted to employees and non-executive directors on or after January 1, 2003 using the estimated fair value. The Corporation has recorded compensation expense of $4.0 and $1.2 million in general and administrative expenses within the consolidated statements of income and retained earnings for the years ended December 31, 2004 and 2003, respectively, with a corresponding increase in contributed surplus within shareholder’s equity. Compensation expense for options granted on or after January 1, 2003 is recognized as compensation expense over the vesting period of the respective options. For common share options granted prior to January 1, 2003 the Corporation discloses the pro forma impact on net income and net income per share as if the estimated fair value of common stock options granted had been recognized as an expense. Asset Retirement Obligations Effective January 1, 2004, the Corporation adopted the new recommendation of the Canadian Institute of Chartered Accountants (“CICA”) regarding asset retirement obligations. This new standard changes the method of estimating and accounting for future site restoration costs. Total estimated asset retirement obligations are discounted to estimate the fair value of the obligation and recorded as a liability when the related assets are constructed and commissioned. The fair value of the obligation increases the value of property, plant and equipment and is depleted using the unit-of-production method based upon estimated proved reserves before royalties. Accretion expense, resulting from the increase in the present value of the liability due to the passage of time is recorded as part of depletion, depreciation and accretion expense. Estimated cash flows are discounted at 8.5%. The total undiscounted estimated cash flows required to settle the obligations are $77.4 million with the expenditures being incurred over ten years commencing in 2014. The new standard has been applied retroactively, and the financial statements of prior periods have been restated. |
| FS10 PetroKazakhstan Inc. |
Adoption of the new standard of accounting for asset retirement obligations resulted in the following changes in the consolidated balance sheet and statement of income and retained earnings.
Changes in consolidated balance sheets:
As at December 31 | 2004 | 2003 | |||||
Increase / (decrease) | |||||||
| Future income tax asset | 377 | 651 | |||||
| Property, plant and equipment | 14,457 | 15,181 | |||||
| Total assets | 14,834 | 15,832 | |||||
| Asset retirement obligations | 21,527 | 22,058 | |||||
| Retained earnings | (6,693 | ) | (6,226 | ) | |||
| Total liabilities and shareholders’ equity | 14,834 | 15,832 | |||||
Changes in consolidated statements of income and retained earnings for the years ended December 31, 2004 and 2003:
| Years ended December | ||||||||||
As at December 31 | 2004 | 2003 | 2002 | |||||||
Increase / (decrease) | ||||||||||
| Accretion expense | 2,433 | 2,124 | 1,789 | |||||||
| Depletion and depreciation | (2,240 | ) | (1,757 | ) | (466 | ) | ||||
| Income before income taxes | (193 | ) | (367 | ) | (1,323 | ) | ||||
| Income taxes | 274 | 181 | (152 | ) | ||||||
| Net income | (467 | ) | (548 | ) | (1,171 | ) | ||||
| Basic net income per share | - | (0.01 | ) | (0.01 | ) | |||||
| Diluted net income per share | - | (0.01 | ) | (0.01 | ) | |||||
The change in asset retirement obligations is as follows:
2004 | 2003 | ||||||
Asset retirement obligations liability, beginning of year | 28,625 | 22,831 | |||||
| Revisions | 1,578 | 3,670 | |||||
| Accretion expense | 2,433 | 2,124 | |||||
| Settlements | (137 | ) | - | ||||
Asset retirement obligations liability, end of year | 32,499 | 28,625 | |||||
Full Cost Accounting
In September 2003 the CICA issued Accounting Guideline 16 “Oil and Gas Accounting - Full Cost” (“AcG 16”), which replaced Accounting Guideline 5 “Full Cost Accounting in the Oil and Gas Industry” (“AcG 5”). The most significant change between AcG 16 and AcG 5 is that under AcG 16 the carrying value of oil and gas properties should not exceed their fair value. The fair value is equal to estimated future cash flows from proved reserves, unproved properties and major development projects using future price forecasts and costs discounted at a risk-free rate. This differs from the cost recovery ceiling test under AcG 5 that used undiscounted cash flows, and constant prices, less general and administrative, financing costs and taxes. The Corporation adopted AcG 16 effective January 1, 2004 and as at December 31, 2004 there were no indications of impairment.
Impairment of Long-Lived Assets
Effective January 1, 2004, the Corporation adopted the new recommendation of the CICA issued in December 2002 on impairment of long-lived assets. This recommendation provides guidance on the recognition, measurement and disclosure of impairment of long-lived assets. There is a requirement to recognize an impairment loss for a long-lived asset when its carrying amount exceeds the sum of the undiscounted cash flows expected from its use and eventual disposition. The impairment loss is measured as the amount by which carrying amount of the asset exceeds its fair value. As at December 31, 2004 there were no indications of impairment of long-lived assets.
| FS11 |
Hedge Accounting | |
| Effective January 1, 2004, the Corporation adopted Accounting Guideline 13 “Hedging Relationships” (AcG 13”). AcG 13 provides guidance regarding the identification, designation, documentation and effectiveness of hedging relationships for the purposes of applying hedge accounting. This guideline establishes certain conditions for when hedge accounting may be applied. The Corporation has applied hedge accounting for the financial instruments disclosed in Note 15. | |
New Canadian GAAP pronouncements | |
| In June 2003 the CICA issued Accounting Guideline 15 “Consolidation of Variable Interest Entities” (“AcG15”). AcG15 provides guidance for determining when an enterprise consolidates the assets, liabilities and results of activities of a variable interest entity (“VIEs”) in its consolidated financial statements. In general, VIEs are entities that either do not have equity investors with voting rights or have equity investors that do not provide sufficient financial resources for the entity to support its activities. AcG15 is effective for the Corporation for the interim and annual financial statements beginning on January 1, 2005. The Corporation does not expect any impact on its consolidated financial statements. | |
| In January 2005, the CICA issued the following new pronouncements: | |
4 | Section 1530 “Comprehensive Income”. |
4 | Section 3251 “Equity” (replacing Section 3050 “Surplus”. |
4 | Section 3855 “Financial Instruments - Recognition and Measurement”. |
4 | Section 3865 “Hedges” |
| These are the highlights of the new standards: | |
4 | All financial instruments, including derivatives, are to be included on the balance sheet and measured, either at their fair values or, in limited circumstances when fair value may not be considered most relevant, at cost or amortized cost. The standards also specify when gains and losses as a result of changes in fair values are to be recognized in the statement of income. |
4 | Existing requirements for hedge accounting are extended. Currently, the CICA has requirements that specify the circumstances under which hedge accounting is permissible, but do not comprehensively specify the accounting entries. |
4 | A new location for recognizing certain gains and losses, “Other comprehensive income”, has been introduced. This provides an ability for certain gains and losses arising from changes in fair value to be temporarily recorded outside of the statement of income, but in a transparent manner. |
| These new pronouncements are effective for interim and annual financial statements for fiscal years beginning on or after October 1, 2006. Earlier adoption is permitted only as of the beginning of a fiscal year ending on or after December 31, 2004. The Corporation has yet to evaluate the impact of these new pronouncements on its consolidated financial statements. | |
NOTE 3 | 4 | SEGMENTED INFORMATION |
| Following the acquisition of PKOP in 2000, the Corporation became an integrated oil and gas company. All of the commercial activity of the Corporation is concentrated in the Republic of Kazakhstan in Central Asia. | |
| On a primary basis, the business segments are: | |
4 | Upstream comprising the exploration, development and production of crude oil and natural gas. |
4 | Downstream comprising the refining and marketing of refined products and the management of the marketing of crude oil. |
| The accounting policies of the operating segments are the same as those described in Note 1. Identifiable assets are those used in the operation of the segment. | |
| Corporate income tax for the year ended December 31, 2004 includes withholding tax on dividends paid to Canada. The consolidated income tax impact of non-deductible interest expense of $2.6 million for the year ended December 31, 2003 ($7.5 million - 2002) has been allocated to Corporate. | |
| The Corporation does not disclose export revenue attributable to individual foreign countries as it is impractical to obtain the information. | |
| FS12 PetroKazakhstan Inc. |
Year ended December 31, 2004 | Upstream | Downstream | Corporate | Eliminations | Consolidated | |||||||||||
| REVENUE | ||||||||||||||||
| Crude oil | 1,090,815 | - | - | (97,935 | ) | 992,880 | ||||||||||
| Reined products | 219,348 | 480,318 | - | (60,261 | ) | 639,405 | ||||||||||
| Service fees | 3,018 | 3,040 | 426 | - | 6,484 | |||||||||||
| Interest income | 1,765 | 638 | 1,255 | - | 3,658 | |||||||||||
1,314,946 | 483,996 | 1,681 | (158,196 | ) | 1,642,427 | |||||||||||
| EXPENSES | ||||||||||||||||
| Production | 89,339 | - | - | - | 89,339 | |||||||||||
| Royalties and taxes | 120,042 | 6,402 | - | - | 126,444 | |||||||||||
| Transportation | 271,809 | - | - | - | 271,809 | |||||||||||
| Refining | - | 21,646 | - | - | 21,646 | |||||||||||
| Crude oil and refined product purchases | 86,943 | 182,592 | - | (158,196 | ) | 111,339 | ||||||||||
| Selling | 18,083 | 19,851 | - | - | 37,934 | |||||||||||
| General and administrative | 34,955 | 14,493 | 11,467 | - | 60,915 | |||||||||||
| Interest and financing costs | 23,848 | 473 | 9 | - | 24,330 | |||||||||||
| Depletion, depreciation and accretion | 83,927 | 20,338 | 1,255 | - | 105,520 | |||||||||||
| Foreign exchange loss (gain) | 3,963 | (13,767 | ) | (115 | ) | - | (9,919 | ) | ||||||||
732,909 | 252,028 | 12,616 | (158,196 | ) | 839,357 | |||||||||||
| INCOME (LOSS) BEFORE INCOME TAXES | 582,037 | 231,968 | (10,935 | ) | - | 803,070 | ||||||||||
| INCOME TAXES | ||||||||||||||||
| Current provision | 272,863 | 75,770 | 7,616 | - | 356,249 | |||||||||||
| Future income tax | (54,649 | ) | (517 | ) | - | - | (55,166 | ) | ||||||||
218,214 | 75,253 | 7,616 | - | 301,083 | ||||||||||||
| NON-CONTOLLING INTEREST | - | 1,139 | - | - | 1,319 | |||||||||||
| NET INCOME (LOSS) | 363,823 | 155,396 | (18,551 | ) | - | 500,668 | ||||||||||
Included in Upstream crude revenue are sales to one customer in the amount of $167.4 million.
Eliminations are intersegment revenue.
As at December 31, 2004 | Upstream | Downstream | Corporate | Consolidated | |||||||||
| Total assets | 1,038,727 | 180,081 | 50,273 | 1,269,081 | |||||||||
| Total liabilities | 335,591 | 29,431 | 15,982 | 379,004 | |||||||||
| Capital expenditures for the year | 148,993 | 15,687 | 1,272 | 165,952 | |||||||||
Year Ended December 31, 2004 | Export | Domestic | Consolidated | |||||||
| Crude oil | 912,854 | 80,026 | 992,880 | |||||||
| Refined products | 219,508 | 419,897 | 639,405 | |||||||
| FS13 |
| Year ended December 31, 2003 | Upstream | Downstream | Corporate | Eliminations | Consolidated | |||||||||||
| Revenue | ||||||||||||||||
| Crude oil | 719,009 | - | - | (97,883 | ) | 621,126 | ||||||||||
| Refined products | 76,885 | 441,200 | - | (36,759 | ) | 481,326 | ||||||||||
| Service fee | 9,086 | 2,191 | 255 | - | 11,532 | |||||||||||
| Interest income | 936 | 416 | 1,988 | - | 3,340 | |||||||||||
| 805,916 | 443,807 | 2,243 | (134,642 | ) | 1,117,324 | |||||||||||
| EXPENSES | ||||||||||||||||
| Production | 65,516 | - | - | - | 65,516 | |||||||||||
| Royalties and taxes | 80,046 | 2,249 | - | - | 82,295 | |||||||||||
| Transportation | 223,000 | 1,987 | - | - | 224,987 | |||||||||||
| Refining | - | 17,760 | - | - | 17,760 | |||||||||||
| Crude oil and refined product purchases | 55,161 | 135,941 | - | (134,842 | ) | 56,460 | ||||||||||
| Selling | 10,508 | 18,021 | - | - | 28,529 | |||||||||||
| General and administrative | 32,721 | 16,075 | 5.483 | - | 54,279 | |||||||||||
| Interest and financing costs | 24,226 | 2,576 | 8,777 | - | 35,579 | |||||||||||
| Depletion, depreciation and accretion | 63,321 | 18,849 | 182 | - | 82,352 | |||||||||||
| Foreign exchange loss (gain) | 2,632 | (9,863 | ) | 1,898 | - | (5,333 | ) | |||||||||
| 557,131 | 203,595 | 16,340 | (134,842 | ) | 642,424 | |||||||||||
| INCOME (LOSS) BEFORE INCOME TAXES | 248,785 | 240,212 | (14,097 | ) | - | 474,900 | ||||||||||
| INCOME TAXES | ||||||||||||||||
| Current provision | 86,803 | 74,217 | 4,359 | - | 165,379 | |||||||||||
| Future income tax | (7,910 | ) | (1,847 | ) | - | (9,757 | ) | |||||||||
| 78,893 | 72,370 | 4,359 | - | 155,622 | ||||||||||||
| NON-CONTROLLING INTEREST | - | 2,338 | - | - | 2,338 | |||||||||||
| NET INCOME (LOSS) | 169,892 | 165,504 | (18,456 | ) | - | 316,940 | ||||||||||
There were no sales to an individual customer in excess of 10% of consolidated revenue.
Eliminations are intersegment revenue.
| As at December 31, 2003 | Upstream | Downstream | Corporate | Consolidated | |||||||||
| Total assets | 737,691 | 157,474 | 146,286 | 1,041,451 | |||||||||
| Total liabilities | 409,145 | 58,554 | 2,063 | 469,762 | |||||||||
| Capital expenditures for the year | 183,134 | 19,070 | 1,009 | 203,213 | |||||||||
| Year Ended December 31, 2003 | Export | Domestic | Consolidated | |||||||
| Crude oil | 596,673 | 24,453 | 621,126 | |||||||
| Refined products | 112,316 | 369,010 | 481,326 | |||||||
| FS14 PetroKazakhstan Inc. |
| Year ended December 31, 2002 | Upstream | Downstream | Corporate | Eliminations | Consolidated | |||||||||||
| REVENUE | ||||||||||||||||
| Crude oil | 566,033 | - | - | (84,919 | ) | 481,114 | ||||||||||
| Refined products | 97,761 | 266,420 | - | (31,542 | ) | 332,639 | ||||||||||
| Service fee | 5,610 | 3,423 | 613 | - | 9,646 | |||||||||||
| Interest income | 282 | 217 | 1,452 | - | 1,951 | |||||||||||
| 669,686 | 270,060 | 2,065 | (116,461 | ) | 825,350 | |||||||||||
| EXPENSES | ||||||||||||||||
| Production | 60,596 | - | - | - | 60,596 | |||||||||||
| Royalties and taxes | 61,400 | 7,314 | - | - | 68,714 | |||||||||||
| Transportation | 163,791 | 10 | - | - | 163,801 | |||||||||||
| Refining | - | 21,721 | - | - | 21,721 | |||||||||||
| Crude oil and reined product purchases | 68,758 | 121,030 | - | (116,461 | ) | 73,327 | ||||||||||
| Selling | 6,815 | 16,438 | - | - | 23,253 | |||||||||||
| General and administrative | 37,093 | 17,216 | 4,570 | - | 58,879 | |||||||||||
| Interest and financing costs | 9,023 | 1,514 | 24,936 | - | 35,473 | |||||||||||
| Depletion. depreciation and accretion | 32,970 | 13,347 | 94 | - | 46,411 | |||||||||||
| Foreign exchange loss | 1,024 | 995 | 214 | - | 2,233 | |||||||||||
| 441,470 | 199,585 | 29,814 | (116,461 | ) | 554,408 | |||||||||||
| INCOME BEFORE UNUSUAL ITEMS | 228,216 | 70,475 | (27,749 | ) | - | 270,942 | ||||||||||
| Arbitration settlement | 7,134 | - | - | - | 7,134 | |||||||||||
| INCOME (LOSS) BEFORE INCOME TAXES | 221,082 | 70,475 | (27,749 | ) | - | 263,808 | ||||||||||
| INCOME TAXES | ||||||||||||||||
| Current provision | 64,500 | 26,463 | 9,845 | - | 100,808 | |||||||||||
| Future income tax | 7,307 | (7,772 | ) | - | - | (465 | ) | |||||||||
| 71,807 | 18,691 | 9,845 | - | 100,343 | ||||||||||||
| NON-CONTROLLING INTEREST | - | 2,068 | - | - | 2,068 | |||||||||||
| NET INCOME (LOSS) | 149,275 | 49,716 | (37,594 | ) | - | 161,397 | ||||||||||
Included in Upstream crude oil revenue are sales to one customer in the amount of $103.0 million.
| As at December 31, 2002 | Upstream | Downstream | Corporate | Consolidated | |||||||||
| Total assets | 506,915 | 169,071 | 33,737 | 709,723 | |||||||||
| Total liabilities | 172,474 | 42,141 | 228,242 | 442,857 | |||||||||
| Capital expenditures for the year | 131,875 | 8,227 | - | 140,102 | |||||||||
| Year Ended December 31, 2002 | Export | Domestic | Consolidated | |||||||
| Crude oil | 445,290 | 35,824 | 481,114 | |||||||
| Refined products | 53,111 | 279,528 | 332,639 | |||||||
| FS15 |
NOTE 4 | 4 | JOINT VENTURES |
| The Corporation has the following interests in two joint ventures: | |
| a) | a 50% equity shareholding with equivalent voting power in Turgai Petroleum CJSC (“Turgai”), which operates the northern part of the Kumkol field in Kazakhstan. |
| b) | a 50% equity shareholding with equivalent voting power in LLP Kazgermunai (“Kazgermunai”), which operates three oil fields in Kazakhstan: Akshabulak, Nurali and Aksai. |
| The Corporation’s interests in these joint ventures have been accounted for using the proportionate consolidation method. Under this method, the Corporation’s balance sheets, statements of income, retained earnings and deficit and cash flow include the Corporation’s share of income, expenses, assets, liabilities and cash flows of these joint ventures. | |
| The following amounts are included in the Corporation’s consolidated financial statements as a result of the proportionate consolidation of its joint ventures and before consolidation eliminations: | |
Year ended December 31, 2004 | Turgai | Kazgermunai | Total | |||||||
| Cash | 34,678 | 50,800 | 85,478 | |||||||
| Current assets, excluding cash | 103,183 | 57,495 | 160,678 | |||||||
| Property, plant and equipment | 86,791 | 62,555 | 149,346 | |||||||
| Current liabilities | 77,849 | 24,343 | 102,192 | |||||||
| Long-term debt | - | - | - | |||||||
| Revenue | 310,221 | 225,882 | 536,103 | |||||||
| Expenses | 206,869 | 140,312 | 347,181 | |||||||
| Net income | 103,352 | 85,570 | 188,922 | |||||||
| Cash flow from operating activities | 66,634 | 77,968 | 144,602 | |||||||
| Cash flow used in financing activities | (46,204 | ) | (25,632 | ) | (71,836 | ) | ||||
| Cash flow used in investing activities | (18,328 | ) | (11,967 | ) | (30,295 | ) | ||||
| Revenue for the year ended December 31, 2004 for Turgai includes $72.9 million of crude oil sales made to Downstream and $29.9 million of crude oil sales made by Turgai to Upstream. These amounts were eliminated on consolidation. | ||
| Revenue for the year ended December 31, 2004 for Kazgermunai includes $8.1 million of crude oil sales made to Upstream and $4.6 million crude oil sales to Downstream. These amounts were eliminated on consolidation. |
| Year ended December 31, 2003 | Turgai | Kazgermunai | Total | |||||||
| Cash | 8,370 | 10,432 | 18,802 | |||||||
| Current assets, excluding cash | 26,890 | 32,875 | 59,765 | |||||||
| Property, plant and equipment | 82,682 | 66,397 | 149,079 | |||||||
| Current liabilities | 76,533 | 11,260 | 87,793 | |||||||
| Long-term debt | - | 37,743 | 37,743 | |||||||
| Revenue | 118,167 | 111,860 | 230,027 | |||||||
| Expenses | 81,623 | 76,675 | 158,298 | |||||||
| Net income | 36,544 | 35,185 | 71,729 | |||||||
| Cash flow from operating activities | 58,566 | 39,089 | 97,655 | |||||||
| Cash flow used in financing activities | - | (9,317 | ) | (9,317 | ) | |||||
| Cash flow used in investing activities | (50,503 | ) | (22,193 | ) | (72,696 | ) | ||||
| FS16 PetroKazakhstan Inc. |
Revenue for the year ended December 31, 2003 for Turgai includes $35.9 million of crude oil sales made to Downstream and $2.5 million of crude oil sales made to Upstream. These amounts were eliminated on consolidation. Revenue for the year ended December 31, 2003 for Kazgermunai includes $0.5 million of crude oil sales made to Upstream and no crude oil sales to Downstream. This amount was eliminated on consolidation. |
| Year ended December 31, 2002 | Turgai | Kazgermunai | Total | |||||||
| Cash | 307 | 2,854 | 3,161 | |||||||
| Current assets, excluding cash | 14,248 | 14,743 | 28,991 | |||||||
| Property, plant and equipment | 41,602 | 58,853 | 100,455 | |||||||
| Current liabilities | 24,909 | 4,798 | 29,707 | |||||||
| Long-term debt | - | 45,231 | 45,231 | |||||||
| Revenue | 72,938 | 48,284 | 121,222 | |||||||
| Expenses | 47,241 | 37,431 | 84,672 | |||||||
| Net income | 25,697 | 10,853 | 36,550 | |||||||
| Cash flow from operating activities | 25,420 | 19,264 | 44,684 | |||||||
| Cash flow used in financing activities | - | (15,837 | ) | (15,837 | ) | |||||
| Cash flow used in investing activities | (26,613 | ) | (12,089 | ) | (38,702 | ) | ||||
| Revenue for the year ended December 31, 2002 includes $55.0 million of crude oil sales made by Turgai and $6.3 million of crude oil sales made by Kazgermunai to Downstream. These amounts were eliminated on consolidation. | ||
NOTE 5 | 4 | ACCOUNTS RECEIVABLE |
| Accounts receivable consist of the following: |
2004 | 2003 | ||||||
| Trade | 150,462 | 70,282 | |||||
| Value added tax recoverable | 29,316 | 22,864 | |||||
| Due from Turgai | 6,942 | 37,231 | |||||
| Other | 11,784 | 19,916 | |||||
198,504 | 150,293 | ||||||
NOTE 6 | 4 | INVENTORY |
| Inventory consists of the following: |
2004 | 2003 | ||||||
| Refined products | 16,682 | 6,626 | |||||
| Crude oil produced | 25,275 | 12,502 | |||||
| Materials and supplies | 19,285 | 17,792 | |||||
61,242 | 36,920 | ||||||
| FS17 |
NOTE 7 | 4 | PREPAID EXPENSES |
| Prepaid expenses consist of the following: |
2004 | 2003 | ||||||
| Advances for services and equipment | 16,825 | 10,930 | |||||
| Prepayment of transportation for crude oil sales | 40,911 | 30,422 | |||||
| Prepayment for pipeline tariff | 4,443 | 3,549 | |||||
62,179 | 44,901 | ||||||
NOTE 8 | 4 | RESTRICTED CASH |
| Restricted cash comprises: |
| a) | Cash dedicated to a debt service reserve account for the Corporation’s term facility of $8.7 million at December 31, 2004 ($10.5 million as at December 31, 2003). On September 30, 2004 the term facility was repaid in full. The Corporation discharged all hedging liabilities related to this facility as at December 31, 2004. The debt service reserve account was repaid in January 2005. |
| b) | Cash dedicated to a margin account for the Corporation’s hedging program being $39.0 million at December 31, 2004 ($25.0 million as at December 31, 2003). |
| Restricted cash is not available for current purposes. | |
NOTE 9 | 4 | PROPERTY, PLANT AND EQUIPMENT |
| Accumulated | ||||||||||
| Depletion and | Net Book | |||||||||
As at December 31 | Cost | Depreciation | Value | |||||||
2004 | ||||||||||
| Oil and gas | 830,977 | 443,369 | 387,608 | |||||||
| Refining | 168,674 | 63,902 | 104,772 | |||||||
| Transportation | 118,098 | 14,639 | 103,459 | |||||||
1,117,749 | 521,910 | 595,839 | ||||||||
| Other | 10,813 | 4,905 | 5,908 | |||||||
1,128,562 | 526,815 | 601,747 | ||||||||
| 2003 | ||||||||||
| Oil and gas | 722,015 | 365,349 | 356,666 | |||||||
| Refining | 154,402 | 44,483 | 109,919 | |||||||
| Transportation | 73,666 | 4,087 | 69,579 | |||||||
| 950,083 | 413,919 | 536,164 | ||||||||
| Other | 9,365 | 3,212 | 6,153 | |||||||
| 959,448 | 417,131 | 542,317 | ||||||||
| Excluded from the depletable base of oil and gas properties are undeveloped properties of $24.5 million (December 31, 2003 - $17.0 million). No work in progress is excluded from the depletable base of oil and gas properties as at December 31, 2004 ($29.1 million as at December 31, 2003). During the year ended December 31, 2004 no interest was capitalized ($0.4 million in 2003). |
| FS18 PetroKazakhstan Inc. |
| The Corporation used future Brent prices for the years 2005-2009 ($40.19 per barrel in 2005, $38.26 per barrel in 2006, $36.62 per barrel for 2007, $35.04 per barrel for 2008 and $33.53 per barrel for 2009) and estimates made by its independent reserve engineers for periods thereafter for its impairment test calculation. The average annual percentage change in the prices after 2009 was 2%. |
NOTE 10 | 4 | ACCOUNTS PAYABLE AND ACCRUED LIABILITIES |
| Accounts payable and accrued liabilities consist of the following: |
2004 | 2003 | ||||||
| Trade | 70,160 | 66,115 | |||||
| Due to Turgai | 19,668 | - | |||||
| Royalties | 18,259 | 16,133 | |||||
| Income taxes | 30,175 | - | |||||
| Common share dividends | 12,588 | - | |||||
| Other | 10,909 | 6,174 | |||||
161,759 | 88,422 | ||||||
NOTE 11 | 4 | INDEBTEDNESS |
Short-term debt |
2004 | 2003 | ||||||
| Current portion of term facility | - | 35,692 | |||||
| Current portion of term loans | 2,039 | 2,039 | |||||
| Joint venture loan payable | - | 11,000 | |||||
| PKOP bonds | - | 24,494 | |||||
| Kazgermunai debt | 13,502 | - | |||||
15,541 | 73,225 | ||||||
Long-term debt |
2004 | 2003 | ||||||
| Long-term portion of term facility | - | 71,384 | |||||
| Long-term portion of term loans | 9,862 | 12,528 | |||||
| 9.625% bonds | 125,000 | 125,000 | |||||
| Kazgermunai debt | - | 37,743 | |||||
134,862 | 246,655 | ||||||
Committed credit facility | ||
| On May 25, 2004 the Corporation entered into a five and one half year $100.0 million committed credit facility. This facility is unsecured, bears interest at LIBOR plus 2.65% and is subject to annual review. $30.0 million of this facility has been dedicated to cover margin calls under the Corporation’s hedging program. This amount is not available for general corporate purposes. Costs related to this facility amounting to $1.5 million are recorded as deferred charges and amortized over the life of the facility. | ||
Term facility | ||
| On January 2, 2003, PetroKazakhstan Kumkol Resources (“PKKR”) entered into a $225.0 million term facility secured by crude oil export contracts. This facility was repayable in 42 equal monthly installments commencing July 2003. The facility bore interest at a rate of LIBOR plus 3.25% per annum. PKKR drew $190.0 million under this facility and chose not to utilize the remainder. On September 30, 2004 the Corporation had fully repaid the term facility. Unamortized issue costs of $2.1 million related to the term facility have been expensed. |
| FS19 |
Joint venture loan
The joint venture loan was fully repaid on October 7, 2004.
PKOP bonds
On February 16, 2001 PetroKazakhstan Oil Products (“PKOP”) registered 250,000 unsecured bonds (par value $100) in the amount of $25.0 million with the National Securities Commission of the Republic of Kazakhstan (the “PKOP bonds”). The PKOP bonds had a three-year maturity and bore a coupon rate of 10% per annum. The PKOP bonds were listed on the Kazakh Stock Exchange.
The PKOP bonds were fully redeemed on February 26, 2004.
Term loans
PKKR has obtained secured term loans guaranteed by Export Credit Agencies for certain equipment related to the KAM pipeline and the Gas Utilization Facility. The loans are secured by the equipment purchased, bear interest at LIBOR plus 4% per annum, are repayable in equal semi-annual installments and have final maturity dates ranging from five to seven years.
9.625% Notes
On February 12, 2003, PetroKazakhstan Finance B.V., a wholly owned subsidiary of PKKR issued U.S. $125.0 million 9.625% Notes due February 12, 2010. The Notes are unsecured, unconditionally guaranteed by the Corporation, PKKR and PKOP, and were issued at a price of 98.389% of par value. Each of the guarantors has agreed to certain covenants, including limitations on indebtedness, restrictions on payments of dividends, repurchase all or any part of the notes at the holders’ discretion in the case of a change of control. On March 15, 2004 the Corporation’s Notes were approved for listing on the Kazakhstan Stock Exchange.
As at December 31, 2004 issue costs and the discount on the sale of the Notes of $3.2 million are recorded as deferred charges and are amortized over the term of the Notes.
Kazgermunai debt
The Kazgermunai debt is non-recourse to the Corporation. The amounts set out below represent the 50% of Kazgermunai’s total debt, which has been included in the consolidated financial statements on a proportionate consolidation basis (see Note 4).
2004 | 2003 | ||||||
| Subordinated debt | - | 25,057 | |||||
| Loan from Government of Kazakhstan | 13,502 | 12,686 | |||||
13,502 | 37,743 | ||||||
Subordinated Debt
The subordinated debt bore interest at LIBOR plus 3% and was unsecured. Accrued interest was added to the principal on a semi-annual basis. On June 24, Kazgermunai repaid $24.3 million of its outstanding subordinated debt and as at December 31, 2004 the subordinated debt was repaid in full.
Amounts Repaid | 2004 | 2003 | |||||
| Principal repaid | 13,655 | 5,224 | |||||
| Interest repaid | 11,977 | 3,848 | |||||
25,632 | 9,072 | ||||||
Loan from Government of Kazakhstan
The loan from the Government of Kazakhstan relates to exploration and development work performed on the Akshabulak, Nurali and Aksai fields prior to the formation of Kazgermunai. The loan bears interest at LIBOR plus 3% and is unsecured. Accrued interest is added to the principal on a semi-annual basis. Kazgermunai expects to repay the government loan in 2005.
| FS20 PetroKazakhstan Inc. |
| Kazgermunai is restricted from paying dividends until all outstanding loans have been repaid in full. | ||
Repayment | ||
| Principal repayments due for each of the next five years and in total are as follows: |
| Less amounts | |||||||||||||||||||||||||
| included in | Total | ||||||||||||||||||||||||
| short-term | long-term | ||||||||||||||||||||||||
| 2005 | 2006 | 2007 | 2008 | 2009 | There-after | debt | debt | ||||||||||||||||||
| Term loans | 2,039 | 2,039 | 1,645 | 1,252 | 626 | 4,300 | (2,039 | ) | 9,862 | ||||||||||||||||
| 9.625% Notes | - | - | - | - | - | 125,000 | - | 125,000 | |||||||||||||||||
| Kazgermunai | 13,502 | - | - | - | - | - | (13,502 | ) | - | ||||||||||||||||
| 15,541 | 2,039 | 1,645 | 1,252 | 626 | 129,300 | (15,541 | ) | 134,862 | |||||||||||||||||
Interest Expense |
2004 | 2003 | 2002 | ||||||||
| Interest on long-term debt | 22,539 | 23,375 | 29,897 | |||||||
| Interest on short-term debt | 1,791 | 12,204 | 5,576 | |||||||
24,330 | 35,579 | 35,473 | ||||||||
NOTE 12 | 4 | SHARE CAPITAL |
| The Corporation’s common shares are listed on the New York, Toronto, London and Frankfurt Stock Exchanges. On October 21, 2004 PetroKazakhstan shares were listed on the Kazakhstan Stock Exchange. | ||
| Authorized share capital consists of an unlimited number of Class A common shares, and an unlimited number of Class B redeemable preferred shares, issuable in series. |
2004 | 2003 | ||||||||||||
December 31 | Number | Amount | Number | Amount | |||||||||
| Balance, beginning of year | 77,920,226 | 191,695 | 78,956,875 | 193,723 | |||||||||
Shares repurchased and cancelled pursuant to Normal Course Issuer Bid (a) | (1,257,500 | ) | (3,120 | ) | (1,477,400 | ) | (3,616 | ) | |||||
Shares repurchased and cancelled pursuant to Substantial Issuer Bid (b) | (3,999,975 | ) | (9,782 | ) | - | - | |||||||
Stock options exercised for cash | 3,531,821 | 12,726 | 411,275 | 1,608 | |||||||||
| Corresponding convertible securities, converted (c) | 28,558 | 10 | 29,476 | (20 | ) | ||||||||
| Balance, end of year | 76,223,130 | 191,529 | 77,920,226 | 191,695 | |||||||||
| (a) | The Corporation’s Normal Course Issuer Bid program was renewed on August 5, 2003. Under the program up to 5,775,028 common shares may be repurchased for cancellation, during the period from August 7, 2003 to August 6, 2004. In August 2004 the Corporation again renewed this program which enabled the Corporation to repurchase 7,091,429 Class A common shares during the period from August 13, 2004 to August 12, 2005. The Corporation purchased and cancelled 1,477,400 shares at an average price of C$14.69 per share during the year ended December 31, 2003 and 1,257,500 shares at an average price of C$40.00 per share during the year ended December 31, 2004. The excess of cost over the book value for the shares purchased was applied to retained earnings. |
| (b) | In June 2004 the Corporation commenced a Substantial Issuer Bid to repurchase, for cancellation, up to C$160 million of its Class A common shares. As at December 31, 2004, the Corporation had purchased and cancelled 3,999,975 shares at an average price of C$40.00 per share. The excess of cost over the book value for the shares purchased was applied to retained earnings. |
| FS21 |
| (c) | On March 31, 2000, in connection with the acquisition of PKOP, the Corporation issued corresponding convertible securities as follows: |
| Options to purchase 1,105,753 Common Shares of the Corporation at prices and terms which were identical to those options outstanding at March 31, 2000, but in each case the number of options equalled 40.80% of the outstanding options. As at December 31, 2004 there were 8,159 outstanding corresponding convertible securities (36,717 - as at December 31, 2003). | |
| (d) | The Corporation maintains an incentive stock option plan (“plan”) under which directors, officers and key personnel may be granted options to purchase class A common shares of the Corporation. The Corporation has reserved 8,076,050 class A common shares for issuance upon the exercise of options granted under the terms of the plan (2003 - 8,076,050). The Board of Directors determines the exercise price of each option, provided that no option shall be granted with an exercise price at a discount to market. The vesting periods established under the Corporation’s stock option plan and the term of the options are set by the board of directors, subject to a maximum term for any option of 10 years. Granted options have a vesting period of 3-5 years, except for options granted to non-executive directors, which vest immediately. |
| A summary of the status of the Corporation’s stock option plan as of December 31, 2004 and the changes during the year ended December 31, 2004 and year ended December 31, 2003 is presented below (expressed in Canadian dollars): | |
| Weighted Average | |||||||
| Options | Exercise Price | ||||||
| Outstanding at December 31, 2001 | 5,736,880 | 3.07 | |||||
| Granted | 605,000 | 14.65 | |||||
| Exercised | (1,393,281 | ) | 1.09 | ||||
| Forfeited | (98,463 | ) | 6.73 | ||||
| Outstanding at December 31, 2002 | 4,850,136 | 5.01 | |||||
| Granted | 791,000 | 25.82 | |||||
| Exercised | (440,751 | ) | 3.76 | ||||
| Forfeited | (84,925 | ) | 9.27 | ||||
| Outstanding at December 31, 2003 | 5,115,460 | 8.17 | |||||
| Granted | 724,100 | 42.50 | |||||
| Exercised | (3,560,379 | ) | 4.77 | ||||
| Forfeited | (192,525 | ) | 15.94 | ||||
Outstanding at December 31, 2004 | 2,086,656 | 25.17 | |||||
| Options exercisable as at: | |||||||
| December 31, 2003 | 2,816,683 | 5.14 | |||||
| December 31, 2004 | 866,903 | 16.29 | |||||
| The weighted average fair value of the 724,100 options granted during the year ended December 31, 2004 was $8.7 million. |
| FS22 PetroKazakhstan Inc. |
All stock options outstanding as of August 3, 2001 were re-priced in connection with the special dividend that was issued by the Corporation. The exercise price was reduced by C$3.78 per share. Certain options had exercise prices less than C$3.78.
As at December 31, 2004 | Outstanding Options | Exercisable Options | ||||||||||||||
| Weighted | ||||||||||||||||
| Average | Weighted | Weighted | ||||||||||||||
| Number of | Remaining | Average | Number of | Average | ||||||||||||
| Range of Exercise Price | Options | Contractual Life | Exercise Price | Options | Exercise Price | |||||||||||
(C$) | (C$) | (C$) | ||||||||||||||
| 0 to 2.50 | 128,159 | 0.22 | 0.61 | 128,159 | 0.61 | |||||||||||
| 2.50 to 7.50 | 101,000 | 1.25 | 6.13 | 68,500 | 5.88 | |||||||||||
| 7.50 to 12.50 | 290,656 | 1.77 | 9.39 | 214,253 | 9.52 | |||||||||||
| 12.50 to 17.50 | 295,500 | 2.95 | 14.72 | 116,750 | 14.65 | |||||||||||
| 17.50 to 31.62 | 607,241 | 3.96 | 26.14 | 289,241 | 26.68 | |||||||||||
| 31.62 to 44.50 | 664,100 | 4.93 | 43.48 | 50,000 | 43.50 | |||||||||||
| 2,086,656 | 3.46 | 25.17 | 866,903 | 16.29 | ||||||||||||
The pro forma net income per share had we recognized compensation expense using the fair value of common stock options granted for all stock options outstanding prior to January 1, 2003 follows:
2004 | 2003 | 2002 | ||||||||
| Net income | ||||||||||
As reported | 500,668 | 316,940 | 161,397 | |||||||
Pro forma | 499,532 | 314,752 | 158,867 | |||||||
| Basic net income per share | ||||||||||
As reported | 6.40 | 4.06 | 2.00 | |||||||
Pro forma | 6.38 | 4.03 | 1.96 | |||||||
| Diluted net income per share | ||||||||||
As reported | 6.28 | 3.90 | 1.92 | |||||||
Pro forma | 6.27 | 3.87 | 1.89 | |||||||
The estimated fair value of the stock options issued were determined using the Black-Scholes option pricing model with the following assumptions:
2004 | 2003 | 2002 | ||||||||
| Risk-free interest rate | 3.66 | % | 3.91 | % | 3.96 | % | ||||
| Expected option life | 5 years | 5 years | 5 years | |||||||
| Expected volatility in the price of the Corporation's common shares | 32 | % | 38 | % | 68 | % | ||||
| Expected dividends | 2 | % | - | - | ||||||
| Weighted average fair value of options granted during the year | $ | 9.88 | $ | 7.82 | $ | 5.73 | ||||
| FS23 |
NOTE 13 | 4 | INCOME TAXES |
| The Corporation and its subsidiaries are required to file tax returns in the jurisdictions in which they operate. The primary operating jurisdiction is Kazakhstan with substantially all income earned in Kazakhstan. | ||
| The provision for income taxes differs from the results, which would have been obtained by applying the statutory tax rate of 30% to PetroKazakhstan’s income before income taxes. This difference results from the following items: |
2004 | 2003 | 2002 | ||||||||
| Income before income taxes | 803,070 | 474,900 | 263,808 | |||||||
| Statutory Kazakhstan income tax rate | 30 | % | 30 | % | 30 | % | ||||
| Expected tax expense | 240,921 | 142,470 | 79,142 | |||||||
| Excess profit tax provision | 35,000 | - | - | |||||||
| Higher tax rate for Kazgermunai | 12,165 | 2,444 | - | |||||||
| Non-deductible amounts, net | 6,148 | 9,324 | 16,475 | |||||||
| Withholding tax on dividends | 6,849 | 1,384 | - | |||||||
Reversal of lower tax rate for South Kumkol field | - | - | 4,726 | |||||||
| Income tax expense | 301,083 | 155,622 | 100,343 | |||||||
| The following are the major future income tax assets and liabilities arising from temporary differences between the carrying values and tax basis of the following assets and liabilities: |
2004 | 2003 | ||||||
| Future income tax assets: | |||||||
Fixed assets | 34,487 | 23,126 | |||||
Excess profit tax | 36,647 | - | |||||
Provision for inter-company profit eliminations | 15,516 | 9,087 | |||||
Provision for royalties | 5,448 | 4,831 | |||||
Provision for obsolete inventories | 1,310 | 1,180 | |||||
Provision for doubtful debts | 6 | 1,515 | |||||
Other | 487 | 424 | |||||
| Total future income tax assets | 93,901 | 40,163 | |||||
Less: current portion of future income tax assets | (65,431 | ) | (14,697 | ) | |||
Long-term future income tax assets | 28,470 | 25,466 | |||||
| Future income tax liabilities: | |||||||
Fixed assets | 9,936 | 13,012 | |||||
| The Corporation’s principal subsidiaries, PKKR and PKOP, and the Corporation’s other subsidiaries and joint ventures operating in Kazakhstan are separate taxpayers under Kazakhstani tax legislation. |
| FS24 PetroKazakhstan Inc. |
| Taxes are payable in Kazakhstan based on financial statements prepared in accordance with the laws of Kazakhstan rather than financial statements prepared in accordance with generally accepted accounting principles in Canada. The majority of the differences between the two sets of financial statements are temporary differences where an expense or revenue item is recorded for Canadian GAAP purposes in a different period than allowed under Kazakhstani law. The provision for Kazakhstani income taxes has been calculated by applying the Kazakhstani statutory tax rate of 30% to the income of PetroKazakhstan’s Kazakhstan subsidiaries. | ||
| Excess profit tax is in addition to statutory income taxes. Excess profit tax takes effect after the field has achieved a cumulative internal rate of return higher than 20% for the specific field. The excess profit tax ranges from 0% to 30% of taxable income for the year for PKKR and from 0% to 50% for Turgai. | ||
| A provision has been made for expected excess profit tax for the 2004 tax year for Turgai. Excess profit tax paid in one year is deductible in the computation of the excess profit tax liability in the following year. |
NOTE 14 | 4 | NET INCOME PER SHARE |
| The income per share calculations are based on the weighted average and diluted numbers of Class A common shares outstanding during the period as follows: |
2004 | 2003 | 2002 | ||||||||
Weighted average number of common shares outstanding | 78,285,025 | 78,149,904 | 80,853,597 | |||||||
Dilution from options (including convertible securities) | 1,423,880 | 3,142,302 | 3,346,939 | |||||||
| Diluted number of shares outstanding | 79,708,905 | 81,292,206 | 84,200,536 | |||||||
| 649,100 options were excluded from the calculation of diluted number of shares outstanding for the year ended December 31, 2004 as the exercise price was in excess of the average market price for the year. 774,000 options were excluded from the calculation of diluted number of shares outstanding for the year ended December 31, 2003. No options were excluded from the calculation of diluted number of shares outstanding for the year ended December 31, 2002. |
NOTE 15 | 4 | FINANCIAL INSTRUMENTS |
| The nature of the Corporation’s operations and issuance of long-term debt exposes the Corporation to fluctuations in commodity prices, foreign currency exchange rates, interest rates and credit risk. The Corporation recognizes these risks and manages operations in a manner such that exposure to these risks is minimized to the extent practical. | ||
| The Corporation’s financial instruments include cash, accounts receivable, all current liabilities and long-term debt. The fair value of cash, accounts receivable and current liabilities approximates their carrying amounts due to the short-term maturity of these instruments. The fair value of Kazgermunai debt and the term loans approximates their carrying value as they bear interest at market rates. The fair value of the 9.625% Notes is $139.5 million versus the carrying value of $125.0 million as at December 31, 2004 as determined through reference to market price. |
a) | Commodity price risk |
| The Corporation has entered into a commodity-hedging program where it is utilizing derivative instruments to manage the Corporation’s exposure to fluctuations in the price of crude oil. The Corporation has entered into the following contracts with a major financial institution. |
| FS25 |
| Contract | Price Ceiling or | ||||||||||||
| Amount | Contract Period | Contract Type | Contracted Price | Price Floor | |||||||||
(bbls per month) | |||||||||||||
| 362,000 | January 2004 to March 2004 | Dated Brent | 29.80-29.82 | - | |||||||||
| 75,000 | January 2004 to December 2004 | Zero cost collar | 28.00 | 17.00 | |||||||||
| 75,000 | January 2004 to December 2004 | Zero cost collar | 29.00 | 17.00 | |||||||||
| 75,000 | January 2004 to December 2004 | Zero cost collar | 29.25 | 17.00 | |||||||||
| 37,500 | January 2004 to December 2004 | Zero cost collar | 29.60 | 17.00 | |||||||||
| 110,000 | January 2004 to December 2004 | Zero cost collar | 30.20 | 18.00 | |||||||||
| 120,000 | January 2005 to March 2005 | IPE Future | 26.30-26.52 | - | |||||||||
| 40,000 | April 2005 to June 2005 | IPE Future | 25.92 | - | |||||||||
| 458,333 | January 2005 to December 2005 | IPE Future | 25.65-25.90 | - | |||||||||
During the year ended December 31, 2004, the Corporation has foregone revenue of $42.1 million through these contracts ($5.0 million during the year ended December 31, 2003).
The unrealized loss on these hedges as at December 31, 2004 is $60.9 million. This amount is deferred and recognized in the consolidated statement of income when the related contract is settled. The fair value of these hedges was determined based on forward prices as at December 31, 2004.
b) | Foreign currency exchange rate risk |
Export revenues are denominated in U.S. dollars and domestic sales of refined products and crude oil are made in the Tenge equivalent to U.S. dollars at the time of sale. Substantial portions of the Corporation’s operating costs are denominated in Tenge. The Corporation manages this exposure by operating in a manner that minimizes the need to convert between these currencies.
The Corporation, through its Downstream operations, has foreign currency exposure as the tax basis of its assets are denominated in Tenge. For Upstream, the Corporation has the possibility to revalue the tax basis of its assets using the industrial price index through the tax stability provisions of its Hydrocarbon Contracts. There is no significant forward market for the Tenge, therefore, the Corporation does not hedge this exposure.
c) | Interest rate risk |
The Corporation manages its interest rate risk through utilizing fixed and floating rate debt to finance its operations. The floating rate debt exposes the Corporation to fluctuations in interest payments due to changes in interest rates.
d) | Credit risk |
A substantial portion of the Corporation’s accounts receivable are with customers in the energy industry and are subject to normal industry risk. The Corporation’s crude oil sales are sold on credit to purchasers with A rating and all other sales are supported by letters of credit issued by major financial institutions. The Corporation’s sales of refined products are either made on a prepayment basis or supported by letters of credit issued by major financial institutions.
| FS26 PetroKazakhstan Inc. |
NOTE 16 | 4 | RELATED PARTY TRANSACTIONS |
| The Corporation had the following transactions with its joint ventures. |
($ millions) | 2004 | 2003 | 2002 | |||||||
| Crude oil purchased from Turgai | 205.5 | 76.8 | 110.0 | |||||||
| Crude oil purchased from Kazgermunai | 25.5 | 1.1 | 12.6 | |||||||
| Services provided to Turgai | 5.0 | 21.0 | 16.4 | |||||||
| The amounts in the table above represent 100% of transactions with the joint ventures. 50% of these amounts are eliminated on consolidation of the Corporation’s 50% interest in joint ventures. The remaining 50% remains in results of operations. | ||
| As at December 31, 2004 the Corporation has an account payable to the shareholder of the Turgai joint venture amounting to $24.8 million ($16.6 million as at December 31, 2003). |
NOTE 17 | 4 | CASH FLOW INFORMATION |
| Interest and income taxes paid: |
2004 | 2003 | 2002 | ||||||||
| Interest paid | 22,111 | 33,988 | 30,622 | |||||||
| Income taxes paid | 322,907 | 173,275 | 97,903 | |||||||
| Changes in non-cash operating working capital items: |
2004 | 2003 | 2002 | ||||||||
| Increase in accounts receivable | (48,211 | ) | (57,525 | ) | (40,144 | ) | ||||
| (Increase)/decrease in inventory | (20,136 | ) | 3,565 | (10,583 | ) | |||||
| Increase in prepaid expenses | (17,278 | ) | (306 | ) | (27,275 | ) | ||||
| Increase/(decrease) in accounts payable and accrued liabilities | 57,462 | (9,470 | ) | 44,068 | ||||||
Increase/(decrease) in prepayments for crude oil and refined products | 3,264 | 3,111 | (3,882 | ) | ||||||
(24,899 | ) | (60,625 | ) | (37,816 | ) | |||||
| Changes in short-tem debt: |
2004 | 2003 | 2002 | ||||||||
| Cash movements: | ||||||||||
Proceeds from working capital facilities | 98,006 | 66,079 | 64,954 | |||||||
Proceeds from term facility | - | - | 40,000 | |||||||
Proceeds from PKOP bonds | - | 11,332 | - | |||||||
Proceeds from joint venture loan | - | - | 5,000 | |||||||
Total proceeds | 98,006 | 77,411 | 109,954 | |||||||
Repayment of working capital facilities | (98,006 | ) | (69,566 | ) | (92,564 | ) | ||||
Pepayment of term facility | (35,692 | ) | (82,923 | ) | (44,000 | ) | ||||
Repayment of PKOP bonds | (24,494 | ) | - | - | ||||||
Repayment of term loans | (2,039 | ) | (2,039 | ) | - | |||||
Repayment of joint venture loan | (11,000 | ) | - | - | ||||||
Total repayment | (171,231 | ) | (154,528 | ) | (136,564 | ) | ||||
| Non-cash movements: | 15,541 | 134,035 | (9,640 | ) | ||||||
| Net change | (57,684 | ) | 56,918 | (36,250 | ) | |||||
| FS27 |
| Changes in long-term debt: |
2004 | 2003 | 2002 | ||||||||
| Cash movement: | ||||||||||
Proceeds from term facility | - | 190,000 | - | |||||||
Proceeds for sale of 9.625% notes | - | 122,986 | - | |||||||
12% Notes sold, net of discount | - | - | 17,195 | |||||||
Total proceeds | - | 312,986 | 17,195 | |||||||
Repayment of term facility | (71,384 | ) | - | (16,000 | ) | |||||
Redemption of 12% Notes | - | (208,210 | ) | - | ||||||
Repayment of Kazgermunai debt | (25,632 | ) | (9,489 | ) | (18,853 | ) | ||||
Total repayment | (97,016 | ) | (217,699 | ) | (34,853 | ) | ||||
| Non-cash movement | (14,777 | ) | (130,429 | ) | 18,280 | |||||
| Net change | (111,793 | ) | (35.142 | ) | 622 | |||||
| Non-cash movement includes reclassifications of current portion of long-term debt to short-term debt and current liabilities. |
NOTE 18 | 4 | COMMITMENTS AND CONTINGENCIES |
Agency for Regulation of Natural Monopolies and Protection of Competition (“ARNM”) | ||
PKOP | ||
| The ARNM alleged that PKOP charged prices for refined oil products that in total were $6.3 million in excess of ARNM authorized maximum prices. PKOP initiated legal proceedings to annul the ARNM claim and the court of first instance reduced the ARNM claim to approximately $1.1 million. PKOP and the ARNM appealed this decision to the Supreme Court. The Supreme Court recognized approximately $3.6 million of the ARNM’s original assessment. This amount has been paid and recorded in the financial statements. The Corporation has no plans to appeal. | ||
| PKOP received an additional assessment from ARNM in the amount of $8.8 million for allegedly charging prices for refined products in excess of ARNM authorized maximum prices. PKOP appealed this assessment. The ARNM revoked approximately $5.2 million of the assessment and the court of the first instance recognized approximately $1.4 million of the remaining $3.6 million. PKOP appealed this decision and was unsuccessful. $1.4 million has been recorded in the financial statements as a final settlement. | ||
| PKOP’s position remains that the ARNM does not have the right to establish prices for the refinery, and the Corporation, as the party in interest under the Privatization Agreement for the Shymkent Refinery, has notified the Government of Kazakhstan that it is in breach of provisions of the Privatization Agreement. The Corporation has the right to proceed to international arbitration under the terms of the Privatization Agreement. | ||
Group companies | ||
| The ARNM claimed $34.1 million ($31.0 million at December 31, 2003) from a group company for allegedly violating Kazakhstan’s competition law. The group company initiated legal proceedings and the court of first instance dismissed the ARNM claim. The ARNM appealed this decision; the appellate court upheld the decision of the lower court. The ARNM has filed a motion to re-open the court case on the basis of new information. | ||
| The ARNM claimed approximately $96.4 million ($91.4 million at December 31, 2003) from group companies for allegedly violating Kazakhstan’s competition law. The group companies initiated legal action, and at the Astana City Court were unsuccessful in their challenge of allegations by the ARNM that these companies had violated Kazakhstan competition laws. The initial trial court judgment upheld the ARNM determination that these group companies had received unjustified revenues totaling approximately $96.4 million. |
| FS28 PetroKazakhstan Inc. |
The group companies appealed this judgment to the Supreme Court. The initial Supreme Court hearing on the matter was held in the second quarter of 2004 and the Court suspended the case and instructed the parties to seek an agreed settlement. During the period from April to May 13, 2004 the parties did engage in discussions aimed at a settlement, but were unable to resolve the matter through negotiations.
On May 13, 2004, after a hearing on the merits, the Supreme Court overturned the lower court decision which was in favour of the ARNM and sent the case back to the Astana City Court for a new trial. During the third quarter of 2004, the General Prosecutor’s office filed a protest regarding the May 13 decision of the Supreme Court with the Supreme Court Supervisory Panel. On August 25, 2004, the Supervisory Panel issued an opinion upholding the May 13 decision and returned the case to the Astana City Court. In September 2004, the Astana City Court issued a ruling suspending further consideration of the merits of the case pending the completion of parallel investigations being conducted by the “Agency of the Republic of Kazakhstan for Fight Against Economic and Corruption Criminality”. This suspension was removed in late 2004 and the case is currently being reviewed by economic and financial experts under order of the Court. It is currently expected that the economic and financial expertise will be concluded during the spring of 2005 and that the case will, at that point, be subject to further review and decision by the Astana City Court. No provision has been made in the consolidated financial statements for these assessments.
It remains the Corporation’s view that the allegations leveled against the group companies are without justification. A highly competitive market exists for oil products within Kazakhstan and the current level of prices reflects current world crude oil prices. Also, the prices charged by the group companies are competitive with Russian imports and with those charged by distributors of the other two refineries in Kazakhstan.
The Corporation is considering its recourse rights under the terms of the Shymkent refinery Privatization Agreement, which clearly stipulates the right to sell any and all its products in Kazakhstan and abroad at free market prices.
The Corporation will continue to seek a dialogue with the appropriate authorities to address the concerns related to the pricing of refined products and possible measures to be taken to further promote transparency and effective monitoring of the dynamics of competition, consistent with market economy principles.
Tax matters
The local and national tax environment in the Republic of Kazakhstan is subject to change and inconsistent application, interpretation and enforcement. Non-compliance with Kazakhstan laws and regulations, as interpreted by the Kazakh authorities, can lead to the imposition of fines, penalties and interest.
In response to the Corporation’s submission, the Minister of Finance initiated the creation of a high-level Working Group between its officials and the Corporation’s representatives to address and seek resolution of all outstanding tax issues through dialogue and negotiations. On January 22, 2004, the Working Group signed a memorandum that sets out the agreed resolution of several important tax issues which were pending. Certain actions, such as the approval of the amendments to hydrocarbon contracts and issuance of an instruction letter, were required to fully implement the terms of the memorandum. The hydrocarbon contract amendments were approved on July 21, 2004, but the instruction letter has not been issued. The terms of this memorandum are reflected in the following discussion of the Corporation’s tax matters.
Tax assessments for 1998 and 1999
PKKR received tax assessments for 1998 and 1999. The assessments were for a total of approximately $10.5 million including taxes, fines, interest and penalties. PKKR was successful in challenging the assessments at the first level of the court system and was unsuccessful on the majority of the issues at the Supreme Court level. Specifically, PKKR was unsuccessful in obtaining agreement of the Supervisory Panel of the Supreme Court to hear its appeal on the assessed taxes. Accordingly, the Corporation provided for $2.9 million of the $10.5 million total assessment in the consolidated financial statements for the year ended December 31, 2002.
PKKR has been disputing the remaining $7.6 million (currently $8.0 million due to strengthening of the tenge), which relates to fines and penalties assessed, because PKKR believes there was an incorrect application of the provisions of tax legislation. However, PKKR paid this amount to stop the further accumulation of fines and penalties and recorded this payment as an account receivable pending resolution of the issue. The Working Group agreed with PKKR’s position and determined that there was an incorrect application of the provisions of the tax legislation. This matter was
| FS29 |
simultaneously appealed to the Supervisory Panel of the Supreme Court (“Supervisory Panel”) due to time limitations. The Supervisory Panel remanded the case back to the lower court for a retrial. The lower court rejected the Supervisory Panel’s instruction, a retrial was not held, and the lower court let the original decision stand. The lower court’s refusal to comply with the Supervisory Panel’s instruction was appealed to the Supervisory Panel. The Supervisory Panel refused to hear the appeal.
The Ministry of Finance has requested that the Working Group memorandum be revised to reflect the Court’s decision. The Corporation does not agree and intends to pursue this matter with the Ministry of Finance. The Corporation believes, and the Ministry of Finance has previously agreed, that there was an incorrect application of the provisions of the tax legislation. Due to the uncertainty of the outcome, the Corporation has recorded, as an expense, the remaining amount of approximately $8.0 million in the consolidated financial statements for the year ended December 31, 2004.
Tax assessments for 2000 and 2001
PKKR also received assessments for 2000 and 2001. Challenges to the assessments were divided into two court cases. The first case was for amounts totaling approximately $13.0 million and at the first level of the court system PKKR was successful on $6.8 million of the $13.0 million and was unsuccessful on the remainder. The major issue on which PKKR was unsuccessful was the assessment of royalties on flared associated gas. PKKR believes the claim for royalties on flared associated gas, which has no commercial value, contravenes the provisions of its hydrocarbon contracts. PKKR appealed to the Supreme Court and the Supervisory Panel of the Supreme Court and was unsuccessful. Royalties on flared gas were recorded in the consolidated financial statements as follows: $2.2 million in 2002, $0.2 million in 2003 and $2.1 million in 2004. As a result of the lost cases, the Corporation recorded additional $2.9 million related to royalties on gas for 2002 and 2003 in its consolidated financial statements for the year ended December 31, 2004. Additionally, the Corporation has provided for $1.6 million relating to interest charges on this tax assessment. A further provision of $1.7 million was made regarding other issues, which was recorded in 2003.
The second case was for $13.5 million, with $6.9 million related to transfer pricing sent back by the court for re-negotiation. The final assessment resulting from the court hearing held in September 2003 totalled $783,000 including the transfer pricing issue. The Ministry of Finance appealed to the Supreme Court, approximately $2.1 million of the assessment relating to the methodology used to revalue tax pools for currency fluctuations ($1.7 million) and the accelerated write-off of certain assets ($0.4 million). PKKR was unsuccessful at the Supreme Court. The Corporation had provided for these amounts in its consolidated financial statements for the year ended December 31, 2003.
Excess profit tax
The Corporation, through its subsidiary PKKR and joint venture Turgai, is subject to excess profit tax under the terms of the Hydrocarbon Exploration and Production contracts they have for oil and gas production. The contracts are specific to each field.
Excess profit tax is in addition to statutory income taxes, which are at a rate of 30%, and excess profit tax takes effect after the field has achieved a cumulative internal rate of return higher than 20% for the specific field. The excess profit tax ranges from 0% to 30% of taxable income for the year for PKKR and from 0% to 50% for Turgai. As at December 31, 2004 the Corporation through Turgai provided for excess profit tax of $35.0 million for 2004. PetroKazakhstan did not incur excess profit tax in any of its other fields in 2004. It may, however be subject to excess profit tax for the year ended December 31, 2005 and subsequent years in certain of its fields.
Turgai tax assessments
During 2004, Turgai was subject to a tax audit for the years 2002-2003 and received a tax assessment for approximately $148.0 million including penalties and interest (the Corporation’s 50% share is $74.0 million). The major issue was an assessment for excess profit taxes of approximately $100.0 million including fines (the Corporation’s 50% share is $50.0 million). The Ministry of Finance had adopted the position that expenditures relating to construction in progress are not allowed as a cash outflow when computing the internal rate of return. The Corporation believes this position is contrary to the concept of an internal rate of return calculation and counter to the legislation of the Republic of Kazakhstan. The Corporation, fellow shareholder Lukoil and Turgai entered into discussions regarding this assessment with the Ministry of Finance. As a result, the assessment was re-issued for $27.0 million (the Corporation’s 50% share is $13.5 million) and discussions will be held to determine the correct method of calculating excess profit tax and to clarify the interpretation of current legislation. A further revised assessment may be issued depending on the outcome of the discussions. The Corporation will continue to work with government authorities, Turgai, and Lukoil to resolve the dispute. No provision has been made in the financial statements for this assessment.
| FS30 PetroKazakhstan Inc. |
Capital expenditures commitment Pursuant to the Share Sale-Purchase Agreement with the Republic of Kazakhstan, a commitment was made to invest, in Kazakhstan, an aggregate of $280.0 million in capital expenditures, investments or other items that may be treated as capital assets of PKKR on or before December 31, 2002. The Government of Kazakhstan audited compliance with the investment commitment and has agreed that PKKR has more than met its commitments. The Corporation has assumed the rights and obligations under the PKOP privatization agreement, whereby the Government of Kazakhstan privatized PKOP. Under this agreement, the Corporation was required to invest, or cause PKOP to invest, the Tenge equivalent of $150.0 million in capital expenditures or investments by December 31, 2001. As of December 31, 2004, the Corporation believes it has met this commitment. The Government of Kazakhstan agrees with the Corporation’s assertion regarding $116.0 million of this commitment and is claiming the remaining obligation has not been met. If it is established that the Corporation has not met the remaining obligation, the Corporation may be required, under the terms of the agreement, to pay a penalty of 15% of the unfulfilled obligation or $5.1 million. No provision has been made in the financial statements for this matter. Commitments The Corporation has entered into a number of operating leases for rail cars, certain oil field equipment and office space. As at December 31, 2004 such commitments totaled $104.0 million. The obligations for each of the next five years and in total are as follows: |
($ millions) | 2005 | 2006 | 2007 | 2008 | 2009 | Thereafter | Total | |||||||||||||||
| Operating leases | 43.0 | 38.8 | 21.0 | 1.0 | 0.2 | - | 104.0 | |||||||||||||||
| Work commitments | 3.5 | 2.1 | 0.5 | - | - | - | 6.1 | |||||||||||||||
| Total | 46.5 | 40.9 | 21.5 | 1.0 | 0.2 | - | 110.1 | |||||||||||||||
Legal proceedings The Corporation was named as defendant in a claim filed by a company alleging it was retained under a consulting contract from January 17, 1997 until services were suspended in May 1999. The liquidated principal amount claimed was, in aggregate, $6.6 million and an additional unspecified amount was claimed as an alleged penalty provision, with the total claim not to exceed $35.0 million. The arbitration decision was received and the Corporation paid $7.1 million for full settlement of the claim. This amount was recorded in the consolidated financial statements for the year ended December 31, 2002. The Corporation is involved in certain other litigation and claims associated with the normal course of operations. Management believes that settlements, if any, would not have a material impact on the Corporation’s financial statements. | ||
NOTE 19 | 4 | SUBSEQUENT EVENTS |
In February 2005 the Corporation, through one of its operating subsidiaries in Kazakhstan received a court claim filed by Turgai for $17.0 million in damages. This claim relates to the temporary production curtailment of Turgai in late December 2004. The Corporation believes the claim is without merit and, accordingly, no provision has been made in the financial statements. In February 2005 the Corporation, through its joint venture Kazgermunai, received a court claim filed by the Kyzylorda Akimat for failure to fulfill infrastructure obligations. The claim is for approximately $102.0 million (the Corporation’s 50% share is $51.0 million), $28.1 million relating to infrastructure obligations with the remainder being interest charges. The Corporation believes the claim is without merit as a substantial portion of the obligation has been met and the agreement does not impose deadlines. Accordingly, no provision has been made for this claim in the financial statements |
| FS31 |
NOTE 20 | 4 | RECONCILIATION OF RESULTS FROM CANADIAN GAAP TO U.S. GAAP |
These consolidated financial statements have been prepared in accordance with accounting principles generally accepted in Canada (“Canadian GAAP”) which conform in all material respects with those applicable in the United States (“U.S. GAAP”), except as set forth below: Income taxes Recommendations of the CICA with respect to accounting for future income taxes differ from U.S. GAAP due to accounting for certain tax incentives. Under the tax legislation in the Republic of Kazakhstan, the Corporation may revalue the tax pool of its upstream assets using the prescribed inflation rate. A future income tax asset is recognized to reflect such revaluation in the consolidated financial statements, which is reversed for U.S. GAAP. Foreign currency translation PetroKazakhstan’s principal operating subsidiaries are PKKR and PKOP and for Canadian GAAP are classified as integrated which leads to the use of the temporal method of translation (Note 1). Under U.S. GAAP, the Corporation, on a consolidated basis, is required to translate the accounts of its principal operating subsidiaries using the current rate method. The significant changes which result from this difference are a reduction in the carrying value of capital assets and the creation of a cumulative translation account within the equity section of the balance sheet, which reduces total equity. Accounting for commodity hedges The Corporation has entered into a commodity-hedging program where it is utilizing derivative instruments as described in Note 17. The Corporation has designated these as cash flow hedges under SFAS 133 and recognizes in earnings, changes in fair value of these derivatives in the same period as the hedged item. Any change in the fair value of these cash flow hedges before that period are recognized in other comprehensive income. For Canadian GAAP the fair value is deferred and recognized as part of sales revenue when the hedges are settled. Comprehensive income for the year ended December 31, 2004 was reduced by $58.3 million (2003 - $1.6 million). The amount recorded as accounts payable as at December 31, 2004 was $60.9 million (2003 - $2.8 million). Accounting for oil and gas properties The Corporation has completed an impairment test calculation under U.S. GAAP at December 31, September 30, June 30 and March 31, in 2004, 2003 and 2002. According to Staff Accounting Bulletin 106 (“SAB 106”) released by the U.S. Securities and Exchange Commission in September 2004, the future cash outflows associated with settling asset retirement obligations should be excluded from the computation of the present value of estimated future net revenues for the purposes of the full cost impairment calculations. As at December 31, 2004 there was no impairment of full cost assets. There are certain differences between the full cost method of accounting for oil and gas assets as applied in Canada and as applied in the United States. The Corporation has reviewed such differences and determined that no variances in financial statement balances would have resulted from the application of full cost accounting in accordance with U.S. GAAP. Canadian GAAP requires that under full cost accounting, depletion for oil and gas properties, including future development costs, should be determined using proved reserves based on estimated future prices and costs. U.S. GAAP requires that future development costs should be based on current costs. As at December 31, 2004, the difference between Canadian GAAP and U.S. GAAP requirements for depletion was immaterial. Comprehensive income U.S. GAAP utilizes the concept of comprehensive income, which includes net income and other comprehensive income. As at December 31, 2004 there was no similar concept under Canadian GAAP. Other comprehensive income represents the change in equity during the period from transactions and other events from non-owner sources and includes items such as changes in the fair value of cash flow hedges. |
| FS32 PetroKazakhstan Inc. |
Change in accounting principles
Accounting for Asset Retirement Obligations
Effective January 1, 2003, the Corporation adopted SFAS 143, Accounting for Asset Retirement Obligations. The Corporation recognized the estimated fair value of the liability for its assets retirement obligation. As at December 31, 2003 the fair value of the obligation was estimated to be $11.0 million (including accretion expense of $0.9 million for the year ended December 31, 2003). These estimated costs were recorded as an increase in the gross book value of property, plant and equipment with a corresponding increase in the asset retirement obligation. The asset retirement obligation is depleted on a unit-of-production basis over the useful life of the related assets. Accretion expense, resulting from the increase in the present value of the liability due to the passage of time, is recorded as part of depletion, depreciation and accretion expense.
During the year ended December 31, 2004, the Corporation revised the estimated fair value of its asset retirement obligations to $32.5 million (including accretion expense of $2.4 million for the year ended December 31, 2004). The increase in the estimate was recorded as an increase in property, plant and equipment with a corresponding increase in asset retirement obligations. This change in estimate had an impact of a $2.0 million decrease in net income for the year ended December 31, 2004.
The change in asset retirement obligations is as follows:
2004 | 2003 | ||||||
| Asset retirement obligations liability, beginning of year | 11,041 | 4,167 | |||||
| Beginning balance reversed for adoption of SFAS 143 | - | (4,167 | ) | ||||
| Estimate following the adoption of SFAS 143 | - | 10,129 | |||||
| Revisions | 19,162 | - | |||||
| Accretion expense | 2,433 | 912 | |||||
| Settlements | (137 | ) | - | ||||
| Asset retirement obligations liability, end of year | 32,499 | 11,041 | |||||
Under U.S. GAAP the new accounting standard pertaining to accounting for asset retirement obligations was effective January 1, 2003. Changes to the equivalent Canadian accounting standards were effective January 1, 2004 (see Note 2), which eliminated asset retirement obligations as a GAAP difference in 2004 and for future years. Under U.S. GAAP, the cumulative effect of initial application is required to be charged to net income in the year the standard became effective. Canadian GAAP requires this change in accounting policy to be applied retroactively and prior periods presented for comparative purposes restated.
The cumulative effect from the date the liability would have been recognized at the date of adoption of SFAS 143 was $2.1 million and is included in net income for the year ended December 31, 2003.
The asset retirement obligation liability, had we applied SFAS 143 for all years presented in these financial statements, would be $10.1 million as at January 1, 2003.
The pro forma information, had we applied SFAS 143 for comparative years presented in these consolidated financial statements, would be as follows:
| 2002 | ||||
| Net income | ||||
As reported | 162,539 | |||
Pro forma | 162,498 | |||
| Basic net income per share: | ||||
As reported | 2.01 | |||
Pro forma | 2.01 | |||
| Diluted net income per share: | ||||
As reported | 1.93 | |||
Pro forma | 1.93 | |||
| FS33 |
Consolidation of variable interest entities
In January 2003, FASB issued Interpretation No. 46 (“FIN 46”), “Consolidation of Variable Interest Entities.” FIN 46 clarifies the application of Accounting Research Bulletin No. 51, “Consolidated Financial Statements,” for certain entities in which equity investors do not have the characteristics of a controlling financial interest or do not have sufficient equity at risk for the entity to finance its activities without additional subordinated support from other parties. This Interpretation requires variable interest entities (“VIE”) to be consolidated by the primary beneficiary, which represents the enterprise that will absorb the majority of the VIE’s expected losses if they occur, receive a majority of the VIE’s residual returns if they occur, or both. FIN 46 was effective for VIE’s created after January 31, 2003 and for VIE’s in which an enterprise obtains an interest after that date. In December 2003, the FASB issued Interpretation No. 46R (“FIN 46R”), “Consolidation of Variable Interest Entities — an interpretation of Accounting Research Bulletin No. 51 (revised December 2003),” which replaces FIN 46. FIN 46R was primarily issued to clarify the required accounting for interests in VIE’s. The Corporation has determined that the adoption of FIN 46 and FIN 46R did not have a material impact on its financial position or results of operations.
Consolidated Statements of Income
The application of U.S. GAPP would have the following effects on net income as reported:
Years ended December 31 | 2004 | 2003 | 2002 | |||||||
| Net income as reported in accordance with Canadian GAAP | 500,668 | 316,940 | 161,397 | |||||||
| Accounting for income taxes | - | 629 | - | |||||||
| Amortization of debt issue costs | - | - | (29 | ) | ||||||
| Depletion, depreciation and accretion expense | (6,018 | ) | 1,614 | 1,171 | ||||||
| Future income tax | 1,026 | (193 | ) | - | ||||||
Net income under U.S. GAAP before cumulative effect of initial application of SFAS 143 | 495,676 | 318,990 | 162,539 | |||||||
| Cumulative effect of initial application of SFAS 143 | - | (2,107 | ) | - | ||||||
Net income under U.S. GAAP | 495,676 | 316,883 | 162,539 | |||||||
Basic income pershareunder U.S. GAAP: | ||||||||||
| Net income under U.S. GAAP before cumulative effect of initial application of SFAS 143 | 6.33 | 4.08 | 2.01 | |||||||
| Cumulative effect of initial application of SFAS 143 | - | (0.03 | ) | - | ||||||
| Net income under U.S. GAAP | 6.33 | 4.05 | 2.01 | |||||||
Diluted income per share under U.S GAAP: | ||||||||||
| Net income under U.S. GAAP before cumulative effect of initial application of SFAS 143 | 6.22 | 3.92 | 1.93 | |||||||
| Cumulative effect of initial application of SFAS 143 | - | (0.02 | ) | - | ||||||
| Net income under U.S. GAAP | 6.22 | 3.90 | 1.93 | |||||||
Comprehensive income | ||||||||||
| Foreign exchange translation adjustment | 57,138 | 35,199 | (2,235 | ) | ||||||
| Fair value adjustment cash flow hedges | (58,102 | ) | 1,594 | (4,392 | ) | |||||
Total comprehensive income | 494,712 | 353,676 | 155,912 | |||||||
| FS34 PetroKazakhstan Inc. |
Stock based compensation
The Corporation has a stock-based compensation plan as described in Note 12. During the year ended December 2003, the Corporation adopted SFAS 123 and 148, which require recognition of compensation expense using the fair value of the equity instrument granted. The Corporation has adopted this recommendation on a prospective basis, effective January 1, 2003. Accordingly, the Corporation has recognized compensation expense for all common stock options granted to employees and non-executive directors on or after January 1, 2003 using the estimated fair value. The Corporation has recorded compensation expense of $4.0 and $1.2 million in general and administrative expenses within the consolidated statements of income and retained earnings for the years ended December 31, 2004 and 2003 with a corresponding increase in contributed surplus within shareholder’s equity. Compensation expense for options granted on or after January 1, 2003 is recognized as compensation expense over the vesting period of the respective options. For common share options granted prior to January 1, 2003 the pro forma impact on net income and net income per share are as follows:
Years ended December 31 | 2004 | 2003 | 2002 | |||||||
| Net income under U.S. GAAP: | ||||||||||
| As reported | 495,676 | 316,883 | 162,539 | |||||||
| Add stock-based employee compensation expense included in reported net income | 4,034 | 1,175 | - | |||||||
| Deduct total stock-based employee compensation expense for all awards | (5,170 | ) | (3,363 | ) | (2,530 | ) | ||||
| Pro forma | 494,540 | 314,695 | 160,009 | |||||||
| Basic net income per share: | ||||||||||
As reported | 6.33 | 4.05 | 2.01 | |||||||
Pro forma | 6.32 | 4.03 | 1.98 | |||||||
| Diluted net income per share: | ||||||||||
As reported | 6.22 | 3.90 | 1.93 | |||||||
Pro forma | 6.21 | 3.87 | 1.90 | |||||||
| Stock options vested during period (thousands) | 371 | 381 | 513 | |||||||
| Weighted average exercise price | 3.06 | 6.59 | 6.02 | |||||||
| Weighted average fair value of options vested during the period | 6.73 | 5.74 | 4.93 | |||||||
| Weighted average fair value of options granted during the period | 9.88 | 7.82 | 5.73 | |||||||
The foregoing information is calculated in accordance with the Black-Scholes option pricing model, using the following data and assumptions: volatility, as of the date of grant, computed using the prior one to three-year weekly average prices of the Corporation’s common shares, which ranged from 32% to 68%; expected dividend yield - 2%; option terms to expiry - 5 years as defined by the option contracts; risk-free rate of return as of the date of grant - 3.60% to 3.96%, based on five year Government of Canada Bond yields.
| FS35 |
CONSOLIDATED BALANCE SHEETS
The application of U.S. GAAP would have the following effects on balance sheet items as reported:
| Foreign | Fair value | ||||||||||||||||||
| exchange | adjustment | Accounting | Asset | ||||||||||||||||
| As | translation | cash flow | for income | retirement | U.S. | ||||||||||||||
| reported | adjustment | hedges | taxes | obligation | GAAP | ||||||||||||||
December 31, 2004 | |||||||||||||||||||
| Current assets | 586,461 | 586,461 | |||||||||||||||||
| Deferred charges | 4,662 | 4,662 | |||||||||||||||||
| Property, plant and equipment | 601,747 | 43,692 | 645,439 | ||||||||||||||||
| Restricted cash | 47,741 | 47,741 | |||||||||||||||||
| Future income tax assets | 28,470 | (5,528 | ) | 22,942 | |||||||||||||||
| Current liabilities | 187,216 | 60,900 | 248,116 | ||||||||||||||||
| Long-term debt | 134,862 | 134,862 | |||||||||||||||||
| Future income tax liability | 9,936 | 9,936 | |||||||||||||||||
| Provision for future site restoration | 32,499 | 32,499 | |||||||||||||||||
| Non-controlling interest | 14,411 | 14,411 | |||||||||||||||||
| Preferred shares of subsidiary | 80 | 80 | |||||||||||||||||
| Shareholders' equity | 890,077 | 43,692 | (60,900 | ) | (5,528 | ) | 867,341 | ||||||||||||
| December 31, 2003 | |||||||||||||||||||
| Current assets | 431,471 | 431,471 | |||||||||||||||||
| Deferred charges | 6,729 | 6,729 | |||||||||||||||||
| Property, plant and equipment | 542,317 | (13,446 | ) | (11,567 | ) | 517,304 | |||||||||||||
| Restricted cash | 35,468 | 35,468 | |||||||||||||||||
| Future income tax assets | 25,466 | (5,528 | ) | (1,025 | ) | 18,913 | |||||||||||||
| Current liabilities | 168,299 | 2,798 | 171,097 | ||||||||||||||||
| Long-term debt | 246,655 | 246,655 | |||||||||||||||||
| Future income tax liability | 13,012 | 13,012 | |||||||||||||||||
| Provision for future site restoration | 28,625 | (17,584 | ) | 11,041 | |||||||||||||||
| Non-controlling interest | 13,091 | 13,091 | |||||||||||||||||
| Preferred shares of subsidiary | 80 | 80 | |||||||||||||||||
| Shareholders' equity | 571,689 | (13,446 | ) | (2,798 | ) | (5,528 | ) | 4,992 | 554,909 | ||||||||||
Consolidated Statements of Income and Retained Earnings (Deficit) Reclassifications
Interest and other income is presented within revenue under Canadian GAAP, under the U.S. GAAP this would be presented as a separate line item after operating income. Interest and financing costs is presented within expenses under Canadian GAAP, under U.S. GAAP this would be presented as a separate line item after operating income. Unusual items as presented under Canadian GAAP would be included within expenses under U.S. GAAP. The “Cash flow” subtotal line would not be presented in a cash flow statement prepared under U.S. GAAP.
New U.S. GAAP pronouncements
In December 2004, the FASB issued Statement of Financial Accounting Standards No. 123R (“SFAS 123R”) “Share Based Payment”, which is a revision of Statement of Financial Accounting Standards No. 123 “Accounting for Stock-Based Compensation”. SFAS 123R establishes standards for the accounting for transactions in which an entity exchanges its equity instruments for goods or services. It also addresses transactions in which an entity incurs liabilities in exchange for goods or services that are based on the fair value of the entity’s equity instruments or that may be settled by the issuance of those equity instruments. SFAS 123R focuses primarily on accounting for transactions in which an entity obtains employee services in share-based payment transactions. SFAS 123R is effective for the Corporation as of June 30, 2005. The Corporation is in the process of evaluating the impact of SFAS 123R on its consolidated financial statements.
The following new U.S. GAAP pronouncements are not expected to have any impact on the Corporation’s consolidated financial statements.
| 4 | Statement of Financial Accounting Standards No. 151 (“SFAS 151”) - Inventory Costs, an Amendment of ARB No. 43, Chapter 4. |
| 4 | Statement of Financial Accounting Standards No. 152 (“SFAS 152”) - Accounting for Real Estate Time-Sharing Transactions—an amendment of FASB Statements No. 66 and 67. |
| 4 | Statement of Financial Accounting Standards No. 153 (“SFAS 153”) - Exchanges of Nonmonetary Assets—an amendment of APB Opinion No. 29. |
| FS36 PetroKazakhstan Inc. |
Historical Financial Data |
Years ended December 31 - UNAUDITED - EXPRESSED IN MILLIONS OF UNITED STATES DOLLARS (EXCEPT PER SHARE AMOUNTS)
2004 | 2003 | 2002 | 2001 | 2000 | 1999 | 1998 | 1997 | ||||||||||||||||||
INCOME | |||||||||||||||||||||||||
| Revenue | 1,642.4 | 1,117.3 | 825.4 | 603.1 | 523.2 | 155.2 | 175.9 | 94.8 | |||||||||||||||||
| Expenses | (733.8 | ) | (560.1 | ) | (508.1 | ) | (323.7 | ) | (223.5 | ) | (136.8 | ) | (153.9 | ) | (56.0 | ) | |||||||||
| Depletion and depreciation | (105.5 | ) | (82.4 | ) | (46.4 | ) | (34.8 | ) | (14.7 | ) | (2.9 | ) | (55.3 | ) | (15.9 | ) | |||||||||
| Ceiling test write-downs | - | - | - | - | - | (2.1 | ) | (173.4 | ) | - | |||||||||||||||
| Income taxes | (301.1 | ) | (155.6 | ) | (100.3 | ) | (68.4 | ) | (99.7 | ) | (17.7 | ) | (22.6 | ) | (7.1 | ) | |||||||||
| Unusual items | - | - | (7.1 | ) | (5.5 | ) | (20.4 | ) | 12.8 | - | - | ||||||||||||||
| Non-controlling interest | (1.3 | ) | (2.3 | ) | (2.1 | ) | (1.9 | ) | (10.0 | ) | - | - | - | ||||||||||||
| Net Income (Loss) | 500.7 | 316.9 | 161.4 | 168.8 | 154.9 | 8.5 | (229.3 | ) | 15.8 | ||||||||||||||||
CASH FLOW | |||||||||||||||||||||||||
| Cash flow | 560.5 | 400.0 | 216.8 | 200.3 | 179.4 | 17.0 | 0.6 | 32.0 | |||||||||||||||||
| Proceeds from shares issued | 13.1 | 1.6 | 1.4 | 0.7 | 26.7 | - | 2.3 | 0.3 | |||||||||||||||||
| Share repurchased and cancelled | 38.6 | 14.8 | 23.5 | - | - | - | - | - | |||||||||||||||||
| Capital expenditures | 166.0 | 203.2 | 140.1 | 110.2 | 17.0 | 15.2 | 113.0 | 47.3 | |||||||||||||||||
BALANCE SHEET | |||||||||||||||||||||||||
| Property, plant and equipment | 601.7 | 542.3 | 417.6 | 342.9 | 264.5 | 87.6 | 76.8 | 178.8 | |||||||||||||||||
| Long-term debt | 134.9 | 246.7 | 281.8 | 281.2 | 82.0 | - | - | 180.5 | |||||||||||||||||
| Net debt | (48.7 | ) | 135.2 | 223.3 | 268.9 | 47.8 | 167.8 | 178.1 | 154.9 | ||||||||||||||||
| Shareholders' Equity | 890.1 | 571.7 | 266.9 | 127.6 | 185.0 | (87.6 | ) | (96.0 | ) | 130.9 | |||||||||||||||
Production(mbopd) | 151.1 | 151.3 | 135.8 | 100.9 | 84.1 | 64.3 | 53.1 | 45.0 | |||||||||||||||||
Reserves(mmboes)(as of January 1 of the following year) (proved plus probable) | 549.8 | 495.4 | 518.3 | 512.3 | 487.6 | 458.6 | 449.5 | 429.9 | |||||||||||||||||
STATISTICS | |||||||||||||||||||||||||
Weighted average common shares outstanding(millions) | 78.29 | 78.15 | 80.85 | 79.81 | 70.59 | 44.51 | 44.24 | 42.83 | |||||||||||||||||
| Per Share (basic) | |||||||||||||||||||||||||
Net income (loss) | $ | 6.40 | $ | 4.06 | $ | 2.00 | $ | 2.12 | $ | 2.19 | $ | 0.19 | $ | (5.18 | ) | $ | 0.37 | ||||||||
Cash flow | $ | 7.16 | $ | 5.12 | $ | 2.68 | $ | 2.51 | $ | 2.54 | $ | 0.38 | $ | 0.01 | $ | 0.75 | |||||||||
| Market Price for shares | |||||||||||||||||||||||||
Toronto(C$) | |||||||||||||||||||||||||
High | 50.58 | 30.93 | 25.70 | 14.30 | 11.25 | 3.65 | 12.00 | 14.40 | |||||||||||||||||
Low | 29.00 | 13.87 | 8.27 | 7.10 | 2.70 | 0.25 | 1.40 | 5.05 | |||||||||||||||||
Close | 44.53 | 29.27 | 16.48 | 10.80 | 7.65 | 3.30 | 1.76 | 11.10 | |||||||||||||||||
United States(U.S.$) | |||||||||||||||||||||||||
High | 42.62 | 23.25 | 16.05 | 9.05 | 7.50 | 2.50 | 8.66 | 10.62 | |||||||||||||||||
Low | 21.67 | 9.51 | 5.23 | 4.41 | 1.06 | 0.06 | 0.84 | 3.67 | |||||||||||||||||
Close | 37.10 | 22.51 | 10.42 | 6.82 | 5.08 | 2.23 | 1.16 | 7.80 | |||||||||||||||||
| FS37 |
Share Price Performance |
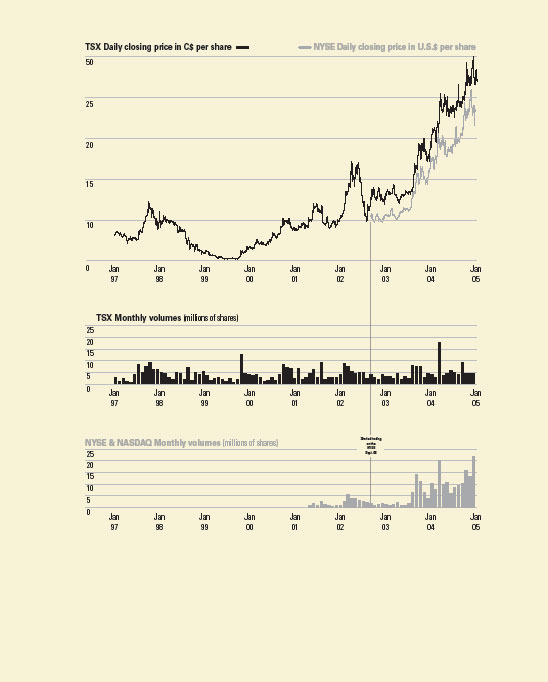
| FS38 PetroKazakhstan Inc. |