As filed with the Securities and Exchange Commission on March 10, 2008
UNITED STATES
SECURITIES AND EXCHANGE COMMISSION
Washington, D.C. 20549
FORM N-CSR
CERTIFIED SHAREHOLDER REPORT OF REGISTERED
MANAGEMENT INVESTMENT COMPANIES
Investment Company Act file number 811-07685
Frontegra Funds, Inc.
(Exact name of registrant as specified in charter)
400 Skokie Blvd.
Suite 500
Northbrook, Illinois 60062
(Address of principal executive offices) (Zip code)
William D. Forsyth III
400 Skokie Blvd., Suite 500
Northbrook, Illinois 60062
(Name and address of agent for service)
(847) 509-9860
Registrant's telephone number, including area code
Date of fiscal year end: June 30, 2008
Date of reporting period: December 31, 2007
Item 1. Report to Stockholders.
SEMI-ANNUAL REPORT
Frontegra Columbus Core Plus Fund
Frontegra Columbus Core Fund
Frontegra IronBridge Small Cap Fund
Frontegra IronBridge SMID Fund
Frontegra New Star International Equity Fund
Frontegra Netols Small Cap Value Fund
Frontegra Asset Management, Inc.
December 31, 2007
TABLE OF CONTENTS
Shareholder Letter | 1 |
Expense Example | 2 |
Allocation of Portfolio Holdings | 6 |
Frontegra Columbus Core Plus Fund | |
Frontegra Columbus Core Fund | |
Report from Reams Asset Management Company, LLC | 9 |
Investment Highlights | 13 |
Schedule of Investments | 14 |
Statement of Assets and Liabilities | 30 |
Statement of Operations | 31 |
Statements of Changes in Net Assets | 32 |
Financial Highlights | 33 |
Investment Highlights | 34 |
Schedule of Investments | 35 |
Statement of Assets and Liabilities | 49 |
Statement of Operations | 50 |
Statements of Changes in Net Assets | 51 |
Financial Highlights | 52 |
Frontegra IronBridge Small Cap Fund | |
Frontegra IronBridge SMID Fund | |
Report from IronBridge Capital Management, L.P. | 54 |
Investment Highlights | 56 |
Schedule of Investments | 57 |
Statement of Assets and Liabilities | 63 |
Statement of Operations | 64 |
Statements of Changes in Net Assets | 65 |
Financial Highlights | 66 |
Investment Highlights | 67 |
Schedule of Investments | 68 |
Statement of Assets and Liabilities | 74 |
Statement of Operations | 75 |
Statements of Changes in Net Assets | 76 |
Financial Highlights | 77 |
Frontegra New Star International Equity Fund | |
Report from New Star Institutional Managers Limited | 79 |
Investment Highlights | 81 |
Schedule of Investments | 82 |
Portfolio Diversification | 87 |
Statement of Assets and Liabilities | 88 |
Statement of Operations | 89 |
Statements of Changes in Net Assets | 90 |
Financial Highlights | 91 |
Frontegra Netols Small Cap Value Fund | |
Report from Netols Asset Management, Inc. | 93 |
Investment Highlights | 94 |
Schedule of Investments | 95 |
Statement of Assets and Liabilities | 100 |
Statement of Operations | 101 |
Statements of Changes in Net Assets | 102 |
Financial Highlights | 103 |
Notes to Financial Statements | 105 |
Board of Directors’ Approval of the Advisory Agreement | 118 |
Additional Information | 128 |
This report is submitted for the general information of the shareholders of the Funds. It is not authorized for distribution to prospective investors unless accompanied or preceded by an effective Prospectus for the applicable Fund. The Prospectus may be obtained by calling 1-888-825-2100. Each Prospectus includes more complete information about management fees and expenses, investment objectives, risks and operating policies of the applicable Fund. Please read the Prospectus carefully.
Frontegra Funds, Inc. are distributed by Frontegra Strategies, LLC, 400 Skokie Blvd., Suite 500, Northbrook, IL 60062. Frontegra Strategies, LLC is an affiliate of Frontegra Asset Management, Inc., the Funds’ Investment Adviser.
| This page intentionally left blank. |
DEAR FELLOW SHAREHOLDERS:
We are pleased to report on the progress of the Frontegra Funds for the first six months of our fiscal year (July 1, 2007 through December 31, 2007). During the past six months, the U.S equity market, as measured by the S&P 500 Index, was actually down (2.33%). Non-U.S. markets, as measured by the MSCI EAFE Index, were barely positive, returning just 0.51%. In the U.S., small capitalization stocks did significantly worse than large capitalization stocks. The Russell 2000 Index was down (7.53%). In contrast to the equity markets, the U.S. bond market had a relatively strong showing in the final six months of 2007 with the Lehman Brothers Aggregate Bond Index up 5.93%. The bond market benefited from the Federal Reserve’s lowering of the federal-funds rate by a total of 1% over the six-month period.
Fund Results
The Frontegra Columbus Core Plus Fund and the Frontegra Columbus Core Fund, managed by Reams Asset Management, returned 6.74% and 6.72%, net of fees, respectively. The Frontegra IronBridge Small Cap and SMID Funds, both managed by IronBridge Capital Management, returned -2.04% and -3.28%, net of fees, respectively. The Frontegra New Star International Equity Fund, managed by New Star Institutional Managers returned 0.85%, net of fees, for the period. Finally, the Frontegra Netols Small Cap Value Fund, managed by Netols Asset Management, returned -4.64%, net of fees.
Summary
We continue to have great confidence in the investment teams at Reams Asset Management, IronBridge Capital Management, New Star Institutional Managers and Netols Asset Management. We believe they are committed to the highest standards of investment decision-making for the shareholders of the Frontegra Funds.
As always, we greatly appreciate your investment and continued confidence in the Frontegra Funds.
Sincerely,
 |  |
| Thomas J. Holmberg, CFA | William D. Forsyth, CFA |
| Frontegra Asset Management, Inc. | Frontegra Asset Management, Inc. |
Frontegra Funds
EXPENSE EXAMPLE
December 31, 2007 (Unaudited)
As a shareholder of a mutual fund, you incur two types of costs: (1) transaction costs, including redemption fees, and (2) ongoing costs, including management fees and other fund expenses. Although the Funds charge no sales loads, you will be assessed fees for outgoing wire transfers, returned checks and stop payment orders at prevailing rates charged by U.S. Bancorp Fund Services, LLC, the Funds’ transfer agent. If you request that a redemption be made by wire transfer, currently the Funds’ transfer agent charges a $15.00 fee. A redemption fee of 2.00% of the then current value of the shares redeemed may be imposed on certain redemptions of shares made within 30 days of purchase for the Frontegra New Star International Equity Fund.
This Example is intended to help you understand your ongoing costs (in dollars) of investing in the Funds and to compare these costs with the ongoing costs of investing in other mutual funds. The Example is based on an investment of $1,000 invested at the beginning of the period and held for the entire period (7/1/07 – 12/31/07).
Actual Expenses
The first line of the tables on the following pages provides information about actual account values and actual expenses. The Example includes management fees, registration fees, fee waivers/reimbursements and other expenses. However, the Example does not include portfolio trading commissions and related expenses and other extraordinary expenses as determined under generally accepted accounting principles. You may use the information in this line, together with the amount you invested, to estimate the expenses that you paid over the period. Simply divide your account value by $1,000 (for example, an $8,600 account value divided by $1,000 = 8.6), then multiply the result by the number in the first line under the heading entitled “Expenses Paid During Period’’ to estimate the expenses you paid on your account during this period.
Hypothetical Example for Comparison Purposes
The second line of the tables provides information about hypothetical account values and hypothetical expenses based on the Funds’ actual expense ratios and an assumed rate of return of 5% per year before expenses, which are not the Funds’ actual returns. The hypothetical account values and expenses may not be used to estimate the actual ending account balance or expenses you paid for the period. You may use this information to compare the ongoing costs of investing in the Funds and other funds. To do so, compare this 5% hypothetical example with the 5% hypothetical examples that appear in the shareholder reports of the other funds. Please note that the expenses shown in the tables are meant to highlight your ongoing costs only and do not reflect any transactional costs. Therefore, the second line of the table is useful in comparing ongoing costs only, and will not help you determine the relative total costs of owning different funds. In addition, if these transactional costs were included, your costs could have been higher.
Frontegra Funds
EXPENSE EXAMPLE (CONTINUED)
December 31, 2007 (Unaudited)
Frontegra Columbus Core Plus Fund
| | | | Expenses Paid |
| | Beginning | Ending | During Period |
| | Account Value | Account Value | July 1, 2007 - |
| | July 1, 2007 | December 31, 2007 | December 31, 2007* |
| Actual | $1,000.00 | $1,067.40 | $1.35 |
| Hypothetical (5% return | | | |
| before expenses) | $1,000.00 | $1,023.83 | $1.32 |
| * | Expenses are equal to the Fund’s annualized expense ratio of 0.26%, multiplied by the average account value over the period, multiplied by 184/366 to reflect the one-half year period. |
Frontegra Columbus Core Fund
| | | | Expenses Paid |
| | Beginning | Ending | During Period |
| | Account Value | Account Value | July 1, 2007 - |
| | July 1, 2007 | December 31, 2007 | December 31, 2007* |
| Actual | $1,000.00 | $1,067.20 | $1.35 |
| Hypothetical (5% return | | | |
| before expenses) | $1,000.00 | $1,023.83 | $1.32 |
| * | Expenses are equal to the Fund’s annualized expense ratio of 0.26%, multiplied by the average account value over the period, multiplied by 184/366 to reflect the one-half year period. |
Frontegra IronBridge Small Cap Fund
| | | | Expenses Paid |
| | Beginning | Ending | During Period |
| | Account Value | Account Value | July 1, 2007 - |
| | July 1, 2007 | December 31, 2007 | December 31, 2007* |
| Actual | $1,000.00 | $979.60 | $5.37 |
| Hypothetical (5% return | | | |
| before expenses) | $1,000.00 | $1,019.71 | $5.48 |
| * | Expenses are equal to the Fund’s annualized expense ratio of 1.08%, multiplied by the average account value over the period, multiplied by 184/366 to reflect the one-half year period. |
Frontegra Funds
EXPENSE EXAMPLE (CONTINUED)
December 31, 2007 (Unaudited)
Frontegra IronBridge SMID Fund
| | | | Expenses Paid |
| | Beginning | Ending | During Period |
| | Account Value | Account Value | July 1, 2007 - |
| | July 1, 2007 | December 31, 2007 | December 31, 2007* |
| Actual | $1,000.00 | $967.20 | $4.70 |
| Hypothetical (5% return | | | |
| before expenses) | $1,000.00 | $1,020.36 | $4.82 |
| * | Expenses are equal to the Fund’s annualized expense ratio of 0.95%, multiplied by the average account value over the period, multiplied by 184/366 to reflect the one-half year period. |
Frontegra New Star International Equity Fund
| | | | Expenses Paid |
| | Beginning | Ending | During Period |
| | Account Value | Account Value | July 1, 2007 - |
| | July 1, 2007 | December 31, 2007 | December 31, 2007* |
| Actual | $1,000.00 | $1,008.50 | $3.79 |
| Hypothetical (5% return | | | |
| before expenses) | $1,000.00 | $1,021.37 | $3.81 |
| * | Expenses are equal to the Fund’s annualized expense ratio of 0.75%, multiplied by the average account value over the period, multiplied by 184/366 to reflect the one-half year period. |
Frontegra Netols Small Cap Value Fund – Institutional Class
| | | | Expenses Paid |
| | Beginning | Ending | During Period |
| | Account Value | Account Value | July 1, 2007 - |
| | July 1, 2007 | December 31, 2007 | December 31, 2007* |
| Actual | $1,000.00 | $953.50 | $5.40 |
| Hypothetical (5% return | | | |
| before expenses) | $1,000.00 | $1,019.61 | $5.58 |
| * | Expenses are equal to the Fund’s annualized expense ratio of 1.10%, multiplied by the average account value over the period, multiplied by 184/366 to reflect the one-half year period. |
Frontegra Funds
EXPENSE EXAMPLE (CONTINUED)
December 31, 2007 (Unaudited)
Frontegra Netols Small Cap Value Fund – Class Y
| | | Ending | |
| | Beginning | Account Value | Expenses Paid |
| | Account Value | December 31, 2007 | During Period |
| Actual* | $1,000.00 | $979.10 | $2.56 |
| Hypothetical (5% return | | | |
| before expenses)** | $1,000.00 | $1,017.34 | $7.86 |
| * | | Actual expenses are equal to the Fund’s annualized expense ratio of 1.55%, multiplied by the average account value over the period, multiplied by 61/366 to reflect the most recent fiscal period end since the Class Y Shares commenced operations on November 1, 2007. |
| ** | | Hypothetical expenses are equal to the Fund’s annualized expense ratio of 1.55% multiplied by the average account value over the period commencing July 1, 2007, multiplied by 184/366 to reflect information had the Class Y Shares been in operation for the entire fiscal half year. |
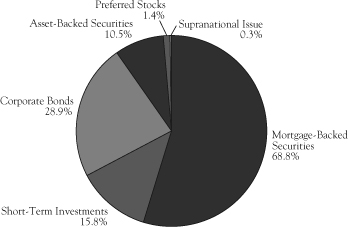
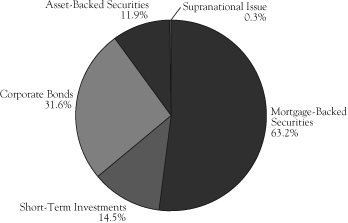
ALLOCATION OF PORTFOLIO HOLDINGS
December 31, 2007 (Unaudited)
Frontegra Columbus Core Plus Fund*
Frontegra Columbus Core Fund*
* Percentages shown are based on the Fund’s total net assets.
Frontegra Funds
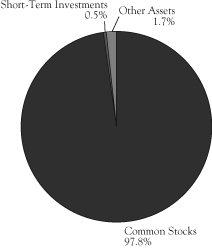
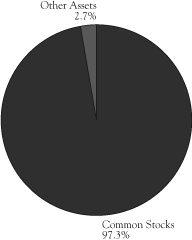
ALLOCATION OF PORTFOLIO HOLDINGS (CONTINUED)
December 31, 2007 (Unaudited)
Frontegra IronBridge Small Cap Fund* | Frontegra IronBridge SMID Fund* |
| | |
| |
Frontegra New Star | Frontegra Netols |
International Equity Fund* | Small Cap Value Fund* |
| | |
| |
* Percentages shown are based on the Fund’s total net assets.
FRONTEGRA
COLUMBUS CORE PLUS FUND
FRONTEGRA
COLUMBUS CORE FUND
REPORT FROM REAMS ASSET
MANAGEMENT COMPANY, LLC:
Dear Shareholders:
The Frontegra Columbus Core Plus Fund strives to achieve a high level of total return consistent with the preservation of capital by investing in a diversified portfolio of fixed income securities of varying maturities. This objective is relative to and measured against the Lehman Brothers Aggregate Bond Index.
The Frontegra Columbus Core Fund strives to achieve a high level of total return consistent with the preservation of capital by investing in a diversified portfolio of investment grade bonds of varying maturities. This objective is relative to and measured against the Lehman Brothers Aggregate Bond Index.
Performance Review
For the six month period ending 12/31/07, the Frontegra Columbus Core Plus Fund had a net return of 6.74% compared to a return of 5.93% for the benchmark, the Lehman Brothers Aggregate Bond Index. The difference in performance was 0.81%. The biggest positive performance factor for the period was the portfolio’s bulleted yield curve strategy, which added 51 basis points to performance as the curve steepened. Duration strategy subtracted 8 basis points as the portfolio was generally invested defensively as interest rates fell. Sector selection added 21 basis points while security selection added 30 basis points. Within these categories, the biggest factor was underweighting and selection in the investment grade credit sector, which added 44 basis points as spreads widened. Mortgage holdings added 29 basis points. High yield holdings subtracted 32 basis points as the high yield market underperformed while it was overweighted in the portfolio. Asset-backed holdings added 3 basis points and government-related holdings added 4 basis points due to their underweightings as these sectors cheapened. TIPS added 3 basis points and fees subtracted 13 basis points.
For the same six month period, the Frontegra Columbus Core Fund had a net return of 6.72% compared to a return of 5.93% for the benchmark, the Lehman Brothers Aggregate Bond Index. The difference in performance was 0.79%. The biggest positive performance factor for the period was the portfolio’s bulleted yield curve strategy, which added 48 basis points to performance as the curve steepened. Duration strategy subtracted 18 basis points as the portfolio was generally invested defensively as interest rates fell. Sector selection added 54 basis points while security selection added 8 basis points. Within these categories, the biggest factor was underweighting of the investment grade credit sector, which added 68 basis points as spreads widened. Mortgage holdings subtracted 14 basis points. Asset-backed holdings added 3 basis points and government-related holdings added 5 basis points due to their underweighting as these sectors cheapened. Fees subtracted 13 basis points.
Fixed Income Outlook
Treasury rates fell sharply during the fourth quarter of 2007 as the Fed funds rate was reduced by 50 basis points to 4.25% and economic indicators weakened. Ten-year Treasury yields fell from 4.55% to 4.00% and 2-year Treasury yields fell from 3.96% to 3.10%, resulting in a steepening of the yield curve.
Corporate, mortgage, and agency spreads widened rapidly during the quarter as subprime mortgage problems continued to spread, particularly in the finance sector, and the flight to quality continued. Forward growth prospects for the U.S. economy continued to weaken.
| • | During the fourth quarter, financial and economic conditions became increasingly stressed by spreading fallout from imprudent mortgage lending. Problem areas include subprime loans, Alt-A (limited documentation) loans, option ARMS, CDOs and SIVs. Major banks and brokers have been crippled by these securities, while FNMA, FHLMC, and the bond insurers (e.g. MBIA, AMBAC) have also suffered losses. |
| • | Housing sector activity and prices continued to decline as a result of the withdrawal of credit, exacerbating the mortgage problems by reducing collateral values. |
| • | The Federal Reserve and Treasury have responded with a variety of measures. The funds rate has been reduced by 100 basis points, the discount window premium has been reduced, and extra liquidity has been supplied to the money market. Attempts are being made to speed up the restructuring of problem mortgages. As a result, money growth remains strong and overall lending does not appear to have been disrupted. While the market expects a 3.0% Funds rate, we are reluctant to lower our forecast below 4.0%. |
| • | Despite bank and broker losses, bank capital is being rapidly replenished through equity offerings and infusions from foreign pools of dollars. As a result, it does not appear that the losses will result in a collapse in lending and money supply. |
| • | Despite very strong U.S. economic growth through third quarter 2007, weakness seems likely going forward due to the mortgage market disruptions. Leading indicators and some employment and new orders statistics have been deteriorating. Housing activity will remain weak for several quarters, and consumption growth is expected to slow dramatically. Our estimate of fourth quarter 2007 and first half 2008 GDP growth has been reduced to 1.0%. While any inventory liquidation could push these numbers negative, they are ameliorated by the shrinking trade deficit. We expect 2.0% growth for the rest of 2008 as housing bottoms, imports shrink, and exports grow. Unemployment is expected to rise, but not dramatically. |
| • | Inflation threats remain persistent due to worldwide pressure on commodity prices and the weak dollar, and this has certainly been a factor in the Fed’s reluctance to lower rates quickly. Furthermore, M2 continues to increase fairly rapidly. We expect long-term monetary inflation of 2.5%, but overall inflation may periodically run higher, as it is now, due to commodity prices and dollar levels. |
| • | With inflation-adjusted Treasury yields having fallen to levels that are well below historical norms, we consider the Treasury market to be unattractive. Rising inflation and capital inflows that shrink along with the trade deficit are also potential negatives for Treasury rates. |
| • | Credit spreads increased rapidly during the quarter, with “BBB” index spreads moving from 169 basis points to 229 basis points, “A” index spreads moving from 133 basis points to 189 basis points, and high yield index spreads moving from 418 basis points to 584 basis points. Expectations of economic weakness, overhanging issuance, disappearance of the CDO bid, |
| and distress in the finance sector are all factors that have widened credit spreads despite low current default rates. We now consider these markets to be reasonably attractive, particularly in the investment grade sector where spreads are historically very high. |
| • | Mortgage and asset-backed spreads also increased during the quarter as poorly-underwritten products deteriorated and FNMA and FHLMC came under pressure. We consider prime, fixed-rate agency pass-throughs and CMBS, which have maintained appropriate underwriting standards, to be particularly attractive. We think FNMA and FHLMC will remain creditworthy since they are key elements of the U.S. financial system. |
Total Return Portfolio Strategy
| • | The major change in portfolio strategy has been an increase in the credit weighting of the portfolio. As recently as six months ago, the investment grade credit sector was heavily underweighted. With the rapid cheapening of the credit sector that has occurred since June, and the decline in Treasury yields, we have moved the portfolio to a substantial overweighting of investment grade credit. Exposure is well-diversified over a wide range of issuers and industries, with an emphasis on seniority of structure. The increased difficulty and cost of buyout financing is also a positive for the investment grade credit market, since buyouts are one of the major threats to high-grade bonds. |
| • | The finance sector of the credit market has been the hardest-hit part of the market due to the involvement of the banks and brokers in the troubled subprime mortgage market. We have increased the portfolio’s weighting in the major finance names from near-zero to a roughly benchmark level, with exposure to additional finance credits bringing total sector exposure to an above-benchmark level. While many of the major finance names have taken huge subprime losses, most of them have easily replenished their capital by tapping foreign equity sources, thereby maintaining the credit worthiness of their bonds. For this reason, we think that a significant exposure to the finance sector is prudent at current spreads. |
| • | High yield credit exposure has been increased slightly since high yield spreads have also gapped out to much higher levels, and well-structured high yield loans are now available at attractive discounts. However, the main portfolio emphasis and overweighting is in the investment grade market, which we find more compelling and less risky. |
| • | Mortgage holdings remain at above-benchmark levels, since well-underwritten mortgage securities remain historically attractive. Emphasis is on Agency pass-throughs, low coupons with discounts, CMBS and short CMOs. The portfolio does not hold subprime issues, Alt-A loans, CDOs, SIVs, or home equity ABS. All mortgage holdings are rated AAA. |
| • | Treasury and Agency holdings have been reduced in order to accommodate the credit and mortgage overweightings. |
| • | With the portfolio’s emphasis shifting to the corporate and mortgage sectors, duration strategy has become just one performance factor among many. We continue to employ a defensive duration strategy due to the unattractive level of inflation-adjusted Treasury yields. |
| • | Yield curve strategy continues to be generally bulleted, since we expect the yield curve to further to steepen over time. |
Investment Grade Portfolio Strategy
| • | The major change in portfolio strategy has been an increase in the credit weighting of the portfolio. As recently as six months ago, the investment grade credit sector was heavily underweighted. With the rapid cheapening of the credit sector that has occurred since June, and the decline in Treasury yields, we have moved the portfolio to a substantial overweighting of investment grade credit. Exposure is well-diversified over a wide range of issuers, with an emphasis on seniority of structure. The increased difficulty and cost of buyout financing is also a positive for the investment grade credit market, since buyouts are one of the major threats to high-grade bonds. |
| • | The finance sector of the credit market has been the hardest-hit part of the market due to the involvement of the banks and brokers in the troubled subprime mortgage market. We have increased the portfolio’s weighting in the major finance names from near-zero to a roughly benchmark level, with exposure to additional finance credits bringing total sector exposure to an above-benchmark level. While many of the major finance names have taken huge subprime losses, most of them have easily replenished their capital by tapping foreign equity sources, thereby maintaining the credit-worthiness of their bonds. For this reason, we think that a significant exposure to the finance sector is prudent at current spreads. |
| • | Mortgage holdings remain at above-benchmark levels, since well-underwritten mortgage securities remain historically attractive. Emphasis is on Agency pass-throughs, low coupons with discounts, CMBS and short CMOs. The portfolio does not hold subprime issues, Alt-A loans, CDOs, SIVs, or home equity ABS. All mortgage holdings are rated AAA. |
| • | Treasury and Agency holdings have been reduced in order to accommodate the credit and mortgage overweightings. |
| • | With the portfolio’s emphasis shifting to the corporate and mortgage sectors, duration strategy has become just one performance factor among many. We continue to employ a defensive duration strategy due to the unattractive level of inflation-adjusted Treasury yields. |
| • | Yield curve strategy continues to be generally bulleted, since we expect the yield curve to further to steepen over time. |
We appreciate your continued support as shareholders in the Funds.
Regards,
 |  |
| Mark M. Egan, CFA, CPA | Robert A. Crider, CFA |
| Reams Asset Management Company, LLC | Reams Asset Management Company, LLC |
INVESTMENT HIGHLIGHTS
Growth of a $100,000 Investment (Unaudited)
| | | | |
| | Portfolio Total Return* | | |
| | FOR THE PERIOD ENDED 12/31/07 | | |
| | | | |
| | SIX MONTHS | 6.74% | |
| | | | |
| | ONE YEAR | 7.86% | |
| | | | |
| | FIVE YEAR | | |
| | AVERAGE ANNUAL | 6.23% | |
| | | | |
| | TEN YEAR | | |
| | AVERAGE ANNUAL | 6.56% | |
| | | | |
This chart assumes an initial gross investment of $100,000 made on 12/31/97. Returns shown include the reinvestment of all distributions. Past performance is not predictive of future results. Investment return and principal value will fluctuate so that shares, when redeemed, may be worth more or less than the original cost. In the absence of existing fee waivers, total return would be reduced. To receive current to the most recent month-end performance, please call 1-888-825-2100.
The Lehman Brothers Aggregate Bond Index is an unmanaged market value-weighted performance benchmark for investment-grade fixed-rate debt issues, including government, corporate, asset backed and mortgage backed securities, with maturities of at least one year. The Index does not reflect investment management fees, brokerage commissions and other expenses associated with investing in fixed income securities. A direct investment in the index is not possible.
* The returns shown do not reflect the deduction of taxes that a shareholder would pay on Fund distributions or the redemption of Fund shares.
Frontegra Columbus Core Plus Fund
SCHEDULE OF INVESTMENTS
December 31, 2007 (Unaudited)
Principal Amount | | | | Value | |
| | | ASSET BACKED SECURITIES 10.5% | | | |
| | | American Express Credit Account Master Trust | | | |
| $ | 1,875,000 | | 2005-3, Class A, 5.030%, 01/18/2011 (c)(e) | | $ | 1,874,637 | |
| | 855,000 | | 2005-6, Class A, 5.030%, 03/15/2011 (c)(e) | | | 854,457 | |
| | | | Americredit Automobile Receivables Trust | | | | |
| | 594,234 | | 2007-DF, Class A1, 5.914%, 10/06/2008 (c)(e) | | | 595,305 | |
| | | | Bank One Issuance Trust | | | | |
| | 2,955,000 | | 2003-3A, Class A3, 5.140%, 12/15/2010 (c)(e) | | | 2,955,950 | |
| | | | Capital One Auto Trust | | | | |
| | 860,035 | | 2007-A, Class A2, 5.330%, 05/15/2010 (e) | | | 861,148 | |
| | 1,679,569 | | 2007-B, Class A2, 5.270%, 06/15/2010 (e) | | | 1,681,648 | |
| | | | Capital One Master Trust | | | | |
| | 4,030,000 | | 2001-1, Class A, 5.227%, 12/15/2010 (c) | | | 4,031,784 | |
| | | | Carmax Auto Trust | | | | |
| | 92,998 | | 2006-2, Class A2, 5.290%, 06/15/2009 | | | 93,046 | |
| | | | Caterpillar Financial Asset Trust | | | | |
| | 420,961 | | 2007-A, Class A1, 5.672%, 09/25/2008 | | | 421,843 | |
| | | | Chase Issuance Trust | | | | |
| | 3,545,000 | | 2005-1A, Class A1, 5.040%, 12/15/2010 (c)(e) | | | 3,545,105 | |
| | | | Citibank Credit Card Issuance Trust | | | | |
| | 1,550,000 | | 2003-A1, Class A1, 5.343%, 01/15/2010 | | | 1,550,367 | |
| | 2,675,000 | | 2001-A1, Class A1, 5.045%, 02/07/2010 (c) | | | 2,675,691 | |
| | 2,090,000 | | 2003-A8, Class A8, 3.500%, 08/16/2010 | | | 2,073,516 | |
| | | | Discover Card Master Trust I | | | | |
| | 825,000 | | 2001-1, Class A, 5.160%, 01/15/2008 (c) | | | 825,087 | |
| | 4,415,000 | | 2003-2, Class A, 5.250%, 08/15/2010 (c)(e) | | | 4,416,224 | |
| | | | Ford Credit Auto Trust | | | | |
| | 857,008 | | 2006-B, Class A2A, 5.420%, 07/15/2009 (e) | | | 858,063 | |
| | | | GS Auto Loan Trust | | | | |
| | 234,234 | | 2006-1, Class A2, 5.470%, 02/15/2009 | | | 234,374 | |
| | | | Hertz Vehicle Financing LLC | | | | |
| | 1,055,000 | | 2005-2A, Class A6, 5.080%, 11/25/2011 | | | | |
| | | | (Acquired 12/15/2005 and 08/03/2007, Cost $1,054,872) (a) | | | 1,062,356 | |
| | | | Honda Auto Receivables Owner Trust | | | | |
| | 522,194 | | 2007-3, Class A1, 5.565%, 04/15/2008 | | | 523,133 | |
| | 1,840,896 | | 2006-1, Class A3, 5.070%, 02/18/2010 | | | 1,843,734 | |
| | | | MBNA Master Credit Card Trust | | | | |
| | 3,860,000 | | 1998-E, Class A, 5.390%, 09/15/2010 (c) | | | 3,861,768 | |
| | 1,810,000 | | 2003-A7, Class A7, 2.650%, 11/15/2010 | | | 1,793,537 | |
The accompanying notes are an integral part of these financial statements.
Frontegra Columbus Core Plus Fund SCHEDULE OF INVESTMENTS (CONTINUED)
December 31, 2007 (Unaudited)
Principal Amount | | | | Value | |
| | | ASSET BACKED SECURITIES 10.5% (continued) | | | |
| | | Mego Mortgage Home Loan Trust | | | |
| $ | 1,105 | | 1996-2, Class A, 7.275%, 08/25/2017 | | $ | 1,102 | |
| | | | Mid-State Trust | | | | |
| | 898,624 | | 11, Class A1, 4.864%, 07/15/2038 | | | 883,959 | |
| | | | Nissan Auto Receivables Owner Trust | | | | |
| | 894,624 | | 2006-B, Class A3, 5.160%, 02/15/2010 | | | 896,399 | |
| | | | SLM Student Loan Trust | | | | |
| | 1,130,326 | | 2007-1, Class A1, 5.050%, 04/25/2012 (c)(e) | | | 1,130,684 | |
| | 1,180,293 | | 2007-2, Class A1, 5.064%, 04/25/2014 (c) | | | 1,178,786 | |
| | | | USAA Auto Owner Trust | | | | |
| | 2,849,004 | | 2006-1, Class A3, 5.010%, 09/15/2010 (e) | | | 2,853,795 | |
| | 2,516,393 | | 2006-3, Class A3, 5.360%, 02/15/2011 (e) | | | 2,527,846 | |
| | | | Total Asset Backed Securities | | | | |
| | | | (Cost $48,650,760) | | | 48,105,344 | |
| | | | | | | | |
| | | | CORPORATE BONDS 28.9% | | | | |
| | | | Automobiles 1.4% | | | | |
| | | | Ford Motor Co. | | | | |
| | 800,000 | | 8.320%, 12/15/2013 | | | 738,000 | |
| | 451,175 | | 8.360%, 12/15/2013 | | | 416,209 | |
| | 2,450,000 | | 7.450%, 07/16/2031 | | | 1,819,125 | |
| | | | General Motors Corp. | | | | |
| | 1,881,000 | | 1.375%, 11/01/2013 | | | 1,758,735 | |
| | 2,025,000 | | 8.375%, 07/15/2033 | | | 1,630,125 | |
| | | | | | | 6,362,194 | |
| | | | Auto Components 0.3% | | | | |
| | 2,005,000 | | Delphi Corp. | | | | |
| | | | 6.500%, 08/15/2013 | | | 1,162,900 | |
| | | | | | | | |
| | | | Beverages 0.1% | | | | |
| | 525,000 | | Diageo Capital plc | | | | |
| | | | 5.750%, 10/23/2017 (b) | | | 527,981 | |
| | | | | | | | |
| | | | Building Products 0.2% | | | | |
| | 1,070,000 | | USG Corp. | | | | |
| | | | 7.750%, 01/15/2018 | | | 1,064,120 | |
The accompanying notes are an integral part of these financial statements.
Frontegra Columbus Core Plus Fund SCHEDULE OF INVESTMENTS (CONTINUED)
December 31, 2007 (Unaudited)
Principal Amount | | | | Value | |
| | | CORPORATE BONDS 28.9% (continued) | | | |
| | | Capital Markets 0.4% | | | |
| $ | 890,000 | | Goldman Sachs Group, Inc. | | | |
| | | | 5.625%, 01/15/2017 | | $ | 869,153 | |
| | 1,170,000 | | Morgan Stanley | | | | |
| | | | 5.550%, 04/27/2017 | | | 1,140,946 | |
| | | | | | | 2,010,099 | |
| | | | | | | | |
| | | | Chemicals 0.1% | | | | |
| | 754,000 | | Georgia Gulf Corp. | | | | |
| | | | 9.500%, 10/15/2014 | | | 601,315 | |
| | | | | | | | |
| | | | Commercial Banks 4.4% | | | | |
| | 1,890,000 | | Bank Of New York Mellon | | | | |
| | | | 4.950%, 11/01/2012 | | | 1,889,979 | |
| | 2,135,000 | | BB&T Corp. | | | | |
| | | | 4.900%, 06/30/2017 | | | 1,971,327 | |
| | 1,015,000 | | Countrywide | | | | |
| | | | 5.625%, 07/15/2009 (Acquired 11/19/2007, Cost $837,914) (a) | | | 774,367 | |
| | | | HSBC Bank | | | | |
| | 1,735,000 | | 4.625%, 04/01/2014 | | | 1,662,635 | |
| | 350,000 | | 6.000%, 08/09/2017 | | | 358,687 | |
| | 1,665,000 | | JP Morgan Chase Bank | | | | |
| | | | 6.000%, 10/01/2017 | | | 1,693,340 | |
| | 4,145,000 | | Marshall & Ilsley Bank | | | | |
| | | | 5.401%, 12/04/2012 (c) | | | 3,909,062 | |
| | 965,000 | | U.S. Bank | | | | |
| | | | 4.950%, 10/30/2014 | | | 940,994 | |
| | 830,000 | | UBS AG Stamford | | | | |
| | | | 5.875%, 12/20/2017 (b) | | | 835,847 | |
| | 2,510,000 | | Wachovia Bank | | | | |
| | | | 6.000%, 11/15/2017 | | | 2,526,772 | |
| | | | Wells Fargo Bank | | | | |
| | 655,000 | | 4.750%, 02/09/2015 | | | 625,601 | |
| | 2,030,000 | | 5.750%, 05/16/2016 | | | 2,059,607 | |
| | 985,000 | | 5.625%, 12/11/2017 | | | 985,602 | |
| | | | | | | 20,233,820 | |
The accompanying notes are an integral part of these financial statements.
Frontegra Columbus Core Plus Fund
SCHEDULE OF INVESTMENTS (CONTINUED)
December 31, 2007 (Unaudited)
Principal Amount | | | | Value | |
| | | CORPORATE BONDS 28.9% (continued) | | | |
| | | Computers & Peripherals 0.2% | | | |
| $ | 970,000 | | Tyco Electronics Group S A | | | |
| | | | 6.000%, 10/01/2012 | | | |
| | | | (Acquired 09/20/2007, Cost $969,573) (a)(b) | | $ | 994,007 | |
| | | | | | | | |
| | | | Consumer Finance 2.5% | | | | |
| | 1,930,000 | | American Express Co. | | | | |
| | | | 6.150%, 08/28/2017 | | | 1,980,709 | |
| | 1,990,000 | | ERAC USA Finance Co. | | | | |
| | | | 6.375%, 10/15/2017 (Acquired 10/10/2007, Cost $1,986,518) (a) | | | 1,922,565 | |
| | | | Ford Motor Credit Co. | | | | |
| | 945,000 | | 7.800%, 06/01/2012 | | | 828,446 | |
| | 3,020,000 | | 8.000%, 12/15/2016 | | | 2,565,221 | |
| | 2,950,000 | | GMAC LLC | | | | |
| | | | 6.625%, 05/15/2012 | | | 2,452,385 | |
| | 2,740,000 | | Residential Capital LLC | | | | |
| | | | 6.500%, 04/17/2013 | | | 1,685,100 | |
| | | | | | | 11,434,426 | |
| | | | Diversified Financial Services 6.3% | | | | |
| | 1,950,000 | | Aetna, Inc. | | | | |
| | | | 6.750%, 12/15/2037 | | | 1,945,119 | |
| | | | American General Finance | | | | |
| | 1,370,000 | | 5.900%, 09/15/2012 | | | 1,385,782 | |
| | 1,730,000 | | 6.900%, 12/15/2017 | | | 1,731,730 | |
| | | | Bank of America Corp. | | | | |
| | 1,630,000 | | 5.300%, 03/15/2017 | | | 1,584,973 | |
| | 725,000 | | 6.000%, 09/01/2017 | | | 740,712 | |
| | 1,205,000 | | 5.750%, 12/01/2017 | | | 1,207,764 | |
| | | | Citigroup, Inc. | | | | |
| | 695,000 | | 5.500%, 02/15/2017 | | | 675,435 | |
| | 1,455,000 | | 6.125%, 11/21/2017 | | | 1,494,567 | |
| | | | CIT Group Inc. | | | | |
| | 1,450,000 | | 7.625%, 11/30/2012 | | | 1,469,729 | |
| | 1,615,000 | | 5.310%, 12/21/2012 (c) | | | 1,413,131 | |
| | 1,600,000 | | General Motors Acceptance Corp. | | | | |
| | | | 6.750%, 12/01/2014 (e) | | | 1,290,478 | |
The accompanying notes are an integral part of these financial statements.
Frontegra Columbus Core Plus Fund
SCHEDULE OF INVESTMENTS (CONTINUED)
December 31, 2007 (Unaudited)
Principal Amount | | | | Value | |
| | | CORPORATE BONDS 28.9% (continued) | | | |
| | | Diversified Financial Services 6.3% (continued) | | | |
| $ | 1,120,000 | | Genworth Global Funding | | | |
| | | | 5.200%, 10/08/2010 | | $ | 1,136,077 | |
| | 1,920,000 | | International Lease Finance Corp. | | | | |
| | | | 5.350%, 03/01/2012 | | | 1,921,260 | |
| | | | JP Morgan Chase & Co. | | | | |
| | 555,000 | | 6.625%, 03/15/2012 | | | 585,235 | |
| | 740,000 | | 6.000%, 01/15/2018 | | | 752,864 | |
| | 1,235,000 | | Liberty Property LP | | | | |
| | | | 6.625%, 10/01/2017 | | | 1,235,677 | |
| | 865,000 | | Merrill Lynch & Co. | | | | |
| | | | 6.400%, 08/28/2017 | | | 878,804 | |
| | 1,230,000 | | Morgan Stanley | | | | |
| | | | 5.950%, 12/28/2017 | | | 1,229,123 | |
| | | | Pricoa Global Funding I | | | | |
| | 800,000 | | 5.331%, 03/03/2009 | | | | |
| | | | (Acquired 03/01/2006 and 08/03/2007, Cost $800,000) (a) | | | 799,235 | |
| | 1,740,000 | | 5.400%, 10/18/2012 | | | | |
| | | | (Acquired 10/11/2007, Cost $1,736,537) (a) | | | 1,804,542 | |
| | 1,445,000 | | Prudential Financial Inc. | | | | |
| | | | 6.000%, 12/01/2017 | | | 1,439,041 | |
| | 910,000 | | Simon Property Group LP | | | | |
| | | | 5.100%, 06/15/2015 | | | 855,572 | |
| | 1,228,234 | | Windsor Financing LLC | | | | |
| | | | 5.881%, 07/15/2017 | | | | |
| | | | (Acquired Multiple Dates, Cost $1,231,640) (a) | | | 1,291,402 | |
| | | | | | | 28,868,252 | |
| | | | Diversified Telecommunication Services 2.2% | | | | |
| | 2,545,000 | | AT&T, Inc. | | | | |
| | | | 6.300%, 01/15/2038 | | | 2,585,702 | |
| | 1,750,000 | | British Telecom plc | | | | |
| | | | 5.950%, 01/15/2018 (b) | | | 1,763,886 | |
| | 935,000 | | Comcast Cable Communications Holdings, Inc. | | | | |
| | | | 8.375%, 03/15/2013 | | | 1,048,961 | |
| | 1,105,000 | | Deutsche Telekom International Finance BV | | | | |
| | | | 5.750%, 03/23/2016 (b) | | | 1,106,035 | |
| | 1,375,000 | | Sprint Nextel Corp. | | | | |
| | | | 6.000%, 12/01/2016 | | | 1,316,965 | |
The accompanying notes are an integral part of these financial statements.
Frontegra Columbus Core Plus Fund
SCHEDULE OF INVESTMENTS (CONTINUED)
December 31, 2007 (Unaudited)
Principal Amount | | | | Value | |
| | | CORPORATE BONDS 28.9% (continued) | | | |
| | | Diversified Telecommunication Services 2.2% (continued) | | | |
| $ | 1,060,000 | | Telecom Italia Capital | | | |
| | | | 5.250%, 11/15/2013 (b) | | $ | 1,047,630 | |
| | 1,200,000 | | Telefonica Emisiones SAU | | | | |
| | | | 6.221%, 07/03/2017 (b) | | | 1,246,791 | |
| | | | | | | 10,115,970 | |
| | | | Electric Utilities 2.9% | | | | |
| | | | Commonwealth Edison Co. | | | | |
| | 790,000 | | 5.950%, 08/15/2016 | | | 801,414 | |
| | 475,000 | | 6.150%, 09/15/2017 | | | 489,494 | |
| | 1,435,000 | | Consumers Energy Co. | | | | |
| | | | 4.400%, 08/15/2009 | | | 1,422,506 | |
| | 1,215,000 | | Entergy Gulf States Inc. | | | | |
| | | | 4.875%, 11/01/2011 | | | 1,172,790 | |
| | 765,000 | | Entergy Louisiana LLC | | | | |
| | | | 5.500%, 04/01/2019 | | | 730,390 | |
| | 415,000 | | Florida Power Corp. | | | | |
| | | | 5.800%, 09/15/2017 | | | 431,049 | |
| | 1,975,000 | | Great River Energy | | | | |
| | | | 5.829%, 07/01/2017 | | | | |
| | | | (Acquired Multiple Dates, Cost $1,976,073) (a)(e) | | | 2,024,987 | |
| | | | Indianapolis Power & Light Co. | | | | |
| | 345,000 | | 6.300%, 07/01/2013 | | | | |
| | | | (Acquired 10/17/2006 and 08/03/2007, Cost $355,729) (a) | | | 361,017 | |
| | 735,000 | | 6.050%, 10/01/2036 | | | | |
| | | | (Acquired 10/02/2006 and 08/03/2007, Cost $730,281) (a) | | | 719,051 | |
| | 909,150 | | Mackinaw Power LLC | | | | |
| | | | 6.296%, 10/31/2023 | | | | |
| | | | (Acquired Multiple Dates, Cost $910,598) (a) | | | 973,063 | |
| | 755,000 | | Northern State Power | | | | |
| | | | 6.200%, 07/01/2037 | | | 779,804 | |
| | 550,000 | | Public Service Electric & Gas | | | | |
| | | | 5.000%, 01/01/2013 | | | 546,788 | |
| | 1,295,000 | | Southern California Edison Co. | | | | |
| | | | 4.994%, 02/02/2009 (c) | | | 1,293,184 | |
The accompanying notes are an integral part of these financial statements.
Frontegra Columbus Core Plus Fund
SCHEDULE OF INVESTMENTS (CONTINUED)
December 31, 2007 (Unaudited)
Principal Amount | | | | Value | |
| | | CORPORATE BONDS 28.9% (continued) | | | |
| | | Electric Utilities 2.9% (continued) | | | |
| $ | 601,883 | | Tenaska Gateway Partners | | | |
| | | | 6.052%, 12/30/2023 | | | |
| | | | (Acquired 05/31/2007 and 08/03/2007, Cost $607,630) (a) | | $ | 636,672 | |
| | 1,030,000 | | Westar Energy Inc. | | | | |
| | | | 6.000%, 07/01/2014 | | | 1,050,254 | |
| | | | | | | 13,432,463 | |
| | | | Food & Staples Retailing 0.7% | | | | |
| | 965,000 | | Kellogg Co. | | | | |
| | | | 5.125%, 12/03/2012 | | | 973,081 | |
| | 2,180,000 | | Kraft Foods, Inc. | | | | |
| | | | 6.125%, 02/01/2018 | | | 2,196,666 | |
| | | | | | | 3,169,747 | |
| | | | Gas Utilities 0.8% | | | | |
| | 240,839 | | Alliance Pipeline U.S. | | | | |
| | | | 4.591%, 12/31/2025 | | | | |
| | | | (Acquired Multiple Dates, Cost $231,361) (a) | | | 239,006 | |
| | 945,000 | | Gulfstream Natural Gas | | | | |
| | | | 5.560%, 11/01/2015 | | | | |
| | | | (Acquired Multiple Dates, Cost $939,361) (a) | | | 928,832 | |
| | 1,465,000 | | Rockies Express Pipeline | | | | |
| | | | 6.448%, 08/20/2009 (Acquired 09/13/2007, Cost $1,461,371) (a) | | | 1,465,398 | |
| | 680,000 | | Source Gas LLC | | | | |
| | | | 5.900%, 04/01/2017 | | | | |
| | | | (Acquired 04/11/2007 and 08/03/2007, Cost $677,858) (a) | | | 647,988 | |
| | 195,000 | | Southern Star Cent Gas | | | | |
| | | | 6.000%, 06/01/2016 | | | | |
| | | | (Acquired Multiple Dates, Cost $192,317) (a) | | | 190,613 | |
| | | | | | | 3,471,837 | |
| | | | Health Care Providers & Services 0.1% | | | | |
| | 675,000 | | Tenet Healthcare Corp. | | | | |
| | | | 9.875%, 07/01/2014 | | | 642,937 | |
| | | | | | | | |
| | | | Hotels, Restaurants & Leisure 0.1% | | | | |
| | 1,000,000 | | Harrahs Operating Co., Inc. | | | | |
| | | | 5.750%, 10/01/2017 | | | 677,500 | |
The accompanying notes are an integral part of these financial statements.
Frontegra Columbus Core Plus Fund
SCHEDULE OF INVESTMENTS (CONTINUED)
December 31, 2007 (Unaudited)
Principal Amount | | | | Value | |
| | | CORPORATE BONDS 28.9% (continued) | | | |
| | | Insurance 1.0% | | | |
| $ | 810,000 | | Jackson National Life Global Funding | | | |
| | | | 5.125%, 02/10/2011 | | | |
| | | | (Acquired 02/03/2006 and 08/03/2007, Cost $809,328) (a) | | $ | 843,319 | |
| | 1,065,000 | | Monumental Global Funding | | | | |
| | | | 5.254%, 01/25/2013 (Acquired 12/14/2007, Cost $1,019,341) (a) | | | 1,031,166 | |
| | 745,000 | | Nationwide Life Global Fund | | | | |
| | | | 5.450%, 10/02/2012 (Acquired 09/25/2007, Cost $744,069) (a)(e) | | | 769,324 | |
| | 1,200,000 | | New York Life Global Funding | | | | |
| | | | 5.250%, 10/16/2012 (Acquired 10/09/2007, Cost $1,199,484) (a) | | | 1,227,816 | |
| | 800,000 | | Protective Life Corp. | | | | |
| | | | 5.450%, 09/28/2012 | | | 824,830 | |
| | | | | | | 4,696,455 | |
| | | | Media 0.7% | | | | |
| | 1,095,000 | | Comcast Corp. | | | | |
| | | | 6.300%, 11/15/2017 | | | 1,136,092 | |
| | | | Time Warner Inc. | | | | |
| | 995,000 | | 7.700%, 05/01/2032 | | | 1,105,500 | |
| | 965,000 | | 6.500%, 11/15/2036 | | | 938,952 | |
| | | | | | | 3,180,544 | |
| | | | Medical Supplies & Services 0.3% | | | | |
| | | | Community Health Systems, Inc. | | | | |
| | 51,353 | | 7.848%, 07/02/2014 | | | 49,428 | |
| | 778,647 | | 7.570%, 07/25/2014 | | | 749,447 | |
| | 643,500 | | HCA Inc. | | | | |
| | | | 8.110%, 11/17/2013 | | | 620,977 | |
| | | | | | | 1,419,852 | |
| | | | Multi-Utilities & Unregulated Power 1.1% | | | | |
| | 704,624 | | Aes Eastern Energy | | | | |
| | | | 9.000%, 01/02/2017 | | | 762,755 | |
| | 289,663 | | Edison Mission Energy Funding | | | | |
| | | | 7.330%, 09/15/2008 | | | | |
| | | | (Acquired 10/23/2002 and 08/03/2007, Cost $283,457) (a) | | | 289,663 | |
| | 1,462,000 | | Homer City Funding LLC | | | | |
| | | | 8.137%, 10/01/2019 | | | 1,549,720 | |
| | 1,011,360 | | Kern River Funding Corp. | | | | |
| | | | 4.893%, 04/30/2018 (Acquired Multiple Dates, Cost $989,769) (a) | | | 990,465 | |
The accompanying notes are an integral part of these financial statements.
Frontegra Columbus Core Plus Fund
SCHEDULE OF INVESTMENTS (CONTINUED)
December 31, 2007 (Unaudited)
Principal Amount | | | | Value | |
| | | CORPORATE BONDS 28.9% (continued) | | | |
| | | Multi-Utilities & Unregulated Power 1.1% (continued) | | | |
| $ | 805,203 | | Kiowa Power Partners LLC | | | |
| | | | 4.811%, 12/30/2013 | | | |
| | | | (Acquired Multiple Dates, Cost $830,439) (a) | | $ | 806,604 | |
| | 457,285 | | Midwest Generation LLC | | | | |
| | | | 8.300%, 07/02/2009 | | | 464,144 | |
| | | | | | | 4,863,351 | |
| | | | Natural Gas Transmission 0.2% | | | | |
| | 860,000 | | Tennessee Gas Pipeline Co. | | | | |
| | | | 7.500%, 04/01/2017 | | | 938,650 | |
| | | | | | | | |
| | | | Oil, Gas & Consumable Fuels 0.2% | | | | |
| | 1,010,000 | | Sabine Pass LNG LP | | | | |
| | | | 7.250%, 11/30/2013 | | | 964,550 | |
| | | | | | | | |
| | | | Paper & Forest Products 0.3% | | | | |
| | 510,000 | | Abitibi-Consolidated, Inc. | | | | |
| | | | 8.500%, 08/01/2029 (b) | | | 348,075 | |
| | 850,000 | | Georgia Pacific Corp. | | | | |
| | | | 7.800%, 12/20/2012 | | | 808,605 | |
| | | | | | | 1,156,680 | |
| | | | Real Estate Investment Trusts 0.3% | | | | |
| | 1,185,000 | | CPG Partners LP | | | | |
| | | | 3.500%, 03/15/2009 | | | 1,159,006 | |
| | | | | | | | |
| | | | Transportation 1.3% | | | | |
| | | | Burlington North Santa Fe | | | | |
| | 149,549 | | 6.230%, 07/02/2018 | | | 156,560 | |
| | 728,662 | | 4.830%, 01/15/2023 (e) | | | 724,801 | |
| | | | CSX Transportation, Inc. | | | | |
| | 990,000 | | 5.750%, 03/15/2013 | | | 1,002,268 | |
| | 1,970,000 | | 6.251%, 01/15/2023 | | | 2,000,082 | |
| | | | Union Pacific Railroad Co. | | | | |
| | 1,425,000 | | 5.450%, 01/31/2013 | | | 1,437,427 | |
| | 699,951 | | 5.866%, 07/02/2030 | | | 759,097 | |
| | | | | | | 6,080,235 | |
The accompanying notes are an integral part of these financial statements.
Frontegra Columbus Core Plus Fund
SCHEDULE OF INVESTMENTS (CONTINUED)
December 31, 2007 (Unaudited)
Principal Amount/Shares | | | | Value | |
| | | CORPORATE BONDS 28.9% (continued) | | | |
| | | Utilities 0.8% | | | |
| $ | 1,075,000 | | Appalachian Power Co. | | | |
| | | | 5.650%, 08/15/2012 | | $ | 1,092,393 | |
| | 678,524 | | Indiantown Cogeneration | | | | |
| | | | 9.260%, 12/15/2010 | | | 707,565 | |
| | 1,860,000 | | West Penn Power Co. | | | | |
| | | | 5.950%, 12/15/2017 | | | | |
| | | | (Acquired Multiple Dates, Cost $1,856,095) (a) | | | 1,869,069 | |
| | | | | | | 3,669,027 | |
| | | | Total Corporate Bonds | | | | |
| | | | (Cost $133,292,363) | | | 132,897,918 | |
| | | | | | | | |
| | | | PREFERRED STOCKS 1.4% | | | | |
| | | | Thrifts & Mortgage Finance 1.4% | | | | |
| | 126,180 | | Fannie Mae | | | | |
| | | | 8.25%, 12/31/2010 | | | 3,217,590 | |
| | 127,757 | | Freddie Mac | | | | |
| | | | 8.375%, 12/31/2012 | | | 3,340,846 | |
| | | | Total Preferred Stocks | | | | |
| | | | (Cost $6,395,049) | | | 6,558,436 | |
| | | | | | | | |
| | | | MORTGAGE BACKED SECURITIES 68.8% | | | | |
| | | | Banc of America Commercial Mortgage Inc. | | | | |
| | 3,135,000 | | Series 2004-2, Class A3, 4.050%, 11/10/2038 | | | 3,092,976 | |
| | 1,328,375 | | Series 2005-2, Class A2, 4.247%, 07/10/2043 | | | 1,326,437 | |
| | 3,370,000 | | Series 2005-5, Class A2, 5.001%, 10/10/2045 | | | 3,364,207 | |
| | 956,460 | | Series 2006-6, Class A1, 5.226%, 10/10/2045 | | | 960,058 | |
| | 1,190,000 | | Series 2006-4, Class A4, 5.634%, 07/10/2046 | | | 1,215,097 | |
| | 1,550,000 | | Series 2005-6, Class A2, 5.165%, 09/10/2047 | | | 1,554,008 | |
| | 1,610,000 | | Series 2007-2, Class A2, 5.634%, 04/10/2049 | | | 1,632,824 | |
| | 4,645,000 | | Citigroup/Deutsche Bank Commercial Mortgage Trust | | | | |
| | | | Series 2007-CD4, Class A4, 5.322%, 12/11/2049 | | | 4,631,285 | |
| | | | CNH Equipment Trust | | | | |
| | 801,348 | | Series 2007-B, Class A1, 5.816%, 10/09/2008 | | | 802,999 | |
| | 1,340,000 | | Series 2007-B, Class A2A, 5.460%, 06/15/2010 | | | 1,348,110 | |
| | 2,859,153 | | Commercial Mortgage Pass-Through Certificate | | | | |
| | | | Series 2003-LB1A, Class A1, 3.251%, 06/10/2038 | | | 2,758,148 | |
The accompanying notes are an integral part of these financial statements.
Frontegra Columbus Core Plus Fund
SCHEDULE OF INVESTMENTS (CONTINUED)
December 31, 2007 (Unaudited)
Principal Amount | | | | Value | |
| | | MORTGAGE BACKED SECURITIES 68.8% (continued) | | | |
| | | Credit Suisse First Boston Mortgage Securities Corp. | | | |
| $ | 602,872 | | Pool # 2005-10, 5.000%, 09/25/2015 | | $ | 593,492 | |
| | 119,914 | | Pool # 2003-1, 7.000%, 02/25/2033 (e) | | | 120,091 | |
| | 2,613 | | Pool # 2003-C3, 2.079%, 05/15/2038 (e) | | | 2,613 | |
| | | | FHLMC PC GOLD CASH | | | | |
| | 1,497,035 | | Pool # E0-1418, 4.000%, 07/01/2018 | | | 1,441,459 | |
| | 1,423,000 | | Pool # G1-1678, 4.500%, 04/01/2020 | | | 1,398,667 | |
| | | | FHLMC Pools | | | | |
| | 151,682 | | Pool # M80779, 5.000%, 11/01/2009 | | | 152,097 | |
| | 1,881,530 | | Pool # B14039, 4.000%, 05/01/2014 | | | 1,866,428 | |
| | 1,717,337 | | Pool # G11672, 5.000%, 03/01/2015 | | | 1,745,760 | |
| | 492,002 | | Pool # B19614, 5.000%, 07/01/2015 | | | 500,654 | |
| | 1,499,760 | | Pool # G11970, 5.000%, 04/01/2016 | | | 1,502,330 | |
| | 1,198,985 | | Pool # E01647, 4.000%, 05/01/2019 | | | 1,153,235 | |
| | 117,979 | | Pool # 2692, 3.500%, 01/15/2023 (e) | | | 117,777 | |
| | 764,464 | | Pool # A45788, 6.500%, 05/01/2035 | | | 789,337 | |
| | | | FHLMC Remic | | | | |
| | 979,222 | | Series 2773, Class EB, 4.500%, 08/15/2013 | | | 977,138 | |
| | 5,571,505 | | Series R001, Class AE, 4.375%, 04/15/2015 | | | 5,544,411 | |
| | 586,461 | | Series 2848, Class CG, 5.000%, 06/15/2015 (e) | | | 586,200 | |
| | 160,433 | | Series 2508, Class CR, 4.500%, 03/15/2016 (e) | | | 160,015 | |
| | 1,714,835 | | Series 2786, Class GA, 4.000%, 08/15/2017 | | | 1,689,002 | |
| | 61,930 | | Series 2912, Class EQ, 5.500%, 12/15/2020 (e) | | | 61,829 | |
| | 596,015 | | Series 2695, Class GU, 3.500%, 11/15/2022 (e) | | | 592,041 | |
| | 1,101,985 | | Series 2731, Class AB, 4.500%, 11/15/2028 | | | 1,092,186 | |
| | 679,380 | | Series 2793, Class BA, 4.500%, 09/15/2029 | | | 668,313 | |
| | 1,495,000 | | Series 3200, Class ED, 5.000%, 12/15/2031 | | | 1,480,889 | |
| | 3,014,954 | | Series 2990, Class EN, 4.500%, 02/15/2033 | | | 2,972,861 | |
| | 2,210,023 | | Series 3031, Class LN, 4.500%, 08/15/2033 | | | 2,179,429 | |
| | 1,952,481 | | Series 3114, Class HN, 5.000%, 09/15/2033 | | | 1,955,021 | |
| | 3,918,528 | | Series 3169, Class BN, 5.000%, 06/15/2034 | | | 3,927,350 | |
| | 2,296,069 | | Series 3202, Class LN, 4.500%, 03/15/2035 | | | 2,264,853 | |
| | 1,413,570 | | Series 3114, Class KZ, 5.000%, 02/15/2036 | | | 1,130,352 | |
| | | | FNMA Pools | | | | |
| | 385,621 | | Pool # 380542, 6.150%, 08/01/2008 | | | 385,268 | |
| | 434,825 | | Pool # 254659, 4.500%, 02/01/2013 | | | 436,184 | |
| | 916,759 | | Pool # 555648, 4.543%, 06/01/2013 | | | 914,470 | |
| | 840,684 | | Pool # 768008, 5.000%, 06/01/2013 | | | 851,463 | |
The accompanying notes are an integral part of these financial statements.
Frontegra Columbus Core Plus Fund
SCHEDULE OF INVESTMENTS (CONTINUED)
December 31, 2007 (Unaudited)
Principal Amount | | | | Value | |
| | | MORTGAGE BACKED SECURITIES 68.8% (continued) | | | |
| | | FNMA Pools (continued) | | | |
| $ | 514,148 | | Pool # 768009, 5.000%, 06/01/2013 | | $ | 520,569 | |
| | 861,983 | | Pool # 254806, 4.500%, 07/01/2013 | | | 864,735 | |
| | 760,448 | | Pool # 735065, 4.498%, 08/01/2013 | | | 757,729 | |
| | 1,386,992 | | Pool # 386341, 3.810%, 08/01/2013 | | | 1,337,047 | |
| | 1,148,173 | | Pool # 386441, 3.980%, 08/01/2013 | | | 1,125,933 | |
| | 445,384 | | Pool # 763019, 5.000%, 08/01/2013 | | | 450,946 | |
| | 1,591,941 | | Pool # 254909, 4.000%, 09/01/2013 | | | 1,579,526 | |
| | 537,933 | | Pool # 255450, 4.500%, 10/01/2014 | | | 539,563 | |
| | 1,167,439 | | Pool # 745659, 5.000%, 04/01/2016 | | | 1,186,977 | |
| | 1,293,062 | | Pool # 745444, 5.500%, 04/01/2016 | | | 1,314,686 | |
| | 4,412,704 | | Pool # 357312, 5.000%, 12/01/2017 | | | 4,423,328 | |
| | 159,923 | | Pool # 254759, 4.500%, 06/01/2018 | | | 157,352 | |
| | 971,221 | | Pool # 254919, 4.000%, 09/01/2018 | | | 934,704 | |
| | 2,808,619 | | Pool # 254865, 4.500%, 09/01/2018 | | | 2,763,465 | |
| | 1,862,496 | | Pool # 725546, 4.500%, 06/01/2019 | | | 1,831,825 | |
| | 4,061,616 | | Pool # 735841, 4.500%, 11/01/2019 | | | 3,994,730 | |
| | 2,944,701 | | Pool # 888105, 5.000%, 08/01/2020 | | | 2,951,790 | |
| | 27,487 | | Pool # 433043, 6.500%, 06/01/2028 | | | 28,491 | |
| | 57,476 | | Pool # 447704, 6.500%, 11/01/2028 | | | 59,573 | |
| | 28,363 | | Pool # 448235, 6.500%, 11/01/2028 | | | 29,398 | |
| | 74,715 | | Pool # 448635, 6.500%, 11/01/2028 | | | 77,442 | |
| | 3,946 | | Pool # 449012, 6.500%, 11/01/2028 | | | 4,090 | |
| | 26,164 | | Pool # 487778, 6.500%, 03/01/2029 | | | 27,112 | |
| | 1,030,290 | | Pool # 555203, 7.000%, 09/01/2032 | | | 1,072,936 | |
| | 2,211,741 | | Pool # 730839, 5.000%, 07/01/2033 | | | 2,161,322 | |
| | 1,694,341 | | Pool # 727181, 5.000%, 08/01/2033 | | | 1,655,717 | |
| | 2,815,390 | | Pool # 739821, 5.000%, 09/01/2033 | | | 2,751,210 | |
| | 2,433,263 | | Pool # 740255, 5.000%, 10/01/2033 | | | 2,377,794 | |
| | 7,407,845 | | Pool # 725027, 5.000%, 11/01/2033 | | | 7,238,975 | |
| | 1,578,370 | | Pool # 952768, 7.000%, 09/01/2037 (e) | | | 1,641,893 | |
| | | | FNMA Remic | | | | |
| | 1,014,072 | | Series 2002-74, Class PJ, 5.000%, 03/25/2015 | | | 1,012,328 | |
| | 4,384,672 | | Series 2005-35, Class AC, 4.000%, 08/25/2018 | | | 4,315,733 | |
| | 3,817,880 | | Series 2004-93, Class DG, 4.250%, 04/25/2019 | | | 3,767,899 | |
| | 97,102 | | Series 2003-58, Class PN, 3.500%, 10/25/2021 (e) | | | 96,836 | |
| | 85,000 | | Series 1994-3, Class PL, 5.500%, 01/25/2024 | | | 86,409 | |
| | 772,235 | | Series 2005-27, Class NA, 5.500%, 01/25/2024 | | | 772,391 | |
The accompanying notes are an integral part of these financial statements.
Frontegra Columbus Core Plus Fund
SCHEDULE OF INVESTMENTS (CONTINUED)
December 31, 2007 (Unaudited)
Principal Amount | | | | Value | |
| | | MORTGAGE BACKED SECURITIES 68.8% (continued) | | | |
| | | FNMA Remic (continued) | | | |
| $ | 2,266,839 | | Series 2005-95, Class LN, 4.500%, 03/25/2033 | | $ | 2,238,070 | |
| | 44,933 | | Series 2004-64, Class BA, 5.000%, 03/25/2034 | | | 44,895 | |
| | 960,000 | | Series 2004-26, Class PE, 4.500%, 04/25/2034 | | | 872,911 | |
| | 760,357 | | Series 2002-T4, Class A3, 7.500%, 12/25/2041 | | | 807,328 | |
| | 415,866 | | Series 2003-W19, Class IA5, 5.500%, 11/25/2043 (e) | | | 414,713 | |
| | 917,696 | | Series 2004-T2, Class IA3, 7.000%, 11/25/2043 | | | 984,575 | |
| | | | FNMA TBA | | | | |
| | 12,280,000 | | 6.000%, 01/01/2029 (d) | | | 12,468,031 | |
| | 24,705,000 | | 6.000%, 02/01/2033 (d) | | | 25,060,134 | |
| | 56,460,000 | | 5.000%, 01/01/2034 (d) | | | 55,083,788 | |
| | 13,350,000 | | 5.500%, 01/01/2034 (d) | | | 13,333,313 | |
| | 30,790,000 | | 6.500%, 01/01/2035 (d) | | | 31,646,333 | |
| | 13,151 | | 9.500%, 10/15/2009 (d) | | | 13,584 | |
| | 2,926,022 | | GMAC Commercial Mortgage Securities Inc. | | | | |
| | | | Pool # 2003-C1, 3.337%, 05/10/2036 | | | 2,843,935 | |
| | 2,001,697 | | GNMA Pool | | | | |
| | | | Pool # 2005-21, 5.000%, 03/20/2035 | | | 1,768,118 | |
| | | | Greenwich Capital Commercial Funding Corp. | | | | |
| | 2,945,000 | | Series 2005-GG5, Class A2, 5.117%, 04/10/2037 | | | 2,950,002 | |
| | 2,470,000 | | Series 2007-GG9, Class A2, 5.381%, 03/10/2039 | | | 2,482,818 | |
| | 2,550,000 | | Series 2007-GG9, Class A4, 5.444%, 03/10/2039 | | | 2,565,055 | |
| | 2,998,326 | | GS Mortgage Securities Corp. II | | | | |
| | | | Series 2007-EOP, Class A1, 5.340%, 03/06/2020 | | | | |
| | | | (Acquired 09/17/2007 and 11/19/2007, Cost $2,973,206) (a)(c) | | | 2,866,244 | |
| | 5,040,000 | | JP Morgan Chase Commercial Mortgage Securities Corp. | | | | |
| | | | Series 2006-LDP9, Class A3, 5.336%, 05/15/2047 | | | 5,021,211 | |
| | | | LB-UBS Commercial Mortgage Trust | | | | |
| | 503,804 | | Series 2003-C3, Class A1, 2.599%, 05/15/2027 | | | 502,227 | |
| | 3,550,000 | | Series 2003-C3, Class A2, 3.086%, 05/15/2027 | | | 3,523,493 | |
| | 1,590,000 | | Series 2005-C5, Class A2, 4.885%, 09/15/2030 | | | 1,586,691 | |
| | 4,300,000 | | Series 2005-C7, Class A25.103%, 11/15/2030 | | | 4,307,184 | |
| | 642,331 | | Series 1998-C4, Class A2, 6.300%, 10/15/2035 | | | 645,944 | |
| | 2,440,000 | | Series 2006-C6, Class A4, 5.372%, 09/15/2039 | | | 2,448,405 | |
| | 4,100,000 | | Series 2007-C2, Class A2, 5.303%, 02/15/2040 | | | 4,111,548 | |
| | 745,378 | | Master Alternative Loans Trust | | | | |
| | | | Pool # 2004-6, 4.500%, 07/25/2014 | | | 732,267 | |
The accompanying notes are an integral part of these financial statements.
Frontegra Columbus Core Plus Fund
SCHEDULE OF INVESTMENTS (CONTINUED)
December 31, 2007 (Unaudited)
Principal Amount | | | | Value | |
| | | MORTGAGE BACKED SECURITIES 68.8% (continued) | | | |
| $ | 593,067 | | Master Asset Securitization Trust | | | |
| | | | Pool # 2004-3, 4.750%, 01/25/2014 | | $ | 591,467 | |
| | 1,550,000 | | MBNA Credit Card Master Trust | | | | |
| | | | Series 2005-A7, Class A7, 4.300%, 02/15/2011 | | | 1,548,042 | |
| | | | Merrill Lynch Commercial Mortgage Trust | | | | |
| | 279,345 | | Series 2002-MW1, Class A2, 4.929%, 07/12/2034 (e) | | | 278,519 | |
| | 1,632,150 | | Series 2006-C2, Class A1, 5.601%, 08/12/2043 | | | 1,648,472 | |
| | 1,404,416 | | Series 2006-3, Class A1, 4.711%, 07/12/2046 | | | 1,395,279 | |
| | | | Morgan Stanley Capital I | | | | |
| | 1,019,725 | | Series # 2003-IQ4, Class A1, 3.270%, 05/15/2040 | | | 999,489 | |
| | 1,375,000 | | Series 2006-HQ8, Class A4, 5.565%, 03/12/2044 | | | 1,388,398 | |
| | 2,260,000 | | SLM Student Loan Trust | | | | |
| | | | Series 2007-7, Class A1, 5.038%, 10/25/2012 (c) | | | 2,248,700 | |
| | | | Wachovia Bank Commercial Mortgage Trust | | | | |
| | 1,185,815 | | Series # 2003-C5, Class A1, 2.986%, 06/15/2035 | | | 1,145,975 | |
| | 1,300,000 | | Series 2006-C24, Class A3, 5.558%, 03/15/2045 | | | 1,318,899 | |
| | 2,796,592 | | Wells Fargo Mortgage Backed Securities Trust | | | | |
| | | | Pool # 2006-3, 5.500%, 03/25/2036 | | | 2,805,950 | |
| | | | Total Mortgage Backed Securities | | | | |
| | | | (Cost $312,913,574) | | | 316,543,825 | |
| | | | | | | | |
| | | | SUPRANATIONAL ISSUE 0.3% | | | | |
| | | | European Investment Bank | | | | |
| | 1,270,000 | | 4.875%, 02/15/2036 (b) | | | 1,249,495 | |
| | | | Total Supranational Issue | | | | |
| | | | (Cost $1,259,548) | | | 1,249,495 | |
The accompanying notes are an integral part of these financial statements.
Frontegra Columbus Core Plus Fund
SCHEDULE OF INVESTMENTS (CONTINUED)
December 31, 2007 (Unaudited)
Principal Amount | | | | Value | |
| | | SHORT-TERM INVESTMENTS 15.8% | | | |
| | | US Government Agency Issue (f) 13.8% | | | |
| $ | 63,578,000 | | Federal Home Loan Bank Discount Note, | | | |
| | | | 2.920%, 01/02/2008 | | $ | 63,567,686 | |
| | | | | | | | |
| | | | Variable Rate Demand Note (g) 2.0% | | | | |
| | 9,138,122 | | U.S. Bank Demand Note, 4.949%, 12/31/2031 | | | 9,138,122 | |
| | | | | | | | |
| | | | Total Short-Term Investments | | | | |
| | | | (Cost $72,705,808) | | | 72,705,808 | |
| | | | | | | | |
| | | | Total Investments 125.7% | | | | |
| | | | (Cost $575,217,102) | | | 578,060,826 | |
| | | | | | | | |
| | | | Liabilities in Excess of Other Assets (25.7)% | | | (118,055,426 | ) |
| | | | | | | | |
| | | | TOTAL NET ASSETS 100.0% | | $ | 460,005,400 | |
| (a) | Security exempt from registration under Rule 144A of the Securities Act of 1933. These securities may be resold in transactions exempt from registration normally to qualified institutional buyers. The total value of these securities amounted to $27,528,771 (6.0% of net assets) at December 31, 2007. |
| (b) | U.S.-dollar denominated security of foreign issuer. |
| (c) | Adjustable Rate. |
| (d) | When-issued security. |
| (e) | Security marked as segregated to cover when-issued security. |
| (f) | The obligations of certain U.S. Government-sponsored entities are neither issued nor guaranteed by the United States Treasury. |
| (g) | Variable rate demand notes are considered short-term obligations and are payable upon demand. Interest rates change periodically on specified dates. The rates listed are as of December 31, 2007. |
The accompanying notes are an integral part of these financial statements.
Frontegra Columbus Core Plus Fund
SCHEDULE OF INVESTMENTS (CONTINUED)
December 31, 2007 (Unaudited)
Credit Default Swaps
| | Expiration | | Notional | | | | |
| | Date | | Amount | | | Value(a) | |
| Receive quarterly a fixed annual rate of 5.15% | | | | | | | |
| multiplied by the notional amount and pay to JP | | | | | | | |
| Morgan Chase upon default event of Ford Motor | | | | | | | |
| Credit Co., par value of the notional amount of | | | | | | | |
| Ford Motor Credit Co. 7.000%, 10/01/13 | 3/20/11 | | $ | 2,250,000 | | | $ | (115,080 | ) |
| | | | | | | | | | |
| Receive quarterly a fixed annual rate of 2.75% | | | | | | | | | |
| multiplied by the notional amount and pay to JP | | | | | | | | | |
| Morgan Chase upon default event of a Dow Jones | | | | | | | | | |
| CDX North America High Yield Index reference | | | | | | | | | |
| obligation, par value of the notional amount of | | | | | | | | | |
| Dow Jones CDX North America High Yield Index | | | | | | | | | |
| reference obligation | 6/20/12 | | | 1,577,800 | | | | (2,367 | ) |
| | | | | | | | | | |
| Receive quarterly a fixed annual rate of 1.20% | | | | | | | | | |
| multiplied by the notional amount and pay to | | | | | | | | | |
| Goldman Sachs upon default event of a Dow Jones | | | | | | | | | |
| CDX North America High Yield Index reference | | | | | | | | | |
| obligation, par value of the notional amount of | | | | | | | | | |
| Dow Jones CDX North America High Yield Index | | | | | | | | | |
| reference obligation | 6/20/12 | | | 21,640,000 | | | | (16,373 | ) |
| | | | | | | | | | |
| Receive quarterly a fixed annual rate of 0.60% | | | | | | | | | |
| multiplied by the notional amount and pay to JP | | | | | | | | | |
| Morgan Chase upon default event of a Dow Jones | | | | | | | | | |
| CDX North America High Yield Index reference | | | | | | | | | |
| obligation, par value of the notional amount of | | | | | | | | | |
| Dow Jones CDX North America High Yield Index | | | | | | | | | |
| reference obligation | 12/20/12 | | | 46,820,000 | | | | 6,989 | |
| | | | $ | 72,287,800 | | | $ | (126,831 | ) |
| (a) | Includes interest paid or received by the Fund on the notional amount. |
The accompanying notes are an integral part of these financial statements.
Frontegra Columbus Core Plus Fund
STATEMENT OF ASSETS AND LIABILITIES
December 31, 2007 (Unaudited)
Assets: | | | |
| Investments at value (cost $575,217,102) | | $ | 578,060,826 | |
| Interest receivable | | | 2,748,331 | |
| Deposits with broker and custodian for swaps | | | 4,190,000 | |
| Receivable for Fund shares sold | | | 594,778 | |
| Receivable for investments sold | | | 443,343,539 | |
| Unrealized appreciation on swaps | | | 6,989 | |
| Other assets | | | 30,312 | |
| Total assets | | | 1,028,974,775 | |
| | | | | |
Liabilities: | | | | |
| Payable to custodian | | | 1,122,175 | |
| Payable for investments purchased | | | 566,124,403 | |
| Payable to broker | | | 1,446,128 | |
| Accrued investment advisory fee | | | 92,638 | |
| Unrealized depreciation on swaps | | | 133,820 | |
| Accrued expenses | | | 50,211 | |
| Total liabilities | | | 568,969,375 | |
Net Assets | | $ | 460,005,400 | |
| | | | | |
Net Assets Consist of: | | | | |
| Paid in capital | | $ | 452,858,391 | |
| Undistributed net investment income | | | 91,567 | |
| Accumulated net realized gain on investments sold, | | | | |
| swap contracts and foreign currency | | | 4,338,549 | |
| Net unrealized appreciation (depreciation) on: | | | | |
| Investments | | | 2,843,724 | |
| Swap contracts | | | (126,831 | ) |
Net Assets | | $ | 460,005,400 | |
| | | | | |
Capital Stock, $0.01 Par Value | | | | |
| Authorized | | | 100,000,000 | |
| Issued and outstanding | | | 14,613,260 | |
Net Asset Value, Redemption Price and Offering Price Per Share | | $ | 31.48 | |
The accompanying notes are an integral part of these financial statements.
Frontegra Columbus Core Plus Fund
STATEMENT OF OPERATIONS
| | | Six Months Ended | |
| | | December 31, 2007 | |
| | | (Unaudited) | |
Investment Income: | | | |
| Interest | | $ | 10,750,070 | |
| | | | | |
Expenses: | | | | |
| Investment advisory fees (Note 3) | | | 824,666 | |
| Fund administration and accounting fees | | | 61,084 | |
| Custody fees | | | 28,982 | |
| Audit fees | | | 16,095 | |
| Federal and state registration fees | | | 13,760 | |
| Legal fees | | | 10,950 | |
| Shareholder servicing fees | | | 5,940 | |
| Compliance support expenses | | | 3,517 | |
| Directors’ fees and related expenses | | | 3,640 | |
| Reports to shareholders | | | 2,444 | |
| Other | | | 4,636 | |
| Total expenses before waiver | | | 975,714 | |
| Waiver of expenses by Adviser (Note 3) | | | (449,467 | ) |
| Net expenses | | | 526,247 | |
Net Investment Income | | | 10,223,823 | |
| | | | | |
Realized and Unrealized | | | | |
Gain (Loss) on Investments: | | | | |
| Realized gain (loss) on: | | | | |
| Investments | | | 9,935,077 | |
| Swap contracts | | | 2,740,341 | |
| Foreign currency translation | | | (92,836 | ) |
| Change in net unrealized appreciation/depreciation on: | | | | |
| Investments | | | 4,489,648 | |
| Swap contracts | | | (375,594 | ) |
Net Realized and Unrealized | | | | |
Gain on Investments | | | 16,696,636 | |
Net Increase in Net Assets | | | | |
Resulting from Operations | | $ | 26,920,459 | |
The accompanying notes are an integral part of these financial statements.
Frontegra Columbus Core Plus Fund
STATEMENTS OF CHANGES IN NET ASSETS
| | | Six Months Ended | | | | |
| | | December 31, 2007 | | | Year Ended | |
| | | (Unaudited) | | | June 30, 2007 | |
Operations: | | | | | | |
| Net investment income | | $ | 10,223,823 | | | $ | 14,451,056 | |
| Net realized gain (loss) on: | | | | | | | | |
| Investments | | | 9,935,077 | | | | 5,102,933 | |
| Swap contracts | | | 2,740,341 | | | | 68,819 | |
| Foreign currency translation | | | (92,836 | ) | | | 75,201 | |
| Change in net unrealized appreciation/depreciation on: | | | | | | | | |
| Investments | | | 4,489,648 | | | | 2,437,286 | |
| Swap contracts | | | (375,594 | ) | | | 254,715 | |
| Net increase in net assets resulting from operations | | | 26,920,459 | | | | 22,390,010 | |
| | | | | | | | | |
Distributions | | | | | | | | |
Paid From: | | | | | | | | |
| Net investment income | | | (10,042,359 | ) | | | (14,405,929 | ) |
| Net realized gain on investments | | | (3,906,915 | ) | | | — | |
| Net decrease in net assets resulting | | | | | | | | |
| from distributions paid | | | (13,949,274 | ) | | | (14,405,929 | ) |
| | | | | | | | | |
Capital Share | | | | | | | | |
Transactions: | | | | | | | | |
| Shares issued in connection with acquisition of | | | | | | | | |
| Columbus Core Plus Fund (see Note 7) | | | 139,917,196 | | | | — | |
| Shares sold | | | 74,712,699 | | | | 31,004,977 | |
| Shares issued to holders in | | | | | | | | |
| reinvestment of distributions | | | 13,095,168 | | | | 13,258,827 | |
| Shares redeemed | | | (57,520,645 | ) | | | (89,297,680 | ) |
| Net increase (decrease) in net assets resulting | | | | | | | | |
| from capital share transactions | | | 170,204,418 | | | | (45,033,876 | ) |
| | | | | | | | | |
Total Increase (Decrease) in Net Assets | | | 183,175,603 | | | | (37,049,795 | ) |
| | | | | | | | | |
Net Assets: | | | | | | | | |
| Beginning of period | | | 276,829,797 | | | | 313,879,592 | |
| End of period | | | | | | | | |
| (includes undistributed net investment income (loss) | | | | | | | | |
| of $91,567 and $(89,897), respectively) | | $ | 460,005,400 | | | $ | 276,829,797 | |
The accompanying notes are an integral part of these financial statements.
Frontegra Columbus Core Plus Fund
FINANCIAL HIGHLIGHTS
| | | Six Months | | | | | | | | | | | | | | | | |
| | | Ended | | | Year | | | Year | | | Year | | | Year | | | Year | |
| | | December 31, | | | Ended | | | Ended | | | Ended | | | Ended | | | Ended | |
| | | 2007 | | | June 30, | | | June 30, | | | June 30, | | | June 30, | | | June 30, | |
| | | (Unaudited) | | | 2007 | | | 2006 | | | 2005 | | | 2004 | | | 2003 | |
Net Asset Value, | | | | | | | | | | | | | | | | | | |
Beginning of Period | | $ | 30.40 | | | $ | 29.72 | | | $ | 31.50 | | | $ | 30.51 | | | $ | 31.92 | | | $ | 30.21 | |
| | | | | | | | | | | | | | | | | | | | | | | | | |
Income (Loss) | | | | | | | | | | | | | | | | | | | | | | | | |
from Investment | | | | | | | | | | | | | | | | | | | | | | | | |
Operations: | | | | | | | | | | | | | | | | | | | | | | | | |
| Net investment income | | | 0.78 | (4) | | | 1.54 | | | | 1.41 | | | | 1.13 | | | | 0.99 | | | | 1.80 | |
| Net realized and unrealized | | | | | | | | | | | | | | | | | | | | | | | | |
| gain (loss) on investments | | | 1.28 | | | | 0.68 | | | | (1.30 | ) | | | 0.98 | | | | (0.45 | ) | | | 2.06 | |
Total Income from | | | | | | | | | | | | | | | | | | | | | | | | |
Investment Operations | | | 2.06 | | | | 2.22 | | | | 0.11 | | | | 2.11 | | | | 0.54 | | | | 3.86 | |
| | | | | | | | | | | | | | | | | | | | | | | | | |
Less Distributions | | | | | | | | | | | | | | | | | | | | | | | | |
Paid: | | | | | | | | | | | | | | | | | | | | | | | | |
| From net investment income | | | (0.71 | ) | | | (1.54 | ) | | | (1.45 | ) | | | (1.12 | ) | | | (0.98 | ) | | | (1.87 | ) |
| From net realized gain on investments | | | (0.27 | ) | | | — | | | | (0.44 | ) | | | — | | | | (0.97 | ) | | | (0.28 | ) |
Total Distributions Paid | | | (0.98 | ) | | | (1.54 | ) | | | (1.89 | ) | | | (1.12 | ) | | | (1.95 | ) | | | (2.15 | ) |
| | | | | | | | | | | | | | | | | | | | | | | | | |
Net Asset Value, End of Period | | $ | 31.48 | | | $ | 30.40 | | | $ | 29.72 | | | $ | 31.50 | | | $ | 30.51 | | | $ | 31.92 | |
Total Return(1) | | | 6.74 | % | | | 7.52 | % | | | 0.36 | % | | | 7.00 | % | | | 1.71 | % | | | 13.29 | % |
| | | | | | | | | | | | | | | | | | | | | | | | | |
Supplemental Data | | | | | | | | | | | | | | | | | | | | | | | | |
and Ratios: | | | | | | | | | | | | | | | | | | | | | | | | |
| Net assets, end of period | | | | | | | | | | | | | | | | | | | | | | | | |
| (in thousands) | | $ | 460,005 | | | $ | 276,830 | | | $ | 313,880 | | | $ | 316,474 | | | $ | 346,733 | | | $ | 358,052 | |
| Ratio of expenses to | | | | | | | | | | | | | | | | | | | | | | | | |
| average net assets(2)(3) | | | 0.26 | % | | | 0.20 | % | | | 0.20 | % | | | 0.408 | % | | | 0.425 | % | | | 0.425 | % |
| Ratio of net investment income to | | | | | | | | | | | | | | | | | | | | | | | | |
| average net assets(2)(3) | | | 4.96 | % | | | 4.95 | % | | | 4.59 | % | | | 3.30 | % | | | 2.71 | % | | | 5.78 | % |
| Portfolio turnover rate(1) | | | 472 | % | | | 978 | % | | | 1,247 | % | | | 1,222 | % | | | 1,409 | % | | | 489 | % |
| (1) | Not annualized for periods less than a full year. |
| (2) | Net of waivers and reimbursements by Adviser. Without waivers and reimbursements of expenses, the ratio of expenses to average net assets would have been 0.48%, 0.50%, 0.50%, 0.501%, 0.507% and 0.505%, and the ratio of net investment income to average net assets would have been 4.74%, 4.65%, 4.29%, 3.21%, 2.63% and 5.70% for the periods ended December 31, 2007, June 30, 2007, June 30, 2006, June 30, 2005, June 30, 2004 and June 30, 2003, respectively. |
| (3) | Annualized for periods less than a full year. |
| (4) | Per share net investment income has been calculated using the daily average share method. |
The accompanying notes are an integral part of these financial statements.
Growth of a $100,000 Investment (Unaudited)
* 2/23/01 commencement of operations.
| | | | |
| | Portfolio Total Return** | | |
| | FOR THE PERIOD ENDED 12/31/07 | | |
| | | | |
| | SIX MONTHS | 6.72% | |
| | | | |
| | ONE YEAR | 7.76% | |
| | | | |
| | FIVE YEAR | | |
| | AVERAGE ANNUAL | 4.88% | |
| | | | |
| | SINCE COMMENCEMENT | | |
| | AVERAGE ANNUAL | 5.49% | |
| | | | |
This chart assumes an initial gross investment of $100,000 made on 2/23/01 (commencement of operations). Past performance is not predictive of future results. Investment return and principal value will fluctuate so that shares, when redeemed, may be worth more or less than the original cost. In the absence of existing fee waivers, total return would be reduced. To receive current to the most recent month-end performance, please call 1-888-825-2100.
The Lehman Brothers Aggregate Bond Index is an unmanaged market value-weighted performance benchmark for investment-grade fixed-rate debt issues, including government, corporate, asset backed and mortgage backed securities, with maturities of at least one year. The Index does not reflect investment management fees, brokerage commissions and other expenses associated with investing in fixed income securities. A direct investment in the index is not possible.
| ** | The returns shown do not reflect the deduction of taxes that a shareholder would pay on Fund distributions or the redemption of Fund shares. |
Frontegra Columbus Core Fund
SCHEDULE OF INVESTMENTS
December 31, 2007 (Unaudited)
Principal Amount | | | | Value | |
| | | ASSET BACKED SECURITIES 11.9% | | | |
| | | American Express Credit Account Master Trust | | | |
| $ | 770,000 | | 2005-3, Class A, 5.030%, 01/18/2011 (c)(e) | | $ | 769,851 | |
| | 235,000 | | 2005-6, Class A, 5.030%, 03/15/2011 (c)(e) | | | 234,851 | |
| | | | Americredit Automobile Receivables Trust | | | | |
| | 193,908 | | 2007-DF, Class A1, 5.914%, 10/06/2008 (c)(e) | | | 194,257 | |
| | 605,000 | | 2007-DF, Class A2A, 5.660%, 01/06/2011 (e) | | | 604,998 | |
| | 775,000 | | Bank One Issuance Trust | | | | |
| | | | 2003-3A, Class A3, 5.140%, 12/15/2010 (c)(e) | | | 775,249 | |
| | | | Capital One Auto Trust | | | | |
| | 238,017 | | 2007-A, Class A2, 5.330%, 05/15/2010 (e) | | | 238,325 | |
| | 405,245 | | 2007-B, Class A2, 5.270%, 06/15/2010 (e) | | | 405,746 | |
| | 930,000 | | Capital One Master Trust | | | | |
| | | | 2001-1, Class A, 5.227%, 12/15/2010 (c) | | | 930,412 | |
| | 78,812 | | Carmax Auto Trust | | | | |
| | | | 2006-2, Class A2, 5.290%, 06/15/2009 (e) | | | 78,853 | |
| | 159,675 | | Caterpillar Financial Asset Trust | | | | |
| | | | 2007-A, Class A1, 5.672%, 09/25/2008 | | | 160,009 | |
| | 935,000 | | Chase Issuance Trust | | | | |
| | | | 2005-1A, Class A1, 5.040%, 12/15/2010 (c)(e) | | | 935,028 | |
| | | | Citibank Credit Card Issuance Trust | | | | |
| | 530,000 | | 2003-A1, Class A1, 5.343%, 01/15/2010 | | | 530,126 | |
| | 830,000 | | 2001-A1, Class A1, 5.045%, 02/07/2010 (c) | | | 830,214 | |
| | 440,000 | | 2003-A8, Class A8, 3.500%, 08/16/2010 | | | 436,530 | |
| | 180,000 | | Discover Card Master Trust I | | | | |
| | | | 2001-1, Class A, 5.160%, 01/15/2008 (c)(e) | | | 180,019 | |
| | 229,526 | | Ford Credit Auto Trust | | | | |
| | | | 2006-B, Class A2A, 5.420%, 07/15/2009 (e) | | | 229,809 | |
| | 120,873 | | GS Auto Loan Trust | | | | |
| | | | 2006-1, Class A2, 5.470%, 02/15/2009 (e) | | | 120,945 | |
| | 295,000 | | Hertz Vehicle Financing LLC | | | | |
| | | | 2005-2A, Class A6, 5.080%, 11/25/2011 | | | | |
| | | | (Acquired 12/15/2005 and 08/03/2007, Cost $294,952) (a) | | | 297,057 | |
| | | | Honda Auto Receivables Owner Trust | | | | |
| | 148,045 | | 2007-3, Class A1, 5.565%, 04/15/2008 | | | 148,311 | |
| | 474,227 | | 2006-1, Class A3, 5.070%, 02/18/2010 | | | 474,958 | |
| | 44,638 | | Keystone Owner Trust | | | | |
| | | | 1998-P1, Class M1, 7.530%, 05/25/2025 | | | | |
| | | | (Acquired 04/22/2003 and 08/03/2007, Cost $46,433) (a) | | | 44,488 | |
The accompanying notes are an integral part of these financial statements.
Frontegra Columbus Core Fund
SCHEDULE OF INVESTMENTS (CONTINUED)
December 31, 2007 (Unaudited)
Principal Amount | | | | Value | |
| | | ASSET BACKED SECURITIES 11.9% (continued) | | | |
| | | MBNA Master Credit Card Trust | | | |
| $ | 815,000 | | 1998-E, Class A, 5.390%, 09/15/2010 | | $ | 815,373 | |
| | 425,000 | | 2003-A7, Class A7, 2.650%, 11/15/2010 | | | 421,134 | |
| | 279,572 | | Mid-State Trust | | | | |
| | | | 11, Class A1, 4.864%, 07/15/2038 | | | 275,010 | |
| | 175,730 | | Nissan Auto Receivables Owner Trust | | | | |
| | | | 2006-B, Class A3, 5.160%, 02/15/2010 | | | 176,078 | |
| | | | SLM Student Loan Trust | | | | |
| | 206,105 | | 2007-1, Class A1, 5.050%, 04/25/2012 (c)(e) | | | 206,171 | |
| | 219,396 | | 2007-2, Class A1, 5.064%, 04/25/2014 (c) | | | 219,115 | |
| | | | USAA Auto Owner Trust | | | | |
| | 733,407 | | 2006-1, Class A3, 5.010%, 09/15/2010 | | | 734,640 | |
| | 571,028 | | 2006-3, Class A3, 5.470%, 02/15/2011 (e) | | | 573,627 | |
| | | | Total Asset Backed Securities | | | | |
| | | | (Cost $14,434,388) | | | 12,041,184 | |
| | | | | | | | |
| | | | CORPORATE BONDS 31.6% | | | | |
| | | | Beverages 0.1% | | | | |
| | 115,000 | | Diageo Capital plc | | | | |
| | | | 5.750%, 10/23/2017 (b) | | | 115,653 | |
| | | | | | | | |
| | | | Capital Markets 0.4% | | | | |
| | 155,000 | | Goldman Sachs Group, Inc. | | | | |
| | | | 5.625%, 01/15/2017 | | | 151,369 | |
| | 215,000 | | Morgan Stanley | | | | |
| | | | 5.550%, 04/27/2017 | | | 209,661 | |
| | | | | | | 361,030 | |
| | | | Commercial Banks 5.3% | | | | |
| | 415,000 | | Bank Of New York Mellon | | | | |
| | | | 4.950%, 11/01/2012 | | | 414,995 | |
| | 475,000 | | BB&T Corp. | | | | |
| | | | 4.900%, 06/30/2017 | | | 438,586 | |
| | 480,000 | | Firstar Bank | | | | |
| | | | 7.125%, 12/01/2009 | | | 504,413 | |
| | | | HSBC Bank | | | | |
| | 310,000 | | 4.625%, 04/01/2014 | | | 297,070 | |
| | 195,000 | | 6.000%, 08/09/2017 | | | 199,840 | |
The accompanying notes are an integral part of these financial statements.
Frontegra Columbus Core Fund
SCHEDULE OF INVESTMENTS (CONTINUED)
December 31, 2007 (Unaudited)
Principal Amount | | | | Value | |
| | | CORPORATE BONDS 31.6% (continued) | | | |
| | | Commercial Banks 5.3% (continued) | | | |
| $ | 335,000 | | JP Morgan Chase Bank | | | |
| | | | 6.000%, 10/01/2017 | | $ | 340,702 | |
| | 870,000 | | Marshall & Ilsley Bank | | | | |
| | | | 5.401%, 12/04/2012 | | | 820,479 | |
| | 695,000 | | Suntrust Bank | | | | |
| | | | 5.092%, 05/21/2012 | | | 683,636 | |
| | 220,000 | | U.S. Bank | | | | |
| | | | 4.950%, 10/30/2014 | | | 214,527 | |
| | 555,000 | | Wachovia Bank | | | | |
| | | | 6.000%, 11/15/2017 | | | 558,709 | |
| | | | Wells Fargo Bank | | | | |
| | 165,000 | | 4.750%, 02/09/2015 | | | 157,594 | |
| | 470,000 | | 5.750%, 05/16/2016 | | | 476,855 | |
| | 220,000 | | 5.625%, 12/11/2017 | | | 220,134 | |
| | | | | | | 5,327,540 | |
| | | | Computers and Peripherals 0.2% | | | | |
| | 185,000 | | Tyco Electronics Group S A | | | | |
| | | | 6.000%, 10/01/2012 | | | | |
| | | | (Acquired 09/20/2007, Cost $184,919) (a)(b) | | | 189,579 | |
| | | | | | | | |
| | | | Consumer Finance 1.2% | | | | |
| | 445,000 | | American Express Co. | | | | |
| | | | 6.150%, 08/28/2017 | | | 456,692 | |
| | 375,000 | | ERAC USA Finance Co. | | | | |
| | | | 6.375%, 10/15/2017 (Acquired 10/10/2007, Cost $374,344) (a) | | | 362,292 | |
| | 435,000 | | Household Finance Corp. | | | | |
| | | | 6.375%, 10/15/2011 | | | 448,191 | |
| | | | | | | 1,267,175 | |
| | | | Diversified Financial Services 6.0% | | | | |
| | 450,000 | | Aetna, Inc. | | | | |
| | | | 6.750%, 12/15/2037 | | | 448,874 | |
| | | | American General Finance | | | | |
| | 275,000 | | 5.900%, 09/15/2012 | | | 278,168 | |
| | 385,000 | | 6.900%, 12/15/2017 | | | 385,385 | |
The accompanying notes are an integral part of these financial statements.
Frontegra Columbus Core Fund
SCHEDULE OF INVESTMENTS (CONTINUED)
December 31, 2007 (Unaudited)
Principal Amount | | | | Value | |
| | | CORPORATE BONDS 31.6% (continued) | | | |
| | | Diversified Financial Services 6.0% (continued) | | | |
| | | Bank Of America Corp. | | | |
| $ | 420,000 | | 5.300%, 03/15/2017 | | $ | 408,398 | |
| | 165,000 | | 6.000%, 09/01/2017 | | | 168,576 | |
| | 280,000 | | 5.750%, 12/01/2017 | | | 280,642 | |
| | 230,000 | | Cargill, Inc. | | | | |
| | | | 5.600%, 09/15/2012 (Acquired 09/06/2007, Cost $229,929) (a) | | | 233,770 | |
| | | | CIT Group Inc. | | | | |
| | 335,000 | | 7.625%, 11/30/2012 | | | 339,558 | |
| | 395,000 | | 5.638%, 12/21/2012 | | | 345,627 | |
| | | | Citigroup, Inc. | | | | |
| | 100,000 | | 5.500%, 02/15/2017 | | | 97,185 | |
| | 320,000 | | 6.125%, 11/21/2017 | | | 328,702 | |
| | 210,000 | | Genworth Global Funding | | | | |
| | | | 5.200%, 10/08/2010 | | | 213,014 | |
| | 370,000 | | International Lease Finance Corp. | | | | |
| | | | 5.350%, 03/01/2012 | | | 370,243 | |
| | | | JP Morgan Chase & Co. | | | | |
| | 105,000 | | 6.625%, 03/15/2012 | | | 110,720 | |
| | 165,000 | | 6.000%, 01/15/2018 | | | 167,868 | |
| | 230,000 | | Liberty Property LP | | | | |
| | | | 6.625%, 10/01/2017 | | | 230,126 | |
| | 145,000 | | Merrill Lynch & Co. | | | | |
| | | | 6.400%, 08/28/2017 | | | 147,314 | |
| | 270,000 | | Morgan Stanley | | | | |
| | | | 5.950%, 12/28/2017 | | | 269,807 | |
| | | | Pricoa Global Funding I | | | | |
| | 180,000 | | 5.331%, 03/03/2009 | | | | |
| | | | (Acquired 03/01/2006 and 08/03/2007, Cost $180,000) (a) | | | 179,828 | |
| | 330,000 | | 5.400%, 10/18/2012 | | | | |
| | | | (Acquired 10/11/2007, Cost $329,343) (a) | | | 342,241 | |
| | 335,000 | | Prudential Financial Inc. | | | | |
| | | | 6.000%, 12/01/2017 | | | 333,618 | |
| | 200,000 | | Simon Property Group LP | | | | |
| | | | 5.100%, 06/15/2015 | | | 188,038 | |
| | 211,037 | | Windsor Financing LLC | | | | |
| | | | 5.881%, 07/15/2017 | | | | |
| | | | (Acquired Multiple Dates, Cost $210,551) (a) | | | 221,891 | |
| | | | | | | 6,089,593 | |
The accompanying notes are an integral part of these financial statements.
Frontegra Columbus Core Fund
SCHEDULE OF INVESTMENTS (CONTINUED)
December 31, 2007 (Unaudited)
Principal Amount | | | | Value | |
| | | CORPORATE BONDS 31.6% (continued) | | | |
| | | Diversified Telecommunication Services 2.3% | | | |
| $ | 575,000 | | AT&T, Inc. | | | |
| | | | 6.300%, 01/15/2038 | | $ | 584,196 | |
| | 385,000 | | British Telecom plc | | | | |
| | | | 5.950%, 01/15/2018 (b) | | | 388,055 | |
| | 180,000 | | Comcast Cable Communications Holdings, Inc. | | | | |
| | | | 8.375%, 03/15/2013 | | | 201,939 | |
| | 285,000 | | Deutsche Telekom International Finance BV | | | | |
| | | | 5.750%, 03/23/2016 (b) | | | 285,267 | |
| | 350,000 | | Sprint Nextel Corp. | | | | |
| | | | 6.000%, 12/01/2016 | | | 335,228 | |
| | 240,000 | | Telecom Italia Capital | | | | |
| | | | 5.250%, 11/15/2013 (b) | | | 237,199 | |
| | 265,000 | | Telefonica Emisiones SAU | | | | |
| | | | 6.221%, 07/03/2017 (b) | | | 275,333 | |
| | | | | | | 2,307,217 | |
| | | | Electric Utilities 4.1% | | | | |
| | | | Commonwealth Edison Co. | | | | |
| | 640,000 | | 4.740%, 08/15/2010 | | | 639,377 | |
| | 200,000 | | 5.950%, 08/15/2016 | | | 202,890 | |
| | 95,000 | | 6.150%, 09/15/2017 | | | 97,899 | |
| | 225,000 | | Consumers Energy Co. | | | | |
| | | | 4.400%, 08/15/2009 | | | 223,041 | |
| | 400,000 | | Entergy Arkansas Inc. | | | | |
| | | | 5.000%, 07/01/2018 | | | | |
| | | | (Acquired 06/18/2003 and 08/03/2007, Cost $394,527) (a) | | | 369,287 | |
| | | | Entergy Gulf States, Inc. | | | | |
| | 215,000 | | 4.875%, 11/01/2011 | | | 207,531 | |
| | 235,000 | | 5.250%, 08/01/2015 | | | 222,412 | |
| | 170,000 | | Entergy Louisiana LLC | | | | |
| | | | 5.500%, 04/01/2019 | | | 162,309 | |
| | 157,830 | | FPL Energy Virginia Funding Corp. | | | | |
| | | | 7.520%, 06/30/2019 | | | | |
| | | | (Acquired 02/10/2006 and 08/03/2007, Cost $176,705) (a) | | | 183,508 | |
| | 375,000 | | Great River Energy | | | | |
| | | | 5.829%, 07/01/2017 | | | | |
| | | | (Acquired 06/21/2007 and 08/03/2007, Cost $375,000) (a)(e) | | | 384,491 | |
The accompanying notes are an integral part of these financial statements.
Frontegra Columbus Core Fund
SCHEDULE OF INVESTMENTS (CONTINUED)
December 31, 2007 (Unaudited)
Principal Amount | | | | Value | |
| | | CORPORATE BONDS 31.6% (continued) | | | |
| | | Electric Utilities 4.1% (continued) | | | |
| | | Indianapolis Power & Light Co. | | | |
| $ | 80,000 | | 6.300%, 07/01/2013 | | | |
| | | | (Acquired 10/17/2006 and 08/03/2007, Cost $82,541) (a) | | $ | 83,714 | |
| | 175,000 | | 6.050%, 10/01/2036 | | | | |
| | | | (Acquired 10/02/2006 and 08/03/2007, Cost $173,877) (a) | | | 171,203 | |
| | 239,250 | | Mackinaw Power LLC | | | | |
| | | | 6.296%, 10/31/2023 | | | | |
| | | | (Acquired Multiple Dates, Cost $239,625) (a) | | | 256,069 | |
| | 165,000 | | Northern State Power | | | | |
| | | | 6.200%, 07/01/2037 | | | 170,421 | |
| | 355,000 | | Southern California Edison Co. | | | | |
| | | | 4.740%, 02/02/2009 | | | 354,502 | |
| | 260,000 | | Virginia Electric & Power Co. | | | | |
| | | | 5.950%, 09/15/2017 | | | 268,008 | |
| | 210,000 | | Westar Energy Inc. | | | | |
| | | | 6.000%, 07/01/2014 | | | 214,129 | |
| | | | | | | 4,210,791 | |
| | | | Food & Staples Retailing 1.2% | | | | |
| | 275,000 | | General Mills, Inc. | | | | |
| | | | 5.650%, 09/10/2012 | | | 279,487 | |
| | 220,000 | | Kellogg Co. | | | | |
| | | | 5.125%, 12/03/2012 | | | 221,842 | |
| | 480,000 | | Kraft Foods, Inc. | | | | |
| | | | 6.125%, 02/01/2018 | | | 483,670 | |
| | 200,000 | | Kroger Co. | | | | |
| | | | 6.400%, 08/15/2017 | | | 209,183 | |
| | | | | | | 1,194,182 | |
| | | | Gas Utilities 1.5% | | | | |
| | 445,551 | | Alliance Pipeline U.S. | | | | |
| | | | 4.591%, 12/31/2025 | | | | |
| | | | (Acquired Multiple Dates, Cost $425,743) (a) | | | 442,161 | |
| | 225,000 | | Gulfstream Natural Gas | | | | |
| | | | 5.560%, 11/01/2015 | | | | |
| | | | (Acquired Multiple Dates, Cost $225,584) (a) | | | 221,150 | |
| | 370,000 | | Northern Natural Gas Co. | | | | |
| | | | 5.375%, 10/31/2012 (Acquired 04/05/2006, Cost $367,010) (a) | | | 380,654 | |
The accompanying notes are an integral part of these financial statements.
Frontegra Columbus Core Fund
SCHEDULE OF INVESTMENTS (CONTINUED)
December 31, 2007 (Unaudited)
Principal Amount | | | | Value | |
| | | CORPORATE BONDS 31.6% (continued) | | | |
| | | Gas Utilities 1.5% (continued) | | | |
| $ | 280,000 | | Rockies Express Pipeline | | | |
| | | | 6.448%, 08/20/2009 (Acquired 09/17/2007, Cost $279,306) (a) | | $ | 280,076 | |
| | 175,000 | | Source Gas LLC | | | | |
| | | | 5.900%, 04/01/2017 | | | | |
| | | | (Acquired 04/11/2007 and 08/03/2007, Cost $174,449) (a) | | | 166,762 | |
| | 50,000 | | Southern Star Cent Gas | | | | |
| | | | 6.000%, 06/01/2016 | | | | |
| | | | (Acquired 04/06/2006 and 08/03/2007 Cost $49,832) (a) | | | 48,875 | |
| | | | | | | 1,539,678 | |
| | | | Insurance 2.7% | | | | |
| | 325,000 | | Genworth Financial, Inc. | | | | |
| | | | 5.650%, 06/15/2012 | | | 328,601 | |
| | 270,000 | | Jackson National Life Global Funding | | | | |
| | | | 5.125%, 02/10/2011 | | | | |
| | | | (Acquired Multiple Dates, Cost $268,461) (a) | | | 281,107 | |
| | 235,000 | | Monumental Global Funding | | | | |
| | | | 5.254%, 01/25/2013 (Acquired 12/14/2007, Cost $224,925) (a) | | | 227,534 | |
| | 795,000 | | Nationwide Life Global Fund | | | | |
| | | | 5.450%, 10/02/2012 (Acquired 09/25/2007, Cost $794,006) (a) | | | 820,956 | |
| | 225,000 | | New York Life Global Funding | | | | |
| | | | 5.250%, 10/16/2012 (Acquired 10/09/2007, Cost $224,903) (a) | | | 230,216 | |
| | 795,000 | | Protective Life Corp. | | | | |
| | | | 5.450%, 09/28/2012 | | | 819,675 | |
| | | | | | | 2,708,089 | |
| | | | Media 0.9% | | | | |
| | 280,000 | | Comcast Corp. | | | | |
| | | | 6.300%, 11/15/2017 | | | 290,508 | |
| | | | Time Warner, Inc. | | | | |
| | 220,000 | | 7.700%, 05/01/2032 | | | 244,432 | |
| | 220,000 | | 6.500%, 11/15/2036 | | | 214,061 | |
| | 165,000 | | Walt Disney Co. | | | | |
| | | | 6.375%, 03/01/2012 | | | 175,189 | |
| | | | | | | 924,190 | |
The accompanying notes are an integral part of these financial statements.
Frontegra Columbus Core Fund
SCHEDULE OF INVESTMENTS (CONTINUED)
December 31, 2007 (Unaudited)
Principal Amount | | | | Value | |
| | | CORPORATE BONDS 31.6% (continued) | | | |
| | | Multi-Utilities & Unregulated Power 0.9% | | | |
| $ | 262,640 | | Kern River Funding Corp. | | | |
| | | | 4.893%, 04/30/2018 | | | |
| | | | (Acquired Multiple Dates, Cost $257,340) (a) | | $ | 257,214 | |
| | 219,601 | | Kiowa Power Partners LLC | | | | |
| | | | 4.811%, 12/30/2013 | | | | |
| | | | (Acquired 11/22/2004 and 08/03/2007, Cost $226,864) (a) | | | 219,983 | |
| | 400,000 | | Midamerican Energy Holdings | | | | |
| | | | 6.500%, 09/15/2037 | | | | |
| | | | (Acquired 08/23/2007 and 11/08/2007, Cost $399,033) (a) | | | 417,714 | |
| | | | | | | 894,911 | |
| | | | Oil, Gas & Consumable Fuels 0.6% | | | | |
| | 245,000 | | EOG Resources, Inc. | | | | |
| | | | 5.875%, 09/15/2017 | | | 251,181 | |
| | 381,408 | | PF Export Receivables Master Trust | | | | |
| | | | 3.748%, 06/01/2013 | | | | |
| | | | (Acquired Multiple Dates, Cost $379,804) (a) | | | 376,118 | |
| | | | | | | 627,299 | |
| | | | Pharmaceuticals 0.2% | | | | |
| | 210,000 | | Astrazeneca plc | | | | |
| | | | 5.400%, 09/15/2012 (b) | | | 217,108 | |
| | | | | | | | |
| | | | Transportation 3.0% | | | | |
| | | | Burlington North Santa Fe | | | | |
| | 667,497 | | 6.230%, 07/02/2018 | | | 698,790 | |
| | 738,519 | | 4.575%, 01/15/2021 | | | 709,753 | |
| | | | CSX Transportation, Inc. | | | | |
| | 205,000 | | 6.750%, 03/15/2011 | | | 215,118 | |
| | 435,000 | | 6.251%, 01/15/2023 | | | 441,642 | |
| | | | Union Pacific Corp. | | | | |
| | 320,000 | | 5.450%, 01/31/2013 | | | 322,790 | |
| | 581,032 | | 5.404%, 07/02/2025 | | | 609,247 | |
| | | | | | | 2,997,340 | |
| | | | Utilities 1.0% | | | | |
| | 235,000 | | Appalachian Power Co. | | | | |
| | | | 5.650%, 08/15/2012 | | | 238,803 | |
The accompanying notes are an integral part of these financial statements.
Frontegra Columbus Core Fund
SCHEDULE OF INVESTMENTS (CONTINUED)
December 31, 2007 (Unaudited)
Principal Amount | | | | Value | |
| | | CORPORATE BONDS 31.6% (continued) | | | |
| | | Utilities 1.0% (continued) | | | |
| $ | 330,000 | | Florida Power Corp. | | | |
| | | | 5.800%, 09/15/2017 | | $ | 342,762 | |
| | 410,000 | | West Penn Power Co. | | | | |
| | | | 5.950%, 12/15/2017 | | | | |
| | | | (Acquired Multiple Dates, Cost $409,144) (a) | | | 411,999 | |
| | | | | | | 993,564 | |
| | | | Total Corporate Bonds | | | | |
| | | | (Cost $29,213,366) | | | 31,964,939 | |
| | | | | | | | |
| | | | MORTGAGE BACKED SECURITIES 63.2% | | | | |
| | | | Banc of America Commercial Mortgage Inc. | | | | |
| | 485,000 | | Series 2004-2, Class A3, 4.050%, 11/10/2038 | | | 478,499 | |
| | 343,705 | | Series 2005-2, Class A2, 4.247%, 07/10/2043 | | | 343,204 | |
| | 180,000 | | Series 2005-5, Class A2, 5.001%, 10/10/2045 | | | 179,691 | |
| | 279,513 | | Series 2006-6, Class A1, 5.226%, 10/10/2045 | | | 280,565 | |
| | 345,000 | | Series 2005-6, Class A2, 5.165%, 09/10/2047 | | | 345,892 | |
| | 295,000 | | Series 2007-2, Class A2, 5.634%, 04/10/2049 | | | 299,182 | |
| | 265,000 | | Series 2006-4, Class A4, 5.634%, 07/10/2046 | | | 270,589 | |
| | 850,000 | | Citigroup/Deutsche Bank Commercial Mortgage Trust | | | | |
| | | | Series 2007-CD4, Class A4, 5.322%, 12/11/2049 | | | 847,490 | |
| | | | CNH Equipment Trust | | | | |
| | 304,512 | | Series 2007-B, Class A1, 5.816%, 10/09/2008 | | | 305,140 | |
| | 295,000 | | Series 2007-B, Class A2A, 5.460%, 06/15/2010 | | | 296,785 | |
| | 803,200 | | Commercial Mortgage Pass-Through Certificate | | | | |
| | | | Series 2003-LB1A, Class A1, 3.251%, 06/10/2038 | | | 774,826 | |
| | | | Credit Suisse First Boston Mortgage Securities Corp. | | | | |
| | 168,679 | | Pool # 2005-10, 5.000%, 09/25/2015 | | | 166,055 | |
| | 36,423 | | Pool # 2003-1, 7.000%, 02/25/2033 (e) | | | 36,477 | |
| | | | FHLMC PC GOLD CASH | | | | |
| | 388,627 | | Pool # E0-1418, 4.000%, 07/01/2018 | | | 374,200 | |
| | 319,659 | | Pool # G1-1678, 4.500%, 04/01/2020 (e) | | | 314,193 | |
| | | | FHLMC Pools | | | | |
| | 367,723 | | Pool # B18639, 4.000%, 01/01/2015 | | | 364,263 | |
| | 133,317 | | Pool # B19614, 5.000%, 07/01/2015 | | | 135,661 | |
| | 419,933 | | Pool # G11970, 5.000%, 04/01/2016 | | | 420,652 | |
| | 337,742 | | Pool # E01647, 4.000%, 05/01/2019 | | | 324,855 | |
The accompanying notes are an integral part of these financial statements.
Frontegra Columbus Core Fund
SCHEDULE OF INVESTMENTS (CONTINUED)
December 31, 2007 (Unaudited)
Principal Amount | | | | Value | |
| | | MORTGAGE BACKED SECURITIES 63.2% (continued) | | | |
| | | FHLMC Pools (continued) | | | |
| $ | 34,445 | | Pool # 2692, 3.500%, 01/15/2023 (e) | | $ | 34,386 | |
| | 206,284 | | Pool # A45788, 6.500%, 05/01/2035 | | | 212,996 | |
| | | | FHLMC Remic | | | | |
| | 7,949 | | Series 25, Class B, 6.500%, 12/25/2008 | | | 7,924 | |
| | 319,536 | | Series 2773, Class EB, 4.500%, 08/15/2013 | | | 318,856 | |
| | 264,018 | | Series 2775, Class ON, 3.000%, 11/15/2013 | | | 260,835 | |
| | 161,253 | | Series 2848, Class CG, 5.000%, 06/15/2015 (e) | | | 161,181 | |
| | 43,958 | | Series 2508, Class CR, 4.500%, 03/15/2016 (e) | | | 43,843 | |
| | 480,849 | | Series 2786, Class GA, 4.000%, 08/15/2017 | | | 473,605 | |
| | 16,673 | | Series 2912, Class EQ, 5.500%, 12/15/2020 (e) | | | 16,646 | |
| | 142,332 | | Series 2695, Class GU, 3.500%, 11/15/2022 (e) | | | 141,383 | |
| | 306,302 | | Series 2731, Class AB, 4.500%, 11/15/2028 | | | 303,579 | |
| | 176,377 | | Series 2793, Class BA, 4.500%, 09/15/2029 | | | 173,504 | |
| | 841,177 | | Series 2990, Class EN, 4.500%, 02/15/2033 | | | 829,433 | |
| | 611,469 | | Series 3031, Class LN, 4.500%, 08/15/2033 | | | 603,004 | |
| | 547,425 | | Series 3114, Class HN, 5.000%, 09/15/2033 | | | 548,137 | |
| | 1,016,265 | | Series 3169, Class BN, 5.000%, 06/15/2034 | | | 1,018,553 | |
| | 547,817 | | Series 3202, Class LN, 4.500%, 03/15/2035 | | | 540,369 | |
| | 423,736 | | Series 3036, Class LZ, 5.000%, 09/15/2035 | | | 339,531 | |
| | 394,485 | | Series 3114, Class KZ, 5.000%, 02/15/2036 | | | 315,447 | |
| | | | FNMA Pools | | | | |
| | 82,324 | | Pool # 380542, 6.150%, 08/01/2008 | | | 82,248 | |
| | 1,204,000 | | Pool # 385537, 4.745%, 11/01/2012 | | | 1,214,711 | |
| | 112,125 | | Pool # 254659, 4.500%, 02/01/2013 | | | 112,475 | |
| | 259,470 | | Pool # 768008, 5.000%, 06/01/2013 | | | 262,797 | |
| | 147,413 | | Pool # 768009, 5.000%, 06/01/2013 | | | 149,254 | |
| | 237,333 | | Pool # 555648, 4.543%, 06/01/2013 | | | 236,741 | |
| | 246,281 | | Pool # 254806, 4.500%, 07/01/2013 | | | 247,067 | |
| | 195,422 | | Pool # 735065, 4.498%, 08/01/2013 | | | 194,724 | |
| | 402,675 | | Pool # 386341, 3.810%, 08/01/2013 | | | 388,175 | |
| | 304,440 | | Pool # 386441, 3.980%, 08/01/2013 | | | 298,543 | |
| | 137,982 | | Pool # 763019, 5.000%, 08/01/2013 | | | 139,705 | |
| | 62,348 | | Pool # 254909, 4.000%, 09/01/2013 | | | 61,861 | |
| | 28,725 | | Pool # 255450, 4.500%, 10/01/2014 | | | 28,812 | |
| | 351,751 | | Pool # 745456, 5.500%, 03/01/2016 | | | 359,608 | |
| | 323,065 | | Pool #745659, 5.000%, 04/01/2016 | | | 328,472 | |
| | 364,891 | | Pool # 745444, 5.500%, 04/01/2016 | | | 370,994 | |
The accompanying notes are an integral part of these financial statements.
Frontegra Columbus Core Fund
SCHEDULE OF INVESTMENTS (CONTINUED)
December 31, 2007 (Unaudited)
Principal Amount | | | | Value | |
| | | MORTGAGE BACKED SECURITIES 63.2% (continued) | | | |
| | | FNMA Pools (continued) | | | |
| $ | 392,461 | | Pool # 357312, 5.000%, 12/01/2017 | | $ | 393,406 | |
| | 155,076 | | Pool # 254759, 4.500%, 06/01/2018 | | | 152,583 | |
| | 252,116 | | Pool # 254919, 4.000%, 09/01/2018 | | | 242,637 | |
| | 522,593 | | Pool # 725546, 4.500%, 06/01/2019 | | | 513,987 | |
| | 1,046,227 | | Pool # 735841, 4.500%, 11/01/2019 | | | 1,028,998 | |
| | 279,073 | | Pool # 555203, 7.000%, 09/01/2032 | | | 290,624 | |
| | 425,656 | | Pool # 730839, 5.000%, 07/01/2033 | | | 415,953 | |
| | 324,586 | | Pool # 727181, 5.000%, 08/01/2033 | | | 317,187 | |
| | 542,000 | | Pool # 739821, 5.000%, 09/01/2033 | | | 529,645 | |
| | 333,537 | | Pool # 386320, 4.550%, 10/01/2033 | | | 319,129 | |
| | 469,147 | | Pool # 740255, 5.000%, 10/01/2033 | | | 458,452 | |
| | 968,386 | | Pool # 725027, 5.000%, 11/01/2033 | | | 946,311 | |
| | 268,025 | | Pool # 952768, 7.000%, 09/01/2037 | | | 278,812 | |
| | | | FNMA Remic | | | | |
| | 262,034 | | Series 2002-74, Class PJ, 5.000%, 03/25/2015 | | | 261,583 | |
| | 846,165 | | Series 2005-35, Class AC, 4.000%, 08/25/2018 | | | 832,861 | |
| | 837,566 | | Series 2004-93, Class DG, 4.250%, 04/25/2019 | | | 826,601 | |
| | 24,781 | | Series 2003-58, Class PN, 3.500%, 10/25/2021 (e) | | | 24,713 | |
| | 198,888 | | Series 2005-27, Class NA, 5.500%, 01/25/2024 | | | 198,928 | |
| | 634,360 | | Series 2005-95, Class LN, 4.500%, 03/25/2033 | | | 626,309 | |
| | 111,843 | | Series 2003-W19, Class IA5, 5.500%, 11/25/2033 (e) | | | 111,533 | |
| | 247,132 | | Series 2004-64, Class BA, 5.000%, 03/25/2034 | | | 246,921 | |
| | 210,000 | | Series 2004-26, Class PE, 4.500%, 04/25/2034 | | | 190,949 | |
| | 175,681 | | Series 2002-T4, Class A3, 7.500%, 12/25/2041 | | | 186,533 | |
| | 244,050 | | Series 2004-T2, Class IA3, 7.000%, 11/25/2043 | | | 261,836 | |
| | | | FNMA TBA | | | | |
| | 2,720,000 | | 6.000%, 01/01/2029 (d) | | | 2,761,648 | |
| | 5,425,000 | | 6.000%, 02/01/2033 (d) | | | 5,502,984 | |
| | 13,310,000 | | 5.000%, 01/01/2034 (d) | | | 12,985,569 | |
| | 3,140,000 | | 5.500%, 01/01/2034 (d) | | | 3,136,075 | |
| | 834,021 | | GMAC Commercial Mortgage Securities Inc. | | | | |
| | | | Pool # 2003-C1, 3.337%, 05/10/2036 | | | 810,623 | |
| | 516,197 | | GNMA Pool | | | | |
| | | | Pool # 2005-21, 5.000%, 03/20/2035 | | | 455,962 | |
| | | | Greenwich Capital Commercial Funding Corp. | | | | |
| | 665,000 | | Series 2005-GG5, Class A2, 5.117%, 04/10/2037 | | | 666,129 | |
| | 475,000 | | Series 2007-GG9, Class A2, 5.381%, 03/10/2039 | | | 477,465 | |
The accompanying notes are an integral part of these financial statements.
Frontegra Columbus Core Fund
SCHEDULE OF INVESTMENTS (CONTINUED)
December 31, 2007 (Unaudited)
Principal Amount | | | | Value | |
| | | MORTGAGE BACKED SECURITIES 63.2% (continued) | | | |
| | | Greenwich Capital Commercial Funding Corp. (continued) | | | |
| $ | 350,000 | | Series 2007-GG9, Class A4, 5.444%, 03/10/2039 | | $ | 352,066 | |
| | 499,721 | | GS Mortgage Securities Corp. II | | | | |
| | | | Series 2007-EOP, Class A1, 5.410%, 03/06/2020 | | | | |
| | | | (Acquired 09/17/2007, Cost $496,598) (a)(c) | | | 477,707 | |
| | 1,300,000 | | JP Morgan Chase Commercial Mortgage Securities Corp. | | | | |
| | | | Series 2006-LDP9, Class A3, 5.336%, 05/15/2047 | | | 1,295,154 | |
| | | | LB-UBS Commercial Mortgage Trust | | | | |
| | 694,607 | | Series 2003-C3, Class A1, 2.599%, 05/15/2027 | | | 692,433 | |
| | 780,000 | | Series 2003-C3, Class A2, 3.086%, 05/15/2027 | | | 774,176 | |
| | 50,000 | | Series 2005-C5, Class A2, 4.885%, 09/15/2030 | | | 49,896 | |
| | 142,389 | | Series 1998-C4, Class A2, 6.300%, 10/15/2035 | | | 143,190 | |
| | 565,000 | | Series 2006-C6, Class A4, 5.372%, 09/15/2039 | | | 566,946 | |
| | 989,000 | | Series 2007-C2, Class A2, 5.303%, 02/15/2040 | | | 991,786 | |
| | 216,337 | | Master Alternative Loans Trust | | | | |
| | | | Pool # 2004-6, 4.500%, 07/25/2014 | | | 212,531 | |
| | 164,973 | | Master Asset Securitization Trust | | | | |
| | | | Pool # 2004-3, 4.750%, 01/25/2014 | | | 164,528 | |
| | 355,000 | | MBNA Credit Card Master Trust | | | | |
| | | | Series 2005-7A, Class A7, 4.300%, 02/15/2011 | | | 354,552 | |
| | | | Merrill Lynch Commercial Mortgage Trust | | | | |
| | 480,667 | | Series 1998-C3, Class A3, 5.880%, 12/15/2030 | | | 482,286 | |
| | 74,043 | | Series 2002-MW1, Class A2, 4.929%, 07/12/2034 | | | 73,824 | |
| | 452,477 | | Series 2006-C2, Class A1, 5.601%, 08/12/2043 | | | 457,002 | |
| | | | Morgan Stanley Capital I | | | | |
| | 305,771 | | Pool # 2003-IQ4, 3.270%, 05/15/2040 | | | 299,703 | |
| | 305,000 | | Pool # 2006-HQ8, 5.565%, 03/12/2044 | | | 307,972 | |
| | 333,840 | | Residential Asset Securitization Trust | | | | |
| | | | Series 2003-A6, Class A1, 4.500%, 07/25/2033 | | | 319,498 | |
| | 500,000 | | SLM Student Loan Trust | | | | |
| | | | Series 2007-7, Class A1, 5.038%, 10/25/2012 (c) | | | 497,500 | |
| | | | Wachovia Bank Commercial Mortgage Trust | | | | |
| | 428,300 | | Pool # 2003-C5, 2.986%, 06/15/2035 | | | 413,910 | |
| | 285,000 | | Pool # 2006-C24, Class A3, 5.558%, 03/15/2045 | | | 289,143 | |
| | 818,534 | | Wells Fargo Mortgage Backed Securities Trust | | | | |
| | | | Pool # 2006-3, 5.500%, 03/25/2036 | | | 821,273 | |
| | | | Total Mortgage Backed Securities | | | | |
| | | | (Cost $63,050,856) | | | 63,867,640 | |
The accompanying notes are an integral part of these financial statements.
Frontegra Columbus Core Fund
SCHEDULE OF INVESTMENTS (CONTINUED)
December 31, 2007 (Unaudited)
Principal Amount | | | | Value | |
| | | SUPRANATIONAL ISSUE 0.3% | | | |
| $ | 355,000 | | European Investment Bank | | | |
| | | | 4.875%, 02/15/2036 (b) | | $ | 349,268 | |
| | | | Total Supranational Issue | | | | |
| | | | (Cost $352,090) | | | 349,268 | |
| | | | | | | | |
| | | | SHORT-TERM INVESTMENTS 14.5% | | | | |
| | | | US Government Agency Issue (f) 12.5% | | | | |
| | 12,687,000 | | Federal Home Loan Bank Discount Note, 2.920%, 01/02/2008 | | | 12,684,942 | |
| | | | | | | | |
| | | | Variable Rate Demand Note (g) 2.0% | | | | |
| | 2,006,599 | | U.S. Bank Demand Note, 4.949%, 12/31/2031 | | | 2,006,599 | |
| | | | | | | | |
| | | | Total Short-Term Investments | | | | |
| | | | (Cost $14,691,541) | | | 14,691,541 | |
| | | | | | | | |
| | | | Total Investments 121.5% | | | | |
| | | | (Cost $121,742,241) | | | 122,914,572 | |
| | | | | | | | |
| | | | Liabilities in Excess of Other Assets (21.5)% | | | (21,750,771 | ) |
| | | | | | | | |
| | | | TOTAL NET ASSETS 100.0% | | $ | 101,163,801 | |
| (a) | Security exempt from registration under Rule 144A of the Securities Act of 1933. These securities may be resold in transactions exempt from registration normally to qualified institutional buyers. The total value of these securities amounted to $8,579,644 (8.5% of net assets) at December 31, 2007. |
| (b) | U.S.-dollar denominated security of foreign issuer. |
| (c) | Adjustable Rate. |
| (d) | When-issued security. |
| (e) | Security marked as segregated to cover when-issued security. |
| (f) | The obligations of certain U.S. Government-sponsored entities are neither issued nor guaranteed by the United States Treasury. |
| (g) | Variable rate demand notes are considered short-term obligations and are payable upon demand. Interest rates change periodically on specified dates. The rates listed are as of December 31, 2007. |
The accompanying notes are an integral part of these financial statements.
Frontegra Columbus Core Fund
SCHEDULE OF INVESTMENTS (CONTINUED)
December 31, 2007 (Unaudited)
| | Expiration | | | Notional | | | | |
| | Date | | | Amount | | | Value (a) | |
| Receive quarterly a fixed annual rate of 0.60% | | | | | | | | |
| multiplied by the notional amount and pay to | | | | | | | | |
| Goldman Sachs upon default event of a Dow Jones | | | | | | | | |
| CDX North America High Yield Index reference | | | | | | | | |
| obligation, par value of the notional amount of | | | | | | | | |
| Dow Jones CDX North America High Yield Index | | | | | | | | |
| reference obligation | 12/20/12 | | $ | 10,780,000 | | $ | (15,282) | |
| (a) | Includes interest paid or received by the Fund on the notional amount. |
The accompanying notes are an integral part of these financial statements.
Frontegra Columbus Core Fund
STATEMENT OF ASSETS AND LIABILITIES
December 31, 2007 (Unaudited)
Assets: | | | |
| Investments at value (cost $121,742,241) | | $ | 122,914,572 | |
| Interest receivable | | | 561,187 | |
| Cash | | | 22,513 | |
| Receivable for investments sold | | | 82,347,766 | |
| Receivable for Fund shares sold | | | 90,000 | |
| Other assets | | | 16,449 | |
| Total assets | | | 205,952,487 | |
| | | | | |
Liabilities: | | | | |
| Payable for investments purchased | | | 104,705,839 | |
| Accrued investment advisory fees | | | 11,716 | |
| Payable to broker | | | 9,476 | |
| Unrealized depreciation on swaps | | | 15,282 | |
| Accrued expenses | | | 46,373 | |
| Total liabilities | | | 104,788,686 | |
Net Assets | | $ | 101,163,801 | |
| | | | | |
Net Assets Consist of: | | | | |
| Paid in capital | | $ | 100,370,913 | |
| Undistributed net investment income | | | 624,114 | |
| Accumulated net realized loss | | | (988,275 | ) |
| Net unrealized appreciation (depreciation) on: | | | | |
| Investments | | | 1,172,331 | |
| Swap contracts | | | (15,282 | ) |
Net Assets | | $ | 101,163,801 | |
| | | | | |
Capital Stock, $0.01 Par Value | | | | |
| Authorized | | | 50,000,000 | |
| Issued and outstanding | | | 9,664,565 | |
Net Asset Value, Redemption Price and Offering Price Per Share | | $ | 10.47 | |
The accompanying notes are an integral part of these financial statements.
Frontegra Columbus Core Fund
STATEMENT OF OPERATIONS
| | | Six Months Ended | |
| | | December 31, 2007 | |
| | | (Unaudited) | |
Investment Income: | | | |
| Interest | | $ | 2,324,396 | |
| | | | | |
Expenses: | | | | |
| Investment advisory fees (Note 3) | | | 192,058 | |
| Fund administration and accounting fees | | | 30,681 | |
| Custody fees | | | 18,492 | |
| Audit fees | | | 15,789 | |
| Federal and state registration fees | | | 11,472 | |
| Legal fees | | | 10,468 | |
| Shareholder servicing fees | | | 4,556 | |
| Directors’ fees and related expenses | | | 3,665 | |
| Compliance support expenses | | | 3,517 | |
| Reports to shareholders | | | 1,211 | |
| Other | | | 910 | |
| Total expenses before waiver and reimbursement | | | 292,819 | |
| Waiver and reimbursement of expenses by Adviser (Note 3) | | | (176,140 | ) |
| Net expenses | | | 116,679 | |
Net Investment Income | | | 2,207,717 | |
| | | | | |
Realized and Unrealized | | | | |
Gain (Loss) on Investments: | | | | |
| Net realized gain on investments | | | 2,029,730 | |
| Change in net unrealized appreciation/depreciation on: | | | | |
| Investments | | | 1,750,133 | |
| Swap contracts | | | (21,343 | ) |
Net Realized and Unrealized | | | | |
Gain on Investments | | | 3,758,520 | |
Net Increase in Net Assets | | | | |
Resulting from Operations | | $ | 5,966,237 | |
The accompanying notes are an integral part of these financial statements.
Frontegra Columbus Core Fund
STATEMENTS OF CHANGES IN NET ASSETS
| | | Six Months Ended | | | | |
| | | December 31, 2007 | | | Year Ended | |
| | | (Unaudited) | | | June 30, 2007 | |
Operations: | | | | | | |
| Net investment income | | $ | 2,207,717 | | | $ | 4,321,715 | |
| Net realized gain on investments | | | 2,029,730 | | | | 346,908 | |
| Change in net unrealized appreciation/depreciation on: | | | | | | | | |
| Investments | | | 1,750,133 | | | | 834,722 | |
| Swap contracts | | | (21,343 | ) | | | 6,061 | |
| Net increase in net assets resulting from operations | | | 5,966,237 | | | | 5,509,406 | |
Distributions | | | | | | | | |
Paid From: | | | | | | | | |
| Net investment income | | | (1,607,511 | ) | | | (4,275,494 | ) |
Capital Share | | | | | | | | |
Transactions: | | | | | | | | |
| Shares issued in connection with acquisition of | | | | | | | | |
| Columbus Core Fund (see Note 7) | | | 14,423,435 | | | | — | |
| Shares sold | | | 20,775,452 | | | | 9,412,455 | |
| Shares issued to holders in | | | | | | | | |
| reinvestment of distributions | | | 1,148,687 | | | | 2,230,746 | |
| Shares redeemed | | | (30,313,593 | ) | | | (18,992,991 | ) |
| Net increase (decrease) in net assets resulting | | | | | | | | |
| from capital share transactions | | | 6,033,981 | | | | (7,349,790 | ) |
Total Increase (Decrease) in Net Assets | | | 10,392,707 | | | | (6,115,878 | ) |
| | | | | | | | | |
| | | | | | | | | |
Net Assets: | | | | | | | | |
| Beginning of period | | | 90,771,094 | | | | 96,886,972 | |
| End of period | | | | | | | | |
| (includes undistributed net investment income | | | | | | | | |
| of $624,114 and $23,908, respectively) | | $ | 101,163,801 | | | $ | 90,771,094 | |
The accompanying notes are an integral part of these financial statements.
Frontegra Columbus Core Fund
FINANCIAL HIGHLIGHTS
| | | Six Months | | | | | | | | | | | | | | | | |
| | | Ended | | | Year | | | Year | | | Year | | | Year | | | Year | |
| | | December 31, | | | Ended | | | Ended | | | Ended | | | Ended | | | Ended | |
| | | 2007 | | | June 30, | | | June 30, | | | June 30, | | | June 30, | | | June 30, | |
| | | (Unaudited) | | | 2007 | | | 2006 | | | 2005 | | | 2004 | | | 2003 | |
Net Asset Value, | | | | | | | | | | | | | | | | | | |
Beginning of Period | | $ | 9.99 | | | $ | 9.86 | | | $ | 10.36 | | | $ | 10.22 | | | $ | 10.62 | | | $ | 10.28 | |
| | | | | | | | | | | | | | | | | | | | | | | | | |
Income (Loss) | | | | | | | | | | | | | | | | | | | | | | | | |
from Investment | | | | | | | | | | | | | | | | | | | | | | | | |
Operations: | | | | | | | | | | | | | | | | | | | | | | | | |
| Net investment income | | | 0.25 | | | | 0.48 | | | | 0.42 | | | | 0.37 | | | | 0.31 | | | | 0.35 | |
| Net realized and unrealized | | | | | | | | | | | | | | | | | | | | | | | | |
| gain (loss) on investments | | | 0.42 | | | | 0.13 | | | | (0.43 | ) | | | 0.27 | | | | (0.15 | ) | | | 0.45 | |
Total Income (Loss) from | | | | | | | | | | | | | | | | | | | | | | | | |
Investment Operations | | | 0.67 | | | | 0.61 | | | | (0.01 | ) | | | 0.64 | | | | 0.16 | | | | 0.80 | |
| | | | | | | | | | | | | | | | | | | | | | | | | |
Less Distributions | | | | | | | | | | | | | | | | | | | | | | | | |
Paid: | | | | | | | | | | | | | | | | | | | | | | | | |
| From net investment income | | | (0.19 | ) | | | (0.48 | ) | | | (0.43 | ) | | | (0.37 | ) | | | (0.31 | ) | | | (0.35 | ) |
| From net realized gain on investments | | | — | | | | — | | | | (0.06 | ) | | | (0.13 | ) | | | (0.25 | ) | | | (0.11 | ) |
Total Distributions Paid | | | (0.19 | ) | | | (0.48 | ) | | | (0.49 | ) | | | (0.50 | ) | | | (0.56 | ) | | | (0.46 | ) |
| | | | | | | | | | | | | | | | | | | | | | | | | |
Net Asset Value, End of Period | | $ | 10.47 | | | $ | 9.99 | | | $ | 9.86 | | | $ | 10.36 | | | $ | 10.22 | | | $ | 10.62 | |
Total Return(1) | | | 6.72 | % | | | 6.26 | % | | | (0.11 | )% | | | 6.32 | % | | | 1.53 | % | | | 7.93 | % |
| | | | | | | | | | | | | | | | | | | | | | | | | |
Supplemental Data | | | | | | | | | | | | | | | | | | | | | | | | |
and Ratios: | | | | | | | | | | | | | | | | | | | | | | | | |
| Net assets, end of period | | | | | | | | | | | | | | | | | | | | | | | | |
| (in thousands) | | $ | 101,164 | | | $ | 90,771 | | | $ | 96,887 | | | $ | 95,719 | | | $ | 123,913 | | | $ | 135,211 | |
| Ratio of expenses to | | | | | | | | | | | | | | | | | | | | | | | | |
| average net assets(2)(3) | | | 0.26 | % | | | 0.20 | % | | | 0.20 | % | | | 0.40 | % | | | 0.42 | % | | | 0.42 | % |
| Ratio of net investment income to | | | | | | | | | | | | | | | | | | | | | | | | |
| average net assets(2)(3) | | | 4.83 | % | | | 4.77 | % | | | 4.20 | % | | | 3.07 | % | | | 2.39 | % | | | 3.78 | % |
| Portfolio turnover rate(1) | | | 469 | % | | | 980 | % | | | 1,121 | % | | | 1,080 | % | | | 1,104 | % | | | 625 | % |
| (1) | Not annualized for periods less than a full year. |
| (2) | Net of waivers and reimbursements by Adviser. Without waivers and reimbursements of expenses, the ratio of expenses to average net assets would have been 0.64%, 0.66%, 0.65%, 0.62%, 0.62% and 0.62% and the ratio of net investment income to average net assets would have been 4.45%, 4.31%, 3.75%, 2.85%, 2.19% and 3.58% for the periods ended December 31, 2007, June 30, 2007, June 30, 2006, June 30, 2005, June 30, 2004 and June 30, 2003, respectively. |
| (3) | Annualized for periods less than a full year. |
The accompanying notes are an integral part of these financial statements.
FRONTEGRA
IRONBRIDGE
SMALL CAP FUND
FRONTEGRA
IRONBRIDGE
SMID FUND
REPORT FROM IRONBRIDGE CAPITAL
MANAGEMENT:
Dear Fellow Shareholders:
The Frontegra IronBridge Small Cap Fund strives to achieve capital appreciation by investing in a diversified portfolio of equity securities of companies with small market capitalizations. The objective is relative to and measured against the Russell 2000®(1) Index.
The Frontegra IronBridge SMID Cap Fund strives to achieve capital appreciation by investing in a diversified portfolio of equity securities of companies with small and mid market capitalizations. The objective is relative to and measured against the Russell 2500TM(2) Index.
Performance Review
For the six months ending December 31, 2007, the Frontegra IronBridge Small Cap Fund returned -2.04% after fees, well ahead of its benchmark’s -7.53% return for the same period.
Small Cap Fund Winners | Return | | Small Cap Fund Losers | Return |
| CEPHEID INC | 210.27% | | PFF BANCORP | -69.14% |
| AMERICAN SUPERCONDUCTOR CORP | 178.59% | | PROGRESSIVE GAMING INTL CORP | -58.43% |
| AQUANTIVE INC | 167.49% | | SYMYX TECHNOLOGIES INC | -50.51% |
| CYPRESS SEMICONDUCTOR CORP | 119.41% | | OXFORD INDUSTRIES INC | -47.09% |
| FLIR SYSTEMS INC | 97.71% | | STEWART INFORMATION SERVICES | -38.13% |
| FMC TECHNOLOGIES INC | 83.99% | | UNIVERSAL FORECT PRODS INC | -36.57% |
| RESPIRONICS INC | 72.99% | | FIRST CASH FINANCIAL SVCS | -36.32% |
| WOODWARD GOVERNOR CO | 72.81% | | SOURCE INTERLINK COS INC | -35.91% |
| OCEANEERING INTERNATIONAL | 69.66% | | CORP OFFICE PPTYS TR INC | -35.28% |
| STRAYER EDUCATION INC | 64.24% | | INTEVAC INC | -35.23% |
For the full year, stock selection contributed over 1,000 basis points, while sector allocation added approximately 170 basis points. Stock selection was strong among our Information Technology, Health Care, and Industrials holdings, but weaker among our Materials and Utilities holdings.
The Frontegra IronBridge SMID Fund returned -3.28% after fees in 2007, ahead of the Russell 2500 Index’s -6.71% return for the six months ending December 31, 2007.
SMID Cap Fund Winners | Return | | SMID Cap Fund Losers | Return |
| INTUITIVE SURGICAL INC | 169.52% | | SYMYX TECHNOLOGIES INC | -58.02% |
| JACOBS ENGINEERING GROUP INC | 124.37% | | ST JOE CO | -49.20% |
| MEDIMMUNE INC | 79.05% | | LEAPFROG ENTERPRISES INC | -39.34% |
| CANADIAN PACIFIC RAILWAY LTD | 58.45% | | TELLABS INC | -37.10% |
| GOODRICH CORP | 57.43% | | STEWART INFORMATION SERVICES | -36.94% |
| PARKER-HANNIFIN CORP | 56.50% | | CIT GROUP INC | -30.19% |
| OAKLEY INC | 52.05% | | HARMAN INTERNATIONAL INDS | -28.90% |
| IDEXX LABS INC | 51.69% | | RTI METALS INC | -27.75% |
| INFRASOURCE SERVICES INC | 50.65% | | MEN’S WEARHOUSE INC | -27.53% |
| TELEDYNE TECHNOLOGIES INC | 50.47% | | SYNAPTICS INC | -23.81% |
| (1) | Russell 2000® Index is either a registered trademark or tradename of Russell Investment Group in the U.S. and/or other countries. Indexes are unmanaged and cannot be invested in directly. |
| (2) | Russell 2500™ Index is either a registered trademark or tradename of Russell Investment Group in the U.S. and/or other countries. Indexes are unmanaged and cannot be invested in directly. |
For the full year, stock selection contributed over 900 basis points, while sector allocation added approximately 70 basis points. Stock selection for the year was led by Industrials, Consumer Discretionary, Health Care, and Financials. Stock selection was weak among the Materials sector.
The significant excess return achieved in 2007 had been building over several years as the market-distorting influences that we identified in 2006 started to unwind. As a reminder, we were concerned that globalization and financial “innovation” was driving excess liquidity, which was responsible for creating market distortions, potentially resulting in a broad misallocation of capital and a dangerous mispricing of risk. The result was leadership among lower quality, higher risk, overvalued, less liquid companies, which we refused to own due to our disciplined framework. We (and many other active managers) looked pretty foolish in 2006 when compared to our Russell benchmarks. This year, the sub-prime crisis exposed the illusion of the disappearing risk premium. Risk has started to be priced more rationally, which has significantly benefited the IronBridge portfolios relative to our benchmarks.
The unwinding of financial “SINnovation” may be signaling a turning point in market leadership. In 2007, large capitalization stocks outperformed small capitalization stocks for the first time in eight years. Growth outperformed value for the second time since 1999 (the last time was 2003). Active portfolio managers outperformed ETFs and other passive strategies. Quantitative strategies performed poorly as their backward-looking models typically failed to capture inflection points. Uncorrelated asset classes became correlated during market meltdowns. All of these observations are potentially related to the unwinding of financial sinnovation. The big question facing the markets over the next few years is whether the “great unwind” will occur in an orderly fashion or whether the government will re-flate the financial system in order to stave off a potential financial crisis.
Portfolio Outlook
Our cautious outlook was justified. We remain cautious, as it is clear to us that the self-correcting mechanism of capitalism has more work to do to clear out poor allocators of capital. We expect volatility as the reality of lower CFROIs and lower growth collides with the political knee-jerk reactions to “do something.” We suspect that the more the government does to bail out the poor allocators of capital the more difficult it will be for us to outperform because it will keep alive the forces that led to a systematic misallocation of capital, and we do not want to bet on those players for the long term. Perhaps the government will bail out the “Countrywide Financials” of the world, but we do not invest based on the philosophy that poor managers of capital get bailed out by taxpayers. We invest based on the philosophy that good managers of capital will create the most wealth over the long term.
We remain confident that our disciplined investment approach and internally-developed investment tools will help us take advantage of market volatility as the market struggles with the near-term cyclical headwinds and the uncertainty regarding the most recent credit crisis.
Thank you for your continued support.
Kind regards,
 |  |
| Christopher C. Faber | Jeffrey B. Madden |
| IronBridge Capital Management, L.P. | IronBridge Capital Management, L.P. |
INVESTMENT HIGHLIGHTS
Growth of a $100,000 Investment (Unaudited)
* 8/30/02 commencement of operations.
| | | | |
| | Portfolio Total Return** | | |
| | FOR THE PERIOD ENDED 12/31/07 | | |
| | | | |
| | SIX MONTHS | (2.04)% | |
| | | | |
| | ONE YEAR | 10.01% | |
| | | | |
| | THREE YEAR | | |
| | AVERAGE ANNUAL | 9.79% | |
| | | | |
| | FIVE YEAR | | |
| | AVERAGE ANNUAL | 17.72% | |
| | | | |
| | SINCE COMMENCEMENT | | |
| | AVERAGE ANNUAL | 17.83% | |
| | | | |
This chart assumes an initial gross investment of $100,000 made on 8/30/02 (commencement of operations). Returns shown include the reinvestment of all distributions. Past performance is not predictive of future results. Investment return and principal value will fluctuate so that shares, when redeemed, may be worth more or less than the original cost. To receive current to the most recent month-end performance, please call 1-888-825-2100.
The Russell 2000 Index measures the performance of the 2,000 smallest companies in the Russell 3000 Index. The Russell 3000 Index measures the performance of the 3,000 largest U.S. companies based on total market capitalization. The Index does not reflect investment management fees, brokerage commissions and other expenses associated with investing in equity securities. A direct investment in the index is not possible.
| ** | The returns shown do not reflect the deduction of taxes that a shareholder would pay on Fund distributions or the redemption of Fund shares. |
Frontegra IronBridge Small Cap Fund
SCHEDULE OF INVESTMENTS
December 31, 2007 (Unaudited)
Number of Shares | | | | Value | |
| | | COMMON STOCKS 95.1% | | | |
| | | Aerospace & Defense 3.6% | | | |
| | 132,259 | | Moog Inc. - Class A (a) | | $ | 6,058,785 | |
| | 186,328 | | Orbital Sciences Corp. (a) | | | 4,568,763 | |
| | 52,807 | | Triumph Group, Inc. | | | 4,348,656 | |
| | | | | | | 14,976,204 | |
| | | | Auto Components 1.7% | | | | |
| | 272,130 | | Gentex Corp. | | | 4,835,750 | |
| | 120,222 | | Superior Industries International, Inc. | | | 2,184,434 | |
| | | | | | | 7,020,184 | |
| | | | Biotechnology 2.5% | | | | |
| | 174,981 | | Cepheid, Inc. (a) | | | 4,610,749 | |
| | 171,174 | | Exelixis, Inc. (a) | | | 1,477,232 | |
| | 74,215 | | Isis Pharmaceuticals, Inc. (a) | | | 1,168,886 | |
| | 50,169 | | Techne Corp. (a) | | | 3,313,663 | |
| | | | | | | 10,570,530 | |
| | | | Building Products 1.6% | | | | |
| | 204,542 | | Apogee Enterprises, Inc. | | | 3,499,714 | |
| | 111,005 | | Universal Forest Products, Inc. | | | 3,270,207 | |
| | | | | | | 6,769,921 | |
| | | | Capital Markets 1.9% | | | | |
| | 347,092 | | Jefferies Group, Inc. | | | 8,000,471 | |
| | | | | | | | |
| | | | Chemicals 4.5% | | | | |
| | 49,664 | | Arch Chemicals, Inc. | | | 1,825,152 | |
| | 158,910 | | FMC Corp. | | | 8,668,540 | |
| | 68,961 | | Lubrizol Corp. | | | 3,734,928 | |
| | 96,184 | | Methanex Corp. (b) | | | 2,654,678 | |
| | 30,387 | | Minerals Technologies Inc. | | | 2,034,410 | |
| | | | | | | 18,917,708 | |
| | | | Commercial Banks 4.5% | | | | |
| | 154,017 | | Cathay General Bancorp | | | 4,079,910 | |
| | 151,925 | | First Midwest Bancorp, Inc. | | | 4,648,905 | |
| | 280,009 | | Sterling Bancshares, Inc. | | | 3,124,901 | |
| | 85,212 | | United Bankshares, Inc. | | | 2,387,640 | |
| | 99,854 | | Westamerica Bancorporation | | | 4,448,496 | |
| | | | | | | 18,689,852 | |
The accompanying notes are an integral part of these financial statements.
Frontegra IronBridge Small Cap Fund
SCHEDULE OF INVESTMENTS (CONTINUED)
December 31, 2007 (Unaudited)
Number of Shares | | | | Value | |
| | | COMMON STOCKS 95.1% (continued) | | | |
| | | Commercial Services & Supplies 3.1% | | | |
| | 147,456 | | Mobile Mini, Inc. (a) | | $ | 2,733,834 | |
| | 23,953 | | Strayer Education, Inc. | | | 4,085,903 | |
| | 93,245 | | TeleTech Holdings, Inc. (a) | | | 1,983,321 | |
| | 93,179 | | Watson Wyatt Worldwide Inc. - Class A | | | 4,324,438 | |
| | | | | | | 13,127,496 | |
| | | | Communications Equipment 3.1% | | | | |
| | 200,458 | | Polycom, Inc. (a) | | | 5,568,723 | |
| | 211,791 | | Tekelec (a) | | | 2,647,388 | |
| | 133,958 | | ViaSat, Inc. (a) | | | 4,612,174 | |
| | | | | | | 12,828,285 | |
| | | | Computer Programming Services 0.4% | | | | |
| | 112,495 | | Perficient, Inc. (a) | | | 1,770,671 | |
| | | | | | | | |
| | | | Computers & Peripherals 0.4% | | | | |
| | 39,404 | | Synaptics Inc. (a) | | | 1,621,869 | |
| | | | | | | | |
| | | | Consumer Finance 0.4% | | | | |
| | 112,535 | | First Cash Financial Services, Inc. (a) | | | 1,652,014 | |
| | | | | | | | |
| | | | Electric Utilities 1.2% | | | | |
| | 111,440 | | Black Hills Corp. | | | 4,914,504 | |
| | | | | | | | |
| | | | Electrical Equipment 3.7% | | | | |
| | 124,812 | | American Superconductor Corp. (a) | | | 3,412,360 | |
| | 98,795 | | Thomas & Betts Corp. (a) | | | 4,844,907 | |
| | 109,645 | | Woodward Governor Co. | | | 7,450,378 | |
| | | | | | | 15,707,645 | |
| | | | Electronic Equipment & Instruments 5.1% | | | | |
| | 130,148 | | Flir Systems, Inc. (a) | | | 4,073,632 | |
| | 128,717 | | National Instruments Corp. | | | 4,290,138 | |
| | 94,460 | | Rofin-Sinar Technologies, Inc. (a) | | | 4,544,471 | |
| | 181,081 | | Trimble Navigation Ltd. (a) | | | 5,475,889 | |
| | 167,852 | | Veeco Instruments, Inc. (a) | | | 2,803,128 | |
| | | | | | | 21,187,258 | |
The accompanying notes are an integral part of these financial statements.
Frontegra IronBridge Small Cap Fund
SCHEDULE OF INVESTMENTS (CONTINUED)
December 31, 2007 (Unaudited)
Number of Shares | | | | Value | |
| | | COMMON STOCKS 95.1% (continued) | | | |
| | | Energy Equipment & Services 5.7% | | | |
| | 115,044 | | FMC Technologies, Inc. (a) | | $ | 6,522,995 | |
| | 46,641 | | Lufkin Industries, Inc. | | | 2,672,063 | |
| | 87,893 | | Matrix Service Co. (a) | | | 1,917,825 | |
| | 84,558 | | Oceaneering International, Inc. (a) | | | 5,694,981 | |
| | 111,990 | | Oil States International, Inc. (a) | | | 3,821,099 | |
| | 67,885 | | Unit Corp. (a) | | | 3,139,681 | |
| | | | | | | 23,768,644 | |
| | | | Food Products 1.7% | | | | |
| | 139,913 | | Corn Products International, Inc. | | | 5,141,803 | |
| | 73,610 | | Peet’s Coffee & Tea, Inc. (a) | | | 2,139,842 | |
| | | | | | | 7,281,645 | |
| | | | Gas Utilities 2.0% | | | | |
| | 116,892 | | AGL Resources, Inc. | | | 4,399,815 | |
| | 129,488 | | Southern Union Co. | | | 3,801,768 | |
| | | | | | | 8,201,583 | |
| | | | Health Care Equipment & Supplies 8.0% | | | | |
| | 230,919 | | ABIOMED, Inc. (a) | | | 3,588,481 | |
| | 34,678 | | Analogic Corp. | | | 2,348,394 | |
| | 19,400 | | ArthroCare Corp. (a) | | | 932,170 | |
| | 36,014 | | Hansen Medical, Inc. (a) | | | 1,078,259 | |
| | 62,844 | | IDEXX Laboratories, Inc. (a) | | | 3,684,544 | |
| | 60,362 | | Illumina, Inc. (a) | | | 3,577,052 | |
| | 92,109 | | Respironics, Inc. (a) | | | 6,031,297 | |
| | 113,026 | | SonoSite, Inc. (a) | | | 3,805,586 | |
| | 149,951 | | Thoratec Corp. (a) | | | 2,727,609 | |
| | 87,817 | | Varian, Inc. (a) | | | 5,734,450 | |
| | | | | | | 33,507,842 | |
| | | | Health Care Providers & Services 4.4% | | | | |
| | 70,313 | | Allscripts Healthcare Solutions, Inc. (a) | | | 1,365,478 | |
| | 161,067 | | Cerner Corp. (a) | | | 9,084,179 | |
| | 83,686 | | Owens & Minor, Inc. | | | 3,550,797 | |
| | 197,679 | | Phase Forward, Inc. (a) | | | 4,299,518 | |
| | | | | | | 18,299,972 | |
| | | | Hotels, Restaurants & Leisure 0.8% | | | | |
| | 223,898 | | California Pizza Kitchen, Inc. (a) | | | 3,486,092 | |
The accompanying notes are an integral part of these financial statements.
Frontegra IronBridge Small Cap Fund
SCHEDULE OF INVESTMENTS (CONTINUED)
December 31, 2007 (Unaudited)
Number of Shares | | | | Value | |
| | | COMMON STOCKS 95.1% (continued) | | | |
| | | Household Durables 3.3% | | | |
| | 83,564 | | AptarGroup, Inc. | | $ | 3,418,603 | |
| | 139,040 | | iRobot Corp. (a) | | | 2,513,843 | |
| | 25,628 | | Snap-on Inc. | | | 1,236,295 | |
| | 131,440 | | Tupperware Brands Corp. | | | 4,341,463 | |
| | 74,406 | | Universal Electronics Inc. (a) | | | 2,488,137 | |
| | | | | | | 13,998,341 | |
| | | | Industrial Conglomerates 1.6% | | | | |
| | 11,230 | | Alleghany Corp. (a) | | | 4,514,460 | |
| | 54,791 | | Raven Industries, Inc. | | | 2,103,426 | |
| | | | | | | 6,617,886 | |
| | | | Insurance 3.3% | | | | |
| | 155,219 | | American Financial Group, Inc. | | | 4,482,725 | |
| | 72,836 | | Argo Group International Holdings, Ltd. (a)(b) | | | 3,068,581 | |
| | 85,035 | | FBL Financial Group, Inc. - Class A | | | 2,936,259 | |
| | 80,453 | | Selective Insurance Group, Inc. | | | 1,849,614 | |
| | 49,916 | | Stewart Information Services Corp. | | | 1,302,308 | |
| | | | | | | 13,639,487 | |
| | | | Leisure Equipment & Products 1.9% | | | | |
| | 316,478 | | Callaway Golf Co. | | | 5,516,211 | |
| | 335,689 | | Leapfrog Enterprises, Inc. (a) | | | 2,259,187 | |
| | | | | | | 7,775,398 | |
| | | | Machinery 4.8% | | | | |
| | 104,803 | | Astec Industries, Inc. (a) | | | 3,897,624 | |
| | 115,534 | | IDEX Corp. | | | 4,174,243 | |
| | 86,526 | | Kaydon Corp. | | | 4,719,128 | |
| | 103,896 | | Lincoln Electric Holdings, Inc. | | | 7,395,317 | |
| | | | | | | 20,186,312 | |
| | | | Marine 1.1% | | | | |
| | 88,212 | | Alexander & Baldwin, Inc. | | | 4,557,032 | |
| | | | | | | | |
| | | | Metals & Mining 1.0% | | | | |
| | 60,572 | | RTI International Metals, Inc. (a) | | | 4,175,228 | |
| | | | | | | | |
| | | | Multi-Utilities & Unregulated Power 1.5% | | | | |
| | 296,203 | | Avista Corp. | | | 6,380,213 | |
The accompanying notes are an integral part of these financial statements.
Frontegra IronBridge Small Cap Fund
SCHEDULE OF INVESTMENTS (CONTINUED)
December 31, 2007 (Unaudited)
Number of Shares | | | | Value | |
| | | COMMON STOCKS 95.1% (continued) | | | |
| | | Oil & Gas 1.2% | | | |
| | 127,252 | | Cabot Oil & Gas Corp. | | $ | 5,137,163 | |
| | | | | | | | |
| | | | Real Estate 4.8% | | | | |
| | 393,179 | | Annaly Mortgage Management, Inc. | | | 7,147,994 | |
| | 169,246 | | Corporate Office Properties Trust | | | 5,331,249 | |
| | 82,420 | | First Industrial Realty Trust, Inc. | | | 2,851,732 | |
| | 117,004 | | Mid-America Apartment Communities, Inc. | | | 5,001,921 | |
| | | | | | | 20,332,896 | |
| | | | Semiconductor & Semiconductor Equipment 2.9% | | | | |
| | 122,668 | | Cohu, Inc. | | | 1,876,820 | |
| | 157,853 | | Cypress Semiconductor Corp. (a) | | | 5,687,444 | |
| | 125,621 | | Varian Semiconductor Equipment Associates, Inc. (a) | | | 4,647,977 | |
| | | | | | | 12,212,241 | |
| | | | Software 2.3% | | | | |
| | 82,174 | | Jack Henry & Associates, Inc. | | | 2,000,115 | |
| | 120,829 | | Manhattan Associates, Inc. (a) | | | 3,185,052 | |
| | 255,677 | | Parametric Technology Corp. (a) | | | 4,563,835 | |
| | | | | | | 9,749,002 | |
| | | | Specialty Retail 2.4% | | | | |
| | 171,278 | | Men’s Wearhouse, Inc. | | | 4,621,081 | |
| | 78,938 | | Stage Stores, Inc. | | | 1,168,282 | |
| | 117,593 | | Tractor Supply Co. (a) | | | 4,226,292 | |
| | | | | | | 10,015,655 | |
| | | | Textiles, Apparel & Luxury Goods 2.7% | | | | |
| | 93,176 | | Oxford Industries, Inc. | | | 2,401,146 | |
| | 357,647 | | Wolverine World Wide, Inc. | | | 8,769,504 | |
| | | | | | | 11,170,650 | |
| | | | Total Common Stocks | | | | |
| | | | (Cost $332,565,951) | | | 398,247,894 | |
The accompanying notes are an integral part of these financial statements.
Frontegra IronBridge Small Cap Fund
SCHEDULE OF INVESTMENTS (CONTINUED)
December 31, 2007 (Unaudited)
Principal Amount | | | | Value | |
| | | SHORT-TERM INVESTMENTS 4.7% | | | |
| | | US Government Agency Issue (c) 3.7% | | | |
| $ | 15,727,000 | | Federal Home Loan Bank Discount Note, 1.460%, 01/02/2008 | | $ | 15,725,724 | |
| | | | | | | | |
| | | | Variable Rate Demand Note (d) 1.0% | | | | |
| | 4,149,708 | | U.S. Bank Demand Note, 4.605%, 12/31/2031 | | | 4,149,708 | |
| | | | | | | | |
| | | | Total Short-Term Investments | | | | |
| | | | (Cost $19,875,432) | | | 19,875,432 | |
| | | | | | | | |
| | | | Total Investments 99.8% | | | | |
| | | | (Cost $352,441,383) | | | 418,123,326 | |
| | | | | | | | |
| | | | Other Assets in Excess of Liabilities 0.2% | | | 801,960 | |
| | | | | | | | |
| | | | TOTAL NET ASSETS 100.0% | | $ | 418,925,286 | |
| (a) | Non-Income Producing. |
| (b) | U.S.-dollar denominated security of foreign issuer. |
| (c) | The obligations of certain U.S. Government-sponsored entities are neither issued nor guaranteed by the United States Treasury. |
| (d) | Variable rate demand notes are considered short-term obligations and are payable upon demand. Interest rates change periodically on specified dates. The rates listed are as of December 31, 2007. |
The accompanying notes are an integral part of these financial statements.
Frontegra IronBridge Small Cap Fund STATEMENT OF ASSETS AND LIABILITIES
December 31, 2007 (Unaudited)
Assets: | | | |
| Investments at value (cost $352,441,383) | | $ | 418,123,326 | |
| Cash | | | 421,722 | |
| Interest and dividend receivable | | | 554,574 | |
| Receivable for investments sold | | | 1,221,832 | |
| Receivable for Fund shares sold | | | 313,724 | |
| Other assets | | | 16,506 | |
| Total assets | | | 420,651,684 | |
| | | | | |
Liabilities: | | | | |
| Payable for investments purchased | | | 1,232,567 | |
| Payable for Fund shares purchased | | | 73,204 | |
| Accrued investment advisory fee | | | 356,965 | |
| Accrued expenses | | | 63,662 | |
| Total liabilities | | | 1,726,398 | |
Net Assets | | $ | 418,925,286 | |
| | | | | |
Net Assets Consist of: | | | | |
| Paid in capital | | $ | 349,565,169 | |
| Undistributed net investment income | | | 9,266 | |
| Undistributed net realized gain | | | 3,668,908 | |
| Net unrealized appreciation on investments | | | 65,681,943 | |
Net Assets | | $ | 418,925,286 | |
| | | | | |
Capital Stock, $0.01 Par Value | | | | |
| Authorized | | | 50,000,000 | |
| Issued and outstanding | | | 23,584,559 | |
Net Asset Value, Redemption Price and Offering Price Per Share | | $ | 17.76 | |
The accompanying notes are an integral part of these financial statements.
Frontegra IronBridge Small Cap Fund
STATEMENT OF OPERATIONS
| | | Six Months Ended | |
| | | December 31, 2007 | |
| | | (Unaudited) | |
Investment Income: | | | |
| Dividends(1) | | $ | 2,088,949 | |
| Interest | | | 379,434 | |
| | | | 2,468,383 | |
| | | | | |
Expenses: | | | | |
| Investment advisory fees (Note 3) | | | 2,177,716 | |
| Fund administration and accounting fees | | | 64,725 | |
| Custody fees | | | 17,444 | |
| Federal and state registration fees | | | 16,893 | |
| Audit fees | | | 15,699 | |
| Legal fees | | | 10,312 | |
| Shareholder servicing fees | | | 9,493 | |
| Reports to shareholders | | | 5,856 | |
| Directors’ fees and related expenses | | | 3,741 | |
| Compliance support expenses | | | 3,517 | |
| Other | | | 5,237 | |
| Total expenses before recapture | | | 2,330,633 | |
| Expenses recaptured by Adviser (Note 3) | | | 32,371 | |
| Total expenses | | | 2,363,004 | |
Net Investment Income | | | 105,379 | |
| | | | | |
Realized and Unrealized | | | | |
Gain (Loss) on Investments: | | | | |
| Net realized gain on investments | | | 30,026,373 | |
| Change in net unrealized appreciation/depreciation on investments | | | (38,726,111 | ) |
Net Realized and Unrealized | | | | |
Loss on Investments | | | (8,699,738 | ) |
Net Decrease in Net Assets | | | | |
Resulting from Operations | | $ | (8,594,359 | ) |
| (1) | Net of $4,040 in foreign witholding taxes. |
The accompanying notes are an integral part of these financial statements.
Frontegra IronBridge Small Cap Fund
STATEMENTS OF CHANGES IN NET ASSETS
| | | Six Months Ended | | | | |
| | | December 31, 2007 | | | Year Ended | |
| | | (Unaudited) | | | June 30, 2007 | |
Operations: | | | | | | |
| Net investment income (loss) | | $ | 105,379 | | | $ | (307,757 | ) |
| Net realized gain on investments | | | 30,026,373 | | | | 26,990,992 | |
| Change in net unrealized | | | | | | | | |
| appreciation/depreciation on investments | | | (38,726,111 | ) | | | 53,525,309 | |
| Net increase (decrease) in net assets | | | | | | | | |
| resulting from operations | | | (8,594,359 | ) | | | 80,208,544 | |
| | | | | | | | | |
Distributions | | | | | | | | |
Paid From: | | | | | | | | |
| Net investment income | | | (96,113 | ) | | | (409,379 | ) |
| Net realized gain on investments | | | (45,487,193 | ) | | | (34,371,912 | ) |
| Net decrease in net assets resulting | | | | | | | | |
| from distributions paid | | | (45,583,306 | ) | | | (34,781,291 | ) |
| | | | | | | | | |
Capital Share | | | | | | | | |
Transactions: | | | | | | | | |
| Shares sold | | | 17,086,828 | | | | 35,281,886 | |
| Shares issued to holders in | | | | | | | | |
| reinvestment of distributions | | | 43,952,221 | | | | 33,624,374 | |
| Shares redeemed | | | (20,339,063 | ) | | | (86,149,770 | ) |
| Net increase (decrease) in net assets resulting | | | | | | | | |
| from capital share transactions | | | 40,699,986 | | | | (17,243,510 | ) |
| | | | | | | | | |
Total Increase (Decrease) in Net Assets | | | (13,477,679 | ) | | | 28,183,743 | |
| | | | | | | | | |
Net Assets: | | | | | | | | |
| Beginning of period | | | 432,402,965 | | | | 404,219,222 | |
| End of period | | | | | | | | |
| (includes undistributed net investment income | | | | | | | | |
| of $9,266 and $0 respectively) | | $ | 418,925,286 | | | $ | 432,402,965 | |
The accompanying notes are an integral part of these financial statements.
Frontegra IronBridge Small Cap Fund
FINANCIAL HIGHLIGHTS
| | | Six Months | | | | | | | | | | | | | | | | |
| | | Ended | | | Year | | | Year | | | Year | | | Year | | | Period | |
| | | December 31, | | | Ended | | | Ended | | | Ended | | | Ended | | | Ended | |
| | | 2007 | | | June 30, | | | June 30, | | | June 30, | | | June 30, | | | June 30, | |
| | | (Unaudited) | | | 2007 | | | 2006 | | | 2005 | | | 2004 | | | 2003(1)(6) | |
Net Asset Value, | | | | | | | | | | | | | | | | | | |
Beginning of Period | | $ | 20.35 | | | $ | 18.25 | | | $ | 16.14 | | | $ | 15.83 | | | $ | 13.04 | | | $ | 10.00 | |
| | | | | | | | | | | | | | | | | | | | | | | | | |
Income (Loss) | | | | | | | | | | | | | | | | | | | | | | | | |
from Investment | | | | | | | | | | | | | | | | | | | | | | | | |
Operations: | | | | | | | | | | | | | | | | | | | | | | | | |
| Net investment income (loss) | | | 0.00 | (5) | | | (0.00 | ) | | | 0.03 | | | | (0.03 | ) | | | (0.04 | ) | | | — | (5) |
| Net realized and unrealized | | | | | | | | | | | | | | | | | | | | | | | | |
| gain (loss) on investments | | | (0.42 | ) | | | 3.82 | | | | 2.25 | | | | 1.38 | | | | 3.17 | | | | 3.04 | |
Total Income (Loss) from | | | | | | | | | | | | | | | | | | | | | | | | |
Investment Operations | | | (0.42 | ) | | | 3.82 | | | | 2.28 | | | | 1.35 | | | | 3.13 | | | | 3.04 | |
| | | | | | | | | | | | | | | | | | | | | | | | | |
Less Distributions | | | | | | | | | | | | | | | | | | | | | | | | |
Paid: | | | | | | | | | | | | | | | | | | | | | | | | |
| From net investment income | | | (0.00 | )(5) | | | (0.02 | ) | | | — | | | | — | | | | — | | | | — | |
| From net realized gain on investments | | | (2.17 | ) | | | (1.70 | ) | | | (0.17 | ) | | | (1.04 | ) | | | (0.34 | ) | | | — | |
Total Distributions Paid | | | (2.17 | ) | | | (1.72 | ) | | | (0.17 | ) | | | (1.04 | ) | | | (0.34 | ) | | | — | |
| | | | | | | | | | | | | | | | | | | | | | | | | |
Net Asset Value, End of Period | | $ | 17.76 | | | $ | 20.35 | | | $ | 18.25 | | | $ | 16.14 | | | $ | 15.83 | | | $ | 13.04 | |
Total Return(2) | | | (2.04 | )% | | | 22.11 | % | | | 14.20 | % | | | 8.47 | % | | | 24.25 | % | | | 30.40 | % |
| | | | | | | | | | | | | | | | | | | | | | | | | |
Supplemental Data | | | | | | | | | | | | | | | | | | | | | | | | |
and Ratios: | | | | | | | | | | | | | | | | | | | | | | | | |
| Net assets, end of period | | | | | | | | | | | | | | | | | | | | | | | | |
| (in thousands) | | $ | 418,925 | | | $ | 432,403 | | | $ | 404,219 | | | $ | 319,081 | | | $ | 144,988 | | | $ | 54,074 | |
| Ratio of expenses to | | | | | | | | | | | | | | | | | | | | | | | | |
| average net assets(3)(4) | | | 1.08 | % | | | 1.10 | % | | | 1.10 | % | | | 1.10 | % | | | 1.10 | % | | | 1.10 | % |
| Ratio of net investment income (loss) | | | | | | | | | | | | | | | | | | | | | | | | |
| to average net assets(3)(4) | | | 0.15 | % | | | (0.08 | )% | | | 0.15 | % | | | (0.27 | )% | | | (0.29 | )% | | | (0.07 | )% |
| Portfolio turnover rate(2) | | | 27 | % | | | 34 | % | | | 60 | % | | | 56 | % | | | 94 | % | | | 28 | % |
| (1) | Commenced operations on August 30, 2002. |
| (2) | Not annualized for periods less than a full year. |
| (3) | Net of waivers, reimbursements and expense recapture by Adviser. Without expense recapture, the ratio of expenses to average net assets would have been 1.07%, 1.07% and 1.08% and the ratio of net investment income (loss) to average net assets would have been 0.16%, (0.05)% and 0.17% for the periods ended December 31, 2007, June 30, 2007 and June 30, 2006, respectively. Without waivers and reimbursements of expenses, the ratio of expenses to average net assets would have been 1.11%, 1.21% and 2.15% and the ratio of net investment loss to average net assets would have been (0.28)%, (0.40)% and (1.12)% for the periods ended June 30, 2005, June 30, 2004, and June 30, 2003, respectively. |
| (4) | Annualized for periods less than a full year. |
| (5) | Less than one cent per share. |
| (6) | Formerly the Frontegra Horizon Fund for the period ended June 30, 2003. |
The accompanying notes are an integral part of these financial statements.
INVESTMENT HIGHLIGHTS
Growth of a $100,000 Investment (Unaudited)
* 12/31/04 commencement of operations.
| | | | |
| | Portfolio Total Return** | | |
| | FOR THE PERIOD ENDED 12/31/07 | | |
| | | | |
| | SIX MONTHS | (3.28)% | |
| | | | |
| | ONE YEAR | 10.53% | |
| | | | |
| | THREE YEAR | | |
| | AVERAGE ANNUAL | 9.49% | |
| | | | |
| | SINCE COMMENCEMENT | | |
| | AVERAGE ANNUAL | 9.49% | |
| | | | |
This chart assumes an initial gross investment of $100,000 made on 12/31/04 (commencement of operations). Returns shown include the reinvestment of all distributions. Past performance is not predictive of future results. Investment return and principal value will fluctuate so that shares, when redeemed, may be worth more or less than the original cost. In the absence of existing fee waivers, total return would be reduced. To receive current to the most recent month-end performance, please call 1-888-825-2100.
The Russell 2500 Index measures the performance of the 2,500 smallest companies in the Russell 3000 Index. The Russell 3000 Index measures the performance of the 3,000 largest U.S. companies based on total market capitalization. The Index does not reflect investment management fees, brokerage commissions and other expenses associated with investing in equity securities. A direct investment in the index is not possible.
| ** | The returns shown do not reflect the deduction of taxes that a shareholder would pay on Fund distributions or the redemption of Fund shares. |
Frontegra IronBridge SMID Fund
SCHEDULE OF INVESTMENTS
December 31, 2007 (Unaudited)
Number of Shares | | | | Value | |
| | | COMMON STOCKS 97.8% | | | |
| | | Aerospace & Defense 4.2% | | | |
| | 25,589 | | BE Aerospace, Inc. (a) | | $ | 1,353,658 | |
| | 27,054 | | Goodrich Corp. | | | 1,910,283 | |
| | 54,568 | | Moog Inc. - Class A (a) | | | 2,499,760 | |
| | 43,671 | | Teledyne Technologies, Inc. (a) | | | 2,328,975 | |
| | | | | | | 8,092,676 | |
| | | | Auto Components 1.3% | | | | |
| | 142,806 | | Gentex Corp. | | | 2,537,663 | |
| | | | | | | | |
| | | | Biotechnology 4.7% | | | | |
| | 40,859 | | Affymetrix, Inc. (a) | | | 945,477 | |
| | 25,530 | | Cephalon, Inc. (a) | | | 1,832,033 | |
| | 71,645 | | Cepheid, Inc. (a) | | | 1,887,846 | |
| | 47,787 | | Isis Pharmaceuticals, Inc. (a) | | | 752,645 | |
| | 119,657 | | Millennium Pharmaceuticals, Inc. (a) | | | 1,792,462 | |
| | 28,010 | | Techne Corp. (a) | | | 1,850,060 | |
| | | | | | | 9,060,523 | |
| | | | Capital Markets 2.6% | | | | |
| | 18,850 | | Affiliated Managers Group, Inc. (a) | | | 2,214,121 | |
| | 122,867 | | Jefferies Group, Inc. | | | 2,832,084 | |
| | | | | | | 5,046,205 | |
| | | | Chemicals 7.3% | | | | |
| | 50,141 | | Airgas, Inc. | | | 2,612,848 | |
| | 56,402 | | FMC Corp. | | | 3,076,729 | |
| | 73,240 | | Huntsman Corp. | | | 1,882,268 | |
| | 42,751 | | Lubrizol Corp. | | | 2,315,394 | |
| | 49,823 | | Methanex Corp. (b) | | | 1,375,115 | |
| | 53,090 | | Sigma-Aldrich Corp. | | | 2,898,714 | |
| | | | | | | 14,161,068 | |
| | | | Commercial Banks 1.8% | | | | |
| | 68,420 | | Cullen/Frost Bankers, Inc. | | | 3,466,157 | |
| | | | | | | | |
| | | | Commercial Services & Supplies 1.5% | | | | |
| | 41,779 | | TeleTech Holdings, Inc. (a) | | | 888,640 | |
| | 41,730 | | Watson Wyatt Worldwide Inc. - Class A | | | 1,936,689 | |
| | | | | | | 2,825,329 | |
The accompanying notes are an integral part of these financial statements.
Frontegra IronBridge SMID Fund
SCHEDULE OF INVESTMENTS (CONTINUED)
December 31, 2007 (Unaudited)
Number of Shares | | | | Value | |
| | | COMMON STOCKS 97.8% (continued) | | | |
| | | Communications Equipment 3.4% | | | |
| | 42,729 | | Belden Inc. | | $ | 1,901,441 | |
| | 64,528 | | Polycom, Inc. (a) | | | 1,792,588 | |
| | 84,759 | | ViaSat, Inc. (a) | | | 2,918,252 | |
| | | | | | | 6,612,281 | |
| | | | Computers & Peripherals 0.5% | | | | |
| | 25,426 | | Synaptics Inc. (a) | | | 1,046,534 | |
| | | | | | | | |
| | | | Construction & Engineering 0.7% | | | | |
| | 50,893 | | Quanta Services, Inc. (a) | | | 1,335,432 | |
| | | | | | | | |
| | | | Distributors 1.6% | | | | |
| | 67,660 | | Genuine Parts Co. | | | 3,132,658 | |
| | | | | | | | |
| | | | Electric Utilities 2.7% | | | | |
| | 30,855 | | Allegheny Energy, Inc. (a) | | | 1,962,687 | |
| | 67,023 | | Wisconsin Energy Corp. | | | 3,264,690 | |
| | | | | | | 5,227,377 | |
| | | | Electrical Equipment 2.5% | | | | |
| | 37,896 | | American Superconductor Corp. (a) | | | 1,036,077 | |
| | 58,065 | | AMETEK, Inc. | | | 2,719,764 | |
| | 15,530 | | Roper Industries, Inc. | | | 971,246 | |
| | | | | | | 4,727,087 | |
| | | | Electronic Equipment & Instruments 3.3% | | | | |
| | 35,588 | | Amphenol Corp. - Class A | | | 1,650,216 | |
| | 63,426 | | National Instruments Corp. | | | 2,113,989 | |
| | 88,356 | | Trimble Navigation Ltd. (a) | | | 2,671,885 | |
| | | | | | | 6,436,090 | |
| | | | Energy Equipment & Services 2.3% | | | | |
| | 35,230 | | ENSCO International Inc. | | | 2,100,413 | |
| | 14,080 | | FMC Technologies, Inc. (a) | | | 798,336 | |
| | 21,410 | | Oceaneering International, Inc. (a) | | | 1,441,963 | |
| | | | | | | 4,340,712 | |
| | | | Food & Staples Retailing 0.8% | | | | |
| | 41,100 | | Supervalu, Inc. | | | 1,542,072 | |
The accompanying notes are an integral part of these financial statements.
Frontegra IronBridge SMID Fund
SCHEDULE OF INVESTMENTS (CONTINUED)
December 31, 2007 (Unaudited)
Number of Shares | | | | Value | |
| | | COMMON STOCKS 97.8% (continued) | | | |
| | | Food Products 3.3% | | | |
| | 79,417 | | Corn Products International, Inc. | | $ | 2,918,575 | |
| | 59,652 | | Hormel Foods Corp. | | | 2,414,713 | |
| | 26,505 | | McCormick & Co., Inc. | | | 1,004,804 | |
| | | | | | | 6,338,092 | |
| | | | Gas Utilities 1.7% | | | | |
| | 59,936 | | Questar Corp. | | | 3,242,538 | |
| | | | | | | | |
| | | | Health Care Equipment & Supplies 5.3% | | | | |
| | 12,690 | | ArthroCare Corp. (a) | | | 609,754 | |
| | 15,490 | | Gen-Probe Inc. (a) | | | 974,786 | |
| | 24,785 | | Hansen Medical, Inc. (a) | | | 742,063 | |
| | 24,900 | | IDEXX Laboratories, Inc. (a) | | | 1,459,887 | |
| | 18,130 | | Illumina, Inc. (a) | | | 1,074,384 | |
| | 65,633 | | PerkinElmer, Inc. | | | 1,707,771 | |
| | 30,251 | | Respironics, Inc. (a) | | | 1,980,835 | |
| | 94,368 | | Thoratec Corp. (a) | | | 1,716,554 | |
| | | | | | | 10,266,034 | |
| | | | Health Care Providers & Services 3.4% | | | | |
| | 60,528 | | Cerner Corp. (a) | | | 3,413,779 | |
| | 38,370 | | Owens & Minor, Inc. | | | 1,628,039 | |
| | 71,952 | | Phase Forward Inc. (a) | | | 1,564,956 | |
| | | | | | | 6,606,774 | |
| | | | Hotels, Restaurants & Leisure 1.1% | | | | |
| | 58,560 | | WMS Industries Inc. (a) | | | 2,145,638 | |
| | | | | | | | |
| | | | Household Durables 5.2% | | | | |
| | 52,754 | | AptarGroup, Inc. | | | 2,158,166 | |
| | 35,890 | | Harman International Industries, Inc. | | | 2,645,452 | |
| | 54,714 | | Snap-on Inc. | | | 2,639,404 | |
| | 79,106 | | Tupperware Brands Corp. | | | 2,612,871 | |
| | | | | | | 10,055,893 | |
| | | | Industrial Conglomerates 1.1% | | | | |
| | 5,286 | | Alleghany Corp. (a) | | | 2,124,972 | |
The accompanying notes are an integral part of these financial statements.
Frontegra IronBridge SMID Fund
SCHEDULE OF INVESTMENTS (CONTINUED)
December 31, 2007 (Unaudited)
Number of Shares | | | | Value | |
| | | COMMON STOCKS 97.8% (continued) | | | |
| | | Insurance 2.9% | | | |
| | 108,669 | | American Financial Group, Inc. | | $ | 3,138,361 | |
| | 44,487 | | SAFECO Corp. | | | 2,477,036 | |
| | | | | | | 5,615,397 | |
| | | | Machinery 3.6% | | | | |
| | 52,660 | | Kennametal Inc. | | | 1,993,708 | |
| | 40,980 | | Lincoln Electric Holdings, Inc. | | | 2,916,956 | |
| | 50,598 | | Pall Corp. | | | 2,040,111 | |
| | | | | | | 6,950,775 | |
| | | | Marine 1.5% | | | | |
| | 56,639 | | Alexander & Baldwin, Inc. | | | 2,925,971 | |
| | | | | | | | |
| | | | Metals & Mining 2.2% | | | | |
| | 59,440 | | Arch Coal, Inc. | | | 2,670,639 | |
| | 23,172 | | RTI International Metals, Inc. (a) | | | 1,597,246 | |
| | | | | | | 4,267,885 | |
| | | | Multi-Utilities & Unregulated Power 1.4% | | | | |
| | 98,780 | | MDU Resources Group, Inc. | | | 2,727,316 | |
| | | | | | | | |
| | | | Oil & Gas 1.2% | | | | |
| | 56,130 | | Cabot Oil & Gas Corp. | | | 2,265,968 | |
| | | | | | | | |
| | | | Paper & Forest Products 1.6% | | | | |
| | 63,507 | | Rayonier Inc. | | | 3,000,071 | |
| | | | | | | | |
| | | | Pharmaceuticals 1.4% | | | | |
| | 49,370 | | Barr Pharmaceuticals Inc. (a) | | | 2,621,547 | |
| | | | | | | | |
| | | | Real Estate 5.7% | | | | |
| | 169,809 | | Annaly Mortgage Management, Inc. | | | 3,087,128 | |
| | 59,435 | | Corporate Office Properties Trust | | | 1,872,202 | |
| | 58,339 | | Forest City Enterprises, Inc. - Class A | | | 2,592,585 | |
| | 95,260 | | The St. Joe Co. | | | 3,382,683 | |
| | | | | | | 10,934,598 | |
The accompanying notes are an integral part of these financial statements.
Frontegra IronBridge SMID Fund
SCHEDULE OF INVESTMENTS (CONTINUED)
December 31, 2007 (Unaudited)
Number of Shares | | | | Value | |
| | | COMMON STOCKS 97.8% (continued) | | | |
| | | Semiconductor & Semiconductor Equipment 1.4% | | | |
| | 33,853 | | Cypress Semiconductor Corp. (a) | | $ | 1,219,724 | |
| | 40,351 | | Varian Semiconductor Equipment Associates, Inc. (a) | | | 1,492,987 | |
| | | | | | | 2,712,711 | |
| | | | Software 4.9% | | | | |
| | 196,805 | | Cadence Design Systems, Inc. (a) | | | 3,347,653 | |
| | 42,241 | | Citrix Systems, Inc. (a) | | | 1,605,580 | |
| | 75,909 | | Manhattan Associates, Inc. (a) | | | 2,000,961 | |
| | 137,903 | | Parametric Technology Corp. (a) | | | 2,461,569 | |
| | | | | | | 9,415,763 | |
| | | | Specialty Retail 3.0% | | | | |
| | 52,634 | | Men’s Wearhouse, Inc. | | | 1,420,065 | |
| | 100,093 | | O’Reilly Automotive, Inc. (a) | | | 3,246,016 | |
| | 32,440 | | Tractor Supply Co. (a) | | | 1,165,894 | |
| | | | | | | 5,831,975 | |
| | | | Textiles, Apparel & Luxury Goods 1.3% | | | | |
| | 100,575 | | Wolverine World Wide, Inc. | | | 2,466,099 | |
| | | | | | | | |
| | | | Thrifts & Mortgage Finance 1.0% | | | | |
| | 95,630 | | Washington Federal, Inc. | | | 2,018,749 | |
| | | | | | | | |
| | | | Trading Companies & Distributors 1.0% | | | | |
| | 22,320 | | W.W. Grainger, Inc. | | | 1,953,446 | |
| | | | | | | | |
| | | | Water Utilities 1.4% | | | | |
| | 124,625 | | Aqua America, Inc. | | | 2,642,050 | |
| | | | | | | | |
| | | | Total Common Stocks | | | | |
| | | | (Cost $176,700,106) | | | 188,720,126 | |
The accompanying notes are an integral part of these financial statements.
Frontegra IronBridge SMID Fund
SCHEDULE OF INVESTMENTS (CONTINUED)
December 31, 2007 (Unaudited)
Principal Amount | | | | Value | |
| | | SHORT-TERM INVESTMENT 0.5% | | | |
| | | Variable Rate Demand Note (c) 0.5% | | | |
| $ | 877,278 | | U.S. Bank, N.A., 4.605%, 12/31/2031 | | $ | 877,278 | |
| | | | | | | | |
| | | | Total Short-Term Investment | | | | |
| | | | (Cost $877,278) | | | 877,278 | |
| | | | | | | | |
| | | | Total Investments 98.3% | | | | |
| | | | (Cost $177,577,384) | | | 189,597,404 | |
| | | | | | | | |
| | | | Other Assets in Excess of Liabilities 1.7% | | | 3,371,073 | |
| | | | | | | | |
| | | | TOTAL NET ASSETS 100.0% | | $ | 192,968,477 | |
| (a) | Non-Income Producing. |
| (b) | U.S.-dollar denominated security of foreign issuer. |
| (c) | Variable rate demand notes are considered short-term obligations and are payable upon demand. Interest rates change periodically on specified dates. The rates listed are as of December 31, 2007. |
The accompanying notes are an integral part of these financial statements.
Frontegra IronBridge SMID Fund
STATEMENT OF ASSETS AND LIABILITIES
December 31, 2007 (Unaudited)
Assets: | | | |
| Investments at value (cost $177,577,384) | | $ | 189,597,404 | |
| Cash | | | 13,055 | |
| Interest and dividend receivable | | | 201,653 | |
| Receivable for investments sold | | | 4,471,038 | |
| Other assets | | | 19,158 | |
| Total assets | | | 194,302,308 | |
| | | | | |
Liabilities: | | | | |
| Payable for investments purchased | | | 999,334 | |
| Payable for Fund shares purchased | | | 149,017 | |
| Accrued investment advisory fee | | | 138,189 | |
| Accrued expenses | | | 47,291 | |
| Total liabilities | | | 1,333,831 | |
Net Assets | | $ | 192,968,477 | |
| | | | | |
Net Assets Consist of: | | | | |
| Paid in capital | | $ | 179,006,172 | |
| Accumulated net realized gain | | | 1,942,285 | |
| Net unrealized appreciation on investments | | | 12,020,020 | |
Net Assets | | $ | 192,968,477 | |
| | | | | |
Capital Stock, $0.01 Par Value | | | | |
| Authorized | | | 50,000,000 | |
| Issued and outstanding | | | 16,435,672 | |
Net Asset Value, Redemption Price and Offering Price Per Share | | $ | 11.74 | |
The accompanying notes are an integral part of these financial statements.
Frontegra IronBridge SMID Fund
STATEMENT OF OPERATIONS
| | | Six Months Ended | |
| | | December 31, 2007 | |
| | | (Unaudited) | |
Investment Income: | | | |
| Dividends(1) | | $ | 876,501 | |
| Interest | | | 182,978 | |
| | | | 1,059,479 | |
| | | | | |
Expenses: | | | | |
| Investment advisory fees (Note 3) | | | 825,597 | |
| Fund administration and accounting fees | | | 33,968 | |
| Audit fees | | | 18,489 | |
| Federal and state registration fees | | | 14,482 | |
| Legal fees | | | 12,120 | |
| Custody fees | | | 8,868 | |
| Shareholder servicing fees | | | 6,616 | |
| Directors’ fees and related expenses | | | 3,790 | |
| Reports to shareholders | | | 3,564 | |
| Compliance support expenses | | | 3,517 | |
| Other | | | 2,162 | |
| Total expenses before waiver | | | 933,173 | |
| Waiver of expenses by Adviser (Note 3) | | | (10,447 | ) |
| Net expenses | | | 922,726 | |
Net Investment Income | | | 136,753 | |
| | | | | |
Realized and Unrealized | | | | |
Gain (Loss) on Investments: | | | | |
| Net realized gain on investments | | | 11,402,030 | |
| Change in net unrealized | | | | |
| appreciation/depreciation on investments | | | (18,115,392 | ) |
Net Realized and Unrealized | | | | |
Loss on Investments | | | (6,713,362 | ) |
Net Decrease in Net Assets | | | | |
Resulting from Operations | | $ | (6,576,609 | ) |
| (1) | Net of $1,803 in foreign witholding taxes. |
The accompanying notes are an integral part of these financial statements.
Frontegra IronBridge SMID Fund
STATEMENTS OF CHANGES IN NET ASSETS
| | | Six Months Ended | | | | |
| | | December 31, 2007 | | | Year Ended | |
| | | (Unaudited) | | | June 30, 2007 | |
Operations: | | | | | | |
| Net investment income | | $ | 136,753 | | | $ | 173,395 | |
| Net realized gain on investments | | | 11,402,030 | | | | 8,354,738 | |
| Change in net unrealized | | | | | | | | |
| appreciation/depreciation on investments | | | (18,115,392 | ) | | | 27,486,376 | |
| Net increase (decrease) in net assets | | | | | | | | |
| resulting from operations | | | (6,576,609 | ) | | | 36,014,509 | |
| | | | | | | | | |
Distributions | | | | | | | | |
Paid From: | | | | | | | | |
| Net investment income | | | (329,765 | ) | | | (64,902 | ) |
| Net realized gain on investments | | | (17,799,376 | ) | | | (2,103,711 | ) |
| Net decrease in net assets resulting | | | | | | | | |
| from distributions paid | | | (18,129,141 | ) | | | (2,168,613 | ) |
| | | | | | | | | |
Capital Share | | | | | | | | |
Transactions: | | | | | | | | |
| Shares sold | | | 20,208,388 | | | | 56,990,350 | |
| Shares issued to holders in | | | | | | | | |
| reinvestment of distributions | | | 16,459,234 | | | | 1,884,048 | |
| Shares redeemed | | | (12,417,560 | ) | | | (32,354,509 | ) |
| Net increase in net assets resulting | | | | | | | | |
| from capital share transactions | | | 24,250,062 | | | | 26,519,889 | |
| | | | | | | | | |
Total Increase (Decrease) in Net Assets | | | (455,688 | ) | | | 60,365,785 | |
| | | | | | | | | |
Net Assets: | | | | | | | | |
| Beginning of period | | | 193,424,165 | | | | 133,058,380 | |
| End of period | | | | | | | | |
| (includes undistributed net investment income | | | | | | | | |
| of $0 and $186,635, respectively) | | $ | 192,968,477 | | | $ | 193,424,165 | |
The accompanying notes are an integral part of these financial statements.
Frontegra IronBridge SMID Fund
FINANCIAL HIGHLIGHTS
| | | Six Months | | | | | | | | | | |
| | | Ended | | | Year | | | Year | | | Period | |
| | | December 31, | | | Ended | | | Ended | | | Ended | |
| | | 2007 | | | June 30, | | | June 30, | | | June 30, | |
| | | (Unaudited) | | | 2007 | | | 2006 | | | 2005(1) | |
Net Asset Value, | | | | | | | | | | | | |
Beginning of Period | | $ | 13.36 | | | $ | 11.07 | | | $ | 10.00 | | | $ | 10.00 | |
| | | | | | | | | | | | | | | | | |
Income (Loss) | | | | | | | | | | | | | | | | |
from Investment | | | | | | | | | | | | | | | | |
Operations: | | | | | | | | | | | | | | | | |
| Net investment income | | | 0.01 | | | | 0.01 | | | | 0.06 | (5) | | | 0.04 | (5) |
| Net realized and unrealized | | | | | | | | | | | | | | | | |
| gain (loss) on investments | | | (0.46 | ) | | | 2.43 | | | | 1.04 | | | | (0.04 | ) |
Total Income (Loss) from | | | | | | | | | | | | | | | | |
Investment Operations | | | (0.45 | ) | | | 2.44 | | | | 1.10 | | | | 0.00 | |
| | | | | | | | | | | | | | | | | |
Less Distributions | | | | | | | | | | | | | | | | |
Paid: | | | | | | | | | | | | | | | | |
| From net investment income | | | (0.02 | ) | | | — | (6) | | | (0.03 | ) | | | — | |
| From net realized gain on investments | | | (1.15 | ) | | | (0.15 | ) | | | — | | | | — | |
Total Distributions Paid | | | (1.17 | ) | | | (0.15 | ) | | | (0.03 | ) | | | — | |
| | | | | | | | | | | | | | | | | |
Net Asset Value, End of Period | | $ | 11.74 | | | $ | 13.36 | | | $ | 11.07 | | | $ | 10.00 | |
Total Return(2) | | | (3.28 | )% | | | 22.25 | % | | | 11.02 | % | | | 0.00 | % |
| | | | | | | | | | | | | | | | | |
Supplemental Data | | | | | | | | | | | | | | | | |
and Ratios: | | | | | | | | | | | | | | | | |
| Net assets, end of period | | | | | | | | | | | | | | | | |
| (in thousands) | | $ | 192,968 | | | $ | 193,424 | | | $ | 133,058 | | | $ | 41,638 | |
| Ratio of expenses to | | | | | | | | | | | | | | | | |
| average net assets(3)(4) | | | 0.95 | % | | | 0.95 | % | | | 0.95 | % | | | 0.95 | % |
| Ratio of net investment income to | | | | | | | | | | | | | | | | |
| average net assets(3)(4) | | | 0.22 | % | | | 0.10 | % | | | 0.28 | % | | | 0.89 | % |
| Portfolio turnover rate(2) | | | 47 | % | | | 71 | % | | | 91 | % | | | 44 | % |
| (1) | Commenced operations on December 31, 2004. |
| (2) | Not annualized for periods less than a full year. |
| (3) | Net of waivers and reimbursements by Adviser. Without waivers and reimbursements of expenses, the ratio of expenses to average net assets would have been 0.96%, 0.98%, 1.08% and 1.49% and the ratio of net investment income to average net assets would have been 0.21%, 0.07%, 0.15% and 0.35% for the periods ended December 31, 2007, June 30, 2007, June 30, 2006 and June 30, 2005, respectively. |
| (4) | Annualized for periods less than a full year. |
| (5) | Per share net investment income has been calculated using the daily average share method. |
| (6) | Less than one cent per share. |
The accompanying notes are an integral part of these financial statements.
FRONTEGRA
NEW STAR INTERNATIONAL
EQUITY FUND
REPORT FROM NEW STAR
INSTITUTIONAL MANAGERS LIMITED:
Dear Shareholders:
The Frontegra New Star International Equity Fund strives to achieve capital appreciation by investing in a diversified portfolio of securities of large- and mid-cap companies located outside the United States. The objective is relative to and measured against the Morgan Stanley EAFE Index.
Performance Review
The Frontegra New Star International Equity Fund returned 0.85%, net of fees, for the six month period ending December 31, 2007. The funds return outperformed the 0.51% return of its benchmark, the MSCI EAFE Index.
Executive Summary
Large cap. international equities showed only modest falls in the face of the credit crisis for the second consecutive quarter. Losses for U.S. investors were mitigated further by weakness of the US$. Excess liquidity in financial markets is high, whether we look at broad money growth, or the actions of central banks to pump cash into the interbank markets over the year end.
The last time central banks were so generous occurred over Y2K, leading to the TMT blow off top. We do not view it as merely a coincidence that the current speculation of choice, commodities, are roaring up in price while other cyclical sectors and indicators are rolling over.
Whether oil and gold prices meet the same fate as internet start-ups depends, for us, on whether the central banks withdraw their liquidity provision in the New Year, as in 2000. In which case, the worse the position of the commercial banks and the more help they are perceived to need, the better for commodities and US$linked emerging markets.
Our perception is that banks are in need of plenty of help. The securitised debt markets are hardly functioning, and that is the case for a wide range of credit sectors, not just US sub-prime residential. The best hope for a resolution of this situation is for sovereign wealth funds to start buying securitised debt as well as US investment bank equity; but no one wants to be first.
We believe that 2007Q3 was a peak for corporate profits in general and for financials in particular. What sort of decline comes next depends on the extent and efficacy of the ease in monetary policy. A modest fall in profitability, such as experienced in 1998/9, would not be harmful to equities; a 2001/02 experience would be more painful.
Pressure on the US dollar remains. Any further easing by the Federal Reserve is not going to be matched by the Europeans, at least not in the short term. A valuation case can increasingly be made but that looks likely in the second half of 2008 at best.
Portfolio Outlook and Strategy
International equities fell 3.3% in local currency terms, mitigated by further US$weakness to -2.0% for US investors; another resilient performance given the freeze in securitised debt markets.
Large cap equities have derived support from the very easy liquidity conditions in financial markets, as monetary authorities try to buy time for the banking sector to sort out their mess. The US$500bn
injection into short term interbank markets by the ECB at the year end is the most spectacular example of this. Longer term support is also forthcoming from sovereign wealth funds providing fresh equity, on very favourable terms, into global investment banks.
The major equity indices also been helped by modest headline valuations, based on current high profitability, and here is the key issue for 2008. Will the coming fall in corporate profits be of the modest 1998/99 type, cushioned by effective easing of monetary policy; or are we facing a 1991/92 or 2001/02 fall of 20%+? The answer will determine whether equities can trade sideways to up with sector rotation within that, or whether markets will face prolonged falls.
Evidence from activity indicators and corporate profit estimates favour a benign fall in profits, of perhaps 0-5%. The vibrancy of emerging market growth is enough to offset slower sales in debt dependent Anglo Saxon markets. Central banks are doing what they can to counteract the credit squeeze emanating from the commercial banking seizure. But it is the withdrawal of credit by the commercial banking system that poses the greatest risk to profits.
We have moved the portfolio further underweight the European commercial banks. U.S. sub-prime mortgage exposure is now well priced into the sector, but not the wider implications for the business of debt securitisation. Bank managements have lost credibility after years of assuring investors that risk from the credit bubble they created had been passed out of the banking system. The hard facts are that the risk has reverted back onto their balance sheets and they did not see it coming. We continue to favour Asian financials and property in particular, as these businesses benefit from the ease of US monetary policy, transmitted through their exchange rate pegs to the US$.
Energy is an overweight position as profitability in the oil majors stays at super-high levels and earnings upgrades have reappeared in the UK and Europe. IT is over-represented and we believe that the stocks we have in this idiosyncratic sector have good prospects. Media is another long held overweight, concentrated on the publishing franchises rather than the advertising reliant stocks. Pharmaceuticals remain at modestly overweight.
Utilities do not show well on our ROIC analysis and do not often feature on the portfolio. Consumer staples are also underweighted as valuations are not attractive for the returns achieved and their flat earnings revisions profiles.
The cyclical combination of industrials and materials are represented at par weight as strength from emerging market demand counteracts possible falls elsewhere. The international miners are maintaining very high profit levels and now have the added spice of takeover activity. Telecoms are also up to level weight, reflecting good earnings upgrades in a number of territories.
Geographically, Asia and emerging markets are favoured over the UK and Japan. The Tokyo equity market has once again disappointed investors with a lacklustre performance. The lack of Japanese monetary growth restrains us from further investment in a market where we can find a number of attractive situations.
Richard Lewis
New Star Institutional Managers Limited
INVESTMENT HIGHLIGHTS
Growth of a $100,000 Investment (Unaudited)
* 1/08/04 commencement of operations.
| | | | |
| | Portfolio Total Return** | | |
| | FOR THE PERIOD ENDED 12/31/07 | | |
| | | | |
| | SIX MONTHS | 0.85% | |
| | | | |
| | ONE YEAR | 14.34% | |
| | | | |
| | THREE YEAR | 15.03% | |
| | | | |
| | SINCE COMMENCEMENT | | |
| | AVERAGE ANNUAL | 14.29% | |
| | | | |
This chart assumes an initial gross investment of $100,000 made on 1/08/04 (commencement of operations). Returns shown include the reinvestment of all distributions. Past performance is not predictive of future results. Investment return and principal value will fluctuate so that shares, when redeemed, may be worth more or less than the original cost. In the absence of existing fee waivers, total return would be reduced. To receive current to the most recent month-end performance, please call 1-888-825-2100.
The Morgan Stanley Capital International EAFE Index measures the overall performance of stock markets in 21 countries within Europe, Australasia and the Far East. The Index does not reflect investment management fees, brokerage commissions and other expenses associated with investing in equity securities. A direct investment in the index is not possible.
| ** | The returns shown do not reflect the deduction of taxes that a shareholder would pay on Fund distributions or the redemption of Fund shares. |
Frontegra New Star International Equity Fund
SCHEDULE OF INVESTMENTS
December 31, 2007 (Unaudited)
Number of Shares | | | | Value | |
| | | COMMON STOCKS 97.3% | | | |
| | | Australia 7.1% | | | |
| | 1,024,261 | | Axa Asia Pacific Holdings Ltd. | | $ | 6,637,205 | |
| | 244,725 | | Orica Ltd. | | | 6,822,449 | |
| | 262,800 | | QBE Insurance Group Ltd. | | | 7,693,238 | |
| | 149,436 | | Rio Tinto Ltd. | | | 17,575,843 | |
| | 320,369 | | Santos Ltd. | | | 3,971,946 | |
| | 132,014 | | Woodside Petroleum Ltd. | | | 5,840,938 | |
| | | | | | | 48,541,619 | |
| | | | Belgium 1.2% | | | | |
| | 92,200 | | Delhaize Group | | | 8,115,034 | |
| | | | | | | | |
| | | | Finland 2.8% | | | | |
| | 156,900 | | Fortum Oyj | | | 7,067,692 | |
| | 305,200 | | Nokia Oyj | | | 11,833,712 | |
| | | | | | | 18,901,404 | |
| | | | France 15.8% | | | | |
| | 52,000 | | Alstom | | | 11,175,929 | |
| | 104,800 | | Arcelor Mittal | | | 8,149,936 | |
| | 63,311 | | Bouygues SA | | | 5,276,148 | |
| | 83,209 | | Carrefour SA | | | 6,483,044 | |
| | 77,754 | | Compagnie Generale des Etablissements Michelin - Class B | | | 8,923,913 | |
| | 60,734 | | LVMH Moet Hennessy Louis Vuitton SA | | | 7,341,677 | |
| | 52,649 | | PPR | | | 8,467,316 | |
| | 176,066 | | Publicis Groupe | | | 6,893,647 | |
| | 87,100 | | Sanofi-Aventis | | | 8,020,173 | |
| | 105,180 | | Technip SA | | | 8,380,938 | |
| | 160,676 | | Total SA | | | 13,350,318 | |
| | 18,800 | | Vallourec SA | | | 5,089,141 | |
| | 221,809 | | Vivendi | | | 10,176,421 | |
| | | | | | | 107,728,601 | |
| | | | Germany 8.6% | | | | |
| | 38,100 | | Allianz AG | | | 8,241,436 | |
| | 161,600 | | Arcandor (a) | | | 3,836,987 | |
| | 82,900 | | DaimlerChrysler AG | | | 8,060,076 | |
| | 56,100 | | Deutsche Bank AG | | | 7,332,690 | |
| | 175,055 | | Deutsche Telekom AG | | | 3,844,213 | |
| | 51,777 | | E.ON AG | | | 11,021,263 | |
The accompanying notes are an integral part of these financial statements.
Frontegra New Star International Equity Fund
SCHEDULE OF INVESTMENTS (CONTINUED)
December 31, 2007 (Unaudited)
Number of Shares | | | | Value | |
| | | COMMON STOCKS 97.3% (continued) | | | |
| | | Germany 8.6% (continued) | | | |
| | 133,681 | | Gea Group AG (a) | | $ | 4,651,677 | |
| | 53,300 | | Siemens AG | | | 8,483,176 | |
| | 118,317 | | Symrise AG (a) | | | 3,335,164 | |
| | | | | | | 58,806,682 | |
| | | | Greece 1.2% | | | | |
| | 219,212 | | Alpha Bank A.E. | | | 7,980,436 | |
| | | | | | | | |
| | | | Hong Kong 6.0% | | | | |
| | 872,000 | | The Bank of East Asia, Ltd. | | | 5,966,245 | |
| | 373,000 | | Cheung Kong (Holdings) Ltd. | | | 6,898,017 | |
| | 290,000 | | China Mobile Ltd. | | | 5,128,761 | |
| | 36,964 | | China Mobile (Hong Kong) Ltd. - ADR | | | 3,211,063 | |
| | 1,600,000 | | Hang Lung Properties Ltd. | | | 7,243,440 | |
| | 325,000 | | Sun Hung Kai Properties Ltd. | | | 6,902,301 | |
| | 885,000 | | Television Broadcasts Ltd. | | | 5,317,446 | |
| | | | | | | 40,667,273 | |
| | | | Italy 2.1% | | | | |
| | 229,381 | | Eni SPA | | | 8,400,945 | |
| | 749,199 | | UniCredito Italiano SPA | | | 6,221,691 | |
| | | | | | | 14,622,636 | |
| | | | Japan 17.9% | | | | |
| | 449,000 | | The Bank of Yokohama, Ltd. | | | 3,151,018 | |
| | 524 | | East Japan Railway Co. | | | 4,324,648 | |
| | 79,600 | | Fanuc Ltd. | | | 7,752,298 | |
| | 402,000 | | Fujitsu, Ltd. | | | 2,709,627 | |
| | 226,900 | | Hitachi Construction Machinery Co., Ltd. | | | 6,804,055 | |
| | 633 | | Inpex Holdings, Inc. | | | 6,856,107 | |
| | 418,000 | | Isetan Co. Ltd. | | | 5,683,588 | |
| | 202,000 | | Kao Corp. | | | 6,075,460 | |
| | 343,700 | | Mitsubishi Corp. | | | 9,414,331 | |
| | 512,000 | | Mitsubishi Tokyo Financial Group, Inc. | | | 4,798,496 | |
| | 338,000 | | Mitsui Fudosan Co., Ltd. | | | 7,352,101 | |
| | 96,900 | | Murata Manufacturing Co., Ltd. | | | 5,620,660 | |
| | 436,000 | | Nippon Electric Glass Co., Ltd. | | | 7,126,492 | |
| | 411,800 | | Nomura Holdings, Inc. | | | 6,985,284 | |
| | 128,800 | | Nomura Research Institute Ltd. | | | 4,242,797 | |
The accompanying notes are an integral part of these financial statements.
Frontegra New Star International Equity Fund
SCHEDULE OF INVESTMENTS (CONTINUED)
December 31, 2007 (Unaudited)
Number of Shares | | | | Value | |
| | | COMMON STOCKS 97.3% (continued) | | | |
| | | Japan 17.9% (continued) | | | |
| | 630,000 | | Sekisui House, Ltd. | | $ | 6,812,335 | |
| | 120,900 | | Shin-Etsu Chemical Co., Ltd. | | | 7,597,171 | |
| | 1,249,000 | | Sumitomo Metal Industries, Ltd. | | | 5,802,542 | |
| | 179,700 | | Toyota Motor Corp. | | | 9,715,687 | |
| | 139,300 | | Yamaha Motor Co., Ltd. | | | 3,372,927 | |
| | | | | | | 122,197,624 | |
| | | | Netherlands 3.4% | | | | |
| | 252,675 | | ASML Holding NV (a) | | | 8,001,726 | |
| | 189,600 | | ING Groep NV | | | 7,415,237 | |
| | 232,505 | | Wolters Kluwer NV | | | 7,641,728 | |
| | | | | | | 23,058,691 | |
| | | | Russia 1.7% | | | | |
| | 88,658 | | LUKOIL - ADR | | | 7,491,601 | |
| | 434,777 | | VTB Bank OJSC - GDR (a) | | | 4,434,725 | |
| | | | | | | 11,926,326 | |
| | | | Singapore 1.2% | | | | |
| | 989,000 | | Capitaland Ltd. | | | 4,307,916 | |
| | 356,000 | | Great Eastern Holdings Ltd. | | | | |
| | | | (Acquired Multiple Dates, Cost $3,058,534) (b) | | | 4,105,457 | |
| | | | | | | 8,413,373 | |
| | | | Spain 2.8% | | | | |
| | 202,206 | | Indra Sistemas, SA | | | 5,492,913 | |
| | 415,400 | | Telefonica SA | | | 13,495,019 | |
| | | | | | | 18,987,932 | |
| | | | Sweden 1.0% | | | | |
| | 184,300 | | Skanska AB | | | 3,478,865 | |
| | 1,573,000 | | Telefonaktiebolaget LM Ericsson - Class B | | | 3,694,476 | |
| | | | | | | 7,173,341 | |
| | | | Switzerland 7.2% | | | | |
| | 181,400 | | Credit Suisse Group | | | 10,911,399 | |
| | 75,700 | | Holcim Ltd. | | | 8,110,595 | |
| | 198,598 | | Novartis AG | | | 10,893,376 | |
| | 63,000 | | Roche Holding AG | | | 10,884,423 | |
| | 28,938 | | Zurich Financial Services AG | | | 8,498,772 | |
| | | | | | | 49,298,565 | |
The accompanying notes are an integral part of these financial statements.
Frontegra New Star International Equity Fund
SCHEDULE OF INVESTMENTS (CONTINUED)
December 31, 2007 (Unaudited)
Number of Shares | | | | Value | |
| | | COMMON STOCKS 97.3% (continued) | | | |
| | | Taiwan 0.6% | | | |
| | 389,437 | | Taiwan Semiconductor Manufacturing Co. Ltd. - ADR | | $ | 3,878,793 | |
| | | | | | | | |
| | | | United Kingdom 16.7% | | | | |
| | 445,800 | | Aviva plc | | | 5,972,279 | |
| | 716,000 | | BAE Systems plc | | | 7,097,858 | |
| | 499,282 | | Barclays plc | | | 5,009,120 | |
| | 590,394 | | BP plc | | | 7,227,731 | |
| | 567,000 | | British Sky Broadcasting Group plc | | | 6,986,484 | |
| | 332,900 | | easyJet plc (a) | | | 4,065,494 | |
| | 469,100 | | GlaxoSmithKline plc | | | 11,943,206 | |
| | 109,686 | | Johnson Matthey plc | | | 4,107,002 | |
| | 2,764,780 | | Legal & General Group plc | | | 7,187,679 | |
| | 408,495 | | National Grid plc | | | 6,781,687 | |
| | 83,521 | | Rio Tinto plc | | | 8,839,899 | |
| | 827,084 | | Rolls-Royce Group plc | | | 8,989,328 | |
| | 195,300 | | Royal Dutch Shell plc - Class A | | | 8,206,830 | |
| | 301,618 | | Scottish & Newcastle plc | | | 4,451,982 | |
| | 205,333 | | Smiths Group plc | | | 4,140,503 | |
| | 2,957,815 | | Vodafone Group plc | | | 11,057,362 | |
| | 131,864 | | Wolseley plc | | | 1,947,669 | |
| | | | | | | 114,012,113 | |
| | | | Total Common Stocks | | | | |
| | | | (Cost $543,004,818) | | | 664,310,443 | |
| | | | | | | | |
| | | | Total Investments 97.3% | | | | |
| | | | (Cost $543,004,818) | | | 664,310,443 | |
| | | | | | | | |
| | | | Other Assets in Excess of Liabilities 2.7% | | | 18,727,906 | |
| | | | | | | | |
| | | | TOTAL NET ASSETS 100.0% | | $ | 683,038,349 | |
| (a) | Non-Income Producing. |
| (b) | Restricted Security. |
ADR - American Depositary Receipt
GDR - Global Depositary Receipt
The accompanying notes are an integral part of these financial statements.
Frontegra New Star International Equity Fund
SCHEDULE OF INVESTMENTS (CONTINUED)
December 31, 2007 (Unaudited)
As of December 31, 2007, the currency diversification as a percentage of net assets was as follows:
| European Monetary Unit | | | 37.9 | % |
| Japanese Yen | | | 17.9 | |
| British Pounds | | | 16.7 | |
| Swiss Francs | | | 7.2 | |
| Australian Dollars | | | 7.1 | |
| Hong Kong Dollars | | | 6.0 | |
| Other | | | 7.2 | * |
| | | | 100.0 | % |
| * | None of the remaining currencies (comprised of four other currencies) exceeds 5.0% each of net assets. |
The accompanying notes are an integral part of these financial statements.
Frontegra New Star International Equity Fund
PORTFOLIO DIVERSIFICATION
December 31, 2007 (Unaudited)
| | | Value | | | Percentage |
| Aerospace/Defense | | $ | 16,087,186 | | | | 2.4 | % |
| Airlines | | | 4,065,494 | | | | 0.6 | |
| Auto Components | | | 8,923,913 | | | | 1.3 | |
| Automobiles | | | 21,148,690 | | | | 3.1 | |
| Beverages | | | 4,451,982 | | | | 0.7 | |
| Capital Markets | | | 25,229,373 | | | | 3.7 | |
| Chemicals | | | 21,861,786 | | | | 3.2 | |
| Commercial Banks | | | 37,561,732 | | | | 5.5 | |
| Communications Equipment | | | 15,528,188 | | | | 2.3 | |
| Computers & Peripherals | | | 2,709,627 | | | | 0.4 | |
| Construction & Engineering | | | 3,478,865 | | | | 0.5 | |
| Construction Materials | | | 8,110,595 | | | | 1.2 | |
| Diversified Financial Services | | | 7,415,237 | | | | 1.1 | |
| Diversified Telecommunication Services | | | 17,339,231 | | | | 2.5 | |
| Electric Utilities | | | 18,088,955 | | | | 2.7 | |
| Electronic Equipment & Instruments | | | 23,923,080 | | | | 3.5 | |
| Energy Equipment & Services | | | 8,380,938 | | | | 1.2 | |
| Food & Staples Retailing | | | 14,598,078 | | | | 2.1 | |
| Household Durables | | | 6,812,335 | | | | 1.0 | |
| Household Products | | | 6,075,460 | | | | 0.9 | |
| Industrial Conglomerates | | | 12,623,680 | | | | 1.8 | |
| Information Technology Services | | | 9,735,709 | | | | 1.4 | |
| Insurance | | | 48,336,067 | | | | 7.1 | |
| Machinery | | | 24,297,172 | | | | 3.6 | |
| Media | | | 37,015,724 | | | | 5.4 | |
| Metals & Mining | | | 40,368,221 | | | | 5.9 | |
| Multiline Retail | | | 17,987,890 | | | | 2.6 | |
| Multi-Utilities | | | 6,781,687 | | | | 1.0 | |
| Oil, Gas & Consumable Fuels | | | 61,346,416 | | | | 9.0 | |
| Pharmaceuticals | | | 41,741,179 | | | | 6.1 | |
| Real Estate Management & Development | | | 32,703,776 | | | | 4.8 | |
| Road & Rail | | | 4,324,648 | | | | 0.6 | |
| Semiconductors & Semiconductor Equipment | | | 11,880,518 | | | | 1.7 | |
| Textiles, Apparel & Luxury Goods | | | 7,341,677 | | | | 1.1 | |
| Trading Companies & Distributors | | | 11,362,000 | | | | 1.7 | |
| Wireless Telecommunication Services | | | 24,673,334 | | | | 3.6 | |
Total Common Stocks | | | 664,310,443 | | | | 97.3 | |
Total Investments | | | 664,310,443 | | | | 97.3 | |
| Other Assets, Less Liabilities | | | 18,727,906 | | | | 2.7 | |
Total Net Assets | | $ | 683,038,349 | | | | 100.0 | % |
The accompanying notes are an integral part of these financial statements.
Frontegra New Star International Equity Fund
STATEMENT OF ASSETS AND LIABILITIES
December 31, 2007 (Unaudited)
Assets: | | | |
| Investments at value (cost $543,004,818) | | $ | 664,310,443 | |
| Foreign currencies at value (cost $5,609,259) | | | 5,660,786 | |
| Interest and dividend receivable | | | 1,091,360 | |
| Receivable for investments sold | | | 17,889,332 | |
| Receivable for Fund shares sold | | | 50,041 | |
| Other assets | | | 21,261 | |
| Total assets | | | 689,023,223 | |
| | | | | |
Liabilities: | | | | |
| Payable to custodian | | | 4,966,257 | |
| Payable for Fund shares purchased | | | 533,197 | |
| Accrued investment advisory fee | | | 399,087 | |
| Accrued expenses | | | 86,333 | |
| Total liabilities | | | 5,984,874 | |
Net Assets | | $ | 683,038,349 | |
| | | | | |
Net Assets Consist of: | | | | |
| Paid in capital | | $ | 554,354,570 | |
| Undistributed net realized gain | | | 7,247,096 | |
| Net unrealized appreciation on: | | | | |
| Investments | | | 121,305,625 | |
| Foreign currency | | | 131,058 | |
Net Assets | | $ | 683,038,349 | |
| | | | | |
Capital Stock, $0.01 Par Value | | | | |
| Authorized | | | 100,000,000 | |
| Issued and outstanding | | | 46,230,899 | |
Net Asset Value, Redemption Price and Offering Price Per Share | | $ | 14.77 | |
The accompanying notes are an integral part of these financial statements.
Frontegra New Star International Equity Fund
STATEMENT OF OPERATIONS
| | | Six Months Ended | |
| | | December 31, 2007 | |
| | | (Unaudited) | |
Investment Income: | | | |
| Dividends(1) | | $ | 4,524,988 | |
| Interest | | | 38,212 | |
| | | | 4,563,200 | |
| | | | | |
Expenses: | | | | |
| Investment advisory fees (Note 3) | | | 3,404,571 | |
| Custody fees | | | 244,226 | |
| Fund administration and accounting fees | | | 116,840 | |
| Federal and state registration fees | | | 17,140 | |
| Audit fees | | | 16,882 | |
| Shareholder servicing fees | | | 12,684 | |
| Legal fees | | | 11,548 | |
| Reports to shareholders | | | 8,924 | |
| Directors’ fees and related expenses | | | 3,940 | |
| Compliance support expenses | | | 3,517 | |
| Other | | | 8,447 | |
| Total expenses before waiver | | | 3,848,719 | |
| Waiver of expenses by Adviser (Note 3) | | | (1,160,900 | ) |
| Net expenses | | | 2,687,819 | |
Net Investment Income | | | 1,875,381 | |
| | | | | |
Realized and Unrealized | | | | |
Gain (Loss) on Investments: | | | | |
| Realized gain on: | | | | |
| Investments | | | 26,286,856 | |
| Foreign currency transactions | | | 480,847 | |
| Change in net unrealized appreciation/depreciation on: | | | | |
| Investments | | | (23,226,936 | ) |
| Foreign currency translation | | | 99,426 | |
Net Realized and Unrealized Gain on Investments | | | 3,640,193 | |
Net Increase in Net Assets Resulting from Operations | | $ | 5,515,574 | |
| (1) | Net of $352,007 in foreign withholding taxes. |
The accompanying notes are an integral part of these financial statements.
Frontegra New Star International Equity Fund
STATEMENTS OF CHANGES IN NET ASSETS
| | | Six Months Ended | | | | |
| | | December 31, 2007 | | | Year Ended | |
| | | (Unaudited) | | | June 30, 2007 | |
Operations: | | | | | | |
| Net investment income | | $ | 1,875,381 | | | $ | 9,777,408 | |
| Net realized gain on: | | | | | | | | |
| Investments | | | 26,286,856 | | | | 36,652,409 | |
| Foreign currency transactions | | | 480,847 | | | | 722,655 | |
| Change in net unrealized appreciation/depreciation on: | | | | | | | | |
| Investments | | | (23,226,936 | ) | | | 99,800,538 | |
| Foreign currency translation | | | 99,426 | | | | (31,386 | ) |
| Net increase in net assets resulting from operations | | | 5,515,574 | | | | 146,921,624 | |
| | | | | | | | | |
Distributions | | | | | | | | |
Paid From: | | | | | | | | |
| Net investment income | | | (10,852,936 | ) | | | (8,904,855 | ) |
| Net realized gain on investments | | | (50,797,918 | ) | | | (10,220,846 | ) |
| Net decrease in net assets resulting | | | | | | | | |
| from distributions paid | | | (61,650,854 | ) | | | (19,125,701 | ) |
| | | | | | | | | |
Capital Share | | | | | | | | |
Transactions: | | | | | | | | |
| Shares sold | | | 14,993,885 | | | | 119,965,159 | |
| Shares issued to holders in | | | | | | | | |
| reinvestment of distributions | | | 56,429,837 | | | | 16,269,562 | |
| Shares redeemed | | | (44,870,364 | ) | | | (82,731,619 | )(1) |
| Net increase in net assets resulting | | | | | | | | |
| from capital share transactions | | | 26,553,358 | | | | 53,503,102 | |
| | | | | | | | | |
Total Increase (Decrease) in Net Assets | | | (29,581,922 | ) | | | 181,299,025 | |
| | | | | | | | | |
Net Assets: | | | | | | | | |
| Beginning of period | | | 712,620,271 | | | | 531,321,246 | |
| End of period | | | | | | | | |
| (includes undistributed net investment income | | | | | | | | |
| of $0 and $8,461,283, respectively) | | $ | 683,038,349 | | | $ | 712,620,271 | |
| (1) | Net of redemption fees of $476 for the year ended June 30, 2007. |
The accompanying notes are an integral part of these financial statements.
Frontegra New Star International Equity Fund
FINANCIAL HIGHLIGHTS
| | | Six Months | | | | | | | | | | | | | |
| | | Ended | | | Year | | | Year | | | Year | | | Period | |
| | | December 31, | | | Ended | | | Ended | | | Ended | | | Ended | |
| | | 2007 | | | June 30, | | | June 30, | | | June 30, | | | June 30, | |
| | | (Unaudited) | | | 2007 | | | 2006 | | | 2005 | | | 2004(1) | |
Net Asset Value, | | | | | | | | | | | | | | | |
Beginning of Period | | $ | 16.11 | | | $ | 13.08 | | | $ | 11.07 | | | $ | 10.03 | | | $ | 10.00 | |
| | | | | | | | | | | | | | | | | | | | | |
Income (Loss) | | | | | | | | | | | | | | | | | | | | |
from Investment | | | | | | | | | | | | | | | | | | | | |
Operations: | | | | | | | | | | | | | | | | | | | | |
| Net investment income | | | 0.05 | | | | 0.25 | | | | 0.31 | (5) | | | 0.21 | (5) | | | 0.09 | (5) |
| Net realized and unrealized | | | | | | | | | | | | | | | | | | | | |
| gain (loss) on investments | | | 0.04 | | | | 3.25 | | | | 1.81 | | | | 0.87 | | | | (0.08 | ) |
Total Income from | | | | | | | | | | | | | | | | | | | | |
Investment Operations | | | 0.09 | | | | 3.50 | | | | 2.12 | | | | 1.08 | | | | 0.01 | |
| | | | | | | | | | | | | | | | | | | | | |
Less Distributions | | | | | | | | | | | | | | | | | | | | |
Paid: | | | | | | | | | | | | | | | | | | | | |
| From net investment income | | | (0.25 | ) | | | (0.22 | ) | | | (0.07 | ) | | | (0.01 | ) | | | — | |
| From net realized gain on investments | | | (1.18 | ) | | | (0.25 | ) | | | (0.04 | ) | | | (0.03 | ) | | | — | |
Total Distributions Paid | | | (1.43 | ) | | | (0.47 | ) | | | (0.11 | ) | | | (0.04 | ) | | | — | |
| | | | | | | | | | | | | | | | | | | | | |
| Payment by Affiliates | | | — | | | | — | | | | — | | | | — | | | | 0.02 | |
Net Asset Value, End of Period | | $ | 14.77 | | | $ | 16.11 | | | $ | 13.08 | | | $ | 11.07 | | | $ | 10.03 | |
Total Return(2) | | | 0.85 | % | | | 27.12 | % | | | 19.27 | % | | | 10.87 | % | | | 0.30 | %(6) |
| | | | | | | | | | | | | | | | | | | | | |
Supplemental Data | | | | | | | | | | | | | | | | | | | | |
and Ratios: | | | | | | | | | | | | | | | | | | | | |
| Net assets, end of period | | | | | | | | | | | | | | | | | | | | |
| (in thousands) | | $ | 683,038 | | | $ | 712,620 | | | $ | 531,321 | | | $ | 137,478 | | | $ | 12,130 | |
| Ratio of expenses to | | | | | | | | | | | | | | | | | | | | |
| average net assets(3)(4) | | | 0.75 | % | | | 0.75 | % | | | 0.75 | % | | | 0.95 | % | | | 0.95 | % |
| Ratio of net investment income to | | | | | | | | | | | | | | | | | | | | |
| average net assets(3)(4) | | | 0.52 | % | | | 1.62 | % | | | 1.94 | % | | | 1.96 | % | | | 2.01 | % |
| Portfolio turnover rate(2) | | | 27 | % | | | 62 | % | | | 35 | % | | | 44 | % | | | 17 | % |
| (1) | Commenced operations on January 8, 2004. |
| (2) | Not annualized for periods less than a full year. |
| (3) | Net of waivers and reimbursements by Adviser. Without waivers and reimbursements of expenses, the ratio of expenses to average net assets would have been 1.07%, 1.07%, 1.09%, 1.31% and 4.41% and the ratio of net investment income (loss) to average net assets would have been 0.20%, 1.30%, 1.60%, 1.60% and (1.45)% for the periods ended December 31, 2007, June 30, 2007, June 30, 2006, June 30, 2005 and June 30, 2004, respectively. |
| (4) | Annualized for periods less than a full year. |
| (5) | Per share net investment income has been calculated using the daily average share method. |
| (6) | During the period ended June 30, 2004, 0.20% of the Fund’s total return consists of a voluntary reimbursement by the Adviser. Excluding this item, total return would have been 0.10%. |
The accompanying notes are an integral part of these financial statements.
FRONTEGRA
NETOLS SMALL CAP
VALUE FUND
REPORT FROM NETOLS ASSET
MANAGEMENT:
Dear Shareholders:
For the six months ended December 31, 2007, the Frontegra Netols Small Cap Value Fund – Institutional Class has outperformed the benchmark after fees, returning -4.64% compared to -13.08% for the Russell 2000 Value Index.
Portfolio Review
Continued credit tightening and reduced financial market liquidity were the dominant market factors during the second half of 2007. Despite the Federal Reserve providing liquidity at auction to depository institutions, significant liquidity issues remain in other areas of the financial system. Additionally, concerns over the health of the U.S. consumer were raised as a result of tighter credit, a downturn in the housing market, and oil approaching $100 per barrel. As a result, consumer discretionary and financial sectors underperformed. As investors looked to sectors less impacted by the domestic economy, energy and health care outperformed.
Positive Contributions to Relative Performance in the second half of 2007:
Stock selection in energy and materials sectors
Overweight in energy and health care sectors
Underweight in financial sector
Best performing stocks for the period: Terra Industries, DeVry, Robbins & Meyers, Whiting Petroleum, Mantech
Negative Contributions to Relative Performance in the second half of 2007:
Stock selection in consumer staples sector
Overweight in consumer discretionary sector
Worst performing stocks for the period: W Holding, Cott, Sturm Ruger, Casual Male, Diamond Management
Thank you for your continued support.
Jeff Netols
Netols Asset Management
INVESTMENT HIGHLIGHTS
Growth of a $100,000 Investment (Unaudited)
* 12/16/05 commencement of operations.
| | | | |
| | Portfolio Total Return** | | |
| | FOR THE PERIOD ENDED 12/31/07 | | |
| | | | |
| | SIX MONTHS | (4.64)% | |
| | | | |
| | ONE YEAR | 7.08% | |
| | | | |
| | SINCE COMMENCEMENT | | |
| | AVERAGE ANNUAL | 10.87% | |
| | | | |
This chart assumes an initial gross investment of $100,000 made on 12/16/05 (commencement of operations). Returns shown include the reinvestment of all distributions. Past performance is not predictive of future results. Investment return and principal value will fluctuate so that shares, when redeemed, may be worth more or less than the original cost. In the absence of existing fee waivers, total return would be reduced. To receive current to the most recent month-end performance, please call 1-888-825-2100.
The Russell 2000 Value Index measures the performance of those Russell 2000 companies with lower price-to-book ratios and lower forecasted growth values. The Russell 2000 Index measures the performance of the 2,000 smallest companies in the Russell 3000 Index. The Russell 3000 Index measures the performance of the 3,000 largest U.S. companies based on total market capitalization. The Index does not reflect investment management fees, brokerage commissions and other expenses associated with investing in equity securities. A direct investment in the index is not possible.
| ** | The returns shown do not reflect the deduction of taxes that a shareholder would pay on Fund distributions or the redemption of Fund shares. |
Frontegra Netols Small Cap Value Fund
SCHEDULE OF INVESTMENTS
December 31, 2007 (Unaudited)
Number of Shares | | | | Value | |
| | | COMMON STOCKS 97.9% | | | |
| | | Aerospace & Defense 4.4% | | | |
| | 7,202 | | American Science & Engineering, Inc. | | $ | 408,713 | |
| | 5,174 | | BE Aerospace, Inc. (a) | | | 273,705 | |
| | 6,109 | | Ceradyne, Inc. (a) | | | 286,695 | |
| | | | | | | 969,113 | |
| | | | | | | | |
| | | | Auto Components 1.2% | | | | |
| | 10,237 | | Tenneco Automotive, Inc. (a) | | | 266,879 | |
| | | | | | | | |
| | | | Automobiles 0.7% | | | | |
| | 24,967 | | Fleetwood Enterprises, Inc. (a) | | | 149,303 | |
| | | | | | | | |
| | | | Beverages 2.1% | | | | |
| | 39,369 | | Cott Corp. (a)(b) | | | 262,198 | |
| | 21,019 | | MGP Ingredients, Inc. | | | 197,999 | |
| | | | | | | 460,197 | |
| | | | | | | | |
| | | | Chemicals 3.0% | | | | |
| | 13,396 | | Terra Industries Inc. (a) | | | 639,793 | |
| | | | | | | | |
| | | | Commercial Banks 3.0% | | | | |
| | 8,062 | | East West Bancorp, Inc. | | | 195,342 | |
| | 13,899 | | UCBH Holdings, Inc. | | | 196,810 | |
| | 5,797 | | Westamerica Bancorporation | | | 258,256 | |
| | | | | | | 650,408 | |
| | | | Commercial Services & Supplies 4.8% | | | | |
| | 22,246 | | Corinthian Colleges, Inc. (a) | | | 342,588 | |
| | 7,309 | | DeVry, Inc. | | | 379,776 | |
| | 7,070 | | Diamond Management & Technology Consultants, Inc. | | | 51,399 | |
| | 7,639 | | School Specialty, Inc. (a) | | | 263,927 | |
| | | | | | | 1,037,690 | |
| | | | Construction & Engineering 1.6% | | | | |
| | 30,424 | | ENGlobal Corp. (a) | | | 345,617 | |
| | | | | | | | |
| | | | Diversified Financial Services 0.8% | | | | |
| | 4,542 | | GATX Corp. | | | 166,601 | |
| | | | | | | | |
The accompanying notes are an integral part of these financial statements.
Frontegra Netols Small Cap Value Fund
SCHEDULE OF INVESTMENTS (CONTINUED)
December 31, 2007 (Unaudited)
Number of Shares | | | | Value | |
| | | COMMON STOCKS 97.9% (continued) | | | |
| | | Diversified Telecommunication Services 1.8% | | | |
| | 25,548 | | Alaska Communications Systems Group Inc. | | $ | 383,220 | |
| | | | | | | | |
| | | | Electrical Equipment 5.8% | | | | |
| | 5,361 | | Acuity Brands, Inc. | | | 241,245 | |
| | 26,775 | | C&D Technologies, Inc. (a) | | | 176,983 | |
| | 7,054 | | General Cable Corp. (a) | | | 516,917 | |
| | 17,264 | | LSI Industries, Inc. | | | 314,205 | |
| | | | | | | 1,249,350 | |
| | | | Electronic Equipment & Instruments 0.8% | | | | |
| | 18,352 | | GTSI Corp. (a) | | | 181,501 | |
| | | | | | | | |
| | | | Energy Equipment & Services 1.2% | | | | |
| | 12,045 | | Global Industries, Ltd. (a) | | | 258,004 | |
| | | | | | | | |
| | | | Food Products 1.5% | | | | |
| | 15,464 | | Lance, Inc. | | | 315,775 | |
| | | | | | | | |
| | | | Health Care Equipment & Services 1.5% | | | | |
| | 16,327 | | PSS World Medical, Inc. (a) | | | 319,519 | |
| | | | | | | | |
| | | | Health Care Equipment & Supplies 11.4% | | | | |
| | 6,410 | | Haemonetics Corp. (a) | | | 403,958 | |
| | 8,669 | | ICU Medical, Inc. (a) | | | 312,171 | |
| | 17,176 | | Medical Action Industries Inc. (a) | | | 358,120 | |
| | 5,641 | | Mentor Corp. | | | 220,563 | |
| | 32,916 | | Merit Medical Systems, Inc. (a) | | | 457,532 | |
| | 6,321 | | SurModics, Inc. (a) | | | 343,041 | |
| | 5,571 | | Varian, Inc. (a) | | | 363,786 | |
| | | | | | | 2,459,171 | |
| | | | Health Care Providers & Services 3.3% | | | | |
| | 18,269 | | Gentiva Health Services, Inc. (a) | | | 347,842 | |
| | 5,981 | | Sunrise Senior Living, Inc. (a) | | | 183,497 | |
| | 13,278 | | U.S. Physical Therapy, Inc. (a) | | | 190,805 | |
| | | | | | | 722,144 | |
The accompanying notes are an integral part of these financial statements.
Frontegra Netols Small Cap Value Fund
SCHEDULE OF INVESTMENTS (CONTINUED)
December 31, 2007 (Unaudited)
Number of Shares | | | | Value | |
| | | COMMON STOCKS 97.9% (continued) | | | |
| | | Household Durables 1.5% | | | |
| | 33,912 | | Champion Enterprises, Inc. (a) | | $ | 319,451 | |
| | | | | | | | |
| | | | Insurance 2.0% | | | | |
| | 6,716 | | Hanover Insurance Group Inc. | | | 307,593 | |
| | 4,621 | | Stewart Information Services Corp. | | | 120,562 | |
| | | | | | | 428,155 | |
| | | | IT Services 3.6% | | | | |
| | 7,598 | | CACI International Inc. - Class A (a) | | | 340,162 | |
| | 9,714 | | Mantech International Corp. - Class A (a) | | | 425,668 | |
| | | | | | | 765,830 | |
| | | | Machinery 6.0% | | | | |
| | 6,410 | | IDEX Corp. | | | 231,593 | |
| | 9,008 | | Robbins & Myers, Inc. | | | 681,275 | |
| | 10,938 | | Wabtec Corp. | | | 376,705 | |
| | | | | | | 1,289,573 | |
| | | | Marine 3.1% | | | | |
| | 5,626 | | Alexander & Baldwin, Inc. | | | 290,639 | |
| | 15,358 | | General Maritime Corp. (b) | | | 375,503 | |
| | | | | | | 666,142 | |
| | | | Media 1.6% | | | | |
| | 8,146 | | Arbitron Inc. | | | 338,629 | |
| | | | | | | | |
| | | | Metals & Mining 4.3% | | | | |
| | 6,202 | | Brush Engineered Materials, Inc. (a) | | | 229,598 | |
| | 9,483 | | Commercial Metals Co. | | | 279,274 | |
| | 10,261 | | Compass Minerals International, Inc. | | | 420,701 | |
| | | | | | | 929,573 | |
| | | | Multiline Retail 2.3% | | | | |
| | 28,638 | | 99 Cents Only Stores (a) | | | 227,958 | |
| | 27,419 | | Fred’s, Inc. - Class A | | | 264,045 | |
| | | | | | | 492,003 | |
| | | | Oil & Gas 6.1% | | | | |
| | 11,069 | | Encore Acquisition Co. (a) | | | 369,373 | |
| | 8,819 | | Forest Oil Corp. (a) | | | 448,358 | |
The accompanying notes are an integral part of these financial statements.
Frontegra Netols Small Cap Value Fund
SCHEDULE OF INVESTMENTS (CONTINUED)
December 31, 2007 (Unaudited)
Number of Shares | | | | Value | |
| | | COMMON STOCKS 97.9% (continued) | | | |
| | | Oil & Gas 6.1% (continued) | | | |
| | 8,694 | | Whiting Petroleum Corp. (a) | | $ | 501,296 | |
| | | | | | | 1,319,027 | |
| | | | Oil, Gas & Consumable Fuels 3.8% | | | | |
| | 8,974 | | Foundation Coal Holdings, Inc. | | | 471,135 | |
| | 63,701 | | International Coal Group, Inc. (a) | | | 341,437 | |
| | | | | | | 812,572 | |
| | | | Personal Products 2.0% | | | | |
| | 5,759 | | Chattem, Inc. (a) | | | 435,035 | |
| | | | | | | | |
| | | | Pharmaceuticals 2.9% | | | | |
| | 10,001 | | K-V Pharmaceutical Co. - Class A (a) | | | 285,429 | |
| | 14,177 | | Par Pharmaceutical Companies, Inc. (a) | | | 340,248 | |
| | | | | | | 625,677 | |
| | | | Real Estate 5.5% | | | | |
| | 14,709 | | Arbor Realty Trust, Inc. | | | 236,962 | |
| | 19,474 | | Cedar Shopping Centers Inc. | | | 199,219 | |
| | 7,250 | | First Industrial Realty Trust, Inc. | | | 250,850 | |
| | 5,119 | | Mid-America Apartment Communities, Inc. | | | 218,837 | |
| | 13,253 | | Sun Communities, Inc. | | | 279,241 | |
| | | | | | | 1,185,109 | |
| | | | Software 1.4% | | | | |
| | 16,935 | | EPIQ Systems, Inc. (a) | | | 294,838 | |
| | | | | | | | |
| | | | Specialty Retail 0.7% | | | | |
| | 29,678 | | Casual Male Retail Group Inc. (a) | | | 153,732 | |
| | | | | | | | |
| | | | Textiles, Apparel & Luxury Goods 1.4% | | | | |
| | 15,404 | | Carter’s, Inc. (a) | | | 298,067 | |
| | | | | | | | |
| | | | Thrifts & Mortgage Finance 0.8% | | | | |
| | 7,637 | | MGIC Investment Corp. | | | 171,298 | |
| | | | | | | | |
| | | | Total Common Stocks | | | | |
| | | | (Cost $19,724,178) | | | 21,098,996 | |
The accompanying notes are an integral part of these financial statements.
Frontegra Netols Small Cap Value Fund
SCHEDULE OF INVESTMENTS (CONTINUED)
December 31, 2007 (Unaudited)
Number of Shares | | | | Value | |
| | | SHORT-TERM INVESTMENT 2.2% | | | |
| | | Investment Company 2.2% | | | |
| | 477,963 | | Fidelity Institutional Money Market Portfolio | | $ | 477,963 | |
| | | | | | | | |
| | | | Total Short-Term Investment | | | | |
| | | | (Cost $477,963) | | | 477,963 | |
| | | | | | | | |
| | | | Total Investments 100.1% | | | | |
| | | | (Cost $20,202,141) | | | 21,576,959 | |
| | | | | | | | |
| | | | Liabilities in Excess of Other Assets (0.1)% | | | (12,804 | ) |
| | | | | | | | |
| | | | TOTAL NET ASSETS 100.0% | | $ | 21,564,155 | |
| (a) | Non-Income Producing. |
| (b) | U.S.-dollar denominated security of foreign issuer. |
The accompanying notes are an integral part of these financial statements.
Frontegra Netols Small Cap Value Fund
STATEMENT OF ASSETS AND LIABILITIES
December 31, 2007 (Unaudited)
Assets: | | | |
| Investments at value (cost $20,202,141) | | $ | 21,576,959 | |
| Interest and dividend receivable | | | 15,111 | |
| Receivable for Fund shares sold | | | 11,396 | |
| Other assets | | | 16,775 | |
| Total assets | | | 21,620,241 | |
| | | | | |
Liabilities: | | | | |
| Accrued investment advisory fee | | | 22,494 | |
| Distribution fees | | | 459 | |
| Shareholder servicing fees | | | 368 | |
| Accrued expenses | | | 32,765 | |
| Total liabilities | | | 56,086 | |
Net Assets | | $ | 21,564,155 | |
| | | | | |
Net Assets Consist of: | | | | |
| Paid in capital | | $ | 20,451,639 | |
| Accumulated net realized loss | | | (262,302 | ) |
| Net unrealized appreciation on investments | | | 1,374,818 | |
Net Assets | | $ | 21,564,155 | |
| | | | | |
Capital Stock, $0.01 Par Value | | | | |
| Authorized | | | 50,000,000 | |
| | | | | |
Institutional Class: | | | | |
| Net Assets | | $ | 20,487,488 | |
| Issued and outstanding | | | 1,691,500 | |
Net Asset Value, Redemption Price and Offering Price Per Share | | $ | 12.11 | |
| | | | | |
Class Y: | | | | |
| Net Assets | | $ | 1,076,667 | |
| Issued and outstanding | | | 88,908 | |
Net Asset Value, Redemption Price and Offering Price Per Share | | $ | 12.11 | |
The accompanying notes are an integral part of these financial statements.
Frontegra Netols Small Cap Value Fund
STATEMENT OF OPERATIONS
| | | Six Months Ended | |
| | | December 31, 2007 | |
| | | (Unaudited) | |
Investment Income: | | | |
| Dividends(1) | | $ | 89,190 | |
| Interest | | | 14,122 | |
| | | | 103,312 | |
| | | | | |
Expenses: | | | | |
| Investment advisory fees (Note 3) | | | 96,304 | |
| Distribution fees - Class Y (Note 8) | | | 459 | |
| Shareholder servicing fees - Class Y (Note 8) | | | 368 | |
| Legal fees | | | 12,332 | |
| Audit fees | | | 11,446 | |
| Fund administration and accounting fees | | | 9,160 | |
| Custody fees | | | 5,752 | |
| Federal and state registration fees | | | 3,954 | |
| Shareholder servicing fees | | | 3,808 | |
| Directors’ fees and related expenses | | | 3,690 | |
| Compliance support expenses | | | 3,517 | |
| Reports to shareholders | | | 1,876 | |
| Total expenses before waiver and reimbursement | | | 152,666 | |
| Waiver and reimbursement of expenses by Adviser (Note 3) | | | (45,904 | ) |
| Net expenses | | | 106,762 | |
Net Investment Loss | | | (3,450 | ) |
| | | | | |
Realized and Unrealized | | | | |
Loss on Investments: | | | | |
| Net realized loss on investments | | | (255,042 | ) |
| Change in net unrealized | | | | |
| appreciation/depreciation on investments | | | (687,560 | ) |
Net Realized and Unrealized | | | | |
Loss on Investments | | | (942,602 | ) |
Net Decrease in Net Assets | | | | |
Resulting from Operations | | $ | (946,052 | ) |
| (1) | Net of $459 in foreign witholding taxes. |
The accompanying notes are an integral part of these financial statements.
Frontegra Netols Small Cap Value Fund
STATEMENTS OF CHANGES IN NET ASSETS
| | | Six Months Ended | | | | |
| | | December 31, 2007 | | | Year Ended | |
| | | (Unaudited) | | | June 30, 2007 | |
Operations: | | | | | | |
| Net investment income (loss) | | $ | (3,450 | ) | | $ | 34,681 | |
| Net realized gain (loss) on investments | | | (255,042 | ) | | | 303,294 | |
| Change in net unrealized appreciation/ | | | | | | | | |
| depreciation on investments | | | (687,560 | ) | | | 2,313,934 | |
| Net increase (decrease) in net assets | | | | | | | | |
| resulting from operations | | | (946,052 | ) | | | 2,651,909 | |
| | | | | | | | | |
Distributions Paid to Institutional | | | | | | | | |
Class Shareholders From: | | | | | | | | |
| Net investment income | | | (34,466 | ) | | | — | |
| Net realized gain on investments | | | (251,672 | ) | | | (55,832 | ) |
| Net decrease in net assets resulting | | | | | | | | |
| from distributions paid | | | (286,138 | ) | | | (55,832 | ) |
| | | | | | | | | |
Distributions Paid to Class Y | | | | | | | | |
Shareholders From: | | | | | | | | |
| Net investment income | | | (1,500 | ) | | | — | |
| Net realized gain on investments | | | (13,294 | ) | | | — | |
| Net decrease in net assets resulting | | | | | | | | |
| from distributions paid | | | (14,794 | ) | | | — | |
| | | | | | | | | |
Capital Share | | | | | | | | |
Transactions: | | | | | | | | |
| Shares sold | | | 5,884,465 | | | | 7,964,269 | |
| Shares issued to holders in | | | | | | | | |
| reinvestment of distributions | | | 273,586 | | | | 55,832 | |
| Shares redeemed | | | (714,692 | ) | | | (976,290 | ) |
| Net increase in net assets resulting | | | | | | | | |
| from capital share transactions | | | 5,443,359 | | | | 7,043,811 | |
| | | | | | | | | |
Total Increase in Net Assets | | | 4,196,375 | | | | 9,639,888 | |
| | | | | | | | | |
Net Assets: | | | | | | | | |
| Beginning of period | | | 17,367,780 | | | | 7,727,892 | |
| End of period | | | | | | | | |
| (includes accumulated net investment income | | | | | | | | |
| of $0 and $35,966, respectively) | | $ | 21,564,155 | | | $ | 17,367,780 | |
The accompanying notes are an integral part of these financial statements.
Frontegra Netols Small Cap Value Fund
FINANCIAL HIGHLIGHTS
| | | Institutional Class | | | | | | | |
| | | Six Months | | | | | | | |
| | | Ended | | | Year | | | Period | |
| | | December 31, | | | Ended | | | Ended | |
| | | 2007(6) | | | June 30, | | | June 30, | |
| | | (Unaudited) | | | 2007 | | | 2006(1) | |
Net Asset Value, | | | | | | | | | |
Beginning of Period | | $ | 12.88 | | | $ | 10.29 | | | $ | 10.00 | |
| | | | | | | | | | | | | |
Income (Loss) | | | | | | | | | | | | |
from Investment | | | | | | | | | | | | |
Operations: | | | | | | | | | | | | |
| Net investment income (loss) | | | (0.01 | ) | | | 0.03 | | | | — | (5) |
| Net realized and unrealized | | | | | | | | | | | | |
| gain (loss) on investments | | | (0.59 | ) | | | 2.62 | | | | 0.29 | |
Total Income (Loss) from | | | | | | | | | | | | |
Investment Operations | | | (0.60 | ) | | | 2.65 | | | | 0.29 | |
| | | | | | | | | | | | | |
Less Distributions | | | | | | | | | | | | |
Paid: | | | | | | | | | | | | |
| From net investment income | | | (0.02 | ) | | | — | | | | — | |
| From net realized gain on investments | | | (0.15 | ) | | | (0.06 | ) | | | — | |
Total Distributions Paid | | | (0.17 | ) | | | (0.06 | ) | | | — | |
| | | | | | | | | | | | | |
Net Asset Value, End of Period | | $ | 12.11 | | | $ | 12.88 | | | $ | 10.29 | |
Total Return(2) | | | (4.64 | )% | | | 25.81 | % | | | 2.90 | % |
| | | | | | | | | | | | | |
Supplemental Data | | | | | | | | | | | | |
and Ratios: | | | | | | | | | | | | |
| Net assets, end of period | | | | | | | | | | | | |
| (in thousands) | | $ | 20,487 | | | $ | 17,368 | | | $ | 7,728 | |
| Ratio of expenses to | | | | | | | | | | | | |
| average net assets(3)(4) | | | 1.10 | % | | | 1.10 | % | | | 1.10 | % |
| Ratio of net investment income (loss) to | | | | | | | | | | | | |
| average net assets(3)(4) | | | (0.03 | )% | | | 0.30 | % | | | 0.05 | % |
| Portfolio turnover rate(2) | | | 21 | % | | | 49 | % | | | 41 | % |
| (1) | Commenced operations on December 16, 2005. |
| (2) | Not annualized for periods less than a full year. |
| (3) | Net of waivers and reimbursements by Adviser. Without waivers and reimbursements of expenses, the ratio of expenses to average net assets would have been 1.58%, 2.10% and 4.59% and the ratio of net investment loss to average net assets would have been (0.51)%, (0.70)% and (3.44)% for the periods ended December 31, 2007, June 30, 2007 and June 30, 2006, respectively. |
| (4) | Annualized for periods less than a full year. |
| (5) | Less than one cent per share. |
| (6) | On November 1, 2007, shares were designated as Institutional Class. |
The accompanying notes are an integral part of these financial statements.
Frontegra Netols Small Cap Value Fund
FINANCIAL HIGHLIGHTS
| | | Class Y | |
| | | Period | |
| | | Ended | |
| | | December 31, | |
| | | 2007(1) | |
| | | (Unaudited) | |
Net Asset Value, | | | |
Beginning of Period | | $ | 12.54 | |
| | | | | |
Income (Loss) | | | | |
from Investment | | | | |
Operations: | | | | |
| Net investment income | | | 0.02 | |
| Net realized and unrealized | | | | |
| loss on investments | | | (0.28 | ) |
Total Loss from | | | | |
Investment Operations | | | (0.26 | ) |
| | | | | |
Less Distributions | | | | |
Paid: | | | | |
| From net investment income | | | (0.02 | ) |
| From net realized gain on investments | | | (0.15 | ) |
Total Distributions Paid | | | (0.17 | ) |
| | | | | |
Net Asset Value, End of Period | | $ | 12.11 | |
Total Return(2) | | | (2.09 | )% |
| | | | | |
Supplemental Data | | | | |
and Ratios: | | | | |
| Net assets, end of period (in thousands) | | $ | 1,077 | |
| Ratio of expenses to average net assets(3)(4) | | | 1.55 | % |
| Ratio of net investment income to average net assets(3)(4) | | | 0.14 | % |
| Portfolio turnover rate(2)(5) | | | 21 | % |
| (1) | Commenced operations on November 1, 2007. |
| (2) | Not annualized. |
| (3) | Net of waivers and reimbursements by Adviser. Without waivers and reimbursements of expenses, the ratio of expenses to average net assets would have been 1.84% and the ratio of net investment loss to average net assets would have been (0.15)% for the period ended December 31, 2007. |
| (4) | Annualized. |
| (5) | Portfolio turnover is calculated on the basis of the Fund as a whole without distinguishing between the classes of shares issued. |
The accompanying notes are an integral part of these financial statements.
Frontegra Funds
NOTES TO FINANCIAL STATEMENTS
December 31, 2007 (Unaudited)
| Frontegra Funds, Inc. (“Frontegra”) was incorporated on May 24, 1996 as a Maryland corporation and is registered under the Investment Company Act of 1940, as amended (the “1940 Act”), as an open-end investment company issuing its shares in series, each series representing a distinct portfolio with its own investment objectives and policies. Frontegra consists of six series: the Frontegra Columbus Core Plus Fund (formerly Frontegra Total Return Bond Fund), the Frontegra Columbus Core Fund (formerly Frontegra Investment Grade Bond Fund), the Frontegra IronBridge Small Cap Fund (formerly Frontegra Horizon Fund), the Frontegra IronBridge SMID Fund, the Frontegra New Star International Equity Fund and the Frontegra Netols Small Cap Value Fund (the “Funds”). The Frontegra Columbus Core Plus and Columbus Core Funds seek a high level of total return, consistent with the preservation of capital. The investment objective of the Frontegra IronBridge Small Cap Fund, the Frontegra IronBridge SMID Fund, the Frontegra New Star International Equity Fund and the Frontegra Netols Small Cap Value Fund is capital appreciation. The Frontegra Columbus Core Plus and Columbus Core Funds, sub-advised by Reams Asset Management Company, LLC (“Reams”), commenced operations on November 25, 1996 and February 23, 2001, respectively. The Frontegra IronBridge Small Cap and IronBridge SMID Funds, sub-advised by IronBridge Capital Management, L.P. (“IronBridge”), commenced operations on August 30, 2002 and December 31, 2004, respectively. The Frontegra New Star International Equity Fund, sub-advised by New Star Institutional Managers Limited (“New Star”), commenced operations on January 8, 2004. The Frontegra Netols Small Cap Value Fund – Institutional Class and the Netols Small Cap Value Fund – Class Y, sub-advised by Netols Asset Management, Inc. (“Netols”), commenced operations on December 16, 2005 and November 1, 2007, respectively. |
(2) | Significant Accounting Policies |
| The following is a summary of significant accounting policies consistently followed by the Funds in the preparation of their financial statements. |
(a) | | Investment Valuation |
| | | |
| | | Securities are stated at value. Debt securities (other than short-term instruments) are valued by an independent pricing service, which uses valuation methods such as matrix pricing and other analytical pricing models as well as market transactions and dealer quotations. Securities (other than short-term investments) for which market quotations are readily available are valued at the last trade price on the national securities exchange on which such securities are primarily traded. Securities for which there were no transactions on a given day or securities not listed on a national securities exchange are valued at the most recent bid price. With respect to all Funds, all equity securities that are traded using the National Association of Securities Dealers’ Automated Quotation System (“NASDAQ”) are valued using the NASDAQ Official Closing Price (“NOCP”). Shares of underlying mutual funds are valued at their respective NAVs. Most securities that are primarily traded on foreign exchanges generally are valued at the last sale price of such securities on their respective |
Frontegra Funds
NOTES TO FINANCIAL STATEMENTS (CONTINUED)
December 31, 2007 (Unaudited)
| | | exchange. In certain countries market maker prices, usually the mean between the bid and ask prices, are used. In certain circumstances, such as when a significant event occurs in a foreign market so that the last sale price no longer reflects actual value, the fair value of these securities may be determined using fair valuation procedures approved by the Board of Directors. The Directors have retained an independent fair value pricing service to assist in valuing foreign securities held by the Frontegra New Star International Equity Fund. In valuing assets, prices denominated in foreign currencies are converted to U.S. dollar equivalents at the current exchange rate, which approximates market value. Securities maturing within 60 days or less when purchased are valued by the amortized cost method. Any securities or other assets for which market quotations are not readily available are valued at their fair value as determined in good faith by Reams, IronBridge, New Star and Netols pursuant to guidelines established by the Board of Directors. |
| | | |
| | | In September 2006, the Financial Accounting Standards Board (“FASB”) issued Statement of Financial Accounting Standards (“SFAS”) No. 157, “Fair Value Measurements”. SFAS No. 157 defines fair value, establishes a framework for measuring fair value in accordance with GAAP, and expands disclosure about fair value measurements. SFAS No. 157 is effective for financial statements issued for fiscal years beginning after November 15, 2007. Management is currently evaluating the implications of SFAS No. 157, and its impact on the financial statements has not yet been determined. |
| | | |
(b) | | Federal Income Taxes |
| | | |
| | | Each Fund intends to comply with the requirements of Subchapter M of the Internal Revenue Code necessary to qualify as a regulated investment company and to make the requisite distributions of income and capital gains to its shareholders sufficient to relieve it from all or substantially all federal income taxes. Therefore, no federal income tax provision has been provided. |
| | | |
| | | Effective December 31, 2007 the Funds adopted Financial Accounting Standards Board (“FASB”) Interpretation No. 48 (“FIN 48”), “Accounting for Uncertainty in Income Taxes,” a clarification of FASB Statement No. 109 “Accounting for Income Taxes.” FIN 48 establishes financial reporting rules regarding recognition and measurement of tax positions taken or expected to be taken on a tax return. The adoption of FIN 48 had no impact on the Funds’ net assets or results of operations. |
| | | |
(c) | | Distributions to Shareholders |
| | | |
| | | Dividends from net investment income are usually declared and paid quarterly for the Frontegra Columbus Core Plus and Frontegra Columbus Core Funds and at least annually for the Frontegra IronBridge Small Cap Fund, Frontegra IronBridge SMID Fund, Frontegra New Star International Equity Fund and the Frontegra Netols Small Cap Value Fund. Distributions of net realized gains, if any, are declared and paid at least annually for all Funds. |
Frontegra Funds
NOTES TO FINANCIAL STATEMENTS (CONTINUED)
December 31, 2007 (Unaudited)
| | All short-term capital gains are included in ordinary income for tax purposes. Distributions to shareholders are recorded on the ex-dividend date. |
| | |
| | The tax character of distributions paid during the periods ended December 31, 2007 and June 30, 2007 were as follows: |
| | | | Period Ended | | | Period Ended | |
| | | | December 31, 2007 | | | June 30, 2007 | |
| | | | Ordinary | | | Long-Term | | | Ordinary | | | Long-Term | |
| | | | Income | | | Capital Gains | | | Income | | | Capital Gains | |
| | Frontegra Columbus | | | | | | | | | | | | |
| | Core Plus Fund | | $ | 13,949,274 | | | $ | — | | | $ | 14,405,929 | | | $ | — | |
| | Frontegra Columbus | | | | | | | | | | | | | | | | |
| | Core Fund | | | 1,607,511 | | | | — | | | | 4,275,494 | | | | — | |
| | Frontegra IronBridge | | | | | | | | | | | | | | | | |
| | Small Cap Fund | | | 10,391,454 | | | | 35,191,852 | | | | 11,937,049 | | | | 22,844,243 | |
| | Frontegra IronBridge | | | | | | | | | | | | | | | | |
| | SMIDFund | | | 7,030,055 | | | | 11,099,086 | | | | 1,276,328 | | | | 892,285 | |
| | Frontegra New Star | | | | | | | | | | | | | | | | |
| | International Equity Fund | | | 31,026,819 | | | | 30,624,035 | | | | 13,562,503 | | | | 5,563,199 | |
| | Frontegra Netols | | | | | | | | | | | | | | | | |
| | Small Cap Value | | | | | | | | | | | | | | | | |
| | Fund – Institutional Class | | | 136,422 | | | | 149,716 | | | | 54,889 | | | | 943 | |
| | Frontegra Netols Small Cap | | | | | | | | | | | | | | | | |
| | Value Fund – Class Y(1) | | | 6,886 | | | | 7,908 | | | | — | | | | — | |
| | (1) | Commenced operations on November 1, 2007. |
| As of June 30, 2007, the Funds’ most recent fiscal year end, the components of accumulated earnings (losses) for income tax purposes were as follows: |
| | | | Frontegra | | | | | | Frontegra | |
| | | | Columbus | | | Frontegra | | | IronBridge | |
| | | | Core | | | Columbus | | | Small Cap | |
| | | | Plus Fund | | | Core Fund | | | Fund | |
| | Cost basis of investments for | | | | | | | | | |
| | federal income tax purposes | | $ | 386,713,274 | | | $ | 130,371,588 | | | $ | 329,523,507 | |
| | Gross tax unrealized appreciation | | $ | 1,394,083 | | | $ | 64 | | | $ | 118,637,102 | |
| | Gross tax unrealized depreciation | | | (5,974,518 | ) | | | (1,449,795 | ) | | | (14,230,223 | ) |
| | Net tax unrealized appreciation (depreciation) | | | (4,580,435 | ) | | | (1,449,731 | ) | | | 104,406,879 | |
| | Undistributed ordinary income | | | 30,337 | | | | 29,969 | | | | 8,541,747 | |
| | Undistributed long-term capital gain | | | — | | | | — | | | | 10,589,156 | |
| | Total distributable earnings | | | 30,337 | | | | 29,969 | | | | 19,130,903 | |
| | Other accumulated losses | | | (1,274,078 | ) | | | (2,146,076 | ) | | | — | |
| | Total accumulated earnings (losses) | | $ | (5,824,176 | ) | | $ | (3,565,838 | ) | | $ | 123,537,782 | |
Frontegra Funds
NOTES TO FINANCIAL STATEMENTS (CONTINUED)
December 31, 2007 (Unaudited)
| | | | | | | Frontegra | | | Frontegra | |
| | | | Frontegra | | | New Star | | | Netols | |
| | | | IronBridge | | | International | | | Small Cap | |
| | | | SMID Fund | | | Equity Fund | | | Value Fund | |
| | Cost basis of investments for | | | | | | | | | |
| | federal income tax purposes | | $ | 163,455,334 | | | $ | 554,468,973 | | | $ | 15,257,080 | |
| | Gross tax unrealized appreciation | | $ | 34,146,238 | | | $ | 149,711,183 | | | $ | 2,763,162 | |
| | Gross tax unrealized depreciation | | | (4,011,017 | ) | | | (5,339,067 | ) | | | (704,571 | ) |
| | Net tax unrealized appreciation (depreciation) | | | 30,135,221 | | | | 144,372,116 | | | | 2,058,591 | |
| | Undistributed ordinary income | | | 5,013,022 | | | | 26,059,867 | | | | 143,297 | |
| | Undistributed long-term capital gain | | | 3,519,812 | | | | 14,374,860 | | | | 157,612 | |
| | Total distributable earnings | | | 8,532,834 | | | | 40,434,727 | | | | 300,909 | |
| | Other accumulated gains (losses) | | | — | | | | 12,216 | | | | — | |
| | Total accumulated earnings | | $ | 38,668,055 | | | $ | 184,819,059 | | | $ | 2,359,500 | |
| | | The difference between book-basis and tax-basis unrealized appreciation is attributable primarily to the tax deferral of losses on wash sales and swaps. |
| | | |
| | | The Funds intend to utilize provisions of the federal income tax laws, which allow them to carry a realized capital loss forward for eight years following the year of loss and offset such losses against any future realized capital gains. At June 30, 2007, the Frontegra Columbus Core Plus Fund had a capital loss carryover of $1,402,608, which expires in 2014; the Frontegra Columbus Core Fund had capital loss carryovers of $889,497 and $845,241, which expire in 2014 and 2015, respectively. |
| | | |
| | | At June 30, 2007, the Frontegra Columbus Core Fund had a post-October capital loss of $417,031. This loss is treated as occurring on July 1, 2007 for tax purposes. |
| | | |
(d) | | When-Issued Securities |
| | | |
| | | The Frontegra Columbus Core Plus and Columbus Core Funds may purchase securities on a when-issued basis. The price of securities purchased on a when-issued basis is fixed at the time the commitment to purchase is made, but delivery and payment for the securities take place at a later date, normally within 45 days of the purchase. At the time of purchase, the Funds will record the transaction and reflect the value of the security and related liability in determining their net asset value. During the period between the purchase and settlement, no payment is made by the Funds to the issuer and no interest is accrued. The Funds maintain segregated cash, U.S. government securities and liquid securities equal in value to commitments for when-issued securities. |
| | | |
(e) | | Mortgage Dollar Rolls |
| | | |
| | | The Frontegra Columbus Core Plus and Columbus Core Funds may enter into mortgage dollar rolls, in which a Fund would sell mortgage-backed securities for delivery in the current |
Frontegra Funds
NOTES TO FINANCIAL STATEMENTS (CONTINUED)
December 31, 2007 (Unaudited)
| | | month and simultaneously contract to purchase similar securities on a specified future date. While a Fund would forego principal and interest paid on the mortgage-backed securities during the roll period, it would be compensated by the difference between the current sale price and the lower price for the future purchase as well as by any interest earned on the proceeds of the initial sale. A Fund also could be compensated through the receipt of fee income equivalent to a lower forward price. |
| | | |
(f) | | Futures Contracts |
| | | |
| | | Each Fund may enter into futures contracts, including index and interest rate futures contracts. Upon entering into a contract, the Fund deposits and maintains as collateral such initial margin as required by the exchange on which the transaction is effected. Pursuant to the contract, the Fund agrees to receive from or pay to the broker an amount of cash equal to the daily fluctuation in value of the contract. Such receipts or payments are known as variation margin and are recorded by the Fund as unrealized gains and losses. When the contract is closed, the Fund records a realized gain or loss equal to the difference between the value of the contract at the time it was opened and the value at the time it was closed. As collateral for futures contracts, the Fund is required under the 1940 Act to maintain assets consisting of cash, cash equivalents or other liquid securities. This collateral is required to be adjusted daily to reflect the market value of the purchase obligation for long futures contracts or the market value of the instrument underlying the contract, but not less than the market price at which the futures contract was established, for short futures contracts. |
| | | |
| | | The risks inherent in the use of futures contracts include 1) adverse changes in the value of such instruments; and 2) the possible absence of a liquid secondary market for any particular instrument at any time. There were no futures contracts open at December 31, 2007. |
| | | |
(g) | | Credit Default Swaps |
| | | |
| | | The Columbus Core Plus and Columbus Core Funds may enter into credit default swap agreements. The credit default swap agreement may have as a reference obligation one or more securities that are not currently held by a Fund. The buyer in a credit default swap agreement is obligated to pay the seller a periodic fee, typically expressed in basis points on the principal amount of the underlying obligation (the “notional” amount), over the term of the agreement in return for a contingent payment upon the occurrence of a credit event with respect to the underlying reference obligation. A credit event is typically a default. |
| | | |
| | | A Fund may be either the buyer or seller of protection in the transaction. As a seller, a Fund accrues for and receives a fixed rate of income throughout the term of the agreement, which typically is between one month and five years, provided that no credit event occurs. If a credit event occurs, the maximum payout amount for a sale contract is limited to the notional amount of the swap contract (“Maximum Payout Amount”). At December 31, 2007, the Frontegra Columbus Core Plus Fund had sale contracts outstanding with Maximum Payout |
Frontegra Funds
NOTES TO FINANCIAL STATEMENTS (CONTINUED)
December 31, 2007 (Unaudited)
| | | Amounts aggregating $72,287,800, with net unrealized depreciation of $126,831. At December 31, 2007, the Frontegra Columbus Core Fund had sale contracts outstanding with Maximum Payout Amounts aggregating $10,780,000 with net unrealized depreciation of $15,282. If a Fund is a buyer and no credit event occurs, the Fund may lose its investment and recover nothing. However, if a credit event occurs, the buyer typically receives full notional value for a reference obligation that may have little or no value. Until a credit default swap agreement is closed, the gain or loss on the notional amount in addition to the interest paid or received by a Fund on the notional amount is recorded as unrealized gains or losses on swaps and when the agreement is closed, the gain or loss is recorded as realized gains or losses on swaps. |
| | | |
| | | Credit default swaps may involve greater risks than if a Fund had invested in the reference obligation directly. Credit default swaps are subject to general market risk, liquidity risk, counterparty credit risk and credit risk of the issuer. As noted above, if a Fund is a buyer in a credit default swap agreement and no credit event occurs, it will lose its investment. In addition, the value of the reference obligation received by a Fund as a seller if a credit event occurs, coupled with the periodic payments previously received, may be less than the full notional value it pays to the buyer, resulting in a loss of value to the Fund. |
| | | |
(h) | | Foreign Currency Translation |
| | | |
| | | Values of investments denominated in foreign currencies are converted into U.S. dollars using a spot market rate of exchange on the day of valuation. Purchases and sales of investments and dividend and interest income are translated to U.S. dollars using a spot market rate of exchange prevailing on the respective dates of such transactions. The portion of security gains or losses resulting from changes in foreign exchange rates is included with net realized and unrealized gain or loss from investments, as appropriate, for both financial reporting and tax purposes. |
| | | |
(i) | | Indemnifications |
| | | |
| | | Under the Funds’ organizational documents, their officers and directors are indemnified against certain liabilities arising out of the performance of their duties to the Funds. In addition, in the normal course of business, the Funds enter into contracts that provide general indemnifications to other parties. The Funds’ maximum exposure under these arrangements is unknown as this would involve future claims that may be made against the Funds that have not yet occurred. However, the Funds have not had prior claims or losses pursuant to these contracts and expect the risk of loss to be remote. |
| | | |
(j) | | Other |
| | | |
| | | Investment transactions are accounted for on the trade date. The Funds determine the gain or loss realized from investment transactions by comparing the original cost of the specifically identified security lot sold with the net sale proceeds. Dividend income, less foreign |
Frontegra Funds
NOTES TO FINANCIAL STATEMENTS (CONTINUED)
December 31, 2007 (Unaudited)
| | | taxes withheld, is recognized on the ex-dividend date, except that certain dividends from foreign securities are recorded as soon as the information becomes available to the Funds. Interest income is recognized on an accrual basis. All discounts/premiums are accreted/amortized using the effective interest method and are included in interest income. Expenses attributable to the Funds are generally allocated to each Fund based on net assets. Expenses attributable to a particular Fund or class of shares are allocated directly to that Fund or class of shares. |
| | | |
| | | The preparation of financial statements in conformity with U.S. generally accepted accounting principles in the United States requires management to make estimates and assumptions that affect the reported amounts of assets and liabilities and disclosure of contingent assets and liabilities at the date of the financial statements, and the reported amounts of increases and decreases in net assets from operations during the reporting period. Actual results could differ from those estimates. |
| Each of the Funds has entered into an agreement with Frontegra Asset Management, Inc. (the “Adviser”), with whom certain officers and a director of the Funds are affiliated, to furnish investment advisory services to the Funds. The terms of these agreements are as follows: |
| The Frontegra Columbus Core Plus Fund will pay the Adviser a monthly fee at the annual rate of 0.40% of the Fund’s average daily net assets. Pursuant to expense cap agreements, the Adviser agreed to waive its management fee and/or reimburse the Fund’s operating expenses (exclusive of brokerage, interest, taxes and extraordinary expenses) to ensure that the Fund’s operating expenses do not exceed 0.20% of the Fund’s average daily net assets through October 31, 2007 and 0.35% of the Fund’s average daily net assets beginning November 1, 2007. The 0.35% expense cap agreement will continue in effect until October 31, 2008 with successive renewal terms of one year unless terminated by the Adviser or the Fund prior to any such renewal. |
| The Frontegra Columbus Core Fund will pay the Adviser a monthly fee at the annual rate of 0.42% of the Fund’s average daily net assets. Pursuant to expense cap agreements, the Adviser agreed to waive its management fee and/or reimburse the Fund’s operating expenses (exclusive of brokerage, interest, taxes and extraordinary expenses) to ensure that the Fund’s operating expenses do not exceed 0.20% of the Fund’s average daily net assets through October 31, 2007 and 0.35% of the Fund’s average daily net assets beginning November 1, 2007. The 0.35% expense cap agreement will continue in effect until October 31, 2008 with successive renewal terms of one year unless terminated by the Adviser or the Fund prior to any such renewal. |
| The Frontegra IronBridge Small Cap Fund will pay the Adviser a monthly fee at the annual rate of 1.00% of the Fund’s average daily net assets. Pursuant to an expense cap agreement, the Adviser has agreed to waive its management fee and/or reimburse the Fund’s operating expenses |
Frontegra Funds
NOTES TO FINANCIAL STATEMENTS (CONTINUED)
December 31, 2007 (Unaudited)
| (exclusive of brokerage, interest, taxes and extraordinary expenses) to ensure that the Fund’s operating expenses do not exceed 1.10% of the Fund’s average daily net assets. This expense cap agreement will continue in effect until October 31, 2008 with successive renewal terms of one year unless terminated by the Adviser or the Fund prior to any such renewal. |
| The Frontegra IronBridge SMID Fund will pay the Adviser a monthly fee at the annual rate of 0.85% of the Fund’s average daily net assets. Pursuant to an expense cap agreement, the Adviser has agreed to waive its management fee and/or reimburse the Fund’s operating expenses (excluding brokerage, interest, taxes and extraordinary expenses) to ensure that the Fund’s operating expenses do not exceed 0.95% of the Fund’s average daily net assets. This expense cap agreement will continue in effect until October 31, 2008 with successive renewal terms of one year unless terminated by the Adviser or the Fund prior to any such renewal. |
| The Frontegra New Star International Equity Fund will pay the Adviser a monthly fee at the annual rate of 0.95% of the Fund’s average daily net assets. Pursuant to an expense cap agreement, the Adviser has agreed to waive its management fee and/or reimburse the Fund’s operating expenses (exclusive of brokerage, interest, taxes and extraordinary expenses) to ensure that the Fund’s operating expenses do not exceed 0.75% of the Fund’s average daily net assets. This expense cap agreement will continue in effect until October 31, 2008 with successive renewal terms of one year unless terminated by the Adviser or the Fund prior to any such renewal. |
| The Frontegra Netols Small Cap Value Fund will pay the Adviser a monthly fee at the annual rate of 1.00% of the Fund’s average daily net assets. Pursuant to an expense cap agreement, the Adviser has agreed to waive its management fee and/or reimburse the Fund’s operating expenses (excluding brokerage, interest, taxes and extraordinary expenses) to ensure that the Fund’s operating expenses do not exceed 1.10% of the Fund’s average daily net assets for Institutional Class Shares and 1.55% of the Fund’s average daily net assets for Class Y Shares. This expense cap agreement will continue in effect until October 31, 2008 with successive renewal terms of one year unless terminated by the Adviser or the Fund prior to any such renewal. |
| Any waivers or reimbursements are subject to later adjustment to allow the Adviser to recoup amounts waived or reimbursed to the extent actual fees and expenses for a fiscal period are less than each Fund’s expense limitation cap, provided, however, that the Adviser shall only be entitled to recoup such amounts for a period of three years from the date such amount was waived or reimbursed. |
Frontegra Funds
NOTES TO FINANCIAL STATEMENTS (CONTINUED)
December 31, 2007 (Unaudited)
| The following table shows the waived or reimbursed expenses subject to potential recovery expiring in: |
| | | | Frontegra | | | | | | | | | Frontegra | | | Frontegra | |
| | | | Columbus | | | Frontegra | | | Frontegra | | | New Star | | | Netols | |
| | | | Core | | | Columbus | | | IronBridge | | | International | | | Small Cap | |
| | | | Plus Fund | | | Core Fund | | | SMID Fund | | | Equity Fund | | | Value Fund | |
| | 2008 | | $ | 320,062 | | | $ | 245,625 | | | $ | 66,381 | | | $ | 293,414 | | | | — | |
| | 2009 | | $ | 965,488 | | | $ | 438,461 | | | $ | 109,169 | | | $ | 1,248,571 | | | $ | 71,972 | |
| | 2010 | | $ | 874,012 | | | $ | 416,403 | | | $ | 43,079 | | | $ | 1,947,759 | | | $ | 114,909 | |
| | 2011 | | $ | 449,467 | | | $ | 176,140 | | | $ | 10,447 | | | $ | 1,160,900 | | | $ | 45,904 | |
| | | | $ | 2,609,029 | | | $ | 1,276,629 | | | $ | 229,076 | | | $ | 4,650,644 | | | $ | 232,785 | |
| The Adviser recouped $32,371 of previously waived/reimbursed expenses in the Frontegra IronBridge Small Cap Fund during the six months ended December 31, 2007. |
| (4) | Capital Share Transactions |
| Transactions in shares of the Frontegra Columbus Core Plus Fund were as follows: |
| | | | Period Ended | | | Year Ended | |
| | | | December 31, 2007 | | | June 30, 2007 | |
| | Shares issued in connection with | | | | | | |
| | acquisition of Columbus Core Plus Fund | | | 4,545,718 | | | | — | |
| | Shares sold | | | 2,383,927 | | | | 998,449 | |
| | Shares issued to holders in | | | | | | | | |
| | reinvestment of distributions | | | 417,336 | | | | 431,576 | |
| | Shares redeemed | | | (1,839,259 | ) | | | (2,884,808 | ) |
| | Net increase (decrease) in shares outstanding | | | 5,507,722 | | | | (1,454,783 | ) |
| | Transactions in shares of the Frontegra Columbus Core Fund were as follows: | | | | | | | | |
| | | | | | | | | | |
| | | | Period Ended | | | Year Ended | |
| | | | December 31, 2007 | | | June 30, 2007 | |
| | Shares issued in connection with | | | | | | | | |
| | acquisition of Columbus Core Fund | | | 1,425,241 | | | | — | |
| | Shares sold | | | 2,022,343 | | | | 918,821 | |
| | Shares issued to holders in | | | | | | | | |
| | reinvestment of distributions | | | 111,559 | | | | 220,493 | |
| | Shares redeemed | | | (2,982,496 | ) | | | (1,877,895 | ) |
| | Net increase (decrease) in shares outstanding | | | 576,647 | | | | (738,581 | ) |
Frontegra Funds
NOTES TO FINANCIAL STATEMENTS (CONTINUED)
December 31, 2007 (Unaudited)
| Transactions in shares of the Frontegra IronBridge Small Cap Fund were as follows: |
| | | | Period Ended | | | Year Ended | |
| | | | December 31, 2007 | | | June 30, 2007 | |
| | Shares sold | | | 858,091 | | | | 1,845,972 | |
| | Shares issued to holders in | | | | | | | | |
| | reinvestment of distributions | | | 2,473,395 | | | | 1,862,846 | |
| | Shares redeemed | | | (994,965 | ) | | | (4,612,068 | ) |
| | Net increase (decrease) in shares outstanding | | | 2,336,521 | | | | (903,250 | ) |
| Transaction in shares of the Frontegra IronBridge SMID Fund were as follows: |
| | | | Period Ended | | | Year Ended | |
| | | | December 31, 2007 | | | June 30, 2007 | |
| | Shares sold | | | 1,533,355 | | | | 4,918,242 | |
| | Shares issued to holders in | | | | | | | | |
| | reinvestment of distributions | | | 1,407,975 | | | | 160,618 | |
| | Shares redeemed | | | (983,391 | ) | | | (2,616,818 | ) |
| | Net increase in shares outstanding | | | 1,957,939 | | | | 2,462,042 | |
| Transaction in shares of the Frontegra New Star International Equity Fund were as follows: |
| | | | Period Ended | | | Year Ended | |
| | | | December 31, 2007 | | | June 30, 2007 | |
| | Shares sold | | | 941,406 | | | | 8,261,623 | |
| | Shares issued to holders in | | | | | | | | |
| | reinvestment of distributions | | | 3,946,143 | | | | 1,150,606 | |
| | Shares redeemed | | | (2,882,839 | ) | | | (5,796,757 | ) |
| | Net increase in shares outstanding | | | 2,004,710 | | | | 3,615,472 | |
| Transaction in shares of the Frontegra Netols Small Cap Value Fund – Institutional Class were as follows: |
| | | | Period Ended | | | Year Ended | |
| | | | December 31, 2007 | | | June 30, 2007 | |
| | Shares sold | | | 369,097 | | | | 675,621 | |
| | Shares issued to holders in | | | | | | | | |
| | reinvestment of distributions | | | 21,388 | | | | 4,880 | |
| | Shares redeemed | | | (47,589 | ) | | | (82,580 | ) |
| | Net increase in shares outstanding | | | 342,896 | | | | 597,921 | |
Frontegra Funds
NOTES TO FINANCIAL STATEMENTS (CONTINUED)
December 31, 2007 (Unaudited)
| Transaction in shares of the Frontegra Netols Small Cap Value Fund – Class Y were as follows: |
| | | | Period Ended | |
| | | | December 31, 2007(1) | |
| | Shares sold | | | 98,083 | |
| | Shares issued to holders in | | | | |
| | reinvestment of distributions | | | 1,223 | |
| | Shares redeemed | | | (10,398 | ) |
| | Net increase in shares outstanding | | | 88,908 | |
| | (1) | Commenced operations on November 1, 2007. |
(5) | Investment Transactions |
| The aggregate purchases and sales of securities, excluding short-term investments and U.S. government securities, for the Funds for the period ended December 31, 2007 are summarized below: |
| | | | Frontegra | | | | | | | |
| | | | Columbus | | | Frontegra | | | Frontegra | |
| | | | Core | | | Columbus | | | IronBridge | |
| | | | Plus Fund | | | Core Fund | | | Small Cap Fund | |
| | Purchases | | $ | 2,177,232,110 | | | $ | 510,109,493 | | | $ | 110,722,399 | |
| | Sales | | $ | 2,512,157,133 | | | $ | 542,596,966 | | | $ | 119,295,857 | |
| | | | | | | | | | | | |
| | | | | | | | Frontegra | | | Frontegra | |
| | | | Frontegra | | | New Star | | | Netols | |
| | | | IronBridge | | | International | | | Small Cap | |
| | | | SMID Fund | | | Equity Fund | | | Value Fund | |
| | Purchases | | $ | 98,843,900 | | | $ | 193,687,707 | | | $ | 8,733,013 | |
| | Sales | | $ | 87,186,867 | | | $ | 228,746,841 | | | $ | 3,936,443 | |
| Purchases and sales of long-term U.S. Government securities for the Frontegra Columbus Core Plus Fund were $9,024,168,943 and $8,614,224,585, respectively. Purchases and sales of long-term U.S. Government securities for the Frontegra Columbus Core Fund were $1,764,403,279 and $1,778,311,548, respectively. |
| There were no purchases or sales of long-term U.S. Government securities for the Frontegra IronBridge Small Cap Fund, the Frontegra IronBridge SMID Fund, the Frontegra New Star International Equity Fund or the Frontegra Netols Small Cap Value Fund. |
| The Independent Directors of the Funds were paid $17,500 in director fees during the six months ended December 31, 2007. The Interested Director did not receive any remuneration from the Funds. |
Frontegra Funds
NOTES TO FINANCIAL STATEMENTS (CONTINUED)
December 31, 2007 (Unaudited)
| On August 3, 2007, Frontegra Columbus Core Plus Fund acquired all the net assets of Columbus Core Plus Fund pursuant to a plan of reorganization approved by Columbus Core Plus Fund shareholders on July 24, 2007. The acquisition was accomplished by a tax-free exchange of 4,547,897 shares of Frontegra Columbus Core Plus Fund (valued at $139,917,106) for the 14,269,548 shares of Columbus Core Plus Fund outstanding on August 3, 2007. Columbus Core Plus Fund’s net assets at that date ($139,917,106), including $110,920 of unrealized appreciation, were combined with those of Frontegra Columbus Core Plus Fund. The aggregate net assets of Frontegra Columbus Core Plus Fund and Columbus Core Plus Fund immediately before the acquisition were $277,318,845 and $139,917,106, respectively. The combined net assets after the acquisition were $417,235,951. |
| On August 3, 2007, Frontegra Columbus Core Fund acquired all the net assets of Columbus Core Fund pursuant to a plan of reorganization approved by Columbus Core Fund shareholders on July 24, 2007. The acquisition was accomplished by a tax-free exchange of 1,425,913 shares of Frontegra Columbus Core Fund (valued at $14,423,390) for the 1,480,025 shares of Columbus Core Fund outstanding on August 3, 2007. Columbus Core Fund’s net assets at that date ($14,423,390), including ($815) of unrealized depreciation, were combined with those of Frontegra Columbus Core Fund. The aggregate net assets of Frontegra Columbus Core Fund and Columbus Core Fund immediately before the acquisition were $91,486,920 and $14,423,390, respectively. The combined net assets after the acquisition were $105,910,310. |
(8) | Distribution Plan and Shareholder Servicing Fee |
| The Corporation, on behalf of the Frontegra Columbus Core Plus Fund, the Frontegra IronBridge SMID Fund and the Frontegra Netols Small Cap Value Fund (collectively, the “Funds”), has adopted a distribution plan pursuant to Rule 12b-1 under the Investment Company Act of 1940 for each Fund’s Class Y shares (the “12b-1 Plan”). Pursuant to the 12b-1 Plan, each Fund pays an annual fee of up to 0.25% to Frontegra Strategies, LLC (the “Distributor”) for payments to brokers, dealers and other financial intermediaries who perform activities or incur expenses intended to result in the sale of Class Y shares of the Funds. For the period ended December 31, 2007, the following expenses were incurred under the 12b-1 Plan: |
| | Class Y |
| Netols Small Cap Value Fund | $459 |
Frontegra Funds
NOTES TO FINANCIAL STATEMENTS (CONTINUED)
December 31, 2007 (Unaudited)
| Class Y shares of the Funds also pay an annual shareholder servicing fee of up to 0.20% per year to the Distributor for payments to brokers, dealers, and other financial intermediaries who provide on-going account services to shareholders. Those services include establishing and maintaining shareholder accounts, mailing prospectuses, account statements and other Fund documents to shareholders, processing shareholder transactions, answering shareholder inquiries and providing other personal services to shareholders. For the period ended December 31, 2007, the Funds incurred the following shareholder servicing expenses: |
| | Class Y |
| Netols Small Cap Value Fund | $368 |
BOARD OF DIRECTORS’ APPROVAL OF THE ADVISORY AGREEMENT
The Board of Directors of Frontegra Funds, Inc. (the “Company”) met on August 20, 2007 to consider the annual renewal of the investment advisory agreement (the “Advisory Agreement”) with Frontegra Asset Management, Inc. (the “Adviser”) and the subadvisory agreements (each, a “Subadvisory Agreement”) for each of the following portfolios of the Company:
| | • | Frontegra Columbus Core Plus Fund (formerly Frontegra Total Return Bond Fund) (“Core Plus Fund”); |
| | | |
| | • | Frontegra Columbus Core Fund (formerly Frontegra Investment Grade Bond Fund) (“Core Fund”); |
| | | |
| | • | Frontegra IronBridge Small Cap Fund (“IronBridge Small Cap Fund”); |
| | | |
| | • | Frontegra IronBridge SMID Fund (“IronBridge SMID Fund”); |
| | | |
| | • | Frontegra New Star International Equity Fund (“International Equity Fund”); and |
| | | |
| | • | Frontegra Netols Small Cap Value Fund (“Netols Small Cap Value Fund”). |
When the Board of Directors reviewed the Advisory Agreement on August 20, 2007, the Board was provided materials relevant to its consideration of the agreement, such as the Adviser’s Form ADV and Code of Ethics and information regarding the Adviser’s compliance program, personnel and financial condition. The Board also reviewed the fee that would be payable by each Fund under the Advisory Agreement, the proposed expense cap agreements between the Company and the Adviser on behalf of each Fund and comparative fee and expense information provided by an independent third party. The Board was also provided with the Adviser’s responses to a detailed request submitted by the Funds’ legal counsel on behalf of the Directors who are not affiliated with the Company or the Adviser (the “Independent Directors”).
In approving the Advisory Agreement, the Directors considered the following factors and made the following conclusions:
| • | Nature, extent and quality of the services to be provided. The Board considered the Adviser’s background and services it provides to the Funds and their shareholders. The Board discussed the fact that the Adviser had chosen each Fund’s investment strategy and had selected the sub-advisers to make the day-to-day investment decisions for the Funds. The Board noted that the Adviser has 11 years of experience in hiring and supervising sub- advisers to portfolios in the Frontegra family of funds. The Board discussed the Adviser’s responsibilities for overseeing the sub-advisers and for monitoring each Fund’s compliance with applicable requirements under the securities laws. The Board concluded that the range of services to be provided by the Adviser was appropriate and that the Adviser was qualified to provide such services. |
| | |
| • | Performance record of the Funds. As described in more detail under “Board of Directors’ Approval of Subadvisory Agreements,” the Board reviewed each Fund’s performance record for the period ended June 30, 2007. The Board noted that one of the Funds had outperformed its benchmark index for the past one-, three-, five- and ten-year periods ended June 30, 2007, one of the Funds had outperformed its benchmark for the one- and three-year periods and slightly underperformed its benchmark for the five-year and since inception periods ended June 30, 2007, one of the Funds |
| | had outperformed its benchmark for the one-, three-year and since-inception periods ended June 30, 2007, one of the Funds outperformed its benchmark for the one-year period and slightly underperformed its benchmark for the since-inception period ended June 30, 2007, one Fund was in line with its benchmark for the one-year period and had underperformed its benchmark for the three-year and since-inception periods ended June 30, 2007 and one Fund had outperformed its benchmark for the one-year and since inception periods ended June 30, 2007. The Board concluded that the Adviser has developed the necessary expertise and resources in selecting and managing qualified sub-advisers to provide investment advisory services to the Funds in accordance with each Fund’s investment objective and strategy. |
| | |
| • | Advisory fees. The Board compared each Fund’s contractual advisory fee and total expense ratio to the industry data provided by an independent service with respect to other mutual funds in the same peer group. The Board noted that the equity Funds’ advisory fees were above the industry average while the bond Funds’ advisory fees were below industry averages, and that the total expense ratios of the Institutional Class shares of the Funds, after giving effect to the contractual expense cap agreements, were well below industry averages. The Board also reviewed the total expense ratios for the Funds that offer Class Y shares. The Board noted that overall, the Funds’ total expense ratios compared favorably to industry averages. The Board concluded that the advisory fee to be paid by each Fund to the Adviser was reasonable in light of the nature and quality of services to be provided and fees paid by comparable funds. |
| | |
| • | Costs and profitability. The Board reviewed information concerning the Adviser’s financial condition, costs and profitability. The Board also considered the fact that the Adviser had renewed contractual expense cap agreements on behalf of the Funds. The Board noted that the Adviser was still reimbursing expenses to five of the six Funds in operation. The Board concluded that the Adviser’s current level of profitability was reasonable considering the quality of management and the fact that the Adviser was waiving its fees and/or reimbursing expenses for most of the Funds. |
| | |
| • | Economies of scale. The Board reviewed net asset growth on a per Fund and aggregate basis and considered whether there may be economies of scale in the management of each Fund if its assets were to increase significantly. However, the Board concluded that the assets of the Funds were not likely to increase to such an extent that breakpoints would be appropriate, particularly in light of the expense cap agreements in place between the Adviser and each Fund. |
| | |
| • | Benefits to the Adviser. The Board considered information presented regarding any benefits to the Adviser or its affiliates from serving as adviser to the Funds (in addition to the advisory fee). The Board noted that the Adviser’s affiliate, Frontier Partners, Inc. (“Frontier”), provides consulting services to, and is compensated by, the sub-advisers. However, the Board determined that the Adviser’s services to the Funds would not be compromised by this potential conflict of interest. |
On the basis of its review of the foregoing information, the Board of Directors found that the terms of the Advisory Agreement were fair and reasonable and in the best interest of each Fund’s shareholders.
On August 20, 2007, the Board also considered the approval of the Advisory Agreement and a sub-advisory agreement with respect to a new portfolio of the Company, the Frontegra Sky International Value Fund (the “Sky International Value Fund”).
When the Board of Directors reviewed the Advisory Agreement on August 20, 2007, the Board was provided materials relevant to its consideration of the agreement, such as the Adviser’s Form ADV and Code of Ethics and information regarding the Adviser’s compliance program, organizational structure and financial condition. The Board also reviewed the fee that would be payable by the Fund under the Advisory Agreement, the proposed expense cap between the Fund and the Adviser and comparative fee and expense information provided by an independent third party.
In approving the Advisory Agreement, the Directors considered the following factors and made the following conclusions:
| • | Nature, extent and quality of the services to be provided. The Board considered the Adviser’s background and services it would provide to the Fund and its shareholders. The Board discussed the fact that the Adviser had chosen the Fund’s investment strategy and had selected Sky Investment Counsel Inc. (“Sky”) to make the day-to-day investment decisions for the Fund. The Board noted that the Adviser has 11 years of experience in hiring and supervising sub-advisers to other portfolios in the Frontegra family of funds. The Board discussed the Adviser’s responsibilities for overseeing Sky as sub-adviser to the Fund and for monitoring the Fund’s compliance with applicable requirements under the securities laws. The Board concluded that the range of services to be provided by the Adviser was appropriate. |
| | |
| • | Proposed fees. The Board compared the Fund’s contractual advisory fee and total expense ratio to the industry data provided by an independent service with respect to other mutual funds in the same peer group. The Board noted that the Fund’s advisory fee was slightly above the industry average and that the Fund’s total expense ratio for both Class Y and Institutional Class shares, after giving effect to the proposed expense cap agreement, was below the industry average. The Board concluded that the advisory fee and total expense ratio are competitive with those of comparable funds. The Board concluded that the proposed fee to be paid by the Fund to the Adviser was reasonable in light of the nature and quality of services to be provided and fees paid by comparable funds. |
| | |
| • | Costs and profitability. The Adviser did not provide any specific information regarding the costs of services to be provided or the profits they might realize because the Fund had not yet commenced operations. |
| | |
| • | Economies of scale. Because the Fund had not yet commenced operations, the Board did not consider whether any alternative fee structures, such as breakpoint fees, would be appropriate to reflect any economies of scale that may result from increases in the Fund’s assets. |
| | |
| • | Benefits to the Adviser. The Board considered information presented regarding any benefits to the Adviser or its affiliates from serving as adviser to the Fund (in addition to the advisory fee). The Board noted that the Adviser’s affiliate, Frontier, provides consulting services to, and is compensated by, Sky. However, the Board determined that the Adviser’s services to the Fund would not be compromised by this potential conflict of interest. |
Board of Directors’ Approval of Subadvisory Agreements
Core Plus and Core Funds
The Board of Directors reviewed the Subadvisory Agreement between the Adviser and Reams Asset Management Company, LLC (“Reams”) on behalf of the Core Plus Fund and the Core Fund on May 14, 2007 in connection with the reorganization of the Funds with corresponding portfolios of Columbus Funds, Inc. The Board reviewed proposed changes to the Subadvisory Agreement and the expense cap agreement in connection with the reorganization. The Board noted that it had previously reviewed information relating to the Subadvisory Agreement at a special Board meeting held on April 5, 2007 relating to the reorganization. At those meetings and at the August 20, 2007 meeting, the Board was provided materials relevant to its consideration of the agreement, such as Reams’ Form ADV and Code of Ethics and information regarding Reams’ investment strategy, trading procedures, compliance program, personnel and financial condition. The Board also reviewed Reams’ responses to a detailed request submitted by the Funds’ legal counsel on behalf of the Independent Directors.
In approving the Subadvisory Agreement between the Adviser and Reams, the Directors considered the following factors and made the following conclusions:
| • | Nature, extent and quality of the services to be provided. The Board’s analysis of the nature, extent and quality of Reams’ services to the Funds took into account knowledge gained from Reams’ presentations to the Board at meetings throughout the year. The Board reviewed and considered Reams’ investment strategy, experience as a fixed income manager, key personnel involved in providing investment management services to the Funds and financial condition. The Board also considered services provided by Reams under the Subadvisory Agreement, including the selection of fixed income dealers, monitoring adherence to each Fund’s investment restrictions and assisting with the Funds’ compliance with applicable securities laws and regulations. The Board concluded that the nature, extent and quality of the services provided by Reams to each Fund was appropriate and that the Funds were likely to continue to benefit from services provided by Reams under the Subadvisory Agreement. |
| | |
| • | Investment performance of the Funds. The Board reviewed the performance record of the Funds. It noted that the Core Plus Fund had outperformed its benchmark index for the one-, three-, five- and ten-year periods ended June 30, 2007, while the Core Fund had outperformed its benchmark index for the one- and three-year periods and slightly underperformed the benchmark for the five-year and since-inception periods ended June 30, 2007. The Board also considered Reams’ quarterly portfolio commentary and review of each Fund’s performance. The Board concluded that Reams would continue to provide a high level of subadvisory services to the Funds. |
| | |
| • | Subadvisory fees. The Board reviewed and considered the subadvisory fees payable by the Adviser to Reams under the Subadvisory Agreement, as amended. The Board noted that the subadvisory fees payable to Reams by the Adviser had been increased under the terms of the reorganization of the Funds with certain portfolios of the Columbus Funds, Inc. The Board determined that the subadvisory fee payable with respect to each Fund was appropriate in light of the Fund’s investment style and in comparison to fees paid by separate account clients of Reams. In evaluating the subadvisory fee, the Board noted that the fee is paid by the Adviser and that therefore the overall advisory fee paid by each Fund is not directly affected by the subadvisory fee. |
| • | Costs and profitability. The Board did not consider the cost of services provided by Reams or the profitability to Reams from its relationship with the Funds because it did not view these factors as relevant given that the subadvisory fee is paid by the Adviser. |
| | |
| • | Economies of scale. Because the subadvisory fee is not paid by the Funds, the Board did not consider whether the fee should reflect any potential economies of scale that might be realized as Fund assets increase. |
| | |
| • | Benefits to Reams. The Board considered information presented regarding any benefits to Reams from serving as sub-adviser to the Funds (in addition to the subadvisory fee). The Board noted that Reams does not participate in soft dollar arrangements with respect to fixed income transactions. The Board also noted that Reams receives consulting services from Frontier, an affiliate of the Adviser. |
On the basis of its review of the foregoing information, the Board of Directors found that the terms of the Subadvisory Agreement with Reams were fair and reasonable and in the best interest of each Fund’s shareholders.
IronBridge Small Cap and SMID Funds
The Board of Directors reviewed the Subadvisory Agreement between the Adviser and IronBridge Capital Management, L.P. (“IronBridge”) on behalf of the IronBridge Small Cap and IronBridge SMID Funds on August 20, 2007. At that time, the Board was provided materials relevant to its consideration of the agreement, such as IronBridge’s Form ADV and Code of Ethics and information regarding IronBridge’s compliance program, investment strategy, trading procedures, personnel and financial condition. The Board also reviewed IronBridge’s responses to a detailed request submitted by the Funds’ legal counsel on behalf of the Independent Directors.
In approving the Subadvisory Agreement between the Adviser and IronBridge, the Directors considered the following factors and made the following conclusions:
| • | Nature, extent and quality of the services provided. The Board’s analysis of the nature, extent and quality of IronBridge’s services to the Funds took into account knowledge gained from IronBridge’s presentations to the Board at meetings throughout the year. The Board reviewed and considered IronBridge’s proprietary investment style, key personnel involved in providing investment management services to the Funds and financial condition. The Board also considered services provided by IronBridge under the Subadvisory Agreement, including the selection of broker-dealers for execution of portfolio transactions, monitoring adherence to each Fund’s investment restrictions and assisting with the Funds’ compliance with applicable securities laws and regulations. The Board concluded that the nature, extent and quality of the services provided by IronBridge to each Fund was appropriate and that the Funds were likely to continue to benefit from services provided by IronBridge under the Subadvisory Agreement. |
| • | Investment performance of the Funds. The Board reviewed the performance record of the Funds. It noted that the IronBridge Small Cap Fund had outperformed its benchmark index for the one-, three- and since-inception periods ended June 30, 2007. The Board noted that the IronBridge SMID Fund had slightly underperformed its benchmark index for the since-inception period but had outperformed its benchmark index for the one-year period ended June 30, 2007. The Board also considered IronBridge’s quarterly portfolio commentary and review of the Fund’s performance. The Board also compared each Fund’s performance for the period ended June 30, 2007 to the performance for the corresponding composite of IronBridge’s separate account clients. The Board concluded that IronBridge would continue to provide a high level of subadvisory services to the Funds. |
| | |
| • | Subadvisory fees. The Board reviewed and considered the subadvisory fees payable by the Adviser to IronBridge under the Subadvisory Agreement. The Board determined that the subadvisory fee payable with respect to each Fund was appropriate in light of the Fund’s investment style. In evaluating the subadvisory fee, the Board noted that the fee is paid by the Adviser and that therefore the overall advisory fee paid by each Fund is not directly affected by the subadvisory fee. |
| | |
| • | Costs and profitability. The Board did not consider the cost of services provided by IronBridge or the profitability to IronBridge from its relationship with the Funds because it did not view these factors as relevant given that the subadvisory fee is paid by the Adviser. |
| | |
| • | Economies of scale. Because the subadvisory fee is not paid by the Funds, the Board did not consider whether the fee should reflect any potential economies of scale that might be realized as Fund assets increase. |
| | |
| • | Benefits to IronBridge. The Board considered information presented regarding any benefits to IronBridge from serving as sub-adviser to the Funds (in addition to the subadvisory fee). The Board noted that IronBridge uses Fund brokerage to obtain non-execution services on a limited basis. The Board also noted that IronBridge receives consulting services from Frontier, an affiliate of the Adviser. |
On the basis of its review of the foregoing information, the Board of Directors found that the terms of the Subadvisory Agreement with IronBridge were fair and reasonable and in the best interest of each Fund’s shareholders.
New Star International Equity Fund
The Board of Directors reviewed the Subadvisory Agreement between the Adviser and New Star Institutional Managers Limited (“New Star”) on behalf of the New Star International Equity Fund on August 20, 2007. At that time, the Board was provided materials relevant to its consideration of the agreement, such as New Star’s Form ADV and Code of Ethics and information regarding New Star’s compliance program, investment strategy, trading procedures, personnel and financial condition. The Board also reviewed New Star’s responses to a detailed request submitted by the Fund’s legal counsel on behalf of the Independent Directors.
In approving the Subadvisory Agreement between the Adviser and New Star regarding the International Equity Fund, the Directors considered the following factors and made the following conclusions:
| • | Nature, extent and quality of the services provided. The Board’s analysis of the nature, extent and quality of New Star’s services to the Fund took into account knowledge gained from New Star’s presentations to the Board at meetings throughout the year. The Board reviewed and considered New Star’s non-US equity (EAFE) investment strategy and experience as an international manager, key personnel involved in providing investment management services to the Fund and financial condition. The Board also considered services provided by New Star under the Subadvisory Agreement, including the selection of broker-dealers for execution of portfolio transactions, monitoring adherence to the Fund’s investment restrictions and assisting with the Fund’s compliance with applicable securities laws and regulations. The Board concluded that the nature, extent and quality of the services provided by New Star to the Fund was appropriate and that the Fund was likely to continue to benefit from services provided by New Star under the Subadvisory Agreement. |
| | |
| • | Investment performance of New Star. The Board reviewed the performance record of the International Equity Fund and noted that the Fund’s performance was in line with its benchmark index for the one-year period and had underperformed its benchmark index for the three-year and since-inception periods ended June 30, 2007. The Board also considered New Star’s quarterly portfolio commentary and review of the Fund’s performance, including discussions of the reasons for the Fund’s underperformance during these periods. The Board also compared the Fund’s recent performance to the performance of New Star’s composite of other accounts managed in the EAFE style. The Board concluded that the Fund’s performance was satisfactory and that New Star would continue to provide a high level of subadvisory services to the Fund. |
| | |
| • | Subadvisory fees. The Board reviewed and considered the subadvisory fee payable by the Adviser to New Star under the Subadvisory Agreement. The Board also reviewed information regarding New Star’s fee structures for other institutional clients. The Board determined that the subadvisory fee was appropriate. In evaluating the subadvisory fee, the Board noted that the fee is paid by the Adviser and that therefore the overall advisory fee paid by the Fund is not directly affected by the subadvisory fee. |
| | |
| • | Costs and profitability. The Board did not consider the cost of services provided by New Star under the Subadvisory Agreement or the profitability to New Star from its relationship with the International Equity Fund because it did not view these factors as relevant given that the sub- advisory fee is paid by the Adviser. |
| | |
| • | Economies of scale. Because the subadvisory fee is not paid by the International Equity Fund, the Board did not consider whether the fee should reflect any potential economies of scale that might be realized as Fund assets increase. |
| | |
| • | Benefits to New Star. The Board considered information presented regarding any benefits to New Star from serving as sub-adviser to the International Equity Fund (in addition to the subadvisory fee). New Star provided information to the Board regarding its policies for the use of soft dollar |
| | commissions. The Board also noted that New Star receives consulting services from Frontier, an affiliate of the Adviser. |
On the basis of its review of the foregoing information, the Board of Directors found that the terms of the Subadvisory Agreement with New Star were fair and reasonable and in the best interest of the International Equity Fund’s shareholders.
Netols Small Cap Value Fund
The Board of Directors reviewed the Subadvisory Agreement between the Adviser and Netols Asset Management, Inc. (“Netols”) on behalf of the Netols Small Cap Value Fund on August 20, 2007. At that time, the Board was provided materials relevant to its consideration of the agreement, such as Netols’ Form ADV and Code of Ethics and information regarding Netols’ compliance program, investment strategy, trading procedures, personnel and financial condition. The Board also reviewed Netols’ responses to a detailed request submitted by the Fund’s legal counsel on behalf of the Independent Directors.
In approving the Subadvisory Agreement between the Adviser and Netols regarding the Netols Small Cap Value Fund, the Directors considered the following factors and made the following conclusions:
| • | Nature, extent and quality of the services to be provided. The Board’s analysis of the nature, extent and quality of Netols’ services to the Fund took into account knowledge gained from Netols’ presentations to the Board at meetings throughout the year. The Board reviewed and considered Netols’ investment strategy and experience as a small-cap value manager, key personnel involved in providing investment management services to the Fund and financial condition. The Board also considered services provided by Netols under the Subadvisory Agreement, including the selection of broker- dealers for execution of portfolio transactions, monitoring adherence to the Fund’s investment restrictions and assisting with the Fund’s compliance with applicable securities laws and regulations. The Board concluded that the nature, extent and quality of the services provided by Netols to the Fund was appropriate and that the Fund was likely to continue to benefit from services provided by Netols under the Subadvisory Agreement. |
| | |
| • | Investment performance of Netols. The Board reviewed the performance record of the Netols Small Cap Value Fund and noted that the Fund had outperformed its benchmark index for the one-year and the since-inception periods ended June 30, 2007. The Board also considered Netols’ quarterly portfolio commentary and review of the Fund’s performance. The Board also compared the Fund’s recent performance to the performance of Netols’ composite of other accounts managed in the small cap value style. The Board concluded that the Fund’s performance was satisfactory and that Netols would continue to provide a high level of subadvisory services to the Fund. |
| | |
| • | Subadvisory fees. The Board reviewed and considered the subadvisory fee payable by the Adviser to Netols under the Subadvisory Agreement. The Board determined that the subadvisory fee was appropriate. In evaluating the subadvisory fee, the Board noted that the fee is paid by the Adviser and that therefore the overall advisory fee paid by the Fund is not directly affected by the subadvisory fee. |
| • | Costs and profitability. The Board did not consider the cost of services provided by Netols under the Subadvisory Agreement or the profitability to Netols from its relationship with the Netols Small Cap Value Fund because it did not view these factors as relevant given that the subadvisory fee is paid by the Adviser. |
| | |
| • | Economies of scale. Because the subadvisory fee is not paid by the Fund, the Board did not consider whether the fee should reflect any potential economies of scale that might be realized as Fund assets increase. |
| | |
| • | Benefits to Netols. The Board considered information presented regarding any benefits to Netols from serving as sub-adviser to the Fund (in addition to the subadvisory fee). Netols provided information to the Board regarding its policies for the use of soft dollar commissions. The Board also noted that Netols receives consulting services from Frontier, an affiliate of the Adviser. |
On the basis of its review of the foregoing information, the Board of Directors found that the terms of the Subadvisory Agreement with Netols were fair and reasonable and in the best interest of the Netols Small Cap Value Fund’s shareholders.
Sky International Value Fund
The Board of Directors reviewed the Subadvisory Agreement between the Adviser and Sky on behalf of the Sky International Value Fund on August 20, 2007. At that time, the Board was provided materials relevant to its consideration of the agreement, such as Sky’s Form ADV and Code of Ethics and information regarding Sky’s compliance program, performance track record, investment strategy, trading procedures, personnel and financial condition.
In approving the Subadvisory Agreement between the Adviser and Sky regarding the Sky International Value Fund, the Directors considered the following factors and made the following conclusions:
| • | Nature, extent and quality of the services to be provided. The Board considered Sky’s background as an independent manager of international equities, specializing in the management of EAFE (Europe, Australasia and Far East) equities. The Board reviewed information regarding Sky’s investment program and the investment experience of the proposed portfolio manager for the Fund. The Board also determined that the Fund was likely to benefit from the fact that Sky’s main focus is EAFE investing. |
| | |
| • | Investment performance of Sky. The Board reviewed historical performance data for Sky’s international equity composite of private accounts. The Board concluded that Sky appeared to have an effective EAFE value investment process. |
| | |
| • | Proposed fee. The Board determined that the proposed sub-advisory fee was appropriate in light of the Fund’s investment style and in comparison to the fees paid by other advisory clients of Sky. In evaluating the sub-advisory fee, the Board noted that the fee is paid by the Adviser and that therefore the overall advisory fee paid by the Fund is not directly affected by the sub-advisory fee. |
| • | Costs and profitability. Sky did not provide any specific information regarding the costs of services to be provided or the profits they might realize because the Fund had not yet commenced operations. |
| | |
| • | Economies of scale. Because the sub-advisory fee is not paid by the Fund, the Board did not consider whether the fee should reflect any potential economies of scale that might be realized as Fund assets increase. |
| | |
| • | Benefits to Sky. The Board considered information presented regarding any benefits to Sky from serving as sub-adviser to the Fund (in addition to the sub-advisory fee). Sky provided information to the Board regarding its policies for the use of soft dollar commissions. The Board also noted that Sky receives consulting services from Frontier, an affiliate of the Adviser. |
On the basis of its review of the foregoing information, the Board of Directors found that the terms of the Sub-advisory Agreement with Sky were fair and reasonable and in the best interest of the Sky International Value Fund’s shareholders.
Frontegra Funds
ADDITIONAL INFORMATION
(Unaudited)
Foreign Tax Credit
For the year ended June 30, 2007, Frontegra New Star International Fund earned foreign source income and paid foreign taxes, which it intends to pass through to its shareholders pursuant to Section 853 of the Internal Revenue Code as follows:
| | | | Foreign Source | | | Foreign | |
| | | | Income Earned | | | Taxes Paid | |
| | Australia | | $ | 770,995.74 | | | $ | 43,110.59 | |
| | Belgium | | | 554,080.48 | | | | 83,112.09 | |
| | Brazil | | | 3,827,983.57 | | | | 117,836.98 | |
| | China | | | 23,459.16 | | | | (9,311.06 | ) |
| | Denmark | | | 7,221.67 | | | | 1,083.25 | |
| | Finland | | | 325,007.32 | | | | 48,751.11 | |
| | France | | | 1,943,573.43 | | | | 290,352.20 | |
| | Germany | | | 1,025,142.55 | | | | 153,771.37 | |
| | Greece | | | 207,467.38 | | | | — | |
| | Hong Kong | | | 681,994.63 | | | | — | |
| | India | | | 9,718.75 | | | | 937.50 | |
| | Italy | | | 760,062.03 | | | | 115,001.03 | |
| | Japan | | | 1,412,729.30 | | | | 98,891.05 | |
| | Netherlands | | | 838,380.44 | | | | 125,757.09 | |
| | Russia | | | 233,374.19 | | | | 36,685.77 | |
| | Singapore | | | 493,306.54 | | | | — | |
| | Spain | | | 339,139.90 | | | | 51,952.16 | |
| | Sweden | | | 470,420.87 | | | | 70,563.12 | |
| | Switzerland | | | 1,117,869.29 | | | | 167,680.40 | |
| | Taiwan | | | 173,920.28 | | | | 34,784.06 | |
| | Thailand | | | 157,721.57 | | | | 15,772.15 | |
| | Turkey | | | 158,346.57 | | | | — | |
| | Total | | $ | 15,531,915.66 | | | $ | 1,446,730.86 | |
Qualified Dividend Income/Dividends Received Deduction
For the fiscal year ended June 30, 2007, certain dividends paid by the Funds may be subject to a maximum tax rate of 15%, as provided for by the Jobs and Growth Tax Relief Reconciliation Act of 2003. The percentage of dividends declared from ordinary income designated as qualified dividend income was as follows:
| | Frontegra IronBridge Small Cap Fund | 28.45% |
| | Frontegra IronBridge SMID Fund | 50.76% |
| | Frontegra New Star International Equity Fund | 77.69% |
| | Frontegra Netols Small Cap Value Fund | 52.48% |
Frontegra Funds
ADDITIONAL INFORMATION (CONTINUED)
(Unaudited)
For corporate shareholders, the percent of ordinary income distributions qualifying for the corporate dividends received deduction for the fiscal year ended June 30, 2007 was as follows:
| | Frontegra IronBridge Small Cap Fund | 27.20% |
| | Frontegra IronBridge SMID Fund | 47.70% |
| | Frontegra Netols Small Cap Value Fund | 24.40% |
Additional Information Applicable to Foreign Shareholders Only
The percent of ordinary income distributions designated as interest related dividends for the fiscal year ended June 30, 2007 was as follows:
| | Frontegra Columbus Core Plus Fund | 99.97% |
| | Frontegra Columbus Core Fund | 99.66% |
| | Frontegra IronBridge Small Cap Fund | 3.45% |
| | Frontegra IronBridge SMID Fund | 6.97% |
| | Frontegra New Star International Equity Fund | 2.40% |
| | Frontegra Netols Small Cap Value Fund | 8.49% |
The percent of ordinary income distributions designated as short-term capital gain distributions for the fiscal year ended June 30, 2007 was as follows:
| | Frontegra IronBridge Small Cap Fund | 96.57% |
| | Frontegra IronBridge SMID Fund | 94.91% |
| | Frontegra New Star International Equity Fund | 34.34% |
| | Frontegra Netols Small Cap Value Fund | 100% |
| This page intentionally left blank. |
A Note on Forward-Looking Statements
This report includes forward-looking statements such as adviser, sub-adviser and/or portfolio manager predictions, assessments, analyses or outlooks for individual securities, industries, market sectors and/or markets. These statements involve risks and uncertainties. In addition to the general risks described for the Funds in the current Prospectuses, other factors bearing on these statements include the accuracy of the adviser’s, sub-advisers’ or portfolio manager’s forecasts and predictions, and the appropriateness of the investment programs designed by the adviser, sub-adviser or portfolio manager to implement their strategies efficiently and effectively. Any one or more of these factors, as well as other risks affecting the securities markets and investment instruments generally, could cause the actual results of the Funds to differ materially as compared to benchmarks associated with the Funds.
In addition, portfolio composition will change due to ongoing management of the Funds. Specific securities named in this report may not currently be owned by the applicable Fund, or the Fund’s position in the securities may have changed.
Additional Information
Frontegra Funds has adopted proxy voting policies and procedures that delegate to Frontegra Asset Management, Inc., the Funds’ investment adviser (the “Adviser”), the authority to vote proxies. The proxy voting policies permit the Adviser to delegate its authority to vote proxies to each Fund’s subadviser. A description of the Frontegra Funds’ proxy voting policies and procedures is available without charge, upon request, by calling the Funds toll free at 1-888-825-2100. A description of these policies and procedures is also included in the Funds’ Statement of Additional Information, which is available on the SEC’s website at http://www.sec.gov.
The actual voting records relating to each Fund’s portfolio securities during the most recent twelve months ended June 30 are available without charge by calling the Funds toll free at 1-888-825-2100 or by accessing the SEC’s website at http://www.sec.gov.
Each Fund files a complete schedule of portfolio holdings for its first and third fiscal quarters with the SEC on Form N-Q. The Form N-Q is available on the SEC’s website at http://www.sec.gov. The Form N-Q may also be reviewed and copied at the SEC’s Public Reference Room in Washington, D.C. Information on the operation of the Public Reference Room may be obtained by calling toll-free 1-800-SEC-0330.
Item 2. Code of Ethics.
Not applicable for semi-annual reports.
Item 3. Audit Committee Financial Expert.
Not applicable for semi-annual reports.
Item 4. Principal Accountant Fees and Services.
Not applicable for semi-annual reports.
Item 5. Audit Committee of Listed Registrants.
Not applicable to registrants who are not listed issuers (as defined in Rule 10A-3 under the Securities Exchange Act of 1934).
Item 6. Schedule of Investments.
Schedule of Investments is included as part of the report to shareholders filed under Item 1 of this Form.
Item 7. Disclosure of Proxy Voting Policies and Procedures for Closed-End Management Investment Companies.
Not applicable to open-end investment companies.
Item 8. Portfolio Managers of Closed-End Management Investment Companies.
Not applicable to open-end investment companies.
Item 9. Purchases of Equity Securities by Closed-End Management Investment Company and Affiliated Purchasers.
Not applicable to open-end investment companies.
Item 10. Submission of Matters to a Vote of Security Holders.
Not Applicable.
Item 11. Controls and Procedures.
| (a) | Based on an evaluation of the registrant's disclosure controls and procedures (as defined in Rule 30a-3(c) under the Investment Company Act of 1940 (the “Act”)) as of a date within 90 days prior to the filing date of this Form N-CSR, the registrant’s Co-Presidents and Treasurer have concluded that the disclosure controls and procedures are effective. |
| (b) | There were no changes in the registrant's internal control over financial reporting (as defined in Rule 30a-3(d) under the Act) that occurred during the second fiscal quarter of the period covered by this report that has materially affected, or is reasonably likely to materially affect, the registrant's internal control over financial reporting. |
Item 12. Exhibits.
(a) | (1) Any code of ethics or amendment thereto, that is subject of the disclosure required by Item 2, to the extent that the registrant intends to satisfy Item 2 requirements through filing an exhibit. Not Applicable |
(2) Certifications pursuant to Section 302 of the Sarbanes-Oxley Act of 2002. Filed herewith.
(3) Any written solicitation to purchase securities under Rule 23c-1 under the Act sent or given during the period covered by the report by or on behalf of the registrant to 10 or more persons. Not applicable to open-end investment companies.
(b) | Certification pursuant to Section 906 of the Sarbanes-Oxley Act of 2002. Furnished herewith. |
SIGNATURES
Pursuant to the requirements of the Securities Exchange Act of 1934 and the Investment Company Act of 1940, the registrant has duly caused this report to be signed on its behalf by the undersigned, thereunto duly authorized.
(Registrant) Frontegra Funds, Inc.
By (Signature and Title) /s/Thomas J. Holmberg, Jr.
Thomas J. Holmberg, Jr. Co-President
(Principal Executive Officer)
Date 3/6/08
Pursuant to the requirements of the Securities Exchange Act of 1934 and the Investment Company Act of 1940, this report has been signed below by the following persons on behalf of the registrant and in the capacities and on the dates indicated.
By (Signature and Title) /s/Thomas J. Holmberg, Jr.
Thomas J. Holmberg, Jr. Co-President
(Principal Executive Officer)
Date 3/6/08
By (Signature and Title) /s/William D. Forsyth III
William D. Forsyth III, Co-President and Treasurer
(Principal Executive and Financial Officer)
Date 3/6/08