UNITED STATES
SECURITIES AND EXCHANGE COMMISSION
Washington, D.C. 20549
FORM N-CSR
CERTIFIED SHAREHOLDER REPORT OF REGISTERED
MANAGEMENT INVESTMENT COMPANIES
Investment Company Act file number 811-07685
Frontegra Funds, Inc.
(Exact name of registrant as specified in charter)
400 Skokie Blvd.
Suite 500
Northbrook, Illinois 60062
(Address of principal executive offices) (Zip code)
William D. Forsyth III
400 Skokie Blvd., Suite 500
Northbrook, Illinois 60062
(Name and address of agent for service)
(847) 509-9860
Registrant's telephone number, including area code
Date of fiscal year end: June 30, 2010
Date of reporting period: December 31, 2009
Item 1. Reports to Stockholders.
SEMI-ANNUAL REPORT
Frontegra Columbus Core Plus Fund
Frontegra Columbus Core Fund
Frontegra IronBridge Small Cap Fund
Frontegra IronBridge SMID Fund
Frontegra IronBridge Global Focus Fund
Frontegra Mastholm International Equity Fund
Frontegra Netols Small Cap Value Fund
Frontegra Asset Management, Inc.
________
December 31, 2009
TABLE OF CONTENTS
| Shareholder Letter | 1 |
| Expense Example | 2 |
| Frontegra Columbus Core Plus Fund | |
| Frontegra Columbus Core Fund | |
| Report from Reams Asset Management Company, LLC | 6 |
| Investment Highlights | 9 |
| Schedule of Investments | 10 |
| Statement of Assets and Liabilities | 16 |
| Statement of Operations | 17 |
| Statements of Changes in Net Assets | 18 |
| Financial Highlights | 19 |
| Investment Highlights | 21 |
| Schedule of Investments | 22 |
| Statement of Assets and Liabilities | 27 |
| Statement of Operations | 28 |
| Statements of Changes in Net Assets | 29 |
| Financial Highlights | 30 |
| Frontegra IronBridge Small Cap Fund | |
| Frontegra IronBridge SMID Fund | |
| Report from IronBridge Capital Management, L.P. | 32 |
| Investment Highlights | 34 |
| Schedule of Investments | 35 |
| Statement of Assets and Liabilities | 39 |
| Statement of Operations | 40 |
| Statements of Changes in Net Assets | 41 |
| Financial Highlights | 42 |
| Investment Highlights | 43 |
| Schedule of Investments | 44 |
| Statement of Assets and Liabilities | 48 |
| Statement of Operations | 49 |
| Statements of Changes in Net Assets | 50 |
| Financial Highlights | 51 |
| | |

| Frontegra IronBridge Global Focus Fund | |
| Report from IronBridge Capital Management, L.P. | 53 |
| Investment Highlights | 55 |
| Schedule of Investments | 56 |
| Portfolio Diversification | 58 |
| Statement of Assets and Liabilities | 59 |
| Statement of Operations | 60 |
| Statements of Changes in Net Assets | 61 |
| Financial Highlights | 62 |
| Frontegra Mastholm International Equity Fund | |
| Report from Mastholm Asset Management, LLC | 64 |
| Investment Highlights | 65 |
| Schedule of Investments | 66 |
| Portfolio Diversification | 68 |
| Statement of Assets and Liabilities | 69 |
| Statement of Operations | 70 |
| Statements of Changes in Net Assets | 71 |
| Financial Highlights | 72 |
| Frontegra Netols Small Cap Value Fund | |
| Report from Netols Asset Management, Inc. | 74 |
| Investment Highlights | 75 |
| Schedule of Investments | 76 |
| Statement of Assets and Liabilities | 79 |
| Statement of Operations | 80 |
| Statements of Changes in Net Assets | 81 |
| Financial Highlights | 82 |
| Notes to Financial Statements | 84 |
| Board of Directors’ Approval of Advisory and Subadvisory Agreements | 97 |
| Voting Results of Special Meeting of Shareholders | 106 |
| | |
This report is submitted for the general information of the shareholders of the Funds. It is not authorized for distribution to prospective investors unless accompanied or preceded by an effective Prospectus for the applicable Fund. The Prospectus may be obtained by calling 1-888-825-2100. Each Prospectus includes more complete information about management fees and expenses, investment objectives, risks and operating policies of the applicable Fund. Please read the Prospectus carefully.
Frontegra Funds, Inc. are distributed by Frontegra Strategies, LLC, 400 Skokie Blvd., Suite 500, Northbrook, IL 60062. Frontegra Strategies, LLC, member of FINRA and SIPC, is an affiliate of Frontegra Asset Management, Inc., the Funds’ investment adviser.
This page intentionally left blank.
DEAR FELLOW SHAREHOLDERS:
We are pleased to report on the progress of the Frontegra Funds over the past six months ending December 31, 2009. Markets rebounded sharply in the second half of 2009 following a significant downturn. The S&P 500 Index was up over 21% for the period. Small capitalization stocks were up, with the Russell 2000 Index returning 23.90%. International stocks, as measured by the MSCI EAFE Index, returned 22.18% over the same time frame. The U.S. bond market, as measured by the Barclays Capital U.S. Aggregate Bond Index, was up 3.95% for the six-month
period due to the strength of the non-Treasury sectors.
Fund Results
For the six month period ending December 31, 2009, the Funds generated the following net (i.e. after fee) returns:
The Frontegra Columbus Core Plus Fund - Institutional Class, managed by Reams Asset Management Company, returned 11.02% versus the 3.95% return of the Barclays Capital U.S. Aggregate Bond Index; the Frontegra Columbus Core Fund, also managed by Reams Asset Management Company, returned 9.33%.
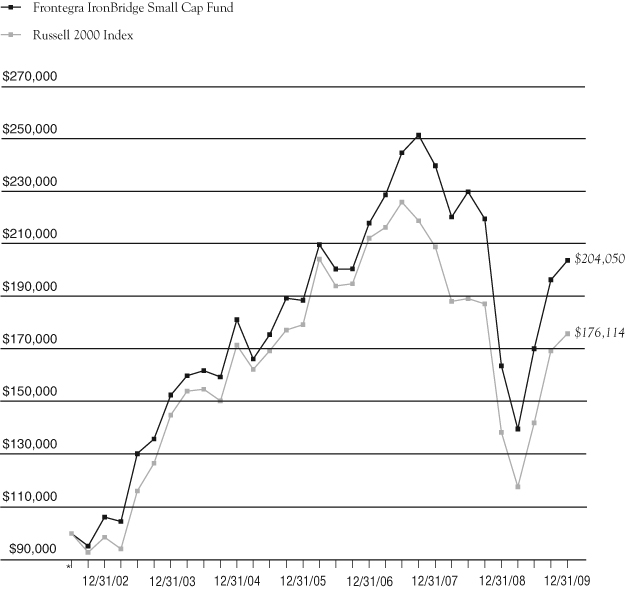
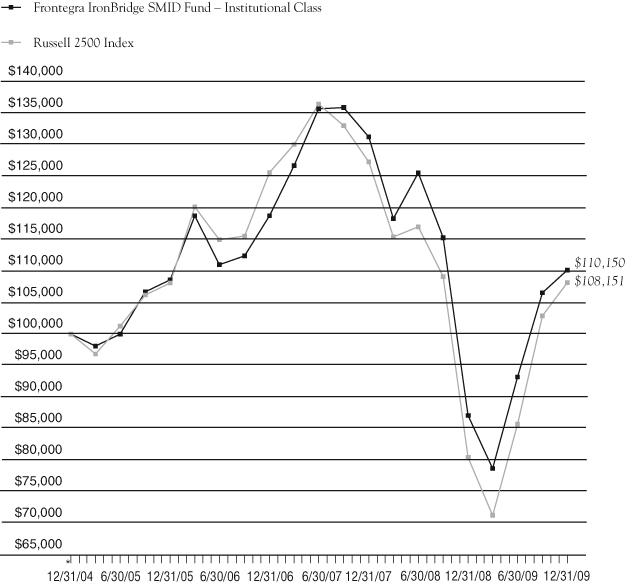
The Frontegra IronBridge Small Cap Fund, managed by IronBridge Capital Management, returned 19.78% versus the 23.90% return for the Russell 2000 Index; the Frontegra IronBridge SMID Fund returned 18.19% versus the Russell 2500 Index return of 26.16%.
The Frontegra Mastholm International Equity Fund, managed by Mastholm Asset Management, returned 17.03% versus the benchmark return of 22.18% for the MSCI EAFE Index.
The Frontegra Netols Small Cap Value Fund – Institutional Class, managed by Netols Asset Management, returned 17.86% versus the Russell 2000 Value Index return of 27.15%.
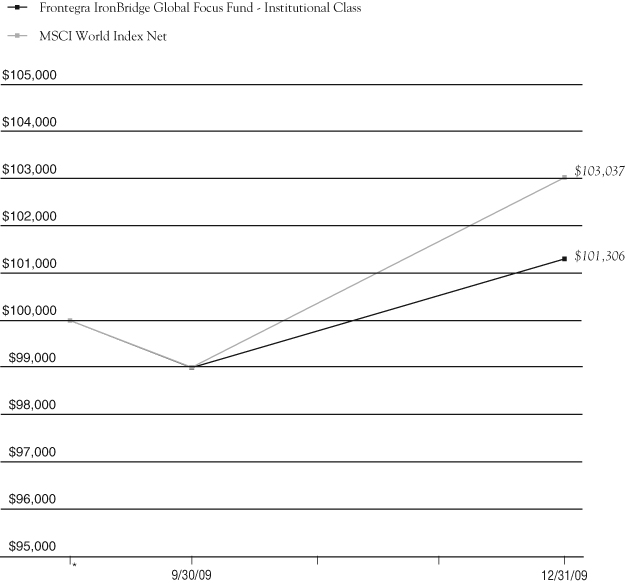
For the period from September 18, 2009 through December 31, 2009, the Frontegra IronBridge Global Focus Fund, also managed by IronBridge Capital Management, returned 1.31% versus the MSCI World Index Net return of 3.04%.
Outlook
The markets continue to be volatile due to concerns with the global economy. We and the subadvisers of the Frontegra Funds will strive to manage skillfully in these turbulent markets.
We will continue to oversee the investment management of the Frontegra Funds with the care and diligence that have served our shareholders well in the past. As always, we appreciate your investment and your continued confidence in the Frontegra Funds.
Best regards,
William D. Forsyth, CFA
President
Frontegra Funds, Inc.
Frontegra Funds
EXPENSE EXAMPLE
December 31, 2009 (Unaudited)
As a shareholder of a mutual fund, you incur two types of costs: (1) transaction costs, including redemption fees, and (2) ongoing costs, including management fees, distribution and/or service (12b-1) fees and other fund expenses. Although the Funds charge no sales loads, you will be assessed fees for outgoing wire transfers, returned checks and stop payment orders at prevailing rates charged by U.S. Bancorp Fund Services, LLC, the Funds’ transfer agent. If you request that a redemption be made by wire transfer, currently the Funds’ transfer agent charges a $15.00 fee. A redemption fee of 2.00% of the then current value of the shares redeemed may be imposed on certain redemptions of shares made within 30 days of purchase for the Frontegra IronBridge Global Focus and Mastholm International Equity Funds.
This Example is intended to help you understand your ongoing costs (in dollars) of investing in the Funds and to compare these costs with the ongoing costs of investing in other mutual funds. The Example is based on an investment of $1,000 invested at the beginning of the period and held for the entire period (7/1/09 – 12/31/09).
Actual Expenses
The first line of the table on the following page for each Fund provides information about actual account values and actual expenses. The Example includes management fees, registration fees, fee waivers/reimbursements and other expenses. However, the Example does not include portfolio trading commissions and related expenses and other extraordinary expenses as determined under generally accepted accounting principles. You may use the information in this line, together with the amount you invested, to estimate the expenses that you paid over the period. Simply divide your account value by $1,000 (for example, an $8,600 account value divided by $1,000 = 8.6), then multiply the result by the number in the first line under the heading entitled “Expenses Paid During the Period’’ to estimate the expenses you paid on your account during this period.
Hypothetical Example for Comparison Purposes
The second line of the table for each Fund provides information about hypothetical account values and hypothetical expenses based on each of the Fund’s actual expense ratios and an assumed rate of return of 5% per year before expenses, which is not the actual return. The hypothetical account values and expenses may not be used to estimate the actual ending account balance or expenses you paid for the period. You may use this information to compare the ongoing costs of investing in each of the Funds and other funds. To do so, compare this 5% hypothetical example with the 5% hypothetical examples that appear in the shareholder reports of the other funds. Please note that the expenses shown in the table are meant to highlight your ongoing costs only and do not reflect any transactional costs. Therefore, the second line of the table is useful in comparing ongoing costs only, and will not help you determine the relative total costs of owning different funds. In addition, if these transactional costs were included, your costs could have been higher.
Frontegra Funds
EXPENSE EXAMPLE (continued)
December 31, 2009 (Unaudited)
| | Beginning Account | Ending Account | Annualized | Expenses Paid |
| Frontegra Fund | Value 7/1/2009 | Value 12/31/2009 | Expense Ratio* | During the Period* |
| Columbus Core Plus | | | | |
| Fund – Institutional Class | | | | |
| Actual Fund Return | $1,000.00 | $1,110.20 | 0.35% | $1.86 |
| Hypothetical 5% Return | $1,000.00 | $1,023.44 | 0.35% | $1.79 |
| | | | | |
| Columbus Core Fund | | | | |
| Actual Fund Return | $1,000.00 | $1,093.30 | 0.35% | $1.85 |
| Hypothetical 5% Return | $1,000.00 | $1,023.44 | 0.35% | $1.79 |
| | | | | |
| IronBridge Small Cap Fund | | | | |
| Actual Fund Return | $1,000.00 | $1,197.80 | 1.07% | $6.09 |
| Hypothetical 5% Return | $1,000.00 | $1,019.66 | 1.07% | $5.60 |
| | | | | |
| IronBridge SMID Fund | | | | |
| Actual Fund Return | $1,000.00 | $1,181.90 | 0.95% | $5.22 |
| Hypothetical 5% Return | $1,000.00 | $1,020.42 | 0.95% | $4.84 |
| | | | | |
| Mastholm International Equity Fund | | | | |
| Actual Fund Return | $1,000.00 | $1,170.30 | 0.75% | $4.10 |
| Hypothetical 5% Return | $1,000.00 | $1,021.42 | 0.75% | $3.82 |
| | | | | |
| Netols Small Cap Value | | | | |
| Fund – Institutional Class | | | | |
| Actual Fund Return | $1,000.00 | $1,178.60 | 1.10% | $6.10 |
| Hypothetical 5% Return | $1,000.00 | $1,019.61 | 1.10% | $5.65 |
| | | | | |
| Netols Small Cap | | | | |
| Value Fund – Class Y | | | | |
| Actual Fund Return | $1,000.00 | $1,177.10 | 1.50% | $8.29 |
| Hypothetical 5% Return | $1,000.00 | $1,017.59 | 1.50% | $7.68 |
| * | Expenses are equal to each Fund’s annualized expense ratio indicated above, multiplied by the average account value over the period, multiplied by 184/365 to reflect the one-half year period. |
Frontegra Funds
EXPENSE EXAMPLE (continued)
December 31, 2009 (Unaudited)
| | Beginning Account | Ending Account | Annualized | Expenses Paid |
| Frontegra Fund | Value | Value 12/31/2009 | Expense Ratio* | During the Period* |
| | | | | |
| Columbus Core Plus Fund – Y Class | | | | |
| Actual Fund Return* | $1,000.00 | $1,002.30 | 0.75% | $1.01 |
| Hypothetical 5% Return** | $1,000.00 | $1,021.42 | 0.75% | $3.82 |
| * | Actual expenses are equal to the Fund’s annualized expense ratio of 0.75% multiplied by the average account value over the period, multiplied by 49/365 to reflect the most recent fiscal period end since the Class Y Shares commenced operations on November 12, 2009. |
| ** | Hypothetical expenses are equal to the Fund’s annualized expense ratio of 0.75% multiplied by the average account value over the period commencing July 1, 2009, multiplied by 184/365 to reflect information had the Class Y Shares been in operation for the entire fiscal half year. |
| | Beginning Account | Ending Account | Annualized | Expenses Paid |
| Frontegra Fund | Value | Value 12/31/2009 | Expense Ratio* | During the Period* |
| | | | | |
| IronBridge Global Focus Fund | | | | |
| Actual Fund Return* | $1,000.00 | $1,013.10 | 1.00% | $2.81 |
| Hypothetical 5% Return** | $1,000.00 | $1,020.16 | 1.00% | $5.09 |
| * | Actual expenses are equal to the Fund’s annualized expense ratio of 1.00% multiplied by the average account value over the period, multiplied by 104/365 to reflect the most recent fiscal period end since the Class Y Shares commenced operations on September 18, 2009. |
| ** | Hypothetical expenses are equal to the Fund’s annualized expense ratio of 1.00% multiplied by the average account value over the period commencing July 1, 2009, multiplied by 184/365 to reflect information had the IronBridge Global Focus Fund been in operation for the entire fiscal half year. |
FRONTEGRA
COLUMBUS CORE PLUS FUND
FRONTEGRA
COLUMBUS CORE FUND
REPORT FROM REAMS ASSET
MANAGEMENT COMPANY, LLC:
Dear Fellow Shareholders:
The Frontegra Columbus Core Plus Fund strives to achieve a high level of total return consistent with the preservation of capital by investing in a diversified portfolio of fixed income securities of varying maturities. This objective is relative to and measured against the Barclays Capital U.S. Aggregate Bond Index.
The Frontegra Columbus Core Fund strives to achieve a high level of total return consistent with the preservation of capital by investing in a diversified portfolio of investment grade bonds of varying maturities. This objective is relative to and measured against the Barclays Capital U.S. Aggregate Bond Index.
Performance Review
For the six month period ending December 31, 2009, the Frontegra Columbus Core Plus Fund (Institutional Class) had a net return of 11.02% compared to a return of 3.95% for the benchmark, the Barclays Capital U.S. Aggregate Bond Index. Duration strategy added 16 basis points to performance for the period as the portfolio duration was positioned aggressively as the Treasury yield curve fell during the third quarter. Yield curve strategy added 3 basis points as the portfolio was overweighted the long end of the yield curve when the curve flattened slightly during the third quarter. Sector selection added 398 basis points to performance and security selection added 307 basis points. Within these categories, investment grade credit holdings added 323 basis points to performance, high yield holdings added 205 basis points, asset backed securities (“ABS”) added 131 basis points and commercial mortgage backed securities (“CMBS”) added 80 basis points to performance as all four sectors outperformed and were overweighted in the portfolio. Government related holdings subtracted 23 basis points and mortgage backed securities (“MBS”) subtracted 11 basis points as both sectors performed well but were underweighted in the portfolio.
For the six month period ending December 31, 2009, the Frontegra Columbus Core Fund had a net return of 9.33% compared to a return of 3.95% for the benchmark, the Barclays Capital U.S. Aggregate Bond Index. Duration strategy added 29 basis points to performance for the period as the portfolio duration was positioned aggressively as the Treasury yield curve fell during the third quarter. Yield curve strategy added 5 basis points as the portfolio was overweighted the long end of the yield curve when the curve flattened slightly during the third quarter. Sector selection added 312 basis points to performance and security selection added 209 basis points. Within these categories, investment grade credit holdings added 417 basis points to performance, CMBS added 56 basis points and ABS added 40 basis points to performance as all three sectors outperformed and were overweighted in the portfolio. MBS added 30 basis points to performance due to an overweight in certain non-agency MBS holdings. Government related holdings subtracted 22 basis points as the sector performed well but was underweighted in the portfolio.
Fixed Income Outlook
Non government-guaranteed sectors continued to outperform during the fourth quarter. Economic numbers have been stabilizing and beginning to improve, particularly toward the end of the quarter. It remains unclear if the magnitude of improvement in the capital markets will be justified by a solid, long-term recovery in the economy. If the underlying economic recovery does not follow through over the next several quarters, returns in the capital markets could be volatile.
| | • | Fed rate policy remains grounded at the current 0.0% to 0.25% level with overt indications that rates will remain low for an “extended period of time.” Although the economy in general, and the labor market specifically, have been slow to respond to the low rates, the Fed acknowledged the danger that the low rates may be sparking undue financial market speculation. This highlights a broader concern that financial markets, which have shown exceptional returns in the last three quarters of 2009, are perhaps getting a bit too far ahead of the true economic condition of the country. |
| | • | Corporate earnings reports for the third quarter were frequently ahead of analyst estimates although revenue was often short of the estimates. It appears that cost cutting drove the better-than-expected earnings results. Overall, investors were disappointed as they were looking for better revenue numbers which would indicate the beginning of an economic recovery. |
| | • | Moves in the U.S. dollar generated considerable media attention during the quarter. The U.S. Dollar Index, an index that averages the exchange rates between the U.S. dollar and six major world currencies, declined nearly 16% from its early March peak through the end of November. The consistent message from the Fed indicating low interest rates will be around for “an extended period of time” has provided a fertile environment for dollar weakness. When a country’s short-term interest rates are low, it is difficult to attract capital in the short-run, keeping downward pressure on the currency. Expectations that the Fed may have to move off its extremely low interest rate policy sooner sparked a small U.S. dollar rally in December, moving the U.S. Dollar Index up almost 4%. |
| | • | A call for a payment standstill by Dubai World sent a mini-shockwave through world markets during the Thanksgiving holiday. The total size of the affected debt was relatively small, but fears centered on a follow-on or domino effect. These fears proved to be unfounded as this incident appeared to be isolated with few follow-on effects. However, this should serve as a “wake-up call” to other emerging markets that have become increasingly complacent regarding the risk of debts that were made during less prudent times. |
| | • | Several Western European country debt issues were downgraded by rating agencies late in the quarter. This resulted in some weakness in the sovereign debt markets. Greece, Spain, and Portugal were singled out for downgrades and increased scrutiny as the rating agencies highlighted high debt to GDP ratios and the deterioration in these measures due to the global recession. |
| | • | With the excessive stimulus and loose monetary policy currently in place, economic data in the first half of 2010 should be relatively strong. However, the high debt levels in the developed markets will take multiple years to be reduced, dampening growth for years to come. As a result, we anticipate increased volatility in capital markets going forward. |
| | • | In regard to market performance, high yield was the best performing sector during the quarter, with option-adjusted spreads tightening nearly 155 basis points. CMBS tightened 65 basis points as investors were willing to assume additional risk in response to recent positive economic data. The investment grade corporate and ABS sectors both exhibited positive performance as well, tightening 47 and 33 basis points, respectively. An already steep Treasury yield curve steepened further as 30-year Treasury rates moved up about 60 basis points while two-year rates increased only about 20 basis points. Concerns continue to be voiced regarding the extensive new issue supply that is expected from the Treasury, but individual auctions have been well received by the market. |
Core Plus Portfolio Strategy
| | • | Maintaining a lower risk profile in the portfolio was an increasing focus during the fourth quarter. Our weighting in Treasury securities rose as a result of this risk reduction focus, but also as a result of our positioning to take advantage of a historically steep yield curve. If the yield curve flattens as we expect it to, the portfolio should outperform. We anticipate maintaining an overweight position in Treasury securities until better investment opportunities become available in other sectors of the fixed income markets. |
| | • | The portfolio’s MBS holdings are currently underweight. This is due, in part, to make room for our curve positioning, but also as a result of our view that mortgage pass-through securities may underperform as the government winds down its purchases in this sector and current tight spreads do not adequately compensate the investor for the risks in this sector. |
| | • | We remain overweight in the ABS sector. We continue to find value in the auto finance portion of this sector. |
| | • | We have become increasingly cautious of the corporate sector in general and as a result we have reduced our holdings in the sector. Our positions are focused on specific themes that we expect to outperform. If the corporate market experiences a pullback, an event that we feel is likely, we will be poised to return to an overweight position. |
Core Portfolio Strategy
| | • | Maintaining a lower risk profile in the portfolio was an increasing focus during the fourth quarter. Our weighting in Treasury securities rose as a result of this risk reduction focus, but also as a result of our positioning to take advantage of a historically steep yield curve. If the yield curve flattens as we expect it to, the portfolio should outperform. We anticipate maintaining an overweight position in Treasury securities until better investment opportunities become available in other sectors of the fixed income markets. |
| | • | The portfolio’s MBS holdings are currently underweight. This is due, in part, to make room for our curve positioning, but also as a result of our view that mortgage pass-through securities may underperform as the government winds down its purchases in this sector and current tight spreads do not adequately compensate the investor for the risks in this sector. |
| | • | We remain overweight in the ABS sector. We continue to find value in the auto finance portion of this sector. |
| | • | We have become increasingly cautious of the corporate sector in general and as a result we have reduced our holdings in the sector. Our positions are focused on specific themes that we expect to outperform. If the corporate market experiences a pullback, an event that we feel is likely, we will be poised to return to an overweight position. |
We appreciate your continued support as fellow shareholders in the Funds.
Regards,
 |  |
| Mark M. Egan, CFA, CPA | Thomas M. Fink, CFA |
| Reams Asset Management Company, LLC | Reams Asset Management Company, LLC |
INVESTMENT HIGHLIGHTS
Growth of a $100,000 Investment (Unaudited)
| | Portfolio Total Return* | | | |
| | FOR PERIODS ENDED 12/31/09 | FUND | INDEX | |
| | | | | |
| | SIX MONTHS | 11.02% | 3.95% | |
| | | | | |
| | ONE YEAR | 35.19% | 5.93% | |
| | | | | |
| | FIVE YEAR | | | |
| | AVERAGE ANNUAL | 7.69% | 4.97% | |
| | | | | |
| | TEN YEAR | | | |
| | AVERAGE ANNUAL | 7.91% | 6.33% | |
This chart assumes an initial gross investment of $100,000 made on 12/31/99. Returns shown include the reinvestment of all distributions. Past performance is not predictive of future results. Investment return and principal value will fluctuate so that shares, when redeemed, may be worth more or less than the original cost. In the absence of existing fee waivers, total return would be reduced. The recent growth rate in the fixed income market has helped to produce short-term returns for some asset classes that are not typical and may not continue in the future. Because of ongoing market volatility, Fund performance may be subject to substantial short-term changes. To receive current to the most recent month-end performance, please call 1-888-825-2100.
The Barclays Capital U.S. Aggregate Bond Index (formerly the Lehman Brothers Aggregate Bond Index) is an unmanaged market value-weighted performance benchmark for investment-grade fixed-rate debt issues, including government, corporate, asset backed and mortgage backed securities, with maturities of at least one year. The Index does not reflect investment management fees, brokerage commissions and other expenses associated with investing in fixed income securities. A direct investment in the index is not possible.
| * | The returns shown do not reflect the deduction of taxes that a shareholder would pay on Fund distributions or the redemption of Fund shares. |
The above graph relates to Institutional Class shares of the Fund. Performance for Class Y shares will vary from the performance of the Institutional Class shares shown above due to differences in expenses.
Frontegra Columbus Core Plus Fund
SCHEDULE OF INVESTMENTS
December 31, 2009 (Unaudited)
| Principal Amount | | | | Value | |
| ASSET BACKED SECURITIES 10.9% | | | |
| | | American Express Credit | | | |
| $ | 1,710,000 | | 2008-3, Class A, | | | |
| | | | 1.183%, 08/15/2012 | | $ | 1,710,393 | |
| | | | Americredit Automobile | | | | |
| | | | Receivables Trust | | | | |
| | 1,630,000 | | 2008-AF, Class A4, | | | | |
| | | | 6.960%, 10/14/2014 | | | 1,714,432 | |
| | | | Capital One Prime Auto | | | | |
| | 2,060,812 | | 2006-1, Class A-4, | | | | |
| | | | 5.010%, 11/15/2011 | | | 2,064,274 | |
| | | | Chase Issuance Trust | | | | |
| | 3,115,000 | | 2009-A7, Class A7, | | | | |
| | | | 0.683%, 09/15/2012 | | | 3,118,719 | |
| | 1,745,000 | | 2005-8A, Class A, | | | | |
| | | | 0.273%, 10/15/2012 | | | 1,742,672 | |
| | | | Chrysler Financial Auto | | | | |
| | | | Securitization Trust | | | | |
| | 1,800,000 | | 2009-B, Class A-2, | | | | |
| | | | 1.150%, 11/08/2011 | | | 1,799,684 | |
| | | | Chrysler Financial Automobile TALF | | | | |
| | 1,010,000 | | 2009-AF, Class A3, | | | | |
| | | | 2.820%, 01/15/2016 | | | 1,025,187 | |
| | | | Citibank Credit Card Issuance Trust | | | | |
| | 3,995,000 | | 2006-A6, Class A6, | | | | |
| | | | 0.242%, 05/24/2012 | | | 3,989,832 | |
| | | | Countrywide | | | | |
| | | | Asset-Backed Certificates | | | | |
| | 346,220 | | 2006-S3, Class A1, | | | | |
| | | | 5.460%, 06/25/2021 (b) | | | 283,197 | |
| | 482,772 | | 2006-S2, Class A2, | | | | |
| | | | 5.627%, 07/25/2027 | | | 380,743 | |
| | 4,061,254 | | 2006-S2, Class A3, | | | | |
| | | | 5.841%, 07/25/2027 | | | 1,297,431 | |
| | 1,743,085 | | 2006-S2, Class A4, | | | | |
| | | | 6.091%, 07/25/2027 | | | 456,037 | |
| | 1,002,603 | | 2006-S5, Class A3, | | | | |
| | | | 5.762%, 06/25/2035 | | | 253,317 | |
| | 1,615,621 | | 2007-S2, Class A6, | | | | |
| | | | 5.779%, 05/25/2037 | | | 766,698 | |
| | | | Credit Suisse Mortgage | | | | |
| | | | Capital Certificates | | | | |
| | 2,061,000 | | 2009-12R, Class 41A1, | | | | |
| | | | 5.250%, 03/27/2037 | | | 2,061,000 | |
| | | | Discover Card Master Trust I | | | | |
| | 930,000 | | 2003-3, Class A, | | | | |
| | | | 0.445%, 09/15/2012 | | | 929,619 | |
| | | | Ford Credit Auto Owner Trust | | | | |
| | 2,355,000 | | Series 2009-D, Class A3, | | | | |
| | | | 2.170%, 10/15/2013 | | | 2,378,299 | |
| | 444,492 | | 2008-C, Class A2A, | | | | |
| | | | 3.720%, 01/15/2011 | | | 445,696 | |
| | | | GE Capital Credit Card | | | | |
| | | | Master Note Trust | | | | |
| | 2,450,000 | | Series 2009-3, Class A, | | | | |
| | | | 2.540%, 09/15/2014 | | | 2,451,959 | |
| | | | GMAC Mortgage | | | | |
| | | | Corporation Loan Trust | | | | |
| | 1,628,782 | | 2006-HE2, Class A3, | | | | |
| | | | 6.320%, 05/25/2036 | | | 735,092 | |
| | 2,218,201 | | 2006-HE3, Class A3, | | | | |
| | | | 5.805%, 10/25/2036 | | | 1,059,264 | |
| | | | GSAA Home Equity Trust | | | | |
| | 1,303,854 | | 2006-S1, Class 1A1, | | | | |
| | | | 2.621%, 01/25/2037 | | | 203,375 | |
| | | | Hertz Vehicle Financing LLC | | | | |
| | 715,000 | | 2005-1A, Class A4, | | | | |
| | | | 2.711%, 11/25/2011 | | | | |
| | | | (Acquired 08/21/2008 and | | | | |
| | | | 12/10/2008, Cost $670,984) (a)(b) | | | 705,051 | |
| | 880,000 | | 2005-2A, Class A5, | | | | |
| | | | 2.711%, 11/25/2011 | | | | |
| | | | (Acquired 08/01/2008 and | | | | |
| | | | 12/10/2008, Cost $836,302) (a)(b) | | | 867,756 | |
The accompanying notes are an integral part of these financial statements.
Frontegra Columbus Core Plus Fund
SCHEDULE OF INVESTMENTS (continued)
December 31, 2009 (Unaudited)
| Principal Amount | | | | Value | |
ASSET BACKED SECURITIES 10.9% (continued) | | | |
| $ | 1,825,000 | | 2009-2A, Class A1, | | | |
| | | | 4.260%, 03/25/2014 | | | |
| | | | (Acquired 10/16/2009, | | | |
| | | | Cost $1,824,891) (a)(b) | | $ | 1,818,692 | |
| | | | Home Equity Mortgage Trust | | | | |
| | 1,440,000 | | 2005-5, Class A1F2, | | | | |
| | | | 5.150%, 04/25/2036 | | | 242,604 | |
| | 4,478,097 | | 2006-5, Class A1, | | | | |
| | | | 5.500%, 01/25/2037 | | | 447,577 | |
| | | | Hyundai Auto Receivables Trust | | | | |
| | 4,140,000 | | Series 2009-A, Class A3, | | | | |
| | | | 2.030%, 08/15/2013 | | | 4,167,156 | |
| | | | Keystone Owner Trust | | | | |
| | 6,224 | | 1998-P1, Class M1, | | | | |
| | | | 7.530%, 05/25/2025 (Acquired | | | | |
| | | | 12/10/2008, Cost $5,512) (a) | | | 5,971 | |
| | | | Mid-State Trust | | | | |
| | 930,954 | | 11, Class A1, 4.864%, 07/15/2038 | | | 832,166 | |
| | | | MSCC Heloc Trust | | | | |
| | 1,555,716 | | Series 2007-1, Class A, | | | | |
| | | | 0.385%, 12/25/2031 | | | 664,225 | |
| | | | Residential Funding | | | | |
| | | | Mortgage Securities | | | | |
| | 202,846 | | 2005-HS1, Class AI2, | | | | |
| | | | 4.660%, 07/25/2020 | | | 182,576 | |
| | 568,764 | | 2003-HS1, Class AI6, | | | | |
| | | | 3.830%, 02/25/2033 | | | 440,706 | |
| | 630,000 | | 2005-HS1, Class AI4, | | | | |
| | | | 5.110%, 09/25/2035 | | | 139,435 | |
| | 1,777,206 | | 2006-HSA1, Class A3, | | | | |
| | | | 5.230%, 02/25/2036 | | | 622,017 | |
| | 1,441,511 | | 2006-HSA1, Class A4, | | | | |
| | | | 5.490%, 02/25/2036 | | | 147,602 | |
| | 2,035,526 | | 2006-HSA1, Class A5, | | | | |
| | | | 5.310%, 02/25/2036 | | | 736,348 | |
| | 877,940 | | 2006-HSA2, Class AI2, | | | | |
| | | | 5.494%, 03/25/2036 | | | 781,698 | |
| | 1,160,000 | | 2006-HSA2, Class AI3, | | | | |
| | | | 5.550%, 03/25/2036 | | | 442,720 | |
| | 820,000 | | 2006-HSA2, Class AI4, | | | | |
| | | | 5.810%, 03/25/2036 | | | 74,630 | |
| | | | Saco I Trust | | | | |
| | 1,106,293 | | 2006-9, Class A1, | | | | |
| | | | 5.480%, 08/25/2036 | | | 183,582 | |
| | | | Total Asset Backed Securities | | | | |
| | | | (Cost $47,312,017) | | | 44,369,432 | |
| CORPORATE BONDS 15.3% | | | | |
| | | | Airlines 2.6% | | | | |
| | | | Delta Air Lines, Inc. | | | | |
| | 3,238,112 | | Series 2002-1, 6.718%, 07/02/2024 | | | 2,817,157 | |
| | | | Northwest Airlines, Inc. | | | | |
| | 4,303,892 | | 7.027%, 05/01/2021 | | | 3,808,944 | |
| | | | United Airlines | | | | |
| | 4,489,534 | | Series 071A, 6.636%, 01/02/2022 | | | 3,816,104 | |
| | | | | | | 10,442,205 | |
| | | | Commercial Banks 2.5% | | | | |
| | | | Manufacturers & Traders Trust Co. | | | | |
| | 2,610,000 | | 3.850%, 04/01/2013 | | | | |
| | | | (Acquired Multiple Dates, | | | | |
| | | | Cost $2,380,600) (a)(b) | | | 2,399,548 | |
| | 1,685,000 | | 5.629%, 12/01/2021 | | | 1,448,499 | |
| | | | Marshall & Ilsley Bank | | | | |
| | 5,935,000 | | 5.413%, 12/04/2012 | | | 4,774,292 | |
| | | | Regions Bank | | | | |
| | 1,745,000 | | 7.500%, 05/15/2018 | | | 1,595,167 | |
| | | | | | | 10,217,506 | |
| | | | Consumer Finance 0.8% | | | | |
| | | | Ford Motor Credit Co. | | | | |
| | 1,540,000 | | 8.000%, 12/15/2016 | | | 1,542,047 | |
| | | | GMAC LLC | | | | |
| | 1,767,000 | | 6.750%, 12/01/2014 | | | | |
| | | | (Acquired 02/05/2009, | | | | |
| | | | Cost $1,232,588) (a) | | | 1,678,650 | |
| | | | | | | 3,220,697 | |
The accompanying notes are an integral part of these financial statements.
Frontegra Columbus Core Plus Fund
SCHEDULE OF INVESTMENTS (continued)
December 31, 2009 (Unaudited)
| Principal Amount | | | | Value | |
CORPORATE BONDS 15.3% (continued) | | | |
| | | Diversified Financial Services 1.6% | | | |
| | | American General Finance | | | |
| $ | 3,075,000 | | 6.900%, 12/15/2017 | | $ | 2,135,138 | |
| | | | International Lease Finance Corp. | | | | |
| | 3,455,000 | | 5.625%, 09/20/2013 | | | 2,710,140 | |
| | | | Lehman Brothers Holdings | | | | |
| | 7,000,000 | | 6.875%, 05/02/2018 | | | | |
| | | | (Acquired 09/16/2008, | | | | |
| | | | Cost $2,313,205) (d) | | | 1,452,500 | |
| | | | | | | 6,297,778 | |
| | | | Diversified Telecommunication | | | | |
| | | | Services 0.5% | | | | |
| | | | Qwest Corp. | | | | |
| | 2,430,000 | | 7.125%, 11/15/2043 | | | 1,992,600 | |
| | | | | | | | |
| | | | Electric Utilities 1.6% | | | | |
| | | | AES Eastern Energy | | | | |
| | 878,785 | | 9.000%, 01/02/2017 | | | 882,081 | |
| | 1,570,000 | | 9.670%, 01/02/2029 | | | 1,652,425 | |
| | | | Indianapolis Power & Light Co. | | | | |
| | 1,100,000 | | 6.050%, 10/01/2036 | | | | |
| | | | (Acquired Multiple Dates, | | | | |
| | | | Cost $1,061,143) (a) | | | 1,086,809 | |
| | | | Mackinaw Power LLC | | | | |
| | 1,147,297 | | 6.296%, 10/31/2023 | | | | |
| | | | (Acquired Multiple Dates, | | | | |
| | | | Cost $1,107,221) (a) | | | 1,125,223 | |
| | | | Tenaska Gateway Partners Ltd. | | | | |
| | 553,331 | | 6.052%, 12/30/2023 | | | | |
| | | | (Acquired 05/31/2007 and | | | | |
| | | | 08/03/2007, Cost $553,331) (a) | | | 524,176 | |
| | | | Windsor Financing LLC | | | | |
| | 1,770,075 | | 5.881%, 07/15/2017 | | | | |
| | | | (Acquired Multiple Dates, | | | | |
| | | | Cost $1,599,428) (a) | | | 1,399,315 | |
| | | | | | | 6,670,029 | |
| | | | Industrial Consumer Services 0.2% | | | | |
| | | | ERAC USA Finance Company | | | | |
| | 980,000 | | 6.375%, 10/15/2017 | | | | |
| | | | (Acquired 10/23/2008 and | | | | |
| | | | 12/10/2008, Cost $738,423) (a) | | | 989,866 | |
| | | | Insurance 3.0% | | | | |
| | | | AIG, Inc. | | | | |
| | 2,020,000 | | 4.250%, 05/15/2013 | | | 1,865,888 | |
| | | | AIG Sunamerica | | | | |
| | 280,000 | | 0.431%, 07/26/2010 | | | 270,900 | |
| | | | AIG Sunamerica Global Financial | | | | |
| | 3,760,000 | | 6.300%, 05/10/2011 | | | | |
| | | | (Acquired Multiple Dates, | | | | |
| | | | Cost $3,575,876) (a) | | | 3,740,023 | |
| | | | ASIF Global Financing XIX | | | | |
| | 535,000 | | 4.900%, 01/17/2013 | | | | |
| | | | (Acquired Multiple Dates, | | | | |
| | | | Cost $438,782) (a) | | | 492,335 | |
| | | | Genworth Global Funding | | | | |
| | 430,000 | | 5.250%, 05/15/2012 | | | 434,119 | |
| | | | Jackson National Life Global Funding | | | | |
| | 830,000 | | 5.375%, 05/08/2013 | | | | |
| | | | (Acquired 05/01/2008 and | | | | |
| | | | 12/10/2008, Cost $824,750) (a) | | | 842,882 | |
| | | | Lincoln National Corp. | | | | |
| | 1,270,000 | | 6.250%, 02/15/2020 | | | 1,251,560 | |
| | | | Monumental Global Funding | | | | |
| | 1,605,000 | | 5.500%, 04/22/2013 | | | | |
| | | | (Acquired Multiple Dates, | | | | |
| | | | Cost $1,603,410) (a) | | | 1,651,389 | |
| | 885,000 | | 5.250%, 01/15/2014 | | | | |
| | | | (Acquired 05/06/2009 and | | | | |
| | | | 06/10/2009, Cost $829,054) (a) | | | 902,935 | |
The accompanying notes are an integral part of these financial statements.
Frontegra Columbus Core Plus Fund
SCHEDULE OF INVESTMENTS (continued)
December 31, 2009 (Unaudited)
| Principal Amount | | | | Value | |
CORPORATE BONDS 15.3% (continued) | | | |
| | | Insurance 3.0% (continued) | | | |
| | | Nationwide Life Global Fund | | | |
| $ | 795,000 | | 5.450%, 10/02/2012 | | | |
| | | | (Acquired 09/25/2007 and | | | |
| | | | 12/10/2008, Cost $793,054) (a) | | $ | 785,296 | |
| | | | | | | 12,237,327 | |
| | | | Metals & Mining 0.9% | | | | |
| | | | Alcoa Inc. | | | | |
| | 1,175,000 | | 5.950%, 02/01/2037 | | | 1,008,411 | |
| | | | Arcelormittal SA Luxembourg | | | | |
| | 1,070,000 | | 6.125%, 06/01/2018 | | | 1,104,064 | |
| | | | U.S. Steel Corp. | | | | |
| | 1,410,000 | | 5.650%, 06/01/2013 | | | 1,402,961 | |
| | | | | | | 3,515,436 | |
| | | | Multi-Utilities & | | | | |
| | | | Unregulated Power 1.4% | | | | |
| | | | Borger Energy Funding | | | | |
| | 2,483,572 | | 7.260%, 12/31/2022 | | | | |
| | | | (Acquired 08/14/2008 and | | | | |
| | | | 12/10/2008, Cost $2,392,160) (a) | | | 2,309,722 | |
| | | | Homer City Funding LLC | | | | |
| | 3,015,272 | | 8.734%, 10/01/2026 | | | 2,909,737 | |
| | | | Kiowa Power Partners LLC | | | | |
| | 620,339 | | 4.811%, 12/30/2013 | | | | |
| | | | (Acquired multiple dates, | | | | |
| | | | Cost $618,166) (a)(b) | | | 626,325 | |
| | | | | | | 5,845,784 | |
| | | | Oil, Gas & Consumable Fuels 0.2% | | | | |
| | | | USX Marathon Group | | | | |
| | 665,000 | | 8.125%, 07/15/2023 | | | 746,466 | |
| | | | Total Corporate Bonds | | | | |
| | | | (Cost $58,262,295) | | | 62,175,694 | |
| | | | | | | | |
| MORTGAGE BACKED SECURITIES 24.7% | | | | |
| | | | Bank of America | | | | |
| | | | Commercial Mortgage, Inc. | | | | |
| | 4,825,000 | | Series 2006-3, Class A4, | | | | |
| | | | 5.889%, 07/10/2044 | | | 4,390,524 | |
| | 4,440,000 | | Series 2009-UB1, Class A4, | | | | |
| | | | 5.620%, 06/24/2050 | | | | |
| | | | (Acquired 06/18/2009 and | | | | |
| | | | 07/07/2009, Cost $3,641,699) (a) | | | 4,031,883 | |
| | | | CitiMortgage Alternative Loan Trust | | | | |
| | 2,037,106 | | Series 2007-A4, Class 2A1, | | | | |
| | | | 5.500%, 04/25/2022 | | | 1,644,963 | |
| | | | Credit Suisse First Boston | | | | |
| | | | Mortgage Securities Corp. | | | | |
| | 337,985 | | Pool # 2005-10, 5.000%, 09/25/2015 | | | 332,915 | |
| | 72,604 | | Pool # 2003-1, 7.000%, 02/25/2033 | | | 71,446 | |
| | | | Credit Suisse Mortgage | | | | |
| | 2,625,000 | | Pool #2009-RR1, | | | | |
| | | | 5.383%, 11/15/2016 | | | | |
| | | | (Acquired 07/09/2009 and | | | | |
| | | | 12/29/2009, Cost $2,133,170) (a) | | | 2,337,741 | |
| | | | FHLMC REMIC (e) | | | | |
| | 2,045,000 | | Series 3563, 4.000%, 08/15/2024 | | | 1,935,075 | |
| | 5,595,000 | | Series 3577, 4.000%, 09/15/2024 | | | 5,315,336 | |
| | 9,810,000 | | Series 3609, 4.000%, 12/15/2024 | | | 10,121,546 | |
| | 501,923 | | Series 2750, 4.000%, 05/15/2026 | | | 508,988 | |
| | | | FNMA (e) | | | | |
| | 4,913,245 | | Pool #931711, 4.000%, 08/01/2019 | | | 5,025,863 | |
| | 2,539,872 | | Pool #MA0174, 4.000%, 09/25/2019 | | | 2,598,089 | |
| | 10,395,516 | | Pool #932108, 4.000%, 11/25/2019 | | | 10,633,795 | |
| | 15,965,000 | | Pool #MA0298, 4.000%, 01/01/2020 | | | 16,346,663 | |
| | | | FNMA REMIC (e) | | | | |
| | 70,068 | | Series 1994-3, Class PL, | | | | |
| | | | 5.500%, 01/25/2024 | | | 74,570 | |
| | | | FNMA TBA (e) | | | | |
| | 12,975,000 | | Pool #000TBA, 6.500%, 02/01/2038 | | | 13,854,861 | |
The accompanying notes are an integral part of these financial statements.
Frontegra Columbus Core Plus Fund
SCHEDULE OF INVESTMENTS (continued)
December 31, 2009 (Unaudited)
| Principal Amount | | | | Value | |
| MORTGAGE BACKED | | | |
SECURITIES 24.7% (continued) | | | |
| | | GS Mortgage Securities Corp. II | | | |
| $ | 3,225,119 | | Series 2007-EOP, Class A1, | | | |
| | | | 5.410%, 03/06/2020 | | | |
| | | | (Acquired Multiple Dates, | | | |
| | | | Cost $3,167,669) (a)(b) | | $ | 3,067,677 | |
| | | | LB-UBS Commercial Mortgage Trust | | | | |
| | 2,610,000 | | Series 2007-C1, Class A4, | | | | |
| | | | 5.424%, 02/15/2040 | | | 2,161,419 | |
| | 4,410,000 | | Series 2007-C2, Class A3, | | | | |
| | | | 5.430%, 02/15/2040 | | | 3,809,311 | |
| | 787,500 | | Series 2007-C3, Class A4, | | | | |
| | | | 6.136%, 07/15/2044 (b) | | | 650,884 | |
| | | | Master Asset Securitization Trust | | | | |
| | 280,415 | | Pool # 2004-3, 4.750%, 01/25/2014 | | | 269,198 | |
| | | | Morgan Stanley Mortgage Loan Trust | | | | |
| | 878,047 | | Series 2006-7, 5.000%, 06/25/2021 | | | 769,251 | |
| | | | Residential Accredit Loans, Inc. | | | | |
| | 1,078,559 | | Series 2005-QS3, Class A1, | | | | |
| | | | 5.000%, 03/25/2020 | | | 962,617 | |
| | 1,233,875 | | Series 2004-QS4, Class A1, | | | | |
| | | | 4.350%, 03/25/2034 | | | 1,125,261 | |
| | | | Wachovia Bank Commercial | | | | |
| | | | Mortgage Trust | | | | |
| | 2,478,474 | | Series 2003-C7, Class A1, 4.241%, | | | | |
| | | | 10/15/2035 (Acquired 12/04/2009 | | | | |
| | | | and 12/29/2009, Cost $2,497,167) (a) | | | 2,494,491 | |
| | 2,650,000 | | Series 2006-C23, Class A4, | | | | |
| | | | 5.418%, 01/15/2045 | | | 2,538,399 | |
| | | | Wells Fargo Alternative Loan Trust | | | | |
| | 1,789,120 | | Series 2007-PA3, Class 6A1, | | | | |
| | | | 5.500%, 07/25/2037 | | | 1,444,714 | |
| | | | Wells Fargo Mortgage | | | | |
| | | | Backed Securities Trust | | | | |
| | 1,993,370 | | Pool # 2006-3, 5.500%, 03/25/2036 | | | 1,826,740 | |
| | | | Total Mortgage Backed Securities | | | | |
| | | | (Cost $100,173,056) | | | 100,344,220 | |
| INSTITUTIONAL TERM LOANS 0.0% | | | | |
| | | | Chrysler LLC | | | | |
| | 7,153,130 | | 6.467%, 11/29/2013 | | | | |
| | | | (Acquired 08/13/2008 and | | | | |
| | | | 08/15/2008, Cost $3,433,612) (d) | | | 125,180 | |
| | | | Total Institutional Term Loans | | | | |
| | | | (Cost $3,433,612) | | | 125,180 | |
| | | | | | | | |
| Number of Shares | | | | | | |
| PREFERRED STOCKS 0.1% | | | | |
| | | | Thrifts & Mortgage Finance 0.1% | | | | |
| | 169,732 | | Fannie Mae | | | | |
| | | | 8.250%, 12/31/2010 (b)(e) | | | 186,705 | |
| | 141,065 | | Freddie Mac | | | | |
| | | | 8.375%, 12/31/2012 (b)(e) | | | 148,118 | |
| | | | Total Preferred Stocks | | | | |
| | | | (Cost $4,155,967) | | | 334,823 | |
| | | | | | | | |
| Principal Amount | | | | | | |
| U.S. TREASURY OBLIGATIONS 49.4% | | | | |
| | | | United States Treasury Bonds 4.9% | | | | |
| $ | 20,435,000 | | 4.500%, 08/15/2039 | | | 19,972,025 | |
| | | | | | | | |
| | | | United States Treasury Notes 40.7% | | | | |
| | 56,825,000 | | 0.875%, 05/31/2011 | | | 56,893,815 | |
| | 6,815,000 | | 1.125%, 06/30/2011 | | | 6,842,682 | |
| | 25,410,000 | | 1.125%, 01/15/2012 | | | 25,386,166 | |
| | 29,530,000 | | 2.125%, 11/30/2014 | | | 28,831,025 | |
| | 7,605,000 | | 3.125%, 10/31/2016 | | | 7,509,344 | |
| | 18,165,000 | | 2.750%, 11/30/2016 | | | 17,488,063 | |
| | 23,215,000 | | 3.375%, 11/15/2019 | | | 22,330,044 | |
| | | | | | | 165,281,139 | |
| | | | United States Treasury Strip 3.8% | | | | |
| | 64,255,000 | | Principal only, 11/15/2039 | | | 15,461,359 | |
| | | | Total U.S. Treasury Obligations | | | | |
| | | | (Cost $203,382,936) | | | 200,714,523 | |
The accompanying notes are an integral part of these financial statements.
Frontegra Columbus Core Plus Fund
SCHEDULE OF INVESTMENTS (continued)
December 31, 2009 (Unaudited)
| Principal Amount | | | | Value | |
| SHORT TERM INVESTMENTS 9.7% | | | |
| | | Commercial Paper 9.4% | | | |
| $ | 38,090,000 | | U.S. Bank, N.A., | | | |
| | | | 0.040%, 01/04/2010 | | $ | 38,090,000 | |
| | | | | | | | |
| | | | Variable Rate Demand Notes 0.3% (c) | | | | |
| | 1,408,627 | | American Family Financial | | | | |
| | | | Services, Inc., 0.100% | | | 1,408,627 | |
| | 19,951 | | U.S. Bank, N.A., 0.000% | | | 19,951 | |
| | | | | | | 1,428,578 | |
| | | | Total Short-Term Investments | | | | |
| | | | (Cost $39,518,366) | | | 39,518,578 | |
| | | | | | | | |
| | | | Total Investments 110.1% | | | | |
| | | | (Cost $456,238,249) | | | 447,582,450 | |
| | | | | | | | |
| | | | Liabilities in Excess of | | | | |
| | | | Other Assets (10.1)% | | | (41,144,331 | ) |
| | | | | | | | |
| | | | TOTAL NET ASSETS 100.0% | | $ | 406,438,119 | |
| (a) | Security exempt from registration under Rule 144A of the Securities Act of 1933. These securities may be resold in transactions exempt from registration normally to qualified institutional buyers. The total value of these securities amounted to $35,883,756 (8.8% of net assets) at December 31, 2009. |
| (c) | Variable rate demand notes are considered short-term obligations and are payable upon demand. Interest rates change periodically on specified dates. The rates listed are as of December 31, 2009. |
| (d) | Security is in default. |
| (e) | Entity under conservatorship of the federal government |
ALLOCATION OF PORTFOLIO HOLDINGS
At December 31, 2009, the allocation of portfolio holdings as a percentage of the Fund’s total net assets were:
| Asset-Backed Securities | | | 10.9 | % | Preferred Stocks | | | 0.1 | |
| Corporate Bonds | | | 15.3 | | U.S. Treasury Obligations | | | 49.4 | |
| Mortgage-Backed Securities | | | 24.7 | | Short-Term Investments | | | 9.7 | |
| Institutional Term Loans | | | 0.0 | | Liabilities in Excess of Other Assets | | | (10.1 | ) |
| | | | | | | | | 100.0 | % |
| | | | | | | | | | |
The accompanying notes are an integral part of these financial statements.
Frontegra Columbus Core Plus Fund
STATEMENT OF ASSETS AND LIABILITIES
December 31, 2009 (Unaudited)
| Assets: | | | |
| Investments at value (cost $456,238,249) | | $ | 447,582,450 | |
| Cash | | | 40,199 | |
| Interest receivable | | | 2,122,153 | |
| Receivable for Fund shares sold | | | 1,259,059 | |
| Receivable for investments sold | | | 163,133,553 | |
| Prepaid expenses and other assets | | | 52,695 | |
| Unrealized appreciation on foreign currency contracts | | | 77,705 | |
| Total assets | | | 614,267,814 | |
| | | | | |
| Liabilities: | | | | |
| Payable for investments purchased | | | 207,426,087 | |
| Payable for Fund shares purchased | | | 178,325 | |
| Accrued investment advisory fee | | | 85,792 | |
| Accrued distribution and shareholder servicing fees | | | 248 | |
| Accrued expenses | | | 56,435 | |
| Unrealized depreciation on foreign currency contracts | | | 82,808 | |
| Total liabilities | | | 207,829,695 | |
| Net Assets | | $ | 406,438,119 | |
| | | | | |
| Net Assets Consist of: | | | | |
| Paid in capital | | $ | 412,669,863 | |
| Undistributed net investment income | | | 375,033 | |
| Accumulated net realized gain on investments sold, swap contracts and foreign currency | | | 2,054,125 | |
| Net unrealized appreciation (depreciation) on: | | | | |
| Investments | | | (8,655,799 | ) |
| Foreign currency | | | (5,103 | ) |
| Net Assets | | $ | 406,438,119 | |
| | | | | |
| Capital Stock, $0.01 Par Value | | | | |
| Institutional Class Shares Authorized | | | 100,000,000 | |
| Class Y Shares Authorized | | | 50,000,000 | |
| | | | | |
| Institutional Class: | | | | |
| Net Assets | | $ | 404,794,456 | |
| Issued and Outstanding | | | 12,992,929 | |
| Net Asset Value, Redemption Price and Offering Price Per Share | | $ | 31.15 | |
| | | | | |
| Class Y: | | | | |
| Net Assets | | $ | 1,643,663 | |
| Issued and outstanding | | | 52,759 | |
| Net Asset Value, Redemption Price and Offering Price Per Share | | $ | 31.15 | |
The accompanying notes are an integral part of these financial statements.
Frontegra Columbus Core Plus Fund
STATEMENT OF OPERATIONS
| | | Six Months Ended | |
| | | December 31, 2009 | |
| | | (Unaudited) | |
| Investment Income: | | | |
| Interest income | | $ | 14,161,031 | |
| Total Investment Income | | | 14,161,031 | |
| | | | | |
| Expenses: | | | | |
| Investment advisory fees (Note 3) | | | 816,050 | |
| Fund administration and accounting fees | | | 59,926 | |
| Custody fees | | | 21,177 | |
| Federal and state registration fees | | | 18,205 | |
| Audit fees | | | 18,121 | |
| Shareholder servicing fees | | | 17,288 | |
| Legal fees | | | 16,766 | |
| Reports to shareholders | | | 6,649 | |
| Directors’ fees and related expenses | | | 4,232 | |
| Compliance related expenses | | | 816 | |
| Distribution and shareholder servicing fees - Class Y (Note 8) | | | 662 | |
| Other | | | 9,612 | |
| Total expenses before waiver and reimbursement | | | 989,504 | |
| Waiver and reimbursement of expenses by Adviser (Note 3) | | | (274,798 | ) |
| Net expenses | | | 714,706 | |
| Net Investment Income | | | 13,446,325 | |
| | | | | |
| Realized and Unrealized Gain (Loss) on Investments: | | | | |
| Net realized gain on : | | | | |
| Investments | | | 29,074,741 | |
| Swap contracts | | | 331,205 | |
| Futures | | | 69,372 | |
| Change in net unrealized appreciation (depreciation) on: | | | | |
| Investments | | | (149,995 | ) |
| Swap contracts | | | (422,098 | ) |
| Foreign currency contracts | | | (5,103 | ) |
| Net Realized and Unrealized Gain on Investments | | | 28,898,122 | |
| Net Increase in Net Assets Resulting from Operations | | $ | 42,344,447 | |
The accompanying notes are an integral part of these financial statements.
Frontegra Columbus Core Plus Fund
STATEMENTS OF CHANGES IN NET ASSETS
| | | For the Six | | | | |
| | | Months Ended | | | For the | |
| | | December 31, 2009 | | | Year Ended | |
| | | (Unaudited) | | | June 30, 2009 | |
| Operations: | | | | | | |
| Net investment income | | $ | 13,446,325 | | | $ | 35,153,932 | |
| Net realized gain (loss) on: | | | | | | | | |
| Investments | | | 29,074,741 | | | | (8,895,311 | ) |
| Swap contracts | | | 331,205 | | | | 2,197,511 | |
| Foreign currency translation | | | — | | | | 831,878 | |
| Futures | | | 69,372 | | | | — | |
| Change in net unrealized appreciation (depreciation) on: | | | | | | | | |
| Investments | | | (149,995 | ) | | | 354,573 | |
| Swap contracts | | | (422,098 | ) | | | 1,390,660 | |
| Foreign currency contracts | | | (5,103 | ) | | | — | |
| Net increase in net assets resulting from operations | | | 42,344,447 | | | | 31,033,243 | |
| Distributions Paid to Institutional Class Shareholders From: | | | | | | | | |
| Net investment income | | | (14,315,502 | ) | | | (33,077,660 | ) |
| Net realized gain | | | (16,735,772 | ) | | | (9,661,730 | ) |
| Net decrease in net assets resulting from distributions paid | | | (31,051,274 | ) | | | (42,739,390 | ) |
| Distributions Paid to Class Y Shareholders From: | | | | | | | | |
| Net investment income | | | (29,063 | ) | | | — | |
| Net realized gain | | | (71,341 | ) | | | — | |
| Net decrease in net assets resulting from distributions paid | | | (100,404 | ) | | | — | |
| Capital Share Transactions: | | | | | | | | |
| Shares sold - Institutional Class | | | 79,536,986 | | | | 110,670,953 | |
| Shares sold - Class Y | | | 1,650,150 | | | | — | |
| Shares issued to holders in reinvestment of distributions - Institutional Class | | | 26,700,859 | | | | 33,980,127 | |
| Shares issued to holders in reinvestment of distributions - Class Y | | | 100,403 | | | | — | |
| Shares redeemed - Institutional Class | | | (109,454,123 | ) | | | (170,148,652 | ) |
| Shares redeemed - Class Y | | | (50 | ) | | | — | |
| Net decrease in net assets resulting from capital share transactions | | | (1,465,775 | ) | | | (25,497,572 | ) |
| Total Increase (Decrease) in Net Assets | | | 9,726,994 | | | | (37,203,719 | ) |
| Net Assets: | | | | | | | | |
| Beginning of Period | | | 396,711,125 | | | | 433,914,844 | |
| End of Period (includes undistributed net investment income of $375,033 and $1,273,273 respectively) | | $ | 406,438,119 | | | $ | 396,711,125 | |
| Transactions In Shares – Institutional Class: | | | | | | | | |
| Shares sold | | | 2,456,141 | | | | 4,019,040 | |
| Shares issued to holders in reinvestment of distributions | | | 841,965 | | | | 1,277,512 | |
| Shares redeemed | | | (3,353,063 | ) | | | (6,367,246 | ) |
| Net decrease in shares outstanding | | | (54,957 | ) | | | (1,070,694 | ) |
| Transactions In Shares – Class Y: | | | | | | | | |
| Shares sold | | | 49,568 | | | | n/a | |
| Shares issued to holders in reinvestment of distributions | | | 3,193 | | | | n/a | |
| Shares redeemed | | | (2 | ) | | | n/a | |
| Net increase in shares outstanding | | | 52,759 | | | | n/a | |
The accompanying notes are an integral part of these financial statements.
Frontegra Columbus Core Plus Fund
FINANCIAL HIGHLIGHTS
| | | Institutional Class | |
| | | Six Months | | | | | | | | | | | | | | | | |
| | | Ended | | | Year | | | Year | | | Year | | | Year | | | Year | |
| | | December 31, | | | Ended | | | Ended | | | Ended | | | Ended | | | Ended | |
| | | 2009 | | | June 30, | | | June 30, | | | June 30, | | | June 30, | | | June 30, | |
| | | (Unaudited) | | | 2009 | | | 2008 | | | 2007 | | | 2006 | | | 2005 | |
| Net Asset Value, Beginning of Period | | $ | 30.40 | | | $ | 30.73 | | | $ | 30.40 | | | $ | 29.72 | | | $ | 31.50 | | | $ | 30.51 | |
| | | | | | | | | | | | | | | | | | | | | | | | | |
| Income (Loss) from | | | | | | | | | | | | | | | | | | | | | | | | |
| Investment Operations: | | | | | | | | | | | | | | | | | | | | | | | | |
| Net investment income | | | 1.13 | | | | 2.50 | | | | 1.48 | | | | 1.54 | | | | 1.41 | | | | 1.13 | |
| Net realized and unrealized gain (loss) on investments | | | 2.26 | | | | 0.16 | | | | 0.61 | | | | 0.68 | | | | (1.30 | ) | | | 0.98 | |
| Total Income from Investment Operations | | | 3.39 | | | | 2.66 | | | | 2.09 | | | | 2.22 | | | | 0.11 | | | | 2.11 | |
| | | | | | | | | | | | | | | | | | | | | | | | | |
| Less Distributions: | | | | | | | | | | | | | | | | | | | | | | | | |
| From net investment income | | | (1.20 | ) | | | (2.33 | ) | | | (1.49 | ) | | | (1.54 | ) | | | (1.45 | ) | | | (1.12 | ) |
| From net realized gain on investments | | | (1.44 | ) | | | (0.66 | ) | | | (0.27 | ) | | | — | | | | (0.44 | ) | | | — | |
| Total Distributions | | | (2.64 | ) | | | (2.99 | ) | | | (1.76 | ) | | | (1.54 | ) | | | (1.89 | ) | | | (1.12 | ) |
| | | | | | | | | | | | | | | | | | | | | | | | | |
| Net Asset Value, End of Period | | $ | 31.15 | | | $ | 30.40 | | | $ | 30.73 | | | $ | 30.40 | | | $ | 29.72 | | | $ | 31.50 | |
| Total Return | | | 11.02 | %(1) | | | 10.52 | % | | | 6.92 | % | | | 7.52 | % | | | 0.36 | % | | | 7.00 | % |
| | | | | | | | | | | | | | | | | | | | | | | | | |
| Supplemental Data and Ratios: | | | | | | | | | | | | | | | | | | | | | | | | |
| Net assets, end of period (in thousands) | | $ | 404,794 | | | $ | 396,711 | | | $ | 433,915 | | | $ | 276,830 | | | $ | 313,880 | | | $ | 316,474 | |
| Ratio of expenses to average net assets | | | | | | | | | | | | | | | | | | | | | | | | |
| Before waivers and reimbursements | | | 0.48 | %(2) | | | 0.49 | % | | | 0.49 | % | | | 0.50 | % | | | 0.50 | % | | | 0.50 | % |
| Net of waivers and reimbursements | | | 0.35 | %(2) | | | 0.35 | % | | | 0.30 | % | | | 0.20 | % | | | 0.20 | % | | | 0.41 | % |
| Ratio of net investment income to average net assets | | | | | | | | | | | | | | | | | | | | | | | | |
| Before waivers and reimbursements | | | 6.59 | %(2) | | | 8.68 | % | | | 4.68 | % | | | 4.65 | % | | | 4.29 | % | | | 3.21 | % |
| Net of waivers and reimbursements | | | 6.46 | %(2) | | | 8.82 | % | | | 4.87 | % | | | 4.95 | % | | | 4.59 | % | | | 3.30 | % |
| Portfolio turnover rate | | | 450 | %(1) | | | 424 | % | | | 1,093 | % | | | 978 | % | | | 1,247 | % | | | 1,222 | % |
The accompanying notes are an integral part of these financial statements.
Frontegra Columbus Core Plus Fund
FINANCIAL HIGHLIGHTS
| | | Class Y | |
| | | Six Months | |
| | | Ended | |
| | | December 31, | |
| | | 2009(1) | |
| | | (Unaudited) | |
| Net Asset Value, Beginning of Period | | $ | 33.08 | |
| | | | | |
| Income (Loss) from | | | | |
| Investment Operations: | | | | |
| Net investment income | | | 0.18 | |
| Net realized and unrealized loss on investments | | | (0.08 | ) |
| Total Income from Investment Operations | | | 0.10 | |
| | | | | |
| Less Distributions: | | | | |
| From net investment income | | | (0.59 | ) |
| From net realized gain on investments | | | (1.44 | ) |
| Total Distributions | | | (2.03 | ) |
| | | | | |
| Net Asset Value, End of Period | | $ | 31.15 | |
| Total Return | | | 0.23 | %(2) |
| | | | | |
| Supplemental Data and Ratios: | | | | |
| Net assets, end of period (in thousands) | | $ | 1,644 | |
| Ratio of expenses to average net assets | | | | |
| Before waivers and reimbursements | | | 0.81 | %(3) |
| Net of waivers and reimbursements | | | 0.75 | %(3) |
| Ratio of net investment income to average net assets | | | | |
| Before waivers and reimbursements | | | 4.71 | %(3) |
| Net of waivers and reimbursements | | | 4.65 | %(3) |
| Portfolio turnover rate | | | 450 | %(2) |
| (1) | Commenced operations on November 12, 2009. |
The accompanying notes are an integral part of these financial statements.
INVESTMENT HIGHLIGHTS
Growth of a $100,000 Investment (Unaudited)
* 2/23/01 commencement of operations.
| | Portfolio Total Return** | | | |
| | FOR PERIODS ENDED 12/31/09 | FUND | INDEX | |
| | | | | |
| | SIX MONTHS | 9.33% | 3.95% | |
| | | | | |
| | ONE YEAR | 28.36% | 5.93% | |
| | | | | |
| | FIVE YEAR | | | |
| | AVERAGE ANNUAL | 6.76% | 4.97% | |
| | | | | |
| | SINCE COMMENCEMENT | | | |
| | AVERAGE ANNUAL | 6.40% | 5.66% | |
This chart assumes an initial gross investment of $100,000 made on 2/23/01 (commencement of operations). Returns shown include the reinvestment of all distributions. Past performance is not predictive of future results. Investment return and principal value will fluctuate so that shares, when redeemed, may be worth more or less than the original cost. In the absence of existing fee waivers, total return would be reduced. The recent growth rate in the fixed income market has helped to produce short-term returns for some asset classes that are not typical and may not continue in the future. Because of ongoing market volatility, Fund performance may be subject to substantial short-term changes. To receive current to the most recent month-end performance, please call 1-888-825-2100.
The Barclays Capital U.S. Aggregate Bond Index (formerly the Lehman Brothers Aggregate Bond Index) is an unmanaged market value-weighted performance benchmark for investment-grade fixed-rate debt issues, including government, corporate, asset backed and mortgage backed securities, with maturities of at least one year. The Index does not reflect investment management fees, brokerage commissions and other expenses associated with investing in fixed income securities. A direct investment in the index is not possible.
| ** | The returns shown do not reflect the deduction of taxes that a shareholder would pay on Fund distributions or the redemption of Fund shares. |
Frontegra Columbus Core Fund
SCHEDULE OF INVESTMENTS
December 31, 2009 (Unaudited)
| Principal Amount | | | | Value | |
| ASSET BACKED SECURITIES 8.2% | | | |
| | | American Express Credit | | | |
| $ | 260,000 | | 2008-3, Class A, | | | |
| | | | 1.183%, 08/15/2012 | | $ | 260,060 | |
| | | | Americredit Automobile | | | | |
| | | | Receivables Trust | | | | |
| | 355,000 | | 2008-AF, Class A4, | | | | |
| | | | 6.960%, 10/14/2014 | | | 373,389 | |
| | | | Capital One Prime Auto | | | | |
| | 356,885 | | 2006-1, Class A4, | | | | |
| | | | 5.010%, 11/15/2011 | | | 357,485 | |
| | | | Chase Issuance Trust | | | | |
| | 525,000 | | 2009-A7, Class A7, | | | | |
| | | | 0.695%, 09/17/2012 | | | 525,627 | |
| | 280,000 | | 2005-8A, Class A8, | | | | |
| | | | 0.273%, 10/15/2012 | | | 279,626 | |
| | | | Chrysler Financial | | | | |
| | | | Auto Securitization Trust | | | | |
| | 290,000 | | 2009-B, Class A2, | | | | |
| | | | 1.150%, 11/08/2011 | | | 289,949 | |
| | | | Chrysler Financial Automobile TALF | | | | |
| | 150,000 | | 2009-AF, Class A3, | | | | |
| | | | 2.820%, 01/15/2016 | | | 152,255 | |
| | | | Citibank Credit Card Issuance Trust | | | | |
| | 635,000 | | 2006-A6, Class A6, | | | | |
| | | | 0.242%, 05/24/2012 | | | 634,179 | |
| | | | Credit Suisse Mortgage | | | | |
| | | | Capital Certificates | | | | |
| | 316,133 | | 2009-12R, 41A1, | | | | |
| | | | 5.250%, 03/27/2037 | | | 316,133 | |
| | | | Discover Card Master Trust I | | | | |
| | 145,000 | | 2003-3, Class A, 0.445%, 09/15/2012 | | | 144,941 | |
| | | | Ford Credit Auto Owner Trust | | | | |
| | 375,000 | | Series 2009-D, Class A3, | | | | |
| | | | 2.170%, 10/15/2013 | | | 378,710 | |
| | 69,592 | | Series 2008-C, Class A2A, | | | | |
| | | | 3.720%, 01/15/2011 | | | 69,781 | |
| | | | GE Capital Credit Card | | | | |
| | | | Master Note Trust | | | | |
| | 385,000 | | Series 2009-3, Class A, | | | | |
| | | | 2.540%, 09/15/2014 | | | 385,308 | |
| | | | Hertz Vehicle Financing LLC | | | | |
| | 160,000 | | 2005-1A, Class A4, | | | | |
| | | | 2.711%, 11/25/2011 | | | | |
| | | | (Acquired 08/21/2008, | | | | |
| | | | Cost $152,092) (a)(b) | | | 157,774 | |
| | 200,000 | | 2005-2A, Class A5, | | | | |
| | | | 2.711%, 11/25/2011 | | | | |
| | | | (Acquired 08/01/2008, | | | | |
| | | | Cost $192,363) (a)(b) | | | 197,217 | |
| | 280,000 | | 2009-2A, Class A1, | | | | |
| | | | 4.260%, 03/25/2014 | | | | |
| | | | (Acquired 10/16/2009, | | | | |
| | | | Cost $279,983) (a)(b) | | | 279,032 | |
| | | | Hyundai Auto Receivables Trust | | | | |
| | 640,000 | | Series 2009-A, Class A3, | | | | |
| | | | 2.030%, 08/15/2013 | | | 644,198 | |
| | | | Keystone Owner Trust | | | | |
| | 28,009 | | 1998-P1, Class M1, | | | | |
| | | | 7.530%, 05/25/2025 | | | | |
| | | | (Acquired 04/22/2003, | | | | |
| | | | Cost $28,740) (a) | | | 26,870 | |
| | | | Mid-State Trust | | | | |
| | 247,917 | | 11, Class A1, 4.864%, 07/15/2038 | | | 221,609 | |
| | | | Total Asset Backed Securities | | | | |
| | | | (Cost $5,684,001) | | | 5,694,143 | |
| | | | | | | | |
| CORPORATE BONDS 13.0% | | | | |
| | | | Airlines 1.0% | | | | |
| | | | Northwest Airlines, Inc. | | | | |
| | 785,203 | | 7.027%, 11/01/2019 | | | 694,904 | |
| | | | | | | | |
| | | | Commercial Banks 1.4% | | | | |
| | | | Manufacturers & Traders Trust Co. | | | | |
| | 335,000 | | 5.629%, 12/01/2021 | | | 287,981 | |
The accompanying notes are an integral part of these financial statements.
Frontegra Columbus Core Fund
SCHEDULE OF INVESTMENTS (continued)
December 31, 2009 (Unaudited)
| Principal Amount | | | | Value | |
CORPORATE BONDS 13.0% (continued) | | | |
| | | Commercial Banks 1.4% (continued) | | | |
| | | Marshall & Ilsley Bank | | | |
| $ | 880,000 | | 5.413%, 12/04/2012 | | $ | 707,898 | |
| | | | | | | 995,879 | |
| | | | Construction Materials 0.1% | | | | |
| | | | Lafarge Coppee SA | | | | |
| | 70,000 | | 6.500%, 07/15/2016 | | | 74,214 | |
| | | | Diversified Financial Services 0.9% | | | | |
| | | | General Electric Company | | | | |
| | 285,000 | | 6.000%, 08/07/2019 | | | 295,836 | |
| | | | International Lease Finance Corp. | | | | |
| | 455,000 | | 5.625%, 09/20/2013 | | | 356,907 | |
| | | | | | | 652,743 | |
| | | | Electric Utilities 1.3% | | | | |
| | | | Entergy Arkansas Inc. | | | | |
| | 175,000 | | 5.000%, 07/01/2018 | | | 168,402 | |
| | | | Indianapolis Power & Light Co. | | | | |
| | 350,000 | | 6.050%, 10/01/2036 (Acquired | | | | |
| | | | Multiple Dates, Cost $337,293) (a) | | | 345,803 | |
| | | | Mackinaw Power LLC | | | | |
| | 309,733 | | 6.296%, 10/31/2023 | | | | |
| | | | (Acquired Multiple Dates, | | | | |
| | | | Cost $300,162) (a) | | | 303,774 | |
| | | | Ohio Power Co. | | | | |
| | 60,000 | | 6.000%, 06/01/2016 | | | 63,610 | |
| | | | | | | 881,589 | |
| | | | Gas Utilities 0.5% | | | | |
| | | | EQT Corp. | | | | |
| | 270,000 | | 8.125%, 06/01/2019 | | | 311,951 | |
| | | | Industrial Consumer Services 0.5% | | | | |
| | | | ERAC USA Finance Company | | | | |
| | 305,000 | | 6.375%, 10/15/2017 | | | | |
| | | | (Acquired 10/21/2008 and | | | | |
| | | | 10/23/2008, Cost $231,598) (a) | | | 308,070 | |
| | | | Insurance 5.2% | | | | |
| | | | AIG Sunamerica Global Financial | | | | |
| | 500,000 | | 6.300%, 05/10/2011 | | | | |
| | | | (Acquired 09/30/2009, | | | | |
| | | | Cost $494,039) (a) | | | 497,344 | |
| | | | Farmers Insurance Exchange | | | | |
| | 230,000 | | 6.000%, 08/01/2014 | | | | |
| | | | (Acquired 07/15/2009, | | | | |
| | | | Cost $195,814) (a) | | | 216,991 | |
| | | | Genworth Global Funding | | | | |
| | 965,000 | | 5.875%, 05/03/2013 | | | | |
| | | | (Acquired Multiple Dates, | | | | |
| | | | Cost $761,765) (a) | | | 956,014 | |
| | | | Jackson National Life Global Funding | | | | |
| | 235,000 | | 5.375%, 05/08/2013 | | | | |
| | | | (Acquired Multiple Dates, | | | | |
| | | | Cost $235,494) (a) | | | 238,647 | |
| | | | Lincoln National Corp. | | | | |
| | 210,000 | | 6.250%, 02/15/2020 | | | 206,951 | |
| | | | Monumental Global Funding | | | | |
| | 390,000 | | 5.500%, 04/22/2013 | | | | |
| | | | (Acquired Multiple Dates, | | | | |
| | | | Cost $393,523) (a) | | | 401,272 | |
| | 135,000 | | 5.250%, 01/15/2014 | | | | |
| | | | (Acquired 06/10/2009 and | | | | |
| | | | 09/30/2009, Cost $129,727) (a) | | | 137,736 | |
| | | | Nationwide Life Global Fund | | | | |
| | 965,000 | | 5.450%, 10/02/2012 | | | | |
| | | | (Acquired 09/25/2007 and | | | | |
| | | | 09/30/2009, Cost $962,774) (a) | | | 953,221 | |
| | | | | | | 3,608,176 | |
| | | | Machinery Manufacturing 0.3% | | | | |
| | | | Weatherford International Ltd. | | | | |
| | 215,000 | | 6.500%, 08/01/2036 | | | 205,331 | |
| | | | Media 0.3% | | | | |
| | | | Time Warner Entertainment Co. LP | | | | |
| | 190,000 | | 8.375%, 07/15/2033 | | | 227,134 | |
The accompanying notes are an integral part of these financial statements.
Frontegra Columbus Core Fund
SCHEDULE OF INVESTMENTS (continued)
December 31, 2009 (Unaudited)
| Principal Amount | | | | Value | |
CORPORATE BONDS 13.0% (continued) | | | |
| | | Metals & Mining 0.7% | | | |
| | | Alcoa Inc. | | | |
| $ | 275,000 | | 5.900%, 02/01/2027 | | $ | 247,903 | |
| | 235,000 | | 5.950%, 02/01/2037 | | | 201,682 | |
| | | | | | | 449,585 | |
| | | | Multi-Utilities & | | | | |
| | | | Unregulated Power 0.3% | | | | |
| | | | Kiowa Power Partners LLC | | | | |
| | 173,902 | | 4.811%, 12/30/2013 | | | | |
| | | | (Acquired Multiple Dates, | | | | |
| | | | Cost $173,720) (a)(b) | | | 175,580 | |
| | | | Oil, Gas & Consumable Fuels 0.5% | | | | |
| | | | Talisman Energy, Inc. | | | | |
| | 280,000 | | 7.750%, 06/01/2019 | | | 328,834 | |
| | | | Total Corporate Bonds | | | | |
| | | | (Cost $8,168,125) | | | 8,913,990 | |
| | | | | | | | |
| MORTGAGE BACKED SECURITIES 27.3% | | | | |
| | | | Bank of America | | | | |
| | | | Commercial Mortgage Inc. | | | | |
| | 385,000 | | Series 2006-3, Class A4, | | | | |
| | | | 5.889%, 07/10/2044 | | | 350,332 | |
| | 720,000 | | Series 2009-UB1, Class A4, | | | | |
| | | | 5.620%, 06/24/2050 | | | | |
| | | | (Acquired Multiple Dates, | | | | |
| | | | Cost $602,220) (a) | | | 653,819 | |
| | | | CitiMortgage Alternative Loan Trust | | �� | | |
| | 1,237,688 | | Series 2007-A7, Class 3A1, | | | | |
| | | | 5.750%, 07/25/2022 | | | 1,010,843 | |
| | | | Credit Suisse First Boston | | | | |
| | | | Mortgage Securities Corp. | | | | |
| | 89,467 | | Pool # 2005-10, 5.000%, 09/25/2015 | | | 88,125 | |
| | 20,704 | | Pool # 2003-1, 7.000%, 02/25/2033 | | | 20,373 | |
| | | | FHLMC Pools (d) | | | | |
| | 88,129 | | Pool #G1-8105, 5.000%, 03/01/2021 | | | 92,464 | |
| | 32,574 | | Pool #G1-1989, 5.500%, 04/01/2021 | | | 34,675 | |
| | 52,185 | | Pool #G1-2522, 5.000%, 02/01/2022 | | | 54,751 | |
| | 107,139 | | Pool #G1-8229, 5.000%, 01/01/2023 | | | 112,174 | |
| | 122,898 | | Pool #G0-2123, 5.500%, 03/01/2036 | | | 129,210 | |
| | 38,663 | | Pool #G0-8131, 7.000%, 03/01/2036 | | | 42,180 | |
| | 59,410 | | Pool #G0-2184, 5.000%, 04/01/2036 | | | 61,038 | |
| | 31,618 | | Pool #G0-2196, 6.500%, 05/01/2036 | | | 33,880 | |
| | 21,949 | | Pool #A5-2716, 6.500%, 10/01/2036 | | | 23,520 | |
| | 202,282 | | Pool #A6-1562, 5.500%, 10/01/2036 | | | 212,291 | |
| | 37,594 | | Pool #G0-4260, 5.500%, 05/01/2038 | | | 39,423 | |
| | 250,227 | | Pool #G0-5092, 5.000%, 11/01/2038 | | | 257,395 | |
| | | | FHLMC REMIC (d) | | | | |
| | 315,000 | | Series 3563, 4.000%, 08/15/2024 | | | 298,068 | |
| | 860,000 | | Series 3577, 4.000%, 09/15/2024 | | | 817,013 | |
| | 1,610,000 | | Series 3609, 4.000%, 12/15/2024 | | | 1,661,130 | |
| | 75,872 | | Series 2750, 4.000%, 05/15/2026 | | | 76,940 | |
| | | | FNMA (d) | | | | |
| | 789,125 | | Pool #931711, 4.000%, 08/01/2019 | | | 807,213 | |
| | 388,903 | | Pool #MA0174, 4.000%, 09/25/2019 | | | 397,817 | |
| | 868,286 | | Pool #MA0235, 4.000%, 11/01/2019 | | | 888,188 | |
| | 777,184 | | Pool #932108, 4.000%, 11/25/2019 | | | 794,998 | |
| | 2,870,000 | | Pool #MA0298, 4.000%, 01/01/2020 | | | 2,938,611 | |
| | 12,548 | | Pool #254711, 4.000%, 03/01/2010 | | | 12,662 | |
| | 24,727 | | Pool #255666, 5.000%, 04/01/2020 | | | 25,990 | |
| | 55,070 | | Pool #735407, 5.000%, 04/01/2020 | | | 57,951 | |
| | 108,308 | | Pool #813929, 4.500%, 11/01/2020 | | | 112,415 | |
| | 89,851 | | Pool #963138, 5.000%, 05/01/2023 | | | 93,999 | |
| | 36,039 | | Pool #256272, 5.500%, 06/01/2026 | | | 38,052 | |
| | 46,079 | | Pool #256751, 5.500%, 06/01/2027 | | | 48,631 | |
| | 59,011 | | Pool #255813, 5.000%, 08/01/2035 | | | 60,674 | |
| | 191,549 | | Pool #255898, 5.000%, 10/01/2035 | | | 196,946 | |
| | 87,896 | | Pool #891475, 6.500%, 04/01/2036 | | | 94,323 | |
| | 95,627 | | Pool #745516, 5.500%, 05/01/2036 | | | 100,448 | |
| | 32,417 | | Pool #256283, 7.000%, 06/01/2036 | | | 35,568 | |
| | 137,847 | | Pool #745875, 6.500%, 09/01/2036 | | | 147,927 | |
| | 175,548 | | Pool #745932, 6.500%, 11/01/2036 | | | 188,385 | |
| | 143,784 | | Pool #256513, 5.500%, 12/01/2036 | | | 150,786 | |
| | 122,888 | | Pool #888129, 5.500%, 02/01/2037 | | | 128,872 | |
| | 134,971 | | Pool #917810, 5.500%, 05/01/2037 | | | 141,439 | |
The accompanying notes are an integral part of these financial statements.
Frontegra Columbus Core Fund
SCHEDULE OF INVESTMENTS (continued)
December 31, 2009 (Unaudited)
��
| Principal Amount | | | | Value | |
| MORTGAGE BACKED | | | |
SECURITIES 27.3% (continued) | | | |
| $ | 239,049 | | Pool #995022, 5.500%, 08/01/2037 | | $ | 251,101 | |
| | 90,205 | | Pool #257161, 5.500%, 04/01/2038 | | | 94,527 | |
| | 122,807 | | Pool #962874, 5.000%, 05/01/2038 | | | 126,165 | |
| | | | FNMA TBA (d) | | | | |
| | 2,235,000 | | Pool #000TBA, 6.500%, 02/01/2038 | | | 2,386,560 | |
| | | | GS Mortgage Securities Corp. II | | | | |
| | 529,906 | | Series 2007-EOP, Class A1, | | | | |
| | | | 5.410%, 03/06/2020 | | | | |
| | | | (Acquired 09/17/2007 and | | | | |
| | | | 04/22/2008, Cost $521,749) (a)(b) | | | 504,038 | |
| | | | LB-UBS Commercial Mortgage Trust | | | | |
| | 580,000 | | Series 2007-C1, Class A4, | | | | |
| | | | 5.424%, 02/15/2040 | | | 480,315 | |
| | 360,000 | | Series 2007-C2, Class A3, | | | | |
| | | | 5.430%, 02/15/2040 | | | 310,964 | |
| | 113,000 | | Series 2007-C3, Class A4, | | | | |
| | | | 6.136%, 07/15/2044 (b) | | | 93,397 | |
| | | | Master Asset Securitization Trust | | | | |
| | 74,090 | | Pool # 2004-3, 4.750%, 01/25/2014 | | | 71,126 | |
| | | | Residential Accredit Loans, Inc. | | | | |
| | 258,681 | | Series 2004-QS4, Class A1, | | | | |
| | | | 4.350%, 03/25/2034 | | | 235,910 | |
| | | | Residential Asset Securitization Trust | | | | |
| | 164,371 | | Series 2003-A6, Class A1, | | | | |
| | | | 4.500%, 07/25/2033 | | | 158,090 | |
| | | | Wachovia Bank | | | | |
| | | | Commercial Mortgage Trust | | | | |
| | 298,611 | | Series 2003-C7, Class A1, | | | | |
| | | | 4.241%, 10/15/2035 | | | | |
| | | | (Acquired 12/04/2009, | | | | |
| | | | Cost $300,940) (a) | | | 300,541 | |
| | 325,000 | | Series 2006-C23, Class A4, | | | | |
| | | | 5.418%, 01/15/2045 | | | 311,313 | |
| | | | Total Mortgage Backed Securities | | | | |
| | | | (Cost $19,026,439) | | | 18,855,586 | |
| | | | | | | | |
| U.S. GOVERNMENT AGENCY ISSUES 0.1% | | | | |
| | | | GNMA | | | | |
| | 30,637 | | Pool #3840, 5.000%, 04/20/2036 | | | 31,561 | |
| | 51,454 | | Pool #3841, 5.500%, 04/20/2036 | | | 54,051 | |
| | | | | | | 85,612 | |
| | | | Total U.S. Government | | | | |
| | | | Agency Issues | | | | |
| | | | (Cost $85,801) | | | 85,612 | |
| | | | | | | | |
| U.S. TREASURY OBLIGATIONS 53.8% | | | | |
| | | | United States Treasury Bonds 4.9% | | | | |
| | 3,425,000 | | 4.500%, 08/15/2039 | | | 3,347,403 | |
| | | | | | | | |
| | | | United States Treasury Notes 45.2% | | | | |
| | 12,930,000 | | 0.875%, 05/31/2011 | | | 12,945,658 | |
| | 1,365,000 | | 1.125%, 06/30/2011 | | | 1,370,545 | |
| | 4,340,000 | | 1.125%, 01/15/2012 | | | 4,335,929 | |
| | 4,910,000 | | 2.125%, 11/30/2014 | | | 4,793,780 | |
| | 1,205,000 | | 3.125%, 10/31/2016 | | | 1,189,844 | |
| | 3,150,000 | | 2.750%, 11/30/2016 | | | 3,032,612 | |
| | 3,750,000 | | 3.375%, 11/15/2019 | | | 3,607,050 | |
| | | | | | | 31,275,418 | |
| | | | United States Treasury Strip 3.8% | | | | |
| | 10,895,000 | | Principal only, 11/15/2039 | | | 2,621,610 | |
| | | | Total U.S. Treasury Obligations | | | | |
| | | | (Cost $37,692,275) | | | 37,244,431 | |
The accompanying notes are an integral part of these financial statements.
Frontegra Columbus Core Fund
SCHEDULE OF INVESTMENTS (continued)
December 31, 2009 (Unaudited)
| Principal Amount | | | | Value | |
| SHORT TERM INVESTMENTS 9.6% | | | |
| | | Commercial Paper 9.0% | | | |
| $ | 6,240,000 | | U.S. Bank, N.A., | | | |
| | | | 0.040%, 01/04/2010 | | $ | 6,240,000 | |
| | | | | | | | |
| | | | Variable Rate Demand Notes 0.6% (c) | | | | |
| | 431,325 | | American Family Financial | | | | |
| | | | Services, Inc., 0.100% | | | 431,325 | |
| | 2,273 | | U.S. Bank, N.A., 0.000% | | | 2,273 | |
| | | | | | | 433,598 | |
| | | | | | | | |
| | | | Total Short Term Investments | | | | |
| | | | (Cost $6,673,564) | | | 6,673,598 | |
| | | | | | | | |
| | | | Total Investments 112.0% | | | | |
| | | | (Cost $77,330,205) | | | 77,467,360 | |
| | | | | | | | |
| | | | Liabilities in Excess of | | | | |
| | | | Other Assets (12.0)% | | | (8,295,909 | ) |
| | | | | | | | |
| | | | TOTAL NET ASSETS 100.0% | | $ | 69,171,451 | |
| (a) | Security exempt from registration under Rule 144A of the Securities Act of 1933. These securities may be resold in transactions exempt from registration normally to qualified institutional buyers. The total value of these securities amounted to $6,653,743 (9.6% of net assets) at December 31, 2009. |
| (c) | Variable rate demand notes are considered short-term obligations and are payable upon demand. Interest rates change periodically on specified dates. The rates listed are as of December 31, 2009. |
| (d) | Entity under conservatorship of the federal government. |
ALLOCATION OF PORTFOLIO HOLDINGS
At December 31, 2009, the allocation of portfolio holdings as a percentage of the Fund’s total net assets were:
| Asset-Backed Securities | | | 8.2 | % | U.S. Treasury Obligations | | | 53.8 | |
| Corporate Bonds | | | 13.0 | | Short-Term Investments | | | 9.6 | |
| Mortgage-Backed Securities | | | 27.3 | | Liabilities in Excess of Other Assets | | | (12.0 | ) |
| U.S. Government Agency Issues | | | 0.1 | | | | | 100.0 | % |
The accompanying notes are an integral part of these financial statements.
Frontegra Columbus Core Fund
STATEMENT OF ASSETS AND LIABILITIES
December 31, 2009 (Unaudited)
| Assets: | | | |
| Investments at value (cost $77,330,205) | | $ | 77,467,360 | |
| Interest receivable | | | 319,538 | |
| Receivable for investments sold | | | 26,554,444 | |
| Prepaid expenses and other assets | | | 22,686 | |
| Total assets | | | 104,364,028 | |
| | | | | |
| Liabilities: | | | | |
| Payable for investments purchased | | | 34,058,741 | |
| Accrued expenses | | | 30,034 | |
| Payable for fund shares purchased | | | 1,097,043 | |
| Accrued investment advisory fee | | | 6,759 | |
| Total liabilities | | | 35,192,577 | |
| Net Assets | | $ | 69,171,451 | |
| | | | | |
| Net Assets Consist of: | | | | |
| Paid in capital | | $ | 74,905,683 | |
| Undistributed net investment income | | | 155,302 | |
| Accumulated net realized loss | | | (6,026,689 | ) |
| Unrealized appreciation on investments | | | 137,155 | |
| Net Assets | | $ | 69,171,451 | |
| | | | | |
| Capital Stock, $0.01 Par Value | | | | |
| Authorized | | | 50,000,000 | |
| Issued and outstanding | | | 6,215,286 | |
| Net Asset Value, Redemption Price and Offering Price Per Share | | $ | 11.13 | |
| | | | | |
The accompanying notes are an integral part of these financial statements.
Frontegra Columbus Core Fund
STATEMENT OF OPERATIONS
| | | Six Months Ended | |
| | | December 31, 2009 | |
| | | (Unaudited) | |
| Investment Income: | | | |
| Interest income | | $ | 1,284,166 | |
| Dividend income | | | 595 | |
| Total Investment Income | | | 1,284,761 | |
| | | | | |
| Expenses: | | | | |
| Investment advisory fees (Note 3) | | | 118,546 | |
| Fund administration and accounting fees | | | 19,660 | |
| Audit fees | | | 17,497 | |
| Legal fees | | | 11,646 | |
| Federal and state registration fees | | | 11,486 | |
| Custody fees | | | 8,619 | |
| Shareholder servicing fees | | | 4,150 | |
| Directors’ fees and related expenses | | | 3,482 | |
| Reports to shareholders | | | 1,079 | |
| Compliance related expenses | | | 1,075 | |
| Other | | | 3,693 | |
| Total expenses before waiver and reimbursement | | | 200,933 | |
| Waiver and reimbursement of expenses by Adviser (Note 3) | | | (102,145 | ) |
| Net expenses | | | 98,788 | |
| Net Investment Income | | | 1,185,973 | |
| | | | | |
| Realized and Unrealized Gain (Loss) on Investments: | | | | |
| Net realized gain on: | | | | |
| Investments | | | 3,700,987 | |
| Change in net unrealized appreciation/depreciation on: | | | | |
| Investments | | | (722,953 | ) |
| Net Realized and Unrealized Gain on Investments | | | 2,978,034 | |
| Net Increase in Net Assets Resulting from Operations | | $ | 4,164,007 | |
The accompanying notes are an integral part of these financial statements.
Frontegra Columbus Core Fund
STATEMENTS OF CHANGES IN NET ASSETS
| | | For the | | | | |
| | | Six Months Ended | | | For the | |
| | | December 31, 2009 | | | Year Ended | |
| | | (Unaudited) | | | June 30, 2009 | |
| Operations: | | | | | | |
| Net investment income | | $ | 1,185,973 | | | $ | 5,509,874 | |
| Net realized gain (loss) on: | | | | | | | | |
| Investments | | | 3,700,987 | | | | (8,876,168 | ) |
| Swap contracts | | | — | | | | 71,746 | |
| Change in net unrealized appreciation/(depreciation) on: | | | | | | | | |
| Investments | | | (722,953 | ) | | | 1,302,219 | |
| Swap contracts | | | — | | | | 72,889 | |
| Net increase (decrease) in net assets resulting from operations | | | 4,164,007 | | | | (1,919,440 | ) |
| | | | | | | | | |
| Distributions Paid From: | | | | | | | | |
| Net investment income | | | (1,148,995 | ) | | | (5,468,450 | ) |
| Net realized gain | | | — | | | | — | |
| Net decrease in net assets resulting from distributions paid | | | (1,148,995 | ) | | | (5,468,450 | ) |
| | | | | | | | | |
| Capital Share Transactions: | | | | | | | | |
| Shares sold | | | 24,769,064 | | | | 14,029,124 | |
| Shares issued to holders in reinvestment of distributions | | | 1,051,839 | | | | 4,545,747 | |
| Shares redeemed | | | (10,240,727 | ) | | | (60,476,919 | ) |
| Net increase (decrease) in net assets resulting from capital share transactions | | | 15,580,176 | | | | (41,902,048 | ) |
| Total Increase (Decrease) in Net Assets | | | 18,595,188 | | | | (49,289,938 | ) |
| | | | | | | | | |
| Net Assets: | | | | | | | | |
| Beginning of Period | | | 50,576,263 | | | | 99,866,201 | |
| End of Period (includes undistributed net investment | | | | | | | | |
| income of $155,302 and $118,324 respectively) | | $ | 69,171,451 | | | $ | 50,576,263 | |
| | | | | | | | | |
| Transactions in Shares: | | | | | | | | |
| Shares sold | | | 2,209,982 | | | | 1,382,214 | |
| Shares issued to holders in reinvestment of distributions | | | 93,930 | | | | 484,314 | |
| Shares redeemed | | | (960,412 | ) | | | (6,693,940 | ) |
| Net increase in shares outstanding | | | 1,343,500 | | | | (4,827,412 | ) |
| | | | | | | | | |
The accompanying notes are an integral part of these financial statements.
Frontegra Columbus Core Fund
FINANCIAL HIGHLIGHTS
| | | Six Months | | | | | | | | | | | | | | | | |
| | | Ended | | | Year | | | Year | | | Year | | | Year | | | Year | |
| | | December 31, | | | Ended | | | Ended | | | Ended | | | Ended | | | Ended | |
| | | 2009 | | | June 30, | | | June 30, | | | June 30, | | | June 30, | | | June 30, | |
| | | (Unaudited) | | | 2009 | | | 2008 | | | 2007 | | | 2006 | | | 2005 | |
| Net Asset Value, Beginning of Period | | $ | 10.38 | | | $ | 10.30 | | | $ | 9.99 | | | $ | 9.86 | | | $ | 10.36 | | | $ | 10.22 | |
| | | | | | | | | | | | | | | | | | | | | | | | | |
| Income (Loss) from | | | | | | | | | | | | | | | | | | | | | | | | |
| Investment Operations: | | | | | | | | | | | | | | | | | | | | | | | | |
| Net investment income | | | 0.22 | | | | 0.72 | | | | 0.48 | | | | 0.48 | | | | 0.42 | | | | 0.37 | |
| Net realized and unrealized gain (loss) on investments | | | 0.75 | | | | 0.08 | | | | 0.30 | | | | 0.13 | | | | (0.43 | ) | | | 0.27 | |
| Total Income (Loss) from Investment Operations | | | 0.97 | | | | 0.80 | | | | 0.78 | | | | 0.61 | | | | (0.01 | ) | | | 0.64 | |
| | | | | | | | | | | | | | | | | | | | | | | | | |
| Less Distributions: | | | | | | | | | | | | | | | | | | | | | | | | |
| From net investment income | | | (0.22 | ) | | | (0.72 | ) | | | (0.47 | ) | | | (0.48 | ) | | | (0.43 | ) | | | (0.37 | ) |
| From net realized gain on investments | | | — | | | | — | | | | — | | | | — | | | | (0.06 | ) | | | (0.13 | ) |
| Total Distributions | | | (0.22 | ) | | | (0.72 | ) | | | (0.47 | ) | | | (0.48 | ) | | | (0.49 | ) | | | (0.50 | ) |
| | | | | | | | | | | | | | | | | | | | | | | | | |
| Net Asset Value, End of Period | | $ | 11.13 | | | $ | 10.38 | | | $ | 10.30 | | | $ | 9.99 | | | $ | 9.86 | | | $ | 10.36 | |
| Total Return | | | 9.33 | %(1) | | | 8.64 | % | | | 7.89 | % | | | 6.26 | % | | | (0.11 | )% | | | 6.32 | % |
| | | | | | | | | | | | | | | | | | | | | | | | | |
| Supplemental Data and Ratios: | | | | | | | | | | | | | | | | | | | | | | | | |
| Net assets, end of period (in thousands) | | $ | 69,171 | | | $ | 50,576 | | | $ | 99,866 | | | $ | 90,771 | | | $ | 96,887 | | | $ | 95,719 | |
| Ratio of expenses to average net assets | | | | | | | | | | | | | | | | | | | | | | | | |
| Before waivers and reimbursements | | | 0.71 | %(2) | | | 0.69 | % | | | 0.66 | % | | | 0.66 | % | | | 0.65 | % | | | 0.62 | % |
| Net of waivers and reimbursements | | | 0.35 | %(2) | | | 0.35 | % | | | 0.30 | % | | | 0.20 | % | | | 0.20 | % | | | 0.40 | % |
| Ratio of net investment income to average net assets | | | | | | | | | | | | | | | | | | | | | | | | |
| Before waivers and reimbursements | | | 3.84 | %(2) | | | 6.38 | % | | | 4.29 | % | | | 4.31 | % | | | 3.75 | % | | | 2.85 | % |
| Net of waivers and reimbursements | | | 4.20 | %(2) | | | 6.72 | % | | | 4.65 | % | | | 4.77 | % | | | 4.20 | % | | | 3.07 | % |
| Portfolio turnover rate | | | 451 | %(1) | | | 414 | % | | | 965 | % | | | 980 | % | | | 1,121 | % | | | 1,080 | % |
| | | | | | | | | | | | | | | | | | | | | | | | | |
The accompanying notes are an integral part of these financial statements.
FRONTEGRA
IRONBRIDGE
SMALL CAP FUND
FRONTEGRA
IRONBRIDGE
SMID FUND
REPORT FROM IRONBRIDGE CAPITAL
MANAGEMENT, L.P.
Dear Fellow Shareholders:
The Frontegra IronBridge Small Cap Fund strives to achieve capital appreciation by investing in a diversified portfolio of equity securities of companies with small market capitalizations. The objective is relative to, and measured against, the Russell 2000®(1) Index.
The Frontegra IronBridge SMID Fund strives to achieve capital appreciation by investing in a diversified portfolio of equity securities of companies with small and mid market capitalizations. The objective is relative to, and measured against, the Russell 2500™(2) Index.
Performance Review
For the six months ending December 31, 2009, the Frontegra IronBridge Small Cap Fund has underperformed the benchmark, returning 19.78%, net of fees, compared with the Russell 2000 Index return of 23.90% for the same period.
| Small Cap Fund Best Performers | Return | Small Cap Fund Worst Performers | Return |
| Alexandria Real Estate Equities, Inc. | 82.72% | Hansen Medical, Inc. | -37.70% |
| Tupperware Brands Corp. | 79.59% | Isis Pharmaceuticals, Inc. | -32.64% |
| Lufkin Industries, Inc. | 75.52% | Myriad Genetics, Inc. | -26.63% |
| Methanex Corp. | 61.68% | Fred’s, Inc. | -22.78% |
| Tesco Corp. | 61.41% | Stewart Information Services Corp. | -22.46% |
| Lubrizol Corp. | 56.04% | Synaptics, Inc. | -21.68% |
| American Superconductor Corp. | 55.54% | Illumina, Inc. | -21.47% |
| Unit Corp. | 53.87% | Luminex Corp. | -19.71% |
| Minerals Technologies, Inc. | 51.25% | SunPower Corp. | -11.56% |
| Exelixis, Inc. | 51.01% | Knight Capital Group, Inc. | -10.07% |
The Frontegra IronBridge SMID Fund has underperformed its benchmark, the Russell 2500 Index, for the six-month period. The Fund returned 18.19%, net of fees, versus the 26.16% return of the Russell 2500 Index.
| SMID Cap Fund Best Performers | Return | SMID Cap Fund Worst Performers | Return |
| priceline.com, Inc. | 95.10% | Hansen Medical, Inc. | -38.66% |
| Tupperware Brands Corp. | 81.14% | Isis Pharmaceuticals, Inc. | -32.81% |
| Methanex Corp. | 60.29% | Synaptics, Inc. | -21.44% |
| FMC Technologies, Inc. | 56.77% | Illumina, Inc. | -19.34% |
| American Superconductor Corp. | 56.05% | Luminex Corp. | -17.54% |
| Intuitive Surgical, Inc. | 55.73% | Tellabs, Inc. | -17.04% |
| Lubrizol Corp. | 55.25% | Jacobs Engineering Group, Inc. | -10.59% |
| F5 Networks, Inc. | 53.69% | URS Corp. | -10.46% |
| Minerals Technologies, Inc. | 51.37% | Knight Capital Group, Inc. | -10.33% |
| Informatica Corp. | 51.35% | Quanta Services, Inc. | -10.20% |
Both the Frontegra IronBridge Small Cap Fund and the Frontegra IronBridge SMID Fund underperformed their respective indices for similar reasons over the past six months. We had difficulty keeping up with the performance benchmarks in 2009 as highly leveraged, distressed businesses (those firms we refer to as “Turn Arounds”) led the market, increasing 72% compared to 27% for the broader Russell 2000 Index. Even though we owned such companies as part of our risk controls, we did not own the “extremely” leveraged distressed firms, which proved to be a sizeable headwind. Adding insult to injury, the extreme leverage factor was amplified in the latter part of the calendar year when the Russell 2000 Index
_______________
| (1) | Russell 2000® Index is either a registered trademark or tradename of Russell Investment Group in the U.S. and/or other countries. Indexes are unmanaged and cannot be invested in directly. |
| (2) | Russell 2500™ Index is either a registered trademark or tradename of Russell Investment Group in the U.S. and/or other countries. Indexes are unmanaged and cannot be invested in directly. |
and Russell 2500 Index rebalanced, and the composition of distressed businesses significantly increased. At IronBridge Capital Management, one factor we do not diversify is “extreme” leverage, and that is because good stewards of capital, those who create shareholder value, rarely find themselves levered over 50% debt to capital. To own such companies would violate our investment discipline.
We are unhappy to have underperformed the benchmark last year, but are “in the game” and think we are well positioned as the excess benefit to extremely leveraged firms is set to moderate when credit spreads approach normalized levels. Importantly, we think our investment results this year are consistent with our stated discipline and believe performance was good enough to stay “in the game” in a year that was anticipated to be challenging for us. We hope that our clients understand that due to very rare and unique circumstances, solid stock selection was unable to overcome some very powerful near-term temporary factors that significantly benefitted those companies least associated with long-term wealth creation. In the long term, we know that focusing on businesses that create shareholder value, run by managers who are good stewards of capital, results in positive returns for clients.
Portfolio Outlook
We believe markets are in a period of transition. The transition out of the leveraged wealth transfer decade to a new period of wealth creation may not be smooth. Before we enter a new age of wealth creation, countries of the developed world will have to eventually deal with the extraordinary debts they have assumed. We suspect that the next several years may be more volatile and that finding the middle of the goal posts (neutralizing the portfolio to wider and less certain market outcomes between inflation and deflation) could be more challenging. That is because in periods of higher volatility, portfolio factors (oil price, commodity prices, credit spreads, government intervention, exchange rates, etc.) may become much bigger drivers of short-term relative performance going forward.
Portfolio performance in 2009 emphasized the point where the portfolio factor of “extreme leverage” overwhelmed good stock selection. However, from July 2007 through July 2008, when credit spreads widened, the portfolio factor “extreme leverage” enhanced our performance. During this rare and unique period, we outperformed our benchmark by over 1,000 basis points, which is an unusually high level of excess return. Over that period, we pointed out to our clients that we were “good, but not that good.” At the time, we did not fully understand the tailwind that the factor of “extreme leverage” was providing the portfolio going into the credit crisis. Now, we do, because at IronBridge we are committed to utilizing our unique perspective about wealth creation, valuation, and risk control to continually learn and gain additional insights into how to capture excess return for our clients.
We want to be very clear. We are in no way saying that the potential for greater volatility among the various portfolio factors will make it more difficult to outperform, but rather, saying it may impact the magnitude of outperformance and underperformance during this transition phase of the market. We will adapt by prudently applying our risk controls. We expect factor volatility to moderate after the market adjusts to the new rules, regulations, tax regime, and quantitative easing exit strategy that are likely to be thrust upon investors over the next few years.
Our long-term strategy never wavers. We will continue to seek to invest in highly skilled managements that are doing the right thing to create shareholder value and invest in them when they are priced at attractive risk/reward levels. We are optimistic that we are transitioning out of the decade of leveraged wealth transfer that produced little in the way of returns to equity investors to a new era of pro-wealth creation globally that may be much kinder to investors in equities. However, the transition phase may be punctuated with above average “factor” volatility as markets rebalance production and consumption globally, and adjust to the new rules, regulations, tax regimes, and monetary policy.
Thank you for your continued support.
 |  |
| Christopher C. Faber | Jeffrey B. Madden |
| IronBridge Capital Management, L.P. | IronBridge Capital Management, L.P. |
INVESTMENT HIGHLIGHTS
Growth of a $100,000 Investment (Unaudited)
* 8/30/02 commencement of operations.
| | Portfolio Total Return** | | | |
| | FOR PERIODS ENDED 12/31/09 | FUND | INDEX | |
| | | | | |
| | SIX MONTHS | 19.78% | 23.90% | |
| | | | | |
| | ONE YEAR | 24.53% | 27.17% | |
| | | | | |
| | FIVE YEAR | | | |
| | AVERAGE ANNUAL | 2.38% | 0.51% | |
| | | | | |
| | SINCE COMMENCEMENT | | | |
| | AVERAGE ANNUAL | 10.21% | 8.02% | |
This chart assumes an initial gross investment of $100,000 made on 8/30/02 (commencement of operations). Returns shown include the reinvestment of all distributions. Past performance is not predictive of future results. Investment return and principal value will fluctuate so that shares, when redeemed, may be worth more or less than the original cost. To receive current to the most recent month-end performance, please call 1-888-825-2100.
The Russell 2000 Index measures the performance of the 2,000 smallest companies in the Russell 3000 Index. The Russell 3000 Index measures the performance of the 3,000 largest U.S. companies based on total market capitalization. The Index does not reflect investment management fees, brokerage commissions and other expenses associated with investing in equity securities. A direct investment in the index is not possible.
| ** | The returns shown do not reflect the deduction of taxes that a shareholder would pay on Fund distributions or the redemption of Fund shares. |
Frontegra IronBridge Small Cap Fund
SCHEDULE OF INVESTMENTS
December 31, 2009 (Unaudited)
| Number of Shares | | | | Value | |
| COMMON STOCKS 95.3% | | | |
| | | Aerospace & Defense 3.1% | | | |
| | 81,943 | | Esterline Technologies Corp. (a) | | $ | 3,340,816 | |
| | 134,753 | | Moog Inc. - Class A (a) | | | 3,938,830 | |
| | 125,551 | | Orbital Sciences Corp. (a) | | | 1,915,908 | |
| | 58,147 | | Triumph Group, Inc. | | | 2,805,593 | |
| | | | | | | 12,001,147 | |
| | | | Apparel Retail 0.7% | | | | |
| | 100,230 | | The Buckle, Inc. | | | 2,934,734 | |
| | | | | | | | |
| | | | Auto Components 0.5% | | | | |
| | 122,761 | | Superior Industries | | | | |
| | | | International, Inc. | | | 1,878,243 | |
| | | | | | | | |
| | | | Biotechnology 4.2% | | | | |
| | 169,547 | | Cepheid, Inc. (a) | | | 2,115,947 | |
| | 366,926 | | Exelixis, Inc. (a) | | | 2,704,245 | |
| | 164,173 | | Isis Pharmaceuticals, Inc. (a) | | | 1,822,320 | |
| | 180,548 | | Luminex Corp. (a) | | | 2,695,582 | |
| | 73,569 | | Metabolix, Inc. (a) | | | 814,409 | |
| | 59,400 | | Myriad Genetics, Inc. (a) | | | 1,550,340 | |
| | 63,541 | | Onyx Pharmaceuticals, Inc. (a) | | | 1,864,293 | |
| | 43,773 | | Techne Corp. | | | 3,001,077 | |
| | | | | | | 16,568,213 | |
| | | | Building Products 1.5% | | | | |
| | 224,568 | | Apogee Enterprises, Inc. | | | 3,143,952 | |
| | 73,903 | | Universal Forest Products, Inc. | | | 2,720,369 | |
| | | | | | | 5,864,321 | |
| | | | Capital Markets 3.1% | | | | |
| | 161,489 | | Jefferies Group, Inc. (a) | | | 3,832,134 | |
| | 253,687 | | Knight Capital Group, | | | | |
| | | | Inc. - Class A (a) | | | 3,906,780 | |
| | 22,543 | | optionsXpress Holdings, Inc. | | | 348,289 | |
| | 34,210 | | Stifel Financial Corp. (a) | | | 2,026,600 | |
| | 64,709 | | Waddell & Reed Financial, Inc. | | | 1,976,213 | |
| | | | | | | 12,090,016 | |
| | | | Chemicals 5.1% | | | | |
| | 65,897 | | Arch Chemicals, Inc. | | | 2,034,899 | |
| | 88,494 | | Cabot Corp. | | | 2,321,198 | |
| | 116,409 | | FMC Corp. | | | 6,490,966 | |
| | 52,930 | | Lubrizol Corp. | | | 3,861,243 | |
| | 155,255 | | Methanex Corp. (b) | | | 3,025,920 | |
| | 38,671 | | Minerals Technologies, Inc. | | | 2,106,409 | |
| | | | | | | 19,840,635 | |
| | | | Commercial Banks 4.0% | | | | |
| | 124,852 | | Columbia Banking System, Inc. | | | 2,020,105 | |
| | 117,416 | | Cullen/Frost Bankers, Inc. | | | 5,870,800 | |
| | 66,886 | | Glacier Bancorp, Inc. | | | 917,676 | |
| | 52,463 | | IBERIABANK Corp. | | | 2,823,034 | |
| | 143,966 | | TCF Financial Corp. | | | 1,960,817 | |
| | 35,635 | | Westamerica Bancorporation | | | 1,973,110 | |
| | | | | | | 15,565,542 | |
| | | | Commercial Services & Supplies 1.8% | | | | |
| | 44,574 | | PICO Holdings, Inc. (a) | | | 1,458,907 | |
| | 12,740 | | Strayer Education, Inc. | | | 2,707,123 | |
| | 104,477 | | Tetra Tech, Inc. (a) | | | 2,838,640 | |
| | | | | | | 7,004,670 | |
| | | | Communications Equipment 1.9% | | | | |
| | 71,395 | | Polycom, Inc. (a) | | | 1,782,733 | |
| | 357,285 | | Tekelec (a) | | | 5,459,315 | |
| | | | | | | 7,242,048 | |
| | | | Computers & Peripherals 1.2% | | | | |
| | 151,377 | | Synaptics, Inc. (a) | | | 4,639,705 | |
| | | | | | | | |
| | | | Construction & Engineering 1.5% | | | | |
| | 98,980 | | Insituform Technologies, Inc. (a) | | | 2,248,826 | |
| | 295,665 | | MasTec, Inc. (a) | | | 3,695,813 | |
| | | | | | | 5,944,639 | |
| | | | Consumer Electronics 0.7% | | | | |
| | 109,908 | | Universal Electronics, Inc. (a) | | | 2,552,064 | |
| | | | Distributors 0.7% | | | | |
| | 89,152 | | Wausau Paper Corp. | | | 1,034,163 | |
The accompanying notes are an integral part of these financial statements.
Frontegra IronBridge Small Cap Fund
SCHEDULE OF INVESTMENTS (continued)
December 31, 2009 (Unaudited)
| Number of Shares | | | | Value | |
COMMON STOCKS 95.3% (continued) | | | |
| | | Distributors 0.7% (continued) | | | |
| | 70,223 | | WESCO International, Inc. (a) | | $ | 1,896,723 | |
| | | | | | | 2,930,886 | |
| | | | Diversified Financial Services 0.7% | | | | |
| | 30,343 | | Financial Federal Corp. | | | 834,433 | |
| | 67,859 | | GATX Corp. | | | 1,950,946 | |
| | | | | | | 2,785,379 | |
| | | | Electric Utilities 2.2% | | | | |
| | 206,778 | | Black Hills Corp. | | | 5,506,498 | |
| | 62,455 | | ITC Holdings Corp. | | | 3,253,281 | |
| | | | | | | 8,759,779 | |
| | | | Electrical Equipment 1.8% | | | | |
| | 55,628 | | American Superconductor Corp. (a) | | | 2,275,185 | |
| | 131,818 | | Thomas & Betts Corp. (a) | | | 4,717,766 | |
| | | | | | | 6,992,951 | |
| | | | Electronic Equipment | | | | |
| | | | & Instruments 6.4% | | | | |
| | 261,404 | | Daktronics, Inc. | | | 2,407,531 | |
| | 28,380 | | Dionex Corp. (a) | | | 2,096,431 | |
| | 178,196 | | FLIR Systems, Inc. (a) | | | 5,830,573 | |
| | 29,500 | | Itron, Inc. (a) | | | 1,993,315 | |
| | 188,539 | | National Instruments Corp. | | | 5,552,473 | |
| | 84,355 | | Rofin-Sinar Technologies, Inc. (a) | | | 1,991,621 | |
| | 110,344 | | ScanSource, Inc. (a) | | | 2,946,185 | |
| | 79,715 | | Trimble Navigation Ltd. (a) | | | 2,008,818 | |
| | | | | | | 24,826,947 | |
| | | | Energy Equipment & Services 3.2% | | | | |
| | 52,118 | | Atwood Oceanics, Inc. (a) | | | 1,868,430 | |
| | 37,314 | | Lufkin Industries, Inc. | | | 2,731,385 | |
| | 66,904 | | Oceaneering International, Inc. (a) | | | 3,915,222 | |
| | 93,440 | | Unit Corp. (a) | | | 3,971,200 | |
| | | | | | | 12,486,237 | |
| | | | Food Products 1.7% | | | | |
| | 157,054 | | Corn Products International, Inc. | | | 4,590,688 | |
| | 84,189 | | Flowers Foods, Inc. | | | 2,000,331 | |
| | | | | | | 6,591,019 | |
| | | | Gas Utilities 3.2% | | | | |
| | 105,088 | | AGL Resources, Inc. | | | 3,832,559 | |
| | 180,831 | | Southern Union Co. | | | 4,104,864 | |
| | 191,705 | | UGI Corp. | | | 4,637,344 | |
| | | | | | | 12,574,767 | |
| | | | General Merchandise 1.5% | | | | |
| | 91,690 | | Casey’s General Stores, Inc. | | | 2,926,745 | |
| | 284,991 | | Fred’s, Inc. - Class A | | | 2,906,908 | |
| | | | | | | 5,833,653 | |
| | | | Health Care Equipment & Supplies 2.9% | | | | |
| | 67,001 | | Gen-Probe, Inc. (a) | | | 2,874,343 | |
| | 234,046 | | Hansen Medical, Inc. (a) | | | 709,159 | |
| | 37,779 | | IDEXX Laboratories, Inc. (a) | | | 2,018,910 | |
| | 96,353 | | Illumina, Inc. (a) | | | 2,953,219 | |
| | 98,394 | | ZOLL Medical Corp. (a) | | | 2,629,088 | |
| | | | | | | 11,184,719 | |
| | | | Health Care Providers & Services 2.8% | | | | |
| | 46,419 | | Cerner Corp. (a) | | | 3,826,782 | |
| | 161,667 | | Owens & Minor, Inc. | | | 6,940,364 | |
| | | | | | | 10,767,146 | |
| | | | Hotels, Restaurants & Leisure 1.0% | | | | |
| | 93,659 | | WMS Industries, Inc. (a) | | | 3,746,360 | |
| | | | | | | | |
| | | | Household Durables 2.8% | | | | |
| | 162,809 | | AptarGroup, Inc. | | | 5,818,794 | |
| | 53,608 | | Snap-On, Inc. | | | 2,265,474 | |
| | 58,515 | | Tupperware Brands Corp. | | | 2,725,044 | |
| | | | | | | 10,809,312 | |
| | | | Industrial Conglomerates 2.6% | | | | |
| | 28,467 | | Alleghany Corp. (a) | | | 7,856,892 | |
| | 70,668 | | Raven Industries, Inc. | | | 2,245,122 | |
| | | | | | | 10,102,014 | |
| | | | Insurance 3.6% | | | | |
| | 270,783 | | American Financial Group, Inc. | | | 6,756,036 | |
| | 131,418 | | Argo Group International | | | | |
| | | | Holdings Ltd. (a)(b) | | | 3,829,520 | |
| | 35,275 | | RLI Corp. | | | 1,878,394 | |
The accompanying notes are an integral part of these financial statements.
Frontegra IronBridge Small Cap Fund
SCHEDULE OF INVESTMENTS (continued)
December 31, 2009 (Unaudited)
| Number of Shares | | | | Value | |
COMMON STOCKS 95.3% (continued) | | | |
| | | Insurance 3.6% (continued) | | | |
| | 158,171 | | Stewart Information Services Corp. | | $ | 1,784,169 | |
| | | | | | | 14,248,119 | |
| | | | Internet & Catalog Retail 0.7% | | | | |
| | 53,137 | | Netflix, Inc. (a) | | | 2,929,974 | |
| | | | | | | | |
| | | | Leisure Equipment & Products 0.8% | | | | |
| | 397,712 | | Callaway Golf Co. | | | 2,998,748 | |
| | | | | | | | |
| | | | Machinery 3.3% | | | | |
| | 122,236 | | Astec Industries, Inc. (a) | | | 3,293,038 | |
| | 65,735 | | IDEX Corp. | | | 2,047,645 | |
| | 58,043 | | Kaydon Corp. | | | 2,075,618 | |
| | 38,948 | | Lincoln Electric Holdings, Inc. | | | 2,082,160 | |
| | 44,768 | | Valmont Industries, Inc. | | | 3,512,050 | |
| | | | | | | 13,010,511 | |
| | | | Marine 1.4% | | | | |
| | 162,163 | | Alexander & Baldwin, Inc. | | | 5,550,840 | |
| | | | | | | | |
| | | | Metals & Mining 1.7% | | | | |
| | 96,799 | | Carpenter Technology Corp. | | | 2,608,733 | |
| | 253,892 | | Graftech International Ltd. (a) | | | 3,948,021 | |
| | | | | | | 6,556,754 | |
| | | | Multiline Retail 0.8% | | | | |
| | 107,170 | | Big Lots, Inc. (a) | | | 3,105,787 | |
| | | | | | | | |
| | | | Multi-Utilities & | | | | |
| | | | Unregulated Power 1.5% | | | | |
| | 270,970 | | Avista Corp. | | | 5,850,242 | |
| | | | | | | | |
| | | | Oil & Gas 2.3% | | | | |
| | 106,943 | | Cabot Oil & Gas Corp. | | | 4,661,646 | |
| | 83,581 | | Swift Energy Co. (a) | | | 2,002,601 | |
| | 179,978 | | Tesco Corp. (a)(b) | | | 2,323,516 | |
| | | | | | | 8,987,763 | |
| | | | Real Estate 5.4% | | | | |
| | 51,760 | | Alexandria Real | | | | |
| | | | Estate Equities, Inc. | | | 3,327,651 | |
| | 153,440 | | Corporate Office Properties Trust | | | 5,620,507 | |
| | 150,411 | | Mid-America Apartment | | | | |
| | | | Communities, Inc. | | | 7,261,843 | |
| | 60,890 | | Potlatch Corp. | | | 1,941,173 | |
| | 99,034 | | The St. Joe Co. (a) | | | 2,861,092 | |
| | | | | | | 21,012,266 | |
| | | | Semiconductor & | | | | |
| | | | Semiconductor Equipment 3.4% | | | | |
| | 397,072 | | Cypress Semiconductor Corp. (a) | | | 4,193,080 | |
| | 160,821 | | Semtech Corp. (a) | | | 2,735,565 | |
| | 136,380 | | Skyworks Solutions, Inc. (a) | | | 1,935,232 | |
| | 112,771 | | Standard Microsystems Corp. (a) | | | 2,343,382 | |
| | 58,585 | | Varian Semiconductor | | | | |
| | | | Equipment Associates, Inc. (a) | | | 2,102,030 | |
| | | | | | | 13,309,289 | |
| | | | Software 3.3% | | | | |
| | 81,920 | | ANSYS, Inc. (a) | | | 3,560,243 | |
| | 98,677 | | Informatica Corp. (a) | | | 2,551,788 | |
| | 110,827 | | Jack Henry & Associates, Inc. | | | 2,562,320 | |
| | 135,218 | | Parametric Technology Corp. (a) | | | 2,209,462 | |
| | 48,060 | | Sybase, Inc. (a) | | | 2,085,804 | |
| | | | | | | 12,969,617 | |
| | | | Specialty Retail 1.5% | | | | |
| | 109,265 | | Tractor Supply Co. (a) | | | 5,786,674 | |
| | | | | | | | |
| | | | Telephone Communications 0.7% | | | | |
| | 283,481 | | TeleCommunication | | | | |
| | | | Systems, Inc. (a) | | | 2,744,096 | |
| | | | | | | | |
| | | | Textiles, Apparel & Luxury Goods 1.0% | | | | |
| | 150,798 | | Wolverine World Wide, Inc. | | | 4,104,722 | |
| | | | | | | | |
| | | | Thrifts & Mortgage Finance 1.1% | | | | |
| | 216,882 | | Provident Financial Services, Inc. | | | 2,309,793 | |
The accompanying notes are an integral part of these financial statements.
Frontegra IronBridge Small Cap Fund
SCHEDULE OF INVESTMENTS (continued)
December 31, 2009 (Unaudited)
| Number of Shares | | | | Value | |
COMMON STOCKS 95.3% (continued) | | | |
| | | Thrifts & Mortgage | | | |
| | | Finance 1.1% (continued) | | | |
| | 100,470 | | Washington Federal, Inc. | | $ | 1,943,090 | |
| | | | | | | 4,252,883 | |
| | | | Total Common Stocks | | | | |
| | | | (Cost $333,836,654) | | | 371,935,431 | |
| | | | | | | | |
| EXCHANGE TRADED FUNDS 1.9% | | | | |
| | 117,349 | | iShares Russell 2000 Index Fund | | | 7,306,148 | |
| | | | Total Exchange Traded Funds | | | | |
| | | | (Cost $5,383,263) | | | 7,306,148 | |
| Principal Amount | | | | | | |
| SHORT TERM INVESTMENTS 3.3% | | | | |
| | | | Commercial Paper 3.3% | | | | |
| $ | 12,720,000 | | U.S. Bank, N.A., | | | | |
| | | | 0.040%, 01/04/2010 | | | 12,720,000 | |
| | | | | | | | |
| | | | Variable Rate Demand Notes (c) 0.0% | | | | |
| | 14,063 | | U.S. Bank, N.A., 0.000% | | | 14,063 | |
| | | | Total Short-Term Investments | | | | |
| | | | (Cost $12,733,992) | | | 12,734,063 | |
| | | | | | | | |
| | | | Total Investments 100.5% | | | | |
| | | | (Cost $351,953,909) | | | 391,975,642 | |
| | | | | | | | |
| | | | Liabilities in Excess of | | | | |
| | | | Other Assets (0.5)% | | | (1,919,083 | ) |
| | | | | | | | |
| | | | TOTAL NET ASSETS 100.0% | | $ | 390,056,559 | |
| (b) | U.S.-dollar denominated security of foreign issuer. |
| (c) | Variable rate demand notes are considered short-term obligations and are payable upon demand. Interest rates change periodically on specified dates. The rates listed are as of December 31, 2009. |
ALLOCATION OF PORTFOLIO HOLDINGS
At December 31, 2009, the allocation of portfolio holdings as a percentage of the Fund’s total net assets were:
| Common Stock | | | 95.3 | % |
| Exchange Traded Funds | | | 1.9 | |
| Short-Term Investments | | | 3.3 | |
| Liabilities in Excess of Other Assets | | | (0.5 | ) |
| | | | 100.0 | % |
The accompanying notes are an integral part of these financial statements.
Frontegra IronBridge Small Cap Fund
STATEMENT OF ASSETS AND LIABILITIES
December 31, 2009 (Unaudited)
| Assets: | | | |
| Investments at value (cost $351,953,909) | | $ | 391,975,642 | |
| Interest receivable | | | 365,219 | |
| Receivable for Fund shares sold | | | 147,832 | |
| Receivable for investments sold | | | 10,306,135 | |
| Prepaid expenses and other assets | | | 34,609 | |
| Total assets | | | 402,829,437 | |
| | | | | |
| Liabilities: | | | | |
| Payable for investments purchased | | | 12,372,424 | |
| Payable for Fund shares purchased | | | 33,110 | |
| Accrued investment advisory fee | | | 323,017 | |
| Accrued expenses | | | 44,327 | |
| Total liabilities | | | 12,772,878 | |
| Net Assets | | $ | 390,056,559 | |
| | | | | |
| Net Assets Consist of: | | | | |
| Paid in capital | | $ | 395,666,584 | |
| Undistributed net investment income | | | 709,749 | |
| Accumulated net realized loss | | | (46,341,507 | ) |
| Unrealized appreciation on investments | | | 40,021,733 | |
| Net Assets | | $ | 390,056,559 | |
| | | | | |
| Capital Stock, $0.01 Par Value | | | | |
| Authorized | | | 50,000,000 | |
| Issued and outstanding | | | 27,677,554 | |
| Net Asset Value, Redemption Price and Offering Price Per Share | | $ | 14.09 | |
The accompanying notes are an integral part of these financial statements.
Frontegra IronBridge Small Cap Fund
STATEMENT OF OPERATIONS
| | | Six Months Ended | |
| | | December 31, 2009 | |
| | | (Unaudited) | |
| Investment Income: | | | |
Dividend income(1) | | $ | 2,445,997 | |
| Interest income | | | 161,459 | |
| Total Investment Income | | | 2,607,456 | |
| | | | | |
| Expenses: | | | | |
| Investment advisory fees (Note 3) | | | 1,765,685 | |
| Fund administration and accounting fees | | | 38,894 | |
| Audit fees | | | 17,249 | |
| Federal and state registration fees | | | 15,322 | |
| Legal fees | | | 14,880 | |
| Shareholder servicing fees | | | 13,749 | |
| Custody fees | | | 12,035 | |
| Reports to shareholders | | | 8,275 | |
| Directors’ fees and related expenses | | | 3,932 | |
| Compliance related expenses | | | 1,075 | |
| Other | | | 6,611 | |
| Total expenses | | | 1,897,707 | |
| Net Investment Income | | | 709,749 | |
| | | | | |
| Realized and Unrealized Gain on Investments: | | | | |
| Net realized gain on: | | | | |
| Investments | | | 4,602,765 | |
| Change in net unrealized appreciation/(depreciation) on: | | | | |
| Investments | | | 54,700,925 | |
| Net Realized and Unrealized Gain on Investments | | | 59,303,690 | |
| Net Increase in Net Assets Resulting from Operations | | $ | 60,013,439 | |
| | | | | |
| (1) | Net of $8,151 in foreign withholding taxes. |
The accompanying notes are an integral part of these financial statements.
Frontegra IronBridge Small Cap Fund
STATEMENTS OF CHANGES IN NET ASSETS
| | | For the | | | | |
| | | Six Months Ended | | | For the Year | |
| | | December 31, 2009 | | | Ended | |
| | | (Unaudited) | | | June 30, 2009 | |
| Operations: | | | | | | |
| Net investment income | | $ | 709,749 | | | $ | 1,213,981 | |
| Net realized gain (loss) on investments | | | 4,602,765 | | | | (50,963,550 | ) |
| Change in net unrealized appreciation/(depreciation) on investments | | | 54,700,925 | | | | (50,588,011 | ) |
| Net increase/(decrease) in net assets resulting from operations | | | 60,013,439 | | | | (100,337,580 | ) |
| Distributions Paid From: | | | | | | | | |
| Net investment income | | | (1,187,053 | ) | | | (189,366 | ) |
| Net realized gain | | | — | | | | (16,024,635 | ) |
| Net decrease in net assets resulting from distributions paid | | | (1,187,053 | ) | | | (16,214,001 | ) |
| Capital Share Transactions: | | | | | | | | |
| Shares sold | | | 49,067,941 | | | | 54,279,666 | |
| Shares issued to holders in reinvestment of distributions | | | 1,116,870 | | | | 15,455,049 | |
| Shares redeemed | | | (15,399,330 | ) | | | (56,770,624 | ) |
| Net increase in net assets resulting from capital share transactions | | | 34,785,481 | | | | 12,964,091 | |
| Total Increase (Decrease) in Net Assets | | | 93,611,867 | | | | (103,587,490 | ) |
| Net Assets: | | | | | | | | |
| Beginning of Period | | | 296,444,692 | | | | 400,032,182 | |
| End of Period (includes undistributed net investment | | | | | | | | |
| income of $709,749 and $1,187,053 respectively) | | $ | 390,056,559 | | | $ | 296,444,692 | |
| Transactions in Shares: | | | | | | | | |
| Shares sold | | | 3,643,492 | | | | 4,728,426 | |
| Shares issued to holders in reinvestment of distributions | | | 80,991 | | | | 1,412,710 | |
| Shares redeemed | | | (1,158,803 | ) | | | (4,512,723 | ) |
| Net increase in shares outstanding | | | 2,565,680 | | | | 1,628,413 | |
| | | | | | | | | |
The accompanying notes are an integral part of these financial statements.
Frontegra IronBridge Small Cap Fund
FINANCIAL HIGHLIGHTS
| | | Six Months | | | | | | | | | | | | | | | | |
| | | Ended | | | Year | | | Year | | | Year | | | Year | | | Year | |
| | | December 31, | | | Ended | | | Ended | | | Ended | | | Ended | | | Ended | |
| | | 2009 | | | June 30, | | | June 30, | | | June 30, | | | June 30, | | | June 30, | |
| | | (Unaudited) | | | 2009 | | | 2008 | | | 2007 | | | 2006 | | | 2005 | |
| Net Asset Value, Beginning of Period | | $ | 11.80 | | | $ | 17.03 | | | $ | 20.35 | | | $ | 18.25 | | | $ | 16.14 | | | $ | 15.83 | |
| | | | | | | | | | | | | | | | | | | | | | | | | |
| Income (Loss) from | | | | | | | | | | | | | | | | | | | | | | | | |
| Investment Operations: | | | | | | | | | | | | | | | | | | | | | | | | |
| Net investment income (loss) | | | 0.02 | | | | 0.05 | | | | 0.02 | | | | — | | | | 0.03 | | | | (0.03 | ) |
| Net realized and unrealized gain (loss) on investments | | | 2.31 | | | | (4.53 | ) | | | (1.16 | ) | | | 3.82 | | | | 2.25 | | | | 1.38 | |
| Total Income (Loss) from Investment Operations | | | 2.33 | | | | (4.48 | ) | | | (1.14 | ) | | | 3.82 | | | | 2.28 | | | | 1.35 | |
| | | | | | | | | | | | | | | | | | | | | | | | | |
| Less Distributions: | | | | | | | | | | | | | | | | | | | | | | | | |
| From net investment income | | | (0.04 | ) | | | (0.01 | ) | | | (0.01 | ) | | | (0.02 | ) | | | — | | | | — | |
| From net realized gain on investments | | | — | | | | (0.74 | ) | | | (2.17 | ) | | | (1.70 | ) | | | (0.17 | ) | | | (1.04 | ) |
| Total Distributions | | | (0.04 | ) | | | (0.75 | ) | | | (2.18 | ) | | | (1.72 | ) | | | (0.17 | ) | | | (1.04 | ) |
| | | | | | | | | | | | | | | | | | | | | | | | | |
| Net Asset Value, End of Period | | $ | 14.09 | | | $ | 11.80 | | | $ | 17.03 | | | $ | 20.35 | | | $ | 18.25 | | | $ | 16.14 | |
| Total Return | | | 19.78 | %(1) | | | (26.00 | )% | | | (6.07 | )% | | | 22.11 | % | | | 14.20 | % | | | 8.47 | % |
| | | | | | | | | | | | | | | | | | | | | | | | | |
| Supplemental Data and Ratios: | | | | | | | | | | | | | | | | | | | | | | | | |
| Net assets, end of period (in thousands) | | $ | 390,056 | | | $ | 296,445 | | | $ | 400,032 | | | $ | 432,403 | | | $ | 404,219 | | | $ | 319,081 | |
| Ratio of expenses to average net assets | | | | | | | | | | | | | | | | | | | | | | | | |
| Before waivers and reimbursements | | | 1.07 | %(2) | | | 1.09 | % | | | 1.07 | % | | | 1.07 | % | | | 1.08 | % | | | 1.11 | % |
| Net of waivers and reimbursements | | | 1.07 | %(2) | | | 1.09 | % | | | 1.08 | % | | | 1.10 | % | | | 1.10 | % | | | 1.10 | % |
| Ratio of net investment income (loss) to average net assets | | | | | | | | | | | | | | | | | | | | | | | | |
| Before waivers and reimbursements | | | 0.40 | %(2) | | | 0.40 | % | | | 0.10 | % | | | (0.01 | )% | | | 0.17 | % | | | (0.28 | )% |
| Net of waivers and reimbursements | | | 0.40 | %(2) | | | 0.40 | % | | | 0.09 | % | | | (0.08 | )% | | | 0.15 | % | | | (0.27 | )% |
| Portfolio turnover rate | | | 17 | %(1) | | | 39 | % | | | 53 | % | | | 34 | % | | | 60 | % | | | 56 | % |
| | | | | | | | | | | | | | | | | | | | | | | | | |
The accompanying notes are an integral part of these financial statements.
INVESTMENT HIGHLIGHTS
Growth of a $100,000 Investment (Unaudited)
* 12/31/04 commencement of operations.
| | Portfolio Total Return** | | | |
| | FOR PERIODS ENDED 12/31/09 | FUND | INDEX | |
| | | | | |
| | SIX MONTHS | 18.19% | 26.16% | |
| | | | | |
| | ONE YEAR | 26.48% | 34.39% | |
| | | | | |
| | FIVE YEAR | | | |
| | AVERAGE ANNUAL | 1.95% | 1.58% | |
| | | | | |
| | SINCE COMMENCEMENT | | | |
| | AVERAGE ANNUAL | 1.95% | 1.58% | |
| | | | | |
This chart assumes an initial gross investment of $100,000 made on 12/31/04 (commencement of operations). Returns shown include the reinvestment of all distributions. Past performance is not predictive of future results. Investment return and principal value will fluctuate so that shares, when redeemed, may be worth more or less than the original cost. In the absence of existing fee waivers, total return would be reduced. To receive current to the most recent month-end performance, please call 1-888-825-2100.
The Russell 2500 Index measures the performance of the 2,500 smallest companies in the Russell 3000 Index. The Russell 3000 Index measures the performance of the 3,000 largest U.S. companies based on total market capitalization. The Index does not reflect investment management fees, brokerage commissions and other expenses associated with investing in equity securities. A direct investment in the index is not possible.
| ** | The returns shown do not reflect the deduction of taxes that a shareholder would pay on Fund distributions or the redemption of Fund shares. |
Frontegra IronBridge SMID Fund
SCHEDULE OF INVESTMENTS
December 31, 2009 (Unaudited)
| Number of Shares | | | | Value | |
| COMMON STOCKS 95.2% | | | |
| | | Aerospace & Defense 2.2% | | | |
| | 81,458 | | Esterline Technologies Corp. (a) | | $ | 3,321,043 | |
| | 62,540 | | Parker Hannifin Corp. | | | 3,369,655 | |
| | 80,444 | | Teledyne Technologies, Inc. (a) | | | 3,085,832 | |
| | | | | | | 9,776,530 | |
| | | | Apparel Retail 0.8% | | | | |
| | 122,078 | | The Buckle, Inc. | | | 3,574,444 | |
| | | | | | | | |
| | | | Biotechnology 4.6% | | | | |
| | 75,217 | | Alexion Pharmaceuticals, Inc. (a) | | | 3,672,094 | |
| | 220,215 | | Cepheid, Inc. (a) | | | 2,748,283 | |
| | 224,492 | | Isis Pharmaceuticals, Inc. (a) | | | 2,491,861 | |
| | 169,156 | | Luminex Corp. (a) | | | 2,525,499 | |
| | 100,366 | | Onyx Pharmaceuticals, Inc. (a) | | | 2,944,738 | |
| | 45,631 | | Techne Corp. | | | 3,128,461 | |
| | 84,762 | | Watson Pharmaceuticals, Inc. (a) | | | 3,357,423 | |
| | | | | | | 20,868,359 | |
| | | | Capital Markets 2.4% | | | | |
| | 44,375 | | Greenhill & Co., Inc. | | | 3,560,650 | |
| | 203,254 | | Knight Capital Group, | | | | |
| | | | Inc. - Class A (a) | | | 3,130,112 | |
| | 129,585 | | Waddell & Reed Financial, Inc. | | | 3,957,526 | |
| | | | | | | 10,648,288 | |
| | | | Chemicals 6.6% | | | | |
| | 122,484 | | Albemarle Corp. | | | 4,454,743 | |
| | 169,403 | | Cabot Corp. | | | 4,443,441 | |
| | 172,672 | | Calgon Carbon Corp. (a) | | | 2,400,141 | |
| | 139,356 | | FMC Corp. | | | 7,770,491 | |
| | 60,897 | | Lubrizol Corp. | | | 4,442,436 | |
| | 187,139 | | Methanex Corp. (b) | | | 3,647,339 | |
| | 45,571 | | Minerals Technologies, Inc. | | | 2,482,252 | |
| | | | | | | 29,640,843 | |
| | | | Commercial Banks 2.4% | | | | |
| | 148,433 | | Cullen/Frost Bankers, Inc. | | | 7,421,650 | |
| | 585,668 | | Keycorp | | | 3,250,458 | |
| | | | | | | 10,672,108 | |
| | | | Commercial Services & Supplies 0.7% | | | | |
| | 15,928 | | Strayer Education, Inc. | | | 3,384,541 | |
| | | | | | | | |
| | | | Communications Equipment 2.0% | | | | |
| | 63,965 | | F5 Networks, Inc. (a) | | | 3,388,866 | |
| | 191,083 | | Tekelec (a) | | | 2,919,748 | |
| | 484,238 | | Tellabs, Inc. (a) | | | 2,750,472 | |
| | | | | | | 9,059,086 | |
| | | | Computers & Peripherals 1.1% | | | | |
| | 161,319 | | Synaptics Inc. (a) | | | 4,944,427 | |
| | | | | | | | |
| | | | Construction & Engineering 2.8% | | | | |
| | 311,035 | | Louisiana-Pacific Corp. (a) | | | 2,171,024 | |
| | 275,937 | | Quanta Services, Inc. (a) | | | 5,750,527 | |
| | 99,752 | | URS Corp. (a) | | | 4,440,959 | |
| | | | | | | 12,362,510 | |
| | | | Containers & Packaging 1.3% | | | | |
| | 51,955 | | Greif, Inc. - Class A | | | 2,804,531 | |
| | 59,262 | | Rock-Tenn Co. | | | 2,987,397 | |
| | | | | | | 5,791,928 | |
| | | | Diversified Financial Services 1.0% | | | | |
| | 153,850 | | GATX Corp. | | | 4,423,188 | |
| | | | | | | | |
| | | | Electric Utilities 1.4% | | | | |
| | 117,347 | | ITC Holdings Corp. | | | 6,112,605 | |
| | | | | | | | |
| | | | Electrical Equipment 2.4% | | | | |
| | 70,972 | | American Superconductor Corp. (a) | | | 2,902,755 | |
| | 95,943 | | AMETEK, Inc. | | | 3,668,860 | |
| | 80,538 | | Roper Industries, Inc. | | | 4,217,775 | |
| | | | | | | 10,789,390 | |
| | | | Electronic Equipment | | | | |
| | | | & Instruments 4.2% | | | | |
| | 109,173 | | Amphenol Corp. - Class A | | | 5,041,609 | |
| | 209,413 | | Avnet, Inc. (a) | | | 6,315,896 | |
| | 65,763 | | FLIR Systems, Inc. (a) | | | 2,151,766 | |
| | 41,397 | | Itron, Inc. (a) | | | 2,797,195 | |
The accompanying notes are an integral part of these financial statements.
Frontegra IronBridge SMID Fund
SCHEDULE OF INVESTMENTS (continued)
December 31, 2009 (Unaudited)
| Number of Shares | | | | Value | |
COMMON STOCKS 95.2% (continued) | | | |
| | | Electronic Equipment | | | |
| | | & Instruments 4.2% (continued) | | | |
| | 103,306 | | Trimble Navigation Ltd. (a) | | $ | 2,603,311 | |
| | | | | | | 18,909,777 | |
| | | | Energy Equipment & Services 2.1% | | | | |
| | 107,670 | | Helmerich & Payne, Inc. | | | 4,293,880 | |
| | 159,928 | | Pride International, Inc. (a) | | | 5,103,302 | |
| | | | | | | 9,397,182 | |
| | | | Food Products 3.7% | | | | |
| | 152,949 | | Corn Products International, Inc. | | | 4,470,699 | |
| | 138,879 | | Flowers Foods, Inc. | | | 3,299,765 | |
| | 249,973 | | McCormick & Co., Inc. | | | 9,031,524 | |
| | | | | | | 16,801,988 | |
| | | | Gas Utilities 3.1% | | | | |
| | 145,029 | | New Jersey Resources Corp. | | | 5,424,085 | |
| | 357,261 | | UGI Corp. | | | 8,642,143 | |
| | | | | | | 14,066,228 | |
| | | | Health Care Equipment & Supplies 3.2% | | | | |
| | 47,010 | | C.R. Bard, Inc. | | | 3,662,079 | |
| | 116,474 | | Hansen Medical, Inc. (a) | | | 352,916 | |
| | 181,817 | | Illumina, Inc. (a) | | | 5,572,691 | |
| | 235,996 | | PerkinElmer, Inc. | | | 4,859,158 | |
| | | | | | | 14,446,844 | |
| | | | Health Care Providers & Services 3.4% | | | | |
| | 66,849 | | Cerner Corp. (a) | | | 5,511,032 | |
| | 165,293 | | Owens & Minor, Inc. | | | 7,096,028 | |
| | 92,010 | | Universal Health Services, Inc. | | | 2,806,305 | |
| | | | | | | 15,413,365 | |
| | | | Hotels, Restaurants & Leisure 0.7% | | | | |
| | 80,907 | | WMS Industries, Inc. (a) | | | 3,236,280 | |
| | | | | | | | |
| | | | Household Durables 2.0% | | | | |
| | 54,736 | | AptarGroup, Inc. | | | 1,956,265 | |
| | 92,817 | | Snap-On, Inc. | | | 3,922,446 | |
| | 67,317 | | Tupperware Brands Corp. | | | 3,134,953 | |
| | | | | | | 9,013,664 | |
| | | | Industrial Conglomerates 1.2% | | | | |
| | 18,853 | | Alleghany Corp. | | | 5,203,428 | |
| | | | | | | | |
| | | | Insurance 3.2% | | | | |
| | 190,176 | | American Financial Group, Inc. | | | 4,744,891 | |
| | 15,951 | | Markel Corp. (a) | | | 5,423,340 | |
| | 83,170 | | RLI Corp. | | | 4,428,803 | |
| | | | | | | 14,597,034 | |
| | | | Internet & Catalog Retail 1.5% | | | | |
| | 57,164 | | Netflix, Inc. (a) | | | 3,152,023 | |
| | 16,597 | | priceline.com, Inc. (a) | | | 3,626,445 | |
| | | | | | | 6,778,468 | |
| | | | Internet Software & Services 0.7% | | | | |
| | 122,587 | | Akamai Technologies, Inc. (a) | | | 3,105,129 | |
| | | | | | | | |
| | | | Leisure Equipment & Products 1.4% | | | | |
| | 191,822 | | Hasbro, Inc. | | | 6,149,813 | |
| | | | | | | | |
| | | | Machinery 1.6% | | | | |
| | 121,189 | | Harsco Corp. | | | 3,905,921 | |
| | 43,462 | | Valmont Industries, Inc. | | | 3,409,594 | |
| | | | | | | 7,315,515 | |
| | | | Marine 1.4% | | | | |
| | 181,877 | | Alexander & Baldwin, Inc. | | | 6,225,650 | |
| | | | | | | | |
| | | | Metals & Mining 1.5% | | | | |
| | 125,773 | | Arch Coal, Inc. | | | 2,798,449 | |
| | 243,969 | | GrafTech International Ltd. (a) | | | 3,793,718 | |
| | | | | | | 6,592,167 | |
| | | | Multiline Retail 1.4% | | | | |
| | 218,261 | | Big Lots, Inc. (a) | | | 6,325,204 | |
The accompanying notes are an integral part of these financial statements.
Frontegra IronBridge SMID Fund
SCHEDULE OF INVESTMENTS (continued)
December 31, 2009 (Unaudited)
| Number of Shares | | | | Value | |
COMMON STOCKS 95.2% (continued) | | | |
| | | Multi-Utilities & | | | |
| | | Unregulated Power 2.7% | | | |
| | 127,440 | | Energen Corp. | | $ | 5,964,192 | |
| | 255,493 | | MDU Resources Group, Inc. | | | 6,029,635 | |
| | | | | | | 11,993,827 | |
| | | | Oil & Gas 3.5% | | | | |
| | 61,217 | | Arena Resources, Inc. (a) | | | 2,639,677 | |
| | 99,214 | | Cabot Oil & Gas Corp. | | | 4,324,738 | |
| | 231,162 | | Denbury Resources, Inc. (a) | | | 3,421,198 | |
| | 129,452 | | Questar Corp. | | | 5,381,320 | |
| | | | | | | 15,766,933 | |
| | | | Paper & Forest Products 1.0% | | | | |
| | 105,130 | | Rayonier, Inc. | | | 4,432,281 | |
| | | | | | | | |
| | | | Real Estate 5.5% | | | | |
| | 202,413 | | Corporate Office Properties Trust | | | 7,414,388 | |
| | 91,215 | | Digital Realty Trust, Inc. | | | 4,586,290 | |
| | 91,633 | | Mid-America Apartment | | | | |
| | | | Communities, Inc. | | | 4,424,041 | |
| | 294,776 | | The St. Joe Co. (a) | | | 8,516,079 | |
| | | | | | | 24,940,798 | |
| | | | Semiconductor & | | | | |
| | | | Semiconductor Equipment 3.1% | | | | |
| | 142,986 | | Altera Corp. | | | 3,235,773 | |
| | 424,742 | | Cypress Semiconductor Corp. (a) | | | 4,485,275 | |
| | 49,402 | | NetLogic Microsystems, Inc. (a) | | | 2,285,337 | |
| | 108,046 | | Varian Semiconductor | | | | |
| | | | Equipment Associates, Inc. (a) | | | 3,876,690 | |
| | | | | | | 13,883,075 | |
| | | | Software 3.9% | | | | |
| | 56,120 | | BMC Software, Inc. (a) | | | 2,250,412 | |
| | 79,011 | | Citrix Systems, Inc. (a) | | | 3,287,648 | |
| | 119,586 | | Informatica Corp. (a) | | | 3,092,494 | |
| | 143,161 | | McAfee, Inc. (a) | | | 5,808,042 | |
| | 74,493 | | Sybase, Inc. (a) | | | 3,232,996 | |
| | | | | | | 17,671,592 | |
| | | | Specialty Retail 1.8% | | | | |
| | 104,370 | | GameStop Corp. - Class A (a) | | | 2,289,878 | |
| | 155,464 | | O’Reilly Automotive, Inc. (a) | | | 5,926,287 | |
| | | | | | | 8,216,165 | |
| | | | Textiles, Apparel & Luxury Goods 1.8% | | | | |
| | 50,935 | | VF Corp. | | | 3,730,479 | |
| | 164,030 | | Wolverine World Wide, Inc. | | | 4,464,897 | |
| | | | | | | 8,195,376 | |
| | | | Thrifts & Mortgage Finance 2.9% | | | | |
| | 456,251 | | Hudson City Bancorp, Inc. | | | 6,264,326 | |
| | 399,286 | | People’s United Financial, Inc. | | | 6,668,076 | |
| | | | | | | 12,932,402 | |
| | | | Trading Companies & Distributors 1.0% | | | | |
| | 44,278 | | W.W. Grainger, Inc. | | | 4,287,439 | |
| | | | Total Common Stocks | | | | |
| | | | (Cost $391,621,222) | | | 427,945,871 | |
The accompanying notes are an integral part of these financial statements.
Frontegra IronBridge SMID Fund
SCHEDULE OF INVESTMENTS (continued)
December 31, 2009 (Unaudited)
| Principal Amount | | | | Value | |
| SHORT TERM INVESTMENTS 4.4% | | | |
| | | Commercial Paper 3.9% | | | |
| $ | 17,660,000 | | U.S. Bank, N.A., | | | |
| | | | 0.040%, 01/04/2010 | | $ | 17,660,000 | |
| | | | | | | | |
| | | | Variable Rate Demand Notes (c) 0.5% | | | | |
| | 2,173,245 | | American Family Financial | | | | |
| | | | Services, Inc., 0.101% | | | 2,173,245 | |
| | 14,718 | | U.S. Bank, N.A., 4.949% | | | 14,718 | |
| | | | | | | 2,187,963 | |
| | | | Total Short-Term Investments | | | | |
| | | | (Cost $19,847,865) | | | 19,847,963 | |
| | | | | | | | |
| | | | Total Investments 99.6% | | | | |
| | | | (Cost $411,469,087) | | | 447,793,834 | |
| | | | | | | | |
| | | | Other Assets in Excess | | | | |
| | | | of Liabilities 0.4% | | | 1,955,283 | |
| | | | | | | | |
| | | | TOTAL NET ASSETS 100.0% | | $ | 449,749,117 | |
| (b) | U.S.-dollar denominated security of foreign issuer. |
| (c) | Variable rate demand notes are considered short-term obligations and are payable upon demand. Interest rates change periodically on specified dates. The rates listed are as of December 31, 2009. |
ALLOCATION OF PORTFOLIO HOLDINGS
At December 31, 2009, the allocation of portfolio holdings as a percentage of the Fund’s total net assets were:
| Common Stock | | | 95.2 | % |
| Short-Term Investments | | | 4.4 | |
| Other Assets in Excess of Liabilities | | | 0.4 | |
| | | | 100.0 | % |
The accompanying notes are an integral part of these financial statements.
Frontegra IronBridge SMID Fund
STATEMENT OF ASSETS AND LIABILITIES
December 31, 2009 (Unaudited)
| Assets: | | | |
| Investments at value (cost $411,469,087) | | $ | 447,793,834 | |
| Cash | | | 24,656 | |
| Interest receivable | | | 486,758 | |
| Receivable for Fund shares sold | | | 2,627,593 | |
| Receivable for investments sold | | | 2,627,790 | |
| Prepaid expenses and other assets | | | 29,165 | |
| Total assets | | | 453,589,796 | |
| | | | | |
| Liabilities: | | | | |
| Payable for investments purchased | | | 3,434,640 | |
| Payable for Fund shares purchased | | | 37,068 | |
| Accrued investment advisory fee | | | 318,809 | |
| Accrued expenses | | | 50,162 | |
| Total liabilities | | | 3,840,679 | |
| Net Assets | | $ | 449,749,117 | |
| | | | | |
| Net Assets Consist of: | | | | |
| Paid in capital | | $ | 455,602,687 | |
| Undistributed net investment income | | | 952,308 | |
| Accumulated net realized loss | | | (43,130,625 | ) |
| Unrealized appreciation on investments | | | 36,324,747 | |
| Net Assets | | $ | 449,749,117 | |
| | | | | |
| Capital Stock, $0.01 Par Value | | | | |
| Authorized | | | 100,000,000 | |
| Issued and outstanding | | | 46,323,058 | |
| Net Asset Value, Redemption Price and Offering Price Per Share | | $ | 9.71 | |
The accompanying notes are an integral part of these financial statements.
Frontegra IronBridge SMID Fund
STATEMENT OF OPERATIONS
| | | Six Months Ended | |
| | | December 31, 2009 | |
| | | (Unaudited) | |
| Investment Income: | | | |
Dividend income(1) | | $ | 2,727,956 | |
| Interest income | | | 6,867 | |
| Total Investment Income | | | 2,734,823 | |
| | | | | |
| Expenses: | | | | |
| Investment advisory fees (Note 3) | | | 1,595,533 | |
| Fund administration and accounting fees | | | 47,592 | |
| Audit fees | | | 17,620 | |
| Federal and state registration fees | | | 16,039 | |
| Legal fees | | | 15,258 | |
| Custody fees | | | 14,271 | |
| Shareholder servicing fees | | | 14,035 | |
| Reports to shareholders | | | 9,352 | |
| Directors’ fees and related expenses | | | 4,269 | |
| Compliance related expenses | | | 1,054 | |
| Other | | | 9,695 | |
| Total expenses before waiver and reimbursement | | | 1,744,718 | |
| Expenses recaptured by Adviser (Note 3) | | | 37,797 | |
| Net expenses | | | 1,782,515 | |
| Net Investment Income | | | 952,308 | |
| | | | | |
| Realized and Unrealized Gain on Investments: | | | | |
| Net realized gain on: | | | | |
| Investments | | | 5,623,583 | |
| Change in net unrealized appreciation/(depreciation) on: | | | | |
| Investments | | | 53,778,067 | |
| Net Realized and Unrealized Gain on Investments | | | 59,401,650 | |
| Net Increase in Net Assets Resulting from Operations | | $ | 60,353,958 | |
| | | | | |
| (1) | Net of $7,831 in foreign withholding taxes. |
The accompanying notes are an integral part of these financial statements.
Frontegra IronBridge SMID Fund
STATEMENTS OF CHANGES IN NET ASSETS
| | | For the | | | | |
| | | Six Months Ended | | | For the Year | |
| | | December 31, 2009 | | | Ended | |
| | | (Unaudited) | | | June 30, 2009 | |
| Operations: | | | | | | |
| Net investment income | | $ | 952,308 | | | $ | 1,331,924 | |
| Net realized gain/(loss) on investments | | | 5,623,583 | | | | (48,731,590 | ) |
| Change in net unrealized appreciation/(depreciation) on investments | | | 53,778,067 | | | | (21,178,183 | ) |
| Net increase (decrease) in net assets resulting from operations | | | 60,353,958 | | | | (68,577,849 | ) |
Distributions Paid From: | | | | | | | | |
| Net investment income | | | (1,315,023 | ) | | | (259,686 | ) |
| Net realized gain | | | — | | | | (2,364,348 | ) |
| Net decrease in net assets resulting from distributions paid | | | (1,315,023 | ) | | | (2,624,034 | ) |
Capital Share Transactions: | | | | | | | | |
| Shares sold | | | 115,952,833 | | | | 179,601,797 | |
| Shares issued to holders in reinvestment of distributions | | | 1,153,134 | | | | 2,451,437 | |
| Shares redeemed | | | (34,368,864 | ) | | | (36,257,970 | ) |
| Net increase in net assets resulting from capital share transactions | | | 82,737,103 | | | | 145,795,264 | |
| Total Increase in Net Assets | | | 141,776,038 | | | | 74,593,381 | |
Net Assets: | | | | | | | | |
| Beginning of Period | | | 307,973,079 | | | | 233,379,698 | |
| End of Period (includes undistributed net investment | | | | | | | | |
| income of $952,308 and $1,315,023 respectively) | | $ | 449,749,117 | | | $ | 307,973,079 | |
Transactions in Shares: | | | | | | | | |
| Shares sold | | | 12,634,862 | | | | 20,791,374 | |
| Shares issued to holders in reinvestment of distributions | | | 120,874 | | | | 328,171 | |
| Shares redeemed | | | (3,827,181 | ) | | | (4,509,587 | ) |
| Net increase in shares outstanding | | | 8,928,555 | | | | 16,609,958 | |
| | | | | | | | | |
The accompanying notes are an integral part of these financial statements.
Frontegra IronBridge SMID Fund
FINANCIAL HIGHLIGHTS
| | | Six Months | | | | | | | | | | | | | | | | |
| | | Ended | | | Year | | | Year | | | Year | | | Year | | | Period | |
| | | December 31, | | | Ended | | | Ended | | | Ended | | | Ended | | | Ended | |
| | | 2009 | | | June 30, | | | June 30, | | | June 30, | | | June 30, | | | June 30, | |
| | | (Unaudited) | | | 2009 | | | 2008 | | | 2007 | | | 2006 | | | 2005(1) | |
| Net Asset Value, Beginning of Period | | $ | 8.24 | | | $ | 11.23 | | | $ | 13.36 | | | $ | 11.07 | | | $ | 10.00 | | | $ | 10.00 | |
| | | | | | | | | | | | | | | | | | | | | | | | | |
| Income (Loss) from | | | | | | | | | | | | | | | | | | | | | | | | |
| Investment Operations: | | | | | | | | | | | | | | | | | | | | | | | | |
| Net investment income | | | 0.01 | | | | 0.03 | | | | 0.02 | | | | 0.01 | | | | 0.06 | (2) | | | 0.04 | (2) |
| Net realized and unrealized gain (loss) on investments | | | 1.49 | | | | (2.93 | ) | | | (0.98 | ) | | | 2.43 | | | | 1.04 | | | | (0.04 | ) |
| Total Income (Loss) from Investment Operations | | | 1.50 | | | | (2.90 | ) | | | (0.96 | ) | | | 2.44 | | | | 1.10 | | | | 0.00 | |
| | | | | | | | | | | | | | | | | | | | | | | | | |
| Less Distributions: | | | | | | | | | | | | | | | | | | | | | | | | |
| From net investment income | | | (0.03 | ) | | | (0.01 | ) | | | (0.02 | ) | | | — | (3) | | | (0.03 | ) | | | — | |
| From net realized gain on investments | | | — | | | | (0.08 | ) | | | (1.15 | ) | | | (0.15 | ) | | | — | | | | — | |
| Total Distributions | | | (0.03 | ) | | | (0.09 | ) | | | (1.17 | ) | | | (0.15 | ) | | | (0.03 | ) | | | — | |
| | | | | | | | | | | | | | | | | | | | | | | | | |
| Net Asset Value, End of Period | | $ | 9.71 | | | $ | 8.24 | | | $ | 11.23 | | | $ | 13.36 | | | $ | 11.07 | | | $ | 10.00 | |
| Total Return | | | 18.19 | %(4) | | | (25.78 | )% | | | (7.48 | )% | | | 22.25 | % | | | 11.02 | % | | | 0.00 | %(4) |
| | | | | | | | | | | | | | | | | | | | | | | | | |
| Supplemental Data and Ratios: | | | | | | | | | | | | | | | | | | | | | | | | |
| Net assets, end of period (in thousands) | | $ | 449,749 | | | $ | 307,973 | | | $ | 233,380 | | | $ | 193,424 | | | $ | 133,058 | | | $ | 41,638 | |
| Ratio of expenses to average net assets | | | | | | | | | | | | | | | | | | | | | | | | |
| Before waivers and reimbursements | | | 0.93 | %(5) | | | 0.96 | % | | | 0.96 | % | | | 0.98 | % | | | 1.08 | % | | | 1.49 | %(5) |
| Net of waivers and reimbursements | | | 0.95 | %(5) | | | 0.95 | % | | | 0.95 | % | | | 0.95 | % | | | 0.95 | % | | | 0.95 | %(5) |
| Ratio of net investment income to average net assets | | | | | | | | | | | | | | | | | | | | | | | | |
| Before waivers and reimbursements | | | 0.53 | %(5) | | | 0.54 | % | | | 0.19 | % | | | 0.08 | % | | | 0.15 | % | | | 0.35 | %(5) |
| Net of waivers and reimbursements | | | 0.51 | %(5) | | | 0.55 | % | | | 0.20 | % | | | 0.10 | % | | | 0.28 | % | | | 0.89 | %(5) |
| Portfolio turnover rate | | | 19 | %(4) | | | 46 | % | | | 71 | % | | | 71 | % | | | 91 | % | | | 44 | %(4) |
| | | | | | | | | | | | | | | | | | | | | | | | | |
| (1) | Commenced operations on December 31, 2004. |
| (2) | Per share net investment income has been calculated using the daily average share method. |
| (3) | Less than one cent per share. |
The accompanying notes are an integral part of these financial statements.
FRONTEGRA
IRONBRIDGE GLOBAL
FOCUS FUND
REPORT FROM IRONBRIDGE
CAPITAL MANAGEMENT, L.P.
Dear Shareholders:
The Frontegra IronBridge Global Focus Fund strives to achieve long-term capital appreciation by investing primarily in equity securities of companies traded in developed markets throughout the world, including the United States.
Performance Review
Since inception on September 18, 2009, the Frontegra IronBridge Global Focus Fund returned 1.31%, net of fees, versus the MSCI World Index Net return of 3.04%.
A combination of huge transfer payments and highly stimulative monetary policy continued to support the recovery as the fourth quarter progressed; a recovery that seemed highly uncertain just twelve months ago. Consequently, confidence that was shattered by the sheer scale of the credit and real economy shocks that penetrated the financial system at the end of 2008 sustained a gradual recovery.
Hence, a normal, cyclically inspired inventory recovery was supercharged by direct government expenditure and abnormally cheap funding costs. A steep yield curve was supporting bank profitability and gradual balance sheet repair, which was augmented by regular capital raisings. At the same time, central bank action was encouraging risk appetite to return as a precaution against any potential re-emergence of the debt deflation trap. Consider that at the end of December, the yield curve in the US steepened to its highest ever level with the gap between two-year yields and ten-year yields eclipsing the previous record set in August 2003.
Portfolio Outlook
The data and the markets continue to give out conflicting messages. For example, while the corporate sector is reporting sharply improving profitability, the signal from government and state tax receipts paints a very different picture. By way of example, all US states reported negative year over year tax collections in October with the weighted average decrease recorded as -10.2% (Source: The Liscio Report – http://tlrii.typepad.com/). In the UK, the negative surprise from the pre budget report released in December was in no small part a function of much lower than anticipated tax receipts and a poor record on collecting arrears. Meanwhile, although consumer expenditure surveys support the notion that economies have stabilized, credit card delinquencies are now reported at all time highs. Finally, the signal from corporate profitability suggests a strong recovery is underway with the revisions ratio at all time highs and showing a current reading of 1.8x. In contrast, labor statistics point to continued high levels of unemployment and underemployment, with record lows in “hours worked.”
For us, outside these short term conflicting data points, we believe a longer-term “re-balancing” phase brought about by market forces may well be underway. We see some selected authorities looking beyond the current economic environment towards their own re-balancing – because they can afford to. The best example being Australia where interest rates have been rising, following the example set last quarter by Israel and by China. The authorities are instigating a number of measures aimed at a tightening of lending standards. From our perspective, re-balancing the interest rate environment is more likely to provide a favorable environment for the efficient allocation of long-term productive capital, which is vital requirement for the health of a market based system.
In broadest outline, we believe the next several years will be marked by an increase in production relative to consumption in the debt-laden nations and an increase in consumption relative to production in the creditor nations. An increase in developed market production relative to consumption will necessarily require an increase in asset growth and corporate spending, both of which are operating well below their long run averages. In the short run it is likely that companies have chosen to preserve cash flow and capital, having experienced the trauma of the recent credit crisis. As the memory of the crisis fades, companies will start investing and spending again. At the moment, G7 investment share of GDP is running well below trend and in the US is at all time lows. At the same time, cash on corporate balance sheets is abnormally high. Looking at our data, US non-financial corporate cash / market capitalization is in the region of 12%. This is at levels similar to the crisis high of 1974 and well above the long run average since 1951, which is nearer 8%.
Contrast these further characteristics in the debt-laden nations with those from the creditor nations. In the US, the consumption share of GDP stands at 73%. In non-Japan Asia the same figure currently stands at 43% and for the Chinese consumer is as low as 36%. These same measures taken in 1980 would show the US at 62% and NJA (non-Japan Asia) at 55%. China has made up for the shortfall in its growth from consumption with a massive expansion in investment. Current investment share of GDP in China, at over 40%, is above that of both Japan and Korea at the peak of their industrialization.
This long-term process in the allocation between consumption and production is also a necessary part of re-balancing the financial markets. For sure, it will be a volatile period of adjustment and it will have its own punctuation marks, just as the previous 30-year regime was marked by a series of booms and busts. Fixed exchange rate regimes and a likely increase in regulation and government interference ensure that will be the case – witness the gyrations in the markets in China and Greece where the currencies are unable to adjust, so the equity and bond markets take the initial strain. An alternative path is currently being taken in Ireland, where austerity measures include significant deflation in wages and salaries of 6-7% for most public sector workers and deeper cuts of 15% for the higher paid. In Spain, the valve has been employment, with the official unemployment rate in November reaching 19.3%, more than double the EU average.
Although we now have a better understanding of the implications of direct government actions, at IronBridge the relative performance of our funds during the “intervention phase” has not been anywhere near as good as we would demand from ourselves. Nevertheless, we continue to believe the best way to manage our clients’ assets over the long run is not to try and forecast the changes in the general market environment nor is it to try and call or time those short run punctuation marks likely to characterize the re-balancing phase. Instead, we believe it is more effective to focus on the key characteristics of wealth creation that transcend the market environment – namely innovation, skilled capital allocation and the avoidance of excess leverage, leverage which often puts mere survival at threat in times of duress. We believe that increased intervention is actually more likely to provide interesting opportunities going forward than it has in the short run phase of the last twelve months.
Consequently, we continue to stick with our long tested investment approach. We monitor our long-term milestones and search for attractive stock opportunities amongst those managements undertaking the correct capital allocation decisions, appropriate for their position in the Life Cycle. We look for attractive pay-off structures and manage concentrated portfolios with Life Cycle diversification as the primary tool for risk control, aiming for consistency of performance regardless of market environment.
Best regards,
 |  |
| Stephen Barrow | Matt Halkyard, CFA |
| | |
 |  |
| James Clarke, CFA | Peter Rutter, CFA |
INVESTMENT HIGHLIGHTS
Growth of a $100,000 Investment (Unaudited)
* 9/18/09 commencement of operations.
| | Portfolio Total Return** | | | |
| | FOR PERIODS ENDED 12/31/09 | FUND | INDEX | |
| | | | | |
| | SINCE INCEPTION | 1.31% | 3.04% | |
This chart assumes an initial gross investment of $100,000 made on 9/18/09. Returns shown include the reinvestment of all distributions. Past performance is not predictive of future results. Investment return and principal value will fluctuate so that shares, when redeemed, may be worth more or less than the original cost. In the absence of existing fee waivers, total return would be reduced. To receive current to the most recent month-end performance, please call 1-888-825-2100.
The MSCI World Index Net is a free float-adjusted market capitalization weighted index that is designed to measure the equity market performance of developed markets. As of June 2007 the MSCI World Index consisted of the following 23 developed market country indices: Australia, Austria, Belgium, Canada, Denmark, Finland, France, Germany, Greece, Hong Kong, Ireland, Italy, Japan, Netherlands, New Zealand, Norway, Portugal, Singapore, Spain, Sweden, Switzerland, the United Kingdom, and the United States. The Index does not reflect investment management fees, brokerage commissions and other expenses associated with investing in equity securities. A direct investment in an index is not possible.
| ** | The returns shown do not reflect the deduction of taxes that a shareholder would pay on Fund distributions or the redemption of Fund shares. |
Frontegra IronBridge Global Focus Fund
SCHEDULE OF INVESTMENTS
December 31, 2009 (Unaudited)
| Number of Shares | | | | Value | |
| COMMON STOCKS 99.5% | | | |
| | | Australia 1.4% | | | |
| | 27,250 | | Westpac Banking Corp. | | $ | 615,542 | |
| | | | | | | | |
| | | | Canada 9.3% | | | | |
| | 19,138 | | Barrick Gold Corp. | | | 753,654 | |
| | 26,626 | | Brookfield Asset Management, Inc. | | | 590,565 | |
| | 9,737 | | Canadian Natural Resources Ltd. | | | 700,577 | |
| | 11,011 | | Petrobank Energy & Resources Ltd. (a) | | | 539,153 | |
| | 16,004 | | Teck Resources Ltd. (a) | | | 563,434 | |
| | 15,528 | | TD Bank Financial Group (a) | | | 979,325 | |
| | | | | | | 4,126,708 | |
| | | | Finland 2.8% | | | | |
| | 51,111 | | Sampo Oyj | | | 1,245,062 | |
| | | | | | | | |
| | | | France 3.3% | | | | |
| | 10,720 | | Compagnie Generale des | | | | |
| | | | Etablissements Michelin - Class B | | | 821,032 | |
| | 22,710 | | Legrand SA | | | 632,056 | |
| | | | | | | 1,453,088 | |
| | | | Germany 5.2% | | | | |
| | 14,970 | | Bayer AG | | | 1,197,951 | |
| | 26,699 | | E.ON AG | | | 1,120,665 | |
| | | | | | | 2,318,616 | |
| | | | Hong Kong 1.8% | | | | |
| | 207,100 | | Hang Lung Properties Ltd. | | | 811,905 | |
| | | | | | | | |
| | | | Ireland (Republic of) 2.0% | | | | |
| | 32,441 | | CRH PLC | | | 886,723 | |
| | | | | | | | |
| | | | Japan 9.7% | | | | |
| | 14,320 | | Canon, Inc. | | | 609,151 | |
| | 32,900 | | Matsushita Electric Industrial Co. Ltd. | | | 473,642 | |
| | 16,060 | | Mitsui Sumitomo Insurance Group | | | 410,192 | |
| | 12,600 | | Nitto Denko Corp. | | | 452,640 | |
| | 239 | | NTT DoCoMo, Inc. | | | 333,522 | |
| | 14,000 | | Shin-Etsu Chemical Co. Ltd. | | | 790,417 | |
| | 18,800 | | Sony Corp. | | | 546,549 | |
| | 29,200 | | Suzuki Motor Corp. | | | 719,109 | |
| | | | | | | 4,335,222 | |
| | | | Netherlands 1.0% | | | | |
| | 7,493 | | Fugro N.V. | | | 430,392 | |
| | | | | | | | |
| | | | Sweden 1.4% | | | | |
| | 21,740 | | Svenska Handelsbanken AB | | | 619,369 | |
| | | | | | | | |
| | | | Switzerland 8.6% | | | | |
| | 7,342 | | Lonza Group AG | | | 517,311 | |
| | 34,436 | | Nestle SA | | | 1,671,304 | |
| | 6,199 | | Roche Holding AG | | | 1,060,109 | |
| | 32,553 | | Weatherford International Ltd. (a) | | | 583,024 | |
| | | | | | | 3,831,748 | |
| | | | United Kingdom 7.7% | | | | |
| | 32,271 | | BHP Billiton PLC | | | 1,028,797 | |
| | 21,809 | | Standard Chartered PLC | | | 550,587 | |
| | 156,073 | | Tesco PLC | | | 1,076,712 | |
| | 24,235 | | Unilever PLC | | | 776,860 | |
| | | | | | | 3,432,956 | |
| | | | United States 45.3% | | | | |
| | 26,125 | | AT&T, Inc. | | | 732,284 | |
| | 12,570 | | BB&T Corp. | | | 318,901 | |
| | 18,473 | | Becton, Dickinson & Co. | | | 1,456,781 | |
| | 228 | | Berkshire Hathaway, Inc. (a) | | | 749,208 | |
| | 16,320 | | Best Buy Co., Inc. | | | 643,987 | |
| | 18,180 | | Costco Wholesale Corp. | | | 1,075,711 | |
| | 28,400 | | eBay, Inc. (a) | | | 668,536 | |
| | 9,427 | | Exelon Corp. | | | 460,697 | |
| | 12,660 | | Exxon Mobil Corp. | | | 863,285 | |
| | 3,427 | | The Goldman Sachs Group, Inc. | | | 578,615 | |
| | 839 | | Google, Inc. (a) | | | 520,163 | |
| | 7,114 | | International Business Machines Corp. | | | 931,223 | |
| | 15,195 | | Johnson & Johnson | | | 978,710 | |
| | 20,352 | | JPMorgan Chase & Co. | | | 848,068 | |
The accompanying notes are an integral part of these financial statements.
Frontegra IronBridge Global Focus Fund
SCHEDULE OF INVESTMENTS (continued)
December 31, 2009 (Unaudited)
| Number of Shares | | | | Value | |
COMMON STOCKS 99.5% (continued) | | | |
| United States 45.3% (continued) | | | |
| | 4,947 | | Monsanto Co. | | $ | 404,417 | |
| | 12,739 | | National Oilwell Varco, Inc. | | | 561,662 | |
| | 6,190 | | Northern Trust Corp. | | | 324,356 | |
| | 20,361 | | Occidental Petroleum Corp. | | | 1,656,361 | |
| | 34,793 | | Oracle Corp. | | | 853,820 | |
| | 12,824 | | Thermo Fisher Scientific, Inc. (a) | | | 611,577 | |
| | 16,871 | | Union Pacific Corp. | | | 1,078,057 | |
| | 19,596 | | United Technologies Corp. | | | 1,360,158 | |
| | 25,320 | | W.R. Berkley Corp. | | | 623,885 | |
| | 8,538 | | W.W. Grainger, Inc. | | | 826,735 | |
| | 27,445 | | Walgreen Co. | | | 1,007,780 | |
| | | | | | | 20,134,977 | |
| | | | Total Common Stocks | | | | |
| | | | (Cost $43,567,128) | | | 44,242,308 | |
| Principal Amount | | | | | | |
| SHORT TERM INVESTMENTS 0.5% | | | | |
| | | | Commercial Paper 0.5% | | | | |
| $ | 228,000 | | U.S. Bank, N.A., | | | | |
| | | | 0.040%, 01/04/2010 | | | 228,000 | |
| | | | Total Short-Term Investments | | | | |
| | | | (Cost $227,999) | | | 228,000 | |
| | | | | | | | |
| | | | Total Investments 100.0% | | | | |
| | | | (Cost $43,795,127) | | | 44,470,308 | |
| | | | | | | | |
| | | | Other Assets in Excess | | | | |
| | | | of Liabilities 0.0% | | | 3,395 | |
| | | | | | | | |
| | | | TOTAL NET ASSETS 100.0% | | $ | 44,473,703 | |
ALLOCATION OF PORTFOLIO HOLDINGS
At December 31, 2009, the allocation of portfolio holdings as a percentage of the Fund’s total net assets were:
| Common Stock | | | 99.5 | % |
| Short-Term Investments | | | 0.5 | |
| Other Assets in Excess of Liabilities | | | 0.0 | |
| | | | 100.0 | % |
The accompanying notes are an integral part of these financial statements.
Frontegra IronBridge Global Focus Fund
PORTFOLIO DIVERSIFICATION
December 31, 2009 (Unaudited)
| | | Value | | | Percentage | |
| Consumer Discretionary | | $ | 3,204,319 | | | | 7.2 | % |
| Consumer Staples | | | 5,608,367 | | | | 12.6 | % |
| Energy | | | 5,334,454 | | | | 12.0 | % |
| Financials | | | 9,265,580 | | | | 20.8 | % |
| Health Care | | | 5,822,439 | | | | 13.1 | % |
| Industrials | | | 3,897,006 | | | | 8.8 | % |
| Information Technology | | | 3,582,893 | | | | 8.1 | % |
| Materials | | | 4,880,082 | | | | 11.0 | % |
| Telecomm Service | | | 1,065,806 | | | | 2.4 | % |
| Utilities | | | 1,581,362 | | | | 3.5 | % |
| Total Common Stocks | | | 44,242,308 | | | | 99.5 | % |
| Total Short-Term Investments | | | 228,000 | | | | 0.5 | % |
| Total Investments | | | 44,470,308 | | | | 100.0 | % |
| Other Assets in Excess of Liabilities | | | 3,395 | | | | 0.0 | % |
| Total Net Assets | | $ | 44,473,703 | | | | 100.0 | % |
The accompanying notes are an integral part of these financial statements.
Frontegra IronBridge Global Focus Fund
STATEMENT OF ASSETS AND LIABILITIES
December 31, 2009 (Unaudited)
| Assets: | | | |
| Investments at value (cost $43,795,127) | | $ | 44,470,308 | |
| Interest and dividends receivable | | | 30,728 | |
| Prepaid expenses and other assets | | | 13,829 | |
| Total assets | | | 44,514,865 | |
| | | | | |
| Liabilities: | | | | |
| Accrued investment advisory fee | | | 9,905 | |
| Accrued expenses | | | 31,257 | |
| Total liabilities | | | 41,162 | |
| Net Assets | | $ | 44,473,703 | |
| | | | | |
| Net Assets Consist of: | | | | |
| Paid in capital | | $ | 43,956,709 | |
| Undistributed net investment income | | | 6,633 | |
| Accumulated net realized loss | | | (164,705 | ) |
| Net unrealized appreciation (depreciation) on: | | | | |
| Investments | | | 675,181 | |
| Foreign currency | | | (115 | ) |
| Net Assets | | $ | 44,473,703 | |
| | | | | |
| Capital Stock, $0.01 Par Value | | | | |
| Authorized | | | 50,000,000 | |
| Issued and outstanding | | | 4,393,323 | |
| Net Asset Value, Redemption Price and Offering Price Per Share | | $ | 10.12 | |
The accompanying notes are an integral part of these financial statements.
Frontegra IronBridge Global Focus Fund
STATEMENT OF OPERATIONS
| | | For the period | |
| | | September 18, 2009(1) | |
| | | through | |
| | | December 31, 2009 | |
| | | (Unaudited) | |
| Investment Income: | | | |
Dividend income(2) | | $ | 159,695 | |
| Interest income | | | 187 | |
| Total Investment Income | | | 159,882 | |
| | | | | |
| Expenses: | | | | |
| Investment advisory fees (Note 3) | | | 91,690 | |
| Audit fees | | | 14,826 | |
| Legal fees | | | 12,700 | |
| Custody fees | | | 9,864 | |
| Fund administration and accounting fees | | | 9,610 | |
| Sub-administration fees (Note 3) | | | 5,394 | |
| Shareholder servicing fees | | | 4,254 | |
| Directors’ fees and related expenses | | | 2,550 | |
| Reports to shareholders | | | 2,040 | |
| Federal and state registration fees | | | 1,836 | |
| Other | | | 1,020 | |
| Total expenses before waiver and reimbursement | | | 155,784 | |
| Waiver and reimbursement of expenses by Adviser (Note 3) | | | (47,913 | ) |
| Net expenses | | | 107,871 | |
| Net Investment Income | | | 52,011 | |
| | | | | |
| Realized and Unrealized Gain (Loss) on Investments: | | | | |
| Net realized loss on: | | | | |
| Investments | | | (159,473 | ) |
| Foreign currency transactions | | | (5,232 | ) |
| Change in net unrealized appreciation/(depreciation) on: | | | | |
| Investments | | | 675,181 | |
| Foreign currency transactions | | | (115 | ) |
| Net Realized and Unrealized Gain on Investments | | | 510,361 | |
| Net Increase in Net Assets Resulting from Operations | | $ | 562,372 | |
| | | | | |
| (1) | Commencement of operations |
| (2) | Net of $3,742 in foreign withholding taxes |
The accompanying notes are an integral part of these financial statements.
Frontegra IronBridge Global Focus Fund
STATEMENTS OF CHANGES IN NET ASSETS
| | | For the period | |
| | | September 18, 2009(1) | |
| | | through | |
| | | December 31, 2009 | |
| | | (Unaudited) | |
| Operations: | | | |
| Net investment income | | $ | 52,011 | |
| Net realized loss on: | | | | |
| Investments | | | (159,473 | ) |
| Foreign currency transactions | | | (5,232 | ) |
| Change in net unrealized appreciation/(depreciation) on: | | | | |
| Investments | | | 675,181 | |
| Foreign currency transactions | | | (115 | ) |
| Net increase in net assets resulting from operations | | | 562,372 | |
| | | | | |
| Distributions Paid From: | | | | |
| Net investment income | | | (45,378 | ) |
| Net realized gain on investments | | | — | |
| Net decrease in net assets resulting from distributions paid | | | (45,378 | ) |
| | | | | |
| Capital Share Transactions: | | | | |
| Shares sold | | | 43,926,670 | |
| Shares issued to holders in reinvestment of distributions | | | 33,135 | |
| Shares redeemed | | | (3,096 | ) |
| Net increase in net assets resulting from capital share transactions | | | 43,956,709 | |
| Total Increase in Net Assets | | | 44,473,703 | |
| | | | | |
| Net Assets: | | | | |
| Beginning of Period | | | — | |
| End of Period (includes undistributed net investment income of $6,633) | | $ | 44,473,703 | |
| | | | | |
| Transactions In Shares: | | | | |
| Shares sold | | | 4,390,289 | |
| Shares issued to holders in reinvestment of distributions | | | 3,347 | |
| Shares redeemed | | | (313 | ) |
| Net increase in shares outstanding | | | 4,393,323 | |
| | | | | |
| (1) | Commencement of operations |
The accompanying notes are an integral part of these financial statements.
Frontegra IronBridge Global Focus Fund
FINANCIAL HIGHLIGHTS
| | | For the Period | |
| | | Ended | |
| | | December 31, | |
| | | 2009(1) | |
| | | (Unaudited) | |
| Net Asset Value, Beginning of Year | | $ | 10.00 | |
| | | | | |
| Income (Loss) from | | | | |
| Investment Operations: | | | | |
| Net investment income | | | 0.01 | |
| Net realized and unrealized gain on investments | | | 0.12 | |
| Total Income from Investment Operations | | | 0.13 | |
| | | | | |
| Less Distributions: | | | | |
| From net investment income | | | (0.01 | ) |
| From net realized gain on investments | | | — | |
| Total Distributions | | | (0.01 | ) |
| | | | | |
| Net Asset Value, End of Year | | $ | 10.12 | |
| Total Return | | | 1.31 | %(2) |
| | | | | |
| Supplemental Data and Ratios: | | | | |
| Net assets, end of period (in thousands) | | $ | 44,473 | |
| Ratio of expenses to average net assets | | | | |
| Before waivers and reimbursements | | | 1.44 | %(3) |
| Net of waivers and reimbursements | | | 1.00 | %(3) |
| Ratio of net investment income to average net assets | | | | |
| Before waivers and reimbursements | | | 0.04 | %(3) |
| Net of waivers and reimbursements | | | 0.48 | %(3) |
| Portfolio turnover rate | | | 14 | %(2) |
| | | | | |
| (1) | Commenced operations on September 18, 2009. |
The accompanying notes are an integral part of these financial statements.
FRONTEGRA
MASTHOLM INTERNATIONAL
EQUITY FUND
REPORT FROM MASTHOLM ASSET MANAGEMENT, LLC:
Dear Shareholders:
The Frontegra Mastholm International Equity Fund strives to achieve capital appreciation by investing in a diversified portfolio of securities of large- and mid-cap companies located outside the United States. The objective is relative to and measured against the Morgan Stanley EAFE Index.
Performance Review
The Frontegra Mastholm International Equity Fund returned 17.03%, net of fees, for the six month period ending December 31, 2009. The Fund’s return underperformed the 22.18% return of its benchmark, the MSCI EAFE Index. Effective October 12, 2009, Mastholm Asset Management became subadviser to the Fund. At that time, the Fund was renamed the Frontegra Mastholm International Equity Fund.
Portfolio Outlook and Strategy
The global equity rally continued in the fourth quarter of 2009, based on investor expectations for economic and earnings improvements. The massive amounts of coordinated fiscal stimulus added by the United States, United Kingdom, Europe and China to avert a global depression led to a liquidity rally among lower quality stocks, emerging markets and corporate debt. Investors shunned risky assets during the depths of the crisis, but narrowing credit spreads for developing markets, mortgage and agency backed securities and high-yield corporate bonds highlight that investors are once again willing to accept pre-crash levels of risk in the pursuit of higher returns.
The international stock market rally was initially led by investments in financials, materials and highly leveraged companies that fared the worst during the credit crisis. Expectations, as compared to fundamentals, have driven P/E ratios higher, to a level where earnings growth will have to exceed analyst expectations in order to drive security prices higher, as these expectations for growth are already priced into the market.
Equity markets did advance in the fourth quarter. However, the relative outperformance of financials, particularly European and British banks, began to wane as government regulatory agencies and politicians joined the public outcry over record earnings and bonuses among the very institutions bailed out through extraordinary liquidity measures.
The materials sector was the top performing group for the quarter, based on expectations for increased demand from China and other developing nations. The Fund was slightly overweight in materials at the end of the year, and these stocks were strong contributors to returns. Health care and consumer staples rebounded in the fourth quarter, due in large part to the dramatic underperformance of these companies during the initial stage of the market rally.
The Fund was significantly underweighted in banks at the end of the period, due to the potential for further significant write-downs in commercial real estate, private equity, and consumer debt. Profits achieved by banks in 2009 from high levels of corporate bond issuance may be difficult to replicate in 2010. The European Central Bank and the U.S. Federal Reserve have started to end emergency liquidity measures, which will result in higher borrowing costs for banks, corporate and individual borrowers.
The Fund was overweight in technology and consumer discretionary companies and similarly weighted in health care and energy stocks at the end of the quarter.
It is unlikely that the market rally can continue without broadening out to include sectors with fundamental earnings growth, the hallmark of the Mastholm investment approach. If economic expectations do not materialize, companies with real earnings growth should be quite competitive in contrast to companies that rallied during the year based solely on expected bottom line improvement.
The Mastholm investment process is designed to identify companies with accelerating top and bottom line growth, regardless of the economic environment.
Thank you for your continued support.
Thomas M. Garr
Mastholm Asset Management, LLC
INVESTMENT HIGHLIGHTS
Growth of a $100,000 Investment (Unaudited)
* 1/08/04 commencement of operations.
| | Portfolio Total Return** | | | |
| | FOR PERIODS ENDED 12/31/09 | FUND | INDEX | |
| | | | | |
| | SIX MONTHS | 17.03% | 22.18% | |
| | | | | |
| | ONE YEAR | 19.47% | 32.46% | |
| | | | | |
| | FIVE YEAR | 0.70% | 4.02% | |
| | | | | |
| | SINCE COMMENCEMENT | | | |
| | AVERAGE ANNUAL | 2.48% | 6.16% | |
This chart assumes an initial gross investment of $100,000 made on 1/08/04 (commencement of operations). Returns shown include the reinvestment of all distributions. Past performance is not predictive of future results. Investment return and principal value will fluctuate so that shares, when redeemed, may be worth more or less than the original cost. In the absence of existing fee waivers, total return would be reduced. Effective October 12, 2009, Mastholm Asset Management, LLC became subadviser to the Fund. To receive current to the most recent month-end performance, please call 1-888-825-2100.
The Morgan Stanley Capital International EAFE Index measures the overall performance of stock markets in 21 countries within Europe, Australasia and the Far East. The Index does not reflect investment management fees, brokerage commissions and other expenses associated with investing in equity securities. A direct investment in the index is not possible.
| ** | The returns shown do not reflect the deduction of taxes that a shareholder would pay on Fund distributions or the redemption of Fund shares. |
Frontegra Mastholm International Equity Fund
SCHEDULE OF INVESTMENTS
December 31, 2009 (Unaudited)
| Number of Shares | | | | Value | |
| COMMON STOCKS 95.0% | | | |
| | | Australia 3.4% | | | |
| | 913,100 | | Incitec Pivot Ltd. | | $ | 2,888,242 | |
| | 379,400 | | Oil Search Ltd. | | | 2,080,158 | |
| | | | | | | 4,968,400 | |
| | | | Bermuda 0.8% | | | | |
| | 2,117,000 | | Biosensors International | | | | |
| | | | Group Ltd. (a) | | | 1,190,873 | |
| | | | | | | | |
| | | | Brazil 3.7% | | | | |
| | 53,700 | | Banco Santander Brasil SA - ADR | | | 748,578 | |
| | 88,700 | | Fibria Celulose SA - ADR (a) | | | 2,025,908 | |
| | 55,800 | | Petroleo Brasileiro SA - ADR | | | 2,660,544 | |
| | | | | | | 5,435,030 | |
| | | | Canada 4.1% | | | | |
| | 26,300 | | Niko Resources Ltd. | | | 2,474,466 | |
| | 38,100 | | Open Text Corp. (a) | | | 1,548,765 | |
| | 106,300 | | Talisman Energy, Inc. (a) | | | 2,001,288 | |
| | | | | | | 6,024,519 | |
| | | | Cayman Islands 2.9% | | | | |
| | 31,100 | | Ctrip.com International | | | | |
| | | | Ltd. - ADR (a) | | | 2,234,846 | |
| | 196,700 | | Shanda Games Ltd. - ADR (a) | | | 2,004,373 | |
| | | | | | | 4,239,219 | |
| | | | China 0.4% | | | | |
| | 562,000 | | PetroChina Co., Ltd. - Class H | | | 668,133 | |
| | | | | | | | |
| | | | France 3.8% | | | | |
| | 58,317 | | Axa SA | | | 1,369,223 | |
| | 35,697 | | BNP Paribas | | | 2,831,413 | |
| | 39,100 | | Valeo SA (a) | | | 1,368,496 | |
| | | | | | | 5,569,132 | |
| | | | Germany 10.2% | | | | |
| | 13,100 | | Adidas AG | | | 709,567 | |
| | 36,000 | | Aixtron AG | | | 1,209,859 | |
| | 9,000 | | Allianz SE | | | 1,115,639 | |
| | 48,897 | | Bayer AG | | | 3,912,908 | |
| | 28,300 | | Fresenius Medical Care AG | | | 2,031,541 | |
| | 52,600 | | HeidelbergCement AG | | | 3,638,961 | |
| | 99,000 | | Kloeckner & Co. SE (a) | | | 2,509,262 | |
| | | | | | | 15,127,737 | |
| | | | Hong Kong 1.6% | | | | |
| | 83,000 | | ASM Pacific Technology Ltd. | | | 784,737 | |
| | 207,200 | | Hengan International | | | | |
| | | | Group Co. Ltd. | | | 1,534,159 | |
| | | | | | | 2,318,896 | |
| | | | Japan 20.8% | | | | |
| | 58,400 | | Canon, Inc. | | | 2,484,247 | |
| | 39,000 | | Eisai Co. Ltd. | | | 1,433,882 | |
| | 18,200 | | Fanuc Ltd. | | | 1,696,277 | |
| | 39,200 | | Gree, Inc. | | | 2,423,724 | |
| | 100,200 | | Honda Motor Co. Ltd. | | | 3,399,656 | |
| | 97,500 | | Koito Manufacturing Co. Ltd. | | | 1,564,891 | |
| | 133,000 | | Komatsu Ltd. | | | 2,784,245 | |
| | 107,600 | | Mitsubishi Corp. | | | 2,680,164 | |
| | 290,700 | | Mitsubishi Tokyo | | | | |
| | | | Financial Group, Inc. | | | 1,431,926 | |
| | 74,600 | | Nikon Corp. | | | 1,473,087 | |
| | 18,800 | | Nitori Co. Ltd. | | | 1,399,324 | |
| | 34,800 | | ORIX Corp. | | | 2,369,332 | |
| | 3,740 | | Rakuten, Inc. | | | 2,847,374 | |
| | 158,000 | | Sega Sammy Holdings, Inc. | | | 1,890,741 | |
| | 29,400 | | Unicharm Petcare Corp. | | | 898,015 | |
| | | | | | | 30,776,885 | |
| | | | Jersey 1.5% | | | | |
| | 220,900 | | WPP PLC | | | 2,160,464 | |
| | | | | | | | |
| | | | Mexico 1.1% | | | | |
| | 36,300 | | America Movil SAB de C.V. - ADR | | | 1,705,374 | |
| | | | | | | | |
| | | | Netherlands 6.5% | | | | |
| | 49,253 | | ASML Holding NV | | | 1,681,585 | |
| | 126,400 | | Koninklijke KPN NV | | | 2,148,479 | |
The accompanying notes are an integral part of these financial statements.
Frontegra Mastholm International Equity Fund
SCHEDULE OF INVESTMENTS (continued)
December 31, 2009 (Unaudited)
| Number of Shares | | | | Value | |
COMMON STOCKS 95.0% (continued) | | | |
| | | Netherlands 6.5% (continued) | | | |
| | 100,100 | | Koninklijke Philips Electronics NV | | $ | 2,958,886 | |
| | 94,600 | | TNT NV | | | 2,906,439 | |
| | | | | | | 9,695,389 | |
| | | | Norway 3.3% | | | | |
| | 147,700 | | Seadrill Ltd. (a) | | | 3,757,917 | |
| | 162,800 | | Storebrand ASA (a) | | | 1,107,969 | |
| | | | | | | 4,865,886 | |
| | | | South Korea 1.7% | | | | |
| | 7,511 | | Samsung Electronics | | | | |
| | | | Co., Ltd. - ADR GDR | | | 2,603,913 | |
| | | | | | | | |
| | | | Switzerland 15.0% | | | | |
| | 41,700 | | Actelion Ltd. (a) | | | 2,227,214 | |
| | 40,500 | | Adecco SA | | | 2,234,181 | |
| | 263,800 | | Clariant AG (a) | | | 3,119,465 | |
| | 89,948 | | Credit Suisse Group AG | | | 4,456,147 | |
| | 1,900 | | Givaudan AG | | | 1,520,314 | |
| | 14,127 | | Holcim Ltd. (a) | | | 1,097,928 | |
| | 78,600 | | Nestle SA | | | 3,814,744 | |
| | 20,400 | | Novartis AG | | | 1,114,028 | |
| | 21,200 | | Sonova Holding AG | | | 2,568,382 | |
| | | | | | | 22,152,403 | |
| | | | Taiwan 1.3% | | | | |
| | 170,600 | | Taiwan Semiconductor | | | | |
| | | | Manufacturing Co. Ltd. - ADR | | | 1,951,664 | |
| | | | | | | | |
| | | | United Kingdom 12.9% | | | | |
| | 92,520 | | BG Group PLC | | | 1,670,564 | |
| | 318,000 | | BT Group PLC | | | 692,549 | |
| | 229,300 | | HSBC Holdings PLC | | | 2,615,928 | |
| | 75,342 | | Imperial Tobacco Group PLC | | | 2,376,837 | |
| | 470,000 | | Kingfisher PLC | | | 1,730,165 | |
| | 26,728 | | Rio Tinto PLC | | | 1,443,223 | |
| | 79,064 | | Unilever PLC | | | 2,534,420 | |
| | 1,006,155 | | Vodafone Group PLC | | | 2,329,961 | |
| | 205,900 | | Xstrata PLC (a) | | | 3,672,442 | |
| | | | | | | 19,066,089 | |
| | | | Total Common Stocks | | | | |
| | | | (Cost $129,622,063) | | | 140,520,006 | |
| | | | | | | | |
| SHORT-TERM INVESTMENTS 4.1% | | | | |
| | | | Investment Company 4.1% | | | | |
| | 6,080,084 | | Fidelity Institutional | | | | |
| | | | Money Market Portfolio | | | 6,080,084 | |
| | | | Total Short-Term Investments | | | | |
| | | | (Cost $6,080,084) | | | 6,080,084 | |
| | | | | | | | |
| | | | Total Investments 99.1% | | | | |
| | | | (Cost $135,702,147) | | | 146,600,090 | |
| | | | | | | | |
| | | | Other Assets in Excess | | | | |
| | | | of Liabilities 0.9% | | | 1,275,757 | |
| | | | | | | | |
| | | | TOTAL NET ASSETS 100.0% | | $ | 147,875,847 | |
ADR - American Depositary Receipt.
GDR - Global Depositary Receipt.
ALLOCATION OF PORTFOLIO HOLDINGS
At December 31, 2009, the allocation of portfolio holdings as a percentage of the Fund’s total net assets were:
| Common Stock | | | 95.0 | % |
| Short-Term Investments | | | 4.1 | |
| Other Assets in Excess of Liabilities | | | 0.9 | |
| | | | 100.0 | % |
The accompanying notes are an integral part of these financial statements.
Frontegra Mastholm International Equity Fund
PORTFOLIO DIVERSIFICATION
December 31, 2009 (Unaudited)
| | | Value | | | Percentage | |
| Consumer Discretionary | | $ | 20,778,611 | | | | 14.1 | % |
| Consumer Staples | | | 11,158,175 | | | | 7.5 | % |
| Energy | | | 15,313,070 | | | | 10.4 | % |
| Financials | | | 18,046,155 | | | | 12.2 | % |
| Health Care | | | 14,478,828 | | | | 9.8 | % |
| Industrials | | | 17,769,454 | | | | 12.0 | % |
| Information Technology | | | 16,692,867 | | | | 11.3 | % |
| Materials | | | 19,406,483 | | | | 13.1 | % |
| Telecomm Service | | | 6,876,363 | | | | 4.6 | % |
| Total Common Stocks | | | 140,520,006 | | | | 95.0 | % |
| Total Short-Term Investments | | | 6,080,084 | | | | 4.1 | % |
| Total Investments | | | 146,600,090 | | | | 99.1 | % |
| Other Assets in Excess of Liabilities | | | 1,275,757 | | | | 0.9 | % |
| Total Net Assets | | $ | 147,875,847 | | | | 100.0 | % |
The accompanying notes are an integral part of these financial statements.
Frontegra Mastholm International Equity Fund
STATEMENT OF ASSETS AND LIABILITIES
December 31, 2009 (Unaudited)
| Assets: | | | |
| Investments at value (cost $135,702,147) | | $ | 146,600,090 | |
| Cash | | | 337,588 | |
| Interest and dividends receivable | | | 928,486 | |
| Receivable for Fund shares sold | | | 33,610 | |
| Prepaid expenses and other assets | | | 63,240 | |
| Total assets | | | 147,963,014 | |
| | | | | |
| Liabilities: | | | | |
| Accrued investment advisory fee | | | 43,073 | |
| Accrued expenses | | | 39,522 | |
| Payable to custodian for foreign currency | | | 4,572 | |
| Total liabilities | | | 87,167 | |
| Net Assets | | $ | 147,875,847 | |
| | | | | |
| Net Assets Consist of: | | | | |
| Paid in capital | | $ | 244,687,301 | |
| Undistributed net investment income | | | 269,073 | |
| Accumulated net realized loss | | | (108,054,272 | ) |
| Net unrealized appreciation on: | | | | |
| Investments | | | 10,897,943 | |
| Foreign Currency | | | 75,802 | |
| Net Assets | | $ | 147,875,847 | |
| | | | | |
| Capital Stock, $0.01 Par Value | | | | |
| Authorized | | | 100,000,000 | |
| Issued and outstanding | | | 16,825,890 | |
| Net Asset Value, Redemption Price and Offering Price Per Share | | $ | 8.79 | |
The accompanying notes are an integral part of these financial statements.
Frontegra Mastholm International Equity Fund
STATEMENT OF OPERATIONS
| | | Six Months Ended | |
| | | December 31, 2009 | |
| | | (Unaudited) | |
| Investment Income: | | | |
Dividend income(1) | | $ | 1,265,845 | |
| Interest income | | | 5,569 | |
| Total Investment Income | | | 1,271,414 | |
| | | | | |
| Expenses: | | | | |
| Investment advisory fees (Note 3) | | | 932,954 | |
| Custody fees | | | 141,237 | |
| Fund administration and accounting fees | | | 42,754 | |
| Audit fees | | | 22,100 | |
| Legal fees | | | 20,626 | |
| Federal and state registration fees | | | 13,321 | |
| Shareholder servicing fees | | | 10,751 | |
| Reports to shareholders | | | 7,792 | |
| Directors’ fees and related expenses | | | 4,232 | |
| Interest expense | | | 1,185 | |
| Compliance related expenses | | | 1,025 | |
| Other | | | 8,370 | |
| Total expenses before waiver and reimbursement | | | 1,206,347 | |
| Waiver and reimbursement of expenses by Adviser (Note 3) | | | (468,665 | ) |
| Net expenses | | | 737,682 | |
| Net Investment Income | | | 533,732 | |
| | | | | |
| Realized and Unrealized Gain (Loss) on Investments: | | | | |
| Net realized gain (loss) on: | | | | |
| Investments | | | 15,862,282 | |
| Foreign currency transactions | | | (19,176 | ) |
| Change in net unrealized appreciation/(depreciation) on: | | | | |
| Investments | | | 17,213,465 | |
| Foreign currency transactions | | | 74,189 | |
| Net Realized and Unrealized Gain on Investments | | | 33,130,760 | |
| Net Increase in Net Assets Resulting from Operations | | $ | 33,664,492 | |
| | | | | |
(1) Net of $67,605 in foreign withholding taxesz
The accompanying notes are an integral part of these financial statements.
Frontegra Mastholm International Equity Fund
STATEMENTS OF CHANGES IN NET ASSETS
| | | For the Six Months | | | | |
| | | Ended | | | For the Year | |
| | | December 31, 2009 | | | Ended | |
| | | (Unaudited) | | | June 30, 2009 | |
| Operations: | | | | | | |
| Net investment income | | $ | 533,732 | | | $ | 5,652,381 | |
| Net realized gain (loss) on: | | | | | | | | |
| Investments | | | 15,862,282 | | | | (120,490,311 | ) |
| Foreign currency transactions | | | (19,176 | ) | | | (167,107 | ) |
| Change in net unrealized appreciation/(depreciation) on: | | | | | | | | |
| Investments | | | 17,213,465 | | | | (49,838,040 | ) |
| Foreign currency translation | | | 74,189 | | | | 77,733 | |
| Net increase (decrease) in net assets resulting from operations | | | 33,664,492 | | | | (164,765,344 | ) |
Distributions Paid From: | | | | | | | | |
| Net investment income | | | (5,738,700 | ) | | | (10,274,560 | ) |
| Net realized gain on investments | | | — | | | | (11,287,593 | ) |
| Net decrease in net assets resulting from distributions paid | | | (5,738,700 | ) | | | (21,562,153 | ) |
Capital Share Transactions: | | | | | | | | |
| Shares sold | | | 12,204,489 | | | | 32,708,631 | |
| Shares issued to holders in reinvestment of distributions | | | 5,738,700 | | | | 17,427,623 | |
| Shares redeemed | | | (97,876,902 | )(1) | | | (138,012,420 | ) |
| Net decrease in net assets resulting from capital share transactions | | | (79,933,713 | ) | | | (87,876,166 | ) |
| Total Decrease in Net Assets | | | (52,007,921 | ) | | | (274,203,663 | ) |
Net Assets: | | | | | | | | |
| Beginning of Period | | | 199,883,768 | | | | 474,087,431 | |
| End of Period (includes undistributed net investment | | | | | | | | |
| income of $269,073 and $5,474,041 respectively) | | $ | 147,875,847 | | | $ | 199,883,768 | |
Transactions in Shares: | | | | | | | | |
| Shares sold | | | 1,387,262 | | | | 3,543,690 | |
| Shares issued to holders in reinvestment of distributions | | | 664,201 | | | | 2,311,356 | |
| Shares redeemed | | | (10,793,875 | ) | | | (16,095,020 | ) |
| Net decrease in shares outstanding | | | (8,742,412 | ) | | | (10,239,974 | ) |
| (1) | Net of redemption fees of $1,445 for the six months ended December 31, 2009. |
The accompanying notes are an integral part of these financial statements.
Frontegra Mastholm International Equity Fund
FINANCIAL HIGHLIGHTS
| | | Six Months | | | | | | | | | | | | | | | | |
| | | Ended | | | Year | | | Year | | | Year | | | Year | | | Year | |
| | | December 31, | | | Ended | | | Ended | | | Ended | | | Ended | | | Ended | |
| | | 2009 | | | June 30, | | | June 30, | | | June 30, | | | June 30, | | | June 30, | |
| | | (Unaudited)(1) | | | 2009 | | | 2008 | | | 2007 | | | 2006 | | | 2005 | |
| Net Asset Value, Beginning of Period | | $ | 7.82 | | | $ | 13.24 | | | $ | 16.11 | | | $ | 13.08 | | | $ | 11.07 | | | $ | 10.03 | |
| | | | | | | | | | | | | | | | | | | | | | | | | |
| Income (Loss) from | | | | | | | | | | | | | | | | | | | | | | | | |
| Investment Operations: | | | | | | | | | | | | | | | | | | | | | | | | |
| Net investment income | | | 0.16 | | | | 0.29 | | | | 0.31 | | | | 0.25 | | | | 0.31 | (2) | | | 0.21 | (2) |
| Net realized and unrealized gain (loss) on investments | | | 1.17 | | | | (4.97 | ) | | | (1.75 | ) | | | 3.25 | | | | 1.81 | | | | 0.87 | |
| Total Income (Loss) from Investment Operations | | | 1.33 | | | | (4.68 | ) | | | (1.44 | ) | | | 3.50 | | | | 2.12 | | | | 1.08 | |
| | | | | | | | | | | | | | | | | | | | | | | | | |
| Less Distributions: | | | | | | | | | | | | | | | | | | | | | | | | |
| From net investment income | | | (0.36 | ) | | | (0.35 | ) | | | (0.25 | ) | | | (0.22 | ) | | | (0.07 | ) | | | (0.01 | ) |
| From net realized gain on investments | | | — | | | | (0.39 | ) | | | (1.18 | ) | | | (0.25 | ) | | | (0.04 | ) | | | (0.03 | ) |
| Total Distributions | | | (0.36 | ) | | | (0.74 | ) | | | (1.43 | ) | | | (0.47 | ) | | | (0.11 | ) | | | (0.04 | ) |
| | | | | | | | | | | | | | | | | | | | | | | | | |
| Net Asset Value, End of Period | | $ | 8.79 | | | $ | 7.82 | | | $ | 13.24 | | | $ | 16.11 | | | $ | 13.08 | | | $ | 11.07 | |
| Total Return | | | 17.03 | %(3) | | | (35.13 | )% | | | (9.60 | )% | | | 27.12 | % | | | 19.27 | % | | | 10.87 | % |
| | | | | | | | | | | | | | | | | | | | | | | | | |
| Supplemental Data and Ratios: | | | | | | | | | | | | | | | | | | | | | | | | |
| Net assets, end of period (in thousands) | | $ | 147,846 | | | $ | 199,884 | | | $ | 474,087 | | | $ | 712,620 | | | $ | 531,321 | | | $ | 137,478 | |
| Ratio of expenses to average net assets | | | | | | | | | | | | | | | | | | | | | | | | |
| Before waivers and reimbursements | | | 1.23 | %(4) | | | 1.16 | % | | | 1.06 | % | | | 1.07 | % | | | 1.09 | % | | | 1.31 | % |
| Net of waivers and reimbursements | | | 0.75 | %(4) | | | 0.75 | % | | | 0.75 | % | | | 0.75 | % | | | 0.75 | % | | | 0.95 | % |
| Ratio of net investment income to average net assets | | | | | | | | | | | | | | | | | | | | | | | | |
| Before waivers and reimbursements | | | 0.07 | %(4) | | | 1.78 | % | | | 1.44 | % | | | 1.30 | % | | | 1.60 | % | | | 1.60 | % |
| Net of waivers and reimbursements | | | 0.55 | %(4) | | | 2.19 | % | | | 1.75 | % | | | 1.62 | % | | | 1.94 | % | | | 1.96 | % |
| Portfolio turnover rate | | | 132 | %(3) | | | 57 | % | | | 54 | % | | | 62 | % | | | 35 | % | | | 44 | % |
| | | | | | | | | | | | | | | | | | | | | | | | | |
| (1) | Effective October 12, 2009, Mastholm Asset Management, LLC became subadviser to the Fund. |
| (2) | Per share net investment income has been calculated using the daily average share method. |
The accompanying notes are an integral part of these financial statements.
FRONTEGRA
NETOLS SMALL CAP
VALUE FUND
REPORT FROM NETOLS ASSET MANAGEMENT, INC.:
Dear Fellow Shareholders:
During the six months ended December 31, 2009, the Frontegra Netols Small Cap Value Fund (Institutional Class) returned 17.86%, net of fees, compared to 27.15% for the Russell 2000 Value Index.
Portfolio Review
The dominant market factor in the second half of 2009 was the stabilization of the world economy. The financial markets stabilized as the U.S. government provided an unprecedented level of liquidity. Additionally, China’s stimulus plan appeared to drive solid growth in the region. As a result, the Materials and Energy sectors were among the best performers. Consumer Discretionary also outperformed as the rate of change in unemployment numbers began to moderate. Conversely, Consumer Staples and Utilities underperformed as investors increased their appetite for risk.
Portfolio Outlook
Our market outlook is somewhat mixed. Most signs point to improvement in the economy. Companies are seeing improvement in their businesses but at reduced levels. Corporate cost structures have been significantly reduced to lessen the impact of the downturn, but now need sales volumes to return to drive profitability. Additionally, the U.S. consumer appears again willing to spend available money as deep discounting drove an improvement in sales. However, questions remain regarding the strength of the economy without government stimulus and the impact when the availability of low cost capital for the financial system is reduced. It also remains to be seen if China can provide a sustainable lift to the world economy, effectively filling the void left by the U.S. consumer.
Positive Contributions to Relative Performance in the second half of 2009:
| | • | Stock selection in Energy and Information Technology sectors |
| | • | Overweight in Energy sector |
| | • | Best performing stocks for the period: ION Geophysical, Kansas City Southern, Whiting Petroleum, Sunrise Senior Living, Tenneco |
Negative Contributions to Relative Performance in the second half of 2009:
| | • | Stock selection in Materials and Consumer Discretionary sectors |
| | • | Overweight in Health Care sector |
| | • | Worst performing stocks for the period: Champion Enterprises, Take-Two Interactive Software, ENGlobal, General Maritime, Smith & Wesson |
Thank you for your continued support.
Jeff Netols
Netols Asset Management, Inc.
INVESTMENT HIGHLIGHTS
Growth of a $100,000 Investment (Unaudited)
* 12/16/05 commencement of operations.
| | Portfolio Total Return** | | | |
| | FOR PERIODS ENDED 12/31/09 | FUND | INDEX | |
| | | | | |
| | SIX MONTHS | 17.86% | 27.15% | |
| | | | | |
| | ONE YEAR | 18.38% | 20.58% | |
| | | | | |
| | THREE YEAR | (1.96)% | (8.22)% | |
| | | | | |
| | SINCE COMMENCEMENT | | | |
| | AVERAGE ANNUAL | 2.08% | (1.49)% | |
This chart assumes an initial gross investment of $100,000 made on 12/16/05 (commencement of operations). Returns shown include the reinvestment of all distributions. Past performance is not predictive of future results. Investment return and principal value will fluctuate so that shares, when redeemed, may be worth more or less than the original cost. In the absence of existing fee waivers, total return would be reduced. To receive current to the most recent month-end performance, please call 1-888-825-2100.
The Russell 2000 Value Index measures the performance of those Russell 2000 companies with lower price-to-book ratios and lower forecasted growth values. The Russell 2000 Index measures the performance of the 2,000 smallest companies in the Russell 3000 Index. The Russell 3000 Index measures the performance of the 3,000 largest U.S. companies based on total market capitalization. The Index does not reflect investment management fees, brokerage commissions and other expenses associated with investing in equity securities. A direct investment in the index is not possible.
| ** | The returns shown do not reflect the deduction of taxes that a shareholder would pay on Fund distributions or the redemption of Fund shares. |
The above graph relates to Institutional Class shares of the Fund. Performance for Class Y shares will vary from the performance of the Institutional Class shares shown above due to differences in expenses.
Frontegra Netols Small Cap Value Fund
SCHEDULE OF INVESTMENTS
December 31, 2009 (Unaudited)
| Number of Shares | | | | Value | |
| COMMON STOCKS 95.6% | | | |
| | | Advertising 1.4% | | | |
| | 58,652 | | Arbitron, Inc. | | $ | 1,373,630 | |
| | | | | | | | |
| | | | Aerospace & Defense 1.2% | | | | |
| | 16,073 | | American Science & Engineering, Inc. | | | 1,218,976 | |
| | | | | | | | |
| | | | Apparel & Accessories 2.9% | | | | |
| | 63,336 | | Carter’s, Inc. (a) | | | 1,662,570 | |
| | 42,880 | | Under Armour, Inc. (a) | | | 1,169,338 | |
| | | | | | | 2,831,908 | |
| | | | Application Software 1.5% | | | | |
| | 68,960 | | Fair Isaac Corp. | | | 1,469,538 | |
| | | | | | | | |
| | | | Auto Parts & Equipment 2.3% | | | | |
| | 73,505 | | Modine Manufacturing Co. (a) | | | 870,299 | |
| | 79,850 | | Tenneco, Inc. (a) | | | 1,415,740 | |
| | | | | | | 2,286,039 | |
| | | | Building Materials 0.8% | | | | |
| | 52,712 | | Gibraltar Industries, Inc. | | | 829,160 | |
| | | | | | | | |
| | | | Chemicals - Agriculture/Fertilizer 1.8% | | | | |
| | 53,888 | | Terra Industries, Inc. | | | 1,734,655 | |
| | | | | | | | |
| | | | Chemicals - Commodity 1.3% | | | | |
| | 121,866 | | Spartech Corp. | | | 1,250,345 | |
| | | | | | | | |
| | | | Communications | | | | |
| | | | Equipment Manufacturing 0.2% | | | | |
| | 30,400 | | Harmonic, Inc. (a) | | | 192,432 | |
| | | | | | | | |
| | | | Construction & Engineering 0.8% | | | | |
| | 44,758 | | Tutor Perini Corp. (a) | | | 809,225 | |
| | | | | | | | |
| | | | Diversified Metals & Mining 2.3% | | | | |
| | 33,704 | | Compass Minerals International, Inc. | | | 2,264,572 | |
| | | | | | | | |
| | | | Educational Services 0.9% | | | | |
| | 67,303 | | Corinthian Colleges, Inc. (a) | | | 926,762 | |
| | | | | | | | |
| | | | Electrical Component 1.2% | | | | |
| | 24,685 | | C&D Technologies, Inc. (a) | | | 38,262 | |
| | 40,264 | | General Cable Corp. (a) | | | 1,184,567 | |
| | | | | | | 1,222,829 | |
| | | | Food Distributors 1.6% | | | | |
| | 59,244 | | United Natural Foods, Inc. (a) | | | 1,584,185 | |
| | | | | | | | |
| | | | General Medical and | | | | |
| | | | Surgical Hospitals 0.8% | | | | |
| | 18,275 | | Magellan Health Services, Inc. (a) | | | 744,341 | |
| | | | | | | | |
| | | | General Merchandise 0.8% | | | | |
| | 77,354 | | Fred’s, Inc. - Class A | | | 789,011 | |
| | | | | | | | |
| | | | Health Care - Distributors 2.1% | | | | |
| | 89,811 | | PSS World Medical, Inc. (a) | | | 2,027,034 | |
| | | | | | | | |
| | | | Health Care - Facility 1.4% | | | | |
| | 89,632 | | Sunrise Senior Living, Inc. (a) | | | 288,615 | |
| | 65,020 | | U.S. Physical Therapy, Inc. (a) | | | 1,100,789 | |
| | | | | | | 1,389,404 | |
| | | | Health Care - Services 1.3% | | | | |
| | 46,406 | | Gentiva Health Services, Inc. (a) | | | 1,253,426 | |
| | | | | | | | |
| | | | Health Care - Supplies 6.9% | | | | |
| | 21,630 | | Haemonetics Corp. (a) | | | 1,192,894 | |
| | 41,647 | | ICU Medical, Inc. (a) | | | 1,517,617 | |
| | 100,559 | | Medical Action Industries, Inc. (a) | | | 1,614,978 | |
| | 127,065 | | Merit Medical Systems, Inc. (a) | | | 2,451,084 | |
| | | | | | | 6,776,573 | |
| | | | Insurance - Property/Casualty 1.5% | | | | |
| | 33,447 | | Hanover Insurance Group, Inc. | | | 1,486,050 | |
The accompanying notes are an integral part of these financial statements.
Frontegra Netols Small Cap Value Fund
SCHEDULE OF INVESTMENTS (continued)
December 31, 2009 (Unaudited)
| Number of Shares | | | | Value | |
COMMON STOCKS 95.6% (continued) | | | |
| | | Investment Bank & Brokerage 1.0% | | | |
| | 11,593 | | Greenhill & Co., Inc. | | $ | 930,222 | |
| | | | | | | | |
| | | | IT Consulting & Services 3.7% | | | | |
| | 37,876 | | CACI International, Inc. - Class A (a) | | | 1,850,243 | |
| | 37,462 | | ManTech International | | | | |
| | | | Corp. - Class A (a) | | | 1,808,665 | |
| | | | | | | 3,658,908 | |
| | | | Leisure Products 0.6% | | | | |
| | 149,461 | | Smith & Wesson Holding Corp. (a) | | | 611,295 | |
| | | | | | | | |
| | | | Machinery - Construction / Farm 2.3% | | | | |
| | 108,044 | | Titan International, Inc. | | | 876,237 | |
| | 34,909 | | Westinghouse Air Brake | | | | |
| | | | Technologies Corp. | | | 1,425,684 | |
| | | | | | | 2,301,921 | |
| | | | Machinery - Industrial 5.9% | | | | |
| | 28,711 | | Gardner Denver, Inc. (a) | | | 1,221,653 | |
| | 34,704 | | IDEX Corp. | | | 1,081,030 | |
| | 37,146 | | Kaydon Corp. | | | 1,328,341 | |
| | 15,330 | | Nordson Corp. | | | 937,889 | |
| | 53,197 | | Robbins & Myers, Inc. | | | 1,251,193 | |
| | | | | | | 5,820,106 | |
| | | | Marine 1.5% | | | | |
| | 42,895 | | Alexander & Baldwin, Inc. | | | 1,468,296 | |
| | | | | | | | |
| | | | Movies and Entertainment 1.5% | | | | |
| | 35,999 | | DreamWorks Animation SKG, Inc. (a) | | | 1,438,160 | |
| | | | | | | | |
| | | | Oil & Gas - Equipment/Services 2.4% | | | | |
| | 36,303 | | ENGlobal Corp. (a) | | | 113,628 | |
| | 216,976 | | ION Geophysical Corp. (a) | | | 1,284,498 | |
| | 132,873 | | North American | | | | |
| | | | Energy Partners (a)(b) | | | 964,658 | |
| | | | | | | 2,362,784 | |
| | | | Oil & Gas - Exploration/Products 4.0% | | | | |
| | 70,288 | | Forest Oil Corp. (a) | | | 1,563,908 | |
| | 33,567 | | Whiting Petroleum Corp. (a) | | | 2,398,362 | |
| | | | | | | 3,962,270 | |
| | | | Oil & Gas - Storage 0.9% | | | | |
| | 125,881 | | General Maritime Corp. | | | 879,908 | |
| | | | | | | | |
| | | | Packaged Foods/Meats 3.9% | | | | |
| | 61,663 | | Lance, Inc. | | | 1,621,737 | |
| | 56,832 | | TreeHouse Foods, Inc. (a) | | | 2,208,491 | |
| | | | | | | 3,830,228 | |
| | | | Personal Products 1.7% | | | | |
| | 17,370 | | Chattem, Inc. (a) | | | 1,620,621 | |
| | | | | | | | |
| | | | Railroads 3.1% | | | | |
| | 40,627 | | Genesee & Wyoming, Inc. (a) | | | 1,326,065 | |
| | 50,886 | | Kansas City Southern (a) | | | 1,693,995 | |
| | | | | | | 3,020,060 | |
| | | | Regional Banks 8.0% | | | | |
| | 29,224 | | Bank of Hawaii Corp. | | | 1,375,281 | |
| | 69,033 | | First Midwest Bancorp, Inc. | | | 751,769 | |
| | 67,806 | | Glacier Bancorp, Inc. | | | 930,298 | |
| | 117,660 | | Old National Bancorp | | | 1,462,514 | |
| | 35,164 | | Prosperity Bancshares, Inc. | | | 1,423,087 | |
| | 33,732 | | Westamerica Bancorporation | | | 1,867,741 | |
| | | | | | | 7,810,690 | |
| | | | Research & Consulting 1.1% | | | | |
| | 43,920 | | School Specialty, Inc. (a) | | | 1,027,289 | |
| | | | | | | | |
| | | | Residential REITS 3.2% | | | | |
| | 33,777 | | Mid-America Apartment | | | | |
| | | | Communities, Inc. | | | 1,630,754 | |
| | 75,546 | | Sun Communities, Inc. | | | 1,492,033 | |
| | | | | | | 3,122,787 | |
| | | | Restaurants 1.7% | | | | |
| | 78,831 | | The Cheesecake Factory, Inc. (a) | | | 1,701,961 | |
The accompanying notes are an integral part of these financial statements.
Frontegra Netols Small Cap Value Fund
SCHEDULE OF INVESTMENTS (continued)
December 31, 2009 (Unaudited)
| Number of Shares | | | | Value | |
COMMON STOCKS 95.6% (continued) | | | |
| | | Retail - Apparel 1.2% | | | |
| | 86,914 | | AnnTaylor Stores Corp. (a) | | $ | 1,185,507 | |
| | | | | | | | |
| | | | Retail REITS 0.9% | | | | |
| | 132,808 | | Cedar Shopping Centers, Inc. | | | 903,094 | |
| | | | | | | | |
| | | | Semiconductor Equipment 2.9% | | | | |
| | 83,761 | | Advanced Energy Industries, Inc. (a) | | | 1,263,116 | |
| | 292,517 | | Entegris, Inc. (a) | | | 1,544,490 | |
| | | | | | | 2,807,606 | |
| | | | Semiconductors 1.6% | | | | |
| | 159,411 | | Fairchild Semiconductor | | | | |
| | | | International, Inc. (a) | | | 1,592,516 | |
| | | | | | | | |
| | | | Services - Environmental 2.6% | | | | |
| | 135,129 | | EnergySolutions, Inc. | | | 1,147,245 | |
| | 63,767 | | Fuel Tech, Inc. (a) | | | 520,977 | |
| | 33,906 | | Tetra Tech, Inc. (a) | | | 921,226 | |
| | | | | | | 2,589,448 | |
| | | | Specialty Stores 1.5% | | | | |
| | 28,119 | | Tractor Supply Co. (a) | | | 1,489,182 | |
| | | | | | | | |
| | | | Steel 1.0% | | | | |
| | 60,276 | | Commercial Metals Co. | | | 943,319 | |
| | | | Technology Distributions 0.1% | | | | |
| | 28,728 | | GTSI Corp. (a) | | | 142,778 | |
| | | | | | | | |
| | | | Thrifts & Mortgage Finance 1.5% | | | | |
| | 64,003 | | Astoria Financial Corp. | | | 795,557 | |
| | 119,238 | | MGIC Investment Corp. (a) | | | 689,196 | |
| | | | | | | 1,484,753 | |
| | | | Trading Companies & Distributors 0.8% | | | | |
| | 26,457 | | GATX Corp. | | | 760,639 | |
| | | | Total Common Stock | | | | |
| | | | (Cost $83,987,172) | | | 93,926,443 | |
| | | | | | | | |
SHORT TERM INVESTMENTS 3.3% | | | | |
Investment Company 3.3% | | | | |
| | 3,262,314 | | Fidelity Money Market Portfolio | | | 3,262,314 | |
| | | | Total Short-Term Investments | | | | |
| | | | (Cost $3,262,314) | | | 3,262,314 | |
| | | | | | | | |
| | | | Total Investments 98.9% | | | | |
| | | | (Cost $87,249,486) | | | 97,188,757 | |
| | | | | | | | |
| | | | Other Assets in Excess | | | | |
| | | | of Liabilities 1.1% | | | 1,114,673 | |
| | | | | | | | |
| | | | TOTAL NET ASSETS 100.0% | | $ | 98,303,430 | |
| (b) | U.S.-dollar denominated security of foreign issuer. |
ALLOCATION OF PORTFOLIO HOLDINGS
At December 31, 2009, the allocation of portfolio holdings as a percentage of the Fund’s total net assets were:
| Common Stock | | | 95.6 | % |
| Short-Term Investments | | | 3.3 | |
| Other Assets in Excess of Liabilities | | | 1.1 | |
| | | | 100.0 | % |
The accompanying notes are an integral part of these financial statements.
Frontegra Netols Small Cap Value Fund
STATEMENT OF ASSETS AND LIABILITIES
December 31, 2009 (Unaudited)
| Assets: | | | |
| Investments at value (cost $87,249,486) | | $ | 97,188,757 | |
| Interest receivable | | | 34,472 | |
| Receivable for Fund shares sold | | | 1,142,207 | |
| Prepaid expenses and other assets | | | 17,053 | |
| Total assets | | | 98,382,489 | |
| | | | | |
| Liabilities: | | | | |
| Accrued investment advisory fee | | | 50,076 | |
| Accrued distribution and shareholder servicing fees | | | 1,126 | |
| Accrued expenses | | | 27,857 | |
| Total liabilities | | | 79,059 | |
| Net Assets | | $ | 98,303,430 | |
| | | | | |
| Net Assets Consist of: | | | | |
| Paid in capital | | $ | 96,535,415 | |
| Undistributed net investment income | | | 212,138 | |
| Accumulated net realized loss | | | (8,383,394 | ) |
| Unrealized appreciation on investments | | | 9,939,271 | |
| Net Assets | | $ | 98,303,430 | |
| | | | | |
Capital Stock, $0.01 Par Value | | | | |
| Institutional Class Shares Authorized | | | 50,000,000 | |
| Class Y Shares Authorized | | | 50,000,000 | |
| | | | | |
| Institutional Class: | | | | |
| Net Assets | | $ | 97,188,982 | |
| Issued and Outstanding | | | 9,143,059 | |
| Net Asset Value, Redemption Price and Offering Price Per Share | | $ | 10.63 | |
| | | | | |
| Class Y: | | | | |
| Net Assets | | $ | 1,114,448 | |
| Issued and Outstanding | | | 105,435 | |
| Net Asset Value, Redemption Price and Offering Price Per Share | | $ | 10.57 | |
The accompanying notes are an integral part of these financial statements.
Frontegra Netols Small Cap Value Fund
STATEMENT OF OPERATIONS
| | | Six Months | |
| | | December 31, 2009 | |
| | | (Unaudited) | |
| Investment Income: | | | |
| Dividend income | | $ | 612,979 | |
| Interest income | | | 4,582 | |
| Total Investment Income | | | 617,561 | |
| | | | | |
| Expenses: | | | | |
| Investment advisory fees (Note 3) | | | 298,070 | |
| Fund administration and accounting fees | | | 16,475 | |
| Legal fees | | | 14,278 | |
| Audit fees | | | 12,917 | |
| Custody fees | | | 8,619 | |
| Federal and state registration fees | | | 7,279 | |
| Shareholder servicing fees | | | 7,279 | |
| Directors’ fees and related expenses | | | 4,032 | |
| Distribution and shareholder servicing fees - Class Y (Note 8) | | | 2,027 | |
| Reports to shareholders | | | 1,762 | |
| Compliance related expenses | | | 1,020 | |
| Other | | | 2,196 | |
| Total expenses before waiver and reimbursement | | | 375,954 | |
| Waiver and reimbursement of expenses by Adviser (Note 3) | | | (46,175 | ) |
| Net expenses | | | 329,779 | |
| Net Investment Income | | | 287,782 | |
| | | | | |
| Realized and Unrealized Gain (Loss) on Investments: | | | | |
| Net realized loss on: | | | | |
| Investments | | | (4,192,570 | ) |
| Change in net unrealized appreciation/(depreciation) on: | | | | |
| Investments | | | 13,427,230 | |
| Net Realized and Unrealized Gain on Investments | | | 9,234,660 | |
| Net Increase in Net Assets Resulting from Operations | | $ | 9,522,442 | |
The accompanying notes are an integral part of these financial statements.
Frontegra Netols Small Cap Value Fund
STATEMENTS OF CHANGES IN NET ASSETS
| | | For the Six | | | | |
| | | Months Ended | | | For the | |
| | | December 31, 2009 | | | Year Ended | |
| | | (Unaudited) | | | June 30, 2009 | |
| Operations: | | | | | | |
| Net investment income | | $ | 287,782 | | | $ | 65,463 | |
| Net realized loss on investments: | | | (4,192,570 | ) | | | (3,424,284 | ) |
| Change in net unrealized appreciation/(depreciation) on investments | | | 13,427,230 | | | | (4,798,290 | ) |
| Net increase (decrease) in net assets resulting from operations | | | 9,522,442 | | | | (8,157,111 | ) |
Distributions Paid to Institutional Class Shareholders From: | | | | | | | | |
| Net investment income | | | (140,161 | ) | | | (12,872 | ) |
| Net realized gain | | | — | | | | — | |
| Net decrease in net assets resulting from distributions paid | | | (140,161 | ) | | | (12,872 | ) |
Distributions Paid to Class Y Shareholders From: | | | | | | | | |
| Net investment income | | | — | | | | — | |
| Net realized gain | | | — | | | | — | |
| Net decrease in net assets resulting from distributions paid | | | — | | | | — | |
Capital Share Transactions: | | | | | | | | |
| Shares sold - Institutional Class | | | 50,545,615 | | | | 25,776,914 | |
| Shares sold - Class Y | | | 117,486 | | | | 172,350 | |
| Shares issued to holders in reinvestment of distributions - Institutional Class | | | 100,276 | | | | 11,142 | |
| Shares issued to holders in reinvestment of distributions - Class Y | | | — | | | | — | |
| Shares redeemed - Institutional Class | | | (6,182,066 | ) | | | (5,704,581 | ) |
| Shares redeemed - Class Y | | | (59,030 | ) | | | (66,608 | ) |
| Net increase in net assets resulting from capital share transactions | | | 44,522,281 | | | | 20,189,217 | |
| Total Increase in Net Assets | | | 53,904,562 | | | | 12,019,234 | |
Net Assets: | | | | | | | | |
| Beginning of Period | | | 44,398,868 | | | | 32,379,634 | |
| End of Period (includes undistributed net investment income of $212,138 and $64,517 respectively) | | $ | 98,303,430 | | | $ | 44,398,868 | |
Transactions In Shares – Institutional Class: | | | | | | | | |
| Shares sold | | | 4,935,965 | | | | 2,834,988 | |
| Shares issued to holders in reinvestment of distributions | | | 9,764 | | | | 1,297 | |
| Shares redeemed | | | (619,421 | ) | | | (674,248 | ) |
| Net increase in shares outstanding | | | 4,326,308 | | | | 2,162,037 | |
Transactions In Shares – Class Y: | | | | | | | | |
| Shares sold | | | 11,739 | | | | 18,620 | |
| Shares issued to holders in reinvestment of distributions | | | — | | | | — | |
| Shares redeemed | | | (5,964 | ) | | | (6,746 | ) |
| Net increase in shares outstanding | | | 5,775 | | | | 11,874 | |
The accompanying notes are an integral part of these financial statements.
Frontegra Netols Small Cap Value Fund
FINANCIAL HIGHLIGHTS
| | | Institutional Class | |
| | | Six Months | | | | | | | | | | | | | |
| | | Ended | | | Year | | | Year | | | Year | | | Period | |
| | | December 31, | | | Ended | | | Ended | | | Ended | | | Ended | |
| | | 2009 | | | June 30, | | | June 30, | | | June 30, | | | June 30, | |
| | | (Unaudited) | | | 2009 | | | 2008 | | | 2007 | | | 2006(1) | |
| Net Asset Value, Beginning of Period | | $ | 9.03 | | | $ | 11.81 | | | $ | 12.88 | | | $ | 10.29 | | | $ | 10.00 | |
| | | | | | | | | | | | | | | | | | | | | |
| Income (Loss) from | | | | | | | | | | | | | | | | | | | | |
| Investment Operations: | | | | | | | | | | | | | | | | | | | | |
| Net investment income | | | 0.03 | | | | 0.01 | | | | — | (2) | | | 0.03 | | | | — | (2) |
| Net realized and unrealized gain (loss) on investments | | | 1.59 | | | | (2.79 | ) | | | (0.90 | ) | | | 2.62 | | | | 0.29 | |
| Total Income (Loss) from Investment Operations | | | 1.62 | | | | (2.78 | ) | | | (0.90 | ) | | | 2.65 | | | | 0.29 | |
| | | | | | | | | | | | | | | | | | | | | |
| Less Distributions: | | | | | | | | | | | | | | | | | | | | |
| From net investment income | | | (0.02 | ) | | | — | (2) | | | (0.02 | ) | | | — | | | | — | |
| From net realized gain on investments | | | — | | | | — | | | | (0.15 | ) | | | (0.06 | ) | | | — | |
| Total Distributions | | | (0.02 | ) | | | — | | | | (0.17 | ) | | | (0.06 | ) | | | — | |
| | | | | | | | | | | | | | | | | | | | | |
| Net Asset Value, End of Period | | $ | 10.63 | | | $ | 9.03 | | | $ | 11.81 | | | $ | 12.88 | | | $ | 10.29 | |
| Total Return | | | 17.86 | %(3) | | | (23.42 | )% | | | (7.01 | )% | | | 25.81 | % | | | 2.90 | %(3) |
| | | | | | | | | | | | | | | | | | | | | |
| Supplemental Data and Ratios: | | | | | | | | | | | | | | | | | | | | |
| Net assets, end of period (in thousands) | | $ | 97,189 | | | $ | 43,504 | | | $ | 31,346 | | | $ | 17,368 | | | $ | 7,728 | |
| Ratio of expenses to average net assets | | | | | | | | | | | | | | | | | | | | |
| Before waivers and reimbursements | | | 1.25 | %(4) | | | 1.45 | % | | | 1.59 | % | | | 2.10 | % | | | 4.59 | %(4) |
| Net of waivers and reimbursements | | | 1.10 | %(4) | | | 1.10 | % | | | 1.10 | % | | | 1.10 | % | | | 1.10 | %(4) |
| Ratio of net investment income (loss) to average net assets | | | | | | | | | | | | | | | | | | | | |
| Before waivers and reimbursements | | | 0.97 | %(4) | | | (0.13 | )% | | | (0.40 | )% | | | (0.70 | )% | | | (3.44 | )%(4) |
| Net of waivers and reimbursements | | | 0.82 | %(4) | | | 0.22 | % | | | 0.09 | % | | | 0.30 | % | | | 0.05 | %(4) |
| Portfolio turnover rate | | | 21 | %(3) | | | 36 | % | | | 32 | % | | | 49 | % | | | 41 | %(3) |
| | | | | | | | | | | | | | | | | | | | | |
| (1) | Commenced operations on December 16, 2005. |
| (2) | Less than one cent per share. |
The accompanying notes are an integral part of these financial statements.
Frontegra Netols Small Cap Value Fund
FINANCIAL HIGHLIGHTS
| | | Class Y | | | | | | | |
| | | Six Months | | | | | | | |
| | | Ended | | | Year | | | Period | |
| | | December 31, | | | Ended | | | Ended | |
| | | 2009 | | | June 30, | | | June 30, | |
| | | (Unaudited) | | | 2009 | | | 2008(1) | |
| Net Asset Value, Beginning of Period | | $ | 8.98 | | | $ | 11.78 | | | $ | 12.54 | |
| | | | | | | | | | | | | |
| Income (Loss) from | | | | | | | | | | | | |
| Investment Operations: | | | | | | | | | | | | |
| Net investment loss | | | (0.02 | ) | | | (0.02 | ) | | | (0.02 | ) |
| Net realized and unrealized gain (loss) on investments | | | 1.61 | | | | (2.78 | ) | | | (0.57 | ) |
| Total Income (Loss) from Investment Operations | | | 1.59 | | | | (2.80 | ) | | | (0.59 | ) |
| | | | | | | | | | | | | |
| Less Distributions: | | | | | | | | | | | | |
| From net investment income | | | — | | | | — | | | | (0.02 | ) |
| From net realized gain on investments | | | — | | | | — | | | | (0.15 | ) |
| Total Distributions | | | — | | | | — | | | | (0.17 | ) |
| | | | | | | | | | | | | |
| Net Asset Value, End of Period | | $ | 10.57 | | | $ | 8.98 | | | $ | 11.78 | |
| Total Return | | | 17.71 | %(2) | | | (23.77 | )% | | | (4.76 | )%(2) |
| | | | | | | | | | | | | |
| Supplemental Data and Ratios: | | | | | | | | | | | | |
| Net assets, end of period (in thousands) | | $ | 1,114 | | | $ | 895 | | | $ | 1,034 | |
| Ratio of expenses to average net assets | | | | | | | | | | | | |
| Before awaivers and reimbursements | | | 1.65 | %(3) | | | 1.85 | % | | | 2.01 | %(3) |
| Net of waivers and reimbursements | | | 1.50 | %(3) | | | 1.50 | % | | | 1.55 | %(3) |
| Ratio of net investment income (loss) to average net assets | | | | | | | | | | | | |
| Before waivers and reimbursements | | | 0.57 | %(3) | | | (0.53 | )% | | | (0.80 | )%(3) |
| Net of waivers and reimbursements | | | 0.42 | %(3) | | | (0.18 | )% | | | (0.34 | )%(3) |
| Portfolio turnover rate | | | 21 | %(2) | | | 36 | % | | | 32 | %(2) |
| | | | | | | | | | | | | |
| (1) | Commenced operations on November 1, 2007. |
The accompanying notes are an integral part of these financial statements.
Frontegra Funds
NOTES TO FINANCIAL STATEMENTS
December 31, 2009 (Unaudited)
| | Frontegra Funds, Inc. (the “Company”) was incorporated on May 24, 1996 as a Maryland corporation and is registered under the Investment Company Act of 1940, as amended (the “1940 Act”), as an open-end investment company issuing shares in series, each series representing a distinct portfolio with its own investment objectives and policies. The Company consists of seven series: the Frontegra Columbus Core Plus Fund (formerly Frontegra Total Return Bond Fund), the Frontegra Columbus Core Fund (formerly Frontegra Investment Grade Bond Fund), the Frontegra IronBridge Small Cap Fund, the Frontegra IronBridge SMID Fund, the Frontegra IronBridge Global Focus Fund, the Frontegra Mastholm International Equity Fund (formerly Frontegra New Star International Equity Fund) and the Frontegra Netols Small Cap Value Fund (the “Funds”). The Frontegra Columbus Core Plus and Columbus Core Funds seek a high level of total return, consistent with the preservation of capital. The investment objective of the Frontegra IronBridge Small Cap Fund, Frontegra IronBridge SMID Fund, Frontegra IronBridge Global Focus Fund, Frontegra Mastholm International Equity Fund and the Frontegra Netols Small Cap Value Fund is capital appreciation. The Frontegra Columbus Core Plus and Columbus Core Funds are sub-advised by Reams Asset Management Company, LLC (“Reams”). The Frontegra Columbus Core Plus Fund – Institutional Class and the Frontegra Columbus Core Plus Fund – Class Y commenced operations on November 25, 1996 and November 12, 2009, respectively. The Frontegra Columbus Core Fund commenced operations on February 23, 2001. The Frontegra IronBridge Small Cap and IronBridge SMID Funds, sub-advised by IronBridge Capital Management, L.P. (“IronBridge”), commenced operations on August 30, 2002 and December 31, 2004, respectively. The Frontegra IronBridge Global Focus Fund, advised by IronBridge, commenced operations on September 18, 2009. The Frontegra Mastholm International Equity Fund, sub-advised by Mastholm Asset Management, LLC (“Mastholm”), commenced operations on January 8, 2004. The Frontegra Netols Small Cap Value Fund – Institutional Class and the Netols Small Cap Value Fund – Class Y, sub-advised by Netols Asset Management, Inc. (“Netols”), commenced operations on December 16, 2005 and November 1, 2007, respectively. |
| (2) | Significant Accounting Policies |
| | The following is a summary of significant accounting policies consistently followed by the Funds in the preparation of their financial statements. |
| | | Debt securities (other than short-term instruments) are valued by an independent pricing service, which uses valuation methods such as matrix pricing and other analytical pricing models as well as market transactions and dealer quotations. Debt securities, such as term loans, when not priced by an independent pricing service, are priced by an independent dealer based on the current closing bid price. Credit default swaps are valued by a third party pricing service. Equity securities for which market quotations are readily available are valued at the last trade price on the national securities exchange on which such securities are primarily traded. Equity securities for which there were no transactions on a given day or securities not listed on a national securities exchange are valued at the most recent bid price. Equity securities that are traded using the National Association of Securities Dealers’ Automated Quotation System (“NASDAQ”) are valued using the NASDAQ Official Closing Price (“NOCP”). Shares of underlying mutual funds are valued at their respective NAVs. Most securities that are primarily traded on foreign exchanges generally are valued at the last sale price of such securities on their respective exchange. In certain countries, market maker prices, usually the mean between the bid and ask prices, are used. In certain circumstances, such as when a significant event occurs in a foreign market so that the last sale price no longer reflects actual value, the fair value of these securities may be determined using fair valuation procedures approved by the Board of Directors. The Directors have retained an independent fair value pricing service to assist in valuing foreign securities held by the Frontegra IronBridge Global Focus and Mastholm International Equity Funds. In valuing assets, prices denominated in foreign currencies are converted to U.S. dollar equivalents at the current exchange rate, which approximates market value. Securities maturing within 60 days or less when pur- |
Frontegra Funds
NOTES TO FINANCIAL STATEMENTS (continued)
December 31, 2009 (Unaudited)
| | | chased are valued by the amortized cost method. Any securities or other assets for which market quotations are not readily available are valued at their fair value as determined in good faith by Reams, IronBridge, Mastholm and Netols pursuant to guidelines established by the Board of Directors. |
| | | The Funds follow a fair value hierarchy that distinguishes between market data obtained from independent sources (observable inputs) and the Funds’ own market assumptions (unobservable inputs). These inputs are used in determining the value of each Fund’s investments and are summarized in the following fair value hierarchy: |
| | Level 1 — | Quoted prices in active markets for identical securities |
| | Level 2 — | Other significant observable inputs (including quoted prices for similar securities, interest rates, prepayment speeds, credit risk, etc.) |
| | Level 3 — | Significant unobservable inputs (including the Fund’s own assumptions in determining fair value of investments) |
| | | The inputs or methodology used for valuing securities are not necessarily an indication of the risk associated with investing in those securities. The following is a summary of the inputs used to value the Funds’ net assets as of December 31, 2009: |
| Columbus Core Plus Fund | | | | | | | | | | | | |
| | | Level 1 - Quoted | | | Level 2 - | | | | | | | |
| | | prices in active markets | | | Significant other | | | Level 3 - Significant | | | | |
| Description | | for identical assets | | | observable inputs | | | unobservable inputs | | | Total | |
| Equity | | | | | | | | | | | | |
| Preferred Stock | | $ | 334,823 | | | $ | — | | | $ | — | | | $ | 334,823 | |
| Fixed Income | | | | | | | | | | | | | | | | |
| U.S. Treasury Obligations | | | — | | | | 200,714,523 | | | | — | | | | 200,714,523 | |
| Corporate Bonds | | | — | | | | 62,175,694 | | | | — | | | | 62,175,694 | |
| Asset Backed Securities | | | — | | | | 44,369,432 | | | | — | | | | 44,369,432 | |
| Mortgage Backed Securities | | | — | | | | 100,344,220 | | | | — | | | | 100,344,220 | |
| Institutional Term Loans | | | — | | | | 125,180 | | | | — | | | | 125,180 | |
| Total Fixed Income | | | 334,823 | | | | 407,729,049 | | | | — | | | | 408,063,872 | |
| Short-Term Investments | | | — | | | | 39,518,578 | | | | — | | | | 39,518,578 | |
| Total Investments in Securities | | $ | 334,823 | | | $ | 447,247,627 | | | $ | — | | | $ | 447,582,450 | |
Other Financial instruments* | | $ | (5,103 | ) | | $ | — | | | $ | — | | | | (5,103 | ) |
| | * | Other financial instruments are derivative instruments not reflected in the Schedule of Investments, such as futures, forwards, swaps contracts, and written options. Futures, forwards, and swap contracts are valued at the unrealized appreciation (depreciation) on the instrument while written options are valued at market value. |
Frontegra Funds
NOTES TO FINANCIAL STATEMENTS (continued)
December 31, 2009 (Unaudited)
| Columbus Core Fund | | | | | | | | | | | | |
| | | Level 1 - Quoted | | | Level 2 - | | | | | | | |
| | | prices in active markets | | | Significant other | | | Level 3 - Significant | | | | |
| Description | | for identical assets | | | observable inputs | | | unobservable inputs | | | Total | |
| Fixed Income | | | | | | | | | | | | |
| U.S. Treasury Obligations | | $ | — | | | $ | 37,244,431 | | | $ | — | | | $ | 37,244,431 | |
| Corporate Bonds | | | — | | | | 8,913,990 | | | | — | | | | 8,913,990 | |
| U.S. Government Agency Issues | | | — | | | | 85,612 | | | | — | | | | 85,612 | |
| Asset Backed Securities | | | — | | | | 5,694,143 | | | | — | | | | 5,694,143 | |
| Mortgage Backed Securities | | | — | | | | 18,855,586 | | | | — | | | | 18,855,586 | |
| Total Fixed Income | | | — | | | | 70,793,762 | | | | — | | | | 70,793,762 | |
| Short-Term Investments | | | — | | | | 6,673,598 | | | | — | | | | 6,673,598 | |
| Total Investments in Securities | | $ | — | | | $ | 77,467,360 | | | $ | — | | | $ | 77,467,360 | |
| | | | | | | | | | | | | | | | | |
| IronBridge Small Cap Fund | | | | | | | | | | | | | | | | |
| | | Level 1 - Quoted | | | Level 2 - | | | | | | | | | |
| | | prices in active markets | | | Significant other | | | Level 3 - Significant | | | | | |
| Description | | for identical assets | | | observable inputs | | | unobservable inputs | | | Total | |
| Equity | | | | | | | | | | | | | | | | |
| Common Stock | | $ | 371,935,431 | | | $ | — | | | $ | — | | | $ | 371,935,431 | |
| Exchange Traded Funds | | | 7,306,148 | | | | — | | | | — | | | | 7,306,148 | |
| Total Equity | | | 379,241,579 | | | | — | | | | — | | | | 379,241,579 | |
| Short-Term Investments | | | — | | | | 12,734,063 | | | | — | | | | 12,734,063 | |
| Total Investments in Securities | | $ | 379,241,579 | | | $ | 12,734,063 | | | $ | — | | | $ | 391,975,642 | |
| | | | | | | | | | | | | | | | | |
| IronBridge SMID Fund | | | | | | | | | | | | | | | | |
| | | Level 1 - Quoted | | | Level 2 - | | | | | | | | | |
| | | prices in active markets | | | Significant other | | | Level 3 - Significant | | | | | |
| Description | | for identical assets | | | observable inputs | | | unobservable inputs | | | Total | |
| Equity | | | | | | | | | | | | | | | | |
| Common Stock | | $ | 427,945,871 | | | $ | — | | | $ | — | | | $ | 427,945,871 | |
| Total Equity | | | 427,945,871 | | | | — | | | | — | | | | 427,945,871 | |
| Short-Term Investments | | | — | | | | 19,847,963 | | | | — | | | | 19,847,963 | |
| Total Investments in Securities | | $ | 427,945,871 | | | $ | 19,847,963 | | | $ | — | | | $ | 447,793,834 | |
Frontegra Funds
NOTES TO FINANCIAL STATEMENTS (continued)
December 31, 2009 (Unaudited)
| IronBridge Global Focus Fund | | | | | | | | | | | | |
| | | Level 1 - Quoted | | | Level 2 - | | | | | | | |
| | | prices in active markets | | | Significant other | | | Level 3 - Significant | | | | |
| Description | | for identical assets | | | observable inputs | | | unobservable inputs | | | Total | |
| Equity | | | | | | | | | | | | |
| Common Stock | | $ | 24,844,710 | | | $ | 19,397,598 | | | $ | — | | | $ | 44,242,308 | |
| Total Equity | | | 24,844,710 | | | | 19,397,598 | | | | — | | | | 44,242,308 | |
| Short-Term Investments | | | — | | | | 228,000 | | | | — | | | | 228,000 | |
| Total Investments in Securities | | $ | 24,844,710 | | | $ | 19,625,598 | | | $ | — | | | $ | 44,470,308 | |
| | | | | | | | | | | | | | | | | |
| Mastholm International Equity Fund | | | | | | | | | | | | | | | | |
| | | Level 1 - Quoted | | | Level 2 - | | | | | | | | | |
| | | prices in active markets | | | Significant other | | | Level 3 - Significant | | | | | |
| Description | | for identical assets | | | observable inputs | | | unobservable inputs | | | Total | |
| Equity | | | | | | | | | | | | | | | | |
| Common Stock | | $ | 16,248,902 | | | $ | 124,271,104 | | | $ | — | | | $ | 140,520,006 | |
| Total Equity | | | 16,248,902 | | | | 124,271,104 | | | | — | | | | 140,520,006 | |
| Short-Term Investments | | | 6,080,084 | | | | — | | | | — | | | | 6,080,084 | |
| Total Investments in Securities | | $ | 22,328,986 | | | $ | 124,271,104 | | | $ | — | | | $ | 146,600,090 | |
| | | | | | | | | | | | | | | | | |
| Netols Small Cap Value Fund | | | | | | | | | | | | | | | | |
| | | Level 1 - Quoted | | | Level 2 - | | | | | | | | | |
| | | prices in active markets | | | Significant other | | | Level 3 - Significant | | | | | |
| Description | | for identical assets | | | observable inputs | | | unobservable inputs | | | Total | |
| Equity | | | | | | | | | | | | | | | | |
| Common Stock | | $ | 93,926,443 | | | $ | — | | | $ | — | | | $ | 93,926,443 | |
| Total Equity | | | 93,926,443 | | | | — | | | | — | | | | 93,926,443 | |
| Short-Term Investments | | | 3,262,314 | | | | — | | | | — | | | | 3,262,314 | |
| Total Investments in Securities | | $ | 97,188,757 | | | $ | — | | | $ | — | | | $ | 97,188,757 | |
| | | The Frontegra Columbus Core Plus Fund is party to financial instruments with off-balance sheet risk, primarily forward contracts, in order to hedge the impact of adverse changes in the relationships between the U.S. dollar and various foreign currencies. These instruments involve market risk in excess of the amount recognized in the Statement of Assets and Liabilities. Risks also arise from the possible inability of counterparties to meet the terms of their contracts, future adverse movement in currency values and contract positions that are not exact offsets. The contract amount indicates the extent of the Funds’ involvement in such currencies. |
| | | A forward contract is an agreement between two parties to exchange different currencies at a specified rate at an agreed upon future date. Forward contracts are reported in the financial statements as unrealized gain (loss) as measured by the difference between the forward |
Frontegra Funds
NOTES TO FINANCIAL STATEMENTS (continued)
December 31, 2009 (Unaudited)
| | | exchange rate at the reporting date and the forward exchange rate on the date that a Fund entered into the contract. At December 31, 2009, the Frontegra Columbus Core Plus Fund had entered into strategic forward currency contracts that obligated the Fund to deliver and receive specified amounts of currencies at a specified future date. The terms of the open contracts are as follows: |
Frontegra Columbus Core Plus Fund
| | | | | | | | | | | | |
| | | | | Currency to | | U.S. $ Value at | | Currency to | | U.S. $ Value at | |
| Settlement Date | | | | be Delivered | | December 31, 2009 | | be Received | | December 31, 2009 | |
| 6/22/10 | | | 4,321,213 | | Australian Dollar | | $ | 3,807,923 | | U.S. Dollar | | $ | 3,778,037 | |
| 6/22/10 | | | 3,807,923 | | U.S. Dollar | | | 3,764,209 | | Australian Dollar | | | 3,807,923 | |
| 6/22/10 | | | 2,667,818 | | Euro Currency | | | 3,822,533 | | U.S. Dollar | | | 3,832,124 | |
| 6/22/10 | | | 3,822,533 | | U.S. Dollar | | | 3,811,779 | | Euro Currency | | | 3,822,533 | |
| 6/22/10 | | | 3,818,710 | | U.S. Dollar | | | 3,805,064 | | British Pound | | | 3,818,710 | |
| 6/22/10 | | | 2,366,775 | | British Pound | | | 3,818,710 | | U.S. Dollar | | | 3,765,788 | |
| | | | | | | | $ | 22,830,218 | | | | $ | 22,825,115 | |
| | | The Frontegra Columbus Core Plus Fund had net unrealized depreciation on forward currency contracts of $(5,103) as of December 31, 2009. |
| | | The Frontegra Columbus Core Fund, Frontegra IronBridge Small Cap Fund, Frontegra IronBridge SMID Fund, Frontegra IronBridge Global Focus Fund, Frontegra Mastholm International Equity Fund, Frontegra Netols Small Cap Value Fund held no forward contracts at December 31, 2009. |
| | | Each Fund intends to comply with the requirements of Subchapter M of the Internal Revenue Code necessary to qualify as a regulated investment company and to make the requisite distributions of income and capital gains to its shareholders sufficient to relieve it from all or substantially all federal income taxes. Therefore, no federal income tax provision has been provided. |
| | | The Funds have adopted financial reporting rules regarding recognition and measurement of tax positions taken or expected to be taken on a tax return. The Funds have reviewed all open tax years and concluded that there is no effect to any of the Fund’s financial positions or results of operations and no tax liability resulting from unrecognized tax benefits relating to uncertain income tax position taken or expected to be taken on a tax return. Open tax years are those years that are open for examination by the relevant income taxing authority. As of December 31, 2009, open Federal and state income tax years include the tax years ended June 30, 2007, June 30, 2008 and June 30, 2009. The Funds have no examinations in progress. The Funds are also not aware of any tax positions for which it is reasonably possible that the total amounts of unrecognized tax expense will significantly change in twelve months. |
| | (d) | Distributions to Shareholders |
| | | Dividends from net investment income are usually declared and paid quarterly for the Frontegra Columbus Core Plus and Frontegra Columbus Core Funds and at least annually for the Frontegra IronBridge Small Cap Fund, Frontegra IronBridge SMID Fund, Frontegra IronBridge Global Focus Fund, Frontegra Mastholm International Equity Fund and the Frontegra Netols Small Cap Value Fund. Distributions of net realized gains, if any, are declared and paid at least annually for all Funds. |
Frontegra Funds
NOTES TO FINANCIAL STATEMENTS (continued)
December 31, 2009 (Unaudited)
| | | All short-term capital gains are included in ordinary income for tax purposes. Distributions to shareholders are recorded on the ex-dividend date. |
| | | The tax character of distributions paid during the six months ended December 31, 2009 and the year ended June 30, 2009 were as follows: |
| | | Six Months Ended | | | Year Ended | |
| | | December 31, 2009 | | | June 30, 2009 | |
| | | Ordinary | | | Long-Term | | | Total | | | Ordinary | | | Long-Term | | | Total | |
| | | Income | | | Capital Gains | | | Distributions | | | Income | | | Capital Gains | | | Distributions | |
| Columbus Core Plus | | $ | 31,151,678 | | | $ | — | | | $ | 31,151,678 | | | $ | 42,290,396 | | | $ | 448,994 | | | $ | 42,739,390 | |
| Columbus Core | | | 1,148,995 | | | | — | | | | 1,148,995 | | | | 5,468,450 | | | | — | | | | 5,468,450 | |
| IronBridge Small Cap | | | 1,187,053 | | | | — | | | | 1,187,053 | | | | 1,863,120 | | | | 14,358,247 | | | | 16,221,367 | |
| IronBridge SMID | | | 1,315,023 | | | | — | | | | 1,315,023 | | | | 1,319,242 | | | | 1,306,867 | | | | 2,626,109 | |
| IronBridge Global Focus | | | 45,378 | | | | — | | | | 45,378 | | | | — | | | | — | | | | — | |
| Mastholm International Equity | | | 5,938,700 | | | | — | | | | 5,938,700 | | | | 10,274,811 | | | | 11,287,342 | | | | 21,562,153 | |
| Netols Small Cap Value | | | 140,161 | | | | — | | | | 140,161 | | | | 12,995 | | | | — | | | | 12,995 | |
| | | At June 30, 2009 the components of accumulated earnings/losses on a tax basis were as follows: |
| | | | | | | | | | | | | | | Mastholm | | | Netols | |
| | | Columbus | | | Columbus | | | IronBridge | | | IronBridge | | | International | | | Small Cap | |
| | | Core Plus | | | Core | | | Small Cap | | | SMID | | | Equity | | | Value | |
| Cost of investments | | $ | 388,551,325 | | | $ | 50,039,002 | | | $ | 306,680,738 | | | $ | 328,016,591 | | | $ | 214,127,463 | | | $ | 56,537,609 | |
| Gross unrealized appreciation | | $ | 21,641,215 | | | $ | 2,899,102 | | | $ | 39,847,060 | | | $ | 29,247,920 | | | $ | 15,385,924 | | | $ | 4,907,535 | |
| Gross unrealized depreciation | | | (31,018,898 | ) | | | (2,335,874 | ) | | | (55,129,212 | ) | | | (49,124,760 | ) | | | (27,068,556 | ) | | | (9,279,475 | ) |
| Net unrealized | | | | | | | | | | | | | | | | | | | | | | | | |
| appreciation/depreciation | | | (9,377,683 | ) | | | 563,228 | | | | (15,282,152 | ) | | | (19,876,840 | ) | | | (11,682,632 | ) | | | (4,371,940 | ) |
| Undistributed ordinary income | | | 1,674,632 | | | | 118,324 | | | | 1,187,053 | | | | 1,315,023 | | | | 5,738,700 | | | | 64,517 | |
| Undistributed long-term capital gain | | | — | | | | — | | | | — | | | | — | | | | — | | | | — | |
| Total distributable earnings | | | 1,674,632 | | | | 118,324 | | | | 1,187,053 | | | | 1,315,023 | | | | 5,738,700 | | | | 64,517 | |
| Other accumulated losses | | | (9,721,462 | ) | | | (9,430,796 | ) | | | (50,341,312 | ) | | | (46,330,688 | ) | | | (118,793,314 | ) | | | (3,306,843 | ) |
| Total accumulated earnings/(losses) | | $ | (17,424,513 | ) | | $ | (8,749,244 | ) | | $ | (64,436,411 | ) | | $ | (64,892,505 | ) | | $ | (124,737,246 | ) | | $ | (7,614,266 | ) |
| | | The difference between book-basis and tax-basis unrealized appreciation is attributable primarily to the tax deferral of losses on wash sales and swaps. |
Frontegra Funds
NOTES TO FINANCIAL STATEMENTS (continued)
December 31, 2009 (Unaudited)
| | | The Funds intend to utilize provisions of the federal income tax laws, which allow them to carry a realized capital loss forward for eight years following the year of loss and offset such losses against any future realized capital gains. At June 30, 2009, the Funds had the following capital loss carryforward available: |
| | | Expiring | | | | |
| | | 6/30/15 | | | 6/30/16 | | | 6/30/17 | | | TOTAL | |
| Columbus Core | | $ | (452,904 | ) | | $ | — | | | $ | — | | | $ | (452,904 | ) |
| IronBridge Small Cap | | | — | | | | — | | | | (9,341,207 | ) | | | (9,341,207 | ) |
| IronBridge SMID | | | — | | | | — | | | | (7,523,419 | ) | | | (7,523,419 | ) |
| Mastholm International Equity | | | — | | | | — | | | | (18,645,962 | ) | | | (18,645,962 | ) |
| Netols Small Cap Value | | | — | | | | (119,331 | ) | | | (351,558 | ) | | | (470,889 | ) |
| | | In order to meet certain excise tax requirements, the Funds are required to measure and distribute annually, net capital gains realized during the twelve month period ending October 31st. In connection with this requirement, the Funds are permitted, for tax purposes, to defer into their next fiscal year any net capital losses incurred from November 1st through the end of the fiscal year. As of June 30, 2009, the following funds deferred, on a tax basis, post October losses of: |
| | | Post-October | | | Post-October | |
| | | Loss Deferred | | | Currency Loss Deferred | |
| Columbus Core Plus | | $ | 8,993,414 | | | $ | 1,519 | |
| Columbus Core | | | 8,906,107 | | | | — | |
| IronBridge Small Cap | | | 41,000,105 | | | | — | |
| IronBridge SMID | | | 38,807,269 | | | | — | |
| Mastholm International Equity | | | 99,886,824 | | | | 262,141 | |
| Netols Small Cap Value | | | 2,835,954 | | | | — | |
| | (e) | When-Issued Securities |
| | | The Frontegra Columbus Core Plus and Columbus Core Funds may purchase securities on a when-issued basis. The price of securities purchased on a when-issued basis is fixed at the time the commitment to purchase is made, but delivery and payment for the securities take place at a later date, normally within 45 days of the purchase. At the time of purchase, the Funds will record the transaction and reflect the value of the security and related liability in determining their net asset value. During the period between the purchase and settlement, no payment is made by the Funds to the issuer and no interest is accrued. The Funds maintain segregated cash, U.S. government securities and liquid securities equal in value to commitments for when-issued securities. |
| | | The Frontegra Columbus Core Plus and Columbus Core Funds may enter into mortgage dollar rolls, in which a Fund would sell mortgage backed securities for delivery in the current month and simultaneously contract to purchase similar securities on a specified future date. While a Fund would forego principal and interest paid on the mortgage-backed securities during the roll period, it would be compensated by the difference between the current sale price and the lower price for the future purchase as well as by any interest earned on the proceeds of the initial sale. A Fund also could be compensated through the receipt of fee income equivalent to a lower forward price. |
| | | Each Fund may enter into futures contracts, including index and interest rate futures contracts. Upon entering into a contract, the Fund deposits and maintains as collateral such initial margin as required by the exchange on which the transaction is effected. Pursuant to the |
Frontegra Funds
NOTES TO FINANCIAL STATEMENTS (continued)
December 31, 2009 (Unaudited)
| | | contract, the Fund agrees to receive from or pay to the broker an amount of cash equal to the daily fluctuation in value of the contract. Such receipts or payments are known as variation margin and are recorded by the Fund as unrealized gains and losses. When the contract is closed, the Fund records a realized gain or loss equal to the difference between the value of the contract at the time it was opened and the value at the time it was closed. As collateral for futures contracts, the Fund is required under the 1940 Act to maintain assets consisting of cash, cash equivalents or other liquid securities. This collateral is required to be adjusted daily to reflect the market value of the purchase obligation for long futures contracts or the market value of the instrument underlying the contract, but not less than the market price at which the futures contract was established, for short futures contracts. |
| | | The risks inherent in the use of futures contracts include 1) adverse changes in the value of such instruments; and 2) the possible absence of a liquid secondary market for any particular instrument at any time. There were no futures contracts open at December 31, 2009. |
| | | The Columbus Core Plus and Columbus Core Funds may enter into credit default swap agreements. The credit default swap agreement may have as a reference obligation one or more securities that are or are not currently held by a Fund. The buyer in a credit default swap agreement is obligated to pay the seller a periodic fee, typically expressed in basis points on the principal amount of the underlying obligation (the “notional” amount), over the term of the agreement in return for a contingent payment upon the occurrence of a credit event with respect to the underlying reference obligation. A credit event is typically a default. |
| | | A Fund may be either the buyer or seller of protection in the transaction. As a seller, a Fund accrues for and receives a fixed rate of income throughout the term of the agreement, which typically is between one month and five years, provided that no credit event occurs. If a credit event occurs, the maximum payout amount for a sale contract is limited to the notional amount of the swap contract (“Maximum Payout Amount”). At December 31, 2009, the Frontegra Columbus Core Plus and Columbus Core Funds had no credit default swap contracts outstanding. If a Fund is a buyer and no credit event occurs, the Fund may lose its investment and recover nothing. However, if a credit event occurs, the buyer typically receives full notional value for a reference obligation that may have little or no value. |
| | | Credit default swaps may involve greater risks than if a Fund had invested in the reference obligation directly. Credit default swaps are subject to general market risk, liquidity risk, counterparty credit risk and credit risk of the issuer. As noted above, if a Fund is a buyer in a credit default swap agreement and no credit event occurs, it will lose its investment. In addition, the value of the reference obligation received by a Fund as a seller if a credit event occurs, coupled with the periodic payments previously received, may be less than the full notional value it pays to the buyer, resulting in a loss of value to the Fund. |
| | (i) | Foreign Currency Translation |
| | | Values of investments denominated in foreign currencies are converted into U.S. dollars using a spot market rate of exchange each day. Purchases and sales of investments and dividend and interest income are translated to U.S. dollars using a spot market rate of exchange prevailing on the dates of such transactions. The portion of security gains or losses resulting from changes in foreign exchange rates are included with net realized and unrealized gain or loss from investments, as appropriate, for both financial reporting and tax purposes. |
| | | Each Fund, respectively, bears the risk of charges in the foreign currency exchange rates and their impact on the value of assets and liabilities denominated in foreign currency. Each Fund also bears the risk of a counterparty failing to fulfill its obligation under a foreign currency contract. |
Frontegra Funds
NOTES TO FINANCIAL STATEMENTS (continued)
December 31, 2009 (Unaudited)
| | | Under the Funds’ organizational documents, their officers and directors are indemnified against certain liabilities arising out of the performance of their duties to the Funds. In addition, in the normal course of business, the Funds enter into contracts that provide general indemnifications to other parties. The Funds’ maximum exposure under these arrangements is unknown as this would involve future claims that may be made against the Funds that have not yet occurred. However, the Funds have not had prior claims or losses pursuant to these contracts and expect the risk of loss to be remote. |
| | | On February 24, 2010, the Board of Directors (the “Board”) of the Company unanimously approved the replacement of Frontegra Asset Management, Inc. (“Frontegra”) with IronBridge as the primary investment adviser to the Frontegra IronBridge Small Cap Fund and Frontegra IronBridge SMID Fund (the “IronBridge Funds”), effective as of the opening business on March 1, 2010. IronBridge has been serving as subadviser to the IronBridge Funds since their inception and will continue the day-to-day investment management responsibilities for the IronBridge Funds as the primary investment adviser. Frontegra had previously notified the Board that it wished to resign as investment adviser to the IronBridge Funds and that IronBridge wished to become the successor primary investment adviser to the IronBridge Funds as mutually agreed by Frontegra and IronBridge. |
| | | As a result of Frontegra’s resignation, the investment advisory agreement between Frontegra and the Company, with respect to the IronBridge Funds only (the “Frontegra Advisory Agreement”), and the subadvisory agreement between Frontegra and IronBridge will terminate effective March 1, 2010. In order to avoid disruption of the IronBridge Funds’ investment management program, the Board unanimously approved an interim investment advisory agreement between the Company, on behalf of the IronBridge Funds, and IronBridge in accordance with Rule 15a-4 under the 1940 Act, to be effective March 1, 2010 upon termination of the Frontegra Advisory Agreement. |
| | | Additionally, the Board unanimously approved a new investment advisory agreement between the Company, on behalf of the IronBridge Funds, and IronBridge, subject to approval by shareholders of the IronBridge Funds at a special meeting to be held later this year. |
| | | As of March 1, 2010, the issuance date of these financial statements, no other subsequent events or transactions had occurred that required disclosure. |
| | | In January 2010, the Financial Accounting Standards Board issued Accounting Standards Update (ASU) No. 2010-6,Fair Value Measurements and Disclosures (Topic 820): Improving Disclosures about Fair Value Measurements. ASU No. 2010-6 enhances and clarifies existing fair value measurement disclosure requirements and is effective for interim and annual periods beginning after December 15, 2009. The Funds are evaluating the impact, if any, of applying the provisions of ASU No. 2010-6. |
| | | In connection with the appointment of IronBridge as the principal investment adviser to the IronBridge Funds, the Board also approved a sub-administration agreement pursuant to which Frontegra would be retained by IronBridge to provide certain compliance and administrative services to the IronBridge Funds. |
| | | Investment transactions are accounted for on the trade date. The Funds determine the gain or loss realized from investment transactions by comparing the original cost of the specifically identified security lot sold with the net sale proceeds. Dividend income, less foreign taxes withheld, is recognized on the ex-dividend date, except that certain dividends from foreign securities are recorded as soon as the information becomes available to the Funds. Interest income is recognized on an accrual basis. All discounts/premiums are accreted/amortized using the effective interest method and are included in interest income. |
Frontegra Funds
NOTES TO FINANCIAL STATEMENTS (continued)
December 31, 2009 (Unaudited)
| | | Income, expenses (other than expenses attributable to a specific class), and realized and unrealized gains or losses on investments attributable to the Funds are generally allocated to each respective class in proportion to the relative net assets of each class. |
| | | The preparation of financial statements in conformity with U.S. generally accepted accounting principles requires management to make estimates and assumptions that affect the reported amounts of assets and liabilities and disclosure of contingent assets and liabilities at the date of the financial statements, and the reported amounts of increases and decreases in net assets from operations during the reporting period. Actual results could differ from those estimates. |
| | | Net investment income and realized gains and losses for federal income tax purposes may differ from that reported on the financial statements because of permanent book-to-tax differences. GAAP requires that permanent differences in net investment income and realized gains and losses due to differences between financial reporting and tax reporting be reclassified between various components of net assets. These reclassifications have no effect on net assets or net asset value per share. For the year ended June 30, 2009, the following table shows the reclassifications made: |
| | | | | | | | | | | | | | | Mastholm | | | Netols | |
| | | Columbus | | | Columbus | | | IronBridge | | | IronBridge | | | International | | | Small Cap | |
| | | Core Plus | | | Core | | | Small Cap | | | SMID | | | Equity | | | Value | |
| Paid in capital | | $ | 735,654 | | | $ | — | | | $ | 7,366 | | | $ | 2,075 | | | $ | (1 | ) | | $ | 946 | |
| Accumulated net investment income (loss) | | | (1,771,537 | ) | | | (11,873 | ) | | | (26,928 | ) | | | (16,901 | ) | | | (167,358 | ) | | | (946 | ) |
| Accumulated net realized gain (loss) | | | 1,035,883 | | | | 11,873 | | | | 19,562 | | | | 14,826 | | | | 167,359 | | | | — | |
| | | The permanent differences primarily relate to foreign currency, paydown, swap and Real Estate Investment Trust (REIT) adjustments with differing book and tax methods. |
| (3) | Investment Advisers and Related Parties |
| | The Frontegra Columbus Core Plus, Columbus Core, IronBridge Small Cap, IronBridge SMID, Mastholm International Equity and Netols Small Cap Value Funds have entered into an agreement with Frontegra, with whom certain officers and a director of the Funds are affiliated, to furnish investment advisory services to the Funds. IronBridge provides investment advisory services to the Frontegra IronBridge Global Focus Fund. Fees are calculated daily and payable monthly, at annual rates set forth in the following table (expressed as a percentage of each Fund’s average daily net assets). Pursuant to expense cap agreements, Frontegra and IronBridge have agreed to waive their respective management fees and/or reimburse each Fund’s operating expenses (exclusive of brokerage, interest, taxes and extraordinary expenses) to ensure that each Fund’s operating expenses do not exceed the expense limitation listed below. Expenses waived are netted with advisory fees on the Statement of Assets and Liabilities. On a monthly basis, these accounts are settled by each Fund making payment to the respective adviser or the respective adviser reimbursing the Fund if the reimbursement amount exceeds the advisory fee. If the amount of fees waived exceeds the advisory fee earned, this is shown on the Statement of Assets and Liabilities as a receivable from the respective adviser. The expense cap agreements will continue in effect until October 31, 2010 with successive renewal terms of one year unless terminated by an adviser or a Fund prior to any such renewal. |
Frontegra Funds
NOTES TO FINANCIAL STATEMENTS (continued)
December 31, 2009 (Unaudited)
| Frontegra Fund | Annual Advisory Fees | Expense Limitation |
| Columbus Core Plus - Institutional Class | 0.40% | 0.35% |
| Columbus Core Plus - Class Y | 0.40% | 0.75% |
| Columbus Core | 0.42% | 0.35% |
| IronBridge Small Cap | 1.00% | 1.10% |
| IronBridge SMID | 0.85% | 0.95% |
| IronBridge Global Focus | 0.85% | 1.00% |
| Mastholm International Equity | 0.95% | 0.75% |
| Netols Small Cap Value - Institutional Class | 1.00% | 1.10% |
| Netols Small Cap Value - Class Y | 1.00% | 1.50% |
| | | Any waivers or reimbursements are subject to later adjustment to allow the advisers to recoup amounts waived or reimbursed to the extent actual fees and expenses for a fiscal period are less than each Fund’s expense limitation cap, provided, however, that an adviser shall only be entitled to recoup such amounts for a period of three years from the date such amount was waived or reimbursed. Expenses attributable to a specific class may only be recouped with respect to that class. |
| | | The following table shows the waived or reimbursed expenses subject to potential recovery expiring in: |
| | | | | | | | | | | | | | | Mastholm | | | Netols | |
| | | Columbus | | | Columbus | | | IronBridge | | | IronBridge | | | International | | | Small Cap | |
| | | Core Plus | | | Core | | | SMID | | | Global Focus | | | Equity | | | Value | |
| 2010 | | $ | 874,012 | | | $ | 416,403 | | | $ | 5,282 | | | | — | | | $ | 1,947,759 | | | $ | 114,909 | |
| 2011 | | | 802,439 | | | | 341,113 | | | | 22,812 | | | | — | | | | 2,007,759 | | | | 110,227 | |
| 2012 | | | 542,331 | | | | 276,351 | | | | 18,348 | | | | — | | | | 1,057,926 | | | | 111,209 | |
| 2013 | | | 410,927 | | | | 152,182 | | | | 0 | | | | 51,873 | | | | 715,479 | | | | 66,812 | |
| | | $ | 2,629,709 | | | $ | 1,186,049 | | | $ | 46,442 | | | $ | 51,873 | | | $ | 5,728,923 | | | $ | 403,157 | |
| | | There are currently no available expenses subject to recapture with respect to the IronBridge Small Cap Fund. During the six months ended December 31, 2009, Frontegra recovered $37,797 of previously waived expenses from the IronBridge SMID Fund. |
| | | The Frontegra IronBridge Global Focus Fund has entered into an agreement with Frontegra under which Frontegra will provide sub-administration services, including general management of the Fund, Board reporting and oversight, the provision of certain officers of the Funds including the Fund’s President, Treasurer and Chief Compliance Officer, oversight of the Fund’s contracts, supervision of the Fund’s service providers, and oversight of other regulatory matters for the Fund. For its services, Frontegra, with whom certain officers and a director of the Fund are affiliated, receives an annual fee of 0.05% on the first $200 million of net assets, 0.04% on the next $200 million of assets, and 0.03% on any assets in excess of $400 million. This fee is calculated daily and payable monthly based on the Fund’s average net assets. |
Frontegra Funds
NOTES TO FINANCIAL STATEMENTS (continued)
December 31, 2009 (Unaudited)
| (4) | Investment Transactions |
| | The aggregate purchases and sales of securities, excluding short-term investments and U.S. Government securities, for the Funds for thesix months ended December 31, 2009 are summarized below: |
| | | | | | | | | | | | | | | | | | Mastholm | | | Netols | |
| | | Columbus | | | Columbus | | | IronBridge | | | IronBridge | | | IronBridge | | | International | | | Small Cap | |
| | | Core Plus | | | Core | | | Small Cap | | | SMID | | | Global Focus | | | Equity | | | Value | |
| Purchases | | $ | 2,022,925,757 | | | $ | 309,172,116 | | | $ | 93,924,318 | | | $ | 150,850,458 | | | $ | 49,127,360 | | | $ | 282,971,103 | | | $ | 63,760,227 | |
| Sales | | $ | 2,020,027,307 | | | $ | 288,849,872 | | | $ | 66,799,438 | | | $ | 77,705,229 | | | $ | 5,400,762 | | | $ | 371,136,331 | | | $ | 14,237,168 | |
| | Purchases and sales of long-term U.S. Government securities for the Frontegra Columbus Core Plus Fund were $1,478,232,553 and $1,338,184,398, respectively. Purchases and sales of long-term U.S. Government securities for the Frontegra Columbus Core Fund were $220,419,503 and $187,793,916, respectively. |
| | There were no purchases or sales of long-term U.S. Government securities for the Frontegra IronBridge Small Cap Fund, the Frontegra IronBridge SMID Fund, the IronBridge Global Focus Fund, the Frontegra Mastholm International Equity Fund or the Frontegra Netols Small Cap Value Fund. |
| | The Independent Directors of the Funds were paid $25,000 in director fees during the period ended December 31, 2009. The Interested Director did not receive any remuneration from the Funds. |
| (6) | Formation of the Global Focus Fund |
| | On September 18, 2009, all of the assets and liabilities of the IronBridge Global Focus Fund, L.P. (the “Partnership”) were transferred to the Frontegra IronBridge Global Focus Fund, a newly formed investment company. The market value of assets on the day of transfer of $29,100,861 for the Global Focus Fund became the cost basis for financial reporting purposes of the Fund. The Global Focus Fund retains the basis and holding periods of the assets transferred from the Partnership for tax purposes. On the date of the transfer, the tax basis of securities held for the Global Focus Fund was $443,766 lower than their basis for financial reporting purposes. On December 31, 2009, the tax basis of the remaining securities held by the Global Focus Fund was $601,743 lower than the basis for financial reporting purposes. |
| | The Frontegra Mastholm International Equity Fund has a $50 million unsecured line of credit with U.S. Bank, N.A., intended to provide short-term financing, if necessary, subject to certain restrictions, in connection with shareholder redemptions. Borrowings under this arrangement bear interest at the bank’s prime rate. At June 30, 2009, the Fund had no balance outstanding. Based upon balances outstanding during the year, the weighted average interest rate was 3.25% and the weighted average amount outstanding was $264,597. |
| (8) | Distribution Plan and Shareholder Servicing Fee |
| | Frontegra, on behalf of the Frontegra Columbus Core Plus Fund, the Frontegra IronBridge SMID Fund and the Frontegra Netols Small Cap Value Fund (collectively, the “Funds”), has adopted a distribution plan pursuant to Rule 12b-1 under the Investment Company Act of 1940 for each Fund’s Class Y shares (the “12b-1 Plan”). Pursuant to the 12b-1 Plan, each Fund pays an annual fee of up to 0.25% to Frontegra Strategies, LLC (the “Distributor”) for payments to brokers, dealers and other financial intermediaries who perform activities or incur expenses intended to result in the sale of Class Y shares of the Funds. For the six months ended December 31, 2009, the Columbus Core Plus and Netols Small Cap Value Funds incurred $414 and $1,267, respectively, under the 12b-1 Plan. |
Frontegra Funds
NOTES TO FINANCIAL STATEMENTS (continued)
December 31, 2009 (Unaudited)
| | Class Y shares of the Funds also pay an annual shareholder servicing fee of up to 0.15% per year to the Distributor for payments to brokers, dealers, and other financial intermediaries who provide on-going account services to shareholders. Those services include establishing and maintaining shareholder accounts, mailing prospectuses, account statements and other Fund documents to shareholders, processing shareholder transactions, answering shareholder inquiries and providing other personal services to shareholders. For the six months ended December 31, 2009, the Columbus Core Plus and Netols Small Cap Value Funds incurred $248 and $760, respectively, in shareholder servicing expenses. |
| (9) | Other Derivative Information |
| | At December 31, 2009, the Funds have invested in derivative contracts which are reflected on the Statement of Assets and Liabilities as follows: |
| | | | | | | | | |
| | Asset Derivatives | | Liability Derivatives | |
| | Statement of Assets | | Fair Value | | Statement of Assets | | Fair Value | |
| | and Liabilities Location | | Amount | | and Liabilities Location | | Amount | |
| Foreign exchange contracts | Unrealized appreciation on | | | | Unrealized depreciation on | | | |
| | forward exchange contracts | | $ | 77,705 | | forward exchange contracts | | $ | 82,808 | |
| Total | | | $ | 77,705 | | Total | | $ | 82,808 | |
| | There were no foreign exchange contracts outstanding as of June 30, 2009 or September 30, 2009 in the Columbus Core Plus Fund. At June 30, 2009, the Columbus Core Plus Fund was a party to credit default swap contracts with a notional value of $17,404,800. The Columbus Core Plus Fund had no credit default swap contracts outstanding at September 30, 2009 or December 31, 2009. With respect to the Frontegra Columbus Core Fund, Frontegra IronBridge Small Cap Fund, Frontegra IronBridge SMID Fund, Frontegra IronBridge Global Focus Fund, Frontegra Mastholm International Equity Fund, Frontegra Netols Small Cap Value Fund, there were no derivative contracts that impacted the Statement of Assets and Liabilities as of December 31, 2009. |
| | For the six months ended December 31, 2009, the effect of derivative contracts on the Funds’ Statement of Operations was as follows: |
Columbus Core Plus Fund
| | | | | | | | | | | | | | | | | | | | |
| Net Realized Gain on Investments | | Change in Net Unrealized Appreciation (Depreciation) on Investments | |
| | | Options | | | Contracts | | | | | | | Options | | | Contracts | | | Total | |
| Credit Default Swaps | | $ | — | | | $ | 331,205 | | | $ | 331,205 | | Credit Default Swaps | | $ | — | | | $ | (422,098 | ) | | $ | (422,098 | ) |
| Equity/Foreign | | | | | | | | | | | | | Equity/Foreign | | | | | | | | | | | | |
| exchange contracts | | | | | | | 69,372 | | | | 69,372 | | exchange contracts | | | | | | | (5,103 | ) | | | (5,103 | ) |
| Total | | $ | — | | | $ | 400,577 | | | $ | 400,577 | | Total | | $ | — | | | $ | (427,201 | ) | | $ | (427,201 | ) |
| | Credit default swaps are subject to credit risk. Foreign exchange contracts are subject to foreign exchange risk. With respect to the Frontegra Columbus Core Fund, Frontegra IronBridge Small Cap Fund, Frontegra IronBridge SMID Fund, Frontegra IronBridge Global Focus Fund, Frontegra Mastholm International Equity Fund, Frontegra Netols Small Cap Value Fund, there were no derivative contracts that impacted the Statement of Operations during the period ended December 31, 2009. |
BOARD OF DIRECTORS’ APPROVAL OF ADVISORY AND SUBADVISORY AGREEMENTS
Board Renewal of Advisory Agreement and Subadvisory Agreements
The Board of Directors (each, a “Director”) (the “Board”) of Frontegra Funds, Inc. (the “Company”) met on August 18, 2009 to consider the annual renewal of the investment advisory agreement (the “Advisory Agreement”) with Frontegra Asset Management, Inc. (the “Adviser”) and the subadvisory agreements (each, a “Subadvisory Agreement”) for each of the following portfolios (each, a “Fund” and collectively, the “Funds”) of the Company:
| | • | Frontegra Columbus Core Plus Fund (the “Columbus Core Plus Fund”); |
| | • | Frontegra Columbus Core Fund (the “Columbus Core Fund”); |
| | • | Frontegra IronBridge Small Cap Fund (the “IronBridge Small Cap Fund”); |
| | • | Frontegra IronBridge SMID Fund (the “IronBridge SMID Fund”); |
| | • | Frontegra Mastholm International Equity Fund (formerly, the Frontegra New Star International Equity Fund) (the “Mastholm International Equity Fund”); and |
| | • | Frontegra Netols Small Cap Value Fund (the “Netols Small Cap Value Fund”). |
Board Renewal of Advisory Agreement
When the Board reviewed the Advisory Agreement on August 18, 2009, the Board was provided materials relevant to its consideration of the agreement, such as the Adviser’s Form ADV and Code of Ethics, information regarding the Adviser’s compliance program, personnel and financial condition and memoranda prepared by the Company’s legal counsel. The Board also reviewed the advisory fee payable by each Fund under the Advisory Agreement, the proposed expense cap agreements between the Company and the Adviser on behalf of each Fund and comparative fee and expense information provided by an independent third party. The Board was also provided with the Adviser’s response to detailed requests submitted by the Company’s legal counsel on behalf of the Directors.
The Board considered whether the Advisory Agreement would continue to be in the best interests of each Fund and its shareholders and the overall fairness of the Advisory Agreement. Among other things, the Board reviewed information concerning: (1) the nature, extent and quality of the services provided by the Adviser; (2) each Fund’s investment performance; (3) the cost of the services provided and the profits realized by the Adviser and its affiliates from their relationship with the Company on behalf of each Fund; (4) the extent to which economies of scale have been or will be realized as each Fund grows; and (5) the extent to which fee levels reflect the economies of scale, if any, for the benefit of each Fund��s shareholders. In their deliberations, the Board did not identify any single factor as determinative.
In considering the Advisory Agreement, the Board reviewed and analyzed various factors with respect to each Fund that it determined were relevant, including the factors below, and made the following conclusions:
Nature, Extent and Quality of the Services to be Provided. The Board considered the Adviser’s background and services it would continue to provide to the Funds and their shareholders under the Advisory Agreement. The Board discussed the fact that the Adviser had chosen each Fund’s investment strategy and had selected the subadvisers to make the day-to-day investment decisions for the Funds. The Board noted that the Adviser has 14 years of experience in hiring and supervising subadvisers to portfolios in the Frontegra family of Funds. The Board discussed the Adviser’s responsibilities for overseeing the subadvisers and for monitoring each Fund’s compliance with applicable requirements under the securities laws. The Board concluded that the range of services to be provided by the Adviser was appropriate and that the Adviser was qualified to provide such services.
Performance record of the Funds. As described in more detail under “Board of Directors’ Approval of Subadvisory Agreements,” the Board reviewed each Fund’s performance record for the period ended June 30, 2009. The Board noted that one of the Funds had outperformed its benchmark index for the past one-, three-, five-, ten-year and since inception periods ended June 30, 2009, one of the Funds had outperformed its benchmark index for the past one-, three-, five-year and since inception periods ended June 30, 2009, one of the Funds had outperformed its benchmark for the three-, five-year and since inception periods and slightly underperformed its benchmark for the one-year period ended June 30, 2009, two of the Funds had outperformed their benchmarks for the one-, three-year and since-inception periods ended June 30, 2009 and one of the Funds underperformed its benchmark for the one-, three-, five-year and since-inception period ended June 30, 2009. The Board concluded that the Adviser has developed the necessary expertise and resources in selecting and managing qualified subadvisers to provide investment advisory services to the Funds in accordance with each Fund’s investment objective and strategy.
Advisory fees. The Board compared each Fund’s contractual advisory fee and total expense ratio to the industry data provided by an independent service with respect to other mutual funds in the same peer group. The Board noted that the equity Funds’ advisory fees were above the industry average while the bond Funds’ advisory fees were below industry averages, and that the total expense ratios of the Institutional Class shares of the Funds, after giving effect to the contractual expense cap agreements, were well below industry averages. The Board also noted that the total expense ratios for the Funds that offer Class Y shares were slightly above industry averages. The Board noted that overall, the Funds’ total expense ratios compared favorably to industry averages. The Board concluded that the advisory fee to be paid by each Fund to the Adviser was reasonable in light of the nature and quality of services to be provided and fees paid by comparable funds.
Costs and profitability. The Board reviewed information concerning the Adviser’s financial condition, costs and profitability. The Board also considered the fact that the Adviser had renewed contractual expense cap agreements on behalf of the Funds. The Board noted that the Adviser was still reimbursing expenses to five of the six Funds. The Board concluded that the Adviser’s current level of profitability was reasonable considering the quality of management and the fact that the Adviser was waiving its fees and/or reimbursing expenses for most of the Funds.
Economies of Scale. The Board reviewed net asset growth on a per Fund and aggregate basis and considered whether there may be economies of scale in the management of each Fund if its assets were to increase significantly. However, the Board concluded that the assets of the Funds were not likely to increase to such an extent that breakpoints would be appropriate, particularly in light of the expense cap agreements in place between the Adviser and each Fund.
Benefits to the Adviser. The Board considered information presented regarding any benefits to the Adviser or its affiliates from serving as adviser to the Funds (in addition to the advisory fee). The Board noted that the Adviser’s affiliate, Frontier Partners, Inc. (“Frontier”), provided consulting services to, and was compensated by, each subadviser. However, the Board determined that the Adviser’s services to the Funds would not be compromised by this potential conflict of interest.
On the basis of its review of the foregoing information, the Board found that the terms of the Advisory Agreement were fair and reasonable and in the best interest of each Fund’s shareholders.
Board Approval of Subadvisory Agreements
Columbus Core Plus and Columbus Core Funds
When the Board reviewed the subadvisory agreement between the Adviser and Reams Asset Management Company, LLC (“Reams”) on behalf of the Columbus Core Plus Fund and Columbus Core Fund (the “Reams Subadvisory Agreement”) on August 18, 2009, the Board was provided materials relevant to its consideration of the Reams Subadvisory Agreement, such as Reams’ Form ADV and Code of Ethics, information regarding Reams’ compliance program, personnel and financial condition and memoranda prepared by the Company’s legal counsel. The Board also reviewed the subadvisory fees payable by each Fund and the Adviser under the Reams Subadvisory Agreement and the proposed expense cap agreement between the Company and the Adviser on behalf of each Fund. The Board was also provided with the Reams’ responses to detailed requests submitted by the Company’s legal counsel on behalf of the Directors.
In approving the Reams Subadvisory Agreement between the Adviser and Reams, the Board considered the following factors and made the following conclusions with respect to each Fund:
Columbus Core Plus Fund
Nature, Extent and Quality of the Services to be Provided. The Board’s analysis of the nature, extent and quality of Reams’ services to the Columbus Core Plus Fund took into account knowledge gained from Reams’ presentations to the Board at meetings throughout the year. The Board reviewed and considered Reams’ investment strategy, experience as a fixed income manager, key personnel involved in providing investment management services to the Columbus Core Plus Fund and financial condition. The Board also considered services provided by Reams under the Reams Subadvisory Agreement, including the selection of fixed income dealers, monitoring adherence to the Columbus Core Plus Fund’s investment restrictions and assisting with the Columbus Core Plus Fund’s compliance with applicable securities laws and regulations. The Board concluded that the nature, extent and quality of the services provided by Reams to the Columbus Core Plus Fund was appropriate and that the Columbus Core Plus Fund was likely to continue to benefit from services provided by Reams under the Reams Subadvisory Agreement.
Investment Performance of the Fund. The Board reviewed the performance record of the Columbus Core Plus Fund. It noted that the Columbus Core Plus Fund had outperformed its benchmark index for the one-, three-, five-, ten-year and since inception periods ended June 30, 2009. The Board also considered Reams’ quarterly portfolio commentary and review of the Core Plus Fund’s performance. The Board concluded that Reams would continue to provide a high level of subadvisory services to the Core Plus Fund.
Subadvisory Fees. The Board reviewed and considered the subadvisory fees payable by the Adviser to Reams under the Reams Subadvisory Agreement. The Board determined that the subadvisory fee payable with respect to the Columbus Core Plus Fund was appropriate in light of the Columbus Core Plus Fund’s investment style and in comparison to fees paid by separate account clients of Reams managed in the same style as the Core Plus Fund. In evaluating the subadvisory fee, the Board noted that the fee is paid by the Adviser and that therefore the overall advisory fee paid by the Columbus Core Plus Fund is not directly affected by the subadvisory fee.
Costs and Profitability. The Board did not consider the cost of services provided by Reams or the profitability to Reams from its relationship with the Columbus Core Plus Fund because it did not view these factors as relevant given that the subadvisory fee is paid by the Adviser.
Economies of Scale. Because the subadvisory fee is not paid by the Columbus Core Plus Fund, the Board did not consider whether the fee should reflect any potential economies of scale that might be realized as the Columbus Core Plus Fund assets increase.
Benefits to Reams. The Board considered information presented regarding any benefits to Reams from serving as subadviser to the Columbus Core Plus Fund (in addition to the subadvisory fee). The Board noted that Reams does not participate in soft dollar arrangements with respect to fixed income transactions. The Board also noted that Reams had received consulting services from Frontier, an affiliate of the Adviser.
Columbus Core Fund
Nature, Extent and Quality of the Services to be Provided. The Board’s analysis of the nature, extent and quality of Reams’ services to the Columbus Core Fund took into account knowledge gained from Reams’ presentations to the Board at meetings throughout the year. The Board reviewed and considered Reams’ investment strategy, experience as a fixed income manager, key personnel involved in providing investment management services to the Columbus Core Fund and financial condition. The Board also considered services provided by Reams under the Reams Subadvisory Agreement, including the selection of fixed income dealers, monitoring adherence to the Columbus Core Fund’s investment restrictions and assisting with the Columbus Core Fund’s compliance with applicable securities laws and regulations. The Board concluded that the nature, extent and quality of the services provided by Reams to the Columbus Core Fund was appropriate and that the Columbus Core Fund was likely to continue to benefit from services provided by Reams under the Reams Subadvisory Agreement.
Investment Performance of the Fund. The Board reviewed the performance record of the Columbus Core Fund. The Board noted that the Columbus Core Fund had outperformed its benchmark index for the one-, three-, five- and since inception periods ended June 30, 2009. The Board also considered Reams’ quarterly portfolio commentary and review of the Columbus Core Fund’s performance. The Board concluded that Reams would continue to provide a high level of subadvisory services to the Columbus Core Fund.
Subadvisory Fees. The Board reviewed and considered the subadvisory fees payable by the Adviser to Reams under the Reams Subadvisory Agreement. The Board determined that the subadvisory fee payable with respect to the Columbus Core Fund was appropriate in light of the Columbus Core Fund’s investment style and in comparison to fees paid by separate account clients of Reams managed in the same style as the Columbus Core Fund. In evaluating the subadvisory fee, the Board noted that the fee is paid by the Adviser and that therefore the overall advisory fee paid by the Columbus Core Fund is not directly affected by the subadvisory fee.
Costs and Profitability. The Board did not consider the cost of services provided by Reams or the profitability to Reams from its relationship with the Columbus Core Fund because it did not view these factors as relevant given that the subadvisory fee is paid by the Adviser.
Economies of Scale. Because the subadvisory fee is not paid by the Columbus Core Fund, the Board did not consider whether the fee should reflect any potential economies of scale that might be realized as the Columbus Core Fund assets increase.
Benefits to Reams. The Board considered information presented regarding any benefits to Reams from serving as subadviser to the Columbus Core Fund (in addition to the subadvisory fee). The Board noted that Reams does not participate in soft dollar arrangements with respect to fixed income transactions. The Board also noted that Reams had received consulting services from Frontier, an affiliate of the Adviser.
On the basis of its review of the foregoing information, the Board found that the terms of the Reams Subadvisory Agreement were fair and reasonable and in the best interest of the shareholders of the Columbus Core Plus and Columbus Core Funds.
IronBridge Small Cap and SMID Funds
When the Board reviewed the subadvisory agreement between the Adviser and IronBridge Capital Management, L.P. (“IronBridge”) on behalf of the IronBridge Small Cap Fund and IronBridge SMID Fund (the “IronBridge Subadvisory Agreement”) on August 18, 2009, the Board was provided materials relevant to its consideration of the IronBridge Subadvisory Agreement, such as IronBridge’ Form ADV and Code of Ethics, information regarding IronBridge’s compliance program, personnel and financial condition and memoranda prepared by the Company’s legal counsel. The Board also reviewed the subadvisory fees payable by each Fund and the Adviser under the IronBridge Subadvisory Agreement and the proposed expense cap agreement between the Company and the Adviser on behalf of each Fund. The Board was also provided with IronBridge’s responses to detailed requests submitted by the Company’s legal counsel on behalf of the Directors.
In approving the IronBridge Subadvisory Agreement between the Adviser and IronBridge, the Board considered the following factors and made the following conclusions with respect to each Fund:
IronBridge Small Cap Fund
Nature, Extent and Quality of the Services to be Provided. The Board’s analysis of the nature, extent and quality of IronBridge’s services to the IronBridge Small Cap Fund took into account knowledge gained from IronBridge’s presentations to the Board at meetings throughout the year. The Board reviewed and considered IronBridge’s proprietary investment style, key personnel involved in providing investment management services to the IronBridge Small Cap Fund and financial condition. The Board also considered services provided by IronBridge under the IronBridge Subadvisory Agreement, including the selection of broker-dealers for execution of portfolio transactions, monitoring adherence to the IronBridge Small Cap Fund’s investment restrictions and assisting with the IronBridge Small Cap Fund’s compliance with applicable securities laws and regulations. The Board concluded that the nature, extent and quality of the services provided by IronBridge to the IronBridge Small Cap Fund was appropriate and that the IronBridge Small Cap Fund was likely to continue to benefit from services provided by IronBridge under the IronBridge Subadvisory Agreement.
Investment Performance of the Fund. The Board reviewed the performance record of the IronBridge Small Cap Fund. It noted that the IronBridge Small Cap Fund had slightly underperformed its benchmark for the one-year period and outperformed its benchmark index for the three-, five-year and since-inception periods ended June 30, 2009. The Board also considered IronBridge’s quarterly portfolio commentary and review of the IronBridge Small Cap Fund’s performance. The Board also compared the IronBridge Small Cap Fund’s performance for the period ended June 30, 2009 to the performance for the corresponding composite of IronBridge’s separate account clients. The Board concluded that IronBridge would continue to provide a high level of subadvisory services to the IronBridge Small Cap Fund.
Subadvisory Fees. The Board reviewed and considered the subadvisory fees payable by the Adviser to IronBridge under the IronBridge Subadvisory Agreement. The Board determined that the subadvisory fee payable with respect to the IronBridge Small Cap Fund was appropriate in light of the IronBridge Small Cap Fund’s investment style. In evaluating the subadvisory fee, the Board noted that such amounts are paid by the Adviser and that therefore the overall advisory fee paid by the IronBridge Small Cap Fund is not directly affected by the subadvisory fee.
Costs and Profitability. The Board did not consider the cost of services provided by IronBridge or the profitability to IronBridge from its relationship with the IronBridge Small Cap Fund because it did not view these factors as relevant given that the subadvisory fee is paid by the Adviser.
Economies of Scale. Because the subadvisory fee is not paid by the IronBridge Small Cap Fund, the Board did not consider whether the fee should reflect any potential economies of scale that might be realized as IronBridge Small Cap Fund assets increase.
Benefits to IronBridge. The Board considered information presented regarding any benefits to IronBridge from serving as subadviser to the IronBridge Small Cap Fund (in addition to the subadvisory fee). The Board noted that IronBridge uses IronBridge Small Cap Fund brokerage to obtain non-execution services on a limited basis. The Board also noted that IronBridge had received consulting services from Frontier, an affiliate of the Adviser.
IronBridge SMID Fund
Nature, Extent and Quality of the Services to be Provided. The Board’s analysis of the nature, extent and quality of IronBridge’s services to the IronBridge SMID Fund took into account knowledge gained from IronBridge’s presentations to the Board at meetings throughout the year. The Board reviewed and considered IronBridge’s proprietary investment style, key personnel involved in providing investment management services to the IronBridge SMID Fund and financial condition. The Board also considered services provided by IronBridge under the IronBridge Subadvisory Agreement, including the selection of broker-dealers for execution of portfolio transactions, monitoring adherence to the IronBridge SMID Fund’s investment restrictions and assisting with the IronBridge SMID Fund’s compliance with applicable securities laws and regulations. The Board concluded that the nature, extent and quality of the services provided by IronBridge to the IronBridge SMID Fund was appropriate and that the IronBridge SMID Fund was likely to continue to benefit from services provided by IronBridge under the IronBridge Subadvisory Agreement.
Investment Performance of the Fund. The Board reviewed the performance record of the IronBridge SMID Fund. The Board noted that the IronBridge SMID Fund had outperformed its benchmark index for the one-, three-year and since-inception periods ended June 30, 2009. The Board also considered IronBridge’s quarterly portfolio commentary and review of the IronBridge SMID Fund’s performance. The Board also compared the IronBridge SMID Fund’s performance for the period ended June 30, 2009 to the performance for the corresponding composite of IronBridge’s separate account clients. The Board concluded that IronBridge would continue to provide a high level of subadvisory services to the IronBridge SMID Fund.
Subadvisory Fees. The Board reviewed and considered the subadvisory fees payable by the Adviser to IronBridge under the IronBridge Subadvisory Agreement. The Board determined that the subadvisory fee payable with respect to the IronBridge SMID Fund was appropriate in light of the IronBridge SMID Fund’s investment style. In evaluating the subadvisory fee, the Board noted that such amounts are paid by the Adviser and that therefore the overall advisory fee paid by the IronBridge SMID Fund is not directly affected by the subadvisory fee.
Costs and Profitability. The Board did not consider the cost of services provided by IronBridge or the profitability to IronBridge from its relationship with the IronBridge SMID Fund because it did not view these factors as relevant given that the subadvisory fee is paid by the Adviser.
Economies of Scale. Because the subadvisory fee is not paid by the IronBridge SMID Fund, the Board did not consider whether the fee should reflect any potential economies of scale that might be realized as IronBridge SMID Fund assets increase.
Benefits to IronBridge. The Board considered information presented regarding any benefits to IronBridge from serving as subadviser to the IronBridge SMID Fund (in addition to the subadvisory fee). The Board noted that IronBridge uses IronBridge SMID Fund brokerage to obtain non-execution services on a limited basis. The Board also noted that IronBridge had received consulting services from Frontier, an affiliate of the Adviser.
On the basis of its review of the foregoing information, the Board found that the terms of the IronBridge Subadvisory Agreement were fair and reasonable and in the best interest of the shareholders of the IronBridge Small Cap and IronBridge SMID Funds.
Netols Small Cap Value Fund
When the Board reviewed the subadvisory agreement between the Adviser and Netols Asset Management, Inc. (“Netols”) on behalf of the Netols Small Cap Value Fund (the “Netols Subadvisory Agreement ”) on August 18, 2009, the Board was provided materials relevant to its consideration of the Netols Subadvisory Agreement, such as Netols’ Form ADV and Code of Ethics, information regarding Netols’ compliance program, personnel and financial condition and memoranda prepared by the Company’s legal counsel. The Board also reviewed the subadvisory fees payable by the Netols Small Cap Value Fund and the Adviser under the Netols Subadvisory Agreement and the proposed expense cap agreement between the Company and the Adviser on behalf of the Netols Small Cap Value Fund. The Board was also provided with Netols’ responses to detailed requests submitted by the Company’s legal counsel on behalf of the Directors.
In approving the Netols Subadvisory Agreement between the Adviser and Netols, the Board considered the following factors and made the following conclusions:
Nature, Extent and Quality of the Services to be Provided. The Board’s analysis of the nature, extent and quality of Netols’ services to the Fund took into account knowledge gained from Netols’ presentations to the Board at meetings throughout the year. The Board reviewed and considered Netols’ investment strategy and experience as a small-cap value manager, key personnel involved in providing investment management services to the Fund and financial condition. The Board also considered services provided by Netols under the Netols Subadvisory Agreement, including the selection of broker-dealers for execution of portfolio transactions, monitoring adherence to the Fund’s investment restrictions and assisting with the Fund’s compliance with applicable securities laws and regulations. The Board concluded that the nature, extent and quality of the services provided by Netols to the Fund was appropriate and that the Fund was likely to continue to benefit from services provided by Netols under the Netols Subadvisory Agreement.
Investment Performance of Netols. The Board reviewed the performance record of the Netols Small Cap Value Fund and noted that the Fund had outperformed its benchmark index for the one-, three-year and since-inception periods ended June 30, 2009. The Board also considered Netols’ quarterly portfolio commentary and review of the Fund’s performance. The Board also compared the Fund’s recent performance to the performance of Netols’ composite of other accounts managed in the small cap value style. The Board concluded that the Fund’s performance was satisfactory and that Netols would continue to provide a high level of subadvisory services to the Fund.
Subadvisory Fees. The Board reviewed and considered the subadvisory fees payable by the Adviser to Netols under the Netols Subadvisory Agreement. The Board determined that the subadvisory fee payable was appropriate in light of the Netols Small Cap Value Fund’s investment style. In evaluating the subadvisory fee, the Board noted that such amounts are paid by the Adviser and that therefore the overall advisory fee paid by the Netols Small Cap Value Fund is not directly affected by the subadvisory fee.
Costs and Profitability. The Board did not consider the cost of services provided by Netols or the profitability to Netols from its relationship with the Netols Small Cap Value Fund because it did not view these factors as relevant given that the subadvisory fee is paid by the Adviser.
Economies of Scale. Because the subadvisory fee is not paid by the Netols Small Cap Value Fund, the Board did not consider whether the fee should reflect any potential economies of scale that might be realized as the Netols Small Cap Value Fund assets increase.
Benefits to Netols. The Board considered information presented regarding any benefits to Netols from serving as subadviser to the Netols Small Cap Value Fund (in addition to the subadvisory fee). Netols provided information to the Board regarding its policies of the use of soft dollar commissions. The Board also noted that Netols had received consulting services from Frontier, an affiliate of the Adviser.
On the basis of its review of the foregoing information, the Board found that the terms of the Netols Subadvisory Agreement were fair and reasonable and in the best interest of the shareholders of the Netols Small Cap Value Fund.
Board Approval of New Subadvisory Agreement for Frontegra IronBridge Global Focus Fund
The Board reviewed the new subadvisory agreement between IronBridge and IronBridge International, Ltd. (“IronBridge International”) on behalf of the Frontegra IronBridge Global Focus Fund (the “IronBridge Global Focus Fund”) on August 18, 2009. The Board had previously approved the investment advisory agreement between IronBridge and the Company, on behalf of the IronBridge Global Focus Fund, pursuant to which IronBridge acts as the IronBridge Global Focus Fund’s investment adviser and permits IronBridge to delegate certain of its responsibilities to a subadviser. On August 18, 2009, the Board was provided materials relevant to its consideration of the agreement, such as IronBridge International’s Form ADV and Code of Ethics and information regarding IronBridge International’s compliance program, performance track record, investment strategy, trading procedures, personnel and financial condition.
In approving the subadvisory agreement between IronBridge and IronBridge International regarding the IronBridge Global Focus Fund, the Board considered the following factors and made the following conclusions:
Nature, Extent and Quality of the Services to be Provided. The Board’s analysis of the nature, extent and quality of IronBridge International’s proposed services to the Fund took into account knowledge gained from IronBridge’s presentations at meetings throughout the year in relation to the existing IronBridge Small Cap and IronBridge SMID Funds and other information presented at previous meetings. The Board reviewed and considered IronBridge International’s global focus investment strategy and experience as an international manager and key personnel involved in providing investment management services to the Fund. The Board also considered services to be provided by IronBridge International under the subadvisory agreement, including monitoring adherence to the Fund’s investment restrictions and assisting with the Fund’s compliance with applicable securities laws and regulations. The Board also considered that IronBridge and IronBridge International are affiliated entities, and that IronBridge would be responsible for the selection of broker-dealers for the execution of portfolio securities and would oversee IronBridge International’s adherence to IronBridge’s compliance policies and procedures. The Board concluded that the nature, extent and quality of the services to be provided by IronBridge International to the Fund was appropriate and that the Fund was likely to benefit from services provided by IronBridge International under the subadvisory agreement.
Investment Performance of IronBridge International. Because the IronBridge Global Focus Fund had not yet commenced operations, the Board did not consider the investment performance of the IronBridge Global Focus Fund.
Proposed Fee. The Board determined that the proposed subadvisory fee was appropriate in light of the Fund’s investment style. In evaluating the subadvisory fee, the Board noted that the fee is paid by IronBridge and that therefore the overall advisory fee paid by the Fund is not directly affected by the subadvisory fee.
Costs and Profitability. IronBridge International did not provide any specific information regarding the costs of services to be provided or the profits they might realize because the Fund had not yet commenced operations.
Economies of Scale. Because the subadvisory fee is not paid by the Fund, the Board did not consider whether the fee should reflect any potential economies of scale that might be realized as Fund assets increase.
Benefits to IronBridge International. The Board considered information presented regarding any benefits to IronBridge International from serving as subadviser to the IronBridge Global Focus Fund (in addition to the subadvisory fee). IronBridge International provided information to the Board regarding its policies for the use of soft dollar commissions.
On the basis of its review of the foregoing information, the Board found that the terms of the subadvisory agreement between IronBridge and IronBridge International were fair and reasonable and in the best interests of the IronBridge Global Focus Fund’s shareholders.
Board Approval of Interim and New Subadvisory Agreements for Frontegra Mastholm International Equity Fund
The Board, including a majority of the Directors who are not interested persons of the Company or the Adviser, approved interim and new subadvisory agreements between the Adviser and Mastholm Asset Management, LLC (“Mastholm”) on behalf of the Mastholm International Equity Fund. The Board approved the interim subadvisory agreement (the “Interim Agreement”) at a special meeting held on October 2, 2009 and approved the new subadvisory agreement (the “Mastholm Subadvisory Agreement”) at a meeting held on November 17, 2009. Both the Interim Agreement and Mastholm Subadvisory Agreement contain identical terms as the prior subadvisory agreement between the Adviser and New Star Institutional Managers Limited (“New Star”), the prior subadviser to the Fund (the “Prior Subadvisory Agreement”), with respect to services provided and fee structure. The Board considered substantially the same factors in approving the Interim Agreement as were considered in approving the Mastholm Subadvisory Agreement. Pursuant to the Mastholm Subadvisory Agreement, Mastholm would continue to provide investment advisory services to the Fund, pending shareholder approval of the Agreement.
In reaching its decision, the Board considered that the terms of the Mastholm Subadvisory Agreement are substantially the same as the terms of the Prior Subadvisory Agreement. The Board also considered the presentation by Mastholm and information received at its October 2, 2009 meeting, and other materials received at the November 17, 2009 meeting. These materials included Mastholm’s Form ADV and Code of Ethics, information regarding Mastholm’s compliance program, personnel and financial condition, memoranda prepared by the Company’s legal counsel and Mastholm’s responses to detailed requests submitted on behalf of the Board. Additionally, the Board reviewed the subadvisory fees payable by the Adviser under the Mastholm Subadvisory Agreement, which are identical to the subadvisory fees payable under the Prior Subadvisory Agreement, and the fact that no changes would be made to the expense cap agreement between the Company and the Adviser on behalf of the Fund. In approving the Mastholm Subadvisory Agreement on November 17, 2009, the Board considered the following factors and made the following conclusions:
Nature, extent and quality of the services to be Provided. The Board reviewed and considered Mastholm’s non-US equity investment strategy and experience as an international manager, key personnel involved in providing investment management services to the Fund and financial condition. The Board considered that the services provided by Mastholm under the Mastholm Subadvisory Agreement would not change from those provided by New Star under the Prior Subadvisory Agreement, including the selection of broker-dealers for execution of portfolio transactions, monitoring adherence to the Fund’s investment restrictions and assisting with the Fund’s compliance with applicable securities laws and regulations. The Board concluded that the nature, extent and quality of the services provided by Mastholm to the Fund were appropriate and that the Fund was likely to benefit from services provided by Mastholm under the Mastholm Subadvisory Agreement.
Investment performance of Mastholm. The Board reviewed historical performance data for Mastholm’s Non-US Growth Equity Composite. The Board concluded that Mastholm appeared to have an effective non-US growth investment process.
Subadvisory fees. The Board reviewed and considered the subadvisory fee payable by the Adviser to Mastholm under the Mastholm Subadvisory Agreement. The Board also reviewed information regarding Mastholm’s fee structures for other investment fund portfolios. The Board determined that the subadvisory fee was appropriate. In evaluating the subadvisory fee, the Board noted that the fee is paid by the Adviser and that therefore the overall advisory fee paid by the Fund is not directly affected by the subadvisory fee.
Costs and profitability. The Board did not consider the cost of services provided by Mastholm under the Mastholm Subadvisory Agreement or the profitability to Mastholm from its relationship with the Fund because it did not view these factors as relevant given that the subadvisory fee is paid by the Adviser.
Economies of scale. Because the subadvisory fee is not paid by the Fund, the Board did not consider whether the fee should reflect any potential economies of scale that might be realized as Fund assets increase.
Benefits to Mastholm. The Board considered information presented regarding any benefits to Mastholm from serving as subadviser to the Fund (in addition to the subadvisory fee). The Board noted that, in the future, Mastholm may receive consulting services from Frontier, an affiliate of the Adviser. The Board concluded that, taking into account this potential benefit, the subadvisory fee was reasonable.
On the basis of its review of the foregoing information, the Board found that the terms of the Mastholm Subadvisory Agreement were fair and reasonable and in the best interest of the shareholders of the Mastholm International Equity Fund.
VOTING RESULTS OF SPECIAL MEETING OF SHAREHOLDERS
A special meeting of shareholders (the “Special Meeting”) of Frontegra Funds, Inc. was held on August 27, 2009. At the Special Meeting, shareholders voted on a proposal to approve a new subadvisory agreement between New Star Institutional Managers Ltd. (“New Star”) and Frontegra Asset Management, Inc. (“Frontegra”). Further details regarding the proposal and the Special Meeting are contained in a definitive proxy statement filed with the SEC on July 27, 2009.
At the Special Meeting held on August 27, 2009, a new subadvisory agreement between New Star and Frontegra was approved by the shareholders of the Frontegra New Star International Equity Fund as follows:
| Votes For | Votes Against | Abstained | Broker Non-Votes |
| 12,813,307 | 0 | 0 | 0 |
A Note on Forward-Looking Statements
This report includes forward-looking statements such as adviser, subadviser and/or portfolio manager predictions, assessments, analyses or outlooks for individual securities, industries, market sectors and/or markets. These statements involve risks and uncertainties. In addition to the general risks described for the Funds in the current Prospectuses, other factors bearing on these statements include the accuracy of the adviser’s, subadvisers’ or portfolio manager’s forecasts and predictions, and the appropriateness of the investment programs designed by the adviser, subadviser or portfolio manager to implement their strategies efficiently and effectively. Any one or more of these factors, as well as other risks affecting the securities markets and investment instruments generally, could cause the actual results of the Funds to differ materially as compared to benchmarks associated with the Funds.
In addition, portfolio composition will change due to ongoing management of the Funds. Specific securities named in this report may not currently be owned by the applicable Fund, or the Fund’s position in the securities may have changed.
Additional Information
Frontegra Funds has adopted proxy voting policies and procedures that delegate to Frontegra Asset Management, Inc., the Funds’ investment adviser (the “Adviser”), the authority to vote proxies. The proxy voting policies permit the Adviser to delegate its authority to vote proxies to each Fund’s subadviser. A description of the Frontegra Funds’ proxy voting policies and procedures is available without charge, upon request, by calling the Funds toll free at 1-888-825-2100. A description of these policies and procedures is also included in the Funds’ Statement of Additional Information, which is available on the SEC’s website at http://www.sec.gov or by calling the Funds toll free at 1-888-825-2100.
The actual voting records relating to each Fund’s portfolio securities during the most recent twelve months ended June 30 are available without charge by calling the Funds toll free at 1-888-825-2100 or by accessing the SEC’s website at http://www.sec.gov.
Each Fund files a complete schedule of portfolio holdings for its first and third fiscal quarters with the SEC on Form N-Q. The Form N-Q is available on the SEC’s website at http://www.sec.gov. The Form N-Q may also be reviewed and copied at the SEC’s Public Reference Room in Washington, D.C. Information on the operation of the Public Reference Room may be obtained by calling toll-free 1-800-SEC-0330.
Item 2. Code of Ethics.
Not applicable for semi-annual reports.
Item 3. Audit Committee Financial Expert.
Not applicable for semi-annual reports.
Item 4. Principal Accountant Fees and Services.
Not applicable for semi-annual reports.
Item 5. Audit Committee of Listed Registrants.
Not applicable to registrants who are not listed issuers (as defined in Rule 10A-3 under the Securities Exchange Act of 1934).
Item 6. Investments.
| (a) | Schedule of Investments is included as part of the report to shareholders filed under Item 1 of this Form. |
Item 7. Disclosure of Proxy Voting Policies and Procedures for Closed-End Management Investment Companies.
Not applicable to open-end investment companies.
Item 8. Portfolio Managers of Closed-End Management Investment Companies.
Not applicable to open-end investment companies.
Item 9. Purchases of Equity Securities by Closed-End Management Investment Company and Affiliated Purchasers.
Not applicable to open-end investment companies.
Item 10. Submission of Matters to a Vote of Security Holders.
Not Applicable.
Item 11. Controls and Procedures.
| (a) | Based on an evaluation of the Registrant's disclosure controls and procedures (as defined in Rule 30a-3(c) under the Investment Company Act of 1940 (the “Act”)) as of a date within 90 days prior to the filing date of this Form N-CSR, the Registrant’s President and Treasurer have concluded that the disclosure controls and procedures are effective. |
| (b) | There were no changes in the Registrant's internal control over financial reporting (as defined in Rule 30a-3(d) under the Act) that occurred during the second fiscal quarter of the period covered by this report that have materially affected, or are reasonably likely to materially affect, the Registrant's internal control over financial reporting. |
Item 12. Exhibits.
| (a) | (1) Any code of ethics or amendment thereto, that is the subject of the disclosure required by Item 2, to the extent that the registrant intends to satisfy Item 2 requirements through filing an exhibit. Not applicable. |
(2) A separate certification for each principal executive and principal financial officer pursuant to Section 302 of the Sarbanes-Oxley Act of 2002. Filed herewith.
(3) Any written solicitation to purchase securities under Rule 23c-1 under the Act sent or given during the period covered by the report by or on behalf of the registrant to 10 or more persons. Not applicable to open-end investment companies.
| (b) | Certifications pursuant to Section 906 of the Sarbanes-Oxley Act of 2002. Furnished herewith. |
SIGNATURES
Pursuant to the requirements of the Securities Exchange Act of 1934 and the Investment Company Act of 1940, the registrant has duly caused this report to be signed on its behalf by the undersigned, thereunto duly authorized.
Frontegra Funds, Inc.
By: /s/ William D. Forsyth III
William D. Forsyth III, President
(Principal Executive Officer)
Date: March 9, 2010
Pursuant to the requirements of the Securities Exchange Act of 1934 and the Investment Company Act of 1940, this report has been signed below by the following persons on behalf of the registrant and in the capacities and on the dates indicated.
By: /s/ William D. Forsyth III
William D. Forsyth III, President and Secretary
(Principal Executive Officer)
Date: March 9, 2010
By: /s/ Elyce D. Dilworth
Elyce D. Dilworth, Treasurer and Assistant Secretary
(Principal Financial Officer)
Date: March 9, 2010